Embed Size (px)
Citation preview
Journal of Fish Biology (2012) 80, 2328–2344
doi:10.1111/j.1095-8649.2012.03292.x, available online at wileyonlinelibrary.com
Age and growth of albacore Thunnus alalungain the North Pacific Ocean
K.-S. Chen*†, T. Shimose‡, T. Tanabe§, C.-Y. Chen‖ and C.-C. Hsu*¶
*Institute of Oceanography, College of Science, National Taiwan University, Taipei 10617,Taiwan, R.O.C., ‡Research Center for Subtropical Fisheries, Seikai National FisheriesResearch Institute, Fisheries Research Agency, 148-446, Fukai-Ohta, Ishigaki, Okinawa
907-0451, Japan, §National Research Institute of Far Seas Fisheries, Fisheries ResearchAgency, 5-7-1, Orido, Shimizu, Shizuoka 424-8633, Japan and ‖Department of Environmental
Engineering, National Kaohsiung Marine University, Kaohsiung 81143, Taiwan, R.O.C.
(Received 20 April 2011, Accepted 28 February 2012)
The age and growth of North Pacific albacore Thunnus alalunga were investigated using obliquelysectioned sagittal otoliths from samples of 126 females and 148 males. Otolith edge analysis indi-cated that the identified annulus in a sagittal otolith is primarily formed during the period fromSeptember to February. The assessments of the fish age at first annulus formation indicated thatthe first annulus represents an age of <1 year. This study presents an age estimate (0·75 years) forthe formation of the first annulus. The oldest fish ages observed in this study were 10 years forfemales and 14 years for males. The von Bertalanffy growth parameters of females estimated wereL∞ = 103·5 cm in fork length (LF), K = 0·340 year−1 and t0 = −0·53 years, and the parametersof males were L∞ = 114·0 cm, K = 0·253 year−1 and t0 = −1·01 years. Sexual size dimorphismbetween males and females seemed to occur after reaching sexual maturity. The coefficients ofthe power function for expressing the LF –mass relationship obtained from sex-pooled data werea = 2·964 × 10−5 and b = 2·928. © 2012 The Authors
Journal of Fish Biology © 2012 The Fisheries Society of the British Isles
Key words: age validation; growth parameter; length and mass relationship; otolith microstructure.
INTRODUCTION
Albacore Thunnus alalunga (Bonnaterre 1788) is a cosmopolitan species and animportant exploited resource for many nations. For stock-assessment and fisheries-management purposes, at least six T. alalunga stocks have been distinguished or used,i.e. North Pacific, South Pacific, North Atlantic, South Atlantic, Mediterranean andIndian stocks (Murray, 1994; ICCAT, 1996; Huang et al., 2003). Young T. alalungatend to inhabit temperate waters, whereas mature fish are likely to stay in sub-tropical waters for protracted periods (Kimura et al., 1997; Chen et al., 2005). Thedistribution of North Pacific T. alalunga ranges from the equator to 45◦ N in thewest and from the waters off Mexico (c. 20◦ N) to the Gulf of Alaska (c. 60◦ N)
¶Author to whom correspondence should be addressed. Tel.: +886 2 33661393; email: [email protected]†Present address: Department of Marine Biotechnology and Resources, National Sun Yat-sen University,
Kaohsiung 80424, Taiwan, R.O.C.
2328© 2012 The Authors
Journal of Fish Biology © 2012 The Fisheries Society of the British Isles
AG E A N D G ROW T H O F T H U N N U S A L A L U N G A 2329
in the east (Foreman, 1980). The annual fisheries production of North Pacific T.alalunga reported for the period of 2000 to 2008 ranges from c. 63 000 to 105 000t (ISC, 2010).
Age and growth studies of fish stocks can provide essential biological parametersfor modelling population dynamics of the stocks. In conducting stock assessmentof an exploited fish stock, growth parameters are frequently estimated and used todetermine the mean length at age, age composition and mortality rates of the stock(Ricker, 1975; King, 2007). Using less accurate and precise biological parameters ininputs of stock assessment models can increase uncertainty in model outputs (Hilborn& Walters, 1992). The growth parameters used in the current stock assessment ofNorth Pacific T. alalunga (ISC, 2006) were based on the studies conducted fourdecades ago (Suda, 1966). To improve assessment outputs of this stock, biologicalparameters must be updated regularly to provide recent information on the life-historytraits of the stock in question.
As reviewed by Foreman (1980), both hard parts (e.g. scales and vertebrae) andtag–recapture methods have been used to investigate the age and growth of NorthPacific T. alalunga. Little information is available, however, on the sex-specificgrowth functions of this stock. Because T. alalunga exhibit the sexual size dimor-phism that adult males attain a larger size than females (Otsu & Uchida, 1959; Otsu& Sumida, 1968; Yoshida, 1975), knowing whether male and female North PacificT. alalunga have different growth functions is important for accurately modellingthe population dynamics of this stock.
Sagittal otoliths are frequently used in age determination studies of tunasand many other teleosts (Campana & Neilson, 1982; Tzeng, 1990; Neilson &Campana, 2008). Transversely sectioned otolith slices are commonly used toassess the fish age in tunas. Nevertheless, the otolith slices produced by obliquesections are longer and wider in appearance than the transversely sectioned slices.Longer and wider otolith slices are helpful for clarifying annuli. In tunas, obliquelysectioned otoliths have been used previously for age-and-growth studies (Stequertet al., 1996; Clear et al., 2000; Schaefer & Fuller, 2006) and were produced andused for the age determination of North Pacific T. alalunga in this study.
The first goal of this study was to determine the sex-specific growth parameters ofNorth Pacific T. alalunga. Length and age were recorded and age of each collectedfish specimen was determined by examining annuli in obliquely sectioned otolithslices. The goodness of fit of the von Bertalanffy growth model was evaluated usingboth the coefficient of determination (R2) and an F -test for lack of fit. The likelihoodratio test was used to compare sex-specific growth and length and mass functions.Bootstrapping was conducted to assess uncertainty in the estimates of the biologicalparameters.
MATERIALS AND METHODS
C O L L E C T I O N O F S P E C I M E N S
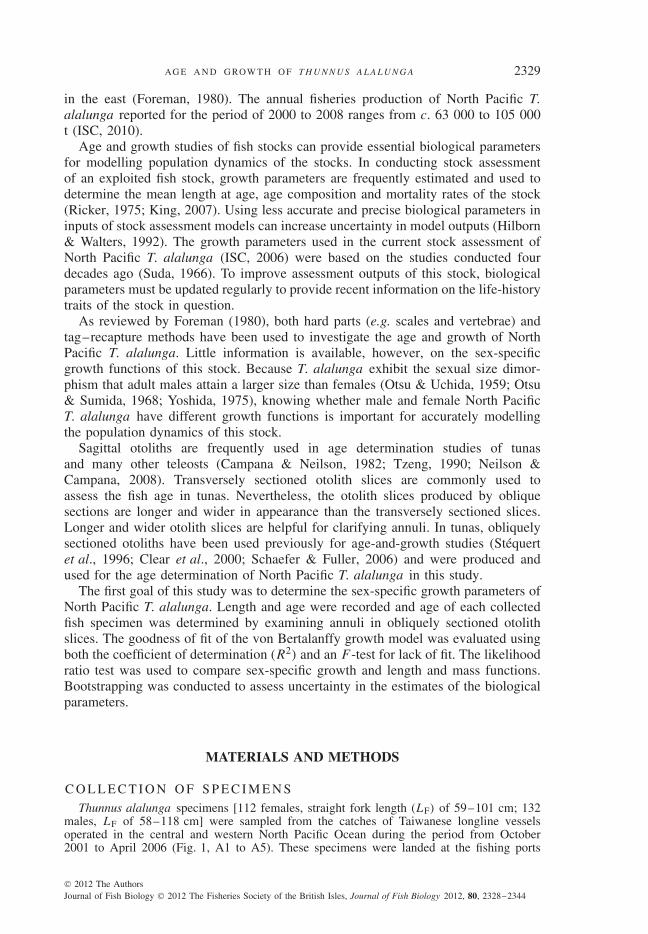
Thunnus alalunga specimens [112 females, straight fork length (LF) of 59–101 cm; 132males, LF of 58–118 cm] were sampled from the catches of Taiwanese longline vesselsoperated in the central and western North Pacific Ocean during the period from October2001 to April 2006 (Fig. 1, A1 to A5). These specimens were landed at the fishing ports
© 2012 The AuthorsJournal of Fish Biology © 2012 The Fisheries Society of the British Isles, Journal of Fish Biology 2012, 80, 2328–2344
2330 K . - S . C H E N E T A L .
50°
40°
30°
20°A1
Japan
TaiwanPacific Ocean
1000 km
A5
A4
A2
A3
10°
0°
110° 120° 130° 140° 150° 160° 170° 170° 160° 150°180°
Fig. 1. Fishing operation areas ( , A1–A5) of the North Pacific Thunnus alalunga specimens collected duringthe period from October 2001 to January 2008. The number of fish collected in each area was: 136 inA1, 120 in A2, 30 in A3, 6 in A4 and 1 in A5.
of Tungkang and Kaohsiung in Taiwan. In addition, specimens of smaller T. alalunga (21females, LF of 46–73 cm; 28 males, LF of 45–74 cm), from A2 in Fig. 1 were collected bycolleagues of the National Research Institute of Far Sea Fisheries, Japan, from the catchesof Japanese pole-and-line vessels during the period from June 2006 to January 2008. Thesespecimens were landed at the fishing port of Kesennuma in Japan. The numbers of fishcollected by year were: 33 in 2001, 79 in 2002, 38 in 2003, 30 in 2004, 40 in 2005, 43 in2006 and 30 between 2007 and 2008; total 293. For each fish, the straight LF (from the tipof the upper jaw to the end of the caudal fork) and body mass (MB) were recorded. In thelaboratory, sagittal otoliths were removed from 288 fish (157 males, LF of 45–118 cm, MBof 2·0–32·2 kg; 131 females, LF of 46–101 cm, MB of 2·2–23·0 kg) and stored in labelledplastic capsules.
P R E PA R I N G OT O L I T H S L I C E S
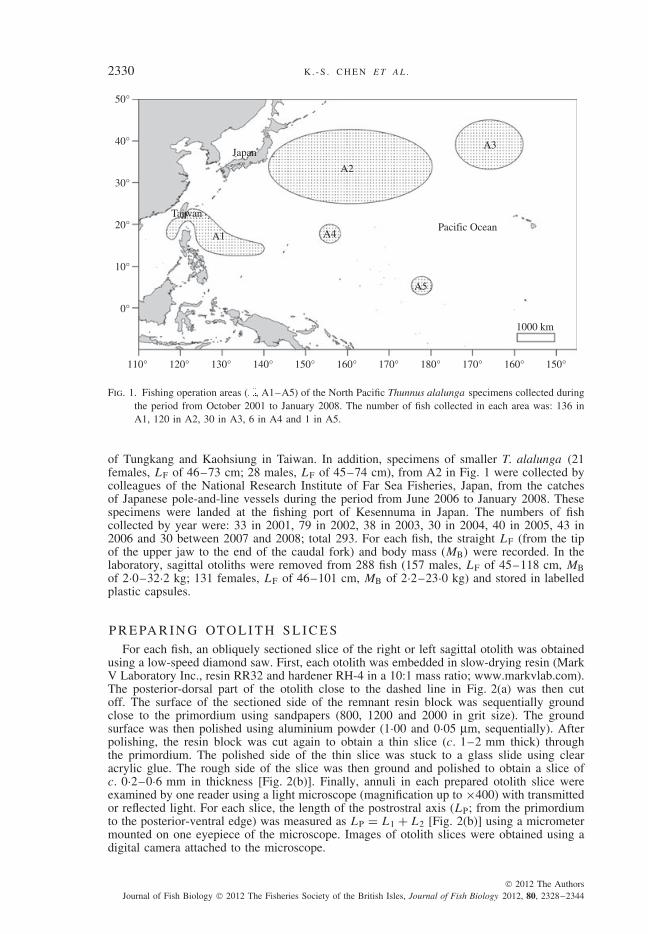
For each fish, an obliquely sectioned slice of the right or left sagittal otolith was obtainedusing a low-speed diamond saw. First, each otolith was embedded in slow-drying resin (MarkV Laboratory Inc., resin RR32 and hardener RH-4 in a 10:1 mass ratio; www.markvlab.com).The posterior-dorsal part of the otolith close to the dashed line in Fig. 2(a) was then cutoff. The surface of the sectioned side of the remnant resin block was sequentially groundclose to the primordium using sandpapers (800, 1200 and 2000 in grit size). The groundsurface was then polished using aluminium powder (1·00 and 0·05 μm, sequentially). Afterpolishing, the resin block was cut again to obtain a thin slice (c. 1–2 mm thick) throughthe primordium. The polished side of the thin slice was stuck to a glass slide using clearacrylic glue. The rough side of the slice was then ground and polished to obtain a slice ofc. 0·2–0·6 mm in thickness [Fig. 2(b)]. Finally, annuli in each prepared otolith slice wereexamined by one reader using a light microscope (magnification up to ×400) with transmittedor reflected light. For each slice, the length of the postrostral axis (LP; from the primordiumto the posterior-ventral edge) was measured as LP = L1 + L2 [Fig. 2(b)] using a micrometermounted on one eyepiece of the microscope. Images of otolith slices were obtained using adigital camera attached to the microscope.
© 2012 The AuthorsJournal of Fish Biology © 2012 The Fisheries Society of the British Isles, Journal of Fish Biology 2012, 80, 2328–2344
AG E A N D G ROW T H O F T H U N N U S A L A L U N G A 2331
(a)
(b)
(c)
A
P
A
Sulcus
FA
B
P
L1
L2
BPR
RO
Ventral
Dorsal
Fig. 2. Legend on next page.
© 2012 The AuthorsJournal of Fish Biology © 2012 The Fisheries Society of the British Isles, Journal of Fish Biology 2012, 80, 2328–2344
2332 K . - S . C H E N E T A L .
AG E E S T I M AT I O N
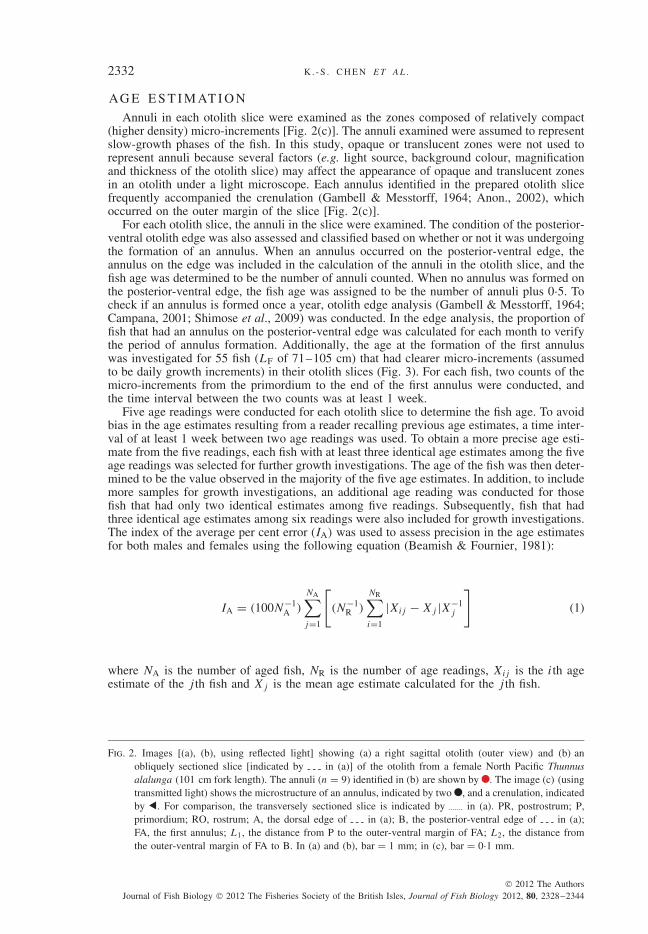
Annuli in each otolith slice were examined as the zones composed of relatively compact(higher density) micro-increments [Fig. 2(c)]. The annuli examined were assumed to representslow-growth phases of the fish. In this study, opaque or translucent zones were not used torepresent annuli because several factors (e.g. light source, background colour, magnificationand thickness of the otolith slice) may affect the appearance of opaque and translucent zonesin an otolith under a light microscope. Each annulus identified in the prepared otolith slicefrequently accompanied the crenulation (Gambell & Messtorff, 1964; Anon., 2002), whichoccurred on the outer margin of the slice [Fig. 2(c)].
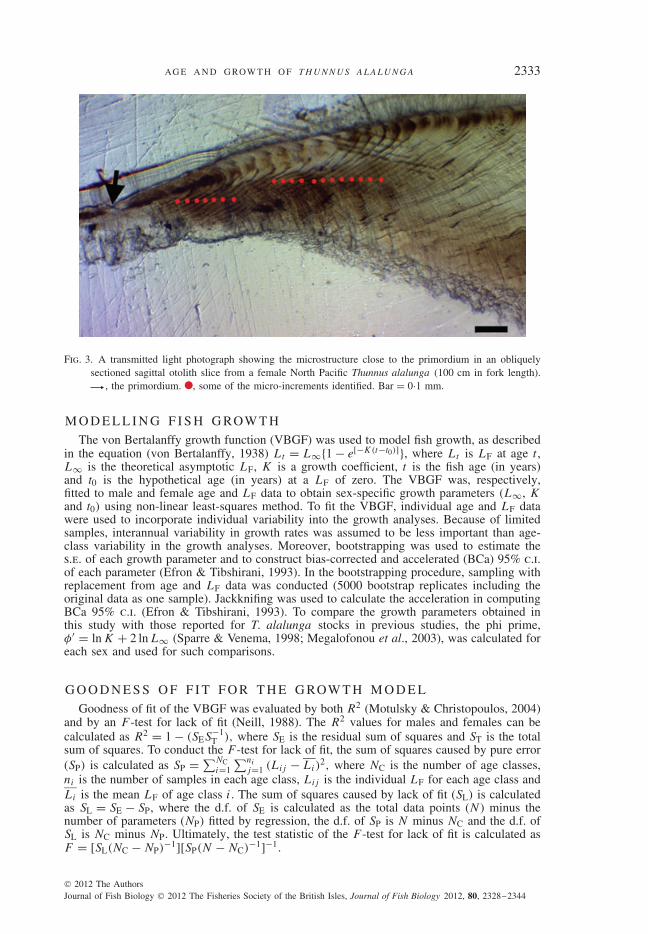
For each otolith slice, the annuli in the slice were examined. The condition of the posterior-ventral otolith edge was also assessed and classified based on whether or not it was undergoingthe formation of an annulus. When an annulus occurred on the posterior-ventral edge, theannulus on the edge was included in the calculation of the annuli in the otolith slice, and thefish age was determined to be the number of annuli counted. When no annulus was formed onthe posterior-ventral edge, the fish age was assigned to be the number of annuli plus 0·5. Tocheck if an annulus is formed once a year, otolith edge analysis (Gambell & Messtorff, 1964;Campana, 2001; Shimose et al., 2009) was conducted. In the edge analysis, the proportion offish that had an annulus on the posterior-ventral edge was calculated for each month to verifythe period of annulus formation. Additionally, the age at the formation of the first annuluswas investigated for 55 fish (LF of 71–105 cm) that had clearer micro-increments (assumedto be daily growth increments) in their otolith slices (Fig. 3). For each fish, two counts of themicro-increments from the primordium to the end of the first annulus were conducted, andthe time interval between the two counts was at least 1 week.
Five age readings were conducted for each otolith slice to determine the fish age. To avoidbias in the age estimates resulting from a reader recalling previous age estimates, a time inter-val of at least 1 week between two age readings was used. To obtain a more precise age esti-mate from the five readings, each fish with at least three identical age estimates among the fiveage readings was selected for further growth investigations. The age of the fish was then deter-mined to be the value observed in the majority of the five age estimates. In addition, to includemore samples for growth investigations, an additional age reading was conducted for thosefish that had only two identical estimates among five readings. Subsequently, fish that hadthree identical age estimates among six readings were also included for growth investigations.The index of the average per cent error (IA) was used to assess precision in the age estimatesfor both males and females using the following equation (Beamish & Fournier, 1981):
IA = (100N−1A )
NA∑j=1
[(N−1
R )
NR∑i=1
|Xij − Xj |X−1j
](1)
where NA is the number of aged fish, NR is the number of age readings, Xij is the ith ageestimate of the j th fish and Xj is the mean age estimate calculated for the j th fish.
Fig. 2. Images [(a), (b), using reflected light] showing (a) a right sagittal otolith (outer view) and (b) anobliquely sectioned slice [indicated by in (a)] of the otolith from a female North Pacific Thunnusalalunga (101 cm fork length). The annuli (n = 9) identified in (b) are shown by . The image (c) (usingtransmitted light) shows the microstructure of an annulus, indicated by two , and a crenulation, indicatedby . For comparison, the transversely sectioned slice is indicated by in (a). PR, postrostrum; P,primordium; RO, rostrum; A, the dorsal edge of in (a); B, the posterior-ventral edge of in (a);FA, the first annulus; L1, the distance from P to the outer-ventral margin of FA; L2, the distance fromthe outer-ventral margin of FA to B. In (a) and (b), bar = 1 mm; in (c), bar = 0·1 mm.
© 2012 The AuthorsJournal of Fish Biology © 2012 The Fisheries Society of the British Isles, Journal of Fish Biology 2012, 80, 2328–2344
AG E A N D G ROW T H O F T H U N N U S A L A L U N G A 2333
Fig. 3. A transmitted light photograph showing the microstructure close to the primordium in an obliquelysectioned sagittal otolith slice from a female North Pacific Thunnus alalunga (100 cm in fork length).
, the primordium. , some of the micro-increments identified. Bar = 0·1 mm.
M O D E L L I N G F I S H G ROW T H
The von Bertalanffy growth function (VBGF) was used to model fish growth, as describedin the equation (von Bertalanffy, 1938) Lt = L∞{1 − e[−K(t−t0)]}, where Lt is LF at age t ,L∞ is the theoretical asymptotic LF, K is a growth coefficient, t is the fish age (in years)and t0 is the hypothetical age (in years) at a LF of zero. The VBGF was, respectively,fitted to male and female age and LF data to obtain sex-specific growth parameters (L∞, Kand t0) using non-linear least-squares method. To fit the VBGF, individual age and LF datawere used to incorporate individual variability into the growth analyses. Because of limitedsamples, interannual variability in growth rates was assumed to be less important than age-class variability in the growth analyses. Moreover, bootstrapping was used to estimate thes.e. of each growth parameter and to construct bias-corrected and accelerated (BCa) 95% c.i.of each parameter (Efron & Tibshirani, 1993). In the bootstrapping procedure, sampling withreplacement from age and LF data was conducted (5000 bootstrap replicates including theoriginal data as one sample). Jackknifing was used to calculate the acceleration in computingBCa 95% c.i. (Efron & Tibshirani, 1993). To compare the growth parameters obtained inthis study with those reported for T. alalunga stocks in previous studies, the phi prime,φ′ = ln K + 2 ln L∞ (Sparre & Venema, 1998; Megalofonou et al., 2003), was calculated foreach sex and used for such comparisons.
G O O D N E S S O F F I T F O R T H E G ROW T H M O D E L
Goodness of fit of the VBGF was evaluated by both R2 (Motulsky & Christopoulos, 2004)and by an F -test for lack of fit (Neill, 1988). The R2 values for males and females can becalculated as R2 = 1 − (SES−1
T ), where SE is the residual sum of squares and ST is the totalsum of squares. To conduct the F -test for lack of fit, the sum of squares caused by pure error(SP) is calculated as SP = ∑NC
i=1
∑ni
j=1 (Lij − Li)2, where NC is the number of age classes,
ni is the number of samples in each age class, Lij is the individual LF for each age class andLi is the mean LF of age class i. The sum of squares caused by lack of fit (SL) is calculatedas SL = SE − SP, where the d.f. of SE is calculated as the total data points (N ) minus thenumber of parameters (NP) fitted by regression, the d.f. of SP is N minus NC and the d.f. ofSL is NC minus NP. Ultimately, the test statistic of the F -test for lack of fit is calculated asF = [SL(NC − NP)
−1][SP(N − NC)−1]−1.
© 2012 The AuthorsJournal of Fish Biology © 2012 The Fisheries Society of the British Isles, Journal of Fish Biology 2012, 80, 2328–2344
2334 K . - S . C H E N E T A L .
C O M PA R I N G S E X - S P E C I F I C G ROW T H F U N C T I O N S
Likelihood ratio tests can be used to compare sex-specific functions of the non-linearVBGF (Haddon, 2001). In this study, the three parameters (L∞, K and t0) of the VBGFwere compared simultaneously using the likelihood ratio test instead of comparing one ortwo parameters. Haddon (2001) found that the test statistic of the likelihood ratio test isempirically a χ2 distribution and can be simplified as χ2
r = −N ln(SSS−1C ), where N is the
total number of samples, r is the d.f. of the assumed χ2 distribution, SS is the total sum ofsquares derived from fitting the VBGF by setting all parameters as being different betweensexes and SC is the total sum of squares obtained from fitting the VBGF using the hypothesizedconstraints of parameters (i.e. an equal value for each parameter between sexes). To avoidcomparing the size distributions of males and females, restricted age and LF data (i.e. ageclasses of 1·25–10·25 years for both sexes) were used in the test.
L E N G T H A N D M A S S R E L AT I O N S H I P
The allometric equation for the LF –MB relationship can be expressed as a power function,MB = aLb
F, where a and b are the coefficients to be estimated (Hsu, 1999). Non-linear least-squares method was used to obtain estimates. Bootstrapping (5000 replicates) was also usedto estimate the s.e. of each coefficient of the LF and MB function. The sex-specific LF andMB functions were compared using a similar approach to that used in comparing sex-specificgrowth functions, as presented above.
The statistical analyses (including curve fitting, likelihood ratio test and bootstrapping) usedin this study were performed using MATLAB (version 7.2, MathWorks Inc.; www.mathworks.com).
RESULTS
AG E VA L I DAT I O N
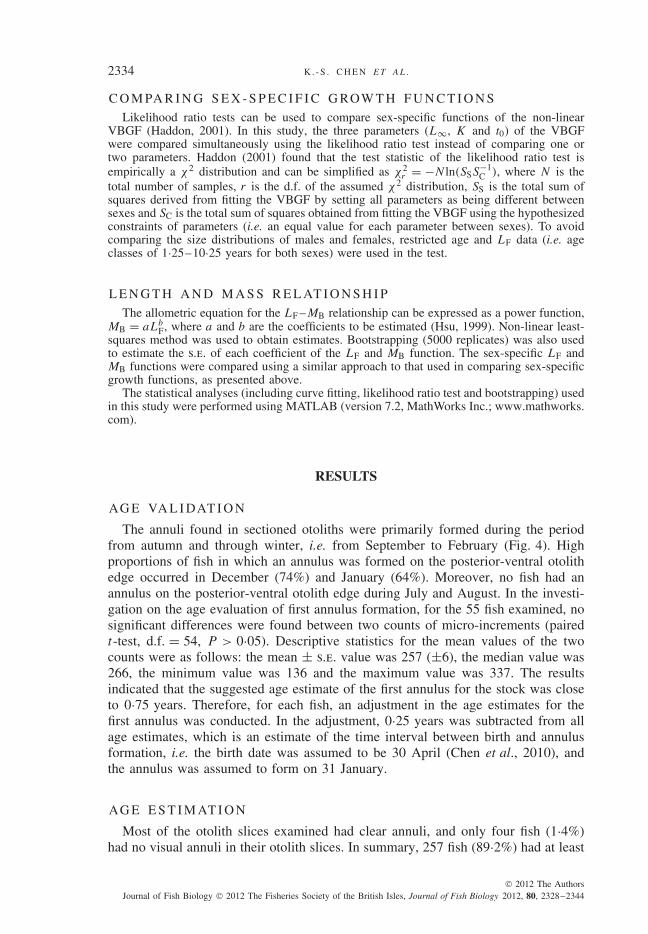
The annuli found in sectioned otoliths were primarily formed during the periodfrom autumn and through winter, i.e. from September to February (Fig. 4). Highproportions of fish in which an annulus was formed on the posterior-ventral otolithedge occurred in December (74%) and January (64%). Moreover, no fish had anannulus on the posterior-ventral otolith edge during July and August. In the investi-gation on the age evaluation of first annulus formation, for the 55 fish examined, nosignificant differences were found between two counts of micro-increments (pairedt-test, d.f. = 54, P > 0·05). Descriptive statistics for the mean values of the twocounts were as follows: the mean ± s.e. value was 257 (±6), the median value was266, the minimum value was 136 and the maximum value was 337. The resultsindicated that the suggested age estimate of the first annulus for the stock was closeto 0·75 years. Therefore, for each fish, an adjustment in the age estimates for thefirst annulus was conducted. In the adjustment, 0·25 years was subtracted from allage estimates, which is an estimate of the time interval between birth and annulusformation, i.e. the birth date was assumed to be 30 April (Chen et al., 2010), andthe annulus was assumed to form on 31 January.
AG E E S T I M AT I O N
Most of the otolith slices examined had clear annuli, and only four fish (1·4%)had no visual annuli in their otolith slices. In summary, 257 fish (89·2%) had at least
© 2012 The AuthorsJournal of Fish Biology © 2012 The Fisheries Society of the British Isles, Journal of Fish Biology 2012, 80, 2328–2344
AG E A N D G ROW T H O F T H U N N U S A L A L U N G A 2335
10028 24 23 44 15 26 21 8 15 22 21 27
80
60
40Freq
uenc
y (%
)
20
Month
0
Janu
ary
Febru
ary
Marc
hApr
ilM
ayJu
ne July
Augus
t
Septem
ber
Octobe
r
Novem
ber
Decem
ber
Fig. 4. The frequency distribution ( ) of North Pacific Thunnus alalunga that had an annulus on the posterior-ventral otolith edge. The number on the top of each bar indicates the sample size.
three identical readings of the five age readings. Ten fish (3·5%) that had inconsistentage estimates (less than three identical readings) were excluded to allow for furthergrowth investigations. Ageing older fish appeared to be more difficult than ageingyounger fish. The IA values of the aged fish were 7·4% for 126 females and 8·6%for 148 males. The assessed ages of females ranged from 1·25 to 10·25 years, andthose of males ranged from 1·25 to 14·25 years.
G ROW T H A N D L E N G T H A N D M A S S F U N C T I O N S
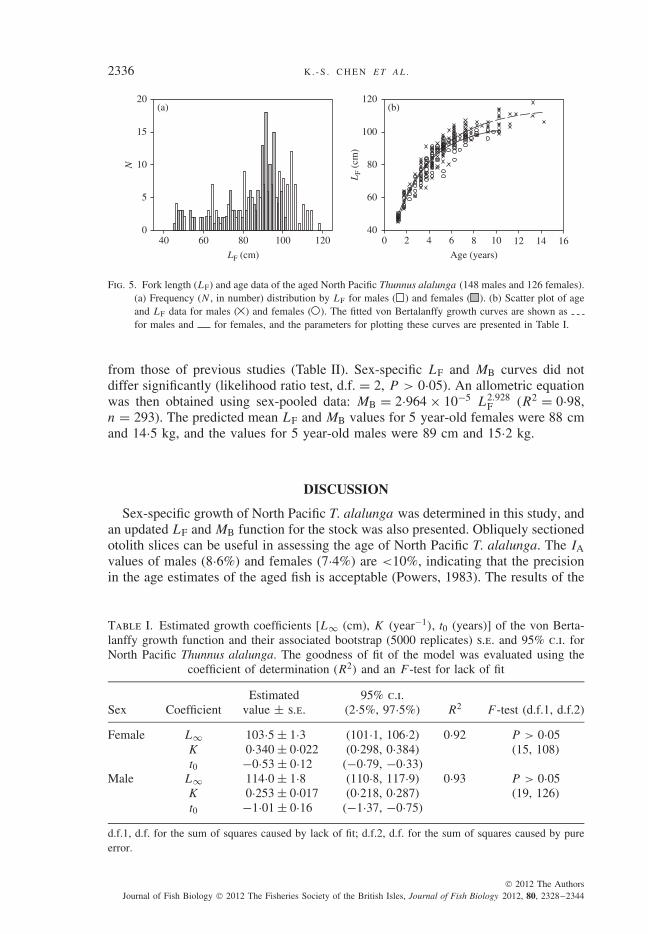
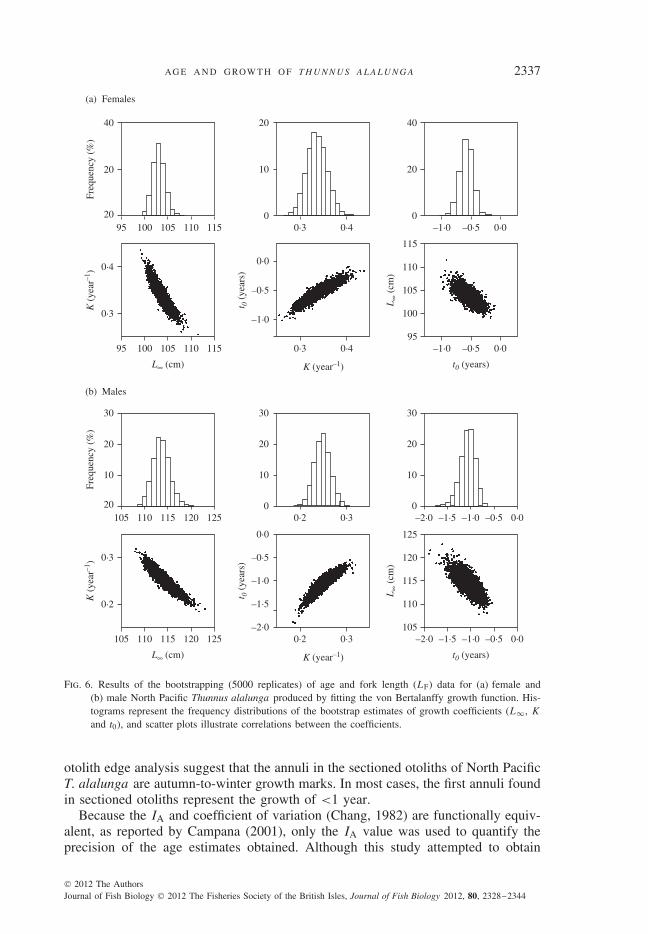
Sex-specific growth curves (Fig. 5) differed significantly (likelihood ratio test,d.f. = 3, P < 0·001). Both male and female age–length data were properly fittedto the VBGF, as indicated by the R2 and F -test values (Table I). As shown in thebootstrap estimates obtained for growth parameters (Fig. 6), all distributions (indi-cated by histograms) appeared to be normal, and there were correlations between theparameters of the VBGF (indicated by scatter plots). For each sex, simple linearregression seemed to delineate the relationship between the ln-transformed dataof the determined fish age and LP (Fig. 7). In the regression, females and maleshad different regression functions (i.e. two parallel lines), as evaluated using thet-test (Zar, 1999) on the regression coefficients (d.f. = 270, P > 0·05) and eleva-tions (d.f. = 271, P < 0·01). For both sexes, the φ′ values do not deviate greatly
© 2012 The AuthorsJournal of Fish Biology © 2012 The Fisheries Society of the British Isles, Journal of Fish Biology 2012, 80, 2328–2344
2336 K . - S . C H E N E T A L .
(a) (b)20
15
10
5
040 60
N
80
LF (cm)
LF
(cm
)
Age (years)
100 120 0 2 4 6 8 10 12 14 16
120
100
80
60
40
Fig. 5. Fork length (LF) and age data of the aged North Pacific Thunnus alalunga (148 males and 126 females).(a) Frequency (N , in number) distribution by LF for males ( ) and females ( ). (b) Scatter plot of ageand LF data for males ( ) and females ( ). The fitted von Bertalanffy growth curves are shown asfor males and for females, and the parameters for plotting these curves are presented in Table I.
from those of previous studies (Table II). Sex-specific LF and MB curves did notdiffer significantly (likelihood ratio test, d.f. = 2, P > 0·05). An allometric equationwas then obtained using sex-pooled data: MB = 2·964 × 10−5 L2.928
F (R2 = 0·98,n = 293). The predicted mean LF and MB values for 5 year-old females were 88 cmand 14·5 kg, and the values for 5 year-old males were 89 cm and 15·2 kg.
DISCUSSION
Sex-specific growth of North Pacific T. alalunga was determined in this study, andan updated LF and MB function for the stock was also presented. Obliquely sectionedotolith slices can be useful in assessing the age of North Pacific T. alalunga. The IAvalues of males (8·6%) and females (7·4%) are <10%, indicating that the precisionin the age estimates of the aged fish is acceptable (Powers, 1983). The results of the
Table I. Estimated growth coefficients [L∞ (cm), K (year−1), t0 (years)] of the von Berta-lanffy growth function and their associated bootstrap (5000 replicates) s.e. and 95% c.i. forNorth Pacific Thunnus alalunga. The goodness of fit of the model was evaluated using the
coefficient of determination (R2) and an F -test for lack of fit
Sex CoefficientEstimated
value ± s.e.95% c.i.
(2·5%, 97·5%) R2 F -test (d.f.1, d.f.2)
Female L∞ 103·5 ± 1·3 (101·1, 106·2) 0·92 P > 0·05K 0·340 ± 0·022 (0·298, 0·384) (15, 108)t0 −0·53 ± 0·12 (−0·79, −0·33)
Male L∞ 114·0 ± 1·8 (110·8, 117·9) 0·93 P > 0·05K 0·253 ± 0·017 (0·218, 0·287) (19, 126)t0 −1·01 ± 0·16 (−1·37, −0·75)
d.f.1, d.f. for the sum of squares caused by lack of fit; d.f.2, d.f. for the sum of squares caused by pureerror.
© 2012 The AuthorsJournal of Fish Biology © 2012 The Fisheries Society of the British Isles, Journal of Fish Biology 2012, 80, 2328–2344
AG E A N D G ROW T H O F T H U N N U S A L A L U N G A 2337
105
30
0·3
0·0 125
120
115
110
105
–0·5
–1·0
–1·5
–2·0
0·2
30 30
20
10
0
20
10
0
20
10
Freq
uenc
y (%
)K
(ye
ar–1
)
K (year–1)
20110 115 120 125 0·2 0·3 –1·5 –1·0–2·0 –0·5 0·0
105 110 115 120 125 0·2 0·3 –2·0 –1·5 –0·5–1·0 0·0
t 0 (
year
s)
t0 (years)
L∞
(cm
)
L∞ (cm)
95
40
(a) Females
(b) Males
0·40·0
115
110
105
100
95
–0·5
–1·00·3
20 40
20
0
10
0
20
Freq
uenc
y (%
)K
(ye
ar–1
)
K (year–1)
20100 105 110 115 0·3 0·4 –1·0 –0·5 0·0
95 100 105 110 115 0·3 0·4 –1·0 –0·5 0·0
t 0 (
year
s)
t0 (years)
L∞
(cm
)
L∞ (cm)
Fig. 6. Results of the bootstrapping (5000 replicates) of age and fork length (LF) data for (a) female and(b) male North Pacific Thunnus alalunga produced by fitting the von Bertalanffy growth function. His-tograms represent the frequency distributions of the bootstrap estimates of growth coefficients (L∞, K
and t0), and scatter plots illustrate correlations between the coefficients.
otolith edge analysis suggest that the annuli in the sectioned otoliths of North PacificT. alalunga are autumn-to-winter growth marks. In most cases, the first annuli foundin sectioned otoliths represent the growth of <1 year.
Because the IA and coefficient of variation (Chang, 1982) are functionally equiv-alent, as reported by Campana (2001), only the IA value was used to quantify theprecision of the age estimates obtained. Although this study attempted to obtain
© 2012 The AuthorsJournal of Fish Biology © 2012 The Fisheries Society of the British Isles, Journal of Fish Biology 2012, 80, 2328–2344

2338 K . - S . C H E N E T A L .
2·2
2·0
1·8
1·6
1·4
1·2
1·00·0 0·5 1·0 1·5
ln AF
ln L
P
2·0 2·5 3·0
Fig. 7. The relationship between the ln-transformed postrostral otolith length (LP, mm) and determined age(AF, years) for North Pacific Thunnus alalunga. For males ( , n = 148), the coefficients of the fittedsimple linear function [ln LP = a + b ln AF, ] and bootstrap s.e. of the coefficients were a = 1·311(±0·023) and b = 0·264 (±0·013) and r2 = 0·805. For females ( , n = 126), the coefficients of thefitted function were a = 1·278 ± 0·021 and b = 0·270 ± 0·013 and r2 = 0·779.
more accurate and precise age estimates using specific methodologies, biases in ageestimates may exist as a result of individual variability at the times of birth andannulus formation, as a result of the misidentification of annuli, or from both ofthese factors. Also, biases in fish sampling may exist but are difficult to verify. AsT. alalunga is a highly migratory species with a wide distribution in the North PacificOcean, collecting more representative samples from the entire stock distribution forbiological investigations is difficult and time-consuming.
Micro-increments in North Pacific T. alalunga sagittae have been shown to bedaily growth marks (Laurs et al., 1985) but they suggested that counts of micro-increments need to be adjusted upward by 5%. In this study, the adjustment of 5%in the counts of micro-increments was ignored because only minor differences inage estimates were obtained. Moreover, the micro-increments deposited at ages of>2 years were compact and could not be precisely counted. Only the age estimatesof first annulus formation were obtained by counting micro-increments. Because itwas difficult to precisely define the margins of latterly formed annuli for older fish,no analyses in marginal increment widths were conducted in this study. In the otolithedge analysis, the micro-increments formed on the posterior-ventral edge during thespring and summer were broader than those formed during the autumn and winter(Fig. 4), indicating that North Pacific T. alalunga tend to grow faster in the spring andsummer than in the autumn and winter. Furthermore, as indicated by L∞ (Table I),mature male North Pacific T. alalunga are expected to attain a greater size thanmature females. As reviewed by Quinn & Deriso (1999), several factors (e.g. depth,
© 2012 The AuthorsJournal of Fish Biology © 2012 The Fisheries Society of the British Isles, Journal of Fish Biology 2012, 80, 2328–2344
AG E A N D G ROW T H O F T H U N N U S A L A L U N G A 2339
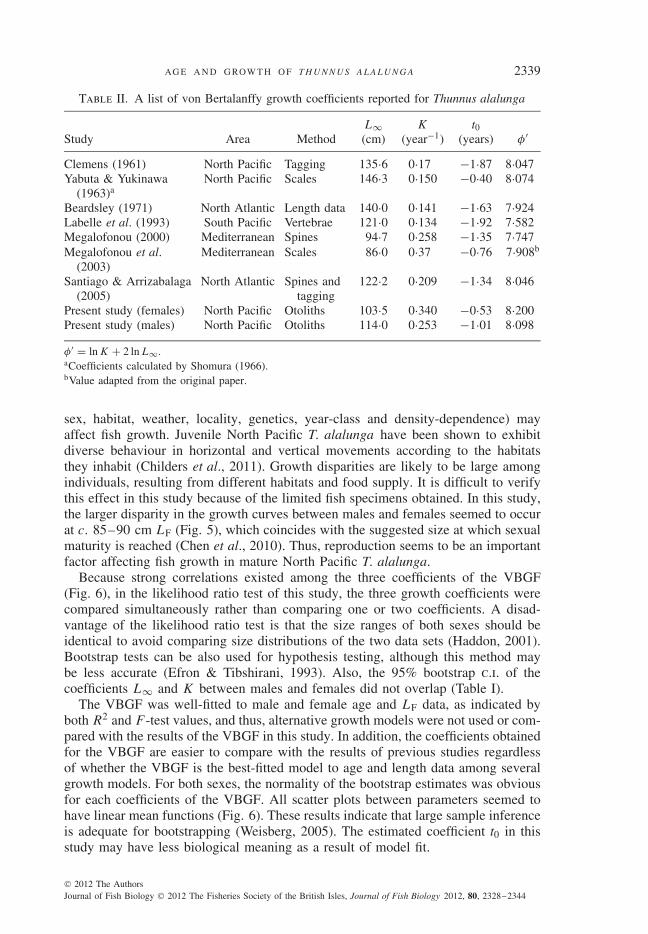
Table II. A list of von Bertalanffy growth coefficients reported for Thunnus alalunga
Study Area MethodL∞(cm)
K
(year−1)t0
(years) φ′
Clemens (1961) North Pacific Tagging 135·6 0·17 −1·87 8·047Yabuta & Yukinawa
(1963)aNorth Pacific Scales 146·3 0·150 −0·40 8·074
Beardsley (1971) North Atlantic Length data 140·0 0·141 −1·63 7·924Labelle et al. (1993) South Pacific Vertebrae 121·0 0·134 −1·92 7·582Megalofonou (2000) Mediterranean Spines 94·7 0·258 −1·35 7·747Megalofonou et al.
(2003)Mediterranean Scales 86·0 0·37 −0·76 7·908b
Santiago & Arrizabalaga(2005)
North Atlantic Spines andtagging
122·2 0·209 −1·34 8·046
Present study (females) North Pacific Otoliths 103·5 0·340 −0·53 8·200Present study (males) North Pacific Otoliths 114·0 0·253 −1·01 8·098
φ′ = ln K + 2 ln L∞.aCoefficients calculated by Shomura (1966).bValue adapted from the original paper.
sex, habitat, weather, locality, genetics, year-class and density-dependence) mayaffect fish growth. Juvenile North Pacific T. alalunga have been shown to exhibitdiverse behaviour in horizontal and vertical movements according to the habitatsthey inhabit (Childers et al., 2011). Growth disparities are likely to be large amongindividuals, resulting from different habitats and food supply. It is difficult to verifythis effect in this study because of the limited fish specimens obtained. In this study,the larger disparity in the growth curves between males and females seemed to occurat c. 85–90 cm LF (Fig. 5), which coincides with the suggested size at which sexualmaturity is reached (Chen et al., 2010). Thus, reproduction seems to be an importantfactor affecting fish growth in mature North Pacific T. alalunga.
Because strong correlations existed among the three coefficients of the VBGF(Fig. 6), in the likelihood ratio test of this study, the three growth coefficients werecompared simultaneously rather than comparing one or two coefficients. A disad-vantage of the likelihood ratio test is that the size ranges of both sexes should beidentical to avoid comparing size distributions of the two data sets (Haddon, 2001).Bootstrap tests can be also used for hypothesis testing, although this method maybe less accurate (Efron & Tibshirani, 1993). Also, the 95% bootstrap c.i. of thecoefficients L∞ and K between males and females did not overlap (Table I).
The VBGF was well-fitted to male and female age and LF data, as indicated byboth R2 and F -test values, and thus, alternative growth models were not used or com-pared with the results of the VBGF in this study. In addition, the coefficients obtainedfor the VBGF are easier to compare with the results of previous studies regardlessof whether the VBGF is the best-fitted model to age and length data among severalgrowth models. For both sexes, the normality of the bootstrap estimates was obviousfor each coefficients of the VBGF. All scatter plots between parameters seemed tohave linear mean functions (Fig. 6). These results indicate that large sample inferenceis adequate for bootstrapping (Weisberg, 2005). The estimated coefficient t0 in thisstudy may have less biological meaning as a result of model fit.
© 2012 The AuthorsJournal of Fish Biology © 2012 The Fisheries Society of the British Isles, Journal of Fish Biology 2012, 80, 2328–2344
2340 K . - S . C H E N E T A L .
Many studies have reported coefficient estimates of the VBGF not only for NorthPacific T. alalunga but also for other T. alalunga stocks (Table II). Other than thestudy by Megalofonou (2000), the present study presented lower values of L∞ andhigher values of K (Table II). One possible explanation for this effect is that onlysmall differences in the mean LF values (by age) of older fish were obtained inthe present study (i.e. slow growth rate for adult fish). Moreover, reasons for thedifferences in growth coefficients among T. alalunga studies are likely to be differ-ent stocks and the methods used for age determination. For example, MediterraneanT. alalunga of older ages tend to exhibit smaller mean sizes than other T. alalungastocks of older ages (Table II); results of tagging experiments have also shown thegrowth differences between North Atlantic and Mediterranean stocks (Ortiz de Zarateet al., 1996; De Metrio et al., 1997) as well as between North Pacific and Mediter-ranean stocks (Clemens, 1961). As calculated by the growth coefficient estimatesobtained in this study, the expected mean LF values for fish that are 1–6 years of ageare close to the tagging results of North Atlantic T. alalunga presented by Santiago& Arrizabalaga (2005). In this study, the predicted mean LF values of 1 year-oldfish (at the beginning of May) were 42 cm LF for females and 45 LF cm for males.These two estimates are close to the estimate (a standard length of 38 cm) reportedby Yoshida (1968). Moreover, the predicted mean LF values (females = 60 cm;males = 61 cm) of 2 year-old fish are close to the estimate (59·9 cm) reported byK. A. Bigelow, R. N. Nishimoto, R. M. Laurs & J. A. Weatherall, unpubl. data.Because many age and growth studies only used a small number of old fish toobtain the von Bertalanffy growth coefficients of T. alalunga, the use of the growthpredictions of old fish by calculating growth coefficients in stock assessment modelsshould be done with caution.
The length–mass curve obtained in this study is close to that reported by Clemens(1961) for North Pacific T. alalunga as well as that reported by Beardsley (1971)for the North Atlantic stock, but the curve apparently differs from those reported forMediterranean and Indian stocks (Megalofonou, 1990; Hsu, 1999;Megalofonou, 2000). Many factors may affect the estimation of length and masscoefficients, for example, different stocks, sampling seasons (or years or locations),measurement methods (e.g. curved or straight LF, the tip of upper or lower jawused as the measurement base, round or dressed mass), sexes, size ranges, storageconditions and regression methods. To find out the potential factors resulting in thedifferences of length and mass coefficients between two studies, at least detailedinformation needs to be known on the fish sampling and fish measurement of thetwo studies. Because many factors may affect the estimation of length and masscoefficients and that limited information is available on the fish sampling and fishmeasurement in previous studies, here trying to verify which factors result in thedifferences in length and mass coefficients among T. alalunga studies was avoided.
The coefficients of the VBGF have been used to estimate fish longevity (Taylor,1958). When applying the growth coefficients obtained to estimate the longevity ofNorth Pacific T. alalunga, the mean LF values of older fish are similar as shown bygrowth curves (Fig. 5). If a smaller proportion of L∞ (e.g. 0·95 L∞ instead of 0·99L∞) is used to estimate the longevity of North Pacific T. alalunga, the longevity willbe underestimated for the oldest fish. In this case, estimates of longevity may be betterinterpreted as the age at which the mean fish length tends to increase slowly towardsL∞ with increasing age. The longevity of a fish species may be better estimated
© 2012 The AuthorsJournal of Fish Biology © 2012 The Fisheries Society of the British Isles, Journal of Fish Biology 2012, 80, 2328–2344
AG E A N D G ROW T H O F T H U N N U S A L A L U N G A 2341
Table III. The maximum age estimates reported for Thunnus species based on the analysesof sagittal otolith annuli
Species Study Maximum age estimate (years)
Thunnus alalunga This study 14Thunnus obesus Farley et al. (2006) 16Thunnus tonggol Griffiths et al. (2010) 18Thunnus orientalis Shimose et al. (2009) 26Thunnus thynnus Secor et al. (2009) 33Thunnus maccoyii Gunn et al. (2008) 41
by ageing mature fish with a large sample size than by growth coefficients. Themaximum age determined in this study was 14·25 years for a male (106 cm LF).Both males and females had age estimates that were >10 years old. In comparingthe maximum fish age estimate obtained in this study with that reported for otherThunnus species (Table III), North Pacific T. alalunga are relatively short-lived.Thunnus alalunga are a small Thunnus species, and the common size of T. alalungain catches is <110 cm LF (Otsu & Sumida, 1968; Yoshida, 1975). Fish size is animportant factor that affects the longevity of pelagic fish species. That is, as a resultof predation, small pelagic fish species are believed to have higher natural mortalityrates than large species. Moreover, according to the Pauly (1980) and Hoenig (1983)equations, female North Pacific T. alalunga would have higher natural mortalityestimates than males based on the growth coefficients obtained in this study.
Because North Pacific T. alalunga exhibit sex-specific growth, the use of an identi-cal growth function for both sexes in stock assessment models may be controversial.Modelling the population dynamics of the stock using sex-specific growth coeffi-cients may, however, be difficult at present because of the lack of sex-specific sizeor age compositions. In addition, it is difficult to precisely split up mature fish intomany age classes using growth coefficients and size-frequency data because the meanfish lengths of older age classes may be similar. More simplified groups are recom-mended to represent the stock in stock assessment models, such as in immature fish(recruited or not recruited) and mature fish (representing the spawning stock, allrecruited). Because of increasing concern regarding the sustainability of the stock,constructing sex-specific age compositions of the stock is urgently needed to advancecurrent stock assessment.
Funding for this study was provided to C.-C. Hsu by the National Science Councilof Taiwan (NSC90-2313-B-002-314; NSC91-2313-B-002-290; NSC92-2313-B-002-060). Wewould like to thank C.-L. Chen, K. Uosaki and anonymous boat captains for their help incollecting fish samples.
References
Beamish, R. J. & Fournier, D. A. (1981). A method for comparing the precision of a set ofage determinations. Canadian Journal of Fisheries and Aquatic Sciences 38, 982–983.
von Bertalanffy, L. (1938). A quantitative theory of organic growth (Inquiries on growth laws.II). Human Biology 10, 181–213.
Beardsley, G. L. (1971). Contribution to population dynamics of Atlantic albacore with com-ments on potential yields. Fishery Bulletin 69, 845–857.
© 2012 The AuthorsJournal of Fish Biology © 2012 The Fisheries Society of the British Isles, Journal of Fish Biology 2012, 80, 2328–2344
2342 K . - S . C H E N E T A L .
Campana, S. E. (2001). Accuracy, precision and quality control in age determination, includ-ing a review of the use and abuse of age validation methods. Journal of Fish Biology59, 197–242. doi: 10.1006/jfbi.2001.1668
Campana, S. E. & Neilson, J. D. (1982). Daily growth increments in otoliths of starry floun-der (Platichthys stellatus) and the influence of some environmental variables in theirproduction. Canadian Journal of Fisheries and Aquatic Sciences 39, 937–942.
Chang, W. Y. B. (1982). A statistical method for evaluating the reproducibility of age deter-mination. Canadian Journal of Fisheries and Aquatic Sciences 39, 1208–1210.
Chen, I. C., Lee, P. F. & Tzeng, W. N. (2005). Distribution of albacore (Thunnus alalunga)in the Indian Ocean and its relation to environmental factors. Fisheries Oceanography14, 71–80. doi: 10.1111/j.1365-2419.2004.00322.x
Chen, K. S., Crone, P. R. & Hsu, C. C. (2010). Reproductive biology of albacore Thunnusalalunga. Journal of Fish Biology 77, 119–136. doi: 10.1111/j.1095-8649.2010.02662.x
Childers, J., Snyder, S. & Kohin, S. (2011). Migration and behavior of juvenile North Pacificalbacore (Thunnus alalunga). Fisheries Oceanography 20, 157–173. doi: 10.1111/j.1365-2419.2011.00575.x
Clear, N. P., Gunn, J. S. & Rees, A. J. (2000). Direct validation of annual increments in theotoliths of juvenile southern bluefin tuna, Thunnus maccoyii, by means of a large-scalemark–recapture experiment with strontium chloride. Fishery Bulletin 98, 25–40.
Clemens, H. B. (1961). The migration, age, and growth of Pacific albacore (Thunnus germo),1951–1958. California Department of Fish and Game, Fish Bulletin 115, 1–128.
De Metrio, G., Megalofonou, P., Caccucci, M., Sion, L., Ortiz de Zarate, V. & Acone, F.(1997). Results of tagging experiments on albacore (Thunnus alalunga) in the NorthernIonian and Southern Adriatic Seas from 1990 to 1995. ICCAT Collective Volume ofScientific Papers 46, 148–151.
Efron, B. & Tibshirani, R. J. (1993). An Introduction to the Bootstrap. New York, NY: Chap-man & Hall.
Farley, J. H., Clear, N. P., Leroy, B., Davis, T. L. O. & McPherson, G. (2006). Age, growthand preliminary estimates of maturity of bigeye tuna, Thunnus obesus, in the Australianregion. Marine and Freshwater Research 57, 713–724.
Foreman, T. J. (1980). Synopsis of biological data on the albacore tuna, Thunnus alalunga(Bonnaterre, 1788), in the Pacific Ocean. In Synopses of Biological Data on EightSpecies of Scombrids (Bayliff, W. H., ed.), pp. 17–70. San Diego, CA: Inter-AmericanTropical Tuna Commission.
Gambell, R. & Messtorff, J. (1964). Age determination in the whiting (Merlangius merlangusL.) by means of the otoliths. Journal du Conseil international pour l’Exploration de laMer 28, 393–404.
Griffiths, S. P., Fry, G. C., Manson, F. J. & Lou, D. C. (2010). Age and growth of longtailtuna (Thunnus tonggol ) in tropical and temperate waters of the central Indo-Pacific.ICES Journal of Marine Science 67, 125–134.
Gunn, J. S., Clear, N. P., Carter, T. I., Rees, A. J., Stanley, C. A., Farley, J. H. & Kalish,J. M. (2008). Age and growth in southern bluefin tuna, Thunnus maccoyii (Castelnau):direct estimation from otoliths, scales and vertebrae. Fisheries Research 92, 207–220.
Haddon, M. (2001). Modelling and Quantitative Methods in Fisheries. New York, NY: Chap-man & Hall.
Hilborn, R. & Walters, C. J. (1992). Quantitative Fisheries Stock Assessment: Choice, Dynam-ics and Uncertainty. New York, NY: Chapman & Hall.
Hoenig, J. M. (1983). Empirical use of longevity data to estimate mortality rates. FisheryBulletin 81, 898–903.
Hsu, C. C. (1999). The length–weight relationship of albacore, Thunnus alalunga, from theIndian Ocean. Fisheries Research 41, 87–92.
Huang, H. W., Hsu, C. C., Lee, H. H. & Yeh, Y. M. (2003). Stock assessment of albacore,Thunnus alalunga, in the Indian Ocean by surplus production models with a newrelative abundance index. Terrestrial, Atmospheric and Oceanic Sciences 14, 201–220.
ICCAT (1996). Report of the final meeting of the ICCAT Albacore Research Program. ICCATCollective Volume of Scientific Papers 43, 1–140.
© 2012 The AuthorsJournal of Fish Biology © 2012 The Fisheries Society of the British Isles, Journal of Fish Biology 2012, 80, 2328–2344
AG E A N D G ROW T H O F T H U N N U S A L A L U N G A 2343
Kimura, S., Nakai, M. & Sugimoto, T. (1997). Migration of albacore, Thunnus alalunga, inthe North Pacific Ocean in relation to large oceanic phenomena. Fisheries Oceanog-raphy 6, 51–57. doi: 10.1046/j.1365-2419.1997.00029.x
King, M. (2007). Fisheries Biology, Assessment and Management. Oxford: Fishing NewsBooks.
Labelle, M., Hampton, J., Bailey, K., Murray, T., Fournier, D. A. & Sibert, J. R. (1993).Determination of age and growth of South Pacific albacore (Thunnus alalunga) usingthree methodologies. Fishery Bulletin 91, 649–663.
Laurs, R. M., Nishimoto, R. & Wetherall, J. A. (1985). Frequency of increment formation onsagittae of North Pacific albacore (Thunnus alalunga). Canadian Journal of Fisheriesand Aquatic Sciences 42, 1552–1555.
Megalofonou, P. (1990). Size distribution, length–weight relationships, age and sex of alba-core, Thunnus alalunga Bonn., in the Aegean Sea. ICCAT Collective Volume of Scien-tific Papers 33, 154–162.
Megalofonou, P. (2000). Age and growth of Mediterranean albacore. Journal of Fish Biology57, 700–715. doi: 10.1006/jfbi.2000.1345
Megalofonou, P., Yannopoulos, C. & Dean, J. M. (2003). The potential use of scales forestimating age and growth of Mediterranean albacore (Thunnus alalunga). Journal ofApplied Ichthyology 19, 189–194. doi: 10.1046/j.1439-0426.2003.00450.x
Motulsky, H. J. & Christopoulos, A. (2004). Fitting Models to Biological Data Using Linearand Nonlinear Regression. New York, NY: Oxford University Press.
Murray, T. 1994. A review of the biology and fisheries for albacore, Thunnus alalunga, inthe South Pacific Ocean. FAO Fisheries Technical Paper 336/2, 188–206.
Neill, J. W. (1988). Testing for lack of fit in nonlinear regression. The Annals of Statistics16, 733–740.
Neilson, J. D. & Campana, S. E. (2008). A validated description of age and growth of westernAtlantic bluefin tuna (Thunnus thynnus). Canadian Journal of Fisheries and AquaticSciences 65, 1523–1527.
Ortiz de Zarate, V., Megalofonou, P., De Metrio, G. & Rodriguez-Cabello, C. (1996). Pre-liminary age validation results from tagged–recaptured fluorochrome label albacore inNorth East Atlantic. ICCAT Collective Volume of Scientific Papers 43, 331–338.
Otsu, T. & Sumida, R. (1968). Distribution, apparent abundance, and size composition ofalbacore (Thunnus alalunga) taken in the longline fishery based in American Samoa,1954–65. Fishery Bulletin of the Fish and Wildlife Service 67, 47–69.
Otsu, T. & Uchida, R. N. (1959). Study of age determination by hard parts of albacore fromcentral north Pacific and Hawaiian waters. Fishery Bulletin of the Fish and WildlifeService 59, 353–363.
Pauly, D. (1980). On the interrelationships between natural mortality, growth parameters, andmean environmental temperature in 175 fish stocks. Journal du Conseil internationalpour l’Exploration de la Mer 39, 175–192.
Powers, J. E. (1983). Some statistical characteristics of ageing data and their ramifications inpopulation analysis of oceanic pelagic fishes. NOAA Technical Report NMFS 8, 19–24.
Quinn, T. J. & Deriso, R. B. (1999). Quantitative Fish Dynamics. New York, NY: OxfordUniversity Press.
Ricker, W. E. (1975). Computation and interpretation of biological statistics of fish popula-tions. Bulletin of the Fisheries Research Board of Canada 191.
Santiago, J. & Arrizabalaga, H. (2005). An integrated growth study for North Atlantic alba-core (Thunnus alalunga Bonn. 1788). ICES Journal Marine Science 62, 740–749.
Schaefer, K. M. & Fuller, D. W. (2006). Estimates of age and growth of bigeye tuna (Thunnusobesus) in the eastern Pacific Ocean, based on otolith increments and tagging data.Inter-American Tropical Tuna Commission, Bulletin 23, 33–76.
Secor, D. H., Wingate, R. L., Neilson, J. D., Rooker, J. R. & Campana, S. E. (2009). Growthof Atlantic bluefin tuna: direct age estimates. ICCAT Collective Volume of ScientificPapers 64, 405–416.
Shimose, T., Tanabe, T., Chen, K. S. & Hsu, C. C. (2009). Age determination and growthof Pacific bluefin tuna, Thunnus orientalis, off Japan and Taiwan. Fisheries Research100, 134–139.
© 2012 The AuthorsJournal of Fish Biology © 2012 The Fisheries Society of the British Isles, Journal of Fish Biology 2012, 80, 2328–2344
2344 K . - S . C H E N E T A L .
Shomura, R. S. (1966). Age and growth studies of four species of tunas in the Pacific Ocean.In Proceedings of the Governor’s Conference on Central Pacific Fishery Resources,Honolulu – Hilo, February 28–March 12, 1966 (Manar, T. A., ed.), pp. 203–219.Honolulu, HI: State of Hawaii.
Sparre, P. & Venema, S. C. (1998). Introduction to tropical fish stock assessment. Part 1:manual. FAO Fisheries Technical Paper 306/1, 1–407.
Stequert, B., Panfili, J. & Dean, J. M. (1996). Age and growth of yellowfin tuna, Thunnusalbacares, from the western Indian Ocean, based on otolith microstructure. FisheryBulletin 94, 124–134.
Suda, A. (1966). Catch variations in the North Pacific albacore VI. The speculations about theinfluences of fisheries on the catch and abundance of the albacore in the North-westPacific by use of some simplified mathematical models (continued paper - I). Reportof Nankai Regional Fisheries Research Laboratory 24, 1–14.
Taylor, C. C. (1958). Cod growth and temperature. Journal du Conseil international pourl’Exploration de la Mer 23, 366–370.
Tzeng, W. N. (1990). Relationship between growth rate and age at recruitment of Anguillajaponica elvers in a Taiwan estuary as inferred from otolith growth increments. MarineBiology 107, 75–81.
Weisberg, S. (2005). Applied Linear Regression. Hoboken, NJ: John Wiley and Sons.Yabuta, Y. & Yukinawa, M. (1963). Growth and age of albacore. Report of Nankai Regional
Fisheries Research Laboratory 17, 111–120.Yoshida, H. O. (1968). Early life history and spawning of the albacore, Thunnus alalunga, in
Hawaiian waters. Fishery Bulletin of the Fish and Wildlife Service 67, 205–211.Yoshida, H. O. (1975). The American Samoa longline fishery, 1966–1971. Fishery Bulletin
73, 747–765.Zar, J. H. (1999). Biostatistical Analysis, 4th edn. Upper Saddle River, NJ: Prentice Hall.
Electronic References
Anon. (2002). A manual for age determination of southern bluefin tuna, Thunnus maccoyii :Otolith sampling, preparation and interpretation. The Direct Age Estimation Workshopof the CCSBT, 11 –14 June 2002. Queenscliff, Australia. Available at http://www.ccsbt.org/userfiles/file/docs_english/operational_resolutions/age_determination_manual.pdf(last accessed 28 October 2011).
ISC (2006). Report of the albacore working group workshop, Annex 5. Proceedings of theInternational Scientific Committee for Tuna and Tuna-like Species in the North PacificOcean, 28 November –5 December 2006. National Research Institute of Far Seas Fish-eries, Orido, Japan. Available at http://isc.ac.affrc.go.jp/pdf/ISC7pdf/Annex_5_ALBWG_Nov2Dec_06.pdf (last accessed 28 October 2011).
ISC (2010). Report of the albacore working group workshop, Annex 9. Proceedings of theInternational Scientific Committee for Tuna and Tuna-like Species in the North PacificOcean, 12 –13 July 2010, Victoria, British Columbia, Canada . Available at http://isc.ac.affrc.go.jp/pdf/ISC10pdf/Annex_9_ISC10_ALBWG_Jul10.pdf (last accessed 28October 2011).
© 2012 The AuthorsJournal of Fish Biology © 2012 The Fisheries Society of the British Isles, Journal of Fish Biology 2012, 80, 2328–2344


![Indian Ocean Stocks › sites.uw.edu › dist › f › ... · Albacore tuna Indian Ocean [ALBAIO] Metadata Scientific Name Thunnus alalunga Current Assess ID IOTC-ALBAIO-1950-2016-PONS](https://img.pdfslide.net/doc/110x75/5f19440ca3302b60007bdf8d/indian-ocean-stocks-a-sitesuwedu-a-dist-a-f-a-albacore-tuna-indian.jpg)