Embed Size (px)
Citation preview
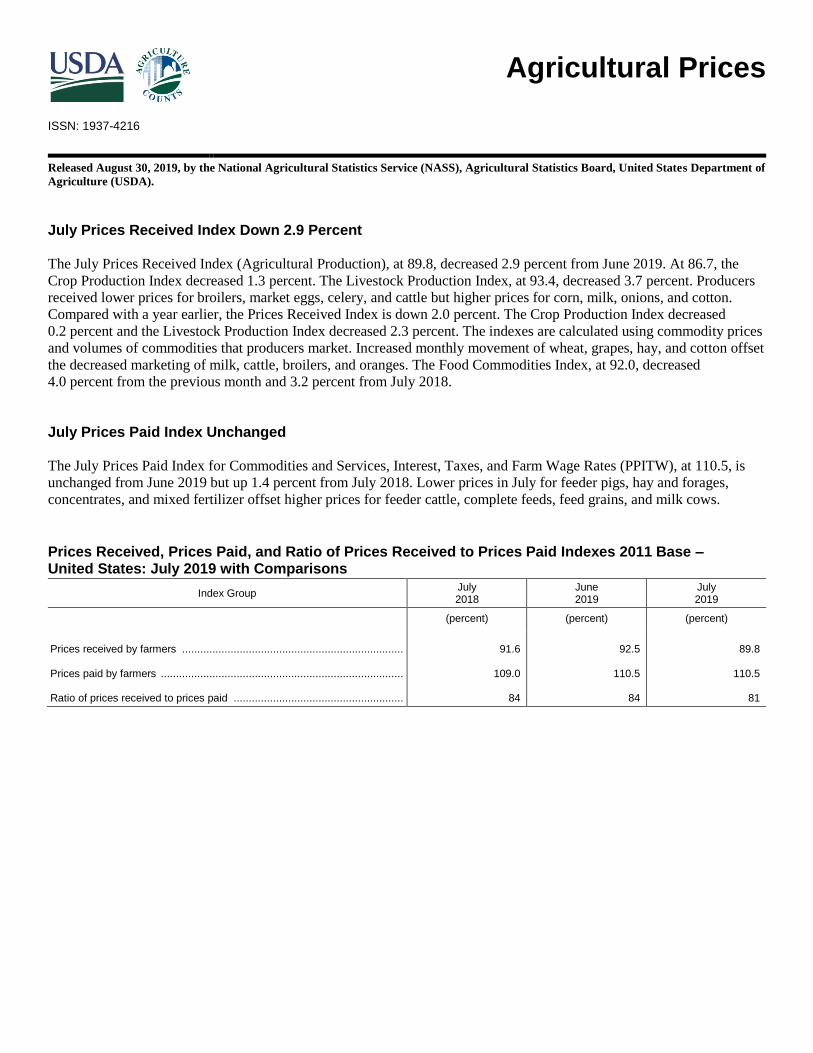
Agricultural Prices
ISSN: 1937-4216
Released August 30, 2019, by the National Agricultural Statistics Service (NASS), Agricultural Statistics Board, United States Department of
Agriculture (USDA).
July Prices Received Index Down 2.9 Percent
The July Prices Received Index (Agricultural Production), at 89.8, decreased 2.9 percent from June 2019. At 86.7, the
Crop Production Index decreased 1.3 percent. The Livestock Production Index, at 93.4, decreased 3.7 percent. Producers
received lower prices for broilers, market eggs, celery, and cattle but higher prices for corn, milk, onions, and cotton.
Compared with a year earlier, the Prices Received Index is down 2.0 percent. The Crop Production Index decreased
0.2 percent and the Livestock Production Index decreased 2.3 percent. The indexes are calculated using commodity prices
and volumes of commodities that producers market. Increased monthly movement of wheat, grapes, hay, and cotton offset
the decreased marketing of milk, cattle, broilers, and oranges. The Food Commodities Index, at 92.0, decreased
4.0 percent from the previous month and 3.2 percent from July 2018.
July Prices Paid Index Unchanged
The July Prices Paid Index for Commodities and Services, Interest, Taxes, and Farm Wage Rates (PPITW), at 110.5, is
unchanged from June 2019 but up 1.4 percent from July 2018. Lower prices in July for feeder pigs, hay and forages,
concentrates, and mixed fertilizer offset higher prices for feeder cattle, complete feeds, feed grains, and milk cows.
Prices Received, Prices Paid, and Ratio of Prices Received to Prices Paid Indexes 2011 Base – United States: July 2019 with Comparisons
Index Group July 2018
June 2019
July 2019
(percent) (percent) (percent)
Prices received by farmers ......................................................................... Prices paid by farmers ................................................................................ Ratio of prices received to prices paid ........................................................
91.6
109.0
84
92.5
110.5
84
89.8
110.5
81

2 Agricultural Prices (August 2019) USDA, National Agricultural Statistics Service
Contents
Prices Received by Farmers .................................................................................................................................................... 4
Prices Received Indexes, 2011 Base – United States: July 2019 with Comparisons .............................................................. 5
Prices Received Indexes, 1910-1914 Base – United States: July 2019 with Comparisons ..................................................... 5
Prices Received Indexes, 2011 Base by Month for Selected Groups – United States: 2018 and 2019 .................................. 5
Prices Paid Indexes, 2011 Base by Month for Selected Groups – United States: 2018 and 2019 .......................................... 6
Prices Received for Field Crops and Fruits – United States: July 2019 with Comparisons .................................................... 7
Prices Received for Vegetables and Livestock – United States: July 2019 with Comparisons .............................................. 8
Prices Received for All Wheat, Corn, and Soybeans by Month – United States: 2019 with Comparisons ............................ 9
Prices Received for Beef Cattle and All Hogs by Month – United States: 2019 with Comparisons ...................................... 9
Prices Received for All Wheat – States and United States: July 2019 with Comparisons .................................................... 10
Prices Received for Winter Wheat – States and United States: July 2019 with Comparisons .............................................. 10
Prices Received for Durum Wheat – States and United States: July 2019 with Comparisons ............................................. 11
Prices Received for Spring Wheat – States and United States: July 2019 with Comparisons .............................................. 11
Prices Received for Oats – States and United States: July 2019 with Comparisons ............................................................. 11
Prices Received for All Barley – States and United States: July 2019 with Comparisons ................................................... 12
Prices Received for Malting Barley – States and United States: July 2019 with Comparisons ............................................ 12
Prices Received for Feed Barley – States and United States: July 2019 with Comparisons ................................................. 12
Prices Received for Sorghum Grain – States and United States: July 2019 with Comparisons ........................................... 12
Prices Received for Corn – States and United States: July 2019 with Comparisons ............................................................ 13
Prices Received for Soybeans – States and United States: July 2019 with Comparisons ..................................................... 14
Prices Received for Dry Beans – States and United States: July 2019 with Comparisons ................................................... 14
Prices Received for Canola – States and United States: July 2019 with Comparisons ......................................................... 15
Prices Received for Flaxseed – States and United States: July 2019 with Comparisons ...................................................... 15
Prices Received for Peanuts (in shell) – States and United States: July 2019 with Comparisons ........................................ 15
Prices Received for Sunflower – States and United States: July 2019 with Comparisons.................................................... 15
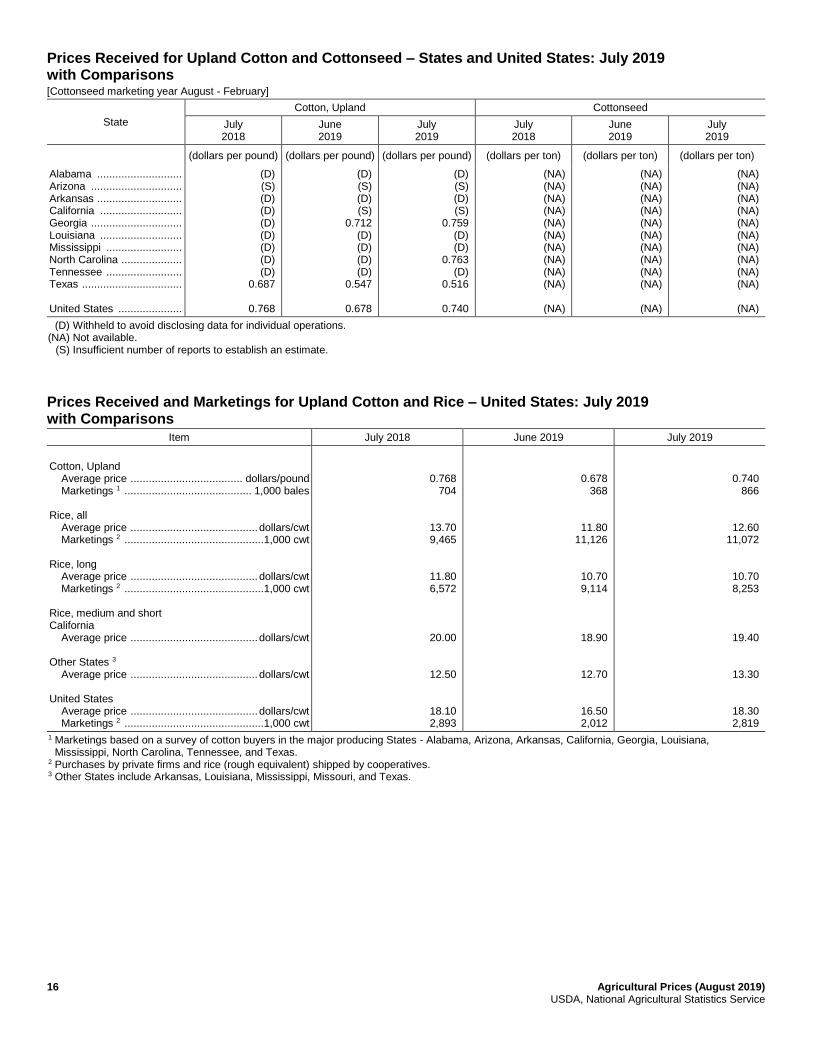
Prices Received for Upland Cotton and Cottonseed – States and United States: July 2019 with Comparisons ................... 16
Prices Received and Marketings for Upland Cotton and Rice – United States: July 2019 with Comparisons ..................... 16
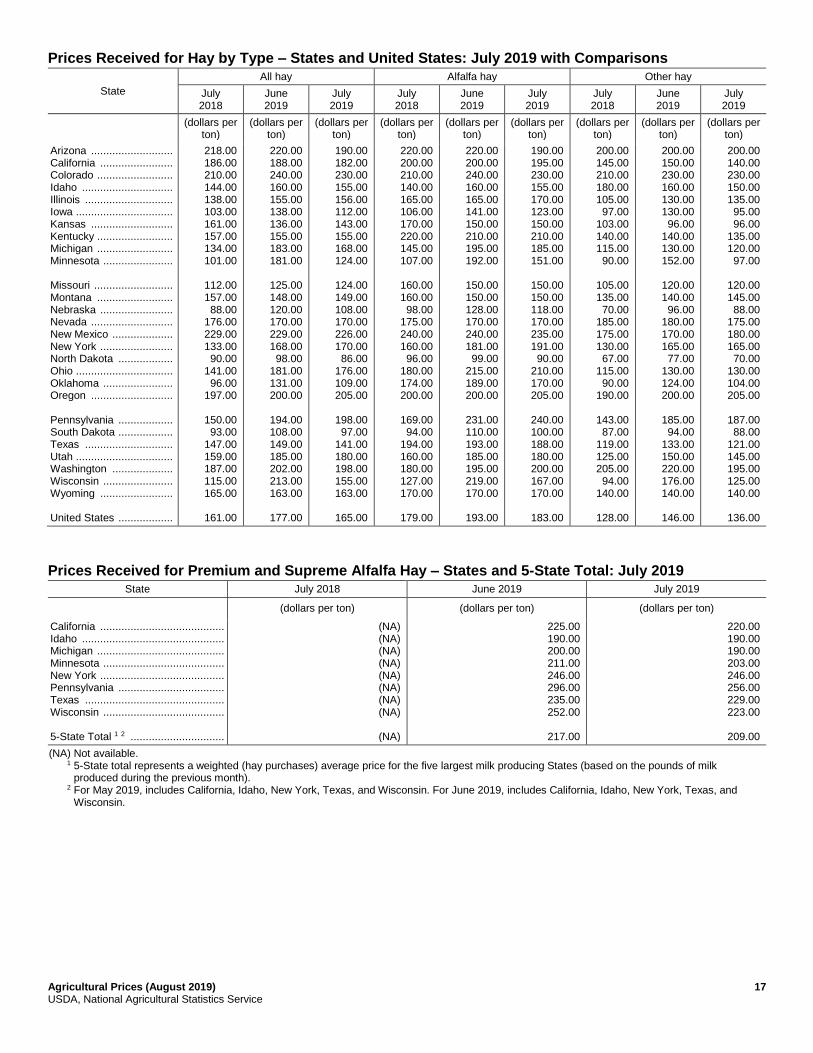
Prices Received for Hay by Type – States and United States: July 2019 with Comparisons ............................................... 17
Prices Received for Premium and Supreme Alfalfa Hay – States and 5-State Total: July 2019 .......................................... 17
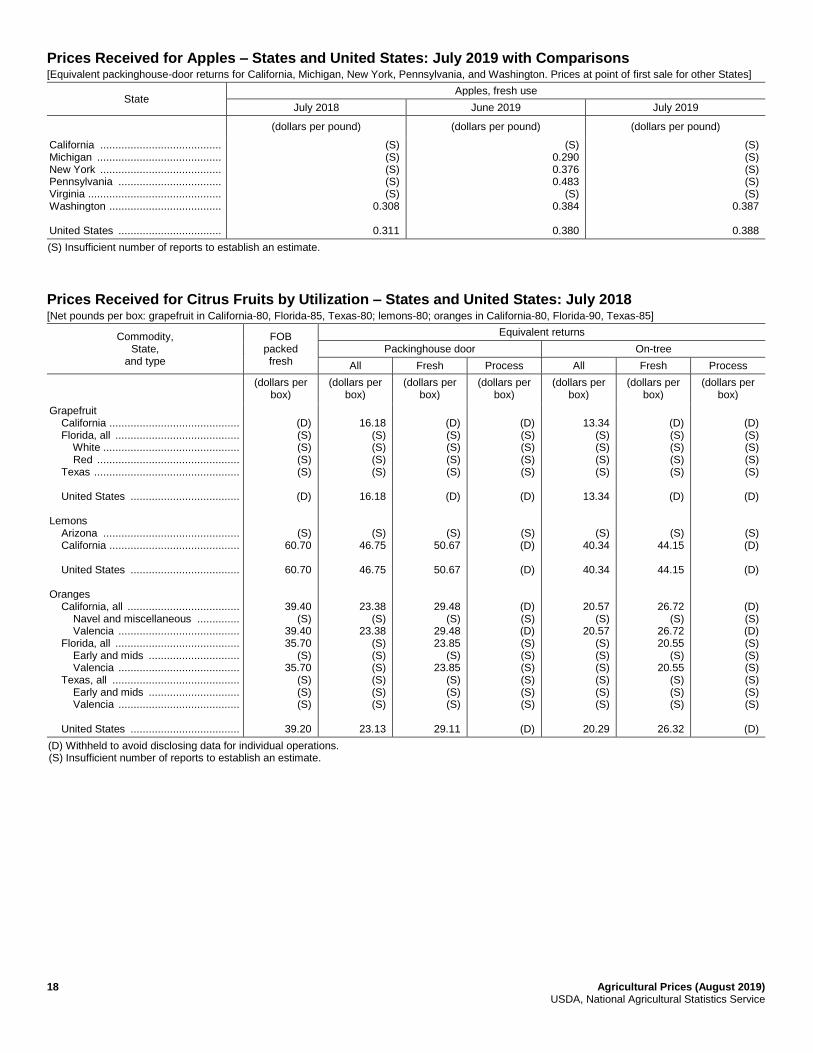
Prices Received for Apples – States and United States: July 2019 with Comparisons ......................................................... 18
Prices Received for Citrus Fruits by Utilization – States and United States: July 2018 ....................................................... 18
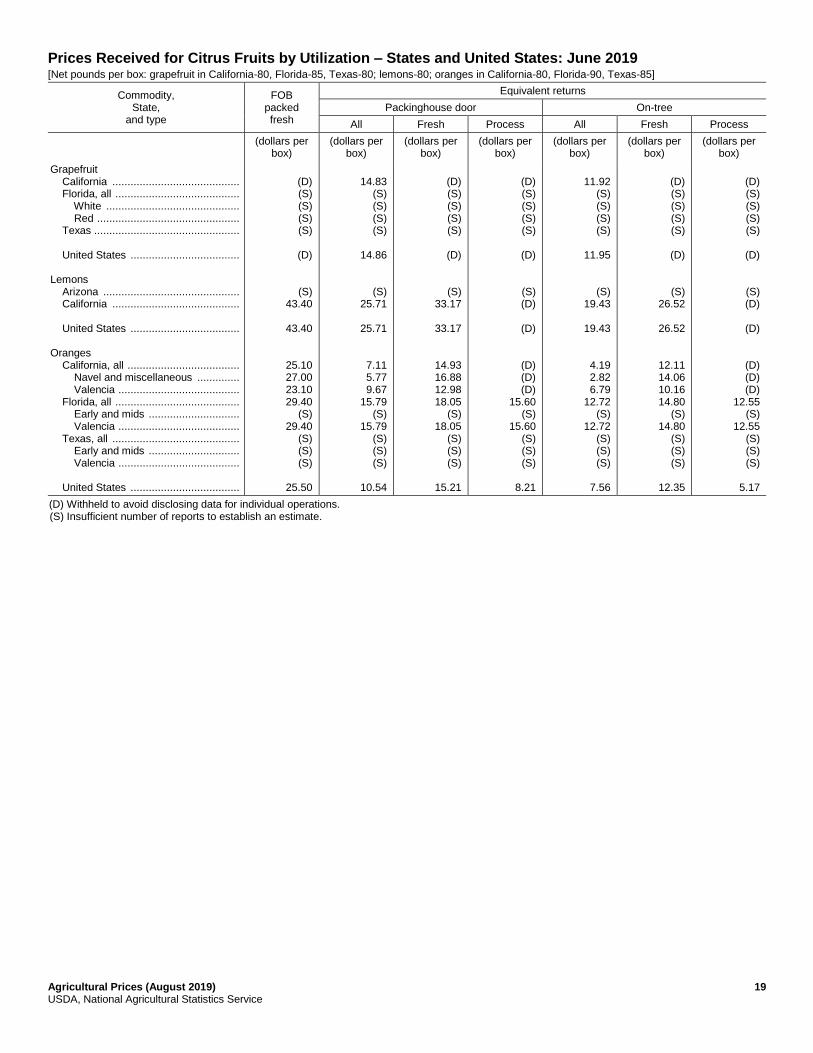
Prices Received for Citrus Fruits by Utilization – States and United States: June 2019 ...................................................... 19
Prices Received for Citrus Fruits by Utilization – States and United States: July 2019 ....................................................... 20
Prices Received for All Milk – States and United States: July 2019 with Comparisons ...................................................... 21
Prices Received for Milk Cows – States and United States: July 2019 with Comparisons .................................................. 21
Commodity Parity Prices and Price as Percent of Parity Price – United States: July 2019 with Comparisons .................... 22
Commodity Parity Prices – United States: July 2019 with Comparisons ............................................................................. 23
Commodity Parity Prices – United States: July 2019 with Comparisons (continued) .......................................................... 24
Marketing Year for Specified Commodities ......................................................................................................................... 25
Wheat Marketing Year Average Prices Received by Class – United States: Marketing Years 2017-2018
and 2018-2019 ................................................................................................................................................................... 25
All Barley Market Year Average Prices Received – States and United States: Marketing Years 2017 and 2018 ............... 26
Feed Barley Market Year Average Prices Received – States and United States: Marketing Years 2017 and 2018 ............. 27
Malting Barley Market Year Average Prices Received – States and United States: Marketing Years
2017 and 2018 .................................................................................................................................................................... 27
Oats Market Year Average Prices Received – States and United States: Marketing Years 2017 and 2018 ......................... 28
Peanut Market Year Average Prices Received – States and United States: Marketing Years 2017 and 2018 ..................... 28
Winter Wheat Market Year Average Prices Received – States and United States: Marketing Years
2017 and 2018 .................................................................................................................................................................... 29
Durum Wheat Market Year Average Prices Received – States and United States: Marketing Years
2017 and 2018 .................................................................................................................................................................... 30
Agricultural Prices (August 2019) 3 USDA, National Agricultural Statistics Service
Other Spring Wheat Market Year Average Prices Received – States and United States: Marketing Years
2017 and 2018 ................................................................................................................................................................... 30
All Wheat Market Year Average Prices Received – States and United States: Marketing Years 2017 and 2018 ............... 31
Rye Market Year Average Prices Received – State and United States: Marketing Years 2017 and 2018 ........................... 31
Hay Market Year Average Prices Received – States and United States: Marketing Years 2017 and 2018 ......................... 32
All Barley Prices Received by Month – States and United States: Marketing Years 2017-2018 and 2018-2019 ................ 33
Feed Barley Prices Received by Month – States and United States: Marketing Years 2017-2018 and 2018-2019 ............. 34
Malting Barley Prices Received by Month – States and United States: Marketing Years 2017-2018
and 2018-2019 ................................................................................................................................................................... 35
Oats Prices Received by Month – States and United States: Marketing Year 2017-2018 .................................................... 36
Oats Prices Received by Month – States and United States: Marketing Year 2018-2019 .................................................... 37
All Wheat Prices Received by Month – States and United States: Marketing Year 2017-2018 .......................................... 38
All Wheat Prices Received by Month – States and United States: Marketing Year 2018-2019 .......................................... 39
Winter Wheat Prices Received by Month – States and United States: Marketing Year 2017-2018..................................... 40
Winter Wheat Prices Received by Month – States and United States: Marketing Year 2018-2019..................................... 41
Other Spring Wheat Prices Received by Month – States and United States: Marketing Years 2017-2018
and 2018-2019 ................................................................................................................................................................... 42
Durum Wheat Prices Received by Month – States and United States: Marketing Years 2017-2018
and 2018-2019 ................................................................................................................................................................... 43
Hard Red Winter Wheat Prices Received by Month – United States: Marketing Years 2017-2018
and 2018-2019 ................................................................................................................................................................... 44
Soft Red Winter Wheat Prices Received by Month – United States: Marketing Years 2017-2018
and 2018-2019 ................................................................................................................................................................... 44
Hard Red Spring Wheat Prices Received by Month – United States: Marketing Years 2017-2018
and 2018-2019 ................................................................................................................................................................... 44
White Wheat Prices Received by Month – United States: Marketing Years 2017-2018 and 2018-2019............................. 44
All Hay Prices Received by Month – States and United States: Marketing Year 2017-2018 .............................................. 45
All Hay Prices Received by Month – States and United States: Marketing Year 2018-2019 .............................................. 47
Alfalfa Hay Prices Received by Month – States and United States: Marketing Year 2017-2018 ........................................ 49
Alfalfa Hay Prices Received by Month – States and United States: Marketing Year 2018-2019 ........................................ 51
Other Hay Prices Received by Month – States and United States: Marketing Year 2017-2018 .......................................... 53
Other Hay Prices Received by Month – States and United States: Marketing Year 2018-2019 .......................................... 55
Peanut Prices Received by Month – States and United States: Marketing Years 2017-2018 and 2018-2019...................... 57
All Barley Marketing Percentages by Month – States and United States: Marketing Years 2017-2018
and 2018-2019 ................................................................................................................................................................... 58
Oats Marketing Percentages by Month – States and United States: Marketing Years 2017-2018 and 2018-2019 .............. 59
All Wheat Marketing Percentages by Month – States and United States: Marketing Years 2017-2018
and 2018-2019 ................................................................................................................................................................... 60
All Hay Marketing Percentages by Month – States and United States: Marketing Years 2017-2018
and 2018-2019 ................................................................................................................................................................... 62
Peanut Marketing Percentages by Month – States and United States: Marketing Years 2017-2018
and 2018-2019 ................................................................................................................................................................... 64
Reliability of Prices Received Estimates .............................................................................................................................. 65
Prices Paid by Farmers .......................................................................................................................................................... 66
Prices Paid Indexes and Related Parity Ratios – United States: July 2019 with Comparisons ............................................ 67
Prices Paid Indexes and Annual Weights for Input Components and Sub-components – United States: July 2019
with Comparisons .............................................................................................................................................................. 68
Feed Price Ratios – United States: July 2019 with Comparisons ......................................................................................... 69
Prices Received Used to Calculate Feed Price Ratios – United States: July 2019 with Comparisons ................................. 69
Prices Paid for Feeder Livestock – United States: July 2019 with Comparisons ................................................................. 69
Reliability of Prices Paid Estimates ...................................................................................................................................... 70
Information Contacts ............................................................................................................................................................ 71
4 Agricultural Prices (August 2019) USDA, National Agricultural Statistics Service
July Prices Received by Farmers
The July Prices Received Index for agricultural production is 89.8 percent of its 2011 base, down 2.9 percent from the
June 2019 index and 2.0 percent from the July 2018 index.
Crop production: The July index, at 86.7, is 1.3 percent lower than June and 0.2 percent lower than July 2018. The
vegetable & melon and other crop index decreases more than offset the fruit & tree nut and grain & oilseed index
increases.
Grain and oilseed: The July index, at 67.1, is up 0.3 percent from June and 2.1 percent from July 2018. Oilseed and feed
grain index increases more than offset the lower food grain index.
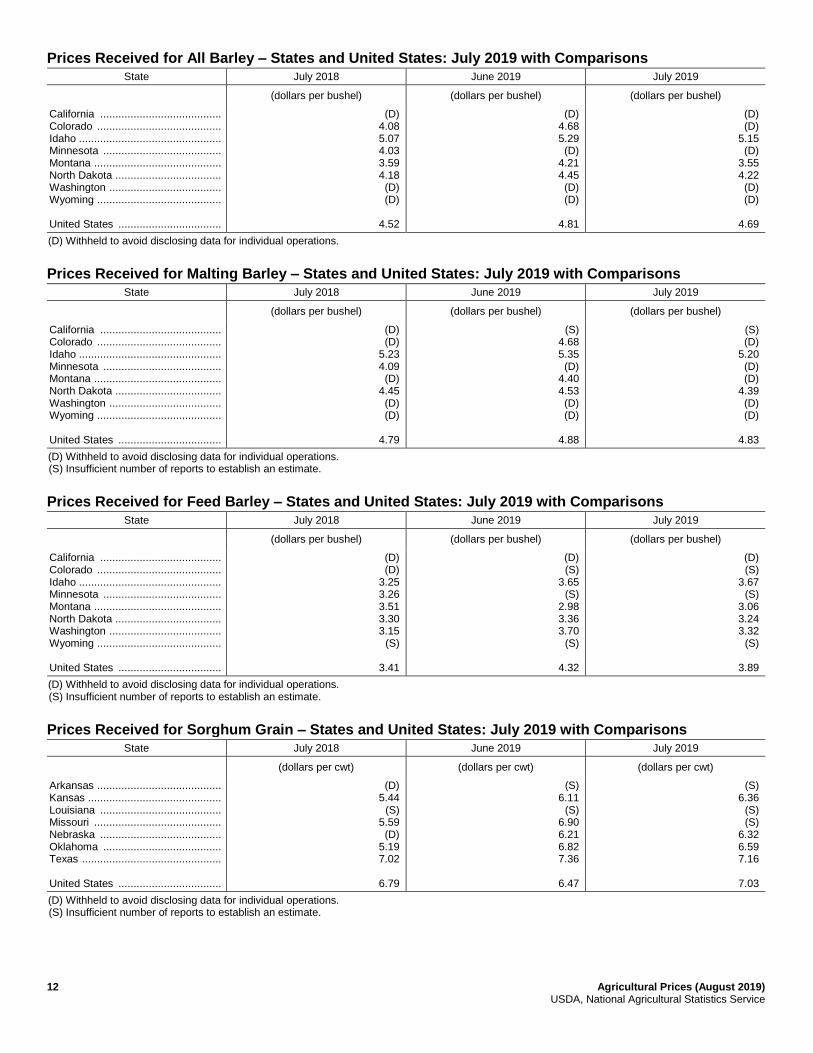
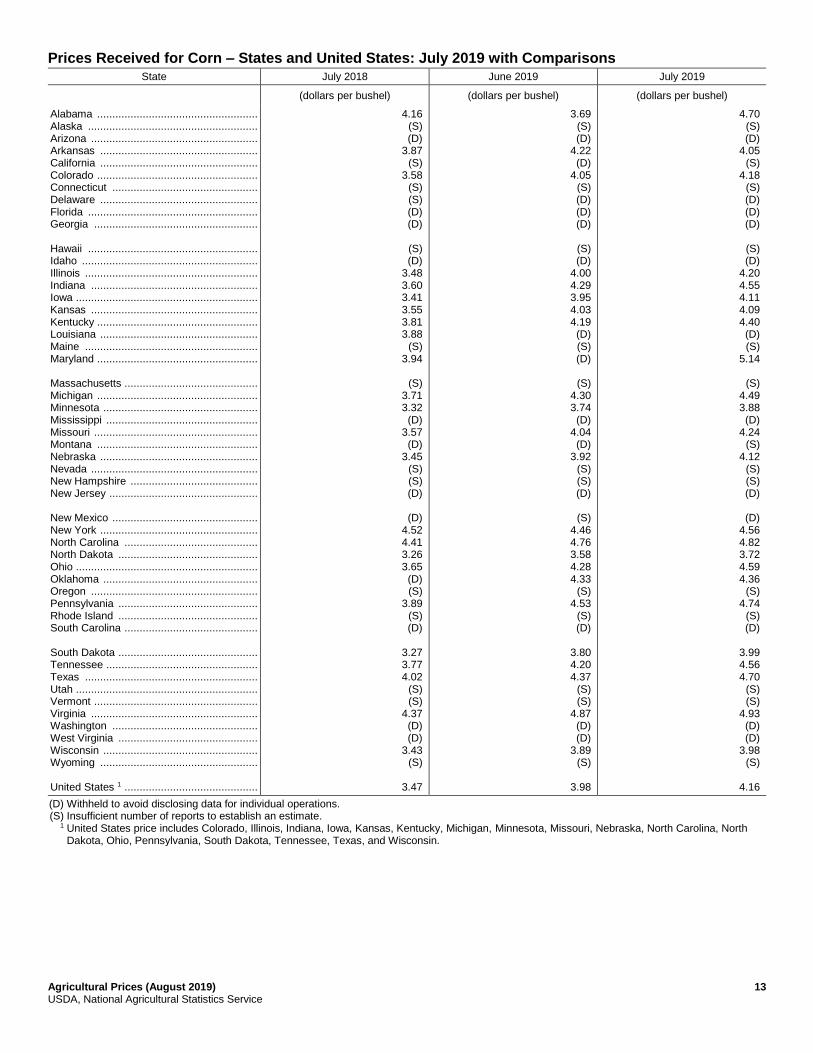
Feed grain: The July index, at 69.7, increased 4.8 percent from last month and 18.7 percent from a year ago. The corn
price, at $4.16 per bushel, is up 18 cents from last month and 69 cents from July 2018. At $7.03 per cwt, sorghum grain is
56 cents above June and 24 cents above July a year earlier.
Food grain: At 63.1, the index for July is down 6.1 percent from the previous month and 9.6 percent from a year ago. The
July price for all wheat, at $4.52 per bushel, is 29 cents lower than June and 48 cents lower than July 2018.
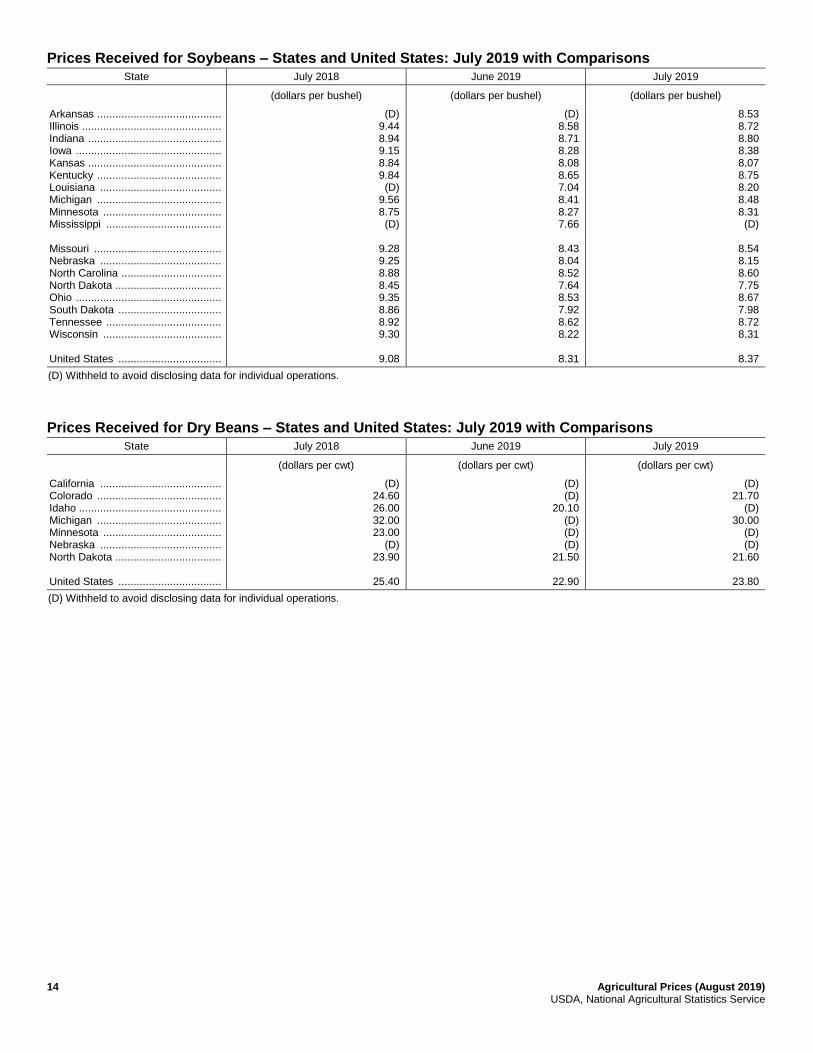
Oilseed: At 67.8, the index for July increased 0.4 percent from June but decreased 7.5 percent from July 2018. The
soybean price, at $8.37 per bushel, is 6 cents higher than June but 71 cents lower than July a year earlier.
Fruit and tree nut: The July index, at 122.3, is up 6.4 percent from June but down 6.9 percent from a year earlier. Price
increases during July for lemons, apples, and pears more than offset price decreases for grapes, peaches, oranges, and
strawberries.
Vegetable and melon: At 119.9, the index for July decreased 6.1 percent from the previous month but increased
35.8 percent from July 2018. Price declines during July for celery, broccoli, tomatoes, and cucumbers more than offset
price increases for onions, sweet corn, cauliflower, and potatoes.
Other crop: The July index, at 92.3, is down 1.3 percent from the previous month and 0.4 percent from July 2018. The all
hay price, at $165.00 per ton, is $12.00 lower than June but $4.00 higher than July 2018. At 74.0 cents per pound, the
price for upland cotton is 6.2 cents higher than June but 2.8 cents lower than July 2018.
Livestock production: The index for July, at 93.4, decreased 3.7 percent from the previous month and 2.3 percent from
July a year earlier. Compared with a year ago, prices are lower for broilers, market eggs, hogs, and calves. Prices are
higher for milk, cattle, and turkeys than a year earlier.
Meat animal: At 94.7, the July index decreased 2.4 percent from the previous month but increased 0.2 percent from a
year earlier. At $56.60 per cwt, the July hog price is $2.90 lower than June and $2.00 lower than a year earlier. The July
beef cattle price of $112.00 per cwt is $2.00 lower than the previous month but $2.00 higher than July 2018.
Dairy: The index for July, at 93.0, is up 3.3 percent from the previous month and 20.6 percent from July a year ago. The
July all milk price of $18.70 per cwt is 60 cents higher than June and $3.20 higher than July 2018.
Poultry and egg: At 91.5, the July index decreased 11.8 percent from June and 29.6 percent from July 2018. The July
market egg price, at 22.4 cents per dozen, is 23.3 cents lower than June and 66.5 cents lower than July 2018. The July
broiler price, at 48.7 cents per pound, is 5.3 cents lower than June and 18.3 cents lower than a year ago. At 57.6 cents per
pound, the July turkey price is 1.5 cents higher than the previous month and 5.7 cents higher than July 2018.
Agricultural Prices (August 2019) 5 USDA, National Agricultural Statistics Service
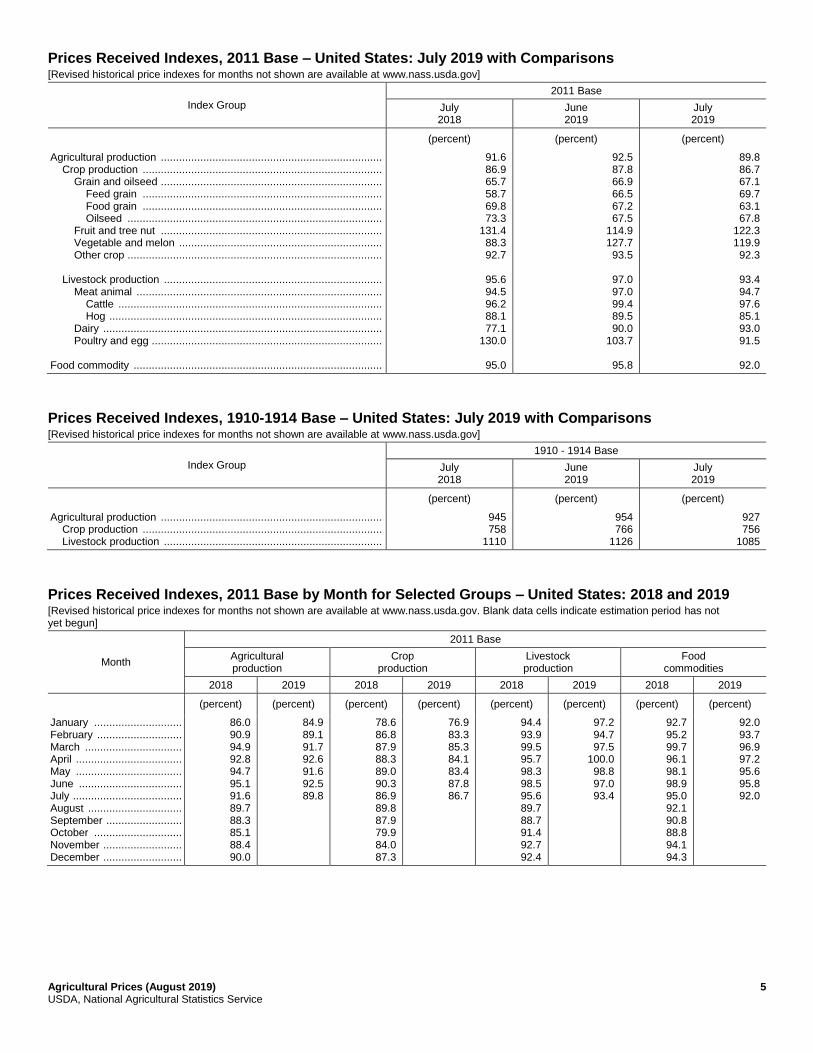
Prices Received Indexes, 2011 Base – United States: July 2019 with Comparisons [Revised historical price indexes for months not shown are available at www.nass.usda.gov]
Index Group
2011 Base
July 2018
June 2019
July 2019
(percent) (percent) (percent)
Agricultural production ......................................................................... Crop production ............................................................................... Grain and oilseed ......................................................................... Feed grain ............................................................................... Food grain ............................................................................... Oilseed .................................................................................... Fruit and tree nut ......................................................................... Vegetable and melon ................................................................... Other crop .................................................................................... Livestock production ........................................................................ Meat animal ................................................................................. Cattle ....................................................................................... Hog .......................................................................................... Dairy ............................................................................................ Poultry and egg ............................................................................ Food commodity ..................................................................................
91.6 86.9 65.7 58.7 69.8 73.3
131.4 88.3 92.7
95.6 94.5 96.2 88.1 77.1
130.0
95.0
92.5 87.8 66.9 66.5 67.2 67.5
114.9 127.7 93.5
97.0 97.0 99.4 89.5 90.0
103.7
95.8
89.8 86.7 67.1 69.7 63.1 67.8
122.3 119.9 92.3
93.4 94.7 97.6 85.1 93.0 91.5
92.0
Prices Received Indexes, 1910-1914 Base – United States: July 2019 with Comparisons [Revised historical price indexes for months not shown are available at www.nass.usda.gov]
Index Group
1910 - 1914 Base
July 2018
June 2019
July 2019
(percent) (percent) (percent)
Agricultural production ......................................................................... Crop production ............................................................................... Livestock production ........................................................................
945 758
1110
954 766
1126
927 756
1085
Prices Received Indexes, 2011 Base by Month for Selected Groups – United States: 2018 and 2019 [Revised historical price indexes for months not shown are available at www.nass.usda.gov. Blank data cells indicate estimation period has not yet begun]
Month
2011 Base
Agricultural production
Crop production
Livestock production
Food commodities
2018 2019 2018 2019 2018 2019 2018 2019
(percent) (percent) (percent) (percent) (percent) (percent) (percent) (percent)
January ............................. February ............................ March ................................ April ................................... May ................................... June .................................. July .................................... August ............................... September ......................... October ............................. November .......................... December ..........................
86.0 90.9 94.9 92.8 94.7 95.1 91.6 89.7 88.3 85.1 88.4 90.0
84.9 89.1 91.7 92.6 91.6 92.5 89.8
78.6 86.8 87.9 88.3 89.0 90.3 86.9 89.8 87.9 79.9 84.0 87.3
76.9 83.3 85.3 84.1 83.4 87.8 86.7
94.4 93.9 99.5 95.7 98.3 98.5 95.6 89.7 88.7 91.4 92.7 92.4
97.2 94.7 97.5
100.0 98.8 97.0 93.4
92.7 95.2 99.7 96.1 98.1 98.9 95.0 92.1 90.8 88.8 94.1 94.3
92.0 93.7 96.9 97.2 95.6 95.8 92.0
6 Agricultural Prices (August 2019) USDA, National Agricultural Statistics Service
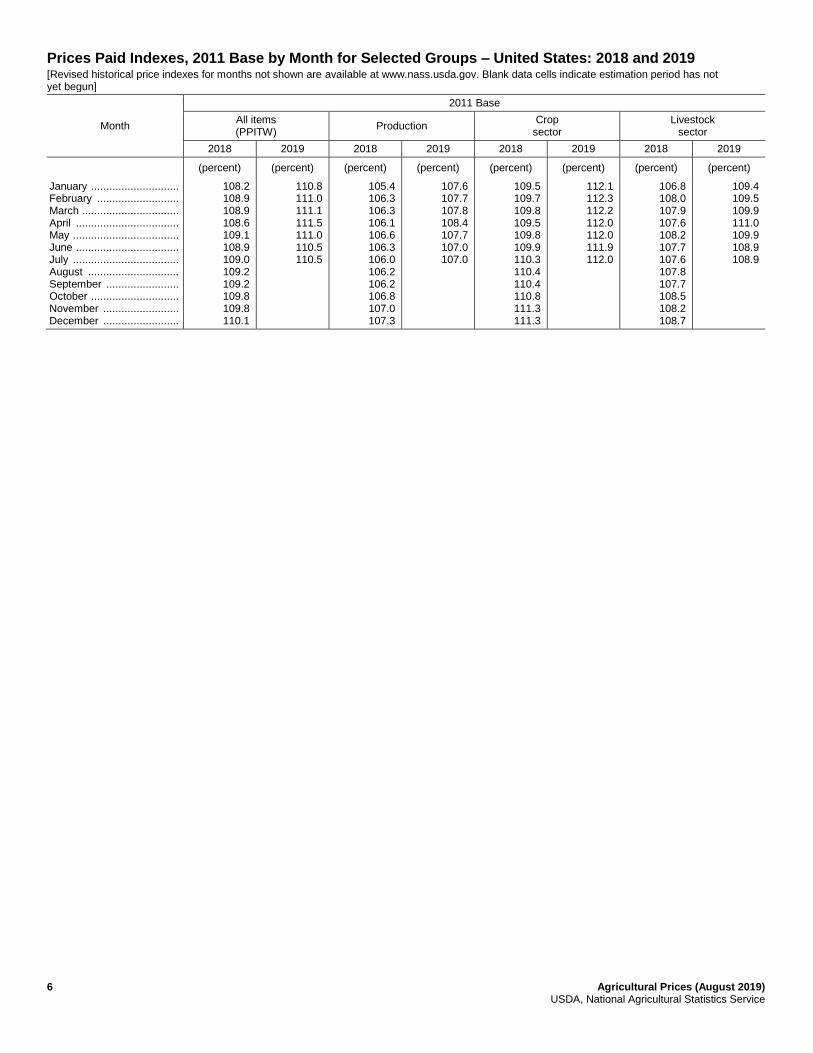
Prices Paid Indexes, 2011 Base by Month for Selected Groups – United States: 2018 and 2019 [Revised historical price indexes for months not shown are available at www.nass.usda.gov. Blank data cells indicate estimation period has not yet begun]
Month
2011 Base
All items (PPITW)
Production Crop
sector Livestock
sector
2018 2019 2018 2019 2018 2019 2018 2019
(percent) (percent) (percent) (percent) (percent) (percent) (percent) (percent)
January ............................. February ........................... March ................................ April .................................. May ................................... June .................................. July ................................... August .............................. September ........................ October ............................. November ......................... December .........................
108.2 108.9 108.9 108.6 109.1 108.9 109.0 109.2 109.2 109.8 109.8 110.1
110.8 111.0 111.1 111.5 111.0 110.5 110.5
105.4 106.3 106.3 106.1 106.6 106.3 106.0 106.2 106.2 106.8 107.0 107.3
107.6 107.7 107.8 108.4 107.7 107.0 107.0
109.5 109.7 109.8 109.5 109.8 109.9 110.3 110.4 110.4 110.8 111.3 111.3
112.1 112.3 112.2 112.0 112.0 111.9 112.0
106.8 108.0 107.9 107.6 108.2 107.7 107.6 107.8 107.7 108.5 108.2 108.7
109.4 109.5 109.9 111.0 109.9 108.9 108.9
Agricultural Prices (August 2019) 7 USDA, National Agricultural Statistics Service
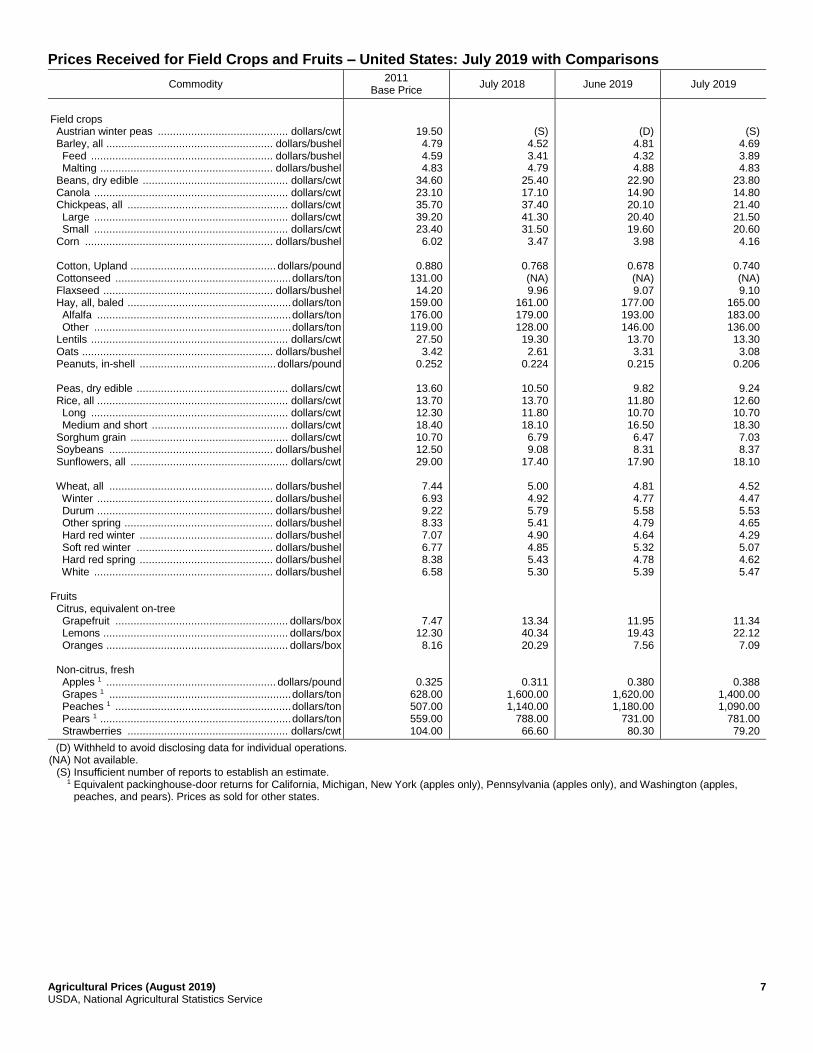
Prices Received for Field Crops and Fruits – United States: July 2019 with Comparisons
Commodity 2011
Base Price July 2018 June 2019 July 2019
Field crops Austrian winter peas ........................................... dollars/cwt Barley, all ....................................................... dollars/bushel Feed ............................................................ dollars/bushel Malting ......................................................... dollars/bushel Beans, dry edible ................................................ dollars/cwt Canola ................................................................ dollars/cwt Chickpeas, all ..................................................... dollars/cwt Large ................................................................ dollars/cwt Small ................................................................ dollars/cwt Corn .............................................................. dollars/bushel Cotton, Upland ................................................ dollars/pound Cottonseed .......................................................... dollars/ton Flaxseed ........................................................ dollars/bushel Hay, all, baled ...................................................... dollars/ton Alfalfa ................................................................ dollars/ton Other ................................................................. dollars/ton Lentils ................................................................. dollars/cwt Oats ............................................................... dollars/bushel Peanuts, in-shell ............................................. dollars/pound Peas, dry edible .................................................. dollars/cwt Rice, all ............................................................... dollars/cwt Long ................................................................. dollars/cwt Medium and short ............................................. dollars/cwt Sorghum grain .................................................... dollars/cwt Soybeans ...................................................... dollars/bushel Sunflowers, all .................................................... dollars/cwt Wheat, all ...................................................... dollars/bushel Winter .......................................................... dollars/bushel Durum .......................................................... dollars/bushel Other spring ................................................. dollars/bushel Hard red winter ............................................ dollars/bushel Soft red winter ............................................. dollars/bushel Hard red spring ............................................ dollars/bushel White ........................................................... dollars/bushel Fruits Citrus, equivalent on-tree Grapefruit ......................................................... dollars/box Lemons ............................................................. dollars/box Oranges ............................................................ dollars/box Non-citrus, fresh Apples 1 ........................................................ dollars/pound Grapes 1 ............................................................ dollars/ton Peaches 1 .......................................................... dollars/ton Pears 1 ............................................................... dollars/ton Strawberries ..................................................... dollars/cwt
19.50 4.79 4.59 4.83
34.60 23.10 35.70 39.20 23.40 6.02
0.880
131.00 14.20
159.00 176.00 119.00 27.50 3.42
0.252
13.60 13.70 12.30 18.40 10.70 12.50 29.00
7.44 6.93 9.22 8.33 7.07 6.77 8.38 6.58
7.47 12.30 8.16
0.325 628.00 507.00 559.00 104.00
(S) 4.52 3.41 4.79
25.40 17.10 37.40 41.30 31.50 3.47
0.768 (NA) 9.96
161.00 179.00 128.00 19.30 2.61
0.224
10.50 13.70 11.80 18.10 6.79 9.08
17.40
5.00 4.92 5.79 5.41 4.90 4.85 5.43 5.30
13.34 40.34 20.29
0.311 1,600.00 1,140.00
788.00 66.60
(D) 4.81 4.32 4.88
22.90 14.90 20.10 20.40 19.60 3.98
0.678 (NA) 9.07
177.00 193.00 146.00 13.70 3.31
0.215
9.82 11.80 10.70 16.50 6.47 8.31
17.90
4.81 4.77 5.58 4.79 4.64 5.32 4.78 5.39
11.95 19.43 7.56
0.380 1,620.00 1,180.00
731.00 80.30
(S) 4.69 3.89 4.83
23.80 14.80 21.40 21.50 20.60 4.16
0.740 (NA) 9.10
165.00 183.00 136.00 13.30 3.08
0.206
9.24 12.60 10.70 18.30 7.03 8.37
18.10
4.52 4.47 5.53 4.65 4.29 5.07 4.62 5.47
11.34 22.12 7.09
0.388 1,400.00 1,090.00
781.00 79.20
(D) Withheld to avoid disclosing data for individual operations. (NA) Not available. (S) Insufficient number of reports to establish an estimate. 1 Equivalent packinghouse-door returns for California, Michigan, New York (apples only), Pennsylvania (apples only), and Washington (apples,
peaches, and pears). Prices as sold for other states.
8 Agricultural Prices (August 2019) USDA, National Agricultural Statistics Service
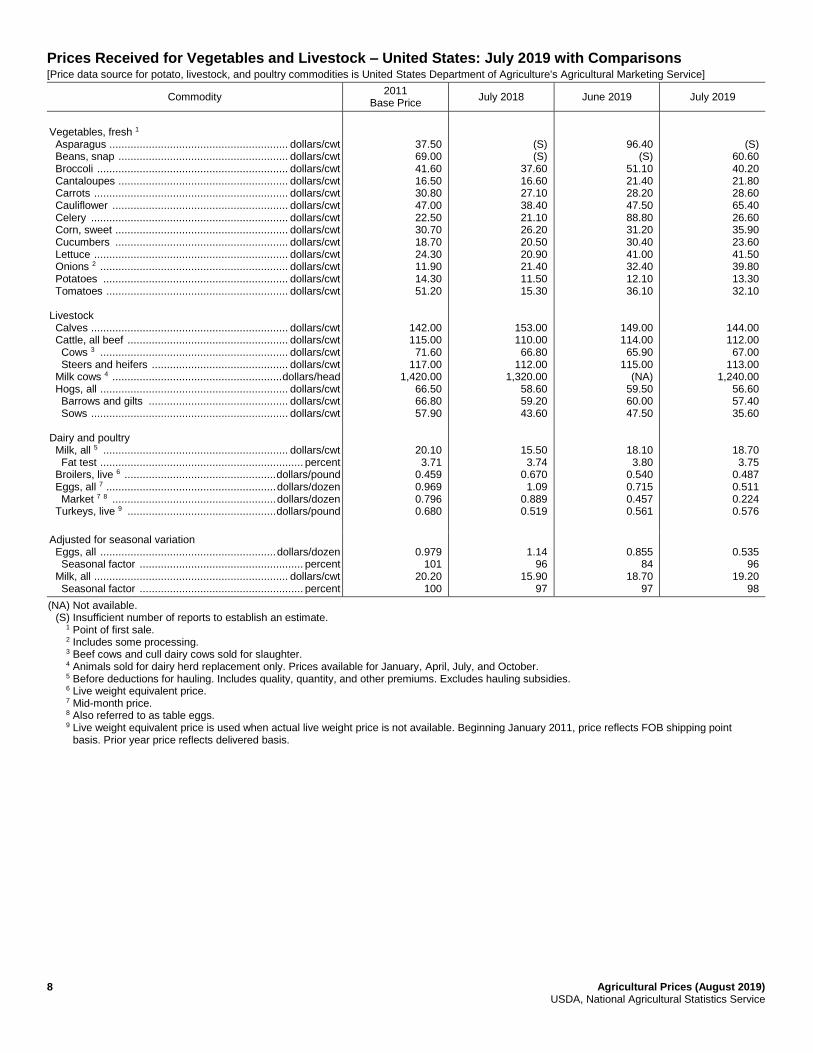
Prices Received for Vegetables and Livestock – United States: July 2019 with Comparisons [Price data source for potato, livestock, and poultry commodities is United States Department of Agriculture's Agricultural Marketing Service]
Commodity 2011
Base Price July 2018 June 2019 July 2019
Vegetables, fresh 1 Asparagus ........................................................... dollars/cwt Beans, snap ........................................................ dollars/cwt Broccoli ............................................................... dollars/cwt Cantaloupes ........................................................ dollars/cwt Carrots ................................................................ dollars/cwt Cauliflower .......................................................... dollars/cwt Celery ................................................................. dollars/cwt Corn, sweet ......................................................... dollars/cwt Cucumbers ......................................................... dollars/cwt Lettuce ................................................................ dollars/cwt Onions 2 .............................................................. dollars/cwt Potatoes ............................................................. dollars/cwt Tomatoes ............................................................ dollars/cwt Livestock Calves ................................................................. dollars/cwt Cattle, all beef ..................................................... dollars/cwt Cows 3 .............................................................. dollars/cwt Steers and heifers ............................................. dollars/cwt Milk cows 4 ........................................................ dollars/head Hogs, all .............................................................. dollars/cwt Barrows and gilts .............................................. dollars/cwt Sows ................................................................. dollars/cwt Dairy and poultry Milk, all 5 ............................................................. dollars/cwt Fat test ................................................................... percent Broilers, live 6 .................................................. dollars/pound Eggs, all 7 ........................................................ dollars/dozen Market 7 8 ...................................................... dollars/dozen Turkeys, live 9 ................................................. dollars/pound
37.50 69.00 41.60 16.50 30.80 47.00 22.50 30.70 18.70 24.30 11.90 14.30 51.20
142.00 115.00 71.60
117.00 1,420.00
66.50 66.80 57.90
20.10 3.71
0.459 0.969 0.796 0.680
(S) (S)
37.60 16.60 27.10 38.40 21.10 26.20 20.50 20.90 21.40 11.50 15.30
153.00 110.00 66.80
112.00 1,320.00
58.60 59.20 43.60
15.50 3.74
0.670 1.09
0.889 0.519
96.40 (S)
51.10 21.40 28.20 47.50 88.80 31.20 30.40 41.00 32.40 12.10 36.10
149.00 114.00 65.90
115.00 (NA)
59.50 60.00 47.50
18.10 3.80
0.540 0.715 0.457 0.561
(S) 60.60 40.20 21.80 28.60 65.40 26.60 35.90 23.60 41.50 39.80 13.30 32.10
144.00 112.00 67.00
113.00 1,240.00
56.60 57.40 35.60
18.70 3.75
0.487 0.511 0.224 0.576
Adjusted for seasonal variation Eggs, all .......................................................... dollars/dozen Seasonal factor ...................................................... percent Milk, all ................................................................ dollars/cwt Seasonal factor ...................................................... percent
0.979
101 20.20
100
1.14
96 15.90
97
0.855
84 18.70
97
0.535
96 19.20
98
(NA) Not available. (S) Insufficient number of reports to establish an estimate. 1 Point of first sale. 2 Includes some processing. 3 Beef cows and cull dairy cows sold for slaughter. 4 Animals sold for dairy herd replacement only. Prices available for January, April, July, and October. 5 Before deductions for hauling. Includes quality, quantity, and other premiums. Excludes hauling subsidies. 6 Live weight equivalent price. 7 Mid-month price. 8 Also referred to as table eggs. 9 Live weight equivalent price is used when actual live weight price is not available. Beginning January 2011, price reflects FOB shipping point
basis. Prior year price reflects delivered basis.
Agricultural Prices (August 2019) 9 USDA, National Agricultural Statistics Service
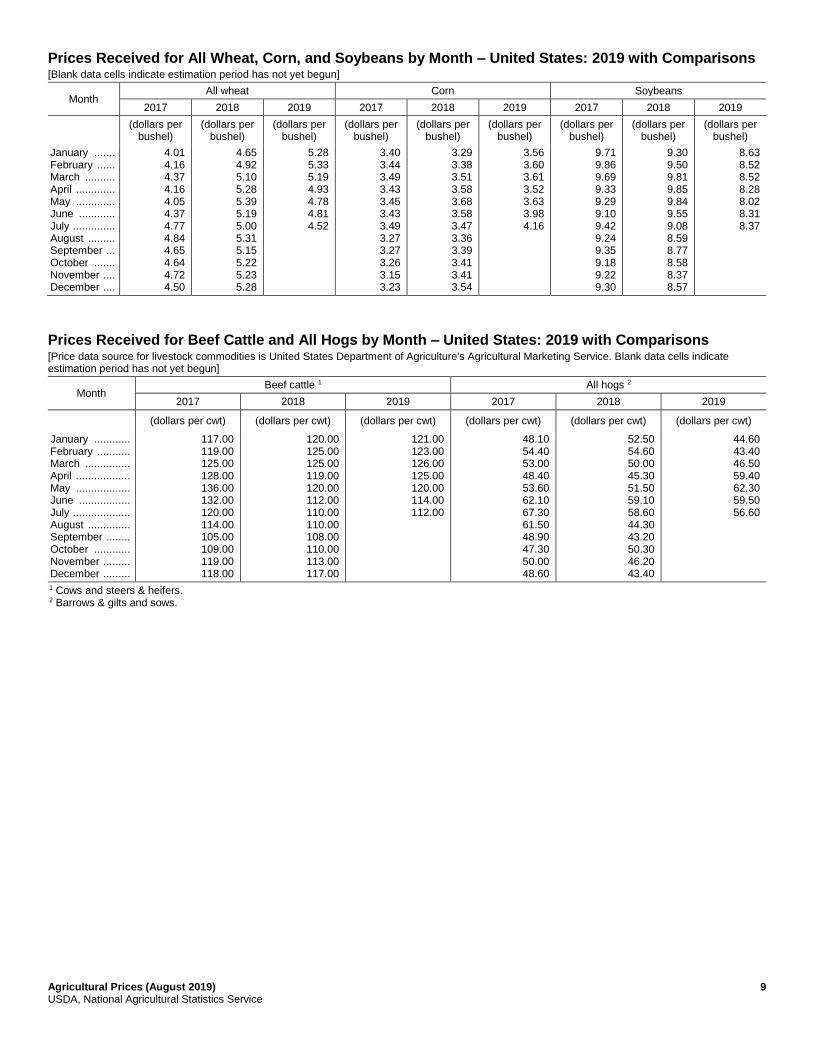
Prices Received for All Wheat, Corn, and Soybeans by Month – United States: 2019 with Comparisons [Blank data cells indicate estimation period has not yet begun]
Month All wheat Corn Soybeans
2017 2018 2019 2017 2018 2019 2017 2018 2019
(dollars per
bushel) (dollars per
bushel) (dollars per
bushel) (dollars per
bushel) (dollars per
bushel) (dollars per
bushel) (dollars per
bushel) (dollars per
bushel) (dollars per
bushel)
January ....... February ...... March .......... April ............. May ............. June ............ July .............. August ......... September ... October ....... November .... December ....
4.01 4.16 4.37 4.16 4.05 4.37 4.77 4.84 4.65 4.64 4.72 4.50
4.65 4.92 5.10 5.28 5.39 5.19 5.00 5.31 5.15 5.22 5.23 5.28
5.28 5.33 5.19 4.93 4.78 4.81 4.52
3.40 3.44 3.49 3.43 3.45 3.43 3.49 3.27 3.27 3.26 3.15 3.23
3.29 3.38 3.51 3.58 3.68 3.58 3.47 3.36 3.39 3.41 3.41 3.54
3.56 3.60 3.61 3.52 3.63 3.98 4.16
9.71 9.86 9.69 9.33 9.29 9.10 9.42 9.24 9.35 9.18 9.22 9.30
9.30 9.50 9.81 9.85 9.84 9.55 9.08 8.59 8.77 8.58 8.37 8.57
8.63 8.52 8.52 8.28 8.02 8.31 8.37
Prices Received for Beef Cattle and All Hogs by Month – United States: 2019 with Comparisons [Price data source for livestock commodities is United States Department of Agriculture's Agricultural Marketing Service. Blank data cells indicate estimation period has not yet begun]
Month Beef cattle 1 All hogs 2
2017 2018 2019 2017 2018 2019
(dollars per cwt) (dollars per cwt) (dollars per cwt) (dollars per cwt) (dollars per cwt) (dollars per cwt)
January ............ February ........... March ............... April .................. May .................. June ................. July ................... August .............. September ........ October ............ November ......... December .........
117.00 119.00 125.00 128.00 136.00 132.00 120.00 114.00 105.00 109.00 119.00 118.00
120.00 125.00 125.00 119.00 120.00 112.00 110.00 110.00 108.00 110.00 113.00 117.00
121.00 123.00 126.00 125.00 120.00 114.00 112.00
48.10 54.40 53.00 48.40 53.60 62.10 67.30 61.50 48.90 47.30 50.00 48.60
52.50 54.60 50.00 45.30 51.50 59.10 58.60 44.30 43.20 50.30 46.20 43.40
44.60 43.40 46.50 59.40 62.30 59.50 56.60
1 Cows and steers & heifers. 2 Barrows & gilts and sows.
10 Agricultural Prices (August 2019) USDA, National Agricultural Statistics Service
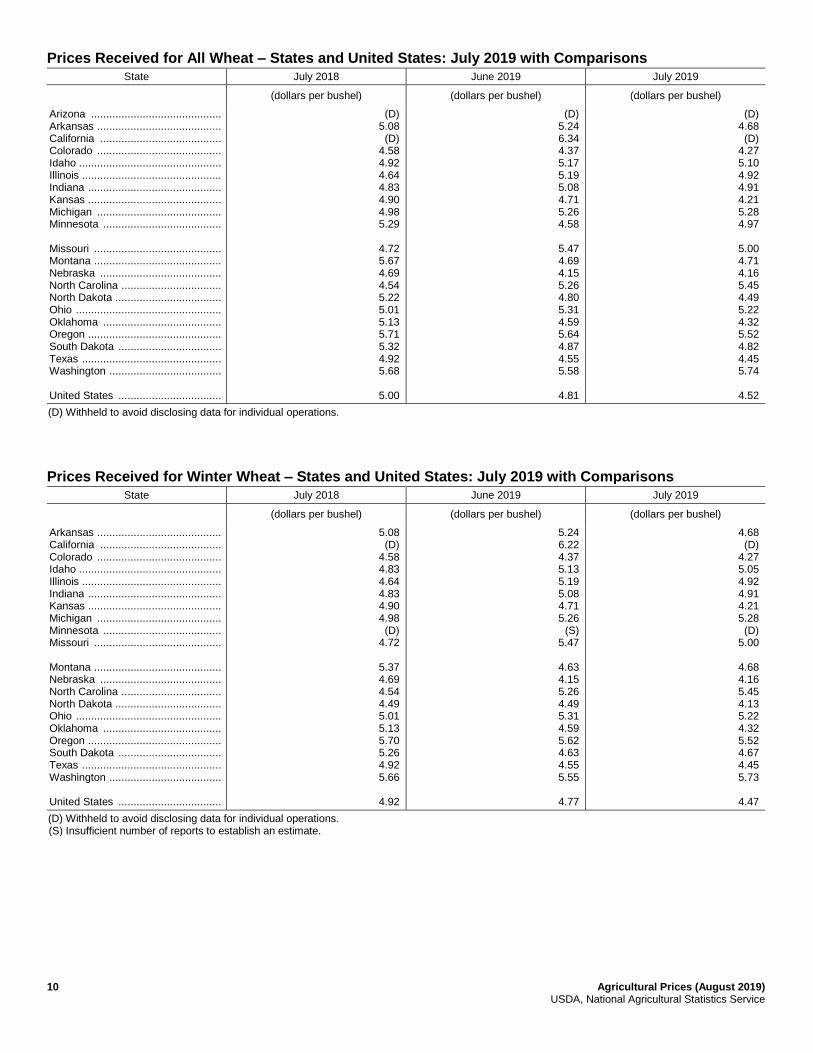
Prices Received for All Wheat – States and United States: July 2019 with Comparisons
State July 2018 June 2019 July 2019
(dollars per bushel) (dollars per bushel) (dollars per bushel)
Arizona ........................................... Arkansas ......................................... California ........................................ Colorado ......................................... Idaho ............................................... Illinois .............................................. Indiana ............................................ Kansas ............................................ Michigan ......................................... Minnesota ....................................... Missouri .......................................... Montana .......................................... Nebraska ........................................ North Carolina ................................. North Dakota ................................... Ohio ................................................ Oklahoma ....................................... Oregon ............................................ South Dakota .................................. Texas .............................................. Washington ..................................... United States ..................................
(D) 5.08 (D)
4.58 4.92 4.64 4.83 4.90 4.98 5.29
4.72 5.67 4.69 4.54 5.22 5.01 5.13 5.71 5.32 4.92 5.68
5.00
(D) 5.24 6.34 4.37 5.17 5.19 5.08 4.71 5.26 4.58
5.47 4.69 4.15 5.26 4.80 5.31 4.59 5.64 4.87 4.55 5.58
4.81
(D) 4.68 (D)
4.27 5.10 4.92 4.91 4.21 5.28 4.97
5.00 4.71 4.16 5.45 4.49 5.22 4.32 5.52 4.82 4.45 5.74
4.52
(D) Withheld to avoid disclosing data for individual operations.
Prices Received for Winter Wheat – States and United States: July 2019 with Comparisons
State July 2018 June 2019 July 2019
(dollars per bushel) (dollars per bushel) (dollars per bushel)
Arkansas ......................................... California ........................................ Colorado ......................................... Idaho ............................................... Illinois .............................................. Indiana ............................................ Kansas ............................................ Michigan ......................................... Minnesota ....................................... Missouri .......................................... Montana .......................................... Nebraska ........................................ North Carolina ................................. North Dakota ................................... Ohio ................................................ Oklahoma ....................................... Oregon ............................................ South Dakota .................................. Texas .............................................. Washington ..................................... United States ..................................
5.08 (D)
4.58 4.83 4.64 4.83 4.90 4.98 (D)
4.72
5.37 4.69 4.54 4.49 5.01 5.13 5.70 5.26 4.92 5.66
4.92
5.24 6.22 4.37 5.13 5.19 5.08 4.71 5.26
(S) 5.47
4.63 4.15 5.26 4.49 5.31 4.59 5.62 4.63 4.55 5.55
4.77
4.68 (D)
4.27 5.05 4.92 4.91 4.21 5.28 (D)
5.00
4.68 4.16 5.45 4.13 5.22 4.32 5.52 4.67 4.45 5.73
4.47
(D) Withheld to avoid disclosing data for individual operations. (S) Insufficient number of reports to establish an estimate.
Agricultural Prices (August 2019) 11 USDA, National Agricultural Statistics Service
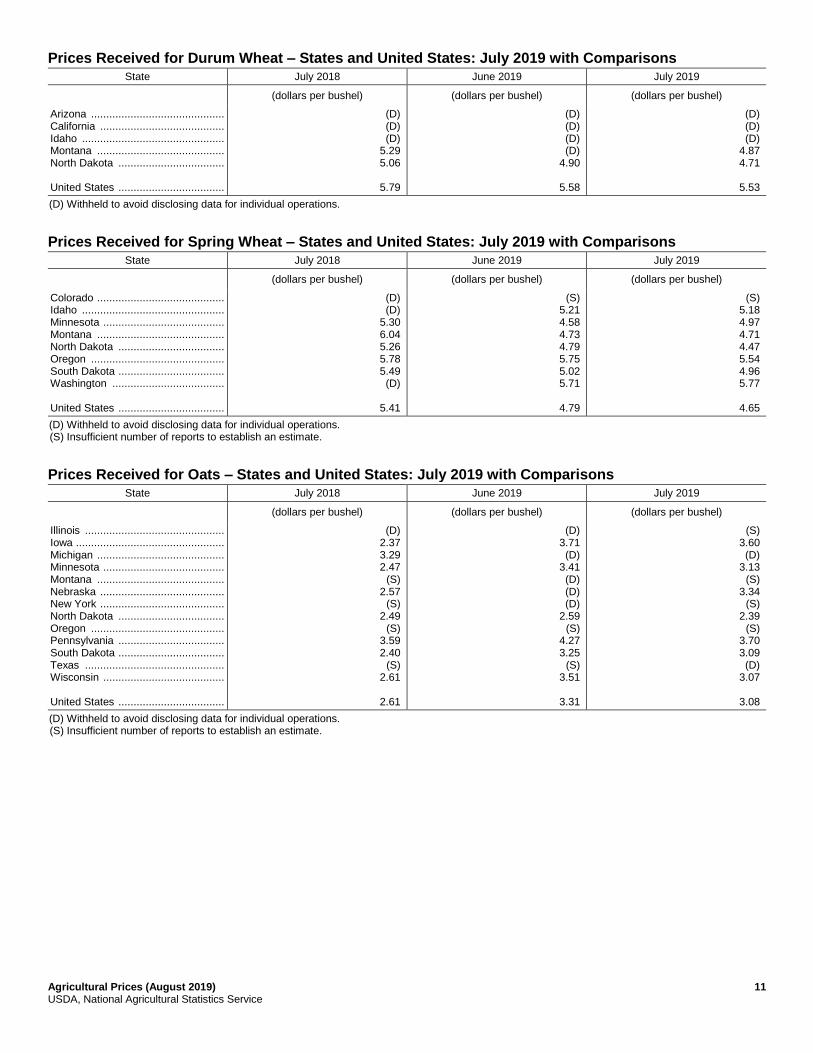
Prices Received for Durum Wheat – States and United States: July 2019 with Comparisons
State July 2018 June 2019 July 2019
(dollars per bushel) (dollars per bushel) (dollars per bushel)
Arizona ............................................ California ......................................... Idaho ............................................... Montana .......................................... North Dakota ................................... United States ...................................
(D) (D) (D)
5.29 5.06
5.79
(D) (D) (D) (D)
4.90
5.58
(D) (D) (D)
4.87 4.71
5.53
(D) Withheld to avoid disclosing data for individual operations.
Prices Received for Spring Wheat – States and United States: July 2019 with Comparisons
State July 2018 June 2019 July 2019
(dollars per bushel) (dollars per bushel) (dollars per bushel)
Colorado .......................................... Idaho ............................................... Minnesota ........................................ Montana .......................................... North Dakota ................................... Oregon ............................................ South Dakota ................................... Washington ..................................... United States ...................................
(D) (D)
5.30 6.04 5.26 5.78 5.49 (D)
5.41
(S) 5.21 4.58 4.73 4.79 5.75 5.02 5.71
4.79
(S) 5.18 4.97 4.71 4.47 5.54 4.96 5.77
4.65
(D) Withheld to avoid disclosing data for individual operations. (S) Insufficient number of reports to establish an estimate.
Prices Received for Oats – States and United States: July 2019 with Comparisons
State July 2018 June 2019 July 2019
(dollars per bushel) (dollars per bushel) (dollars per bushel)
Illinois .............................................. Iowa ................................................. Michigan .......................................... Minnesota ........................................ Montana .......................................... Nebraska ......................................... New York ......................................... North Dakota ................................... Oregon ............................................ Pennsylvania ................................... South Dakota ................................... Texas .............................................. Wisconsin ........................................ United States ...................................
(D) 2.37 3.29 2.47
(S) 2.57
(S) 2.49
(S) 3.59 2.40
(S) 2.61
2.61
(D) 3.71 (D)
3.41 (D) (D) (D)
2.59 (S)
4.27 3.25
(S) 3.51
3.31
(S) 3.60 (D)
3.13 (S)
3.34 (S)
2.39 (S)
3.70 3.09 (D)
3.07
3.08
(D) Withheld to avoid disclosing data for individual operations. (S) Insufficient number of reports to establish an estimate.
12 Agricultural Prices (August 2019) USDA, National Agricultural Statistics Service
Prices Received for All Barley – States and United States: July 2019 with Comparisons
State July 2018 June 2019 July 2019
(dollars per bushel) (dollars per bushel) (dollars per bushel)
California ........................................ Colorado ......................................... Idaho ............................................... Minnesota ....................................... Montana .......................................... North Dakota ................................... Washington ..................................... Wyoming ......................................... United States ..................................
(D) 4.08 5.07 4.03 3.59 4.18 (D) (D)
4.52
(D) 4.68 5.29 (D)
4.21 4.45 (D) (D)
4.81
(D) (D)
5.15 (D)
3.55 4.22 (D) (D)
4.69
(D) Withheld to avoid disclosing data for individual operations.
Prices Received for Malting Barley – States and United States: July 2019 with Comparisons
State July 2018 June 2019 July 2019
(dollars per bushel) (dollars per bushel) (dollars per bushel)
California ........................................ Colorado ......................................... Idaho ............................................... Minnesota ....................................... Montana .......................................... North Dakota ................................... Washington ..................................... Wyoming ......................................... United States ..................................
(D) (D)
5.23 4.09 (D)
4.45 (D) (D)
4.79
(S) 4.68 5.35 (D)
4.40 4.53 (D) (D)
4.88
(S) (D)
5.20 (D) (D)
4.39 (D) (D)
4.83
(D) Withheld to avoid disclosing data for individual operations. (S) Insufficient number of reports to establish an estimate.
Prices Received for Feed Barley – States and United States: July 2019 with Comparisons
State July 2018 June 2019 July 2019
(dollars per bushel) (dollars per bushel) (dollars per bushel)
California ........................................ Colorado ......................................... Idaho ............................................... Minnesota ....................................... Montana .......................................... North Dakota ................................... Washington ..................................... Wyoming ......................................... United States ..................................
(D) (D)
3.25 3.26 3.51 3.30 3.15
(S)
3.41
(D) (S)
3.65 (S)
2.98 3.36 3.70
(S)
4.32
(D) (S)
3.67 (S)
3.06 3.24 3.32
(S)
3.89
(D) Withheld to avoid disclosing data for individual operations. (S) Insufficient number of reports to establish an estimate.
Prices Received for Sorghum Grain – States and United States: July 2019 with Comparisons
State July 2018 June 2019 July 2019
(dollars per cwt) (dollars per cwt) (dollars per cwt)
Arkansas ......................................... Kansas ............................................ Louisiana ........................................ Missouri .......................................... Nebraska ........................................ Oklahoma ....................................... Texas .............................................. United States ..................................
(D) 5.44
(S) 5.59 (D)
5.19 7.02
6.79
(S) 6.11
(S) 6.90 6.21 6.82 7.36
6.47
(S) 6.36
(S) (S)
6.32 6.59 7.16
7.03
(D) Withheld to avoid disclosing data for individual operations. (S) Insufficient number of reports to establish an estimate.
Agricultural Prices (August 2019) 13 USDA, National Agricultural Statistics Service
Prices Received for Corn – States and United States: July 2019 with Comparisons
State July 2018 June 2019 July 2019
(dollars per bushel) (dollars per bushel) (dollars per bushel)
Alabama ..................................................... Alaska ........................................................ Arizona ....................................................... Arkansas .................................................... California .................................................... Colorado ..................................................... Connecticut ................................................ Delaware .................................................... Florida ........................................................ Georgia ...................................................... Hawaii ........................................................ Idaho .......................................................... Illinois ......................................................... Indiana ....................................................... Iowa ............................................................ Kansas ....................................................... Kentucky ..................................................... Louisiana .................................................... Maine ......................................................... Maryland ..................................................... Massachusetts ............................................ Michigan ..................................................... Minnesota ................................................... Mississippi .................................................. Missouri ...................................................... Montana ..................................................... Nebraska .................................................... Nevada ....................................................... New Hampshire .......................................... New Jersey ................................................. New Mexico ................................................ New York .................................................... North Carolina ............................................ North Dakota .............................................. Ohio ............................................................ Oklahoma ................................................... Oregon ....................................................... Pennsylvania .............................................. Rhode Island .............................................. South Carolina ............................................ South Dakota .............................................. Tennessee .................................................. Texas ......................................................... Utah ............................................................ Vermont ...................................................... Virginia ....................................................... Washington ................................................ West Virginia .............................................. Wisconsin ................................................... Wyoming .................................................... United States 1 ............................................
4.16 (S) (D)
3.87 (S)
3.58 (S) (S) (D) (D)
(S) (D)
3.48 3.60 3.41 3.55 3.81 3.88
(S) 3.94
(S)
3.71 3.32 (D)
3.57 (D)
3.45 (S) (S) (D)
(D)
4.52 4.41 3.26 3.65 (D) (S)
3.89 (S) (D)
3.27 3.77 4.02
(S) (S)
4.37 (D) (D)
3.43 (S)
3.47
3.69 (S) (D)
4.22 (D)
4.05 (S) (D) (D) (D)
(S) (D)
4.00 4.29 3.95 4.03 4.19 (D) (S) (D)
(S)
4.30 3.74 (D)
4.04 (D)
3.92 (S) (S) (D)
(S)
4.46 4.76 3.58 4.28 4.33
(S) 4.53
(S) (D)
3.80 4.20 4.37
(S) (S)
4.87 (D) (D)
3.89 (S)
3.98
4.70 (S) (D)
4.05 (S)
4.18 (S) (D) (D) (D)
(S) (D)
4.20 4.55 4.11 4.09 4.40 (D) (S)
5.14
(S) 4.49 3.88 (D)
4.24 (S)
4.12 (S) (S) (D)
(D)
4.56 4.82 3.72 4.59 4.36
(S) 4.74
(S) (D)
3.99 4.56 4.70
(S) (S)
4.93 (D) (D)
3.98 (S)
4.16
(D) Withheld to avoid disclosing data for individual operations. (S) Insufficient number of reports to establish an estimate. 1 United States price includes Colorado, Illinois, Indiana, Iowa, Kansas, Kentucky, Michigan, Minnesota, Missouri, Nebraska, North Carolina, North
Dakota, Ohio, Pennsylvania, South Dakota, Tennessee, Texas, and Wisconsin.
14 Agricultural Prices (August 2019) USDA, National Agricultural Statistics Service
Prices Received for Soybeans – States and United States: July 2019 with Comparisons
State July 2018 June 2019 July 2019
(dollars per bushel) (dollars per bushel) (dollars per bushel)
Arkansas ......................................... Illinois .............................................. Indiana ............................................ Iowa ................................................ Kansas ............................................ Kentucky ......................................... Louisiana ........................................ Michigan ......................................... Minnesota ....................................... Mississippi ...................................... Missouri .......................................... Nebraska ........................................ North Carolina ................................. North Dakota ................................... Ohio ................................................ South Dakota .................................. Tennessee ...................................... Wisconsin ....................................... United States ..................................
(D) 9.44 8.94 9.15 8.84 9.84 (D)
9.56 8.75 (D)
9.28 9.25 8.88 8.45 9.35 8.86 8.92 9.30
9.08
(D) 8.58 8.71 8.28 8.08 8.65 7.04 8.41 8.27 7.66
8.43 8.04 8.52 7.64 8.53 7.92 8.62 8.22
8.31
8.53 8.72 8.80 8.38 8.07 8.75 8.20 8.48 8.31 (D)
8.54 8.15 8.60 7.75 8.67 7.98 8.72 8.31
8.37
(D) Withheld to avoid disclosing data for individual operations.
Prices Received for Dry Beans – States and United States: July 2019 with Comparisons
State July 2018 June 2019 July 2019
(dollars per cwt) (dollars per cwt) (dollars per cwt)
California ........................................ Colorado ......................................... Idaho ............................................... Michigan ......................................... Minnesota ....................................... Nebraska ........................................ North Dakota ................................... United States ..................................
(D) 24.60 26.00 32.00 23.00
(D) 23.90
25.40
(D) (D)
20.10 (D) (D) (D)
21.50
22.90
(D) 21.70
(D) 30.00
(D) (D)
21.60
23.80
(D) Withheld to avoid disclosing data for individual operations.
Agricultural Prices (August 2019) 15 USDA, National Agricultural Statistics Service
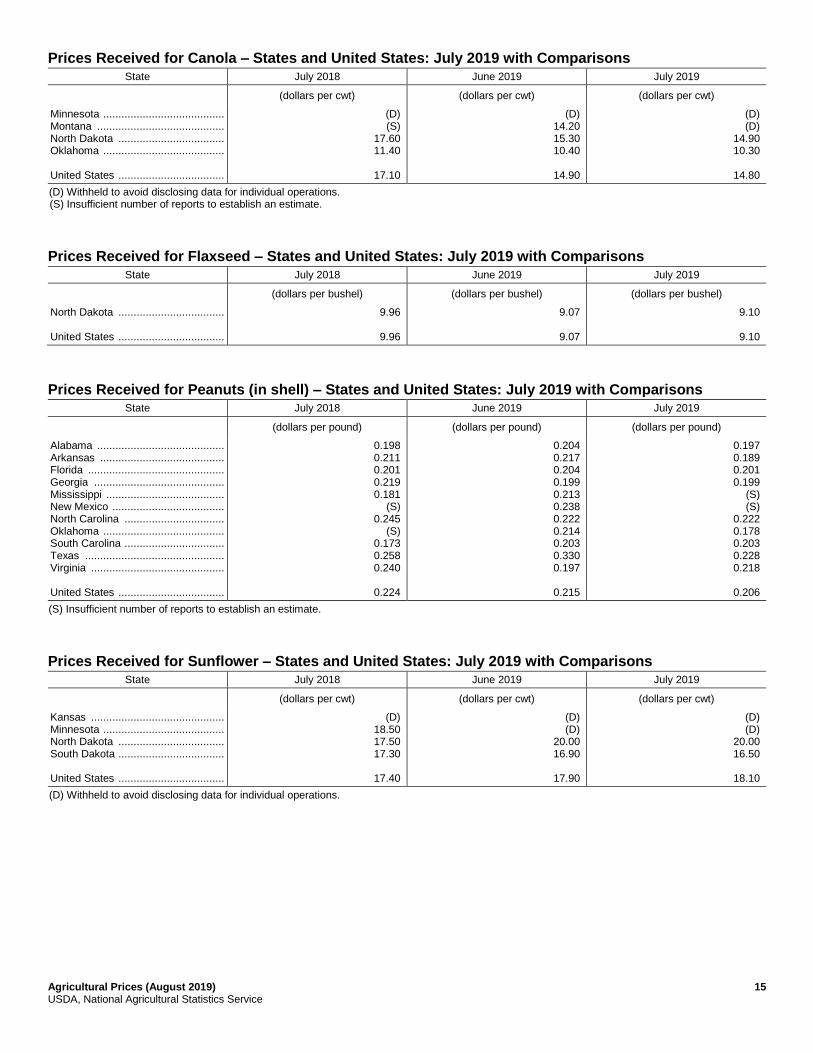
Prices Received for Canola – States and United States: July 2019 with Comparisons
State July 2018 June 2019 July 2019
(dollars per cwt) (dollars per cwt) (dollars per cwt)
Minnesota ........................................ Montana .......................................... North Dakota ................................... Oklahoma ........................................ United States ...................................
(D) (S)
17.60 11.40
17.10
(D) 14.20 15.30 10.40
14.90
(D) (D)
14.90 10.30
14.80
(D) Withheld to avoid disclosing data for individual operations. (S) Insufficient number of reports to establish an estimate.
Prices Received for Flaxseed – States and United States: July 2019 with Comparisons
State July 2018 June 2019 July 2019
(dollars per bushel) (dollars per bushel) (dollars per bushel)
North Dakota ................................... United States ...................................
9.96
9.96
9.07
9.07
9.10
9.10
Prices Received for Peanuts (in shell) – States and United States: July 2019 with Comparisons State July 2018 June 2019 July 2019
(dollars per pound) (dollars per pound) (dollars per pound)
Alabama .......................................... Arkansas ......................................... Florida ............................................. Georgia ........................................... Mississippi ....................................... New Mexico ..................................... North Carolina ................................. Oklahoma ........................................ South Carolina ................................. Texas .............................................. Virginia ............................................ United States ...................................
0.198 0.211 0.201 0.219 0.181
(S) 0.245
(S) 0.173 0.258 0.240
0.224
0.204 0.217 0.204 0.199 0.213 0.238 0.222 0.214 0.203 0.330 0.197
0.215
0.197 0.189 0.201 0.199
(S) (S)
0.222 0.178 0.203 0.228 0.218
0.206
(S) Insufficient number of reports to establish an estimate.
Prices Received for Sunflower – States and United States: July 2019 with Comparisons State July 2018 June 2019 July 2019
(dollars per cwt) (dollars per cwt) (dollars per cwt)
Kansas ............................................ Minnesota ........................................ North Dakota ................................... South Dakota ................................... United States ...................................
(D) 18.50 17.50 17.30
17.40
(D) (D)
20.00 16.90
17.90
(D) (D)
20.00 16.50
18.10
(D) Withheld to avoid disclosing data for individual operations.
16 Agricultural Prices (August 2019) USDA, National Agricultural Statistics Service
Prices Received for Upland Cotton and Cottonseed – States and United States: July 2019 with Comparisons [Cottonseed marketing year August - February]
State
Cotton, Upland Cottonseed
July 2018
June 2019
July 2019
July 2018
June 2019
July 2019
(dollars per pound) (dollars per pound) (dollars per pound) (dollars per ton) (dollars per ton) (dollars per ton)
Alabama ............................ Arizona .............................. Arkansas ............................ California ........................... Georgia .............................. Louisiana ........................... Mississippi ......................... North Carolina .................... Tennessee ......................... Texas ................................. United States .....................
(D) (S) (D) (D) (D) (D) (D) (D) (D)
0.687
0.768
(D) (S) (D) (S)
0.712 (D) (D) (D) (D)
0.547
0.678
(D) (S) (D) (S)
0.759 (D) (D)
0.763 (D)
0.516
0.740
(NA) (NA) (NA) (NA) (NA) (NA) (NA) (NA) (NA) (NA)
(NA)
(NA) (NA) (NA) (NA) (NA) (NA) (NA) (NA) (NA) (NA)
(NA)
(NA) (NA) (NA) (NA) (NA) (NA) (NA) (NA) (NA) (NA)
(NA)
(D) Withheld to avoid disclosing data for individual operations. (NA) Not available. (S) Insufficient number of reports to establish an estimate.
Prices Received and Marketings for Upland Cotton and Rice – United States: July 2019 with Comparisons
Item July 2018 June 2019 July 2019
Cotton, Upland Average price ..................................... dollars/pound Marketings 1 .......................................... 1,000 bales Rice, all Average price .......................................... dollars/cwt Marketings 2 ..............................................1,000 cwt Rice, long Average price .......................................... dollars/cwt Marketings 2 ..............................................1,000 cwt Rice, medium and short California Average price .......................................... dollars/cwt Other States 3 Average price .......................................... dollars/cwt United States Average price .......................................... dollars/cwt Marketings 2 ..............................................1,000 cwt
0.768 704
13.70 9,465
11.80 6,572
20.00
12.50
18.10 2,893
0.678 368
11.80 11,126
10.70 9,114
18.90
12.70
16.50 2,012
0.740 866
12.60 11,072
10.70 8,253
19.40
13.30
18.30 2,819
1 Marketings based on a survey of cotton buyers in the major producing States - Alabama, Arizona, Arkansas, California, Georgia, Louisiana, Mississippi, North Carolina, Tennessee, and Texas.
2 Purchases by private firms and rice (rough equivalent) shipped by cooperatives. 3 Other States include Arkansas, Louisiana, Mississippi, Missouri, and Texas.
Agricultural Prices (August 2019) 17 USDA, National Agricultural Statistics Service
Prices Received for Hay by Type – States and United States: July 2019 with Comparisons
State
All hay Alfalfa hay Other hay
July 2018
June 2019
July 2019
July 2018
June 2019
July 2019
July 2018
June 2019
July 2019
(dollars per
ton) (dollars per
ton) (dollars per
ton) (dollars per
ton) (dollars per
ton) (dollars per
ton) (dollars per
ton) (dollars per
ton) (dollars per
ton)
Arizona ........................... California ........................ Colorado ......................... Idaho .............................. Illinois ............................. Iowa ................................ Kansas ........................... Kentucky ......................... Michigan ......................... Minnesota ....................... Missouri .......................... Montana ......................... Nebraska ........................ Nevada ........................... New Mexico .................... New York ........................ North Dakota .................. Ohio ................................ Oklahoma ....................... Oregon ........................... Pennsylvania .................. South Dakota .................. Texas ............................. Utah ................................ Washington .................... Wisconsin ....................... Wyoming ........................ United States ..................
218.00 186.00 210.00 144.00 138.00 103.00 161.00 157.00 134.00 101.00
112.00 157.00 88.00
176.00 229.00 133.00 90.00
141.00 96.00
197.00
150.00 93.00
147.00 159.00 187.00 115.00 165.00
161.00
220.00 188.00 240.00 160.00 155.00 138.00 136.00 155.00 183.00 181.00
125.00 148.00 120.00 170.00 229.00 168.00 98.00
181.00 131.00 200.00
194.00 108.00 149.00 185.00 202.00 213.00 163.00
177.00
190.00 182.00 230.00 155.00 156.00 112.00 143.00 155.00 168.00 124.00
124.00 149.00 108.00 170.00 226.00 170.00 86.00
176.00 109.00 205.00
198.00 97.00
141.00 180.00 198.00 155.00 163.00
165.00
220.00 200.00 210.00 140.00 165.00 106.00 170.00 220.00 145.00 107.00
160.00 160.00 98.00
175.00 240.00 160.00 96.00
180.00 174.00 200.00
169.00 94.00
194.00 160.00 180.00 127.00 170.00
179.00
220.00 200.00 240.00 160.00 165.00 141.00 150.00 210.00 195.00 192.00
150.00 150.00 128.00 170.00 240.00 181.00 99.00
215.00 189.00 200.00
231.00 110.00 193.00 185.00 195.00 219.00 170.00
193.00
190.00 195.00 230.00 155.00 170.00 123.00 150.00 210.00 185.00 151.00
150.00 150.00 118.00 170.00 235.00 191.00 90.00
210.00 170.00 205.00
240.00 100.00 188.00 180.00 200.00 167.00 170.00
183.00
200.00 145.00 210.00 180.00 105.00 97.00
103.00 140.00 115.00 90.00
105.00 135.00 70.00
185.00 175.00 130.00 67.00
115.00 90.00
190.00
143.00 87.00
119.00 125.00 205.00 94.00
140.00
128.00
200.00 150.00 230.00 160.00 130.00 130.00 96.00
140.00 130.00 152.00
120.00 140.00 96.00
180.00 170.00 165.00 77.00
130.00 124.00 200.00
185.00 94.00
133.00 150.00 220.00 176.00 140.00
146.00
200.00 140.00 230.00 150.00 135.00 95.00 96.00
135.00 120.00 97.00
120.00 145.00 88.00
175.00 180.00 165.00 70.00
130.00 104.00 205.00
187.00 88.00
121.00 145.00 195.00 125.00 140.00
136.00
Prices Received for Premium and Supreme Alfalfa Hay – States and 5-State Total: July 2019 State July 2018 June 2019 July 2019
(dollars per ton) (dollars per ton) (dollars per ton)
California ......................................... Idaho ............................................... Michigan .......................................... Minnesota ........................................ New York ......................................... Pennsylvania ................................... Texas .............................................. Wisconsin ........................................ 5-State Total 1 2 ...............................
(NA) (NA) (NA) (NA) (NA) (NA) (NA) (NA)
(NA)
225.00 190.00 200.00 211.00 246.00 296.00 235.00 252.00
217.00
220.00 190.00 190.00 203.00 246.00 256.00 229.00 223.00
209.00
(NA) Not available. 1 5-State total represents a weighted (hay purchases) average price for the five largest milk producing States (based on the pounds of milk
produced during the previous month). 2 For May 2019, includes California, Idaho, New York, Texas, and Wisconsin. For June 2019, includes California, Idaho, New York, Texas, and
Wisconsin.
18 Agricultural Prices (August 2019) USDA, National Agricultural Statistics Service
Prices Received for Apples – States and United States: July 2019 with Comparisons [Equivalent packinghouse-door returns for California, Michigan, New York, Pennsylvania, and Washington. Prices at point of first sale for other States]
State Apples, fresh use
July 2018 June 2019 July 2019
(dollars per pound) (dollars per pound) (dollars per pound)
California ........................................ Michigan ......................................... New York ........................................ Pennsylvania .................................. Virginia ............................................ Washington ..................................... United States ..................................
(S) (S) (S) (S) (S)
0.308
0.311
(S) 0.290 0.376 0.483
(S) 0.384
0.380
(S) (S) (S) (S) (S)
0.387
0.388
(S) Insufficient number of reports to establish an estimate.
Prices Received for Citrus Fruits by Utilization – States and United States: July 2018 [Net pounds per box: grapefruit in California-80, Florida-85, Texas-80; lemons-80; oranges in California-80, Florida-90, Texas-85]
Commodity, State,
and type
FOB packed fresh
Equivalent returns
Packinghouse door On-tree
All Fresh Process All Fresh Process
(dollars per
box) (dollars per
box) (dollars per
box) (dollars per
box) (dollars per
box) (dollars per
box) (dollars per
box)
Grapefruit California ........................................... Florida, all ......................................... White ............................................. Red ............................................... Texas ................................................ United States .................................... Lemons Arizona ............................................. California ........................................... United States .................................... Oranges California, all ..................................... Navel and miscellaneous .............. Valencia ........................................ Florida, all ......................................... Early and mids .............................. Valencia ........................................ Texas, all .......................................... Early and mids .............................. Valencia ........................................ United States ....................................
(D) (S) (S) (S) (S)
(D)
(S) 60.70
60.70
39.40 (S)
39.40 35.70
(S) 35.70
(S) (S) (S)
39.20
16.18
(S) (S) (S) (S)
16.18
(S) 46.75
46.75
23.38 (S)
23.38 (S) (S) (S) (S) (S) (S)
23.13
(D) (S) (S) (S) (S)
(D)
(S) 50.67
50.67
29.48 (S)
29.48 23.85
(S) 23.85
(S) (S) (S)
29.11
(D) (S) (S) (S) (S)
(D)
(S) (D)
(D)
(D) (S) (D) (S) (S) (S) (S) (S) (S)
(D)
13.34
(S) (S) (S) (S)
13.34
(S) 40.34
40.34
20.57 (S)
20.57 (S) (S) (S) (S) (S) (S)
20.29
(D) (S) (S) (S) (S)
(D)
(S) 44.15
44.15
26.72 (S)
26.72 20.55
(S) 20.55
(S) (S) (S)
26.32
(D) (S) (S) (S) (S)
(D)
(S) (D)
(D)
(D) (S) (D) (S) (S) (S) (S) (S) (S)
(D)
(D) Withheld to avoid disclosing data for individual operations. (S) Insufficient number of reports to establish an estimate.
Agricultural Prices (August 2019) 19 USDA, National Agricultural Statistics Service
Prices Received for Citrus Fruits by Utilization – States and United States: June 2019 [Net pounds per box: grapefruit in California-80, Florida-85, Texas-80; lemons-80; oranges in California-80, Florida-90, Texas-85]
Commodity, State,
and type
FOB packed fresh
Equivalent returns
Packinghouse door On-tree
All Fresh Process All Fresh Process
(dollars per
box) (dollars per
box) (dollars per
box) (dollars per
box) (dollars per
box) (dollars per
box) (dollars per
box)
Grapefruit California .......................................... Florida, all ......................................... White ............................................ Red ............................................... Texas ................................................ United States .................................... Lemons Arizona ............................................. California .......................................... United States .................................... Oranges California, all ..................................... Navel and miscellaneous .............. Valencia ........................................ Florida, all ......................................... Early and mids .............................. Valencia ........................................ Texas, all .......................................... Early and mids .............................. Valencia ........................................ United States ....................................
(D) (S) (S) (S) (S)
(D)
(S) 43.40
43.40
25.10 27.00 23.10 29.40
(S) 29.40
(S) (S) (S)
25.50
14.83
(S) (S) (S) (S)
14.86
(S) 25.71
25.71
7.11 5.77 9.67
15.79 (S)
15.79 (S) (S) (S)
10.54
(D) (S) (S) (S) (S)
(D)
(S) 33.17
33.17
14.93 16.88 12.98 18.05
(S) 18.05
(S) (S) (S)
15.21
(D) (S) (S) (S) (S)
(D)
(S) (D)
(D)
(D) (D) (D)
15.60 (S)
15.60 (S) (S) (S)
8.21
11.92
(S) (S) (S) (S)
11.95
(S) 19.43
19.43
4.19 2.82 6.79
12.72 (S)
12.72 (S) (S) (S)
7.56
(D) (S) (S) (S) (S)
(D)
(S) 26.52
26.52
12.11 14.06 10.16 14.80
(S) 14.80
(S) (S) (S)
12.35
(D) (S) (S) (S) (S)
(D)
(S) (D)
(D)
(D) (D) (D)
12.55 (S)
12.55 (S) (S) (S)
5.17
(D) Withheld to avoid disclosing data for individual operations. (S) Insufficient number of reports to establish an estimate.
20 Agricultural Prices (August 2019) USDA, National Agricultural Statistics Service
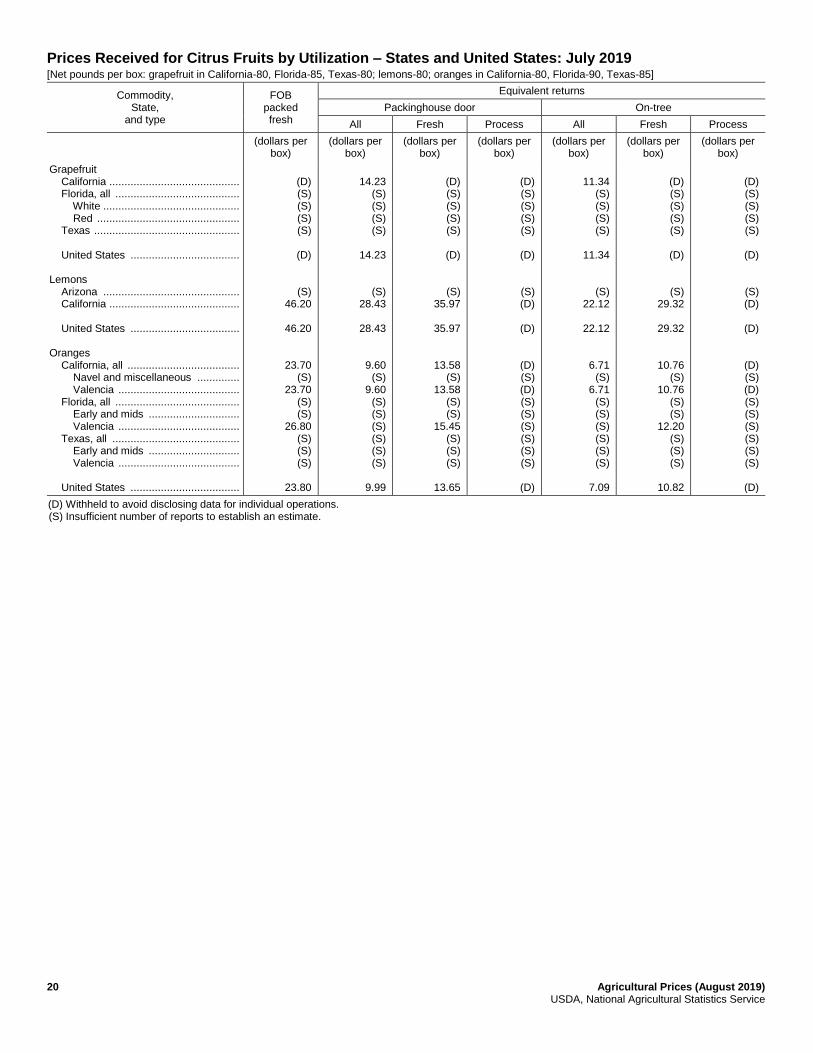
Prices Received for Citrus Fruits by Utilization – States and United States: July 2019 [Net pounds per box: grapefruit in California-80, Florida-85, Texas-80; lemons-80; oranges in California-80, Florida-90, Texas-85]
Commodity, State,
and type
FOB packed fresh
Equivalent returns
Packinghouse door On-tree
All Fresh Process All Fresh Process
(dollars per
box) (dollars per
box) (dollars per
box) (dollars per
box) (dollars per
box) (dollars per
box) (dollars per
box)
Grapefruit California ........................................... Florida, all ......................................... White ............................................. Red ............................................... Texas ................................................ United States .................................... Lemons Arizona ............................................. California ........................................... United States .................................... Oranges California, all ..................................... Navel and miscellaneous .............. Valencia ........................................ Florida, all ......................................... Early and mids .............................. Valencia ........................................ Texas, all .......................................... Early and mids .............................. Valencia ........................................ United States ....................................
(D) (S) (S) (S) (S)
(D)
(S) 46.20
46.20
23.70 (S)
23.70 (S) (S)
26.80 (S) (S) (S)
23.80
14.23
(S) (S) (S) (S)
14.23
(S) 28.43
28.43
9.60 (S)
9.60 (S) (S) (S) (S) (S) (S)
9.99
(D) (S) (S) (S) (S)
(D)
(S) 35.97
35.97
13.58 (S)
13.58 (S) (S)
15.45 (S) (S) (S)
13.65
(D) (S) (S) (S) (S)
(D)
(S) (D)
(D)
(D) (S) (D) (S) (S) (S) (S) (S) (S)
(D)
11.34
(S) (S) (S) (S)
11.34
(S) 22.12
22.12
6.71 (S)
6.71 (S) (S) (S) (S) (S) (S)
7.09
(D) (S) (S) (S) (S)
(D)
(S) 29.32
29.32
10.76 (S)
10.76 (S) (S)
12.20 (S) (S) (S)
10.82
(D) (S) (S) (S) (S)
(D)
(S) (D)
(D)
(D) (S) (D) (S) (S) (S) (S) (S) (S)
(D)
(D) Withheld to avoid disclosing data for individual operations. (S) Insufficient number of reports to establish an estimate.
Agricultural Prices (August 2019) 21 USDA, National Agricultural Statistics Service
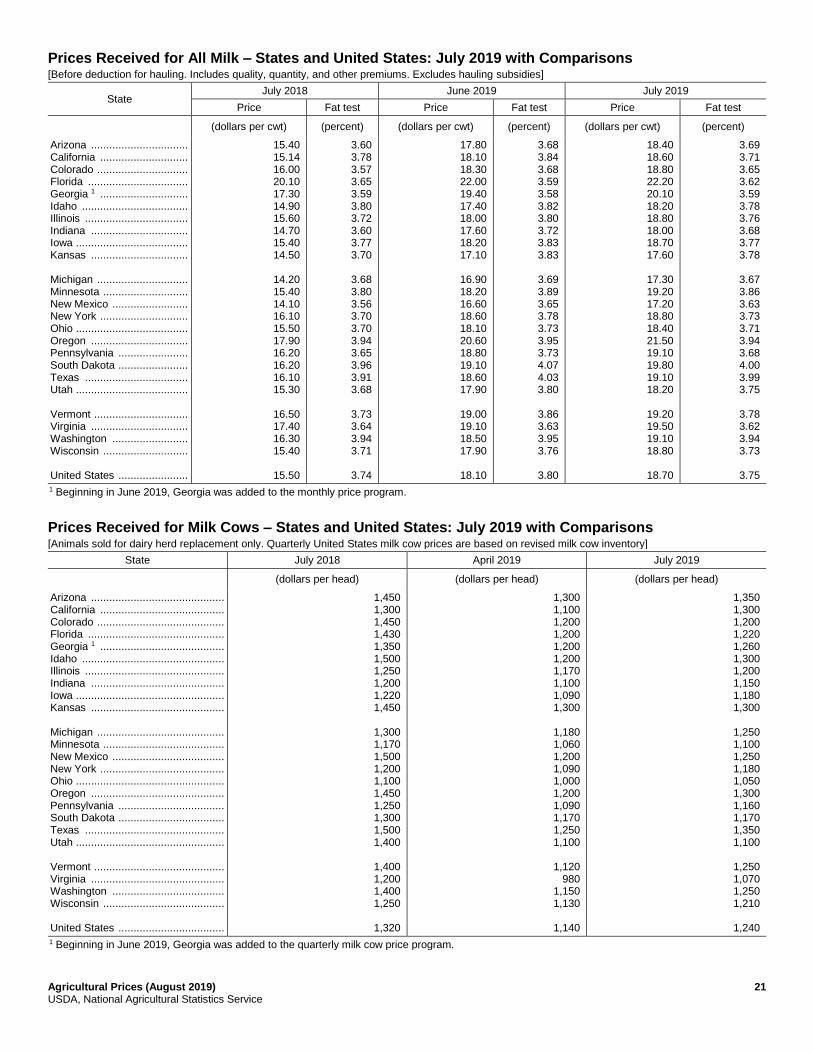
Prices Received for All Milk – States and United States: July 2019 with Comparisons [Before deduction for hauling. Includes quality, quantity, and other premiums. Excludes hauling subsidies]
State July 2018 June 2019 July 2019
Price Fat test Price Fat test Price Fat test
(dollars per cwt) (percent) (dollars per cwt) (percent) (dollars per cwt) (percent)
Arizona ................................ California ............................. Colorado .............................. Florida ................................. Georgia 1 ............................. Idaho ................................... Illinois .................................. Indiana ................................ Iowa ..................................... Kansas ................................ Michigan .............................. Minnesota ............................ New Mexico ......................... New York ............................. Ohio ..................................... Oregon ................................ Pennsylvania ....................... South Dakota ....................... Texas .................................. Utah ..................................... Vermont ............................... Virginia ................................ Washington ......................... Wisconsin ............................ United States .......................
15.40 15.14 16.00 20.10 17.30 14.90 15.60 14.70 15.40 14.50
14.20 15.40 14.10 16.10 15.50 17.90 16.20 16.20 16.10 15.30
16.50 17.40 16.30 15.40
15.50
3.60 3.78 3.57 3.65 3.59 3.80 3.72 3.60 3.77 3.70
3.68 3.80 3.56 3.70 3.70 3.94 3.65 3.96 3.91 3.68
3.73 3.64 3.94 3.71
3.74
17.80 18.10 18.30 22.00 19.40 17.40 18.00 17.60 18.20 17.10
16.90 18.20 16.60 18.60 18.10 20.60 18.80 19.10 18.60 17.90
19.00 19.10 18.50 17.90
18.10
3.68 3.84 3.68 3.59 3.58 3.82 3.80 3.72 3.83 3.83
3.69 3.89 3.65 3.78 3.73 3.95 3.73 4.07 4.03 3.80
3.86 3.63 3.95 3.76
3.80
18.40 18.60 18.80 22.20 20.10 18.20 18.80 18.00 18.70 17.60
17.30 19.20 17.20 18.80 18.40 21.50 19.10 19.80 19.10 18.20
19.20 19.50 19.10 18.80
18.70
3.69 3.71 3.65 3.62 3.59 3.78 3.76 3.68 3.77 3.78
3.67 3.86 3.63 3.73 3.71 3.94 3.68 4.00 3.99 3.75
3.78 3.62 3.94 3.73
3.75
1 Beginning in June 2019, Georgia was added to the monthly price program.
Prices Received for Milk Cows – States and United States: July 2019 with Comparisons [Animals sold for dairy herd replacement only. Quarterly United States milk cow prices are based on revised milk cow inventory]
State July 2018 April 2019 July 2019
(dollars per head) (dollars per head) (dollars per head)
Arizona ............................................ California ......................................... Colorado .......................................... Florida ............................................. Georgia 1 ......................................... Idaho ............................................... Illinois .............................................. Indiana ............................................ Iowa ................................................. Kansas ............................................ Michigan .......................................... Minnesota ........................................ New Mexico ..................................... New York ......................................... Ohio ................................................. Oregon ............................................ Pennsylvania ................................... South Dakota ................................... Texas .............................................. Utah ................................................. Vermont ........................................... Virginia ............................................ Washington ..................................... Wisconsin ........................................ United States ...................................
1,450 1,300 1,450 1,430 1,350 1,500 1,250 1,200 1,220 1,450
1,300 1,170 1,500 1,200 1,100 1,450 1,250 1,300 1,500 1,400
1,400 1,200 1,400 1,250
1,320
1,300 1,100 1,200 1,200 1,200 1,200 1,170 1,100 1,090 1,300
1,180 1,060 1,200 1,090 1,000 1,200 1,090 1,170 1,250 1,100
1,120
980 1,150 1,130
1,140
1,350 1,300 1,200 1,220 1,260 1,300 1,200 1,150 1,180 1,300
1,250 1,100 1,250 1,180 1,050 1,300 1,160 1,170 1,350 1,100
1,250 1,070 1,250 1,210
1,240
1 Beginning in June 2019, Georgia was added to the quarterly milk cow price program.
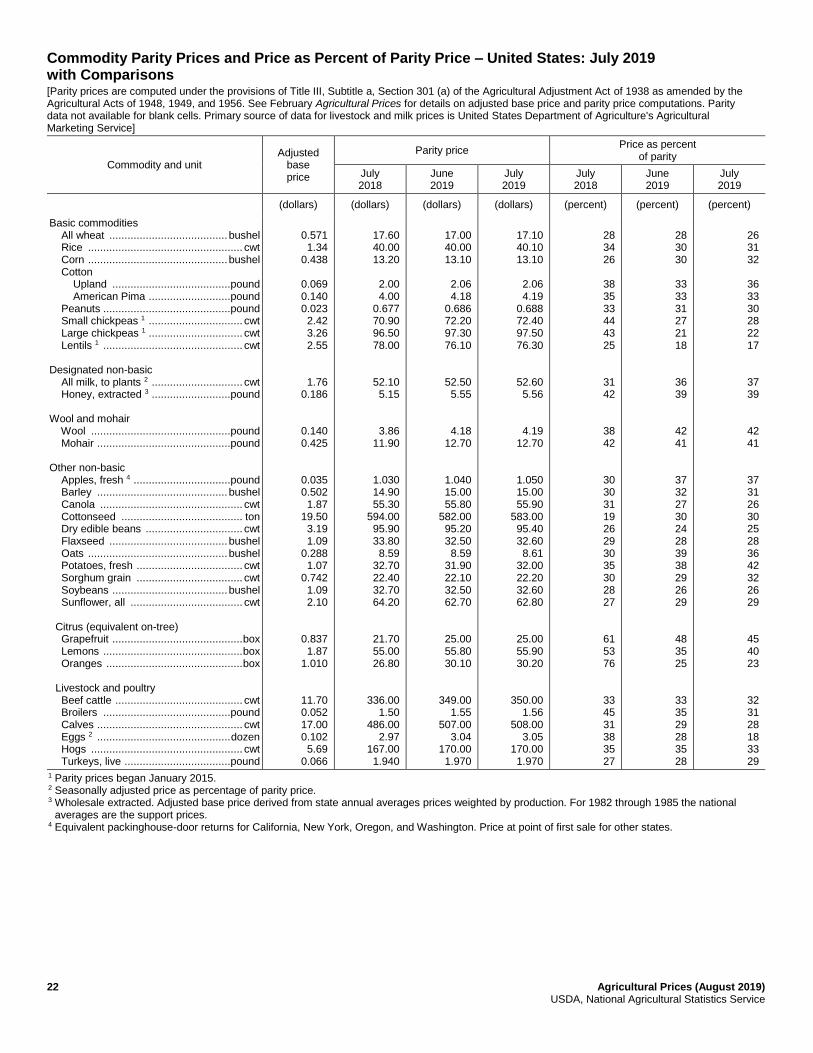
22 Agricultural Prices (August 2019) USDA, National Agricultural Statistics Service
Commodity Parity Prices and Price as Percent of Parity Price – United States: July 2019 with Comparisons [Parity prices are computed under the provisions of Title III, Subtitle a, Section 301 (a) of the Agricultural Adjustment Act of 1938 as amended by the Agricultural Acts of 1948, 1949, and 1956. See February Agricultural Prices for details on adjusted base price and parity price computations. Parity data not available for blank cells. Primary source of data for livestock and milk prices is United States Department of Agriculture's Agricultural Marketing Service]
Commodity and unit Adjusted
base price
Parity price Price as percent
of parity
July 2018
June 2019
July 2019
July 2018
June 2019
July 2019
(dollars) (dollars) (dollars) (dollars) (percent) (percent) (percent)
Basic commodities All wheat ....................................... bushel Rice ................................................... cwt Corn .............................................. bushel Cotton Upland .......................................pound American Pima ...........................pound Peanuts ..........................................pound Small chickpeas 1 ............................... cwt Large chickpeas 1 ............................... cwt Lentils 1 .............................................. cwt Designated non-basic All milk, to plants 2 .............................. cwt Honey, extracted 3 ..........................pound Wool and mohair Wool ..............................................pound Mohair ............................................pound Other non-basic Apples, fresh 4 ................................pound Barley ........................................... bushel Canola ............................................... cwt Cottonseed ........................................ ton Dry edible beans ................................ cwt Flaxseed ....................................... bushel Oats .............................................. bushel Potatoes, fresh ................................... cwt Sorghum grain ................................... cwt Soybeans ...................................... bushel Sunflower, all ..................................... cwt Citrus (equivalent on-tree) Grapefruit ........................................... box Lemons .............................................. box Oranges ............................................. box Livestock and poultry Beef cattle .......................................... cwt Broilers ..........................................pound Calves ................................................ cwt Eggs 2 ............................................ dozen Hogs .................................................. cwt Turkeys, live ...................................pound
0.571 1.34
0.438
0.069 0.140 0.023 2.42 3.26 2.55
1.76 0.186
0.140 0.425
0.035 0.502 1.87
19.50 3.19 1.09
0.288 1.07
0.742 1.09 2.10
0.837 1.87
1.010
11.70 0.052 17.00 0.102 5.69
0.066
17.60 40.00 13.20
2.00 4.00
0.677 70.90 96.50 78.00
52.10 5.15
3.86 11.90
1.030 14.90 55.30
594.00 95.90 33.80 8.59
32.70 22.40 32.70 64.20
21.70 55.00 26.80
336.00 1.50
486.00 2.97
167.00 1.940
17.00 40.00 13.10
2.06 4.18
0.686 72.20 97.30 76.10
52.50 5.55
4.18 12.70
1.040 15.00 55.80
582.00 95.20 32.50 8.59
31.90 22.10 32.50 62.70
25.00 55.80 30.10
349.00 1.55
507.00 3.04
170.00 1.970
17.10 40.10 13.10
2.06 4.19
0.688 72.40 97.50 76.30
52.60 5.56
4.19 12.70
1.050 15.00 55.90
583.00 95.40 32.60 8.61
32.00 22.20 32.60 62.80
25.00 55.90 30.20
350.00 1.56
508.00 3.05
170.00 1.970
28 34 26
38 35 33 44 43 25
31 42
38 42
30 30 31 19 26 29 30 35 30 28 27
61 53 76
33 45 31 38 35 27
28 30 30
33 33 31 27 21 18
36 39
42 41
37 32 27 30 24 28 39 38 29 26 29
48 35 25
33 35 29 28 35 28
26 31 32
36 33 30 28 22 17
37 39
42 41
37 31 26 30 25 28 36 42 32 26 29
45 40 23
32 31 28 18 33 29
1 Parity prices began January 2015. 2 Seasonally adjusted price as percentage of parity price. 3 Wholesale extracted. Adjusted base price derived from state annual averages prices weighted by production. For 1982 through 1985 the national
averages are the support prices. 4 Equivalent packinghouse-door returns for California, New York, Oregon, and Washington. Price at point of first sale for other states.
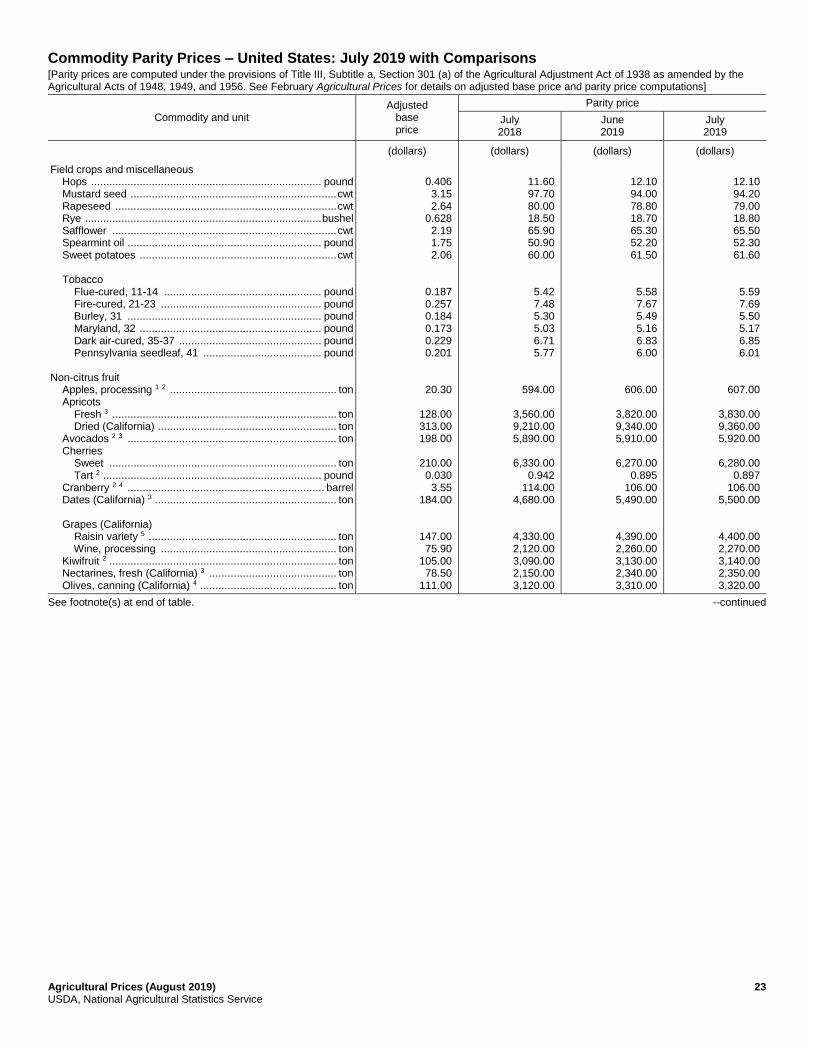
Agricultural Prices (August 2019) 23 USDA, National Agricultural Statistics Service
Commodity Parity Prices – United States: July 2019 with Comparisons [Parity prices are computed under the provisions of Title III, Subtitle a, Section 301 (a) of the Agricultural Adjustment Act of 1938 as amended by the Agricultural Acts of 1948, 1949, and 1956. See February Agricultural Prices for details on adjusted base price and parity price computations]
Commodity and unit Adjusted
base price
Parity price
July 2018
June 2019
July 2019
(dollars) (dollars) (dollars) (dollars)
Field crops and miscellaneous Hops ............................................................................ pound Mustard seed .................................................................... cwt Rapeseed ......................................................................... cwt Rye .............................................................................. bushel Safflower .......................................................................... cwt Spearmint oil ................................................................ pound Sweet potatoes ................................................................. cwt Tobacco Flue-cured, 11-14 .................................................... pound Fire-cured, 21-23 ..................................................... pound Burley, 31 ................................................................ pound Maryland, 32 ............................................................ pound Dark air-cured, 35-37 ............................................... pound Pennsylvania seedleaf, 41 ....................................... pound Non-citrus fruit Apples, processing 1 2 ....................................................... ton Apricots Fresh 3 .......................................................................... ton Dried (California) ........................................................... ton Avocados 2 3 ..................................................................... ton Cherries Sweet ........................................................................... ton Tart 2 ........................................................................ pound Cranberry 2 4 ................................................................. barrel Dates (California) 3 ............................................................ ton Grapes (California) Raisin variety 5 .............................................................. ton Wine, processing .......................................................... ton Kiwifruit 2 ........................................................................... ton Nectarines, fresh (California) 3 .......................................... ton Olives, canning (California) 4 ............................................. ton
0.406 3.15 2.64
0.628 2.19 1.75 2.06
0.187 0.257 0.184 0.173 0.229 0.201
20.30
128.00 313.00 198.00
210.00 0.030 3.55
184.00
147.00 75.90
105.00 78.50
111.00
11.60 97.70 80.00 18.50 65.90 50.90 60.00
5.42 7.48 5.30 5.03 6.71 5.77
594.00
3,560.00 9,210.00 5,890.00
6,330.00
0.942 114.00
4,680.00
4,330.00 2,120.00 3,090.00 2,150.00 3,120.00
12.10 94.00 78.80 18.70 65.30 52.20 61.50
5.58 7.67 5.49 5.16 6.83 6.00
606.00
3,820.00 9,340.00 5,910.00
6,270.00
0.895 106.00
5,490.00
4,390.00 2,260.00 3,130.00 2,340.00 3,310.00
12.10 94.20 79.00 18.80 65.50 52.30 61.60
5.59 7.69 5.50 5.17 6.85 6.01
607.00
3,830.00 9,360.00 5,920.00
6,280.00
0.897 106.00
5,500.00
4,400.00 2,270.00 3,140.00 2,350.00 3,320.00
See footnote(s) at end of table. --continued
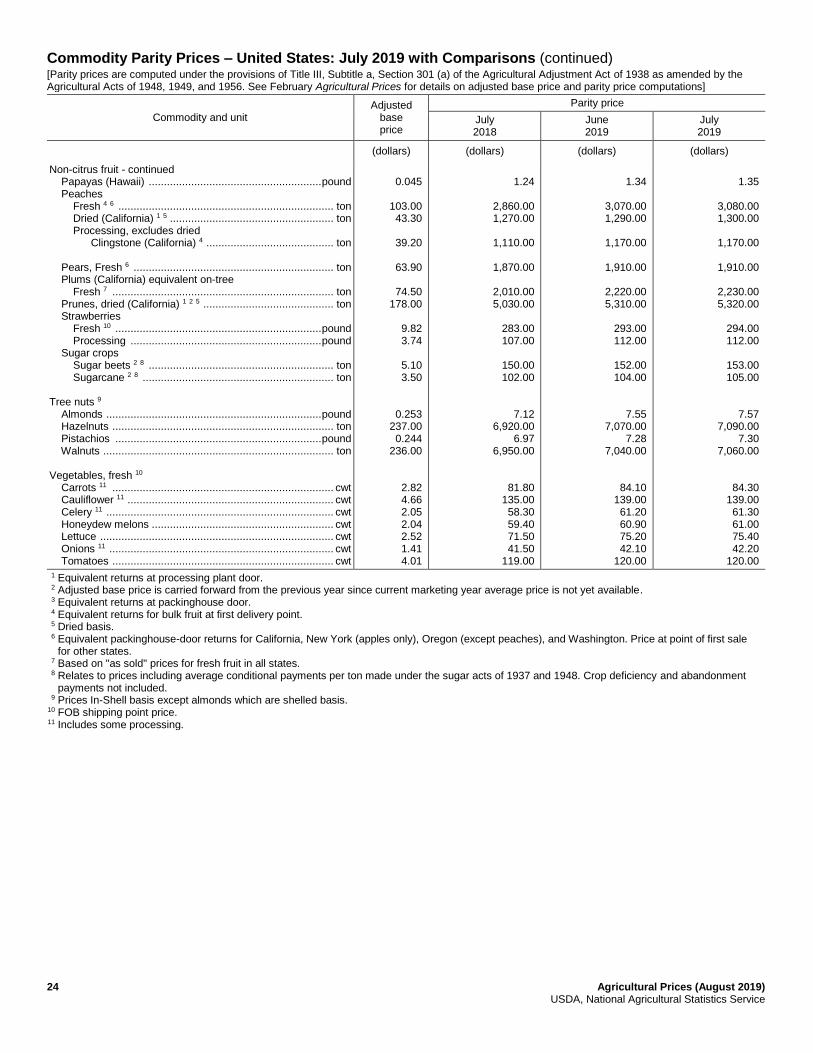
24 Agricultural Prices (August 2019) USDA, National Agricultural Statistics Service
Commodity Parity Prices – United States: July 2019 with Comparisons (continued) [Parity prices are computed under the provisions of Title III, Subtitle a, Section 301 (a) of the Agricultural Adjustment Act of 1938 as amended by the Agricultural Acts of 1948, 1949, and 1956. See February Agricultural Prices for details on adjusted base price and parity price computations]
Commodity and unit Adjusted
base price
Parity price
July 2018
June 2019
July 2019
(dollars) (dollars) (dollars) (dollars)
Non-citrus fruit - continued Papayas (Hawaii) ......................................................... pound Peaches Fresh 4 6 ....................................................................... ton Dried (California) 1 5 ...................................................... ton Processing, excludes dried Clingstone (California) 4 .......................................... ton Pears, Fresh 6 .................................................................. ton Plums (California) equivalent on-tree Fresh 7 ......................................................................... ton Prunes, dried (California) 1 2 5 ........................................... ton Strawberries Fresh 10 .................................................................... pound Processing ............................................................... pound Sugar crops Sugar beets 2 8 ............................................................. ton Sugarcane 2 8 ............................................................... ton Tree nuts 9 Almonds ....................................................................... pound Hazelnuts ......................................................................... ton Pistachios .................................................................... pound Walnuts ............................................................................ ton Vegetables, fresh 10 Carrots 11 ......................................................................... cwt Cauliflower 11 .................................................................... cwt Celery 11 ........................................................................... cwt Honeydew melons ............................................................ cwt Lettuce ............................................................................. cwt Onions 11 .......................................................................... cwt Tomatoes ......................................................................... cwt
0.045
103.00 43.30
39.20
63.90
74.50
178.00
9.82 3.74
5.10 3.50
0.253 237.00 0.244
236.00
2.82 4.66 2.05 2.04 2.52 1.41 4.01
1.24
2,860.00 1,270.00
1,110.00
1,870.00
2,010.00 5,030.00
283.00 107.00
150.00 102.00
7.12 6,920.00
6.97 6,950.00
81.80 135.00 58.30 59.40 71.50 41.50
119.00
1.34
3,070.00 1,290.00
1,170.00
1,910.00
2,220.00 5,310.00
293.00 112.00
152.00 104.00
7.55 7,070.00
7.28 7,040.00
84.10 139.00
61.20 60.90 75.20 42.10
120.00
1.35
3,080.00 1,300.00
1,170.00
1,910.00
2,230.00 5,320.00
294.00 112.00
153.00 105.00
7.57 7,090.00
7.30 7,060.00
84.30 139.00 61.30 61.00 75.40 42.20
120.00
1 Equivalent returns at processing plant door. 2 Adjusted base price is carried forward from the previous year since current marketing year average price is not yet available. 3 Equivalent returns at packinghouse door. 4 Equivalent returns for bulk fruit at first delivery point. 5 Dried basis. 6 Equivalent packinghouse-door returns for California, New York (apples only), Oregon (except peaches), and Washington. Price at point of first sale
for other states. 7 Based on "as sold" prices for fresh fruit in all states. 8 Relates to prices including average conditional payments per ton made under the sugar acts of 1937 and 1948. Crop deficiency and abandonment
payments not included. 9 Prices In-Shell basis except almonds which are shelled basis. 10 FOB shipping point price. 11 Includes some processing.
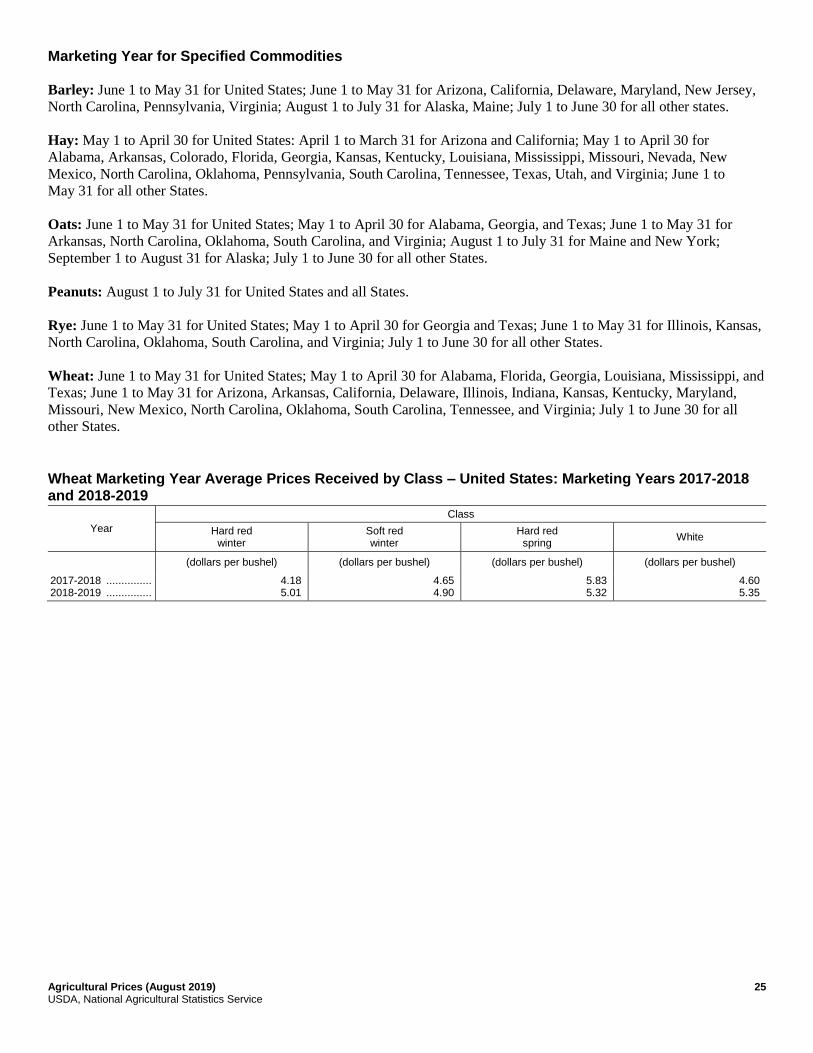
Agricultural Prices (August 2019) 25 USDA, National Agricultural Statistics Service
Marketing Year for Specified Commodities
Barley: June 1 to May 31 for United States; June 1 to May 31 for Arizona, California, Delaware, Maryland, New Jersey,
North Carolina, Pennsylvania, Virginia; August 1 to July 31 for Alaska, Maine; July 1 to June 30 for all other states.
Hay: May 1 to April 30 for United States: April 1 to March 31 for Arizona and California; May 1 to April 30 for
Alabama, Arkansas, Colorado, Florida, Georgia, Kansas, Kentucky, Louisiana, Mississippi, Missouri, Nevada, New
Mexico, North Carolina, Oklahoma, Pennsylvania, South Carolina, Tennessee, Texas, Utah, and Virginia; June 1 to
May 31 for all other States.
Oats: June 1 to May 31 for United States; May 1 to April 30 for Alabama, Georgia, and Texas; June 1 to May 31 for
Arkansas, North Carolina, Oklahoma, South Carolina, and Virginia; August 1 to July 31 for Maine and New York;
September 1 to August 31 for Alaska; July 1 to June 30 for all other States.
Peanuts: August 1 to July 31 for United States and all States.
Rye: June 1 to May 31 for United States; May 1 to April 30 for Georgia and Texas; June 1 to May 31 for Illinois, Kansas,
North Carolina, Oklahoma, South Carolina, and Virginia; July 1 to June 30 for all other States.
Wheat: June 1 to May 31 for United States; May 1 to April 30 for Alabama, Florida, Georgia, Louisiana, Mississippi, and
Texas; June 1 to May 31 for Arizona, Arkansas, California, Delaware, Illinois, Indiana, Kansas, Kentucky, Maryland,
Missouri, New Mexico, North Carolina, Oklahoma, South Carolina, Tennessee, and Virginia; July 1 to June 30 for all
other States.
Wheat Marketing Year Average Prices Received by Class – United States: Marketing Years 2017-2018 and 2018-2019
Year
Class
Hard red winter
Soft red winter
Hard red spring
White
(dollars per bushel) (dollars per bushel) (dollars per bushel) (dollars per bushel)
2017-2018 ............... 2018-2019 ...............
4.18 5.01
4.65 4.90
5.83 5.32
4.60 5.35
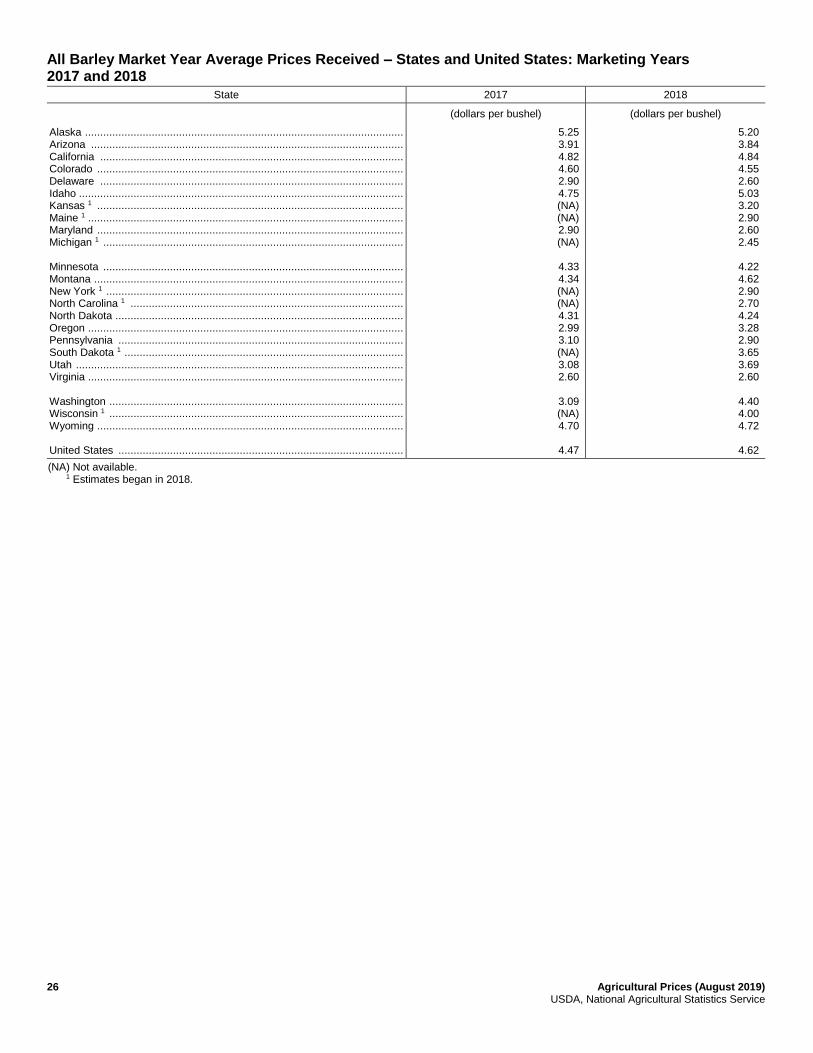
26 Agricultural Prices (August 2019) USDA, National Agricultural Statistics Service
All Barley Market Year Average Prices Received – States and United States: Marketing Years 2017 and 2018
State 2017 2018
(dollars per bushel) (dollars per bushel)
Alaska ......................................................................................................... Arizona ....................................................................................................... California .................................................................................................... Colorado ..................................................................................................... Delaware .................................................................................................... Idaho ........................................................................................................... Kansas 1 ..................................................................................................... Maine 1 ........................................................................................................ Maryland ..................................................................................................... Michigan 1 ................................................................................................... Minnesota ................................................................................................... Montana ...................................................................................................... New York 1 .................................................................................................. North Carolina 1 .......................................................................................... North Dakota ............................................................................................... Oregon ........................................................................................................ Pennsylvania .............................................................................................. South Dakota 1 ............................................................................................ Utah ............................................................................................................ Virginia ........................................................................................................ Washington ................................................................................................. Wisconsin 1 ................................................................................................. Wyoming ..................................................................................................... United States ..............................................................................................
5.25 3.91 4.82 4.60 2.90 4.75 (NA) (NA) 2.90 (NA)
4.33 4.34 (NA) (NA) 4.31 2.99 3.10 (NA) 3.08 2.60
3.09 (NA) 4.70
4.47
5.20 3.84 4.84 4.55 2.60 5.03 3.20 2.90 2.60 2.45
4.22 4.62 2.90 2.70 4.24 3.28 2.90 3.65 3.69 2.60
4.40 4.00 4.72
4.62
(NA) Not available. 1 Estimates began in 2018.
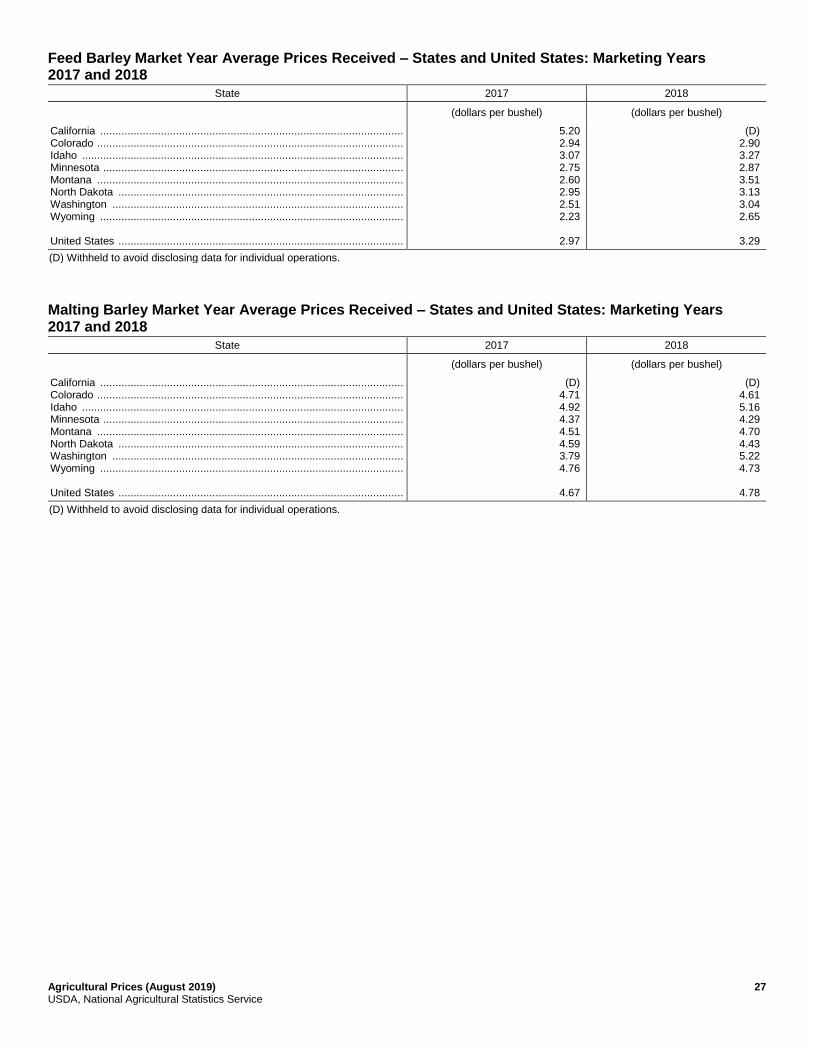
Agricultural Prices (August 2019) 27 USDA, National Agricultural Statistics Service
Feed Barley Market Year Average Prices Received – States and United States: Marketing Years 2017 and 2018
State 2017 2018
(dollars per bushel) (dollars per bushel)
California .................................................................................................... Colorado ..................................................................................................... Idaho .......................................................................................................... Minnesota ................................................................................................... Montana ..................................................................................................... North Dakota .............................................................................................. Washington ................................................................................................ Wyoming .................................................................................................... United States ..............................................................................................
5.20 2.94 3.07 2.75 2.60 2.95 2.51 2.23
2.97
(D) 2.90 3.27 2.87 3.51 3.13 3.04 2.65
3.29
(D) Withheld to avoid disclosing data for individual operations.
Malting Barley Market Year Average Prices Received – States and United States: Marketing Years 2017 and 2018
State 2017 2018
(dollars per bushel) (dollars per bushel)
California .................................................................................................... Colorado ..................................................................................................... Idaho .......................................................................................................... Minnesota ................................................................................................... Montana ..................................................................................................... North Dakota .............................................................................................. Washington ................................................................................................ Wyoming .................................................................................................... United States ..............................................................................................
(D) 4.71 4.92 4.37 4.51 4.59 3.79 4.76
4.67
(D) 4.61 5.16 4.29 4.70 4.43 5.22 4.73
4.78
(D) Withheld to avoid disclosing data for individual operations.
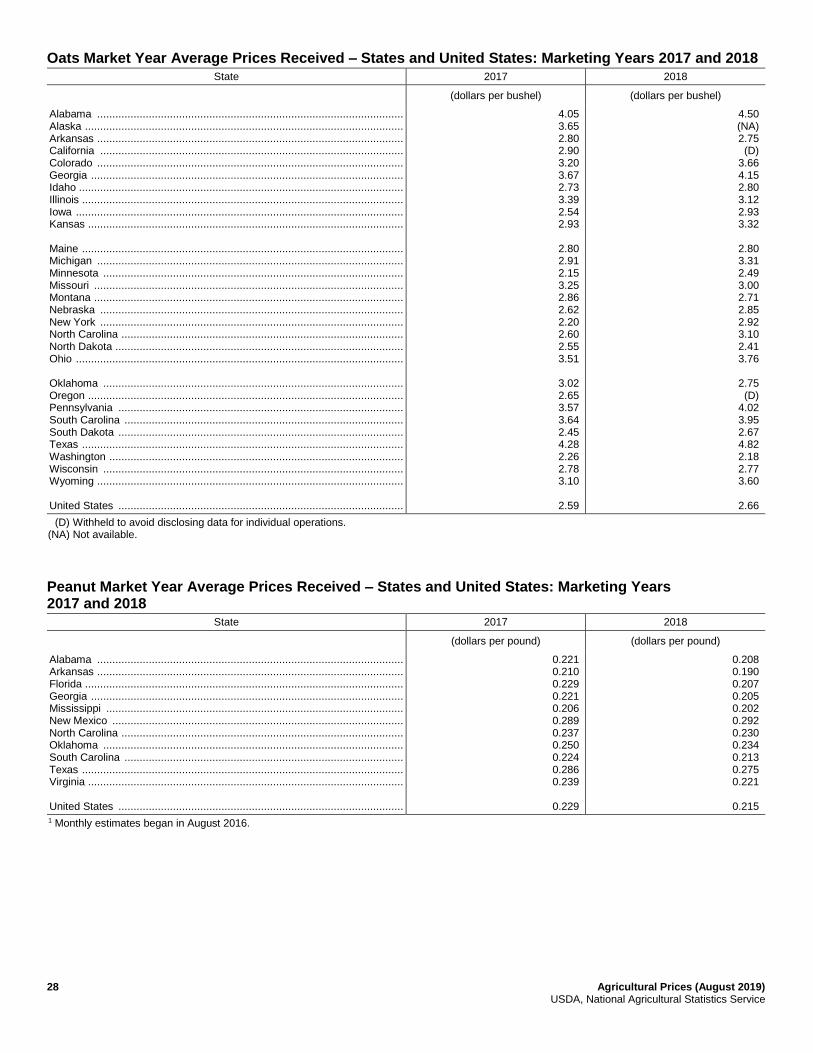
28 Agricultural Prices (August 2019) USDA, National Agricultural Statistics Service
Oats Market Year Average Prices Received – States and United States: Marketing Years 2017 and 2018
State 2017 2018
(dollars per bushel) (dollars per bushel)
Alabama ..................................................................................................... Alaska ......................................................................................................... Arkansas ..................................................................................................... California .................................................................................................... Colorado ..................................................................................................... Georgia ....................................................................................................... Idaho ........................................................................................................... Illinois .......................................................................................................... Iowa ............................................................................................................ Kansas ........................................................................................................ Maine .......................................................................................................... Michigan ..................................................................................................... Minnesota ................................................................................................... Missouri ...................................................................................................... Montana ...................................................................................................... Nebraska .................................................................................................... New York .................................................................................................... North Carolina ............................................................................................. North Dakota ............................................................................................... Ohio ............................................................................................................ Oklahoma ................................................................................................... Oregon ........................................................................................................ Pennsylvania .............................................................................................. South Carolina ............................................................................................ South Dakota .............................................................................................. Texas .......................................................................................................... Washington ................................................................................................. Wisconsin ................................................................................................... Wyoming ..................................................................................................... United States ..............................................................................................
4.05 3.65 2.80 2.90 3.20 3.67 2.73 3.39 2.54 2.93
2.80 2.91 2.15 3.25 2.86 2.62 2.20 2.60 2.55 3.51
3.02 2.65 3.57 3.64 2.45 4.28 2.26 2.78 3.10
2.59
4.50 (NA) 2.75 (D)
3.66 4.15 2.80 3.12 2.93 3.32
2.80 3.31 2.49 3.00 2.71 2.85 2.92 3.10 2.41 3.76
2.75 (D)
4.02 3.95 2.67 4.82 2.18 2.77 3.60
2.66
(D) Withheld to avoid disclosing data for individual operations. (NA) Not available.
Peanut Market Year Average Prices Received – States and United States: Marketing Years 2017 and 2018
State 2017 2018
(dollars per pound) (dollars per pound)
Alabama ..................................................................................................... Arkansas ..................................................................................................... Florida ......................................................................................................... Georgia ....................................................................................................... Mississippi .................................................................................................. New Mexico ................................................................................................ North Carolina ............................................................................................. Oklahoma ................................................................................................... South Carolina ............................................................................................ Texas .......................................................................................................... Virginia ........................................................................................................ United States ..............................................................................................
0.221 0.210 0.229 0.221 0.206 0.289 0.237 0.250 0.224 0.286 0.239
0.229
0.208 0.190 0.207 0.205 0.202 0.292 0.230 0.234 0.213 0.275 0.221
0.215
1 Monthly estimates began in August 2016.
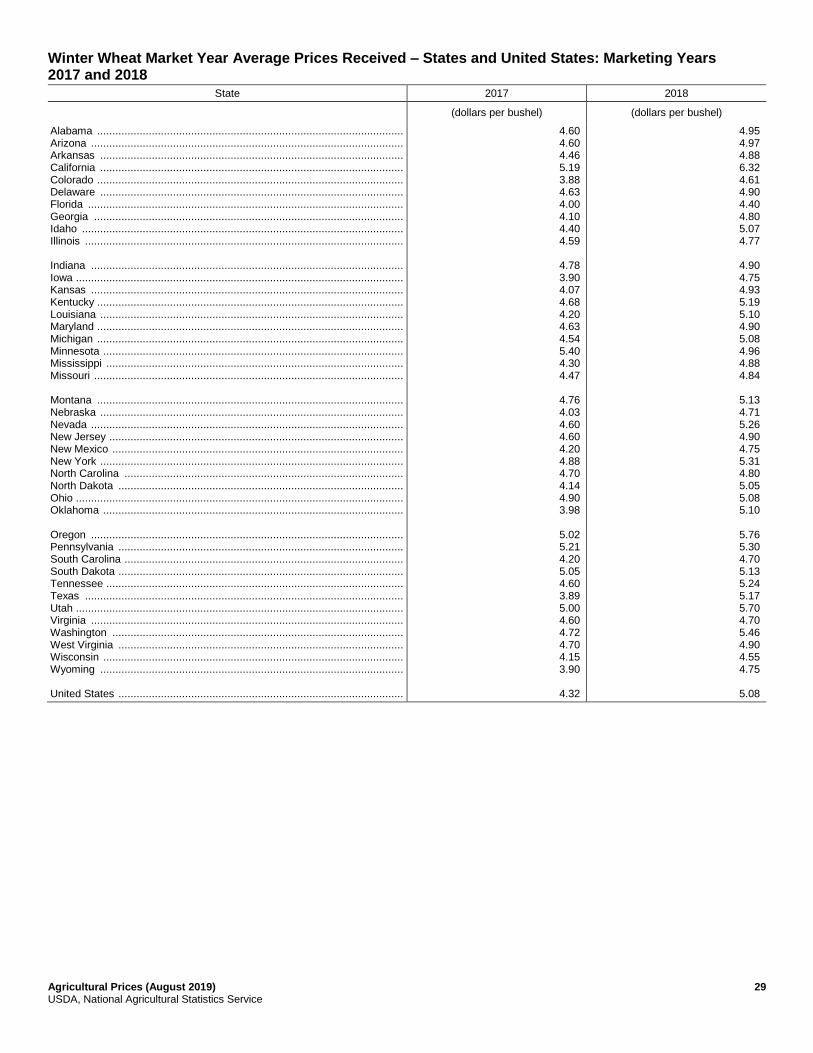
Agricultural Prices (August 2019) 29 USDA, National Agricultural Statistics Service
Winter Wheat Market Year Average Prices Received – States and United States: Marketing Years 2017 and 2018
State 2017 2018
(dollars per bushel) (dollars per bushel)
Alabama ..................................................................................................... Arizona ....................................................................................................... Arkansas .................................................................................................... California .................................................................................................... Colorado ..................................................................................................... Delaware .................................................................................................... Florida ........................................................................................................ Georgia ...................................................................................................... Idaho .......................................................................................................... Illinois ......................................................................................................... Indiana ....................................................................................................... Iowa ............................................................................................................ Kansas ....................................................................................................... Kentucky ..................................................................................................... Louisiana .................................................................................................... Maryland ..................................................................................................... Michigan ..................................................................................................... Minnesota ................................................................................................... Mississippi .................................................................................................. Missouri ...................................................................................................... Montana ..................................................................................................... Nebraska .................................................................................................... Nevada ....................................................................................................... New Jersey ................................................................................................. New Mexico ................................................................................................ New York .................................................................................................... North Carolina ............................................................................................ North Dakota .............................................................................................. Ohio ............................................................................................................ Oklahoma ................................................................................................... Oregon ....................................................................................................... Pennsylvania .............................................................................................. South Carolina ............................................................................................ South Dakota .............................................................................................. Tennessee .................................................................................................. Texas ......................................................................................................... Utah ............................................................................................................ Virginia ....................................................................................................... Washington ................................................................................................ West Virginia .............................................................................................. Wisconsin ................................................................................................... Wyoming .................................................................................................... United States ..............................................................................................
4.60 4.60 4.46 5.19 3.88 4.63 4.00 4.10 4.40 4.59
4.78 3.90 4.07 4.68 4.20 4.63 4.54 5.40 4.30 4.47
4.76 4.03 4.60 4.60 4.20 4.88 4.70 4.14 4.90 3.98
5.02 5.21 4.20 5.05 4.60 3.89 5.00 4.60 4.72 4.70 4.15 3.90
4.32
4.95 4.97 4.88 6.32 4.61 4.90 4.40 4.80 5.07 4.77
4.90 4.75 4.93 5.19 5.10 4.90 5.08 4.96 4.88 4.84
5.13 4.71 5.26 4.90 4.75 5.31 4.80 5.05 5.08 5.10
5.76 5.30 4.70 5.13 5.24 5.17 5.70 4.70 5.46 4.90 4.55 4.75
5.08
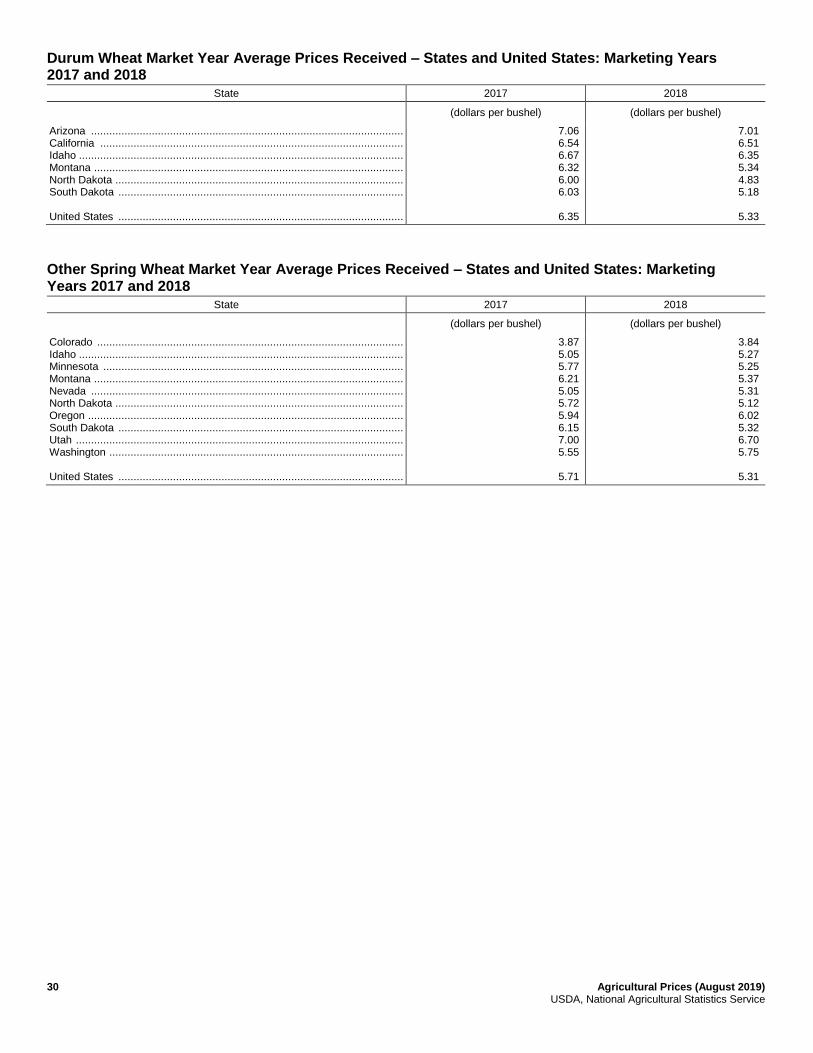
30 Agricultural Prices (August 2019) USDA, National Agricultural Statistics Service
Durum Wheat Market Year Average Prices Received – States and United States: Marketing Years 2017 and 2018
State 2017 2018
(dollars per bushel) (dollars per bushel)
Arizona ....................................................................................................... California .................................................................................................... Idaho ........................................................................................................... Montana ...................................................................................................... North Dakota ............................................................................................... South Dakota .............................................................................................. United States ..............................................................................................
7.06 6.54 6.67 6.32 6.00 6.03
6.35
7.01 6.51 6.35 5.34 4.83 5.18
5.33
Other Spring Wheat Market Year Average Prices Received – States and United States: Marketing Years 2017 and 2018
State 2017 2018
(dollars per bushel) (dollars per bushel)
Colorado ..................................................................................................... Idaho ........................................................................................................... Minnesota ................................................................................................... Montana ...................................................................................................... Nevada ....................................................................................................... North Dakota ............................................................................................... Oregon ........................................................................................................ South Dakota .............................................................................................. Utah ............................................................................................................ Washington ................................................................................................. United States ..............................................................................................
3.87 5.05 5.77 6.21 5.05 5.72 5.94 6.15 7.00 5.55
5.71
3.84 5.27 5.25 5.37 5.31 5.12 6.02 5.32 6.70 5.75
5.31
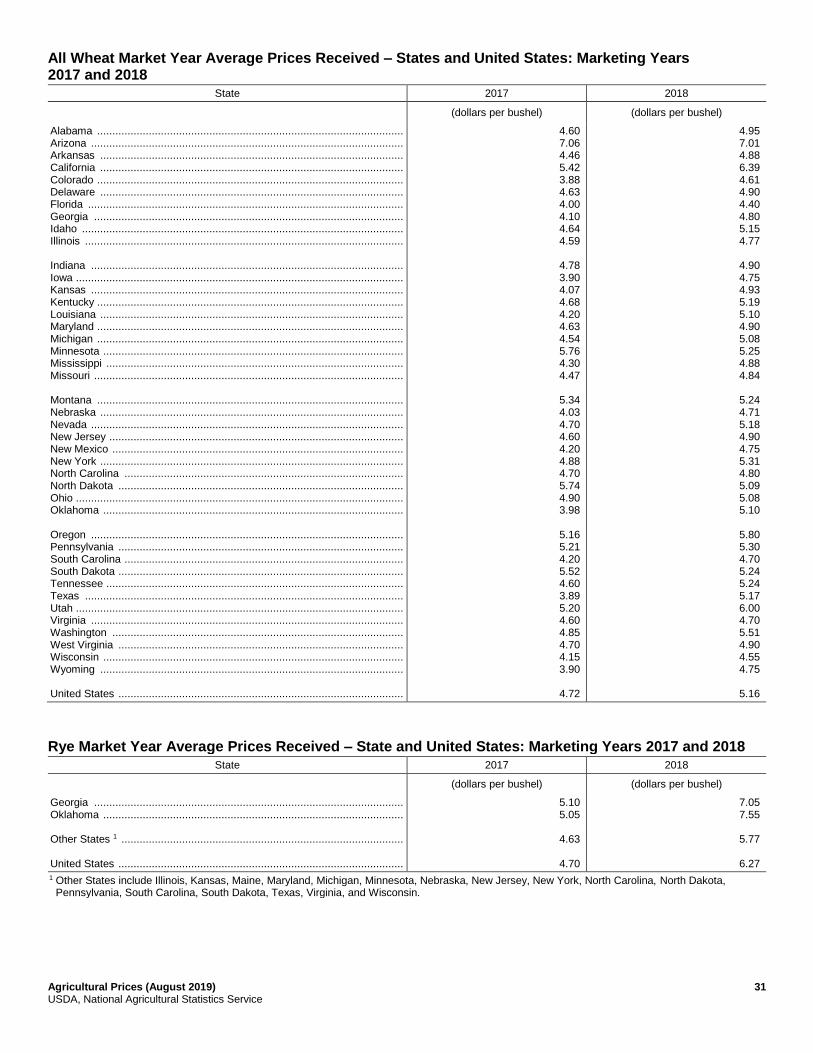
Agricultural Prices (August 2019) 31 USDA, National Agricultural Statistics Service
All Wheat Market Year Average Prices Received – States and United States: Marketing Years 2017 and 2018
State 2017 2018
(dollars per bushel) (dollars per bushel)
Alabama ..................................................................................................... Arizona ....................................................................................................... Arkansas .................................................................................................... California .................................................................................................... Colorado ..................................................................................................... Delaware .................................................................................................... Florida ........................................................................................................ Georgia ...................................................................................................... Idaho .......................................................................................................... Illinois ......................................................................................................... Indiana ....................................................................................................... Iowa ............................................................................................................ Kansas ....................................................................................................... Kentucky ..................................................................................................... Louisiana .................................................................................................... Maryland ..................................................................................................... Michigan ..................................................................................................... Minnesota ................................................................................................... Mississippi .................................................................................................. Missouri ...................................................................................................... Montana ..................................................................................................... Nebraska .................................................................................................... Nevada ....................................................................................................... New Jersey ................................................................................................. New Mexico ................................................................................................ New York .................................................................................................... North Carolina ............................................................................................ North Dakota .............................................................................................. Ohio ............................................................................................................ Oklahoma ................................................................................................... Oregon ....................................................................................................... Pennsylvania .............................................................................................. South Carolina ............................................................................................ South Dakota .............................................................................................. Tennessee .................................................................................................. Texas ......................................................................................................... Utah ............................................................................................................ Virginia ....................................................................................................... Washington ................................................................................................ West Virginia .............................................................................................. Wisconsin ................................................................................................... Wyoming .................................................................................................... United States ..............................................................................................
4.60 7.06 4.46 5.42 3.88 4.63 4.00 4.10 4.64 4.59
4.78 3.90 4.07 4.68 4.20 4.63 4.54 5.76 4.30 4.47
5.34 4.03 4.70 4.60 4.20 4.88 4.70 5.74 4.90 3.98
5.16 5.21 4.20 5.52 4.60 3.89 5.20 4.60 4.85 4.70 4.15 3.90
4.72
4.95 7.01 4.88 6.39 4.61 4.90 4.40 4.80 5.15 4.77
4.90 4.75 4.93 5.19 5.10 4.90 5.08 5.25 4.88 4.84
5.24 4.71 5.18 4.90 4.75 5.31 4.80 5.09 5.08 5.10
5.80 5.30 4.70 5.24 5.24 5.17 6.00 4.70 5.51 4.90 4.55 4.75
5.16
Rye Market Year Average Prices Received – State and United States: Marketing Years 2017 and 2018
State 2017 2018
(dollars per bushel) (dollars per bushel)
Georgia ...................................................................................................... Oklahoma ................................................................................................... Other States 1 ............................................................................................. United States ..............................................................................................
5.10 5.05
4.63
4.70
7.05 7.55
5.77
6.27
1 Other States include Illinois, Kansas, Maine, Maryland, Michigan, Minnesota, Nebraska, New Jersey, New York, North Carolina, North Dakota, Pennsylvania, South Carolina, South Dakota, Texas, Virginia, and Wisconsin.
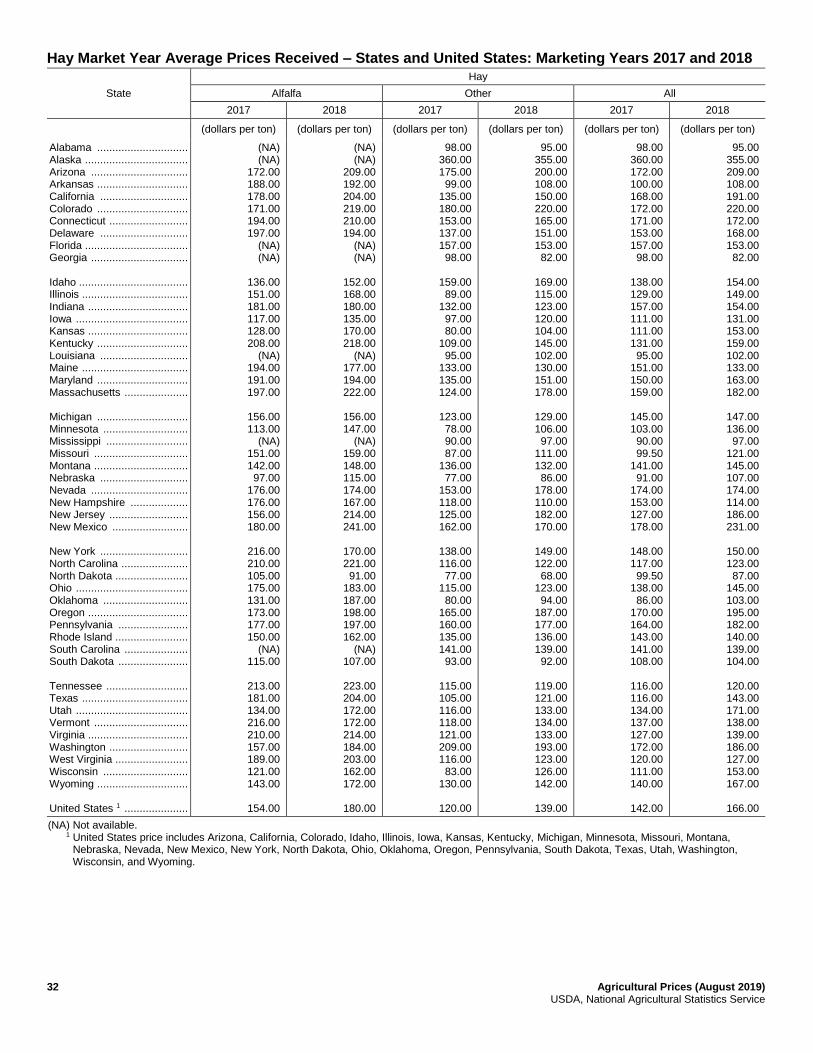
32 Agricultural Prices (August 2019) USDA, National Agricultural Statistics Service
Hay Market Year Average Prices Received – States and United States: Marketing Years 2017 and 2018
State
Hay
Alfalfa Other All
2017 2018 2017 2018 2017 2018
(dollars per ton) (dollars per ton) (dollars per ton) (dollars per ton) (dollars per ton) (dollars per ton)
Alabama .............................. Alaska .................................. Arizona ................................ Arkansas .............................. California ............................. Colorado .............................. Connecticut .......................... Delaware ............................. Florida .................................. Georgia ................................ Idaho .................................... Illinois ................................... Indiana ................................. Iowa ..................................... Kansas ................................. Kentucky .............................. Louisiana ............................. Maine ................................... Maryland .............................. Massachusetts ..................... Michigan .............................. Minnesota ............................ Mississippi ........................... Missouri ............................... Montana ............................... Nebraska ............................. Nevada ................................ New Hampshire ................... New Jersey .......................... New Mexico ......................... New York ............................. North Carolina ...................... North Dakota ........................ Ohio ..................................... Oklahoma ............................ Oregon ................................. Pennsylvania ....................... Rhode Island ........................ South Carolina ..................... South Dakota ....................... Tennessee ........................... Texas ................................... Utah ..................................... Vermont ............................... Virginia ................................. Washington .......................... West Virginia ........................ Wisconsin ............................ Wyoming .............................. United States 1 .....................
(NA) (NA)
172.00 188.00 178.00 171.00 194.00 197.00
(NA) (NA)
136.00 151.00 181.00 117.00 128.00 208.00
(NA) 194.00 191.00 197.00
156.00 113.00
(NA) 151.00 142.00 97.00
176.00 176.00 156.00 180.00
216.00 210.00 105.00 175.00 131.00 173.00 177.00 150.00
(NA) 115.00
213.00 181.00 134.00 216.00 210.00 157.00 189.00 121.00 143.00
154.00
(NA) (NA)
209.00 192.00 204.00 219.00 210.00 194.00
(NA) (NA)
152.00 168.00 180.00 135.00 170.00 218.00
(NA) 177.00 194.00 222.00
156.00 147.00
(NA) 159.00 148.00 115.00 174.00 167.00 214.00 241.00
170.00 221.00 91.00
183.00 187.00 198.00 197.00 162.00
(NA) 107.00
223.00 204.00 172.00 172.00 214.00 184.00 203.00 162.00 172.00
180.00
98.00 360.00 175.00 99.00
135.00 180.00 153.00 137.00 157.00 98.00
159.00 89.00
132.00 97.00 80.00
109.00 95.00
133.00 135.00 124.00
123.00 78.00 90.00 87.00
136.00 77.00
153.00 118.00 125.00 162.00
138.00 116.00 77.00
115.00 80.00
165.00 160.00 135.00 141.00 93.00
115.00 105.00 116.00 118.00 121.00 209.00 116.00 83.00
130.00
120.00
95.00 355.00 200.00 108.00 150.00 220.00 165.00 151.00 153.00 82.00
169.00 115.00 123.00 120.00 104.00 145.00 102.00 130.00 151.00 178.00
129.00 106.00 97.00
111.00 132.00 86.00
178.00 110.00 182.00 170.00
149.00 122.00 68.00
123.00 94.00
187.00 177.00 136.00 139.00 92.00
119.00 121.00 133.00 134.00 133.00 193.00 123.00 126.00 142.00
139.00
98.00 360.00 172.00 100.00 168.00 172.00 171.00 153.00 157.00 98.00
138.00 129.00 157.00 111.00 111.00 131.00 95.00
151.00 150.00 159.00
145.00 103.00 90.00 99.50
141.00 91.00
174.00 153.00 127.00 178.00
148.00 117.00 99.50
138.00 86.00
170.00 164.00 143.00 141.00 108.00
116.00 116.00 134.00 137.00 127.00 172.00 120.00 111.00 140.00
142.00
95.00 355.00 209.00 108.00 191.00 220.00 172.00 168.00 153.00 82.00
154.00 149.00 154.00 131.00 153.00 159.00 102.00 133.00 163.00 182.00
147.00 136.00 97.00
121.00 145.00 107.00 174.00 114.00 186.00 231.00
150.00 123.00 87.00
145.00 103.00 195.00 182.00 140.00 139.00 104.00
120.00 143.00 171.00 138.00 139.00 186.00 127.00 153.00 167.00
166.00
(NA) Not available. 1 United States price includes Arizona, California, Colorado, Idaho, Illinois, Iowa, Kansas, Kentucky, Michigan, Minnesota, Missouri, Montana,
Nebraska, Nevada, New Mexico, New York, North Dakota, Ohio, Oklahoma, Oregon, Pennsylvania, South Dakota, Texas, Utah, Washington, Wisconsin, and Wyoming.
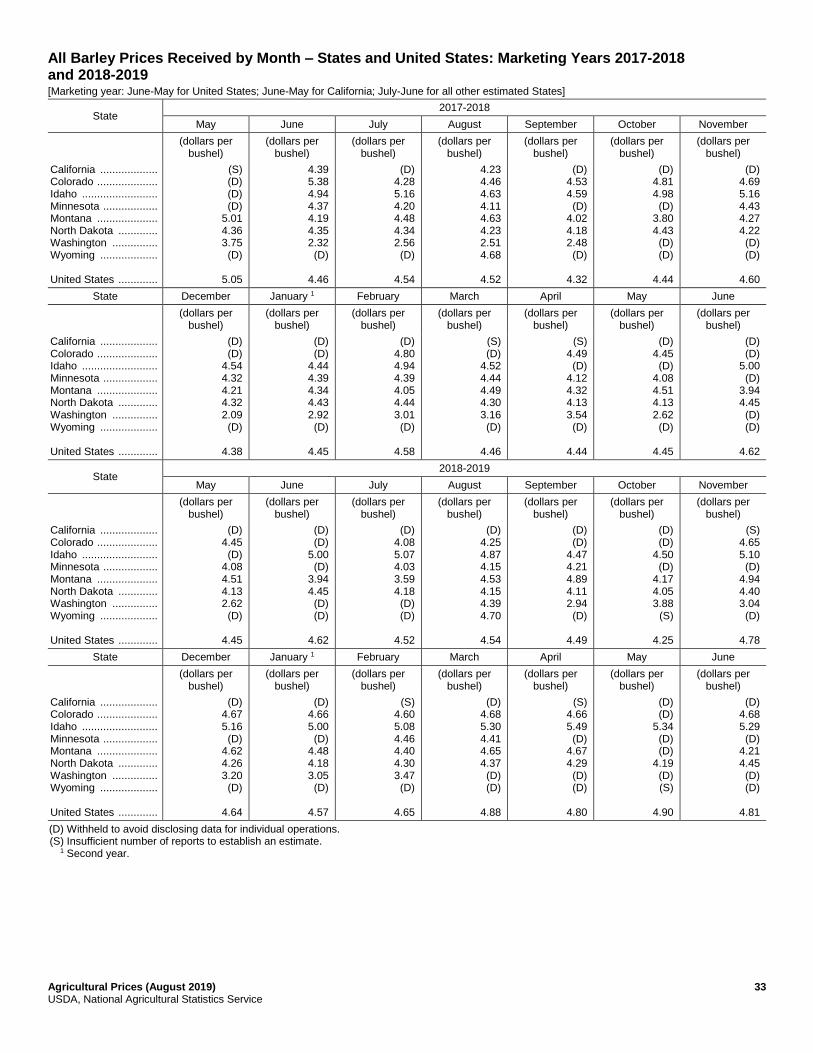
Agricultural Prices (August 2019) 33 USDA, National Agricultural Statistics Service
All Barley Prices Received by Month – States and United States: Marketing Years 2017-2018 and 2018-2019 [Marketing year: June-May for United States; June-May for California; July-June for all other estimated States]
State 2017-2018
May June July August September October November
(dollars per
bushel) (dollars per
bushel) (dollars per
bushel) (dollars per
bushel) (dollars per
bushel) (dollars per
bushel) (dollars per
bushel)
California ................... Colorado .................... Idaho ......................... Minnesota .................. Montana .................... North Dakota ............. Washington ............... Wyoming ................... United States .............
(S) (D) (D) (D)
5.01 4.36 3.75 (D)
5.05
4.39 5.38 4.94 4.37 4.19 4.35 2.32 (D)
4.46
(D) 4.28 5.16 4.20 4.48 4.34 2.56 (D)
4.54
4.23 4.46 4.63 4.11 4.63 4.23 2.51 4.68
4.52
(D) 4.53 4.59 (D)
4.02 4.18 2.48 (D)
4.32
(D) 4.81 4.98 (D)
3.80 4.43 (D) (D)
4.44
(D) 4.69 5.16 4.43 4.27 4.22 (D) (D)
4.60
State December January 1 February March April May June
(dollars per bushel)
(dollars per bushel)
(dollars per bushel)
(dollars per bushel)
(dollars per bushel)
(dollars per bushel)
(dollars per bushel)
California ................... Colorado .................... Idaho ......................... Minnesota .................. Montana .................... North Dakota ............. Washington ............... Wyoming ................... United States .............
(D) (D)
4.54 4.32 4.21 4.32 2.09 (D)
4.38
(D) (D)
4.44 4.39 4.34 4.43 2.92 (D)
4.45
(D) 4.80 4.94 4.39 4.05 4.44 3.01 (D)
4.58
(S) (D)
4.52 4.44 4.49 4.30 3.16 (D)
4.46
(S) 4.49 (D)
4.12 4.32 4.13 3.54 (D)
4.44
(D) 4.45 (D)
4.08 4.51 4.13 2.62 (D)
4.45
(D) (D)
5.00 (D)
3.94 4.45 (D) (D)
4.62
State 2018-2019
May June July August September October November
(dollars per bushel)
(dollars per bushel)
(dollars per bushel)
(dollars per bushel)
(dollars per bushel)
(dollars per bushel)
(dollars per bushel)
California ................... Colorado .................... Idaho ......................... Minnesota .................. Montana .................... North Dakota ............. Washington ............... Wyoming ................... United States .............
(D) 4.45 (D)
4.08 4.51 4.13 2.62 (D)
4.45
(D) (D)
5.00 (D)
3.94 4.45 (D) (D)
4.62
(D) 4.08 5.07 4.03 3.59 4.18 (D) (D)
4.52
(D) 4.25 4.87 4.15 4.53 4.15 4.39 4.70
4.54
(D) (D)
4.47 4.21 4.89 4.11 2.94 (D)
4.49
(D) (D)
4.50 (D)
4.17 4.05 3.88
(S)
4.25
(S) 4.65 5.10 (D)
4.94 4.40 3.04 (D)
4.78
State December January 1 February March April May June
(dollars per bushel)
(dollars per bushel)
(dollars per bushel)
(dollars per bushel)
(dollars per bushel)
(dollars per bushel)
(dollars per bushel)
California ................... Colorado .................... Idaho ......................... Minnesota .................. Montana .................... North Dakota ............. Washington ............... Wyoming ................... United States .............
(D) 4.67 5.16 (D)
4.62 4.26 3.20 (D)
4.64
(D) 4.66 5.00 (D)
4.48 4.18 3.05 (D)
4.57
(S) 4.60 5.08 4.46 4.40 4.30 3.47 (D)
4.65
(D) 4.68 5.30 4.41 4.65 4.37 (D) (D)
4.88
(S) 4.66 5.49 (D)
4.67 4.29 (D) (D)
4.80
(D) (D)
5.34 (D) (D)
4.19 (D) (S)
4.90
(D) 4.68 5.29 (D)
4.21 4.45 (D) (D)
4.81
(D) Withheld to avoid disclosing data for individual operations. (S) Insufficient number of reports to establish an estimate. 1 Second year.
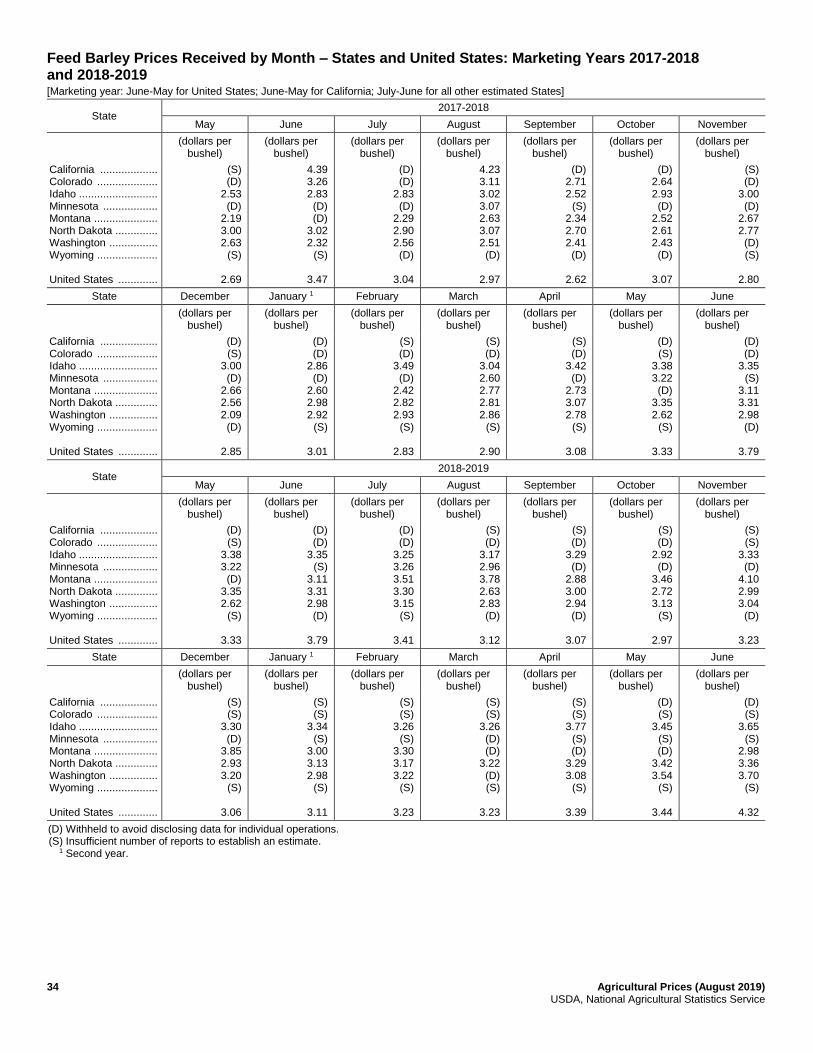
34 Agricultural Prices (August 2019) USDA, National Agricultural Statistics Service
Feed Barley Prices Received by Month – States and United States: Marketing Years 2017-2018 and 2018-2019 [Marketing year: June-May for United States; June-May for California; July-June for all other estimated States]
State 2017-2018
May June July August September October November
(dollars per
bushel) (dollars per
bushel) (dollars per
bushel) (dollars per
bushel) (dollars per
bushel) (dollars per
bushel) (dollars per
bushel)
California ................... Colorado .................... Idaho .......................... Minnesota .................. Montana ..................... North Dakota .............. Washington ................ Wyoming .................... United States .............
(S) (D)
2.53 (D)
2.19 3.00 2.63
(S)
2.69
4.39 3.26 2.83 (D) (D)
3.02 2.32
(S)
3.47
(D) (D)
2.83 (D)
2.29 2.90 2.56 (D)
3.04
4.23 3.11 3.02 3.07 2.63 3.07 2.51 (D)
2.97
(D) 2.71 2.52
(S) 2.34 2.70 2.41 (D)
2.62
(D) 2.64 2.93 (D)
2.52 2.61 2.43 (D)
3.07
(S) (D)
3.00 (D)
2.67 2.77 (D) (S)
2.80
State December January 1 February March April May June
(dollars per bushel)
(dollars per bushel)
(dollars per bushel)
(dollars per bushel)
(dollars per bushel)
(dollars per bushel)
(dollars per bushel)
California ................... Colorado .................... Idaho .......................... Minnesota .................. Montana ..................... North Dakota .............. Washington ................ Wyoming .................... United States .............
(D) (S)
3.00 (D)
2.66 2.56 2.09 (D)
2.85
(D) (D)
2.86 (D)
2.60 2.98 2.92
(S)
3.01
(S) (D)
3.49 (D)
2.42 2.82 2.93
(S)
2.83
(S) (D)
3.04 2.60 2.77 2.81 2.86
(S)
2.90
(S) (D)
3.42 (D)
2.73 3.07 2.78
(S)
3.08
(D) (S)
3.38 3.22 (D)
3.35 2.62
(S)
3.33
(D) (D)
3.35 (S)
3.11 3.31 2.98 (D)
3.79
State 2018-2019
May June July August September October November
(dollars per bushel)
(dollars per bushel)
(dollars per bushel)
(dollars per bushel)
(dollars per bushel)
(dollars per bushel)
(dollars per bushel)
California ................... Colorado .................... Idaho .......................... Minnesota .................. Montana ..................... North Dakota .............. Washington ................ Wyoming .................... United States .............
(D) (S)
3.38 3.22 (D)
3.35 2.62
(S)
3.33
(D) (D)
3.35 (S)
3.11 3.31 2.98 (D)
3.79
(D) (D)
3.25 3.26 3.51 3.30 3.15
(S)
3.41
(S) (D)
3.17 2.96 3.78 2.63 2.83 (D)
3.12
(S) (D)
3.29 (D)
2.88 3.00 2.94 (D)
3.07
(S) (D)
2.92 (D)
3.46 2.72 3.13
(S)
2.97
(S) (S)
3.33 (D)
4.10 2.99 3.04 (D)
3.23
State December January 1 February March April May June
(dollars per bushel)
(dollars per bushel)
(dollars per bushel)
(dollars per bushel)
(dollars per bushel)
(dollars per bushel)
(dollars per bushel)
California ................... Colorado .................... Idaho .......................... Minnesota .................. Montana ..................... North Dakota .............. Washington ................ Wyoming .................... United States .............
(S) (S)
3.30 (D)
3.85 2.93 3.20
(S)
3.06
(S) (S)
3.34 (S)
3.00 3.13 2.98
(S)
3.11
(S) (S)
3.26 (S)
3.30 3.17 3.22
(S)
3.23
(S) (S)
3.26 (D) (D)
3.22 (D) (S)
3.23
(S) (S)
3.77 (S) (D)
3.29 3.08
(S)
3.39
(D) (S)
3.45 (S) (D)
3.42 3.54
(S)
3.44
(D) (S)
3.65 (S)
2.98 3.36 3.70
(S)
4.32
(D) Withheld to avoid disclosing data for individual operations. (S) Insufficient number of reports to establish an estimate. 1 Second year.
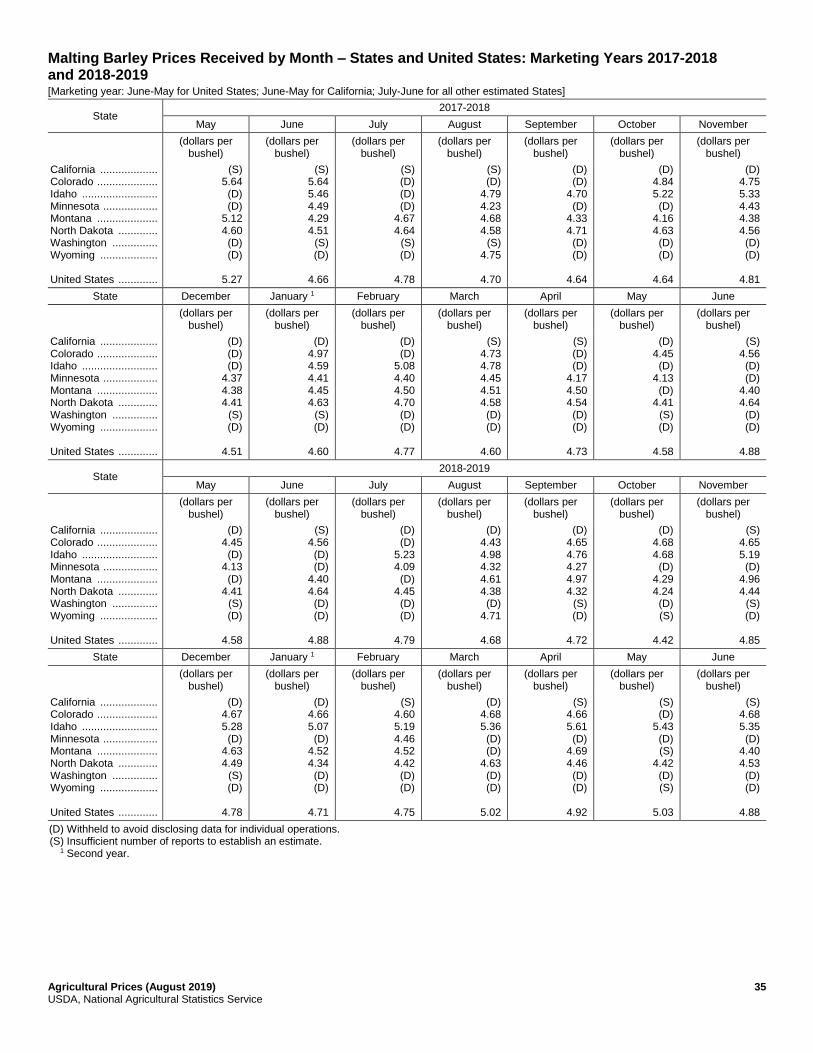
Agricultural Prices (August 2019) 35 USDA, National Agricultural Statistics Service
Malting Barley Prices Received by Month – States and United States: Marketing Years 2017-2018 and 2018-2019 [Marketing year: June-May for United States; June-May for California; July-June for all other estimated States]
State 2017-2018
May June July August September October November
(dollars per
bushel) (dollars per
bushel) (dollars per
bushel) (dollars per
bushel) (dollars per
bushel) (dollars per
bushel) (dollars per
bushel)
California ................... Colorado .................... Idaho ......................... Minnesota .................. Montana .................... North Dakota ............. Washington ............... Wyoming ................... United States .............
(S) 5.64 (D) (D)
5.12 4.60 (D) (D)
5.27
(S) 5.64 5.46 4.49 4.29 4.51
(S) (D)
4.66
(S) (D) (D) (D)
4.67 4.64
(S) (D)
4.78
(S) (D)
4.79 4.23 4.68 4.58
(S) 4.75
4.70
(D) (D)
4.70 (D)
4.33 4.71 (D) (D)
4.64
(D) 4.84 5.22 (D)
4.16 4.63 (D) (D)
4.64
(D) 4.75 5.33 4.43 4.38 4.56 (D) (D)
4.81
State December January 1 February March April May June
(dollars per bushel)
(dollars per bushel)
(dollars per bushel)
(dollars per bushel)
(dollars per bushel)
(dollars per bushel)
(dollars per bushel)
California ................... Colorado .................... Idaho ......................... Minnesota .................. Montana .................... North Dakota ............. Washington ............... Wyoming ................... United States .............
(D) (D) (D)
4.37 4.38 4.41
(S) (D)
4.51
(D) 4.97 4.59 4.41 4.45 4.63
(S) (D)
4.60
(D) (D)
5.08 4.40 4.50 4.70 (D) (D)
4.77
(S) 4.73 4.78 4.45 4.51 4.58 (D) (D)
4.60
(S) (D) (D)
4.17 4.50 4.54 (D) (D)
4.73
(D) 4.45 (D)
4.13 (D)
4.41 (S) (D)
4.58
(S) 4.56 (D) (D)
4.40 4.64 (D) (D)
4.88
State 2018-2019
May June July August September October November
(dollars per bushel)
(dollars per bushel)
(dollars per bushel)
(dollars per bushel)
(dollars per bushel)
(dollars per bushel)
(dollars per bushel)
California ................... Colorado .................... Idaho ......................... Minnesota .................. Montana .................... North Dakota ............. Washington ............... Wyoming ................... United States .............
(D) 4.45 (D)
4.13 (D)
4.41 (S) (D)
4.58
(S) 4.56 (D) (D)
4.40 4.64 (D) (D)
4.88
(D) (D)
5.23 4.09 (D)
4.45 (D) (D)
4.79
(D) 4.43 4.98 4.32 4.61 4.38 (D)
4.71
4.68
(D) 4.65 4.76 4.27 4.97 4.32
(S) (D)
4.72
(D) 4.68 4.68 (D)
4.29 4.24 (D) (S)
4.42
(S) 4.65 5.19 (D)
4.96 4.44
(S) (D)
4.85
State December January 1 February March April May June
(dollars per bushel)
(dollars per bushel)
(dollars per bushel)
(dollars per bushel)
(dollars per bushel)
(dollars per bushel)
(dollars per bushel)
California ................... Colorado .................... Idaho ......................... Minnesota .................. Montana .................... North Dakota ............. Washington ............... Wyoming ................... United States .............
(D) 4.67 5.28 (D)
4.63 4.49
(S) (D)
4.78
(D) 4.66 5.07 (D)
4.52 4.34 (D) (D)
4.71
(S) 4.60 5.19 4.46 4.52 4.42 (D) (D)
4.75
(D) 4.68 5.36 (D) (D)
4.63 (D) (D)
5.02
(S) 4.66 5.61 (D)
4.69 4.46 (D) (D)
4.92
(S) (D)
5.43 (D) (S)
4.42 (D) (S)
5.03
(S) 4.68 5.35 (D)
4.40 4.53 (D) (D)
4.88
(D) Withheld to avoid disclosing data for individual operations. (S) Insufficient number of reports to establish an estimate. 1 Second year.
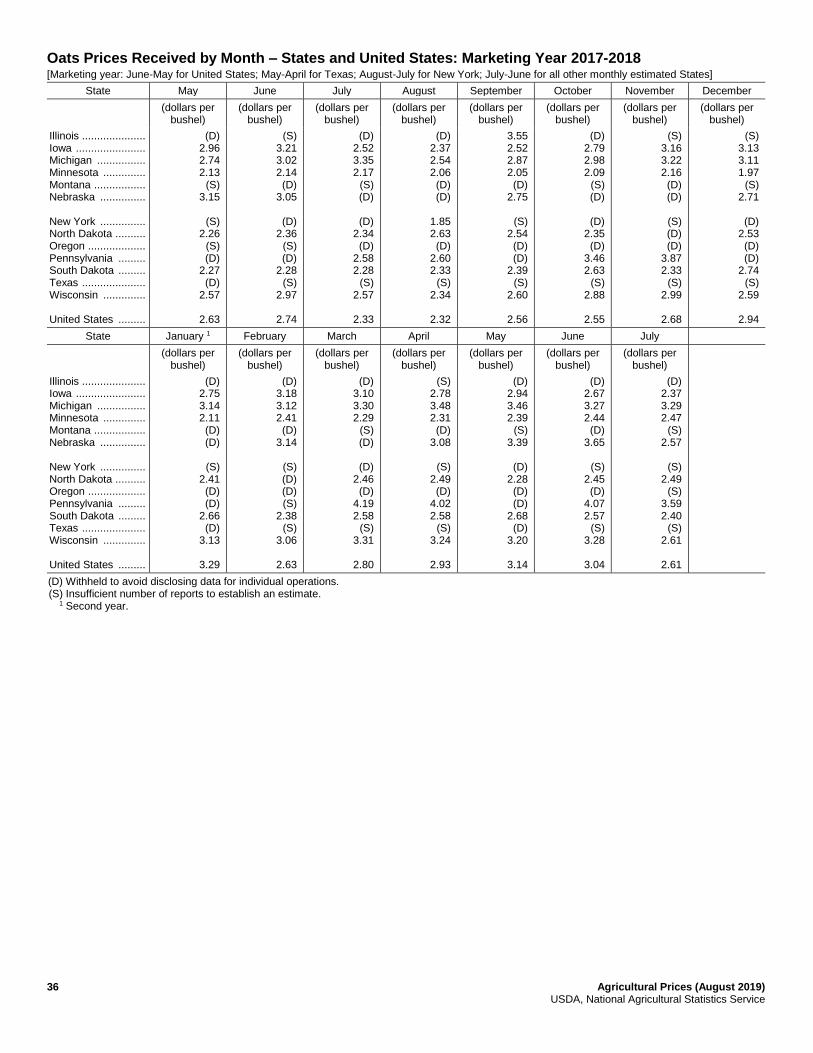
36 Agricultural Prices (August 2019) USDA, National Agricultural Statistics Service
Oats Prices Received by Month – States and United States: Marketing Year 2017-2018 [Marketing year: June-May for United States; May-April for Texas; August-July for New York; July-June for all other monthly estimated States]
State May June July August September October November December
(dollars per
bushel) (dollars per
bushel) (dollars per
bushel) (dollars per
bushel) (dollars per
bushel) (dollars per
bushel) (dollars per
bushel) (dollars per
bushel)
Illinois ..................... Iowa ....................... Michigan ................ Minnesota .............. Montana ................. Nebraska ............... New York ............... North Dakota .......... Oregon ................... Pennsylvania ......... South Dakota ......... Texas ..................... Wisconsin .............. United States .........
(D) 2.96 2.74 2.13
(S) 3.15
(S)
2.26 (S) (D)
2.27 (D)
2.57
2.63
(S) 3.21 3.02 2.14 (D)
3.05
(D) 2.36
(S) (D)
2.28 (S)
2.97
2.74
(D) 2.52 3.35 2.17
(S) (D)
(D)
2.34 (D)
2.58 2.28
(S) 2.57
2.33
(D) 2.37 2.54 2.06 (D) (D)
1.85 2.63 (D)
2.60 2.33
(S) 2.34
2.32
3.55 2.52 2.87 2.05 (D)
2.75
(S) 2.54 (D) (D)
2.39 (S)
2.60
2.56
(D) 2.79 2.98 2.09
(S) (D)
(D)
2.35 (D)
3.46 2.63
(S) 2.88
2.55
(S) 3.16 3.22 2.16 (D) (D)
(S) (D) (D)
3.87 2.33
(S) 2.99
2.68
(S) 3.13 3.11 1.97
(S) 2.71
(D)
2.53 (D) (D)
2.74 (S)
2.59
2.94
State January 1 February March April May June July
(dollars per bushel)
(dollars per bushel)
(dollars per bushel)
(dollars per bushel)
(dollars per bushel)
(dollars per bushel)
(dollars per bushel)
Illinois ..................... Iowa ....................... Michigan ................ Minnesota .............. Montana ................. Nebraska ............... New York ............... North Dakota .......... Oregon ................... Pennsylvania ......... South Dakota ......... Texas ..................... Wisconsin .............. United States .........
(D) 2.75 3.14 2.11 (D) (D)
(S)
2.41 (D) (D)
2.66 (D)
3.13
3.29
(D) 3.18 3.12 2.41 (D)
3.14
(S) (D) (D) (S)
2.38 (S)
3.06
2.63
(D) 3.10 3.30 2.29
(S) (D)
(D)
2.46 (D)
4.19 2.58
(S) 3.31
2.80
(S) 2.78 3.48 2.31 (D)
3.08
(S) 2.49 (D)
4.02 2.58
(S) 3.24
2.93
(D) 2.94 3.46 2.39
(S) 3.39
(D)
2.28 (D) (D)
2.68 (D)
3.20
3.14
(D) 2.67 3.27 2.44 (D)
3.65
(S) 2.45 (D)
4.07 2.57
(S) 3.28
3.04
(D) 2.37 3.29 2.47
(S) 2.57
(S)
2.49 (S)
3.59 2.40
(S) 2.61
2.61
(D) Withheld to avoid disclosing data for individual operations. (S) Insufficient number of reports to establish an estimate. 1 Second year.
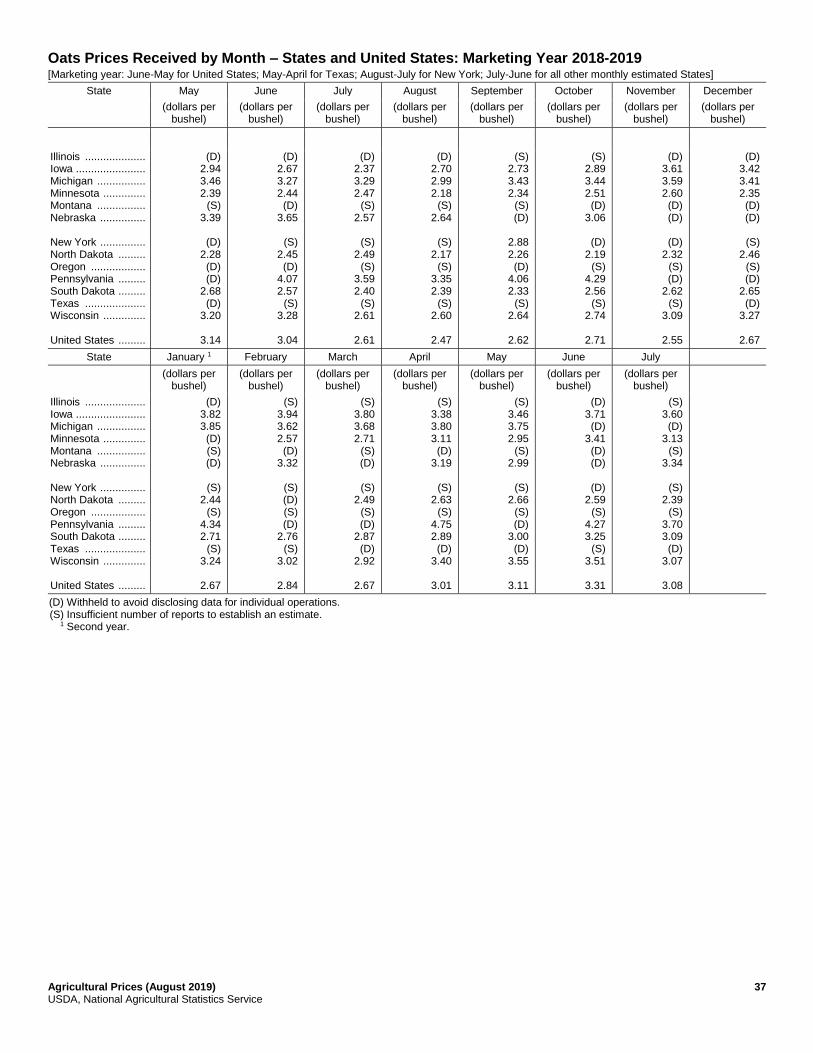
Agricultural Prices (August 2019) 37 USDA, National Agricultural Statistics Service
Oats Prices Received by Month – States and United States: Marketing Year 2018-2019 [Marketing year: June-May for United States; May-April for Texas; August-July for New York; July-June for all other monthly estimated States]
State May June July August September October November December
(dollars per
bushel) (dollars per
bushel) (dollars per
bushel) (dollars per
bushel) (dollars per
bushel) (dollars per
bushel) (dollars per
bushel) (dollars per
bushel)
Illinois .................... Iowa ....................... Michigan ................ Minnesota .............. Montana ................ Nebraska ............... New York ............... North Dakota ......... Oregon .................. Pennsylvania ......... South Dakota ......... Texas .................... Wisconsin .............. United States .........
(D) 2.94 3.46 2.39
(S) 3.39
(D)
2.28 (D) (D)
2.68 (D)
3.20
3.14
(D) 2.67 3.27 2.44 (D)
3.65
(S) 2.45 (D)
4.07 2.57
(S) 3.28
3.04
(D) 2.37 3.29 2.47
(S) 2.57
(S)
2.49 (S)
3.59 2.40
(S) 2.61
2.61
(D) 2.70 2.99 2.18
(S) 2.64
(S)
2.17 (S)
3.35 2.39
(S) 2.60
2.47
(S) 2.73 3.43 2.34
(S) (D)
2.88 2.26 (D)
4.06 2.33
(S) 2.64
2.62
(S) 2.89 3.44 2.51 (D)
3.06
(D) 2.19
(S) 4.29 2.56
(S) 2.74
2.71
(D) 3.61 3.59 2.60 (D) (D)
(D)
2.32 (S) (D)
2.62 (S)
3.09
2.55
(D) 3.42 3.41 2.35 (D) (D)
(S)
2.46 (S) (D)
2.65 (D)
3.27
2.67
State January 1 February March April May June July
(dollars per bushel)
(dollars per bushel)
(dollars per bushel)
(dollars per bushel)
(dollars per bushel)
(dollars per bushel)
(dollars per bushel)
Illinois .................... Iowa ....................... Michigan ................ Minnesota .............. Montana ................ Nebraska ............... New York ............... North Dakota ......... Oregon .................. Pennsylvania ......... South Dakota ......... Texas .................... Wisconsin .............. United States .........
(D) 3.82 3.85 (D) (S) (D)
(S)
2.44 (S)
4.34 2.71
(S) 3.24
2.67
(S) 3.94 3.62 2.57 (D)
3.32
(S) (D) (S) (D)
2.76 (S)
3.02
2.84
(S) 3.80 3.68 2.71
(S) (D)
(S)
2.49 (S) (D)
2.87 (D)
2.92
2.67
(S) 3.38 3.80 3.11 (D)
3.19
(S) 2.63
(S) 4.75 2.89 (D)
3.40
3.01
(S) 3.46 3.75 2.95
(S) 2.99
(S)
2.66 (S) (D)
3.00 (D)
3.55
3.11
(D) 3.71 (D)
3.41 (D) (D)
(D)
2.59 (S)
4.27 3.25
(S) 3.51
3.31
(S) 3.60 (D)
3.13 (S)
3.34
(S) 2.39
(S) 3.70 3.09 (D)
3.07
3.08
(D) Withheld to avoid disclosing data for individual operations. (S) Insufficient number of reports to establish an estimate. 1 Second year.
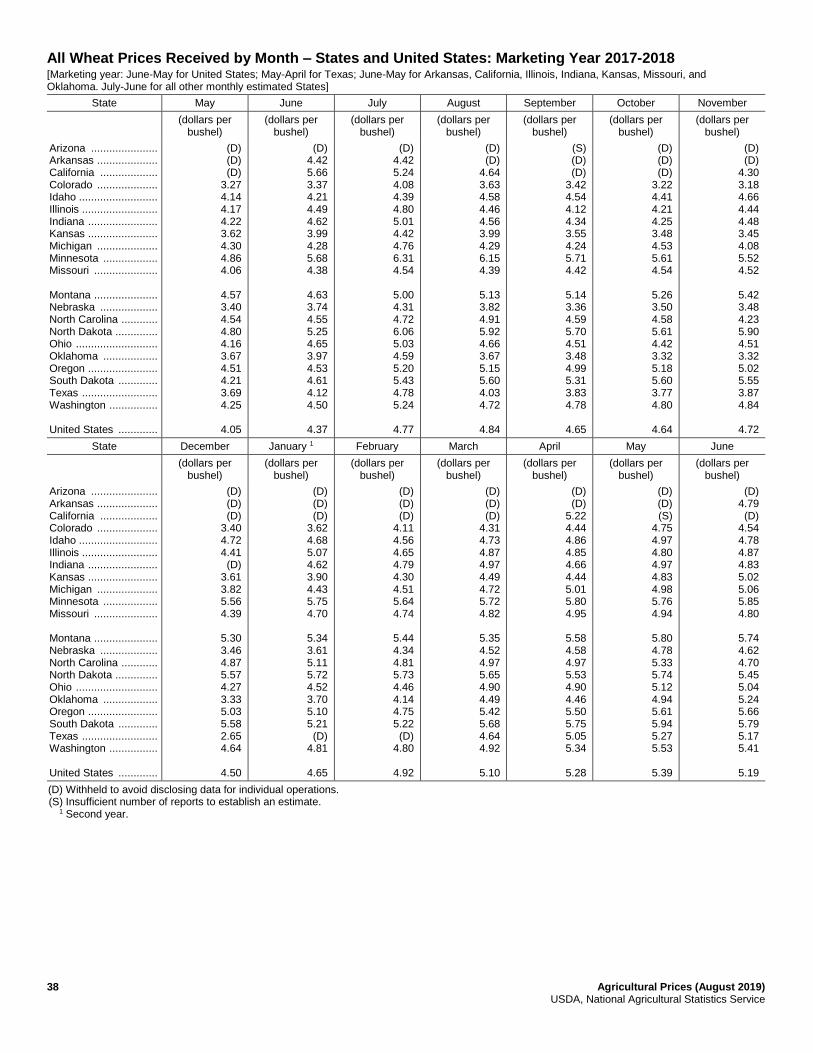
38 Agricultural Prices (August 2019) USDA, National Agricultural Statistics Service
All Wheat Prices Received by Month – States and United States: Marketing Year 2017-2018 [Marketing year: June-May for United States; May-April for Texas; June-May for Arkansas, California, Illinois, Indiana, Kansas, Missouri, and Oklahoma. July-June for all other monthly estimated States]
State May June July August September October November
(dollars per
bushel) (dollars per
bushel) (dollars per
bushel) (dollars per
bushel) (dollars per
bushel) (dollars per
bushel) (dollars per
bushel)
Arizona ...................... Arkansas .................... California ................... Colorado .................... Idaho .......................... Illinois ......................... Indiana ....................... Kansas ....................... Michigan .................... Minnesota .................. Missouri ..................... Montana ..................... Nebraska ................... North Carolina ............ North Dakota .............. Ohio ........................... Oklahoma .................. Oregon ....................... South Dakota ............. Texas ......................... Washington ................ United States .............
(D) (D) (D)
3.27 4.14 4.17 4.22 3.62 4.30 4.86 4.06
4.57 3.40 4.54 4.80 4.16 3.67 4.51 4.21 3.69 4.25
4.05
(D) 4.42 5.66 3.37 4.21 4.49 4.62 3.99 4.28 5.68 4.38
4.63 3.74 4.55 5.25 4.65 3.97 4.53 4.61 4.12 4.50
4.37
(D) 4.42 5.24 4.08 4.39 4.80 5.01 4.42 4.76 6.31 4.54
5.00 4.31 4.72 6.06 5.03 4.59 5.20 5.43 4.78 5.24
4.77
(D) (D)
4.64 3.63 4.58 4.46 4.56 3.99 4.29 6.15 4.39
5.13 3.82 4.91 5.92 4.66 3.67 5.15 5.60 4.03 4.72
4.84
(S) (D) (D)
3.42 4.54 4.12 4.34 3.55 4.24 5.71 4.42
5.14 3.36 4.59 5.70 4.51 3.48 4.99 5.31 3.83 4.78
4.65
(D) (D) (D)
3.22 4.41 4.21 4.25 3.48 4.53 5.61 4.54
5.26 3.50 4.58 5.61 4.42 3.32 5.18 5.60 3.77 4.80
4.64
(D) (D)
4.30 3.18 4.66 4.44 4.48 3.45 4.08 5.52 4.52
5.42 3.48 4.23 5.90 4.51 3.32 5.02 5.55 3.87 4.84
4.72
State December January 1 February March April May June
(dollars per bushel)
(dollars per bushel)
(dollars per bushel)
(dollars per bushel)
(dollars per bushel)
(dollars per bushel)
(dollars per bushel)
Arizona ...................... Arkansas .................... California ................... Colorado .................... Idaho .......................... Illinois ......................... Indiana ....................... Kansas ....................... Michigan .................... Minnesota .................. Missouri ..................... Montana ..................... Nebraska ................... North Carolina ............ North Dakota .............. Ohio ........................... Oklahoma .................. Oregon ....................... South Dakota ............. Texas ......................... Washington ................ United States .............
(D) (D) (D)
3.40 4.72 4.41 (D)
3.61 3.82 5.56 4.39
5.30 3.46 4.87 5.57 4.27 3.33 5.03 5.58 2.65 4.64
4.50
(D) (D) (D)
3.62 4.68 5.07 4.62 3.90 4.43 5.75 4.70
5.34 3.61 5.11 5.72 4.52 3.70 5.10 5.21 (D)
4.81
4.65
(D) (D) (D)
4.11 4.56 4.65 4.79 4.30 4.51 5.64 4.74
5.44 4.34 4.81 5.73 4.46 4.14 4.75 5.22 (D)
4.80
4.92
(D) (D) (D)
4.31 4.73 4.87 4.97 4.49 4.72 5.72 4.82
5.35 4.52 4.97 5.65 4.90 4.49 5.42 5.68 4.64 4.92
5.10
(D) (D)
5.22 4.44 4.86 4.85 4.66 4.44 5.01 5.80 4.95
5.58 4.58 4.97 5.53 4.90 4.46 5.50 5.75 5.05 5.34
5.28
(D) (D) (S)
4.75 4.97 4.80 4.97 4.83 4.98 5.76 4.94
5.80 4.78 5.33 5.74 5.12 4.94 5.61 5.94 5.27 5.53
5.39
(D) 4.79 (D)
4.54 4.78 4.87 4.83 5.02 5.06 5.85 4.80
5.74 4.62 4.70 5.45 5.04 5.24 5.66 5.79 5.17 5.41
5.19
(D) Withheld to avoid disclosing data for individual operations. (S) Insufficient number of reports to establish an estimate. 1 Second year.
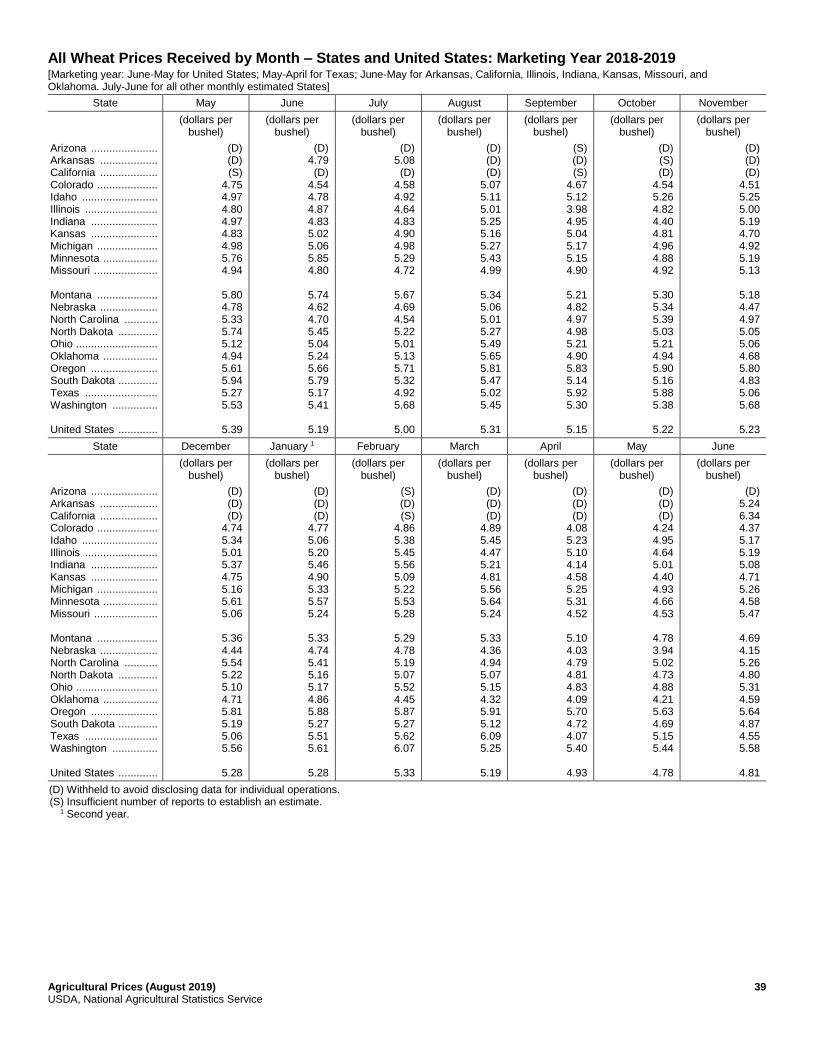
Agricultural Prices (August 2019) 39 USDA, National Agricultural Statistics Service
All Wheat Prices Received by Month – States and United States: Marketing Year 2018-2019 [Marketing year: June-May for United States; May-April for Texas; June-May for Arkansas, California, Illinois, Indiana, Kansas, Missouri, and Oklahoma. July-June for all other monthly estimated States]
State May June July August September October November
(dollars per
bushel) (dollars per
bushel) (dollars per
bushel) (dollars per
bushel) (dollars per
bushel) (dollars per
bushel) (dollars per
bushel)
Arizona ...................... Arkansas ................... California ................... Colorado .................... Idaho ......................... Illinois ........................ Indiana ...................... Kansas ...................... Michigan .................... Minnesota .................. Missouri ..................... Montana .................... Nebraska ................... North Carolina ........... North Dakota ............. Ohio ........................... Oklahoma .................. Oregon ...................... South Dakota ............. Texas ........................ Washington ............... United States .............
(D) (D) (S)
4.75 4.97 4.80 4.97 4.83 4.98 5.76 4.94
5.80 4.78 5.33 5.74 5.12 4.94 5.61 5.94 5.27 5.53
5.39
(D) 4.79 (D)
4.54 4.78 4.87 4.83 5.02 5.06 5.85 4.80
5.74 4.62 4.70 5.45 5.04 5.24 5.66 5.79 5.17 5.41
5.19
(D) 5.08 (D)
4.58 4.92 4.64 4.83 4.90 4.98 5.29 4.72
5.67 4.69 4.54 5.22 5.01 5.13 5.71 5.32 4.92 5.68
5.00
(D) (D) (D)
5.07 5.11 5.01 5.25 5.16 5.27 5.43 4.99
5.34 5.06 5.01 5.27 5.49 5.65 5.81 5.47 5.02 5.45
5.31
(S) (D) (S)
4.67 5.12 3.98 4.95 5.04 5.17 5.15 4.90
5.21 4.82 4.97 4.98 5.21 4.90 5.83 5.14 5.92 5.30
5.15
(D) (S) (D)
4.54 5.26 4.82 4.40 4.81 4.96 4.88 4.92
5.30 5.34 5.39 5.03 5.21 4.94 5.90 5.16 5.88 5.38
5.22
(D) (D) (D)
4.51 5.25 5.00 5.19 4.70 4.92 5.19 5.13
5.18 4.47 4.97 5.05 5.06 4.68 5.80 4.83 5.06 5.68
5.23
State December January 1 February March April May June
(dollars per bushel)
(dollars per bushel)
(dollars per bushel)
(dollars per bushel)
(dollars per bushel)
(dollars per bushel)
(dollars per bushel)
Arizona ...................... Arkansas ................... California ................... Colorado .................... Idaho ......................... Illinois ........................ Indiana ...................... Kansas ...................... Michigan .................... Minnesota .................. Missouri ..................... Montana .................... Nebraska ................... North Carolina ........... North Dakota ............. Ohio ........................... Oklahoma .................. Oregon ...................... South Dakota ............. Texas ........................ Washington ............... United States .............
(D) (D) (D)
4.74 5.34 5.01 5.37 4.75 5.16 5.61 5.06
5.36 4.44 5.54 5.22 5.10 4.71 5.81 5.19 5.06 5.56
5.28
(D) (D) (D)
4.77 5.06 5.20 5.46 4.90 5.33 5.57 5.24
5.33 4.74 5.41 5.16 5.17 4.86 5.88 5.27 5.51 5.61
5.28
(S) (D) (S)
4.86 5.38 5.45 5.56 5.09 5.22 5.53 5.28
5.29 4.78 5.19 5.07 5.52 4.45 5.87 5.27 5.62 6.07
5.33
(D) (D) (D)
4.89 5.45 4.47 5.21 4.81 5.56 5.64 5.24
5.33 4.36 4.94 5.07 5.15 4.32 5.91 5.12 6.09 5.25
5.19
(D) (D) (D)
4.08 5.23 5.10 4.14 4.58 5.25 5.31 4.52
5.10 4.03 4.79 4.81 4.83 4.09 5.70 4.72 4.07 5.40
4.93
(D) (D) (D)
4.24 4.95 4.64 5.01 4.40 4.93 4.66 4.53
4.78 3.94 5.02 4.73 4.88 4.21 5.63 4.69 5.15 5.44
4.78
(D) 5.24 6.34 4.37 5.17 5.19 5.08 4.71 5.26 4.58 5.47
4.69 4.15 5.26 4.80 5.31 4.59 5.64 4.87 4.55 5.58
4.81
(D) Withheld to avoid disclosing data for individual operations. (S) Insufficient number of reports to establish an estimate. 1 Second year.
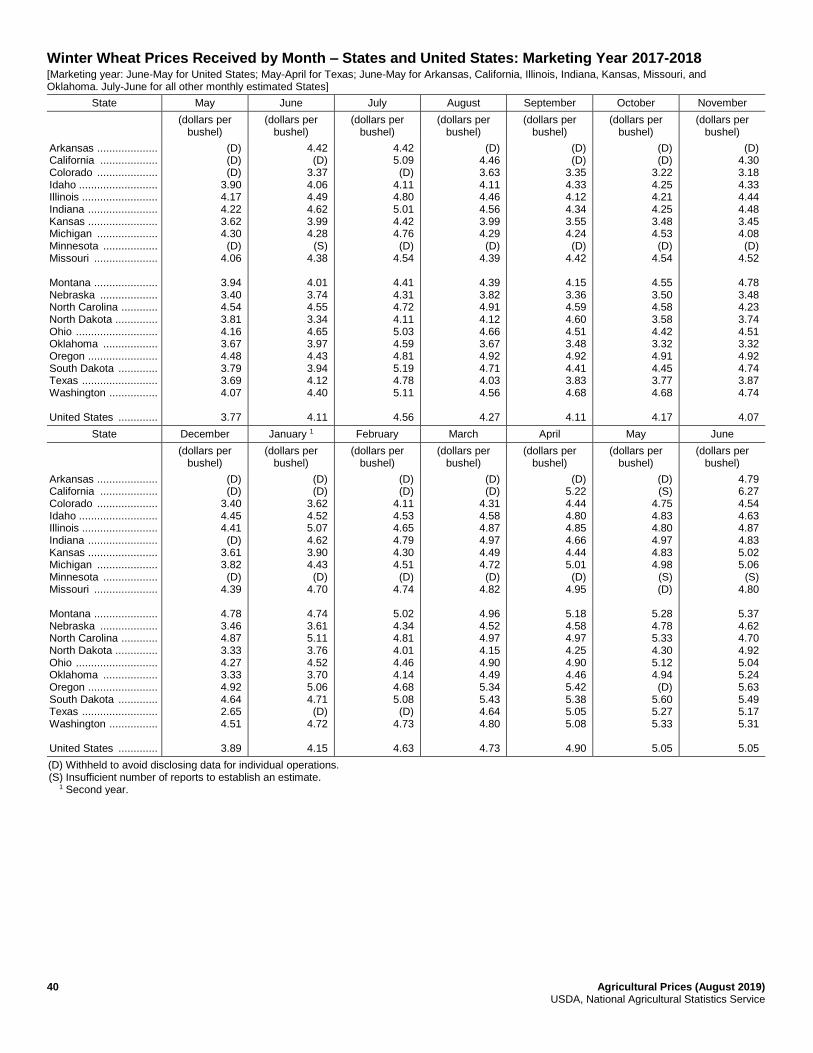
40 Agricultural Prices (August 2019) USDA, National Agricultural Statistics Service
Winter Wheat Prices Received by Month – States and United States: Marketing Year 2017-2018 [Marketing year: June-May for United States; May-April for Texas; June-May for Arkansas, California, Illinois, Indiana, Kansas, Missouri, and Oklahoma. July-June for all other monthly estimated States]
State May June July August September October November
(dollars per
bushel) (dollars per
bushel) (dollars per
bushel) (dollars per
bushel) (dollars per
bushel) (dollars per
bushel) (dollars per
bushel)
Arkansas .................... California ................... Colorado .................... Idaho .......................... Illinois ......................... Indiana ....................... Kansas ....................... Michigan .................... Minnesota .................. Missouri ..................... Montana ..................... Nebraska ................... North Carolina ............ North Dakota .............. Ohio ........................... Oklahoma .................. Oregon ....................... South Dakota ............. Texas ......................... Washington ................ United States .............
(D) (D) (D)
3.90 4.17 4.22 3.62 4.30 (D)
4.06
3.94 3.40 4.54 3.81 4.16 3.67 4.48 3.79 3.69 4.07
3.77
4.42 (D)
3.37 4.06 4.49 4.62 3.99 4.28
(S) 4.38
4.01 3.74 4.55 3.34 4.65 3.97 4.43 3.94 4.12 4.40
4.11
4.42 5.09 (D)
4.11 4.80 5.01 4.42 4.76 (D)
4.54
4.41 4.31 4.72 4.11 5.03 4.59 4.81 5.19 4.78 5.11
4.56
(D) 4.46 3.63 4.11 4.46 4.56 3.99 4.29 (D)
4.39
4.39 3.82 4.91 4.12 4.66 3.67 4.92 4.71 4.03 4.56
4.27
(D) (D)
3.35 4.33 4.12 4.34 3.55 4.24 (D)
4.42
4.15 3.36 4.59 4.60 4.51 3.48 4.92 4.41 3.83 4.68
4.11
(D) (D)
3.22 4.25 4.21 4.25 3.48 4.53 (D)
4.54
4.55 3.50 4.58 3.58 4.42 3.32 4.91 4.45 3.77 4.68
4.17
(D) 4.30 3.18 4.33 4.44 4.48 3.45 4.08 (D)
4.52
4.78 3.48 4.23 3.74 4.51 3.32 4.92 4.74 3.87 4.74
4.07
State December January 1 February March April May June
(dollars per bushel)
(dollars per bushel)
(dollars per bushel)
(dollars per bushel)
(dollars per bushel)
(dollars per bushel)
(dollars per bushel)
Arkansas .................... California ................... Colorado .................... Idaho .......................... Illinois ......................... Indiana ....................... Kansas ....................... Michigan .................... Minnesota .................. Missouri ..................... Montana ..................... Nebraska ................... North Carolina ............ North Dakota .............. Ohio ........................... Oklahoma .................. Oregon ....................... South Dakota ............. Texas ......................... Washington ................ United States .............
(D) (D)
3.40 4.45 4.41 (D)
3.61 3.82 (D)
4.39
4.78 3.46 4.87 3.33 4.27 3.33 4.92 4.64 2.65 4.51
3.89
(D) (D)
3.62 4.52 5.07 4.62 3.90 4.43 (D)
4.70
4.74 3.61 5.11 3.76 4.52 3.70 5.06 4.71 (D)
4.72
4.15
(D) (D)
4.11 4.53 4.65 4.79 4.30 4.51 (D)
4.74
5.02 4.34 4.81 4.01 4.46 4.14 4.68 5.08 (D)
4.73
4.63
(D) (D)
4.31 4.58 4.87 4.97 4.49 4.72 (D)
4.82
4.96 4.52 4.97 4.15 4.90 4.49 5.34 5.43 4.64 4.80
4.73
(D) 5.22 4.44 4.80 4.85 4.66 4.44 5.01 (D)
4.95
5.18 4.58 4.97 4.25 4.90 4.46 5.42 5.38 5.05 5.08
4.90
(D) (S)
4.75 4.83 4.80 4.97 4.83 4.98
(S) (D)
5.28 4.78 5.33 4.30 5.12 4.94 (D)
5.60 5.27 5.33
5.05
4.79 6.27 4.54 4.63 4.87 4.83 5.02 5.06
(S) 4.80
5.37 4.62 4.70 4.92 5.04 5.24 5.63 5.49 5.17 5.31
5.05
(D) Withheld to avoid disclosing data for individual operations. (S) Insufficient number of reports to establish an estimate. 1 Second year.
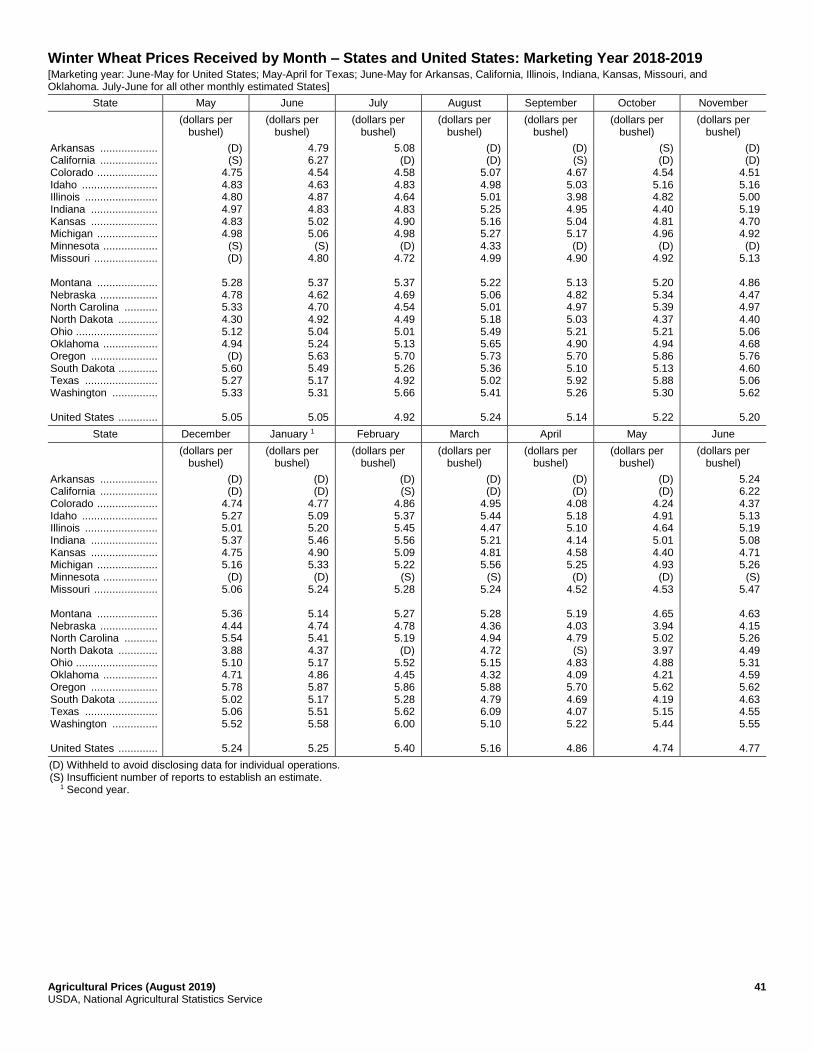
Agricultural Prices (August 2019) 41 USDA, National Agricultural Statistics Service
Winter Wheat Prices Received by Month – States and United States: Marketing Year 2018-2019 [Marketing year: June-May for United States; May-April for Texas; June-May for Arkansas, California, Illinois, Indiana, Kansas, Missouri, and Oklahoma. July-June for all other monthly estimated States]
State May June July August September October November
(dollars per
bushel) (dollars per
bushel) (dollars per
bushel) (dollars per
bushel) (dollars per
bushel) (dollars per
bushel) (dollars per
bushel)
Arkansas ................... California ................... Colorado .................... Idaho ......................... Illinois ........................ Indiana ...................... Kansas ...................... Michigan .................... Minnesota .................. Missouri ..................... Montana .................... Nebraska ................... North Carolina ........... North Dakota ............. Ohio ........................... Oklahoma .................. Oregon ...................... South Dakota ............. Texas ........................ Washington ............... United States .............
(D) (S)
4.75 4.83 4.80 4.97 4.83 4.98
(S) (D)
5.28 4.78 5.33 4.30 5.12 4.94 (D)
5.60 5.27 5.33
5.05
4.79 6.27 4.54 4.63 4.87 4.83 5.02 5.06
(S) 4.80
5.37 4.62 4.70 4.92 5.04 5.24 5.63 5.49 5.17 5.31
5.05
5.08 (D)
4.58 4.83 4.64 4.83 4.90 4.98 (D)
4.72
5.37 4.69 4.54 4.49 5.01 5.13 5.70 5.26 4.92 5.66
4.92
(D) (D)
5.07 4.98 5.01 5.25 5.16 5.27 4.33 4.99
5.22 5.06 5.01 5.18 5.49 5.65 5.73 5.36 5.02 5.41
5.24
(D) (S)
4.67 5.03 3.98 4.95 5.04 5.17 (D)
4.90
5.13 4.82 4.97 5.03 5.21 4.90 5.70 5.10 5.92 5.26
5.14
(S) (D)
4.54 5.16 4.82 4.40 4.81 4.96 (D)
4.92
5.20 5.34 5.39 4.37 5.21 4.94 5.86 5.13 5.88 5.30
5.22
(D) (D)
4.51 5.16 5.00 5.19 4.70 4.92 (D)
5.13
4.86 4.47 4.97 4.40 5.06 4.68 5.76 4.60 5.06 5.62
5.20
State December January 1 February March April May June
(dollars per bushel)
(dollars per bushel)
(dollars per bushel)
(dollars per bushel)
(dollars per bushel)
(dollars per bushel)
(dollars per bushel)
Arkansas ................... California ................... Colorado .................... Idaho ......................... Illinois ........................ Indiana ...................... Kansas ...................... Michigan .................... Minnesota .................. Missouri ..................... Montana .................... Nebraska ................... North Carolina ........... North Dakota ............. Ohio ........................... Oklahoma .................. Oregon ...................... South Dakota ............. Texas ........................ Washington ............... United States .............
(D) (D)
4.74 5.27 5.01 5.37 4.75 5.16 (D)
5.06
5.36 4.44 5.54 3.88 5.10 4.71 5.78 5.02 5.06 5.52
5.24
(D) (D)
4.77 5.09 5.20 5.46 4.90 5.33 (D)
5.24
5.14 4.74 5.41 4.37 5.17 4.86 5.87 5.17 5.51 5.58
5.25
(D) (S)
4.86 5.37 5.45 5.56 5.09 5.22
(S) 5.28
5.27 4.78 5.19 (D)
5.52 4.45 5.86 5.28 5.62 6.00
5.40
(D) (D)
4.95 5.44 4.47 5.21 4.81 5.56
(S) 5.24
5.28 4.36 4.94 4.72 5.15 4.32 5.88 4.79 6.09 5.10
5.16
(D) (D)
4.08 5.18 5.10 4.14 4.58 5.25 (D)
4.52
5.19 4.03 4.79
(S) 4.83 4.09 5.70 4.69 4.07 5.22
4.86
(D) (D)
4.24 4.91 4.64 5.01 4.40 4.93 (D)
4.53
4.65 3.94 5.02 3.97 4.88 4.21 5.62 4.19 5.15 5.44
4.74
5.24 6.22 4.37 5.13 5.19 5.08 4.71 5.26
(S) 5.47
4.63 4.15 5.26 4.49 5.31 4.59 5.62 4.63 4.55 5.55
4.77
(D) Withheld to avoid disclosing data for individual operations. (S) Insufficient number of reports to establish an estimate. 1 Second year.
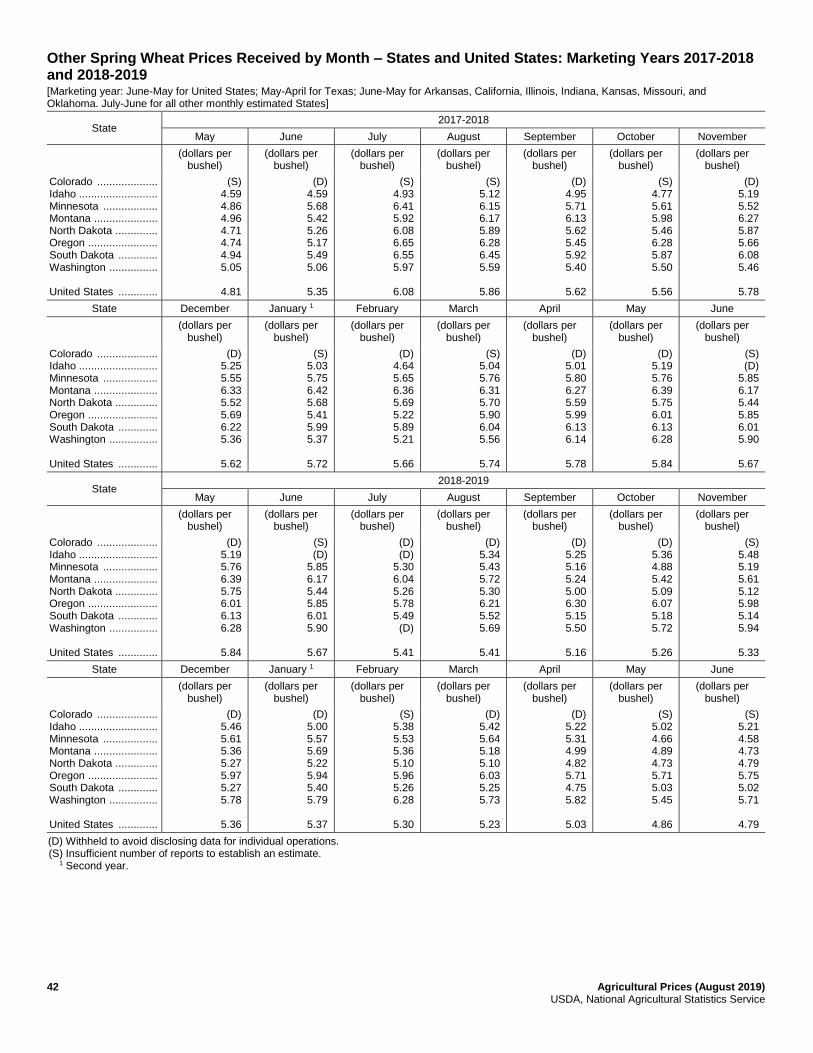
42 Agricultural Prices (August 2019) USDA, National Agricultural Statistics Service
Other Spring Wheat Prices Received by Month – States and United States: Marketing Years 2017-2018 and 2018-2019 [Marketing year: June-May for United States; May-April for Texas; June-May for Arkansas, California, Illinois, Indiana, Kansas, Missouri, and Oklahoma. July-June for all other monthly estimated States]
State 2017-2018
May June July August September October November
(dollars per
bushel) (dollars per
bushel) (dollars per
bushel) (dollars per
bushel) (dollars per
bushel) (dollars per
bushel) (dollars per
bushel)
Colorado .................... Idaho .......................... Minnesota .................. Montana ..................... North Dakota .............. Oregon ....................... South Dakota ............. Washington ................ United States .............
(S) 4.59 4.86 4.96 4.71 4.74 4.94 5.05
4.81
(D) 4.59 5.68 5.42 5.26 5.17 5.49 5.06
5.35
(S) 4.93 6.41 5.92 6.08 6.65 6.55 5.97
6.08
(S) 5.12 6.15 6.17 5.89 6.28 6.45 5.59
5.86
(D) 4.95 5.71 6.13 5.62 5.45 5.92 5.40
5.62
(S) 4.77 5.61 5.98 5.46 6.28 5.87 5.50
5.56
(D) 5.19 5.52 6.27 5.87 5.66 6.08 5.46
5.78
State December January 1 February March April May June
(dollars per bushel)
(dollars per bushel)
(dollars per bushel)
(dollars per bushel)
(dollars per bushel)
(dollars per bushel)
(dollars per bushel)
Colorado .................... Idaho .......................... Minnesota .................. Montana ..................... North Dakota .............. Oregon ....................... South Dakota ............. Washington ................ United States .............
(D) 5.25 5.55 6.33 5.52 5.69 6.22 5.36
5.62
(S) 5.03 5.75 6.42 5.68 5.41 5.99 5.37
5.72
(D) 4.64 5.65 6.36 5.69 5.22 5.89 5.21
5.66
(S) 5.04 5.76 6.31 5.70 5.90 6.04 5.56
5.74
(D) 5.01 5.80 6.27 5.59 5.99 6.13 6.14
5.78
(D) 5.19 5.76 6.39 5.75 6.01 6.13 6.28
5.84
(S) (D)
5.85 6.17 5.44 5.85 6.01 5.90
5.67
State 2018-2019
May June July August September October November
(dollars per bushel)
(dollars per bushel)
(dollars per bushel)
(dollars per bushel)
(dollars per bushel)
(dollars per bushel)
(dollars per bushel)
Colorado .................... Idaho .......................... Minnesota .................. Montana ..................... North Dakota .............. Oregon ....................... South Dakota ............. Washington ................ United States .............
(D) 5.19 5.76 6.39 5.75 6.01 6.13 6.28
5.84
(S) (D)
5.85 6.17 5.44 5.85 6.01 5.90
5.67
(D) (D)
5.30 6.04 5.26 5.78 5.49 (D)
5.41
(D) 5.34 5.43 5.72 5.30 6.21 5.52 5.69
5.41
(D) 5.25 5.16 5.24 5.00 6.30 5.15 5.50
5.16
(D) 5.36 4.88 5.42 5.09 6.07 5.18 5.72
5.26
(S) 5.48 5.19 5.61 5.12 5.98 5.14 5.94
5.33
State December January 1 February March April May June
(dollars per bushel)
(dollars per bushel)
(dollars per bushel)
(dollars per bushel)
(dollars per bushel)
(dollars per bushel)
(dollars per bushel)
Colorado .................... Idaho .......................... Minnesota .................. Montana ..................... North Dakota .............. Oregon ....................... South Dakota ............. Washington ................ United States .............
(D) 5.46 5.61 5.36 5.27 5.97 5.27 5.78
5.36
(D) 5.00 5.57 5.69 5.22 5.94 5.40 5.79
5.37
(S) 5.38 5.53 5.36 5.10 5.96 5.26 6.28
5.30
(D) 5.42 5.64 5.18 5.10 6.03 5.25 5.73
5.23
(D) 5.22 5.31 4.99 4.82 5.71 4.75 5.82
5.03
(S) 5.02 4.66 4.89 4.73 5.71 5.03 5.45
4.86
(S) 5.21 4.58 4.73 4.79 5.75 5.02 5.71
4.79
(D) Withheld to avoid disclosing data for individual operations. (S) Insufficient number of reports to establish an estimate. 1 Second year.
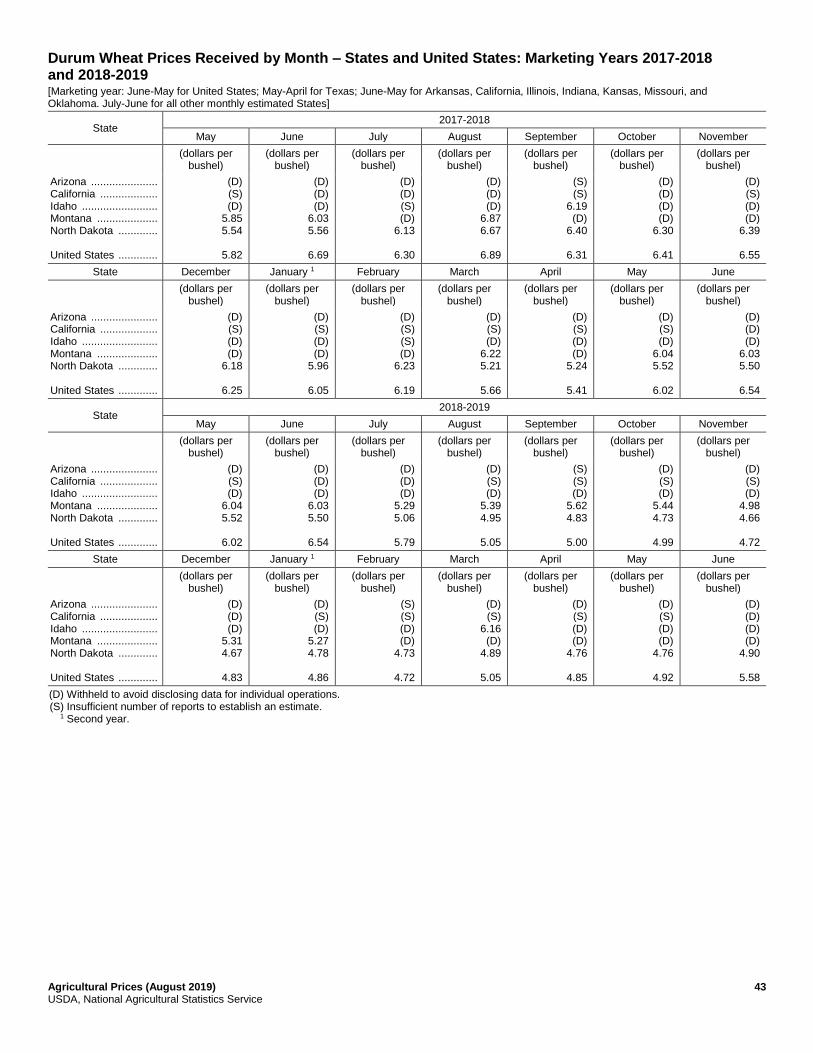
Agricultural Prices (August 2019) 43 USDA, National Agricultural Statistics Service
Durum Wheat Prices Received by Month – States and United States: Marketing Years 2017-2018 and 2018-2019 [Marketing year: June-May for United States; May-April for Texas; June-May for Arkansas, California, Illinois, Indiana, Kansas, Missouri, and Oklahoma. July-June for all other monthly estimated States]
State 2017-2018
May June July August September October November
(dollars per
bushel) (dollars per
bushel) (dollars per
bushel) (dollars per
bushel) (dollars per
bushel) (dollars per
bushel) (dollars per
bushel)
Arizona ...................... California ................... Idaho ......................... Montana .................... North Dakota ............. United States .............
(D) (S) (D)
5.85 5.54
5.82
(D) (D) (D)
6.03 5.56
6.69
(D) (D) (S) (D)
6.13
6.30
(D) (D) (D)
6.87 6.67
6.89
(S) (S)
6.19 (D)
6.40
6.31
(D) (D) (D) (D)
6.30
6.41
(D) (S) (D) (D)
6.39
6.55
State December January 1 February March April May June
(dollars per bushel)
(dollars per bushel)
(dollars per bushel)
(dollars per bushel)
(dollars per bushel)
(dollars per bushel)
(dollars per bushel)
Arizona ...................... California ................... Idaho ......................... Montana .................... North Dakota ............. United States .............
(D) (S) (D) (D)
6.18
6.25
(D) (S) (D) (D)
5.96
6.05
(D) (S) (S) (D)
6.23
6.19
(D) (S) (D)
6.22 5.21
5.66
(D) (S) (D) (D)
5.24
5.41
(D) (S) (D)
6.04 5.52
6.02
(D) (D) (D)
6.03 5.50
6.54
State 2018-2019
May June July August September October November
(dollars per bushel)
(dollars per bushel)
(dollars per bushel)
(dollars per bushel)
(dollars per bushel)
(dollars per bushel)
(dollars per bushel)
Arizona ...................... California ................... Idaho ......................... Montana .................... North Dakota ............. United States .............
(D) (S) (D)
6.04 5.52
6.02
(D) (D) (D)
6.03 5.50
6.54
(D) (D) (D)
5.29 5.06
5.79
(D) (S) (D)
5.39 4.95
5.05
(S) (S) (D)
5.62 4.83
5.00
(D) (S) (D)
5.44 4.73
4.99
(D) (S) (D)
4.98 4.66
4.72
State December January 1 February March April May June
(dollars per bushel)
(dollars per bushel)
(dollars per bushel)
(dollars per bushel)
(dollars per bushel)
(dollars per bushel)
(dollars per bushel)
Arizona ...................... California ................... Idaho ......................... Montana .................... North Dakota ............. United States .............
(D) (D) (D)
5.31 4.67
4.83
(D) (S) (D)
5.27 4.78
4.86
(S) (S) (D) (D)
4.73
4.72
(D) (S)
6.16 (D)
4.89
5.05
(D) (S) (D) (D)
4.76
4.85
(D) (S) (D) (D)
4.76
4.92
(D) (D) (D) (D)
4.90
5.58
(D) Withheld to avoid disclosing data for individual operations. (S) Insufficient number of reports to establish an estimate. 1 Second year.
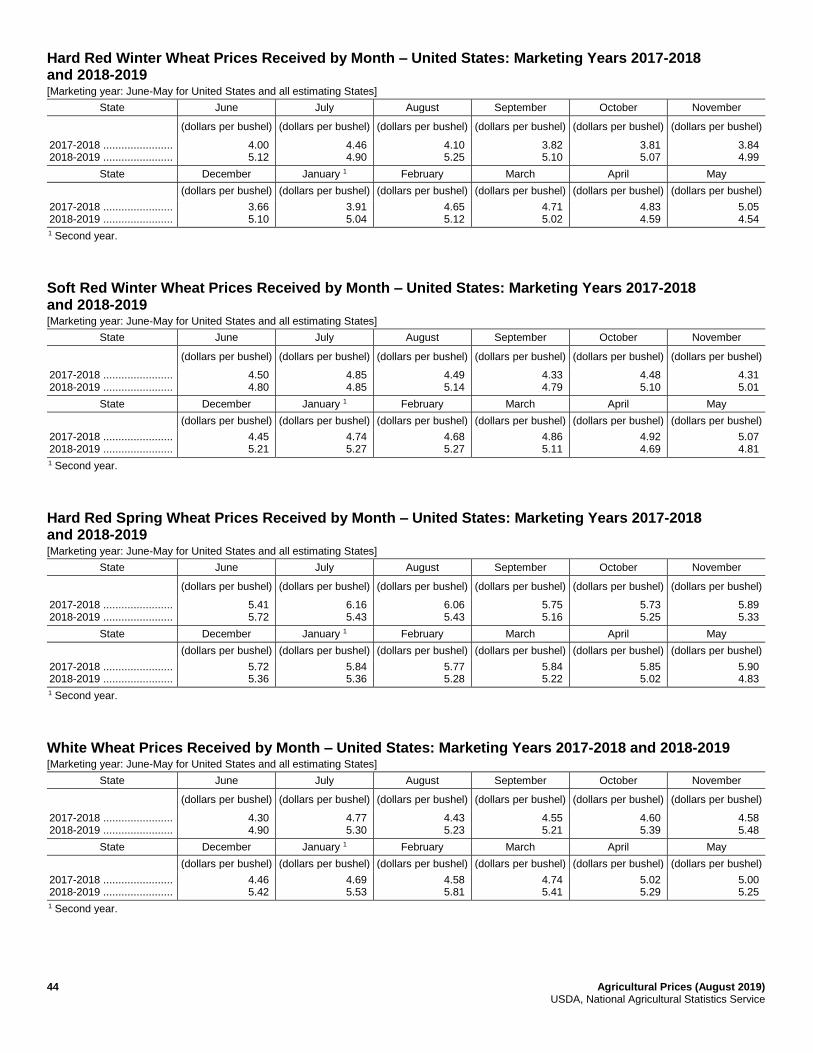
44 Agricultural Prices (August 2019) USDA, National Agricultural Statistics Service
Hard Red Winter Wheat Prices Received by Month – United States: Marketing Years 2017-2018 and 2018-2019 [Marketing year: June-May for United States and all estimating States]
State June July August September October November
(dollars per bushel) (dollars per bushel) (dollars per bushel) (dollars per bushel) (dollars per bushel) (dollars per bushel)
2017-2018 ....................... 2018-2019 .......................
4.00 5.12
4.46 4.90
4.10 5.25
3.82 5.10
3.81 5.07
3.84 4.99
State December January 1 February March April May
(dollars per bushel) (dollars per bushel) (dollars per bushel) (dollars per bushel) (dollars per bushel) (dollars per bushel)
2017-2018 ....................... 2018-2019 .......................
3.66 5.10
3.91 5.04
4.65 5.12
4.71 5.02
4.83 4.59
5.05 4.54
1 Second year.
Soft Red Winter Wheat Prices Received by Month – United States: Marketing Years 2017-2018 and 2018-2019 [Marketing year: June-May for United States and all estimating States]
State June July August September October November
(dollars per bushel) (dollars per bushel) (dollars per bushel) (dollars per bushel) (dollars per bushel) (dollars per bushel)
2017-2018 ....................... 2018-2019 .......................
4.50 4.80
4.85 4.85
4.49 5.14
4.33 4.79
4.48 5.10
4.31 5.01
State December January 1 February March April May
(dollars per bushel) (dollars per bushel) (dollars per bushel) (dollars per bushel) (dollars per bushel) (dollars per bushel)
2017-2018 ....................... 2018-2019 .......................
4.45 5.21
4.74 5.27
4.68 5.27
4.86 5.11
4.92 4.69
5.07 4.81
1 Second year.
Hard Red Spring Wheat Prices Received by Month – United States: Marketing Years 2017-2018 and 2018-2019 [Marketing year: June-May for United States and all estimating States]
State June July August September October November
(dollars per bushel) (dollars per bushel) (dollars per bushel) (dollars per bushel) (dollars per bushel) (dollars per bushel)
2017-2018 ....................... 2018-2019 .......................
5.41 5.72
6.16 5.43
6.06 5.43
5.75 5.16
5.73 5.25
5.89 5.33
State December January 1 February March April May
(dollars per bushel) (dollars per bushel) (dollars per bushel) (dollars per bushel) (dollars per bushel) (dollars per bushel)
2017-2018 ....................... 2018-2019 .......................
5.72 5.36
5.84 5.36
5.77 5.28
5.84 5.22
5.85 5.02
5.90 4.83
1 Second year.
White Wheat Prices Received by Month – United States: Marketing Years 2017-2018 and 2018-2019 [Marketing year: June-May for United States and all estimating States]
State June July August September October November
(dollars per bushel) (dollars per bushel) (dollars per bushel) (dollars per bushel) (dollars per bushel) (dollars per bushel)
2017-2018 ....................... 2018-2019 .......................
4.30 4.90
4.77 5.30
4.43 5.23
4.55 5.21
4.60 5.39
4.58 5.48
State December January 1 February March April May
(dollars per bushel) (dollars per bushel) (dollars per bushel) (dollars per bushel) (dollars per bushel) (dollars per bushel)
2017-2018 ....................... 2018-2019 .......................
4.46 5.42
4.69 5.53
4.58 5.81
4.74 5.41
5.02 5.29
5.00 5.25
1 Second year.
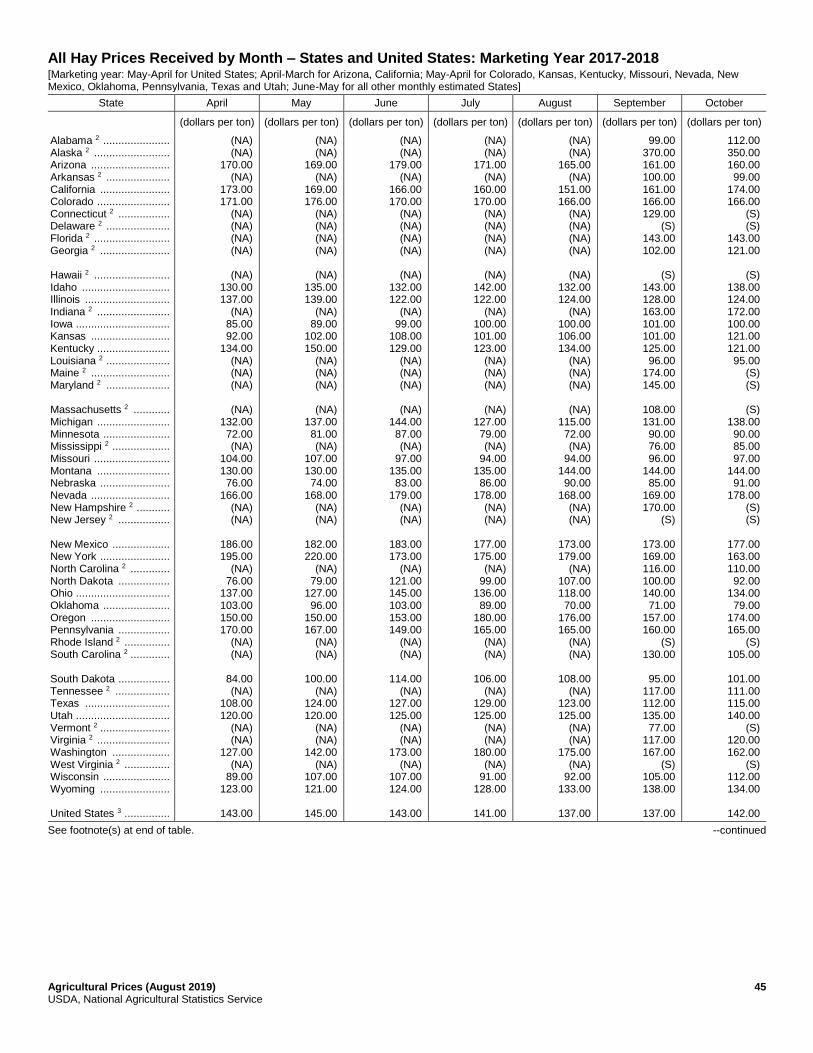
Agricultural Prices (August 2019) 45 USDA, National Agricultural Statistics Service
All Hay Prices Received by Month – States and United States: Marketing Year 2017-2018 [Marketing year: May-April for United States; April-March for Arizona, California; May-April for Colorado, Kansas, Kentucky, Missouri, Nevada, New Mexico, Oklahoma, Pennsylvania, Texas and Utah; June-May for all other monthly estimated States]
State April May June July August September October
(dollars per ton) (dollars per ton) (dollars per ton) (dollars per ton) (dollars per ton) (dollars per ton) (dollars per ton)
Alabama 2 ...................... Alaska 2 ......................... Arizona .......................... Arkansas 2 ..................... California ....................... Colorado ........................ Connecticut 2 ................. Delaware 2 ..................... Florida 2 ......................... Georgia 2 ....................... Hawaii 2 ......................... Idaho ............................. Illinois ............................ Indiana 2 ........................ Iowa ............................... Kansas .......................... Kentucky ........................ Louisiana 2 ..................... Maine 2 .......................... Maryland 2 ..................... Massachusetts 2 ............ Michigan ........................ Minnesota ...................... Mississippi 2 ................... Missouri ......................... Montana ........................ Nebraska ....................... Nevada .......................... New Hampshire 2 ........... New Jersey 2 ................. New Mexico ................... New York ....................... North Carolina 2 ............. North Dakota ................. Ohio ............................... Oklahoma ...................... Oregon .......................... Pennsylvania ................. Rhode Island 2 ............... South Carolina 2 ............. South Dakota ................. Tennessee 2 .................. Texas ............................ Utah ............................... Vermont 2 ....................... Virginia 2 ........................ Washington ................... West Virginia 2 ............... Wisconsin ...................... Wyoming ....................... United States 3 ...............
(NA) (NA)
170.00 (NA)
173.00 171.00
(NA) (NA) (NA) (NA)
(NA)
130.00 137.00
(NA) 85.00 92.00
134.00 (NA) (NA) (NA)
(NA)
132.00 72.00 (NA)
104.00 130.00 76.00
166.00 (NA) (NA)
186.00 195.00
(NA) 76.00
137.00 103.00 150.00 170.00
(NA) (NA)
84.00 (NA)
108.00 120.00
(NA) (NA)
127.00 (NA)
89.00 123.00
143.00
(NA) (NA)
169.00 (NA)
169.00 176.00
(NA) (NA) (NA) (NA)
(NA)
135.00 139.00
(NA) 89.00
102.00 150.00
(NA) (NA) (NA)
(NA)
137.00 81.00 (NA)
107.00 130.00 74.00
168.00 (NA) (NA)
182.00 220.00
(NA) 79.00
127.00 96.00
150.00 167.00
(NA) (NA)
100.00
(NA) 124.00 120.00
(NA) (NA)
142.00 (NA)
107.00 121.00
145.00
(NA) (NA)
179.00 (NA)
166.00 170.00
(NA) (NA) (NA) (NA)
(NA)
132.00 122.00
(NA) 99.00
108.00 129.00
(NA) (NA) (NA)
(NA)
144.00 87.00 (NA)
97.00 135.00 83.00
179.00 (NA) (NA)
183.00 173.00
(NA) 121.00 145.00 103.00 153.00 149.00
(NA) (NA)
114.00
(NA) 127.00 125.00
(NA) (NA)
173.00 (NA)
107.00 124.00
143.00
(NA) (NA)
171.00 (NA)
160.00 170.00
(NA) (NA) (NA) (NA)
(NA)
142.00 122.00
(NA) 100.00 101.00 123.00
(NA) (NA) (NA)
(NA)
127.00 79.00 (NA)
94.00 135.00 86.00
178.00 (NA) (NA)
177.00 175.00
(NA) 99.00
136.00 89.00
180.00 165.00
(NA) (NA)
106.00
(NA) 129.00 125.00
(NA) (NA)
180.00 (NA)
91.00 128.00
141.00
(NA) (NA)
165.00 (NA)
151.00 166.00
(NA) (NA) (NA) (NA)
(NA)
132.00 124.00
(NA) 100.00 106.00 134.00
(NA) (NA) (NA)
(NA)
115.00 72.00 (NA)
94.00 144.00 90.00
168.00 (NA) (NA)
173.00 179.00
(NA) 107.00 118.00 70.00
176.00 165.00
(NA) (NA)
108.00
(NA) 123.00 125.00
(NA) (NA)
175.00 (NA)
92.00 133.00
137.00
99.00 370.00 161.00 100.00 161.00 166.00 129.00
(S) 143.00 102.00
(S)
143.00 128.00 163.00 101.00 101.00 125.00 96.00
174.00 145.00
108.00 131.00 90.00 76.00 96.00
144.00 85.00
169.00 170.00
(S)
173.00 169.00 116.00 100.00 140.00 71.00
157.00 160.00
(S) 130.00
95.00
117.00 112.00 135.00 77.00
117.00 167.00
(S) 105.00 138.00
137.00
112.00 350.00 160.00 99.00
174.00 166.00
(S) (S)
143.00 121.00
(S)
138.00 124.00 172.00 100.00 121.00 121.00 95.00
(S) (S)
(S)
138.00 90.00 85.00 97.00
144.00 91.00
178.00 (S) (S)
177.00 163.00 110.00 92.00
134.00 79.00
174.00 165.00
(S) 105.00
101.00 111.00 115.00 140.00
(S) 120.00 162.00
(S) 112.00 134.00
142.00
See footnote(s) at end of table. --continued
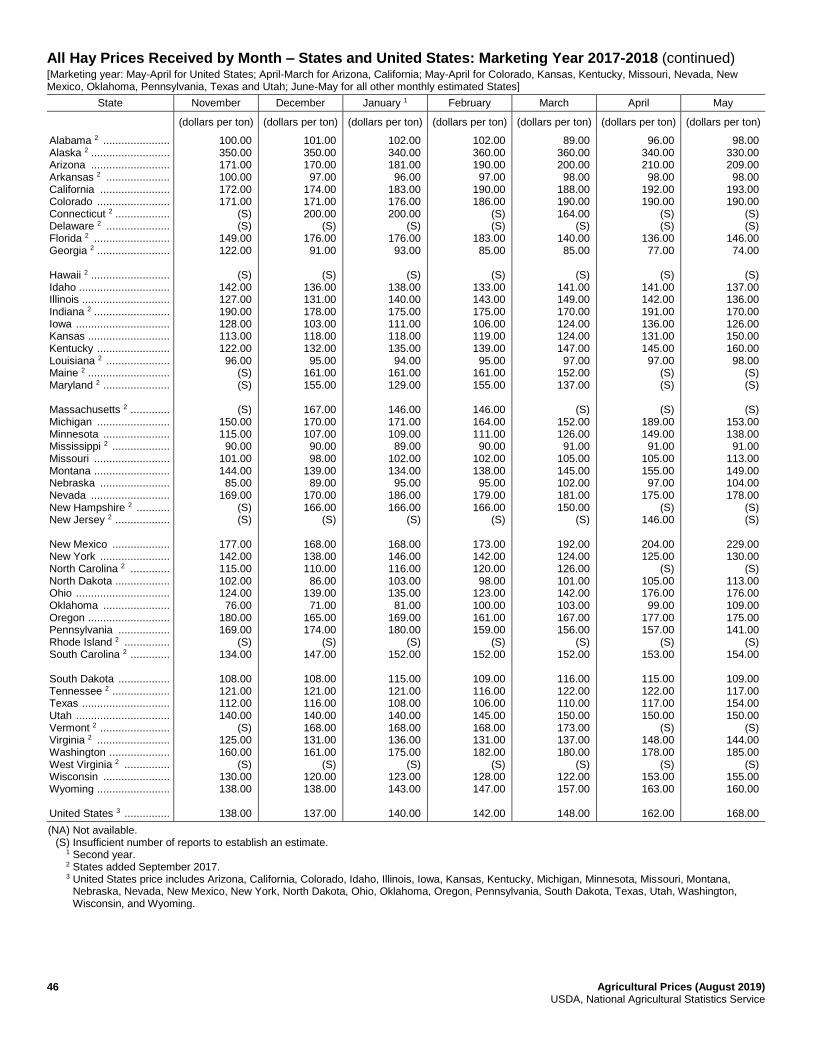
46 Agricultural Prices (August 2019) USDA, National Agricultural Statistics Service
All Hay Prices Received by Month – States and United States: Marketing Year 2017-2018 (continued) [Marketing year: May-April for United States; April-March for Arizona, California; May-April for Colorado, Kansas, Kentucky, Missouri, Nevada, New Mexico, Oklahoma, Pennsylvania, Texas and Utah; June-May for all other monthly estimated States]
State November December January 1 February March April May
(dollars per ton) (dollars per ton) (dollars per ton) (dollars per ton) (dollars per ton) (dollars per ton) (dollars per ton)
Alabama 2 ...................... Alaska 2 .......................... Arizona .......................... Arkansas 2 ..................... California ....................... Colorado ........................ Connecticut 2 .................. Delaware 2 ..................... Florida 2 ......................... Georgia 2 ........................ Hawaii 2 .......................... Idaho .............................. Illinois ............................. Indiana 2 ......................... Iowa ............................... Kansas ........................... Kentucky ........................ Louisiana 2 ..................... Maine 2 ........................... Maryland 2 ...................... Massachusetts 2 ............. Michigan ........................ Minnesota ...................... Mississippi 2 ................... Missouri ......................... Montana ......................... Nebraska ....................... Nevada .......................... New Hampshire 2 ........... New Jersey 2 .................. New Mexico ................... New York ....................... North Carolina 2 ............. North Dakota .................. Ohio ............................... Oklahoma ...................... Oregon ........................... Pennsylvania ................. Rhode Island 2 ............... South Carolina 2 ............. South Dakota ................. Tennessee 2 ................... Texas ............................. Utah ............................... Vermont 2 ....................... Virginia 2 ........................ Washington .................... West Virginia 2 ............... Wisconsin ...................... Wyoming ........................ United States 3 ...............
100.00 350.00 171.00 100.00 172.00 171.00
(S) (S)
149.00 122.00
(S)
142.00 127.00 190.00 128.00 113.00 122.00 96.00
(S) (S)
(S)
150.00 115.00 90.00
101.00 144.00 85.00
169.00 (S) (S)
177.00 142.00 115.00 102.00 124.00 76.00
180.00 169.00
(S) 134.00
108.00 121.00 112.00 140.00
(S) 125.00 160.00
(S) 130.00 138.00
138.00
101.00 350.00 170.00 97.00
174.00 171.00 200.00
(S) 176.00 91.00
(S)
136.00 131.00 178.00 103.00 118.00 132.00 95.00
161.00 155.00
167.00 170.00 107.00 90.00 98.00
139.00 89.00
170.00 166.00
(S)
168.00 138.00 110.00 86.00
139.00 71.00
165.00 174.00
(S) 147.00
108.00 121.00 116.00 140.00 168.00 131.00 161.00
(S) 120.00 138.00
137.00
102.00 340.00 181.00 96.00
183.00 176.00 200.00
(S) 176.00 93.00
(S)
138.00 140.00 175.00 111.00 118.00 135.00 94.00
161.00 129.00
146.00 171.00 109.00 89.00
102.00 134.00 95.00
186.00 166.00
(S)
168.00 146.00 116.00 103.00 135.00 81.00
169.00 180.00
(S) 152.00
115.00 121.00 108.00 140.00 168.00 136.00 175.00
(S) 123.00 143.00
140.00
102.00 360.00 190.00 97.00
190.00 186.00
(S) (S)
183.00 85.00
(S)
133.00 143.00 175.00 106.00 119.00 139.00 95.00
161.00 155.00
146.00 164.00 111.00 90.00
102.00 138.00 95.00
179.00 166.00
(S)
173.00 142.00 120.00 98.00
123.00 100.00 161.00 159.00
(S) 152.00
109.00 116.00 106.00 145.00 168.00 131.00 182.00
(S) 128.00 147.00
142.00
89.00 360.00 200.00 98.00
188.00 190.00 164.00
(S) 140.00 85.00
(S)
141.00 149.00 170.00 124.00 124.00 147.00 97.00
152.00 137.00
(S)
152.00 126.00 91.00
105.00 145.00 102.00 181.00 150.00
(S)
192.00 124.00 126.00 101.00 142.00 103.00 167.00 156.00
(S) 152.00
116.00 122.00 110.00 150.00 173.00 137.00 180.00
(S) 122.00 157.00
148.00
96.00 340.00 210.00 98.00
192.00 190.00
(S) (S)
136.00 77.00
(S)
141.00 142.00 191.00 136.00 131.00 145.00 97.00
(S) (S)
(S)
189.00 149.00 91.00
105.00 155.00 97.00
175.00 (S)
146.00
204.00 125.00
(S) 105.00 176.00 99.00
177.00 157.00
(S) 153.00
115.00 122.00 117.00 150.00
(S) 148.00 178.00
(S) 153.00 163.00
162.00
98.00 330.00 209.00 98.00
193.00 190.00
(S) (S)
146.00 74.00
(S)
137.00 136.00 170.00 126.00 150.00 160.00 98.00
(S) (S)
(S)
153.00 138.00 91.00
113.00 149.00 104.00 178.00
(S) (S)
229.00 130.00
(S) 113.00 176.00 109.00 175.00 141.00
(S) 154.00
109.00 117.00 154.00 150.00
(S) 144.00 185.00
(S) 155.00 160.00
168.00
(NA) Not available. (S) Insufficient number of reports to establish an estimate. 1 Second year. 2 States added September 2017. 3 United States price includes Arizona, California, Colorado, Idaho, Illinois, Iowa, Kansas, Kentucky, Michigan, Minnesota, Missouri, Montana,
Nebraska, Nevada, New Mexico, New York, North Dakota, Ohio, Oklahoma, Oregon, Pennsylvania, South Dakota, Texas, Utah, Washington, Wisconsin, and Wyoming.
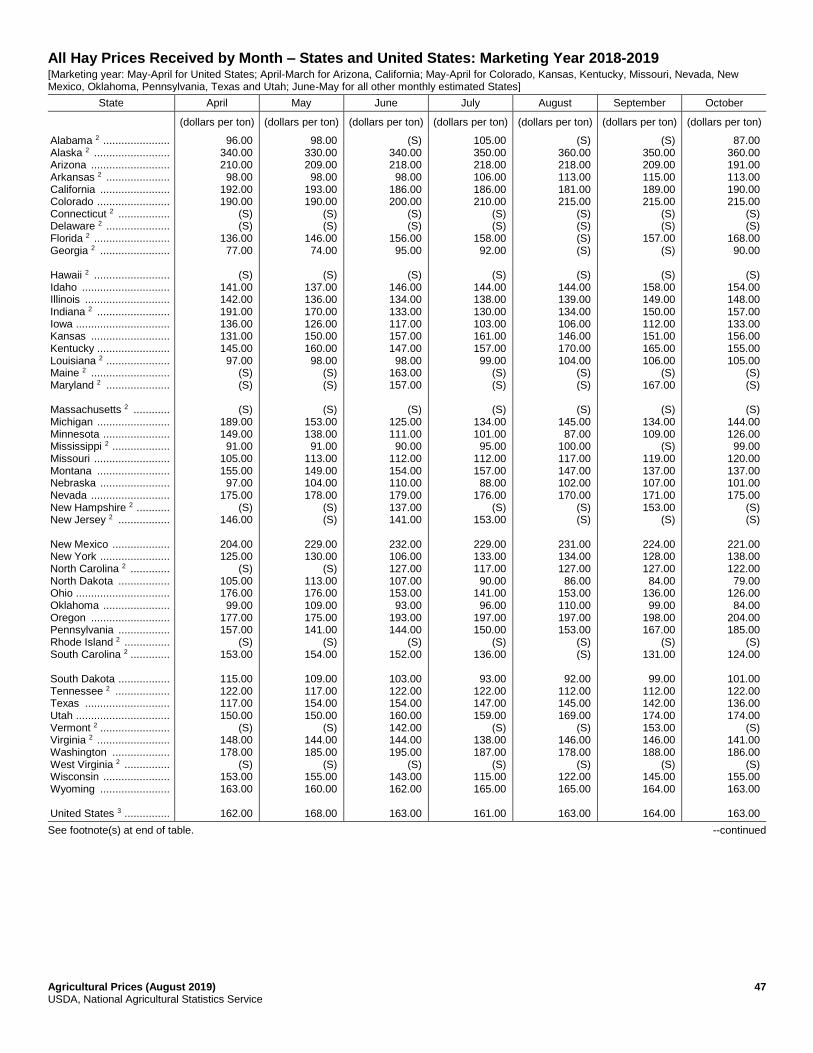
Agricultural Prices (August 2019) 47 USDA, National Agricultural Statistics Service
All Hay Prices Received by Month – States and United States: Marketing Year 2018-2019 [Marketing year: May-April for United States; April-March for Arizona, California; May-April for Colorado, Kansas, Kentucky, Missouri, Nevada, New Mexico, Oklahoma, Pennsylvania, Texas and Utah; June-May for all other monthly estimated States]
State April May June July August September October
(dollars per ton) (dollars per ton) (dollars per ton) (dollars per ton) (dollars per ton) (dollars per ton) (dollars per ton)
Alabama 2 ...................... Alaska 2 ......................... Arizona .......................... Arkansas 2 ..................... California ....................... Colorado ........................ Connecticut 2 ................. Delaware 2 ..................... Florida 2 ......................... Georgia 2 ....................... Hawaii 2 ......................... Idaho ............................. Illinois ............................ Indiana 2 ........................ Iowa ............................... Kansas .......................... Kentucky ........................ Louisiana 2 ..................... Maine 2 .......................... Maryland 2 ..................... Massachusetts 2 ............ Michigan ........................ Minnesota ...................... Mississippi 2 ................... Missouri ......................... Montana ........................ Nebraska ....................... Nevada .......................... New Hampshire 2 ........... New Jersey 2 ................. New Mexico ................... New York ....................... North Carolina 2 ............. North Dakota ................. Ohio ............................... Oklahoma ...................... Oregon .......................... Pennsylvania ................. Rhode Island 2 ............... South Carolina 2 ............. South Dakota ................. Tennessee 2 .................. Texas ............................ Utah ............................... Vermont 2 ....................... Virginia 2 ........................ Washington ................... West Virginia 2 ............... Wisconsin ...................... Wyoming ....................... United States 3 ...............
96.00 340.00 210.00 98.00
192.00 190.00
(S) (S)
136.00 77.00
(S)
141.00 142.00 191.00 136.00 131.00 145.00 97.00
(S) (S)
(S)
189.00 149.00 91.00
105.00 155.00 97.00
175.00 (S)
146.00
204.00 125.00
(S) 105.00 176.00 99.00
177.00 157.00
(S) 153.00
115.00 122.00 117.00 150.00
(S) 148.00 178.00
(S) 153.00 163.00
162.00
98.00 330.00 209.00 98.00
193.00 190.00
(S) (S)
146.00 74.00
(S)
137.00 136.00 170.00 126.00 150.00 160.00 98.00
(S) (S)
(S)
153.00 138.00 91.00
113.00 149.00 104.00 178.00
(S) (S)
229.00 130.00
(S) 113.00 176.00 109.00 175.00 141.00
(S) 154.00
109.00 117.00 154.00 150.00
(S) 144.00 185.00
(S) 155.00 160.00
168.00
(S) 340.00 218.00 98.00
186.00 200.00
(S) (S)
156.00 95.00
(S)
146.00 134.00 133.00 117.00 157.00 147.00 98.00
163.00 157.00
(S)
125.00 111.00 90.00
112.00 154.00 110.00 179.00 137.00 141.00
232.00 106.00 127.00 107.00 153.00 93.00
193.00 144.00
(S) 152.00
103.00 122.00 154.00 160.00 142.00 144.00 195.00
(S) 143.00 162.00
163.00
105.00 350.00 218.00 106.00 186.00 210.00
(S) (S)
158.00 92.00
(S)
144.00 138.00 130.00 103.00 161.00 157.00 99.00
(S) (S)
(S)
134.00 101.00 95.00
112.00 157.00 88.00
176.00 (S)
153.00
229.00 133.00 117.00 90.00
141.00 96.00
197.00 150.00
(S) 136.00
93.00
122.00 147.00 159.00
(S) 138.00 187.00
(S) 115.00 165.00
161.00
(S) 360.00 218.00 113.00 181.00 215.00
(S) (S) (S) (S)
(S)
144.00 139.00 134.00 106.00 146.00 170.00 104.00
(S) (S)
(S)
145.00 87.00
100.00 117.00 147.00 102.00 170.00
(S) (S)
231.00 134.00 127.00 86.00
153.00 110.00 197.00 153.00
(S) (S)
92.00
112.00 145.00 169.00
(S) 146.00 178.00
(S) 122.00 165.00
163.00
(S) 350.00 209.00 115.00 189.00 215.00
(S) (S)
157.00 (S)
(S)
158.00 149.00 150.00 112.00 151.00 165.00 106.00
(S) 167.00
(S)
134.00 109.00
(S) 119.00 137.00 107.00 171.00 153.00
(S)
224.00 128.00 127.00 84.00
136.00 99.00
198.00 167.00
(S) 131.00
99.00
112.00 142.00 174.00 153.00 146.00 188.00
(S) 145.00 164.00
164.00
87.00 360.00 191.00 113.00 190.00 215.00
(S) (S)
168.00 90.00
(S)
154.00 148.00 157.00 133.00 156.00 155.00 105.00
(S) (S)
(S)
144.00 126.00 99.00
120.00 137.00 101.00 175.00
(S) (S)
221.00 138.00 122.00 79.00
126.00 84.00
204.00 185.00
(S) 124.00
101.00 122.00 136.00 174.00
(S) 141.00 186.00
(S) 155.00 163.00
163.00
See footnote(s) at end of table. --continued
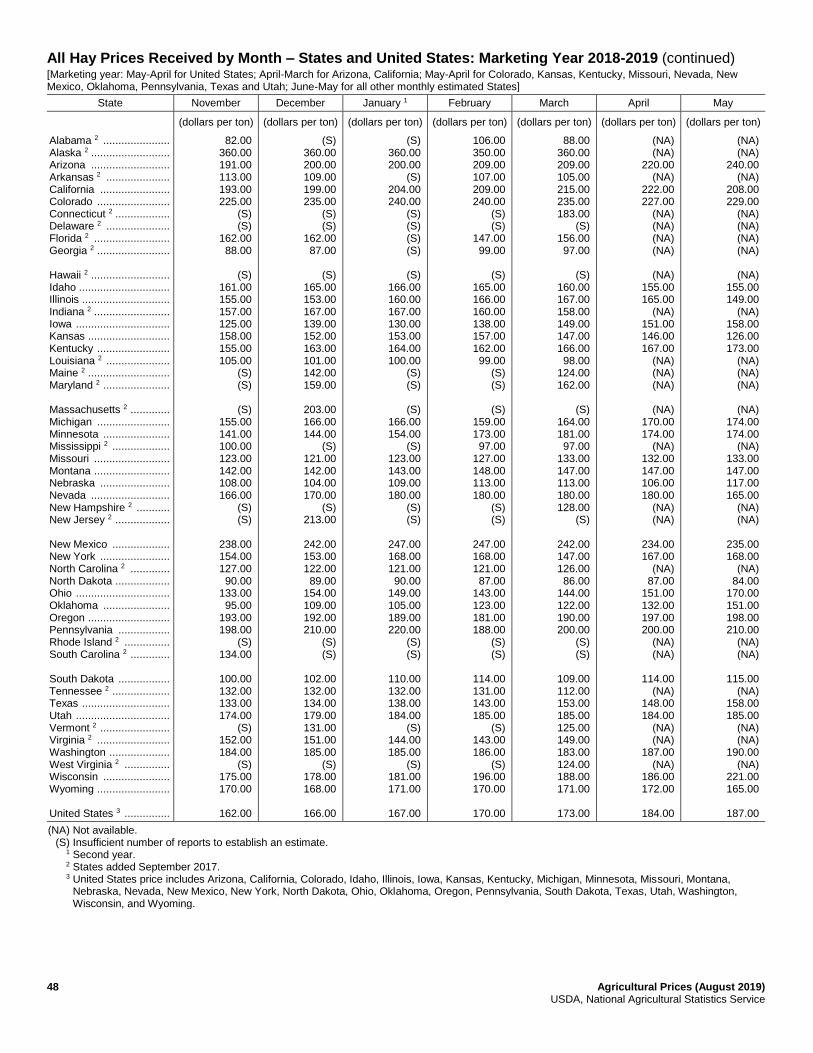
48 Agricultural Prices (August 2019) USDA, National Agricultural Statistics Service
All Hay Prices Received by Month – States and United States: Marketing Year 2018-2019 (continued) [Marketing year: May-April for United States; April-March for Arizona, California; May-April for Colorado, Kansas, Kentucky, Missouri, Nevada, New Mexico, Oklahoma, Pennsylvania, Texas and Utah; June-May for all other monthly estimated States]
State November December January 1 February March April May
(dollars per ton) (dollars per ton) (dollars per ton) (dollars per ton) (dollars per ton) (dollars per ton) (dollars per ton)
Alabama 2 ...................... Alaska 2 .......................... Arizona .......................... Arkansas 2 ..................... California ....................... Colorado ........................ Connecticut 2 .................. Delaware 2 ..................... Florida 2 ......................... Georgia 2 ........................ Hawaii 2 .......................... Idaho .............................. Illinois ............................. Indiana 2 ......................... Iowa ............................... Kansas ........................... Kentucky ........................ Louisiana 2 ..................... Maine 2 ........................... Maryland 2 ...................... Massachusetts 2 ............. Michigan ........................ Minnesota ...................... Mississippi 2 ................... Missouri ......................... Montana ......................... Nebraska ....................... Nevada .......................... New Hampshire 2 ........... New Jersey 2 .................. New Mexico ................... New York ....................... North Carolina 2 ............. North Dakota .................. Ohio ............................... Oklahoma ...................... Oregon ........................... Pennsylvania ................. Rhode Island 2 ............... South Carolina 2 ............. South Dakota ................. Tennessee 2 ................... Texas ............................. Utah ............................... Vermont 2 ....................... Virginia 2 ........................ Washington .................... West Virginia 2 ............... Wisconsin ...................... Wyoming ........................ United States 3 ...............
82.00 360.00 191.00 113.00 193.00 225.00
(S) (S)
162.00 88.00
(S)
161.00 155.00 157.00 125.00 158.00 155.00 105.00
(S) (S)
(S)
155.00 141.00 100.00 123.00 142.00 108.00 166.00
(S) (S)
238.00 154.00 127.00 90.00
133.00 95.00
193.00 198.00
(S) 134.00
100.00 132.00 133.00 174.00
(S) 152.00 184.00
(S) 175.00 170.00
162.00
(S) 360.00 200.00 109.00 199.00 235.00
(S) (S)
162.00 87.00
(S)
165.00 153.00 167.00 139.00 152.00 163.00 101.00 142.00 159.00
203.00 166.00 144.00
(S) 121.00 142.00 104.00 170.00
(S) 213.00
242.00 153.00 122.00 89.00
154.00 109.00 192.00 210.00
(S) (S)
102.00 132.00 134.00 179.00 131.00 151.00 185.00
(S) 178.00 168.00
166.00
(S) 360.00 200.00
(S) 204.00 240.00
(S) (S) (S) (S)
(S)
166.00 160.00 167.00 130.00 153.00 164.00 100.00
(S) (S)
(S)
166.00 154.00
(S) 123.00 143.00 109.00 180.00
(S) (S)
247.00 168.00 121.00 90.00
149.00 105.00 189.00 220.00
(S) (S)
110.00 132.00 138.00 184.00
(S) 144.00 185.00
(S) 181.00 171.00
167.00
106.00 350.00 209.00 107.00 209.00 240.00
(S) (S)
147.00 99.00
(S)
165.00 166.00 160.00 138.00 157.00 162.00 99.00
(S) (S)
(S)
159.00 173.00 97.00
127.00 148.00 113.00 180.00
(S) (S)
247.00 168.00 121.00 87.00
143.00 123.00 181.00 188.00
(S) (S)
114.00 131.00 143.00 185.00
(S) 143.00 186.00
(S) 196.00 170.00
170.00
88.00 360.00 209.00 105.00 215.00 235.00 183.00
(S) 156.00 97.00
(S)
160.00 167.00 158.00 149.00 147.00 166.00 98.00
124.00 162.00
(S)
164.00 181.00 97.00
133.00 147.00 113.00 180.00 128.00
(S)
242.00 147.00 126.00 86.00
144.00 122.00 190.00 200.00
(S) (S)
109.00 112.00 153.00 185.00 125.00 149.00 183.00 124.00 188.00 171.00
173.00
(NA) (NA)
220.00 (NA)
222.00 227.00
(NA) (NA) (NA) (NA)
(NA)
155.00 165.00
(NA) 151.00 146.00 167.00
(NA) (NA) (NA)
(NA)
170.00 174.00
(NA) 132.00 147.00 106.00 180.00
(NA) (NA)
234.00 167.00
(NA) 87.00
151.00 132.00 197.00 200.00
(NA) (NA)
114.00
(NA) 148.00 184.00
(NA) (NA)
187.00 (NA)
186.00 172.00
184.00
(NA) (NA)
240.00 (NA)
208.00 229.00
(NA) (NA) (NA) (NA)
(NA)
155.00 149.00
(NA) 158.00 126.00 173.00
(NA) (NA) (NA)
(NA)
174.00 174.00
(NA) 133.00 147.00 117.00 165.00
(NA) (NA)
235.00 168.00
(NA) 84.00
170.00 151.00 198.00 210.00
(NA) (NA)
115.00
(NA) 158.00 185.00
(NA) (NA)
190.00 (NA)
221.00 165.00
187.00
(NA) Not available. (S) Insufficient number of reports to establish an estimate. 1 Second year. 2 States added September 2017. 3 United States price includes Arizona, California, Colorado, Idaho, Illinois, Iowa, Kansas, Kentucky, Michigan, Minnesota, Missouri, Montana,
Nebraska, Nevada, New Mexico, New York, North Dakota, Ohio, Oklahoma, Oregon, Pennsylvania, South Dakota, Texas, Utah, Washington, Wisconsin, and Wyoming.
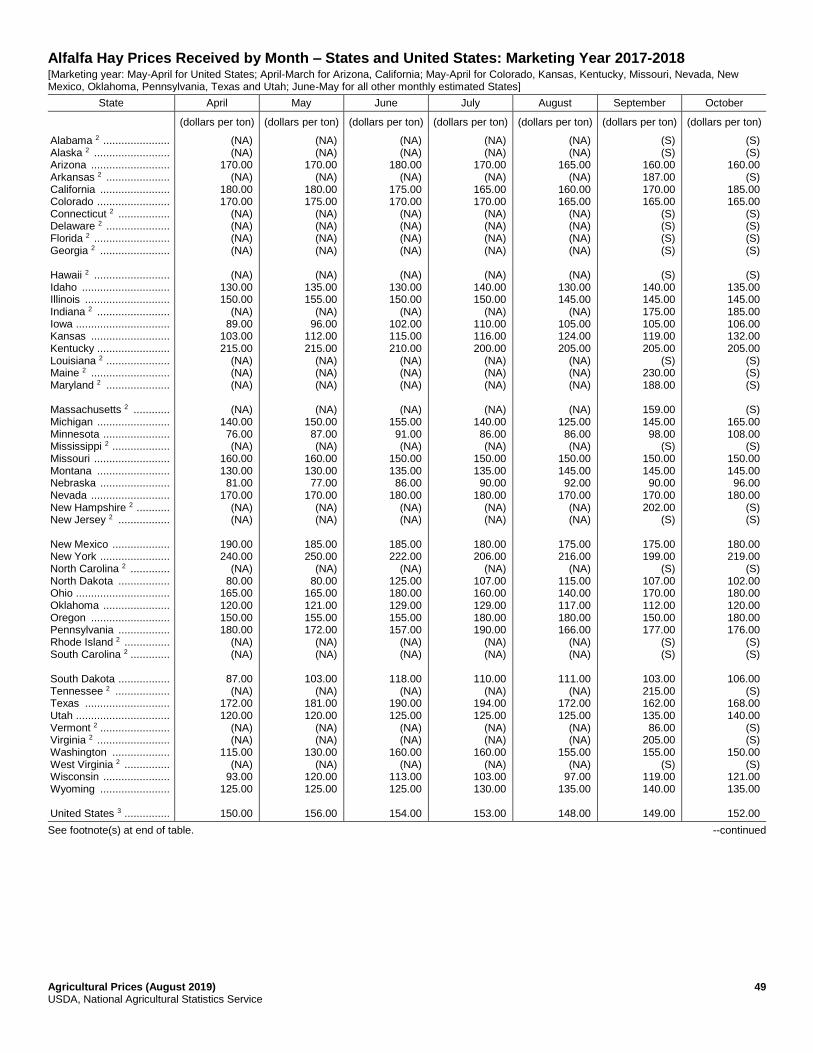
Agricultural Prices (August 2019) 49 USDA, National Agricultural Statistics Service
Alfalfa Hay Prices Received by Month – States and United States: Marketing Year 2017-2018 [Marketing year: May-April for United States; April-March for Arizona, California; May-April for Colorado, Kansas, Kentucky, Missouri, Nevada, New Mexico, Oklahoma, Pennsylvania, Texas and Utah; June-May for all other monthly estimated States]
State April May June July August September October
(dollars per ton) (dollars per ton) (dollars per ton) (dollars per ton) (dollars per ton) (dollars per ton) (dollars per ton)
Alabama 2 ...................... Alaska 2 ......................... Arizona .......................... Arkansas 2 ..................... California ....................... Colorado ........................ Connecticut 2 ................. Delaware 2 ..................... Florida 2 ......................... Georgia 2 ....................... Hawaii 2 ......................... Idaho ............................. Illinois ............................ Indiana 2 ........................ Iowa ............................... Kansas .......................... Kentucky ........................ Louisiana 2 ..................... Maine 2 .......................... Maryland 2 ..................... Massachusetts 2 ............ Michigan ........................ Minnesota ...................... Mississippi 2 ................... Missouri ......................... Montana ........................ Nebraska ....................... Nevada .......................... New Hampshire 2 ........... New Jersey 2 ................. New Mexico ................... New York ....................... North Carolina 2 ............. North Dakota ................. Ohio ............................... Oklahoma ...................... Oregon .......................... Pennsylvania ................. Rhode Island 2 ............... South Carolina 2 ............. South Dakota ................. Tennessee 2 .................. Texas ............................ Utah ............................... Vermont 2 ....................... Virginia 2 ........................ Washington ................... West Virginia 2 ............... Wisconsin ...................... Wyoming ....................... United States 3 ...............
(NA) (NA)
170.00 (NA)
180.00 170.00
(NA) (NA) (NA) (NA)
(NA)
130.00 150.00
(NA) 89.00
103.00 215.00
(NA) (NA) (NA)
(NA)
140.00 76.00 (NA)
160.00 130.00 81.00
170.00 (NA) (NA)
190.00 240.00
(NA) 80.00
165.00 120.00 150.00 180.00
(NA) (NA)
87.00 (NA)
172.00 120.00
(NA) (NA)
115.00 (NA)
93.00 125.00
150.00
(NA) (NA)
170.00 (NA)
180.00 175.00
(NA) (NA) (NA) (NA)
(NA)
135.00 155.00
(NA) 96.00
112.00 215.00
(NA) (NA) (NA)
(NA)
150.00 87.00 (NA)
160.00 130.00 77.00
170.00 (NA) (NA)
185.00 250.00
(NA) 80.00
165.00 121.00 155.00 172.00
(NA) (NA)
103.00
(NA) 181.00 120.00
(NA) (NA)
130.00 (NA)
120.00 125.00
156.00
(NA) (NA)
180.00 (NA)
175.00 170.00
(NA) (NA) (NA) (NA)
(NA)
130.00 150.00
(NA) 102.00 115.00 210.00
(NA) (NA) (NA)
(NA)
155.00 91.00 (NA)
150.00 135.00 86.00
180.00 (NA) (NA)
185.00 222.00
(NA) 125.00 180.00 129.00 155.00 157.00
(NA) (NA)
118.00
(NA) 190.00 125.00
(NA) (NA)
160.00 (NA)
113.00 125.00
154.00
(NA) (NA)
170.00 (NA)
165.00 170.00
(NA) (NA) (NA) (NA)
(NA)
140.00 150.00
(NA) 110.00 116.00 200.00
(NA) (NA) (NA)
(NA)
140.00 86.00 (NA)
150.00 135.00 90.00
180.00 (NA) (NA)
180.00 206.00
(NA) 107.00 160.00 129.00 180.00 190.00
(NA) (NA)
110.00
(NA) 194.00 125.00
(NA) (NA)
160.00 (NA)
103.00 130.00
153.00
(NA) (NA)
165.00 (NA)
160.00 165.00
(NA) (NA) (NA) (NA)
(NA)
130.00 145.00
(NA) 105.00 124.00 205.00
(NA) (NA) (NA)
(NA)
125.00 86.00 (NA)
150.00 145.00 92.00
170.00 (NA) (NA)
175.00 216.00
(NA) 115.00 140.00 117.00 180.00 166.00
(NA) (NA)
111.00
(NA) 172.00 125.00
(NA) (NA)
155.00 (NA)
97.00 135.00
148.00
(S) (S)
160.00 187.00 170.00 165.00
(S) (S) (S) (S)
(S)
140.00 145.00 175.00 105.00 119.00 205.00
(S) 230.00 188.00
159.00 145.00 98.00
(S) 150.00 145.00 90.00
170.00 202.00
(S)
175.00 199.00
(S) 107.00 170.00 112.00 150.00 177.00
(S) (S)
103.00 215.00 162.00 135.00 86.00
205.00 155.00
(S) 119.00 140.00
149.00
(S) (S)
160.00 (S)
185.00 165.00
(S) (S) (S) (S)
(S)
135.00 145.00 185.00 106.00 132.00 205.00
(S) (S) (S)
(S)
165.00 108.00
(S) 150.00 145.00 96.00
180.00 (S) (S)
180.00 219.00
(S) 102.00 180.00 120.00 180.00 176.00
(S) (S)
106.00
(S) 168.00 140.00
(S) (S)
150.00 (S)
121.00 135.00
152.00
See footnote(s) at end of table. --continued
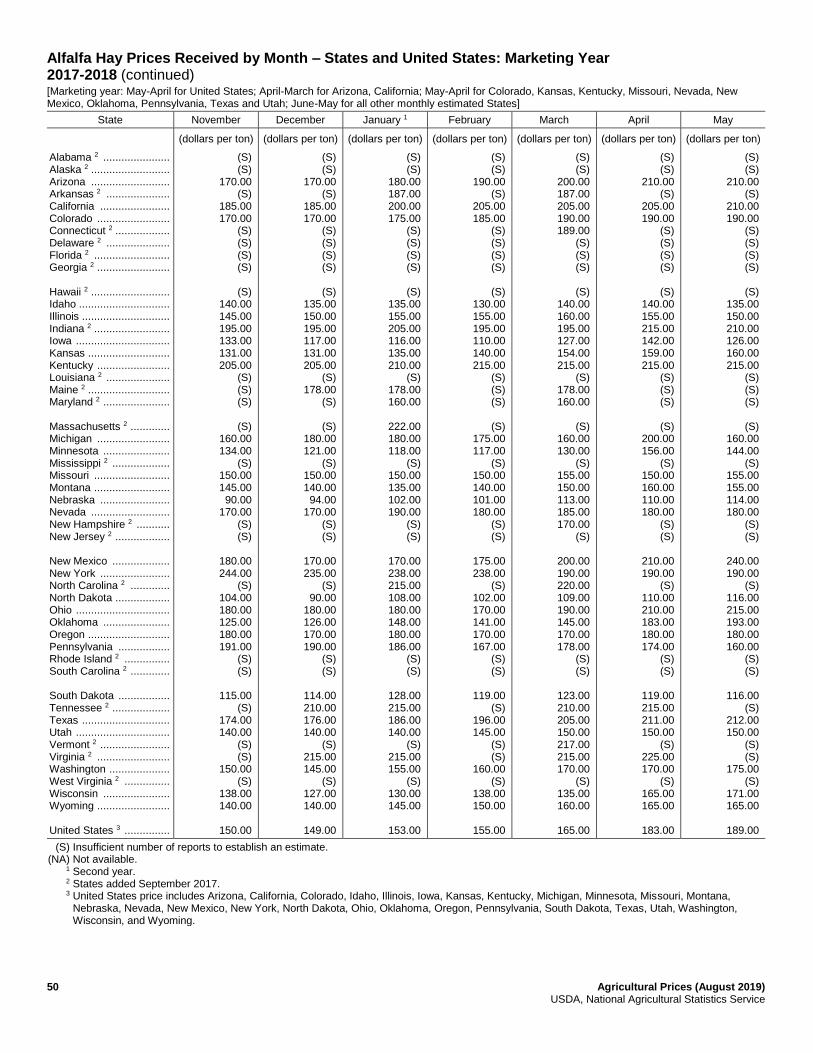
50 Agricultural Prices (August 2019) USDA, National Agricultural Statistics Service
Alfalfa Hay Prices Received by Month – States and United States: Marketing Year 2017-2018 (continued) [Marketing year: May-April for United States; April-March for Arizona, California; May-April for Colorado, Kansas, Kentucky, Missouri, Nevada, New Mexico, Oklahoma, Pennsylvania, Texas and Utah; June-May for all other monthly estimated States]
State November December January 1 February March April May
(dollars per ton) (dollars per ton) (dollars per ton) (dollars per ton) (dollars per ton) (dollars per ton) (dollars per ton)
Alabama 2 ...................... Alaska 2 .......................... Arizona .......................... Arkansas 2 ..................... California ....................... Colorado ........................ Connecticut 2 .................. Delaware 2 ..................... Florida 2 ......................... Georgia 2 ........................ Hawaii 2 .......................... Idaho .............................. Illinois ............................. Indiana 2 ......................... Iowa ............................... Kansas ........................... Kentucky ........................ Louisiana 2 ..................... Maine 2 ........................... Maryland 2 ...................... Massachusetts 2 ............. Michigan ........................ Minnesota ...................... Mississippi 2 ................... Missouri ......................... Montana ......................... Nebraska ....................... Nevada .......................... New Hampshire 2 ........... New Jersey 2 .................. New Mexico ................... New York ....................... North Carolina 2 ............. North Dakota .................. Ohio ............................... Oklahoma ...................... Oregon ........................... Pennsylvania ................. Rhode Island 2 ............... South Carolina 2 ............. South Dakota ................. Tennessee 2 ................... Texas ............................. Utah ............................... Vermont 2 ....................... Virginia 2 ........................ Washington .................... West Virginia 2 ............... Wisconsin ...................... Wyoming ........................ United States 3 ...............
(S) (S)
170.00 (S)
185.00 170.00
(S) (S) (S) (S)
(S)
140.00 145.00 195.00 133.00 131.00 205.00
(S) (S) (S)
(S)
160.00 134.00
(S) 150.00 145.00 90.00
170.00 (S) (S)
180.00 244.00
(S) 104.00 180.00 125.00 180.00 191.00
(S) (S)
115.00
(S) 174.00 140.00
(S) (S)
150.00 (S)
138.00 140.00
150.00
(S) (S)
170.00 (S)
185.00 170.00
(S) (S) (S) (S)
(S)
135.00 150.00 195.00 117.00 131.00 205.00
(S) 178.00
(S)
(S) 180.00 121.00
(S) 150.00 140.00 94.00
170.00 (S) (S)
170.00 235.00
(S) 90.00
180.00 126.00 170.00 190.00
(S) (S)
114.00 210.00 176.00 140.00
(S) 215.00 145.00
(S) 127.00 140.00
149.00
(S) (S)
180.00 187.00 200.00 175.00
(S) (S) (S) (S)
(S)
135.00 155.00 205.00 116.00 135.00 210.00
(S) 178.00 160.00
222.00 180.00 118.00
(S) 150.00 135.00 102.00 190.00
(S) (S)
170.00 238.00 215.00 108.00 180.00 148.00 180.00 186.00
(S) (S)
128.00 215.00 186.00 140.00
(S) 215.00 155.00
(S) 130.00 145.00
153.00
(S) (S)
190.00 (S)
205.00 185.00
(S) (S) (S) (S)
(S)
130.00 155.00 195.00 110.00 140.00 215.00
(S) (S) (S)
(S)
175.00 117.00
(S) 150.00 140.00 101.00 180.00
(S) (S)
175.00 238.00
(S) 102.00 170.00 141.00 170.00 167.00
(S) (S)
119.00
(S) 196.00 145.00
(S) (S)
160.00 (S)
138.00 150.00
155.00
(S) (S)
200.00 187.00 205.00 190.00 189.00
(S) (S) (S)
(S)
140.00 160.00 195.00 127.00 154.00 215.00
(S) 178.00 160.00
(S)
160.00 130.00
(S) 155.00 150.00 113.00 185.00 170.00
(S)
200.00 190.00 220.00 109.00 190.00 145.00 170.00 178.00
(S) (S)
123.00 210.00 205.00 150.00 217.00 215.00 170.00
(S) 135.00 160.00
165.00
(S) (S)
210.00 (S)
205.00 190.00
(S) (S) (S) (S)
(S)
140.00 155.00 215.00 142.00 159.00 215.00
(S) (S) (S)
(S)
200.00 156.00
(S) 150.00 160.00 110.00 180.00
(S) (S)
210.00 190.00
(S) 110.00 210.00 183.00 180.00 174.00
(S) (S)
119.00 215.00 211.00 150.00
(S) 225.00 170.00
(S) 165.00 165.00
183.00
(S) (S)
210.00 (S)
210.00 190.00
(S) (S) (S) (S)
(S)
135.00 150.00 210.00 126.00 160.00 215.00
(S) (S) (S)
(S)
160.00 144.00
(S) 155.00 155.00 114.00 180.00
(S) (S)
240.00 190.00
(S) 116.00 215.00 193.00 180.00 160.00
(S) (S)
116.00
(S) 212.00 150.00
(S) (S)
175.00 (S)
171.00 165.00
189.00
(S) Insufficient number of reports to establish an estimate. (NA) Not available. 1 Second year. 2 States added September 2017. 3 United States price includes Arizona, California, Colorado, Idaho, Illinois, Iowa, Kansas, Kentucky, Michigan, Minnesota, Missouri, Montana,
Nebraska, Nevada, New Mexico, New York, North Dakota, Ohio, Oklahoma, Oregon, Pennsylvania, South Dakota, Texas, Utah, Washington, Wisconsin, and Wyoming.
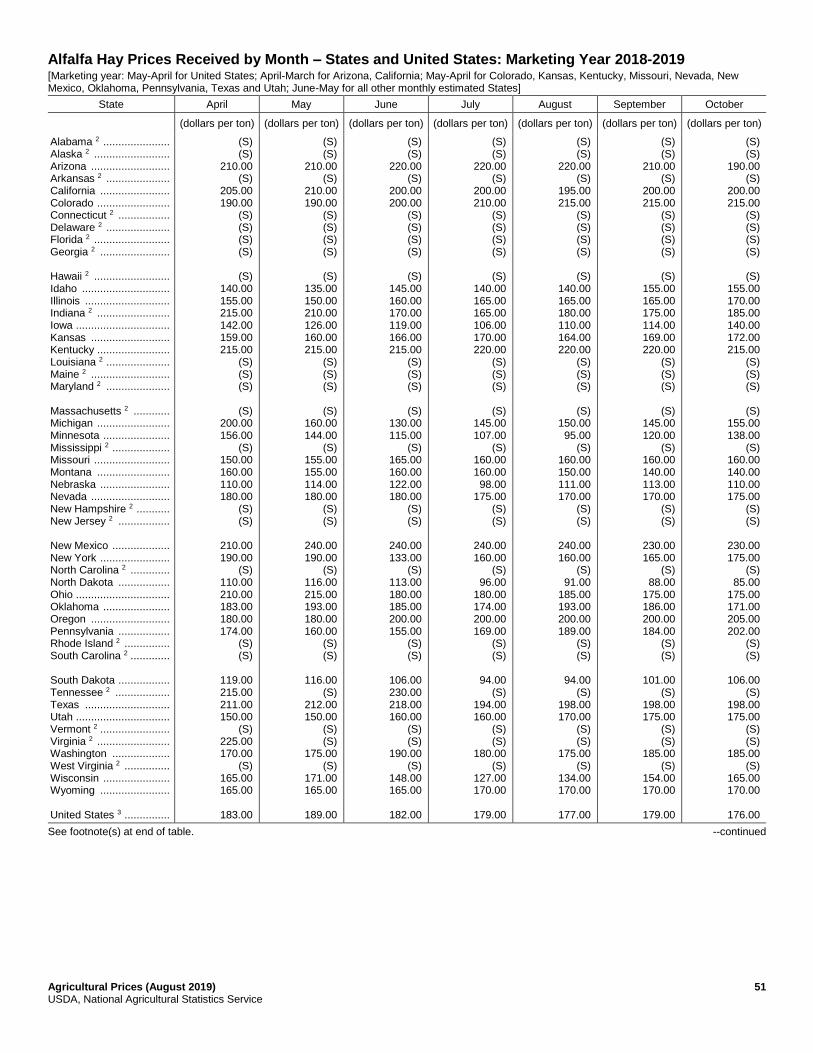
Agricultural Prices (August 2019) 51 USDA, National Agricultural Statistics Service
Alfalfa Hay Prices Received by Month – States and United States: Marketing Year 2018-2019 [Marketing year: May-April for United States; April-March for Arizona, California; May-April for Colorado, Kansas, Kentucky, Missouri, Nevada, New Mexico, Oklahoma, Pennsylvania, Texas and Utah; June-May for all other monthly estimated States]
State April May June July August September October
(dollars per ton) (dollars per ton) (dollars per ton) (dollars per ton) (dollars per ton) (dollars per ton) (dollars per ton)
Alabama 2 ...................... Alaska 2 ......................... Arizona .......................... Arkansas 2 ..................... California ....................... Colorado ........................ Connecticut 2 ................. Delaware 2 ..................... Florida 2 ......................... Georgia 2 ....................... Hawaii 2 ......................... Idaho ............................. Illinois ............................ Indiana 2 ........................ Iowa ............................... Kansas .......................... Kentucky ........................ Louisiana 2 ..................... Maine 2 .......................... Maryland 2 ..................... Massachusetts 2 ............ Michigan ........................ Minnesota ...................... Mississippi 2 ................... Missouri ......................... Montana ........................ Nebraska ....................... Nevada .......................... New Hampshire 2 ........... New Jersey 2 ................. New Mexico ................... New York ....................... North Carolina 2 ............. North Dakota ................. Ohio ............................... Oklahoma ...................... Oregon .......................... Pennsylvania ................. Rhode Island 2 ............... South Carolina 2 ............. South Dakota ................. Tennessee 2 .................. Texas ............................ Utah ............................... Vermont 2 ....................... Virginia 2 ........................ Washington ................... West Virginia 2 ............... Wisconsin ...................... Wyoming ....................... United States 3 ...............
(S) (S)
210.00 (S)
205.00 190.00
(S) (S) (S) (S)
(S)
140.00 155.00 215.00 142.00 159.00 215.00
(S) (S) (S)
(S)
200.00 156.00
(S) 150.00 160.00 110.00 180.00
(S) (S)
210.00 190.00
(S) 110.00 210.00 183.00 180.00 174.00
(S) (S)
119.00 215.00 211.00 150.00
(S) 225.00 170.00
(S) 165.00 165.00
183.00
(S) (S)
210.00 (S)
210.00 190.00
(S) (S) (S) (S)
(S)
135.00 150.00 210.00 126.00 160.00 215.00
(S) (S) (S)
(S)
160.00 144.00
(S) 155.00 155.00 114.00 180.00
(S) (S)
240.00 190.00
(S) 116.00 215.00 193.00 180.00 160.00
(S) (S)
116.00
(S) 212.00 150.00
(S) (S)
175.00 (S)
171.00 165.00
189.00
(S) (S)
220.00 (S)
200.00 200.00
(S) (S) (S) (S)
(S)
145.00 160.00 170.00 119.00 166.00 215.00
(S) (S) (S)
(S)
130.00 115.00
(S) 165.00 160.00 122.00 180.00
(S) (S)
240.00 133.00
(S) 113.00 180.00 185.00 200.00 155.00
(S) (S)
106.00 230.00 218.00 160.00
(S) (S)
190.00 (S)
148.00 165.00
182.00
(S) (S)
220.00 (S)
200.00 210.00
(S) (S) (S) (S)
(S)
140.00 165.00 165.00 106.00 170.00 220.00
(S) (S) (S)
(S)
145.00 107.00
(S) 160.00 160.00 98.00
175.00 (S) (S)
240.00 160.00
(S) 96.00
180.00 174.00 200.00 169.00
(S) (S)
94.00
(S) 194.00 160.00
(S) (S)
180.00 (S)
127.00 170.00
179.00
(S) (S)
220.00 (S)
195.00 215.00
(S) (S) (S) (S)
(S)
140.00 165.00 180.00 110.00 164.00 220.00
(S) (S) (S)
(S)
150.00 95.00
(S) 160.00 150.00 111.00 170.00
(S) (S)
240.00 160.00
(S) 91.00
185.00 193.00 200.00 189.00
(S) (S)
94.00
(S) 198.00 170.00
(S) (S)
175.00 (S)
134.00 170.00
177.00
(S) (S)
210.00 (S)
200.00 215.00
(S) (S) (S) (S)
(S)
155.00 165.00 175.00 114.00 169.00 220.00
(S) (S) (S)
(S)
145.00 120.00
(S) 160.00 140.00 113.00 170.00
(S) (S)
230.00 165.00
(S) 88.00
175.00 186.00 200.00 184.00
(S) (S)
101.00
(S) 198.00 175.00
(S) (S)
185.00 (S)
154.00 170.00
179.00
(S) (S)
190.00 (S)
200.00 215.00
(S) (S) (S) (S)
(S)
155.00 170.00 185.00 140.00 172.00 215.00
(S) (S) (S)
(S)
155.00 138.00
(S) 160.00 140.00 110.00 175.00
(S) (S)
230.00 175.00
(S) 85.00
175.00 171.00 205.00 202.00
(S) (S)
106.00
(S) 198.00 175.00
(S) (S)
185.00 (S)
165.00 170.00
176.00
See footnote(s) at end of table. --continued
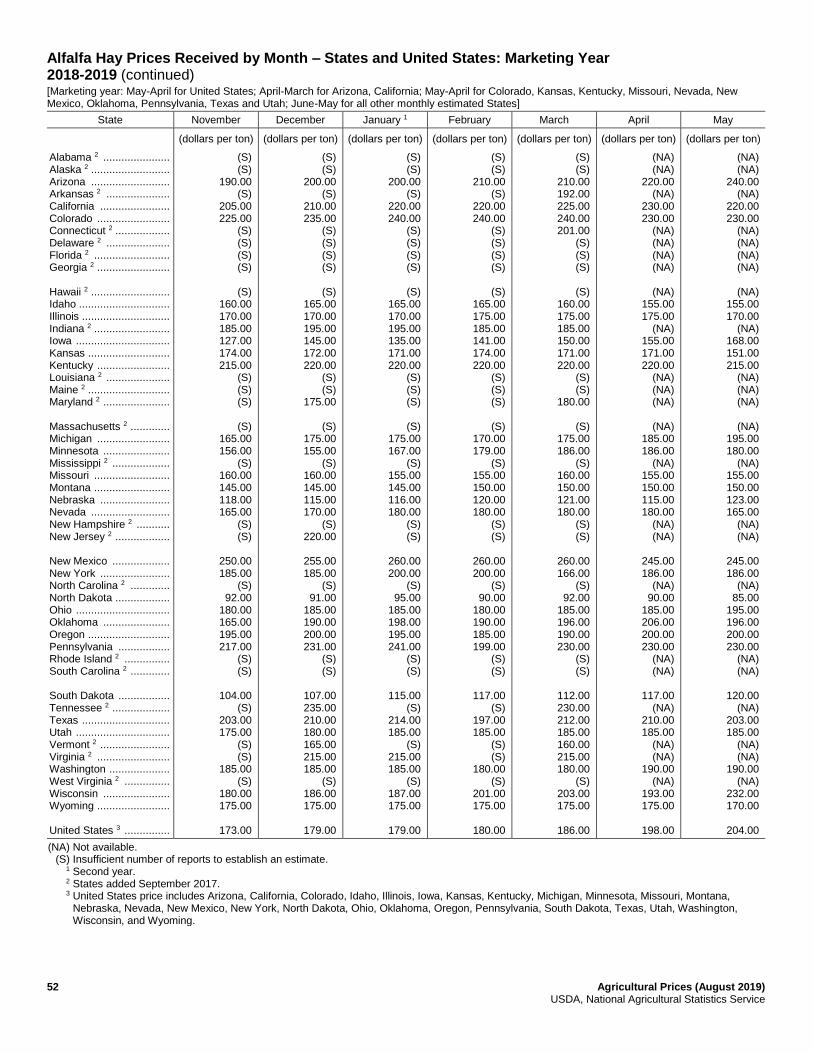
52 Agricultural Prices (August 2019) USDA, National Agricultural Statistics Service
Alfalfa Hay Prices Received by Month – States and United States: Marketing Year 2018-2019 (continued) [Marketing year: May-April for United States; April-March for Arizona, California; May-April for Colorado, Kansas, Kentucky, Missouri, Nevada, New Mexico, Oklahoma, Pennsylvania, Texas and Utah; June-May for all other monthly estimated States]
State November December January 1 February March April May
(dollars per ton) (dollars per ton) (dollars per ton) (dollars per ton) (dollars per ton) (dollars per ton) (dollars per ton)
Alabama 2 ...................... Alaska 2 .......................... Arizona .......................... Arkansas 2 ..................... California ....................... Colorado ........................ Connecticut 2 .................. Delaware 2 ..................... Florida 2 ......................... Georgia 2 ........................ Hawaii 2 .......................... Idaho .............................. Illinois ............................. Indiana 2 ......................... Iowa ............................... Kansas ........................... Kentucky ........................ Louisiana 2 ..................... Maine 2 ........................... Maryland 2 ...................... Massachusetts 2 ............. Michigan ........................ Minnesota ...................... Mississippi 2 ................... Missouri ......................... Montana ......................... Nebraska ....................... Nevada .......................... New Hampshire 2 ........... New Jersey 2 .................. New Mexico ................... New York ....................... North Carolina 2 ............. North Dakota .................. Ohio ............................... Oklahoma ...................... Oregon ........................... Pennsylvania ................. Rhode Island 2 ............... South Carolina 2 ............. South Dakota ................. Tennessee 2 ................... Texas ............................. Utah ............................... Vermont 2 ....................... Virginia 2 ........................ Washington .................... West Virginia 2 ............... Wisconsin ...................... Wyoming ........................ United States 3 ...............
(S) (S)
190.00 (S)
205.00 225.00
(S) (S) (S) (S)
(S)
160.00 170.00 185.00 127.00 174.00 215.00
(S) (S) (S)
(S)
165.00 156.00
(S) 160.00 145.00 118.00 165.00
(S) (S)
250.00 185.00
(S) 92.00
180.00 165.00 195.00 217.00
(S) (S)
104.00
(S) 203.00 175.00
(S) (S)
185.00 (S)
180.00 175.00
173.00
(S) (S)
200.00 (S)
210.00 235.00
(S) (S) (S) (S)
(S)
165.00 170.00 195.00 145.00 172.00 220.00
(S) (S)
175.00
(S) 175.00 155.00
(S) 160.00 145.00 115.00 170.00
(S) 220.00
255.00 185.00
(S) 91.00
185.00 190.00 200.00 231.00
(S) (S)
107.00 235.00 210.00 180.00 165.00 215.00 185.00
(S) 186.00 175.00
179.00
(S) (S)
200.00 (S)
220.00 240.00
(S) (S) (S) (S)
(S)
165.00 170.00 195.00 135.00 171.00 220.00
(S) (S) (S)
(S)
175.00 167.00
(S) 155.00 145.00 116.00 180.00
(S) (S)
260.00 200.00
(S) 95.00
185.00 198.00 195.00 241.00
(S) (S)
115.00
(S) 214.00 185.00
(S) 215.00 185.00
(S) 187.00 175.00
179.00
(S) (S)
210.00 (S)
220.00 240.00
(S) (S) (S) (S)
(S)
165.00 175.00 185.00 141.00 174.00 220.00
(S) (S) (S)
(S)
170.00 179.00
(S) 155.00 150.00 120.00 180.00
(S) (S)
260.00 200.00
(S) 90.00
180.00 190.00 185.00 199.00
(S) (S)
117.00
(S) 197.00 185.00
(S) (S)
180.00 (S)
201.00 175.00
180.00
(S) (S)
210.00 192.00 225.00 240.00 201.00
(S) (S) (S)
(S)
160.00 175.00 185.00 150.00 171.00 220.00
(S) (S)
180.00
(S) 175.00 186.00
(S) 160.00 150.00 121.00 180.00
(S) (S)
260.00 166.00
(S) 92.00
185.00 196.00 190.00 230.00
(S) (S)
112.00 230.00 212.00 185.00 160.00 215.00 180.00
(S) 203.00 175.00
186.00
(NA) (NA)
220.00 (NA)
230.00 230.00
(NA) (NA) (NA) (NA)
(NA)
155.00 175.00
(NA) 155.00 171.00 220.00
(NA) (NA) (NA)
(NA)
185.00 186.00
(NA) 155.00 150.00 115.00 180.00
(NA) (NA)
245.00 186.00
(NA) 90.00
185.00 206.00 200.00 230.00
(NA) (NA)
117.00
(NA) 210.00 185.00
(NA) (NA)
190.00 (NA)
193.00 175.00
198.00
(NA) (NA)
240.00 (NA)
220.00 230.00
(NA) (NA) (NA) (NA)
(NA)
155.00 170.00
(NA) 168.00 151.00 215.00
(NA) (NA) (NA)
(NA)
195.00 180.00
(NA) 155.00 150.00 123.00 165.00
(NA) (NA)
245.00 186.00
(NA) 85.00
195.00 196.00 200.00 230.00
(NA) (NA)
120.00
(NA) 203.00 185.00
(NA) (NA)
190.00 (NA)
232.00 170.00
204.00
(NA) Not available. (S) Insufficient number of reports to establish an estimate. 1 Second year. 2 States added September 2017. 3 United States price includes Arizona, California, Colorado, Idaho, Illinois, Iowa, Kansas, Kentucky, Michigan, Minnesota, Missouri, Montana,
Nebraska, Nevada, New Mexico, New York, North Dakota, Ohio, Oklahoma, Oregon, Pennsylvania, South Dakota, Texas, Utah, Washington, Wisconsin, and Wyoming.
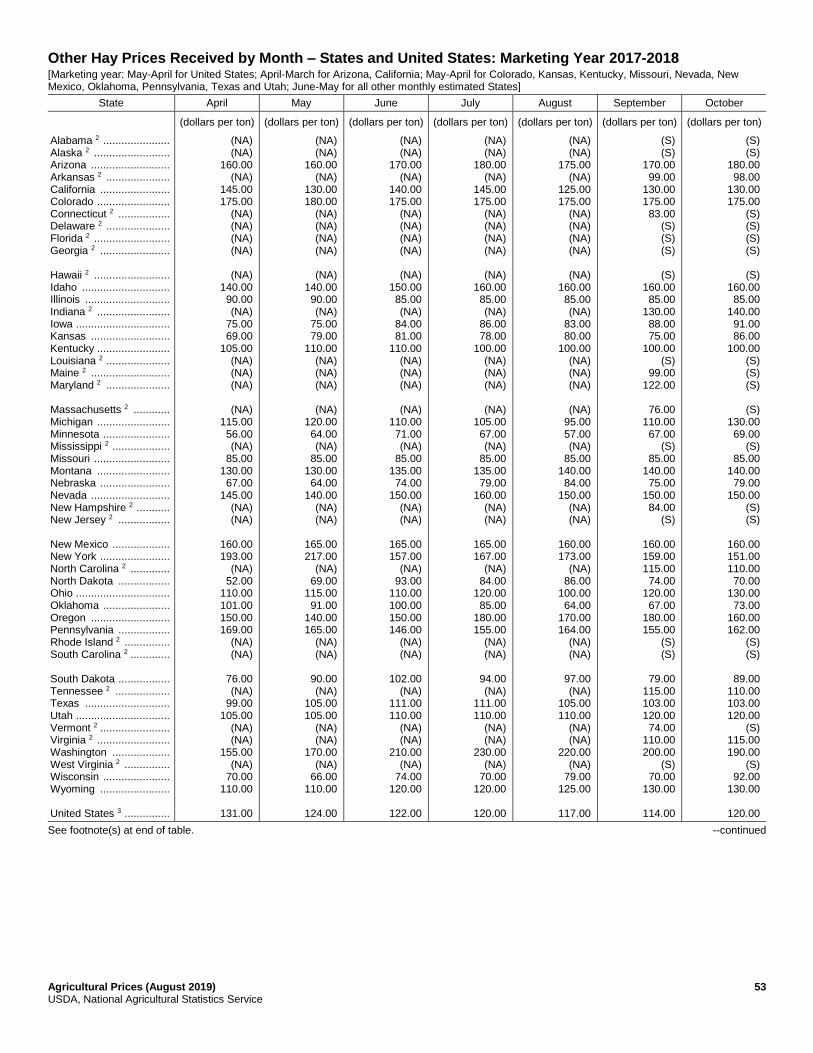
Agricultural Prices (August 2019) 53 USDA, National Agricultural Statistics Service
Other Hay Prices Received by Month – States and United States: Marketing Year 2017-2018 [Marketing year: May-April for United States; April-March for Arizona, California; May-April for Colorado, Kansas, Kentucky, Missouri, Nevada, New Mexico, Oklahoma, Pennsylvania, Texas and Utah; June-May for all other monthly estimated States]
State April May June July August September October
(dollars per ton) (dollars per ton) (dollars per ton) (dollars per ton) (dollars per ton) (dollars per ton) (dollars per ton)
Alabama 2 ...................... Alaska 2 ......................... Arizona .......................... Arkansas 2 ..................... California ....................... Colorado ........................ Connecticut 2 ................. Delaware 2 ..................... Florida 2 ......................... Georgia 2 ....................... Hawaii 2 ......................... Idaho ............................. Illinois ............................ Indiana 2 ........................ Iowa ............................... Kansas .......................... Kentucky ........................ Louisiana 2 ..................... Maine 2 .......................... Maryland 2 ..................... Massachusetts 2 ............ Michigan ........................ Minnesota ...................... Mississippi 2 ................... Missouri ......................... Montana ........................ Nebraska ....................... Nevada .......................... New Hampshire 2 ........... New Jersey 2 ................. New Mexico ................... New York ....................... North Carolina 2 ............. North Dakota ................. Ohio ............................... Oklahoma ...................... Oregon .......................... Pennsylvania ................. Rhode Island 2 ............... South Carolina 2 ............. South Dakota ................. Tennessee 2 .................. Texas ............................ Utah ............................... Vermont 2 ....................... Virginia 2 ........................ Washington ................... West Virginia 2 ............... Wisconsin ...................... Wyoming ....................... United States 3 ...............
(NA) (NA)
160.00 (NA)
145.00 175.00
(NA) (NA) (NA) (NA)
(NA)
140.00 90.00 (NA)
75.00 69.00
105.00 (NA) (NA) (NA)
(NA)
115.00 56.00 (NA)
85.00 130.00 67.00
145.00 (NA) (NA)
160.00 193.00
(NA) 52.00
110.00 101.00 150.00 169.00
(NA) (NA)
76.00 (NA)
99.00 105.00
(NA) (NA)
155.00 (NA)
70.00 110.00
131.00
(NA) (NA)
160.00 (NA)
130.00 180.00
(NA) (NA) (NA) (NA)
(NA)
140.00 90.00 (NA)
75.00 79.00
110.00 (NA) (NA) (NA)
(NA)
120.00 64.00 (NA)
85.00 130.00 64.00
140.00 (NA) (NA)
165.00 217.00
(NA) 69.00
115.00 91.00
140.00 165.00
(NA) (NA)
90.00 (NA)
105.00 105.00
(NA) (NA)
170.00 (NA)
66.00 110.00
124.00
(NA) (NA)
170.00 (NA)
140.00 175.00
(NA) (NA) (NA) (NA)
(NA)
150.00 85.00 (NA)
84.00 81.00
110.00 (NA) (NA) (NA)
(NA)
110.00 71.00 (NA)
85.00 135.00 74.00
150.00 (NA) (NA)
165.00 157.00
(NA) 93.00
110.00 100.00 150.00 146.00
(NA) (NA)
102.00
(NA) 111.00 110.00
(NA) (NA)
210.00 (NA)
74.00 120.00
122.00
(NA) (NA)
180.00 (NA)
145.00 175.00
(NA) (NA) (NA) (NA)
(NA)
160.00 85.00 (NA)
86.00 78.00
100.00 (NA) (NA) (NA)
(NA)
105.00 67.00 (NA)
85.00 135.00 79.00
160.00 (NA) (NA)
165.00 167.00
(NA) 84.00
120.00 85.00
180.00 155.00
(NA) (NA)
94.00 (NA)
111.00 110.00
(NA) (NA)
230.00 (NA)
70.00 120.00
120.00
(NA) (NA)
175.00 (NA)
125.00 175.00
(NA) (NA) (NA) (NA)
(NA)
160.00 85.00 (NA)
83.00 80.00
100.00 (NA) (NA) (NA)
(NA)
95.00 57.00 (NA)
85.00 140.00 84.00
150.00 (NA) (NA)
160.00 173.00
(NA) 86.00
100.00 64.00
170.00 164.00
(NA) (NA)
97.00 (NA)
105.00 110.00
(NA) (NA)
220.00 (NA)
79.00 125.00
117.00
(S) (S)
170.00 99.00
130.00 175.00 83.00
(S) (S) (S)
(S)
160.00 85.00
130.00 88.00 75.00
100.00 (S)
99.00 122.00
76.00
110.00 67.00
(S) 85.00
140.00 75.00
150.00 84.00
(S)
160.00 159.00 115.00 74.00
120.00 67.00
180.00 155.00
(S) (S)
79.00
115.00 103.00 120.00 74.00
110.00 200.00
(S) 70.00
130.00
114.00
(S) (S)
180.00 98.00
130.00 175.00
(S) (S) (S) (S)
(S)
160.00 85.00
140.00 91.00 86.00
100.00 (S) (S) (S)
(S)
130.00 69.00
(S) 85.00
140.00 79.00
150.00 (S) (S)
160.00 151.00 110.00 70.00
130.00 73.00
160.00 162.00
(S) (S)
89.00
110.00 103.00 120.00
(S) 115.00 190.00
(S) 92.00
130.00
120.00
See footnote(s) at end of table. --continued
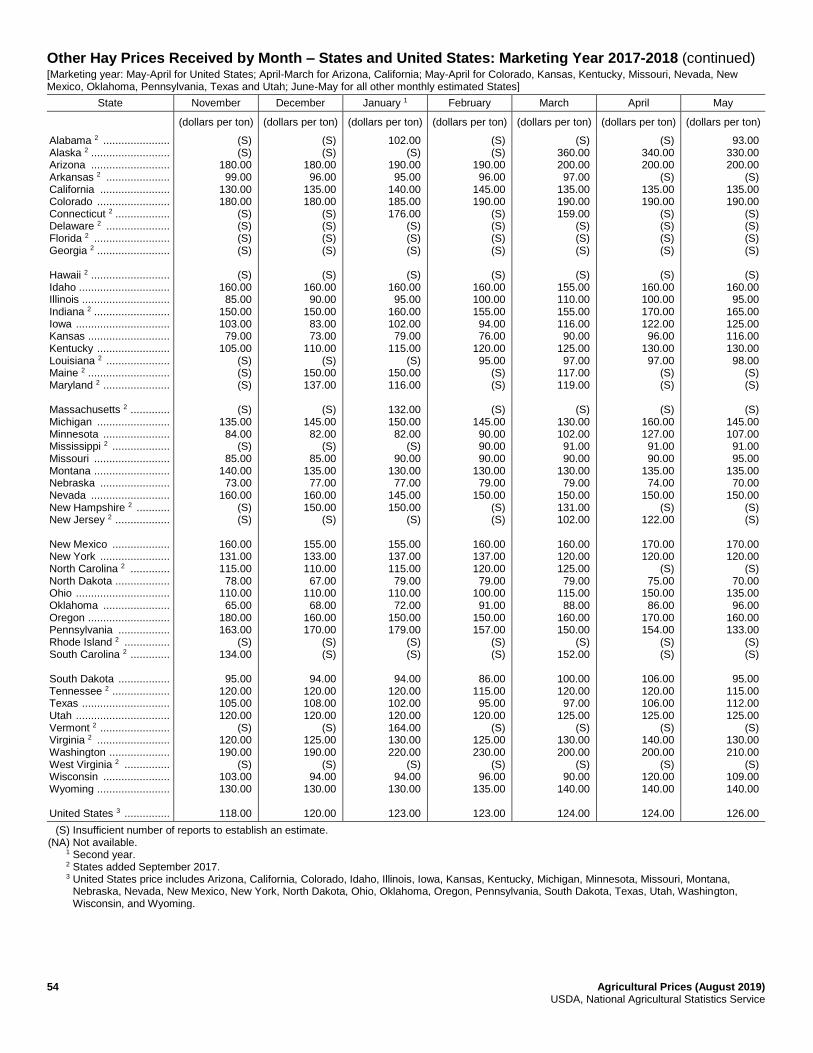
54 Agricultural Prices (August 2019) USDA, National Agricultural Statistics Service
Other Hay Prices Received by Month – States and United States: Marketing Year 2017-2018 (continued) [Marketing year: May-April for United States; April-March for Arizona, California; May-April for Colorado, Kansas, Kentucky, Missouri, Nevada, New Mexico, Oklahoma, Pennsylvania, Texas and Utah; June-May for all other monthly estimated States]
State November December January 1 February March April May
(dollars per ton) (dollars per ton) (dollars per ton) (dollars per ton) (dollars per ton) (dollars per ton) (dollars per ton)
Alabama 2 ...................... Alaska 2 .......................... Arizona .......................... Arkansas 2 ..................... California ....................... Colorado ........................ Connecticut 2 .................. Delaware 2 ..................... Florida 2 ......................... Georgia 2 ........................ Hawaii 2 .......................... Idaho .............................. Illinois ............................. Indiana 2 ......................... Iowa ............................... Kansas ........................... Kentucky ........................ Louisiana 2 ..................... Maine 2 ........................... Maryland 2 ...................... Massachusetts 2 ............. Michigan ........................ Minnesota ...................... Mississippi 2 ................... Missouri ......................... Montana ......................... Nebraska ....................... Nevada .......................... New Hampshire 2 ........... New Jersey 2 .................. New Mexico ................... New York ....................... North Carolina 2 ............. North Dakota .................. Ohio ............................... Oklahoma ...................... Oregon ........................... Pennsylvania ................. Rhode Island 2 ............... South Carolina 2 ............. South Dakota ................. Tennessee 2 ................... Texas ............................. Utah ............................... Vermont 2 ....................... Virginia 2 ........................ Washington .................... West Virginia 2 ............... Wisconsin ...................... Wyoming ........................ United States 3 ...............
(S) (S)
180.00 99.00
130.00 180.00
(S) (S) (S) (S)
(S)
160.00 85.00
150.00 103.00 79.00
105.00 (S) (S) (S)
(S)
135.00 84.00
(S) 85.00
140.00 73.00
160.00 (S) (S)
160.00 131.00 115.00 78.00
110.00 65.00
180.00 163.00
(S) 134.00
95.00
120.00 105.00 120.00
(S) 120.00 190.00
(S) 103.00 130.00
118.00
(S) (S)
180.00 96.00
135.00 180.00
(S) (S) (S) (S)
(S)
160.00 90.00
150.00 83.00 73.00
110.00 (S)
150.00 137.00
(S)
145.00 82.00
(S) 85.00
135.00 77.00
160.00 150.00
(S)
155.00 133.00 110.00 67.00
110.00 68.00
160.00 170.00
(S) (S)
94.00
120.00 108.00 120.00
(S) 125.00 190.00
(S) 94.00
130.00
120.00
102.00 (S)
190.00 95.00
140.00 185.00 176.00
(S) (S) (S)
(S)
160.00 95.00
160.00 102.00 79.00
115.00 (S)
150.00 116.00
132.00 150.00 82.00
(S) 90.00
130.00 77.00
145.00 150.00
(S)
155.00 137.00 115.00 79.00
110.00 72.00
150.00 179.00
(S) (S)
94.00
120.00 102.00 120.00 164.00 130.00 220.00
(S) 94.00
130.00
123.00
(S) (S)
190.00 96.00
145.00 190.00
(S) (S) (S) (S)
(S)
160.00 100.00 155.00 94.00 76.00
120.00 95.00
(S) (S)
(S)
145.00 90.00 90.00 90.00
130.00 79.00
150.00 (S) (S)
160.00 137.00 120.00 79.00
100.00 91.00
150.00 157.00
(S) (S)
86.00
115.00 95.00
120.00 (S)
125.00 230.00
(S) 96.00
135.00
123.00
(S) 360.00 200.00 97.00
135.00 190.00 159.00
(S) (S) (S)
(S)
155.00 110.00 155.00 116.00 90.00
125.00 97.00
117.00 119.00
(S)
130.00 102.00 91.00 90.00
130.00 79.00
150.00 131.00 102.00
160.00 120.00 125.00 79.00
115.00 88.00
160.00 150.00
(S) 152.00
100.00 120.00 97.00
125.00 (S)
130.00 200.00
(S) 90.00
140.00
124.00
(S) 340.00 200.00
(S) 135.00 190.00
(S) (S) (S) (S)
(S)
160.00 100.00 170.00 122.00 96.00
130.00 97.00
(S) (S)
(S)
160.00 127.00 91.00 90.00
135.00 74.00
150.00 (S)
122.00
170.00 120.00
(S) 75.00
150.00 86.00
170.00 154.00
(S) (S)
106.00 120.00 106.00 125.00
(S) 140.00 200.00
(S) 120.00 140.00
124.00
93.00 330.00 200.00
(S) 135.00 190.00
(S) (S) (S) (S)
(S)
160.00 95.00
165.00 125.00 116.00 130.00 98.00
(S) (S)
(S)
145.00 107.00 91.00 95.00
135.00 70.00
150.00 (S) (S)
170.00 120.00
(S) 70.00
135.00 96.00
160.00 133.00
(S) (S)
95.00
115.00 112.00 125.00
(S) 130.00 210.00
(S) 109.00 140.00
126.00
(S) Insufficient number of reports to establish an estimate. (NA) Not available. 1 Second year. 2 States added September 2017. 3 United States price includes Arizona, California, Colorado, Idaho, Illinois, Iowa, Kansas, Kentucky, Michigan, Minnesota, Missouri, Montana,
Nebraska, Nevada, New Mexico, New York, North Dakota, Ohio, Oklahoma, Oregon, Pennsylvania, South Dakota, Texas, Utah, Washington, Wisconsin, and Wyoming.
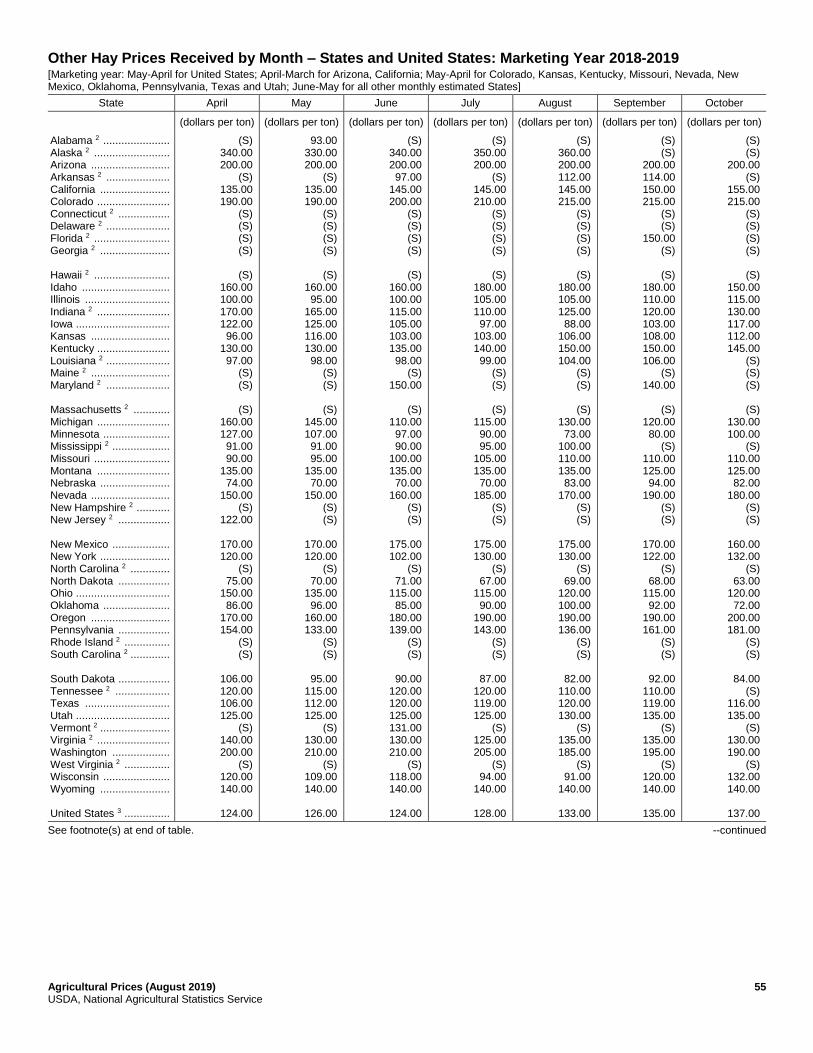
Agricultural Prices (August 2019) 55 USDA, National Agricultural Statistics Service
Other Hay Prices Received by Month – States and United States: Marketing Year 2018-2019 [Marketing year: May-April for United States; April-March for Arizona, California; May-April for Colorado, Kansas, Kentucky, Missouri, Nevada, New Mexico, Oklahoma, Pennsylvania, Texas and Utah; June-May for all other monthly estimated States]
State April May June July August September October
(dollars per ton) (dollars per ton) (dollars per ton) (dollars per ton) (dollars per ton) (dollars per ton) (dollars per ton)
Alabama 2 ...................... Alaska 2 ......................... Arizona .......................... Arkansas 2 ..................... California ....................... Colorado ........................ Connecticut 2 ................. Delaware 2 ..................... Florida 2 ......................... Georgia 2 ....................... Hawaii 2 ......................... Idaho ............................. Illinois ............................ Indiana 2 ........................ Iowa ............................... Kansas .......................... Kentucky ........................ Louisiana 2 ..................... Maine 2 .......................... Maryland 2 ..................... Massachusetts 2 ............ Michigan ........................ Minnesota ...................... Mississippi 2 ................... Missouri ......................... Montana ........................ Nebraska ....................... Nevada .......................... New Hampshire 2 ........... New Jersey 2 ................. New Mexico ................... New York ....................... North Carolina 2 ............. North Dakota ................. Ohio ............................... Oklahoma ...................... Oregon .......................... Pennsylvania ................. Rhode Island 2 ............... South Carolina 2 ............. South Dakota ................. Tennessee 2 .................. Texas ............................ Utah ............................... Vermont 2 ....................... Virginia 2 ........................ Washington ................... West Virginia 2 ............... Wisconsin ...................... Wyoming ....................... United States 3 ...............
(S) 340.00 200.00
(S) 135.00 190.00
(S) (S) (S) (S)
(S)
160.00 100.00 170.00 122.00 96.00
130.00 97.00
(S) (S)
(S)
160.00 127.00 91.00 90.00
135.00 74.00
150.00 (S)
122.00
170.00 120.00
(S) 75.00
150.00 86.00
170.00 154.00
(S) (S)
106.00 120.00 106.00 125.00
(S) 140.00 200.00
(S) 120.00 140.00
124.00
93.00 330.00 200.00
(S) 135.00 190.00
(S) (S) (S) (S)
(S)
160.00 95.00
165.00 125.00 116.00 130.00 98.00
(S) (S)
(S)
145.00 107.00 91.00 95.00
135.00 70.00
150.00 (S) (S)
170.00 120.00
(S) 70.00
135.00 96.00
160.00 133.00
(S) (S)
95.00
115.00 112.00 125.00
(S) 130.00 210.00
(S) 109.00 140.00
126.00
(S) 340.00 200.00 97.00
145.00 200.00
(S) (S) (S) (S)
(S)
160.00 100.00 115.00 105.00 103.00 135.00 98.00
(S) 150.00
(S)
110.00 97.00 90.00
100.00 135.00 70.00
160.00 (S) (S)
175.00 102.00
(S) 71.00
115.00 85.00
180.00 139.00
(S) (S)
90.00
120.00 120.00 125.00 131.00 130.00 210.00
(S) 118.00 140.00
124.00
(S) 350.00 200.00
(S) 145.00 210.00
(S) (S) (S) (S)
(S)
180.00 105.00 110.00 97.00
103.00 140.00 99.00
(S) (S)
(S)
115.00 90.00 95.00
105.00 135.00 70.00
185.00 (S) (S)
175.00 130.00
(S) 67.00
115.00 90.00
190.00 143.00
(S) (S)
87.00
120.00 119.00 125.00
(S) 125.00 205.00
(S) 94.00
140.00
128.00
(S) 360.00 200.00 112.00 145.00 215.00
(S) (S) (S) (S)
(S)
180.00 105.00 125.00 88.00
106.00 150.00 104.00
(S) (S)
(S)
130.00 73.00
100.00 110.00 135.00 83.00
170.00 (S) (S)
175.00 130.00
(S) 69.00
120.00 100.00 190.00 136.00
(S) (S)
82.00
110.00 120.00 130.00
(S) 135.00 185.00
(S) 91.00
140.00
133.00
(S) (S)
200.00 114.00 150.00 215.00
(S) (S)
150.00 (S)
(S)
180.00 110.00 120.00 103.00 108.00 150.00 106.00
(S) 140.00
(S)
120.00 80.00
(S) 110.00 125.00 94.00
190.00 (S) (S)
170.00 122.00
(S) 68.00
115.00 92.00
190.00 161.00
(S) (S)
92.00
110.00 119.00 135.00
(S) 135.00 195.00
(S) 120.00 140.00
135.00
(S) (S)
200.00 (S)
155.00 215.00
(S) (S) (S) (S)
(S)
150.00 115.00 130.00 117.00 112.00 145.00
(S) (S) (S)
(S)
130.00 100.00
(S) 110.00 125.00 82.00
180.00 (S) (S)
160.00 132.00
(S) 63.00
120.00 72.00
200.00 181.00
(S) (S)
84.00
(S) 116.00 135.00
(S) 130.00 190.00
(S) 132.00 140.00
137.00
See footnote(s) at end of table. --continued
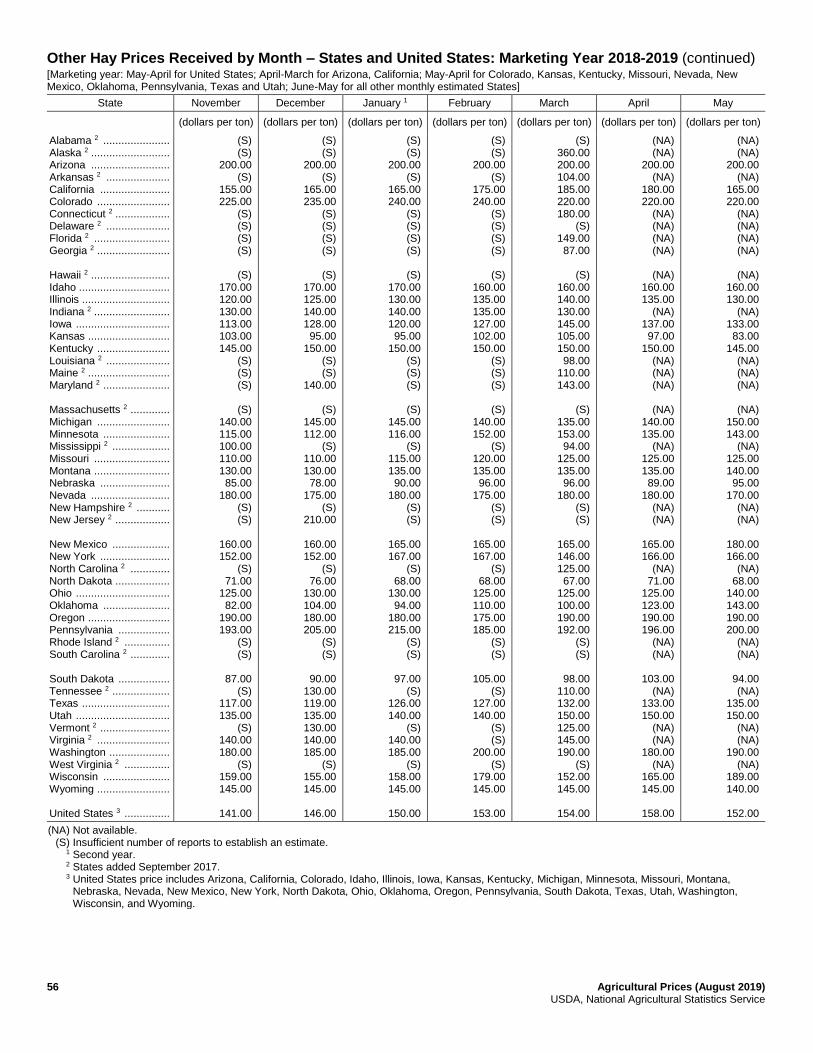
56 Agricultural Prices (August 2019) USDA, National Agricultural Statistics Service
Other Hay Prices Received by Month – States and United States: Marketing Year 2018-2019 (continued) [Marketing year: May-April for United States; April-March for Arizona, California; May-April for Colorado, Kansas, Kentucky, Missouri, Nevada, New Mexico, Oklahoma, Pennsylvania, Texas and Utah; June-May for all other monthly estimated States]
State November December January 1 February March April May
(dollars per ton) (dollars per ton) (dollars per ton) (dollars per ton) (dollars per ton) (dollars per ton) (dollars per ton)
Alabama 2 ...................... Alaska 2 .......................... Arizona .......................... Arkansas 2 ..................... California ....................... Colorado ........................ Connecticut 2 .................. Delaware 2 ..................... Florida 2 ......................... Georgia 2 ........................ Hawaii 2 .......................... Idaho .............................. Illinois ............................. Indiana 2 ......................... Iowa ............................... Kansas ........................... Kentucky ........................ Louisiana 2 ..................... Maine 2 ........................... Maryland 2 ...................... Massachusetts 2 ............. Michigan ........................ Minnesota ...................... Mississippi 2 ................... Missouri ......................... Montana ......................... Nebraska ....................... Nevada .......................... New Hampshire 2 ........... New Jersey 2 .................. New Mexico ................... New York ....................... North Carolina 2 ............. North Dakota .................. Ohio ............................... Oklahoma ...................... Oregon ........................... Pennsylvania ................. Rhode Island 2 ............... South Carolina 2 ............. South Dakota ................. Tennessee 2 ................... Texas ............................. Utah ............................... Vermont 2 ....................... Virginia 2 ........................ Washington .................... West Virginia 2 ............... Wisconsin ...................... Wyoming ........................ United States 3 ...............
(S) (S)
200.00 (S)
155.00 225.00
(S) (S) (S) (S)
(S)
170.00 120.00 130.00 113.00 103.00 145.00
(S) (S) (S)
(S)
140.00 115.00 100.00 110.00 130.00 85.00
180.00 (S) (S)
160.00 152.00
(S) 71.00
125.00 82.00
190.00 193.00
(S) (S)
87.00
(S) 117.00 135.00
(S) 140.00 180.00
(S) 159.00 145.00
141.00
(S) (S)
200.00 (S)
165.00 235.00
(S) (S) (S) (S)
(S)
170.00 125.00 140.00 128.00 95.00
150.00 (S) (S)
140.00
(S) 145.00 112.00
(S) 110.00 130.00 78.00
175.00 (S)
210.00
160.00 152.00
(S) 76.00
130.00 104.00 180.00 205.00
(S) (S)
90.00
130.00 119.00 135.00 130.00 140.00 185.00
(S) 155.00 145.00
146.00
(S) (S)
200.00 (S)
165.00 240.00
(S) (S) (S) (S)
(S)
170.00 130.00 140.00 120.00 95.00
150.00 (S) (S) (S)
(S)
145.00 116.00
(S) 115.00 135.00 90.00
180.00 (S) (S)
165.00 167.00
(S) 68.00
130.00 94.00
180.00 215.00
(S) (S)
97.00
(S) 126.00 140.00
(S) 140.00 185.00
(S) 158.00 145.00
150.00
(S) (S)
200.00 (S)
175.00 240.00
(S) (S) (S) (S)
(S)
160.00 135.00 135.00 127.00 102.00 150.00
(S) (S) (S)
(S)
140.00 152.00
(S) 120.00 135.00 96.00
175.00 (S) (S)
165.00 167.00
(S) 68.00
125.00 110.00 175.00 185.00
(S) (S)
105.00
(S) 127.00 140.00
(S) (S)
200.00 (S)
179.00 145.00
153.00
(S) 360.00 200.00 104.00 185.00 220.00 180.00
(S) 149.00 87.00
(S)
160.00 140.00 130.00 145.00 105.00 150.00 98.00
110.00 143.00
(S)
135.00 153.00 94.00
125.00 135.00 96.00
180.00 (S) (S)
165.00 146.00 125.00 67.00
125.00 100.00 190.00 192.00
(S) (S)
98.00
110.00 132.00 150.00 125.00 145.00 190.00
(S) 152.00 145.00
154.00
(NA) (NA)
200.00 (NA)
180.00 220.00
(NA) (NA) (NA) (NA)
(NA)
160.00 135.00
(NA) 137.00 97.00
150.00 (NA) (NA) (NA)
(NA)
140.00 135.00
(NA) 125.00 135.00 89.00
180.00 (NA) (NA)
165.00 166.00
(NA) 71.00
125.00 123.00 190.00 196.00
(NA) (NA)
103.00
(NA) 133.00 150.00
(NA) (NA)
180.00 (NA)
165.00 145.00
158.00
(NA) (NA)
200.00 (NA)
165.00 220.00
(NA) (NA) (NA) (NA)
(NA)
160.00 130.00
(NA) 133.00 83.00
145.00 (NA) (NA) (NA)
(NA)
150.00 143.00
(NA) 125.00 140.00 95.00
170.00 (NA) (NA)
180.00 166.00
(NA) 68.00
140.00 143.00 190.00 200.00
(NA) (NA)
94.00 (NA)
135.00 150.00
(NA) (NA)
190.00 (NA)
189.00 140.00
152.00
(NA) Not available. (S) Insufficient number of reports to establish an estimate. 1 Second year. 2 States added September 2017. 3 United States price includes Arizona, California, Colorado, Idaho, Illinois, Iowa, Kansas, Kentucky, Michigan, Minnesota, Missouri, Montana,
Nebraska, Nevada, New Mexico, New York, North Dakota, Ohio, Oklahoma, Oregon, Pennsylvania, South Dakota, Texas, Utah, Washington, Wisconsin, and Wyoming.
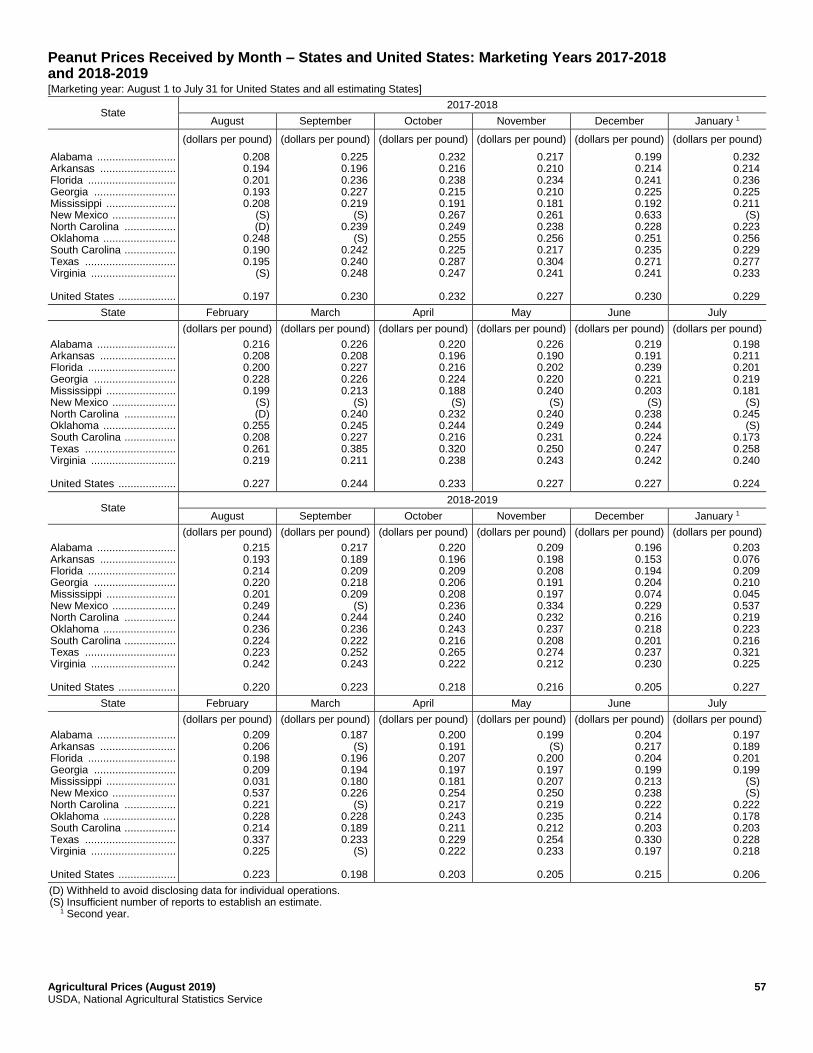
Agricultural Prices (August 2019) 57 USDA, National Agricultural Statistics Service
Peanut Prices Received by Month – States and United States: Marketing Years 2017-2018 and 2018-2019 [Marketing year: August 1 to July 31 for United States and all estimating States]
State 2017-2018
August September October November December January 1
(dollars per pound) (dollars per pound) (dollars per pound) (dollars per pound) (dollars per pound) (dollars per pound)
Alabama .......................... Arkansas ......................... Florida ............................. Georgia ........................... Mississippi ....................... New Mexico ..................... North Carolina ................. Oklahoma ........................ South Carolina ................. Texas .............................. Virginia ............................ United States ...................
0.208 0.194 0.201 0.193 0.208
(S) (D)
0.248 0.190 0.195
(S)
0.197
0.225 0.196 0.236 0.227 0.219
(S) 0.239
(S) 0.242 0.240 0.248
0.230
0.232 0.216 0.238 0.215 0.191 0.267 0.249 0.255 0.225 0.287 0.247
0.232
0.217 0.210 0.234 0.210 0.181 0.261 0.238 0.256 0.217 0.304 0.241
0.227
0.199 0.214 0.241 0.225 0.192 0.633 0.228 0.251 0.235 0.271 0.241
0.230
0.232 0.214 0.236 0.225 0.211
(S) 0.223 0.256 0.229 0.277 0.233
0.229
State February March April May June July
(dollars per pound) (dollars per pound) (dollars per pound) (dollars per pound) (dollars per pound) (dollars per pound)
Alabama .......................... Arkansas ......................... Florida ............................. Georgia ........................... Mississippi ....................... New Mexico ..................... North Carolina ................. Oklahoma ........................ South Carolina ................. Texas .............................. Virginia ............................ United States ...................
0.216 0.208 0.200 0.228 0.199
(S) (D)
0.255 0.208 0.261 0.219
0.227
0.226 0.208 0.227 0.226 0.213
(S) 0.240 0.245 0.227 0.385 0.211
0.244
0.220 0.196 0.216 0.224 0.188
(S) 0.232 0.244 0.216 0.320 0.238
0.233
0.226 0.190 0.202 0.220 0.240
(S) 0.240 0.249 0.231 0.250 0.243
0.227
0.219 0.191 0.239 0.221 0.203
(S) 0.238 0.244 0.224 0.247 0.242
0.227
0.198 0.211 0.201 0.219 0.181
(S) 0.245
(S) 0.173 0.258 0.240
0.224
State 2018-2019
August September October November December January 1
(dollars per pound) (dollars per pound) (dollars per pound) (dollars per pound) (dollars per pound) (dollars per pound)
Alabama .......................... Arkansas ......................... Florida ............................. Georgia ........................... Mississippi ....................... New Mexico ..................... North Carolina ................. Oklahoma ........................ South Carolina ................. Texas .............................. Virginia ............................ United States ...................
0.215 0.193 0.214 0.220 0.201 0.249 0.244 0.236 0.224 0.223 0.242
0.220
0.217 0.189 0.209 0.218 0.209
(S) 0.244 0.236 0.222 0.252 0.243
0.223
0.220 0.196 0.209 0.206 0.208 0.236 0.240 0.243 0.216 0.265 0.222
0.218
0.209 0.198 0.208 0.191 0.197 0.334 0.232 0.237 0.208 0.274 0.212
0.216
0.196 0.153 0.194 0.204 0.074 0.229 0.216 0.218 0.201 0.237 0.230
0.205
0.203 0.076 0.209 0.210 0.045 0.537 0.219 0.223 0.216 0.321 0.225
0.227
State February March April May June July
(dollars per pound) (dollars per pound) (dollars per pound) (dollars per pound) (dollars per pound) (dollars per pound)
Alabama .......................... Arkansas ......................... Florida ............................. Georgia ........................... Mississippi ....................... New Mexico ..................... North Carolina ................. Oklahoma ........................ South Carolina ................. Texas .............................. Virginia ............................ United States ...................
0.209 0.206 0.198 0.209 0.031 0.537 0.221 0.228 0.214 0.337 0.225
0.223
0.187 (S)
0.196 0.194 0.180 0.226
(S) 0.228 0.189 0.233
(S)
0.198
0.200 0.191 0.207 0.197 0.181 0.254 0.217 0.243 0.211 0.229 0.222
0.203
0.199 (S)
0.200 0.197 0.207 0.250 0.219 0.235 0.212 0.254 0.233
0.205
0.204 0.217 0.204 0.199 0.213 0.238 0.222 0.214 0.203 0.330 0.197
0.215
0.197 0.189 0.201 0.199
(S) (S)
0.222 0.178 0.203 0.228 0.218
0.206
(D) Withheld to avoid disclosing data for individual operations. (S) Insufficient number of reports to establish an estimate. 1 Second year.
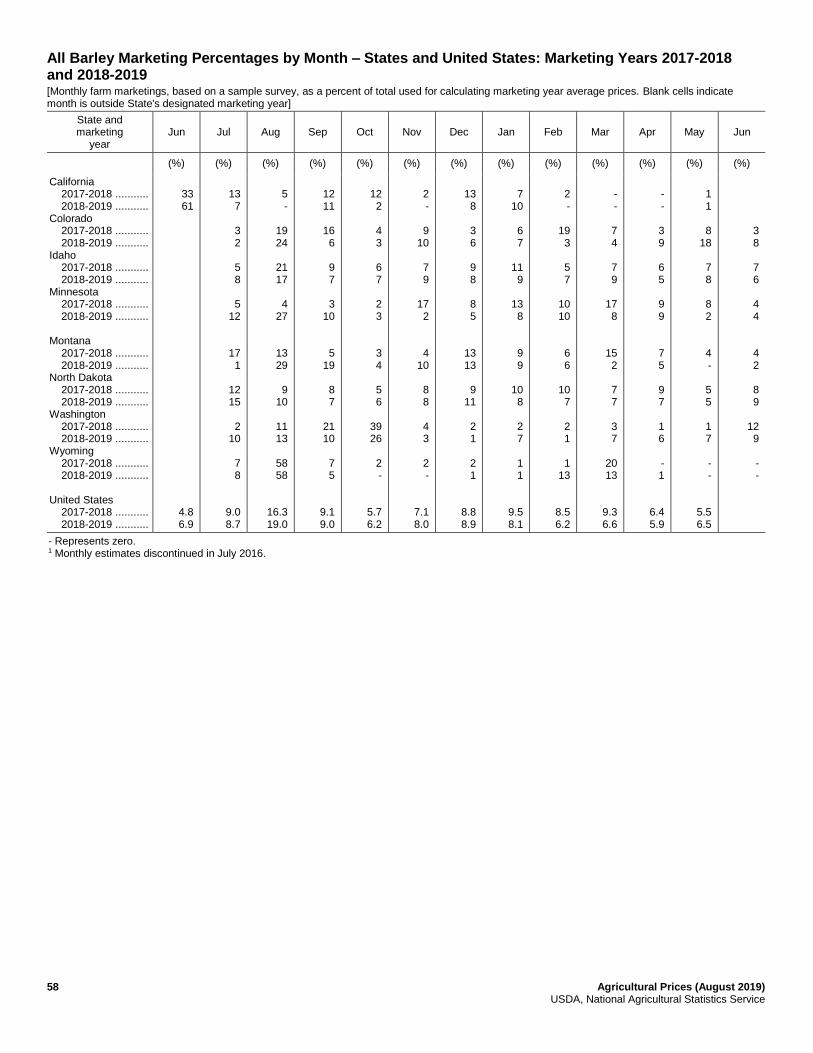
58 Agricultural Prices (August 2019) USDA, National Agricultural Statistics Service
All Barley Marketing Percentages by Month – States and United States: Marketing Years 2017-2018 and 2018-2019 [Monthly farm marketings, based on a sample survey, as a percent of total used for calculating marketing year average prices. Blank cells indicate month is outside State's designated marketing year]
State and marketing
year Jun Jul Aug Sep Oct Nov Dec Jan Feb Mar Apr May Jun
(%) (%) (%) (%) (%) (%) (%) (%) (%) (%) (%) (%) (%)
California 2017-2018 ........... 2018-2019 ........... Colorado 2017-2018 ........... 2018-2019 ........... Idaho 2017-2018 ........... 2018-2019 ........... Minnesota 2017-2018 ........... 2018-2019 ........... Montana 2017-2018 ........... 2018-2019 ........... North Dakota 2017-2018 ........... 2018-2019 ........... Washington 2017-2018 ........... 2018-2019 ........... Wyoming 2017-2018 ........... 2018-2019 ........... United States 2017-2018 ........... 2018-2019 ...........
33 61
4.8 6.9
13 7
3 2
5 8
5 12
17 1
12 15
2
10
7 8
9.0 8.7
5 -
19 24
21 17
4
27
13 29
9
10
11 13
58 58
16.3 19.0
12 11
16 6
9 7
3 10
5 19
8 7
21 10
7 5
9.1 9.0
12 2
4 3
6 7
2 3
3 4
5 6
39 26
2 -
5.7 6.2
2 -
9 10
7 9
17 2
4 10
8 8
4 3
2 -
7.1 8.0
13 8
3 6
9 8
8 5
13 13
9
11
2 1
2 1
8.8 8.9
7
10
6 7
11 9
13 8
9 9
10 8
2 7
1 1
9.5 8.1
2 -
19 3
5 7
10 10
6 6
10 7
2 1
1 13
8.5 6.2
- -
7 4
7 9
17 8
15 2
7 7
3 7
20 13
9.3 6.6
- -
3 9
6 5
9 9
7 5
9 7
1 6
- 1
6.4 5.9
1 1
8 18
7 8
8 2
4 -
5 5
1 7
- -
5.5 6.5
3 8
7 6
4 4
4 2
8 9
12 9
- -
- Represents zero. 1 Monthly estimates discontinued in July 2016.
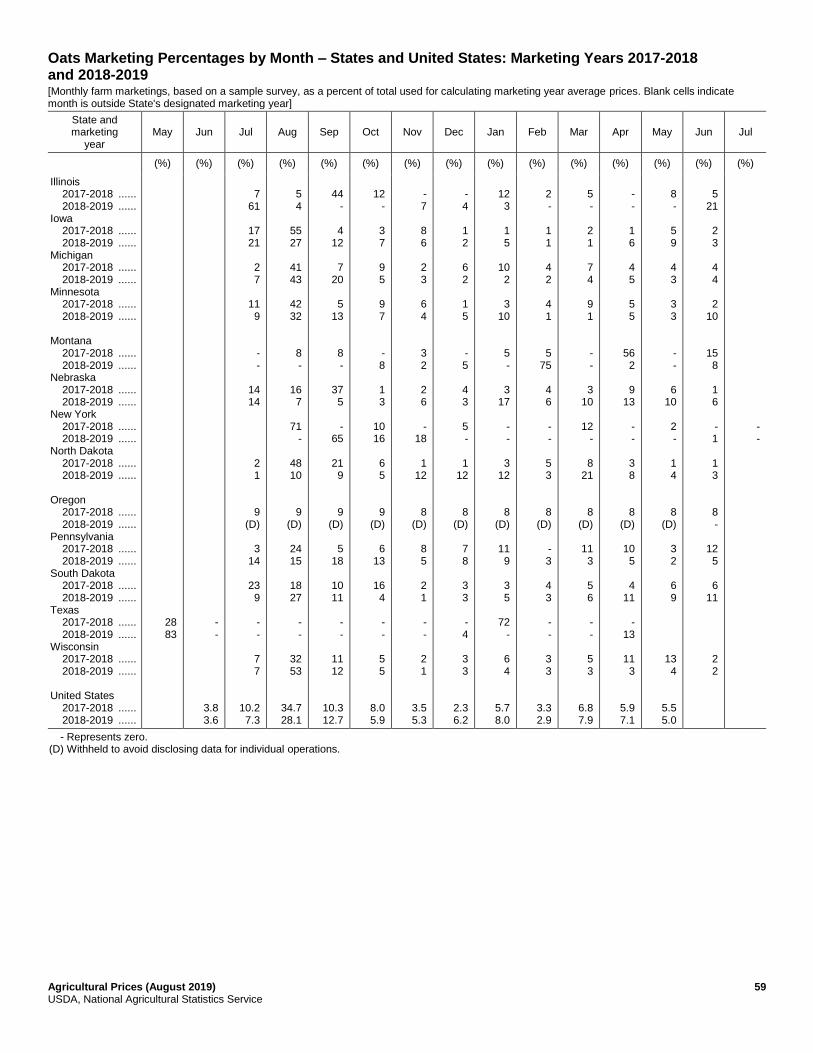
Agricultural Prices (August 2019) 59 USDA, National Agricultural Statistics Service
Oats Marketing Percentages by Month – States and United States: Marketing Years 2017-2018 and 2018-2019 [Monthly farm marketings, based on a sample survey, as a percent of total used for calculating marketing year average prices. Blank cells indicate month is outside State's designated marketing year]
State and marketing
year May Jun Jul Aug Sep Oct Nov Dec Jan Feb Mar Apr May Jun Jul
(%) (%) (%) (%) (%) (%) (%) (%) (%) (%) (%) (%) (%) (%) (%)
Illinois 2017-2018 ...... 2018-2019 ...... Iowa 2017-2018 ...... 2018-2019 ...... Michigan 2017-2018 ...... 2018-2019 ...... Minnesota 2017-2018 ...... 2018-2019 ...... Montana 2017-2018 ...... 2018-2019 ...... Nebraska 2017-2018 ...... 2018-2019 ...... New York 2017-2018 ...... 2018-2019 ...... North Dakota 2017-2018 ...... 2018-2019 ...... Oregon 2017-2018 ...... 2018-2019 ...... Pennsylvania 2017-2018 ...... 2018-2019 ...... South Dakota 2017-2018 ...... 2018-2019 ...... Texas 2017-2018 ...... 2018-2019 ...... Wisconsin 2017-2018 ...... 2018-2019 ...... United States 2017-2018 ...... 2018-2019 ......
28 83
- -
3.8 3.6
7
61
17 21
2 7
11 9
- -
14 14
2 1
9 (D)
3
14
23 9
- -
7 7
10.2 7.3
5 4
55 27
41 43
42 32
8 -
16 7
71 -
48 10
9 (D)
24 15
18 27
- -
32 53
34.7 28.1
44
-
4 12
7
20
5 13
8 -
37 5
- 65
21 9
9 (D)
5
18
10 11
- -
11 12
10.3 12.7
12
-
3 7
9 5
9 7
- 8
1 3
10 16
6 5
9 (D)
6
13
16 4
- -
5 5
8.0 5.9
- 7
8 6
2 3
6 4
3 2
2 6
- 18
1
12
8 (D)
8 5
2 1
- -
2 1
3.5 5.3
- 4
1 2
6 2
1 5
- 5
4 3
5 -
1 12
8 (D)
7 8
3 3
- 4
3 3
2.3 6.2
12 3
1 5
10 2
3 10
5 -
3 17
- -
3 12
8 (D)
11 9
3 5
72 -
6 4
5.7 8.0
2 -
1 1
4 2
4 1
5 75
4 6
- -
5 3
8 (D)
- 3
4 3
- -
3 3
3.3 2.9
5 -
2 1
7 4
9 1
- -
3 10
12
-
8 21
8 (D)
11 3
5 6
- -
5 3
6.8 7.9
- -
1 6
4 5
5 5
56 2
9 13
- -
3 8
8 (D)
10 5
4 11
-
13
11 3
5.9 7.1
8 -
5 9
4 3
3 3
- -
6 10
2 -
1 4
8 (D)
3 2
6 9
13 4
5.5 5.0
5
21
2 3
4 4
2 10
15 8
1 6
- 1
1 3
8 -
12 5
6 11
2 2
- -
- Represents zero. (D) Withheld to avoid disclosing data for individual operations.
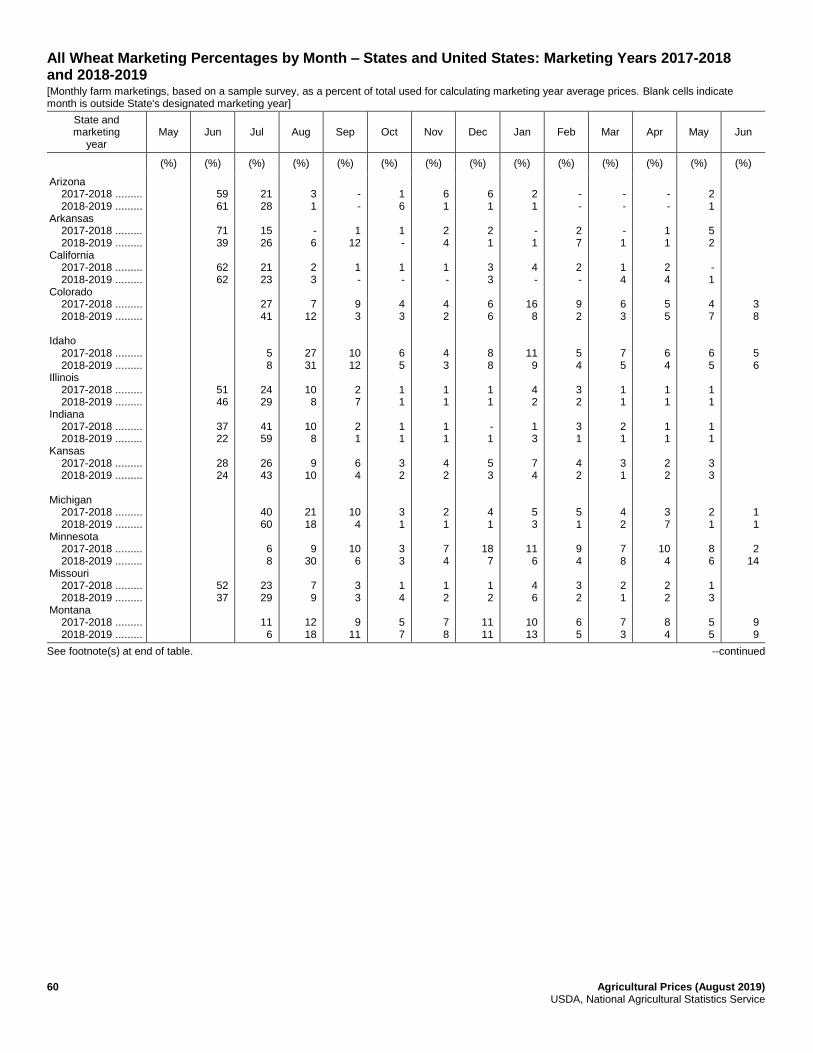
60 Agricultural Prices (August 2019) USDA, National Agricultural Statistics Service
All Wheat Marketing Percentages by Month – States and United States: Marketing Years 2017-2018 and 2018-2019 [Monthly farm marketings, based on a sample survey, as a percent of total used for calculating marketing year average prices. Blank cells indicate month is outside State's designated marketing year]
State and marketing
year May Jun Jul Aug Sep Oct Nov Dec Jan Feb Mar Apr May Jun
(%) (%) (%) (%) (%) (%) (%) (%) (%) (%) (%) (%) (%) (%)
Arizona 2017-2018 ......... 2018-2019 ......... Arkansas 2017-2018 ......... 2018-2019 ......... California 2017-2018 ......... 2018-2019 ......... Colorado 2017-2018 ......... 2018-2019 ......... Idaho 2017-2018 ......... 2018-2019 ......... Illinois 2017-2018 ......... 2018-2019 ......... Indiana 2017-2018 ......... 2018-2019 ......... Kansas 2017-2018 ......... 2018-2019 ......... Michigan 2017-2018 ......... 2018-2019 ......... Minnesota 2017-2018 ......... 2018-2019 ......... Missouri 2017-2018 ......... 2018-2019 ......... Montana 2017-2018 ......... 2018-2019 .........
59 61
71 39
62 62
51 46
37 22
28 24
52 37
21 28
15 26
21 23
27 41
5 8
24 29
41 59
26 43
40 60
6 8
23 29
11
6
3 1
- 6
2 3
7 12
27 31
10 8
10 8
9 10
21 18
9
30
7 9
12 18
- -
1 12
1 -
9 3
10 12
2 7
2 1
6 4
10 4
10 6
3 3
9 11
1 6
1 -
1 -
4 3
6 5
1 1
1 1
3 2
3 1
3 3
1 4
5 7
6 1
2 4
1 -
4 2
4 3
1 1
1 1
4 2
2 1
7 4
1 2
7 8
6 1
2 1
3 3
6 6
8 8
1 1
- 1
5 3
4 1
18 7
1 2
11 11
2 1
- 1
4 -
16 8
11 9
4 2
1 3
7 4
5 3
11 6
4 6
10 13
- -
2 7
2 -
9 2
5 4
3 2
3 1
4 2
5 1
9 4
3 2
6 5
- -
- 1
1 4
6 3
7 5
1 1
2 1
3 1
4 2
7 8
2 1
7 3
- -
1 1
2 4
5 5
6 4
1 1
1 1
2 2
3 7
10 4
2 2
8 4
2 1
5 2
- 1
4 7
6 5
1 1
1 1
3 3
2 1
8 6
1 3
5 5
3 8
5 6
1 1
2 14
9 9
See footnote(s) at end of table. --continued
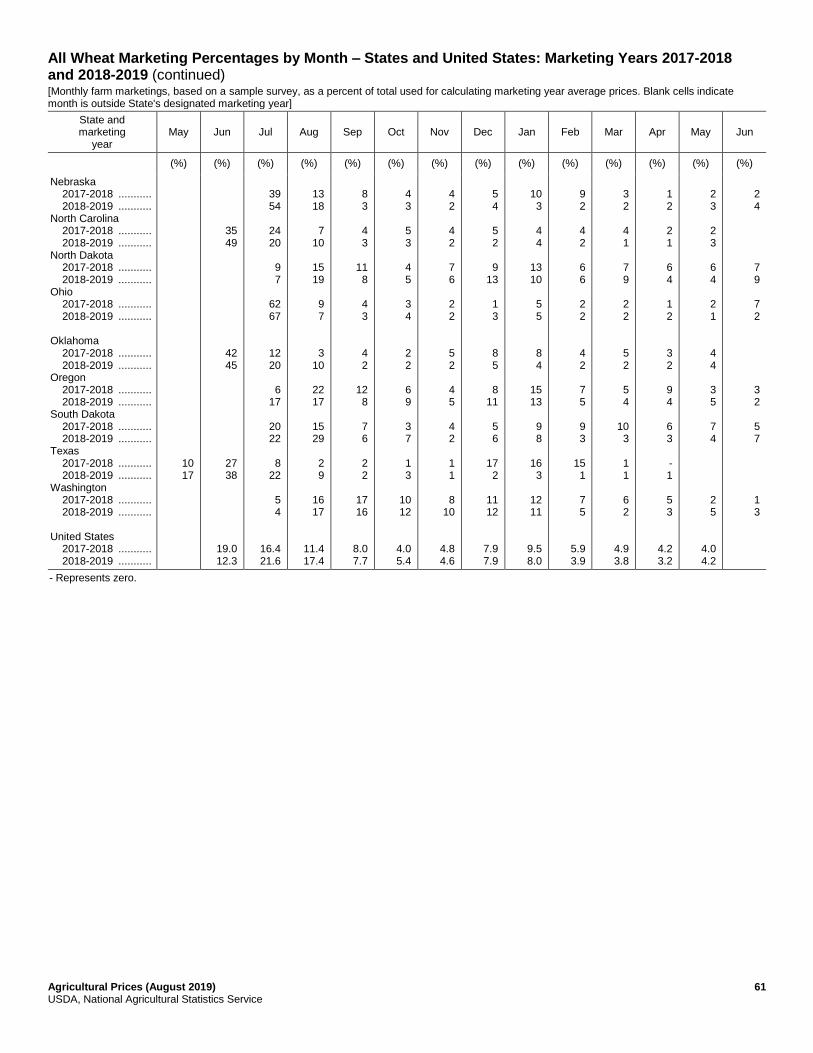
Agricultural Prices (August 2019) 61 USDA, National Agricultural Statistics Service
All Wheat Marketing Percentages by Month – States and United States: Marketing Years 2017-2018 and 2018-2019 (continued) [Monthly farm marketings, based on a sample survey, as a percent of total used for calculating marketing year average prices. Blank cells indicate month is outside State's designated marketing year]
State and marketing
year May Jun Jul Aug Sep Oct Nov Dec Jan Feb Mar Apr May Jun
(%) (%) (%) (%) (%) (%) (%) (%) (%) (%) (%) (%) (%) (%)
Nebraska 2017-2018 ........... 2018-2019 ........... North Carolina 2017-2018 ........... 2018-2019 ........... North Dakota 2017-2018 ........... 2018-2019 ........... Ohio 2017-2018 ........... 2018-2019 ........... Oklahoma 2017-2018 ........... 2018-2019 ........... Oregon 2017-2018 ........... 2018-2019 ........... South Dakota 2017-2018 ........... 2018-2019 ........... Texas 2017-2018 ........... 2018-2019 ........... Washington 2017-2018 ........... 2018-2019 ........... United States 2017-2018 ........... 2018-2019 ...........
10 17
35 49
42 45
27 38
19.0 12.3
39 54
24 20
9 7
62 67
12 20
6
17
20 22
8
22
5 4
16.4 21.6
13 18
7
10
15 19
9 7
3 10
22 17
15 29
2 9
16 17
11.4 17.4
8 3
4 3
11 8
4 3
4 2
12 8
7 6
2 2
17 16
8.0 7.7
4 3
5 3
4 5
3 4
2 2
6 9
3 7
1 3
10 12
4.0 5.4
4 2
4 2
7 6
2 2
5 2
4 5
4 2
1 1
8 10
4.8 4.6
5 4
5 2
9 13
1 3
8 5
8 11
5 6
17 2
11 12
7.9 7.9
10 3
4 4
13 10
5 5
8 4
15 13
9 8
16 3
12 11
9.5 8.0
9 2
4 2
6 6
2 2
4 2
7 5
9 3
15 1
7 5
5.9 3.9
3 2
4 1
7 9
2 2
5 2
5 4
10 3
1 1
6 2
4.9 3.8
1 2
2 1
6 4
1 2
3 2
9 4
6 3
- 1
5 3
4.2 3.2
2 3
2 3
6 4
2 1
4 4
3 5
7 4
2 5
4.0 4.2
2 4
7 9
7 2
3 2
5 7
1 3
- Represents zero.
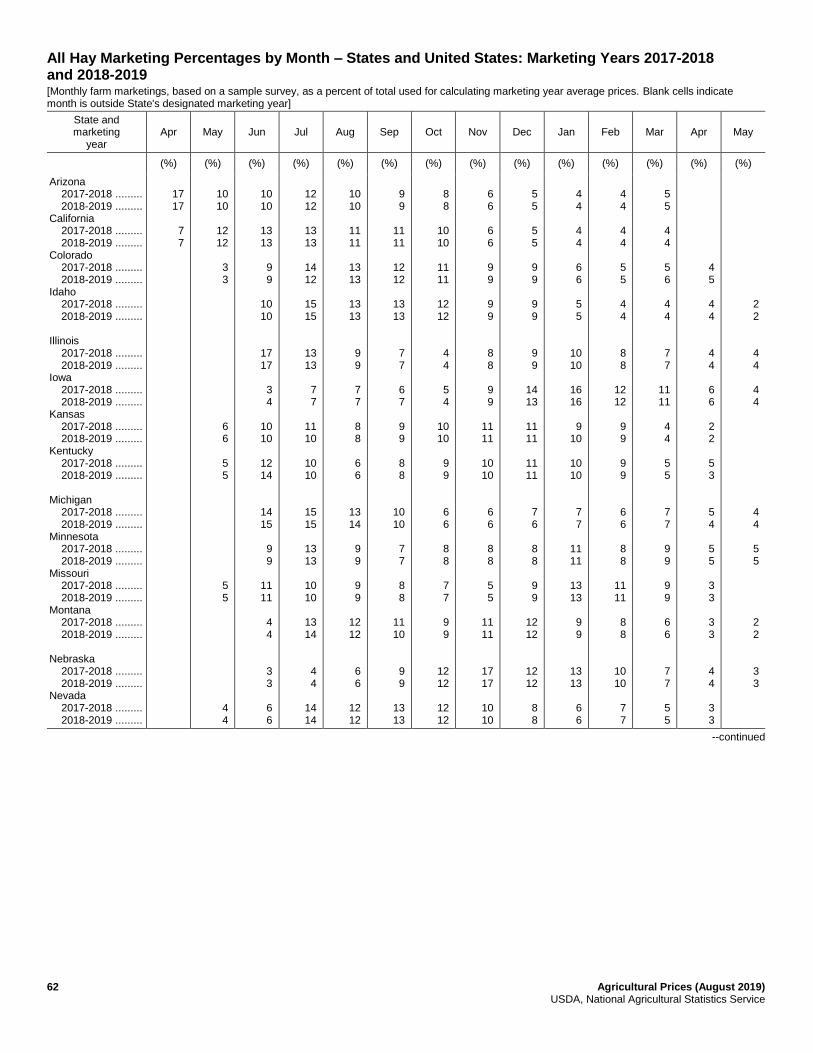
62 Agricultural Prices (August 2019) USDA, National Agricultural Statistics Service
All Hay Marketing Percentages by Month – States and United States: Marketing Years 2017-2018 and 2018-2019 [Monthly farm marketings, based on a sample survey, as a percent of total used for calculating marketing year average prices. Blank cells indicate month is outside State's designated marketing year]
State and marketing
year Apr May Jun Jul Aug Sep Oct Nov Dec Jan Feb Mar Apr May
(%) (%) (%) (%) (%) (%) (%) (%) (%) (%) (%) (%) (%) (%)
Arizona 2017-2018 ......... 2018-2019 ......... California 2017-2018 ......... 2018-2019 ......... Colorado 2017-2018 ......... 2018-2019 ......... Idaho 2017-2018 ......... 2018-2019 ......... Illinois 2017-2018 ......... 2018-2019 ......... Iowa 2017-2018 ......... 2018-2019 ......... Kansas 2017-2018 ......... 2018-2019 ......... Kentucky 2017-2018 ......... 2018-2019 ......... Michigan 2017-2018 ......... 2018-2019 ......... Minnesota 2017-2018 ......... 2018-2019 ......... Missouri 2017-2018 ......... 2018-2019 ......... Montana 2017-2018 ......... 2018-2019 ......... Nebraska 2017-2018 ......... 2018-2019 ......... Nevada 2017-2018 ......... 2018-2019 .........
17 17
7 7
10 10
12 12
3 3
6 6
5 5
5 5
4 4
10 10
13 13
9 9
10 10
17 17
3 4
10 10
12 14
14 15
9 9
11 11
4 4
3 3
6 6
12 12
13 13
14 12
15 15
13 13
7 7
11 10
10 10
15 15
13 13
10 10
13 14
4 4
14 14
10 10
11 11
13 13
13 13
9 9
7 7
8 8
6 6
13 14
9 9
9 9
12 12
6 6
12 12
9 9
11 11
12 12
13 13
7 7
6 7
9 9
8 8
10 10
7 7
8 8
11 10
9 9
13 13
8 8
10 10
11 11
12 12
4 4
5 4
10 10
9 9
6 6
8 8
7 7
9 9
12 12
12 12
6 6
6 6
9 9
9 9
8 8
9 9
11 11
10 10
6 6
8 8
5 5
11 11
17 17
10 10
5 5
5 5
9 9
9 9
9 9
14 13
11 11
11 11
7 6
8 8
9 9
12 12
12 12
8 8
4 4
4 4
6 6
5 5
10 10
16 16
9
10
10 10
7 7
11 11
13 13
9 9
13 13
6 6
4 4
4 4
5 5
4 4
8 8
12 12
9 9
9 9
6 6
8 8
11 11
8 8
10 10
7 7
5 5
4 4
5 6
4 4
7 7
11 11
4 4
5 5
7 7
9 9
9 9
6 6
7 7
5 5
4 5
4 4
4 4
6 6
2 2
5 3
5 4
5 5
3 3
3 3
4 4
3 3
2 2
4 4
4 4
4 4
5 5
2 2
3 3
--continued
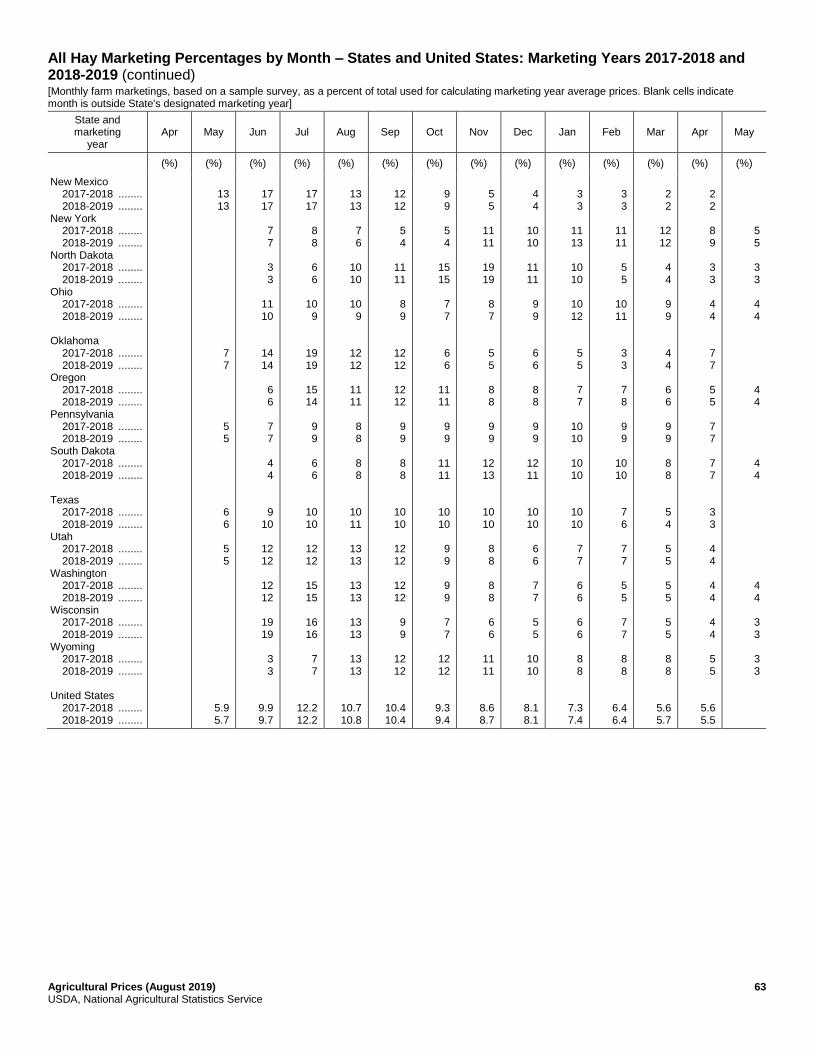
Agricultural Prices (August 2019) 63 USDA, National Agricultural Statistics Service
All Hay Marketing Percentages by Month – States and United States: Marketing Years 2017-2018 and 2018-2019 (continued) [Monthly farm marketings, based on a sample survey, as a percent of total used for calculating marketing year average prices. Blank cells indicate month is outside State's designated marketing year]
State and marketing
year Apr May Jun Jul Aug Sep Oct Nov Dec Jan Feb Mar Apr May
(%) (%) (%) (%) (%) (%) (%) (%) (%) (%) (%) (%) (%) (%)
New Mexico 2017-2018 ........ 2018-2019 ........ New York 2017-2018 ........ 2018-2019 ........ North Dakota 2017-2018 ........ 2018-2019 ........ Ohio 2017-2018 ........ 2018-2019 ........ Oklahoma 2017-2018 ........ 2018-2019 ........ Oregon 2017-2018 ........ 2018-2019 ........ Pennsylvania 2017-2018 ........ 2018-2019 ........ South Dakota 2017-2018 ........ 2018-2019 ........ Texas 2017-2018 ........ 2018-2019 ........ Utah 2017-2018 ........ 2018-2019 ........ Washington 2017-2018 ........ 2018-2019 ........ Wisconsin 2017-2018 ........ 2018-2019 ........ Wyoming 2017-2018 ........ 2018-2019 ........ United States 2017-2018 ........ 2018-2019 ........
13 13
7 7
5 5
6 6
5 5
5.9 5.7
17 17
7 7
3 3
11 10
14 14
6 6
7 7
4 4
9 10
12 12
12 12
19 19
3 3
9.9 9.7
17 17
8 8
6 6
10 9
19 19
15 14
9 9
6 6
10 10
12 12
15 15
16 16
7 7
12.2 12.2
13 13
7 6
10 10
10 9
12 12
11 11
8 8
8 8
10 11
13 13
13 13
13 13
13 13
10.7 10.8
12 12
5 4
11 11
8 9
12 12
12 12
9 9
8 8
10 10
12 12
12 12
9 9
12 12
10.4 10.4
9 9
5 4
15 15
7 7
6 6
11 11
9 9
11 11
10 10
9 9
9 9
7 7
12 12
9.3 9.4
5 5
11 11
19 19
8 7
5 5
8 8
9 9
12 13
10 10
8 8
8 8
6 6
11 11
8.6 8.7
4 4
10 10
11 11
9 9
6 6
8 8
9 9
12 11
10 10
6 6
7 7
5 5
10 10
8.1 8.1
3 3
11 13
10 10
10 12
5 5
7 7
10 10
10 10
10 10
7 7
6 6
6 6
8 8
7.3 7.4
3 3
11 11
5 5
10 11
3 3
7 8
9 9
10 10
7 6
7 7
5 5
7 7
8 8
6.4 6.4
2 2
12 12
4 4
9 9
4 4
6 6
9 9
8 8
5 4
5 5
5 5
5 5
8 8
5.6 5.7
2 2
8 9
3 3
4 4
7 7
5 5
7 7
7 7
3 3
4 4
4 4
4 4
5 5
5.6 5.5
5 5
3 3
4 4
4 4
4 4
4 4
3 3
3 3
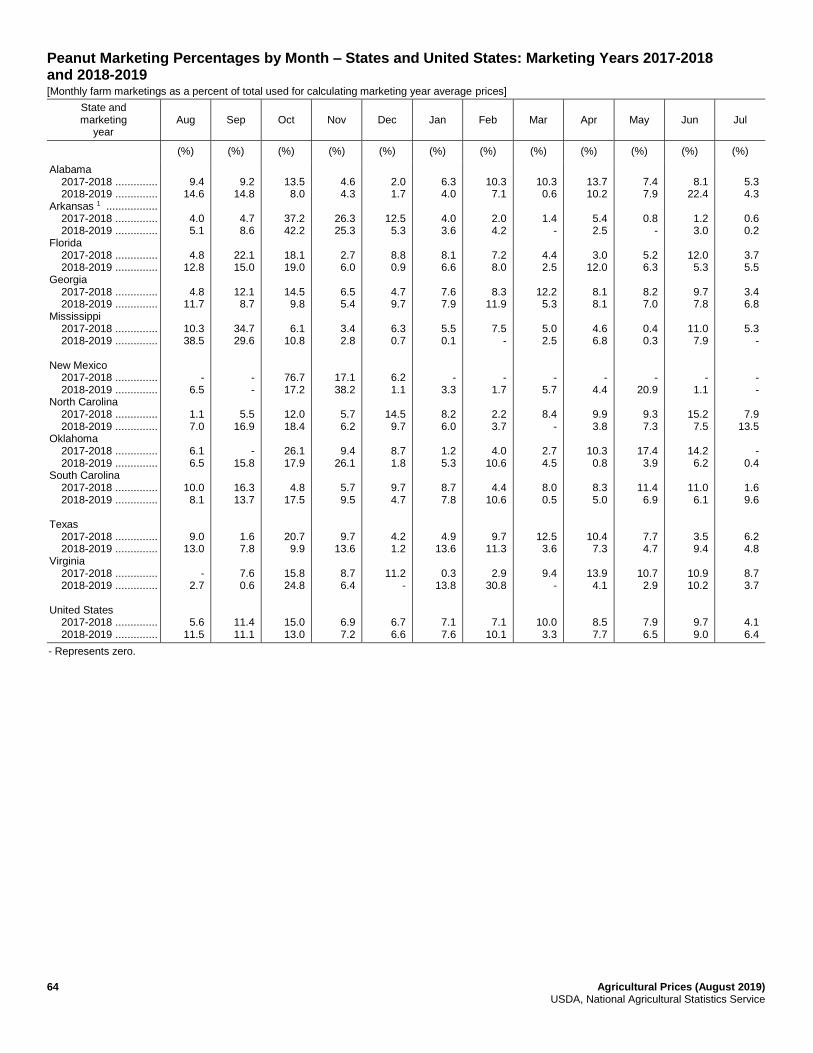
64 Agricultural Prices (August 2019) USDA, National Agricultural Statistics Service
Peanut Marketing Percentages by Month – States and United States: Marketing Years 2017-2018 and 2018-2019 [Monthly farm marketings as a percent of total used for calculating marketing year average prices]
State and marketing
year Aug Sep Oct Nov Dec Jan Feb Mar Apr May Jun Jul
(%) (%) (%) (%) (%) (%) (%) (%) (%) (%) (%) (%)
Alabama 2017-2018 .............. 2018-2019 .............. Arkansas 1 ................. 2017-2018 .............. 2018-2019 .............. Florida 2017-2018 .............. 2018-2019 .............. Georgia 2017-2018 .............. 2018-2019 .............. Mississippi 2017-2018 .............. 2018-2019 .............. New Mexico 2017-2018 .............. 2018-2019 .............. North Carolina 2017-2018 .............. 2018-2019 .............. Oklahoma 2017-2018 .............. 2018-2019 .............. South Carolina 2017-2018 .............. 2018-2019 .............. Texas 2017-2018 .............. 2018-2019 .............. Virginia 2017-2018 .............. 2018-2019 .............. United States 2017-2018 .............. 2018-2019 ..............
9.4
14.6
4.0 5.1
4.8
12.8
4.8 11.7
10.3 38.5
- 6.5
1.1 7.0
6.1 6.5
10.0 8.1
9.0 13.0
-
2.7
5.6 11.5
9.2
14.8
4.7 8.6
22.1 15.0
12.1 8.7
34.7 29.6
- -
5.5 16.9
-
15.8
16.3 13.7
1.6 7.8
7.6 0.6
11.4 11.1
13.5 8.0
37.2 42.2
18.1 19.0
14.5 9.8
6.1
10.8
76.7 17.2
12.0 18.4
26.1 17.9
4.8
17.5
20.7 9.9
15.8 24.8
15.0 13.0
4.6 4.3
26.3 25.3
2.7 6.0
6.5 5.4
3.4 2.8
17.1 38.2
5.7 6.2
9.4
26.1
5.7 9.5
9.7 13.6
8.7 6.4
6.9 7.2
2.0 1.7
12.5 5.3
8.8 0.9
4.7 9.7
6.3 0.7
6.2 1.1
14.5 9.7
8.7 1.8
9.7 4.7
4.2 1.2
11.2
-
6.7 6.6
6.3 4.0
4.0 3.6
8.1 6.6
7.6 7.9
5.5 0.1
- 3.3
8.2 6.0
1.2 5.3
8.7 7.8
4.9 13.6
0.3
13.8
7.1 7.6
10.3 7.1
2.0 4.2
7.2 8.0
8.3
11.9
7.5 -
- 1.7
2.2 3.7
4.0
10.6
4.4 10.6
9.7 11.3
2.9
30.8
7.1 10.1
10.3 0.6
1.4
-
4.4 2.5
12.2 5.3
5.0 2.5
- 5.7
8.4
-
2.7 4.5
8.0 0.5
12.5 3.6
9.4
-
10.0 3.3
13.7 10.2
5.4 2.5
3.0
12.0
8.1 8.1
4.6 6.8
- 4.4
9.9 3.8
10.3 0.8
8.3 5.0
10.4 7.3
13.9 4.1
8.5 7.7
7.4 7.9
0.8
-
5.2 6.3
8.2 7.0
0.4 0.3
- 20.9
9.3 7.3
17.4 3.9
11.4 6.9
7.7 4.7
10.7 2.9
7.9 6.5
8.1
22.4
1.2 3.0
12.0 5.3
9.7 7.8
11.0 7.9
- 1.1
15.2 7.5
14.2 6.2
11.0 6.1
3.5 9.4
10.9 10.2
9.7 9.0
5.3 4.3
0.6 0.2
3.7 5.5
3.4 6.8
5.3
-
- -
7.9 13.5
-
0.4
1.6 9.6
6.2 4.8
8.7 3.7
4.1 6.4
- Represents zero.
Agricultural Prices (August 2019) 65 USDA, National Agricultural Statistics Service
Reliability of Prices Received Estimates
Definition: Prices received represent sales from producers to first buyers. They include all grades and qualities. The
average commodity price from the survey multiplied by the total quantity marketed theoretically should give the total cash
receipts for the commodity.
Survey procedures: Primary sales data used to determine grain prices were obtained from probability samples of about
1,900 mills and elevators. These procedures ensure that virtually all grain moving into commercial channels has a chance
of being included in the survey. Generally, States surveyed account for 90 percent or more of total United States
production. Livestock prices are obtained from packers, stockyards, auctions, dealers, and market check data from
AMS-USDA, private marketing organizations, and state commodity groups and agencies. Inter-farm sales of grain and
livestock are not included since they represent very small percentages of the total sales. Grain marketed for seed is also
excluded. Fruit and vegetable prices are obtained from sample surveys and market check data from AMS-USDA, private
marketing organizations, state agencies, and universities.
Summary and estimation procedures: Survey quantities sold are expanded by strata to state levels and used to weight
average strata prices to a state average. State prices are then weighted to a United States price based on expanded sales.
Recommendations are prepared by the Regional Field Offices and reviewed by the Agricultural Statistics Board in
Washington, D.C. State recommendations are reviewed for reasonableness with survey data, other States, and recent
historic estimates.
Revisions: In general, revisions are made during annual commodity market year estimation time, following five-year
Census revisions, or when later information is received. Revisions are published in monthly issues of Agricultural Prices.
Reliability: United States price estimates based on probability surveys generally have a sampling error of less than one
percent for the major commodities such as corn, wheat, soybeans, cotton, and rice. Current methods of summarization for
non-probability commodities are not designed directly to calculate sampling errors. However, analytical measures
approximate the United States relative sampling errors at around five percent. Any non-sampling errors are attributed to
such things as the inability to obtain correct information, differences in interpreting questions or definitions, mistakes in
coding or processing the data, etc. Efforts are made at each step in the survey process to minimize these non-sampling
errors.
Program Changes: After the Council on Food, Agricultural and Resource Economics (C-FARE) 2009 program review which
included changes in farm production practices, plans were implemented to make necessary program improvements in the
agricultural price program. The index group structure for prices received was modified to maintain a more universal structure
and consistency with the required 1910-1914 series.
Modifications implemented January 2014 include the following: updated the current 1990-1992 base reference period to
2011; linked the 1910-1914 series to the updated base reference period, 2011; created index groups used universally by
researchers, data users, and policymakers; and re-classified agricultural commodities into the index groups. Also the
modifications expanded the commodity coverage for vegetable, melon, non-citrus, and tree nuts; updated monthly market
weights; and adjusted (normalized) current five year moving average cash receipts and farm input cost weights.
Modifications implemented January 2015 discontinued preliminary prices and replaced the annual average index with an
annual index.
The February 2016 program update changed the rounding of the 2011 base period indexes to nearest tenth of a percent.
The 1910-1914 base period indexes remain rounded to the nearest whole number.
See Price Program Links at end of this report for program change details.
66 Agricultural Prices (August 2019) USDA, National Agricultural Statistics Service
July Prices Paid by Farmers
The July Prices Paid Index for Commodities and Services, Interest, Taxes, and Farm Wage Rates (PPITW), at 110.5, is
unchanged from June 2019 but up 1.4 percent from July 2018.
Production: The July index, at 107.0, is unchanged from June but 0.9 percent higher than last year. Lower prices for
feeder pigs, hay and forages, concentrates, and mixed fertilizer offset higher prices for feeder cattle, complete feeds, feed
grains, and milk cows.
Feed: At 103.6, the July index decreased 0.5 percent from June but increased 2.7 percent from last July. Since June,
lower prices for hay and forages and concentrates more than offset higher prices for complete feeds, feed grains,
and supplements.
Livestock and poultry: The July index, at 98.0, increased 0.8 percent from June but decreased 2.6 percent from
July last year. Since June, higher prices for feeder cattle and milk cows more than offset lower prices for feeder
pigs. The July feeder cattle price, at $137.00 per cwt, is up $4.00 per cwt from June. The July feeder pigs price, at
$123.00 per cwt, is down $26.00 per cwt from June.
Fertilizer: The index for July, at 66.8, is down 1.5 percent from June but 1.8 percent above July a year ago. Since
June, lower prices for mixed fertilizer and potash and phosphate more than offset higher prices for nitrogen.
Chemicals: The July index, at 103.9, is up 1.7 percent from June and 6.1 percent from July last year.
Fuels: At 68.8, the July index is up 0.3 percent from June but down 6.3 percent from July 2018. Compared with
June, the prices are higher for LP gas and gasoline but lower for diesel.
Machinery: The index for July, at 125.8, decreased 0.2 percent from June but increased 5.0 percent from last July.
Compared with last month, the prices are lower for other machinery and self-propelled machinery but unchanged
for tractors.
Consumer Price Index: The July 2019 Consumer Price Index for All Urban Consumers (CPI-U), as issued by the Bureau
of Labor Statistics, increased 1.8 percent over the last 12 months to an index level of 256.571 (1982-1984=100). For the
month, the index increased 0.2 percent prior to seasonal adjustment.
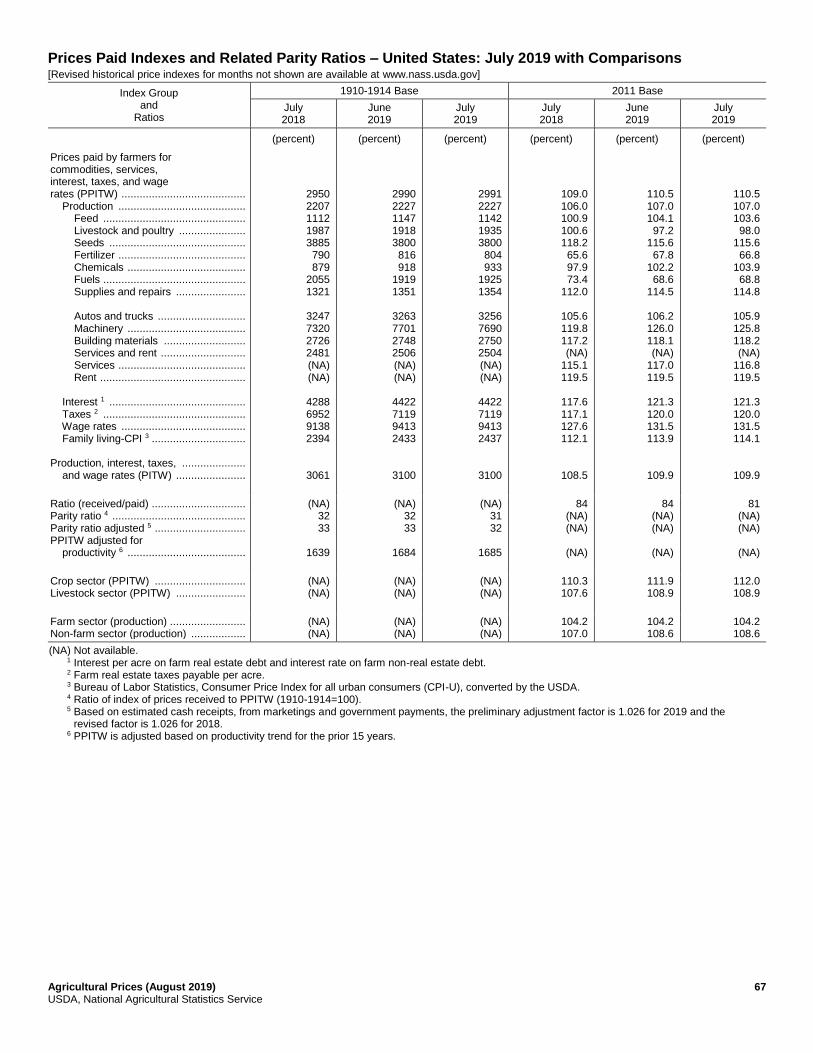
Agricultural Prices (August 2019) 67 USDA, National Agricultural Statistics Service
Prices Paid Indexes and Related Parity Ratios – United States: July 2019 with Comparisons [Revised historical price indexes for months not shown are available at www.nass.usda.gov]
Index Group and
Ratios
1910-1914 Base 2011 Base
July 2018
June 2019
July 2019
July 2018
June 2019
July 2019
(percent) (percent) (percent) (percent) (percent) (percent)
Prices paid by farmers for commodities, services, interest, taxes, and wage rates (PPITW) ......................................... Production .......................................... Feed ............................................... Livestock and poultry ...................... Seeds ............................................. Fertilizer .......................................... Chemicals ....................................... Fuels ............................................... Supplies and repairs ....................... Autos and trucks ............................. Machinery ....................................... Building materials ........................... Services and rent ............................ Services .......................................... Rent ................................................ Interest 1 ............................................. Taxes 2 ............................................... Wage rates ......................................... Family living-CPI 3 ............................... Production, interest, taxes, ..................... and wage rates (PITW) .......................
2950 2207 1112 1987 3885 790 879
2055 1321
3247 7320 2726 2481 (NA) (NA)
4288 6952 9138 2394
3061
2990 2227 1147 1918 3800 816 918
1919 1351
3263 7701 2748 2506 (NA) (NA)
4422 7119 9413 2433
3100
2991 2227 1142 1935 3800 804 933
1925 1354
3256 7690 2750 2504 (NA) (NA)
4422 7119 9413 2437
3100
109.0 106.0 100.9 100.6 118.2 65.6 97.9 73.4
112.0
105.6 119.8 117.2 (NA)
115.1 119.5
117.6 117.1 127.6 112.1
108.5
110.5 107.0 104.1 97.2
115.6 67.8
102.2 68.6
114.5
106.2 126.0 118.1 (NA)
117.0 119.5
121.3 120.0 131.5 113.9
109.9
110.5 107.0 103.6 98.0
115.6 66.8
103.9 68.8
114.8
105.9 125.8 118.2 (NA)
116.8 119.5
121.3 120.0 131.5 114.1
109.9
Ratio (received/paid) ............................... Parity ratio 4 ............................................ Parity ratio adjusted 5 .............................. PPITW adjusted for productivity 6 .......................................
(NA) 32 33
1639
(NA) 32 33
1684
(NA) 31 32
1685
84 (NA) (NA)
(NA)
84 (NA) (NA)
(NA)
81 (NA) (NA)
(NA)
Crop sector (PPITW) .............................. Livestock sector (PPITW) .......................
(NA) (NA)
(NA) (NA)
(NA) (NA)
110.3 107.6
111.9 108.9
112.0 108.9
Farm sector (production) ......................... Non-farm sector (production) ..................
(NA) (NA)
(NA) (NA)
(NA) (NA)
104.2 107.0
104.2 108.6
104.2 108.6
(NA) Not available. 1 Interest per acre on farm real estate debt and interest rate on farm non-real estate debt. 2 Farm real estate taxes payable per acre. 3 Bureau of Labor Statistics, Consumer Price Index for all urban consumers (CPI-U), converted by the USDA. 4 Ratio of index of prices received to PPITW (1910-1914=100). 5 Based on estimated cash receipts, from marketings and government payments, the preliminary adjustment factor is 1.026 for 2019 and the
revised factor is 1.026 for 2018. 6 PPITW is adjusted based on productivity trend for the prior 15 years.
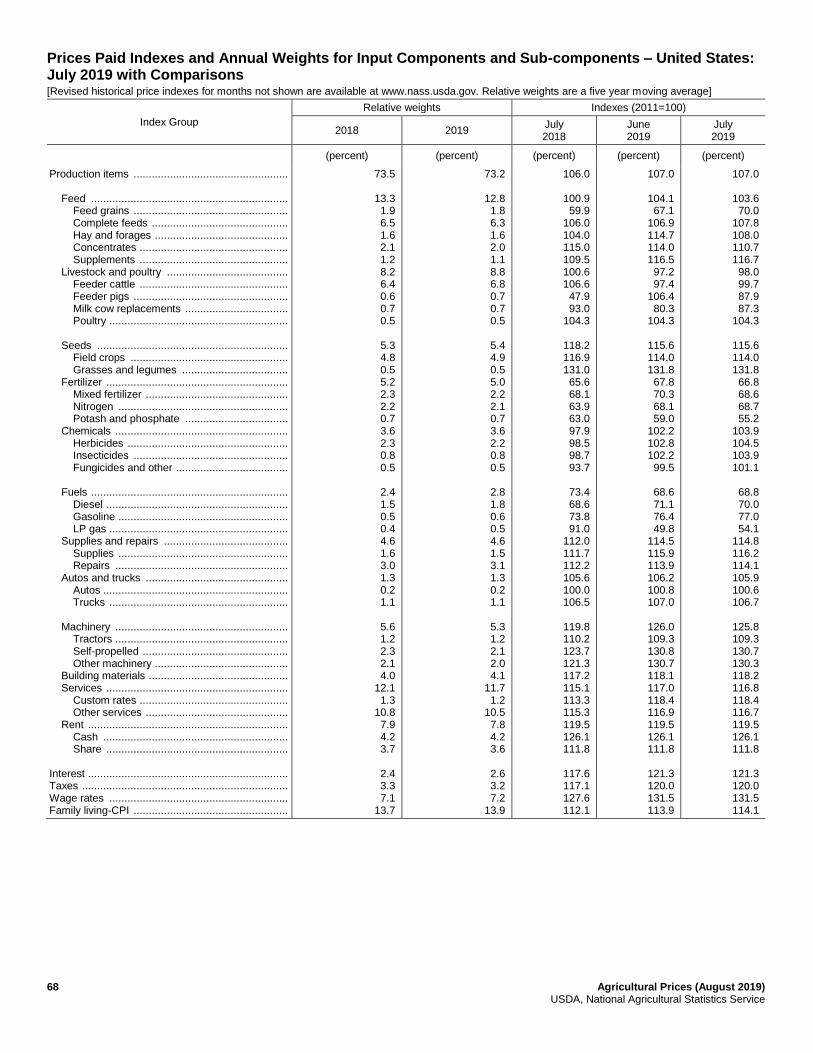
68 Agricultural Prices (August 2019) USDA, National Agricultural Statistics Service
Prices Paid Indexes and Annual Weights for Input Components and Sub-components – United States: July 2019 with Comparisons [Revised historical price indexes for months not shown are available at www.nass.usda.gov. Relative weights are a five year moving average]
Index Group
Relative weights Indexes (2011=100)
2018 2019 July 2018
June 2019
July 2019
(percent) (percent) (percent) (percent) (percent)
Production items ................................................... Feed ................................................................. Feed grains ................................................... Complete feeds ............................................. Hay and forages ............................................ Concentrates ................................................. Supplements ................................................. Livestock and poultry ........................................ Feeder cattle ................................................. Feeder pigs ................................................... Milk cow replacements .................................. Poultry ........................................................... Seeds ............................................................... Field crops .................................................... Grasses and legumes ................................... Fertilizer ............................................................ Mixed fertilizer ............................................... Nitrogen ........................................................ Potash and phosphate .................................. Chemicals ......................................................... Herbicides ..................................................... Insecticides ................................................... Fungicides and other ..................................... Fuels ................................................................. Diesel ............................................................ Gasoline ........................................................ LP gas ........................................................... Supplies and repairs ......................................... Supplies ........................................................ Repairs ......................................................... Autos and trucks ............................................... Autos ............................................................. Trucks ........................................................... Machinery ......................................................... Tractors ......................................................... Self-propelled ................................................ Other machinery ............................................ Building materials .............................................. Services ............................................................ Custom rates ................................................. Other services ............................................... Rent .................................................................. Cash ............................................................. Share ............................................................ Interest .................................................................. Taxes .................................................................... Wage rates ........................................................... Family living-CPI ...................................................
73.5
13.3 1.9 6.5 1.6 2.1 1.2 8.2 6.4 0.6 0.7 0.5
5.3 4.8 0.5 5.2 2.3 2.2 0.7 3.6 2.3 0.8 0.5
2.4 1.5 0.5 0.4 4.6 1.6 3.0 1.3 0.2 1.1
5.6 1.2 2.3 2.1 4.0
12.1 1.3
10.8 7.9 4.2 3.7
2.4 3.3 7.1
13.7
73.2
12.8 1.8 6.3 1.6 2.0 1.1 8.8 6.8 0.7 0.7 0.5
5.4 4.9 0.5 5.0 2.2 2.1 0.7 3.6 2.2 0.8 0.5
2.8 1.8 0.6 0.5 4.6 1.5 3.1 1.3 0.2 1.1
5.3 1.2 2.1 2.0 4.1
11.7 1.2
10.5 7.8 4.2 3.6
2.6 3.2 7.2
13.9
106.0
100.9 59.9
106.0 104.0 115.0 109.5 100.6 106.6 47.9 93.0
104.3
118.2 116.9 131.0 65.6 68.1 63.9 63.0 97.9 98.5 98.7 93.7
73.4 68.6 73.8 91.0
112.0 111.7 112.2 105.6 100.0 106.5
119.8 110.2 123.7 121.3 117.2 115.1 113.3 115.3 119.5 126.1 111.8
117.6 117.1 127.6 112.1
107.0
104.1 67.1
106.9 114.7 114.0 116.5 97.2 97.4
106.4 80.3
104.3
115.6 114.0 131.8 67.8 70.3 68.1 59.0
102.2 102.8 102.2 99.5
68.6 71.1 76.4 49.8
114.5 115.9 113.9 106.2 100.8 107.0
126.0 109.3 130.8 130.7 118.1 117.0 118.4 116.9 119.5 126.1 111.8
121.3 120.0 131.5 113.9
107.0
103.6 70.0
107.8 108.0 110.7 116.7 98.0 99.7 87.9 87.3
104.3
115.6 114.0 131.8 66.8 68.6 68.7 55.2
103.9 104.5 103.9 101.1
68.8 70.0 77.0 54.1
114.8 116.2 114.1 105.9 100.6 106.7
125.8 109.3 130.7 130.3 118.2 116.8 118.4 116.7 119.5 126.1 111.8
121.3 120.0 131.5 114.1
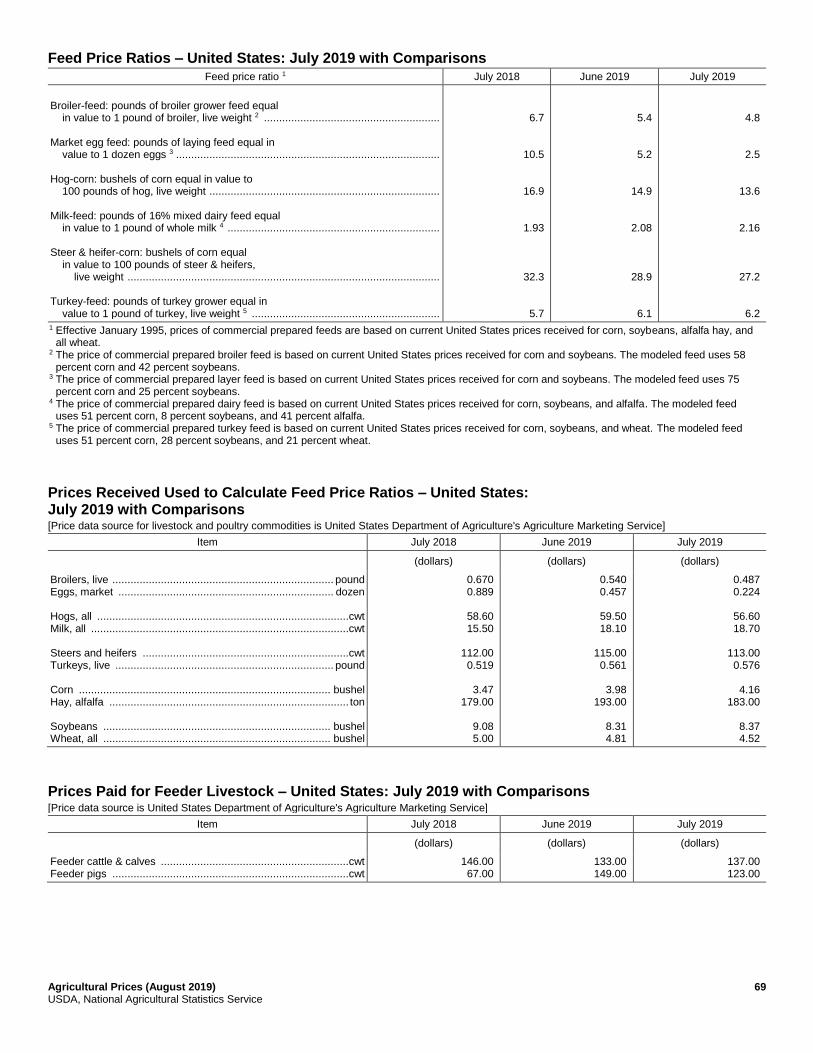
Agricultural Prices (August 2019) 69 USDA, National Agricultural Statistics Service
Feed Price Ratios – United States: July 2019 with Comparisons
Feed price ratio 1 July 2018 June 2019 July 2019
Broiler-feed: pounds of broiler grower feed equal in value to 1 pound of broiler, live weight 2 .......................................................... Market egg feed: pounds of laying feed equal in value to 1 dozen eggs 3 ....................................................................................... Hog-corn: bushels of corn equal in value to 100 pounds of hog, live weight ............................................................................ Milk-feed: pounds of 16% mixed dairy feed equal in value to 1 pound of whole milk 4 ...................................................................... Steer & heifer-corn: bushels of corn equal in value to 100 pounds of steer & heifers, live weight ....................................................................................................... Turkey-feed: pounds of turkey grower equal in value to 1 pound of turkey, live weight 5 ..............................................................
6.7
10.5
16.9
1.93
32.3
5.7
5.4
5.2
14.9
2.08
28.9
6.1
4.8
2.5
13.6
2.16
27.2
6.2
1 Effective January 1995, prices of commercial prepared feeds are based on current United States prices received for corn, soybeans, alfalfa hay, and all wheat.
2 The price of commercial prepared broiler feed is based on current United States prices received for corn and soybeans. The modeled feed uses 58 percent corn and 42 percent soybeans.
3 The price of commercial prepared layer feed is based on current United States prices received for corn and soybeans. The modeled feed uses 75 percent corn and 25 percent soybeans.
4 The price of commercial prepared dairy feed is based on current United States prices received for corn, soybeans, and alfalfa. The modeled feed uses 51 percent corn, 8 percent soybeans, and 41 percent alfalfa.
5 The price of commercial prepared turkey feed is based on current United States prices received for corn, soybeans, and wheat. The modeled feed uses 51 percent corn, 28 percent soybeans, and 21 percent wheat.
Prices Received Used to Calculate Feed Price Ratios – United States: July 2019 with Comparisons [Price data source for livestock and poultry commodities is United States Department of Agriculture's Agriculture Marketing Service]
Item July 2018 June 2019 July 2019
(dollars) (dollars) (dollars)
Broilers, live ......................................................................... pound Eggs, market ....................................................................... dozen Hogs, all ...................................................................................cwt Milk, all .....................................................................................cwt Steers and heifers ....................................................................cwt Turkeys, live ........................................................................ pound Corn ................................................................................... bushel Hay, alfalfa ............................................................................... ton Soybeans ........................................................................... bushel Wheat, all ........................................................................... bushel
0.670 0.889
58.60 15.50
112.00 0.519
3.47
179.00
9.08 5.00
0.540 0.457
59.50 18.10
115.00 0.561
3.98
193.00
8.31 4.81
0.487 0.224
56.60 18.70
113.00 0.576
4.16
183.00
8.37 4.52
Prices Paid for Feeder Livestock – United States: July 2019 with Comparisons [Price data source is United States Department of Agriculture's Agriculture Marketing Service]
Item July 2018 June 2019 July 2019
(dollars) (dollars) (dollars)
Feeder cattle & calves ..............................................................cwt Feeder pigs ..............................................................................cwt
146.00 67.00
133.00 149.00
137.00 123.00
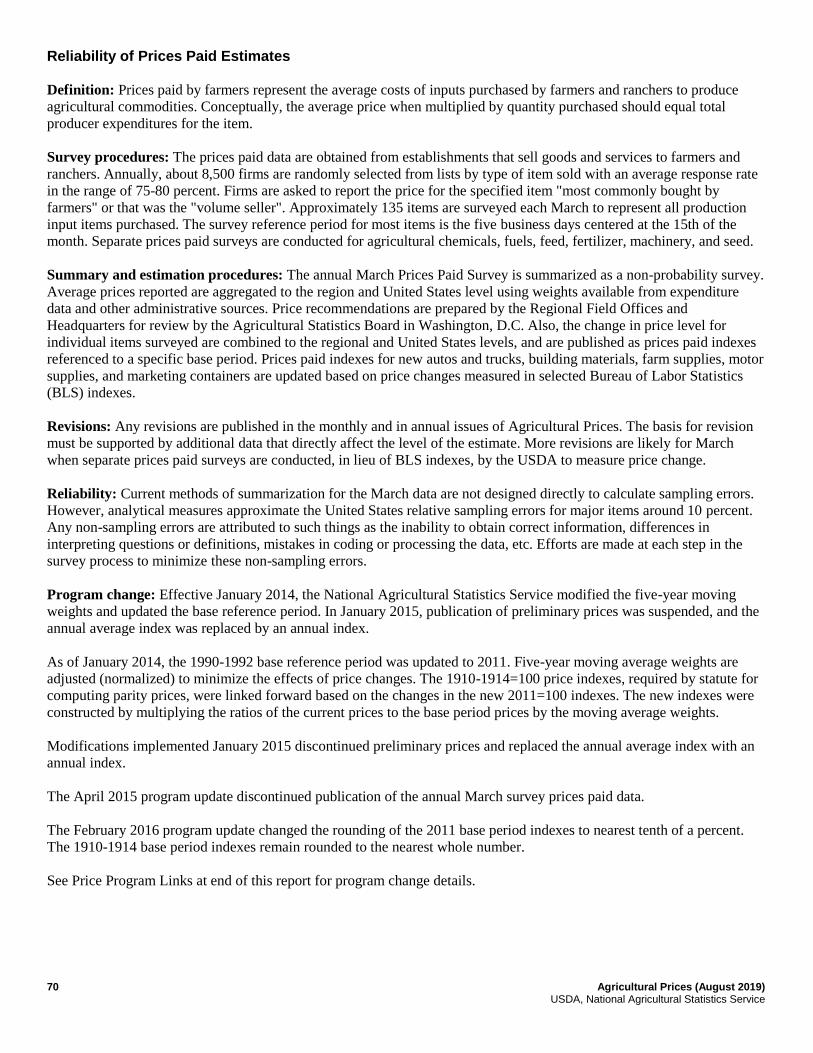
70 Agricultural Prices (August 2019) USDA, National Agricultural Statistics Service
Reliability of Prices Paid Estimates
Definition: Prices paid by farmers represent the average costs of inputs purchased by farmers and ranchers to produce
agricultural commodities. Conceptually, the average price when multiplied by quantity purchased should equal total
producer expenditures for the item.
Survey procedures: The prices paid data are obtained from establishments that sell goods and services to farmers and
ranchers. Annually, about 8,500 firms are randomly selected from lists by type of item sold with an average response rate
in the range of 75-80 percent. Firms are asked to report the price for the specified item "most commonly bought by
farmers" or that was the "volume seller". Approximately 135 items are surveyed each March to represent all production
input items purchased. The survey reference period for most items is the five business days centered at the 15th of the
month. Separate prices paid surveys are conducted for agricultural chemicals, fuels, feed, fertilizer, machinery, and seed.
Summary and estimation procedures: The annual March Prices Paid Survey is summarized as a non-probability survey.
Average prices reported are aggregated to the region and United States level using weights available from expenditure
data and other administrative sources. Price recommendations are prepared by the Regional Field Offices and
Headquarters for review by the Agricultural Statistics Board in Washington, D.C. Also, the change in price level for
individual items surveyed are combined to the regional and United States levels, and are published as prices paid indexes
referenced to a specific base period. Prices paid indexes for new autos and trucks, building materials, farm supplies, motor
supplies, and marketing containers are updated based on price changes measured in selected Bureau of Labor Statistics
(BLS) indexes.
Revisions: Any revisions are published in the monthly and in annual issues of Agricultural Prices. The basis for revision
must be supported by additional data that directly affect the level of the estimate. More revisions are likely for March
when separate prices paid surveys are conducted, in lieu of BLS indexes, by the USDA to measure price change.
Reliability: Current methods of summarization for the March data are not designed directly to calculate sampling errors.
However, analytical measures approximate the United States relative sampling errors for major items around 10 percent.
Any non-sampling errors are attributed to such things as the inability to obtain correct information, differences in
interpreting questions or definitions, mistakes in coding or processing the data, etc. Efforts are made at each step in the
survey process to minimize these non-sampling errors.
Program change: Effective January 2014, the National Agricultural Statistics Service modified the five-year moving
weights and updated the base reference period. In January 2015, publication of preliminary prices was suspended, and the
annual average index was replaced by an annual index.
As of January 2014, the 1990-1992 base reference period was updated to 2011. Five-year moving average weights are
adjusted (normalized) to minimize the effects of price changes. The 1910-1914=100 price indexes, required by statute for
computing parity prices, were linked forward based on the changes in the new 2011=100 indexes. The new indexes were
constructed by multiplying the ratios of the current prices to the base period prices by the moving average weights.
Modifications implemented January 2015 discontinued preliminary prices and replaced the annual average index with an
annual index.
The April 2015 program update discontinued publication of the annual March survey prices paid data.
The February 2016 program update changed the rounding of the 2011 base period indexes to nearest tenth of a percent.
The 1910-1914 base period indexes remain rounded to the nearest whole number.
See Price Program Links at end of this report for program change details.
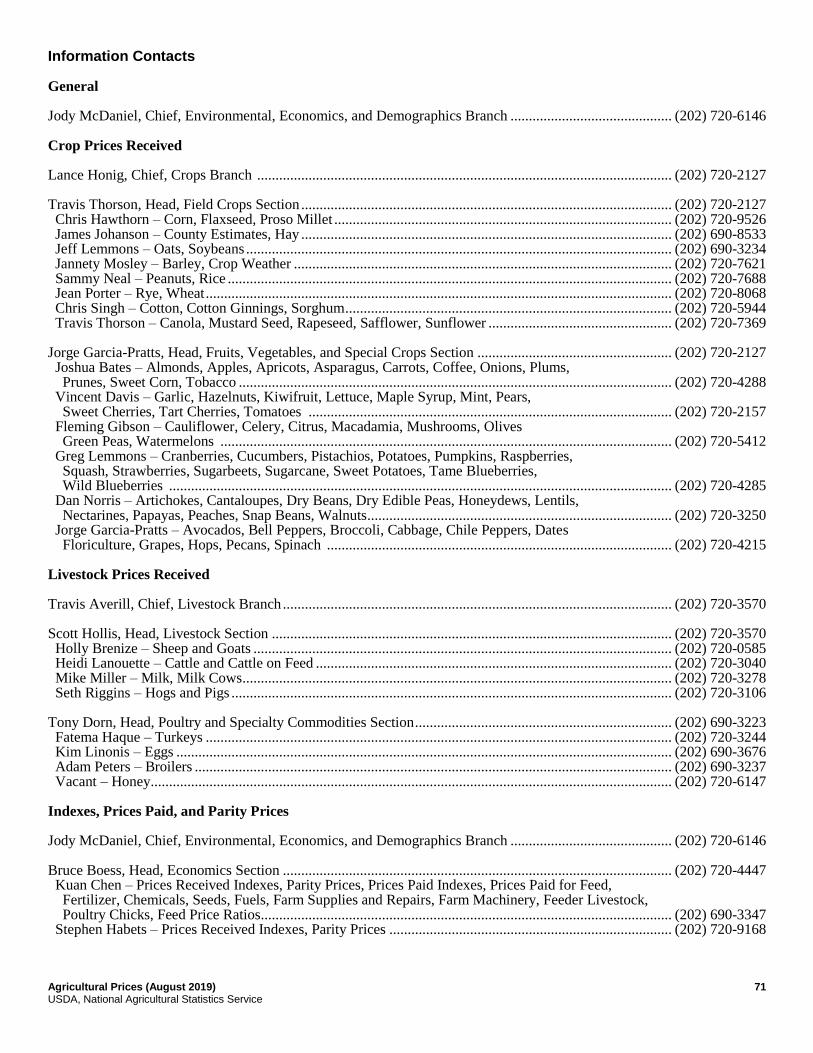
Agricultural Prices (August 2019) 71 USDA, National Agricultural Statistics Service
Information Contacts General Jody McDaniel, Chief, Environmental, Economics, and Demographics Branch ............................................ (202) 720-6146 Crop Prices Received Lance Honig, Chief, Crops Branch ................................................................................................................. (202) 720-2127 Travis Thorson, Head, Field Crops Section ..................................................................................................... (202) 720-2127 Chris Hawthorn – Corn, Flaxseed, Proso Millet ............................................................................................ (202) 720-9526 James Johanson – County Estimates, Hay ..................................................................................................... (202) 690-8533 Jeff Lemmons – Oats, Soybeans .................................................................................................................... (202) 690-3234 Jannety Mosley – Barley, Crop Weather ....................................................................................................... (202) 720-7621 Sammy Neal – Peanuts, Rice ......................................................................................................................... (202) 720-7688 Jean Porter – Rye, Wheat ............................................................................................................................... (202) 720-8068 Chris Singh – Cotton, Cotton Ginnings, Sorghum ......................................................................................... (202) 720-5944 Travis Thorson – Canola, Mustard Seed, Rapeseed, Safflower, Sunflower .................................................. (202) 720-7369 Jorge Garcia-Pratts, Head, Fruits, Vegetables, and Special Crops Section ..................................................... (202) 720-2127 Joshua Bates – Almonds, Apples, Apricots, Asparagus, Carrots, Coffee, Onions, Plums, Prunes, Sweet Corn, Tobacco ...................................................................................................................... (202) 720-4288 Vincent Davis – Garlic, Hazelnuts, Kiwifruit, Lettuce, Maple Syrup, Mint, Pears, Sweet Cherries, Tart Cherries, Tomatoes ................................................................................................... (202) 720-2157 Fleming Gibson – Cauliflower, Celery, Citrus, Macadamia, Mushrooms, Olives Green Peas, Watermelons ........................................................................................................................... (202) 720-5412 Greg Lemmons – Cranberries, Cucumbers, Pistachios, Potatoes, Pumpkins, Raspberries, Squash, Strawberries, Sugarbeets, Sugarcane, Sweet Potatoes, Tame Blueberries, Wild Blueberries ......................................................................................................................................... (202) 720-4285 Dan Norris – Artichokes, Cantaloupes, Dry Beans, Dry Edible Peas, Honeydews, Lentils, Nectarines, Papayas, Peaches, Snap Beans, Walnuts ................................................................................... (202) 720-3250 Jorge Garcia-Pratts – Avocados, Bell Peppers, Broccoli, Cabbage, Chile Peppers, Dates Floriculture, Grapes, Hops, Pecans, Spinach .............................................................................................. (202) 720-4215 Livestock Prices Received Travis Averill, Chief, Livestock Branch .......................................................................................................... (202) 720-3570 Scott Hollis, Head, Livestock Section ............................................................................................................. (202) 720-3570 Holly Brenize – Sheep and Goats .................................................................................................................. (202) 720-0585 Heidi Lanouette – Cattle and Cattle on Feed ................................................................................................. (202) 720-3040 Mike Miller – Milk, Milk Cows ..................................................................................................................... (202) 720-3278 Seth Riggins – Hogs and Pigs ........................................................................................................................ (202) 720-3106 Tony Dorn, Head, Poultry and Specialty Commodities Section ...................................................................... (202) 690-3223 Fatema Haque – Turkeys ............................................................................................................................... (202) 720-3244 Kim Linonis – Eggs ....................................................................................................................................... (202) 690-3676 Adam Peters – Broilers .................................................................................................................................. (202) 690-3237 Vacant – Honey .............................................................................................................................................. (202) 720-6147 Indexes, Prices Paid, and Parity Prices Jody McDaniel, Chief, Environmental, Economics, and Demographics Branch ............................................ (202) 720-6146 Bruce Boess, Head, Economics Section .......................................................................................................... (202) 720-4447 Kuan Chen – Prices Received Indexes, Parity Prices, Prices Paid Indexes, Prices Paid for Feed, Fertilizer, Chemicals, Seeds, Fuels, Farm Supplies and Repairs, Farm Machinery, Feeder Livestock, Poultry Chicks, Feed Price Ratios ................................................................................................................ (202) 690-3347 Stephen Habets – Prices Received Indexes, Parity Prices ............................................................................. (202) 720-9168
Access to NASS Reports
For your convenience, you may access NASS reports and products the following ways:
All reports are available electronically, at no cost, on the NASS web site: www.nass.usda.gov
Both national and state specific reports are available via a free e-mail subscription. To set-up this free
subscription, visit www.nass.usda.gov and click on “National” or “State” in upper right corner above “search”
box to create an account and select the reports you would like to receive.
Cornell’s Mann Library has launched a new website housing NASS’s and other agency’s archived
reports. The new website, https://usda.library.cornell.edu. All email subscriptions containing reports will
be sent from the new website, https://usda.library.cornell.edu. To continue receiving the reports via e-
mail, you will have to go to the new website, create a new account and re-subscribe to the reports. If you
need instructions to set up an account or subscribe, they are located at:
https://usda.library.cornell.edu/help. You should whitelist notifications@usda-
esmis.library.cornell.edu in your email client to avoid the emails going into spam/junk folders.
For more information on NASS surveys and reports, call the NASS Agricultural Statistics Hotline at (800) 727-9540,
7:30 a.m. to 4:00 p.m. ET, or e-mail: [email protected].
The U.S. Department of Agriculture (USDA) prohibits discrimination against its customers, employees, and applicants for
employment on the basis of race, color, national origin, age, disability, sex, gender identity, religion, reprisal, and where
applicable, political beliefs, marital status, familial or parental status, sexual orientation, or all or part of an individual's
income is derived from any public assistance program, or protected genetic information in employment or in any program
or activity conducted or funded by the Department. (Not all prohibited bases will apply to all programs and/or
employment activities.)
If you wish to file a Civil Rights program complaint of discrimination, complete the USDA Program Discrimination
Complaint Form (PDF), found online at www.ascr.usda.gov/filing-program-discrimination-complaint-usda-customer, or
at any USDA office, or call (866) 632-9992 to request the form. You may also write a letter containing all of the
information requested in the form. Send your completed complaint form or letter to us by mail at U.S. Department of
Agriculture, Director, Office of Adjudication, 1400 Independence Avenue, S.W., Washington, D.C. 20250-9410, by fax
(202) 690-7442 or email at [email protected].
Price Program Links Economics and Prices
http://www.nass.usda.gov/Statistics_by_Subject/Economics_and_Prices/index.php
January 2014 Price Program Update
http://www.nass.usda.gov/Surveys/Guide_to_NASS_Surveys/Prices/updates.pdf
January 2015 Price Program Update
http://www.nass.usda.gov/Surveys/Guide_to_NASS_Surveys/Prices/update2015.pdf
April 2015 Price Program Update
http://www.nass.usda.gov/Surveys/Guide_to_NASS_Surveys/Prices/updateApr2015.pdf
February 2016 Price Program Update
http://www.nass.usda.gov/Surveys/Guide_to_NASS_Surveys/Prices/updateFeb2016.pdf

![[eng] AGRICULTURAL PRICES : Price indices and absolute ... · agricultural production Eurostat publications on agricultural price statistics Page 5 Signes et abréviations employés](https://img.pdfslide.net/doc/110x75/5f82febcf143ec7a1a0d0d02/eng-agricultural-prices-price-indices-and-absolute-agricultural-production.jpg)