Embed Size (px)
Citation preview
Agricultural Prices
5.1 Food and agricultural commodity prices in India are primarily determined bydomestic demand and supply factors influenced by domestic price policy. The natureof markets facing the agricultural commodities and imperfections in these markets alsoinfluence the price transmission and the final consumer prices. India meets the bulk ofits large food demand through domestic production, barring few commodities like edibleoils and pulses.
5.2 Inflation and price rise of food items have become a major concern for policy makersworldwide and particularly for India and other developing countries. In India, the recentfood inflation is largely due to an inadequate supply response to increasing demand,aggravated by various other logistic and market-related constraints. Inflation affects thepoor disproportionately and adversely impacts the achievement of removal of poverty.
Food Articles
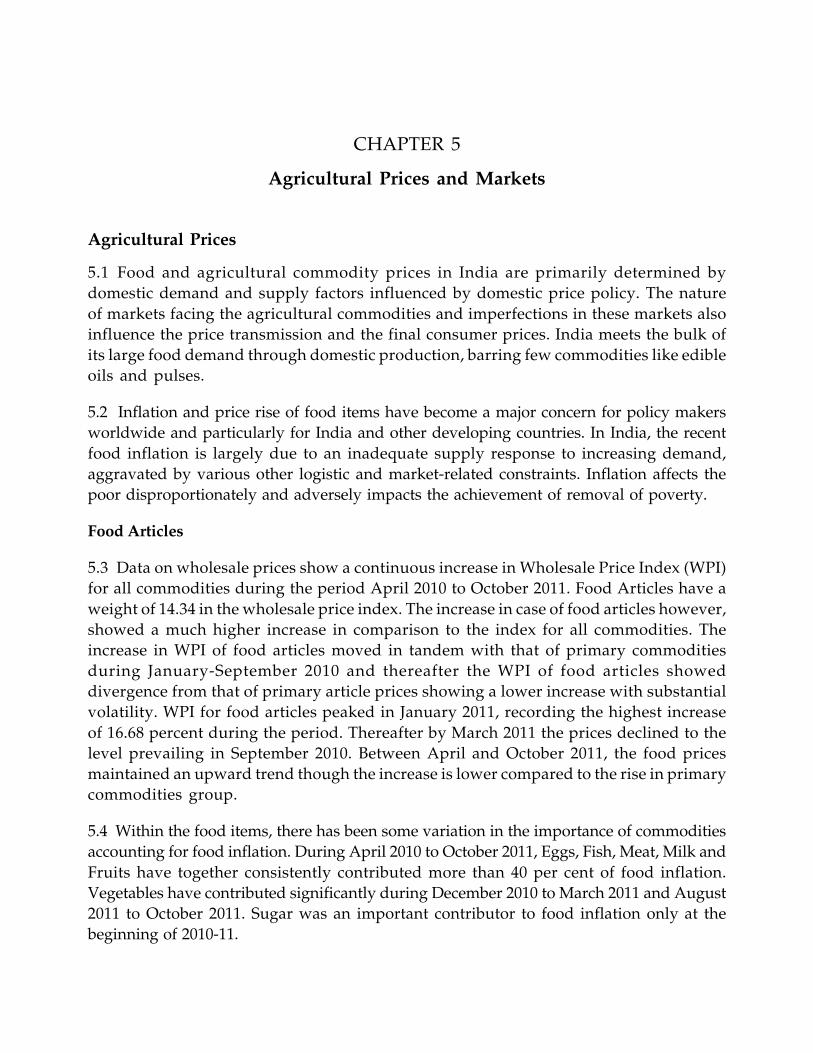
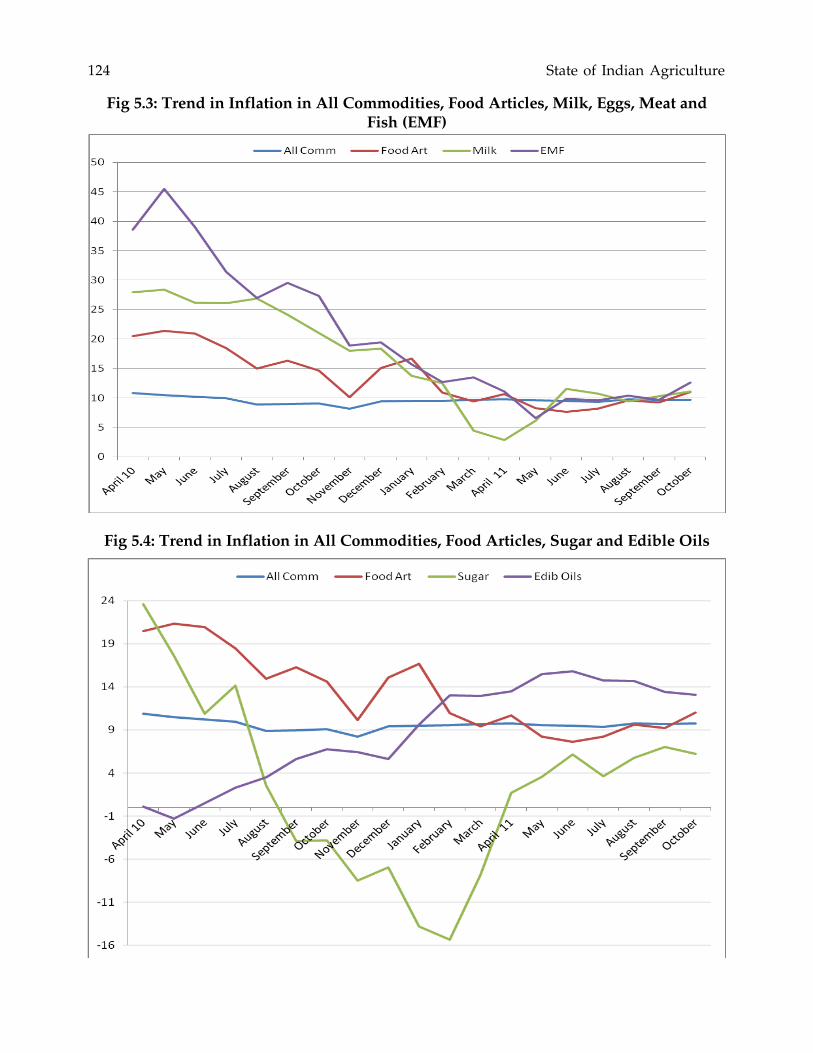
5.3 Data on wholesale prices show a continuous increase in Wholesale Price Index (WPI)for all commodities during the period April 2010 to October 2011. Food Articles have aweight of 14.34 in the wholesale price index. The increase in case of food articles however,showed a much higher increase in comparison to the index for all commodities. Theincrease in WPI of food articles moved in tandem with that of primary commoditiesduring January-September 2010 and thereafter the WPI of food articles showeddivergence from that of primary article prices showing a lower increase with substantialvolatility. WPI for food articles peaked in January 2011, recording the highest increaseof 16.68 percent during the period. Thereafter by March 2011 the prices declined to thelevel prevailing in September 2010. Between April and October 2011, the food pricesmaintained an upward trend though the increase is lower compared to the rise in primarycommodities group.
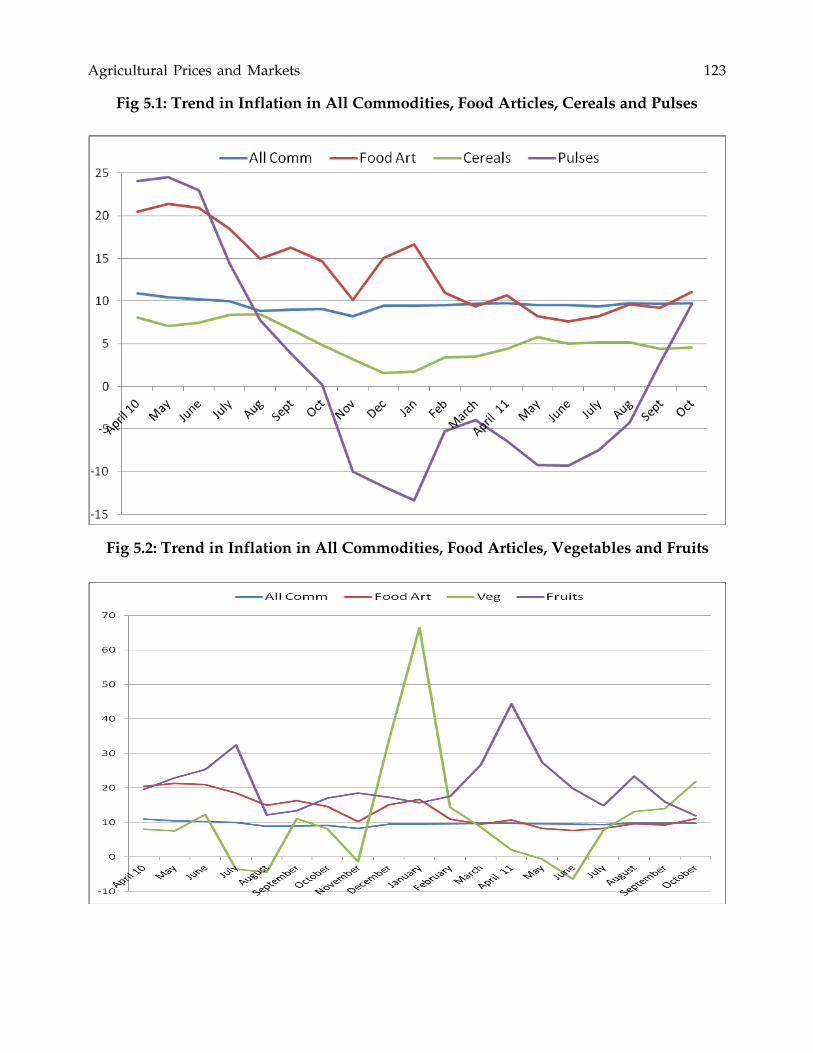
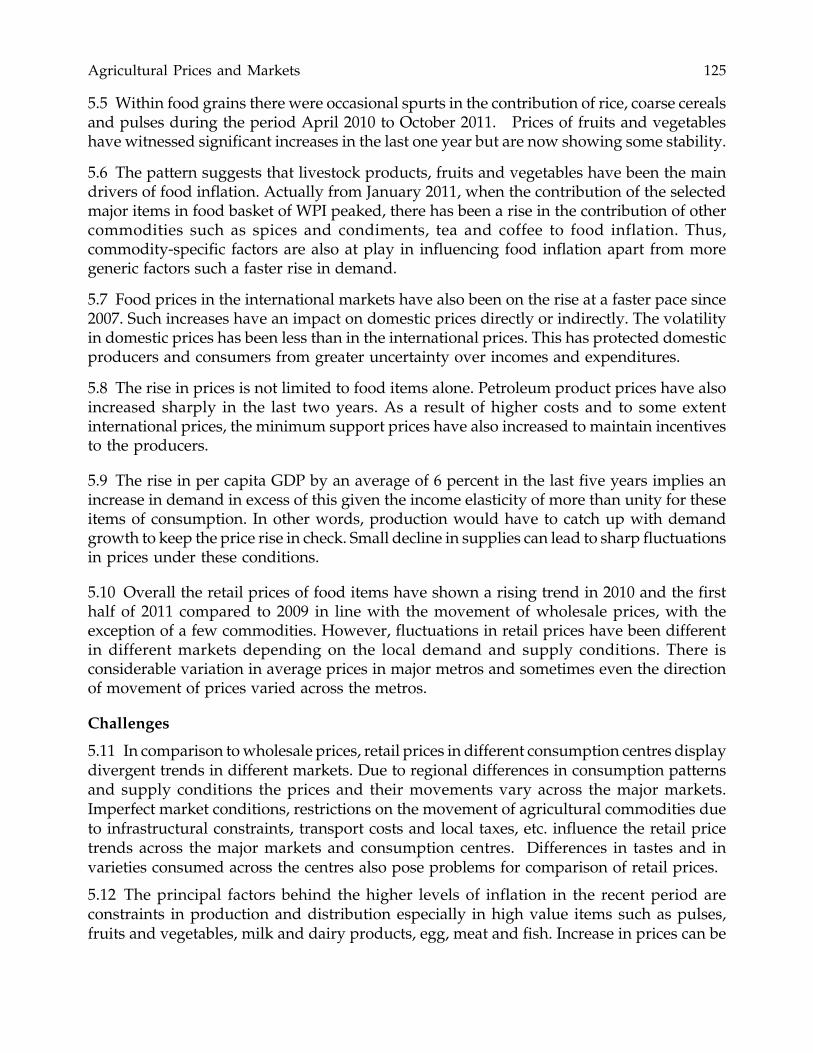
5.4 Within the food items, there has been some variation in the importance of commoditiesaccounting for food inflation. During April 2010 to October 2011, Eggs, Fish, Meat, Milk andFruits have together consistently contributed more than 40 per cent of food inflation.Vegetables have contributed significantly during December 2010 to March 2011 and August2011 to October 2011. Sugar was an important contributor to food inflation only at thebeginning of 2010-11.
CHAPTER 5
Agricultural Prices and Markets
Agricultural Prices and Markets 123
Fig 5.1: Trend in Inflation in All Commodities, Food Articles, Cereals and Pulses
Fig 5.2: Trend in Inflation in All Commodities, Food Articles, Vegetables and Fruits
124 State of Indian Agriculture
Fig 5.3: Trend in Inflation in All Commodities, Food Articles, Milk, Eggs, Meat andFish (EMF)
Fig 5.4: Trend in Inflation in All Commodities, Food Articles, Sugar and Edible Oils
Agricultural Prices and Markets 125
5.5 Within food grains there were occasional spurts in the contribution of rice, coarse cerealsand pulses during the period April 2010 to October 2011. Prices of fruits and vegetableshave witnessed significant increases in the last one year but are now showing some stability.
5.6 The pattern suggests that livestock products, fruits and vegetables have been the maindrivers of food inflation. Actually from January 2011, when the contribution of the selectedmajor items in food basket of WPI peaked, there has been a rise in the contribution of othercommodities such as spices and condiments, tea and coffee to food inflation. Thus,commodity-specific factors are also at play in influencing food inflation apart from moregeneric factors such a faster rise in demand.
5.7 Food prices in the international markets have also been on the rise at a faster pace since2007. Such increases have an impact on domestic prices directly or indirectly. The volatilityin domestic prices has been less than in the international prices. This has protected domesticproducers and consumers from greater uncertainty over incomes and expenditures.
5.8 The rise in prices is not limited to food items alone. Petroleum product prices have alsoincreased sharply in the last two years. As a result of higher costs and to some extentinternational prices, the minimum support prices have also increased to maintain incentivesto the producers.
5.9 The rise in per capita GDP by an average of 6 percent in the last five years implies anincrease in demand in excess of this given the income elasticity of more than unity for theseitems of consumption. In other words, production would have to catch up with demandgrowth to keep the price rise in check. Small decline in supplies can lead to sharp fluctuationsin prices under these conditions.
5.10 Overall the retail prices of food items have shown a rising trend in 2010 and the firsthalf of 2011 compared to 2009 in line with the movement of wholesale prices, with theexception of a few commodities. However, fluctuations in retail prices have been differentin different markets depending on the local demand and supply conditions. There isconsiderable variation in average prices in major metros and sometimes even the directionof movement of prices varied across the metros.
Challenges
5.11 In comparison to wholesale prices, retail prices in different consumption centres displaydivergent trends in different markets. Due to regional differences in consumption patternsand supply conditions the prices and their movements vary across the major markets.Imperfect market conditions, restrictions on the movement of agricultural commodities dueto infrastructural constraints, transport costs and local taxes, etc. influence the retail pricetrends across the major markets and consumption centres. Differences in tastes and invarieties consumed across the centres also pose problems for comparison of retail prices.
5.12 The principal factors behind the higher levels of inflation in the recent period areconstraints in production and distribution especially in high value items such as pulses,fruits and vegetables, milk and dairy products, egg, meat and fish. Increase in prices can be
126 State of Indian Agriculture
attributed to both supply and demand factors. The per capita availability of some of theitems such as cereals and pulses have been declining resulting in some pressure on theirprices. In the case of fruits and vegetables, milk, egg, meat and fish, prices have gone updespite an increase in per capita availability. This is due to a changing pattern in the demandof the households for high value items with increasing income levels. Supply constraintsare important in influencing the recent price rise both globally and nationally. Supplyconstraints are long term and short term in nature. Long-term supply constraints include forexample: inelastic supply of land; water; inadequate investments in key areas like irrigation;land development; and R&D.
5.13 Short-term constraints are weather fluctuations, lack of timely availability of inputslike fertilizers, quality seed, credit and policy environment, etc. Both long-term and short-term factors have influenced the production of agricultural output in the recent period.Market imperfections also add to these trends by restricting the price transmission. Theseinclude lack of infrastructure facilities like efficient transport facilities, storage, processing,marketing and credit facilities.
5.14 The Population of India increased from 1.03 to 1.21 billion during 2001-2011. Increasingpopulation in the face of a relatively constrained supply of agricultural output has broughtdown the per capita net availability of food grains from 510 grams per day in 1991 to 444grams per day in 2009. This is an indicator of constrained supply in the face of increasingdemand exerting pressure on the prices of food commodities.
5.15 Substantial funds are being spent on various welfare and employment orienetedprogrammes and the same are likely to increase significantly in the near future with theintroduction of the currently debated Food Security Bill. These programmes have infusedsubstantial amounts of liquidity and purchasing power generating increased demand forfood items.
5.16 When growth picks up at low income levels the demand for food items would increaseas income elasticity of demand for food is higher at lower levels of income. Thus, lower percapita availability of food grains and structural shortage of key agricultural commoditieslike oilseeds and pulses combined with the rising demand have kept food price inflationhigh. This process has got further accentuated by spikes in global food prices throughinternational transmission.
5.17 Rising international prices of oil also impacted the cost of production of agriculturethrough increase in input costs of fertilizers, transportation and a general rise in the cost ofall other inputs and services. Increase in cost of production results in increasing the MSP ofagricultural commodities which also influences market sentiments.
5.18 Supply responses to demand hikes are usually affected with a time lag. In the interveningperiod an injection of extra liquidity in the economy would lead to an upward pressure onprices. In India, expansionary monetary policies and fiscal deficits have been adopted inthe recent years to maintain high growth rates in the face of global recession.
Agricultural Prices and Markets 127
5.19 In the recent years, particularly since the commodity price hike of 2007-8, marketshave become highly volatile. International stocks of key food items like cereals and animalfeedstock are reduced due to shocks in major producing regions of Europe, Canada andAustralia as also due to rising demand in developing countries putting upward pressureon prices. To some extent, speculative activities in the commodity markets also influenceprices.
The Way Forward
5.20 The enduring solution to price inflation lies in increasing productivity, productionand decreasing market imperfections.
Agricultural Price Policy and MSP
5.21 Minimum Support Priceshave been a cornerstone of theagricultural policy since 1965.The objective is to ensureremunerative prices to thegrowers for their produce with aview to encourage higherinvestment and production andevolve a balanced and integratedprice structure in the context ofoverall needs of the economywhile safeguarding the interest ofconsumers by making availablesupplies at reasonable prices.
5.22 Implementation of MSP isundertaken through procurementby central and state levelagencies. The procurement ofwheat and rice is undertaken bythe Food Corporation of Indiaunder the Department of Food &Public Distribution, primarily tomeet the requirements of bufferstock; Targeted PublicDistribution Scheme (TPDS) andother welfare schemes of the
Box 5.1: Minimum Support Prices
The rationale behind determination of MSP include, (i) the need toprovide incentive to the producer/farmer for adopting improvedtechnology and for developing a production pattern broadly in thelight of national requirements; (ii) the need to ensure rationalutilization of land, water and other production resources; (iii) thelikely effect on the price policy on the rest of the economy, particularlyon cost of living, level of wages, etc., and (iv) the terms of tradebetween agricultural sector and non-agricultural sector.
The Commission for Agricultural Costs & Prices (CACP), whileformulating the recommendations on Price Policy, considers anumber of important factors which, inter alia, include cost ofproduction, changes in input price, trends in market prices, demandand supply situation etc. Cost of cultivation data for principal cropsare collected under a plan scheme to generate state wise and cropwise estimates of cost of cultivation/production and made availableto the CACP for use in connection with their recommendations ofMSPs. The cost of cultivation/production takes into account all paidout costs, such as, those incurred on account of hired human labour,bullock labor and machine labor (both hired and owned) and rentpaid for leased-in land besides cash and kind expenses on use ofmaterial inputs like seeds, fertilizers, manures, irrigation chargesincluding cost of diesel or electricity for operation of pump sets, etc.Besides, cost of production includes imputed values of wages offamily labour and rent for owned land. The cost also coversdepreciation for farm machinery, building, transportation andinsurance charges. As such, the cost of production covers not onlyactual expenses in cash and kind but also imputed value of ownedassets including land and family labor.
government. However, the designated agencies’ intervention in the market for undertakingprocurement operations assist market prices not to fall below the MSPs fixed by thegovernment.
128 State of Indian Agriculture
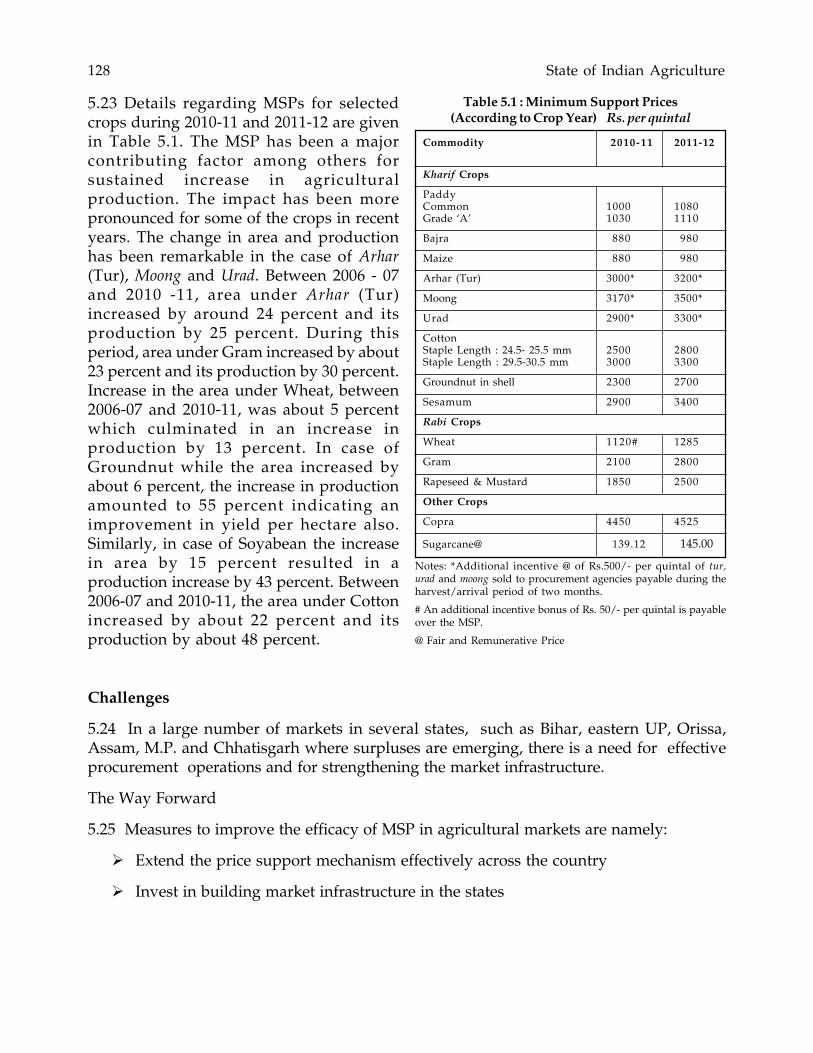
Table 5.1 : Minimum Support Prices(According to Crop Year) Rs. per quintal
Commodity 2010-11 2011-12
Kharif Crops
PaddyCommon 1000 1080Grade ‘A’ 1030 1110
Bajra 880 980
Maize 880 980
Arhar (Tur) 3000* 3200*
Moong 3170* 3500*
Urad 2900* 3300*
CottonStaple Length : 24.5- 25.5 mm 2500 2800Staple Length : 29.5-30.5 mm 3000 3300
Groundnut in shell 2300 2700
Sesamum 2900 3400
Rabi Crops
Wheat 1120# 1285
Gram 2100 2800
Rapeseed & Mustard 1850 2500
Other Crops
Copra 4450 4525
Sugarcane@ 139.12 145.00
Notes: *Additional incentive @ of Rs.500/- per quintal of tur,urad and moong sold to procurement agencies payable during theharvest/arrival period of two months.
# An additional incentive bonus of Rs. 50/- per quintal is payableover the MSP.
@ Fair and Remunerative Price
Challenges
5.24 In a large number of markets in several states, such as Bihar, eastern UP, Orissa,Assam, M.P. and Chhatisgarh where surpluses are emerging, there is a need for effectiveprocurement operations and for strengthening the market infrastructure.
The Way Forward
5.25 Measures to improve the efficacy of MSP in agricultural markets are namely:
� Extend the price support mechanism effectively across the country
� Invest in building market infrastructure in the states
5.23 Details regarding MSPs for selectedcrops during 2010-11 and 2011-12 are givenin Table 5.1. The MSP has been a majorcontributing factor among others forsustained increase in agriculturalproduction. The impact has been morepronounced for some of the crops in recentyears. The change in area and productionhas been remarkable in the case of Arhar(Tur), Moong and Urad. Between 2006 - 07and 2010 -11, area under Arhar (Tur)increased by around 24 percent and itsproduction by 25 percent. During thisperiod, area under Gram increased by about23 percent and its production by 30 percent.Increase in the area under Wheat, between2006-07 and 2010-11, was about 5 percentwhich culminated in an increase inproduction by 13 percent. In case ofGroundnut while the area increased byabout 6 percent, the increase in productionamounted to 55 percent indicating animprovement in yield per hectare also.Similarly, in case of Soyabean the increasein area by 15 percent resulted in aproduction increase by 43 percent. Between2006-07 and 2010-11, the area under Cottonincreased by about 22 percent and itsproduction by about 48 percent.
Agricultural Prices and Markets 129
Market Intervention and Price Support Schemes
5.26 The Department of Agriculture & Cooperation implements the Market InterventionScheme (MIS) for procurement of horticultural commodities which are perishable in natureand are not covered under the Price Support Scheme. The objective of intervention is toprotect the growers of these commodities from making distress sale in the event of a bumpercrop during the peak arrival period when the prices tend to fall below economic levels andcost of production. The MIP is implemented when there is at least a 10 percent increase inproduction or a 10 percent decrease in the ruling market prices over the previous normalyear. The Market Intervention Scheme (MIS) is implemented at the request of a state /UTgovernment which is ready to bear 50 percent of the loss (25 percent in case of North-EasternStates), if any, incurred on its implementation. The extent of total amount of loss to beshared on a 50:50 basis between the central government and the state government is restrictedto 25 percent of the total procurement value which includes cost of the commodity procuredplus permitted overhead expenses. Under the Scheme, in accordance with MIS guidelines,a pre-determined quantity at a fixed Market Intervention Price (MIP) is procured by NAFEDas the Central agency and the agencies designated by the state government for a fixed periodor till the prices are stabilized above the MIP whichever is earlier. The area of operation isrestricted to the concerned state only.
5.27 During the year 2010-11, the MIS has been implemented in five states covering potato(U.P. and W.B. with a total quantity of 10 lakh metric tonnes), oil palm ( Andhra Pradesh :47500 metric tonnes), apple ( Himachal Pradesh 6100 metric tonnes) and areca nut (Karnataka1200 metric tonnes).
Price Supports Scheme (PSS)
5.28 The Department of Agriculture & Cooperation implements the PSS for procurement ofoil seeds, pulses and cotton, through NAFED which is the Central nodal agency, at theMinimum Support Price (MSP) declared by the government. NAFED undertakesprocurement of oil seeds, pulses and cotton under the PSS as and when prices fall below theMSP. Procurement under PSS is continued till prices stabilize at or above the MSP. Losses,if any incurred by NAFED in undertaking MSP operations are reimbursed by the centralcovernment. Profit, if any, earned in undertaking MSP operations is credited to the centralgovernment.
5.29 Under the PSS during 2010-11, procurement was made Milling Copra in four states,Tamil Nadu (7,434 metric tonnes), Kerala (12,408 mertic tonnes), A&N Islands (53, 35 metrictonnes) and Karnataka (30,86 metric tonnes) for a total value of Rs 135 crore.
Agricultural Markets
5.30 The increasing trend of agricultural production has brought in its wake, new challengesin terms of finding markets for the increased marketed surplus in the country. Challengesand opportunities that the global markets offer in the liberalized trade regime are also to beaddressed. For the farming community to benefit from the new global market accessopportunities, the internal agricultural marketing system in the country needs to beintegrated and strengthened. Agricultural marketing reforms and the creation of marketinginfrastructure has therefore been a prime concern of the government.
130 State of Indian Agriculture
5.31 The subject of agriculture and agricultural marketing is dealt with both by the state aswell as the central government in the country. Starting from 1951, various Five-Year Planslaid stress on development of physical markets, on-farm and off-farm storage structures,facilities for standardization and grading, packaging, transportation, etc. Most agriculturalcommodity markets generally operate under the normal forces of demand and supply. Therole of government is normally limited to protecting the interests of producers and consumers,only in respect of wage goods, mass consumption goods and essential goods; and to promotethe organized marketing of agricultural commodities in the country through a network ofregulated markets.
Regulation of Agricultural Produce Markets (APMCs)
5.32 To achieve an efficient system of buying and selling of agricultural commodities, mostof the state governments and union territories have enacted several legislations to providefor regulation of the Agricultural Produce Markets. The basic objective in the setting up ofsetting up of a network of physical markets has been to ensure reasonable gains to thefarmers by creating a market environment where there is fair play of supply and demandforces, to regulate market practices and to attain transparency in transactions. With growingagricultural production, the number of regulated markets has also been increasing in thecountry. While, there were 286 regulated markets in the country at the end of 1950, theirnumber has increased to 7157 by 2010.
Marketing Reforms Initiatives
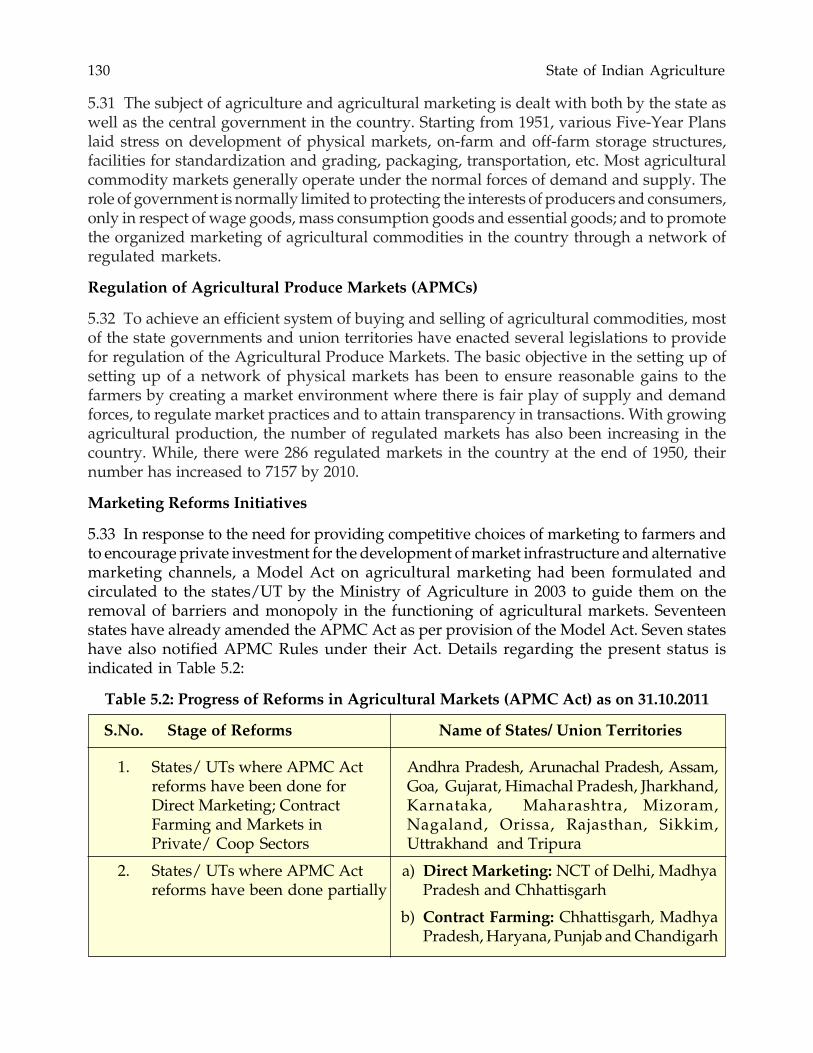
5.33 In response to the need for providing competitive choices of marketing to farmers andto encourage private investment for the development of market infrastructure and alternativemarketing channels, a Model Act on agricultural marketing had been formulated andcirculated to the states/UT by the Ministry of Agriculture in 2003 to guide them on theremoval of barriers and monopoly in the functioning of agricultural markets. Seventeenstates have already amended the APMC Act as per provision of the Model Act. Seven stateshave also notified APMC Rules under their Act. Details regarding the present status isindicated in Table 5.2:
Table 5.2: Progress of Reforms in Agricultural Markets (APMC Act) as on 31.10.2011
S.No. Stage of Reforms Name of States/ Union Territories
1. States/ UTs where APMC Act Andhra Pradesh, Arunachal Pradesh, Assam,reforms have been done for Goa, Gujarat, Himachal Pradesh, Jharkhand,Direct Marketing; Contract Karnataka, Maharashtra, Mizoram,Farming and Markets in Nagaland, Orissa, Rajasthan, Sikkim,Private/ Coop Sectors Uttrakhand and Tripura
2. States/ UTs where APMC Act a) Direct Marketing: NCT of Delhi, Madhyareforms have been done partially Pradesh and Chhattisgarh
b) Contract Farming: Chhattisgarh, MadhyaPradesh, Haryana, Punjab and Chandigarh
Agricultural Prices and Markets 131
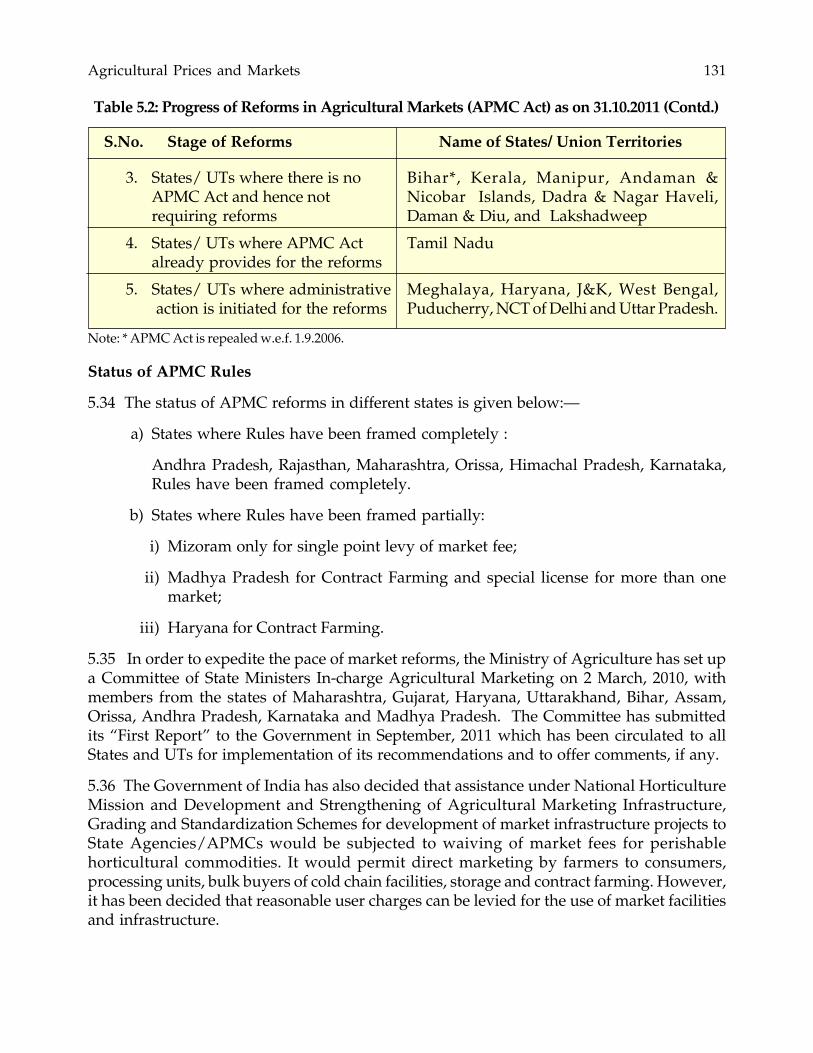
3. States/ UTs where there is no Bihar*, Kerala, Manipur, Andaman &APMC Act and hence not Nicobar Islands, Dadra & Nagar Haveli,requiring reforms Daman & Diu, and Lakshadweep
4. States/ UTs where APMC Act Tamil Nadualready provides for the reforms
5. States/ UTs where administrative Meghalaya, Haryana, J&K, West Bengal, action is initiated for the reforms Puducherry, NCT of Delhi and Uttar Pradesh.
Note: * APMC Act is repealed w.e.f. 1.9.2006.
Status of APMC Rules
5.34 The status of APMC reforms in different states is given below:—
a) States where Rules have been framed completely :
Andhra Pradesh, Rajasthan, Maharashtra, Orissa, Himachal Pradesh, Karnataka,Rules have been framed completely.
b) States where Rules have been framed partially:
i) Mizoram only for single point levy of market fee;
ii) Madhya Pradesh for Contract Farming and special license for more than onemarket;
iii) Haryana for Contract Farming.
5.35 In order to expedite the pace of market reforms, the Ministry of Agriculture has set upa Committee of State Ministers In-charge Agricultural Marketing on 2 March, 2010, withmembers from the states of Maharashtra, Gujarat, Haryana, Uttarakhand, Bihar, Assam,Orissa, Andhra Pradesh, Karnataka and Madhya Pradesh. The Committee has submittedits “First Report” to the Government in September, 2011 which has been circulated to allStates and UTs for implementation of its recommendations and to offer comments, if any.
5.36 The Government of India has also decided that assistance under National HorticultureMission and Development and Strengthening of Agricultural Marketing Infrastructure,Grading and Standardization Schemes for development of market infrastructure projects toState Agencies/APMCs would be subjected to waiving of market fees for perishablehorticultural commodities. It would permit direct marketing by farmers to consumers,processing units, bulk buyers of cold chain facilities, storage and contract farming. However,it has been decided that reasonable user charges can be levied for the use of market facilitiesand infrastructure.
S.No. Stage of Reforms Name of States/ Union Territories
Table 5.2: Progress of Reforms in Agricultural Markets (APMC Act) as on 31.10.2011 (Contd.)
132 State of Indian Agriculture
Linking Farmers to Markets
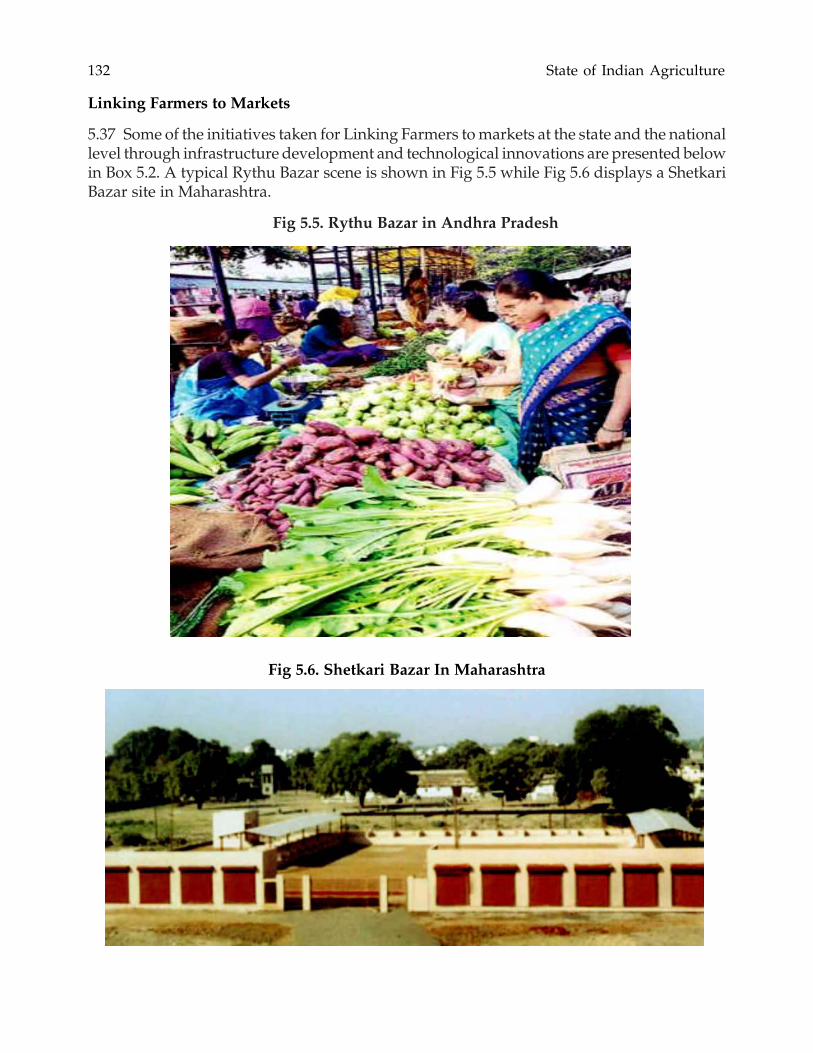
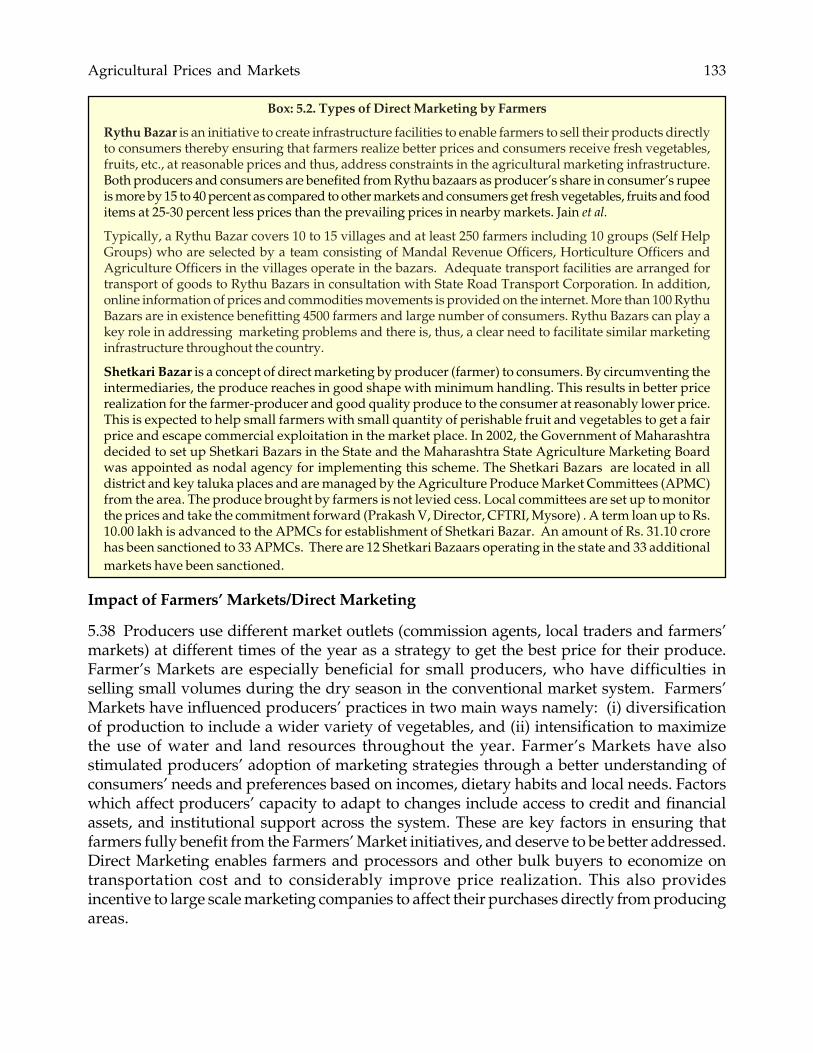
5.37 Some of the initiatives taken for Linking Farmers to markets at the state and the nationallevel through infrastructure development and technological innovations are presented belowin Box 5.2. A typical Rythu Bazar scene is shown in Fig 5.5 while Fig 5.6 displays a ShetkariBazar site in Maharashtra.
Fig 5.5. Rythu Bazar in Andhra Pradesh
Fig 5.6. Shetkari Bazar In Maharashtra
Agricultural Prices and Markets 133
Box: 5.2. Types of Direct Marketing by Farmers
Rythu Bazar is an initiative to create infrastructure facilities to enable farmers to sell their products directlyto consumers thereby ensuring that farmers realize better prices and consumers receive fresh vegetables,fruits, etc., at reasonable prices and thus, address constraints in the agricultural marketing infrastructure.Both producers and consumers are benefited from Rythu bazaars as producer’s share in consumer’s rupeeis more by 15 to 40 percent as compared to other markets and consumers get fresh vegetables, fruits and fooditems at 25-30 percent less prices than the prevailing prices in nearby markets. Jain et al.
Typically, a Rythu Bazar covers 10 to 15 villages and at least 250 farmers including 10 groups (Self HelpGroups) who are selected by a team consisting of Mandal Revenue Officers, Horticulture Officers andAgriculture Officers in the villages operate in the bazars. Adequate transport facilities are arranged fortransport of goods to Rythu Bazars in consultation with State Road Transport Corporation. In addition,online information of prices and commodities movements is provided on the internet. More than 100 RythuBazars are in existence benefitting 4500 farmers and large number of consumers. Rythu Bazars can play akey role in addressing marketing problems and there is, thus, a clear need to facilitate similar marketinginfrastructure throughout the country.
Shetkari Bazar is a concept of direct marketing by producer (farmer) to consumers. By circumventing theintermediaries, the produce reaches in good shape with minimum handling. This results in better pricerealization for the farmer-producer and good quality produce to the consumer at reasonably lower price.This is expected to help small farmers with small quantity of perishable fruit and vegetables to get a fairprice and escape commercial exploitation in the market place. In 2002, the Government of Maharashtradecided to set up Shetkari Bazars in the State and the Maharashtra State Agriculture Marketing Boardwas appointed as nodal agency for implementing this scheme. The Shetkari Bazars are located in alldistrict and key taluka places and are managed by the Agriculture Produce Market Committees (APMC)from the area. The produce brought by farmers is not levied cess. Local committees are set up to monitorthe prices and take the commitment forward (Prakash V, Director, CFTRI, Mysore) . A term loan up to Rs.10.00 lakh is advanced to the APMCs for establishment of Shetkari Bazar. An amount of Rs. 31.10 crorehas been sanctioned to 33 APMCs. There are 12 Shetkari Bazaars operating in the state and 33 additionalmarkets have been sanctioned.
Impact of Farmers’ Markets/Direct Marketing
5.38 Producers use different market outlets (commission agents, local traders and farmers’markets) at different times of the year as a strategy to get the best price for their produce.Farmer’s Markets are especially beneficial for small producers, who have difficulties inselling small volumes during the dry season in the conventional market system. Farmers’Markets have influenced producers’ practices in two main ways namely: (i) diversificationof production to include a wider variety of vegetables, and (ii) intensification to maximizethe use of water and land resources throughout the year. Farmer’s Markets have alsostimulated producers’ adoption of marketing strategies through a better understanding ofconsumers’ needs and preferences based on incomes, dietary habits and local needs. Factorswhich affect producers’ capacity to adapt to changes include access to credit and financialassets, and institutional support across the system. These are key factors in ensuring thatfarmers fully benefit from the Farmers’ Market initiatives, and deserve to be better addressed.Direct Marketing enables farmers and processors and other bulk buyers to economize ontransportation cost and to considerably improve price realization. This also providesincentive to large scale marketing companies to affect their purchases directly from producingareas.
134 State of Indian Agriculture
Market Research Information Network (MRIN)
5.39 Market information is of vital importance to all in the marketing system whether farmers,traders, processors or consumers who require market information for different purposes.For provision of information of prices of agricultural commodities prevailing in AgriculturalProduce Markets in the country, the Ministry of Agriculture has launched the ICT-basedCentral Sector Scheme of Marketing Research and Information Network in March, 2000.This provides electronic connectivity to important wholesale markets in the country forcollection and dissemination of price and market-related information. The scheme wasimplemented in the year 2000-2001 and presently, more than 3000 markets from all over thecountry have been linked to a central portal (http://agmarknet.nic.in). These markets reportthe daily prices and arrivals for more than 300 commodities and 2000 varieties from morethan 1900 markets covering nearly all the major agricultural and horticultural produce. Theinformation on arrivals and prices are disseminated in 12 regional languages.
5.40 In addition to price, diverse other market-related information is provided on the portal,for example, the accepted standards of grade labeling; sanitary and phyto-sanitaryrequirement; physical infrastructure of storage and warehousing; marketing yards; feespayable; etc. Efforts are underway to prepare a national atlas of agricultural markets on aGIS Platform that would indicate the availability of the entire marketing infrastructure inthe country including storage, cold storages, markets and related infrastructure. Similarly,commodity profiles indicating the post-harvest requirements of important commoditiesare being loaded on to the portal.
5.41 Major stakeholders of the project are farmers, buyers and commission agents ofagricultural produce, media persons, government functionaries, academicians, marketfunctionaries, agri-business consultants, etc. The information available on the Portal is inthe public domain and can be instantly accessed from anywhere in the world. Farmers andstakeholders are accessing this information throughout the length and width of the countryand many agencies are using the contents of the Portal to generate market intelligence andmaking the same available to various stakeholders to support them in appropriate decisionmaking. The project provides ready contents for the proposed one lakh IT kiosks beinginstalled in rural areas by the Department of Information Technology.
Construction of Rural Godown Scheme (Grameen Bhandaran Yojana)
5.42 Presently, there is limitedwarehousing capacity in the country ascan be seen from Table 5.3. To createadditional storage capacity thegovernment launched on 1 April 2011, theGramin Bhandaran Yojana aimed at thecreation of scientific storage capacity withallied facilities in rural areas. This willmeet the requirement of farmers inmanifold ways such as, storing farmproduce, processed farm produce,
Table 5.3: Agriculture Warehousing Capacity in the Country
PSU Capacity (in MT)
FCI 32.05
CWC 10.07
SWCs 21.29
State Civil Supplies Corp./Deptt 11.30
Total Public Sector 74.71
Cooperative Sector 15.07
Private Sector 18.97
Total 108.75
Source: Report of Sub-Group on Warehousing and Bulk Handling forXII Plan, Department of Food and Public Distribution.
Agricultural Prices and Markets 135
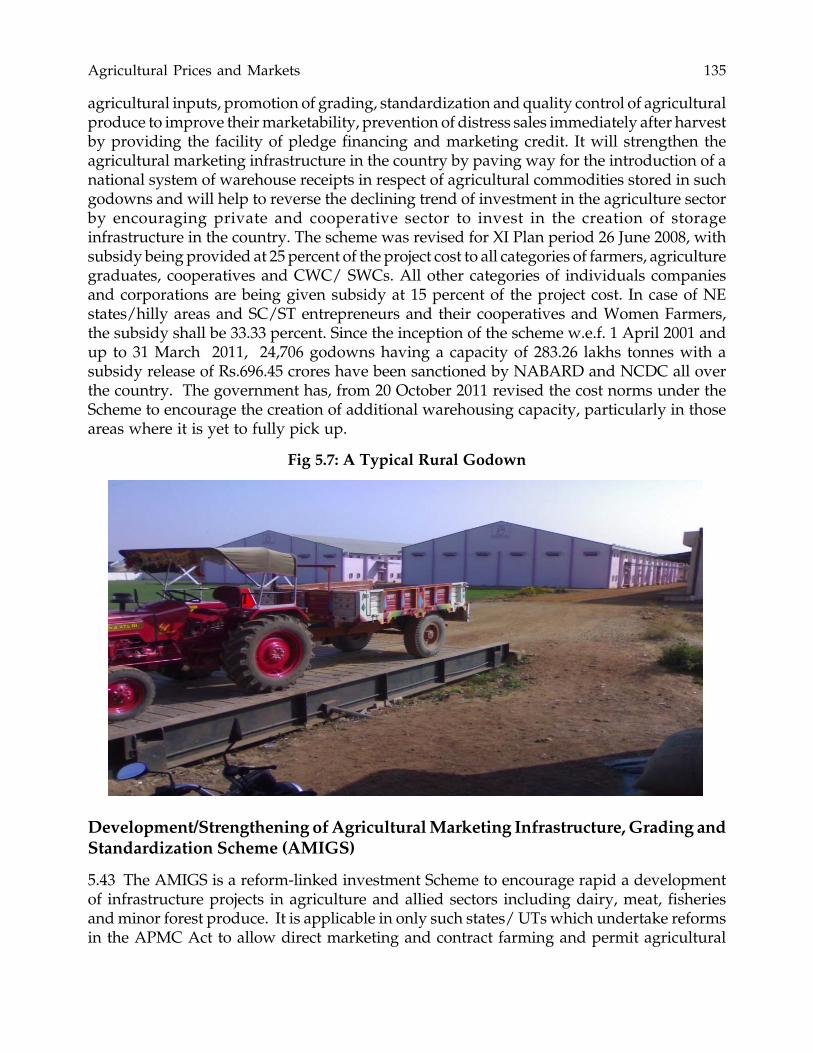
agricultural inputs, promotion of grading, standardization and quality control of agriculturalproduce to improve their marketability, prevention of distress sales immediately after harvestby providing the facility of pledge financing and marketing credit. It will strengthen theagricultural marketing infrastructure in the country by paving way for the introduction of anational system of warehouse receipts in respect of agricultural commodities stored in suchgodowns and will help to reverse the declining trend of investment in the agriculture sectorby encouraging private and cooperative sector to invest in the creation of storageinfrastructure in the country. The scheme was revised for XI Plan period 26 June 2008, withsubsidy being provided at 25 percent of the project cost to all categories of farmers, agriculturegraduates, cooperatives and CWC/ SWCs. All other categories of individuals companiesand corporations are being given subsidy at 15 percent of the project cost. In case of NEstates/hilly areas and SC/ST entrepreneurs and their cooperatives and Women Farmers,the subsidy shall be 33.33 percent. Since the inception of the scheme w.e.f. 1 April 2001 andup to 31 March 2011, 24,706 godowns having a capacity of 283.26 lakhs tonnes with asubsidy release of Rs.696.45 crores have been sanctioned by NABARD and NCDC all overthe country. The government has, from 20 October 2011 revised the cost norms under theScheme to encourage the creation of additional warehousing capacity, particularly in thoseareas where it is yet to fully pick up.
Fig 5.7: A Typical Rural Godown
Development/Strengthening of Agricultural Marketing Infrastructure, Grading andStandardization Scheme (AMIGS)
5.43 The AMIGS is a reform-linked investment Scheme to encourage rapid a developmentof infrastructure projects in agriculture and allied sectors including dairy, meat, fisheriesand minor forest produce. It is applicable in only such states/ UTs which undertake reformsin the APMC Act to allow direct marketing and contract farming and permit agricultural
136 State of Indian Agriculture
produce markets to exist in private and cooperative sectors. The Scheme was launched inOctober, 2004. The assistance is provided for development of market infrastructure, linkagesand value addition by private entrepreneurs, cooperatives and state agencies for projectssuch as cleaning, sorting, grading, drying and auction platform, pack-house etc. The Schemeis credit linked and demand driven. The subsidy for the projects under the Scheme isreleased through NABARD, NCDC and the Directorate of Marketing & Inspection. Thesanctioned projects include combined harvesters, milk chilling units, cotton ginning andprocessing units, paddy parboiling units, fruits packaging, grading and marketing units,fruit and vegetables market yards, etc., which benefit the farmers during post-harvestmanagement/ marketing of agricultural produce. Under the Scheme 6214 projects with asubsidy release of 439.54 crores has been sanctioned so far.
Challenges
5.44 Inefficiency in the wholesale markets result in a long chain of intermediaries, multiplehandling, loss of quality and increase in the gap between the producer and consumer prices.A large number of small retailers, each handling small quantities, create high overheadsleading to a high marketing margin on the produce.
5.45 The purpose of regulation of agricultural markets was to protect farmers from theexploitation of intermediaries and traders and also to ensure better prices and timely paymentfor the produce. However, due to lack of development of an appropriate marketinfrastructure in tandem with changes in production, intermediation has tended to continueresulting in post-harvest losses at every stage thereby reducing the farmer’s share inconsumer’s price. There is a strong need for providing an appropriate backward and forwardintegration to producers for ensuring primary value additions to the produce to enhanceshelf-life while ensuring quality.
5.46 It is observed that only five states namely, Madhya Pradesh, Andhra Pradesh, Punjab,Maharashtra, and Haryana have more than 60 percent of the total capacity of godownssanctioned in the country. Other states like Karnataka, Uttar Pradesh, West Bengal andGujarat are picking up whereas there is little progress in the states like Goa, Jharkhand,Kerala, Uttarakhand, and Bihar and the North Eastern States. Long payback period and lowlevels of viability are attributed to be the main reasons for this imbalance. In the NorthEastern Region, there has been a lack of response also due to the reluctance of financialinstitutions to provide credit facilities to such back-ended credit linked projects due to acommunity land holding pattern which does not facilitate land collateral in the name ofindividual borrowers.
5.47 There has been a lack of investment in the logistics of the retail chain, leading to afragmented market chain. Across the States there is wide variation in the availability ofmarketing infrastructure such as auction platform, electronic weigh bridge, pricedissemination terminals and display, storages and warehousing facilities, cleaning, gradingand packaging facilities, processing and value addition, etc. However, it is observed thatdespite some reform initiatives by the states, there has been a lukewarm response from theprivate sector for taking up projects for the development of marketing infrastructure. It isfelt that this is mainly due to viability issues given the long gestation period of projects
Agricultural Prices and Markets 137
involving agricultural marketing infrastructure. It may not be possible to fund very largeinvestment requirements of these projects fully from the limited budgetary resources of thegovernment of India alone. In order to remove this shortcoming and to bring in privatesector investment and techno-managerial efficiencies, the government is promoting PublicPrivate Partnerships (PPP) in infrastructure development through a special facility envisagingsupport to PPP projects through ‘viability gap funding’. Primarily, this facility is meant toreduce the capital cost of the projects by credit enhancement, and to make them viable andattractive for private investments through supplementary grant funding. In order to give afurther boost to the creation of warehousing capacity in the country, the Ministry of Financehas allocated Rs.2,000.00 crore in the current financial year under the Rural InfrastructureDevelopment Fund (RIDF).
The Way Forward
5.48 The farming community requires facilities for efficient marketing including scientificstorage so that wastage and produce deterioration are avoided. Also by meeting the creditrequirement of the farmers, he will not be compelled to sell the produce at a time whenprices are low. The states need to implement market reforms in their entirety to provideeffective marketing channels to the producers.
5.49 The markets and their related infrastructure need to be covered under Viability GapFunding so that the private sector is encouraged to make investments in the sector. Moreawareness programmes need be organized to popularize the Schemes with a special focuson the North Eastern Region.
India in Global Agriculture
5.50 The Department of Agriculture and Cooperation is the nodal contact point in governmentof India for the Food & Agriculture Organization and World Food Programme. Bilaterallywith countries of strategic interest, Memoranda of Understanding, Agreements, Protocolsand Work Plans are signed and implemented for furthering cooperation in the field ofagriculture and its allied sectors. The benefits that accrue to the sector from such agreementsand MoUs are in the nature of capacity building, knowledge exchange through visits ofscientists and technicians, exchange of genetic resources, etc. that aid in development ofappropriate technologies and farm practices for enhancing agriculture productivity atfarmers’ field. Such cooperation also facilitates the creation of opportunities for trade inagricultural commodities. India’s strategic interests are also served through partnershipswith other countries.
5.51 India is a founder member of the FAO and has been taking part in all its activities.India has been availing services from the FAO from time to time in the form of training,consultancy services, equipment and material in the field of agriculture and allied sectorsunder its Technical Cooperation Programme. The World Food Programme (WFP) was setup in 1963 jointly by the United Nations and the Food & Agriculture Organization (UN/FAO). India is the founder member of WFP. WFP is mandated to provide emergencyfeeding in places facing acute food insecurity due to natural calamities as also man-madecauses. Currently, the India Country Programme 2008-12 is under operation which focuses
138 State of Indian Agriculture
on reducing hunger and malnutrition amongst women and children in vulnerable areas,development of appropriate products to deal with malnutrition at early ages of the childrenand creating livelihood opportunities for the poor. WFP has also made notable contributionsthrough product innovations such as Indiamix and mapping of hunger in India throughFood Atlases, etc. Presently, there are five agriculture sector-based projects which are beingoperated with the assistance of the World Bank. These projects mainly relate to WatershedDevelopment, Soil and Water Conservation measures (Natural Resource Management), aswell as overall agricultural development related issues. India also has cooperationprogrammes with other multilateral organizations such as the Japan InternationalCooperation Agency (JICA), German Technical Cooperation (GTZ), Asian Development Bankand International Fund for Agriculture Development (IFAD).
G-20 Initiatives
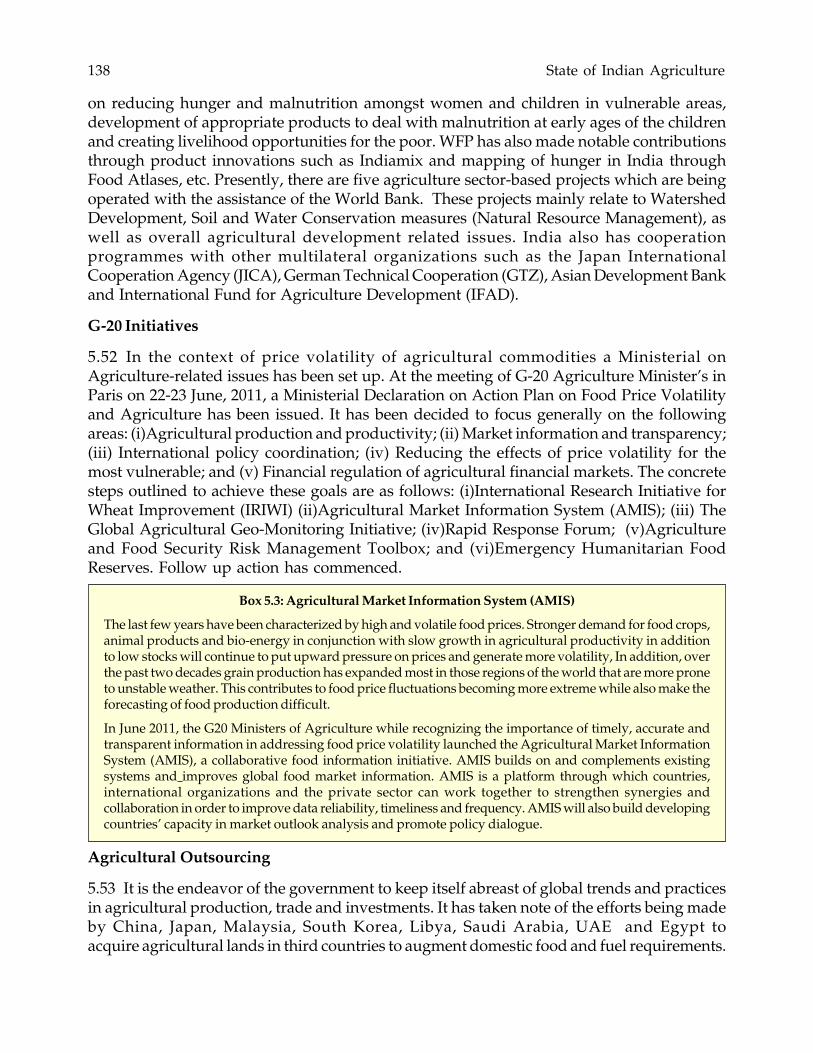
5.52 In the context of price volatility of agricultural commodities a Ministerial onAgriculture-related issues has been set up. At the meeting of G-20 Agriculture Minister’s inParis on 22-23 June, 2011, a Ministerial Declaration on Action Plan on Food Price Volatilityand Agriculture has been issued. It has been decided to focus generally on the followingareas: (i)Agricultural production and productivity; (ii) Market information and transparency;(iii) International policy coordination; (iv) Reducing the effects of price volatility for themost vulnerable; and (v) Financial regulation of agricultural financial markets. The concretesteps outlined to achieve these goals are as follows: (i)International Research Initiative forWheat Improvement (IRIWI) (ii)Agricultural Market Information System (AMIS); (iii) TheGlobal Agricultural Geo-Monitoring Initiative; (iv)Rapid Response Forum; (v)Agricultureand Food Security Risk Management Toolbox; and (vi)Emergency Humanitarian FoodReserves. Follow up action has commenced.
Box 5.3: Agricultural Market Information System (AMIS)
The last few years have been characterized by high and volatile food prices. Stronger demand for food crops,animal products and bio-energy in conjunction with slow growth in agricultural productivity in additionto low stocks will continue to put upward pressure on prices and generate more volatility, In addition, overthe past two decades grain production has expanded most in those regions of the world that are more proneto unstable weather. This contributes to food price fluctuations becoming more extreme while also make theforecasting of food production difficult.
In June 2011, the G20 Ministers of Agriculture while recognizing the importance of timely, accurate andtransparent information in addressing food price volatility launched the Agricultural Market InformationSystem (AMIS), a collaborative food information initiative. AMIS builds on and complements existingsystems and improves global food market information. AMIS is a platform through which countries,international organizations and the private sector can work together to strengthen synergies andcollaboration in order to improve data reliability, timeliness and frequency. AMIS will also build developingcountries’ capacity in market outlook analysis and promote policy dialogue.
Agricultural Outsourcing
5.53 It is the endeavor of the government to keep itself abreast of global trends and practicesin agricultural production, trade and investments. It has taken note of the efforts being madeby China, Japan, Malaysia, South Korea, Libya, Saudi Arabia, UAE and Egypt toacquire agricultural lands in third countries to augment domestic food and fuel requirements.
Agricultural Prices and Markets 139
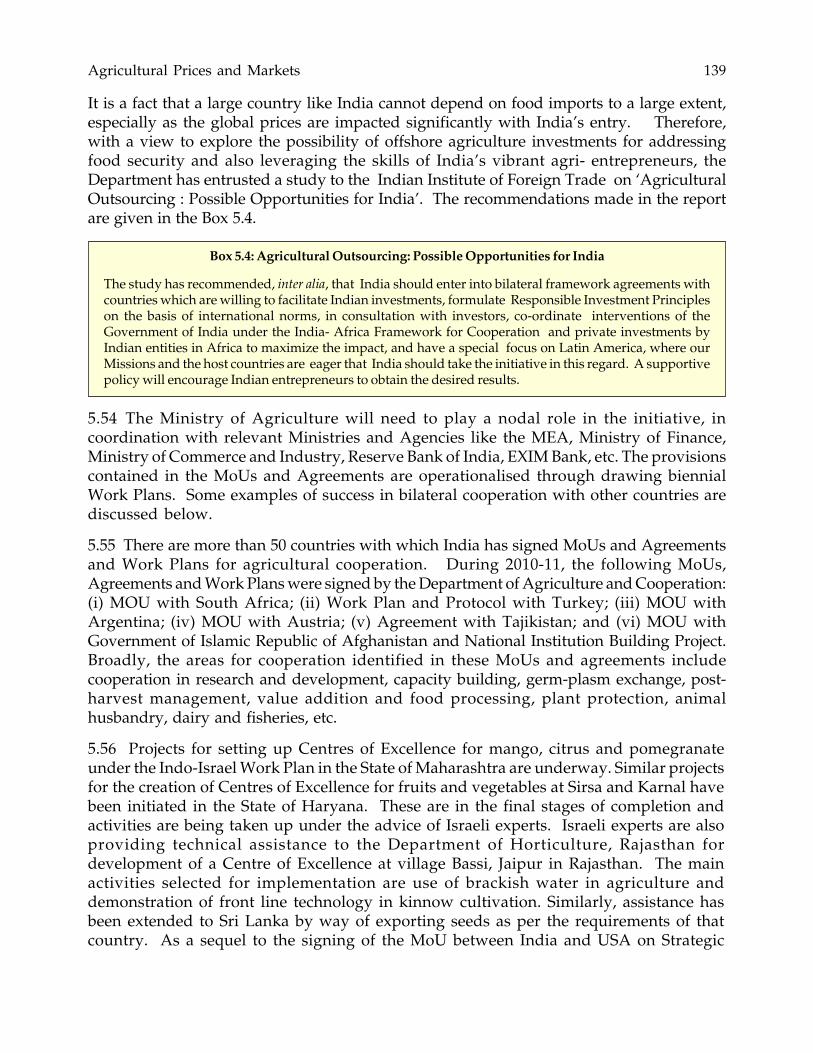
It is a fact that a large country like India cannot depend on food imports to a large extent,especially as the global prices are impacted significantly with India’s entry. Therefore,with a view to explore the possibility of offshore agriculture investments for addressingfood security and also leveraging the skills of India’s vibrant agri- entrepreneurs, theDepartment has entrusted a study to the Indian Institute of Foreign Trade on ‘AgriculturalOutsourcing : Possible Opportunities for India’. The recommendations made in the reportare given in the Box 5.4.
Box 5.4: Agricultural Outsourcing: Possible Opportunities for India
The study has recommended, inter alia, that India should enter into bilateral framework agreements withcountries which are willing to facilitate Indian investments, formulate Responsible Investment Principleson the basis of international norms, in consultation with investors, co-ordinate interventions of theGovernment of India under the India- Africa Framework for Cooperation and private investments byIndian entities in Africa to maximize the impact, and have a special focus on Latin America, where ourMissions and the host countries are eager that India should take the initiative in this regard. A supportivepolicy will encourage Indian entrepreneurs to obtain the desired results.
5.54 The Ministry of Agriculture will need to play a nodal role in the initiative, incoordination with relevant Ministries and Agencies like the MEA, Ministry of Finance,Ministry of Commerce and Industry, Reserve Bank of India, EXIM Bank, etc. The provisionscontained in the MoUs and Agreements are operationalised through drawing biennialWork Plans. Some examples of success in bilateral cooperation with other countries arediscussed below.
5.55 There are more than 50 countries with which India has signed MoUs and Agreementsand Work Plans for agricultural cooperation. During 2010-11, the following MoUs,Agreements and Work Plans were signed by the Department of Agriculture and Cooperation:(i) MOU with South Africa; (ii) Work Plan and Protocol with Turkey; (iii) MOU withArgentina; (iv) MOU with Austria; (v) Agreement with Tajikistan; and (vi) MOU withGovernment of Islamic Republic of Afghanistan and National Institution Building Project.Broadly, the areas for cooperation identified in these MoUs and agreements includecooperation in research and development, capacity building, germ-plasm exchange, post-harvest management, value addition and food processing, plant protection, animalhusbandry, dairy and fisheries, etc.
5.56 Projects for setting up Centres of Excellence for mango, citrus and pomegranateunder the Indo-Israel Work Plan in the State of Maharashtra are underway. Similar projectsfor the creation of Centres of Excellence for fruits and vegetables at Sirsa and Karnal havebeen initiated in the State of Haryana. These are in the final stages of completion andactivities are being taken up under the advice of Israeli experts. Israeli experts are alsoproviding technical assistance to the Department of Horticulture, Rajasthan fordevelopment of a Centre of Excellence at village Bassi, Jaipur in Rajasthan. The mainactivities selected for implementation are use of brackish water in agriculture anddemonstration of front line technology in kinnow cultivation. Similarly, assistance hasbeen extended to Sri Lanka by way of exporting seeds as per the requirements of thatcountry. As a sequel to the signing of the MoU between India and USA on Strategic
140 State of Indian Agriculture
Cooperation in Agriculture and Food Security in 2010, three working groups namely:(i) Working Group-I:-Strategic Cooperation for Food Security (including trilateralcooperation with African countries); (ii) Working Group-II:-Food Processing, Farm toMarket Linkages and Agricultural Extension; (iii) Working Group-III:- Crop and Weatherand Climate Forecasting were constituted. Follow up action has commenced.
5.57 India is also part of the strategic groups such as India, Brazil, South Africa (IBSA),Brazil, Russia, India, China and South Africa (BRICS), Bengal Initiative for Multi-SectoralTechnical and Economic Cooperation (BIMSTEC) and South Asian Association for RegionalCooperation (SAARC), etc. for further cooperation with other countries for advancing itsstrategic interests.
Indian Agriculture in World Trade
5.58 India is among the 15 leading exporters of agricultural products in the world. As perinternational trade statistics, 2010, published by WTO, India’s agricultural exports amountedto US $ 17 billion with a share of 1.4 percent of word trade in agriculture in 2009. On theother hand, India’s agricultural imports amounted to US 14 billion with a share of 1.2 percentof World Trade on agriculture in 2009.
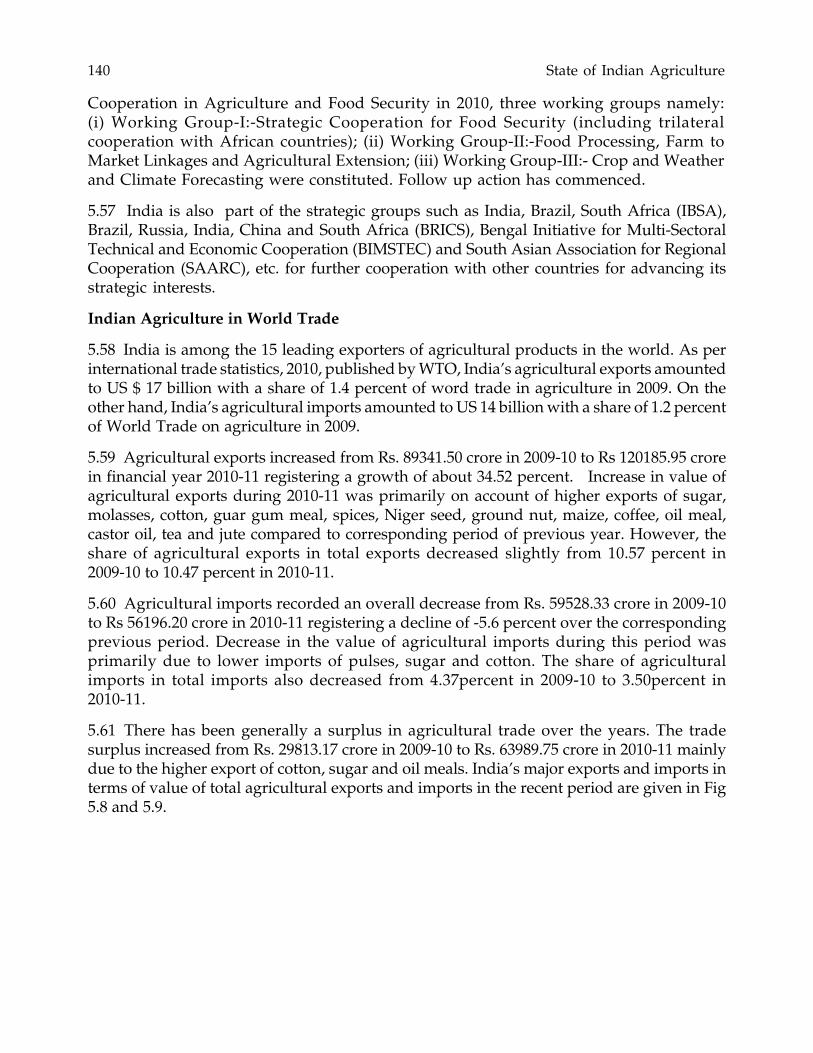
5.59 Agricultural exports increased from Rs. 89341.50 crore in 2009-10 to Rs 120185.95 crorein financial year 2010-11 registering a growth of about 34.52 percent. Increase in value ofagricultural exports during 2010-11 was primarily on account of higher exports of sugar,molasses, cotton, guar gum meal, spices, Niger seed, ground nut, maize, coffee, oil meal,castor oil, tea and jute compared to corresponding period of previous year. However, theshare of agricultural exports in total exports decreased slightly from 10.57 percent in2009-10 to 10.47 percent in 2010-11.
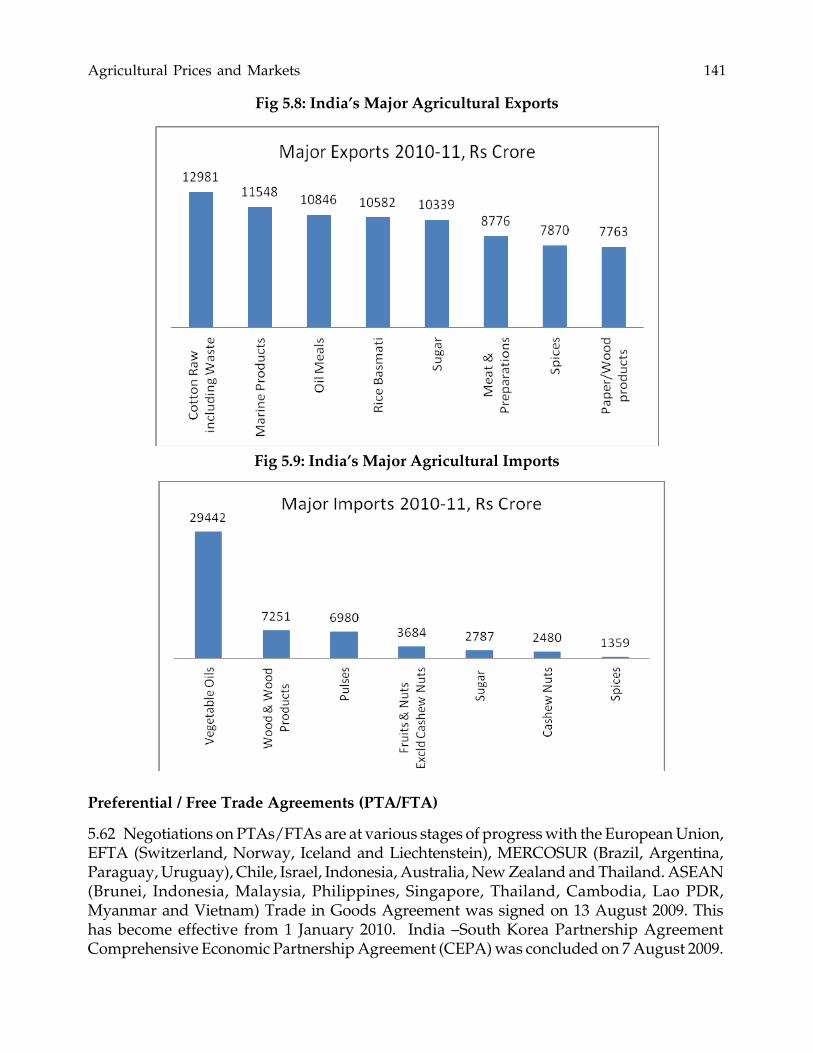
5.60 Agricultural imports recorded an overall decrease from Rs. 59528.33 crore in 2009-10to Rs 56196.20 crore in 2010-11 registering a decline of -5.6 percent over the correspondingprevious period. Decrease in the value of agricultural imports during this period wasprimarily due to lower imports of pulses, sugar and cotton. The share of agriculturalimports in total imports also decreased from 4.37percent in 2009-10 to 3.50percent in2010-11.
5.61 There has been generally a surplus in agricultural trade over the years. The tradesurplus increased from Rs. 29813.17 crore in 2009-10 to Rs. 63989.75 crore in 2010-11 mainlydue to the higher export of cotton, sugar and oil meals. India’s major exports and imports interms of value of total agricultural exports and imports in the recent period are given in Fig5.8 and 5.9.
Agricultural Prices and Markets 141
Preferential / Free Trade Agreements (PTA/FTA)
5.62 Negotiations on PTAs/FTAs are at various stages of progress with the European Union,EFTA (Switzerland, Norway, Iceland and Liechtenstein), MERCOSUR (Brazil, Argentina,Paraguay, Uruguay), Chile, Israel, Indonesia, Australia, New Zealand and Thailand. ASEAN(Brunei, Indonesia, Malaysia, Philippines, Singapore, Thailand, Cambodia, Lao PDR,Myanmar and Vietnam) Trade in Goods Agreement was signed on 13 August 2009. Thishas become effective from 1 January 2010. India –South Korea Partnership AgreementComprehensive Economic Partnership Agreement (CEPA) was concluded on 7 August 2009.
Fig 5.8: India’s Major Agricultural Exports
Fig 5.9: India’s Major Agricultural Imports
142 State of Indian Agriculture
Trade in goods agreements under India- Japan CEPA and India-Malaysia ComprehensiveEconomic Cooperation Agreement (CECA) were concluded during 2010-11 and have becomeeffective from 1 August 2011 and 1 July 2011, respectively.
5.63 The Doha round of trade negotiations in the World Trade Organizations (WTO), whichwere launched in November 2001, is essentially on hold currently. The last revised DraftModalities on Agriculture was brought on 6 December, 2008. Ten issues are namely Bluebox support for US, Cotton, Sensitive Products / Non Sensitive Products beyond 100 percentduties, Tariff Simplifications, Tropical Products & Diversification Products and Preservationof Long Standing Preferences have been in square brackets or otherwise annotated in themodalities since December 2008.
5.64 The focus shifted to possibility of selecting some issues for finalization as an ‘EarlyHarvest’ in time for the 8th Ministerial Conference of the WTO scheduled to be held inDecember 2011,. As part of the “Early Harvest’, it was decided to take up LDC issues ,which were enlarged to LDC+ issues as largely insisted upon by USA. Australia has beentaking the lead in pushing the Early Harvest Package which would include several otherissues apart from LDC issues. Core LDC issues are Duty Free Quota Free (DFQF) marketaccess and cotton subsidies. USA has been insisting that all the major players includingBrazil, China, and India should make significant contributions in the package to take shape.
5.65 India has said that though the early harvest of LDC issues was important, the remainingissues of the Doha development agenda should also be dealt with. USA is unwilling tocommit in LDC core issues such as DFQF and cotton it has been seeking to shift the onus onBrazil, China and India.
Challenges
5.66 A Mini Ministerial was held in Geneva from 21 -29 July, 2008 to finalize the Modalitiesfor Agriculture and NAMA. However, the Agricultural Negotiations broke down due tolack of consensus on the Special Safeguard Mechanism (SSM) apart from lack of consensuson other important areas of negotiation like sensitive products, tariff capping, tariffsimplification etc. There were several other important developing country issues like cotton,preference erosion, tropical products, Duty Free Quota Free (DFQF) market access on whichno agreement has been reached.
The Way Forward
5.67 It is reported that the July 2008 negotiations in Geneva had moved very close toconsensus. This development has enough flexibility to enable India to protect its agricultureagainst imports from developed countries. Hence India has to try hard to hasten theconclusion of this round.