Embed Size (px)
Citation preview

AGRICULTURAL PROFILE OF HARYANA
D.S.Bhupal
AGRICULTURAL ECONOMICS RESEARCH CENTRE
University of Delhi,
November, 2012
1
Contents
Sl. No. Figures and tables page no.
1. District Map of Haryana 2 2. Rural-Urban Population 2011 3 3. Percentage Distribution of Workers 4 4. District wise Rural population 4 5. District wise Urban population 5 6. Distribution of total workers 5 7. Distribution of male workers 5 8. Distribution of female workers 6 9. Movement of SDGP 6-7 10. Index of SGDP 7 11. Gross State Domestic Product (at current Prices) 8 12 Gross State Domestic Product (at constant Prices) 9-10 13 Number and Area of Holdings by Ownership 11 14 Average size and number of holdings 12 15 Growth of area (important crops) 13-14 16 Growth of production (important crops) 15-16 17 Growth of average yield (important crops) 17-18 18 Cropped area, production and yield 19 18 Gross fixed capital formation (current prices) 20 19 Gross fixed capital formation (constant prices) 21-22 23 Number of markets 23 24 Storage Capacity 24 25 Land use 24 26 Soil fertility and micro nutrients 26-27 27 Fertilizer consumption 27 24 Pesticides consumption 27 26 Animal driven equipment and implements 28 27 Area irrigated 29 27 Ground Level Credit Supply 29 28 Credit for agriculture and allied activities 29 29 Animal husbandry 30
30 Requirement and availability of seeds (Rabi) 31 31 Requirement and availability of seeds (Kharif) 32 32
.

2
Haryana as 17th state was constituted in1966. It is one of the two newly created states carved out of the greater Punjab province. It is bordered by Punjab and Himachal Pradesh in the north and by Rajasthan in the West and South. The perennial river Yamuna defines its eastern border with Uttrakhand and Uttar Pradesh. Haryana surrounds Delhi on three sides. Consequently, a large area of Haryana to her advantage is included in the National Capital Region.
Haryana is now a leading contributor to the country's production of food grains and milk.
Agriculture is the principal occupation of the residents of the state. The flat arable land is
irrigated with ground water extracted with submersible pumps and tube wells, and by
surface water through extensive canal system. Haryana’s contribution to the Green
Revolution made India self-sufficient in food production in the 1960s and onwards.
Haryana is one of the wealthiest states of India and has the third highest Per capita
income in the country with per capita GDP at Rs. 109227 (2011-12). Haryana is also one
of the most economically developed regions in South Asia and its agricultural and
manufacturing industry has experienced sustained growth since 1970s. Haryana is India's
largest manufacturer of passenger cars, two-wheelers, and tractors. Since 2000, the
state has emerged as the largest recipient of investment per capita in India.
At present Haryana has 4 administrative divisions constituted of 21 districts – (1) Ambala
Division with 4 districts viz. Ambala, Kurukshetra, Panch Kula and Yamuna Nagar, (2)
Gurgaon Division with 6 districts viz. Faridabad, Palwal, Gurgaon, Mahendragarh, Mewat
and Rewari, (3) Hissar Division with 5 districts viz. Bhiwani, Fatehabad, Hissar, Kaithal
and Sirsa, (4) Rohtak Division with 6 districts viz. Jhajjar, Karnal, Panipat, Rohtak,
Sonepat, and Jind.
The district map further illustrates.
����
Fig.1

3
About 65% of Haryana’s population lives in villages. The percentage of rural population has come down by about 6 % since 2001. Faridabad with less than 21% rural population is the most urbanized district whereas Mewat with more than 88% rural population is least urbanized. Total population in Haryana in 2011 increased by about 20% as compared with 2001, male population by 19% and female population by about 21%. It has significant implications, for example, increase in total population by about 2% annually is more as compared with population growth in the country. Secondly, the gender ratio which was notoriously low in Haryana seems to be improving (table 1).
Table 1: Rural and Urban Population by Sex in Haryana : 2011
District
Population Rural
Population as % of total
Rural Urban
Total
Males
Females
Total
Males
Females
Ambala 632243 334564 297679 504541 269480 235061 55.62
Panchkula 252231 136008 116223 306659 162911 143748 45.13
Yamunanagar 741370 394010 347360 472792 252791 220001 61.06
Kurukshetra 685296 360790 324506 278935 149580 129355 71.07
Kaithal 837171 445614 391557 235690 124981 110709 78.03
Karnal 1050293 557305 492988 456030 241535 214495 69.73
Panipat 649866 349674 300192 552945 296650 256295 54.03
Sonipat 1028393 557103 471290 451687 241845 209842 69.48
Rohtak 613864 330788 283076 444819 235920 208899 57.98
Jhajjar 713933 383887 330046 242974 130416 112558 74.61
Faridabad 369861 197827 172034 1429093 763705 665388 20.56
Palwal 804830 428516 376314 235663 125188 110475 77.35
Gurgaon 472085 251520 220565 1042000 565754 476246 31.18
Mewat (P) 965389 506297 459092 124017 65183 58834 88.62
Rewari 664718 348631 316087 231411 123623 107788 74.18 Mahendragarh 788705 416217 372488 132975 70336 62639 85.57
Bhiwani 1306531 692944 613587 322578 171672 150906 80.2
Jind 1028119 550513 477606 303923 161741 142182 77.18
Hisar 1189789 634149 555640 553026 297386 255640 68.27
Fatehabad 762182 400587 361595 179340 94247 85093 80.96
Sirsa 974624 514092 460532 320490 169150 151340 75.25
Total 2011 16531493 8791036 7740457 8821588 4714094 4107494 65.21
2001 15029260 8052988 6976272 6115304 3310965 2804339 71.08
% change over 2001 10.00 9.16 10.95 44.25 42.38 46.47 - 5.87
Source : Director of Census Operations, Haryana
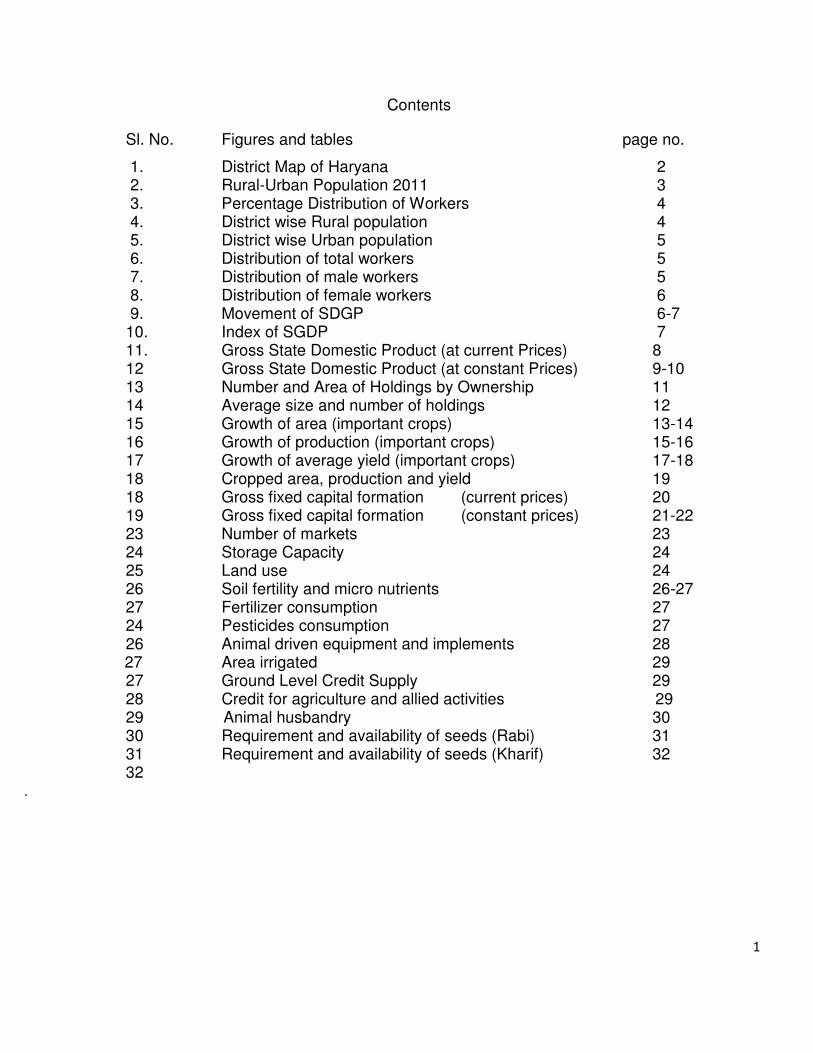
Data regarding workers for the 2011 census is yet to be out. We have presented data regarding cultivators, agricultural labourers, workers in household industries and other workers based on the 2001 census in table 2. Surprisingly, though female cultivators were less in numbers than their male counterparts, but as percentage of total female workers, their percentage was more
4
than male cultivators. The reason was that in other professions more male workers were employed. Overall about 39% females were cultivators and about 44% agricultural labourers. And these numbers are significant to support female rights in agricultural land holdings, notwithstanding strongest resistance from male dominant Haryana farmers.
Table 2: Number and Percentage Distribution of Workers (Main + Marginal)
by Broad Industrial Categories, 2001 Categories Numbers Percentage to Total
Persons Males Females Persons Males Females
Cultivators 3018014 1855547 1162467 36.03 32.47 43.67
Agricultural Labourers 1278821 717133 561688 15.26 12.55 21.1
Workers in Household Industries 214755 132069 82686 2.56 2.31 3.11
Other Workers 3865876 3010777 855099 46.15 52.67 32.12
Total Workers (Main+Marginal) 8377466 5715526 2661940 100 100 100
Source : Director of Census Operations, Haryana. Note : The main workers is one who has worked for 183 days or more in a year in one or more than one economic activity. A person who has worked for less than 183 days a year is considered marginal worker.
District-wise Rural Population, Haryana, 2011
0
100000
200000
300000
400000
500000
600000
700000
800000
Am
bal
aP
anch
kula
Yam
un
ana
gar
Ku
ruks
he
tra
Kai
thal
Kar
na
l
Pan
ipat
Son
ipat
Ro
hta
k
Jhaj
jar
Fari
dab
ad
Pal
wa
lG
urg
aon
Mew
at
Re
war
iM
ahe
ndra
garh
Bh
iwan
i
Jin
d
His
arFa
teh
aba
d
Sirs
a
Districts of Haryana
Po
pu
lati
on
Males Females
Fig.2

5
District-wise Urban Population, Haryana, 2011
0
100000
200000
300000
400000
500000
600000
700000
800000
900000
Am
bal
aP
anch
kula
Yam
un
anag
arK
uru
ksh
etr
a
Kai
thal
Kar
na
l
Pan
ipat
Son
ipat
Ro
hta
k
Jhaj
jar
Fari
dab
ad
Pal
wal
Gu
rgao
n
Mew
at
Rew
ari
Mah
end
raga
rh
Bh
iwan
i
Jin
d
His
ar
Fate
hab
ad
Sirs
a
Districts of Haryana
Po
pu
lati
on
Males Females
Fig.3
Percentage Distribution of Total Workers (Main + Marginal), by broad Industrial Categories, Haryana,
2001
Cultivators
36%
Agricultural Labourers
15%
Workers in Household
Industries
3%
Other Workers
46%
Fig.4
Percentage Distribution of Male Workers (Main + Marginal) by Broad Industrial Categories, 2001
Cultivators
32%
Agricultural Labourers
13%Workers in Household
Industries
2%
Other Workers
53%
Fig.5

6
Percentage Distribution of Female Workers (Main + Marginal) by Broad
Industrial Categories, 2001
Cultivators
44%
Agricultural Labourers
21%
Workers in Household
Industries
3%
Other Workers
32%
Fig.6
Index of Gross State Domestic Product (GSDP) at Factor cost at
Current and Constant (2004-05) Prices, Haryana
100
120
140
160
180
200
220
240
260
280
300
2004-05 2005-06 2006-07 2007-08 2008-09 2009-10 2010-11
Ind
ex
(20
04
-05
=1
00
)
GSDP at Current Prices Per Capita GSDP at Current Prices
GSDP at Constant Prices 2004-05 Per Capita GSDP at Constant Prices 2004-05
Fig.7
Fig.7
7
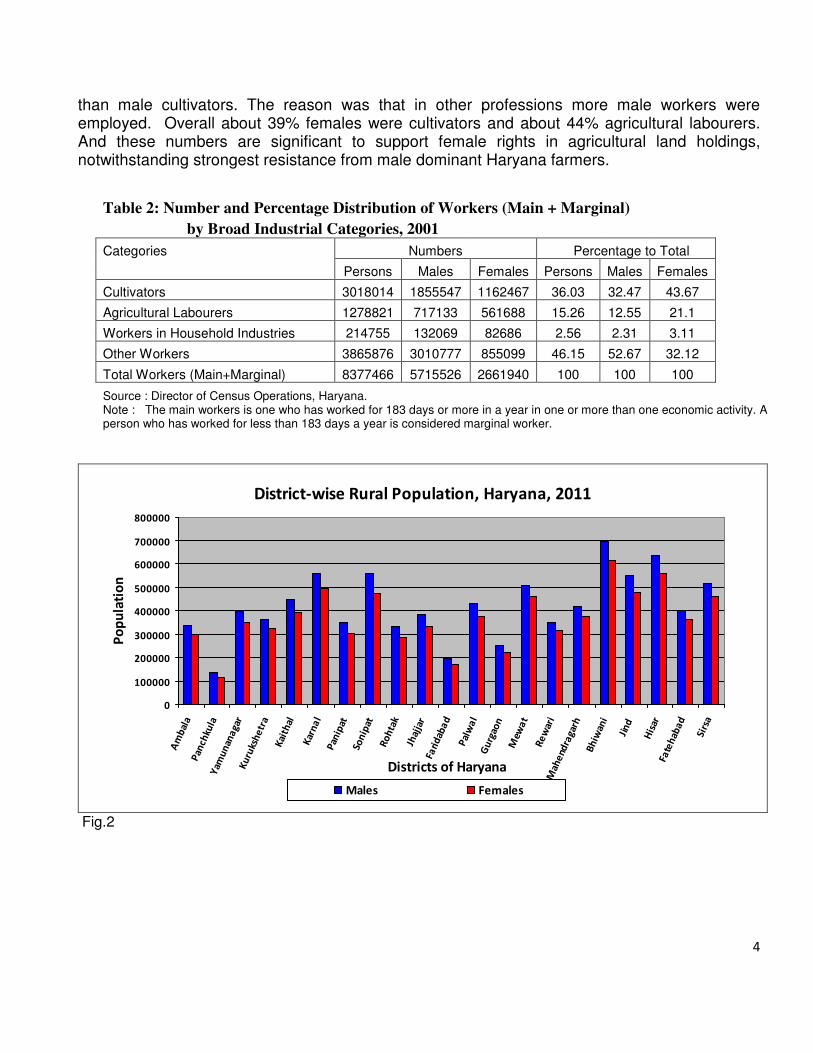
Movement of State GDP: Final data for the 5 years (2004-05 to 2008-09), provisional estimates for the years 2009-10 and quick estimates for the year 2010-11 were available which have been included to work out annual compound growth rates of state gross domestic product both at current prices and on the basis of 2004-05 prices, as well as in per capita terms. For the state the SDP(both Gross and Net) increased at about 0.19% annually whereas in terms of per capita SDP increased at much lower rates 0.17%, obviously due to the impact of increase in population. But on adjustment to inflation or at the 2004-05 prices, the rate of enhancement in SDP comes down to 0.095 in state terms and to 0.076% in per capita terms (table 3)
Table 3: Movement of Gross and Net State Domestic Product at Factor Cost at
Current and Constant (2004-05) Prices, Haryana
Item Rs Crores. 2004-05
2005-06
2006-07 2007-08
2008-09
2009-10 (P)
2010-11 (Q)
cgr
1.At Current prices
GSDP 95795 108887 128740 151607 182502 222030.6 264148.69
0.188
NSDP 86222 97905.3 116111 136595 164616 200678.1 239255.55 0.189
GSDP per
42187 47056 54622 63178 74719 89352 104531 0.167
NSDP per
capita 37972 42310 49264 56922 67397 80759 94680 0.168
2. At 2004-05 Prices
GSDP 95795 104610 116348 126192 136540 151563 166095.37 0.095
NSDP 86222 94013.4 104705 112917 121650 136381.7 149650.55 0.095
GSDP per
capita 42187 45207 49365 52586 55902 60994 65728
0.076
NSDP per 37972 40628 44425 47055 49806 54884 59221 0.076 3. Index Numbers with 2004-05 as base
A. At current Prices
GSDP 100 113.67 134.39 158.26 190.51 231.78 275.74 0.188
NSDP 100 113.55 134.66 158.42 190.92 232.75 277.49 0.189
GSDP per
capita 100 111.54 129.48 149.75 177.11 211.8 247.78 0.167
NSDP per
capita 100 111.43 129.74 149.91 177.49 212.68 249.34
0.168
B. At 2004-05 Prices
GSDP 100 109.2 121.46 131.73 142.53 158.22 173.39 0.095
NSDP 100 109.04 121.44 130.96 141.09 158.17 173.56 0.095
GSDP per
capita 100 107.16 117.01 124.65 132.51 144.58 155.8
0.076
NSDP per
capita 100 107 116.99 123.92 131.17 144.54 155.96 0.076
Q = quick estimates, p = provisional Source :—Department of Economic and Statistical Analysis, Haryana
.
8
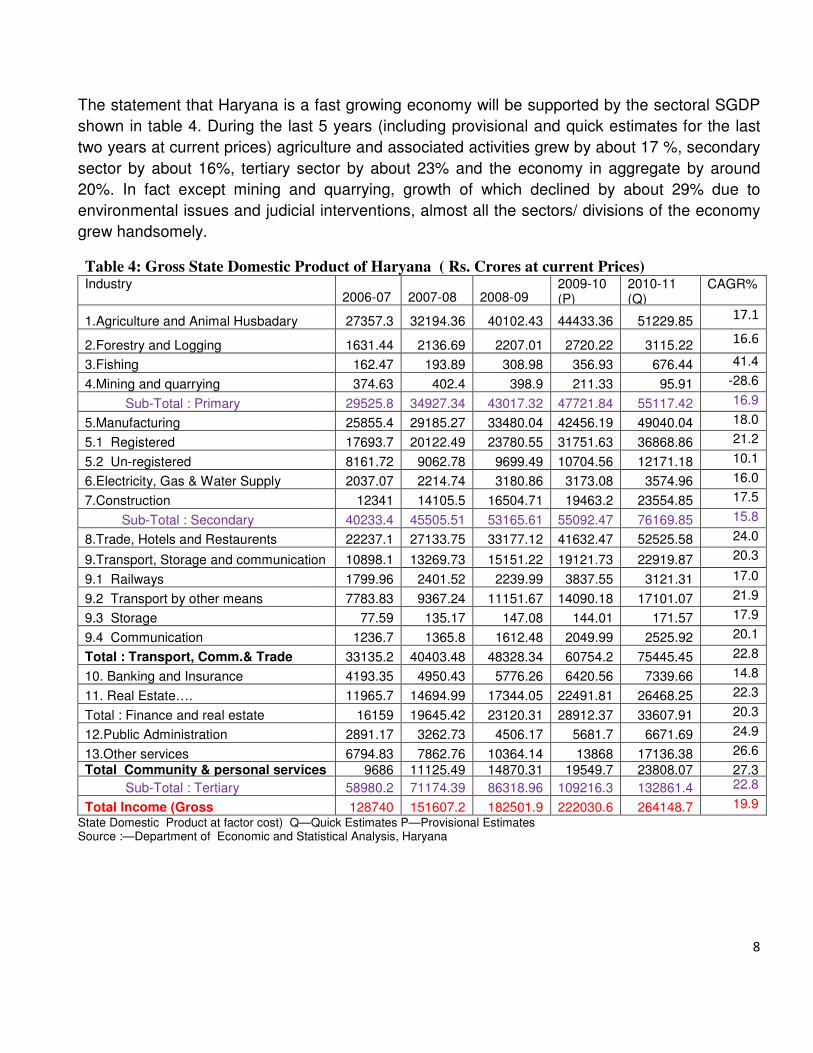
The statement that Haryana is a fast growing economy will be supported by the sectoral SGDP
shown in table 4. During the last 5 years (including provisional and quick estimates for the last
two years at current prices) agriculture and associated activities grew by about 17 %, secondary
sector by about 16%, tertiary sector by about 23% and the economy in aggregate by around
20%. In fact except mining and quarrying, growth of which declined by about 29% due to
environmental issues and judicial interventions, almost all the sectors/ divisions of the economy
grew handsomely.
Table 4: Gross State Domestic Product of Haryana ( Rs. Crores at current Prices) Industry
2006-07 2007-08 2008-09 2009-10 (P)
2010-11 (Q)
CAGR%
1.Agriculture and Animal Husbadary 27357.3 32194.36 40102.43 44433.36 51229.85 17.1
2.Forestry and Logging 1631.44 2136.69 2207.01 2720.22 3115.22 16.6
3.Fishing 162.47 193.89 308.98 356.93 676.44 41.4
4.Mining and quarrying 374.63 402.4 398.9 211.33 95.91 -28.6
Sub-Total : Primary 29525.8 34927.34 43017.32 47721.84 55117.42 16.9
5.Manufacturing 25855.4 29185.27 33480.04 42456.19 49040.04 18.0
5.1 Registered 17693.7 20122.49 23780.55 31751.63 36868.86 21.2
5.2 Un-registered 8161.72 9062.78 9699.49 10704.56 12171.18 10.1
6.Electricity, Gas & Water Supply 2037.07 2214.74 3180.86 3173.08 3574.96 16.0
7.Construction 12341 14105.5 16504.71 19463.2 23554.85 17.5
Sub-Total : Secondary 40233.4 45505.51 53165.61 55092.47 76169.85 15.8
8.Trade, Hotels and Restaurents 22237.1 27133.75 33177.12 41632.47 52525.58 24.0
9.Transport, Storage and communication 10898.1 13269.73 15151.22 19121.73 22919.87 20.3
9.1 Railways 1799.96 2401.52 2239.99 3837.55 3121.31 17.0
9.2 Transport by other means 7783.83 9367.24 11151.67 14090.18 17101.07 21.9
9.3 Storage 77.59 135.17 147.08 144.01 171.57 17.9
9.4 Communication 1236.7 1365.8 1612.48 2049.99 2525.92 20.1
Total : Transport, Comm.& Trade 33135.2 40403.48 48328.34 60754.2 75445.45 22.8
10. Banking and Insurance 4193.35 4950.43 5776.26 6420.56 7339.66 14.8
11. Real Estate…. 11965.7 14694.99 17344.05 22491.81 26468.25 22.3
Total : Finance and real estate 16159 19645.42 23120.31 28912.37 33607.91 20.3
12.Public Administration 2891.17 3262.73 4506.17 5681.7 6671.69 24.9
13.Other services 6794.83 7862.76 10364.14 13868 17136.38 26.6
Total Community & personal services 9686 11125.49 14870.31 19549.7 23808.07 27.3
Sub-Total : Tertiary 58980.2 71174.39 86318.96 109216.3 132861.4 22.8
Total Income (Gross 128740 151607.2 182501.9 222030.6 264148.7 19.9
State Domestic Product at factor cost) Q—Quick Estimates P—Provisional Estimates Source :—Department of Economic and Statistical Analysis, Haryana
9
0
20000
40000
60000
80000
100000
120000
140000R
s C
rore
s
2006-07 2007-08 2008-09 2009-10 2010-11
Years
Gross State Domestic Product of Haryana (Rs. Crores at current Prices)
Agri & Allied Industries Services
Fig.8
0
10000
20000
30000
40000
50000
60000
70000
80000
90000
Rs
Cro
res
2006-07 2007-08 2008-09 2009-10 2010-11
Years
Gross State Domestic Product of Haryana (Rs. Crores) at Constant 2004-05 Prices
Agri & Allied Industries Services
Fig.9
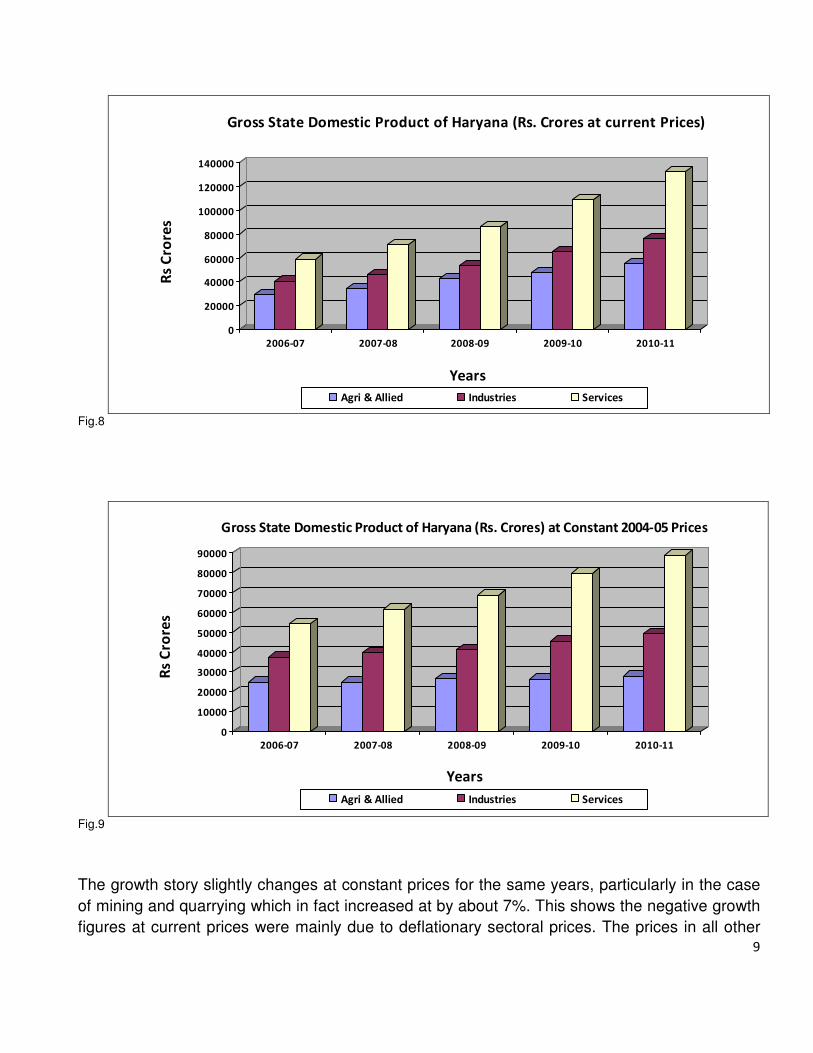
The growth story slightly changes at constant prices for the same years, particularly in the case
of mining and quarrying which in fact increased at by about 7%. This shows the negative growth
figures at current prices were mainly due to deflationary sectoral prices. The prices in all other
10
sectors increased and that is why at constant prices the growth was significantly lower, in
primary sector only 2.6%, in secondary 7.4%, and 13% in tertiary sector and thus overall a little
less than 10% (table 5).
Table 5: Gross State Domestic Product of Haryana (Rs. Cr.) at constant (2004-05) Prices
Industry
2006-07 2007-08 2008-09 2009-10 (P)
2010-11(Q)
CAGR%
1.Agriculture and Animal Husbadary 23543.4 23475.85 25235.75 24832.19 26392.16 2.9
2.Forestry and Logging 1098.26 1134.09 1164.68 1192.76 1227.57 2.8
3.Fishing
162.46 181.78 205.99 237.95 253.67 12.3
4.Mining and quarrying 342.74 355.77 328.2 164.36 74.54 31.8
Sub-Total : Primary 25146.9 25147.49 26934.62 26427.26 27947.94 2.6
5.Manufacturing
24023.3 26051.59 26741.89 29560.78 32088.28 7.3
5.1 Registered
16562.6 18047.65 18624.47 20941.74 22864.87 8.3
5.2 Un-registered 7460.73 8003.94 8117.42 8619.04 9223.41 5.1
6.Electricity, Gas & Water Supply 1856.29 2017.91 2213 2567.08 2827.46 11.4
7.Construction
11124.5 11397.14 11945.12 13224.63 14325.79 6.8
Sub-Total : Secondary 37004.1 39466.64 40900.01 45352.49 49241.53 7.4
8.Trade, Hotels and Restaurents 19922.1 23163.67 26181.91 31590.66 36353.89 16.3
9.Transport, Storage and Communication 10225.1 11649.83 12278.26 13668.02 14914.07 9.6
9.1 Railways
1675.03 2105.58 1941.91 2124.73 2141.73 5.1
9.2 Transport by other means 6956.62 7736.64 8281.23 9105.02 9984.79 9.3
9.3 Storage
67.96 69.65 71.53 79.36 81.69 5.1
9.4 Communication 1525.47 1737.96 1983.59 2358.91 2705.86 15.6
Total : Transport, Comm.& Trade 30147.2 34813.5 38460.17 45258.68 51267.96 14.2
10. Banking and Insurance 4615.71 5497.18 6145.55 6865.26 7668.5 13.2
11. Real Estate …. 10758.2 11921.05 12799.47 14539.44 15480.66 9.7
Total : Finance and real estate 15373.9 17418.23 18945.02 21404.7 23149.16 10.8
12.Public Administration 2603.38 2776.13 3481.87 3948.21 4233.63 14.2
13.Other services 6073.01 6569.52 7818.36 9171.62 10255.16 14.8
Total : Community & personal service 8676.39 9345.65 11300.23 13119.83 14488.79 14.6
Sub-Total : Tertiary 54197.5 61577.38 68705.42 79783.21 88905.91 13.3
Total Income (Gross 116349 126191.5 136540.1 151563 166095.4 9.4
Q—Quick Estimates, P—Provisional Estimates , Source :—Department of Economic and Statistical Analysis, Haryana.
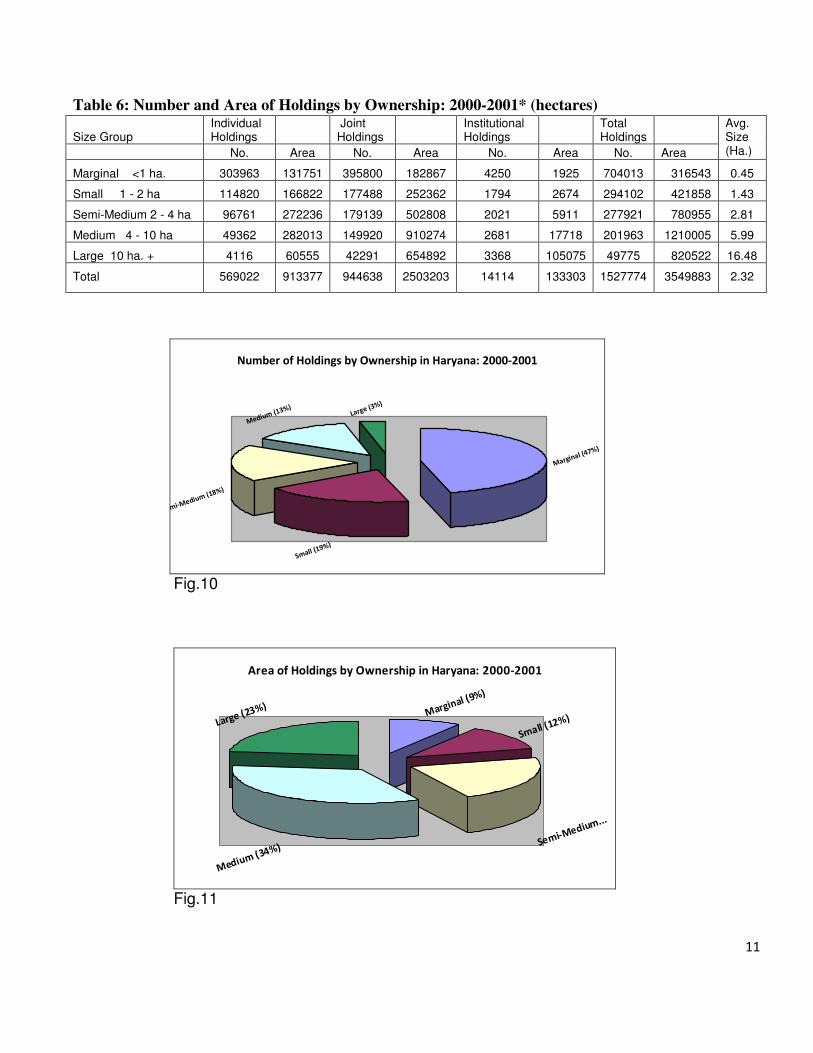
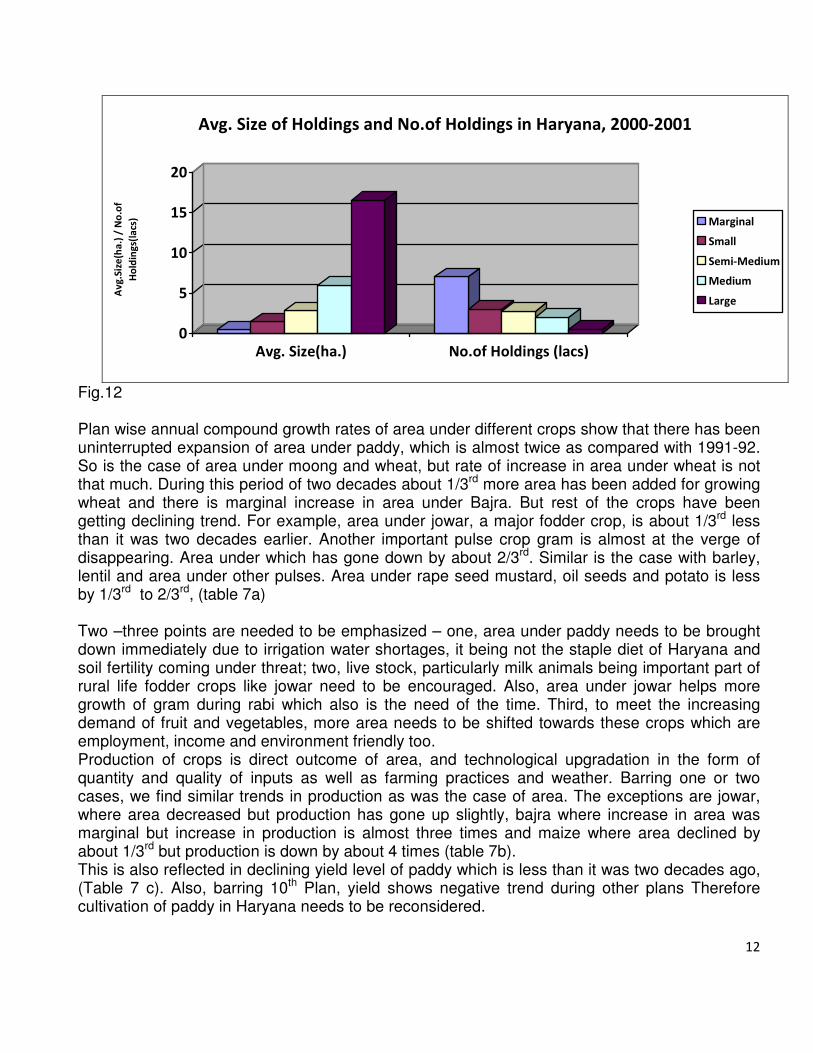
Due to non-availability of 2011 census data, number and size of holdings in the state are based upon 2000- 01 data (table 6). As would be clear, about 46% holdings are marginal having less than 9% of total area, whereas large holdings (3%) occupy more than 23% area and that is why the average size varies highly from less than 0.5 hectares to about 16.5% hectares in the case of large holdings.
11
Table 6: Number and Area of Holdings by Ownership: 2000-2001* (hectares)
Size Group Individual Holdings
Joint Holdings
Institutional Holdings
Total Holdings
Avg. Size (Ha.) No. Area No. Area No. Area No. Area
Marginal <1 ha. 303963 131751 395800 182867 4250 1925 704013 316543 0.45
Small 1 - 2 ha 114820 166822 177488 252362 1794 2674 294102 421858 1.43
Semi-Medium 2 - 4 ha 96761 272236 179139 502808 2021 5911 277921 780955 2.81
Medium 4 - 10 ha 49362 282013 149920 910274 2681 17718 201963 1210005 5.99
Large 10 ha. + 4116 60555 42291 654892 3368 105075 49775 820522 16.48
Total 569022 913377 944638 2503203 14114 133303 1527774 3549883 2.32
Number of Holdings by Ownership in Haryana: 2000-2001
Marginal (47%)
Small (19%)
Semi-Medium (18%)
Medium (13%)Large (3%)
Fig.10
Area of Holdings by Ownership in Haryana: 2000-2001
Marginal (9%)
Small (12%)
Semi-Medium...
Medium (34%)
Large (23%)
Fig.11
12
0
5
10
15
20
Av
g.S
ize
(ha
.) /
No
.of
Ho
ldin
gs(
lacs
)
Avg. Size(ha.) No.of Holdings (lacs)
Avg. Size of Holdings and No.of Holdings in Haryana, 2000-2001
Marginal
Small
Semi-Medium
Medium
Large
Fig.12
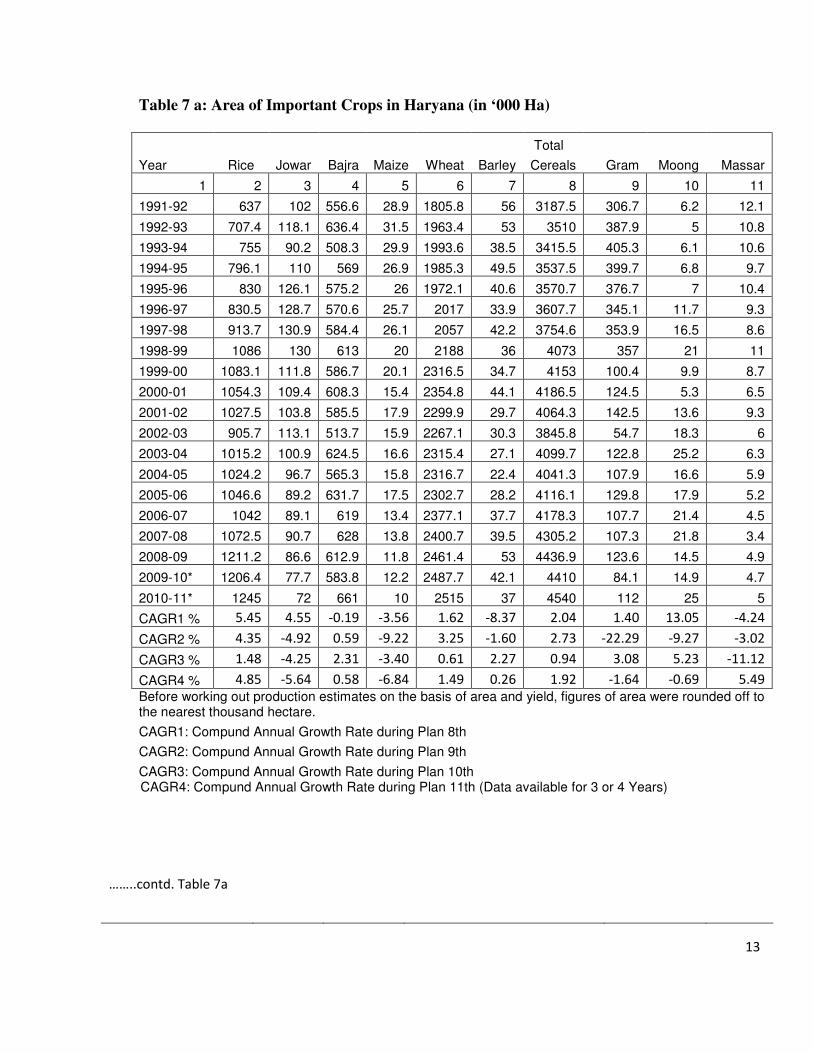
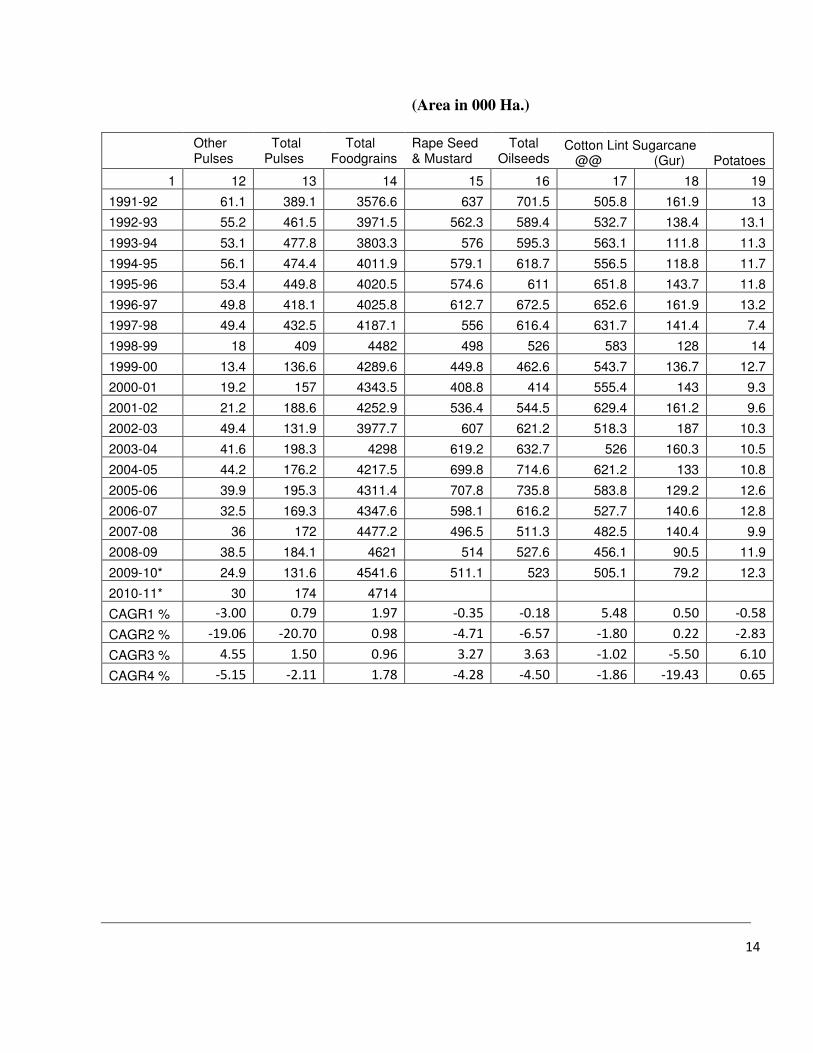
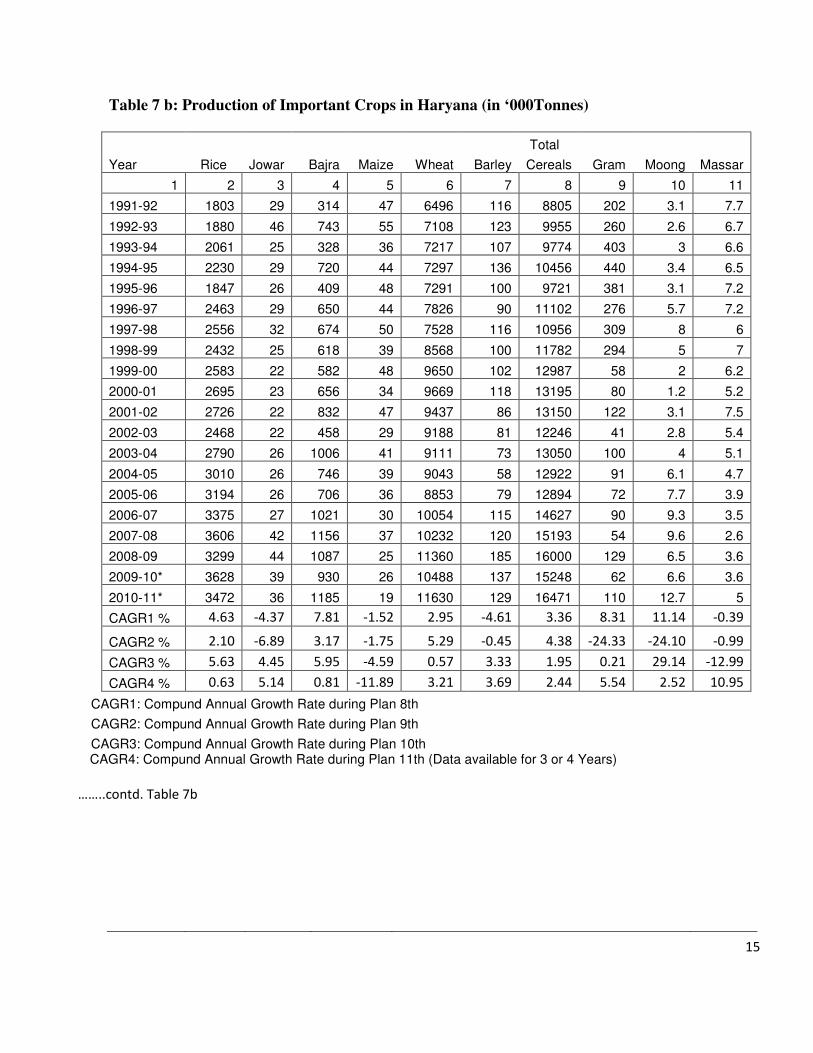
Plan wise annual compound growth rates of area under different crops show that there has been uninterrupted expansion of area under paddy, which is almost twice as compared with 1991-92. So is the case of area under moong and wheat, but rate of increase in area under wheat is not that much. During this period of two decades about 1/3rd more area has been added for growing wheat and there is marginal increase in area under Bajra. But rest of the crops have been getting declining trend. For example, area under jowar, a major fodder crop, is about 1/3rd less than it was two decades earlier. Another important pulse crop gram is almost at the verge of disappearing. Area under which has gone down by about 2/3rd. Similar is the case with barley, lentil and area under other pulses. Area under rape seed mustard, oil seeds and potato is less by 1/3rd to 2/3rd, (table 7a) Two –three points are needed to be emphasized – one, area under paddy needs to be brought down immediately due to irrigation water shortages, it being not the staple diet of Haryana and soil fertility coming under threat; two, live stock, particularly milk animals being important part of rural life fodder crops like jowar need to be encouraged. Also, area under jowar helps more growth of gram during rabi which also is the need of the time. Third, to meet the increasing demand of fruit and vegetables, more area needs to be shifted towards these crops which are employment, income and environment friendly too. Production of crops is direct outcome of area, and technological upgradation in the form of quantity and quality of inputs as well as farming practices and weather. Barring one or two cases, we find similar trends in production as was the case of area. The exceptions are jowar, where area decreased but production has gone up slightly, bajra where increase in area was marginal but increase in production is almost three times and maize where area declined by about 1/3rd but production is down by about 4 times (table 7b). This is also reflected in declining yield level of paddy which is less than it was two decades ago, (Table 7 c). Also, barring 10th Plan, yield shows negative trend during other plans Therefore cultivation of paddy in Haryana needs to be reconsidered.
13
Table 7 a: Area of Important Crops in Haryana (in ‘000 Ha)
Total
Year Rice Jowar Bajra Maize Wheat Barley Cereals Gram Moong Massar
1 2 3 4 5 6 7 8 9 10 11
1991-92 637 102 556.6 28.9 1805.8 56 3187.5 306.7 6.2 12.1
1992-93 707.4 118.1 636.4 31.5 1963.4 53 3510 387.9 5 10.8
1993-94 755 90.2 508.3 29.9 1993.6 38.5 3415.5 405.3 6.1 10.6
1994-95 796.1 110 569 26.9 1985.3 49.5 3537.5 399.7 6.8 9.7
1995-96 830 126.1 575.2 26 1972.1 40.6 3570.7 376.7 7 10.4
1996-97 830.5 128.7 570.6 25.7 2017 33.9 3607.7 345.1 11.7 9.3
1997-98 913.7 130.9 584.4 26.1 2057 42.2 3754.6 353.9 16.5 8.6
1998-99 1086 130 613 20 2188 36 4073 357 21 11
1999-00 1083.1 111.8 586.7 20.1 2316.5 34.7 4153 100.4 9.9 8.7
2000-01 1054.3 109.4 608.3 15.4 2354.8 44.1 4186.5 124.5 5.3 6.5
2001-02 1027.5 103.8 585.5 17.9 2299.9 29.7 4064.3 142.5 13.6 9.3
2002-03 905.7 113.1 513.7 15.9 2267.1 30.3 3845.8 54.7 18.3 6
2003-04 1015.2 100.9 624.5 16.6 2315.4 27.1 4099.7 122.8 25.2 6.3
2004-05 1024.2 96.7 565.3 15.8 2316.7 22.4 4041.3 107.9 16.6 5.9
2005-06 1046.6 89.2 631.7 17.5 2302.7 28.2 4116.1 129.8 17.9 5.2
2006-07 1042 89.1 619 13.4 2377.1 37.7 4178.3 107.7 21.4 4.5
2007-08 1072.5 90.7 628 13.8 2400.7 39.5 4305.2 107.3 21.8 3.4
2008-09 1211.2 86.6 612.9 11.8 2461.4 53 4436.9 123.6 14.5 4.9
2009-10* 1206.4 77.7 583.8 12.2 2487.7 42.1 4410 84.1 14.9 4.7
2010-11* 1245 72 661 10 2515 37 4540 112 25 5
CAGR1 % 5.45 4.55 -0.19 -3.56 1.62 -8.37 2.04 1.40 13.05 -4.24
CAGR2 % 4.35 -4.92 0.59 -9.22 3.25 -1.60 2.73 -22.29 -9.27 -3.02
CAGR3 % 1.48 -4.25 2.31 -3.40 0.61 2.27 0.94 3.08 5.23 -11.12
CAGR4 % 4.85 -5.64 0.58 -6.84 1.49 0.26 1.92 -1.64 -0.69 5.49
Before working out production estimates on the basis of area and yield, figures of area were rounded off to the nearest thousand hectare.
CAGR1: Compund Annual Growth Rate during Plan 8th
CAGR2: Compund Annual Growth Rate during Plan 9th
CAGR3: Compund Annual Growth Rate during Plan 10th CAGR4: Compund Annual Growth Rate during Plan 11th (Data available for 3 or 4 Years)
……..contd. Table 7a
14
(Area in 000 Ha.)
Other Pulses
Total Pulses
Total Foodgrains
Rape Seed & Mustard
Total Oilseeds
Cotton Lint Sugarcane @@ (Gur)
Potatoes
1 12 13 14 15 16 17 18 19
1991-92 61.1 389.1 3576.6 637 701.5 505.8 161.9 13
1992-93 55.2 461.5 3971.5 562.3 589.4 532.7 138.4 13.1
1993-94 53.1 477.8 3803.3 576 595.3 563.1 111.8 11.3
1994-95 56.1 474.4 4011.9 579.1 618.7 556.5 118.8 11.7
1995-96 53.4 449.8 4020.5 574.6 611 651.8 143.7 11.8
1996-97 49.8 418.1 4025.8 612.7 672.5 652.6 161.9 13.2
1997-98 49.4 432.5 4187.1 556 616.4 631.7 141.4 7.4
1998-99 18 409 4482 498 526 583 128 14
1999-00 13.4 136.6 4289.6 449.8 462.6 543.7 136.7 12.7
2000-01 19.2 157 4343.5 408.8 414 555.4 143 9.3
2001-02 21.2 188.6 4252.9 536.4 544.5 629.4 161.2 9.6
2002-03 49.4 131.9 3977.7 607 621.2 518.3 187 10.3
2003-04 41.6 198.3 4298 619.2 632.7 526 160.3 10.5
2004-05 44.2 176.2 4217.5 699.8 714.6 621.2 133 10.8
2005-06 39.9 195.3 4311.4 707.8 735.8 583.8 129.2 12.6
2006-07 32.5 169.3 4347.6 598.1 616.2 527.7 140.6 12.8
2007-08 36 172 4477.2 496.5 511.3 482.5 140.4 9.9
2008-09 38.5 184.1 4621 514 527.6 456.1 90.5 11.9
2009-10* 24.9 131.6 4541.6 511.1 523 505.1 79.2 12.3
2010-11* 30 174 4714
CAGR1 % -3.00 0.79 1.97 -0.35 -0.18 5.48 0.50 -0.58
CAGR2 % -19.06 -20.70 0.98 -4.71 -6.57 -1.80 0.22 -2.83
CAGR3 % 4.55 1.50 0.96 3.27 3.63 -1.02 -5.50 6.10
CAGR4 % -5.15 -2.11 1.78 -4.28 -4.50 -1.86 -19.43 0.65
15
Table 7 b: Production of Important Crops in Haryana (in ‘000Tonnes)
Total
Year Rice Jowar Bajra Maize Wheat Barley Cereals Gram Moong Massar
1 2 3 4 5 6 7 8 9 10 11
1991-92 1803 29 314 47 6496 116 8805 202 3.1 7.7
1992-93 1880 46 743 55 7108 123 9955 260 2.6 6.7
1993-94 2061 25 328 36 7217 107 9774 403 3 6.6
1994-95 2230 29 720 44 7297 136 10456 440 3.4 6.5
1995-96 1847 26 409 48 7291 100 9721 381 3.1 7.2
1996-97 2463 29 650 44 7826 90 11102 276 5.7 7.2
1997-98 2556 32 674 50 7528 116 10956 309 8 6
1998-99 2432 25 618 39 8568 100 11782 294 5 7
1999-00 2583 22 582 48 9650 102 12987 58 2 6.2
2000-01 2695 23 656 34 9669 118 13195 80 1.2 5.2
2001-02 2726 22 832 47 9437 86 13150 122 3.1 7.5
2002-03 2468 22 458 29 9188 81 12246 41 2.8 5.4
2003-04 2790 26 1006 41 9111 73 13050 100 4 5.1
2004-05 3010 26 746 39 9043 58 12922 91 6.1 4.7
2005-06 3194 26 706 36 8853 79 12894 72 7.7 3.9
2006-07 3375 27 1021 30 10054 115 14627 90 9.3 3.5
2007-08 3606 42 1156 37 10232 120 15193 54 9.6 2.6
2008-09 3299 44 1087 25 11360 185 16000 129 6.5 3.6
2009-10* 3628 39 930 26 10488 137 15248 62 6.6 3.6
2010-11* 3472 36 1185 19 11630 129 16471 110 12.7 5
CAGR1 % 4.63 -4.37 7.81 -1.52 2.95 -4.61 3.36 8.31 11.14 -0.39
CAGR2 % 2.10 -6.89 3.17 -1.75 5.29 -0.45 4.38 -24.33 -24.10 -0.99
CAGR3 % 5.63 4.45 5.95 -4.59 0.57 3.33 1.95 0.21 29.14 -12.99
CAGR4 % 0.63 5.14 0.81 -11.89 3.21 3.69 2.44 5.54 2.52 10.95
CAGR1: Compund Annual Growth Rate during Plan 8th
CAGR2: Compund Annual Growth Rate during Plan 9th
CAGR3: Compund Annual Growth Rate during Plan 10th CAGR4: Compund Annual Growth Rate during Plan 11th (Data available for 3 or 4 Years)
……..contd. Table 7b
16
(Production in 000 Tonnes)
Other Pulses
Total Pulses
Total Foodgrains
Rape Seed & Mustard
Total Oilseeds Cotton Lint Sugarcane
@@ (Gur)
Potatoes
11 12 13 14 15 16 17 18 19
1991-92 59.2 273.1 9078.1 662 757.3 1341 905 235.4
1992-93 55.9 326.1 10281.1 518 558.5 1411 672 219.5
1993-94 55.4 468.7 10242.7 798 822.9 1124 646 189.6
1994-95 65.5 516.3 10972.3 802 860.5 1371 696 160
1995-96 58.3 450.7 10171.7 729 783.1 1284 809 161.6
1996-97 56.3 346 11448 894 985 1507 902 179
1997-98 51 376 11332 368 455.9 1107 750 67.7
1998-99 16 323 12105 615 653 874 701 213
1999-00 11.4 78.2 13065.2 595 604.6 1304 764 199.8
2000-01 13.1 99.8 13294.8 560 562.8 1383 817 141.2
2001-02 15.3 148.3 13298.3 800 805.4 722 927 203.1
2002-03 33 82.8 12328.8 697 705.6 1038 1065 291.9
2003-04 33.6 143.1 13193.1 965 976.8 1407 928 256.9
2004-05 32.4 134.9 13056.9 824 835.9 2095 823 269.1
2005-06 27.3 111.8 13005.8 792.8 822.1 1502 831 312.5
2006-07 31.9 136 14763 804 821.2 1805 965.1 319.9
2007-08 33.5 101 15294.1 597 617.2 1882 885 177.6
2008-09 37.5 177.8 16177.8 894.9 911.5 1862 520.6 258.6
2009-10* 24 97.3 15345.3 847 862 1918 570.7 138.4
2010-11* 30 158.4 16629.4
CAGR1 % 0.12 6.64 3.48 7.50 7.02 1.44 1.77 -6.78
CAGR2 % -26.82 -24.06 3.80 1.94 -1.28 -7.19 1.38 8.24
CAGR3 % 9.16 1.18 1.94 0.73 1.15 19.00 -1.88 7.47
CAGR4 % -4.46 2.71 2.44 5.77 5.50 1.73 -19.00 -19.25

17
Table 7 c: Average Yield per hectare of Important Crops in Haryana
(Yield in Kgs. per hectare)
Total
Year Rice Jowar Bajra Maize Wheat Barley Cereals Gram Moong Massar
1 2 3 4 5 6 7 8 9 10 11
1991-92 2831 236 563 1604 3597 2074 2762 659 491 634
1992-93 2650 394 1168 1772 3621 2324 2836 669 582 611
1993-94 2730 272 646 1190 3619 2816 2862 995 485 619
1994-95 2802 264 1265 1620 3676 2720 2956 1099 500 671
1995-96 2225 238 711 1827 3697 2507 2722 1010 444 692
1996-97 2967 222 1138 1691 3880 2585 3077 799 491 602
1997-98 2800 244 1154 1923 3660 2762 2918 872 500 718
1998-99 2239 192 1008 1950 3916 2778 2893 824 260 685
1999-00 2385 196 991 2400 4165 2914 3127 577 196 930
2000-01 2557 208 1079 2267 4106 2682 3152 640 226 798
2001-02 2652 209 1422 2584 4103 2880 3235 853 229 804
2002-03 2724 195 891 1833 4053 2700 3184 745 159 893
2003-04 2749 257 1607 2412 3937 2701 3183 813 158 816
2004-05 2939 272 1318 2600 3901 2636 3197 843 384 854
2005-06 3051 272 1117 2118 3844 2821 3133 554 431 741
2006-07 3238 300 1649 2308 4232 3026 3501 843 435 788
2007-08 3361 450 1841 2643 4158 3000 3529 505 439 746
2008-09 2724 500 1773 2154 4614 3491 3606 1040 453 728
2009-10* 3008 500 1592 2167 4215 3262 3458 735 400 761
2010-11* 2789 500 1793 1900 4624 3486 3628 982 508 1000
CAGR1 % -0.75 -5.14 8.02 1.92 1.31 3.77 1.29 6.79 -2.21 0.56
CAGR2 % -2.18 -2.15 2.59 8.40 1.98 1.44 1.61 -2.70 -16.90 6.09
CAGR3 % 4.10 8.52 3.55 -0.16 -0.04 1.02 1.00 -2.57 22.45 -1.74
CAGR4 % -4.01 11.93 0.22 -5.71 1.93 3.74 0.51 7.05 2.20 5.09
Source : Director of Land Records, Haryana.
Before working out production estimates on the basis of area and yield, figures of area were rounded off to the nearest thousand hectare.
CAGR1: Compund Annual Growth Rate during Plan 8th
CAGR2: Compund Annual Growth Rate during Plan 9th
CAGR3: Compund Annual Growth Rate during Plan 10th CAGR4: Compund Annual Growth Rate during Plan 11th (Data available for 3 or 4 Years)
……..contd. Table 7c

18
(Yield in Kgs. per hectare)
Other Pulses
Total Pulses
Total Foodgrains
Rape Seed & Mustard
Total Oilseeds
Cotton Lint Sugarcane @@ (Gur)
Potatoes
1 12 13 14 15 16 17 18 19
1991-92 969 702 2538 1004 1080 451 5590 18152
1992-93 1013 707 2589 921 948 450 4855 16697
1993-94 1043 981 2693 1385 1382 339 5778 16729
1994-95 1168 1088 2735 1385 1391 255 5859 13692
1995-96 1092 1002 2530 1269 1282 408 5616 13545
1996-97 1131 828 2844 1459 1465 423 5571 13598
1997-98 1032 869 2706 662 740 195 5304 9130
1998-99 889 790 2701 1235 1241 255 5477 15787
1999-00 851 572 3046 1323 1307 488 5589 15771
2000-01 682 636 3061 1369 1359 424 5713 15226
2001-02 722 786 3127 1490 1479 195 5751 21126
2002-03 668 628 3099 1148 1136 340 5695 28256
2003-04 808 722 3070 1559 1544 455 5789 24417
2004-05 733 766 3096 1177 1170 568 6188 24848
2005-06 684 572 3017 1117 1117 437 6442 24804
2006-07 982 803 3396 1344 1333 581 6864 24941
2007-08 931 587 3416 1202 1207 664 6303 17910
2008-09 974 966 3501 1722 1728 694 5720 21664
2009-10* 964 739 3379 1657 1648 646 7224 11280
2010-11* 1000 910 3528
CAGR1 % 3.22 5.81 1.48 8.42 7.21 -2.53 1.25 -6.29
CAGR2 % -9.60 -4.24 2.79 6.96 5.66 -2.53 1.15 11.27
CAGR3 % 4.42 -0.32 0.97 -2.48 -2.39 20.18 3.85 1.31
CAGR4 % 0.73 4.92 0.66 10.38 10.47 3.69 0.56 -19.67
19
Cropped Area in Haryana
0
1000
2000
3000
4000
5000
1991-92 1996-97 2001-02 2006-07 2011-12 8th Plan 9th Plan 10th Plan 11th Plan
Are
a i
n '
00
0h
a
Cereals Pulses Foodgrains Oilseeds Cotton Sugarcane
Fig.13
Agriculturals Production in Haryana
0
5000
10000
15000
20000
1991-92 1996-97 2001-02 2006-07 2011-12 8th Plan 9th Plan 10th Plan 11th Plan
Pro
d'n
in
'0
00
T
Cereals Pulses Foodgrains Oilseeds Cotton Sugarcane
Fig.14
Cropwise Yield in Haryana
0
2000
4000
6000
8000
1991-92 1996-97 2001-02 2006-07 2011-12 8th Plan 9th Plan 10th Plan 11th Plan
Yie
ld i
n K
gs/
ha
Cereals Pulses Foodgrains Oilseeds Cotton Sugarcane
Fig.15

20
Yield level depends upon level of investment. During the last 5 years investment in agriculture has increased at a compounded rate of around 0.3%, in absolute terms from Rs. 1300 Cr. to Rs. 3650 Cr. or 3 times at current prices (table 8), but at constant prices (table 9), it was much less or twice of what in absolute terms was in 2005-06.
Table 8 : Estimates of Gross Fixed Capital Formation in Haryana (Rs. Cr at current prices)
Industry 2005-06 2006-07 2007-08 2008-09 (P) 2009-10 (P) CAGR*
1 Agriculture 1300.66 1668.91 2467.16 2912.31 3649.61 0.2996 (7.80) (8.20) (9.30) (9.10) (9.60)
2 Forestry 67.84 67.76 73.16 92.24 70.22 0.0385
(0.40) (0.30) (0.30) (0.30) (0.20)
3 Fishing 7.74 5.22 7.91 9.82 9.66 0.1135
0 0 0 0 0
4 Mining and Quarrying 49.44 51.12 54.33 54.53 18.79 0.1706
(0.30) (0.30) (0.20) (0.20) 0.00
5 Manufacturing 7449.55 8898.8 11371.09 12998.34 16257.01 0.2141
(44.80) (43.90) (43.00) (40.80) (42.90)
5.1 Registered 4315.72 5309.51 7386.49 8733.01 11559.13 0.2799
5.2 Un-registered 3133.83 3589.29 3984.6 4265.33 4697.88 0.1032
6 Electricity, Gas and Water Supply
1580.02 2456.83 3068.75 4506.95 4376.14 0.3027
(9.50) (12.10) (11.60) (14.10) (11.60)
7 Construction 374.3 400.8 682.72 704.73 1008.81 0.2901
(2.20) (2.00) (2.60) (2.20) (2.70)
8 Trade, Hotels and Restaurants 92.95 96.62 129.08 373.24 397.83 0.5310
(0.60) (0.50) (0.50) (1.20) (1.10)
8.1 Trade 53.49 54.36 85.56 316.39 343.05 0.7295
8.2 Hotels and Restaurants 39.46 42.26 43.52 56.85 54.78 0.1000
9 Transport, Storage and communication
1234.45 1407.09 1936.22 2036.9 2472.41 0.1923
(7.40) (7.00) (7.30) (6.40) (6.50)
9.1 Railways 315.2 338.21 751.65 653.18 840.65 0.2995
9.2 Transport by other means 277.94 409.04 418.35 504.22 417.88 0.1079
9.3 Storage 5.03 9.35 12.54 5.98 80.92 0.6668
9.4 Communication 636.28 650.49 753.68 873.52 1132.96 0.1559
10 Banking and Insurance 160.06 171.4 247.42 273.64 308.94 0.1952
(1.00) (0.80) (0.90) (0.90) (0.80)
11 Real Estate, Ownership of Dwellings, and Business Services (only Residential Building Part)
2590.89 2933.13 3386.59 3895.67 4251.64 0.1359
(15.60) (14.50) (12.80) (12.20) (11.20)
12 Public Administration 1514.65 1840.14 2658.85 3556.15 4425.83 0.3236
(9.10) (9.10) (10.00) (11.10) (11.70)
13 Other Services 208.31 267.22 380.14 467.42 623.2 0.3166
(1.30) (1.30) (1.50) (1.50) (1.70)
Total 16630.86 20264.32 26463.42 31881.94 37870.09 0.2336
(100.00) (100.00) (100.00) (100.00) (100.00) Source :Department of Economic and Statistical Analysis, Haryana.;* compounded annual growth rate Note - Figures in brackets are percentages to total. P- Provisional ,
21
Table 9: Estimates of Gross Fixed Capital Formation in Haryana (constant prices, 2004-05)
Industry 2005-06 2006-07 2007-08 2008-09 (P) 2009-10 (P) CAGR*
Agriculture 1242.93 1527.54 2033.21 2139.72 2400.25 0.1798
(7.70) (8.30) (9.10) (8.60) (8.40)
Forestry 65.94 62.12 60.05 68.14 49.1 -0.0485
(0.40) (0.30) (0.30) (0.30) (0.20)
Fishing 7.52 4.79 6.51 7.34 6.96 0.0276
0 0 0 0 0
Mining and Quarrying 48.32 46.44 44.67 40.4 14.53 -0.2245
(0.30) (0.30) (0.20) (0.20) (0.10)
Manufacturing 7225.33 8067.16 9703.55 10269.93 13033.45 0.1527
(44.80) (43.80) (43.50) (41.40) (45.90)
Registered 4174.77 4818.54 6389.81 7004.19 9539.71 0.2247
Un-registered 3050.56 3248.62 3313.74 3265.74 3493.74 0.0280
Electricity, Gas and Water Supply
1531.53 2250.64 2638.67 3750.53 3120.14 0.2134
(9.50) (12.20) (11.80) (15.10) (11.00)
Construction 366.01 367.01 560.42 521.02 705.87 0.1810
(2.30) (2.10) (2.50) (2.20) (2.40)
Trade, Hotels and Restaurants 90.63 89.05 114.64 286.06 298.54 0.4264
(0.60) (0.50) (0.50) (1.10) (1.00)
Trade 52.09 50.95 79.18 244.22 259.55 0.6127
Hotels and Restaurants 38.54 38.1 35.46 41.84 38.99 0.0118
Transport, Storage and Communication
1197.48 1294.67 1670.31 1648.89 1953.05 0.1298
(7.40) (7.00) (7.50) (6.60) (6.90)
9.1 Railways 306.11 305.77 631.31 512.4 643.07 0.2215
9.2 Transport by other means
270.63 387.93 385.62 439.89 354.21 0.0687
9.3 Storage 4.9 7.97 10.29 4.63 59.21 0.5590
9.4 Communication 615.84 593 646.09 691.97 896.56 0.0948
10 Banking and Insurance 155.49 155.94 214.48 202.34 246.12 0.1251
(1.00) (0.80) (1.00) (0.80) (0.90)
Real Estate, Ownership of Dwellings,
2523.81 2644.92 2747.66 2863.5 2984.68 0.0424
Business Services (only Residential Building Part)
(15.60) (14.30) (12.30) (11.50) (10.50)
12 Public Administration 1470.69 1686.23 2198.27 2682.36 3142.09 0.2193
(9.10) (9.10) (9.90) (10.80) (11.10) 13 Other Services 202.76 242.58 312.18 348.41 453.14 0.2178
(1.30) (1.30) (1.40) (1.40) (1.60)
Total 16128.44 18439.09 22304.62 24828.64 28407.92 0.1537
(100.00) (100.00) (100.00) (100.00) (100.00)
Note— Figures in brackets are percentages to total, P –Provisional, ;* compounded annual growth rate
Source :—Department of Economic and Statistical Analysis, Haryana.
Same as above
22
0
5000
10000
15000
20000
25000R
s C
rore
s
2006-07 2007-08 2008-09 2009-10 2010-11
Years
Estimates of Gross Fixed Capital Formation in Haryana
(Rs. Crores at current Prices)
Agri & Allied Industries Services
Fig.16
0
2000
4000
6000
8000
10000
12000
14000
16000
18000
Rs
Cro
res
2006-07 2007-08 2008-09 2009-10 2010-11
Years
Estimates of Gross Fixed Capital Formation in Haryana
(Rs. Crores) at Constant 2004-05 Prices
Agri & Allied Industries Services
Fig.17
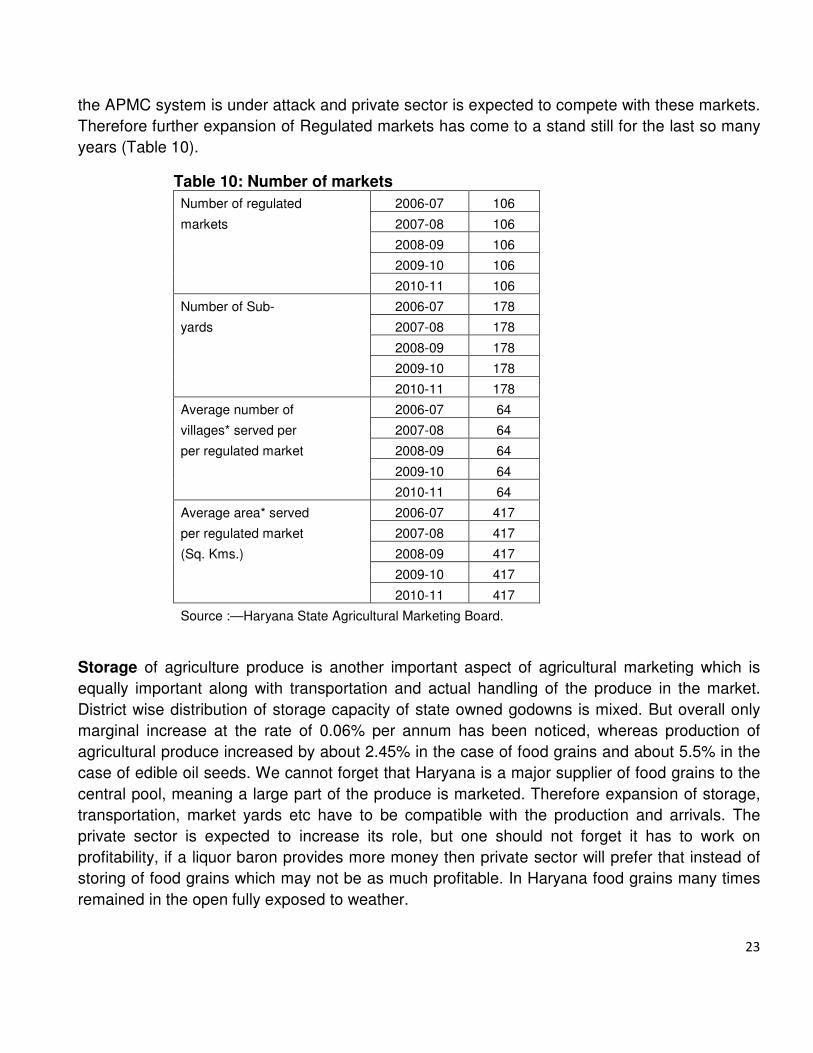
Marketing and storage: The agricultural produce markets were regulated in Haryana under
the Punjab Agricultural produce Markets Act, 1961. The progress of regulation was steady and
helped improve the state of agricultural marketing in the state. With the increase in volume of
arrivals due to increased production as well as due to more commodities coming under
regulation, space was inadequate and sub yards were introduced. Later on due to heavy rush of
arrivals and delay in disposal village purchase centres were developed. But after liberalization
23
the APMC system is under attack and private sector is expected to compete with these markets.
Therefore further expansion of Regulated markets has come to a stand still for the last so many
years (Table 10).
Table 10: Number of markets
Number of regulated 2006-07 106
markets 2007-08 106
2008-09 106
2009-10 106
2010-11 106
Number of Sub- 2006-07 178
yards 2007-08 178
2008-09 178
2009-10 178
2010-11 178
Average number of 2006-07 64
villages* served per 2007-08 64
per regulated market 2008-09 64
2009-10 64
2010-11 64
Average area* served 2006-07 417
per regulated market 2007-08 417
(Sq. Kms.) 2008-09 417
2009-10 417
2010-11 417
Source :—Haryana State Agricultural Marketing Board.
Storage of agriculture produce is another important aspect of agricultural marketing which is
equally important along with transportation and actual handling of the produce in the market.
District wise distribution of storage capacity of state owned godowns is mixed. But overall only
marginal increase at the rate of 0.06% per annum has been noticed, whereas production of
agricultural produce increased by about 2.45% in the case of food grains and about 5.5% in the
case of edible oil seeds. We cannot forget that Haryana is a major supplier of food grains to the
central pool, meaning a large part of the produce is marketed. Therefore expansion of storage,
transportation, market yards etc have to be compatible with the production and arrivals. The
private sector is expected to increase its role, but one should not forget it has to work on
profitability, if a liquor baron provides more money then private sector will prefer that instead of
storing of food grains which may not be as much profitable. In Haryana food grains many times
remained in the open fully exposed to weather.
24
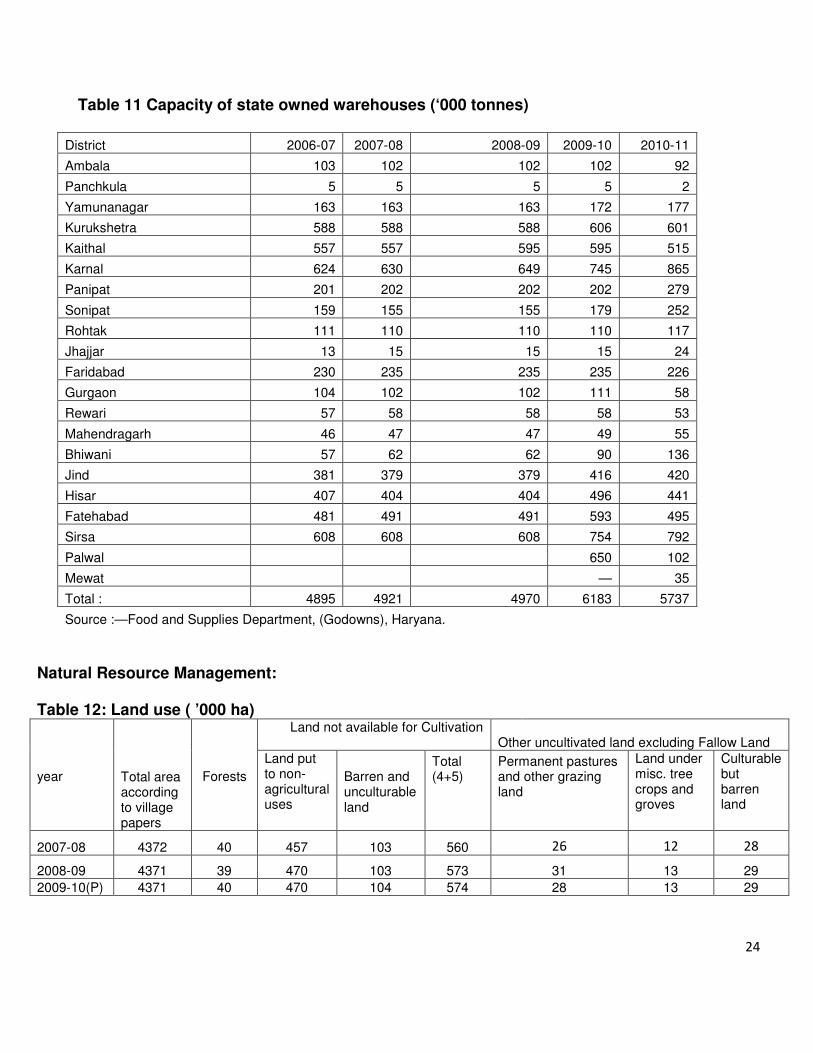
Table 11 Capacity of state owned warehouses (‘000 tonnes)
District 2006-07 2007-08 2008-09 2009-10 2010-11
Ambala 103 102 102 102 92
Panchkula 5 5 5 5 2
Yamunanagar 163 163 163 172 177
Kurukshetra 588 588 588 606 601
Kaithal 557 557 595 595 515
Karnal 624 630 649 745 865
Panipat 201 202 202 202 279
Sonipat 159 155 155 179 252
Rohtak 111 110 110 110 117
Jhajjar 13 15 15 15 24
Faridabad 230 235 235 235 226
Gurgaon 104 102 102 111 58
Rewari 57 58 58 58 53
Mahendragarh 46 47 47 49 55
Bhiwani 57 62 62 90 136
Jind 381 379 379 416 420
Hisar 407 404 404 496 441
Fatehabad 481 491 491 593 495
Sirsa 608 608 608 754 792
Palwal 650 102
Mewat — 35
Total : 4895 4921 4970 6183 5737
Source :—Food and Supplies Department, (Godowns), Haryana.
Natural Resource Management: Table 12: Land use ( ’000 ha)
year
Total area according to village papers
Forests
Land not available for Cultivation Other uncultivated land excluding Fallow Land
Land put to non- agricultural uses
Barren and unculturable land
Total (4+5)
Permanent pastures and other grazing land
Land under misc. tree crops and groves
Culturable but barren land
2007-08 4372 40 457 103 560 26 12 28
2008-09 4371 39 470 103 573 31 13 29
2009-10(P) 4371 40 470 104 574 28 13 29
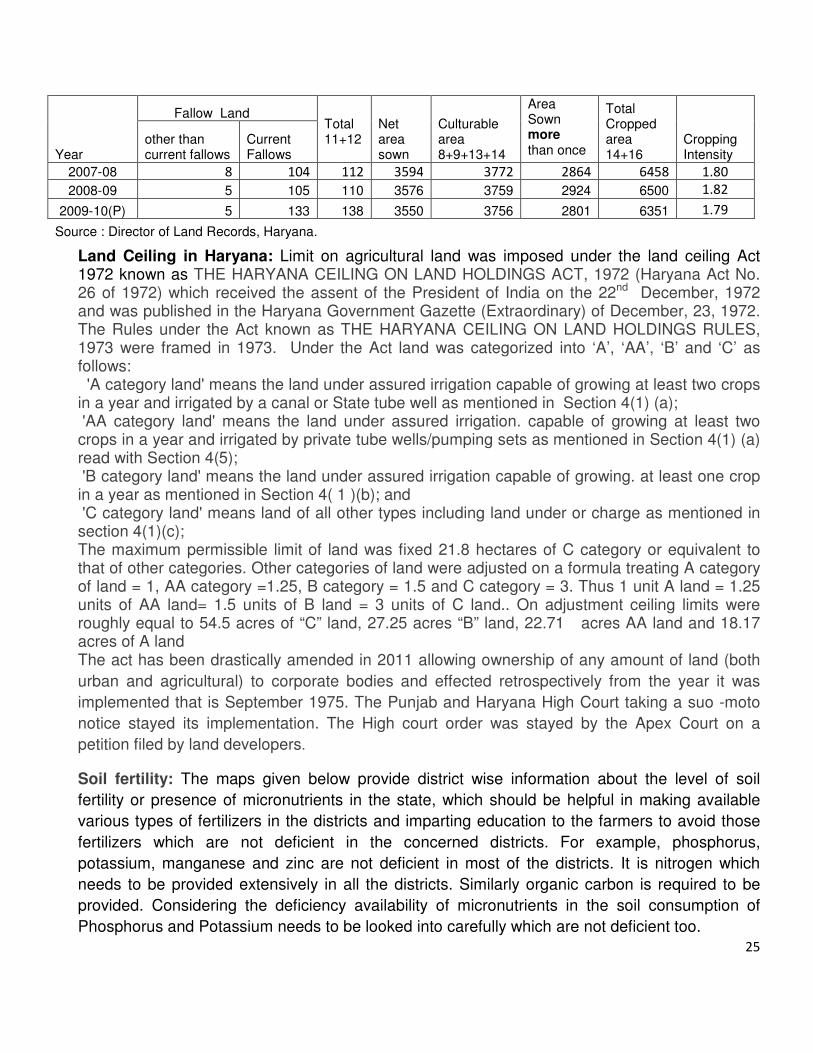
25
Fallow Land Total 11+12
Net area sown
Culturable area 8+9+13+14
Area Sown more than once
Total Cropped area 14+16
Cropping Intensity
Year
other than current fallows
Current Fallows
2007-08 8 104 112 3594 3772 2864 6458 1.80
2008-09 5 105 110 3576 3759 2924 6500 1.82
2009-10(P) 5 133 138 3550 3756 2801 6351 1.79
Source : Director of Land Records, Haryana.
Land Ceiling in Haryana: Limit on agricultural land was imposed under the land ceiling Act 1972 known as THE HARYANA CEILING ON LAND HOLDINGS ACT, 1972 (Haryana Act No. 26 of 1972) which received the assent of the President of India on the 22nd December, 1972 and was published in the Haryana Government Gazette (Extraordinary) of December, 23, 1972. The Rules under the Act known as THE HARYANA CEILING ON LAND HOLDINGS RULES, 1973 were framed in 1973. Under the Act land was categorized into ‘A’, ‘AA’, ‘B’ and ‘C’ as follows: 'A category land' means the land under assured irrigation capable of growing at least two crops in a year and irrigated by a canal or State tube well as mentioned in Section 4(1) (a); 'AA category land' means the land under assured irrigation. capable of growing at least two crops in a year and irrigated by private tube wells/pumping sets as mentioned in Section 4(1) (a) read with Section 4(5); 'B category land' means the land under assured irrigation capable of growing. at least one crop in a year as mentioned in Section 4( 1 )(b); and 'C category land' means land of all other types including land under or charge as mentioned in section 4(1)(c); The maximum permissible limit of land was fixed 21.8 hectares of C category or equivalent to that of other categories. Other categories of land were adjusted on a formula treating A category of land = 1, AA category =1.25, B category = 1.5 and C category = 3. Thus 1 unit A land = 1.25 units of AA land= 1.5 units of B land = 3 units of C land.. On adjustment ceiling limits were roughly equal to 54.5 acres of “C” land, 27.25 acres “B” land, 22.71 acres AA land and 18.17 acres of A land The act has been drastically amended in 2011 allowing ownership of any amount of land (both
urban and agricultural) to corporate bodies and effected retrospectively from the year it was
implemented that is September 1975. The Punjab and Haryana High Court taking a suo -moto
notice stayed its implementation. The High court order was stayed by the Apex Court on a
petition filed by land developers.
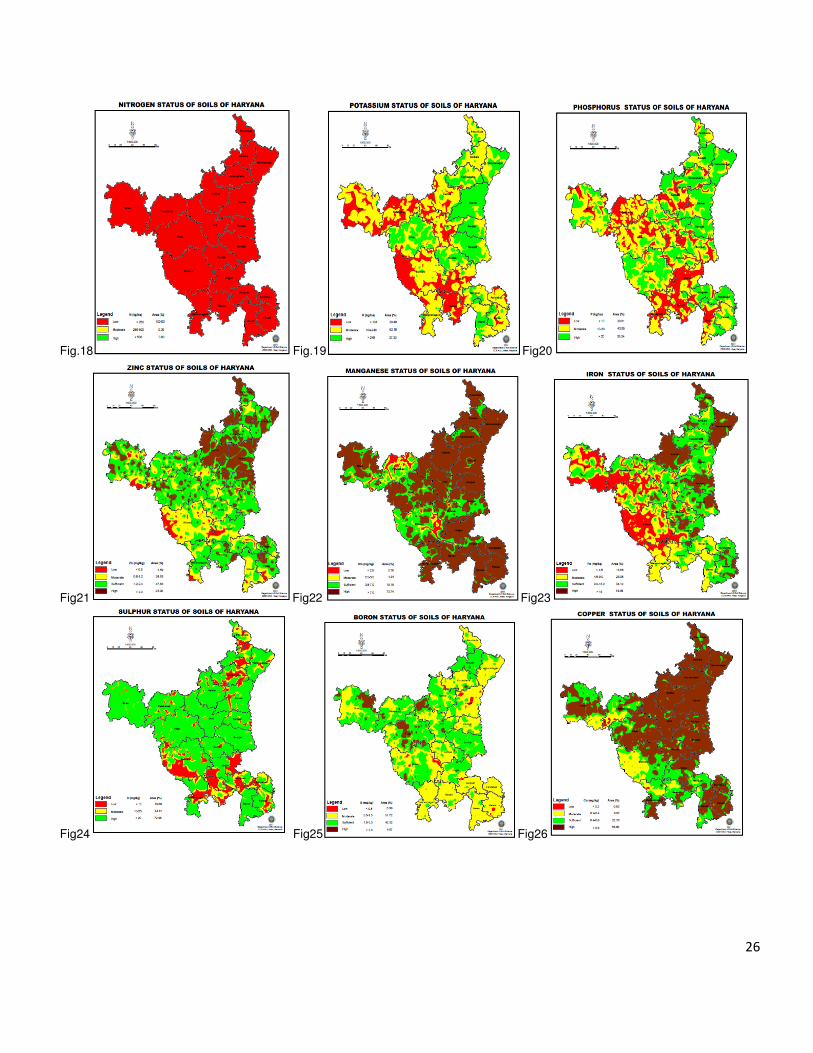
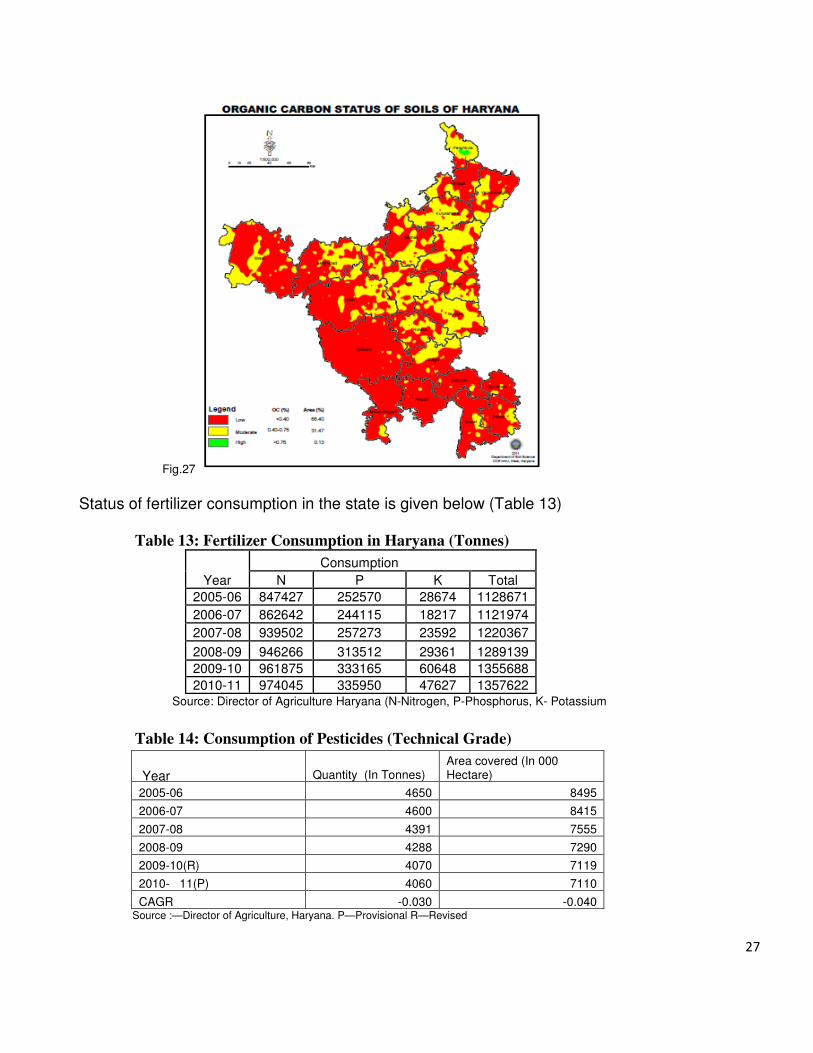
Soil fertility: The maps given below provide district wise information about the level of soil
fertility or presence of micronutrients in the state, which should be helpful in making available
various types of fertilizers in the districts and imparting education to the farmers to avoid those
fertilizers which are not deficient in the concerned districts. For example, phosphorus,
potassium, manganese and zinc are not deficient in most of the districts. It is nitrogen which
needs to be provided extensively in all the districts. Similarly organic carbon is required to be
provided. Considering the deficiency availability of micronutrients in the soil consumption of
Phosphorus and Potassium needs to be looked into carefully which are not deficient too.
26
Fig.18 Fig.19 Fig20
Fig21 Fig22 Fig23
Fig24 Fig25 Fig26
27
Fig.27
Status of fertilizer consumption in the state is given below (Table 13)
Table 13: Fertilizer Consumption in Haryana (Tonnes)
Consumption
Year N P K Total
2005-06 847427 252570 28674 1128671
2006-07 862642 244115 18217 1121974
2007-08 939502 257273 23592 1220367
2008-09 946266 313512 29361 1289139
2009-10 961875 333165 60648 1355688
2010-11 974045 335950 47627 1357622 Source: Director of Agriculture Haryana (N-Nitrogen, P-Phosphorus, K- Potassium
Table 14: Consumption of Pesticides (Technical Grade)
Quantity (In Tonnes) Area covered (In 000 Hectare) Year
2005-06 4650 8495
2006-07 4600 8415
2007-08 4391 7555
2008-09 4288 7290
2009-10(R) 4070 7119
2010- 11(P) 4060 7110
CAGR -0.030 -0.040 Source :—Director of Agriculture, Haryana. P—Provisional R—Revised
28
Consumption of pesticides is another area of concern. We had information with regard to spray of pesticides on vegetables, which were used without considering the seriousness and after effects health of the consumers.
Table 15 Animal Driven implements and equipment Census 2007
Steel plough
Seed-cum- fertiliser/drill /Seed drill
Wet land puddle
r
Sugarcane crusher
Wooden plough
Cultivator
Disc Leveller Cart
harrow
1 2 3 4 5 6 7 8 9 10
Panchkula 2363 1532 142 411 200 2235 1185 21 1755
Ambala 1495 2120 1939 2897 1133 2159 583 35 6254
Yamunanagar 1564 8654 1548 2686 647 7658 1254 66 7542
Kurukshetra 1018 635 1691 2349 845 1804 771 8 14520
Kaithal 2157 3005 1092 2656 773 2095 392 25 16704
Karnal 2281 1964 2472 3924 1127 2823 772 81 20240
Panipat 1363 341 1901 2213 607 1512 421 41 14042
Sonipat 2420 573 1399 1390 782 1175 256 21 12109
Jind 14673 17176 6128 10026 3626 13063 627 5 53780
Fatehabad 6653 7354 2217 2005 1976 3434 404 162 6477
Sirsa 6735 4992 2071 1619 1837 3711 570 28 12401
Hisar 25413 35339 8955 11551 6363 16442 3601 77 32826
Bhiwani 13175 18999 4237 4062 3913 4908 634 84 10440
Rohtak 3613 3246 2306 2633 2002 2668 493 70 13437
Jhajjar 498 278 1364 1279 988 1206 338 6 1607
Mahendergarh 4937 1579 9 11 9 1123 2 0 4224
Rewari 1002 339 553 555 609 516 54 0 1024
Gurgaon 1853 964 323 211 305 615 76 93 549
Faridabad 198 42 303 309 235 223 166 10 870
Mewat 320 33 140 136 172 110 32 1 19
Total 93731 10916
5 40790 52923 28149 69480 12631 834 23082
0
Mechanization of Haryana agriculture has been fast. Almost animal drought power has been replaced by use of tractors. Many times that has not benefitted the farmers. Status of animal driven implements as 2007 census is give in table 15 above.
Haryana is mostly irrigated about 85% of Net sown area is irrigated by private tube wells and canals. Tank or public sector tube well irrigation is not in vogue in the state (Table16).
29
Table 16: Net Area under Irrigation in Haryana (000 ha) Year
canals Tanks
Wells
Tubewells
Others Total
% Net area sown
2005-06 1331.0 (a) (a) 1591.0 14.0 2936.0 82.3
2006-07 1309.0 (a) (a) 1667.0 14.0 2990.0 84.1
2007-08 1381.0 (a) (a) 1630.0 14.0 3025.0 84.2
2008-09 1274.0 (a) 1.0 1600.0 2.0 2877.0 80.5
2009-10* 1282.0 (a) 2.0 1783.0 2.0 3069.0 86.4
CAGR -0.0077 -0.0006 -0.442 -0.0049 -0.0065
Source :— Director of Land Records, Haryana. (a) less than 500 hectares *provisional
Availability of credit in adequate amount, at proper time and at economical costs has been a major constraint on agriculture. The tables below illustrates further. Growth of credit from all sources has been marginal 0.16%. But negative growth from scheduled commercial banks, which is relatively less costly is more serious. It means farmers have to depend upon private sources. Hence, further steps to increase supply of credit are needed.
Table 17 : Ground Level Credit for Agriculture and Allied activities (Rs. Crores)
2005-06 2006-07 2007-08 2008-09 2009-10 CAGR
Public Sector CBs 4372.34 5535.22 5582.68 7238.01 11835.65 0.25
Private Sector Banks 585.22 674.8 646.25 1766.19 1291.06 0.29
SCB/CCBs 4860.7 4625.68 5813.84 4132.89 4910.08 -0.009
Land Development Banks (LDBs) 229.52 184.09 306.97 155.65
Regional Rural Banks 799.59 972.96 1399.36 1471.25 2044.8 0.26
Other 0.06 - - - 10.31
Total 10847.43 11992.75 13442.13 14915.31 20247.55 0.16
Source: Ferilizer Statistics, FAI, New Delhi, Note- In year 2007-08, SCB/CCBs includes LDBs. Table 18: Credit for Agriculture and Allied activities, Haryana (1-4-2011 to 31-3-2012)
Small Farmers Non-Agri. ST
Cash Kind Total RA NAP TC FDR NSC Total
11762.90 193.42 11956.32 21.66 30.38 7.37 211.94 9.77 281.12
Cash Credit Huda
financing
MT Agri. Advances
Fertilizer Revolving Individual Total Dairy Land
Purchase DRDA Milch cattle Total
81.87 41.26 164.14 287.27 110.44 21.07 0.00 1.26 0.25 22.58
Non-agri. MT Total
Advances
HHKN SJRY MV HouseLoan Study Loan SE CD Integrated Total
32.42 1.37 8.10 157.84 1.60 704.69 111.21 154.24 1171.47 13829.20
30
Livestock is a major source of subsidiary income to the farmers. The state of animal husbandry is given below in Table 19 Table 19 Animal Husbandary and Dairying, Haryana 2012-13
Particulars Upto Sept.2012
Livestock Pu[poulation (Lacs.) 90.50
Milk Production (Lac tonnes) 66.61
Per Capita/day availability of milk (gms.) 708
Poultry Population (Lacs.) 28785
Eggs Production (Lacs.) 41884
Wool Production (Lac Kgs.) 13.33
Meat Production (Lac Kgs.) 132.07
Veterinary University 1
Veterinary Hospitals 945
Veterinary Dispensaries 1814
Semen Production Cenres 3
Semen Banks 10
Diagnostic Laboratories 20
Haryana Vererinary Vaccine Institute 1
Haryana Vererinary Training Institute 1
Pet Anomal Hospitals-cum-Teaching-Center 1
Veterinary Polyclinics 3
Registered Gaushalas 256
Total Staff 10849
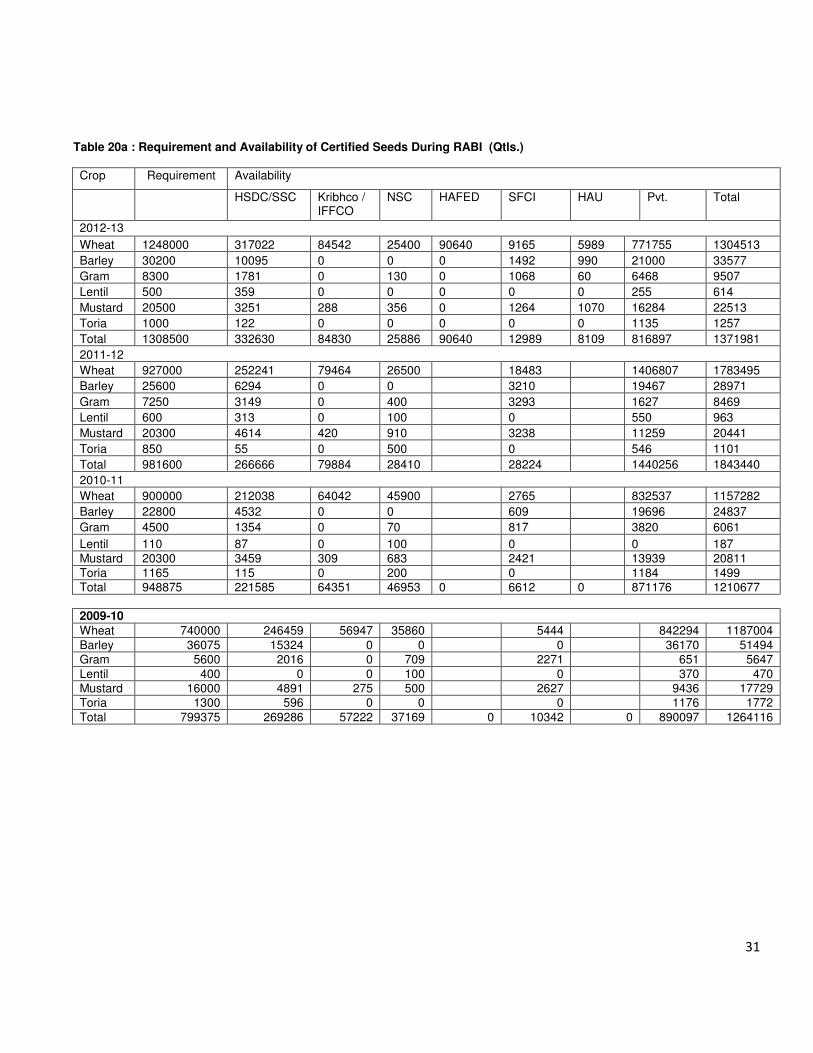
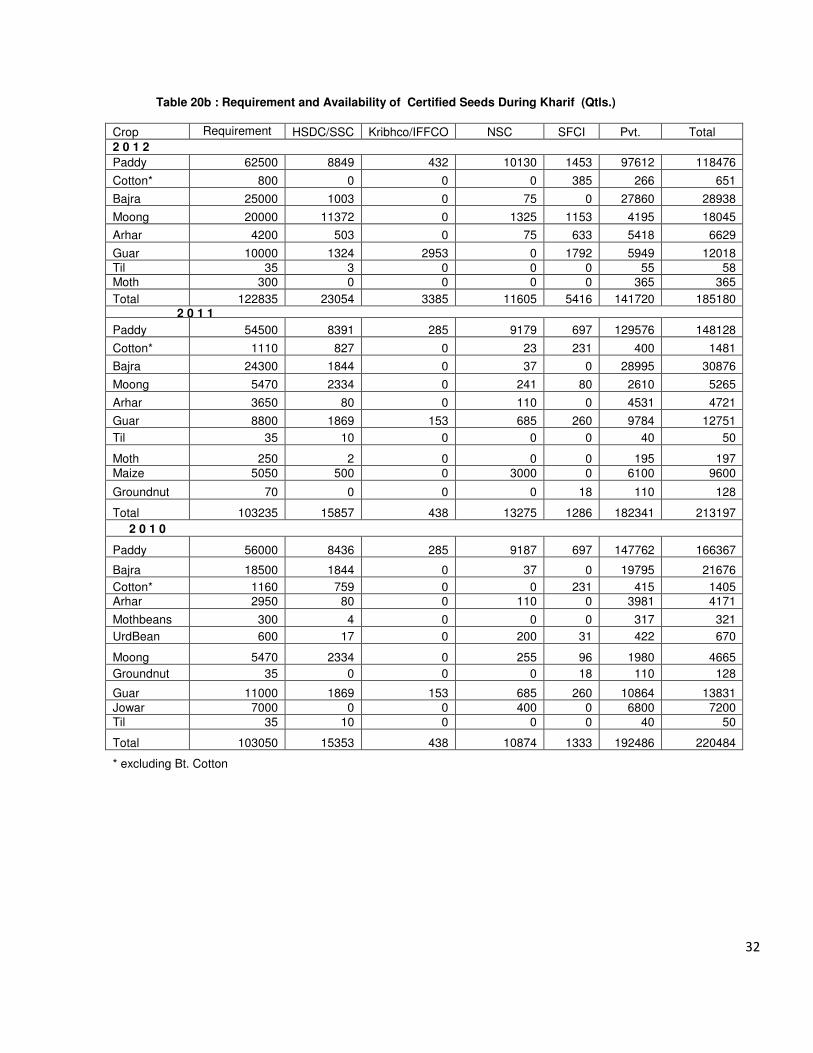
Availability of certified seeds at reasonable rates is equally important and one of the vital inputs of agricultural growth. The state of seeds, viz. availability as well as requirement in the state is given below (table a for Rabi crops and table 20 b for Kharif crops)
31
Table 20a : Requirement and Availability of Certified Seeds During RABI (Qtls.)
Crop Requirement
Availability
HSDC/SSC Kribhco / IFFCO
NSC HAFED SFCI HAU Pvt. Total
2012-13
Wheat 1248000 317022 84542 25400 90640 9165 5989 771755 1304513
Barley 30200 10095 0 0 0 1492 990 21000 33577
Gram 8300 1781 0 130 0 1068 60 6468 9507
Lentil 500 359 0 0 0 0 0 255 614
Mustard 20500 3251 288 356 0 1264 1070 16284 22513
Toria 1000 122 0 0 0 0 0 1135 1257
Total 1308500 332630 84830 25886 90640 12989 8109 816897 1371981
2011-12
Wheat 927000 252241 79464 26500 18483 1406807 1783495
Barley 25600 6294 0 0 3210 19467 28971
Gram 7250 3149 0 400 3293 1627 8469
Lentil 600 313 0 100 0 550 963
Mustard 20300 4614 420 910 3238 11259 20441
Toria 850 55 0 500 0 546 1101
Total 981600 266666 79884 28410 28224 1440256 1843440
2010-11
Wheat 900000 212038 64042 45900 2765 832537 1157282
Barley 22800 4532 0 0 609 19696 24837
Gram 4500 1354 0 70 817 3820 6061
Lentil 110 87 0 100 0 0 187
Mustard 20300 3459 309 683 2421 13939 20811
Toria 1165 115 0 200 0 1184 1499
Total 948875 221585 64351 46953 0 6612 0 871176 1210677
2009-10
Wheat 740000 246459 56947 35860 5444 842294 1187004
Barley 36075 15324 0 0 0 36170 51494
Gram 5600 2016 0 709 2271 651 5647
Lentil 400 0 0 100 0 370 470
Mustard 16000 4891 275 500 2627 9436 17729
Toria 1300 596 0 0 0 1176 1772
Total 799375 269286 57222 37169 0 10342 0 890097 1264116
32
Table 20b : Requirement and Availability of Certified Seeds During Kharif (Qtls.)
Crop Requirement
HSDC/SSC Kribhco/IFFCO NSC SFCI Pvt. Total
2 0 1 2
Paddy 62500 8849 432 10130 1453 97612 118476
Cotton* 800 0 0 0 385 266 651
Bajra 25000 1003 0 75 0 27860 28938
Moong 20000 11372 0 1325 1153 4195 18045
Arhar 4200 503 0 75 633 5418 6629
Guar 10000 1324 2953 0 1792 5949 12018
Til 35 3 0 0 0 55 58
Moth 300 0 0 0 0 365 365
Total 122835 23054 3385 11605 5416 141720 185180 2 0 1 1
Paddy 54500 8391 285 9179 697 129576 148128
Cotton* 1110 827 0 23 231 400 1481
Bajra 24300 1844 0 37 0 28995 30876
Moong 5470 2334 0 241 80 2610 5265
Arhar 3650 80 0 110 0 4531 4721
Guar 8800 1869 153 685 260 9784 12751
Til 35 10 0 0 0 40 50
Moth 250 2 0 0 0 195 197
Maize 5050 500 0 3000 0 6100 9600
Groundnut 70 0 0 0 18 110 128
Total 103235 15857 438 13275 1286 182341 213197
2 0 1 0
Paddy 56000 8436 285 9187 697 147762 166367
Bajra 18500 1844 0 37 0 19795 21676
Cotton* 1160 759 0 0 231 415 1405
Arhar 2950 80 0 110 0 3981 4171
Mothbeans 300 4 0 0 0 317 321
UrdBean 600 17 0 200 31 422 670
Moong 5470 2334 0 255 96 1980 4665
Groundnut 35 0 0 0 18 110 128
Guar 11000 1869 153 685 260 10864 13831
Jowar 7000 0 0 400 0 6800 7200
Til 35 10 0 0 0 40 50
Total 103050 15353 438 10874 1333 192486 220484
* excluding Bt. Cotton