Embed Size (px)
Citation preview
UNITED STATES DEPARTMENT OF AGRICULTURE
NATIONAL AGRICULTURAL STATISTICS SERVICE
AGRICULTURAL
STATISTICS
2011
UNITED STATES GOVERNMENT PRINTING OFFICE
WASHINGTON: 2011
For sale by the Superintendent of Documents, U.S. Government Printing Office Internet: bookstore.gpo.gov Phone: toll free (866) 512-1800; DC area (202)512-1800
Fax: (202) 512-2104 Mail: Stop IDCC, Washington, DC 20402-0001 ISBN 978-0-16-090545-2
VerDate Aug 31 2005 12:10 Mar 12, 2012 Jkt 000000 PO 00000 Frm 00001 Fmt 1001 Sfmt 1001 H:\SHARED\DAPP\FPU\AGSTAT\MASTER~2\OTHER_~1\FRONT_~1.AG8 USDA
ii
Agricultural Statistics 2011
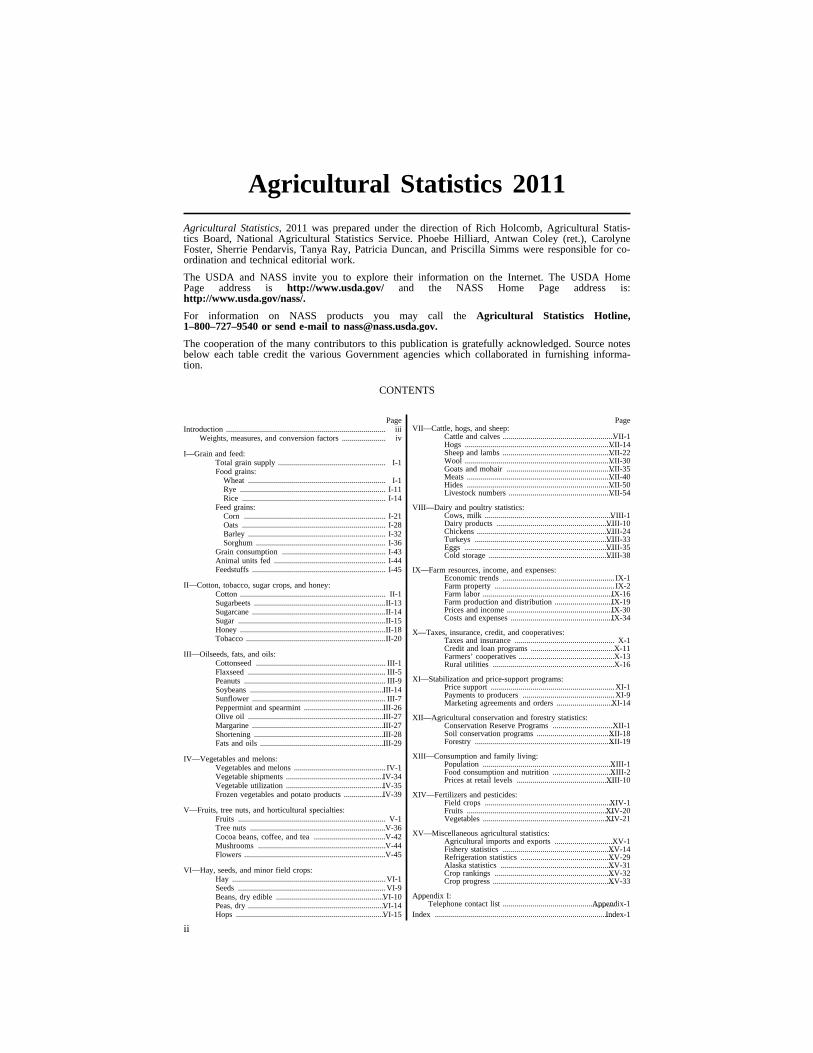
Agricultural Statistics, 2011 was prepared under the direction of Rich Holcomb, Agricultural Statis-tics Board, National Agricultural Statistics Service. Phoebe Hilliard, Antwan Coley (ret.), Carolyne Foster, Sherrie Pendarvis, Tanya Ray, Patricia Duncan, and Priscilla Simms were responsible for co-ordination and technical editorial work.
The USDA and NASS invite you to explore their information on the Internet. The USDA Home Page address is http://www.usda.gov/ and the NASS Home Page address is: http://www.usda.gov/nass/.
For information on NASS products you may call the Agricultural Statistics Hotline, 1–800–727–9540 or send e-mail to [email protected].
The cooperation of the many contributors to this publication is gratefully acknowledged. Source notes below each table credit the various Government agencies which collaborated in furnishing informa-tion.
CONTENTS
Page Introduction ................................................................................ iii
Weights, measures, and conversion factors ...................... iv
I—Grain and feed: Total grain supply ...................................................... I-1 Food grains:
Wheat ..................................................................... I-1 Rye ......................................................................... I-11 Rice ........................................................................ I-14
Feed grains: Corn ....................................................................... I-21 Oats ........................................................................ I-28 Barley ..................................................................... I-32 Sorghum ................................................................. I-36
Grain consumption .................................................... I-43 Animal units fed ........................................................ I-44 Feedstuffs ................................................................... I-45
II—Cotton, tobacco, sugar crops, and honey: Cotton ......................................................................... II-1 Sugarbeets ..................................................................II-13 Sugarcane ...................................................................II-14 Sugar ..........................................................................II-15 Honey .........................................................................II-18 Tobacco ......................................................................II-20
III—Oilseeds, fats, and oils: Cottonseed ................................................................. III-1 Flaxseed ..................................................................... III-5 Peanuts ....................................................................... III-9 Soybeans ....................................................................III-14 Sunflower ................................................................... III-7 Peppermint and spearmint .........................................III-26 Olive oil .....................................................................III-27 Margarine ...................................................................III-27 Shortening ..................................................................III-28 Fats and oils ...............................................................III-29
IV—Vegetables and melons: Vegetables and melons .............................................. IV-1 Vegetable shipments ..................................................IV-34 Vegetable utilization ..................................................IV-35 Frozen vegetables and potato products .....................IV-39
V—Fruits, tree nuts, and horticultural specialties: Fruits .......................................................................... V-1 Tree nuts ....................................................................V-36 Cocoa beans, coffee, and tea ....................................V-42 Mushrooms ................................................................V-44 Flowers .......................................................................V-45
VI—Hay, seeds, and minor field crops: Hay .............................................................................VI-1 Seeds ..........................................................................VI-9 Beans, dry edible .......................................................VI-10 Peas, dry .....................................................................VI-14 Hops ...........................................................................VI-15
Page VII—Cattle, hogs, and sheep:
Cattle and calves ........................................................VII-1 Hogs ...........................................................................VII-14 Sheep and lambs ........................................................VII-22 Wool ...........................................................................VII-30 Goats and mohair ......................................................VII-35 Meats ..........................................................................VII-40 Hides ..........................................................................VII-50 Livestock numbers .....................................................VII-54
VIII—Dairy and poultry statistics: Cows, milk .................................................................VIII-1 Dairy products ...........................................................VIII-10 Chickens .....................................................................VIII-24 Turkeys ......................................................................VIII-33 Eggs ...........................................................................VIII-35 Cold storage ...............................................................VIII-38
IX—Farm resources, income, and expenses: Economic trends ........................................................ IX-1 Farm property ............................................................ IX-2 Farm labor ..................................................................IX-16 Farm production and distribution ..............................IX-19 Prices and income ......................................................IX-30 Costs and expenses ....................................................IX-34
X—Taxes, insurance, credit, and cooperatives: Taxes and insurance .................................................. X-1 Credit and loan programs ..........................................X-11 Farmers’ cooperatives ................................................X-13 Rural utilities .............................................................X-16
XI—Stabilization and price-support programs: Price support ..............................................................XI-1 Payments to producers ..............................................XI-9 Marketing agreements and orders .............................XI-14
XII—Agricultural conservation and forestry statistics: Conservation Reserve Programs ...............................XII-1 Soil conservation programs .......................................XII-18 Forestry ......................................................................XII-19
XIII—Consumption and family living: Population ..................................................................XIII-1 Food consumption and nutrition ...............................XIII-2 Prices at retail levels .................................................XIII-10
XIV—Fertilizers and pesticides: Field crops .................................................................XIV-1 Fruits ..........................................................................XIV-20 Vegetables ..................................................................XIV-21
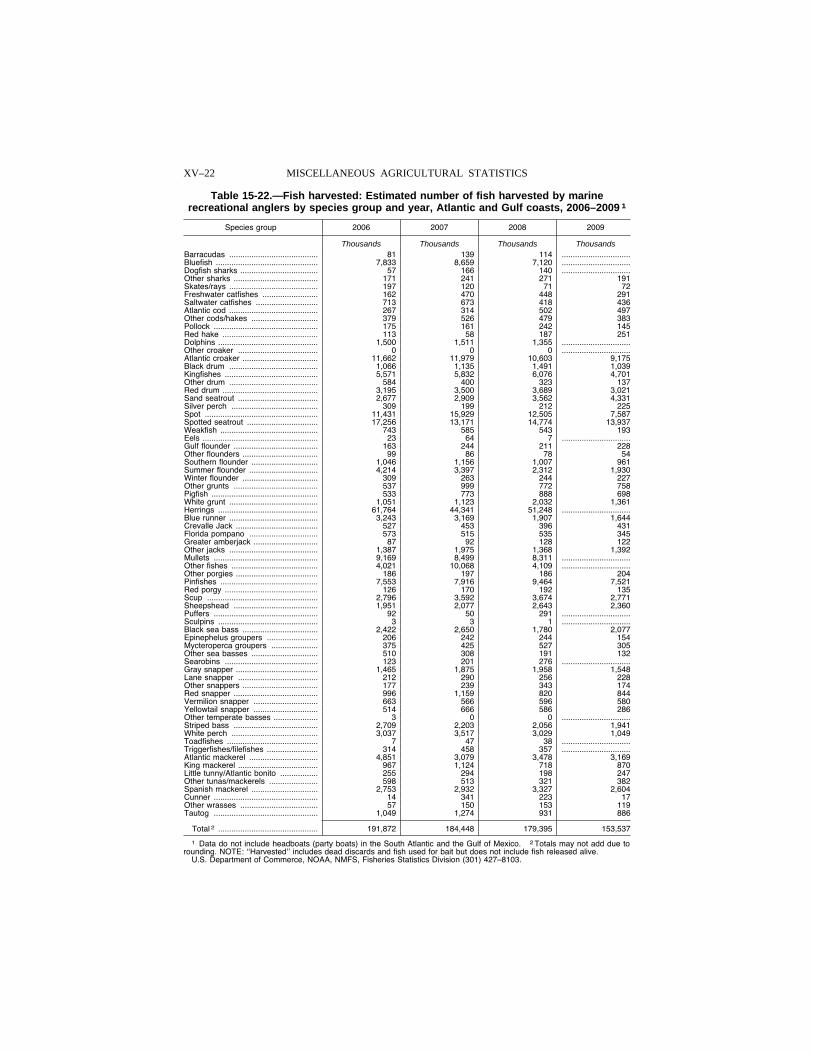
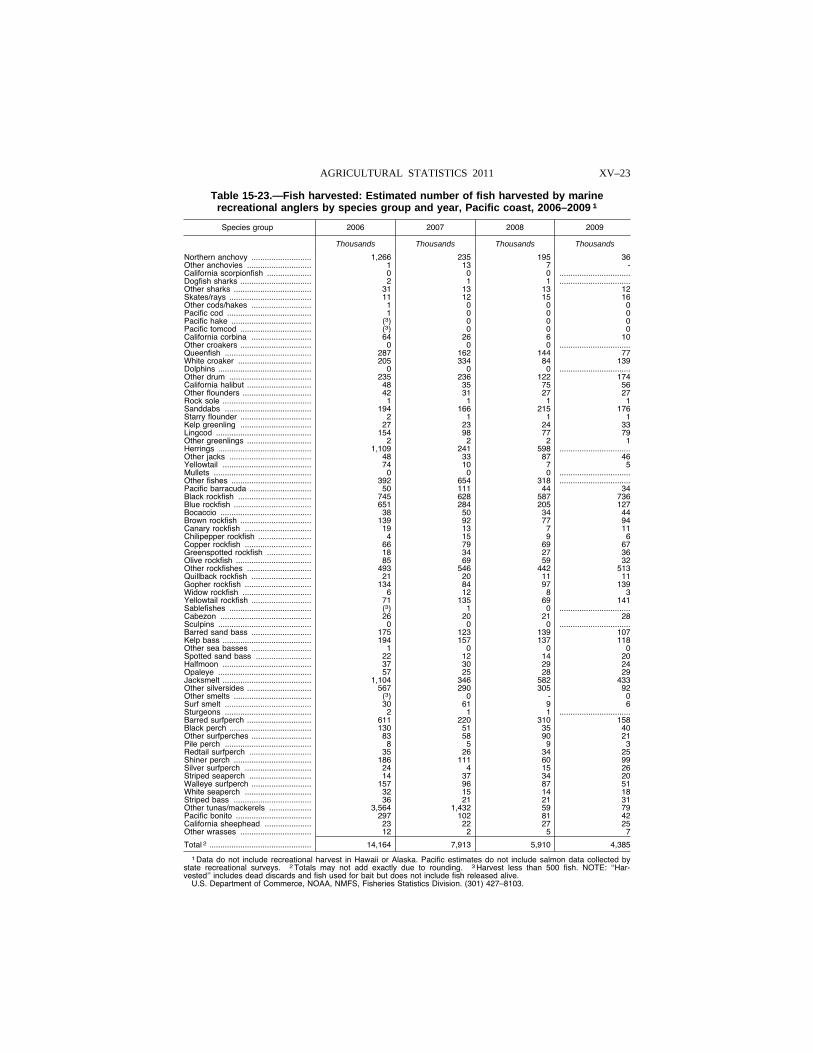
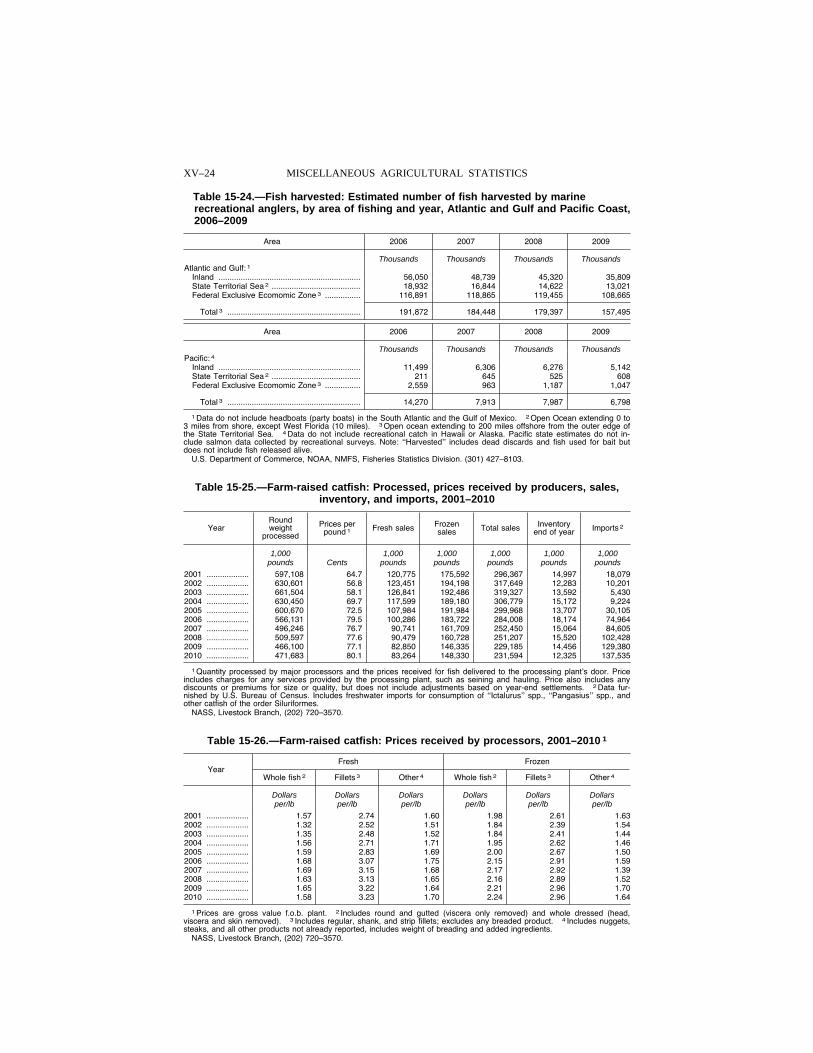
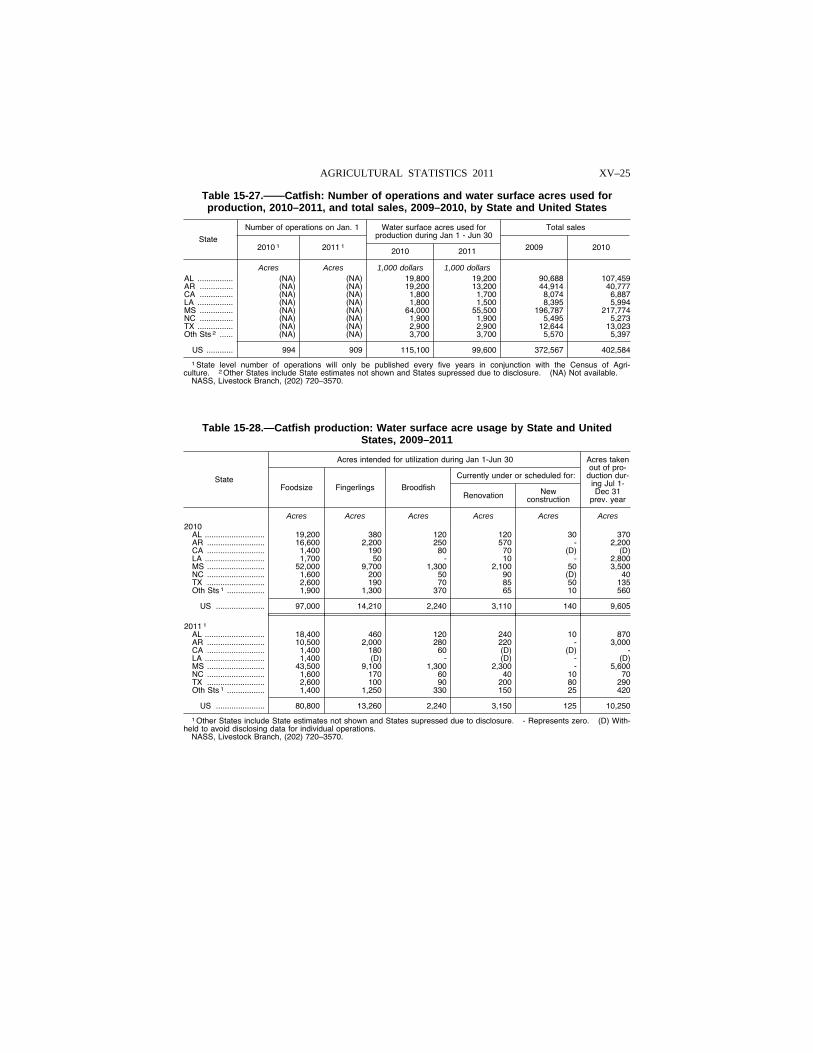
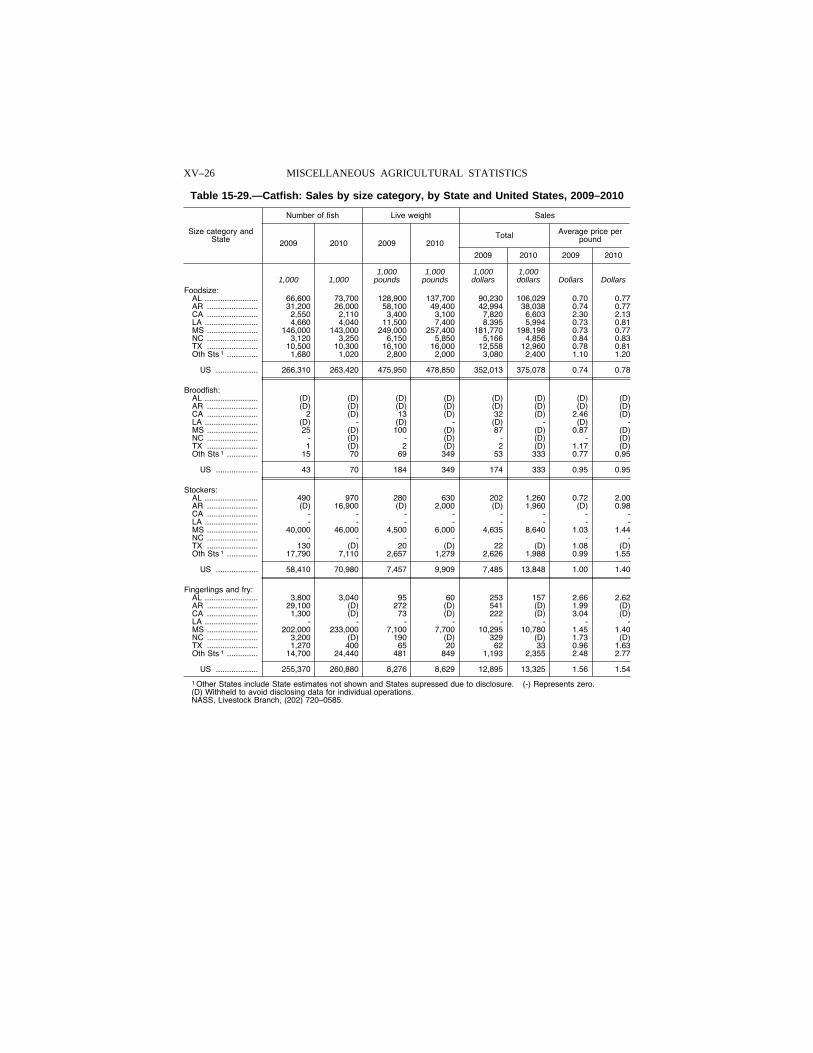
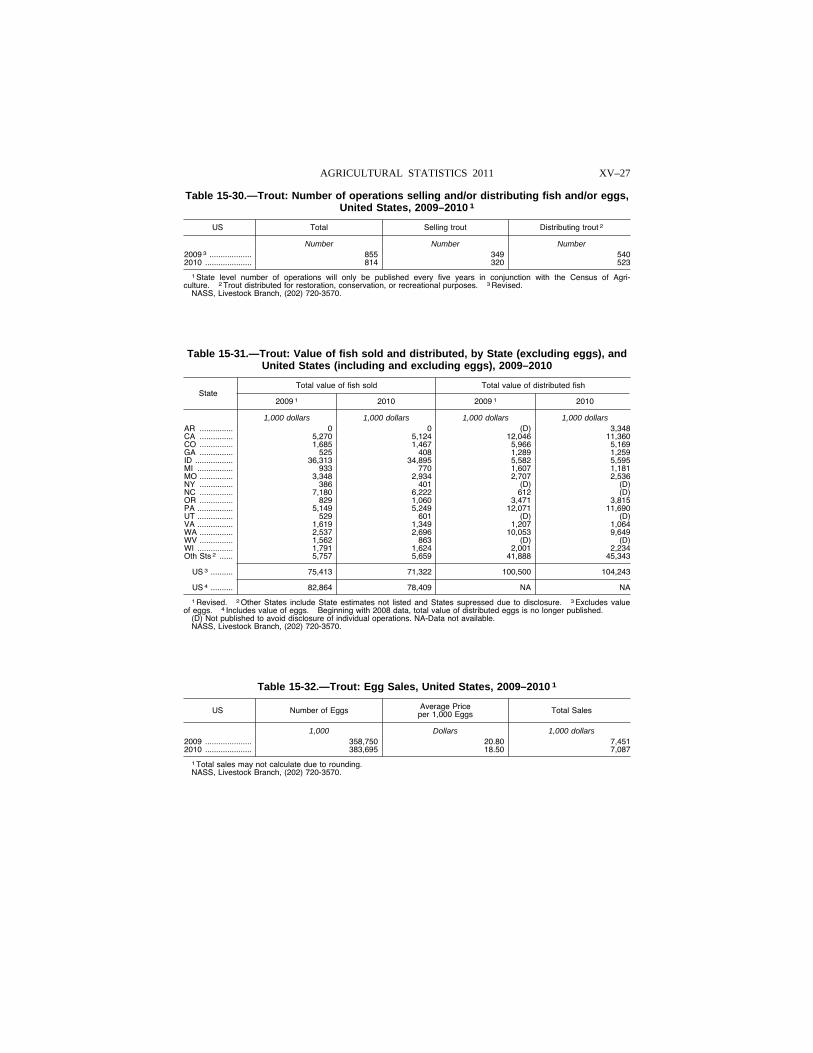
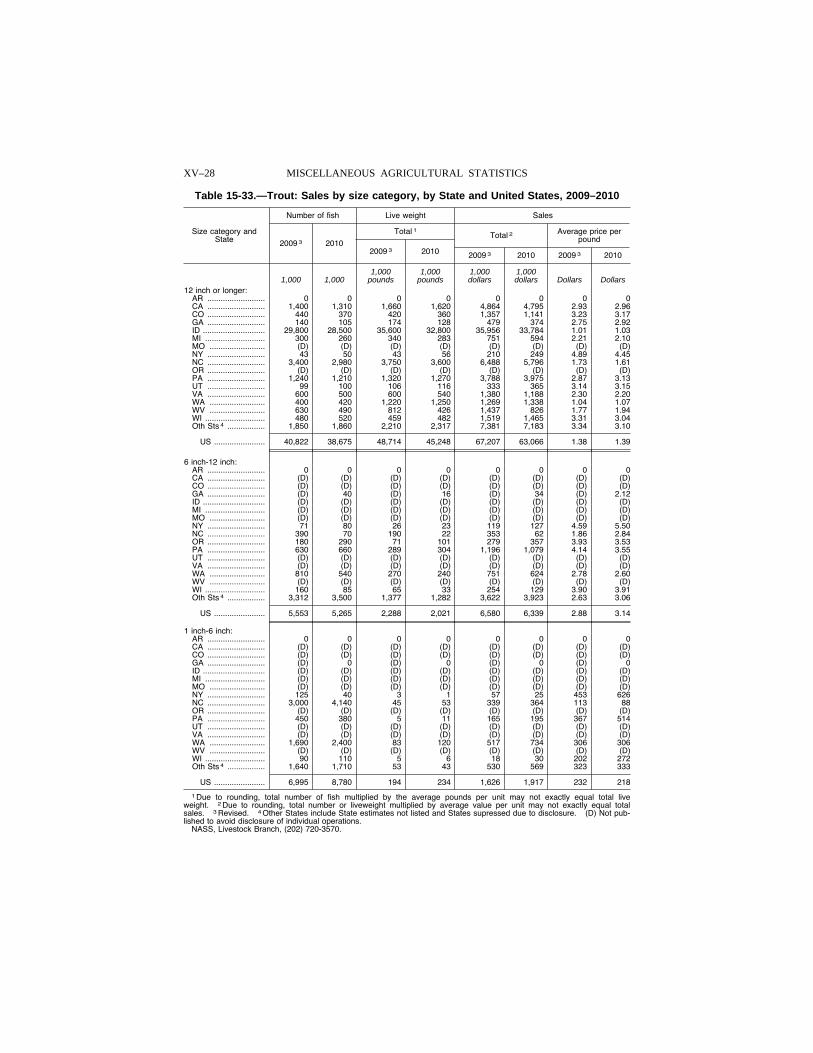
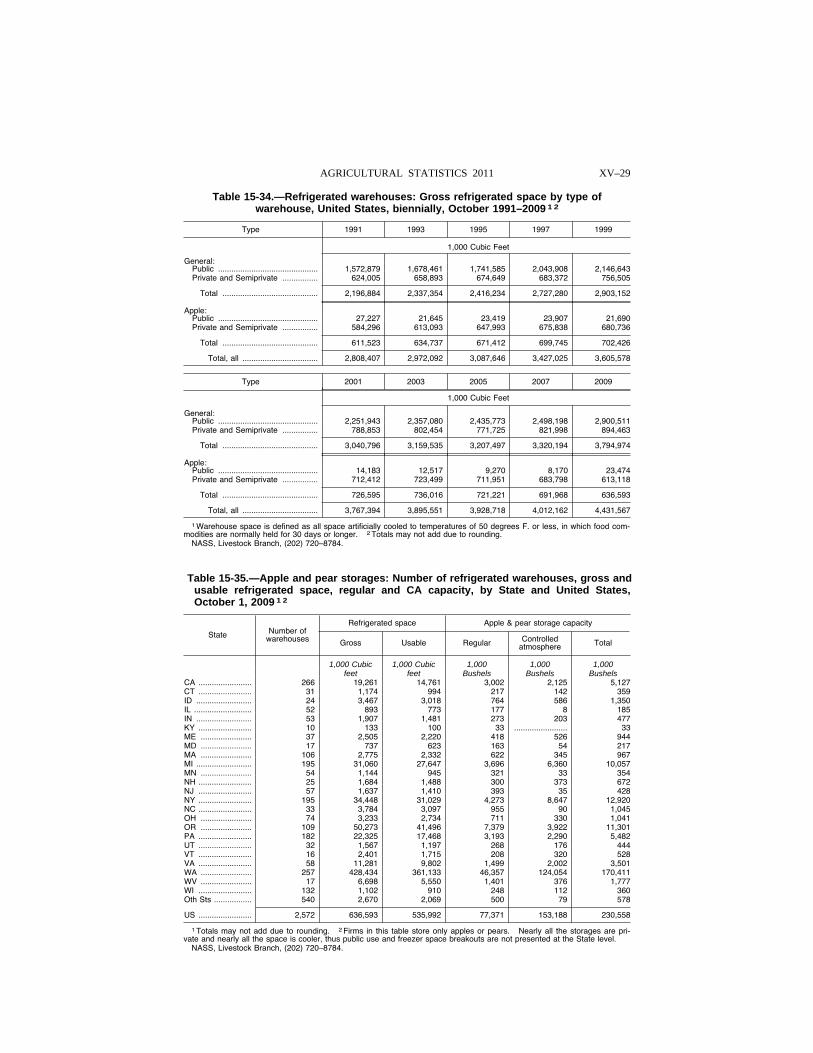
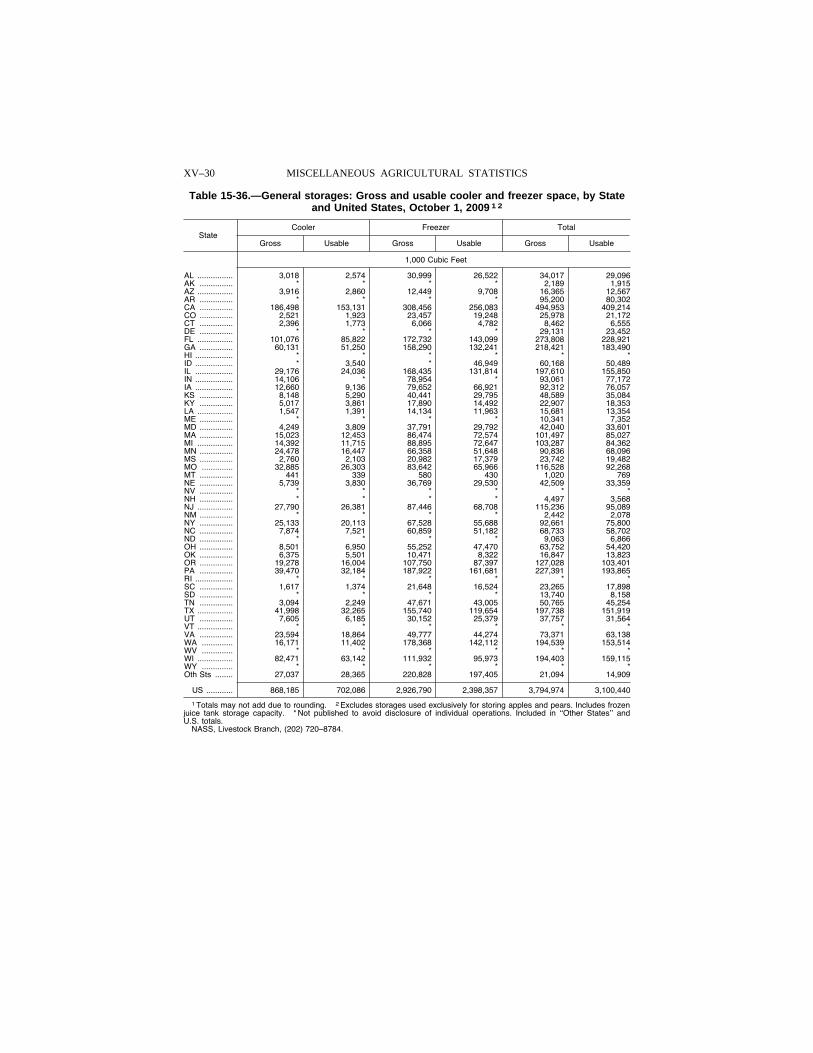
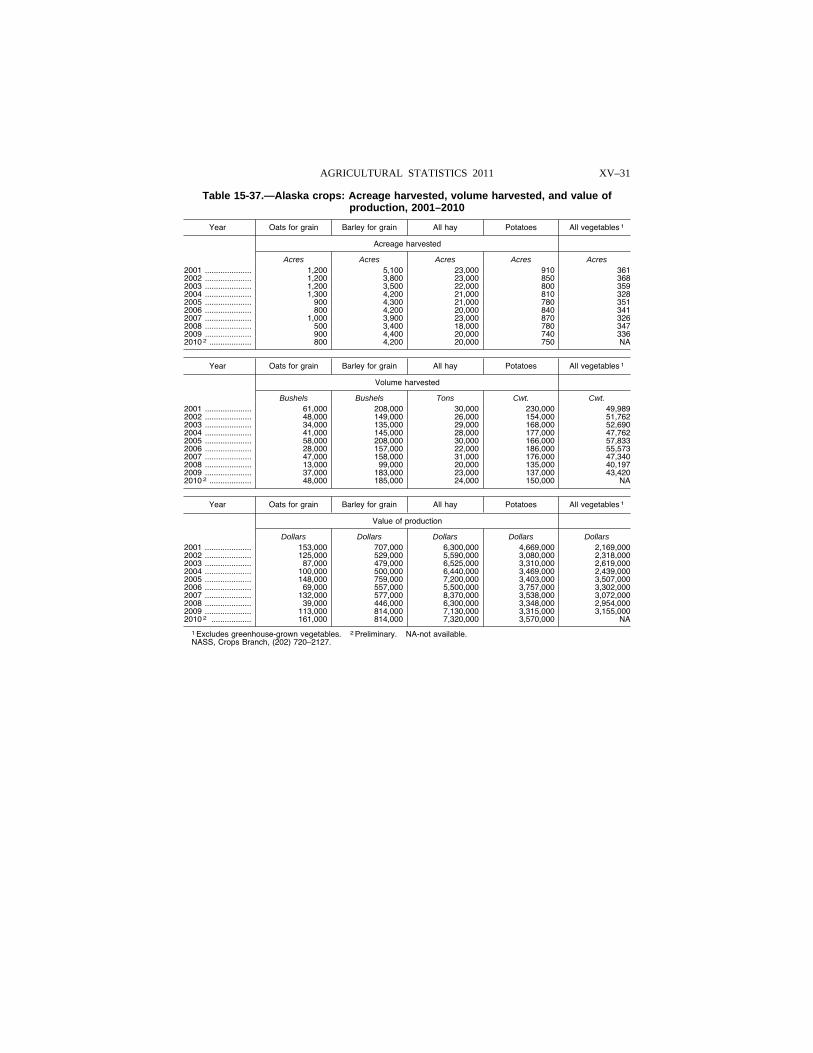
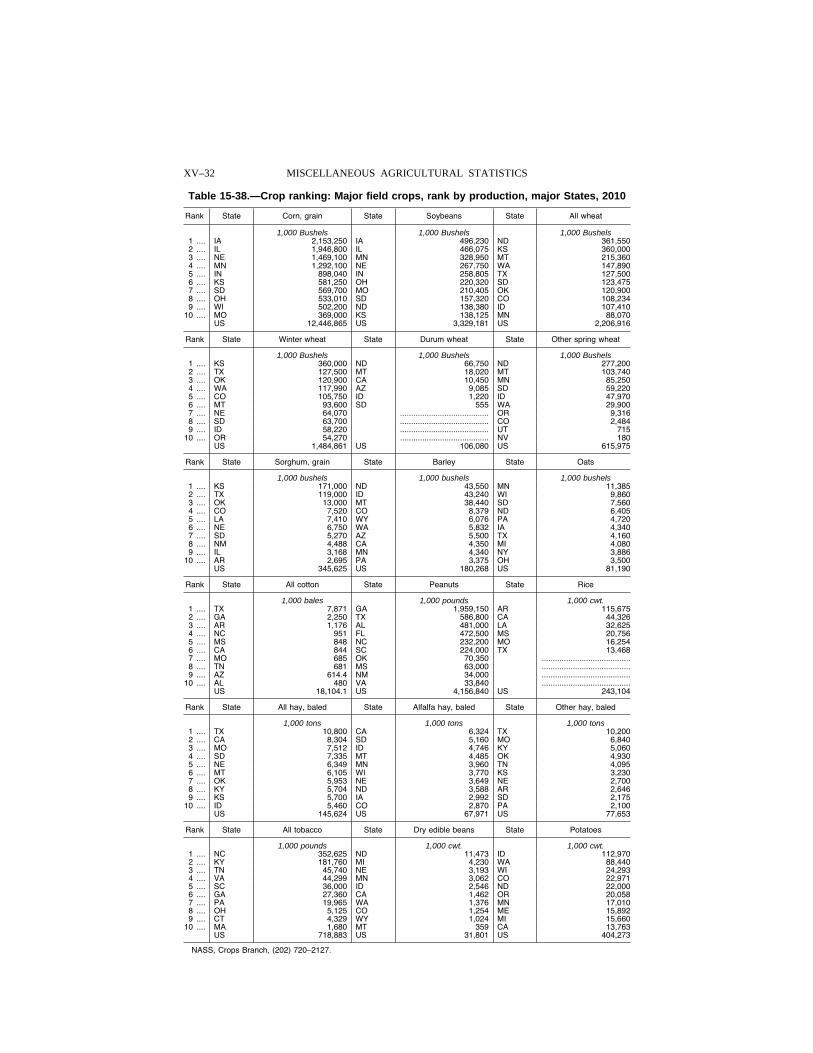
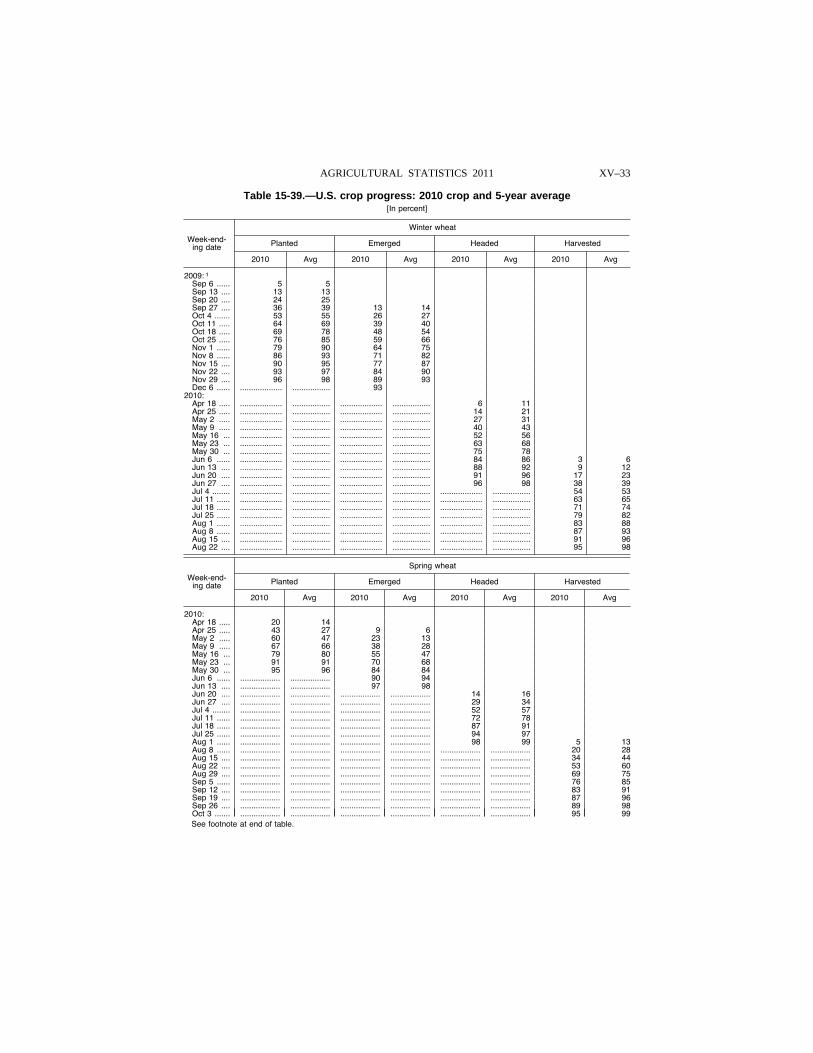
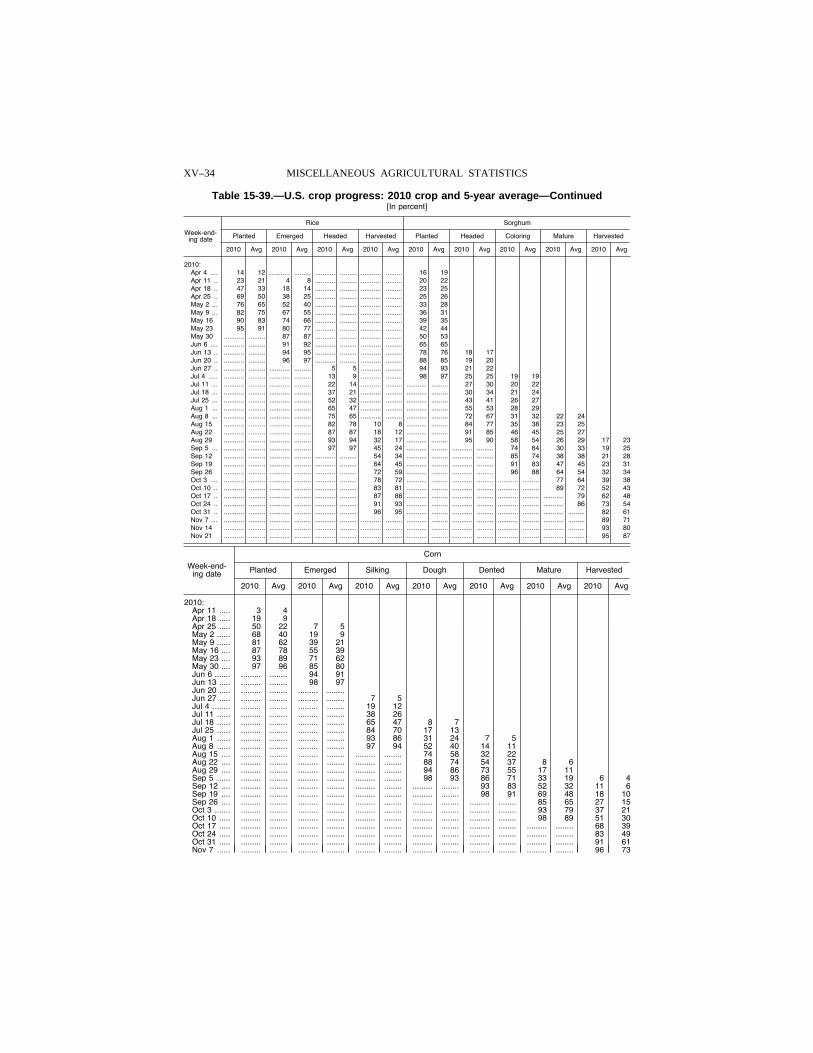
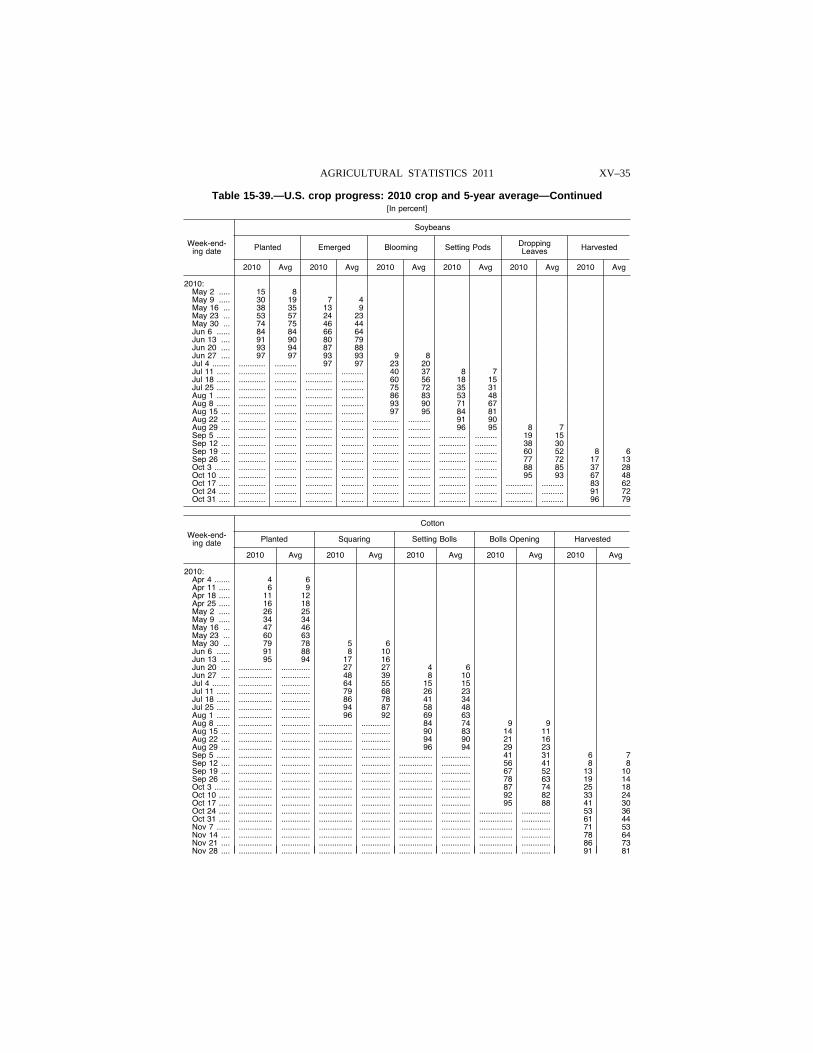
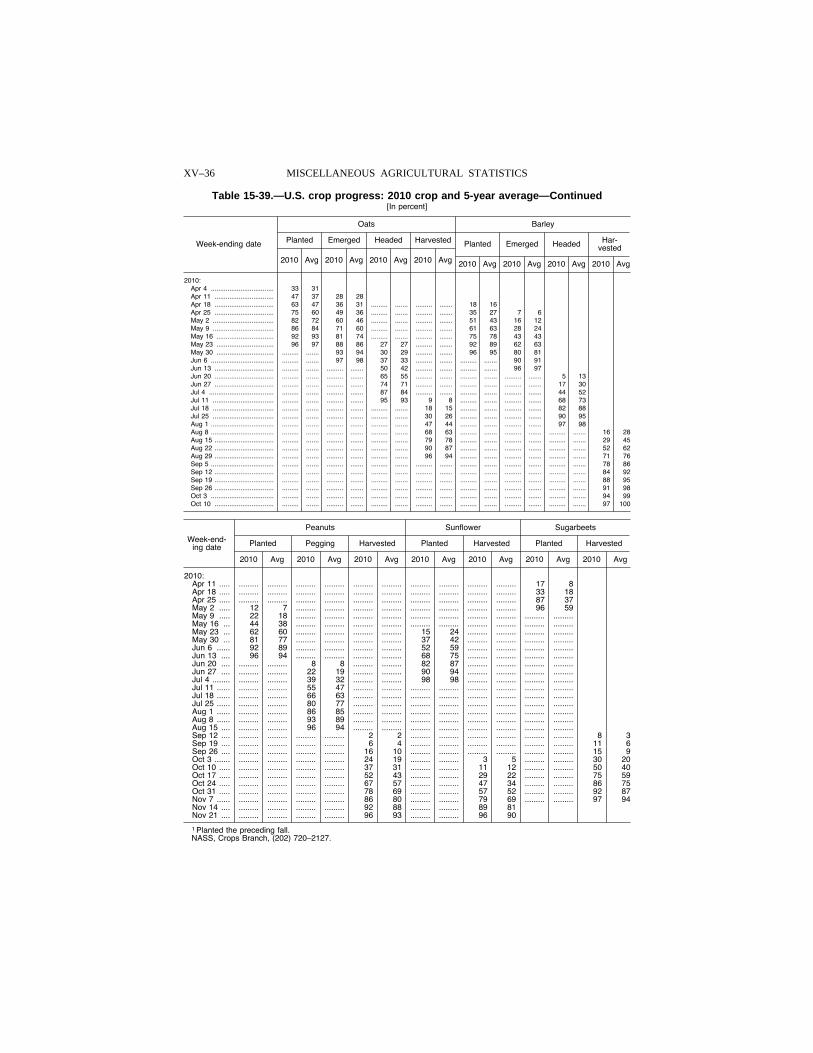
XV—Miscellaneous agricultural statistics: Agricultural imports and exports ..............................XV-1 Fishery statistics ........................................................XV-14 Refrigeration statistics ...............................................XV-29 Alaska statistics .........................................................XV-31 Crop rankings ............................................................XV-32 Crop progress .............................................................XV-33
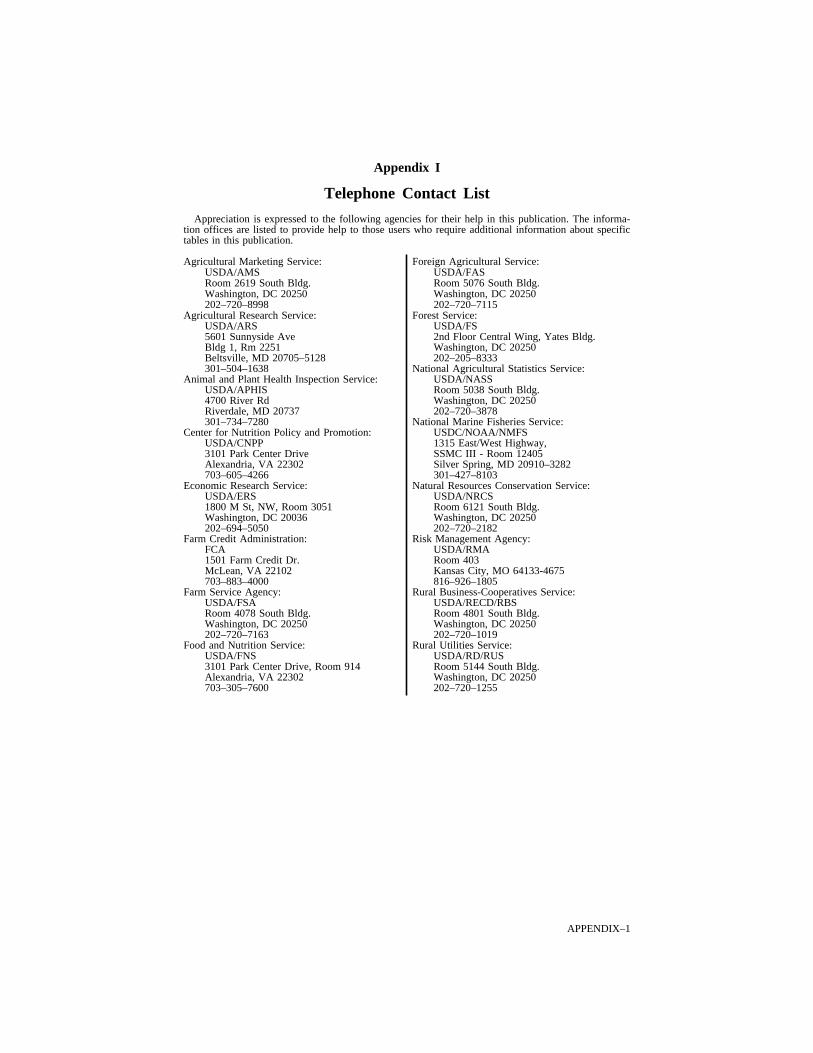
Appendix I: Telephone contact list ........................................................Appendix-1
Index ..........................................................................................Index-1
VerDate Aug 31 2005 12:10 Mar 12, 2012 Jkt 000000 PO 00000 Frm 00002 Fmt 1001 Sfmt 1001 H:\SHARED\DAPP\FPU\AGSTAT\MASTER~2\OTHER_~1\FRONT_~1.AG8 USDA
iii
Introduction Agricultural Statistics is published each year to meet the diverse need for a reliable reference book
on agricultural production, supplies, consumption, facilities, costs, and returns. Its tables of annual data cover a wide variety of facts in forms suited to most common use.
Inquiries concerning more current or more detailed data, past and prospective revisions, or the sta-tistical methodology used should be addressed directly to the agency credited with preparing the table. Most of the data were prepared or compiled in the U.S. Department of Agriculture.
The historical series in this volume have been generally limited to data beginning with 2001 or later.
Foreign agricultural trade statistics include Government as well as non-Government shipments of merchandise from the United States and Territories to foreign countries. They do not include U.S. shipments to the U.S. Armed Forces abroad for their own use or shipments between the States and U.S. Territories. The world summaries of production and trade of major farm products are prepared by the U.S. Department of Agriculture from reports of the U.S. Department of Commerce, official statistics of foreign governments, other foreign source materials, reports of U.S. Agricultural Attache and Foreign Service Officers, and the result of office research.
Statistics presented in many of the tables represent actual counts of the items covered. Most of the statistics relating to foreign trade and to Government programs, such as numbers and amounts of loans made to farmers, and amounts of loans made by the Commodity Credit Corporation, etc., are data of this type. A large number of other tables, however, contain data that are estimates made by the Department of Agriculture.
The estimates for crops, livestock, and poultry made by the U.S. Department of Agriculture are prepared mainly to give timely current State and national totals and averages. They are based on data obtained by sample surveys of farmers and of people who do business with farmers. The survey data are supplemented by information from the Censuses of Agriculture taken every five years and check data from various sources. Being estimates, they are subject to revision as more data become available from commercial or Government sources. Unless otherwise indicated, the totals for the United States shown in the various tables on area, production, numbers, price, value, supplies, and disposition are based on official Department estimates. They exclude States for which no official esti-mates are compiled.
DEFINITIONS
‘‘Value of production’’ as applied to crops in the various tables, is derived by multiplying produc-tion by the estimated season average price received by farmers for that portion of the commodity actually sold. In the case of fruits and vegetables, quantities not harvested because of low prices or other economic factors are not included in value of production. The word ‘‘Value’’ is used in the inventory tables on livestock and poultry to mean value of the number of head on the inventory date. It is derived by multiplying the number of head by an estimated value per head as of the date.
The word ‘‘Year’’ (alone) in a column heading means calendar year unless otherwise indicated. ‘‘Ton’’ when used in this book without qualifications means a short ton of 2,000 pounds.
VerDate Aug 31 2005 12:10 Mar 12, 2012 Jkt 000000 PO 00000 Frm 00003 Fmt 1001 Sfmt 1001 H:\SHARED\DAPP\FPU\AGSTAT\MASTER~2\OTHER_~1\FRONT_~1.AG8 USDA
iv AGRICULTURAL STATISTICS 2011
WEIGHTS, MEASURES, AND CONVERSION FACTORS
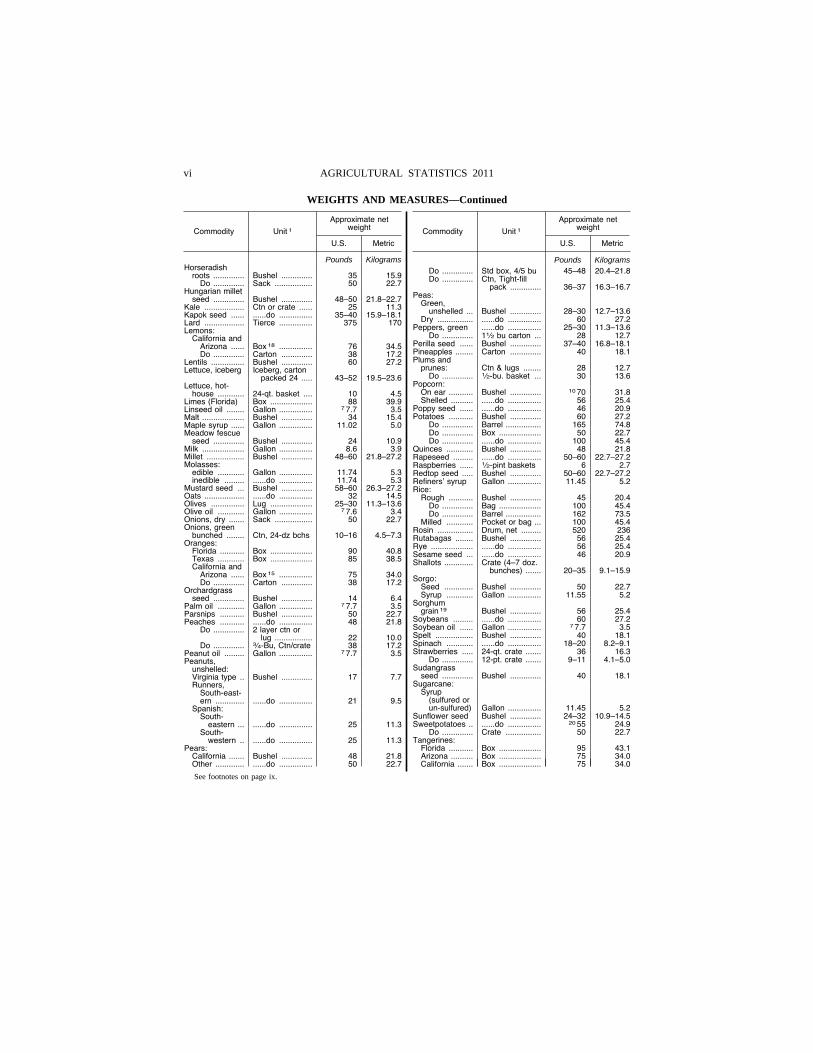
The following table on weights, measures, and conversion factors covers the most important agri-cultural products, or the products for which such information is most frequently asked of the U.S. Department of Agriculture. It does not cover all farm products nor all containers for any one product.
The information has been assembled from State schedules of legal weights, various sources within the U.S. Department of Agriculture, and other Government agencies. For most products, particularly fruits and vegetables, there is a considerable variation in weight per unit of volume due to differences in variety or size of commodity, condition and tightness of pack, degree to which the container is heaped, etc. Effort has been made to select the most representative and fairest average for each prod-uct. For those commodities which develop considerable shrinkage, the point of origin weight or weight at harvest has been used.
The approximate or average weights as given in this table do not necessarily have official standing as a basis for packing or as grounds for settling disputes. Not all of them are recognized as legal weight. The table was prepared chiefly for use of workers in the U.S. Department of Agriculture who have need of conversion factors in statistical computations.
VerDate Aug 31 2005 12:10 Mar 12, 2012 Jkt 000000 PO 00000 Frm 00004 Fmt 1000 Sfmt 1000 H:\SHARED\DAPP\FPU\AGSTAT\MASTER~2\OTHER_~1\FRONT_~1.AG8 USDA
v AGRICULTURAL STATISTICS 2011
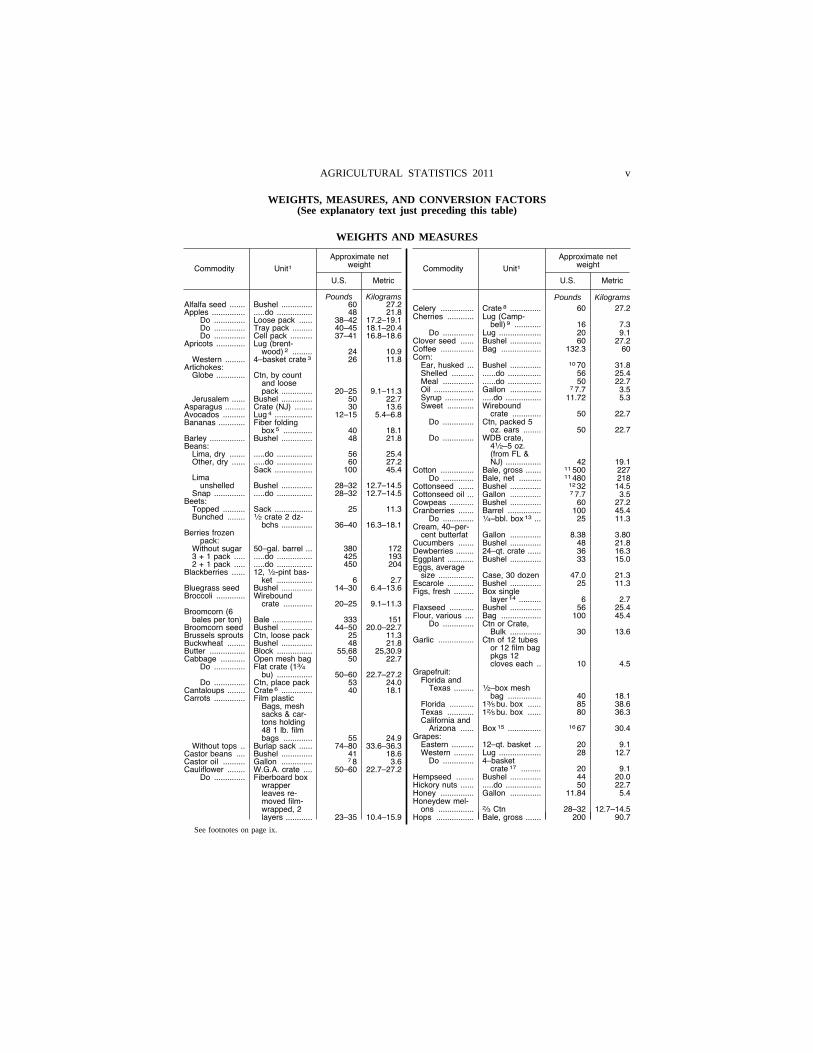
WEIGHTS, MEASURES, AND CONVERSION FACTORS (See explanatory text just preceding this table)
WEIGHTS AND MEASURES
Commodity Unit1
Approximate net weight
U.S. Metric
Pounds Kilograms Alfalfa seed ....... Bushel .............. 60 27.2 Apples ............... .....do ................ 48 21.8
Do .............. Loose pack ...... 38–42 17.2–19.1 Do .............. Tray pack ......... 40–45 18.1–20.4 Do .............. Cell pack .......... 37–41 16.8–18.6
Apricots ............. Lug (brent-wood) 2 ......... 24 10.9
Western ......... 4–basket crate 3 26 11.8 Artichokes:
Globe ............. Ctn, by count and loose pack .............. 20–25 9.1–11.3
Jerusalem ...... Bushel .............. 50 22.7 Asparagus ......... Crate (NJ) ........ 30 13.6 Avocados .......... Lug 4 ................. 12–15 5.4–6.8 Bananas ............ Fiber folding
box 5 ............. 40 18.1 Barley ................ Bushel .............. 48 21.8 Beans:
Lima, dry ....... .....do ................ 56 25.4 Other, dry ...... .....do ................ 60 27.2
Sack ................. 100 45.4 Lima
unshelled Bushel .............. 28–32 12.7–14.5 Snap .............. .....do ................ 28–32 12.7–14.5
Beets: Topped .......... Sack ................. 25 11.3 Bunched ........ 1⁄2 crate 2 dz-
bchs .............. 36–40 16.3–18.1 Berries frozen
pack: Without sugar 50–gal. barrel ... 380 172 3 + 1 pack ..... .....do ................ 425 193 2 + 1 pack ..... .....do ................ 450 204
Blackberries ...... 12, 1⁄2-pint bas-ket ................ 6 2.7
Bluegrass seed Bushel .............. 14–30 6.4–13.6 Broccoli ............. Wirebound
crate ............. 20–25 9.1–11.3 Broomcorn (6
bales per ton) Bale .................. 333 151 Broomcorn seed Bushel .............. 44–50 20.0–22.7 Brussels sprouts Ctn, loose pack 25 11.3 Buckwheat ........ Bushel .............. 48 21.8 Butter ................ Block ................ 55,68 25,30.9 Cabbage ........... Open mesh bag 50 22.7
Do .............. Flat crate (13⁄4 bu) ................ 50–60 22.7–27.2
Do .............. Ctn, place pack 53 24.0 Cantaloups ........ Crate 6 .............. 40 18.1 Carrots .............. Film plastic
Bags, mesh sacks & car-tons holding 48 1 lb. film bags ............. 55 24.9
Without tops .. Burlap sack ...... 74–80 33.6–36.3 Castor beans .... Bushel .............. 41 18.6 Castor oil .......... Gallon .............. 7 8 3.6 Cauliflower ........ W.G.A. crate .... 50–60 22.7–27.2
Do .............. Fiberboard box wrapper leaves re-moved film-wrapped, 2 layers ............ 23–35 10.4–15.9
Commodity Unit1
Approximate net weight
U.S. Metric
Pounds Kilograms Celery ............... Crate 8 .............. 60 27.2 Cherries ............ Lug (Camp-
bell) 9 ............ 16 7.3 Do .............. Lug ................... 20 9.1
Clover seed ...... Bushel .............. 60 27.2 Coffee ............... Bag .................. 132.3 60 Corn:
Ear, husked ... Bushel .............. 10 70 31.8 Shelled .......... ......do ............... 56 25.4 Meal .............. ......do ............... 50 22.7 Oil .................. Gallon .............. 7 7.7 3.5 Syrup ............. .....do ................ 11.72 5.3 Sweet ............ Wirebound
crate ............. 50 22.7 Do .............. Ctn, packed 5
oz. ears ........ 50 22.7 Do .............. WDB crate,
41⁄2–5 oz. (from FL & NJ) ................ 42 19.1
Cotton ............... Bale, gross ....... 11 500 227 Do .............. Bale, net .......... 11 480 218
Cottonseed ....... Bushel .............. 12 32 14.5 Cottonseed oil ... Gallon .............. 7 7.7 3.5 Cowpeas ........... Bushel .............. 60 27.2 Cranberries ....... Barrel ............... 100 45.4
Do .............. 1⁄4–bbl. box 13 ... 25 11.3 Cream, 40–per-
cent butterfat Gallon .............. 8.38 3.80 Cucumbers ....... Bushel .............. 48 21.8 Dewberries ........ 24–qt. crate ...... 36 16.3 Eggplant ............ Bushel .............. 33 15.0 Eggs, average
size ................ Case, 30 dozen 47.0 21.3 Escarole ............ Bushel .............. 25 11.3 Figs, fresh ......... Box single
layer 14 .......... 6 2.7 Flaxseed ........... Bushel .............. 56 25.4 Flour, various .... Bag .................. 100 45.4
Do .............. Ctn or Crate, Bulk .............. 30 13.6
Garlic ................ Ctn of 12 tubes or 12 film bag pkgs 12 cloves each .. 10 4.5
Grapefruit: Florida and
Texas ......... 1⁄2–box mesh bag ............... 40 18.1
Florida ........... 13⁄5 bu. box ...... 85 38.6 Texas ............ 12⁄5 bu. box ...... 80 36.3 California and
Arizona ...... Box 15 ............... 16 67 30.4 Grapes:
Eastern .......... 12–qt. basket ... 20 9.1 Western ......... Lug ................... 28 12.7
Do .............. 4–basket crate 17 ......... 20 9.1
Hempseed ........ Bushel .............. 44 20.0 Hickory nuts ...... .....do ................ 50 22.7 Honey ............... Gallon .............. 11.84 5.4 Honeydew mel-
ons ................ 2⁄3 Ctn 28–32 12.7–14.5 Hops ................. Bale, gross ....... 200 90.7
See footnotes on page ix.
VerDate Aug 31 2005 12:10 Mar 12, 2012 Jkt 000000 PO 00000 Frm 00005 Fmt 1004 Sfmt 1004 H:\SHARED\DAPP\FPU\AGSTAT\MASTER~2\OTHER_~1\FRONT_~1.AG8 USDA
vi AGRICULTURAL STATISTICS 2011
WEIGHTS AND MEASURES—Continued
Commodity Unit 1
Approximate net weight
U.S. Metric
Pounds Kilograms Horseradish
roots .............. Bushel .............. 35 15.9 Do .............. Sack ................. 50 22.7
Hungarian millet seed .............. Bushel .............. 48–50 21.8–22.7
Kale .................. Ctn or crate ...... 25 11.3 Kapok seed ...... ......do ............... 35–40 15.9–18.1 Lard .................. Tierce ............... 375 170 Lemons:
California and Arizona ...... Box 18 ............... 76 34.5 Do .............. Carton .............. 38 17.2
Lentils ............... Bushel .............. 60 27.2 Lettuce, iceberg Iceberg, carton
packed 24 ..... 43–52 19.5–23.6 Lettuce, hot-
house ............ 24-qt. basket .... 10 4.5 Limes (Florida) Box ................... 88 39.9 Linseed oil ........ Gallon ............... 7 7.7 3.5 Malt ................... Bushel .............. 34 15.4 Maple syrup ...... Gallon ............... 11.02 5.0 Meadow fescue
seed .............. Bushel .............. 24 10.9 Milk ................... Gallon ............... 8.6 3.9 Millet ................. Bushel .............. 48–60 21.8–27.2 Molasses:
edible ............ Gallon ............... 11.74 5.3 inedible ......... ......do ............... 11.74 5.3
Mustard seed ... Bushel .............. 58–60 26.3–27.2 Oats .................. ......do ............... 32 14.5 Olives ............... Lug ................... 25–30 11.3–13.6 Olive oil ............ Gallon ............... 7 7.6 3.4 Onions, dry ....... Sack ................. 50 22.7 Onions, green
bunched ........ Ctn, 24-dz bchs 10–16 4.5–7.3 Oranges:
Florida ........... Box ................... 90 40.8 Texas ............ Box ................... 85 38.5 California and
Arizona ...... Box 15 ............... 75 34.0 Do .............. Carton .............. 38 17.2
Orchardgrass seed .............. Bushel .............. 14 6.4
Palm oil ............ Gallon ............... 7 7.7 3.5 Parsnips ........... Bushel .............. 50 22.7 Peaches ........... ......do ............... 48 21.8
Do .............. 2 layer ctn or lug ................. 22 10.0
Do .............. 3⁄4-Bu, Ctn/crate 38 17.2 Peanut oil ......... Gallon ............... 7 7.7 3.5 Peanuts,
unshelled: Virginia type .. Bushel .............. 17 7.7 Runners,
South-east-ern ............. ......do ............... 21 9.5
Spanish: South-
eastern ... ......do ............... 25 11.3 South-
western .. ......do ............... 25 11.3 Pears:
California ....... Bushel .............. 48 21.8 Other ............. ......do ............... 50 22.7
Commodity Unit 1
Approximate net weight
U.S. Metric
Pounds Kilograms Do .............. Std box, 4/5 bu 45–48 20.4–21.8 Do .............. Ctn, Tight-fill
pack .............. 36–37 16.3–16.7 Peas:
Green, unshelled ... Bushel .............. 28–30 12.7–13.6
Dry ................ ......do ............... 60 27.2 Peppers, green ......do ............... 25–30 11.3–13.6
Do .............. 11⁄2 bu carton ... 28 12.7 Perilla seed ...... Bushel .............. 37–40 16.8–18.1 Pineapples ........ Carton .............. 40 18.1 Plums and
prunes: Ctn & lugs ........ 28 12.7 Do .............. 1⁄2-bu. basket ... 30 13.6
Popcorn: On ear ........... Bushel .............. 10 70 31.8 Shelled .......... ......do ............... 56 25.4
Poppy seed ...... ......do ............... 46 20.9 Potatoes ........... Bushel .............. 60 27.2
Do .............. Barrel ................ 165 74.8 Do .............. Box ................... 50 22.7 Do .............. ......do ............... 100 45.4
Quinces ............ Bushel .............. 48 21.8 Rapeseed ......... ......do ............... 50–60 22.7–27.2 Raspberries ...... 1⁄2-pint baskets 6 2.7 Redtop seed ..... Bushel .............. 50–60 22.7–27.2 Refiners’ syrup Gallon ............... 11.45 5.2 Rice:
Rough ........... Bushel .............. 45 20.4 Do .............. Bag ................... 100 45.4 Do .............. Barrel ................ 162 73.5
Milled ............ Pocket or bag ... 100 45.4 Rosin ................ Drum, net ......... 520 236 Rutabagas ........ Bushel .............. 56 25.4 Rye ................... ......do ............... 56 25.4 Sesame seed ... ......do ............... 46 20.9 Shallots ............. Crate (4–7 doz.
bunches) ....... 20–35 9.1–15.9 Sorgo:
Seed ............. Bushel .............. 50 22.7 Syrup ............ Gallon ............... 11.55 5.2
Sorghum grain 19 Bushel .............. 56 25.4
Soybeans ......... ......do ............... 60 27.2 Soybean oil ...... Gallon ............... 7 7.7 3.5 Spelt ................. Bushel .............. 40 18.1 Spinach ............ ......do ............... 18–20 8.2–9.1 Strawberries ..... 24-qt. crate ....... 36 16.3
Do .............. 12-pt. crate ....... 9–11 4.1–5.0 Sudangrass
seed .............. Bushel .............. 40 18.1 Sugarcane:
Syrup (sulfured or un-sulfured) Gallon ............... 11.45 5.2
Sunflower seed Bushel .............. 24–32 10.9–14.5 Sweetpotatoes .. ......do ............... 20 55 24.9
Do .............. Crate ................ 50 22.7 Tangerines:
Florida ........... Box ................... 95 43.1 Arizona .......... Box ................... 75 34.0 California ....... Box ................... 75 34.0
See footnotes on page ix.
VerDate Aug 31 2005 12:10 Mar 12, 2012 Jkt 000000 PO 00000 Frm 00006 Fmt 1004 Sfmt 1004 H:\SHARED\DAPP\FPU\AGSTAT\MASTER~2\OTHER_~1\FRONT_~1.AG8 USDA
vii AGRICULTURAL STATISTICS 2011
WEIGHTS AND MEASURES—Continued
Commodity Unit 1
Approximate net weight
U.S. Metric
Pounds Kilograms Timothy seed .... Bushel .............. 45 20.4 Tobacco:
Maryland ....... Hogshead ......... 775 352 Flue-cured ..... .....do ................ 950 431 Burley ............ .....do ................ 975 442 Dark air-cured .....do ................ 1,150 522 Virginia fire-
cured .....do ................ 1,350 612 Kentucky and
Tennessee fire-cured .....do ................ 1,500 680
Cigar-leaf ...... Case ................. 250–365 113–166 Do .............. Bale .................. 150–175 68.0–79.4
Tomatoes ......... Crate ................ 60 27.2 Do .............. Lug box ............ 32 14.5 Do .............. 2-layer flat ........ 21 9.5
Tomatoes, hot-house 12-qt. basket .... 20 9.1
Tung oil ............ Gallon ............... 7 7.8 3.5
Commodity Unit 1
Approximate net weight
U.S. Metric
Pounds Kilograms Turnips:
Without tops .. Mesh sack ........ 50 22.7 Bunched ........ Crate 6 .............. 70–80 31.8–36.3
Turpentine ........ Gallon ............... 7.23 3.3 Velvetbeans
(hulled) Bushel .............. 60 27.2 Vetch seed ....... .....do ................ 60 27.2 Walnuts ............ Sacks ............... 50 22.7 Water 60° F ...... Gallon ............... 8.33 3.8 Watermelons .... Melons of aver-
age or me-dium size ...... 25 11.3
Wheat ............... Bushel .............. 60 27.2 Various com-
modities ........ Short ton .......... 2,000 907 Do .............. Long ton ........... 2,240 1,016 Do .............. Metric ton ......... 2,204.6 1,000
See footnotes on page ix.
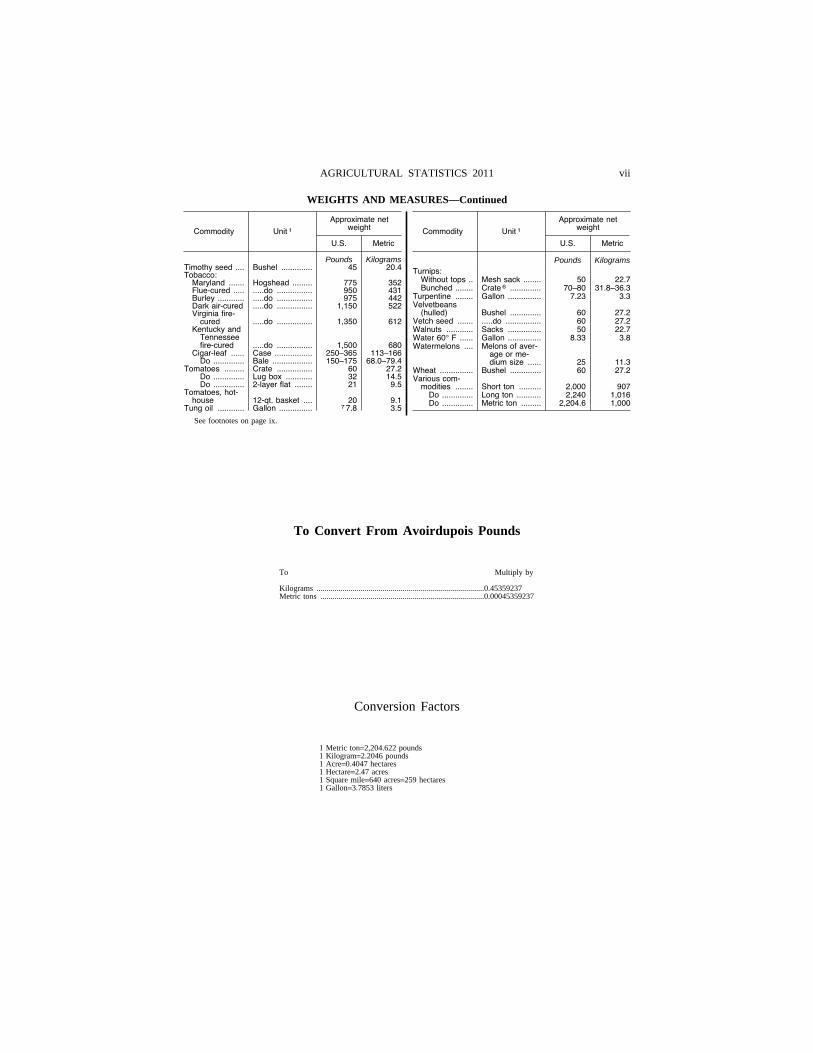
To Convert From Avoirdupois Pounds
To Multiply by
Kilograms ....................................................................................0.45359237 Metric tons ..................................................................................0.00045359237
Conversion Factors
1 Metric ton=2,204.622 pounds 1 Kilogram=2.2046 pounds 1 Acre=0.4047 hectares 1 Hectare=2.47 acres 1 Square mile=640 acres=259 hectares 1 Gallon=3.7853 liters
VerDate Aug 31 2005 12:10 Mar 12, 2012 Jkt 000000 PO 00000 Frm 00007 Fmt 1004 Sfmt 1004 H:\SHARED\DAPP\FPU\AGSTAT\MASTER~2\OTHER_~1\FRONT_~1.AG8 USDA
viii AGRICULTURAL STATISTICS 2011
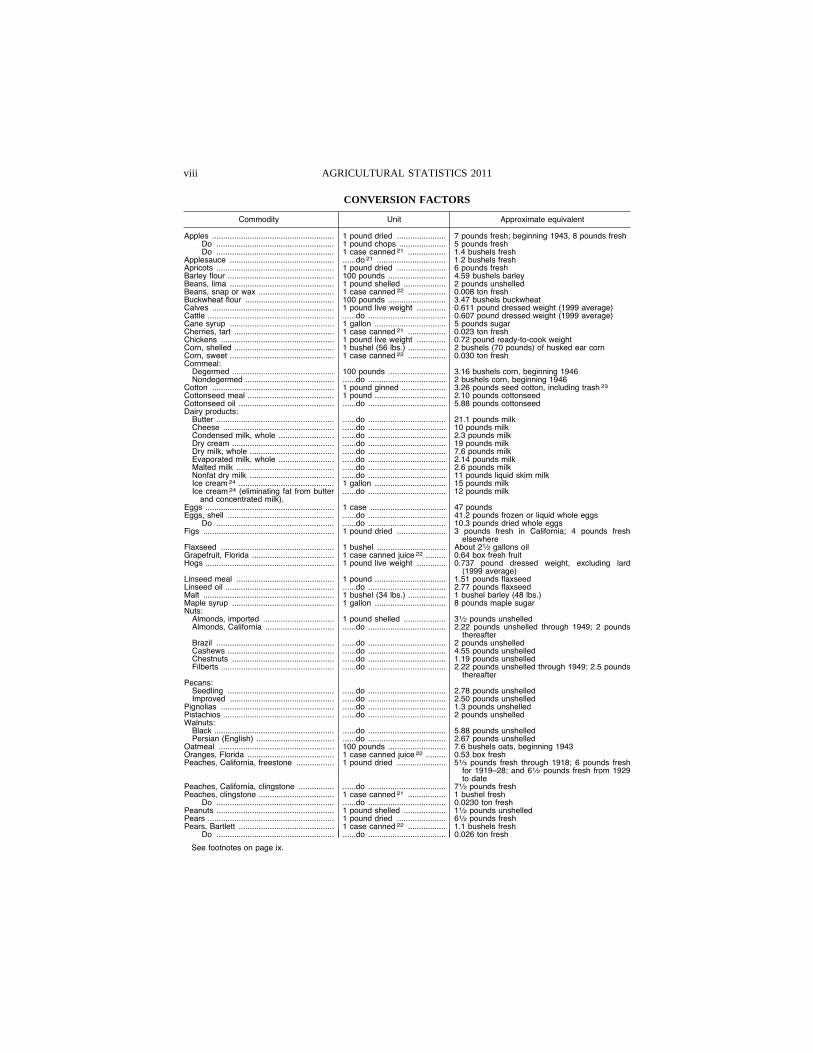
CONVERSION FACTORS
Commodity Unit Approximate equivalent
Apples ....................................................... 1 pound dried ...................... 7 pounds fresh; beginning 1943, 8 pounds fresh Do ..................................................... 1 pound chops ..................... 5 pounds fresh Do ..................................................... 1 case canned 21 ................. 1.4 bushels fresh
Applesauce ............................................... ......do 21 ............................... 1.2 bushels fresh Apricots ..................................................... 1 pound dried ...................... 6 pounds fresh Barley flour ................................................ 100 pounds .......................... 4.59 bushels barley Beans, lima ............................................... 1 pound shelled ................... 2 pounds unshelled Beans, snap or wax .................................. 1 case canned 22 ................. 0.008 ton fresh Buckwheat flour ........................................ 100 pounds .......................... 3.47 bushels buckwheat Calves ....................................................... 1 pound live weight ............. 0.611 pound dressed weight (1999 average) Cattle ......................................................... ......do ................................... 0.607 pound dressed weight (1999 average) Cane syrup ............................................... 1 gallon ................................ 5 pounds sugar Cherries, tart ............................................. 1 case canned 21 ................. 0.023 ton fresh Chickens ................................................... 1 pound live weight ............. 0.72 pound ready-to-cook weight Corn, shelled ............................................. 1 bushel (56 lbs.) ................. 2 bushels (70 pounds) of husked ear corn Corn, sweet ............................................... 1 case canned 22 ................. 0.030 ton fresh Cornmeal:
Degermed .............................................. 100 pounds .......................... 3.16 bushels corn, beginning 1946 Nondegermed ........................................ ......do ................................... 2 bushels corn, beginning 1946
Cotton ....................................................... 1 pound ginned .................... 3.26 pounds seed cotton, including trash 23 Cottonseed meal ....................................... 1 pound ................................ 2.10 pounds cottonseed Cottonseed oil ........................................... ......do ................................... 5.88 pounds cottonseed Dairy products:
Butter ..................................................... ......do ................................... 21.1 pounds milk Cheese .................................................. ......do ................................... 10 pounds milk Condensed milk, whole ......................... ......do ................................... 2.3 pounds milk Dry cream .............................................. ......do ................................... 19 pounds milk Dry milk, whole ...................................... ......do ................................... 7.6 pounds milk Evaporated milk, whole ......................... ......do ................................... 2.14 pounds milk Malted milk ............................................ ......do ................................... 2.6 pounds milk Nonfat dry milk ...................................... ......do ................................... 11 pounds liquid skim milk Ice cream 24 ........................................... 1 gallon ................................ 15 pounds milk Ice cream 24 (eliminating fat from butter
and concentrated milk).......do ................................... 12 pounds milk
Eggs .......................................................... 1 case .................................. 47 pounds Eggs, shell ................................................ ......do ................................... 41.2 pounds frozen or liquid whole eggs
Do ..................................................... ......do ................................... 10.3 pounds dried whole eggs Figs ........................................................... 1 pound dried ...................... 3 pounds fresh in California; 4 pounds fresh
elsewhere Flaxseed ................................................... 1 bushel ............................... About 21⁄2 gallons oil Grapefruit, Florida ..................................... 1 case canned juice 22 ......... 0.64 box fresh fruit Hogs .......................................................... 1 pound live weight ............. 0.737 pound dressed weight, excluding lard
(1999 average) Linseed meal ............................................ 1 pound ................................ 1.51 pounds flaxseed Linseed oil ................................................. ......do ................................... 2.77 pounds flaxseed Malt ........................................................... 1 bushel (34 lbs.) ................. 1 bushel barley (48 lbs.) Maple syrup .............................................. 1 gallon ................................ 8 pounds maple sugar Nuts:
Almonds, imported ................................ 1 pound shelled ................... 31⁄2 pounds unshelled Almonds, California ............................... ......do ................................... 2.22 pounds unshelled through 1949; 2 pounds
thereafter Brazil ..................................................... ......do ................................... 2 pounds unshelled Cashews ................................................ ......do ................................... 4.55 pounds unshelled Chestnuts .............................................. ......do ................................... 1.19 pounds unshelled Filberts ................................................... ......do ................................... 2.22 pounds unshelled through 1949; 2.5 pounds
thereafter Pecans:
Seedling ................................................ ......do ................................... 2.78 pounds unshelled Improved ............................................... ......do ................................... 2.50 pounds unshelled
Pignolias ................................................... ......do ................................... 1.3 pounds unshelled Pistachios .................................................. ......do ................................... 2 pounds unshelled Walnuts:
Black ...................................................... ......do ................................... 5.88 pounds unshelled Persian (English) ................................... ......do ................................... 2.67 pounds unshelled
Oatmeal .................................................... 100 pounds .......................... 7.6 bushels oats, beginning 1943 Oranges, Florida ....................................... 1 case canned juice 22 ......... 0.53 box fresh Peaches, California, freestone ................. 1 pound dried ...................... 51⁄3 pounds fresh through 1918; 6 pounds fresh
for 1919–28; and 61⁄2 pounds fresh from 1929 to date
Peaches, California, clingstone ................ ......do ................................... 71⁄2 pounds fresh Peaches, clingstone .................................. 1 case canned 21 ................. 1 bushel fresh
Do ..................................................... ......do ................................... 0.0230 ton fresh Peanuts ..................................................... 1 pound shelled ................... 11⁄2 pounds unshelled Pears ......................................................... 1 pound dried ...................... 61⁄2 pounds fresh Pears, Bartlett ........................................... 1 case canned 22 ................. 1.1 bushels fresh
Do ..................................................... ......do ................................... 0.026 ton fresh
See footnotes on page ix.
VerDate Aug 31 2005 12:10 Mar 12, 2012 Jkt 000000 PO 00000 Frm 00008 Fmt 1000 Sfmt 1000 H:\SHARED\DAPP\FPU\AGSTAT\MASTER~2\OTHER_~1\FRONT_~1.AG8 USDA
ix AGRICULTURAL STATISTICS 2011
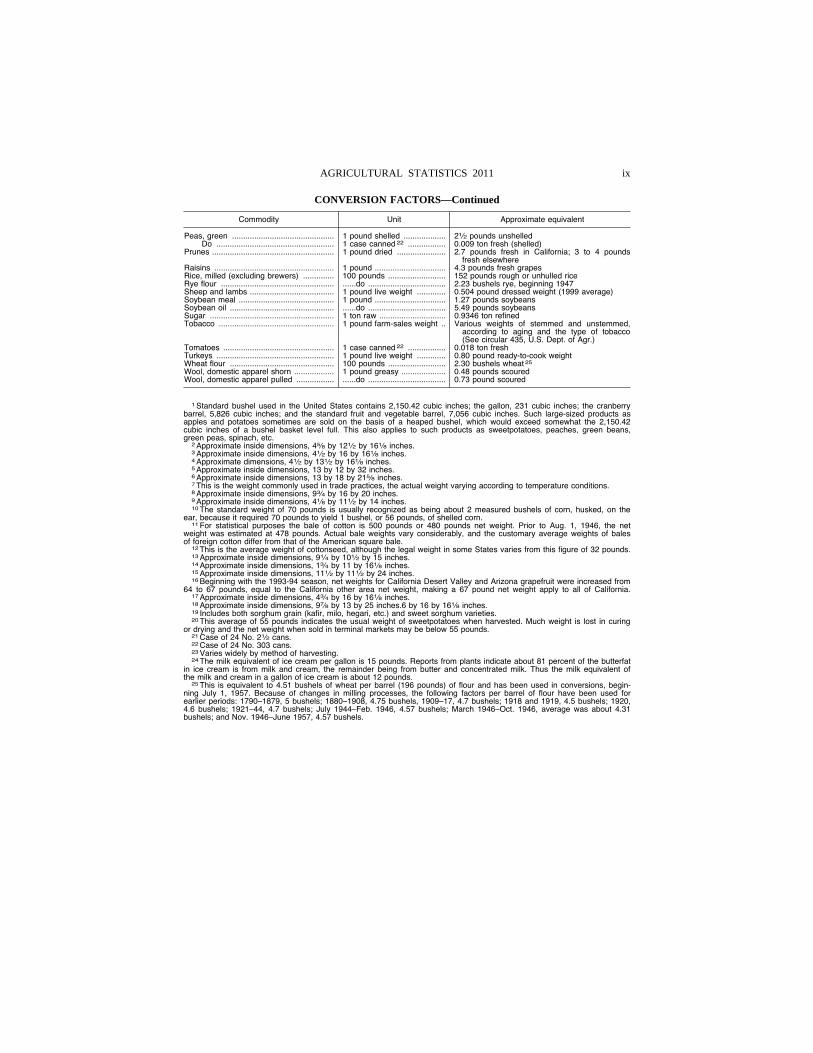
CONVERSION FACTORS—Continued
Commodity Unit Approximate equivalent
Peas, green .............................................. 1 pound shelled ................... 21⁄2 pounds unshelled Do ..................................................... 1 case canned 22 ................. 0.009 ton fresh (shelled)
Prunes ....................................................... 1 pound dried ...................... 2.7 pounds fresh in California; 3 to 4 pounds fresh elsewhere
Raisins ...................................................... 1 pound ................................ 4.3 pounds fresh grapes Rice, milled (excluding brewers) .............. 100 pounds .......................... 152 pounds rough or unhulled rice Rye flour ................................................... ......do ................................... 2.23 bushels rye, beginning 1947 Sheep and lambs ...................................... 1 pound live weight ............. 0.504 pound dressed weight (1999 average) Soybean meal ........................................... 1 pound ................................ 1.27 pounds soybeans Soybean oil ............................................... ......do ................................... 5.49 pounds soybeans Sugar ........................................................ 1 ton raw .............................. 0.9346 ton refined Tobacco .................................................... 1 pound farm-sales weight .. Various weights of stemmed and unstemmed,
according to aging and the type of tobacco (See circular 435, U.S. Dept. of Agr.)
Tomatoes .................................................. 1 case canned 22 ................. 0.018 ton fresh Turkeys ..................................................... 1 pound live weight ............. 0.80 pound ready-to-cook weight Wheat flour ............................................... 100 pounds .......................... 2.30 bushels wheat 25 Wool, domestic apparel shorn .................. 1 pound greasy .................... 0.48 pounds scoured Wool, domestic apparel pulled ................. ......do ................................... 0.73 pound scoured
1 Standard bushel used in the United States contains 2,150.42 cubic inches; the gallon, 231 cubic inches; the cranberry barrel, 5,826 cubic inches; and the standard fruit and vegetable barrel, 7,056 cubic inches. Such large-sized products as apples and potatoes sometimes are sold on the basis of a heaped bushel, which would exceed somewhat the 2,150.42 cubic inches of a bushel basket level full. This also applies to such products as sweetpotatoes, peaches, green beans, green peas, spinach, etc.
2 Approximate inside dimensions, 45⁄8 by 121⁄2 by 161⁄8 inches. 3 Approximate inside dimensions, 41⁄2 by 16 by 161⁄8 inches. 4 Approximate dimensions, 41⁄2 by 131⁄2 by 161⁄8 inches. 5 Approximate inside dimensions, 13 by 12 by 32 inches. 6 Approximate inside dimensions, 13 by 18 by 215⁄8 inches. 7 This is the weight commonly used in trade practices, the actual weight varying according to temperature conditions. 8 Approximate inside dimensions, 93⁄4 by 16 by 20 inches. 9 Approximate inside dimensions, 41⁄8 by 111⁄2 by 14 inches. 10 The standard weight of 70 pounds is usually recognized as being about 2 measured bushels of corn, husked, on the
ear, because it required 70 pounds to yield 1 bushel, or 56 pounds, of shelled corn. 11 For statistical purposes the bale of cotton is 500 pounds or 480 pounds net weight. Prior to Aug. 1, 1946, the net
weight was estimated at 478 pounds. Actual bale weights vary considerably, and the customary average weights of bales of foreign cotton differ from that of the American square bale.
12 This is the average weight of cottonseed, although the legal weight in some States varies from this figure of 32 pounds. 13 Approximate inside dimensions, 91⁄4 by 101⁄2 by 15 inches. 14 Approximate inside dimensions, 13⁄4 by 11 by 161⁄8 inches. 15 Approximate inside dimensions, 111⁄2 by 111⁄2 by 24 inches. 16 Beginning with the 1993-94 season, net weights for California Desert Valley and Arizona grapefruit were increased from
64 to 67 pounds, equal to the California other area net weight, making a 67 pound net weight apply to all of California. 17 Approximate inside dimensions, 43⁄4 by 16 by 161⁄8 inches. 18 Approximate inside dimensions, 97⁄8 by 13 by 25 inches.6 by 16 by 161⁄8 inches. 19 Includes both sorghum grain (kafir, milo, hegari, etc.) and sweet sorghum varieties. 20 This average of 55 pounds indicates the usual weight of sweetpotatoes when harvested. Much weight is lost in curing
or drying and the net weight when sold in terminal markets may be below 55 pounds. 21 Case of 24 No. 21⁄2 cans. 22 Case of 24 No. 303 cans. 23 Varies widely by method of harvesting. 24 The milk equivalent of ice cream per gallon is 15 pounds. Reports from plants indicate about 81 percent of the butterfat
in ice cream is from milk and cream, the remainder being from butter and concentrated milk. Thus the milk equivalent of the milk and cream in a gallon of ice cream is about 12 pounds.
25 This is equivalent to 4.51 bushels of wheat per barrel (196 pounds) of flour and has been used in conversions, begin-ning July 1, 1957. Because of changes in milling processes, the following factors per barrel of flour have been used for earlier periods: 1790–1879, 5 bushels; 1880–1908, 4.75 bushels, 1909–17, 4.7 bushels; 1918 and 1919, 4.5 bushels; 1920, 4.6 bushels; 1921–44, 4.7 bushels; July 1944–Feb. 1946, 4.57 bushels; March 1946–Oct. 1946, average was about 4.31 bushels; and Nov. 1946–June 1957, 4.57 bushels.
VerDate Aug 31 2005 12:10 Mar 12, 2012 Jkt 000000 PO 00000 Frm 00009 Fmt 1000 Sfmt 1000 H:\SHARED\DAPP\FPU\AGSTAT\MASTER~2\OTHER_~1\FRONT_~1.AG8 USDA

I–1
CHAPTER I
STATISTICS OF GRAIN AND FEED
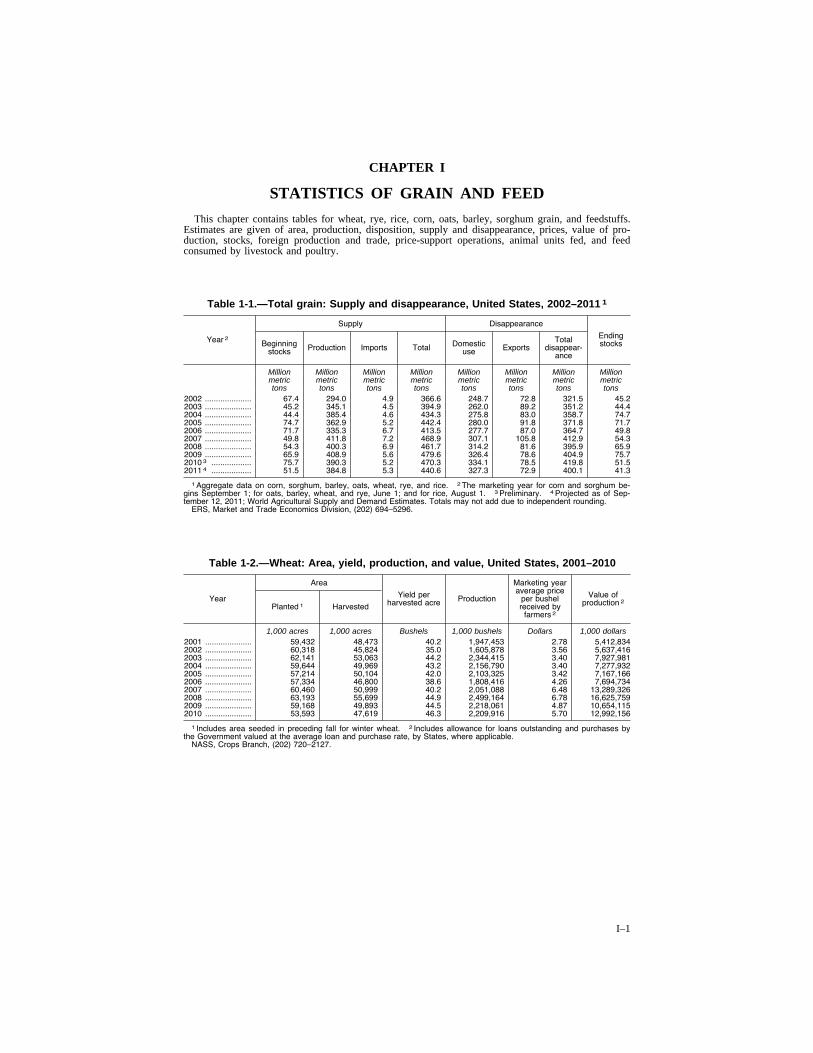
This chapter contains tables for wheat, rye, rice, corn, oats, barley, sorghum grain, and feedstuffs. Estimates are given of area, production, disposition, supply and disappearance, prices, value of pro-duction, stocks, foreign production and trade, price-support operations, animal units fed, and feed consumed by livestock and poultry.
Table 1-1.—Total grain: Supply and disappearance, United States, 2002–2011 1
Year 2
Supply Disappearance
Ending stocks Beginning
stocks Production Imports Total Domestic use Exports
Total disappear-
ance
Million Million Million Million Million Million Million Million metric tons
metric tons
metric tons
metric tons
metric tons
metric tons
metric tons
metric tons
2002 ..................... 67.4 294.0 4.9 366.6 248.7 72.8 321.5 45.2 2003 ..................... 45.2 345.1 4.5 394.9 262.0 89.2 351.2 44.4 2004 ..................... 44.4 385.4 4.6 434.3 275.8 83.0 358.7 74.7 2005 ..................... 74.7 362.9 5.2 442.4 280.0 91.8 371.8 71.7 2006 ..................... 71.7 335.3 6.7 413.5 277.7 87.0 364.7 49.8 2007 ..................... 49.8 411.8 7.2 468.9 307.1 105.8 412.9 54.3 2008 ..................... 54.3 400.3 6.9 461.7 314.2 81.6 395.9 65.9 2009 ..................... 65.9 408.9 5.6 479.6 326.4 78.6 404.9 75.7 2010 3 .................. 75.7 390.3 5.2 470.3 334.1 78.5 419.8 51.5 2011 4 .................. 51.5 384.8 5.3 440.6 327.3 72.9 400.1 41.3
1 Aggregate data on corn, sorghum, barley, oats, wheat, rye, and rice. 2 The marketing year for corn and sorghum be-gins September 1; for oats, barley, wheat, and rye, June 1; and for rice, August 1. 3 Preliminary. 4 Projected as of Sep-tember 12, 2011; World Agricultural Supply and Demand Estimates. Totals may not add due to independent rounding.
ERS, Market and Trade Economics Division, (202) 694–5296.
Table 1-2.—Wheat: Area, yield, production, and value, United States, 2001–2010
Year
Area
Yield per harvested acre Production
Marketing year average price
per bushel received by
farmers 2
Value of production 2 Planted 1 Harvested
1,000 acres 1,000 acres Bushels 1,000 bushels Dollars 1,000 dollars 2001 ..................... 59,432 48,473 40.2 1,947,453 2.78 5,412,834 2002 ..................... 60,318 45,824 35.0 1,605,878 3.56 5,637,416 2003 ..................... 62,141 53,063 44.2 2,344,415 3.40 7,927,981 2004 ..................... 59,644 49,969 43.2 2,156,790 3.40 7,277,932 2005 ..................... 57,214 50,104 42.0 2,103,325 3.42 7,167,166 2006 ..................... 57,334 46,800 38.6 1,808,416 4.26 7,694,734 2007 ..................... 60,460 50,999 40.2 2,051,088 6.48 13,289,326 2008 ..................... 63,193 55,699 44.9 2,499,164 6.78 16,625,759 2009 ..................... 59,168 49,893 44.5 2,218,061 4.87 10,654,115 2010 ..................... 53,593 47,619 46.3 2,209,916 5.70 12,992,156
1 Includes area seeded in preceding fall for winter wheat. 2 Includes allowance for loans outstanding and purchases by the Government valued at the average loan and purchase rate, by States, where applicable.
NASS, Crops Branch, (202) 720–2127.
VerDate Aug 31 2005 11:43 Mar 12, 2012 Jkt 000000 PO 00000 Frm 00001 Fmt 1001 Sfmt 1001 H:\SHARED\DAPP\FPU\AGSTAT\MASTER~2\CHAPTR01\I-01.AG8 USDA
I–2 GRAIN AND FEED
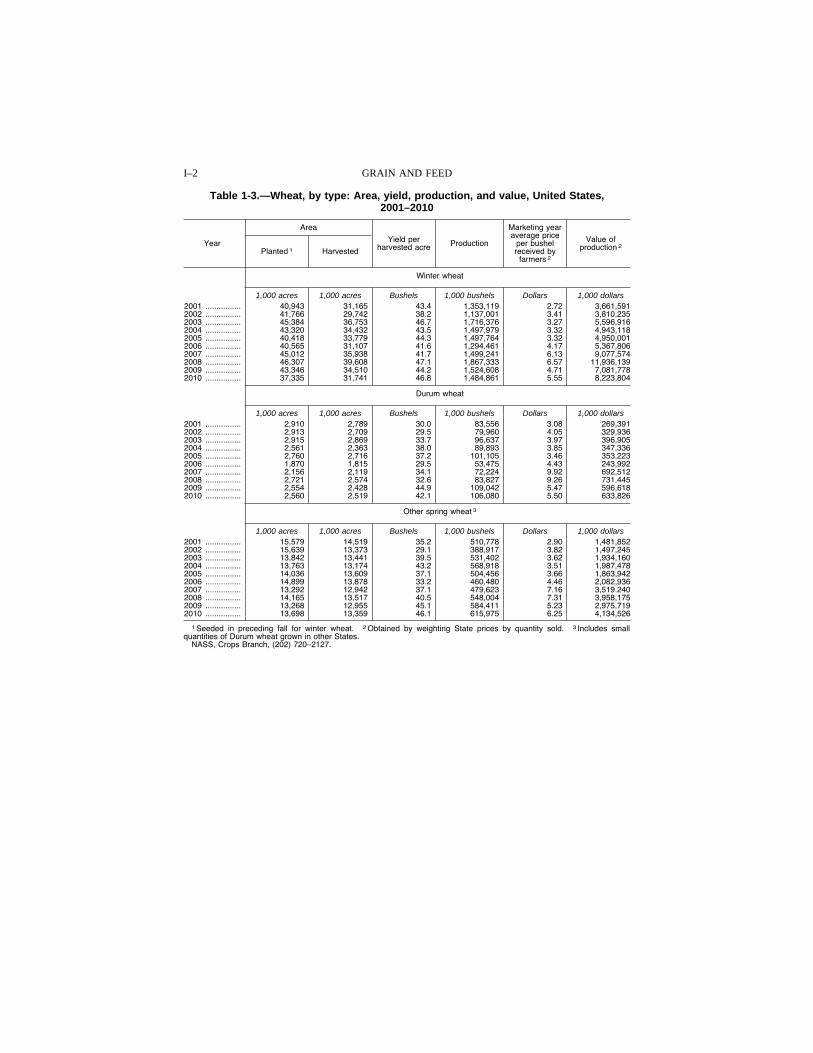
Table 1-3.—Wheat, by type: Area, yield, production, and value, United States, 2001–2010
Year
Area
Yield per harvested acre Production
Marketing year average price
per bushel received by
farmers 2
Value of production 2 Planted 1 Harvested
Winter wheat
1,000 acres 1,000 acres Bushels 1,000 bushels Dollars 1,000 dollars 2001 ................ 40,943 31,165 43.4 1,353,119 2.72 3,661,591 2002 ................ 41,766 29,742 38.2 1,137,001 3.41 3,810,235 2003 ................ 45,384 36,753 46.7 1,716,376 3.27 5,596,916 2004 ................ 43,320 34,432 43.5 1,497,979 3.32 4,943,118 2005 ................ 40,418 33,779 44.3 1,497,764 3.32 4,950,001 2006 ................ 40,565 31,107 41.6 1,294,461 4.17 5,367,806 2007 ................ 45,012 35,938 41.7 1,499,241 6.13 9,077,574 2008 ................ 46,307 39,608 47.1 1,867,333 6.57 11,936,139 2009 ................ 43,346 34,510 44.2 1,524,608 4.71 7,081,778 2010 ................ 37,335 31,741 46.8 1,484,861 5.55 8,223,804
Durum wheat
1,000 acres 1,000 acres Bushels 1,000 bushels Dollars 1,000 dollars 2001 ................ 2,910 2,789 30.0 83,556 3.08 269,391 2002 ................ 2,913 2,709 29.5 79,960 4.05 329,936 2003 ................ 2,915 2,869 33.7 96,637 3.97 396,905 2004 ................ 2,561 2,363 38.0 89,893 3.85 347,336 2005 ................ 2,760 2,716 37.2 101,105 3.46 353,223 2006 ................ 1,870 1,815 29.5 53,475 4.43 243,992 2007 ................ 2,156 2,119 34.1 72,224 9.92 692,512 2008 ................ 2,721 2,574 32.6 83,827 9.26 731,445 2009 ................ 2,554 2,428 44.9 109,042 5.47 596,618 2010 ................ 2,560 2,519 42.1 106,080 5.50 633,826
Other spring wheat 3
1,000 acres 1,000 acres Bushels 1,000 bushels Dollars 1,000 dollars 2001 ................ 15,579 14,519 35.2 510,778 2.90 1,481,852 2002 ................ 15,639 13,373 29.1 388,917 3.82 1,497,245 2003 ................ 13,842 13,441 39.5 531,402 3.62 1,934,160 2004 ................ 13,763 13,174 43.2 568,918 3.51 1,987,478 2005 ................ 14,036 13,609 37.1 504,456 3.66 1,863,942 2006 ................ 14,899 13,878 33.2 460,480 4.46 2,082,936 2007 ................ 13,292 12,942 37.1 479,623 7.16 3,519.240 2008 ................ 14,165 13,517 40.5 548,004 7.31 3,958,175 2009 ................ 13,268 12,955 45.1 584,411 5.23 2,975,719 2010 ................ 13,698 13,359 46.1 615,975 6.25 4,134,526
1 Seeded in preceding fall for winter wheat. 2 Obtained by weighting State prices by quantity sold. 3 Includes small quantities of Durum wheat grown in other States.
NASS, Crops Branch, (202) 720–2127.
VerDate Aug 31 2005 11:43 Mar 12, 2012 Jkt 000000 PO 00000 Frm 00002 Fmt 1000 Sfmt 1000 H:\SHARED\DAPP\FPU\AGSTAT\MASTER~2\CHAPTR01\I-02.AG8 USDA
I–3 AGRICULTURAL STATISTICS 2011
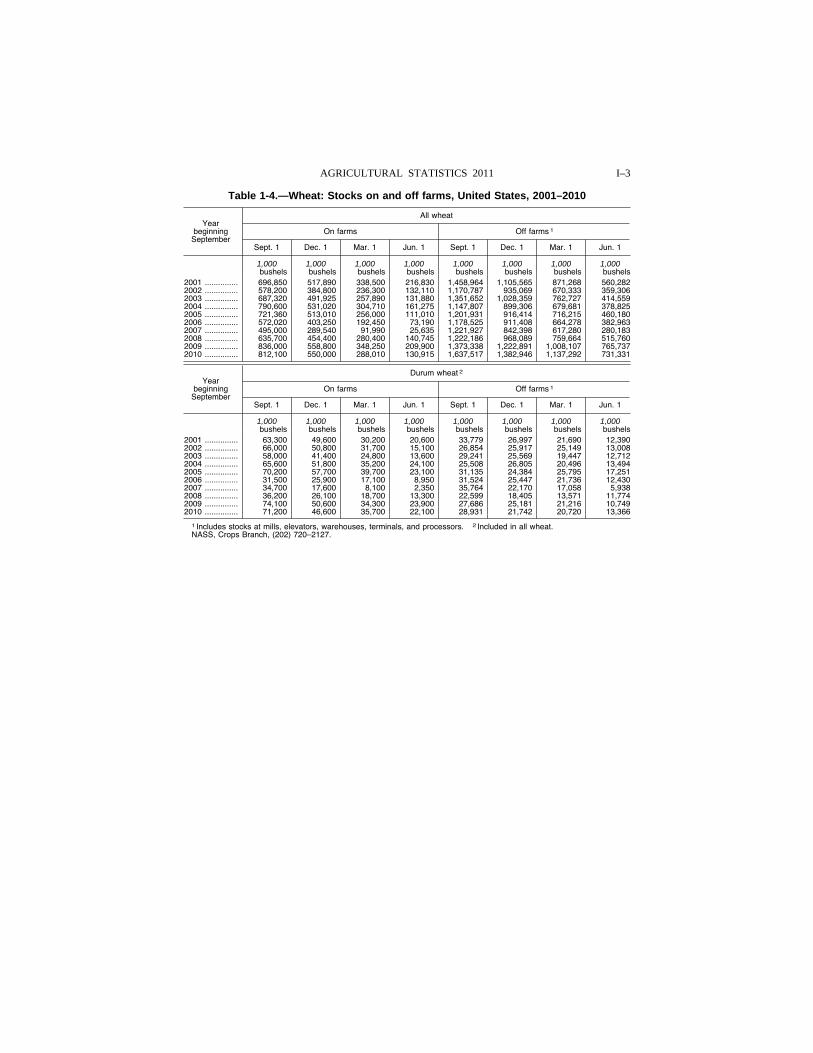
Table 1-4.—Wheat: Stocks on and off farms, United States, 2001–2010
Year beginning
September
All wheat
On farms Off farms 1
Sept. 1 Dec. 1 Mar. 1 Jun. 1 Sept. 1 Dec. 1 Mar. 1 Jun. 1
1,000 bushels
1,000 bushels
1,000 bushels
1,000 bushels
1,000 bushels
1,000 bushels
1,000 bushels
1,000 bushels
2001 ............... 696,850 517,890 338,500 216,830 1,458,964 1,105,565 871,268 560,282 2002 ............... 578,200 384,800 236,300 132,110 1,170,787 935,069 670,333 359,306 2003 ............... 687,320 491,925 257,890 131,880 1,351,652 1,028,359 762,727 414,559 2004 ............... 790,600 531,020 304,710 161,275 1,147,807 899,306 679,681 378,825 2005 ............... 721,360 513,010 256,000 111,010 1,201,931 916,414 716,215 460,180 2006 ............... 572,020 403,250 192,450 73,190 1,178,525 911,408 664,278 382,963 2007 ............... 495,000 289,540 91,990 25,635 1,221,927 842,398 617,280 280,183 2008 ............... 635,700 454,400 280,400 140,745 1,222,186 968,089 759,664 515,760 2009 ............... 836,000 558,800 348,250 209,900 1,373,338 1,222,891 1,008,107 765,737 2010 ............... 812,100 550,000 288,010 130,915 1,637,517 1,382,946 1,137,292 731,331
Year beginning
September
Durum wheat 2
On farms Off farms 1
Sept. 1 Dec. 1 Mar. 1 Jun. 1 Sept. 1 Dec. 1 Mar. 1 Jun. 1
1,000 bushels
1,000 bushels
1,000 bushels
1,000 bushels
1,000 bushels
1,000 bushels
1,000 bushels
1,000 bushels
2001 ............... 63,300 49,600 30,200 20,600 33,779 26,997 21,690 12,390 2002 ............... 66,000 50,800 31,700 15,100 26,854 25,917 25,149 13,008 2003 ............... 58,000 41,400 24,800 13,600 29,241 25,569 19,447 12,712 2004 ............... 65,600 51,800 35,200 24,100 25,508 26,805 20,496 13,494 2005 ............... 70,200 57,700 39,700 23,100 31,135 24,384 25,795 17,251 2006 ............... 31,500 25,900 17,100 8,950 31,524 25,447 21,736 12,430 2007 ............... 34,700 17,600 8,100 2,350 35,764 22,170 17,058 5,938 2008 ............... 36,200 26,100 18,700 13,300 22,599 18,405 13,571 11,774 2009 ............... 74,100 50,600 34,300 23,900 27,686 25,181 21,216 10,749 2010 ............... 71,200 46,600 35,700 22,100 28,931 21,742 20,720 13,366
1 Includes stocks at mills, elevators, warehouses, terminals, and processors. 2 Included in all wheat. NASS, Crops Branch, (202) 720–2127.
VerDate Aug 31 2005 11:43 Mar 12, 2012 Jkt 000000 PO 00000 Frm 00003 Fmt 1000 Sfmt 1000 H:\SHARED\DAPP\FPU\AGSTAT\MASTER~2\CHAPTR01\I-03.AG8 USDA
I–4 GRAIN AND FEED
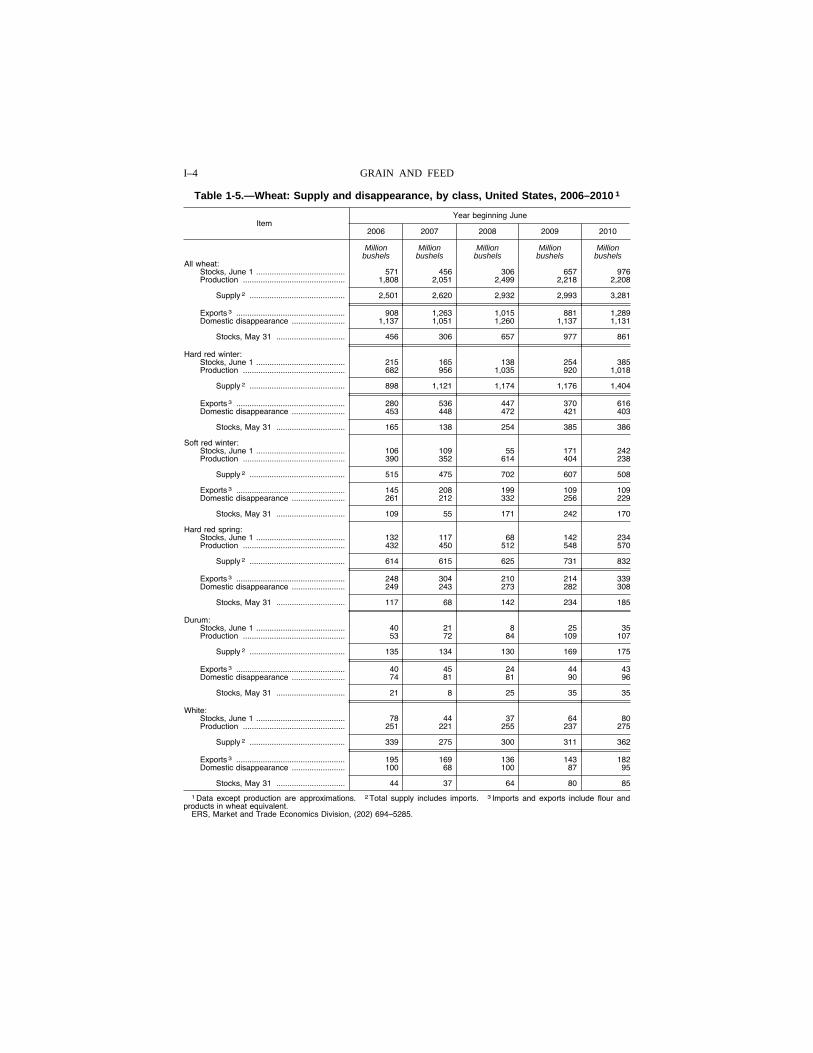
Table 1-5.—Wheat: Supply and disappearance, by class, United States, 2006–2010 1
Item Year beginning June
2006 2007 2008 2009 2010
Million Million Million Million Million bushels bushels bushels bushels bushels
All wheat: Stocks, June 1 ........................................ 571 456 306 657 976 Production .............................................. 1,808 2,051 2,499 2,218 2,208
Supply 2 ........................................... 2,501 2,620 2,932 2,993 3,281
Exports 3 ................................................. 908 1,263 1,015 881 1,289 Domestic disappearance ........................ 1,137 1,051 1,260 1,137 1,131
Stocks, May 31 ............................... 456 306 657 977 861
Hard red winter: Stocks, June 1 ........................................ 215 165 138 254 385 Production .............................................. 682 956 1,035 920 1,018
Supply 2 ........................................... 898 1,121 1,174 1,176 1,404
Exports 3 ................................................. 280 536 447 370 616 Domestic disappearance ........................ 453 448 472 421 403
Stocks, May 31 ............................... 165 138 254 385 386
Soft red winter: Stocks, June 1 ........................................ 106 109 55 171 242 Production .............................................. 390 352 614 404 238
Supply 2 ........................................... 515 475 702 607 508
Exports 3 ................................................. 145 208 199 109 109 Domestic disappearance ........................ 261 212 332 256 229
Stocks, May 31 ............................... 109 55 171 242 170
Hard red spring: Stocks, June 1 ........................................ 132 117 68 142 234 Production .............................................. 432 450 512 548 570
Supply 2 ........................................... 614 615 625 731 832
Exports 3 ................................................. 248 304 210 214 339 Domestic disappearance ........................ 249 243 273 282 308
Stocks, May 31 ............................... 117 68 142 234 185
Durum: Stocks, June 1 ........................................ 40 21 8 25 35 Production .............................................. 53 72 84 109 107
Supply 2 ........................................... 135 134 130 169 175
Exports 3 ................................................. 40 45 24 44 43 Domestic disappearance ........................ 74 81 81 90 96
Stocks, May 31 ............................... 21 8 25 35 35
White: Stocks, June 1 ........................................ 78 44 37 64 80 Production .............................................. 251 221 255 237 275
Supply 2 ........................................... 339 275 300 311 362
Exports 3 ................................................. 195 169 136 143 182 Domestic disappearance ........................ 100 68 100 87 95
Stocks, May 31 ............................... 44 37 64 80 85
1 Data except production are approximations. 2 Total supply includes imports. 3 Imports and exports include flour and products in wheat equivalent.
ERS, Market and Trade Economics Division, (202) 694–5285.
VerDate Aug 31 2005 11:43 Mar 12, 2012 Jkt 000000 PO 00000 Frm 00004 Fmt 1000 Sfmt 1000 H:\SHARED\DAPP\FPU\AGSTAT\MASTER~2\CHAPTR01\I-04.AG8 USDA
I–5 AGRICULTURAL STATISTICS 2011
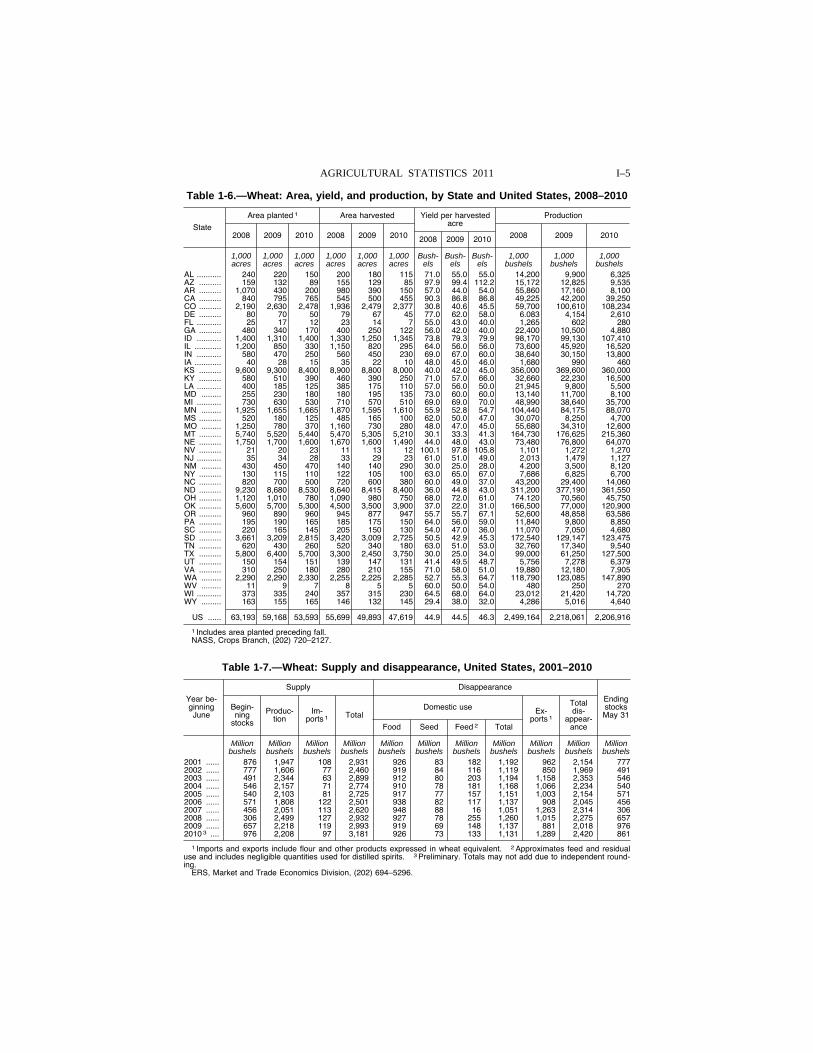
Table 1-6.—Wheat: Area, yield, and production, by State and United States, 2008–2010
State
Area planted 1 Area harvested Yield per harvested acre
Production
2008 2009 2010 2008 2009 2010 2008 2009 2010 2008 2009 2010
1,000 1,000 1,000 1,000 1,000 1,000 Bush- Bush- Bush- 1,000 1,000 1,000 acres acres acres acres acres acres els els els bushels bushels bushels
AL ........... 240 220 150 200 180 115 71.0 55.0 55.0 14,200 9,900 6,325 AZ .......... 159 132 89 155 129 85 97.9 99.4 112.2 15,172 12,825 9,535 AR .......... 1,070 430 200 980 390 150 57.0 44.0 54.0 55,860 17,160 8,100 CA .......... 840 795 765 545 500 455 90.3 86.8 86.8 49,225 42,200 39,250 CO .......... 2,190 2,630 2,478 1,936 2,479 2,377 30.8 40.6 45.5 59,700 100,610 108,234 DE .......... 80 70 50 79 67 45 77.0 62.0 58.0 6.083 4,154 2,610 FL ........... 25 17 12 23 14 7 55.0 43.0 40.0 1,265 602 280 GA .......... 480 340 170 400 250 122 56.0 42.0 40.0 22,400 10,500 4,880 ID ........... 1,400 1,310 1,400 1,330 1,250 1,345 73.8 79.3 79.9 98,170 99,130 107,410 IL ............ 1,200 850 330 1,150 820 295 64.0 56.0 56.0 73,600 45,920 16,520 IN ........... 580 470 250 560 450 230 69.0 67.0 60.0 38,640 30,150 13,800 IA ............ 40 28 15 35 22 10 48.0 45.0 46.0 1,680 990 460 KS .......... 9,600 9,300 8,400 8,900 8,800 8,000 40.0 42.0 45.0 356,000 369,600 360,000 KY .......... 580 510 390 460 390 250 71.0 57.0 66.0 32,660 22,230 16,500 LA ........... 400 185 125 385 175 110 57.0 56.0 50.0 21,945 9,800 5,500 MD ......... 255 230 180 180 195 135 73.0 60.0 60.0 13,140 11,700 8,100 MI ........... 730 630 530 710 570 510 69.0 69.0 70.0 48,990 38,640 35,700 MN ......... 1,925 1,655 1,665 1,870 1,595 1,610 55.9 52.8 54.7 104,440 84,175 88,070 MS .......... 520 180 125 485 165 100 62.0 50.0 47.0 30,070 8,250 4,700 MO ......... 1,250 780 370 1,160 730 280 48.0 47.0 45.0 55,680 34,310 12,600 MT .......... 5,740 5,520 5,440 5,470 5,305 5,210 30.1 33.3 41.3 164,730 176,625 215,360 NE .......... 1,750 1,700 1,600 1,670 1,600 1,490 44.0 48.0 43.0 73,480 76,800 64,070 NV .......... 21 20 23 11 13 12 100.1 97.8 105.8 1,101 1,272 1,270 NJ ........... 35 34 28 33 29 23 61.0 51.0 49.0 2,013 1,479 1,127 NM ......... 430 450 470 140 140 290 30.0 25.0 28.0 4.200 3,500 8,120 NY .......... 130 115 110 122 105 100 63.0 65.0 67.0 7,686 6,825 6,700 NC .......... 820 700 500 720 600 380 60.0 49.0 37.0 43,200 29,400 14,060 ND .......... 9,230 8,680 8,530 8,640 8,415 8,400 36.0 44.8 43.0 311,200 377,190 361,550 OH .......... 1,120 1,010 780 1,090 980 750 68.0 72.0 61.0 74.120 70,560 45,750 OK .......... 5,600 5,700 5,300 4,500 3,500 3,900 37.0 22.0 31.0 166,500 77,000 120,900 OR .......... 960 890 960 945 877 947 55.7 55.7 67.1 52,600 48,858 63,586 PA .......... 195 190 165 185 175 150 64.0 56.0 59.0 11,840 9,800 8,850 SC .......... 220 165 145 205 150 130 54.0 47.0 36.0 11,070 7,050 4,680 SD .......... 3,661 3,209 2,815 3,420 3,009 2,725 50.5 42.9 45.3 172,540 129,147 123,475 TN .......... 620 430 260 520 340 180 63.0 51.0 53.0 32,760 17,340 9,540 TX .......... 5,800 6,400 5,700 3,300 2,450 3,750 30.0 25.0 34.0 99,000 61,250 127,500 UT .......... 150 154 151 139 147 131 41.4 49.5 48.7 5,756 7,278 6,379 VA .......... 310 250 180 280 210 155 71.0 58.0 51.0 19,880 12,180 7,905 WA ......... 2,290 2,290 2,330 2,255 2,225 2,285 52.7 55.3 64.7 118,790 123,085 147,890 WV ......... 11 9 7 8 5 5 60.0 50.0 54.0 480 250 270 WI ........... 373 335 240 357 315 230 64.5 68.0 64.0 23,012 21,420 14,720 WY ......... 163 155 165 146 132 145 29.4 38.0 32.0 4,286 5,016 4,640
US ...... 63,193 59,168 53,593 55,699 49,893 47,619 44.9 44.5 46.3 2,499,164 2,218,061 2,206,916
1 Includes area planted preceding fall. NASS, Crops Branch, (202) 720–2127.
Table 1-7.—Wheat: Supply and disappearance, United States, 2001–2010
Year be-ginning June
Supply Disappearance
Ending stocks May 31
Begin-ning
stocks
Produc-tion
Im-ports 1 Total
Domestic use Ex-ports 1
Total dis-
appear-ance Food Seed Feed 2 Total
Million Million Million Million Million Million Million Million Million Million Million bushels bushels bushels bushels bushels bushels bushels bushels bushels bushels bushels
2001 ...... 876 1,947 108 2,931 926 83 182 1,192 962 2,154 777 2002 ...... 777 1,606 77 2,460 919 84 116 1,119 850 1,969 491 2003 ...... 491 2,344 63 2,899 912 80 203 1,194 1,158 2,353 546 2004 ...... 546 2,157 71 2,774 910 78 181 1,168 1,066 2,234 540 2005 ...... 540 2,103 81 2,725 917 77 157 1,151 1,003 2,154 571 2006 ...... 571 1,808 122 2,501 938 82 117 1,137 908 2,045 456 2007 ...... 456 2,051 113 2,620 948 88 16 1,051 1,263 2,314 306 2008 ...... 306 2,499 127 2,932 927 78 255 1,260 1,015 2,275 657 2009 ...... 657 2,218 119 2,993 919 69 148 1,137 881 2,018 976 2010 3 .... 976 2,208 97 3,181 926 73 133 1,131 1,289 2,420 861
1 Imports and exports include flour and other products expressed in wheat equivalent. 2 Approximates feed and residual use and includes negligible quantities used for distilled spirits. 3 Preliminary. Totals may not add due to independent round-ing.
ERS, Market and Trade Economics Division, (202) 694–5296.
VerDate Aug 31 2005 11:43 Mar 12, 2012 Jkt 000000 PO 00000 Frm 00005 Fmt 1000 Sfmt 1000 H:\SHARED\DAPP\FPU\AGSTAT\MASTER~2\CHAPTR01\I-05.AG8 USDA
I–6 GRAIN AND FEED
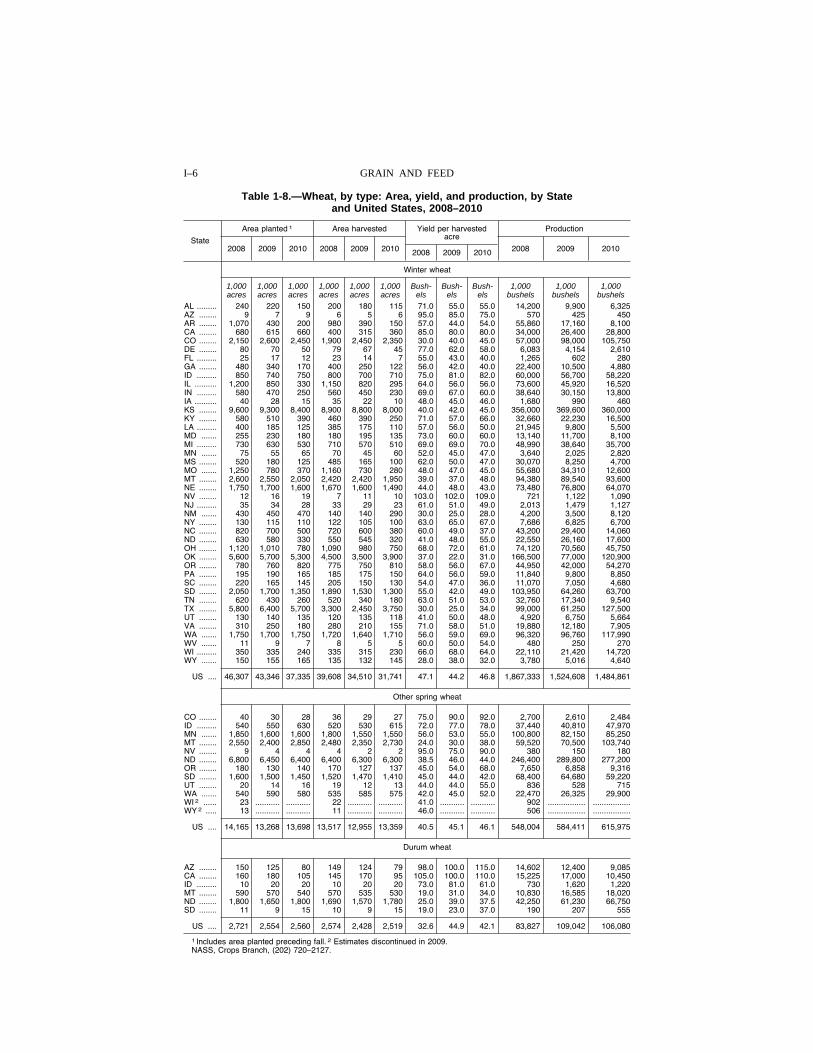
Table 1-8.—Wheat, by type: Area, yield, and production, by State and United States, 2008–2010
State
Area planted 1 Area harvested Yield per harvested acre
Production
2008 2009 2010 2008 2009 2010 2008 2009 2010 2008 2009 2010
Winter wheat
1,000 1,000 1,000 1,000 1,000 1,000 Bush- Bush- Bush- 1,000 1,000 1,000 acres acres acres acres acres acres els els els bushels bushels bushels
AL ......... 240 220 150 200 180 115 71.0 55.0 55.0 14,200 9,900 6,325 AZ ........ 9 7 9 6 5 6 95.0 85.0 75.0 570 425 450 AR ........ 1,070 430 200 980 390 150 57.0 44.0 54.0 55,860 17,160 8,100 CA ........ 680 615 660 400 315 360 85.0 80.0 80.0 34,000 26,400 28,800 CO ........ 2,150 2,600 2,450 1,900 2,450 2,350 30.0 40.0 45.0 57,000 98,000 105,750 DE ........ 80 70 50 79 67 45 77.0 62.0 58.0 6,083 4,154 2,610 FL ......... 25 17 12 23 14 7 55.0 43.0 40.0 1,265 602 280 GA ........ 480 340 170 400 250 122 56.0 42.0 40.0 22,400 10,500 4,880 ID ......... 850 740 750 800 700 710 75.0 81.0 82.0 60,000 56,700 58,220 IL .......... 1,200 850 330 1,150 820 295 64.0 56.0 56.0 73,600 45,920 16,520 IN ......... 580 470 250 560 450 230 69.0 67.0 60.0 38,640 30,150 13,800 IA .......... 40 28 15 35 22 10 48.0 45.0 46.0 1,680 990 460 KS ........ 9,600 9,300 8,400 8,900 8,800 8,000 40.0 42.0 45.0 356,000 369,600 360,000 KY ........ 580 510 390 460 390 250 71.0 57.0 66.0 32,660 22,230 16,500 LA ......... 400 185 125 385 175 110 57.0 56.0 50.0 21,945 9,800 5,500 MD ....... 255 230 180 180 195 135 73.0 60.0 60.0 13,140 11,700 8,100 MI ......... 730 630 530 710 570 510 69.0 69.0 70.0 48,990 38,640 35,700 MN ....... 75 55 65 70 45 60 52.0 45.0 47.0 3,640 2,025 2,820 MS ........ 520 180 125 485 165 100 62.0 50.0 47.0 30,070 8,250 4,700 MO ....... 1,250 780 370 1,160 730 280 48.0 47.0 45.0 55,680 34,310 12,600 MT ........ 2,600 2,550 2,050 2,420 2,420 1,950 39.0 37.0 48.0 94,380 89,540 93,600 NE ........ 1,750 1,700 1,600 1,670 1,600 1,490 44.0 48.0 43.0 73,480 76,800 64,070 NV ........ 12 16 19 7 11 10 103.0 102.0 109.0 721 1,122 1,090 NJ ......... 35 34 28 33 29 23 61.0 51.0 49.0 2,013 1,479 1,127 NM ....... 430 450 470 140 140 290 30.0 25.0 28.0 4,200 3,500 8,120 NY ........ 130 115 110 122 105 100 63.0 65.0 67.0 7,686 6,825 6,700 NC ........ 820 700 500 720 600 380 60.0 49.0 37.0 43,200 29,400 14,060 ND ........ 630 580 330 550 545 320 41.0 48.0 55.0 22,550 26,160 17,600 OH ........ 1,120 1,010 780 1,090 980 750 68.0 72.0 61.0 74,120 70,560 45,750 OK ........ 5,600 5,700 5,300 4,500 3,500 3,900 37.0 22.0 31.0 166,500 77,000 120,900 OR ........ 780 760 820 775 750 810 58.0 56.0 67.0 44,950 42,000 54,270 PA ........ 195 190 165 185 175 150 64.0 56.0 59.0 11,840 9,800 8,850 SC ........ 220 165 145 205 150 130 54.0 47.0 36.0 11,070 7,050 4,680 SD ........ 2,050 1,700 1,350 1,890 1,530 1,300 55.0 42.0 49.0 103,950 64,260 63,700 TN ........ 620 430 260 520 340 180 63.0 51.0 53.0 32,760 17,340 9,540 TX ........ 5,800 6,400 5,700 3,300 2,450 3,750 30.0 25.0 34.0 99,000 61,250 127,500 UT ........ 130 140 135 120 135 118 41.0 50.0 48.0 4,920 6,750 5,664 VA ........ 310 250 180 280 210 155 71.0 58.0 51.0 19,880 12,180 7,905 WA ....... 1,750 1,700 1,750 1,720 1,640 1,710 56.0 59.0 69.0 96,320 96,760 117,990 WV ....... 11 9 7 8 5 5 60.0 50.0 54.0 480 250 270 WI ......... 350 335 240 335 315 230 66.0 68.0 64.0 22,110 21,420 14,720 WY ....... 150 155 165 135 132 145 28.0 38.0 32.0 3,780 5,016 4,640
US .... 46,307 43,346 37,335 39,608 34,510 31,741 47.1 44.2 46.8 1,867,333 1,524,608 1,484,861
Other spring wheat
CO ........ 40 30 28 36 29 27 75.0 90.0 92.0 2,700 2,610 2,484 ID ......... 540 550 630 520 530 615 72.0 77.0 78.0 37,440 40,810 47,970 MN ....... 1,850 1,600 1,600 1,800 1,550 1,550 56.0 53.0 55.0 100,800 82,150 85,250 MT ........ 2,550 2,400 2,850 2,480 2,350 2,730 24.0 30.0 38.0 59,520 70,500 103,740 NV ........ 9 4 4 4 2 2 95.0 75.0 90.0 380 150 180 ND ........ 6,800 6,450 6,400 6,400 6,300 6,300 38.5 46.0 44.0 246,400 289,800 277,200 OR ........ 180 130 140 170 127 137 45.0 54.0 68.0 7,650 6,858 9,316 SD ........ 1,600 1,500 1,450 1,520 1,470 1,410 45.0 44.0 42.0 68,400 64,680 59,220 UT ........ 20 14 16 19 12 13 44.0 44.0 55.0 836 528 715 WA ....... 540 590 580 535 585 575 42.0 45.0 52.0 22,470 26,325 29,900 WI 2 ...... 23 ........... ........... 22 ........... ........... 41.0 ........... ........... 902 ................. .................WY 2 ..... 13 ........... ........... 11 ........... ........... 46.0 ........... ........... 506 ................. .................
US .... 14,165 13,268 13,698 13,517 12,955 13,359 40.5 45.1 46.1 548,004 584,411 615,975
Durum wheat
AZ ........ 150 125 80 149 124 79 98.0 100.0 115.0 14,602 12,400 9,085 CA ........ 160 180 105 145 170 95 105.0 100.0 110.0 15,225 17,000 10,450 ID ......... 10 20 20 10 20 20 73.0 81.0 61.0 730 1,620 1,220 MT ........ 590 570 540 570 535 530 19.0 31.0 34.0 10,830 16,585 18,020 ND ........ 1,800 1,650 1,800 1,690 1,570 1,780 25.0 39.0 37.5 42,250 61,230 66,750 SD ........ 11 9 15 10 9 15 19.0 23.0 37.0 190 207 555
US .... 2,721 2,554 2,560 2,574 2,428 2,519 32.6 44.9 42.1 83,827 109,042 106,080
1 Includes area planted preceding fall. 2 Estimates discontinued in 2009. NASS, Crops Branch, (202) 720–2127.
VerDate Aug 31 2005 11:43 Mar 12, 2012 Jkt 000000 PO 00000 Frm 00006 Fmt 1000 Sfmt 1000 H:\SHARED\DAPP\FPU\AGSTAT\MASTER~2\CHAPTR01\I-06.AG8 USDA
I–7 AGRICULTURAL STATISTICS 2011
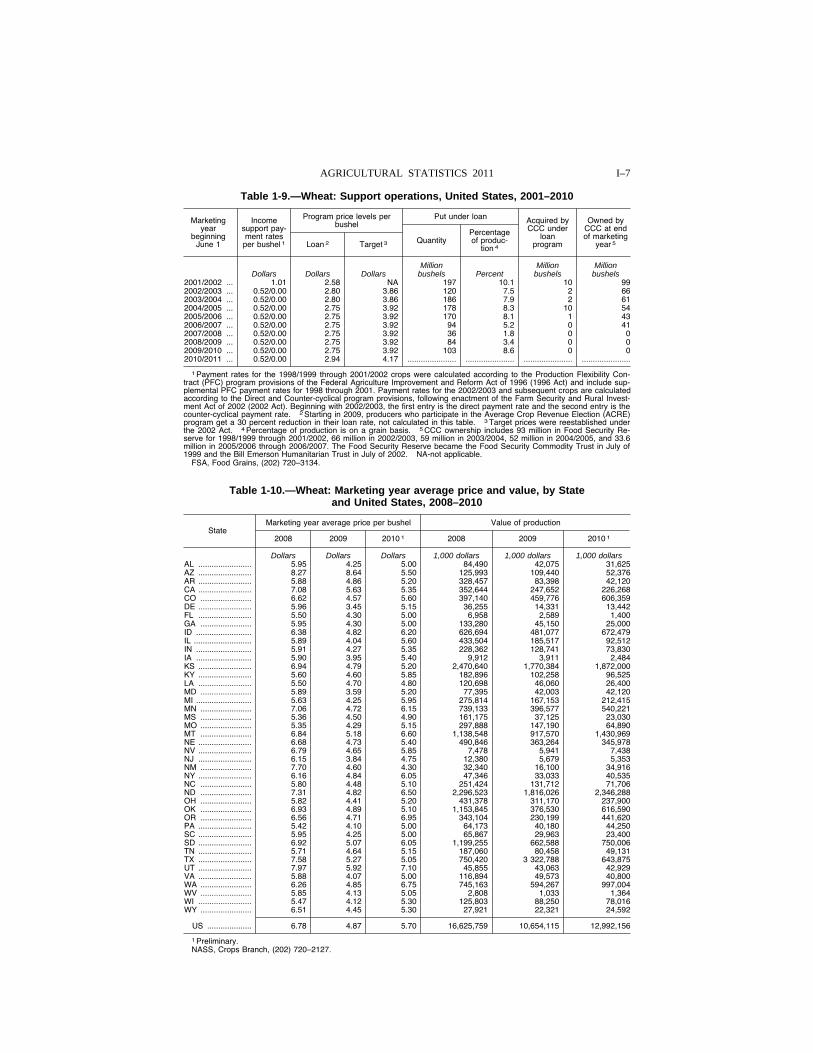
Table 1-9.—Wheat: Support operations, United States, 2001–2010
Marketing year
beginning June 1
Income support pay-ment rates per bushel 1
Program price levels per bushel
Put under loan Acquired by CCC under
loan program
Owned by CCC at end of marketing
year 5 Loan 2 Target 3 Quantity Percentage of produc-
tion 4
Million Million Million Dollars Dollars Dollars bushels Percent bushels bushels
2001/2002 ... 1.01 2.58 NA 197 10.1 10 99 2002/2003 ... 0.52/0.00 2.80 3.86 120 7.5 2 66 2003/2004 ... 0.52/0.00 2.80 3.86 186 7.9 2 61 2004/2005 ... 0.52/0.00 2.75 3.92 178 8.3 10 54 2005/2006 ... 0.52/0.00 2.75 3.92 170 8.1 1 43 2006/2007 ... 0.52/0.00 2.75 3.92 94 5.2 0 41 2007/2008 ... 0.52/0.00 2.75 3.92 36 1.8 0 0 2008/2009 ... 0.52/0.00 2.75 3.92 84 3.4 0 0 2009/2010 ... 0.52/0.00 2.75 3.92 103 8.6 0 0 2010/2011 ... 0.52/0.00 2.94 4.17 ...................... ...................... ...................... ......................
1 Payment rates for the 1998/1999 through 2001/2002 crops were calculated according to the Production Flexibility Con-tract (PFC) program provisions of the Federal Agriculture Improvement and Reform Act of 1996 (1996 Act) and include sup-plemental PFC payment rates for 1998 through 2001. Payment rates for the 2002/2003 and subsequent crops are calculated according to the Direct and Counter-cyclical program provisions, following enactment of the Farm Security and Rural Invest-ment Act of 2002 (2002 Act). Beginning with 2002/2003, the first entry is the direct payment rate and the second entry is the counter-cyclical payment rate. 2 Starting in 2009, producers who participate in the Average Crop Revenue Election (ACRE) program get a 30 percent reduction in their loan rate, not calculated in this table. 3 Target prices were reestablished under the 2002 Act. 4 Percentage of production is on a grain basis. 5 CCC ownership includes 93 million in Food Security Re-serve for 1998/1999 through 2001/2002, 66 million in 2002/2003, 59 million in 2003/2004, 52 million in 2004/2005, and 33.6 million in 2005/2006 through 2006/2007. The Food Security Reserve became the Food Security Commodity Trust in July of 1999 and the Bill Emerson Humanitarian Trust in July of 2002. NA-not applicable.
FSA, Food Grains, (202) 720–3134.
Table 1-10.—Wheat: Marketing year average price and value, by State and United States, 2008–2010
State Marketing year average price per bushel Value of production
2008 2009 2010 1 2008 2009 2010 1
Dollars Dollars Dollars 1,000 dollars 1,000 dollars 1,000 dollars AL ........................ 5.95 4.25 5.00 84,490 42,075 31,625 AZ ........................ 8.27 8.64 5.50 125,993 109,440 52,376 AR ........................ 5.88 4.86 5.20 328,457 83,398 42,120 CA ........................ 7.08 5.63 5.35 352,644 247,652 226,268 CO ....................... 6.62 4.57 5.60 397,140 459,776 606,359 DE ........................ 5.96 3.45 5.15 36,255 14,331 13,442 FL ........................ 5.50 4.30 5.00 6,958 2,589 1,400 GA ....................... 5.95 4.30 5.00 133,280 45,150 25,000 ID ......................... 6.38 4.82 6.20 626,694 481,077 672,479 IL .......................... 5.89 4.04 5.60 433,504 185,517 92,512 IN ......................... 5.91 4.27 5.35 228,362 128,741 73,830 IA ......................... 5.90 3.95 5.40 9,912 3,911 2,484 KS ........................ 6.94 4.79 5.20 2,470,640 1,770,384 1,872,000 KY ........................ 5.60 4.60 5.85 182,896 102,258 96,525 LA ........................ 5.50 4.70 4.80 120,698 46,060 26,400 MD ....................... 5.89 3.59 5.20 77,395 42,003 42,120 MI ......................... 5.63 4.25 5.95 275,814 167,153 212,415 MN ....................... 7.06 4.72 6.15 739,133 396,577 540,221 MS ....................... 5.36 4.50 4.90 161,175 37,125 23,030 MO ....................... 5.35 4.29 5.15 297,888 147,190 64,890 MT ....................... 6.84 5.18 6.60 1,138,548 917,570 1,430,969 NE ........................ 6.68 4.73 5.40 490,846 363,264 345,978 NV ........................ 6.79 4.65 5.85 7,478 5,941 7,438 NJ ........................ 6.15 3.84 4.75 12,380 5,679 5,353 NM ....................... 7.70 4.60 4.30 32,340 16,100 34,916 NY ........................ 6.16 4.84 6.05 47,346 33,033 40,535 NC ....................... 5.80 4.48 5.10 251,424 131,712 71,706 ND ....................... 7.31 4.82 6.50 2,296,523 1,816,026 2,346,288 OH ....................... 5.82 4.41 5.20 431,378 311,170 237,900 OK ....................... 6.93 4.89 5.10 1,153,845 376,530 616,590 OR ....................... 6.56 4.71 6.95 343,104 230,199 441,620 PA ........................ 5.42 4.10 5.00 64,173 40,180 44,250 SC ........................ 5.95 4.25 5.00 65,867 29,963 23,400 SD ........................ 6.92 5.07 6.05 1,199,255 662,588 750,006 TN ........................ 5.71 4.64 5.15 187,060 80,458 49,131 TX ........................ 7.58 5.27 5.05 750,420 3 322,788 643,875 UT ........................ 7.97 5.92 7.10 45,855 43,063 42,929 VA ........................ 5.88 4.07 5.00 116,894 49,573 40,800 WA ....................... 6.26 4.85 6.75 745,163 594,267 997,004 WV ....................... 5.85 4.13 5.05 2,808 1,033 1,364 WI ........................ 5.47 4.12 5.30 125,803 88,250 78,016 WY ....................... 6.51 4.45 5.30 27,921 22,321 24,592
US .................... 6.78 4.87 5.70 16,625,759 10,654,115 12,992,156
1 Preliminary. NASS, Crops Branch, (202) 720–2127.
VerDate Aug 31 2005 11:43 Mar 12, 2012 Jkt 000000 PO 00000 Frm 00007 Fmt 1000 Sfmt 1000 H:\SHARED\DAPP\FPU\AGSTAT\MASTER~2\CHAPTR01\I-07.AG8 USDA
I–8 GRAIN AND FEED
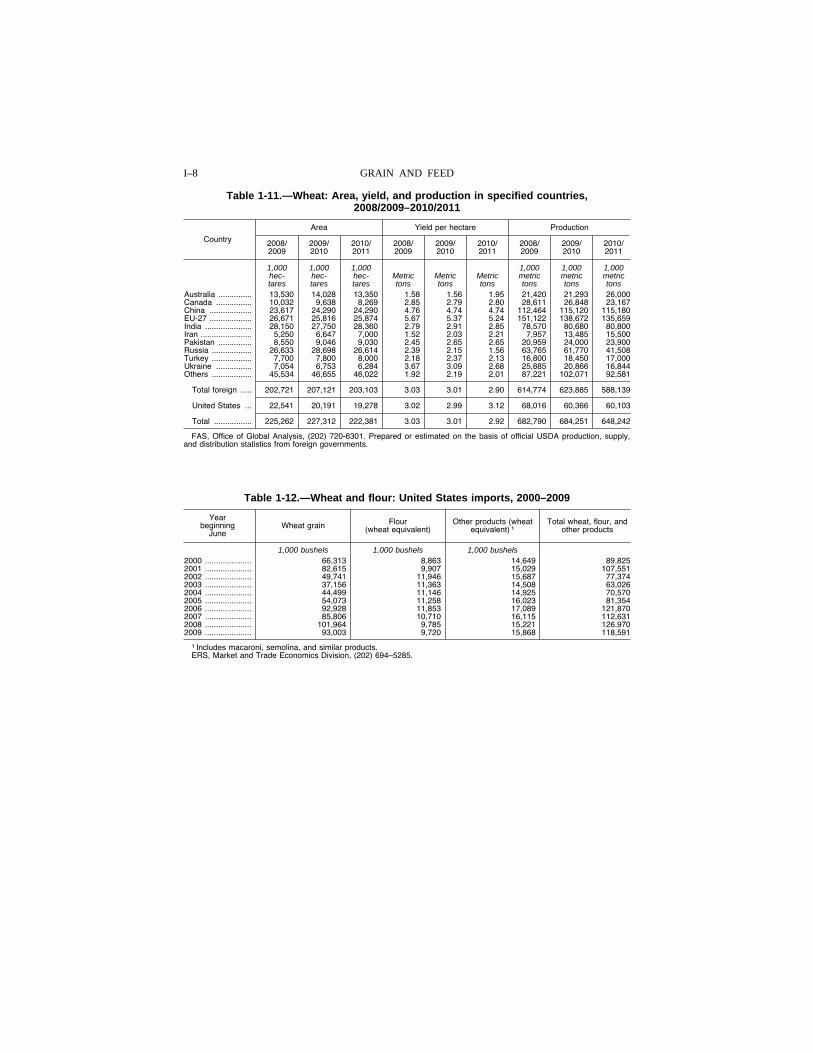
Table 1-11.—Wheat: Area, yield, and production in specified countries, 2008/2009–2010/2011
Country
Area Yield per hectare Production
2008/ 2009
2009/ 2010
2010/ 2011
2008/ 2009
2009/ 2010
2010/ 2011
2008/ 2009
2009/ 2010
2010/ 2011
1,000 1,000 1,000 1,000 1,000 1,000 hec- hec- hec- Metric Metric Metric metric metric metric tares tares tares tons tons tons tons tons tons
Australia ............... 13,530 14,028 13,350 1.58 1.56 1.95 21,420 21,293 26,000 Canada ................ 10,032 9,638 8,269 2.85 2.79 2.80 28,611 26,848 23,167 China ................... 23,617 24,290 24,290 4.76 4.74 4.74 112,464 115,120 115,180 EU-27 ................... 26,671 25,816 25,874 5.67 5.37 5.24 151,122 138,672 135,659 India ..................... 28,150 27,750 28,360 2.79 2.91 2.85 78,570 80,680 80,800 Iran ....................... 5,250 6,647 7,000 1.52 2.03 2.21 7,957 13,485 15,500 Pakistan ............... 8,550 9,046 9,030 2.45 2.65 2.65 20,959 24,000 23,900 Russia .................. 26,633 28,698 26,614 2.39 2.15 1.56 63,765 61,770 41,508 Turkey .................. 7,700 7,800 8,000 2.18 2.37 2.13 16,800 18,450 17,000 Ukraine ................ 7,054 6,753 6,284 3.67 3.09 2.68 25,885 20,866 16,844 Others .................. 45,534 46,655 46,022 1.92 2.19 2.01 87,221 102,071 92,581
Total foreign ..... 202,721 207,121 203,103 3.03 3.01 2.90 614,774 623,885 588,139
United States ... 22,541 20,191 19,278 3.02 2.99 3.12 68,016 60,366 60,103
Total ................. 225,262 227,312 222,381 3.03 3.01 2.92 682,790 684,251 648,242
FAS, Office of Global Analysis, (202) 720-6301. Prepared or estimated on the basis of official USDA production, supply, and distribution statistics from foreign governments.
Table 1-12.—Wheat and flour: United States imports, 2000–2009
Year beginning
June Wheat grain Flour
(wheat equivalent) Other products (wheat
equivalent) 1 Total wheat, flour, and
other products
1,000 bushels 1,000 bushels 1,000 bushels 2000 ..................... 66,313 8,863 14,649 89,825 2001 ..................... 82,615 9,907 15,029 107,551 2002 ..................... 49,741 11,946 15,687 77,374 2003 ..................... 37,156 11,363 14,508 63,026 2004 ..................... 44,499 11,146 14,925 70,570 2005 ..................... 54,073 11,258 16,023 81,354 2006 ..................... 92,928 11,853 17,089 121,870 2007 ..................... 85,806 10,710 16,115 112,631 2008 ..................... 101,964 9,785 15,221 126.970 2009 ..................... 93,003 9,720 15,868 118,591
1 Includes macaroni, semolina, and similar products. ERS, Market and Trade Economics Division, (202) 694–5285.
VerDate Aug 31 2005 11:43 Mar 12, 2012 Jkt 000000 PO 00000 Frm 00008 Fmt 1000 Sfmt 1000 H:\SHARED\DAPP\FPU\AGSTAT\MASTER~2\CHAPTR01\I-08.AG8 USDA
I–9 AGRICULTURAL STATISTICS 2011
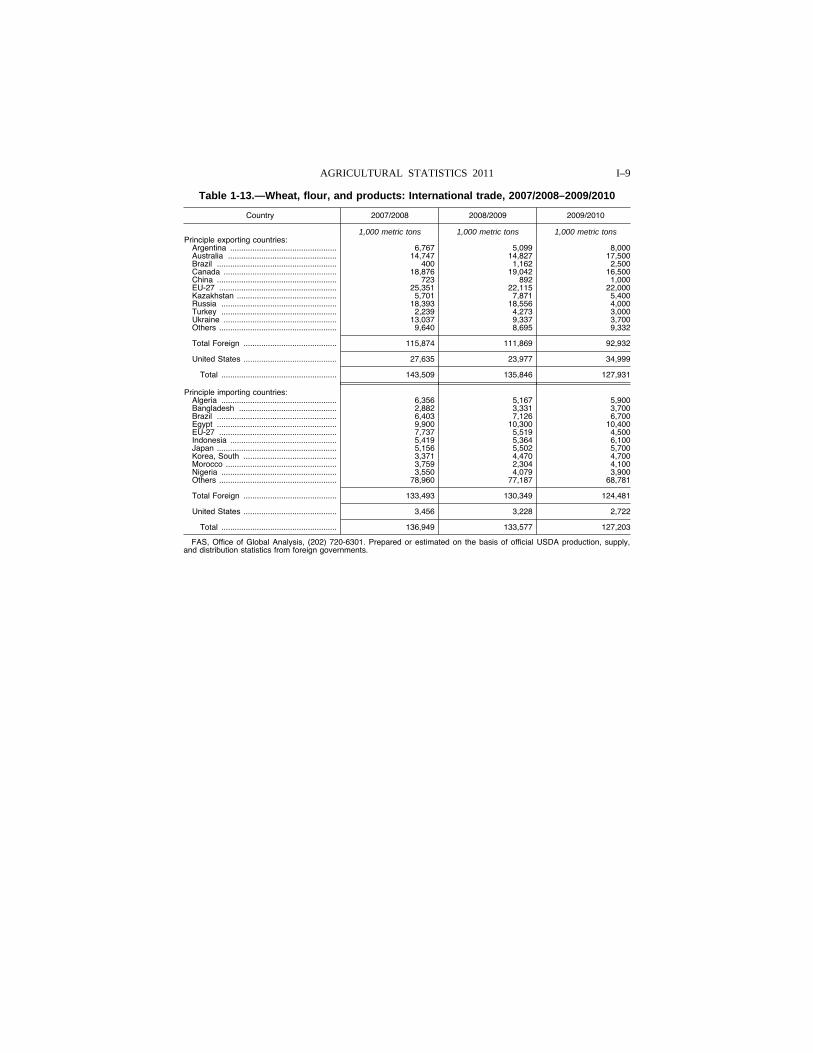
Table 1-13.—Wheat, flour, and products: International trade, 2007/2008–2009/2010
Country 2007/2008 2008/2009 2009/2010
1,000 metric tons 1,000 metric tons 1,000 metric tons Principle exporting countries:
Argentina ................................................ 6,767 5,099 8,000 Australia ................................................. 14,747 14,827 17,500 Brazil ...................................................... 400 1,162 2,500 Canada ................................................... 18,876 19,042 16,500 China ...................................................... 723 892 1,000 EU-27 ..................................................... 25,351 22,115 22,000 Kazakhstan ............................................. 5,701 7,871 5,400 Russia .................................................... 18,393 18,556 4,000 Turkey .................................................... 2,239 4,273 3,000 Ukraine ................................................... 13,037 9,337 3,700 Others ..................................................... 9,640 8,695 9,332
Total Foreign .......................................... 115,874 111,869 92,932
United States .......................................... 27,635 23,977 34,999
Total .................................................... 143,509 135,846 127,931
Principle importing countries: Algeria .................................................... 6,356 5,167 5,900 Bangladesh ............................................ 2,882 3,331 3,700 Brazil ...................................................... 6,403 7,126 6,700 Egypt ...................................................... 9,900 10,300 10,400 EU-27 ..................................................... 7,737 5,519 4,500 Indonesia ................................................ 5,419 5,364 6,100 Japan ...................................................... 5,156 5,502 5,700 Korea, South .......................................... 3,371 4,470 4,700 Morocco .................................................. 3,759 2,304 4,100 Nigeria .................................................... 3,550 4,079 3,900 Others ..................................................... 78,960 77,187 68,781
Total Foreign .......................................... 133,493 130,349 124,481
United States .......................................... 3,456 3,228 2,722
Total .................................................... 136,949 133,577 127,203
FAS, Office of Global Analysis, (202) 720-6301. Prepared or estimated on the basis of official USDA production, supply, and distribution statistics from foreign governments.
VerDate Aug 31 2005 11:43 Mar 12, 2012 Jkt 000000 PO 00000 Frm 00009 Fmt 1000 Sfmt 1000 H:\SHARED\DAPP\FPU\AGSTAT\MASTER~2\CHAPTR01\I-09.AG8 USDA
I–10 GRAIN AND FEED
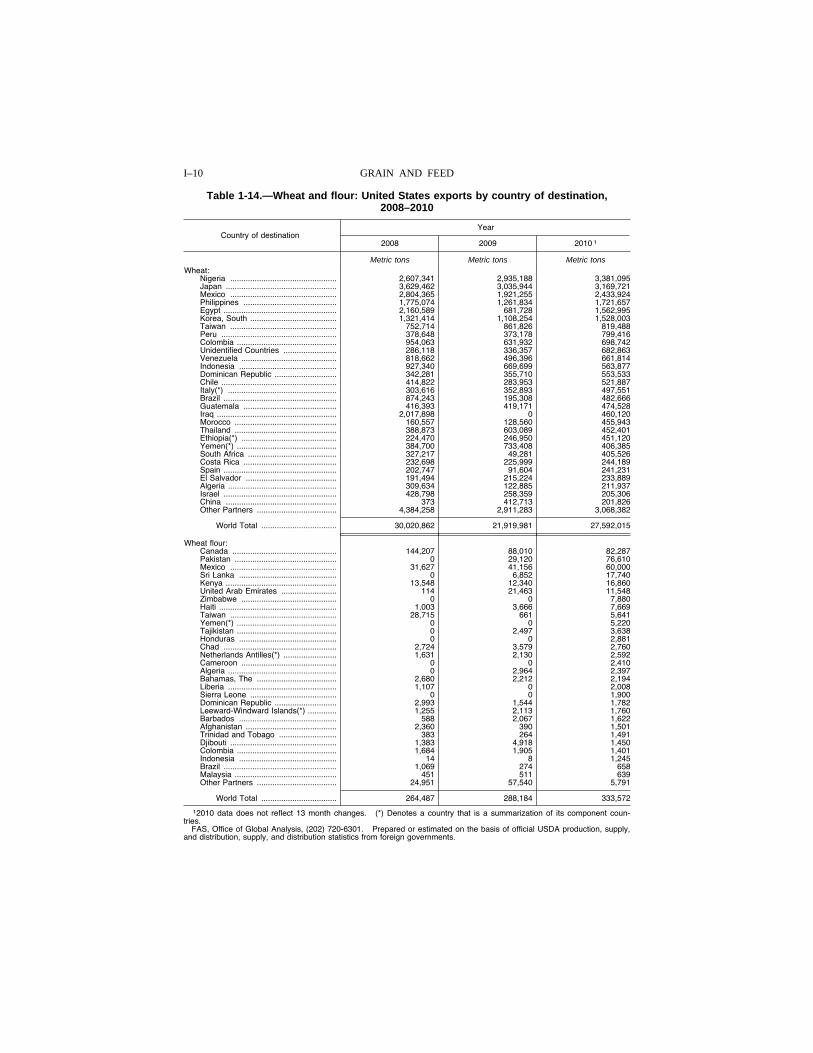
Table 1-14.—Wheat and flour: United States exports by country of destination, 2008–2010
Country of destination Year
2008 2009 2010 1
Metric tons Metric tons Metric tons Wheat:
Nigeria ................................................ 2,607,341 2,935,188 3,381,095 Japan .................................................. 3,629,462 3,035,944 3,169,721 Mexico ................................................ 2,804,365 1,921,255 2,433,924 Philippines .......................................... 1,775,074 1,261,834 1,721,657 Egypt ................................................... 2,160,589 681,728 1,562,995 Korea, South ....................................... 1,321,414 1,108,254 1,528,003 Taiwan ................................................ 752,714 861,826 819,488 Peru .................................................... 378,648 373,178 799,416 Colombia ............................................. 954,063 631,932 698,742 Unidentified Countries ........................ 286,118 336,357 682,863 Venezuela ........................................... 818,662 496,396 661,814 Indonesia ............................................ 927,340 669,699 563,877 Dominican Republic ............................ 342,281 355,710 553,533 Chile .................................................... 414,822 283,953 521,887 Italy(*) ................................................. 303,616 352,893 497,551 Brazil ................................................... 874,243 195,308 482,666 Guatemala .......................................... 416,393 419,171 474,528 Iraq ...................................................... 2,017,898 0 460,120 Morocco .............................................. 160,557 128,560 455,943 Thailand .............................................. 388,873 603,089 452,401 Ethiopia(*) ........................................... 224,470 246,950 451,120 Yemen(*) ............................................. 384,700 733,408 406,385 South Africa ........................................ 327,217 49,281 405,526 Costa Rica .......................................... 232,698 225,999 244,189 Spain ................................................... 202,747 91,604 241,231 El Salvador ......................................... 191,494 215,224 233,889 Algeria ................................................. 309,634 122,885 211,937 Israel ................................................... 428,798 258,359 205,306 China .................................................. 373 412,713 201,826 Other Partners .................................... 4,384,258 2,911,283 3,068,382
World Total .................................. 30,020,862 21,919,981 27,592,015
Wheat flour: Canada ............................................... 144,207 88,010 82,287 Pakistan .............................................. 0 29,120 76,610 Mexico ................................................ 31,627 41,156 60,000 Sri Lanka ............................................ 0 6,852 17,740 Kenya .................................................. 13,548 12,340 16,860 United Arab Emirates ......................... 114 21,463 11,548 Zimbabwe ........................................... 0 0 7,880 Haiti ..................................................... 1,003 3,666 7,669 Taiwan ................................................ 28,715 661 5,641 Yemen(*) ............................................. 0 0 5,220 Tajikistan ............................................. 0 2,497 3,638 Honduras ............................................ 0 0 2,881 Chad ................................................... 2,724 3,579 2,760 Netherlands Antilles(*) ........................ 1,631 2,130 2,592 Cameroon ........................................... 0 0 2,410 Algeria ................................................. 0 2,964 2,397 Bahamas, The .................................... 2,680 2,212 2,194 Liberia ................................................. 1,107 0 2,008 Sierra Leone ....................................... 0 0 1,900 Dominican Republic ............................ 2,993 1,544 1,782 Leeward-Windward Islands(*) ............. 1,255 2,113 1,760 Barbados ............................................ 588 2,067 1,622 Afghanistan ......................................... 2,360 390 1,501 Trinidad and Tobago .......................... 383 264 1,491 Djibouti ................................................ 1,383 4,918 1,450 Colombia ............................................. 1,684 1,905 1,401 Indonesia ............................................ 14 8 1,245 Brazil ................................................... 1,069 274 658 Malaysia .............................................. 451 511 639 Other Partners .................................... 24,951 57,540 5,791
World Total .................................. 264,487 288,184 333,572
12010 data does not reflect 13 month changes. (*) Denotes a country that is a summarization of its component coun-tries.
FAS, Office of Global Analysis, (202) 720-6301. Prepared or estimated on the basis of official USDA production, supply, and distribution, supply, and distribution statistics from foreign governments.
VerDate Aug 31 2005 11:43 Mar 12, 2012 Jkt 000000 PO 00000 Frm 00010 Fmt 1000 Sfmt 1000 H:\SHARED\DAPP\FPU\AGSTAT\MASTER~2\CHAPTR01\I-10.AG8 USDA
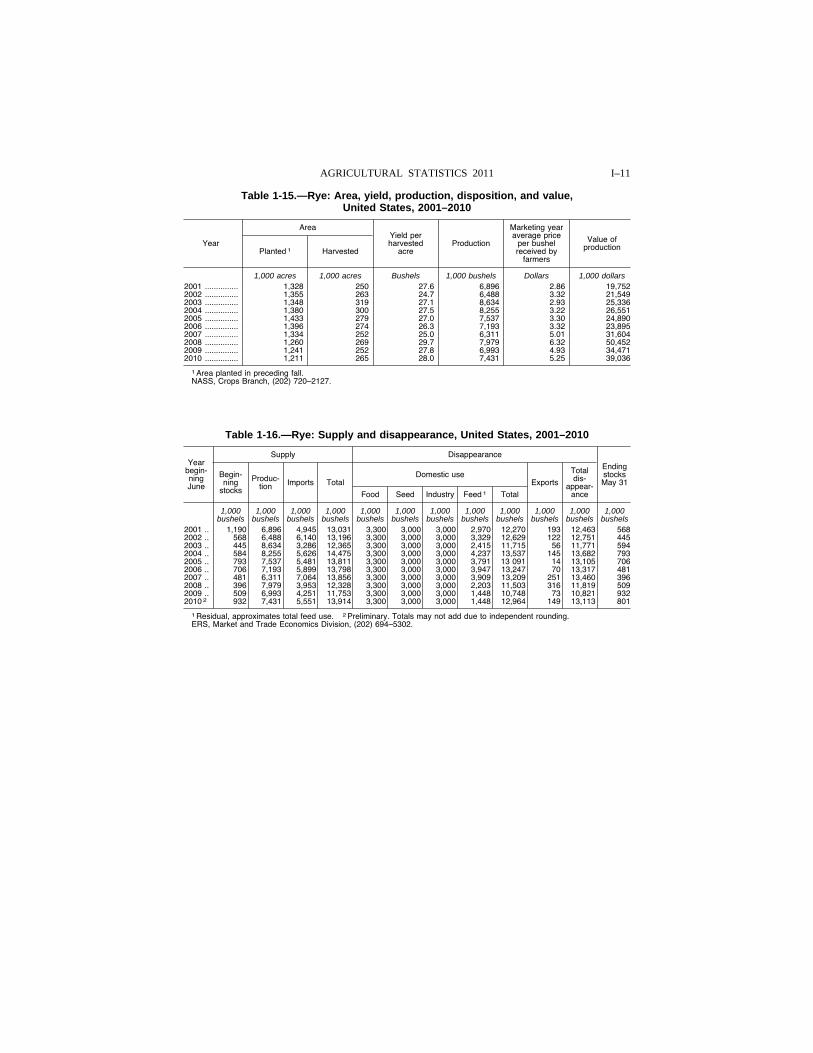
I–11 AGRICULTURAL STATISTICS 2011
Table 1-15.—Rye: Area, yield, production, disposition, and value, United States, 2001–2010
Year
Area Yield per harvested
acre Production
Marketing year average price
per bushel received by
farmers
Value of production Planted 1 Harvested
1,000 acres 1,000 acres Bushels 1,000 bushels Dollars 1,000 dollars 2001 ............... 1,328 250 27.6 6,896 2.86 19,752 2002 ............... 1,355 263 24.7 6,488 3.32 21,549 2003 ............... 1,348 319 27.1 8,634 2.93 25,336 2004 ............... 1,380 300 27.5 8,255 3.22 26,551 2005 ............... 1,433 279 27.0 7,537 3.30 24,890 2006 ............... 1,396 274 26.3 7,193 3.32 23,895 2007 ............... 1,334 252 25.0 6,311 5.01 31,604 2008 ............... 1,260 269 29.7 7,979 6.32 50,452 2009 ............... 1,241 252 27.8 6,993 4.93 34,471 2010 ............... 1,211 265 28.0 7,431 5.25 39,036
1 Area planted in preceding fall. NASS, Crops Branch, (202) 720–2127.
Table 1-16.—Rye: Supply and disappearance, United States, 2001–2010
Year begin-ning June
Supply Disappearance
Ending stocks May 31
Begin-ning
stocks
Produc-tion Imports Total
Domestic use Exports
Total dis-
appear-ance Food Seed Industry Feed 1 Total
1,000 1,000 1,000 1,000 1,000 1,000 1,000 1,000 1,000 1,000 1,000 1,000 bushels bushels bushels bushels bushels bushels bushels bushels bushels bushels bushels bushels
2001 .. 1,190 6,896 4,945 13,031 3,300 3,000 3,000 2,970 12,270 193 12,463 568 2002 .. 568 6,488 6,140 13,196 3,300 3,000 3,000 3,329 12,629 122 12,751 445 2003 .. 445 8,634 3,286 12,365 3,300 3,000 3,000 2,415 11,715 56 11,771 594 2004 .. 584 8,255 5,626 14,475 3,300 3,000 3,000 4,237 13,537 145 13,682 793 2005 .. 793 7,537 5,481 13,811 3,300 3,000 3,000 3,791 13 091 14 13,105 706 2006 .. 706 7,193 5,899 13,798 3,300 3,000 3,000 3,947 13,247 70 13,317 481 2007 .. 481 6,311 7,064 13,856 3,300 3,000 3,000 3,909 13,209 251 13,460 396 2008 .. 396 7,979 3,953 12,328 3,300 3,000 3,000 2,203 11,503 316 11,819 509 2009 .. 509 6,993 4,251 11,753 3,300 3,000 3,000 1,448 10,748 73 10,821 932 2010 2 932 7,431 5,551 13,914 3,300 3,000 3,000 1,448 12,964 149 13,113 801
1 Residual, approximates total feed use. 2 Preliminary. Totals may not add due to independent rounding. ERS, Market and Trade Economics Division, (202) 694–5302.
VerDate Aug 31 2005 11:43 Mar 12, 2012 Jkt 000000 PO 00000 Frm 00011 Fmt 1000 Sfmt 1000 H:\SHARED\DAPP\FPU\AGSTAT\MASTER~2\CHAPTR01\I-11.AG8 USDA
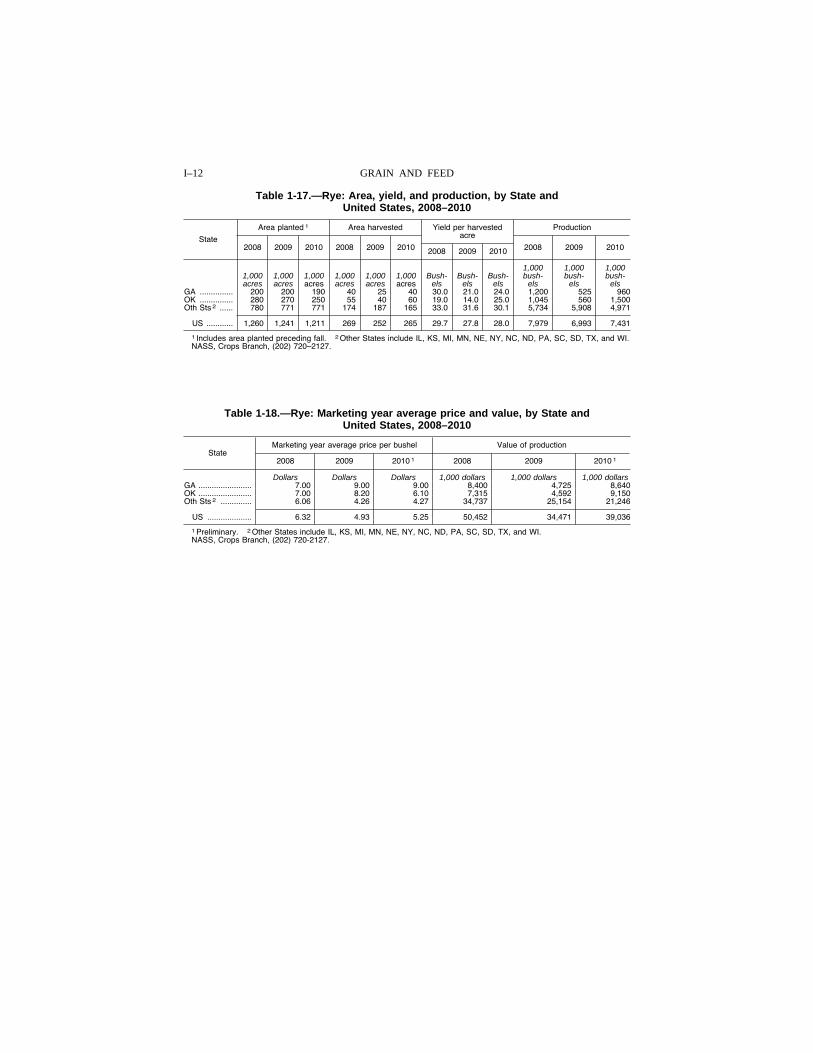
I–12 GRAIN AND FEED
Table 1-17.—Rye: Area, yield, and production, by State and United States, 2008–2010
State
Area planted 1 Area harvested Yield per harvested acre
Production
2008 2009 2010 2008 2009 2010 2008 2009 2010 2008 2009 2010
1,000 1,000 1,000 1,000 1,000 1,000 1,000 1,000 1,000 Bush- Bush- Bush- bush- bush- bush- acres acres acres acres acres acres els els els els els els
GA ............... 200 200 190 40 25 40 30.0 21.0 24.0 1,200 525 960 OK ............... 280 270 250 55 40 60 19.0 14.0 25.0 1,045 560 1,500 Oth Sts 2 ...... 780 771 771 174 187 165 33.0 31.6 30.1 5,734 5,908 4,971
US ............ 1,260 1,241 1,211 269 252 265 29.7 27.8 28.0 7,979 6,993 7,431
1 Includes area planted preceding fall. 2 Other States include IL, KS, MI, MN, NE, NY, NC, ND, PA, SC, SD, TX, and WI. NASS, Crops Branch, (202) 720–2127.
Table 1-18.—Rye: Marketing year average price and value, by State and United States, 2008–2010
State Marketing year average price per bushel Value of production
2008 2009 2010 1 2008 2009 2010 1
Dollars Dollars Dollars 1,000 dollars 1,000 dollars 1,000 dollars GA ........................ 7.00 9.00 9.00 8,400 4,725 8,640 OK ........................ 7.00 8.20 6.10 7,315 4,592 9,150 Oth Sts 2 .............. 6.06 4.26 4.27 34,737 25,154 21,246
US .................... 6.32 4.93 5.25 50,452 34,471 39,036
1 Preliminary. 2 Other States include IL, KS, MI, MN, NE, NY, NC, ND, PA, SC, SD, TX, and WI. NASS, Crops Branch, (202) 720-2127.
VerDate Aug 31 2005 11:43 Mar 12, 2012 Jkt 000000 PO 00000 Frm 00012 Fmt 1000 Sfmt 1000 H:\SHARED\DAPP\FPU\AGSTAT\MASTER~2\CHAPTR01\I-12.AG8 USDA
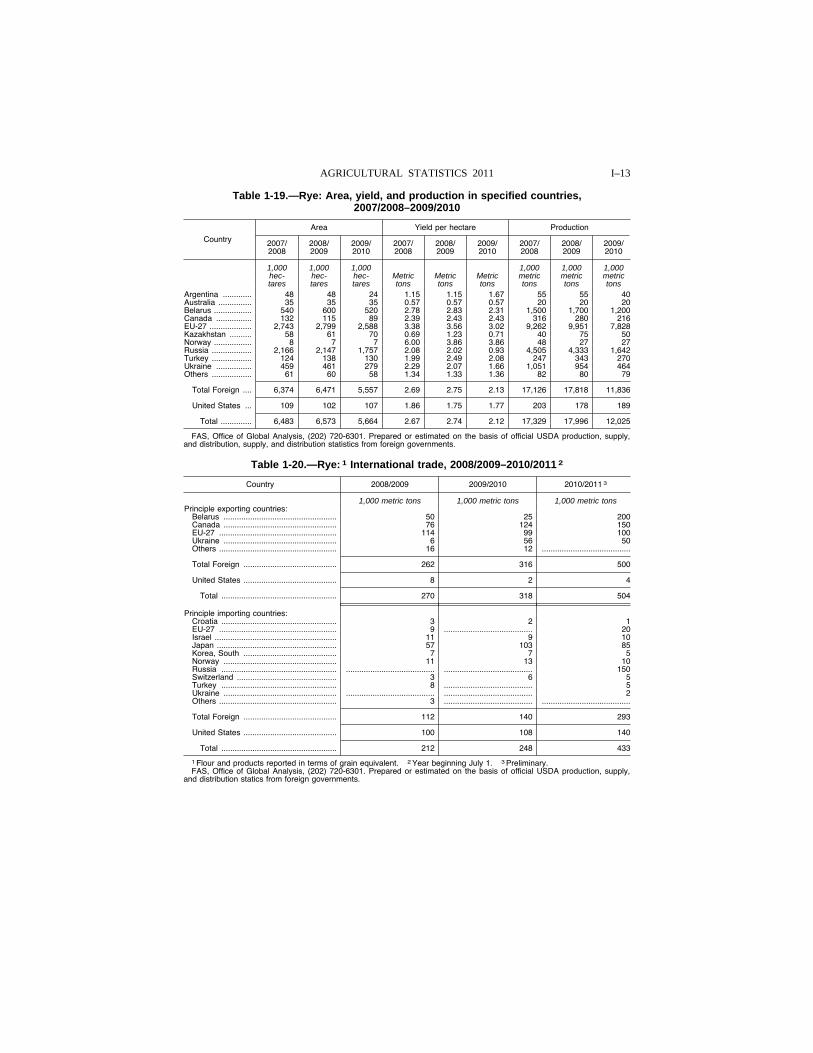
I–13 AGRICULTURAL STATISTICS 2011
Table 1-19.—Rye: Area, yield, and production in specified countries, 2007/2008–2009/2010
Country
Area Yield per hectare Production
2007/ 2008
2008/ 2009
2009/ 2010
2007/ 2008
2008/ 2009
2009/ 2010
2007/ 2008
2008/ 2009
2009/ 2010
1,000 1,000 1,000 1,000 1,000 1,000 hec- hec- hec- Metric Metric Metric metric metric metric tares tares tares tons tons tons tons tons tons
Argentina ............. 48 48 24 1.15 1.15 1.67 55 55 40 Australia ............... 35 35 35 0.57 0.57 0.57 20 20 20 Belarus ................. 540 600 520 2.78 2.83 2.31 1,500 1,700 1,200 Canada ................ 132 115 89 2.39 2.43 2.43 316 280 216 EU-27 ................... 2,743 2,799 2,588 3.38 3.56 3.02 9,262 9,951 7,828 Kazakhstan .......... 58 61 70 0.69 1.23 0.71 40 75 50 Norway ................. 8 7 7 6.00 3.86 3.86 48 27 27 Russia .................. 2,166 2,147 1,757 2.08 2.02 0.93 4,505 4,333 1,642 Turkey .................. 124 138 130 1.99 2.49 2.08 247 343 270 Ukraine ................ 459 461 279 2.29 2.07 1.66 1,051 954 464 Others .................. 61 60 58 1.34 1.33 1.36 82 80 79
Total Foreign .... 6,374 6,471 5,557 2.69 2.75 2.13 17,126 17,818 11,836
United States ... 109 102 107 1.86 1.75 1.77 203 178 189
Total .............. 6,483 6,573 5,664 2.67 2.74 2.12 17,329 17,996 12,025
FAS, Office of Global Analysis, (202) 720-6301. Prepared or estimated on the basis of official USDA production, supply, and distribution, supply, and distribution statistics from foreign governments.
Table 1-20.—Rye: 1 International trade, 2008/2009–2010/2011 2
Country 2008/2009 2009/2010 2010/2011 3
1,000 metric tons 1,000 metric tons 1,000 metric tons Principle exporting countries:
Belarus ................................................... 50 25 200 Canada ................................................... 76 124 150 EU-27 ..................................................... 114 99 100 Ukraine ................................................... 6 56 50 Others ..................................................... 16 12 ........................................
Total Foreign .......................................... 262 316 500
United States .......................................... 8 2 4
Total .................................................... 270 318 504
Principle importing countries: Croatia .................................................... 3 2 1 EU-27 ..................................................... 9 ........................................ 20 Israel ....................................................... 11 9 10 Japan ...................................................... 57 103 85 Korea, South .......................................... 7 7 5 Norway ................................................... 11 13 10 Russia .................................................... ........................................ ........................................ 150 Switzerland ............................................. 3 6 5 Turkey .................................................... 8 ........................................ 5 Ukraine ................................................... ........................................ ........................................ 2 Others ..................................................... 3 ........................................ ........................................
Total Foreign .......................................... 112 140 293
United States .......................................... 100 108 140
Total .................................................... 212 248 433
1 Flour and products reported in terms of grain equivalent. 2 Year beginning July 1. 3 Preliminary. FAS, Office of Global Analysis, (202) 720-6301. Prepared or estimated on the basis of official USDA production, supply,
and distribution statics from foreign governments.
VerDate Aug 31 2005 11:43 Mar 12, 2012 Jkt 000000 PO 00000 Frm 00013 Fmt 1000 Sfmt 1000 H:\SHARED\DAPP\FPU\AGSTAT\MASTER~2\CHAPTR01\I-13.AG8 USDA
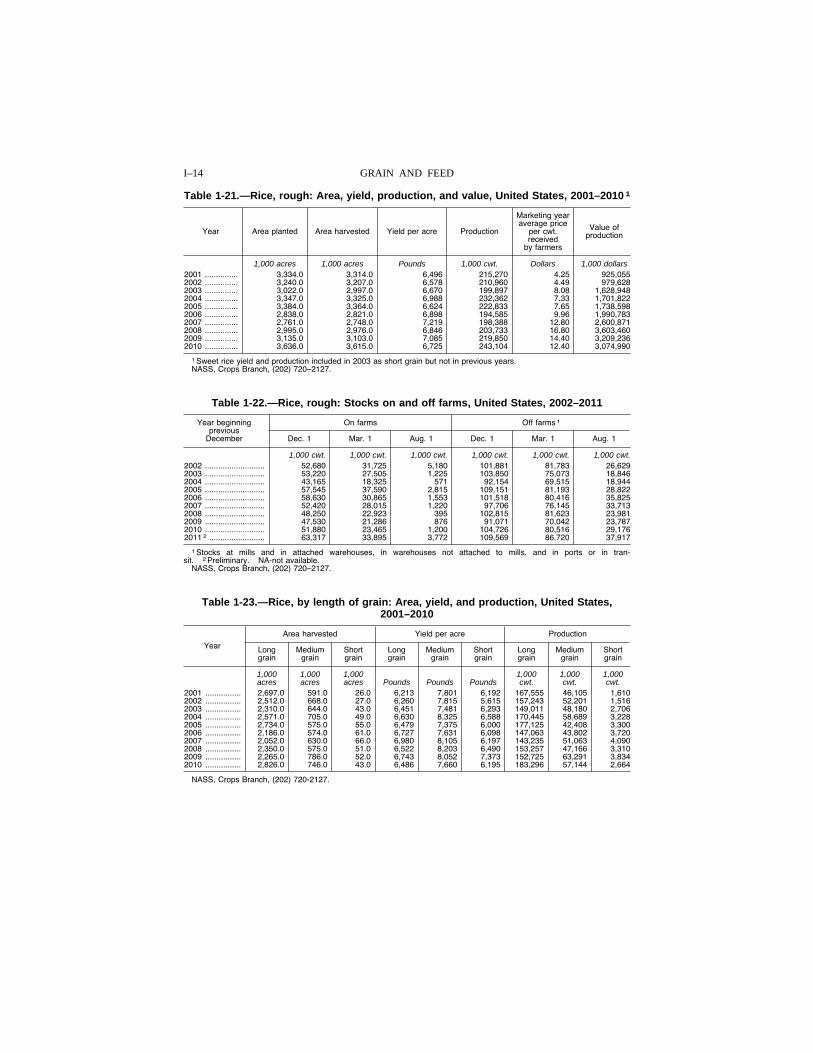
I–14 GRAIN AND FEED
Table 1-21.—Rice, rough: Area, yield, production, and value, United States, 2001–2010 1
Year Area planted Area harvested Yield per acre Production
Marketing year average price
per cwt. received
by farmers
Value of production
1,000 acres 1,000 acres Pounds 1,000 cwt. Dollars 1,000 dollars 2001 ............... 3,334.0 3,314.0 6,496 215,270 4.25 925,055 2002 ............... 3,240.0 3,207.0 6,578 210,960 4.49 979,628 2003 ............... 3,022.0 2,997.0 6,670 199,897 8.08 1,628,948 2004 ............... 3,347.0 3,325.0 6,988 232,362 7.33 1,701,822 2005 ............... 3,384.0 3,364.0 6,624 222,833 7.65 1,738,598 2006 ............... 2,838.0 2,821.0 6,898 194,585 9.96 1,990,783 2007 ............... 2,761.0 2,748.0 7,219 198,388 12.80 2,600,871 2008 ............... 2,995.0 2,976.0 6,846 203,733 16.80 3,603,460 2009 ............... 3,135.0 3,103.0 7,085 219,850 14.40 3,209,236 2010 ............... 3,636.0 3,615.0 6,725 243,104 12.40 3,074,990
1 Sweet rice yield and production included in 2003 as short grain but not in previous years. NASS, Crops Branch, (202) 720–2127.
Table 1-22.—Rice, rough: Stocks on and off farms, United States, 2002–2011
Year beginning previous
December
On farms Off farms 1
Dec. 1 Mar. 1 Aug. 1 Dec. 1 Mar. 1 Aug. 1
1,000 cwt. 1,000 cwt. 1,000 cwt. 1,000 cwt. 1,000 cwt. 1,000 cwt. 2002 ........................... 52,680 31,725 5,180 101,881 81,783 26,629 2003 ........................... 53,220 27,505 1,225 103,850 75,073 18,846 2004 ........................... 43,165 18,325 571 92,154 69,515 18,944 2005 ........................... 57,545 37,590 2,815 109,151 81,193 28,822 2006 ........................... 58,630 30,865 1,553 101,518 80,416 35,825 2007 ........................... 52,420 28,015 1,220 97,706 76,145 33,713 2008 ........................... 48,250 22,923 395 102,815 81,623 23,981 2009 ........................... 47,530 21,286 876 91,071 70,042 23,787 2010 ........................... 51,880 23,465 1,200 104,726 80,516 29,176 2011 2 ......................... 63,317 33,895 3,772 109,569 86,720 37,917
1 Stocks at mills and in attached warehouses, in warehouses not attached to mills, and in ports or in tran-sit. 2 Preliminary. NA-not available.
NASS, Crops Branch, (202) 720–2127.
Table 1-23.—Rice, by length of grain: Area, yield, and production, United States, 2001–2010
Year
Area harvested Yield per acre Production
Long grain
Medium grain
Short grain
Long grain
Medium grain
Short grain
Long grain
Medium grain
Short grain
1,000 1,000 1,000 1,000 1,000 1,000 acres acres acres Pounds Pounds Pounds cwt. cwt. cwt.
2001 ................ 2,697.0 591.0 26.0 6,213 7,801 6,192 167,555 46,105 1,610 2002 ................ 2,512.0 668.0 27.0 6,260 7,815 5,615 157,243 52,201 1,516 2003 ................ 2,310.0 644.0 43.0 6,451 7,481 6,293 149,011 48,180 2,706 2004 ................ 2,571.0 705.0 49.0 6,630 8,325 6,588 170,445 58,689 3,228 2005 ................ 2,734.0 575.0 55.0 6,479 7,375 6,000 177,125 42,408 3,300 2006 ................ 2,186.0 574.0 61.0 6,727 7,631 6,098 147,063 43,802 3,720 2007 ................ 2,052.0 630.0 66.0 6,980 8,105 6,197 143,235 51,063 4,090 2008 ................ 2,350.0 575.0 51.0 6,522 8,203 6,490 153,257 47,166 3,310 2009 ................ 2,265.0 786.0 52.0 6,743 8,052 7,373 152,725 63,291 3,834 2010 ................ 2,826.0 746.0 43.0 6,486 7,660 6,195 183,296 57,144 2,664
NASS, Crops Branch, (202) 720-2127.
VerDate Aug 31 2005 11:43 Mar 12, 2012 Jkt 000000 PO 00000 Frm 00014 Fmt 1000 Sfmt 1000 H:\SHARED\DAPP\FPU\AGSTAT\MASTER~2\CHAPTR01\I-14.AG8 USDA
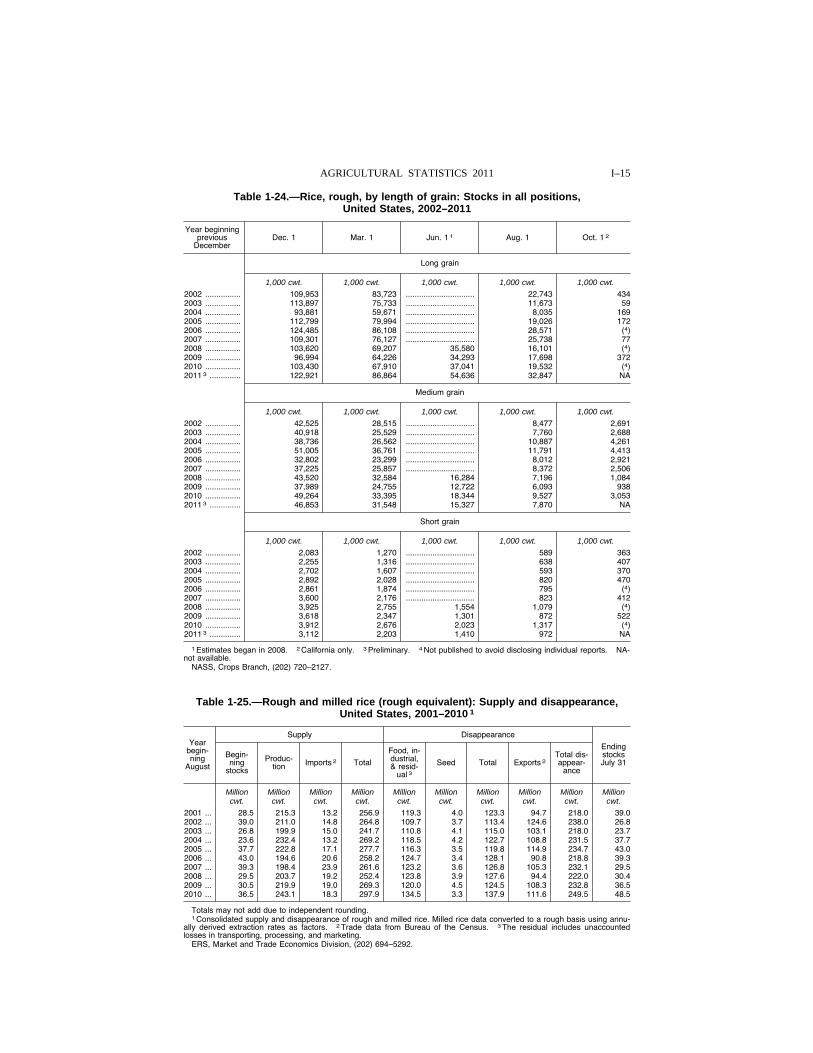
I–15 AGRICULTURAL STATISTICS 2011
Table 1-24.—Rice, rough, by length of grain: Stocks in all positions, United States, 2002–2011
Year beginning previous
December Dec. 1 Mar. 1 Jun. 1 1 Aug. 1 Oct. 1 2
Long grain
1,000 cwt. 1,000 cwt. 1,000 cwt. 1,000 cwt. 1,000 cwt.
2002 ................ 109,953 83,723 ............................... 22,743 434 2003 ................ 113,897 75,733 ............................... 11,673 59 2004 ................ 93,881 59,671 ............................... 8,035 169 2005 ................ 112,799 79,994 ............................... 19,026 172 2006 ................ 124,485 86,108 ............................... 28,571 (4) 2007 ................ 109,301 76,127 ............................... 25,738 77 2008 ................ 103,620 69,207 35,580 16,101 (4) 2009 ................ 96,994 64,226 34,293 17,698 372 2010 ................ 103,430 67,910 37,041 19,532 (4) 2011 3 .............. 122,921 86,864 54,636 32,847 NA
Medium grain
1,000 cwt. 1,000 cwt. 1,000 cwt. 1,000 cwt. 1,000 cwt.
2002 ................ 42,525 28,515 ............................... 8,477 2,691 2003 ................ 40,918 25,529 ............................... 7,760 2,688 2004 ................ 38,736 26,562 ............................... 10,887 4,261 2005 ................ 51,005 36,761 ............................... 11,791 4,413 2006 ................ 32,802 23,299 ............................... 8,012 2,921 2007 ................ 37,225 25,857 ............................... 8,372 2,506 2008 ................ 43,520 32,584 16,284 7,196 1,084 2009 ................ 37,989 24,755 12,722 6,093 938 2010 ................ 49,264 33,395 18,344 9,527 3,053 2011 3 .............. 46,853 31,548 15,327 7,870 NA
Short grain
1,000 cwt. 1,000 cwt. 1,000 cwt. 1,000 cwt. 1,000 cwt.
2002 ................ 2,083 1,270 ............................... 589 363 2003 ................ 2,255 1,316 ............................... 638 407 2004 ................ 2,702 1,607 ............................... 593 370 2005 ................ 2,892 2,028 ............................... 820 470 2006 ................ 2,861 1,874 ............................... 795 (4) 2007 ................ 3,600 2,176 ............................... 823 412 2008 ................ 3,925 2,755 1,554 1,079 (4) 2009 ................ 3,618 2,347 1,301 872 522 2010 ................ 3,912 2,676 2,023 1,317 (4) 2011 3 .............. 3,112 2,203 1,410 972 NA
1 Estimates began in 2008. 2 California only. 3 Preliminary. 4 Not published to avoid disclosing individual reports. NA- not available.
NASS, Crops Branch, (202) 720–2127.
Table 1-25.—Rough and milled rice (rough equivalent): Supply and disappearance, United States, 2001–2010 1
Year begin-ning
August
Supply Disappearance
Ending stocks July 31
Begin-ning
stocks
Produc-tion Imports 2 Total
Food, in-dustrial, & resid-
ual 3
Seed Total Exports 2 Total dis-appear-
ance
Million Million Million Million Million Million Million Million Million Million cwt. cwt. cwt. cwt. cwt. cwt. cwt. cwt. cwt. cwt.
2001 ... 28.5 215.3 13.2 256.9 119.3 4.0 123.3 94.7 218.0 39.0 2002 ... 39.0 211.0 14.8 264.8 109.7 3.7 113.4 124.6 238.0 26.8 2003 ... 26.8 199.9 15.0 241.7 110.8 4.1 115.0 103.1 218.0 23.7 2004 ... 23.6 232.4 13.2 269.2 118.5 4.2 122.7 108.8 231.5 37.7 2005 ... 37.7 222.8 17.1 277.7 116.3 3.5 119.8 114.9 234.7 43.0 2006 ... 43.0 194.6 20.6 258.2 124.7 3.4 128.1 90.8 218.8 39.3 2007 ... 39.3 198.4 23.9 261.6 123.2 3.6 126.8 105.3 232.1 29.5 2008 ... 29.5 203.7 19.2 252.4 123.8 3.9 127.6 94.4 222.0 30.4 2009 ... 30.5 219.9 19.0 269.3 120.0 4.5 124.5 108.3 232.8 36.5 2010 ... 36.5 243.1 18.3 297.9 134.5 3.3 137.9 111.6 249.5 48.5
Totals may not add due to independent rounding. 1 Consolidated supply and disappearance of rough and milled rice. Milled rice data converted to a rough basis using annu-
ally derived extraction rates as factors. 2 Trade data from Bureau of the Census. 3 The residual includes unaccounted losses in transporting, processing, and marketing.
ERS, Market and Trade Economics Division, (202) 694–5292.
VerDate Aug 31 2005 11:43 Mar 12, 2012 Jkt 000000 PO 00000 Frm 00015 Fmt 1000 Sfmt 1000 H:\SHARED\DAPP\FPU\AGSTAT\MASTER~2\CHAPTR01\I-15.AG8 USDA
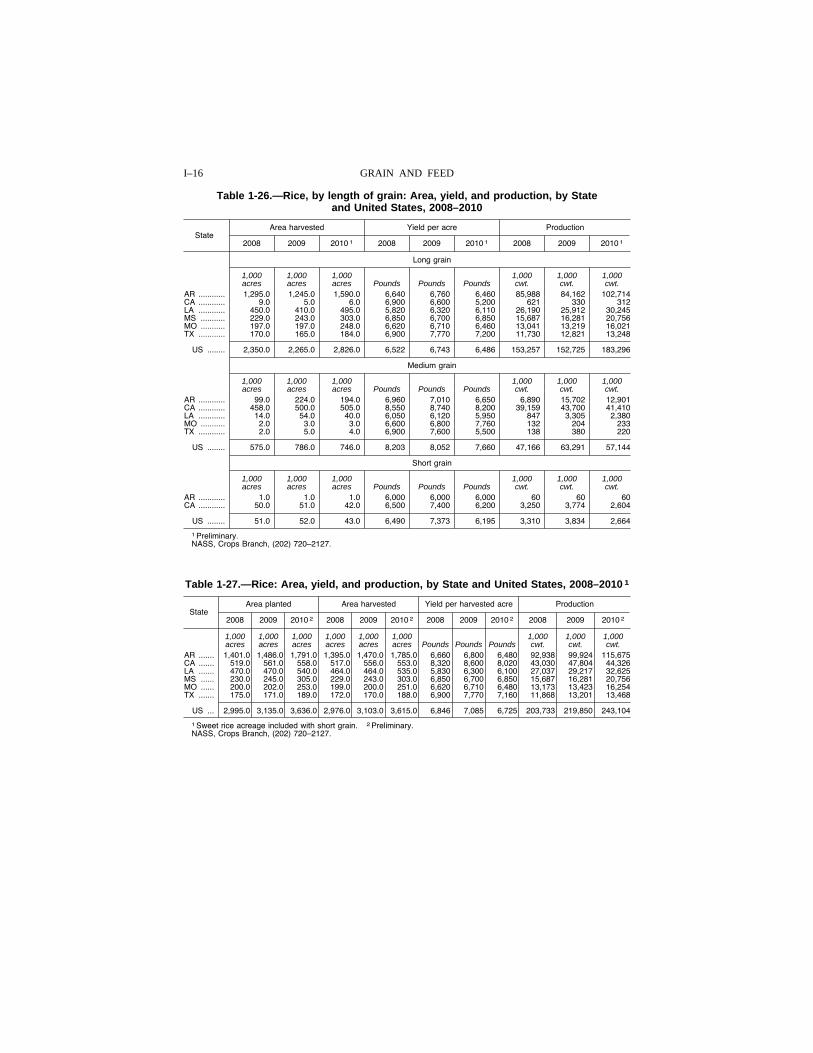
I–16 GRAIN AND FEED
Table 1-26.—Rice, by length of grain: Area, yield, and production, by State and United States, 2008–2010
State Area harvested Yield per acre Production
2008 2009 2010 1 2008 2009 2010 1 2008 2009 2010 1
Long grain
1,000 1,000 1,000 1,000 1,000 1,000 acres acres acres Pounds Pounds Pounds cwt. cwt. cwt.
AR ............ 1,295.0 1,245.0 1,590.0 6,640 6,760 6,460 85,988 84,162 102,714 CA ............ 9.0 5.0 6.0 6,900 6,600 5,200 621 330 312 LA ............ 450.0 410.0 495.0 5,820 6,320 6,110 26,190 25,912 30,245 MS ........... 229.0 243.0 303.0 6,850 6,700 6,850 15,687 16,281 20,756 MO ........... 197.0 197.0 248.0 6,620 6,710 6,460 13,041 13,219 16,021 TX ............ 170.0 165.0 184.0 6,900 7,770 7,200 11,730 12,821 13,248
US ........ 2,350.0 2,265.0 2,826.0 6,522 6,743 6,486 153,257 152,725 183,296
Medium grain
1,000 1,000 1,000 1,000 1,000 1,000 acres acres acres Pounds Pounds Pounds cwt. cwt. cwt.
AR ............ 99.0 224.0 194.0 6,960 7,010 6,650 6,890 15,702 12,901 CA ............ 458.0 500.0 505.0 8,550 8,740 8,200 39,159 43,700 41,410 LA ............ 14.0 54.0 40.0 6,050 6,120 5,950 847 3,305 2,380 MO ........... 2.0 3.0 3.0 6,600 6,800 7,760 132 204 233 TX ............ 2.0 5.0 4.0 6,900 7,600 5,500 138 380 220
US ........ 575.0 786.0 746.0 8,203 8,052 7,660 47,166 63,291 57,144
Short grain
1,000 1,000 1,000 1,000 1,000 1,000 acres acres acres Pounds Pounds Pounds cwt. cwt. cwt.
AR ............ 1.0 1.0 1.0 6,000 6,000 6,000 60 60 60 CA ............ 50.0 51.0 42.0 6,500 7,400 6,200 3,250 3,774 2,604
US ........ 51.0 52.0 43.0 6,490 7,373 6,195 3,310 3,834 2,664
1 Preliminary. NASS, Crops Branch, (202) 720–2127.
Table 1-27.—Rice: Area, yield, and production, by State and United States, 2008–2010 1
State Area planted Area harvested Yield per harvested acre Production
2008 2009 2010 2 2008 2009 2010 2 2008 2009 2010 2 2008 2009 2010 2
1,000 1,000 1,000 1,000 1,000 1,000 1,000 1,000 1,000 acres acres acres acres acres acres Pounds Pounds Pounds cwt. cwt. cwt.
AR ....... 1,401.0 1,486.0 1,791.0 1,395.0 1,470.0 1,785.0 6,660 6,800 6,480 92,938 99,924 115,675 CA ....... 519.0 561.0 558.0 517.0 556.0 553.0 8,320 8,600 8,020 43,030 47,804 44,326 LA ....... 470.0 470.0 540.0 464.0 464.0 535.0 5,830 6,300 6,100 27,037 29,217 32,625 MS ...... 230.0 245.0 305.0 229.0 243.0 303.0 6,850 6,700 6,850 15,687 16,281 20,756 MO ...... 200.0 202.0 253.0 199.0 200.0 251.0 6,620 6,710 6,480 13,173 13,423 16,254 TX ....... 175.0 171.0 189.0 172.0 170.0 188.0 6,900 7,770 7,160 11,868 13,201 13,468
US ... 2,995.0 3,135.0 3,636.0 2,976.0 3,103.0 3,615.0 6,846 7,085 6,725 203,733 219,850 243,104
1 Sweet rice acreage included with short grain. 2 Preliminary. NASS, Crops Branch, (202) 720–2127.
VerDate Aug 31 2005 11:43 Mar 12, 2012 Jkt 000000 PO 00000 Frm 00016 Fmt 1000 Sfmt 1000 H:\SHARED\DAPP\FPU\AGSTAT\MASTER~2\CHAPTR01\I-16.AG8 USDA
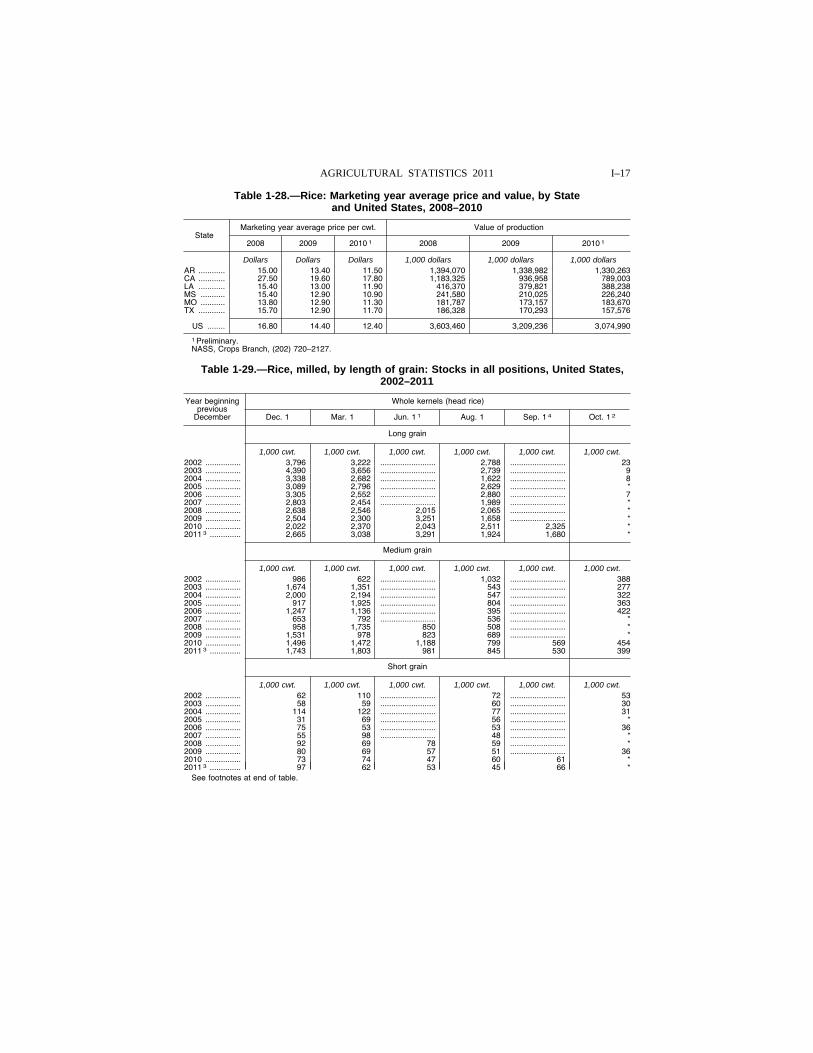
I–17 AGRICULTURAL STATISTICS 2011
Table 1-28.—Rice: Marketing year average price and value, by State and United States, 2008–2010
State Marketing year average price per cwt. Value of production
2008 2009 2010 1 2008 2009 2010 1
Dollars Dollars Dollars 1,000 dollars 1,000 dollars 1,000 dollars AR ............ 15.00 13.40 11.50 1,394,070 1,338,982 1,330,263 CA ............ 27.50 19.60 17.80 1,183,325 936,958 789,003 LA ............ 15.40 13.00 11.90 416,370 379,821 388,238 MS ........... 15.40 12.90 10.90 241,580 210,025 226,240 MO ........... 13.80 12.90 11.30 181,787 173,157 183,670 TX ............ 15.70 12.90 11.70 186,328 170,293 157,576
US ........ 16.80 14.40 12.40 3,603,460 3,209,236 3,074,990
1 Preliminary. NASS, Crops Branch, (202) 720–2127.
Table 1-29.—Rice, milled, by length of grain: Stocks in all positions, United States, 2002–2011
Year beginning previous
December
Whole kernels (head rice)
Dec. 1 Mar. 1 Jun. 1 1 Aug. 1 Sep. 1 4 Oct. 1 2
Long grain
1,000 cwt. 1,000 cwt. 1,000 cwt. 1,000 cwt. 1,000 cwt. 1,000 cwt. 2002 ................ 3,796 3,222 ......................... 2,788 ......................... 23 2003 ................ 4,390 3,656 ......................... 2,739 ......................... 9 2004 ................ 3,338 2,682 ......................... 1,622 ......................... 8 2005 ................ 3,089 2,796 ......................... 2,629 ......................... * 2006 ................ 3,305 2,552 ......................... 2,880 ......................... 7 2007 ................ 2,803 2,454 ......................... 1,989 ......................... * 2008 ................ 2,638 2,546 2,015 2,065 ......................... * 2009 ................ 2,504 2,300 3,251 1,658 ......................... * 2010 ................ 2,022 2,370 2,043 2,511 2,325 * 2011 3 .............. 2,665 3,038 3,291 1,924 1,680 *
Medium grain
1,000 cwt. 1,000 cwt. 1,000 cwt. 1,000 cwt. 1,000 cwt. 1,000 cwt. 2002 ................ 986 622 ......................... 1,032 ......................... 388 2003 ................ 1,674 1,351 ......................... 543 ......................... 277 2004 ................ 2,000 2,194 ......................... 547 ......................... 322 2005 ................ 917 1,925 ......................... 804 ......................... 363 2006 ................ 1,247 1,136 ......................... 395 ......................... 422 2007 ................ 653 792 ......................... 536 ......................... * 2008 ................ 958 1,735 850 508 ......................... * 2009 ................ 1,531 978 823 689 ......................... * 2010 ................ 1,496 1,472 1,188 799 569 454 2011 3 .............. 1,743 1,803 981 845 530 399
Short grain
1,000 cwt. 1,000 cwt. 1,000 cwt. 1,000 cwt. 1,000 cwt. 1,000 cwt. 2002 ................ 62 110 ......................... 72 ......................... 53 2003 ................ 58 59 ......................... 60 ......................... 30 2004 ................ 114 122 ......................... 77 ......................... 31 2005 ................ 31 69 ......................... 56 ......................... * 2006 ................ 75 53 ......................... 53 ......................... 36 2007 ................ 55 98 ......................... 48 ......................... * 2008 ................ 92 69 78 59 ......................... * 2009 ................ 80 69 57 51 ......................... 36 2010 ................ 73 74 47 60 61 * 2011 3 .............. 97 62 53 45 66 *
See footnotes at end of table.
VerDate Aug 31 2005 11:43 Mar 12, 2012 Jkt 000000 PO 00000 Frm 00017 Fmt 1000 Sfmt 1000 H:\SHARED\DAPP\FPU\AGSTAT\MASTER~2\CHAPTR01\I-17NEW.AG8 USDA
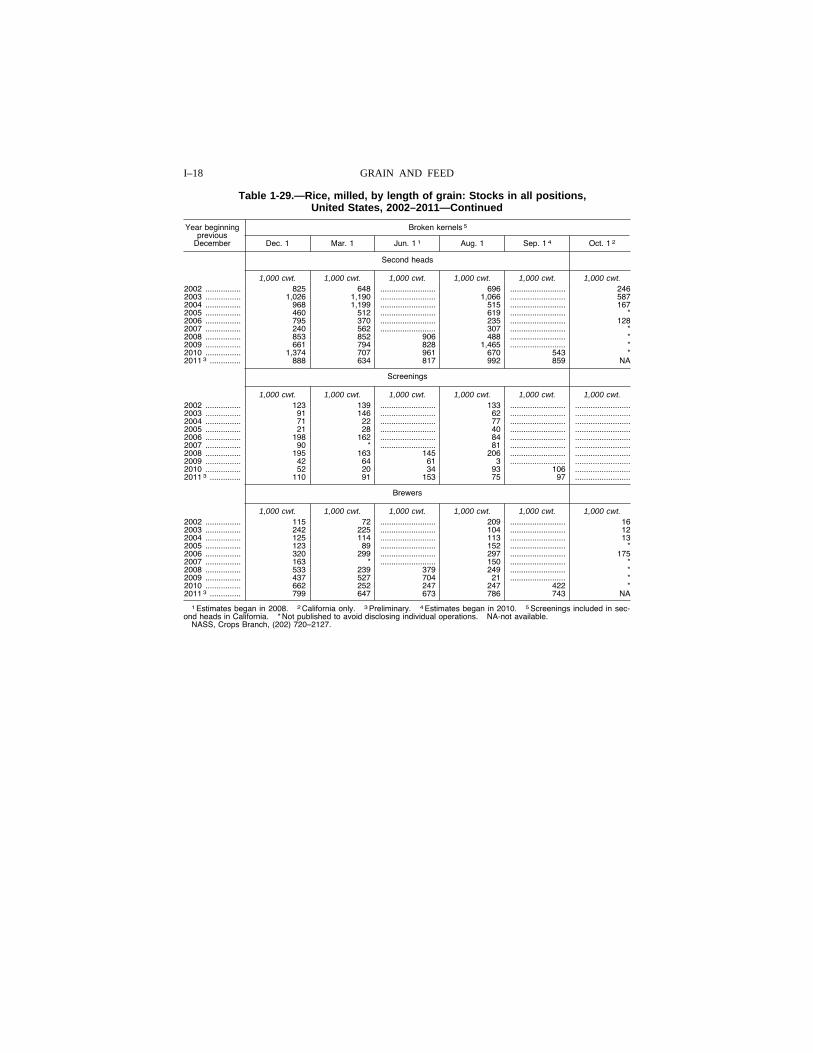
I–18 GRAIN AND FEED
Table 1-29.—Rice, milled, by length of grain: Stocks in all positions, United States, 2002–2011—Continued
Year beginning previous
December
Broken kernels 5
Dec. 1 Mar. 1 Jun. 1 1 Aug. 1 Sep. 1 4 Oct. 1 2
Second heads
1,000 cwt. 1,000 cwt. 1,000 cwt. 1,000 cwt. 1,000 cwt. 1,000 cwt. 2002 ................ 825 648 ......................... 696 ......................... 246 2003 ................ 1,026 1,190 ......................... 1,066 ......................... 587 2004 ................ 968 1,199 ......................... 515 ......................... 167 2005 ................ 460 512 ......................... 619 ......................... * 2006 ................ 795 370 ......................... 235 ......................... 128 2007 ................ 240 562 ......................... 307 ......................... * 2008 ................ 853 852 906 488 ......................... * 2009 ................ 661 794 828 1,465 ......................... * 2010 ................ 1,374 707 961 670 543 * 2011 3 .............. 888 634 817 992 859 NA
Screenings
1,000 cwt. 1,000 cwt. 1,000 cwt. 1,000 cwt. 1,000 cwt. 1,000 cwt. 2002 ................ 123 139 ......................... 133 ......................... .........................2003 ................ 91 146 ......................... 62 ......................... .........................2004 ................ 71 22 ......................... 77 ......................... .........................2005 ................ 21 28 ......................... 40 ......................... .........................2006 ................ 198 162 ......................... 84 ......................... .........................2007 ................ 90 * ......................... 81 ......................... .........................2008 ................ 195 163 145 206 ......................... .........................2009 ................ 42 64 61 3 ......................... .........................2010 ................ 52 20 34 93 106 .........................2011 3 .............. 110 91 153 75 97 .........................
Brewers
1,000 cwt. 1,000 cwt. 1,000 cwt. 1,000 cwt. 1,000 cwt. 1,000 cwt. 2002 ................ 115 72 ......................... 209 ......................... 16 2003 ................ 242 225 ......................... 104 ......................... 12 2004 ................ 125 114 ......................... 113 ......................... 13 2005 ................ 123 89 ......................... 152 ......................... * 2006 ................ 320 299 ......................... 297 ......................... 175 2007 ................ 163 * ......................... 150 ......................... * 2008 ................ 533 239 379 249 ......................... * 2009 ................ 437 527 704 21 ......................... * 2010 ................ 662 252 247 247 422 * 2011 3 .............. 799 647 673 786 743 NA
1 Estimates began in 2008. 2 California only. 3 Preliminary. 4 Estimates began in 2010. 5 Screenings included in sec-ond heads in California. * Not published to avoid disclosing individual operations. NA-not available.
NASS, Crops Branch, (202) 720–2127.
VerDate Aug 31 2005 11:43 Mar 12, 2012 Jkt 000000 PO 00000 Frm 00018 Fmt 1000 Sfmt 1000 H:\SHARED\DAPP\FPU\AGSTAT\MASTER~2\CHAPTR01\I-17NEWB.AG8 USDA
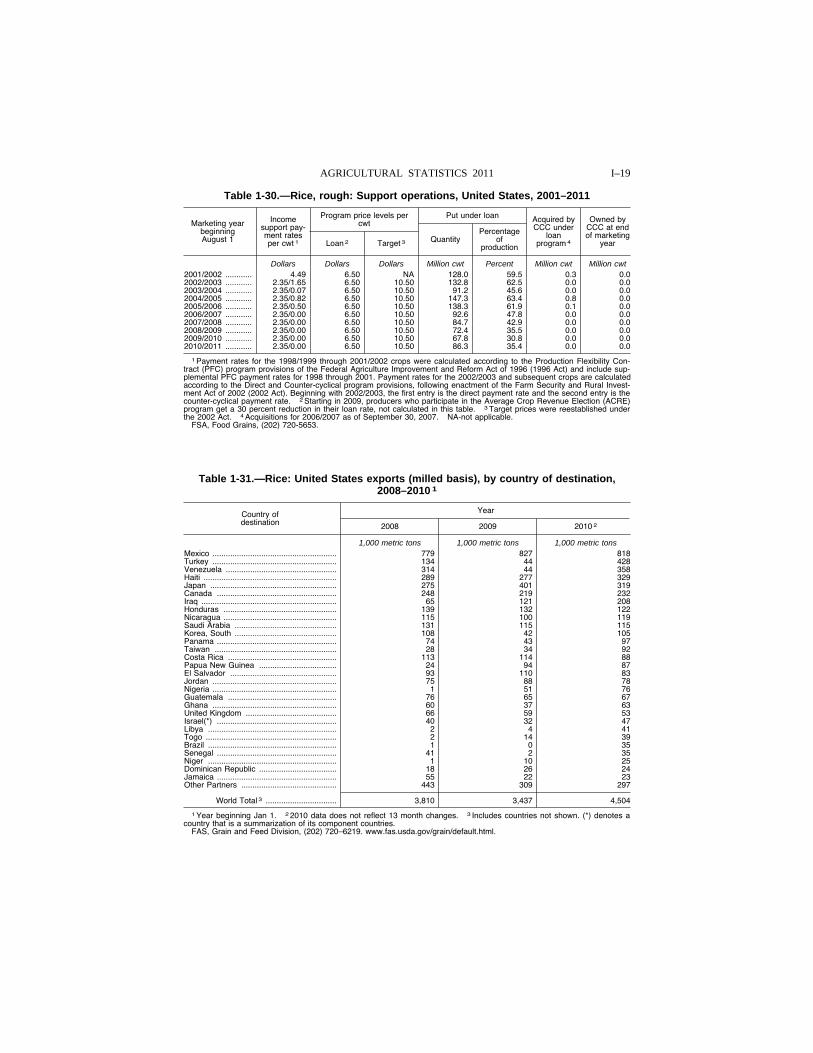
I–19 AGRICULTURAL STATISTICS 2011
Table 1-30.—Rice, rough: Support operations, United States, 2001–2011
Marketing year beginning August 1
Income support pay-ment rates per cwt 1
Program price levels per cwt
Put under loan Acquired by CCC under
loan program 4
Owned by CCC at end of marketing
year Loan 2 Target 3 Quantity Percentage
of production
Dollars Dollars Dollars Million cwt Percent Million cwt Million cwt 2001/2002 ............ 4.49 6.50 NA 128.0 59.5 0.3 0.0 2002/2003 ............ 2.35/1.65 6.50 10.50 132.8 62.5 0.0 0.0 2003/2004 ............ 2.35/0.07 6.50 10.50 91.2 45.6 0.0 0.0 2004/2005 ............ 2.35/0.82 6.50 10.50 147.3 63.4 0.8 0.0 2005/2006 ............ 2.35/0.50 6.50 10.50 138.3 61.9 0.1 0.0 2006/2007 ............ 2.35/0.00 6.50 10.50 92.6 47.8 0.0 0.0 2007/2008 ............ 2.35/0.00 6.50 10.50 84.7 42.9 0.0 0.0 2008/2009 ............ 2.35/0.00 6.50 10.50 72.4 35.5 0.0 0.0 2009/2010 ............ 2.35/0.00 6.50 10.50 67.8 30.8 0.0 0.0 2010/2011 ............ 2.35/0.00 6.50 10.50 86.3 35.4 0.0 0.0
1 Payment rates for the 1998/1999 through 2001/2002 crops were calculated according to the Production Flexibility Con-tract (PFC) program provisions of the Federal Agriculture Improvement and Reform Act of 1996 (1996 Act) and include sup-plemental PFC payment rates for 1998 through 2001. Payment rates for the 2002/2003 and subsequent crops are calculated according to the Direct and Counter-cyclical program provisions, following enactment of the Farm Security and Rural Invest-ment Act of 2002 (2002 Act). Beginning with 2002/2003, the first entry is the direct payment rate and the second entry is the counter-cyclical payment rate. 2 Starting in 2009, producers who participate in the Average Crop Revenue Election (ACRE) program get a 30 percent reduction in their loan rate, not calculated in this table. 3 Target prices were reestablished under the 2002 Act. 4 Acquisitions for 2006/2007 as of September 30, 2007. NA-not applicable.
FSA, Food Grains, (202) 720-5653.
Table 1-31.—Rice: United States exports (milled basis), by country of destination, 2008–2010 1
Country of destination
Year
2008 2009 2010 2
1,000 metric tons 1,000 metric tons 1,000 metric tons Mexico ........................................................ 779 827 818 Turkey ........................................................ 134 44 428 Venezuela .................................................. 314 44 358 Haiti ............................................................ 289 277 329 Japan ......................................................... 275 401 319 Canada ...................................................... 248 219 232 Iraq ............................................................. 65 121 208 Honduras ................................................... 139 132 122 Nicaragua ................................................... 115 100 119 Saudi Arabia .............................................. 131 115 115 Korea, South .............................................. 108 42 105 Panama ...................................................... 74 43 97 Taiwan ....................................................... 28 34 92 Costa Rica ................................................. 113 114 88 Papua New Guinea ................................... 24 94 87 El Salvador ................................................ 93 110 83 Jordan ........................................................ 75 88 78 Nigeria ........................................................ 1 51 76 Guatemala ................................................. 76 65 67 Ghana ........................................................ 60 37 63 United Kingdom ......................................... 66 59 53 Israel(*) ...................................................... 40 32 47 Libya .......................................................... 2 4 41 Togo ........................................................... 2 14 39 Brazil .......................................................... 1 0 35 Senegal ...................................................... 41 2 35 Niger .......................................................... 1 10 25 Dominican Republic ................................... 18 26 24 Jamaica ...................................................... 55 22 23 Other Partners ........................................... 443 309 297
World Total 3 ................................ 3,810 3,437 4,504
1 Year beginning Jan 1. 2 2010 data does not reflect 13 month changes. 3 Includes countries not shown. (*) denotes a country that is a summarization of its component countries.
FAS, Grain and Feed Division, (202) 720–6219. www.fas.usda.gov/grain/default.html.
VerDate Aug 31 2005 11:43 Mar 12, 2012 Jkt 000000 PO 00000 Frm 00019 Fmt 1000 Sfmt 1000 H:\SHARED\DAPP\FPU\AGSTAT\MASTER~2\CHAPTR01\I-18.AG8 USDA
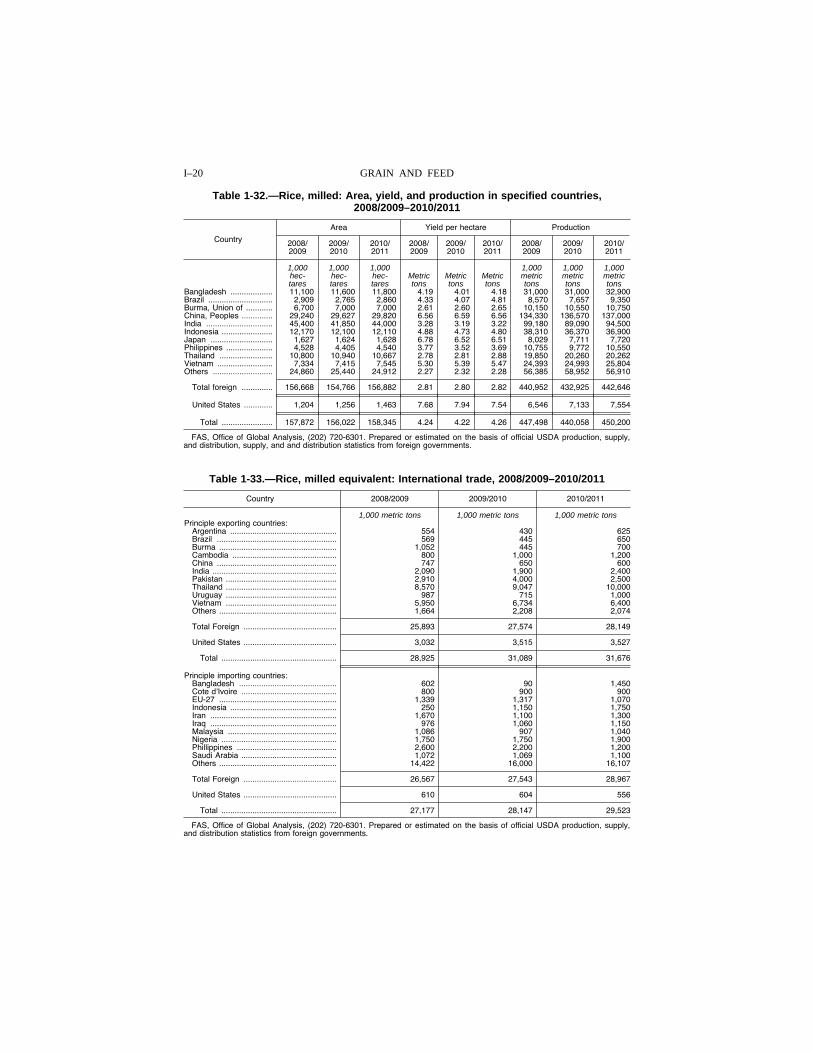
I–20 GRAIN AND FEED
Table 1-32.—Rice, milled: Area, yield, and production in specified countries, 2008/2009–2010/2011
Country
Area Yield per hectare Production
2008/ 2009
2009/ 2010
2010/ 2011
2008/ 2009
2009/ 2010
2010/ 2011
2008/ 2009
2009/ 2010
2010/ 2011
1,000 1,000 1,000 1,000 1,000 1,000 hec- hec- hec- Metric Metric Metric metric metric metric tares tares tares tons tons tons tons tons tons
Bangladesh ................... 11,100 11,600 11,800 4.19 4.01 4.18 31,000 31,000 32,900 Brazil ............................. 2,909 2,765 2,860 4.33 4.07 4.81 8,570 7,657 9,350 Burma, Union of ............ 6,700 7,000 7,000 2.61 2.60 2.65 10,150 10,550 10,750 China, Peoples .............. 29,240 29,627 29,820 6.56 6.59 6.56 134,330 136,570 137,000 India .............................. 45,400 41,850 44,000 3.28 3.19 3.22 99,180 89,090 94,500 Indonesia ....................... 12,170 12,100 12,110 4.88 4.73 4.80 38,310 36,370 36,900 Japan ............................ 1,627 1,624 1,628 6.78 6.52 6.51 8,029 7,711 7,720 Philippines ..................... 4,528 4,405 4,540 3.77 3.52 3.69 10,755 9,772 10,550 Thailand ........................ 10,800 10,940 10,667 2.78 2.81 2.88 19,850 20,260 20,262 Vietnam ......................... 7,334 7,415 7,545 5.30 5.39 5.47 24,393 24,993 25,804 Others ........................... 24,860 25,440 24,912 2.27 2.32 2.28 56,385 58,952 56,910
Total foreign .............. 156,668 154,766 156,882 2.81 2.80 2.82 440,952 432,925 442,646
United States ............. 1,204 1,256 1,463 7.68 7.94 7.54 6,546 7,133 7,554
Total ....................... 157,872 156,022 158,345 4.24 4.22 4.26 447,498 440,058 450,200
FAS, Office of Global Analysis, (202) 720-6301. Prepared or estimated on the basis of official USDA production, supply, and distribution, supply, and and distribution statistics from foreign governments.
Table 1-33.—Rice, milled equivalent: International trade, 2008/2009–2010/2011
Country 2008/2009 2009/2010 2010/2011
1,000 metric tons 1,000 metric tons 1,000 metric tons Principle exporting countries:
Argentina ................................................ 554 430 625 Brazil ...................................................... 569 445 650 Burma ..................................................... 1,052 445 700 Cambodia ............................................... 800 1,000 1,200 China ...................................................... 747 650 600 India ........................................................ 2,090 1,900 2,400 Pakistan .................................................. 2,910 4,000 2,500 Thailand .................................................. 8,570 9,047 10,000 Uruguay .................................................. 987 715 1,000 Vietnam .................................................. 5,950 6,734 6,400 Others ..................................................... 1,664 2,208 2,074
Total Foreign .......................................... 25,893 27,574 28,149
United States .......................................... 3,032 3,515 3,527
Total .................................................... 28,925 31,089 31,676
Principle importing countries: Bangladesh ............................................ 602 90 1,450 Cote d’Ivoire ........................................... 800 900 900 EU-27 ..................................................... 1,339 1,317 1,070 Indonesia ................................................ 250 1,150 1,750 Iran ......................................................... 1,670 1,100 1,300 Iraq ......................................................... 976 1,060 1,150 Malaysia ................................................. 1,086 907 1,040 Nigeria .................................................... 1,750 1,750 1,900 Phillippines ............................................. 2,600 2,200 1,200 Saudi Arabia ........................................... 1,072 1,069 1,100 Others ..................................................... 14,422 16,000 16,107
Total Foreign .......................................... 26,567 27,543 28,967
United States .......................................... 610 604 556
Total .................................................... 27,177 28,147 29,523
FAS, Office of Global Analysis, (202) 720-6301. Prepared or estimated on the basis of official USDA production, supply, and distribution statistics from foreign governments.
VerDate Aug 31 2005 11:43 Mar 12, 2012 Jkt 000000 PO 00000 Frm 00020 Fmt 1000 Sfmt 1000 H:\SHARED\DAPP\FPU\AGSTAT\MASTER~2\CHAPTR01\I-19.AG8 USDA
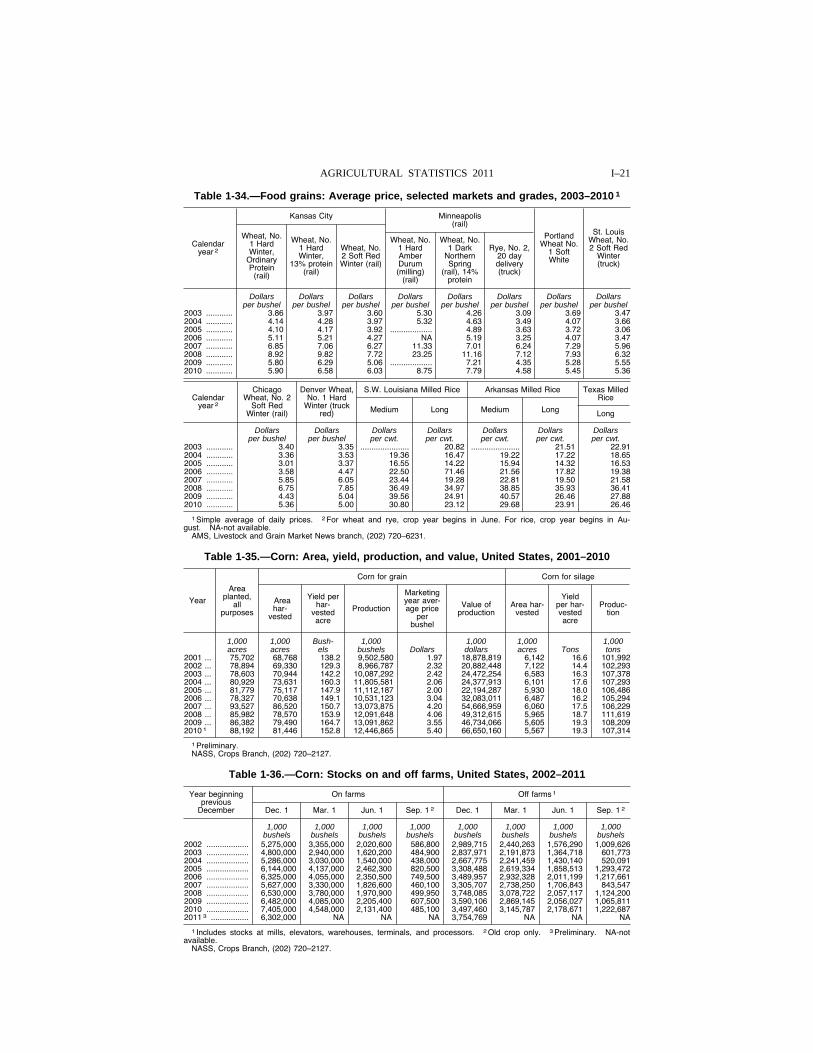
I–21 AGRICULTURAL STATISTICS 2011
Table 1-34.—Food grains: Average price, selected markets and grades, 2003–2010 1
Calendar year 2
Kansas City Minneapolis (rail)
Portland Wheat No.
1 Soft White
St. Louis Wheat, No. 2 Soft Red
Winter (truck)
Wheat, No. 1 Hard Winter,
Ordinary Protein
(rail)
Wheat, No. 1 Hard Winter,
13% protein (rail)
Wheat, No. 2 Soft Red Winter (rail)
Wheat, No. 1 Hard Amber Durum (milling)
(rail)
Wheat, No. 1 Dark
Northern Spring
(rail), 14% protein
Rye, No. 2, 20 day delivery (truck)
Dollars Dollars Dollars Dollars Dollars Dollars Dollars Dollars per bushel per bushel per bushel per bushel per bushel per bushel per bushel per bushel
2003 ............ 3.86 3.97 3.60 5.30 4.26 3.09 3.69 3.47 2004 ............ 4.14 4.28 3.97 5.32 4.63 3.49 4.07 3.66 2005 ............ 4.10 4.17 3.92 ................... 4.89 3.63 3.72 3.06 2006 ............ 5.11 5.21 4.27 NA 5.19 3.25 4.07 3.47 2007 ............ 6.85 7.06 6.27 11.33 7.01 6.24 7.29 5.96 2008 ............ 8.92 9.82 7.72 23.25 11.16 7.12 7.93 6.32 2009 ............ 5.80 6.29 5.06 ................... 7.21 4.35 5.28 5.55 2010 ............ 5.90 6.58 6.03 8.75 7.79 4.58 5.45 5.36
Calendar year 2
Chicago Wheat, No. 2
Soft Red Winter (rail)
Denver Wheat, No. 1 Hard
Winter (truck red)
S.W. Louisiana Milled Rice Arkansas Milled Rice Texas Milled Rice
Medium Long Medium Long Long
Dollars Dollars Dollars Dollars Dollars Dollars Dollars per bushel per bushel per cwt. per cwt. per cwt. per cwt. per cwt.
2003 ............ 3.40 3.35 ...................... 20.82 ...................... 21.51 22.91 2004 ............ 3.36 3.53 19.36 16.47 19.22 17.22 18.65 2005 ............ 3.01 3.37 16.55 14.22 15.94 14.32 16.53 2006 ............ 3.58 4.47 22.50 71.46 21.56 17.82 19.38 2007 ............ 5.85 6.05 23.44 19.28 22.81 19.50 21.58 2008 ............ 6.75 7.85 36.49 34.97 38.85 35.93 36.41 2009 ............ 4.43 5.04 39.56 24.91 40.57 26.46 27.88 2010 ............ 5.36 5.00 30.80 23.12 29.68 23.91 26.46
1 Simple average of daily prices. 2 For wheat and rye, crop year begins in June. For rice, crop year begins in Au-gust. NA-not available.
AMS, Livestock and Grain Market News branch, (202) 720–6231.
Table 1-35.—Corn: Area, yield, production, and value, United States, 2001–2010
Year
Area planted,
all purposes
Corn for grain Corn for silage
Area har-
vested
Yield per har-
vested acre
Production
Marketing year aver-age price
per bushel
Value of production
Area har- vested
Yield per har- vested acre
Produc- tion
1,000 1,000 Bush- 1,000 1,000 1,000 1,000 acres acres els bushels Dollars dollars acres Tons tons
2001 ... 75,702 68,768 138.2 9,502,580 1.97 18,878,819 6,142 16.6 101,992 2002 ... 78,894 69,330 129.3 8,966,787 2.32 20,882,448 7,122 14.4 102,293 2003 ... 78,603 70,944 142.2 10,087,292 2.42 24,472,254 6,583 16.3 107,378 2004 ... 80,929 73,631 160.3 11,805,581 2.06 24,377,913 6,101 17.6 107,293 2005 ... 81,779 75,117 147.9 11,112,187 2.00 22,194,287 5,930 18.0 106,486 2006 ... 78,327 70,638 149.1 10,531,123 3.04 32,083,011 6,487 16.2 105,294 2007 ... 93,527 86,520 150.7 13,073,875 4.20 54,666,959 6,060 17.5 106,229 2008 ... 85,982 78,570 153.9 12,091,648 4.06 49,312,615 5,965 18.7 111,619 2009 ... 86,382 79,490 164.7 13,091,862 3.55 46,734,066 5,605 19.3 108,209 2010 1 88,192 81,446 152.8 12,446,865 5.40 66,650,160 5,567 19.3 107,314
1 Preliminary. NASS, Crops Branch, (202) 720–2127.
Table 1-36.—Corn: Stocks on and off farms, United States, 2002–2011
Year beginning previous
December
On farms Off farms 1
Dec. 1 Mar. 1 Jun. 1 Sep. 1 2 Dec. 1 Mar. 1 Jun. 1 Sep. 1 2
1,000 1,000 1,000 1,000 1,000 1,000 1,000 1,000 bushels bushels bushels bushels bushels bushels bushels bushels
2002 ................... 5,275,000 3,355,000 2,020,600 586,800 2,989,715 2,440,263 1,576,290 1,009,626 2003 ................... 4,800,000 2,940,000 1,620,200 484,900 2,837,971 2,191,873 1,364,718 601,773 2004 ................... 5,286,000 3,030,000 1,540,000 438,000 2,667,775 2,241,459 1,430,140 520,091 2005 ................... 6,144,000 4,137,000 2,462,300 820,500 3,308,488 2,619,334 1,858,513 1,293,472 2006 ................... 6,325,000 4,055,000 2,350,500 749,500 3,489,957 2,932,328 2,011,199 1,217,661 2007 ................... 5,627,000 3,330,000 1,826,600 460,100 3,305,707 2,738,250 1,706,843 843,547 2008 ................... 6,530,000 3,780,000 1,970,900 499,950 3,748,085 3,078,722 2,057,117 1,124,200 2009 ................... 6,482,000 4,085,000 2,205,400 607,500 3,590,106 2,869,145 2,056,027 1,065,811 2010 ................... 7,405,000 4,548,000 2,131,400 485,100 3,497,460 3,145,787 2,178,671 1,222,687 2011 3 ................. 6,302,000 NA NA NA 3,754,769 NA NA NA
1 Includes stocks at mills, elevators, warehouses, terminals, and processors. 2 Old crop only. 3 Preliminary. NA-not available.
NASS, Crops Branch, (202) 720–2127.
VerDate Aug 31 2005 11:43 Mar 12, 2012 Jkt 000000 PO 00000 Frm 00021 Fmt 1000 Sfmt 1000 H:\SHARED\DAPP\FPU\AGSTAT\MASTER~2\CHAPTR01\I-20.AG8 USDA
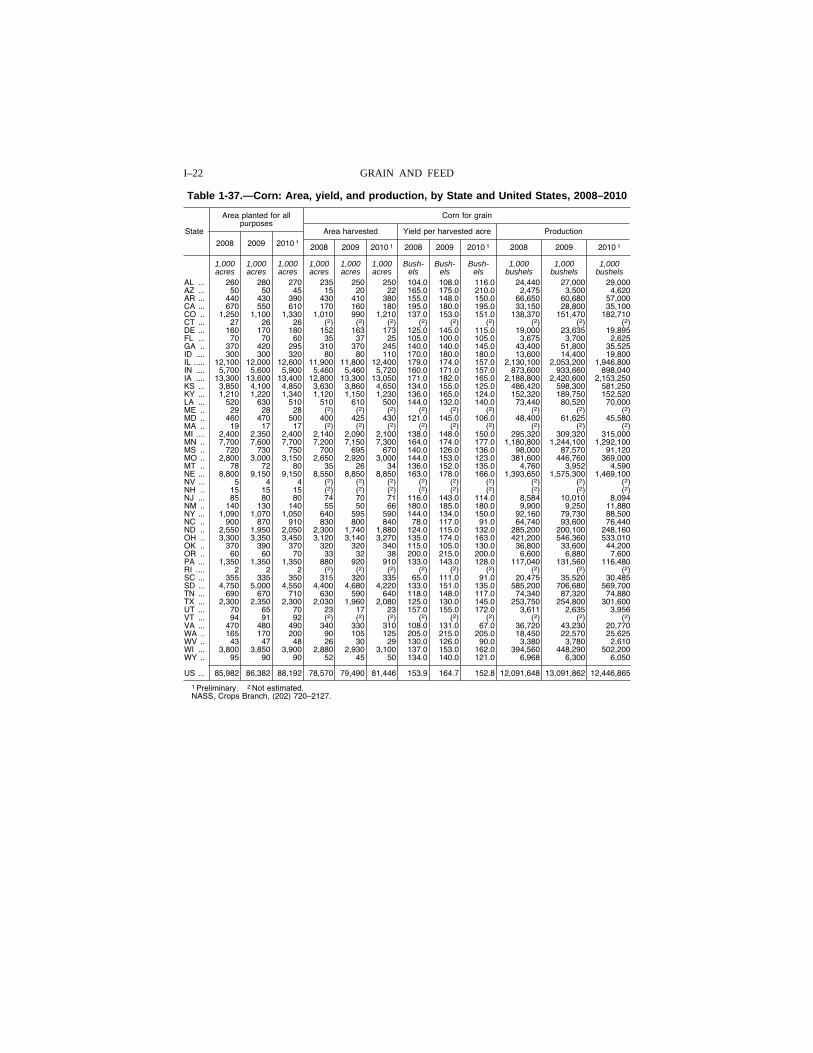
I–22 GRAIN AND FEED
Table 1-37.—Corn: Area, yield, and production, by State and United States, 2008–2010
State
Area planted for all purposes
Corn for grain
2008 2009 2010 1
Area harvested Yield per harvested acre Production
2008 2009 2010 1 2008 2009 2010 1 2008 2009 2010 1
1,000 1,000 1,000 1,000 1,000 1,000 Bush- Bush- Bush- 1,000 1,000 1,000 acres acres acres acres acres acres els els els bushels bushels bushels
AL ... 260 280 270 235 250 250 104.0 108.0 116.0 24,440 27,000 29,000 AZ ... 50 50 45 15 20 22 165.0 175.0 210.0 2,475 3,500 4,620 AR ... 440 430 390 430 410 380 155.0 148.0 150.0 66,650 60,680 57,000 CA ... 670 550 610 170 160 180 195.0 180.0 195.0 33,150 28,800 35,100 CO .. 1,250 1,100 1,330 1,010 990 1,210 137.0 153.0 151.0 138,370 151,470 182,710 CT ... 27 26 26 (2) (2) (2) (2) (2) (2) (2) (2) (2) DE ... 160 170 180 152 163 173 125.0 145.0 115.0 19,000 23,635 19,895 FL ... 70 70 60 35 37 25 105.0 100.0 105.0 3,675 3,700 2,625 GA .. 370 420 295 310 370 245 140.0 140.0 145.0 43,400 51,800 35,525 ID .... 300 300 320 80 80 110 170.0 180.0 180.0 13,600 14,400 19,800 IL ..... 12,100 12,000 12,600 11,900 11,800 12,400 179.0 174.0 157.0 2,130,100 2,053,200 1,946,800 IN .... 5,700 5,600 5,900 5,460 5,460 5,720 160.0 171.0 157.0 873,600 933,660 898,040 IA .... 13,300 13,600 13,400 12,800 13,300 13,050 171.0 182.0 165.0 2,188,800 2,420,600 2,153,250 KS ... 3,850 4,100 4,850 3,630 3,860 4,650 134.0 155.0 125.0 486,420 598,300 581,250 KY ... 1,210 1,220 1,340 1,120 1,150 1,230 136.0 165.0 124.0 152,320 189,750 152,520 LA ... 520 630 510 510 610 500 144.0 132.0 140.0 73,440 80,520 70,000 ME .. 29 28 28 (2) (2) (2) (2) (2) (2) (2) (2) (2) MD .. 460 470 500 400 425 430 121.0 145.0 106.0 48,400 61,625 45,580 MA .. 19 17 17 (2) (2) (2) (2) (2) (2) (2) (2) (2) MI .... 2,400 2,350 2,400 2,140 2,090 2,100 138.0 148.0 150.0 295,320 309,320 315,000 MN .. 7,700 7,600 7,700 7,200 7,150 7,300 164.0 174.0 177.0 1,180,800 1,244,100 1,292,100 MS .. 720 730 750 700 695 670 140.0 126.0 136.0 98,000 87,570 91,120 MO .. 2,800 3,000 3,150 2,650 2,920 3,000 144.0 153.0 123.0 381,600 446,760 369,000 MT .. 78 72 80 35 26 34 136.0 152.0 135.0 4,760 3,952 4,590 NE ... 8,800 9,150 9,150 8,550 8,850 8,850 163.0 178.0 166.0 1,393,650 1,575,300 1,469,100 NV ... 5 4 4 (2) (2) (2) (2) (2) (2) (2) (2) (2) NH .. 15 15 15 (2) (2) (2) (2) (2) (2) (2) (2) (2) NJ ... 85 80 80 74 70 71 116.0 143.0 114.0 8,584 10,010 8,094 NM .. 140 130 140 55 50 66 180.0 185.0 180.0 9,900 9,250 11,880 NY ... 1,090 1,070 1,050 640 595 590 144.0 134.0 150.0 92,160 79,730 88,500 NC .. 900 870 910 830 800 840 78.0 117.0 91.0 64,740 93,600 76,440 ND .. 2,550 1,950 2,050 2,300 1,740 1,880 124.0 115.0 132.0 285,200 200,100 248,160 OH .. 3,300 3,350 3,450 3,120 3,140 3,270 135.0 174.0 163.0 421,200 546,360 533,010 OK .. 370 390 370 320 320 340 115.0 105.0 130.0 36,800 33,600 44,200 OR .. 60 60 70 33 32 38 200.0 215.0 200.0 6,600 6,880 7,600 PA ... 1,350 1,350 1,350 880 920 910 133.0 143.0 128.0 117,040 131,560 116,480 RI .... 2 2 2 (2) (2) (2) (2) (2) (2) (2) (2) (2) SC ... 355 335 350 315 320 335 65.0 111.0 91.0 20,475 35,520 30,485 SD ... 4,750 5,000 4,550 4,400 4,680 4,220 133.0 151.0 135.0 585,200 706,680 569,700 TN ... 690 670 710 630 590 640 118.0 148.0 117.0 74,340 87,320 74,880 TX ... 2,300 2,350 2,300 2,030 1,960 2,080 125.0 130.0 145.0 253,750 254,800 301,600 UT ... 70 65 70 23 17 23 157.0 155.0 172.0 3,611 2,635 3,956 VT ... 94 91 92 (2) (2) (2) (2) (2) (2) (2) (2) (2) VA ... 470 480 490 340 330 310 108.0 131.0 67.0 36,720 43,230 20,770 WA .. 165 170 200 90 105 125 205.0 215.0 205.0 18,450 22,570 25,625 WV .. 43 47 48 26 30 29 130.0 126.0 90.0 3,380 3,780 2,610 WI ... 3,800 3,850 3,900 2,880 2,930 3,100 137.0 153.0 162.0 394,560 448,290 502,200 WY .. 95 90 90 52 45 50 134.0 140.0 121.0 6,968 6,300 6,050
US ... 85,982 86,382 88,192 78,570 79,490 81,446 153.9 164.7 152.8 12,091,648 13,091,862 12,446,865
1 Preliminary. 2 Not estimated. NASS, Crops Branch, (202) 720–2127.
VerDate Aug 31 2005 11:43 Mar 12, 2012 Jkt 000000 PO 00000 Frm 00022 Fmt 1000 Sfmt 1000 H:\SHARED\DAPP\FPU\AGSTAT\MASTER~2\CHAPTR01\I-21.AG8 USDA
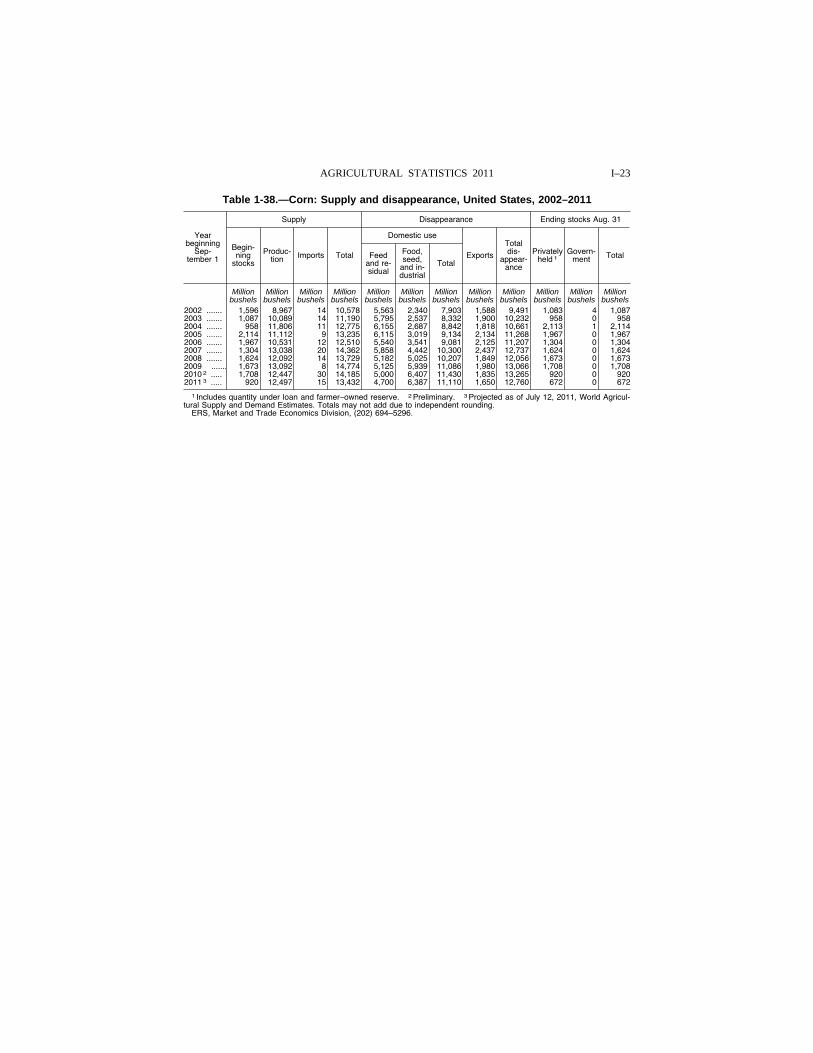
I–23 AGRICULTURAL STATISTICS 2011
Table 1-38.—Corn: Supply and disappearance, United States, 2002–2011
Year beginning
Sep-tember 1
Supply Disappearance Ending stocks Aug. 31
Begin-ning
stocks
Produc-tion Imports Total
Domestic use
Exports
Total dis-
appear-ance
Privately held 1
Govern-ment Total Feed
and re-sidual
Food, seed,
and in-dustrial
Total
Million Million Million Million Million Million Million Million Million Million Million Million bushels bushels bushels bushels bushels bushels bushels bushels bushels bushels bushels bushels
2002 ....... 1,596 8,967 14 10,578 5,563 2,340 7,903 1,588 9,491 1,083 4 1,087 2003 ....... 1,087 10,089 14 11,190 5,795 2,537 8,332 1,900 10,232 958 0 958 2004 ....... 958 11,806 11 12,775 6,155 2,687 8,842 1,818 10,661 2,113 1 2,114 2005 ....... 2,114 11,112 9 13,235 6,115 3,019 9,134 2,134 11,268 1,967 0 1,967 2006 ....... 1,967 10,531 12 12,510 5,540 3,541 9,081 2,125 11,207 1,304 0 1,304 2007 ....... 1,304 13,038 20 14,362 5,858 4,442 10,300 2,437 12,737 1,624 0 1,624 2008 ....... 1,624 12,092 14 13,729 5,182 5,025 10,207 1,849 12,056 1,673 0 1,673 2009 ....... 1,673 13,092 8 14,774 5,125 5,939 11,086 1,980 13,066 1,708 0 1,708 2010 2 ..... 1,708 12,447 30 14,185 5,000 6,407 11,430 1,835 13,265 920 0 920 2011 3 ..... 920 12,497 15 13,432 4,700 6,387 11,110 1,650 12,760 672 0 672
1 Includes quantity under loan and farmer–owned reserve. 2 Preliminary. 3 Projected as of July 12, 2011, World Agricul-tural Supply and Demand Estimates. Totals may not add due to independent rounding.
ERS, Market and Trade Economics Division, (202) 694–5296.
VerDate Aug 31 2005 11:43 Mar 12, 2012 Jkt 000000 PO 00000 Frm 00023 Fmt 1000 Sfmt 1000 H:\SHARED\DAPP\FPU\AGSTAT\MASTER~2\CHAPTR01\I-21.AG8 USDA
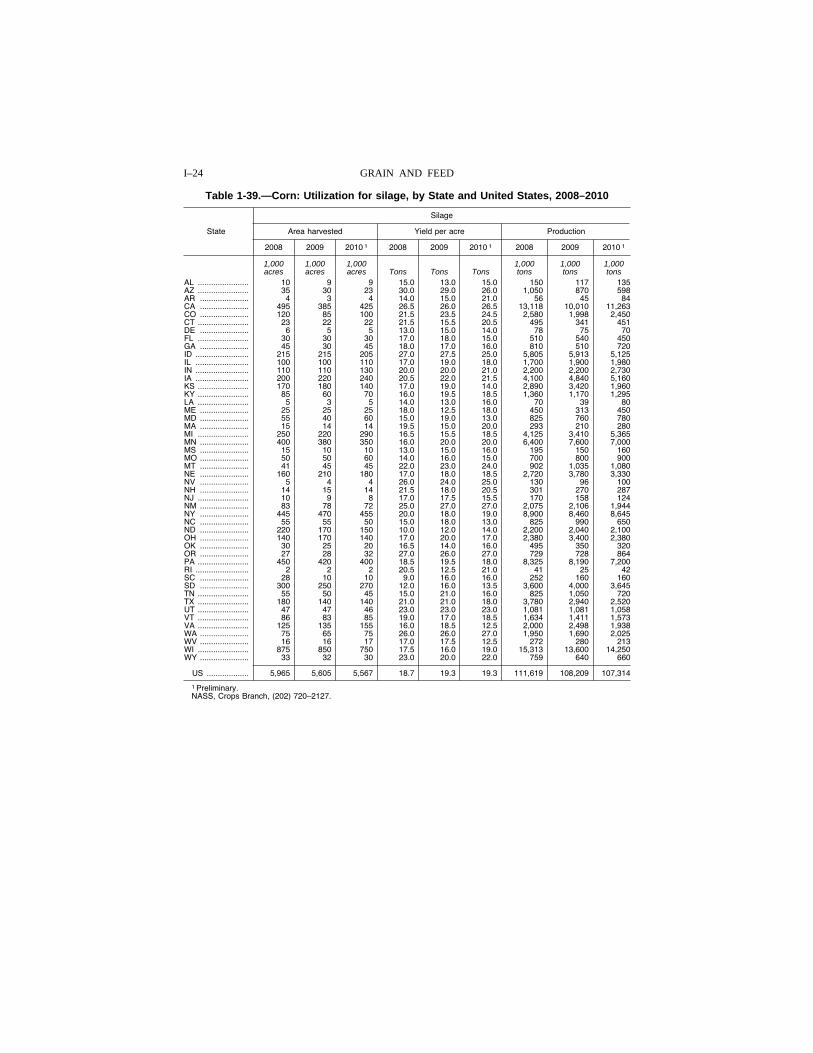
I–24 GRAIN AND FEED
Table 1-39.—Corn: Utilization for silage, by State and United States, 2008–2010
State
Silage
Area harvested Yield per acre Production
2008 2009 2010 1 2008 2009 2010 1 2008 2009 2010 1
1,000 1,000 1,000 1,000 1,000 1,000 acres acres acres Tons Tons Tons tons tons tons
AL ....................... 10 9 9 15.0 13.0 15.0 150 117 135 AZ ....................... 35 30 23 30.0 29.0 26.0 1,050 870 598 AR ...................... 4 3 4 14.0 15.0 21.0 56 45 84 CA ...................... 495 385 425 26.5 26.0 26.5 13,118 10,010 11,263 CO ...................... 120 85 100 21.5 23.5 24.5 2,580 1,998 2,450 CT ....................... 23 22 22 21.5 15.5 20.5 495 341 451 DE ...................... 6 5 5 13.0 15.0 14.0 78 75 70 FL ....................... 30 30 30 17.0 18.0 15.0 510 540 450 GA ...................... 45 30 45 18.0 17.0 16.0 810 510 720 ID ........................ 215 215 205 27.0 27.5 25.0 5,805 5,913 5,125 IL ........................ 100 100 110 17.0 19.0 18.0 1,700 1,900 1,980 IN ........................ 110 110 130 20.0 20.0 21.0 2,200 2,200 2,730 IA ........................ 200 220 240 20.5 22.0 21.5 4,100 4,840 5,160 KS ....................... 170 180 140 17.0 19.0 14.0 2,890 3,420 1,960 KY ....................... 85 60 70 16.0 19.5 18.5 1,360 1,170 1,295 LA ....................... 5 3 5 14.0 13.0 16.0 70 39 80 ME ...................... 25 25 25 18.0 12.5 18.0 450 313 450 MD ...................... 55 40 60 15.0 19.0 13.0 825 760 780 MA ...................... 15 14 14 19.5 15.0 20.0 293 210 280 MI ....................... 250 220 290 16.5 15.5 18.5 4,125 3,410 5,365 MN ...................... 400 380 350 16.0 20.0 20.0 6,400 7,600 7,000 MS ...................... 15 10 10 13.0 15.0 16.0 195 150 160 MO ...................... 50 50 60 14.0 16.0 15.0 700 800 900 MT ...................... 41 45 45 22.0 23.0 24.0 902 1,035 1,080 NE ...................... 160 210 180 17.0 18.0 18.5 2,720 3,780 3,330 NV ...................... 5 4 4 26.0 24.0 25.0 130 96 100 NH ...................... 14 15 14 21.5 18.0 20.5 301 270 287 NJ ....................... 10 9 8 17.0 17.5 15.5 170 158 124 NM ...................... 83 78 72 25.0 27.0 27.0 2,075 2,106 1,944 NY ...................... 445 470 455 20.0 18.0 19.0 8,900 8,460 8,645 NC ...................... 55 55 50 15.0 18.0 13.0 825 990 650 ND ...................... 220 170 150 10.0 12.0 14.0 2,200 2,040 2,100 OH ...................... 140 170 140 17.0 20.0 17.0 2,380 3,400 2,380 OK ...................... 30 25 20 16.5 14.0 16.0 495 350 320 OR ...................... 27 28 32 27.0 26.0 27.0 729 728 864 PA ....................... 450 420 400 18.5 19.5 18.0 8,325 8,190 7,200 RI ........................ 2 2 2 20.5 12.5 21.0 41 25 42 SC ...................... 28 10 10 9.0 16.0 16.0 252 160 160 SD ...................... 300 250 270 12.0 16.0 13.5 3,600 4,000 3,645 TN ....................... 55 50 45 15.0 21.0 16.0 825 1,050 720 TX ....................... 180 140 140 21.0 21.0 18.0 3,780 2,940 2,520 UT ....................... 47 47 46 23.0 23.0 23.0 1,081 1,081 1,058 VT ....................... 86 83 85 19.0 17.0 18.5 1,634 1,411 1,573 VA ....................... 125 135 155 16.0 18.5 12.5 2,000 2,498 1,938 WA ...................... 75 65 75 26.0 26.0 27.0 1,950 1,690 2,025 WV ...................... 16 16 17 17.0 17.5 12.5 272 280 213 WI ....................... 875 850 750 17.5 16.0 19.0 15,313 13,600 14,250 WY ...................... 33 32 30 23.0 20.0 22.0 759 640 660
US ................... 5,965 5,605 5,567 18.7 19.3 19.3 111,619 108,209 107,314
1 Preliminary. NASS, Crops Branch, (202) 720–2127.
VerDate Aug 31 2005 11:43 Mar 12, 2012 Jkt 000000 PO 00000 Frm 00024 Fmt 1000 Sfmt 1000 H:\SHARED\DAPP\FPU\AGSTAT\MASTER~2\CHAPTR01\I-22.AG8 USDA
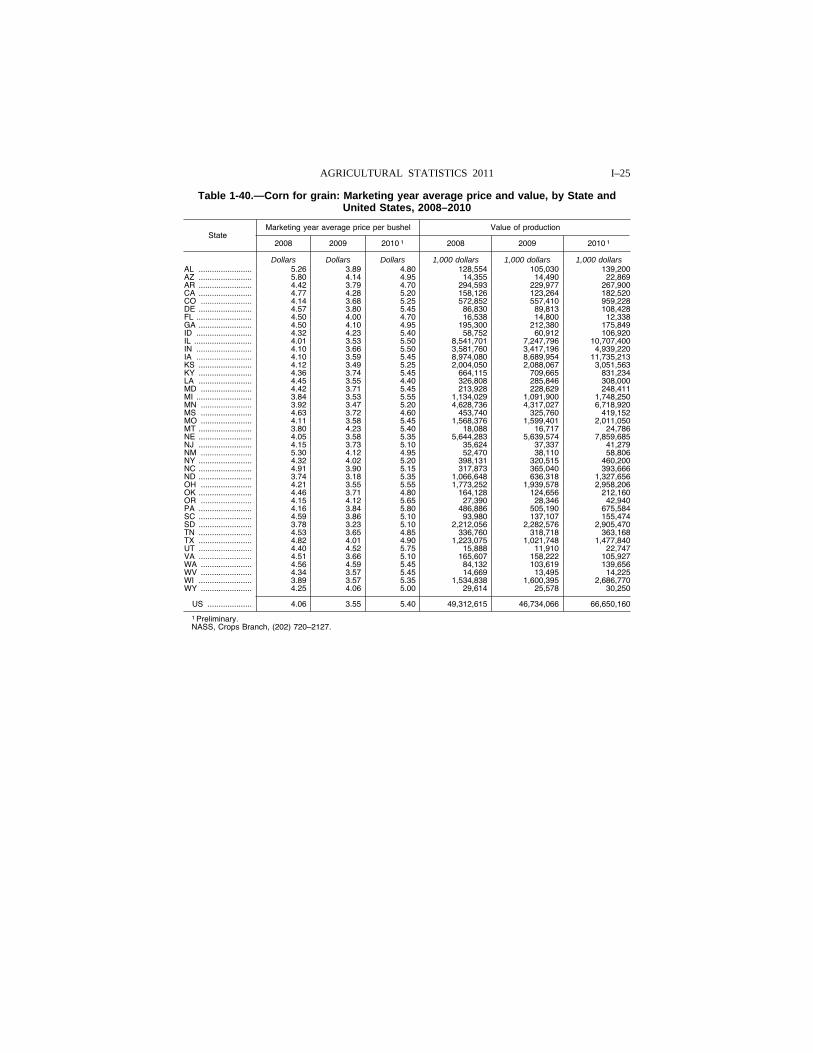
I–25 AGRICULTURAL STATISTICS 2011
Table 1-40.—Corn for grain: Marketing year average price and value, by State and United States, 2008–2010
State Marketing year average price per bushel Value of production
2008 2009 2010 1 2008 2009 2010 1
Dollars Dollars Dollars 1,000 dollars 1,000 dollars 1,000 dollars AL ........................ 5.26 3.89 4.80 128,554 105,030 139,200 AZ ........................ 5.80 4.14 4.95 14,355 14,490 22,869 AR ........................ 4.42 3.79 4.70 294,593 229,977 267,900 CA ........................ 4.77 4.28 5.20 158,126 123,264 182,520 CO ....................... 4.14 3.68 5.25 572,852 557,410 959,228 DE ........................ 4.57 3.80 5.45 86,830 89,813 108,428 FL ......................... 4.50 4.00 4.70 16,538 14,800 12,338 GA ........................ 4.50 4.10 4.95 195,300 212,380 175,849 ID ......................... 4.32 4.23 5.40 58,752 60,912 106,920 IL .......................... 4.01 3.53 5.50 8,541,701 7,247,796 10,707,400 IN ......................... 4.10 3.66 5.50 3,581,760 3,417,196 4,939,220 IA ......................... 4.10 3.59 5.45 8,974,080 8,689,954 11,735,213 KS ........................ 4.12 3.49 5.25 2,004,050 2,088,067 3,051,563 KY ........................ 4.36 3.74 5.45 664,115 709,665 831,234 LA ........................ 4.45 3.55 4.40 326,808 285,846 308,000 MD ....................... 4.42 3.71 5.45 213,928 228,629 248,411 MI ......................... 3.84 3.53 5.55 1,134,029 1,091,900 1,748,250 MN ....................... 3.92 3.47 5.20 4,628,736 4,317,027 6,718,920 MS ....................... 4.63 3.72 4.60 453,740 325,760 419,152 MO ....................... 4.11 3.58 5.45 1,568,376 1,599,401 2,011,050 MT ........................ 3.80 4.23 5.40 18,088 16,717 24,786 NE ........................ 4.05 3.58 5.35 5,644,283 5,639,574 7,859,685 NJ ........................ 4.15 3.73 5.10 35,624 37,337 41,279 NM ....................... 5.30 4.12 4.95 52,470 38,110 58,806 NY ........................ 4.32 4.02 5.20 398,131 320,515 460,200 NC ........................ 4.91 3.90 5.15 317,873 365,040 393,666 ND ........................ 3.74 3.18 5.35 1,066,648 636,318 1,327,656 OH ....................... 4.21 3.55 5.55 1,773,252 1,939,578 2,958,206 OK ........................ 4.46 3.71 4.80 164,128 124,656 212,160 OR ....................... 4.15 4.12 5.65 27,390 28,346 42,940 PA ........................ 4.16 3.84 5.80 486,886 505,190 675,584 SC ........................ 4.59 3.86 5.10 93,980 137,107 155,474 SD ........................ 3.78 3.23 5.10 2,212,056 2,282,576 2,905,470 TN ........................ 4.53 3.65 4.85 336,760 318,718 363,168 TX ........................ 4.82 4.01 4.90 1,223,075 1,021,748 1,477,840 UT ........................ 4.40 4.52 5.75 15,888 11,910 22,747 VA ........................ 4.51 3.66 5.10 165,607 158,222 105,927 WA ....................... 4.56 4.59 5.45 84,132 103,619 139,656 WV ....................... 4.34 3.57 5.45 14,669 13,495 14,225 WI ........................ 3.89 3.57 5.35 1,534,838 1,600,395 2,686,770 WY ....................... 4.25 4.06 5.00 29,614 25,578 30,250
US .................... 4.06 3.55 5.40 49,312,615 46,734,066 66,650,160
1 Preliminary. NASS, Crops Branch, (202) 720–2127.
VerDate Aug 31 2005 11:43 Mar 12, 2012 Jkt 000000 PO 00000 Frm 00025 Fmt 1000 Sfmt 1000 H:\SHARED\DAPP\FPU\AGSTAT\MASTER~2\CHAPTR01\I-23.AG8 USDA
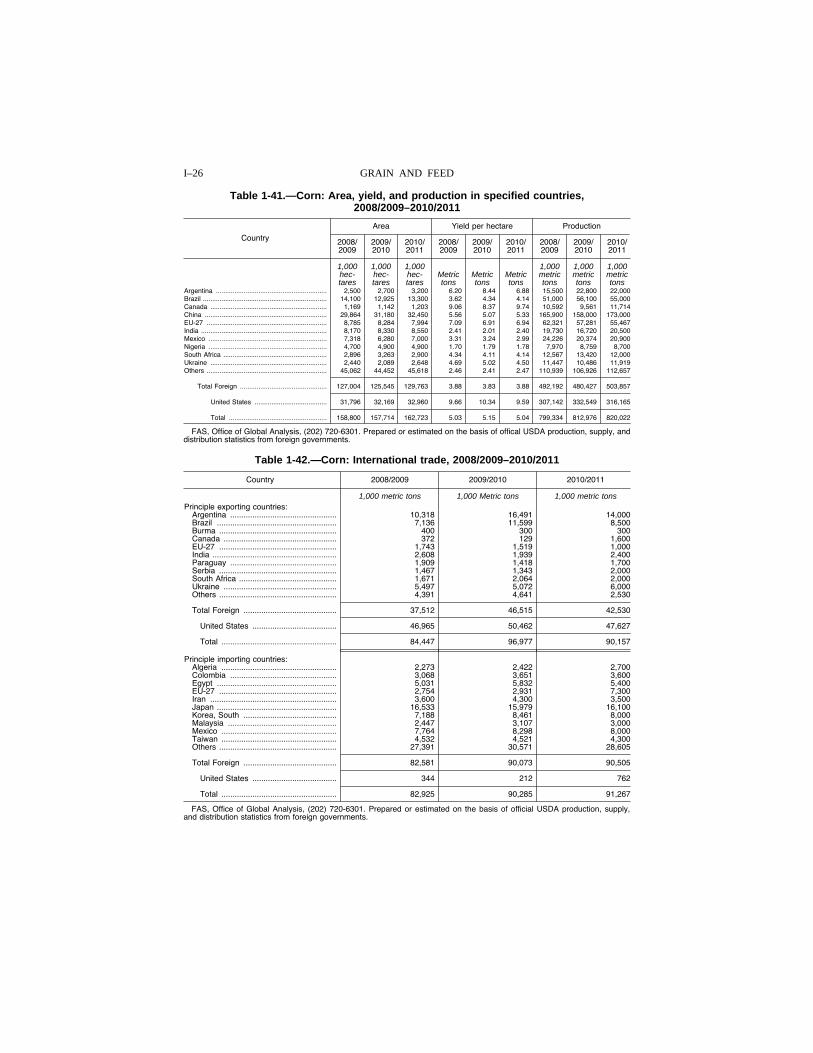
I–26 GRAIN AND FEED
Table 1-41.—Corn: Area, yield, and production in specified countries, 2008/2009–2010/2011
Country
Area Yield per hectare Production
2008/ 2009
2009/ 2010
2010/ 2011
2008/ 2009
2009/ 2010
2010/ 2011
2008/ 2009
2009/ 2010
2010/ 2011
1,000 1,000 1,000 1,000 1,000 1,000 hec- hec- hec- Metric Metric Metric metric metric metric tares tares tares tons tons tons tons tons tons
Argentina ............................................................ 2,500 2,700 3,200 6.20 8.44 6.88 15,500 22,800 22,000 Brazil ................................................................... 14,100 12,925 13,300 3.62 4.34 4.14 51,000 56,100 55,000 Canada ............................................................... 1,169 1,142 1,203 9.06 8.37 9.74 10,592 9,561 11,714 China .................................................................. 29,864 31,180 32,450 5.56 5.07 5.33 165,900 158,000 173,000 EU-27 ................................................................. 8,785 8,284 7,994 7.09 6.91 6.94 62,321 57,281 55,467 India .................................................................... 8,170 8,330 8,550 2.41 2.01 2.40 19,730 16,720 20,500 Mexico ................................................................ 7,318 6,280 7,000 3.31 3.24 2.99 24,226 20,374 20,900 Nigeria ................................................................ 4,700 4,900 4,900 1.70 1.79 1.78 7,970 8,759 8,700 South Africa ........................................................ 2,896 3,263 2,900 4.34 4.11 4.14 12,567 13,420 12,000 Ukraine ............................................................... 2,440 2,089 2,648 4.69 5.02 4.50 11,447 10,486 11,919 Others ................................................................. 45,062 44,452 45,618 2.46 2.41 2.47 110,939 106,926 112,657
Total Foreign ............................................... 127,004 125,545 129,763 3.88 3.83 3.88 492,192 480,427 503,857
United States ....................................... 31,796 32,169 32,960 9.66 10.34 9.59 307,142 332,549 316,165
Total ..................................................... 158,800 157,714 162,723 5.03 5.15 5.04 799,334 812,976 820,022
FAS, Office of Global Analysis, (202) 720-6301. Prepared or estimated on the basis of offical USDA production, supply, and distribution statistics from foreign governments.
Table 1-42.—Corn: International trade, 2008/2009–2010/2011
Country 2008/2009 2009/2010 2010/2011
1,000 metric tons 1,000 Metric tons 1,000 metric tons Principle exporting countries:
Argentina ................................................ 10,318 16,491 14,000 Brazil ...................................................... 7,136 11,599 8,500 Burma ..................................................... 400 300 300 Canada ................................................... 372 129 1,600 EU-27 ..................................................... 1,743 1,519 1,000 India ........................................................ 2,608 1,939 2,400 Paraguay ................................................ 1,909 1,418 1,700 Serbia ..................................................... 1,467 1,343 2,000 South Africa ............................................ 1,671 2,064 2,000 Ukraine ................................................... 5,497 5,072 6,000 Others ..................................................... 4,391 4,641 2,530
Total Foreign .......................................... 37,512 46,515 42,530
United States ...................................... 46,965 50,462 47,627
Total .................................................... 84,447 96,977 90,157
Principle importing countries: Algeria .................................................... 2,273 2,422 2,700 Colombia ................................................ 3,068 3,651 3,600 Egypt ...................................................... 5,031 5,832 5,400 EU-27 ..................................................... 2,754 2,931 7,300 Iran ......................................................... 3,600 4,300 3,500 Japan ...................................................... 16,533 15,979 16,100 Korea, South .......................................... 7,188 8,461 8,000 Malaysia ................................................. 2,447 3,107 3,000 Mexico .................................................... 7,764 8,298 8,000 Taiwan .................................................... 4,532 4,521 4,300 Others ..................................................... 27,391 30,571 28,605
Total Foreign .......................................... 82,581 90,073 90,505
United States ...................................... 344 212 762
Total .................................................... 82,925 90,285 91,267
FAS, Office of Global Analysis, (202) 720-6301. Prepared or estimated on the basis of official USDA production, supply, and distribution statistics from foreign governments.
VerDate Aug 31 2005 11:43 Mar 12, 2012 Jkt 000000 PO 00000 Frm 00026 Fmt 1000 Sfmt 1000 H:\SHARED\DAPP\FPU\AGSTAT\MASTER~2\CHAPTR01\I-24.AG8 USDA
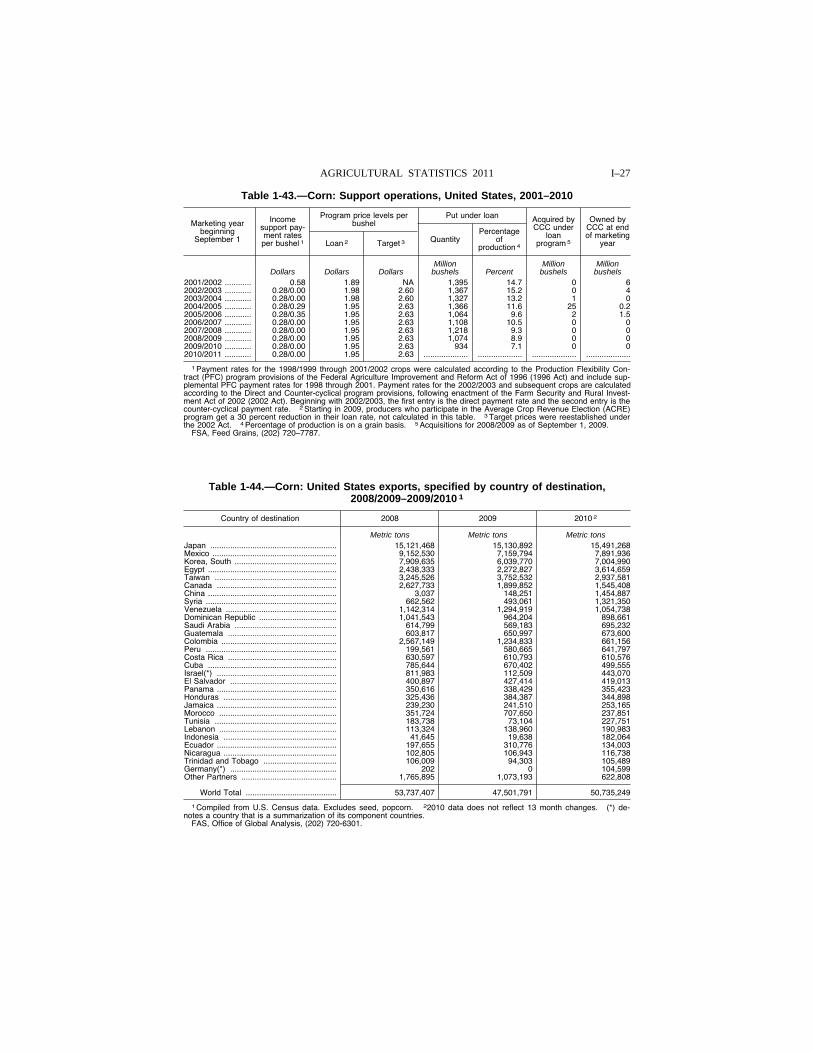
I–27 AGRICULTURAL STATISTICS 2011
Table 1-43.—Corn: Support operations, United States, 2001–2010
Marketing year beginning
September 1
Income support pay-ment rates per bushel 1
Program price levels per bushel
Put under loan Acquired by CCC under
loan program 5
Owned by CCC at end of marketing
year Loan 2 Target 3 Quantity Percentage
of production 4
Million Million Million Dollars Dollars Dollars bushels Percent bushels bushels
2001/2002 ............ 0.58 1.89 NA 1,395 14.7 0 6 2002/2003 ............ 0.28/0.00 1.98 2.60 1,367 15.2 0 4 2003/2004 ............ 0.28/0.00 1.98 2.60 1,327 13.2 1 0 2004/2005 ............ 0.28/0.29 1.95 2.63 1,366 11.6 25 0.2 2005/2006 ............ 0.28/0.35 1.95 2.63 1,064 9.6 2 1.5 2006/2007 ............ 0.28/0.00 1.95 2.63 1,108 10.5 0 0 2007/2008 ............ 0.28/0.00 1.95 2.63 1,218 9.3 0 0 2008/2009 ............ 0.28/0.00 1.95 2.63 1,074 8.9 0 0 2009/2010 ............ 0.28/0.00 1.95 2.63 934 7.1 0 0 2010/2011 ............ 0.28/0.00 1.95 2.63 .................... .................... .................... ....................
1 Payment rates for the 1998/1999 through 2001/2002 crops were calculated according to the Production Flexibility Con-tract (PFC) program provisions of the Federal Agriculture Improvement and Reform Act of 1996 (1996 Act) and include sup-plemental PFC payment rates for 1998 through 2001. Payment rates for the 2002/2003 and subsequent crops are calculated according to the Direct and Counter-cyclical program provisions, following enactment of the Farm Security and Rural Invest-ment Act of 2002 (2002 Act). Beginning with 2002/2003, the first entry is the direct payment rate and the second entry is the counter-cyclical payment rate. 2 Starting in 2009, producers who participate in the Average Crop Revenue Election (ACRE) program get a 30 percent reduction in their loan rate, not calculated in this table. 3 Target prices were reestablished under the 2002 Act. 4 Percentage of production is on a grain basis. 5 Acquisitions for 2008/2009 as of September 1, 2009.
FSA, Feed Grains, (202) 720–7787.
Table 1-44.—Corn: United States exports, specified by country of destination, 2008/2009–2009/2010 1
Country of destination 2008 2009 2010 2
Metric tons Metric tons Metric tons Japan ......................................................... 15,121,468 15,130,892 15,491,268 Mexico ........................................................ 9,152,530 7,159,794 7,891,936 Korea, South .............................................. 7,909,635 6,039,770 7,004,990 Egypt .......................................................... 2,438,333 2,272,827 3,614,659 Taiwan ....................................................... 3,245,526 3,752,532 2,937,581 Canada ...................................................... 2,627,733 1,899,852 1,545,408 China .......................................................... 3,037 148,251 1,454,887 Syria ........................................................... 662,562 493,061 1,321,350 Venezuela .................................................. 1,142,314 1,294,919 1,054,738 Dominican Republic ................................... 1,041,543 964,204 898,661 Saudi Arabia .............................................. 614,799 569,183 695,232 Guatemala ................................................. 603,817 650,997 673,600 Colombia .................................................... 2,567,149 1,234,833 661,156 Peru ........................................................... 199,561 580,665 641,797 Costa Rica ................................................. 630,597 610,793 610,576 Cuba .......................................................... 785,644 670,402 499,555 Israel(*) ...................................................... 811,983 112,509 443,070 El Salvador ................................................ 400,897 427,414 419,013 Panama ...................................................... 350,616 338,429 355,423 Honduras ................................................... 325,436 384,387 344,898 Jamaica ...................................................... 239,230 241,510 253,165 Morocco ..................................................... 351,724 707,650 237,851 Tunisia ....................................................... 183,738 73,104 227,751 Lebanon ..................................................... 113,324 138,960 190,983 Indonesia ................................................... 41,645 19,638 182,064 Ecuador ...................................................... 197,655 310,776 134,003 Nicaragua ................................................... 102,805 106,943 116,738 Trinidad and Tobago ................................. 106,009 94,303 105,489 Germany(*) ................................................ 202 0 104,599 Other Partners ........................................... 1,765,895 1,073,193 622,808
World Total ......................................... 53,737,407 47,501,791 50,735,249
1 Compiled from U.S. Census data. Excludes seed, popcorn. 22010 data does not reflect 13 month changes. (*) de-notes a country that is a summarization of its component countries.
FAS, Office of Global Analysis, (202) 720-6301.
VerDate Aug 31 2005 11:43 Mar 12, 2012 Jkt 000000 PO 00000 Frm 00027 Fmt 1000 Sfmt 1000 H:\SHARED\DAPP\FPU\AGSTAT\MASTER~2\CHAPTR01\I-25.AG8 USDA
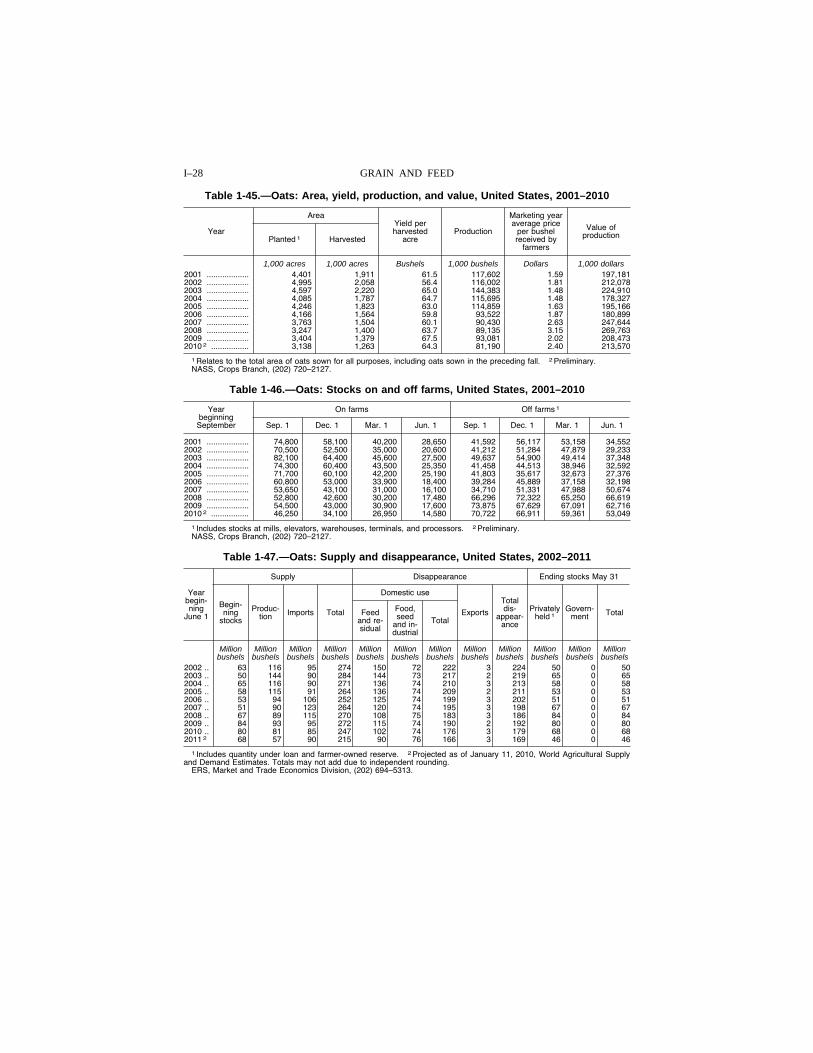
I–28 GRAIN AND FEED
Table 1-45.—Oats: Area, yield, production, and value, United States, 2001–2010
Year
Area Yield per harvested
acre Production
Marketing year average price
per bushel received by
farmers
Value of production Planted 1 Harvested
1,000 acres 1,000 acres Bushels 1,000 bushels Dollars 1,000 dollars 2001 ................... 4,401 1,911 61.5 117,602 1.59 197,181 2002 ................... 4,995 2,058 56.4 116,002 1.81 212,078 2003 ................... 4,597 2,220 65.0 144,383 1.48 224,910 2004 ................... 4,085 1,787 64.7 115,695 1.48 178,327 2005 ................... 4,246 1,823 63.0 114,859 1.63 195,166 2006 ................... 4,166 1,564 59.8 93,522 1.87 180,899 2007 ................... 3,763 1,504 60.1 90,430 2.63 247,644 2008 ................... 3,247 1,400 63.7 89,135 3.15 269,763 2009 ................... 3,404 1,379 67.5 93,081 2.02 208,473 2010 2 ................. 3,138 1,263 64.3 81,190 2.40 213,570
1 Relates to the total area of oats sown for all purposes, including oats sown in the preceding fall. 2 Preliminary. NASS, Crops Branch, (202) 720–2127.
Table 1-46.—Oats: Stocks on and off farms, United States, 2001–2010
Year beginning September
On farms Off farms 1
Sep. 1 Dec. 1 Mar. 1 Jun. 1 Sep. 1 Dec. 1 Mar. 1 Jun. 1
2001 ................... 74,800 58,100 40,200 28,650 41,592 56,117 53,158 34,552 2002 ................... 70,500 52,500 35,000 20,600 41,212 51,284 47,879 29,233 2003 ................... 82,100 64,400 45,600 27,500 49,637 54,900 49,414 37,348 2004 ................... 74,300 60,400 43,500 25,350 41,458 44,513 38,946 32,592 2005 ................... 71,700 60,100 42,200 25,190 41,803 35,617 32,673 27,376 2006 ................... 60,800 53,000 33,900 18,400 39,284 45,889 37,158 32,198 2007 ................... 53,650 43,100 31,000 16,100 34,710 51,331 47,988 50,674 2008 ................... 52,800 42,600 30,200 17,480 66,296 72,322 65,250 66,619 2009 ................... 54,500 43,000 30,900 17,600 73,875 67,629 67,091 62,716 2010 2 ................. 46,250 34,100 26,950 14,580 70,722 66,911 59,361 53,049
1 Includes stocks at mills, elevators, warehouses, terminals, and processors. 2 Preliminary. NASS, Crops Branch, (202) 720–2127.
Table 1-47.—Oats: Supply and disappearance, United States, 2002–2011
Year begin-ning
June 1
Supply Disappearance Ending stocks May 31
Begin-ning
stocks
Produc-tion Imports Total
Domestic use
Exports
Total dis-
appear-ance
Privately held 1
Govern-ment Total Feed
and re-sidual
Food, seed
and in-dustrial
Total
Million Million Million Million Million Million Million Million Million Million Million Million bushels bushels bushels bushels bushels bushels bushels bushels bushels bushels bushels bushels
2002 .. 63 116 95 274 150 72 222 3 224 50 0 50 2003 .. 50 144 90 284 144 73 217 2 219 65 0 65 2004 .. 65 116 90 271 136 74 210 3 213 58 0 58 2005 .. 58 115 91 264 136 74 209 2 211 53 0 53 2006 .. 53 94 106 252 125 74 199 3 202 51 0 51 2007 .. 51 90 123 264 120 74 195 3 198 67 0 67 2008 .. 67 89 115 270 108 75 183 3 186 84 0 84 2009 .. 84 93 95 272 115 74 190 2 192 80 0 80 2010 .. 80 81 85 247 102 74 176 3 179 68 0 68 2011 2 68 57 90 215 90 76 166 3 169 46 0 46
1 Includes quantity under loan and farmer-owned reserve. 2 Projected as of January 11, 2010, World Agricultural Supply and Demand Estimates. Totals may not add due to independent rounding.
ERS, Market and Trade Economics Division, (202) 694–5313.
VerDate Aug 31 2005 11:43 Mar 12, 2012 Jkt 000000 PO 00000 Frm 00028 Fmt 1000 Sfmt 1000 H:\SHARED\DAPP\FPU\AGSTAT\MASTER~2\CHAPTR01\I-26.AG8 USDA
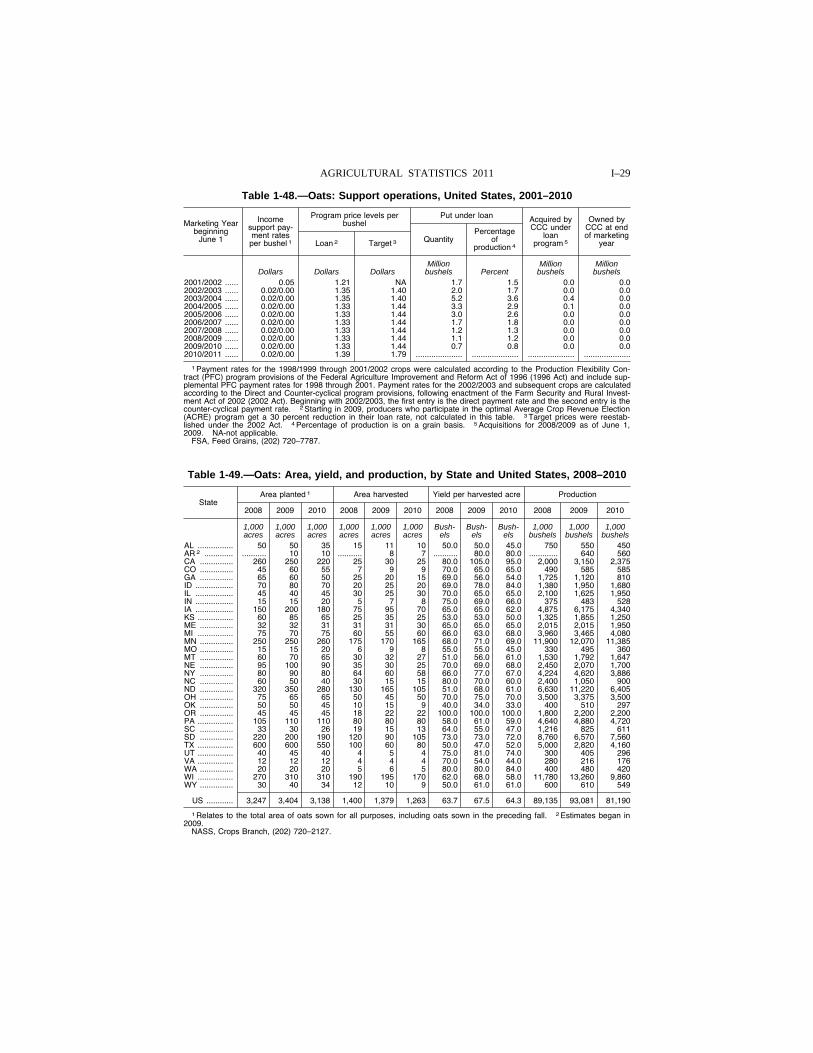
I–29 AGRICULTURAL STATISTICS 2011
Table 1-48.—Oats: Support operations, United States, 2001–2010
Marketing Year beginning
June 1
Income support pay-ment rates per bushel 1
Program price levels per bushel
Put under loan Acquired by CCC under
loan program 5
Owned by CCC at end of marketing
year Loan 2 Target 3 Quantity Percentage
of production 4
Million Million Million Dollars Dollars Dollars bushels Percent bushels bushels
2001/2002 ...... 0.05 1.21 NA 1.7 1.5 0.0 0.0 2002/2003 ...... 0.02/0.00 1.35 1.40 2.0 1.7 0.0 0.0 2003/2004 ...... 0.02/0.00 1.35 1.40 5.2 3.6 0.4 0.0 2004/2005 ...... 0.02/0.00 1.33 1.44 3.3 2.9 0.1 0.0 2005/2006 ...... 0.02/0.00 1.33 1.44 3.0 2.6 0.0 0.0 2006/2007 ...... 0.02/0.00 1.33 1.44 1.7 1.8 0.0 0.0 2007/2008 ...... 0.02/0.00 1.33 1.44 1.2 1.3 0.0 0.0 2008/2009 ...... 0.02/0.00 1.33 1.44 1.1 1.2 0.0 0.0 2009/2010 ...... 0.02/0.00 1.33 1.44 0.7 0.8 0.0 0.0 2010/2011 ...... 0.02/0.00 1.39 1.79 ..................... ..................... ..................... .....................
1 Payment rates for the 1998/1999 through 2001/2002 crops were calculated according to the Production Flexibility Con-tract (PFC) program provisions of the Federal Agriculture Improvement and Reform Act of 1996 (1996 Act) and include sup-plemental PFC payment rates for 1998 through 2001. Payment rates for the 2002/2003 and subsequent crops are calculated according to the Direct and Counter-cyclical program provisions, following enactment of the Farm Security and Rural Invest-ment Act of 2002 (2002 Act). Beginning with 2002/2003, the first entry is the direct payment rate and the second entry is the counter-cyclical payment rate. 2 Starting in 2009, producers who participate in the optimal Average Crop Revenue Election (ACRE) program get a 30 percent reduction in their loan rate, not calculated in this table. 3 Target prices were reestab-lished under the 2002 Act. 4 Percentage of production is on a grain basis. 5 Acquisitions for 2008/2009 as of June 1, 2009. NA-not applicable.
FSA, Feed Grains, (202) 720–7787.
Table 1-49.—Oats: Area, yield, and production, by State and United States, 2008–2010
State Area planted 1 Area harvested Yield per harvested acre Production
2008 2009 2010 2008 2009 2010 2008 2009 2010 2008 2009 2010
1,000 1,000 1,000 1,000 1,000 1,000 Bush- Bush- Bush- 1,000 1,000 1,000 acres acres acres acres acres acres els els els bushels bushels bushels
AL ................ 50 50 35 15 11 10 50.0 50.0 45.0 750 550 450 AR 2 ............. ........... 10 10 ........... 8 7 ........... 80.0 80.0 ............. 640 560 CA ............... 260 250 220 25 30 25 80.0 105.0 95.0 2,000 3,150 2,375 CO ............... 45 60 55 7 9 9 70.0 65.0 65.0 490 585 585 GA ............... 65 60 50 25 20 15 69.0 56.0 54.0 1,725 1,120 810 ID ................. 70 80 70 20 25 20 69.0 78.0 84.0 1,380 1,950 1,680 IL ................. 45 40 45 30 25 30 70.0 65.0 65.0 2,100 1,625 1,950 IN ................. 15 15 20 5 7 8 75.0 69.0 66.0 375 483 528 IA ................. 150 200 180 75 95 70 65.0 65.0 62.0 4,875 6,175 4,340 KS ................ 60 85 65 25 35 25 53.0 53.0 50.0 1,325 1,855 1,250 ME ............... 32 32 31 31 31 30 65.0 65.0 65.0 2,015 2,015 1,950 MI ................ 75 70 75 60 55 60 66.0 63.0 68.0 3,960 3,465 4,080 MN ............... 250 250 260 175 170 165 68.0 71.0 69.0 11,900 12,070 11,385 MO ............... 15 15 20 6 9 8 55.0 55.0 45.0 330 495 360 MT ............... 60 70 65 30 32 27 51.0 56.0 61.0 1,530 1,792 1,647 NE ............... 95 100 90 35 30 25 70.0 69.0 68.0 2,450 2,070 1,700 NY ............... 80 90 80 64 60 58 66.0 77.0 67.0 4,224 4,620 3,886 NC ............... 60 50 40 30 15 15 80.0 70.0 60.0 2,400 1,050 900 ND ............... 320 350 280 130 165 105 51.0 68.0 61.0 6,630 11,220 6,405 OH ............... 75 65 65 50 45 50 70.0 75.0 70.0 3,500 3,375 3,500 OK ............... 50 50 45 10 15 9 40.0 34.0 33.0 400 510 297 OR ............... 45 45 45 18 22 22 100.0 100.0 100.0 1,800 2,200 2,200 PA ................ 105 110 110 80 80 80 58.0 61.0 59.0 4,640 4,880 4,720 SC ............... 33 30 26 19 15 13 64.0 55.0 47.0 1,216 825 611 SD ............... 220 200 190 120 90 105 73.0 73.0 72.0 8,760 6,570 7,560 TX ................ 600 600 550 100 60 80 50.0 47.0 52.0 5,000 2,820 4,160 UT ................ 40 45 40 4 5 4 75.0 81.0 74.0 300 405 296 VA ................ 12 12 12 4 4 4 70.0 54.0 44.0 280 216 176 WA ............... 20 20 20 5 6 5 80.0 80.0 84.0 400 480 420 WI ................ 270 310 310 190 195 170 62.0 68.0 58.0 11,780 13,260 9,860 WY ............... 30 40 34 12 10 9 50.0 61.0 61.0 600 610 549
US ............ 3,247 3,404 3,138 1,400 1,379 1,263 63.7 67.5 64.3 89,135 93,081 81,190
1 Relates to the total area of oats sown for all purposes, including oats sown in the preceding fall. 2 Estimates began in 2009.
NASS, Crops Branch, (202) 720–2127.
VerDate Aug 31 2005 11:43 Mar 12, 2012 Jkt 000000 PO 00000 Frm 00029 Fmt 1000 Sfmt 1000 H:\SHARED\DAPP\FPU\AGSTAT\MASTER~2\CHAPTR01\I-27.AG8 USDA
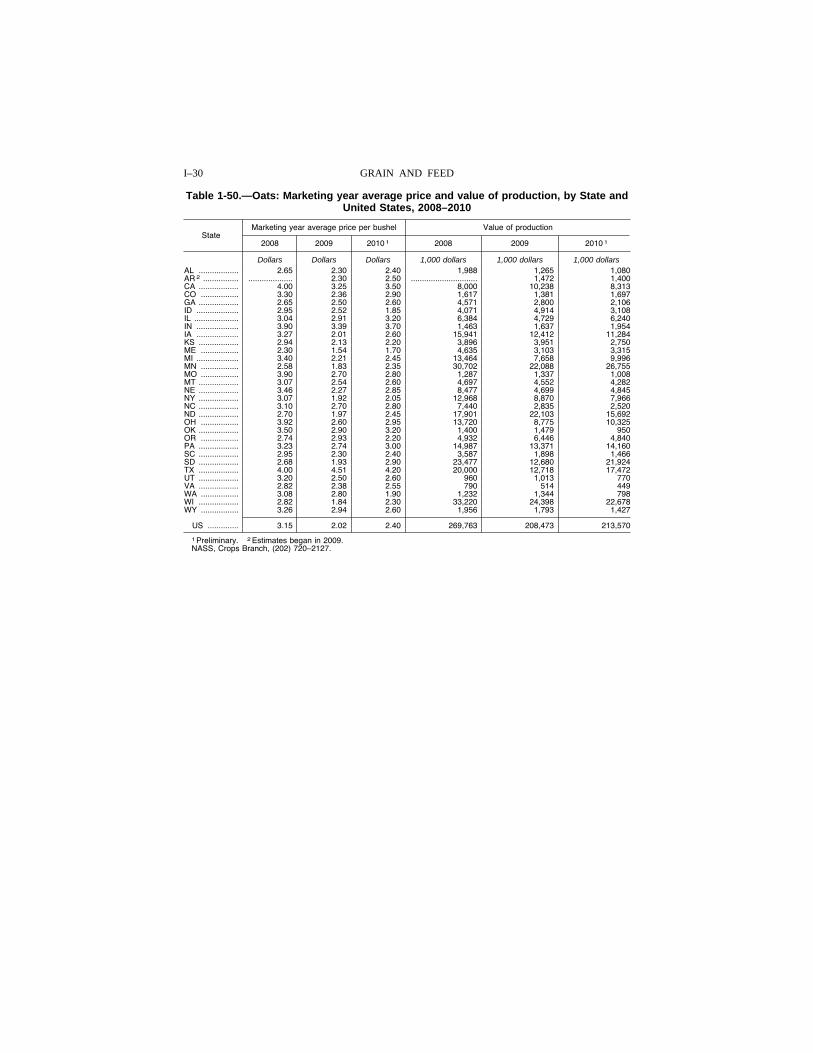
I–30 GRAIN AND FEED
Table 1-50.—Oats: Marketing year average price and value of production, by State and United States, 2008–2010
State Marketing year average price per bushel Value of production
2008 2009 2010 1 2008 2009 2010 1
Dollars Dollars Dollars 1,000 dollars 1,000 dollars 1,000 dollars AL .................. 2.65 2.30 2.40 1,988 1,265 1,080 AR 2 ................ .................... 2.30 2.50 .............................. 1,472 1,400 CA .................. 4.00 3.25 3.50 8,000 10,238 8,313 CO ................. 3.30 2.36 2.90 1,617 1,381 1,697 GA .................. 2.65 2.50 2.60 4,571 2,800 2,106 ID ................... 2.95 2.52 1.85 4,071 4,914 3,108 IL .................... 3.04 2.91 3.20 6,384 4,729 6,240 IN ................... 3.90 3.39 3.70 1,463 1,637 1,954 IA ................... 3.27 2.01 2.60 15,941 12,412 11,284 KS .................. 2.94 2.13 2.20 3,896 3,951 2,750 ME ................. 2.30 1.54 1.70 4,635 3,103 3,315 MI ................... 3.40 2.21 2.45 13,464 7,658 9,996 MN ................. 2.58 1.83 2.35 30,702 22,088 26,755 MO ................. 3.90 2.70 2.80 1,287 1,337 1,008 MT .................. 3.07 2.54 2.60 4,697 4,552 4,282 NE .................. 3.46 2.27 2.85 8,477 4,699 4,845 NY .................. 3.07 1.92 2.05 12,968 8,870 7,966 NC .................. 3.10 2.70 2.80 7,440 2,835 2,520 ND .................. 2.70 1.97 2.45 17,901 22,103 15,692 OH ................. 3.92 2.60 2.95 13,720 8,775 10,325 OK .................. 3.50 2.90 3.20 1,400 1,479 950 OR ................. 2.74 2.93 2.20 4,932 6,446 4,840 PA .................. 3.23 2.74 3.00 14,987 13,371 14,160 SC .................. 2.95 2.30 2.40 3,587 1,898 1,466 SD .................. 2.68 1.93 2.90 23,477 12,680 21,924 TX .................. 4.00 4.51 4.20 20,000 12,718 17,472 UT .................. 3.20 2.50 2.60 960 1,013 770 VA .................. 2.82 2.38 2.55 790 514 449 WA ................. 3.08 2.80 1.90 1,232 1,344 798 WI .................. 2.82 1.84 2.30 33,220 24,398 22,678 WY ................. 3.26 2.94 2.60 1,956 1,793 1,427
US .............. 3.15 2.02 2.40 269,763 208,473 213,570
1 Preliminary. 2 Estimates began in 2009. NASS, Crops Branch, (202) 720–2127.
VerDate Aug 31 2005 11:43 Mar 12, 2012 Jkt 000000 PO 00000 Frm 00030 Fmt 1000 Sfmt 1000 H:\SHARED\DAPP\FPU\AGSTAT\MASTER~2\CHAPTR01\I-28.AG8 USDA
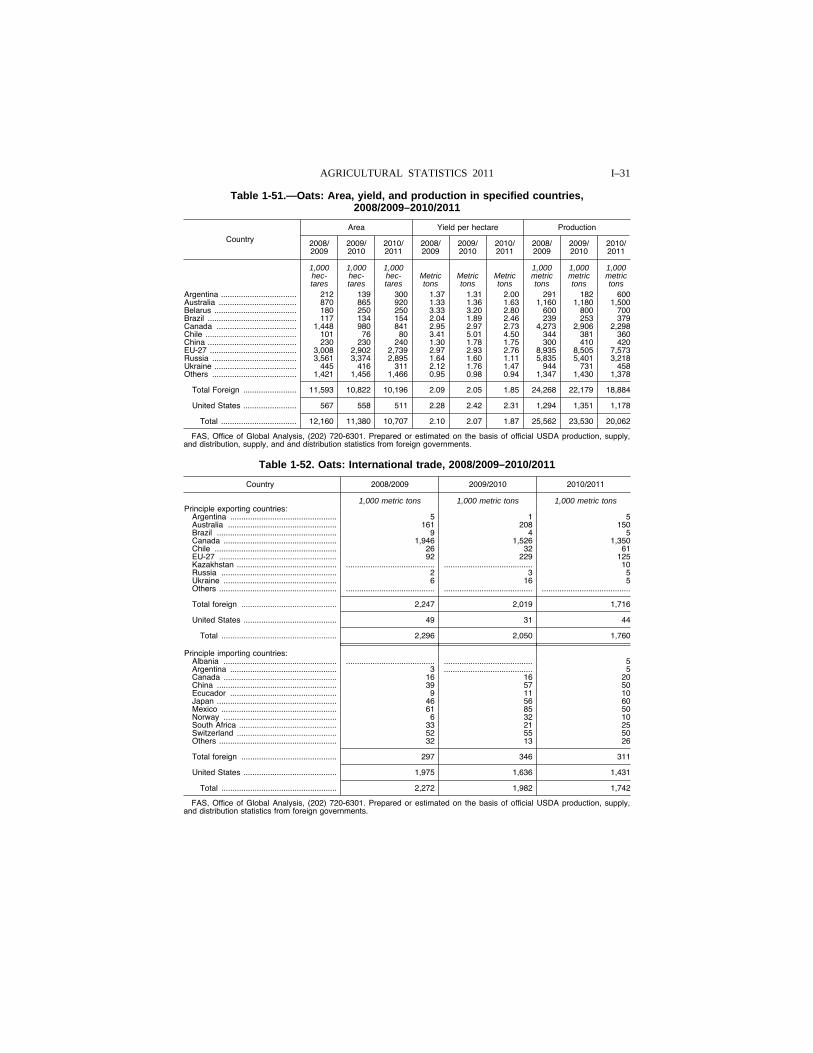
I–31 AGRICULTURAL STATISTICS 2011
Table 1-51.—Oats: Area, yield, and production in specified countries, 2008/2009–2010/2011
Country
Area Yield per hectare Production
2008/ 2009
2009/ 2010
2010/ 2011
2008/ 2009
2009/ 2010
2010/ 2011
2008/ 2009
2009/ 2010
2010/ 2011
1,000 1,000 1,000 1,000 1,000 1,000 hec- hec- hec- Metric Metric Metric metric metric metric tares tares tares tons tons tons tons tons tons
Argentina .................................. 212 139 300 1.37 1.31 2.00 291 182 600 Australia ................................... 870 865 920 1.33 1.36 1.63 1,160 1,180 1,500 Belarus ..................................... 180 250 250 3.33 3.20 2.80 600 800 700 Brazil ........................................ 117 134 154 2.04 1.89 2.46 239 253 379 Canada .................................... 1,448 980 841 2.95 2.97 2.73 4,273 2,906 2,298 Chile ......................................... 101 76 80 3.41 5.01 4.50 344 381 360 China ........................................ 230 230 240 1.30 1.78 1.75 300 410 420 EU-27 ....................................... 3,008 2,902 2,739 2.97 2.93 2.76 8,935 8,505 7,573 Russia ...................................... 3,561 3,374 2,895 1.64 1.60 1.11 5,835 5,401 3,218 Ukraine ..................................... 445 416 311 2.12 1.76 1.47 944 731 458 Others ...................................... 1,421 1,456 1,466 0.95 0.98 0.94 1,347 1,430 1,378
Total Foreign ........................ 11,593 10,822 10,196 2.09 2.05 1.85 24,268 22,179 18,884
United States ........................ 567 558 511 2.28 2.42 2.31 1,294 1,351 1,178
Total .................................. 12,160 11,380 10,707 2.10 2.07 1.87 25,562 23,530 20,062
FAS, Office of Global Analysis, (202) 720-6301. Prepared or estimated on the basis of official USDA production, supply, and distribution, supply, and and distribution statistics from foreign governments.
Table 1-52. Oats: International trade, 2008/2009–2010/2011
Country 2008/2009 2009/2010 2010/2011
1,000 metric tons 1,000 metric tons 1,000 metric tons Principle exporting countries:
Argentina ................................................ 5 1 5 Australia ................................................. 161 208 150 Brazil ...................................................... 9 4 5 Canada ................................................... 1,946 1,526 1,350 Chile ....................................................... 26 32 61 EU-27 ..................................................... 92 229 125 Kazakhstan ............................................. ........................................ ........................................ 10 Russia .................................................... 2 3 5 Ukraine ................................................... 6 16 5 Others ..................................................... ........................................ ........................................ ........................................
Total foreign ........................................... 2,247 2,019 1,716
United States .......................................... 49 31 44
Total .................................................... 2,296 2,050 1,760
Principle importing countries: Albania ................................................... ........................................ ........................................ 5 Argentina ................................................ 3 ........................................ 5 Canada ................................................... 16 16 20 China ...................................................... 39 57 50 Ecucador ................................................ 9 11 10 Japan ...................................................... 46 56 60 Mexico .................................................... 61 85 50 Norway ................................................... 6 32 10 South Africa ............................................ 33 21 25 Switzerland ............................................. 52 55 50 Others ..................................................... 32 13 26
Total foreign ........................................... 297 346 311
United States .......................................... 1,975 1,636 1,431
Total .................................................... 2,272 1,982 1,742
FAS, Office of Global Analysis, (202) 720-6301. Prepared or estimated on the basis of official USDA production, supply, and distribution statistics from foreign governments.
VerDate Aug 31 2005 11:43 Mar 12, 2012 Jkt 000000 PO 00000 Frm 00031 Fmt 1000 Sfmt 1000 H:\SHARED\DAPP\FPU\AGSTAT\MASTER~2\CHAPTR01\I-29.AG8 USDA
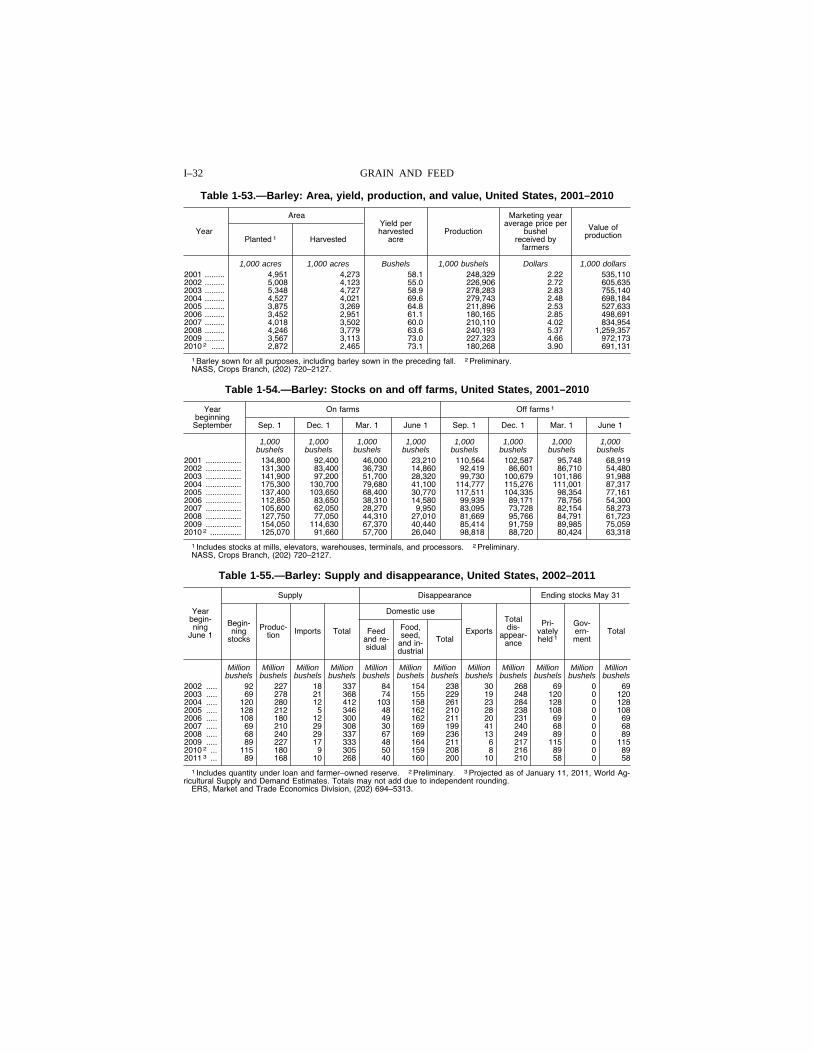
I–32 GRAIN AND FEED
Table 1-53.—Barley: Area, yield, production, and value, United States, 2001–2010
Year
Area Yield per harvested
acre Production
Marketing year average price per
bushel received by
farmers
Value of production Planted 1 Harvested
1,000 acres 1,000 acres Bushels 1,000 bushels Dollars 1,000 dollars 2001 ......... 4,951 4,273 58.1 248,329 2 .22 535,110 2002 ......... 5,008 4,123 55.0 226,906 2 .72 605,635 2003 ......... 5,348 4,727 58.9 278,283 2 .83 755,140 2004 ......... 4,527 4,021 69.6 279,743 2 .48 698,184 2005 ......... 3,875 3,269 64.8 211,896 2 .53 527,633 2006 ......... 3,452 2,951 61.1 180,165 2 .85 498,691 2007 ......... 4,018 3,502 60.0 210,110 4 .02 834,954 2008 ......... 4,246 3,779 63.6 240,193 5 .37 1,259,357 2009 ......... 3,567 3,113 73.0 227,323 4 .66 972,173 2010 2 ...... 2,872 2,465 73.1 180,268 3 .90 691,131
1 Barley sown for all purposes, including barley sown in the preceding fall. 2 Preliminary. NASS, Crops Branch, (202) 720–2127.
Table 1-54.—Barley: Stocks on and off farms, United States, 2001–2010
Year beginning
September
On farms Off farms 1
Sep. 1 Dec. 1 Mar. 1 June 1 Sep. 1 Dec. 1 Mar. 1 June 1
1,000 1,000 1,000 1,000 1,000 1,000 1,000 1,000 bushels bushels bushels bushels bushels bushels bushels bushels
2001 ................ 134,800 92,400 46,000 23,210 110,564 102,587 95,748 68,919 2002 ................ 131,300 83,400 36,730 14,860 92,419 86,601 86,710 54,480 2003 ................ 141,900 97,200 51,700 28,320 99,730 100,679 101,186 91,988 2004 ................ 175,300 130,700 79,680 41,100 114,777 115,276 111,001 87,317 2005 ................ 137,400 103,650 68,400 30,770 117,511 104,335 98,354 77,161 2006 ................ 112,850 83,650 38,310 14,580 99,939 89,171 78,756 54,300 2007 ................ 105,600 62,050 28,270 9,950 83,095 73,728 82,154 58,273 2008 ................ 127,750 77,050 44,310 27,010 81,669 95,766 84,791 61,723 2009 ................ 154,050 114,630 67,370 40,440 85,414 91,759 89,985 75,059 2010 2 .............. 125,070 91,660 57,700 26,040 98,818 88,720 80,424 63,318
1 Includes stocks at mills, elevators, warehouses, terminals, and processors. 2 Preliminary. NASS, Crops Branch, (202) 720–2127.
Table 1-55.—Barley: Supply and disappearance, United States, 2002–2011
Year begin-ning
June 1
Supply Disappearance Ending stocks May 31
Begin-ning
stocks
Produc-tion Imports Total
Domestic use
Exports
Total dis-
appear-ance
Pri-vately held 1
Gov-ern-ment
Total Feed and re-sidual
Food, seed,
and in-dustrial
Total
Million Million Million Million Million Million Million Million Million Million Million Million bushels bushels bushels bushels bushels bushels bushels bushels bushels bushels bushels bushels
2002 ..... 92 227 18 337 84 154 238 30 268 69 0 69 2003 ..... 69 278 21 368 74 155 229 19 248 120 0 120 2004 ..... 120 280 12 412 103 158 261 23 284 128 0 128 2005 ..... 128 212 5 346 48 162 210 28 238 108 0 108 2006 ..... 108 180 12 300 49 162 211 20 231 69 0 69 2007 ..... 69 210 29 308 30 169 199 41 240 68 0 68 2008 ..... 68 240 29 337 67 169 236 13 249 89 0 89 2009 ..... 89 227 17 333 48 164 211 6 217 115 0 115 2010 2 ... 115 180 9 305 50 159 208 8 216 89 0 89 2011 3 ... 89 168 10 268 40 160 200 10 210 58 0 58
1 Includes quantity under loan and farmer–owned reserve. 2 Preliminary. 3 Projected as of January 11, 2011, World Ag-ricultural Supply and Demand Estimates. Totals may not add due to independent rounding.
ERS, Market and Trade Economics Division, (202) 694–5313.
VerDate Aug 31 2005 11:43 Mar 12, 2012 Jkt 000000 PO 00000 Frm 00032 Fmt 1000 Sfmt 1000 H:\SHARED\DAPP\FPU\AGSTAT\MASTER~2\CHAPTR01\I-30.AG8 USDA
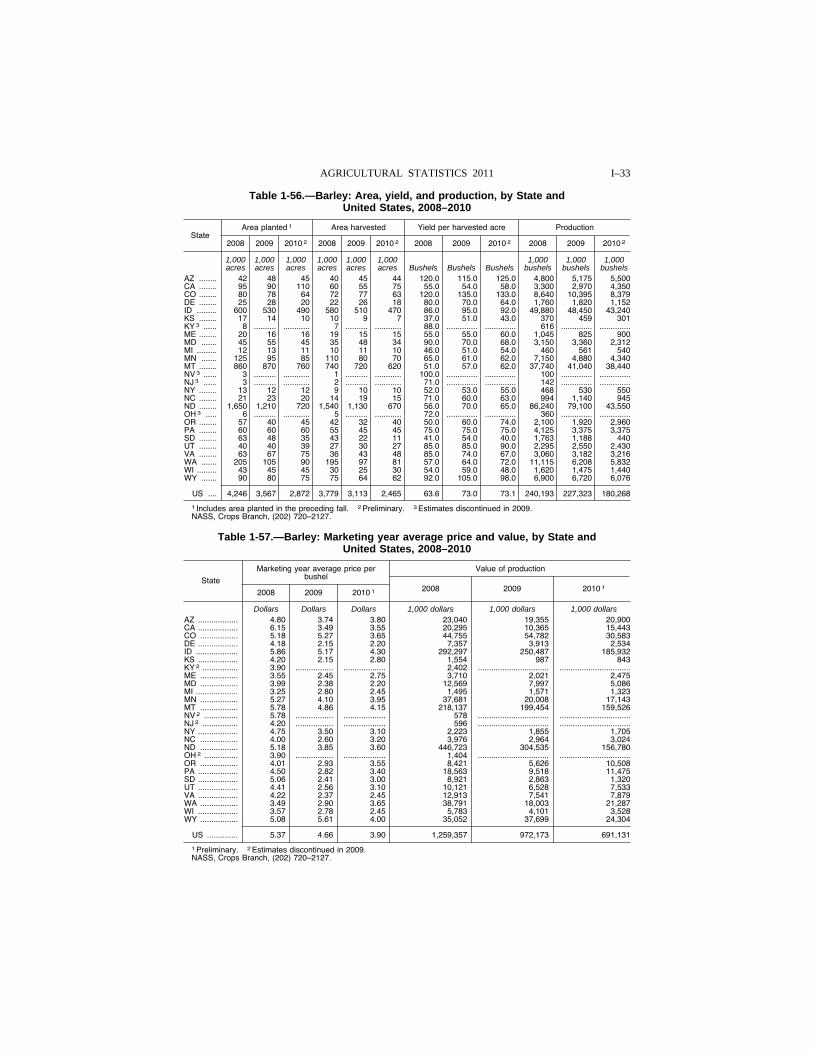
I–33 AGRICULTURAL STATISTICS 2011
Table 1-56.—Barley: Area, yield, and production, by State and United States, 2008–2010
State Area planted 1 Area harvested Yield per harvested acre Production
2008 2009 2010 2 2008 2009 2010 2 2008 2009 2010 2 2008 2009 2010 2
1,000 1,000 1,000 1,000 1,000 1,000 1,000 1,000 1,000 acres acres acres acres acres acres Bushels Bushels Bushels bushels bushels bushels
AZ ........ 42 48 45 40 45 44 120.0 115.0 125.0 4,800 5,175 5,500 CA ........ 95 90 110 60 55 75 55.0 54.0 58.0 3,300 2,970 4,350 CO ........ 80 78 64 72 77 63 120.0 135.0 133.0 8,640 10,395 8,379 DE ........ 25 28 20 22 26 18 80.0 70.0 64.0 1,760 1,820 1,152 ID ......... 600 530 490 580 510 470 86.0 95.0 92.0 49,880 48,450 43,240 KS ........ 17 14 10 10 9 7 37.0 51.0 43.0 370 459 301 KY 3 ...... 8 .......... ............ 7 .......... ............ 88.0 .............. .............. 616 .............. ..............ME ........ 20 16 16 19 15 15 55.0 55.0 60.0 1,045 825 900 MD ....... 45 55 45 35 48 34 90.0 70.0 68.0 3,150 3,360 2,312 MI ......... 12 13 11 10 11 10 46.0 51.0 54.0 460 561 540 MN ....... 125 95 85 110 80 70 65.0 61.0 62.0 7,150 4,880 4,340 MT ........ 860 870 760 740 720 620 51.0 57.0 62.0 37,740 41,040 38,440 NV 3 ...... 3 .......... ............ 1 .......... ............ 100.0 .............. .............. 100 .............. ..............NJ 3 ...... 3 .......... ............ 2 .......... ............ 71.0 .............. .............. 142 .............. ..............NY ........ 13 12 12 9 10 10 52.0 53.0 55.0 468 530 550 NC ........ 21 23 20 14 19 15 71.0 60.0 63.0 994 1,140 945 ND ........ 1,650 1,210 720 1,540 1,130 670 56.0 70.0 65.0 86,240 79,100 43,550 OH 3 ..... 6 .......... ............ 5 .......... ............ 72.0 .............. .............. 360 .............. ..............OR ........ 57 40 45 42 32 40 50.0 60.0 74.0 2,100 1,920 2,960 PA ........ 60 60 60 55 45 45 75.0 75.0 75.0 4,125 3,375 3,375 SD ........ 63 48 35 43 22 11 41.0 54.0 40.0 1,763 1,188 440 UT ........ 40 40 39 27 30 27 85.0 85.0 90.0 2,295 2,550 2,430 VA ........ 63 67 75 36 43 48 85.0 74.0 67.0 3,060 3,182 3,216 WA ....... 205 105 90 195 97 81 57.0 64.0 72.0 11,115 6,208 5,832 WI ......... 43 45 45 30 25 30 54.0 59.0 48.0 1,620 1,475 1,440 WY ....... 90 80 75 75 64 62 92.0 105.0 98.0 6,900 6,720 6,076
US .... 4,246 3,567 2,872 3,779 3,113 2,465 63.6 73.0 73.1 240,193 227,323 180,268
1 Includes area planted in the preceding fall. 2 Preliminary. 3 Estimates discontinued in 2009. NASS, Crops Branch, (202) 720–2127.
Table 1-57.—Barley: Marketing year average price and value, by State and United States, 2008–2010
State
Marketing year average price per bushel
Value of production
2008 2009 2010 1 2008 2009 2010 1
Dollars Dollars Dollars 1,000 dollars 1,000 dollars 1,000 dollars AZ .................. 4.80 3.74 3.80 23,040 19,355 20,900 CA .................. 6.15 3.49 3.55 20,295 10,365 15,443 CO ................. 5.18 5.27 3.65 44,755 54,782 30,583 DE .................. 4.18 2.15 2.20 7,357 3,913 2,534 ID ................... 5.86 5.17 4.30 292,297 250,487 185,932 KS .................. 4.20 2.15 2.80 1,554 987 843 KY 2 ................ 3.90 ................. ................... 2,402 ................................ ................................ME ................. 3.55 2.45 2.75 3,710 2,021 2,475 MD ................. 3.99 2.38 2.20 12,569 7,997 5,086 MI ................... 3.25 2.80 2.45 1,495 1,571 1,323 MN ................. 5.27 4.10 3.95 37,681 20,008 17,143 MT ................. 5.78 4.86 4.15 218,137 199,454 159,526 NV 2 ............... 5.78 ................. ................... 578 ................................ ................................NJ 2 ................ 4.20 ................. ................... 596 ................................ ................................NY .................. 4.75 3.50 3.10 2,223 1,855 1,705 NC ................. 4.00 2.60 3.20 3,976 2,964 3,024 ND ................. 5.18 3.85 3.60 446,723 304,535 156,780 OH 2 ............... 3.90 ................. ................... 1,404 ................................ ................................OR ................. 4.01 2.93 3.55 8,421 5,626 10,508 PA .................. 4.50 2.82 3.40 18,563 9,518 11,475 SD .................. 5.06 2.41 3.00 8,921 2,863 1,320 UT .................. 4.41 2.56 3.10 10,121 6,528 7,533 VA .................. 4.22 2.37 2.45 12,913 7,541 7,879 WA ................. 3.49 2.90 3.65 38,791 18,003 21,287 WI .................. 3.57 2.78 2.45 5,783 4,101 3,528 WY ................. 5.08 5.61 4.00 35,052 37,699 24,304
US .............. 5.37 4.66 3.90 1,259,357 972,173 691,131
1 Preliminary. 2 Estimates discontinued in 2009. NASS, Crops Branch, (202) 720–2127.
VerDate Aug 31 2005 11:43 Mar 12, 2012 Jkt 000000 PO 00000 Frm 00033 Fmt 1000 Sfmt 1000 H:\SHARED\DAPP\FPU\AGSTAT\MASTER~2\CHAPTR01\I-31.AG8 USDA
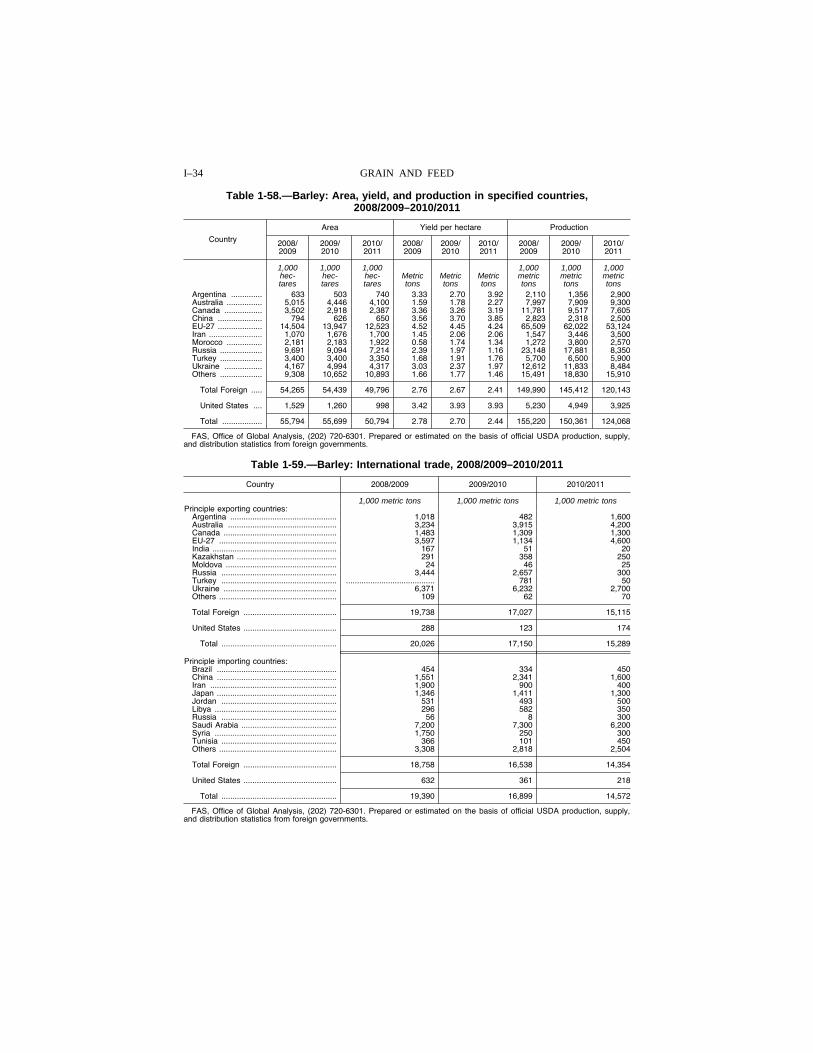
I–34 GRAIN AND FEED
Table 1-58.—Barley: Area, yield, and production in specified countries, 2008/2009–2010/2011
Country
Area Yield per hectare Production
2008/ 2009
2009/ 2010
2010/ 2011
2008/ 2009
2009/ 2010
2010/ 2011
2008/ 2009
2009/ 2010
2010/ 2011
1,000 1,000 1,000 1,000 1,000 1,000 hec- hec- hec- Metric Metric Metric metric metric metric tares tares tares tons tons tons tons tons tons
Argentina .............. 633 503 740 3.33 2.70 3.92 2,110 1,356 2,900 Australia ................ 5,015 4,446 4,100 1.59 1.78 2.27 7,997 7,909 9,300 Canada ................. 3,502 2,918 2,387 3.36 3.26 3.19 11,781 9,517 7,605 China .................... 794 626 650 3.56 3.70 3.85 2,823 2,318 2,500 EU-27 .................... 14,504 13,947 12,523 4.52 4.45 4.24 65,509 62,022 53,124 Iran ........................ 1,070 1,676 1,700 1.45 2.06 2.06 1,547 3,446 3,500 Morocco ................ 2,181 2,183 1,922 0.58 1.74 1.34 1,272 3,800 2,570 Russia ................... 9,691 9,094 7,214 2.39 1.97 1.16 23,148 17,881 8,350 Turkey ................... 3,400 3,400 3,350 1.68 1.91 1.76 5,700 6,500 5,900 Ukraine ................. 4,167 4,994 4,317 3.03 2.37 1.97 12,612 11,833 8,484 Others ................... 9,308 10,652 10,893 1.66 1.77 1.46 15,491 18,830 15,910
Total Foreign ..... 54,265 54,439 49,796 2.76 2.67 2.41 149,990 145,412 120,143
United States .... 1,529 1,260 998 3.42 3.93 3.93 5,230 4,949 3,925
Total .................. 55,794 55,699 50,794 2.78 2.70 2.44 155,220 150,361 124,068
FAS, Office of Global Analysis, (202) 720-6301. Prepared or estimated on the basis of official USDA production, supply, and distribution statistics from foreign governments.
Table 1-59.—Barley: International trade, 2008/2009–2010/2011
Country 2008/2009 2009/2010 2010/2011
1,000 metric tons 1,000 metric tons 1,000 metric tons Principle exporting countries:
Argentina ................................................ 1,018 482 1,600 Australia ................................................. 3,234 3,915 4,200 Canada ................................................... 1,483 1,309 1,300 EU-27 ..................................................... 3,597 1,134 4,600 India ........................................................ 167 51 20 Kazakhstan ............................................. 291 358 250 Moldova .................................................. 24 46 25 Russia .................................................... 3,444 2,657 300 Turkey .................................................... ........................................ 781 50 Ukraine ................................................... 6,371 6,232 2,700 Others ..................................................... 109 62 70
Total Foreign .......................................... 19,738 17,027 15,115
United States .......................................... 288 123 174
Total .................................................... 20,026 17,150 15,289
Principle importing countries: Brazil ...................................................... 454 334 450 China ...................................................... 1,551 2,341 1,600 Iran ......................................................... 1,900 900 400 Japan ...................................................... 1,346 1,411 1,300 Jordan .................................................... 531 493 500 Libya ....................................................... 296 582 350 Russia .................................................... 56 8 300 Saudi Arabia ........................................... 7,200 7,300 6,200 Syria ....................................................... 1,750 250 300 Tunisia .................................................... 366 101 450 Others ..................................................... 3,308 2,818 2,504
Total Foreign .......................................... 18,758 16,538 14,354
United States .......................................... 632 361 218
Total .................................................... 19,390 16,899 14,572
FAS, Office of Global Analysis, (202) 720-6301. Prepared or estimated on the basis of official USDA production, supply, and distribution statistics from foreign governments.
VerDate Aug 31 2005 11:43 Mar 12, 2012 Jkt 000000 PO 00000 Frm 00034 Fmt 1000 Sfmt 1000 H:\SHARED\DAPP\FPU\AGSTAT\MASTER~2\CHAPTR01\I-32.AG8 USDA
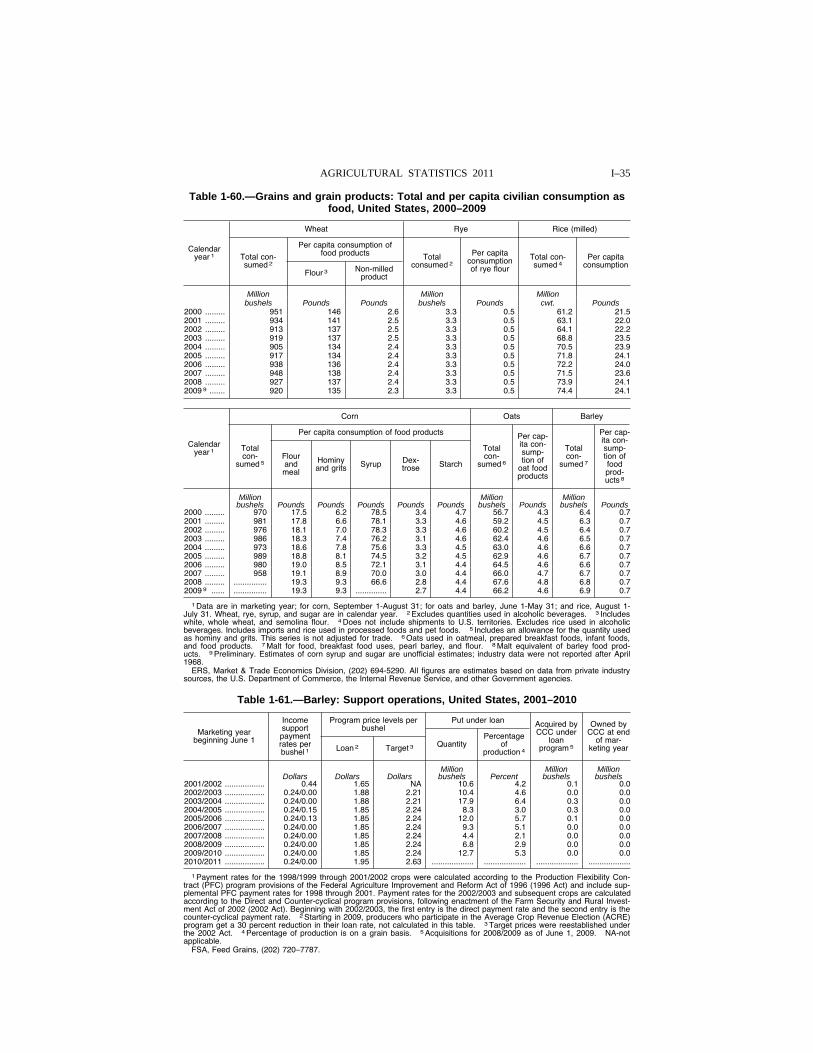
I–35 AGRICULTURAL STATISTICS 2011
Table 1-60.—Grains and grain products: Total and per capita civilian consumption as food, United States, 2000–2009
Calendar year 1
Wheat Rye Rice (milled)
Total con-sumed 2
Per capita consumption of food products Total
consumed 2
Per capita consumption of rye flour
Total con-sumed 4
Per capita consumption
Flour 3 Non-milled product
Million Million Million bushels Pounds Pounds bushels Pounds cwt. Pounds
2000 ......... 951 146 2.6 3.3 0.5 61.2 21.5 2001 ......... 934 141 2.5 3.3 0.5 63.1 22.0 2002 ......... 913 137 2.5 3.3 0.5 64.1 22.2 2003 ......... 919 137 2.5 3.3 0.5 68.8 23.5 2004 ......... 905 134 2.4 3.3 0.5 70.5 23.9 2005 ......... 917 134 2.4 3.3 0.5 71.8 24.1 2006 ......... 938 136 2.4 3.3 0.5 72.2 24.0 2007 ......... 948 138 2.4 3.3 0.5 71.5 23.6 2008 ......... 927 137 2.4 3.3 0.5 73.9 24.1 2009 9 ....... 920 135 2.3 3.3 0.5 74.4 24.1
Calendar year 1
Corn Oats Barley
Total con-
sumed 5
Per capita consumption of food products
Total con-
sumed 6
Per cap-ita con-sump-tion of
oat food products
Total con-
sumed 7
Per cap-ita con-sump-tion of food prod-ucts 8
Flour and meal
Hominy and grits Syrup Dex-
trose Starch
Million Million Million bushels Pounds Pounds Pounds Pounds Pounds bushels Pounds bushels Pounds
2000 ......... 970 17.5 6.2 78.5 3.4 4.7 56.7 4.3 6.4 0.7 2001 ......... 981 17.8 6.6 78.1 3.3 4.6 59.2 4.5 6.3 0.7 2002 ......... 976 18.1 7.0 78.3 3.3 4.6 60.2 4.5 6.4 0.7 2003 ......... 986 18.3 7.4 76.2 3.1 4.6 62.4 4.6 6.5 0.7 2004 ......... 973 18.6 7.8 75.6 3.3 4.5 63.0 4.6 6.6 0.7 2005 ......... 989 18.8 8.1 74.5 3.2 4.5 62.9 4.6 6.7 0.7 2006 ......... 980 19.0 8.5 72.1 3.1 4.4 64.5 4.6 6.6 0.7 2007 ......... 958 19.1 8.9 70.0 3.0 4.4 66.0 4.7 6.7 0.7 2008 ......... ............... 19.3 9.3 66.6 2.8 4.4 67.6 4.8 6.8 0.7 2009 9 ...... ............... 19.3 9.3 .............. 2.7 4.4 66.2 4.6 6.9 0.7
1 Data are in marketing year; for corn, September 1-August 31; for oats and barley, June 1-May 31; and rice, August 1- July 31. Wheat, rye, syrup, and sugar are in calendar year. 2 Excludes quantities used in alcoholic beverages. 3 Includes white, whole wheat, and semolina flour. 4 Does not include shipments to U.S. territories. Excludes rice used in alcoholic beverages. Includes imports and rice used in processed foods and pet foods. 5 Includes an allowance for the quantity used as hominy and grits. This series is not adjusted for trade. 6 Oats used in oatmeal, prepared breakfast foods, infant foods, and food products. 7 Malt for food, breakfast food uses, pearl barley, and flour. 8 Malt equivalent of barley food prod-ucts. 9 Preliminary. Estimates of corn syrup and sugar are unofficial estimates; industry data were not reported after April 1968.
ERS, Market & Trade Economics Division, (202) 694-5290. All figures are estimates based on data from private industry sources, the U.S. Department of Commerce, the Internal Revenue Service, and other Government agencies.
Table 1-61.—Barley: Support operations, United States, 2001–2010
Marketing year beginning June 1
Income support payment rates per bushel 1
Program price levels per bushel
Put under loan Acquired by CCC under
loan program 5
Owned by CCC at end
of mar-keting year Loan 2 Target 3 Quantity
Percentage of
production 4
Million Million Million Dollars Dollars Dollars bushels Percent bushels bushels
2001/2002 .................. 0.44 1.65 NA 10.6 4.2 0.1 0.0 2002/2003 .................. 0.24/0.00 1.88 2.21 10.4 4.6 0.0 0.0 2003/2004 .................. 0.24/0.00 1.88 2.21 17.9 6.4 0.3 0.0 2004/2005 .................. 0.24/0.15 1.85 2.24 8.3 3.0 0.3 0.0 2005/2006 .................. 0.24/0.13 1.85 2.24 12.0 5.7 0.1 0.0 2006/2007 .................. 0.24/0.00 1.85 2.24 9.3 5.1 0.0 0.0 2007/2008 .................. 0.24/0.00 1.85 2.24 4.4 2.1 0.0 0.0 2008/2009 .................. 0.24/0.00 1.85 2.24 6.8 2.9 0.0 0.0 2009/2010 .................. 0.24/0.00 1.85 2.24 12.7 5.3 0.0 0.0 2010/2011 .................. 0.24/0.00 1.95 2.63 ................... ................... ................... ...................
1 Payment rates for the 1998/1999 through 2001/2002 crops were calculated according to the Production Flexibility Con-tract (PFC) program provisions of the Federal Agriculture Improvement and Reform Act of 1996 (1996 Act) and include sup-plemental PFC payment rates for 1998 through 2001. Payment rates for the 2002/2003 and subsequent crops are calculated according to the Direct and Counter-cyclical program provisions, following enactment of the Farm Security and Rural Invest-ment Act of 2002 (2002 Act). Beginning with 2002/2003, the first entry is the direct payment rate and the second entry is the counter-cyclical payment rate. 2 Starting in 2009, producers who participate in the Average Crop Revenue Election (ACRE) program get a 30 percent reduction in their loan rate, not calculated in this table. 3 Target prices were reestablished under the 2002 Act. 4 Percentage of production is on a grain basis. 5 Acquisitions for 2008/2009 as of June 1, 2009. NA-not applicable.
FSA, Feed Grains, (202) 720–7787.
VerDate Aug 31 2005 11:43 Mar 12, 2012 Jkt 000000 PO 00000 Frm 00035 Fmt 1000 Sfmt 1000 H:\SHARED\DAPP\FPU\AGSTAT\MASTER~2\CHAPTR01\I-33.AG8 USDA
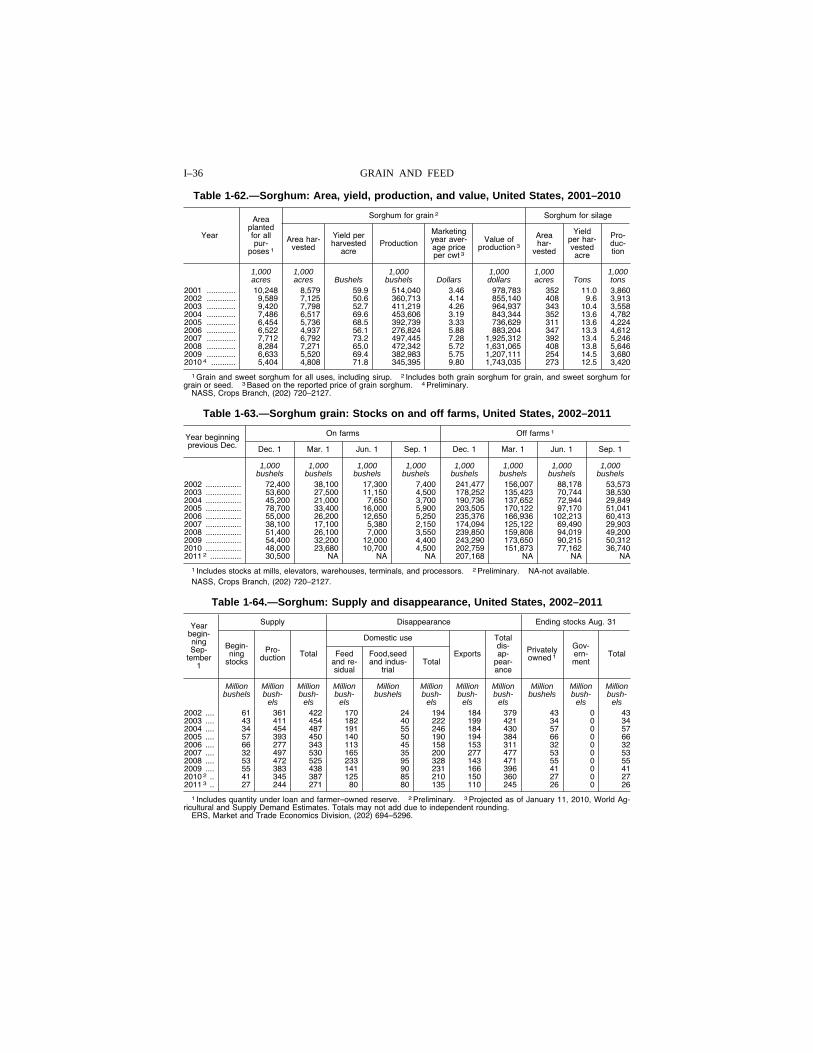
I–36 GRAIN AND FEED
Table 1-62.—Sorghum: Area, yield, production, and value, United States, 2001–2010
Year
Area planted for all pur-
poses 1
Sorghum for grain 2 Sorghum for silage
Area har-vested
Yield per harvested
acre Production
Marketing year aver-age price per cwt 3
Value of production 3
Area har-
vested
Yield per har-vested acre
Pro-duc-tion
1,000 1,000 1,000 1,000 1,000 1,000 acres acres Bushels bushels Dollars dollars acres Tons tons
2001 ............. 10,248 8,579 59.9 514,040 3 .46 978,783 352 11.0 3,860 2002 ............. 9,589 7,125 50.6 360,713 4 .14 855,140 408 9.6 3,913 2003 ............. 9,420 7,798 52.7 411,219 4 .26 964,937 343 10.4 3,558 2004 ............. 7,486 6,517 69.6 453,606 3 .19 843,344 352 13.6 4,782 2005 ............. 6,454 5,736 68.5 392,739 3 .33 736,629 311 13.6 4,224 2006 ............. 6,522 4,937 56.1 276,824 5 .88 883,204 347 13.3 4,612 2007 ............. 7,712 6,792 73.2 497,445 7 .28 1,925,312 392 13.4 5,246 2008 ............. 8,284 7,271 65.0 472,342 5 .72 1,631,065 408 13.8 5,646 2009 ............. 6,633 5,520 69.4 382,983 5 .75 1,207,111 254 14.5 3,680 2010 4 ........... 5,404 4,808 71.8 345,395 9 .80 1,743,035 273 12.5 3,420
1 Grain and sweet sorghum for all uses, including sirup. 2 Includes both grain sorghum for grain, and sweet sorghum for grain or seed. 3 Based on the reported price of grain sorghum. 4 Preliminary.
NASS, Crops Branch, (202) 720–2127.
Table 1-63.—Sorghum grain: Stocks on and off farms, United States, 2002–2011
Year beginning previous Dec.
On farms Off farms 1
Dec. 1 Mar. 1 Jun. 1 Sep. 1 Dec. 1 Mar. 1 Jun. 1 Sep. 1
1,000 1,000 1,000 1,000 1,000 1,000 1,000 1,000 bushels bushels bushels bushels bushels bushels bushels bushels
2002 ................ 72,400 38,100 17,300 7,400 241,477 156,007 88,178 53,573 2003 ................ 53,600 27,500 11,150 4,500 178,252 135,423 70,744 38,530 2004 ................ 45,200 21,000 7,650 3,700 190,736 137,652 72,944 29,849 2005 ................ 78,700 33,400 16,000 5,900 203,505 170,122 97,170 51,041 2006 ................ 55,000 26,200 12,650 5,250 235,376 166,936 102,213 60,413 2007 ................ 38,100 17,100 5,380 2,150 174,094 125,122 69,490 29,903 2008 ................ 51,400 26,100 7,000 3,550 239,850 159,808 94,019 49,200 2009 ................ 54,400 32,200 12,000 4,400 243,290 173,650 90,215 50,312 2010 ................ 48,000 23,680 10,700 4,500 202,759 151,873 77,162 36,740 2011 2 .............. 30,500 NA NA NA 207,168 NA NA NA
1 Includes stocks at mills, elevators, warehouses, terminals, and processors. 2 Preliminary. NA-not available. NASS, Crops Branch, (202) 720–2127.
Table 1-64.—Sorghum: Supply and disappearance, United States, 2002–2011
Year begin-ning Sep-
tember 1
Supply Disappearance Ending stocks Aug. 31
Begin-ning
stocks
Pro-duction Total
Domestic use
Exports
Total dis-ap-
pear-ance
Privately owned 1
Gov-ern-ment
Total Feed and re-sidual
Food,seed and indus-
trial Total
Million Million Million Million Million Million Million Million Million Million Million bushels bush-
els bush-
els bush-
els bushels bush-
els bush-
els bush-
els bushels bush-
els bush-
els 2002 .... 61 361 422 170 24 194 184 379 43 0 43 2003 .... 43 411 454 182 40 222 199 421 34 0 34 2004 .... 34 454 487 191 55 246 184 430 57 0 57 2005 .... 57 393 450 140 50 190 194 384 66 0 66 2006 .... 66 277 343 113 45 158 153 311 32 0 32 2007 .... 32 497 530 165 35 200 277 477 53 0 53 2008 .... 53 472 525 233 95 328 143 471 55 0 55 2009 .... 55 383 438 141 90 231 166 396 41 0 41 2010 2 .. 41 345 387 125 85 210 150 360 27 0 27 2011 3 .. 27 244 271 80 80 135 110 245 26 0 26
1 Includes quantity under loan and farmer–owned reserve. 2 Preliminary. 3 Projected as of January 11, 2010, World Ag-ricultural and Supply Demand Estimates. Totals may not add due to independent rounding.
ERS, Market and Trade Economics Division, (202) 694–5296.
VerDate Aug 31 2005 11:43 Mar 12, 2012 Jkt 000000 PO 00000 Frm 00036 Fmt 1000 Sfmt 1000 H:\SHARED\DAPP\FPU\AGSTAT\MASTER~2\CHAPTR01\I-34.AG8 USDA
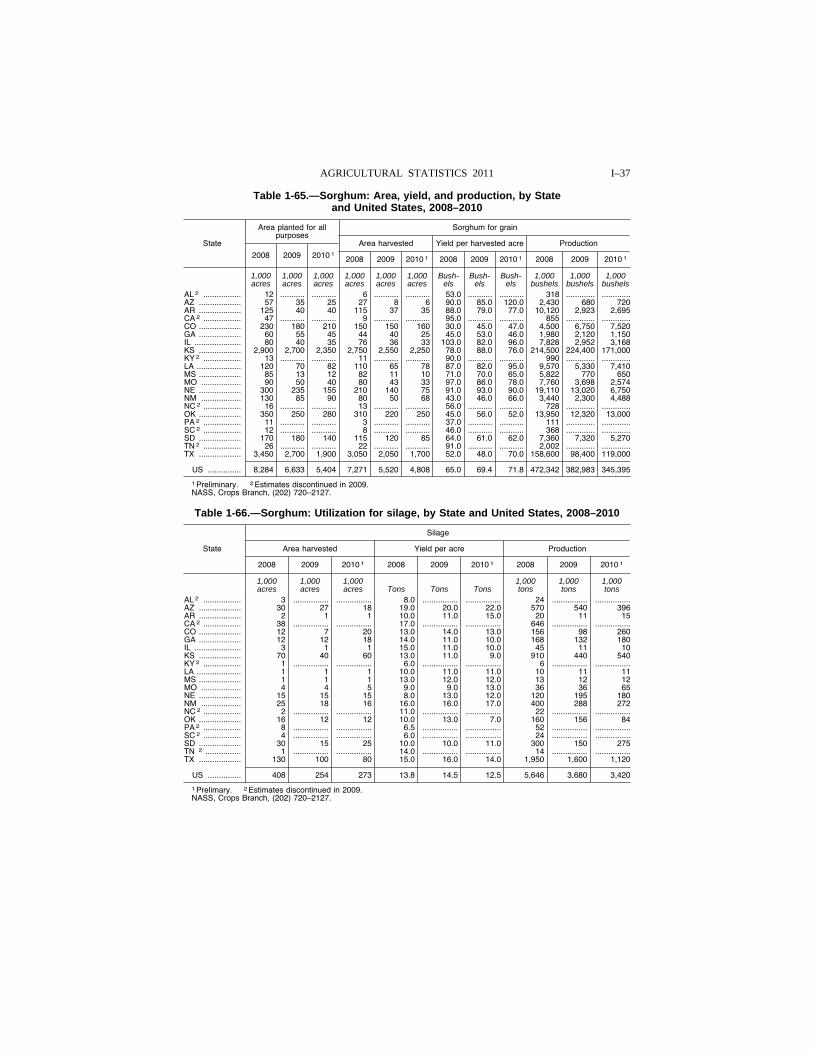
I–37 AGRICULTURAL STATISTICS 2011
Table 1-65.—Sorghum: Area, yield, and production, by State and United States, 2008–2010
State
Area planted for all purposes
Sorghum for grain
2008 2009 2010 1
Area harvested Yield per harvested acre Production
2008 2009 2010 1 2008 2009 2010 1 2008 2009 2010 1
1,000 1,000 1,000 1,000 1,000 1,000 Bush- Bush- Bush- 1,000 1,000 1,000 acres acres acres acres acres acres els els els bushels bushels bushels
AL 2 ................. 12 ........... ........... 6 ........... ........... 53.0 ........... ........... 318 ............. .............AZ ................... 57 35 25 27 8 6 90.0 85.0 120.0 2,430 680 720 AR ................... 125 40 40 115 37 35 88.0 79.0 77.0 10,120 2,923 2,695 CA 2 ................. 47 ........... ........... 9 ........... ........... 95.0 ........... ........... 855 ............. .............CO ................... 230 180 210 150 150 160 30.0 45.0 47.0 4,500 6,750 7,520 GA ................... 60 55 45 44 40 25 45.0 53.0 46.0 1,980 2,120 1,150 IL ..................... 80 40 35 76 36 33 103.0 82.0 96.0 7,828 2,952 3,168 KS ................... 2,900 2,700 2,350 2,750 2,550 2,250 78.0 88.0 76.0 214,500 224,400 171,000 KY 2 ................. 13 ........... ........... 11 ........... ........... 90.0 ........... ........... 990 ............. .............LA .................... 120 70 82 110 65 78 87.0 82.0 95.0 9,570 5,330 7,410 MS ................... 85 13 12 82 11 10 71.0 70.0 65.0 5,822 770 650 MO .................. 90 50 40 80 43 33 97.0 86.0 78.0 7,760 3,698 2,574 NE ................... 300 235 155 210 140 75 91.0 93.0 90.0 19,110 13,020 6,750 NM .................. 130 85 90 80 50 68 43.0 46.0 66.0 3,440 2,300 4,488 NC 2 ................. 16 ........... ........... 13 ........... ........... 56.0 ........... ........... 728 ............. .............OK ................... 350 250 280 310 220 250 45.0 56.0 52.0 13,950 12,320 13,000 PA 2 ................. 11 ........... ........... 3 ........... ........... 37.0 ........... ........... 111 ............. .............SC 2 ................. 12 ........... ........... 8 ........... ........... 46.0 ........... ........... 368 ............. .............SD ................... 170 180 140 115 120 85 64.0 61.0 62.0 7,360 7,320 5,270 TN 2 ................. 26 ........... ........... 22 ........... ........... 91.0 ........... ........... 2,002 ............. .............TX ................... 3,450 2,700 1,900 3,050 2,050 1,700 52.0 48.0 70.0 158,600 98,400 119,000
US ............... 8,284 6,633 5,404 7,271 5,520 4,808 65.0 69.4 71.8 472,342 382,983 345,395
1 Preliminary. 2 Estimates discontinued in 2009. NASS, Crops Branch, (202) 720–2127.
Table 1-66.—Sorghum: Utilization for silage, by State and United States, 2008–2010
State
Silage
Area harvested Yield per acre Production
2008 2009 2010 1 2008 2009 2010 1 2008 2009 2010 1
1,000 1,000 1,000 1,000 1,000 1,000 acres acres acres Tons Tons Tons tons tons tons
AL 2 ................. 3 ................ ................ 8.0 ................ ................ 24 ................ ................AZ ................... 30 27 18 19.0 20.0 22.0 570 540 396 AR ................... 2 1 1 10.0 11.0 15.0 20 11 15 CA 2 ................. 38 ................ ................ 17.0 ................ ................ 646 ................ ................CO ................... 12 7 20 13.0 14.0 13.0 156 98 260 GA ................... 12 12 18 14.0 11.0 10.0 168 132 180 IL ..................... 3 1 1 15.0 11.0 10.0 45 11 10 KS ................... 70 40 60 13.0 11.0 9.0 910 440 540 KY 2 ................. 1 ................ ................ 6.0 ................ ................ 6 ................ ................LA .................... 1 1 1 10.0 11.0 11.0 10 11 11 MS ................... 1 1 1 13.0 12.0 12.0 13 12 12 MO .................. 4 4 5 9.0 9.0 13.0 36 36 65 NE ................... 15 15 15 8.0 13.0 12.0 120 195 180 NM .................. 25 18 16 16.0 16.0 17.0 400 288 272 NC 2 ................. 2 ................ ................ 11.0 ................ ................ 22 ................ ................OK ................... 16 12 12 10.0 13.0 7.0 160 156 84 PA 2 ................. 8 ................ ................ 6.5 ................ ................ 52 ................ ................SC 2 ................. 4 ................ ................ 6.0 ................ ................ 24 ................ ................SD ................... 30 15 25 10.0 10.0 11.0 300 150 275 TN 2 ................ 1 ................ ................ 14.0 ................ ................ 14 ................ ................TX ................... 130 100 80 15.0 16.0 14.0 1,950 1,600 1,120
US ............... 408 254 273 13.8 14.5 12.5 5,646 3,680 3,420
1 Prelimary. 2 Estimates discontinued in 2009. NASS, Crops Branch, (202) 720–2127.
VerDate Aug 31 2005 11:43 Mar 12, 2012 Jkt 000000 PO 00000 Frm 00037 Fmt 1000 Sfmt 1000 H:\SHARED\DAPP\FPU\AGSTAT\MASTER~2\CHAPTR01\I-35.AG8 USDA
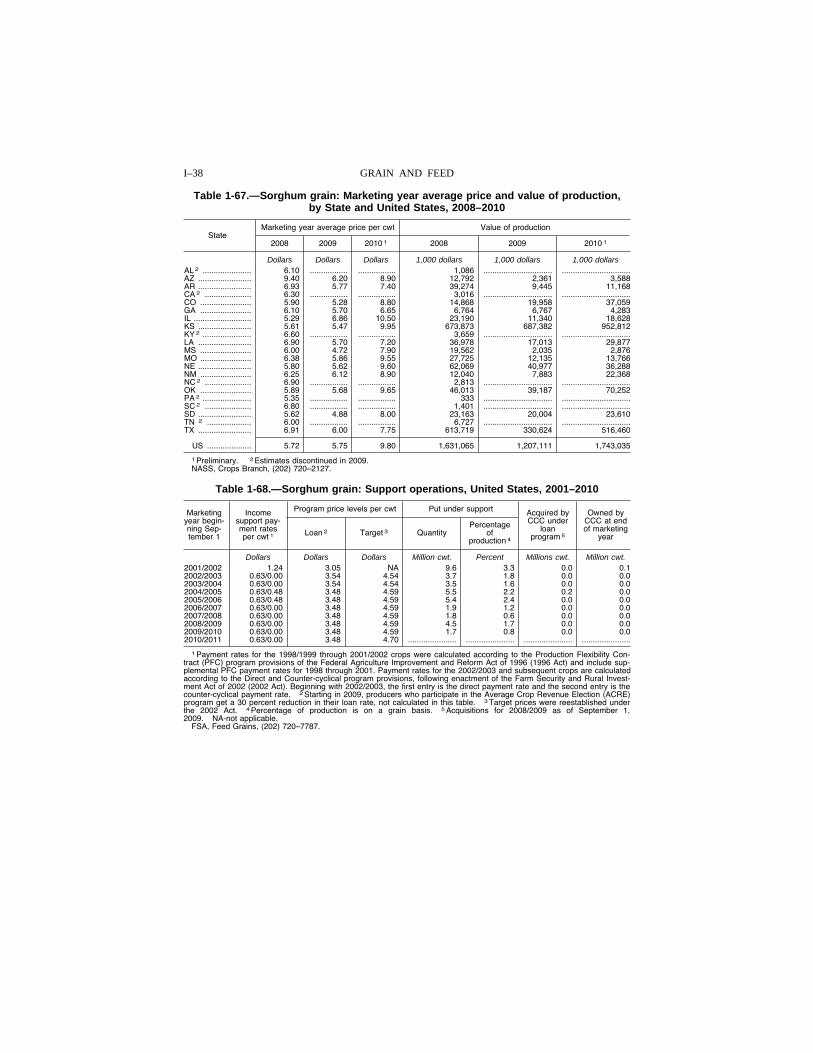
I–38 GRAIN AND FEED
Table 1-67.—Sorghum grain: Marketing year average price and value of production, by State and United States, 2008–2010
State Marketing year average price per cwt Value of production
2008 2009 2010 1 2008 2009 2010 1
Dollars Dollars Dollars 1,000 dollars 1,000 dollars 1,000 dollars AL 2 ...................... 6.10 ................. ................. 1,086 ............................... ...............................AZ ........................ 9.40 6.20 8.90 12,792 2,361 3,588 AR ........................ 6.93 5.77 7.40 39,274 9,445 11,168 CA 2 ..................... 6.30 ................. ................. 3,016 ............................... ...............................CO ....................... 5.90 5.28 8.80 14,868 19,958 37,059 GA ....................... 6.10 5.70 6.65 6,764 6,767 4,283 IL .......................... 5.29 6.86 10.50 23,190 11,340 18,628 KS ........................ 5.61 5.47 9.95 673,873 687,382 952,812 KY 2 ...................... 6.60 ................. ................. 3,659 ............................... ...............................LA ........................ 6.90 5.70 7.20 36,978 17,013 29,877 MS ....................... 6.00 4.72 7.90 19,562 2,035 2,876 MO ....................... 6.38 5.86 9.55 27,725 12,135 13,766 NE ........................ 5.80 5.62 9.60 62,069 40,977 36,288 NM ....................... 6.25 6.12 8.90 12,040 7,883 22,368 NC 2 ..................... 6.90 ................. ................. 2,813 ............................... ...............................OK ....................... 5.89 5.68 9.65 46,013 39,187 70,252 PA 2 ...................... 5.35 ................. ................. 333 ............................... ...............................SC 2 ..................... 6.80 ................. ................. 1,401 ............................... ...............................SD ........................ 5.62 4.88 8.00 23,163 20,004 23,610 TN 2 .................... 6.00 ................. ................. 6,727 ............................... ...............................TX ........................ 6.91 6.00 7.75 613,719 330,624 516,460
US .................... 5.72 5.75 9.80 1,631,065 1,207,111 1,743,035
1 Preliminary. 2 Estimates discontinued in 2009. NASS, Crops Branch, (202) 720–2127.
Table 1-68.—Sorghum grain: Support operations, United States, 2001–2010
Marketing year begin-ning Sep-tember 1
Income support pay-ment rates per cwt 1
Program price levels per cwt Put under support Acquired by CCC under
loan program 5
Owned by CCC at end of marketing
year Loan 2 Target 3 Quantity Percentage
of production 4
Dollars Dollars Dollars Million cwt. Percent Millions cwt. Million cwt. 2001/2002 1.24 3.05 NA 9.6 3.3 0.0 0.1 2002/2003 0.63/0.00 3.54 4.54 3.7 1.8 0.0 0.0 2003/2004 0.63/0.00 3.54 4.54 3.5 1.6 0.0 0.0 2004/2005 0.63/0.48 3.48 4.59 5.5 2.2 0.2 0.0 2005/2006 0.63/0.48 3.48 4.59 5.4 2.4 0.0 0.0 2006/2007 0.63/0.00 3.48 4.59 1.9 1.2 0.0 0.0 2007/2008 0.63/0.00 3.48 4.59 1.8 0.6 0.0 0.0 2008/2009 0.63/0.00 3.48 4.59 4.5 1.7 0.0 0.0 2009/2010 0.63/0.00 3.48 4.59 1.7 0.8 0.0 0.0 2010/2011 0.63/0.00 3.48 4.70 ...................... ...................... ...................... ......................
1 Payment rates for the 1998/1999 through 2001/2002 crops were calculated according to the Production Flexibility Con-tract (PFC) program provisions of the Federal Agriculture Improvement and Reform Act of 1996 (1996 Act) and include sup-plemental PFC payment rates for 1998 through 2001. Payment rates for the 2002/2003 and subsequent crops are calculated according to the Direct and Counter-cyclical program provisions, following enactment of the Farm Security and Rural Invest-ment Act of 2002 (2002 Act). Beginning with 2002/2003, the first entry is the direct payment rate and the second entry is the counter-cyclical payment rate. 2 Starting in 2009, producers who participate in the Average Crop Revenue Election (ACRE) program get a 30 percent reduction in their loan rate, not calculated in this table. 3 Target prices were reestablished under the 2002 Act. 4 Percentage of production is on a grain basis. 5 Acquisitions for 2008/2009 as of September 1, 2009. NA-not applicable.
FSA, Feed Grains, (202) 720–7787.
VerDate Aug 31 2005 11:43 Mar 12, 2012 Jkt 000000 PO 00000 Frm 00038 Fmt 1000 Sfmt 1000 H:\SHARED\DAPP\FPU\AGSTAT\MASTER~2\CHAPTR01\I-36.AG8 USDA
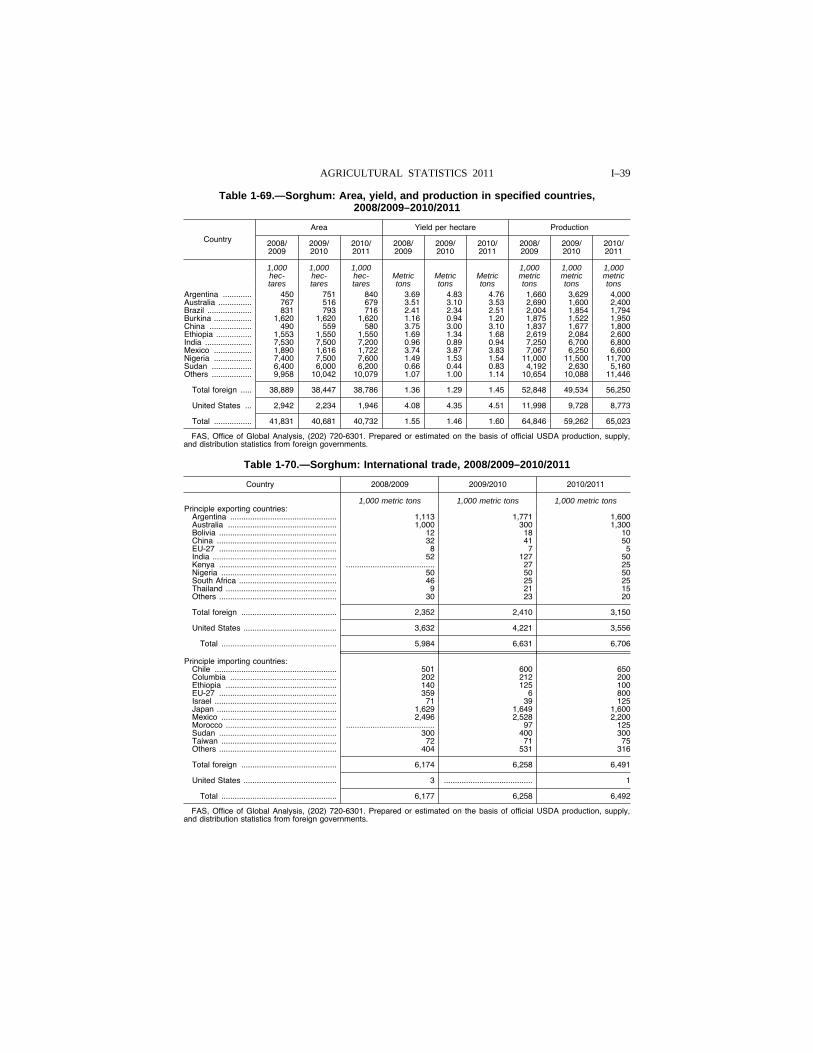
I–39 AGRICULTURAL STATISTICS 2011
Table 1-69.—Sorghum: Area, yield, and production in specified countries, 2008/2009–2010/2011
Country
Area Yield per hectare Production
2008/ 2009
2009/ 2010
2010/ 2011
2008/ 2009
2009/ 2010
2010/ 2011
2008/ 2009
2009/ 2010
2010/ 2011
1,000 1,000 1,000 1,000 1,000 1,000 hec- hec- hec- Metric Metric Metric metric metric metric tares tares tares tons tons tons tons tons tons
Argentina ............. 450 751 840 3.69 4.83 4.76 1,660 3,629 4,000 Australia ............... 767 516 679 3.51 3.10 3.53 2,690 1,600 2,400 Brazil .................... 831 793 716 2.41 2.34 2.51 2,004 1,854 1,794 Burkina ................. 1,620 1,620 1,620 1.16 0.94 1.20 1,875 1,522 1,950 China ................... 490 559 580 3.75 3.00 3.10 1,837 1,677 1,800 Ethiopia ................ 1,553 1,550 1,550 1.69 1.34 1.68 2,619 2,084 2,600 India ..................... 7,530 7,500 7,200 0.96 0.89 0.94 7,250 6,700 6,800 Mexico ................. 1,890 1,616 1,722 3.74 3.87 3.83 7,067 6,250 6,600 Nigeria ................. 7,400 7,500 7,600 1.49 1.53 1.54 11,000 11,500 11,700 Sudan .................. 6,400 6,000 6,200 0.66 0.44 0.83 4,192 2,630 5,160 Others .................. 9,958 10,042 10,079 1.07 1.00 1.14 10,654 10,088 11,446
Total foreign ..... 38,889 38,447 38,786 1.36 1.29 1.45 52,848 49,534 56,250
United States ... 2,942 2,234 1,946 4.08 4.35 4.51 11,998 9,728 8,773
Total ................. 41,831 40,681 40,732 1.55 1.46 1.60 64,846 59,262 65,023
FAS, Office of Global Analysis, (202) 720-6301. Prepared or estimated on the basis of official USDA production, supply, and distribution statistics from foreign governments.
Table 1-70.—Sorghum: International trade, 2008/2009–2010/2011
Country 2008/2009 2009/2010 2010/2011
1,000 metric tons 1,000 metric tons 1,000 metric tons Principle exporting countries:
Argentina ................................................ 1,113 1,771 1,600 Australia ................................................. 1,000 300 1,300 Bolivia ..................................................... 12 18 10 China ...................................................... 32 41 50 EU-27 ..................................................... 8 7 5 India ........................................................ 52 127 50 Kenya ..................................................... ........................................ 27 25 Nigeria .................................................... 50 50 50 South Africa ............................................ 46 25 25 Thailand .................................................. 9 21 15 Others ..................................................... 30 23 20
Total foreign ........................................... 2,352 2,410 3,150
United States .......................................... 3,632 4,221 3,556
Total .................................................... 5,984 6,631 6,706
Principle importing countries: Chile ....................................................... 501 600 650 Columbia ................................................ 202 212 200 Ethiopia .................................................. 140 125 100 EU-27 ..................................................... 359 6 800 Israel ....................................................... 71 39 125 Japan ...................................................... 1,629 1,649 1,600 Mexico .................................................... 2,496 2,528 2,200 Morocco .................................................. ........................................ 97 125 Sudan ..................................................... 300 400 300 Taiwan .................................................... 72 71 75 Others ..................................................... 404 531 316
Total foreign ........................................... 6,174 6,258 6,491
United States .......................................... 3 ........................................ 1
Total .................................................... 6,177 6,258 6,492
FAS, Office of Global Analysis, (202) 720-6301. Prepared or estimated on the basis of official USDA production, supply, and distribution statistics from foreign governments.
VerDate Aug 31 2005 11:43 Mar 12, 2012 Jkt 000000 PO 00000 Frm 00039 Fmt 1000 Sfmt 1000 H:\SHARED\DAPP\FPU\AGSTAT\MASTER~2\CHAPTR01\I-37.AG8 USDA
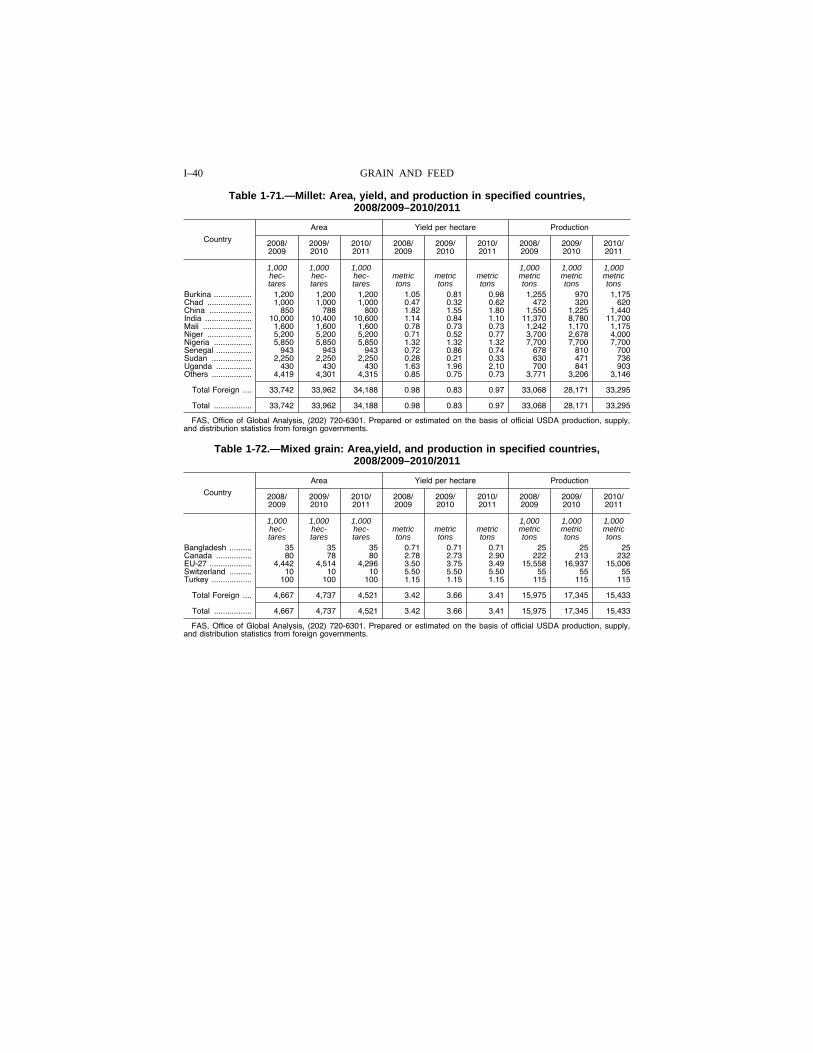
I–40 GRAIN AND FEED
Table 1-71.—Millet: Area, yield, and production in specified countries, 2008/2009–2010/2011
Country
Area Yield per hectare Production
2008/ 2009
2009/ 2010
2010/ 2011
2008/ 2009
2009/ 2010
2010/ 2011
2008/ 2009
2009/ 2010
2010/ 2011
1,000 1,000 1,000 1,000 1,000 1,000 hec- hec- hec- metric metric metric metric metric metric tares tares tares tons tons tons tons tons tons
Burkina ................. 1,200 1,200 1,200 1.05 0.81 0.98 1,255 970 1,175 Chad .................... 1,000 1,000 1,000 0.47 0.32 0.62 472 320 620 China ................... 850 788 800 1.82 1.55 1.80 1,550 1,225 1,440 India ..................... 10,000 10,400 10,600 1.14 0.84 1.10 11,370 8,780 11,700 Mali ...................... 1,600 1,600 1,600 0.78 0.73 0.73 1,242 1,170 1,175 Niger .................... 5,200 5,200 5,200 0.71 0.52 0.77 3,700 2,678 4,000 Nigeria ................. 5,850 5,850 5,850 1.32 1.32 1.32 7,700 7,700 7,700 Senegal ................ 943 943 943 0.72 0.86 0.74 678 810 700 Sudan .................. 2,250 2,250 2,250 0.28 0.21 0.33 630 471 736 Uganda ................ 430 430 430 1.63 1.96 2.10 700 841 903 Others .................. 4,419 4,301 4,315 0.85 0.75 0.73 3,771 3,206 3,146
Total Foreign .... 33,742 33,962 34,188 0.98 0.83 0.97 33,068 28,171 33,295
Total ................. 33,742 33,962 34,188 0.98 0.83 0.97 33,068 28,171 33,295
FAS, Office of Global Analysis, (202) 720-6301. Prepared or estimated on the basis of official USDA production, supply, and distribution statistics from foreign governments.
Table 1-72.—Mixed grain: Area,yield, and production in specified countries, 2008/2009–2010/2011
Country
Area Yield per hectare Production
2008/ 2009
2009/ 2010
2010/ 2011
2008/ 2009
2009/ 2010
2010/ 2011
2008/ 2009
2009/ 2010
2010/ 2011
1,000 1,000 1,000 1,000 1,000 1,000 hec- hec- hec- metric metric metric metric metric metric tares tares tares tons tons tons tons tons tons
Bangladesh .......... 35 35 35 0.71 0.71 0.71 25 25 25 Canada ................ 80 78 80 2.78 2.73 2.90 222 213 232 EU-27 ................... 4,442 4,514 4,296 3.50 3.75 3.49 15,558 16,937 15,006 Switzerland .......... 10 10 10 5.50 5.50 5.50 55 55 55 Turkey .................. 100 100 100 1.15 1.15 1.15 115 115 115
Total Foreign .... 4,667 4,737 4,521 3.42 3.66 3.41 15,975 17,345 15,433
Total ................. 4,667 4,737 4,521 3.42 3.66 3.41 15,975 17,345 15,433
FAS, Office of Global Analysis, (202) 720-6301. Prepared or estimated on the basis of official USDA production, supply, and distribution statistics from foreign governments.
VerDate Aug 31 2005 11:43 Mar 12, 2012 Jkt 000000 PO 00000 Frm 00040 Fmt 1000 Sfmt 1000 H:\SHARED\DAPP\FPU\AGSTAT\MASTER~2\CHAPTR01\I-38.AG8 USDA
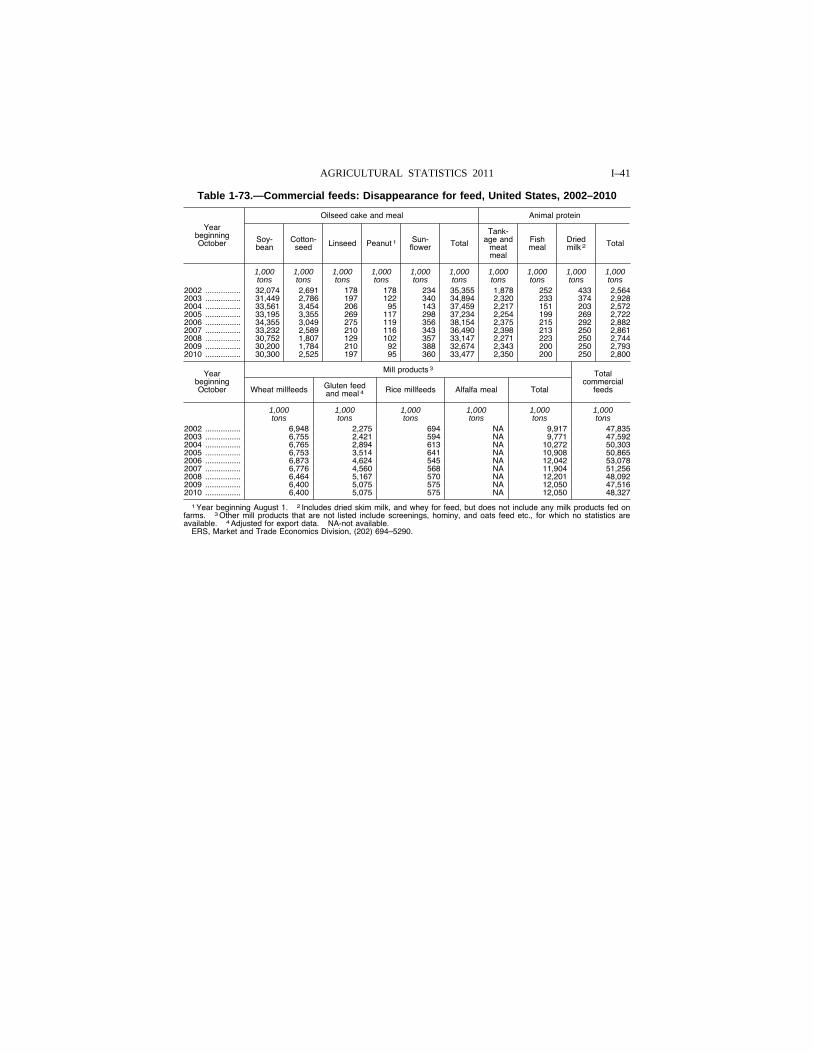
I–41 AGRICULTURAL STATISTICS 2011
Table 1-73.—Commercial feeds: Disappearance for feed, United States, 2002–2010
Year beginning October
Oilseed cake and meal Animal protein
Soy-bean
Cotton-seed Linseed Peanut 1 Sun-
flower Total
Tank-age and
meat meal
Fish meal
Dried milk 2 Total
1,000 1,000 1,000 1,000 1,000 1,000 1,000 1,000 1,000 1,000 tons tons tons tons tons tons tons tons tons tons
2002 ................ 32,074 2,691 178 178 234 35,355 1,878 252 433 2,564 2003 ................ 31,449 2,786 197 122 340 34,894 2,320 233 374 2,928 2004 ................ 33,561 3,454 206 95 143 37,459 2,217 151 203 2,572 2005 ................ 33,195 3,355 269 117 298 37,234 2,254 199 269 2,722 2006 ................ 34,355 3,049 275 119 356 38,154 2,375 215 292 2,882 2007 ................ 33,232 2,589 210 116 343 36,490 2,398 213 250 2,861 2008 ................ 30,752 1,807 129 102 357 33,147 2,271 223 250 2,744 2009 ................ 30,200 1,784 210 92 388 32,674 2,343 200 250 2,793 2010 ................ 30,300 2,525 197 95 360 33,477 2,350 200 250 2,800
Year beginning October
Mill products 3 Total commercial
feeds Wheat millfeeds Gluten feed and meal 4 Rice millfeeds Alfalfa meal Total
1,000 1,000 1,000 1,000 1,000 1,000 tons tons tons tons tons tons
2002 ................ 6,948 2,275 694 NA 9,917 47,835 2003 ................ 6,755 2,421 594 NA 9,771 47,592 2004 ................ 6,765 2,894 613 NA 10,272 50,303 2005 ................ 6,753 3,514 641 NA 10,908 50,865 2006 ................ 6,873 4,624 545 NA 12,042 53,078 2007 ................ 6,776 4,560 568 NA 11,904 51,256 2008 ................ 6,464 5,167 570 NA 12,201 48,092 2009 ................ 6,400 5,075 575 NA 12,050 47,516 2010 ................ 6,400 5,075 575 NA 12,050 48,327
1 Year beginning August 1. 2 Includes dried skim milk, and whey for feed, but does not include any milk products fed on farms. 3 Other mill products that are not listed include screenings, hominy, and oats feed etc., for which no statistics are available. 4 Adjusted for export data. NA-not available.
ERS, Market and Trade Economics Division, (202) 694–5290.
VerDate Aug 31 2005 11:43 Mar 12, 2012 Jkt 000000 PO 00000 Frm 00041 Fmt 1000 Sfmt 1000 H:\SHARED\DAPP\FPU\AGSTAT\MASTER~2\CHAPTR01\I-39.AG8 USDA
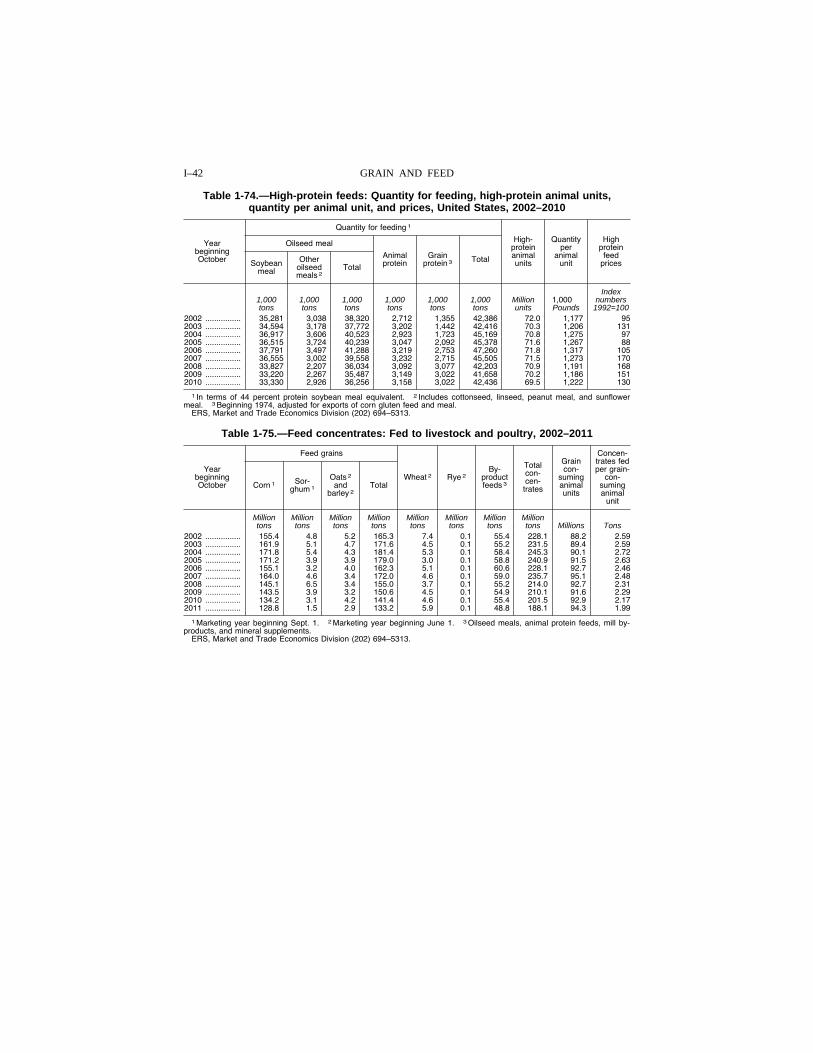
I–42 GRAIN AND FEED
Table 1-74.—High-protein feeds: Quantity for feeding, high-protein animal units, quantity per animal unit, and prices, United States, 2002–2010
Year beginning October
Quantity for feeding 1
High- protein animal units
Quantity per
animal unit
High protein
feed prices
Oilseed meal
Animal protein
Grain protein 3 Total Soybean
meal
Other oilseed meals 2
Total
Index 1,000 1,000 1,000 1,000 1,000 1,000 Million 1,000 numbers tons tons tons tons tons tons units Pounds 1992=100
2002 ................ 35,281 3,038 38,320 2,712 1,355 42,386 72.0 1,177 95 2003 ................ 34,594 3,178 37,772 3,202 1,442 42,416 70.3 1,206 131 2004 ................ 36,917 3,606 40,523 2,923 1,723 45,169 70.8 1,275 97 2005 ................ 36,515 3,724 40,239 3,047 2,092 45,378 71.6 1,267 88 2006 ................ 37,791 3,497 41,288 3,219 2,753 47,260 71.8 1,317 105 2007 ................ 36,555 3,002 39,558 3,232 2,715 45,505 71.5 1,273 170 2008 ................ 33,827 2,207 36,034 3,092 3,077 42,203 70.9 1,191 168 2009 ................ 33,220 2,267 35,487 3,149 3,022 41,658 70.2 1,186 151 2010 ................ 33,330 2,926 36,256 3,158 3,022 42,436 69.5 1,222 130
1 In terms of 44 percent protein soybean meal equivalent. 2 Includes cottonseed, linseed, peanut meal, and sunflower meal. 3 Beginning 1974, adjusted for exports of corn gluten feed and meal.
ERS, Market and Trade Economics Division (202) 694–5313.
Table 1-75.—Feed concentrates: Fed to livestock and poultry, 2002–2011
Year beginning October
Feed grains
Wheat 2 Rye 2 By-
product feeds 3
Total con-cen-
trates
Grain con-
suming animal units
Concen- trates fed per grain-
con-suming animal
unit
Corn 1 Sor-ghum 1
Oats 2 and
barley 2 Total
Million Million Million Million Million Million Million Million tons tons tons tons tons tons tons tons Millions Tons
2002 ................ 155.4 4.8 5.2 165.3 7.4 0.1 55.4 228.1 88.2 2.59 2003 ................ 161.9 5.1 4.7 171.6 4.5 0.1 55.2 231.5 89.4 2.59 2004 ................ 171.8 5.4 4.3 181.4 5.3 0.1 58.4 245.3 90.1 2.72 2005 ................ 171.2 3.9 3.9 179.0 3.0 0.1 58.8 240.9 91.5 2.63 2006 ................ 155.1 3.2 4.0 162.3 5.1 0.1 60.6 228.1 92.7 2.46 2007 ................ 164.0 4.6 3.4 172.0 4.6 0.1 59.0 235.7 95.1 2.48 2008 ................ 145.1 6.5 3.4 155.0 3.7 0.1 55.2 214.0 92.7 2.31 2009 ................ 143.5 3.9 3.2 150.6 4.5 0.1 54.9 210.1 91.6 2.29 2010 ................ 134.2 3.1 4.2 141.4 4.6 0.1 55.4 201.5 92.9 2.17 2011 ................ 128.8 1.5 2.9 133.2 5.9 0.1 48.8 188.1 94.3 1.99
1 Marketing year beginning Sept. 1. 2 Marketing year beginning June 1. 3 Oilseed meals, animal protein feeds, mill by-products, and mineral supplements.
ERS, Market and Trade Economics Division (202) 694–5313.
VerDate Aug 31 2005 11:43 Mar 12, 2012 Jkt 000000 PO 00000 Frm 00042 Fmt 1000 Sfmt 1000 H:\SHARED\DAPP\FPU\AGSTAT\MASTER~2\CHAPTR01\I-40.AG8 USDA
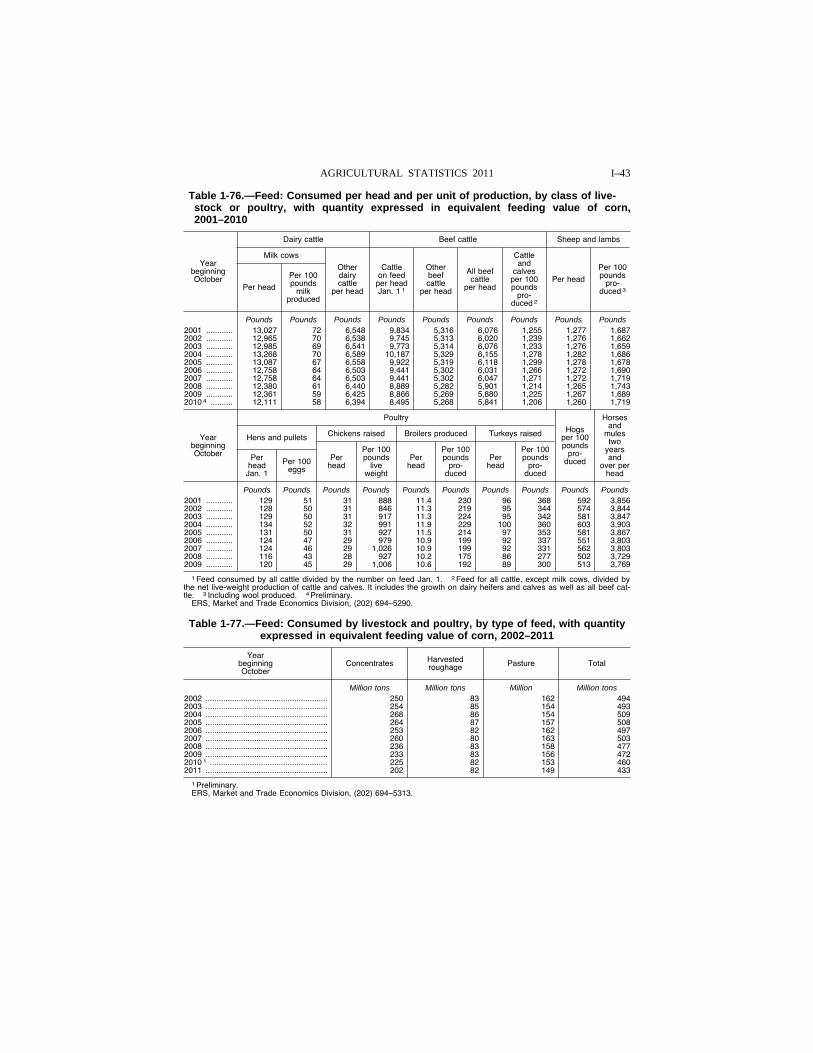
I–43 AGRICULTURAL STATISTICS 2011
Table 1-76.—Feed: Consumed per head and per unit of production, by class of live-stock or poultry, with quantity expressed in equivalent feeding value of corn, 2001–2010
Year beginning October
Dairy cattle Beef cattle Sheep and lambs
Milk cows
Other dairy cattle
per head
Cattle on feed
per head Jan. 1 1
Other beef cattle
per head
All beef cattle
per head
Cattle and
calves per 100 pounds
pro-duced 2
Per head
Per 100 pounds
pro-duced 3 Per head
Per 100 pounds
milk produced
Pounds Pounds Pounds Pounds Pounds Pounds Pounds Pounds Pounds 2001 ............ 13,027 72 6,548 9,834 5,316 6,076 1,255 1,277 1,687 2002 ............ 12,965 70 6,538 9,745 5,313 6,020 1,239 1,276 1,662 2003 ............ 12,985 69 6,541 9,773 5,314 6,076 1,233 1,276 1,659 2004 ............ 13,268 70 6,589 10,187 5,329 6,155 1,278 1,282 1,686 2005 ............ 13,087 67 6,558 9,922 5,319 6,118 1,299 1,278 1,678 2006 ............ 12,758 64 6,503 9,441 5,302 6,031 1,266 1,272 1,690 2007 ............ 12,758 64 6,503 9,441 5,302 6,047 1,271 1,272 1,719 2008 ............ 12,380 61 6,440 8,889 5,282 5,901 1,214 1,265 1,743 2009 ............ 12,361 59 6,425 8,866 5,269 5,880 1,225 1,267 1,689 2010 4 .......... 12,111 58 6,394 8,495 5,268 5,841 1,206 1,260 1,719
Year beginning October
Poultry
Hogs per 100 pounds
pro-duced
Horses and
mules two
years and
over per head
Hens and pullets Chickens raised Broilers produced Turkeys raised
Per head Jan. 1
Per 100 eggs
Per head
Per 100 pounds
live weight
Per head
Per 100 pounds
pro-duced
Per head
Per 100 pounds
pro-duced
Pounds Pounds Pounds Pounds Pounds Pounds Pounds Pounds Pounds Pounds 2001 ............ 129 51 31 888 11.4 230 96 368 592 3,856 2002 ............ 128 50 31 846 11.3 219 95 344 574 3,844 2003 ............ 129 50 31 917 11.3 224 95 342 581 3,847 2004 ............ 134 52 32 991 11.9 229 100 360 603 3,903 2005 ............ 131 50 31 927 11.5 214 97 353 581 3,867 2006 ............ 124 47 29 979 10.9 199 92 337 551 3,803 2007 ............ 124 46 29 1,026 10.9 199 92 331 562 3,803 2008 ............ 116 43 28 927 10.2 175 86 277 502 3,729 2009 ............ 120 45 29 1,006 10.6 192 89 300 513 3,769
1 Feed consumed by all cattle divided by the number on feed Jan. 1. 2 Feed for all cattle, except milk cows, divided by the net live-weight production of cattle and calves. It includes the growth on dairy heifers and calves as well as all beef cat-tle. 3 Including wool produced. 4 Preliminary.
ERS, Market and Trade Economics Division, (202) 694–5290.
Table 1-77.—Feed: Consumed by livestock and poultry, by type of feed, with quantity expressed in equivalent feeding value of corn, 2002–2011
Year beginning October
Concentrates Harvested roughage Pasture Total
Million tons Million tons Million Million tons 2002 ....................................................... 250 83 162 494 2003 ....................................................... 254 85 154 493 2004 ....................................................... 268 86 154 509 2005 ....................................................... 264 87 157 508 2006 ....................................................... 253 82 162 497 2007 ....................................................... 260 80 163 503 2008 ....................................................... 236 83 158 477 2009 ....................................................... 233 83 156 472 2010 1 ..................................................... 225 82 153 460 2011 ....................................................... 202 82 149 433
1 Preliminary. ERS, Market and Trade Economics Division, (202) 694–5313.
VerDate Aug 31 2005 11:43 Mar 12, 2012 Jkt 000000 PO 00000 Frm 00043 Fmt 1000 Sfmt 1000 H:\SHARED\DAPP\FPU\AGSTAT\MASTER~2\CHAPTR01\I-41.AG8 USDA
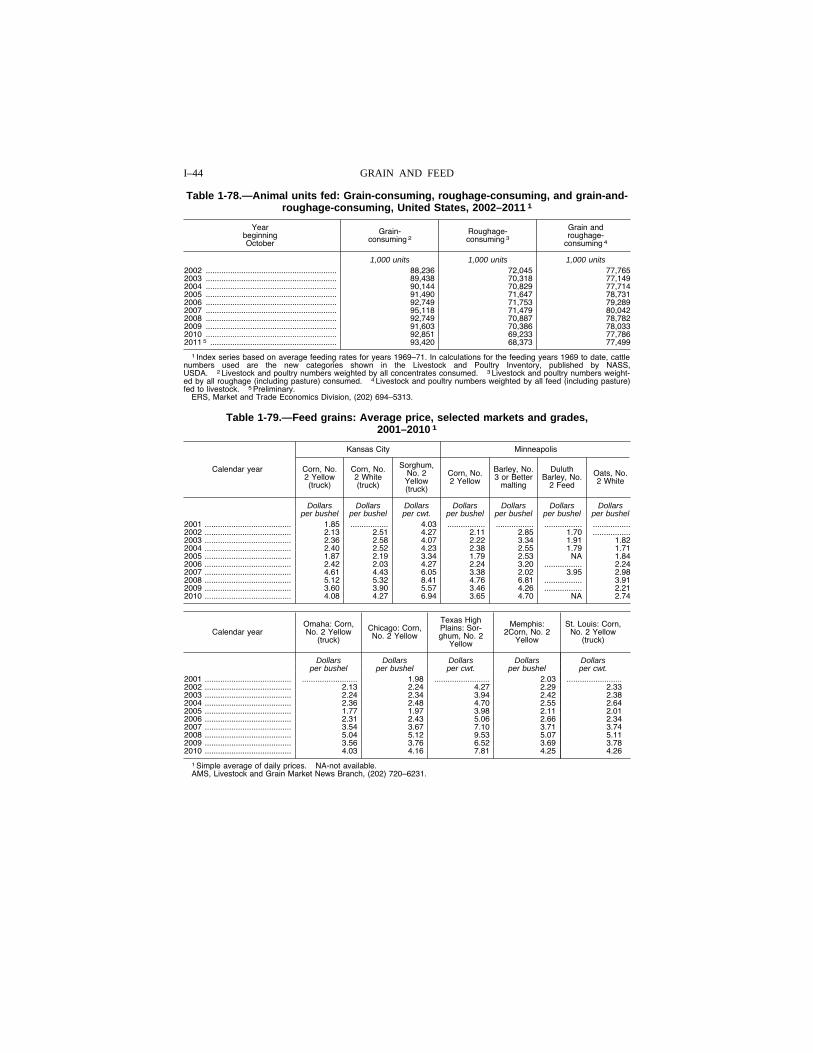
I–44 GRAIN AND FEED
Table 1-78.—Animal units fed: Grain-consuming, roughage-consuming, and grain-and- roughage-consuming, United States, 2002–2011 1
Year beginning October
Grain- consuming 2
Roughage- consuming 3
Grain and roughage-
consuming 4
1,000 units 1,000 units 1,000 units 2002 ........................................................... 88,236 72,045 77,765 2003 ........................................................... 89,438 70,318 77,149 2004 ........................................................... 90,144 70,829 77,714 2005 ........................................................... 91,490 71,647 78,731 2006 ........................................................... 92,749 71,753 79,289 2007 ........................................................... 95,118 71,479 80,042 2008 ........................................................... 92,749 70,887 78,782 2009 ........................................................... 91,603 70,386 78,033 2010 ........................................................... 92,851 69,233 77,786 2011 5 ......................................................... 93,420 68,373 77,499
1 Index series based on average feeding rates for years 1969–71. In calculations for the feeding years 1969 to date, cattle numbers used are the new categories shown in the Livestock and Poultry Inventory, published by NASS, USDA. 2 Livestock and poultry numbers weighted by all concentrates consumed. 3 Livestock and poultry numbers weight-ed by all roughage (including pasture) consumed. 4 Livestock and poultry numbers weighted by all feed (including pasture) fed to livestock. 5 Preliminary.
ERS, Market and Trade Economics Division, (202) 694–5313.
Table 1-79.—Feed grains: Average price, selected markets and grades, 2001–2010 1
Calendar year
Kansas City Minneapolis
Corn, No. 2 Yellow (truck)
Corn, No. 2 White (truck)
Sorghum, No. 2 Yellow (truck)
Corn, No. 2 Yellow
Barley, No. 3 or Better
malting
Duluth Barley, No.
2 Feed
Oats, No. 2 White
Dollars Dollars Dollars Dollars Dollars Dollars Dollars per bushel per bushel per cwt. per bushel per bushel per bushel per bushel
2001 ....................................... 1.85 ................. 4.03 ................. ................. ................. .................2002 ....................................... 2.13 2.51 4.27 2.11 2.85 1.70 .................2003 ....................................... 2.36 2.58 4.07 2.22 3.34 1.91 1.82 2004 ....................................... 2.40 2.52 4.23 2.38 2.55 1.79 1.71 2005 ....................................... 1.87 2.19 3.34 1.79 2.53 NA 1.84 2006 ....................................... 2.42 2.03 4.27 2.24 3.20 ................. 2.24 2007 ....................................... 4.61 4.43 6.05 3.38 2.02 3.95 2.98 2008 ....................................... 5.12 5.32 8.41 4.76 6.81 ................. 3.91 2009 ....................................... 3.60 3.90 5.57 3.46 4.26 ................. 2.21 2010 ....................................... 4.08 4.27 6.94 3.65 4.70 NA 2.74
Calendar year Omaha: Corn, No. 2 Yellow
(truck)
Chicago: Corn, No. 2 Yellow
Texas High Plains: Sor-ghum, No. 2
Yellow
Memphis: 2Corn, No. 2
Yellow
St. Louis: Corn, No. 2 Yellow
(truck)
Dollars Dollars Dollars Dollars Dollars per bushel per bushel per cwt. per bushel per cwt.
2001 ....................................... ......................... 1.98 ......................... 2.03 .........................2002 ....................................... 2.13 2.24 4.27 2.29 2.33 2003 ....................................... 2.24 2.34 3.94 2.42 2.38 2004 ....................................... 2.36 2.48 4.70 2.55 2.64 2005 ....................................... 1.77 1.97 3.98 2.11 2.01 2006 ....................................... 2.31 2.43 5.06 2.66 2.34 2007 ....................................... 3.54 3.67 7.10 3.71 3.74 2008 ....................................... 5.04 5.12 9.53 5.07 5.11 2009 ....................................... 3.56 3.76 6.52 3.69 3.78 2010 ....................................... 4.03 4.16 7.81 4.25 4.26
1 Simple average of daily prices. NA-not available. AMS, Livestock and Grain Market News Branch, (202) 720–6231.
VerDate Aug 31 2005 11:43 Mar 12, 2012 Jkt 000000 PO 00000 Frm 00044 Fmt 1000 Sfmt 1000 H:\SHARED\DAPP\FPU\AGSTAT\MASTER~2\CHAPTR01\I-42.AG8 USDA
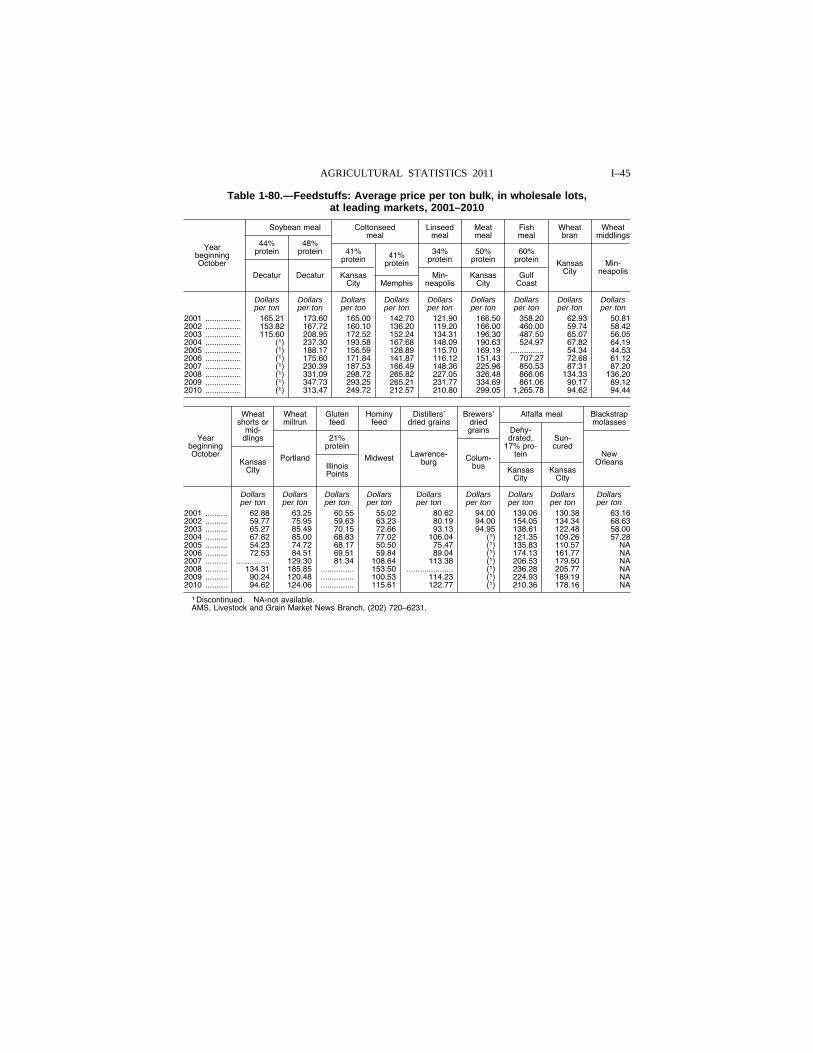
I–45 AGRICULTURAL STATISTICS 2011
Table 1-80.—Feedstuffs: Average price per ton bulk, in wholesale lots, at leading markets, 2001–2010
Year beginning October
Soybean meal Cottonseedmeal
Linseed meal
Meat meal
Fish meal
Wheat bran
Wheat middlings
44% protein
48% protein 41%
protein 41% protein
34% protein
50% protein
60% protein Kansas
City Min-
neapolis Decatur Decatur Kansas City Memphis
Min-neapolis
Kansas City
Gulf Coast
Dollars Dollars Dollars Dollars Dollars Dollars Dollars Dollars Dollars per ton per ton per ton per ton per ton per ton per ton per ton per ton
2001 ................ 165.21 173.60 165.00 142.70 121.90 166.50 358.20 62.93 50.81 2002 ................ 153.82 167.72 160.10 136.20 119.20 166.00 460.00 59.74 58.42 2003 ................ 115.60 208.95 172.52 152.24 134.31 196.30 487.50 65.07 56.05 2004 ................ (1) 237.30 193.58 167.68 148.09 190.63 524.97 67.82 64.19 2005 ................ (1) 188.17 156.59 128.89 115.70 169.19 ............... 54.34 44.53 2006 ................ (1) 175.60 171.84 141.87 116.12 151.43 707.27 72.68 61.12 2007 ................ (1) 230.39 187.53 166.49 148.36 225.96 850.53 87.31 87.20 2008 ................ (1) 331.09 298.72 265.82 227.05 326.48 866.06 134.33 136.20 2009 ................ (1) 347.73 293.25 265.21 231.77 334.69 861.06 90.17 89.12 2010 ................ (1) 313.47 249.72 212.57 210.80 299.05 1,265.78 94.62 94.44
Year beginning October
Wheat shorts or
mid-dlings
Wheat millrun
Gluten feed
Hominy feed
Distillers’ dried grains
Brewers’ dried grains
Alfalfa meal Blackstrap molasses
Kansas City
Portland
21% protein
Midwest Lawrence-burg Colum-
bus
Dehy-drated,
17% pro-tein
Sun- cured
New Orleans Illinois
Points Kansas City
Kansas City
Dollars Dollars Dollars Dollars Dollars Dollars Dollars Dollars Dollars per ton per ton per ton per ton per ton per ton per ton per ton per ton
2001 .......... 62.88 63.25 60.55 55.02 80.62 94.00 139.06 130.38 63.16 2002 .......... 59.77 75.95 59.63 63.23 80.19 94.00 154.05 134.34 68.63 2003 .......... 65.27 85.49 70.15 72.66 93.13 94.95 138.61 122.48 58.00 2004 .......... 67.82 85.00 68.83 77.02 106.04 (1) 121.35 109.26 57.28 2005 .......... 54.23 74.72 68.17 50.50 75.47 (1) 135.83 110.57 NA 2006 .......... 72.53 84.51 69.51 59.84 89.04 (1) 174.13 161.77 NA 2007 .......... ............... 129.30 81.34 108.64 113.38 (1) 206.53 179.50 NA 2008 .......... 134.31 185.85 ............... 153.50 ..................... (1) 236.28 205.77 NA 2009 .......... 90.24 120.48 ............... 100.53 114.23 (1) 224.93 189.19 NA 2010 .......... 94.62 124.06 ............... 115.61 122.77 (1) 210.36 178.16 NA
1 Discontinued. NA-not available. AMS, Livestock and Grain Market News Branch, (202) 720–6231.
VerDate Aug 31 2005 11:43 Mar 12, 2012 Jkt 000000 PO 00000 Frm 00045 Fmt 1000 Sfmt 1000 H:\SHARED\DAPP\FPU\AGSTAT\MASTER~2\CHAPTR01\I-43.AG8 USDA
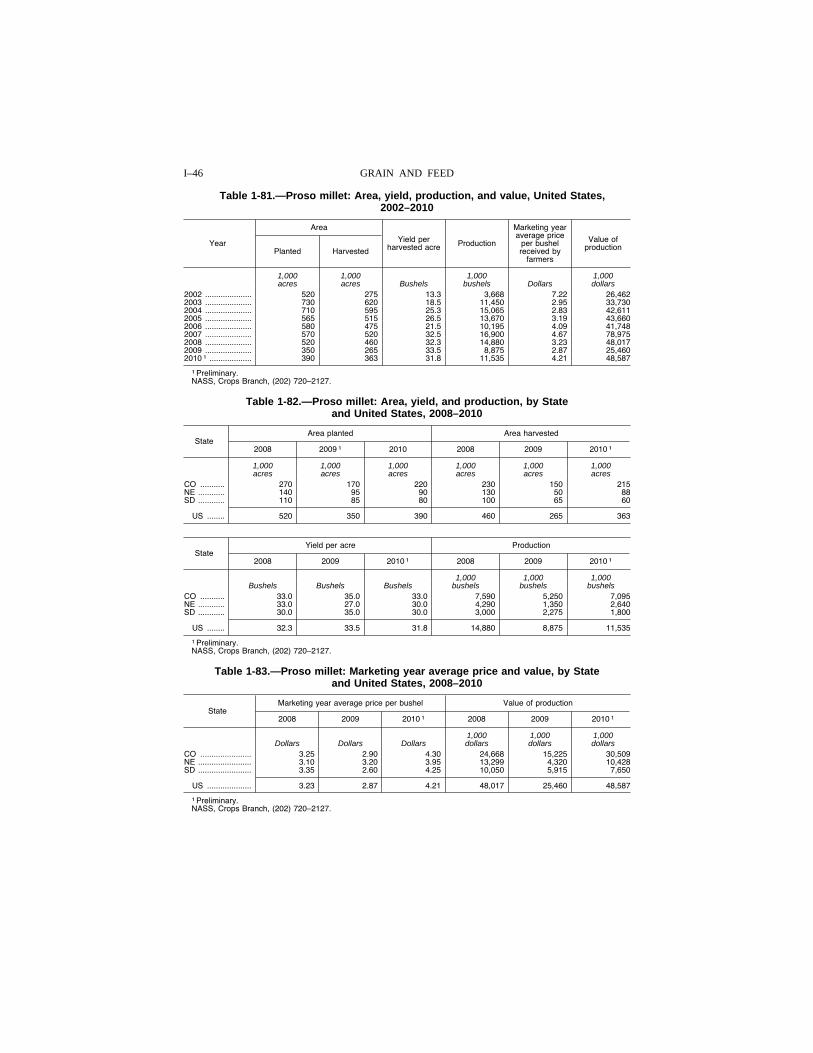
I–46 GRAIN AND FEED
Table 1-81.—Proso millet: Area, yield, production, and value, United States, 2002–2010
Year
Area
Yield per harvested acre Production
Marketing year average price
per bushel received by
farmers
Value of production Planted Harvested
1,000 1,000 1,000 1,000 acres acres Bushels bushels Dollars dollars
2002 ..................... 520 275 13.3 3,668 7.22 26,462 2003 ..................... 730 620 18.5 11,450 2.95 33,730 2004 ..................... 710 595 25.3 15,065 2.83 42,611 2005 ..................... 565 515 26.5 13,670 3.19 43,660 2006 ..................... 580 475 21.5 10,195 4.09 41,748 2007 ..................... 570 520 32.5 16,900 4.67 78,975 2008 ..................... 520 460 32.3 14,880 3.23 48,017 2009 ..................... 350 265 33.5 8,875 2.87 25,460 2010 1 ................... 390 363 31.8 11,535 4.21 48,587
1 Preliminary. NASS, Crops Branch, (202) 720–2127.
Table 1-82.—Proso millet: Area, yield, and production, by State and United States, 2008–2010
State Area planted Area harvested
2008 2009 1 2010 2008 2009 2010 1
1,000 1,000 1,000 1,000 1,000 1,000 acres acres acres acres acres acres
CO ........... 270 170 220 230 150 215 NE ............ 140 95 90 130 50 88 SD ............ 110 85 80 100 65 60
US ........ 520 350 390 460 265 363
State Yield per acre Production
2008 2009 2010 1 2008 2009 2010 1
1,000 1,000 1,000 Bushels Bushels Bushels bushels bushels bushels
CO ........... 33.0 35.0 33.0 7,590 5,250 7,095 NE ............ 33.0 27.0 30.0 4,290 1,350 2,640 SD ............ 30.0 35.0 30.0 3,000 2,275 1,800
US ........ 32.3 33.5 31.8 14,880 8,875 11,535
1 Preliminary. NASS, Crops Branch, (202) 720–2127.
Table 1-83.—Proso millet: Marketing year average price and value, by State and United States, 2008–2010
State Marketing year average price per bushel Value of production
2008 2009 2010 1 2008 2009 2010 1
1,000 1,000 1,000 Dollars Dollars Dollars dollars dollars dollars
CO ....................... 3.25 2.90 4.30 24,668 15,225 30,509 NE ........................ 3.10 3.20 3.95 13,299 4,320 10,428 SD ........................ 3.35 2.60 4.25 10,050 5,915 7,650
US .................... 3.23 2.87 4.21 48,017 25,460 48,587
1 Preliminary. NASS, Crops Branch, (202) 720–2127.
VerDate Aug 31 2005 11:43 Mar 12, 2012 Jkt 000000 PO 00000 Frm 00046 Fmt 1000 Sfmt 1000 H:\SHARED\DAPP\FPU\AGSTAT\MASTER~2\CHAPTR01\I-44.AG8 USDA
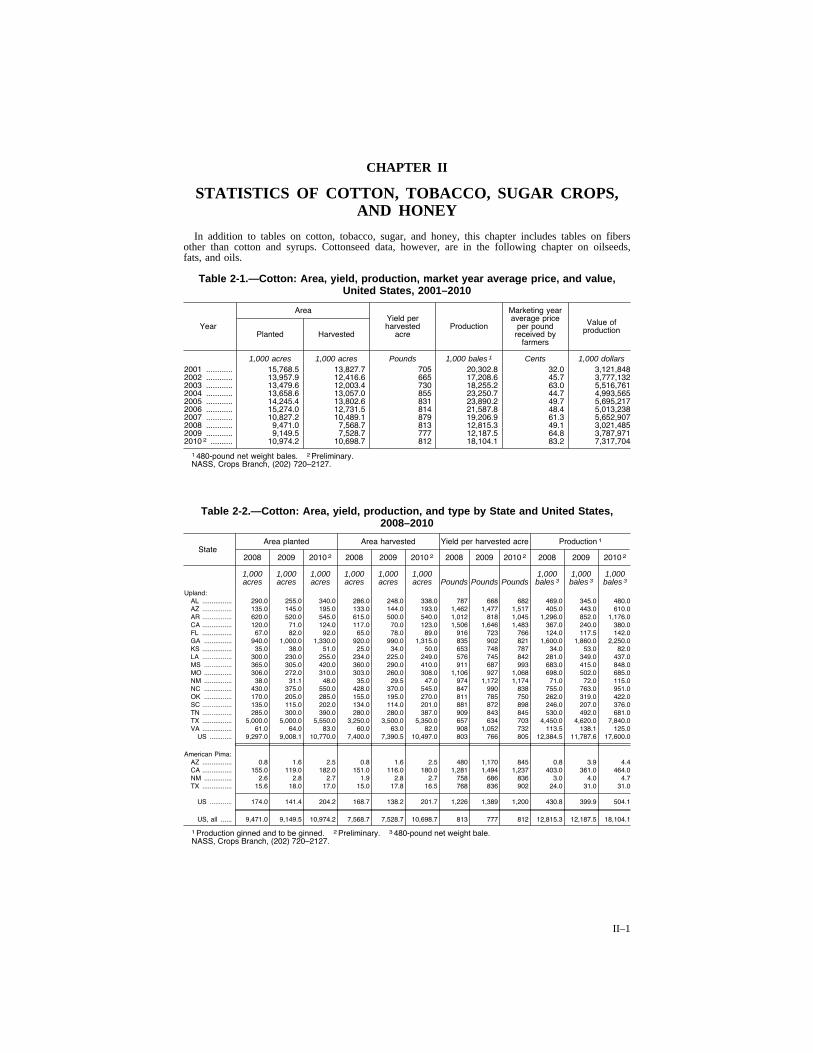
II–1
CHAPTER II
STATISTICS OF COTTON, TOBACCO, SUGAR CROPS, AND HONEY
In addition to tables on cotton, tobacco, sugar, and honey, this chapter includes tables on fibers other than cotton and syrups. Cottonseed data, however, are in the following chapter on oilseeds, fats, and oils.
Table 2-1.—Cotton: Area, yield, production, market year average price, and value, United States, 2001–2010
Year
Area Yield per harvested
acre Production
Marketing year average price
per pound received by
farmers
Value of production Planted Harvested
1,000 acres 1,000 acres Pounds 1,000 bales 1 Cents 1,000 dollars 2001 ............ 15,768.5 13,827.7 705 20,302.8 32.0 3,121,848 2002 ............ 13,957.9 12,416.6 665 17,208.6 45.7 3,777,132 2003 ............ 13,479.6 12,003.4 730 18,255.2 63.0 5,516,761 2004 ............ 13,658.6 13,057.0 855 23,250.7 44.7 4,993,565 2005 ............ 14,245.4 13,802.6 831 23,890.2 49.7 5,695,217 2006 ............ 15,274.0 12,731.5 814 21,587.8 48.4 5,013,238 2007 ............ 10,827.2 10,489.1 879 19,206.9 61.3 5,652,907 2008 ............ 9,471.0 7,568.7 813 12,815.3 49.1 3,021,485 2009 ............ 9,149.5 7,528.7 777 12,187.5 64.8 3,787,971 2010 2 .......... 10,974.2 10,698.7 812 18,104.1 83.2 7,317,704
1 480-pound net weight bales. 2 Preliminary. NASS, Crops Branch, (202) 720–2127.
Table 2-2.—Cotton: Area, yield, production, and type by State and United States, 2008–2010
State Area planted Area harvested Yield per harvested acre Production 1
2008 2009 2010 2 2008 2009 2010 2 2008 2009 2010 2 2008 2009 2010 2
1,000 acres
1,000 acres
1,000 acres
1,000 acres
1,000 acres
1,000 acres Pounds Pounds Pounds
1,000 bales 3
1,000 bales 3
1,000 bales 3
Upland: AL ................ 290.0 255.0 340.0 286.0 248.0 338.0 787 668 682 469.0 345.0 480.0 AZ ................ 135.0 145.0 195.0 133.0 144.0 193.0 1,462 1,477 1,517 405.0 443.0 610.0 AR ................ 620.0 520.0 545.0 615.0 500.0 540.0 1,012 818 1,045 1,296.0 852.0 1,176.0 CA ................ 120.0 71.0 124.0 117.0 70.0 123.0 1,506 1,646 1,483 367.0 240.0 380.0 FL ................ 67.0 82.0 92.0 65.0 78.0 89.0 916 723 766 124.0 117.5 142.0 GA ............... 940.0 1,000.0 1,330.0 920.0 990.0 1,315.0 835 902 821 1,600.0 1,860.0 2,250.0 KS ................ 35.0 38.0 51.0 25.0 34.0 50.0 653 748 787 34.0 53.0 82.0 LA ................ 300.0 230.0 255.0 234.0 225.0 249.0 576 745 842 281.0 349.0 437.0 MS ............... 365.0 305.0 420.0 360.0 290.0 410.0 911 687 993 683.0 415.0 848.0 MO ............... 306.0 272.0 310.0 303.0 260.0 308.0 1,106 927 1,068 698.0 502.0 685.0 NM ............... 38.0 31.1 48.0 35.0 29.5 47.0 974 1,172 1,174 71.0 72.0 115.0 NC ............... 430.0 375.0 550.0 428.0 370.0 545.0 847 990 838 755.0 763.0 951.0 OK ............... 170.0 205.0 285.0 155.0 195.0 270.0 811 785 750 262.0 319.0 422.0 SC ................ 135.0 115.0 202.0 134.0 114.0 201.0 881 872 898 246.0 207.0 376.0 TN ................ 285.0 300.0 390.0 280.0 280.0 387.0 909 843 845 530.0 492.0 681.0 TX ................ 5,000.0 5,000.0 5,550.0 3,250.0 3,500.0 5,350.0 657 634 703 4,450.0 4,620.0 7,840.0 VA ................ 61.0 64.0 83.0 60.0 63.0 82.0 908 1,052 732 113.5 138.1 125.0
US ............ 9,297.0 9,008.1 10,770.0 7,400.0 7,390.5 10,497.0 803 766 805 12,384.5 11,787.6 17,600.0
American Pima: AZ ................ 0.8 1.6 2.5 0.8 1.6 2.5 480 1,170 845 0.8 3.9 4.4 CA ................ 155.0 119.0 182.0 151.0 116.0 180.0 1,281 1,494 1,237 403.0 361.0 464.0 NM ............... 2.6 2.8 2.7 1.9 2.8 2.7 758 686 836 3.0 4.0 4.7 TX ................ 15.6 18.0 17.0 15.0 17.8 16.5 768 836 902 24.0 31.0 31.0
US ............ 174.0 141.4 204.2 168.7 138.2 201.7 1,226 1,389 1,200 430.8 399.9 504.1
US, all ...... 9,471.0 9,149.5 10,974.2 7,568.7 7,528.7 10,698.7 813 777 812 12,815.3 12,187.5 18,104.1
1 Production ginned and to be ginned. 2 Preliminary. 3 480-pound net weight bale. NASS, Crops Branch, (202) 720–2127.
VerDate Aug 31 2005 10:11 Feb 29, 2012 Jkt 000000 PO 00000 Frm 00001 Fmt 1001 Sfmt 1001 H:\SHARED\DAPP\FPU\AGSTAT\MASTER~2\CHAPTR02\II-01.AG8 USDA
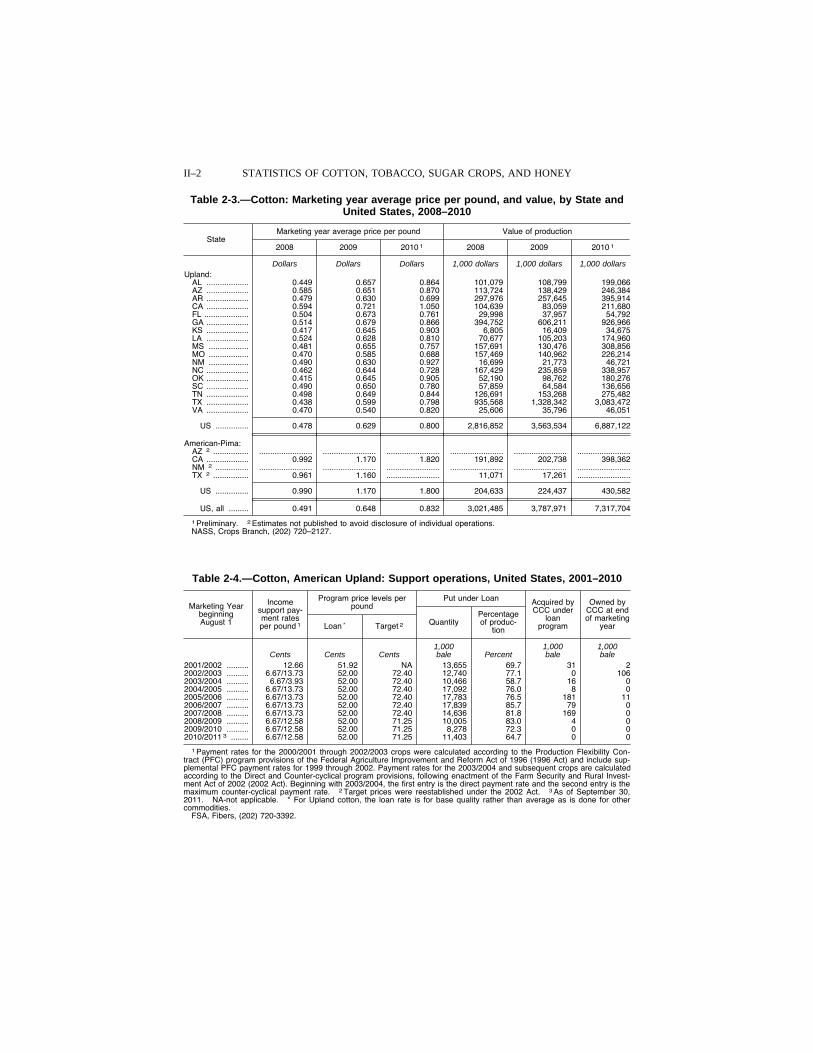
II–2 STATISTICS OF COTTON, TOBACCO, SUGAR CROPS, AND HONEY
Table 2-3.—Cotton: Marketing year average price per pound, and value, by State and United States, 2008–2010
State Marketing year average price per pound Value of production
2008 2009 2010 1 2008 2009 2010 1
Dollars Dollars Dollars 1,000 dollars 1,000 dollars 1,000 dollars Upland:
AL ................... 0.449 0.657 0.864 101,079 108,799 199,066 AZ ................... 0.585 0.651 0.870 113,724 138,429 246,384 AR ................... 0.479 0.630 0.699 297,976 257,645 395,914 CA ................... 0.594 0.721 1.050 104,639 83,059 211,680 FL .................... 0.504 0.673 0.761 29,998 37,957 54,792 GA ................... 0.514 0.679 0.866 394,752 606,211 926,966 KS ................... 0.417 0.645 0.903 6,805 16,409 34,675 LA ................... 0.524 0.628 0.810 70,677 105,203 174,960 MS .................. 0.481 0.655 0.757 157,691 130,476 308,856 MO .................. 0.470 0.585 0.688 157,469 140,962 226,214 NM .................. 0.490 0.630 0.927 16,699 21,773 46,721 NC ................... 0.462 0.644 0.728 167,429 235,859 338,957 OK ................... 0.415 0.645 0.905 52,190 98,762 180,276 SC ................... 0.490 0.650 0.780 57,859 64,584 136,656 TN ................... 0.498 0.649 0.844 126,691 153,268 275,482 TX ................... 0.438 0.599 0.798 935,568 1,328,342 3,083,472 VA ................... 0.470 0.540 0.820 25,606 35,796 46,051
US ............... 0.478 0.629 0.800 2,816,852 3,563,534 6,887,122
American-Pima: AZ 2 ................ ........................ ........................ ........................ ........................ ........................ ........................CA ................... 0.992 1.170 1.820 191,892 202,738 398,362 NM 2 ............... ........................ ........................ ........................ ........................ ........................ ........................TX 2 ................ 0.961 1.160 ........................ 11,071 17,261 ........................
US ............... 0.990 1.170 1.800 204,633 224,437 430,582
US, all ......... 0.491 0.648 0.832 3,021,485 3,787,971 7,317,704
1 Preliminary. 2 Estimates not published to avoid disclosure of individual operations. NASS, Crops Branch, (202) 720–2127.
Table 2-4.—Cotton, American Upland: Support operations, United States, 2001–2010
Marketing Year beginning August 1
Income support pay-ment rates per pound 1
Program price levels per pound
Put under Loan Acquired by CCC under
loan program
Owned by CCC at end of marketing
year Loan * Target 2 Quantity Percentage of produc-
tion
1,000 1,000 1,000 Cents Cents Cents bale Percent bale bale
2001/2002 .......... 12.66 51.92 NA 13,655 69.7 31 2 2002/2003 .......... 6.67/13.73 52.00 72.40 12,740 77.1 0 106 2003/2004 .......... 6.67/3.93 52.00 72.40 10,466 58.7 16 0 2004/2005 .......... 6.67/13.73 52.00 72.40 17,092 76.0 8 0 2005/2006 .......... 6.67/13.73 52.00 72.40 17,783 76.5 181 11 2006/2007 .......... 6.67/13.73 52.00 72.40 17,839 85.7 79 0 2007/2008 .......... 6.67/13.73 52.00 72.40 14,636 81.8 169 0 2008/2009 .......... 6.67/12.58 52.00 71.25 10,005 83.0 4 0 2009/2010 .......... 6.67/12.58 52.00 71.25 8,278 72.3 0 0 2010/2011 3 ........ 6.67/12.58 52.00 71.25 11,403 64.7 0 0
1 Payment rates for the 2000/2001 through 2002/2003 crops were calculated according to the Production Flexibility Con-tract (PFC) program provisions of the Federal Agriculture Improvement and Reform Act of 1996 (1996 Act) and include sup-plemental PFC payment rates for 1999 through 2002. Payment rates for the 2003/2004 and subsequent crops are calculated according to the Direct and Counter-cyclical program provisions, following enactment of the Farm Security and Rural Invest-ment Act of 2002 (2002 Act). Beginning with 2003/2004, the first entry is the direct payment rate and the second entry is the maximum counter-cyclical payment rate. 2 Target prices were reestablished under the 2002 Act. 3 As of September 30, 2011. NA-not applicable. * For Upland cotton, the loan rate is for base quality rather than average as is done for other commodities.
FSA, Fibers, (202) 720-3392.
VerDate Aug 31 2005 10:11 Feb 29, 2012 Jkt 000000 PO 00000 Frm 00002 Fmt 1000 Sfmt 1000 H:\SHARED\DAPP\FPU\AGSTAT\MASTER~2\CHAPTR02\II-02.AG8 USDA
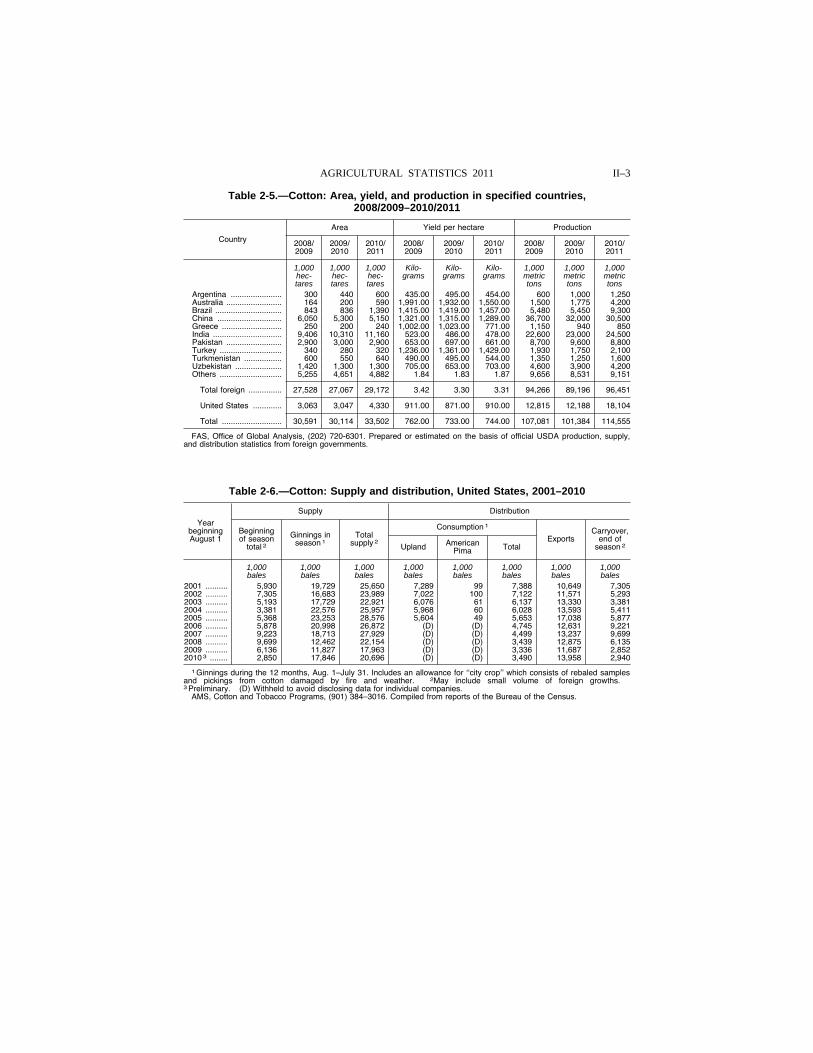
II–3 AGRICULTURAL STATISTICS 2011
Table 2-5.—Cotton: Area, yield, and production in specified countries, 2008/2009–2010/2011
Country
Area Yield per hectare Production
2008/ 2009
2009/ 2010
2010/ 2011
2008/ 2009
2009/ 2010
2010/ 2011
2008/ 2009
2009/ 2010
2010/ 2011
1,000 hec-tares
1,000 hec-tares
1,000 hec-tares
Kilo-grams
Kilo-grams
Kilo-grams
1,000 metric tons
1,000 metric tons
1,000 metric tons
Argentina ....................... 300 440 600 435.00 495.00 454.00 600 1,000 1,250 Australia ......................... 164 200 590 1,991.00 1,932.00 1,550.00 1,500 1,775 4,200 Brazil .............................. 843 836 1,390 1,415.00 1,419.00 1,457.00 5,480 5,450 9,300 China ............................. 6,050 5,300 5,150 1,321.00 1,315.00 1,289.00 36,700 32,000 30,500 Greece ........................... 250 200 240 1,002.00 1,023.00 771.00 1,150 940 850 India ............................... 9,406 10,310 11,160 523.00 486.00 478.00 22,600 23,000 24,500 Pakistan ......................... 2,900 3,000 2,900 653.00 697.00 661.00 8,700 9,600 8,800 Turkey ............................ 340 280 320 1,236.00 1,361.00 1,429.00 1,930 1,750 2,100 Turkmenistan ................. 600 550 640 490.00 495.00 544.00 1,350 1,250 1,600 Uzbekistan ..................... 1,420 1,300 1,300 705.00 653.00 703.00 4,600 3,900 4,200 Others ............................ 5,255 4,651 4,882 1.84 1.83 1.87 9,656 8,531 9,151
Total foreign ............... 27,528 27,067 29,172 3.42 3.30 3.31 94,266 89,196 96,451
United States ............. 3,063 3,047 4,330 911.00 871.00 910.00 12,815 12,188 18,104
Total ........................... 30,591 30,114 33,502 762.00 733.00 744.00 107,081 101,384 114,555
FAS, Office of Global Analysis, (202) 720-6301. Prepared or estimated on the basis of official USDA production, supply, and distribution statistics from foreign governments.
Table 2-6.—Cotton: Supply and distribution, United States, 2001–2010
Year beginning August 1
Supply Distribution
Beginning of season
total 2
Ginnings in season 1
Total supply 2
Consumption 1
Exports Carryover,
end of season 2 Upland American
Pima Total
1,000 1,000 1,000 1,000 1,000 1,000 1,000 1,000 bales bales bales bales bales bales bales bales
2001 .......... 5,930 19,729 25,650 7,289 99 7,388 10,649 7,305 2002 .......... 7,305 16,683 23,989 7,022 100 7,122 11,571 5,293 2003 .......... 5,193 17,729 22,921 6,076 61 6,137 13,330 3,381 2004 .......... 3,381 22,576 25,957 5,968 60 6,028 13,593 5,411 2005 .......... 5,368 23,253 28,576 5,604 49 5,653 17,038 5,877 2006 .......... 5,878 20,998 26,872 (D) (D) 4,745 12,631 9,221 2007 .......... 9,223 18,713 27,929 (D) (D) 4,499 13,237 9,699 2008 .......... 9,699 12,462 22,154 (D) (D) 3,439 12,875 6,135 2009 .......... 6,136 11,827 17,963 (D) (D) 3,336 11,687 2,852 2010 3 ........ 2,850 17,846 20,696 (D) (D) 3,490 13,958 2,940
1 Ginnings during the 12 months, Aug. 1–July 31. Includes an allowance for ‘‘city crop’’ which consists of rebaled samples and pickings from cotton damaged by fire and weather. 2May include small volume of foreign growths.3 Preliminary. (D) Withheld to avoid disclosing data for individual companies.
AMS, Cotton and Tobacco Programs, (901) 384–3016. Compiled from reports of the Bureau of the Census.
VerDate Aug 31 2005 10:11 Feb 29, 2012 Jkt 000000 PO 00000 Frm 00003 Fmt 1000 Sfmt 1000 H:\SHARED\DAPP\FPU\AGSTAT\MASTER~2\CHAPTR02\II-03.AG8 USDA
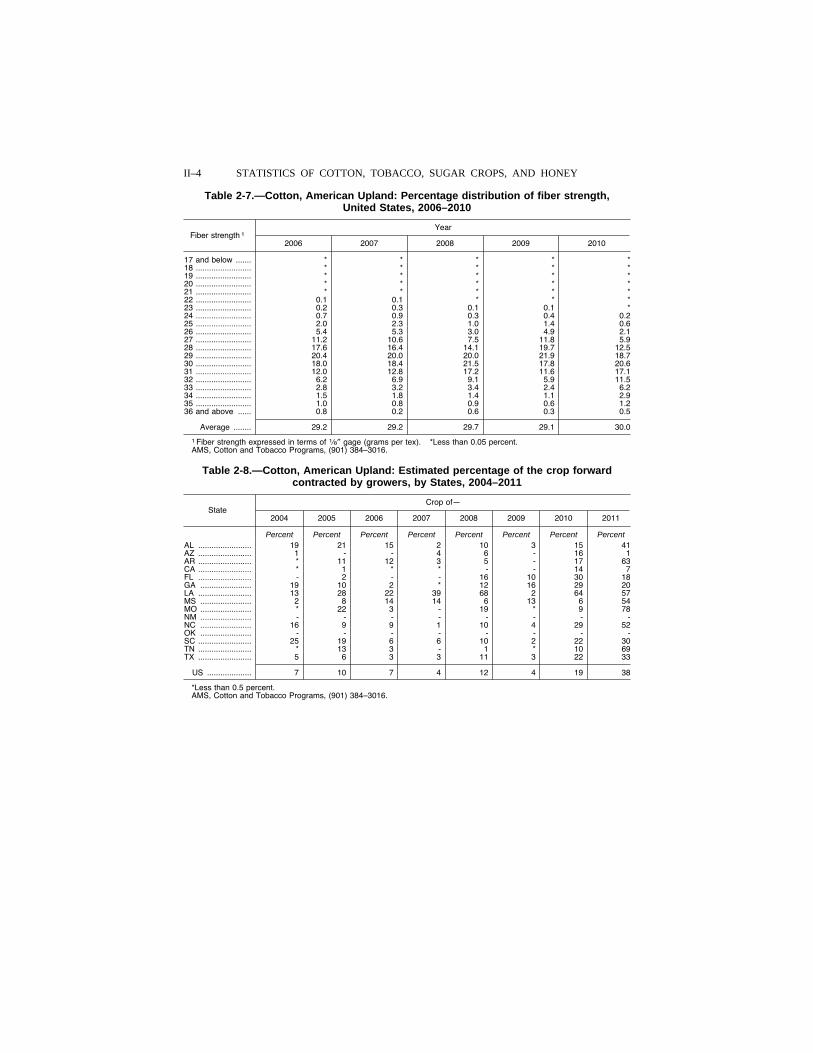
II–4 STATISTICS OF COTTON, TOBACCO, SUGAR CROPS, AND HONEY
Table 2-7.—Cotton, American Upland: Percentage distribution of fiber strength, United States, 2006–2010
Fiber strength 1 Year
2006 2007 2008 2009 2010
17 and below ....... * * * * * 18 ......................... * * * * * 19 ......................... * * * * * 20 ......................... * * * * * 21 ......................... * * * * * 22 ......................... 0.1 0.1 * * * 23 ......................... 0.2 0.3 0.1 0.1 * 24 ......................... 0.7 0.9 0.3 0.4 0.2 25 ......................... 2.0 2.3 1.0 1.4 0.6 26 ......................... 5.4 5.3 3.0 4.9 2.1 27 ......................... 11.2 10.6 7.5 11.8 5.9 28 ......................... 17.6 16.4 14.1 19.7 12.5 29 ......................... 20.4 20.0 20.0 21.9 18.7 30 ......................... 18.0 18.4 21.5 17.8 20.6 31 ......................... 12.0 12.8 17.2 11.6 17.1 32 ......................... 6.2 6.9 9.1 5.9 11.5 33 ......................... 2.8 3.2 3.4 2.4 6.2 34 ......................... 1.5 1.8 1.4 1.1 2.9 35 ......................... 1.0 0.8 0.9 0.6 1.2 36 and above ...... 0.8 0.2 0.6 0.3 0.5
Average ........ 29.2 29.2 29.7 29.1 30.0
1 Fiber strength expressed in terms of 1⁄8″ gage (grams per tex). *Less than 0.05 percent. AMS, Cotton and Tobacco Programs, (901) 384–3016.
Table 2-8.—Cotton, American Upland: Estimated percentage of the crop forward contracted by growers, by States, 2004–2011
State Crop of—
2004 2005 2006 2007 2008 2009 2010 2011
Percent Percent Percent Percent Percent Percent Percent Percent AL ........................ 19 21 15 2 10 3 15 41 AZ ........................ 1 - - 4 6 - 16 1 AR ........................ * 11 12 3 5 - 17 63 CA ........................ * 1 * * - - 14 7 FL ........................ - 2 - - 16 10 30 18 GA ....................... 19 10 2 * 12 16 29 20 LA ........................ 13 28 22 39 68 2 64 57 MS ....................... 2 8 14 14 6 13 6 54 MO ....................... * 22 3 - 19 * 9 78 NM ....................... - - - - - - - - NC ....................... 16 9 9 1 10 4 29 52 OK ....................... - - - - - - - - SC ........................ 25 19 6 6 10 2 22 30 TN ........................ * 13 3 - 1 * 10 69 TX ........................ 5 6 3 3 11 3 22 33
US .................... 7 10 7 4 12 4 19 38
*Less than 0.5 percent. AMS, Cotton and Tobacco Programs, (901) 384–3016.
VerDate Aug 31 2005 10:11 Feb 29, 2012 Jkt 000000 PO 00000 Frm 00004 Fmt 1000 Sfmt 1000 H:\SHARED\DAPP\FPU\AGSTAT\MASTER~2\CHAPTR02\II-04.AG8 USDA
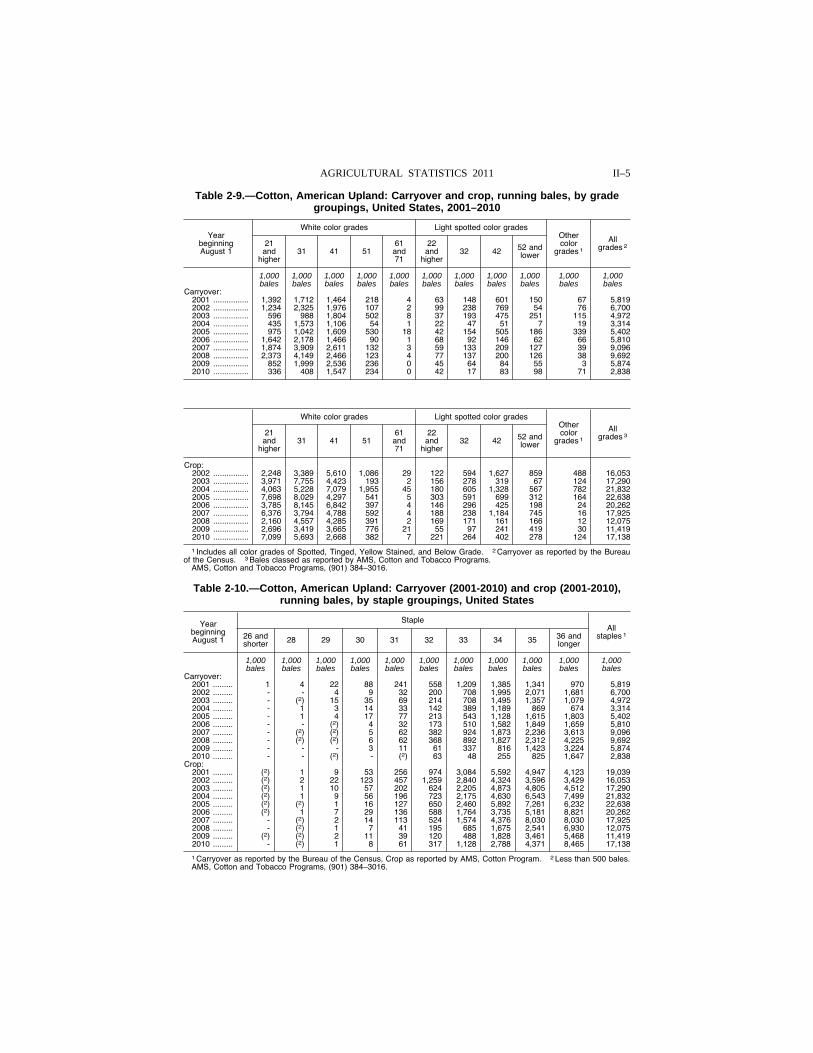
II–5 AGRICULTURAL STATISTICS 2011
Table 2-9.—Cotton, American Upland: Carryover and crop, running bales, by grade groupings, United States, 2001–2010
Year beginning August 1
White color grades Light spotted color grades Other color
grades 1
All grades 2 21
and higher
31 41 51 61 and 71
22 and
higher 32 42 52 and
lower
1,000 bales
1,000 bales
1,000 bales
1,000 bales
1,000 bales
1,000 bales
1,000 bales
1,000 bales
1,000 bales
1,000 bales
1,000 bales
Carryover: 2001 ................ 1,392 1,712 1,464 218 4 63 148 601 150 67 5,819 2002 ................ 1,234 2,325 1,976 107 2 99 238 769 54 76 6,700 2003 ................ 596 988 1,804 502 8 37 193 475 251 115 4,972 2004 ................ 435 1,573 1,106 54 1 22 47 51 7 19 3,314 2005 ................ 975 1,042 1,609 530 18 42 154 505 186 339 5,402 2006 ................ 1,642 2,178 1,466 90 1 68 92 146 62 66 5,810 2007 ................ 1,874 3,909 2,611 132 3 59 133 209 127 39 9,096 2008 ................ 2,373 4,149 2,466 123 4 77 137 200 126 38 9,692 2009 ................ 852 1,999 2,536 236 0 45 64 84 55 3 5,874 2010 ................ 336 408 1,547 234 0 42 17 83 98 71 2,838
White color grades Light spotted color grades Other color
grades 1
All grades 3 21
and higher
31 41 51 61 and 71
22 and
higher 32 42 52 and
lower
Crop: 2002 ................ 2,248 3,389 5,610 1,086 29 122 594 1,627 859 488 16,053 2003 ................ 3,971 7,755 4,423 193 2 156 278 319 67 124 17,290 2004 ................ 4,063 5,228 7,079 1,955 45 180 605 1,328 567 782 21,832 2005 ................ 7,698 8,029 4,297 541 5 303 591 699 312 164 22,638 2006 ................ 3,785 8,145 6,842 397 4 146 296 425 198 24 20,262 2007 ................ 6,376 3,794 4,788 592 4 188 238 1,184 745 16 17,925 2008 ................ 2,160 4,557 4,285 391 2 169 171 161 166 12 12,075 2009 ................ 2,696 3,419 3,665 776 21 55 97 241 419 30 11,419 2010 ................ 7,099 5,693 2,668 382 7 221 264 402 278 124 17,138
1 Includes all color grades of Spotted, Tinged, Yellow Stained, and Below Grade. 2 Carryover as reported by the Bureau of the Census. 3 Bales classed as reported by AMS, Cotton and Tobacco Programs.
AMS, Cotton and Tobacco Programs, (901) 384–3016.
Table 2-10.—Cotton, American Upland: Carryover (2001-2010) and crop (2001-2010), running bales, by staple groupings, United States
Year beginning August 1
Staple All
staples 1 26 and shorter 28 29 30 31 32 33 34 35 36 and
longer
1,000 bales
1,000 bales
1,000 bales
1,000 bales
1,000 bales
1,000 bales
1,000 bales
1,000 bales
1,000 bales
1,000 bales
1,000 bales
Carryover: 2001 ......... 1 4 22 88 241 558 1,209 1,385 1,341 970 5,819 2002 ......... - - 4 9 32 200 708 1,995 2,071 1,681 6,700 2003 ......... - (2) 15 35 69 214 708 1,495 1,357 1,079 4,972 2004 ......... - 1 3 14 33 142 389 1,189 869 674 3,314 2005 ......... - 1 4 17 77 213 543 1,128 1,615 1,803 5,402 2006 ......... - - (2) 4 32 173 510 1,582 1,849 1,659 5,810 2007 ......... - (2) (2) 5 62 382 924 1,873 2,236 3,613 9,096 2008 ......... - (2) (2) 6 62 368 892 1,827 2,312 4,225 9,692 2009 ......... - - - 3 11 61 337 816 1,423 3,224 5,874 2010 ......... - - (2) - (2) 63 48 255 825 1,647 2,838
Crop: 2001 ......... (2) 1 9 53 256 974 3,084 5,592 4,947 4,123 19,039 2002 ......... (2) 2 22 123 457 1,259 2,840 4,324 3,596 3,429 16,053 2003 ......... (2) 1 10 57 202 624 2,205 4,873 4,805 4,512 17,290 2004 ......... (2) 1 9 56 196 723 2,175 4,630 6,543 7,499 21,832 2005 ......... (2) (2) 1 16 127 650 2,460 5,892 7,261 6,232 22,638 2006 ......... (2) 1 7 29 136 588 1,764 3,735 5,181 8,821 20,262 2007 ......... - (2) 2 14 113 524 1,574 4,376 8,030 8,030 17,925 2008 ......... - (2) 1 7 41 195 685 1,675 2,541 6,930 12,075 2009 ......... (2) (2) 2 11 39 120 488 1,828 3,461 5,468 11,419 2010 ......... - (2) 1 8 61 317 1,128 2,788 4,371 8,465 17,138
1 Carryover as reported by the Bureau of the Census, Crop as reported by AMS, Cotton Program. 2 Less than 500 bales. AMS, Cotton and Tobacco Programs, (901) 384–3016.
VerDate Aug 31 2005 10:11 Feb 29, 2012 Jkt 000000 PO 00000 Frm 00005 Fmt 1000 Sfmt 1000 H:\SHARED\DAPP\FPU\AGSTAT\MASTER~2\CHAPTR02\II-05.AG8 USDA
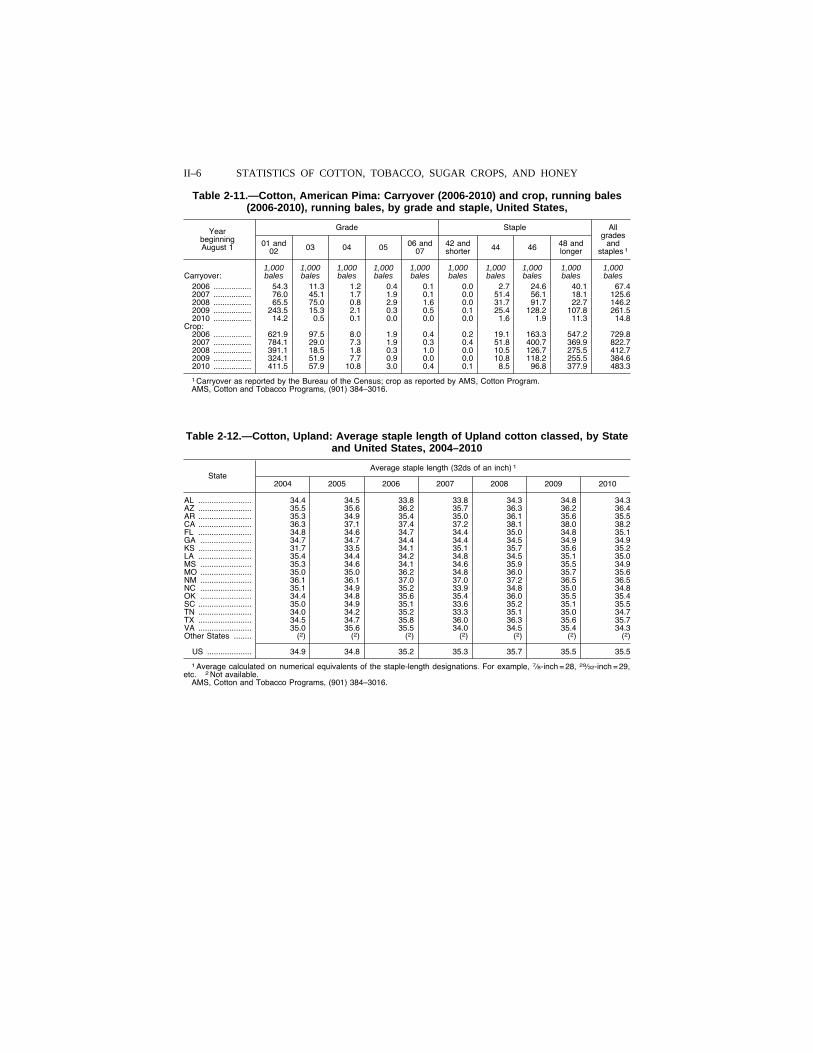
II–6 STATISTICS OF COTTON, TOBACCO, SUGAR CROPS, AND HONEY
Table 2-11.—Cotton, American Pima: Carryover (2006-2010) and crop, running bales (2006-2010), running bales, by grade and staple, United States,
Year beginning August 1
Grade Staple All grades
and staples 1
01 and 02 03 04 05 06 and
07 42 and shorter 44 46 48 and
longer
1,000 1,000 1,000 1,000 1,000 1,000 1,000 1,000 1,000 1,000 Carryover: bales bales bales bales bales bales bales bales bales bales
2006 ................. 54.3 11.3 1.2 0.4 0.1 0.0 2.7 24.6 40.1 67.4 2007 ................. 76.0 45.1 1.7 1.9 0.1 0.0 51.4 56.1 18.1 125.6 2008 ................. 65.5 75.0 0.8 2.9 1.6 0.0 31.7 91.7 22.7 146.2 2009 ................. 243.5 15.3 2.1 0.3 0.5 0.1 25.4 128.2 107.8 261.5 2010 ................. 14.2 0.5 0.1 0.0 0.0 0.0 1.6 1.9 11.3 14.8
Crop: 2006 ................. 621.9 97.5 8.0 1.9 0.4 0.2 19.1 163.3 547.2 729.8 2007 ................. 784.1 29.0 7.3 1.9 0.3 0.4 51.8 400.7 369.9 822.7 2008 ................. 391.1 18.5 1.8 0.3 1.0 0.0 10.5 126.7 275.5 412.7 2009 ................. 324.1 51.9 7.7 0.9 0.0 0.0 10.8 118.2 255.5 384.6 2010 ................. 411.5 57.9 10.8 3.0 0.4 0.1 8.5 96.8 377.9 483.3
1 Carryover as reported by the Bureau of the Census; crop as reported by AMS, Cotton Program. AMS, Cotton and Tobacco Programs, (901) 384–3016.
Table 2-12.—Cotton, Upland: Average staple length of Upland cotton classed, by State and United States, 2004–2010
State Average staple length (32ds of an inch) 1
2004 2005 2006 2007 2008 2009 2010
AL ........................ 34.4 34.5 33.8 33.8 34.3 34.8 34.3 AZ ........................ 35.5 35.6 36.2 35.7 36.3 36.2 36.4 AR ........................ 35.3 34.9 35.4 35.0 36.1 35.6 35.5 CA ........................ 36.3 37.1 37.4 37.2 38.1 38.0 38.2 FL ........................ 34.8 34.6 34.7 34.4 35.0 34.8 35.1 GA ....................... 34.7 34.7 34.4 34.4 34.5 34.9 34.9 KS ........................ 31.7 33.5 34.1 35.1 35.7 35.6 35.2 LA ........................ 35.4 34.4 34.2 34.8 34.5 35.1 35.0 MS ....................... 35.3 34.6 34.1 34.6 35.9 35.5 34.9 MO ....................... 35.0 35.0 36.2 34.8 36.0 35.7 35.6 NM ....................... 36.1 36.1 37.0 37.0 37.2 36.5 36.5 NC ....................... 35.1 34.9 35.2 33.9 34.8 35.0 34.8 OK ....................... 34.4 34.8 35.6 35.4 36.0 35.5 35.4 SC ........................ 35.0 34.9 35.1 33.6 35.2 35.1 35.5 TN ........................ 34.0 34.2 35.2 33.3 35.1 35.0 34.7 TX ........................ 34.5 34.7 35.8 36.0 36.3 35.6 35.7 VA ........................ 35.0 35.6 35.5 34.0 34.5 35.4 34.3 Other States ........ (2) (2) (2) (2) (2) (2) (2)
US .................... 34.9 34.8 35.2 35.3 35.7 35.5 35.5
1 Average calculated on numerical equivalents of the staple-length designations. For example, 7⁄8-inch = 28, 29⁄32-inch = 29, etc. 2 Not available.
AMS, Cotton and Tobacco Programs, (901) 384–3016.
VerDate Aug 31 2005 10:11 Feb 29, 2012 Jkt 000000 PO 00000 Frm 00006 Fmt 1000 Sfmt 1000 H:\SHARED\DAPP\FPU\AGSTAT\MASTER~2\CHAPTR02\II-06.AG8 USDA
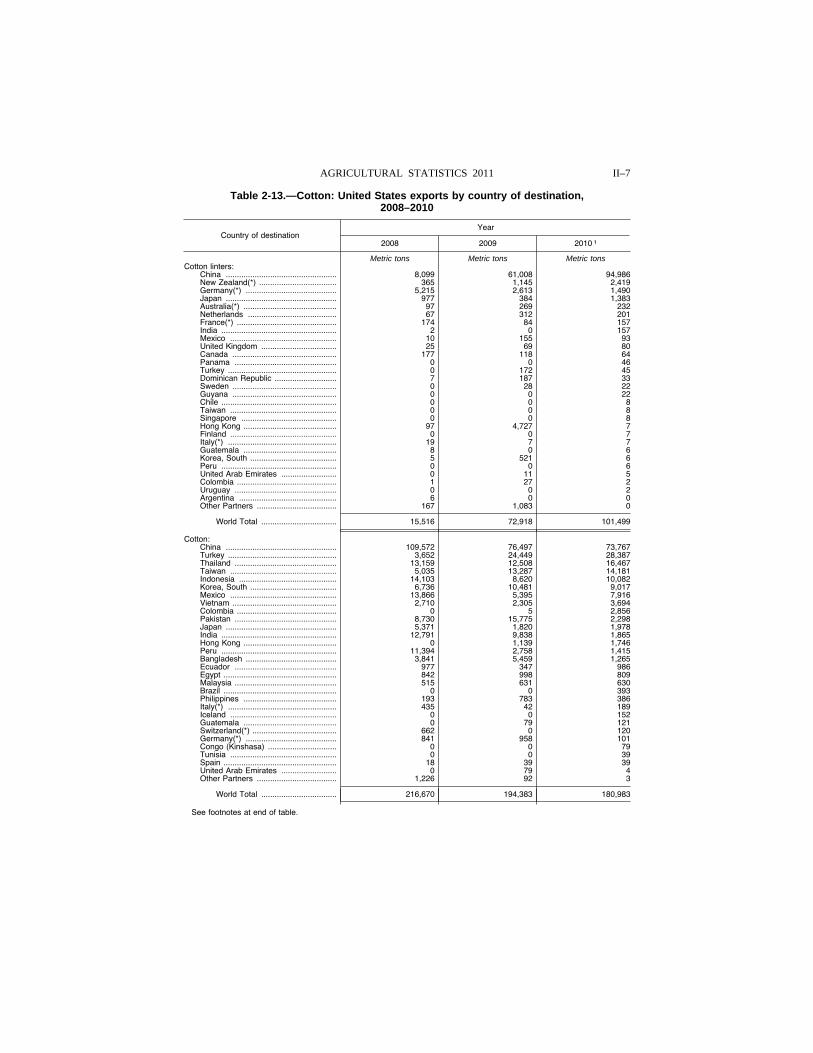
II–7 AGRICULTURAL STATISTICS 2011
Table 2-13.—Cotton: United States exports by country of destination, 2008–2010
Country of destination Year
2008 2009 2010 1
Metric tons Metric tons Metric tons Cotton linters:
China .................................................. 8,099 61,008 94,986 New Zealand(*) ................................... 365 1,145 2,419 Germany(*) ......................................... 5,215 2,613 1,490 Japan .................................................. 977 384 1,383 Australia(*) .......................................... 97 269 232 Netherlands ........................................ 67 312 201 France(*) ............................................. 174 84 157 India .................................................... 2 0 157 Mexico ................................................ 10 155 93 United Kingdom .................................. 25 69 80 Canada ............................................... 177 118 64 Panama .............................................. 0 0 46 Turkey ................................................. 0 172 45 Dominican Republic ............................ 7 187 33 Sweden ............................................... 0 28 22 Guyana ............................................... 0 0 22 Chile .................................................... 0 0 8 Taiwan ................................................ 0 0 8 Singapore ........................................... 0 0 8 Hong Kong .......................................... 97 4,727 7 Finland ................................................ 0 0 7 Italy(*) ................................................. 19 7 7 Guatemala .......................................... 8 0 6 Korea, South ....................................... 5 521 6 Peru .................................................... 0 0 6 United Arab Emirates ......................... 0 11 5 Colombia ............................................. 1 27 2 Uruguay .............................................. 0 0 2 Argentina ............................................ 6 0 0 Other Partners .................................... 167 1,083 0
World Total .................................. 15,516 72,918 101,499
Cotton: China .................................................. 109,572 76,497 73,767 Turkey ................................................. 3,652 24,449 28,387 Thailand .............................................. 13,159 12,508 16,467 Taiwan ................................................ 5,035 13,287 14,181 Indonesia ............................................ 14,103 8,620 10,082 Korea, South ....................................... 6,736 10,481 9,017 Mexico ................................................ 13,866 5,395 7,916 Vietnam ............................................... 2,710 2,305 3,694 Colombia ............................................. 0 5 2,856 Pakistan .............................................. 8,730 15,775 2,298 Japan .................................................. 5,371 1,820 1,978 India .................................................... 12,791 9,838 1,865 Hong Kong .......................................... 0 1,139 1,746 Peru .................................................... 11,394 2,758 1,415 Bangladesh ......................................... 3,841 5,459 1,265 Ecuador .............................................. 977 347 986 Egypt ................................................... 842 998 809 Malaysia .............................................. 515 631 630 Brazil ................................................... 0 0 393 Philippines .......................................... 193 783 386 Italy(*) ................................................. 435 42 189 Iceland ................................................ 0 0 152 Guatemala .......................................... 0 79 121 Switzerland(*) ...................................... 662 0 120 Germany(*) ......................................... 841 958 101 Congo (Kinshasa) ............................... 0 0 79 Tunisia ................................................ 0 0 39 Spain ................................................... 18 39 39 United Arab Emirates ......................... 0 79 4 Other Partners .................................... 1,226 92 3
World Total .................................. 216,670 194,383 180,983
See footnotes at end of table.
VerDate Aug 31 2005 10:11 Feb 29, 2012 Jkt 000000 PO 00000 Frm 00007 Fmt 1000 Sfmt 1000 H:\SHARED\DAPP\FPU\AGSTAT\MASTER~2\CHAPTR02\II-07.AG8 USDA
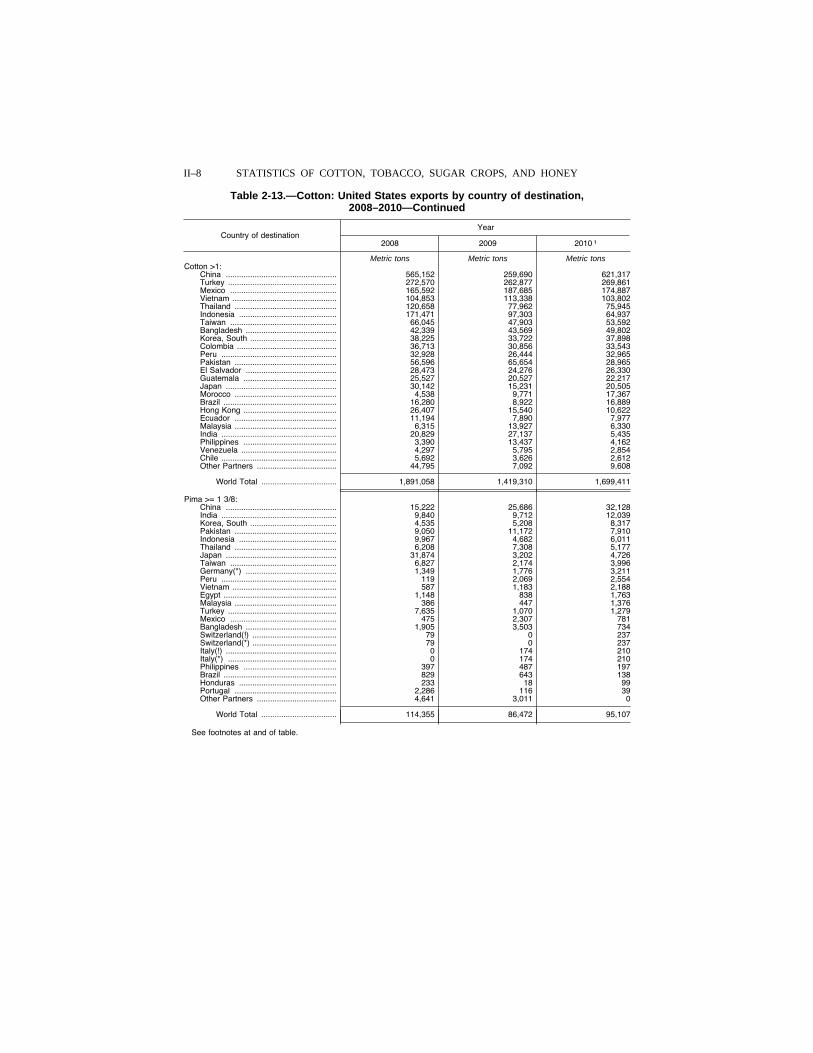
II–8 STATISTICS OF COTTON, TOBACCO, SUGAR CROPS, AND HONEY
Table 2-13.—Cotton: United States exports by country of destination, 2008–2010—Continued
Country of destination Year
2008 2009 2010 1
Metric tons Metric tons Metric tons Cotton >1:
China .................................................. 565,152 259,690 621,317 Turkey ................................................. 272,570 262,877 269,861 Mexico ................................................ 165,592 187,685 174,887 Vietnam ............................................... 104,853 113,338 103,802 Thailand .............................................. 120,658 77,962 75,945 Indonesia ............................................ 171,471 97,303 64,937 Taiwan ................................................ 66,045 47,903 53,592 Bangladesh ......................................... 42,339 43,569 49,802 Korea, South ....................................... 38,225 33,722 37,898 Colombia ............................................. 36,713 30,856 33,543 Peru .................................................... 32,928 26,444 32,965 Pakistan .............................................. 56,596 65,654 28,965 El Salvador ......................................... 28,473 24,276 26,330 Guatemala .......................................... 25,527 20,527 22,217 Japan .................................................. 30,142 15,231 20,505 Morocco .............................................. 4,538 9,771 17,367 Brazil ................................................... 16,280 8,922 16,889 Hong Kong .......................................... 26,407 15,540 10,622 Ecuador .............................................. 11,194 7,890 7,977 Malaysia .............................................. 6,315 13,927 6,330 India .................................................... 20,829 27,137 5,435 Philippines .......................................... 3,390 13,437 4,162 Venezuela ........................................... 4,297 5,795 2,854 Chile .................................................... 5,692 3,626 2,612 Other Partners .................................... 44,795 7,092 9,608
World Total .................................. 1,891,058 1,419,310 1,699,411
Pima >= 1 3/8: China .................................................. 15,222 25,686 32,128 India .................................................... 9,840 9,712 12,039 Korea, South ....................................... 4,535 5,208 8,317 Pakistan .............................................. 9,050 11,172 7,910 Indonesia ............................................ 9,967 4,682 6,011 Thailand .............................................. 6,208 7,308 5,177 Japan .................................................. 31,874 3,202 4,726 Taiwan ................................................ 6,827 2,174 3,996 Germany(*) ......................................... 1,349 1,776 3,211 Peru .................................................... 119 2,069 2,554 Vietnam ............................................... 587 1,183 2,188 Egypt ................................................... 1,148 838 1,763 Malaysia .............................................. 386 447 1,376 Turkey ................................................. 7,635 1,070 1,279 Mexico ................................................ 475 2,307 781 Bangladesh ......................................... 1,905 3,503 734 Switzerland(!) ...................................... 79 0 237 Switzerland(*) ...................................... 79 0 237 Italy(!) .................................................. 0 174 210 Italy(*) ................................................. 0 174 210 Philippines .......................................... 397 487 197 Brazil ................................................... 829 643 138 Honduras ............................................ 233 18 99 Portugal .............................................. 2,286 116 39 Other Partners .................................... 4,641 3,011 0
World Total .................................. 114,355 86,472 95,107
See footnotes at and of table.
VerDate Aug 31 2005 10:11 Feb 29, 2012 Jkt 000000 PO 00000 Frm 00008 Fmt 1000 Sfmt 1000 H:\SHARED\DAPP\FPU\AGSTAT\MASTER~2\CHAPTR02\II-07C~1.AG8 USDA
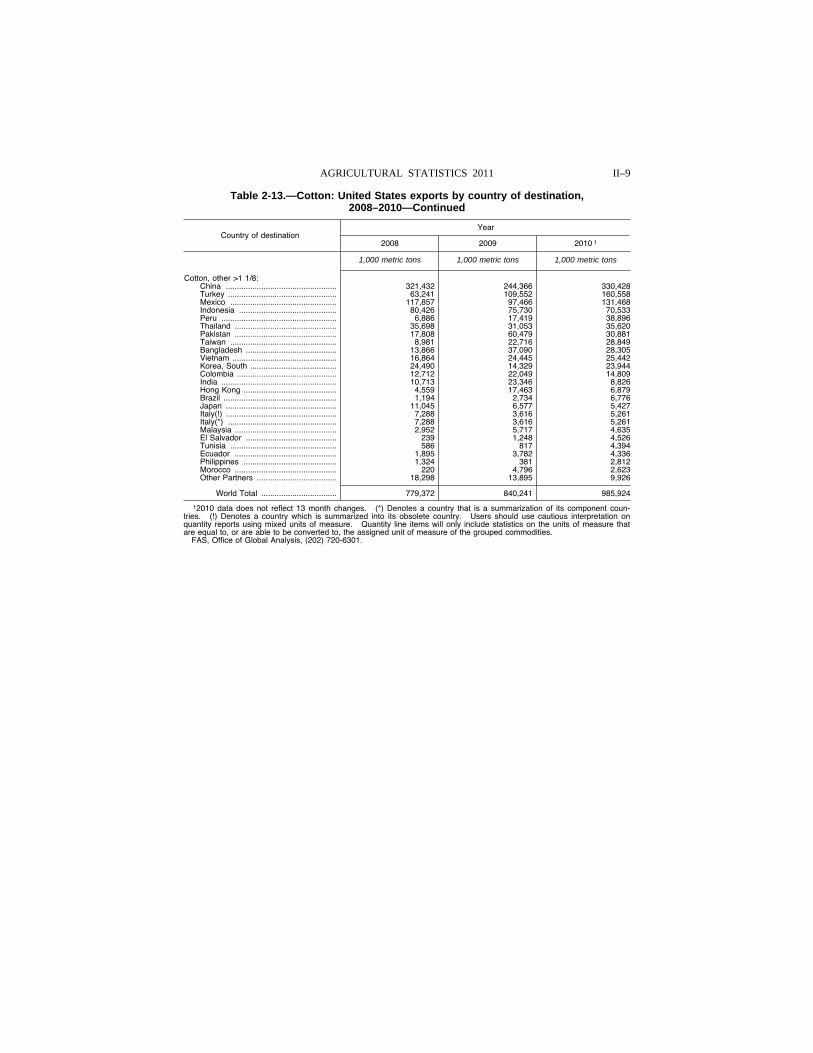
II–9 AGRICULTURAL STATISTICS 2011
Table 2-13.—Cotton: United States exports by country of destination, 2008–2010—Continued
Country of destination Year
2008 2009 2010 1
1,000 metric tons 1,000 metric tons 1,000 metric tons
Cotton, other >1 1/8: China .................................................. 321,432 244,366 330,428 Turkey ................................................. 63,241 109,552 160,558 Mexico ................................................ 117,857 97,466 131,468 Indonesia ............................................ 80,426 75,730 70,533 Peru .................................................... 6,886 17,419 38,896 Thailand .............................................. 35,698 31,053 35,620 Pakistan .............................................. 17,808 60,479 30,881 Taiwan ................................................ 8,981 22,716 28,849 Bangladesh ......................................... 13,866 37,090 28,305 Vietnam ............................................... 16,864 24,445 25,442 Korea, South ....................................... 24,490 14,329 23,944 Colombia ............................................. 12,712 22,049 14,809 India .................................................... 10,713 23,346 8,826 Hong Kong .......................................... 4,559 17,463 6,879 Brazil ................................................... 1,194 2,734 6,776 Japan .................................................. 11,045 6,577 5,427 Italy(!) .................................................. 7,288 3,616 5,261 Italy(*) ................................................. 7,288 3,616 5,261 Malaysia .............................................. 2,952 5,717 4,635 El Salvador ......................................... 239 1,248 4,526 Tunisia ................................................ 586 817 4,394 Ecuador .............................................. 1,895 3,782 4,336 Philippines .......................................... 1,324 381 2,812 Morocco .............................................. 220 4,796 2,623 Other Partners .................................... 18,298 13,895 9,926
World Total .................................. 779,372 840,241 985,924
12010 data does not reflect 13 month changes. (*) Denotes a country that is a summarization of its component coun-tries. (!) Denotes a country which is summarized into its obsolete country. Users should use cautious interpretation on quantity reports using mixed units of measure. Quantity line items will only include statistics on the units of measure that are equal to, or are able to be converted to, the assigned unit of measure of the grouped commodities.
FAS, Office of Global Analysis, (202) 720-6301.
VerDate Aug 31 2005 10:11 Feb 29, 2012 Jkt 000000 PO 00000 Frm 00009 Fmt 1000 Sfmt 1000 H:\SHARED\DAPP\FPU\AGSTAT\MASTER~2\CHAPTR02\II-08.AG8 USDA
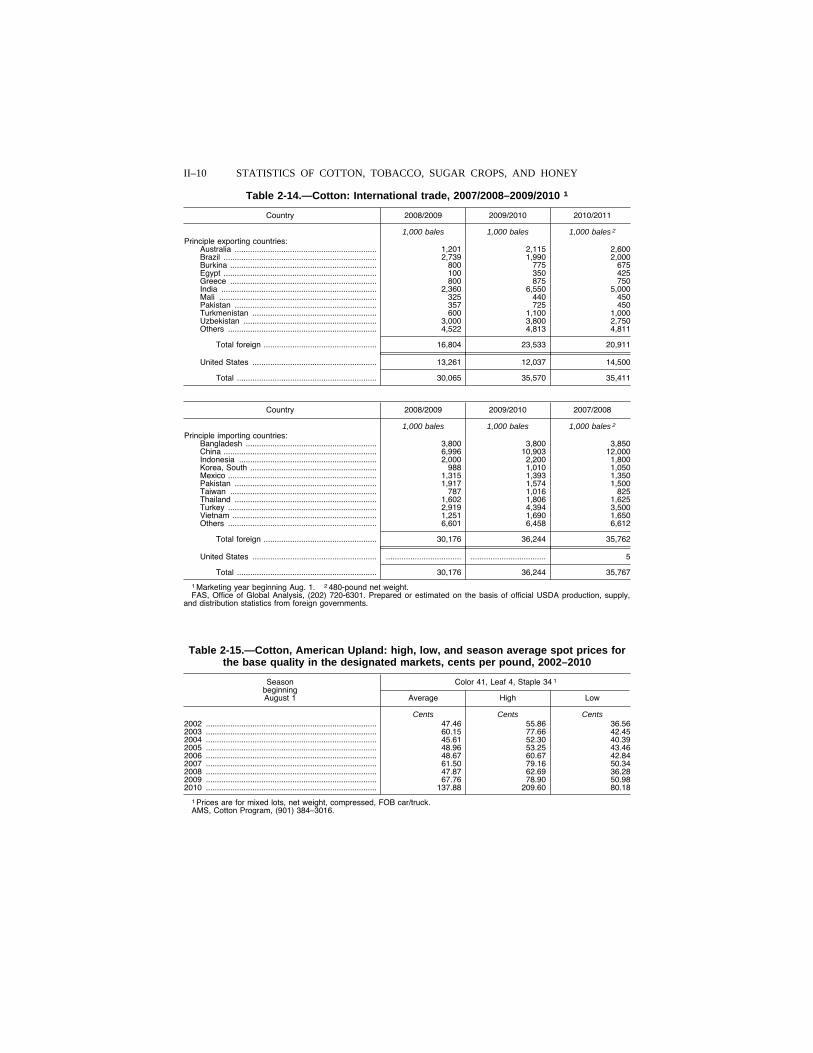
II–10 STATISTICS OF COTTON, TOBACCO, SUGAR CROPS, AND HONEY
Table 2-14.—Cotton: International trade, 2007/2008–2009/2010 1
Country 2008/2009 2009/2010 2010/2011
1,000 bales 1,000 bales 1,000 bales 2 Principle exporting countries:
Australia ................................................................ 1,201 2,115 2,600 Brazil ..................................................................... 2,739 1,990 2,000 Burkina .................................................................. 800 775 675 Egypt ..................................................................... 100 350 425 Greece .................................................................. 800 875 750 India ...................................................................... 2,360 6,550 5,000 Mali ....................................................................... 325 440 450 Pakistan ................................................................ 357 725 450 Turkmenistan ........................................................ 600 1,100 1,000 Uzbekistan ............................................................ 3,000 3,800 2,750 Others ................................................................... 4,522 4,813 4,811
Total foreign ................................................... 16,804 23,533 20,911
United States ........................................................ 13,261 12,037 14,500
Total ............................................................... 30,065 35,570 35,411
Country 2008/2009 2009/2010 2007/2008
1,000 bales 1,000 bales 1,000 bales 2 Principle importing countries:
Bangladesh ........................................................... 3,800 3,800 3,850 China ..................................................................... 6,996 10,903 12,000 Indonesia .............................................................. 2,000 2,200 1,800 Korea, South ......................................................... 988 1,010 1,050 Mexico ................................................................... 1,315 1,393 1,350 Pakistan ................................................................ 1,917 1,574 1,500 Taiwan .................................................................. 787 1,016 825 Thailand ................................................................ 1,602 1,806 1,625 Turkey ................................................................... 2,919 4,394 3,500 Vietnam ................................................................. 1,251 1,690 1,650 Others ................................................................... 6,601 6,458 6,612
Total foreign ................................................... 30,176 36,244 35,762
United States ........................................................ .................................. .................................. 5
Total ............................................................... 30,176 36,244 35,767
1 Marketing year beginning Aug. 1. 2 480-pound net weight. FAS, Office of Global Analysis, (202) 720-6301. Prepared or estimated on the basis of official USDA production, supply,
and distribution statistics from foreign governments.
Table 2-15.—Cotton, American Upland: high, low, and season average spot prices for the base quality in the designated markets, cents per pound, 2002–2010
Season beginning August 1
Color 41, Leaf 4, Staple 34 1
Average High Low
Cents Cents Cents 2002 ............................................................................. 47.46 55.86 36.56 2003 ............................................................................. 60.15 77.66 42.45 2004 ............................................................................. 45.61 52.30 40.39 2005 ............................................................................. 48.96 53.25 43.46 2006 ............................................................................. 48.67 60.67 42.84 2007 ............................................................................. 61.50 79.16 50.34 2008 ............................................................................. 47.87 62.69 36.28 2009 ............................................................................. 67.76 78.90 50.98 2010 ............................................................................. 137.88 209.60 80.18
1 Prices are for mixed lots, net weight, compressed, FOB car/truck. AMS, Cotton Program, (901) 384–3016.
VerDate Aug 31 2005 10:11 Feb 29, 2012 Jkt 000000 PO 00000 Frm 00010 Fmt 1000 Sfmt 1000 H:\SHARED\DAPP\FPU\AGSTAT\MASTER~2\CHAPTR02\II-09.AG8 USDA
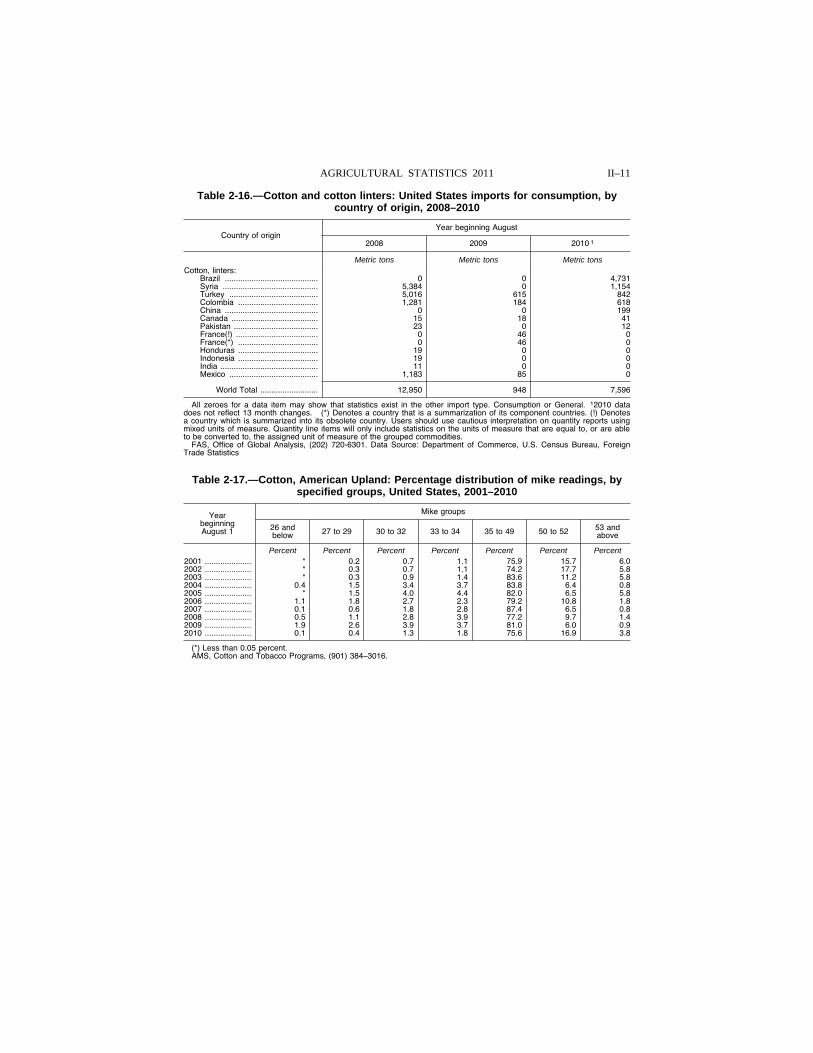
II–11 AGRICULTURAL STATISTICS 2011
Table 2-16.—Cotton and cotton linters: United States imports for consumption, by country of origin, 2008–2010
Country of origin Year beginning August
2008 2009 2010 1
Metric tons Metric tons Metric tons Cotton, linters:
Brazil .......................................... 0 0 4,731 Syria ........................................... 5,384 0 1,154 Turkey ........................................ 5,016 615 842 Colombia .................................... 1,281 184 618 China .......................................... 0 0 199 Canada ....................................... 15 18 41 Pakistan ...................................... 23 0 12 France(!) ..................................... 0 46 0 France(*) .................................... 0 46 0 Honduras .................................... 19 0 0 Indonesia .................................... 19 0 0 India ............................................ 11 0 0 Mexico ........................................ 1,183 85 0
World Total .......................... 12,950 948 7,596
All zeroes for a data item may show that statistics exist in the other import type. Consumption or General. 12010 data does not reflect 13 month changes. (*) Denotes a country that is a summarization of its component countries. (!) Denotes a country which is summarized into its obsolete country. Users should use cautious interpretation on quantity reports using mixed units of measure. Quantity line items will only include statistics on the units of measure that are equal to, or are able to be converted to, the assigned unit of measure of the grouped commodities.
FAS, Office of Global Analysis, (202) 720-6301. Data Source: Department of Commerce, U.S. Census Bureau, Foreign Trade Statistics
Table 2-17.—Cotton, American Upland: Percentage distribution of mike readings, by specified groups, United States, 2001–2010
Year beginning August 1
Mike groups
26 and below 27 to 29 30 to 32 33 to 34 35 to 49 50 to 52 53 and
above
Percent Percent Percent Percent Percent Percent Percent 2001 ..................... * 0.2 0.7 1.1 75.9 15.7 6.0 2002 ..................... * 0.3 0.7 1.1 74.2 17.7 5.8 2003 ..................... * 0.3 0.9 1.4 83.6 11.2 5.8 2004 ..................... 0.4 1.5 3.4 3.7 83.8 6.4 0.8 2005 ..................... * 1.5 4.0 4.4 82.0 6.5 5.8 2006 ..................... 1.1 1.8 2.7 2.3 79.2 10.8 1.8 2007 ..................... 0.1 0.6 1.8 2.8 87.4 6.5 0.8 2008 ..................... 0.5 1.1 2.8 3.9 77.2 9.7 1.4 2009 ..................... 1.9 2.6 3.9 3.7 81.0 6.0 0.9 2010 ..................... 0.1 0.4 1.3 1.8 75.6 16.9 3.8
(*) Less than 0.05 percent. AMS, Cotton and Tobacco Programs, (901) 384–3016.
VerDate Aug 31 2005 10:11 Feb 29, 2012 Jkt 000000 PO 00000 Frm 00011 Fmt 1000 Sfmt 1000 H:\SHARED\DAPP\FPU\AGSTAT\MASTER~2\CHAPTR02\II-10.AG8 USDA
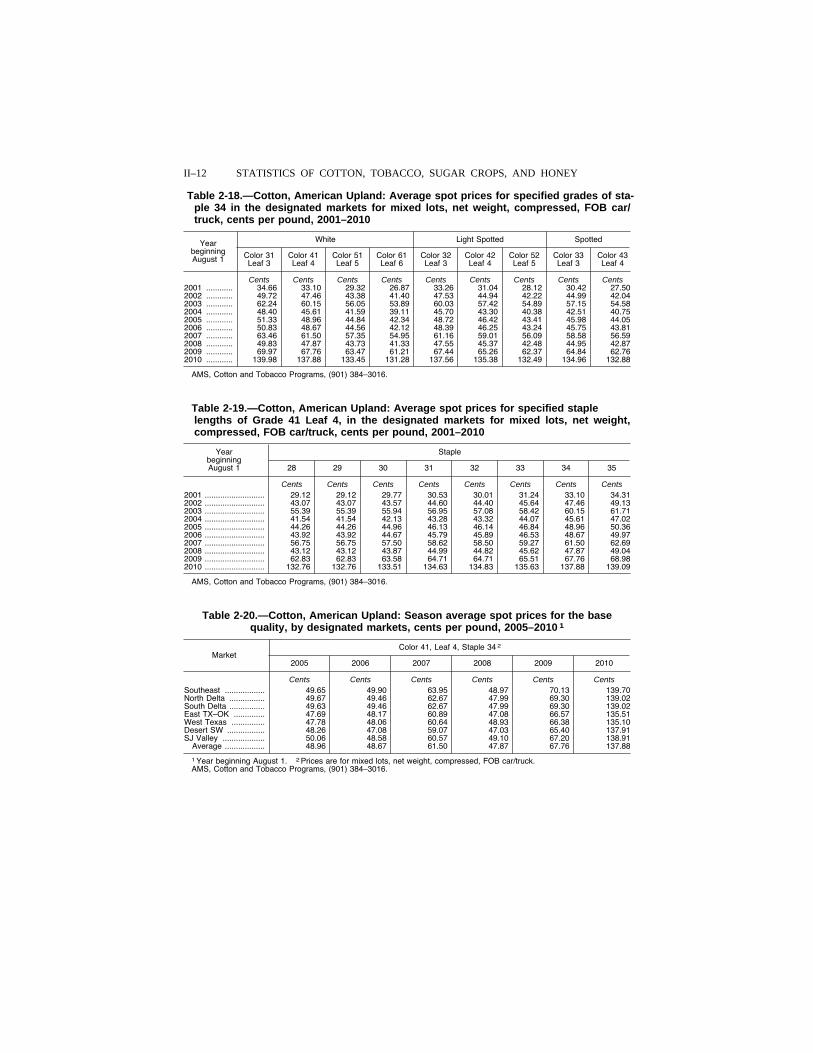
II–12 STATISTICS OF COTTON, TOBACCO, SUGAR CROPS, AND HONEY
Table 2-18.—Cotton, American Upland: Average spot prices for specified grades of sta-ple 34 in the designated markets for mixed lots, net weight, compressed, FOB car/ truck, cents per pound, 2001–2010
Year beginning August 1
White Light Spotted Spotted
Color 31 Leaf 3
Color 41 Leaf 4
Color 51 Leaf 5
Color 61 Leaf 6
Color 32 Leaf 3
Color 42 Leaf 4
Color 52 Leaf 5
Color 33 Leaf 3
Color 43 Leaf 4
Cents Cents Cents Cents Cents Cents Cents Cents Cents 2001 ............ 34.66 33.10 29.32 26.87 33.26 31.04 28.12 30.42 27.50 2002 ............ 49.72 47.46 43.38 41.40 47.53 44.94 42.22 44.99 42.04 2003 ............ 62.24 60.15 56.05 53.89 60.03 57.42 54.89 57.15 54.58 2004 ............ 48.40 45.61 41.59 39.11 45.70 43.30 40.38 42.51 40.75 2005 ............ 51.33 48.96 44.84 42.34 48.72 46.42 43.41 45.98 44.05 2006 ............ 50.83 48.67 44.56 42.12 48.39 46.25 43.24 45.75 43.81 2007 ............ 63.46 61.50 57.35 54.95 61.16 59.01 56.09 58.58 56.59 2008 ............ 49.83 47.87 43.73 41.33 47.55 45.37 42.48 44.95 42.87 2009 ............ 69.97 67.76 63.47 61.21 67.44 65.26 62.37 64.84 62.76 2010 ............ 139.98 137.88 133.45 131.28 137.56 135.38 132.49 134.96 132.88
AMS, Cotton and Tobacco Programs, (901) 384–3016.
Table 2-19.—Cotton, American Upland: Average spot prices for specified staple lengths of Grade 41 Leaf 4, in the designated markets for mixed lots, net weight, compressed, FOB car/truck, cents per pound, 2001–2010
Year beginning August 1
Staple
28 29 30 31 32 33 34 35
Cents Cents Cents Cents Cents Cents Cents Cents 2001 ........................... 29.12 29.12 29.77 30.53 30.01 31.24 33.10 34.31 2002 ........................... 43.07 43.07 43.57 44.60 44.40 45.64 47.46 49.13 2003 ........................... 55.39 55.39 55.94 56.95 57.08 58.42 60.15 61.71 2004 ........................... 41.54 41.54 42.13 43.28 43.32 44.07 45.61 47.02 2005 ........................... 44.26 44.26 44.96 46.13 46.14 46.84 48.96 50.36 2006 ........................... 43.92 43.92 44.67 45.79 45.89 46.53 48.67 49.97 2007 ........................... 56.75 56.75 57.50 58.62 58.50 59.27 61.50 62.69 2008 ........................... 43.12 43.12 43.87 44.99 44.82 45.62 47.87 49.04 2009 ........................... 62.83 62.83 63.58 64.71 64.71 65.51 67.76 68.98 2010 ........................... 132.76 132.76 133.51 134.63 134.83 135.63 137.88 139.09
AMS, Cotton and Tobacco Programs, (901) 384–3016.
Table 2-20.—Cotton, American Upland: Season average spot prices for the base quality, by designated markets, cents per pound, 2005–2010 1
Market Color 41, Leaf 4, Staple 34 2
2005 2006 2007 2008 2009 2010
Cents Cents Cents Cents Cents Cents Southeast .................. 49.65 49.90 63.95 48.97 70.13 139.70 North Delta ................ 49.67 49.46 62.67 47.99 69.30 139.02 South Delta ................ 49.63 49.46 62.67 47.99 69.30 139.02 East TX–OK .............. 47.69 48.17 60.89 47.08 66.57 135.51 West Texas ............... 47.78 48.06 60.64 48.93 66.38 135.10 Desert SW ................. 48.26 47.08 59.07 47.03 65.40 137.91 SJ Valley ................... 50.06 48.58 60.57 49.10 67.20 138.91
Average .................. 48.96 48.67 61.50 47.87 67.76 137.88
1 Year beginning August 1. 2 Prices are for mixed lots, net weight, compressed, FOB car/truck. AMS, Cotton and Tobacco Programs, (901) 384–3016.
VerDate Aug 31 2005 10:11 Feb 29, 2012 Jkt 000000 PO 00000 Frm 00012 Fmt 1000 Sfmt 1000 H:\SHARED\DAPP\FPU\AGSTAT\MASTER~2\CHAPTR02\II-11.AG8 USDA
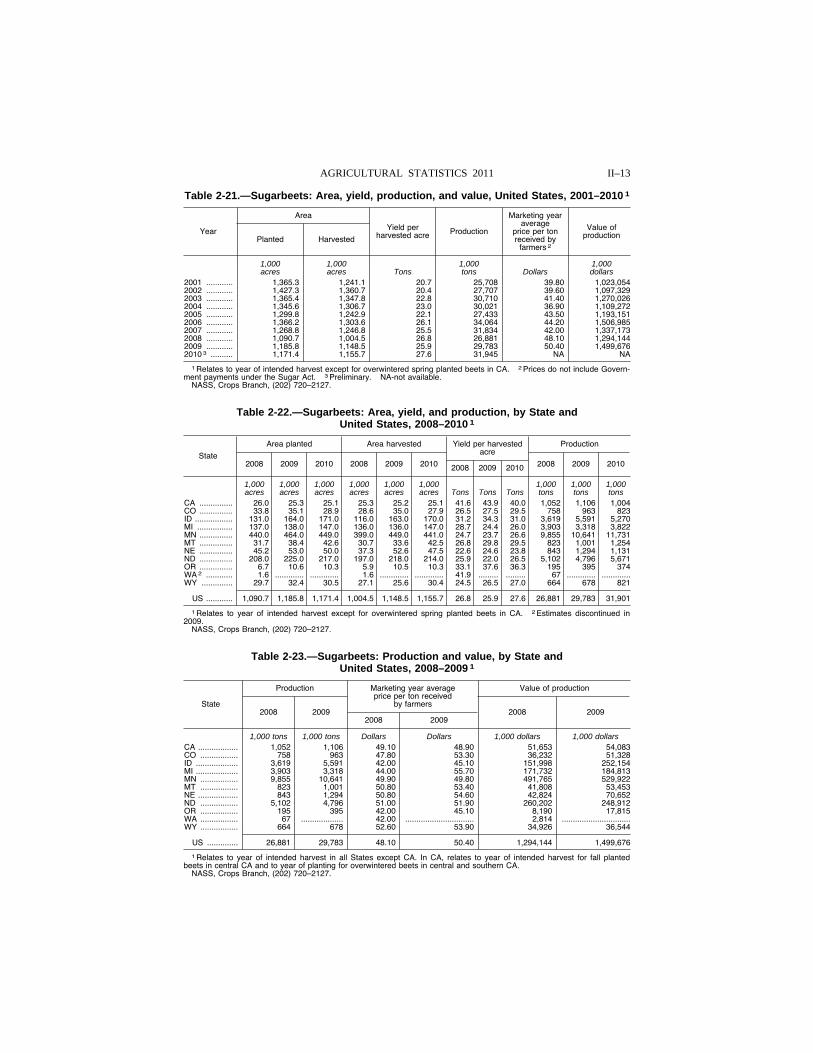
II–13 AGRICULTURAL STATISTICS 2011
Table 2-21.—Sugarbeets: Area, yield, production, and value, United States, 2001–2010 1
Year
Area
Yield per harvested acre Production
Marketing year average
price per ton received by
farmers 2
Value of production Planted Harvested
1,000 1,000 1,000 1,000 acres acres Tons tons Dollars dollars
2001 ............ 1,365.3 1,241.1 20.7 25,708 39.80 1,023,054 2002 ............ 1,427.3 1,360.7 20.4 27,707 39.60 1,097,329 2003 ............ 1,365.4 1,347.8 22.8 30,710 41.40 1,270,026 2004 ............ 1,345.6 1,306.7 23.0 30,021 36.90 1,109,272 2005 ............ 1,299.8 1,242.9 22.1 27,433 43.50 1,193,151 2006 ............ 1,366.2 1,303.6 26.1 34,064 44.20 1,506,985 2007 ............ 1,268.8 1,246.8 25.5 31,834 42.00 1,337,173 2008 ............ 1,090.7 1,004.5 26.8 26,881 48.10 1,294,144 2009 ............ 1,185.8 1,148.5 25.9 29,783 50.40 1,499,676 2010 3 .......... 1,171.4 1,155.7 27.6 31,945 NA NA
1 Relates to year of intended harvest except for overwintered spring planted beets in CA. 2 Prices do not include Govern-ment payments under the Sugar Act. 3 Preliminary. NA-not available.
NASS, Crops Branch, (202) 720–2127.
Table 2-22.—Sugarbeets: Area, yield, and production, by State and United States, 2008–2010 1
State
Area planted Area harvested Yield per harvested acre
Production
2008 2009 2010 2008 2009 2010 2008 2009 2010 2008 2009 2010
1,000 1,000 1,000 1,000 1,000 1,000 1,000 1,000 1,000 acres acres acres acres acres acres Tons Tons Tons tons tons tons
CA ............... 26.0 25.3 25.1 25.3 25.2 25.1 41.6 43.9 40.0 1,052 1,106 1,004 CO ............... 33.8 35.1 28.9 28.6 35.0 27.9 26.5 27.5 29.5 758 963 823 ID ................. 131.0 164.0 171.0 116.0 163.0 170.0 31.2 34.3 31.0 3,619 5,591 5,270 MI ................ 137.0 138.0 147.0 136.0 136.0 147.0 28.7 24.4 26.0 3,903 3,318 3,822 MN ............... 440.0 464.0 449.0 399.0 449.0 441.0 24.7 23.7 26.6 9,855 10,641 11,731 MT ............... 31.7 38.4 42.6 30.7 33.6 42.5 26.8 29.8 29.5 823 1,001 1,254 NE ............... 45.2 53.0 50.0 37.3 52.6 47.5 22.6 24.6 23.8 843 1,294 1,131 ND ............... 208.0 225.0 217.0 197.0 218.0 214.0 25.9 22.0 26.5 5,102 4,796 5,671 OR ............... 6.7 10.6 10.3 5.9 10.5 10.3 33.1 37.6 36.3 195 395 374 WA 2 ............ 1.6 ............. ............. 1.6 ............. ............. 41.9 ......... ......... 67 ............. .............WY .............. 29.7 32.4 30.5 27.1 25.6 30.4 24.5 26.5 27.0 664 678 821
US ............ 1,090.7 1,185.8 1,171.4 1,004.5 1,148.5 1,155.7 26.8 25.9 27.6 26,881 29,783 31,901
1 Relates to year of intended harvest except for overwintered spring planted beets in CA. 2 Estimates discontinued in 2009.
NASS, Crops Branch, (202) 720–2127.
Table 2-23.—Sugarbeets: Production and value, by State and United States, 2008–2009 1
State
Production Marketing year average price per ton received
by farmers
Value of production
2008 2009 2008 2009
2008 2009
1,000 tons 1,000 tons Dollars Dollars 1,000 dollars 1,000 dollars CA .................. 1,052 1,106 49.10 48.90 51,653 54,083 CO ................. 758 963 47.80 53.30 36,232 51,328 ID ................... 3,619 5,591 42.00 45.10 151,998 252,154 MI ................... 3,903 3,318 44.00 55.70 171,732 184,813 MN ................. 9,855 10,641 49.90 49.80 491,765 529,922 MT ................. 823 1,001 50.80 53.40 41,808 53,453 NE .................. 843 1,294 50.80 54.60 42,824 70,652 ND ................. 5,102 4,796 51.00 51.90 260,202 248,912 OR ................. 195 395 42.00 45.10 8,190 17,815 WA ................. 67 ................... 42.00 ............................... 2,814 ...............................WY ................. 664 678 52.60 53.90 34,926 36,544
US .............. 26,881 29,783 48.10 50.40 1,294,144 1,499,676
1 Relates to year of intended harvest in all States except CA. In CA, relates to year of intended harvest for fall planted beets in central CA and to year of planting for overwintered beets in central and southern CA.
NASS, Crops Branch, (202) 720–2127.
VerDate Aug 31 2005 10:11 Feb 29, 2012 Jkt 000000 PO 00000 Frm 00013 Fmt 1000 Sfmt 1000 H:\SHARED\DAPP\FPU\AGSTAT\MASTER~2\CHAPTR02\II-12.AG8 USDA
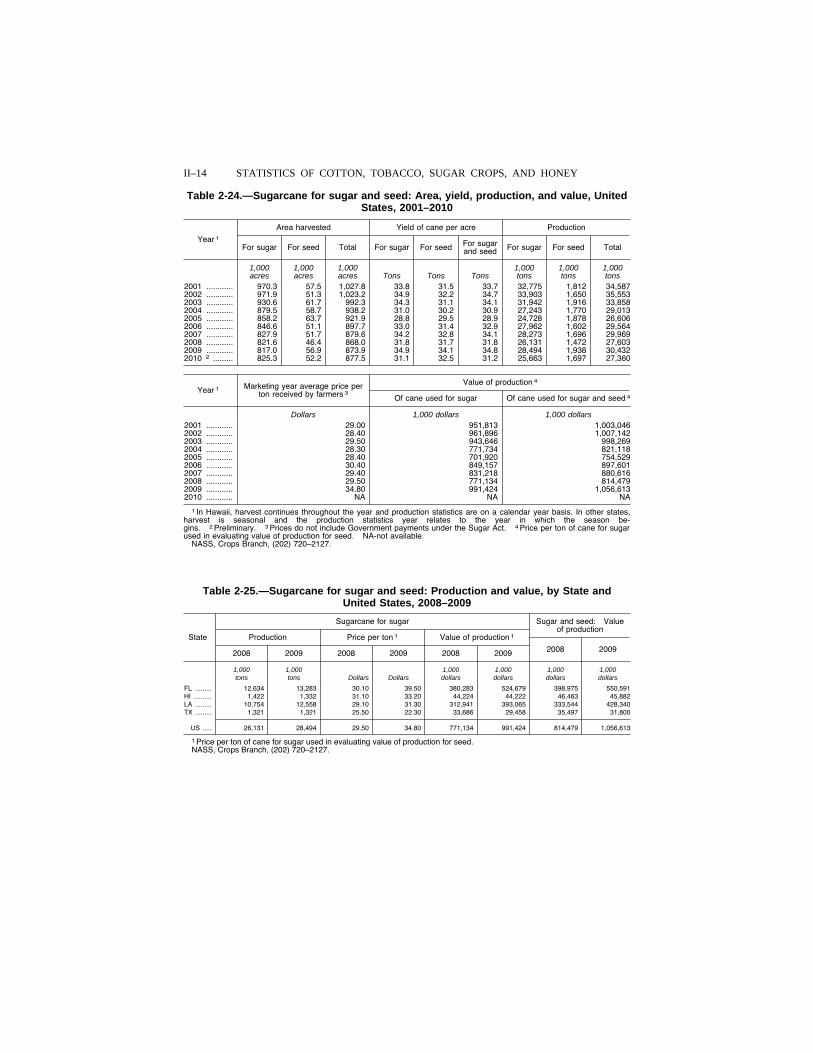
II–14 STATISTICS OF COTTON, TOBACCO, SUGAR CROPS, AND HONEY
Table 2-24.—Sugarcane for sugar and seed: Area, yield, production, and value, United States, 2001–2010
Year 1
Area harvested Yield of cane per acre Production
For sugar For seed Total For sugar For seed For sugar and seed For sugar For seed Total
1,000 1,000 1,000 1,000 1,000 1,000 acres acres acres Tons Tons Tons tons tons tons
2001 ............ 970.3 57.5 1,027.8 33.8 31.5 33.7 32,775 1,812 34,587 2002 ............ 971.9 51.3 1,023.2 34.9 32.2 34.7 33,903 1,650 35,553 2003 ............ 930.6 61.7 992.3 34.3 31.1 34.1 31,942 1,916 33,858 2004 ............ 879.5 58.7 938.2 31.0 30.2 30.9 27,243 1,770 29,013 2005 ............ 858.2 63.7 921.9 28.8 29.5 28.9 24,728 1,878 26,606 2006 ............ 846.6 51.1 897.7 33.0 31.4 32.9 27,962 1,602 29,564 2007 ............ 827.9 51.7 879.6 34.2 32.8 34.1 28,273 1,696 29,969 2008 ............ 821.6 46.4 868.0 31.8 31.7 31.8 26,131 1,472 27,603 2009 ............ 817.0 56.9 873.9 34.9 34.1 34.8 28,494 1,938 30,432 2010 2 ......... 825.3 52.2 877.5 31.1 32.5 31.2 25,663 1,697 27,360
Year 1 Marketing year average price per ton received by farmers 3
Value of production 4
Of cane used for sugar Of cane used for sugar and seed 4
Dollars 1,000 dollars 1,000 dollars 2001 ............ 29.00 951,813 1,003,046 2002 ............ 28.40 961,896 1,007,142 2003 ............ 29.50 943,646 998,269 2004 ............ 28.30 771,734 821,118 2005 ............ 28.40 701,920 754,529 2006 ............ 30.40 849,157 897,601 2007 ............ 29.40 831,218 880,616 2008 ............ 29.50 771,134 814,479 2009 ............ 34.80 991,424 1,056,613 2010 ............ NA NA NA
1 In Hawaii, harvest continues throughout the year and production statistics are on a calendar year basis. In other states, harvest is seasonal and the production statistics year relates to the year in which the season be-gins. 2 Preliminary. 3 Prices do not include Government payments under the Sugar Act. 4 Price per ton of cane for sugar used in evaluating value of production for seed. NA-not available.
NASS, Crops Branch, (202) 720–2127.
Table 2-25.—Sugarcane for sugar and seed: Production and value, by State and United States, 2008–2009
State
Sugarcane for sugar Sugar and seed: Value of production
Production Price per ton 1 Value of production 1
2008 2009 2008 2009 2008 2009 2008 2009
1,000 1,000 1,000 1,000 1,000 1,000 tons tons Dollars Dollars dollars dollars dollars dollars
FL ......... 12,634 13,283 30.10 39.50 380,283 524,679 398,975 550,591 HI .......... 1,422 1,332 31.10 33.20 44,224 44,222 46,463 45,882 LA ......... 10,754 12,558 29.10 31.30 312,941 393,065 333,544 428,340 TX ......... 1,321 1,321 25.50 22.30 33,686 29,458 35,497 31,800
US ..... 26,131 28,494 29.50 34.80 771,134 991,424 814,479 1,056,613
1 Price per ton of cane for sugar used in evaluating value of production for seed. NASS, Crops Branch, (202) 720–2127.
VerDate Aug 31 2005 10:11 Feb 29, 2012 Jkt 000000 PO 00000 Frm 00014 Fmt 1000 Sfmt 1000 H:\SHARED\DAPP\FPU\AGSTAT\MASTER~2\CHAPTR02\II-13.AG8 USDA
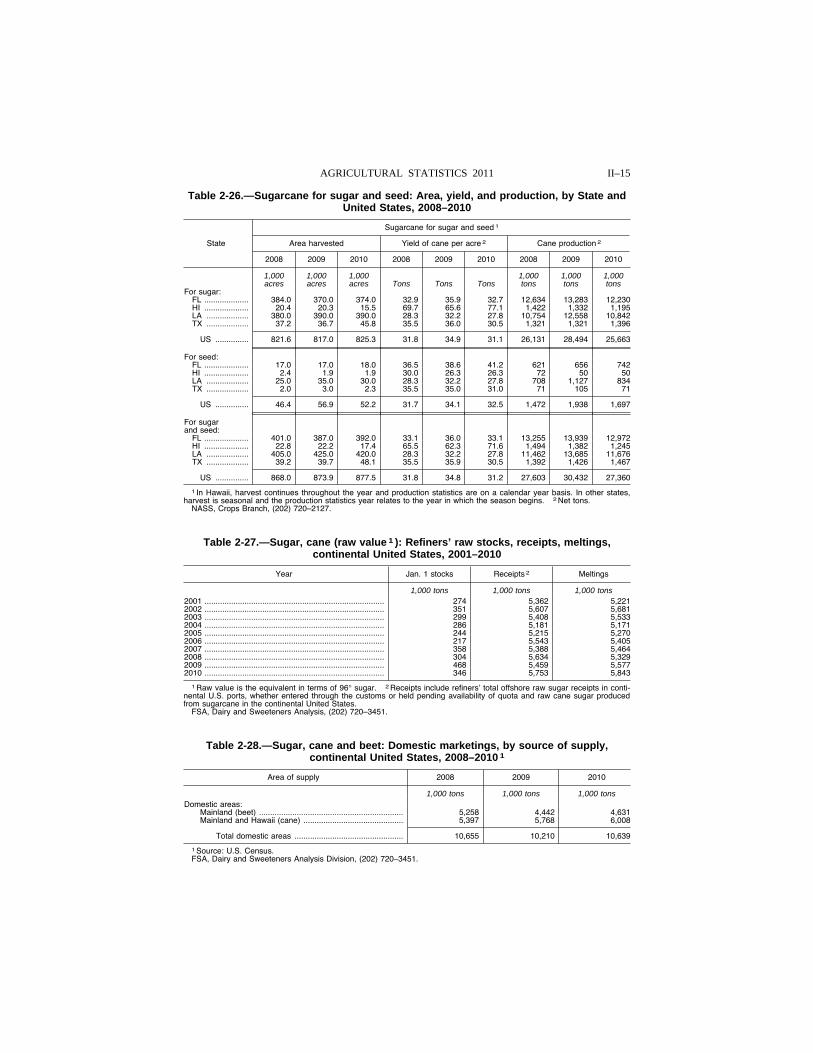
II–15 AGRICULTURAL STATISTICS 2011
Table 2-26.—Sugarcane for sugar and seed: Area, yield, and production, by State and United States, 2008–2010
State
Sugarcane for sugar and seed 1
Area harvested Yield of cane per acre 2 Cane production 2
2008 2009 2010 2008 2009 2010 2008 2009 2010
1,000 1,000 1,000 1,000 1,000 1,000 acres acres acres Tons Tons Tons tons tons tons
For sugar: FL .................... 384.0 370.0 374.0 32.9 35.9 32.7 12,634 13,283 12,230 HI .................... 20.4 20.3 15.5 69.7 65.6 77.1 1,422 1,332 1,195 LA ................... 380.0 390.0 390.0 28.3 32.2 27.8 10,754 12,558 10,842 TX ................... 37.2 36.7 45.8 35.5 36.0 30.5 1,321 1,321 1,396
US ............... 821.6 817.0 825.3 31.8 34.9 31.1 26,131 28,494 25,663
For seed: FL .................... 17.0 17.0 18.0 36.5 38.6 41.2 621 656 742 HI .................... 2.4 1.9 1.9 30.0 26.3 26.3 72 50 50 LA ................... 25.0 35.0 30.0 28.3 32.2 27.8 708 1,127 834 TX ................... 2.0 3.0 2.3 35.5 35.0 31.0 71 105 71
US ............... 46.4 56.9 52.2 31.7 34.1 32.5 1,472 1,938 1,697
For sugar and seed:
FL .................... 401.0 387.0 392.0 33.1 36.0 33.1 13,255 13,939 12,972 HI .................... 22.8 22.2 17.4 65.5 62.3 71.6 1,494 1,382 1,245 LA ................... 405.0 425.0 420.0 28.3 32.2 27.8 11,462 13,685 11,676 TX ................... 39.2 39.7 48.1 35.5 35.9 30.5 1,392 1,426 1,467
US ............... 868.0 873.9 877.5 31.8 34.8 31.2 27,603 30,432 27,360
1 In Hawaii, harvest continues throughout the year and production statistics are on a calendar year basis. In other states, harvest is seasonal and the production statistics year relates to the year in which the season begins. 2 Net tons.
NASS, Crops Branch, (202) 720–2127.
Table 2-27.—Sugar, cane (raw value 1 ): Refiners’ raw stocks, receipts, meltings, continental United States, 2001–2010
Year Jan. 1 stocks Receipts 2 Meltings
1,000 tons 1,000 tons 1,000 tons 2001 ................................................................................. 274 5,362 5,221 2002 ................................................................................. 351 5,607 5,681 2003 ................................................................................. 299 5,408 5,533 2004 ................................................................................. 286 5,181 5,171 2005 ................................................................................. 244 5,215 5,270 2006 ................................................................................. 217 5,543 5,405 2007 ................................................................................. 358 5,388 5,464 2008 ................................................................................. 304 5,634 5,329 2009 ................................................................................. 468 5,459 5,577 2010 ................................................................................. 346 5,753 5,843
1 Raw value is the equivalent in terms of 96° sugar. 2 Receipts include refiners’ total offshore raw sugar receipts in conti-nental U.S. ports, whether entered through the customs or held pending availability of quota and raw cane sugar produced from sugarcane in the continental United States.
FSA, Dairy and Sweeteners Analysis, (202) 720–3451.
Table 2-28.—Sugar, cane and beet: Domestic marketings, by source of supply, continental United States, 2008–2010 1
Area of supply 2008 2009 2010
1,000 tons 1,000 tons 1,000 tons Domestic areas:
Mainland (beet) ................................................................. 5,258 4,442 4,631 Mainland and Hawaii (cane) ............................................. 5,397 5,768 6,008
Total domestic areas ................................................. 10,655 10,210 10,639
1 Source: U.S. Census. FSA, Dairy and Sweeteners Analysis Division, (202) 720–3451.
VerDate Aug 31 2005 10:11 Feb 29, 2012 Jkt 000000 PO 00000 Frm 00015 Fmt 1000 Sfmt 1000 H:\SHARED\DAPP\FPU\AGSTAT\MASTER~2\CHAPTR02\II-14.AG8 USDA
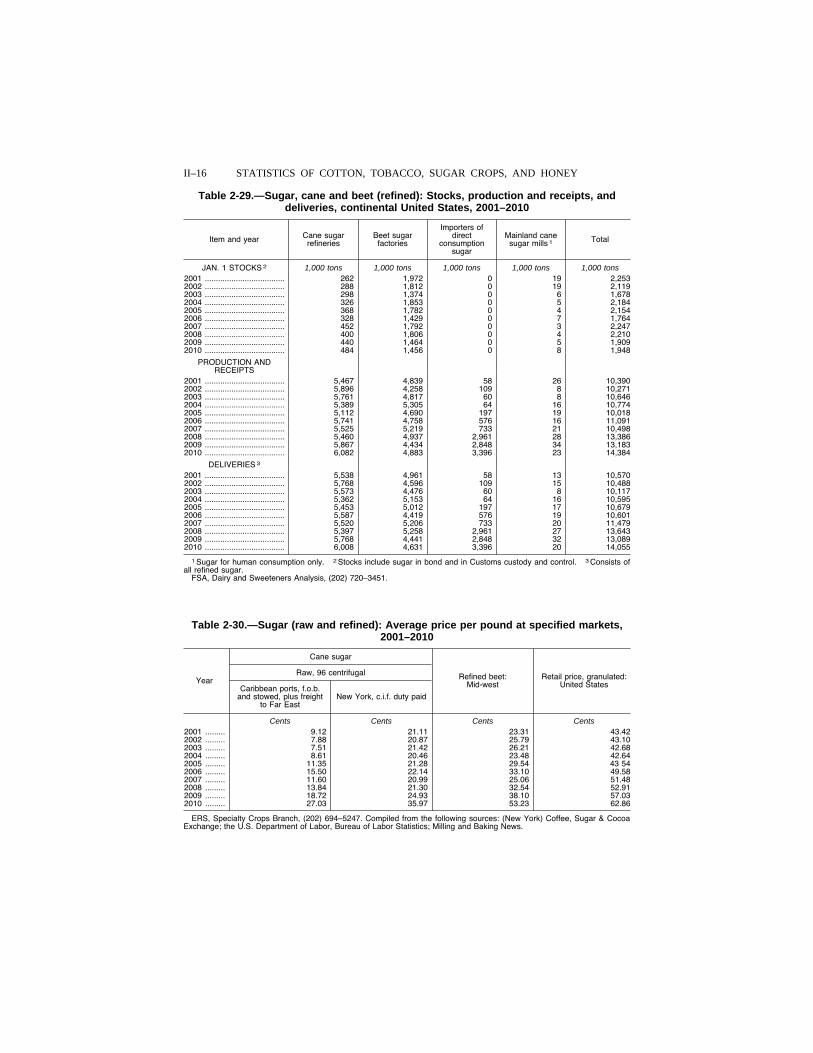
II–16 STATISTICS OF COTTON, TOBACCO, SUGAR CROPS, AND HONEY
Table 2-29.—Sugar, cane and beet (refined): Stocks, production and receipts, and deliveries, continental United States, 2001–2010
Item and year Cane sugar refineries
Beet sugar factories
Importers of direct
consumption sugar
Mainland cane sugar mills 1 Total
JAN. 1 STOCKS 2 1,000 tons 1,000 tons 1,000 tons 1,000 tons 1,000 tons 2001 .................................... 262 1,972 0 19 2,253 2002 .................................... 288 1,812 0 19 2,119 2003 .................................... 298 1,374 0 6 1,678 2004 .................................... 326 1,853 0 5 2,184 2005 .................................... 368 1,782 0 4 2,154 2006 .................................... 328 1,429 0 7 1,764 2007 .................................... 452 1,792 0 3 2,247 2008 .................................... 400 1,806 0 4 2,210 2009 .................................... 440 1,464 0 5 1,909 2010 .................................... 484 1,456 0 8 1,948
PRODUCTION AND RECEIPTS
2001 .................................... 5,467 4,839 58 26 10,390 2002 .................................... 5,896 4,258 109 8 10,271 2003 .................................... 5,761 4,817 60 8 10,646 2004 .................................... 5,389 5,305 64 16 10,774 2005 .................................... 5,112 4,690 197 19 10,018 2006 .................................... 5,741 4,758 576 16 11,091 2007 .................................... 5,525 5,219 733 21 10,498 2008 .................................... 5,460 4,937 2,961 28 13,386 2009 .................................... 5,867 4,434 2,848 34 13,183 2010 .................................... 6,082 4,883 3,396 23 14,384
DELIVERIES 3 2001 .................................... 5,538 4,961 58 13 10,570 2002 .................................... 5,768 4,596 109 15 10,488 2003 .................................... 5,573 4,476 60 8 10,117 2004 .................................... 5,362 5,153 64 16 10,595 2005 .................................... 5,453 5,012 197 17 10,679 2006 .................................... 5,587 4,419 576 19 10,601 2007 .................................... 5,520 5,206 733 20 11,479 2008 .................................... 5,397 5,258 2,961 27 13,643 2009 .................................... 5,768 4,441 2,848 32 13,089 2010 .................................... 6,008 4,631 3,396 20 14,055
1 Sugar for human consumption only. 2 Stocks include sugar in bond and in Customs custody and control. 3 Consists of all refined sugar.
FSA, Dairy and Sweeteners Analysis, (202) 720–3451.
Table 2-30.—Sugar (raw and refined): Average price per pound at specified markets, 2001–2010
Year
Cane sugar
Refined beet: Mid-west
Retail price, granulated: United States
Raw, 96 centrifugal
Caribbean ports, f.o.b. and stowed, plus freight
to Far East New York, c.i.f. duty paid
Cents Cents Cents Cents 2001 ......... 9.12 21.11 23.31 43.42 2002 ......... 7.88 20.87 25.79 43.10 2003 ......... 7.51 21.42 26.21 42.68 2004 ......... 8.61 20.46 23.48 42.64 2005 ......... 11.35 21.28 29.54 43 54 2006 ......... 15.50 22.14 33.10 49.58 2007 ......... 11.60 20.99 25.06 51.48 2008 ......... 13.84 21.30 32.54 52.91 2009 ......... 18.72 24.93 38.10 57.03 2010 ......... 27.03 35.97 53.23 62.86
ERS, Specialty Crops Branch, (202) 694–5247. Compiled from the following sources: (New York) Coffee, Sugar & Cocoa Exchange; the U.S. Department of Labor, Bureau of Labor Statistics; Milling and Baking News.
VerDate Aug 31 2005 10:11 Feb 29, 2012 Jkt 000000 PO 00000 Frm 00016 Fmt 1000 Sfmt 1000 H:\SHARED\DAPP\FPU\AGSTAT\MASTER~2\CHAPTR02\II-15.AG8 USDA
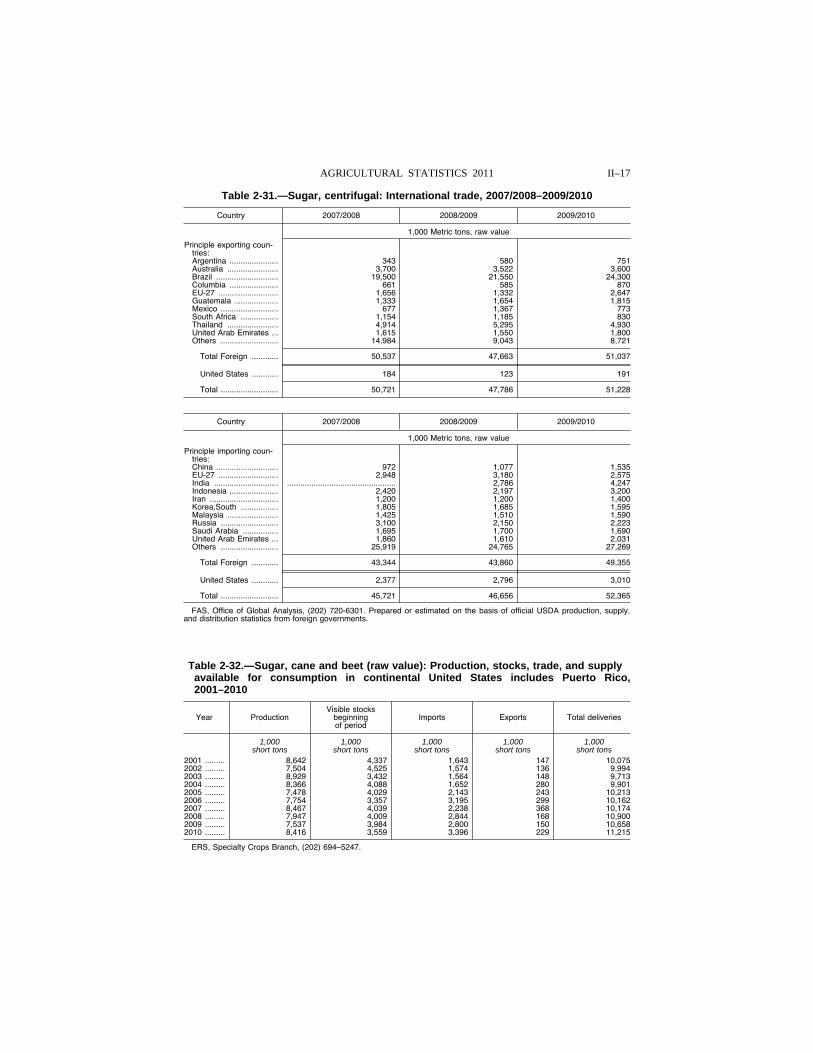
II–17 AGRICULTURAL STATISTICS 2011
Table 2-31.—Sugar, centrifugal: International trade, 2007/2008–2009/2010
Country 2007/2008 2008/2009 2009/2010
1,000 Metric tons, raw value
Principle exporting coun-tries: Argentina ...................... 343 580 751 Australia ....................... 3,700 3,522 3,600 Brazil ............................ 19,500 21,550 24,300 Columbia ...................... 661 585 870 EU-27 ........................... 1,656 1,332 2,647 Guatemala .................... 1,333 1,654 1,815 Mexico .......................... 677 1,367 773 South Africa ................. 1,154 1,185 830 Thailand ....................... 4,914 5,295 4,930 United Arab Emirates ... 1,615 1,550 1,800 Others .......................... 14,984 9,043 8,721
Total Foreign ............ 50,537 47,663 51,037
United States ............ 184 123 191
Total .......................... 50,721 47,786 51,228
Country 2007/2008 2008/2009 2009/2010
1,000 Metric tons, raw value
Principle importing coun-tries: China ............................ 972 1,077 1,535 EU-27 ........................... 2,948 3,180 2,575 India ............................. ................................................. 2,786 4,247 Indonesia ...................... 2,420 2,197 3,200 Iran ............................... 1,200 1,200 1,400 Korea,South ................. 1,805 1,685 1,595 Malaysia ....................... 1,425 1,510 1,590 Russia .......................... 3,100 2,150 2,223 Saudi Arabia ................ 1,695 1,700 1,690 United Arab Emirates ... 1,860 1,610 2,031 Others .......................... 25,919 24,765 27,269
Total Foreign ............ 43,344 43,860 49,355
United States ............ 2,377 2,796 3,010
Total .......................... 45,721 46,656 52,365
FAS, Office of Global Analysis, (202) 720-6301. Prepared or estimated on the basis of official USDA production, supply, and distribution statistics from foreign governments.
Table 2-32.—Sugar, cane and beet (raw value): Production, stocks, trade, and supply available for consumption in continental United States includes Puerto Rico, 2001–2010
Year Production Visible stocks
beginning of period
Imports Exports Total deliveries
1,000 1,000 1,000 1,000 1,000 short tons short tons short tons short tons short tons
2001 ......... 8,642 4,337 1,643 147 10,075 2002 ......... 7,504 4,525 1,574 136 9,994 2003 ......... 8,929 3,432 1,564 148 9,713 2004 ......... 8,366 4,088 1,652 280 9,901 2005 ......... 7,478 4,029 2,143 243 10,213 2006 ......... 7,754 3,357 3,195 299 10,162 2007 ......... 8,467 4,039 2,238 368 10,174 2008 ......... 7,947 4,009 2,844 168 10,900 2009 ......... 7,537 3,984 2,800 150 10,658 2010 ......... 8,416 3,559 3,396 229 11,215
ERS, Specialty Crops Branch, (202) 694–5247.
VerDate Aug 31 2005 10:11 Feb 29, 2012 Jkt 000000 PO 00000 Frm 00017 Fmt 1000 Sfmt 1000 H:\SHARED\DAPP\FPU\AGSTAT\MASTER~2\CHAPTR02\II-16.AG8 USDA
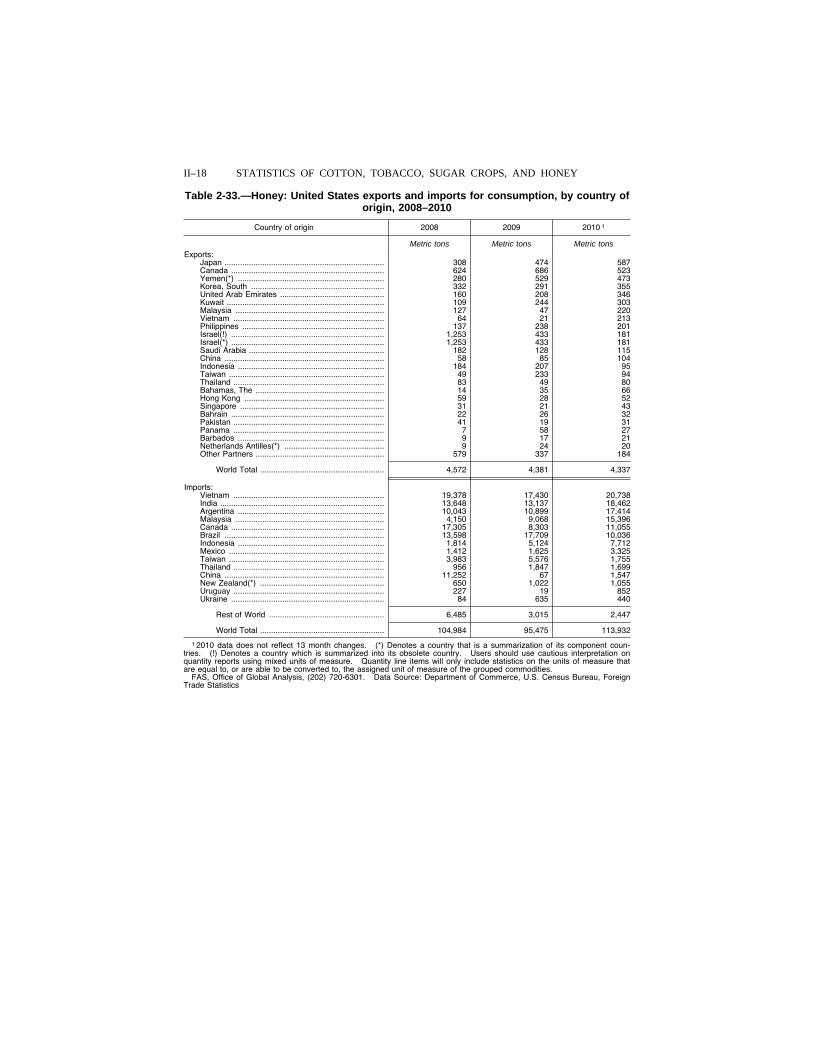
II–18 STATISTICS OF COTTON, TOBACCO, SUGAR CROPS, AND HONEY
Table 2-33.—Honey: United States exports and imports for consumption, by country of origin, 2008–2010
Country of origin 2008 2009 2010 1
Metric tons Metric tons Metric tons Exports:
Japan ........................................................................ 308 474 587 Canada ..................................................................... 624 686 523 Yemen(*) .................................................................. 280 529 473 Korea, South ............................................................ 332 291 355 United Arab Emirates ............................................... 160 208 346 Kuwait ....................................................................... 109 244 303 Malaysia ................................................................... 127 47 220 Vietnam .................................................................... 64 21 213 Philippines ................................................................ 137 238 201 Israel(!) ..................................................................... 1,253 433 181 Israel(*) ..................................................................... 1,253 433 181 Saudi Arabia ............................................................. 182 128 115 China ........................................................................ 58 85 104 Indonesia .................................................................. 184 207 95 Taiwan ...................................................................... 49 233 94 Thailand .................................................................... 83 49 80 Bahamas, The .......................................................... 14 35 66 Hong Kong ............................................................... 59 28 52 Singapore ................................................................. 31 21 43 Bahrain ..................................................................... 22 26 32 Pakistan .................................................................... 41 19 31 Panama .................................................................... 7 58 27 Barbados .................................................................. 9 17 21 Netherlands Antilles(*) ............................................. 9 24 20 Other Partners .......................................................... 579 337 184
World Total ........................................................ 4,572 4,381 4,337
Imports: Vietnam .................................................................... 19,378 17,430 20,738 India .......................................................................... 13,648 13,137 18,462 Argentina .................................................................. 10,043 10,899 17,414 Malaysia ................................................................... 4,150 9,068 15,396 Canada ..................................................................... 17,305 8,303 11,055 Brazil ........................................................................ 13,598 17,709 10,036 Indonesia .................................................................. 1,814 5,124 7,712 Mexico ...................................................................... 1,412 1,625 3,325 Taiwan ...................................................................... 3,983 5,576 1,755 Thailand .................................................................... 956 1,847 1,699 China ........................................................................ 11,252 67 1,547 New Zealand(*) ........................................................ 650 1,022 1,055 Uruguay .................................................................... 227 19 852 Ukraine ..................................................................... 84 635 440
Rest of World .................................................... 6,485 3,015 2,447
World Total ........................................................ 104,984 95,475 113,932
1 2010 data does not reflect 13 month changes. (*) Denotes a country that is a summarization of its component coun-tries. (!) Denotes a country which is summarized into its obsolete country. Users should use cautious interpretation on quantity reports using mixed units of measure. Quantity line items will only include statistics on the units of measure that are equal to, or are able to be converted to, the assigned unit of measure of the grouped commodities.
FAS, Office of Global Analysis, (202) 720-6301. Data Source: Department of Commerce, U.S. Census Bureau, Foreign Trade Statistics
VerDate Aug 31 2005 10:11 Feb 29, 2012 Jkt 000000 PO 00000 Frm 00018 Fmt 1000 Sfmt 1000 H:\SHARED\DAPP\FPU\AGSTAT\MASTER~2\CHAPTR02\II-17.AG8 USDA
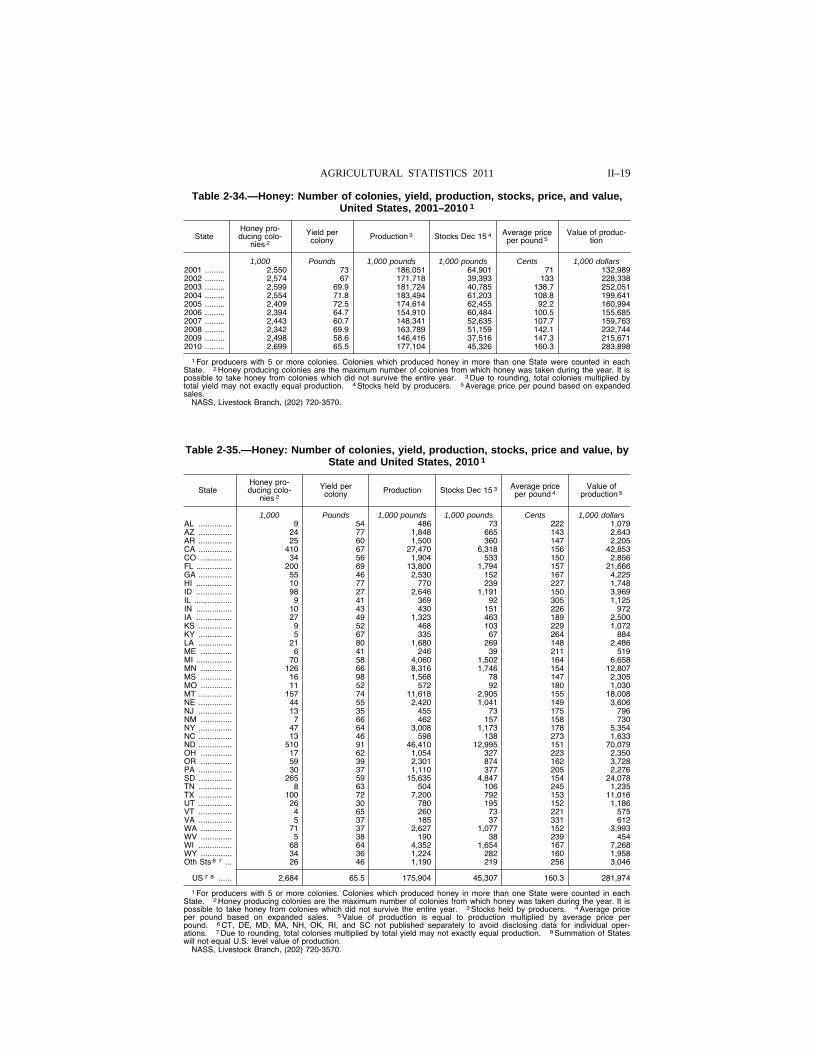
II–19 AGRICULTURAL STATISTICS 2011
Table 2-34.—Honey: Number of colonies, yield, production, stocks, price, and value, United States, 2001–2010 1
State Honey pro-ducing colo-
nies 2
Yield per colony Production 3 Stocks Dec 15 4 Average price
per pound 5 Value of produc-
tion
1,000 Pounds 1,000 pounds 1,000 pounds Cents 1,000 dollars 2001 ......... 2,550 73 186,051 64,901 71 132,989 2002 ......... 2,574 67 171,718 39,393 133 228,338 2003 ......... 2,599 69.9 181,724 40,785 138.7 252,051 2004 ......... 2,554 71.8 183,494 61,203 108.8 199,641 2005 ......... 2,409 72.5 174,614 62,455 92.2 160,994 2006 ......... 2,394 64.7 154,910 60,484 100.5 155,685 2007 ......... 2,443 60.7 148,341 52,635 107.7 159,763 2008 ......... 2,342 69.9 163,789 51,159 142.1 232,744 2009 ......... 2,498 58.6 146,416 37,516 147.3 215,671 2010 ......... 2,699 65.5 177,104 45,326 160.3 283,898
1 For producers with 5 or more colonies. Colonies which produced honey in more than one State were counted in each State. 2 Honey producing colonies are the maximum number of colonies from which honey was taken during the year. It is possible to take honey from colonies which did not survive the entire year. 3 Due to rounding, total colonies multiplied by total yield may not exactly equal production. 4 Stocks held by producers. 5 Average price per pound based on expanded sales.
NASS, Livestock Branch, (202) 720-3570.
Table 2-35.—Honey: Number of colonies, yield, production, stocks, price and value, by State and United States, 2010 1
State Honey pro-ducing colo-
nies 2
Yield per colony Production Stocks Dec 15 3 Average price
per pound 4 Value of
production 5
1,000 Pounds 1,000 pounds 1,000 pounds Cents 1,000 dollars AL ............... 9 54 486 73 222 1,079 AZ ............... 24 77 1,848 665 143 2,643 AR ............... 25 60 1,500 360 147 2,205 CA ............... 410 67 27,470 6,318 156 42,853 CO .............. 34 56 1,904 533 150 2,856 FL ................ 200 69 13,800 1,794 157 21,666 GA ............... 55 46 2,530 152 167 4,225 HI ................ 10 77 770 239 227 1,748 ID ................ 98 27 2,646 1,191 150 3,969 IL ................. 9 41 369 92 305 1,125 IN ................ 10 43 430 151 226 972 IA ................ 27 49 1,323 463 189 2,500 KS ............... 9 52 468 103 229 1,072 KY ............... 5 67 335 67 264 884 LA ............... 21 80 1,680 269 148 2,486 ME .............. 6 41 246 39 211 519 MI ................ 70 58 4,060 1,502 164 6,658 MN .............. 126 66 8,316 1,746 154 12,807 MS .............. 16 98 1,568 78 147 2,305 MO .............. 11 52 572 92 180 1,030 MT ............... 157 74 11,618 2,905 155 18,008 NE ............... 44 55 2,420 1,041 149 3,606 NJ ............... 13 35 455 73 175 796 NM .............. 7 66 462 157 158 730 NY ............... 47 64 3,008 1,173 178 5,354 NC ............... 13 46 598 138 273 1,633 ND ............... 510 91 46,410 12,995 151 70,079 OH .............. 17 62 1,054 327 223 2,350 OR .............. 59 39 2,301 874 162 3,728 PA ............... 30 37 1,110 377 205 2,276 SD ............... 265 59 15,635 4,847 154 24,078 TN ............... 8 63 504 106 245 1,235 TX ............... 100 72 7,200 792 153 11,016 UT ............... 26 30 780 195 152 1,186 VT ............... 4 65 260 73 221 575 VA ............... 5 37 185 37 331 612 WA .............. 71 37 2,627 1,077 152 3,993 WV .............. 5 38 190 38 239 454 WI ............... 68 64 4,352 1,654 167 7,268 WY .............. 34 36 1,224 282 160 1,958 Oth Sts 6 7 ... 26 46 1,190 219 256 3,046
US 7 8 ...... 2,684 65.5 175,904 45,307 160.3 281,974
1 For producers with 5 or more colonies. Colonies which produced honey in more than one State were counted in each State. 2 Honey producing colonies are the maximum number of colonies from which honey was taken during the year. It is possible to take honey from colonies which did not survive the entire year. 3 Stocks held by producers. 4 Average price per pound based on expanded sales. 5 Value of production is equal to production multiplied by average price per pound. 6 CT, DE, MD, MA, NH, OK, RI, and SC not published separately to avoid disclosing data for individual oper-ations. 7 Due to rounding, total colonies multiplied by total yield may not exactly equal production. 8 Summation of States will not equal U.S. level value of production.
NASS, Livestock Branch, (202) 720-3570.
VerDate Aug 31 2005 10:11 Feb 29, 2012 Jkt 000000 PO 00000 Frm 00019 Fmt 1000 Sfmt 1000 H:\SHARED\DAPP\FPU\AGSTAT\MASTER~2\CHAPTR02\II-18.AG8 USDA
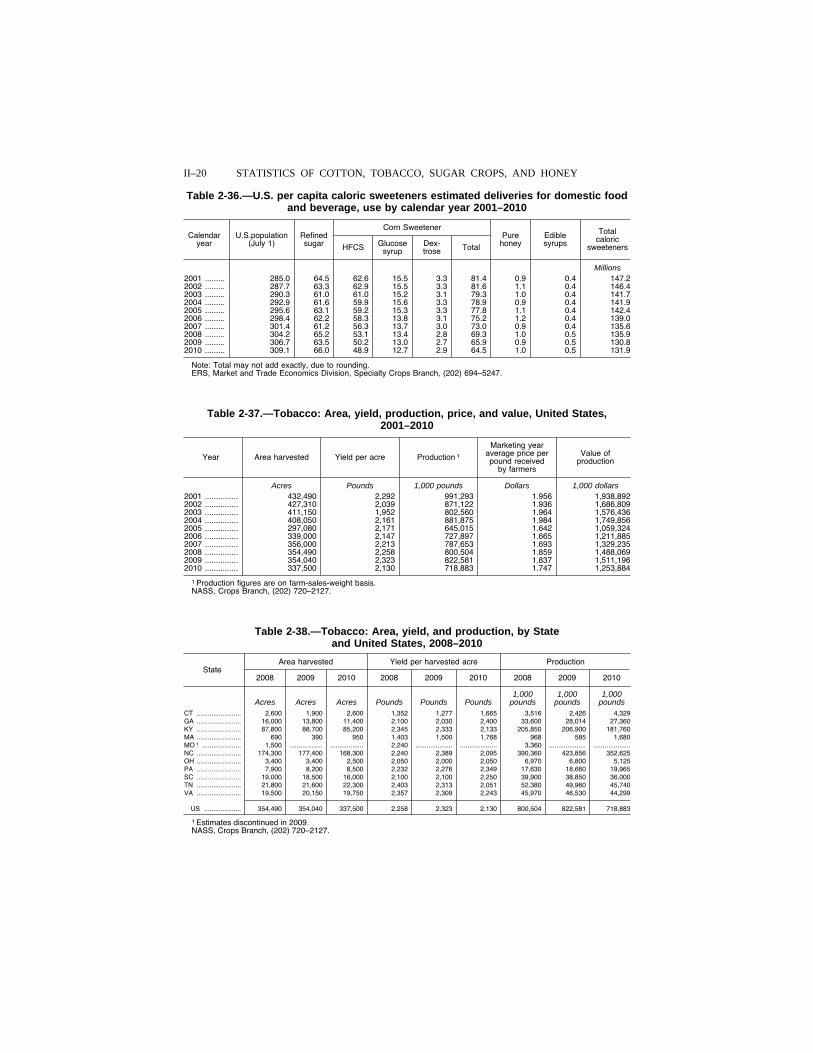
II–20 STATISTICS OF COTTON, TOBACCO, SUGAR CROPS, AND HONEY
Table 2-36.—U.S. per capita caloric sweeteners estimated deliveries for domestic food and beverage, use by calendar year 2001–2010
Calendar year
U.S.population (July 1)
Refined sugar
Corn Sweetener Pure
honey Edible syrups
Total caloric
sweeteners HFCS Glucose syrup
Dex-trose Total
Millions 2001 ......... 285.0 64.5 62.6 15.5 3.3 81.4 0.9 0.4 147.2 2002 ......... 287.7 63.3 62.9 15.5 3.3 81.6 1.1 0.4 146.4 2003 ......... 290.3 61.0 61.0 15.2 3.1 79.3 1.0 0.4 141.7 2004 ......... 292.9 61.6 59.9 15.6 3.3 78.9 0.9 0.4 141.9 2005 ......... 295.6 63.1 59.2 15.3 3.3 77.8 1.1 0.4 142.4 2006 ......... 298.4 62.2 58.3 13.8 3.1 75.2 1.2 0.4 139.0 2007 ......... 301.4 61.2 56.3 13.7 3.0 73.0 0.9 0.4 135.6 2008 ......... 304.2 65.2 53.1 13.4 2.8 69.3 1.0 0.5 135.9 2009 ......... 306.7 63.5 50.2 13.0 2.7 65.9 0.9 0.5 130.8 2010 ......... 309.1 66.0 48.9 12.7 2.9 64.5 1.0 0.5 131.9
Note: Total may not add exactly, due to rounding. ERS, Market and Trade Economics Division, Specialty Crops Branch, (202) 694–5247.
Table 2-37.—Tobacco: Area, yield, production, price, and value, United States, 2001–2010
Year Area harvested Yield per acre Production 1
Marketing year average price per pound received
by farmers
Value of production
Acres Pounds 1,000 pounds Dollars 1,000 dollars 2001 ............... 432,490 2,292 991,293 1.956 1,938,892 2002 ............... 427,310 2,039 871,122 1.936 1,686,809 2003 ............... 411,150 1,952 802,560 1.964 1,576,436 2004 ............... 408,050 2,161 881,875 1.984 1,749,856 2005 ............... 297,080 2,171 645,015 1.642 1,059,324 2006 ............... 339,000 2,147 727,897 1.665 1,211,885 2007 ............... 356,000 2,213 787,653 1.693 1,329,235 2008 ............... 354,490 2,258 800,504 1.859 1,488,069 2009 ............... 354,040 2,323 822,581 1.837 1,511,196 2010 ............... 337,500 2,130 718,883 1.747 1,253,884
1 Production figures are on farm-sales-weight basis. NASS, Crops Branch, (202) 720–2127.
Table 2-38.—Tobacco: Area, yield, and production, by State and United States, 2008–2010
State Area harvested Yield per harvested acre Production
2008 2009 2010 2008 2009 2010 2008 2009 2010
1,000 1,000 1,000 Acres Acres Acres Pounds Pounds Pounds pounds pounds pounds
CT ........................ 2,600 1,900 2,600 1,352 1,277 1,665 3,516 2,426 4,329 GA ........................ 16,000 13,800 11,400 2,100 2,030 2,400 33,600 28,014 27,360 KY ........................ 87,800 88,700 85,200 2,345 2,333 2,133 205,850 206,900 181,760 MA ........................ 690 390 950 1,403 1,500 1,768 968 585 1,680 MO 1 ..................... 1,500 .................. .................. 2,240 .................... .................... 3,360 .................... ....................NC ........................ 174,300 177,400 168,300 2,240 2,389 2,095 390,360 423,856 352,625 OH ........................ 3,400 3,400 2,500 2,050 2,000 2,050 6,970 6,800 5,125 PA ........................ 7,900 8,200 8,500 2,232 2,276 2,349 17,630 18,660 19,965 SC ........................ 19,000 18,500 16,000 2,100 2,100 2,250 39,900 38,850 36,000 TN ........................ 21,800 21,600 22,300 2,403 2,313 2,051 52,380 49,960 45,740 VA ........................ 19,500 20,150 19,750 2,357 2,309 2,243 45,970 46,530 44,299
US .................... 354,490 354,040 337,500 2,258 2,323 2,130 800,504 822,581 718,883
1 Estimates discontinued in 2009. NASS, Crops Branch, (202) 720–2127.
VerDate Aug 31 2005 10:11 Feb 29, 2012 Jkt 000000 PO 00000 Frm 00020 Fmt 1000 Sfmt 1000 H:\SHARED\DAPP\FPU\AGSTAT\MASTER~2\CHAPTR02\II-19.AG8 USDA
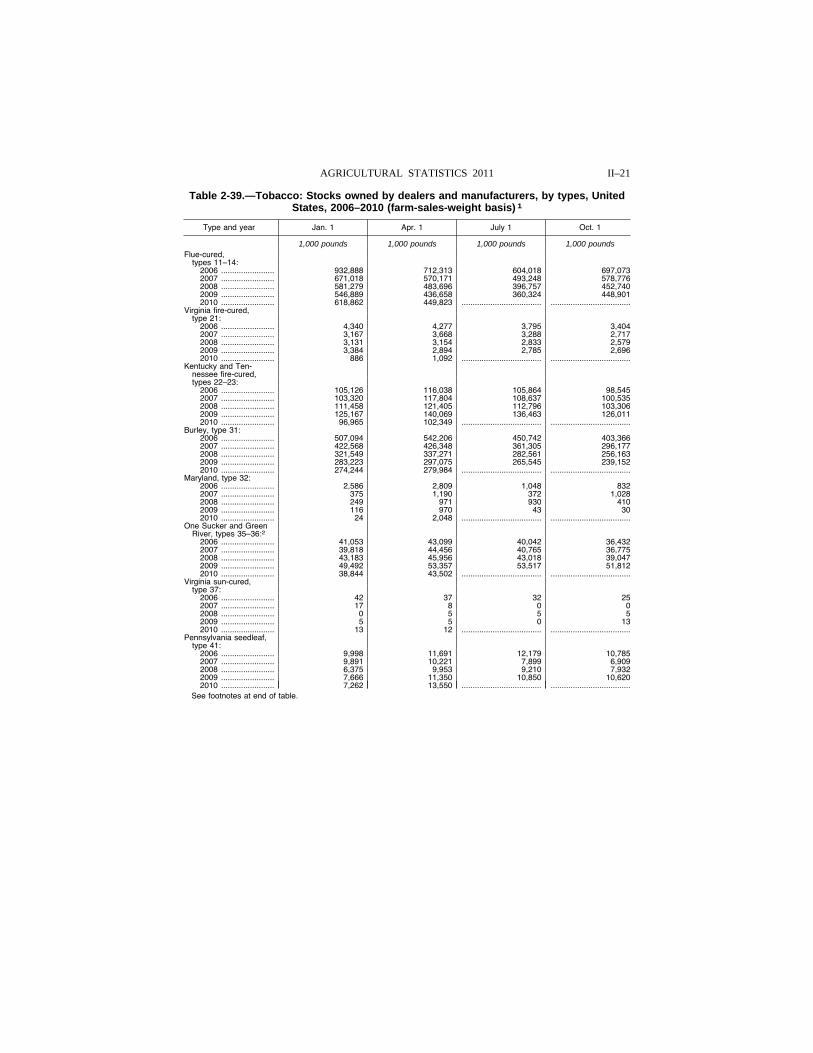
II–21 AGRICULTURAL STATISTICS 2011
Table 2-39.—Tobacco: Stocks owned by dealers and manufacturers, by types, United States, 2006–2010 (farm-sales-weight basis) 1
Type and year Jan. 1 Apr. 1 July 1 Oct. 1
1,000 pounds 1,000 pounds 1,000 pounds 1,000 pounds Flue-cured,
types 11–14: 2006 ........................ 932,888 712,313 604,018 697,073 2007 ........................ 671,018 570,171 493,248 578,776 2008 ........................ 581,279 483,696 396,757 452,740 2009 ........................ 546,889 436,658 360,324 448,901 2010 ........................ 618,862 449,823 .................................... ....................................
Virginia fire-cured, type 21:
2006 ........................ 4,340 4,277 3,795 3,404 2007 ........................ 3,167 3,668 3,288 2,717 2008 ........................ 3,131 3,154 2,833 2,579 2009 ........................ 3,384 2,894 2,785 2,696 2010 ........................ 886 1,092 .................................... ....................................
Kentucky and Ten-nessee fire-cured, types 22–23:
2006 ........................ 105,126 116,038 105,864 98,545 2007 ........................ 103,320 117,804 108,637 100,535 2008 ........................ 111,458 121,405 112,796 103,306 2009 ........................ 125,167 140,069 136,463 126,011 2010 ........................ 96,965 102,349 .................................... ....................................
Burley, type 31: 2006 ........................ 507,094 542,206 450,742 403,366 2007 ........................ 422,568 426,348 361,305 296,177 2008 ........................ 321,549 337,271 282,561 256,163 2009 ........................ 283,223 297,075 265,545 239,152 2010 ........................ 274,244 279,984 .................................... ....................................
Maryland, type 32: 2006 ........................ 2,586 2,809 1,048 832 2007 ........................ 375 1,190 372 1,028 2008 ........................ 249 971 930 410 2009 ........................ 116 970 43 30 2010 ........................ 24 2,048 .................................... ....................................
One Sucker and Green River, types 35–36:2
2006 ........................ 41,053 43,099 40,042 36,432 2007 ........................ 39,818 44,456 40,765 36,775 2008 ........................ 43,183 45,956 43,018 39,047 2009 ........................ 49,492 53,357 53,517 51,812 2010 ........................ 38,844 43,502 .................................... ....................................
Virginia sun-cured, type 37:
2006 ........................ 42 37 32 25 2007 ........................ 17 8 0 0 2008 ........................ 0 5 5 5 2009 ........................ 5 5 0 13 2010 ........................ 13 12 .................................... ....................................
Pennsylvania seedleaf, type 41:
2006 ........................ 9,998 11,691 12,179 10,785 2007 ........................ 9,891 10,221 7,899 6,909 2008 ........................ 6,375 9,953 9,210 7,932 2009 ........................ 7,666 11,350 10,850 10,620 2010 ........................ 7,262 13,550 .................................... ....................................
See footnotes at end of table.
VerDate Aug 31 2005 10:11 Feb 29, 2012 Jkt 000000 PO 00000 Frm 00021 Fmt 1000 Sfmt 1000 H:\SHARED\DAPP\FPU\AGSTAT\MASTER~2\CHAPTR02\II-23.AG8 USDA
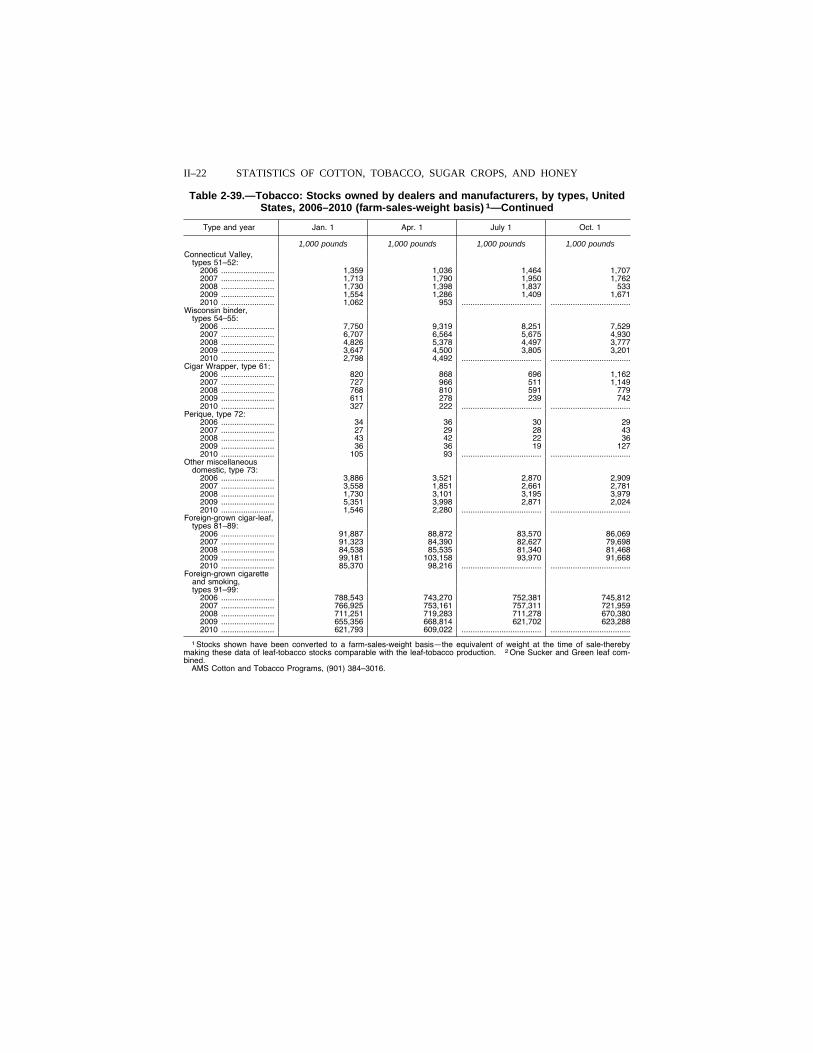
II–22 STATISTICS OF COTTON, TOBACCO, SUGAR CROPS, AND HONEY
Table 2-39.—Tobacco: Stocks owned by dealers and manufacturers, by types, United States, 2006–2010 (farm-sales-weight basis) 1—Continued
Type and year Jan. 1 Apr. 1 July 1 Oct. 1
1,000 pounds 1,000 pounds 1,000 pounds 1,000 pounds Connecticut Valley,
types 51–52: 2006 ........................ 1,359 1,036 1,464 1,707 2007 ........................ 1,713 1,790 1,950 1,762 2008 ........................ 1,730 1,398 1,837 533 2009 ........................ 1,554 1,286 1,409 1,671 2010 ........................ 1,062 953 .................................... ....................................
Wisconsin binder, types 54–55:
2006 ........................ 7,750 9,319 8,251 7,529 2007 ........................ 6,707 6,564 5,675 4,930 2008 ........................ 4,826 5,378 4,497 3,777 2009 ........................ 3,647 4,500 3,805 3,201 2010 ........................ 2,798 4,492 .................................... ....................................
Cigar Wrapper, type 61: 2006 ........................ 820 868 696 1,162 2007 ........................ 727 966 511 1,149 2008 ........................ 768 810 591 779 2009 ........................ 611 278 239 742 2010 ........................ 327 222 .................................... ....................................
Perique, type 72: 2006 ........................ 34 36 30 29 2007 ........................ 27 29 28 43 2008 ........................ 43 42 22 36 2009 ........................ 36 36 19 127 2010 ........................ 105 93 .................................... ....................................
Other miscellaneous domestic, type 73:
2006 ........................ 3,886 3,521 2,870 2,909 2007 ........................ 3,558 1,851 2,661 2,781 2008 ........................ 1,730 3,101 3,195 3,979 2009 ........................ 5,351 3,998 2,871 2,024 2010 ........................ 1,546 2,280 .................................... ....................................
Foreign-grown cigar-leaf, types 81–89:
2006 ........................ 91,887 88,872 83,570 86,069 2007 ........................ 91,323 84,390 82,627 79,698 2008 ........................ 84,538 85,535 81,340 81,468 2009 ........................ 99,181 103,158 93,970 91,668 2010 ........................ 85,370 98,216 .................................... ....................................
Foreign-grown cigarette and smoking, types 91–99:
2006 ........................ 788,543 743,270 752,381 745,812 2007 ........................ 766,925 753,161 757,311 721,959 2008 ........................ 711,251 719,283 711,278 670,380 2009 ........................ 655,356 668,814 621,702 623,288 2010 ........................ 621,793 609,022 .................................... ....................................
1 Stocks shown have been converted to a farm-sales-weight basis—the equivalent of weight at the time of sale-thereby making these data of leaf-tobacco stocks comparable with the leaf-tobacco production. 2 One Sucker and Green leaf com-bined.
AMS Cotton and Tobacco Programs, (901) 384–3016.
VerDate Aug 31 2005 10:11 Feb 29, 2012 Jkt 000000 PO 00000 Frm 00022 Fmt 1000 Sfmt 1000 H:\SHARED\DAPP\FPU\AGSTAT\MASTER~2\CHAPTR02\II-24.AG8 USDA
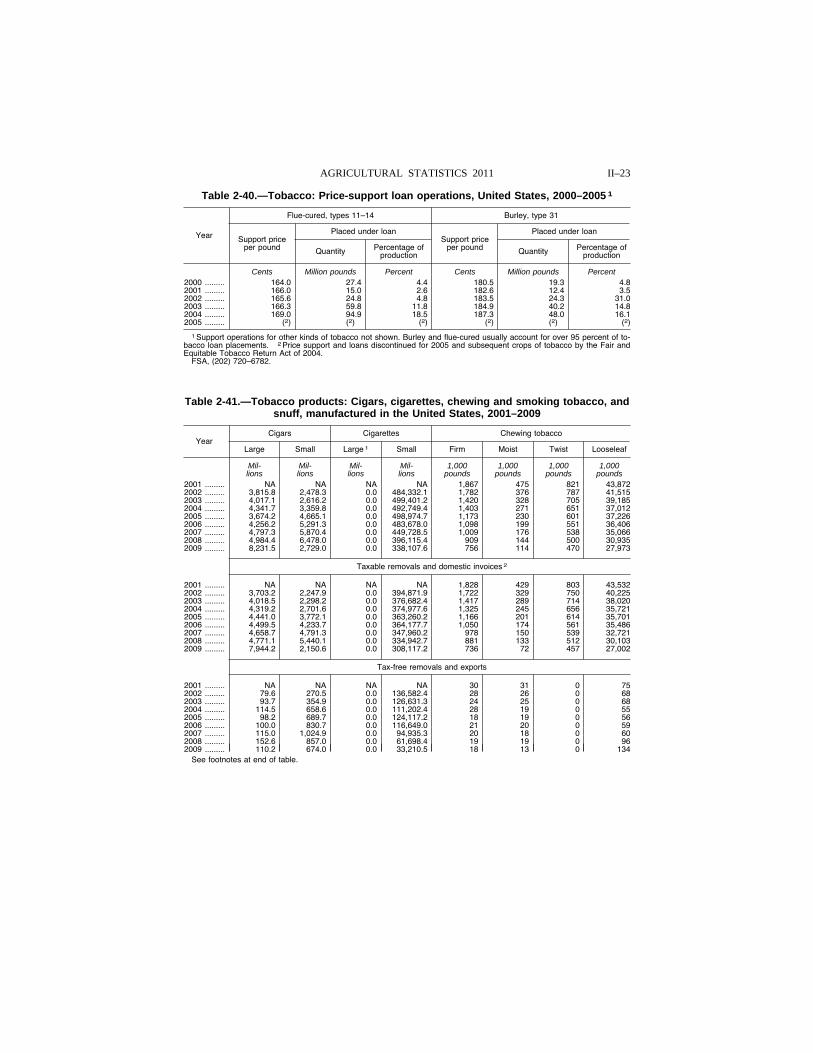
II–23 AGRICULTURAL STATISTICS 2011
Table 2-40.—Tobacco: Price-support loan operations, United States, 2000–2005 1
Year
Flue-cured, types 11–14 Burley, type 31
Support price per pound
Placed under loan Support price
per pound
Placed under loan
Quantity Percentage of production Quantity Percentage of
production
Cents Million pounds Percent Cents Million pounds Percent 2000 ......... 164.0 27 .4 4.4 180.5 19 .3 4.8 2001 ......... 166.0 15 .0 2.6 182.6 12 .4 3.5 2002 ......... 165.6 24 .8 4.8 183.5 24 .3 31.0 2003 ......... 166.3 59 .8 11.8 184.9 40 .2 14.8 2004 ......... 169.0 94 .9 18.5 187.3 48 .0 16.1 2005 ......... (2) (2) (2) (2) (2) (2)
1 Support operations for other kinds of tobacco not shown. Burley and flue-cured usually account for over 95 percent of to-bacco loan placements. 2 Price support and loans discontinued for 2005 and subsequent crops of tobacco by the Fair and Equitable Tobacco Return Act of 2004.
FSA, (202) 720–6782.
Table 2-41.—Tobacco products: Cigars, cigarettes, chewing and smoking tobacco, and snuff, manufactured in the United States, 2001–2009
Year Cigars Cigarettes Chewing tobacco
Large Small Large 1 Small Firm Moist Twist Looseleaf
Mil- Mil- Mil- Mil- 1,000 1,000 1,000 1,000 lions lions lions lions pounds pounds pounds pounds
2001 ......... NA NA NA NA 1,867 475 821 43,872 2002 ......... 3,815.8 2,478.3 0.0 484,332.1 1,782 376 787 41,515 2003 ......... 4,017.1 2,616.2 0.0 499,401.2 1,420 328 705 39,185 2004 ......... 4,341.7 3,359.8 0.0 492,749.4 1,403 271 651 37,012 2005 ......... 3,674.2 4,665.1 0.0 498,974.7 1,173 230 601 37,226 2006 ......... 4,256.2 5,291.3 0.0 483,678.0 1,098 199 551 36,406 2007 ......... 4,797.3 5,870.4 0.0 449,728.5 1,009 176 538 35,066 2008 ......... 4,984.4 6,478.0 0.0 396,115.4 909 144 500 30,935 2009 ......... 8,231.5 2,729.0 0.0 338,107.6 756 114 470 27,973
Taxable removals and domestic invoices 2
2001 ......... NA NA NA NA 1,828 429 803 43,532 2002 ......... 3,703.2 2,247.9 0.0 394,871.9 1,722 329 750 40,225 2003 ......... 4,018.5 2,298.2 0.0 376,682.4 1,417 289 714 38,020 2004 ......... 4,319.2 2,701.6 0.0 374,977.6 1,325 245 656 35,721 2005 ......... 4,441.0 3,772.1 0.0 363,260.2 1,166 201 614 35,701 2006 ......... 4,499.5 4,233.7 0.0 364,177.7 1,050 174 561 35,486 2007 ......... 4,658.7 4,791.3 0.0 347,960.2 978 150 539 32,721 2008 ......... 4,771.1 5,440.1 0.0 334,942.7 881 133 512 30,103 2009 ......... 7,944.2 2,150.6 0.0 308,117.2 736 72 457 27,002
Tax-free removals and exports
2001 ......... NA NA NA NA 30 31 0 75 2002 ......... 79.6 270.5 0.0 136,582.4 28 26 0 68 2003 ......... 93.7 354.9 0.0 126,631.3 24 25 0 68 2004 ......... 114.5 658.6 0.0 111,202.4 28 19 0 55 2005 ......... 98.2 689.7 0.0 124,117.2 18 19 0 56 2006 ......... 100.0 830.7 0.0 116,649.0 21 20 0 59 2007 ......... 115.0 1,024.9 0.0 94,935.3 20 18 0 60 2008 ......... 152.6 857.0 0.0 61,698.4 19 19 0 96 2009 ......... 110.2 674.0 0.0 33,210.5 18 13 0 134
See footnotes at end of table.
VerDate Aug 31 2005 10:11 Feb 29, 2012 Jkt 000000 PO 00000 Frm 00023 Fmt 1000 Sfmt 1000 H:\SHARED\DAPP\FPU\AGSTAT\MASTER~2\CHAPTR02\II-25.AG8 USDA
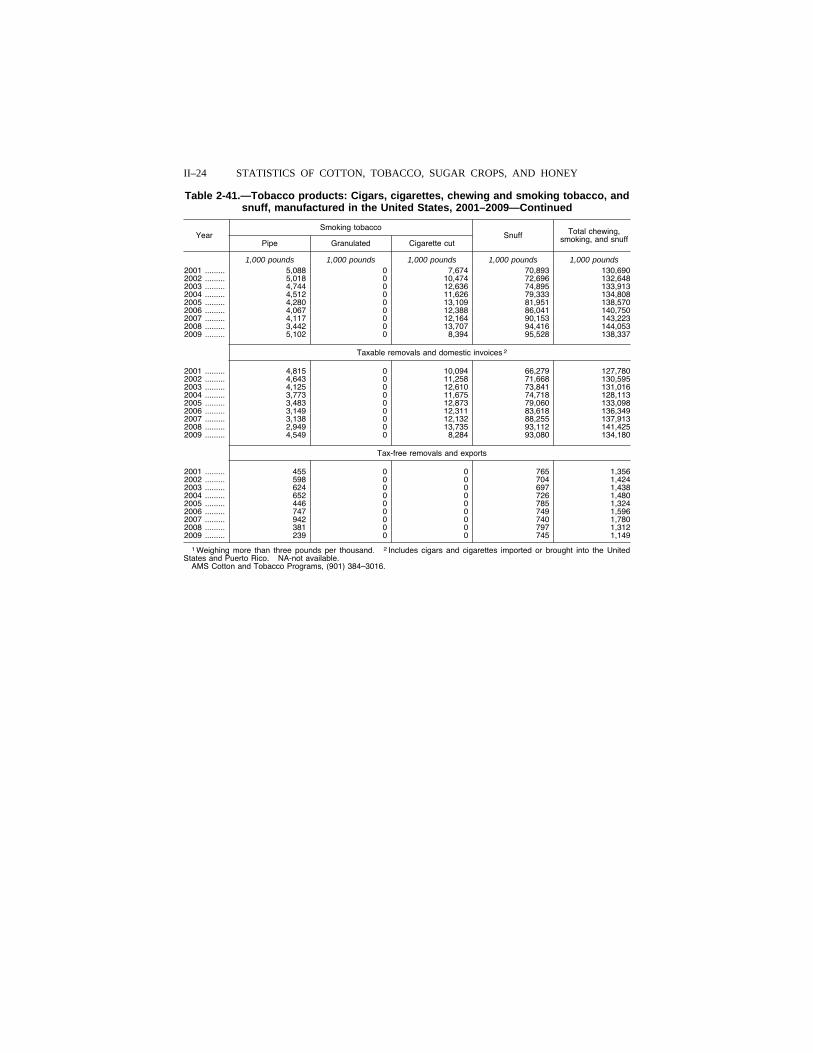
II–24 STATISTICS OF COTTON, TOBACCO, SUGAR CROPS, AND HONEY
Table 2-41.—Tobacco products: Cigars, cigarettes, chewing and smoking tobacco, and snuff, manufactured in the United States, 2001–2009—Continued
Year Smoking tobacco
Snuff Total chewing, smoking, and snuff Pipe Granulated Cigarette cut
1,000 pounds 1,000 pounds 1,000 pounds 1,000 pounds 1,000 pounds 2001 ......... 5,088 0 7,674 70,893 130,690 2002 ......... 5,018 0 10,474 72,696 132,648 2003 ......... 4,744 0 12,636 74,895 133,913 2004 ......... 4,512 0 11,626 79,333 134,808 2005 ......... 4,280 0 13,109 81,951 138,570 2006 ......... 4,067 0 12,388 86,041 140,750 2007 ......... 4,117 0 12,164 90,153 143,223 2008 ......... 3,442 0 13,707 94,416 144,053 2009 ......... 5,102 0 8,394 95,528 138,337
Taxable removals and domestic invoices 2
2001 ......... 4,815 0 10,094 66,279 127,780 2002 ......... 4,643 0 11,258 71,668 130,595 2003 ......... 4,125 0 12,610 73,841 131,016 2004 ......... 3,773 0 11,675 74,718 128,113 2005 ......... 3,483 0 12,873 79,060 133,098 2006 ......... 3,149 0 12,311 83,618 136,349 2007 ......... 3,138 0 12,132 88,255 137,913 2008 ......... 2,949 0 13,735 93,112 141,425 2009 ......... 4,549 0 8,284 93,080 134,180
Tax-free removals and exports
2001 ......... 455 0 0 765 1,356 2002 ......... 598 0 0 704 1,424 2003 ......... 624 0 0 697 1,438 2004 ......... 652 0 0 726 1,480 2005 ......... 446 0 0 785 1,324 2006 ......... 747 0 0 749 1,596 2007 ......... 942 0 0 740 1,780 2008 ......... 381 0 0 797 1,312 2009 ......... 239 0 0 745 1,149
1 Weighing more than three pounds per thousand. 2 Includes cigars and cigarettes imported or brought into the United States and Puerto Rico. NA-not available.
AMS Cotton and Tobacco Programs, (901) 384–3016.
VerDate Aug 31 2005 10:11 Feb 29, 2012 Jkt 000000 PO 00000 Frm 00024 Fmt 1000 Sfmt 1000 H:\SHARED\DAPP\FPU\AGSTAT\MASTER~2\CHAPTR02\II-26.AG8 USDA
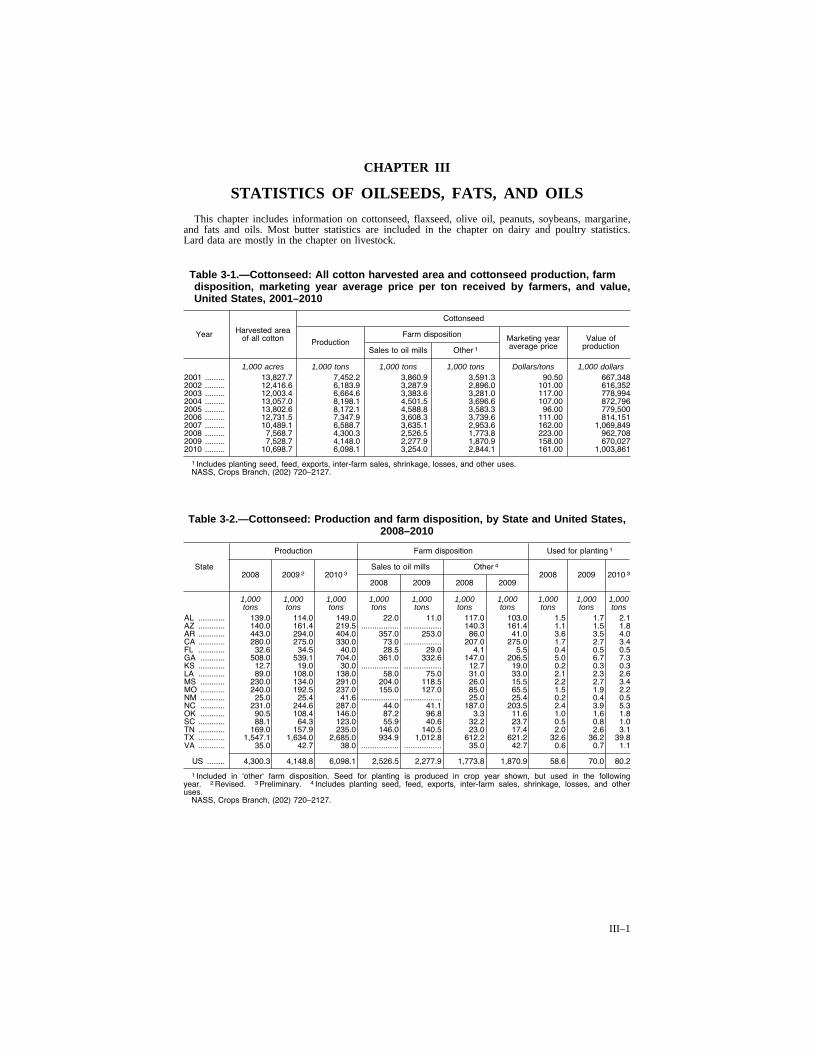
III–1
CHAPTER III
STATISTICS OF OILSEEDS, FATS, AND OILS
This chapter includes information on cottonseed, flaxseed, olive oil, peanuts, soybeans, margarine, and fats and oils. Most butter statistics are included in the chapter on dairy and poultry statistics. Lard data are mostly in the chapter on livestock.
Table 3-1.—Cottonseed: All cotton harvested area and cottonseed production, farm disposition, marketing year average price per ton received by farmers, and value, United States, 2001–2010
Year Harvested area of all cotton
Cottonseed
Production Farm disposition Marketing year
average price Value of
production Sales to oil mills Other 1
1,000 acres 1,000 tons 1,000 tons 1,000 tons Dollars/tons 1,000 dollars 2001 ......... 13,827.7 7,452.2 3,860.9 3,591.3 90.50 667,348 2002 ......... 12,416.6 6,183.9 3,287.9 2,896.0 101.00 616,352 2003 ......... 12,003.4 6,664.6 3,383.6 3,281.0 117.00 778,994 2004 ......... 13,057.0 8,198.1 4,501.5 3,696.6 107.00 872,796 2005 ......... 13,802.6 8,172.1 4,588.8 3,583.3 96.00 779,500 2006 ......... 12,731.5 7,347.9 3,608.3 3,739.6 111.00 814,151 2007 ......... 10,489.1 6,588.7 3,635.1 2,953.6 162.00 1,069,849 2008 ......... 7,568.7 4,300.3 2,526.5 1,773.8 223.00 962,708 2009 ......... 7,528.7 4,148.0 2,277.9 1,870.9 158.00 670,027 2010 ......... 10,698.7 6,098.1 3,254.0 2,844.1 161.00 1,003,861
1 Includes planting seed, feed, exports, inter-farm sales, shrinkage, losses, and other uses. NASS, Crops Branch, (202) 720–2127.
Table 3-2.—Cottonseed: Production and farm disposition, by State and United States, 2008–2010
State
Production Farm disposition Used for planting 1
2008 2009 2 2010 3 Sales to oil mills Other 4
2008 2009 2010 3 2008 2009 2008 2009
1,000 1,000 1,000 1,000 1,000 1,000 1,000 1,000 1,000 1,000 tons tons tons tons tons tons tons tons tons tons
AL ............ 139.0 114.0 149.0 22.0 11.0 117.0 103.0 1.5 1.7 2.1 AZ ............ 140.0 161.4 219.5 ................. ................. 140.3 161.4 1.1 1.5 1.8 AR ............ 443.0 294.0 404.0 357.0 253.0 86.0 41.0 3.6 3.5 4.0 CA ............ 280.0 275.0 330.0 73.0 ................. 207.0 275.0 1.7 2.7 3.4 FL ............ 32.6 34.5 40.0 28.5 29.0 4.1 5.5 0.4 0.5 0.5 GA ........... 508.0 539.1 704.0 361.0 332.6 147.0 206.5 5.0 6.7 7.3 KS ............ 12.7 19.0 30.0 ................. ................. 12.7 19.0 0.2 0.3 0.3 LA ............ 89.0 108.0 138.0 58.0 75.0 31.0 33.0 2.1 2.3 2.6 MS ........... 230.0 134.0 291.0 204.0 118.5 26.0 15.5 2.2 2.7 3.4 MO ........... 240.0 192.5 237.0 155.0 127.0 85.0 65.5 1.5 1.9 2.2 NM ........... 25.0 25.4 41.6 ................. ................. 25.0 25.4 0.2 0.4 0.5 NC ........... 231.0 244.6 287.0 44.0 41.1 187.0 203.5 2.4 3.9 5.3 OK ........... 90.5 108.4 146.0 87.2 96.8 3.3 11.6 1.0 1.6 1.8 SC ............ 88.1 64.3 123.0 55.9 40.6 32.2 23.7 0.5 0.8 1.0 TN ............ 169.0 157.9 235.0 146.0 140.5 23.0 17.4 2.0 2.6 3.1 TX ............ 1,547.1 1,634.0 2,685.0 934.9 1,012.8 612.2 621.2 32.6 36.2 39.8 VA ............ 35.0 42.7 38.0 ................. ................. 35.0 42.7 0.6 0.7 1.1
US ........ 4,300.3 4,148.8 6,098.1 2,526.5 2,277.9 1,773.8 1,870.9 58.6 70.0 80.2
1 Included in ‘other‘ farm disposition. Seed for planting is produced in crop year shown, but used in the following year. 2 Revised. 3 Preliminary. 4 Includes planting seed, feed, exports, inter-farm sales, shrinkage, losses, and other uses.
NASS, Crops Branch, (202) 720–2127.
VerDate Aug 31 2005 13:41 Mar 01, 2012 Jkt 000000 PO 00000 Frm 00001 Fmt 1001 Sfmt 1000 H:\SHARED\DAPP\FPU\AGSTAT\MASTER~2\CHAPTR03\III-01.AG8 USDA
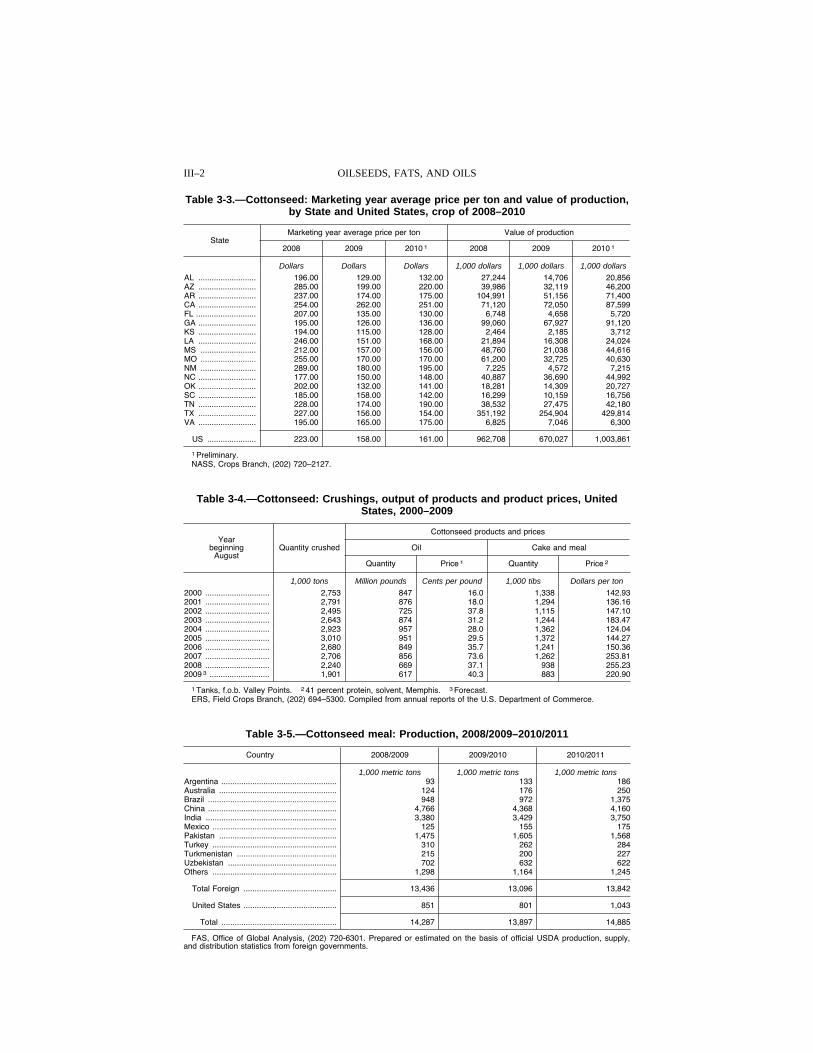
III–2 OILSEEDS, FATS, AND OILS
Table 3-3.—Cottonseed: Marketing year average price per ton and value of production, by State and United States, crop of 2008–2010
State Marketing year average price per ton Value of production
2008 2009 2010 1 2008 2009 2010 1
Dollars Dollars Dollars 1,000 dollars 1,000 dollars 1,000 dollars
AL .......................... 196.00 129.00 132.00 27,244 14,706 20,856 AZ .......................... 285.00 199.00 220.00 39,986 32,119 46,200 AR .......................... 237.00 174.00 175.00 104,991 51,156 71,400 CA .......................... 254.00 262.00 251.00 71,120 72,050 87,599 FL ........................... 207.00 135.00 130.00 6,748 4,658 5,720 GA .......................... 195.00 126.00 136.00 99,060 67,927 91,120 KS .......................... 194.00 115.00 128.00 2,464 2,185 3,712 LA .......................... 246.00 151.00 168.00 21,894 16,308 24,024 MS ......................... 212.00 157.00 156.00 48,760 21,038 44,616 MO ......................... 255.00 170.00 170.00 61,200 32,725 40,630 NM ......................... 289.00 180.00 195.00 7,225 4,572 7,215 NC .......................... 177.00 150.00 148.00 40,887 36,690 44,992 OK .......................... 202.00 132.00 141.00 18,281 14,309 20,727 SC .......................... 185.00 158.00 142.00 16,299 10,159 16,756 TN .......................... 228.00 174.00 190.00 38,532 27,475 42,180 TX .......................... 227.00 156.00 154.00 351,192 254,904 429,814 VA .......................... 195.00 165.00 175.00 6,825 7,046 6,300
US ...................... 223.00 158.00 161.00 962,708 670,027 1,003,861
1 Preliminary. NASS, Crops Branch, (202) 720–2127.
Table 3-4.—Cottonseed: Crushings, output of products and product prices, United States, 2000–2009
Year beginning
August Quantity crushed
Cottonseed products and prices
Oil Cake and meal
Quantity Price 1 Quantity Price 2
1,000 tons Million pounds Cents per pound 1,000 tibs Dollars per ton
2000 ............................. 2,753 847 16.0 1,338 142.93 2001 ............................. 2,791 876 18.0 1,294 136.16 2002 ............................. 2,495 725 37.8 1,115 147.10 2003 ............................. 2,643 874 31.2 1,244 183.47 2004 ............................. 2,923 957 28.0 1,362 124.04 2005 ............................. 3,010 951 29.5 1,372 144.27 2006 ............................. 2,680 849 35.7 1,241 150.36 2007 ............................. 2,706 856 73.6 1,262 253.81 2008 ............................. 2,240 669 37.1 938 255.23 2009 3 ........................... 1,901 617 40.3 883 220.90
1 Tanks, f.o.b. Valley Points. 2 41 percent protein, solvent, Memphis. 3 Forecast. ERS, Field Crops Branch, (202) 694–5300. Compiled from annual reports of the U.S. Department of Commerce.
Table 3-5.—Cottonseed meal: Production, 2008/2009–2010/2011
Country 2008/2009 2009/2010 2010/2011
1,000 metric tons 1,000 metric tons 1,000 metric tons Argentina .................................................... 93 133 186 Australia ..................................................... 124 176 250 Brazil .......................................................... 948 972 1,375 China .......................................................... 4,766 4,368 4,160 India ........................................................... 3,380 3,429 3,750 Mexico ........................................................ 125 155 175 Pakistan ..................................................... 1,475 1,605 1,568 Turkey ........................................................ 310 262 284 Turkmenistan ............................................. 215 200 227 Uzbekistan ................................................. 702 632 622 Others ........................................................ 1,298 1,164 1,245
Total Foreign .......................................... 13,436 13,096 13,842
United States .......................................... 851 801 1,043
Total .................................................... 14,287 13,897 14,885
FAS, Office of Global Analysis, (202) 720-6301. Prepared or estimated on the basis of official USDA production, supply, and distribution statistics from foreign governments.
VerDate Aug 31 2005 13:41 Mar 01, 2012 Jkt 000000 PO 00000 Frm 00002 Fmt 1000 Sfmt 1000 H:\SHARED\DAPP\FPU\AGSTAT\MASTER~2\CHAPTR03\III-02.AG8 USDA
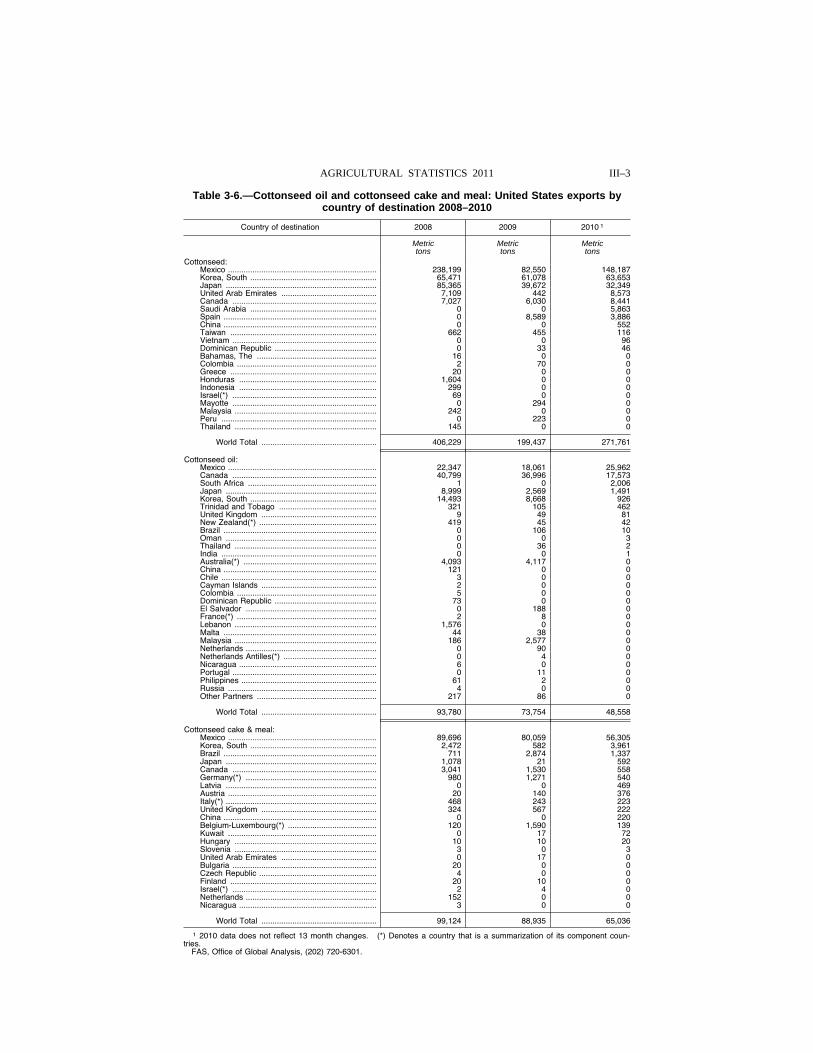
III–3 AGRICULTURAL STATISTICS 2011
Table 3-6.—Cottonseed oil and cottonseed cake and meal: United States exports by country of destination 2008–2010
Country of destination 2008 2009 2010 1
Metric Metric Metric tons tons tons
Cottonseed: Mexico ................................................................... 238,199 82,550 148,187 Korea, South ......................................................... 65,471 61,078 63,653 Japan .................................................................... 85,365 39,672 32,349 United Arab Emirates ........................................... 7,109 442 8,573 Canada ................................................................. 7,027 6,030 8,441 Saudi Arabia ......................................................... 0 0 5,863 Spain ..................................................................... 0 8,589 3,886 China ..................................................................... 0 0 552 Taiwan .................................................................. 662 455 116 Vietnam ................................................................. 0 0 96 Dominican Republic .............................................. 0 33 46 Bahamas, The ...................................................... 16 0 0 Colombia ............................................................... 2 70 0 Greece .................................................................. 20 0 0 Honduras .............................................................. 1,604 0 0 Indonesia .............................................................. 299 0 0 Israel(*) ................................................................. 69 0 0 Mayotte ................................................................. 0 294 0 Malaysia ................................................................ 242 0 0 Peru ...................................................................... 0 223 0 Thailand ................................................................ 145 0 0
World Total .................................................... 406,229 199,437 271,761
Cottonseed oil: Mexico ................................................................... 22,347 18,061 25,962 Canada ................................................................. 40,799 36,996 17,573 South Africa .......................................................... 1 0 2,006 Japan .................................................................... 8,999 2,569 1,491 Korea, South ......................................................... 14,493 8,668 926 Trinidad and Tobago ............................................ 321 105 462 United Kingdom .................................................... 9 49 81 New Zealand(*) ..................................................... 419 45 42 Brazil ..................................................................... 0 106 10 Oman .................................................................... 0 0 3 Thailand ................................................................ 0 36 2 India ...................................................................... 0 0 1 Australia(*) ............................................................ 4,093 4,117 0 China ..................................................................... 121 0 0 Chile ...................................................................... 3 0 0 Cayman Islands .................................................... 2 0 0 Colombia ............................................................... 5 0 0 Dominican Republic .............................................. 73 0 0 El Salvador ........................................................... 0 188 0 France(*) ............................................................... 2 8 0 Lebanon ................................................................ 1,576 0 0 Malta ..................................................................... 44 38 0 Malaysia ................................................................ 186 2,577 0 Netherlands ........................................................... 0 90 0 Netherlands Antilles(*) .......................................... 0 4 0 Nicaragua .............................................................. 6 0 0 Portugal ................................................................. 0 11 0 Philippines ............................................................. 61 2 0 Russia ................................................................... 4 0 0 Other Partners ...................................................... 217 86 0
World Total .................................................... 93,780 73,754 48,558
Cottonseed cake & meal: Mexico ................................................................... 89,696 80,059 56,305 Korea, South ......................................................... 2,472 582 3,961 Brazil ..................................................................... 711 2,874 1,337 Japan .................................................................... 1,078 21 592 Canada ................................................................. 3,041 1,530 558 Germany(*) ........................................................... 980 1,271 540 Latvia .................................................................... 0 0 469 Austria ................................................................... 20 140 376 Italy(*) .................................................................... 468 243 223 United Kingdom .................................................... 324 567 222 China ..................................................................... 0 0 220 Belgium-Luxembourg(*) ........................................ 120 1,590 139 Kuwait ................................................................... 0 17 72 Hungary ................................................................ 10 10 20 Slovenia ................................................................ 3 0 3 United Arab Emirates ........................................... 0 17 0 Bulgaria ................................................................. 20 0 0 Czech Republic ..................................................... 4 0 0 Finland .................................................................. 20 10 0 Israel(*) ................................................................. 2 4 0 Netherlands ........................................................... 152 0 0 Nicaragua .............................................................. 3 0 0
World Total .................................................... 99,124 88,935 65,036
1 2010 data does not reflect 13 month changes. (*) Denotes a country that is a summarization of its component coun-tries.
FAS, Office of Global Analysis, (202) 720-6301.
VerDate Aug 31 2005 13:41 Mar 01, 2012 Jkt 000000 PO 00000 Frm 00003 Fmt 1000 Sfmt 1000 H:\SHARED\DAPP\FPU\AGSTAT\MASTER~2\CHAPTR03\III-03.AG8 USDA
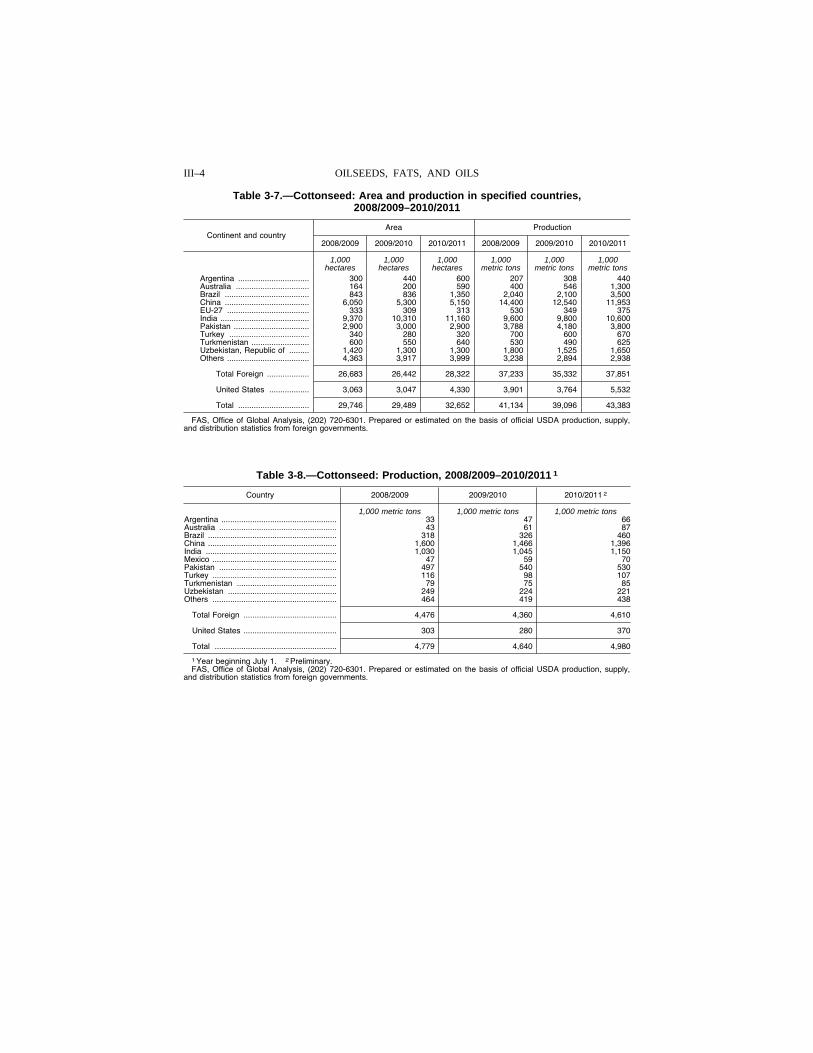
III–4 OILSEEDS, FATS, AND OILS
Table 3-7.—Cottonseed: Area and production in specified countries, 2008/2009–2010/2011
Continent and country Area Production
2008/2009 2009/2010 2010/2011 2008/2009 2009/2010 2010/2011
1,000 1,000 1,000 1,000 1,000 1,000 hectares hectares hectares metric tons metric tons metric tons
Argentina ................................ 300 440 600 207 308 440 Australia ................................. 164 200 590 400 546 1,300 Brazil ...................................... 843 836 1,350 2,040 2,100 3,500 China ...................................... 6,050 5,300 5,150 14,400 12,540 11,953 EU-27 ..................................... 333 309 313 530 349 375 India ........................................ 9,370 10,310 11,160 9,600 9,800 10,600 Pakistan .................................. 2,900 3,000 2,900 3,788 4,180 3,800 Turkey .................................... 340 280 320 700 600 670 Turkmenistan .......................... 600 550 640 530 490 625 Uzbekistan, Republic of ......... 1,420 1,300 1,300 1,800 1,525 1,650 Others ..................................... 4,363 3,917 3,999 3,238 2,894 2,938
Total Foreign ................... 26,683 26,442 28,322 37,233 35,332 37,851
United States .................. 3,063 3,047 4,330 3,901 3,764 5,532
Total ................................ 29,746 29,489 32,652 41,134 39,096 43,383
FAS, Office of Global Analysis, (202) 720-6301. Prepared or estimated on the basis of official USDA production, supply, and distribution statistics from foreign governments.
Table 3-8.—Cottonseed: Production, 2008/2009–2010/2011 1
Country 2008/2009 2009/2010 2010/2011 2
1,000 metric tons 1,000 metric tons 1,000 metric tons Argentina .................................................... 33 47 66 Australia ..................................................... 43 61 87 Brazil .......................................................... 318 326 460 China .......................................................... 1,600 1,466 1,396 India ........................................................... 1,030 1,045 1,150 Mexico ........................................................ 47 59 70 Pakistan ..................................................... 497 540 530 Turkey ........................................................ 116 98 107 Turkmenistan ............................................. 79 75 85 Uzbekistan ................................................. 249 224 221 Others ........................................................ 464 419 438
Total Foreign .......................................... 4,476 4,360 4,610
United States .......................................... 303 280 370
Total ....................................................... 4,779 4,640 4,980
1 Year beginning July 1. 2 Preliminary. FAS, Office of Global Analysis, (202) 720-6301. Prepared or estimated on the basis of official USDA production, supply,
and distribution statistics from foreign governments.
VerDate Aug 31 2005 13:41 Mar 01, 2012 Jkt 000000 PO 00000 Frm 00004 Fmt 1000 Sfmt 1000 H:\SHARED\DAPP\FPU\AGSTAT\MASTER~2\CHAPTR03\III-04.AG8 USDA
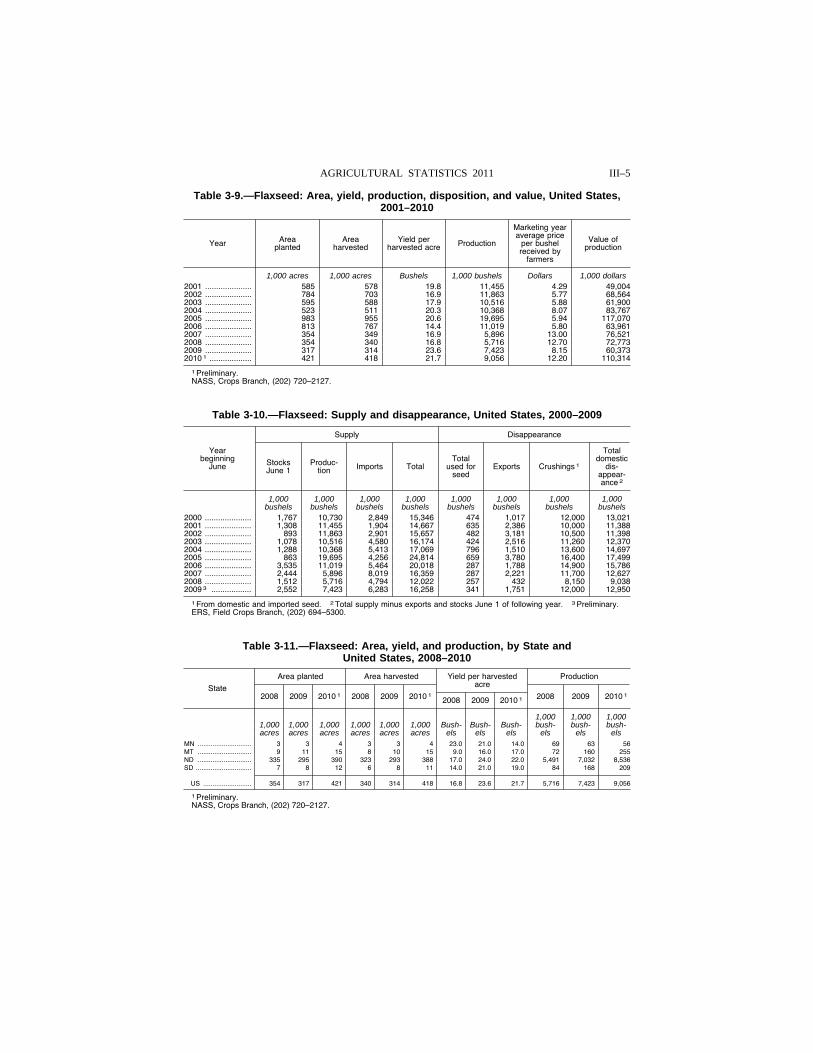
III–5 AGRICULTURAL STATISTICS 2011
Table 3-9.—Flaxseed: Area, yield, production, disposition, and value, United States, 2001–2010
Year Area planted
Area harvested
Yield per harvested acre Production
Marketing year average price
per bushel received by
farmers
Value of production
1,000 acres 1,000 acres Bushels 1,000 bushels Dollars 1,000 dollars 2001 ..................... 585 578 19.8 11,455 4.29 49,004 2002 ..................... 784 703 16.9 11,863 5.77 68,564 2003 ..................... 595 588 17.9 10,516 5.88 61,900 2004 ..................... 523 511 20.3 10,368 8.07 83,767 2005 ..................... 983 955 20.6 19,695 5.94 117,070 2006 ..................... 813 767 14.4 11,019 5.80 63,961 2007 ..................... 354 349 16.9 5,896 13.00 76,521 2008 ..................... 354 340 16.8 5,716 12.70 72,773 2009 ..................... 317 314 23.6 7,423 8.15 60,373 2010 1 ................... 421 418 21.7 9,056 12.20 110,314
1 Preliminary. NASS, Crops Branch, (202) 720–2127.
Table 3-10.—Flaxseed: Supply and disappearance, United States, 2000–2009
Year beginning
June
Supply Disappearance
Stocks June 1
Produc-tion Imports Total
Total used for
seed Exports Crushings 1
Total domestic
dis-appear-ance 2
1,000 1,000 1,000 1,000 1,000 1,000 1,000 1,000 bushels bushels bushels bushels bushels bushels bushels bushels
2000 ..................... 1,767 10,730 2,849 15,346 474 1,017 12,000 13,021 2001 ..................... 1,308 11,455 1,904 14,667 635 2,386 10,000 11,388 2002 ..................... 893 11,863 2,901 15,657 482 3,181 10,500 11,398 2003 ..................... 1,078 10,516 4,580 16,174 424 2,516 11,260 12,370 2004 ..................... 1,288 10,368 5,413 17,069 796 1,510 13,600 14,697 2005 ..................... 863 19,695 4,256 24,814 659 3,780 16,400 17,499 2006 ..................... 3,535 11,019 5,464 20,018 287 1,788 14,900 15,786 2007 ..................... 2,444 5,896 8,019 16,359 287 2,221 11,700 12,627 2008 ..................... 1,512 5,716 4,794 12,022 257 432 8,150 9,038 2009 3 .................. 2,552 7,423 6,283 16,258 341 1,751 12,000 12,950
1 From domestic and imported seed. 2 Total supply minus exports and stocks June 1 of following year. 3 Preliminary. ERS, Field Crops Branch, (202) 694–5300.
Table 3-11.—Flaxseed: Area, yield, and production, by State and United States, 2008–2010
State
Area planted Area harvested Yield per harvested acre
Production
2008 2009 2010 1 2008 2009 2010 1 2008 2009 2010 1 2008 2009 2010 1
1,000 1,000 1,000 1,000 1,000 1,000 1,000 1,000 1,000 Bush- Bush- Bush- bush- bush- bush- acres acres acres acres acres acres els els els els els els
MN ............................. 3 3 4 3 3 4 23.0 21.0 14.0 69 63 56 MT ............................. 9 11 15 8 10 15 9.0 16.0 17.0 72 160 255 ND ............................. 335 295 390 323 293 388 17.0 24.0 22.0 5,491 7,032 8,536 SD .............................. 7 8 12 6 8 11 14.0 21.0 19.0 84 168 209
US .......................... 354 317 421 340 314 418 16.8 23.6 21.7 5,716 7,423 9,056
1 Preliminary. NASS, Crops Branch, (202) 720–2127.
VerDate Aug 31 2005 13:41 Mar 01, 2012 Jkt 000000 PO 00000 Frm 00005 Fmt 1000 Sfmt 1000 H:\SHARED\DAPP\FPU\AGSTAT\MASTER~2\CHAPTR03\III-05.AG8 USDA
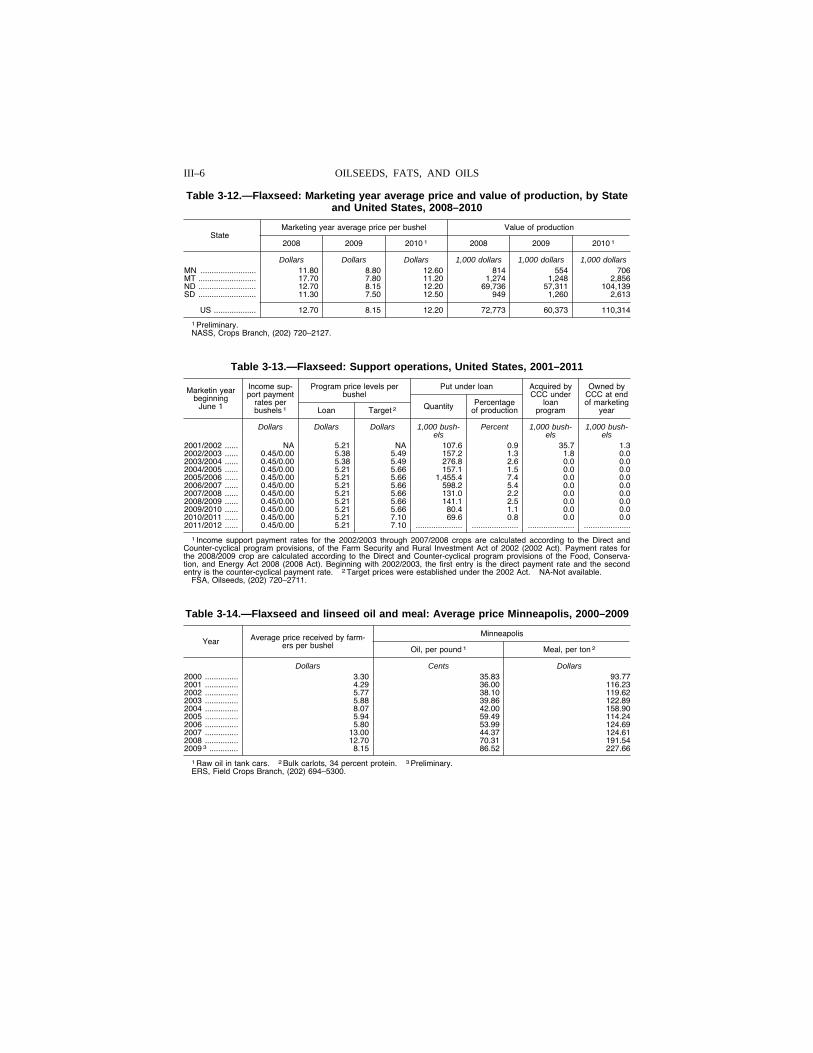
III–6 OILSEEDS, FATS, AND OILS
Table 3-12.—Flaxseed: Marketing year average price and value of production, by State and United States, 2008–2010
State Marketing year average price per bushel Value of production
2008 2009 2010 1 2008 2009 2010 1
Dollars Dollars Dollars 1,000 dollars 1,000 dollars 1,000 dollars MN ......................... 11.80 8.80 12.60 814 554 706 MT .......................... 17.70 7.80 11.20 1,274 1,248 2,856 ND .......................... 12.70 8.15 12.20 69,736 57,311 104,139 SD .......................... 11.30 7.50 12.50 949 1,260 2,613
US ................... 12.70 8.15 12.20 72,773 60,373 110,314
1 Preliminary. NASS, Crops Branch, (202) 720–2127.
Table 3-13.—Flaxseed: Support operations, United States, 2001–2011
Marketin year beginning
June 1
Income sup-port payment
rates per bushels 1
Program price levels per bushel
Put under loan Acquired by CCC under
loan program
Owned by CCC at end of marketing
year Loan Target 2 Quantity Percentage of production
Dollars Dollars Dollars 1,000 bush-els
Percent 1,000 bush-els
1,000 bush-els
2001/2002 ...... NA 5.21 NA 107.6 0.9 35.7 1.3 2002/2003 ...... 0.45/0.00 5.38 5.49 157.2 1.3 1.8 0.0 2003/2004 ...... 0.45/0.00 5.38 5.49 276.8 2.6 0.0 0.0 2004/2005 ...... 0.45/0.00 5.21 5.66 157.1 1.5 0.0 0.0 2005/2006 ...... 0.45/0.00 5.21 5.66 1,455.4 7.4 0.0 0.0 2006/2007 ...... 0.45/0.00 5.21 5.66 598.2 5.4 0.0 0.0 2007/2008 ...... 0.45/0.00 5.21 5.66 131.0 2.2 0.0 0.0 2008/2009 ...... 0.45/0.00 5.21 5.66 141.1 2.5 0.0 0.0 2009/2010 ...... 0.45/0.00 5.21 5.66 80.4 1.1 0.0 0.0 2010/2011 ...... 0.45/0.00 5.21 7.10 69.6 0.8 0.0 0.0 2011/2012 ...... 0.45/0.00 5.21 7.10 ..................... ..................... ..................... .....................
1 Income support payment rates for the 2002/2003 through 2007/2008 crops are calculated according to the Direct and Counter-cyclical program provisions, of the Farm Security and Rural Investment Act of 2002 (2002 Act). Payment rates for the 2008/2009 crop are calculated according to the Direct and Counter-cyclical program provisions of the Food, Conserva-tion, and Energy Act 2008 (2008 Act). Beginning with 2002/2003, the first entry is the direct payment rate and the second entry is the counter-cyclical payment rate. 2 Target prices were established under the 2002 Act. NA-Not available.
FSA, Oilseeds, (202) 720–2711.
Table 3-14.—Flaxseed and linseed oil and meal: Average price Minneapolis, 2000–2009
Year Average price received by farm-ers per bushel
Minneapolis
Oil, per pound 1 Meal, per ton 2
Dollars Cents Dollars 2000 ............... 3.30 35.83 93.77 2001 ............... 4.29 36.00 116.23 2002 ............... 5.77 38.10 119.62 2003 ............... 5.88 39.86 122.89 2004 ............... 8.07 42.00 158.90 2005 ............... 5.94 59.49 114.24 2006 ............... 5.80 53.99 124.69 2007 ............... 13.00 44.37 124.61 2008 ............... 12.70 70.31 191.54 2009 3 ............. 8.15 86.52 227.66
1 Raw oil in tank cars. 2 Bulk carlots, 34 percent protein. 3 Preliminary. ERS, Field Crops Branch, (202) 694–5300.
VerDate Aug 31 2005 13:41 Mar 01, 2012 Jkt 000000 PO 00000 Frm 00006 Fmt 1000 Sfmt 1000 H:\SHARED\DAPP\FPU\AGSTAT\MASTER~2\CHAPTR03\III-06.AG8 USDA
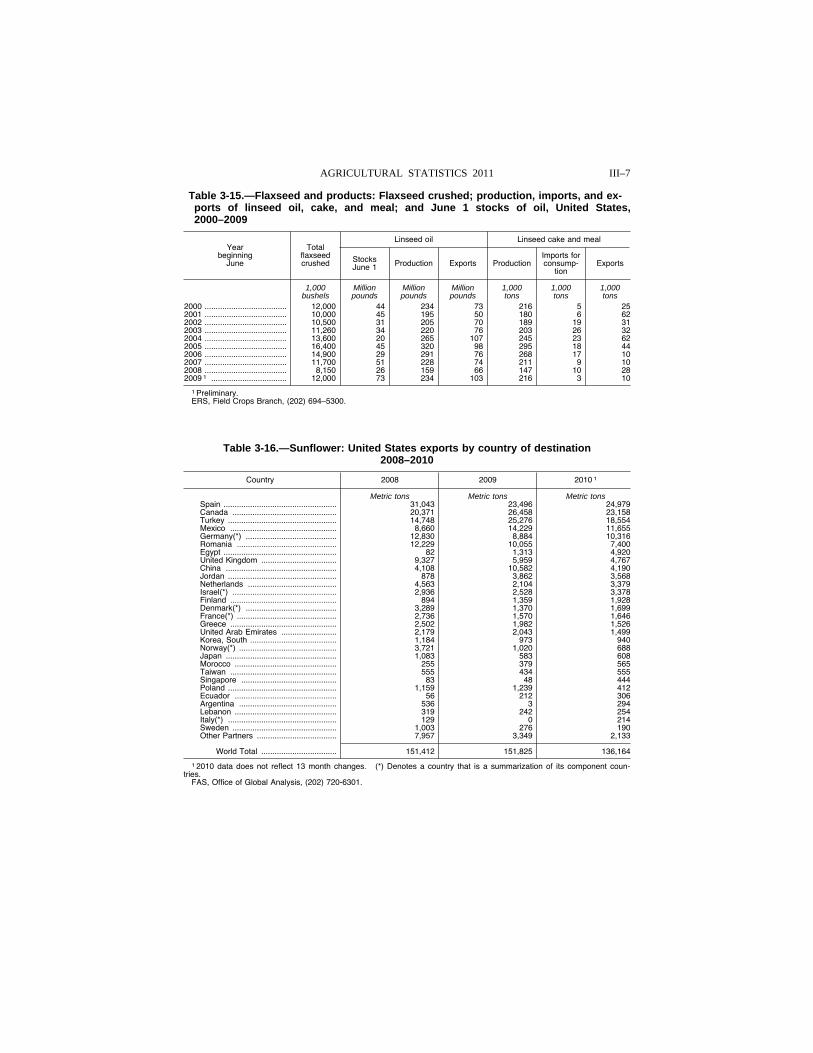
III–7 AGRICULTURAL STATISTICS 2011
Table 3-15.—Flaxseed and products: Flaxseed crushed; production, imports, and ex-ports of linseed oil, cake, and meal; and June 1 stocks of oil, United States, 2000–2009
Year beginning
June
Total flaxseed crushed
Linseed oil Linseed cake and meal
Stocks June 1 Production Exports Production
Imports for consump-
tion Exports
1,000 Million Million Million 1,000 1,000 1,000 bushels pounds pounds pounds tons tons tons
2000 ..................................... 12,000 44 234 73 216 5 25 2001 ..................................... 10,000 45 195 50 180 6 62 2002 ..................................... 10,500 31 205 70 189 19 31 2003 ..................................... 11,260 34 220 76 203 26 32 2004 ..................................... 13,600 20 265 107 245 23 62 2005 ..................................... 16,400 45 320 98 295 18 44 2006 ..................................... 14,900 29 291 76 268 17 10 2007 ..................................... 11,700 51 228 74 211 9 10 2008 ..................................... 8,150 26 159 66 147 10 28 2009 1 .................................. 12,000 73 234 103 216 3 10
1 Preliminary. ERS, Field Crops Branch, (202) 694–5300.
Table 3-16.—Sunflower: United States exports by country of destination 2008–2010
Country 2008 2009 2010 1
Metric tons Metric tons Metric tons Spain ................................................... 31,043 23,496 24,979 Canada ............................................... 20,371 26,458 23,158 Turkey ................................................. 14,748 25,276 18,554 Mexico ................................................ 8,660 14,229 11,655 Germany(*) ......................................... 12,830 8,884 10,316 Romania ............................................. 12,229 10,055 7,400 Egypt ................................................... 82 1,313 4,920 United Kingdom .................................. 9,327 5,959 4,767 China .................................................. 4,108 10,582 4,190 Jordan ................................................. 878 3,862 3,568 Netherlands ........................................ 4,563 2,104 3,379 Israel(*) ............................................... 2,936 2,528 3,378 Finland ................................................ 894 1,359 1,928 Denmark(*) ......................................... 3,289 1,370 1,699 France(*) ............................................. 2,736 1,570 1,646 Greece ................................................ 2,502 1,982 1,526 United Arab Emirates ......................... 2,179 2,043 1,499 Korea, South ....................................... 1,184 973 940 Norway(*) ............................................ 3,721 1,020 688 Japan .................................................. 1,083 583 608 Morocco .............................................. 255 379 565 Taiwan ................................................ 555 434 555 Singapore ........................................... 83 48 444 Poland ................................................. 1,159 1,239 412 Ecuador .............................................. 56 212 306 Argentina ............................................ 536 3 294 Lebanon .............................................. 319 242 254 Italy(*) ................................................. 129 0 214 Sweden ............................................... 1,003 276 190 Other Partners .................................... 7,957 3,349 2,133
World Total .................................. 151,412 151,825 136,164
1 2010 data does not reflect 13 month changes. (*) Denotes a country that is a summarization of its component coun-tries.
FAS, Office of Global Analysis, (202) 720-6301.
VerDate Aug 31 2005 13:41 Mar 01, 2012 Jkt 000000 PO 00000 Frm 00007 Fmt 1000 Sfmt 1000 H:\SHARED\DAPP\FPU\AGSTAT\MASTER~2\CHAPTR03\III-07.AG8 USDA
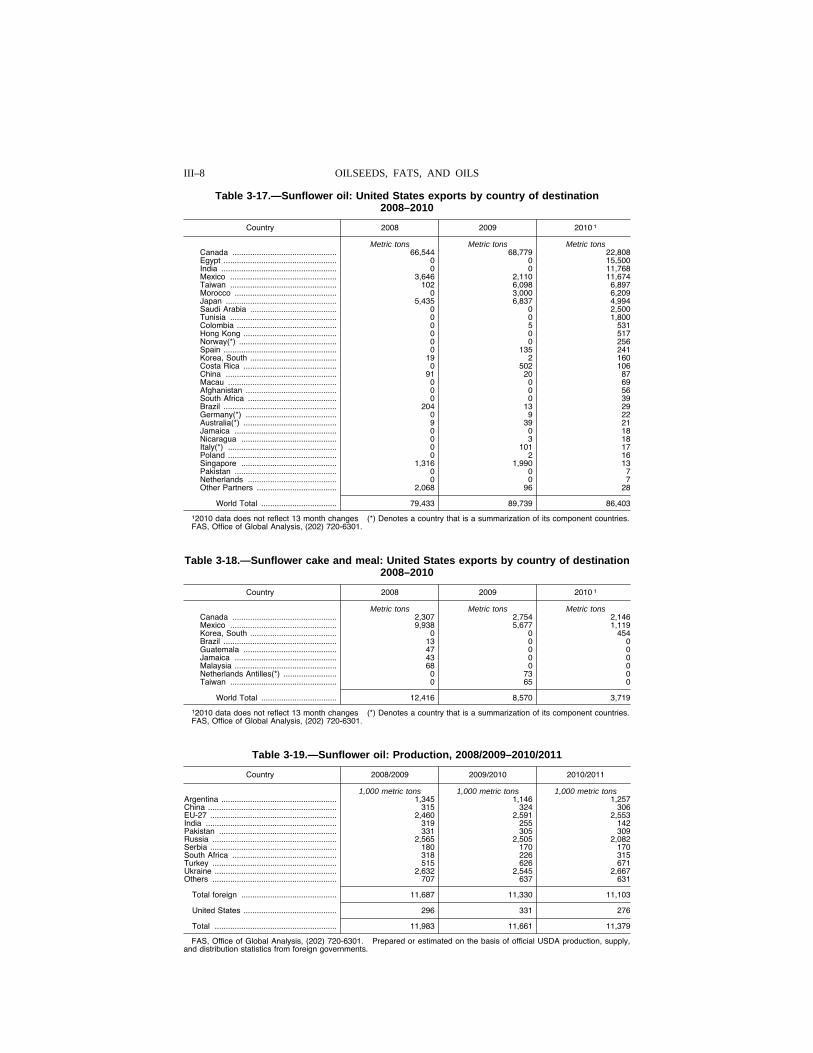
III–8 OILSEEDS, FATS, AND OILS
Table 3-17.—Sunflower oil: United States exports by country of destination 2008–2010
Country 2008 2009 2010 1
Metric tons Metric tons Metric tons Canada ............................................... 66,544 68,779 22,808 Egypt ................................................... 0 0 15,500 India .................................................... 0 0 11,768 Mexico ................................................ 3,646 2,110 11,674 Taiwan ................................................ 102 6,098 6,897 Morocco .............................................. 0 3,000 6,209 Japan .................................................. 5,435 6,837 4,994 Saudi Arabia ....................................... 0 0 2,500 Tunisia ................................................ 0 0 1,800 Colombia ............................................. 0 5 531 Hong Kong .......................................... 0 0 517 Norway(*) ............................................ 0 0 256 Spain ................................................... 0 135 241 Korea, South ....................................... 19 2 160 Costa Rica .......................................... 0 502 106 China .................................................. 91 20 87 Macau ................................................. 0 0 69 Afghanistan ......................................... 0 0 56 South Africa ........................................ 0 0 39 Brazil ................................................... 204 13 29 Germany(*) ......................................... 0 9 22 Australia(*) .......................................... 9 39 21 Jamaica .............................................. 0 0 18 Nicaragua ........................................... 0 3 18 Italy(*) ................................................. 0 101 17 Poland ................................................. 0 2 16 Singapore ........................................... 1,316 1,990 13 Pakistan .............................................. 0 0 7 Netherlands ........................................ 0 0 7 Other Partners .................................... 2,068 96 28
World Total .................................. 79,433 89,739 86,403
12010 data does not reflect 13 month changes (*) Denotes a country that is a summarization of its component countries. FAS, Office of Global Analysis, (202) 720-6301.
Table 3-18.—Sunflower cake and meal: United States exports by country of destination 2008–2010
Country 2008 2009 2010 1
Metric tons Metric tons Metric tons Canada ............................................... 2,307 2,754 2,146 Mexico ................................................ 9,938 5,677 1,119 Korea, South ....................................... 0 0 454 Brazil ................................................... 13 0 0 Guatemala .......................................... 47 0 0 Jamaica .............................................. 43 0 0 Malaysia .............................................. 68 0 0 Netherlands Antilles(*) ........................ 0 73 0 Taiwan ................................................ 0 65 0
World Total .................................. 12,416 8,570 3,719
12010 data does not reflect 13 month changes (*) Denotes a country that is a summarization of its component countries. FAS, Office of Global Analysis, (202) 720-6301.
Table 3-19.—Sunflower oil: Production, 2008/2009–2010/2011
Country 2008/2009 2009/2010 2010/2011
1,000 metric tons 1,000 metric tons 1,000 metric tons Argentina .................................................... 1,345 1,146 1,257 China .......................................................... 315 324 306 EU-27 ......................................................... 2,460 2,591 2,553 India ........................................................... 319 255 142 Pakistan ..................................................... 331 305 309 Russia ........................................................ 2,565 2,505 2,082 Serbia ......................................................... 180 170 170 South Africa ............................................... 318 226 315 Turkey ........................................................ 515 626 671 Ukraine ....................................................... 2,632 2,545 2,667 Others ........................................................ 707 637 631
Total foreign ........................................... 11,687 11,330 11,103
United States .......................................... 296 331 276
Total ....................................................... 11,983 11,661 11,379
FAS, Office of Global Analysis, (202) 720-6301. Prepared or estimated on the basis of official USDA production, supply, and distribution statistics from foreign governments.
VerDate Aug 31 2005 13:41 Mar 01, 2012 Jkt 000000 PO 00000 Frm 00008 Fmt 1000 Sfmt 1000 H:\SHARED\DAPP\FPU\AGSTAT\MASTER~2\CHAPTR03\III-08.AG8 USDA
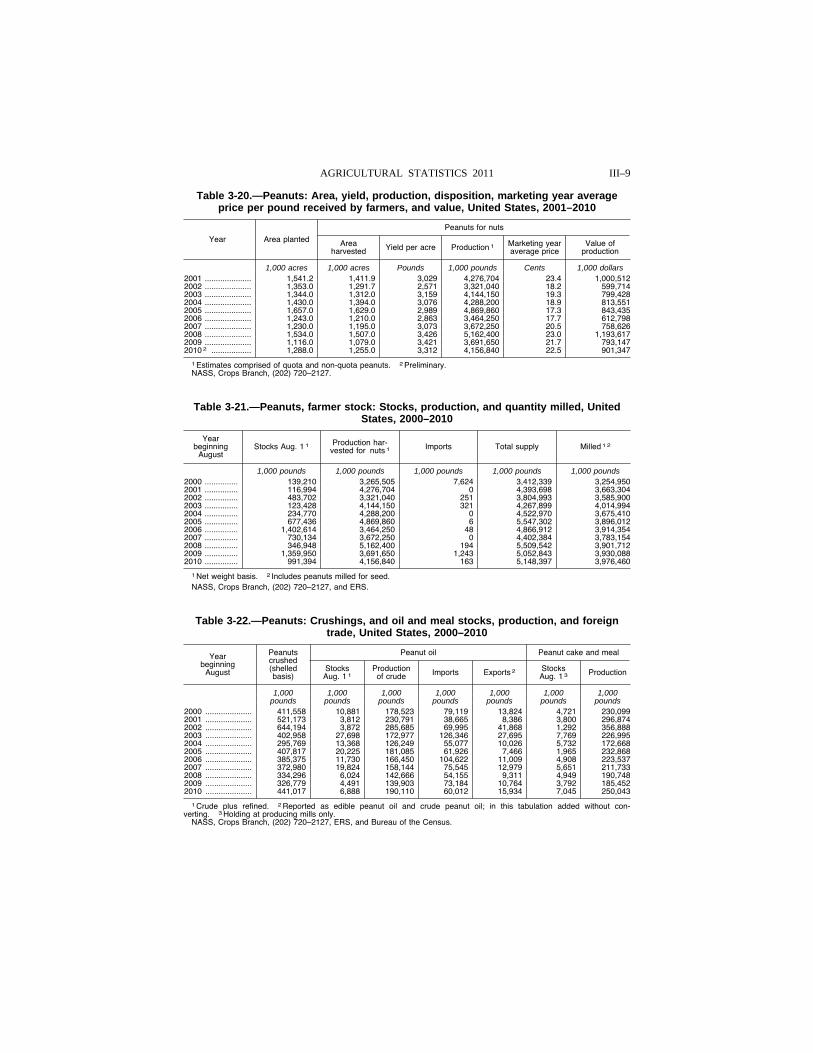
III–9 AGRICULTURAL STATISTICS 2011
Table 3-20.—Peanuts: Area, yield, production, disposition, marketing year average price per pound received by farmers, and value, United States, 2001–2010
Year Area planted
Peanuts for nuts
Area harvested Yield per acre Production 1 Marketing year
average price Value of
production
1,000 acres 1,000 acres Pounds 1,000 pounds Cents 1,000 dollars 2001 ..................... 1,541.2 1,411.9 3,029 4,276,704 23.4 1,000,512 2002 ..................... 1,353.0 1,291.7 2,571 3,321,040 18.2 599,714 2003 ..................... 1,344.0 1,312.0 3,159 4,144,150 19.3 799,428 2004 ..................... 1,430.0 1,394.0 3,076 4,288,200 18.9 813,551 2005 ..................... 1,657.0 1,629.0 2,989 4,869,860 17.3 843,435 2006 ..................... 1,243.0 1,210.0 2,863 3,464,250 17.7 612,798 2007 ..................... 1,230.0 1,195.0 3,073 3,672,250 20.5 758,626 2008 ..................... 1,534.0 1,507.0 3,426 5,162,400 23.0 1,193,617 2009 ..................... 1,116.0 1,079.0 3,421 3,691,650 21.7 793,147 2010 2 .................. 1,288.0 1,255.0 3,312 4,156,840 22.5 901,347
1 Estimates comprised of quota and non-quota peanuts. 2 Preliminary. NASS, Crops Branch, (202) 720–2127.
Table 3-21.—Peanuts, farmer stock: Stocks, production, and quantity milled, United States, 2000–2010
Year beginning
August Stocks Aug. 1 1 Production har-
vested for nuts 1 Imports Total supply Milled 1 2
1,000 pounds 1,000 pounds 1,000 pounds 1,000 pounds 1,000 pounds 2000 ............... 139,210 3,265,505 7,624 3,412,339 3,254,950 2001 ............... 116,994 4,276,704 0 4,393,698 3,663,304 2002 ............... 483,702 3,321,040 251 3,804,993 3,585,900 2003 ............... 123,428 4,144,150 321 4,267,899 4,014,994 2004 ............... 234,770 4,288,200 0 4,522,970 3,675,410 2005 ............... 677,436 4,869,860 6 5,547,302 3,896,012 2006 ............... 1,402,614 3,464,250 48 4,866,912 3,914,354 2007 ............... 730,134 3,672,250 0 4,402,384 3,783,154 2008 ............... 346,948 5,162,400 194 5,509,542 3,901,712 2009 ............... 1,359,950 3,691,650 1,243 5,052,843 3,930,088 2010 ............... 991,394 4,156,840 163 5,148,397 3,976,460
1 Net weight basis. 2 Includes peanuts milled for seed. NASS, Crops Branch, (202) 720–2127, and ERS.
Table 3-22.—Peanuts: Crushings, and oil and meal stocks, production, and foreign trade, United States, 2000–2010
Year beginning
August
Peanuts crushed (shelled basis)
Peanut oil Peanut cake and meal
Stocks Aug. 1 1
Production of crude Imports Exports 2 Stocks
Aug. 1 3 Production
1,000 1,000 1,000 1,000 1,000 1,000 1,000 pounds pounds pounds pounds pounds pounds pounds
2000 ..................... 411,558 10,881 178,523 79,119 13,824 4,721 230,099 2001 ..................... 521,173 3,812 230,791 38,665 8,386 3,800 296,874 2002 ..................... 644,194 3,872 285,685 69,995 41,868 1,292 356,888 2003 ..................... 402,958 27,698 172,977 126,346 27,695 7,769 226,995 2004 ..................... 295,769 13,368 126,249 55,077 10,026 5,732 172,668 2005 ..................... 407,817 20,225 181,085 61,926 7,466 1,965 232,868 2006 ..................... 385,375 11,730 166,450 104,622 11,009 4,908 223,537 2007 ..................... 372,980 19,824 158,144 75,545 12,979 5,651 211,733 2008 ..................... 334,296 6,024 142,666 54,155 9,311 4,949 190,748 2009 ..................... 326,779 4,491 139,903 73,184 10,764 3,792 185,452 2010 ..................... 441,017 6,888 190,110 60,012 15,934 7,045 250,043
1 Crude plus refined. 2 Reported as edible peanut oil and crude peanut oil; in this tabulation added without con-verting. 3 Holding at producing mills only.
NASS, Crops Branch, (202) 720–2127, ERS, and Bureau of the Census.
VerDate Aug 31 2005 13:41 Mar 01, 2012 Jkt 000000 PO 00000 Frm 00009 Fmt 1000 Sfmt 1000 H:\SHARED\DAPP\FPU\AGSTAT\MASTER~2\CHAPTR03\III-09.AG8 USDA
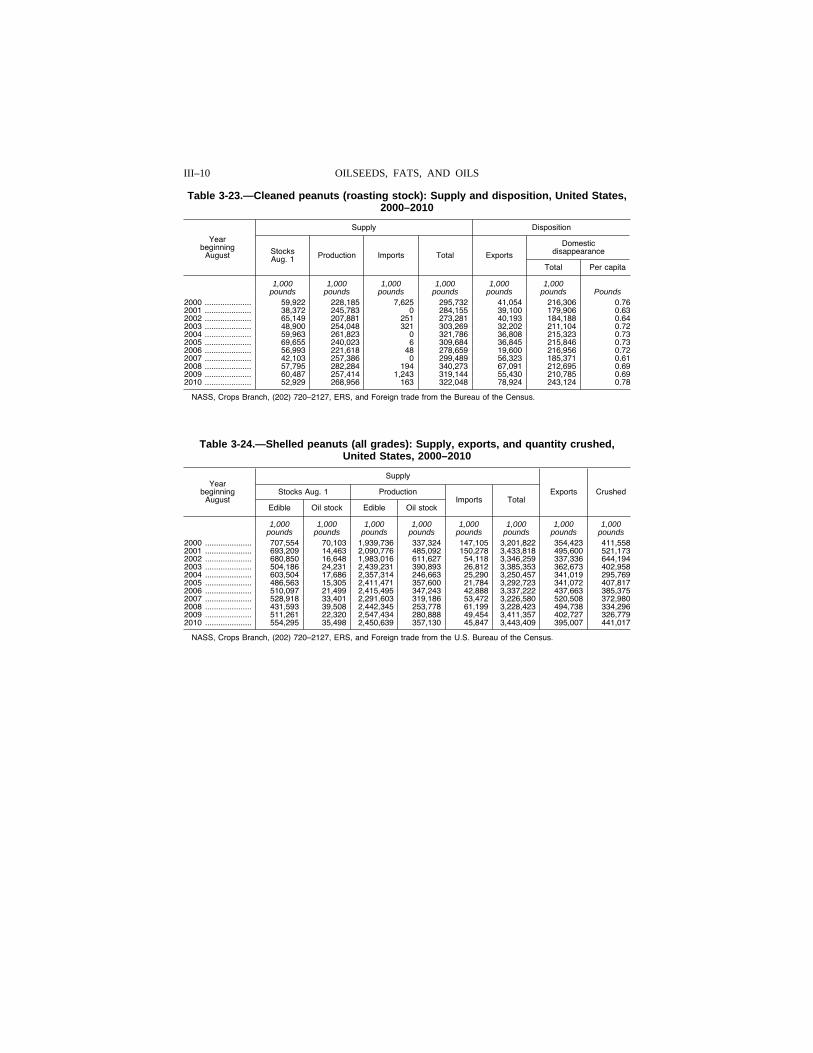
III–10 OILSEEDS, FATS, AND OILS
Table 3-23.—Cleaned peanuts (roasting stock): Supply and disposition, United States, 2000–2010
Year beginning
August
Supply Disposition
Stocks Aug. 1 Production Imports Total Exports
Domestic disappearance
Total Per capita
1,000 1,000 1,000 1,000 1,000 1,000 pounds pounds pounds pounds pounds pounds Pounds
2000 ..................... 59,922 228,185 7,625 295,732 41,054 216,306 0.76 2001 ..................... 38,372 245,783 0 284,155 39,100 179,906 0.63 2002 ..................... 65,149 207,881 251 273,281 40,193 184,188 0.64 2003 ..................... 48,900 254,048 321 303,269 32,202 211,104 0.72 2004 ..................... 59,963 261,823 0 321,786 36,808 215,323 0.73 2005 ..................... 69,655 240,023 6 309,684 36,845 215,846 0.73 2006 ..................... 56,993 221,618 48 278,659 19,600 216,956 0.72 2007 ..................... 42,103 257,386 0 299,489 56,323 185,371 0.61 2008 ..................... 57,795 282,284 194 340,273 67,091 212,695 0.69 2009 ..................... 60,487 257,414 1,243 319,144 55,430 210,785 0.69 2010 ..................... 52,929 268,956 163 322,048 78,924 243,124 0.78
NASS, Crops Branch, (202) 720–2127, ERS, and Foreign trade from the Bureau of the Census.
Table 3-24.—Shelled peanuts (all grades): Supply, exports, and quantity crushed, United States, 2000–2010
Year beginning
August
Supply
Exports Crushed Stocks Aug. 1 Production Imports Total
Edible Oil stock Edible Oil stock
1,000 1,000 1,000 1,000 1,000 1,000 1,000 1,000 pounds pounds pounds pounds pounds pounds pounds pounds
2000 ..................... 707,554 70,103 1,939,736 337,324 147,105 3,201,822 354,423 411,558 2001 ..................... 693,209 14,463 2,090,776 485,092 150,278 3,433,818 495,600 521,173 2002 ..................... 680,850 16,648 1,983,016 611,627 54,118 3,346,259 337,336 644,194 2003 ..................... 504,186 24,231 2,439,231 390,893 26,812 3,385,353 362,673 402,958 2004 ..................... 603,504 17,686 2,357,314 246,663 25,290 3,250,457 341,019 295,769 2005 ..................... 486,563 15,305 2,411,471 357,600 21,784 3,292,723 341,072 407,817 2006 ..................... 510,097 21,499 2,415,495 347,243 42,888 3,337,222 437,663 385,375 2007 ..................... 528,918 33,401 2,291,603 319,186 53,472 3,226,580 520,508 372,980 2008 ..................... 431,593 39,508 2,442,345 253,778 61,199 3,228,423 494,738 334,296 2009 ..................... 511,261 22,320 2,547,434 280,888 49,454 3,411,357 402,727 326,779 2010 ..................... 554,295 35,498 2,450,639 357,130 45,847 3,443,409 395,007 441,017
NASS, Crops Branch, (202) 720–2127, ERS, and Foreign trade from the U.S. Bureau of the Census.
VerDate Aug 31 2005 13:41 Mar 01, 2012 Jkt 000000 PO 00000 Frm 00010 Fmt 1000 Sfmt 1000 H:\SHARED\DAPP\FPU\AGSTAT\MASTER~2\CHAPTR03\III-10.AG8 USDA
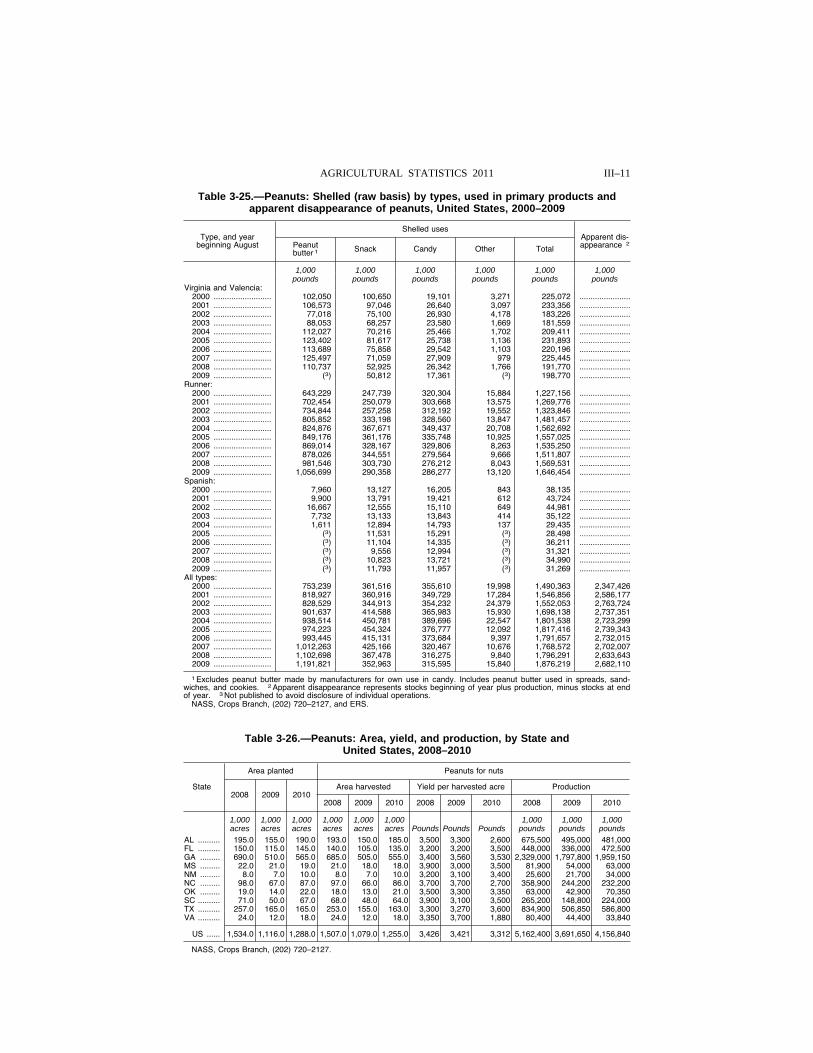
III–11 AGRICULTURAL STATISTICS 2011
Table 3-25.—Peanuts: Shelled (raw basis) by types, used in primary products and apparent disappearance of peanuts, United States, 2000–2009
Type, and year beginning August
Shelled uses Apparent dis-appearance 2 Peanut
butter 1 Snack Candy Other Total
1,000 1,000 1,000 1,000 1,000 1,000 pounds pounds pounds pounds pounds pounds
Virginia and Valencia: 2000 .......................... 102,050 100,650 19,101 3,271 225,072 .......................2001 .......................... 106,573 97,046 26,640 3,097 233,356 .......................2002 .......................... 77,018 75,100 26,930 4,178 183,226 .......................2003 .......................... 88,053 68,257 23,580 1,669 181,559 .......................2004 .......................... 112,027 70,216 25,466 1,702 209,411 .......................2005 .......................... 123,402 81,617 25,738 1,136 231,893 .......................2006 .......................... 113,689 75,858 29,542 1,103 220,196 .......................2007 .......................... 125,497 71,059 27,909 979 225,445 .......................2008 .......................... 110,737 52,925 26,342 1,766 191,770 .......................2009 .......................... (3) 50,812 17,361 (3) 198,770 .......................
Runner: 2000 .......................... 643,229 247,739 320,304 15,884 1,227,156 .......................2001 .......................... 702,454 250,079 303,668 13,575 1,269,776 .......................2002 .......................... 734,844 257,258 312,192 19,552 1,323,846 .......................2003 .......................... 805,852 333,198 328,560 13,847 1,481,457 .......................2004 .......................... 824,876 367,671 349,437 20,708 1,562,692 .......................2005 .......................... 849,176 361,176 335,748 10,925 1,557,025 .......................2006 .......................... 869,014 328,167 329,806 8,263 1,535,250 .......................2007 .......................... 878,026 344,551 279,564 9,666 1,511,807 .......................2008 .......................... 981,546 303,730 276,212 8,043 1,569,531 .......................2009 .......................... 1,056,699 290,358 286,277 13,120 1,646,454 .......................
Spanish: 2000 .......................... 7,960 13,127 16,205 843 38,135 .......................2001 .......................... 9,900 13,791 19,421 612 43,724 .......................2002 .......................... 16,667 12,555 15,110 649 44,981 .......................2003 .......................... 7,732 13,133 13,843 414 35,122 .......................2004 .......................... 1,611 12,894 14,793 137 29,435 .......................2005 .......................... (3) 11,531 15,291 (3) 28,498 .......................2006 .......................... (3) 11,104 14,335 (3) 36,211 .......................2007 .......................... (3) 9,556 12,994 (3) 31,321 .......................2008 .......................... (3) 10,823 13,721 (3) 34,990 .......................2009 .......................... (3) 11,793 11,957 (3) 31,269 .......................
All types: 2000 .......................... 753,239 361,516 355,610 19,998 1,490,363 2,347,426 2001 .......................... 818,927 360,916 349,729 17,284 1,546,856 2,586,177 2002 .......................... 828,529 344,913 354,232 24,379 1,552,053 2,763,724 2003 .......................... 901,637 414,588 365,983 15,930 1,698,138 2,737,351 2004 .......................... 938,514 450,781 389,696 22,547 1,801,538 2,723,299 2005 .......................... 974,223 454,324 376,777 12,092 1,817,416 2,739,343 2006 .......................... 993,445 415,131 373,684 9,397 1,791,657 2,732,015 2007 .......................... 1,012,263 425,166 320,467 10,676 1,768,572 2,702,007 2008 .......................... 1,102,698 367,478 316,275 9,840 1,796,291 2,633,643 2009 .......................... 1,191,821 352,963 315,595 15,840 1,876,219 2,682,110
1 Excludes peanut butter made by manufacturers for own use in candy. Includes peanut butter used in spreads, sand-wiches, and cookies. 2 Apparent disappearance represents stocks beginning of year plus production, minus stocks at end of year. 3 Not published to avoid disclosure of individual operations.
NASS, Crops Branch, (202) 720–2127, and ERS.
Table 3-26.—Peanuts: Area, yield, and production, by State and United States, 2008–2010
State
Area planted Peanuts for nuts
2008 2009 2010 Area harvested Yield per harvested acre Production
2008 2009 2010 2008 2009 2010 2008 2009 2010
1,000 1,000 1,000 1,000 1,000 1,000 1,000 1,000 1,000 acres acres acres acres acres acres Pounds Pounds Pounds pounds pounds pounds
AL .......... 195.0 155.0 190.0 193.0 150.0 185.0 3,500 3,300 2,600 675,500 495,000 481,000 FL .......... 150.0 115.0 145.0 140.0 105.0 135.0 3,200 3,200 3,500 448,000 336,000 472,500 GA ......... 690.0 510.0 565.0 685.0 505.0 555.0 3,400 3,560 3,530 2,329,000 1,797,800 1,959,150 MS ......... 22.0 21.0 19.0 21.0 18.0 18.0 3,900 3,000 3,500 81,900 54,000 63,000 NM ......... 8.0 7.0 10.0 8.0 7.0 10.0 3,200 3,100 3,400 25,600 21,700 34,000 NC ......... 98.0 67.0 87.0 97.0 66.0 86.0 3,700 3,700 2,700 358,900 244,200 232,200 OK ......... 19.0 14.0 22.0 18.0 13.0 21.0 3,500 3,300 3,350 63,000 42,900 70,350 SC .......... 71.0 50.0 67.0 68.0 48.0 64.0 3,900 3,100 3,500 265,200 148,800 224,000 TX .......... 257.0 165.0 165.0 253.0 155.0 163.0 3,300 3,270 3,600 834,900 506,850 586,800 VA .......... 24.0 12.0 18.0 24.0 12.0 18.0 3,350 3,700 1,880 80,400 44,400 33,840
US ...... 1,534.0 1,116.0 1,288.0 1,507.0 1,079.0 1,255.0 3,426 3,421 3,312 5,162,400 3,691,650 4,156,840
NASS, Crops Branch, (202) 720–2127.
VerDate Aug 31 2005 13:41 Mar 01, 2012 Jkt 000000 PO 00000 Frm 00011 Fmt 1000 Sfmt 1000 H:\SHARED\DAPP\FPU\AGSTAT\MASTER~2\CHAPTR03\III-11.AG8 USDA
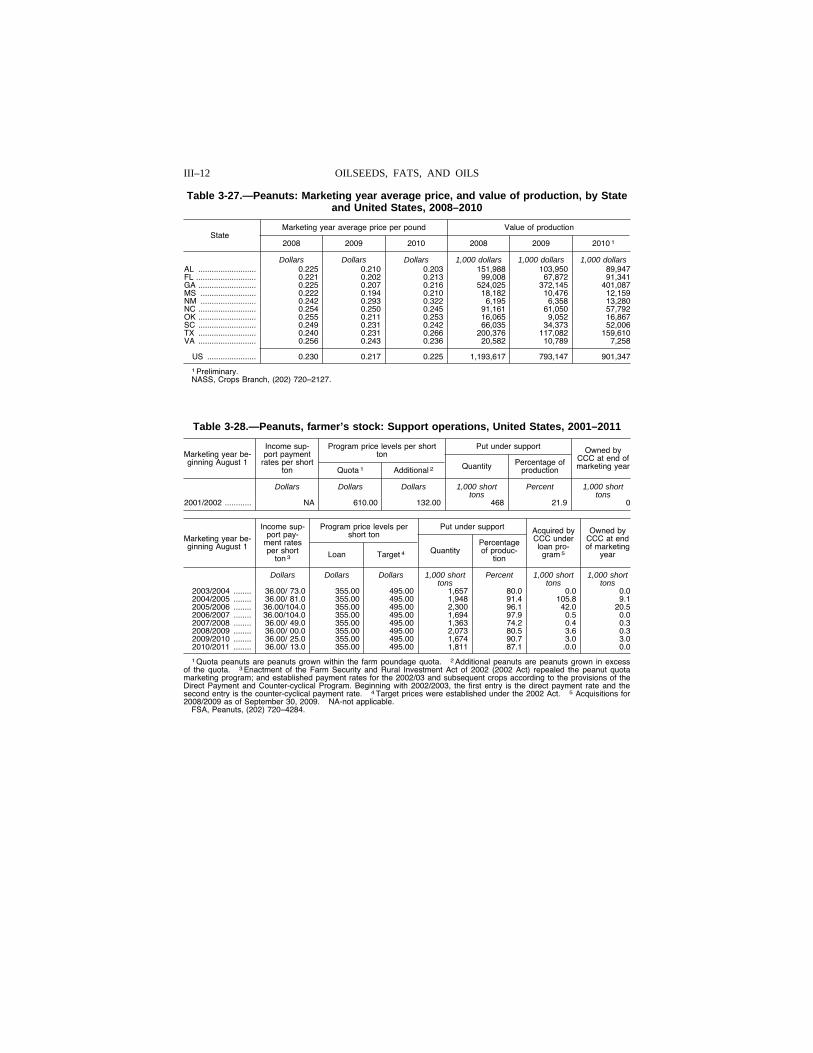
III–12 OILSEEDS, FATS, AND OILS
Table 3-27.—Peanuts: Marketing year average price, and value of production, by State and United States, 2008–2010
State Marketing year average price per pound Value of production
2008 2009 2010 2008 2009 2010 1
Dollars Dollars Dollars 1,000 dollars 1,000 dollars 1,000 dollars AL .......................... 0.225 0.210 0.203 151,988 103,950 89,947 FL ........................... 0.221 0.202 0.213 99,008 67,872 91,341 GA .......................... 0.225 0.207 0.216 524,025 372,145 401,087 MS ......................... 0.222 0.194 0.210 18,182 10,476 12,159 NM ......................... 0.242 0.293 0.322 6,195 6,358 13,280 NC .......................... 0.254 0.250 0.245 91,161 61,050 57,792 OK .......................... 0.255 0.211 0.253 16,065 9,052 16,867 SC .......................... 0.249 0.231 0.242 66,035 34,373 52,006 TX .......................... 0.240 0.231 0.266 200,376 117,082 159,610 VA .......................... 0.256 0.243 0.236 20,582 10,789 7,258
US ...................... 0.230 0.217 0.225 1,193,617 793,147 901,347
1 Preliminary. NASS, Crops Branch, (202) 720–2127.
Table 3-28.—Peanuts, farmer’s stock: Support operations, United States, 2001–2011
Marketing year be-ginning August 1
Income sup-port payment
rates per short ton
Program price levels per short ton
Put under support Owned by CCC at end of marketing year Quota 1 Additional 2 Quantity Percentage of
production
Dollars Dollars Dollars 1,000 short tons
Percent 1,000 short tons
2001/2002 ............ NA 610.00 132.00 468 21.9 0
Marketing year be-ginning August 1
Income sup-port pay-
ment rates per short
ton 3
Program price levels per short ton
Put under support Acquired by CCC under loan pro-
gram 5
Owned by CCC at end of marketing
year Loan Target 4 Quantity Percentage of produc-
tion
Dollars Dollars Dollars 1,000 short tons
Percent 1,000 short tons
1,000 short tons
2003/2004 ........ 36.00/ 73.0 355.00 495.00 1,657 80.0 0.0 0.0 2004/2005 ........ 36.00/ 81.0 355.00 495.00 1,948 91.4 105.8 9.1 2005/2006 ........ 36.00/104.0 355.00 495.00 2,300 96.1 42.0 20.5 2006/2007 ........ 36.00/104.0 355.00 495.00 1,694 97.9 0.5 0.0 2007/2008 ........ 36.00/ 49.0 355.00 495.00 1,363 74.2 0.4 0.3 2008/2009 ........ 36.00/ 00.0 355.00 495.00 2,073 80.5 3.6 0.3 2009/2010 ........ 36.00/ 25.0 355.00 495.00 1,674 90.7 3.0 3.0 2010/2011 ........ 36.00/ 13.0 355.00 495.00 1,811 87.1 .0.0 0.0
1 Quota peanuts are peanuts grown within the farm poundage quota. 2 Additional peanuts are peanuts grown in excess of the quota. 3 Enactment of the Farm Security and Rural Investment Act of 2002 (2002 Act) repealed the peanut quota marketing program; and established payment rates for the 2002/03 and subsequent crops according to the provisions of the Direct Payment and Counter-cyclical Program. Beginning with 2002/2003, the first entry is the direct payment rate and the second entry is the counter-cyclical payment rate. 4 Target prices were established under the 2002 Act. 5 Acquisitions for 2008/2009 as of September 30, 2009. NA-not applicable.
FSA, Peanuts, (202) 720–4284.
VerDate Aug 31 2005 13:41 Mar 01, 2012 Jkt 000000 PO 00000 Frm 00012 Fmt 1000 Sfmt 1000 H:\SHARED\DAPP\FPU\AGSTAT\MASTER~2\CHAPTR03\III-12.AG8 USDA
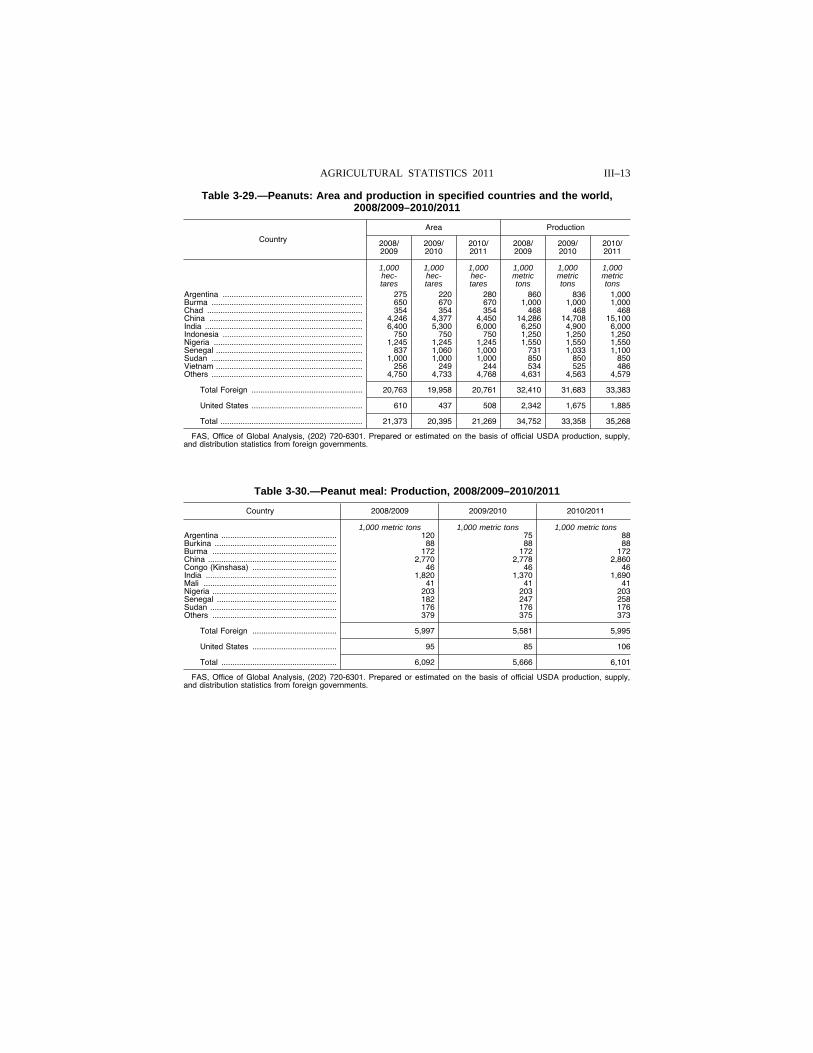
III–13 AGRICULTURAL STATISTICS 2011
Table 3-29.—Peanuts: Area and production in specified countries and the world, 2008/2009–2010/2011
Country
Area Production
2008/ 2009
2009/ 2010
2010/ 2011
2008/ 2009
2009/ 2010
2010/ 2011
1,000 1,000 1,000 1,000 1,000 1,000 hec- hec- hec- metric metric metric tares tares tares tons tons tons
Argentina ............................................................... 275 220 280 860 836 1,000 Burma .................................................................... 650 670 670 1,000 1,000 1,000 Chad ...................................................................... 354 354 354 468 468 468 China ..................................................................... 4,246 4,377 4,450 14,286 14,708 15,100 India ....................................................................... 6,400 5,300 6,000 6,250 4,900 6,000 Indonesia ............................................................... 750 750 750 1,250 1,250 1,250 Nigeria ................................................................... 1,245 1,245 1,245 1,550 1,550 1,550 Senegal .................................................................. 837 1,060 1,000 731 1,033 1,100 Sudan .................................................................... 1,000 1,000 1,000 850 850 850 Vietnam .................................................................. 256 249 244 534 525 486 Others .................................................................... 4,750 4,733 4,768 4,631 4,563 4,579
Total Foreign .................................................. 20,763 19,958 20,761 32,410 31,683 33,383
United States .................................................. 610 437 508 2,342 1,675 1,885
Total ................................................................ 21,373 20,395 21,269 34,752 33,358 35,268
FAS, Office of Global Analysis, (202) 720-6301. Prepared or estimated on the basis of official USDA production, supply, and distribution statistics from foreign governments.
Table 3-30.—Peanut meal: Production, 2008/2009–2010/2011
Country 2008/2009 2009/2010 2010/2011
1,000 metric tons 1,000 metric tons 1,000 metric tons Argentina .................................................... 120 75 88 Burkina ....................................................... 88 88 88 Burma ........................................................ 172 172 172 China .......................................................... 2,770 2,778 2,860 Congo (Kinshasa) ...................................... 46 46 46 India ........................................................... 1,820 1,370 1,690 Mali ............................................................ 41 41 41 Nigeria ........................................................ 203 203 203 Senegal ...................................................... 182 247 258 Sudan ......................................................... 176 176 176 Others ........................................................ 379 375 373
Total Foreign ...................................... 5,997 5,581 5,995
United States ...................................... 95 85 106
Total .................................................... 6,092 5,666 6,101
FAS, Office of Global Analysis, (202) 720-6301. Prepared or estimated on the basis of official USDA production, supply, and distribution statistics from foreign governments.
VerDate Aug 31 2005 13:41 Mar 01, 2012 Jkt 000000 PO 00000 Frm 00013 Fmt 1000 Sfmt 1000 H:\SHARED\DAPP\FPU\AGSTAT\MASTER~2\CHAPTR03\III-13.AG8 USDA
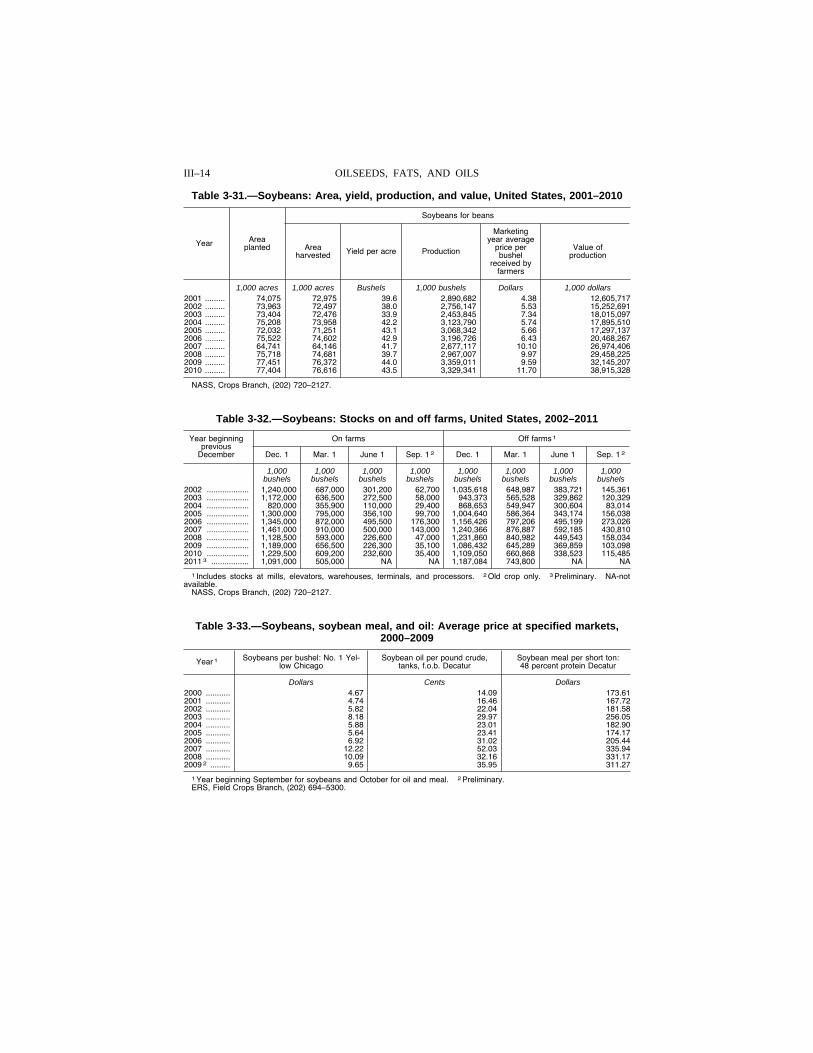
III–14 OILSEEDS, FATS, AND OILS
Table 3-31.—Soybeans: Area, yield, production, and value, United States, 2001–2010
Year Area planted
Soybeans for beans
Area harvested Yield per acre Production
Marketing year average
price per bushel
received by farmers
Value of production
1,000 acres 1,000 acres Bushels 1,000 bushels Dollars 1,000 dollars 2001 ......... 74,075 72,975 39.6 2,890,682 4.38 12,605,717 2002 ......... 73,963 72,497 38.0 2,756,147 5.53 15,252,691 2003 ......... 73,404 72,476 33.9 2,453,845 7.34 18,015,097 2004 ......... 75,208 73,958 42.2 3,123,790 5.74 17,895,510 2005 ......... 72,032 71,251 43.1 3,068,342 5.66 17,297,137 2006 ......... 75,522 74,602 42.9 3,196,726 6.43 20,468,267 2007 ......... 64,741 64,146 41.7 2,677,117 10.10 26,974,406 2008 ......... 75,718 74,681 39.7 2,967,007 9.97 29,458,225 2009 ......... 77,451 76,372 44.0 3,359,011 9.59 32,145,207 2010 ......... 77,404 76,616 43.5 3,329,341 11.70 38,915,328
NASS, Crops Branch, (202) 720–2127.
Table 3-32.—Soybeans: Stocks on and off farms, United States, 2002–2011
Year beginning previous
December
On farms Off farms 1
Dec. 1 Mar. 1 June 1 Sep. 1 2 Dec. 1 Mar. 1 June 1 Sep. 1 2
1,000 1,000 1,000 1,000 1,000 1,000 1,000 1,000 bushels bushels bushels bushels bushels bushels bushels bushels
2002 ................... 1,240,000 687,000 301,200 62,700 1,035,618 648,987 383,721 145,361 2003 ................... 1,172,000 636,500 272,500 58,000 943,373 565,528 329,862 120,329 2004 ................... 820,000 355,900 110,000 29,400 868,653 549,947 300,604 83,014 2005 ................... 1,300,000 795,000 356,100 99,700 1,004,640 586,364 343,174 156,038 2006 ................... 1,345,000 872,000 495,500 176,300 1,156,426 797,206 495,199 273,026 2007 ................... 1,461,000 910,000 500,000 143,000 1,240,366 876,887 592,185 430,810 2008 ................... 1,128,500 593,000 226,600 47,000 1,231,860 840,982 449,543 158,034 2009 ................... 1,189,000 656,500 226,300 35,100 1,086,432 645,289 369,859 103,098 2010 ................... 1,229,500 609,200 232,600 35,400 1,109,050 660,868 338,523 115,485 2011 3 ................. 1,091,000 505,000 NA NA 1,187,084 743,800 NA NA
1 Includes stocks at mills, elevators, warehouses, terminals, and processors. 2 Old crop only. 3 Preliminary. NA-not available.
NASS, Crops Branch, (202) 720–2127.
Table 3-33.—Soybeans, soybean meal, and oil: Average price at specified markets, 2000–2009
Year 1 Soybeans per bushel: No. 1 Yel-low Chicago
Soybean oil per pound crude, tanks, f.o.b. Decatur
Soybean meal per short ton: 48 percent protein Decatur
Dollars Cents Dollars 2000 ........... 4.67 14.09 173.61 2001 ........... 4.74 16.46 167.72 2002 ........... 5.82 22.04 181.58 2003 ........... 8.18 29.97 256.05 2004 ........... 5.88 23.01 182.90 2005 ........... 5.64 23.41 174.17 2006 ........... 6.92 31.02 205.44 2007 ........... 12.22 52.03 335.94 2008 ........... 10.09 32.16 331.17 2009 2 ......... 9.65 35.95 311.27
1 Year beginning September for soybeans and October for oil and meal. 2 Preliminary. ERS, Field Crops Branch, (202) 694–5300.
VerDate Aug 31 2005 13:41 Mar 01, 2012 Jkt 000000 PO 00000 Frm 00014 Fmt 1000 Sfmt 1000 H:\SHARED\DAPP\FPU\AGSTAT\MASTER~2\CHAPTR03\III-14.AG8 USDA
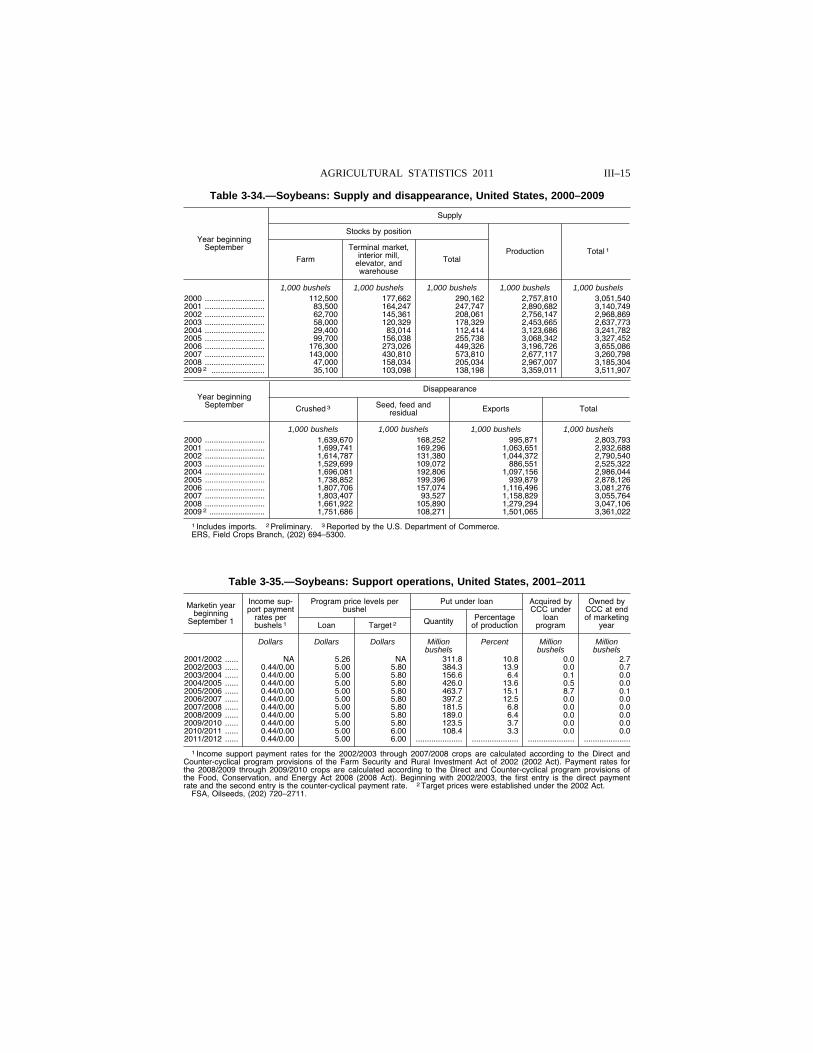
III–15 AGRICULTURAL STATISTICS 2011
Table 3-34.—Soybeans: Supply and disappearance, United States, 2000–2009
Year beginning September
Supply
Stocks by position
Production Total 1 Farm
Terminal market, interior mill,
elevator, and warehouse
Total
1,000 bushels 1,000 bushels 1,000 bushels 1,000 bushels 1,000 bushels 2000 ........................... 112,500 177,662 290,162 2,757,810 3,051,540 2001 ........................... 83,500 164,247 247,747 2,890,682 3,140,749 2002 ........................... 62,700 145,361 208,061 2,756,147 2,968,869 2003 ........................... 58,000 120,329 178,329 2,453,665 2,637,773 2004 ........................... 29,400 83,014 112,414 3,123,686 3,241,782 2005 ........................... 99,700 156,038 255,738 3,068,342 3,327,452 2006 ........................... 176,300 273,026 449,326 3,196,726 3,655,086 2007 ........................... 143,000 430,810 573,810 2,677,117 3,260,798 2008 ........................... 47,000 158,034 205,034 2,967,007 3,185,304 2009 2 ........................ 35,100 103,098 138,198 3,359,011 3,511,907
Year beginning September
Disappearance
Crushed 3 Seed, feed and residual Exports Total
1,000 bushels 1,000 bushels 1,000 bushels 1,000 bushels 2000 ........................... 1,639,670 168,252 995,871 2,803,793 2001 ........................... 1,699,741 169,296 1,063,651 2,932,688 2002 ........................... 1,614,787 131,380 1,044,372 2,790,540 2003 ........................... 1,529,699 109,072 886,551 2,525,322 2004 ........................... 1,696,081 192,806 1,097,156 2,986,044 2005 ........................... 1,738,852 199,396 939,879 2,878,126 2006 ........................... 1,807,706 157,074 1,116,496 3,081,276 2007 ........................... 1,803,407 93,527 1,158,829 3,055,764 2008 ........................... 1,661,922 105,890 1,279,294 3,047,106 2009 2 ......................... 1,751,686 108,271 1,501,065 3,361,022
1 Includes imports. 2 Preliminary. 3 Reported by the U.S. Department of Commerce. ERS, Field Crops Branch, (202) 694–5300.
Table 3-35.—Soybeans: Support operations, United States, 2001–2011
Marketin year beginning
September 1
Income sup-port payment
rates per bushels 1
Program price levels per bushel
Put under loan Acquired by CCC under
loan program
Owned by CCC at end of marketing
year Loan Target 2 Quantity Percentage of production
Dollars Dollars Dollars Million Percent Million Million bushels bushels bushels
2001/2002 ...... NA 5.26 NA 311.8 10.8 0.0 2.7 2002/2003 ...... 0.44/0.00 5.00 5.80 384.3 13.9 0.0 0.7 2003/2004 ...... 0.44/0.00 5.00 5.80 156.6 6.4 0.1 0.0 2004/2005 ...... 0.44/0.00 5.00 5.80 426.0 13.6 0.5 0.0 2005/2006 ...... 0.44/0.00 5.00 5.80 463.7 15.1 8.7 0.1 2006/2007 ...... 0.44/0.00 5.00 5.80 397.2 12.5 0.0 0.0 2007/2008 ...... 0.44/0.00 5.00 5.80 181.5 6.8 0.0 0.0 2008/2009 ...... 0.44/0.00 5.00 5.80 189.0 6.4 0.0 0.0 2009/2010 ...... 0.44/0.00 5.00 5.80 123.5 3.7 0.0 0.0 2010/2011 ...... 0.44/0.00 5.00 6.00 108.4 3.3 0.0 0.0 2011/2012 ...... 0.44/0.00 5.00 6.00 ..................... ..................... ..................... .....................
1 Income support payment rates for the 2002/2003 through 2007/2008 crops are calculated according to the Direct and Counter-cyclical program provisions of the Farm Security and Rural Investment Act of 2002 (2002 Act). Payment rates for the 2008/2009 through 2009/2010 crops are calculated according to the Direct and Counter-cyclical program provisions of the Food, Conservation, and Energy Act 2008 (2008 Act). Beginning with 2002/2003, the first entry is the direct payment rate and the second entry is the counter-cyclical payment rate. 2 Target prices were established under the 2002 Act.
FSA, Oilseeds, (202) 720–2711.
VerDate Aug 31 2005 13:41 Mar 01, 2012 Jkt 000000 PO 00000 Frm 00015 Fmt 1000 Sfmt 1000 H:\SHARED\DAPP\FPU\AGSTAT\MASTER~2\CHAPTR03\III-15.AG8 USDA
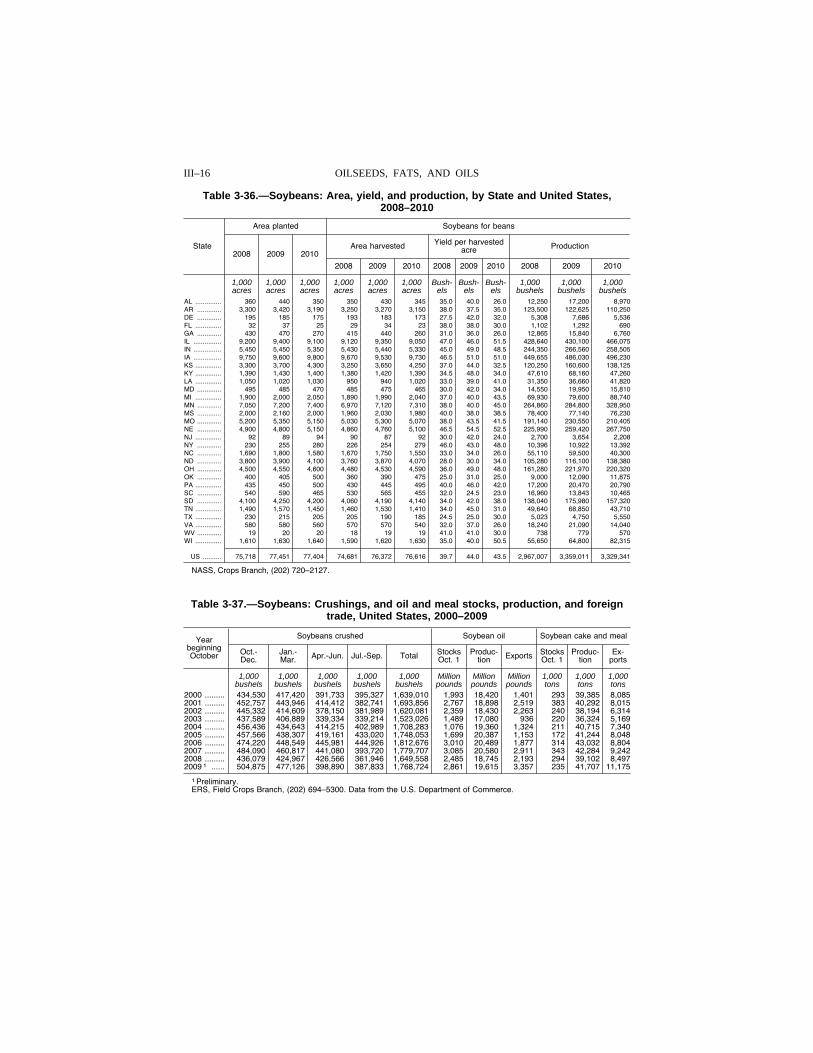
III–16 OILSEEDS, FATS, AND OILS
Table 3-36.—Soybeans: Area, yield, and production, by State and United States, 2008–2010
State
Area planted Soybeans for beans
2008 2009 2010 Area harvested Yield per harvested
acre Production
2008 2009 2010 2008 2009 2010 2008 2009 2010
1,000 1,000 1,000 1,000 1,000 1,000 Bush- Bush- Bush- 1,000 1,000 1,000 acres acres acres acres acres acres els els els bushels bushels bushels
AL .............. 360 440 350 350 430 345 35.0 40.0 26.0 12,250 17,200 8,970 AR ............. 3,300 3,420 3,190 3,250 3,270 3,150 38.0 37.5 35.0 123,500 122,625 110,250 DE ............. 195 185 175 193 183 173 27.5 42.0 32.0 5,308 7,686 5,536 FL .............. 32 37 25 29 34 23 38.0 38.0 30.0 1,102 1,292 690 GA ............. 430 470 270 415 440 260 31.0 36.0 26.0 12,865 15,840 6,760 IL ............... 9,200 9,400 9,100 9,120 9,350 9,050 47.0 46.0 51.5 428,640 430,100 466,075 IN ............... 5,450 5,450 5,350 5,430 5,440 5,330 45.0 49.0 48.5 244,350 266,560 258,505 IA ............... 9,750 9,600 9,800 9,670 9,530 9,730 46.5 51.0 51.0 449,655 486,030 496,230 KS .............. 3,300 3,700 4,300 3,250 3,650 4,250 37.0 44.0 32.5 120,250 160,600 138,125 KY .............. 1,390 1,430 1,400 1,380 1,420 1,390 34.5 48.0 34.0 47,610 68,160 47,260 LA .............. 1,050 1,020 1,030 950 940 1,020 33.0 39.0 41.0 31,350 36,660 41,820 MD ............. 495 485 470 485 475 465 30.0 42.0 34.0 14,550 19,950 15,810 MI .............. 1,900 2,000 2,050 1,890 1,990 2,040 37.0 40.0 43.5 69,930 79,600 88,740 MN ............. 7,050 7,200 7,400 6,970 7,120 7,310 38.0 40.0 45.0 264,860 284,800 328,950 MS ............. 2,000 2,160 2,000 1,960 2,030 1,980 40.0 38.0 38.5 78,400 77,140 76,230 MO ............. 5,200 5,350 5,150 5,030 5,300 5,070 38.0 43.5 41.5 191,140 230,550 210,405 NE ............. 4,900 4,800 5,150 4,860 4,760 5,100 46.5 54.5 52.5 225,990 259,420 267,750 NJ .............. 92 89 94 90 87 92 30.0 42.0 24.0 2,700 3,654 2,208 NY ............. 230 255 280 226 254 279 46.0 43.0 48.0 10,396 10,922 13,392 NC ............. 1,690 1,800 1,580 1,670 1,750 1,550 33.0 34.0 26.0 55,110 59,500 40,300 ND ............. 3,800 3,900 4,100 3,760 3,870 4,070 28.0 30.0 34.0 105,280 116,100 138,380 OH ............. 4,500 4,550 4,600 4,480 4,530 4,590 36.0 49.0 48.0 161,280 221,970 220,320 OK ............. 400 405 500 360 390 475 25.0 31.0 25.0 9,000 12,090 11,875 PA .............. 435 450 500 430 445 495 40.0 46.0 42.0 17,200 20,470 20,790 SC ............. 540 590 465 530 565 455 32.0 24.5 23.0 16,960 13,843 10,465 SD ............. 4,100 4,250 4,200 4,060 4,190 4,140 34.0 42.0 38.0 138,040 175,980 157,320 TN .............. 1,490 1,570 1,450 1,460 1,530 1,410 34.0 45.0 31.0 49,640 68,850 43,710 TX .............. 230 215 205 205 190 185 24.5 25.0 30.0 5,023 4,750 5,550 VA .............. 580 580 560 570 570 540 32.0 37.0 26.0 18,240 21,090 14,040 WV ............. 19 20 20 18 19 19 41.0 41.0 30.0 738 779 570 WI .............. 1,610 1,630 1,640 1,590 1,620 1,630 35.0 40.0 50.5 55,650 64,800 82,315
US .......... 75,718 77,451 77,404 74,681 76,372 76,616 39.7 44.0 43.5 2,967,007 3,359,011 3,329,341
NASS, Crops Branch, (202) 720–2127.
Table 3-37.—Soybeans: Crushings, and oil and meal stocks, production, and foreign trade, United States, 2000–2009
Year beginning October
Soybeans crushed Soybean oil Soybean cake and meal
Oct.- Dec.
Jan.- Mar. Apr.-Jun. Jul.-Sep. Total Stocks
Oct. 1 Produc-
tion Exports Stocks Oct. 1
Produc-tion
Ex-ports
1,000 1,000 1,000 1,000 1,000 Million Million Million 1,000 1,000 1,000 bushels bushels bushels bushels bushels pounds pounds pounds tons tons tons
2000 ......... 434,530 417,420 391,733 395,327 1,639,010 1,993 18,420 1,401 293 39,385 8,085 2001 ......... 452,757 443,946 414,412 382,741 1,693,856 2,767 18,898 2,519 383 40,292 8,015 2002 ......... 445,332 414,609 378,150 381,989 1,620,081 2,359 18,430 2,263 240 38,194 6,314 2003 ......... 437,589 406,889 339,334 339,214 1,523,026 1,489 17,080 936 220 36,324 5,169 2004 ......... 456,436 434,643 414,215 402,989 1,708,283 1,076 19,360 1,324 211 40,715 7,340 2005 ......... 457,566 438,307 419,161 433,020 1,748,053 1,699 20,387 1,153 172 41,244 8,048 2006 ......... 474,220 448,549 445,981 444,926 1,812,676 3,010 20,489 1,877 314 43,032 8,804 2007 ......... 484,090 460,817 441,080 393,720 1,779,707 3,085 20,580 2,911 343 42,284 9,242 2008 ......... 436,079 424,967 426,566 361,946 1,649,558 2,485 18,745 2,193 294 39,102 8,497 2009 1 ...... 504,875 477,126 398,890 387,833 1,768,724 2,861 19,615 3,357 235 41,707 11,175
1 Preliminary. ERS, Field Crops Branch, (202) 694–5300. Data from the U.S. Department of Commerce.
VerDate Aug 31 2005 13:41 Mar 01, 2012 Jkt 000000 PO 00000 Frm 00016 Fmt 1000 Sfmt 1000 H:\SHARED\DAPP\FPU\AGSTAT\MASTER~2\CHAPTR03\III-16.AG8 USDA
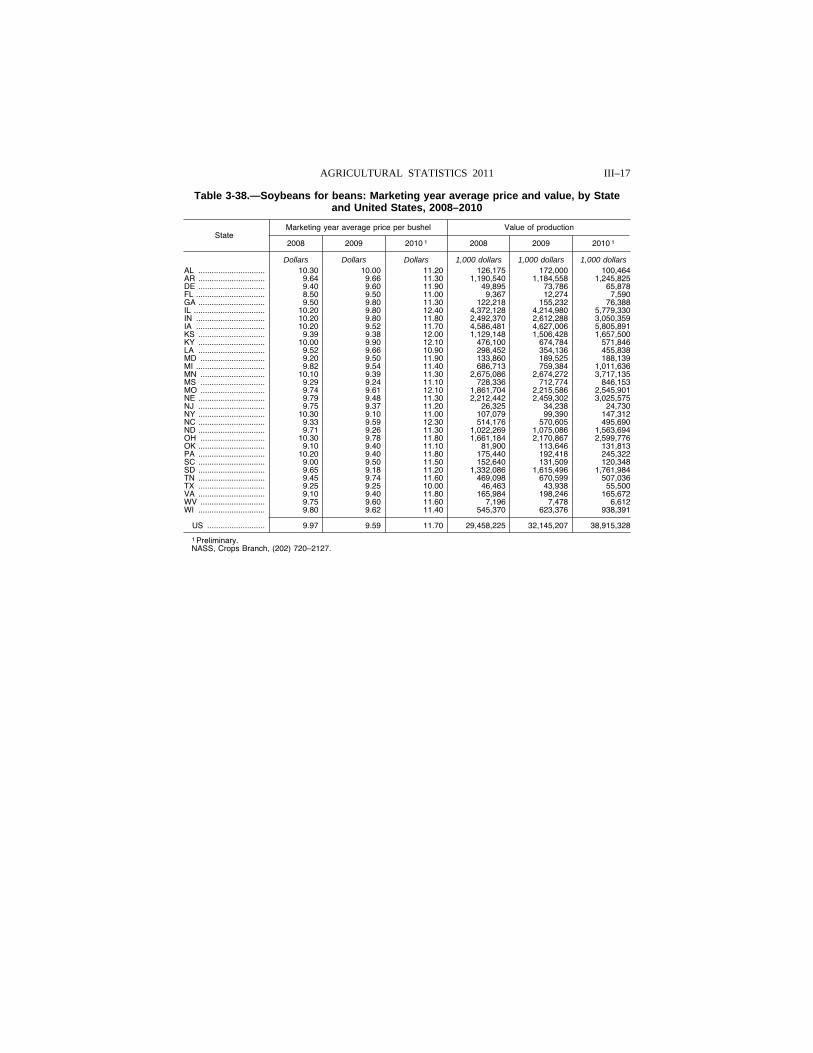
III–17 AGRICULTURAL STATISTICS 2011
Table 3-38.—Soybeans for beans: Marketing year average price and value, by State and United States, 2008–2010
State Marketing year average price per bushel Value of production
2008 2009 2010 1 2008 2009 2010 1
Dollars Dollars Dollars 1,000 dollars 1,000 dollars 1,000 dollars AL .............................. 10.30 10.00 11.20 126,175 172,000 100,464 AR .............................. 9.64 9.66 11.30 1,190,540 1,184,558 1,245,825 DE .............................. 9.40 9.60 11.90 49,895 73,786 65,878 FL ............................... 8.50 9.50 11.00 9,367 12,274 7,590 GA .............................. 9.50 9.80 11.30 122,218 155,232 76,388 IL ................................ 10.20 9.80 12.40 4,372,128 4,214,980 5,779,330 IN ............................... 10.20 9.80 11.80 2,492,370 2,612,288 3,050,359 IA ............................... 10.20 9.52 11.70 4,586,481 4,627,006 5,805,891 KS .............................. 9.39 9.38 12.00 1,129,148 1,506,428 1,657,500 KY .............................. 10.00 9.90 12.10 476,100 674,784 571,846 LA .............................. 9.52 9.66 10.90 298,452 354,136 455,838 MD ............................. 9.20 9.50 11.90 133,860 189,525 188,139 MI ............................... 9.82 9.54 11.40 686,713 759,384 1,011,636 MN ............................. 10.10 9.39 11.30 2,675,086 2,674,272 3,717,135 MS ............................. 9.29 9.24 11.10 728,336 712,774 846,153 MO ............................. 9.74 9.61 12.10 1,861,704 2,215,586 2,545,901 NE .............................. 9.79 9.48 11.30 2,212,442 2,459,302 3,025,575 NJ .............................. 9.75 9.37 11.20 26,325 34,238 24,730 NY .............................. 10.30 9.10 11.00 107,079 99,390 147,312 NC .............................. 9.33 9.59 12.30 514,176 570,605 495,690 ND .............................. 9.71 9.26 11.30 1,022,269 1,075,086 1,563,694 OH ............................. 10.30 9.78 11.80 1,661,184 2,170,867 2,599,776 OK .............................. 9.10 9.40 11.10 81,900 113,646 131,813 PA .............................. 10.20 9.40 11.80 175,440 192,418 245,322 SC .............................. 9.00 9.50 11.50 152,640 131,509 120,348 SD .............................. 9.65 9.18 11.20 1,332,086 1,615,496 1,761,984 TN .............................. 9.45 9.74 11.60 469,098 670,599 507,036 TX .............................. 9.25 9.25 10.00 46,463 43,938 55,500 VA .............................. 9.10 9.40 11.80 165,984 198,246 165,672 WV ............................. 9.75 9.60 11.60 7,196 7,478 6,612 WI .............................. 9.80 9.62 11.40 545,370 623,376 938,391
US .......................... 9.97 9.59 11.70 29,458,225 32,145,207 38,915,328
1 Preliminary. NASS, Crops Branch, (202) 720–2127.
VerDate Aug 31 2005 13:41 Mar 01, 2012 Jkt 000000 PO 00000 Frm 00017 Fmt 1000 Sfmt 1000 H:\SHARED\DAPP\FPU\AGSTAT\MASTER~2\CHAPTR03\III-17.AG8 USDA
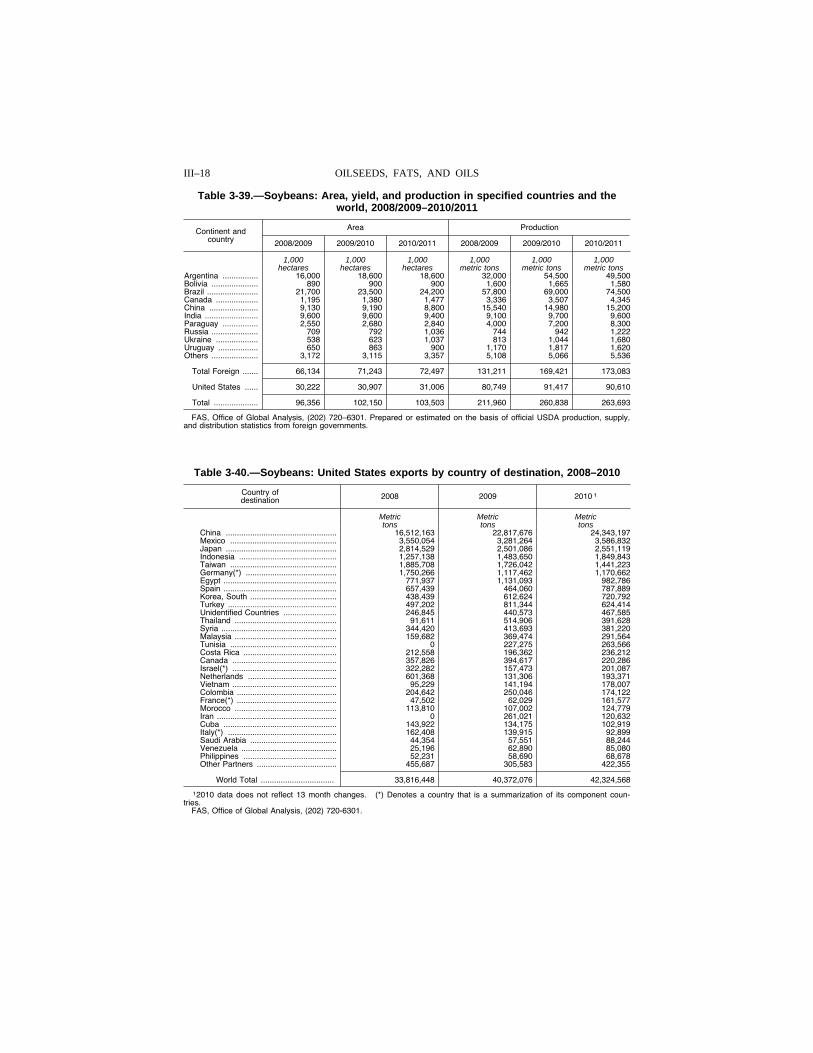
III–18 OILSEEDS, FATS, AND OILS
Table 3-39.—Soybeans: Area, yield, and production in specified countries and the world, 2008/2009–2010/2011
Continent and country
Area Production
2008/2009 2009/2010 2010/2011 2008/2009 2009/2010 2010/2011
1,000 1,000 1,000 1,000 1,000 1,000 hectares hectares hectares metric tons metric tons metric tons
Argentina ................ 16,000 18,600 18,600 32,000 54,500 49,500 Bolivia ..................... 890 900 900 1,600 1,665 1,580 Brazil ....................... 21,700 23,500 24,200 57,800 69,000 74,500 Canada ................... 1,195 1,380 1,477 3,336 3,507 4,345 China ...................... 9,130 9,190 8,800 15,540 14,980 15,200 India ........................ 9,600 9,600 9,400 9,100 9,700 9,600 Paraguay ................ 2,550 2,680 2,840 4,000 7,200 8,300 Russia ..................... 709 792 1,036 744 942 1,222 Ukraine ................... 538 623 1,037 813 1,044 1,680 Uruguay .................. 650 863 900 1,170 1,817 1,620 Others ..................... 3,172 3,115 3,357 5,108 5,066 5,536
Total Foreign ....... 66,134 71,243 72,497 131,211 169,421 173,083
United States ...... 30,222 30,907 31,006 80,749 91,417 90,610
Total .................... 96,356 102,150 103,503 211,960 260,838 263,693
FAS, Office of Global Analysis, (202) 720–6301. Prepared or estimated on the basis of official USDA production, supply, and distribution statistics from foreign governments.
Table 3-40.—Soybeans: United States exports by country of destination, 2008–2010
Country of destination 2008 2009 2010 1
Metric Metric Metric tons tons tons
China .................................................. 16,512,163 22,817,676 24,343,197 Mexico ................................................ 3,550,054 3,281,264 3,586,832 Japan .................................................. 2,814,529 2,501,086 2,551,119 Indonesia ............................................ 1,257,138 1,483,650 1,849,843 Taiwan ................................................ 1,885,708 1,726,042 1,441,223 Germany(*) ......................................... 1,750,266 1,117,462 1,170,662 Egypt ................................................... 771,937 1,131,093 982,786 Spain ................................................... 657,439 464,060 787,889 Korea, South ....................................... 438,439 612,624 720,792 Turkey ................................................. 497,202 811,344 624,414 Unidentified Countries ........................ 246,845 440,573 467,585 Thailand .............................................. 91,611 514,906 391,628 Syria .................................................... 344,420 413,693 381,220 Malaysia .............................................. 159,682 369,474 291,564 Tunisia ................................................ 0 227,275 263,566 Costa Rica .......................................... 212,558 196,362 236,212 Canada ............................................... 357,826 394,617 220,286 Israel(*) ............................................... 322,282 157,473 201,087 Netherlands ........................................ 601,368 131,306 193,371 Vietnam ............................................... 95,229 141,194 178,007 Colombia ............................................. 204,642 250,046 174,122 France(*) ............................................. 47,502 62,029 161,577 Morocco .............................................. 113,810 107,002 124,779 Iran ...................................................... 0 261,021 120,632 Cuba ................................................... 143,922 134,175 102,919 Italy(*) ................................................. 162,408 139,915 92,899 Saudi Arabia ....................................... 44,354 57,551 88,244 Venezuela ........................................... 25,196 62,890 85,080 Philippines .......................................... 52,231 58,690 68,678 Other Partners .................................... 455,687 305,583 422,355
World Total ................................. 33,816,448 40,372,076 42,324,568
12010 data does not reflect 13 month changes. (*) Denotes a country that is a summarization of its component coun-tries.
FAS, Office of Global Analysis, (202) 720-6301.
VerDate Aug 31 2005 13:41 Mar 01, 2012 Jkt 000000 PO 00000 Frm 00018 Fmt 1000 Sfmt 1000 H:\SHARED\DAPP\FPU\AGSTAT\MASTER~2\CHAPTR03\III-18.AG8 USDA
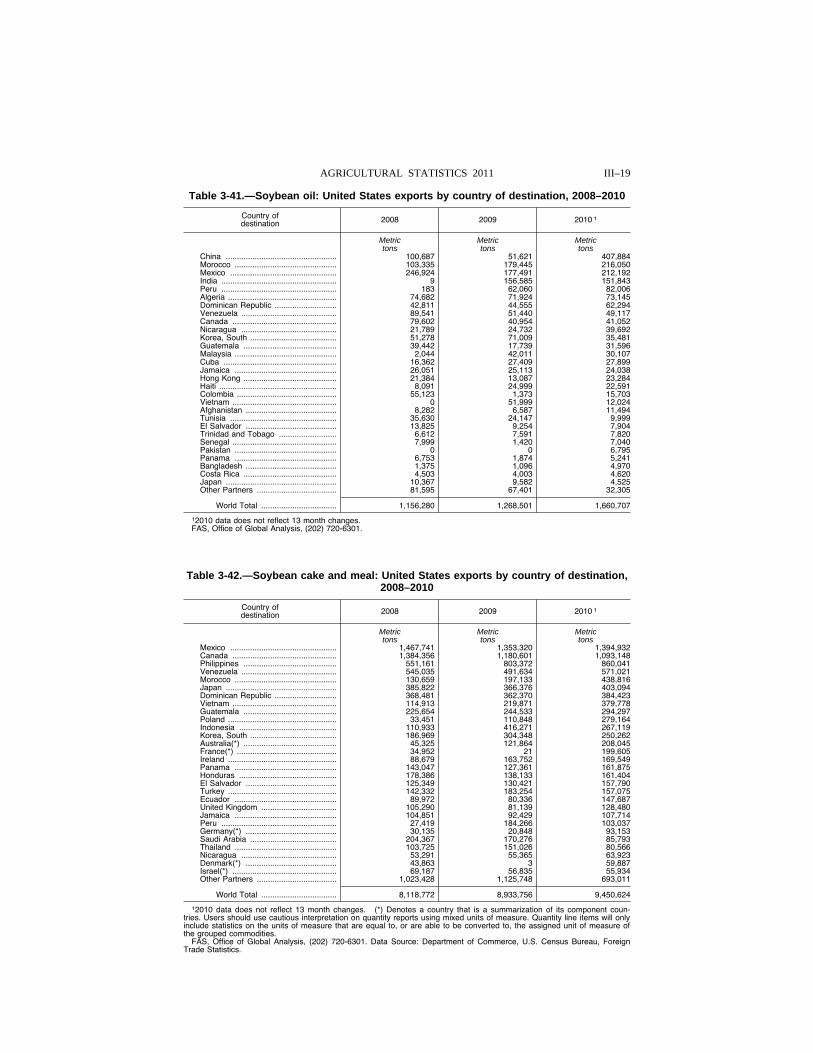
III–19 AGRICULTURAL STATISTICS 2011
Table 3-41.—Soybean oil: United States exports by country of destination, 2008–2010
Country of destination 2008 2009 2010 1
Metric Metric Metric tons tons tons
China .................................................. 100,687 51,621 407,884 Morocco .............................................. 103,335 179,445 216,050 Mexico ................................................ 246,924 177,491 212,192 India .................................................... 9 156,585 151,843 Peru .................................................... 183 62,060 82,006 Algeria ................................................. 74,682 71,924 73,145 Dominican Republic ............................ 42,811 44,555 62,294 Venezuela ........................................... 89,541 51,440 49,117 Canada ............................................... 79,602 40,954 41,052 Nicaragua ........................................... 21,789 24,732 39,692 Korea, South ....................................... 51,278 71,009 35,481 Guatemala .......................................... 39,442 17,739 31,596 Malaysia .............................................. 2,044 42,011 30,107 Cuba ................................................... 16,362 27,409 27,899 Jamaica .............................................. 26,051 25,113 24,038 Hong Kong .......................................... 21,384 13,087 23,284 Haiti ..................................................... 8,091 24,999 22,591 Colombia ............................................. 55,123 1,373 15,703 Vietnam ............................................... 0 51,999 12,024 Afghanistan ......................................... 8,282 6,587 11,494 Tunisia ................................................ 35,630 24,147 9,999 El Salvador ......................................... 13,825 9,254 7,904 Trinidad and Tobago .......................... 6,612 7,591 7,820 Senegal ............................................... 7,999 1,420 7,040 Pakistan .............................................. 0 0 6,795 Panama .............................................. 6,753 1,874 5,241 Bangladesh ......................................... 1,375 1,096 4,970 Costa Rica .......................................... 4,503 4,003 4,620 Japan .................................................. 10,367 9,582 4,525 Other Partners .................................... 81,595 67,401 32,305
World Total .................................. 1,156,280 1,268,501 1,660,707
12010 data does not reflect 13 month changes. FAS, Office of Global Analysis, (202) 720-6301.
Table 3-42.—Soybean cake and meal: United States exports by country of destination, 2008–2010
Country of destination 2008 2009 2010 1
Metric Metric Metric tons tons tons
Mexico ................................................ 1,467,741 1,353,320 1,394,932 Canada ............................................... 1,384,356 1,180,601 1,093,148 Philippines .......................................... 551,161 803,372 860,041 Venezuela ........................................... 545,035 491,634 571,021 Morocco .............................................. 130,659 197,133 438,816 Japan .................................................. 385,822 366,376 403,094 Dominican Republic ............................ 368,481 362,370 384,423 Vietnam ............................................... 114,913 219,871 379,778 Guatemala .......................................... 225,654 244,533 294,297 Poland ................................................. 33,451 110,848 279,164 Indonesia ............................................ 110,933 416,271 267,119 Korea, South ....................................... 186,969 304,348 250,262 Australia(*) .......................................... 45,325 121,864 208,045 France(*) ............................................. 34,952 21 199,605 Ireland ................................................. 88,679 163,752 169,549 Panama .............................................. 143,047 127,361 161,875 Honduras ............................................ 178,386 138,133 161,404 El Salvador ......................................... 125,349 130,421 157,790 Turkey ................................................. 142,332 183,254 157,075 Ecuador .............................................. 89,972 80,336 147,687 United Kingdom .................................. 105,290 81,139 128,480 Jamaica .............................................. 104,851 92,429 107,714 Peru .................................................... 27,419 184,266 103,037 Germany(*) ......................................... 30,135 20,848 93,153 Saudi Arabia ....................................... 204,367 170,276 85,793 Thailand .............................................. 103,725 151,026 80,566 Nicaragua ........................................... 53,291 55,365 63,923 Denmark(*) ......................................... 43,863 3 59,887 Israel(*) ............................................... 69,187 56,835 55,934 Other Partners .................................... 1,023,428 1,125,748 693,011
World Total .................................. 8,118,772 8,933,756 9,450,624
12010 data does not reflect 13 month changes. (*) Denotes a country that is a summarization of its component coun-tries. Users should use cautious interpretation on quantity reports using mixed units of measure. Quantity line items will only include statistics on the units of measure that are equal to, or are able to be converted to, the assigned unit of measure of the grouped commodities.
FAS, Office of Global Analysis, (202) 720-6301. Data Source: Department of Commerce, U.S. Census Bureau, Foreign Trade Statistics.
VerDate Aug 31 2005 13:41 Mar 01, 2012 Jkt 000000 PO 00000 Frm 00019 Fmt 1000 Sfmt 1000 H:\SHARED\DAPP\FPU\AGSTAT\MASTER~2\CHAPTR03\III-19.AG8 USDA
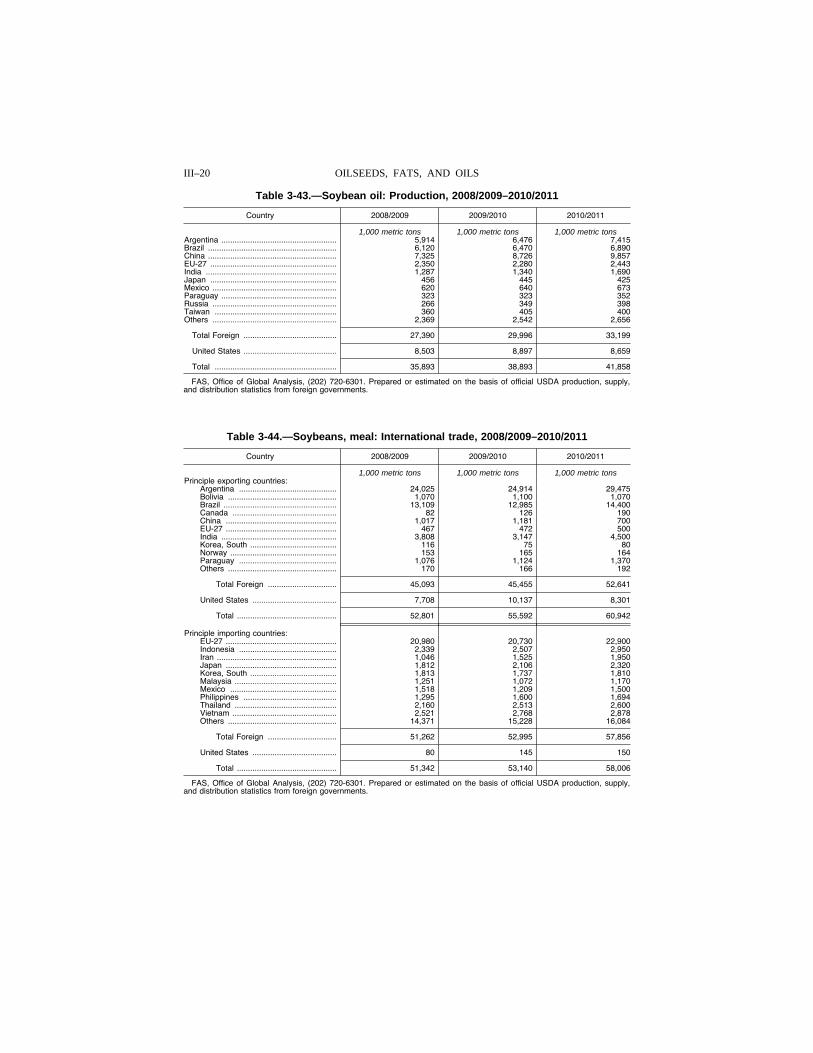
III–20 OILSEEDS, FATS, AND OILS
Table 3-43.—Soybean oil: Production, 2008/2009–2010/2011
Country 2008/2009 2009/2010 2010/2011
1,000 metric tons 1,000 metric tons 1,000 metric tons Argentina .................................................... 5,914 6,476 7,415 Brazil .......................................................... 6,120 6,470 6,890 China .......................................................... 7,325 8,726 9,857 EU-27 ......................................................... 2,350 2,280 2,443 India ........................................................... 1,287 1,340 1,690 Japan ......................................................... 456 445 425 Mexico ........................................................ 620 640 673 Paraguay .................................................... 323 323 352 Russia ........................................................ 266 349 398 Taiwan ....................................................... 360 405 400 Others ........................................................ 2,369 2,542 2,656
Total Foreign .......................................... 27,390 29,996 33,199
United States .......................................... 8,503 8,897 8,659
Total ....................................................... 35,893 38,893 41,858
FAS, Office of Global Analysis, (202) 720-6301. Prepared or estimated on the basis of official USDA production, supply, and distribution statistics from foreign governments.
Table 3-44.—Soybeans, meal: International trade, 2008/2009–2010/2011
Country 2008/2009 2009/2010 2010/2011
1,000 metric tons 1,000 metric tons 1,000 metric tons Principle exporting countries:
Argentina ............................................ 24,025 24,914 29,475 Bolivia ................................................. 1,070 1,100 1,070 Brazil ................................................... 13,109 12,985 14,400 Canada ............................................... 82 126 190 China .................................................. 1,017 1,181 700 EU-27 .................................................. 467 472 500 India .................................................... 3,808 3,147 4,500 Korea, South ....................................... 116 75 80 Norway ................................................ 153 165 164 Paraguay ............................................ 1,076 1,124 1,370 Others ................................................. 170 166 192
Total Foreign ............................... 45,093 45,455 52,641
United States ...................................... 7,708 10,137 8,301
Total ............................................. 52,801 55,592 60,942
Principle importing countries: EU-27 .................................................. 20,980 20,730 22,900 Indonesia ............................................ 2,339 2,507 2,950 Iran ...................................................... 1,046 1,525 1,950 Japan .................................................. 1,812 2,106 2,320 Korea, South ....................................... 1,813 1,737 1,810 Malaysia .............................................. 1,251 1,072 1,170 Mexico ................................................ 1,518 1,209 1,500 Philippines .......................................... 1,295 1,600 1,694 Thailand .............................................. 2,160 2,513 2,600 Vietnam ............................................... 2,521 2,768 2,878 Others ................................................. 14,371 15,228 16,084
Total Foreign ............................... 51,262 52,995 57,856
United States ...................................... 80 145 150
Total ............................................. 51,342 53,140 58,006
FAS, Office of Global Analysis, (202) 720-6301. Prepared or estimated on the basis of official USDA production, supply, and distribution statistics from foreign governments.
VerDate Aug 31 2005 13:41 Mar 01, 2012 Jkt 000000 PO 00000 Frm 00020 Fmt 1000 Sfmt 1000 H:\SHARED\DAPP\FPU\AGSTAT\MASTER~2\CHAPTR03\III-20.AG8 USDA
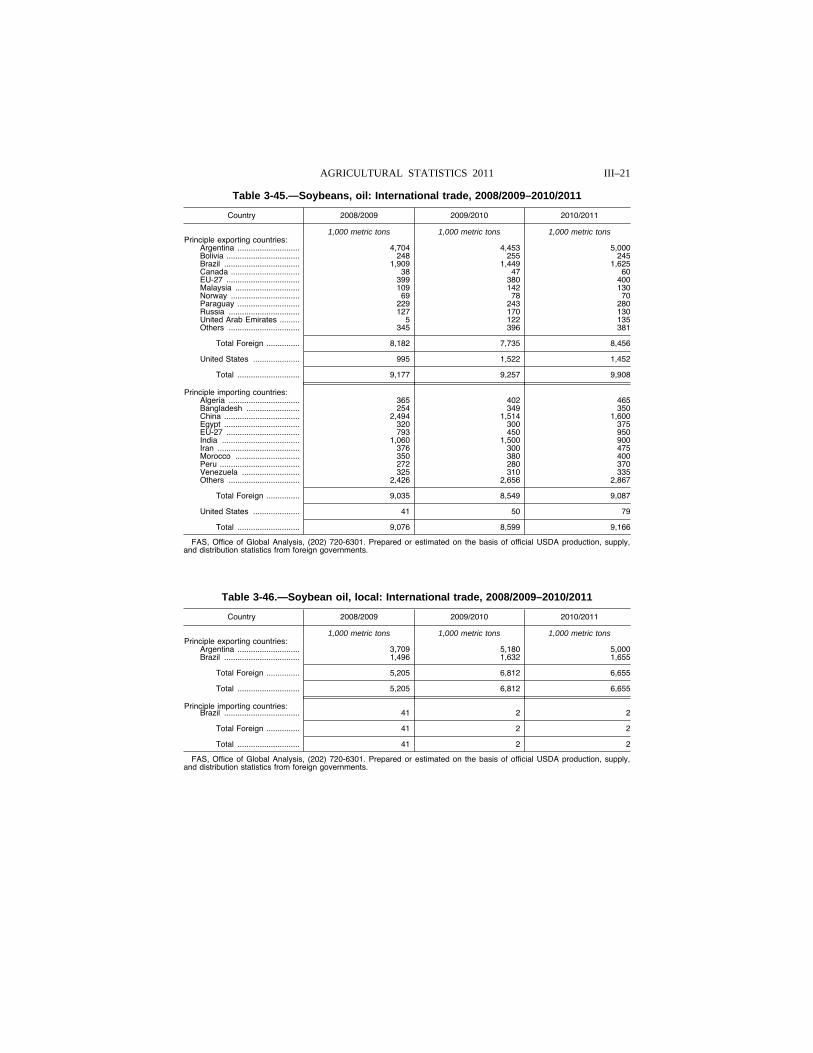
III–21 AGRICULTURAL STATISTICS 2011
Table 3-45.—Soybeans, oil: International trade, 2008/2009–2010/2011
Country 2008/2009 2009/2010 2010/2011
1,000 metric tons 1,000 metric tons 1,000 metric tons Principle exporting countries:
Argentina ............................ 4,704 4,453 5,000 Bolivia ................................. 248 255 245 Brazil .................................. 1,909 1,449 1,625 Canada ............................... 38 47 60 EU-27 ................................. 399 380 400 Malaysia ............................. 109 142 130 Norway ............................... 69 78 70 Paraguay ............................ 229 243 280 Russia ................................ 127 170 130 United Arab Emirates ......... 5 122 135 Others ................................ 345 396 381
Total Foreign ............... 8,182 7,735 8,456
United States ..................... 995 1,522 1,452
Total ............................ 9,177 9,257 9,908
Principle importing countries: Algeria ................................ 365 402 465 Bangladesh ........................ 254 349 350 China .................................. 2,494 1,514 1,600 Egypt .................................. 320 300 375 EU-27 ................................. 793 450 950 India ................................... 1,060 1,500 900 Iran ..................................... 376 300 475 Morocco ............................. 350 380 400 Peru .................................... 272 280 370 Venezuela .......................... 325 310 335 Others ................................ 2,426 2,656 2,867
Total Foreign ............... 9,035 8,549 9,087
United States ..................... 41 50 79
Total ............................ 9,076 8,599 9,166
FAS, Office of Global Analysis, (202) 720-6301. Prepared or estimated on the basis of official USDA production, supply, and distribution statistics from foreign governments.
Table 3-46.—Soybean oil, local: International trade, 2008/2009–2010/2011
Country 2008/2009 2009/2010 2010/2011
1,000 metric tons 1,000 metric tons 1,000 metric tons Principle exporting countries:
Argentina ............................ 3,709 5,180 5,000 Brazil .................................. 1,496 1,632 1,655
Total Foreign ............... 5,205 6,812 6,655
Total ............................ 5,205 6,812 6,655
Principle importing countries: Brazil .................................. 41 2 2
Total Foreign ............... 41 2 2
Total ............................ 41 2 2
FAS, Office of Global Analysis, (202) 720-6301. Prepared or estimated on the basis of official USDA production, supply, and distribution statistics from foreign governments.
VerDate Aug 31 2005 13:41 Mar 01, 2012 Jkt 000000 PO 00000 Frm 00021 Fmt 1000 Sfmt 1000 H:\SHARED\DAPP\FPU\AGSTAT\MASTER~2\CHAPTR03\III-21.AG8 USDA
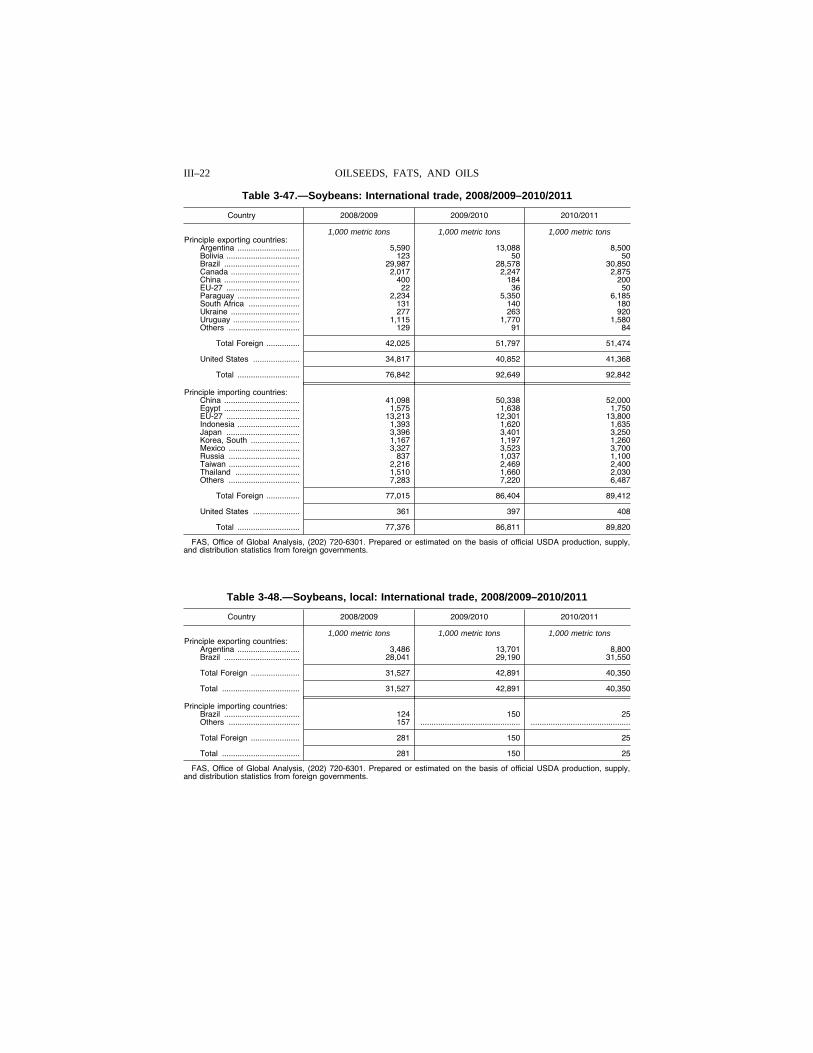
III–22 OILSEEDS, FATS, AND OILS
Table 3-47.—Soybeans: International trade, 2008/2009–2010/2011
Country 2008/2009 2009/2010 2010/2011
1,000 metric tons 1,000 metric tons 1,000 metric tons Principle exporting countries:
Argentina ............................ 5,590 13,088 8,500 Bolivia ................................. 123 50 50 Brazil .................................. 29,987 28,578 30,850 Canada ............................... 2,017 2,247 2,875 China .................................. 400 184 200 EU-27 ................................. 22 36 50 Paraguay ............................ 2,234 5,350 6,185 South Africa ....................... 131 140 180 Ukraine ............................... 277 263 920 Uruguay .............................. 1,115 1,770 1,580 Others ................................ 129 91 84
Total Foreign ............... 42,025 51,797 51,474
United States ..................... 34,817 40,852 41,368
Total ............................ 76,842 92,649 92,842
Principle importing countries: China .................................. 41,098 50,338 52,000 Egypt .................................. 1,575 1,638 1,750 EU-27 ................................. 13,213 12,301 13,800 Indonesia ............................ 1,393 1,620 1,635 Japan ................................. 3,396 3,401 3,250 Korea, South ...................... 1,167 1,197 1,260 Mexico ................................ 3,327 3,523 3,700 Russia ................................ 837 1,037 1,100 Taiwan ................................ 2,216 2,469 2,400 Thailand ............................. 1,510 1,660 2,030 Others ................................ 7,283 7,220 6,487
Total Foreign ............... 77,015 86,404 89,412
United States ..................... 361 397 408
Total ............................ 77,376 86,811 89,820
FAS, Office of Global Analysis, (202) 720-6301. Prepared or estimated on the basis of official USDA production, supply, and distribution statistics from foreign governments.
Table 3-48.—Soybeans, local: International trade, 2008/2009–2010/2011
Country 2008/2009 2009/2010 2010/2011
1,000 metric tons 1,000 metric tons 1,000 metric tons Principle exporting countries:
Argentina ............................ 3,486 13,701 8,800 Brazil .................................. 28,041 29,190 31,550
Total Foreign ...................... 31,527 42,891 40,350
Total ................................... 31,527 42,891 40,350
Principle importing countries: Brazil .................................. 124 150 25 Others ................................ 157 ............................................. .............................................
Total Foreign ...................... 281 150 25
Total ................................... 281 150 25
FAS, Office of Global Analysis, (202) 720-6301. Prepared or estimated on the basis of official USDA production, supply, and distribution statistics from foreign governments.
VerDate Aug 31 2005 13:41 Mar 01, 2012 Jkt 000000 PO 00000 Frm 00022 Fmt 1000 Sfmt 1000 H:\SHARED\DAPP\FPU\AGSTAT\MASTER~2\CHAPTR03\III-22.AG8 USDA
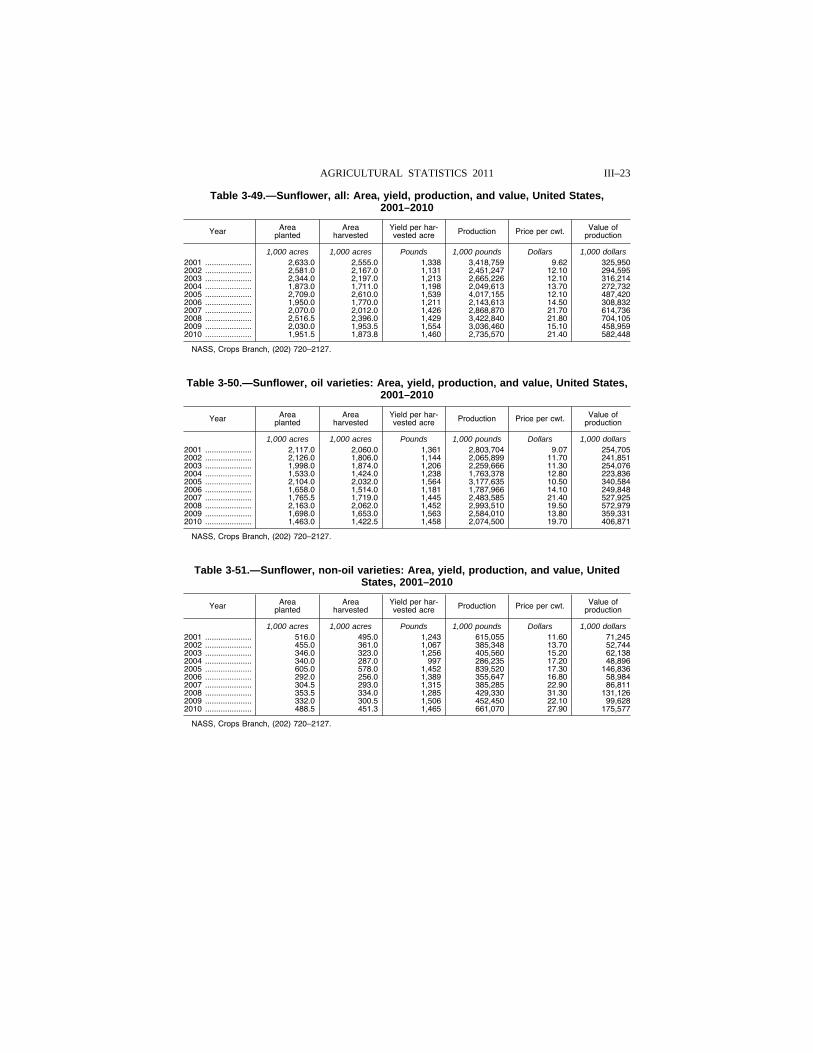
III–23 AGRICULTURAL STATISTICS 2011
Table 3-49.—Sunflower, all: Area, yield, production, and value, United States, 2001–2010
Year Area planted
Area harvested
Yield per har-vested acre Production Price per cwt. Value of
production
1,000 acres 1,000 acres Pounds 1,000 pounds Dollars 1,000 dollars 2001 ..................... 2,633.0 2,555.0 1,338 3,418,759 9.62 325,950 2002 ..................... 2,581.0 2,167.0 1,131 2,451,247 12.10 294,595 2003 ..................... 2,344.0 2,197.0 1,213 2,665,226 12.10 316,214 2004 ..................... 1,873.0 1,711.0 1,198 2,049,613 13.70 272,732 2005 ..................... 2,709.0 2,610.0 1,539 4,017,155 12.10 487,420 2006 ..................... 1,950.0 1,770.0 1,211 2,143,613 14.50 308,832 2007 ..................... 2,070.0 2,012.0 1,426 2,868,870 21.70 614,736 2008 ..................... 2,516.5 2,396.0 1,429 3,422,840 21.80 704,105 2009 ..................... 2,030.0 1,953.5 1,554 3,036,460 15.10 458,959 2010 ..................... 1,951.5 1,873.8 1,460 2,735,570 21.40 582,448
NASS, Crops Branch, (202) 720–2127.
Table 3-50.—Sunflower, oil varieties: Area, yield, production, and value, United States, 2001–2010
Year Area planted
Area harvested
Yield per har-vested acre Production Price per cwt. Value of
production
1,000 acres 1,000 acres Pounds 1,000 pounds Dollars 1,000 dollars 2001 ..................... 2,117.0 2,060.0 1,361 2,803,704 9.07 254,705 2002 ..................... 2,126.0 1,806.0 1,144 2,065,899 11.70 241,851 2003 ..................... 1,998.0 1,874.0 1,206 2,259,666 11.30 254,076 2004 ..................... 1,533.0 1,424.0 1,238 1,763,378 12.80 223,836 2005 ..................... 2,104.0 2,032.0 1,564 3,177,635 10.50 340,584 2006 ..................... 1,658.0 1,514.0 1,181 1,787,966 14.10 249,848 2007 ..................... 1,765.5 1,719.0 1,445 2,483,585 21.40 527,925 2008 ..................... 2,163.0 2,062.0 1,452 2,993,510 19.50 572,979 2009 ..................... 1,698.0 1,653.0 1,563 2,584,010 13.80 359,331 2010 ..................... 1,463.0 1,422.5 1,458 2,074,500 19.70 406,871
NASS, Crops Branch, (202) 720–2127.
Table 3-51.—Sunflower, non-oil varieties: Area, yield, production, and value, United States, 2001–2010
Year Area planted
Area harvested
Yield per har-vested acre Production Price per cwt. Value of
production
1,000 acres 1,000 acres Pounds 1,000 pounds Dollars 1,000 dollars 2001 ..................... 516.0 495.0 1,243 615,055 11.60 71,245 2002 ..................... 455.0 361.0 1,067 385,348 13.70 52,744 2003 ..................... 346.0 323.0 1,256 405,560 15.20 62,138 2004 ..................... 340.0 287.0 997 286,235 17.20 48,896 2005 ..................... 605.0 578.0 1,452 839,520 17.30 146,836 2006 ..................... 292.0 256.0 1,389 355,647 16.80 58,984 2007 ..................... 304.5 293.0 1,315 385,285 22.90 86,811 2008 ..................... 353.5 334.0 1,285 429,330 31.30 131,126 2009 ..................... 332.0 300.5 1,506 452,450 22.10 99,628 2010 ..................... 488.5 451.3 1,465 661,070 27.90 175,577
NASS, Crops Branch, (202) 720–2127.
VerDate Aug 31 2005 13:41 Mar 01, 2012 Jkt 000000 PO 00000 Frm 00023 Fmt 1000 Sfmt 1000 H:\SHARED\DAPP\FPU\AGSTAT\MASTER~2\CHAPTR03\III-23.AG8 USDA
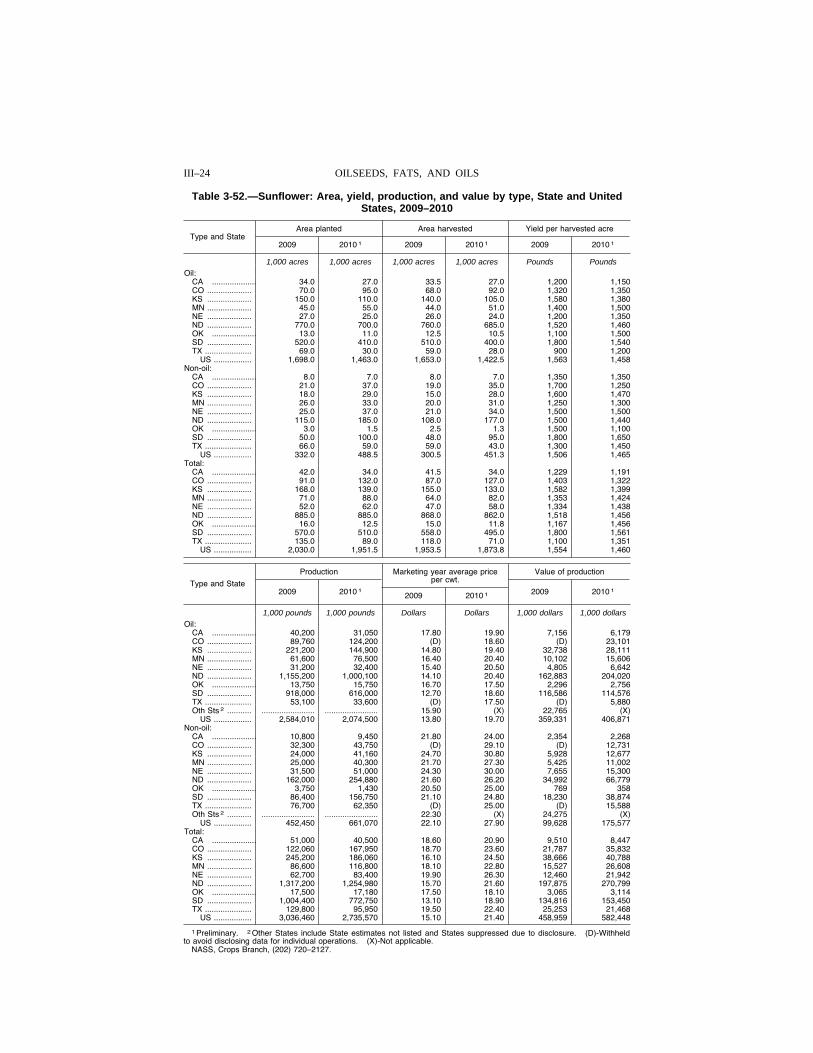
III–24 OILSEEDS, FATS, AND OILS
Table 3-52.—Sunflower: Area, yield, production, and value by type, State and United States, 2009–2010
Type and State Area planted Area harvested Yield per harvested acre
2009 2010 1 2009 2010 1 2009 2010 1
1,000 acres 1,000 acres 1,000 acres 1,000 acres Pounds Pounds Oil:
CA .................... 34.0 27.0 33.5 27.0 1,200 1,150 CO .................... 70.0 95.0 68.0 92.0 1,320 1,350 KS .................... 150.0 110.0 140.0 105.0 1,580 1,380 MN .................... 45.0 55.0 44.0 51.0 1,400 1,500 NE .................... 27.0 25.0 26.0 24.0 1,200 1,350 ND .................... 770.0 700.0 760.0 685.0 1,520 1,460 OK .................... 13.0 11.0 12.5 10.5 1,100 1,500 SD .................... 520.0 410.0 510.0 400.0 1,800 1,540 TX ..................... 69.0 30.0 59.0 28.0 900 1,200
US ................. 1,698.0 1,463.0 1,653.0 1,422.5 1,563 1,458 Non-oil:
CA .................... 8.0 7.0 8.0 7.0 1,350 1,350 CO .................... 21.0 37.0 19.0 35.0 1,700 1,250 KS .................... 18.0 29.0 15.0 28.0 1,600 1,470 MN .................... 26.0 33.0 20.0 31.0 1,250 1,300 NE .................... 25.0 37.0 21.0 34.0 1,500 1,500 ND .................... 115.0 185.0 108.0 177.0 1,500 1,440 OK .................... 3.0 1.5 2.5 1.3 1,500 1,100 SD .................... 50.0 100.0 48.0 95.0 1,800 1,650 TX ..................... 66.0 59.0 59.0 43.0 1,300 1,450
US ................. 332.0 488.5 300.5 451.3 1,506 1,465 Total:
CA .................... 42.0 34.0 41.5 34.0 1,229 1,191 CO .................... 91.0 132.0 87.0 127.0 1,403 1,322 KS .................... 168.0 139.0 155.0 133.0 1,582 1,399 MN .................... 71.0 88.0 64.0 82.0 1,353 1,424 NE .................... 52.0 62.0 47.0 58.0 1,334 1,438 ND .................... 885.0 885.0 868.0 862.0 1,518 1,456 OK .................... 16.0 12.5 15.0 11.8 1,167 1,456 SD .................... 570.0 510.0 558.0 495.0 1,800 1,561 TX ..................... 135.0 89.0 118.0 71.0 1,100 1,351
US ................. 2,030.0 1,951.5 1,953.5 1,873.8 1,554 1,460
Type and State
Production Marketing year average price per cwt.
Value of production
2009 2010 1 2009 2010 1 2009 2010 1
1,000 pounds 1,000 pounds Dollars Dollars 1,000 dollars 1,000 dollars Oil:
CA .................... 40,200 31,050 17.80 19.90 7,156 6,179 CO .................... 89,760 124,200 (D) 18.60 (D) 23,101 KS .................... 221,200 144,900 14.80 19.40 32,738 28,111 MN .................... 61,600 76,500 16.40 20.40 10,102 15,606 NE .................... 31,200 32,400 15.40 20.50 4,805 6,642 ND .................... 1,155,200 1,000,100 14.10 20.40 162,883 204,020 OK .................... 13,750 15,750 16.70 17.50 2,296 2,756 SD .................... 918,000 616,000 12.70 18.60 116,586 114,576 TX ..................... 53,100 33,600 (D) 17.50 (D) 5,880 Oth Sts 2 ........... ........................ ........................ 15.90 (X) 22,765 (X)
US ................. 2,584,010 2,074,500 13.80 19.70 359,331 406,871 Non-oil:
CA .................... 10,800 9,450 21.80 24.00 2,354 2,268 CO .................... 32,300 43,750 (D) 29.10 (D) 12,731 KS .................... 24,000 41,160 24.70 30.80 5,928 12,677 MN .................... 25,000 40,300 21.70 27.30 5,425 11,002 NE .................... 31,500 51,000 24.30 30.00 7,655 15,300 ND .................... 162,000 254,880 21.60 26.20 34,992 66,779 OK .................... 3,750 1,430 20.50 25.00 769 358 SD .................... 86,400 156,750 21.10 24.80 18,230 38,874 TX ..................... 76,700 62,350 (D) 25.00 (D) 15,588 Oth Sts 2 ........... ........................ ........................ 22.30 (X) 24,275 (X)
US ................. 452,450 661,070 22.10 27.90 99,628 175,577 Total:
CA .................... 51,000 40,500 18.60 20.90 9,510 8,447 CO .................... 122,060 167,950 18.70 23.60 21,787 35,832 KS .................... 245,200 186,060 16.10 24.50 38,666 40,788 MN .................... 86,600 116,800 18.10 22.80 15,527 26,608 NE .................... 62,700 83,400 19.90 26.30 12,460 21,942 ND .................... 1,317,200 1,254,980 15.70 21.60 197,875 270,799 OK .................... 17,500 17,180 17.50 18.10 3,065 3,114 SD .................... 1,004,400 772,750 13.10 18.90 134,816 153,450 TX ..................... 129,800 95,950 19.50 22.40 25,253 21,468
US ................. 3,036,460 2,735,570 15.10 21.40 458,959 582,448
1 Preliminary. 2 Other States include State estimates not listed and States suppressed due to disclosure. (D)-Withheld to avoid disclosing data for individual operations. (X)-Not applicable.
NASS, Crops Branch, (202) 720–2127.
VerDate Aug 31 2005 13:41 Mar 01, 2012 Jkt 000000 PO 00000 Frm 00024 Fmt 1000 Sfmt 1000 H:\SHARED\DAPP\FPU\AGSTAT\MASTER~2\CHAPTR03\III-24.AG8 USDA
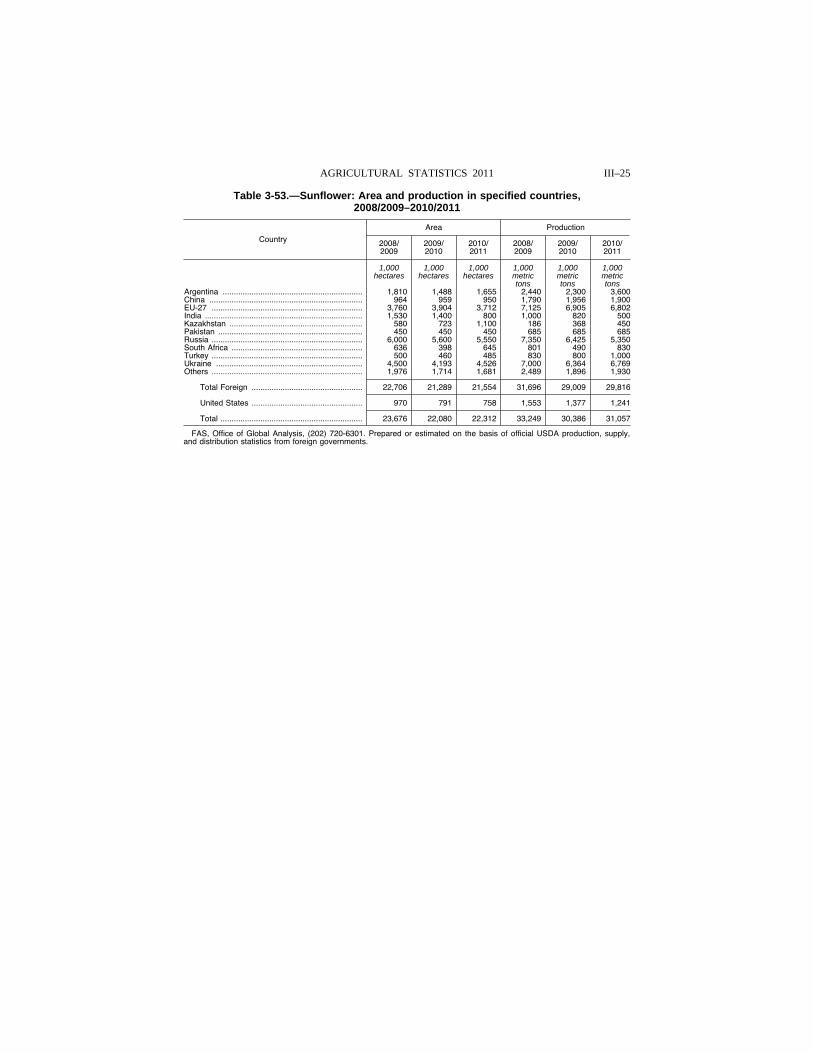
III–25 AGRICULTURAL STATISTICS 2011
Table 3-53.—Sunflower: Area and production in specified countries, 2008/2009–2010/2011
Country
Area Production
2008/ 2009
2009/ 2010
2010/ 2011
2008/ 2009
2009/ 2010
2010/ 2011
1,000 hectares
1,000 hectares
1,000 hectares
1,000 metric tons
1,000 metric tons
1,000 metric tons
Argentina ............................................................... 1,810 1,488 1,655 2,440 2,300 3,600 China ..................................................................... 964 959 950 1,790 1,956 1,900 EU-27 .................................................................... 3,760 3,904 3,712 7,125 6,905 6,802 India ....................................................................... 1,530 1,400 800 1,000 820 500 Kazakhstan ............................................................ 580 723 1,100 186 368 450 Pakistan ................................................................. 450 450 450 685 685 685 Russia .................................................................... 6,000 5,600 5,550 7,350 6,425 5,350 South Africa ........................................................... 636 398 645 801 490 830 Turkey .................................................................... 500 460 485 830 800 1,000 Ukraine .................................................................. 4,500 4,193 4,526 7,000 6,364 6,769 Others .................................................................... 1,976 1,714 1,681 2,489 1,896 1,930
Total Foreign .................................................. 22,706 21,289 21,554 31,696 29,009 29,816
United States .................................................. 970 791 758 1,553 1,377 1,241
Total ................................................................ 23,676 22,080 22,312 33,249 30,386 31,057
FAS, Office of Global Analysis, (202) 720-6301. Prepared or estimated on the basis of official USDA production, supply, and distribution statistics from foreign governments.
VerDate Aug 31 2005 13:41 Mar 01, 2012 Jkt 000000 PO 00000 Frm 00025 Fmt 1000 Sfmt 1000 H:\SHARED\DAPP\FPU\AGSTAT\MASTER~2\CHAPTR03\III-25.AG8 USDA
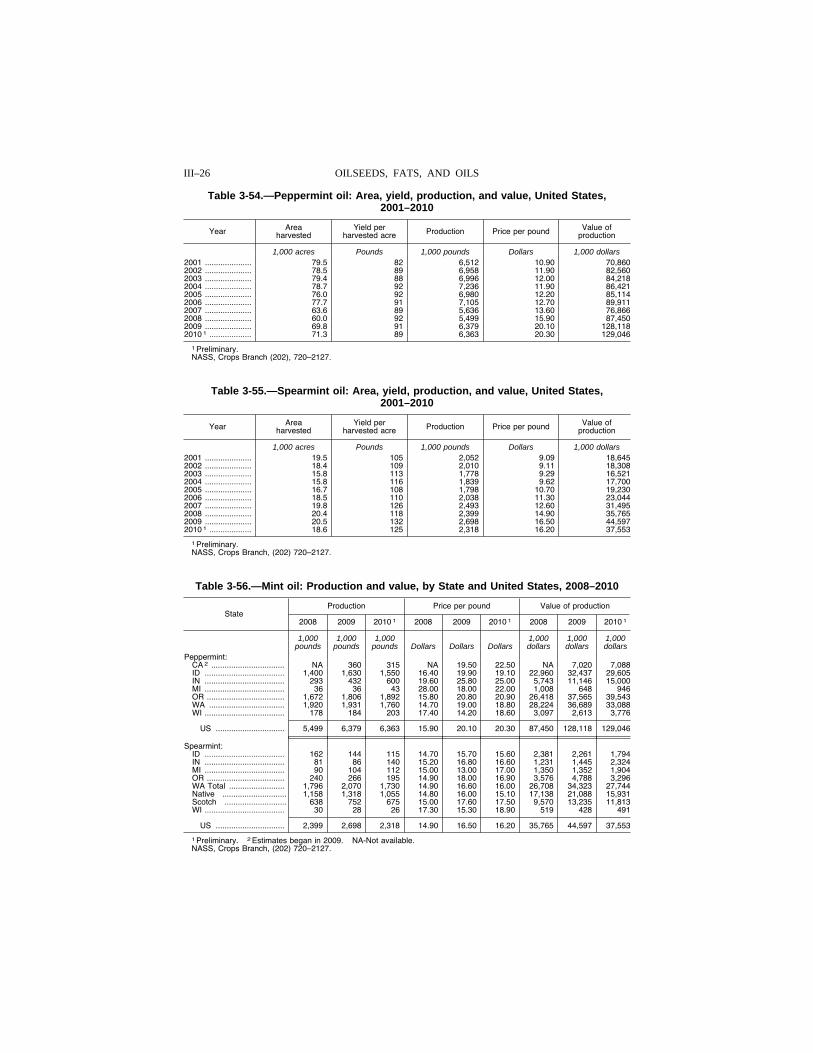
III–26 OILSEEDS, FATS, AND OILS
Table 3-54.—Peppermint oil: Area, yield, production, and value, United States, 2001–2010
Year Area harvested
Yield per harvested acre Production Price per pound Value of
production
1,000 acres Pounds 1,000 pounds Dollars 1,000 dollars 2001 ..................... 79.5 82 6,512 10.90 70,860 2002 ..................... 78.5 89 6,958 11.90 82,560 2003 ..................... 79.4 88 6,996 12.00 84,218 2004 ..................... 78.7 92 7,236 11.90 86,421 2005 ..................... 76.0 92 6,980 12.20 85,114 2006 ..................... 77.7 91 7,105 12.70 89,911 2007 ..................... 63.6 89 5,636 13.60 76,866 2008 ..................... 60.0 92 5,499 15.90 87,450 2009 ..................... 69.8 91 6,379 20.10 128,118 2010 1 ................... 71.3 89 6,363 20.30 129,046
1 Preliminary. NASS, Crops Branch (202), 720–2127.
Table 3-55.—Spearmint oil: Area, yield, production, and value, United States, 2001–2010
Year Area harvested
Yield per harvested acre Production Price per pound Value of
production
1,000 acres Pounds 1,000 pounds Dollars 1,000 dollars 2001 ..................... 19.5 105 2,052 9.09 18,645 2002 ..................... 18.4 109 2,010 9.11 18,308 2003 ..................... 15.8 113 1,778 9.29 16,521 2004 ..................... 15.8 116 1,839 9.62 17,700 2005 ..................... 16.7 108 1,798 10.70 19,230 2006 ..................... 18.5 110 2,038 11.30 23,044 2007 ..................... 19.8 126 2,493 12.60 31,495 2008 ..................... 20.4 118 2,399 14.90 35,765 2009 ..................... 20.5 132 2,698 16.50 44,597 2010 1 ................... 18.6 125 2,318 16.20 37,553
1 Preliminary. NASS, Crops Branch, (202) 720–2127.
Table 3-56.—Mint oil: Production and value, by State and United States, 2008–2010
State Production Price per pound Value of production
2008 2009 2010 1 2008 2009 2010 1 2008 2009 2010 1
1,000 1,000 1,000 1,000 1,000 1,000 pounds pounds pounds Dollars Dollars Dollars dollars dollars dollars
Peppermint: CA 2 ................................. NA 360 315 NA 19.50 22.50 NA 7,020 7,088 ID .................................... 1,400 1,630 1,550 16.40 19.90 19.10 22,960 32,437 29,605 IN .................................... 293 432 600 19.60 25.80 25.00 5,743 11,146 15,000 MI .................................... 36 36 43 28.00 18.00 22.00 1,008 648 946 OR ................................... 1,672 1,806 1,892 15.80 20.80 20.90 26,418 37,565 39,543 WA .................................. 1,920 1,931 1,760 14.70 19.00 18.80 28,224 36,689 33,088 WI .................................... 178 184 203 17.40 14.20 18.60 3,097 2,613 3,776
US ............................... 5,499 6,379 6,363 15.90 20.10 20.30 87,450 128,118 129,046
Spearmint: ID .................................... 162 144 115 14.70 15.70 15.60 2,381 2,261 1,794 IN .................................... 81 86 140 15.20 16.80 16.60 1,231 1,445 2,324 MI .................................... 90 104 112 15.00 13.00 17.00 1,350 1,352 1,904 OR ................................... 240 266 195 14.90 18.00 16.90 3,576 4,788 3,296 WA Total ......................... 1,796 2,070 1,730 14.90 16.60 16.00 26,708 34,323 27,744 Native ............................. 1,158 1,318 1,055 14.80 16.00 15.10 17,138 21,088 15,931 Scotch ............................ 638 752 675 15.00 17.60 17.50 9,570 13,235 11,813 WI .................................... 30 28 26 17.30 15.30 18.90 519 428 491
US ............................... 2,399 2,698 2,318 14.90 16.50 16.20 35,765 44,597 37,553
1 Preliminary. 2 Estimates began in 2009. NA-Not available. NASS, Crops Branch, (202) 720–2127.
VerDate Aug 31 2005 13:41 Mar 01, 2012 Jkt 000000 PO 00000 Frm 00026 Fmt 1000 Sfmt 1000 H:\SHARED\DAPP\FPU\AGSTAT\MASTER~2\CHAPTR03\III-26.AG8 USDA
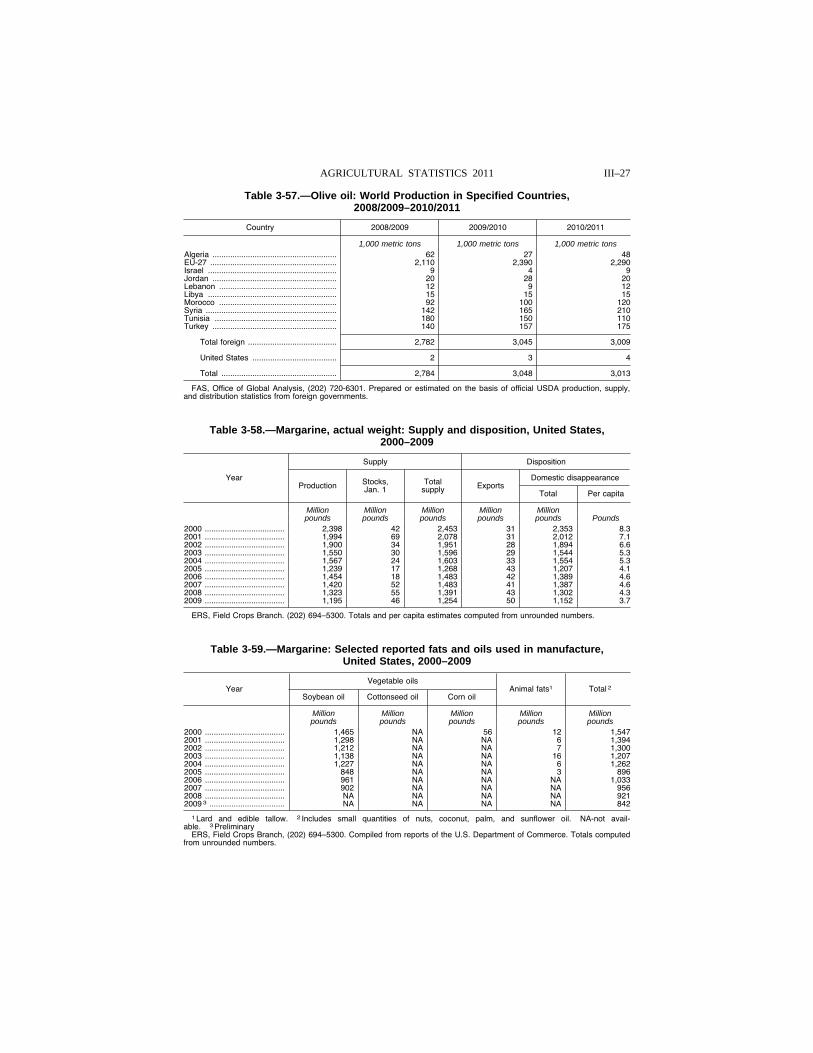
III–27 AGRICULTURAL STATISTICS 2011
Table 3-57.—Olive oil: World Production in Specified Countries, 2008/2009–2010/2011
Country 2008/2009 2009/2010 2010/2011
1,000 metric tons 1,000 metric tons 1,000 metric tons Algeria ........................................................ 62 27 48 EU-27 ......................................................... 2,110 2,390 2,290 Israel .......................................................... 9 4 9 Jordan ........................................................ 20 28 20 Lebanon ..................................................... 12 9 12 Libya .......................................................... 15 15 15 Morocco ..................................................... 92 100 120 Syria ........................................................... 142 165 210 Tunisia ....................................................... 180 150 110 Turkey ........................................................ 140 157 175
Total foreign ........................................ 2,782 3,045 3,009
United States ...................................... 2 3 4
Total .................................................... 2,784 3,048 3,013
FAS, Office of Global Analysis, (202) 720-6301. Prepared or estimated on the basis of official USDA production, supply, and distribution statistics from foreign governments.
Table 3-58.—Margarine, actual weight: Supply and disposition, United States, 2000–2009
Year
Supply Disposition
Production Stocks, Jan. 1
Total supply Exports
Domestic disappearance
Total Per capita
Million Million Million Million Million pounds pounds pounds pounds pounds Pounds
2000 .................................... 2,398 42 2,453 31 2,353 8.3 2001 .................................... 1,994 69 2,078 31 2,012 7.1 2002 .................................... 1,900 34 1,951 28 1,894 6.6 2003 .................................... 1,550 30 1,596 29 1,544 5.3 2004 .................................... 1,567 24 1,603 33 1,554 5.3 2005 .................................... 1,239 17 1,268 43 1,207 4.1 2006 .................................... 1,454 18 1,483 42 1,389 4.6 2007 .................................... 1,420 52 1,483 41 1,387 4.6 2008 .................................... 1,323 55 1,391 43 1,302 4.3 2009 .................................... 1,195 46 1,254 50 1,152 3.7
ERS, Field Crops Branch. (202) 694–5300. Totals and per capita estimates computed from unrounded numbers.
Table 3-59.—Margarine: Selected reported fats and oils used in manufacture, United States, 2000–2009
Year Vegetable oils
Animal fats1 Total 2 Soybean oil Cottonseed oil Corn oil
Million Million Million Million Million pounds pounds pounds pounds pounds
2000 .................................... 1,465 NA 56 12 1,547 2001 .................................... 1,298 NA NA 6 1,394 2002 .................................... 1,212 NA NA 7 1,300 2003 .................................... 1,138 NA NA 16 1,207 2004 .................................... 1,227 NA NA 6 1,262 2005 .................................... 848 NA NA 3 896 2006 .................................... 961 NA NA NA 1,033 2007 .................................... 902 NA NA NA 956 2008 .................................... NA NA NA NA 921 2009 3 .................................. NA NA NA NA 842
1 Lard and edible tallow. 2 Includes small quantities of nuts, coconut, palm, and sunflower oil. NA-not avail-able. 3 Preliminary
ERS, Field Crops Branch, (202) 694–5300. Compiled from reports of the U.S. Department of Commerce. Totals computed from unrounded numbers.
VerDate Aug 31 2005 13:41 Mar 01, 2012 Jkt 000000 PO 00000 Frm 00027 Fmt 1000 Sfmt 1000 H:\SHARED\DAPP\FPU\AGSTAT\MASTER~2\CHAPTR03\III-27.AG8 USDA
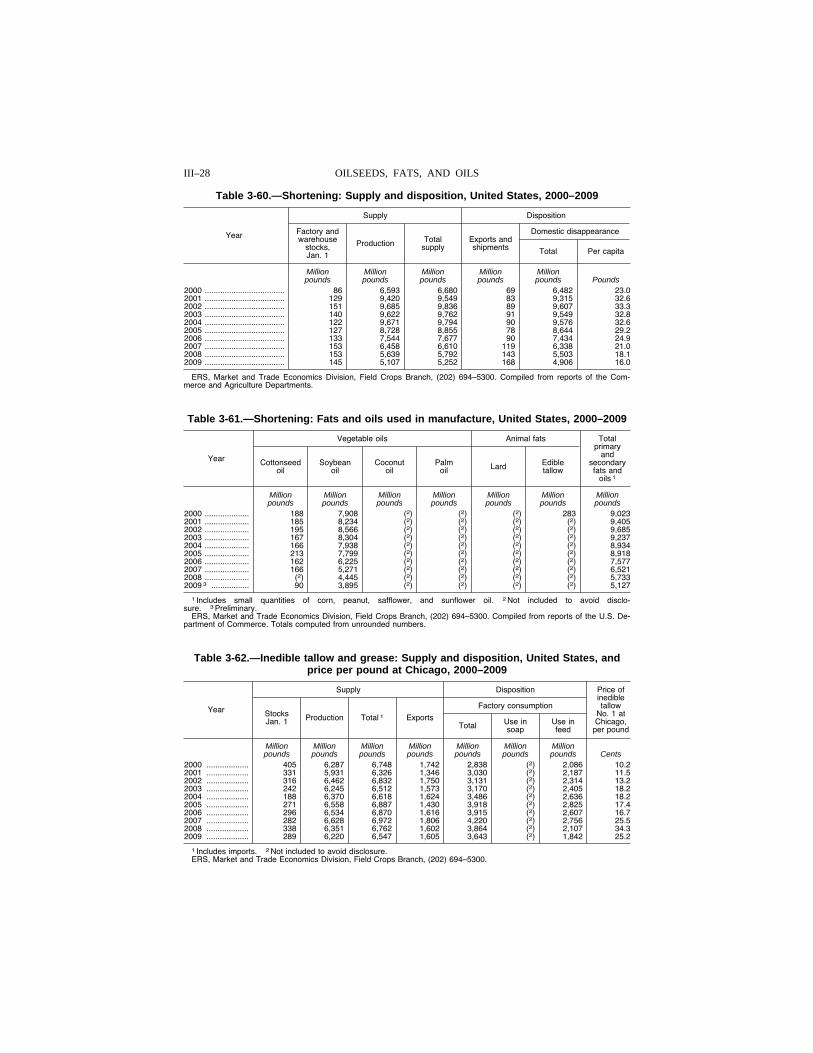
III–28 OILSEEDS, FATS, AND OILS
Table 3-60.—Shortening: Supply and disposition, United States, 2000–2009
Year
Supply Disposition
Factory and warehouse
stocks, Jan. 1
Production Total supply
Exports and shipments
Domestic disappearance
Total Per capita
Million Million Million Million Million pounds pounds pounds pounds pounds Pounds
2000 .................................... 86 6,593 6,680 69 6,482 23.0 2001 .................................... 129 9,420 9,549 83 9,315 32.6 2002 .................................... 151 9,685 9,836 89 9,607 33.3 2003 .................................... 140 9,622 9,762 91 9,549 32.8 2004 .................................... 122 9,671 9,794 90 9,576 32.6 2005 .................................... 127 8,728 8,855 78 8,644 29.2 2006 .................................... 133 7,544 7,677 90 7,434 24.9 2007 .................................... 153 6,458 6,610 119 6,338 21.0 2008 .................................... 153 5,639 5,792 143 5,503 18.1 2009 .................................... 145 5,107 5,252 168 4,906 16.0
ERS, Market and Trade Economics Division, Field Crops Branch, (202) 694–5300. Compiled from reports of the Com-merce and Agriculture Departments.
Table 3-61.—Shortening: Fats and oils used in manufacture, United States, 2000–2009
Year
Vegetable oils Animal fats Total primary
and secondary fats and
oils 1
Cottonseed oil
Soybean oil
Coconut oil
Palm oil Lard Edible
tallow
Million Million Million Million Million Million Million pounds pounds pounds pounds pounds pounds pounds
2000 .................... 188 7,908 (2) (2) (2) 283 9,023 2001 .................... 185 8,234 (2) (2) (2) (2) 9,405 2002 .................... 195 8,566 (2) (2) (2) (2) 9,685 2003 .................... 167 8,304 (2) (2) (2) (2) 9,237 2004 .................... 166 7,938 (2) (2) (2) (2) 8,934 2005 .................... 213 7,799 (2) (2) (2) (2) 8,918 2006 .................... 162 6,225 (2) (2) (2) (2) 7,577 2007 .................... 166 5,271 (2) (2) (2) (2) 6,521 2008 .................... (2) 4,445 (2) (2) (2) (2) 5,733 2009 3 ................. 90 3,895 (2) (2) (2) (2) 5,127
1 Includes small quantities of corn, peanut, safflower, and sunflower oil. 2 Not included to avoid disclo-sure. 3 Preliminary.
ERS, Market and Trade Economics Division, Field Crops Branch, (202) 694–5300. Compiled from reports of the U.S. De-partment of Commerce. Totals computed from unrounded numbers.
Table 3-62.—Inedible tallow and grease: Supply and disposition, United States, and price per pound at Chicago, 2000–2009
Year
Supply Disposition Price of inedible tallow
No. 1 at Chicago,
per pound
Stocks Jan. 1 Production Total 1 Exports
Factory consumption
Total Use in soap
Use in feed
Million Million Million Million Million Million Million pounds pounds pounds pounds pounds pounds pounds Cents
2000 ................... 405 6,287 6,748 1,742 2,838 (2) 2,086 10.2 2001 ................... 331 5,931 6,326 1,346 3,030 (2) 2,187 11.5 2002 ................... 316 6,462 6,832 1,750 3,131 (2) 2,314 13.2 2003 ................... 242 6,245 6,512 1,573 3,170 (2) 2,405 18.2 2004 ................... 188 6,370 6,618 1,624 3,486 (2) 2,636 18.2 2005 ................... 271 6,558 6,887 1,430 3,918 (2) 2,825 17.4 2006 ................... 296 6,534 6,870 1,616 3,915 (2) 2,607 16.7 2007 ................... 282 6,628 6,972 1,806 4,220 (2) 2,756 25.5 2008 ................... 338 6,351 6,762 1,602 3,864 (2) 2,107 34.3 2009 ................... 289 6,220 6,547 1,605 3,643 (2) 1,842 25.2
1 Includes imports. 2 Not included to avoid disclosure. ERS, Market and Trade Economics Division, Field Crops Branch, (202) 694–5300.
VerDate Aug 31 2005 13:41 Mar 01, 2012 Jkt 000000 PO 00000 Frm 00028 Fmt 1000 Sfmt 1000 H:\SHARED\DAPP\FPU\AGSTAT\MASTER~2\CHAPTR03\III-28.AG8 USDA
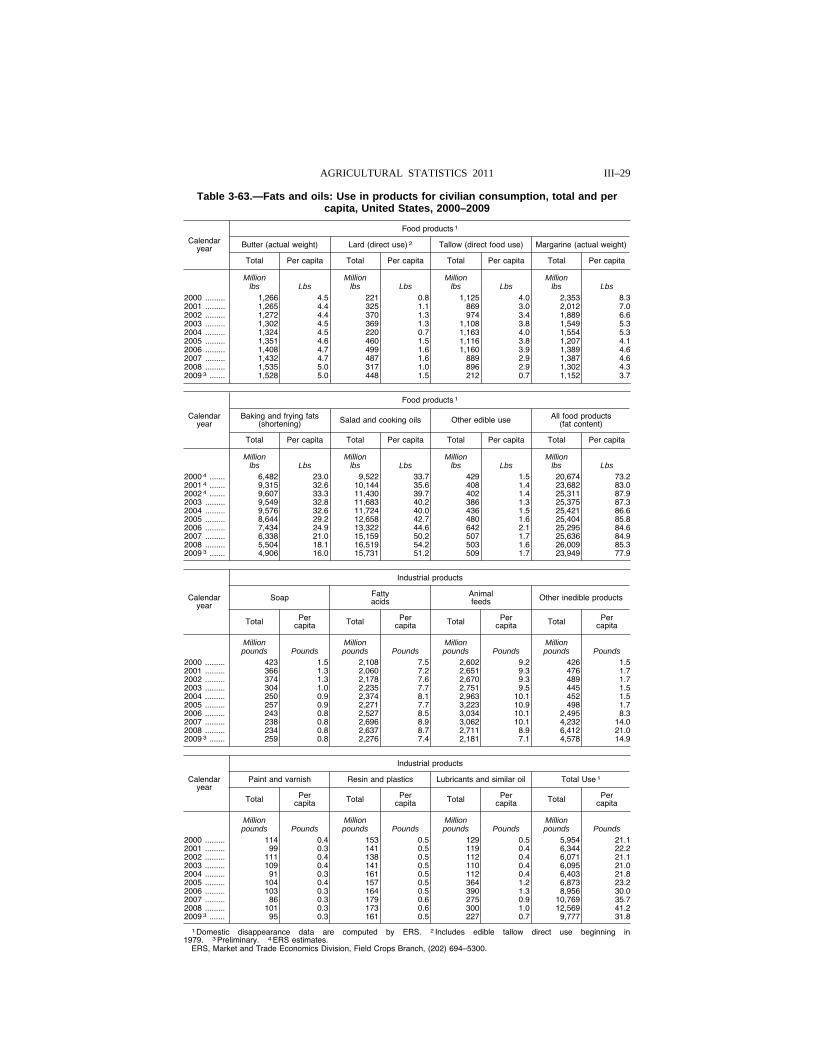
III–29 AGRICULTURAL STATISTICS 2011
Table 3-63.—Fats and oils: Use in products for civilian consumption, total and per capita, United States, 2000–2009
Calendar year
Food products 1
Butter (actual weight) Lard (direct use) 2 Tallow (direct food use) Margarine (actual weight)
Total Per capita Total Per capita Total Per capita Total Per capita
Million Million Million Million lbs Lbs lbs Lbs lbs Lbs lbs Lbs
2000 ......... 1,266 4.5 221 0.8 1,125 4.0 2,353 8.3 2001 ......... 1,265 4.4 325 1.1 869 3.0 2,012 7.0 2002 ......... 1,272 4.4 370 1.3 974 3.4 1,889 6.6 2003 ......... 1,302 4.5 369 1.3 1,108 3.8 1,549 5.3 2004 ......... 1,324 4.5 220 0.7 1,163 4.0 1,554 5.3 2005 ......... 1,351 4.6 460 1.5 1,116 3.8 1,207 4.1 2006 ......... 1,408 4.7 499 1.6 1,160 3.9 1,389 4.6 2007 ......... 1,432 4.7 487 1.6 889 2.9 1,387 4.6 2008 ......... 1,535 5.0 317 1.0 896 2.9 1,302 4.3 2009 3 ....... 1,528 5.0 448 1.5 212 0.7 1,152 3.7
Calendar year
Food products 1
Baking and frying fats (shortening) Salad and cooking oils Other edible use All food products
(fat content)
Total Per capita Total Per capita Total Per capita Total Per capita
Million Million Million Million lbs Lbs lbs Lbs lbs Lbs lbs Lbs
2000 4 ....... 6,482 23.0 9,522 33.7 429 1.5 20,674 73.2 2001 4 ....... 9,315 32.6 10,144 35.6 408 1.4 23,682 83.0 2002 4 ....... 9,607 33.3 11,430 39.7 402 1.4 25,311 87.9 2003 ......... 9,549 32.8 11,683 40.2 386 1.3 25,375 87.3 2004 ......... 9,576 32.6 11,724 40.0 436 1.5 25,421 86.6 2005 ......... 8,644 29.2 12,658 42.7 480 1.6 25,404 85.8 2006 ......... 7,434 24.9 13,322 44.6 642 2.1 25,295 84.6 2007 ......... 6,338 21.0 15,159 50.2 507 1.7 25,636 84.9 2008 ......... 5,504 18.1 16,519 54.2 503 1.6 26,009 85.3 2009 3 ....... 4,906 16.0 15,731 51.2 509 1.7 23,949 77.9
Calendar year
Industrial products
Soap Fatty acids
Animal feeds Other inedible products
Total Per capita Total Per
capita Total Per capita Total Per
capita
Million Million Million Million pounds Pounds pounds Pounds pounds Pounds pounds Pounds
2000 ......... 423 1.5 2,108 7.5 2,602 9.2 426 1.5 2001 ......... 366 1.3 2,060 7.2 2,651 9.3 476 1.7 2002 ......... 374 1.3 2,178 7.6 2,670 9.3 489 1.7 2003 ......... 304 1.0 2,235 7.7 2,751 9.5 445 1.5 2004 ......... 250 0.9 2,374 8.1 2,963 10.1 452 1.5 2005 ......... 257 0.9 2,271 7.7 3,223 10.9 498 1.7 2006 ......... 243 0.8 2,527 8.5 3,034 10.1 2,495 8.3 2007 ......... 238 0.8 2,696 8.9 3,062 10.1 4,232 14.0 2008 ......... 234 0.8 2,637 8.7 2,711 8.9 6,412 21.0 2009 3 ....... 259 0.8 2,276 7.4 2,181 7.1 4,578 14.9
Calendar year
Industrial products
Paint and varnish Resin and plastics Lubricants and similar oil Total Use 1
Total Per capita Total Per
capita Total Per capita Total Per
capita
Million Million Million Million pounds Pounds pounds Pounds pounds Pounds pounds Pounds
2000 ......... 114 0.4 153 0.5 129 0.5 5,954 21.1 2001 ......... 99 0.3 141 0.5 119 0.4 6,344 22.2 2002 ......... 111 0.4 138 0.5 112 0.4 6,071 21.1 2003 ......... 109 0.4 141 0.5 110 0.4 6,095 21.0 2004 ......... 91 0.3 161 0.5 112 0.4 6,403 21.8 2005 ......... 104 0.4 157 0.5 364 1.2 6,873 23.2 2006 ......... 103 0.3 164 0.5 390 1.3 8,956 30.0 2007 ......... 86 0.3 179 0.6 275 0.9 10,769 35.7 2008 ......... 101 0.3 173 0.6 300 1.0 12,569 41.2 2009 3 ....... 95 0.3 161 0.5 227 0.7 9,777 31.8
1 Domestic disappearance data are computed by ERS. 2 Includes edible tallow direct use beginning in 1979. 3 Preliminary. 4 ERS estimates.
ERS, Market and Trade Economics Division, Field Crops Branch, (202) 694–5300.
VerDate Aug 31 2005 13:41 Mar 01, 2012 Jkt 000000 PO 00000 Frm 00029 Fmt 1000 Sfmt 1000 H:\SHARED\DAPP\FPU\AGSTAT\MASTER~2\CHAPTR03\III-29.AG8 USDA
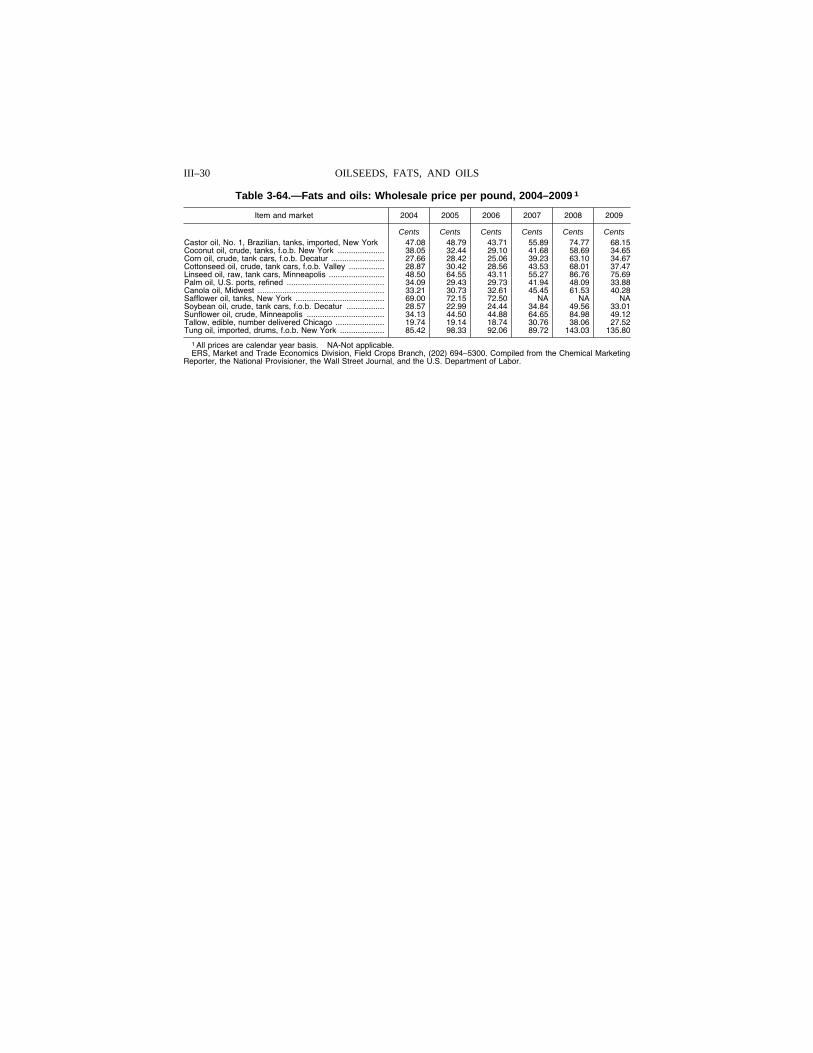
III–30 OILSEEDS, FATS, AND OILS
Table 3-64.—Fats and oils: Wholesale price per pound, 2004–2009 1
Item and market 2004 2005 2006 2007 2008 2009
Cents Cents Cents Cents Cents Cents Castor oil, No. 1, Brazilian, tanks, imported, New York 47.08 48.79 43.71 55.89 74.77 68.15 Coconut oil, crude, tanks, f.o.b. New York ..................... 38.05 32.44 29.10 41.68 58.69 34.65 Corn oil, crude, tank cars, f.o.b. Decatur ........................ 27.66 28.42 25.06 39.23 63.10 34.67 Cottonseed oil, crude, tank cars, f.o.b. Valley ................ 28.87 30.42 28.56 43.53 68.01 37.47 Linseed oil, raw, tank cars, Minneapolis ......................... 48.50 64.55 43.11 55.27 86.76 75.69 Palm oil, U.S. ports, refined ............................................ 34.09 29.43 29.73 41.94 48.09 33.88 Canola oil, Midwest ......................................................... 33.21 30.73 32.61 45.45 61.53 40.28 Safflower oil, tanks, New York ........................................ 69.00 72.15 72.50 NA NA NA Soybean oil, crude, tank cars, f.o.b. Decatur ................. 28.57 22.99 24.44 34.84 49.56 33.01 Sunflower oil, crude, Minneapolis ................................... 34.13 44.50 44.88 64.65 84.98 49.12 Tallow, edible, number delivered Chicago ...................... 19.74 19.14 18.74 30.76 38.06 27.52 Tung oil, imported, drums, f.o.b. New York .................... 85.42 98.33 92.06 89.72 143.03 135.80
1 All prices are calendar year basis. NA-Not applicable. ERS, Market and Trade Economics Division, Field Crops Branch, (202) 694–5300. Compiled from the Chemical Marketing
Reporter, the National Provisioner, the Wall Street Journal, and the U.S. Department of Labor.
VerDate Aug 31 2005 13:41 Mar 01, 2012 Jkt 000000 PO 00000 Frm 00030 Fmt 1000 Sfmt 1000 H:\SHARED\DAPP\FPU\AGSTAT\MASTER~2\CHAPTR03\III-30.AG8 USDA
IV–1
CHAPTER IV
STATISTICS OF VEGETABLES AND MELONS
This chapter contains statistics on potatoes, sweet potatoes, and commercial vegetables and melons. For potatoes and sweet potatoes, the estimates of area, production, value, and farm disposition per-
tain to the total crop and include quantities produced both for sale and for use on farms where grown. Potato statistics are shown on a within-year seasonal grouping of winter, spring, summer, and fall crops, by States. Some States have production in more than one seasonal group.
For processing vegetables, the estimates of area, production, and value for each of 10 crops relate to production used by commercial canners, freezers, and other processors, except dehydrators. These estimates include raw products grown by processors themselves and those grown under contract or purchased on the open market. This production and the actual area harvested are not duplicated in the fresh market estimates for the same commodities. The production of those vegetables used for processing for which regular processing estimates are not made is included in the fresh market esti-mates. The processed segment of production for asparagus, broccoli, and cauliflower, combined with fresh market production during the year, is published at the end of the season, separately. In 2000, estimates were added for collard greens, kale, mustard greens, turnip greens, okra, chili peppers, pumpkins, radishes, and squash. In 2002, estimates for fresh market lima beans, beets for canning, Brussels sprouts, cabbage for kraut, eggplant, escarole/endive, collard greens, kale, mustard greens, turnip greens, okra, and radishes were discontinued. Additionally, States were removed from the pro-gram for certain commodities. For details on the 2002 program changes see the following website: http:/www.usda.gov/nass/events/programchg/vegprogchgs.htm.
Seasonal Groups and Marketing Period
Prospective Area For Harvest
Winter: January, February, March Summer: July, August, September
Spring: April, May, June Fall: October, November, December
Annual Acreage, Yield, Production, and Value
The seasonal patterns of harvest do not correspond precisely in all States to the estimating period or periods designated. In some cases, only one seasonal group is shown for a State, but marketing may be active in earlier or later months. Because of the small volume from this earlier or later pe-riod, the crop estimate has been placed in the seasonal group where the largest portion is harvested.
In 2002, commercial vegetables for fresh market include 24 principal vegetable and melon crops in the major producing States. These estimates relate to crops which are grown primarily for sale, and they do not include vegetables and melons produced in farm and nonfarm gardens. The bulk of the production of the principal vegetable and melon crops is for consumption in the fresh state. However, quantities used by processors of artichokes, celery, garlic, onions, bell peppers, chile pep-pers, pumpkins, and squash are included, and separate estimates of commercial processing are not made for these crops. The commercial estimates of the principal crops include local market produc-tion from areas near consuming centers as well as production from well recognized commercial areas which specialize in producing supplies for shipment to distant markets.
For fresh market vegetables and melons, value per unit and total value are on a f.o.b. basis. For processed vegetables, value per unit and total value are at processing plant door.
Aggregate data for the years 2000, 2000 and 2001, and 2001 and 2002 lack comparability with data from other years because of program changes altering the crops included.
VerDate Aug 31 2005 10:23 Feb 29, 2012 Jkt 000000 PO 00000 Frm 00001 Fmt 1001 Sfmt 1001 H:\SHARED\DAPP\FPU\AGSTAT\MASTER~2\CHAPTR04\IV-01.AG8 USDA
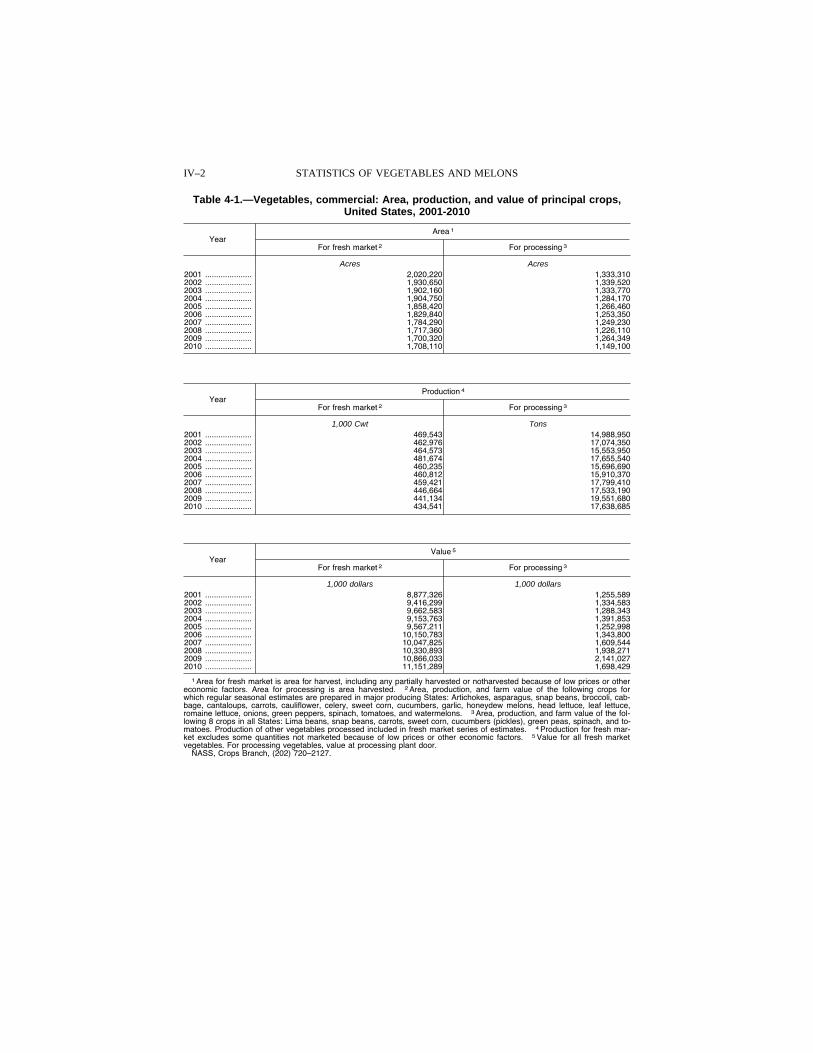
IV–2 STATISTICS OF VEGETABLES AND MELONS
Table 4-1.—Vegetables, commercial: Area, production, and value of principal crops, United States, 2001-2010
Year Area 1
For fresh market 2 For processing 3
Acres Acres 2001 ..................... 2,020,220 1,333,310 2002 ..................... 1,930,650 1,339,520 2003 ..................... 1,902,160 1,333,770 2004 ..................... 1,904,750 1,284,170 2005 ..................... 1,858,420 1,266,460 2006 ..................... 1,829,840 1,253,350 2007 ..................... 1,784,290 1,249,230 2008 ..................... 1,717,360 1,226,110 2009 ..................... 1,700,320 1,264,349 2010 ..................... 1,708,110 1,149,100
Year Production 4
For fresh market 2 For processing 3
1,000 Cwt Tons 2001 ..................... 469,543 14,988,950 2002 ..................... 462,976 17,074,350 2003 ..................... 464,573 15,553,950 2004 ..................... 481,674 17,655,540 2005 ..................... 460,235 15,696,690 2006 ..................... 460,812 15,910,370 2007 ..................... 459,421 17,799,410 2008 ..................... 446,664 17,533,190 2009 ..................... 441,134 19,551,680 2010 ..................... 434,541 17,638,685
Year Value 5
For fresh market 2 For processing 3
1,000 dollars 1,000 dollars 2001 ..................... 8,877,326 1,255,589 2002 ..................... 9,416,299 1,334,583 2003 ..................... 9,662,583 1,288,343 2004 ..................... 9,153,763 1,391,853 2005 ..................... 9,567,211 1,252,998 2006 ..................... 10,150,783 1,343,800 2007 ..................... 10,047,825 1,609,544 2008 ..................... 10,330,893 1,938,271 2009 ..................... 10,866,033 2,141,027 2010 ..................... 11,151,289 1,698,429
1 Area for fresh market is area for harvest, including any partially harvested or notharvested because of low prices or other economic factors. Area for processing is area harvested. 2 Area, production, and farm value of the following crops for which regular seasonal estimates are prepared in major producing States: Artichokes, asparagus, snap beans, broccoli, cab-bage, cantaloups, carrots, cauliflower, celery, sweet corn, cucumbers, garlic, honeydew melons, head lettuce, leaf lettuce, romaine lettuce, onions, green peppers, spinach, tomatoes, and watermelons. 3 Area, production, and farm value of the fol-lowing 8 crops in all States: Lima beans, snap beans, carrots, sweet corn, cucumbers (pickles), green peas, spinach, and to-matoes. Production of other vegetables processed included in fresh market series of estimates. 4 Production for fresh mar-ket excludes some quantities not marketed because of low prices or other economic factors. 5 Value for all fresh market vegetables. For processing vegetables, value at processing plant door.
NASS, Crops Branch, (202) 720–2127.
VerDate Aug 31 2005 10:23 Feb 29, 2012 Jkt 000000 PO 00000 Frm 00002 Fmt 1000 Sfmt 1000 H:\SHARED\DAPP\FPU\AGSTAT\MASTER~2\CHAPTR04\IV-02.AG8 USDA
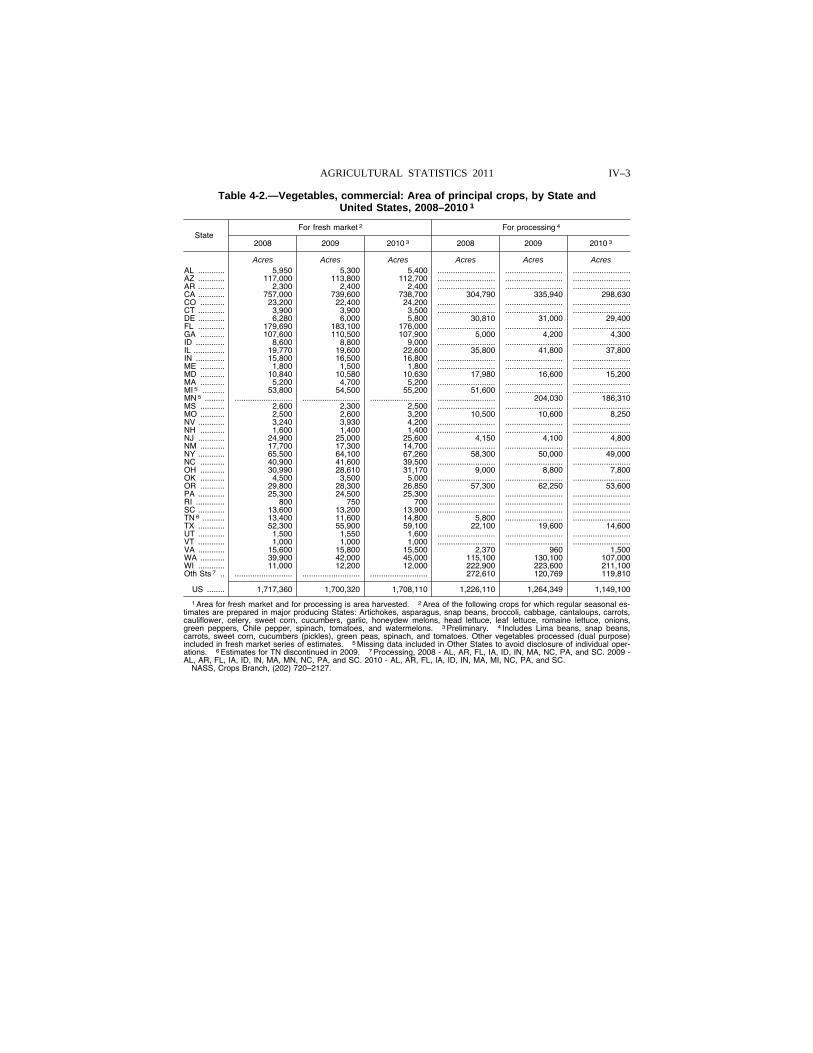
IV–3 AGRICULTURAL STATISTICS 2011
Table 4-2.—Vegetables, commercial: Area of principal crops, by State and United States, 2008–2010 1
State For fresh market 2 For processing 4
2008 2009 2010 3 2008 2009 2010 3
Acres Acres Acres Acres Acres Acres AL ............ 5,950 5,300 5,400 .......................... .......................... ..........................AZ ............ 117,000 113,800 112,700 .......................... .......................... ..........................AR ............ 2,300 2,400 2,400 .......................... .......................... ..........................CA ............ 757,000 739,600 738,700 304,790 335,940 298,630 CO ........... 23,200 22,400 24,200 .......................... .......................... ..........................CT ............ 3,900 3,900 3,500 .......................... .......................... ..........................DE ............ 6,280 6,000 5,800 30,810 31,000 29,400 FL ............ 179,690 183,100 176,000 .......................... .......................... ..........................GA ........... 107,600 110,500 107,900 5,000 4,200 4,300 ID ............. 8,600 8,800 9,000 .......................... .......................... ..........................IL .............. 19,770 19,600 22,600 35,800 41,800 37,800 IN ............. 15,800 16,500 16,800 .......................... .......................... ..........................ME ........... 1,800 1,500 1,800 .......................... .......................... ..........................MD ........... 10,840 10,580 10,630 17,980 16,600 15,200 MA ........... 5,200 4,700 5,200 .......................... .......................... ..........................MI 5 .......... 53,800 54,500 55,200 51,600 .......................... ..........................MN 5 ......... .......................... .......................... .......................... .......................... 204,030 186,310 MS ........... 2,600 2,300 2,500 .......................... .......................... ..........................MO ........... 2,500 2,600 3,200 10,500 10,600 8,250 NV ............ 3,240 3,930 4,200 .......................... .......................... ..........................NH ........... 1,600 1,400 1,400 .......................... .......................... ..........................NJ ............ 24,900 25,000 25,600 4,150 4,100 4,800 NM ........... 17,700 17,300 14,700 .......................... .......................... ..........................NY ............ 65,500 64,100 67,260 58,300 50,000 49,000 NC ........... 40,900 41,600 39,500 .......................... .......................... ..........................OH ........... 30,990 28,610 31,170 9,000 8,800 7,800 OK ........... 4,500 3,500 5,000 .......................... .......................... ..........................OR ........... 29,800 28,300 26,850 57,300 62,250 53,600 PA ............ 25,300 24,500 25,300 .......................... .......................... ..........................RI ............. 800 750 700 .......................... .......................... ..........................SC ............ 13,600 13,200 13,900 .......................... .......................... ..........................TN 6 .......... 13,400 11,600 14,800 5,800 .......................... ..........................TX ............ 52,300 55,900 59,100 22,100 19,600 14,600 UT ............ 1,500 1,550 1,600 .......................... .......................... ..........................VT ............ 1,000 1,000 1,000 .......................... .......................... ..........................VA ............ 15,600 15,800 15,500 2,370 960 1,500 WA ........... 39,900 42,000 45,000 115,100 130,100 107,000 WI ............ 11,000 12,200 12,000 222,900 223,600 211,100 Oth Sts 7 .. .......................... .......................... .......................... 272,610 120,769 119,810
US ........ 1,717,360 1,700,320 1,708,110 1,226,110 1,264,349 1,149,100
1 Area for fresh market and for processing is area harvested. 2 Area of the following crops for which regular seasonal es-timates are prepared in major producing States: Artichokes, asparagus, snap beans, broccoli, cabbage, cantaloups, carrots, cauliflower, celery, sweet corn, cucumbers, garlic, honeydew melons, head lettuce, leaf lettuce, romaine lettuce, onions, green peppers, Chile pepper, spinach, tomatoes, and watermelons. 3 Preliminary. 4 Includes Lima beans, snap beans, carrots, sweet corn, cucumbers (pickles), green peas, spinach, and tomatoes. Other vegetables processed (dual purpose) included in fresh market series of estimates. 5 Missing data included in Other States to avoid disclosure of individual oper-ations. 6 Estimates for TN discontinued in 2009. 7 Processing, 2008 - AL, AR, FL, IA, ID, IN, MA, NC, PA, and SC. 2009 - AL, AR, FL, IA, ID, IN, MA, MN, NC, PA, and SC. 2010 - AL, AR, FL, IA, ID, IN, MA, MI, NC, PA, and SC.
NASS, Crops Branch, (202) 720–2127.
VerDate Aug 31 2005 10:23 Feb 29, 2012 Jkt 000000 PO 00000 Frm 00003 Fmt 1000 Sfmt 1000 H:\SHARED\DAPP\FPU\AGSTAT\MASTER~2\CHAPTR04\IV-03.AG8 USDA
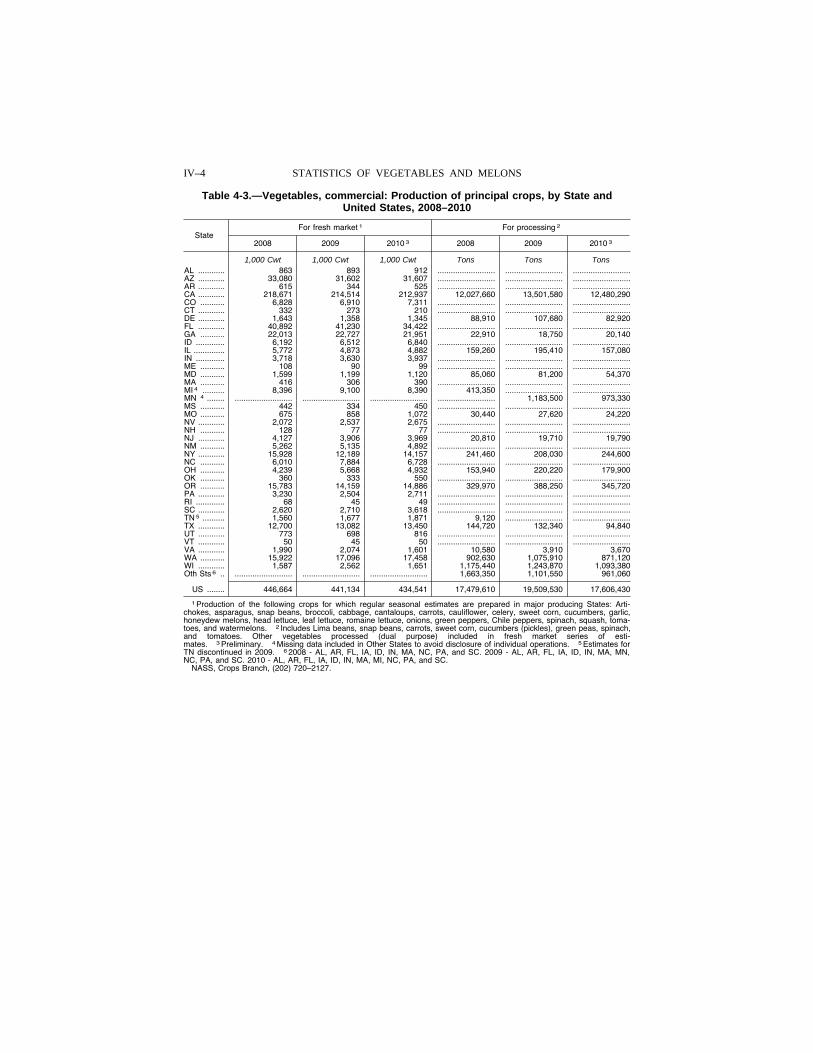
IV–4 STATISTICS OF VEGETABLES AND MELONS
Table 4-3.—Vegetables, commercial: Production of principal crops, by State and United States, 2008–2010
State For fresh market 1 For processing 2
2008 2009 2010 3 2008 2009 2010 3
1,000 Cwt 1,000 Cwt 1,000 Cwt Tons Tons Tons AL ............ 863 893 912 .......................... .......................... ..........................AZ ............ 33,080 31,602 31,607 .......................... .......................... ..........................AR ............ 615 344 525 .......................... .......................... ..........................CA ............ 218,671 214,514 212,937 12,027,660 13,501,580 12,480,290 CO ........... 6,828 6,910 7,311 .......................... .......................... ..........................CT ............ 332 273 210 .......................... .......................... ..........................DE ............ 1,643 1,358 1,345 88,910 107,680 82,920 FL ............ 40,892 41,230 34,422 .......................... .......................... ..........................GA ........... 22,013 22,727 21,951 22,910 18,750 20,140 ID ............. 6,192 6,512 6,840 .......................... .......................... ..........................IL .............. 5,772 4,873 4,882 159,260 195,410 157,080 IN ............. 3,718 3,630 3,937 .......................... .......................... ..........................ME ........... 108 90 99 .......................... .......................... ..........................MD ........... 1,599 1,199 1,120 85,060 81,200 54,370 MA ........... 416 306 390 .......................... .......................... ..........................MI 4 .......... 8,396 9,100 8,390 413,350 .......................... ..........................MN 4 ........ .......................... .......................... .......................... .......................... 1,183,500 973,330 MS ........... 442 334 450 .......................... .......................... ..........................MO ........... 675 858 1,072 30,440 27,620 24,220 NV ............ 2,072 2,537 2,675 .......................... .......................... ..........................NH ........... 128 77 77 .......................... .......................... ..........................NJ ............ 4,127 3,906 3,969 20,810 19,710 19,790 NM ........... 5,262 5,135 4,892 .......................... .......................... ..........................NY ............ 15,928 12,189 14,157 241,460 208,030 244,600 NC ........... 6,010 7,884 6,728 .......................... .......................... ..........................OH ........... 4,239 5,668 4,932 153,940 220,220 179,900 OK ........... 360 333 550 .......................... .......................... ..........................OR ........... 15,783 14,159 14,886 329,970 388,250 345,720 PA ............ 3,230 2,504 2,711 .......................... .......................... ..........................RI ............. 68 45 49 .......................... .......................... ..........................SC ............ 2,620 2,710 3,618 .......................... .......................... ..........................TN 5 .......... 1,560 1,677 1,871 9,120 .......................... ..........................TX ............ 12,700 13,082 13,450 144,720 132,340 94,840 UT ............ 773 698 816 .......................... .......................... ..........................VT ............ 50 45 50 .......................... .......................... ..........................VA ............ 1,990 2,074 1,601 10,580 3,910 3,670 WA ........... 15,922 17,096 17,458 902,630 1,075,910 871,120 WI ............ 1,587 2,562 1,651 1,175,440 1,243,870 1,093,380 Oth Sts 6 .. .......................... .......................... .......................... 1,663,350 1,101,550 961,060
US ........ 446,664 441,134 434,541 17,479,610 19,509,530 17,606,430
1 Production of the following crops for which regular seasonal estimates are prepared in major producing States: Arti-chokes, asparagus, snap beans, broccoli, cabbage, cantaloups, carrots, cauliflower, celery, sweet corn, cucumbers, garlic, honeydew melons, head lettuce, leaf lettuce, romaine lettuce, onions, green peppers, Chile peppers, spinach, squash, toma-toes, and watermelons. 2 Includes Lima beans, snap beans, carrots, sweet corn, cucumbers (pickles), green peas, spinach, and tomatoes. Other vegetables processed (dual purpose) included in fresh market series of esti-mates. 3 Preliminary. 4 Missing data included in Other States to avoid disclosure of individual operations. 5 Estimates for TN discontinued in 2009. 6 2008 - AL, AR, FL, IA, ID, IN, MA, NC, PA, and SC. 2009 - AL, AR, FL, IA, ID, IN, MA, MN, NC, PA, and SC. 2010 - AL, AR, FL, IA, ID, IN, MA, MI, NC, PA, and SC.
NASS, Crops Branch, (202) 720–2127.
VerDate Aug 31 2005 10:23 Feb 29, 2012 Jkt 000000 PO 00000 Frm 00004 Fmt 1000 Sfmt 1000 H:\SHARED\DAPP\FPU\AGSTAT\MASTER~2\CHAPTR04\IV-04.AG8 USDA
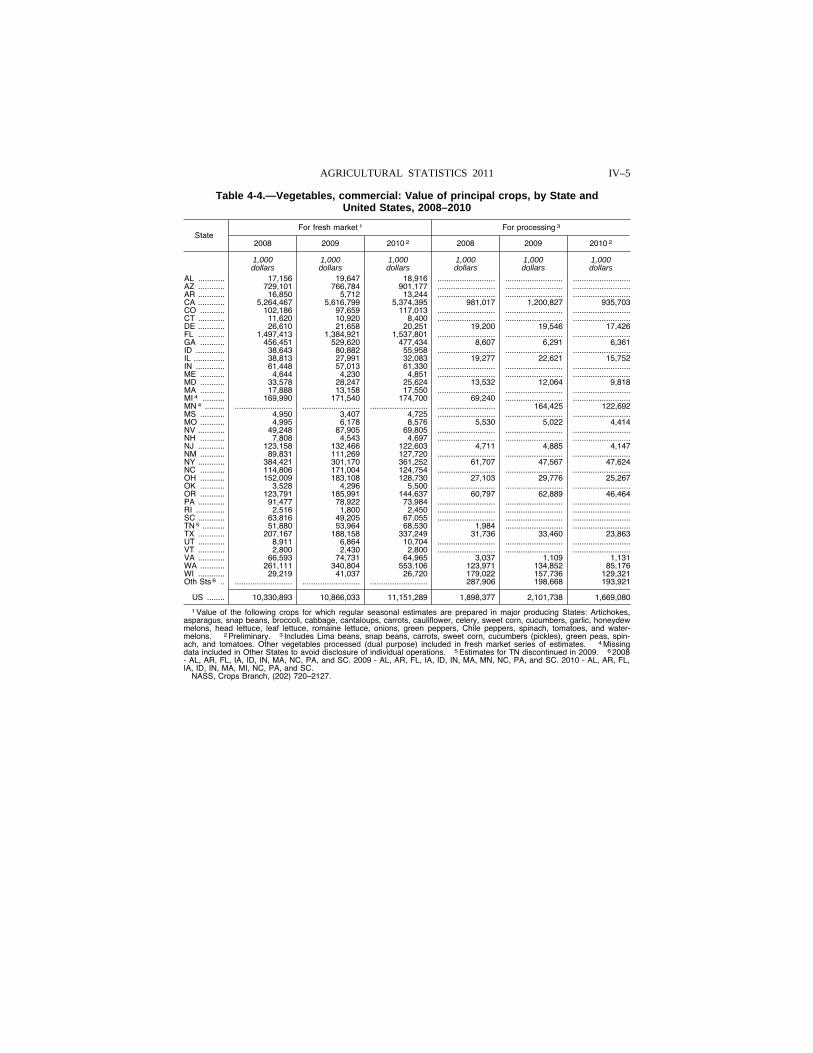
IV–5 AGRICULTURAL STATISTICS 2011
Table 4-4.—Vegetables, commercial: Value of principal crops, by State and United States, 2008–2010
State For fresh market 1 For processing 3
2008 2009 2010 2 2008 2009 2010 2
1,000 1,000 1,000 1,000 1,000 1,000 dollars dollars dollars dollars dollars dollars
AL ............ 17,156 19,647 18,916 .......................... .......................... ..........................AZ ............ 729,101 766,784 901,177 .......................... .......................... ..........................AR ............ 16,850 5,712 13,244 .......................... .......................... ..........................CA ............ 5,264,467 5,616,799 5,374,395 981,017 1,200,827 935,703 CO ........... 102,186 97,659 117,013 .......................... .......................... ..........................CT ............ 11,620 10,920 8,400 .......................... .......................... ..........................DE ............ 26,610 21,658 20,251 19,200 19,546 17,426 FL ............ 1,497,413 1,384,921 1,537,801 .......................... .......................... ..........................GA ........... 456,451 529,620 477,434 8,607 6,291 6,361 ID ............. 38,643 80,882 55,958 .......................... .......................... ..........................IL .............. 38,813 27,991 32,083 19,277 22,621 15,752 IN ............. 61,448 57,013 61,330 .......................... .......................... ..........................ME ........... 4,644 4,230 4,851 .......................... .......................... ..........................MD ........... 33,578 28,247 25,624 13,532 12,064 9,818 MA ........... 17,888 13,158 17,550 .......................... .......................... ..........................MI 4 .......... 169,990 171,540 174,700 69,240 .......................... ..........................MN 4 ......... .......................... .......................... .......................... .......................... 164,425 122,692 MS ........... 4,950 3,407 4,725 .......................... .......................... ..........................MO ........... 4,995 6,178 8,576 5,530 5,022 4,414 NV ............ 49,248 87,905 69,805 .......................... .......................... ..........................NH ........... 7,808 4,543 4,697 .......................... .......................... ..........................NJ ............ 123,158 132,466 122,603 4,711 4,885 4,147 NM ........... 89,831 111,269 127,720 .......................... .......................... ..........................NY ............ 384,421 301,170 361,252 61,707 47,567 47,624 NC ........... 114,806 171,004 124,754 .......................... .......................... ..........................OH ........... 152,009 183,108 128,730 27,103 29,776 25,267 OK ........... 3,528 4,296 5,500 .......................... .......................... ..........................OR ........... 123,791 185,991 144,637 60,797 62,889 46,464 PA ............ 91,477 78,922 73,984 .......................... .......................... ..........................RI ............. 2,516 1,800 2,450 .......................... .......................... ..........................SC ............ 63,816 49,205 67,055 .......................... .......................... ..........................TN 5 .......... 51,880 53,964 68,530 1,984 .......................... ..........................TX ............ 207,167 188,158 337,249 31,736 33,460 23,863 UT ............ 8,911 6,864 10,704 .......................... .......................... ..........................VT ............ 2,800 2,430 2,800 .......................... .......................... ..........................VA ............ 66,593 74,731 64,965 3,037 1,109 1,131 WA ........... 261,111 340,804 553,106 123,971 134,852 85,176 WI ............ 29,219 41,037 26,720 179,022 157,736 129,321 Oth Sts 6 .. .......................... .......................... .......................... 287,906 198,668 193,921
US ........ 10,330,893 10,866,033 11,151,289 1,898,377 2,101,738 1,669,080
1 Value of the following crops for which regular seasonal estimates are prepared in major producing States: Artichokes, asparagus, snap beans, broccoli, cabbage, cantaloups, carrots, cauliflower, celery, sweet corn, cucumbers, garlic, honeydew melons, head lettuce, leaf lettuce, romaine lettuce, onions, green peppers, Chile peppers, spinach, tomatoes, and water-melons. 2 Preliminary. 3 Includes Lima beans, snap beans, carrots, sweet corn, cucumbers (pickles), green peas, spin-ach, and tomatoes. Other vegetables processed (dual purpose) included in fresh market series of estimates. 4 Missing data included in Other States to avoid disclosure of individual operations. 5 Estimates for TN discontinued in 2009. 6 2008 - AL, AR, FL, IA, ID, IN, MA, NC, PA, and SC. 2009 - AL, AR, FL, IA, ID, IN, MA, MN, NC, PA, and SC. 2010 - AL, AR, FL, IA, ID, IN, MA, MI, NC, PA, and SC.
NASS, Crops Branch, (202) 720–2127.
VerDate Aug 31 2005 10:23 Feb 29, 2012 Jkt 000000 PO 00000 Frm 00005 Fmt 1000 Sfmt 1000 H:\SHARED\DAPP\FPU\AGSTAT\MASTER~2\CHAPTR04\IV-05.AG8 USDA
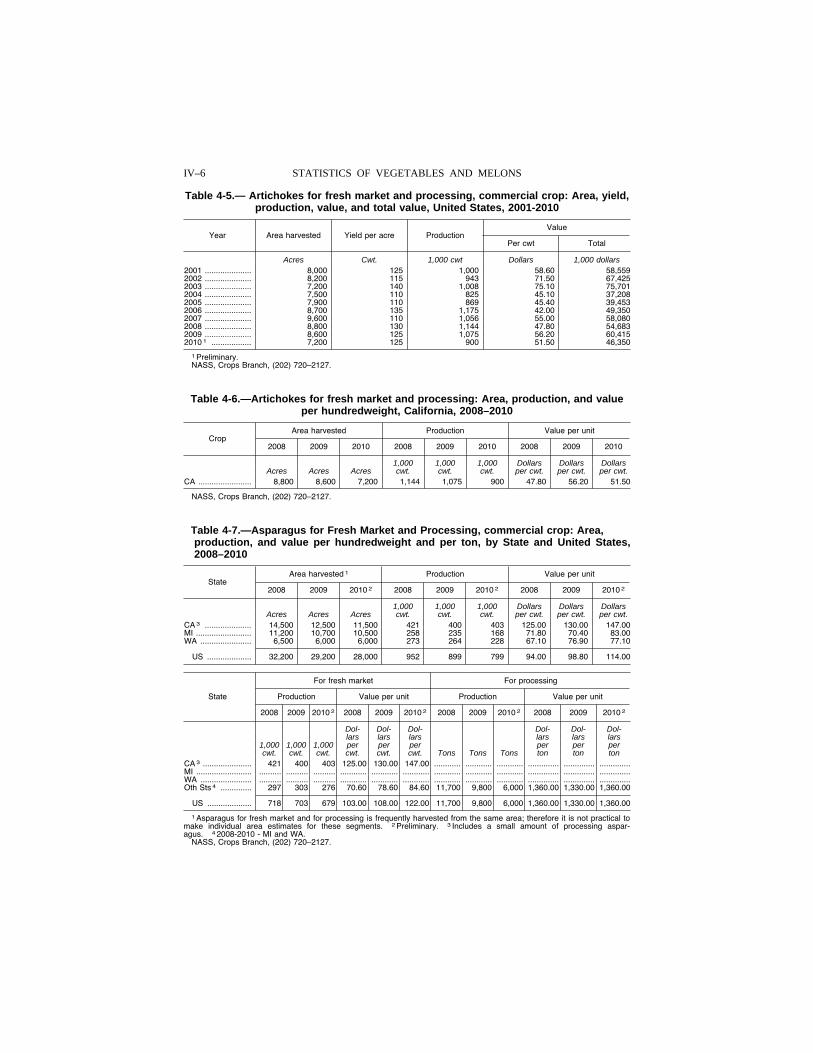
IV–6 STATISTICS OF VEGETABLES AND MELONS
Table 4-5.— Artichokes for fresh market and processing, commercial crop: Area, yield, production, value, and total value, United States, 2001-2010
Year Area harvested Yield per acre Production Value
Per cwt Total
Acres Cwt. 1,000 cwt Dollars 1,000 dollars 2001 ..................... 8,000 125 1,000 58.60 58,559 2002 ..................... 8,200 115 943 71.50 67,425 2003 ..................... 7,200 140 1,008 75.10 75,701 2004 ..................... 7,500 110 825 45.10 37,208 2005 ..................... 7,900 110 869 45.40 39,453 2006 ..................... 8,700 135 1,175 42.00 49,350 2007 ..................... 9,600 110 1,056 55.00 58,080 2008 ..................... 8,800 130 1,144 47.80 54,683 2009 ..................... 8,600 125 1,075 56.20 60,415 2010 1 .................. 7,200 125 900 51.50 46,350
1 Preliminary. NASS, Crops Branch, (202) 720–2127.
Table 4-6.—Artichokes for fresh market and processing: Area, production, and value per hundredweight, California, 2008–2010
Crop Area harvested Production Value per unit
2008 2009 2010 2008 2009 2010 2008 2009 2010
1,000 1,000 1,000 Dollars Dollars Dollars Acres Acres Acres cwt. cwt. cwt. per cwt. per cwt. per cwt.
CA ........................ 8,800 8,600 7,200 1,144 1,075 900 47.80 56.20 51.50
NASS, Crops Branch, (202) 720–2127.
Table 4-7.—Asparagus for Fresh Market and Processing, commercial crop: Area, production, and value per hundredweight and per ton, by State and United States, 2008–2010
State Area harvested 1 Production Value per unit
2008 2009 2010 2 2008 2009 2010 2 2008 2009 2010 2
1,000 1,000 1,000 Dollars Dollars Dollars Acres Acres Acres cwt. cwt. cwt. per cwt. per cwt. per cwt.
CA 3 ..................... 14,500 12,500 11,500 421 400 403 125.00 130.00 147.00 MI ......................... 11,200 10,700 10,500 258 235 168 71.80 70.40 83.00 WA ....................... 6,500 6,000 6,000 273 264 228 67.10 76.90 77.10
US .................... 32,200 29,200 28,000 952 899 799 94.00 98.80 114.00
State
For fresh market For processing
Production Value per unit Production Value per unit
2008 2009 2010 2 2008 2009 2010 2 2008 2009 2010 2 2008 2009 2010 2
Dol- Dol- Dol- Dol- Dol- Dol- lars lars lars lars lars lars
1,000 1,000 1,000 per per per per per per cwt. cwt. cwt. cwt. cwt. cwt. Tons Tons Tons ton ton ton
CA 3 ...................... 421 400 403 125.00 130.00 147.00 ............ ............ ............ .............. .............. ..............MI ......................... .......... .......... .......... ............ ............ ............ ............ ............ ............ .............. .............. ..............WA ....................... .......... .......... .......... ............ ............ ............ ............ ............ ............ .............. .............. ..............Oth Sts 4 .............. 297 303 276 70.60 78.60 84.60 11,700 9,800 6,000 1,360.00 1,330.00 1,360.00
US .................... 718 703 679 103.00 108.00 122.00 11,700 9,800 6,000 1,360.00 1,330.00 1,360.00
1 Asparagus for fresh market and for processing is frequently harvested from the same area; therefore it is not practical to make individual area estimates for these segments. 2 Preliminary. 3 Includes a small amount of processing aspar-agus. 4 2008-2010 - MI and WA.
NASS, Crops Branch, (202) 720–2127.
VerDate Aug 31 2005 10:23 Feb 29, 2012 Jkt 000000 PO 00000 Frm 00006 Fmt 1000 Sfmt 1000 H:\SHARED\DAPP\FPU\AGSTAT\MASTER~2\CHAPTR04\IV-06.AG8 USDA
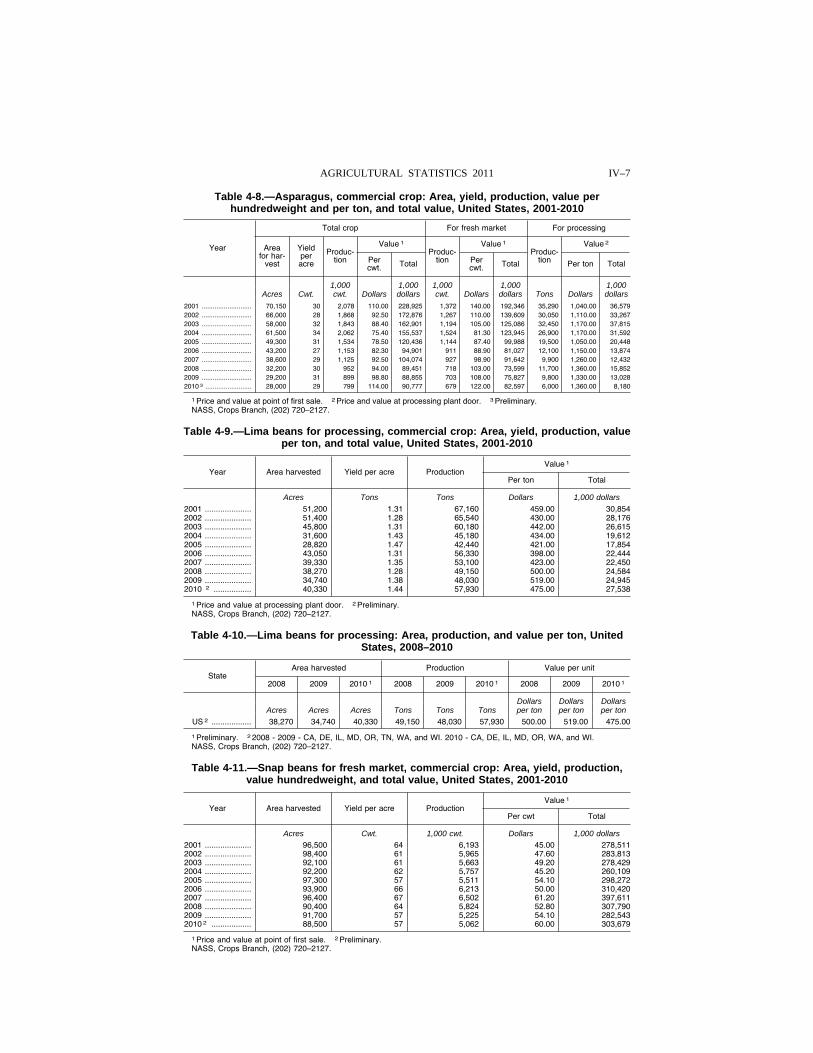
IV–7 AGRICULTURAL STATISTICS 2011
Table 4-8.—Asparagus, commercial crop: Area, yield, production, value per hundredweight and per ton, and total value, United States, 2001-2010
Year
Total crop For fresh market For processing
Area for har-
vest
Yield per acre
Produc-tion
Value 1 Produc-
tion
Value 1 Produc-
tion
Value 2
Per cwt. Total Per
cwt. Total Per ton Total
1,000 1,000 1,000 1,000 1,000 Acres Cwt. cwt. Dollars dollars cwt. Dollars dollars Tons Dollars dollars
2001 ........................... 70,150 30 2,078 110.00 228,925 1,372 140.00 192,346 35,290 1,040.00 36,579 2002 ........................... 66,000 28 1,868 92.50 172,876 1,267 110.00 139,609 30,050 1,110.00 33,267 2003 ........................... 58,000 32 1,843 88.40 162,901 1,194 105.00 125,086 32,450 1,170.00 37,815 2004 ........................... 61,500 34 2,062 75.40 155,537 1,524 81.30 123,945 26,900 1,170.00 31,592 2005 ........................... 49,300 31 1,534 78.50 120,436 1,144 87.40 99,988 19,500 1,050.00 20,448 2006 ........................... 43,200 27 1,153 82.30 94,901 911 88.90 81,027 12,100 1,150.00 13,874 2007 ........................... 38,600 29 1,125 92.50 104,074 927 98.90 91,642 9,900 1,260.00 12,432 2008 ........................... 32,200 30 952 94.00 89,451 718 103.00 73,599 11,700 1,360.00 15,852 2009 ........................... 29,200 31 899 98.80 88,855 703 108.00 75,827 9,800 1,330.00 13,028 2010 3 ......................... 28,000 29 799 114.00 90,777 679 122.00 82,597 6,000 1,360.00 8,180
1 Price and value at point of first sale. 2 Price and value at processing plant door. 3 Preliminary. NASS, Crops Branch, (202) 720–2127.
Table 4-9.—Lima beans for processing, commercial crop: Area, yield, production, value per ton, and total value, United States, 2001-2010
Year Area harvested Yield per acre Production Value 1
Per ton Total
Acres Tons Tons Dollars 1,000 dollars
2001 ..................... 51,200 1.31 67,160 459.00 30,854 2002 ..................... 51,400 1.28 65,540 430.00 28,176 2003 ..................... 45,800 1.31 60,180 442.00 26,615 2004 ..................... 31,600 1.43 45,180 434.00 19,612 2005 ..................... 28,820 1.47 42,440 421.00 17,854 2006 ..................... 43,050 1.31 56,330 398.00 22,444 2007 ..................... 39,330 1.35 53,100 423.00 22,450 2008 ..................... 38,270 1.28 49,150 500.00 24,584 2009 ..................... 34,740 1.38 48,030 519.00 24,945 2010 2 ................. 40,330 1.44 57,930 475.00 27,538
1 Price and value at processing plant door. 2 Preliminary. NASS, Crops Branch, (202) 720–2127.
Table 4-10.—Lima beans for processing: Area, production, and value per ton, United States, 2008–2010
State Area harvested Production Value per unit
2008 2009 2010 1 2008 2009 2010 1 2008 2009 2010 1
Dollars Dollars Dollars Acres Acres Acres Tons Tons Tons per ton per ton per ton
US 2 .................. 38,270 34,740 40,330 49,150 48,030 57,930 500.00 519.00 475.00
1 Preliminary. 2 2008 - 2009 - CA, DE, IL, MD, OR, TN, WA, and WI. 2010 - CA, DE, IL, MD, OR, WA, and WI. NASS, Crops Branch, (202) 720–2127.
Table 4-11.—Snap beans for fresh market, commercial crop: Area, yield, production, value hundredweight, and total value, United States, 2001-2010
Year Area harvested Yield per acre Production Value 1
Per cwt Total
Acres Cwt. 1,000 cwt. Dollars 1,000 dollars 2001 ..................... 96,500 64 6,193 45.00 278,511 2002 ..................... 98,400 61 5,965 47.60 283,813 2003 ..................... 92,100 61 5,663 49.20 278,429 2004 ..................... 92,200 62 5,757 45.20 260,109 2005 ..................... 97,300 57 5,511 54.10 298,272 2006 ..................... 93,900 66 6,213 50.00 310,420 2007 ..................... 96,400 67 6,502 61.20 397,611 2008 ..................... 90,400 64 5,824 52.80 307,790 2009 ..................... 91,700 57 5,225 54.10 282,543 2010 2 .................. 88,500 57 5,062 60.00 303,679
1 Price and value at point of first sale. 2 Preliminary. NASS, Crops Branch, (202) 720–2127.
VerDate Aug 31 2005 10:23 Feb 29, 2012 Jkt 000000 PO 00000 Frm 00007 Fmt 1000 Sfmt 1000 H:\SHARED\DAPP\FPU\AGSTAT\MASTER~2\CHAPTR04\IV-07.AG8 USDA
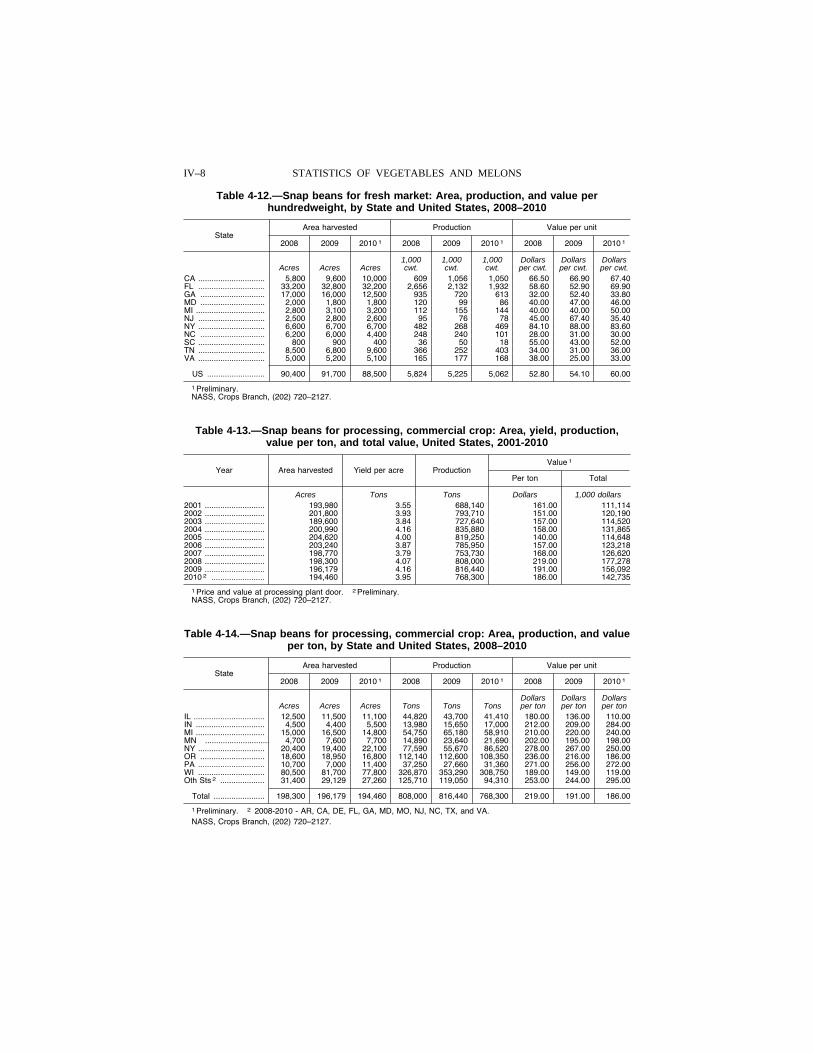
IV–8 STATISTICS OF VEGETABLES AND MELONS
Table 4-12.—Snap beans for fresh market: Area, production, and value per hundredweight, by State and United States, 2008–2010
State Area harvested Production Value per unit
2008 2009 2010 1 2008 2009 2010 1 2008 2009 2010 1
1,000 1,000 1,000 Dollars Dollars Dollars Acres Acres Acres cwt. cwt. cwt. per cwt. per cwt. per cwt.
CA .............................. 5,800 9,600 10,000 609 1,056 1,050 66.50 66.90 67.40 FL .............................. 33,200 32,800 32,200 2,656 2,132 1,932 58.60 52.90 69.90 GA ............................. 17,000 16,000 12,500 935 720 613 32.00 52.40 33.80 MD ............................. 2,000 1,800 1,800 120 99 86 40.00 47.00 46.00 MI ............................... 2,800 3,100 3,200 112 155 144 40.00 40.00 50.00 NJ .............................. 2,500 2,800 2,600 95 76 78 45.00 67.40 35.40 NY .............................. 6,600 6,700 6,700 482 268 469 84.10 88.00 83.60 NC ............................. 6,200 6,000 4,400 248 240 101 28.00 31.00 30.00 SC .............................. 800 900 400 36 50 18 55.00 43.00 52.00 TN .............................. 8,500 6,800 9,600 366 252 403 34.00 31.00 36.00 VA .............................. 5,000 5,200 5,100 165 177 168 38.00 25.00 33.00
US .......................... 90,400 91,700 88,500 5,824 5,225 5,062 52.80 54.10 60.00
1 Preliminary. NASS, Crops Branch, (202) 720–2127.
Table 4-13.—Snap beans for processing, commercial crop: Area, yield, production, value per ton, and total value, United States, 2001-2010
Year Area harvested Yield per acre Production Value 1
Per ton Total
Acres Tons Tons Dollars 1,000 dollars 2001 ........................... 193,980 3.55 688,140 161.00 111,114 2002 ........................... 201,800 3.93 793,710 151.00 120,190 2003 ........................... 189,600 3.84 727,640 157.00 114,520 2004 ........................... 200,990 4.16 835,880 158.00 131,865 2005 ........................... 204,620 4.00 819,250 140.00 114,648 2006 ........................... 203,240 3.87 785,950 157.00 123,218 2007 ........................... 198,770 3.79 753,730 168.00 126,620 2008 ........................... 198,300 4.07 808,000 219.00 177,278 2009 ........................... 196,179 4.16 816,440 191.00 156,092 2010 2 ........................ 194,460 3.95 768,300 186.00 142,735
1 Price and value at processing plant door. 2 Preliminary. NASS, Crops Branch, (202) 720–2127.
Table 4-14.—Snap beans for processing, commercial crop: Area, production, and value per ton, by State and United States, 2008–2010
State Area harvested Production Value per unit
2008 2009 2010 1 2008 2009 2010 1 2008 2009 2010 1
Dollars Dollars Dollars Acres Acres Acres Tons Tons Tons per ton per ton per ton
IL ................................ 12,500 11,500 11,100 44,820 43,700 41,410 180.00 136.00 110.00 IN ............................... 4,500 4,400 5,500 13,980 15,650 17,000 212.00 209.00 284.00 MI ............................... 15,000 16,500 14,800 54,750 65,180 58,910 210.00 220.00 240.00 MN ............................. 4,700 7,600 7,700 14,890 23,640 21,690 202.00 195.00 198.00 NY .............................. 20,400 19,400 22,100 77,590 55,670 86,520 278.00 267.00 250.00 OR ............................. 18,600 18,950 16,800 112,140 112,600 108,350 236.00 216.00 186.00 PA .............................. 10,700 7,000 11,400 37,250 27,660 31,360 271.00 256.00 272.00 WI .............................. 80,500 81,700 77,800 326,870 353,290 308,750 189.00 149.00 119.00 Oth Sts 2 .................... 31,400 29,129 27,260 125,710 119,050 94,310 253.00 244.00 295.00
Total ....................... 198,300 196,179 194,460 808,000 816,440 768,300 219.00 191.00 186.00
1 Preliminary. 2 2008-2010 - AR, CA, DE, FL, GA, MD, MO, NJ, NC, TX, and VA. NASS, Crops Branch, (202) 720–2127.
VerDate Aug 31 2005 10:23 Feb 29, 2012 Jkt 000000 PO 00000 Frm 00008 Fmt 1000 Sfmt 1000 H:\SHARED\DAPP\FPU\AGSTAT\MASTER~2\CHAPTR04\IV-08.AG8 USDA
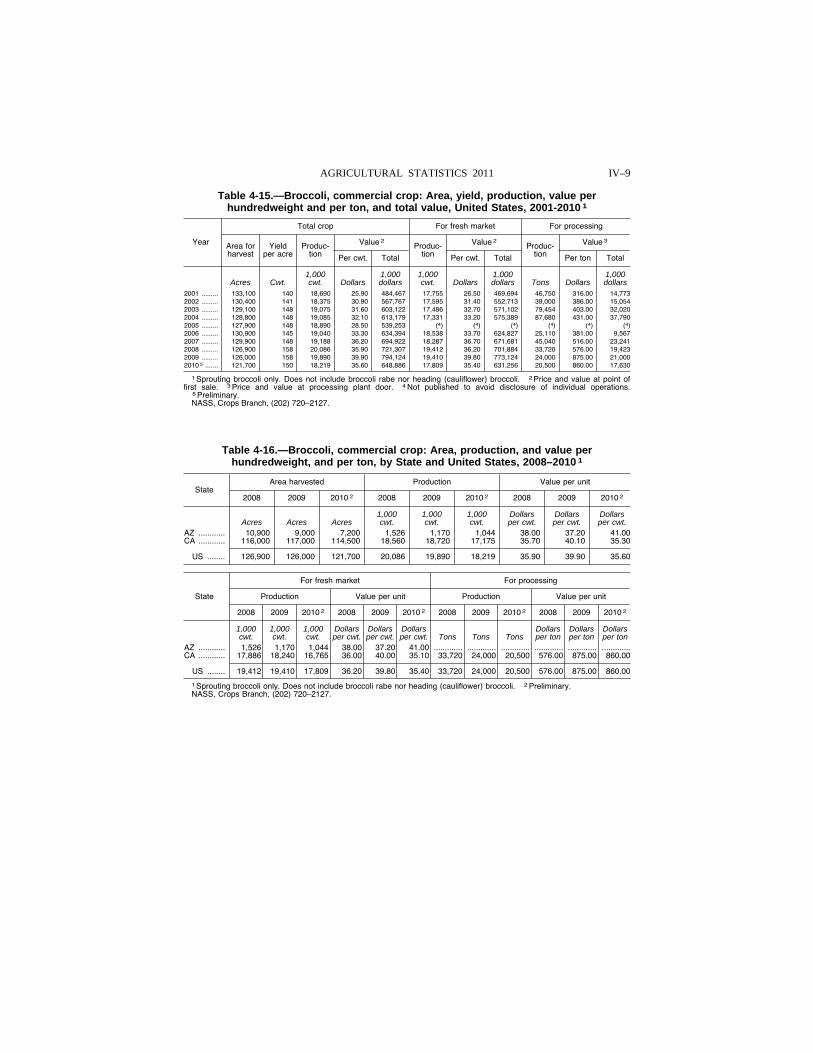
IV–9 AGRICULTURAL STATISTICS 2011
Table 4-15.—Broccoli, commercial crop: Area, yield, production, value per hundredweight and per ton, and total value, United States, 2001-2010 1
Year
Total crop For fresh market For processing
Area for harvest
Yield per acre
Produc-tion
Value 2 Produc-tion
Value 2 Produc-tion
Value 3
Per cwt. Total Per cwt. Total Per ton Total
1,000 1,000 1,000 1,000 1,000 Acres Cwt. cwt. Dollars dollars cwt. Dollars dollars Tons Dollars dollars
2001 ......... 133,100 140 18,690 25.90 484,467 17,755 26.50 469,694 46,750 316.00 14,773 2002 ......... 130,400 141 18,375 30.90 567,767 17,595 31.40 552,713 39,000 386.00 15,054 2003 ......... 129,100 148 19,075 31.60 603,122 17,486 32.70 571,102 79,454 403.00 32,020 2004 ......... 128,800 148 19,085 32.10 613,179 17,331 33.20 575,389 87,680 431.00 37,790 2005 ......... 127,900 148 18,890 28.50 539,253 (4) (4) (4) (4) (4) (4) 2006 ......... 130,900 145 19,040 33.30 634,394 18,538 33.70 624,827 25,110 381.00 9,567 2007 ......... 129,900 148 19,188 36.20 694,922 18,287 36.70 671,681 45,040 516.00 23,241 2008 ......... 126,900 158 20,086 35.90 721,307 19,412 36.20 701,884 33,720 576.00 19,423 2009 ......... 126,000 158 19,890 39.90 794,124 19,410 39.80 773,124 24,000 875.00 21,000 2010 5 ....... 121,700 150 18,219 35.60 648,886 17,809 35.40 631,256 20,500 860.00 17,630
1 Sprouting broccoli only. Does not include broccoli rabe nor heading (cauliflower) broccoli. 2 Price and value at point of first sale. 3 Price and value at processing plant door. 4 Not published to avoid disclosure of individual operations.
5 Preliminary. NASS, Crops Branch, (202) 720–2127.
Table 4-16.—Broccoli, commercial crop: Area, production, and value per hundredweight, and per ton, by State and United States, 2008–2010 1
State Area harvested Production Value per unit
2008 2009 2010 2 2008 2009 2010 2 2008 2009 2010 2
1,000 1,000 1,000 Dollars Dollars Dollars Acres Acres Acres cwt. cwt. cwt. per cwt. per cwt. per cwt.
AZ ............ 10,900 9,000 7,200 1,526 1,170 1,044 38.00 37.20 41.00 CA ............ 116,000 117,000 114,500 18,560 18,720 17,175 35.70 40.10 35.30
US ........ 126,900 126,000 121,700 20,086 19,890 18,219 35.90 39.90 35.60
State
For fresh market For processing
Production Value per unit Production Value per unit
2008 2009 2010 2 2008 2009 2010 2 2008 2009 2010 2 2008 2009 2010 2
1,000 1,000 1,000 Dollars Dollars Dollars Dollars Dollars Dollars cwt. cwt. cwt. per cwt. per cwt. per cwt. Tons Tons Tons per ton per ton per ton
AZ ............ 1,526 1,170 1,044 38.00 37.20 41.00 ............. ............. ............. ............. ............. .............CA ............ 17,886 18,240 16,765 36.00 40.00 35.10 33,720 24,000 20,500 576.00 875.00 860.00
US ........ 19,412 19,410 17,809 36.20 39.80 35.40 33,720 24,000 20,500 576.00 875.00 860.00
1 Sprouting broccoli only. Does not include broccoli rabe nor heading (cauliflower) broccoli. 2 Preliminary.NASS, Crops Branch, (202) 720–2127.
VerDate Aug 31 2005 10:23 Feb 29, 2012 Jkt 000000 PO 00000 Frm 00009 Fmt 1000 Sfmt 1000 H:\SHARED\DAPP\FPU\AGSTAT\MASTER~2\CHAPTR04\IV-09.AG8 USDA
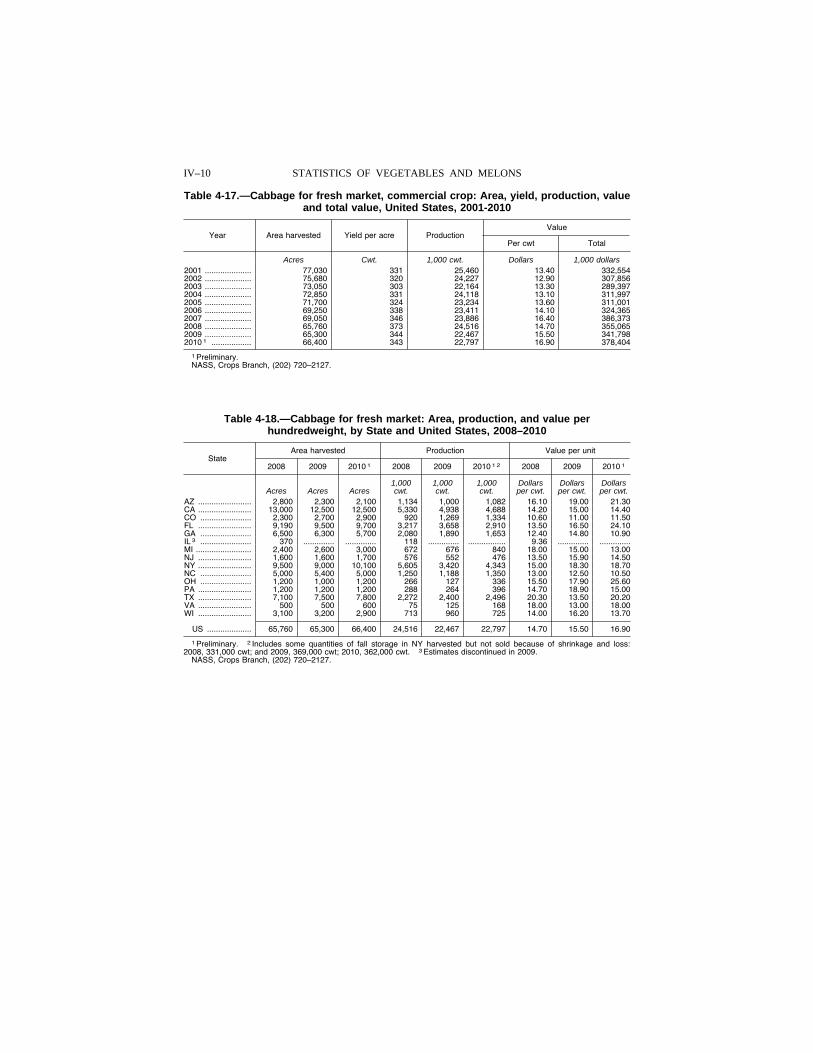
IV–10 STATISTICS OF VEGETABLES AND MELONS
Table 4-17.—Cabbage for fresh market, commercial crop: Area, yield, production, value and total value, United States, 2001-2010
Year Area harvested Yield per acre Production Value
Per cwt Total
Acres Cwt. 1,000 cwt. Dollars 1,000 dollars 2001 ..................... 77,030 331 25,460 13.40 332,554 2002 ..................... 75,680 320 24,227 12.90 307,856 2003 ..................... 73,050 303 22,164 13.30 289,397 2004 ..................... 72,850 331 24,118 13.10 311,997 2005 ..................... 71,700 324 23,234 13.60 311,001 2006 ..................... 69,250 338 23,411 14.10 324,365 2007 ..................... 69,050 346 23,886 16.40 386,373 2008 ..................... 65,760 373 24,516 14.70 355,065 2009 ..................... 65,300 344 22,467 15.50 341,798 2010 1 .................. 66,400 343 22,797 16.90 378,404
1 Preliminary. NASS, Crops Branch, (202) 720–2127.
Table 4-18.—Cabbage for fresh market: Area, production, and value per hundredweight, by State and United States, 2008–2010
State Area harvested Production Value per unit
2008 2009 2010 1 2008 2009 2010 1 2 2008 2009 2010 1
1,000 1,000 1,000 Dollars Dollars Dollars Acres Acres Acres cwt. cwt. cwt. per cwt. per cwt. per cwt.
AZ ........................ 2,800 2,300 2,100 1,134 1,000 1,082 16.10 19.00 21.30 CA ........................ 13,000 12,500 12,500 5,330 4,938 4,688 14.20 15.00 14.40 CO ....................... 2,300 2,700 2,900 920 1,269 1,334 10.60 11.00 11.50 FL ........................ 9,190 9,500 9,700 3,217 3,658 2,910 13.50 16.50 24.10 GA ....................... 6,500 6,300 5,700 2,080 1,890 1,653 12.40 14.80 10.90 IL 3 ....................... 370 .............. .............. 118 .............. ................. 9.36 .............. ..............MI ......................... 2,400 2,600 3,000 672 676 840 18.00 15.00 13.00 NJ ........................ 1,600 1,600 1,700 576 552 476 13.50 15.90 14.50 NY ........................ 9,500 9,000 10,100 5,605 3,420 4,343 15.00 18.30 18.70 NC ....................... 5,000 5,400 5,000 1,250 1,188 1,350 13.00 12.50 10.50 OH ....................... 1,200 1,000 1,200 266 127 336 15.50 17.90 25.60 PA ........................ 1,200 1,200 1,200 288 264 396 14.70 18.90 15.00 TX ........................ 7,100 7,500 7,800 2,272 2,400 2,496 20.30 13.50 20.20 VA ........................ 500 500 600 75 125 168 18.00 13.00 18.00 WI ........................ 3,100 3,200 2,900 713 960 725 14.00 16.20 13.70
US .................... 65,760 65,300 66,400 24,516 22,467 22,797 14.70 15.50 16.90
1 Preliminary. 2 Includes some quantities of fall storage in NY harvested but not sold because of shrinkage and loss: 2008, 331,000 cwt; and 2009, 369,000 cwt; 2010, 362,000 cwt. 3 Estimates discontinued in 2009.
NASS, Crops Branch, (202) 720–2127.
VerDate Aug 31 2005 10:23 Feb 29, 2012 Jkt 000000 PO 00000 Frm 00010 Fmt 1000 Sfmt 1000 H:\SHARED\DAPP\FPU\AGSTAT\MASTER~2\CHAPTR04\IV-10.AG8 USDA
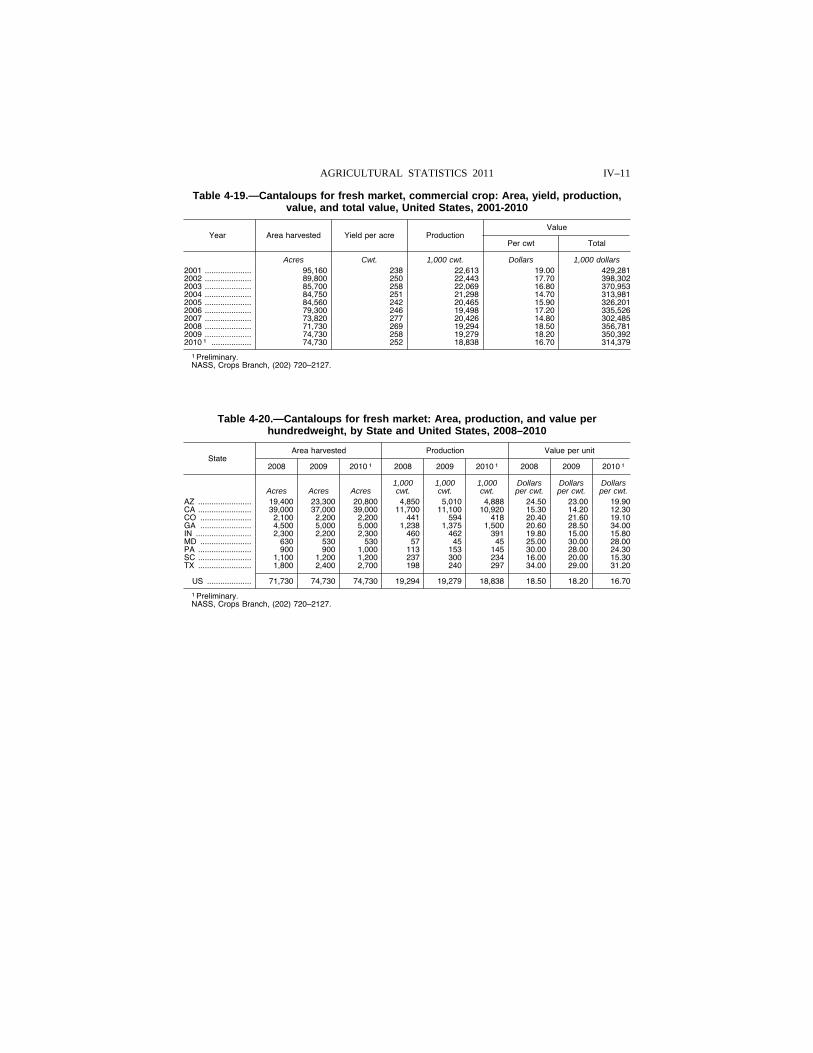
IV–11 AGRICULTURAL STATISTICS 2011
Table 4-19.—Cantaloups for fresh market, commercial crop: Area, yield, production, value, and total value, United States, 2001-2010
Year Area harvested Yield per acre Production Value
Per cwt Total
Acres Cwt. 1,000 cwt. Dollars 1,000 dollars 2001 ..................... 95,160 238 22,613 19.00 429,281 2002 ..................... 89,800 250 22,443 17.70 398,302 2003 ..................... 85,700 258 22,069 16.80 370,953 2004 ..................... 84,750 251 21,298 14.70 313,981 2005 ..................... 84,560 242 20,465 15.90 326,201 2006 ..................... 79,300 246 19,498 17.20 335,526 2007 ..................... 73,820 277 20,426 14.80 302,485 2008 ..................... 71,730 269 19,294 18.50 356,781 2009 ..................... 74,730 258 19,279 18.20 350,392 2010 1 .................. 74,730 252 18,838 16.70 314,379
1 Preliminary. NASS, Crops Branch, (202) 720–2127.
Table 4-20.—Cantaloups for fresh market: Area, production, and value per hundredweight, by State and United States, 2008–2010
State Area harvested Production Value per unit
2008 2009 2010 1 2008 2009 2010 1 2008 2009 2010 1
1,000 1,000 1,000 Dollars Dollars Dollars Acres Acres Acres cwt. cwt. cwt. per cwt. per cwt. per cwt.
AZ ........................ 19,400 23,300 20,800 4,850 5,010 4,888 24.50 23.00 19.90 CA ........................ 39,000 37,000 39,000 11,700 11,100 10,920 15.30 14.20 12.30 CO ....................... 2,100 2,200 2,200 441 594 418 20.40 21.60 19.10 GA ....................... 4,500 5,000 5,000 1,238 1,375 1,500 20.60 28.50 34.00 IN ......................... 2,300 2,200 2,300 460 462 391 19.80 15.00 15.80 MD ....................... 630 530 530 57 45 45 25.00 30.00 28.00 PA ........................ 900 900 1,000 113 153 145 30.00 28.00 24.30 SC ........................ 1,100 1,200 1,200 237 300 234 16.00 20.00 15.30 TX ........................ 1,800 2,400 2,700 198 240 297 34.00 29.00 31.20
US .................... 71,730 74,730 74,730 19,294 19,279 18,838 18.50 18.20 16.70
1 Preliminary. NASS, Crops Branch, (202) 720–2127.
VerDate Aug 31 2005 10:23 Feb 29, 2012 Jkt 000000 PO 00000 Frm 00011 Fmt 1000 Sfmt 1000 H:\SHARED\DAPP\FPU\AGSTAT\MASTER~2\CHAPTR04\IV-11.AG8 USDA
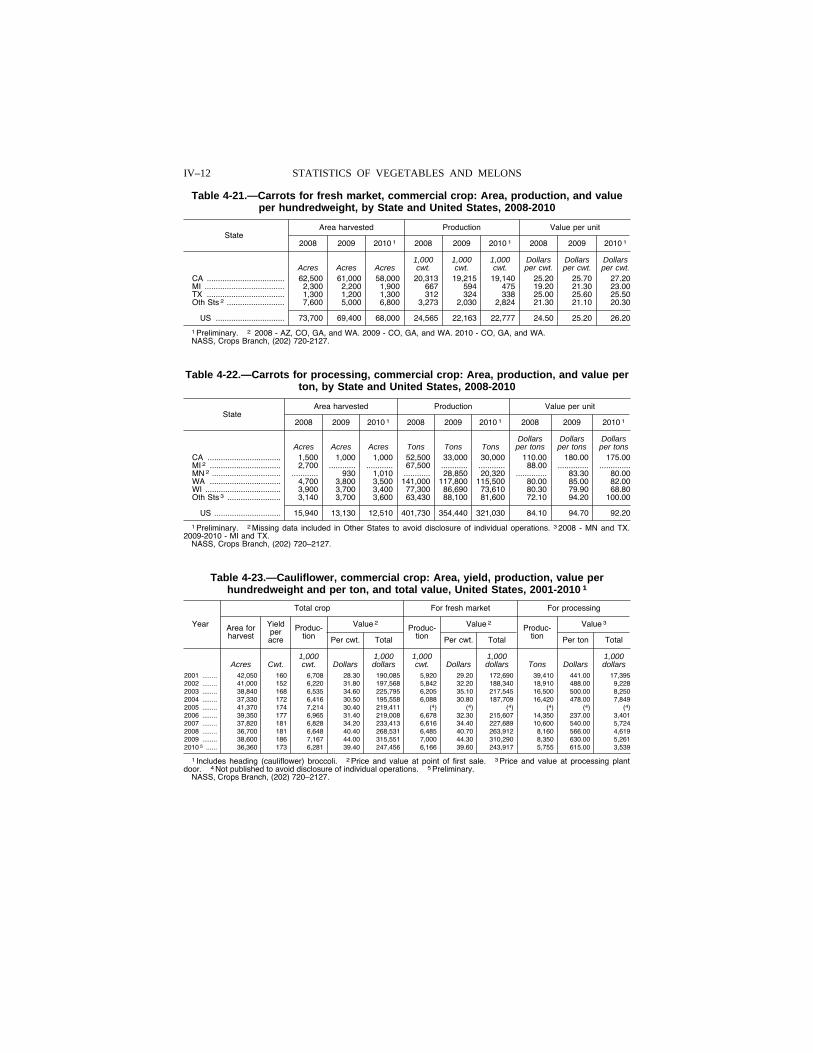
IV–12 STATISTICS OF VEGETABLES AND MELONS
Table 4-21.—Carrots for fresh market, commercial crop: Area, production, and value per hundredweight, by State and United States, 2008-2010
State Area harvested Production Value per unit
2008 2009 2010 1 2008 2009 2010 1 2008 2009 2010 1
1,000 1,000 1,000 Dollars Dollars Dollars Acres Acres Acres cwt. cwt. cwt. per cwt. per cwt. per cwt.
CA ................................... 62,500 61,000 58,000 20,313 19,215 19,140 25.20 25.70 27.20 MI .................................... 2,300 2,200 1,900 667 594 475 19.20 21.30 23.00 TX ................................... 1,300 1,200 1,300 312 324 338 25.00 25.60 25.50 Oth Sts 2 .......................... 7,600 5,000 6,800 3,273 2,030 2,824 21.30 21.10 20.30
US ............................... 73,700 69,400 68,000 24,565 22,163 22,777 24.50 25.20 26.20
1 Preliminary. 2 2008 - AZ, CO, GA, and WA. 2009 - CO, GA, and WA. 2010 - CO, GA, and WA. NASS, Crops Branch, (202) 720-2127.
Table 4-22.—Carrots for processing, commercial crop: Area, production, and value per ton, by State and United States, 2008-2010
State Area harvested Production Value per unit
2008 2009 2010 1 2008 2009 2010 1 2008 2009 2010 1
Dollars Dollars Dollars Acres Acres Acres Tons Tons Tons per tons per tons per tons
CA ................................. 1,500 1,000 1,000 52,500 33,000 30,000 110.00 180.00 175.00 MI 2 ................................ 2,700 ............ ............ 67,500 ............ ............ 88.00 .............. ..............MN 2 ............................... ............ 930 1,010 ............ 28,850 20,320 .............. 83.30 80.00 WA ................................ 4,700 3,800 3,500 141,000 117,800 115,500 80.00 85.00 82.00 WI .................................. 3,900 3,700 3,400 77,300 86,690 73,610 80.30 79.90 68.80 Oth Sts 3 ........................ 3,140 3,700 3,600 63,430 88,100 81,600 72.10 94.20 100.00
US .............................. 15,940 13,130 12,510 401,730 354,440 321,030 84.10 94.70 92.20
1 Preliminary. 2 Missing data included in Other States to avoid disclosure of individual operations. 3 2008 - MN and TX. 2009-2010 - MI and TX.
NASS, Crops Branch, (202) 720–2127.
Table 4-23.—Cauliflower, commercial crop: Area, yield, production, value per hundredweight and per ton, and total value, United States, 2001-2010 1
Year
Total crop For fresh market For processing
Area for harvest
Yield per acre
Produc-tion
Value 2 Produc-tion
Value 2 Produc-tion
Value 3
Per cwt. Total Per cwt. Total Per ton Total
1,000 1,000 1,000 1,000 1,000 Acres Cwt. cwt. Dollars dollars cwt. Dollars dollars Tons Dollars dollars
2001 ........ 42,050 160 6,708 28.30 190,085 5,920 29.20 172,690 39,410 441.00 17,395 2002 ........ 41,000 152 6,220 31.80 197,568 5,842 32.20 188,340 18,910 488.00 9,228 2003 ........ 38,840 168 6,535 34.60 225,795 6,205 35.10 217,545 16,500 500.00 8,250 2004 ........ 37,330 172 6,416 30.50 195,558 6,088 30.80 187,709 16,420 478.00 7,849 2005 ........ 41,370 174 7,214 30.40 219,411 (4) (4) (4) (4) (4) (4) 2006 ........ 39,350 177 6,965 31.40 219,008 6,678 32.30 215,607 14,350 237.00 3,401 2007 ........ 37,820 181 6,828 34.20 233,413 6,616 34.40 227,689 10,600 540.00 5,724 2008 ........ 36,700 181 6,648 40.40 268,531 6,485 40.70 263,912 8,160 566.00 4,619 2009 ........ 38,600 186 7,167 44.00 315,551 7,000 44.30 310,290 8,350 630.00 5,261 2010 5 ...... 36,360 173 6,281 39.40 247,456 6,166 39.60 243,917 5,755 615.00 3,539
1 Includes heading (cauliflower) broccoli. 2 Price and value at point of first sale. 3 Price and value at processing plant door. 4 Not published to avoid disclosure of individual operations. 5 Preliminary.
NASS, Crops Branch, (202) 720–2127.
VerDate Aug 31 2005 10:23 Feb 29, 2012 Jkt 000000 PO 00000 Frm 00012 Fmt 1000 Sfmt 1000 H:\SHARED\DAPP\FPU\AGSTAT\MASTER~2\CHAPTR04\IV-12.AG8 USDA
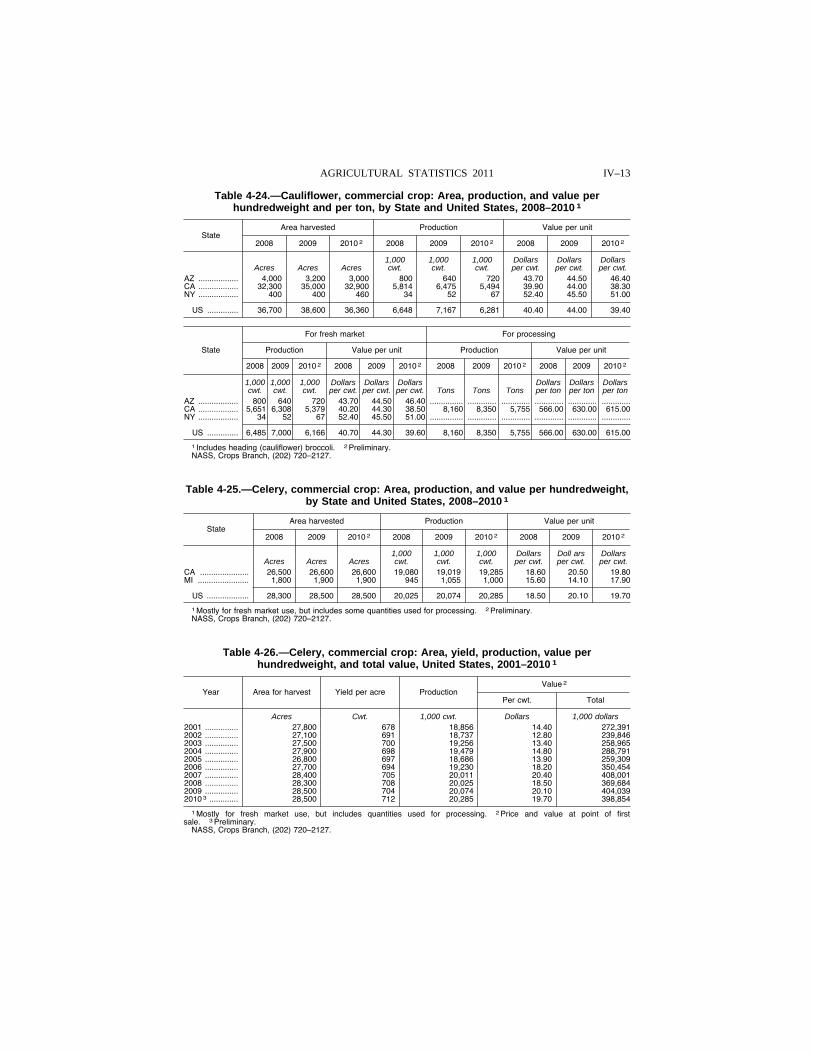
IV–13 AGRICULTURAL STATISTICS 2011
Table 4-24.—Cauliflower, commercial crop: Area, production, and value per hundredweight and per ton, by State and United States, 2008–2010 1
State Area harvested Production Value per unit
2008 2009 2010 2 2008 2009 2010 2 2008 2009 2010 2
1,000 1,000 1,000 Dollars Dollars Dollars Acres Acres Acres cwt. cwt. cwt. per cwt. per cwt. per cwt.
AZ .................. 4,000 3,200 3,000 800 640 720 43.70 44.50 46.40 CA .................. 32,300 35,000 32,900 5,814 6,475 5,494 39.90 44.00 38.30 NY .................. 400 400 460 34 52 67 52.40 45.50 51.00
US .............. 36,700 38,600 36,360 6,648 7,167 6,281 40.40 44.00 39.40
State
For fresh market For processing
Production Value per unit Production Value per unit
2008 2009 2010 2 2008 2009 2010 2 2008 2009 2010 2 2008 2009 2010 2
1,000 1,000 1,000 Dollars Dollars Dollars Dollars Dollars Dollars cwt. cwt. cwt. per cwt. per cwt. per cwt. Tons Tons Tons per ton per ton per ton
AZ .................. 800 640 720 43.70 44.50 46.40 ............... ............. ............. ............. ............. .............CA .................. 5,651 6,308 5,379 40.20 44.30 38.50 8,160 8,350 5,755 566.00 630.00 615.00 NY .................. 34 52 67 52.40 45.50 51.00 ............... ............. ............. ............. ............. .............
US .............. 6,485 7,000 6,166 40.70 44.30 39.60 8,160 8,350 5,755 566.00 630.00 615.00
1 Includes heading (cauliflower) broccoli. 2 Preliminary. NASS, Crops Branch, (202) 720–2127.
Table 4-25.—Celery, commercial crop: Area, production, and value per hundredweight, by State and United States, 2008–2010 1
State Area harvested Production Value per unit
2008 2009 2010 2 2008 2009 2010 2 2008 2009 2010 2
1,000 1,000 1,000 Dollars Doll ars Dollars Acres Acres Acres cwt. cwt. cwt. per cwt. per cwt. per cwt.
CA ...................... 26,500 26,600 26,600 19,080 19,019 19,285 18.60 20.50 19.80 MI ....................... 1,800 1,900 1,900 945 1,055 1,000 15.60 14.10 17.90
US ................... 28,300 28,500 28,500 20,025 20,074 20,285 18.50 20.10 19.70
1 Mostly for fresh market use, but includes some quantities used for processing. 2 Preliminary. NASS, Crops Branch, (202) 720–2127.
Table 4-26.—Celery, commercial crop: Area, yield, production, value per hundredweight, and total value, United States, 2001–2010 1
Year Area for harvest Yield per acre Production Value 2
Per cwt. Total
Acres Cwt. 1,000 cwt. Dollars 1,000 dollars 2001 ............... 27,800 678 18,856 14.40 272,391 2002 ............... 27,100 691 18,737 12.80 239,846 2003 ............... 27,500 700 19,256 13.40 258,965 2004 ............... 27,900 698 19,479 14.80 288,791 2005 ............... 26,800 697 18,686 13.90 259,309 2006 ............... 27,700 694 19,230 18.20 350,454 2007 ............... 28,400 705 20,011 20.40 408,001 2008 ............... 28,300 708 20,025 18.50 369,684 2009 ............... 28,500 704 20,074 20.10 404,039 2010 3 ............. 28,500 712 20,285 19.70 398,854
1 Mostly for fresh market use, but includes quantities used for processing. 2 Price and value at point of first sale. 3 Preliminary.
NASS, Crops Branch, (202) 720–2127.
VerDate Aug 31 2005 10:23 Feb 29, 2012 Jkt 000000 PO 00000 Frm 00013 Fmt 1000 Sfmt 1000 H:\SHARED\DAPP\FPU\AGSTAT\MASTER~2\CHAPTR04\IV-13.AG8 USDA
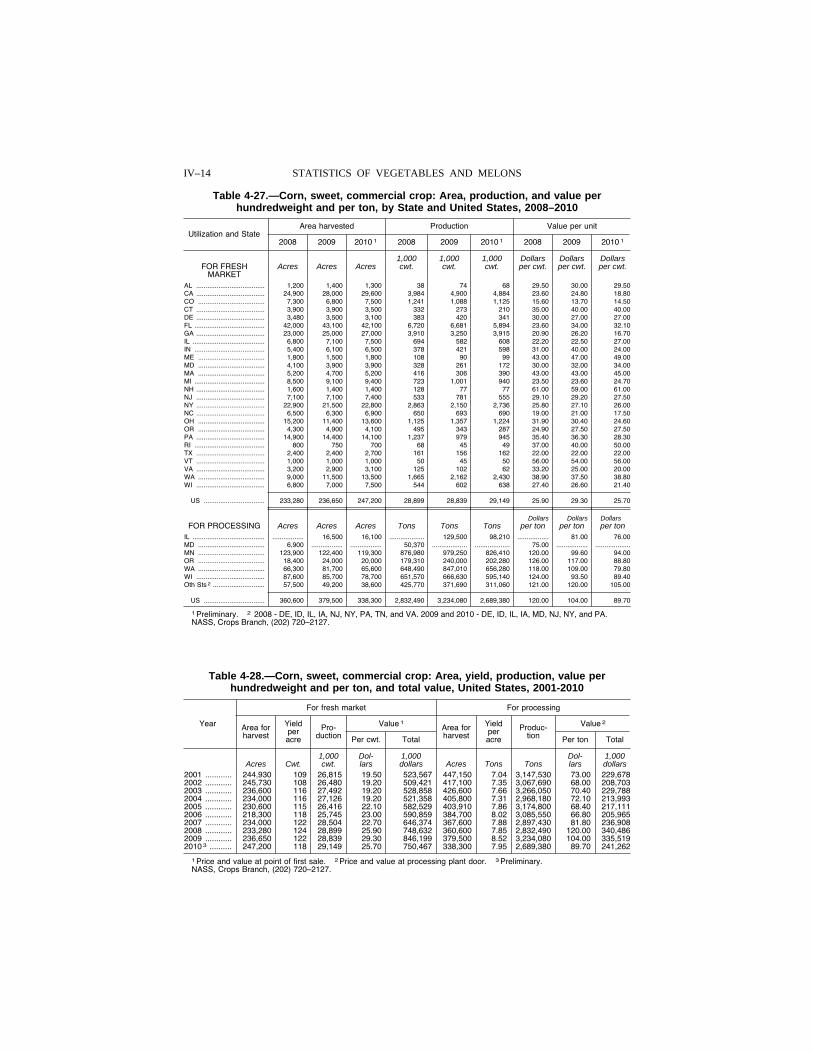
IV–14 STATISTICS OF VEGETABLES AND MELONS
Table 4-27.—Corn, sweet, commercial crop: Area, production, and value per hundredweight and per ton, by State and United States, 2008–2010
Utilization and State Area harvested Production Value per unit
2008 2009 2010 1 2008 2009 2010 1 2008 2009 2010 1
1,000 1,000 1,000 Dollars Dollars Dollars FOR FRESH
MARKET Acres Acres Acres cwt. cwt. cwt. per cwt. per cwt. per cwt.
AL ..................................... 1,200 1,400 1,300 38 74 68 29.50 30.00 29 .50 CA ..................................... 24,900 28,000 29,600 3,984 4,900 4,884 23.60 24.80 18 .80 CO .................................... 7,300 6,800 7,500 1,241 1,088 1,125 15.60 13.70 14 .50 CT ..................................... 3,900 3,900 3,500 332 273 210 35.00 40.00 40 .00 DE ..................................... 3,480 3,500 3,100 383 420 341 30.00 27.00 27 .00 FL ...................................... 42,000 43,100 42,100 6,720 6,681 5,894 23.60 34.00 32 .10 GA ..................................... 23,000 25,000 27,000 3,910 3,250 3,915 20.90 26.20 16 .70 IL ....................................... 6,800 7,100 7,500 694 582 608 22.20 22.50 27 .00 IN ...................................... 5,400 6,100 6,500 378 421 598 31.00 40.00 24 .00 ME .................................... 1,800 1,500 1,800 108 90 99 43.00 47.00 49 .00 MD .................................... 4,100 3,900 3,900 328 261 172 30.00 32.00 34 .00 MA .................................... 5,200 4,700 5,200 416 306 390 43.00 43.00 45 .00 MI ...................................... 8,500 9,100 9,400 723 1,001 940 23.50 23.60 24 .70 NH ..................................... 1,600 1,400 1,400 128 77 77 61.00 59.00 61 .00 NJ ..................................... 7,100 7,100 7,400 533 781 555 29.10 29.20 27 .50 NY ..................................... 22,900 21,500 22,800 2,863 2,150 2,736 25.80 27.10 26 .00 NC ..................................... 6,500 6,300 6,900 650 693 690 19.00 21.00 17 .50 OH .................................... 15,200 11,400 13,600 1,125 1,357 1,224 31.90 30.40 24 .60 OR .................................... 4,300 4,900 4,100 495 343 287 24.90 27.50 27 .50 PA ..................................... 14,900 14,400 14,100 1,237 979 945 35.40 36.30 28 .30 RI ...................................... 800 750 700 68 45 49 37.00 40.00 50 .00 TX ..................................... 2,400 2,400 2,700 161 156 162 22.00 22.00 22 .00 VT ..................................... 1,000 1,000 1,000 50 45 50 56.00 54.00 56 .00 VA ..................................... 3,200 2,900 3,100 125 102 62 33.20 25.00 20 .00 WA .................................... 9,000 11,500 13,500 1,665 2,162 2,430 38.90 37.50 38 .80 WI ..................................... 6,800 7,000 7,500 544 602 638 27.40 26.60 21 .40
US ................................. 233,280 236,650 247,200 28,899 28,839 29,149 25.90 29.30 25 .70
Dollars Dollars Dollars FOR PROCESSING Acres Acres Acres Tons Tons Tons per ton per ton per ton
IL ....................................... ................. 16,500 16,100 ................... 129,500 98,210 ................. 81.00 76 .00 MD .................................... 6,900 ................. ................. 50,370 ................... ................... 75.00 ................. ...................MN .................................... 123,900 122,400 119,300 876,980 979,250 826,410 120.00 99.60 94 .00 OR .................................... 18,400 24,000 20,000 179,310 240,000 202,280 126.00 117.00 88 .80 WA .................................... 66,300 81,700 65,600 648,490 847,010 656,280 118.00 109.00 79 .80 WI ..................................... 87,600 85,700 78,700 651,570 666,630 595,140 124.00 93.50 89 .40 Oth Sts 2 ............................ 57,500 49,200 38,600 425,770 371,690 311,060 121.00 120.00 105 .00
US ................................. 360,600 379,500 338,300 2,832,490 3,234,080 2,689,380 120.00 104.00 89 .70
1 Preliminary. 2 2008 - DE, ID, IL, IA, NJ, NY, PA, TN, and VA. 2009 and 2010 - DE, ID, IL, IA, MD, NJ, NY, and PA. NASS, Crops Branch, (202) 720–2127.
Table 4-28.—Corn, sweet, commercial crop: Area, yield, production, value per hundredweight and per ton, and total value, United States, 2001-2010
Year
For fresh market For processing
Area for harvest
Yield per acre
Pro-duction
Value 1 Area for harvest
Yield per acre
Produc-tion
Value 2
Per cwt. Total Per ton Total
1,000 Dol- 1,000 Dol- 1,000 Acres Cwt. cwt. lars dollars Acres Tons Tons lars dollars
2001 ............ 244,930 109 26,815 19.50 523,567 447,150 7.04 3,147,530 73.00 229,678 2002 ............ 245,730 108 26,480 19.20 509,421 417,100 7.35 3,067,690 68.00 208,703 2003 ............ 236,600 116 27,492 19.20 528,858 426,600 7.66 3,266,050 70.40 229,788 2004 ............ 234,000 116 27,126 19.20 521,358 405,800 7.31 2,968,180 72.10 213,993 2005 ............ 230,600 115 26,416 22.10 582,529 403,910 7.86 3,174,800 68.40 217,111 2006 ............ 218,300 118 25,745 23.00 590,859 384,700 8.02 3,085,550 66.80 205,965 2007 ............ 234,000 122 28,504 22.70 646,374 367,600 7.88 2,897,430 81.80 236,908 2008 ............ 233,280 124 28,899 25.90 748,632 360,600 7.85 2,832,490 120.00 340,486 2009 ............ 236,650 122 28,839 29.30 846,199 379,500 8.52 3,234,080 104.00 335,519 2010 3 .......... 247,200 118 29,149 25.70 750,467 338,300 7.95 2,689,380 89.70 241,262
1 Price and value at point of first sale. 2 Price and value at processing plant door. 3 Preliminary. NASS, Crops Branch, (202) 720–2127.
VerDate Aug 31 2005 10:23 Feb 29, 2012 Jkt 000000 PO 00000 Frm 00014 Fmt 1000 Sfmt 1000 H:\SHARED\DAPP\FPU\AGSTAT\MASTER~2\CHAPTR04\IV-14.AG8 USDA
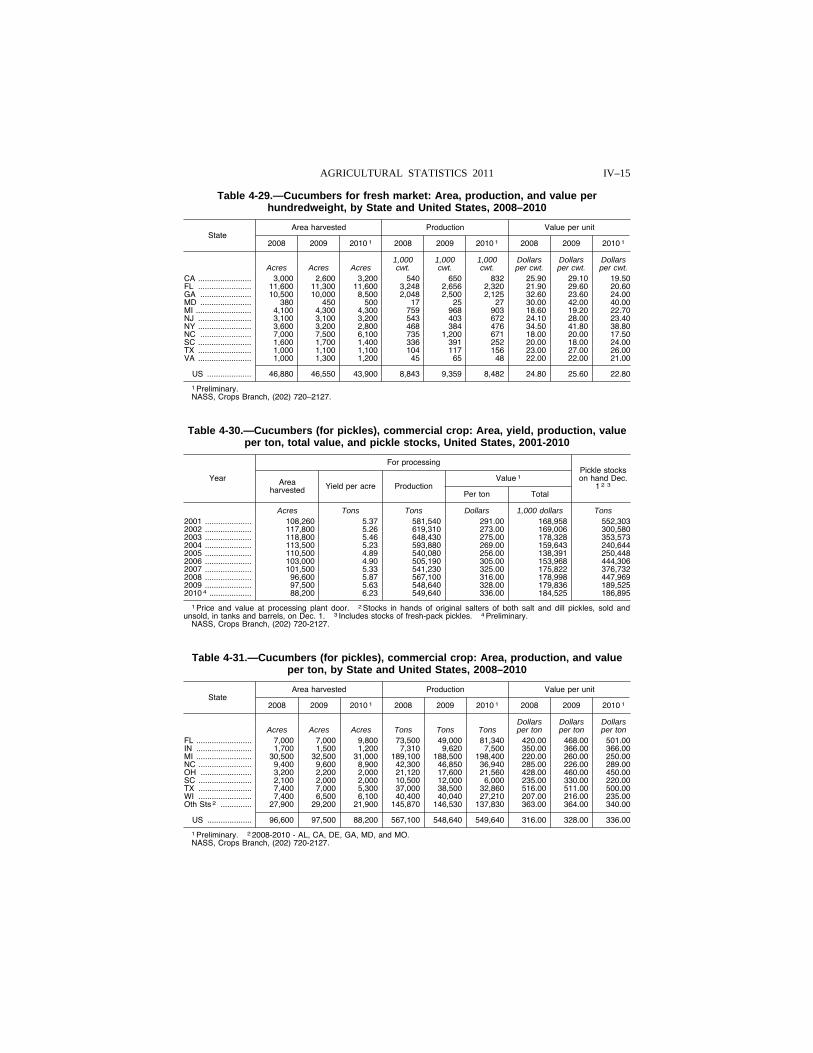
IV–15 AGRICULTURAL STATISTICS 2011
Table 4-29.—Cucumbers for fresh market: Area, production, and value per hundredweight, by State and United States, 2008–2010
State Area harvested Production Value per unit
2008 2009 2010 1 2008 2009 2010 1 2008 2009 2010 1
1,000 1,000 1,000 Dollars Dollars Dollars Acres Acres Acres cwt. cwt. cwt. per cwt. per cwt. per cwt.
CA ........................ 3,000 2,600 3,200 540 650 832 25.90 29.10 19.50 FL ........................ 11,600 11,300 11,600 3,248 2,656 2,320 21.90 29.60 20.60 GA ....................... 10,500 10,000 8,500 2,048 2,500 2,125 32.60 23.60 24.00 MD ....................... 380 450 500 17 25 27 30.00 42.00 40.00 MI ......................... 4,100 4,300 4,300 759 968 903 18.60 19.20 22.70 NJ ........................ 3,100 3,100 3,200 543 403 672 24.10 28.00 23.40 NY ........................ 3,600 3,200 2,800 468 384 476 34.50 41.80 38.80 NC ....................... 7,000 7,500 6,100 735 1,200 671 18.00 20.00 17.50 SC ........................ 1,600 1,700 1,400 336 391 252 20.00 18.00 24.00 TX ........................ 1,000 1,100 1,100 104 117 156 23.00 27.00 26.00 VA ........................ 1,000 1,300 1,200 45 65 48 22.00 22.00 21.00
US .................... 46,880 46,550 43,900 8,843 9,359 8,482 24.80 25.60 22.80
1 Preliminary. NASS, Crops Branch, (202) 720–2127.
Table 4-30.—Cucumbers (for pickles), commercial crop: Area, yield, production, value per ton, total value, and pickle stocks, United States, 2001-2010
Year
For processing Pickle stocks on hand Dec.
1 2 3 Area harvested Yield per acre Production
Value 1
Per ton Total
Acres Tons Tons Dollars 1,000 dollars Tons 2001 ..................... 108,260 5.37 581,540 291.00 168,958 552,303 2002 ..................... 117,800 5.26 619,310 273.00 169,006 300,580 2003 ..................... 118,800 5.46 648,430 275.00 178,328 353,573 2004 ..................... 113,500 5.23 593,880 269.00 159,643 240,644 2005 ..................... 110,500 4.89 540,080 256.00 138,391 250,448 2006 ..................... 103,000 4.90 505,190 305.00 153,968 444,306 2007 ..................... 101,500 5.33 541,230 325.00 175,822 376,732 2008 ..................... 96,600 5.87 567,100 316.00 178,998 447,969 2009 ..................... 97,500 5.63 548,640 328.00 179,836 189,525 2010 4 ................... 88,200 6.23 549,640 336.00 184,525 186,895
1 Price and value at processing plant door. 2 Stocks in hands of original salters of both salt and dill pickles, sold and unsold, in tanks and barrels, on Dec. 1. 3 Includes stocks of fresh-pack pickles. 4 Preliminary.
NASS, Crops Branch, (202) 720-2127.
Table 4-31.—Cucumbers (for pickles), commercial crop: Area, production, and value per ton, by State and United States, 2008–2010
State Area harvested Production Value per unit
2008 2009 2010 1 2008 2009 2010 1 2008 2009 2010 1
Dollars Dollars Dollars Acres Acres Acres Tons Tons Tons per ton per ton per ton
FL ......................... 7,000 7,000 9,800 73,500 49,000 81,340 420.00 468.00 501.00 IN ......................... 1,700 1,500 1,200 7,310 9,620 7,500 350.00 366.00 366.00 MI ......................... 30,500 32,500 31,000 189,100 188,500 198,400 220.00 260.00 250.00 NC ........................ 9,400 9,600 8,900 42,300 46,850 36,940 285.00 226.00 289.00 OH ....................... 3,200 2,200 2,000 21,120 17,600 21,560 428.00 460.00 450.00 SC ........................ 2,100 2,000 2,000 10,500 12,000 6,000 235.00 330.00 220.00 TX ........................ 7,400 7,000 5,300 37,000 38,500 32,860 516.00 511.00 500.00 WI ........................ 7,400 6,500 6,100 40,400 40,040 27,210 207.00 216.00 235.00 Oth Sts 2 .............. 27,900 29,200 21,900 145,870 146,530 137,830 363.00 364.00 340.00
US .................... 96,600 97,500 88,200 567,100 548,640 549,640 316.00 328.00 336.00
1 Preliminary. 2 2008-2010 - AL, CA, DE, GA, MD, and MO. NASS, Crops Branch, (202) 720-2127.
VerDate Aug 31 2005 10:23 Feb 29, 2012 Jkt 000000 PO 00000 Frm 00015 Fmt 1000 Sfmt 1000 H:\SHARED\DAPP\FPU\AGSTAT\MASTER~2\CHAPTR04\IV-15.AG8 USDA
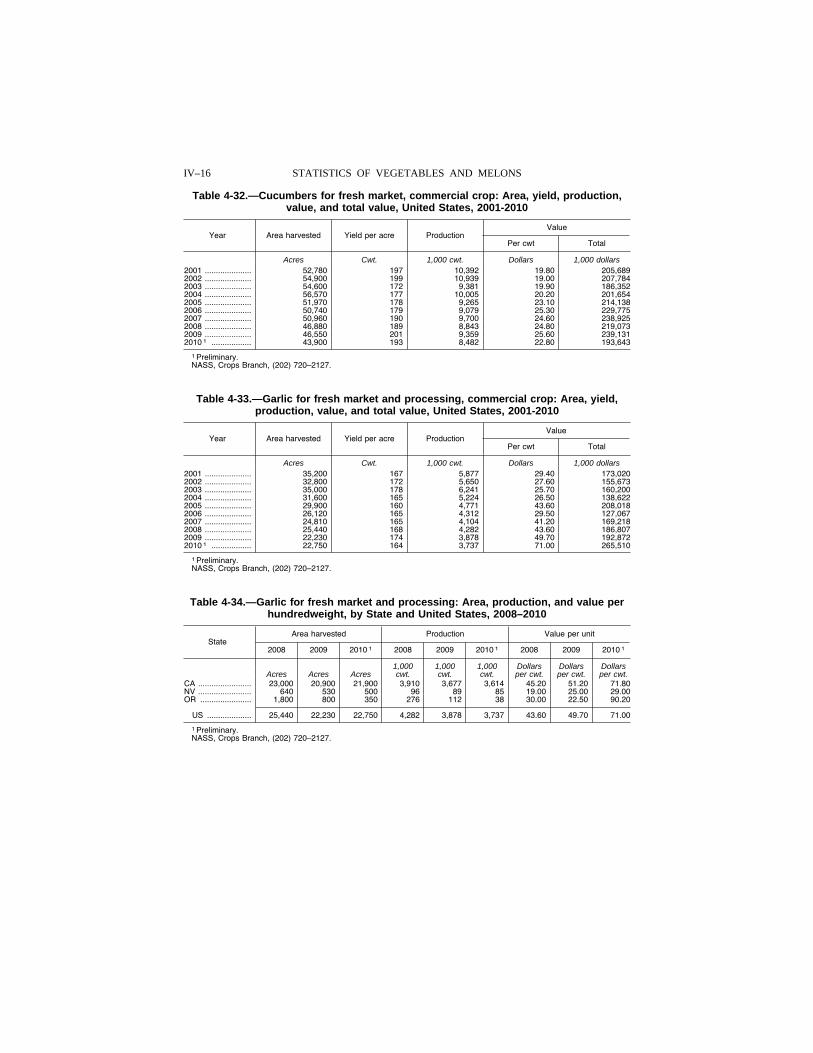
IV–16 STATISTICS OF VEGETABLES AND MELONS
Table 4-32.—Cucumbers for fresh market, commercial crop: Area, yield, production, value, and total value, United States, 2001-2010
Year Area harvested Yield per acre Production Value
Per cwt Total
Acres Cwt. 1,000 cwt. Dollars 1,000 dollars 2001 ..................... 52,780 197 10,392 19.80 205,689 2002 ..................... 54,900 199 10,939 19.00 207,784 2003 ..................... 54,600 172 9,381 19.90 186,352 2004 ..................... 56,570 177 10,005 20.20 201,654 2005 ..................... 51,970 178 9,265 23.10 214,138 2006 ..................... 50,740 179 9,079 25.30 229,775 2007 ..................... 50,960 190 9,700 24.60 238,925 2008 ..................... 46,880 189 8,843 24.80 219,073 2009 ..................... 46,550 201 9,359 25.60 239,131 2010 1 .................. 43,900 193 8,482 22.80 193,643
1 Preliminary. NASS, Crops Branch, (202) 720–2127.
Table 4-33.—Garlic for fresh market and processing, commercial crop: Area, yield, production, value, and total value, United States, 2001-2010
Year Area harvested Yield per acre Production Value
Per cwt Total
Acres Cwt. 1,000 cwt. Dollars 1,000 dollars 2001 ..................... 35,200 167 5,877 29.40 173,020 2002 ..................... 32,800 172 5,650 27.60 155,673 2003 ..................... 35,000 178 6,241 25.70 160,200 2004 ..................... 31,600 165 5,224 26.50 138,622 2005 ..................... 29,900 160 4,771 43.60 208,018 2006 ..................... 26,120 165 4,312 29.50 127,067 2007 ..................... 24,810 165 4,104 41.20 169,218 2008 ..................... 25,440 168 4,282 43.60 186,807 2009 ..................... 22,230 174 3,878 49.70 192,872 2010 1 .................. 22,750 164 3,737 71.00 265,510
1 Preliminary. NASS, Crops Branch, (202) 720–2127.
Table 4-34.—Garlic for fresh market and processing: Area, production, and value per hundredweight, by State and United States, 2008–2010
State Area harvested Production Value per unit
2008 2009 2010 1 2008 2009 2010 1 2008 2009 2010 1
1,000 1,000 1,000 Dollars Dollars Dollars Acres Acres Acres cwt. cwt. cwt. per cwt. per cwt. per cwt.
CA ........................ 23,000 20,900 21,900 3,910 3,677 3,614 45.20 51.20 71.80 NV ........................ 640 530 500 96 89 85 19.00 25.00 29.00 OR ....................... 1,800 800 350 276 112 38 30.00 22.50 90.20
US .................... 25,440 22,230 22,750 4,282 3,878 3,737 43.60 49.70 71.00
1 Preliminary. NASS, Crops Branch, (202) 720–2127.
VerDate Aug 31 2005 10:23 Feb 29, 2012 Jkt 000000 PO 00000 Frm 00016 Fmt 1000 Sfmt 1000 H:\SHARED\DAPP\FPU\AGSTAT\MASTER~2\CHAPTR04\IV-16.AG8 USDA
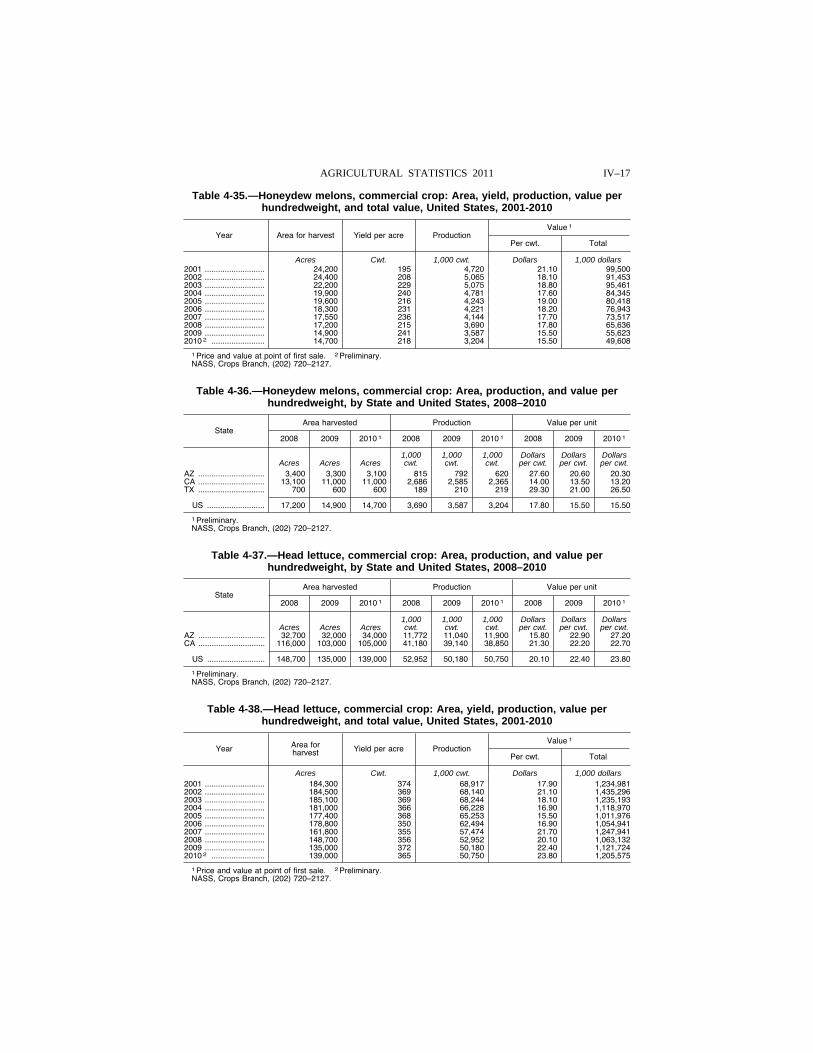
IV–17 AGRICULTURAL STATISTICS 2011
Table 4-35.—Honeydew melons, commercial crop: Area, yield, production, value per hundredweight, and total value, United States, 2001-2010
Year Area for harvest Yield per acre Production Value 1
Per cwt. Total
Acres Cwt. 1,000 cwt. Dollars 1,000 dollars 2001 ........................... 24,200 195 4,720 21.10 99,500 2002 ........................... 24,400 208 5,065 18.10 91,453 2003 ........................... 22,200 229 5,075 18.80 95,461 2004 ........................... 19,900 240 4,781 17.60 84,345 2005 ........................... 19,600 216 4,243 19.00 80,418 2006 ........................... 18,300 231 4,221 18.20 76,943 2007 ........................... 17,550 236 4,144 17.70 73,517 2008 ........................... 17,200 215 3,690 17.80 65,636 2009 ........................... 14,900 241 3,587 15.50 55,623 2010 2 ........................ 14,700 218 3,204 15.50 49,608
1 Price and value at point of first sale. 2 Preliminary. NASS, Crops Branch, (202) 720–2127.
Table 4-36.—Honeydew melons, commercial crop: Area, production, and value per hundredweight, by State and United States, 2008–2010
State Area harvested Production Value per unit
2008 2009 2010 1 2008 2009 2010 1 2008 2009 2010 1
1,000 1,000 1,000 Dollars Dollars Dollars Acres Acres Acres cwt. cwt. cwt. per cwt. per cwt. per cwt.
AZ .............................. 3,400 3,300 3,100 815 792 620 27.60 20.60 20.30 CA .............................. 13,100 11,000 11,000 2,686 2,585 2,365 14.00 13.50 13.20 TX .............................. 700 600 600 189 210 219 29.30 21.00 26.50
US .......................... 17,200 14,900 14,700 3,690 3,587 3,204 17.80 15.50 15.50
1 Preliminary. NASS, Crops Branch, (202) 720–2127.
Table 4-37.—Head lettuce, commercial crop: Area, production, and value per hundredweight, by State and United States, 2008–2010
State Area harvested Production Value per unit
2008 2009 2010 1 2008 2009 2010 1 2008 2009 2010 1
1,000 1,000 1,000 Dollars Dollars Dollars Acres Acres Acres cwt. cwt. cwt. per cwt. per cwt. per cwt.
AZ .............................. 32,700 32,000 34,000 11,772 11,040 11,900 15.80 22.90 27.20 CA .............................. 116,000 103,000 105,000 41,180 39,140 38,850 21.30 22.20 22.70
US .......................... 148,700 135,000 139,000 52,952 50,180 50,750 20.10 22.40 23.80
1 Preliminary. NASS, Crops Branch, (202) 720–2127.
Table 4-38.—Head lettuce, commercial crop: Area, yield, production, value per hundredweight, and total value, United States, 2001-2010
Year Area for harvest Yield per acre Production
Value 1
Per cwt. Total
Acres Cwt. 1,000 cwt. Dollars 1,000 dollars 2001 ........................... 184,300 374 68,917 17.90 1,234,981 2002 ........................... 184,500 369 68,140 21.10 1,435,296 2003 ........................... 185,100 369 68,244 18.10 1,235,193 2004 ........................... 181,000 366 66,228 16.90 1,118,970 2005 ........................... 177,400 368 65,253 15.50 1,011,976 2006 ........................... 178,800 350 62,494 16.90 1,054,941 2007 ........................... 161,800 355 57,474 21.70 1,247,941 2008 ........................... 148,700 356 52,952 20.10 1,063,132 2009 ........................... 135,000 372 50,180 22.40 1,121,724 2010 2 ........................ 139,000 365 50,750 23.80 1,205,575
1 Price and value at point of first sale. 2 Preliminary. NASS, Crops Branch, (202) 720–2127.
VerDate Aug 31 2005 10:23 Feb 29, 2012 Jkt 000000 PO 00000 Frm 00017 Fmt 1000 Sfmt 1000 H:\SHARED\DAPP\FPU\AGSTAT\MASTER~2\CHAPTR04\IV-17.AG8 USDA
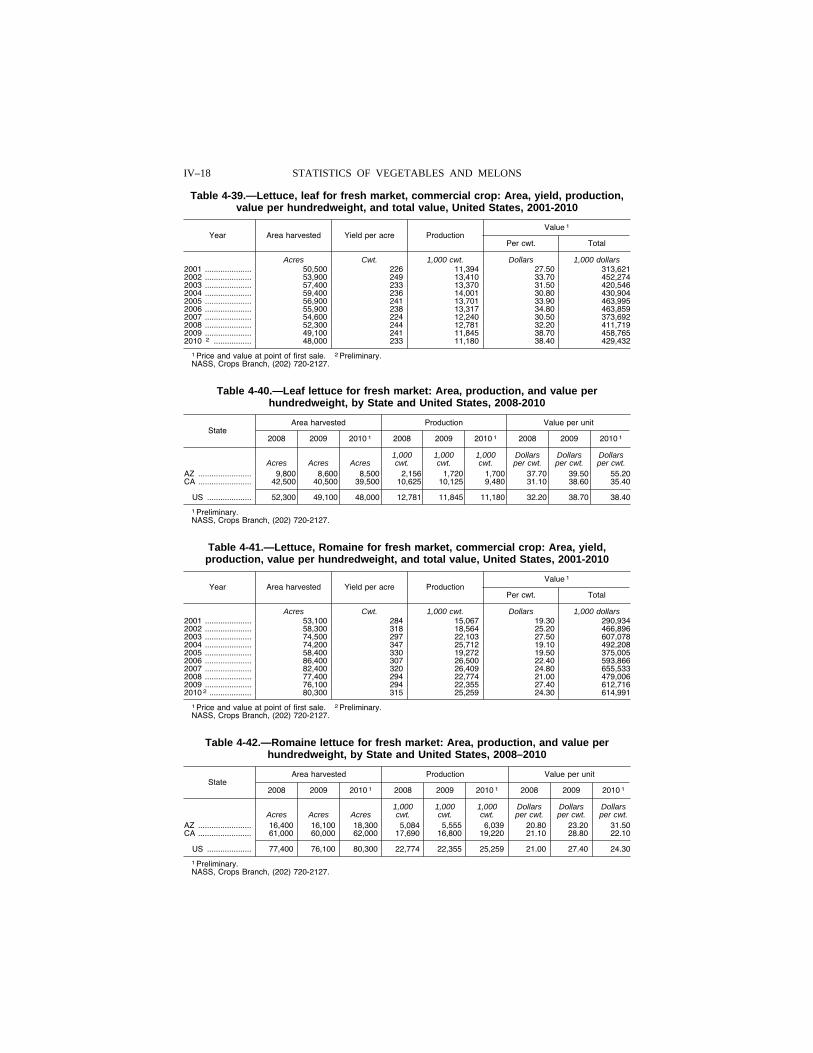
IV–18 STATISTICS OF VEGETABLES AND MELONS
Table 4-39.—Lettuce, leaf for fresh market, commercial crop: Area, yield, production, value per hundredweight, and total value, United States, 2001-2010
Year Area harvested Yield per acre Production Value 1
Per cwt. Total
Acres Cwt. 1,000 cwt. Dollars 1,000 dollars 2001 ..................... 50,500 226 11,394 27.50 313,621 2002 ..................... 53,900 249 13,410 33.70 452,274 2003 ..................... 57,400 233 13,370 31.50 420,546 2004 ..................... 59,400 236 14,001 30.80 430,904 2005 ..................... 56,900 241 13,701 33.90 463,995 2006 ..................... 55,900 238 13,317 34.80 463,859 2007 ..................... 54,600 224 12,240 30.50 373,692 2008 ..................... 52,300 244 12,781 32.20 411,719 2009 ..................... 49,100 241 11,845 38.70 458,765 2010 2 ................. 48,000 233 11,180 38.40 429,432
1 Price and value at point of first sale. 2 Preliminary. NASS, Crops Branch, (202) 720-2127.
Table 4-40.—Leaf lettuce for fresh market: Area, production, and value per hundredweight, by State and United States, 2008-2010
State Area harvested Production Value per unit
2008 2009 2010 1 2008 2009 2010 1 2008 2009 2010 1
1,000 1,000 1,000 Dollars Dollars Dollars Acres Acres Acres cwt. cwt. cwt. per cwt. per cwt. per cwt.
AZ ........................ 9,800 8,600 8,500 2,156 1,720 1,700 37.70 39.50 55.20 CA ........................ 42,500 40,500 39,500 10,625 10,125 9,480 31.10 38.60 35.40
US .................... 52,300 49,100 48,000 12,781 11,845 11,180 32.20 38.70 38.40
1 Preliminary. NASS, Crops Branch, (202) 720-2127.
Table 4-41.—Lettuce, Romaine for fresh market, commercial crop: Area, yield, production, value per hundredweight, and total value, United States, 2001-2010
Year Area harvested Yield per acre Production Value 1
Per cwt. Total
Acres Cwt. 1,000 cwt. Dollars 1,000 dollars 2001 ..................... 53,100 284 15,067 19.30 290,934 2002 ..................... 58,300 318 18,564 25.20 466,896 2003 ..................... 74,500 297 22,103 27.50 607,078 2004 ..................... 74,200 347 25,712 19.10 492,208 2005 ..................... 58,400 330 19,272 19.50 375,005 2006 ..................... 86,400 307 26,500 22.40 593,866 2007 ..................... 82,400 320 26,409 24.80 655,533 2008 ..................... 77,400 294 22,774 21.00 479,006 2009 ..................... 76,100 294 22,355 27.40 612,716 2010 2 ................... 80,300 315 25,259 24.30 614,991
1 Price and value at point of first sale. 2 Preliminary. NASS, Crops Branch, (202) 720-2127.
Table 4-42.—Romaine lettuce for fresh market: Area, production, and value per hundredweight, by State and United States, 2008–2010
State Area harvested Production Value per unit
2008 2009 2010 1 2008 2009 2010 1 2008 2009 2010 1
1,000 1,000 1,000 Dollars Dollars Dollars Acres Acres Acres cwt. cwt. cwt. per cwt. per cwt. per cwt.
AZ ........................ 16,400 16,100 18,300 5,084 5,555 6,039 20.80 23.20 31.50 CA ........................ 61,000 60,000 62,000 17,690 16,800 19,220 21.10 28.80 22.10
US .................... 77,400 76,100 80,300 22,774 22,355 25,259 21.00 27.40 24.30
1 Preliminary. NASS, Crops Branch, (202) 720-2127.
VerDate Aug 31 2005 10:23 Feb 29, 2012 Jkt 000000 PO 00000 Frm 00018 Fmt 1000 Sfmt 1000 H:\SHARED\DAPP\FPU\AGSTAT\MASTER~2\CHAPTR04\IV-18.AG8 USDA
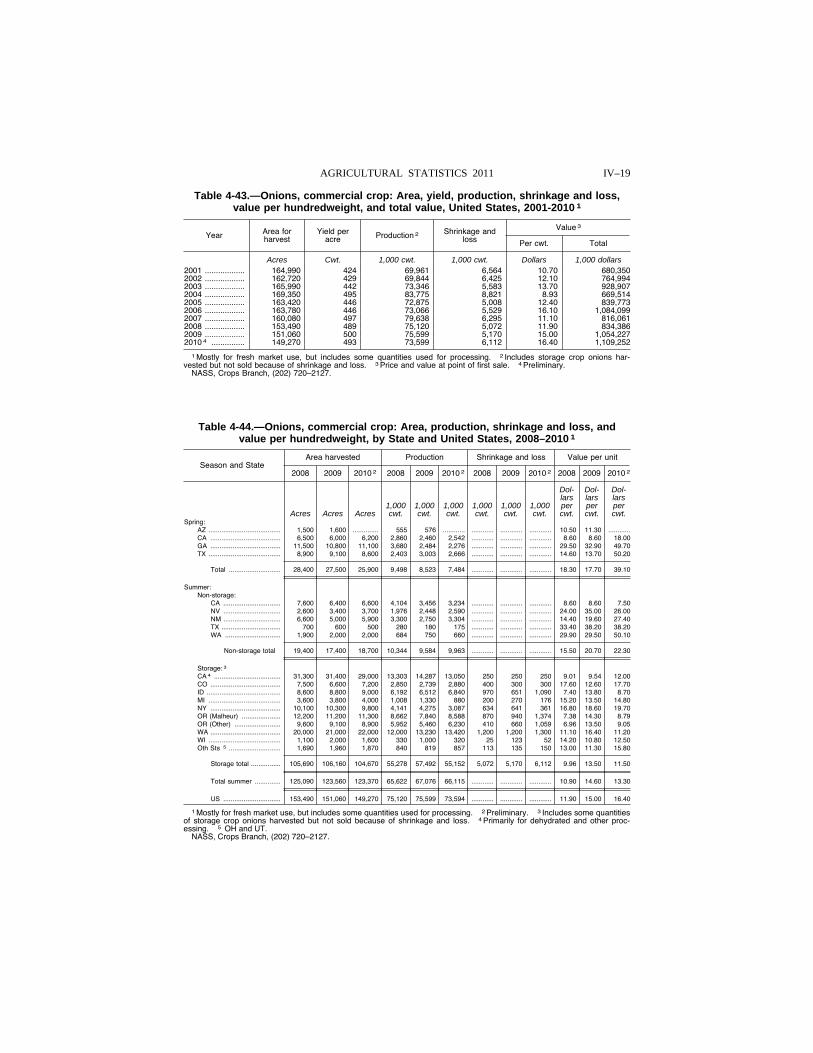
IV–19 AGRICULTURAL STATISTICS 2011
Table 4-43.—Onions, commercial crop: Area, yield, production, shrinkage and loss, value per hundredweight, and total value, United States, 2001-2010 1
Year Area for harvest
Yield per acre Production 2 Shrinkage and
loss
Value 3
Per cwt. Total
Acres Cwt. 1,000 cwt. 1,000 cwt. Dollars 1,000 dollars 2001 .................. 164,990 424 69,961 6,564 10.70 680,350 2002 .................. 162,720 429 69,844 6,425 12.10 764,994 2003 .................. 165,990 442 73,346 5,583 13.70 928,907 2004 .................. 169,350 495 83,775 8,821 8.93 669,514 2005 .................. 163,420 446 72,875 5,008 12.40 839,773 2006 .................. 163,780 446 73,066 5,529 16.10 1,084,099 2007 .................. 160,080 497 79,638 6,295 11.10 816,061 2008 .................. 153,490 489 75,120 5,072 11.90 834,386 2009 .................. 151,060 500 75,599 5,170 15.00 1,054,227 2010 4 ............... 149,270 493 73,599 6,112 16.40 1,109,252
1 Mostly for fresh market use, but includes some quantities used for processing. 2 Includes storage crop onions har-vested but not sold because of shrinkage and loss. 3 Price and value at point of first sale. 4 Preliminary.
NASS, Crops Branch, (202) 720–2127.
Table 4-44.—Onions, commercial crop: Area, production, shrinkage and loss, and value per hundredweight, by State and United States, 2008–2010 1
Season and State Area harvested Production Shrinkage and loss Value per unit
2008 2009 2010 2 2008 2009 2010 2 2008 2009 2010 2 2008 2009 2010 2
Dol- Dol- Dol- lars lars lars
1,000 1,000 1,000 1,000 1,000 1,000 per per per Acres Acres Acres cwt. cwt. cwt. cwt. cwt. cwt. cwt. cwt. cwt.
Spring: AZ ....................................... 1,500 1,600 .............. 555 576 ............ ............ ............ ............ 10.50 11.30 ............CA ...................................... 6,500 6,000 6,200 2,860 2,460 2,542 ............ ............ ............ 8.60 8.60 18.00 GA ...................................... 11,500 10,800 11,100 3,680 2,484 2,276 ............ ............ ............ 29.50 32.90 49.70 TX ....................................... 8,900 9,100 8,600 2,403 3,003 2,666 ............ ............ ............ 14.60 13.70 50.20
Total ............................ 28,400 27,500 25,900 9,498 8,523 7,484 ............ ............ ............ 18.30 17.70 39.10
Summer: Non-storage:
CA ............................... 7,600 6,400 6,600 4,104 3,456 3,234 ............ ............ ............ 8.60 8.60 7.50 NV ............................... 2,600 3,400 3,700 1,976 2,448 2,590 ............ ............ ............ 24.00 35.00 26.00 NM ............................... 6,600 5,000 5,900 3,300 2,750 3,304 ............ ............ ............ 14.40 19.60 27.40 TX ................................ 700 600 500 280 180 175 ............ ............ ............ 33.40 38.20 38.20 WA .............................. 1,900 2,000 2,000 684 750 660 ............ ............ ............ 29.90 29.50 50.10
Non-storage total 19,400 17,400 18,700 10,344 9,584 9,963 ............ ............ ............ 15.50 20.70 22.30
Storage: 3 CA 4 .................................... 31,300 31,400 29,000 13,303 14,287 13,050 250 250 250 9.01 9.54 12.00 CO ...................................... 7,500 6,600 7,200 2,850 2,739 2,880 400 300 300 17.60 12.60 17.70 ID ........................................ 8,600 8,800 9,000 6,192 6,512 6,840 970 651 1,090 7.40 13.80 8.70 MI ....................................... 3,600 3,800 4,000 1,008 1,330 880 200 270 176 15.20 13.50 14.80 NY ...................................... 10,100 10,300 9,800 4,141 4,275 3,087 634 641 361 16.80 18.60 19.70 OR (Malheur) ..................... 12,200 11,200 11,300 8,662 7,840 8,588 870 940 1,374 7.38 14.30 8.79 OR (Other) ......................... 9,600 9,100 8,900 5,952 5,460 6,230 410 660 1,059 6.96 13.50 9.05 WA ...................................... 20,000 21,000 22,000 12,000 13,230 13,420 1,200 1,200 1,300 11.10 16.40 11.20 WI ....................................... 1,100 2,000 1,600 330 1,000 320 25 123 52 14.20 10.80 12.50 Oth Sts 5 ............................ 1,690 1,960 1,870 840 819 857 113 135 150 13.00 11.30 15.80
Storage total ................ 105,690 106,160 104,670 55,278 57,492 55,152 5,072 5,170 6,112 9.96 13.50 11.50
Total summer .............. 125,090 123,560 123,370 65,622 67,076 66,115 ............ ............ ............ 10.90 14.60 13.30
US ............................... 153,490 151,060 149,270 75,120 75,599 73,594 ............ ............ ............ 11.90 15.00 16.40
1 Mostly for fresh market use, but includes some quantities used for processing. 2 Preliminary. 3 Includes some quantities of storage crop onions harvested but not sold because of shrinkage and loss. 4 Primarily for dehydrated and other proc-essing. 5 OH and UT.
NASS, Crops Branch, (202) 720–2127.
VerDate Aug 31 2005 10:23 Feb 29, 2012 Jkt 000000 PO 00000 Frm 00019 Fmt 1000 Sfmt 1000 H:\SHARED\DAPP\FPU\AGSTAT\MASTER~2\CHAPTR04\IV-19.AG8 USDA
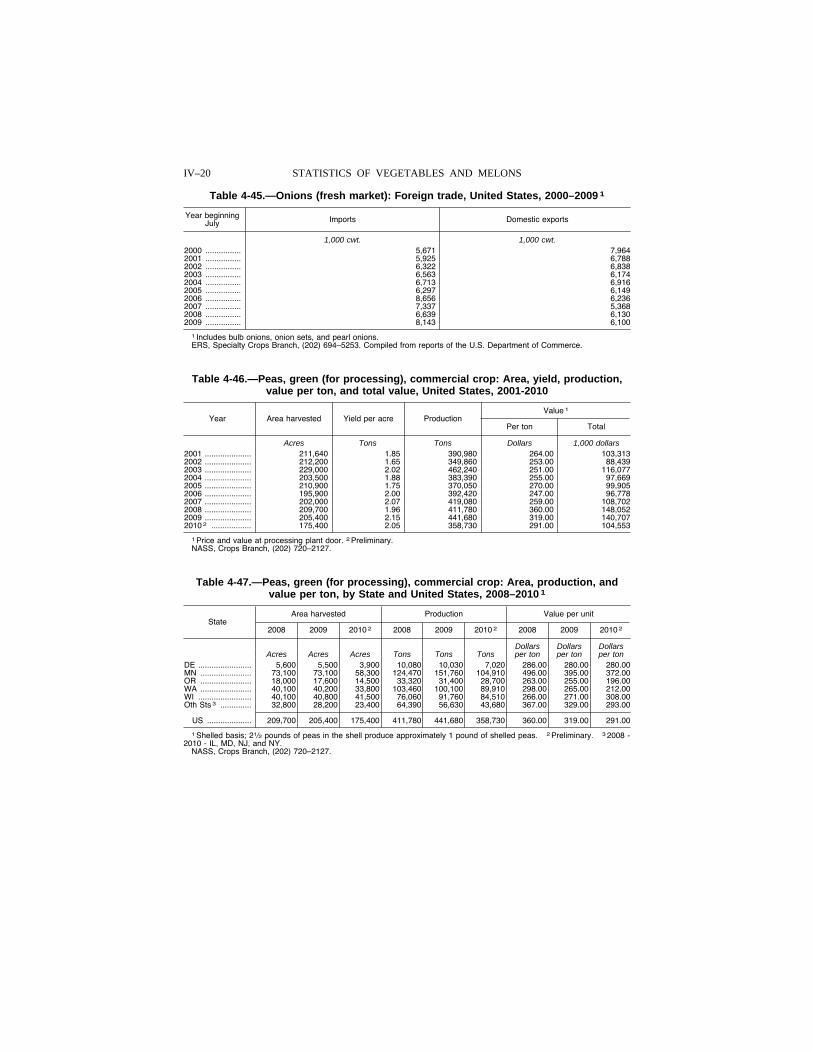
IV–20 STATISTICS OF VEGETABLES AND MELONS
Table 4-45.—Onions (fresh market): Foreign trade, United States, 2000–2009 1
Year beginning July Imports Domestic exports
1,000 cwt. 1,000 cwt. 2000 ................ 5,671 7,964 2001 ................ 5,925 6,788 2002 ................ 6,322 6,838 2003 ................ 6,563 6,174 2004 ................ 6,713 6,916 2005 ................ 6,297 6,149 2006 ................ 8,656 6,236 2007 ................ 7,337 5,368 2008 ................ 6,639 6,130 2009 ................ 8,143 6,100
1 Includes bulb onions, onion sets, and pearl onions. ERS, Specialty Crops Branch, (202) 694–5253. Compiled from reports of the U.S. Department of Commerce.
Table 4-46.—Peas, green (for processing), commercial crop: Area, yield, production, value per ton, and total value, United States, 2001-2010
Year Area harvested Yield per acre Production Value 1
Per ton Total
Acres Tons Tons Dollars 1,000 dollars 2001 ..................... 211,640 1.85 390,980 264.00 103,313 2002 ..................... 212,200 1.65 349,860 253.00 88,439 2003 ..................... 229,000 2.02 462,240 251.00 116,077 2004 ..................... 203,500 1.88 383,390 255.00 97,669 2005 ..................... 210,900 1.75 370,050 270.00 99,905 2006 ..................... 195,900 2.00 392,420 247.00 96,778 2007 ..................... 202,000 2.07 419,080 259.00 108,702 2008 ..................... 209,700 1.96 411,780 360.00 148,052 2009 ..................... 205,400 2.15 441,680 319.00 140,707 2010 2 .................. 175,400 2.05 358,730 291.00 104,553
1 Price and value at processing plant door. 2 Preliminary. NASS, Crops Branch, (202) 720–2127.
Table 4-47.—Peas, green (for processing), commercial crop: Area, production, and value per ton, by State and United States, 2008–2010 1
State Area harvested Production Value per unit
2008 2009 2010 2 2008 2009 2010 2 2008 2009 2010 2
Dollars Dollars Dollars Acres Acres Acres Tons Tons Tons per ton per ton per ton
DE ........................ 5,600 5,500 3,900 10,080 10,030 7,020 286.00 280.00 280.00 MN ....................... 73,100 73,100 58,300 124,470 151,760 104,910 496.00 395.00 372.00 OR ....................... 18,000 17,600 14,500 33,320 31,400 28,700 263.00 255.00 196.00 WA ....................... 40,100 40,200 33,800 103,460 100,100 89,910 298.00 265.00 212.00 WI ........................ 40,100 40,800 41,500 76,060 91,760 84,510 266.00 271.00 308.00 Oth Sts 3 .............. 32,800 28,200 23,400 64,390 56,630 43,680 367.00 329.00 293.00
US .................... 209,700 205,400 175,400 411,780 441,680 358,730 360.00 319.00 291.00
1 Shelled basis; 21⁄2 pounds of peas in the shell produce approximately 1 pound of shelled peas. 2 Preliminary. 3 2008 - 2010 - IL, MD, NJ, and NY.
NASS, Crops Branch, (202) 720–2127.
VerDate Aug 31 2005 10:23 Feb 29, 2012 Jkt 000000 PO 00000 Frm 00020 Fmt 1000 Sfmt 1000 H:\SHARED\DAPP\FPU\AGSTAT\MASTER~2\CHAPTR04\IV-20.AG8 USDA
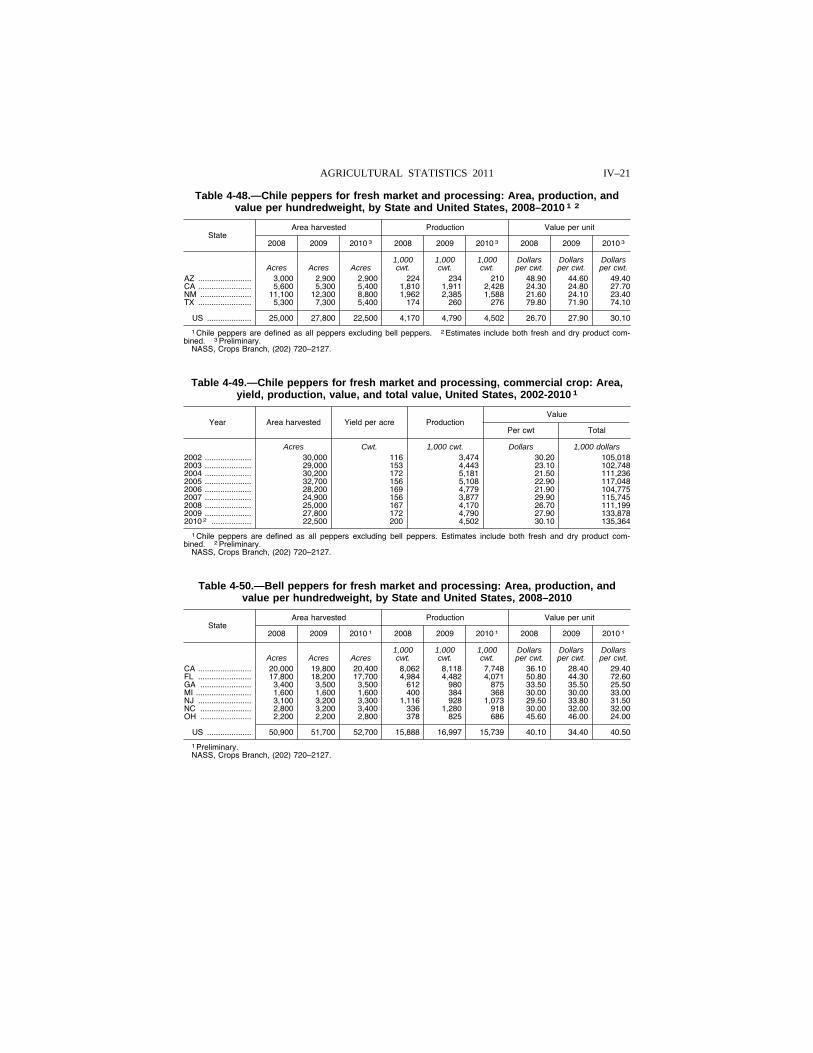
IV–21 AGRICULTURAL STATISTICS 2011
Table 4-48.—Chile peppers for fresh market and processing: Area, production, and value per hundredweight, by State and United States, 2008–2010 1 2
State Area harvested Production Value per unit
2008 2009 2010 3 2008 2009 2010 3 2008 2009 2010 3
1,000 1,000 1,000 Dollars Dollars Dollars Acres Acres Acres cwt. cwt. cwt. per cwt. per cwt. per cwt.
AZ ........................ 3,000 2,900 2,900 224 234 210 48.90 44.60 49.40 CA ........................ 5,600 5,300 5,400 1,810 1,911 2,428 24.30 24.80 27.70 NM ....................... 11,100 12,300 8,800 1,962 2,385 1,588 21.60 24.10 23.40 TX ........................ 5,300 7,300 5,400 174 260 276 79.80 71.90 74.10
US .................... 25,000 27,800 22,500 4,170 4,790 4,502 26.70 27.90 30.10
1 Chile peppers are defined as all peppers excluding bell peppers. 2 Estimates include both fresh and dry product com-bined. 3 Preliminary.
NASS, Crops Branch, (202) 720–2127.
Table 4-49.—Chile peppers for fresh market and processing, commercial crop: Area, yield, production, value, and total value, United States, 2002-2010 1
Year Area harvested Yield per acre Production Value
Per cwt Total
Acres Cwt. 1,000 cwt. Dollars 1,000 dollars 2002 ..................... 30,000 116 3,474 30.20 105,018 2003 ..................... 29,000 153 4,443 23.10 102,748 2004 ..................... 30,200 172 5,181 21.50 111,236 2005 ..................... 32,700 156 5,108 22.90 117,048 2006 ..................... 28,200 169 4,779 21.90 104,775 2007 ..................... 24,900 156 3,877 29.90 115,745 2008 ..................... 25,000 167 4,170 26.70 111,199 2009 ..................... 27,800 172 4,790 27.90 133,878 2010 2 .................. 22,500 200 4,502 30.10 135,364
1 Chile peppers are defined as all peppers excluding bell peppers. Estimates include both fresh and dry product com-bined. 2 Preliminary.
NASS, Crops Branch, (202) 720–2127.
Table 4-50.—Bell peppers for fresh market and processing: Area, production, and value per hundredweight, by State and United States, 2008–2010
State Area harvested Production Value per unit
2008 2009 2010 1 2008 2009 2010 1 2008 2009 2010 1
1,000 1,000 1,000 Dollars Dollars Dollars Acres Acres Acres cwt. cwt. cwt. per cwt. per cwt. per cwt.
CA ........................ 20,000 19,800 20,400 8,062 8,118 7,748 36.10 28.40 29.40 FL ........................ 17,800 18,200 17,700 4,984 4,482 4,071 50.80 44.30 72.60 GA ....................... 3,400 3,500 3,500 612 980 875 33.50 35.50 25.50 MI ......................... 1,600 1,600 1,600 400 384 368 30.00 30.00 33.00 NJ ........................ 3,100 3,200 3,300 1,116 928 1,073 29.50 33.80 31.50 NC ....................... 2,800 3,200 3,400 336 1,280 918 30.00 32.00 32.00 OH ....................... 2,200 2,200 2,800 378 825 686 45.60 46.00 24.00
US .................... 50,900 51,700 52,700 15,888 16,997 15,739 40.10 34.40 40.50
1 Preliminary. NASS, Crops Branch, (202) 720–2127.
VerDate Aug 31 2005 10:23 Feb 29, 2012 Jkt 000000 PO 00000 Frm 00021 Fmt 1000 Sfmt 1000 H:\SHARED\DAPP\FPU\AGSTAT\MASTER~2\CHAPTR04\IV-21.AG8 USDA
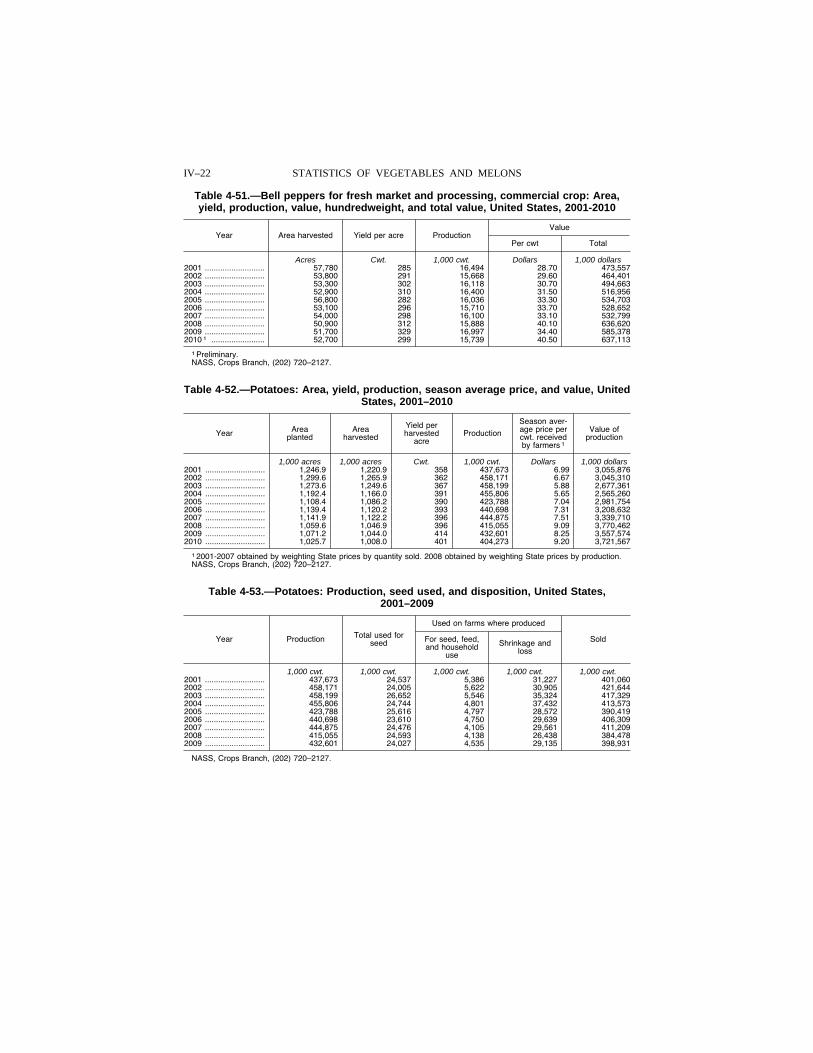
IV–22 STATISTICS OF VEGETABLES AND MELONS
Table 4-51.—Bell peppers for fresh market and processing, commercial crop: Area, yield, production, value, hundredweight, and total value, United States, 2001-2010
Year Area harvested Yield per acre Production Value
Per cwt Total
Acres Cwt. 1,000 cwt. Dollars 1,000 dollars 2001 ........................... 57,780 285 16,494 28.70 473,557 2002 ........................... 53,800 291 15,668 29.60 464,401 2003 ........................... 53,300 302 16,118 30.70 494,663 2004 ........................... 52,900 310 16,400 31.50 516,956 2005 ........................... 56,800 282 16,036 33.30 534,703 2006 ........................... 53,100 296 15,710 33.70 528,652 2007 ........................... 54,000 298 16,100 33.10 532,799 2008 ........................... 50,900 312 15,888 40.10 636,620 2009 ........................... 51,700 329 16,997 34.40 585,378 2010 1 ........................ 52,700 299 15,739 40.50 637,113
1 Preliminary. NASS, Crops Branch, (202) 720–2127.
Table 4-52.—Potatoes: Area, yield, production, season average price, and value, United States, 2001–2010
Year Area planted
Area harvested
Yield per harvested
acre Production
Season aver-age price per cwt. received by farmers 1
Value of production
1,000 acres 1,000 acres Cwt. 1,000 cwt. Dollars 1,000 dollars 2001 ........................... 1,246.9 1,220.9 358 437,673 6.99 3,055,876 2002 ........................... 1,299.6 1,265.9 362 458,171 6.67 3,045,310 2003 ........................... 1,273.6 1,249.6 367 458,199 5.88 2,677,361 2004 ........................... 1,192.4 1,166.0 391 455,806 5.65 2,565,260 2005 ........................... 1,108.4 1,086.2 390 423,788 7.04 2,981,754 2006 ........................... 1,139.4 1,120.2 393 440,698 7.31 3,208,632 2007 ........................... 1,141.9 1,122.2 396 444,875 7.51 3,339,710 2008 ........................... 1,059.6 1,046.9 396 415,055 9.09 3,770,462 2009 ........................... 1,071.2 1,044.0 414 432,601 8.25 3,557,574 2010 ........................... 1,025.7 1,008.0 401 404,273 9.20 3,721,567
1 2001-2007 obtained by weighting State prices by quantity sold. 2008 obtained by weighting State prices by production. NASS, Crops Branch, (202) 720–2127.
Table 4-53.—Potatoes: Production, seed used, and disposition, United States, 2001–2009
Year Production Total used for seed
Used on farms where produced
Sold For seed, feed, and household
use
Shrinkage and loss
1,000 cwt. 1,000 cwt. 1,000 cwt. 1,000 cwt. 1,000 cwt. 2001 ........................... 437,673 24,537 5,386 31,227 401,060 2002 ........................... 458,171 24,005 5,622 30,905 421,644 2003 ........................... 458,199 26,652 5,546 35,324 417,329 2004 ........................... 455,806 24,744 4,801 37,432 413,573 2005 ........................... 423,788 25,616 4,797 28,572 390,419 2006 ........................... 440,698 23,610 4,750 29,639 406,309 2007 ........................... 444,875 24,476 4,105 29,561 411,209 2008 ........................... 415,055 24,593 4,138 26,438 384,478 2009 ........................... 432,601 24,027 4,535 29,135 398,931
NASS, Crops Branch, (202) 720–2127.
VerDate Aug 31 2005 10:23 Feb 29, 2012 Jkt 000000 PO 00000 Frm 00022 Fmt 1000 Sfmt 1000 H:\SHARED\DAPP\FPU\AGSTAT\MASTER~2\CHAPTR04\IV-22.AG8 USDA
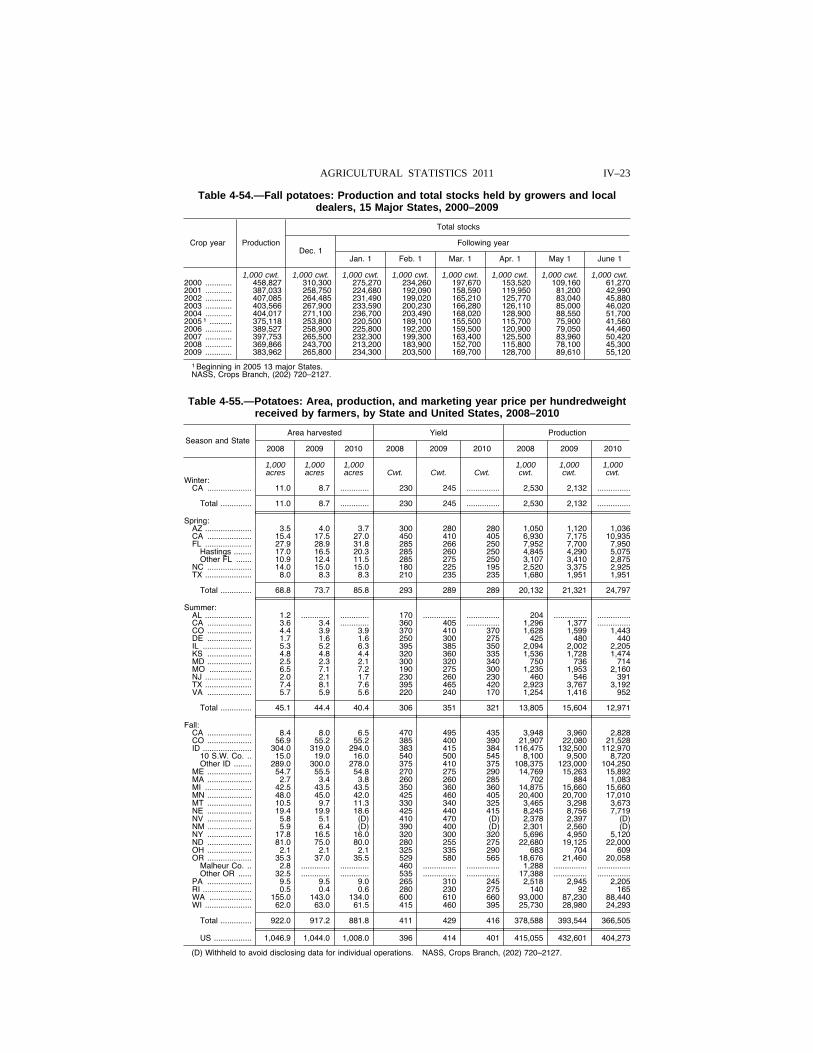
IV–23 AGRICULTURAL STATISTICS 2011
Table 4-54.—Fall potatoes: Production and total stocks held by growers and local dealers, 15 Major States, 2000–2009
Crop year Production
Total stocks
Dec. 1 Following year
Jan. 1 Feb. 1 Mar. 1 Apr. 1 May 1 June 1
1,000 cwt. 1,000 cwt. 1,000 cwt. 1,000 cwt. 1,000 cwt. 1,000 cwt. 1,000 cwt. 1,000 cwt. 2000 ............ 458,827 310,300 275,270 234,260 197,670 153,520 109,160 61,270 2001 ............ 387,033 258,750 224,680 192,090 158,590 119,950 81,200 42,990 2002 ............ 407,085 264,485 231,490 199,020 165,210 125,770 83,040 45,880 2003 ............ 403,566 267,900 233,590 200,230 166,280 126,110 85,000 46,020 2004 ............ 404,017 271,100 236,700 203,490 168,020 128,900 88,550 51,700 2005 1 .......... 375,118 253,800 220,500 189,100 155,500 115,700 75,900 41,560 2006 ............ 389,527 258,900 225,800 192,200 159,500 120,900 79,050 44,460 2007 ............ 397,753 265,500 232,300 199,300 163,400 125,500 83,960 50,420 2008 ............ 369,866 243,700 213,200 183,900 152,700 115,800 78,100 45,300 2009 ............ 383,962 265,800 234,300 203,500 169,700 128,700 89,610 55,120
1 Beginning in 2005 13 major States. NASS, Crops Branch, (202) 720–2127.
Table 4-55.—Potatoes: Area, production, and marketing year price per hundredweight received by farmers, by State and United States, 2008–2010
Season and State Area harvested Yield Production
2008 2009 2010 2008 2009 2010 2008 2009 2010
1,000 1,000 1,000 1,000 1,000 1,000 acres acres acres Cwt. Cwt. Cwt. cwt. cwt. cwt.
Winter: CA .................... 11.0 8.7 ............. 230 245 ............... 2,530 2,132 ...............
Total .............. 11.0 8.7 ............. 230 245 ............... 2,530 2,132 ...............
Spring: AZ ..................... 3.5 4.0 3.7 300 280 280 1,050 1,120 1,036 CA .................... 15.4 17.5 27.0 450 410 405 6,930 7,175 10,935 FL ..................... 27.9 28.9 31.8 285 266 250 7,952 7,700 7,950
Hastings ........ 17.0 16.5 20.3 285 260 250 4,845 4,290 5,075 Other FL ....... 10.9 12.4 11.5 285 275 250 3,107 3,410 2,875
NC .................... 14.0 15.0 15.0 180 225 195 2,520 3,375 2,925 TX ..................... 8.0 8.3 8.3 210 235 235 1,680 1,951 1,951
Total .............. 68.8 73.7 85.8 293 289 289 20,132 21,321 24,797
Summer: AL ..................... 1.2 ............. ............. 170 ............... ............... 204 ............... ...............CA .................... 3.6 3.4 ............. 360 405 ............... 1,296 1,377 ...............CO .................... 4.4 3.9 3.9 370 410 370 1,628 1,599 1,443 DE .................... 1.7 1.6 1.6 250 300 275 425 480 440 IL ...................... 5.3 5.2 6.3 395 385 350 2,094 2,002 2,205 KS .................... 4.8 4.8 4.4 320 360 335 1,536 1,728 1,474 MD .................... 2.5 2.3 2.1 300 320 340 750 736 714 MO ................... 6.5 7.1 7.2 190 275 300 1,235 1,953 2,160 NJ ..................... 2.0 2.1 1.7 230 260 230 460 546 391 TX ..................... 7.4 8.1 7.6 395 465 420 2,923 3,767 3,192 VA .................... 5.7 5.9 5.6 220 240 170 1,254 1,416 952
Total .............. 45.1 44.4 40.4 306 351 321 13,805 15,604 12,971
Fall: CA .................... 8.4 8.0 6.5 470 495 435 3,948 3,960 2,828 CO .................... 56.9 55.2 55.2 385 400 390 21,907 22,080 21,528 ID ...................... 304.0 319.0 294.0 383 415 384 116,475 132,500 112,970
10 S.W. Co. .. 15.0 19.0 16.0 540 500 545 8,100 9,500 8,720 Other ID ........ 289.0 300.0 278.0 375 410 375 108,375 123,000 104,250
ME .................... 54.7 55.5 54.8 270 275 290 14,769 15,263 15,892 MA .................... 2.7 3.4 3.8 260 260 285 702 884 1,083 MI ..................... 42.5 43.5 43.5 350 360 360 14,875 15,660 15,660 MN .................... 48.0 45.0 42.0 425 460 405 20,400 20,700 17,010 MT .................... 10.5 9.7 11.3 330 340 325 3,465 3,298 3,673 NE .................... 19.4 19.9 18.6 425 440 415 8,245 8,756 7,719 NV .................... 5.8 5.1 (D) 410 470 (D) 2,378 2,397 (D) NM .................... 5.9 6.4 (D) 390 400 (D) 2,301 2,560 (D) NY .................... 17.8 16.5 16.0 320 300 320 5,696 4,950 5,120 ND .................... 81.0 75.0 80.0 280 255 275 22,680 19,125 22,000 OH .................... 2.1 2.1 2.1 325 335 290 683 704 609 OR .................... 35.3 37.0 35.5 529 580 565 18,676 21,460 20,058
Malheur Co. .. 2.8 ............. ............. 460 ............... ............... 1,288 ............... ...............Other OR ...... 32.5 ............. ............. 535 ............... ............... 17,388 ............... ...............
PA .................... 9.5 9.5 9.0 265 310 245 2,518 2,945 2,205 RI ...................... 0.5 0.4 0.6 280 230 275 140 92 165 WA ................... 155.0 143.0 134.0 600 610 660 93,000 87,230 88,440 WI ..................... 62.0 63.0 61.5 415 460 395 25,730 28,980 24,293
Total .............. 922.0 917.2 881.8 411 429 416 378,588 393,544 366,505
US ................. 1,046.9 1,044.0 1,008.0 396 414 401 415,055 432,601 404,273
(D) Withheld to avoid disclosing data for individual operations. NASS, Crops Branch, (202) 720–2127.
VerDate Aug 31 2005 10:23 Feb 29, 2012 Jkt 000000 PO 00000 Frm 00023 Fmt 1000 Sfmt 1000 H:\SHARED\DAPP\FPU\AGSTAT\MASTER~2\CHAPTR04\IV-23.AG8 USDA
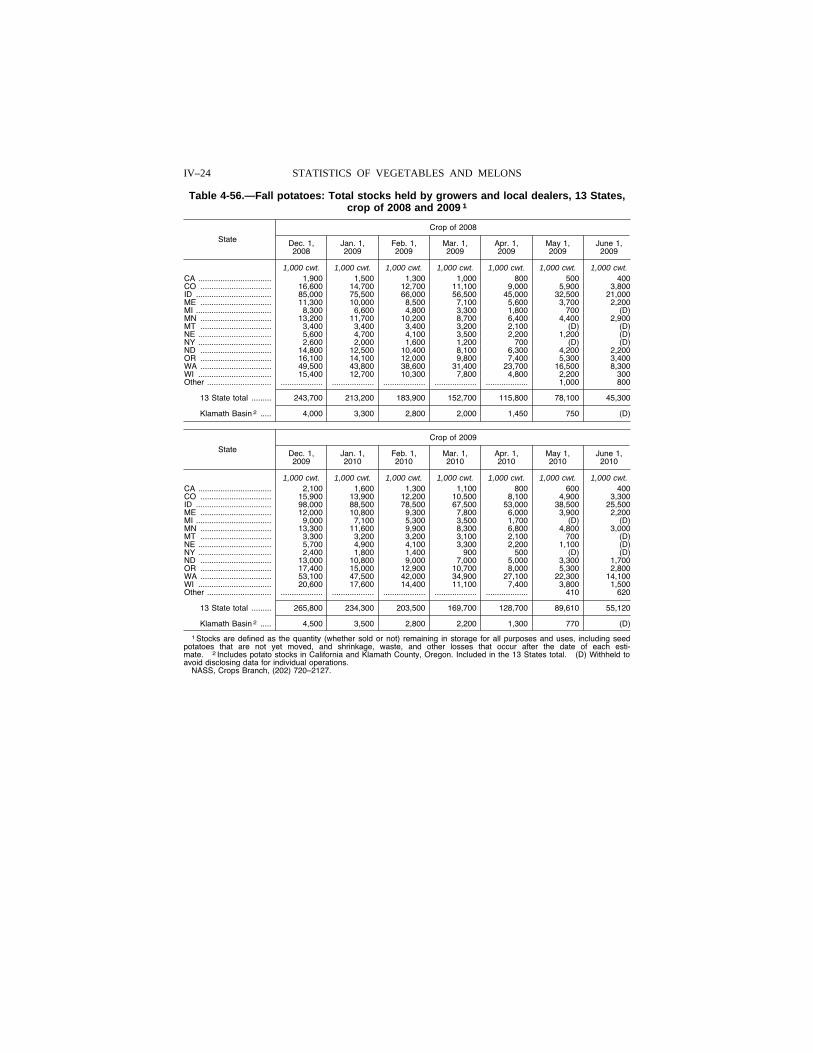
IV–24 STATISTICS OF VEGETABLES AND MELONS
Table 4-56.—Fall potatoes: Total stocks held by growers and local dealers, 13 States, crop of 2008 and 2009 1
State
Crop of 2008
Dec. 1, 2008
Jan. 1, 2009
Feb. 1, 2009
Mar. 1, 2009
Apr. 1, 2009
May 1, 2009
June 1, 2009
1,000 cwt. 1,000 cwt. 1,000 cwt. 1,000 cwt. 1,000 cwt. 1,000 cwt. 1,000 cwt. CA ................................. 1,900 1,500 1,300 1,000 800 500 400 CO ................................ 16,600 14,700 12,700 11,100 9,000 5,900 3,800 ID .................................. 85,000 75,500 66,000 56,500 45,000 32,500 21,000 ME ................................ 11,300 10,000 8,500 7,100 5,600 3,700 2,200 MI .................................. 8,300 6,600 4,800 3,300 1,800 700 (D) MN ................................ 13,200 11,700 10,200 8,700 6,400 4,400 2,900 MT ................................ 3,400 3,400 3,400 3,200 2,100 (D) (D) NE ................................. 5,600 4,700 4,100 3,500 2,200 1,200 (D) NY ................................. 2,600 2,000 1,600 1,200 700 (D) (D) ND ................................ 14,800 12,500 10,400 8,100 6,300 4,200 2,200 OR ................................ 16,100 14,100 12,000 9,800 7,400 5,300 3,400 WA ................................ 49,500 43,800 38,600 31,400 23,700 16,500 8,300 WI ................................. 15,400 12,700 10,300 7,800 4,800 2,200 300 Other ............................. ................... ................... ................... ................... ................... 1,000 800
13 State total ......... 243,700 213,200 183,900 152,700 115,800 78,100 45,300
Klamath Basin 2 ..... 4,000 3,300 2,800 2,000 1,450 750 (D)
State
Crop of 2009
Dec. 1, 2009
Jan. 1, 2010
Feb. 1, 2010
Mar. 1, 2010
Apr. 1, 2010
May 1, 2010
June 1, 2010
1,000 cwt. 1,000 cwt. 1,000 cwt. 1,000 cwt. 1,000 cwt. 1,000 cwt. 1,000 cwt. CA ................................. 2,100 1,600 1,300 1,100 800 600 400 CO ................................ 15,900 13,900 12,200 10,500 8,100 4,900 3,300 ID .................................. 98,000 88,500 78,500 67,500 53,000 38,500 25,500 ME ................................ 12,000 10,800 9,300 7,800 6,000 3,900 2,200 MI .................................. 9,000 7,100 5,300 3,500 1,700 (D) (D) MN ................................ 13,300 11,600 9,900 8,300 6,800 4,800 3,000 MT ................................ 3,300 3,200 3,200 3,100 2,100 700 (D) NE ................................. 5,700 4,900 4,100 3,300 2,200 1,100 (D) NY ................................. 2,400 1,800 1,400 900 500 (D) (D) ND ................................ 13,000 10,800 9,000 7,000 5,000 3,300 1,700 OR ................................ 17,400 15,000 12,900 10,700 8,000 5,300 2,800 WA ................................ 53,100 47,500 42,000 34,900 27,100 22,300 14,100 WI ................................. 20,600 17,600 14,400 11,100 7,400 3,800 1,500 Other ............................. ................... ................... ................... ................... ................... 410 620
13 State total ......... 265,800 234,300 203,500 169,700 128,700 89,610 55,120
Klamath Basin 2 ..... 4,500 3,500 2,800 2,200 1,300 770 (D)
1 Stocks are defined as the quantity (whether sold or not) remaining in storage for all purposes and uses, including seed potatoes that are not yet moved, and shrinkage, waste, and other losses that occur after the date of each esti-mate. 2 Includes potato stocks in California and Klamath County, Oregon. Included in the 13 States total. (D) Withheld to avoid disclosing data for individual operations.
NASS, Crops Branch, (202) 720–2127.
VerDate Aug 31 2005 10:23 Feb 29, 2012 Jkt 000000 PO 00000 Frm 00024 Fmt 1000 Sfmt 1000 H:\SHARED\DAPP\FPU\AGSTAT\MASTER~2\CHAPTR04\IV-24.AG8 USDA
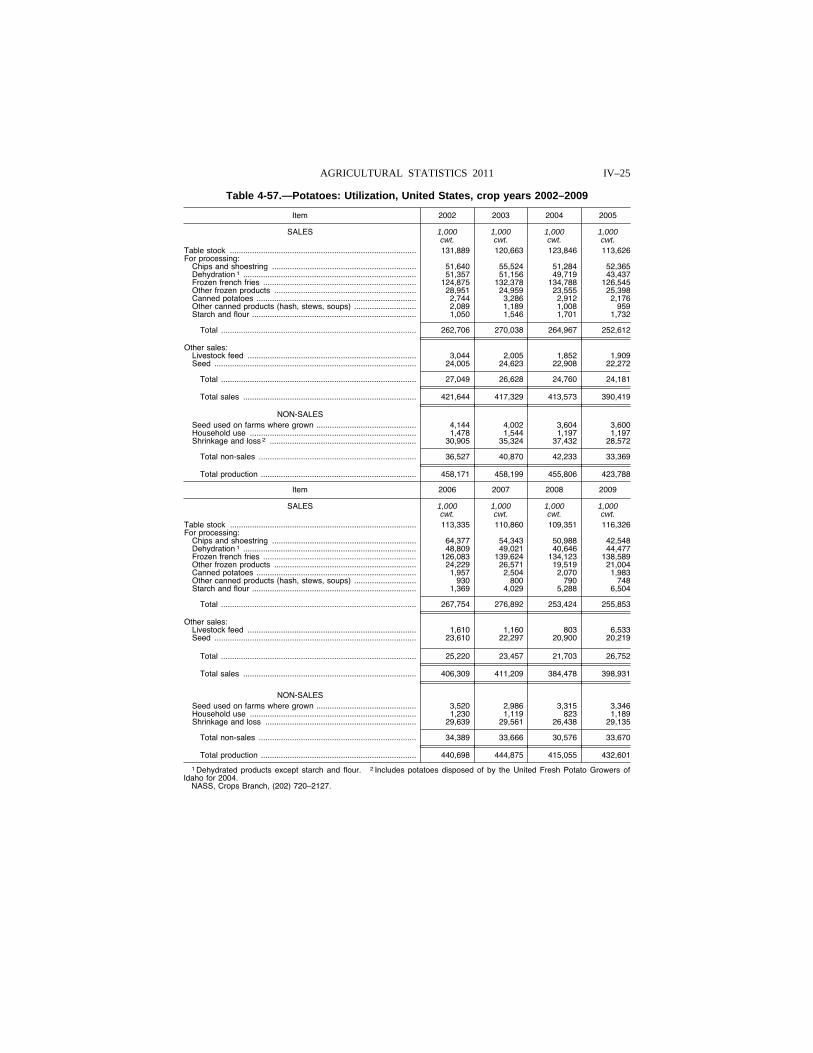
IV–25 AGRICULTURAL STATISTICS 2011
Table 4-57.—Potatoes: Utilization, United States, crop years 2002–2009
Item 2002 2003 2004 2005
SALES 1,000 1,000 1,000 1,000 cwt. cwt. cwt. cwt.
Table stock .................................................................................... 131,889 120,663 123,846 113,626 For processing:
Chips and shoestring ................................................................. 51,640 55,524 51,284 52,365 Dehydration 1 .............................................................................. 51,357 51,156 49,719 43,437 Frozen french fries ..................................................................... 124,875 132,378 134,788 126,545 Other frozen products ................................................................ 28,951 24,959 23,555 25,398 Canned potatoes ........................................................................ 2,744 3,286 2,912 2,176 Other canned products (hash, stews, soups) ............................ 2,089 1,189 1,008 959 Starch and flour .......................................................................... 1,050 1,546 1,701 1,732
Total ........................................................................................ 262,706 270,038 264,967 252,612
Other sales: Livestock feed ............................................................................ 3,044 2,005 1,852 1,909 Seed ........................................................................................... 24,005 24,623 22,908 22,272
Total ........................................................................................ 27,049 26,628 24,760 24,181
Total sales .............................................................................. 421,644 417,329 413,573 390,419
NON-SALES Seed used on farms where grown ............................................. 4,144 4,002 3,604 3,600 Household use ........................................................................... 1,478 1,544 1,197 1,197 Shrinkage and loss 2 .................................................................. 30,905 35,324 37,432 28,572
Total non-sales ....................................................................... 36,527 40,870 42,233 33,369
Total production ...................................................................... 458,171 458,199 455,806 423,788
Item 2006 2007 2008 2009
SALES 1,000 1,000 1,000 1,000 cwt. cwt. cwt. cwt.
Table stock .................................................................................... 113,335 110,860 109,351 116,326 For processing:
Chips and shoestring ................................................................. 64,377 54,343 50,988 42,548 Dehydration 1 .............................................................................. 48,809 49,021 40,646 44,477 Frozen french fries ..................................................................... 126,083 139,624 134,123 138,589 Other frozen products ................................................................ 24,229 26,571 19,519 21,004 Canned potatoes ........................................................................ 1,957 2,504 2,070 1,983 Other canned products (hash, stews, soups) ............................ 930 800 790 748 Starch and flour .......................................................................... 1,369 4,029 5,288 6,504
Total ........................................................................................ 267,754 276,892 253,424 255,853
Other sales: Livestock feed ............................................................................ 1,610 1,160 803 6,533 Seed ........................................................................................... 23,610 22,297 20,900 20,219
Total ........................................................................................ 25,220 23,457 21,703 26,752
Total sales .............................................................................. 406,309 411,209 384,478 398,931
NON-SALES Seed used on farms where grown ............................................. 3,520 2,986 3,315 3,346 Household use ........................................................................... 1,230 1,119 823 1,189 Shrinkage and loss .................................................................... 29,639 29,561 26,438 29,135
Total non-sales ....................................................................... 34,389 33,666 30,576 33,670
Total production ...................................................................... 440,698 444,875 415,055 432,601
1 Dehydrated products except starch and flour. 2 Includes potatoes disposed of by the United Fresh Potato Growers of Idaho for 2004.
NASS, Crops Branch, (202) 720–2127.
VerDate Aug 31 2005 10:23 Feb 29, 2012 Jkt 000000 PO 00000 Frm 00025 Fmt 1000 Sfmt 1000 H:\SHARED\DAPP\FPU\AGSTAT\MASTER~2\CHAPTR04\IV-25.AG8 USDA
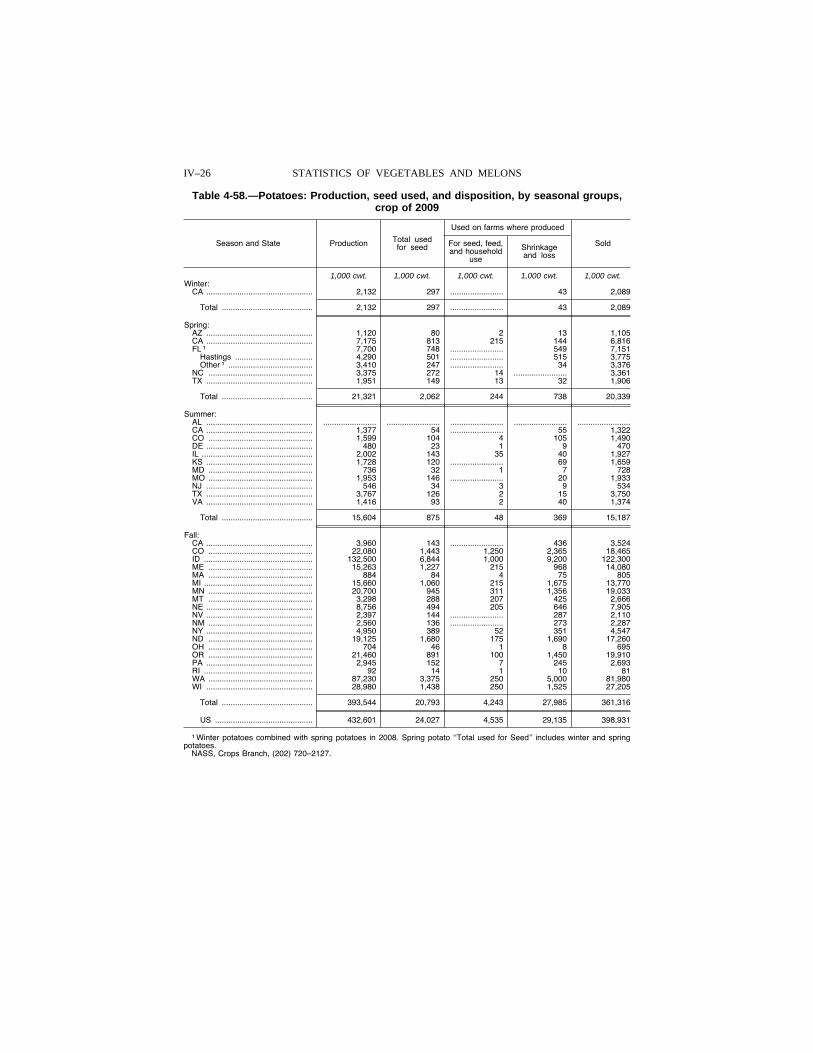
IV–26 STATISTICS OF VEGETABLES AND MELONS
Table 4-58.—Potatoes: Production, seed used, and disposition, by seasonal groups, crop of 2009
Season and State Production Total used for seed
Used on farms where produced
Sold For seed, feed, and household
use
Shrinkage and loss
1,000 cwt. 1,000 cwt. 1,000 cwt. 1,000 cwt. 1,000 cwt. Winter:
CA ................................................ 2,132 297 ........................ 43 2,089
Total ......................................... 2,132 297 ........................ 43 2,089
Spring: AZ ................................................ 1,120 80 2 13 1,105 CA ................................................ 7,175 813 215 144 6,816 FL 1 7,700 748 ........................ 549 7,151
Hastings ................................... 4,290 501 ........................ 515 3,775 Other 1 ...................................... 3,410 247 ........................ 34 3,376
NC ............................................... 3,375 272 14 ........................ 3,361 TX ................................................ 1,951 149 13 32 1,906
Total ......................................... 21,321 2,062 244 738 20,339
Summer: AL ................................................ ........................ ........................ ........................ ........................ ........................CA ................................................ 1,377 54 ........................ 55 1,322 CO ............................................... 1,599 104 4 105 1,490 DE ................................................ 480 23 1 9 470 IL .................................................. 2,002 143 35 40 1,927 KS ................................................ 1,728 120 ........................ 69 1,659 MD ............................................... 736 32 1 7 728 MO ............................................... 1,953 146 ........................ 20 1,933 NJ ................................................ 546 34 3 9 534 TX ................................................ 3,767 126 2 15 3,750 VA ................................................ 1,416 93 2 40 1,374
Total ......................................... 15,604 875 48 369 15,187
Fall: CA ................................................ 3,960 143 ........................ 436 3,524 CO ............................................... 22,080 1,443 1,250 2,365 18,465 ID ................................................. 132,500 6,844 1,000 9,200 122,300 ME ............................................... 15,263 1,227 215 968 14,080 MA ............................................... 884 84 4 75 805 MI ................................................. 15,660 1,060 215 1,675 13,770 MN ............................................... 20,700 945 311 1,356 19,033 MT ............................................... 3,298 288 207 425 2,666 NE ................................................ 8,756 494 205 646 7,905 NV ................................................ 2,397 144 ........................ 287 2,110 NM ............................................... 2,560 136 ........................ 273 2,287 NY ................................................ 4,950 389 52 351 4,547 ND ............................................... 19,125 1,680 175 1,690 17,260 OH ............................................... 704 46 1 8 695 OR ............................................... 21,460 891 100 1,450 19,910 PA ................................................ 2,945 152 7 245 2,693 RI ................................................. 92 14 1 10 81 WA ............................................... 87,230 3,375 250 5,000 81,980 WI ................................................ 28,980 1,438 250 1,525 27,205
Total ......................................... 393,544 20,793 4,243 27,985 361,316
US ............................................ 432,601 24,027 4,535 29,135 398,931
1 Winter potatoes combined with spring potatoes in 2008. Spring potato ‘‘Total used for Seed’’ includes winter and spring potatoes.
NASS, Crops Branch, (202) 720–2127.
VerDate Aug 31 2005 10:23 Feb 29, 2012 Jkt 000000 PO 00000 Frm 00026 Fmt 1000 Sfmt 1000 H:\SHARED\DAPP\FPU\AGSTAT\MASTER~2\CHAPTR04\IV-26.AG8 USDA
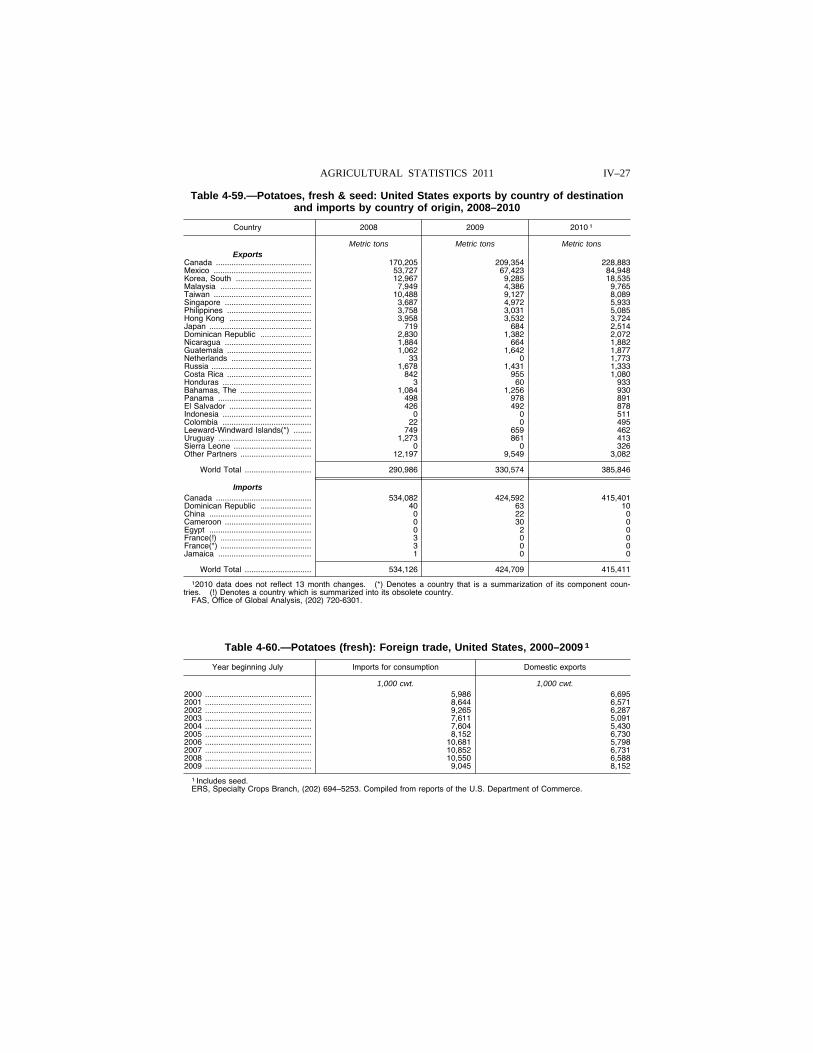
IV–27 AGRICULTURAL STATISTICS 2011
Table 4-59.—Potatoes, fresh & seed: United States exports by country of destination and imports by country of origin, 2008–2010
Country 2008 2009 2010 1
Metric tons Metric tons Metric tons Exports
Canada ........................................... 170,205 209,354 228,883 Mexico ............................................ 53,727 67,423 84,948 Korea, South .................................. 12,967 9,285 18,535 Malaysia ......................................... 7,949 4,386 9,765 Taiwan ............................................ 10,488 9,127 8,089 Singapore ....................................... 3,687 4,972 5,933 Philippines ...................................... 3,758 3,031 5,085 Hong Kong ..................................... 3,958 3,532 3,724 Japan .............................................. 719 684 2,514 Dominican Republic ....................... 2,830 1,382 2,072 Nicaragua ....................................... 1,884 664 1,882 Guatemala ...................................... 1,062 1,642 1,877 Netherlands .................................... 33 0 1,773 Russia ............................................. 1,678 1,431 1,333 Costa Rica ...................................... 842 955 1,080 Honduras ........................................ 3 60 933 Bahamas, The ................................ 1,084 1,256 930 Panama .......................................... 498 978 891 El Salvador ..................................... 426 492 878 Indonesia ........................................ 0 0 511 Colombia ........................................ 22 0 495 Leeward-Windward Islands(*) ........ 749 659 462 Uruguay .......................................... 1,273 861 413 Sierra Leone ................................... 0 0 326 Other Partners ................................ 12,197 9,549 3,082
World Total .............................. 290,986 330,574 385,846
Imports Canada ........................................... 534,082 424,592 415,401 Dominican Republic ....................... 40 63 10 China .............................................. 0 22 0 Cameroon ....................................... 0 30 0 Egypt .............................................. 0 2 0 France(!) ......................................... 3 0 0 France(*) ......................................... 3 0 0 Jamaica .......................................... 1 0 0
World Total .............................. 534,126 424,709 415,411
12010 data does not reflect 13 month changes. (*) Denotes a country that is a summarization of its component coun-tries. (!) Denotes a country which is summarized into its obsolete country.
FAS, Office of Global Analysis, (202) 720-6301.
Table 4-60.—Potatoes (fresh): Foreign trade, United States, 2000–2009 1
Year beginning July Imports for consumption Domestic exports
1,000 cwt. 1,000 cwt. 2000 ................................................ 5,986 6,695 2001 ................................................ 8,644 6,571 2002 ................................................ 9,265 6,287 2003 ................................................ 7,611 5,091 2004 ................................................ 7,604 5,430 2005 ................................................ 8,152 6,730 2006 ................................................ 10,681 5,798 2007 ................................................ 10,852 6,731 2008 ................................................ 10,550 6,588 2009 ................................................ 9,045 8,152
1 Includes seed. ERS, Specialty Crops Branch, (202) 694–5253. Compiled from reports of the U.S. Department of Commerce.
VerDate Aug 31 2005 10:23 Feb 29, 2012 Jkt 000000 PO 00000 Frm 00027 Fmt 1000 Sfmt 1000 H:\SHARED\DAPP\FPU\AGSTAT\MASTER~2\CHAPTR04\IV-27.AG8 USDA
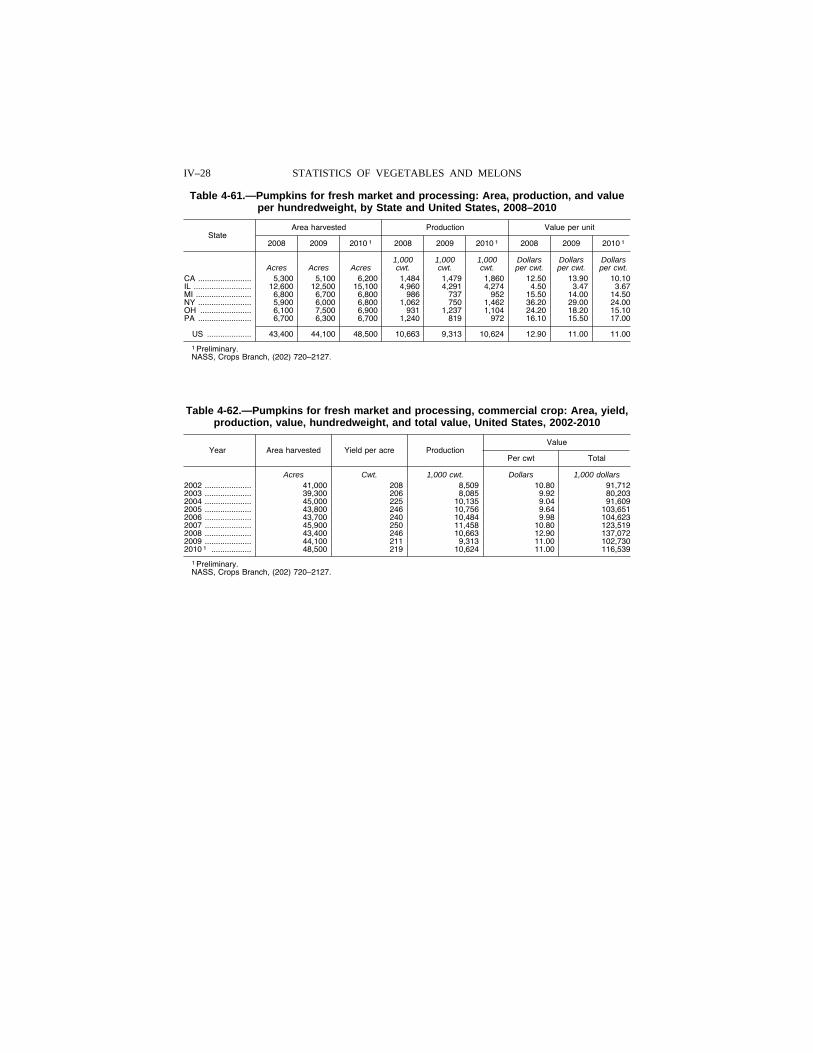
IV–28 STATISTICS OF VEGETABLES AND MELONS
Table 4-61.—Pumpkins for fresh market and processing: Area, production, and value per hundredweight, by State and United States, 2008–2010
State Area harvested Production Value per unit
2008 2009 2010 1 2008 2009 2010 1 2008 2009 2010 1
1,000 1,000 1,000 Dollars Dollars Dollars Acres Acres Acres cwt. cwt. cwt. per cwt. per cwt. per cwt.
CA ........................ 5,300 5,100 6,200 1,484 1,479 1,860 12.50 13.90 10.10 IL .......................... 12,600 12,500 15,100 4,960 4,291 4,274 4.50 3.47 3.67 MI ......................... 6,800 6,700 6,800 986 737 952 15.50 14.00 14.50 NY ........................ 5,900 6,000 6,800 1,062 750 1,462 36.20 29.00 24.00 OH ....................... 6,100 7,500 6,900 931 1,237 1,104 24.20 18.20 15.10 PA ........................ 6,700 6,300 6,700 1,240 819 972 16.10 15.50 17.00
US .................... 43,400 44,100 48,500 10,663 9,313 10,624 12.90 11.00 11.00
1 Preliminary. NASS, Crops Branch, (202) 720–2127.
Table 4-62.—Pumpkins for fresh market and processing, commercial crop: Area, yield, production, value, hundredweight, and total value, United States, 2002-2010
Year Area harvested Yield per acre Production Value
Per cwt Total
Acres Cwt. 1,000 cwt. Dollars 1,000 dollars 2002 ..................... 41,000 208 8,509 10.80 91,712 2003 ..................... 39,300 206 8,085 9.92 80,203 2004 ..................... 45,000 225 10,135 9.04 91,609 2005 ..................... 43,800 246 10,756 9.64 103,651 2006 ..................... 43,700 240 10,484 9.98 104,623 2007 ..................... 45,900 250 11,458 10.80 123,519 2008 ..................... 43,400 246 10,663 12.90 137,072 2009 ..................... 44,100 211 9,313 11.00 102,730 2010 1 .................. 48,500 219 10,624 11.00 116,539
1 Preliminary. NASS, Crops Branch, (202) 720–2127.
VerDate Aug 31 2005 10:23 Feb 29, 2012 Jkt 000000 PO 00000 Frm 00028 Fmt 1000 Sfmt 1000 H:\SHARED\DAPP\FPU\AGSTAT\MASTER~2\CHAPTR04\IV-28.AG8 USDA
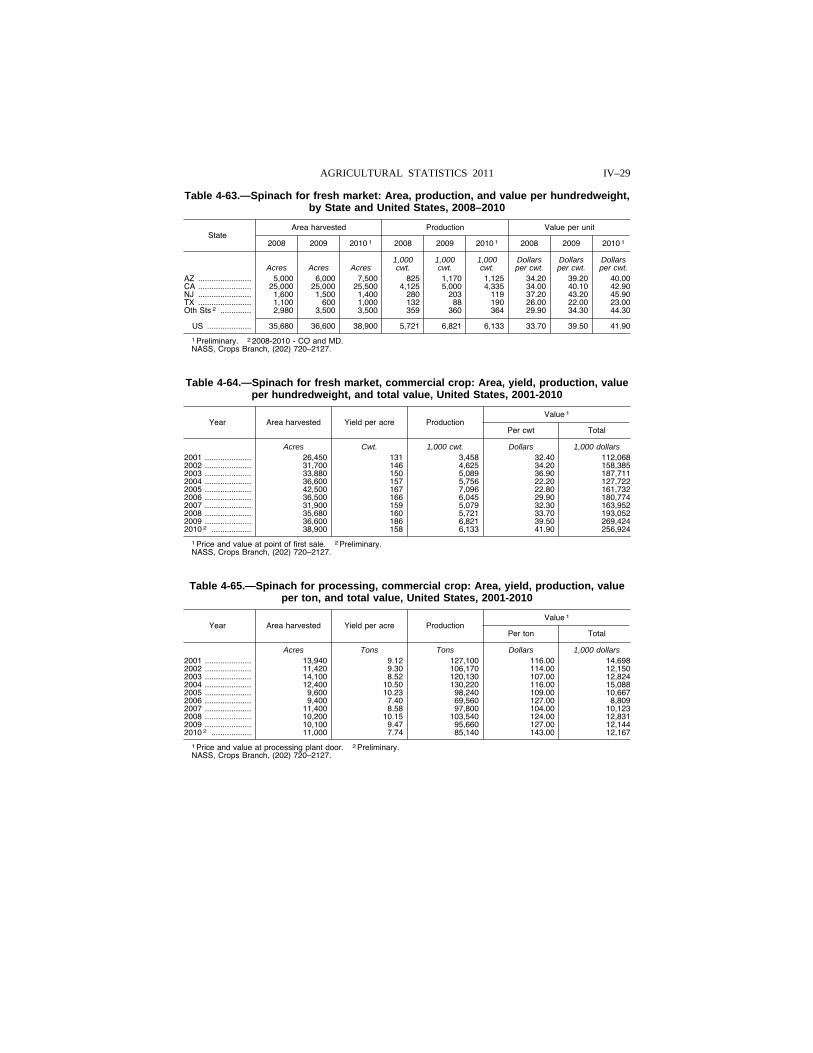
IV–29 AGRICULTURAL STATISTICS 2011
Table 4-63.—Spinach for fresh market: Area, production, and value per hundredweight, by State and United States, 2008–2010
State Area harvested Production Value per unit
2008 2009 2010 1 2008 2009 2010 1 2008 2009 2010 1
1,000 1,000 1,000 Dollars Dollars Dollars Acres Acres Acres cwt. cwt. cwt. per cwt. per cwt. per cwt.
AZ ........................ 5,000 6,000 7,500 825 1,170 1,125 34.20 39.20 40.00 CA ........................ 25,000 25,000 25,500 4,125 5,000 4,335 34.00 40.10 42.90 NJ ........................ 1,600 1,500 1,400 280 203 119 37.20 43.20 45.90 TX ........................ 1,100 600 1,000 132 88 190 26.00 22.00 23.00 Oth Sts 2 .............. 2,980 3,500 3,500 359 360 364 29.90 34.30 44.30
US .................... 35,680 36,600 38,900 5,721 6,821 6,133 33.70 39.50 41.90
1 Preliminary. 2 2008-2010 - CO and MD. NASS, Crops Branch, (202) 720–2127.
Table 4-64.—Spinach for fresh market, commercial crop: Area, yield, production, value per hundredweight, and total value, United States, 2001-2010
Year Area harvested Yield per acre Production Value 1
Per cwt Total
Acres Cwt. 1,000 cwt. Dollars 1,000 dollars 2001 ..................... 26,450 131 3,458 32.40 112,068 2002 ..................... 31,700 146 4,625 34.20 158,385 2003 ..................... 33,880 150 5,089 36.90 187,711 2004 ..................... 36,600 157 5,756 22.20 127,722 2005 ..................... 42,500 167 7,096 22.80 161,732 2006 ..................... 36,500 166 6,045 29.90 180,774 2007 ..................... 31,900 159 5,079 32.30 163,952 2008 ..................... 35,680 160 5,721 33.70 193,052 2009 ..................... 36,600 186 6,821 39.50 269,424 2010 2 .................. 38,900 158 6,133 41.90 256,924
1 Price and value at point of first sale. 2 Preliminary. NASS, Crops Branch, (202) 720–2127.
Table 4-65.—Spinach for processing, commercial crop: Area, yield, production, value per ton, and total value, United States, 2001-2010
Year Area harvested Yield per acre Production Value 1
Per ton Total
Acres Tons Tons Dollars 1,000 dollars 2001 ..................... 13,940 9.12 127,100 116.00 14,698 2002 ..................... 11,420 9.30 106,170 114.00 12,150 2003 ..................... 14,100 8.52 120,130 107.00 12,824 2004 ..................... 12,400 10.50 130,220 116.00 15,088 2005 ..................... 9,600 10.23 98,240 109.00 10,667 2006 ..................... 9,400 7.40 69,560 127.00 8,809 2007 ..................... 11,400 8.58 97,800 104.00 10,123 2008 ..................... 10,200 10.15 103,540 124.00 12,831 2009 ..................... 10,100 9.47 95,660 127.00 12,144 2010 2 .................. 11,000 7.74 85,140 143.00 12,167
1 Price and value at processing plant door. 2 Preliminary. NASS, Crops Branch, (202) 720–2127.
VerDate Aug 31 2005 10:23 Feb 29, 2012 Jkt 000000 PO 00000 Frm 00029 Fmt 1000 Sfmt 1000 H:\SHARED\DAPP\FPU\AGSTAT\MASTER~2\CHAPTR04\IV-29.AG8 USDA
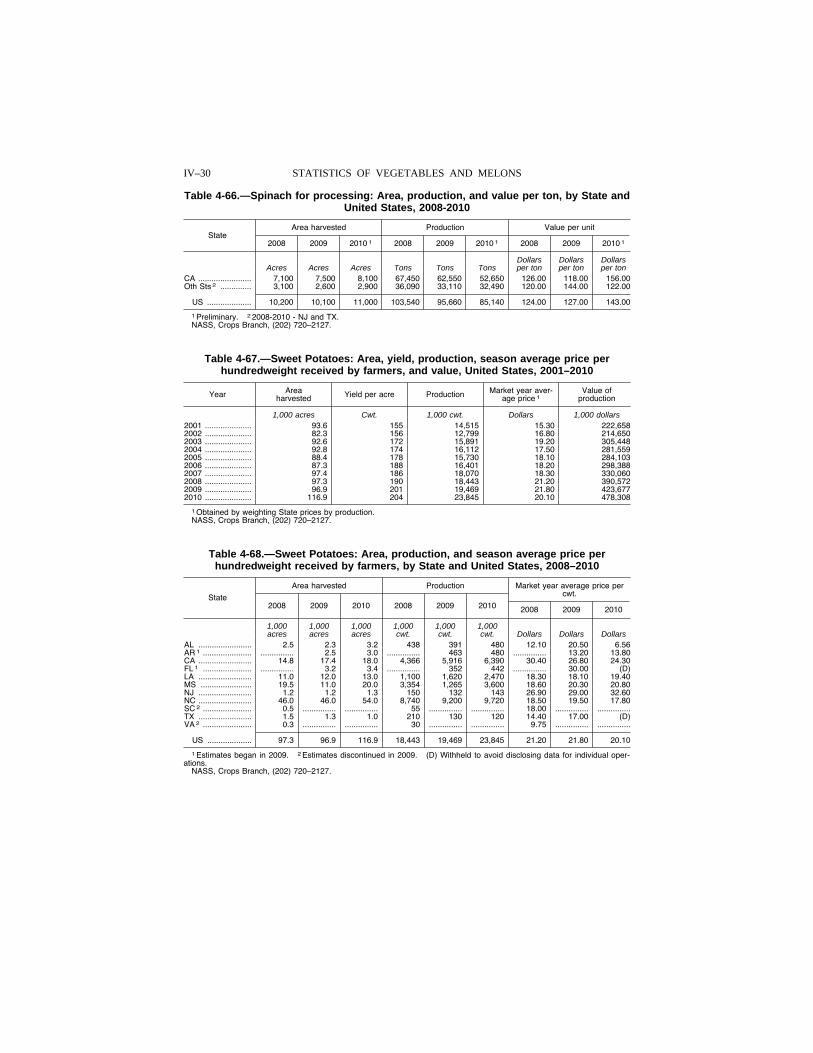
IV–30 STATISTICS OF VEGETABLES AND MELONS
Table 4-66.—Spinach for processing: Area, production, and value per ton, by State and United States, 2008-2010
State Area harvested Production Value per unit
2008 2009 2010 1 2008 2009 2010 1 2008 2009 2010 1
Dollars Dollars Dollars Acres Acres Acres Tons Tons Tons per ton per ton per ton
CA ........................ 7,100 7,500 8,100 67,450 62,550 52,650 126.00 118.00 156.00 Oth Sts 2 .............. 3,100 2,600 2,900 36,090 33,110 32,490 120.00 144.00 122.00
US .................... 10,200 10,100 11,000 103,540 95,660 85,140 124.00 127.00 143.00
1 Preliminary. 2 2008-2010 - NJ and TX. NASS, Crops Branch, (202) 720–2127.
Table 4-67.—Sweet Potatoes: Area, yield, production, season average price per hundredweight received by farmers, and value, United States, 2001–2010
Year Area harvested Yield per acre Production Market year aver-
age price 1 Value of
production
1,000 acres Cwt. 1,000 cwt. Dollars 1,000 dollars 2001 ..................... 93.6 155 14,515 15.30 222,658 2002 ..................... 82.3 156 12,799 16.80 214,650 2003 ..................... 92.6 172 15,891 19.20 305,448 2004 ..................... 92.8 174 16,112 17.50 281,559 2005 ..................... 88.4 178 15,730 18.10 284,103 2006 ..................... 87.3 188 16,401 18.20 298,388 2007 ..................... 97.4 186 18,070 18.30 330,060 2008 ..................... 97.3 190 18,443 21.20 390,572 2009 ..................... 96.9 201 19,469 21.80 423,677 2010 ..................... 116.9 204 23,845 20.10 478,308
1 Obtained by weighting State prices by production. NASS, Crops Branch, (202) 720–2127.
Table 4-68.—Sweet Potatoes: Area, production, and season average price per hundredweight received by farmers, by State and United States, 2008–2010
State
Area harvested Production Market year average price per cwt.
2008 2009 2010 2008 2009 2010 2008 2009 2010
1,000 1,000 1,000 1,000 1,000 1,000 acres acres acres cwt. cwt. cwt. Dollars Dollars Dollars
AL ........................ 2.5 2.3 3.2 438 391 480 12.10 20.50 6.56 AR 1 ...................... ............... 2.5 3.0 ............... 463 480 ............... 13.20 13.80 CA ........................ 14.8 17.4 18.0 4,366 5,916 6,390 30.40 26.80 24.30 FL 1 ...................... ............... 3.2 3.4 ............... 352 442 ............... 30.00 (D) LA ........................ 11.0 12.0 13.0 1,100 1,620 2,470 18.30 18.10 19.40 MS ....................... 19.5 11.0 20.0 3,354 1,265 3,600 18.60 20.30 20.80 NJ ........................ 1.2 1.2 1.3 150 132 143 26.90 29.00 32.60 NC ........................ 46.0 46.0 54.0 8,740 9,200 9,720 18.50 19.50 17.80 SC 2 ...................... 0.5 ............... ............... 55 ............... ............... 18.00 ............... ...............TX ........................ 1.5 1.3 1.0 210 130 120 14.40 17.00 (D) VA 2 ...................... 0.3 ............... ............... 30 ............... ............... 9.75 ............... ...............
US .................... 97.3 96.9 116.9 18,443 19,469 23,845 21.20 21.80 20.10
1 Estimates began in 2009. 2 Estimates discontinued in 2009. (D) Withheld to avoid disclosing data for individual oper-ations.
NASS, Crops Branch, (202) 720–2127.
VerDate Aug 31 2005 10:23 Feb 29, 2012 Jkt 000000 PO 00000 Frm 00030 Fmt 1000 Sfmt 1000 H:\SHARED\DAPP\FPU\AGSTAT\MASTER~2\CHAPTR04\IV-30.AG8 USDA
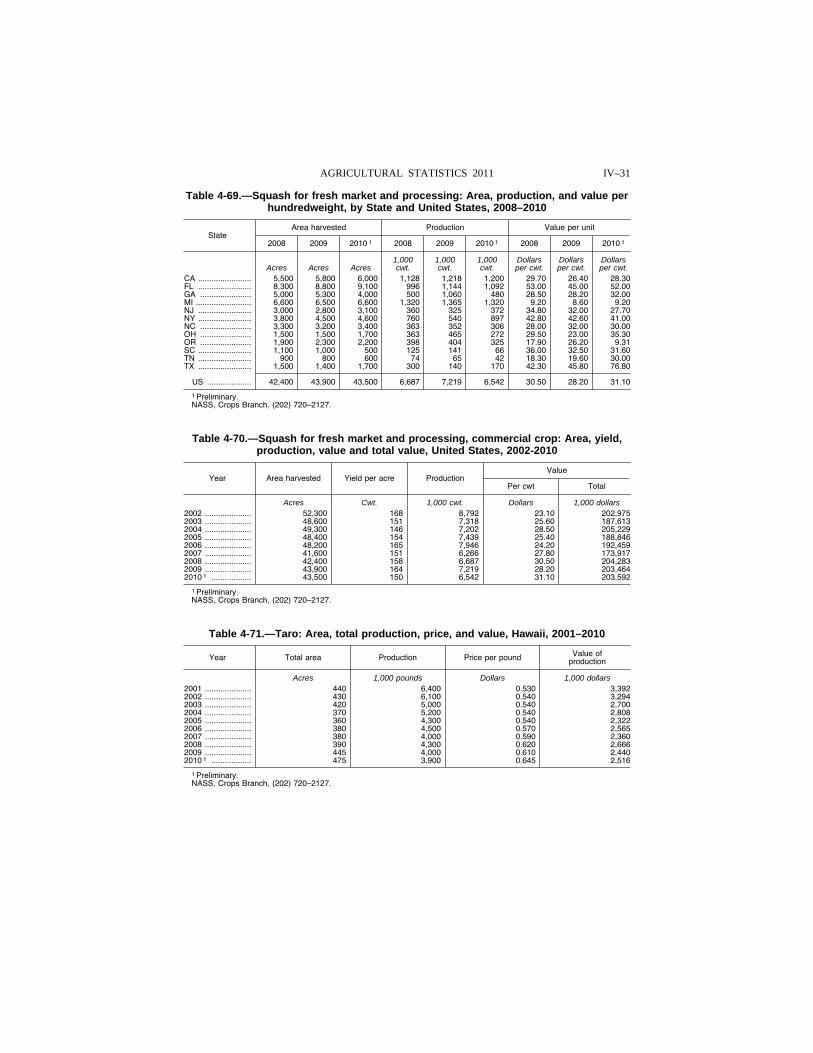
IV–31 AGRICULTURAL STATISTICS 2011
Table 4-69.—Squash for fresh market and processing: Area, production, and value per hundredweight, by State and United States, 2008–2010
State Area harvested Production Value per unit
2008 2009 2010 1 2008 2009 2010 1 2008 2009 2010 1
1,000 1,000 1,000 Dollars Dollars Dollars Acres Acres Acres cwt. cwt. cwt. per cwt. per cwt. per cwt.
CA ........................ 5,500 5,800 6,000 1,128 1,218 1,200 29.70 26.40 28.30 FL ........................ 8,300 8,800 9,100 996 1,144 1,092 53.00 45.00 52.00 GA ....................... 5,000 5,300 4,000 500 1,060 480 28.50 28.20 32.00 MI ......................... 6,600 6,500 6,600 1,320 1,365 1,320 9.20 8.60 9.20 NJ ........................ 3,000 2,800 3,100 360 325 372 34.80 32.00 27.70 NY ........................ 3,800 4,500 4,600 760 540 897 42.80 42.60 41.00 NC ....................... 3,300 3,200 3,400 363 352 306 28.00 32.00 30.00 OH ....................... 1,500 1,500 1,700 363 465 272 29.50 23.00 35.30 OR ....................... 1,900 2,300 2,200 398 404 325 17.90 26.20 9.31 SC ........................ 1,100 1,000 500 125 141 66 36.00 32.50 31.60 TN ........................ 900 800 600 74 65 42 18.30 19.60 30.00 TX ........................ 1,500 1,400 1,700 300 140 170 42.30 45.80 76.80
US .................... 42,400 43,900 43,500 6,687 7,219 6,542 30.50 28.20 31.10
1 Preliminary. NASS, Crops Branch, (202) 720–2127.
Table 4-70.—Squash for fresh market and processing, commercial crop: Area, yield, production, value and total value, United States, 2002-2010
Year Area harvested Yield per acre Production Value
Per cwt Total
Acres Cwt. 1,000 cwt. Dollars 1,000 dollars 2002 ..................... 52,300 168 8,792 23.10 202,975 2003 ..................... 48,600 151 7,318 25.60 187,613 2004 ..................... 49,300 146 7,202 28.50 205,229 2005 ..................... 48,400 154 7,439 25.40 188,846 2006 ..................... 48,200 165 7,946 24.20 192,459 2007 ..................... 41,600 151 6,266 27.80 173,917 2008 ..................... 42,400 158 6,687 30.50 204,283 2009 ..................... 43,900 164 7,219 28.20 203,464 2010 1 .................. 43,500 150 6,542 31.10 203,592
1 Preliminary. NASS, Crops Branch, (202) 720–2127.
Table 4-71.—Taro: Area, total production, price, and value, Hawaii, 2001–2010
Year Total area Production Price per pound Value of production
Acres 1,000 pounds Dollars 1,000 dollars 2001 ..................... 440 6,400 0.530 3,392 2002 ..................... 430 6,100 0.540 3,294 2003 ..................... 420 5,000 0.540 2,700 2004 ..................... 370 5,200 0.540 2,808 2005 ..................... 360 4,300 0.540 2,322 2006 ..................... 380 4,500 0.570 2,565 2007 ..................... 380 4,000 0.590 2,360 2008 ..................... 390 4,300 0.620 2,666 2009 ..................... 445 4,000 0.610 2,440 2010 1 .................. 475 3,900 0.645 2,516
1 Preliminary. NASS, Crops Branch, (202) 720–2127.
VerDate Aug 31 2005 10:23 Feb 29, 2012 Jkt 000000 PO 00000 Frm 00031 Fmt 1000 Sfmt 1000 H:\SHARED\DAPP\FPU\AGSTAT\MASTER~2\CHAPTR04\IV-31.AG8 USDA
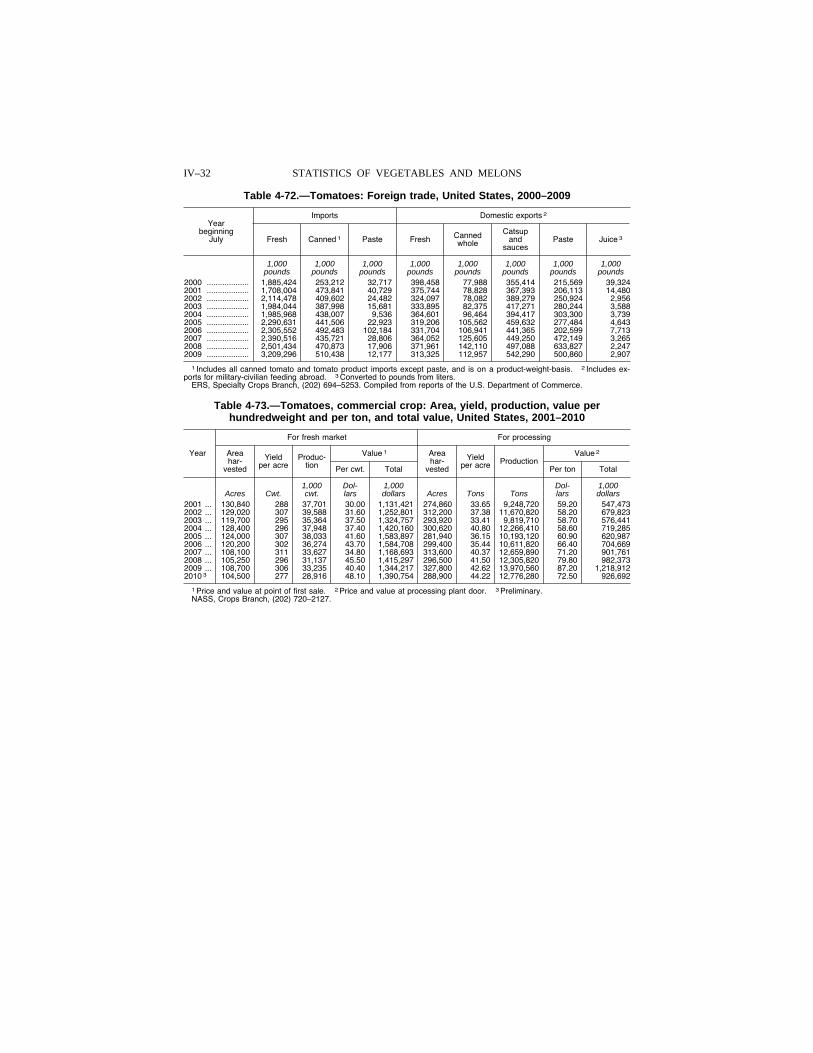
IV–32 STATISTICS OF VEGETABLES AND MELONS
Table 4-72.—Tomatoes: Foreign trade, United States, 2000–2009
Year beginning
July
Imports Domestic exports 2
Fresh Canned 1 Paste Fresh Canned whole
Catsup and
sauces Paste Juice 3
1,000 1,000 1,000 1,000 1,000 1,000 1,000 1,000 pounds pounds pounds pounds pounds pounds pounds pounds
2000 ................... 1,885,424 253,212 32,717 398,458 77,988 355,414 215,569 39,324 2001 ................... 1,708,004 473,841 40,729 375,744 78,828 367,393 206,113 14,480 2002 ................... 2,114,478 409,602 24,482 324,097 78,082 389,279 250,924 2,956 2003 ................... 1,984,044 387,998 15,681 333,895 82,375 417,271 280,244 3,588 2004 ................... 1,985,968 438,007 9,536 364,601 96,464 394,417 303,300 3,739 2005 ................... 2,290,631 441,506 22,923 319,206 105,562 459,632 277,484 4,643 2006 ................... 2,305,552 492,483 102,184 331,704 106,941 441,365 202,599 7,713 2007 ................... 2,390,516 435,721 28,806 364,052 125,605 449,250 472,149 3,265 2008 ................... 2,501,434 470,873 17,906 371,961 142,110 497,088 633,827 2,247 2009 ................... 3,209,296 510,438 12,177 313,325 112,957 542,290 500,860 2,907
1 Includes all canned tomato and tomato product imports except paste, and is on a product-weight-basis. 2 Includes ex-ports for military-civilian feeding abroad. 3 Converted to pounds from liters.
ERS, Specialty Crops Branch, (202) 694–5253. Compiled from reports of the U.S. Department of Commerce.
Table 4-73.—Tomatoes, commercial crop: Area, yield, production, value per hundredweight and per ton, and total value, United States, 2001–2010
Year
For fresh market For processing
Area har-
vested
Yield per acre
Produc-tion
Value 1 Area har-
vested
Yield per acre Production
Value 2
Per cwt. Total Per ton Total
1,000 Dol- 1,000 Dol- 1,000 Acres Cwt. cwt. lars dollars Acres Tons Tons lars dollars
2001 ... 130,840 288 37,701 30.00 1,131,421 274,860 33.65 9,248,720 59.20 547,473 2002 ... 129,020 307 39,588 31.60 1,252,801 312,200 37.38 11,670,820 58.20 679,823 2003 ... 119,700 295 35,364 37.50 1,324,757 293,920 33.41 9,819,710 58.70 576,441 2004 ... 128,400 296 37,948 37.40 1,420,160 300,620 40.80 12,266,410 58.60 719,285 2005 ... 124,000 307 38,033 41.60 1,583,897 281,940 36.15 10,193,120 60.90 620,987 2006 ... 120,200 302 36,274 43.70 1,584,708 299,400 35.44 10,611,820 66.40 704,669 2007 ... 108,100 311 33,627 34.80 1,168,693 313,600 40.37 12,659,890 71.20 901,761 2008 ... 105,250 296 31,137 45.50 1,415,297 296,500 41.50 12,305,820 79.80 982,373 2009 ... 108,700 306 33,235 40.40 1,344,217 327,800 42.62 13,970,560 87.20 1,218,912 2010 3 104,500 277 28,916 48.10 1,390,754 288,900 44.22 12,776,280 72.50 926,692
1 Price and value at point of first sale. 2 Price and value at processing plant door. 3 Preliminary. NASS, Crops Branch, (202) 720–2127.
VerDate Aug 31 2005 10:23 Feb 29, 2012 Jkt 000000 PO 00000 Frm 00032 Fmt 1000 Sfmt 1000 H:\SHARED\DAPP\FPU\AGSTAT\MASTER~2\CHAPTR04\IV-32.AG8 USDA
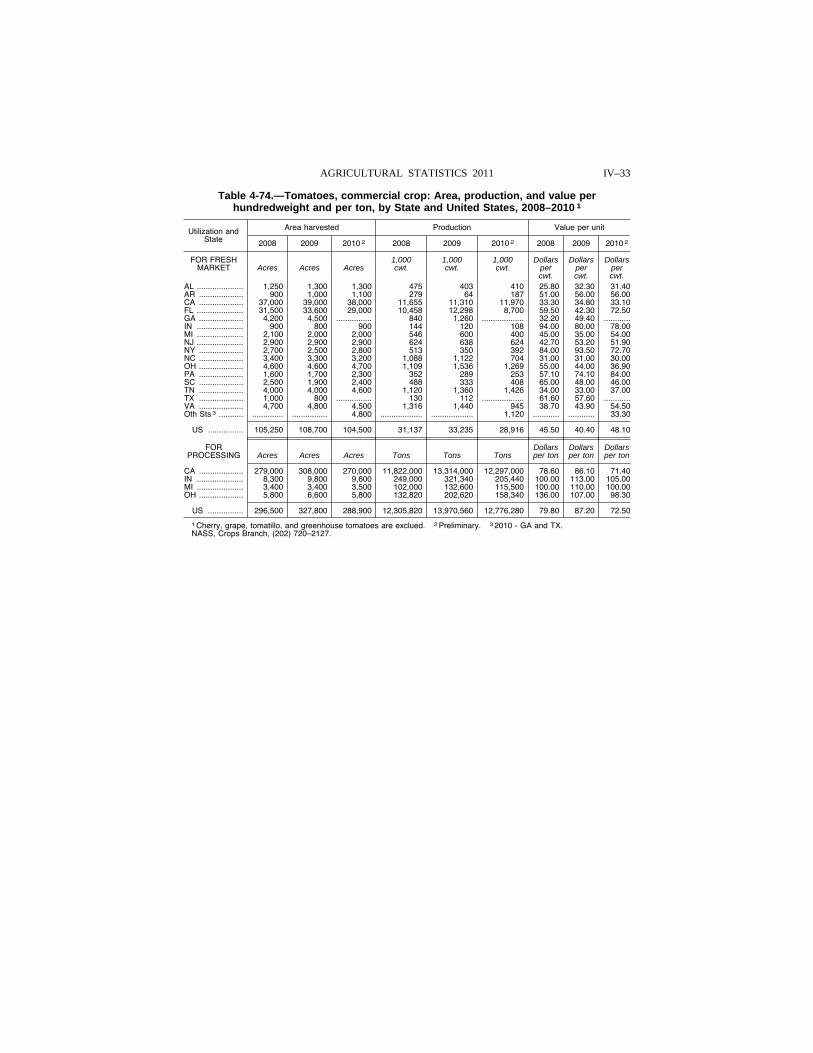
IV–33 AGRICULTURAL STATISTICS 2011
Table 4-74.—Tomatoes, commercial crop: Area, production, and value per hundredweight and per ton, by State and United States, 2008–2010 1
Utilization and State
Area harvested Production Value per unit
2008 2009 2010 2 2008 2009 2010 2 2008 2009 2010 2
FOR FRESH 1,000 1,000 1,000 Dollars Dollars Dollars MARKET Acres Acres Acres cwt. cwt. cwt. per
cwt. per cwt.
per cwt.
AL ..................... 1,250 1,300 1,300 475 403 410 25.80 32.30 31.40 AR .................... 900 1,000 1,100 279 64 187 51.00 56.00 56.00 CA .................... 37,000 39,000 38,000 11,655 11,310 11,970 33.30 34.80 33.10 FL ..................... 31,500 33,600 29,000 10,458 12,298 8,700 59.50 42.30 72.50 GA .................... 4,200 4,500 ................ 840 1,260 ................... 32.20 49.40 ............IN ..................... 900 800 900 144 120 108 94.00 80.00 78.00 MI ..................... 2,100 2,000 2,000 546 600 400 45.00 35.00 54.00 NJ ..................... 2,900 2,900 2,900 624 638 624 42.70 53.20 51.90 NY .................... 2,700 2,500 2,800 513 350 392 84.00 93.50 72.70 NC .................... 3,400 3,300 3,200 1,088 1,122 704 31.00 31.00 30.00 OH .................... 4,600 4,600 4,700 1,109 1,536 1,269 55.00 44.00 36.90 PA .................... 1,600 1,700 2,300 352 289 253 57.10 74.10 84.00 SC .................... 2,500 1,900 2,400 488 333 408 65.00 48.00 46.00 TN .................... 4,000 4,000 4,600 1,120 1,360 1,426 34.00 33.00 37.00 TX .................... 1,000 800 ................ 130 112 ................... 61.60 57.60 ............VA .................... 4,700 4,800 4,500 1,316 1,440 945 38.70 43.90 54.50 Oth Sts 3 ........... .............. ................ 4,800 ................... ................... 1,120 ............ ............ 33.30
US ................ 105,250 108,700 104,500 31,137 33,235 28,916 45.50 40.40 48.10
FOR Dollars Dollars Dollars PROCESSING Acres Acres Acres Tons Tons Tons per ton per ton per ton
CA .................... 279,000 308,000 270,000 11,822,000 13,314,000 12,297,000 78.60 86.10 71.40 IN ..................... 8,300 9,800 9,600 249,000 321,340 205,440 100.00 113.00 105.00 MI ..................... 3,400 3,400 3,500 102,000 132,600 115,500 100.00 110.00 100.00 OH .................... 5,800 6,600 5,800 132,820 202,620 158,340 136.00 107.00 98.30
US ................ 296,500 327,800 288,900 12,305,820 13,970,560 12,776,280 79.80 87.20 72.50
1 Cherry, grape, tomatillo, and greenhouse tomatoes are exclued. 2 Preliminary. 3 2010 - GA and TX. NASS, Crops Branch, (202) 720–2127.
VerDate Aug 31 2005 10:23 Feb 29, 2012 Jkt 000000 PO 00000 Frm 00033 Fmt 1000 Sfmt 1000 H:\SHARED\DAPP\FPU\AGSTAT\MASTER~2\CHAPTR04\IV-74.AG8 USDA
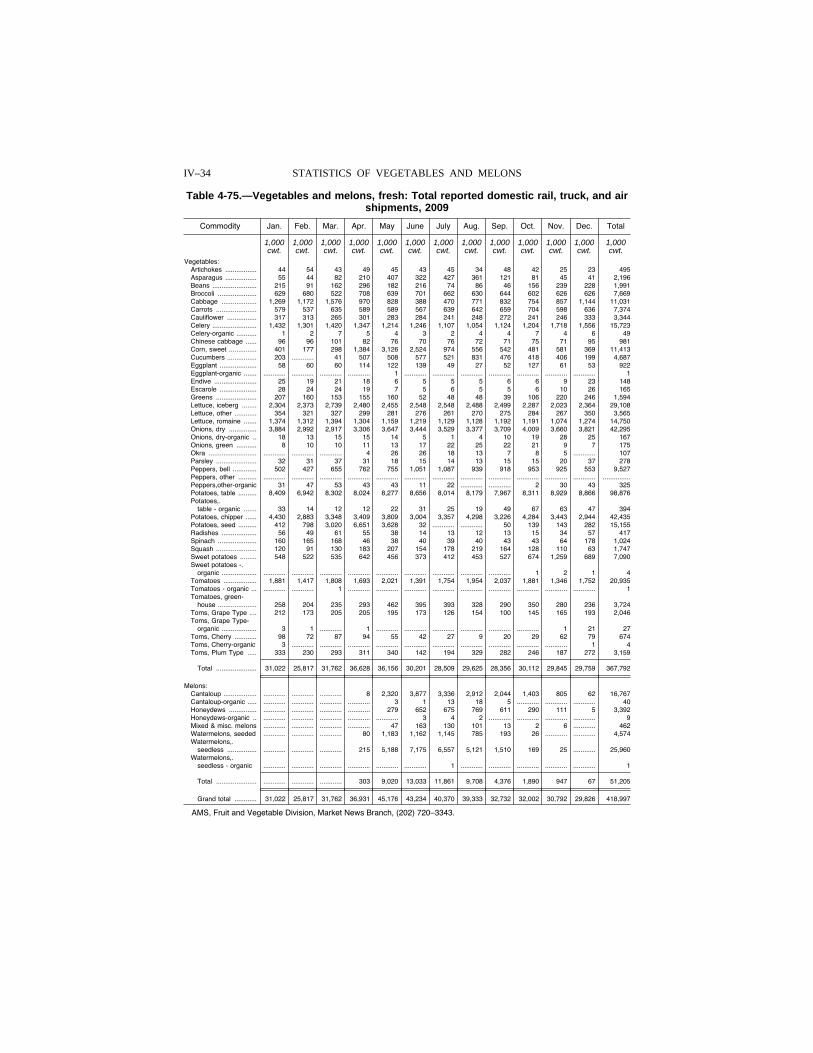
IV–34 STATISTICS OF VEGETABLES AND MELONS
Table 4-75.—Vegetables and melons, fresh: Total reported domestic rail, truck, and air shipments, 2009
Commodity Jan. Feb. Mar. Apr. May June July Aug. Sep. Oct. Nov. Dec. Total
1,000 1,000 1,000 1,000 1,000 1,000 1,000 1,000 1,000 1,000 1,000 1,000 1,000 cwt. cwt. cwt. cwt. cwt. cwt. cwt. cwt. cwt. cwt. cwt. cwt. cwt.
Vegetables: Artichokes ................. 44 54 43 49 45 43 45 34 48 42 25 23 495 Asparagus ................. 55 44 82 210 407 322 427 361 121 81 45 41 2,196 Beans ........................ 215 91 162 296 182 216 74 86 46 156 239 228 1,991 Broccoli ..................... 629 680 522 708 639 701 662 630 644 602 626 626 7,669 Cabbage ................... 1,269 1,172 1,576 970 828 388 470 771 832 754 857 1,144 11,031 Carrots ...................... 579 537 635 589 589 567 639 642 659 704 598 636 7,374 Cauliflower ................ 317 313 265 301 283 284 241 248 272 241 246 333 3,344 Celery ........................ 1,432 1,301 1,420 1,347 1,214 1,246 1,107 1,054 1,124 1,204 1,718 1,556 15,723 Celery-organic ........... 1 2 7 5 4 3 2 4 4 7 4 6 49 Chinese cabbage ...... 96 96 101 82 76 70 76 72 71 75 71 95 981 Corn, sweet ............... 401 177 298 1,384 3,126 2,524 974 556 542 481 581 369 11,413 Cucumbers ................ 203 ............ 41 507 508 577 521 831 476 418 406 199 4,687 Eggplant .................... 58 60 60 114 122 139 49 27 52 127 61 53 922 Eggplant-organic ....... ............ ............ ............ ............ 1 ............ ............ ............ ............ ............ ............ ............ 1 Endive ....................... 25 19 21 18 6 5 5 5 6 6 9 23 148 Escarole .................... 28 24 24 19 7 5 6 5 5 6 10 26 165 Greens ...................... 207 160 153 155 160 52 48 48 39 106 220 246 1,594 Lettuce, iceberg ........ 2,304 2,373 2,739 2,480 2,455 2,548 2,548 2,488 2,499 2,287 2,023 2,364 29,108 Lettuce, other ............ 354 321 327 299 281 276 261 270 275 284 267 350 3,565 Lettuce, romaine ....... 1,374 1,312 1,394 1,304 1,159 1,219 1,129 1,128 1,192 1,191 1,074 1,274 14,750 Onions, dry ............... 3,884 2,992 2,917 3,306 3,647 3,444 3,529 3,377 3,709 4,009 3,660 3,821 42,295 Onions, dry-organic .. 18 13 15 15 14 5 1 4 10 19 28 25 167 Onions, green ........... 8 10 10 11 13 17 22 25 22 21 9 7 175 Okra .......................... ............ ............ ............ 4 26 26 18 13 7 8 5 ............ 107 Parsley ...................... 32 31 37 31 18 15 14 13 15 15 20 37 278 Peppers, bell ............. 502 427 655 762 755 1,051 1,087 939 918 953 925 553 9,527 Peppers, other .......... ............ ............ ............ ............ ............ ............ ............ ............ ............ ............ ............ ............ ...............Peppers,other-organic 31 47 53 43 43 11 22 ............ ............ 2 30 43 325 Potatoes, table .......... 8,409 6,942 8,302 8,024 8,277 8,656 8,014 8,179 7,967 8,311 8,929 8,866 98,876 Potatoes,.
table - organic ....... 33 14 12 12 22 31 25 19 49 67 63 47 394 Potatoes, chipper ...... 4,430 2,883 3,348 3,409 3,809 3,004 3,357 4,298 3,226 4,284 3,443 2,944 42,435 Potatoes, seed .......... 412 798 3,020 6,651 3,628 32 ............ ............ 50 139 143 282 15,155 Radishes ................... 56 49 61 55 38 14 13 12 13 15 34 57 417 Spinach ..................... 160 165 168 46 38 40 39 40 43 43 64 178 1,024 Squash ...................... 120 91 130 183 207 154 178 219 164 128 110 63 1,747 Sweet potatoes ......... 548 522 535 642 456 373 412 453 527 674 1,259 689 7,090 Sweet potatoes -.
organic ................... ............ ............ ............ ............ ............ ............ ............ ............ ............ 1 2 1 4 Tomatoes .................. 1,881 1,417 1,808 1,693 2,021 1,391 1,754 1,954 2,037 1,881 1,346 1,752 20,935 Tomatoes - organic ... ............ ............ 1 ............ ............ ............ ............ ............ ............ ............ ............ ............ 1 Tomatoes, green-
house ..................... 258 204 235 293 462 395 393 328 290 350 280 236 3,724 Toms, Grape Type .... 212 173 205 205 195 173 126 154 100 145 165 193 2,046 Toms, Grape Type-
organic ................... 3 1 ............ 1 ............ ............ ............ ............ ............ ............ 1 21 27 Toms, Cherry ............ 98 72 87 94 55 42 27 9 20 29 62 79 674 Toms, Cherry-organic 3 ............ ............ ............ ............ ............ ............ ............ ............ ............ ............ 1 4 Toms, Plum Type ..... 333 230 293 311 340 142 194 329 282 246 187 272 3,159
Total ...................... 31,022 25,817 31,762 36,628 36,156 30,201 28,509 29,625 28,356 30,112 29,845 29,759 367,792
Melons: Cantaloup .................. ............ ............ ............ 8 2,320 3,877 3,336 2,912 2,044 1,403 805 62 16,767 Cantaloup-organic ..... ............ ............ ............ ............ 3 1 13 18 5 ............ ............ ............ 40 Honeydews ............... ............ ............ ............ ............ 279 652 675 769 611 290 111 5 3,392 Honeydews-organic .. ............ ............ ............ ............ ............ 3 4 2 ............ ............ ............ ............ 9 Mixed & misc. melons ............ ............ ............ ............ 47 163 130 101 13 2 6 ............ 462 Watermelons, seeded ............ ............ ............ 80 1,183 1,162 1,145 785 193 26 ............ ............ 4,574 Watermelons,.
seedless ................ ............ ............ ............ 215 5,188 7,175 6,557 5,121 1,510 169 25 ............ 25,960 Watermelons,.
seedless - organic ............ ............ ............ ............ ............ ............ 1 ............ ............ ............ ............ ............ 1
Total ...................... ............ ............ ............ 303 9,020 13,033 11,861 9,708 4,376 1,890 947 67 51,205
Grand total ............ 31,022 25,817 31,762 36,931 45,176 43,234 40,370 39,333 32,732 32,002 30,792 29,826 418,997
AMS, Fruit and Vegetable Division, Market News Branch, (202) 720–3343.
VerDate Aug 31 2005 10:23 Feb 29, 2012 Jkt 000000 PO 00000 Frm 00034 Fmt 1000 Sfmt 1000 H:\SHARED\DAPP\FPU\AGSTAT\MASTER~2\CHAPTR04\IV-34.AG8 USDA
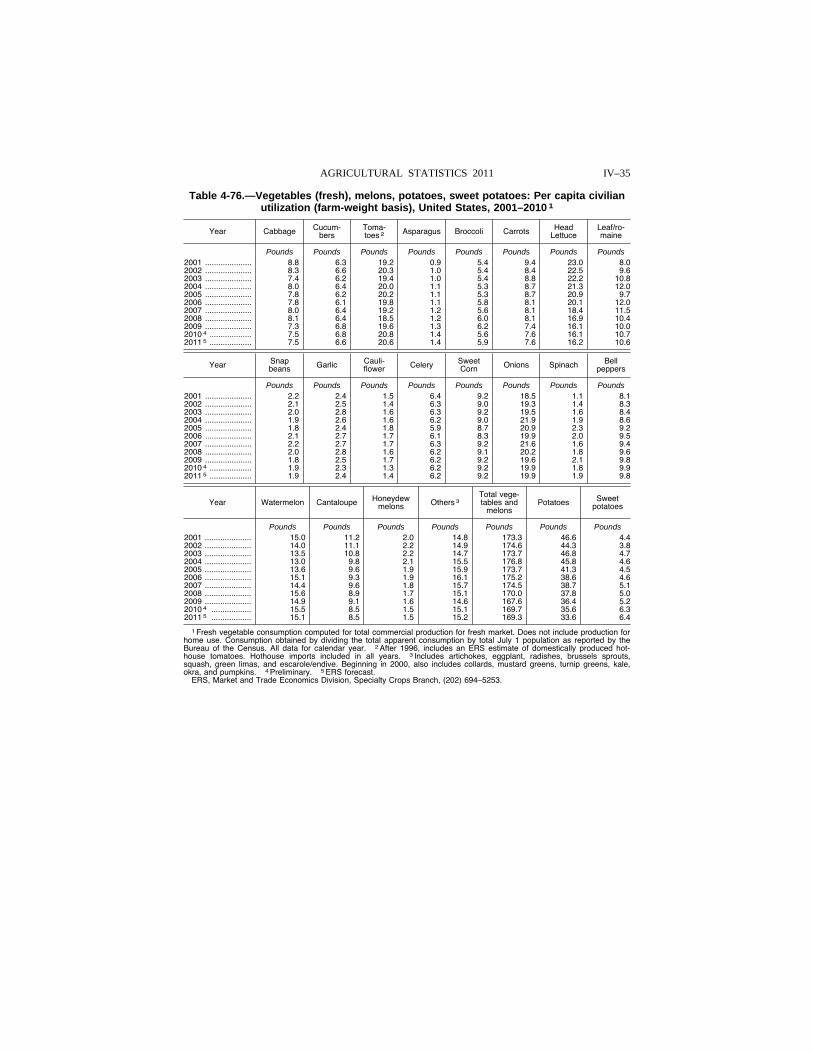
IV–35 AGRICULTURAL STATISTICS 2011
Table 4-76.—Vegetables (fresh), melons, potatoes, sweet potatoes: Per capita civilian utilization (farm-weight basis), United States, 2001–2010 1
Year Cabbage Cucum-bers
Toma-toes 2 Asparagus Broccoli Carrots Head
Lettuce Leaf/ro-maine
Pounds Pounds Pounds Pounds Pounds Pounds Pounds Pounds 2001 ..................... 8.8 6.3 19.2 0.9 5.4 9.4 23.0 8.0 2002 ..................... 8.3 6.6 20.3 1.0 5.4 8.4 22.5 9.6 2003 ..................... 7.4 6.2 19.4 1.0 5.4 8.8 22.2 10.8 2004 ..................... 8.0 6.4 20.0 1.1 5.3 8.7 21.3 12.0 2005 ..................... 7.8 6.2 20.2 1.1 5.3 8.7 20.9 9.7 2006 ..................... 7.8 6.1 19.8 1.1 5.8 8.1 20.1 12.0 2007 ..................... 8.0 6.4 19.2 1.2 5.6 8.1 18.4 11.5 2008 ..................... 8.1 6.4 18.5 1.2 6.0 8.1 16.9 10.4 2009 ..................... 7.3 6.8 19.6 1.3 6.2 7.4 16.1 10.0 2010 4 ................... 7.5 6.8 20.8 1.4 5.6 7.6 16.1 10.7 2011 5 ................... 7.5 6.6 20.6 1.4 5.9 7.6 16.2 10.6
Year Snap beans Garlic Cauli-
flower Celery Sweet Corn Onions Spinach Bell
peppers
Pounds Pounds Pounds Pounds Pounds Pounds Pounds Pounds 2001 ..................... 2.2 2.4 1.5 6.4 9.2 18.5 1.1 8.1 2002 ..................... 2.1 2.5 1.4 6.3 9.0 19.3 1.4 8.3 2003 ..................... 2.0 2.8 1.6 6.3 9.2 19.5 1.6 8.4 2004 ..................... 1.9 2.6 1.6 6.2 9.0 21.9 1.9 8.6 2005 ..................... 1.8 2.4 1.8 5.9 8.7 20.9 2.3 9.2 2006 ..................... 2.1 2.7 1.7 6.1 8.3 19.9 2.0 9.5 2007 ..................... 2.2 2.7 1.7 6.3 9.2 21.6 1.6 9.4 2008 ..................... 2.0 2.8 1.6 6.2 9.1 20.2 1.8 9.6 2009 ..................... 1.8 2.5 1.7 6.2 9.2 19.6 2.1 9.8 2010 4 ................... 1.9 2.3 1.3 6.2 9.2 19.9 1.8 9.9 2011 5 ................... 1.9 2.4 1.4 6.2 9.2 19.9 1.9 9.8
Year Watermelon Cantaloupe Honeydew melons Others 3
Total vege-tables and
melons Potatoes Sweet
potatoes
Pounds Pounds Pounds Pounds Pounds Pounds Pounds 2001 ..................... 15.0 11.2 2.0 14.8 173.3 46.6 4.4 2002 ..................... 14.0 11.1 2.2 14.9 174.6 44.3 3.8 2003 ..................... 13.5 10.8 2.2 14.7 173.7 46.8 4.7 2004 ..................... 13.0 9.8 2.1 15.5 176.8 45.8 4.6 2005 ..................... 13.6 9.6 1.9 15.9 173.7 41.3 4.5 2006 ..................... 15.1 9.3 1.9 16.1 175.2 38.6 4.6 2007 ..................... 14.4 9.6 1.8 15.7 174.5 38.7 5.1 2008 ..................... 15.6 8.9 1.7 15.1 170.0 37.8 5.0 2009 ..................... 14.9 9.1 1.6 14.6 167.6 36.4 5.2 2010 4 .................. 15.5 8.5 1.5 15.1 169.7 35.6 6.3 2011 5 .................. 15.1 8.5 1.5 15.2 169.3 33.6 6.4
1 Fresh vegetable consumption computed for total commercial production for fresh market. Does not include production for home use. Consumption obtained by dividing the total apparent consumption by total July 1 population as reported by the Bureau of the Census. All data for calendar year. 2 After 1996, includes an ERS estimate of domestically produced hot-house tomatoes. Hothouse imports included in all years. 3 Includes artichokes, eggplant, radishes, brussels sprouts, squash, green limas, and escarole/endive. Beginning in 2000, also includes collards, mustard greens, turnip greens, kale, okra, and pumpkins. 4 Preliminary. 5 ERS forecast.
ERS, Market and Trade Economics Division, Specialty Crops Branch, (202) 694–5253.
VerDate Aug 31 2005 10:23 Feb 29, 2012 Jkt 000000 PO 00000 Frm 00035 Fmt 1000 Sfmt 1000 H:\SHARED\DAPP\FPU\AGSTAT\MASTER~2\CHAPTR04\IV-35.AG8 USDA
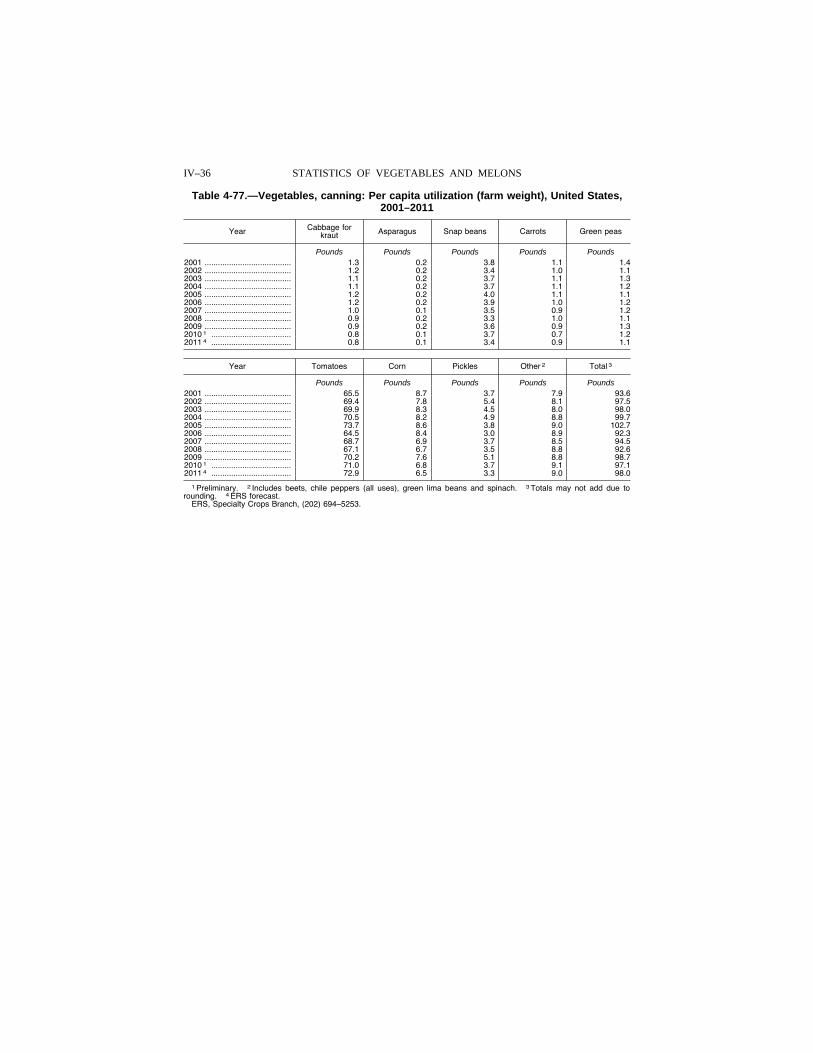
IV–36 STATISTICS OF VEGETABLES AND MELONS
Table 4-77.—Vegetables, canning: Per capita utilization (farm weight), United States, 2001–2011
Year Cabbage for kraut Asparagus Snap beans Carrots Green peas
Pounds Pounds Pounds Pounds Pounds 2001 ....................................... 1.3 0.2 3.8 1.1 1.4 2002 ....................................... 1.2 0.2 3.4 1.0 1.1 2003 ....................................... 1.1 0.2 3.7 1.1 1.3 2004 ....................................... 1.1 0.2 3.7 1.1 1.2 2005 ....................................... 1.2 0.2 4.0 1.1 1.1 2006 ....................................... 1.2 0.2 3.9 1.0 1.2 2007 ....................................... 1.0 0.1 3.5 0.9 1.2 2008 ....................................... 0.9 0.2 3.3 1.0 1.1 2009 ....................................... 0.9 0.2 3.6 0.9 1.3 2010 1 .................................... 0.8 0.1 3.7 0.7 1.2 2011 4 .................................... 0.8 0.1 3.4 0.9 1.1
Year Tomatoes Corn Pickles Other 2 Total 3
Pounds Pounds Pounds Pounds Pounds 2001 ....................................... 65.5 8.7 3.7 7.9 93.6 2002 ....................................... 69.4 7.8 5.4 8.1 97.5 2003 ....................................... 69.9 8.3 4.5 8.0 98.0 2004 ....................................... 70.5 8.2 4.9 8.8 99.7 2005 ....................................... 73.7 8.6 3.8 9.0 102.7 2006 ....................................... 64.5 8.4 3.0 8.9 92.3 2007 ....................................... 68.7 6.9 3.7 8.5 94.5 2008 ....................................... 67.1 6.7 3.5 8.8 92.6 2009 ....................................... 70.2 7.6 5.1 8.8 98.7 2010 1 .................................... 71.0 6.8 3.7 9.1 97.1 2011 4 .................................... 72.9 6.5 3.3 9.0 98.0
1 Preliminary. 2 Includes beets, chile peppers (all uses), green lima beans and spinach. 3 Totals may not add due to rounding. 4 ERS forecast.
ERS, Specialty Crops Branch, (202) 694–5253.
VerDate Aug 31 2005 10:23 Feb 29, 2012 Jkt 000000 PO 00000 Frm 00036 Fmt 1000 Sfmt 1000 H:\SHARED\DAPP\FPU\AGSTAT\MASTER~2\CHAPTR04\IV-37.AG8 USDA
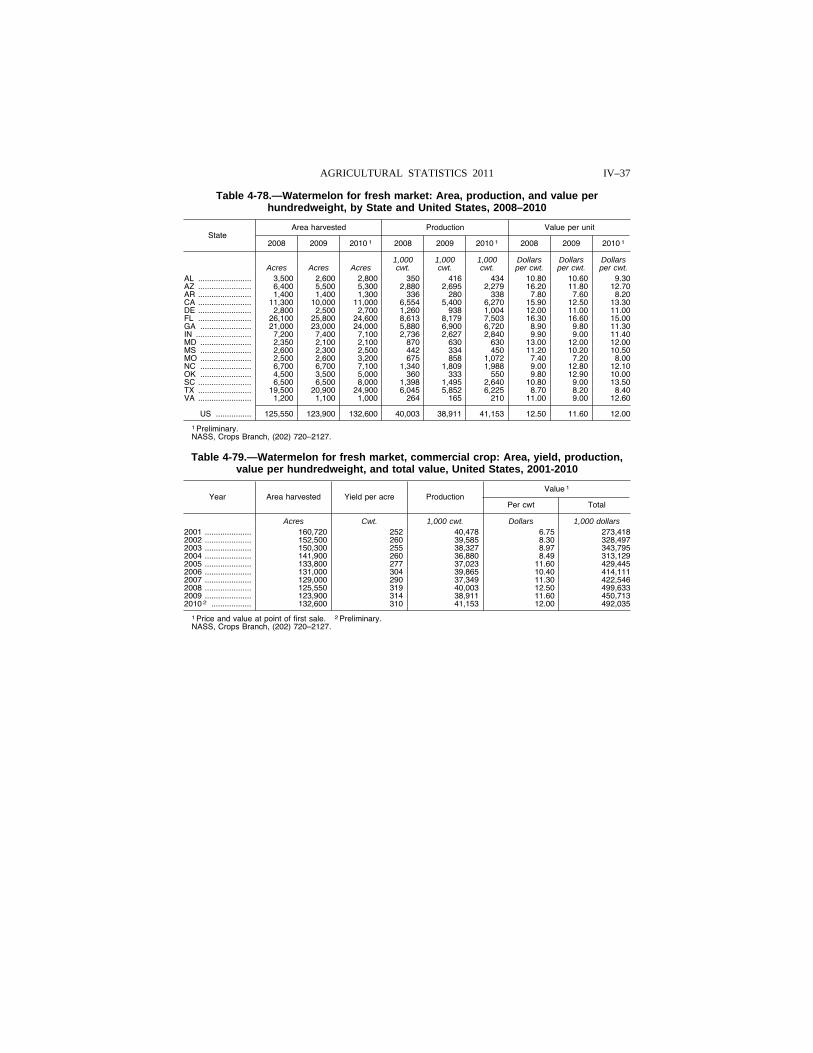
IV–37 AGRICULTURAL STATISTICS 2011
Table 4-78.—Watermelon for fresh market: Area, production, and value per hundredweight, by State and United States, 2008–2010
State Area harvested Production Value per unit
2008 2009 2010 1 2008 2009 2010 1 2008 2009 2010 1
1,000 1,000 1,000 Dollars Dollars Dollars Acres Acres Acres cwt. cwt. cwt. per cwt. per cwt. per cwt.
AL ........................ 3,500 2,600 2,800 350 416 434 10.80 10.60 9.30 AZ ........................ 6,400 5,500 5,300 2,880 2,695 2,279 16.20 11.80 12.70 AR ........................ 1,400 1,400 1,300 336 280 338 7.80 7.60 8.20 CA ........................ 11,300 10,000 11,000 6,554 5,400 6,270 15.90 12.50 13.30 DE ........................ 2,800 2,500 2,700 1,260 938 1,004 12.00 11.00 11.00 FL ........................ 26,100 25,800 24,600 8,613 8,179 7,503 16.30 16.60 15.00 GA ....................... 21,000 23,000 24,000 5,880 6,900 6,720 8.90 9.80 11.30 IN ......................... 7,200 7,400 7,100 2,736 2,627 2,840 9.90 9.00 11.40 MD ....................... 2,350 2,100 2,100 870 630 630 13.00 12.00 12.00 MS ....................... 2,600 2,300 2,500 442 334 450 11.20 10.20 10.50 MO ....................... 2,500 2,600 3,200 675 858 1,072 7.40 7.20 8.00 NC ....................... 6,700 6,700 7,100 1,340 1,809 1,988 9.00 12.80 12.10 OK ....................... 4,500 3,500 5,000 360 333 550 9.80 12.90 10.00 SC ........................ 6,500 6,500 8,000 1,398 1,495 2,640 10.80 9.00 13.50 TX ........................ 19,500 20,900 24,900 6,045 5,852 6,225 8.70 8.20 8.40 VA ........................ 1,200 1,100 1,000 264 165 210 11.00 9.00 12.60
US ................ 125,550 123,900 132,600 40,003 38,911 41,153 12.50 11.60 12.00
1 Preliminary.NASS, Crops Branch, (202) 720–2127.
Table 4-79.—Watermelon for fresh market, commercial crop: Area, yield, production, value per hundredweight, and total value, United States, 2001-2010
Year Area harvested Yield per acre Production Value 1
Per cwt Total
Acres Cwt. 1,000 cwt. Dollars 1,000 dollars 2001 ..................... 160,720 252 40,478 6.75 273,418 2002 ..................... 152,500 260 39,585 8.30 328,497 2003 ..................... 150,300 255 38,327 8.97 343,795 2004 ..................... 141,900 260 36,880 8.49 313,129 2005 ..................... 133,800 277 37,023 11.60 429,445 2006 ..................... 131,000 304 39,865 10.40 414,111 2007 ..................... 129,000 290 37,349 11.30 422,546 2008 ..................... 125,550 319 40,003 12.50 499,633 2009 ..................... 123,900 314 38,911 11.60 450,713 2010 2 .................. 132,600 310 41,153 12.00 492,035
1 Price and value at point of first sale. 2 Preliminary. NASS, Crops Branch, (202) 720–2127.
VerDate Aug 31 2005 10:23 Feb 29, 2012 Jkt 000000 PO 00000 Frm 00037 Fmt 1000 Sfmt 1000 H:\SHARED\DAPP\FPU\AGSTAT\MASTER~2\CHAPTR04\IV-78.AG8 USDA
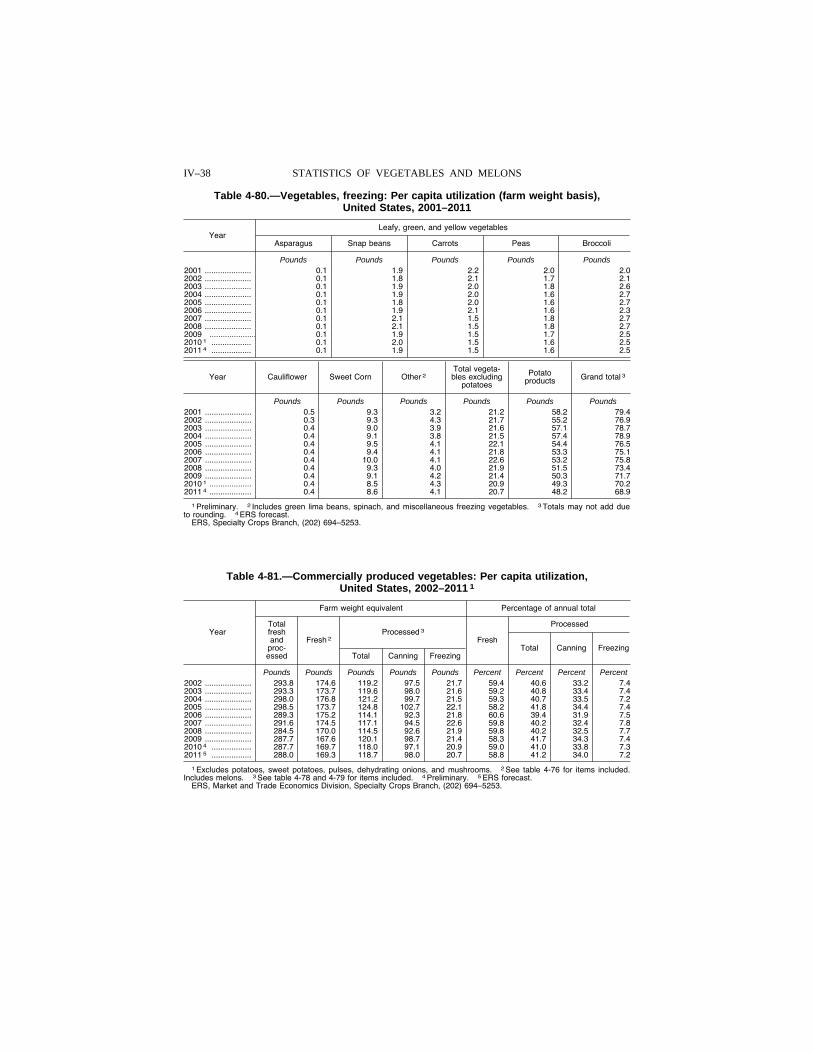
IV–38 STATISTICS OF VEGETABLES AND MELONS
Table 4-80.—Vegetables, freezing: Per capita utilization (farm weight basis), United States, 2001–2011
Year Leafy, green, and yellow vegetables
Asparagus Snap beans Carrots Peas Broccoli
Pounds Pounds Pounds Pounds Pounds 2001 ..................... 0 .1 1 .9 2 .2 2 .0 2 .0 2002 ..................... 0 .1 1 .8 2 .1 1 .7 2 .1 2003 ..................... 0 .1 1 .9 2 .0 1 .8 2 .6 2004 ..................... 0 .1 1 .9 2 .0 1 .6 2 .7 2005 ..................... 0 .1 1 .8 2 .0 1 .6 2 .7 2006 ..................... 0 .1 1 .9 2 .1 1 .6 2 .3 2007 ..................... 0 .1 2 .1 1 .5 1 .8 2 .7 2008 ..................... 0 .1 2 .1 1 .5 1 .8 2 .7 2009 ..................... 0 .1 1 .9 1 .5 1 .7 2 .5 2010 1 .................. 0 .1 2 .0 1 .5 1 .6 2 .5 2011 4 .................. 0 .1 1 .9 1 .5 1 .6 2 .5
Year Cauliflower Sweet Corn Other 2 Total vegeta-bles excluding
potatoes
Potato products Grand total 3
Pounds Pounds Pounds Pounds Pounds Pounds 2001 ..................... 0.5 9.3 3.2 21.2 58.2 79.4 2002 ..................... 0.3 9.3 4.3 21.7 55.2 76.9 2003 ..................... 0.4 9.0 3.9 21.6 57.1 78.7 2004 ..................... 0.4 9.1 3.8 21.5 57.4 78.9 2005 ..................... 0.4 9.5 4.1 22.1 54.4 76.5 2006 ..................... 0.4 9.4 4.1 21.8 53.3 75.1 2007 ..................... 0.4 10.0 4.1 22.6 53.2 75.8 2008 ..................... 0.4 9.3 4.0 21.9 51.5 73.4 2009 ..................... 0.4 9.1 4.2 21.4 50.3 71.7 2010 1 ................... 0.4 8.5 4.3 20.9 49.3 70.2 2011 4 ................... 0.4 8.6 4.1 20.7 48.2 68.9
1 Preliminary. 2 Includes green lima beans, spinach, and miscellaneous freezing vegetables. 3 Totals may not add due to rounding. 4 ERS forecast.
ERS, Specialty Crops Branch, (202) 694–5253.
Table 4-81.—Commercially produced vegetables: Per capita utilization, United States, 2002–2011 1
Year
Farm weight equivalent Percentage of annual total
Total fresh and
proc-essed
Fresh 2 Processed 3
Fresh
Processed
Total Canning Freezing Total Canning Freezing
Pounds Pounds Pounds Pounds Pounds Percent Percent Percent Percent 2002 ..................... 293.8 174.6 119.2 97.5 21.7 59.4 40.6 33.2 7.4 2003 ..................... 293.3 173.7 119.6 98.0 21.6 59.2 40.8 33.4 7.4 2004 ..................... 298.0 176.8 121.2 99.7 21.5 59.3 40.7 33.5 7.2 2005 ..................... 298.5 173.7 124.8 102.7 22.1 58.2 41.8 34.4 7.4 2006 ..................... 289.3 175.2 114.1 92.3 21.8 60.6 39.4 31.9 7.5 2007 ..................... 291.6 174.5 117.1 94.5 22.6 59.8 40.2 32.4 7.8 2008 ..................... 284.5 170.0 114.5 92.6 21.9 59.8 40.2 32.5 7.7 2009 ..................... 287.7 167.6 120.1 98.7 21.4 58.3 41.7 34.3 7.4 2010 4 .................. 287.7 169.7 118.0 97.1 20.9 59.0 41.0 33.8 7.3 2011 5 .................. 288.0 169.3 118.7 98.0 20.7 58.8 41.2 34.0 7.2
1 Excludes potatoes, sweet potatoes, pulses, dehydrating onions, and mushrooms. 2 See table 4-76 for items included. Includes melons. 3 See table 4-78 and 4-79 for items included. 4 Preliminary. 5 ERS forecast.
ERS, Market and Trade Economics Division, Specialty Crops Branch, (202) 694–5253.
VerDate Aug 31 2005 10:23 Feb 29, 2012 Jkt 000000 PO 00000 Frm 00038 Fmt 1000 Sfmt 1000 H:\SHARED\DAPP\FPU\AGSTAT\MASTER~2\CHAPTR04\IV-38.AG8 USDA
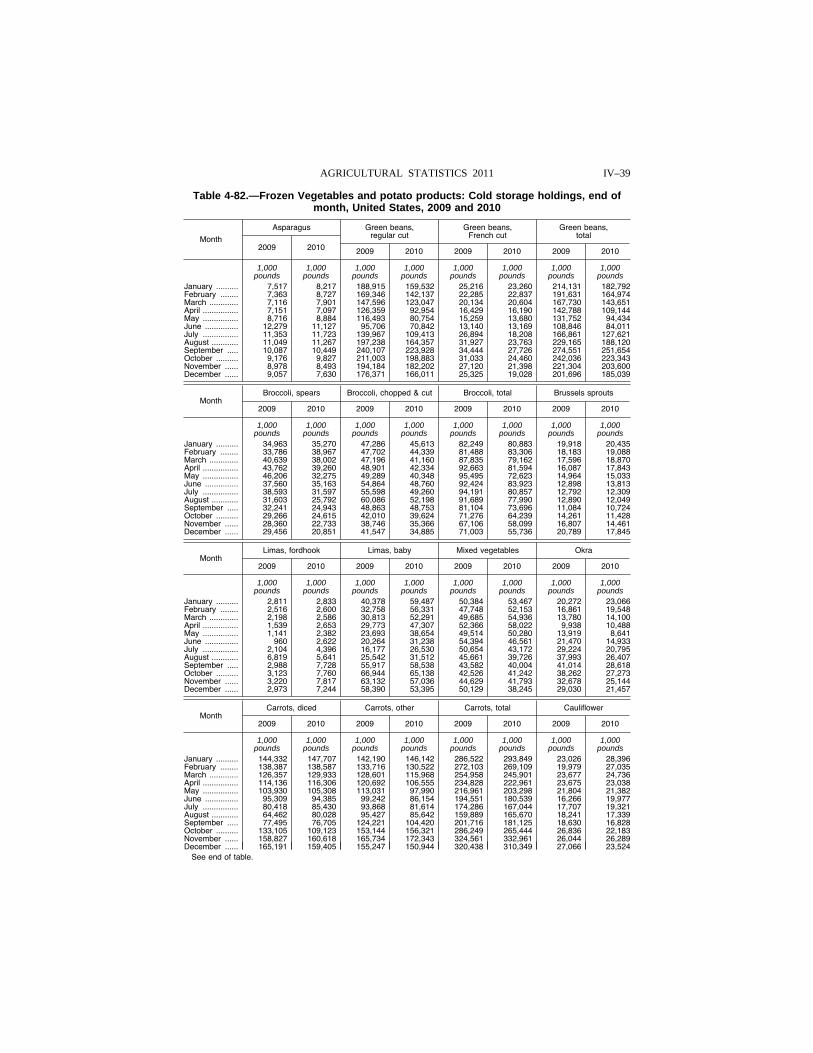
IV–39 AGRICULTURAL STATISTICS 2011
Table 4-82.—Frozen Vegetables and potato products: Cold storage holdings, end of month, United States, 2009 and 2010
Month
Asparagus Green beans, regular cut
Green beans, French cut
Green beans, total
2009 2010 2009 2010 2009 2010 2009 2010
1,000 1,000 1,000 1,000 1,000 1,000 1,000 1,000 pounds pounds pounds pounds pounds pounds pounds pounds
January .......... 7,517 8,217 188,915 159,532 25,216 23,260 214,131 182,792 February ........ 7,363 8,727 169,346 142,137 22,285 22,837 191,631 164,974 March ............. 7,116 7,901 147,596 123,047 20,134 20,604 167,730 143,651 April ................ 7,151 7,097 126,359 92,954 16,429 16,190 142,788 109,144 May ................ 8,716 8,884 116,493 80,754 15,259 13,680 131,752 94,434 June ............... 12,279 11,127 95,706 70,842 13,140 13,169 108,846 84,011 July ................ 11,353 11,723 139,967 109,413 26,894 18,208 166,861 127,621 August ............ 11,049 11,267 197,238 164,357 31,927 23,763 229,165 188,120 September ..... 10,087 10,449 240,107 223,928 34,444 27,726 274,551 251,654 October .......... 9,176 9,827 211,003 198,883 31,033 24,460 242,036 223,343 November ...... 8,978 8,493 194,184 182,202 27,120 21,398 221,304 203,600 December ...... 9,057 7,630 176,371 166,011 25,325 19,028 201,696 185,039
Month Broccoli, spears Broccoli, chopped & cut Broccoli, total Brussels sprouts
2009 2010 2009 2010 2009 2010 2009 2010
1,000 1,000 1,000 1,000 1,000 1,000 1,000 1,000 pounds pounds pounds pounds pounds pounds pounds pounds
January .......... 34,963 35,270 47,286 45,613 82,249 80,883 19,918 20,435 February ........ 33,786 38,967 47,702 44,339 81,488 83,306 18,183 19,088 March ............. 40,639 38,002 47,196 41,160 87,835 79,162 17,596 18,870 April ................ 43,762 39,260 48,901 42,334 92,663 81,594 16,087 17,843 May ................ 46,206 32,275 49,289 40,348 95,495 72,623 14,964 15,033 June ............... 37,560 35,163 54,864 48,760 92,424 83,923 12,898 13,813 July ................ 38,593 31,597 55,598 49,260 94,191 80,857 12,792 12,309 August ............ 31,603 25,792 60,086 52,198 91,689 77,990 12,890 12,049 September ..... 32,241 24,943 48,863 48,753 81,104 73,696 11,084 10,724 October .......... 29,266 24,615 42,010 39,624 71,276 64,239 14,261 11,428 November ...... 28,360 22,733 38,746 35,366 67,106 58,099 16,807 14,461 December ...... 29,456 20,851 41,547 34,885 71,003 55,736 20,789 17,845
Month Limas, fordhook Limas, baby Mixed vegetables Okra
2009 2010 2009 2010 2009 2010 2009 2010
1,000 1,000 1,000 1,000 1,000 1,000 1,000 1,000 pounds pounds pounds pounds pounds pounds pounds pounds
January .......... 2,811 2,833 40,378 59,487 50,384 53,467 20,272 23,066 February ........ 2,516 2,600 32,758 56,331 47,748 52,153 16,861 19,548 March ............. 2,198 2,586 30,813 52,291 49,685 54,936 13,780 14,100 April ................ 1,539 2,653 29,773 47,307 52,366 58,022 9,938 10,488 May ................ 1,141 2,382 23,693 38,654 49,514 50,280 13,919 8,641 June ............... 960 2,622 20,264 31,238 54,394 46,561 21,470 14,933 July ................ 2,104 4,396 16,177 26,530 50,654 43,172 29,224 20,795 August ............ 6,819 5,641 25,542 31,512 45,661 39,726 37,993 26,407 September ..... 2,988 7,728 55,917 58,538 43,582 40,004 41,014 28,618 October .......... 3,123 7,760 66,944 65,138 42,526 41,242 38,262 27,273 November ...... 3,220 7,817 63,132 57,036 44,629 41,793 32,678 25,144 December ...... 2,973 7,244 58,390 53,395 50,129 38,245 29,030 21,457
Month Carrots, diced Carrots, other Carrots, total Cauliflower
2009 2010 2009 2010 2009 2010 2009 2010
1,000 1,000 1,000 1,000 1,000 1,000 1,000 1,000 pounds pounds pounds pounds pounds pounds pounds pounds
January .......... 144,332 147,707 142,190 146,142 286,522 293,849 23,026 28,396 February ........ 138,387 138,587 133,716 130,522 272,103 269,109 19,979 27,035 March ............. 126,357 129,933 128,601 115,968 254,958 245,901 23,677 24,736 April ................ 114,136 116,306 120,692 106,555 234,828 222,961 23,675 23,038 May ................ 103,930 105,308 113,031 97,990 216,961 203,298 21,804 21,382 June ............... 95,309 94,385 99,242 86,154 194,551 180,539 16,266 19,977 July ................ 80,418 85,430 93,868 81,614 174,286 167,044 17,707 19,321 August ............ 64,462 80,028 95,427 85,642 159,889 165,670 18,241 17,339 September ..... 77,495 76,705 124,221 104,420 201,716 181,125 18,630 16,828 October .......... 133,105 109,123 153,144 156,321 286,249 265,444 26,836 22,183 November ...... 158,827 160,618 165,734 172,343 324,561 332,961 26,044 26,289 December ...... 165,191 159,405 155,247 150,944 320,438 310,349 27,066 23,524
See end of table.
VerDate Aug 31 2005 10:23 Feb 29, 2012 Jkt 000000 PO 00000 Frm 00039 Fmt 1000 Sfmt 1000 H:\SHARED\DAPP\FPU\AGSTAT\MASTER~2\CHAPTR04\IV-39.AG8 USDA
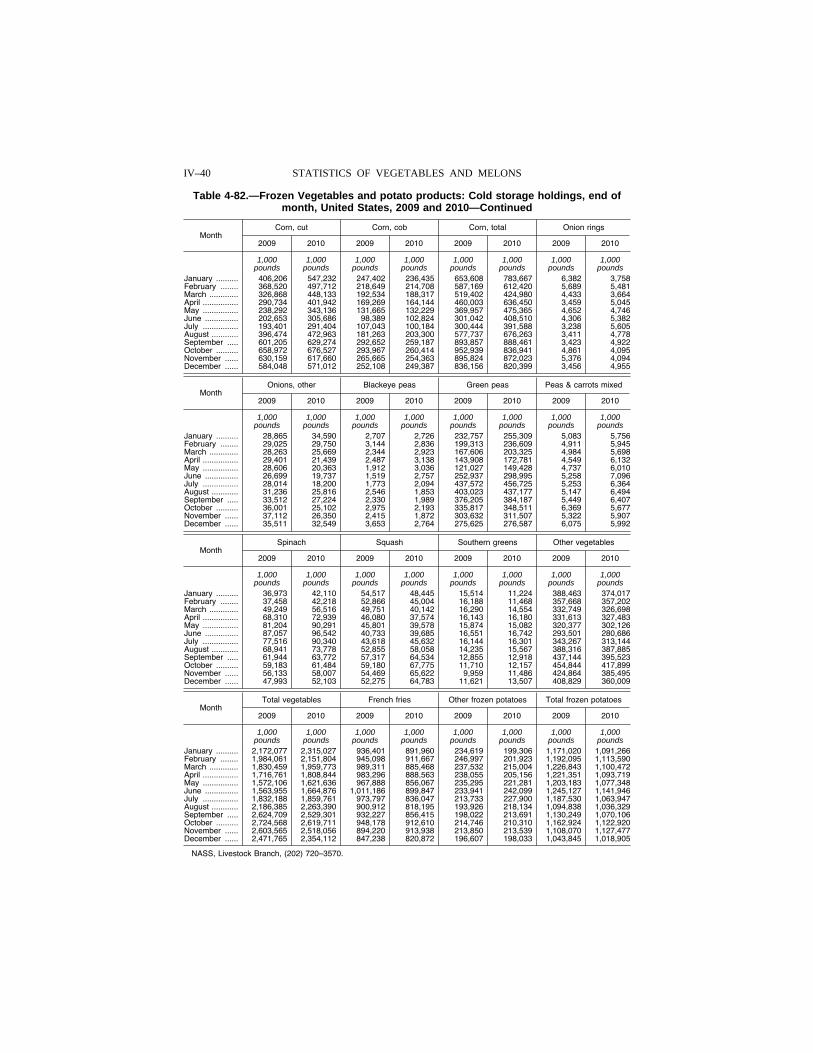
IV–40 STATISTICS OF VEGETABLES AND MELONS
Table 4-82.—Frozen Vegetables and potato products: Cold storage holdings, end of month, United States, 2009 and 2010—Continued
Month Corn, cut Corn, cob Corn, total Onion rings
2009 2010 2009 2010 2009 2010 2009 2010
1,000 1,000 1,000 1,000 1,000 1,000 1,000 1,000 pounds pounds pounds pounds pounds pounds pounds pounds
January .......... 406,206 547,232 247,402 236,435 653,608 783,667 6,382 3,758 February ........ 368,520 497,712 218,649 214,708 587,169 612,420 5,689 5,481 March ............. 326,868 448,133 192,534 188,317 519,402 424,980 4,433 3,664 April ................ 290,734 401,942 169,269 164,144 460,003 636,450 3,459 5,045 May ................ 238,292 343,136 131,665 132,229 369,957 475,365 4,652 4,746 June ............... 202,653 305,686 98,389 102,824 301,042 408,510 4,306 5,382 July ................ 193,401 291,404 107,043 100,184 300,444 391,588 3,238 5,605 August ............ 396,474 472,963 181,263 203,300 577,737 676,263 3,411 4,778 September ..... 601,205 629,274 292,652 259,187 893,857 888,461 3,423 4,922 October .......... 658,972 676,527 293,967 260,414 952,939 836,941 4,861 4,095 November ...... 630,159 617,660 265,665 254,363 895,824 872,023 5,376 4,094 December ...... 584,048 571,012 252,108 249,387 836,156 820,399 3,456 4,955
Month Onions, other Blackeye peas Green peas Peas & carrots mixed
2009 2010 2009 2010 2009 2010 2009 2010
1,000 1,000 1,000 1,000 1,000 1,000 1,000 1,000 pounds pounds pounds pounds pounds pounds pounds pounds
January .......... 28,865 34,590 2,707 2,726 232,757 255,309 5,083 5,756 February ........ 29,025 29,750 3,144 2,836 199,313 236,609 4,911 5,945 March ............. 28,263 25,669 2,344 2,923 167,606 203,325 4,984 5,698 April ................ 29,401 21,439 2,487 3,138 143,908 172,781 4,549 6,132 May ................ 28,606 20,363 1,912 3,036 121,027 149,428 4,737 6,010 June ............... 26,699 19,737 1,519 2,757 252,937 298,995 5,258 7,096 July ................ 28,014 18,200 1,773 2,094 437,572 456,725 5,253 6,364 August ............ 31,236 25,816 2,546 1,853 403,023 437,177 5,147 6,494 September ..... 33,512 27,224 2,330 1,989 376,205 384,187 5,449 6,407 October .......... 36,001 25,102 2,975 2,193 335,817 348,511 6,369 5,677 November ...... 37,112 26,350 2,415 1,872 303,632 311,507 5,322 5,907 December ...... 35,511 32,549 3,653 2,764 275,625 276,587 6,075 5,992
Month Spinach Squash Southern greens Other vegetables
2009 2010 2009 2010 2009 2010 2009 2010
1,000 1,000 1,000 1,000 1,000 1,000 1,000 1,000 pounds pounds pounds pounds pounds pounds pounds pounds
January .......... 36,973 42,110 54,517 48,445 15,514 11,224 388,463 374,017 February ........ 37,458 42,218 52,866 45,004 16,188 11,468 357,668 357,202 March ............. 49,249 56,516 49,751 40,142 16,290 14,554 332,749 326,698 April ................ 68,310 72,939 46,080 37,574 16,143 16,180 331,613 327,483 May ................ 81,204 90,291 45,801 39,578 15,874 15,082 320,377 302,126 June ............... 87,057 96,542 40,733 39,685 16,551 16,742 293,501 280,686 July ................ 77,516 90,340 43,618 45,632 16,144 16,301 343,267 313,144 August ............ 68,941 73,778 52,855 58,058 14,235 15,567 388,316 387,885 September ..... 61,944 63,772 57,317 64,534 12,855 12,918 437,144 395,523 October .......... 59,183 61,484 59,180 67,775 11,710 12,157 454,844 417,899 November ...... 56,133 58,007 54,469 65,622 9,959 11,486 424,864 385,495 December ...... 47,993 52,103 52,275 64,783 11,621 13,507 408,829 360,009
Month Total vegetables French fries Other frozen potatoes Total frozen potatoes
2009 2010 2009 2010 2009 2010 2009 2010
1,000 1,000 1,000 1,000 1,000 1,000 1,000 1,000 pounds pounds pounds pounds pounds pounds pounds pounds
January .......... 2,172,077 2,315,027 936,401 891,960 234,619 199,306 1,171,020 1,091,266 February ........ 1,984,061 2,151,804 945,098 911,667 246,997 201,923 1,192,095 1,113,590 March ............. 1,830,459 1,959,773 989,311 885,468 237,532 215,004 1,226,843 1,100,472 April ................ 1,716,761 1,808,844 983,296 888,563 238,055 205,156 1,221,351 1,093,719 May ................ 1,572,106 1,621,636 967,888 856,067 235,295 221,281 1,203,183 1,077,348 June ............... 1,563,955 1,664,876 1,011,186 899,847 233,941 242,099 1,245,127 1,141,946 July ................ 1,832,188 1,859,761 973,797 836,047 213,733 227,900 1,187,530 1,063,947 August ............ 2,186,385 2,263,390 900,912 818,195 193,926 218,134 1,094,838 1,036,329 September ..... 2,624,709 2,529,301 932,227 856,415 198,022 213,691 1,130,249 1,070,106 October .......... 2,724,568 2,619,711 948,178 912,610 214,746 210,310 1,162,924 1,122,920 November ...... 2,603,565 2,518,056 894,220 913,938 213,850 213,539 1,108,070 1,127,477 December ...... 2,471,765 2,354,112 847,238 820,872 196,607 198,033 1,043,845 1,018,905
NASS, Livestock Branch, (202) 720–3570.
VerDate Aug 31 2005 10:23 Feb 29, 2012 Jkt 000000 PO 00000 Frm 00040 Fmt 1000 Sfmt 1000 H:\SHARED\DAPP\FPU\AGSTAT\MASTER~2\CHAPTR04\IV-40.AG8 USDA
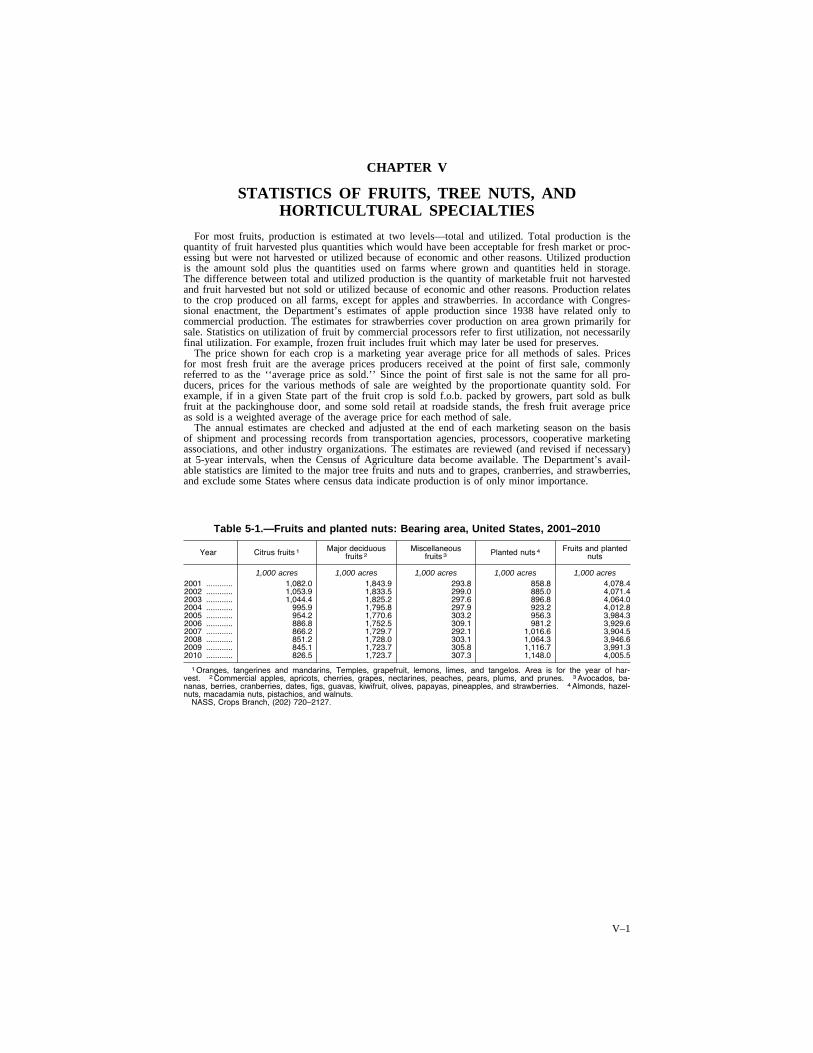
V–1
CHAPTER V
STATISTICS OF FRUITS, TREE NUTS, AND HORTICULTURAL SPECIALTIES
For most fruits, production is estimated at two levels—total and utilized. Total production is the quantity of fruit harvested plus quantities which would have been acceptable for fresh market or proc-essing but were not harvested or utilized because of economic and other reasons. Utilized production is the amount sold plus the quantities used on farms where grown and quantities held in storage. The difference between total and utilized production is the quantity of marketable fruit not harvested and fruit harvested but not sold or utilized because of economic and other reasons. Production relates to the crop produced on all farms, except for apples and strawberries. In accordance with Congres-sional enactment, the Department’s estimates of apple production since 1938 have related only to commercial production. The estimates for strawberries cover production on area grown primarily for sale. Statistics on utilization of fruit by commercial processors refer to first utilization, not necessarily final utilization. For example, frozen fruit includes fruit which may later be used for preserves.
The price shown for each crop is a marketing year average price for all methods of sales. Prices for most fresh fruit are the average prices producers received at the point of first sale, commonly referred to as the ‘‘average price as sold.’’ Since the point of first sale is not the same for all pro-ducers, prices for the various methods of sale are weighted by the proportionate quantity sold. For example, if in a given State part of the fruit crop is sold f.o.b. packed by growers, part sold as bulk fruit at the packinghouse door, and some sold retail at roadside stands, the fresh fruit average price as sold is a weighted average of the average price for each method of sale.
The annual estimates are checked and adjusted at the end of each marketing season on the basis of shipment and processing records from transportation agencies, processors, cooperative marketing associations, and other industry organizations. The estimates are reviewed (and revised if necessary) at 5-year intervals, when the Census of Agriculture data become available. The Department’s avail-able statistics are limited to the major tree fruits and nuts and to grapes, cranberries, and strawberries, and exclude some States where census data indicate production is of only minor importance.
Table 5-1.—Fruits and planted nuts: Bearing area, United States, 2001–2010
Year Citrus fruits 1 Major deciduous fruits 2
Miscellaneous fruits 3 Planted nuts 4 Fruits and planted
nuts
1,000 acres 1,000 acres 1,000 acres 1,000 acres 1,000 acres 2001 ............ 1,082.0 1,843.9 293.8 858.8 4,078.4 2002 ............ 1,053.9 1,833.5 299.0 885.0 4,071.4 2003 ............ 1,044.4 1,825.2 297.6 896.8 4,064.0 2004 ............ 995.9 1,795.8 297.9 923.2 4,012.8 2005 ............ 954.2 1,770.6 303.2 956.3 3,984.3 2006 ............ 886.8 1,752.5 309.1 981.2 3,929.6 2007 ............ 866.2 1,729.7 292.1 1,016.6 3,904.5 2008 ............ 851.2 1,728.0 303.1 1,064.3 3,946.6 2009 ............ 845.1 1,723.7 305.8 1,116.7 3,991.3 2010 ............ 826.5 1,723.7 307.3 1,148.0 4,005.5
1 Oranges, tangerines and mandarins, Temples, grapefruit, lemons, limes, and tangelos. Area is for the year of har-vest. 2 Commercial apples, apricots, cherries, grapes, nectarines, peaches, pears, plums, and prunes. 3 Avocados, ba-nanas, berries, cranberries, dates, figs, guavas, kiwifruit, olives, papayas, pineapples, and strawberries. 4 Almonds, hazel-nuts, macadamia nuts, pistachios, and walnuts.
NASS, Crops Branch, (202) 720–2127.
VerDate Aug 31 2005 10:25 Feb 29, 2012 Jkt 000000 PO 00000 Frm 00001 Fmt 1001 Sfmt 1001 H:\SHARED\DAPP\FPU\AGSTAT\MASTER~2\CHAPTR05\V-01.AG8 USDA
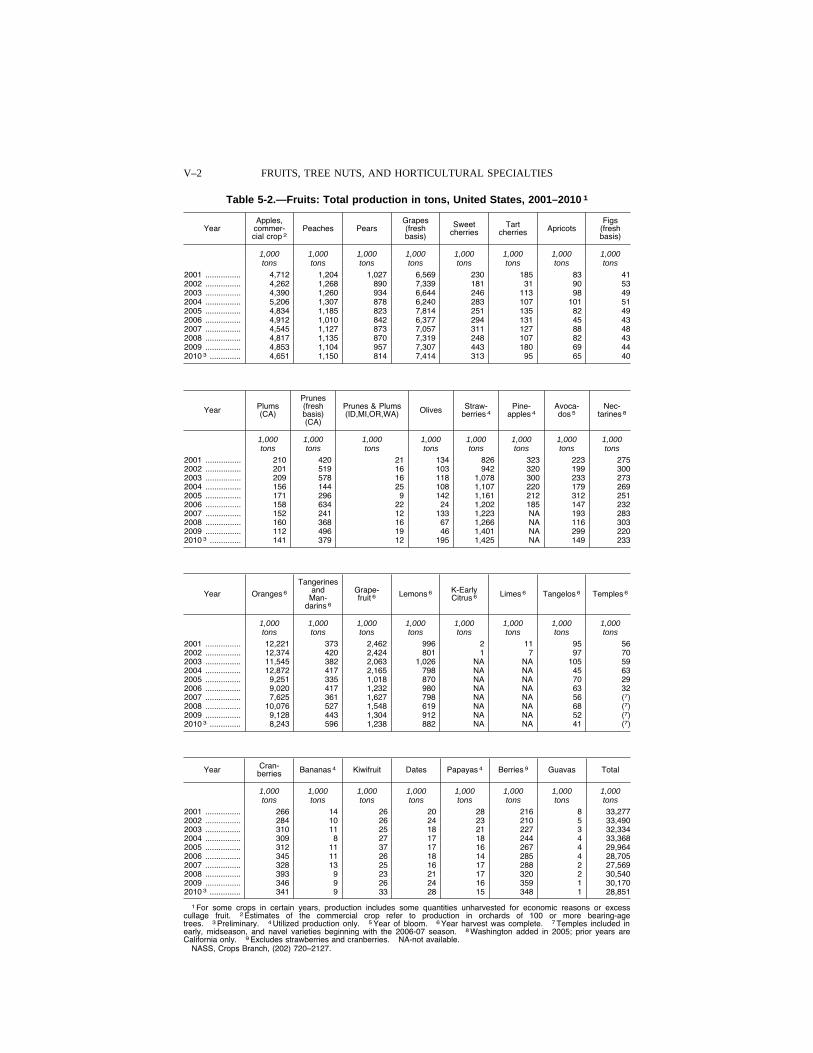
V–2 FRUITS, TREE NUTS, AND HORTICULTURAL SPECIALTIES
Table 5-2.—Fruits: Total production in tons, United States, 2001–2010 1
Year Apples,
commer-cial crop 2
Peaches Pears Grapes (fresh basis)
Sweet cherries
Tart cherries Apricots
Figs (fresh basis)
1,000 1,000 1,000 1,000 1,000 1,000 1,000 1,000 tons tons tons tons tons tons tons tons
2001 ................ 4,712 1,204 1,027 6,569 230 185 83 41 2002 ................ 4,262 1,268 890 7,339 181 31 90 53 2003 ................ 4,390 1,260 934 6,644 246 113 98 49 2004 ................ 5,206 1,307 878 6,240 283 107 101 51 2005 ................ 4,834 1,185 823 7,814 251 135 82 49 2006 ................ 4,912 1,010 842 6,377 294 131 45 43 2007 ................ 4,545 1,127 873 7,057 311 127 88 48 2008 ................ 4,817 1,135 870 7,319 248 107 82 43 2009 ................ 4,853 1,104 957 7,307 443 180 69 44 2010 3 .............. 4,651 1,150 814 7,414 313 95 65 40
Year Plums (CA)
Prunes (fresh basis) (CA)
Prunes & Plums (ID,MI,OR,WA) Olives Straw-
berries 4 Pine-
apples 4 Avoca-dos 5
Nec-tarines 8
1,000 1,000 1,000 1,000 1,000 1,000 1,000 1,000 tons tons tons tons tons tons tons tons
2001 ................ 210 420 21 134 826 323 223 275 2002 ................ 201 519 16 103 942 320 199 300 2003 ................ 209 578 16 118 1,078 300 233 273 2004 ................ 156 144 25 108 1,107 220 179 269 2005 ................ 171 296 9 142 1,161 212 312 251 2006 ................ 158 634 22 24 1,202 185 147 232 2007 ................ 152 241 12 133 1,223 NA 193 283 2008 ................ 160 368 16 67 1,266 NA 116 303 2009 ................ 112 496 19 46 1,401 NA 299 220 2010 3 .............. 141 379 12 195 1,425 NA 149 233
Year Oranges 6
Tangerines and
Man-darins 6
Grape-fruit 6 Lemons 6 K-Early
Citrus 6 Limes 6 Tangelos 6 Temples 6
1,000 1,000 1,000 1,000 1,000 1,000 1,000 1,000 tons tons tons tons tons tons tons tons
2001 ................ 12,221 373 2,462 996 2 11 95 56 2002 ................ 12,374 420 2,424 801 1 7 97 70 2003 ................ 11,545 382 2,063 1,026 NA NA 105 59 2004 ................ 12,872 417 2,165 798 NA NA 45 63 2005 ................ 9,251 335 1,018 870 NA NA 70 29 2006 ................ 9,020 417 1,232 980 NA NA 63 32 2007 ................ 7,625 361 1,627 798 NA NA 56 (7) 2008 ................ 10,076 527 1,548 619 NA NA 68 (7) 2009 ................ 9,128 443 1,304 912 NA NA 52 (7) 2010 3 .............. 8,243 596 1,238 882 NA NA 41 (7)
Year Cran-berries Bananas 4 Kiwifruit Dates Papayas 4 Berries 9 Guavas Total
1,000 1,000 1,000 1,000 1,000 1,000 1,000 1,000 tons tons tons tons tons tons tons tons
2001 ................ 266 14 26 20 28 216 8 33,277 2002 ................ 284 10 26 24 23 210 5 33,490 2003 ................ 310 11 25 18 21 227 3 32,334 2004 ................ 309 8 27 17 18 244 4 33,368 2005 ................ 312 11 37 17 16 267 4 29,964 2006 ................ 345 11 26 18 14 285 4 28,705 2007 ................ 328 13 25 16 17 288 2 27,569 2008 ................ 393 9 23 21 17 320 2 30,540 2009 ................ 346 9 26 24 16 359 1 30,170 2010 3 .............. 341 9 33 28 15 348 1 28,851
1 For some crops in certain years, production includes some quantities unharvested for economic reasons or excess cullage fruit. 2 Estimates of the commercial crop refer to production in orchards of 100 or more bearing-age trees. 3 Preliminary. 4 Utilized production only. 5 Year of bloom. 6 Year harvest was complete. 7 Temples included in early, midseason, and navel varieties beginning with the 2006-07 season. 8 Washington added in 2005; prior years are California only. 9 Excludes strawberries and cranberries. NA-not available.
NASS, Crops Branch, (202) 720–2127.
VerDate Aug 31 2005 10:25 Feb 29, 2012 Jkt 000000 PO 00000 Frm 00002 Fmt 1000 Sfmt 1000 H:\SHARED\DAPP\FPU\AGSTAT\MASTER~2\CHAPTR05\V-02.AG8 USDA
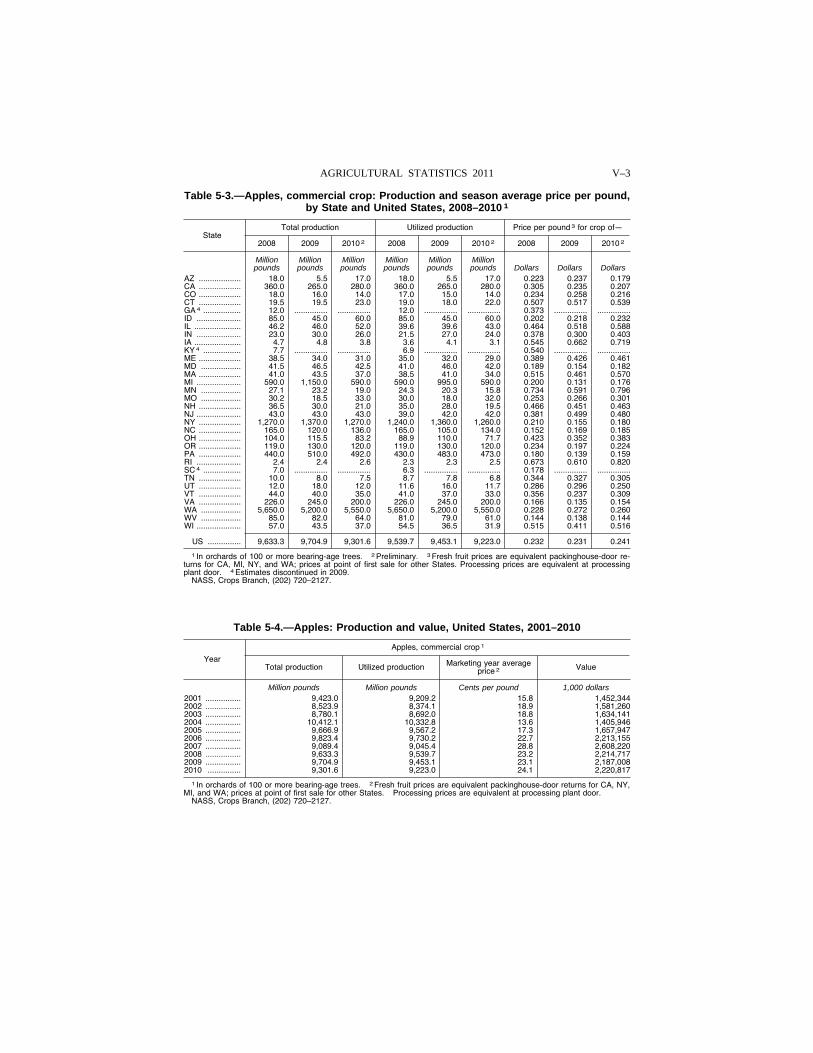
V–3 AGRICULTURAL STATISTICS 2011
Table 5-3.—Apples, commercial crop: Production and season average price per pound, by State and United States, 2008–2010 1
State Total production Utilized production Price per pound 3 for crop of—
2008 2009 2010 2 2008 2009 2010 2 2008 2009 2010 2
Million Million Million Million Million Million pounds pounds pounds pounds pounds pounds Dollars Dollars Dollars
AZ ................... 18.0 5.5 17.0 18.0 5.5 17.0 0.223 0.237 0.179 CA ................... 360.0 265.0 280.0 360.0 265.0 280.0 0.305 0.235 0.207 CO ................... 18.0 16.0 14.0 17.0 15.0 14.0 0.234 0.258 0.216 CT ................... 19.5 19.5 23.0 19.0 18.0 22.0 0.507 0.517 0.539 GA 4 ................. 12.0 ............... ............... 12.0 ............... ............... 0.373 ............... ...............ID .................... 85.0 45.0 60.0 85.0 45.0 60.0 0.202 0.218 0.232 IL ..................... 46.2 46.0 52.0 39.6 39.6 43.0 0.464 0.518 0.588 IN .................... 23.0 30.0 26.0 21.5 27.0 24.0 0.378 0.300 0.403 IA ..................... 4.7 4.8 3.8 3.6 4.1 3.1 0.545 0.662 0.719 KY 4 ................. 7.7 ............... ............... 6.9 ............... ............... 0.540 ............... ...............ME ................... 38.5 34.0 31.0 35.0 32.0 29.0 0.389 0.426 0.461 MD .................. 41.5 46.5 42.5 41.0 46.0 42.0 0.189 0.154 0.182 MA ................... 41.0 43.5 37.0 38.5 41.0 34.0 0.515 0.461 0.570 MI .................... 590.0 1,150.0 590.0 590.0 995.0 590.0 0.200 0.131 0.176 MN .................. 27.1 23.2 19.0 24.3 20.3 15.8 0.734 0.591 0.796 MO .................. 30.2 18.5 33.0 30.0 18.0 32.0 0.253 0.266 0.301 NH ................... 36.5 30.0 21.0 35.0 28.0 19.5 0.466 0.451 0.463 NJ .................... 43.0 43.0 43.0 39.0 42.0 42.0 0.381 0.499 0.480 NY ................... 1,270.0 1,370.0 1,270.0 1,240.0 1,360.0 1,260.0 0.210 0.155 0.180 NC ................... 165.0 120.0 136.0 165.0 105.0 134.0 0.152 0.169 0.185 OH ................... 104.0 115.5 83.2 88.9 110.0 71.7 0.423 0.352 0.383 OR ................... 119.0 130.0 120.0 119.0 130.0 120.0 0.234 0.197 0.224 PA ................... 440.0 510.0 492.0 430.0 483.0 473.0 0.180 0.139 0.159 RI .................... 2.4 2.4 2.6 2.3 2.3 2.5 0.673 0.610 0.820 SC 4 ................. 7.0 ............... ............... 6.3 ............... ............... 0.178 ............... ...............TN ................... 10.0 8.0 7.5 8.7 7.8 6.8 0.344 0.327 0.305 UT ................... 12.0 18.0 12.0 11.6 16.0 11.7 0.286 0.296 0.250 VT ................... 44.0 40.0 35.0 41.0 37.0 33.0 0.356 0.237 0.309 VA ................... 226.0 245.0 200.0 226.0 245.0 200.0 0.166 0.135 0.154 WA .................. 5,650.0 5,200.0 5,550.0 5,650.0 5,200.0 5,550.0 0.228 0.272 0.260 WV .................. 85.0 82.0 64.0 81.0 79.0 61.0 0.144 0.138 0.144 WI .................... 57.0 43.5 37.0 54.5 36.5 31.9 0.515 0.411 0.516
US ............... 9,633.3 9,704.9 9,301.6 9,539.7 9,453.1 9,223.0 0.232 0.231 0.241
1 In orchards of 100 or more bearing-age trees. 2 Preliminary. 3 Fresh fruit prices are equivalent packinghouse-door re-turns for CA, MI, NY, and WA; prices at point of first sale for other States. Processing prices are equivalent at processing plant door. 4 Estimates discontinued in 2009.
NASS, Crops Branch, (202) 720–2127.
Table 5-4.—Apples: Production and value, United States, 2001–2010
Year
Apples, commercial crop 1
Total production Utilized production Marketing year average price 2 Value
Million pounds Million pounds Cents per pound 1,000 dollars 2001 ................ 9,423.0 9,209.2 15.8 1,452,344 2002 ................ 8,523.9 8,374.1 18.9 1,581,260 2003 ................ 8,780.1 8,692.0 18.8 1,634,141 2004 ................ 10,412.1 10,332.8 13.6 1,405,946 2005 ................ 9,666.9 9,567.2 17.3 1,657,947 2006 ................ 9,823.4 9,730.2 22.7 2,213,155 2007 ................ 9,089.4 9,045.4 28.8 2,608,220 2008 ................ 9,633.3 9,539.7 23.2 2,214,717 2009 ................ 9,704.9 9,453.1 23.1 2,187,008 2010 ............... 9,301.6 9,223.0 24.1 2,220,817
1 In orchards of 100 or more bearing-age trees. 2 Fresh fruit prices are equivalent packinghouse-door returns for CA, NY, MI, and WA; prices at point of first sale for other States. Processing prices are equivalent at processing plant door.
NASS, Crops Branch, (202) 720–2127.
VerDate Aug 31 2005 10:25 Feb 29, 2012 Jkt 000000 PO 00000 Frm 00003 Fmt 1000 Sfmt 1000 H:\SHARED\DAPP\FPU\AGSTAT\MASTER~2\CHAPTR05\V-03.AG8 USDA
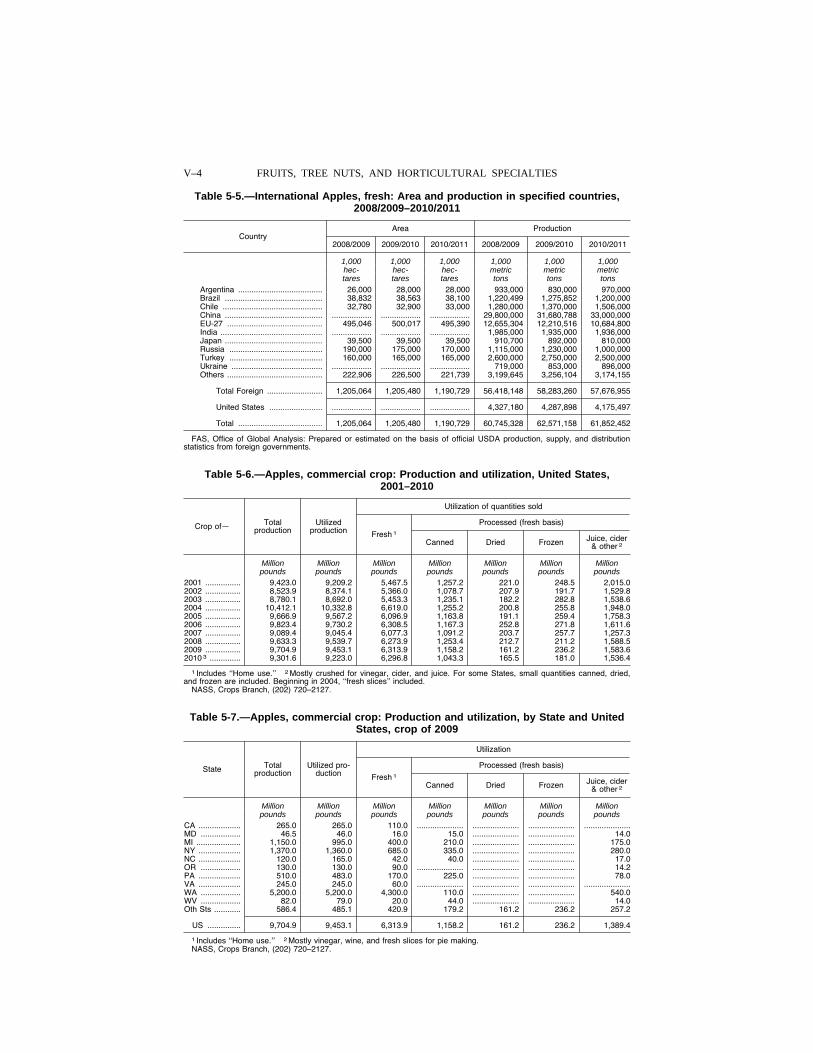
V–4 FRUITS, TREE NUTS, AND HORTICULTURAL SPECIALTIES
Table 5-5.—International Apples, fresh: Area and production in specified countries, 2008/2009–2010/2011
Country Area Production
2008/2009 2009/2010 2010/2011 2008/2009 2009/2010 2010/2011
1,000 1,000 1,000 1,000 1,000 1,000 hec- hec- hec- metric metric metric tares tares tares tons tons tons
Argentina ...................................... 26,000 28,000 28,000 933,000 830,000 970,000 Brazil ............................................ 38,832 38,563 38,100 1,220,499 1,275,852 1,200,000 Chile ............................................. 32,780 32,900 33,000 1,280,000 1,370,000 1,506,000 China ............................................ .................. .................. .................. 29,800,000 31,680,788 33,000,000 EU-27 ........................................... 495,046 500,017 495,390 12,655,304 12,210,516 10,684,800 India .............................................. .................. .................. .................. 1,985,000 1,935,000 1,936,000 Japan ............................................ 39,500 39,500 39,500 910,700 892,000 810,000 Russia .......................................... 190,000 175,000 170,000 1,115,000 1,230,000 1,000,000 Turkey .......................................... 160,000 165,000 165,000 2,600,000 2,750,000 2,500,000 Ukraine ......................................... .................. .................. .................. 719,000 853,000 896,000 Others ........................................... 222,906 226,500 221,739 3,199,645 3,256,104 3,174,155
Total Foreign ......................... 1,205,064 1,205,480 1,190,729 56,418,148 58,283,260 57,676,955
United States ........................ .................. .................. .................. 4,327,180 4,287,898 4,175,497
Total ...................................... 1,205,064 1,205,480 1,190,729 60,745,328 62,571,158 61,852,452
FAS, Office of Global Analysis: Prepared or estimated on the basis of official USDA production, supply, and distribution statistics from foreign governments.
Table 5-6.—Apples, commercial crop: Production and utilization, United States, 2001–2010
Crop of— Total production
Utilized production
Utilization of quantities sold
Fresh 1
Processed (fresh basis)
Canned Dried Frozen Juice, cider & other 2
Million Million Million Million Million Million Million pounds pounds pounds pounds pounds pounds pounds
2001 ................ 9,423.0 9,209.2 5,467.5 1,257.2 221.0 248.5 2,015.0 2002 ................ 8,523.9 8,374.1 5,366.0 1,078.7 207.9 191.7 1,529.8 2003 ................ 8,780.1 8,692.0 5,453.3 1,235.1 182.2 282.8 1,538.6 2004 ................ 10,412.1 10,332.8 6,619.0 1,255.2 200.8 255.8 1,948.0 2005 ................ 9,666.9 9,567.2 6,096.9 1,163.8 191.1 259.4 1,758.3 2006 ................ 9,823.4 9,730.2 6,308.5 1,167.3 252.8 271.8 1,611.6 2007 ................ 9,089.4 9,045.4 6,077.3 1,091.2 203.7 257.7 1,257.3 2008 ................ 9,633.3 9,539.7 6,273.9 1,253.4 212.7 211.2 1,588.5 2009 ................ 9,704.9 9,453.1 6,313.9 1,158.2 161.2 236.2 1,583.6 2010 3 .............. 9,301.6 9,223.0 6,296.8 1,043.3 165.5 181.0 1,536.4
1 Includes ‘‘Home use.’’ 2 Mostly crushed for vinegar, cider, and juice. For some States, small quantities canned, dried, and frozen are included. Beginning in 2004, ‘‘fresh slices’’ included.
NASS, Crops Branch, (202) 720–2127.
Table 5-7.—Apples, commercial crop: Production and utilization, by State and United States, crop of 2009
State Total production
Utilized pro-duction
Utilization
Fresh 1
Processed (fresh basis)
Canned Dried Frozen Juice, cider & other 2
Million Million Million Million Million Million Million pounds pounds pounds pounds pounds pounds pounds
CA ................... 265.0 265.0 110.0 ..................... ..................... ..................... .....................MD .................. 46.5 46.0 16.0 15.0 ..................... ..................... 14.0 MI .................... 1,150.0 995.0 400.0 210.0 ..................... ..................... 175.0 NY ................... 1,370.0 1,360.0 685.0 335.0 ..................... ..................... 280.0 NC ................... 120.0 165.0 42.0 40.0 ..................... ..................... 17.0 OR .................. 130.0 130.0 90.0 ..................... ..................... ..................... 14.2 PA ................... 510.0 483.0 170.0 225.0 ..................... ..................... 78.0 VA ................... 245.0 245.0 60.0 ..................... ..................... ..................... .....................WA .................. 5,200.0 5,200.0 4,300.0 110.0 ..................... ..................... 540.0 WV .................. 82.0 79.0 20.0 44.0 ..................... ..................... 14.0 Oth Sts ............ 586.4 485.1 420.9 179.2 161.2 236.2 257.2
US ............... 9,704.9 9,453.1 6,313.9 1,158.2 161.2 236.2 1,389.4
1 Includes ‘‘Home use.’’ 2 Mostly vinegar, wine, and fresh slices for pie making. NASS, Crops Branch, (202) 720–2127.
VerDate Aug 31 2005 10:25 Feb 29, 2012 Jkt 000000 PO 00000 Frm 00004 Fmt 1000 Sfmt 1000 H:\SHARED\DAPP\FPU\AGSTAT\MASTER~2\CHAPTR05\V-04.AG8 USDA
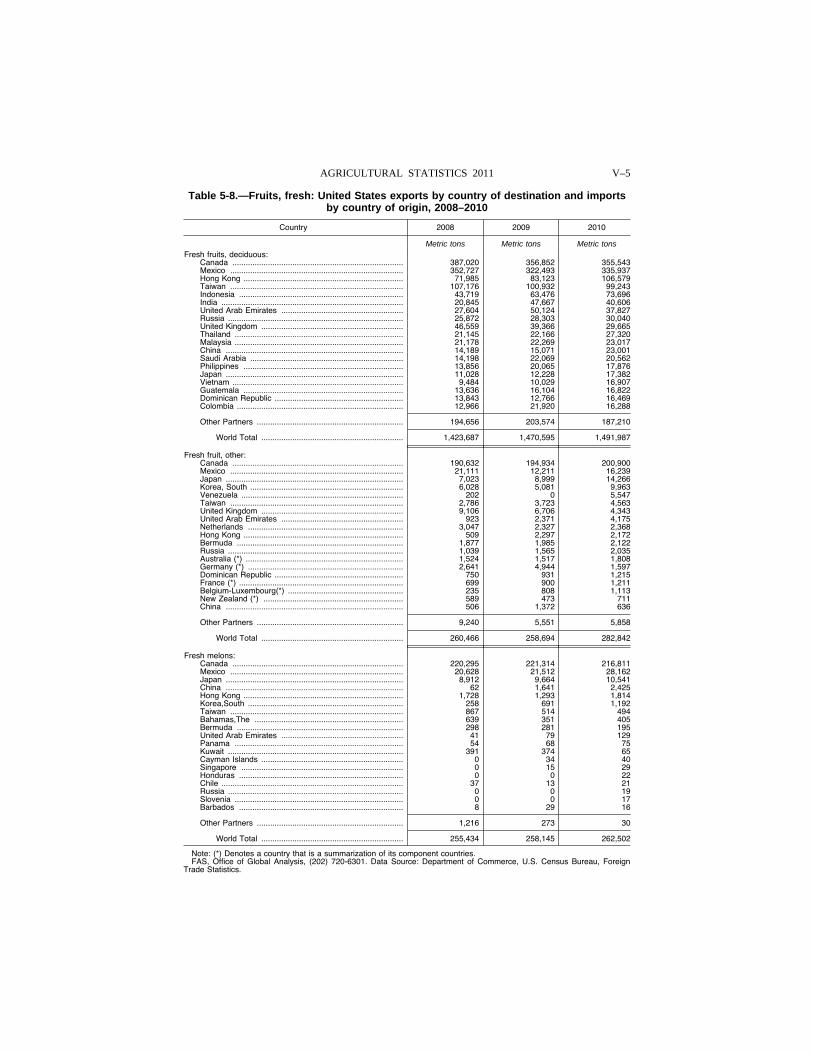
V–5 AGRICULTURAL STATISTICS 2011
Table 5-8.—Fruits, fresh: United States exports by country of destination and imports by country of origin, 2008–2010
Country 2008 2009 2010
Metric tons Metric tons Metric tons Fresh fruits, deciduous:
Canada ............................................................................. 387,020 356,852 355,543 Mexico .............................................................................. 352,727 322,493 335,937 Hong Kong ........................................................................ 71,985 83,123 106,579 Taiwan .............................................................................. 107,176 100,932 99,243 Indonesia .......................................................................... 43,719 63,476 73,696 India .................................................................................. 20,845 47,667 40,606 United Arab Emirates ....................................................... 27,604 50,124 37,827 Russia ............................................................................... 25,872 28,303 30,040 United Kingdom ................................................................ 46,559 39,366 29,665 Thailand ............................................................................ 21,145 22,166 27,320 Malaysia ............................................................................ 21,178 22,269 23,017 China ................................................................................ 14,189 15,071 23,001 Saudi Arabia ..................................................................... 14,198 22,069 20,562 Philippines ........................................................................ 13,856 20,065 17,876 Japan ................................................................................ 11,028 12,228 17,382 Vietnam ............................................................................. 9,484 10,029 16,907 Guatemala ........................................................................ 13,636 16,104 16,822 Dominican Republic .......................................................... 13,843 12,766 16,469 Colombia ........................................................................... 12,966 21,920 16,288
Other Partners .................................................................. 194,656 203,574 187,210
World Total ................................................................ 1,423,687 1,470,595 1,491,987
Fresh fruit, other: Canada ............................................................................. 190,632 194,934 200,900 Mexico .............................................................................. 21,111 12,211 16,239 Japan ................................................................................ 7,023 8,999 14,266 Korea, South ..................................................................... 6,028 5,081 9,963 Venezuela ......................................................................... 202 0 5,547 Taiwan .............................................................................. 2,786 3,723 4,563 United Kingdom ................................................................ 9,106 6,706 4,343 United Arab Emirates ....................................................... 923 2,371 4,175 Netherlands ...................................................................... 3,047 2,327 2,368 Hong Kong ........................................................................ 509 2,297 2,172 Bermuda ........................................................................... 1,877 1,985 2,122 Russia ............................................................................... 1,039 1,565 2,035 Australia (*) ....................................................................... 1,524 1,517 1,808 Germany (*) ...................................................................... 2,641 4,944 1,597 Dominican Republic .......................................................... 750 931 1,215 France (*) .......................................................................... 699 900 1,211 Belgium-Luxembourg(*) .................................................... 235 808 1,113 New Zealand (*) ............................................................... 589 473 711 China ................................................................................ 506 1,372 636
Other Partners .................................................................. 9,240 5,551 5,858
World Total ................................................................ 260,466 258,694 282,842
Fresh melons: Canada ............................................................................. 220,295 221,314 216,811 Mexico .............................................................................. 20,628 21,512 28,162 Japan ................................................................................ 8,912 9,664 10,541 China ................................................................................ 62 1,641 2,425 Hong Kong ........................................................................ 1,728 1,293 1,814 Korea,South ...................................................................... 258 691 1,192 Taiwan .............................................................................. 867 514 494 Bahamas,The ................................................................... 639 351 405 Bermuda ........................................................................... 298 281 195 United Arab Emirates ....................................................... 41 79 129 Panama ............................................................................ 54 68 75 Kuwait ............................................................................... 391 374 65 Cayman Islands ................................................................ 0 34 40 Singapore ......................................................................... 0 15 29 Honduras .......................................................................... 0 0 22 Chile .................................................................................. 37 13 21 Russia ............................................................................... 0 0 19 Slovenia ............................................................................ 0 0 17 Barbados .......................................................................... 8 29 16
Other Partners .................................................................. 1,216 273 30
World Total ................................................................ 255,434 258,145 262,502
Note: (*) Denotes a country that is a summarization of its component countries. FAS, Office of Global Analysis, (202) 720-6301. Data Source: Department of Commerce, U.S. Census Bureau, Foreign
Trade Statistics.
VerDate Aug 31 2005 10:25 Feb 29, 2012 Jkt 000000 PO 00000 Frm 00005 Fmt 1000 Sfmt 1000 H:\SHARED\DAPP\FPU\AGSTAT\MASTER~2\CHAPTR05\V-06.AG8 USDA
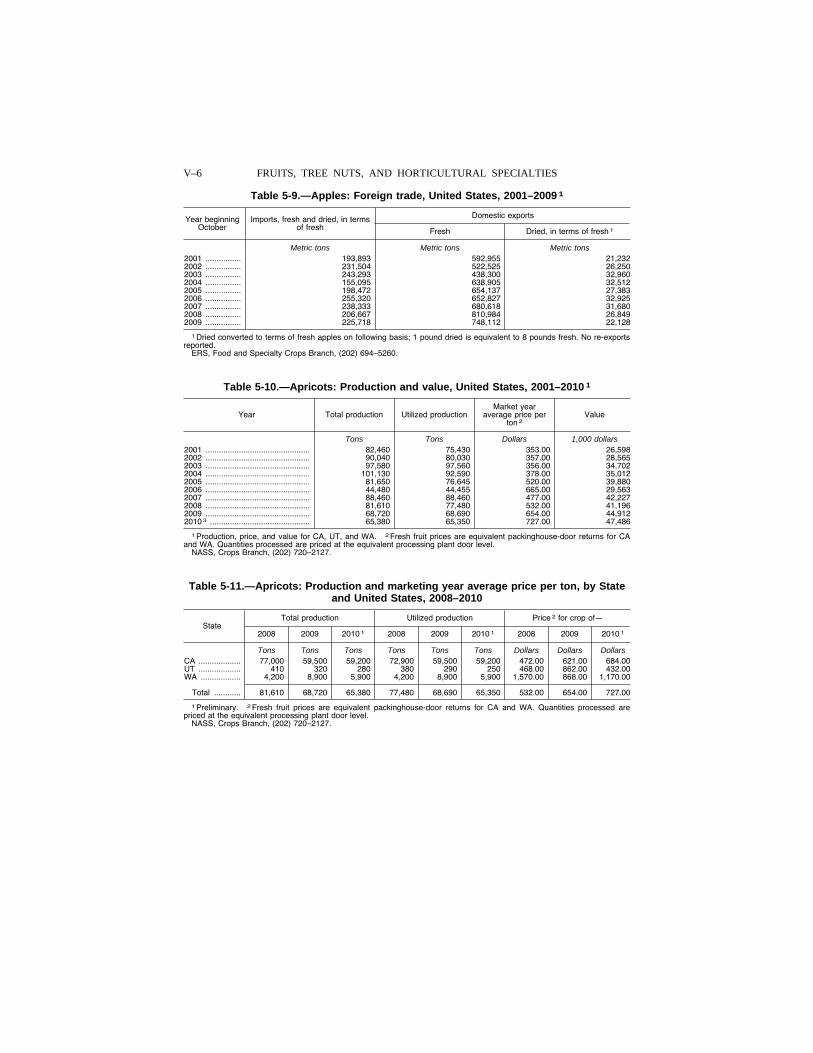
V–6 FRUITS, TREE NUTS, AND HORTICULTURAL SPECIALTIES
Table 5-9.—Apples: Foreign trade, United States, 2001–2009 1
Year beginning October
Imports, fresh and dried, in terms of fresh
Domestic exports
Fresh Dried, in terms of fresh 1
Metric tons Metric tons Metric tons 2001 ................ 193,893 592,955 21,232 2002 ................ 231,504 522,525 26,250 2003 ................ 243,293 438,300 32,960 2004 ................ 155,095 638,905 32,512 2005 ................ 198,472 654,137 27,383 2006 ................ 255,320 652,827 32,925 2007 ................ 238,333 680,618 31,680 2008 ................ 206,667 810,984 26,849 2009 ................ 225,718 748,112 22,128
1 Dried converted to terms of fresh apples on following basis; 1 pound dried is equivalent to 8 pounds fresh. No re-exports reported.
ERS, Food and Specialty Crops Branch, (202) 694–5260.
Table 5-10.—Apricots: Production and value, United States, 2001–2010 1
Year Total production Utilized production Market year
average price per ton 2
Value
Tons Tons Dollars 1,000 dollars 2001 ............................................... 82,460 75,430 353.00 26,598 2002 ............................................... 90,040 80,030 357.00 28,565 2003 ............................................... 97,580 97,560 356.00 34,702 2004 ............................................... 101,130 92,590 378.00 35,012 2005 ............................................... 81,650 76,645 520.00 39,880 2006 ............................................... 44,480 44,455 665.00 29,563 2007 ............................................... 88,460 88,460 477.00 42,227 2008 ............................................... 81,610 77,480 532.00 41,196 2009 ............................................... 68,720 68,690 654.00 44,912 2010 3 ............................................. 65,380 65,350 727.00 47,486
1 Production, price, and value for CA, UT, and WA. 2 Fresh fruit prices are equivalent packinghouse-door returns for CA and WA. Quantities processed are priced at the equivalent processing plant door level.
NASS, Crops Branch, (202) 720–2127.
Table 5-11.—Apricots: Production and marketing year average price per ton, by State and United States, 2008–2010
State Total production Utilized production Price 2 for crop of—
2008 2009 2010 1 2008 2009 2010 1 2008 2009 2010 1
Tons Tons Tons Tons Tons Tons Dollars Dollars Dollars CA ................... 77,000 59,500 59,200 72,900 59,500 59,200 472.00 621.00 684.00 UT ................... 410 320 280 380 290 250 468.00 862.00 432.00 WA .................. 4,200 8,900 5,900 4,200 8,900 5,900 1,570.00 868.00 1,170.00
Total ............ 81,610 68,720 65,380 77,480 68,690 65,350 532.00 654.00 727.00
1 Preliminary. 2 Fresh fruit prices are equivalent packinghouse-door returns for CA and WA. Quantities processed are priced at the equivalent processing plant door level.
NASS, Crops Branch, (202) 720–2127.
VerDate Aug 31 2005 10:25 Feb 29, 2012 Jkt 000000 PO 00000 Frm 00006 Fmt 1000 Sfmt 1000 H:\SHARED\DAPP\FPU\AGSTAT\MASTER~2\CHAPTR05\V-07.AG8 USDA
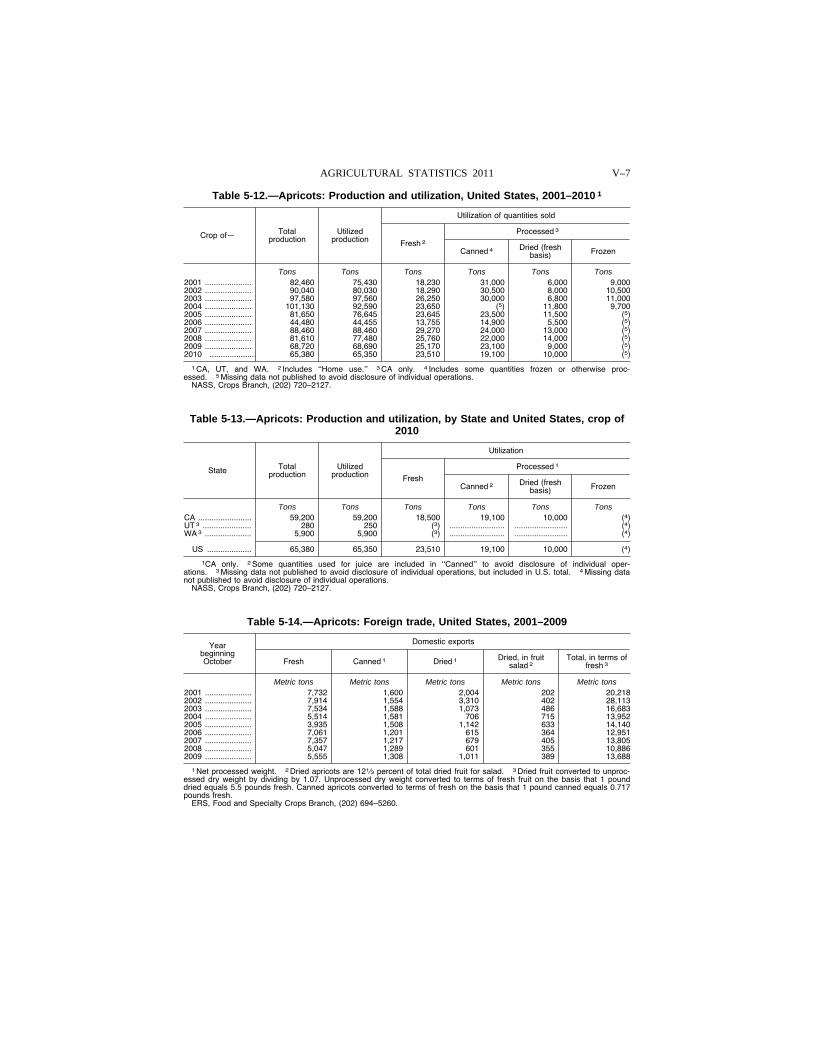
V–7 AGRICULTURAL STATISTICS 2011
Table 5-12.—Apricots: Production and utilization, United States, 2001–2010 1
Crop of— Total production
Utilized production
Utilization of quantities sold
Fresh 2
Processed 3
Canned 4 Dried (fresh basis) Frozen
Tons Tons Tons Tons Tons Tons 2001 ..................... 82,460 75,430 18,230 31,000 6,000 9,000 2002 ..................... 90,040 80,030 18,290 30,500 8,000 10,500 2003 ..................... 97,580 97,560 26,250 30,000 6,800 11,000 2004 ..................... 101,130 92,590 23,650 (5) 11,800 9,700 2005 ..................... 81,650 76,645 23,645 23,500 11,500 (5) 2006 ..................... 44,480 44,455 13,755 14,900 5,500 (5) 2007 ..................... 88,460 88,460 29,270 24,000 13,000 (5) 2008 ..................... 81,610 77,480 25,760 22,000 14,000 (5) 2009 ..................... 68,720 68,690 25,170 23,100 9,000 (5) 2010 ..................... 65,380 65,350 23,510 19,100 10,000 (5)
1 CA, UT, and WA. 2 Includes ‘‘Home use.’’ 3 CA only. 4 Includes some quantities frozen or otherwise proc-essed. 5 Missing data not published to avoid disclosure of individual operations.
NASS, Crops Branch, (202) 720–2127.
Table 5-13.—Apricots: Production and utilization, by State and United States, crop of 2010
State Total production
Utilized production
Utilization
Fresh
Processed 1
Canned 2 Dried (fresh basis) Frozen
Tons Tons Tons Tons Tons Tons CA ........................ 59,200 59,200 18,500 19,100 10,000 (4) UT 3 ...................... 280 250 (3) ......................... ........................ (4) WA 3 ..................... 5,900 5,900 (3) ......................... ........................ (4)
US .................... 65,380 65,350 23,510 19,100 10,000 (4)
1CA only. 2 Some quantities used for juice are included in ‘‘Canned’’ to avoid disclosure of individual oper-ations. 3 Missing data not published to avoid disclosure of individual operations, but included in U.S. total. 4 Missing data not published to avoid disclosure of individual operations.
NASS, Crops Branch, (202) 720–2127.
Table 5-14.—Apricots: Foreign trade, United States, 2001–2009
Year beginning October
Domestic exports
Fresh Canned 1 Dried 1 Dried, in fruit salad 2
Total, in terms of fresh 3
Metric tons Metric tons Metric tons Metric tons Metric tons 2001 ..................... 7,732 1,600 2,004 202 20,218 2002 ..................... 7,914 1,554 3,310 402 28,113 2003 ..................... 7,534 1,588 1,073 486 16,683 2004 ..................... 5,514 1,581 706 715 13,952 2005 ..................... 3,935 1,508 1,142 633 14,140 2006 ..................... 7,061 1,201 615 364 12,951 2007 ..................... 7,357 1,217 679 405 13,805 2008 ..................... 5,047 1,289 601 355 10,886 2009 ..................... 5,555 1,308 1,011 389 13,688
1 Net processed weight. 2 Dried apricots are 121⁄3 percent of total dried fruit for salad. 3 Dried fruit converted to unproc-essed dry weight by dividing by 1.07. Unprocessed dry weight converted to terms of fresh fruit on the basis that 1 pound dried equals 5.5 pounds fresh. Canned apricots converted to terms of fresh on the basis that 1 pound canned equals 0.717 pounds fresh.
ERS, Food and Specialty Crops Branch, (202) 694–5260.
VerDate Aug 31 2005 10:25 Feb 29, 2012 Jkt 000000 PO 00000 Frm 00007 Fmt 1000 Sfmt 1000 H:\SHARED\DAPP\FPU\AGSTAT\MASTER~2\CHAPTR05\V-08.AG8 USDA
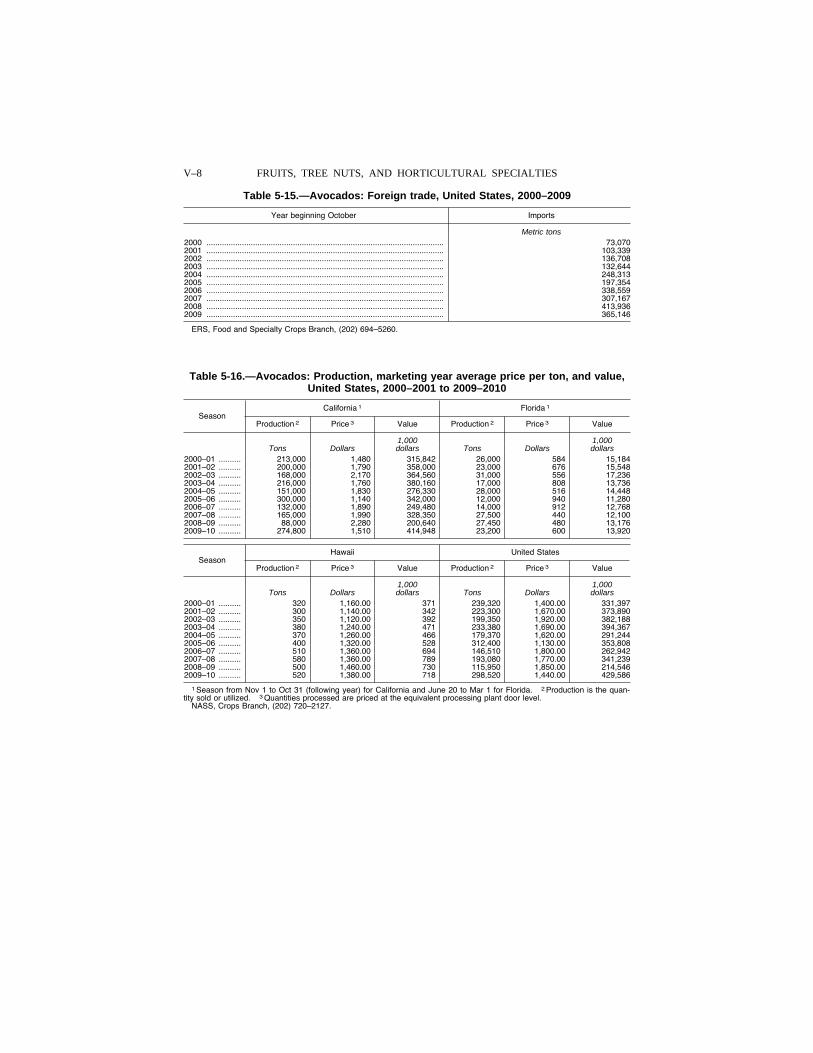
V–8 FRUITS, TREE NUTS, AND HORTICULTURAL SPECIALTIES
Table 5-15.—Avocados: Foreign trade, United States, 2000–2009
Year beginning October Imports
Metric tons 2000 ........................................................................................................... 73,070 2001 ........................................................................................................... 103,339 2002 ........................................................................................................... 136,708 2003 ........................................................................................................... 132,644 2004 ........................................................................................................... 248,313 2005 ........................................................................................................... 197,354 2006 ........................................................................................................... 338,559 2007 ........................................................................................................... 307,167 2008 ........................................................................................................... 413,936 2009 ........................................................................................................... 365,146
ERS, Food and Specialty Crops Branch, (202) 694–5260.
Table 5-16.—Avocados: Production, marketing year average price per ton, and value, United States, 2000–2001 to 2009–2010
Season California 1 Florida 1
Production 2 Price 3 Value Production 2 Price 3 Value
1,000 1,000 Tons Dollars dollars Tons Dollars dollars
2000–01 .......... 213,000 1,480 315,842 26,000 584 15,184 2001–02 .......... 200,000 1,790 358,000 23,000 676 15,548 2002–03 .......... 168,000 2,170 364,560 31,000 556 17,236 2003–04 .......... 216,000 1,760 380,160 17,000 808 13,736 2004–05 .......... 151,000 1,830 276,330 28,000 516 14,448 2005–06 .......... 300,000 1,140 342,000 12,000 940 11,280 2006–07 .......... 132,000 1,890 249,480 14,000 912 12,768 2007–08 .......... 165,000 1,990 328,350 27,500 440 12,100 2008–09 .......... 88,000 2,280 200,640 27,450 480 13,176 2009–10 .......... 274,800 1,510 414,948 23,200 600 13,920
Season Hawaii United States
Production 2 Price 3 Value Production 2 Price 3 Value
1,000 1,000 Tons Dollars dollars Tons Dollars dollars
2000–01 .......... 320 1,160.00 371 239,320 1,400.00 331,397 2001–02 .......... 300 1,140.00 342 223,300 1,670.00 373,890 2002–03 .......... 350 1,120.00 392 199,350 1,920.00 382,188 2003–04 .......... 380 1,240.00 471 233,380 1,690.00 394,367 2004–05 .......... 370 1,260.00 466 179,370 1,620.00 291,244 2005–06 .......... 400 1,320.00 528 312,400 1,130.00 353,808 2006–07 .......... 510 1,360.00 694 146,510 1,800.00 262,942 2007–08 .......... 580 1,360.00 789 193,080 1,770.00 341,239 2008–09 .......... 500 1,460.00 730 115,950 1,850.00 214,546 2009–10 .......... 520 1,380.00 718 298,520 1,440.00 429,586
1 Season from Nov 1 to Oct 31 (following year) for California and June 20 to Mar 1 for Florida. 2 Production is the quan-tity sold or utilized. 3 Quantities processed are priced at the equivalent processing plant door level.
NASS, Crops Branch, (202) 720–2127.
VerDate Aug 31 2005 10:25 Feb 29, 2012 Jkt 000000 PO 00000 Frm 00008 Fmt 1000 Sfmt 1000 H:\SHARED\DAPP\FPU\AGSTAT\MASTER~2\CHAPTR05\V-09.AG8 USDA
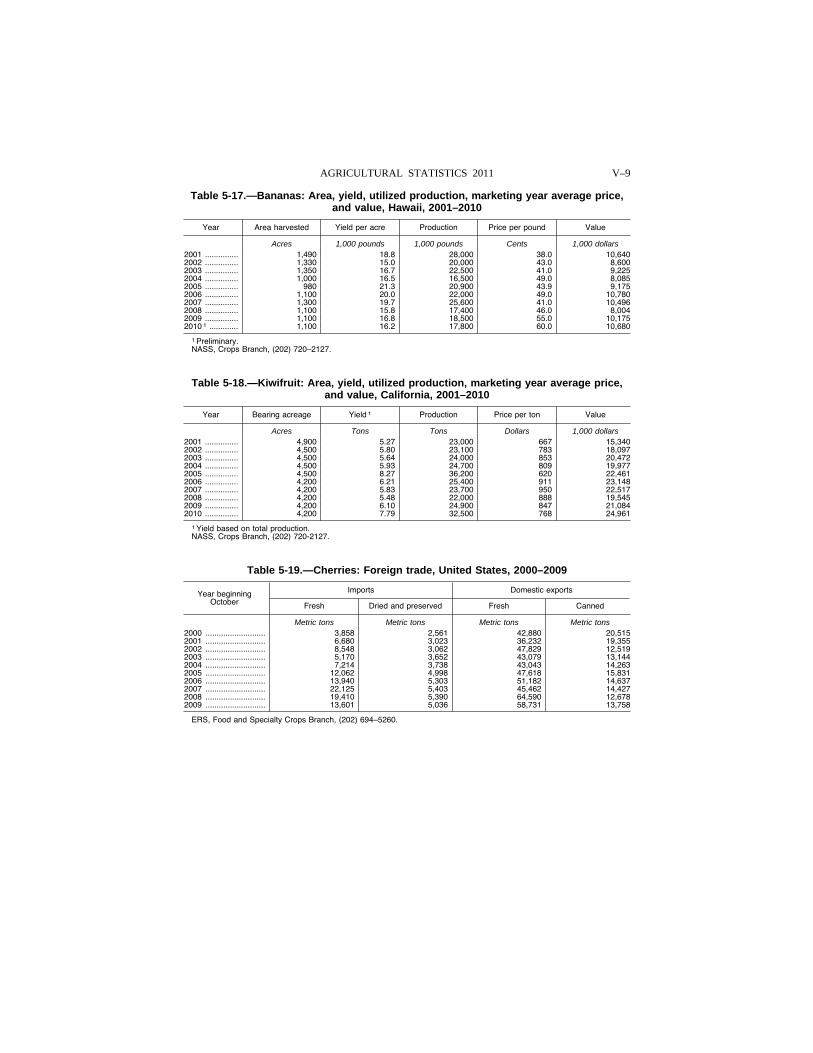
V–9 AGRICULTURAL STATISTICS 2011
Table 5-17.—Bananas: Area, yield, utilized production, marketing year average price, and value, Hawaii, 2001–2010
Year Area harvested Yield per acre Production Price per pound Value
Acres 1,000 pounds 1,000 pounds Cents 1,000 dollars 2001 ............... 1,490 18.8 28,000 38.0 10,640 2002 ............... 1,330 15.0 20,000 43.0 8,600 2003 ............... 1,350 16.7 22,500 41.0 9,225 2004 ............... 1,000 16.5 16,500 49.0 8,085 2005 ............... 980 21.3 20,900 43.9 9,175 2006 ............... 1,100 20.0 22,000 49.0 10,780 2007 ............... 1,300 19.7 25,600 41.0 10,496 2008 ............... 1,100 15.8 17,400 46.0 8,004 2009 ............... 1,100 16.8 18,500 55.0 10,175 2010 1 ............. 1,100 16.2 17,800 60.0 10,680
1 Preliminary. NASS, Crops Branch, (202) 720–2127.
Table 5-18.—Kiwifruit: Area, yield, utilized production, marketing year average price, and value, California, 2001–2010
Year Bearing acreage Yield 1 Production Price per ton Value
Acres Tons Tons Dollars 1,000 dollars 2001 ............... 4,900 5.27 23,000 667 15,340 2002 ............... 4,500 5.80 23,100 783 18,097 2003 ............... 4,500 5.64 24,000 853 20,472 2004 ............... 4,500 5.93 24,700 809 19,977 2005 ............... 4,500 8.27 36,200 620 22,461 2006 ............... 4,200 6.21 25,400 911 23,148 2007 ............... 4,200 5.83 23,700 950 22,517 2008 ............... 4,200 5.48 22,000 888 19,545 2009 ............... 4,200 6.10 24,900 847 21,084 2010 ............... 4,200 7.79 32,500 768 24,961
1 Yield based on total production. NASS, Crops Branch, (202) 720-2127.
Table 5-19.—Cherries: Foreign trade, United States, 2000–2009
Year beginning October
Imports Domestic exports
Fresh Dried and preserved Fresh Canned
Metric tons Metric tons Metric tons Metric tons 2000 ........................... 3,858 2,561 42,880 20,515 2001 ........................... 6,680 3,023 36,232 19,355 2002 ........................... 8,548 3,062 47,829 12,519 2003 ........................... 5,170 3,652 43,079 13,144 2004 ........................... 7,214 3,738 43,043 14,263 2005 ........................... 12,062 4,998 47,618 15,831 2006 ........................... 13,940 5,303 51,182 14,637 2007 ........................... 22,125 5,403 45,462 14,427 2008 ........................... 19,410 5,390 64,590 12,678 2009 ........................... 13,601 5,036 58,731 13,758
ERS, Food and Specialty Crops Branch, (202) 694–5260.
VerDate Aug 31 2005 10:25 Feb 29, 2012 Jkt 000000 PO 00000 Frm 00009 Fmt 1000 Sfmt 1000 H:\SHARED\DAPP\FPU\AGSTAT\MASTER~2\CHAPTR05\V-10.AG8 USDA
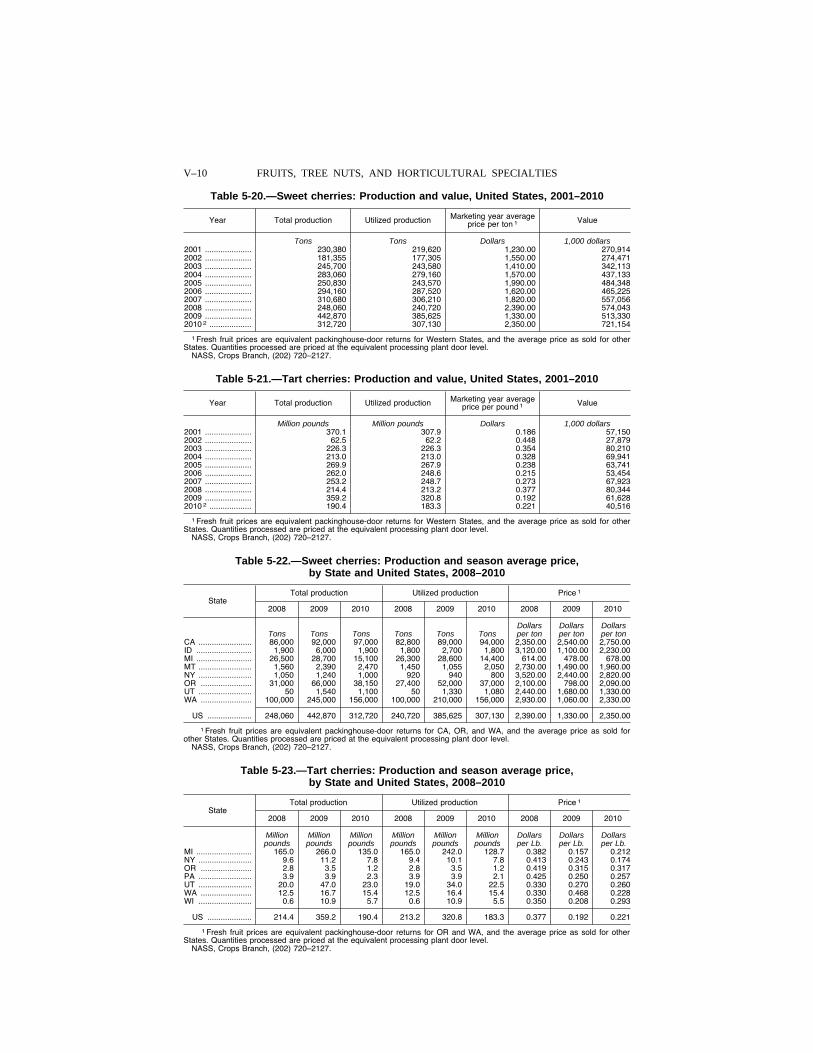
V–10 FRUITS, TREE NUTS, AND HORTICULTURAL SPECIALTIES
Table 5-20.—Sweet cherries: Production and value, United States, 2001–2010
Year Total production Utilized production Marketing year average price per ton 1 Value
Tons Tons Dollars 1,000 dollars 2001 ..................... 230,380 219,620 1,230.00 270,914 2002 ..................... 181,355 177,305 1,550.00 274,471 2003 ..................... 245,700 243,580 1,410.00 342,113 2004 ..................... 283,060 279,160 1,570.00 437,133 2005 ..................... 250,830 243,570 1,990.00 484,348 2006 ..................... 294,160 287,520 1,620.00 465,225 2007 ..................... 310,680 306,210 1,820.00 557,056 2008 ..................... 248,060 240,720 2,390.00 574,043 2009 ..................... 442,870 385,625 1,330.00 513,330 2010 2 ................... 312,720 307,130 2,350.00 721,154
1 Fresh fruit prices are equivalent packinghouse-door returns for Western States, and the average price as sold for other States. Quantities processed are priced at the equivalent processing plant door level.
NASS, Crops Branch, (202) 720–2127.
Table 5-21.—Tart cherries: Production and value, United States, 2001–2010
Year Total production Utilized production Marketing year average price per pound 1 Value
Million pounds Million pounds Dollars 1,000 dollars 2001 ..................... 370.1 307.9 0.186 57,150 2002 ..................... 62.5 62.2 0.448 27,879 2003 ..................... 226.3 226.3 0.354 80,210 2004 ..................... 213.0 213.0 0.328 69,941 2005 ..................... 269.9 267.9 0.238 63,741 2006 ..................... 262.0 248.6 0.215 53,454 2007 ..................... 253.2 248.7 0.273 67,923 2008 ..................... 214.4 213.2 0.377 80,344 2009 ..................... 359.2 320.8 0.192 61,628 2010 2 ................... 190.4 183.3 0.221 40,516
1 Fresh fruit prices are equivalent packinghouse-door returns for Western States, and the average price as sold for other States. Quantities processed are priced at the equivalent processing plant door level.
NASS, Crops Branch, (202) 720–2127.
Table 5-22.—Sweet cherries: Production and season average price, by State and United States, 2008–2010
State Total production Utilized production Price 1
2008 2009 2010 2008 2009 2010 2008 2009 2010
Dollars Dollars Dollars Tons Tons Tons Tons Tons Tons per ton per ton per ton
CA ........................ 86,000 92,000 97,000 82,800 89,000 94,000 2,350.00 2,540.00 2,750.00 ID ......................... 1,900 6,000 1,900 1,800 2,700 1,800 3,120.00 1,100.00 2,230.00 MI ......................... 26,500 28,700 15,100 26,300 28,600 14,400 614.00 478.00 678.00 MT ........................ 1,560 2,390 2,470 1,450 1,055 2,050 2,730.00 1,490.00 1,960.00 NY ........................ 1,050 1,240 1,000 920 940 800 3,520.00 2,440.00 2,820.00 OR ....................... 31,000 66,000 38,150 27,400 52,000 37,000 2,100.00 798.00 2,090.00 UT ........................ 50 1,540 1,100 50 1,330 1,080 2,440.00 1,680.00 1,330.00 WA ....................... 100,000 245,000 156,000 100,000 210,000 156,000 2,930.00 1,060.00 2,330.00
US .................... 248,060 442,870 312,720 240,720 385,625 307,130 2,390.00 1,330.00 2,350.00
1 Fresh fruit prices are equivalent packinghouse-door returns for CA, OR, and WA, and the average price as sold for other States. Quantities processed are priced at the equivalent processing plant door level.
NASS, Crops Branch, (202) 720–2127.
Table 5-23.—Tart cherries: Production and season average price, by State and United States, 2008–2010
State Total production Utilized production Price 1
2008 2009 2010 2008 2009 2010 2008 2009 2010
Million Million Million Million Million Million Dollars Dollars Dollars pounds pounds pounds pounds pounds pounds per Lb. per Lb. per Lb.
MI ......................... 165.0 266.0 135.0 165.0 242.0 128.7 0.382 0.157 0.212 NY ........................ 9.6 11.2 7.8 9.4 10.1 7.8 0.413 0.243 0.174 OR ....................... 2.8 3.5 1.2 2.8 3.5 1.2 0.419 0.315 0.317 PA ........................ 3.9 3.9 2.3 3.9 3.9 2.1 0.425 0.250 0.257 UT ........................ 20.0 47.0 23.0 19.0 34.0 22.5 0.330 0.270 0.260 WA ....................... 12.5 16.7 15.4 12.5 16.4 15.4 0.330 0.468 0.228 WI ........................ 0.6 10.9 5.7 0.6 10.9 5.5 0.350 0.208 0.293
US .................... 214.4 359.2 190.4 213.2 320.8 183.3 0.377 0.192 0.221
1 Fresh fruit prices are equivalent packinghouse-door returns for OR and WA, and the average price as sold for other States. Quantities processed are priced at the equivalent processing plant door level.
NASS, Crops Branch, (202) 720–2127.
VerDate Aug 31 2005 10:25 Feb 29, 2012 Jkt 000000 PO 00000 Frm 00010 Fmt 1000 Sfmt 1000 H:\SHARED\DAPP\FPU\AGSTAT\MASTER~2\CHAPTR05\V-11.AG8 USDA
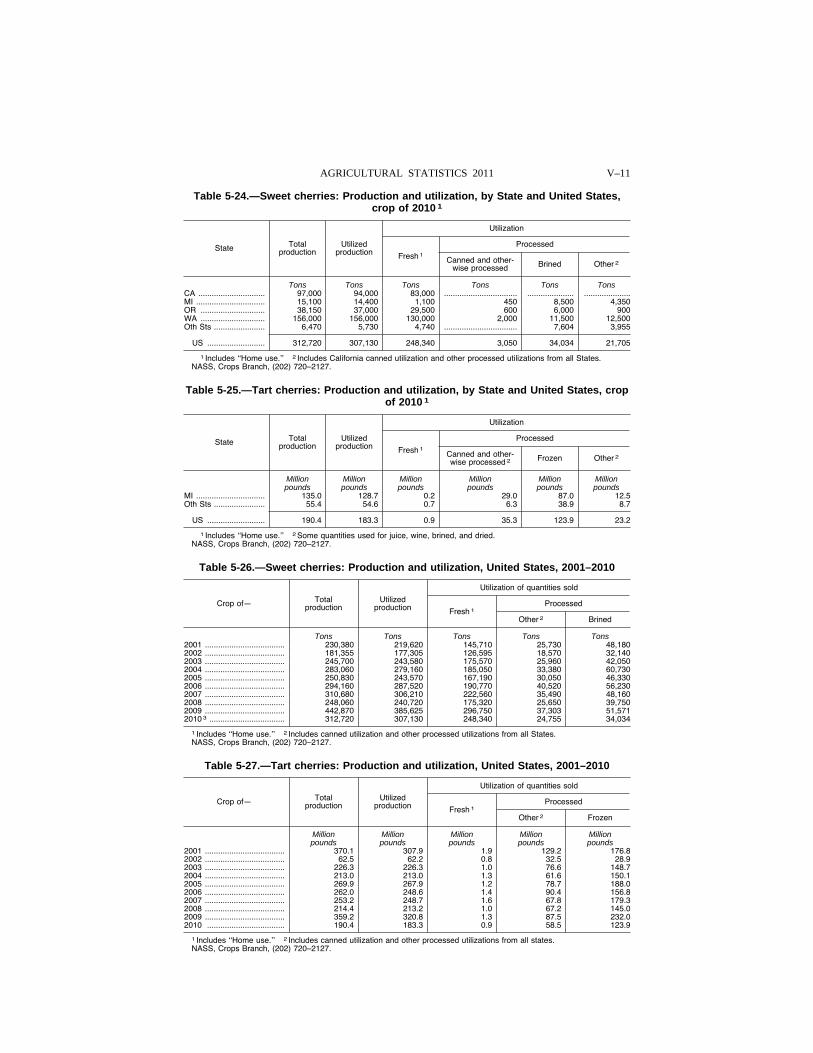
V–11 AGRICULTURAL STATISTICS 2011
Table 5-24.—Sweet cherries: Production and utilization, by State and United States, crop of 2010 1
State Total production
Utilized production
Utilization
Fresh 1
Processed
Canned and other-wise processed Brined Other 2
Tons Tons Tons Tons Tons Tons CA .............................. 97,000 94,000 83,000 ................................. ..................... .....................MI ............................... 15,100 14,400 1,100 450 8,500 4,350 OR ............................. 38,150 37,000 29,500 600 6,000 900 WA ............................. 156,000 156,000 130,000 2,000 11,500 12,500 Oth Sts ....................... 6,470 5,730 4,740 ................................. 7,604 3,955
US .......................... 312,720 307,130 248,340 3,050 34,034 21,705
1 Includes ‘‘Home use.’’ 2 Includes California canned utilization and other processed utilizations from all States. NASS, Crops Branch, (202) 720–2127.
Table 5-25.—Tart cherries: Production and utilization, by State and United States, crop of 2010 1
State Total production
Utilized production
Utilization
Fresh 1
Processed
Canned and other-wise processed 2 Frozen Other 2
Million Million Million Million Million Million pounds pounds pounds pounds pounds pounds
MI ............................... 135.0 128.7 0.2 29.0 87.0 12.5 Oth Sts ....................... 55.4 54.6 0.7 6.3 38.9 8.7
US .......................... 190.4 183.3 0.9 35.3 123.9 23.2
1 Includes ‘‘Home use.’’ 2 Some quantities used for juice, wine, brined, and dried. NASS, Crops Branch, (202) 720–2127.
Table 5-26.—Sweet cherries: Production and utilization, United States, 2001–2010
Crop of— Total production
Utilized production
Utilization of quantities sold
Fresh 1 Processed
Other 2 Brined
Tons Tons Tons Tons Tons 2001 .................................... 230,380 219,620 145,710 25,730 48,180 2002 .................................... 181,355 177,305 126,595 18,570 32,140 2003 .................................... 245,700 243,580 175,570 25,960 42,050 2004 .................................... 283,060 279,160 185,050 33,380 60,730 2005 .................................... 250,830 243,570 167,190 30,050 46,330 2006 .................................... 294,160 287,520 190,770 40,520 56,230 2007 .................................... 310,680 306,210 222,560 35,490 48,160 2008 .................................... 248,060 240,720 175,320 25,650 39,750 2009 .................................... 442,870 385,625 296,750 37,303 51,571 2010 3 .................................. 312,720 307,130 248,340 24,755 34,034
1 Includes ‘‘Home use.’’ 2 Includes canned utilization and other processed utilizations from all States.NASS, Crops Branch, (202) 720–2127.
Table 5-27.—Tart cherries: Production and utilization, United States, 2001–2010
Crop of— Total production
Utilized production
Utilization of quantities sold
Fresh 1 Processed
Other 2 Frozen
Million Million Million Million Million pounds pounds pounds pounds pounds
2001 .................................... 370.1 307.9 1.9 129.2 176.8 2002 .................................... 62.5 62.2 0.8 32.5 28.9 2003 .................................... 226.3 226.3 1.0 76.6 148.7 2004 .................................... 213.0 213.0 1.3 61.6 150.1 2005 .................................... 269.9 267.9 1.2 78.7 188.0 2006 .................................... 262.0 248.6 1.4 90.4 156.8 2007 .................................... 253.2 248.7 1.6 67.8 179.3 2008 .................................... 214.4 213.2 1.0 67.2 145.0 2009 .................................... 359.2 320.8 1.3 87.5 232.0 2010 ................................... 190.4 183.3 0.9 58.5 123.9
1 Includes ‘‘Home use.’’ 2 Includes canned utilization and other processed utilizations from all states.NASS, Crops Branch, (202) 720–2127.
VerDate Aug 31 2005 10:25 Feb 29, 2012 Jkt 000000 PO 00000 Frm 00011 Fmt 1000 Sfmt 1000 H:\SHARED\DAPP\FPU\AGSTAT\MASTER~2\CHAPTR05\V-12.AG8 USDA
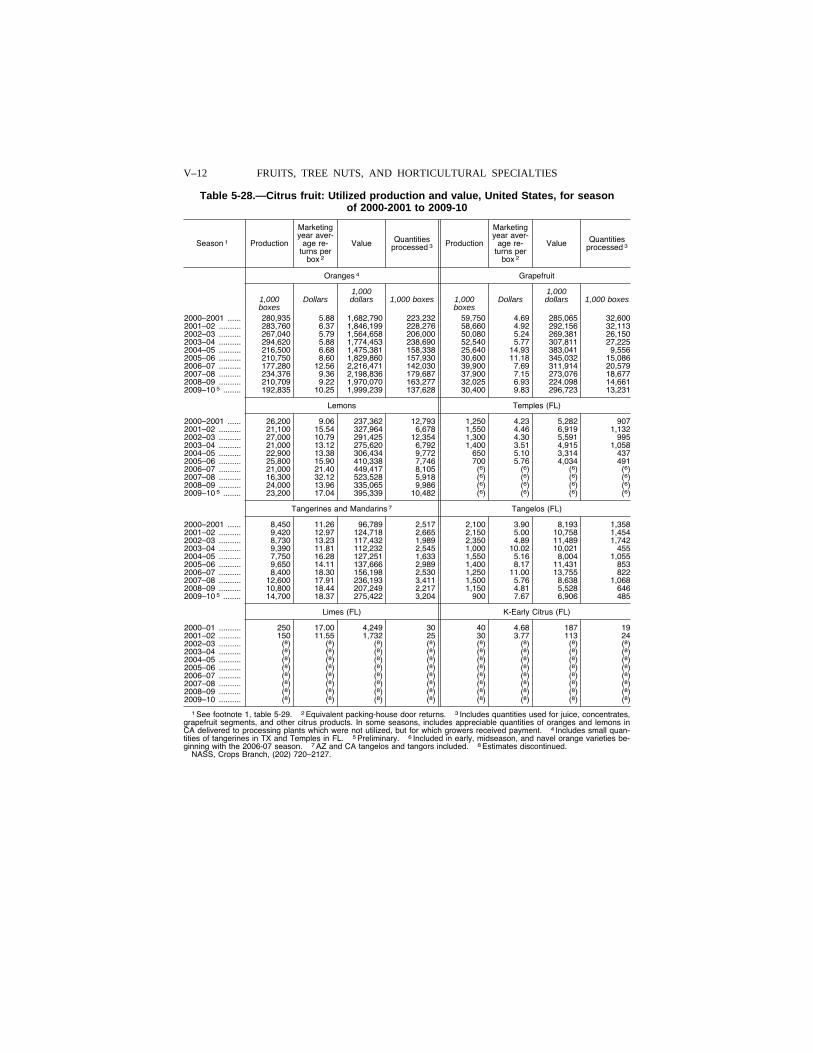
V–12 FRUITS, TREE NUTS, AND HORTICULTURAL SPECIALTIES
Table 5-28.—Citrus fruit: Utilized production and value, United States, for season of 2000-2001 to 2009-10
Season 1 Production
Marketing year aver-
age re-turns per
box 2
Value Quantities processed 3 Production
Marketing year aver-
age re-turns per
box 2
Value Quantities processed 3
Oranges 4 Grapefruit
1,000 1,000 1,000 boxes
Dollars dollars 1,000 boxes 1,000 boxes
Dollars dollars 1,000 boxes
2000–2001 ...... 280,935 5.88 1,682,790 223,232 59,750 4.69 285,065 32,600 2001–02 .......... 283,760 6.37 1,846,199 228,276 58,660 4.92 292,156 32,113 2002–03 .......... 267,040 5.79 1,564,658 206,000 50,080 5.24 269,381 26,150 2003–04 .......... 294,620 5.88 1,774,453 238,690 52,540 5.77 307,811 27,225 2004–05 .......... 216,500 6.68 1,475,381 158,338 25,640 14.93 383,041 9,556 2005–06 .......... 210,750 8.60 1,829,860 157,930 30,600 11.18 345,032 15,086 2006–07 .......... 177,280 12.56 2,216,471 142,030 39,900 7.69 311,914 20,579 2007–08 .......... 234,376 9.36 2,198,836 179,687 37,900 7.15 273,076 18,677 2008–09 .......... 210,709 9.22 1,970,070 163,277 32,025 6.93 224,098 14,661 2009–10 5 ........ 192,835 10.25 1,999,239 137,628 30,400 9.83 296,723 13,231
Lemons Temples (FL)
2000–2001 ...... 26,200 9.06 237,362 12,793 1,250 4.23 5,282 907 2001–02 .......... 21,100 15.54 327,964 6,678 1,550 4.46 6,919 1,132 2002–03 .......... 27,000 10.79 291,425 12,354 1,300 4.30 5,591 995 2003–04 .......... 21,000 13.12 275,620 6,792 1,400 3.51 4,915 1,058 2004–05 .......... 22,900 13.38 306,434 9,772 650 5.10 3,314 437 2005–06 .......... 25,800 15.90 410,338 7,746 700 5.76 4,034 491 2006–07 .......... 21,000 21.40 449,417 8,105 (6) (6) (6) (6) 2007–08 .......... 16,300 32.12 523,528 5,918 (6) (6) (6) (6) 2008–09 .......... 24,000 13.96 335,065 9,986 (6) (6) (6) (6) 2009–10 5 ........ 23,200 17.04 395,339 10,482 (6) (6) (6) (6)
Tangerines and Mandarins 7 Tangelos (FL)
2000–2001 ...... 8,450 11.26 96,789 2,517 2,100 3.90 8,193 1,358 2001–02 .......... 9,420 12.97 124,718 2,665 2,150 5.00 10,758 1,454 2002–03 .......... 8,730 13.23 117,432 1,989 2,350 4.89 11,489 1,742 2003–04 .......... 9,390 11.81 112,232 2,545 1,000 10.02 10,021 455 2004–05 .......... 7,750 16.28 127,251 1,633 1,550 5.16 8,004 1,055 2005–06 .......... 9,650 14.11 137,666 2,989 1,400 8.17 11,431 853 2006–07 .......... 8,400 18.30 156,198 2,530 1,250 11.00 13,755 822 2007–08 .......... 12,600 17.91 236,193 3,411 1,500 5.76 8,638 1,068 2008–09 .......... 10,800 18.44 207,249 2,217 1,150 4.81 5,528 646 2009–10 5 ........ 14,700 18.37 275,422 3,204 900 7.67 6,906 485
Limes (FL) K-Early Citrus (FL)
2000–01 .......... 250 17.00 4,249 30 40 4.68 187 19 2001–02 .......... 150 11.55 1,732 25 30 3.77 113 24 2002–03 .......... (8) (8) (8) (8) (8) (8) (8) (8) 2003–04 .......... (8) (8) (8) (8) (8) (8) (8) (8) 2004–05 .......... (8) (8) (8) (8) (8) (8) (8) (8) 2005–06 .......... (8) (8) (8) (8) (8) (8) (8) (8) 2006–07 .......... (8) (8) (8) (8) (8) (8) (8) (8) 2007–08 .......... (8) (8) (8) (8) (8) (8) (8) (8) 2008–09 .......... (8) (8) (8) (8) (8) (8) (8) (8) 2009–10 .......... (8) (8) (8) (8) (8) (8) (8) (8)
1 See footnote 1, table 5-29. 2 Equivalent packing-house door returns. 3 Includes quantities used for juice, concentrates, grapefruit segments, and other citrus products. In some seasons, includes appreciable quantities of oranges and lemons in CA delivered to processing plants which were not utilized, but for which growers received payment. 4 Includes small quan-tities of tangerines in TX and Temples in FL. 5 Preliminary. 6 Included in early, midseason, and navel orange varieties be-ginning with the 2006-07 season. 7 AZ and CA tangelos and tangors included. 8 Estimates discontinued.
NASS, Crops Branch, (202) 720–2127.
VerDate Aug 31 2005 10:25 Feb 29, 2012 Jkt 000000 PO 00000 Frm 00012 Fmt 1000 Sfmt 1000 H:\SHARED\DAPP\FPU\AGSTAT\MASTER~2\CHAPTR05\V-13.AG8 USDA
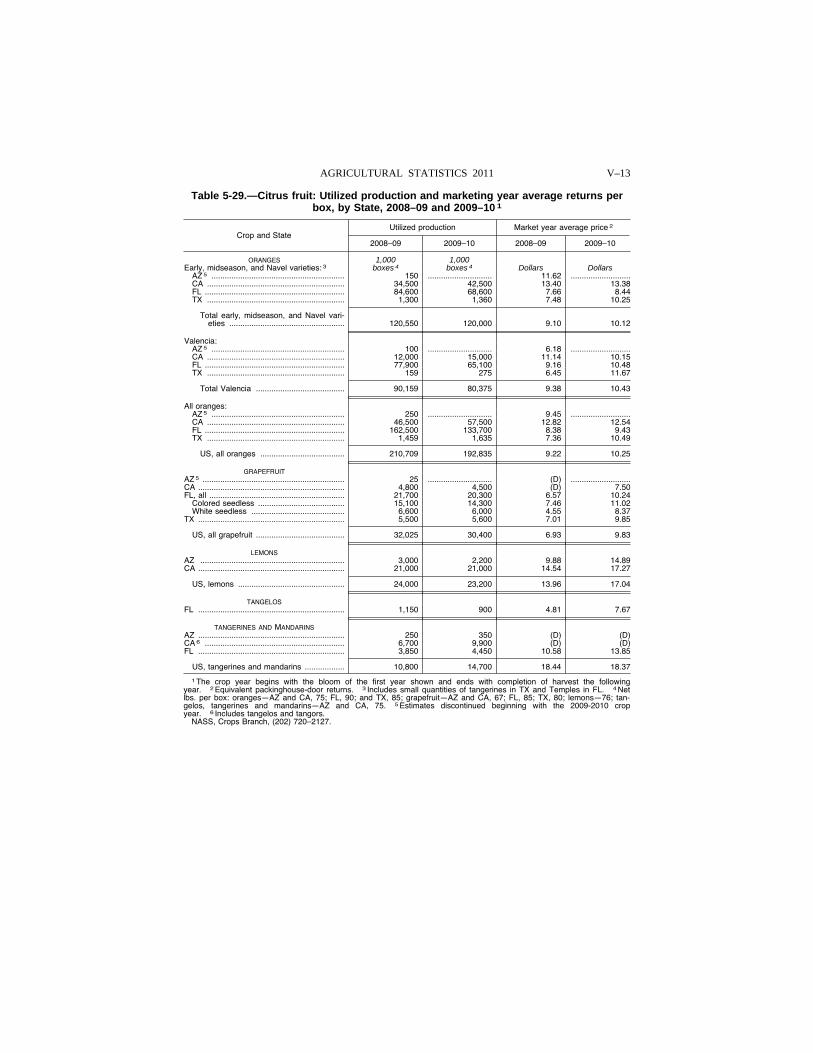
V–13 AGRICULTURAL STATISTICS 2011
Table 5-29.—Citrus fruit: Utilized production and marketing year average returns per box, by State, 2008–09 and 2009–10 1
Crop and State Utilized production Market year average price 2
2008–09 2009–10 2008–09 2009–10
ORANGES 1,000 1,000 Early, midseason, and Navel varieties: 3 boxes 4 boxes 4 Dollars Dollars
AZ 5 ............................................................ 150 ............................. 11.62 ...........................CA .............................................................. 34,500 42,500 13.40 13.38 FL ............................................................... 84,600 68,600 7.66 8.44 TX .............................................................. 1,300 1,360 7.48 10.25
Total early, midseason, and Navel vari-eties .................................................... 120,550 120,000 9.10 10.12
Valencia: AZ 5 ............................................................ 100 ............................. 6.18 ...........................CA .............................................................. 12,000 15,000 11.14 10.15 FL ............................................................... 77,900 65,100 9.16 10.48 TX .............................................................. 159 275 6.45 11.67
Total Valencia ........................................ 90,159 80,375 9.38 10.43
All oranges: AZ 5 ............................................................ 250 ............................. 9.45 ...........................CA .............................................................. 46,500 57,500 12.82 12.54 FL ............................................................... 162,500 133,700 8.38 9.43 TX .............................................................. 1,459 1,635 7.36 10.49
US, all oranges ...................................... 210,709 192,835 9.22 10.25
GRAPEFRUIT AZ 5 ................................................................ 25 ............................. (D) ...........................CA .................................................................. 4,800 4,500 (D) 7.50 FL, all ............................................................. 21,700 20,300 6.57 10.24
Colored seedless ....................................... 15,100 14,300 7.46 11.02 White seedless .......................................... 6,600 6,000 4.55 8.37
TX .................................................................. 5,500 5,600 7.01 9.85
US, all grapefruit ........................................ 32,025 30,400 6.93 9.83
LEMONS AZ ................................................................. 3,000 2,200 9.88 14.89 CA .................................................................. 21,000 21,000 14.54 17.27
US, lemons ................................................ 24,000 23,200 13.96 17.04
TANGELOS FL .................................................................. 1,150 900 4.81 7.67
TANGERINES AND MANDARINS AZ .................................................................. 250 350 (D) (D) CA 6 ............................................................... 6,700 9,900 (D) (D) FL .................................................................. 3,850 4,450 10.58 13.85
US, tangerines and mandarins .................. 10,800 14,700 18.44 18.37
1 The crop year begins with the bloom of the first year shown and ends with completion of harvest the following year. 2 Equivalent packinghouse-door returns. 3 Includes small quantities of tangerines in TX and Temples in FL. 4 Net lbs. per box: oranges—AZ and CA, 75; FL, 90; and TX, 85; grapefruit—AZ and CA, 67; FL, 85; TX, 80; lemons—76; tan-gelos, tangerines and mandarins—AZ and CA, 75. 5 Estimates discontinued beginning with the 2009-2010 crop year. 6 Includes tangelos and tangors.
NASS, Crops Branch, (202) 720–2127.
VerDate Aug 31 2005 10:25 Feb 29, 2012 Jkt 000000 PO 00000 Frm 00013 Fmt 1000 Sfmt 1000 H:\SHARED\DAPP\FPU\AGSTAT\MASTER~2\CHAPTR05\V-14.AG8 USDA
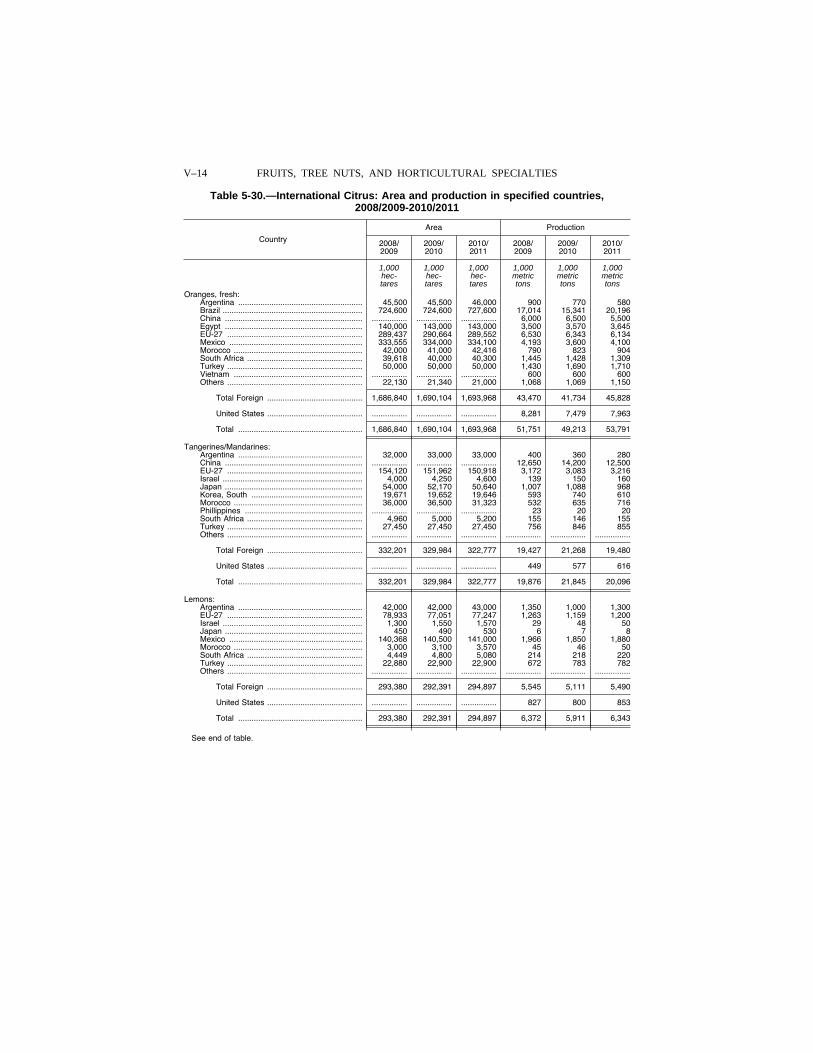
V–14 FRUITS, TREE NUTS, AND HORTICULTURAL SPECIALTIES
Table 5-30.—International Citrus: Area and production in specified countries, 2008/2009-2010/2011
Country
Area Production
2008/ 2009
2009/ 2010
2010/ 2011
2008/ 2009
2009/ 2010
2010/ 2011
1,000 1,000 1,000 1,000 1,000 1,000 hec- hec- hec- metric metric metric tares tares tares tons tons tons
Oranges, fresh: Argentina ........................................................ 45,500 45,500 46,000 900 770 580 Brazil ............................................................... 724,600 724,600 727,600 17,014 15,341 20,196 China .............................................................. ................ ................ ................ 6,000 6,500 5,500 Egypt .............................................................. 140,000 143,000 143,000 3,500 3,570 3,645 EU-27 ............................................................. 289,437 290,664 289,552 6,530 6,343 6,134 Mexico ............................................................ 333,555 334,000 334,100 4,193 3,600 4,100 Morocco .......................................................... 42,000 41,000 42,416 790 823 904 South Africa .................................................... 39,618 40,000 40,300 1,445 1,428 1,309 Turkey ............................................................. 50,000 50,000 50,000 1,430 1,690 1,710 Vietnam .......................................................... ................ ................ ................ 600 600 600 Others ............................................................. 22,130 21,340 21,000 1,068 1,069 1,150
Total Foreign ........................................... 1,686,840 1,690,104 1,693,968 43,470 41,734 45,828
United States ........................................... ................ ................ ................ 8,281 7,479 7,963
Total ........................................................ 1,686,840 1,690,104 1,693,968 51,751 49,213 53,791
Tangerines/Mandarines: Argentina ........................................................ 32,000 33,000 33,000 400 360 280 China .............................................................. ................ ................ ................ 12,650 14,200 12,500 EU-27 ............................................................. 154,120 151,962 150,918 3,172 3,083 3,216 Israel ............................................................... 4,000 4,250 4,600 139 150 160 Japan .............................................................. 54,000 52,170 50,640 1,007 1,088 968 Korea, South .................................................. 19,671 19,652 19,646 593 740 610 Morocco .......................................................... 36,000 36,500 31,323 532 635 716 Phillippines ..................................................... ................ ................ ................ 23 20 20 South Africa .................................................... 4,960 5,000 5,200 155 146 155 Turkey ............................................................. 27,450 27,450 27,450 756 846 855 Others ............................................................. ................ ................ ................ ................ ................ ................
Total Foreign ........................................... 332,201 329,984 322,777 19,427 21,268 19,480
United States ........................................... ................ ................ ................ 449 577 616
Total ........................................................ 332,201 329,984 322,777 19,876 21,845 20,096
Lemons: Argentina ........................................................ 42,000 42,000 43,000 1,350 1,000 1,300 EU-27 ............................................................. 78,933 77,051 77,247 1,263 1,159 1,200 Israel ............................................................... 1,300 1,550 1,570 29 48 50 Japan .............................................................. 450 490 530 6 7 8 Mexico ............................................................ 140,368 140,500 141,000 1,966 1,850 1,880 Morocco .......................................................... 3,000 3,100 3,570 45 46 50 South Africa .................................................... 4,449 4,800 5,080 214 218 220 Turkey ............................................................. 22,880 22,900 22,900 672 783 782 Others ............................................................. ................ ................ ................ ................ ................ ................
Total Foreign ........................................... 293,380 292,391 294,897 5,545 5,111 5,490
United States ........................................... ................ ................ ................ 827 800 853
Total ........................................................ 293,380 292,391 294,897 6,372 5,911 6,343
See end of table.
VerDate Aug 31 2005 10:25 Feb 29, 2012 Jkt 000000 PO 00000 Frm 00014 Fmt 1000 Sfmt 1000 H:\SHARED\DAPP\FPU\AGSTAT\MASTER~2\CHAPTR05\V-15.AG8 USDA
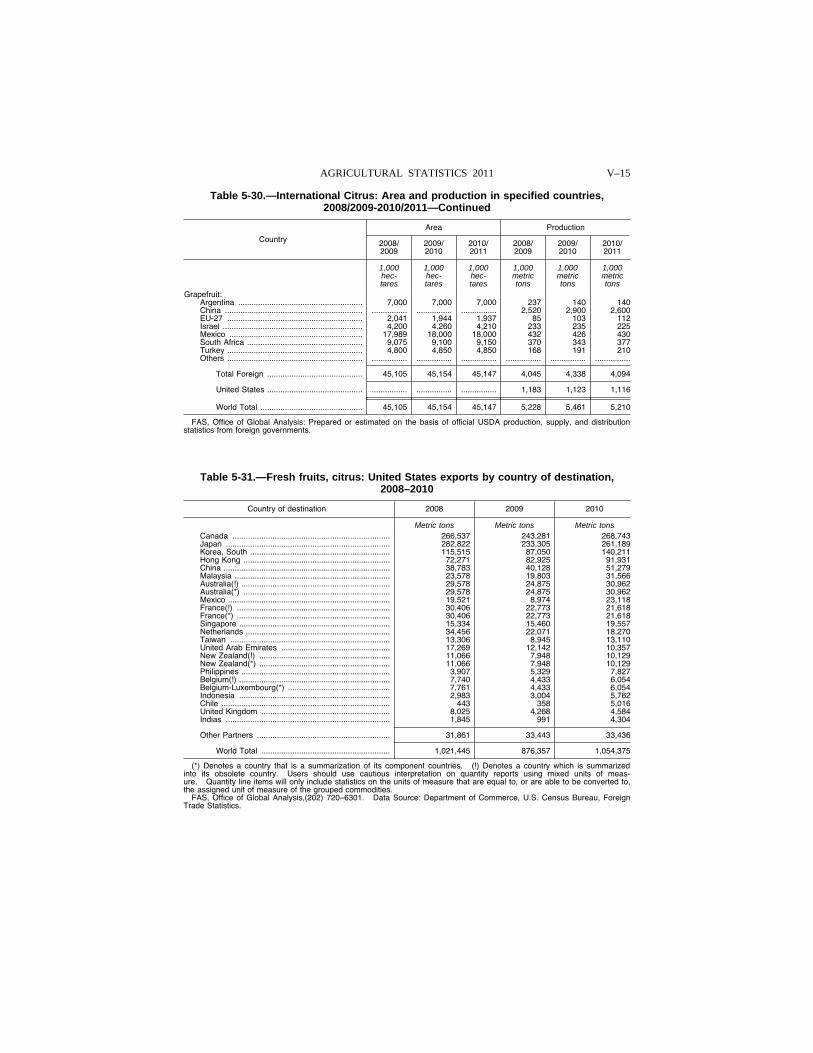
V–15 AGRICULTURAL STATISTICS 2011
Table 5-30.—International Citrus: Area and production in specified countries, 2008/2009-2010/2011—Continued
Country
Area Production
2008/ 2009
2009/ 2010
2010/ 2011
2008/ 2009
2009/ 2010
2010/ 2011
1,000 1,000 1,000 1,000 1,000 1,000 hec- hec- hec- metric metric metric tares tares tares tons tons tons
Grapefruit: Argentina ........................................................ 7,000 7,000 7,000 237 140 140 China .............................................................. ................ ................ ................ 2,520 2,900 2,600 EU-27 ............................................................. 2,041 1,944 1,937 85 103 112 Israel ............................................................... 4,200 4,260 4,210 233 235 225 Mexico ............................................................ 17,989 18,000 18,000 432 426 430 South Africa .................................................... 9,075 9,100 9,150 370 343 377 Turkey ............................................................. 4,800 4,850 4,850 168 191 210 Others ............................................................. ................ ................ ................ ................ ................ ................
Total Foreign ........................................... 45,105 45,154 45,147 4,045 4,338 4,094
United States ........................................... ................ ................ ................ 1,183 1,123 1,116
World Total .............................................. 45,105 45,154 45,147 5,228 5,461 5,210
FAS, Office of Global Analysis: Prepared or estimated on the basis of official USDA production, supply, and distribution statistics from foreign governments.
Table 5-31.—Fresh fruits, citrus: United States exports by country of destination, 2008–2010
Country of destination 2008 2009 2010
Metric tons Metric tons Metric tons Canada ....................................................................... 266,537 243,281 268,743 Japan .......................................................................... 282,822 233,305 261,189 Korea, South ............................................................... 115,515 87,050 140,211 Hong Kong .................................................................. 72,271 82,925 91,931 China ........................................................................... 38,783 40,128 51,279 Malaysia ...................................................................... 23,578 19,803 31,566 Australia(!) ................................................................... 29,578 24,875 30,962 Australia(*) .................................................................. 29,578 24,875 30,962 Mexico ......................................................................... 19,521 8,974 23,118 France(!) ..................................................................... 30,406 22,773 21,618 France(*) ..................................................................... 30,406 22,773 21,618 Singapore .................................................................... 15,334 15,460 19,557 Netherlands ................................................................. 34,456 22,071 18,270 Taiwan ........................................................................ 13,306 8,945 13,110 United Arab Emirates ................................................. 17,269 12,142 10,357 New Zealand(!) ........................................................... 11,066 7,948 10,129 New Zealand(*) ........................................................... 11,066 7,948 10,129 Philippines ................................................................... 3,907 5,329 7,827 Belgium(!) .................................................................... 7,740 4,433 6,054 Belgium-Luxembourg(*) .............................................. 7,761 4,433 6,054 Indonesia .................................................................... 2,983 3,004 5,762 Chile ............................................................................ 443 358 5,016 United Kingdom .......................................................... 8,025 4,268 4,584 Indias .......................................................................... 1,845 991 4,304
Other Partners ............................................................ 31,861 33,443 33,436
World Total .......................................................... 1,021,445 876,357 1,054,375
(*) Denotes a country that is a summarization of its component countries. (!) Denotes a country which is summarized into its obsolete country. Users should use cautious interpretation on quantity reports using mixed units of meas-ure. Quantity line items will only include statistics on the units of measure that are equal to, or are able to be converted to, the assigned unit of measure of the grouped commodities.
FAS, Office of Global Analysis,(202) 720–6301. Data Source: Department of Commerce, U.S. Census Bureau, Foreign Trade Statistics.
VerDate Aug 31 2005 10:25 Feb 29, 2012 Jkt 000000 PO 00000 Frm 00015 Fmt 1000 Sfmt 1000 H:\SHARED\DAPP\FPU\AGSTAT\MASTER~2\CHAPTR05\V-16.AG8 USDA
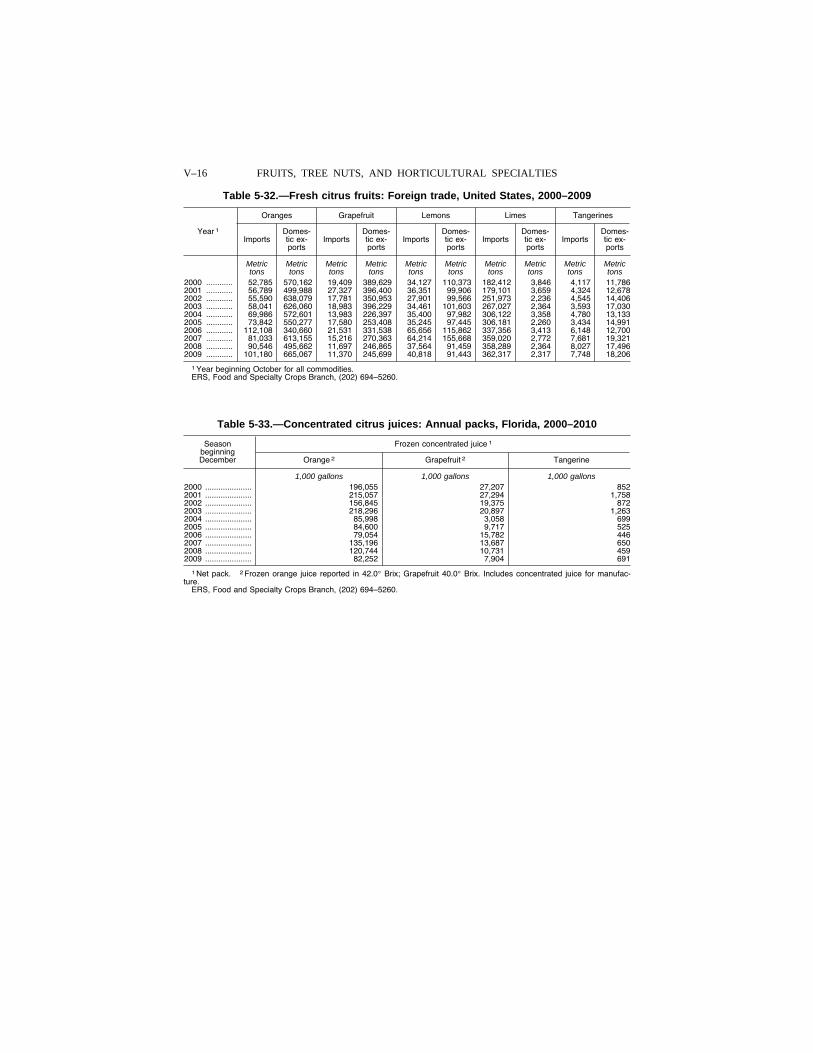
V–16 FRUITS, TREE NUTS, AND HORTICULTURAL SPECIALTIES
Table 5-32.—Fresh citrus fruits: Foreign trade, United States, 2000–2009
Year 1
Oranges Grapefruit Lemons Limes Tangerines
Imports Domes-tic ex-ports
Imports Domes-tic ex-ports
Imports Domes-tic ex-ports
Imports Domes-tic ex-ports
Imports Domes-tic ex-ports
Metric Metric Metric Metric Metric Metric Metric Metric Metric Metric tons tons tons tons tons tons tons tons tons tons
2000 ............ 52,785 570,162 19,409 389,629 34,127 110,373 182,412 3,846 4,117 11,786 2001 ............ 56,789 499,988 27,327 396,400 36,351 99,906 179,101 3,659 4,324 12,678 2002 ............ 55,590 638,079 17,781 350,953 27,901 99,566 251,973 2,236 4,545 14,406 2003 ............ 58,041 626,060 18,983 396,229 34,461 101,603 267,027 2,364 3,593 17,030 2004 ............ 69,986 572,601 13,983 226,397 35,400 97,982 306,122 3,358 4,780 13,133 2005 ............ 73,842 550,277 17,580 253,408 35,245 97,445 306,181 2,260 3,434 14,991 2006 ............ 112,108 340,660 21,531 331,538 65,656 115,862 337,356 3,413 6,148 12,700 2007 ............ 81,033 613,155 15,216 270,363 64,214 155,668 359,020 2,772 7,681 19,321 2008 ............ 90,546 495,662 11,697 246,865 37,564 91,459 358,289 2,364 8,027 17,496 2009 ............ 101,180 665,067 11,370 245,699 40,818 91,443 362,317 2,317 7,748 18,206
1 Year beginning October for all commodities. ERS, Food and Specialty Crops Branch, (202) 694–5260.
Table 5-33.—Concentrated citrus juices: Annual packs, Florida, 2000–2010
Season beginning December
Frozen concentrated juice 1
Orange 2 Grapefruit 2 Tangerine
1,000 gallons 1,000 gallons 1,000 gallons 2000 ..................... 196,055 27,207 852 2001 ..................... 215,057 27,294 1,758 2002 ..................... 156,845 19,375 872 2003 ..................... 218,296 20,897 1,263 2004 ..................... 85,998 3,058 699 2005 ..................... 84,600 9,717 525 2006 ..................... 79,054 15,782 446 2007 ..................... 135,196 13,687 650 2008 ..................... 120,744 10,731 459 2009 ..................... 82,252 7,904 691
1 Net pack. 2 Frozen orange juice reported in 42.0° Brix; Grapefruit 40.0° Brix. Includes concentrated juice for manufac-ture.
ERS, Food and Specialty Crops Branch, (202) 694–5260.
VerDate Aug 31 2005 10:25 Feb 29, 2012 Jkt 000000 PO 00000 Frm 00016 Fmt 1000 Sfmt 1000 H:\SHARED\DAPP\FPU\AGSTAT\MASTER~2\CHAPTR05\V-17.AG8 USDA
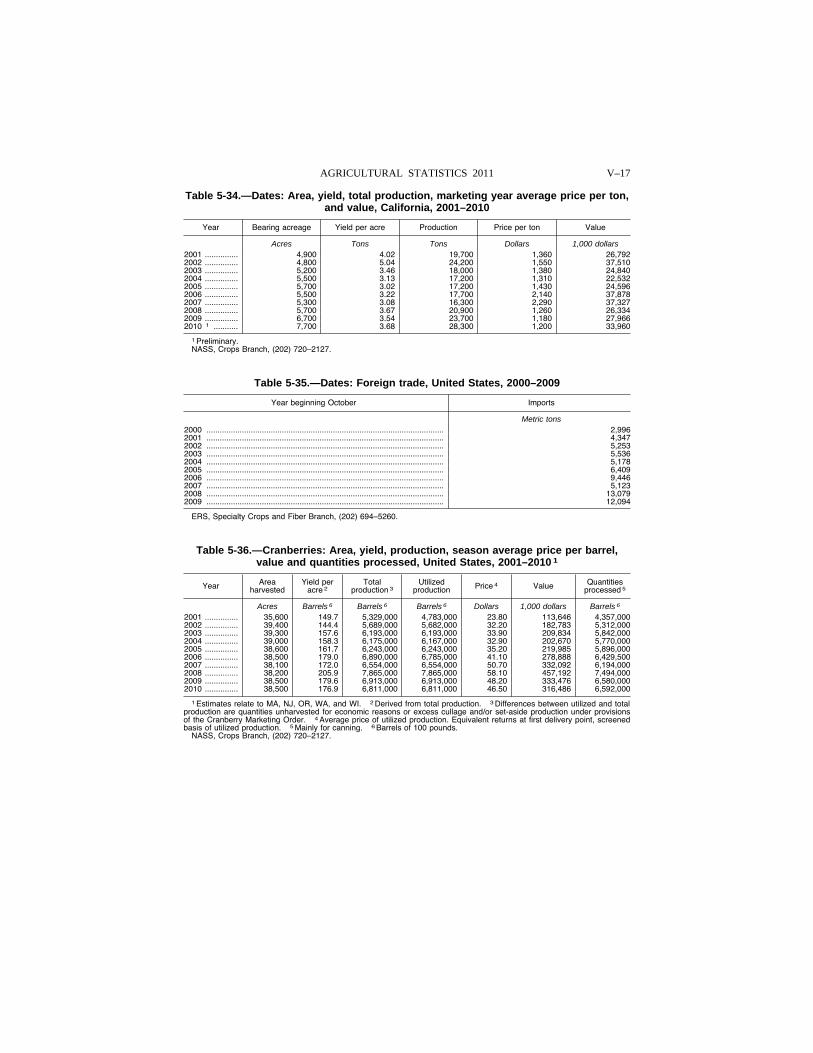
V–17 AGRICULTURAL STATISTICS 2011
Table 5-34.—Dates: Area, yield, total production, marketing year average price per ton, and value, California, 2001–2010
Year Bearing acreage Yield per acre Production Price per ton Value
Acres Tons Tons Dollars 1,000 dollars 2001 ............... 4,900 4.02 19,700 1,360 26,792 2002 ............... 4,800 5.04 24,200 1,550 37,510 2003 ............... 5,200 3.46 18,000 1,380 24,840 2004 ............... 5,500 3.13 17,200 1,310 22,532 2005 ............... 5,700 3.02 17,200 1,430 24,596 2006 ............... 5,500 3.22 17,700 2,140 37,878 2007 ............... 5,300 3.08 16,300 2,290 37,327 2008 ............... 5,700 3.67 20,900 1,260 26,334 2009 ............... 6,700 3.54 23,700 1,180 27,966 2010 1 ........... 7,700 3.68 28,300 1,200 33,960
1 Preliminary. NASS, Crops Branch, (202) 720–2127.
Table 5-35.—Dates: Foreign trade, United States, 2000–2009
Year beginning October Imports
Metric tons 2000 ........................................................................................................... 2,996 2001 ........................................................................................................... 4,347 2002 ........................................................................................................... 5,253 2003 ........................................................................................................... 5,536 2004 ........................................................................................................... 5,178 2005 ........................................................................................................... 6,409 2006 ........................................................................................................... 9,446 2007 ........................................................................................................... 5,123 2008 ........................................................................................................... 13,079 2009 ........................................................................................................... 12,094
ERS, Specialty Crops and Fiber Branch, (202) 694–5260.
Table 5-36.—Cranberries: Area, yield, production, season average price per barrel, value and quantities processed, United States, 2001–2010 1
Year Area harvested
Yield per acre 2
Total production 3
Utilized production Price 4 Value Quantities
processed 5
Acres Barrels 6 Barrels 6 Barrels 6 Dollars 1,000 dollars Barrels 6 2001 ............... 35,600 149.7 5,329,000 4,783,000 23.80 113,646 4,357,000 2002 ............... 39,400 144.4 5,689,000 5,682,000 32.20 182,783 5,312,000 2003 ............... 39,300 157.6 6,193,000 6,193,000 33.90 209,834 5,842,000 2004 ............... 39,000 158.3 6,175,000 6,167,000 32.90 202,670 5,770,000 2005 ............... 38,600 161.7 6,243,000 6,243,000 35.20 219,985 5,896,000 2006 ............... 38,500 179.0 6,890,000 6,785,000 41.10 278,888 6,429,500 2007 ............... 38,100 172.0 6,554,000 6,554,000 50.70 332,092 6,194,000 2008 ............... 38,200 205.9 7,865,000 7,865,000 58.10 457,192 7,494,000 2009 ............... 38,500 179.6 6,913,000 6,913,000 48.20 333,476 6,580,000 2010 ............... 38,500 176.9 6,811,000 6,811,000 46.50 316,486 6,592,000
1 Estimates relate to MA, NJ, OR, WA, and WI. 2 Derived from total production. 3 Differences between utilized and total production are quantities unharvested for economic reasons or excess cullage and/or set-aside production under provisions of the Cranberry Marketing Order. 4 Average price of utilized production. Equivalent returns at first delivery point, screened basis of utilized production. 5 Mainly for canning. 6 Barrels of 100 pounds.
NASS, Crops Branch, (202) 720–2127.
VerDate Aug 31 2005 10:25 Feb 29, 2012 Jkt 000000 PO 00000 Frm 00017 Fmt 1000 Sfmt 1000 H:\SHARED\DAPP\FPU\AGSTAT\MASTER~2\CHAPTR05\V-18.AG8 USDA
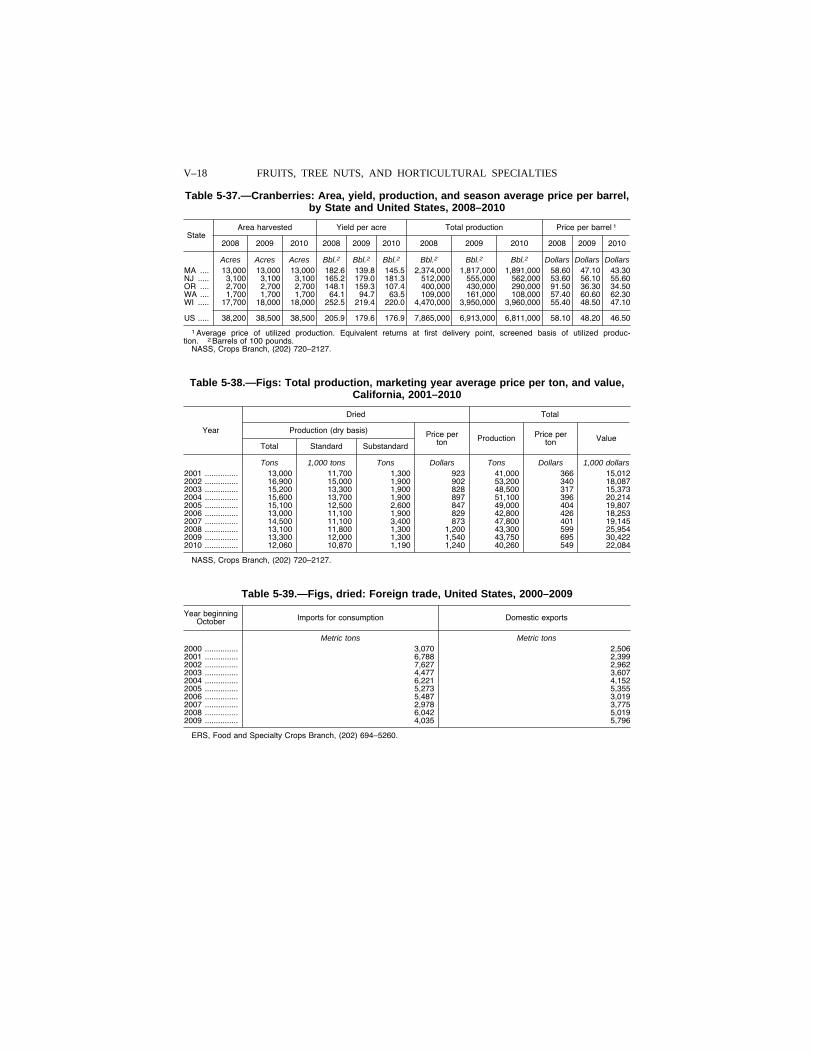
V–18 FRUITS, TREE NUTS, AND HORTICULTURAL SPECIALTIES
Table 5-37.—Cranberries: Area, yield, production, and season average price per barrel, by State and United States, 2008–2010
State Area harvested Yield per acre Total production Price per barrel 1
2008 2009 2010 2008 2009 2010 2008 2009 2010 2008 2009 2010
Acres Acres Acres Bbl.2 Bbl.2 Bbl.2 Bbl.2 Bbl.2 Bbl.2 Dollars Dollars Dollars MA .... 13,000 13,000 13,000 182.6 139.8 145.5 2,374,000 1,817,000 1,891,000 58.60 47.10 43.30 NJ ..... 3,100 3,100 3,100 165.2 179.0 181.3 512,000 555,000 562,000 53.60 56.10 55.60 OR .... 2,700 2,700 2,700 148.1 159.3 107.4 400,000 430,000 290,000 91.50 36.30 34.50 WA .... 1,700 1,700 1,700 64.1 94.7 63.5 109,000 161,000 108,000 57.40 60.60 62.30 WI ..... 17,700 18,000 18,000 252.5 219.4 220.0 4,470,000 3,950,000 3,960,000 55.40 48.50 47.10
US ..... 38,200 38,500 38,500 205.9 179.6 176.9 7,865,000 6,913,000 6,811,000 58.10 48.20 46.50
1 Average price of utilized production. Equivalent returns at first delivery point, screened basis of utilized produc-tion. 2 Barrels of 100 pounds.
NASS, Crops Branch, (202) 720–2127.
Table 5-38.—Figs: Total production, marketing year average price per ton, and value, California, 2001–2010
Year
Dried Total
Production (dry basis) Price per ton Production Price per
ton Value Total Standard Substandard
Tons 1,000 tons Tons Dollars Tons Dollars 1,000 dollars 2001 ............... 13,000 11,700 1,300 923 41,000 366 15,012 2002 ............... 16,900 15,000 1,900 902 53,200 340 18,087 2003 ............... 15,200 13,300 1,900 828 48,500 317 15,373 2004 ............... 15,600 13,700 1,900 897 51,100 396 20,214 2005 ............... 15,100 12,500 2,600 847 49,000 404 19,807 2006 ............... 13,000 11,100 1,900 829 42,800 426 18,253 2007 ............... 14,500 11,100 3,400 873 47,800 401 19,145 2008 ............... 13,100 11,800 1,300 1,200 43,300 599 25,954 2009 ............... 13,300 12,000 1,300 1,540 43,750 695 30,422 2010 ............... 12,060 10,870 1,190 1,240 40,260 549 22,084
NASS, Crops Branch, (202) 720–2127.
Table 5-39.—Figs, dried: Foreign trade, United States, 2000–2009
Year beginning October Imports for consumption Domestic exports
Metric tons Metric tons 2000 ............... 3,070 2,506 2001 ............... 6,788 2,399 2002 ............... 7,627 2,962 2003 ............... 4,477 3,607 2004 ............... 6,221 4,152 2005 ............... 5,273 5,355 2006 ............... 5,487 3,019 2007 ............... 2,978 3,775 2008 ............... 6,042 5,019 2009 ............... 4,035 5,796
ERS, Food and Specialty Crops Branch, (202) 694–5260.
VerDate Aug 31 2005 10:25 Feb 29, 2012 Jkt 000000 PO 00000 Frm 00018 Fmt 1000 Sfmt 1000 H:\SHARED\DAPP\FPU\AGSTAT\MASTER~2\CHAPTR05\V-19.AG8 USDA
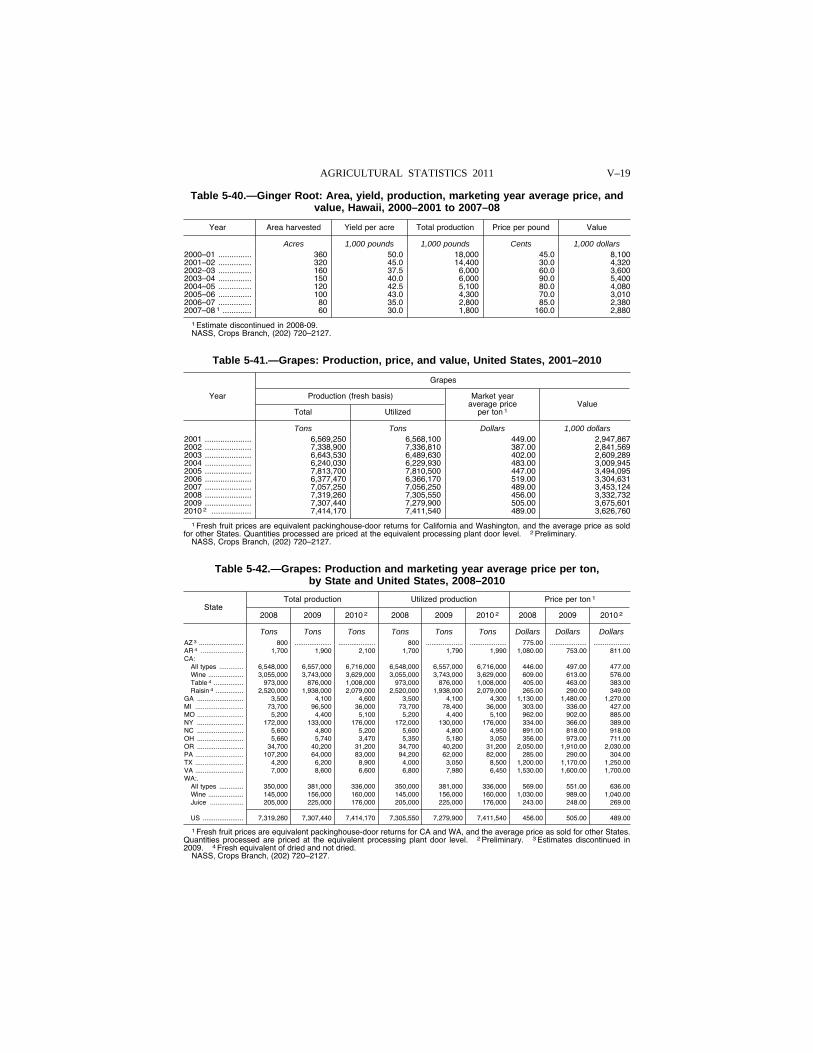
V–19 AGRICULTURAL STATISTICS 2011
Table 5-40.—Ginger Root: Area, yield, production, marketing year average price, and value, Hawaii, 2000–2001 to 2007–08
Year Area harvested Yield per acre Total production Price per pound Value
Acres 1,000 pounds 1,000 pounds Cents 1,000 dollars 2000–01 ............... 360 50.0 18,000 45.0 8,100 2001–02 ............... 320 45.0 14,400 30.0 4,320 2002–03 ............... 160 37.5 6,000 60.0 3,600 2003–04 ............... 150 40.0 6,000 90.0 5,400 2004–05 ............... 120 42.5 5,100 80.0 4,080 2005–06 ............... 100 43.0 4,300 70.0 3,010 2006–07 ............... 80 35.0 2,800 85.0 2,380 2007–08 1 ............. 60 30.0 1,800 160.0 2,880
1 Estimate discontinued in 2008-09. NASS, Crops Branch, (202) 720–2127.
Table 5-41.—Grapes: Production, price, and value, United States, 2001–2010
Year
Grapes
Production (fresh basis) Market year average price
per ton 1 Value
Total Utilized
Tons Tons Dollars 1,000 dollars 2001 ..................... 6,569,250 6,568,100 449.00 2,947,867 2002 ..................... 7,338,900 7,336,810 387.00 2,841,569 2003 ..................... 6,643,530 6,489,630 402.00 2,609,289 2004 ..................... 6,240,030 6,229,930 483.00 3,009,945 2005 ..................... 7,813,700 7,810,500 447.00 3,494,095 2006 ..................... 6,377,470 6,366,170 519.00 3,304,631 2007 ..................... 7,057,250 7,056,250 489.00 3,453,124 2008 ..................... 7,319,260 7,305,550 456.00 3,332,732 2009 ..................... 7,307,440 7,279,900 505.00 3,675,601 2010 2 .................. 7,414,170 7,411,540 489.00 3,626,760
1 Fresh fruit prices are equivalent packinghouse-door returns for California and Washington, and the average price as sold for other States. Quantities processed are priced at the equivalent processing plant door level. 2 Preliminary.
NASS, Crops Branch, (202) 720–2127.
Table 5-42.—Grapes: Production and marketing year average price per ton, by State and United States, 2008–2010
State Total production Utilized production Price per ton 1
2008 2009 2010 2 2008 2009 2010 2 2008 2009 2010 2
Tons Tons Tons Tons Tons Tons Dollars Dollars Dollars AZ 3 ........................ 800 .................... .................... 800 .................... .................... 775.00 .................... ....................AR 4 ....................... 1,700 1,900 2,100 1,700 1,790 1,990 1,080.00 753.00 811.00 CA:
All types ............. 6,548,000 6,557,000 6,716,000 6,548,000 6,557,000 6,716,000 446.00 497.00 477.00 Wine ................... 3,055,000 3,743,000 3,629,000 3,055,000 3,743,000 3,629,000 609.00 613.00 576.00 Table 4 ................ 973,000 876,000 1,008,000 973,000 876,000 1,008,000 405.00 463.00 383.00 Raisin 4 ............... 2,520,000 1,938,000 2,079,000 2,520,000 1,938,000 2,079,000 265.00 290.00 349.00
GA ......................... 3,500 4,100 4,600 3,500 4,100 4,300 1,130.00 1,480.00 1,270.00 MI .......................... 73,700 96,500 36,000 73,700 78,400 36,000 303.00 336.00 427.00 MO ......................... 5,200 4,400 5,100 5,200 4,400 5,100 962.00 902.00 885.00 NY ......................... 172,000 133,000 176,000 172,000 130,000 176,000 334.00 366.00 389.00 NC ......................... 5,600 4,800 5,200 5,600 4,800 4,950 891.00 818.00 918.00 OH ......................... 5,660 5,740 3,470 5,350 5,180 3,050 356.00 973.00 711.00 OR ......................... 34,700 40,200 31,200 34,700 40,200 31,200 2,050.00 1,910.00 2,030.00 PA .......................... 107,200 64,000 83,000 94,200 62,000 82,000 285.00 290.00 304.00 TX .......................... 4,200 6,200 8,900 4,000 3,050 8,500 1,200.00 1,170.00 1,250.00 VA .......................... 7,000 8,600 6,600 6,800 7,980 6,450 1,530.00 1,600.00 1,700.00 WA:.
All types ............. 350,000 381,000 336,000 350,000 381,000 336,000 569.00 551.00 636.00 Wine ................... 145,000 156,000 160,000 145,000 156,000 160,000 1,030.00 989.00 1,040.00 Juice .................. 205,000 225,000 176,000 205,000 225,000 176,000 243.00 248.00 269.00
US ...................... 7,319,260 7,307,440 7,414,170 7,305,550 7,279,900 7,411,540 456.00 505.00 489.00
1 Fresh fruit prices are equivalent packinghouse-door returns for CA and WA, and the average price as sold for other States. Quantities processed are priced at the equivalent processing plant door level. 2 Preliminary. 3 Estimates discontinued in 2009. 4 Fresh equivalent of dried and not dried.
NASS, Crops Branch, (202) 720–2127.
VerDate Aug 31 2005 10:25 Feb 29, 2012 Jkt 000000 PO 00000 Frm 00019 Fmt 1000 Sfmt 1000 H:\SHARED\DAPP\FPU\AGSTAT\MASTER~2\CHAPTR05\V-20.AG8 USDA
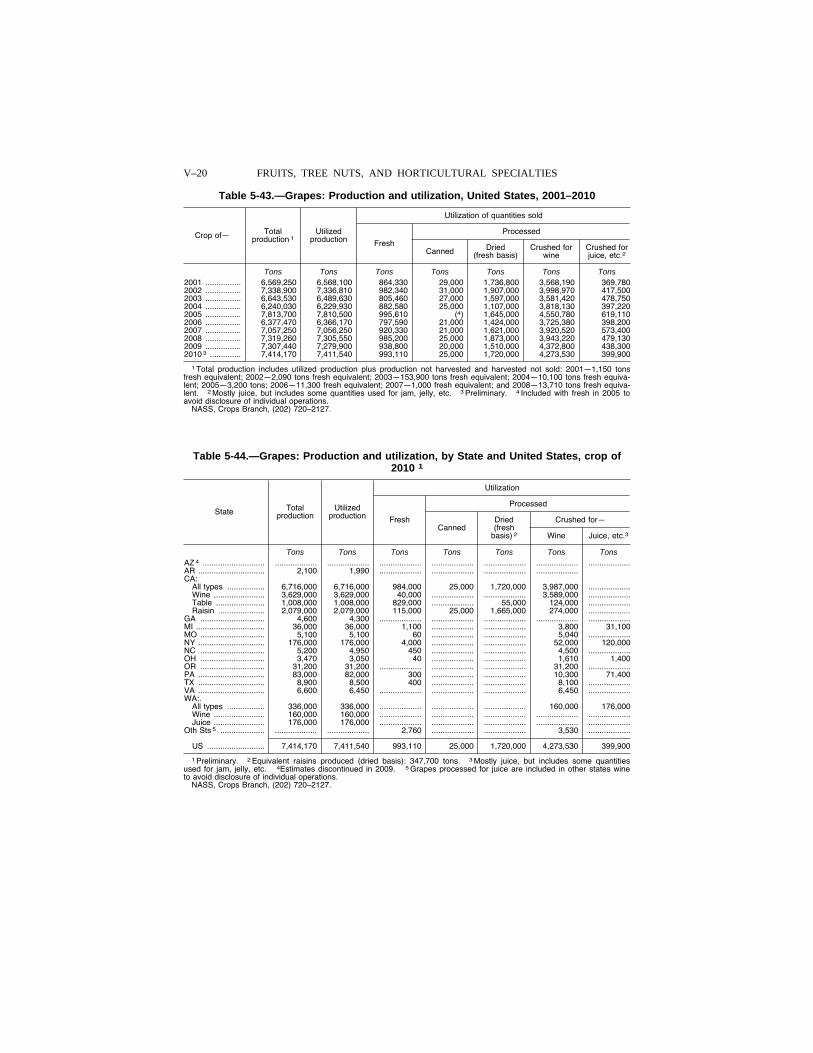
V–20 FRUITS, TREE NUTS, AND HORTICULTURAL SPECIALTIES
Table 5-43.—Grapes: Production and utilization, United States, 2001–2010
Crop of— Total production 1
Utilized production
Utilization of quantities sold
Fresh
Processed
Canned Dried (fresh basis)
Crushed for wine
Crushed for juice, etc.2
Tons Tons Tons Tons Tons Tons Tons 2001 ................ 6,569,250 6,568,100 864,330 29,000 1,736,800 3,568,190 369,780 2002 ................ 7,338,900 7,336,810 982,340 31,000 1,907,000 3,998,970 417,500 2003 ................ 6,643,530 6,489,630 805,460 27,000 1,597,000 3,581,420 478,750 2004 ................ 6,240,030 6,229,930 882,580 25,000 1,107,000 3,818,130 397,220 2005 ................ 7,813,700 7,810,500 995,610 (4) 1,645,000 4,550,780 619,110 2006 ................ 6,377,470 6,366,170 797,590 21,000 1,424,000 3,725,380 398,200 2007 ................ 7,057,250 7,056,250 920,330 21,000 1,621,000 3,920,520 573,400 2008 ................ 7,319,260 7,305,550 985,200 25,000 1,873,000 3,943,220 479,130 2009 ................ 7,307,440 7,279,900 938,800 20,000 1,510,000 4,372,800 438,300 2010 3 .............. 7,414,170 7,411,540 993,110 25,000 1,720,000 4,273,530 399,900
1 Total production includes utilized production plus production not harvested and harvested not sold: 2001—1,150 tons fresh equivalent; 2002—2,090 tons fresh equivalent; 2003—153,900 tons fresh equivalent; 2004—10,100 tons fresh equiva-lent; 2005—3,200 tons; 2006—11,300 fresh equivalent; 2007—1,000 fresh equivalent; and 2008—13,710 tons fresh equiva-lent. 2 Mostly juice, but includes some quantities used for jam, jelly, etc. 3 Preliminary. 4 Included with fresh in 2005 to avoid disclosure of individual operations.
NASS, Crops Branch, (202) 720–2127.
Table 5-44.—Grapes: Production and utilization, by State and United States, crop of 2010 1
State Total production
Utilized production
Utilization
Fresh
Processed
Canned Dried (fresh
basis) 2
Crushed for—
Wine Juice, etc.3
Tons Tons Tons Tons Tons Tons Tons AZ 4 ............................ ................... ................... ................... ................... ................... ................... ...................AR .............................. 2,100 1,990 ................... ................... ................... ...................CA:
All types ................. 6,716,000 6,716,000 984,000 25,000 1,720,000 3,987,000 ...................Wine ....................... 3,629,000 3,629,000 40,000 ................... ................... 3,589,000 ...................Table ...................... 1,008,000 1,008,000 829,000 ................... 55,000 124,000 ...................Raisin ..................... 2,079,000 2,079,000 115,000 25,000 1,665,000 274,000 ...................
GA ............................. 4,600 4,300 ................... ................... ................... ................... ...................MI ............................... 36,000 36,000 1,100 ................... ................... 3,800 31,100 MO ............................. 5,100 5,100 60 ................... ................... 5,040 ...................NY .............................. 176,000 176,000 4,000 ................... ................... 52,000 120,000 NC ............................. 5,200 4,950 450 ................... ................... 4,500 ...................OH ............................. 3,470 3,050 40 ................... ................... 1,610 1,400 OR ............................. 31,200 31,200 ................... ................... ................... 31,200 ...................PA .............................. 83,000 82,000 300 ................... ................... 10,300 71,400 TX .............................. 8,900 8,500 400 ................... ................... 8,100 ...................VA .............................. 6,600 6,450 ................... ................... ................... 6,450 ...................WA:.
All types ................. 336,000 336,000 ................... ................... ................... 160,000 176,000 Wine ....................... 160,000 160,000 ................... ................... ................... ................... ...................Juice ....................... 176,000 176,000 ................... ................... ................... ................... ...................
Oth Sts 5 .................... ................... ................... 2,760 ................... ................... 3,530 ...................
US .......................... 7,414,170 7,411,540 993,110 25,000 1,720,000 4,273,530 399,900
1 Preliminary. 2 Equivalent raisins produced (dried basis): 347,700 tons. 3 Mostly juice, but includes some quantities used for jam, jelly, etc. 4Estimates discontinued in 2009. 5 Grapes processed for juice are included in other states wine to avoid disclosure of individual operations.
NASS, Crops Branch, (202) 720–2127.
VerDate Aug 31 2005 10:25 Feb 29, 2012 Jkt 000000 PO 00000 Frm 00020 Fmt 1000 Sfmt 1000 H:\SHARED\DAPP\FPU\AGSTAT\MASTER~2\CHAPTR05\V-21.AG8 USDA
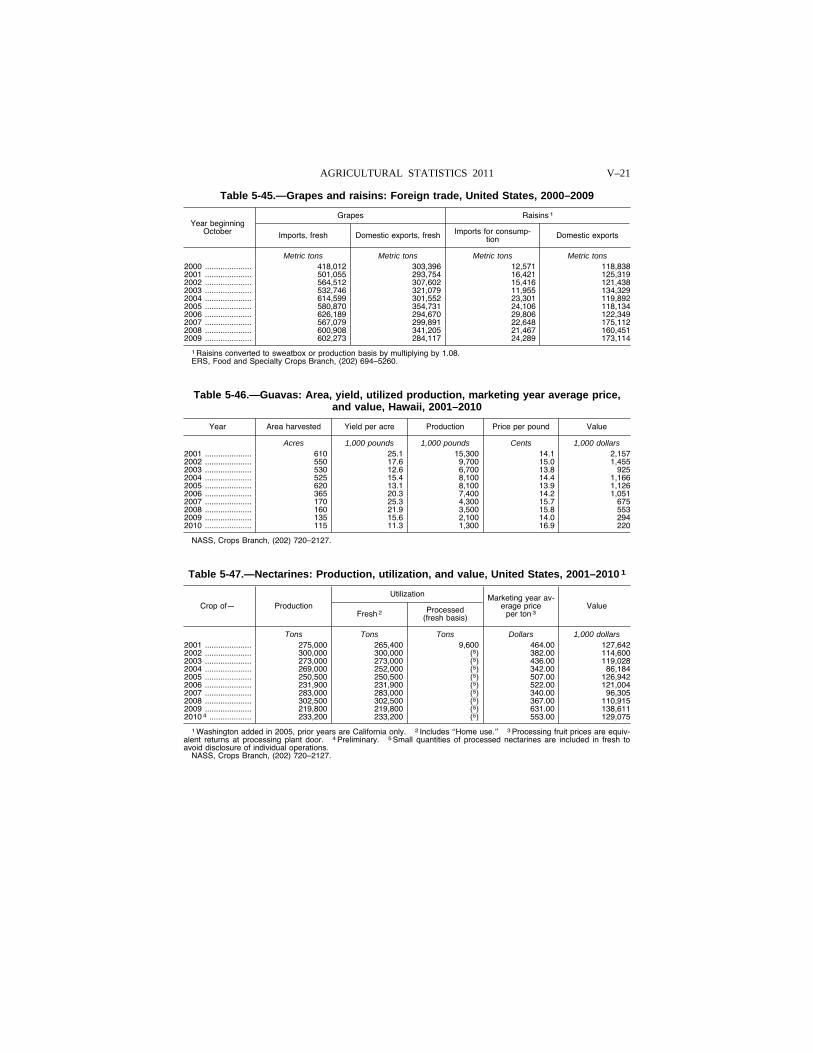
V–21 AGRICULTURAL STATISTICS 2011
Table 5-45.—Grapes and raisins: Foreign trade, United States, 2000–2009
Year beginning October
Grapes Raisins 1
Imports, fresh Domestic exports, fresh Imports for consump-tion Domestic exports
Metric tons Metric tons Metric tons Metric tons 2000 ..................... 418,012 303,396 12,571 118,838 2001 ..................... 501,055 293,754 16,421 125,319 2002 ..................... 564,512 307,602 15,416 121,438 2003 ..................... 532,746 321,079 11,955 134,329 2004 ..................... 614,599 301,552 23,301 119,892 2005 ..................... 580,870 354,731 24,106 118,134 2006 ..................... 626,189 294,670 29,806 122,349 2007 ..................... 567,079 299,891 22,648 175,112 2008 ..................... 600,908 341,205 21,467 160,451 2009 ..................... 602,273 284,117 24,289 173,114
1 Raisins converted to sweatbox or production basis by multiplying by 1.08. ERS, Food and Specialty Crops Branch, (202) 694–5260.
Table 5-46.—Guavas: Area, yield, utilized production, marketing year average price, and value, Hawaii, 2001–2010
Year Area harvested Yield per acre Production Price per pound Value
Acres 1,000 pounds 1,000 pounds Cents 1,000 dollars 2001 ..................... 610 25.1 15,300 14.1 2,157 2002 ..................... 550 17.6 9,700 15.0 1,455 2003 ..................... 530 12.6 6,700 13.8 925 2004 ..................... 525 15.4 8,100 14.4 1,166 2005 ..................... 620 13.1 8,100 13.9 1,126 2006 ..................... 365 20.3 7,400 14.2 1,051 2007 ..................... 170 25.3 4,300 15.7 675 2008 ..................... 160 21.9 3,500 15.8 553 2009 ..................... 135 15.6 2,100 14.0 294 2010 ..................... 115 11.3 1,300 16.9 220
NASS, Crops Branch, (202) 720–2127.
Table 5-47.—Nectarines: Production, utilization, and value, United States, 2001–2010 1
Crop of— Production
Utilization Marketing year av-erage price
per ton 3 Value
Fresh 2 Processed (fresh basis)
Tons Tons Tons Dollars 1,000 dollars 2001 ..................... 275,000 265,400 9,600 464.00 127,642 2002 ..................... 300,000 300,000 (5) 382.00 114,600 2003 ..................... 273,000 273,000 (5) 436.00 119,028 2004 ..................... 269,000 252,000 (5) 342.00 86,184 2005 ..................... 250,500 250,500 (5) 507.00 126,942 2006 ..................... 231,900 231,900 (5) 522.00 121,004 2007 ..................... 283,000 283,000 (5) 340.00 96,305 2008 ..................... 302,500 302,500 (5) 367.00 110,915 2009 ..................... 219,800 219,800 (5) 631.00 138,611 2010 4 ................... 233,200 233,200 (5) 553.00 129,075
1 Washington added in 2005, prior years are California only. 2 Includes ‘‘Home use.’’ 3 Processing fruit prices are equiv-alent returns at processing plant door. 4 Preliminary. 5 Small quantities of processed nectarines are included in fresh to avoid disclosure of individual operations.
NASS, Crops Branch, (202) 720–2127.
VerDate Aug 31 2005 10:25 Feb 29, 2012 Jkt 000000 PO 00000 Frm 00021 Fmt 1000 Sfmt 1000 H:\SHARED\DAPP\FPU\AGSTAT\MASTER~2\CHAPTR05\V-23.AG8 USDA
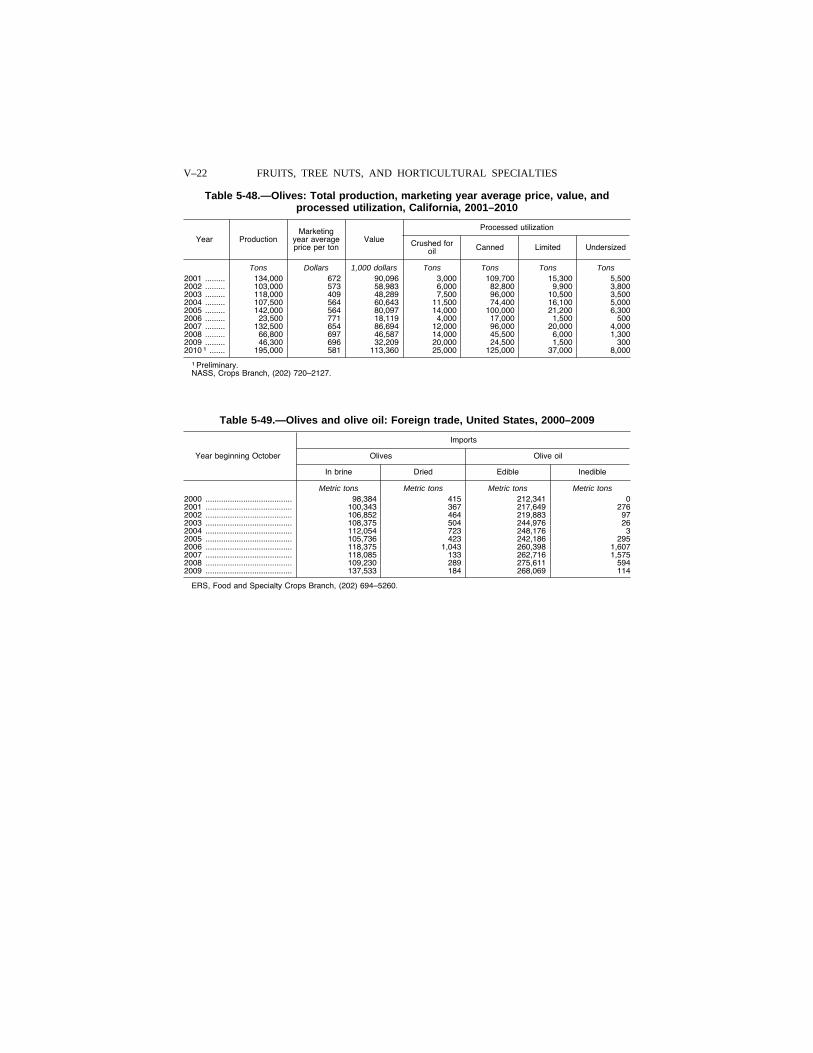
V–22 FRUITS, TREE NUTS, AND HORTICULTURAL SPECIALTIES
Table 5-48.—Olives: Total production, marketing year average price, value, and processed utilization, California, 2001–2010
Year Production Marketing
year average price per ton
Value
Processed utilization
Crushed for oil Canned Limited Undersized
Tons Dollars 1,000 dollars Tons Tons Tons Tons 2001 ......... 134,000 672 90,096 3,000 109,700 15,300 5,500 2002 ......... 103,000 573 58,983 6,000 82,800 9,900 3,800 2003 ......... 118,000 409 48,289 7,500 96,000 10,500 3,500 2004 ......... 107,500 564 60,643 11,500 74,400 16,100 5,000 2005 ......... 142,000 564 80,097 14,000 100,000 21,200 6,300 2006 ......... 23,500 771 18,119 4,000 17,000 1,500 500 2007 ......... 132,500 654 86,694 12,000 96,000 20,000 4,000 2008 ......... 66,800 697 46,587 14,000 45,500 6,000 1,300 2009 ......... 46,300 696 32,209 20,000 24,500 1,500 300 2010 1 ....... 195,000 581 113,360 25,000 125,000 37,000 8,000
1 Preliminary. NASS, Crops Branch, (202) 720–2127.
Table 5-49.—Olives and olive oil: Foreign trade, United States, 2000–2009
Year beginning October
Imports
Olives Olive oil
In brine Dried Edible Inedible
Metric tons Metric tons Metric tons Metric tons 2000 ....................................... 98,384 415 212,341 0 2001 ....................................... 100,343 367 217,649 276 2002 ....................................... 106,852 464 219,883 97 2003 ....................................... 108,375 504 244,976 26 2004 ....................................... 112,054 723 248,176 3 2005 ....................................... 105,736 423 242,186 295 2006 ....................................... 118,375 1,043 260,398 1,607 2007 ....................................... 118,085 133 262,716 1,575 2008 ....................................... 109,230 289 275,611 594 2009 ....................................... 137,533 184 268,069 114
ERS, Food and Specialty Crops Branch, (202) 694–5260.
VerDate Aug 31 2005 10:25 Feb 29, 2012 Jkt 000000 PO 00000 Frm 00022 Fmt 1000 Sfmt 1000 H:\SHARED\DAPP\FPU\AGSTAT\MASTER~2\CHAPTR05\V-24.AG8 USDA
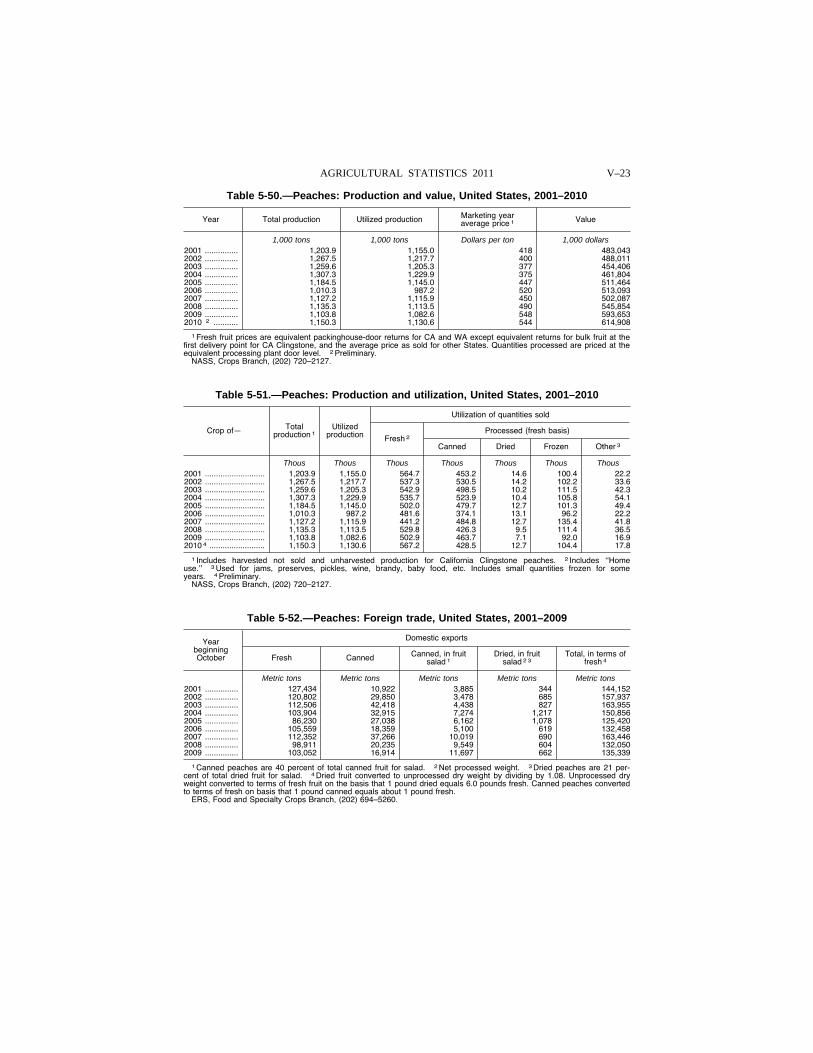
V–23 AGRICULTURAL STATISTICS 2011
Table 5-50.—Peaches: Production and value, United States, 2001–2010
Year Total production Utilized production Marketing year average price 1 Value
1,000 tons 1,000 tons Dollars per ton 1,000 dollars 2001 ............... 1,203.9 1,155.0 418 483,043 2002 ............... 1,267.5 1,217.7 400 488,011 2003 ............... 1,259.6 1,205.3 377 454,406 2004 ............... 1,307.3 1,229.9 375 461,804 2005 ............... 1,184.5 1,145.0 447 511,464 2006 ............... 1,010.3 987.2 520 513,093 2007 ............... 1,127.2 1,115.9 450 502,087 2008 ............... 1,135.3 1,113.5 490 545,854 2009 ............... 1,103.8 1,082.6 548 593,653 2010 2 ........... 1,150.3 1,130.6 544 614,908
1 Fresh fruit prices are equivalent packinghouse-door returns for CA and WA except equivalent returns for bulk fruit at the first delivery point for CA Clingstone, and the average price as sold for other States. Quantities processed are priced at the equivalent processing plant door level. 2 Preliminary.
NASS, Crops Branch, (202) 720–2127.
Table 5-51.—Peaches: Production and utilization, United States, 2001–2010
Crop of— Total production 1
Utilized production
Utilization of quantities sold
Fresh 2 Processed (fresh basis)
Canned Dried Frozen Other 3
Thous Thous Thous Thous Thous Thous Thous 2001 ........................... 1,203.9 1,155.0 564.7 453.2 14.6 100.4 22.2 2002 ........................... 1,267.5 1,217.7 537.3 530.5 14.2 102.2 33.6 2003 ........................... 1,259.6 1,205.3 542.9 498.5 10.2 111.5 42.3 2004 ........................... 1,307.3 1,229.9 535.7 523.9 10.4 105.8 54.1 2005 ........................... 1,184.5 1,145.0 502.0 479.7 12.7 101.3 49.4 2006 ........................... 1,010.3 987.2 481.6 374.1 13.1 96.2 22.2 2007 ........................... 1,127.2 1,115.9 441.2 484.8 12.7 135.4 41.8 2008 ........................... 1,135.3 1,113.5 529.8 426.3 9.5 111.4 36.5 2009 ........................... 1,103.8 1,082.6 502.9 463.7 7.1 92.0 16.9 2010 4 ......................... 1,150.3 1,130.6 567.2 428.5 12.7 104.4 17.8
1 Includes harvested not sold and unharvested production for California Clingstone peaches. 2 Includes ‘‘Home use.’’ 3 Used for jams, preserves, pickles, wine, brandy, baby food, etc. Includes small quantities frozen for some years. 4 Preliminary.
NASS, Crops Branch, (202) 720–2127.
Table 5-52.—Peaches: Foreign trade, United States, 2001–2009
Year beginning October
Domestic exports
Fresh Canned Canned, in fruit salad 1
Dried, in fruit salad 2 3
Total, in terms of fresh 4
Metric tons Metric tons Metric tons Metric tons Metric tons 2001 ............... 127,434 10,922 3,885 344 144,152 2002 ............... 120,802 29,850 3,478 685 157,937 2003 ............... 112,506 42,418 4,438 827 163,955 2004 ............... 103,904 32,915 7,274 1,217 150,856 2005 ............... 86,230 27,038 6,162 1,078 125,420 2006 ............... 105,559 18,359 5,100 619 132,458 2007 ............... 112,352 37,266 10,019 690 163,446 2008 ............... 98,911 20,235 9,549 604 132,050 2009 ............... 103,052 16,914 11,697 662 135,339
1 Canned peaches are 40 percent of total canned fruit for salad. 2 Net processed weight. 3 Dried peaches are 21 per-cent of total dried fruit for salad. 4 Dried fruit converted to unprocessed dry weight by dividing by 1.08. Unprocessed dry weight converted to terms of fresh fruit on the basis that 1 pound dried equals 6.0 pounds fresh. Canned peaches converted to terms of fresh on basis that 1 pound canned equals about 1 pound fresh.
ERS, Food and Specialty Crops Branch, (202) 694–5260.
VerDate Aug 31 2005 10:25 Feb 29, 2012 Jkt 000000 PO 00000 Frm 00023 Fmt 1000 Sfmt 1000 H:\SHARED\DAPP\FPU\AGSTAT\MASTER~2\CHAPTR05\V-25.AG8 USDA
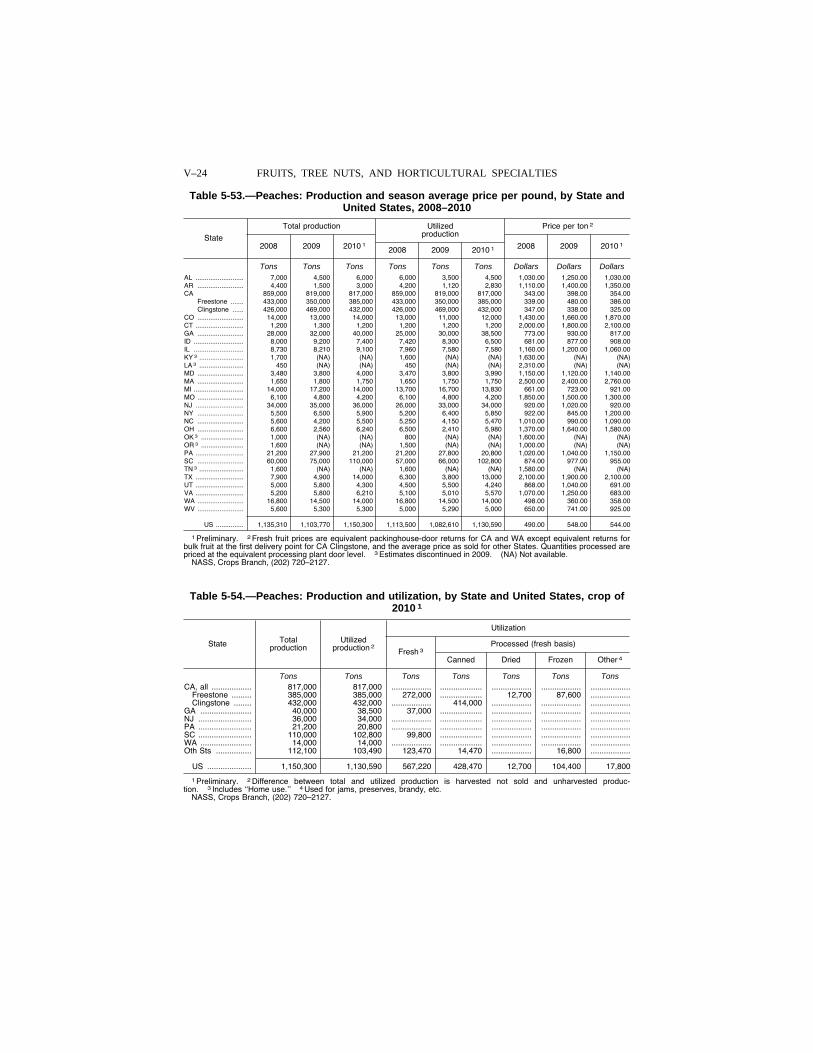
V–24 FRUITS, TREE NUTS, AND HORTICULTURAL SPECIALTIES
Table 5-53.—Peaches: Production and season average price per pound, by State and United States, 2008–2010
State
Total production Utilized production
Price per ton 2
2008 2009 2010 1 2008 2009 2010 1 2008 2009 2010 1
Tons Tons Tons Tons Tons Tons Dollars Dollars Dollars AL .......................... 7,000 4,500 6,000 6,000 3,500 4,500 1,030.00 1,250.00 1,030.00 AR ......................... 4,400 1,500 3,000 4,200 1,120 2,830 1,110.00 1,400.00 1,350.00 CA 859,000 819,000 817,000 859,000 819,000 817,000 343.00 398.00 354.00
Freestone ....... 433,000 350,000 385,000 433,000 350,000 385,000 339.00 480.00 386.00 Clingstone ...... 426,000 469,000 432,000 426,000 469,000 432,000 347.00 338.00 325.00
CO ......................... 14,000 13,000 14,000 13,000 11,000 12,000 1,430.00 1,660.00 1,870.00 CT .......................... 1,200 1,300 1,200 1,200 1,200 1,200 2,000.00 1,800.00 2,100.00 GA ......................... 28,000 32,000 40,000 25,000 30,000 38,500 773.00 930.00 817.00 ID ........................... 8,000 9,200 7,400 7,420 8,300 6,500 681.00 877.00 908.00 IL ........................... 8,730 8,210 9,100 7,960 7,580 7,580 1,160.00 1,200.00 1,060.00 KY 3 ........................ 1,700 (NA) (NA) 1,600 (NA) (NA) 1,630.00 (NA) (NA) LA 3 ........................ 450 (NA) (NA) 450 (NA) (NA) 2,310.00 (NA) (NA) MD ......................... 3,480 3,800 4,000 3,470 3,800 3,990 1,150.00 1,120.00 1,140.00 MA ......................... 1,650 1,800 1,750 1,650 1,750 1,750 2,500.00 2,400.00 2,760.00 MI ........................... 14,000 17,200 14,000 13,700 16,700 13,830 661.00 723.00 921.00 MO ......................... 6,100 4,800 4,200 6,100 4,800 4,200 1,850.00 1,500.00 1,300.00 NJ .......................... 34,000 35,000 36,000 26,000 33,000 34,000 920.00 1,020.00 920.00 NY ......................... 5,500 6,500 5,900 5,200 6,400 5,850 922.00 845.00 1,200.00 NC ......................... 5,600 4,200 5,500 5,250 4,150 5,470 1,010.00 990.00 1,090.00 OH ......................... 6,600 2,560 6,240 6,500 2,410 5,980 1,370.00 1,640.00 1,580.00 OK 3 ....................... 1,000 (NA) (NA) 800 (NA) (NA) 1,600.00 (NA) (NA) OR 3 ....................... 1,600 (NA) (NA) 1,500 (NA) (NA) 1,000.00 (NA) (NA) PA .......................... 21,200 27,900 21,200 21,200 27,800 20,800 1,020.00 1,040.00 1,150.00 SC ......................... 60,000 75,000 110,000 57,000 66,000 102,800 874.00 977.00 955.00 TN 3 ........................ 1,600 (NA) (NA) 1,600 (NA) (NA) 1,580.00 (NA) (NA) TX .......................... 7,900 4,900 14,000 6,300 3,800 13,000 2,100.00 1,900.00 2,100.00 UT .......................... 5,000 5,800 4,300 4,500 5,500 4,240 868.00 1,040.00 691.00 VA .......................... 5,200 5,800 6,210 5,100 5,010 5,570 1,070.00 1,250.00 683.00 WA ......................... 16,800 14,500 14,000 16,800 14,500 14,000 498.00 360.00 358.00 WV ......................... 5,600 5,300 5,300 5,000 5,290 5,000 650.00 741.00 925.00
US ............... 1,135,310 1,103,770 1,150,300 1,113,500 1,082,610 1,130,590 490.00 548.00 544.00
1 Preliminary. 2 Fresh fruit prices are equivalent packinghouse-door returns for CA and WA except equivalent returns for bulk fruit at the first delivery point for CA Clingstone, and the average price as sold for other States. Quantities processed are priced at the equivalent processing plant door level. 3 Estimates discontinued in 2009. (NA) Not available.
NASS, Crops Branch, (202) 720–2127.
Table 5-54.—Peaches: Production and utilization, by State and United States, crop of 2010 1
State Total production
Utilized production 2
Utilization
Fresh 3 Processed (fresh basis)
Canned Dried Frozen Other 4
Tons Tons Tons Tons Tons Tons Tons CA, all .................. 817,000 817,000 .................. ................... .................. .................. ..................
Freestone ......... 385,000 385,000 272,000 ................... 12,700 87,600 ..................Clingstone ........ 432,000 432,000 .................. 414,000 .................. .................. ..................
GA ....................... 40,000 38,500 37,000 ................... .................. .................. ..................NJ ........................ 36,000 34,000 .................. ................... .................. .................. ..................PA ........................ 21,200 20,800 .................. ................... .................. .................. ..................SC ........................ 110,000 102,800 99,800 ................... .................. .................. ..................WA ....................... 14,000 14,000 .................. ................... .................. .................. ..................Oth Sts ................ 112,100 103,490 123,470 14,470 .................. 16,800 ..................
US .................... 1,150,300 1,130,590 567,220 428,470 12,700 104,400 17,800
1 Preliminary. 2 Difference between total and utilized production is harvested not sold and unharvested produc-tion. 3 Includes ‘‘Home use.’’ 4 Used for jams, preserves, brandy, etc.
NASS, Crops Branch, (202) 720–2127.
VerDate Aug 31 2005 10:25 Feb 29, 2012 Jkt 000000 PO 00000 Frm 00024 Fmt 1000 Sfmt 1000 H:\SHARED\DAPP\FPU\AGSTAT\MASTER~2\CHAPTR05\V-26.AG8 USDA
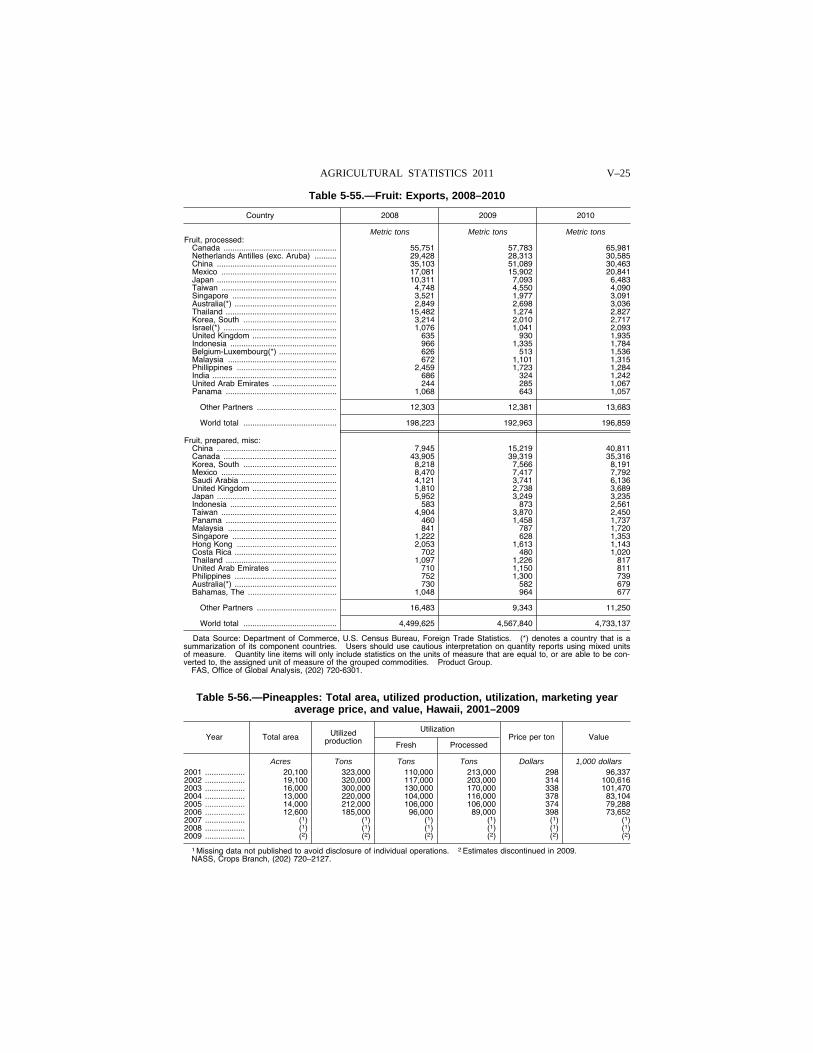
V–25 AGRICULTURAL STATISTICS 2011
Table 5-55.—Fruit: Exports, 2008–2010
Country 2008 2009 2010
Metric tons Metric tons Metric tons Fruit, processed:
Canada ................................................... 55,751 57,783 65,981 Netherlands Antilles (exc. Aruba) .......... 29,428 28,313 30,585 China ...................................................... 35,103 51,089 30,463 Mexico .................................................... 17,081 15,902 20,841 Japan ...................................................... 10,311 7,093 6,483 Taiwan .................................................... 4,748 4,550 4,090 Singapore ............................................... 3,521 1,977 3,091 Australia(*) .............................................. 2,849 2,698 3,036 Thailand .................................................. 15,482 1,274 2,827 Korea, South .......................................... 3,214 2,010 2,717 Israel(*) ................................................... 1,076 1,041 2,093 United Kingdom ...................................... 635 930 1,935 Indonesia ................................................ 966 1,335 1,784 Belgium-Luxembourg(*) .......................... 626 513 1,536 Malaysia ................................................. 672 1,101 1,315 Phillippines ............................................. 2,459 1,723 1,284 India ........................................................ 686 324 1,242 United Arab Emirates ............................. 244 285 1,067 Panama .................................................. 1,068 643 1,057
Other Partners .................................... 12,303 12,381 13,683
World total .......................................... 198,223 192,963 196,859
Fruit, prepared, misc: China ...................................................... 7,945 15,219 40,811 Canada ................................................... 43,905 39,319 35,316 Korea, South .......................................... 8,218 7,566 8,191 Mexico .................................................... 8,470 7,417 7,792 Saudi Arabia ........................................... 4,121 3,741 6,136 United Kingdom ...................................... 1,810 2,738 3,689 Japan ...................................................... 5,952 3,249 3,235 Indonesia ................................................ 583 873 2,561 Taiwan .................................................... 4,904 3,870 2,450 Panama .................................................. 460 1,458 1,737 Malaysia ................................................. 841 787 1,720 Singapore ............................................... 1,222 628 1,353 Hong Kong ............................................. 2,053 1,613 1,143 Costa Rica .............................................. 702 480 1,020 Thailand .................................................. 1,097 1,226 817 United Arab Emirates ............................. 710 1,150 811 Philippines .............................................. 752 1,300 739 Australia(*) .............................................. 730 582 679 Bahamas, The ........................................ 1,048 964 677
Other Partners .................................... 16,483 9,343 11,250
World total .......................................... 4,499,625 4,567,840 4,733,137
Data Source: Department of Commerce, U.S. Census Bureau, Foreign Trade Statistics. (*) denotes a country that is a summarization of its component countries. Users should use cautious interpretation on quantity reports using mixed units of measure. Quantity line items will only include statistics on the units of measure that are equal to, or are able to be con-verted to, the assigned unit of measure of the grouped commodities. Product Group.
FAS, Office of Global Analysis, (202) 720-6301.
Table 5-56.—Pineapples: Total area, utilized production, utilization, marketing year average price, and value, Hawaii, 2001–2009
Year Total area Utilized production
Utilization Price per ton Value
Fresh Processed
Acres Tons Tons Tons Dollars 1,000 dollars 2001 .................. 20,100 323,000 110,000 213,000 298 96,337 2002 .................. 19,100 320,000 117,000 203,000 314 100,616 2003 .................. 16,000 300,000 130,000 170,000 338 101,470 2004 .................. 13,000 220,000 104,000 116,000 378 83,104 2005 .................. 14,000 212,000 106,000 106,000 374 79,288 2006 .................. 12,600 185,000 96,000 89,000 398 73,652 2007 .................. (1) (1) (1) (1) (1) (1) 2008 .................. (1) (1) (1) (1) (1) (1) 2009 .................. (2) (2) (2) (2) (2) (2)
1 Missing data not published to avoid disclosure of individual operations. 2 Estimates discontinued in 2009. NASS, Crops Branch, (202) 720–2127.
VerDate Aug 31 2005 10:25 Feb 29, 2012 Jkt 000000 PO 00000 Frm 00025 Fmt 1000 Sfmt 1000 H:\SHARED\DAPP\FPU\AGSTAT\MASTER~2\CHAPTR05\V-27.AG8 USDA
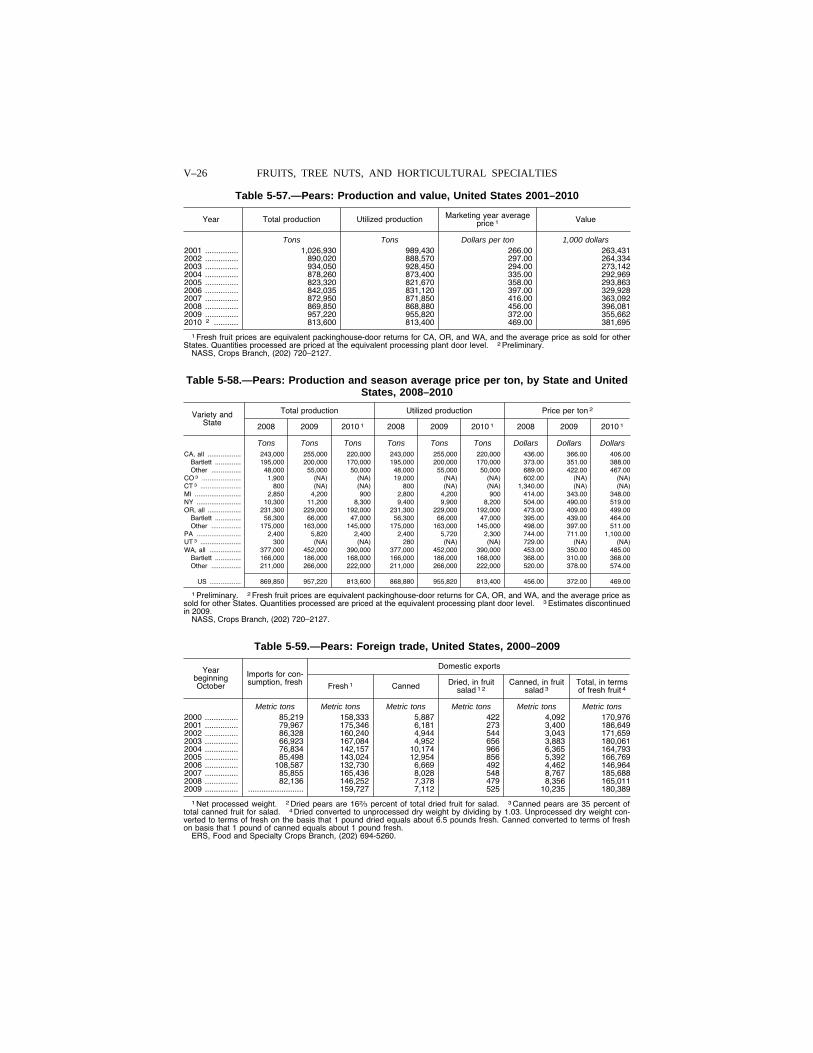
V–26 FRUITS, TREE NUTS, AND HORTICULTURAL SPECIALTIES
Table 5-57.—Pears: Production and value, United States 2001–2010
Year Total production Utilized production Marketing year average price 1 Value
Tons Tons Dollars per ton 1,000 dollars 2001 ............... 1,026,930 989,430 266.00 263,431 2002 ............... 890,020 888,570 297.00 264,334 2003 ............... 934,050 928,450 294.00 273,142 2004 ............... 878,260 873,400 335.00 292,969 2005 ............... 823,320 821,670 358.00 293,863 2006 ............... 842,035 831,120 397.00 329,928 2007 ............... 872,950 871,850 416.00 363,092 2008 ............... 869,850 868,880 456.00 396,081 2009 ............... 957,220 955,820 372.00 355,662 2010 2 ........... 813,600 813,400 469.00 381,695
1 Fresh fruit prices are equivalent packinghouse-door returns for CA, OR, and WA, and the average price as sold for other States. Quantities processed are priced at the equivalent processing plant door level. 2 Preliminary.
NASS, Crops Branch, (202) 720–2127.
Table 5-58.—Pears: Production and season average price per ton, by State and United States, 2008–2010
Variety and State
Total production Utilized production Price per ton 2
2008 2009 2010 1 2008 2009 2010 1 2008 2009 2010 1
Tons Tons Tons Tons Tons Tons Dollars Dollars Dollars CA, all .................. 243,000 255,000 220,000 243,000 255,000 220,000 436.00 366.00 406.00
Bartlett .............. 195,000 200,000 170,000 195,000 200,000 170,000 373.00 351.00 388.00 Other ................ 48,000 55,000 50,000 48,000 55,000 50,000 689.00 422.00 467.00
CO 3 ..................... 1,900 (NA) (NA) 19,000 (NA) (NA) 602.00 (NA) (NA) CT 3 ...................... 800 (NA) (NA) 800 (NA) (NA) 1,340.00 (NA) (NA) MI ......................... 2,850 4,200 900 2,800 4,200 900 414.00 343.00 348.00 NY ........................ 10,300 11,200 8,300 9,400 9,900 8,200 504.00 490.00 519.00 OR, all .................. 231,300 229,000 192,000 231,300 229,000 192,000 473.00 409.00 499.00
Bartlett .............. 56,300 66,000 47,000 56,300 66,000 47,000 395.00 439.00 464.00 Other ................ 175,000 163,000 145,000 175,000 163,000 145,000 498.00 397.00 511.00
PA ........................ 2,400 5,820 2,400 2,400 5,720 2,300 744.00 711.00 1,100.00 UT 3 ...................... 300 (NA) (NA) 280 (NA) (NA) 729.00 (NA) (NA) WA, all ................. 377,000 452,000 390,000 377,000 452,000 390,000 453.00 350.00 485.00
Bartlett .............. 166,000 186,000 168,000 166,000 186,000 168,000 368.00 310.00 368.00 Other ................ 211,000 266,000 222,000 211,000 266,000 222,000 520.00 378.00 574.00
US ................. 869,850 957,220 813,600 868,880 955,820 813,400 456.00 372.00 469.00
1 Preliminary. 2 Fresh fruit prices are equivalent packinghouse-door returns for CA, OR, and WA, and the average price as sold for other States. Quantities processed are priced at the equivalent processing plant door level. 3 Estimates discontinued in 2009.
NASS, Crops Branch, (202) 720–2127.
Table 5-59.—Pears: Foreign trade, United States, 2000–2009
Year beginning October
Imports for con-sumption, fresh
Domestic exports
Fresh 1 Canned Dried, in fruit salad 1 2
Canned, in fruit salad 3
Total, in terms of fresh fruit 4
Metric tons Metric tons Metric tons Metric tons Metric tons Metric tons 2000 ............... 85,219 158,333 5,887 422 4,092 170,976 2001 ............... 79,967 175,346 6,181 273 3,400 186,649 2002 ............... 86,328 160,240 4,944 544 3,043 171,659 2003 ............... 66,923 167,084 4,952 656 3,883 180,061 2004 ............... 76,834 142,157 10,174 966 6,365 164,793 2005 ............... 85,498 143,024 12,954 856 5,392 166,769 2006 ............... 108,587 132,730 6,669 492 4,462 146,964 2007 ............... 85,855 165,436 8,028 548 8,767 185,688 2008 ............... 82,136 146,252 7,378 479 8,356 165,011 2009 ............... ......................... 159,727 7,112 525 10,235 180,389
1 Net processed weight. 2 Dried pears are 162⁄3 percent of total dried fruit for salad. 3 Canned pears are 35 percent of total canned fruit for salad. 4 Dried converted to unprocessed dry weight by dividing by 1.03. Unprocessed dry weight con-verted to terms of fresh on the basis that 1 pound dried equals about 6.5 pounds fresh. Canned converted to terms of fresh on basis that 1 pound of canned equals about 1 pound fresh.
ERS, Food and Specialty Crops Branch, (202) 694-5260.
VerDate Aug 31 2005 10:25 Feb 29, 2012 Jkt 000000 PO 00000 Frm 00026 Fmt 1000 Sfmt 1000 H:\SHARED\DAPP\FPU\AGSTAT\MASTER~2\CHAPTR05\V-28.AG8 USDA
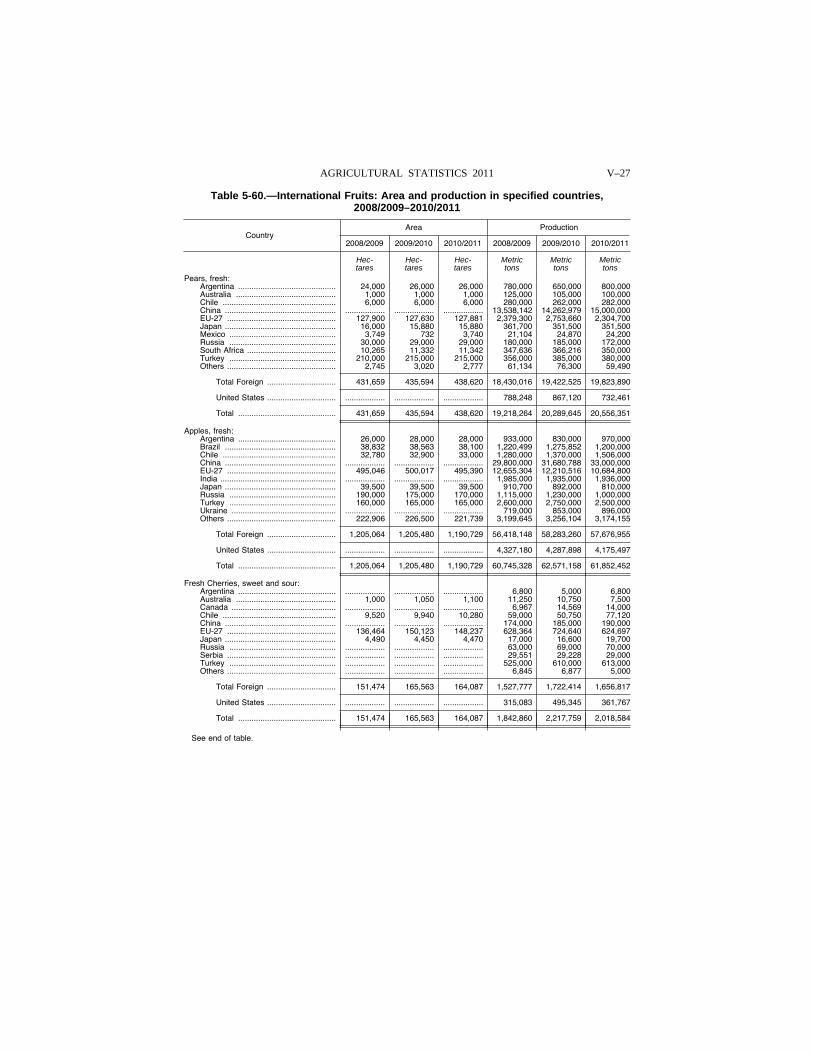
V–27 AGRICULTURAL STATISTICS 2011
Table 5-60.—International Fruits: Area and production in specified countries, 2008/2009–2010/2011
Country Area Production
2008/2009 2009/2010 2010/2011 2008/2009 2009/2010 2010/2011
Hec- Hec- Hec- Metric Metric Metric tares tares tares tons tons tons
Pears, fresh: Argentina ............................................ 24,000 26,000 26,000 780,000 650,000 800,000 Australia ............................................. 1,000 1,000 1,000 125,000 105,000 100,000 Chile ................................................... 6,000 6,000 6,000 280,000 262,000 282,000 China .................................................. .................. .................. .................. 13,538,142 14,262,979 15,000,000 EU-27 ................................................. 127,900 127,630 127,881 2,379,300 2,753,660 2,304,700 Japan .................................................. 16,000 15,880 15,880 361,700 351,500 351,500 Mexico ................................................ 3,749 732 3,740 21,104 24,870 24,200 Russia ................................................ 30,000 29,000 29,000 180,000 185,000 172,000 South Africa ........................................ 10,265 11,332 11,342 347,636 366,216 350,000 Turkey ................................................ 210,000 215,000 215,000 356,000 385,000 380,000 Others ................................................. 2,745 3,020 2,777 61,134 76,300 59,490
Total Foreign ............................... 431,659 435,594 438,620 18,430,016 19,422,525 19,823,890
United States ............................... .................. .................. .................. 788,248 867,120 732,461
Total ............................................ 431,659 435,594 438,620 19,218,264 20,289,645 20,556,351
Apples, fresh: Argentina ............................................ 26,000 28,000 28,000 933,000 830,000 970,000 Brazil .................................................. 38,832 38,563 38,100 1,220,499 1,275,852 1,200,000 Chile ................................................... 32,780 32,900 33,000 1,280,000 1,370,000 1,506,000 China .................................................. .................. .................. .................. 29,800,000 31,680,788 33,000,000 EU-27 ................................................. 495,046 500,017 495,390 12,655,304 12,210,516 10,684,800 India .................................................... .................. .................. .................. 1,985,000 1,935,000 1,936,000 Japan .................................................. 39,500 39,500 39,500 910,700 892,000 810,000 Russia ................................................ 190,000 175,000 170,000 1,115,000 1,230,000 1,000,000 Turkey ................................................ 160,000 165,000 165,000 2,600,000 2,750,000 2,500,000 Ukraine ............................................... .................. .................. .................. 719,000 853,000 896,000 Others ................................................. 222,906 226,500 221,739 3,199,645 3,256,104 3,174,155
Total Foreign ............................... 1,205,064 1,205,480 1,190,729 56,418,148 58,283,260 57,676,955
United States ............................... .................. .................. .................. 4,327,180 4,287,898 4,175,497
Total ............................................ 1,205,064 1,205,480 1,190,729 60,745,328 62,571,158 61,852,452
Fresh Cherries, sweet and sour: Argentina ............................................ .................. .................. .................. 6,800 5,000 6,800 Australia ............................................. 1,000 1,050 1,100 11,250 10,750 7,500 Canada ............................................... .................. .................. .................. 6,967 14,569 14,000 Chile ................................................... 9,520 9,940 10,280 59,000 50,750 77,120 China .................................................. .................. .................. .................. 174,000 185,000 190,000 EU-27 ................................................. 136,464 150,123 148,237 628,364 724,640 624,697 Japan .................................................. 4,490 4,450 4,470 17,000 16,600 19,700 Russia ................................................ .................. .................. .................. 63,000 69,000 70,000 Serbia ................................................. .................. .................. .................. 29,551 29,228 29,000 Turkey ................................................ .................. .................. .................. 525,000 610,000 613,000 Others ................................................. .................. .................. .................. 6,845 6,877 5,000
Total Foreign ............................... 151,474 165,563 164,087 1,527,777 1,722,414 1,656,817
United States ............................... .................. .................. .................. 315,083 495,345 361,767
Total ............................................ 151,474 165,563 164,087 1,842,860 2,217,759 2,018,584
See end of table.
VerDate Aug 31 2005 10:25 Feb 29, 2012 Jkt 000000 PO 00000 Frm 00027 Fmt 1000 Sfmt 1000 H:\SHARED\DAPP\FPU\AGSTAT\MASTER~2\CHAPTR05\V-29.AG8 USDA
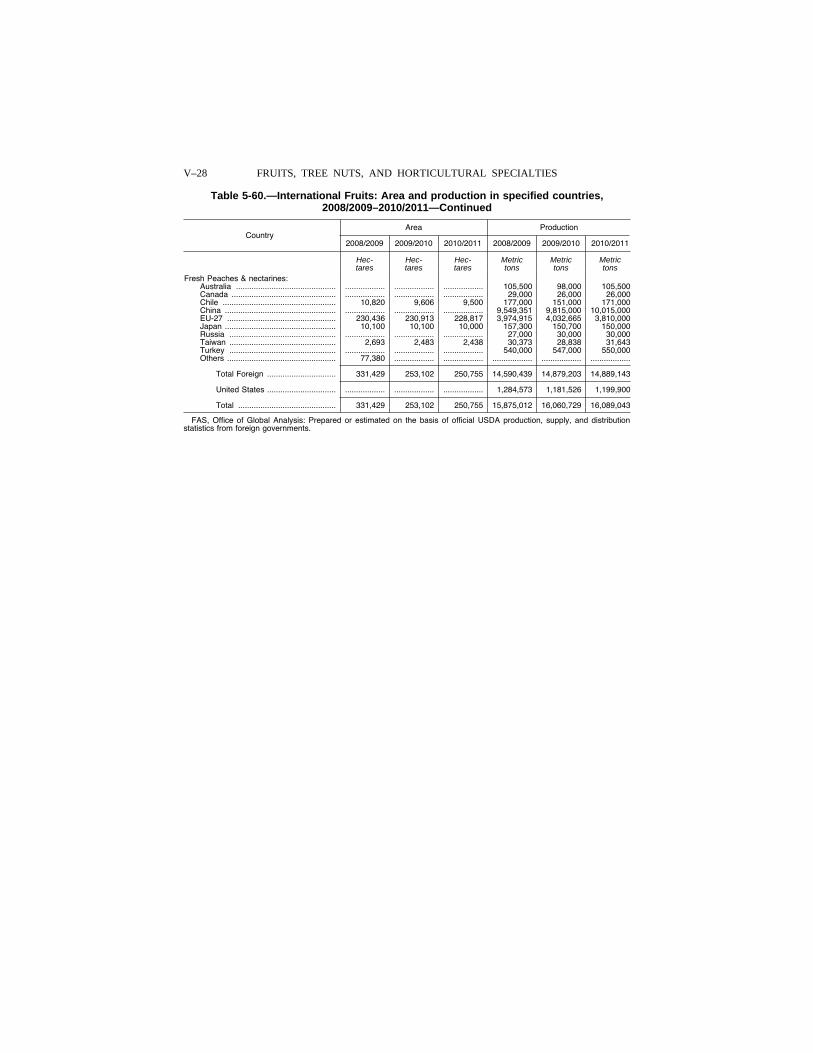
V–28 FRUITS, TREE NUTS, AND HORTICULTURAL SPECIALTIES
Table 5-60.—International Fruits: Area and production in specified countries, 2008/2009–2010/2011—Continued
Country Area Production
2008/2009 2009/2010 2010/2011 2008/2009 2009/2010 2010/2011
Hec- Hec- Hec- Metric Metric Metric tares tares tares tons tons tons
Fresh Peaches & nectarines: Australia ............................................. .................. .................. .................. 105,500 98,000 105,500 Canada ............................................... .................. .................. .................. 29,000 26,000 26,000 Chile ................................................... 10,820 9,606 9,500 177,000 151,000 171,000 China .................................................. .................. .................. .................. 9,549,351 9,815,000 10,015,000 EU-27 ................................................. 230,436 230,913 228,817 3,974,915 4,032,665 3,810,000 Japan .................................................. 10,100 10,100 10,000 157,300 150,700 150,000 Russia ................................................ .................. .................. .................. 27,000 30,000 30,000 Taiwan ................................................ 2,693 2,483 2,438 30,373 28,838 31,643 Turkey ................................................ .................. .................. .................. 540,000 547,000 550,000 Others ................................................. 77,380 .................. .................. .................. .................. ..................
Total Foreign ............................... 331,429 253,102 250,755 14,590,439 14,879,203 14,889,143
United States ............................... .................. .................. .................. 1,284,573 1,181,526 1,199,900
Total ............................................ 331,429 253,102 250,755 15,875,012 16,060,729 16,089,043
FAS, Office of Global Analysis: Prepared or estimated on the basis of official USDA production, supply, and distribution statistics from foreign governments.
VerDate Aug 31 2005 10:25 Feb 29, 2012 Jkt 000000 PO 00000 Frm 00028 Fmt 1000 Sfmt 1000 H:\SHARED\DAPP\FPU\AGSTAT\MASTER~2\CHAPTR05\V-30.AG8 USDA
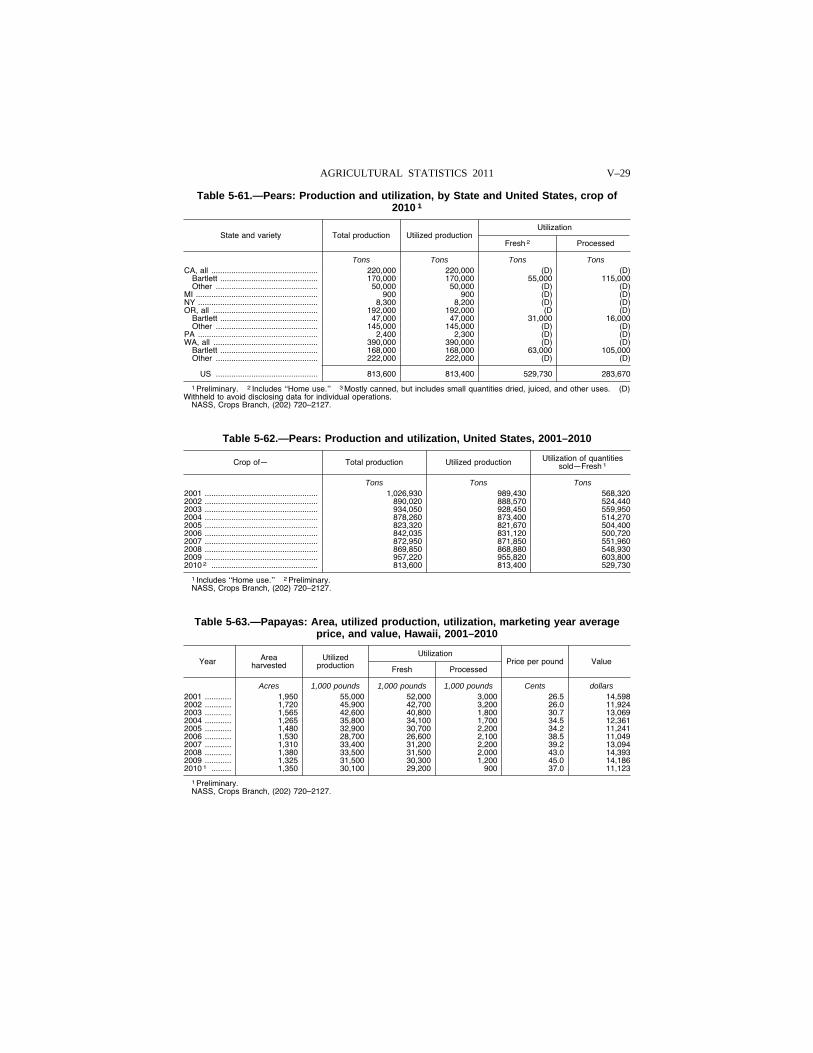
V–29 AGRICULTURAL STATISTICS 2011
Table 5-61.—Pears: Production and utilization, by State and United States, crop of 2010 1
State and variety Total production Utilized production Utilization
Fresh 2 Processed
Tons Tons Tons Tons CA, all ................................................ 220,000 220,000 (D) (D)
Bartlett ............................................ 170,000 170,000 55,000 115,000 Other .............................................. 50,000 50,000 (D) (D)
MI ....................................................... 900 900 (D) (D) NY ...................................................... 8,300 8,200 (D) (D) OR, all ............................................... 192,000 192,000 (D (D)
Bartlett ............................................ 47,000 47,000 31,000 16,000 Other .............................................. 145,000 145,000 (D) (D)
PA ...................................................... 2,400 2,300 (D) (D) WA, all ............................................... 390,000 390,000 (D) (D)
Bartlett ............................................ 168,000 168,000 63,000 105,000 Other .............................................. 222,000 222,000 (D) (D)
US .............................................. 813,600 813,400 529,730 283,670
1 Preliminary. 2 Includes ‘‘Home use.’’ 3 Mostly canned, but includes small quantities dried, juiced, and other uses. (D) Withheld to avoid disclosing data for individual operations.
NASS, Crops Branch, (202) 720–2127.
Table 5-62.—Pears: Production and utilization, United States, 2001–2010
Crop of— Total production Utilized production Utilization of quantities sold—Fresh 1
Tons Tons Tons 2001 ................................................... 1,026,930 989,430 568,320 2002 ................................................... 890,020 888,570 524,440 2003 ................................................... 934,050 928,450 559,950 2004 ................................................... 878,260 873,400 514,270 2005 ................................................... 823,320 821,670 504,400 2006 ................................................... 842,035 831,120 500,720 2007 ................................................... 872,950 871,850 551,960 2008 ................................................... 869,850 868,880 548,930 2009 ................................................... 957,220 955,820 603,800 2010 2 ................................................ 813,600 813,400 529,730
1 Includes ‘‘Home use.’’ 2 Preliminary. NASS, Crops Branch, (202) 720–2127.
Table 5-63.—Papayas: Area, utilized production, utilization, marketing year average price, and value, Hawaii, 2001–2010
Year Area harvested
Utilized production
Utilization Price per pound Value
Fresh Processed
Acres 1,000 pounds 1,000 pounds 1,000 pounds Cents dollars 2001 ............ 1,950 55,000 52,000 3,000 26.5 14,598 2002 ............ 1,720 45,900 42,700 3,200 26.0 11,924 2003 ............ 1,565 42,600 40,800 1,800 30.7 13,069 2004 ............ 1,265 35,800 34,100 1,700 34.5 12,361 2005 ............ 1,480 32,900 30,700 2,200 34.2 11,241 2006 ............ 1,530 28,700 26,600 2,100 38.5 11,049 2007 ............ 1,310 33,400 31,200 2,200 39.2 13,094 2008 ............ 1,380 33,500 31,500 2,000 43.0 14,393 2009 ............ 1,325 31,500 30,300 1,200 45.0 14,186 2010 1 ......... 1,350 30,100 29,200 900 37.0 11,123
1 Preliminary. NASS, Crops Branch, (202) 720–2127.
VerDate Aug 31 2005 10:25 Feb 29, 2012 Jkt 000000 PO 00000 Frm 00029 Fmt 1000 Sfmt 1000 H:\SHARED\DAPP\FPU\AGSTAT\MASTER~2\CHAPTR05\V-31.AG8 USDA
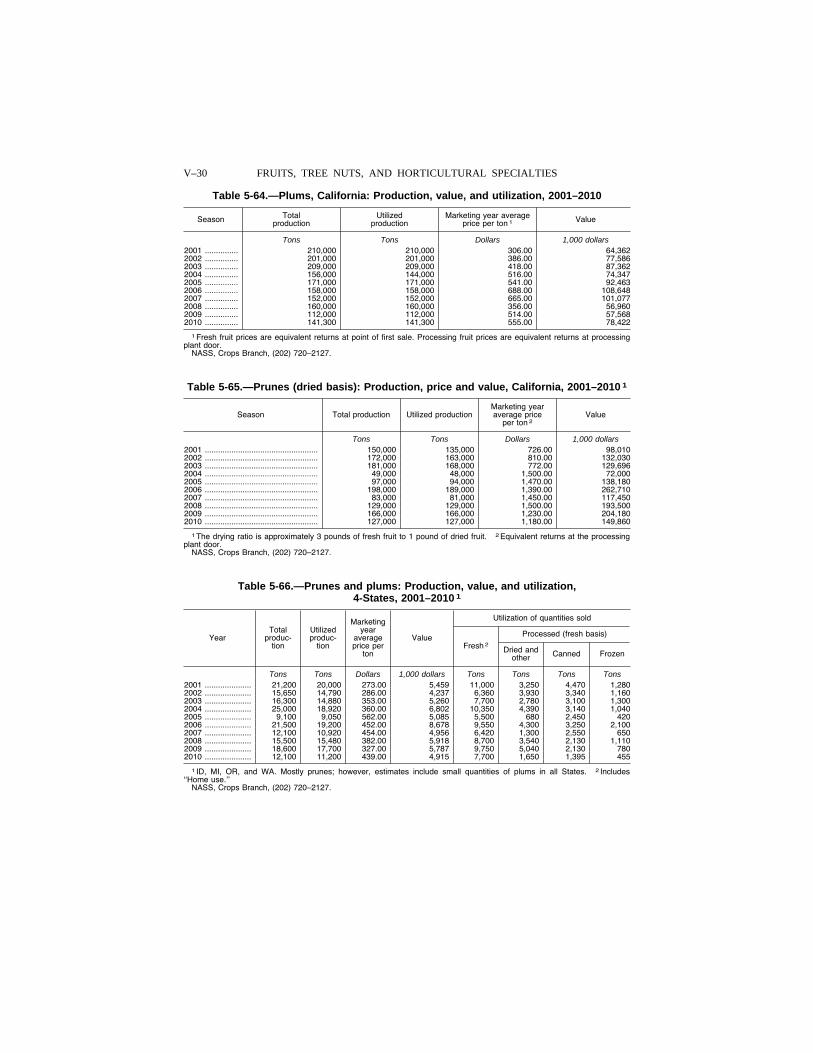
V–30 FRUITS, TREE NUTS, AND HORTICULTURAL SPECIALTIES
Table 5-64.—Plums, California: Production, value, and utilization, 2001–2010
Season Total production
Utilized production
Marketing year average price per ton 1 Value
Tons Tons Dollars 1,000 dollars 2001 ............... 210,000 210,000 306.00 64,362 2002 ............... 201,000 201,000 386.00 77,586 2003 ............... 209,000 209,000 418.00 87,362 2004 ............... 156,000 144,000 516.00 74,347 2005 ............... 171,000 171,000 541.00 92,463 2006 ............... 158,000 158,000 688.00 108,648 2007 ............... 152,000 152,000 665.00 101,077 2008 ............... 160,000 160,000 356.00 56,960 2009 ............... 112,000 112,000 514.00 57,568 2010 ............... 141,300 141,300 555.00 78,422
1 Fresh fruit prices are equivalent returns at point of first sale. Processing fruit prices are equivalent returns at processing plant door.
NASS, Crops Branch, (202) 720–2127.
Table 5-65.—Prunes (dried basis): Production, price and value, California, 2001–2010 1
Season Total production Utilized production Marketing year average price
per ton 2 Value
Tons Tons Dollars 1,000 dollars 2001 ................................................... 150,000 135,000 726.00 98,010 2002 ................................................... 172,000 163,000 810.00 132,030 2003 ................................................... 181,000 168,000 772.00 129,696 2004 ................................................... 49,000 48,000 1,500.00 72,000 2005 ................................................... 97,000 94,000 1,470.00 138,180 2006 ................................................... 198,000 189,000 1,390.00 262,710 2007 ................................................... 83,000 81,000 1,450.00 117,450 2008 ................................................... 129,000 129,000 1,500.00 193,500 2009 ................................................... 166,000 166,000 1,230.00 204,180 2010 ................................................... 127,000 127,000 1,180.00 149,860
1 The drying ratio is approximately 3 pounds of fresh fruit to 1 pound of dried fruit. 2 Equivalent returns at the processing plant door.
NASS, Crops Branch, (202) 720–2127.
Table 5-66.—Prunes and plums: Production, value, and utilization, 4-States, 2001–2010 1
Year Total
produc-tion
Utilized produc-
tion
Marketing year
average price per
ton
Value
Utilization of quantities sold
Fresh 2
Processed (fresh basis)
Dried and other Canned Frozen
Tons Tons Dollars 1,000 dollars Tons Tons Tons Tons 2001 ..................... 21,200 20,000 273.00 5,459 11,000 3,250 4,470 1,280 2002 ..................... 15,650 14,790 286.00 4,237 6,360 3,930 3,340 1,160 2003 ..................... 16,300 14,880 353.00 5,260 7,700 2,780 3,100 1,300 2004 ..................... 25,000 18,920 360.00 6,802 10,350 4,390 3,140 1,040 2005 ..................... 9,100 9,050 562.00 5,085 5,500 680 2,450 420 2006 ..................... 21,500 19,200 452.00 8,678 9,550 4,300 3,250 2,100 2007 ..................... 12,100 10,920 454.00 4,956 6,420 1,300 2,550 650 2008 ..................... 15,500 15,480 382.00 5,918 8,700 3,540 2,130 1,110 2009 ..................... 18,600 17,700 327.00 5,787 9,750 5,040 2,130 780 2010 ..................... 12,100 11,200 439.00 4,915 7,700 1,650 1,395 455
1 ID, MI, OR, and WA. Mostly prunes; however, estimates include small quantities of plums in all States. 2 Includes ‘‘Home use.’’
NASS, Crops Branch, (202) 720–2127.
VerDate Aug 31 2005 10:25 Feb 29, 2012 Jkt 000000 PO 00000 Frm 00030 Fmt 1000 Sfmt 1000 H:\SHARED\DAPP\FPU\AGSTAT\MASTER~2\CHAPTR05\V-32.AG8 USDA
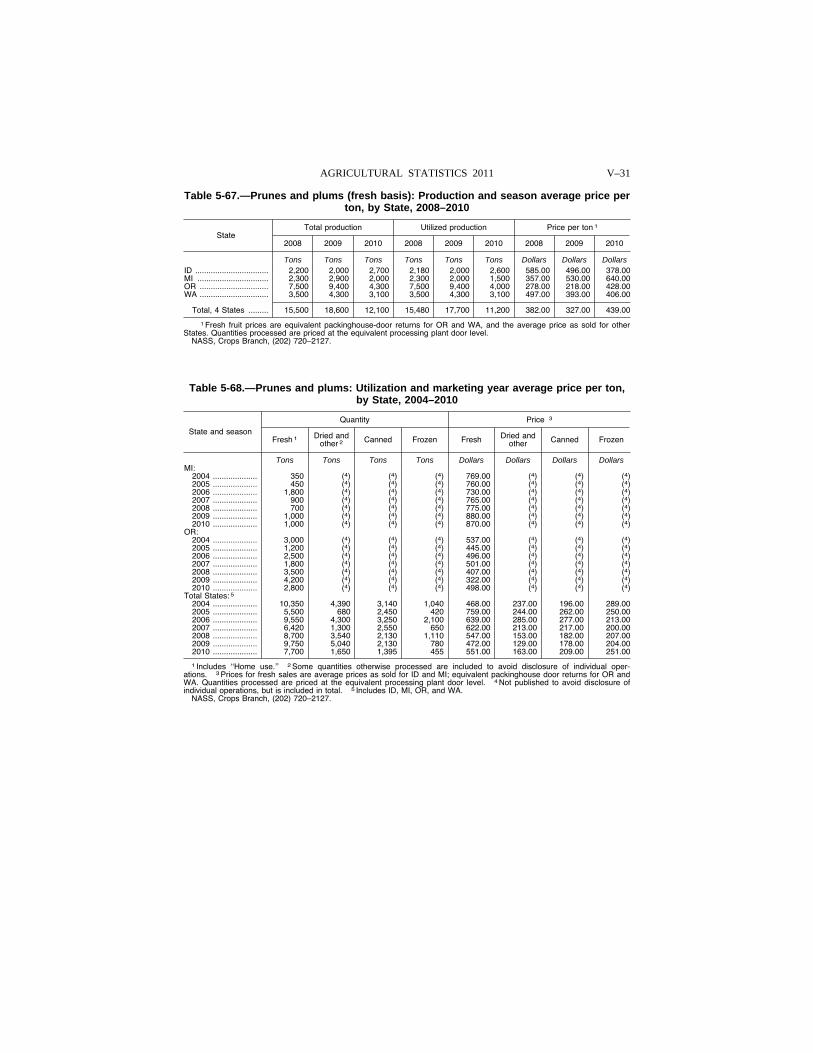
V–31 AGRICULTURAL STATISTICS 2011
Table 5-67.—Prunes and plums (fresh basis): Production and season average price per ton, by State, 2008–2010
State Total production Utilized production Price per ton 1
2008 2009 2010 2008 2009 2010 2008 2009 2010
Tons Tons Tons Tons Tons Tons Dollars Dollars Dollars ID ................................. 2,200 2,000 2,700 2,180 2,000 2,600 585.00 496.00 378.00 MI ................................ 2,300 2,900 2,000 2,300 2,000 1,500 357.00 530.00 640.00 OR ............................... 7,500 9,400 4,300 7,500 9,400 4,000 278.00 218.00 428.00 WA ............................... 3,500 4,300 3,100 3,500 4,300 3,100 497.00 393.00 406.00
Total, 4 States ......... 15,500 18,600 12,100 15,480 17,700 11,200 382.00 327.00 439.00
1 Fresh fruit prices are equivalent packinghouse-door returns for OR and WA, and the average price as sold for other States. Quantities processed are priced at the equivalent processing plant door level.
NASS, Crops Branch, (202) 720–2127.
Table 5-68.—Prunes and plums: Utilization and marketing year average price per ton, by State, 2004–2010
State and season
Quantity Price 3
Fresh 1 Dried and other 2 Canned Frozen Fresh Dried and
other Canned Frozen
Tons Tons Tons Tons Dollars Dollars Dollars Dollars MI:
2004 .................... 350 (4) (4) (4) 769.00 (4) (4) (4) 2005 .................... 450 (4) (4) (4) 760.00 (4) (4) (4) 2006 .................... 1,800 (4) (4) (4) 730.00 (4) (4) (4) 2007 .................... 900 (4) (4) (4) 765.00 (4) (4) (4) 2008 .................... 700 (4) (4) (4) 775.00 (4) (4) (4) 2009 .................... 1,000 (4) (4) (4) 880.00 (4) (4) (4) 2010 .................... 1,000 (4) (4) (4) 870.00 (4) (4) (4)
OR: 2004 .................... 3,000 (4) (4) (4) 537.00 (4) (4) (4) 2005 .................... 1,200 (4) (4) (4) 445.00 (4) (4) (4) 2006 .................... 2,500 (4) (4) (4) 496.00 (4) (4) (4) 2007 .................... 1,800 (4) (4) (4) 501.00 (4) (4) (4) 2008 .................... 3,500 (4) (4) (4) 407.00 (4) (4) (4) 2009 .................... 4,200 (4) (4) (4) 322.00 (4) (4) (4) 2010 .................... 2,800 (4) (4) (4) 498.00 (4) (4) (4)
Total States: 5 2004 .................... 10,350 4,390 3,140 1,040 468.00 237.00 196.00 289.00 2005 .................... 5,500 680 2,450 420 759.00 244.00 262.00 250.00 2006 .................... 9,550 4,300 3,250 2,100 639.00 285.00 277.00 213.00 2007 .................... 6,420 1,300 2,550 650 622.00 213.00 217.00 200.00 2008 .................... 8,700 3,540 2,130 1,110 547.00 153.00 182.00 207.00 2009 .................... 9,750 5,040 2,130 780 472.00 129.00 178.00 204.00 2010 .................... 7,700 1,650 1,395 455 551.00 163.00 209.00 251.00
1 Includes ‘‘Home use.’’ 2 Some quantities otherwise processed are included to avoid disclosure of individual oper-ations. 3 Prices for fresh sales are average prices as sold for ID and MI; equivalent packinghouse door returns for OR and WA. Quantities processed are priced at the equivalent processing plant door level. 4 Not published to avoid disclosure of individual operations, but is included in total. 5 Includes ID, MI, OR, and WA.
NASS, Crops Branch, (202) 720–2127.
VerDate Aug 31 2005 10:25 Feb 29, 2012 Jkt 000000 PO 00000 Frm 00031 Fmt 1000 Sfmt 1000 H:\SHARED\DAPP\FPU\AGSTAT\MASTER~2\CHAPTR05\V-33.AG8 USDA
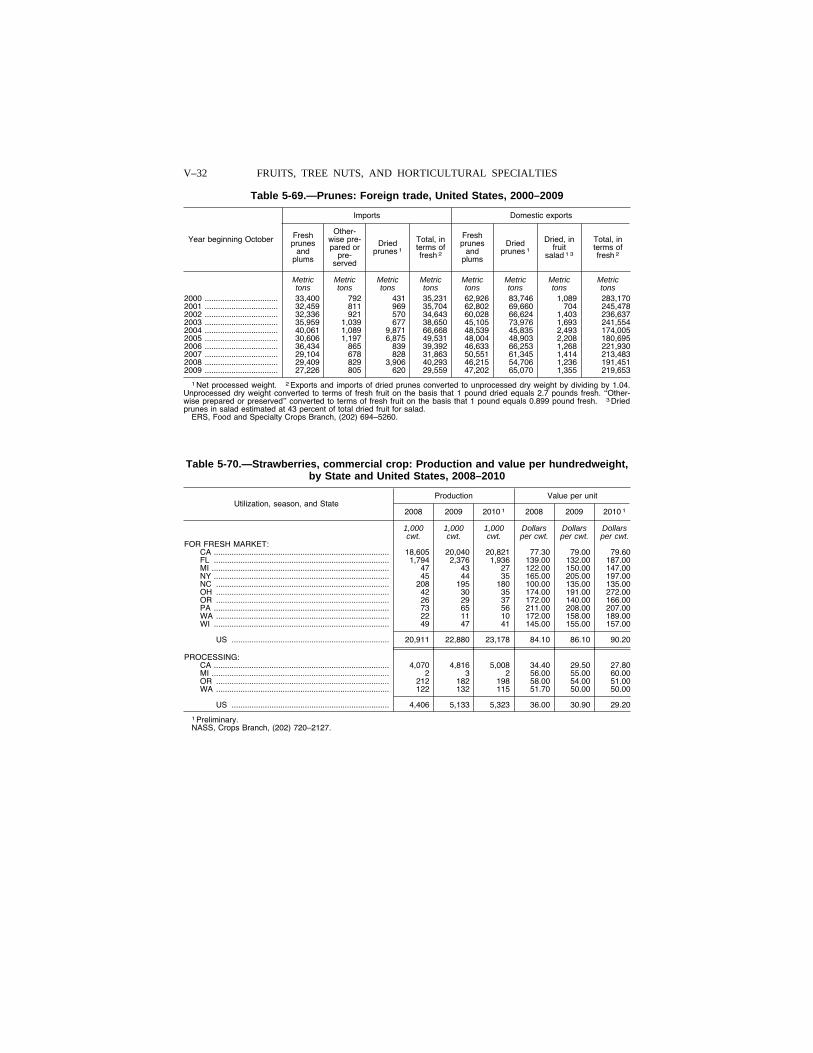
V–32 FRUITS, TREE NUTS, AND HORTICULTURAL SPECIALTIES
Table 5-69.—Prunes: Foreign trade, United States, 2000–2009
Year beginning October
Imports Domestic exports
Fresh prunes
and plums
Other-wise pre-pared or
pre-served
Dried prunes 1
Total, in terms of fresh 2
Fresh prunes
and plums
Dried prunes 1
Dried, in fruit
salad 1 3
Total, in terms of fresh 2
Metric Metric Metric Metric Metric Metric Metric Metric tons tons tons tons tons tons tons tons
2000 ................................. 33,400 792 431 35,231 62,926 83,746 1,089 283,170 2001 ................................. 32,459 811 969 35,704 62,802 69,660 704 245,478 2002 ................................. 32,336 921 570 34,643 60,028 66,624 1,403 236,637 2003 ................................. 35,959 1,039 677 38,650 45,105 73,976 1,693 241,554 2004 ................................. 40,061 1,089 9,871 66,668 48,539 45,835 2,493 174,005 2005 ................................. 30,606 1,197 6,875 49,531 48,004 48,903 2,208 180,695 2006 ................................. 36,434 865 839 39,392 46,633 66,253 1,268 221,930 2007 ................................. 29,104 678 828 31,863 50,551 61,345 1,414 213,483 2008 ................................. 29,409 829 3,906 40,293 46,215 54,706 1,236 191,451 2009 ................................. 27,226 805 620 29,559 47,202 65,070 1,355 219,653
1 Net processed weight. 2 Exports and imports of dried prunes converted to unprocessed dry weight by dividing by 1.04. Unprocessed dry weight converted to terms of fresh fruit on the basis that 1 pound dried equals 2.7 pounds fresh. ‘‘Other-wise prepared or preserved’’ converted to terms of fresh fruit on the basis that 1 pound equals 0.899 pound fresh. 3 Dried prunes in salad estimated at 43 percent of total dried fruit for salad.
ERS, Food and Specialty Crops Branch, (202) 694–5260.
Table 5-70.—Strawberries, commercial crop: Production and value per hundredweight, by State and United States, 2008–2010
Utilization, season, and State Production Value per unit
2008 2009 2010 1 2008 2009 2010 1
1,000 1,000 1,000 Dollars Dollars Dollars cwt. cwt. cwt. per cwt. per cwt. per cwt.
FOR FRESH MARKET: CA ............................................................................... 18,605 20,040 20,821 77.30 79.00 79.60 FL ............................................................................... 1,794 2,376 1,936 139.00 132.00 187.00 MI ................................................................................ 47 43 27 122.00 150.00 147.00 NY ............................................................................... 45 44 35 165.00 205.00 197.00 NC .............................................................................. 208 195 180 100.00 135.00 135.00 OH .............................................................................. 42 30 35 174.00 191.00 272.00 OR .............................................................................. 26 29 37 172.00 140.00 166.00 PA ............................................................................... 73 65 56 211.00 208.00 207.00 WA .............................................................................. 22 11 10 172.00 158.00 189.00 WI ............................................................................... 49 47 41 145.00 155.00 157.00
US ....................................................................... 20,911 22,880 23,178 84.10 86.10 90.20
PROCESSING: CA ............................................................................... 4,070 4,816 5,008 34.40 29.50 27.80 MI ................................................................................ 2 3 2 56.00 55.00 60.00 OR .............................................................................. 212 182 198 58.00 54.00 51.00 WA .............................................................................. 122 132 115 51.70 50.00 50.00
US ....................................................................... 4,406 5,133 5,323 36.00 30.90 29.20
1 Preliminary. NASS, Crops Branch, (202) 720–2127.
VerDate Aug 31 2005 10:25 Feb 29, 2012 Jkt 000000 PO 00000 Frm 00032 Fmt 1000 Sfmt 1000 H:\SHARED\DAPP\FPU\AGSTAT\MASTER~2\CHAPTR05\V-34.AG8 USDA
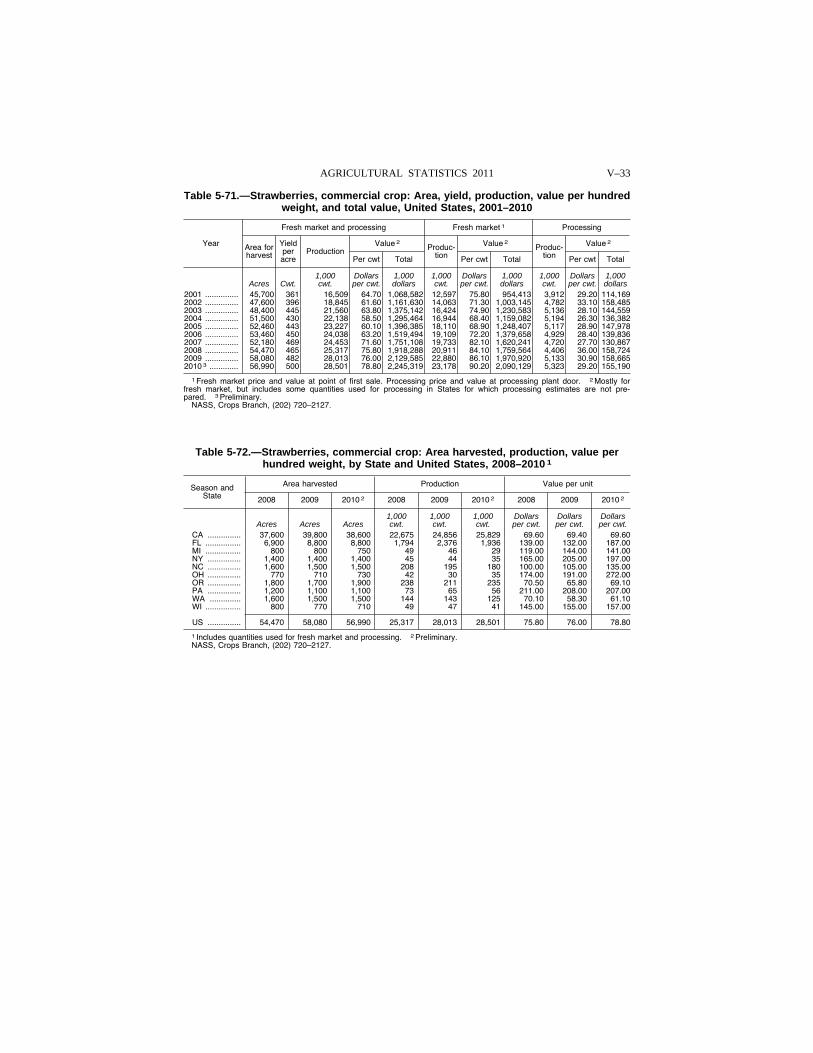
V–33 AGRICULTURAL STATISTICS 2011
Table 5-71.—Strawberries, commercial crop: Area, yield, production, value per hundred weight, and total value, United States, 2001–2010
Year
Fresh market and processing Fresh market 1 Processing
Area for harvest
Yield per acre
Production Value 2 Produc-
tion
Value 2 Produc-tion
Value 2
Per cwt Total Per cwt Total Per cwt Total
1,000 Dollars 1,000 1,000 Dollars 1,000 1,000 Dollars 1,000 Acres Cwt. cwt. per cwt. dollars cwt. per cwt. dollars cwt. per cwt. dollars
2001 ............... 45,700 361 16,509 64.70 1,068,582 12,597 75.80 954,413 3,912 29.20 114,169 2002 ............... 47,600 396 18,845 61.60 1,161,630 14,063 71.30 1,003,145 4,782 33.10 158,485 2003 ............... 48,400 445 21,560 63.80 1,375,142 16,424 74.90 1,230,583 5,136 28.10 144,559 2004 ............... 51,500 430 22,138 58.50 1,295,464 16,944 68.40 1,159,082 5,194 26.30 136,382 2005 ............... 52,460 443 23,227 60.10 1,396,385 18,110 68.90 1,248,407 5,117 28.90 147,978 2006 ............... 53,460 450 24,038 63.20 1,519,494 19,109 72.20 1,379,658 4,929 28.40 139,836 2007 ............... 52,180 469 24,453 71.60 1,751,108 19,733 82.10 1,620,241 4,720 27.70 130,867 2008 ............... 54,470 465 25,317 75.80 1,918,288 20,911 84.10 1,759,564 4,406 36.00 158,724 2009 ............... 58,080 482 28,013 76.00 2,129,585 22,880 86.10 1,970,920 5,133 30.90 158,665 2010 3 ............. 56,990 500 28,501 78.80 2,245,319 23,178 90.20 2,090,129 5,323 29.20 155,190
1 Fresh market price and value at point of first sale. Processing price and value at processing plant door. 2 Mostly for fresh market, but includes some quantities used for processing in States for which processing estimates are not pre-pared. 3 Preliminary.
NASS, Crops Branch, (202) 720–2127.
Table 5-72.—Strawberries, commercial crop: Area harvested, production, value per hundred weight, by State and United States, 2008–2010 1
Season and State
Area harvested Production Value per unit
2008 2009 2010 2 2008 2009 2010 2 2008 2009 2010 2
1,000 1,000 1,000 Dollars Dollars Dollars Acres Acres Acres cwt. cwt. cwt. per cwt. per cwt. per cwt.
CA ............... 37,600 39,800 38,600 22,675 24,856 25,829 69.60 69.40 69.60 FL ................ 6,900 8,800 8,800 1,794 2,376 1,936 139.00 132.00 187.00 MI ................ 800 800 750 49 46 29 119.00 144.00 141.00 NY ............... 1,400 1,400 1,400 45 44 35 165.00 205.00 197.00 NC ............... 1,600 1,500 1,500 208 195 180 100.00 105.00 135.00 OH ............... 770 710 730 42 30 35 174.00 191.00 272.00 OR ............... 1,800 1,700 1,900 238 211 235 70.50 65.80 69.10 PA ............... 1,200 1,100 1,100 73 65 56 211.00 208.00 207.00 WA .............. 1,600 1,500 1,500 144 143 125 70.10 58.30 61.10 WI ................ 800 770 710 49 47 41 145.00 155.00 157.00
US ............... 54,470 58,080 56,990 25,317 28,013 28,501 75.80 76.00 78.80
1 Includes quantities used for fresh market and processing. 2 Preliminary. NASS, Crops Branch, (202) 720–2127.
VerDate Aug 31 2005 10:25 Feb 29, 2012 Jkt 000000 PO 00000 Frm 00033 Fmt 1000 Sfmt 1000 H:\SHARED\DAPP\FPU\AGSTAT\MASTER~2\CHAPTR05\V-35.AG8 USDA
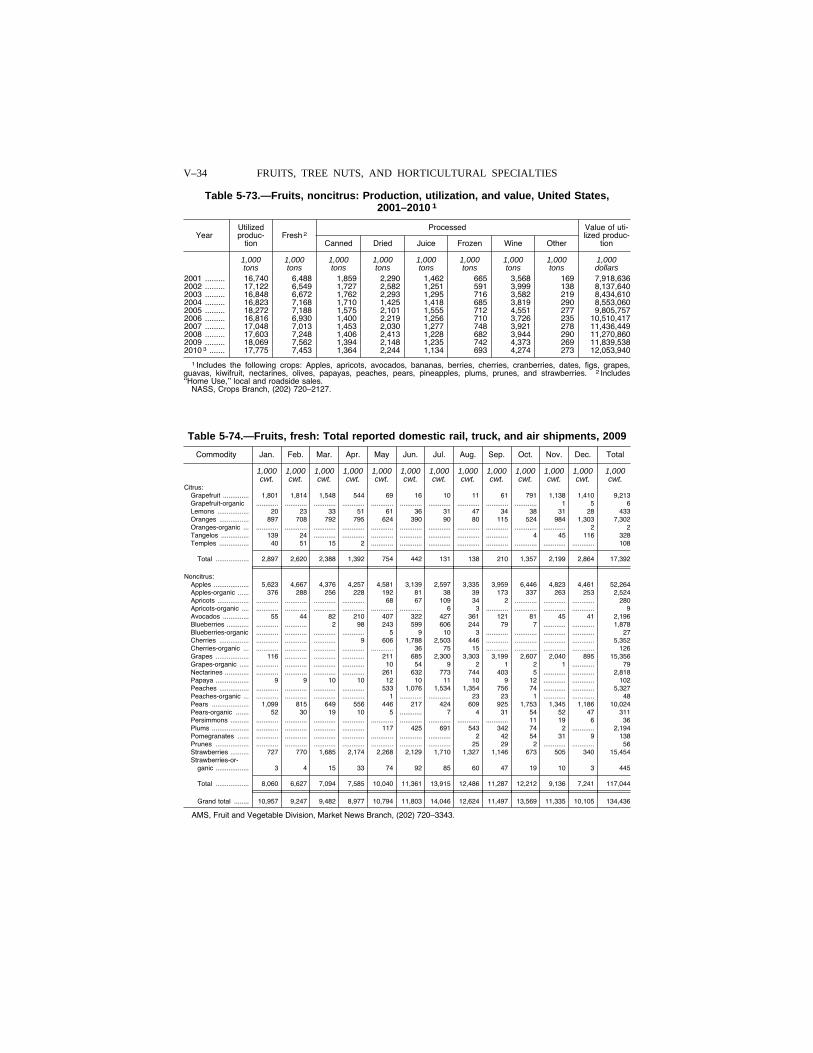
V–34 FRUITS, TREE NUTS, AND HORTICULTURAL SPECIALTIES
Table 5-73.—Fruits, noncitrus: Production, utilization, and value, United States, 2001–2010 1
Year Utilized produc-
tion Fresh 2
Processed Value of uti-lized produc-
tion Canned Dried Juice Frozen Wine Other
1,000 1,000 1,000 1,000 1,000 1,000 1,000 1,000 1,000 tons tons tons tons tons tons tons tons dollars
2001 ......... 16,740 6,488 1,859 2,290 1,462 665 3,568 169 7,918,636 2002 ......... 17,122 6,549 1,727 2,582 1,251 591 3,999 138 8,137,640 2003 ......... 16,848 6,672 1,762 2,293 1,295 716 3,582 219 8,434,610 2004 ......... 16,823 7,168 1,710 1,425 1,418 685 3,819 290 8,553,060 2005 ......... 18,272 7,188 1,575 2,101 1,555 712 4,551 277 9,805,757 2006 ......... 16,816 6,930 1,400 2,219 1,256 710 3,726 235 10,510,417 2007 ......... 17,048 7,013 1,453 2,030 1,277 748 3,921 278 11,436,449 2008 ......... 17,603 7,248 1,406 2,413 1,228 682 3,944 290 11,270,860 2009 ......... 18,069 7,562 1,394 2,148 1,235 742 4,373 269 11,839,538 2010 3 ....... 17,775 7,453 1,364 2,244 1,134 693 4,274 273 12,053,940
1 Includes the following crops: Apples, apricots, avocados, bananas, berries, cherries, cranberries, dates, figs, grapes, guavas, kiwifruit, nectarines, olives, papayas, peaches, pears, pineapples, plums, prunes, and strawberries. 2 Includes ‘‘Home Use,’’ local and roadside sales.
NASS, Crops Branch, (202) 720–2127.
Table 5-74.—Fruits, fresh: Total reported domestic rail, truck, and air shipments, 2009
Commodity Jan. Feb. Mar. Apr. May Jun. Jul. Aug. Sep. Oct. Nov. Dec. Total
1,000 1,000 1,000 1,000 1,000 1,000 1,000 1,000 1,000 1,000 1,000 1,000 1,000 cwt. cwt. cwt. cwt. cwt. cwt. cwt. cwt. cwt. cwt. cwt. cwt. cwt.
Citrus: Grapefruit .............. 1,801 1,814 1,548 544 69 16 10 11 61 791 1,138 1,410 9,213 Grapefruit-organic ............ ............ ............ ............ ............ ............ ............ ............ ............ ............ 1 5 6 Lemons ................. 20 23 33 51 61 36 31 47 34 38 31 28 433 Oranges ................ 897 708 792 795 624 390 90 80 115 524 984 1,303 7,302 Oranges-organic ... ............ ............ ............ ............ ............ ............ ............ ............ ............ ............ ............ 2 2 Tangelos ............... 139 24 ............ ............ ............ ............ ............ ............ ............ 4 45 116 328 Temples ................ 40 51 15 2 ............ ............ ............ ............ ............ ............ ............ ............ 108
Total .................. 2,897 2,620 2,388 1,392 754 442 131 138 210 1,357 2,199 2,864 17,392
Noncitrus: Apples ................... 5,623 4,667 4,376 4,257 4,581 3,139 2,597 3,335 3,959 6,446 4,823 4,461 52,264 Apples-organic ...... 376 288 256 228 192 81 38 39 173 337 263 253 2,524 Apricots ................. ............ ............ ............ ............ 68 67 109 34 2 ............ ............ ............ 280 Apricots-organic .... ............ ............ ............ ............ ............ ............ 6 3 ............ ............ ............ ............ 9 Avocados .............. 55 44 82 210 407 322 427 361 121 81 45 41 2,196 Blueberries ............ ............ ............ 2 98 243 599 606 244 79 7 ............ ............ 1,878 Blueberries-organic ............ ............ ............ ............ 5 9 10 3 ............ ............ ............ ............ 27 Cherries ................ ............ ............ ............ 9 606 1,788 2,503 446 ............ ............ ............ ............ 5,352 Cherries-organic ... ............ ............ ............ ............ ............ 36 75 15 ............ ............ ............ ............ 126 Grapes .................. 116 ............ ............ ............ 211 685 2,300 3,303 3,199 2,607 2,040 895 15,356 Grapes-organic ..... ............ ............ ............ ............ 10 54 9 2 1 2 1 ............ 79 Nectarines ............. ............ ............ ............ ............ 261 632 773 744 403 5 ............ ............ 2,818 Papaya .................. 9 9 10 10 12 10 11 10 9 12 ............ ............ 102 Peaches ................ ............ ............ ............ ............ 533 1,076 1,534 1,354 756 74 ............ ............ 5,327 Peaches-organic ... ............ ............ ............ ............ 1 ............ ............ 23 23 1 ............ ............ 48 Pears .................... 1,099 815 649 556 446 217 424 609 925 1,753 1,345 1,186 10,024 Pears-organic ....... 52 30 19 10 5 ............ 7 4 31 54 52 47 311 Persimmons .......... ............ ............ ............ ............ ............ ............ ............ ............ ............ 11 19 6 36 Plums .................... ............ ............ ............ ............ 117 425 691 543 342 74 2 ............ 2,194 Pomegranates ...... ............ ............ ............ ............ ............ ............ ............ 2 42 54 31 9 138 Prunes .................. ............ ............ ............ ............ ............ ............ ............ 25 29 2 ............ ............ 56 Strawberries .......... 727 770 1,685 2,174 2,268 2,129 1,710 1,327 1,146 673 505 340 15,454 Strawberries-or-
ganic .................. 3 4 15 33 74 92 85 60 47 19 10 3 445
Total .................. 8,060 6,627 7,094 7,585 10,040 11,361 13,915 12,486 11,287 12,212 9,136 7,241 117,044
Grand total ........ 10,957 9,247 9,482 8,977 10,794 11,803 14,046 12,624 11,497 13,569 11,335 10,105 134,436
AMS, Fruit and Vegetable Division, Market News Branch, (202) 720–3343.
VerDate Aug 31 2005 10:25 Feb 29, 2012 Jkt 000000 PO 00000 Frm 00034 Fmt 1000 Sfmt 1000 H:\SHARED\DAPP\FPU\AGSTAT\MASTER~2\CHAPTR05\V-36.AG8 USDA
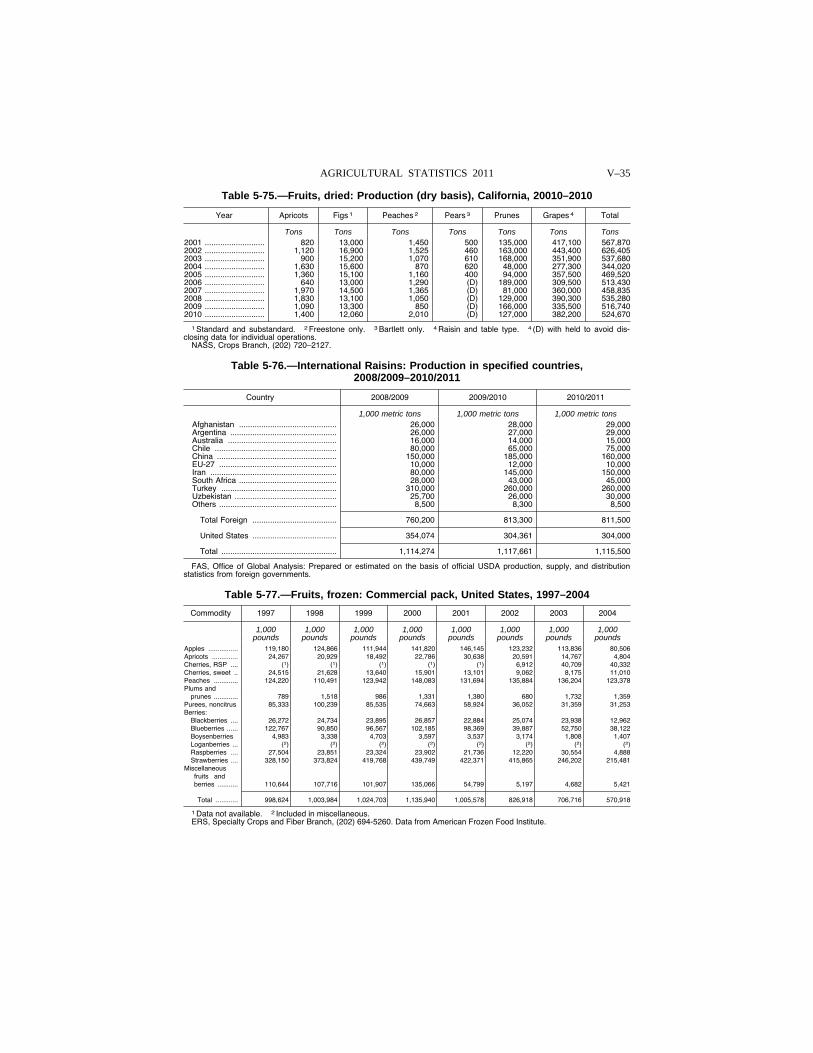
V–35 AGRICULTURAL STATISTICS 2011
Table 5-75.—Fruits, dried: Production (dry basis), California, 20010–2010
Year Apricots Figs 1 Peaches 2 Pears 3 Prunes Grapes 4 Total
Tons Tons Tons Tons Tons Tons Tons 2001 ........................... 820 13,000 1,450 500 135,000 417,100 567,870 2002 ........................... 1,120 16,900 1,525 460 163,000 443,400 626,405 2003 ........................... 900 15,200 1,070 610 168,000 351,900 537,680 2004 ........................... 1,630 15,600 870 620 48,000 277,300 344,020 2005 ........................... 1,360 15,100 1,160 400 94,000 357,500 469,520 2006 ........................... 640 13,000 1,290 (D) 189,000 309,500 513,430 2007 ........................... 1,970 14,500 1,365 (D) 81,000 360,000 458,835 2008 ........................... 1,830 13,100 1,050 (D) 129,000 390,300 535,280 2009 ........................... 1,090 13,300 850 (D) 166,000 335,500 516,740 2010 ........................... 1,400 12,060 2,010 (D) 127,000 382,200 524,670
1 Standard and substandard. 2 Freestone only. 3 Bartlett only. 4 Raisin and table type. 4 (D) with held to avoid dis-closing data for individual operations.
NASS, Crops Branch, (202) 720–2127.
Table 5-76.—International Raisins: Production in specified countries, 2008/2009–2010/2011
Country 2008/2009 2009/2010 2010/2011
1,000 metric tons 1,000 metric tons 1,000 metric tons Afghanistan ............................................ 26,000 28,000 29,000 Argentina ................................................ 26,000 27,000 29,000 Australia ................................................. 16,000 14,000 15,000 Chile ....................................................... 80,000 65,000 75,000 China ...................................................... 150,000 185,000 160,000 EU-27 ..................................................... 10,000 12,000 10,000 Iran ......................................................... 80,000 145,000 150,000 South Africa ............................................ 28,000 43,000 45,000 Turkey .................................................... 310,000 260,000 260,000 Uzbekistan .............................................. 25,700 26,000 30,000 Others ..................................................... 8,500 8,300 8,500
Total Foreign ...................................... 760,200 813,300 811,500
United States ...................................... 354,074 304,361 304,000
Total .................................................... 1,114,274 1,117,661 1,115,500
FAS, Office of Global Analysis: Prepared or estimated on the basis of official USDA production, supply, and distribution statistics from foreign governments.
Table 5-77.—Fruits, frozen: Commercial pack, United States, 1997–2004
Commodity 1997 1998 1999 2000 2001 2002 2003 2004
1,000 1,000 1,000 1,000 1,000 1,000 1,000 1,000 pounds pounds pounds pounds pounds pounds pounds pounds
Apples ................ 119,180 124,866 111,944 141,820 146,145 123,232 113,836 80,506 Apricots .............. 24,267 20,929 18,492 22,786 30,638 20,591 14,767 4,804 Cherries, RSP .... (1) (1) (1) (1) (1) 6,912 40,709 40,332 Cherries, sweet .. 24,515 21,628 13,640 15,901 13,101 9,062 8,175 11,010 Peaches ............. 124,220 110,491 123,942 148,083 131,694 135,884 136,204 123,378 Plums and
prunes ............. 789 1,518 986 1,331 1,380 680 1,732 1,359 Purees, noncitrus 85,333 100,239 85,535 74,663 58,924 36,052 31,359 31,253 Berries:
Blackberries .... 26,272 24,734 23,895 26,857 22,884 25,074 23,938 12,962 Blueberries ...... 122,767 90,850 96,567 102,185 98,369 39,887 52,750 38,122 Boysenberries 4,983 3,338 4,703 3,597 3,537 3,174 1,808 1,407 Loganberries ... (2) (2) (2) (2) (2) (2) (2) (2) Raspberries .... 27,504 23,851 23,324 23,902 21,736 12,220 30,554 4,888 Strawberries .... 328,150 373,824 419,768 439,749 422,371 415,865 246,202 215,481
Miscellaneous fruits and berries ........... 110,644 107,716 101,907 135,066 54,799 5,197 4,682 5,421
Total ............ 998,624 1,003,984 1,024,703 1,135,940 1,005,578 826,918 706,716 570,918
1 Data not available. 2 Included in miscellaneous. ERS, Specialty Crops and Fiber Branch, (202) 694-5260. Data from American Frozen Food Institute.
VerDate Aug 31 2005 10:25 Feb 29, 2012 Jkt 000000 PO 00000 Frm 00035 Fmt 1000 Sfmt 1000 H:\SHARED\DAPP\FPU\AGSTAT\MASTER~2\CHAPTR05\V-37.AG8 USDA
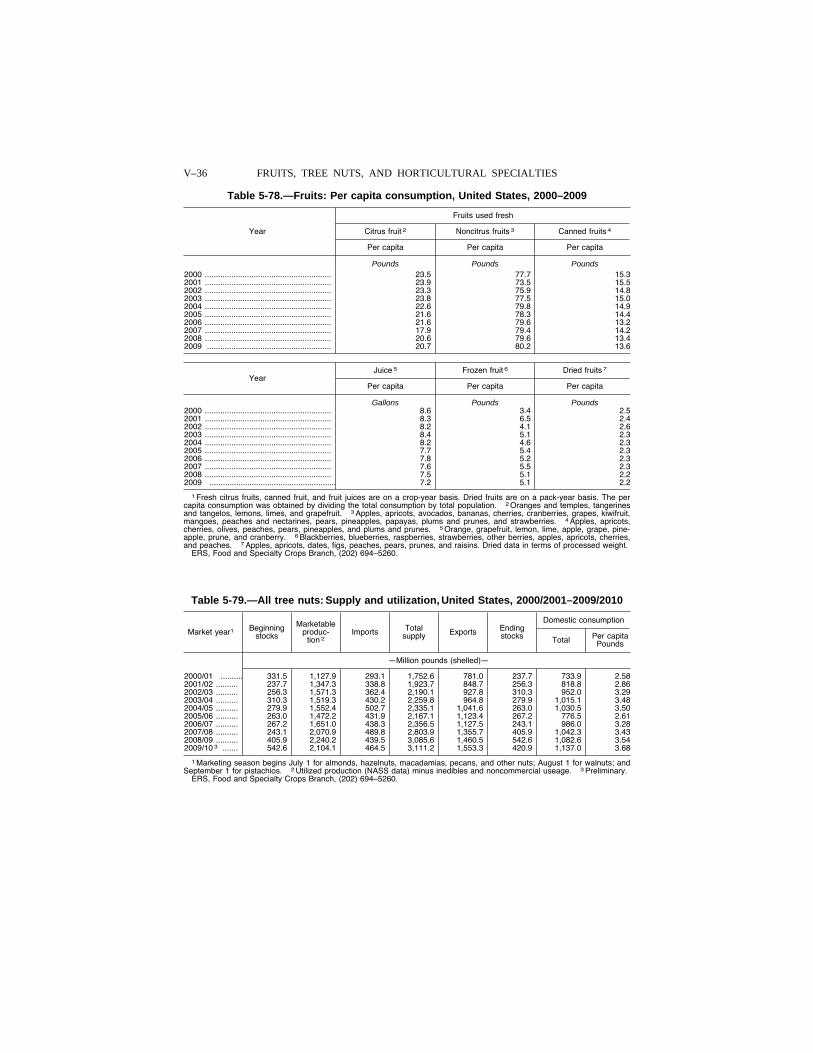
V–36 FRUITS, TREE NUTS, AND HORTICULTURAL SPECIALTIES
Table 5-78.—Fruits: Per capita consumption, United States, 2000–2009
Year
Fruits used fresh
Citrus fruit 2 Noncitrus fruits 3 Canned fruits 4
Per capita Per capita Per capita
Pounds Pounds Pounds 2000 ......................................................... 23.5 77.7 15.3 2001 ......................................................... 23.9 73.5 15.5 2002 ......................................................... 23.3 75.9 14.8 2003 ......................................................... 23.8 77.5 15.0 2004 ......................................................... 22.6 79.8 14.9 2005 ......................................................... 21.6 78.3 14.4 2006 ......................................................... 21.6 79.6 13.2 2007 ......................................................... 17.9 79.4 14.2 2008 ......................................................... 20.6 79.6 13.4 2009 ........................................................ 20.7 80.2 13.6
Year Juice 5 Frozen fruit 6 Dried fruits 7
Per capita Per capita Per capita
Gallons Pounds Pounds 2000 ......................................................... 8.6 3.4 2.5 2001 ......................................................... 8.3 6.5 2.4 2002 ......................................................... 8.2 4.1 2.6 2003 ......................................................... 8.4 5.1 2.3 2004 ......................................................... 8.2 4.6 2.3 2005 ......................................................... 7.7 5.4 2.3 2006 ......................................................... 7.8 5.2 2.3 2007 ......................................................... 7.6 5.5 2.3 2008 ......................................................... 7.5 5.1 2.2 2009 ......................................................... 7.2 5.1 2.2
1 Fresh citrus fruits, canned fruit, and fruit juices are on a crop-year basis. Dried fruits are on a pack-year basis. The per capita consumption was obtained by dividing the total consumption by total population. 2 Oranges and temples, tangerines and tangelos, lemons, limes, and grapefruit. 3 Apples, apricots, avocados, bananas, cherries, cranberries, grapes, kiwifruit, mangoes, peaches and nectarines, pears, pineapples, papayas, plums and prunes, and strawberries. 4 Apples, apricots, cherries, olives, peaches, pears, pineapples, and plums and prunes. 5 Orange, grapefruit, lemon, lime, apple, grape, pine-apple, prune, and cranberry. 6 Blackberries, blueberries, raspberries, strawberries, other berries, apples, apricots, cherries, and peaches. 7 Apples, apricots, dates, figs, peaches, pears, prunes, and raisins. Dried data in terms of processed weight.
ERS, Food and Specialty Crops Branch, (202) 694–5260.
Table 5-79.—All tree nuts: Supply and utilization, United States, 2000/2001–2009/2010
Market year1 Beginning stocks
Marketable produc-
tion 2 Imports Total
supply Exports Ending stocks
Domestic consumption
Total Per capita Pounds
—Million pounds (shelled)—
2000/01 .......... 331.5 1,127.9 293.1 1,752.6 781.0 237.7 733.9 2.58 2001/02 .......... 237.7 1,347.3 338.8 1,923.7 848.7 256.3 818.8 2.86 2002/03 .......... 256.3 1,571.3 362.4 2,190.1 927.8 310.3 952.0 3.29 2003/04 .......... 310.3 1,519.3 430.2 2,259.8 964.8 279.9 1,015.1 3.48 2004/05 .......... 279.9 1,552.4 502.7 2,335.1 1,041.6 263.0 1,030.5 3.50 2005/06 .......... 263.0 1,472.2 431.9 2,167.1 1,123.4 267.2 776.5 2.61 2006/07 .......... 267.2 1,651.0 438.3 2,356.5 1,127.5 243.1 986.0 3.28 2007/08 .......... 243.1 2,070.9 489.8 2,803.9 1,355.7 405.9 1,042.3 3.43 2008/09 .......... 405.9 2,240.2 439.5 3,085.6 1,460.5 542.6 1,082.6 3.54 2009/10 3 ....... 542.6 2,104.1 464.5 3,111.2 1,553.3 420.9 1,137.0 3.68
1 Marketing season begins July 1 for almonds, hazelnuts, macadamias, pecans, and other nuts; August 1 for walnuts; and September 1 for pistachios. 2 Utilized production (NASS data) minus inedibles and noncommercial useage. 3 Preliminary.
ERS, Food and Specialty Crops Branch, (202) 694–5260.
VerDate Aug 31 2005 10:25 Feb 29, 2012 Jkt 000000 PO 00000 Frm 00036 Fmt 1000 Sfmt 1000 H:\SHARED\DAPP\FPU\AGSTAT\MASTER~2\CHAPTR05\V-38.AG8 USDA
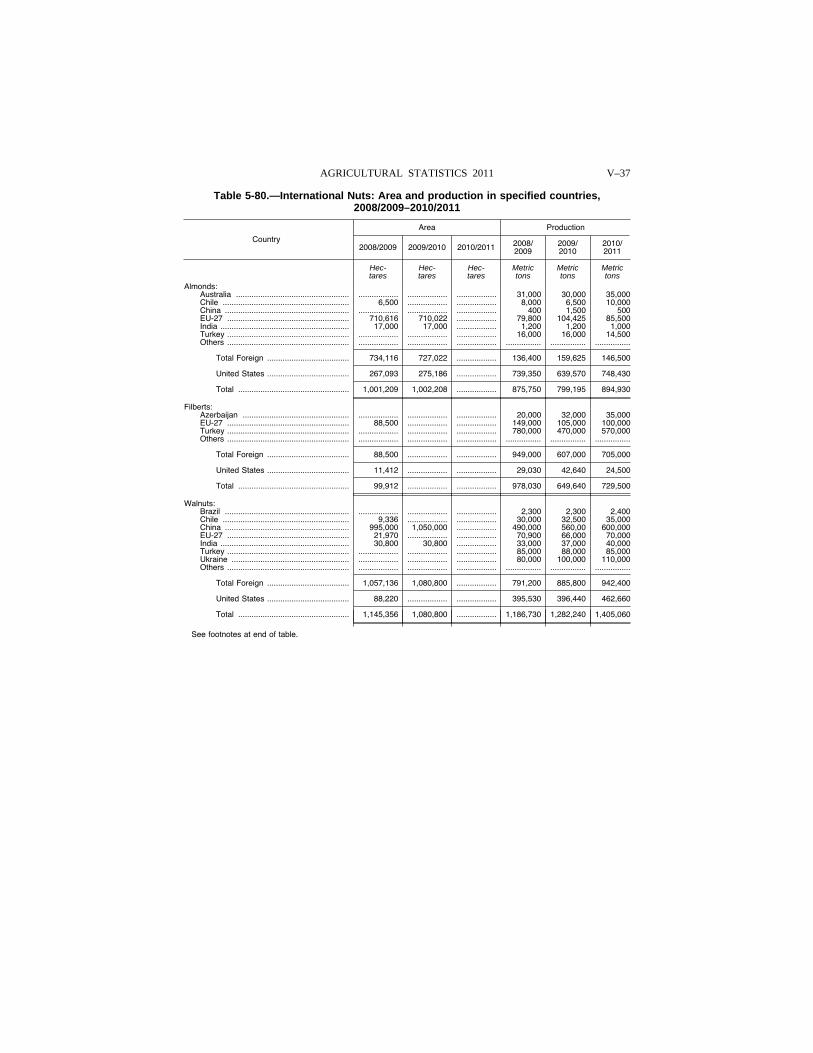
V–37 AGRICULTURAL STATISTICS 2011
Table 5-80.—International Nuts: Area and production in specified countries, 2008/2009–2010/2011
Country
Area Production
2008/2009 2009/2010 2010/2011 2008/ 2009
2009/ 2010
2010/ 2011
Hec- Hec- Hec- Metric Metric Metric tares tares tares tons tons tons
Almonds: Australia ................................................... .................. .................. .................. 31,000 30,000 35,000 Chile ......................................................... 6,500 .................. .................. 8,000 6,500 10,000 China ........................................................ .................. .................. .................. 400 1,500 500 EU-27 ....................................................... 710,616 710,022 .................. 79,800 104,425 85,500 India .......................................................... 17,000 17,000 .................. 1,200 1,200 1,000 Turkey ....................................................... .................. .................. .................. 16,000 16,000 14,500 Others ....................................................... .................. .................. .................. ................ ................ ................
Total Foreign ..................................... 734,116 727,022 .................. 136,400 159,625 146,500
United States ..................................... 267,093 275,186 .................. 739,350 639,570 748,430
Total .................................................. 1,001,209 1,002,208 .................. 875,750 799,195 894,930
Filberts: Azerbaijan ................................................ .................. .................. .................. 20,000 32,000 35,000 EU-27 ....................................................... 88,500 .................. .................. 149,000 105,000 100,000 Turkey ....................................................... .................. .................. .................. 780,000 470,000 570,000 Others ....................................................... .................. .................. .................. ................ ................ ................
Total Foreign ..................................... 88,500 .................. .................. 949,000 607,000 705,000
United States ..................................... 11,412 .................. .................. 29,030 42,640 24,500
Total .................................................. 99,912 .................. .................. 978,030 649,640 729,500
Walnuts: Brazil ........................................................ .................. .................. .................. 2,300 2,300 2,400 Chile ......................................................... 9,336 .................. .................. 30,000 32,500 35,000 China ........................................................ 995,000 1,050,000 .................. 490,000 560,00 600,000 EU-27 ....................................................... 21,970 .................. .................. 70,900 66,000 70,000 India .......................................................... 30,800 30,800 .................. 33,000 37,000 40,000 Turkey ....................................................... .................. .................. .................. 85,000 88,000 85,000 Ukraine ..................................................... .................. .................. .................. 80,000 100,000 110,000 Others ....................................................... .................. .................. .................. ................ ................ ................
Total Foreign ..................................... 1,057,136 1,080,800 .................. 791,200 885,800 942,400
United States ..................................... 88,220 .................. .................. 395,530 396,440 462,660
Total .................................................. 1,145,356 1,080,800 .................. 1,186,730 1,282,240 1,405,060
See footnotes at end of table.
VerDate Aug 31 2005 10:25 Feb 29, 2012 Jkt 000000 PO 00000 Frm 00037 Fmt 1000 Sfmt 1000 H:\SHARED\DAPP\FPU\AGSTAT\MASTER~2\CHAPTR05\V-39.AG8 USDA
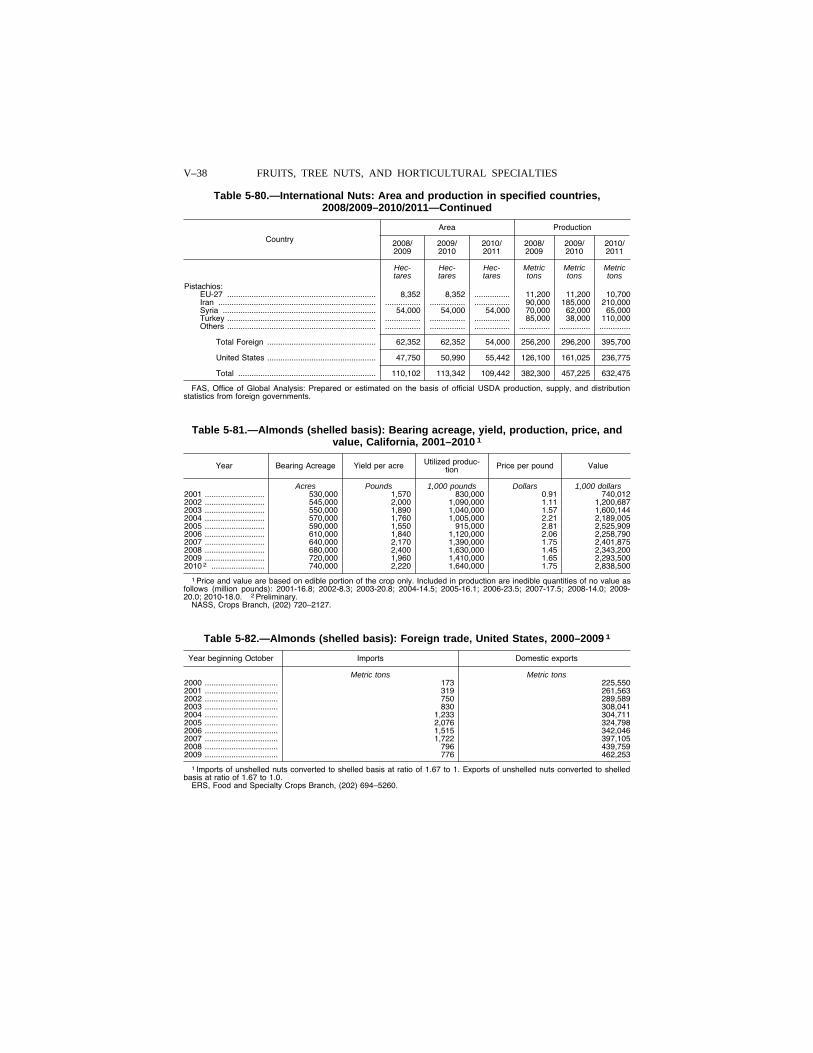
V–38 FRUITS, TREE NUTS, AND HORTICULTURAL SPECIALTIES
Table 5-80.—International Nuts: Area and production in specified countries, 2008/2009–2010/2011—Continued
Country
Area Production
2008/ 2009
2009/ 2010
2010/ 2011
2008/ 2009
2009/ 2010
2010/ 2011
Hec- Hec- Hec- Metric Metric Metric tares tares tares tons tons tons
Pistachios: EU-27 ................................................................... 8,352 8,352 ................ 11,200 11,200 10,700 Iran ....................................................................... ................ ................ ................ 90,000 185,000 210,000 Syria ..................................................................... 54,000 54,000 54,000 70,000 62,000 65,000 Turkey ................................................................... ................ ................ ................ 85,000 38,000 110,000 Others ................................................................... ................ ................ ................ .............. .............. ..............
Total Foreign ................................................. 62,352 62,352 54,000 256,200 296,200 395,700
United States ................................................. 47,750 50,990 55,442 126,100 161,025 236,775
Total .............................................................. 110,102 113,342 109,442 382,300 457,225 632,475
FAS, Office of Global Analysis: Prepared or estimated on the basis of official USDA production, supply, and distribution statistics from foreign governments.
Table 5-81.—Almonds (shelled basis): Bearing acreage, yield, production, price, and value, California, 2001–2010 1
Year Bearing Acreage Yield per acre Utilized produc-tion Price per pound Value
Acres Pounds 1,000 pounds Dollars 1,000 dollars 2001 ........................... 530,000 1,570 830,000 0.91 740,012 2002 ........................... 545,000 2,000 1,090,000 1.11 1,200,687 2003 ........................... 550,000 1,890 1,040,000 1.57 1,600,144 2004 ........................... 570,000 1,760 1,005,000 2.21 2,189,005 2005 ........................... 590,000 1,550 915,000 2.81 2,525,909 2006 ........................... 610,000 1,840 1,120,000 2.06 2,258,790 2007 ........................... 640,000 2,170 1,390,000 1.75 2,401,875 2008 ........................... 680,000 2,400 1,630,000 1.45 2,343,200 2009 ........................... 720,000 1,960 1,410,000 1.65 2,293,500 2010 2 ........................ 740,000 2,220 1,640,000 1.75 2,838,500
1 Price and value are based on edible portion of the crop only. Included in production are inedible quantities of no value as follows (million pounds): 2001-16.8; 2002-8.3; 2003-20.8; 2004-14.5; 2005-16.1; 2006-23.5; 2007-17.5; 2008-14.0; 2009- 20.0; 2010-18.0. 2 Preliminary.
NASS, Crops Branch, (202) 720–2127.
Table 5-82.—Almonds (shelled basis): Foreign trade, United States, 2000–2009 1
Year beginning October Imports Domestic exports
Metric tons Metric tons 2000 ................................. 173 225,550 2001 ................................. 319 261,563 2002 ................................. 750 289,589 2003 ................................. 830 308,041 2004 ................................. 1,233 304,711 2005 ................................. 2,076 324,798 2006 ................................. 1,515 342,046 2007 ................................. 1,722 397,105 2008 ................................. 796 439,759 2009 ................................. 776 462,253
1 Imports of unshelled nuts converted to shelled basis at ratio of 1.67 to 1. Exports of unshelled nuts converted to shelled basis at ratio of 1.67 to 1.0.
ERS, Food and Specialty Crops Branch, (202) 694–5260.
VerDate Aug 31 2005 10:25 Feb 29, 2012 Jkt 000000 PO 00000 Frm 00038 Fmt 1000 Sfmt 1000 H:\SHARED\DAPP\FPU\AGSTAT\MASTER~2\CHAPTR05\V-40.AG8 USDA
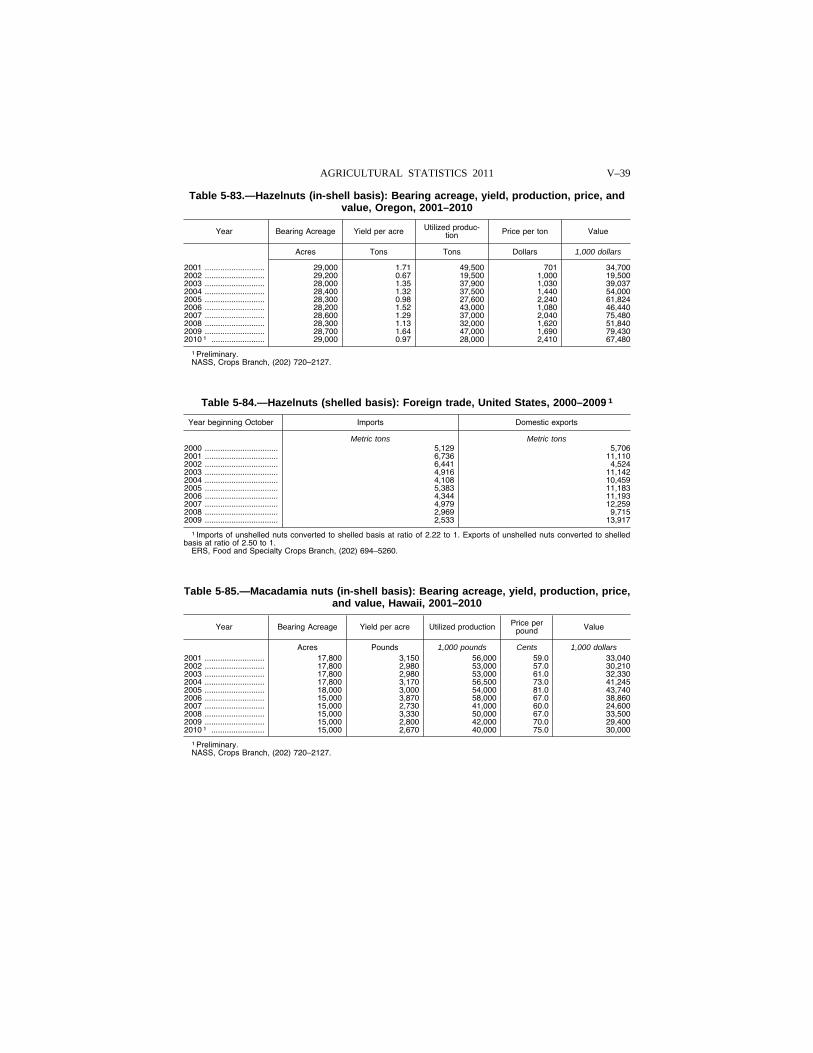
V–39 AGRICULTURAL STATISTICS 2011
Table 5-83.—Hazelnuts (in-shell basis): Bearing acreage, yield, production, price, and value, Oregon, 2001–2010
Year Bearing Acreage Yield per acre Utilized produc-tion Price per ton Value
Acres Tons Tons Dollars 1,000 dollars
2001 ........................... 29,000 1.71 49,500 701 34,700 2002 ........................... 29,200 0.67 19,500 1,000 19,500 2003 ........................... 28,000 1.35 37,900 1,030 39,037 2004 ........................... 28,400 1.32 37,500 1,440 54,000 2005 ........................... 28,300 0.98 27,600 2,240 61,824 2006 ........................... 28,200 1.52 43,000 1,080 46,440 2007 ........................... 28,600 1.29 37,000 2,040 75,480 2008 ........................... 28,300 1.13 32,000 1,620 51,840 2009 ........................... 28,700 1.64 47,000 1,690 79,430 2010 1 ........................ 29,000 0.97 28,000 2,410 67,480
1 Preliminary. NASS, Crops Branch, (202) 720–2127.
Table 5-84.—Hazelnuts (shelled basis): Foreign trade, United States, 2000–2009 1
Year beginning October Imports Domestic exports
Metric tons Metric tons 2000 ................................. 5,129 5,706 2001 ................................. 6,736 11,110 2002 ................................. 6,441 4,524 2003 ................................. 4,916 11,142 2004 ................................. 4,108 10,459 2005 ................................. 5,383 11,183 2006 ................................. 4,344 11,193 2007 ................................. 4,979 12,259 2008 ................................. 2,969 9,715 2009 ................................. 2,533 13,917
1 Imports of unshelled nuts converted to shelled basis at ratio of 2.22 to 1. Exports of unshelled nuts converted to shelled basis at ratio of 2.50 to 1.
ERS, Food and Specialty Crops Branch, (202) 694–5260.
Table 5-85.—Macadamia nuts (in-shell basis): Bearing acreage, yield, production, price, and value, Hawaii, 2001–2010
Year Bearing Acreage Yield per acre Utilized production Price per pound Value
Acres Pounds 1,000 pounds Cents 1,000 dollars 2001 ........................... 17,800 3,150 56,000 59.0 33,040 2002 ........................... 17,800 2,980 53,000 57.0 30,210 2003 ........................... 17,800 2,980 53,000 61.0 32,330 2004 ........................... 17,800 3,170 56,500 73.0 41,245 2005 ........................... 18,000 3,000 54,000 81.0 43,740 2006 ........................... 15,000 3,870 58,000 67.0 38,860 2007 ........................... 15,000 2,730 41,000 60.0 24,600 2008 ........................... 15,000 3,330 50,000 67.0 33,500 2009 ........................... 15,000 2,800 42,000 70.0 29,400 2010 1 ........................ 15,000 2,670 40,000 75.0 30,000
1 Preliminary. NASS, Crops Branch, (202) 720–2127.
VerDate Aug 31 2005 10:25 Feb 29, 2012 Jkt 000000 PO 00000 Frm 00039 Fmt 1000 Sfmt 1000 H:\SHARED\DAPP\FPU\AGSTAT\MASTER~2\CHAPTR05\V-41.AG8 USDA
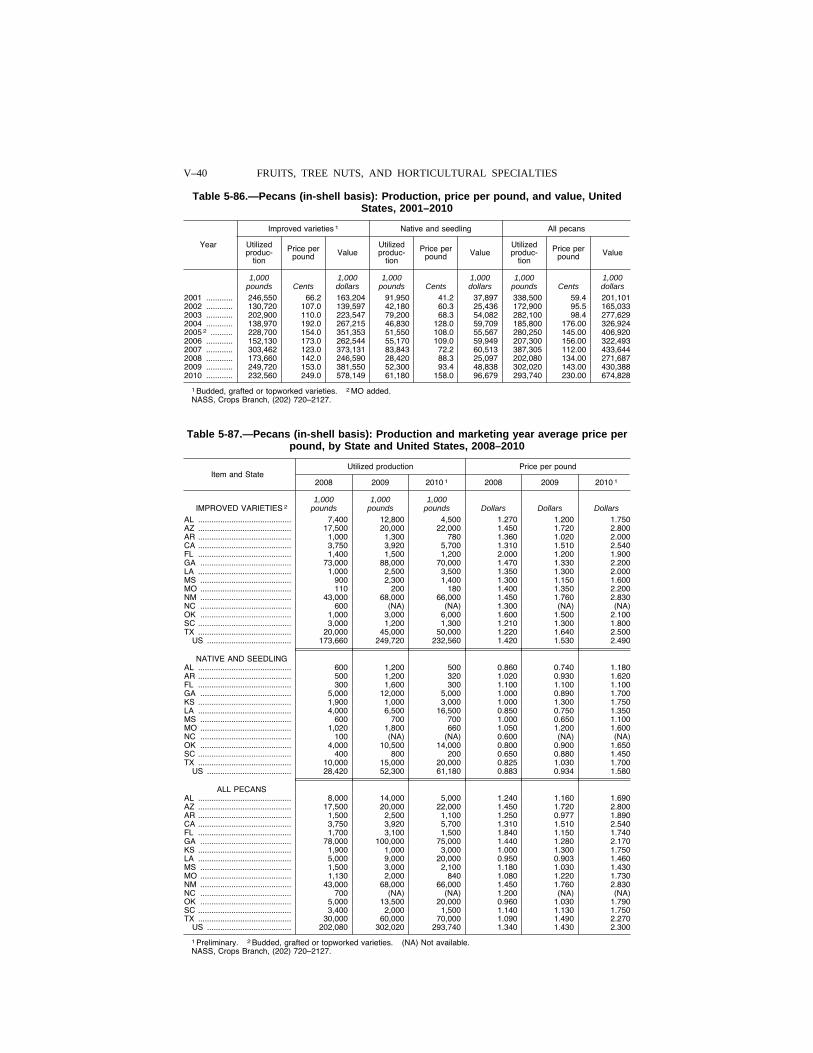
V–40 FRUITS, TREE NUTS, AND HORTICULTURAL SPECIALTIES
Table 5-86.—Pecans (in-shell basis): Production, price per pound, and value, United States, 2001–2010
Year
Improved varieties 1 Native and seedling All pecans
Utilized produc-
tion
Price per pound Value
Utilized produc-
tion
Price per pound Value
Utilized produc-
tion
Price per pound Value
1,000 1,000 1,000 1,000 1,000 1,000 pounds Cents dollars pounds Cents dollars pounds Cents dollars
2001 ............ 246,550 66.2 163,204 91,950 41.2 37,897 338,500 59.4 201,101 2002 ............ 130,720 107.0 139,597 42,180 60.3 25,436 172,900 95.5 165,033 2003 ............ 202,900 110.0 223,547 79,200 68.3 54,082 282,100 98.4 277,629 2004 ............ 138,970 192.0 267,215 46,830 128.0 59,709 185,800 176.00 326,924 2005 2 .......... 228,700 154.0 351,353 51,550 108.0 55,567 280,250 145.00 406,920 2006 ............ 152,130 173.0 262,544 55,170 109.0 59,949 207,300 156.00 322,493 2007 ............ 303,462 123.0 373,131 83,843 72.2 60,513 387,305 112.00 433,644 2008 ............ 173,660 142.0 246,590 28,420 88.3 25,097 202,080 134.00 271,687 2009 ............ 249,720 153.0 381,550 52,300 93.4 48,838 302,020 143.00 430,388 2010 ............ 232,560 249.0 578,149 61,180 158.0 96,679 293,740 230.00 674,828
1 Budded, grafted or topworked varieties. 2 MO added. NASS, Crops Branch, (202) 720–2127.
Table 5-87.—Pecans (in-shell basis): Production and marketing year average price per pound, by State and United States, 2008–2010
Item and State Utilized production Price per pound
2008 2009 2010 1 2008 2009 2010 1
1,000 1,000 1,000 IMPROVED VARIETIES 2 pounds pounds pounds Dollars Dollars Dollars
AL .......................................... 7,400 12,800 4,500 1.270 1.200 1.750 AZ .......................................... 17,500 20,000 22,000 1.450 1.720 2.800 AR .......................................... 1,000 1,300 780 1.360 1.020 2.000 CA .......................................... 3,750 3,920 5,700 1.310 1.510 2.540 FL .......................................... 1,400 1,500 1,200 2.000 1.200 1.900 GA ......................................... 73,000 88,000 70,000 1.470 1.330 2.200 LA .......................................... 1,000 2,500 3,500 1.350 1.300 2.000 MS ......................................... 900 2,300 1,400 1.300 1.150 1.600 MO ......................................... 110 200 180 1.400 1.350 2.200 NM ......................................... 43,000 68,000 66,000 1.450 1.760 2.830 NC ......................................... 600 (NA) (NA) 1.300 (NA) (NA) OK ......................................... 1,000 3,000 6,000 1.600 1.500 2.100 SC .......................................... 3,000 1,200 1,300 1.210 1.300 1.800 TX .......................................... 20,000 45,000 50,000 1.220 1.640 2.500
US ...................................... 173,660 249,720 232,560 1.420 1.530 2.490
NATIVE AND SEEDLING AL .......................................... 600 1,200 500 0.860 0.740 1.180 AR .......................................... 500 1,200 320 1.020 0.930 1.620 FL .......................................... 300 1,600 300 1.100 1.100 1.100 GA ......................................... 5,000 12,000 5,000 1.000 0.890 1.700 KS .......................................... 1,900 1,000 3,000 1.000 1.300 1.750 LA .......................................... 4,000 6,500 16,500 0.850 0.750 1.350 MS ......................................... 600 700 700 1.000 0.650 1.100 MO ......................................... 1,020 1,800 660 1.050 1.200 1.600 NC ......................................... 100 (NA) (NA) 0.600 (NA) (NA) OK ......................................... 4,000 10,500 14,000 0.800 0.900 1.650 SC .......................................... 400 800 200 0.650 0.880 1.450 TX .......................................... 10,000 15,000 20,000 0.825 1.030 1.700
US ...................................... 28,420 52,300 61,180 0.883 0.934 1.580
ALL PECANS AL .......................................... 8,000 14,000 5,000 1.240 1.160 1.690 AZ .......................................... 17,500 20,000 22,000 1.450 1.720 2.800 AR .......................................... 1,500 2,500 1,100 1.250 0.977 1.890 CA .......................................... 3,750 3,920 5,700 1.310 1.510 2.540 FL .......................................... 1,700 3,100 1,500 1.840 1.150 1.740 GA ......................................... 78,000 100,000 75,000 1.440 1.280 2.170 KS .......................................... 1,900 1,000 3,000 1.000 1.300 1.750 LA .......................................... 5,000 9,000 20,000 0.950 0.903 1.460 MS ......................................... 1,500 3,000 2,100 1.180 1.030 1.430 MO ......................................... 1,130 2,000 840 1.080 1.220 1.730 NM ......................................... 43,000 68,000 66,000 1.450 1.760 2.830 NC ......................................... 700 (NA) (NA) 1.200 (NA) (NA) OK ......................................... 5,000 13,500 20,000 0.960 1.030 1.790 SC .......................................... 3,400 2,000 1,500 1.140 1.130 1.750 TX .......................................... 30,000 60,000 70,000 1.090 1.490 2.270
US ...................................... 202,080 302,020 293,740 1.340 1.430 2.300
1 Preliminary. 2 Budded, grafted or topworked varieties. (NA) Not available. NASS, Crops Branch, (202) 720–2127.
VerDate Aug 31 2005 10:25 Feb 29, 2012 Jkt 000000 PO 00000 Frm 00040 Fmt 1000 Sfmt 1000 H:\SHARED\DAPP\FPU\AGSTAT\MASTER~2\CHAPTR05\V-42.AG8 USDA
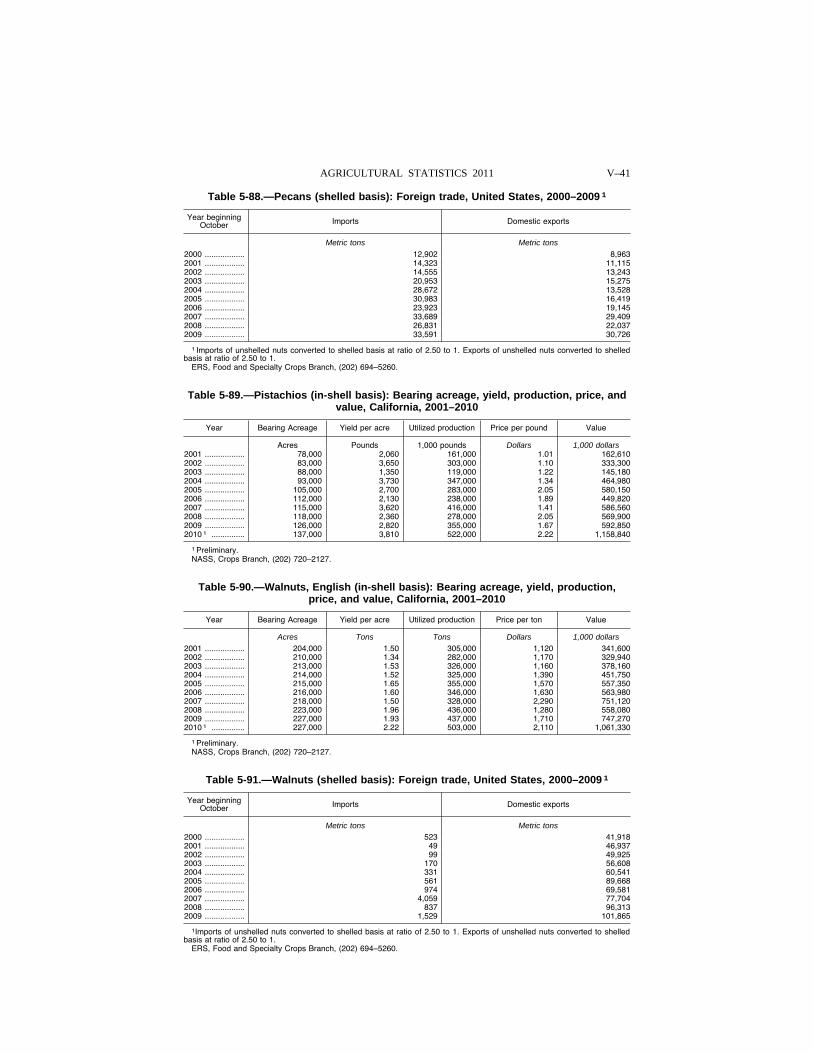
V–41 AGRICULTURAL STATISTICS 2011
Table 5-88.—Pecans (shelled basis): Foreign trade, United States, 2000–2009 1
Year beginning October Imports Domestic exports
Metric tons Metric tons
2000 .................. 12,902 8,963 2001 .................. 14,323 11,115 2002 .................. 14,555 13,243 2003 .................. 20,953 15,275 2004 .................. 28,672 13,528 2005 .................. 30,983 16,419 2006 .................. 23,923 19,145 2007 .................. 33,689 29,409 2008 .................. 26,831 22,037 2009 .................. 33,591 30,726
1 Imports of unshelled nuts converted to shelled basis at ratio of 2.50 to 1. Exports of unshelled nuts converted to shelled basis at ratio of 2.50 to 1.
ERS, Food and Specialty Crops Branch, (202) 694–5260.
Table 5-89.—Pistachios (in-shell basis): Bearing acreage, yield, production, price, and value, California, 2001–2010
Year Bearing Acreage Yield per acre Utilized production Price per pound Value
Acres Pounds 1,000 pounds Dollars 1,000 dollars 2001 .................. 78,000 2,060 161,000 1.01 162,610 2002 .................. 83,000 3,650 303,000 1.10 333,300 2003 .................. 88,000 1,350 119,000 1.22 145,180 2004 .................. 93,000 3,730 347,000 1.34 464,980 2005 .................. 105,000 2,700 283,000 2.05 580,150 2006 .................. 112,000 2,130 238,000 1.89 449,820 2007 .................. 115,000 3,620 416,000 1.41 586,560 2008 .................. 118,000 2,360 278,000 2.05 569,900 2009 .................. 126,000 2,820 355,000 1.67 592,850 2010 1 ............... 137,000 3,810 522,000 2.22 1,158,840
1 Preliminary. NASS, Crops Branch, (202) 720–2127.
Table 5-90.—Walnuts, English (in-shell basis): Bearing acreage, yield, production, price, and value, California, 2001–2010
Year Bearing Acreage Yield per acre Utilized production Price per ton Value
Acres Tons Tons Dollars 1,000 dollars 2001 .................. 204,000 1.50 305,000 1,120 341,600 2002 .................. 210,000 1.34 282,000 1,170 329,940 2003 .................. 213,000 1.53 326,000 1,160 378,160 2004 .................. 214,000 1.52 325,000 1,390 451,750 2005 .................. 215,000 1.65 355,000 1,570 557,350 2006 .................. 216,000 1.60 346,000 1,630 563,980 2007 .................. 218,000 1.50 328,000 2,290 751,120 2008 .................. 223,000 1.96 436,000 1,280 558,080 2009 .................. 227,000 1.93 437,000 1,710 747,270 2010 1 ............... 227,000 2.22 503,000 2,110 1,061,330
1 Preliminary. NASS, Crops Branch, (202) 720–2127.
Table 5-91.—Walnuts (shelled basis): Foreign trade, United States, 2000–2009 1
Year beginning October Imports Domestic exports
Metric tons Metric tons 2000 .................. 523 41,918 2001 .................. 49 46,937 2002 .................. 99 49,925 2003 .................. 170 56,608 2004 .................. 331 60,541 2005 .................. 561 89,668 2006 .................. 974 69,581 2007 .................. 4,059 77,704 2008 .................. 837 96,313 2009 .................. 1,529 101,865
1Imports of unshelled nuts converted to shelled basis at ratio of 2.50 to 1. Exports of unshelled nuts converted to shelled basis at ratio of 2.50 to 1.
ERS, Food and Specialty Crops Branch, (202) 694–5260.
VerDate Aug 31 2005 10:25 Feb 29, 2012 Jkt 000000 PO 00000 Frm 00041 Fmt 1000 Sfmt 1000 H:\SHARED\DAPP\FPU\AGSTAT\MASTER~2\CHAPTR05\V-43.AG8 USDA
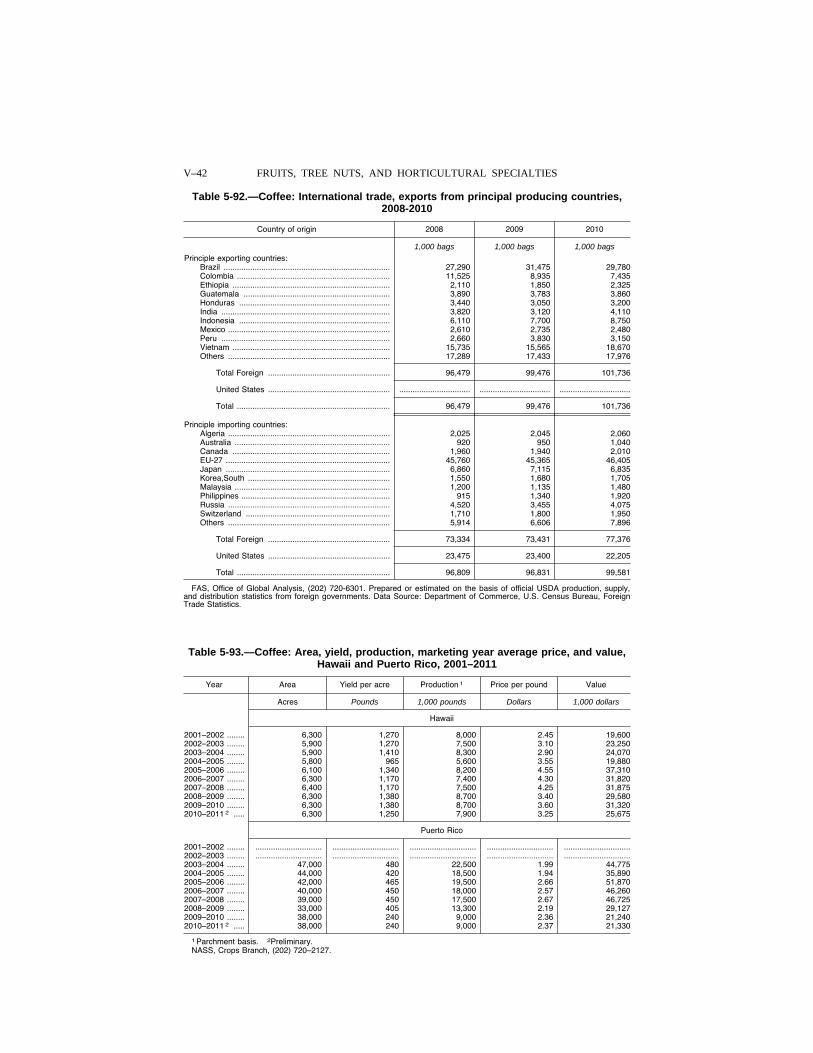
V–42 FRUITS, TREE NUTS, AND HORTICULTURAL SPECIALTIES
Table 5-92.—Coffee: International trade, exports from principal producing countries, 2008-2010
Country of origin 2008 2009 2010
1,000 bags 1,000 bags 1,000 bags
Principle exporting countries: Brazil ........................................................................... 27,290 31,475 29,780 Colombia ..................................................................... 11,525 8,935 7,435 Ethiopia ....................................................................... 2,110 1,850 2,325 Guatemala .................................................................. 3,890 3,783 3,860 Honduras .................................................................... 3,440 3,050 3,200 India ............................................................................ 3,820 3,120 4,110 Indonesia .................................................................... 6,110 7,700 8,750 Mexico ......................................................................... 2,610 2,735 2,480 Peru ............................................................................ 2,660 3,830 3,150 Vietnam ....................................................................... 15,735 15,565 18,670 Others ......................................................................... 17,289 17,433 17,976
Total Foreign ....................................................... 96,479 99,476 101,736
United States ....................................................... ................................ ................................ ................................
Total ..................................................................... 96,479 99,476 101,736
Principle importing countries: Algeria ......................................................................... 2,025 2,045 2,060 Australia ...................................................................... 920 950 1,040 Canada ....................................................................... 1,960 1,940 2,010 EU-27 .......................................................................... 45,760 45,365 46,405 Japan .......................................................................... 6,860 7,115 6,835 Korea,South ................................................................ 1,550 1,680 1,705 Malaysia ...................................................................... 1,200 1,135 1,480 Philippines ................................................................... 915 1,340 1,920 Russia ......................................................................... 4,520 3,455 4,075 Switzerland ................................................................. 1,710 1,800 1,950 Others ......................................................................... 5,914 6,606 7,896
Total Foreign ....................................................... 73,334 73,431 77,376
United States ....................................................... 23,475 23,400 22,205
Total ..................................................................... 96,809 96,831 99,581
FAS, Office of Global Analysis, (202) 720-6301. Prepared or estimated on the basis of official USDA production, supply, and distribution statistics from foreign governments. Data Source: Department of Commerce, U.S. Census Bureau, Foreign Trade Statistics.
Table 5-93.—Coffee: Area, yield, production, marketing year average price, and value, Hawaii and Puerto Rico, 2001–2011
Year Area Yield per acre Production 1 Price per pound Value
Acres Pounds 1,000 pounds Dollars 1,000 dollars
Hawaii
2001–2002 ........ 6,300 1,270 8,000 2.45 19,600 2002–2003 ........ 5,900 1,270 7,500 3.10 23,250 2003–2004 ........ 5,900 1,410 8,300 2.90 24,070 2004–2005 ........ 5,800 965 5,600 3.55 19,880 2005–2006 ........ 6,100 1,340 8,200 4.55 37,310 2006–2007 ........ 6,300 1,170 7,400 4.30 31,820 2007–2008 ........ 6,400 1,170 7,500 4.25 31,875 2008–2009 ........ 6,300 1,380 8,700 3.40 29,580 2009–2010 ........ 6,300 1,380 8,700 3.60 31,320 2010–2011 2 ..... 6,300 1,250 7,900 3.25 25,675
Puerto Rico
2001–2002 ........ .............................. .............................. .............................. .............................. ..............................2002–2003 ........ .............................. .............................. .............................. .............................. ..............................2003–2004 ........ 47,000 480 22,500 1.99 44,775 2004–2005 ........ 44,000 420 18,500 1.94 35,890 2005–2006 ........ 42,000 465 19,500 2.66 51,870 2006–2007 ........ 40,000 450 18,000 2.57 46,260 2007–2008 ........ 39,000 450 17,500 2.67 46,725 2008–2009 ........ 33,000 405 13,300 2.19 29,127 2009–2010 ........ 38,000 240 9,000 2.36 21,240 2010–2011 2 ..... 38,000 240 9,000 2.37 21,330
1 Parchment basis. 2Preliminary. NASS, Crops Branch, (202) 720–2127.
VerDate Aug 31 2005 10:25 Feb 29, 2012 Jkt 000000 PO 00000 Frm 00042 Fmt 1000 Sfmt 1000 H:\SHARED\DAPP\FPU\AGSTAT\MASTER~2\CHAPTR05\V-44.AG8 USDA
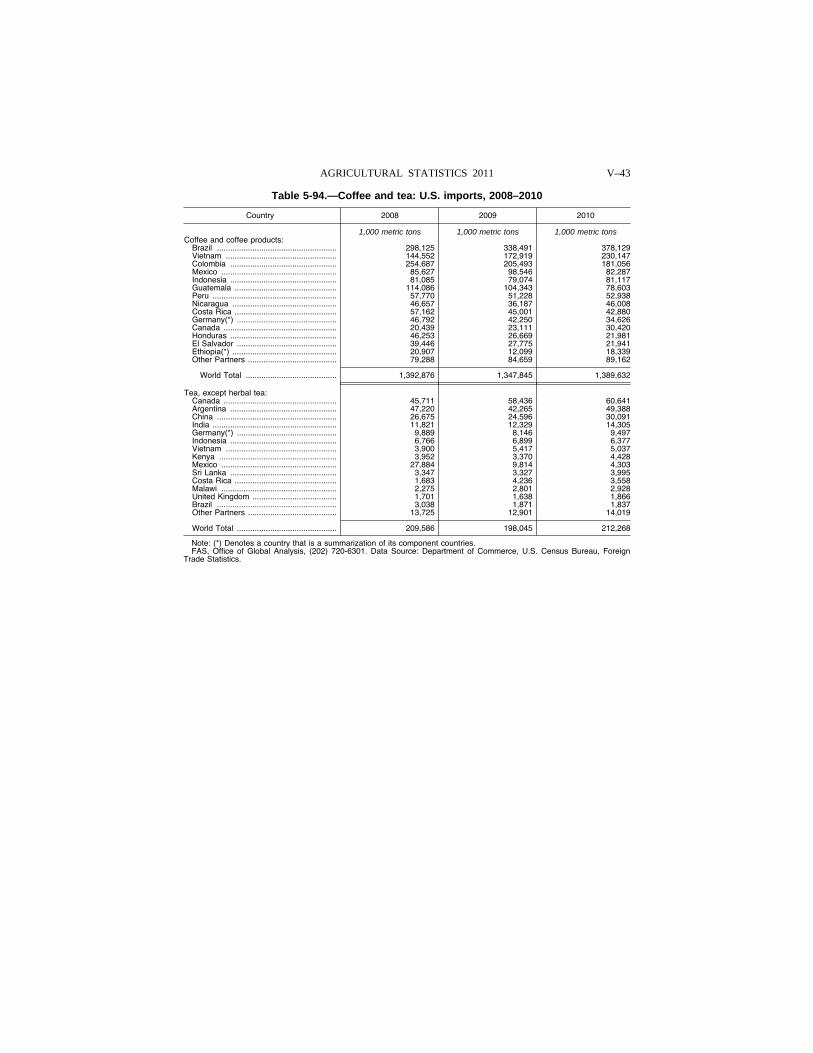
V–43 AGRICULTURAL STATISTICS 2011
Table 5-94.—Coffee and tea: U.S. imports, 2008–2010
Country 2008 2009 2010
1,000 metric tons 1,000 metric tons 1,000 metric tons Coffee and coffee products:
Brazil ...................................................... 298,125 338,491 378,129 Vietnam .................................................. 144,552 172,919 230,147 Colombia ................................................ 254,687 205,493 181,056 Mexico .................................................... 85,627 98,546 82,287 Indonesia ................................................ 81,085 79,074 81,117 Guatemala .............................................. 114,086 104,343 78,603 Peru ........................................................ 57,770 51,228 52,938 Nicaragua ............................................... 46,657 36,187 46,008 Costa Rica .............................................. 57,162 45,001 42,880 Germany(*) ............................................. 46,792 42,250 34,626 Canada ................................................... 20,439 23,111 30,420 Honduras ................................................ 46,253 26,669 21,981 El Salvador ............................................. 39,446 27,775 21,941 Ethiopia(*) ............................................... 20,907 12,099 18,339 Other Partners ........................................ 79,288 84,659 89,162
World Total ......................................... 1,392,876 1,347,845 1,389,632
Tea, except herbal tea: Canada ................................................... 45,711 58,436 60,641 Argentina ................................................ 47,220 42,265 49,388 China ...................................................... 26,675 24,596 30,091 India ........................................................ 11,821 12,329 14,305 Germany(*) ............................................. 9,889 8,146 9,497 Indonesia ................................................ 6,766 6,899 6,377 Vietnam .................................................. 3,900 5,417 5,037 Kenya ..................................................... 3,952 3,370 4,428 Mexico .................................................... 27,884 9,814 4,303 Sri Lanka ................................................ 3,347 3,327 3,995 Costa Rica .............................................. 1,683 4,236 3,558 Malawi .................................................... 2,275 2,801 2,928 United Kingdom ...................................... 1,701 1,638 1,866 Brazil ...................................................... 3,038 1,871 1,837 Other Partners ........................................ 13,725 12,901 14,019
World Total ............................................. 209,586 198,045 212,268
Note: (*) Denotes a country that is a summarization of its component countries. FAS, Office of Global Analysis, (202) 720-6301. Data Source: Department of Commerce, U.S. Census Bureau, Foreign
Trade Statistics.
VerDate Aug 31 2005 10:25 Feb 29, 2012 Jkt 000000 PO 00000 Frm 00043 Fmt 1000 Sfmt 1000 H:\SHARED\DAPP\FPU\AGSTAT\MASTER~2\CHAPTR05\V-46.AG8 USDA
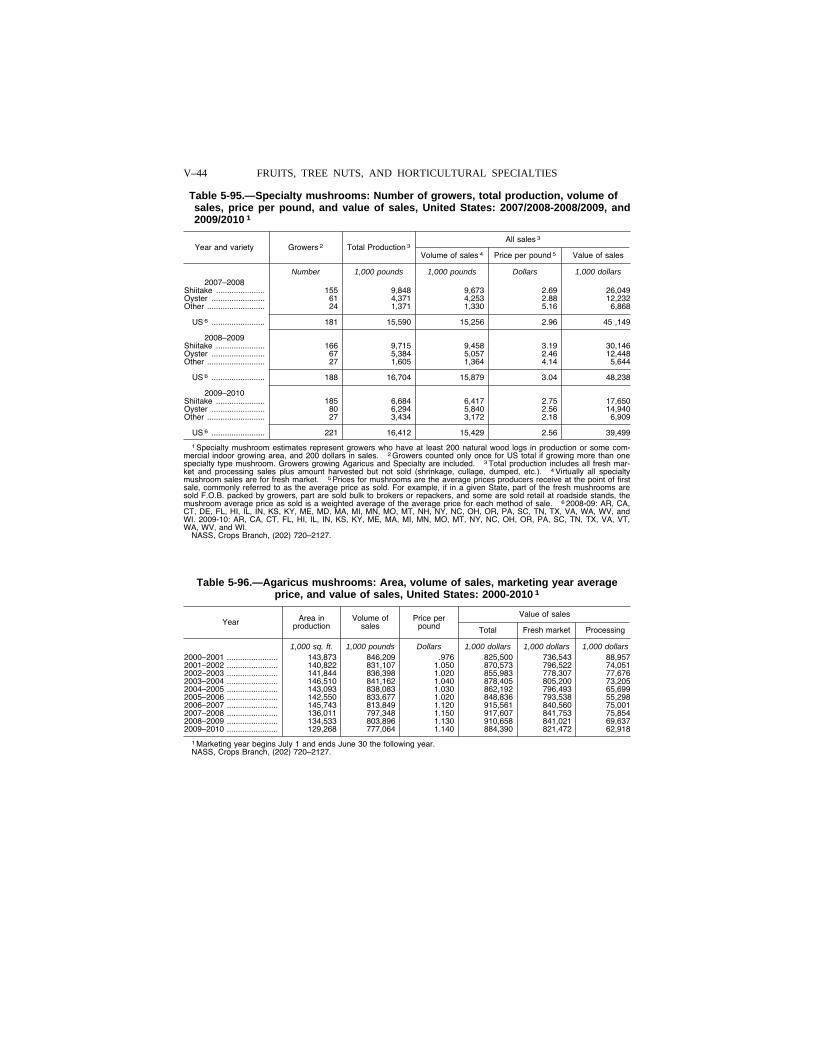
V–44 FRUITS, TREE NUTS, AND HORTICULTURAL SPECIALTIES
Table 5-95.—Specialty mushrooms: Number of growers, total production, volume of sales, price per pound, and value of sales, United States: 2007/2008-2008/2009, and 2009/2010 1
Year and variety Growers 2 Total Production 3 All sales 3
Volume of sales 4 Price per pound 5 Value of sales
Number 1,000 pounds 1,000 pounds Dollars 1,000 dollars 2007–2008
Shiitake ...................... 155 9,848 9,673 2.69 26,049 Oyster ........................ 61 4,371 4,253 2.88 12,232 Other .......................... 24 1,371 1,330 5.16 6,868
US 6 ........................ 181 15,590 15,256 2.96 45 ,149
2008–2009 Shiitake ...................... 166 9,715 9,458 3.19 30,146 Oyster ........................ 67 5,384 5,057 2.46 12,448 Other .......................... 27 1,605 1,364 4.14 5,644
US 6 ........................ 188 16,704 15,879 3.04 48,238
2009–2010 Shiitake ...................... 185 6,684 6,417 2.75 17,650 Oyster ........................ 80 6,294 5,840 2.56 14,940 Other .......................... 27 3,434 3,172 2.18 6,909
US 6 ........................ 221 16,412 15,429 2.56 39,499
1 Specialty mushroom estimates represent growers who have at least 200 natural wood logs in production or some com-mercial indoor growing area, and 200 dollars in sales. 2 Growers counted only once for US total if growing more than one specialty type mushroom. Growers growing Agaricus and Specialty are included. 3 Total production includes all fresh mar-ket and processing sales plus amount harvested but not sold (shrinkage, cullage, dumped, etc.). 4 Virtually all specialty mushroom sales are for fresh market. 5 Prices for mushrooms are the average prices producers receive at the point of first sale, commonly referred to as the average price as sold. For example, if in a given State, part of the fresh mushrooms are sold F.O.B. packed by growers, part are sold bulk to brokers or repackers, and some are sold retail at roadside stands, the mushroom average price as sold is a weighted average of the average price for each method of sale. 6 2008-09: AR, CA, CT, DE, FL, HI, IL, IN, KS, KY, ME, MD, MA, MI, MN, MO, MT, NH, NY, NC, OH, OR, PA, SC, TN, TX, VA, WA, WV, and WI. 2009-10: AR, CA, CT, FL, HI, IL, IN, KS, KY, ME, MA, MI, MN, MO, MT, NY, NC, OH, OR, PA, SC, TN, TX, VA, VT, WA, WV, and WI.
NASS, Crops Branch, (202) 720–2127.
Table 5-96.—Agaricus mushrooms: Area, volume of sales, marketing year average price, and value of sales, United States: 2000-2010 1
Year Area in production
Volume of sales
Price per pound
Value of sales
Total Fresh market Processing
1,000 sq. ft. 1,000 pounds Dollars 1,000 dollars 1,000 dollars 1,000 dollars 2000–2001 ....................... 143,873 846,209 .976 825,500 736,543 88,957 2001–2002 ....................... 140,822 831,107 1.050 870,573 796,522 74,051 2002–2003 ....................... 141,844 836,398 1.020 855,983 778,307 77,676 2003–2004 ....................... 146,510 841,162 1.040 878,405 805,200 73,205 2004–2005 ....................... 143,093 838,083 1.030 862,192 796,493 65,699 2005–2006 ....................... 142,550 833,677 1.020 848,836 793,538 55,298 2006–2007 ....................... 145,743 813,849 1.120 915,561 840,560 75,001 2007–2008 ....................... 136,011 797,348 1.150 917,607 841,753 75,854 2008–2009 ....................... 134,533 803,896 1.130 910,658 841,021 69,637 2009–2010 ....................... 129,268 777,064 1.140 884,390 821,472 62,918
1 Marketing year begins July 1 and ends June 30 the following year. NASS, Crops Branch, (202) 720–2127.
VerDate Aug 31 2005 10:25 Feb 29, 2012 Jkt 000000 PO 00000 Frm 00044 Fmt 1000 Sfmt 1000 H:\SHARED\DAPP\FPU\AGSTAT\MASTER~2\CHAPTR05\V-47.AG8 USDA
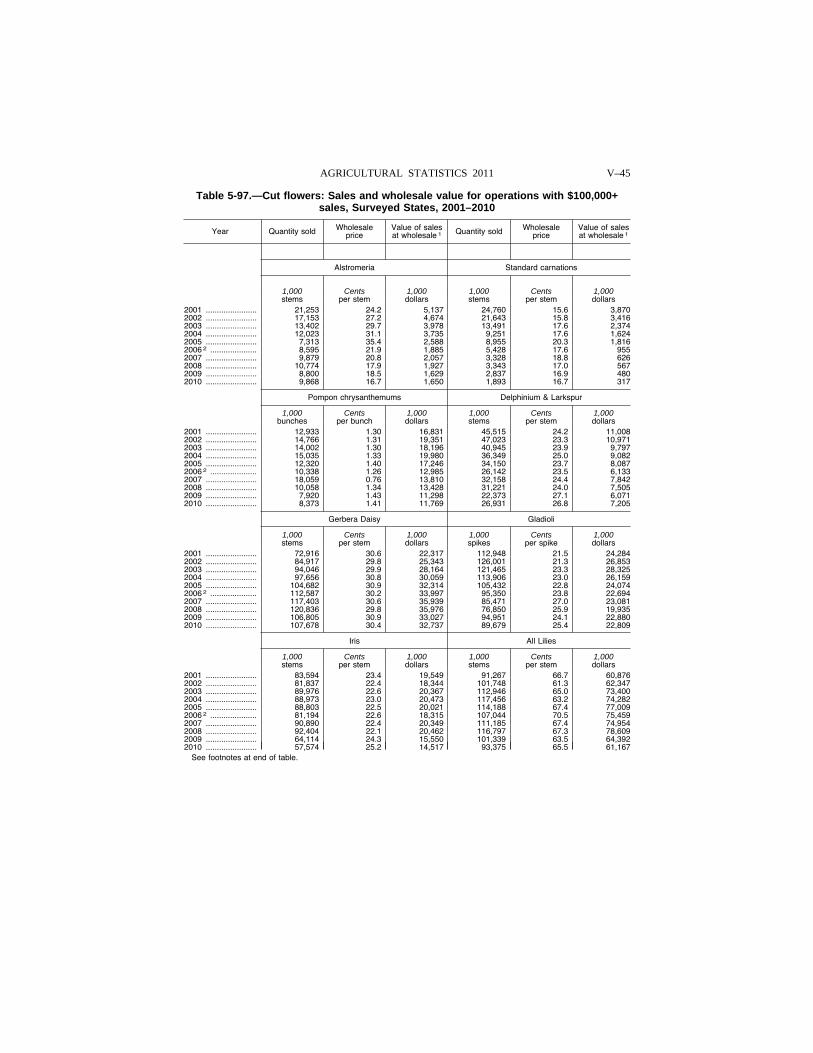
V–45 AGRICULTURAL STATISTICS 2011
Table 5-97.—Cut flowers: Sales and wholesale value for operations with $100,000+ sales, Surveyed States, 2001–2010
Year Quantity sold Wholesale price
Value of sales at wholesale 1 Quantity sold Wholesale
price Value of sales at wholesale 1
Alstromeria Standard carnations
1,000 stems
Cents per stem
1,000 dollars
1,000 stems
Cents per stem
1,000 dollars
2001 ....................... 21,253 24.2 5,137 24,760 15.6 3,870 2002 ....................... 17,153 27.2 4,674 21,643 15.8 3,416 2003 ....................... 13,402 29.7 3,978 13,491 17.6 2,374 2004 ....................... 12,023 31.1 3,735 9,251 17.6 1,624 2005 ....................... 7,313 35.4 2,588 8,955 20.3 1,816 2006 2 ..................... 8,595 21.9 1,885 5,428 17.6 955 2007 ....................... 9,879 20.8 2,057 3,328 18.8 626 2008 ....................... 10,774 17.9 1,927 3,343 17.0 567 2009 ....................... 8,800 18.5 1,629 2,837 16.9 480 2010 ....................... 9,868 16.7 1,650 1,893 16.7 317
Pompon chrysanthemums Delphinium & Larkspur
1,000 bunches
Cents per bunch
1,000 dollars
1,000 stems
Cents per stem
1,000 dollars
2001 ....................... 12,933 1.30 16,831 45,515 24.2 11,008 2002 ....................... 14,766 1.31 19,351 47,023 23.3 10,971 2003 ....................... 14,002 1.30 18,196 40,945 23.9 9,797 2004 ....................... 15,035 1.33 19,980 36,349 25.0 9,082 2005 ....................... 12,320 1.40 17,246 34,150 23.7 8,087 2006 2 ..................... 10,338 1.26 12,985 26,142 23.5 6,133 2007 ....................... 18,059 0.76 13,810 32,158 24.4 7,842 2008 ....................... 10,058 1.34 13,428 31,221 24.0 7,505 2009 ....................... 7,920 1.43 11,298 22,373 27.1 6,071 2010 ....................... 8,373 1.41 11,769 26,931 26.8 7,205
Gerbera Daisy Gladioli
1,000 stems
Cents per stem
1,000 dollars
1,000 spikes
Cents per spike
1,000 dollars
2001 ....................... 72,916 30.6 22,317 112,948 21.5 24,284 2002 ....................... 84,917 29.8 25,343 126,001 21.3 26,853 2003 ....................... 94,046 29.9 28,164 121,465 23.3 28,325 2004 ....................... 97,656 30.8 30,059 113,906 23.0 26,159 2005 ....................... 104,682 30.9 32,314 105,432 22.8 24,074 2006 2 ..................... 112,587 30.2 33,997 95,350 23.8 22,694 2007 ....................... 117,403 30.6 35,939 85,471 27.0 23,081 2008 ....................... 120,836 29.8 35,976 76,850 25.9 19,935 2009 ....................... 106,805 30.9 33,027 94,951 24.1 22,880 2010 ....................... 107,678 30.4 32,737 89,679 25.4 22,809
Iris All Lilies
1,000 stems
Cents per stem
1,000 dollars
1,000 stems
Cents per stem
1,000 dollars
2001 ....................... 83,594 23.4 19,549 91,267 66.7 60,876 2002 ....................... 81,837 22.4 18,344 101,748 61.3 62,347 2003 ....................... 89,976 22.6 20,367 112,946 65.0 73,400 2004 ....................... 88,973 23.0 20,473 117,456 63.2 74,282 2005 ....................... 88,803 22.5 20,021 114,188 67.4 77,009 2006 2 ..................... 81,194 22.6 18,315 107,044 70.5 75,459 2007 ....................... 90,890 22.4 20,349 111,185 67.4 74,954 2008 ....................... 92,404 22.1 20,462 116,797 67.3 78,609 2009 ....................... 64,114 24.3 15,550 101,339 63.5 64,392 2010 ....................... 57,574 25.2 14,517 93,375 65.5 61,167
See footnotes at end of table.
VerDate Aug 31 2005 10:25 Feb 29, 2012 Jkt 000000 PO 00000 Frm 00045 Fmt 1000 Sfmt 1000 H:\SHARED\DAPP\FPU\AGSTAT\MASTER~2\CHAPTR05\V-48.AG8 USDA
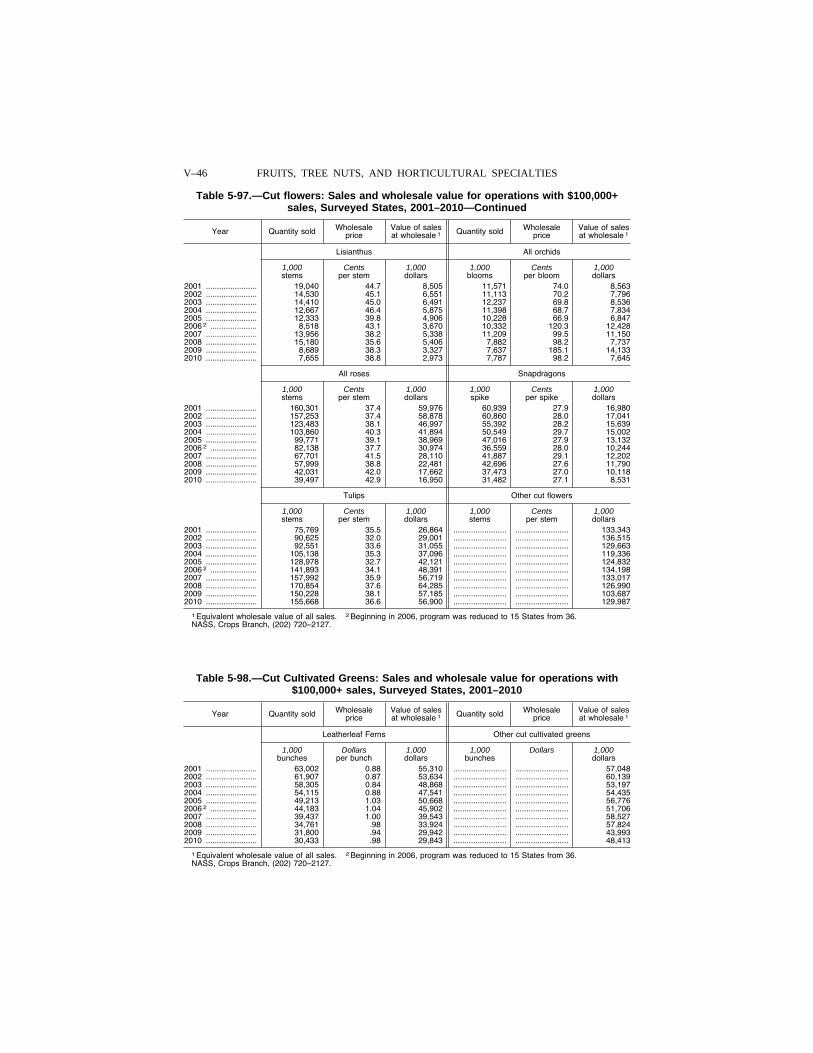
V–46 FRUITS, TREE NUTS, AND HORTICULTURAL SPECIALTIES
Table 5-97.—Cut flowers: Sales and wholesale value for operations with $100,000+ sales, Surveyed States, 2001–2010—Continued
Year Quantity sold Wholesale price
Value of sales at wholesale 1 Quantity sold Wholesale
price Value of sales at wholesale 1
Lisianthus All orchids
1,000 stems
Cents per stem
1,000 dollars
1,000 blooms
Cents per bloom
1,000 dollars
2001 ....................... 19,040 44.7 8,505 11,571 74.0 8,563 2002 ....................... 14,530 45.1 6,551 11,113 70.2 7,796 2003 ....................... 14,410 45.0 6,491 12,237 69.8 8,536 2004 ....................... 12,667 46.4 5,875 11,398 68.7 7,834 2005 ....................... 12,333 39.8 4,906 10,228 66.9 6,847 2006 2 ..................... 8,518 43.1 3,670 10,332 120.3 12,428 2007 ....................... 13,956 38.2 5,338 11,209 99.5 11,150 2008 ....................... 15,180 35.6 5,406 7,882 98.2 7,737 2009 ....................... 8,689 38.3 3,327 7,637 185.1 14,133 2010 ....................... 7,655 38.8 2,973 7,787 98.2 7,645
All roses Snapdragons
1,000 stems
Cents per stem
1,000 dollars
1,000 spike
Cents per spike
1,000 dollars
2001 ....................... 160,301 37.4 59,976 60,939 27.9 16,980 2002 ....................... 157,253 37.4 58,878 60,860 28.0 17,041 2003 ....................... 123,483 38.1 46,997 55,392 28.2 15,639 2004 ....................... 103,860 40.3 41,894 50,549 29.7 15,002 2005 ....................... 99,771 39.1 38,969 47,016 27.9 13,132 2006 2 ..................... 82,138 37.7 30,974 36,559 28.0 10,244 2007 ....................... 67,701 41.5 28,110 41,887 29.1 12,202 2008 ....................... 57,999 38.8 22,481 42,696 27.6 11,790 2009 ....................... 42,031 42.0 17,662 37,473 27.0 10,118 2010 ....................... 39,497 42.9 16,950 31,482 27.1 8,531
Tulips Other cut flowers
1,000 stems
Cents per stem
1,000 dollars
1,000 stems
Cents per stem
1,000 dollars
2001 ....................... 75,769 35.5 26,864 ........................ ........................ 133,343 2002 ....................... 90,625 32.0 29,001 ........................ ........................ 136,515 2003 ....................... 92,551 33.6 31,055 ........................ ........................ 129,663 2004 ....................... 105,138 35.3 37,096 ........................ ........................ 119,336 2005 ....................... 128,978 32.7 42,121 ........................ ........................ 124,832 2006 2 ..................... 141,893 34.1 48,391 ........................ ........................ 134,198 2007 ....................... 157,992 35.9 56,719 ........................ ........................ 133,017 2008 ....................... 170,854 37.6 64,285 ........................ ........................ 126,990 2009 ....................... 150,228 38.1 57,185 ........................ ........................ 103,687 2010 ....................... 155,668 36.6 56,900 ........................ ........................ 129,987
1 Equivalent wholesale value of all sales. 2 Beginning in 2006, program was reduced to 15 States from 36. NASS, Crops Branch, (202) 720–2127.
Table 5-98.—Cut Cultivated Greens: Sales and wholesale value for operations with $100,000+ sales, Surveyed States, 2001–2010
Year Quantity sold Wholesale price
Value of sales at wholesale 1 Quantity sold Wholesale
price Value of sales at wholesale 1
Leatherleaf Ferns Other cut cultivated greens
1,000 bunches
Dollars per bunch
1,000 dollars
1,000 bunches
Dollars 1,000 dollars
2001 ....................... 63,002 0.88 55,310 ........................ ........................ 57,048 2002 ....................... 61,907 0.87 53,634 ........................ ........................ 60,139 2003 ....................... 58,305 0.84 48,868 ........................ ........................ 53,197 2004 ....................... 54,115 0.88 47,541 ........................ ........................ 54,435 2005 ....................... 49,213 1.03 50,668 ........................ ........................ 56,776 2006 2 ..................... 44,183 1.04 45,902 ........................ ........................ 51,706 2007 ....................... 39,437 1.00 39,543 ........................ ........................ 58,527 2008 ....................... 34,761 .98 33,924 ........................ ........................ 57,824 2009 ....................... 31,800 .94 29,942 ........................ ........................ 43,993 2010 ....................... 30,433 .98 29,843 ........................ ........................ 48,413
1 Equivalent wholesale value of all sales. 2 Beginning in 2006, program was reduced to 15 States from 36. NASS, Crops Branch, (202) 720–2127.
VerDate Aug 31 2005 10:25 Feb 29, 2012 Jkt 000000 PO 00000 Frm 00046 Fmt 1000 Sfmt 1000 H:\SHARED\DAPP\FPU\AGSTAT\MASTER~2\CHAPTR05\V-49.AG8 USDA
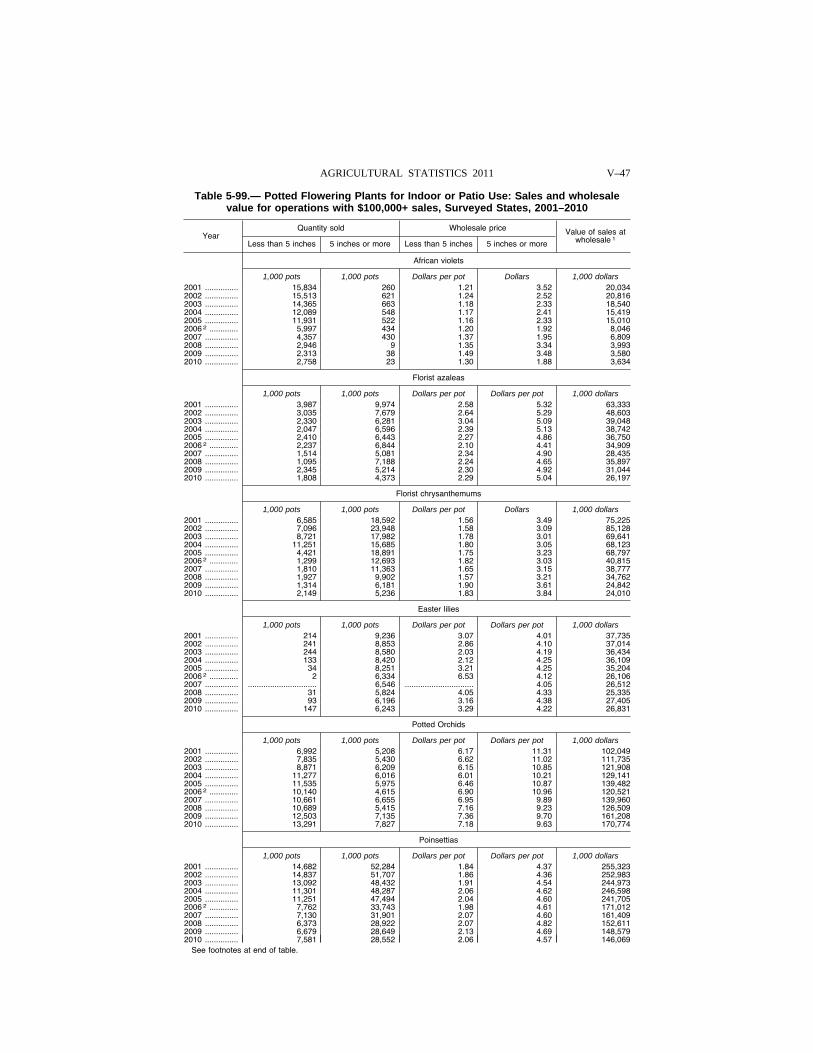
V–47 AGRICULTURAL STATISTICS 2011
Table 5-99.— Potted Flowering Plants for Indoor or Patio Use: Sales and wholesale value for operations with $100,000+ sales, Surveyed States, 2001–2010
Year Quantity sold Wholesale price Value of sales at
wholesale 1 Less than 5 inches 5 inches or more Less than 5 inches 5 inches or more
African violets
1,000 pots 1,000 pots Dollars per pot Dollars 1,000 dollars 2001 ............... 15,834 260 1.21 3.52 20,034 2002 ............... 15,513 621 1.24 2.52 20,816 2003 ............... 14,365 663 1.18 2.33 18,540 2004 ............... 12,089 548 1.17 2.41 15,419 2005 ............... 11,931 522 1.16 2.33 15,010 2006 2 ............. 5,997 434 1.20 1.92 8,046 2007 ............... 4,357 430 1.37 1.95 6,809 2008 ............... 2,946 9 1.35 3.34 3,993 2009 ............... 2,313 38 1.49 3.48 3,580 2010 ............... 2,758 23 1.30 1.88 3,634
Florist azaleas
1,000 pots 1,000 pots Dollars per pot Dollars per pot 1,000 dollars 2001 ............... 3,987 9,974 2.58 5.32 63,333 2002 ............... 3,035 7,679 2.64 5.29 48,603 2003 ............... 2,330 6,281 3.04 5.09 39,048 2004 ............... 2,047 6,596 2.39 5.13 38,742 2005 ............... 2,410 6,443 2.27 4.86 36,750 2006 2 ............. 2,237 6,844 2.10 4.41 34,909 2007 ............... 1,514 5,081 2.34 4.90 28,435 2008 ............... 1,095 7,188 2.24 4.65 35,897 2009 ............... 2,345 5,214 2.30 4.92 31,044 2010 ............... 1,808 4,373 2.29 5.04 26,197
Florist chrysanthemums
1,000 pots 1,000 pots Dollars per pot Dollars 1,000 dollars 2001 ............... 6,585 18,592 1.56 3.49 75,225 2002 ............... 7,096 23,948 1.58 3.09 85,128 2003 ............... 8,721 17,982 1.78 3.01 69,641 2004 ............... 11,251 15,685 1.80 3.05 68,123 2005 ............... 4,421 18,891 1.75 3.23 68,797 2006 2 ............. 1,299 12,693 1.82 3.03 40,815 2007 ............... 1,810 11,363 1.65 3.15 38,777 2008 ............... 1,927 9,902 1.57 3.21 34,762 2009 ............... 1,314 6,181 1.90 3.61 24,842 2010 ............... 2,149 5,236 1.83 3.84 24,010
Easter lilies
1,000 pots 1,000 pots Dollars per pot Dollars per pot 1,000 dollars 2001 ............... 214 9,236 3.07 4.01 37,735 2002 ............... 241 8,853 2.86 4.10 37,014 2003 ............... 244 8,580 2.03 4.19 36,434 2004 ............... 133 8,420 2.12 4.25 36,109 2005 ............... 34 8,251 3.21 4.25 35,204 2006 2 ............. 2 6,334 6.53 4.12 26,106 2007 ............... ............................... 6,546 ............................... 4.05 26,512 2008 ............... 31 5,824 4.05 4.33 25,335 2009 ............... 93 6,196 3.16 4.38 27,405 2010 ............... 147 6,243 3.29 4.22 26,831
Potted Orchids
1,000 pots 1,000 pots Dollars per pot Dollars per pot 1,000 dollars 2001 ............... 6,992 5,208 6.17 11.31 102,049 2002 ............... 7,835 5,430 6.62 11.02 111,735 2003 ............... 8,871 6,209 6.15 10.85 121,908 2004 ............... 11,277 6,016 6.01 10.21 129,141 2005 ............... 11,535 5,975 6.46 10.87 139,482 2006 2 ............. 10,140 4,615 6.90 10.96 120,521 2007 ............... 10,661 6,655 6.95 9.89 139,960 2008 ............... 10,689 5,415 7.16 9.23 126,509 2009 ............... 12,503 7,135 7.36 9.70 161,208 2010 ............... 13,291 7,827 7.18 9.63 170,774
Poinsettias
1,000 pots 1,000 pots Dollars per pot Dollars per pot 1,000 dollars 2001 ............... 14,682 52,284 1.84 4.37 255,323 2002 ............... 14,837 51,707 1.86 4.36 252,983 2003 ............... 13,092 48,432 1.91 4.54 244,973 2004 ............... 11,301 48,287 2.06 4.62 246,598 2005 ............... 11,251 47,494 2.04 4.60 241,705 2006 2 ............. 7,762 33,743 1.98 4.61 171,012 2007 ............... 7,130 31,901 2.07 4.60 161,409 2008 ............... 6,373 28,922 2.07 4.82 152,611 2009 ............... 6,679 28,649 2.13 4.69 148,579 2010 ............... 7,581 28,552 2.06 4.57 146,069
See footnotes at end of table.
VerDate Aug 31 2005 10:25 Feb 29, 2012 Jkt 000000 PO 00000 Frm 00047 Fmt 1000 Sfmt 1000 H:\SHARED\DAPP\FPU\AGSTAT\MASTER~2\CHAPTR05\V-50.AG8 USDA
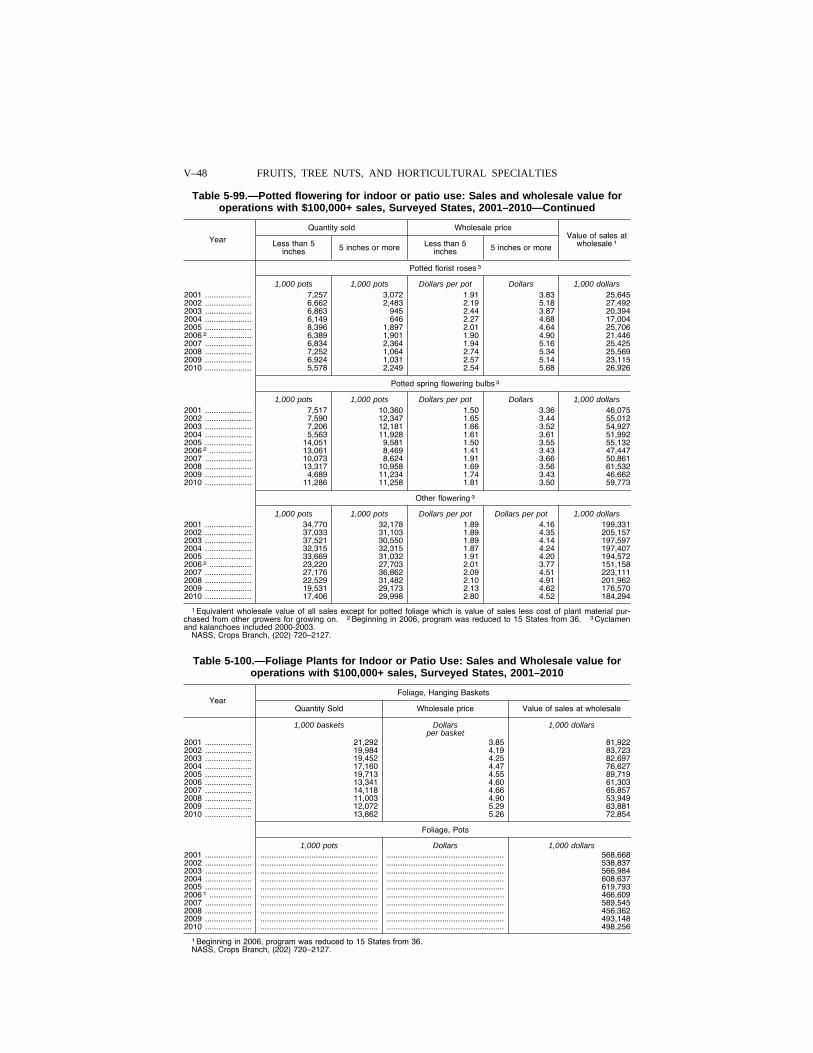
V–48 FRUITS, TREE NUTS, AND HORTICULTURAL SPECIALTIES
Table 5-99.—Potted flowering for indoor or patio use: Sales and wholesale value for operations with $100,000+ sales, Surveyed States, 2001–2010—Continued
Year
Quantity sold Wholesale price Value of sales at
wholesale 1 Less than 5 inches 5 inches or more Less than 5
inches 5 inches or more
Potted florist roses 3
1,000 pots 1,000 pots Dollars per pot Dollars 1,000 dollars 2001 ..................... 7,257 3,072 1.91 3.83 25,645 2002 ..................... 6,662 2,483 2.19 5.18 27,492 2003 ..................... 6,863 945 2.44 3.87 20,394 2004 ..................... 6,149 646 2.27 4.68 17,004 2005 ..................... 8,396 1,897 2.01 4.64 25,706 2006 2 ................... 6,389 1,901 1.90 4.90 21,446 2007 ..................... 6,834 2,364 1.94 5.16 25,425 2008 ..................... 7,252 1,064 2.74 5.34 25,569 2009 ..................... 6,924 1,031 2.57 5.14 23,115 2010 ..................... 5,578 2,249 2.54 5.68 26,926
Potted spring flowering bulbs 3
1,000 pots 1,000 pots Dollars per pot Dollars 1,000 dollars 2001 ..................... 7,517 10,360 1.50 3.36 46,075 2002 ..................... 7,590 12,347 1.65 3.44 55,012 2003 ..................... 7,206 12,181 1.66 3.52 54,927 2004 ..................... 5,563 11,928 1.61 3.61 51,992 2005 ..................... 14,051 9,581 1.50 3.55 55,132 2006 2 ................... 13,061 8,469 1.41 3.43 47,447 2007 ..................... 10,073 8,624 1.91 3.66 50,861 2008 ..................... 13,317 10,958 1.69 3.56 61,532 2009 ..................... 4,689 11,234 1.74 3.43 46,662 2010 ..................... 11,286 11,258 1.81 3.50 59,773
Other flowering 3
1,000 pots 1,000 pots Dollars per pot Dollars per pot 1,000 dollars 2001 ..................... 34,770 32,178 1.89 4.16 199,331 2002 ..................... 37,033 31,103 1.89 4.35 205,157 2003 ..................... 37,521 30,550 1.89 4.14 197,597 2004 ..................... 32,315 32,315 1.87 4.24 197,407 2005 ..................... 33,669 31,032 1.91 4.20 194,572 2006 2 ................... 23,220 27,703 2.01 3.77 151,158 2007 ..................... 27,176 36,862 2.09 4.51 223,111 2008 ..................... 22,529 31,482 2.10 4.91 201,962 2009 ..................... 19,531 29,173 2.13 4.62 176,570 2010 ..................... 17,406 29,998 2.80 4.52 184,294
1 Equivalent wholesale value of all sales except for potted foliage which is value of sales less cost of plant material pur-chased from other growers for growing on. 2 Beginning in 2006, program was reduced to 15 States from 36. 3 Cyclamen and kalanchoes included 2000-2003.
NASS, Crops Branch, (202) 720–2127.
Table 5-100.—Foliage Plants for Indoor or Patio Use: Sales and Wholesale value for operations with $100,000+ sales, Surveyed States, 2001–2010
Year Foliage, Hanging Baskets
Quantity Sold Wholesale price Value of sales at wholesale
1,000 baskets Dollars 1,000 dollars per basket
2001 ..................... 21,292 3.85 81,922 2002 ..................... 19,984 4.19 83,723 2003 ..................... 19,452 4.25 82,697 2004 ..................... 17,160 4.47 76,627 2005 ..................... 19,713 4.55 89,719 2006 ..................... 13,341 4.60 61,303 2007 ..................... 14,118 4.66 65,857 2008 ..................... 11,003 4.90 53,949 2009 ..................... 12,072 5.29 63,881 2010 ..................... 13,862 5.26 72,854
Foliage, Pots
1,000 pots Dollars 1,000 dollars 2001 ..................... ..................................................... ..................................................... 568,668 2002 ..................... ..................................................... ..................................................... 538,837 2003 ..................... ..................................................... ..................................................... 566,984 2004 ..................... ..................................................... ..................................................... 608,637 2005 ..................... ..................................................... ..................................................... 619,793 2006 1 ................... ..................................................... ..................................................... 466,609 2007 ..................... ..................................................... ..................................................... 589,545 2008 ..................... ..................................................... ..................................................... 456,362 2009 ..................... ..................................................... ..................................................... 493,148 2010 ..................... ..................................................... ..................................................... 498,256
1 Beginning in 2006, program was reduced to 15 States from 36. NASS, Crops Branch, (202) 720–2127.
VerDate Aug 31 2005 10:25 Feb 29, 2012 Jkt 000000 PO 00000 Frm 00048 Fmt 1000 Sfmt 1000 H:\SHARED\DAPP\FPU\AGSTAT\MASTER~2\CHAPTR05\V-51.AG8 USDA
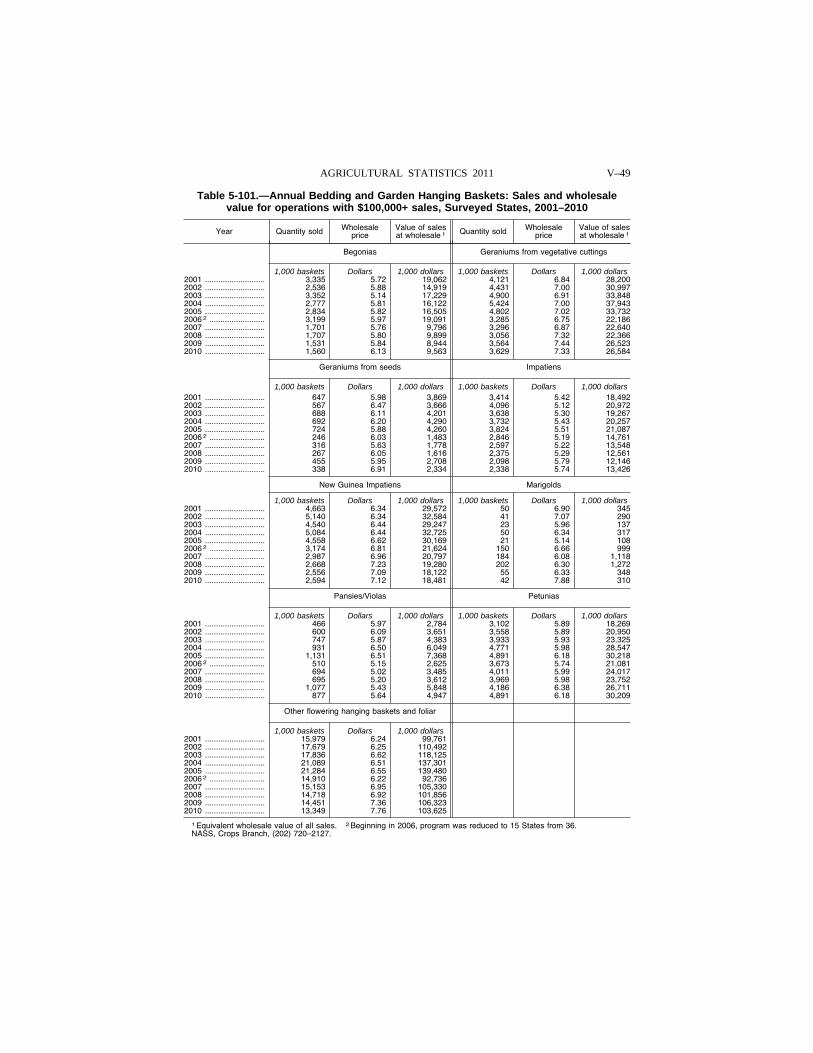
V–49 AGRICULTURAL STATISTICS 2011
Table 5-101.—Annual Bedding and Garden Hanging Baskets: Sales and wholesale value for operations with $100,000+ sales, Surveyed States, 2001–2010
Year Quantity sold Wholesale price
Value of sales at wholesale 1 Quantity sold Wholesale
price Value of sales at wholesale 1
Begonias Geraniums from vegetative cuttings
1,000 baskets Dollars 1,000 dollars 1,000 baskets Dollars 1,000 dollars 2001 ........................... 3,335 5.72 19,062 4,121 6.84 28,200 2002 ........................... 2,536 5.88 14,919 4,431 7.00 30,997 2003 ........................... 3,352 5.14 17,229 4,900 6.91 33,848 2004 ........................... 2,777 5.81 16,122 5,424 7.00 37,943 2005 ........................... 2,834 5.82 16,505 4,802 7.02 33,732 2006 2 ......................... 3,199 5.97 19,091 3,285 6.75 22,186 2007 ........................... 1,701 5.76 9,796 3,296 6.87 22,640 2008 ........................... 1,707 5.80 9,899 3,056 7.32 22,366 2009 ........................... 1,531 5.84 8,944 3,564 7.44 26,523 2010 ........................... 1,560 6.13 9,563 3,629 7.33 26,584
Geraniums from seeds Impatiens
1,000 baskets Dollars 1,000 dollars 1,000 baskets Dollars 1,000 dollars 2001 ........................... 647 5.98 3,869 3,414 5.42 18,492 2002 ........................... 567 6.47 3,666 4,096 5.12 20,972 2003 ........................... 688 6.11 4,201 3,638 5.30 19,267 2004 ........................... 692 6.20 4,290 3,732 5.43 20,257 2005 ........................... 724 5.88 4,260 3,824 5.51 21,087 2006 2 ......................... 246 6.03 1,483 2,846 5.19 14,761 2007 ........................... 316 5.63 1,778 2,597 5.22 13,548 2008 ........................... 267 6.05 1,616 2,375 5.29 12,561 2009 ........................... 455 5.95 2,708 2,098 5.79 12,146 2010 ........................... 338 6.91 2,334 2,338 5.74 13,426
New Guinea Impatiens Marigolds
1,000 baskets Dollars 1,000 dollars 1,000 baskets Dollars 1,000 dollars 2001 ........................... 4,663 6.34 29,572 50 6.90 345 2002 ........................... 5,140 6.34 32,584 41 7.07 290 2003 ........................... 4,540 6.44 29,247 23 5.96 137 2004 ........................... 5,084 6.44 32,725 50 6.34 317 2005 ........................... 4,558 6.62 30,169 21 5.14 108 2006 2 ......................... 3,174 6.81 21,624 150 6.66 999 2007 ........................... 2,987 6.96 20,797 184 6.08 1,118 2008 ........................... 2,668 7.23 19,280 202 6.30 1,272 2009 ........................... 2,556 7.09 18,122 55 6.33 348 2010 ........................... 2,594 7.12 18,481 42 7.88 310
Pansies/Violas Petunias
1,000 baskets Dollars 1,000 dollars 1,000 baskets Dollars 1,000 dollars 2001 ........................... 466 5.97 2,784 3,102 5.89 18,269 2002 ........................... 600 6.09 3,651 3,558 5.89 20,950 2003 ........................... 747 5.87 4,383 3,933 5.93 23,325 2004 ........................... 931 6.50 6,049 4,771 5.98 28,547 2005 ........................... 1,131 6.51 7,368 4,891 6.18 30,218 2006 2 ......................... 510 5.15 2,625 3,673 5.74 21,081 2007 ........................... 694 5.02 3,485 4,011 5.99 24,017 2008 ........................... 695 5.20 3,612 3,969 5.98 23,752 2009 ........................... 1,077 5.43 5,848 4,186 6.38 26,711 2010 ........................... 877 5.64 4,947 4,891 6.18 30,209
Other flowering hanging baskets and foliar
1,000 baskets Dollars 1,000 dollars 2001 ........................... 15,979 6.24 99,761 2002 ........................... 17,679 6.25 110,492 2003 ........................... 17,836 6.62 118,125 2004 ........................... 21,089 6.51 137,301 2005 ........................... 21,284 6.55 139,480 2006 2 ......................... 14,910 6.22 92,736 2007 ........................... 15,153 6.95 105,330 2008 ........................... 14,718 6.92 101,856 2009 ........................... 14,451 7.36 106,323 2010 ........................... 13,349 7.76 103,625
1 Equivalent wholesale value of all sales. 2 Beginning in 2006, program was reduced to 15 States from 36. NASS, Crops Branch, (202) 720–2127.
VerDate Aug 31 2005 10:25 Feb 29, 2012 Jkt 000000 PO 00000 Frm 00049 Fmt 1000 Sfmt 1000 H:\SHARED\DAPP\FPU\AGSTAT\MASTER~2\CHAPTR05\V-53.AG8 USDA
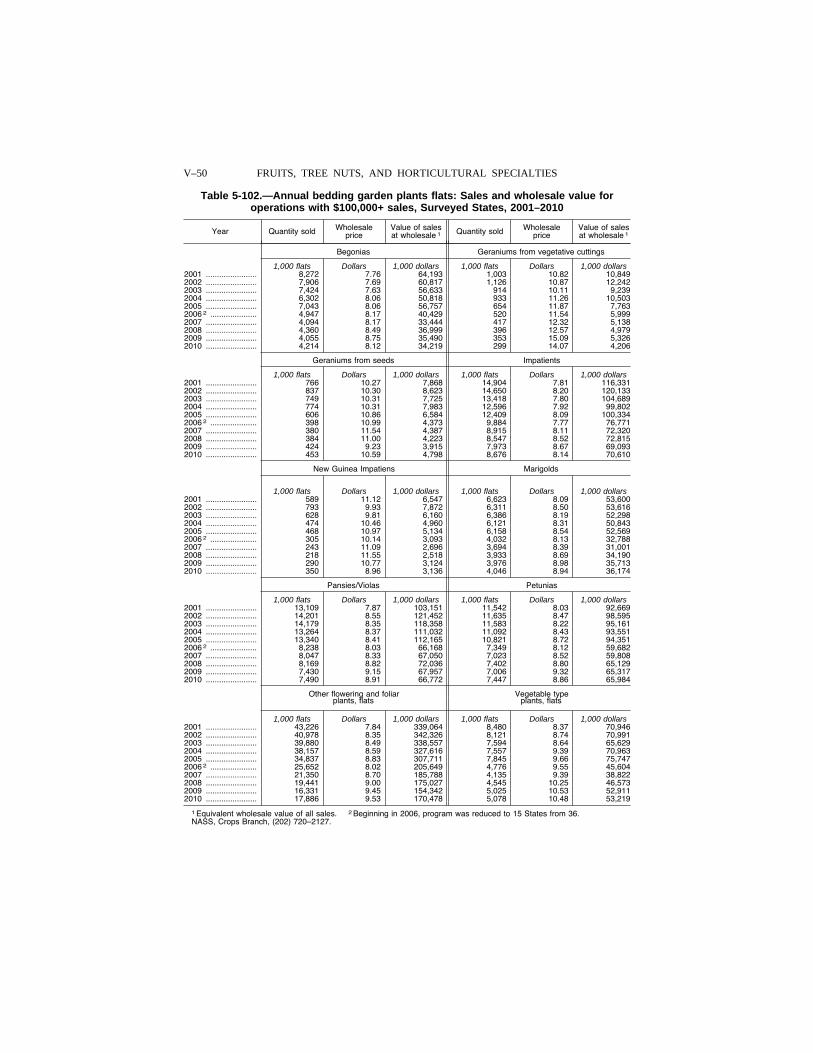
V–50 FRUITS, TREE NUTS, AND HORTICULTURAL SPECIALTIES
Table 5-102.—Annual bedding garden plants flats: Sales and wholesale value for operations with $100,000+ sales, Surveyed States, 2001–2010
Year Quantity sold Wholesale price
Value of sales at wholesale 1 Quantity sold Wholesale
price Value of sales at wholesale 1
Begonias Geraniums from vegetative cuttings
1,000 flats Dollars 1,000 dollars 1,000 flats Dollars 1,000 dollars 2001 ....................... 8,272 7.76 64,193 1,003 10.82 10,849 2002 ....................... 7,906 7.69 60,817 1,126 10.87 12,242 2003 ....................... 7,424 7.63 56,633 914 10.11 9,239 2004 ....................... 6,302 8.06 50,818 933 11.26 10,503 2005 ....................... 7,043 8.06 56,757 654 11.87 7,763 2006 2 ..................... 4,947 8.17 40,429 520 11.54 5,999 2007 ....................... 4,094 8.17 33,444 417 12.32 5,138 2008 ....................... 4,360 8.49 36,999 396 12.57 4,979 2009 ....................... 4,055 8.75 35,490 353 15.09 5,326 2010 ....................... 4,214 8.12 34,219 299 14.07 4,206
Geraniums from seeds Impatients
1,000 flats Dollars 1,000 dollars 1,000 flats Dollars 1,000 dollars 2001 ....................... 766 10.27 7,868 14,904 7.81 116,331 2002 ....................... 837 10.30 8,623 14,650 8.20 120,133 2003 ....................... 749 10.31 7,725 13,418 7.80 104,689 2004 ....................... 774 10.31 7,983 12,596 7.92 99,802 2005 ....................... 606 10.86 6,584 12,409 8.09 100,334 2006 2 ..................... 398 10.99 4,373 9,884 7.77 76,771 2007 ....................... 380 11.54 4,387 8,915 8.11 72,320 2008 ....................... 384 11.00 4,223 8,547 8.52 72,815 2009 ....................... 424 9.23 3,915 7,973 8.67 69,093 2010 ....................... 453 10.59 4,798 8,676 8.14 70,610
New Guinea Impatiens Marigolds
1,000 flats Dollars 1,000 dollars 1,000 flats Dollars 1,000 dollars 2001 ....................... 589 11.12 6,547 6,623 8.09 53,600 2002 ....................... 793 9.93 7,872 6,311 8.50 53,616 2003 ....................... 628 9.81 6,160 6,386 8.19 52,298 2004 ....................... 474 10.46 4,960 6,121 8.31 50,843 2005 ....................... 468 10.97 5,134 6,158 8.54 52,569 2006 2 ..................... 305 10.14 3,093 4,032 8.13 32,788 2007 ....................... 243 11.09 2,696 3,694 8.39 31,001 2008 ....................... 218 11.55 2,518 3,933 8.69 34,190 2009 ....................... 290 10.77 3,124 3,976 8.98 35,713 2010 ....................... 350 8.96 3,136 4,046 8.94 36,174
Pansies/Violas Petunias
1,000 flats Dollars 1,000 dollars 1,000 flats Dollars 1,000 dollars 2001 ....................... 13,109 7.87 103,151 11,542 8.03 92,669 2002 ....................... 14,201 8.55 121,452 11,635 8.47 98,595 2003 ....................... 14,179 8.35 118,358 11,583 8.22 95,161 2004 ....................... 13,264 8.37 111,032 11,092 8.43 93,551 2005 ....................... 13,340 8.41 112,165 10,821 8.72 94,351 2006 2 ..................... 8,238 8.03 66,168 7,349 8.12 59,682 2007 ....................... 8,047 8.33 67,050 7,023 8.52 59,808 2008 ....................... 8,169 8.82 72,036 7,402 8.80 65,129 2009 ....................... 7,430 9.15 67,957 7,006 9.32 65,317 2010 ....................... 7,490 8.91 66,772 7,447 8.86 65,984
Other flowering and foliar Vegetable type plants, flats plants, flats
1,000 flats Dollars 1,000 dollars 1,000 flats Dollars 1,000 dollars 2001 ....................... 43,226 7.84 339,064 8,480 8.37 70,946 2002 ....................... 40,978 8.35 342,326 8,121 8.74 70,991 2003 ....................... 39,880 8.49 338,557 7,594 8.64 65,629 2004 ....................... 38,157 8.59 327,616 7,557 9.39 70,963 2005 ....................... 34,837 8.83 307,711 7,845 9.66 75,747 2006 2 ..................... 25,652 8.02 205,649 4,776 9.55 45,604 2007 ....................... 21,350 8.70 185,788 4,135 9.39 38,822 2008 ....................... 19,441 9.00 175,027 4,545 10.25 46,573 2009 ....................... 16,331 9.45 154,342 5,025 10.53 52,911 2010 ....................... 17,886 9.53 170,478 5,078 10.48 53,219
1 Equivalent wholesale value of all sales. 2 Beginning in 2006, program was reduced to 15 States from 36.NASS, Crops Branch, (202) 720–2127.
VerDate Aug 31 2005 10:25 Feb 29, 2012 Jkt 000000 PO 00000 Frm 00050 Fmt 1000 Sfmt 1000 H:\SHARED\DAPP\FPU\AGSTAT\MASTER~2\CHAPTR05\V-55.AG8 USDA
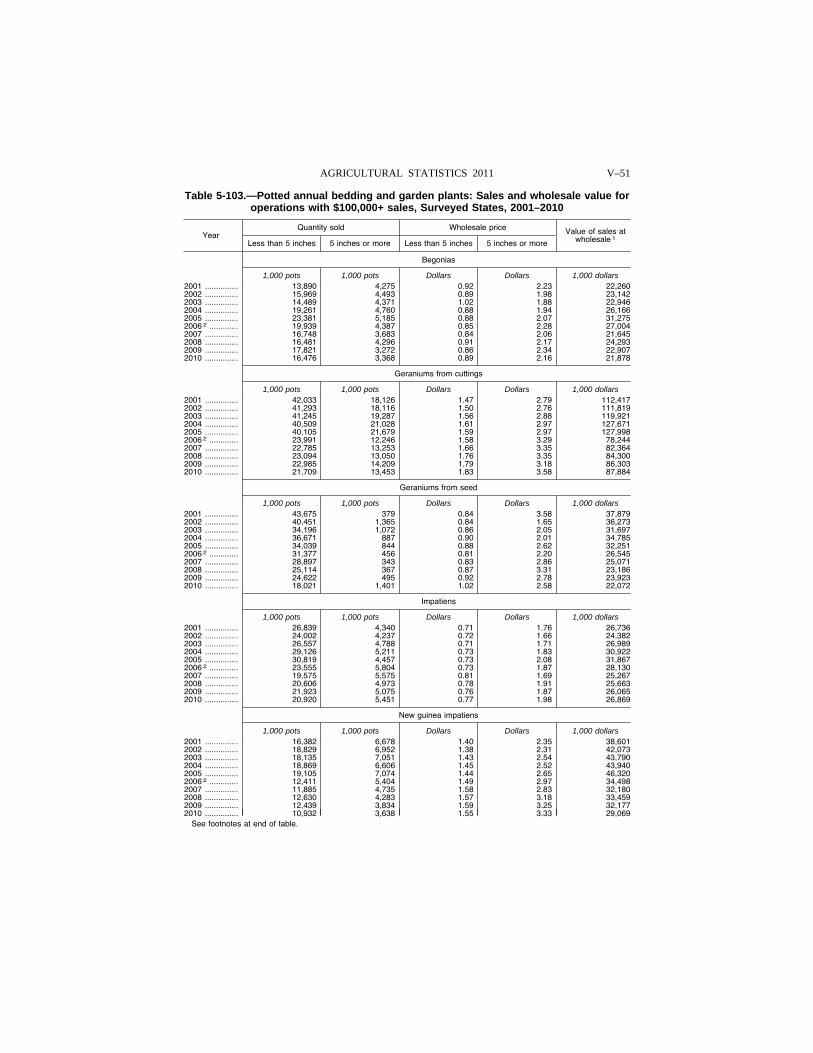
V–51 AGRICULTURAL STATISTICS 2011
Table 5-103.—Potted annual bedding and garden plants: Sales and wholesale value for operations with $100,000+ sales, Surveyed States, 2001–2010
Year Quantity sold Wholesale price Value of sales at
wholesale 1 Less than 5 inches 5 inches or more Less than 5 inches 5 inches or more
Begonias
1,000 pots 1,000 pots Dollars Dollars 1,000 dollars 2001 ............... 13,890 4,275 0.92 2.23 22,260 2002 ............... 15,969 4,493 0.89 1.98 23,142 2003 ............... 14,489 4,371 1.02 1.88 22,946 2004 ............... 19,261 4,760 0.88 1.94 26,166 2005 ............... 23,381 5,185 0.88 2.07 31,275 2006 2 ............. 19,939 4,387 0.85 2.28 27,004 2007 ............... 16,748 3,683 0.84 2.06 21,645 2008 ............... 16,481 4,296 0.91 2.17 24,293 2009 ............... 17,821 3,272 0.86 2.34 22,907 2010 ............... 16,476 3,368 0.89 2.16 21,878
Geraniums from cuttings
1,000 pots 1,000 pots Dollars Dollars 1,000 dollars 2001 ............... 42,033 18,126 1.47 2.79 112,417 2002 ............... 41,293 18,116 1.50 2.76 111,819 2003 ............... 41,245 19,287 1.56 2.88 119,921 2004 ............... 40,509 21,028 1.61 2.97 127,671 2005 ............... 40,105 21,679 1.59 2.97 127,998 2006 2 ............. 23,991 12,246 1.58 3.29 78,244 2007 ............... 22,785 13,253 1.66 3.35 82,364 2008 ............... 23,094 13,050 1.76 3.35 84,300 2009 ............... 22,985 14,209 1.79 3.18 86,303 2010 ............... 21,709 13,453 1.83 3.58 87,884
Geraniums from seed
1,000 pots 1,000 pots Dollars Dollars 1,000 dollars 2001 ............... 43,675 379 0.84 3.58 37,879 2002 ............... 40,451 1,365 0.84 1.65 36,273 2003 ............... 34,196 1,072 0.86 2.05 31,697 2004 ............... 36,671 887 0.90 2.01 34,785 2005 ............... 34,039 844 0.88 2.62 32,251 2006 2 ............. 31,377 456 0.81 2.20 26,545 2007 ............... 28,897 343 0.83 2.86 25,071 2008 ............... 25,114 367 0.87 3.31 23,186 2009 ............... 24,622 495 0.92 2.78 23,923 2010 ............... 18,021 1,401 1.02 2.58 22,072
Impatiens
1,000 pots 1,000 pots Dollars Dollars 1,000 dollars 2001 ............... 26,839 4,340 0.71 1.76 26,736 2002 ............... 24,002 4,237 0.72 1.66 24,382 2003 ............... 26,557 4,788 0.71 1.71 26,989 2004 ............... 29,126 5,211 0.73 1.83 30,922 2005 ............... 30,819 4,457 0.73 2.08 31,867 2006 2 ............. 23,555 5,804 0.73 1.87 28,130 2007 ............... 19,575 5,575 0.81 1.69 25,267 2008 ............... 20,606 4,973 0.78 1.91 25,663 2009 ............... 21,923 5,075 0.76 1.87 26,065 2010 ............... 20,920 5,451 0.77 1.98 26,869
New guinea impatiens
1,000 pots 1,000 pots Dollars Dollars 1,000 dollars 2001 ............... 16,382 6,678 1.40 2.35 38,601 2002 ............... 18,829 6,952 1.38 2.31 42,073 2003 ............... 18,135 7,051 1.43 2.54 43,790 2004 ............... 18,869 6,606 1.45 2.52 43,940 2005 ............... 19,105 7,074 1.44 2.65 46,320 2006 2 ............. 12,411 5,404 1.49 2.97 34,498 2007 ............... 11,885 4,735 1.58 2.83 32,180 2008 ............... 12,630 4,283 1.57 3.18 33,459 2009 ............... 12,439 3,834 1.59 3.25 32,177 2010 ............... 10,932 3,638 1.55 3.33 29,069
See footnotes at end of table.
VerDate Aug 31 2005 10:25 Feb 29, 2012 Jkt 000000 PO 00000 Frm 00051 Fmt 1000 Sfmt 1000 H:\SHARED\DAPP\FPU\AGSTAT\MASTER~2\CHAPTR05\V-56.AG8 USDA
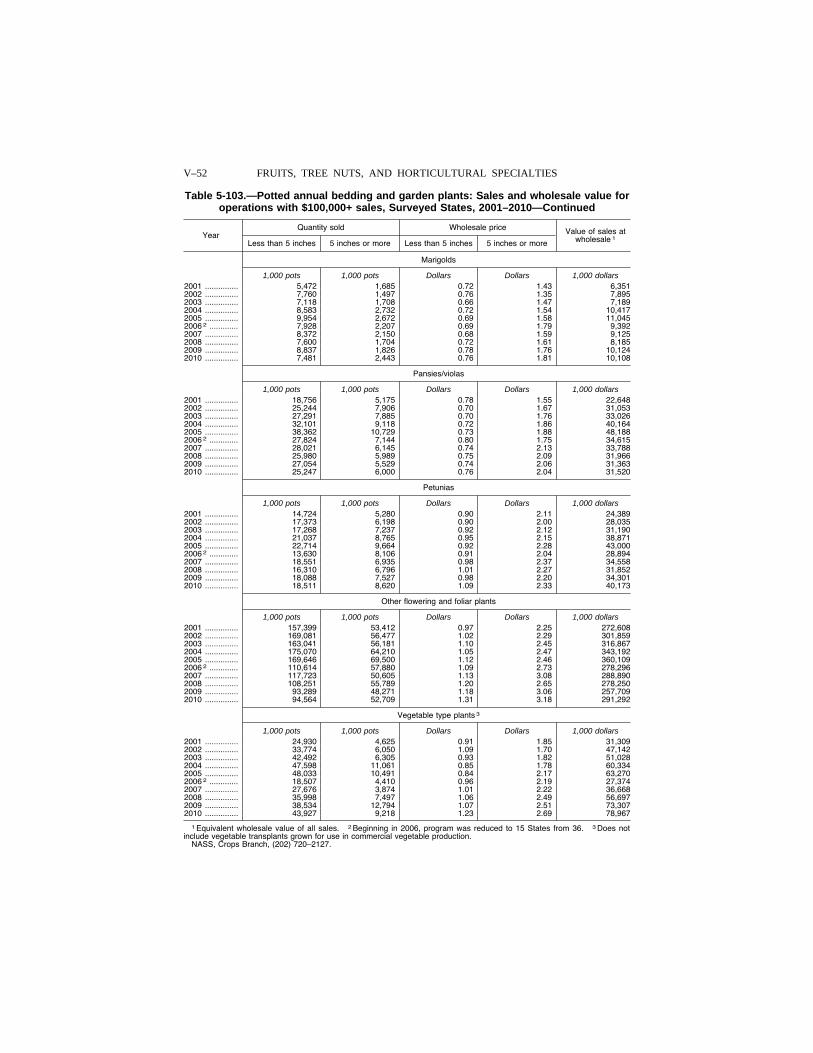
V–52 FRUITS, TREE NUTS, AND HORTICULTURAL SPECIALTIES
Table 5-103.—Potted annual bedding and garden plants: Sales and wholesale value for operations with $100,000+ sales, Surveyed States, 2001–2010—Continued
Year Quantity sold Wholesale price Value of sales at
wholesale 1 Less than 5 inches 5 inches or more Less than 5 inches 5 inches or more
Marigolds
1,000 pots 1,000 pots Dollars Dollars 1,000 dollars 2001 ............... 5,472 1,685 0.72 1.43 6,351 2002 ............... 7,760 1,497 0.76 1.35 7,895 2003 ............... 7,118 1,708 0.66 1.47 7,189 2004 ............... 8,583 2,732 0.72 1.54 10,417 2005 ............... 9,954 2,672 0.69 1.58 11,045 2006 2 ............. 7,928 2,207 0.69 1.79 9,392 2007 ............... 8,372 2,150 0.68 1.59 9,125 2008 ............... 7,600 1,704 0.72 1.61 8,185 2009 ............... 8,837 1,826 0.78 1.76 10,124 2010 ............... 7,481 2,443 0.76 1.81 10,108
Pansies/violas
1,000 pots 1,000 pots Dollars Dollars 1,000 dollars 2001 ............... 18,756 5,175 0.78 1.55 22,648 2002 ............... 25,244 7,906 0.70 1.67 31,053 2003 ............... 27,291 7,885 0.70 1.76 33,026 2004 ............... 32,101 9,118 0.72 1.86 40,164 2005 ............... 38,362 10,729 0.73 1.88 48,188 2006 2 ............. 27,824 7,144 0.80 1.75 34,615 2007 ............... 28,021 6,145 0.74 2.13 33,788 2008 ............... 25,980 5,989 0.75 2.09 31,966 2009 ............... 27,054 5,529 0.74 2.06 31,363 2010 ............... 25,247 6,000 0.76 2.04 31,520
Petunias
1,000 pots 1,000 pots Dollars Dollars 1,000 dollars 2001 ............... 14,724 5,280 0.90 2.11 24,389 2002 ............... 17,373 6,198 0.90 2.00 28,035 2003 ............... 17,268 7,237 0.92 2.12 31,190 2004 ............... 21,037 8,765 0.95 2.15 38,871 2005 ............... 22,714 9,664 0.92 2.28 43,000 2006 2 ............. 13,630 8,106 0.91 2.04 28,894 2007 ............... 18,551 6,935 0.98 2.37 34,558 2008 ............... 16,310 6,796 1.01 2.27 31,852 2009 ............... 18,088 7,527 0.98 2.20 34,301 2010 ............... 18,511 8,620 1.09 2.33 40,173
Other flowering and foliar plants
1,000 pots 1,000 pots Dollars Dollars 1,000 dollars 2001 ............... 157,399 53,412 0.97 2.25 272,608 2002 ............... 169,081 56,477 1.02 2.29 301,859 2003 ............... 163,041 56,181 1.10 2.45 316,867 2004 ............... 175,070 64,210 1.05 2.47 343,192 2005 ............... 169,646 69,500 1.12 2.46 360,109 2006 2 ............. 110,614 57,880 1.09 2.73 278,296 2007 ............... 117,723 50,605 1.13 3.08 288,890 2008 ............... 108,251 55,789 1.20 2.65 278,250 2009 ............... 93,289 48,271 1.18 3.06 257,709 2010 ............... 94,564 52,709 1.31 3.18 291,292
Vegetable type plants 3
1,000 pots 1,000 pots Dollars Dollars 1,000 dollars 2001 ............... 24,930 4,625 0.91 1.85 31,309 2002 ............... 33,774 6,050 1.09 1.70 47,142 2003 ............... 42,492 6,305 0.93 1.82 51,028 2004 ............... 47,598 11,061 0.85 1.78 60,334 2005 ............... 48,033 10,491 0.84 2.17 63,270 2006 2 ............. 18,507 4,410 0.96 2.19 27,374 2007 ............... 27,676 3,874 1.01 2.22 36,668 2008 ............... 35,998 7,497 1.06 2.49 56,697 2009 ............... 38,534 12,794 1.07 2.51 73,307 2010 ............... 43,927 9,218 1.23 2.69 78,967
1 Equivalent wholesale value of all sales. 2 Beginning in 2006, program was reduced to 15 States from 36. 3 Does not include vegetable transplants grown for use in commercial vegetable production.
NASS, Crops Branch, (202) 720–2127.
VerDate Aug 31 2005 10:25 Feb 29, 2012 Jkt 000000 PO 00000 Frm 00052 Fmt 1000 Sfmt 1000 H:\SHARED\DAPP\FPU\AGSTAT\MASTER~2\CHAPTR05\V-57.AG8 USDA
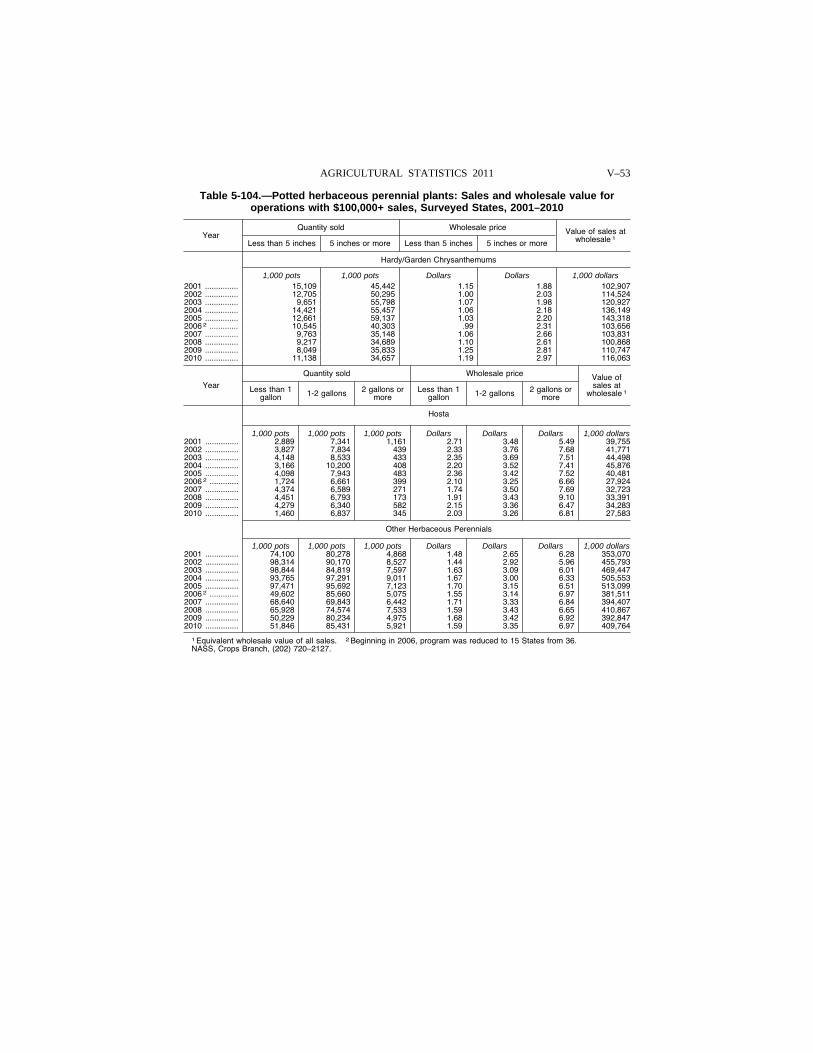
V–53 AGRICULTURAL STATISTICS 2011
Table 5-104.—Potted herbaceous perennial plants: Sales and wholesale value for operations with $100,000+ sales, Surveyed States, 2001–2010
Year Quantity sold Wholesale price Value of sales at
wholesale 1 Less than 5 inches 5 inches or more Less than 5 inches 5 inches or more
Hardy/Garden Chrysanthemums
1,000 pots 1,000 pots Dollars Dollars 1,000 dollars 2001 ............... 15,109 45,442 1.15 1.88 102,907 2002 ............... 12,705 50,295 1.00 2.03 114,524 2003 ............... 9,651 55,798 1.07 1.98 120,927 2004 ............... 14,421 55,457 1.06 2.18 136,149 2005 ............... 12,661 59,137 1.03 2.20 143,318 2006 2 ............. 10,545 40,303 .99 2.31 103,656 2007 ............... 9,763 35,148 1.06 2.66 103,831 2008 ............... 9,217 34,689 1.10 2.61 100,868 2009 ............... 8,049 35,833 1.25 2.81 110,747 2010 ............... 11,138 34,657 1.19 2.97 116,063
Year
Quantity sold Wholesale price Value of sales at
wholesale 1 Less than 1 gallon 1-2 gallons 2 gallons or
more Less than 1
gallon 1-2 gallons 2 gallons or more
Hosta
1,000 pots 1,000 pots 1,000 pots Dollars Dollars Dollars 1,000 dollars 2001 ............... 2,889 7,341 1,161 2.71 3.48 5.49 39,755 2002 ............... 3,827 7,834 439 2.33 3.76 7.68 41,771 2003 ............... 4,148 8,533 433 2.35 3.69 7.51 44,498 2004 ............... 3,166 10,200 408 2.20 3.52 7.41 45,876 2005 ............... 4,098 7,943 483 2.36 3.42 7.52 40,481 2006 2 ............. 1,724 6,661 399 2.10 3.25 6.66 27,924 2007 ............... 4,374 6,589 271 1.74 3.50 7.69 32,723 2008 ............... 4,451 6,793 173 1.91 3.43 9.10 33,391 2009 ............... 4,279 6,340 582 2.15 3.36 6.47 34,283 2010 ............... 1,460 6,837 345 2.03 3.26 6.81 27,583
Other Herbaceous Perennials
1,000 pots 1,000 pots 1,000 pots Dollars Dollars Dollars 1,000 dollars 2001 ............... 74,100 80,278 4,868 1.48 2.65 6.28 353,070 2002 ............... 98,314 90,170 8,527 1.44 2.92 5.96 455,793 2003 ............... 98,844 84,819 7,597 1.63 3.09 6.01 469,447 2004 ............... 93,765 97,291 9,011 1.67 3.00 6.33 505,553 2005 ............... 97,471 95,692 7,123 1.70 3.15 6.51 513,099 2006 2 ............. 49,602 85,660 5,075 1.55 3.14 6.97 381,511 2007 ............... 68,640 69,843 6,442 1.71 3.33 6.84 394,407 2008 ............... 65,928 74,574 7,533 1.59 3.43 6.65 410,867 2009 ............... 50,229 80,234 4,975 1.68 3.42 6.92 392,847 2010 ............... 51,846 85,431 5,921 1.59 3.35 6.97 409,764
1 Equivalent wholesale value of all sales. 2 Beginning in 2006, program was reduced to 15 States from 36. NASS, Crops Branch, (202) 720–2127.
VerDate Aug 31 2005 10:25 Feb 29, 2012 Jkt 000000 PO 00000 Frm 00053 Fmt 1000 Sfmt 1000 H:\SHARED\DAPP\FPU\AGSTAT\MASTER~2\CHAPTR05\V-58.AG8 USDA
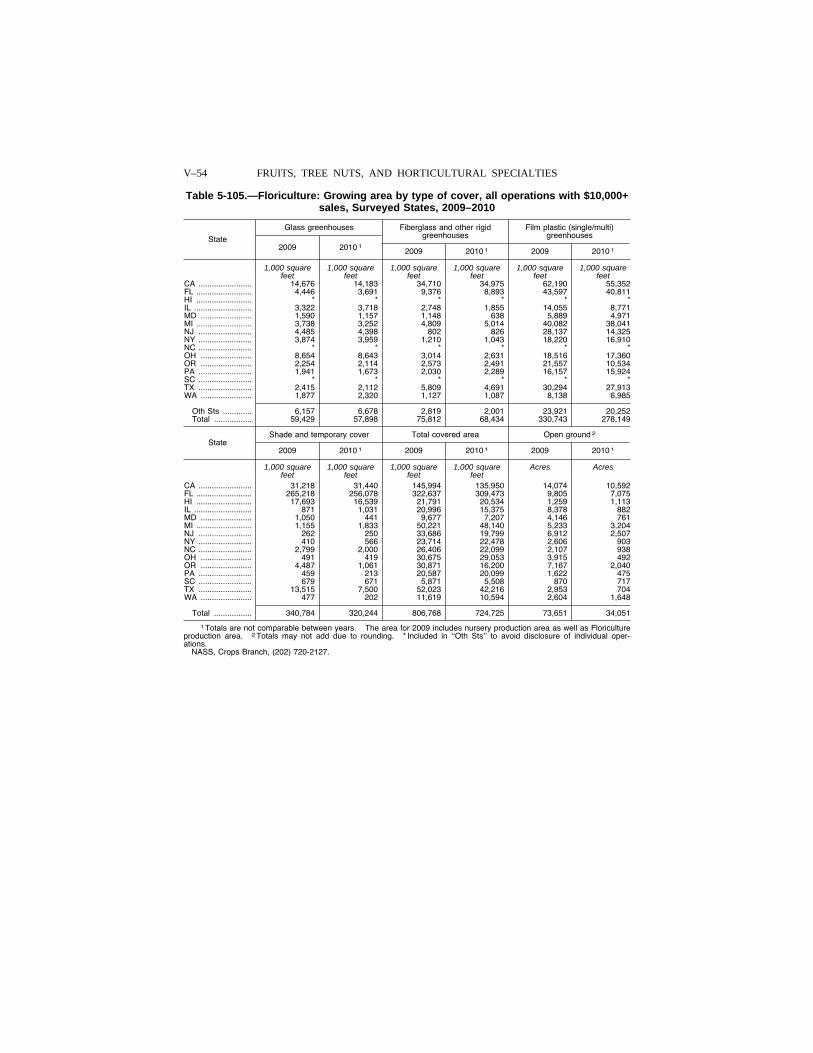
V–54 FRUITS, TREE NUTS, AND HORTICULTURAL SPECIALTIES
Table 5-105.—Floriculture: Growing area by type of cover, all operations with $10,000+ sales, Surveyed States, 2009–2010
State
Glass greenhouses Fiberglass and other rigid greenhouses
Film plastic (single/multi) greenhouses
2009 2010 1 2009 2010 1 2009 2010 1
1,000 square feet
1,000 square feet
1,000 square feet
1,000 square feet
1,000 square feet
1,000 square feet
CA ........................ 14,676 14,183 34,710 34,975 62,190 55,352 FL ......................... 4,446 3,691 9,376 8,893 43,597 40,811 HI ......................... * * * * * * IL .......................... 3,322 3,718 2,748 1,855 14,055 8,771 MD ....................... 1,590 1,157 1,148 638 5,889 4,971 MI ......................... 3,738 3,252 4,809 5,014 40,082 38,041 NJ ........................ 4,485 4,398 802 826 28,137 14,325 NY ........................ 3,874 3,959 1,210 1,043 18,220 16,910 NC ........................ * * * * * * OH ....................... 8,654 8,643 3,014 2,631 18,516 17,360 OR ....................... 2,254 2,114 2,573 2,491 21,557 10,534 PA ........................ 1,941 1,673 2,030 2,289 16,157 15,924 SC ........................ * * * * * * TX ........................ 2,415 2,112 5,809 4,691 30,294 27,913 WA ....................... 1,877 2,320 1,127 1,087 8,138 6,985
Oth Sts ............. 6,157 6,678 2,819 2,001 23,921 20,252 Total ................. 59,429 57,898 75,812 68,434 330,743 278,149
State Shade and temporary cover Total covered area Open ground 2
2009 2010 1 2009 2010 1 2009 2010 1
1,000 square feet
1,000 square feet
1,000 square feet
1,000 square feet
Acres Acres
CA ........................ 31,218 31,440 145,994 135,950 14,074 10,592 FL ......................... 265,218 256,078 322,637 309,473 9,805 7,075 HI ......................... 17,693 16,539 21,791 20,534 1,259 1,113 IL .......................... 871 1,031 20,996 15,375 8,378 882 MD ....................... 1,050 441 9,677 7,207 4,146 761 MI ......................... 1,155 1,833 50,221 48,140 5,233 3,204 NJ ........................ 262 250 33,686 19,799 6,912 2,507 NY ........................ 410 566 23,714 22,478 2,606 903 NC ........................ 2,799 2,000 26,406 22,099 2,107 938 OH ....................... 491 419 30,675 29,053 3,915 492 OR ....................... 4,487 1,061 30,871 16,200 7,167 2,040 PA ........................ 459 213 20,587 20,099 1,622 475 SC ........................ 679 671 5,871 5,508 870 717 TX ........................ 13,515 7,500 52,023 42,216 2,953 704 WA ....................... 477 202 11,619 10,594 2,604 1,648
Total ................. 340,784 320,244 806,768 724,725 73,651 34,051
1 Totals are not comparable between years. The area for 2009 includes nursery production area as well as Floriculture production area. 2 Totals may not add due to rounding. * Included in ‘‘Oth Sts’’ to avoid disclosure of individual oper-ations.
NASS, Crops Branch, (202) 720-2127.
VerDate Aug 31 2005 10:25 Feb 29, 2012 Jkt 000000 PO 00000 Frm 00054 Fmt 1000 Sfmt 1000 H:\SHARED\DAPP\FPU\AGSTAT\MASTER~2\CHAPTR05\V-59.AG8 USDA
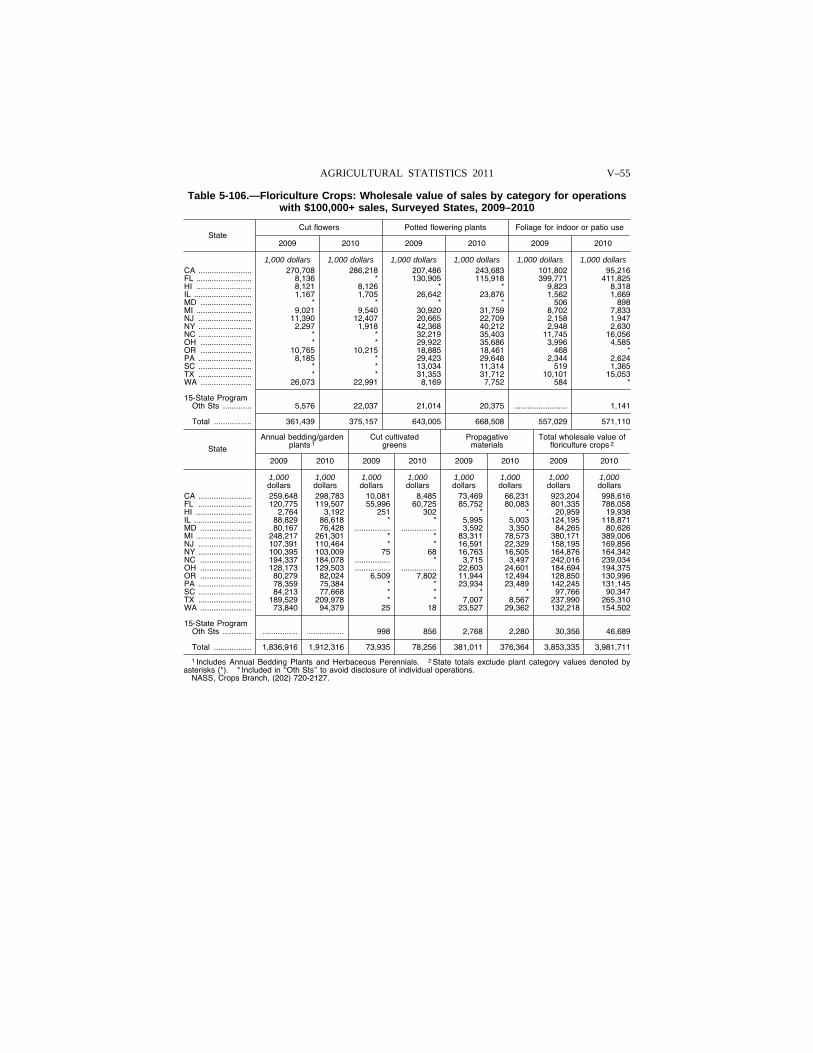
V–55 AGRICULTURAL STATISTICS 2011
Table 5-106.—Floriculture Crops: Wholesale value of sales by category for operations with $100,000+ sales, Surveyed States, 2009–2010
State Cut flowers Potted flowering plants Foliage for indoor or patio use
2009 2010 2009 2010 2009 2010
1,000 dollars 1,000 dollars 1,000 dollars 1,000 dollars 1,000 dollars 1,000 dollars CA ........................ 270,708 286,218 207,486 243,683 101,802 95,216 FL ......................... 8,136 * 130,905 115,918 399,771 411,825 HI ......................... 8,121 8,126 * * 9,823 8,318 IL .......................... 1,167 1,705 26,642 23,876 1,562 1,669 MD ....................... * * * * 506 898 MI ......................... 9,021 9,540 30,920 31,759 8,702 7,833 NJ ........................ 11,390 12,407 20,665 22,709 2,158 1,947 NY ........................ 2,297 1,918 42,368 40,212 2,948 2,630 NC ........................ * * 32,219 35,403 11,745 16,056 OH ....................... * * 29,922 35,686 3,996 4,585 OR ....................... 10,765 10,215 18,885 18,461 468 * PA ........................ 8,185 * 29,423 29,648 2,344 2,624 SC ........................ * * 13,034 11,314 519 1,365 TX ........................ * * 31,353 31,712 10,101 15,053 WA ....................... 26,073 22,991 8,169 7,752 584 *
15-State Program Oth Sts ............. 5,576 22,037 21,014 20,375 ........................ 1,141
Total ................. 361,439 375,157 643,005 668,508 557,029 571,110
State
Annual bedding/garden plants 1
Cut cultivated greens
Propagative materials
Total wholesale value of floriculture crops 2
2009 2010 2009 2010 2009 2010 2009 2010
1,000 dollars
1,000 dollars
1,000 dollars
1,000 dollars
1,000 dollars
1,000 dollars
1,000 dollars
1,000 dollars
CA ........................ 259,648 298,783 10,081 8,485 73,469 66,231 923,204 998,616 FL ........................ 120,775 119,507 55,996 60,725 85,752 80,083 801,335 788,058 HI ......................... 2,764 3,192 251 302 * * 20,959 19,938 IL .......................... 88,829 86,618 * * 5,995 5,003 124,195 118,871 MD ....................... 80,167 76,428 ................ ................ 3,592 3,350 84,265 80,626 MI ......................... 248,217 261,301 * * 83,311 78,573 380,171 389,006 NJ ........................ 107,391 110,464 * * 16,591 22,329 158,195 169,856 NY ........................ 100,395 103,009 75 68 16,763 16,505 164,876 164,342 NC ....................... 194,337 184,078 ................ * 3,715 3,497 242,016 239,034 OH ....................... 128,173 129,503 ................ ................ 22,603 24,601 184,694 194,375 OR ....................... 80,279 82,024 6,509 7,802 11,944 12,494 128,850 130,996 PA ........................ 78,359 75,384 * * 23,934 23,489 142,245 131,145 SC ........................ 84,213 77,668 * * * * 97,766 90,347 TX ........................ 189,529 209,978 * * 7,007 8,567 237,990 265,310 WA ....................... 73,840 94,379 25 18 23,527 29,362 132,218 154,502
15-State Program Oth Sts ............. ................ ................ 998 856 2,768 2,280 30,356 46,689
Total ................. 1,836,916 1,912,316 73,935 78,256 381,011 376,364 3,853,335 3,981,711
1 Includes Annual Bedding Plants and Herbaceous Perennials. 2 State totals exclude plant category values denoted by asterisks (*). * Included in ‘‘Oth Sts’’ to avoid disclosure of individual operations.
NASS, Crops Branch, (202) 720-2127.
VerDate Aug 31 2005 10:25 Feb 29, 2012 Jkt 000000 PO 00000 Frm 00055 Fmt 1000 Sfmt 1000 H:\SHARED\DAPP\FPU\AGSTAT\MASTER~2\CHAPTR05\V-62.AG8 USDA
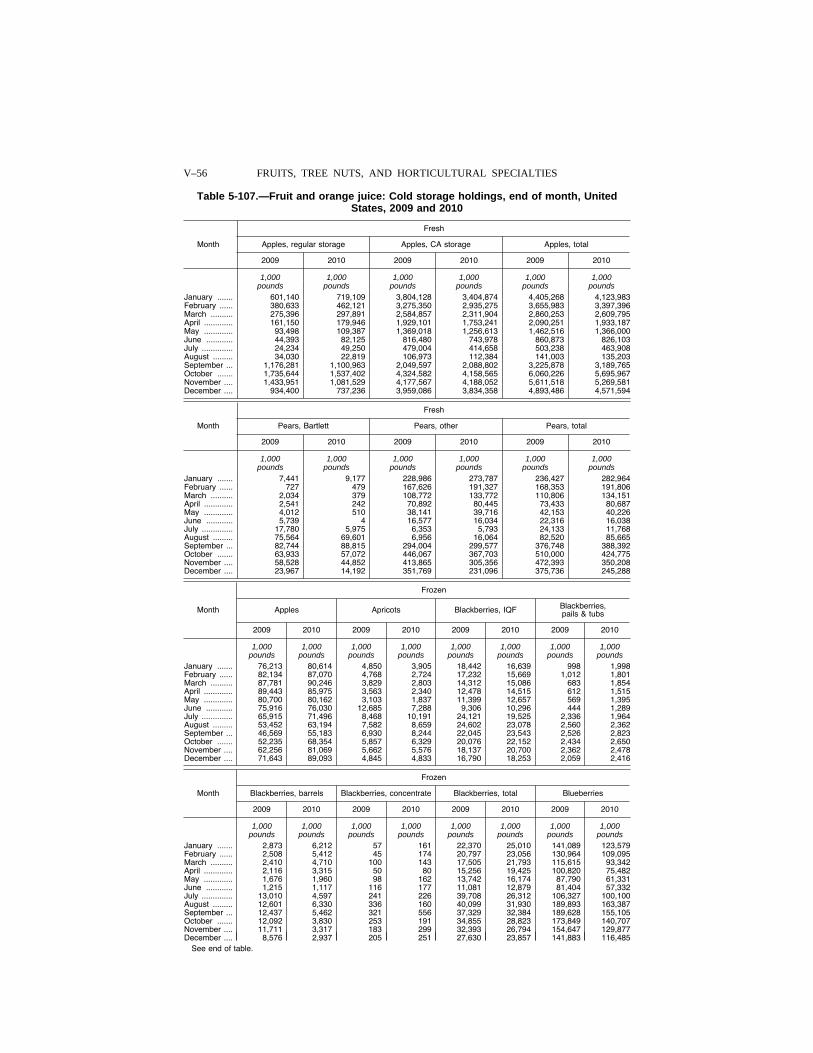
V–56 FRUITS, TREE NUTS, AND HORTICULTURAL SPECIALTIES
Table 5-107.—Fruit and orange juice: Cold storage holdings, end of month, United States, 2009 and 2010
Month
Fresh
Apples, regular storage Apples, CA storage Apples, total
2009 2010 2009 2010 2009 2010
1,000 1,000 1,000 1,000 1,000 1,000 pounds pounds pounds pounds pounds pounds
January ....... 601,140 719,109 3,804,128 3,404,874 4,405,268 4,123,983 February ...... 380,633 462,121 3,275,350 2,935,275 3,655,983 3,397,396 March .......... 275,396 297,891 2,584,857 2,311,904 2,860,253 2,609,795 April ............. 161,150 179,946 1,929,101 1,753,241 2,090,251 1,933,187 May ............. 93,498 109,387 1,369,018 1,256,613 1,462,516 1,366,000 June ............ 44,393 82,125 816,480 743,978 860,873 826,103 July .............. 24,234 49,250 479,004 414,658 503,238 463,908 August ......... 34,030 22,819 106,973 112,384 141,003 135,203 September ... 1,176,281 1,100,963 2,049,597 2,088,802 3,225,878 3,189,765 October ....... 1,735,644 1,537,402 4,324,582 4,158,565 6,060,226 5,695,967 November .... 1,433,951 1,081,529 4,177,567 4,188,052 5,611,518 5,269,581 December .... 934,400 737,236 3,959,086 3,834,358 4,893,486 4,571,594
Month
Fresh
Pears, Bartlett Pears, other Pears, total
2009 2010 2009 2010 2009 2010
1,000 1,000 1,000 1,000 1,000 1,000 pounds pounds pounds pounds pounds pounds
January ....... 7,441 9,177 228,986 273,787 236,427 282,964 February ...... 727 479 167,626 191,327 168,353 191,806 March .......... 2,034 379 108,772 133,772 110,806 134,151 April ............. 2,541 242 70,892 80,445 73,433 80,687 May ............. 4,012 510 38,141 39,716 42,153 40,226 June ............ 5,739 4 16,577 16,034 22,316 16,038 July .............. 17,780 5,975 6,353 5,793 24,133 11,768 August ......... 75,564 69,601 6,956 16,064 82,520 85,665 September ... 82,744 88,815 294,004 299,577 376,748 388,392 October ....... 63,933 57,072 446,067 367,703 510,000 424,775 November .... 58,528 44,852 413,865 305,356 472,393 350,208 December .... 23,967 14,192 351,769 231,096 375,736 245,288
Month
Frozen
Apples Apricots Blackberries, IQF Blackberries, pails & tubs
2009 2010 2009 2010 2009 2010 2009 2010
1,000 1,000 1,000 1,000 1,000 1,000 1,000 1,000 pounds pounds pounds pounds pounds pounds pounds pounds
January ....... 76,213 80,614 4,850 3,905 18,442 16,639 998 1,998 February ...... 82,134 87,070 4,768 2,724 17,232 15,669 1,012 1,801 March .......... 87,781 90,246 3,829 2,803 14,312 15,086 683 1,854 April ............. 89,443 85,975 3,563 2,340 12,478 14,515 612 1,515 May ............. 80,700 80,162 3,103 1,837 11,399 12,657 569 1,395 June ............ 75,916 76,030 12,685 7,288 9,306 10,296 444 1,289 July .............. 65,915 71,496 8,468 10,191 24,121 19,525 2,336 1,964 August ......... 53,452 63,194 7,582 8,659 24,602 23,078 2,560 2,362 September ... 46,569 55,183 6,930 8,244 22,045 23,543 2,526 2,823 October ....... 52,235 68,354 5,857 6,329 20,076 22,152 2,434 2,650 November .... 62,256 81,069 5,662 5,576 18,137 20,700 2,362 2,478 December .... 71,643 89,093 4,845 4,833 16,790 18,253 2,059 2,416
Month
Frozen
Blackberries, barrels Blackberries, concentrate Blackberries, total Blueberries
2009 2010 2009 2010 2009 2010 2009 2010
1,000 1,000 1,000 1,000 1,000 1,000 1,000 1,000 pounds pounds pounds pounds pounds pounds pounds pounds
January ....... 2,873 6,212 57 161 22,370 25,010 141,089 123,579 February ...... 2,508 5,412 45 174 20,797 23,056 130,964 109,095 March .......... 2,410 4,710 100 143 17,505 21,793 115,615 93,342 April ............. 2,116 3,315 50 80 15,256 19,425 100,820 75,482 May ............. 1,676 1,960 98 162 13,742 16,174 87,790 61,331 June ............ 1,215 1,117 116 177 11,081 12,879 81,404 57,332 July .............. 13,010 4,597 241 226 39,708 26,312 106,327 100,100 August ......... 12,601 6,330 336 160 40,099 31,930 189,893 163,387 September ... 12,437 5,462 321 556 37,329 32,384 189,628 155,105 October ....... 12,092 3,830 253 191 34,855 28,823 173,849 140,707 November .... 11,711 3,317 183 299 32,393 26,794 154,647 129,877 December .... 8,576 2,937 205 251 27,630 23,857 141,883 116,485
See end of table.
VerDate Aug 31 2005 10:25 Feb 29, 2012 Jkt 000000 PO 00000 Frm 00056 Fmt 1000 Sfmt 1000 H:\SHARED\DAPP\FPU\AGSTAT\MASTER~2\CHAPTR05\V-64.AG8 USDA
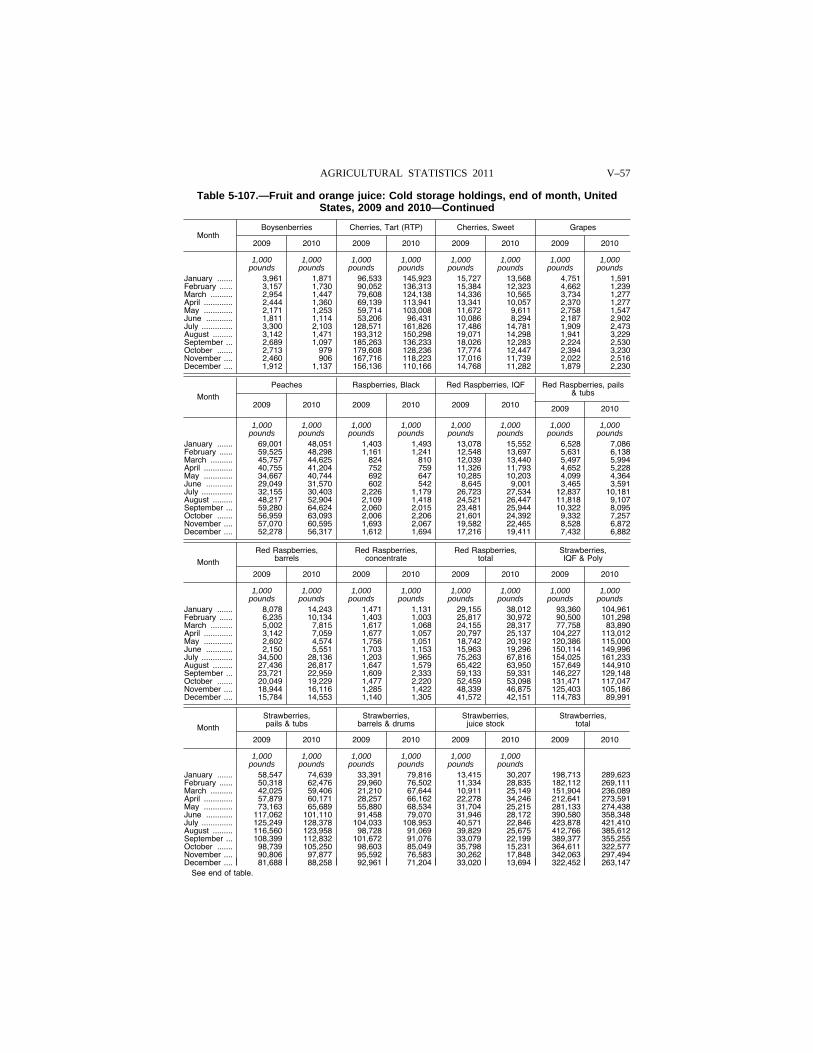
V–57 AGRICULTURAL STATISTICS 2011
Table 5-107.—Fruit and orange juice: Cold storage holdings, end of month, United States, 2009 and 2010—Continued
Month Boysenberries Cherries, Tart (RTP) Cherries, Sweet Grapes
2009 2010 2009 2010 2009 2010 2009 2010
1,000 1,000 1,000 1,000 1,000 1,000 1,000 1,000 pounds pounds pounds pounds pounds pounds pounds pounds
January ....... 3,961 1,871 96,533 145,923 15,727 13,568 4,751 1,591 February ...... 3,157 1,730 90,052 136,313 15,384 12,323 4,662 1,239 March .......... 2,954 1,447 79,608 124,138 14,336 10,565 3,734 1,277 April ............. 2,444 1,360 69,139 113,941 13,341 10,057 2,370 1,277 May ............. 2,171 1,253 59,714 103,008 11,672 9,611 2,758 1,547 June ............ 1,811 1,114 53,206 96,431 10,086 8,294 2,187 2,902 July .............. 3,300 2,103 128,571 161,826 17,486 14,781 1,909 2,473 August ......... 3,142 1,471 193,312 150,298 19,071 14,298 1,941 3,229 September ... 2,689 1,097 185,263 136,233 18,026 12,283 2,224 2,530 October ....... 2,713 979 179,608 128,236 17,774 12,447 2,394 3,230 November .... 2,460 906 167,716 118,223 17,016 11,739 2,022 2,516 December .... 1,912 1,137 156,136 110,166 14,768 11,282 1,879 2,230
Month
Peaches Raspberries, Black Red Raspberries, IQF Red Raspberries, pails & tubs
2009 2010 2009 2010 2009 2010 2009 2010
1,000 1,000 1,000 1,000 1,000 1,000 1,000 1,000 pounds pounds pounds pounds pounds pounds pounds pounds
January ....... 69,001 48,051 1,403 1,493 13,078 15,552 6,528 7,086 February ...... 59,525 48,298 1,161 1,241 12,548 13,697 5,631 6,138 March .......... 45,757 44,625 824 810 12,039 13,440 5,497 5,994 April ............. 40,755 41,204 752 759 11,326 11,793 4,652 5,228 May ............. 34,667 40,744 692 647 10,285 10,203 4,099 4,364 June ............ 29,049 31,570 602 542 8,645 9,001 3,465 3,591 July .............. 32,155 30,403 2,226 1,179 26,723 27,534 12,837 10,181 August ......... 48,217 52,904 2,109 1,418 24,521 26,447 11,818 9,107 September ... 59,280 64,624 2,060 2,015 23,481 25,944 10,322 8,095 October ....... 56,959 63,093 2,006 2,206 21,601 24,392 9,332 7,257 November .... 57,070 60,595 1,693 2,067 19,582 22,465 8,528 6,872 December .... 52,278 56,317 1,612 1,694 17,216 19,411 7,432 6,882
Month
Red Raspberries, barrels
Red Raspberries, concentrate
Red Raspberries, total
Strawberries, IQF & Poly
2009 2010 2009 2010 2009 2010 2009 2010
1,000 1,000 1,000 1,000 1,000 1,000 1,000 1,000 pounds pounds pounds pounds pounds pounds pounds pounds
January ....... 8,078 14,243 1,471 1,131 29,155 38,012 93,360 104,961 February ...... 6,235 10,134 1,403 1,003 25,817 30,972 90,500 101,298 March .......... 5,002 7,815 1,617 1,068 24,155 28,317 77,758 83,890 April ............. 3,142 7,059 1,677 1,057 20,797 25,137 104,227 113,012 May ............. 2,602 4,574 1,756 1,051 18,742 20,192 120,386 115,000 June ............ 2,150 5,551 1,703 1,153 15,963 19,296 150,114 149,996 July .............. 34,500 28,136 1,203 1,965 75,263 67,816 154,025 161,233 August ......... 27,436 26,817 1,647 1,579 65,422 63,950 157,649 144,910 September ... 23,721 22,959 1,609 2,333 59,133 59,331 146,227 129,148 October ....... 20,049 19,229 1,477 2,220 52,459 53,098 131,471 117,047 November .... 18,944 16,116 1,285 1,422 48,339 46,875 125,403 105,186 December .... 15,784 14,553 1,140 1,305 41,572 42,151 114,783 89,991
Month
Strawberries, pails & tubs
Strawberries, barrels & drums
Strawberries, juice stock
Strawberries, total
2009 2010 2009 2010 2009 2010 2009 2010
1,000 1,000 1,000 1,000 1,000 1,000 pounds pounds pounds pounds pounds pounds
January ....... 58,547 74,639 33,391 79,816 13,415 30,207 198,713 289,623 February ...... 50,318 62,476 29,960 76,502 11,334 28,835 182,112 269,111 March .......... 42,025 59,406 21,210 67,644 10,911 25,149 151,904 236,089 April ............. 57,879 60,171 28,257 66,162 22,278 34,246 212,641 273,591 May ............. 73,163 65,689 55,880 68,534 31,704 25,215 281,133 274,438 June ............ 117,062 101,110 91,458 79,070 31,946 28,172 390,580 358,348 July .............. 125,249 128,378 104,033 108,953 40,571 22,846 423,878 421,410 August ......... 116,560 123,958 98,728 91,069 39,829 25,675 412,766 385,612 September ... 108,399 112,832 101,672 91,076 33,079 22,199 389,377 355,255 October ....... 98,739 105,250 98,603 85,049 35,798 15,231 364,611 322,577 November .... 90,806 97,877 95,592 76,583 30,262 17,848 342,063 297,494 December .... 81,688 88,258 92,961 71,204 33,020 13,694 322,452 263,147
See end of table.
VerDate Aug 31 2005 10:25 Feb 29, 2012 Jkt 000000 PO 00000 Frm 00057 Fmt 1000 Sfmt 1000 H:\SHARED\DAPP\FPU\AGSTAT\MASTER~2\CHAPTR05\V-65.AG8 USDA
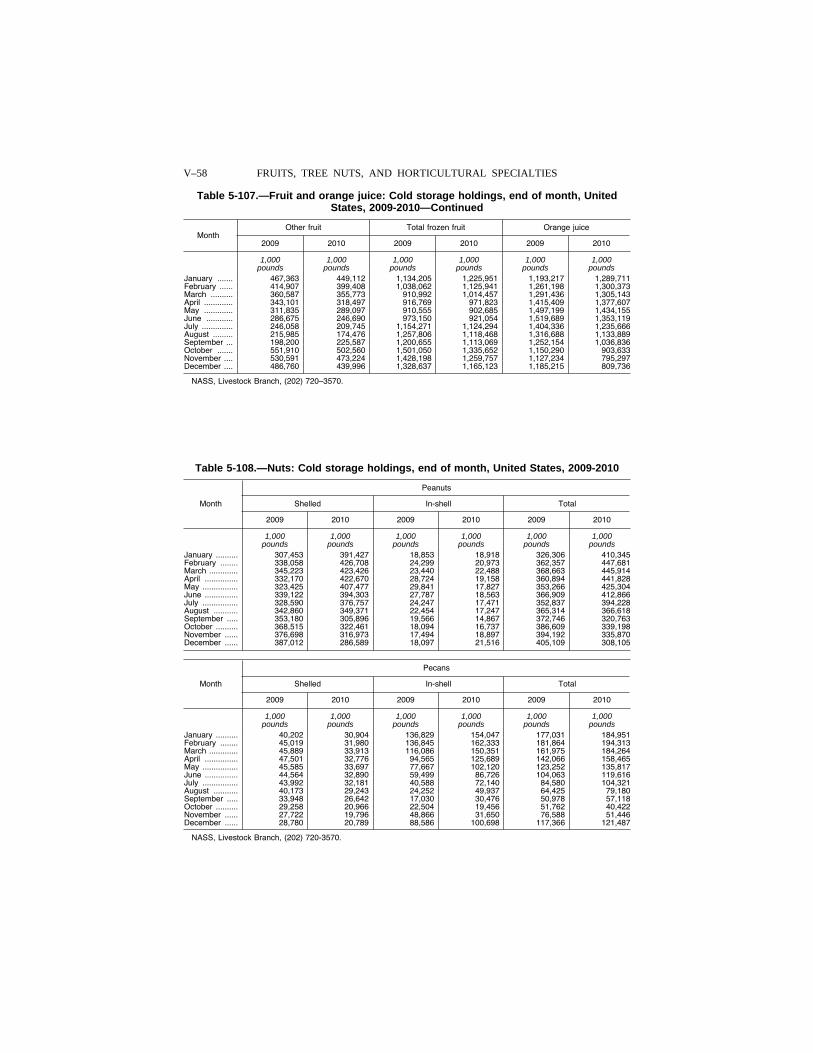
V–58 FRUITS, TREE NUTS, AND HORTICULTURAL SPECIALTIES
Table 5-107.—Fruit and orange juice: Cold storage holdings, end of month, United States, 2009-2010—Continued
Month Other fruit Total frozen fruit Orange juice
2009 2010 2009 2010 2009 2010
1,000 1,000 1,000 1,000 1,000 1,000 pounds pounds pounds pounds pounds pounds
January ....... 467,363 449,112 1,134,205 1,225,951 1,193,217 1,289,711 February ...... 414,907 399,408 1,038,062 1,125,941 1,261,198 1,300,373 March .......... 360,587 355,773 910,992 1,014,457 1,291,436 1,305,143 April ............. 343,101 318,497 916,769 971,823 1,415,409 1,377,607 May ............. 311,835 289,097 910,555 902,685 1,497,199 1,434,155 June ............ 286,675 246,690 973,150 921,054 1,519,689 1,353,119 July .............. 246,058 209,745 1,154,271 1,124,294 1,404,336 1,235,666 August ......... 215,985 174,476 1,257,806 1,118,468 1,316,688 1,133,889 September ... 198,200 225,587 1,200,655 1,113,069 1,252,154 1,036,836 October ....... 551,910 502,560 1,501,050 1,335,652 1,150,290 903,633 November .... 530,591 473,224 1,428,198 1,259,757 1,127,234 795,297 December .... 486,760 439,996 1,328,637 1,165,123 1,185,215 809,736
NASS, Livestock Branch, (202) 720–3570.
Table 5-108.—Nuts: Cold storage holdings, end of month, United States, 2009-2010
Month
Peanuts
Shelled In-shell Total
2009 2010 2009 2010 2009 2010
1,000 1,000 1,000 1,000 1,000 1,000 pounds pounds pounds pounds pounds pounds
January .......... 307,453 391,427 18,853 18,918 326,306 410,345 February ........ 338,058 426,708 24,299 20,973 362,357 447,681 March ............. 345,223 423,426 23,440 22,488 368,663 445,914 April ............... 332,170 422,670 28,724 19,158 360,894 441,828 May ................ 323,425 407,477 29,841 17,827 353,266 425,304 June ............... 339,122 394,303 27,787 18,563 366,909 412,866 July ................ 328,590 376,757 24,247 17,471 352,837 394,228 August ........... 342,860 349,371 22,454 17,247 365,314 366,618 September ..... 353,180 305,896 19,566 14,867 372,746 320,763 October .......... 368,515 322,461 18,094 16,737 386,609 339,198 November ...... 376,698 316,973 17,494 18,897 394,192 335,870 December ...... 387,012 286,589 18,097 21,516 405,109 308,105
Month
Pecans
Shelled In-shell Total
2009 2010 2009 2010 2009 2010
1,000 1,000 1,000 1,000 1,000 1,000 pounds pounds pounds pounds pounds pounds
January .......... 40,202 30,904 136,829 154,047 177,031 184,951 February ........ 45,019 31,980 136,845 162,333 181,864 194,313 March ............. 45,889 33,913 116,086 150,351 161,975 184,264 April ............... 47,501 32,776 94,565 125,689 142,066 158,465 May ................ 45,585 33,697 77,667 102,120 123,252 135,817 June ............... 44,564 32,890 59,499 86,726 104,063 119,616 July ................ 43,992 32,181 40,588 72,140 84,580 104,321 August ........... 40,173 29,243 24,252 49,937 64,425 79,180 September ..... 33,948 26,642 17,030 30,476 50,978 57,118 October .......... 29,258 20,966 22,504 19,456 51,762 40,422 November ...... 27,722 19,796 48,866 31,650 76,588 51,446 December ...... 28,780 20,789 88,586 100,698 117,366 121,487
NASS, Livestock Branch, (202) 720-3570.
VerDate Aug 31 2005 10:25 Feb 29, 2012 Jkt 000000 PO 00000 Frm 00058 Fmt 1000 Sfmt 1000 H:\SHARED\DAPP\FPU\AGSTAT\MASTER~2\CHAPTR05\V-66.AG8 USDA
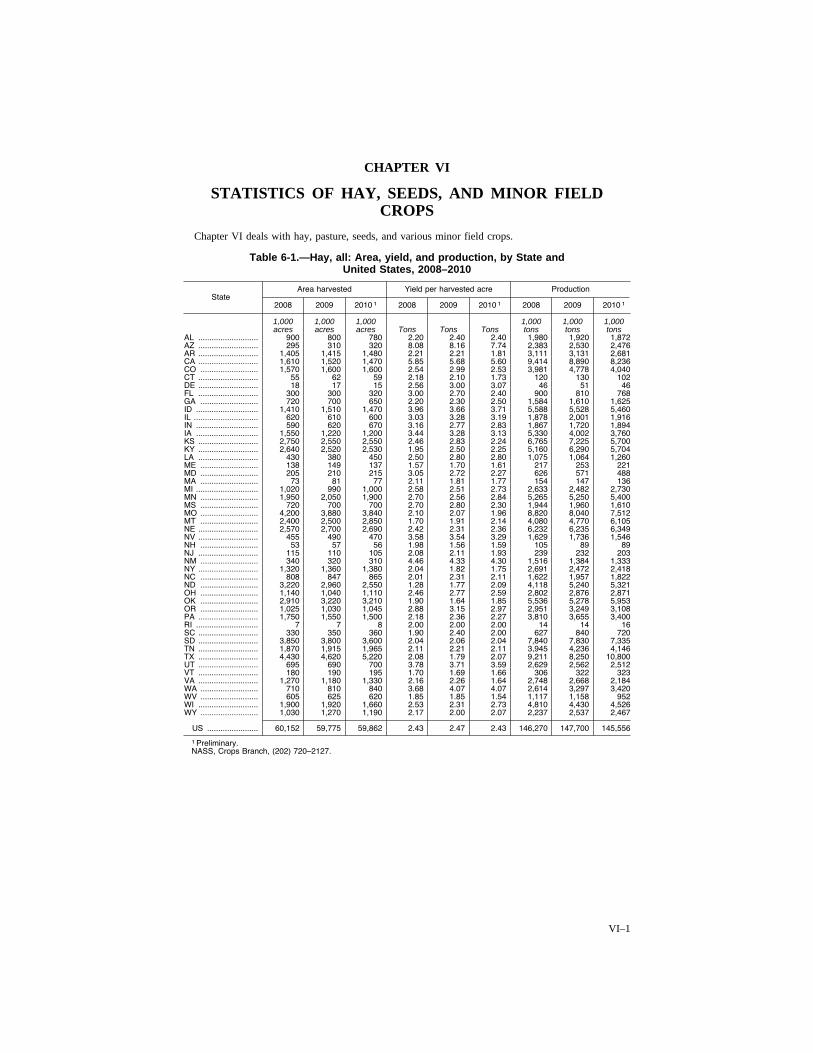
VI–1
CHAPTER VI
STATISTICS OF HAY, SEEDS, AND MINOR FIELD CROPS
Chapter VI deals with hay, pasture, seeds, and various minor field crops.
Table 6-1.—Hay, all: Area, yield, and production, by State and United States, 2008–2010
State Area harvested Yield per harvested acre Production
2008 2009 2010 1 2008 2009 2010 1 2008 2009 2010 1
1,000 1,000 1,000 1,000 1,000 1,000 acres acres acres Tons Tons Tons tons tons tons
AL ........................... 900 800 780 2.20 2.40 2.40 1,980 1,920 1,872 AZ ........................... 295 310 320 8.08 8.16 7.74 2,383 2,530 2,476 AR ........................... 1,405 1,415 1,480 2.21 2.21 1.81 3,111 3,131 2,681 CA ........................... 1,610 1,520 1,470 5.85 5.68 5.60 9,414 8,890 8,236 CO .......................... 1,570 1,600 1,600 2.54 2.99 2.53 3,981 4,778 4,040 CT ........................... 55 62 59 2.18 2.10 1.73 120 130 102 DE ........................... 18 17 15 2.56 3.00 3.07 46 51 46 FL ........................... 300 300 320 3.00 2.70 2.40 900 810 768 GA .......................... 720 700 650 2.20 2.30 2.50 1,584 1,610 1,625 ID ............................ 1,410 1,510 1,470 3.96 3.66 3.71 5,588 5,528 5,460 IL ............................. 620 610 600 3.03 3.28 3.19 1,878 2,001 1,916 IN ............................ 590 620 670 3.16 2.77 2.83 1,867 1,720 1,894 IA ............................ 1,550 1,220 1,200 3.44 3.28 3.13 5,330 4,002 3,760 KS ........................... 2,750 2,550 2,550 2.46 2.83 2.24 6,765 7,225 5,700 KY ........................... 2,640 2,520 2,530 1.95 2.50 2.25 5,160 6,290 5,704 LA ........................... 430 380 450 2.50 2.80 2.80 1,075 1,064 1,260 ME .......................... 138 149 137 1.57 1.70 1.61 217 253 221 MD .......................... 205 210 215 3.05 2.72 2.27 626 571 488 MA .......................... 73 81 77 2.11 1.81 1.77 154 147 136 MI ............................ 1,020 990 1,000 2.58 2.51 2.73 2,633 2,482 2,730 MN .......................... 1,950 2,050 1,900 2.70 2.56 2.84 5,265 5,250 5,400 MS .......................... 720 700 700 2.70 2.80 2.30 1,944 1,960 1,610 MO .......................... 4,200 3,880 3,840 2.10 2.07 1.96 8,820 8,040 7,512 MT .......................... 2,400 2,500 2,850 1.70 1.91 2.14 4,080 4,770 6,105 NE ........................... 2,570 2,700 2,690 2.42 2.31 2.36 6,232 6,235 6,349 NV ........................... 455 490 470 3.58 3.54 3.29 1,629 1,736 1,546 NH .......................... 53 57 56 1.98 1.56 1.59 105 89 89 NJ ........................... 115 110 105 2.08 2.11 1.93 239 232 203 NM .......................... 340 320 310 4.46 4.33 4.30 1,516 1,384 1,333 NY ........................... 1,320 1,360 1,380 2.04 1.82 1.75 2,691 2,472 2,418 NC .......................... 808 847 865 2.01 2.31 2.11 1,622 1,957 1,822 ND .......................... 3,220 2,960 2,550 1.28 1.77 2.09 4,118 5,240 5,321 OH .......................... 1,140 1,040 1,110 2.46 2.77 2.59 2,802 2,876 2,871 OK .......................... 2,910 3,220 3,210 1.90 1.64 1.85 5,536 5,278 5,953 OR .......................... 1,025 1,030 1,045 2.88 3.15 2.97 2,951 3,249 3,108 PA ........................... 1,750 1,550 1,500 2.18 2.36 2.27 3,810 3,655 3,400 RI ............................ 7 7 8 2.00 2.00 2.00 14 14 16 SC ........................... 330 350 360 1.90 2.40 2.00 627 840 720 SD ........................... 3,850 3,800 3,600 2.04 2.06 2.04 7,840 7,830 7,335 TN ........................... 1,870 1,915 1,965 2.11 2.21 2.11 3,945 4,236 4,146 TX ........................... 4,430 4,620 5,220 2.08 1.79 2.07 9,211 8,250 10,800 UT ........................... 695 690 700 3.78 3.71 3.59 2,629 2,562 2,512 VT ........................... 180 190 195 1.70 1.69 1.66 306 322 323 VA ........................... 1,270 1,180 1,330 2.16 2.26 1.64 2,748 2,668 2,184 WA .......................... 710 810 840 3.68 4.07 4.07 2,614 3,297 3,420 WV .......................... 605 625 620 1.85 1.85 1.54 1,117 1,158 952 WI ........................... 1,900 1,920 1,660 2.53 2.31 2.73 4,810 4,430 4,526 WY .......................... 1,030 1,270 1,190 2.17 2.00 2.07 2,237 2,537 2,467
US ....................... 60,152 59,775 59,862 2.43 2.47 2.43 146,270 147,700 145,556
1 Preliminary. NASS, Crops Branch, (202) 720–2127.
VerDate Aug 31 2005 10:29 Feb 29, 2012 Jkt 000000 PO 00000 Frm 00001 Fmt 1001 Sfmt 1001 H:\SHARED\DAPP\FPU\AGSTAT\MASTER~2\CHAPTR06\VI-01.AG8 USDA
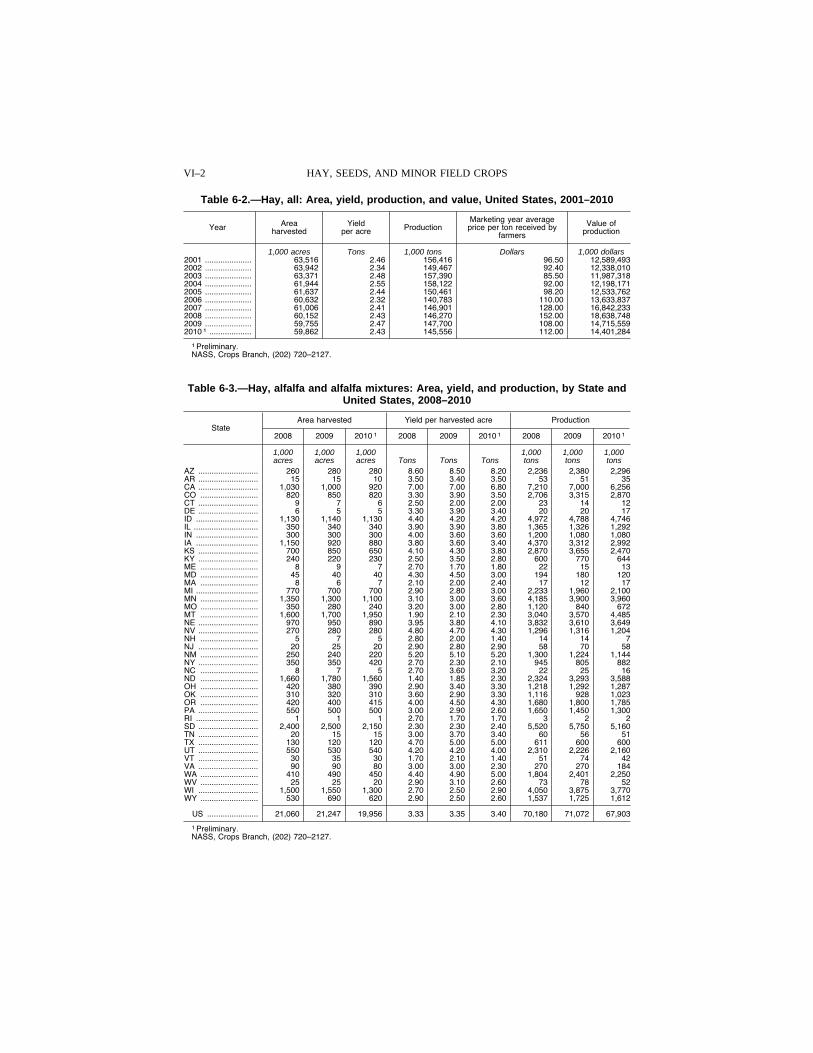
VI–2 HAY, SEEDS, AND MINOR FIELD CROPS
Table 6-2.—Hay, all: Area, yield, production, and value, United States, 2001–2010
Year Area harvested
Yield per acre Production
Marketing year average price per ton received by
farmers
Value of production
1,000 acres Tons 1,000 tons Dollars 1,000 dollars 2001 ..................... 63,516 2.46 156,416 96.50 12,589,493 2002 ..................... 63,942 2.34 149,467 92.40 12,338,010 2003 ..................... 63,371 2.48 157,390 85.50 11,987,318 2004 ..................... 61,944 2.55 158,122 92.00 12,198,171 2005 ..................... 61,637 2.44 150,461 98.20 12,533,762 2006 ..................... 60,632 2.32 140,783 110.00 13,633,837 2007 ..................... 61,006 2.41 146,901 128.00 16,842,233 2008 ..................... 60,152 2.43 146,270 152.00 18,638,748 2009 ..................... 59,755 2.47 147,700 108.00 14,715,559 2010 1 ................... 59,862 2.43 145,556 112.00 14,401,284
1 Preliminary. NASS, Crops Branch, (202) 720–2127.
Table 6-3.—Hay, alfalfa and alfalfa mixtures: Area, yield, and production, by State and United States, 2008–2010
State Area harvested Yield per harvested acre Production
2008 2009 2010 1 2008 2009 2010 1 2008 2009 2010 1
1,000 1,000 1,000 1,000 1,000 1,000 acres acres acres Tons Tons Tons tons tons tons
AZ ........................... 260 280 280 8.60 8.50 8.20 2,236 2,380 2,296 AR ........................... 15 15 10 3.50 3.40 3.50 53 51 35 CA ........................... 1,030 1,000 920 7.00 7.00 6.80 7,210 7,000 6,256 CO .......................... 820 850 820 3.30 3.90 3.50 2,706 3,315 2,870 CT ........................... 9 7 6 2.50 2.00 2.00 23 14 12 DE ........................... 6 5 5 3.30 3.90 3.40 20 20 17 ID ............................ 1,130 1,140 1,130 4.40 4.20 4.20 4,972 4,788 4,746 IL ............................. 350 340 340 3.90 3.90 3.80 1,365 1,326 1,292 IN ............................ 300 300 300 4.00 3.60 3.60 1,200 1,080 1,080 IA ............................ 1,150 920 880 3.80 3.60 3.40 4,370 3,312 2,992 KS ........................... 700 850 650 4.10 4.30 3.80 2,870 3,655 2,470 KY ........................... 240 220 230 2.50 3.50 2.80 600 770 644 ME .......................... 8 9 7 2.70 1.70 1.80 22 15 13 MD .......................... 45 40 40 4.30 4.50 3.00 194 180 120 MA .......................... 8 6 7 2.10 2.00 2.40 17 12 17 MI ............................ 770 700 700 2.90 2.80 3.00 2,233 1,960 2,100 MN .......................... 1,350 1,300 1,100 3.10 3.00 3.60 4,185 3,900 3,960 MO .......................... 350 280 240 3.20 3.00 2.80 1,120 840 672 MT .......................... 1,600 1,700 1,950 1.90 2.10 2.30 3,040 3,570 4,485 NE ........................... 970 950 890 3.95 3.80 4.10 3,832 3,610 3,649 NV ........................... 270 280 280 4.80 4.70 4.30 1,296 1,316 1,204 NH .......................... 5 7 5 2.80 2.00 1.40 14 14 7 NJ ........................... 20 25 20 2.90 2.80 2.90 58 70 58 NM .......................... 250 240 220 5.20 5.10 5.20 1,300 1,224 1,144 NY ........................... 350 350 420 2.70 2.30 2.10 945 805 882 NC .......................... 8 7 5 2.70 3.60 3.20 22 25 16 ND .......................... 1,660 1,780 1,560 1.40 1.85 2.30 2,324 3,293 3,588 OH .......................... 420 380 390 2.90 3.40 3.30 1,218 1,292 1,287 OK .......................... 310 320 310 3.60 2.90 3.30 1,116 928 1,023 OR .......................... 420 400 415 4.00 4.50 4.30 1,680 1,800 1,785 PA ........................... 550 500 500 3.00 2.90 2.60 1,650 1,450 1,300 RI ............................ 1 1 1 2.70 1.70 1.70 3 2 2 SD ........................... 2,400 2,500 2,150 2.30 2.30 2.40 5,520 5,750 5,160 TN ........................... 20 15 15 3.00 3.70 3.40 60 56 51 TX ........................... 130 120 120 4.70 5.00 5.00 611 600 600 UT ........................... 550 530 540 4.20 4.20 4.00 2,310 2,226 2,160 VT ........................... 30 35 30 1.70 2.10 1.40 51 74 42 VA ........................... 90 90 80 3.00 3.00 2.30 270 270 184 WA .......................... 410 490 450 4.40 4.90 5.00 1,804 2,401 2,250 WV .......................... 25 25 20 2.90 3.10 2.60 73 78 52 WI ........................... 1,500 1,550 1,300 2.70 2.50 2.90 4,050 3,875 3,770 WY .......................... 530 690 620 2.90 2.50 2.60 1,537 1,725 1,612
US ....................... 21,060 21,247 19,956 3.33 3.35 3.40 70,180 71,072 67,903
1 Preliminary. NASS, Crops Branch, (202) 720–2127.
VerDate Aug 31 2005 10:29 Feb 29, 2012 Jkt 000000 PO 00000 Frm 00002 Fmt 1000 Sfmt 1000 H:\SHARED\DAPP\FPU\AGSTAT\MASTER~2\CHAPTR06\VI-02.AG8 USDA
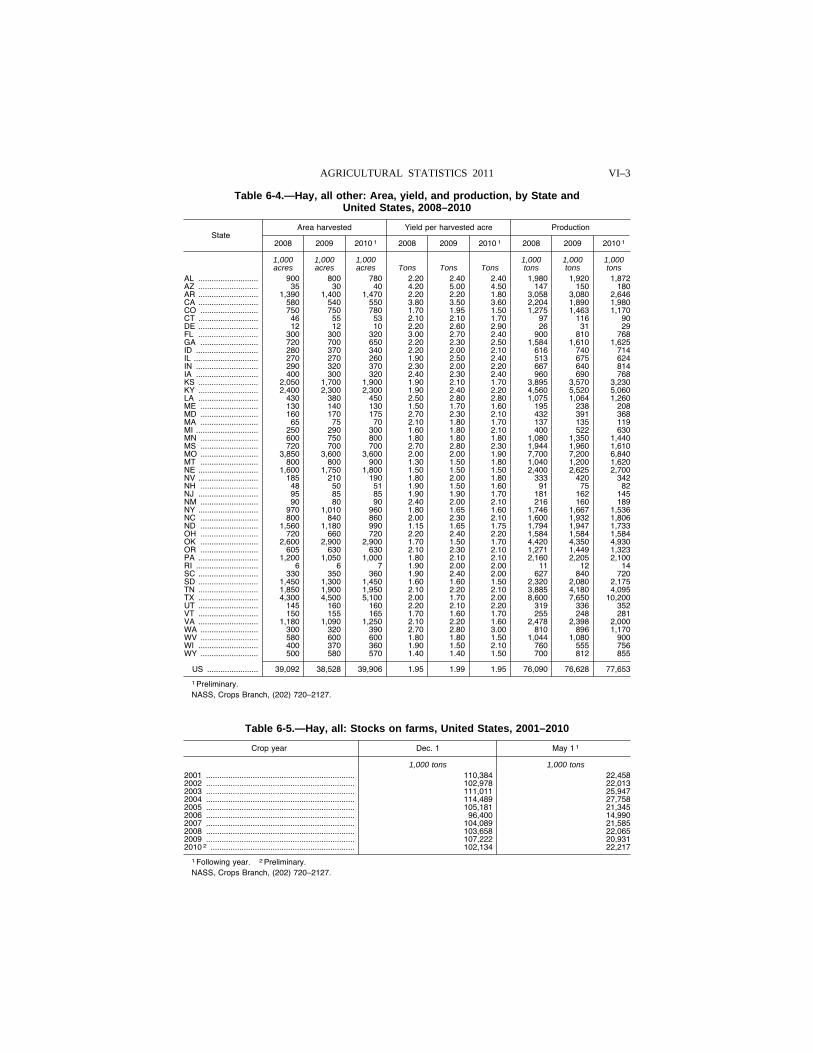
VI–3 AGRICULTURAL STATISTICS 2011
Table 6-4.—Hay, all other: Area, yield, and production, by State and United States, 2008–2010
State Area harvested Yield per harvested acre Production
2008 2009 2010 1 2008 2009 2010 1 2008 2009 2010 1
1,000 1,000 1,000 1,000 1,000 1,000 acres acres acres Tons Tons Tons tons tons tons
AL ........................... 900 800 780 2.20 2.40 2.40 1,980 1,920 1,872 AZ ........................... 35 30 40 4.20 5.00 4.50 147 150 180 AR ........................... 1,390 1,400 1,470 2.20 2.20 1.80 3,058 3,080 2,646 CA ........................... 580 540 550 3.80 3.50 3.60 2,204 1,890 1,980 CO .......................... 750 750 780 1.70 1.95 1.50 1,275 1,463 1,170 CT ........................... 46 55 53 2.10 2.10 1.70 97 116 90 DE ........................... 12 12 10 2.20 2.60 2.90 26 31 29 FL ........................... 300 300 320 3.00 2.70 2.40 900 810 768 GA .......................... 720 700 650 2.20 2.30 2.50 1,584 1,610 1,625 ID ............................ 280 370 340 2.20 2.00 2.10 616 740 714 IL ............................. 270 270 260 1.90 2.50 2.40 513 675 624 IN ............................ 290 320 370 2.30 2.00 2.20 667 640 814 IA ............................ 400 300 320 2.40 2.30 2.40 960 690 768 KS ........................... 2,050 1,700 1,900 1.90 2.10 1.70 3,895 3,570 3,230 KY ........................... 2,400 2,300 2,300 1.90 2.40 2.20 4,560 5,520 5,060 LA ........................... 430 380 450 2.50 2.80 2.80 1,075 1,064 1,260 ME .......................... 130 140 130 1.50 1.70 1.60 195 238 208 MD .......................... 160 170 175 2.70 2.30 2.10 432 391 368 MA .......................... 65 75 70 2.10 1.80 1.70 137 135 119 MI ............................ 250 290 300 1.60 1.80 2.10 400 522 630 MN .......................... 600 750 800 1.80 1.80 1.80 1,080 1,350 1,440 MS .......................... 720 700 700 2.70 2.80 2.30 1,944 1,960 1,610 MO .......................... 3,850 3,600 3,600 2.00 2.00 1.90 7,700 7,200 6,840 MT .......................... 800 800 900 1.30 1.50 1.80 1,040 1,200 1,620 NE ........................... 1,600 1,750 1,800 1.50 1.50 1.50 2,400 2,625 2,700 NV ........................... 185 210 190 1.80 2.00 1.80 333 420 342 NH .......................... 48 50 51 1.90 1.50 1.60 91 75 82 NJ ........................... 95 85 85 1.90 1.90 1.70 181 162 145 NM .......................... 90 80 90 2.40 2.00 2.10 216 160 189 NY ........................... 970 1,010 960 1.80 1.65 1.60 1,746 1,667 1,536 NC .......................... 800 840 860 2.00 2.30 2.10 1,600 1,932 1,806 ND .......................... 1,560 1,180 990 1.15 1.65 1.75 1,794 1,947 1,733 OH .......................... 720 660 720 2.20 2.40 2.20 1,584 1,584 1,584 OK .......................... 2,600 2,900 2,900 1.70 1.50 1.70 4,420 4,350 4,930 OR .......................... 605 630 630 2.10 2.30 2.10 1,271 1,449 1,323 PA ........................... 1,200 1,050 1,000 1.80 2.10 2.10 2,160 2,205 2,100 RI ............................ 6 6 7 1.90 2.00 2.00 11 12 14 SC ........................... 330 350 360 1.90 2.40 2.00 627 840 720 SD ........................... 1,450 1,300 1,450 1.60 1.60 1.50 2,320 2,080 2,175 TN ........................... 1,850 1,900 1,950 2.10 2.20 2.10 3,885 4,180 4,095 TX ........................... 4,300 4,500 5,100 2.00 1.70 2.00 8,600 7,650 10,200 UT ........................... 145 160 160 2.20 2.10 2.20 319 336 352 VT ........................... 150 155 165 1.70 1.60 1.70 255 248 281 VA ........................... 1,180 1,090 1,250 2.10 2.20 1.60 2,478 2,398 2,000 WA .......................... 300 320 390 2.70 2.80 3.00 810 896 1,170 WV .......................... 580 600 600 1.80 1.80 1.50 1,044 1,080 900 WI ........................... 400 370 360 1.90 1.50 2.10 760 555 756 WY .......................... 500 580 570 1.40 1.40 1.50 700 812 855
US ....................... 39,092 38,528 39,906 1.95 1.99 1.95 76,090 76,628 77,653
1 Preliminary. NASS, Crops Branch, (202) 720–2127.
Table 6-5.—Hay, all: Stocks on farms, United States, 2001–2010
Crop year Dec. 1 May 1 1
1,000 tons 1,000 tons 2001 ................................................................... 110,384 22,458 2002 ................................................................... 102,978 22,013 2003 ................................................................... 111,011 25,947 2004 ................................................................... 114,489 27,758 2005 ................................................................... 105,181 21,345 2006 ................................................................... 96,400 14,990 2007 ................................................................... 104,089 21,585 2008 ................................................................... 103,658 22,065 2009 ................................................................... 107,222 20,931 2010 2 ................................................................. 102,134 22,217
1 Following year. 2 Preliminary. NASS, Crops Branch, (202) 720–2127.
VerDate Aug 31 2005 10:29 Feb 29, 2012 Jkt 000000 PO 00000 Frm 00003 Fmt 1000 Sfmt 1000 H:\SHARED\DAPP\FPU\AGSTAT\MASTER~2\CHAPTR06\VI-03.AG8 USDA
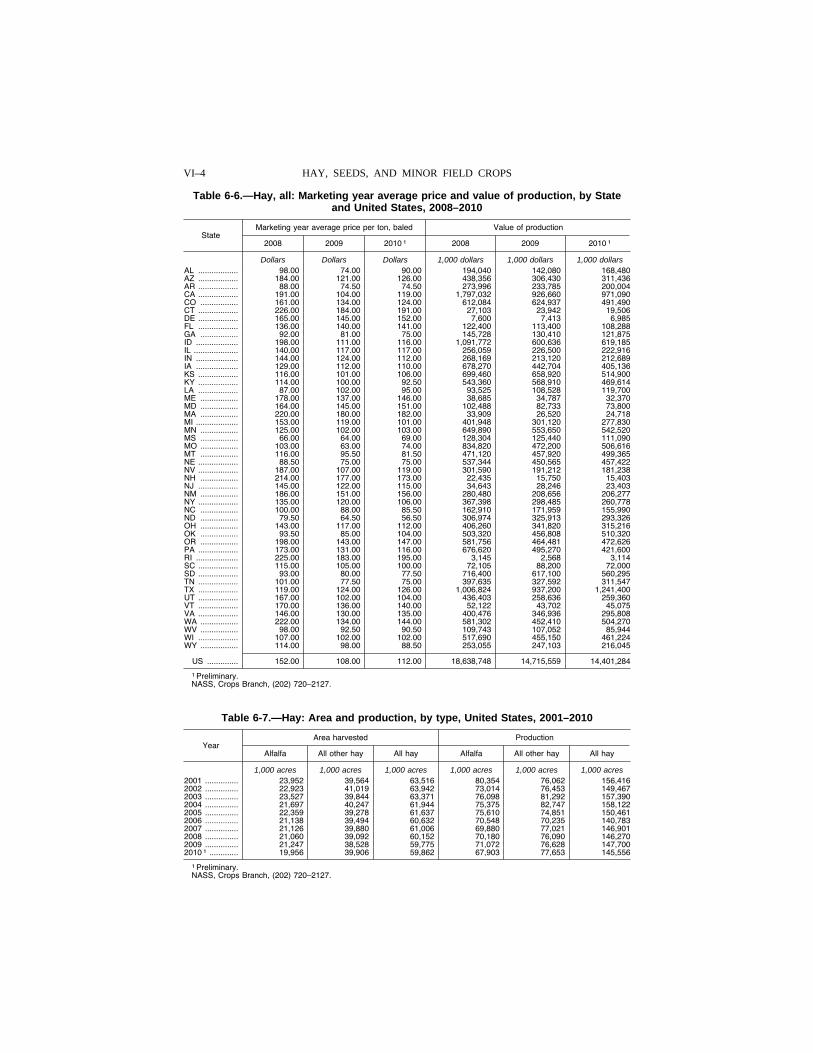
VI–4 HAY, SEEDS, AND MINOR FIELD CROPS
Table 6-6.—Hay, all: Marketing year average price and value of production, by State and United States, 2008–2010
State Marketing year average price per ton, baled Value of production
2008 2009 2010 1 2008 2009 2010 1
Dollars Dollars Dollars 1,000 dollars 1,000 dollars 1,000 dollars AL .................. 98.00 74.00 90.00 194,040 142,080 168,480 AZ .................. 184.00 121.00 126.00 438,356 306,430 311,436 AR .................. 88.00 74.50 74.50 273,996 233,785 200,004 CA .................. 191.00 104.00 119.00 1,797,032 926,660 971,090 CO ................. 161.00 134.00 124.00 612,084 624,937 491,490 CT .................. 226.00 184.00 191.00 27,103 23,942 19,506 DE .................. 165.00 145.00 152.00 7,600 7,413 6,985 FL .................. 136.00 140.00 141.00 122,400 113,400 108,288 GA ................. 92.00 81.00 75.00 145,728 130,410 121,875 ID ................... 198.00 111.00 116.00 1,091,772 600,636 619,185 IL .................... 140.00 117.00 117.00 256,059 226,500 222,916 IN ................... 144.00 124.00 112.00 268,169 213,120 212,689 IA ................... 129.00 112.00 110.00 678,270 442,704 405,136 KS .................. 116.00 101.00 106.00 699,460 658,920 514,900 KY .................. 114.00 100.00 92.50 543,360 568,910 469,614 LA .................. 87.00 102.00 95.00 93,525 108,528 119,700 ME ................. 178.00 137.00 146.00 38,685 34,787 32,370 MD ................. 164.00 145.00 151.00 102,488 82,733 73,800 MA ................. 220.00 180.00 182.00 33,909 26,520 24,718 MI ................... 153.00 119.00 101.00 401,948 301,120 277,830 MN ................. 125.00 102.00 103.00 649,890 553,650 542,520 MS ................. 66.00 64.00 69.00 128,304 125,440 111,090 MO ................. 103.00 63.00 74.00 834,820 472,200 506,616 MT ................. 116.00 95.50 81.50 471,120 457,920 499,365 NE .................. 88.50 75.00 75.00 537,344 450,565 457,422 NV .................. 187.00 107.00 119.00 301,590 191,212 181,238 NH ................. 214.00 177.00 173.00 22,435 15,750 15,403 NJ .................. 145.00 122.00 115.00 34,643 28,246 23,403 NM ................. 186.00 151.00 156.00 280,480 208,656 206,277 NY .................. 135.00 120.00 106.00 367,398 298,485 260,778 NC ................. 100.00 88.00 85.50 162,910 171,959 155,990 ND ................. 79.50 64.50 56.50 306,974 325,913 293,326 OH ................. 143.00 117.00 112.00 406,260 341,820 315,216 OK ................. 93.50 85.00 104.00 503,320 456,808 510,320 OR ................. 198.00 143.00 147.00 581,756 464,481 472,626 PA .................. 173.00 131.00 116.00 676,620 495,270 421,600 RI ................... 225.00 183.00 195.00 3,145 2,568 3,114 SC .................. 115.00 105.00 100.00 72,105 88,200 72,000 SD .................. 93.00 80.00 77.50 716,400 617,100 560,295 TN .................. 101.00 77.50 75.00 397,635 327,592 311,547 TX .................. 119.00 124.00 126.00 1,006,824 937,200 1,241,400 UT .................. 167.00 102.00 104.00 436,403 258,636 259,360 VT .................. 170.00 136.00 140.00 52,122 43,702 45,075 VA .................. 146.00 130.00 135.00 400,476 346,936 295,808 WA ................. 222.00 134.00 144.00 581,302 452,410 504,270 WV ................. 98.00 92.50 90.50 109,743 107,052 85,944 WI .................. 107.00 102.00 102.00 517,690 455,150 461,224 WY ................. 114.00 98.00 88.50 253,055 247,103 216,045
US .............. 152.00 108.00 112.00 18,638,748 14,715,559 14,401,284
1 Preliminary. NASS, Crops Branch, (202) 720–2127.
Table 6-7.—Hay: Area and production, by type, United States, 2001–2010
Year Area harvested Production
Alfalfa All other hay All hay Alfalfa All other hay All hay
1,000 acres 1,000 acres 1,000 acres 1,000 acres 1,000 acres 1,000 acres 2001 ............... 23,952 39,564 63,516 80,354 76,062 156,416 2002 ............... 22,923 41,019 63,942 73,014 76,453 149,467 2003 ............... 23,527 39,844 63,371 76,098 81,292 157,390 2004 ............... 21,697 40,247 61,944 75,375 82,747 158,122 2005 ............... 22,359 39,278 61,637 75,610 74,851 150,461 2006 ............... 21,138 39,494 60,632 70,548 70,235 140,783 2007 ............... 21,126 39,880 61,006 69,880 77,021 146,901 2008 ............... 21,060 39,092 60,152 70,180 76,090 146,270 2009 ............... 21,247 38,528 59,775 71,072 76,628 147,700 2010 1 ............. 19,956 39,906 59,862 67,903 77,653 145,556
1 Preliminary. NASS, Crops Branch, (202) 720–2127.
VerDate Aug 31 2005 10:29 Feb 29, 2012 Jkt 000000 PO 00000 Frm 00004 Fmt 1000 Sfmt 1000 H:\SHARED\DAPP\FPU\AGSTAT\MASTER~2\CHAPTR06\VI-04.AG8 USDA
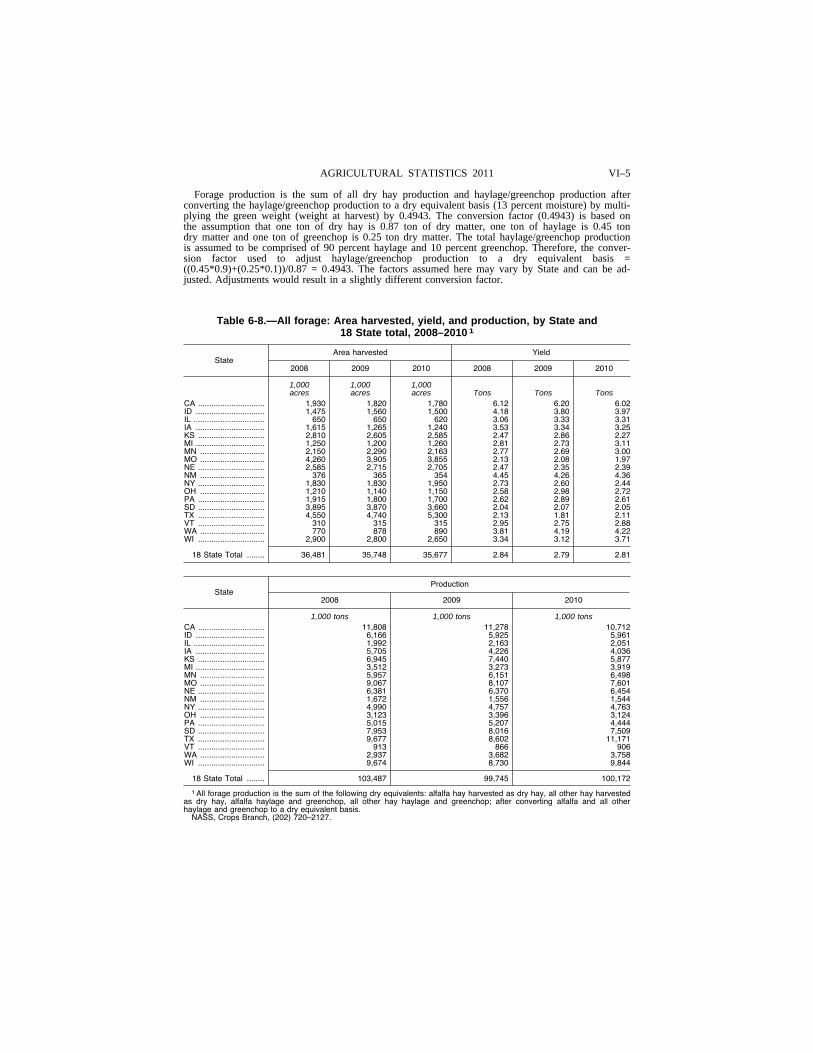
VI–5 AGRICULTURAL STATISTICS 2011
Forage production is the sum of all dry hay production and haylage/greenchop production after converting the haylage/greenchop production to a dry equivalent basis (13 percent moisture) by multi-plying the green weight (weight at harvest) by 0.4943. The conversion factor (0.4943) is based on the assumption that one ton of dry hay is 0.87 ton of dry matter, one ton of haylage is 0.45 ton dry matter and one ton of greenchop is 0.25 ton dry matter. The total haylage/greenchop production is assumed to be comprised of 90 percent haylage and 10 percent greenchop. Therefore, the conver-sion factor used to adjust haylage/greenchop production to a dry equivalent basis = ((0.45*0.9)+(0.25*0.1))/0.87 = 0.4943. The factors assumed here may vary by State and can be ad-justed. Adjustments would result in a slightly different conversion factor.
Table 6-8.—All forage: Area harvested, yield, and production, by State and 18 State total, 2008–2010 1
State Area harvested Yield
2008 2009 2010 2008 2009 2010
1,000 1,000 1,000 acres acres acres Tons Tons Tons
CA .............................. 1,930 1,820 1,780 6.12 6.20 6.02 ID ............................... 1,475 1,560 1,500 4.18 3.80 3.97 IL ................................ 650 650 620 3.06 3.33 3.31 IA ............................... 1,615 1,265 1,240 3.53 3.34 3.25 KS .............................. 2,810 2,605 2,585 2.47 2.86 2.27 MI ............................... 1,250 1,200 1,260 2.81 2.73 3.11 MN ............................. 2,150 2,290 2,163 2.77 2.69 3.00 MO ............................. 4,260 3,905 3,855 2.13 2.08 1.97 NE .............................. 2,585 2,715 2,705 2.47 2.35 2.39 NM ............................. 376 365 354 4.45 4.26 4.36 NY .............................. 1,830 1,830 1,950 2.73 2.60 2.44 OH ............................. 1,210 1,140 1,150 2.58 2.98 2.72 PA .............................. 1,915 1,800 1,700 2.62 2.89 2.61 SD .............................. 3,895 3,870 3,660 2.04 2.07 2.05 TX .............................. 4,550 4,740 5,300 2.13 1.81 2.11 VT .............................. 310 315 315 2.95 2.75 2.88 WA ............................. 770 878 890 3.81 4.19 4.22 WI .............................. 2,900 2,800 2,650 3.34 3.12 3.71
18 State Total ........ 36,481 35,748 35,677 2.84 2.79 2.81
State Production
2008 2009 2010
1,000 tons 1,000 tons 1,000 tons CA .............................. 11,808 11,278 10,712 ID ............................... 6,166 5,925 5,961 IL ................................ 1,992 2,163 2,051 IA ............................... 5,705 4,226 4,036 KS .............................. 6,945 7,440 5,877 MI ............................... 3,512 3,273 3,919 MN ............................. 5,957 6,151 6,498 MO ............................. 9,067 8,107 7,601 NE .............................. 6,381 6,370 6,454 NM ............................. 1,672 1,556 1,544 NY .............................. 4,990 4,757 4,763 OH ............................. 3,123 3,396 3,124 PA .............................. 5,015 5,207 4,444 SD .............................. 7,953 8,016 7,509 TX .............................. 9,677 8,602 11,171 VT .............................. 913 866 906 WA ............................. 2,937 3,682 3,758 WI .............................. 9,674 8,730 9,844
18 State Total ........ 103,487 99,745 100,172
1 All forage production is the sum of the following dry equivalents: alfalfa hay harvested as dry hay, all other hay harvested as dry hay, alfalfa haylage and greenchop, all other hay haylage and greenchop; after converting alfalfa and all other haylage and greenchop to a dry equivalent basis.
NASS, Crops Branch, (202) 720–2127.
VerDate Aug 31 2005 10:29 Feb 29, 2012 Jkt 000000 PO 00000 Frm 00005 Fmt 1000 Sfmt 1000 H:\SHARED\DAPP\FPU\AGSTAT\MASTER~2\CHAPTR06\VI-05.AG8 USDA
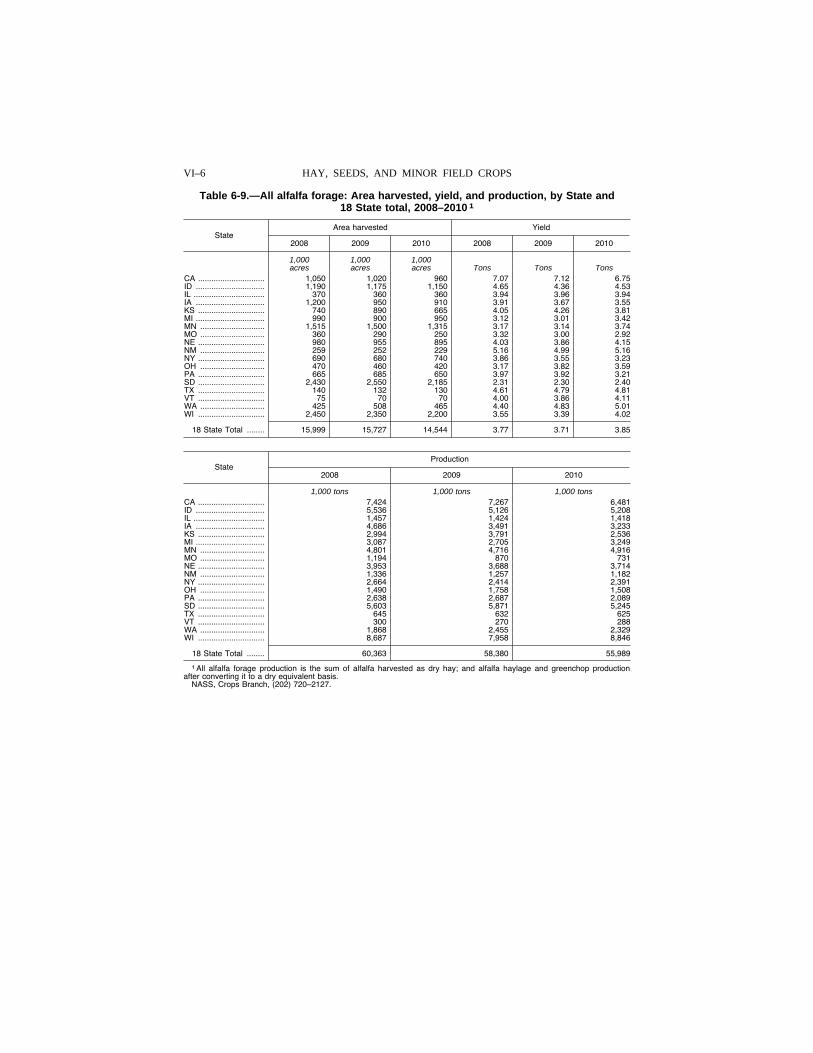
VI–6 HAY, SEEDS, AND MINOR FIELD CROPS
Table 6-9.—All alfalfa forage: Area harvested, yield, and production, by State and 18 State total, 2008–2010 1
State Area harvested Yield
2008 2009 2010 2008 2009 2010
1,000 1,000 1,000 acres acres acres Tons Tons Tons
CA .............................. 1,050 1,020 960 7.07 7.12 6.75 ID ............................... 1,190 1,175 1,150 4.65 4.36 4.53 IL ................................ 370 360 360 3.94 3.96 3.94 IA ............................... 1,200 950 910 3.91 3.67 3.55 KS .............................. 740 890 665 4.05 4.26 3.81 MI ............................... 990 900 950 3.12 3.01 3.42 MN ............................. 1,515 1,500 1,315 3.17 3.14 3.74 MO ............................. 360 290 250 3.32 3.00 2.92 NE .............................. 980 955 895 4.03 3.86 4.15 NM ............................. 259 252 229 5.16 4.99 5.16 NY .............................. 690 680 740 3.86 3.55 3.23 OH ............................. 470 460 420 3.17 3.82 3.59 PA .............................. 665 685 650 3.97 3.92 3.21 SD .............................. 2,430 2,550 2,185 2.31 2.30 2.40 TX .............................. 140 132 130 4.61 4.79 4.81 VT .............................. 75 70 70 4.00 3.86 4.11 WA ............................. 425 508 465 4.40 4.83 5.01 WI .............................. 2,450 2,350 2,200 3.55 3.39 4.02
18 State Total ........ 15,999 15,727 14,544 3.77 3.71 3.85
State Production
2008 2009 2010
1,000 tons 1,000 tons 1,000 tons CA .............................. 7,424 7,267 6,481 ID ............................... 5,536 5,126 5,208 IL ................................ 1,457 1,424 1,418 IA ............................... 4,686 3,491 3,233 KS .............................. 2,994 3,791 2,536 MI ............................... 3,087 2,705 3,249 MN ............................. 4,801 4,716 4,916 MO ............................. 1,194 870 731 NE .............................. 3,953 3,688 3,714 NM ............................. 1,336 1,257 1,182 NY .............................. 2,664 2,414 2,391 OH ............................. 1,490 1,758 1,508 PA .............................. 2,638 2,687 2,089 SD .............................. 5,603 5,871 5,245 TX .............................. 645 632 625 VT .............................. 300 270 288 WA ............................. 1,868 2,455 2,329 WI .............................. 8,687 7,958 8,846
18 State Total ........ 60,363 58,380 55,989
1 All alfalfa forage production is the sum of alfalfa harvested as dry hay; and alfalfa haylage and greenchop production after converting it to a dry equivalent basis.
NASS, Crops Branch, (202) 720–2127.
VerDate Aug 31 2005 10:29 Feb 29, 2012 Jkt 000000 PO 00000 Frm 00006 Fmt 1000 Sfmt 1000 H:\SHARED\DAPP\FPU\AGSTAT\MASTER~2\CHAPTR06\VI-06.AG8 USDA
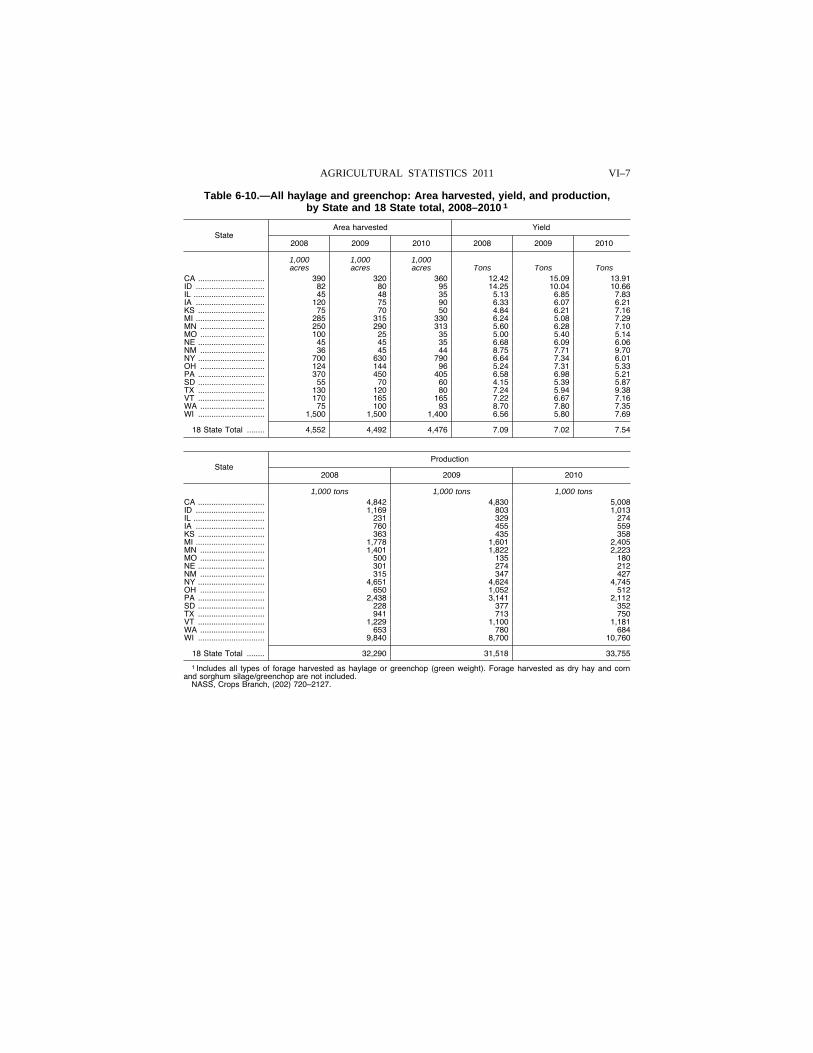
VI–7 AGRICULTURAL STATISTICS 2011
Table 6-10.—All haylage and greenchop: Area harvested, yield, and production, by State and 18 State total, 2008–2010 1
State Area harvested Yield
2008 2009 2010 2008 2009 2010
1,000 1,000 1,000 acres acres acres Tons Tons Tons
CA .............................. 390 320 360 12.42 15.09 13.91 ID ............................... 82 80 95 14.25 10.04 10.66 IL ................................ 45 48 35 5.13 6.85 7.83 IA ............................... 120 75 90 6.33 6.07 6.21 KS .............................. 75 70 50 4.84 6.21 7.16 MI ............................... 285 315 330 6.24 5.08 7.29 MN ............................. 250 290 313 5.60 6.28 7.10 MO ............................. 100 25 35 5.00 5.40 5.14 NE .............................. 45 45 35 6.68 6.09 6.06 NM ............................. 36 45 44 8.75 7.71 9.70 NY .............................. 700 630 790 6.64 7.34 6.01 OH ............................. 124 144 96 5.24 7.31 5.33 PA .............................. 370 450 405 6.58 6.98 5.21 SD .............................. 55 70 60 4.15 5.39 5.87 TX .............................. 130 120 80 7.24 5.94 9.38 VT .............................. 170 165 165 7.22 6.67 7.16 WA ............................. 75 100 93 8.70 7.80 7.35 WI .............................. 1,500 1,500 1,400 6.56 5.80 7.69
18 State Total ........ 4,552 4,492 4,476 7.09 7.02 7.54
State Production
2008 2009 2010
1,000 tons 1,000 tons 1,000 tons CA .............................. 4,842 4,830 5,008 ID ............................... 1,169 803 1,013 IL ................................ 231 329 274 IA ............................... 760 455 559 KS .............................. 363 435 358 MI ............................... 1,778 1,601 2,405 MN ............................. 1,401 1,822 2,223 MO ............................. 500 135 180 NE .............................. 301 274 212 NM ............................. 315 347 427 NY .............................. 4,651 4,624 4,745 OH ............................. 650 1,052 512 PA .............................. 2,438 3,141 2,112 SD .............................. 228 377 352 TX .............................. 941 713 750 VT .............................. 1,229 1,100 1,181 WA ............................. 653 780 684 WI .............................. 9,840 8,700 10,760
18 State Total ........ 32,290 31,518 33,755
1 Includes all types of forage harvested as haylage or greenchop (green weight). Forage harvested as dry hay and corn and sorghum silage/greenchop are not included.
NASS, Crops Branch, (202) 720–2127.
VerDate Aug 31 2005 10:29 Feb 29, 2012 Jkt 000000 PO 00000 Frm 00007 Fmt 1000 Sfmt 1000 H:\SHARED\DAPP\FPU\AGSTAT\MASTER~2\CHAPTR06\VI-07.AG8 USDA
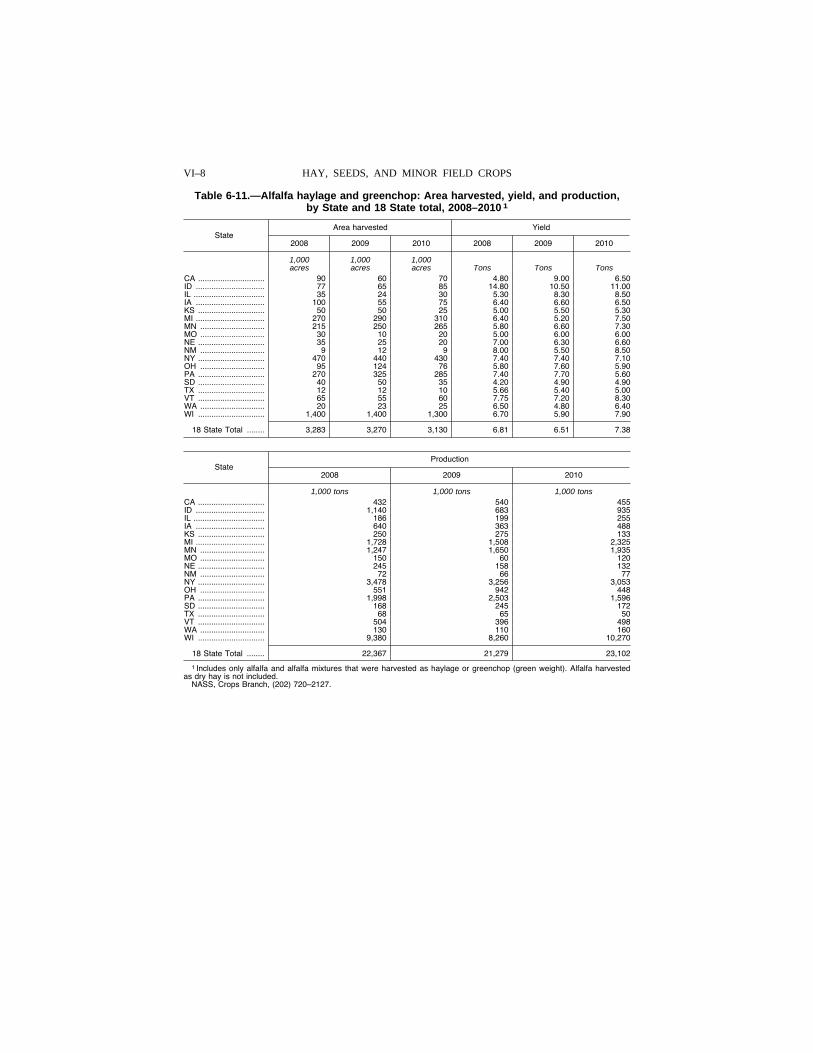
VI–8 HAY, SEEDS, AND MINOR FIELD CROPS
Table 6-11.—Alfalfa haylage and greenchop: Area harvested, yield, and production, by State and 18 State total, 2008–2010 1
State Area harvested Yield
2008 2009 2010 2008 2009 2010
1,000 1,000 1,000 acres acres acres Tons Tons Tons
CA .............................. 90 60 70 4.80 9.00 6.50 ID ............................... 77 65 85 14.80 10.50 11.00 IL ................................ 35 24 30 5.30 8.30 8.50 IA ............................... 100 55 75 6.40 6.60 6.50 KS .............................. 50 50 25 5.00 5.50 5.30 MI ............................... 270 290 310 6.40 5.20 7.50 MN ............................. 215 250 265 5.80 6.60 7.30 MO ............................. 30 10 20 5.00 6.00 6.00 NE .............................. 35 25 20 7.00 6.30 6.60 NM ............................. 9 12 9 8.00 5.50 8.50 NY .............................. 470 440 430 7.40 7.40 7.10 OH ............................. 95 124 76 5.80 7.60 5.90 PA .............................. 270 325 285 7.40 7.70 5.60 SD .............................. 40 50 35 4.20 4.90 4.90 TX .............................. 12 12 10 5.66 5.40 5.00 VT .............................. 65 55 60 7.75 7.20 8.30 WA ............................. 20 23 25 6.50 4.80 6.40 WI .............................. 1,400 1,400 1,300 6.70 5.90 7.90
18 State Total ........ 3,283 3,270 3,130 6.81 6.51 7.38
State Production
2008 2009 2010
1,000 tons 1,000 tons 1,000 tons CA .............................. 432 540 455 ID ............................... 1,140 683 935 IL ................................ 186 199 255 IA ............................... 640 363 488 KS .............................. 250 275 133 MI ............................... 1,728 1,508 2,325 MN ............................. 1,247 1,650 1,935 MO ............................. 150 60 120 NE .............................. 245 158 132 NM ............................. 72 66 77 NY .............................. 3,478 3,256 3,053 OH ............................. 551 942 448 PA .............................. 1,998 2,503 1,596 SD .............................. 168 245 172 TX .............................. 68 65 50 VT .............................. 504 396 498 WA ............................. 130 110 160 WI .............................. 9,380 8,260 10,270
18 State Total ........ 22,367 21,279 23,102
1 Includes only alfalfa and alfalfa mixtures that were harvested as haylage or greenchop (green weight). Alfalfa harvested as dry hay is not included.
NASS, Crops Branch, (202) 720–2127.
VerDate Aug 31 2005 10:29 Feb 29, 2012 Jkt 000000 PO 00000 Frm 00008 Fmt 1000 Sfmt 1000 H:\SHARED\DAPP\FPU\AGSTAT\MASTER~2\CHAPTR06\VI-08.AG8 USDA
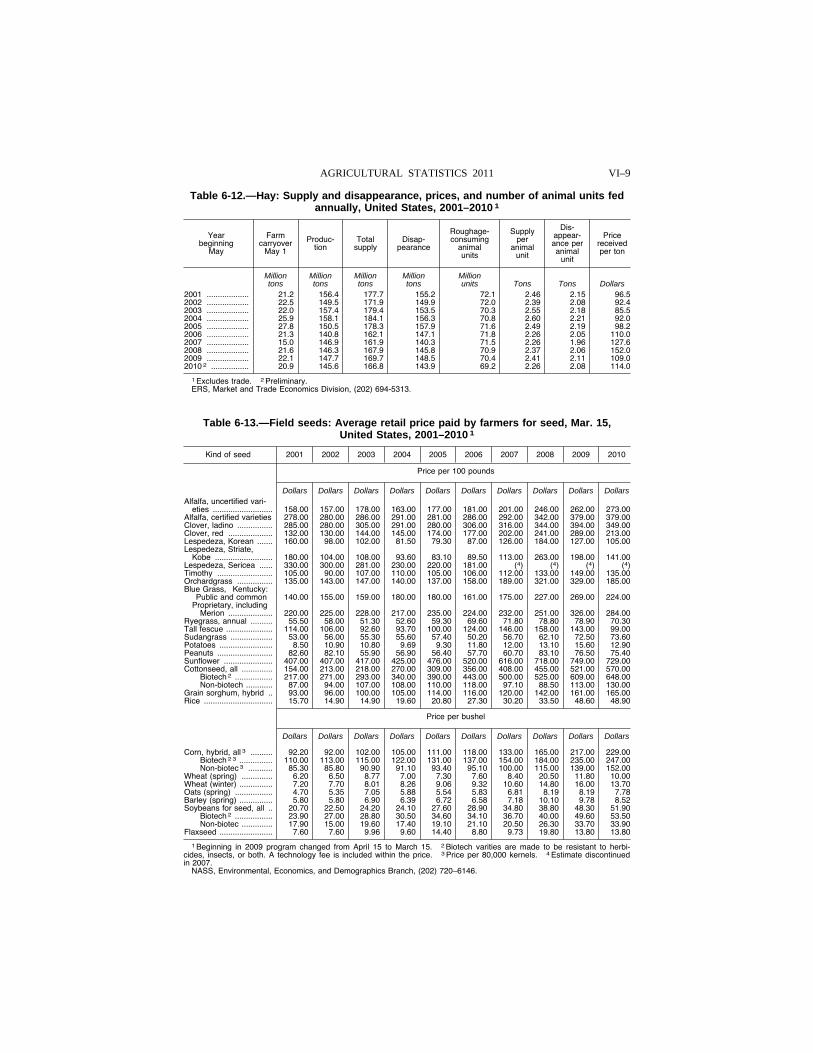
VI–9 AGRICULTURAL STATISTICS 2011
Table 6-12.—Hay: Supply and disappearance, prices, and number of animal units fed annually, United States, 2001–2010 1
Year beginning
May
Farm carryover
May 1
Produc-tion
Total supply
Disap- pearance
Roughage- consuming
animal units
Supply per
animal unit
Dis-appear-ance per animal
unit
Price received per ton
Million Million Million Million Million tons tons tons tons units Tons Tons Dollars
2001 ................... 21.2 156.4 177.7 155.2 72.1 2.46 2.15 96.5 2002 ................... 22.5 149.5 171.9 149.9 72.0 2.39 2.08 92.4 2003 ................... 22.0 157.4 179.4 153.5 70.3 2.55 2.18 85.5 2004 ................... 25.9 158.1 184.1 156.3 70.8 2.60 2.21 92.0 2005 ................... 27.8 150.5 178.3 157.9 71.6 2.49 2.19 98.2 2006 ................... 21.3 140.8 162.1 147.1 71.8 2.26 2.05 110.0 2007 ................... 15.0 146.9 161.9 140.3 71.5 2.26 1.96 127.6 2008 ................... 21.6 146.3 167.9 145.8 70.9 2.37 2.06 152.0 2009 ................... 22.1 147.7 169.7 148.5 70.4 2.41 2.11 109.0 2010 2 ................. 20.9 145.6 166.8 143.9 69.2 2.26 2.08 114.0
1 Excludes trade. 2 Preliminary. ERS, Market and Trade Economics Division, (202) 694-5313.
Table 6-13.—Field seeds: Average retail price paid by farmers for seed, Mar. 15, United States, 2001–2010 1
Kind of seed 2001 2002 2003 2004 2005 2006 2007 2008 2009 2010
Price per 100 pounds
Dollars Dollars Dollars Dollars Dollars Dollars Dollars Dollars Dollars Dollars Alfalfa, uncertified vari-
eties ........................... 158.00 157.00 178.00 163.00 177.00 181.00 201.00 246.00 262.00 273.00 Alfalfa, certified varieties 278.00 280.00 286.00 291.00 281.00 286.00 292.00 342.00 379.00 379.00 Clover, ladino ................ 285.00 280.00 305.00 291.00 280.00 306.00 316.00 344.00 394.00 349.00 Clover, red .................... 132.00 130.00 144.00 145.00 174.00 177.00 202.00 241.00 289.00 213.00 Lespedeza, Korean ....... 160.00 98.00 102.00 81.50 79.30 87.00 126.00 184.00 127.00 105.00 Lespedeza, Striate,
Kobe .......................... 180.00 104.00 108.00 93.60 83.10 89.50 113.00 263.00 198.00 141.00 Lespedeza, Sericea ...... 330.00 300.00 281.00 230.00 220.00 181.00 (4) (4) (4) (4) Timothy ......................... 105.00 90.00 107.00 110.00 105.00 106.00 112.00 133.00 149.00 135.00 Orchardgrass ................ 135.00 143.00 147.00 140.00 137.00 158.00 189.00 321.00 329.00 185.00 Blue Grass, Kentucky:
Public and common 140.00 155.00 159.00 180.00 180.00 161.00 175.00 227.00 269.00 224.00 Proprietary, including
Merion .................... 220.00 225.00 228.00 217.00 235.00 224.00 232.00 251.00 326.00 284.00 Ryegrass, annual .......... 55.50 58.00 51.30 52.60 59.30 69.60 71.80 78.80 78.90 70.30 Tall fescue ..................... 114.00 106.00 92.60 93.70 100.00 124.00 146.00 158.00 143.00 99.00 Sudangrass ................... 53.00 56.00 55.30 55.60 57.40 50.20 56.70 62.10 72.50 73.60 Potatoes ........................ 8.50 10.90 10.80 9.69 9.30 11.80 12.00 13.10 15.60 12.90 Peanuts ......................... 82.60 82.10 55.90 56.90 56.40 57.70 60.70 83.10 76.50 75.40 Sunflower ...................... 407.00 407.00 417.00 425.00 476.00 520.00 616.00 718.00 749.00 729.00 Cottonseed, all .............. 154.00 213.00 218.00 270.00 309.00 356.00 408.00 455.00 521.00 570.00
Biotech 2 ................. 217.00 271.00 293.00 340.00 390.00 443.00 500.00 525.00 609.00 648.00 Non-biotech ............ 87.00 94.00 107.00 108.00 110.00 118.00 97.10 88.50 113.00 130.00
Grain sorghum, hybrid .. 93.00 96.00 100.00 105.00 114.00 116.00 120.00 142.00 161.00 165.00 Rice ............................... 15.70 14.90 14.90 19.60 20.80 27.30 30.20 33.50 48.60 48.90
Price per bushel
Dollars Dollars Dollars Dollars Dollars Dollars Dollars Dollars Dollars Dollars
Corn, hybrid, all 3 .......... 92.20 92.00 102.00 105.00 111.00 118.00 133.00 165.00 217.00 229.00 Biotech 2 3 ............... 110.00 113.00 115.00 122.00 131.00 137.00 154.00 184.00 235.00 247.00 Non-biotec 3 ........... 85.30 85.80 90.90 91.10 93.40 95.10 100.00 115.00 139.00 152.00
Wheat (spring) .............. 6.20 6.50 8.77 7.00 7.30 7.60 8.40 20.50 11.80 10.00 Wheat (winter) ............... 7.20 7.70 8.01 8.26 9.06 9.32 10.60 14.80 16.00 13.70 Oats (spring) ................. 4.70 5.35 7.05 5.88 5.54 5.83 6.81 8.19 8.19 7.78 Barley (spring) ............... 5.80 5.80 6.90 6.39 6.72 6.58 7.18 10.10 9.78 8.52 Soybeans for seed, all .. 20.70 22.50 24.20 24.10 27.60 28.90 34.80 38.80 48.30 51.90
Biotech 2 ................. 23.90 27.00 28.80 30.50 34.60 34.10 36.70 40.00 49.60 53.50 Non-biotec .............. 17.90 15.00 19.60 17.40 19.10 21.10 20.50 26.30 33.70 33.90
Flaxseed ........................ 7.60 7.60 9.96 9.60 14.40 8.80 9.73 19.80 13.80 13.80
1 Beginning in 2009 program changed from April 15 to March 15. 2 Biotech varities are made to be resistant to herbi-cides, insects, or both. A technology fee is included within the price. 3 Price per 80,000 kernels. 4 Estimate discontinued in 2007.
NASS, Environmental, Economics, and Demographics Branch, (202) 720–6146.
VerDate Aug 31 2005 10:29 Feb 29, 2012 Jkt 000000 PO 00000 Frm 00009 Fmt 1000 Sfmt 1000 H:\SHARED\DAPP\FPU\AGSTAT\MASTER~2\CHAPTR06\VI-09.AG8 USDA
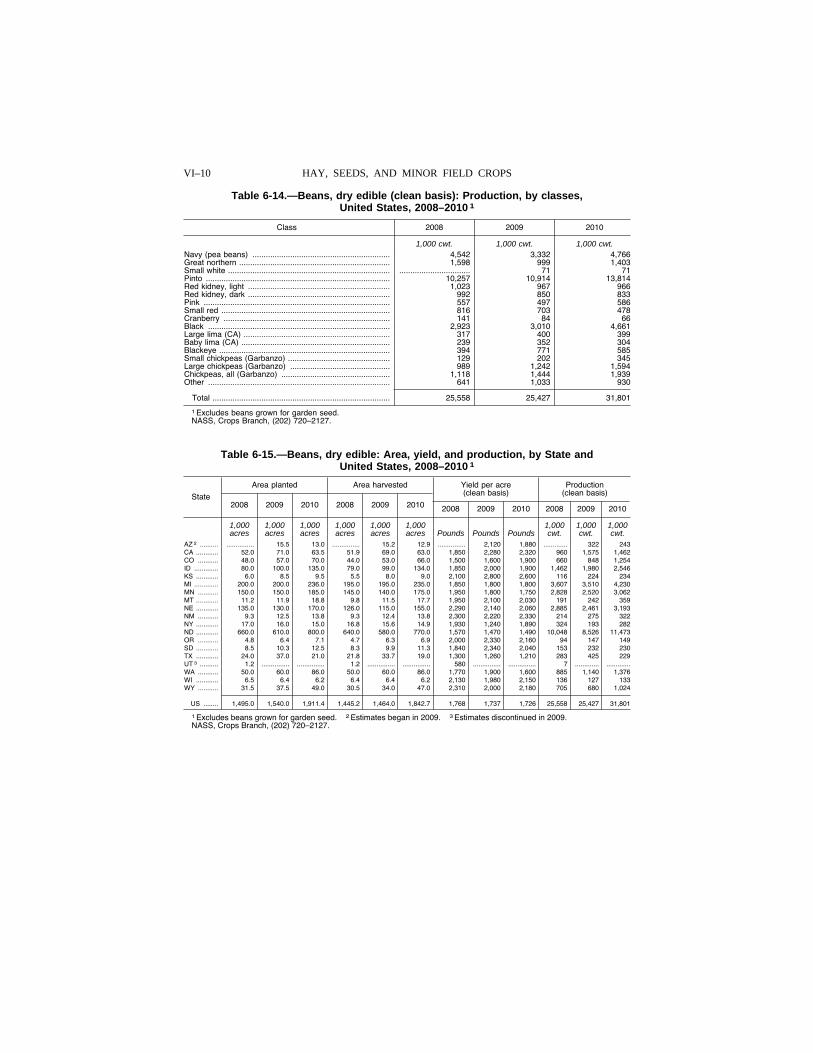
VI–10 HAY, SEEDS, AND MINOR FIELD CROPS
Table 6-14.—Beans, dry edible (clean basis): Production, by classes, United States, 2008–2010 1
Class 2008 2009 2010
1,000 cwt. 1,000 cwt. 1,000 cwt. Navy (pea beans) .............................................................. 4,542 3,332 4,766 Great northern .................................................................... 1,598 999 1,403 Small white ......................................................................... ................................ 71 71 Pinto ................................................................................... 10,257 10,914 13,814 Red kidney, light ................................................................ 1,023 967 966 Red kidney, dark ................................................................ 992 850 833 Pink .................................................................................... 557 497 586 Small red ............................................................................ 816 703 478 Cranberry ........................................................................... 141 84 66 Black .................................................................................. 2,923 3,010 4,661 Large lima (CA) .................................................................. 317 400 399 Baby lima (CA) ................................................................... 239 352 304 Blackeye ............................................................................. 394 771 585 Small chickpeas (Garbanzo) .............................................. 129 202 345 Large chickpeas (Garbanzo) ............................................. 989 1,242 1,594 Chickpeas, all (Garbanzo) ................................................. 1,118 1,444 1,939 Other .................................................................................. 641 1,033 930
Total ................................................................................ 25,558 25,427 31,801
1 Excludes beans grown for garden seed. NASS, Crops Branch, (202) 720–2127.
Table 6-15.—Beans, dry edible: Area, yield, and production, by State and United States, 2008–2010 1
State
Area planted Area harvested Yield per acre (clean basis)
Production (clean basis)
2008 2009 2010 2008 2009 2010 2008 2009 2010 2008 2009 2010
1,000 1,000 1,000 1,000 1,000 1,000 1,000 1,000 1,000 acres acres acres acres acres acres Pounds Pounds Pounds cwt. cwt. cwt.
AZ 2 .......... ............... 15.5 13.0 ............... 15.2 12.9 ............... 2,120 1,880 ............. 322 243 CA ............ 52.0 71.0 63.5 51.9 69.0 63.0 1,850 2,280 2,320 960 1,575 1,462 CO ........... 48.0 57.0 70.0 44.0 53.0 66.0 1,500 1,600 1,900 660 848 1,254 ID ............. 80.0 100.0 135.0 79.0 99.0 134.0 1,850 2,000 1,900 1,462 1,980 2,546 KS ............ 6.0 8.5 9.5 5.5 8.0 9.0 2,100 2,800 2,600 116 224 234 MI ............. 200.0 200.0 236.0 195.0 195.0 235.0 1,850 1,800 1,800 3,607 3,510 4,230 MN ........... 150.0 150.0 185.0 145.0 140.0 175.0 1,950 1,800 1,750 2,828 2,520 3,062 MT ............ 11.2 11.9 18.8 9.8 11.5 17.7 1,950 2,100 2,030 191 242 359 NE ............ 135.0 130.0 170.0 126.0 115.0 155.0 2,290 2,140 2,060 2,885 2,461 3,193 NM ........... 9.3 12.5 13.8 9.3 12.4 13.8 2,300 2,220 2,330 214 275 322 NY ............ 17.0 16.0 15.0 16.8 15.6 14.9 1,930 1,240 1,890 324 193 282 ND ............ 660.0 610.0 800.0 640.0 580.0 770.0 1,570 1,470 1,490 10,048 8,526 11,473 OR ........... 4.8 6.4 7.1 4.7 6.3 6.9 2,000 2,330 2,160 94 147 149 SD ............ 8.5 10.3 12.5 8.3 9.9 11.3 1,840 2,340 2,040 153 232 230 TX ............ 24.0 37.0 21.0 21.8 33.7 19.0 1,300 1,260 1,210 283 425 229 UT 3 .......... 1.2 ............... ............... 1.2 ............... ............... 580 ............... ............... 7 ............. .............WA ........... 50.0 60.0 86.0 50.0 60.0 86.0 1,770 1,900 1,600 885 1,140 1,376 WI ............ 6.5 6.4 6.2 6.4 6.4 6.2 2,130 1,980 2,150 136 127 133 WY ........... 31.5 37.5 49.0 30.5 34.0 47.0 2,310 2,000 2,180 705 680 1,024
US ........ 1,495.0 1,540.0 1,911.4 1,445.2 1,464.0 1,842.7 1,768 1,737 1,726 25,558 25,427 31,801
1 Excludes beans grown for garden seed. 2 Estimates began in 2009. 3 Estimates discontinued in 2009. NASS, Crops Branch, (202) 720–2127.
VerDate Aug 31 2005 10:29 Feb 29, 2012 Jkt 000000 PO 00000 Frm 00010 Fmt 1000 Sfmt 1000 H:\SHARED\DAPP\FPU\AGSTAT\MASTER~2\CHAPTR06\VI-10.AG8 USDA
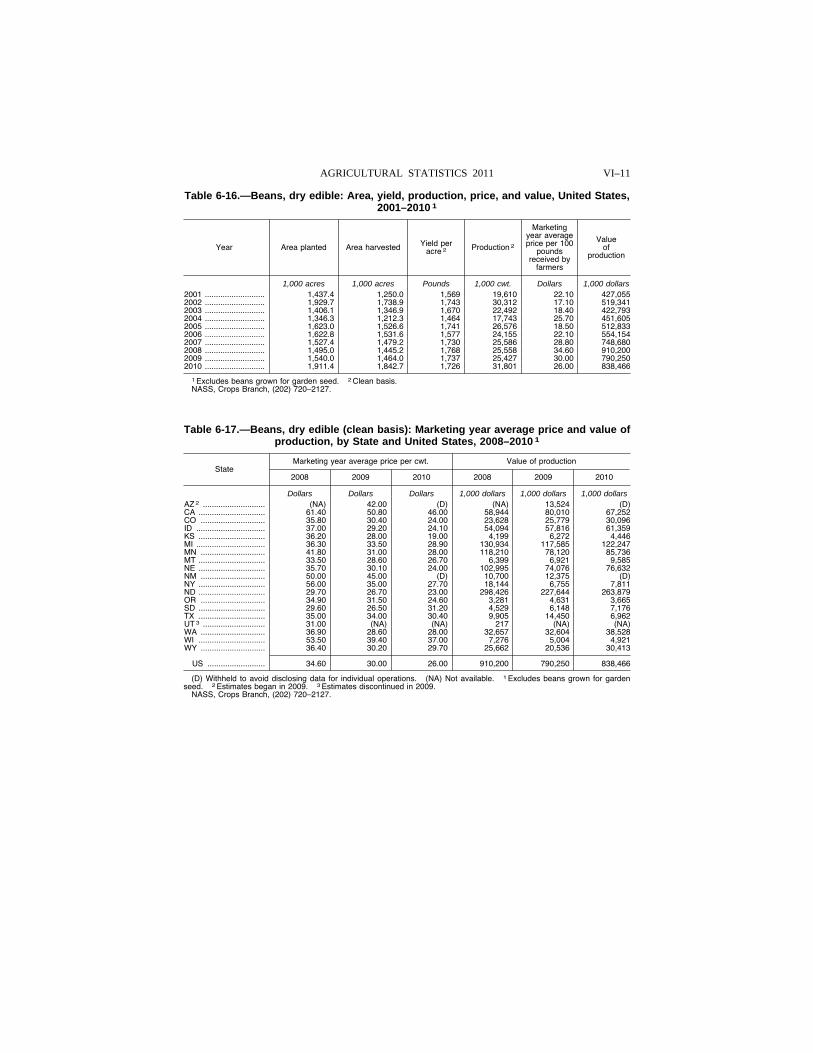
VI–11 AGRICULTURAL STATISTICS 2011
Table 6-16.—Beans, dry edible: Area, yield, production, price, and value, United States, 2001–2010 1
Year Area planted Area harvested Yield per acre 2 Production 2
Marketing year average price per 100
pounds received by
farmers
Value of
production
1,000 acres 1,000 acres Pounds 1,000 cwt. Dollars 1,000 dollars 2001 ........................... 1,437 .4 1,250 .0 1,569 19,610 22.10 427,055 2002 ........................... 1,929 .7 1,738 .9 1,743 30,312 17.10 519,341 2003 ........................... 1,406 .1 1,346 .9 1,670 22,492 18.40 422,793 2004 ........................... 1,346 .3 1,212 .3 1,464 17,743 25.70 451,605 2005 ........................... 1,623 .0 1,526 .6 1,741 26,576 18.50 512,833 2006 ........................... 1,622 .8 1,531 .6 1,577 24,155 22.10 554,154 2007 ........................... 1,527 .4 1,479 .2 1,730 25,586 28.80 748,680 2008 ........................... 1,495 .0 1,445 .2 1,768 25,558 34.60 910,200 2009 ........................... 1,540 .0 1,464 .0 1,737 25,427 30.00 790,250 2010 ........................... 1,911 .4 1,842 .7 1,726 31,801 26.00 838,466
1 Excludes beans grown for garden seed. 2 Clean basis. NASS, Crops Branch, (202) 720–2127.
Table 6-17.—Beans, dry edible (clean basis): Marketing year average price and value of production, by State and United States, 2008–2010 1
State Marketing year average price per cwt. Value of production
2008 2009 2010 2008 2009 2010
Dollars Dollars Dollars 1,000 dollars 1,000 dollars 1,000 dollars AZ 2 ............................ (NA) 42.00 (D) (NA) 13,524 (D) CA .............................. 61.40 50.80 46.00 58,944 80,010 67,252 CO ............................. 35.80 30.40 24.00 23,628 25,779 30,096 ID ............................... 37.00 29.20 24.10 54,094 57,816 61,359 KS .............................. 36.20 28.00 19.00 4,199 6,272 4,446 MI ............................... 36.30 33.50 28.90 130,934 117,585 122,247 MN ............................. 41.80 31.00 28.00 118,210 78,120 85,736 MT .............................. 33.50 28.60 26.70 6,399 6,921 9,585 NE .............................. 35.70 30.10 24.00 102,995 74,076 76,632 NM ............................. 50.00 45.00 (D) 10,700 12,375 (D) NY .............................. 56.00 35.00 27.70 18,144 6,755 7,811 ND .............................. 29.70 26.70 23.00 298,426 227,644 263,879 OR ............................. 34.90 31.50 24.60 3,281 4,631 3,665 SD .............................. 29.60 26.50 31.20 4,529 6,148 7,176 TX .............................. 35.00 34.00 30.40 9,905 14,450 6,962 UT 3 ............................ 31.00 (NA) (NA) 217 (NA) (NA) WA ............................. 36.90 28.60 28.00 32,657 32,604 38,528 WI .............................. 53.50 39.40 37.00 7,276 5,004 4,921 WY ............................. 36.40 30.20 29.70 25,662 20,536 30,413
US .......................... 34.60 30.00 26.00 910,200 790,250 838,466
(D) Withheld to avoid disclosing data for individual operations. (NA) Not available. 1 Excludes beans grown for garden seed. 2 Estimates began in 2009. 3 Estimates discontinued in 2009.
NASS, Crops Branch, (202) 720–2127.
VerDate Aug 31 2005 10:29 Feb 29, 2012 Jkt 000000 PO 00000 Frm 00011 Fmt 1000 Sfmt 1000 H:\SHARED\DAPP\FPU\AGSTAT\MASTER~2\CHAPTR06\VI-11.AG8 USDA
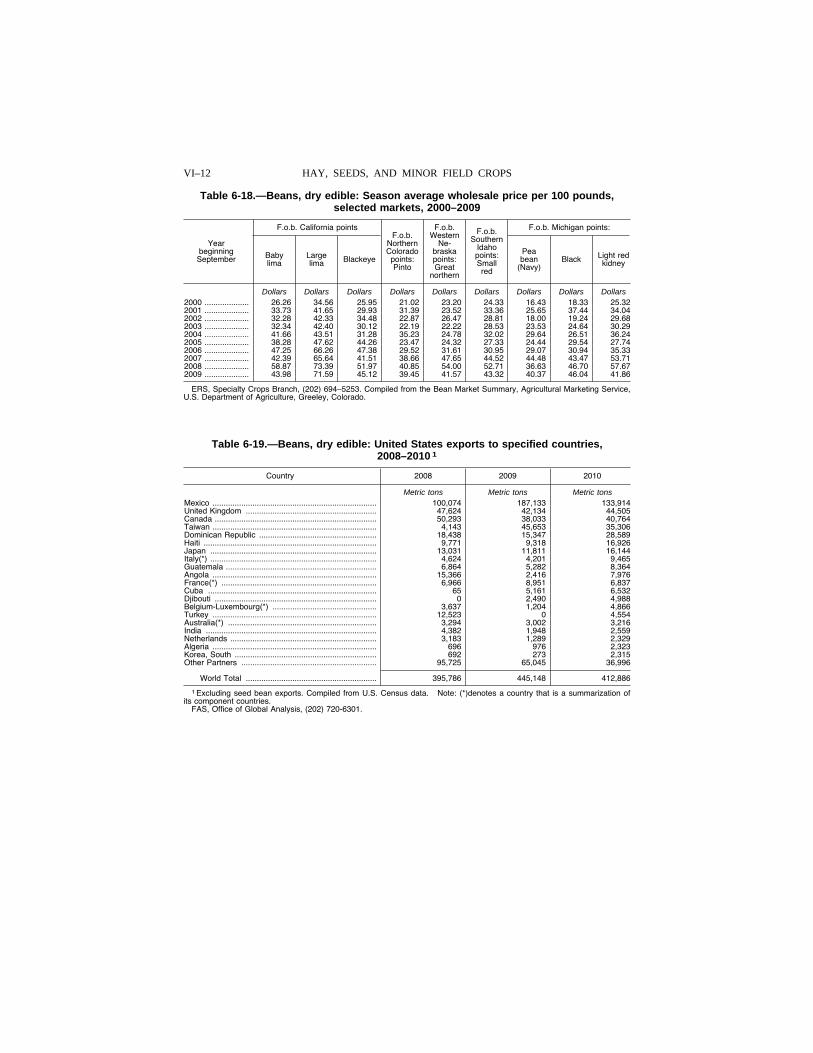
VI–12 HAY, SEEDS, AND MINOR FIELD CROPS
Table 6-18.—Beans, dry edible: Season average wholesale price per 100 pounds, selected markets, 2000–2009
Year beginning
September
F.o.b. California points F.o.b.
Northern Colorado
points: Pinto
F.o.b. Western
Ne-braska points: Great
northern
F.o.b. Southern
Idaho points: Small red
F.o.b. Michigan points:
Baby lima
Large lima Blackeye
Pea bean
(Navy) Black Light red
kidney
Dollars Dollars Dollars Dollars Dollars Dollars Dollars Dollars Dollars 2000 .................... 26.26 34.56 25.95 21.02 23.20 24.33 16.43 18.33 25.32 2001 .................... 33.73 41.65 29.93 31.39 23.52 33.36 25.65 37.44 34.04 2002 .................... 32.28 42.33 34.48 22.87 26.47 28.81 18.00 19.24 29.68 2003 .................... 32.34 42.40 30.12 22.19 22.22 28.53 23.53 24.64 30.29 2004 .................... 41.66 43.51 31.28 35.23 24.78 32.02 29.64 26.51 36.24 2005 .................... 38.28 47.62 44.26 23.47 24.32 27.33 24.44 29.54 27.74 2006 .................... 47.25 66.26 47.38 29.52 31.61 30.95 29.07 30.94 35.33 2007 .................... 42.39 65.64 41.51 38.66 47.65 44.52 44.48 43.47 53.71 2008 .................... 58.87 73.39 51.97 40.85 54.00 52.71 36.63 46.70 57.67 2009 .................... 43.98 71.59 45.12 39.45 41.57 43.32 40.37 46.04 41.86
ERS, Specialty Crops Branch, (202) 694–5253. Compiled from the Bean Market Summary, Agricultural Marketing Service, U.S. Department of Agriculture, Greeley, Colorado.
Table 6-19.—Beans, dry edible: United States exports to specified countries, 2008–2010 1
Country 2008 2009 2010
Metric tons Metric tons Metric tons Mexico .......................................................................... 100,074 187,133 133,914 United Kingdom ........................................................... 47,624 42,134 44,505 Canada ......................................................................... 50,293 38,033 40,764 Taiwan .......................................................................... 4,143 45,653 35,306 Dominican Republic ..................................................... 18,438 15,347 28,589 Haiti .............................................................................. 9,771 9,318 16,926 Japan ........................................................................... 13,031 11,811 16,144 Italy(*) ........................................................................... 4,624 4,201 9,465 Guatemala .................................................................... 6,864 5,282 8,364 Angola .......................................................................... 15,366 2,416 7,976 France(*) ...................................................................... 6,966 8,951 6,837 Cuba ............................................................................ 65 5,161 6,532 Djibouti ......................................................................... 0 2,490 4,988 Belgium-Luxembourg(*) ............................................... 3,637 1,204 4,866 Turkey .......................................................................... 12,523 0 4,554 Australia(*) ................................................................... 3,294 3,002 3,216 India ............................................................................. 4,382 1,948 2,559 Netherlands .................................................................. 3,183 1,289 2,329 Algeria .......................................................................... 696 976 2,323 Korea, South ................................................................ 692 273 2,315 Other Partners ............................................................. 95,725 65,045 36,996
World Total ........................................................... 395,786 445,148 412,886
1 Excluding seed bean exports. Compiled from U.S. Census data. Note: (*)denotes a country that is a summarization of its component countries.
FAS, Office of Global Analysis, (202) 720-6301.
VerDate Aug 31 2005 10:29 Feb 29, 2012 Jkt 000000 PO 00000 Frm 00012 Fmt 1000 Sfmt 1000 H:\SHARED\DAPP\FPU\AGSTAT\MASTER~2\CHAPTR06\VI-12.AG8 USDA
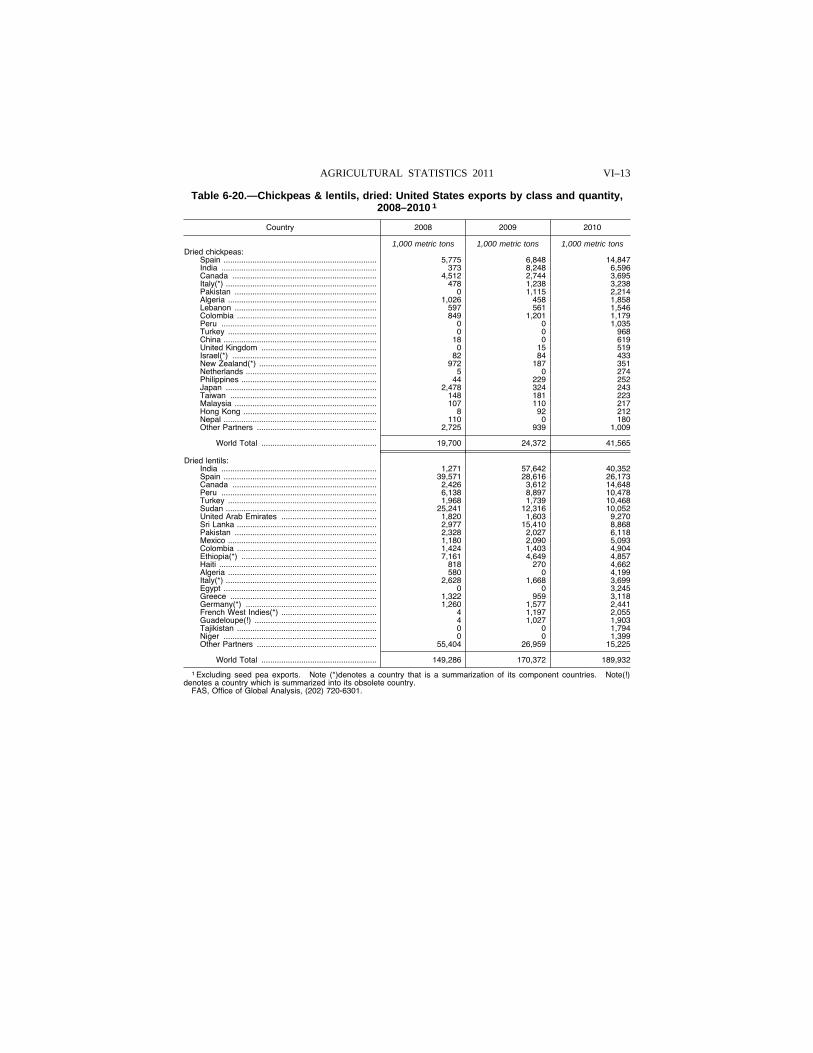
VI–13 AGRICULTURAL STATISTICS 2011
Table 6-20.—Chickpeas & lentils, dried: United States exports by class and quantity, 2008–2010 1
Country 2008 2009 2010
1,000 metric tons 1,000 metric tons 1,000 metric tons Dried chickpeas:
Spain ..................................................................... 5,775 6,848 14,847 India ...................................................................... 373 8,248 6,596 Canada ................................................................. 4,512 2,744 3,695 Italy(*) .................................................................... 478 1,238 3,238 Pakistan ................................................................ 0 1,115 2,214 Algeria ................................................................... 1,026 458 1,858 Lebanon ................................................................ 597 561 1,546 Colombia ............................................................... 849 1,201 1,179 Peru ...................................................................... 0 0 1,035 Turkey ................................................................... 0 0 968 China ..................................................................... 18 0 619 United Kingdom .................................................... 0 15 519 Israel(*) ................................................................. 82 84 433 New Zealand(*) ..................................................... 972 187 351 Netherlands ........................................................... 5 0 274 Philippines ............................................................. 44 229 252 Japan .................................................................... 2,478 324 243 Taiwan .................................................................. 148 181 223 Malaysia ................................................................ 107 110 217 Hong Kong ............................................................ 8 92 212 Nepal ..................................................................... 110 0 180 Other Partners ...................................................... 2,725 939 1,009
World Total .................................................... 19,700 24,372 41,565
Dried lentils: India ...................................................................... 1,271 57,642 40,352 Spain ..................................................................... 39,571 28,616 26,173 Canada ................................................................. 2,426 3,612 14,648 Peru ...................................................................... 6,138 8,897 10,478 Turkey ................................................................... 1,968 1,739 10,468 Sudan .................................................................... 25,241 12,316 10,052 United Arab Emirates ........................................... 1,820 1,603 9,270 Sri Lanka ............................................................... 2,977 15,410 8,868 Pakistan ................................................................ 2,328 2,027 6,118 Mexico ................................................................... 1,180 2,090 5,093 Colombia ............................................................... 1,424 1,403 4,904 Ethiopia(*) ............................................................. 7,161 4,649 4,857 Haiti ....................................................................... 818 270 4,662 Algeria ................................................................... 580 0 4,199 Italy(*) .................................................................... 2,628 1,668 3,699 Egypt ..................................................................... 0 0 3,245 Greece .................................................................. 1,322 959 3,118 Germany(*) ........................................................... 1,260 1,577 2,441 French West Indies(*) ........................................... 4 1,197 2,055 Guadeloupe(!) ....................................................... 4 1,027 1,903 Tajikistan ............................................................... 0 0 1,794 Niger ..................................................................... 0 0 1,399 Other Partners ...................................................... 55,404 26,959 15,225
World Total .................................................... 149,286 170,372 189,932
1 Excluding seed pea exports. Note (*)denotes a country that is a summarization of its component countries. Note(!) denotes a country which is summarized into its obsolete country.
FAS, Office of Global Analysis, (202) 720-6301.
VerDate Aug 31 2005 10:29 Feb 29, 2012 Jkt 000000 PO 00000 Frm 00013 Fmt 1000 Sfmt 1000 H:\SHARED\DAPP\FPU\AGSTAT\MASTER~2\CHAPTR06\VI-13.AG8 USDA
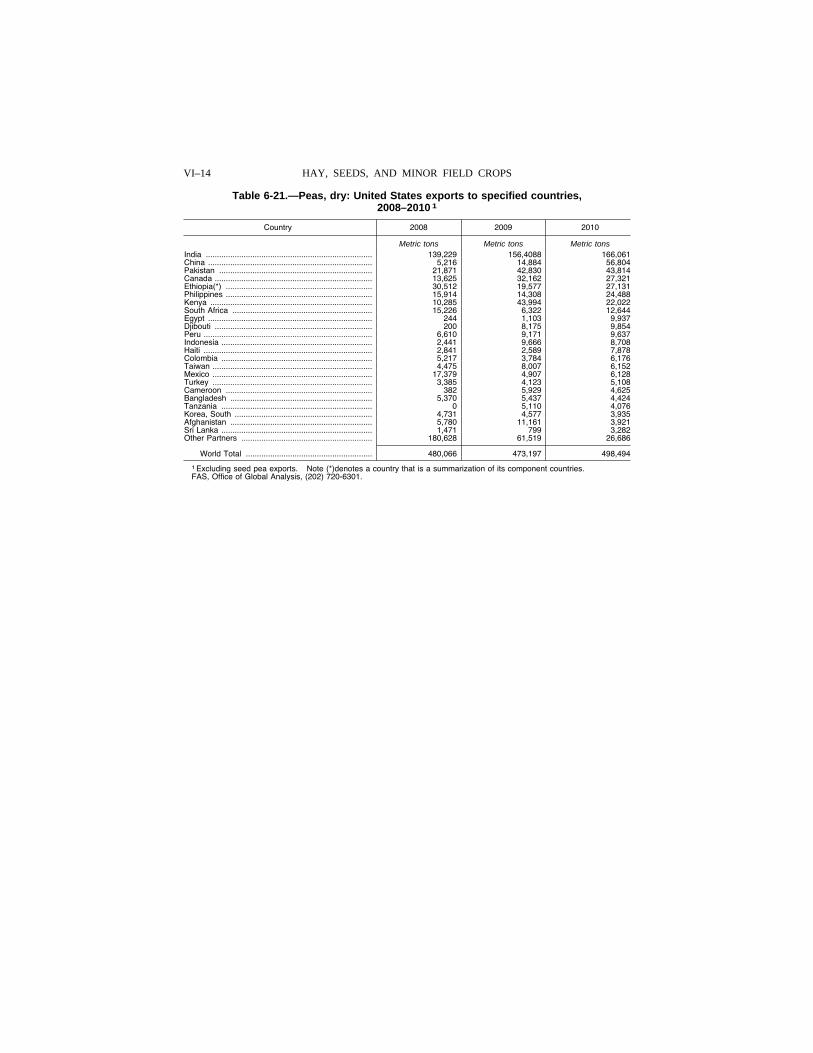
VI–14 HAY, SEEDS, AND MINOR FIELD CROPS
Table 6-21.—Peas, dry: United States exports to specified countries, 2008–2010 1
Country 2008 2009 2010
Metric tons Metric tons Metric tons India ........................................................................... 139,229 156,4088 166,061 China .......................................................................... 5,216 14,884 56,804 Pakistan ..................................................................... 21,871 42,830 43,814 Canada ....................................................................... 13,625 32,162 27,321 Ethiopia(*) .................................................................. 30,512 19,577 27,131 Philippines .................................................................. 15,914 14,308 24,488 Kenya ......................................................................... 10,285 43,994 22,022 South Africa ............................................................... 15,226 6,322 12,644 Egypt .......................................................................... 244 1,103 9,937 Djibouti ....................................................................... 200 8,175 9,854 Peru ............................................................................ 6,610 9,171 9,637 Indonesia .................................................................... 2,441 9,666 8,708 Haiti ............................................................................ 2,841 2,589 7,878 Colombia .................................................................... 5,217 3,784 6,176 Taiwan ........................................................................ 4,475 8,007 6,152 Mexico ........................................................................ 17,379 4,907 6,128 Turkey ........................................................................ 3,385 4,123 5,108 Cameroon .................................................................. 382 5,929 4,625 Bangladesh ................................................................ 5,370 5,437 4,424 Tanzania .................................................................... 0 5,110 4,076 Korea, South .............................................................. 4,731 4,577 3,935 Afghanistan ................................................................ 5,780 11,161 3,921 Sri Lanka .................................................................... 1,471 799 3,282 Other Partners ........................................................... 180,628 61,519 26,686
World Total ......................................................... 480,066 473,197 498,494
1 Excluding seed pea exports. Note (*)denotes a country that is a summarization of its component countries. FAS, Office of Global Analysis, (202) 720-6301.
VerDate Aug 31 2005 10:29 Feb 29, 2012 Jkt 000000 PO 00000 Frm 00014 Fmt 1000 Sfmt 1000 H:\SHARED\DAPP\FPU\AGSTAT\MASTER~2\CHAPTR06\VI-14.AG8 USDA
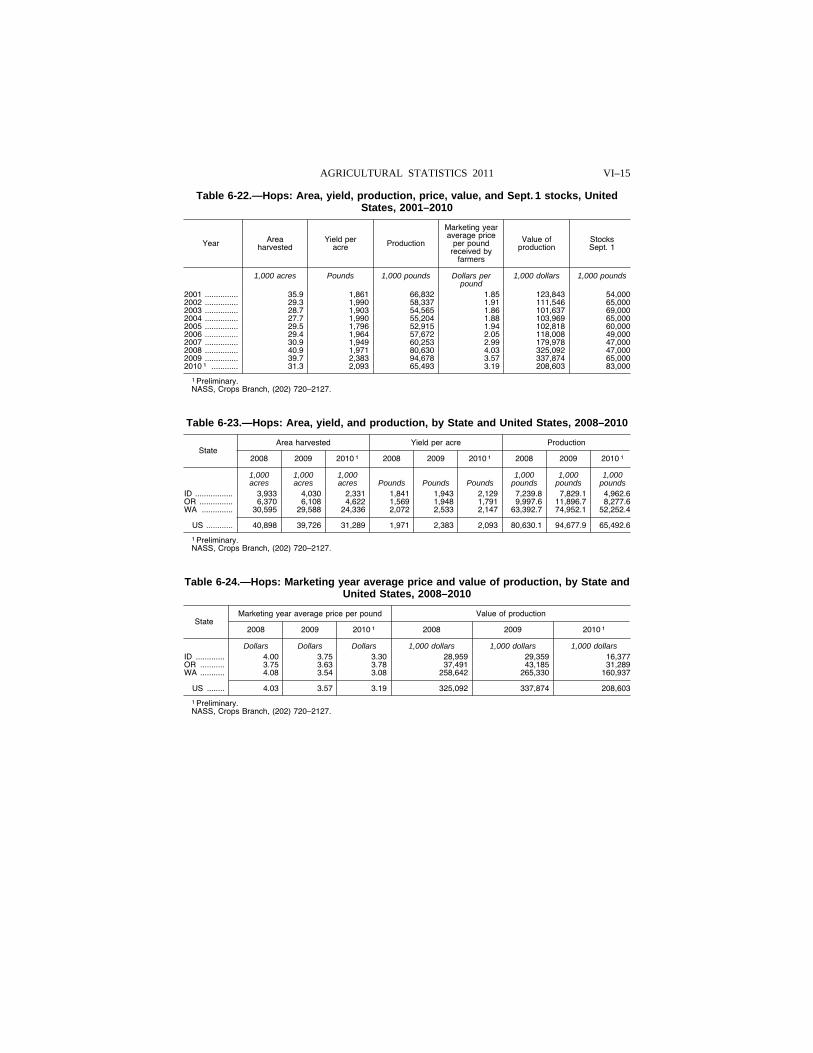
VI–15 AGRICULTURAL STATISTICS 2011
Table 6-22.—Hops: Area, yield, production, price, value, and Sept. 1 stocks, United States, 2001–2010
Year Area harvested
Yield per acre Production
Marketing year average price
per pound received by
farmers
Value of production
Stocks Sept. 1
1,000 acres Pounds 1,000 pounds Dollars per pound
1,000 dollars 1,000 pounds
2001 ............... 35.9 1,861 66,832 1.85 123,843 54,000 2002 ............... 29.3 1,990 58,337 1.91 111,546 65,000 2003 ............... 28.7 1,903 54,565 1.86 101,637 69,000 2004 ............... 27.7 1,990 55,204 1.88 103,969 65,000 2005 ............... 29.5 1,796 52,915 1.94 102,818 60,000 2006 ............... 29.4 1,964 57,672 2.05 118,008 49,000 2007 ............... 30.9 1,949 60,253 2.99 179,978 47,000 2008 ............... 40.9 1,971 80,630 4.03 325,092 47,000 2009 ............... 39.7 2,383 94,678 3.57 337,874 65,000 2010 1 ............ 31.3 2,093 65,493 3.19 208,603 83,000
1 Preliminary. NASS, Crops Branch, (202) 720–2127.
Table 6-23.—Hops: Area, yield, and production, by State and United States, 2008–2010
State Area harvested Yield per acre Production
2008 2009 2010 1 2008 2009 2010 1 2008 2009 2010 1
1,000 1,000 1,000 1,000 1,000 1,000 acres acres acres Pounds Pounds Pounds pounds pounds pounds
ID ................. 3,933 4,030 2,331 1,841 1,943 2,129 7,239.8 7,829.1 4,962.6 OR ............... 6,370 6,108 4,622 1,569 1,948 1,791 9,997.6 11,896.7 8,277.6 WA .............. 30,595 29,588 24,336 2,072 2,533 2,147 63,392.7 74,952.1 52,252.4
US ............ 40,898 39,726 31,289 1,971 2,383 2,093 80,630.1 94,677.9 65,492.6
1 Preliminary. NASS, Crops Branch, (202) 720–2127.
Table 6-24.—Hops: Marketing year average price and value of production, by State and United States, 2008–2010
State Marketing year average price per pound Value of production
2008 2009 2010 1 2008 2009 2010 1
Dollars Dollars Dollars 1,000 dollars 1,000 dollars 1,000 dollars ID ............. 4.00 3.75 3.30 28,959 29,359 16,377 OR ........... 3.75 3.63 3.78 37,491 43,185 31,289 WA ........... 4.08 3.54 3.08 258,642 265,330 160,937
US ........ 4.03 3.57 3.19 325,092 337,874 208,603
1 Preliminary. NASS, Crops Branch, (202) 720–2127.
VerDate Aug 31 2005 10:29 Feb 29, 2012 Jkt 000000 PO 00000 Frm 00015 Fmt 1000 Sfmt 1000 H:\SHARED\DAPP\FPU\AGSTAT\MASTER~2\CHAPTR06\VI-15.AG8 USDA
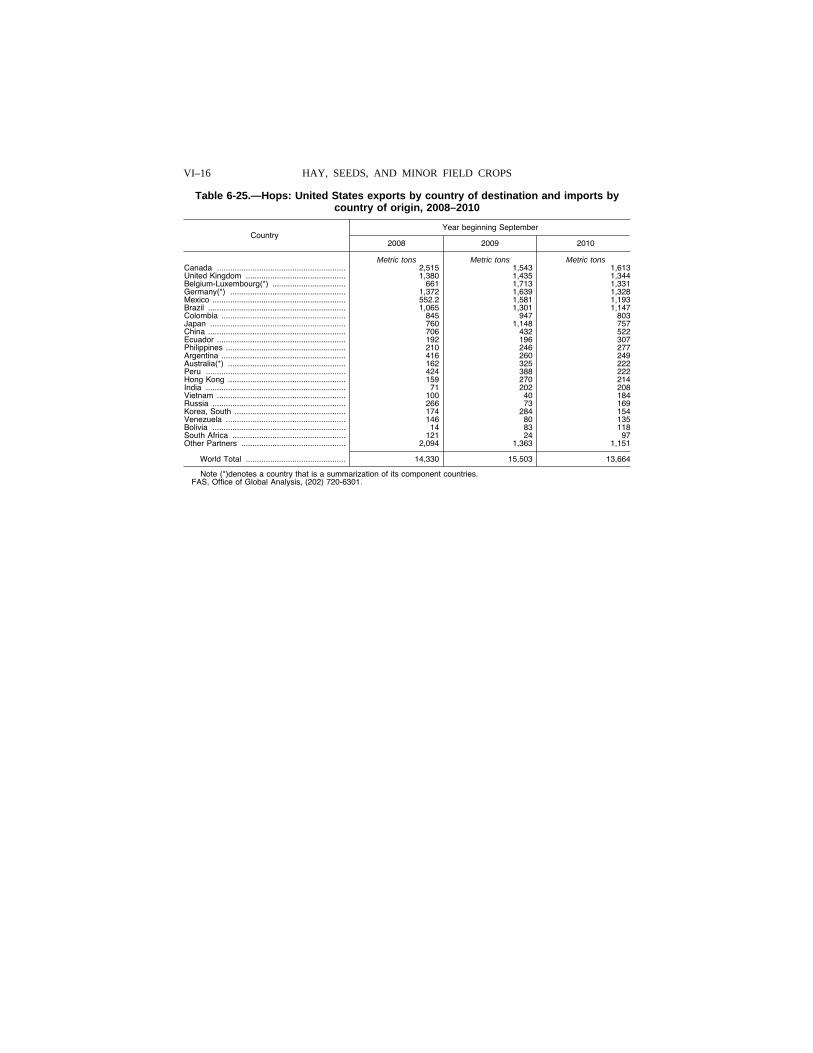
VI–16 HAY, SEEDS, AND MINOR FIELD CROPS
Table 6-25.—Hops: United States exports by country of destination and imports by country of origin, 2008–2010
Country Year beginning September
2008 2009 2010
Metric tons Metric tons Metric tons Canada .......................................................... 2,515 1,543 1,613 United Kingdom ............................................. 1,380 1,435 1,344 Belgium-Luxembourg(*) ................................. 661 1,713 1,331 Germany(*) .................................................... 1,372 1,639 1,328 Mexico ............................................................ 552.2 1,581 1,193 Brazil .............................................................. 1,065 1,301 1,147 Colombia ........................................................ 845 947 803 Japan ............................................................. 760 1,148 757 China .............................................................. 706 432 522 Ecuador .......................................................... 192 196 307 Philippines ...................................................... 210 246 277 Argentina ........................................................ 416 260 249 Australia(*) ..................................................... 162 325 222 Peru ............................................................... 424 388 222 Hong Kong ..................................................... 159 270 214 India ............................................................... 71 202 208 Vietnam .......................................................... 100 40 184 Russia ............................................................ 266 73 169 Korea, South .................................................. 174 284 154 Venezuela ...................................................... 146 80 135 Bolivia ............................................................ 14 83 118 South Africa ................................................... 121 24 97 Other Partners ............................................... 2,094 1,363 1,151
World Total ............................................. 14,330 15,503 13,664
Note (*)denotes a country that is a summarization of its component countries. FAS, Office of Global Analysis, (202) 720-6301.
VerDate Aug 31 2005 10:29 Feb 29, 2012 Jkt 000000 PO 00000 Frm 00016 Fmt 1000 Sfmt 1000 H:\SHARED\DAPP\FPU\AGSTAT\MASTER~2\CHAPTR06\VI-16.AG8 USDA
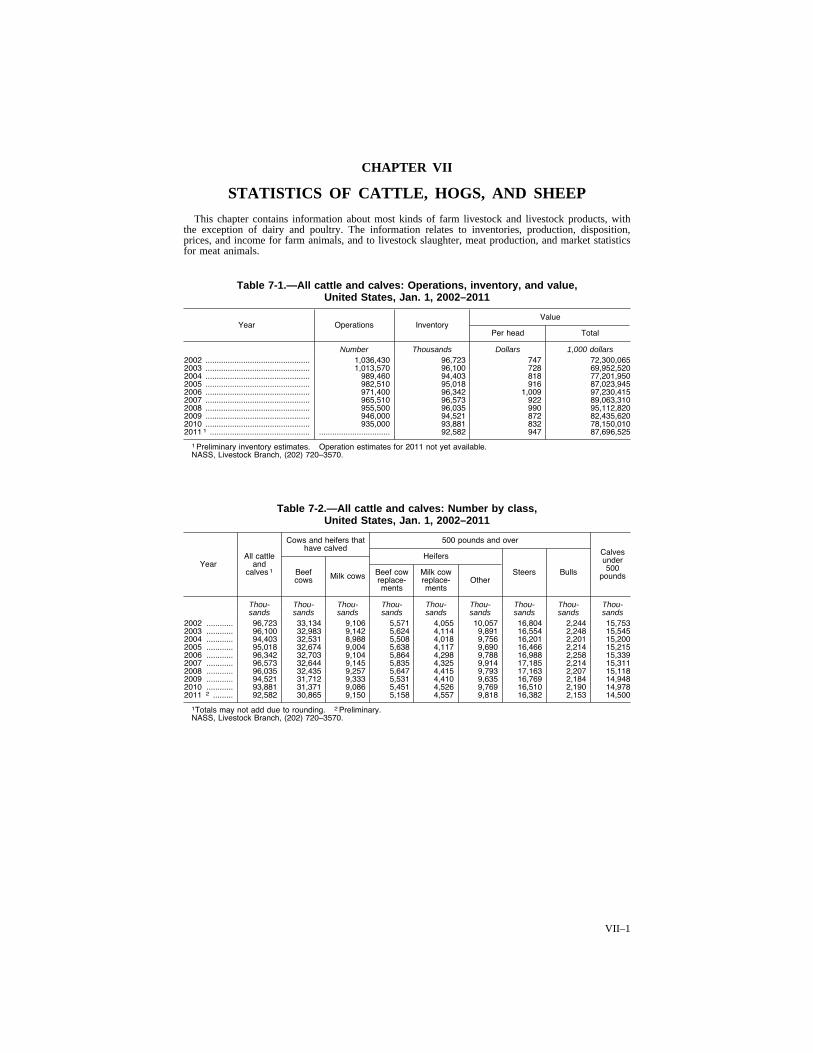
VII–1
CHAPTER VII
STATISTICS OF CATTLE, HOGS, AND SHEEP
This chapter contains information about most kinds of farm livestock and livestock products, with the exception of dairy and poultry. The information relates to inventories, production, disposition, prices, and income for farm animals, and to livestock slaughter, meat production, and market statistics for meat animals.
Table 7-1.—All cattle and calves: Operations, inventory, and value, United States, Jan. 1, 2002–2011
Year Operations Inventory Value
Per head Total
Number Thousands Dollars 1,000 dollars 2002 ............................................... 1,036,430 96,723 747 72,300,065 2003 ............................................... 1,013,570 96,100 728 69,952,520 2004 ............................................... 989,460 94,403 818 77,201,950 2005 ............................................... 982,510 95,018 916 87,023,945 2006 ............................................... 971,400 96,342 1,009 97,230,415 2007 ............................................... 965,510 96,573 922 89,063,310 2008 ............................................... 955,500 96,035 990 95,112,820 2009 ............................................... 946,000 94,521 872 82,435,620 2010 ............................................... 935,000 93,881 832 78,150,010 2011 1 ............................................. ................................ 92,582 947 87,696,525
1 Preliminary inventory estimates. Operation estimates for 2011 not yet available. NASS, Livestock Branch, (202) 720–3570.
Table 7-2.—All cattle and calves: Number by class, United States, Jan. 1, 2002–2011
Year All cattle
and calves 1
Cows and heifers that have calved
500 pounds and over
Calves under 500
pounds Beef cows Milk cows
Heifers
Steers Bulls Beef cow replace-ments
Milk cow replace-ments
Other
Thou- Thou- Thou- Thou- Thou- Thou- Thou- Thou- Thou- sands sands sands sands sands sands sands sands sands
2002 ............ 96,723 33,134 9,106 5,571 4,055 10,057 16,804 2,244 15,753 2003 ............ 96,100 32,983 9,142 5,624 4,114 9,891 16,554 2,248 15,545 2004 ............ 94,403 32,531 8,988 5,508 4,018 9,756 16,201 2,201 15,200 2005 ............ 95,018 32,674 9,004 5,638 4,117 9,690 16,466 2,214 15,215 2006 ............ 96,342 32,703 9,104 5,864 4,298 9,788 16,988 2,258 15,339 2007 ............ 96,573 32,644 9,145 5,835 4,325 9,914 17,185 2,214 15,311 2008 ............ 96,035 32,435 9,257 5,647 4,415 9,793 17,163 2,207 15,118 2009 ............ 94,521 31,712 9,333 5,531 4,410 9,635 16,769 2,184 14,948 2010 ............ 93,881 31,371 9,086 5,451 4,526 9,769 16,510 2,190 14,978 2011 2 ......... 92,582 30,865 9,150 5,158 4,557 9,818 16,382 2,153 14,500
1Totals may not add due to rounding. 2 Preliminary. NASS, Livestock Branch, (202) 720–3570.
VerDate Aug 31 2005 13:43 Mar 01, 2012 Jkt 000000 PO 00000 Frm 00001 Fmt 1001 Sfmt 1000 H:\SHARED\DAPP\FPU\AGSTAT\MASTER~2\CHAPTR07\VII-01.AG8 USDA
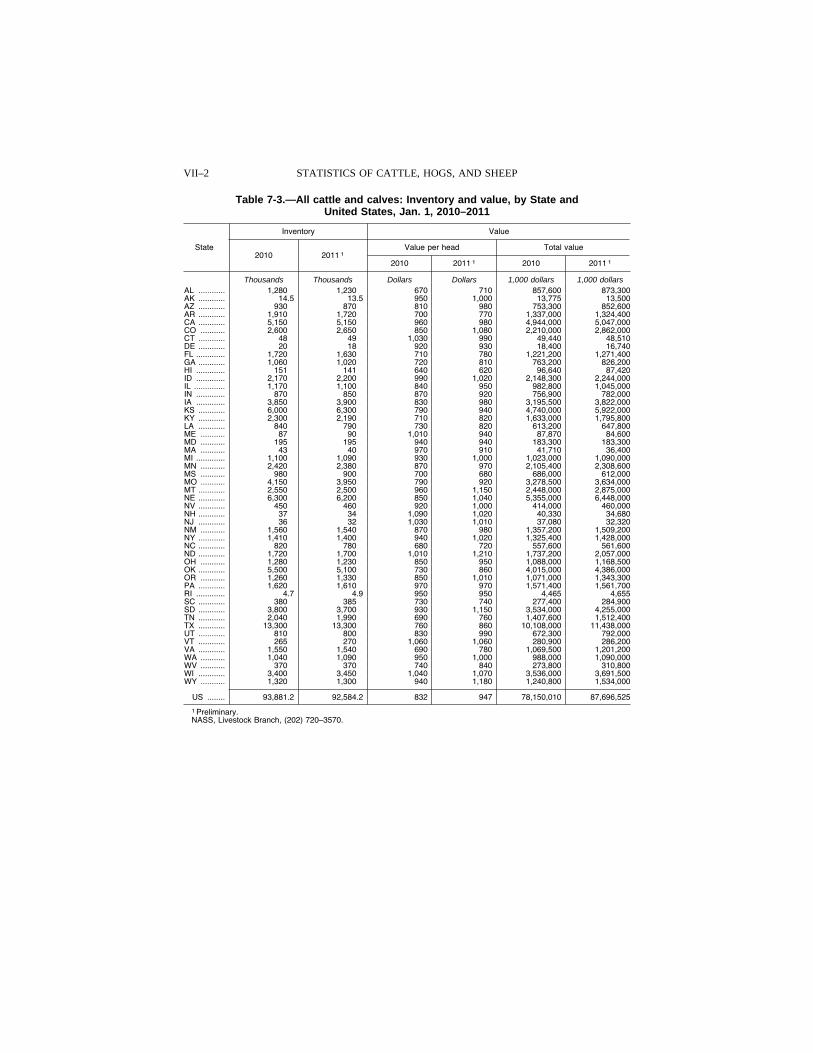
VII–2 STATISTICS OF CATTLE, HOGS, AND SHEEP
Table 7-3.—All cattle and calves: Inventory and value, by State and United States, Jan. 1, 2010–2011
State
Inventory Value
2010 2011 1 Value per head Total value
2010 2011 1 2010 2011 1
Thousands Thousands Dollars Dollars 1,000 dollars 1,000 dollars AL ............ 1,280 1,230 670 710 857,600 873,300 AK ............ 14 .5 13 .5 950 1,000 13,775 13,500 AZ ............ 930 870 810 980 753,300 852,600 AR ............ 1,910 1,720 700 770 1,337,000 1,324,400 CA ............ 5,150 5,150 960 980 4,944,000 5,047,000 CO ........... 2,600 2,650 850 1,080 2,210,000 2,862,000 CT ............ 48 49 1,030 990 49,440 48,510 DE ............ 20 18 920 930 18,400 16,740 FL ............. 1,720 1,630 710 780 1,221,200 1,271,400 GA ............ 1,060 1,020 720 810 763,200 826,200 HI ............. 151 141 640 620 96,640 87,420 ID ............. 2,170 2,200 990 1,020 2,148,300 2,244,000 IL .............. 1,170 1,100 840 950 982,800 1,045,000 IN ............. 870 850 870 920 756,900 782,000 IA ............. 3,850 3,900 830 980 3,195,500 3,822,000 KS ............ 6,000 6,300 790 940 4,740,000 5,922,000 KY ............ 2,300 2,190 710 820 1,633,000 1,795,800 LA ............ 840 790 730 820 613,200 647,800 ME ........... 87 90 1,010 940 87,870 84,600 MD ........... 195 195 940 940 183,300 183,300 MA ........... 43 40 970 910 41,710 36,400 MI ............. 1,100 1,090 930 1,000 1,023,000 1,090,000 MN ........... 2,420 2,380 870 970 2,105,400 2,308,600 MS ........... 980 900 700 680 686,000 612,000 MO ........... 4,150 3,950 790 920 3,278,500 3,634,000 MT ............ 2,550 2,500 960 1,150 2,448,000 2,875,000 NE ............ 6,300 6,200 850 1,040 5,355,000 6,448,000 NV ............ 450 460 920 1,000 414,000 460,000 NH ............ 37 34 1,090 1,020 40,330 34,680 NJ ............ 36 32 1,030 1,010 37,080 32,320 NM ........... 1,560 1,540 870 980 1,357,200 1,509,200 NY ............ 1,410 1,400 940 1,020 1,325,400 1,428,000 NC ............ 820 780 680 720 557,600 561,600 ND ............ 1,720 1,700 1,010 1,210 1,737,200 2,057,000 OH ........... 1,280 1,230 850 950 1,088,000 1,168,500 OK ............ 5,500 5,100 730 860 4,015,000 4,386,000 OR ........... 1,260 1,330 850 1,010 1,071,000 1,343,300 PA ............ 1,620 1,610 970 970 1,571,400 1,561,700 RI ............. 4 .7 4 .9 950 950 4,465 4,655 SC ............ 380 385 730 740 277,400 284,900 SD ............ 3,800 3,700 930 1,150 3,534,000 4,255,000 TN ............ 2,040 1,990 690 760 1,407,600 1,512,400 TX ............ 13,300 13,300 760 860 10,108,000 11,438,000 UT ............ 810 800 830 990 672,300 792,000 VT ............ 265 270 1,060 1,060 280,900 286,200 VA ............ 1,550 1,540 690 780 1,069,500 1,201,200 WA ........... 1,040 1,090 950 1,000 988,000 1,090,000 WV ........... 370 370 740 840 273,800 310,800 WI ............ 3,400 3,450 1,040 1,070 3,536,000 3,691,500 WY ........... 1,320 1,300 940 1,180 1,240,800 1,534,000
US ........ 93,881 .2 92,584 .2 832 947 78,150,010 87,696,525
1 Preliminary. NASS, Livestock Branch, (202) 720–3570.
VerDate Aug 31 2005 13:43 Mar 01, 2012 Jkt 000000 PO 00000 Frm 00002 Fmt 1000 Sfmt 1000 H:\SHARED\DAPP\FPU\AGSTAT\MASTER~2\CHAPTR07\VII-02.AG8 USDA
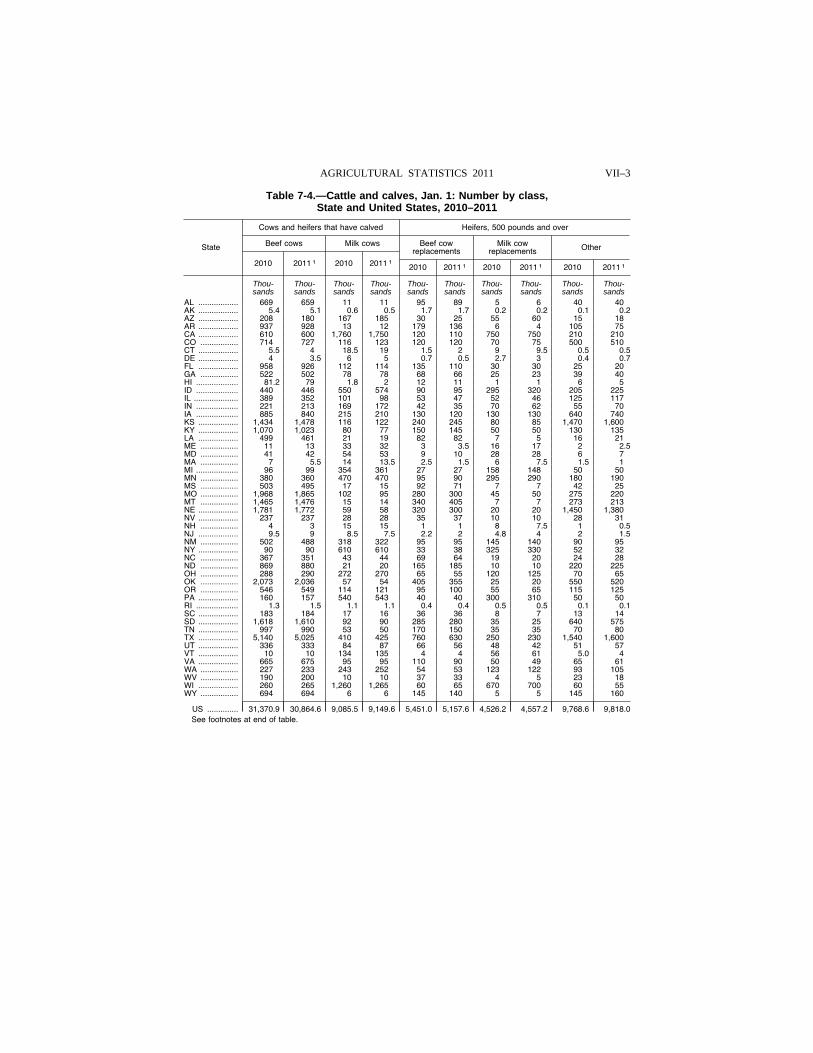
VII–3 AGRICULTURAL STATISTICS 2011
Table 7-4.—Cattle and calves, Jan. 1: Number by class, State and United States, 2010–2011
State
Cows and heifers that have calved Heifers, 500 pounds and over
Beef cows Milk cows Beef cow replacements
Milk cow replacements Other
2010 2011 1 2010 2011 1 2010 2011 1 2010 2011 1 2010 2011 1
Thou- Thou- Thou- Thou- Thou- Thou- Thou- Thou- Thou- Thou- sands sands sands sands sands sands sands sands sands sands
AL .................. 669 659 11 11 95 89 5 6 40 40 AK .................. 5 .4 5 .1 0 .6 0 .5 1 .7 1 .7 0 .2 0 .2 0 .1 0 .2 AZ .................. 208 180 167 185 30 25 55 60 15 18 AR .................. 937 928 13 12 179 136 6 4 105 75 CA .................. 610 600 1,760 1,750 120 110 750 750 210 210 CO ................. 714 727 116 123 120 120 70 75 500 510 CT .................. 5 .5 4 18 .5 19 1 .5 2 9 9 .5 0 .5 0 .5 DE .................. 4 3 .5 6 5 0 .7 0 .5 2 .7 3 0 .4 0 .7 FL .................. 958 926 112 114 135 110 30 30 25 20 GA ................. 522 502 78 78 68 66 25 23 39 40 HI ................... 81 .2 79 1 .8 2 12 11 1 1 6 5 ID ................... 440 446 550 574 90 95 295 320 205 225 IL .................... 389 352 101 98 53 47 52 46 125 117 IN ................... 221 213 169 172 42 35 70 62 55 70 IA ................... 885 840 215 210 130 120 130 130 640 740 KS .................. 1,434 1,478 116 122 240 245 80 85 1,470 1,600 KY .................. 1,070 1,023 80 77 150 145 50 50 130 135 LA .................. 499 461 21 19 82 82 7 5 16 21 ME ................. 11 13 33 32 3 3 .5 16 17 2 2 .5 MD ................. 41 42 54 53 9 10 28 28 6 7 MA ................. 7 5 .5 14 13 .5 2 .5 1 .5 6 7 .5 1 .5 1 MI ................... 96 99 354 361 27 27 158 148 50 50 MN ................. 380 360 470 470 95 90 295 290 180 190 MS ................. 503 495 17 15 92 71 7 7 42 25 MO ................. 1,968 1,865 102 95 280 300 45 50 275 220 MT ................. 1,465 1,476 15 14 340 405 7 7 273 213 NE .................. 1,781 1,772 59 58 320 300 20 20 1,450 1,380 NV .................. 237 237 28 28 35 37 10 10 28 31 NH ................. 4 3 15 15 1 1 8 7 .5 1 0 .5 NJ .................. 9 .5 9 8 .5 7 .5 2 .2 2 4 .8 4 2 1 .5 NM ................. 502 488 318 322 95 95 145 140 90 95 NY .................. 90 90 610 610 33 38 325 330 52 32 NC ................. 367 351 43 44 69 64 19 20 24 28 ND ................. 869 880 21 20 165 185 10 10 220 225 OH ................. 288 290 272 270 65 55 120 125 70 65 OK ................. 2,073 2,036 57 54 405 355 25 20 550 520 OR ................. 546 549 114 121 95 100 55 65 115 125 PA .................. 160 157 540 543 40 40 300 310 50 50 RI ................... 1 .3 1 .5 1 .1 1 .1 0 .4 0 .4 0 .5 0 .5 0 .1 0 .1 SC .................. 183 184 17 16 36 36 8 7 13 14 SD .................. 1,618 1,610 92 90 285 280 35 25 640 575 TN .................. 997 990 53 50 170 150 35 35 70 80 TX .................. 5,140 5,025 410 425 760 630 250 230 1,540 1,600 UT .................. 336 333 84 87 66 56 48 42 51 57 VT .................. 10 10 134 135 4 4 56 61 5 .0 4 VA .................. 665 675 95 95 110 90 50 49 65 61 WA ................. 227 233 243 252 54 53 123 122 93 105 WV ................. 190 200 10 10 37 33 4 5 23 18 WI .................. 260 265 1,260 1,265 60 65 670 700 60 55 WY ................. 694 694 6 6 145 140 5 5 145 160
US .............. 31,370 .9 30,864 .6 9,085 .5 9,149 .6 5,451 .0 5,157 .6 4,526 .2 4,557 .2 9,768 .6 9,818 .0 See footnotes at end of table.
VerDate Aug 31 2005 13:43 Mar 01, 2012 Jkt 000000 PO 00000 Frm 00003 Fmt 1000 Sfmt 1000 H:\SHARED\DAPP\FPU\AGSTAT\MASTER~2\CHAPTR07\VII-03.AG8 USDA
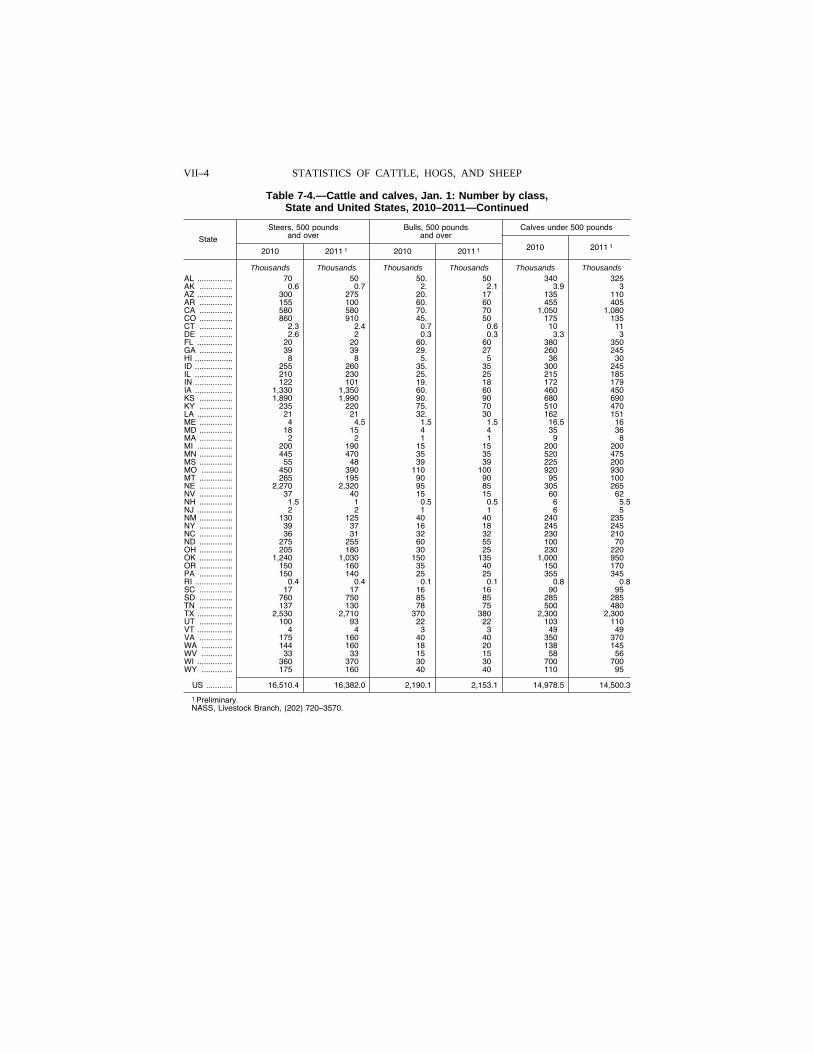
VII–4 STATISTICS OF CATTLE, HOGS, AND SHEEP
Table 7-4.—Cattle and calves, Jan. 1: Number by class, State and United States, 2010–2011—Continued
State
Steers, 500 pounds and over
Bulls, 500 pounds and over
Calves under 500 pounds
2010 2011 1 2010 2011 1 2010 2011 1
Thousands Thousands Thousands Thousands Thousands Thousands AL ................ 70 50 50 . 50 340 325 AK ............... 0 .6 0 .7 2 . 2 .1 3 .9 3 AZ ................ 300 275 20 . 17 135 110 AR ............... 155 100 60 . 60 455 405 CA ............... 580 580 70 . 70 1,050 1,080 CO ............... 860 910 45 . 50 175 135 CT ............... 2 .3 2 .4 0 .7 0 .6 10 11 DE ............... 2 .6 2 0 .3 0 .3 3 .3 3 FL ................ 20 20 60 . 60 380 350 GA ............... 39 39 29 . 27 260 245 HI ................. 8 8 5 . 5 36 30 ID ................. 255 260 35 . 35 300 245 IL ................. 210 230 25 . 25 215 185 IN ................. 122 101 19 . 18 172 179 IA ................. 1,330 1,350 60 . 60 460 450 KS ............... 1,890 1,990 90 . 90 680 690 KY ............... 235 220 75 . 70 510 470 LA ................ 21 21 32 . 30 162 151 ME ............... 4 4 .5 1 .5 1 .5 16 .5 16 MD ............... 18 15 4 4 35 36 MA ............... 2 2 1 1 9 8 MI ................ 200 190 15 15 200 200 MN ............... 445 470 35 35 520 475 MS ............... 55 48 39 39 225 200 MO .............. 450 390 110 100 920 930 MT ............... 265 195 90 90 95 100 NE ............... 2,270 2,320 95 85 305 265 NV ............... 37 40 15 15 60 62 NH ............... 1 .5 1 0 .5 0 .5 6 5 .5 NJ ................ 2 2 1 1 6 5 NM ............... 130 125 40 40 240 235 NY ............... 39 37 16 18 245 245 NC ............... 36 31 32 32 230 210 ND ............... 275 255 60 55 100 70 OH ............... 205 180 30 25 230 220 OK ............... 1,240 1,030 150 135 1,000 950 OR ............... 150 160 35 40 150 170 PA ............... 150 140 25 25 355 345 RI ................. 0 .4 0 .4 0 .1 0 .1 0 .8 0 .8 SC ............... 17 17 16 16 90 95 SD ............... 760 750 85 85 285 285 TN ............... 137 130 78 75 500 480 TX ................ 2,530 2,710 370 380 2,300 2,300 UT ............... 100 93 22 22 103 110 VT ................ 4 4 3 3 49 49 VA ............... 175 160 40 40 350 370 WA .............. 144 160 18 20 138 145 WV .............. 33 33 15 15 58 56 WI ................ 360 370 30 30 700 700 WY .............. 175 160 40 40 110 95
US ............ 16,510 .4 16,382 .0 2,190 .1 2,153 .1 14,978 .5 14,500 .3
1 Preliminary. NASS, Livestock Branch, (202) 720–3570.
VerDate Aug 31 2005 13:43 Mar 01, 2012 Jkt 000000 PO 00000 Frm 00004 Fmt 1000 Sfmt 1000 H:\SHARED\DAPP\FPU\AGSTAT\MASTER~2\CHAPTR07\VII-04.AG8 USDA
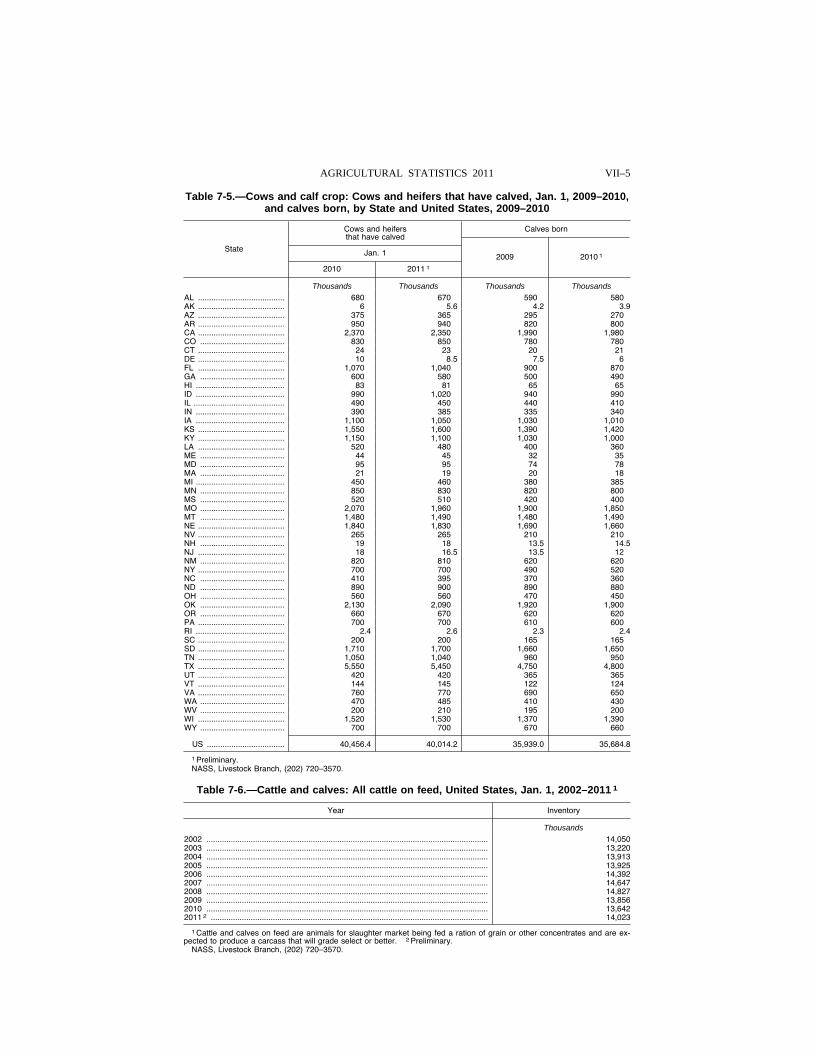
VII–5 AGRICULTURAL STATISTICS 2011
Table 7-5.—Cows and calf crop: Cows and heifers that have calved, Jan. 1, 2009–2010, and calves born, by State and United States, 2009–2010
State
Cows and heifers that have calved
Calves born
Jan. 1 2009 2010 1
2010 2011 1
Thousands Thousands Thousands Thousands AL ....................................... 680 670 590 580 AK ....................................... 6 5 .6 4 .2 3 .9 AZ ....................................... 375 365 295 270 AR ....................................... 950 940 820 800 CA ....................................... 2,370 2,350 1,990 1,980 CO ...................................... 830 850 780 780 CT ....................................... 24 23 20 21 DE ....................................... 10 8 .5 7 .5 6 FL ....................................... 1,070 1,040 900 870 GA ...................................... 600 580 500 490 HI ........................................ 83 81 65 65 ID ........................................ 990 1,020 940 990 IL ......................................... 490 450 440 410 IN ........................................ 390 385 335 340 IA ........................................ 1,100 1,050 1,030 1,010 KS ....................................... 1,550 1,600 1,390 1,420 KY ....................................... 1,150 1,100 1,030 1,000 LA ....................................... 520 480 400 360 ME ...................................... 44 45 32 35 MD ...................................... 95 95 74 78 MA ...................................... 21 19 20 18 MI ........................................ 450 460 380 385 MN ...................................... 850 830 820 800 MS ...................................... 520 510 420 400 MO ...................................... 2,070 1,960 1,900 1,850 MT ...................................... 1,480 1,490 1,480 1,490 NE ....................................... 1,840 1,830 1,690 1,660 NV ....................................... 265 265 210 210 NH ...................................... 19 18 13 .5 14 .5 NJ ....................................... 18 16 .5 13 .5 12 NM ...................................... 820 810 620 620 NY ....................................... 700 700 490 520 NC ...................................... 410 395 370 360 ND ...................................... 890 900 890 880 OH ...................................... 560 560 470 450 OK ...................................... 2,130 2,090 1,920 1,900 OR ...................................... 660 670 620 620 PA ....................................... 700 700 610 600 RI ........................................ 2 .4 2 .6 2 .3 2 .4 SC ....................................... 200 200 165 165 SD ....................................... 1,710 1,700 1,660 1,650 TN ....................................... 1,050 1,040 960 950 TX ....................................... 5,550 5,450 4,750 4,800 UT ....................................... 420 420 365 365 VT ....................................... 144 145 122 124 VA ....................................... 760 770 690 650 WA ...................................... 470 485 410 430 WV ...................................... 200 210 195 200 WI ....................................... 1,520 1,530 1,370 1,390 WY ...................................... 700 700 670 660
US ................................... 40,456 .4 40,014 .2 35,939 .0 35,684 .8
1 Preliminary. NASS, Livestock Branch, (202) 720–3570.
Table 7-6.—Cattle and calves: All cattle on feed, United States, Jan. 1, 2002–2011 1
Year Inventory
Thousands 2002 ............................................................................................................................... 14,050 2003 ............................................................................................................................... 13,220 2004 ............................................................................................................................... 13,913 2005 ............................................................................................................................... 13,925 2006 ............................................................................................................................... 14,392 2007 ............................................................................................................................... 14,647 2008 ............................................................................................................................... 14,827 2009 ............................................................................................................................... 13,856 2010 ............................................................................................................................... 13,642 2011 2 ............................................................................................................................. 14,023
1 Cattle and calves on feed are animals for slaughter market being fed a ration of grain or other concentrates and are ex-pected to produce a carcass that will grade select or better. 2 Preliminary.
NASS, Livestock Branch, (202) 720–3570.
VerDate Aug 31 2005 13:43 Mar 01, 2012 Jkt 000000 PO 00000 Frm 00005 Fmt 1000 Sfmt 1000 H:\SHARED\DAPP\FPU\AGSTAT\MASTER~2\CHAPTR07\VII-05.AG8 USDA
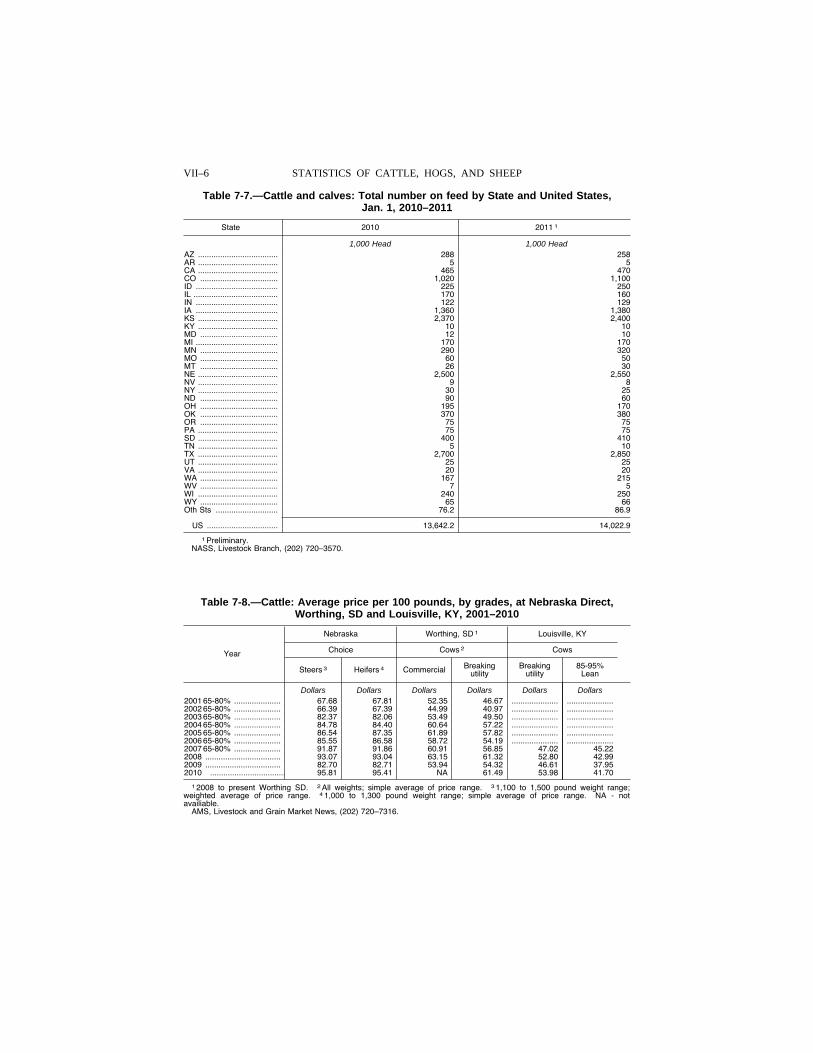
VII–6 STATISTICS OF CATTLE, HOGS, AND SHEEP
Table 7-7.—Cattle and calves: Total number on feed by State and United States, Jan. 1, 2010–2011
State 2010 2011 1
1,000 Head 1,000 Head AZ .................................... 288 258 AR .................................... 5 5 CA .................................... 465 470 CO ................................... 1,020 1,100 ID ..................................... 225 250 IL ...................................... 170 160 IN ..................................... 122 129 IA ..................................... 1,360 1,380 KS .................................... 2,370 2,400 KY .................................... 10 10 MD ................................... 12 10 MI ..................................... 170 170 MN ................................... 290 320 MO ................................... 60 50 MT ................................... 26 30 NE .................................... 2,500 2,550 NV .................................... 9 8 NY .................................... 30 25 ND ................................... 90 60 OH ................................... 195 170 OK ................................... 370 380 OR ................................... 75 75 PA .................................... 75 75 SD .................................... 400 410 TN .................................... 5 10 TX .................................... 2,700 2,850 UT .................................... 25 25 VA .................................... 20 20 WA ................................... 167 215 WV ................................... 7 5 WI .................................... 240 250 WY ................................... 65 66 Oth Sts ............................ 76.2 86.9
US ................................ 13,642.2 14,022.9
1 Preliminary. NASS, Livestock Branch, (202) 720–3570.
Table 7-8.—Cattle: Average price per 100 pounds, by grades, at Nebraska Direct, Worthing, SD and Louisville, KY, 2001–2010
Year
Nebraska Worthing, SD 1 Louisville, KY
Choice Cows 2 Cows
Steers 3 Heifers 4 Commercial Breaking utility
Breaking utility
85-95% Lean
Dollars Dollars Dollars Dollars Dollars Dollars 2001 65-80% ..................... 67.68 67.81 52.35 46.67 ..................... .....................2002 65-80% ..................... 66.39 67.39 44.99 40.97 ..................... .....................2003 65-80% ..................... 82.37 82.06 53.49 49.50 ..................... .....................2004 65-80% ..................... 84.78 84.40 60.64 57.22 ..................... .....................2005 65-80% ..................... 86.54 87.35 61.89 57.82 ..................... .....................2006 65-80% ..................... 85.55 86.58 58.72 54.19 ..................... .....................2007 65-80% ..................... 91.87 91.86 60.91 56.85 47.02 45.22 2008 .................................. 93.07 93.04 63.15 61.32 52.80 42.99 2009 .................................. 82.70 82.71 53.94 54.32 46.61 37.95 2010 .................................. 95.81 95.41 NA 61.49 53.98 41.70
1 2008 to present Worthing SD. 2 All weights; simple average of price range. 3 1,100 to 1,500 pound weight range; weighted average of price range. 4 1,000 to 1,300 pound weight range; simple average of price range. NA - not availiable.
AMS, Livestock and Grain Market News, (202) 720–7316.
VerDate Aug 31 2005 13:43 Mar 01, 2012 Jkt 000000 PO 00000 Frm 00006 Fmt 1000 Sfmt 1000 H:\SHARED\DAPP\FPU\AGSTAT\MASTER~2\CHAPTR07\VII-06.AG8 USDA
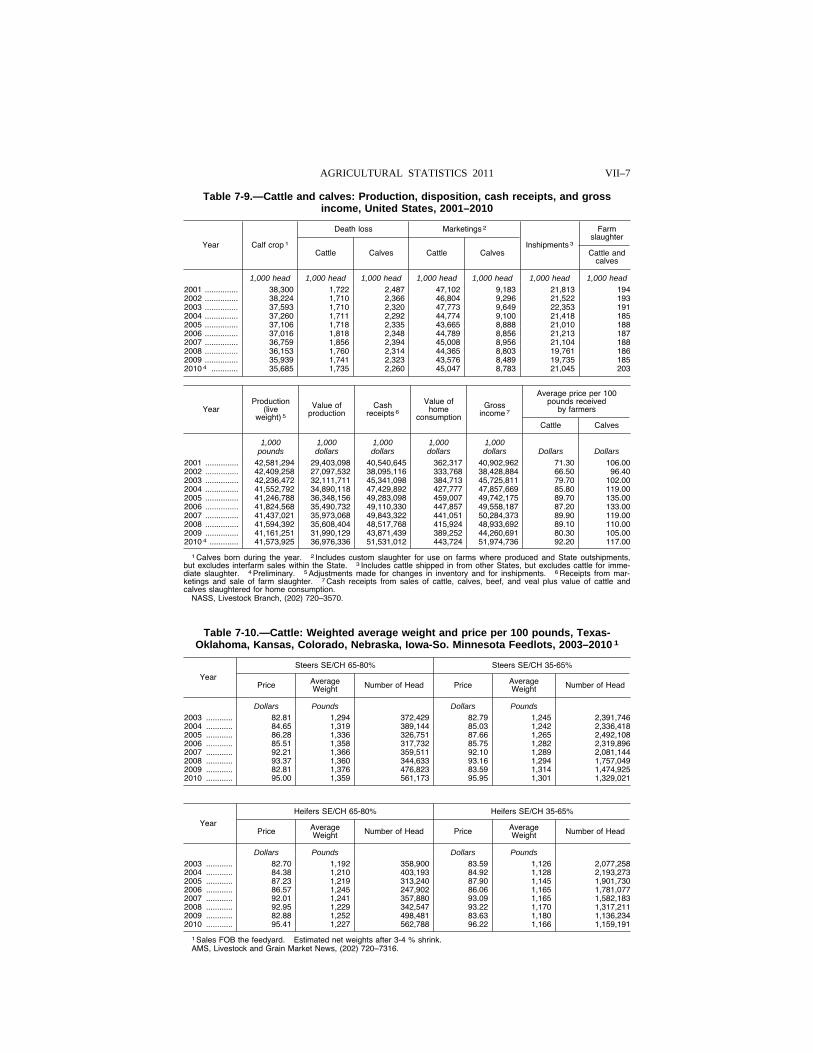
VII–7 AGRICULTURAL STATISTICS 2011
Table 7-9.—Cattle and calves: Production, disposition, cash receipts, and gross income, United States, 2001–2010
Year Calf crop 1
Death loss Marketings 2
Inshipments 3
Farm slaughter
Cattle Calves Cattle Calves Cattle and calves
1,000 head 1,000 head 1,000 head 1,000 head 1,000 head 1,000 head 1,000 head 2001 ............... 38,300 1,722 2,487 47,102 9,183 21,813 194 2002 ............... 38,224 1,710 2,366 46,804 9,296 21,522 193 2003 ............... 37,593 1,710 2,320 47,773 9,649 22,353 191 2004 ............... 37,260 1,711 2,292 44,774 9,100 21,418 185 2005 ............... 37,106 1,718 2,335 43,665 8,888 21,010 188 2006 ............... 37,016 1,818 2,348 44,789 8,856 21,213 187 2007 ............... 36,759 1,856 2,394 45,008 8,956 21,104 188 2008 ............... 36,153 1,760 2,314 44,365 8,803 19,761 186 2009 ............... 35,939 1,741 2,323 43,576 8,489 19,735 185 2010 4 ............ 35,685 1,735 2,260 45,047 8,783 21,045 203
Year Production
(live weight) 5
Value of production
Cash receipts 6
Value of home
consumption
Gross income 7
Average price per 100 pounds received
by farmers
Cattle Calves
1,000 1,000 1,000 1,000 1,000 pounds dollars dollars dollars dollars Dollars Dollars
2001 ............... 42,581,294 29,403,098 40,540,645 362,317 40,902,962 71.30 106.00 2002 ............... 42,409,258 27,097,532 38,095,116 333,768 38,428,884 66.50 96.40 2003 ............... 42,236,472 32,111,711 45,341,098 384,713 45,725,811 79.70 102.00 2004 ............... 41,552,792 34,890,118 47,429,892 427,777 47,857,669 85.80 119.00 2005 ............... 41,246,788 36,348,156 49,283,098 459,007 49,742,175 89.70 135.00 2006 ............... 41,824,568 35,490,732 49,110,330 447,857 49,558,187 87.20 133.00 2007 ............... 41,437,021 35,973,068 49,843,322 441,051 50,284,373 89.90 119.00 2008 ............... 41,594,392 35,608,404 48,517,768 415,924 48,933,692 89.10 110.00 2009 ............... 41,161,251 31,990,129 43,871,439 389,252 44,260,691 80.30 105.00 2010 4 ............. 41,573,925 36,976,336 51,531,012 443,724 51,974,736 92.20 117.00
1 Calves born during the year. 2 Includes custom slaughter for use on farms where produced and State outshipments, but excludes interfarm sales within the State. 3 Includes cattle shipped in from other States, but excludes cattle for imme-diate slaughter. 4 Preliminary. 5 Adjustments made for changes in inventory and for inshipments. 6 Receipts from mar-ketings and sale of farm slaughter. 7 Cash receipts from sales of cattle, calves, beef, and veal plus value of cattle and calves slaughtered for home consumption.
NASS, Livestock Branch, (202) 720–3570.
Table 7-10.—Cattle: Weighted average weight and price per 100 pounds, Texas- Oklahoma, Kansas, Colorado, Nebraska, Iowa-So. Minnesota Feedlots, 2003–2010 1
Year
Steers SE/CH 65-80% Steers SE/CH 35-65%
Price Average Weight Number of Head Price Average
Weight Number of Head
Dollars Pounds Dollars Pounds 2003 ............ 82.81 1,294 372,429 82.79 1,245 2,391,746 2004 ............ 84.65 1,319 389,144 85.03 1,242 2,336,418 2005 ............ 86.28 1,336 326,751 87.66 1,265 2,492,108 2006 ............ 85.51 1,358 317,732 85.75 1,282 2,319,896 2007 ............ 92.21 1,366 359,511 92.10 1,289 2,081,144 2008 ............ 93.37 1,360 344,633 93.16 1,294 1,757,049 2009 ............ 82.81 1,376 476,823 83.59 1,314 1,474,925 2010 ............ 95.00 1,359 561,173 95.95 1,301 1,329,021
Year
Heifers SE/CH 65-80% Heifers SE/CH 35-65%
Price Average Weight Number of Head Price Average
Weight Number of Head
Dollars Pounds Dollars Pounds 2003 ............ 82.70 1,192 358,900 83.59 1,126 2,077,258 2004 ............ 84.38 1,210 403,193 84.92 1,128 2,193,273 2005 ............ 87.23 1,219 313,240 87.90 1,145 1,901,730 2006 ............ 86.57 1,245 247,902 86.06 1,165 1,781,077 2007 ............ 92.01 1,241 357,880 93.09 1,165 1,582,183 2008 ............ 92.95 1,229 342,547 93.22 1,170 1,317,211 2009 ............ 82.88 1,252 498,481 83.63 1,180 1,136,234 2010 ............ 95.41 1,227 562,788 96.22 1,166 1,159,191
1 Sales FOB the feedyard. Estimated net weights after 3-4 % shrink. AMS, Livestock and Grain Market News, (202) 720–7316.
VerDate Aug 31 2005 13:43 Mar 01, 2012 Jkt 000000 PO 00000 Frm 00007 Fmt 1000 Sfmt 1000 H:\SHARED\DAPP\FPU\AGSTAT\MASTER~2\CHAPTR07\VII-07.AG8 USDA
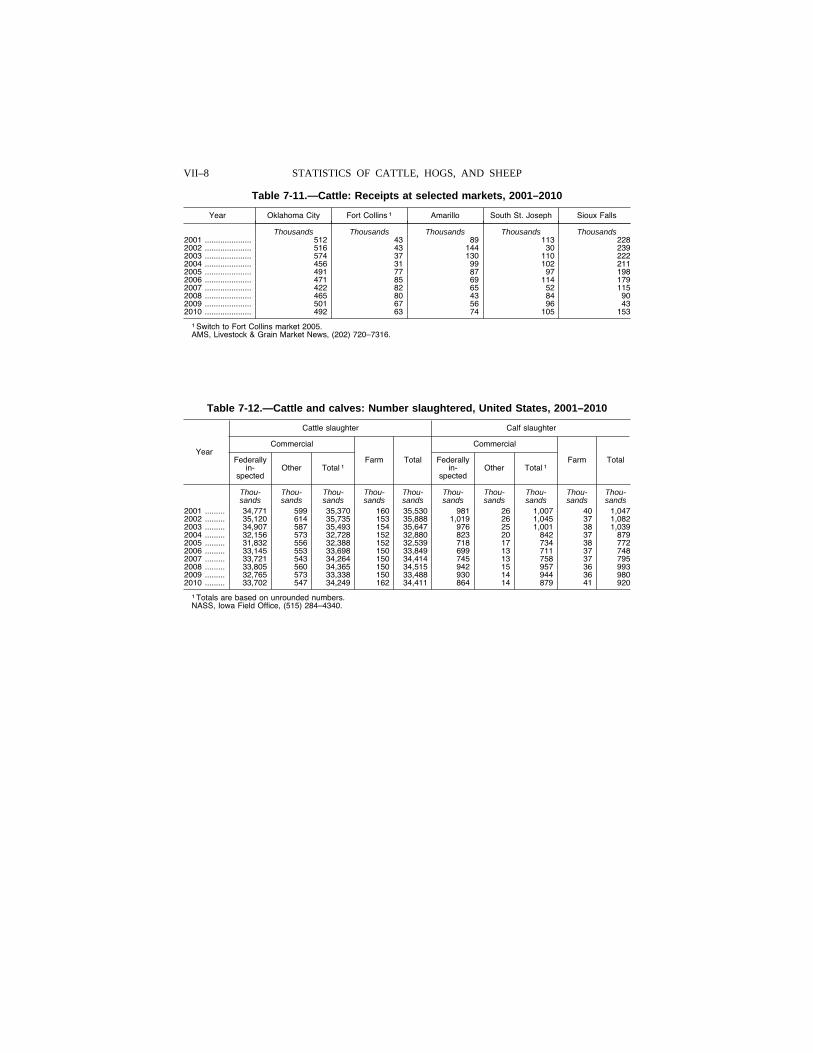
VII–8 STATISTICS OF CATTLE, HOGS, AND SHEEP
Table 7-11.—Cattle: Receipts at selected markets, 2001–2010
Year Oklahoma City Fort Collins 1 Amarillo South St. Joseph Sioux Falls
Thousands Thousands Thousands Thousands Thousands 2001 ..................... 512 43 89 113 228 2002 ..................... 516 43 144 30 239 2003 ..................... 574 37 130 110 222 2004 ..................... 456 31 99 102 211 2005 ..................... 491 77 87 97 198 2006 ..................... 471 85 69 114 179 2007 ..................... 422 82 65 52 115 2008 ..................... 465 80 43 84 90 2009 ..................... 501 67 56 96 43 2010 ..................... 492 63 74 105 153
1 Switch to Fort Collins market 2005. AMS, Livestock & Grain Market News, (202) 720–7316.
Table 7-12.—Cattle and calves: Number slaughtered, United States, 2001–2010
Year
Cattle slaughter Calf slaughter
Commercial
Farm Total
Commercial
Farm Total Federally in-
spected Other Total 1
Federally in-
spected Other Total 1
Thou- Thou- Thou- Thou- Thou- Thou- Thou- Thou- Thou- Thou- sands sands sands sands sands sands sands sands sands sands
2001 ......... 34,771 599 35,370 160 35,530 981 26 1,007 40 1,047 2002 ......... 35,120 614 35,735 153 35,888 1,019 26 1,045 37 1,082 2003 ......... 34,907 587 35,493 154 35,647 976 25 1,001 38 1,039 2004 ......... 32,156 573 32,728 152 32,880 823 20 842 37 879 2005 ......... 31,832 556 32,388 152 32,539 718 17 734 38 772 2006 ......... 33,145 553 33,698 150 33,849 699 13 711 37 748 2007 ......... 33,721 543 34,264 150 34,414 745 13 758 37 795 2008 ......... 33,805 560 34,365 150 34,515 942 15 957 36 993 2009 ......... 32,765 573 33,338 150 33,488 930 14 944 36 980 2010 ......... 33,702 547 34,249 162 34,411 864 14 879 41 920
1 Totals are based on unrounded numbers. NASS, Iowa Field Office, (515) 284–4340.
VerDate Aug 31 2005 13:43 Mar 01, 2012 Jkt 000000 PO 00000 Frm 00008 Fmt 1000 Sfmt 1000 H:\SHARED\DAPP\FPU\AGSTAT\MASTER~2\CHAPTR07\VII-08.AG8 USDA
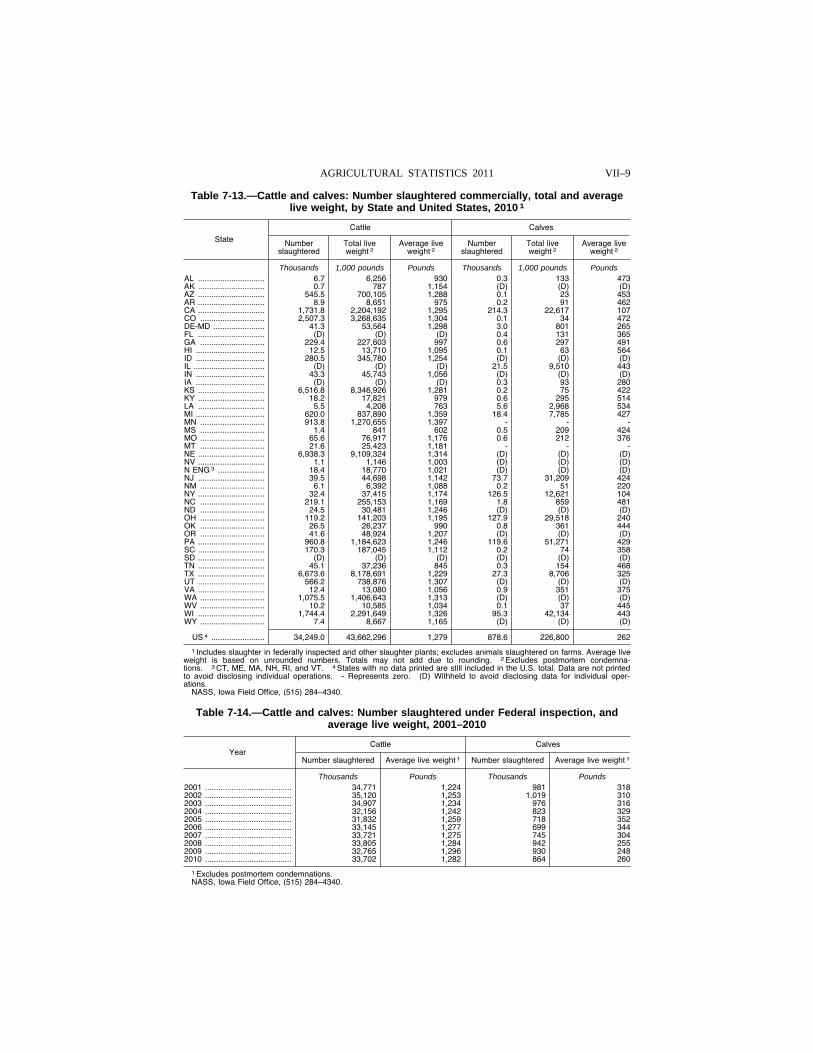
VII–9 AGRICULTURAL STATISTICS 2011
Table 7-13.—Cattle and calves: Number slaughtered commercially, total and average live weight, by State and United States, 2010 1
State
Cattle Calves
Number slaughtered
Total live weight 2
Average live weight 2
Number slaughtered
Total live weight 2
Average live weight 2
Thousands 1,000 pounds Pounds Thousands 1,000 pounds Pounds AL .............................. 6.7 6,256 930 0.3 133 473 AK .............................. 0.7 787 1,154 (D) (D) (D) AZ .............................. 545.5 700,105 1,288 0.1 23 453 AR .............................. 8.9 8,651 975 0.2 91 462 CA .............................. 1,731.8 2,204,192 1,295 214.3 22,617 107 CO ............................. 2,507.3 3,268,635 1,304 0.1 34 472 DE-MD ....................... 41.3 53,564 1,298 3.0 801 265 FL .............................. (D) (D) (D) 0.4 131 365 GA ............................. 229.4 227,603 997 0.6 297 491 HI ............................... 12.5 13,710 1,095 0.1 63 564 ID ............................... 280.5 345,780 1,254 (D) (D) (D) IL ................................ (D) (D) (D) 21.5 9,510 443 IN ............................... 43.3 45,743 1,056 (D) (D) (D) IA ............................... (D) (D) (D) 0.3 93 280 KS .............................. 6,516.8 8,346,926 1,281 0.2 75 422 KY .............................. 18.2 17,821 979 0.6 295 514 LA .............................. 5.5 4,208 763 5.6 2,968 534 MI ............................... 620.0 837,890 1,359 18.4 7,785 427 MN ............................. 913.8 1,270,655 1,397 - - - MS ............................. 1.4 841 602 0.5 209 424 MO ............................. 65.6 76,917 1,176 0.6 212 376 MT ............................. 21.6 25,423 1,181 - - - NE .............................. 6,938.3 9,109,324 1,314 (D) (D) (D) NV .............................. 1.1 1,146 1,003 (D) (D) (D) N ENG 3 ..................... 18.4 18,770 1,021 (D) (D) (D) NJ .............................. 39.5 44,698 1,142 73.7 31,209 424 NM ............................. 6.1 6,392 1,088 0.2 51 220 NY .............................. 32.4 37,415 1,174 126.5 12,621 104 NC ............................. 219.1 255,153 1,169 1.8 859 481 ND ............................. 24.5 30,481 1,246 (D) (D) (D) OH ............................. 119.2 141,203 1,195 127.9 29,518 240 OK ............................. 26.5 26,237 990 0.8 361 444 OR ............................. 41.6 48,924 1,207 (D) (D) (D) PA .............................. 960.8 1,184,623 1,246 119.6 51,271 429 SC .............................. 170.3 187,045 1,112 0.2 74 358 SD .............................. (D) (D) (D) (D) (D) (D) TN .............................. 45.1 37,236 845 0.3 154 468 TX .............................. 6,673.6 8,178,691 1,229 27.3 8,706 325 UT .............................. 566.2 738,876 1,307 (D) (D) (D) VA .............................. 12.4 13,080 1,056 0.9 351 375 WA ............................. 1,075.5 1,406,643 1,313 (D) (D) (D) WV ............................. 10.2 10,585 1,034 0.1 37 445 WI .............................. 1,744.4 2,291,649 1,326 95.3 42,134 443 WY ............................. 7.4 8,667 1,165 (D) (D) (D)
US 4 ........................ 34,249.0 43,662,296 1,279 878.6 226,800 262
1 Includes slaughter in federally inspected and other slaughter plants; excludes animals slaughtered on farms. Average live weight is based on unrounded numbers. Totals may not add due to rounding. 2 Excludes postmortem condemna-tions. 3 CT, ME, MA, NH, RI, and VT. 4 States with no data printed are still included in the U.S. total. Data are not printed to avoid disclosing individual operations. - Represents zero. (D) Withheld to avoid disclosing data for individual oper-ations.
NASS, Iowa Field Office, (515) 284–4340.
Table 7-14.—Cattle and calves: Number slaughtered under Federal inspection, and average live weight, 2001–2010
Year Cattle Calves
Number slaughtered Average live weight 1 Number slaughtered Average live weight 1
Thousands Pounds Thousands Pounds 2001 ....................................... 34,771 1,224 981 318 2002 ....................................... 35,120 1,253 1,019 310 2003 ....................................... 34,907 1,234 976 316 2004 ....................................... 32,156 1,242 823 329 2005 ....................................... 31,832 1,259 718 352 2006 ....................................... 33,145 1,277 699 344 2007 ....................................... 33,721 1,275 745 304 2008 ....................................... 33,805 1,284 942 255 2009 ....................................... 32,765 1,296 930 248 2010 ....................................... 33,702 1,282 864 260
1 Excludes postmortem condemnations. NASS, Iowa Field Office, (515) 284–4340.
VerDate Aug 31 2005 13:43 Mar 01, 2012 Jkt 000000 PO 00000 Frm 00009 Fmt 1000 Sfmt 1000 H:\SHARED\DAPP\FPU\AGSTAT\MASTER~2\CHAPTR07\VII-09.AG8 USDA
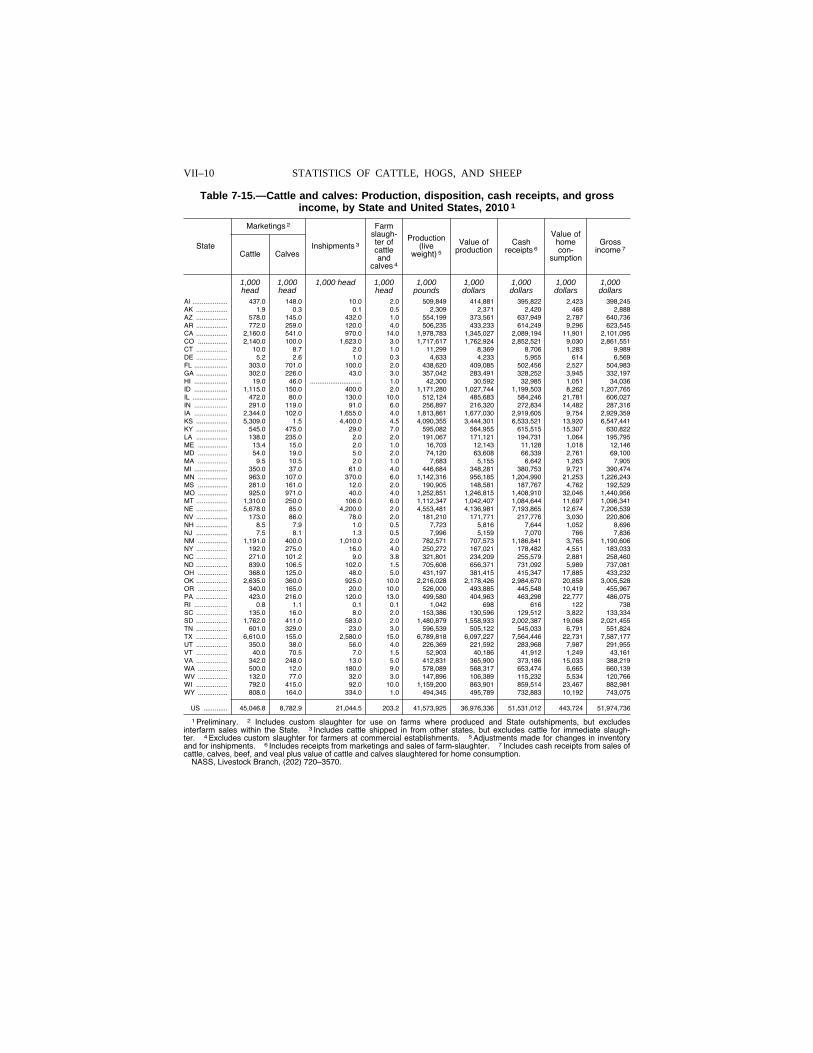
VII–10 STATISTICS OF CATTLE, HOGS, AND SHEEP
Table 7-15.—Cattle and calves: Production, disposition, cash receipts, and gross income, by State and United States, 2010 1
State
Marketings 2
Inshipments 3
Farm slaugh-ter of cattle and
calves 4
Production (live
weight) 5
Value of production
Cash receipts 6
Value of home con-
sumption
Gross income 7 Cattle Calves
1,000 head
1,000 head
1,000 head 1,000 head
1,000 pounds
1,000 dollars
1,000 dollars
1,000 dollars
1,000 dollars
Al ................... 437 .0 148 .0 10 .0 2 .0 509,849 414,881 395,822 2,423 398,245 AK ................. 1 .9 0 .3 0 .1 0 .5 2,309 2,371 2,420 468 2,888 AZ ................. 578 .0 145 .0 432 .0 1 .0 554,199 373,561 637,949 2,787 640,736 AR ................. 772 .0 259 .0 120 .0 4 .0 506,235 433,233 614,249 9,296 623,545 CA ................. 2,160 .0 541 .0 970 .0 14 .0 1,978,783 1,345,027 2,089,194 11,901 2,101,095 CO ................ 2,140 .0 100 .0 1,623 .0 3 .0 1,717,617 1,762,924 2,852,521 9,030 2,861,551 CT ................. 10 .0 8 .7 2 .0 1 .0 11,299 8,369 8,706 1,283 9,989 DE ................. 5 .2 2 .6 1 .0 0 .3 4,633 4,233 5,955 614 6,569 FL .................. 303 .0 701 .0 100 .0 2 .0 438,620 409,085 502,456 2,527 504,983 GA ................. 302 .0 226 .0 43 .0 3 .0 357,042 283,491 328,252 3,945 332,197 HI .................. 19 .0 46 .0 ............................ 1 .0 42,300 30,592 32,985 1,051 34,036 ID .................. 1,115 .0 150 .0 400 .0 2 .0 1,171,280 1,027,744 1,199,503 8,262 1,207,765 IL ................... 472 .0 80 .0 130 .0 10 .0 512,124 485,683 584,246 21,781 606,027 IN .................. 291 .0 119 .0 91 .0 6 .0 256,897 216,320 272,834 14,482 287,316 IA .................. 2,344 .0 102 .0 1,655 .0 4 .0 1,813,861 1,677,030 2,919,605 9,754 2,929,359 KS ................. 5,309 .0 1 .5 4,400 .0 4 .5 4,090,355 3,444,301 6,533,521 13,920 6,547,441 KY ................. 545 .0 475 .0 29 .0 7 .0 595,082 564,955 615,515 15,307 630,822 LA ................. 138 .0 235 .0 2 .0 2 .0 191,067 171,121 194,731 1,064 195,795 ME ................ 13 .4 15 .0 2 .0 1 .0 16,703 12,143 11,128 1,018 12,146 MD ................ 54 .0 19 .0 5 .0 2 .0 74,120 63,608 66,339 2,761 69,100 MA ................ 9 .5 10 .5 2 .0 1 .0 7,683 5,155 6,642 1,263 7,905 MI .................. 350 .0 37 .0 61 .0 4 .0 446,684 348,281 380,753 9,721 390,474 MN ................ 963 .0 107 .0 370 .0 6 .0 1,142,316 956,185 1,204,990 21,253 1,226,243 MS ................ 281 .0 161 .0 12 .0 2 .0 190,905 148,581 187,767 4,762 192,529 MO ................ 925 .0 971 .0 40 .0 4 .0 1,252,851 1,246,815 1,408,910 32,046 1,440,956 MT ................. 1,310 .0 250 .0 106 .0 6 .0 1,112,347 1,042,407 1,084,644 11,697 1,096,341 NE ................. 5,678 .0 85 .0 4,200 .0 2 .0 4,553,481 4,136,981 7,193,865 12,674 7,206,539 NV ................. 173 .0 86 .0 78 .0 2 .0 181,210 171,771 217,776 3,030 220,806 NH ................. 8 .5 7 .9 1 .0 0 .5 7,723 5,816 7,644 1,052 8,696 NJ ................. 7 .5 8 .1 1 .3 0 .5 7,996 5,159 7,070 766 7,836 NM ................ 1,191 .0 400 .0 1,010 .0 2 .0 782,571 707,573 1,186,841 3,765 1,190,606 NY ................. 192 .0 275 .0 16 .0 4 .0 250,272 167,021 178,482 4,551 183,033 NC ................. 271 .0 101 .2 9 .0 3 .8 321,801 234,209 255,579 2,881 258,460 ND ................. 839 .0 106 .5 102 .0 1 .5 705,608 656,371 731,092 5,989 737,081 OH ................ 368 .0 125 .0 48 .0 5 .0 431,197 381,415 415,347 17,885 433,232 OK ................. 2,635 .0 360 .0 925 .0 10 .0 2,216,028 2,178,426 2,984,670 20,858 3,005,528 OR ................ 340 .0 165 .0 20 .0 10 .0 526,000 493,885 445,548 10,419 455,967 PA ................. 423 .0 216 .0 120 .0 13 .0 499,580 404,963 463,298 22,777 486,075 RI .................. 0 .8 1 .1 0 .1 0 .1 1,042 698 616 122 738 SC ................. 135 .0 16 .0 8 .0 2 .0 153,386 130,596 129,512 3,822 133,334 SD ................. 1,762 .0 411 .0 583 .0 2 .0 1,480,879 1,558,933 2,002,387 19,068 2,021,455 TN ................. 601 .0 329 .0 23 .0 3 .0 596,539 505,122 545,033 6,791 551,824 TX ................. 6,610 .0 155 .0 2,580 .0 15 .0 6,789,818 6,097,227 7,564,446 22,731 7,587,177 UT ................. 350 .0 38 .0 56 .0 4 .0 226,369 221,592 283,968 7,987 291,955 VT ................. 40 .0 70 .5 7 .0 1 .5 52,903 40,186 41,912 1,249 43,161 VA ................. 342 .0 248 .0 13 .0 5 .0 412,831 365,900 373,186 15,033 388,219 WA ................ 500 .0 12 .0 180 .0 9 .0 578,089 568,317 653,474 6,665 660,139 WV ................ 132 .0 77 .0 32 .0 3 .0 147,896 106,389 115,232 5,534 120,766 WI ................. 792 .0 415 .0 92 .0 10 .0 1,159,200 863,901 859,514 23,467 882,981 WY ................ 808 .0 164 .0 334 .0 1 .0 494,345 495,789 732,883 10,192 743,075
US ............. 45,046 .8 8,782 .9 21,044 .5 203 .2 41,573,925 36,976,336 51,531,012 443,724 51,974,736
1 Preliminary. 2 Includes custom slaughter for use on farms where produced and State outshipments, but excludes interfarm sales within the State. 3 Includes cattle shipped in from other states, but excludes cattle for immediate slaugh-ter. 4 Excludes custom slaughter for farmers at commercial establishments. 5 Adjustments made for changes in inventory and for inshipments. 6 Includes receipts from marketings and sales of farm-slaughter. 7 Includes cash receipts from sales of cattle, calves, beef, and veal plus value of cattle and calves slaughtered for home consumption.
NASS, Livestock Branch, (202) 720–3570.
VerDate Aug 31 2005 13:43 Mar 01, 2012 Jkt 000000 PO 00000 Frm 00010 Fmt 1000 Sfmt 1000 H:\SHARED\DAPP\FPU\AGSTAT\MASTER~2\CHAPTR07\VII-10.AG8 USDA
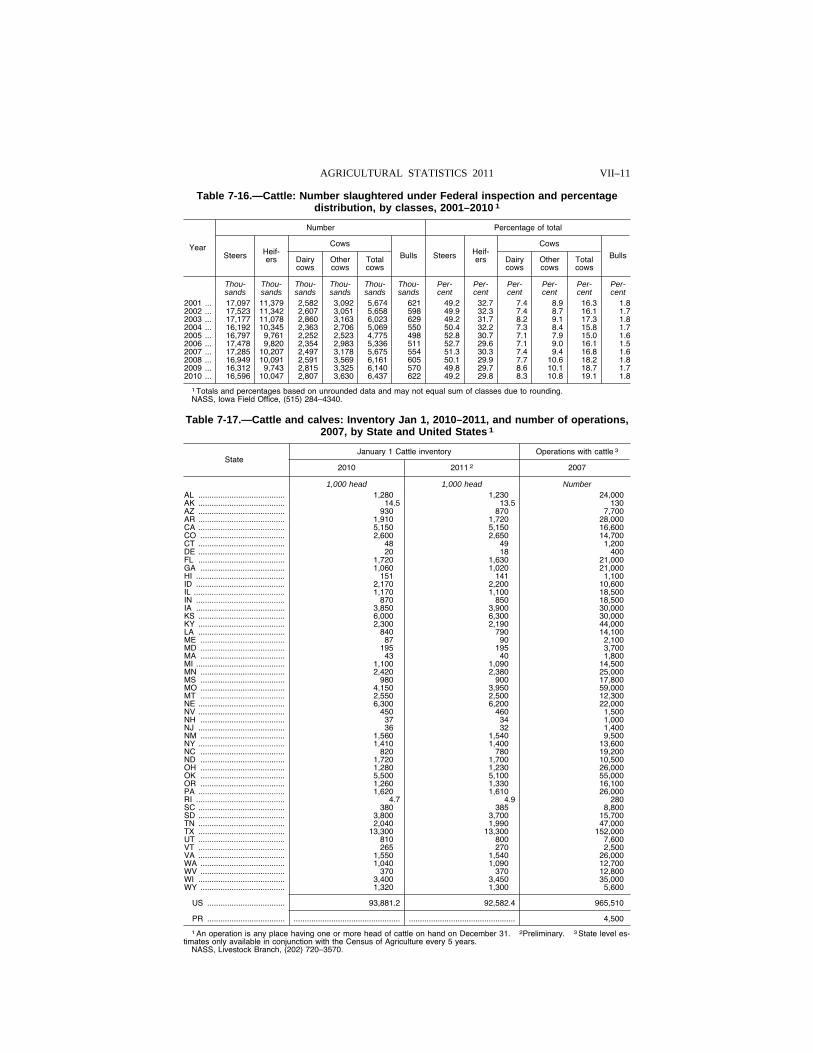
VII–11 AGRICULTURAL STATISTICS 2011
Table 7-16.—Cattle: Number slaughtered under Federal inspection and percentage distribution, by classes, 2001–2010 1
Year
Number Percentage of total
Steers Heif-ers
Cows
Bulls Steers Heif-ers
Cows
Bulls Dairy cows
Other cows
Total cows
Dairy cows
Other cows
Total cows
Thou- Thou- Thou- Thou- Thou- Thou- Per- Per- Per- Per- Per- Per- sands sands sands sands sands sands cent cent cent cent cent cent
2001 ... 17,097 11,379 2,582 3,092 5,674 621 49.2 32.7 7.4 8.9 16.3 1.8 2002 ... 17,523 11,342 2,607 3,051 5,658 598 49.9 32.3 7.4 8.7 16.1 1.7 2003 ... 17,177 11,078 2,860 3,163 6,023 629 49.2 31.7 8.2 9.1 17.3 1.8 2004 ... 16,192 10,345 2,363 2,706 5,069 550 50.4 32.2 7.3 8.4 15.8 1.7 2005 ... 16,797 9,761 2,252 2,523 4,775 498 52.8 30.7 7.1 7.9 15.0 1.6 2006 ... 17,478 9,820 2,354 2,983 5,336 511 52.7 29.6 7.1 9.0 16.1 1.5 2007 ... 17,285 10,207 2,497 3,178 5,675 554 51.3 30.3 7.4 9.4 16.8 1.6 2008 ... 16,949 10,091 2,591 3,569 6,161 605 50.1 29.9 7.7 10.6 18.2 1.8 2009 ... 16,312 9,743 2,815 3,325 6,140 570 49.8 29.7 8.6 10.1 18.7 1.7 2010 ... 16,596 10,047 2,807 3,630 6,437 622 49.2 29.8 8.3 10.8 19.1 1.8
1 Totals and percentages based on unrounded data and may not equal sum of classes due to rounding. NASS, Iowa Field Office, (515) 284–4340.
Table 7-17.—Cattle and calves: Inventory Jan 1, 2010–2011, and number of operations, 2007, by State and United States 1
State January 1 Cattle inventory Operations with cattle 3
2010 2011 2 2007
1,000 head 1,000 head Number AL ....................................... 1,280 1,230 24,000 AK ....................................... 14 .5 13 .5 130 AZ ....................................... 930 870 7,700 AR ....................................... 1,910 1,720 28,000 CA ....................................... 5,150 5,150 16,600 CO ...................................... 2,600 2,650 14,700 CT ....................................... 48 49 1,200 DE ....................................... 20 18 400 FL ....................................... 1,720 1,630 21,000 GA ...................................... 1,060 1,020 21,000 HI ........................................ 151 141 1,100 ID ........................................ 2,170 2,200 10,600 IL ......................................... 1,170 1,100 18,500 IN ........................................ 870 850 18,500 IA ........................................ 3,850 3,900 30,000 KS ....................................... 6,000 6,300 30,000 KY ....................................... 2,300 2,190 44,000 LA ....................................... 840 790 14,100 ME ...................................... 87 90 2,100 MD ...................................... 195 195 3,700 MA ...................................... 43 40 1,800 MI ........................................ 1,100 1,090 14,500 MN ...................................... 2,420 2,380 25,000 MS ...................................... 980 900 17,800 MO ...................................... 4,150 3,950 59,000 MT ...................................... 2,550 2,500 12,300 NE ....................................... 6,300 6,200 22,000 NV ....................................... 450 460 1,500 NH ...................................... 37 34 1,000 NJ ....................................... 36 32 1,400 NM ...................................... 1,560 1,540 9,500 NY ....................................... 1,410 1,400 13,600 NC ...................................... 820 780 19,200 ND ...................................... 1,720 1,700 10,500 OH ...................................... 1,280 1,230 26,000 OK ...................................... 5,500 5,100 55,000 OR ...................................... 1,260 1,330 16,100 PA ....................................... 1,620 1,610 26,000 RI ........................................ 4 .7 4 .9 280 SC ....................................... 380 385 8,800 SD ....................................... 3,800 3,700 15,700 TN ....................................... 2,040 1,990 47,000 TX ....................................... 13,300 13,300 152,000 UT ....................................... 810 800 7,600 VT ....................................... 265 270 2,500 VA ....................................... 1,550 1,540 26,000 WA ...................................... 1,040 1,090 12,700 WV ...................................... 370 370 12,800 WI ....................................... 3,400 3,450 35,000 WY ...................................... 1,320 1,300 5,600
US ................................... 93,881 .2 92,582 .4 965,510
PR ................................... ................................................ ................................................ 4,500
1 An operation is any place having one or more head of cattle on hand on December 31. 2Preliminary. 3 State level es-timates only available in conjunction with the Census of Agriculture every 5 years.
NASS, Livestock Branch, (202) 720–3570.
VerDate Aug 31 2005 13:43 Mar 01, 2012 Jkt 000000 PO 00000 Frm 00011 Fmt 1000 Sfmt 1000 H:\SHARED\DAPP\FPU\AGSTAT\MASTER~2\CHAPTR07\VII-11.AG8 USDA
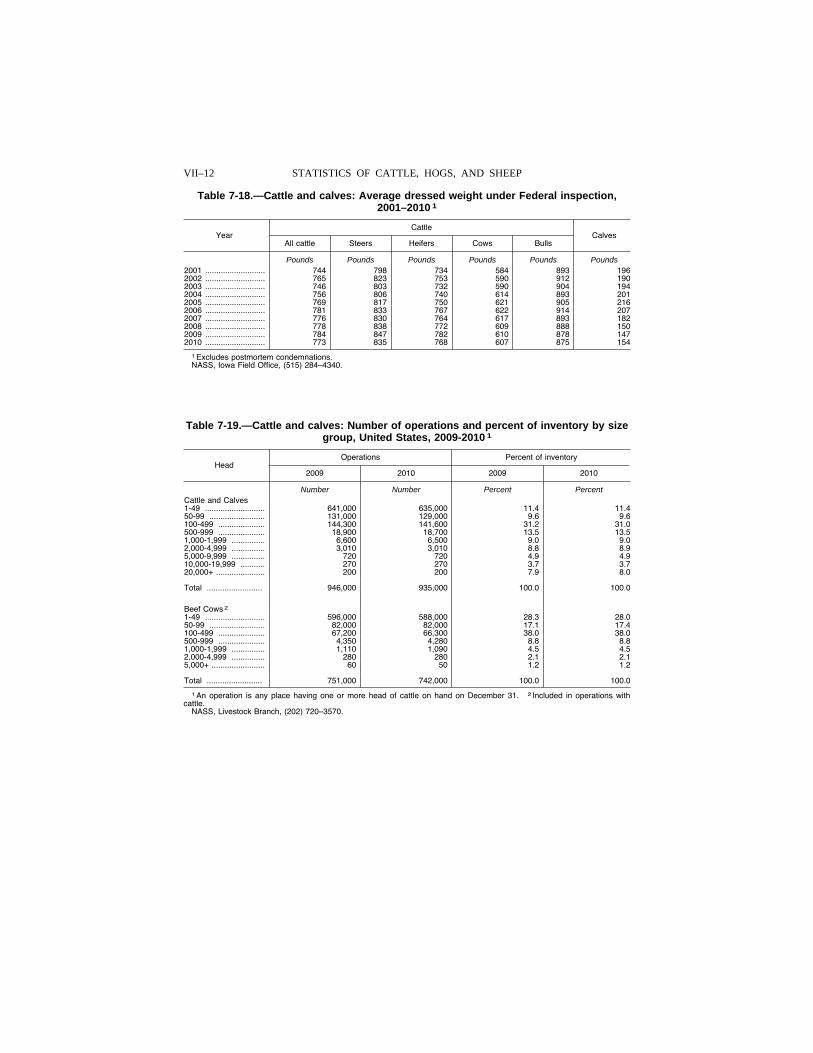
VII–12 STATISTICS OF CATTLE, HOGS, AND SHEEP
Table 7-18.—Cattle and calves: Average dressed weight under Federal inspection, 2001–2010 1
Year Cattle
Calves All cattle Steers Heifers Cows Bulls
Pounds Pounds Pounds Pounds Pounds Pounds 2001 ........................... 744 798 734 584 893 196 2002 ........................... 765 823 753 590 912 190 2003 ........................... 746 803 732 590 904 194 2004 ........................... 756 806 740 614 893 201 2005 ........................... 769 817 750 621 905 216 2006 ........................... 781 833 767 622 914 207 2007 ........................... 776 830 764 617 893 182 2008 ........................... 778 838 772 609 888 150 2009 ........................... 784 847 782 610 878 147 2010 ........................... 773 835 768 607 875 154
1 Excludes postmortem condemnations. NASS, Iowa Field Office, (515) 284–4340.
Table 7-19.—Cattle and calves: Number of operations and percent of inventory by size group, United States, 2009-2010 1
Head Operations Percent of inventory
2009 2010 2009 2010
Number Number Percent Percent Cattle and Calves 1-49 ........................... 641,000 635,000 11.4 11.4 50-99 ......................... 131,000 129,000 9.6 9.6 100-499 ..................... 144,300 141,600 31.2 31.0 500-999 ..................... 18,900 18,700 13.5 13.5 1,000-1,999 ............... 6,600 6,500 9.0 9.0 2,000-4,999 ............... 3,010 3,010 8.8 8.9 5,000-9,999 ............... 720 720 4.9 4.9 10,000-19,999 ........... 270 270 3.7 3.7 20,000+ ...................... 200 200 7.9 8.0
Total ......................... 946,000 935,000 100.0 100.0
Beef Cows 2 1-49 ........................... 596,000 588,000 28.3 28.0 50-99 ......................... 82,000 82,000 17.1 17.4 100-499 ..................... 67,200 66,300 38.0 38.0 500-999 ..................... 4,350 4,280 8.8 8.8 1,000-1,999 ............... 1,110 1,090 4.5 4.5 2,000-4,999 ............... 280 280 2.1 2.1 5,000+ ........................ 60 50 1.2 1.2
Total ......................... 751,000 742,000 100.0 100.0
1 An operation is any place having one or more head of cattle on hand on December 31. 2 Included in operations with cattle.
NASS, Livestock Branch, (202) 720–3570.
VerDate Aug 31 2005 13:43 Mar 01, 2012 Jkt 000000 PO 00000 Frm 00012 Fmt 1000 Sfmt 1000 H:\SHARED\DAPP\FPU\AGSTAT\MASTER~2\CHAPTR07\VII-12.AG8 USDA
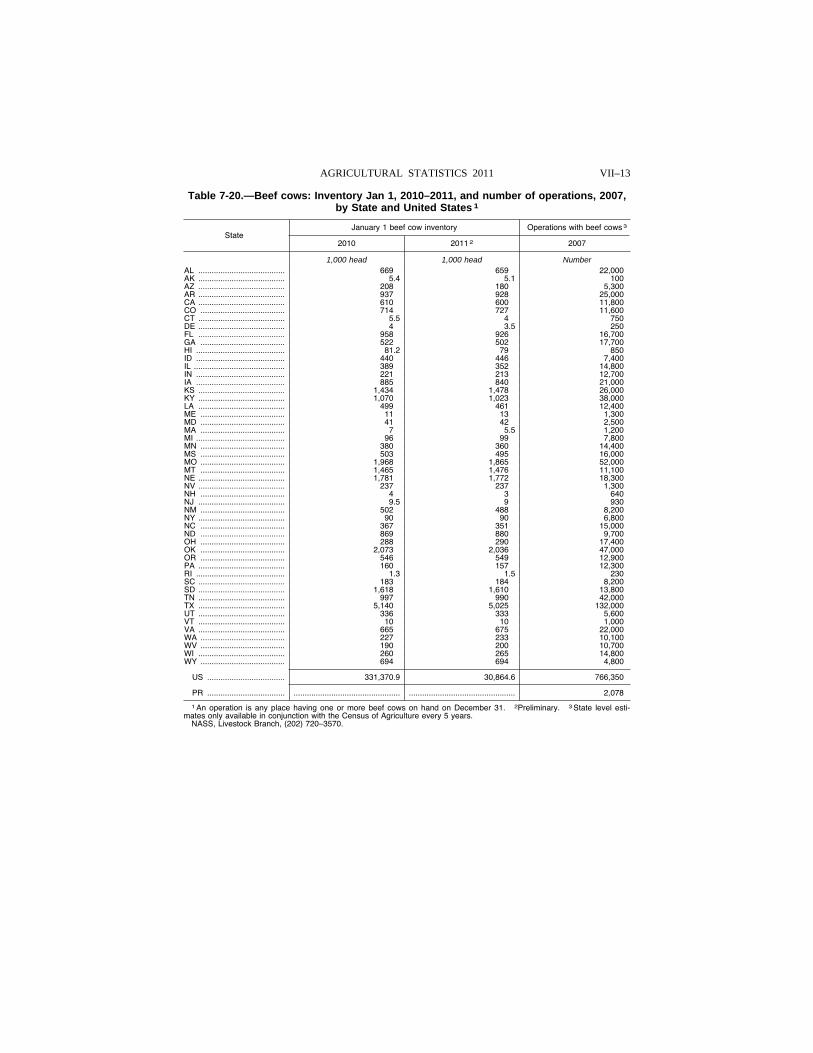
VII–13 AGRICULTURAL STATISTICS 2011
Table 7-20.—Beef cows: Inventory Jan 1, 2010–2011, and number of operations, 2007, by State and United States 1
State January 1 beef cow inventory Operations with beef cows 3
2010 2011 2 2007
1,000 head 1,000 head Number AL ....................................... 669 659 22,000 AK ....................................... 5 .4 5 .1 100 AZ ....................................... 208 180 5,300 AR ....................................... 937 928 25,000 CA ....................................... 610 600 11,800 CO ...................................... 714 727 11,600 CT ....................................... 5 .5 4 750 DE ....................................... 4 3 .5 250 FL ....................................... 958 926 16,700 GA ...................................... 522 502 17,700 HI ........................................ 81 .2 79 850 ID ........................................ 440 446 7,400 IL ......................................... 389 352 14,800 IN ........................................ 221 213 12,700 IA ........................................ 885 840 21,000 KS ....................................... 1,434 1,478 26,000 KY ....................................... 1,070 1,023 38,000 LA ....................................... 499 461 12,400 ME ...................................... 11 13 1,300 MD ...................................... 41 42 2,500 MA ...................................... 7 5 .5 1,200 MI ........................................ 96 99 7,800 MN ...................................... 380 360 14,400 MS ...................................... 503 495 16,000 MO ...................................... 1,968 1,865 52,000 MT ...................................... 1,465 1,476 11,100 NE ....................................... 1,781 1,772 18,300 NV ....................................... 237 237 1,300 NH ...................................... 4 3 640 NJ ....................................... 9 .5 9 930 NM ...................................... 502 488 8,200 NY ....................................... 90 90 6,800 NC ...................................... 367 351 15,000 ND ...................................... 869 880 9,700 OH ...................................... 288 290 17,400 OK ...................................... 2,073 2,036 47,000 OR ...................................... 546 549 12,900 PA ....................................... 160 157 12,300 RI ........................................ 1 .3 1 .5 230 SC ....................................... 183 184 8,200 SD ....................................... 1,618 1,610 13,800 TN ....................................... 997 990 42,000 TX ....................................... 5,140 5,025 132,000 UT ....................................... 336 333 5,600 VT ....................................... 10 10 1,000 VA ....................................... 665 675 22,000 WA ...................................... 227 233 10,100 WV ...................................... 190 200 10,700 WI ....................................... 260 265 14,800 WY ...................................... 694 694 4,800
US ................................... 331,370 .9 30,864 .6 766,350
PR ................................... ................................................ ................................................ 2,078
1 An operation is any place having one or more beef cows on hand on December 31. 2Preliminary. 3 State level esti-mates only available in conjunction with the Census of Agriculture every 5 years.
NASS, Livestock Branch, (202) 720–3570.
VerDate Aug 31 2005 13:43 Mar 01, 2012 Jkt 000000 PO 00000 Frm 00013 Fmt 1000 Sfmt 1000 H:\SHARED\DAPP\FPU\AGSTAT\MASTER~2\CHAPTR07\VII-14.AG8 USDA
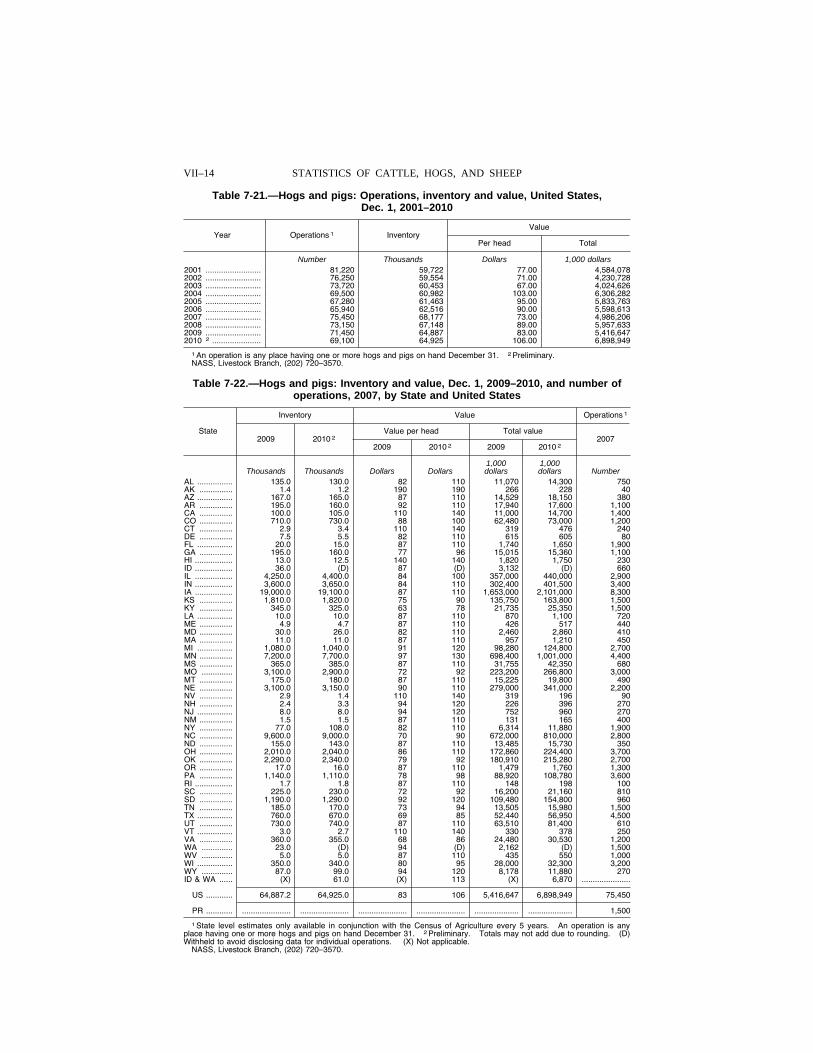
VII–14 STATISTICS OF CATTLE, HOGS, AND SHEEP
Table 7-21.—Hogs and pigs: Operations, inventory and value, United States, Dec. 1, 2001–2010
Year Operations 1 Inventory Value
Per head Total
Number Thousands Dollars 1,000 dollars 2001 ......................... 81,220 59,722 77.00 4,584,078 2002 ......................... 76,250 59,554 71.00 4,230,728 2003 ......................... 73,720 60,453 67.00 4,024,626 2004 ......................... 69,500 60,982 103.00 6,306,282 2005 ......................... 67,280 61,463 95.00 5,833,763 2006 ......................... 65,940 62,516 90.00 5,598,613 2007 ......................... 75,450 68,177 73.00 4,986,206 2008 ......................... 73,150 67,148 89.00 5,957,633 2009 ......................... 71,450 64,887 83.00 5,416,647 2010 2 ...................... 69,100 64,925 106.00 6,898,949
1 An operation is any place having one or more hogs and pigs on hand December 31. 2 Preliminary. NASS, Livestock Branch, (202) 720–3570.
Table 7-22.—Hogs and pigs: Inventory and value, Dec. 1, 2009–2010, and number of operations, 2007, by State and United States
State
Inventory Value Operations 1
2009 2010 2 Value per head Total value
2007 2009 2010 2 2009 2010 2
1,000 1,000 Thousands Thousands Dollars Dollars dollars dollars Number
AL ................ 135.0 130.0 82 110 11,070 14,300 750 AK ............... 1.4 1.2 190 190 266 228 40 AZ ................ 167.0 165.0 87 110 14,529 18,150 380 AR ............... 195.0 160.0 92 110 17,940 17,600 1,100 CA ............... 100.0 105.0 110 140 11,000 14,700 1,400 CO ............... 710.0 730.0 88 100 62,480 73,000 1,200 CT ............... 2.9 3.4 110 140 319 476 240 DE ............... 7.5 5.5 82 110 615 605 80 FL ................ 20.0 15.0 87 110 1,740 1,650 1,900 GA ............... 195.0 160.0 77 96 15,015 15,360 1,100 HI ................. 13.0 12.5 140 140 1,820 1,750 230 ID ................. 36.0 (D) 87 (D) 3,132 (D) 660 IL ................. 4,250.0 4,400.0 84 100 357,000 440,000 2,900 IN ................. 3,600.0 3,650.0 84 110 302,400 401,500 3,400 IA ................. 19,000.0 19,100.0 87 110 1,653,000 2,101,000 8,300 KS ............... 1,810.0 1,820.0 75 90 135,750 163,800 1,500 KY ............... 345.0 325.0 63 78 21,735 25,350 1,500 LA ................ 10.0 10.0 87 110 870 1,100 720 ME ............... 4.9 4.7 87 110 426 517 440 MD ............... 30.0 26.0 82 110 2,460 2,860 410 MA ............... 11.0 11.0 87 110 957 1,210 450 MI ................ 1,080.0 1,040.0 91 120 98,280 124,800 2,700 MN ............... 7,200.0 7,700.0 97 130 698,400 1,001,000 4,400 MS ............... 365.0 385.0 87 110 31,755 42,350 680 MO .............. 3,100.0 2,900.0 72 92 223,200 266,800 3,000 MT ............... 175.0 180.0 87 110 15,225 19,800 490 NE ............... 3,100.0 3,150.0 90 110 279,000 341,000 2,200 NV ............... 2.9 1.4 110 140 319 196 90 NH ............... 2.4 3.3 94 120 226 396 270 NJ ................ 8.0 8.0 94 120 752 960 270 NM ............... 1.5 1.5 87 110 131 165 400 NY ............... 77.0 108.0 82 110 6,314 11,880 1,900 NC ............... 9,600.0 9,000.0 70 90 672,000 810,000 2,800 ND ............... 155.0 143.0 87 110 13,485 15,730 350 OH ............... 2,010.0 2,040.0 86 110 172,860 224,400 3,700 OK ............... 2,290.0 2,340.0 79 92 180,910 215,280 2,700 OR ............... 17.0 16.0 87 110 1,479 1,760 1,300 PA ............... 1,140.0 1,110.0 78 98 88,920 108,780 3,600 RI ................. 1.7 1.8 87 110 148 198 100 SC ............... 225.0 230.0 72 92 16,200 21,160 810 SD ............... 1,190.0 1,290.0 92 120 109,480 154,800 960 TN ............... 185.0 170.0 73 94 13,505 15,980 1,500 TX ................ 760.0 670.0 69 85 52,440 56,950 4,500 UT ............... 730.0 740.0 87 110 63,510 81,400 610 VT ................ 3.0 2.7 110 140 330 378 250 VA ............... 360.0 355.0 68 86 24,480 30,530 1,200 WA .............. 23.0 (D) 94 (D) 2,162 (D) 1,500 WV .............. 5.0 5.0 87 110 435 550 1,000 WI ................ 350.0 340.0 80 95 28,000 32,300 3,200 WY .............. 87.0 99.0 94 120 8,178 11,880 270 ID & WA ...... (X) 61.0 (X) 113 (X) 6,870 ......................
US ............ 64,887.2 64,925.0 83 106 5,416,647 6,898,949 75,450
PR ............ ...................... ...................... ...................... ...................... .................... .................... 1,500
1 State level estimates only available in conjunction with the Census of Agriculture every 5 years. An operation is any place having one or more hogs and pigs on hand December 31. 2 Preliminary. Totals may not add due to rounding. (D) Withheld to avoid disclosing data for individual operations. (X) Not applicable.
NASS, Livestock Branch, (202) 720–3570.
VerDate Aug 31 2005 13:43 Mar 01, 2012 Jkt 000000 PO 00000 Frm 00014 Fmt 1000 Sfmt 1000 H:\SHARED\DAPP\FPU\AGSTAT\MASTER~2\CHAPTR07\VII-17.AG8 USDA
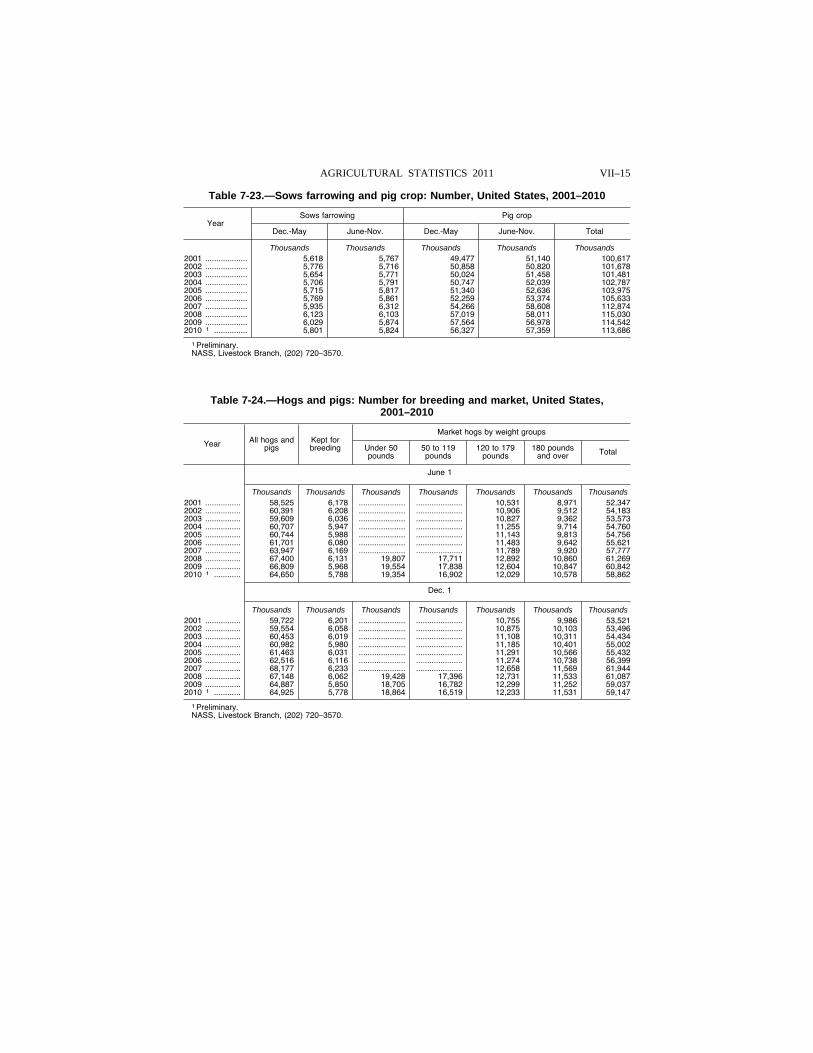
VII–15 AGRICULTURAL STATISTICS 2011
Table 7-23.—Sows farrowing and pig crop: Number, United States, 2001–2010
Year Sows farrowing Pig crop
Dec.-May June-Nov. Dec.-May June-Nov. Total
Thousands Thousands Thousands Thousands Thousands 2001 ................... 5,618 5,767 49,477 51,140 100,617 2002 ................... 5,776 5,716 50,858 50,820 101,678 2003 ................... 5,654 5,771 50,024 51,458 101,481 2004 ................... 5,706 5,791 50,747 52,039 102,787 2005 ................... 5,715 5,817 51,340 52,636 103,975 2006 ................... 5,769 5,861 52,259 53,374 105,633 2007 ................... 5,935 6,312 54,266 58,608 112,874 2008 ................... 6,123 6,103 57,019 58,011 115,030 2009 ................... 6,029 5,874 57,564 56,978 114,542 2010 1 ............... 5,801 5,824 56,327 57,359 113,686
1 Preliminary. NASS, Livestock Branch, (202) 720–3570.
Table 7-24.—Hogs and pigs: Number for breeding and market, United States, 2001–2010
Year All hogs and pigs
Kept for breeding
Market hogs by weight groups
Under 50 pounds
50 to 119 pounds
120 to 179 pounds
180 pounds and over Total
June 1
Thousands Thousands Thousands Thousands Thousands Thousands Thousands 2001 ................ 58,525 6,178 ..................... ..................... 10,531 8,971 52,347 2002 ................ 60,391 6,208 ..................... ..................... 10,906 9,512 54,183 2003 ................ 59,609 6,036 ..................... ..................... 10,827 9,362 53,573 2004 ................ 60,707 5,947 ..................... ..................... 11,255 9,714 54,760 2005 ................ 60,744 5,988 ..................... ..................... 11,143 9,813 54,756 2006 ................ 61,701 6,080 ..................... ..................... 11,483 9,642 55,621 2007 ................ 63,947 6,169 ..................... ..................... 11,789 9,920 57,777 2008 ................ 67,400 6,131 19,807 17,711 12,892 10,860 61,269 2009 ................ 66,809 5,968 19,554 17,838 12,604 10,847 60,842 2010 1 ............ 64,650 5,788 19,354 16,902 12,029 10,578 58,862
Dec. 1
Thousands Thousands Thousands Thousands Thousands Thousands Thousands 2001 ................ 59,722 6,201 ..................... ..................... 10,755 9,986 53,521 2002 ................ 59,554 6,058 ..................... ..................... 10,875 10,103 53,496 2003 ................ 60,453 6,019 ..................... ..................... 11,108 10,311 54,434 2004 ................ 60,982 5,980 ..................... ..................... 11,185 10,401 55,002 2005 ................ 61,463 6,031 ..................... ..................... 11,291 10,566 55,432 2006 ................ 62,516 6,116 ..................... ..................... 11,274 10,738 56,399 2007 ................ 68,177 6,233 ..................... ..................... 12,658 11,569 61,944 2008 ................ 67,148 6,062 19,428 17,396 12,731 11,533 61,087 2009 ................ 64,887 5,850 18,705 16,782 12,299 11,252 59,037 2010 1 ............ 64,925 5,778 18,864 16,519 12,233 11,531 59,147
1 Preliminary. NASS, Livestock Branch, (202) 720–3570.
VerDate Aug 31 2005 13:43 Mar 01, 2012 Jkt 000000 PO 00000 Frm 00015 Fmt 1000 Sfmt 1000 H:\SHARED\DAPP\FPU\AGSTAT\MASTER~2\CHAPTR07\VII-18.AG8 USDA
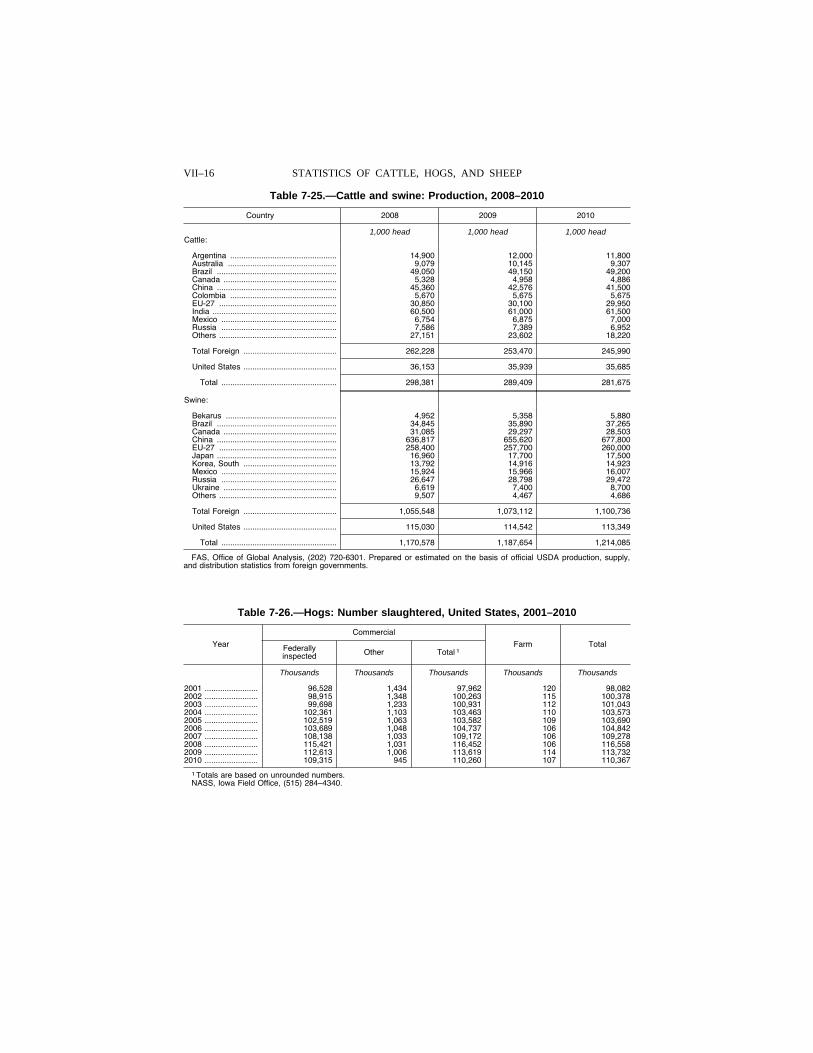
VII–16 STATISTICS OF CATTLE, HOGS, AND SHEEP
Table 7-25.—Cattle and swine: Production, 2008–2010
Country 2008 2009 2010
1,000 head 1,000 head 1,000 head Cattle:
Argentina ................................................ 14,900 12,000 11,800 Australia ................................................. 9,079 10,145 9,307 Brazil ...................................................... 49,050 49,150 49,200 Canada ................................................... 5,328 4,958 4,886 China ...................................................... 45,360 42,576 41,500 Colombia ................................................ 5,670 5,675 5,675 EU-27 ..................................................... 30,850 30,100 29,950 India ........................................................ 60,500 61,000 61,500 Mexico .................................................... 6,754 6,875 7,000 Russia .................................................... 7,586 7,389 6,952 Others ..................................................... 27,151 23,602 18,220
Total Foreign .......................................... 262,228 253,470 245,990
United States .......................................... 36,153 35,939 35,685
Total .................................................... 298,381 289,409 281,675
Swine:
Bekarus .................................................. 4,952 5,358 5,880 Brazil ...................................................... 34,845 35,890 37,265 Canada ................................................... 31,085 29,297 28,503 China ...................................................... 636,817 655,620 677,800 EU-27 ..................................................... 258,400 257,700 260,000 Japan ...................................................... 16,960 17,700 17,500 Korea, South .......................................... 13,792 14,916 14,923 Mexico .................................................... 15,924 15,966 16,007 Russia .................................................... 26,647 28,798 29,472 Ukraine ................................................... 6,619 7,400 8,700 Others ..................................................... 9,507 4,467 4,686
Total Foreign .......................................... 1,055,548 1,073,112 1,100,736
United States .......................................... 115,030 114,542 113,349
Total .................................................... 1,170,578 1,187,654 1,214,085
FAS, Office of Global Analysis, (202) 720-6301. Prepared or estimated on the basis of official USDA production, supply, and distribution statistics from foreign governments.
Table 7-26.—Hogs: Number slaughtered, United States, 2001–2010
Year
Commercial
Farm Total Federally inspected Other Total 1
Thousands Thousands Thousands Thousands Thousands
2001 ........................ 96,528 1,434 97,962 120 98,082 2002 ........................ 98,915 1,348 100,263 115 100,378 2003 ........................ 99,698 1,233 100,931 112 101,043 2004 ........................ 102,361 1,103 103,463 110 103,573 2005 ........................ 102,519 1,063 103,582 109 103,690 2006 ........................ 103,689 1,048 104,737 106 104,842 2007 ........................ 108,138 1,033 109,172 106 109,278 2008 ........................ 115,421 1,031 116,452 106 116,558 2009 ........................ 112,613 1,006 113,619 114 113,732 2010 ........................ 109,315 945 110,260 107 110,367
1 Totals are based on unrounded numbers. NASS, Iowa Field Office, (515) 284–4340.
VerDate Aug 31 2005 13:43 Mar 01, 2012 Jkt 000000 PO 00000 Frm 00016 Fmt 1000 Sfmt 1000 H:\SHARED\DAPP\FPU\AGSTAT\MASTER~2\CHAPTR07\VII-19.AG8 USDA
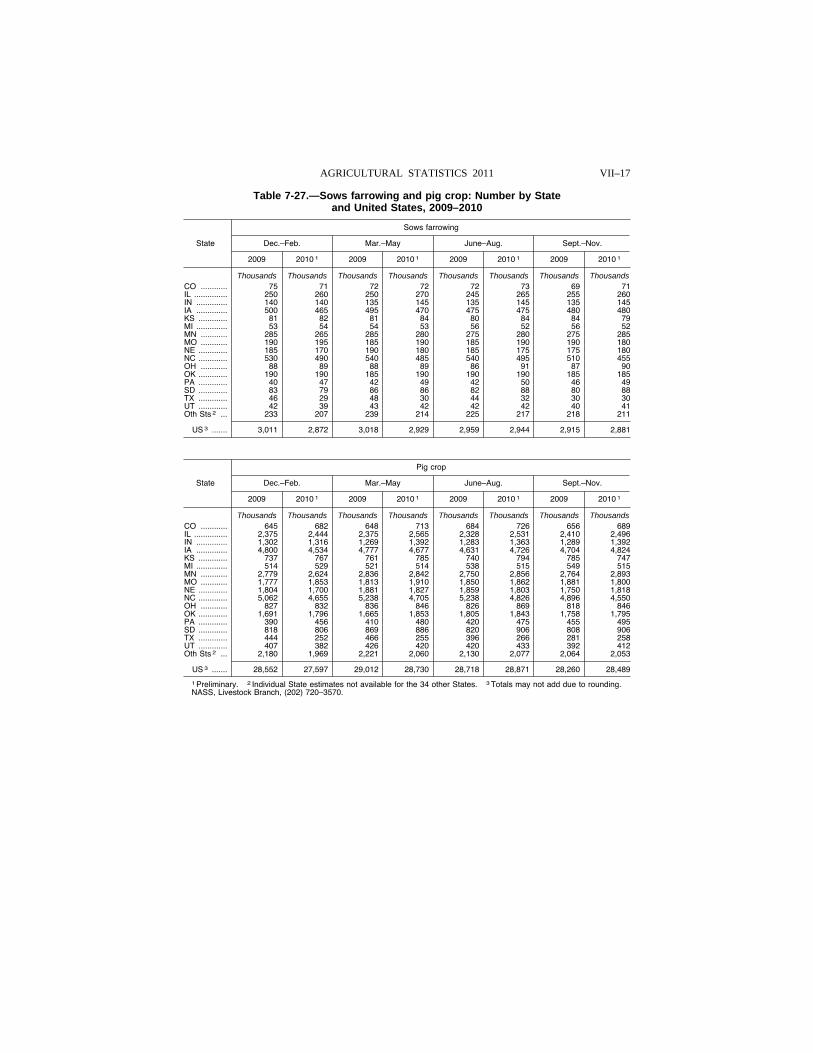
VII–17 AGRICULTURAL STATISTICS 2011
Table 7-27.—Sows farrowing and pig crop: Number by State and United States, 2009–2010
State
Sows farrowing
Dec.–Feb. Mar.–May June–Aug. Sept.–Nov.
2009 2010 1 2009 2010 1 2009 2010 1 2009 2010 1
Thousands Thousands Thousands Thousands Thousands Thousands Thousands Thousands CO ............ 75 71 72 72 72 73 69 71 IL ............... 250 260 250 270 245 265 255 260 IN .............. 140 140 135 145 135 145 135 145 IA .............. 500 465 495 470 475 475 480 480 KS ............. 81 82 81 84 80 84 84 79 MI .............. 53 54 54 53 56 52 56 52 MN ............ 285 265 285 280 275 280 275 285 MO ............ 190 195 185 190 185 190 190 180 NE ............. 185 170 190 180 185 175 175 180 NC ............. 530 490 540 485 540 495 510 455 OH ............ 88 89 88 89 86 91 87 90 OK ............. 190 190 185 190 190 190 185 185 PA ............. 40 47 42 49 42 50 46 49 SD ............. 83 79 86 86 82 88 80 88 TX ............. 46 29 48 30 44 32 30 30 UT ............. 42 39 43 42 42 42 40 41 Oth Sts 2 ... 233 207 239 214 225 217 218 211
US 3 ....... 3,011 2,872 3,018 2,929 2,959 2,944 2,915 2,881
State
Pig crop
Dec.–Feb. Mar.–May June–Aug. Sept.–Nov.
2009 2010 1 2009 2010 1 2009 2010 1 2009 2010 1
Thousands Thousands Thousands Thousands Thousands Thousands Thousands Thousands CO ............ 645 682 648 713 684 726 656 689 IL ............... 2,375 2,444 2,375 2,565 2,328 2,531 2,410 2,496 IN .............. 1,302 1,316 1,269 1,392 1,283 1,363 1,289 1,392 IA .............. 4,800 4,534 4,777 4,677 4,631 4,726 4,704 4,824 KS ............. 737 767 761 785 740 794 785 747 MI .............. 514 529 521 514 538 515 549 515 MN ............ 2,779 2,624 2,836 2,842 2,750 2,856 2,764 2,893 MO ............ 1,777 1,853 1,813 1,910 1,850 1,862 1,881 1,800 NE ............. 1,804 1,700 1,881 1,827 1,859 1,803 1,750 1,818 NC ............. 5,062 4,655 5,238 4,705 5,238 4,826 4,896 4,550 OH ............ 827 832 836 846 826 869 818 846 OK ............. 1,691 1,796 1,665 1,853 1,805 1,843 1,758 1,795 PA ............. 390 456 410 480 420 475 455 495 SD ............. 818 806 869 886 820 906 808 906 TX ............. 444 252 466 255 396 266 281 258 UT ............. 407 382 426 420 420 433 392 412 Oth Sts 2 ... 2,180 1,969 2,221 2,060 2,130 2,077 2,064 2,053
US 3 ....... 28,552 27,597 29,012 28,730 28,718 28,871 28,260 28,489
1 Preliminary. 2 Individual State estimates not available for the 34 other States. 3 Totals may not add due to rounding. NASS, Livestock Branch, (202) 720–3570.
VerDate Aug 31 2005 13:43 Mar 01, 2012 Jkt 000000 PO 00000 Frm 00017 Fmt 1000 Sfmt 1000 H:\SHARED\DAPP\FPU\AGSTAT\MASTER~2\CHAPTR07\VII-20.AG8 USDA
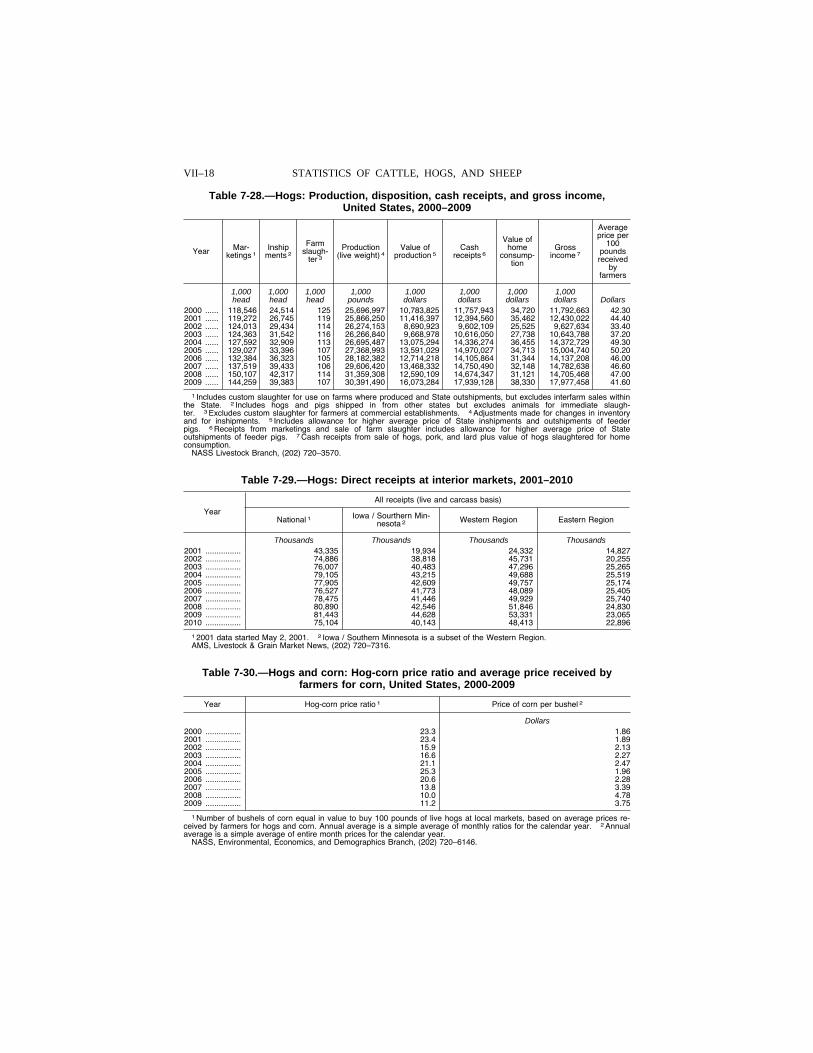
VII–18 STATISTICS OF CATTLE, HOGS, AND SHEEP
Table 7-28.—Hogs: Production, disposition, cash receipts, and gross income, United States, 2000–2009
Year Mar-ketings 1
Inship ments 2
Farm slaugh-
ter 3
Production (live weight) 4
Value of production 5
Cash receipts 6
Value of home
consump-tion
Gross income 7
Average price per
100 pounds received
by farmers
1,000 1,000 1,000 1,000 1,000 1,000 1,000 1,000 head head head pounds dollars dollars dollars dollars Dollars
2000 ...... 118,546 24,514 125 25,696,997 10,783,825 11,757,943 34,720 11,792,663 42.30 2001 ...... 119,272 26,745 119 25,866,250 11,416,397 12,394,560 35,462 12,430,022 44.40 2002 ...... 124,013 29,434 114 26,274,153 8,690,923 9,602,109 25,525 9,627,634 33.40 2003 ...... 124,363 31,542 116 26,266,840 9,668,978 10,616,050 27,738 10,643,788 37.20 2004 ...... 127,592 32,909 113 26,695,487 13,075,294 14,336,274 36,455 14,372,729 49.30 2005 ...... 129,027 33,396 107 27,368,993 13,591,029 14,970,027 34,713 15,004,740 50.20 2006 ...... 132,384 36,323 105 28,182,382 12,714,218 14,105,864 31,344 14,137,208 46.00 2007 ...... 137,519 39,433 106 29,606,420 13,468,332 14,750,490 32,148 14,782,638 46.60 2008 ...... 150,107 42,317 114 31,359,308 12,590,109 14,674,347 31,121 14,705,468 47.00 2009 ...... 144,259 39,383 107 30,391,490 16,073,284 17,939,128 38,330 17,977,458 41.60
1 Includes custom slaughter for use on farms where produced and State outshipments, but excludes interfarm sales within the State. 2 Includes hogs and pigs shipped in from other states but excludes animals for immediate slaugh-ter. 3 Excludes custom slaughter for farmers at commercial establishments. 4 Adjustments made for changes in inventory and for inshipments. 5 Includes allowance for higher average price of State inshipments and outshipments of feeder pigs. 6 Receipts from marketings and sale of farm slaughter includes allowance for higher average price of State outshipments of feeder pigs. 7 Cash receipts from sale of hogs, pork, and lard plus value of hogs slaughtered for home consumption.
NASS Livestock Branch, (202) 720–3570.
Table 7-29.—Hogs: Direct receipts at interior markets, 2001–2010
Year
All receipts (live and carcass basis)
National 1 Iowa / Sourthern Min-nesota 2 Western Region Eastern Region
Thousands Thousands Thousands Thousands 2001 ................ 43,335 19,934 24,332 14,827 2002 ................ 74,886 38,818 45,731 20,255 2003 ................ 76,007 40,483 47,296 25,265 2004 ................ 79,105 43,215 49,688 25,519 2005 ................ 77,905 42,609 49,757 25,174 2006 ................ 76,527 41,773 48,089 25,405 2007 ................ 78,475 41,446 49,929 25,740 2008 ................ 80,890 42,546 51,846 24,830 2009 ................ 81,443 44,628 53,331 23,065 2010 ................ 75,104 40,143 48,413 22,896
1 2001 data started May 2, 2001. 2 Iowa / Southern Minnesota is a subset of the Western Region. AMS, Livestock & Grain Market News, (202) 720–7316.
Table 7-30.—Hogs and corn: Hog-corn price ratio and average price received by farmers for corn, United States, 2000-2009
Year Hog-corn price ratio 1 Price of corn per bushel 2
Dollars 2000 ................ 23.3 1.86 2001 ................ 23.4 1.89 2002 ................ 15.9 2.13 2003 ................ 16.6 2.27 2004 ................ 21.1 2.47 2005 ................ 25.3 1.96 2006 ................ 20.6 2.28 2007 ................ 13.8 3.39 2008 ................ 10.0 4.78 2009 ................ 11.2 3.75
1 Number of bushels of corn equal in value to buy 100 pounds of live hogs at local markets, based on average prices re-ceived by farmers for hogs and corn. Annual average is a simple average of monthly ratios for the calendar year. 2 Annual average is a simple average of entire month prices for the calendar year.
NASS, Environmental, Economics, and Demographics Branch, (202) 720–6146.
VerDate Aug 31 2005 13:43 Mar 01, 2012 Jkt 000000 PO 00000 Frm 00018 Fmt 1000 Sfmt 1000 H:\SHARED\DAPP\FPU\AGSTAT\MASTER~2\CHAPTR07\VII-21.AG8 USDA
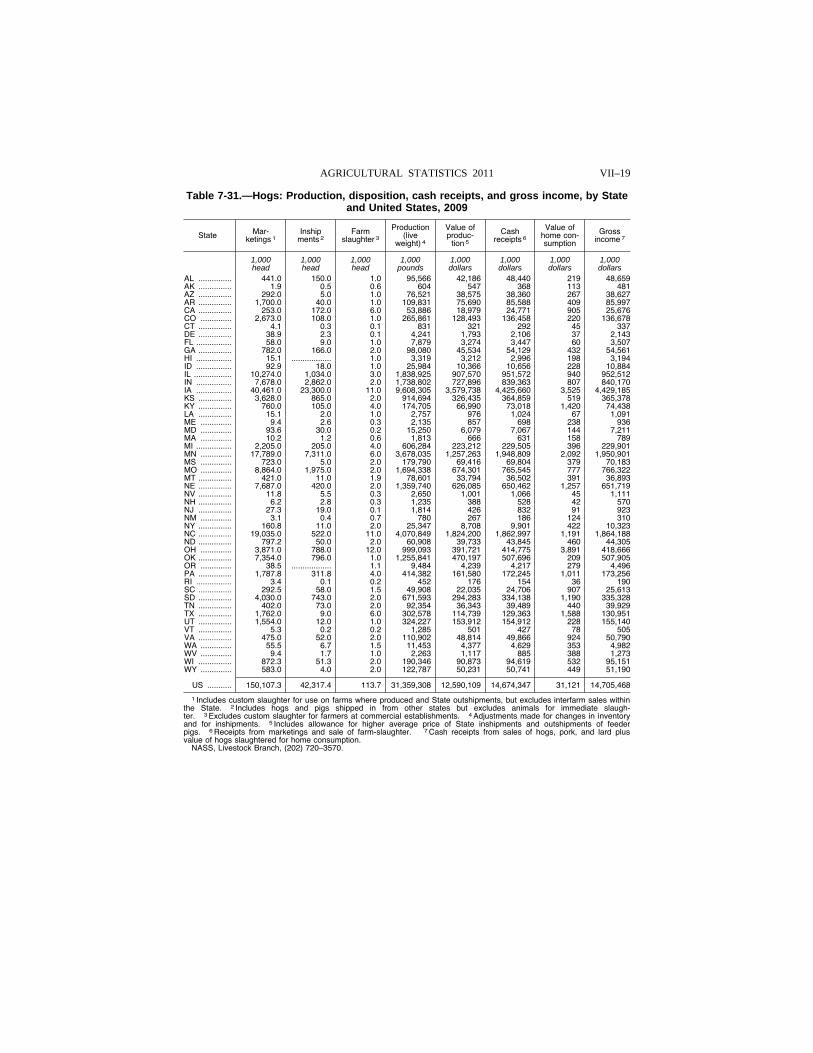
VII–19 AGRICULTURAL STATISTICS 2011
Table 7-31.—Hogs: Production, disposition, cash receipts, and gross income, by State and United States, 2009
State Mar-ketings 1
Inship ments 2
Farm slaughter 3
Production (live
weight) 4
Value of produc-
tion 5
Cash receipts 6
Value of home con-sumption
Gross income 7
1,000 1,000 1,000 1,000 1,000 1,000 1,000 1,000 head head head pounds dollars dollars dollars dollars
AL ............... 441 .0 150 .0 1 .0 95,566 42,186 48,440 219 48,659 AK ............... 1 .9 0 .5 0 .6 604 547 368 113 481 AZ ............... 292 .0 5 .0 1 .0 76,521 38,575 38,360 267 38,627 AR ............... 1,700 .0 40 .0 1 .0 109,831 75,690 85,588 409 85,997 CA ............... 253 .0 172 .0 6 .0 53,886 18,979 24,771 905 25,676 CO .............. 2,673 .0 108 .0 1 .0 265,861 128,493 136,458 220 136,678 CT ............... 4 .1 0 .3 0 .1 831 321 292 45 337 DE ............... 38 .9 2 .3 0 .1 4,241 1,793 2,106 37 2,143 FL ................ 58 .0 9 .0 1 .0 7,879 3,274 3,447 60 3,507 GA ............... 782 .0 166 .0 2 .0 98,080 45,534 54,129 432 54,561 HI ................ 15 .1 .................. 1 .0 3,319 3,212 2,996 198 3,194 ID ................ 92 .9 18 .0 1 .0 25,984 10,366 10,656 228 10,884 IL ................. 10,274 .0 1,034 .0 3 .0 1,838,925 907,570 951,572 940 952,512 IN ................ 7,678 .0 2,862 .0 2 .0 1,738,802 727,896 839,363 807 840,170 IA ................ 40,461 .0 23,300 .0 11 .0 9,608,305 3,579,738 4,425,660 3,525 4,429,185 KS ............... 3,628 .0 865 .0 2 .0 914,694 326,435 364,859 519 365,378 KY ............... 760 .0 105 .0 4 .0 174,705 66,990 73,018 1,420 74,438 LA ............... 15 .1 2 .0 1 .0 2,757 976 1,024 67 1,091 ME .............. 9 .4 2 .6 0 .3 2,135 857 698 238 936 MD .............. 93 .6 30 .0 0 .2 15,250 6,079 7,067 144 7,211 MA .............. 10 .2 1 .2 0 .6 1,813 666 631 158 789 MI ................ 2,205 .0 205 .0 4 .0 606,284 223,212 229,505 396 229,901 MN .............. 17,789 .0 7,311 .0 6 .0 3,678,035 1,257,263 1,948,809 2,092 1,950,901 MS .............. 723 .0 5 .0 2 .0 179,790 69,416 69,804 379 70,183 MO .............. 8,864 .0 1,975 .0 2 .0 1,694,338 674,301 765,545 777 766,322 MT ............... 421 .0 11 .0 1 .9 78,601 33,794 36,502 391 36,893 NE ............... 7,687 .0 420 .0 2 .0 1,359,740 626,085 650,462 1,257 651,719 NV ............... 11 .8 5 .5 0 .3 2,650 1,001 1,066 45 1,111 NH ............... 6 .2 2 .8 0 .3 1,235 388 528 42 570 NJ ............... 27 .3 19 .0 0 .1 1,814 426 832 91 923 NM .............. 3 .1 0 .4 0 .7 780 267 186 124 310 NY ............... 160 .8 11 .0 2 .0 25,347 8,708 9,901 422 10,323 NC ............... 19,035 .0 522 .0 11 .0 4,070,849 1,824,200 1,862,997 1,191 1,864,188 ND ............... 797 .2 50 .0 2 .0 60,908 39,733 43,845 460 44,305 OH .............. 3,871 .0 788 .0 12 .0 999,093 391,721 414,775 3,891 418,666 OK ............... 7,354 .0 796 .0 1 .0 1,255,841 470,197 507,696 209 507,905 OR .............. 38 .5 .................. 1 .1 9,484 4,239 4,217 279 4,496 PA ............... 1,787 .8 311 .8 4 .0 414,382 161,580 172,245 1,011 173,256 RI ................ 3 .4 0 .1 0 .2 452 176 154 36 190 SC ............... 292 .5 58 .0 1 .5 49,908 22,035 24,706 907 25,613 SD ............... 4,030 .0 743 .0 2 .0 671,593 294,283 334,138 1,190 335,328 TN ............... 402 .0 73 .0 2 .0 92,354 36,343 39,489 440 39,929 TX ............... 1,762 .0 9 .0 6 .0 302,578 114,739 129,363 1,588 130,951 UT ............... 1,554 .0 12 .0 1 .0 324,227 153,912 154,912 228 155,140 VT ............... 5 .3 0 .2 0 .2 1,285 501 427 78 505 VA ............... 475 .0 52 .0 2 .0 110,902 48,814 49,866 924 50,790 WA .............. 55 .5 6 .7 1 .5 11,453 4,377 4,629 353 4,982 WV .............. 9 .4 1 .7 1 .0 2,263 1,117 885 388 1,273 WI ............... 872 .3 51 .3 2 .0 190,346 90,873 94,619 532 95,151 WY .............. 583 .0 4 .0 2 .0 122,787 50,231 50,741 449 51,190
US ........... 150,107 .3 42,317 .4 113 .7 31,359,308 12,590,109 14,674,347 31,121 14,705,468
1 Includes custom slaughter for use on farms where produced and State outshipments, but excludes interfarm sales within the State. 2 Includes hogs and pigs shipped in from other states but excludes animals for immediate slaugh-ter. 3 Excludes custom slaughter for farmers at commercial establishments. 4 Adjustments made for changes in inventory and for inshipments. 5 Includes allowance for higher average price of State inshipments and outshipments of feeder pigs. 6 Receipts from marketings and sale of farm-slaughter. 7 Cash receipts from sales of hogs, pork, and lard plus value of hogs slaughtered for home consumption.
NASS, Livestock Branch, (202) 720–3570.
VerDate Aug 31 2005 13:43 Mar 01, 2012 Jkt 000000 PO 00000 Frm 00019 Fmt 1000 Sfmt 1000 H:\SHARED\DAPP\FPU\AGSTAT\MASTER~2\CHAPTR07\VII-22.AG8 USDA
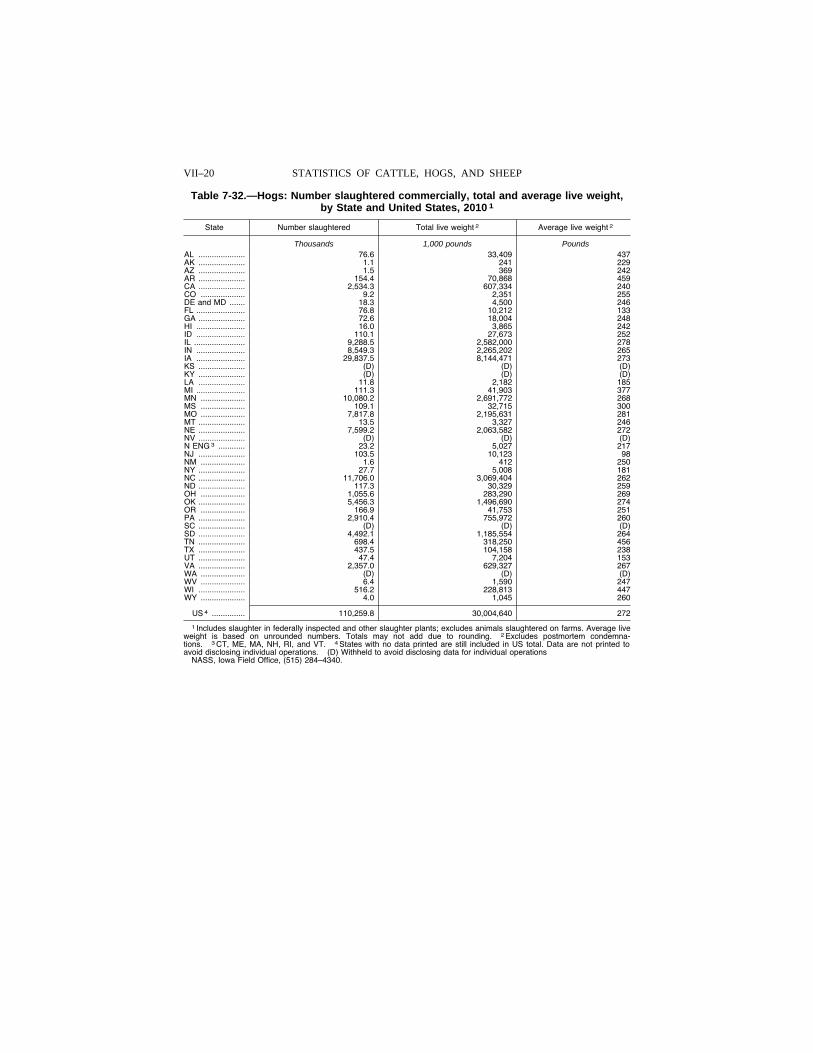
VII–20 STATISTICS OF CATTLE, HOGS, AND SHEEP
Table 7-32.—Hogs: Number slaughtered commercially, total and average live weight, by State and United States, 2010 1
State Number slaughtered Total live weight 2 Average live weight 2
Thousands 1,000 pounds Pounds AL ..................... 76.6 33,409 437 AK ..................... 1.1 241 229 AZ ..................... 1.5 369 242 AR ..................... 154.4 70,868 459 CA ..................... 2,534.3 607,334 240 CO .................... 9.2 2,351 255 DE and MD ....... 18.3 4,500 246 FL ...................... 76.8 10,212 133 GA ..................... 72.6 18,004 248 HI ...................... 16.0 3,865 242 ID ...................... 110.1 27,673 252 IL ....................... 9,288.5 2,582,000 278 IN ...................... 8,549.3 2,265,202 265 IA ...................... 29,837.5 8,144,471 273 KS ..................... (D) (D) (D) KY ..................... (D) (D) (D) LA ..................... 11.8 2,182 185 MI ...................... 111.3 41,903 377 MN .................... 10,080.2 2,691,772 268 MS .................... 109.1 32,715 300 MO .................... 7,817.8 2,195,631 281 MT ..................... 13.5 3,327 246 NE ..................... 7,599.2 2,063,582 272 NV ..................... (D) (D) (D) N ENG 3 ............ 23.2 5,027 217 NJ ..................... 103.5 10,123 98 NM .................... 1.6 412 250 NY ..................... 27.7 5,008 181 NC ..................... 11,706.0 3,069,404 262 ND ..................... 117.3 30,329 259 OH .................... 1,055.6 283,290 269 OK ..................... 5,456.3 1,496,690 274 OR .................... 166.9 41,753 251 PA ..................... 2,910.4 755,972 260 SC ..................... (D) (D) (D) SD ..................... 4,492.1 1,185,554 264 TN ..................... 698.4 318,250 456 TX ..................... 437.5 104,158 238 UT ..................... 47.4 7,204 153 VA ..................... 2,357.0 629,327 267 WA .................... (D) (D) (D) WV .................... 6.4 1,590 247 WI ..................... 516.2 228,813 447 WY .................... 4.0 1,045 260
US 4 ............... 110,259.8 30,004,640 272
1 Includes slaughter in federally inspected and other slaughter plants; excludes animals slaughtered on farms. Average live weight is based on unrounded numbers. Totals may not add due to rounding. 2 Excludes postmortem condemna-tions. 3 CT, ME, MA, NH, RI, and VT. 4 States with no data printed are still included in US total. Data are not printed to avoid disclosing individual operations. (D) Withheld to avoid disclosing data for individual operations
NASS, Iowa Field Office, (515) 284–4340.
VerDate Aug 31 2005 13:43 Mar 01, 2012 Jkt 000000 PO 00000 Frm 00020 Fmt 1000 Sfmt 1000 H:\SHARED\DAPP\FPU\AGSTAT\MASTER~2\CHAPTR07\VII-23.AG8 USDA
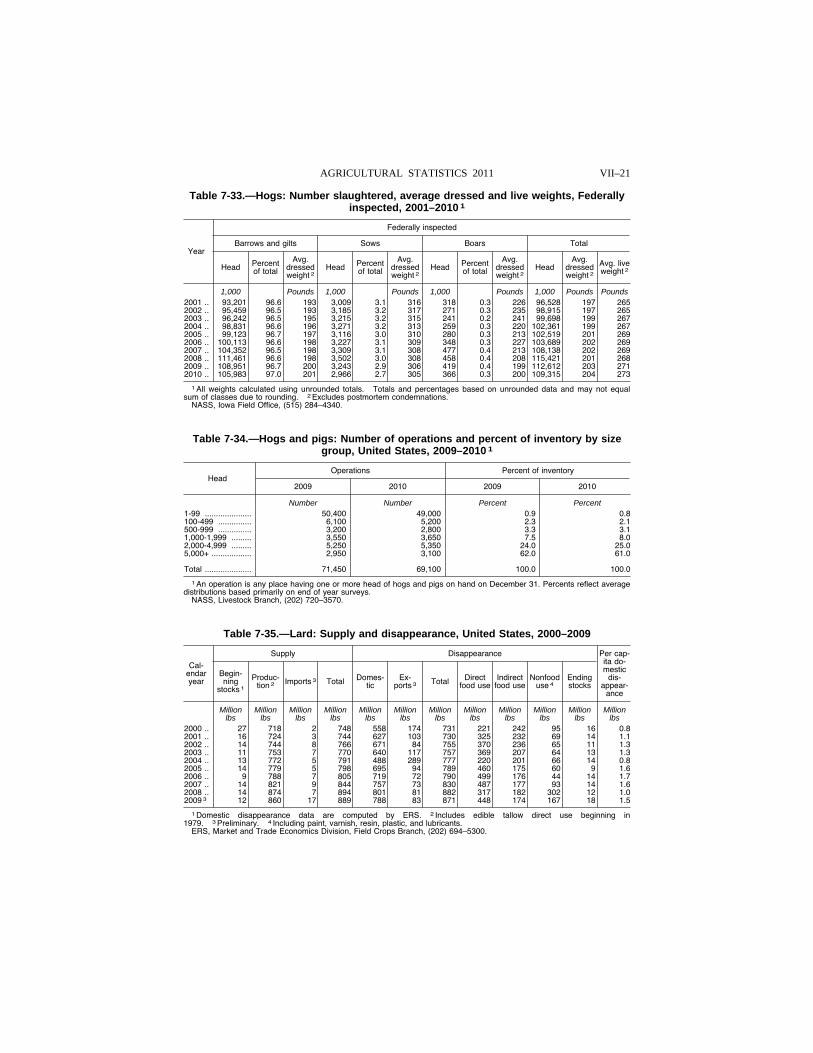
VII–21 AGRICULTURAL STATISTICS 2011
Table 7-33.—Hogs: Number slaughtered, average dressed and live weights, Federally inspected, 2001–2010 1
Year
Federally inspected
Barrows and gilts Sows Boars Total
Head Percent of total
Avg. dressed weight 2
Head Percent of total
Avg. dressed weight 2
Head Percent of total
Avg. dressed weight 2
Head Avg.
dressed weight 2
Avg. live weight 2
1,000 Pounds 1,000 Pounds 1,000 Pounds 1,000 Pounds Pounds 2001 .. 93,201 96.6 193 3,009 3.1 316 318 0.3 226 96,528 197 265 2002 .. 95,459 96.5 193 3,185 3.2 317 271 0.3 235 98,915 197 265 2003 .. 96,242 96.5 195 3,215 3.2 315 241 0.2 241 99,698 199 267 2004 .. 98,831 96.6 196 3,271 3.2 313 259 0.3 220 102,361 199 267 2005 .. 99,123 96.7 197 3,116 3.0 310 280 0.3 213 102,519 201 269 2006 .. 100,113 96.6 198 3,227 3.1 309 348 0.3 227 103,689 202 269 2007 .. 104,352 96.5 198 3,309 3.1 308 477 0.4 213 108,138 202 269 2008 .. 111,461 96.6 198 3,502 3.0 308 458 0.4 208 115,421 201 268 2009 .. 108,951 96.7 200 3,243 2.9 306 419 0.4 199 112,612 203 271 2010 .. 105,983 97.0 201 2,966 2.7 305 366 0.3 200 109,315 204 273
1 All weights calculated using unrounded totals. Totals and percentages based on unrounded data and may not equal sum of classes due to rounding. 2 Excludes postmortem condemnations.
NASS, Iowa Field Office, (515) 284–4340.
Table 7-34.—Hogs and pigs: Number of operations and percent of inventory by size group, United States, 2009–2010 1
Head Operations Percent of inventory
2009 2010 2009 2010
Number Number Percent Percent 1-99 ..................... 50,400 49,000 0.9 0.8 100-499 ............... 6,100 5,200 2.3 2.1 500-999 ............... 3,200 2,800 3.3 3.1 1,000-1,999 ......... 3,550 3,650 7.5 8.0 2,000-4,999 ......... 5,250 5,350 24.0 25.0 5,000+ .................. 2,950 3,100 62.0 61.0
Total ..................... 71,450 69,100 100.0 100.0
1 An operation is any place having one or more head of hogs and pigs on hand on December 31. Percents reflect average distributions based primarily on end of year surveys.
NASS, Livestock Branch, (202) 720–3570.
Table 7-35.—Lard: Supply and disappearance, United States, 2000–2009
Cal-endar year
Supply Disappearance Per cap-ita do-mestic
dis-appear-
ance
Begin-ning
stocks 1
Produc-tion 2 Imports 3 Total Domes-
tic Ex-
ports 3 Total Direct food use
Indirect food use
Nonfood use 4
Ending stocks
Million Million Million Million Million Million Million Million Million Million Million Million lbs lbs lbs lbs lbs lbs lbs lbs lbs lbs lbs lbs
2000 .. 27 718 2 748 558 174 731 221 242 95 16 0.8 2001 .. 16 724 3 744 627 103 730 325 232 69 14 1.1 2002 .. 14 744 8 766 671 84 755 370 236 65 11 1.3 2003 .. 11 753 7 770 640 117 757 369 207 64 13 1.3 2004 .. 13 772 5 791 488 289 777 220 201 66 14 0.8 2005 .. 14 779 5 798 695 94 789 460 175 60 9 1.6 2006 .. 9 788 7 805 719 72 790 499 176 44 14 1.7 2007 .. 14 821 9 844 757 73 830 487 177 93 14 1.6 2008 .. 14 874 7 894 801 81 882 317 182 302 12 1.0 2009 3 12 860 17 889 788 83 871 448 174 167 18 1.5
1 Domestic disappearance data are computed by ERS. 2 Includes edible tallow direct use beginning in 1979. 3 Preliminary. 4 Including paint, varnish, resin, plastic, and lubricants.
ERS, Market and Trade Economics Division, Field Crops Branch, (202) 694–5300.
VerDate Aug 31 2005 13:43 Mar 01, 2012 Jkt 000000 PO 00000 Frm 00021 Fmt 1000 Sfmt 1000 H:\SHARED\DAPP\FPU\AGSTAT\MASTER~2\CHAPTR07\VII-24.AG8 USDA
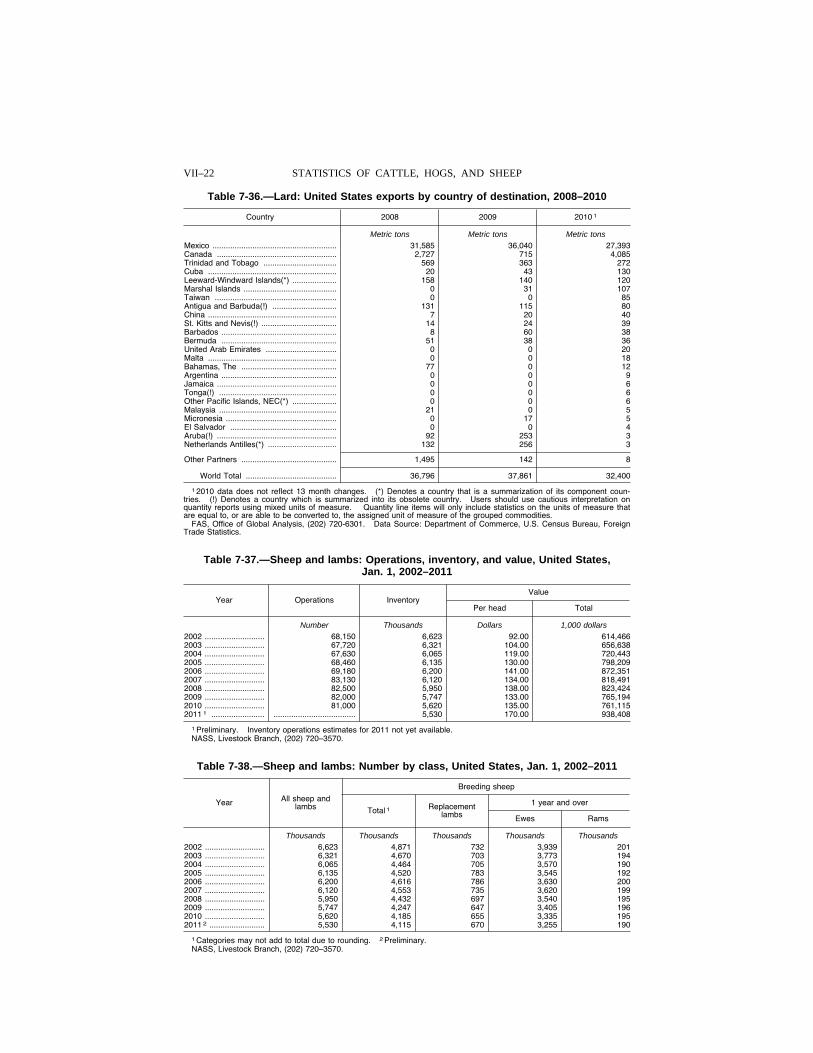
VII–22 STATISTICS OF CATTLE, HOGS, AND SHEEP
Table 7-36.—Lard: United States exports by country of destination, 2008–2010
Country 2008 2009 2010 1
Metric tons Metric tons Metric tons Mexico ........................................................ 31,585 36,040 27,393 Canada ...................................................... 2,727 715 4,085 Trinidad and Tobago ................................. 569 363 272 Cuba .......................................................... 20 43 130 Leeward-Windward Islands(*) .................... 158 140 120 Marshal Islands .......................................... 0 31 107 Taiwan ....................................................... 0 0 85 Antigua and Barbuda(!) ............................. 131 115 80 China .......................................................... 7 20 40 St. Kitts and Nevis(!) .................................. 14 24 39 Barbados .................................................... 8 60 38 Bermuda .................................................... 51 38 36 United Arab Emirates ................................ 0 0 20 Malta .......................................................... 0 0 18 Bahamas, The ........................................... 77 0 12 Argentina .................................................... 0 0 9 Jamaica ...................................................... 0 0 6 Tonga(!) ..................................................... 0 0 6 Other Pacific Islands, NEC(*) .................... 0 0 6 Malaysia ..................................................... 21 0 5 Micronesia .................................................. 0 17 5 El Salvador ................................................ 0 0 4 Aruba(!) ...................................................... 92 253 3 Netherlands Antilles(*) ............................... 132 256 3
Other Partners ........................................... 1,495 142 8
World Total ......................................... 36,796 37,861 32,400
1 2010 data does not reflect 13 month changes. (*) Denotes a country that is a summarization of its component coun-tries. (!) Denotes a country which is summarized into its obsolete country. Users should use cautious interpretation on quantity reports using mixed units of measure. Quantity line items will only include statistics on the units of measure that are equal to, or are able to be converted to, the assigned unit of measure of the grouped commodities.
FAS, Office of Global Analysis, (202) 720-6301. Data Source: Department of Commerce, U.S. Census Bureau, Foreign Trade Statistics.
Table 7-37.—Sheep and lambs: Operations, inventory, and value, United States, Jan. 1, 2002–2011
Year Operations Inventory Value
Per head Total
Number Thousands Dollars 1,000 dollars 2002 ........................... 68,150 6,623 92.00 614,466 2003 ........................... 67,720 6,321 104.00 656,638 2004 ........................... 67,630 6,065 119.00 720,443 2005 ........................... 68,460 6,135 130.00 798,209 2006 ........................... 69,180 6,200 141.00 872,351 2007 ........................... 83,130 6,120 134.00 818,491 2008 ........................... 82,500 5,950 138.00 823,424 2009 ........................... 82,000 5,747 133.00 765,194 2010 ........................... 81,000 5,620 135.00 761,115 2011 1 ........................ ..................................... 5,530 170.00 938,408
1 Preliminary. Inventory operations estimates for 2011 not yet available. NASS, Livestock Branch, (202) 720–3570.
Table 7-38.—Sheep and lambs: Number by class, United States, Jan. 1, 2002–2011
Year All sheep and lambs
Breeding sheep
Total 1 Replacement lambs
1 year and over
Ewes Rams
Thousands Thousands Thousands Thousands Thousands 2002 ........................... 6,623 4,871 732 3,939 201 2003 ........................... 6,321 4,670 703 3,773 194 2004 ........................... 6,065 4,464 705 3,570 190 2005 ........................... 6,135 4,520 783 3,545 192 2006 ........................... 6,200 4,616 786 3,630 200 2007 ........................... 6,120 4,553 735 3,620 199 2008 ........................... 5,950 4,432 697 3,540 195 2009 ........................... 5,747 4,247 647 3,405 196 2010 ........................... 5,620 4,185 655 3,335 195 2011 2 ......................... 5,530 4,115 670 3,255 190
1 Categories may not add to total due to rounding. 2 Preliminary. NASS, Livestock Branch, (202) 720–3570.
VerDate Aug 31 2005 13:43 Mar 01, 2012 Jkt 000000 PO 00000 Frm 00022 Fmt 1000 Sfmt 1000 H:\SHARED\DAPP\FPU\AGSTAT\MASTER~2\CHAPTR07\VII-25.AG8 USDA
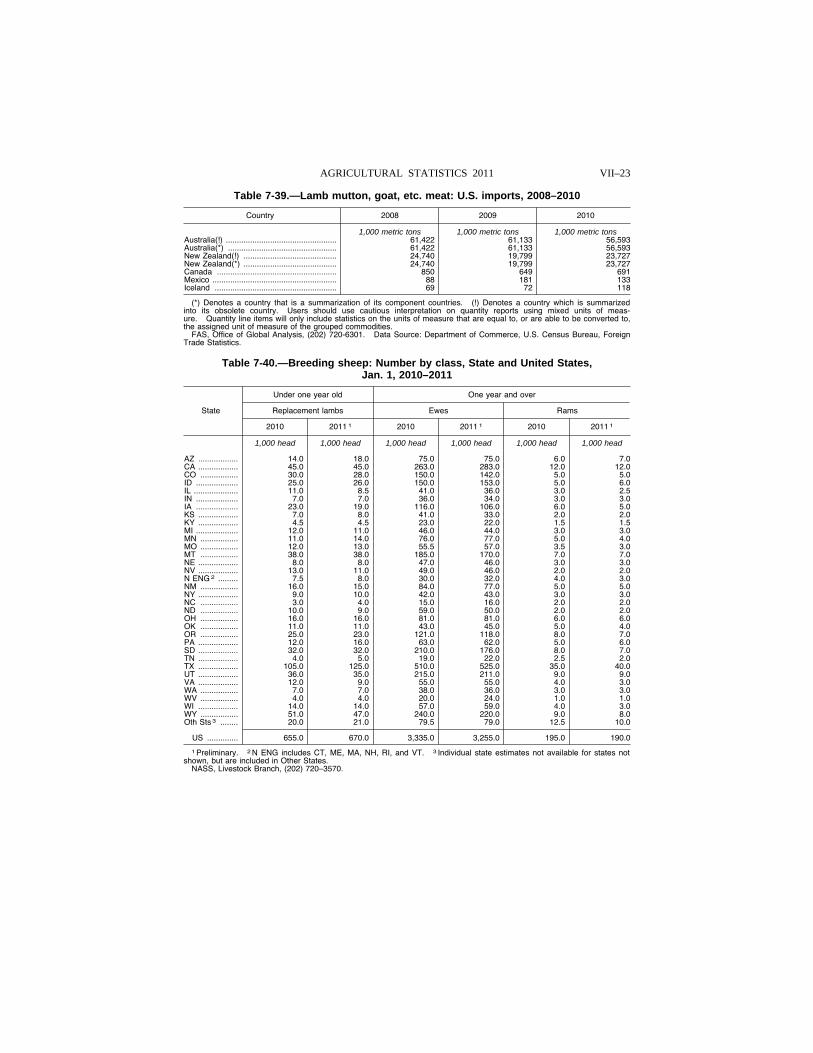
VII–23 AGRICULTURAL STATISTICS 2011
Table 7-39.—Lamb mutton, goat, etc. meat: U.S. imports, 2008–2010
Country 2008 2009 2010
1,000 metric tons 1,000 metric tons 1,000 metric tons Australia(!) .................................................. 61,422 61,133 56,593 Australia(*) ................................................. 61,422 61,133 56,593 New Zealand(!) .......................................... 24,740 19,799 23,727 New Zealand(*) .......................................... 24,740 19,799 23,727 Canada ...................................................... 850 649 691 Mexico ........................................................ 88 181 133 Iceland ....................................................... 69 72 118
(*) Denotes a country that is a summarization of its component countries. (!) Denotes a country which is summarized into its obsolete country. Users should use cautious interpretation on quantity reports using mixed units of meas-ure. Quantity line items will only include statistics on the units of measure that are equal to, or are able to be converted to, the assigned unit of measure of the grouped commodities.
FAS, Office of Global Analysis, (202) 720-6301. Data Source: Department of Commerce, U.S. Census Bureau, Foreign Trade Statistics.
Table 7-40.—Breeding sheep: Number by class, State and United States, Jan. 1, 2010–2011
State
Under one year old One year and over
Replacement lambs Ewes Rams
2010 2011 1 2010 2011 1 2010 2011 1
1,000 head 1,000 head 1,000 head 1,000 head 1,000 head 1,000 head
AZ .................. 14.0 18.0 75.0 75.0 6.0 7.0 CA .................. 45.0 45.0 263.0 283.0 12.0 12.0 CO ................. 30.0 28.0 150.0 142.0 5.0 5.0 ID ................... 25.0 26.0 150.0 153.0 5.0 6.0 IL .................... 11.0 8.5 41.0 36.0 3.0 2.5 IN ................... 7.0 7.0 36.0 34.0 3.0 3.0 IA ................... 23.0 19.0 116.0 106.0 6.0 5.0 KS .................. 7.0 8.0 41.0 33.0 2.0 2.0 KY .................. 4.5 4.5 23.0 22.0 1.5 1.5 MI ................... 12.0 11.0 46.0 44.0 3.0 3.0 MN ................. 11.0 14.0 76.0 77.0 5.0 4.0 MO ................. 12.0 13.0 55.5 57.0 3.5 3.0 MT ................. 38.0 38.0 185.0 170.0 7.0 7.0 NE .................. 8.0 8.0 47.0 46.0 3.0 3.0 NV .................. 13.0 11.0 49.0 46.0 2.0 2.0 N ENG 2 ......... 7.5 8.0 30.0 32.0 4.0 3.0 NM ................. 16.0 15.0 84.0 77.0 5.0 5.0 NY .................. 9.0 10.0 42.0 43.0 3.0 3.0 NC ................. 3.0 4.0 15.0 16.0 2.0 2.0 ND ................. 10.0 9.0 59.0 50.0 2.0 2.0 OH ................. 16.0 16.0 81.0 81.0 6.0 6.0 OK ................. 11.0 11.0 43.0 45.0 5.0 4.0 OR ................. 25.0 23.0 121.0 118.0 8.0 7.0 PA .................. 12.0 16.0 63.0 62.0 5.0 6.0 SD .................. 32.0 32.0 210.0 176.0 8.0 7.0 TN .................. 4.0 5.0 19.0 22.0 2.5 2.0 TX .................. 105.0 125.0 510.0 525.0 35.0 40.0 UT .................. 36.0 35.0 215.0 211.0 9.0 9.0 VA .................. 12.0 9.0 55.0 55.0 4.0 3.0 WA ................. 7.0 7.0 38.0 36.0 3.0 3.0 WV ................. 4.0 4.0 20.0 24.0 1.0 1.0 WI .................. 14.0 14.0 57.0 59.0 4.0 3.0 WY ................. 51.0 47.0 240.0 220.0 9.0 8.0 Oth Sts 3 ........ 20.0 21.0 79.5 79.0 12.5 10.0
US .............. 655.0 670.0 3,335.0 3,255.0 195.0 190.0
1 Preliminary. 2 N ENG includes CT, ME, MA, NH, RI, and VT. 3 Individual state estimates not available for states not shown, but are included in Other States.
NASS, Livestock Branch, (202) 720–3570.
VerDate Aug 31 2005 13:43 Mar 01, 2012 Jkt 000000 PO 00000 Frm 00023 Fmt 1000 Sfmt 1000 H:\SHARED\DAPP\FPU\AGSTAT\MASTER~2\CHAPTR07\VII-27.AG8 USDA
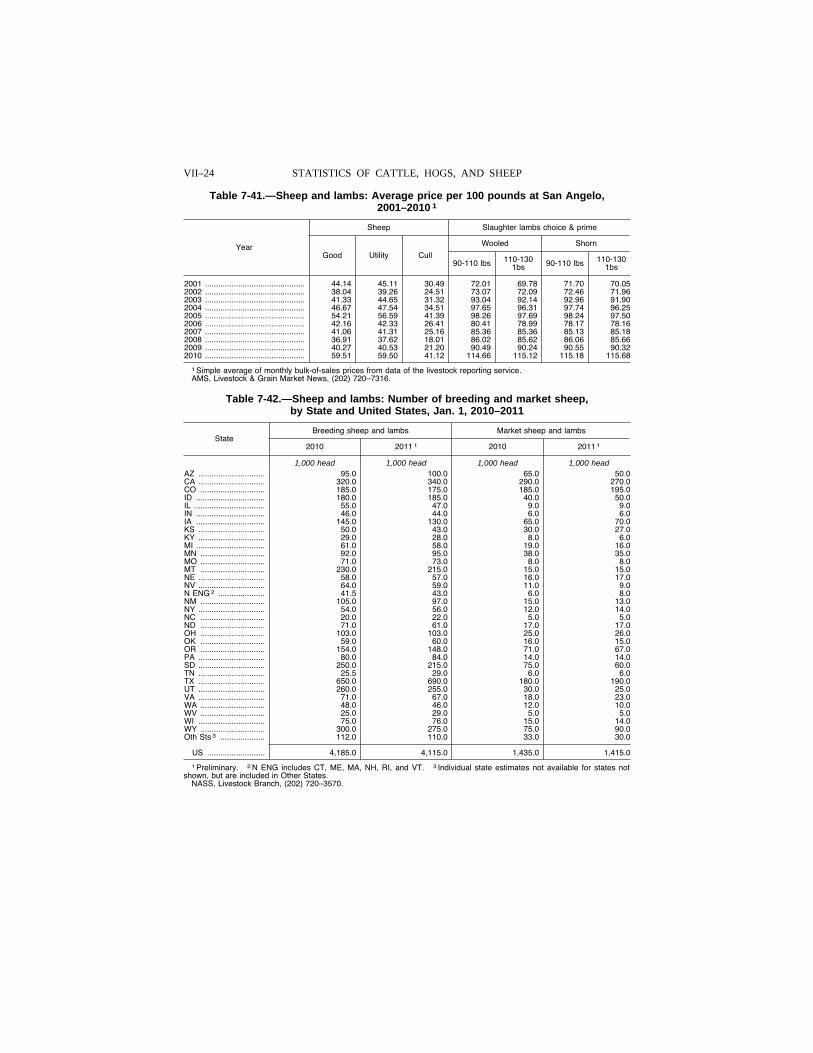
VII–24 STATISTICS OF CATTLE, HOGS, AND SHEEP
Table 7-41.—Sheep and lambs: Average price per 100 pounds at San Angelo, 2001–2010 1
Year
Sheep Slaughter lambs choice & prime
Good Utility Cull
Wooled Shorn
90-110 lbs 110-130 1bs 90-110 lbs 110-130
1bs
2001 ............................................. 44.14 45.11 30.49 72.01 69.78 71.70 70.05 2002 ............................................. 38.04 39.26 24.51 73.07 72.09 72.46 71.96 2003 ............................................. 41.33 44.65 31.32 93.04 92.14 92.96 91.90 2004 ............................................. 46.67 47.54 34.51 97.65 96.31 97.74 96.25 2005 ............................................. 54.21 56.59 41.39 98.26 97.69 98.24 97.50 2006 ............................................. 42.16 42.33 26.41 80.41 78.99 78.17 78.16 2007 ............................................. 41.06 41.31 25.16 85.36 85.36 85.13 85.18 2008 ............................................. 36.91 37.62 18.01 86.02 85.62 86.06 85.66 2009 ............................................. 40.27 40.53 21.20 90.49 90.24 90.55 90.32 2010 ............................................. 59.51 59.50 41.12 114.66 115.12 115.18 115.68
1 Simple average of monthly bulk-of-sales prices from data of the livestock reporting service. AMS, Livestock & Grain Market News, (202) 720–7316.
Table 7-42.—Sheep and lambs: Number of breeding and market sheep, by State and United States, Jan. 1, 2010–2011
State Breeding sheep and lambs Market sheep and lambs
2010 2011 1 2010 2011 1
1,000 head 1,000 head 1,000 head 1,000 head AZ .............................. 95.0 100.0 65.0 50.0 CA .............................. 320.0 340.0 290.0 270.0 CO ............................. 185.0 175.0 185.0 195.0 ID ............................... 180.0 185.0 40.0 50.0 IL ................................ 55.0 47.0 9.0 9.0 IN ............................... 46.0 44.0 6.0 6.0 IA ............................... 145.0 130.0 65.0 70.0 KS .............................. 50.0 43.0 30.0 27.0 KY .............................. 29.0 28.0 8.0 6.0 MI ............................... 61.0 58.0 19.0 16.0 MN ............................. 92.0 95.0 38.0 35.0 MO ............................. 71.0 73.0 8.0 8.0 MT ............................. 230.0 215.0 15.0 15.0 NE .............................. 58.0 57.0 16.0 17.0 NV .............................. 64.0 59.0 11.0 9.0 N ENG 2 ..................... 41.5 43.0 6.0 8.0 NM ............................. 105.0 97.0 15.0 13.0 NY .............................. 54.0 56.0 12.0 14.0 NC ............................. 20.0 22.0 5.0 5.0 ND ............................. 71.0 61.0 17.0 17.0 OH ............................. 103.0 103.0 25.0 26.0 OK ............................. 59.0 60.0 16.0 15.0 OR ............................. 154.0 148.0 71.0 67.0 PA .............................. 80.0 84.0 14.0 14.0 SD .............................. 250.0 215.0 75.0 60.0 TN .............................. 25.5 29.0 6.0 6.0 TX .............................. 650.0 690.0 180.0 190.0 UT .............................. 260.0 255.0 30.0 25.0 VA .............................. 71.0 67.0 18.0 23.0 WA ............................. 48.0 46.0 12.0 10.0 WV ............................. 25.0 29.0 5.0 5.0 WI .............................. 75.0 76.0 15.0 14.0 WY ............................. 300.0 275.0 75.0 90.0 Oth Sts 3 .................... 112.0 110.0 33.0 30.0
US .......................... 4,185.0 4,115.0 1,435.0 1,415.0
1 Preliminary. 2 N ENG includes CT, ME, MA, NH, RI, and VT. 3 Individual state estimates not available for states not shown, but are included in Other States.
NASS, Livestock Branch, (202) 720–3570.
VerDate Aug 31 2005 13:43 Mar 01, 2012 Jkt 000000 PO 00000 Frm 00024 Fmt 1000 Sfmt 1000 H:\SHARED\DAPP\FPU\AGSTAT\MASTER~2\CHAPTR07\VII-28.AG8 USDA
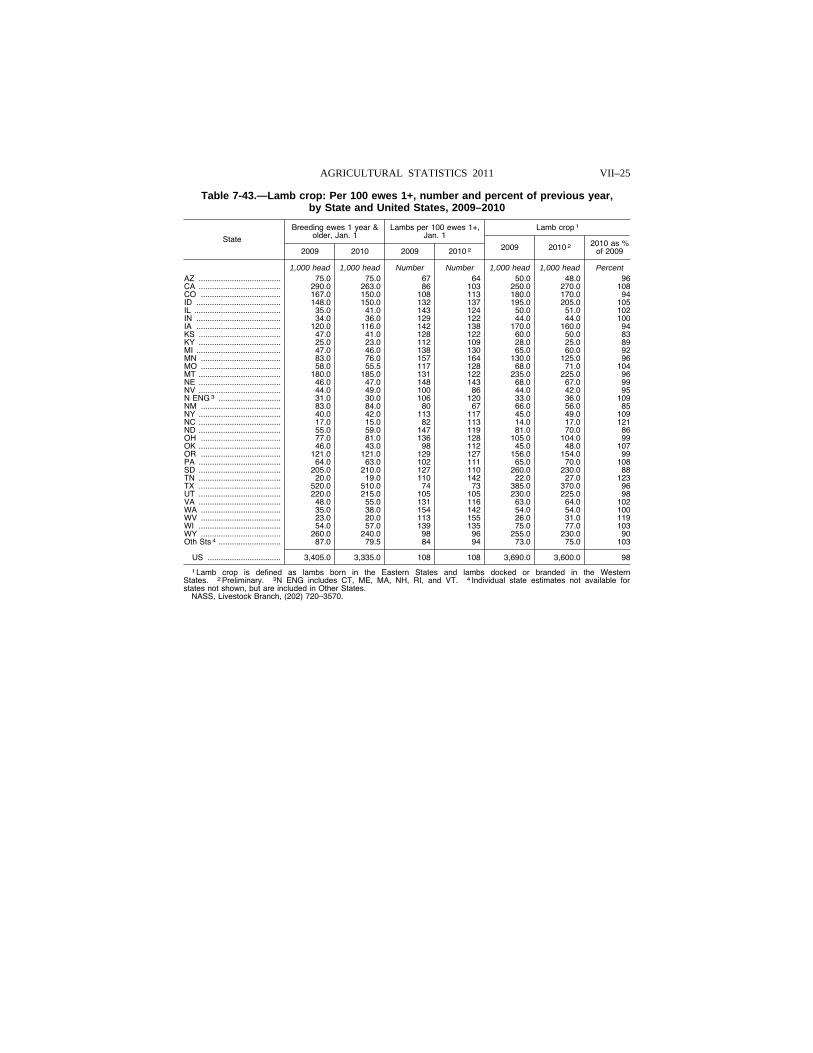
VII–25 AGRICULTURAL STATISTICS 2011
Table 7-43.—Lamb crop: Per 100 ewes 1+, number and percent of previous year, by State and United States, 2009–2010
State
Breeding ewes 1 year & older, Jan. 1
Lambs per 100 ewes 1+, Jan. 1
Lamb crop 1
2009 2010 2009 2010 2 2009 2010 2 2010 as % of 2009
1,000 head 1,000 head Number Number 1,000 head 1,000 head Percent AZ ..................................... 75.0 75.0 67 64 50.0 48.0 96 CA ..................................... 290.0 263.0 86 103 250.0 270.0 108 CO .................................... 167.0 150.0 108 113 180.0 170.0 94 ID ...................................... 148.0 150.0 132 137 195.0 205.0 105 IL ....................................... 35.0 41.0 143 124 50.0 51.0 102 IN ...................................... 34.0 36.0 129 122 44.0 44.0 100 IA ...................................... 120.0 116.0 142 138 170.0 160.0 94 KS ..................................... 47.0 41.0 128 122 60.0 50.0 83 KY ..................................... 25.0 23.0 112 109 28.0 25.0 89 MI ...................................... 47.0 46.0 138 130 65.0 60.0 92 MN .................................... 83.0 76.0 157 164 130.0 125.0 96 MO .................................... 58.0 55.5 117 128 68.0 71.0 104 MT ..................................... 180.0 185.0 131 122 235.0 225.0 96 NE ..................................... 46.0 47.0 148 143 68.0 67.0 99 NV ..................................... 44.0 49.0 100 86 44.0 42.0 95 N ENG 3 ............................ 31.0 30.0 106 120 33.0 36.0 109 NM .................................... 83.0 84.0 80 67 66.0 56.0 85 NY ..................................... 40.0 42.0 113 117 45.0 49.0 109 NC ..................................... 17.0 15.0 82 113 14.0 17.0 121 ND ..................................... 55.0 59.0 147 119 81.0 70.0 86 OH .................................... 77.0 81.0 136 128 105.0 104.0 99 OK ..................................... 46.0 43.0 98 112 45.0 48.0 107 OR .................................... 121.0 121.0 129 127 156.0 154.0 99 PA ..................................... 64.0 63.0 102 111 65.0 70.0 108 SD ..................................... 205.0 210.0 127 110 260.0 230.0 88 TN ..................................... 20.0 19.0 110 142 22.0 27.0 123 TX ..................................... 520.0 510.0 74 73 385.0 370.0 96 UT ..................................... 220.0 215.0 105 105 230.0 225.0 98 VA ..................................... 48.0 55.0 131 116 63.0 64.0 102 WA .................................... 35.0 38.0 154 142 54.0 54.0 100 WV .................................... 23.0 20.0 113 155 26.0 31.0 119 WI ..................................... 54.0 57.0 139 135 75.0 77.0 103 WY .................................... 260.0 240.0 98 96 255.0 230.0 90 Oth Sts 4 ............................ 87.0 79.5 84 94 73.0 75.0 103
US ................................. 3,405.0 3,335.0 108 108 3,690.0 3,600.0 98
1 Lamb crop is defined as lambs born in the Eastern States and lambs docked or branded in the Western States. 2 Preliminary. 3N ENG includes CT, ME, MA, NH, RI, and VT. 4 Individual state estimates not available for states not shown, but are included in Other States.
NASS, Livestock Branch, (202) 720–3570.
VerDate Aug 31 2005 13:43 Mar 01, 2012 Jkt 000000 PO 00000 Frm 00025 Fmt 1000 Sfmt 1000 H:\SHARED\DAPP\FPU\AGSTAT\MASTER~2\CHAPTR07\VII-29.AG8 USDA
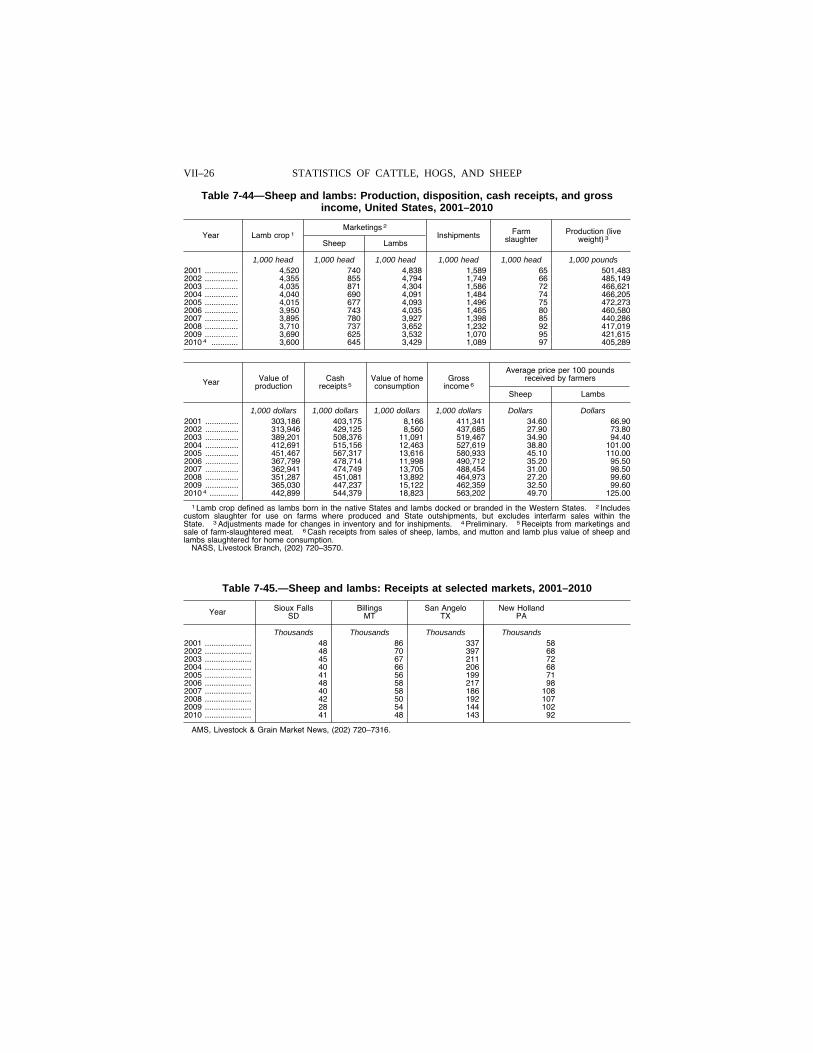
VII–26 STATISTICS OF CATTLE, HOGS, AND SHEEP
Table 7-44—Sheep and lambs: Production, disposition, cash receipts, and gross income, United States, 2001–2010
Year Lamb crop 1 Marketings 2
Inshipments Farm slaughter
Production (live weight) 3 Sheep Lambs
1,000 head 1,000 head 1,000 head 1,000 head 1,000 head 1,000 pounds 2001 ............... 4,520 740 4,838 1,589 65 501,483 2002 ............... 4,355 855 4,794 1,749 66 485,149 2003 ............... 4,035 871 4,304 1,586 72 466,621 2004 ............... 4,040 690 4,091 1,484 74 466,205 2005 ............... 4,015 677 4,093 1,496 75 472,273 2006 ............... 3,950 743 4,035 1,465 80 460,580 2007 ............... 3,895 780 3,927 1,398 85 440,286 2008 ............... 3,710 737 3,652 1,232 92 417,019 2009 ............... 3,690 625 3,532 1,070 95 421,615 2010 4 ............ 3,600 645 3,429 1,089 97 405,289
Year Value of production
Cash receipts 5
Value of home consumption
Gross income 6
Average price per 100 pounds received by farmers
Sheep Lambs
1,000 dollars 1,000 dollars 1,000 dollars 1,000 dollars Dollars Dollars 2001 ............... 303,186 403,175 8,166 411,341 34.60 66.90 2002 ............... 313,946 429,125 8,560 437,685 27.90 73.80 2003 ............... 389,201 508,376 11,091 519,467 34.90 94.40 2004 ............... 412,691 515,156 12,463 527,619 38.80 101.00 2005 ............... 451,467 567,317 13,616 580,933 45.10 110.00 2006 ............... 367,799 478,714 11,998 490,712 35.20 95.50 2007 ............... 362,941 474,749 13,705 488,454 31.00 98.50 2008 ............... 351,287 451,081 13,892 464,973 27.20 99.60 2009 ............... 365,030 447,237 15,122 462,359 32.50 99.60 2010 4 ............. 442,899 544,379 18,823 563,202 49.70 125.00
1 Lamb crop defined as lambs born in the native States and lambs docked or branded in the Western States. 2 Includes custom slaughter for use on farms where produced and State outshipments, but excludes interfarm sales within the State. 3 Adjustments made for changes in inventory and for inshipments. 4 Preliminary. 5 Receipts from marketings and sale of farm-slaughtered meat. 6 Cash receipts from sales of sheep, lambs, and mutton and lamb plus value of sheep and lambs slaughtered for home consumption.
NASS, Livestock Branch, (202) 720–3570.
Table 7-45.—Sheep and lambs: Receipts at selected markets, 2001–2010
Year Sioux Falls SD
Billings MT
San Angelo TX
New Holland PA
Thousands Thousands Thousands Thousands 2001 ..................... 48 86 337 58 2002 ..................... 48 70 397 68 2003 ..................... 45 67 211 72 2004 ..................... 40 66 206 68 2005 ..................... 41 56 199 71 2006 ..................... 48 58 217 98 2007 ..................... 40 58 186 108 2008 ..................... 42 50 192 107 2009 ..................... 28 54 144 102 2010 ..................... 41 48 143 92
AMS, Livestock & Grain Market News, (202) 720–7316.
VerDate Aug 31 2005 13:43 Mar 01, 2012 Jkt 000000 PO 00000 Frm 00026 Fmt 1000 Sfmt 1000 H:\SHARED\DAPP\FPU\AGSTAT\MASTER~2\CHAPTR07\VII-30.AG8 USDA
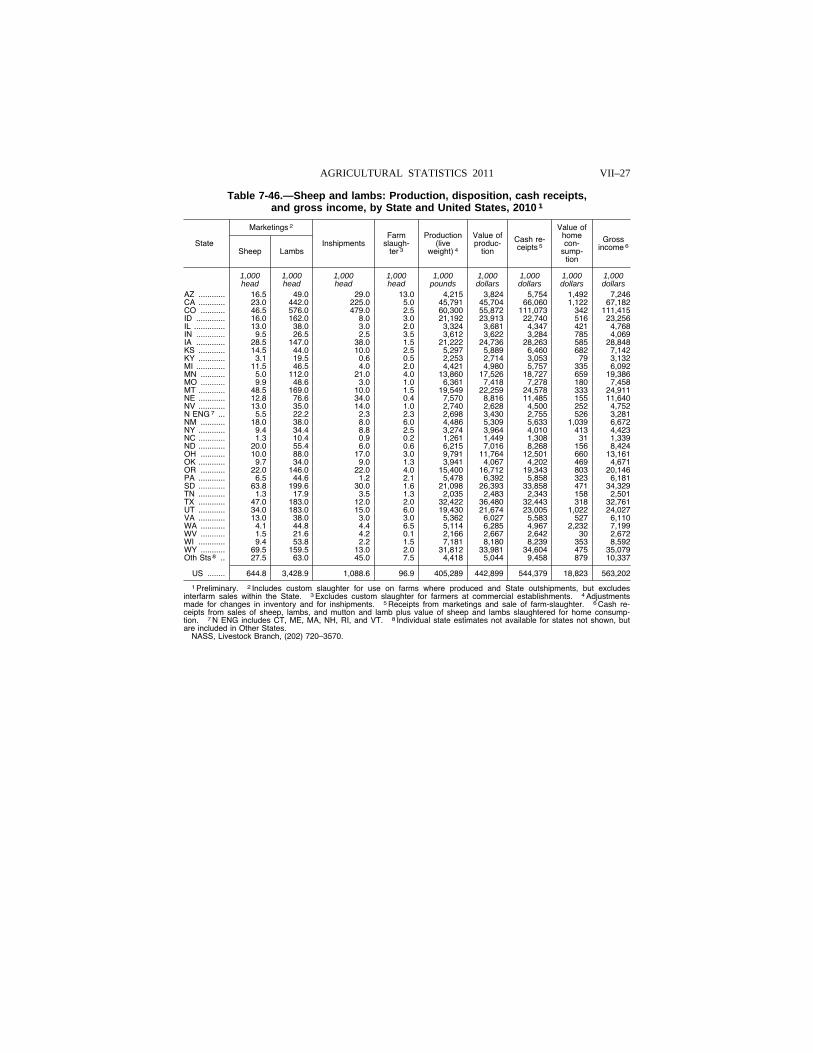
VII–27 AGRICULTURAL STATISTICS 2011
Table 7-46.—Sheep and lambs: Production, disposition, cash receipts, and gross income, by State and United States, 2010 1
State
Marketings 2
Inshipments Farm
slaugh-ter 3
Production (live
weight) 4
Value of produc-
tion
Cash re-ceipts 5
Value of home con-
sump-tion
Gross income 6 Sheep Lambs
1,000 1,000 1,000 1,000 1,000 1,000 1,000 1,000 1,000 head head head head pounds dollars dollars dollars dollars
AZ ............ 16.5 49.0 29.0 13.0 4,215 3,824 5,754 1,492 7,246 CA ............ 23.0 442.0 225.0 5.0 45,791 45,704 66,060 1,122 67,182 CO ........... 46.5 576.0 479.0 2.5 60,300 55,872 111,073 342 111,415 ID ............. 16.0 162.0 8.0 3.0 21,192 23,913 22,740 516 23,256 IL .............. 13.0 38.0 3.0 2.0 3,324 3,681 4,347 421 4,768 IN ............. 9.5 26.5 2.5 3.5 3,612 3,622 3,284 785 4,069 IA ............. 28.5 147.0 38.0 1.5 21,222 24,736 28,263 585 28,848 KS ............ 14.5 44.0 10.0 2.5 5,297 5,889 6,460 682 7,142 KY ............ 3.1 19.5 0.6 0.5 2,253 2,714 3,053 79 3,132 MI ............. 11.5 46.5 4.0 2.0 4,421 4,980 5,757 335 6,092 MN ........... 5.0 112.0 21.0 4.0 13,860 17,526 18,727 659 19,386 MO ........... 9.9 48.6 3.0 1.0 6,361 7,418 7,278 180 7,458 MT ............ 48.5 169.0 10.0 1.5 19,549 22,259 24,578 333 24,911 NE ............ 12.8 76.6 34.0 0.4 7,570 8,816 11,485 155 11,640 NV ............ 13.0 35.0 14.0 1.0 2,740 2,628 4,500 252 4,752 N ENG 7 ... 5.5 22.2 2.3 2.3 2,698 3,430 2,755 526 3,281 NM ........... 18.0 38.0 8.0 6.0 4,486 5,309 5,633 1,039 6,672 NY ............ 9.4 34.4 8.8 2.5 3,274 3,964 4,010 413 4,423 NC ............ 1.3 10.4 0.9 0.2 1,261 1,449 1,308 31 1,339 ND ............ 20.0 55.4 6.0 0.6 6,215 7,016 8,268 156 8,424 OH ........... 10.0 88.0 17.0 3.0 9,791 11,764 12,501 660 13,161 OK ............ 9.7 34.0 9.0 1.3 3,941 4,067 4,202 469 4,671 OR ........... 22.0 146.0 22.0 4.0 15,400 16,712 19,343 803 20,146 PA ............ 6.5 44.6 1.2 2.1 5,478 6,392 5,858 323 6,181 SD ............ 63.8 199.6 30.0 1.6 21,098 26,393 33,858 471 34,329 TN ............ 1.3 17.9 3.5 1.3 2,035 2,483 2,343 158 2,501 TX ............ 47.0 183.0 12.0 2.0 32,422 36,480 32,443 318 32,761 UT ............ 34.0 183.0 15.0 6.0 19,430 21,674 23,005 1,022 24,027 VA ............ 13.0 38.0 3.0 3.0 5,362 6,027 5,583 527 6,110 WA ........... 4.1 44.8 4.4 6.5 5,114 6,285 4,967 2,232 7,199 WV ........... 1.5 21.6 4.2 0.1 2,166 2,667 2,642 30 2,672 WI ............ 9.4 53.8 2.2 1.5 7,181 8,180 8,239 353 8,592 WY ........... 69.5 159.5 13.0 2.0 31,812 33,981 34,604 475 35,079 Oth Sts 8 .. 27.5 63.0 45.0 7.5 4,418 5,044 9,458 879 10,337
US ........ 644.8 3,428.9 1,088.6 96.9 405,289 442,899 544,379 18,823 563,202
1 Preliminary. 2 Includes custom slaughter for use on farms where produced and State outshipments, but excludes interfarm sales within the State. 3 Excludes custom slaughter for farmers at commercial establishments. 4 Adjustments made for changes in inventory and for inshipments. 5 Receipts from marketings and sale of farm-slaughter. 6 Cash re-ceipts from sales of sheep, lambs, and mutton and lamb plus value of sheep and lambs slaughtered for home consump-tion. 7 N ENG includes CT, ME, MA, NH, RI, and VT. 8 Individual state estimates not available for states not shown, but are included in Other States.
NASS, Livestock Branch, (202) 720–3570.
VerDate Aug 31 2005 13:43 Mar 01, 2012 Jkt 000000 PO 00000 Frm 00027 Fmt 1000 Sfmt 1000 H:\SHARED\DAPP\FPU\AGSTAT\MASTER~2\CHAPTR07\VII-31.AG8 USDA
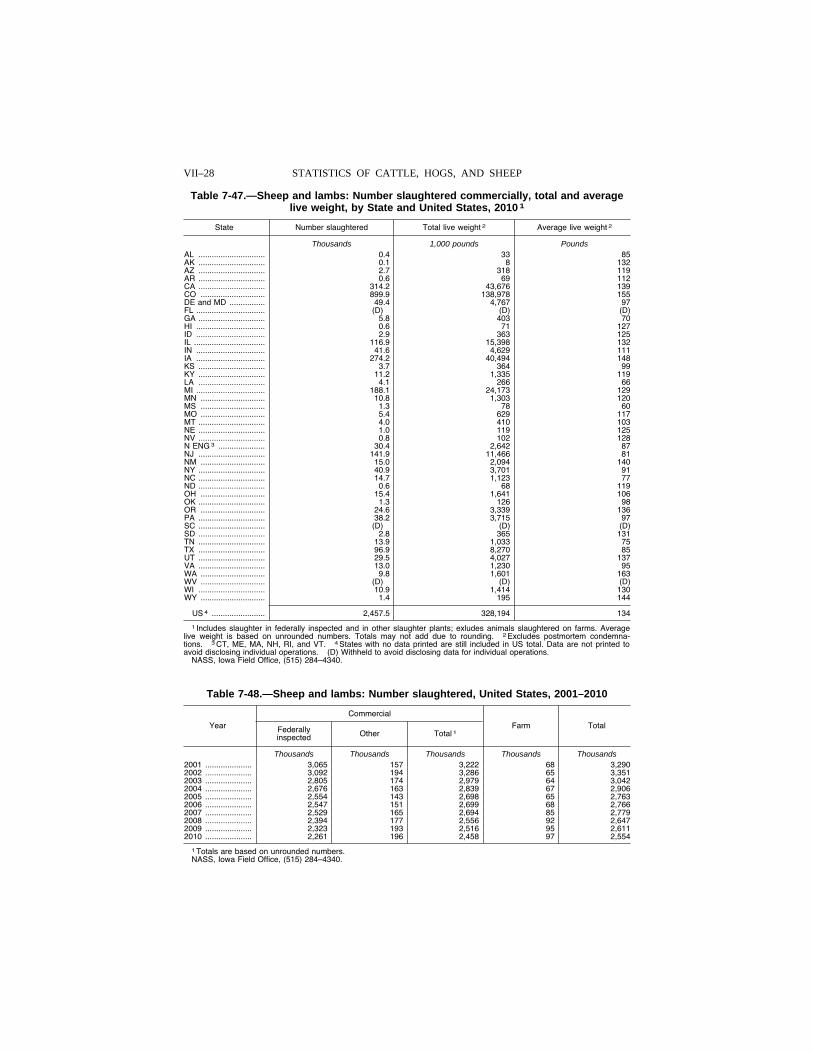
VII–28 STATISTICS OF CATTLE, HOGS, AND SHEEP
Table 7-47.—Sheep and lambs: Number slaughtered commercially, total and average live weight, by State and United States, 2010 1
State Number slaughtered Total live weight 2 Average live weight 2
Thousands 1,000 pounds Pounds AL .............................. 0 .4 33 85 AK .............................. 0 .1 8 132 AZ .............................. 2 .7 318 119 AR .............................. 0 .6 69 112 CA .............................. 314 .2 43,676 139 CO ............................. 899 .9 138,978 155 DE and MD ................ 49 .4 4,767 97 FL ............................... (D) (D) (D) GA .............................. 5 .8 403 70 HI ............................... 0 .6 71 127 ID ............................... 2 .9 363 125 IL ................................ 116 .9 15,398 132 IN ............................... 41 .6 4,629 111 IA ............................... 274 .2 40,494 148 KS .............................. 3 .7 364 99 KY .............................. 11 .2 1,335 119 LA .............................. 4 .1 266 66 MI ............................... 188 .1 24,173 129 MN ............................. 10 .8 1,303 120 MS ............................. 1 .3 78 60 MO ............................. 5 .4 629 117 MT .............................. 4 .0 410 103 NE .............................. 1 .0 119 125 NV .............................. 0 .8 102 128 N ENG 3 ..................... 30 .4 2,642 87 NJ .............................. 141 .9 11,466 81 NM ............................. 15 .0 2,094 140 NY .............................. 40 .9 3,701 91 NC .............................. 14 .7 1,123 77 ND .............................. 0 .6 68 119 OH ............................. 15 .4 1,641 106 OK .............................. 1 .3 126 98 OR ............................. 24 .6 3,339 136 PA .............................. 38 .2 3,715 97 SC .............................. (D) (D) (D) SD .............................. 2 .8 365 131 TN .............................. 13 .9 1,033 75 TX .............................. 96 .9 8,270 85 UT .............................. 29 .5 4,027 137 VA .............................. 13 .0 1,230 95 WA ............................. 9 .8 1,601 163 WV ............................. (D) (D) (D) WI .............................. 10 .9 1,414 130 WY ............................. 1 .4 195 144
US 4 ........................ 2,457 .5 328,194 134
1 Includes slaughter in federally inspected and in other slaughter plants; exludes animals slaughtered on farms. Average live weight is based on unrounded numbers. Totals may not add due to rounding. 2 Excludes postmortem condemna-tions. 3 CT, ME, MA, NH, RI, and VT. 4 States with no data printed are still included in US total. Data are not printed to avoid disclosing individual operations. (D) Withheld to avoid disclosing data for individual operations.
NASS, Iowa Field Office, (515) 284–4340.
Table 7-48.—Sheep and lambs: Number slaughtered, United States, 2001–2010
Year
Commercial
Farm Total Federally inspected Other Total 1
Thousands Thousands Thousands Thousands Thousands 2001 ..................... 3,065 157 3,222 68 3,290 2002 ..................... 3,092 194 3,286 65 3,351 2003 ..................... 2,805 174 2,979 64 3,042 2004 ..................... 2,676 163 2,839 67 2,906 2005 ..................... 2,554 143 2,698 65 2,763 2006 ..................... 2,547 151 2,699 68 2,766 2007 ..................... 2,529 165 2,694 85 2,779 2008 ..................... 2,394 177 2,556 92 2,647 2009 ..................... 2,323 193 2,516 95 2,611 2010 ..................... 2,261 196 2,458 97 2,554
1 Totals are based on unrounded numbers. NASS, Iowa Field Office, (515) 284–4340.
VerDate Aug 31 2005 13:43 Mar 01, 2012 Jkt 000000 PO 00000 Frm 00028 Fmt 1000 Sfmt 1000 H:\SHARED\DAPP\FPU\AGSTAT\MASTER~2\CHAPTR07\VII-32.AG8 USDA
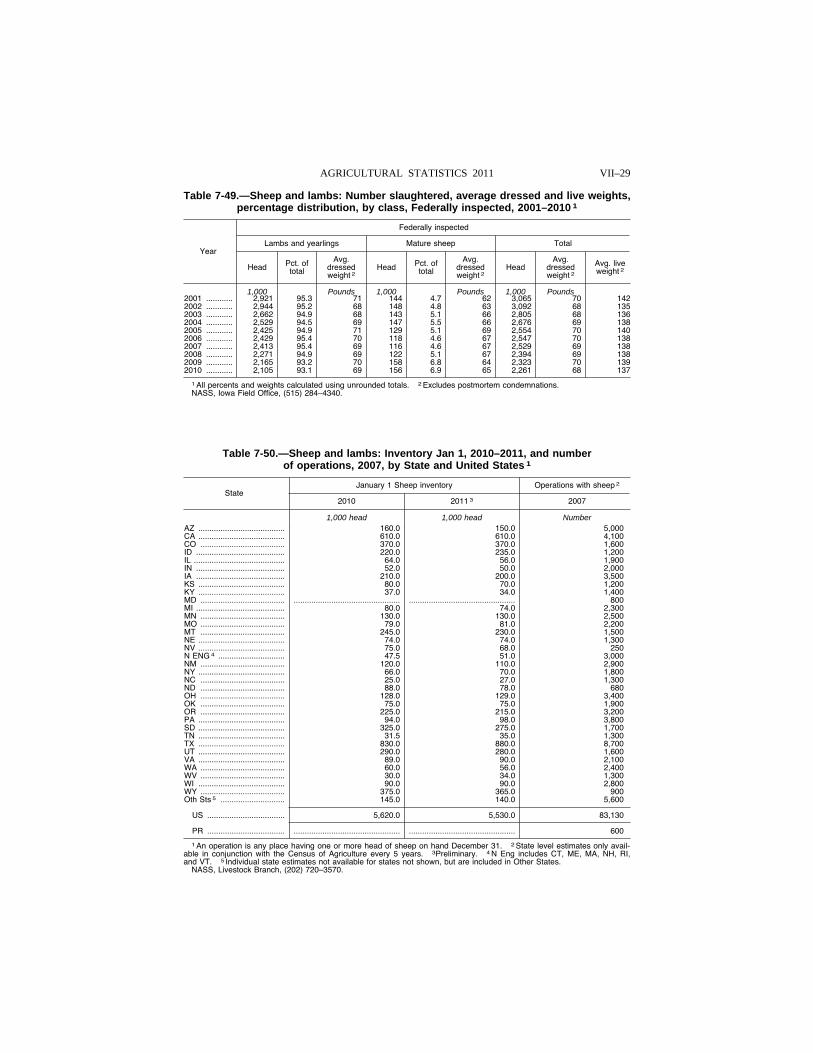
VII–29 AGRICULTURAL STATISTICS 2011
Table 7-49.—Sheep and lambs: Number slaughtered, average dressed and live weights, percentage distribution, by class, Federally inspected, 2001–2010 1
Year
Federally inspected
Lambs and yearlings Mature sheep Total
Head Pct. of total
Avg. dressed weight 2
Head Pct. of total
Avg. dressed weight 2
Head Avg.
dressed weight 2
Avg. live weight 2
1,000 Pounds 1,000 Pounds 1,000 Pounds 2001 ............ 2,921 95.3 71 144 4.7 62 3,065 70 142 2002 ............ 2,944 95.2 68 148 4.8 63 3,092 68 135 2003 ............ 2,662 94.9 68 143 5.1 66 2,805 68 136 2004 ............ 2,529 94.5 69 147 5.5 66 2,676 69 138 2005 ............ 2,425 94.9 71 129 5.1 69 2,554 70 140 2006 ............ 2,429 95.4 70 118 4.6 67 2,547 70 138 2007 ............ 2,413 95.4 69 116 4.6 67 2,529 69 138 2008 ............ 2,271 94.9 69 122 5.1 67 2,394 69 138 2009 ............ 2,165 93.2 70 158 6.8 64 2,323 70 139 2010 ............ 2,105 93.1 69 156 6.9 65 2,261 68 137
1 All percents and weights calculated using unrounded totals. 2 Excludes postmortem condemnations. NASS, Iowa Field Office, (515) 284–4340.
Table 7-50.—Sheep and lambs: Inventory Jan 1, 2010–2011, and number of operations, 2007, by State and United States 1
State January 1 Sheep inventory Operations with sheep 2
2010 2011 3 2007
1,000 head 1,000 head Number AZ ....................................... 160 .0 150 .0 5,000 CA ....................................... 610 .0 610 .0 4,100 CO ...................................... 370 .0 370 .0 1,600 ID ........................................ 220 .0 235 .0 1,200 IL ......................................... 64 .0 56 .0 1,900 IN ........................................ 52 .0 50 .0 2,000 IA ........................................ 210 .0 200 .0 3,500 KS ....................................... 80 .0 70 .0 1,200 KY ....................................... 37 .0 34 .0 1,400 MD ...................................... ................................................ ................................................ 800 MI ........................................ 80 .0 74 .0 2,300 MN ...................................... 130 .0 130 .0 2,500 MO ...................................... 79 .0 81 .0 2,200 MT ...................................... 245 .0 230 .0 1,500 NE ....................................... 74 .0 74 .0 1,300 NV ....................................... 75 .0 68 .0 250 N ENG 4 .............................. 47 .5 51 .0 3,000 NM ...................................... 120 .0 110 .0 2,900 NY ....................................... 66 .0 70 .0 1,800 NC ...................................... 25 .0 27 .0 1,300 ND ...................................... 88 .0 78 .0 680 OH ...................................... 128 .0 129 .0 3,400 OK ...................................... 75 .0 75 .0 1,900 OR ...................................... 225 .0 215 .0 3,200 PA ....................................... 94 .0 98 .0 3,800 SD ....................................... 325 .0 275 .0 1,700 TN ....................................... 31 .5 35 .0 1,300 TX ....................................... 830 .0 880 .0 8,700 UT ....................................... 290 .0 280 .0 1,600 VA ....................................... 89 .0 90 .0 2,100 WA ...................................... 60 .0 56 .0 2,400 WV ...................................... 30 .0 34 .0 1,300 WI ....................................... 90 .0 90 .0 2,800 WY ...................................... 375 .0 365 .0 900 Oth Sts 5 ............................. 145 .0 140 .0 5,600
US ................................... 5,620 .0 5,530 .0 83,130
PR ................................... ................................................ ................................................ 600
1 An operation is any place having one or more head of sheep on hand December 31. 2 State level estimates only avail-able in conjunction with the Census of Agriculture every 5 years. 3Preliminary. 4 N Eng includes CT, ME, MA, NH, RI, and VT. 5 Individual state estimates not available for states not shown, but are included in Other States.
NASS, Livestock Branch, (202) 720–3570.
VerDate Aug 31 2005 13:43 Mar 01, 2012 Jkt 000000 PO 00000 Frm 00029 Fmt 1000 Sfmt 1000 H:\SHARED\DAPP\FPU\AGSTAT\MASTER~2\CHAPTR07\VII-33.AG8 USDA
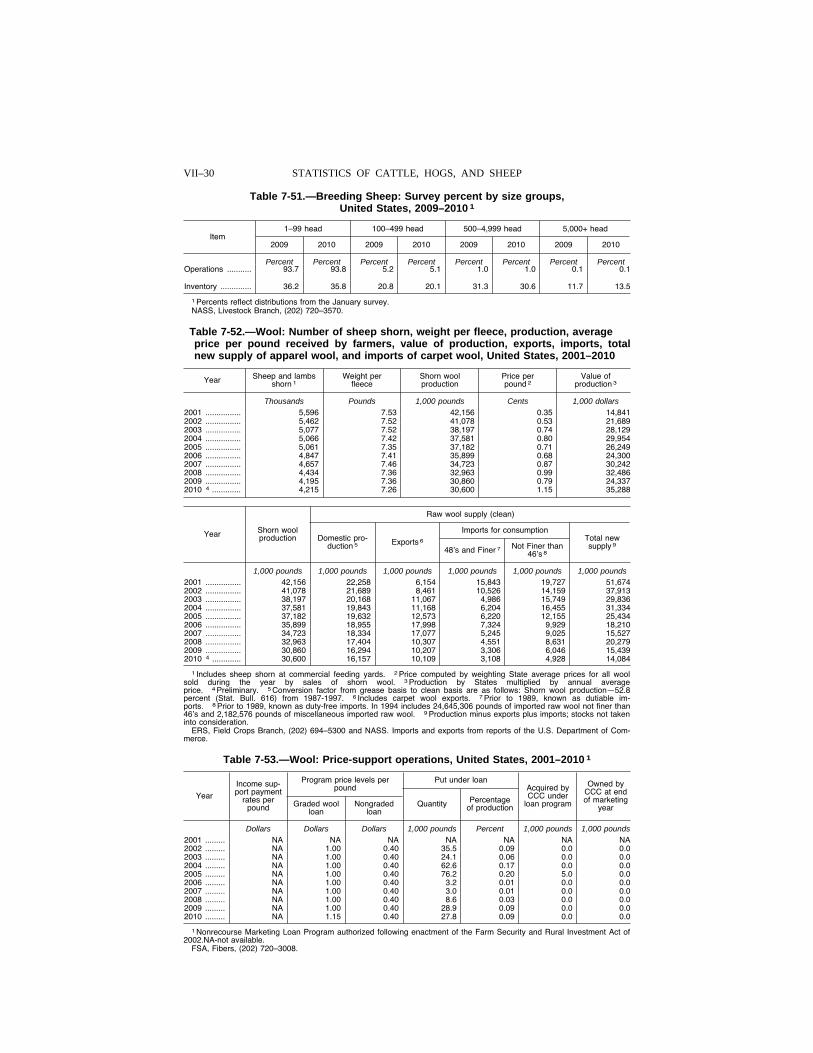
VII–30 STATISTICS OF CATTLE, HOGS, AND SHEEP
Table 7-51.—Breeding Sheep: Survey percent by size groups, United States, 2009–2010 1
Item 1–99 head 100–499 head 500–4,999 head 5,000+ head
2009 2010 2009 2010 2009 2010 2009 2010
Percent Percent Percent Percent Percent Percent Percent Percent Operations ........... 93.7 93.8 5.2 5.1 1.0 1.0 0.1 0.1
Inventory .............. 36.2 35.8 20.8 20.1 31.3 30.6 11.7 13.5
1 Percents reflect distributions from the January survey. NASS, Livestock Branch, (202) 720–3570.
Table 7-52.—Wool: Number of sheep shorn, weight per fleece, production, average price per pound received by farmers, value of production, exports, imports, total new supply of apparel wool, and imports of carpet wool, United States, 2001–2010
Year Sheep and lambs shorn 1
Weight per fleece
Shorn wool production
Price per pound 2
Value of production 3
Thousands Pounds 1,000 pounds Cents 1,000 dollars 2001 ................ 5,596 7.53 42,156 0.35 14,841 2002 ................ 5,462 7.52 41,078 0.53 21,689 2003 ................ 5,077 7.52 38,197 0.74 28,129 2004 ................ 5,066 7.42 37,581 0.80 29,954 2005 ................ 5,061 7.35 37,182 0.71 26,249 2006 ................ 4,847 7.41 35,899 0.68 24,300 2007 ................ 4,657 7.46 34,723 0.87 30,242 2008 ................ 4,434 7.36 32,963 0.99 32,486 2009 ................ 4,195 7.36 30,860 0.79 24,337 2010 4 ............. 4,215 7.26 30,600 1.15 35,288
Year Shorn wool production
Raw wool supply (clean)
Domestic pro-duction 5 Exports 6
Imports for consumption Total new supply 9 48’s and Finer 7 Not Finer than
46’s 8
1,000 pounds 1,000 pounds 1,000 pounds 1,000 pounds 1,000 pounds 1,000 pounds 2001 ................ 42,156 22,258 6,154 15,843 19,727 51,674 2002 ................ 41,078 21,689 8,461 10,526 14,159 37,913 2003 ................ 38,197 20,168 11,067 4,986 15,749 29,836 2004 ................ 37,581 19,843 11,168 6,204 16,455 31,334 2005 ................ 37,182 19,632 12,573 6,220 12,155 25,434 2006 ................ 35,899 18,955 17,998 7,324 9,929 18,210 2007 ................ 34,723 18,334 17,077 5,245 9,025 15,527 2008 ................ 32,963 17,404 10,307 4,551 8,631 20,279 2009 ................ 30,860 16,294 10,207 3,306 6,046 15,439 2010 4 ............. 30,600 16,157 10,109 3,108 4,928 14,084
1 Includes sheep shorn at commercial feeding yards. 2 Price computed by weighting State average prices for all wool sold during the year by sales of shorn wool. 3 Production by States multiplied by annual average price. 4 Preliminary. 5 Conversion factor from grease basis to clean basis are as follows: Shorn wool production—52.8 percent (Stat. Bull. 616) from 1987-1997. 6 Includes carpet wool exports. 7 Prior to 1989, known as dutiable im-ports. 8 Prior to 1989, known as duty-free imports. In 1994 includes 24,645,306 pounds of imported raw wool not finer than 46’s and 2,182,576 pounds of miscellaneous imported raw wool. 9 Production minus exports plus imports; stocks not taken into consideration.
ERS, Field Crops Branch, (202) 694–5300 and NASS. Imports and exports from reports of the U.S. Department of Com-merce.
Table 7-53.—Wool: Price-support operations, United States, 2001–2010 1
Year
Income sup-port payment
rates per pound
Program price levels per pound
Put under loan Acquired by CCC under
loan program
Owned by CCC at end of marketing
year Graded wool loan
Nongraded loan
Quantity Percentage of production
Dollars Dollars Dollars 1,000 pounds Percent 1,000 pounds 1,000 pounds 2001 ......... NA NA NA NA NA NA NA 2002 ......... NA 1.00 0.40 35.5 0.09 0.0 0.0 2003 ......... NA 1.00 0.40 24.1 0.06 0.0 0.0 2004 ......... NA 1.00 0.40 62.6 0.17 0.0 0.0 2005 ......... NA 1.00 0.40 76.2 0.20 5.0 0.0 2006 ......... NA 1.00 0.40 3.2 0.01 0.0 0.0 2007 ......... NA 1.00 0.40 3.0 0.01 0.0 0.0 2008 ......... NA 1.00 0.40 8.6 0.03 0.0 0.0 2009 ......... NA 1.00 0.40 28.9 0.09 0.0 0.0 2010 ......... NA 1.15 0.40 27.8 0.09 0.0 0.0
1 Nonrecourse Marketing Loan Program authorized following enactment of the Farm Security and Rural Investment Act of 2002.NA-not available.
FSA, Fibers, (202) 720–3008.
VerDate Aug 31 2005 13:43 Mar 01, 2012 Jkt 000000 PO 00000 Frm 00030 Fmt 1000 Sfmt 1000 H:\SHARED\DAPP\FPU\AGSTAT\MASTER~2\CHAPTR07\VII-34.AG8 USDA
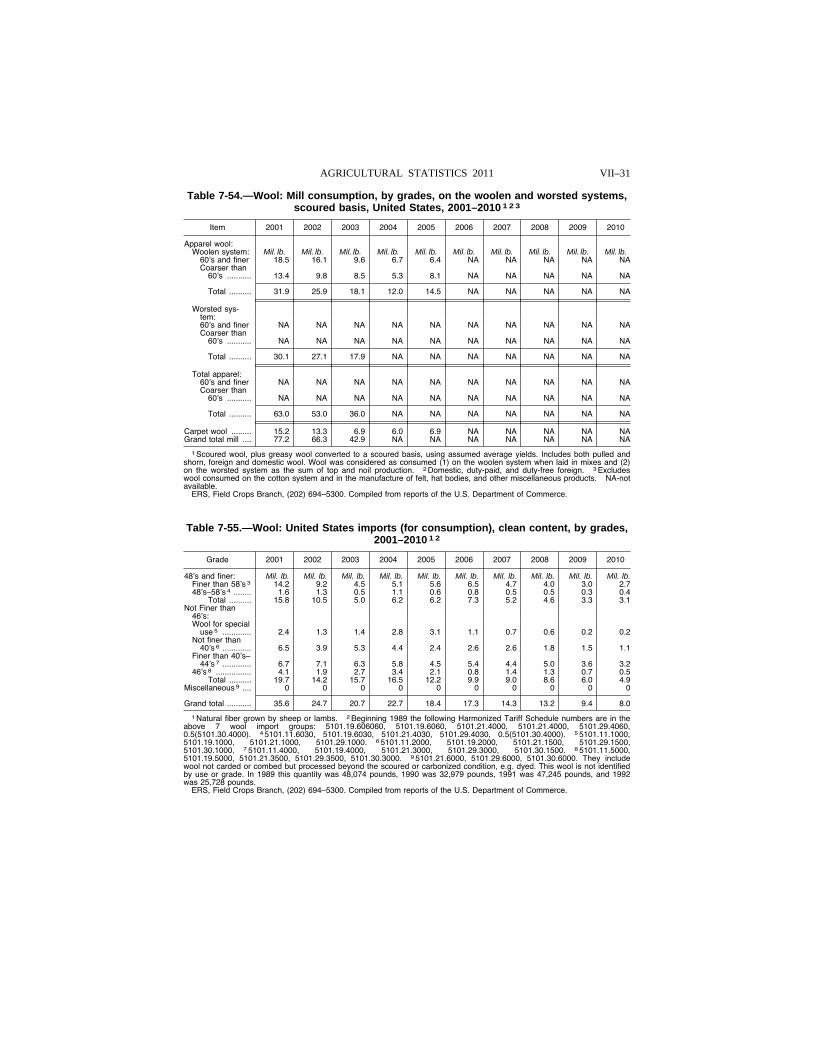
VII–31 AGRICULTURAL STATISTICS 2011
Table 7-54.—Wool: Mill consumption, by grades, on the woolen and worsted systems, scoured basis, United States, 2001–2010 1 2 3
Item 2001 2002 2003 2004 2005 2006 2007 2008 2009 2010
Apparel wool: Woolen system: Mil. lb. Mil. lb. Mil. lb. Mil. lb. Mil. lb. Mil. lb. Mil. lb. Mil. lb. Mil. lb. Mil. lb.
60’s and finer 18.5 16.1 9.6 6.7 6.4 NA NA NA NA NA Coarser than
60’s ........... 13.4 9.8 8.5 5.3 8.1 NA NA NA NA NA
Total .......... 31.9 25.9 18.1 12.0 14.5 NA NA NA NA NA
Worsted sys-tem: 60’s and finer NA NA NA NA NA NA NA NA NA NA Coarser than
60’s ........... NA NA NA NA NA NA NA NA NA NA
Total .......... 30.1 27.1 17.9 NA NA NA NA NA NA NA
Total apparel: 60’s and finer NA NA NA NA NA NA NA NA NA NA Coarser than
60’s ........... NA NA NA NA NA NA NA NA NA NA
Total .......... 63.0 53.0 36.0 NA NA NA NA NA NA NA
Carpet wool ......... 15.2 13.3 6.9 6.0 6.9 NA NA NA NA NA Grand total mill .... 77.2 66.3 42.9 NA NA NA NA NA NA NA
1 Scoured wool, plus greasy wool converted to a scoured basis, using assumed average yields. Includes both pulled and shorn, foreign and domestic wool. Wool was considered as consumed (1) on the woolen system when laid in mixes and (2) on the worsted system as the sum of top and noil production. 2 Domestic, duty-paid, and duty-free foreign. 3 Excludes wool consumed on the cotton system and in the manufacture of felt, hat bodies, and other miscellaneous products. NA-not available.
ERS, Field Crops Branch, (202) 694–5300. Compiled from reports of the U.S. Department of Commerce.
Table 7-55.—Wool: United States imports (for consumption), clean content, by grades, 2001–2010 1 2
Grade 2001 2002 2003 2004 2005 2006 2007 2008 2009 2010
48’s and finer: Mil. lb. Mil. lb. Mil. lb. Mil. lb. Mil. lb. Mil. lb. Mil. lb. Mil. lb. Mil. lb. Mil. lb. Finer than 58’s 3 14.2 9.2 4.5 5.1 5.6 6.5 4.7 4.0 3.0 2.7 48’s–58’s 4 ........ 1.6 1.3 0.5 1.1 0.6 0.8 0.5 0.5 0.3 0.4
Total .......... 15.8 10.5 5.0 6.2 6.2 7.3 5.2 4.6 3.3 3.1 Not Finer than
46’s: Wool for special
use 5 ............. 2.4 1.3 1.4 2.8 3.1 1.1 0.7 0.6 0.2 0.2 Not finer than
40’s 6 ............. 6.5 3.9 5.3 4.4 2.4 2.6 2.6 1.8 1.5 1.1 Finer than 40’s–
44’s 7 ............. 6.7 7.1 6.3 5.8 4.5 5.4 4.4 5.0 3.6 3.2 46’s 8 ................ 4.1 1.9 2.7 3.4 2.1 0.8 1.4 1.3 0.7 0.5
Total .......... 19.7 14.2 15.7 16.5 12.2 9.9 9.0 8.6 6.0 4.9 Miscellaneous 9 .... 0 0 0 0 0 0 0 0 0 0
Grand total ........... 35.6 24.7 20.7 22.7 18.4 17.3 14.3 13.2 9.4 8.0
1 Natural fiber grown by sheep or lambs. 2 Beginning 1989 the following Harmonized Tariff Schedule numbers are in the above 7 wool import groups: 5101.19.606060, 5101.19.6060, 5101.21.4000, 5101.21.4000, 5101.29.4060, 0.5(5101.30.4000). 4 5101.11.6030, 5101.19.6030, 5101.21.4030, 5101.29.4030, 0.5(5101.30.4000). 5 5101.11.1000, 5101.19.1000, 5101.21.1000, 5101.29.1000. 6 5101.11.2000, 5101.19.2000, 5101.21.1500, 5101.29.1500, 5101.30.1000. 7 5101.11.4000, 5101.19.4000, 5101.21.3000, 5101.29.3000, 5101.30.1500. 8 5101.11.5000, 5101.19.5000, 5101.21.3500, 5101.29.3500, 5101.30.3000. 9 5101.21.6000, 5101.29.6000, 5101.30.6000. They include wool not carded or combed but processed beyond the scoured or carbonized condition, e.g. dyed. This wool is not identified by use or grade. In 1989 this quantity was 48,074 pounds, 1990 was 32,979 pounds, 1991 was 47,245 pounds, and 1992 was 25,728 pounds.
ERS, Field Crops Branch, (202) 694–5300. Compiled from reports of the U.S. Department of Commerce.
VerDate Aug 31 2005 13:43 Mar 01, 2012 Jkt 000000 PO 00000 Frm 00031 Fmt 1000 Sfmt 1000 H:\SHARED\DAPP\FPU\AGSTAT\MASTER~2\CHAPTR07\VII-35.AG8 USDA
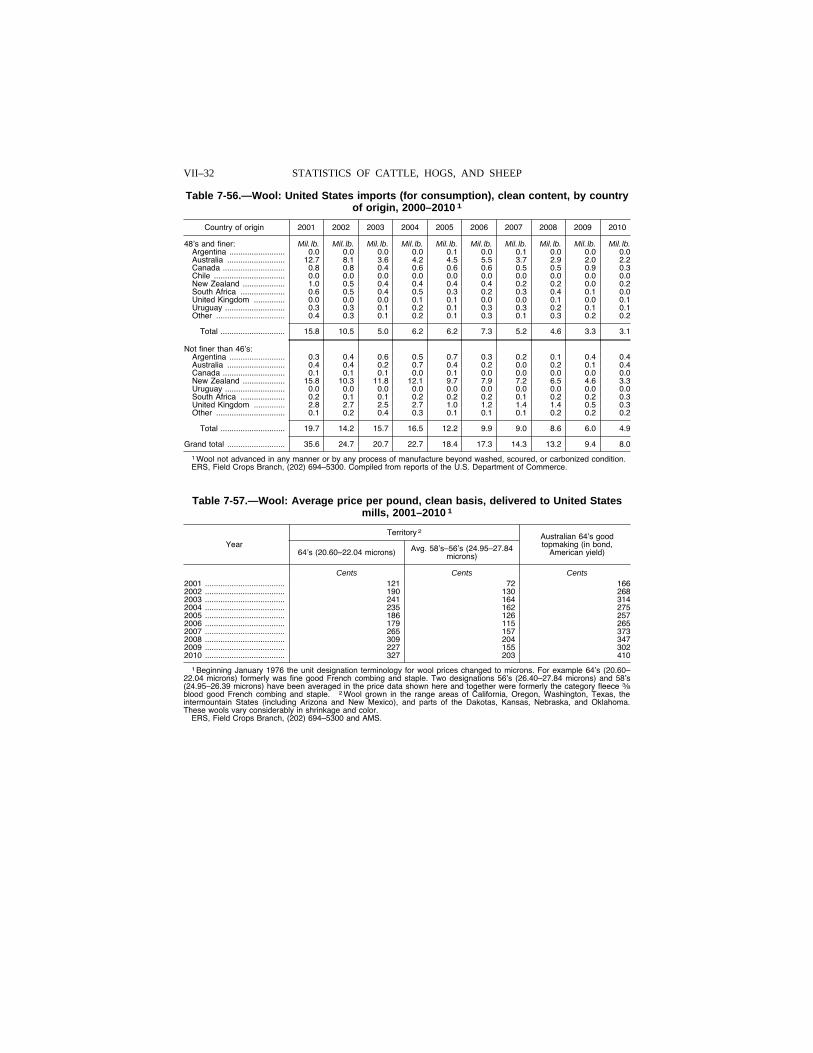
VII–32 STATISTICS OF CATTLE, HOGS, AND SHEEP
Table 7-56.—Wool: United States imports (for consumption), clean content, by country of origin, 2000–2010 1
Country of origin 2001 2002 2003 2004 2005 2006 2007 2008 2009 2010
48’s and finer: Mil. lb. Mil. lb. Mil. lb. Mil. lb. Mil. lb. Mil. lb. Mil. lb. Mil. lb. Mil. lb. Mil. lb. Argentina ......................... 0.0 0.0 0.0 0.0 0.1 0.0 0.1 0.0 0.0 0.0 Australia .......................... 12.7 8.1 3.6 4.2 4.5 5.5 3.7 2.9 2.0 2.2 Canada ............................ 0.8 0.8 0.4 0.6 0.6 0.6 0.5 0.5 0.9 0.3 Chile ................................ 0.0 0.0 0.0 0.0 0.0 0.0 0.0 0.0 0.0 0.0 New Zealand ................... 1.0 0.5 0.4 0.4 0.4 0.4 0.2 0.2 0.0 0.2 South Africa .................... 0.6 0.5 0.4 0.5 0.3 0.2 0.3 0.4 0.1 0.0 United Kingdom .............. 0.0 0.0 0.0 0.1 0.1 0.0 0.0 0.1 0.0 0.1 Uruguay ........................... 0.3 0.3 0.1 0.2 0.1 0.3 0.3 0.2 0.1 0.1 Other ............................... 0.4 0.3 0.1 0.2 0.1 0.3 0.1 0.3 0.2 0.2
Total ............................. 15.8 10.5 5.0 6.2 6.2 7.3 5.2 4.6 3.3 3.1
Not finer than 46’s: Argentina ......................... 0.3 0.4 0.6 0.5 0.7 0.3 0.2 0.1 0.4 0.4 Australia .......................... 0.4 0.4 0.2 0.7 0.4 0.2 0.0 0.2 0.1 0.4 Canada ............................ 0.1 0.1 0.1 0.0 0.1 0.0 0.0 0.0 0.0 0.0 New Zealand ................... 15.8 10.3 11.8 12.1 9.7 7.9 7.2 6.5 4.6 3.3 Uruguay ........................... 0.0 0.0 0.0 0.0 0.0 0.0 0.0 0.0 0.0 0.0 South Africa .................... 0.2 0.1 0.1 0.2 0.2 0.2 0.1 0.2 0.2 0.3 United Kingdom .............. 2.8 2.7 2.5 2.7 1.0 1.2 1.4 1.4 0.5 0.3 Other ............................... 0.1 0.2 0.4 0.3 0.1 0.1 0.1 0.2 0.2 0.2
Total ............................. 19.7 14.2 15.7 16.5 12.2 9.9 9.0 8.6 6.0 4.9
Grand total .......................... 35.6 24.7 20.7 22.7 18.4 17.3 14.3 13.2 9.4 8.0
1 Wool not advanced in any manner or by any process of manufacture beyond washed, scoured, or carbonized condition. ERS, Field Crops Branch, (202) 694–5300. Compiled from reports of the U.S. Department of Commerce.
Table 7-57.—Wool: Average price per pound, clean basis, delivered to United States mills, 2001–2010 1
Year
Territory 2 Australian 64’s good topmaking (in bond,
American yield) 64’s (20.60–22.04 microns) Avg. 58’s–56’s (24.95–27.84 microns)
Cents Cents Cents 2001 .................................... 121 72 166 2002 .................................... 190 130 268 2003 .................................... 241 164 314 2004 .................................... 235 162 275 2005 .................................... 186 126 257 2006 .................................... 179 115 265 2007 .................................... 265 157 373 2008 .................................... 309 204 347 2009 .................................... 227 155 302 2010 .................................... 327 203 410
1 Beginning January 1976 the unit designation terminology for wool prices changed to microns. For example 64’s (20.60– 22.04 microns) formerly was fine good French combing and staple. Two designations 56’s (26.40–27.84 microns) and 58’s (24.95–26.39 microns) have been averaged in the price data shown here and together were formerly the category fleece 3⁄8 blood good French combing and staple. 2 Wool grown in the range areas of California, Oregon, Washington, Texas, the intermountain States (including Arizona and New Mexico), and parts of the Dakotas, Kansas, Nebraska, and Oklahoma. These wools vary considerably in shrinkage and color.
ERS, Field Crops Branch, (202) 694–5300 and AMS.
VerDate Aug 31 2005 13:43 Mar 01, 2012 Jkt 000000 PO 00000 Frm 00032 Fmt 1000 Sfmt 1000 H:\SHARED\DAPP\FPU\AGSTAT\MASTER~2\CHAPTR07\VII-36.AG8 USDA
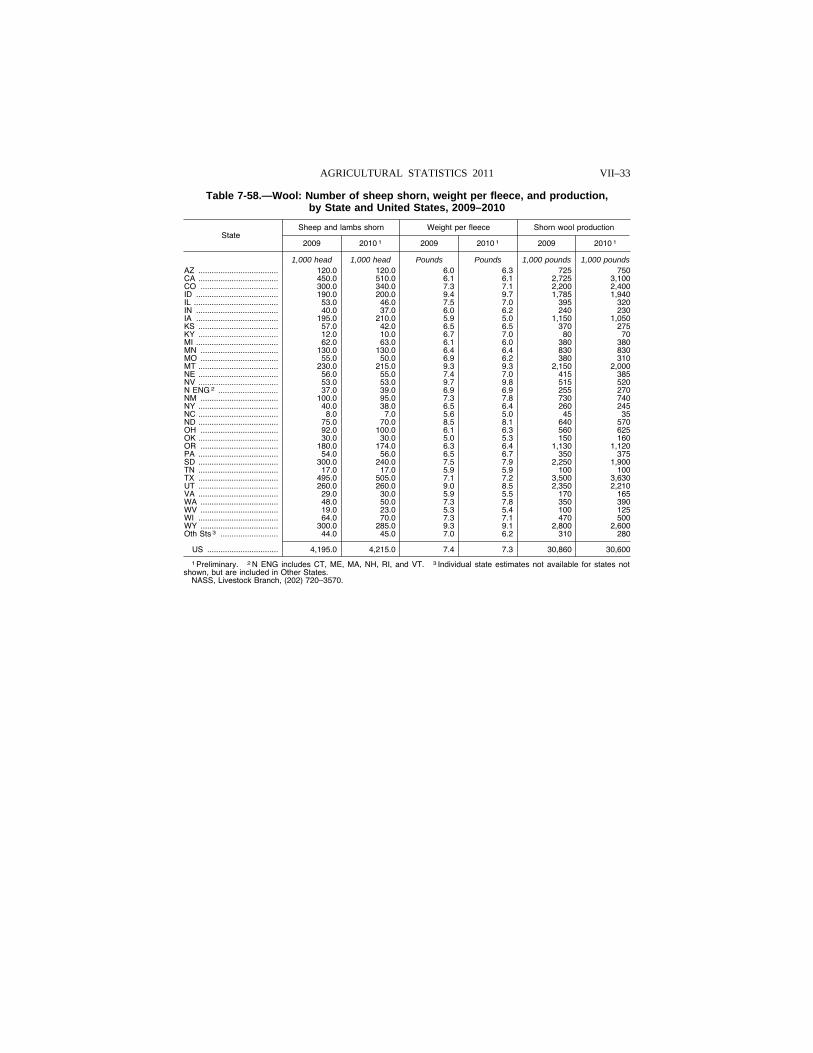
VII–33 AGRICULTURAL STATISTICS 2011
Table 7-58.—Wool: Number of sheep shorn, weight per fleece, and production, by State and United States, 2009–2010
State Sheep and lambs shorn Weight per fleece Shorn wool production
2009 2010 1 2009 2010 1 2009 2010 1
1,000 head 1,000 head Pounds Pounds 1,000 pounds 1,000 pounds AZ .................................... 120.0 120.0 6.0 6.3 725 750 CA .................................... 450.0 510.0 6.1 6.1 2,725 3,100 CO ................................... 300.0 340.0 7.3 7.1 2,200 2,400 ID ..................................... 190.0 200.0 9.4 9.7 1,785 1,940 IL ...................................... 53.0 46.0 7.5 7.0 395 320 IN ..................................... 40.0 37.0 6.0 6.2 240 230 IA ..................................... 195.0 210.0 5.9 5.0 1,150 1,050 KS .................................... 57.0 42.0 6.5 6.5 370 275 KY .................................... 12.0 10.0 6.7 7.0 80 70 MI ..................................... 62.0 63.0 6.1 6.0 380 380 MN ................................... 130.0 130.0 6.4 6.4 830 830 MO ................................... 55.0 50.0 6.9 6.2 380 310 MT .................................... 230.0 215.0 9.3 9.3 2,150 2,000 NE .................................... 56.0 55.0 7.4 7.0 415 385 NV .................................... 53.0 53.0 9.7 9.8 515 520 N ENG 2 ........................... 37.0 39.0 6.9 6.9 255 270 NM ................................... 100.0 95.0 7.3 7.8 730 740 NY .................................... 40.0 38.0 6.5 6.4 260 245 NC .................................... 8.0 7.0 5.6 5.0 45 35 ND .................................... 75.0 70.0 8.5 8.1 640 570 OH ................................... 92.0 100.0 6.1 6.3 560 625 OK .................................... 30.0 30.0 5.0 5.3 150 160 OR ................................... 180.0 174.0 6.3 6.4 1,130 1,120 PA .................................... 54.0 56.0 6.5 6.7 350 375 SD .................................... 300.0 240.0 7.5 7.9 2,250 1,900 TN .................................... 17.0 17.0 5.9 5.9 100 100 TX .................................... 495.0 505.0 7.1 7.2 3,500 3,630 UT .................................... 260.0 260.0 9.0 8.5 2,350 2,210 VA .................................... 29.0 30.0 5.9 5.5 170 165 WA ................................... 48.0 50.0 7.3 7.8 350 390 WV ................................... 19.0 23.0 5.3 5.4 100 125 WI .................................... 64.0 70.0 7.3 7.1 470 500 WY ................................... 300.0 285.0 9.3 9.1 2,800 2,600 Oth Sts 3 .......................... 44.0 45.0 7.0 6.2 310 280
US ................................ 4,195.0 4,215.0 7.4 7.3 30,860 30,600
1 Preliminary. 2 N ENG includes CT, ME, MA, NH, RI, and VT. 3 Individual state estimates not available for states not shown, but are included in Other States.
NASS, Livestock Branch, (202) 720–3570.
VerDate Aug 31 2005 13:43 Mar 01, 2012 Jkt 000000 PO 00000 Frm 00033 Fmt 1000 Sfmt 1000 H:\SHARED\DAPP\FPU\AGSTAT\MASTER~2\CHAPTR07\VII-37.AG8 USDA
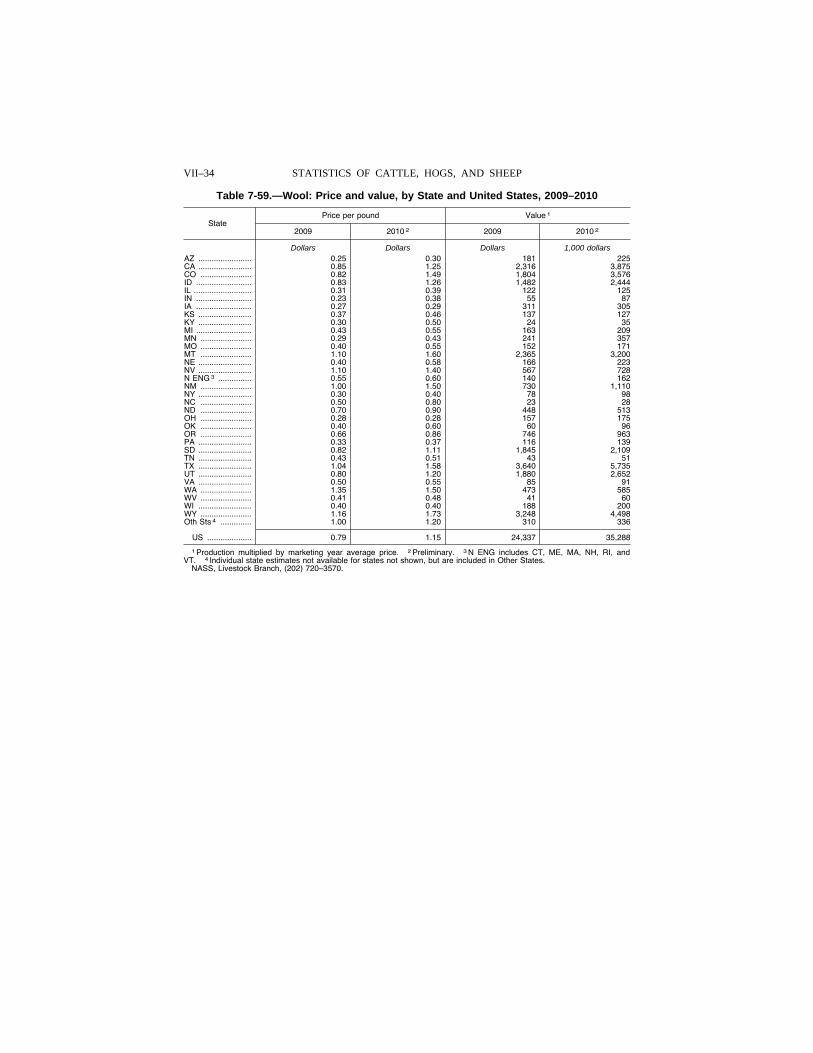
VII–34 STATISTICS OF CATTLE, HOGS, AND SHEEP
Table 7-59.—Wool: Price and value, by State and United States, 2009–2010
State Price per pound Value 1
2009 2010 2 2009 2010 2
Dollars Dollars Dollars 1,000 dollars AZ ........................ 0.25 0.30 181 225 CA ........................ 0.85 1.25 2,316 3,875 CO ....................... 0.82 1.49 1,804 3,576 ID ......................... 0.83 1.26 1,482 2,444 IL .......................... 0.31 0.39 122 125 IN ......................... 0.23 0.38 55 87 IA ......................... 0.27 0.29 311 305 KS ........................ 0.37 0.46 137 127 KY ........................ 0.30 0.50 24 35 MI ......................... 0.43 0.55 163 209 MN ....................... 0.29 0.43 241 357 MO ....................... 0.40 0.55 152 171 MT ....................... 1.10 1.60 2,365 3,200 NE ........................ 0.40 0.58 166 223 NV ........................ 1.10 1.40 567 728 N ENG 3 ............... 0.55 0.60 140 162 NM ....................... 1.00 1.50 730 1,110 NY ........................ 0.30 0.40 78 98 NC ....................... 0.50 0.80 23 28 ND ....................... 0.70 0.90 448 513 OH ....................... 0.28 0.28 157 175 OK ....................... 0.40 0.60 60 96 OR ....................... 0.66 0.86 746 963 PA ........................ 0.33 0.37 116 139 SD ........................ 0.82 1.11 1,845 2,109 TN ........................ 0.43 0.51 43 51 TX ........................ 1.04 1.58 3,640 5,735 UT ........................ 0.80 1.20 1,880 2,652 VA ........................ 0.50 0.55 85 91 WA ....................... 1.35 1.50 473 585 WV ....................... 0.41 0.48 41 60 WI ........................ 0.40 0.40 188 200 WY ....................... 1.16 1.73 3,248 4,498 Oth Sts 4 .............. 1.00 1.20 310 336
US .................... 0.79 1.15 24,337 35,288
1 Production multiplied by marketing year average price. 2 Preliminary. 3 N ENG includes CT, ME, MA, NH, RI, and VT. 4 Individual state estimates not available for states not shown, but are included in Other States.
NASS, Livestock Branch, (202) 720–3570.
VerDate Aug 31 2005 13:43 Mar 01, 2012 Jkt 000000 PO 00000 Frm 00034 Fmt 1000 Sfmt 1000 H:\SHARED\DAPP\FPU\AGSTAT\MASTER~2\CHAPTR07\VII-38.AG8 USDA
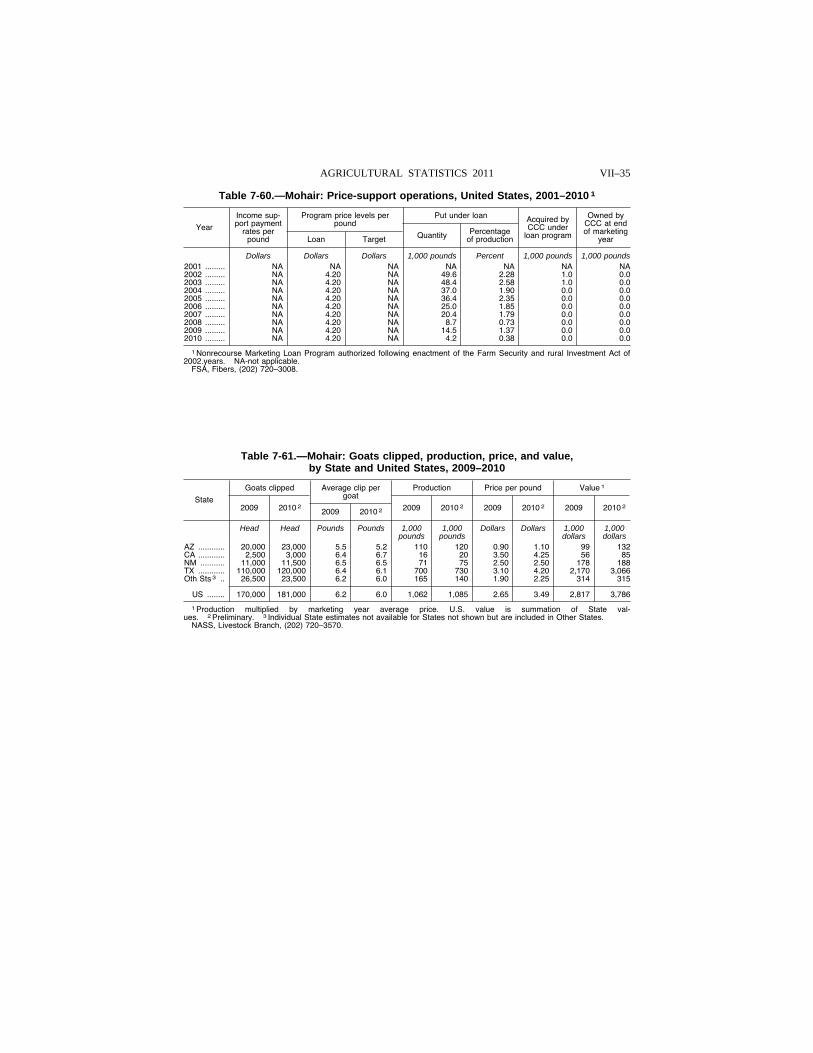
VII–35 AGRICULTURAL STATISTICS 2011
Table 7-60.—Mohair: Price-support operations, United States, 2001–2010 1
Year
Income sup-port payment
rates per pound
Program price levels per pound
Put under loan Acquired by CCC under
loan program
Owned by CCC at end of marketing
year Loan Target Quantity Percentage of production
Dollars Dollars Dollars 1,000 pounds Percent 1,000 pounds 1,000 pounds 2001 ......... NA NA NA NA NA NA NA 2002 ......... NA 4.20 NA 49.6 2.28 1.0 0.0 2003 ......... NA 4.20 NA 48.4 2.58 1.0 0.0 2004 ......... NA 4.20 NA 37.0 1.90 0.0 0.0 2005 ......... NA 4.20 NA 36.4 2.35 0.0 0.0 2006 ......... NA 4.20 NA 25.0 1.85 0.0 0.0 2007 ......... NA 4.20 NA 20.4 1.79 0.0 0.0 2008 ......... NA 4.20 NA 8.7 0.73 0.0 0.0 2009 ......... NA 4.20 NA 14.5 1.37 0.0 0.0 2010 ......... NA 4.20 NA 4.2 0.38 0.0 0.0
1 Nonrecourse Marketing Loan Program authorized following enactment of the Farm Security and rural Investment Act of 2002.years. NA-not applicable.
FSA, Fibers, (202) 720–3008.
Table 7-61.—Mohair: Goats clipped, production, price, and value, by State and United States, 2009–2010
State
Goats clipped Average clip per goat
Production Price per pound Value 1
2009 2010 2 2009 2010 2 2009 2010 2 2009 2010 2 2009 2010 2
Head Head Pounds Pounds 1,000 pounds
1,000 pounds
Dollars Dollars 1,000 dollars
1,000 dollars
AZ ............ 20,000 23,000 5.5 5.2 110 120 0.90 1.10 99 132 CA ............ 2,500 3,000 6.4 6.7 16 20 3.50 4.25 56 85 NM ........... 11,000 11,500 6.5 6.5 71 75 2.50 2.50 178 188 TX ............ 110,000 120,000 6.4 6.1 700 730 3.10 4.20 2,170 3,066 Oth Sts 3 .. 26,500 23,500 6.2 6.0 165 140 1.90 2.25 314 315
US ........ 170,000 181,000 6.2 6.0 1,062 1,085 2.65 3.49 2,817 3,786
1 Production multiplied by marketing year average price. U.S. value is summation of State val-ues. 2 Preliminary. 3 Individual State estimates not available for States not shown but are included in Other States.
NASS, Livestock Branch, (202) 720–3570.
VerDate Aug 31 2005 13:43 Mar 01, 2012 Jkt 000000 PO 00000 Frm 00035 Fmt 1000 Sfmt 1000 H:\SHARED\DAPP\FPU\AGSTAT\MASTER~2\CHAPTR07\VII-39.AG8 USDA
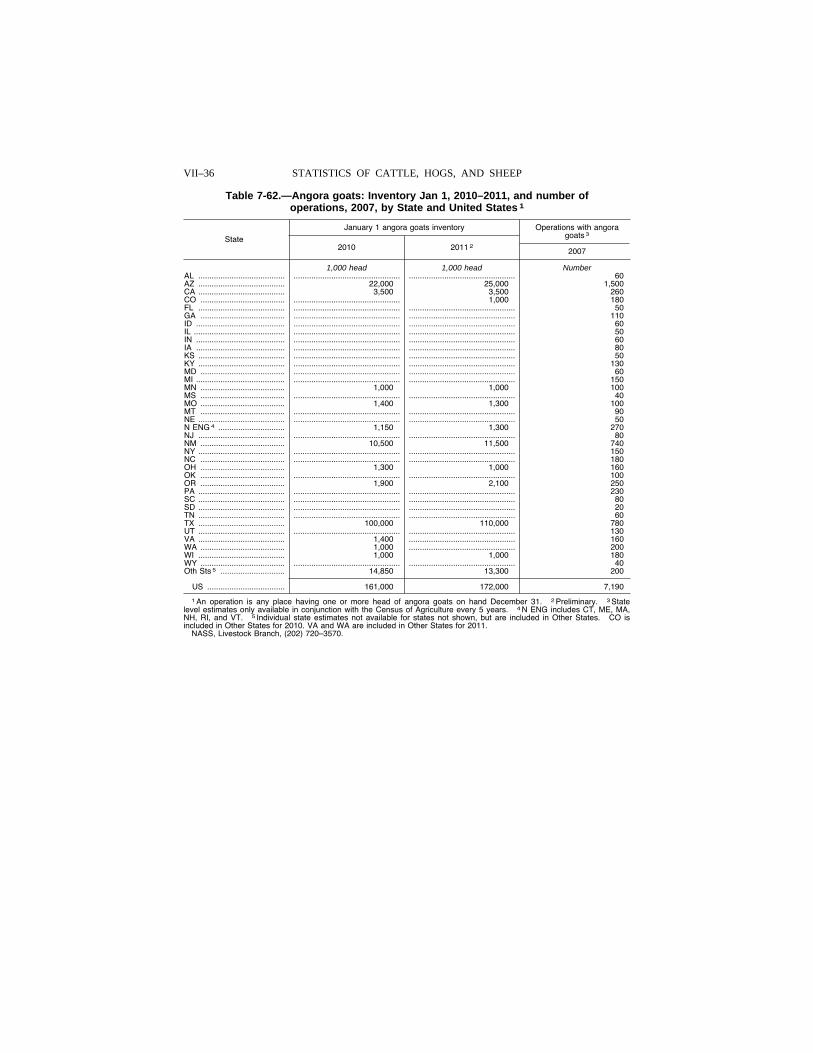
VII–36 STATISTICS OF CATTLE, HOGS, AND SHEEP
Table 7-62.—Angora goats: Inventory Jan 1, 2010–2011, and number of operations, 2007, by State and United States 1
State
January 1 angora goats inventory Operations with angora goats 3
2010 2011 2 2007
1,000 head 1,000 head Number AL ....................................... ................................................ ................................................ 60 AZ ....................................... 22,000 25,000 1,500 CA ....................................... 3,500 3,500 260 CO ...................................... ................................................ 1,000 180 FL ....................................... ................................................ ................................................ 50 GA ...................................... ................................................ ................................................ 110 ID ........................................ ................................................ ................................................ 60 IL ......................................... ................................................ ................................................ 50 IN ........................................ ................................................ ................................................ 60 IA ........................................ ................................................ ................................................ 80 KS ....................................... ................................................ ................................................ 50 KY ....................................... ................................................ ................................................ 130 MD ...................................... ................................................ ................................................ 60 MI ........................................ ................................................ ................................................ 150 MN ...................................... 1,000 1,000 100 MS ...................................... ................................................ ................................................ 40 MO ...................................... 1,400 1,300 100 MT ...................................... ................................................ ................................................ 90 NE ....................................... ................................................ ................................................ 50 N ENG 4 .............................. 1,150 1,300 270 NJ ....................................... ................................................ ................................................ 80 NM ...................................... 10,500 11,500 740 NY ....................................... ................................................ ................................................ 150 NC ...................................... ................................................ ................................................ 180 OH ...................................... 1,300 1,000 160 OK ...................................... ................................................ ................................................ 100 OR ...................................... 1,900 2,100 250 PA ....................................... ................................................ ................................................ 230 SC ....................................... ................................................ ................................................ 80 SD ....................................... ................................................ ................................................ 20 TN ....................................... ................................................ ................................................ 60 TX ....................................... 100,000 110,000 780 UT ....................................... ................................................ ................................................ 130 VA ....................................... 1,400 ................................................ 160 WA ...................................... 1,000 ................................................ 200 WI ....................................... 1,000 1,000 180 WY ...................................... ................................................ ................................................ 40 Oth Sts 5 ............................. 14,850 13,300 200
US ................................... 161,000 172,000 7,190
1 An operation is any place having one or more head of angora goats on hand December 31. 2 Preliminary. 3 State level estimates only available in conjunction with the Census of Agriculture every 5 years. 4 N ENG includes CT, ME, MA, NH, RI, and VT. 5 Individual state estimates not available for states not shown, but are included in Other States. CO is included in Other States for 2010. VA and WA are included in Other States for 2011.
NASS, Livestock Branch, (202) 720–3570.
VerDate Aug 31 2005 13:43 Mar 01, 2012 Jkt 000000 PO 00000 Frm 00036 Fmt 1000 Sfmt 1000 H:\SHARED\DAPP\FPU\AGSTAT\MASTER~2\CHAPTR07\VII-40.AG8 USDA
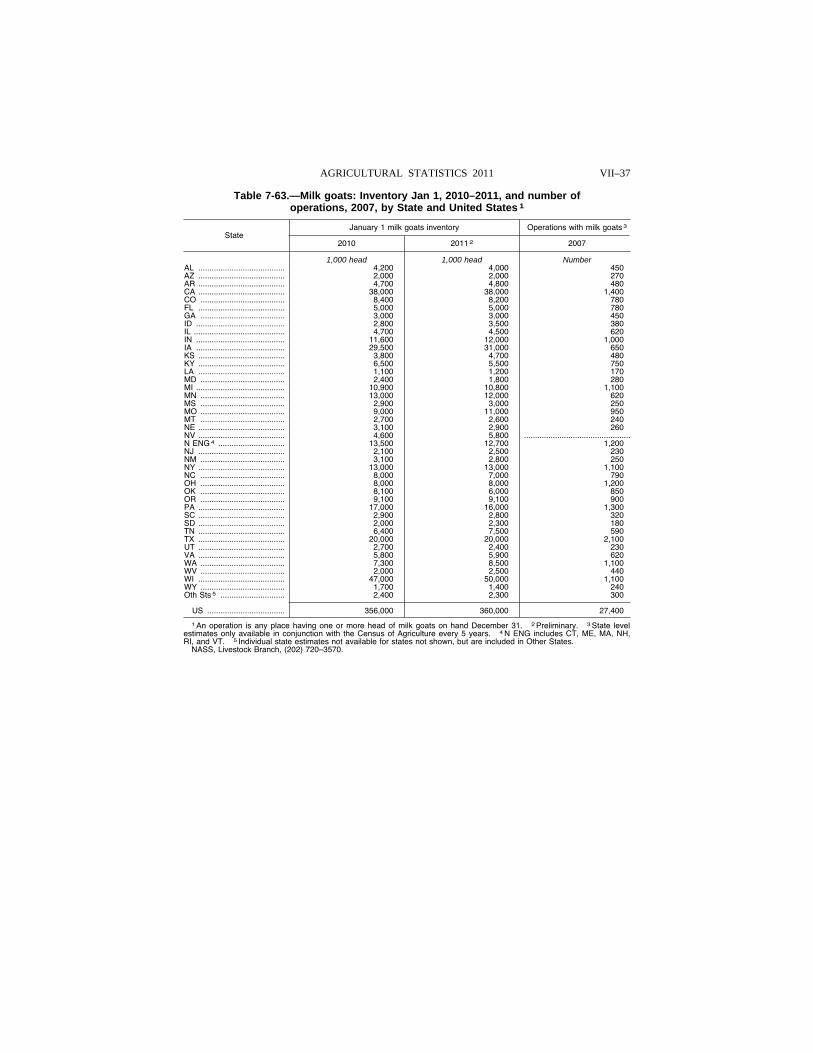
VII–37 AGRICULTURAL STATISTICS 2011
Table 7-63.—Milk goats: Inventory Jan 1, 2010–2011, and number of operations, 2007, by State and United States 1
State January 1 milk goats inventory Operations with milk goats 3
2010 2011 2 2007
1,000 head 1,000 head Number AL ....................................... 4,200 4,000 450 AZ ....................................... 2,000 2,000 270 AR ....................................... 4,700 4,800 480 CA ....................................... 38,000 38,000 1,400 CO ...................................... 8,400 8,200 780 FL ....................................... 5,000 5,000 780 GA ...................................... 3,000 3,000 450 ID ........................................ 2,800 3,500 380 IL ......................................... 4,700 4,500 620 IN ........................................ 11,600 12,000 1,000 IA ........................................ 29,500 31,000 650 KS ....................................... 3,800 4,700 480 KY ....................................... 6,500 5,500 750 LA ....................................... 1,100 1,200 170 MD ...................................... 2,400 1,800 280 MI ........................................ 10,900 10,800 1,100 MN ...................................... 13,000 12,000 620 MS ...................................... 2,900 3,000 250 MO ...................................... 9,000 11,000 950 MT ...................................... 2,700 2,600 240 NE ....................................... 3,100 2,900 260 NV ....................................... 4,600 5,800 ................................................N ENG 4 .............................. 13,500 12,700 1,200 NJ ....................................... 2,100 2,500 230 NM ...................................... 3,100 2,800 250 NY ....................................... 13,000 13,000 1,100 NC ...................................... 8,000 7,000 790 OH ...................................... 8,000 8,000 1,200 OK ...................................... 8,100 6,000 850 OR ...................................... 9,100 9,100 900 PA ....................................... 17,000 16,000 1,300 SC ....................................... 2,900 2,800 320 SD ....................................... 2,000 2,300 180 TN ....................................... 6,400 7,500 590 TX ....................................... 20,000 20,000 2,100 UT ....................................... 2,700 2,400 230 VA ....................................... 5,800 5,900 620 WA ...................................... 7,300 8,500 1,100 WV ...................................... 2,000 2,500 440 WI ....................................... 47,000 50,000 1,100 WY ...................................... 1,700 1,400 240 Oth Sts 5 ............................. 2,400 2,300 300
US ................................... 356,000 360,000 27,400
1 An operation is any place having one or more head of milk goats on hand December 31. 2 Preliminary. 3 State level estimates only available in conjunction with the Census of Agriculture every 5 years. 4 N ENG includes CT, ME, MA, NH, RI, and VT. 5 Individual state estimates not available for states not shown, but are included in Other States.
NASS, Livestock Branch, (202) 720–3570.
VerDate Aug 31 2005 13:43 Mar 01, 2012 Jkt 000000 PO 00000 Frm 00037 Fmt 1000 Sfmt 1000 H:\SHARED\DAPP\FPU\AGSTAT\MASTER~2\CHAPTR07\VII-41.AG8 USDA
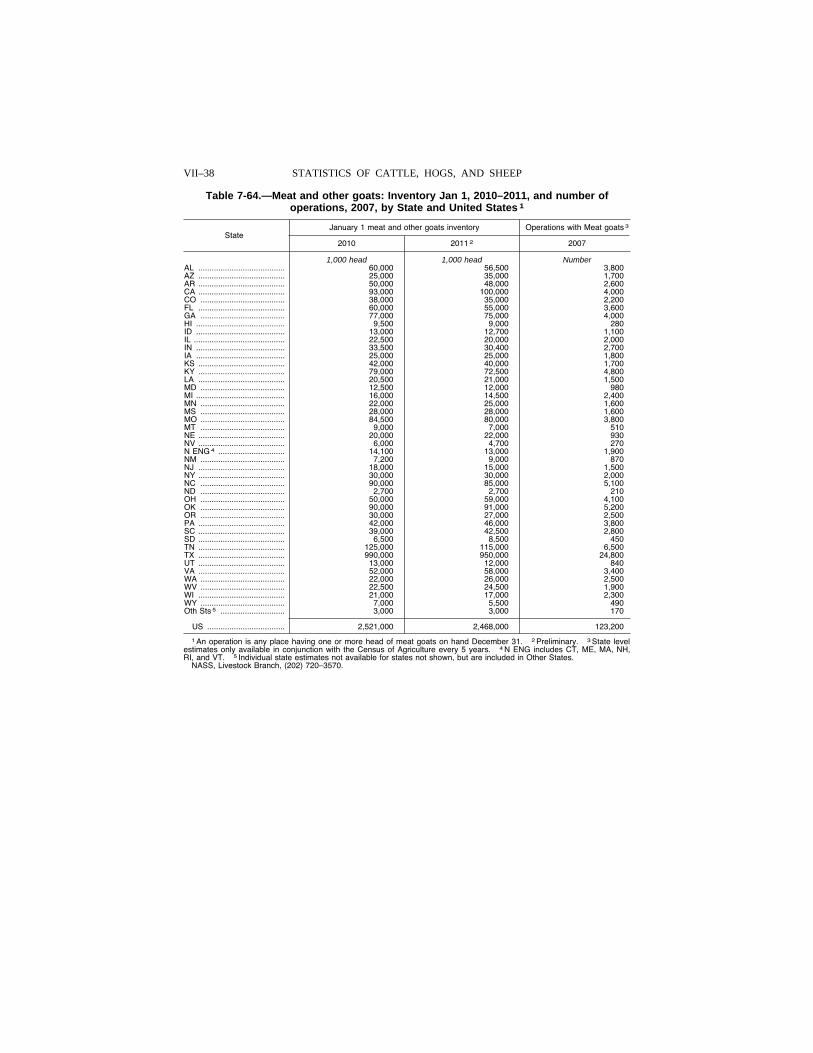
VII–38 STATISTICS OF CATTLE, HOGS, AND SHEEP
Table 7-64.—Meat and other goats: Inventory Jan 1, 2010–2011, and number of operations, 2007, by State and United States 1
State January 1 meat and other goats inventory Operations with Meat goats 3
2010 2011 2 2007
1,000 head 1,000 head Number AL ....................................... 60,000 56,500 3,800 AZ ....................................... 25,000 35,000 1,700 AR ....................................... 50,000 48,000 2,600 CA ....................................... 93,000 100,000 4,000 CO ...................................... 38,000 35,000 2,200 FL ....................................... 60,000 55,000 3,600 GA ...................................... 77,000 75,000 4,000 HI ........................................ 9,500 9,000 280 ID ........................................ 13,000 12,700 1,100 IL ......................................... 22,500 20,000 2,000 IN ........................................ 33,500 30,400 2,700 IA ........................................ 25,000 25,000 1,800 KS ....................................... 42,000 40,000 1,700 KY ....................................... 79,000 72,500 4,800 LA ....................................... 20,500 21,000 1,500 MD ...................................... 12,500 12,000 980 MI ........................................ 16,000 14,500 2,400 MN ...................................... 22,000 25,000 1,600 MS ...................................... 28,000 28,000 1,600 MO ...................................... 84,500 80,000 3,800 MT ...................................... 9,000 7,000 510 NE ....................................... 20,000 22,000 930 NV ....................................... 6,000 4,700 270 N ENG 4 .............................. 14,100 13,000 1,900 NM ...................................... 7,200 9,000 870 NJ ....................................... 18,000 15,000 1,500 NY ....................................... 30,000 30,000 2,000 NC ...................................... 90,000 85,000 5,100 ND ...................................... 2,700 2,700 210 OH ...................................... 50,000 59,000 4,100 OK ...................................... 90,000 91,000 5,200 OR ...................................... 30,000 27,000 2,500 PA ....................................... 42,000 46,000 3,800 SC ....................................... 39,000 42,500 2,800 SD ....................................... 6,500 8,500 450 TN ....................................... 125,000 115,000 6,500 TX ....................................... 990,000 950,000 24,800 UT ....................................... 13,000 12,000 840 VA ....................................... 52,000 58,000 3,400 WA ...................................... 22,000 26,000 2,500 WV ...................................... 22,500 24,500 1,900 WI ....................................... 21,000 17,000 2,300 WY ...................................... 7,000 5,500 490 Oth Sts 5 ............................. 3,000 3,000 170
US ................................... 2,521,000 2,468,000 123,200
1 An operation is any place having one or more head of meat goats on hand December 31. 2 Preliminary. 3 State level estimates only available in conjunction with the Census of Agriculture every 5 years. 4 N ENG includes CT, ME, MA, NH, RI, and VT. 5 Individual state estimates not available for states not shown, but are included in Other States.
NASS, Livestock Branch, (202) 720–3570.
VerDate Aug 31 2005 13:43 Mar 01, 2012 Jkt 000000 PO 00000 Frm 00038 Fmt 1000 Sfmt 1000 H:\SHARED\DAPP\FPU\AGSTAT\MASTER~2\CHAPTR07\VII-42.AG8 USDA
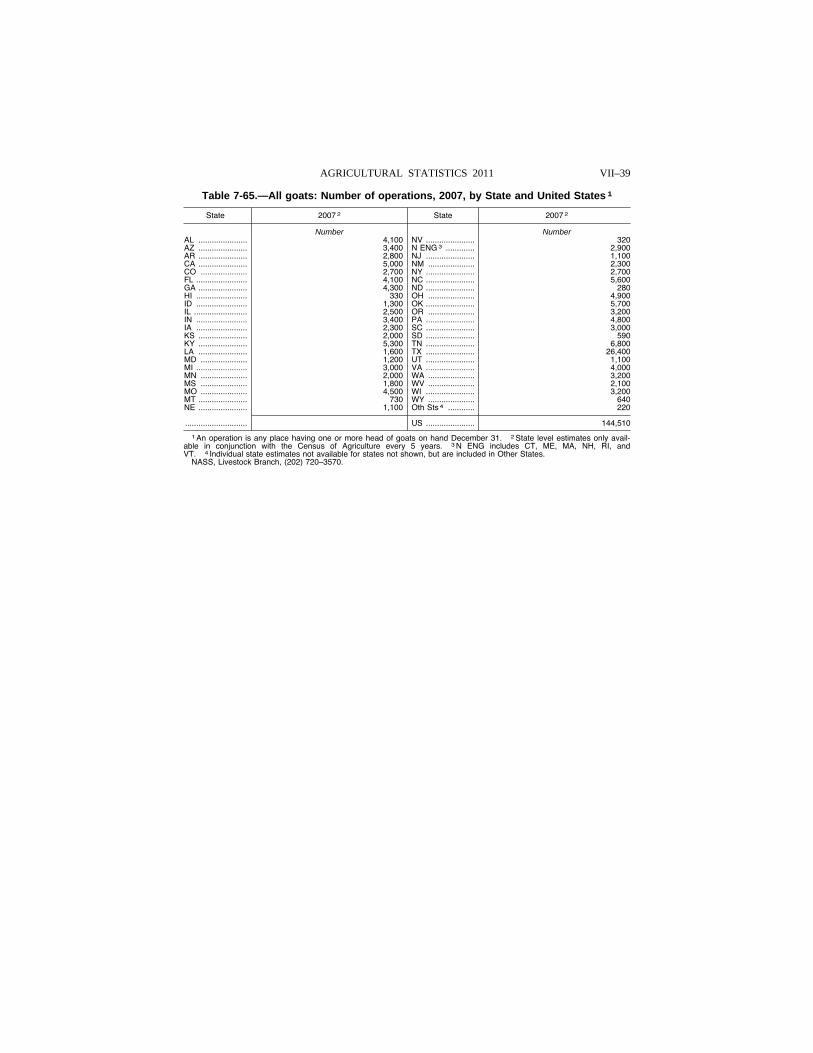
VII–39 AGRICULTURAL STATISTICS 2011
Table 7-65.—All goats: Number of operations, 2007, by State and United States 1
State 2007 2 State 2007 2
Number Number AL ...................... 4,100 NV ...................... 320 AZ ...................... 3,400 N ENG 3 ............. 2,900 AR ...................... 2,800 NJ ...................... 1,100 CA ...................... 5,000 NM ..................... 2,300 CO ..................... 2,700 NY ...................... 2,700 FL ....................... 4,100 NC ...................... 5,600 GA ...................... 4,300 ND ...................... 280 HI ....................... 330 OH ..................... 4,900 ID ....................... 1,300 OK ...................... 5,700 IL ........................ 2,500 OR ..................... 3,200 IN ....................... 3,400 PA ...................... 4,800 IA ....................... 2,300 SC ...................... 3,000 KS ...................... 2,000 SD ...................... 590 KY ...................... 5,300 TN ...................... 6,800 LA ...................... 1,600 TX ...................... 26,400 MD ..................... 1,200 UT ...................... 1,100 MI ....................... 3,000 VA ...................... 4,000 MN ..................... 2,000 WA ..................... 3,200 MS ..................... 1,800 WV ..................... 2,100 MO ..................... 4,500 WI ...................... 3,200 MT ...................... 730 WY ..................... 640 NE ...................... 1,100 Oth Sts 4 ............ 220
............................ US ...................... 144,510
1 An operation is any place having one or more head of goats on hand December 31. 2 State level estimates only avail-able in conjunction with the Census of Agriculture every 5 years. 3 N ENG includes CT, ME, MA, NH, RI, and VT. 4 Individual state estimates not available for states not shown, but are included in Other States.
NASS, Livestock Branch, (202) 720–3570.
VerDate Aug 31 2005 13:43 Mar 01, 2012 Jkt 000000 PO 00000 Frm 00039 Fmt 1000 Sfmt 1000 H:\SHARED\DAPP\FPU\AGSTAT\MASTER~2\CHAPTR07\VII-43.AG8 USDA
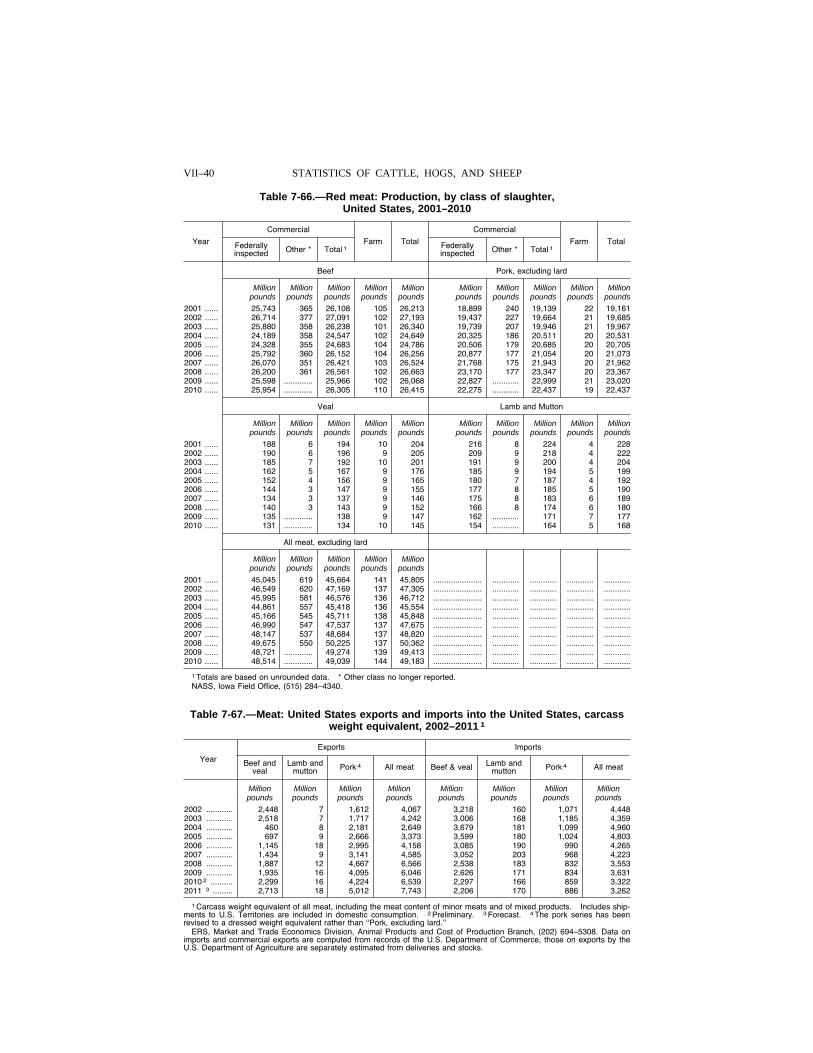
VII–40 STATISTICS OF CATTLE, HOGS, AND SHEEP
Table 7-66.—Red meat: Production, by class of slaughter, United States, 2001–2010
Year
Commercial
Farm Total
Commercial
Farm Total Federally inspected Other * Total 1 Federally
inspected Other * Total 1
Beef Pork, excluding lard
Million Million Million Million Million Million Million Million Million Million pounds pounds pounds pounds pounds pounds pounds pounds pounds pounds
2001 ...... 25,743 365 26,108 105 26,213 18,899 240 19,139 22 19,161 2002 ...... 26,714 377 27,091 102 27,193 19,437 227 19,664 21 19,685 2003 ...... 25,880 358 26,238 101 26,340 19,739 207 19,946 21 19,967 2004 ...... 24,189 358 24,547 102 24,649 20,325 186 20,511 20 20,531 2005 ...... 24,328 355 24,683 104 24,786 20,506 179 20,685 20 20,705 2006 ...... 25,792 360 26,152 104 26,256 20,877 177 21,054 20 21,073 2007 ...... 26,070 351 26,421 103 26,524 21,768 175 21,943 20 21,962 2008 ...... 26,200 361 26,561 102 26,663 23,170 177 23,347 20 23,367 2009 ...... 25,598 ............. 25,966 102 26,068 22,827 ............ 22,999 21 23,020 2010 ...... 25,954 ............. 26,305 110 26,415 22,275 ............ 22,437 19 22,437
Veal Lamb and Mutton
Million Million Million Million Million Million Million Million Million Million pounds pounds pounds pounds pounds pounds pounds pounds pounds pounds
2001 ...... 188 6 194 10 204 216 8 224 4 228 2002 ...... 190 6 196 9 205 209 9 218 4 222 2003 ...... 185 7 192 10 201 191 9 200 4 204 2004 ...... 162 5 167 9 176 185 9 194 5 199 2005 ...... 152 4 156 9 165 180 7 187 4 192 2006 ...... 144 3 147 9 155 177 8 185 5 190 2007 ...... 134 3 137 9 146 175 8 183 6 189 2008 ...... 140 3 143 9 152 166 8 174 6 180 2009 ...... 135 ............. 138 9 147 162 ............ 171 7 177 2010 ...... 131 ............. 134 10 145 154 ............ 164 5 168
All meat, excluding lard
Million Million Million Million Million pounds pounds pounds pounds pounds
2001 ...... 45,045 619 45,664 141 45,805 ...................... ............ ............ ............ ............2002 ...... 46,549 620 47,169 137 47,305 ...................... ............ ............ ............ ............2003 ...... 45,995 581 46,576 136 46,712 ...................... ............ ............ ............ ............2004 ...... 44,861 557 45,418 136 45,554 ...................... ............ ............ ............ ............2005 ...... 45,166 545 45,711 138 45,848 ...................... ............ ............ ............ ............2006 ...... 46,990 547 47,537 137 47,675 ...................... ............ ............ ............ ............2007 ...... 48,147 537 48,684 137 48,820 ...................... ............ ............ ............ ............2008 ...... 49,675 550 50,225 137 50,362 ...................... ............ ............ ............ ............2009 ...... 48,721 ............. 49,274 139 49,413 ...................... ............ ............ ............ ............2010 ...... 48,514 ............. 49,039 144 49,183 ...................... ............ ............ ............ ............
1 Totals are based on unrounded data. * Other class no longer reported. NASS, Iowa Field Office, (515) 284–4340.
Table 7-67.—Meat: United States exports and imports into the United States, carcass weight equivalent, 2002–2011 1
Year
Exports Imports
Beef and veal
Lamb and mutton Pork 4 All meat Beef & veal Lamb and
mutton Pork 4 All meat
Million Million Million Million Million Million Million Million pounds pounds pounds pounds pounds pounds pounds pounds
2002 ............ 2,448 7 1,612 4,067 3,218 160 1,071 4,448 2003 ............ 2,518 7 1,717 4,242 3,006 168 1,185 4,359 2004 ............ 460 8 2,181 2,649 3,679 181 1,099 4,960 2005 ............ 697 9 2,666 3,373 3,599 180 1,024 4,803 2006 ............ 1,145 18 2,995 4,158 3,085 190 990 4,265 2007 ............ 1,434 9 3,141 4,585 3,052 203 968 4,223 2008 ............ 1,887 12 4,667 6,566 2,538 183 832 3,553 2009 ............ 1,935 16 4,095 6,046 2,626 171 834 3,631 2010 2 .......... 2,299 16 4,224 6,539 2,297 166 859 3,322 2011 3 ......... 2,713 18 5,012 7,743 2,206 170 886 3,262
1 Carcass weight equivalent of all meat, including the meat content of minor meats and of mixed products. Includes ship-ments to U.S. Territories are included in domestic consumption. 2 Preliminary. 3 Forecast. 4 The pork series has been revised to a dressed weight equivalent rather than ‘‘Pork, excluding lard.’’
ERS, Market and Trade Economics Division, Animal Products and Cost of Production Branch, (202) 694–5308. Data on imports and commercial exports are computed from records of the U.S. Department of Commerce, those on exports by the U.S. Department of Agriculture are separately estimated from deliveries and stocks.
VerDate Aug 31 2005 13:43 Mar 01, 2012 Jkt 000000 PO 00000 Frm 00040 Fmt 1000 Sfmt 1000 H:\SHARED\DAPP\FPU\AGSTAT\MASTER~2\CHAPTR07\VII-44.AG8 USDA
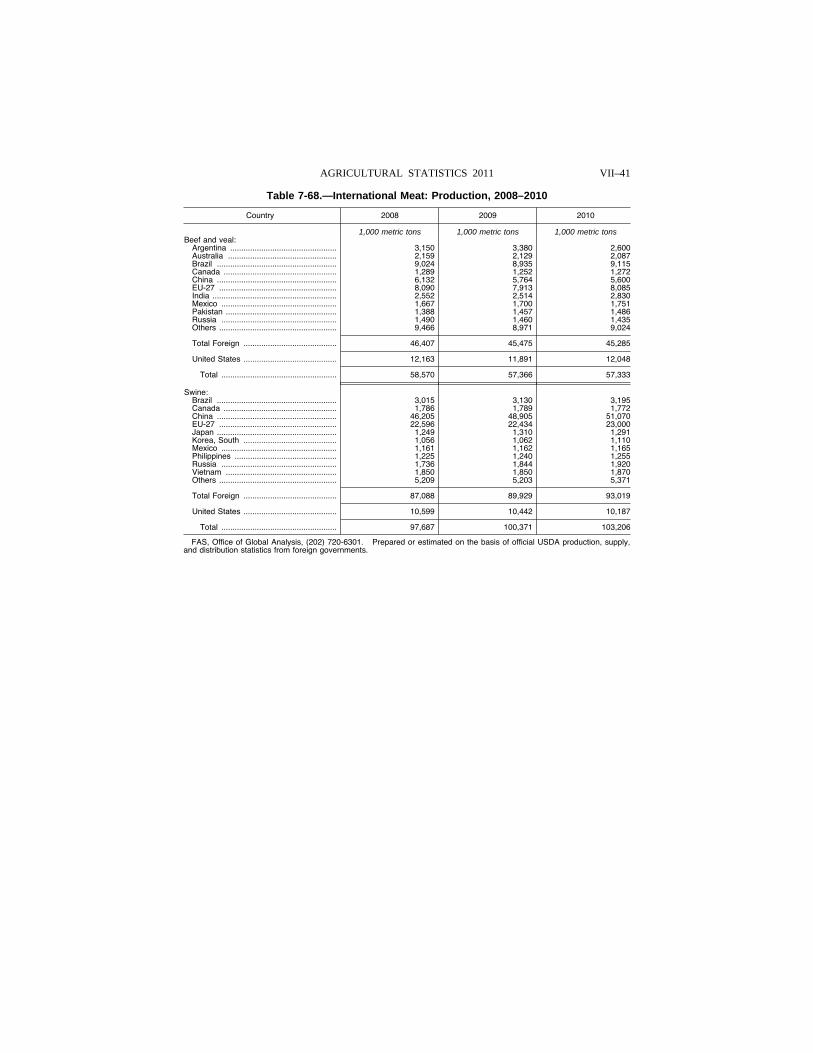
VII–41 AGRICULTURAL STATISTICS 2011
Table 7-68.—International Meat: Production, 2008–2010
Country 2008 2009 2010
1,000 metric tons 1,000 metric tons 1,000 metric tons Beef and veal:
Argentina ................................................ 3,150 3,380 2,600 Australia ................................................. 2,159 2,129 2,087 Brazil ...................................................... 9,024 8,935 9,115 Canada ................................................... 1,289 1,252 1,272 China ...................................................... 6,132 5,764 5,600 EU-27 ..................................................... 8,090 7,913 8,085 India ........................................................ 2,552 2,514 2,830 Mexico .................................................... 1,667 1,700 1,751 Pakistan .................................................. 1,388 1,457 1,486 Russia .................................................... 1,490 1,460 1,435 Others ..................................................... 9,466 8,971 9,024
Total Foreign .......................................... 46,407 45,475 45,285
United States .......................................... 12,163 11,891 12,048
Total .................................................... 58,570 57,366 57,333
Swine: Brazil ...................................................... 3,015 3,130 3,195 Canada ................................................... 1,786 1,789 1,772 China ...................................................... 46,205 48,905 51,070 EU-27 ..................................................... 22,596 22,434 23,000 Japan ...................................................... 1,249 1,310 1,291 Korea, South .......................................... 1,056 1,062 1,110 Mexico .................................................... 1,161 1,162 1,165 Philippines .............................................. 1,225 1,240 1,255 Russia .................................................... 1,736 1,844 1,920 Vietnam .................................................. 1,850 1,850 1,870 Others ..................................................... 5,209 5,203 5,371
Total Foreign .......................................... 87,088 89,929 93,019
United States .......................................... 10,599 10,442 10,187
Total .................................................... 97,687 100,371 103,206
FAS, Office of Global Analysis, (202) 720-6301. Prepared or estimated on the basis of official USDA production, supply, and distribution statistics from foreign governments.
VerDate Aug 31 2005 13:43 Mar 01, 2012 Jkt 000000 PO 00000 Frm 00041 Fmt 1000 Sfmt 1000 H:\SHARED\DAPP\FPU\AGSTAT\MASTER~2\CHAPTR07\VII-45.AG8 USDA
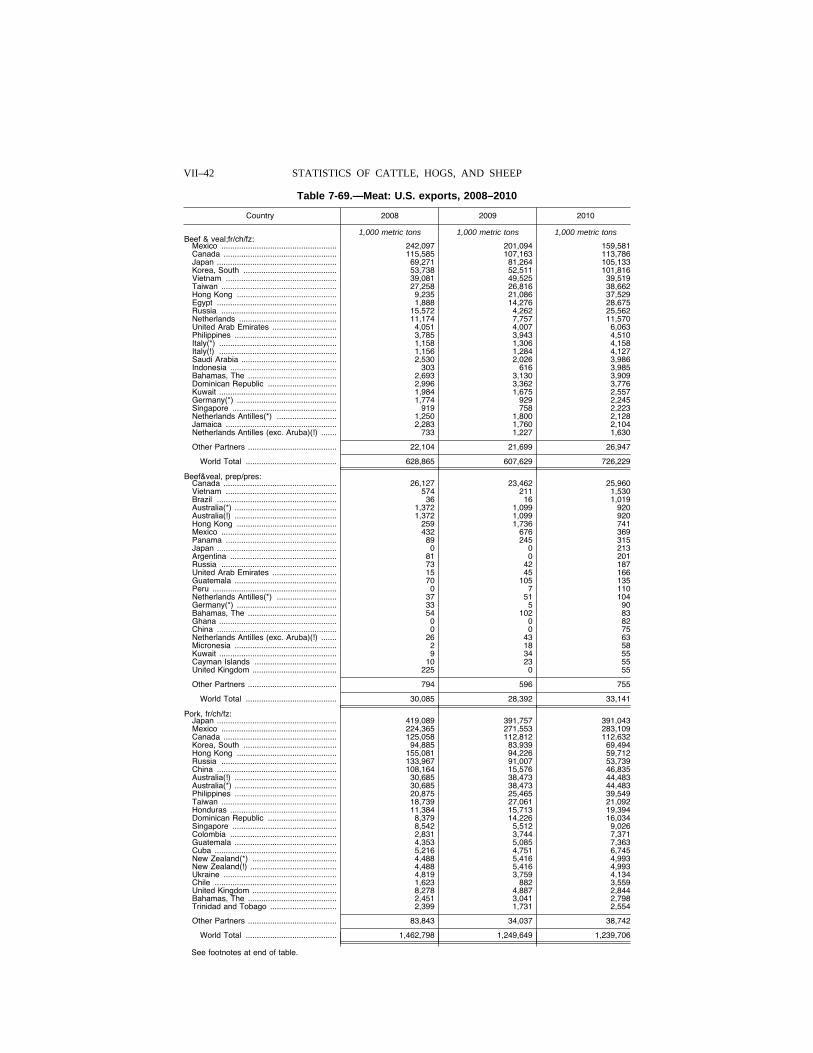
VII–42 STATISTICS OF CATTLE, HOGS, AND SHEEP
Table 7-69.—Meat: U.S. exports, 2008–2010
Country 2008 2009 2010
1,000 metric tons 1,000 metric tons 1,000 metric tons Beef & veal;fr/ch/fz:
Mexico .................................................... 242,097 201,094 159,581 Canada ................................................... 115,585 107,163 113,786 Japan ...................................................... 69,271 81,264 105,133 Korea, South .......................................... 53,738 52,511 101,816 Vietnam .................................................. 39,081 49,525 39,519 Taiwan .................................................... 27,258 26,816 38,662 Hong Kong ............................................. 9,235 21,086 37,529 Egypt ...................................................... 1,888 14,276 28,675 Russia .................................................... 15,572 4,262 25,562 Netherlands ............................................ 11,174 7,757 11,570 United Arab Emirates ............................. 4,051 4,007 6,063 Philippines .............................................. 3,785 3,943 4,510 Italy(*) ..................................................... 1,158 1,306 4,158 Italy(!) ..................................................... 1,156 1,284 4,127 Saudi Arabia ........................................... 2,530 2,026 3,986 Indonesia ................................................ 303 616 3,985 Bahamas, The ........................................ 2,693 3,130 3,909 Dominican Republic ............................... 2,996 3,362 3,776 Kuwait ..................................................... 1,984 1,675 2,557 Germany(*) ............................................. 1,774 929 2,245 Singapore ............................................... 919 758 2,223 Netherlands Antilles(*) ........................... 1,250 1,800 2,128 Jamaica .................................................. 2,283 1,760 2,104 Netherlands Antilles (exc. Aruba)(!) ....... 733 1,227 1,630
Other Partners ........................................ 22,104 21,699 26,947
World Total ......................................... 628,865 607,629 726,229
Beef&veal, prep/pres: Canada ................................................... 26,127 23,462 25,960 Vietnam .................................................. 574 211 1,530 Brazil ...................................................... 36 16 1,019 Australia(*) .............................................. 1,372 1,099 920 Australia(!) .............................................. 1,372 1,099 920 Hong Kong ............................................. 259 1,736 741 Mexico .................................................... 432 676 369 Panama .................................................. 89 245 315 Japan ...................................................... 0 0 213 Argentina ................................................ 81 0 201 Russia .................................................... 73 42 187 United Arab Emirates ............................. 15 45 166 Guatemala .............................................. 70 105 135 Peru ........................................................ 0 7 110 Netherlands Antilles(*) ........................... 37 51 104 Germany(*) ............................................. 33 5 90 Bahamas, The ........................................ 54 102 83 Ghana ..................................................... 0 0 82 China ...................................................... 0 0 75 Netherlands Antilles (exc. Aruba)(!) ....... 26 43 63 Micronesia .............................................. 2 18 58 Kuwait ..................................................... 9 34 55 Cayman Islands ..................................... 10 23 55 United Kingdom ...................................... 225 0 55
Other Partners ........................................ 794 596 755
World Total ......................................... 30,085 28,392 33,141
Pork, fr/ch/fz: Japan ...................................................... 419,089 391,757 391,043 Mexico .................................................... 224,365 271,553 283,109 Canada ................................................... 125,058 112,812 112,632 Korea, South .......................................... 94,885 83,939 69,494 Hong Kong ............................................. 155,081 94,226 59,712 Russia .................................................... 133,967 91,007 53,739 China ...................................................... 108,164 15,576 46,835 Australia(!) .............................................. 30,685 38,473 44,483 Australia(*) .............................................. 30,685 38,473 44,483 Philippines .............................................. 20,875 25,465 39,549 Taiwan .................................................... 18,739 27,061 21,092 Honduras ................................................ 11,384 15,713 19,394 Dominican Republic ............................... 8,379 14,226 16,034 Singapore ............................................... 8,542 5,512 9,026 Colombia ................................................ 2,831 3,744 7,371 Guatemala .............................................. 4,353 5,085 7,363 Cuba ....................................................... 5,216 4,751 6,745 New Zealand(*) ...................................... 4,488 5,416 4,993 New Zealand(!) ....................................... 4,488 5,416 4,993 Ukraine ................................................... 4,819 3,759 4,134 Chile ....................................................... 1,623 882 3,559 United Kingdom ...................................... 8,278 4,887 2,844 Bahamas, The ........................................ 2,451 3,041 2,798 Trinidad and Tobago .............................. 2,399 1,731 2,554
Other Partners ........................................ 83,843 34,037 38,742
World Total ......................................... 1,462,798 1,249,649 1,239,706
See footnotes at end of table.
VerDate Aug 31 2005 13:43 Mar 01, 2012 Jkt 000000 PO 00000 Frm 00042 Fmt 1000 Sfmt 1000 H:\SHARED\DAPP\FPU\AGSTAT\MASTER~2\CHAPTR07\VII-46.AG8 USDA
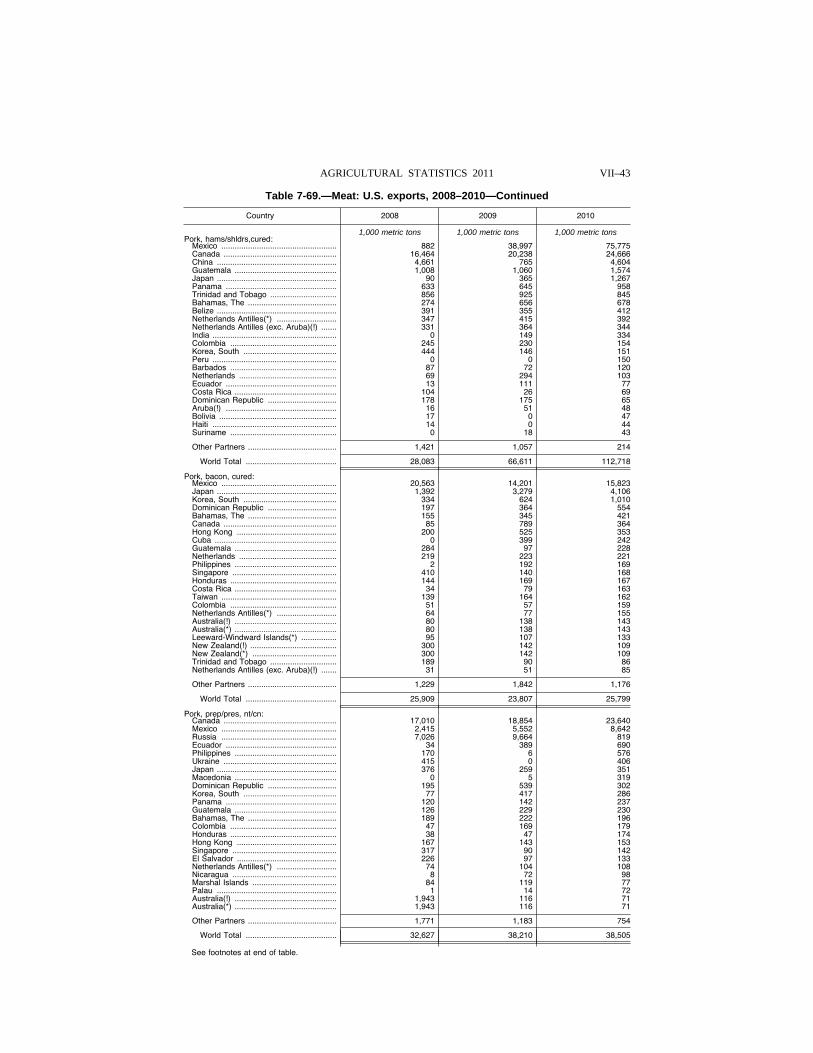
VII–43 AGRICULTURAL STATISTICS 2011
Table 7-69.—Meat: U.S. exports, 2008–2010—Continued
Country 2008 2009 2010
1,000 metric tons 1,000 metric tons 1,000 metric tons Pork, hams/shldrs,cured:
Mexico .................................................... 882 38,997 75,775 Canada ................................................... 16,464 20,238 24,666 China ...................................................... 4,661 765 4,604 Guatemala .............................................. 1,008 1,060 1,574 Japan ...................................................... 90 365 1,267 Panama .................................................. 633 645 958 Trinidad and Tobago .............................. 856 925 845 Bahamas, The ........................................ 274 656 678 Belize ...................................................... 391 355 412 Netherlands Antilles(*) ........................... 347 415 392 Netherlands Antilles (exc. Aruba)(!) ....... 331 364 344 India ........................................................ 0 149 334 Colombia ................................................ 245 230 154 Korea, South .......................................... 444 146 151 Peru ........................................................ 0 0 150 Barbados ................................................ 87 72 120 Netherlands ............................................ 69 294 103 Ecuador .................................................. 13 111 77 Costa Rica .............................................. 104 26 69 Dominican Republic ............................... 178 175 65 Aruba(!) .................................................. 16 51 48 Bolivia ..................................................... 17 0 47 Haiti ........................................................ 14 0 44 Suriname ................................................ 0 18 43
Other Partners ........................................ 1,421 1,057 214
World Total ......................................... 28,083 66,611 112,718
Pork, bacon, cured: Mexico .................................................... 20,563 14,201 15,823 Japan ...................................................... 1,392 3,279 4,106 Korea, South .......................................... 334 624 1,010 Dominican Republic ............................... 197 364 554 Bahamas, The ........................................ 155 345 421 Canada ................................................... 85 789 364 Hong Kong ............................................. 200 525 353 Cuba ....................................................... 0 399 242 Guatemala .............................................. 284 97 228 Netherlands ............................................ 219 223 221 Philippines .............................................. 2 192 169 Singapore ............................................... 410 140 168 Honduras ................................................ 144 169 167 Costa Rica .............................................. 34 79 163 Taiwan .................................................... 139 164 162 Colombia ................................................ 51 57 159 Netherlands Antilles(*) ........................... 64 77 155 Australia(!) .............................................. 80 138 143 Australia(*) .............................................. 80 138 143 Leeward-Windward Islands(*) ................ 95 107 133 New Zealand(!) ....................................... 300 142 109 New Zealand(*) ...................................... 300 142 109 Trinidad and Tobago .............................. 189 90 86 Netherlands Antilles (exc. Aruba)(!) ....... 31 51 85
Other Partners ........................................ 1,229 1,842 1,176
World Total ......................................... 25,909 23,807 25,799
Pork, prep/pres, nt/cn: Canada ................................................... 17,010 18,854 23,640 Mexico .................................................... 2,415 5,552 8,642 Russia .................................................... 7,026 9,664 819 Ecuador .................................................. 34 389 690 Philippines .............................................. 170 6 576 Ukraine ................................................... 415 0 406 Japan ...................................................... 376 259 351 Macedonia .............................................. 0 5 319 Dominican Republic ............................... 195 539 302 Korea, South .......................................... 77 417 286 Panama .................................................. 120 142 237 Guatemala .............................................. 126 229 230 Bahamas, The ........................................ 189 222 196 Colombia ................................................ 47 169 179 Honduras ................................................ 38 47 174 Hong Kong ............................................. 167 143 153 Singapore ............................................... 317 90 142 El Salvador ............................................. 226 97 133 Netherlands Antilles(*) ........................... 74 104 108 Nicaragua ............................................... 8 72 98 Marshal Islands ...................................... 84 119 77 Palau ...................................................... 1 14 72 Australia(!) .............................................. 1,943 116 71 Australia(*) .............................................. 1,943 116 71
Other Partners ........................................ 1,771 1,183 754
World Total ......................................... 32,627 38,210 38,505
See footnotes at end of table.
VerDate Aug 31 2005 13:43 Mar 01, 2012 Jkt 000000 PO 00000 Frm 00043 Fmt 1000 Sfmt 1000 H:\SHARED\DAPP\FPU\AGSTAT\MASTER~2\CHAPTR07\VII-47.AG8 USDA
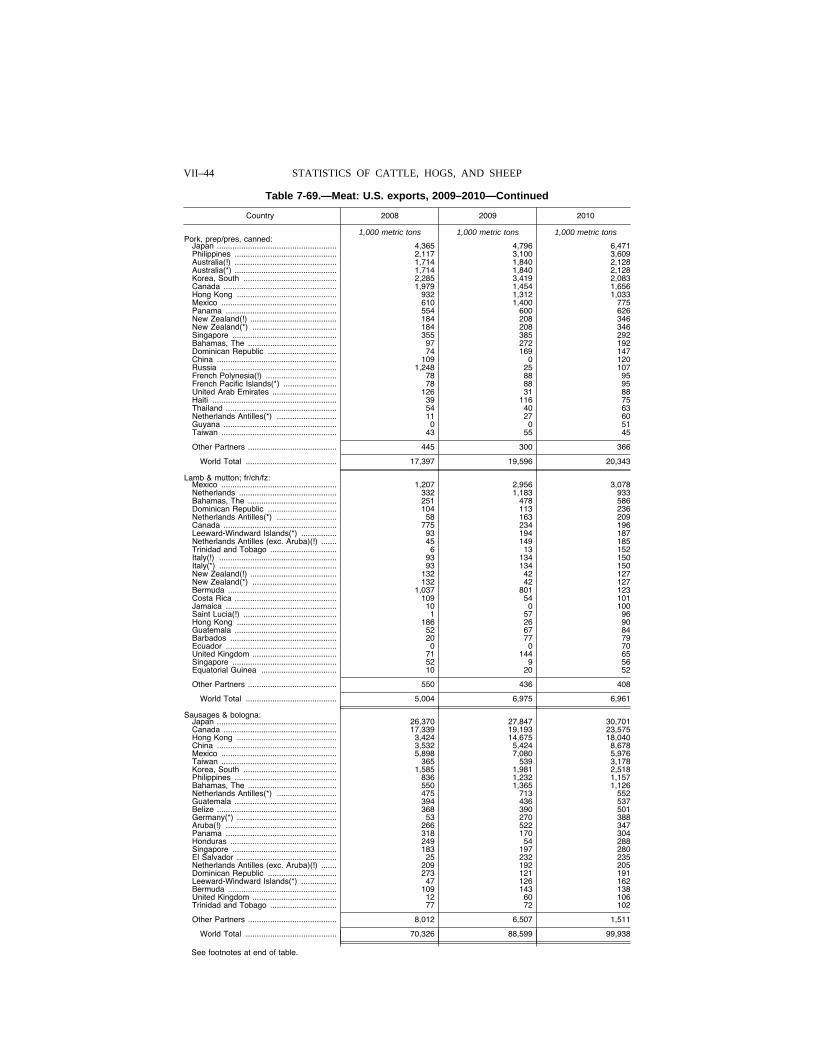
VII–44 STATISTICS OF CATTLE, HOGS, AND SHEEP
Table 7-69.—Meat: U.S. exports, 2009–2010—Continued
Country 2008 2009 2010
1,000 metric tons 1,000 metric tons 1,000 metric tons Pork, prep/pres, canned:
Japan ...................................................... 4,365 4,796 6,471 Philippines .............................................. 2,117 3,100 3,609 Australia(!) .............................................. 1,714 1,840 2,128 Australia(*) .............................................. 1,714 1,840 2,128 Korea, South .......................................... 2,285 3,419 2,083 Canada ................................................... 1,979 1,454 1,656 Hong Kong ............................................. 932 1,312 1,033 Mexico .................................................... 610 1,400 775 Panama .................................................. 554 600 626 New Zealand(!) ....................................... 184 208 346 New Zealand(*) ...................................... 184 208 346 Singapore ............................................... 355 385 292 Bahamas, The ........................................ 97 272 192 Dominican Republic ............................... 74 169 147 China ...................................................... 109 0 120 Russia .................................................... 1,248 25 107 French Polynesia(!) ................................ 78 88 95 French Pacific Islands(*) ........................ 78 88 95 United Arab Emirates ............................. 126 31 88 Haiti ........................................................ 39 116 75 Thailand .................................................. 54 40 63 Netherlands Antilles(*) ........................... 11 27 60 Guyana ................................................... 0 0 51 Taiwan .................................................... 43 55 45
Other Partners ........................................ 445 300 366
World Total ......................................... 17,397 19,596 20,343
Lamb & mutton; fr/ch/fz: Mexico .................................................... 1,207 2,956 3,078 Netherlands ............................................ 332 1,183 933 Bahamas, The ........................................ 251 478 586 Dominican Republic ............................... 104 113 236 Netherlands Antilles(*) ........................... 58 163 209 Canada ................................................... 775 234 196 Leeward-Windward Islands(*) ................ 93 194 187 Netherlands Antilles (exc. Aruba)(!) ....... 45 149 185 Trinidad and Tobago .............................. 6 13 152 Italy(!) ..................................................... 93 134 150 Italy(*) ..................................................... 93 134 150 New Zealand(!) ....................................... 132 42 127 New Zealand(*) ...................................... 132 42 127 Bermuda ................................................. 1,037 801 123 Costa Rica .............................................. 109 54 101 Jamaica .................................................. 10 0 100 Saint Lucia(!) .......................................... 1 57 96 Hong Kong ............................................. 186 26 90 Guatemala .............................................. 52 67 84 Barbados ................................................ 20 77 79 Ecuador .................................................. 0 0 70 United Kingdom ...................................... 71 144 65 Singapore ............................................... 52 9 56 Equatorial Guinea .................................. 10 20 52
Other Partners ........................................ 550 436 408
World Total ......................................... 5,004 6,975 6,961
Sausages & bologna: Japan ...................................................... 26,370 27,847 30,701 Canada ................................................... 17,339 19,193 23,575 Hong Kong ............................................. 3,424 14,675 18,040 China ...................................................... 3,532 5,424 8,678 Mexico .................................................... 5,898 7,080 5,976 Taiwan .................................................... 365 539 3,178 Korea, South .......................................... 1,585 1,981 2,518 Philippines .............................................. 836 1,232 1,157 Bahamas, The ........................................ 550 1,365 1,126 Netherlands Antilles(*) ........................... 475 713 552 Guatemala .............................................. 394 436 537 Belize ...................................................... 368 390 501 Germany(*) ............................................. 53 270 388 Aruba(!) .................................................. 266 522 347 Panama .................................................. 318 170 304 Honduras ................................................ 249 54 288 Singapore ............................................... 183 197 280 El Salvador ............................................. 25 232 235 Netherlands Antilles (exc. Aruba)(!) ....... 209 192 205 Dominican Republic ............................... 273 121 191 Leeward-Windward Islands(*) ................ 47 126 162 Bermuda ................................................. 109 143 138 United Kingdom ...................................... 12 60 106 Trinidad and Tobago .............................. 77 72 102
Other Partners ........................................ 8,012 6,507 1,511
World Total ......................................... 70,326 88,599 99,938
See footnotes at end of table.
VerDate Aug 31 2005 13:43 Mar 01, 2012 Jkt 000000 PO 00000 Frm 00044 Fmt 1000 Sfmt 1000 H:\SHARED\DAPP\FPU\AGSTAT\MASTER~2\CHAPTR07\VII-48.AG8 USDA
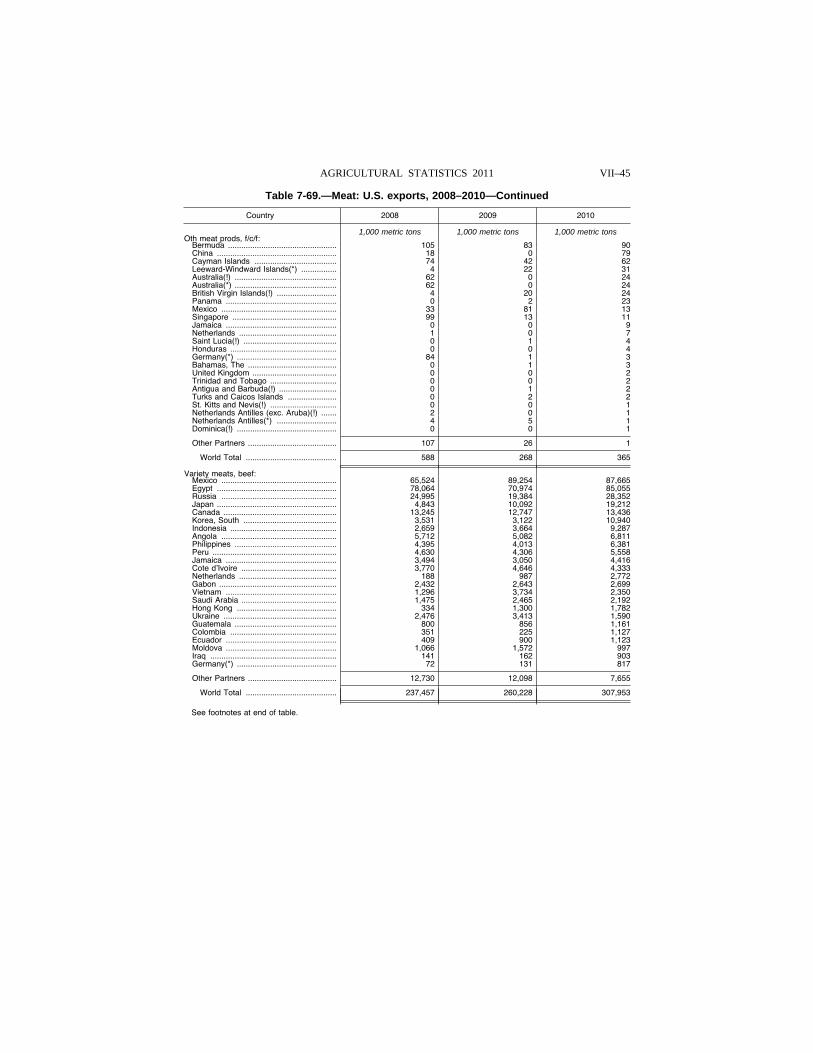
VII–45 AGRICULTURAL STATISTICS 2011
Table 7-69.—Meat: U.S. exports, 2008–2010—Continued
Country 2008 2009 2010
1,000 metric tons 1,000 metric tons 1,000 metric tons Oth meat prods, f/c/f:
Bermuda ................................................. 105 83 90 China ...................................................... 18 0 79 Cayman Islands ..................................... 74 42 62 Leeward-Windward Islands(*) ................ 4 22 31 Australia(!) .............................................. 62 0 24 Australia(*) .............................................. 62 0 24 British Virgin Islands(!) ........................... 4 20 24 Panama .................................................. 0 2 23 Mexico .................................................... 33 81 13 Singapore ............................................... 99 13 11 Jamaica .................................................. 0 0 9 Netherlands ............................................ 1 0 7 Saint Lucia(!) .......................................... 0 1 4 Honduras ................................................ 0 0 4 Germany(*) ............................................. 84 1 3 Bahamas, The ........................................ 0 1 3 United Kingdom ...................................... 0 0 2 Trinidad and Tobago .............................. 0 0 2 Antigua and Barbuda(!) .......................... 0 1 2 Turks and Caicos Islands ...................... 0 2 2 St. Kitts and Nevis(!) .............................. 0 0 1 Netherlands Antilles (exc. Aruba)(!) ....... 2 0 1 Netherlands Antilles(*) ........................... 4 5 1 Dominica(!) ............................................. 0 0 1
Other Partners ........................................ 107 26 1
World Total ......................................... 588 268 365
Variety meats, beef: Mexico .................................................... 65,524 89,254 87,665 Egypt ...................................................... 78,064 70,974 85,055 Russia .................................................... 24,995 19,384 28,352 Japan ...................................................... 4,843 10,092 19,212 Canada ................................................... 13,245 12,747 13,436 Korea, South .......................................... 3,531 3,122 10,940 Indonesia ................................................ 2,659 3,664 9,287 Angola .................................................... 5,712 5,082 6,811 Philippines .............................................. 4,395 4,013 6,381 Peru ........................................................ 4,630 4,306 5,558 Jamaica .................................................. 3,494 3,050 4,416 Cote d’Ivoire ........................................... 3,770 4,646 4,333 Netherlands ............................................ 188 987 2,772 Gabon ..................................................... 2,432 2,643 2,699 Vietnam .................................................. 1,296 3,734 2,350 Saudi Arabia ........................................... 1,475 2,465 2,192 Hong Kong ............................................. 334 1,300 1,782 Ukraine ................................................... 2,476 3,413 1,590 Guatemala .............................................. 800 856 1,161 Colombia ................................................ 351 225 1,127 Ecuador .................................................. 409 900 1,123 Moldova .................................................. 1,066 1,572 997 Iraq ......................................................... 141 162 903 Germany(*) ............................................. 72 131 817
Other Partners ........................................ 12,730 12,098 7,655
World Total ......................................... 237,457 260,228 307,953
See footnotes at end of table.
VerDate Aug 31 2005 13:43 Mar 01, 2012 Jkt 000000 PO 00000 Frm 00045 Fmt 1000 Sfmt 1000 H:\SHARED\DAPP\FPU\AGSTAT\MASTER~2\CHAPTR07\VII-49.AG8 USDA
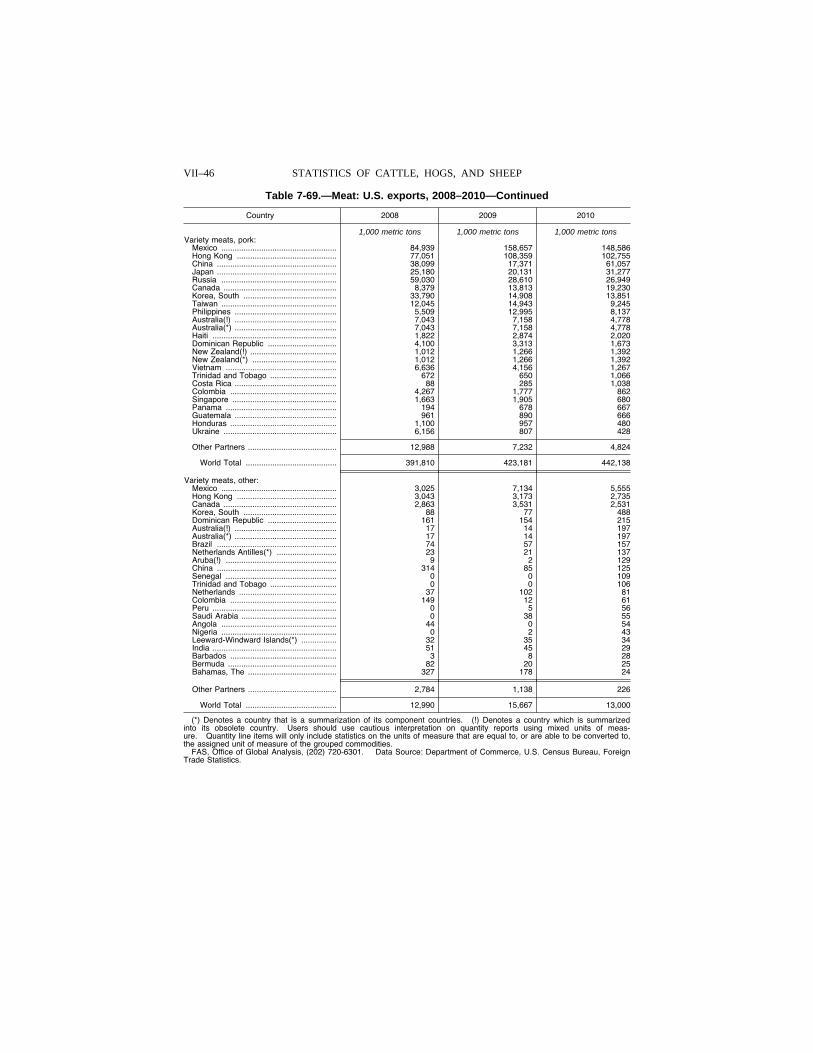
VII–46 STATISTICS OF CATTLE, HOGS, AND SHEEP
Table 7-69.—Meat: U.S. exports, 2008–2010—Continued
Country 2008 2009 2010
1,000 metric tons 1,000 metric tons 1,000 metric tons Variety meats, pork:
Mexico .................................................... 84,939 158,657 148,586 Hong Kong ............................................. 77,051 108,359 102,755 China ...................................................... 38,099 17,371 61,057 Japan ...................................................... 25,180 20,131 31,277 Russia .................................................... 59,030 28,610 26,949 Canada ................................................... 8,379 13,813 19,230 Korea, South .......................................... 33,790 14,908 13,851 Taiwan .................................................... 12,045 14,943 9,245 Philippines .............................................. 5,509 12,995 8,137 Australia(!) .............................................. 7,043 7,158 4,778 Australia(*) .............................................. 7,043 7,158 4,778 Haiti ........................................................ 1,822 2,874 2,020 Dominican Republic ............................... 4,100 3,313 1,673 New Zealand(!) ....................................... 1,012 1,266 1,392 New Zealand(*) ...................................... 1,012 1,266 1,392 Vietnam .................................................. 6,636 4,156 1,267 Trinidad and Tobago .............................. 672 650 1,066 Costa Rica .............................................. 88 285 1,038 Colombia ................................................ 4,267 1,777 862 Singapore ............................................... 1,663 1,905 680 Panama .................................................. 194 678 667 Guatemala .............................................. 961 890 666 Honduras ................................................ 1,100 957 480 Ukraine ................................................... 6,156 807 428
Other Partners ........................................ 12,988 7,232 4,824
World Total ......................................... 391,810 423,181 442,138
Variety meats, other: Mexico .................................................... 3,025 7,134 5,555 Hong Kong ............................................. 3,043 3,173 2,735 Canada ................................................... 2,863 3,531 2,531 Korea, South .......................................... 88 77 488 Dominican Republic ............................... 161 154 215 Australia(!) .............................................. 17 14 197 Australia(*) .............................................. 17 14 197 Brazil ...................................................... 74 57 157 Netherlands Antilles(*) ........................... 23 21 137 Aruba(!) .................................................. 9 2 129 China ...................................................... 314 85 125 Senegal .................................................. 0 0 109 Trinidad and Tobago .............................. 0 0 106 Netherlands ............................................ 37 102 81 Colombia ................................................ 149 12 61 Peru ........................................................ 0 5 56 Saudi Arabia ........................................... 0 38 55 Angola .................................................... 44 0 54 Nigeria .................................................... 0 2 43 Leeward-Windward Islands(*) ................ 32 35 34 India ........................................................ 51 45 29 Barbados ................................................ 3 8 28 Bermuda ................................................. 82 20 25 Bahamas, The ........................................ 327 178 24
Other Partners ........................................ 2,784 1,138 226
World Total ......................................... 12,990 15,667 13,000
(*) Denotes a country that is a summarization of its component countries. (!) Denotes a country which is summarized into its obsolete country. Users should use cautious interpretation on quantity reports using mixed units of meas-ure. Quantity line items will only include statistics on the units of measure that are equal to, or are able to be converted to, the assigned unit of measure of the grouped commodities.
FAS, Office of Global Analysis, (202) 720-6301. Data Source: Department of Commerce, U.S. Census Bureau, Foreign Trade Statistics.
VerDate Aug 31 2005 13:43 Mar 01, 2012 Jkt 000000 PO 00000 Frm 00046 Fmt 1000 Sfmt 1000 H:\SHARED\DAPP\FPU\AGSTAT\MASTER~2\CHAPTR07\VII-50.AG8 USDA
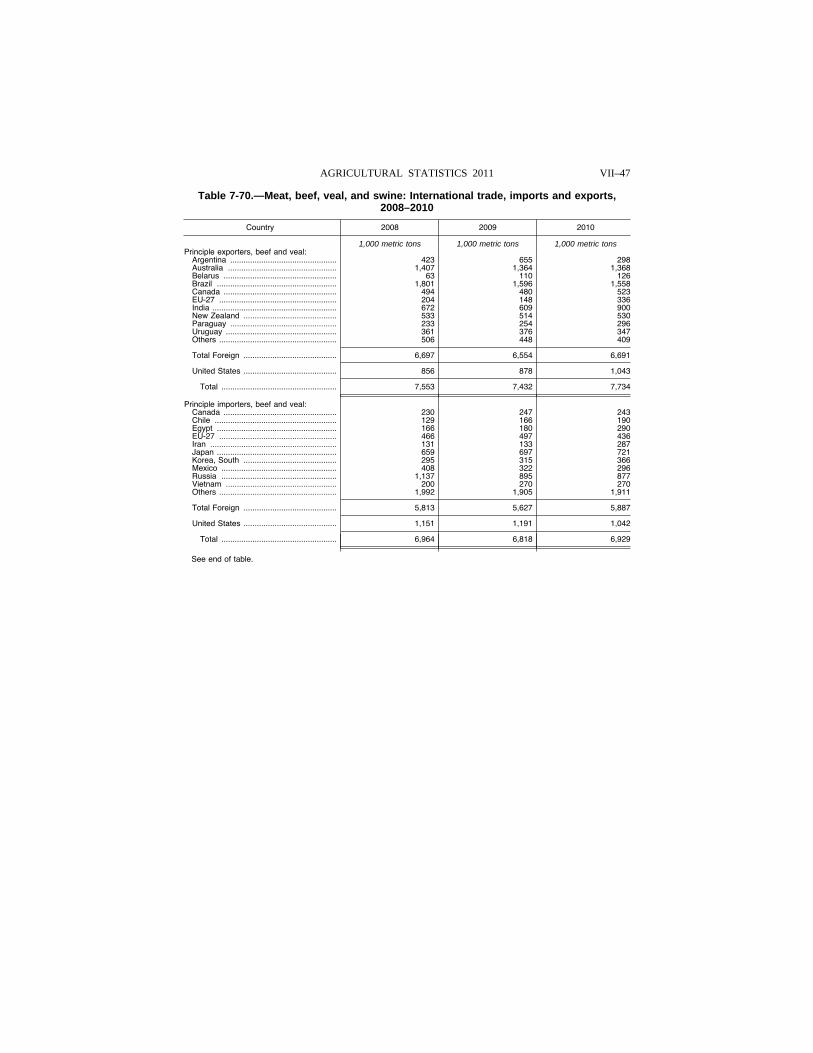
VII–47 AGRICULTURAL STATISTICS 2011
Table 7-70.—Meat, beef, veal, and swine: International trade, imports and exports, 2008–2010
Country 2008 2009 2010
1,000 metric tons 1,000 metric tons 1,000 metric tons Principle exporters, beef and veal:
Argentina ................................................ 423 655 298 Australia ................................................. 1,407 1,364 1,368 Belarus ................................................... 63 110 126 Brazil ...................................................... 1,801 1,596 1,558 Canada ................................................... 494 480 523 EU-27 ..................................................... 204 148 336 India ........................................................ 672 609 900 New Zealand .......................................... 533 514 530 Paraguay ................................................ 233 254 296 Uruguay .................................................. 361 376 347 Others ..................................................... 506 448 409
Total Foreign .......................................... 6,697 6,554 6,691
United States .......................................... 856 878 1,043
Total .................................................... 7,553 7,432 7,734
Principle importers, beef and veal: Canada ................................................... 230 247 243 Chile ....................................................... 129 166 190 Egypt ...................................................... 166 180 290 EU-27 ..................................................... 466 497 436 Iran ......................................................... 131 133 287 Japan ...................................................... 659 697 721 Korea, South .......................................... 295 315 366 Mexico .................................................... 408 322 296 Russia .................................................... 1,137 895 877 Vietnam .................................................. 200 270 270 Others ..................................................... 1,992 1,905 1,911
Total Foreign .......................................... 5,813 5,627 5,887
United States .......................................... 1,151 1,191 1,042
Total .................................................... 6,964 6,818 6,929
See end of table.
VerDate Aug 31 2005 13:43 Mar 01, 2012 Jkt 000000 PO 00000 Frm 00047 Fmt 1000 Sfmt 1000 H:\SHARED\DAPP\FPU\AGSTAT\MASTER~2\CHAPTR07\VII-51.AG8 USDA
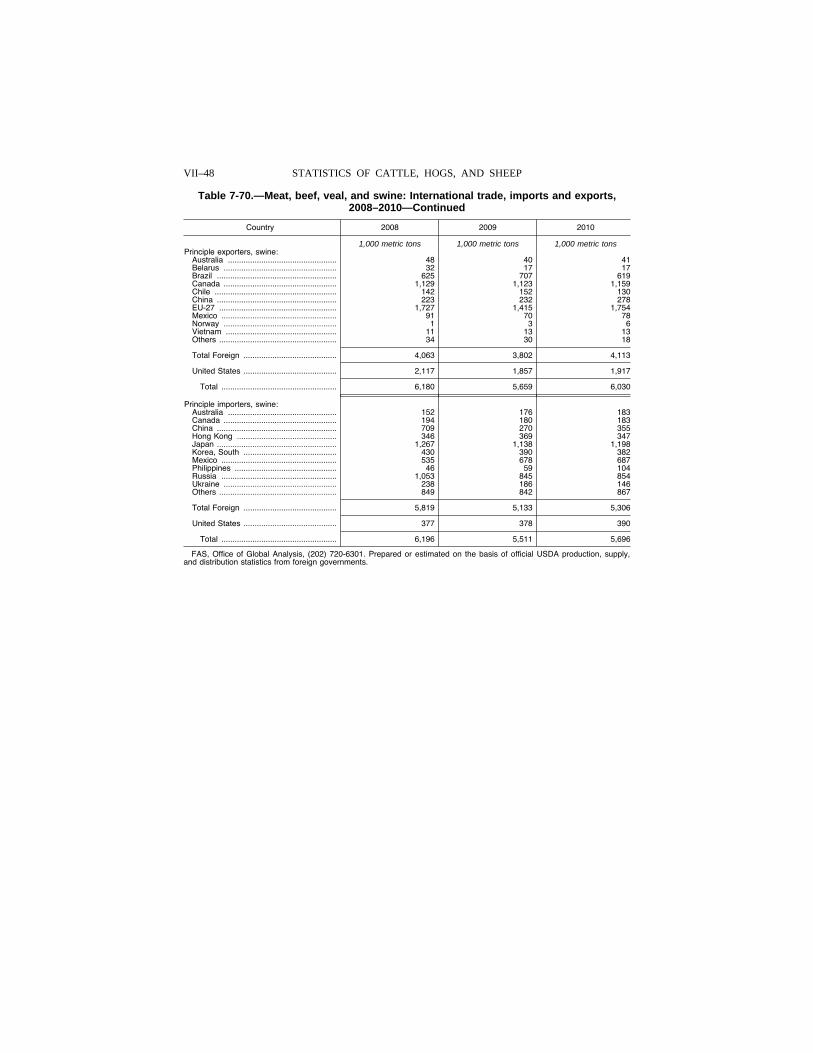
VII–48 STATISTICS OF CATTLE, HOGS, AND SHEEP
Table 7-70.—Meat, beef, veal, and swine: International trade, imports and exports, 2008–2010—Continued
Country 2008 2009 2010
1,000 metric tons 1,000 metric tons 1,000 metric tons Principle exporters, swine:
Australia ................................................. 48 40 41 Belarus ................................................... 32 17 17 Brazil ...................................................... 625 707 619 Canada ................................................... 1,129 1,123 1,159 Chile ....................................................... 142 152 130 China ...................................................... 223 232 278 EU-27 ..................................................... 1,727 1,415 1,754 Mexico .................................................... 91 70 78 Norway ................................................... 1 3 6 Vietnam .................................................. 11 13 13 Others ..................................................... 34 30 18
Total Foreign .......................................... 4,063 3,802 4,113
United States .......................................... 2,117 1,857 1,917
Total .................................................... 6,180 5,659 6,030
Principle importers, swine: Australia ................................................. 152 176 183 Canada ................................................... 194 180 183 China ...................................................... 709 270 355 Hong Kong ............................................. 346 369 347 Japan ...................................................... 1,267 1,138 1,198 Korea, South .......................................... 430 390 382 Mexico .................................................... 535 678 687 Philippines .............................................. 46 59 104 Russia .................................................... 1,053 845 854 Ukraine ................................................... 238 186 146 Others ..................................................... 849 842 867
Total Foreign .......................................... 5,819 5,133 5,306
United States .......................................... 377 378 390
Total .................................................... 6,196 5,511 5,696
FAS, Office of Global Analysis, (202) 720-6301. Prepared or estimated on the basis of official USDA production, supply, and distribution statistics from foreign governments.
VerDate Aug 31 2005 13:43 Mar 01, 2012 Jkt 000000 PO 00000 Frm 00048 Fmt 1000 Sfmt 1000 H:\SHARED\DAPP\FPU\AGSTAT\MASTER~2\CHAPTR07\VII-52.AG8 USDA
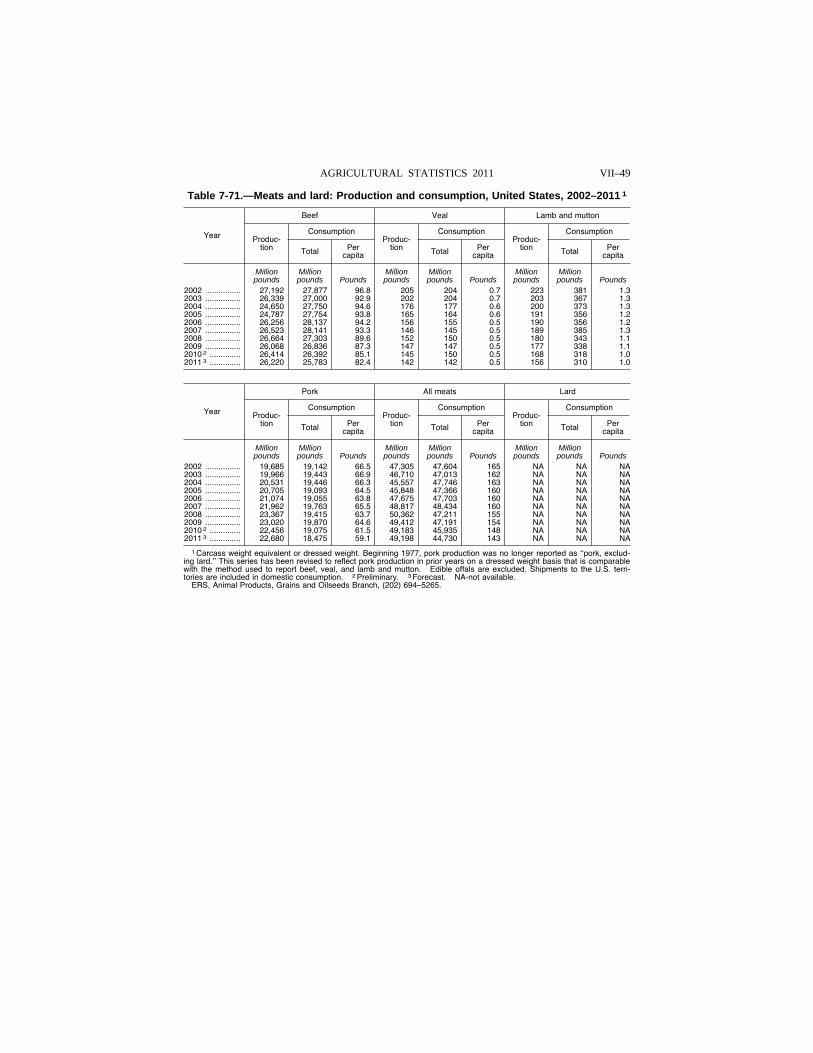
VII–49 AGRICULTURAL STATISTICS 2011
Table 7-71.—Meats and lard: Production and consumption, United States, 2002–2011 1
Year
Beef Veal Lamb and mutton
Produc-tion
Consumption Produc-
tion
Consumption Produc-
tion
Consumption
Total Per capita Total Per
capita Total Per capita
Million Million Million Million Million Million pounds pounds Pounds pounds pounds Pounds pounds pounds Pounds
2002 ................ 27,192 27,877 96.8 205 204 0.7 223 381 1.3 2003 ................ 26,339 27,000 92.9 202 204 0.7 203 367 1.3 2004 ................ 24,650 27,750 94.6 176 177 0.6 200 373 1.3 2005 ................ 24,787 27,754 93.8 165 164 0.6 191 356 1.2 2006 ................ 26,256 28,137 94.2 156 155 0.5 190 356 1.2 2007 ................ 26,523 28,141 93.3 146 145 0.5 189 385 1.3 2008 ................ 26,664 27,303 89.6 152 150 0.5 180 343 1.1 2009 ................ 26,068 26,836 87.3 147 147 0.5 177 338 1.1 2010 2 .............. 26,414 26,392 85.1 145 150 0.5 168 318 1.0 2011 3 .............. 26,220 25,783 82.4 142 142 0.5 156 310 1.0
Year
Pork All meats Lard
Produc-tion
Consumption Produc-
tion
Consumption Produc-
tion
Consumption
Total Per capita Total Per
capita Total Per capita
Million Million Million Million Million Million pounds pounds Pounds pounds pounds Pounds pounds pounds Pounds
2002 ................ 19,685 19,142 66.5 47,305 47,604 165 NA NA NA 2003 ................ 19,966 19,443 66.9 46,710 47,013 162 NA NA NA 2004 ................ 20,531 19,446 66.3 45,557 47,746 163 NA NA NA 2005 ................ 20,705 19,093 64.5 45,848 47,366 160 NA NA NA 2006 ................ 21,074 19,055 63.8 47,675 47,703 160 NA NA NA 2007 ................ 21,962 19,763 65.5 48,817 48,434 160 NA NA NA 2008 ................ 23,367 19,415 63.7 50,362 47,211 155 NA NA NA 2009 ................ 23,020 19,870 64.6 49,412 47,191 154 NA NA NA 2010 2 .............. 22,456 19,075 61.5 49,183 45,935 148 NA NA NA 2011 3 .............. 22,680 18,475 59.1 49,198 44,730 143 NA NA NA
1 Carcass weight equivalent or dressed weight. Beginning 1977, pork production was no longer reported as ‘‘pork, exclud-ing lard.’’ This series has been revised to reflect pork production in prior years on a dressed weight basis that is comparable with the method used to report beef, veal, and lamb and mutton. Edible offals are excluded. Shipments to the U.S. terri-tories are included in domestic consumption. 2 Preliminary. 3 Forecast. NA-not available.
ERS, Animal Products, Grains and Oilseeds Branch, (202) 694–5265.
VerDate Aug 31 2005 13:43 Mar 01, 2012 Jkt 000000 PO 00000 Frm 00049 Fmt 1000 Sfmt 1000 H:\SHARED\DAPP\FPU\AGSTAT\MASTER~2\CHAPTR07\VII-53.AG8 USDA
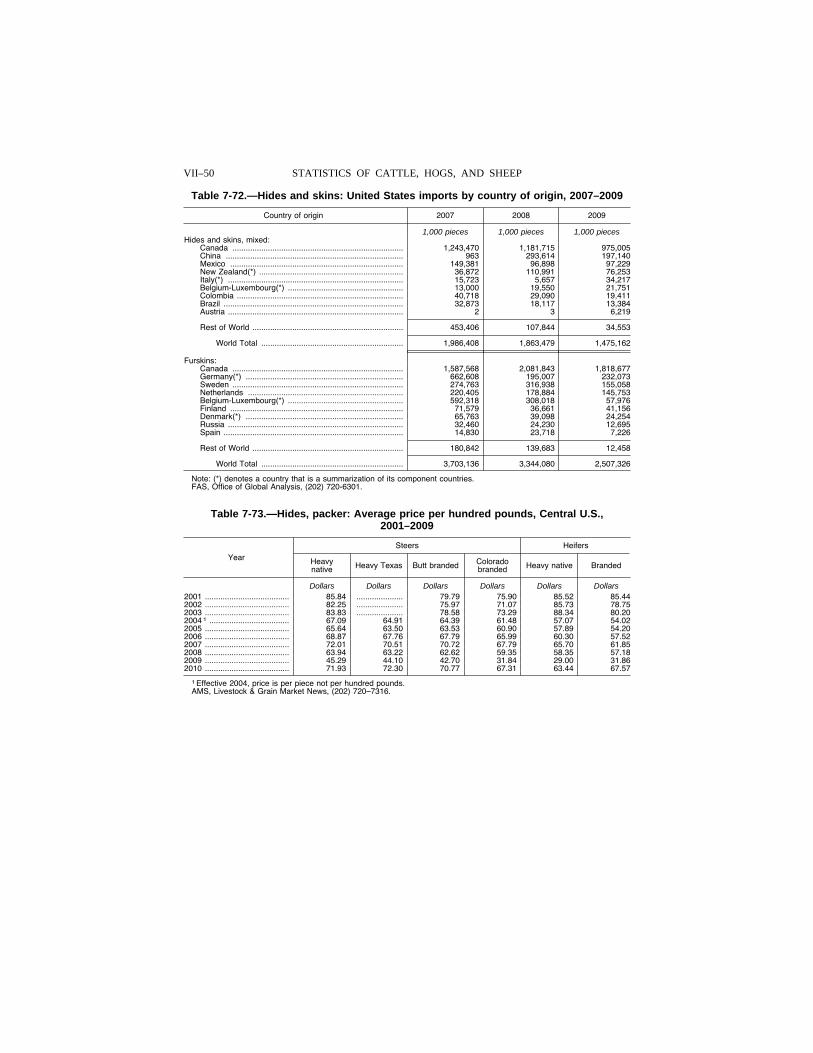
VII–50 STATISTICS OF CATTLE, HOGS, AND SHEEP
Table 7-72.—Hides and skins: United States imports by country of origin, 2007–2009
Country of origin 2007 2008 2009
1,000 pieces 1,000 pieces 1,000 pieces Hides and skins, mixed:
Canada ............................................................................. 1,243,470 1,181,715 975,005 China ................................................................................ 963 293,614 197,140 Mexico .............................................................................. 149,381 96,898 97,229 New Zealand(*) ................................................................. 36,872 110,991 76,253 Italy(*) ............................................................................... 15,723 5,657 34,217 Belgium-Luxembourg(*) .................................................... 13,000 19,550 21,751 Colombia ........................................................................... 40,718 29,090 19,411 Brazil ................................................................................. 32,873 18,117 13,384 Austria ............................................................................... 2 3 6,219
Rest of World .................................................................... 453,406 107,844 34,553
World Total ................................................................ 1,986,408 1,863,479 1,475,162
Furskins: Canada ............................................................................. 1,587,568 2,081,843 1,818,677 Germany(*) ....................................................................... 662,608 195,007 232,073 Sweden ............................................................................. 274,763 316,938 155,058 Netherlands ...................................................................... 220,405 178,884 145,753 Belgium-Luxembourg(*) .................................................... 592,318 308,018 57,976 Finland .............................................................................. 71,579 36,661 41,156 Denmark(*) ....................................................................... 65,763 39,098 24,254 Russia ............................................................................... 32,460 24,230 12,695 Spain ................................................................................. 14,830 23,718 7,226
Rest of World .................................................................... 180,842 139,683 12,458
World Total ................................................................ 3,703,136 3,344,080 2,507,326
Note: (*) denotes a country that is a summarization of its component countries. FAS, Office of Global Analysis, (202) 720-6301.
Table 7-73.—Hides, packer: Average price per hundred pounds, Central U.S., 2001–2009
Year
Steers Heifers
Heavy native Heavy Texas Butt branded Colorado
branded Heavy native Branded
Dollars Dollars Dollars Dollars Dollars Dollars 2001 ...................................... 85.84 ..................... 79.79 75.90 85.52 85.44 2002 ...................................... 82.25 ..................... 75.97 71.07 85.73 78.75 2003 ...................................... 83.83 ..................... 78.58 73.29 88.34 80.20 2004 1 .................................... 67.09 64.91 64.39 61.48 57.07 54.02 2005 ...................................... 65.64 63.50 63.53 60.90 57.89 54.20 2006 ...................................... 68.87 67.76 67.79 65.99 60.30 57.52 2007 ...................................... 72.01 70.51 70.72 67.79 65.70 61.85 2008 ...................................... 63.94 63.22 62.62 59.35 58.35 57.18 2009 ...................................... 45.29 44.10 42.70 31.84 29.00 31.86 2010 ...................................... 71.93 72.30 70.77 67.31 63.44 67.57
1 Effective 2004, price is per piece not per hundred pounds. AMS, Livestock & Grain Market News, (202) 720–7316.
VerDate Aug 31 2005 13:43 Mar 01, 2012 Jkt 000000 PO 00000 Frm 00050 Fmt 1000 Sfmt 1000 H:\SHARED\DAPP\FPU\AGSTAT\MASTER~2\CHAPTR07\VII-54.AG8 USDA
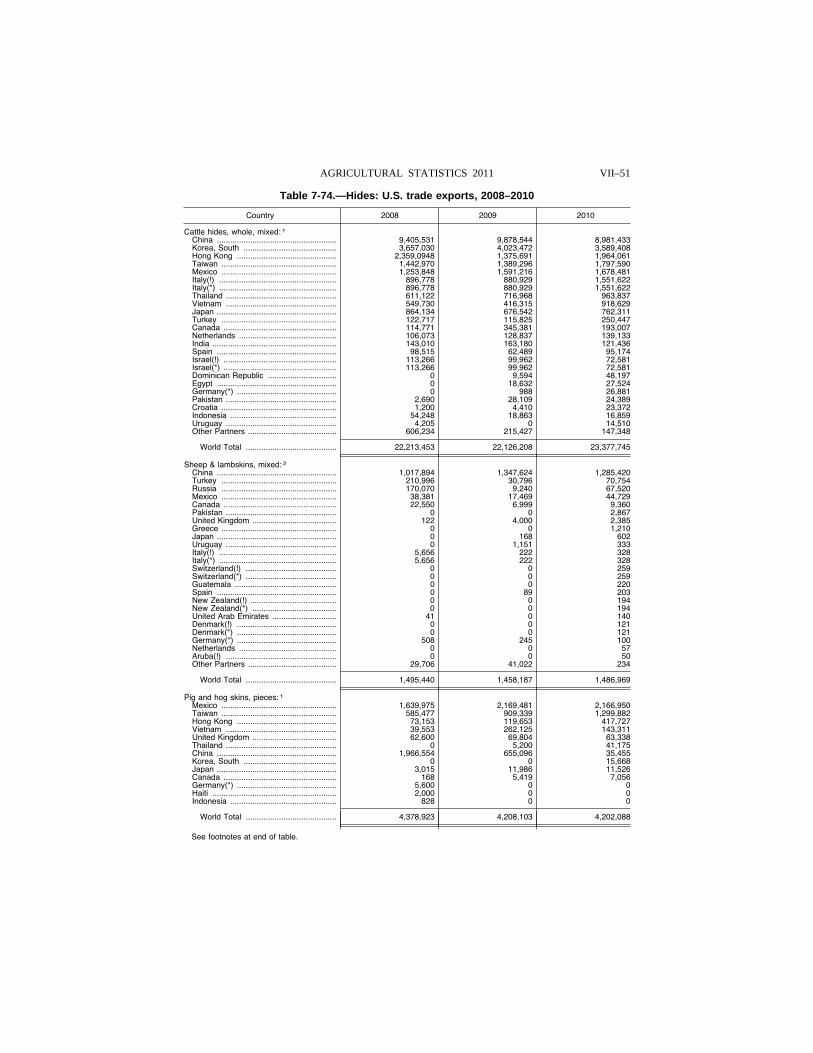
VII–51 AGRICULTURAL STATISTICS 2011
Table 7-74.—Hides: U.S. trade exports, 2008–2010
Country 2008 2009 2010
Cattle hides, whole, mixed: 1 China ...................................................... 9,405,531 9,878,544 8,981,433 Korea, South .......................................... 3,657,030 4,023,472 3,589,408 Hong Kong ............................................. 2,359,0948 1,375,691 1,964,061 Taiwan .................................................... 1,442,970 1,389,296 1,797,590 Mexico .................................................... 1,253,848 1,591,216 1,678,481 Italy(!) ..................................................... 896,778 880,929 1,551,622 Italy(*) ..................................................... 896,778 880,929 1,551,622 Thailand .................................................. 611,122 716,968 963,837 Vietnam .................................................. 549,730 416,315 918,629 Japan ...................................................... 864,134 676,542 762,311 Turkey .................................................... 122,717 115,825 250,447 Canada ................................................... 114,771 345,381 193,007 Netherlands ............................................ 106,073 128,837 139,133 India ........................................................ 143,010 163,180 121,436 Spain ...................................................... 98,515 62,489 95,174 Israel(!) ................................................... 113,266 99,962 72,581 Israel(*) ................................................... 113,266 99,962 72,581 Dominican Republic ............................... 0 9,594 48,197 Egypt ...................................................... 0 18,632 27,524 Germany(*) ............................................. 0 988 26,881 Pakistan .................................................. 2,690 28,109 24,389 Croatia .................................................... 1,200 4,410 23,372 Indonesia ................................................ 54,248 18,863 16,859 Uruguay .................................................. 4,205 0 14,510 Other Partners ........................................ 606,234 215,427 147,348
World Total ......................................... 22,213,453 22,126,208 23,377,745
Sheep & lambskins, mixed: 2 China ...................................................... 1,017,894 1,347,624 1,285,420 Turkey .................................................... 210,996 30,796 70,754 Russia .................................................... 170,070 9,240 67,520 Mexico .................................................... 38,381 17,469 44,729 Canada ................................................... 22,550 6,999 9,360 Pakistan .................................................. 0 0 2,867 United Kingdom ...................................... 122 4,000 2,385 Greece .................................................... 0 0 1,210 Japan ...................................................... 0 168 602 Uruguay .................................................. 0 1,151 333 Italy(!) ..................................................... 5,656 222 328 Italy(*) ..................................................... 5,656 222 328 Switzerland(!) ......................................... 0 0 259 Switzerland(*) ......................................... 0 0 259 Guatemala .............................................. 0 0 220 Spain ...................................................... 0 89 203 New Zealand(!) ....................................... 0 0 194 New Zealand(*) ...................................... 0 0 194 United Arab Emirates ............................. 41 0 140 Denmark(!) ............................................. 0 0 121 Denmark(*) ............................................. 0 0 121 Germany(*) ............................................. 508 245 100 Netherlands ............................................ 0 0 57 Aruba(!) .................................................. 0 0 50 Other Partners ........................................ 29,706 41,022 234
World Total ......................................... 1,495,440 1,458,187 1,486,969
Pig and hog skins, pieces: 1 Mexico .................................................... 1,639,975 2,169,481 2,166,950 Taiwan .................................................... 585,477 909,339 1,299,882 Hong Kong ............................................. 73,153 119,653 417,727 Vietnam .................................................. 39,553 262,125 143,311 United Kingdom ...................................... 62,600 69,804 63,338 Thailand .................................................. 0 5,200 41,175 China ...................................................... 1,966,554 655,096 35,455 Korea, South .......................................... 0 0 15,668 Japan ...................................................... 3,015 11,986 11,526 Canada ................................................... 168 5,419 7,056 Germany(*) ............................................. 5,600 0 0 Haiti ........................................................ 2,000 0 0 Indonesia ................................................ 828 0 0
World Total ......................................... 4,378,923 4,208,103 4,202,088
See footnotes at end of table.
VerDate Aug 31 2005 13:43 Mar 01, 2012 Jkt 000000 PO 00000 Frm 00051 Fmt 1000 Sfmt 1000 H:\SHARED\DAPP\FPU\AGSTAT\MASTER~2\CHAPTR07\VII-55.AG8 USDA
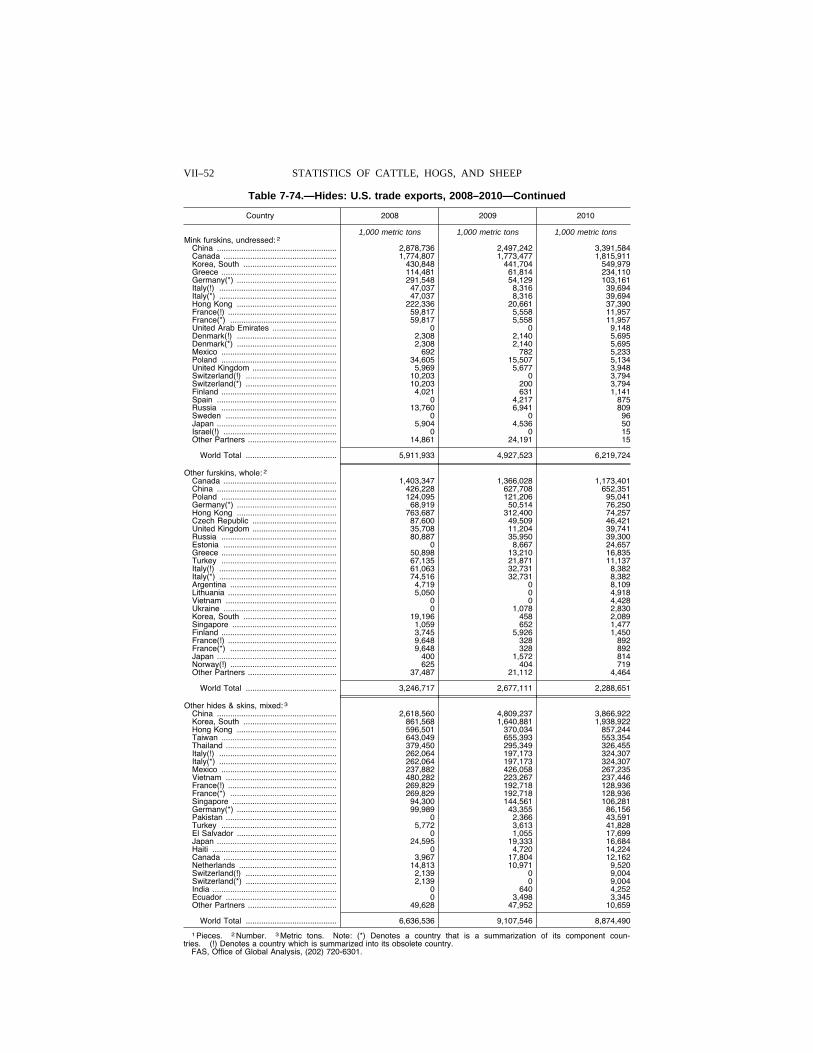
VII–52 STATISTICS OF CATTLE, HOGS, AND SHEEP
Table 7-74.—Hides: U.S. trade exports, 2008–2010—Continued
Country 2008 2009 2010
1,000 metric tons 1,000 metric tons 1,000 metric tons Mink furskins, undressed: 2
China ...................................................... 2,878,736 2,497,242 3,391,584 Canada ................................................... 1,774,807 1,773,477 1,815,911 Korea, South .......................................... 430,848 441,704 549,979 Greece .................................................... 114,481 61,814 234,110 Germany(*) ............................................. 291,548 54,129 103,161 Italy(!) ..................................................... 47,037 8,316 39,694 Italy(*) ..................................................... 47,037 8,316 39,694 Hong Kong ............................................. 222,336 20,661 37,390 France(!) ................................................. 59,817 5,558 11,957 France(*) ................................................ 59,817 5,558 11,957 United Arab Emirates ............................. 0 0 9,148 Denmark(!) ............................................. 2,308 2,140 5,695 Denmark(*) ............................................. 2,308 2,140 5,695 Mexico .................................................... 692 782 5,233 Poland .................................................... 34,605 15,507 5,134 United Kingdom ...................................... 5,969 5,677 3,948 Switzerland(!) ......................................... 10,203 0 3,794 Switzerland(*) ......................................... 10,203 200 3,794 Finland .................................................... 4,021 631 1,141 Spain ...................................................... 0 4,217 875 Russia .................................................... 13,760 6,941 809 Sweden .................................................. 0 0 96 Japan ...................................................... 5,904 4,536 50 Israel(!) ................................................... 0 0 15 Other Partners ........................................ 14,861 24,191 15
World Total ......................................... 5,911,933 4,927,523 6,219,724
Other furskins, whole: 2 Canada ................................................... 1,403,347 1,366,028 1,173,401 China ...................................................... 426,228 627,708 652,351 Poland .................................................... 124,095 121,206 95,041 Germany(*) ............................................. 68,919 50,514 76,250 Hong Kong ............................................. 763,687 312,400 74,257 Czech Republic ...................................... 87,600 49,509 46,421 United Kingdom ...................................... 35,708 11,204 39,741 Russia .................................................... 80,887 35,950 39,300 Estonia ................................................... 0 8,667 24,657 Greece .................................................... 50,898 13,210 16,835 Turkey .................................................... 67,135 21,871 11,137 Italy(!) ..................................................... 61,063 32,731 8,382 Italy(*) ..................................................... 74,516 32,731 8,382 Argentina ................................................ 4,719 0 8,109 Lithuania ................................................. 5,050 0 4,918 Vietnam .................................................. 0 0 4,428 Ukraine ................................................... 0 1,078 2,830 Korea, South .......................................... 19,196 458 2,089 Singapore ............................................... 1,059 652 1,477 Finland .................................................... 3,745 5,926 1,450 France(!) ................................................. 9,648 328 892 France(*) ................................................ 9,648 328 892 Japan ...................................................... 400 1,572 814 Norway(!) ................................................ 625 404 719 Other Partners ........................................ 37,487 21,112 4,464
World Total ......................................... 3,246,717 2,677,111 2,288,651
Other hides & skins, mixed: 3 China ...................................................... 2,618,560 4,809,237 3,866,922 Korea, South .......................................... 861,568 1,640,881 1,938,922 Hong Kong ............................................. 596,501 370,034 857,244 Taiwan .................................................... 643,049 655,393 553,354 Thailand .................................................. 379,450 295,349 326,455 Italy(!) ..................................................... 262,064 197,173 324,307 Italy(*) ..................................................... 262,064 197,173 324,307 Mexico .................................................... 237,882 426,058 267,235 Vietnam .................................................. 480,282 223,267 237,446 France(!) ................................................. 269,829 192,718 128,936 France(*) ................................................ 269,829 192,718 128,936 Singapore ............................................... 94,300 144,561 106,281 Germany(*) ............................................. 99,989 43,355 86,156 Pakistan .................................................. 0 2,366 43,591 Turkey .................................................... 5,772 3,613 41,828 El Salvador ............................................. 0 1,055 17,699 Japan ...................................................... 24,595 19,333 16,684 Haiti ........................................................ 0 4,720 14,224 Canada ................................................... 3,967 17,804 12,162 Netherlands ............................................ 14,813 10,971 9,520 Switzerland(!) ......................................... 2,139 0 9,004 Switzerland(*) ......................................... 2,139 0 9,004 India ........................................................ 0 640 4,252 Ecuador .................................................. 0 3,498 3,345 Other Partners ........................................ 49,628 47,952 10,659
World Total ......................................... 6,636,536 9,107,546 8,874,490
1 Pieces. 2 Number. 3 Metric tons. Note: (*) Denotes a country that is a summarization of its component coun-tries. (!) Denotes a country which is summarized into its obsolete country.
FAS, Office of Global Analysis, (202) 720-6301.
VerDate Aug 31 2005 13:43 Mar 01, 2012 Jkt 000000 PO 00000 Frm 00052 Fmt 1000 Sfmt 1000 H:\SHARED\DAPP\FPU\AGSTAT\MASTER~2\CHAPTR07\VII-56.AG8 USDA
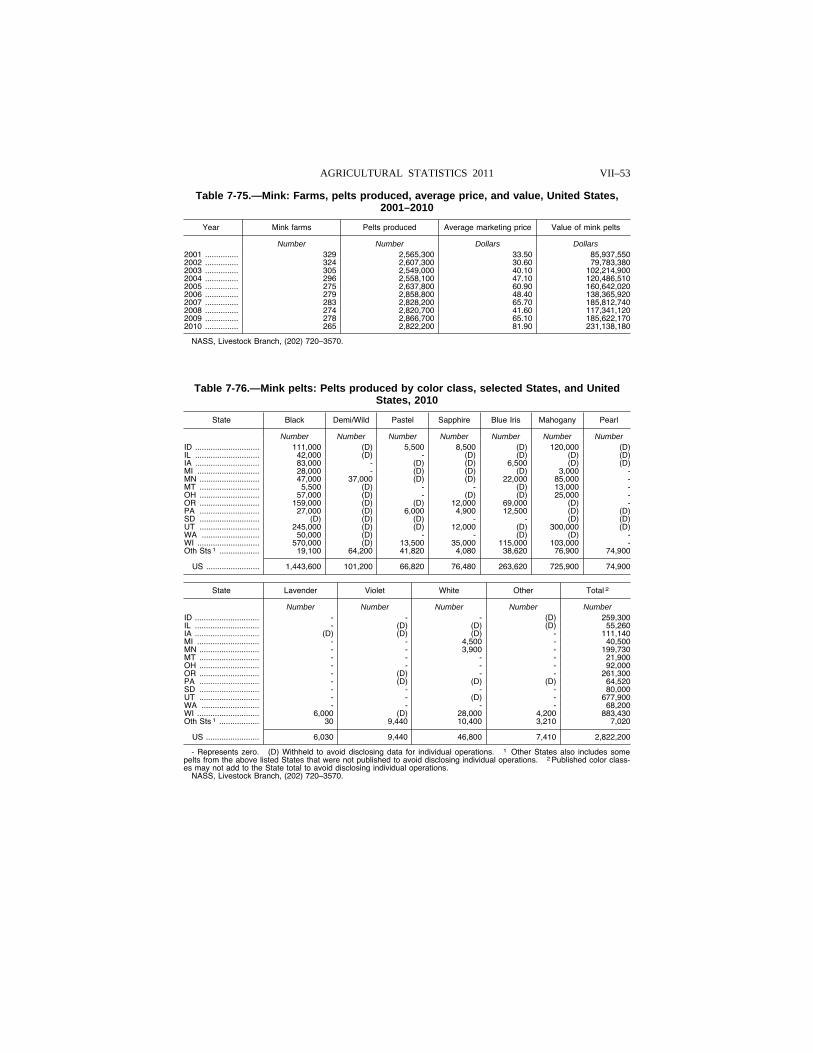
VII–53 AGRICULTURAL STATISTICS 2011
Table 7-75.—Mink: Farms, pelts produced, average price, and value, United States, 2001–2010
Year Mink farms Pelts produced Average marketing price Value of mink pelts
Number Number Dollars Dollars 2001 ............... 329 2,565,300 33.50 85,937,550 2002 ............... 324 2,607,300 30.60 79,783,380 2003 ............... 305 2,549,000 40.10 102,214,900 2004 ............... 296 2,558,100 47.10 120,486,510 2005 ............... 275 2,637,800 60.90 160,642,020 2006 ............... 279 2,858,800 48.40 138,365,920 2007 ............... 283 2,828,200 65.70 185,812,740 2008 ............... 274 2,820,700 41.60 117,341,120 2009 ............... 278 2,866,700 65.10 185,622,170 2010 ............... 265 2,822,200 81.90 231,138,180
NASS, Livestock Branch, (202) 720–3570.
Table 7-76.—Mink pelts: Pelts produced by color class, selected States, and United States, 2010
State Black Demi/Wild Pastel Sapphire Blue Iris Mahogany Pearl
Number Number Number Number Number Number Number ID ............................. 111,000 (D) 5,500 8,500 (D) 120,000 (D) IL ............................. 42,000 (D) - (D) (D) (D) (D) IA ............................. 83,000 - (D) (D) 6,500 (D) (D) MI ............................ 28,000 - (D) (D) (D) 3,000 - MN ........................... 47,000 37,000 (D) (D) 22,000 85,000 - MT ........................... 5,500 (D) - - (D) 13,000 - OH ........................... 57,000 (D) - (D) (D) 25,000 - OR ........................... 159,000 (D) (D) 12,000 69,000 (D) - PA ........................... 27,000 (D) 6,000 4,900 12,500 (D) (D) SD ........................... (D) (D) (D) - - (D) (D) UT ........................... 245,000 (D) (D) 12,000 (D) 300,000 (D) WA .......................... 50,000 (D) - - (D) (D) - WI ............................ 570,000 (D) 13,500 35,000 115,000 103,000 - Oth Sts 1 .................. 19,100 64,200 41,820 4,080 38,620 76,900 74,900
US ........................ 1,443,600 101,200 66,820 76,480 263,620 725,900 74,900
State Lavender Violet White Other Total 2
Number Number Number Number Number ID ............................. - - - (D) 259,300 IL ............................. - (D) (D) (D) 55,260 IA ............................. (D) (D) (D) - 111,140 MI ............................ - - 4,500 - 40,500 MN ........................... - - 3,900 - 199,730 MT ........................... - - - - 21,900 OH ........................... - - - - 92,000 OR ........................... - (D) - - 261,300 PA ........................... - (D) (D) (D) 64,520 SD ........................... - - - - 80,000 UT ........................... - - (D) - 677,900 WA .......................... - - - - 68,200 WI ............................ 6,000 (D) 28,000 4,200 883,430 Oth Sts 1 .................. 30 9,440 10,400 3,210 7,020
US ........................ 6,030 9,440 46,800 7,410 2,822,200
- Represents zero. (D) Withheld to avoid disclosing data for individual operations. 1 Other States also includes some pelts from the above listed States that were not published to avoid disclosing individual operations. 2 Published color class-es may not add to the State total to avoid disclosing individual operations.
NASS, Livestock Branch, (202) 720–3570.
VerDate Aug 31 2005 13:43 Mar 01, 2012 Jkt 000000 PO 00000 Frm 00053 Fmt 1000 Sfmt 1000 H:\SHARED\DAPP\FPU\AGSTAT\MASTER~2\CHAPTR07\VII-57.AG8 USDA
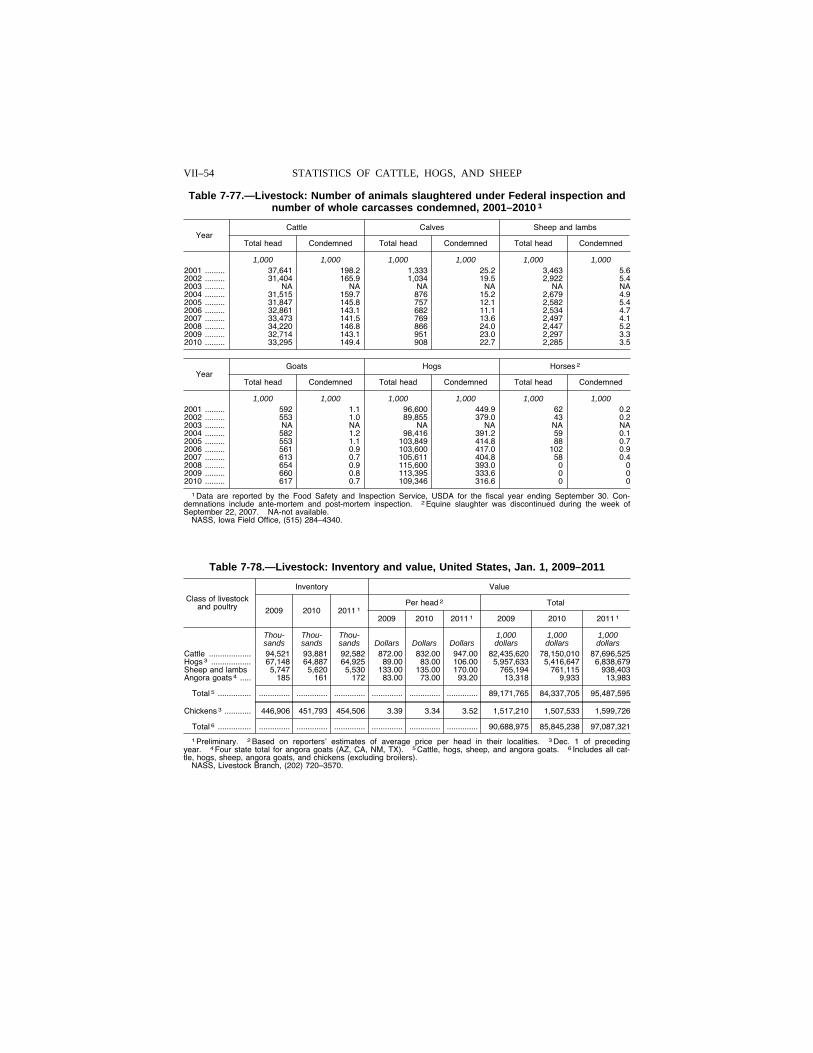
VII–54 STATISTICS OF CATTLE, HOGS, AND SHEEP
Table 7-77.—Livestock: Number of animals slaughtered under Federal inspection and number of whole carcasses condemned, 2001–2010 1
Year Cattle Calves Sheep and lambs
Total head Condemned Total head Condemned Total head Condemned
1,000 1,000 1,000 1,000 1,000 1,000 2001 ......... 37,641 198.2 1,333 25.2 3,463 5.6 2002 ......... 31,404 165.9 1,034 19.5 2,922 5.4 2003 ......... NA NA NA NA NA NA 2004 ......... 31,515 159.7 876 15.2 2,679 4.9 2005 ......... 31,847 145.8 757 12.1 2,582 5.4 2006 ......... 32,861 143.1 682 11.1 2,534 4.7 2007 ......... 33,473 141.5 769 13.6 2,497 4.1 2008 ......... 34,220 146.8 866 24.0 2,447 5.2 2009 ......... 32,714 143.1 951 23.0 2,297 3.3 2010 ......... 33,295 149.4 908 22.7 2,285 3.5
Year Goats Hogs Horses 2
Total head Condemned Total head Condemned Total head Condemned
1,000 1,000 1,000 1,000 1,000 1,000 2001 ......... 592 1.1 96,600 449.9 62 0.2 2002 ......... 553 1.0 89,855 379.0 43 0.2 2003 ......... NA NA NA NA NA NA 2004 ......... 582 1.2 98,416 391.2 59 0.1 2005 ......... 553 1.1 103,849 414.8 88 0.7 2006 ......... 561 0.9 103,600 417.0 102 0.9 2007 ......... 613 0.7 105,611 404.8 58 0.4 2008 ......... 654 0.9 115,600 393.0 0 0 2009 ......... 660 0.8 113,395 333.6 0 0 2010 ......... 617 0.7 109,346 316.6 0 0
1 Data are reported by the Food Safety and Inspection Service, USDA for the fiscal year ending September 30. Con-demnations include ante-mortem and post-mortem inspection. 2 Equine slaughter was discontinued during the week of September 22, 2007. NA-not available.
NASS, Iowa Field Office, (515) 284–4340.
Table 7-78.—Livestock: Inventory and value, United States, Jan. 1, 2009–2011
Class of livestock and poultry
Inventory Value
2009 2010 2011 1 Per head 2 Total
2009 2010 2011 1 2009 2010 2011 1
Thou- Thou- Thou- 1,000 1,000 1,000 sands sands sands Dollars Dollars Dollars dollars dollars dollars
Cattle ................... 94,521 93,881 92,582 872.00 832.00 947.00 82,435,620 78,150,010 87,696,525 Hogs 3 .................. 67,148 64,887 64,925 89.00 83.00 106.00 5,957,633 5,416,647 6,838,679 Sheep and lambs 5,747 5,620 5,530 133.00 135.00 170.00 765,194 761,115 938,403 Angora goats 4 ..... 185 161 172 83.00 73.00 93.20 13,318 9,933 13,983
Total 5 ............... .............. .............. .............. .............. .............. .............. 89,171,765 84,337,705 95,487,595
Chickens 3 ............ 446,906 451,793 454,506 3.39 3.34 3.52 1,517,210 1,507,533 1,599,726
Total 6 ............... .............. .............. .............. .............. .............. .............. 90,688,975 85,845,238 97,087,321
1 Preliminary. 2 Based on reporters’ estimates of average price per head in their localities. 3 Dec. 1 of preceding year. 4 Four state total for angora goats (AZ, CA, NM, TX). 5 Cattle, hogs, sheep, and angora goats. 6 Includes all cat-tle, hogs, sheep, angora goats, and chickens (excluding broilers).
NASS, Livestock Branch, (202) 720–3570.
VerDate Aug 31 2005 13:43 Mar 01, 2012 Jkt 000000 PO 00000 Frm 00054 Fmt 1000 Sfmt 1000 H:\SHARED\DAPP\FPU\AGSTAT\MASTER~2\CHAPTR07\VII-58.AG8 USDA
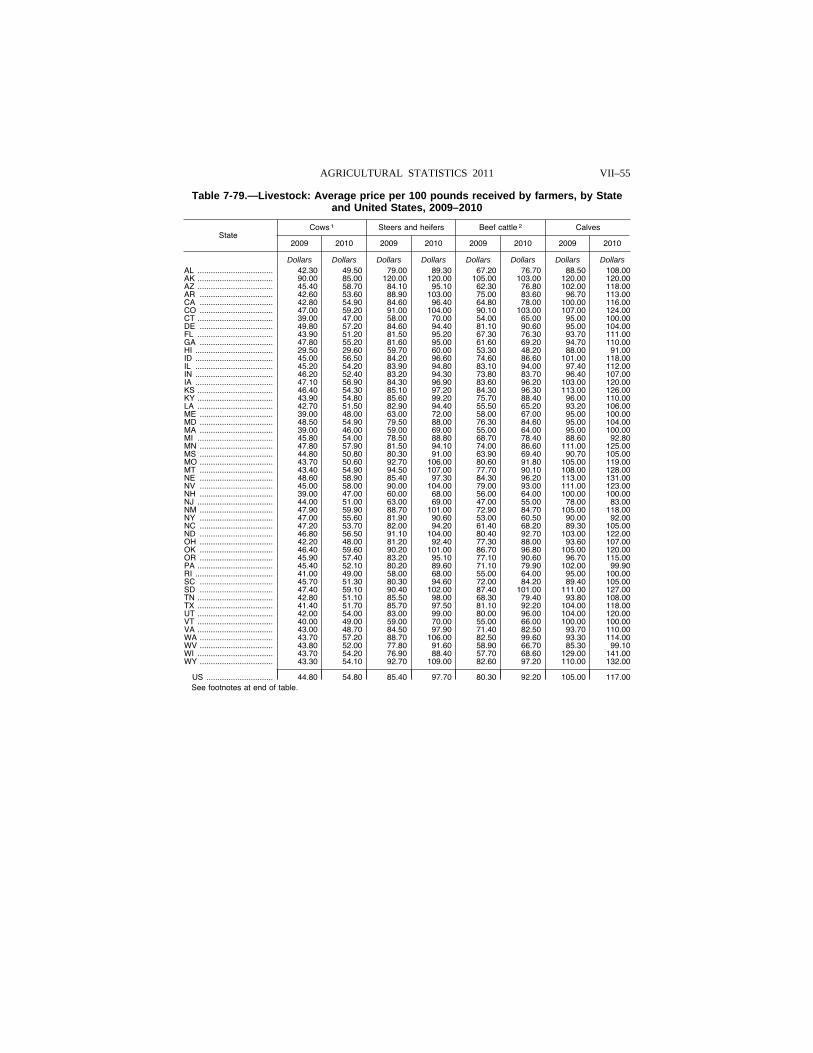
VII–55 AGRICULTURAL STATISTICS 2011
Table 7-79.—Livestock: Average price per 100 pounds received by farmers, by State and United States, 2009–2010
State Cows 1 Steers and heifers Beef cattle 2 Calves
2009 2010 2009 2010 2009 2010 2009 2010
Dollars Dollars Dollars Dollars Dollars Dollars Dollars Dollars AL .................................. 42.30 49.50 79.00 89.30 67.20 76.70 88.50 108.00 AK .................................. 90.00 85.00 120.00 120.00 105.00 103.00 120.00 120.00 AZ .................................. 45.40 58.70 84.10 95.10 62.30 76.80 102.00 118.00 AR ................................. 42.60 53.60 88.90 103.00 75.00 83.60 96.70 113.00 CA ................................. 42.80 54.90 84.60 96.40 64.80 78.00 100.00 116.00 CO ................................. 47.00 59.20 91.00 104.00 90.10 103.00 107.00 124.00 CT .................................. 39.00 47.00 58.00 70.00 54.00 65.00 95.00 100.00 DE ................................. 49.80 57.20 84.60 94.40 81.10 90.60 95.00 104.00 FL .................................. 43.90 51.20 81.50 95.20 67.30 76.30 93.70 111.00 GA ................................. 47.80 55.20 81.60 95.00 61.60 69.20 94.70 110.00 HI ................................... 29.50 29.60 59.70 60.00 53.30 48.20 88.00 91.00 ID ................................... 45.00 56.50 84.20 96.60 74.60 86.60 101.00 118.00 IL ................................... 45.20 54.20 83.90 94.80 83.10 94.00 97.40 112.00 IN ................................... 46.20 52.40 83.20 94.30 73.80 83.70 96.40 107.00 IA ................................... 47.10 56.90 84.30 96.90 83.60 96.20 103.00 120.00 KS .................................. 46.40 54.30 85.10 97.20 84.30 96.30 113.00 126.00 KY .................................. 43.90 54.80 85.60 99.20 75.70 88.40 96.00 110.00 LA .................................. 42.70 51.50 82.90 94.40 55.50 65.20 93.20 106.00 ME ................................. 39.00 48.00 63.00 72.00 58.00 67.00 95.00 100.00 MD ................................. 48.50 54.90 79.50 88.00 76.30 84.60 95.00 104.00 MA ................................. 39.00 46.00 59.00 69.00 55.00 64.00 95.00 100.00 MI .................................. 45.80 54.00 78.50 88.80 68.70 78.40 88.60 92.80 MN ................................. 47.80 57.90 81.50 94.10 74.00 86.60 111.00 125.00 MS ................................. 44.80 50.80 80.30 91.00 63.90 69.40 90.70 105.00 MO ................................. 43.70 50.60 92.70 106.00 80.60 91.80 105.00 119.00 MT ................................. 43.40 54.90 94.50 107.00 77.70 90.10 108.00 128.00 NE ................................. 48.60 58.90 85.40 97.30 84.30 96.20 113.00 131.00 NV ................................. 45.00 58.00 90.00 104.00 79.00 93.00 111.00 123.00 NH ................................. 39.00 47.00 60.00 68.00 56.00 64.00 100.00 100.00 NJ .................................. 44.00 51.00 63.00 69.00 47.00 55.00 78.00 83.00 NM ................................. 47.90 59.90 88.70 101.00 72.90 84.70 105.00 118.00 NY ................................. 47.00 55.60 81.90 90.60 53.00 60.50 90.00 92.00 NC ................................. 47.20 53.70 82.00 94.20 61.40 68.20 89.30 105.00 ND ................................. 46.80 56.50 91.10 104.00 80.40 92.70 103.00 122.00 OH ................................. 42.20 48.00 81.20 92.40 77.30 88.00 93.60 107.00 OK ................................. 46.40 59.60 90.20 101.00 86.70 96.80 105.00 120.00 OR ................................. 45.90 57.40 83.20 95.10 77.10 90.60 96.70 115.00 PA .................................. 45.40 52.10 80.20 89.60 71.10 79.90 102.00 99.90 RI ................................... 41.00 49.00 58.00 68.00 55.00 64.00 95.00 100.00 SC ................................. 45.70 51.30 80.30 94.60 72.00 84.20 89.40 105.00 SD ................................. 47.40 59.10 90.40 102.00 87.40 101.00 111.00 127.00 TN .................................. 42.80 51.10 85.50 98.00 68.30 79.40 93.80 108.00 TX .................................. 41.40 51.70 85.70 97.50 81.10 92.20 104.00 118.00 UT .................................. 42.00 54.00 83.00 99.00 80.00 96.00 104.00 120.00 VT .................................. 40.00 49.00 59.00 70.00 55.00 66.00 100.00 100.00 VA .................................. 43.00 48.70 84.50 97.90 71.40 82.50 93.70 110.00 WA ................................. 43.70 57.20 88.70 106.00 82.50 99.60 93.30 114.00 WV ................................. 43.80 52.00 77.80 91.60 58.90 66.70 85.30 99.10 WI .................................. 43.70 54.20 76.90 88.40 57.70 68.60 129.00 141.00 WY ................................. 43.30 54.10 92.70 109.00 82.60 97.20 110.00 132.00
US .............................. 44.80 54.80 85.40 97.70 80.30 92.20 105.00 117.00 See footnotes at end of table.
VerDate Aug 31 2005 13:43 Mar 01, 2012 Jkt 000000 PO 00000 Frm 00055 Fmt 1000 Sfmt 1000 H:\SHARED\DAPP\FPU\AGSTAT\MASTER~2\CHAPTR07\VII-59.AG8 USDA
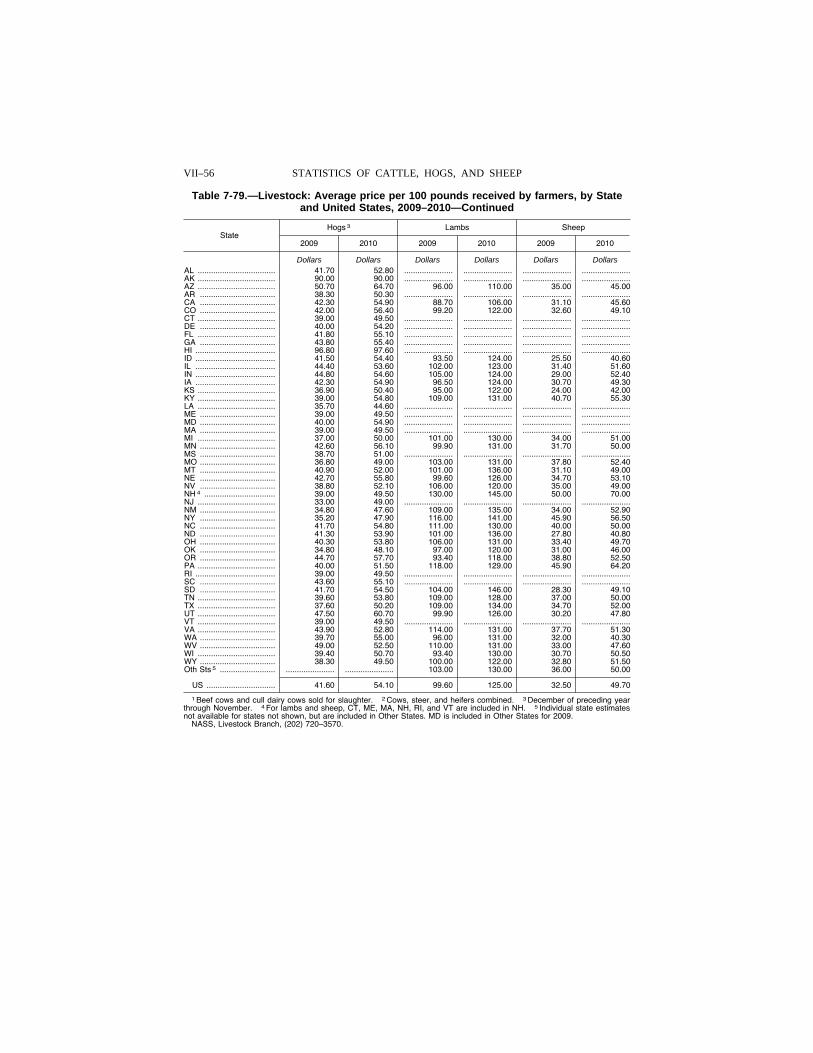
VII–56 STATISTICS OF CATTLE, HOGS, AND SHEEP
Table 7-79.—Livestock: Average price per 100 pounds received by farmers, by State and United States, 2009–2010—Continued
State Hogs 3 Lambs Sheep
2009 2010 2009 2010 2009 2010
Dollars Dollars Dollars Dollars Dollars Dollars AL ................................... 41.70 52.80 ...................... ...................... ...................... ......................AK ................................... 90.00 90.00 ...................... ...................... ...................... ......................AZ ................................... 50.70 64.70 96.00 110.00 35.00 45.00 AR .................................. 38.30 50.30 ...................... ...................... ...................... ......................CA .................................. 42.30 54.90 88.70 106.00 31.10 45.60 CO .................................. 42.00 56.40 99.20 122.00 32.60 49.10 CT ................................... 39.00 49.50 ...................... ...................... ...................... ......................DE .................................. 40.00 54.20 ...................... ...................... ...................... ......................FL ................................... 41.80 55.10 ...................... ...................... ...................... ......................GA .................................. 43.80 55.40 ...................... ...................... ...................... ......................HI .................................... 96.80 97.60 ...................... ...................... ...................... ......................ID .................................... 41.50 54.40 93.50 124.00 25.50 40.60 IL .................................... 44.40 53.60 102.00 123.00 31.40 51.60 IN .................................... 44.80 54.60 105.00 124.00 29.00 52.40 IA .................................... 42.30 54.90 96.50 124.00 30.70 49.30 KS ................................... 36.90 50.40 95.00 122.00 24.00 42.00 KY ................................... 39.00 54.80 109.00 131.00 40.70 55.30 LA ................................... 35.70 44.60 ...................... ...................... ...................... ......................ME .................................. 39.00 49.50 ...................... ...................... ...................... ......................MD .................................. 40.00 54.90 ...................... ...................... ...................... ......................MA .................................. 39.00 49.50 ...................... ...................... ...................... ......................MI ................................... 37.00 50.00 101.00 130.00 34.00 51.00 MN .................................. 42.60 56.10 99.90 131.00 31.70 50.00 MS .................................. 38.70 51.00 ...................... ...................... ...................... ......................MO .................................. 36.80 49.00 103.00 131.00 37.80 52.40 MT .................................. 40.90 52.00 101.00 136.00 31.10 49.00 NE .................................. 42.70 55.80 99.60 126.00 34.70 53.10 NV .................................. 38.80 52.10 106.00 120.00 35.00 49.00 NH 4 ................................ 39.00 49.50 130.00 145.00 50.00 70.00 NJ ................................... 33.00 49.00 ...................... ...................... ...................... ......................NM .................................. 34.80 47.60 109.00 135.00 34.00 52.90 NY .................................. 35.20 47.90 116.00 141.00 45.90 56.50 NC .................................. 41.70 54.80 111.00 130.00 40.00 50.00 ND .................................. 41.30 53.90 101.00 136.00 27.80 40.80 OH .................................. 40.30 53.80 106.00 131.00 33.40 49.70 OK .................................. 34.80 48.10 97.00 120.00 31.00 46.00 OR .................................. 44.70 57.70 93.40 118.00 38.80 52.50 PA ................................... 40.00 51.50 118.00 129.00 45.90 64.20 RI .................................... 39.00 49.50 ...................... ...................... ...................... ......................SC .................................. 43.60 55.10 ...................... ...................... ...................... ......................SD .................................. 41.70 54.50 104.00 146.00 28.30 49.10 TN ................................... 39.60 53.80 109.00 128.00 37.00 50.00 TX ................................... 37.60 50.20 109.00 134.00 34.70 52.00 UT ................................... 47.50 60.70 99.90 126.00 30.20 47.80 VT ................................... 39.00 49.50 ...................... ...................... ...................... ......................VA ................................... 43.90 52.80 114.00 131.00 37.70 51.30 WA .................................. 39.70 55.00 96.00 131.00 32.00 40.30 WV .................................. 49.00 52.50 110.00 131.00 33.00 47.60 WI ................................... 39.40 50.70 93.40 130.00 30.70 50.50 WY .................................. 38.30 49.50 100.00 122.00 32.80 51.50 Oth Sts 5 ......................... ...................... ...................... 103.00 130.00 36.00 50.00
US ............................... 41.60 54.10 99.60 125.00 32.50 49.70
1 Beef cows and cull dairy cows sold for slaughter. 2 Cows, steer, and heifers combined. 3 December of preceding year through November. 4 For lambs and sheep, CT, ME, MA, NH, RI, and VT are included in NH. 5 Individual state estimates not available for states not shown, but are included in Other States. MD is included in Other States for 2009.
NASS, Livestock Branch, (202) 720–3570.
VerDate Aug 31 2005 13:43 Mar 01, 2012 Jkt 000000 PO 00000 Frm 00056 Fmt 1000 Sfmt 1000 H:\SHARED\DAPP\FPU\AGSTAT\MASTER~2\CHAPTR07\VII-60.AG8 USDA
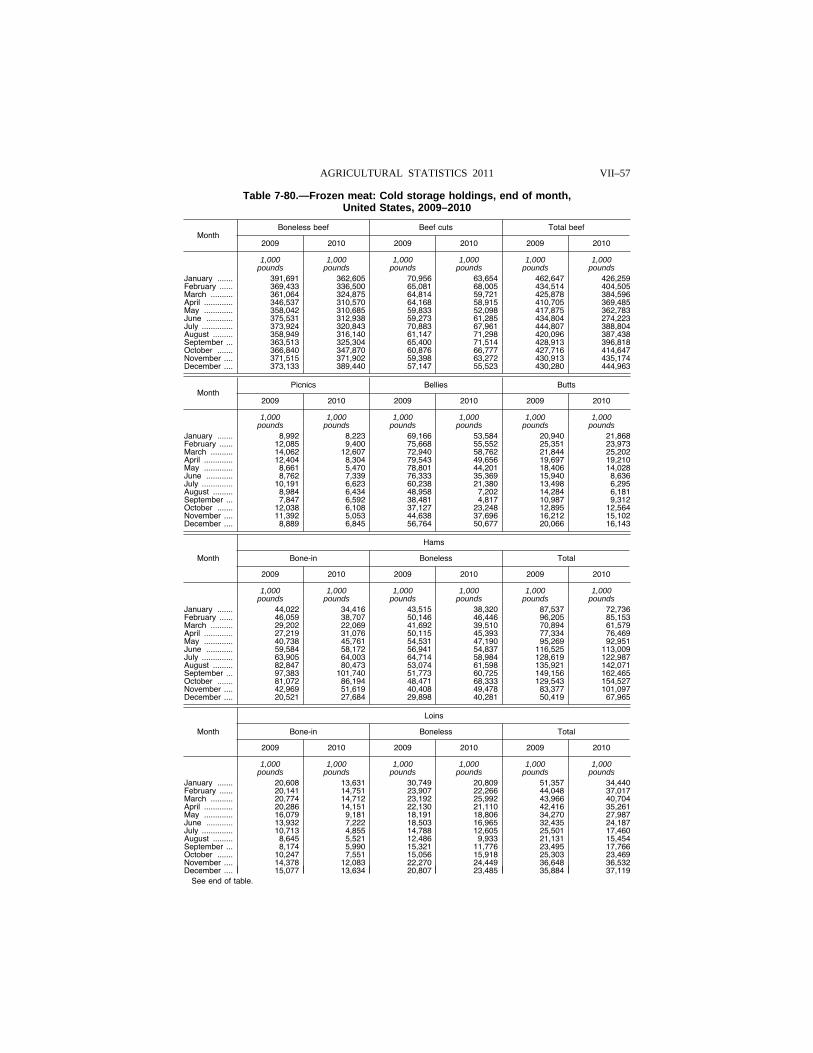
VII–57 AGRICULTURAL STATISTICS 2011
Table 7-80.—Frozen meat: Cold storage holdings, end of month, United States, 2009–2010
Month Boneless beef Beef cuts Total beef
2009 2010 2009 2010 2009 2010
1,000 1,000 1,000 1,000 1,000 1,000 pounds pounds pounds pounds pounds pounds
January ....... 391,691 362,605 70,956 63,654 462,647 426,259 February ...... 369,433 336,500 65,081 68,005 434,514 404,505 March .......... 361,064 324,875 64,814 59,721 425,878 384,596 April ............. 346,537 310,570 64,168 58,915 410,705 369,485 May ............. 358,042 310,685 59,833 52,098 417,875 362,783 June ............ 375,531 312,938 59,273 61,285 434,804 274,223 July .............. 373,924 320,843 70,883 67,961 444,807 388,804 August ......... 358,949 316,140 61,147 71,298 420,096 387,438 September ... 363,513 325,304 65,400 71,514 428,913 396,818 October ....... 366,840 347,870 60,876 66,777 427,716 414,647 November .... 371,515 371,902 59,398 63,272 430,913 435,174 December .... 373,133 389,440 57,147 55,523 430,280 444,963
Month Picnics Bellies Butts
2009 2010 2009 2010 2009 2010
1,000 1,000 1,000 1,000 1,000 1,000 pounds pounds pounds pounds pounds pounds
January ....... 8,992 8,223 69,166 53,584 20,940 21,868 February ...... 12,085 9,400 75,668 55,552 25,351 23,973 March .......... 14,062 12,607 72,940 58,762 21,844 25,202 April ............. 12,404 8,304 79,543 49,656 19,697 19,210 May ............. 8,661 5,470 78,801 44,201 18,406 14,028 June ............ 8,762 7,339 76,333 35,369 15,940 8,636 July .............. 10,191 6,623 60,238 21,380 13,498 6,295 August ......... 8,984 6,434 48,958 7,202 14,284 6,181 September ... 7,847 6,592 38,481 4,817 10,987 9,312 October ....... 12,038 6,108 37,127 23,248 12,895 12,564 November .... 11,392 5,053 44,638 37,696 16,212 15,102 December .... 8,889 6,845 56,764 50,677 20,066 16,143
Month
Hams
Bone-in Boneless Total
2009 2010 2009 2010 2009 2010
1,000 1,000 1,000 1,000 1,000 1,000 pounds pounds pounds pounds pounds pounds
January ....... 44,022 34,416 43,515 38,320 87,537 72,736 February ...... 46,059 38,707 50,146 46,446 96,205 85,153 March .......... 29,202 22,069 41,692 39,510 70,894 61,579 April ............. 27,219 31,076 50,115 45,393 77,334 76,469 May ............. 40,738 45,761 54,531 47,190 95,269 92,951 June ............ 59,584 58,172 56,941 54,837 116,525 113,009 July .............. 63,905 64,003 64,714 58,984 128,619 122,987 August ......... 82,847 80,473 53,074 61,598 135,921 142,071 September ... 97,383 101,740 51,773 60,725 149,156 162,465 October ....... 81,072 86,194 48,471 68,333 129,543 154,527 November .... 42,969 51,619 40,408 49,478 83,377 101,097 December .... 20,521 27,684 29,898 40,281 50,419 67,965
Month
Loins
Bone-in Boneless Total
2009 2010 2009 2010 2009 2010
1,000 1,000 1,000 1,000 1,000 1,000 pounds pounds pounds pounds pounds pounds
January ....... 20,608 13,631 30,749 20,809 51,357 34,440 February ...... 20,141 14,751 23,907 22,266 44,048 37,017 March .......... 20,774 14,712 23,192 25,992 43,966 40,704 April ............. 20,286 14,151 22,130 21,110 42,416 35,261 May ............. 16,079 9,181 18,191 18,806 34,270 27,987 June ............ 13,932 7,222 18,503 16,965 32,435 24,187 July .............. 10,713 4,855 14,788 12,605 25,501 17,460 August ......... 8,645 5,521 12,486 9,933 21,131 15,454 September ... 8,174 5,990 15,321 11,776 23,495 17,766 October ....... 10,247 7,551 15,056 15,918 25,303 23,469 November .... 14,378 12,083 22,270 24,449 36,648 36,532 December .... 15,077 13,634 20,807 23,485 35,884 37,119
See end of table.
VerDate Aug 31 2005 13:43 Mar 01, 2012 Jkt 000000 PO 00000 Frm 00057 Fmt 1000 Sfmt 1000 H:\SHARED\DAPP\FPU\AGSTAT\MASTER~2\CHAPTR07\VII-61.AG8 USDA
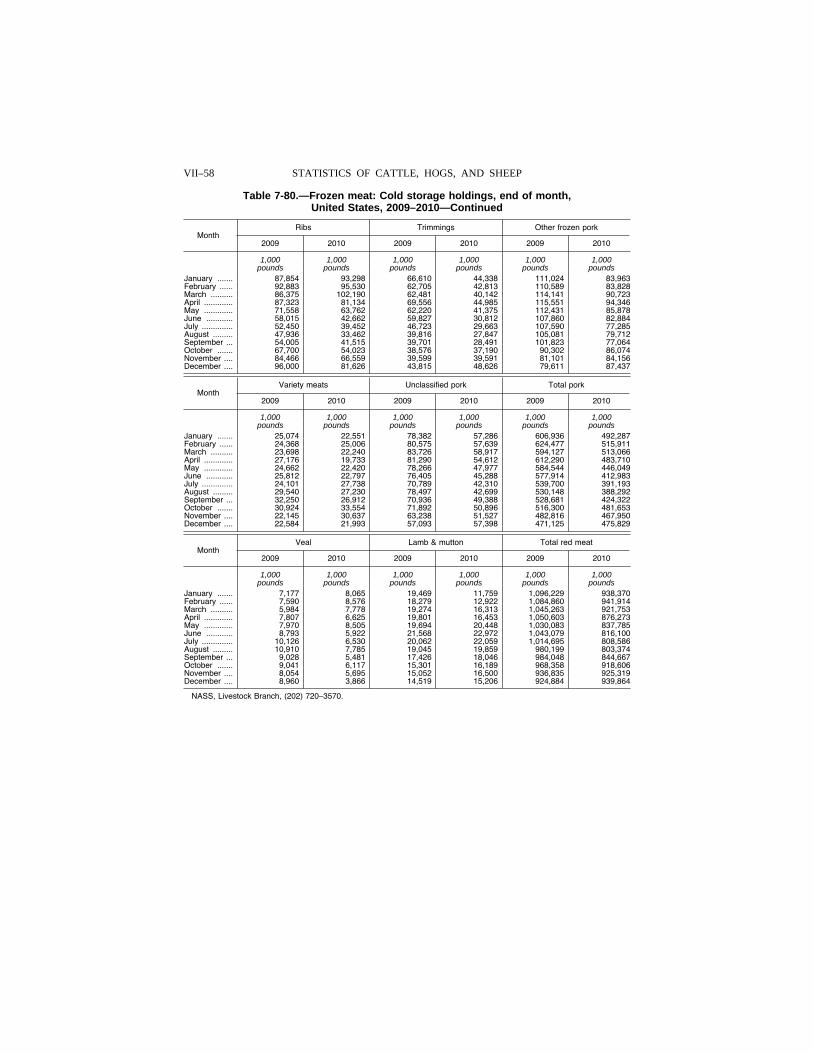
VII–58 STATISTICS OF CATTLE, HOGS, AND SHEEP
Table 7-80.—Frozen meat: Cold storage holdings, end of month, United States, 2009–2010—Continued
Month Ribs Trimmings Other frozen pork
2009 2010 2009 2010 2009 2010
1,000 1,000 1,000 1,000 1,000 1,000 pounds pounds pounds pounds pounds pounds
January ....... 87,854 93,298 66,610 44,338 111,024 83,963 February ...... 92,883 95,530 62,705 42,813 110,589 83,828 March .......... 86,375 102,190 62,481 40,142 114,141 90,723 April ............. 87,323 81,134 69,556 44,985 115,551 94,346 May ............. 71,558 63,762 62,220 41,375 112,431 85,878 June ............ 58,015 42,662 59,827 30,812 107,860 82,884 July .............. 52,450 39,452 46,723 29,663 107,590 77,285 August ......... 47,936 33,462 39,816 27,847 105,081 79,712 September ... 54,005 41,515 39,701 28,491 101,823 77,064 October ....... 67,700 54,023 38,576 37,190 90,302 86,074 November .... 84,466 66,559 39,599 39,591 81,101 84,156 December .... 96,000 81,626 43,815 48,626 79,611 87,437
Month Variety meats Unclassified pork Total pork
2009 2010 2009 2010 2009 2010
1,000 1,000 1,000 1,000 1,000 1,000 pounds pounds pounds pounds pounds pounds
January ....... 25,074 22,551 78,382 57,286 606,936 492,287 February ...... 24,368 25,006 80,575 57,639 624,477 515,911 March .......... 23,698 22,240 83,726 58,917 594,127 513,066 April ............. 27,176 19,733 81,290 54,612 612,290 483,710 May ............. 24,662 22,420 78,266 47,977 584,544 446,049 June ............ 25,812 22,797 76,405 45,288 577,914 412,983 July .............. 24,101 27,738 70,789 42,310 539,700 391,193 August ......... 29,540 27,230 78,497 42,699 530,148 388,292 September ... 32,250 26,912 70,936 49,388 528,681 424,322 October ....... 30,924 33,554 71,892 50,896 516,300 481,653 November .... 22,145 30,637 63,238 51,527 482,816 467,950 December .... 22,584 21,993 57,093 57,398 471,125 475,829
Month Veal Lamb & mutton Total red meat
2009 2010 2009 2010 2009 2010
1,000 1,000 1,000 1,000 1,000 1,000 pounds pounds pounds pounds pounds pounds
January ....... 7,177 8,065 19,469 11,759 1,096,229 938,370 February ...... 7,590 8,576 18,279 12,922 1,084,860 941,914 March .......... 5,984 7,778 19,274 16,313 1,045,263 921,753 April ............. 7,807 6,625 19,801 16,453 1,050,603 876,273 May ............. 7,970 8,505 19,694 20,448 1,030,083 837,785 June ............ 8,793 5,922 21,568 22,972 1,043,079 816,100 July .............. 10,126 6,530 20,062 22,059 1,014,695 808,586 August ......... 10,910 7,785 19,045 19,859 980,199 803,374 September ... 9,028 5,481 17,426 18,046 984,048 844,667 October ....... 9,041 6,117 15,301 16,189 968,358 918,606 November .... 8,054 5,695 15,052 16,500 936,835 925,319 December .... 8,960 3,866 14,519 15,206 924,884 939,864
NASS, Livestock Branch, (202) 720–3570.
VerDate Aug 31 2005 13:43 Mar 01, 2012 Jkt 000000 PO 00000 Frm 00058 Fmt 1000 Sfmt 1000 H:\SHARED\DAPP\FPU\AGSTAT\MASTER~2\CHAPTR07\VII-62.AG8 USDA
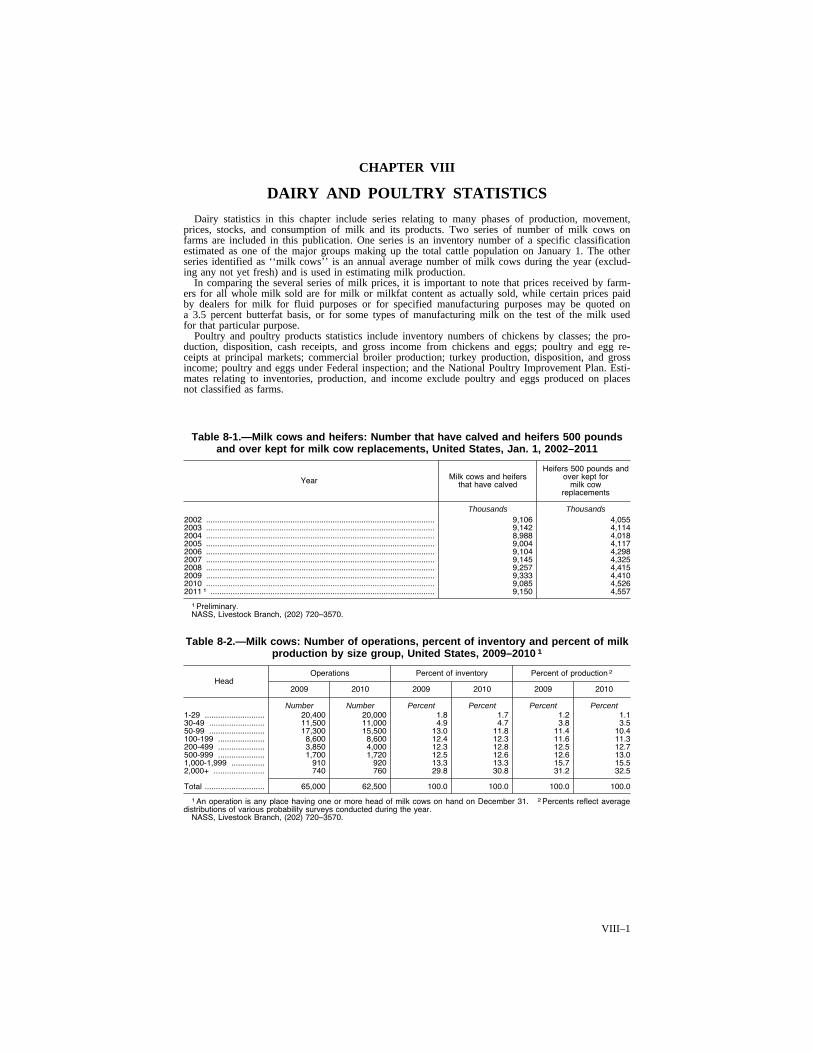
VIII–1
CHAPTER VIII
DAIRY AND POULTRY STATISTICS
Dairy statistics in this chapter include series relating to many phases of production, movement, prices, stocks, and consumption of milk and its products. Two series of number of milk cows on farms are included in this publication. One series is an inventory number of a specific classification estimated as one of the major groups making up the total cattle population on January 1. The other series identified as ‘‘milk cows’’ is an annual average number of milk cows during the year (exclud-ing any not yet fresh) and is used in estimating milk production.
In comparing the several series of milk prices, it is important to note that prices received by farm-ers for all whole milk sold are for milk or milkfat content as actually sold, while certain prices paid by dealers for milk for fluid purposes or for specified manufacturing purposes may be quoted on a 3.5 percent butterfat basis, or for some types of manufacturing milk on the test of the milk used for that particular purpose.
Poultry and poultry products statistics include inventory numbers of chickens by classes; the pro-duction, disposition, cash receipts, and gross income from chickens and eggs; poultry and egg re-ceipts at principal markets; commercial broiler production; turkey production, disposition, and gross income; poultry and eggs under Federal inspection; and the National Poultry Improvement Plan. Esti-mates relating to inventories, production, and income exclude poultry and eggs produced on places not classified as farms.
Table 8-1.—Milk cows and heifers: Number that have calved and heifers 500 pounds and over kept for milk cow replacements, United States, Jan. 1, 2002–2011
Year Milk cows and heifers that have calved
Heifers 500 pounds and over kept for
milk cow replacements
Thousands Thousands 2002 ....................................................................................................... 9,106 4,055 2003 ....................................................................................................... 9,142 4,114 2004 ....................................................................................................... 8,988 4,018 2005 ....................................................................................................... 9,004 4,117 2006 ....................................................................................................... 9,104 4,298 2007 ....................................................................................................... 9,145 4,325 2008 ....................................................................................................... 9,257 4,415 2009 ....................................................................................................... 9,333 4,410 2010 ....................................................................................................... 9,085 4,526 2011 1 ..................................................................................................... 9,150 4,557
1 Preliminary. NASS, Livestock Branch, (202) 720–3570.
Table 8-2.—Milk cows: Number of operations, percent of inventory and percent of milk production by size group, United States, 2009–2010 1
Head Operations Percent of inventory Percent of production 2
2009 2010 2009 2010 2009 2010
Number Number Percent Percent Percent Percent 1-29 ........................... 20,400 20,000 1.8 1.7 1.2 1.1 30-49 ......................... 11,500 11,000 4.9 4.7 3.8 3.5 50-99 ......................... 17,300 15,500 13.0 11.8 11.4 10.4 100-199 ..................... 8,600 8,600 12.4 12.3 11.6 11.3 200-499 ..................... 3,850 4,000 12.3 12.8 12.5 12.7 500-999 ..................... 1,700 1,720 12.5 12.6 12.6 13.0 1,000-1,999 ............... 910 920 13.3 13.3 15.7 15.5 2,000+ ....................... 740 760 29.8 30.8 31.2 32.5
Total ........................... 65,000 62,500 100.0 100.0 100.0 100.0
1 An operation is any place having one or more head of milk cows on hand on December 31. 2 Percents reflect average distributions of various probability surveys conducted during the year.
NASS, Livestock Branch, (202) 720–3570.
VerDate Aug 31 2005 17:17 Mar 01, 2012 Jkt 000000 PO 00000 Frm 00001 Fmt 1001 Sfmt 1001 H:\SHARED\DAPP\FPU\AGSTAT\MASTER~2\CHAPTR08\VIII-01.AG8 USDA
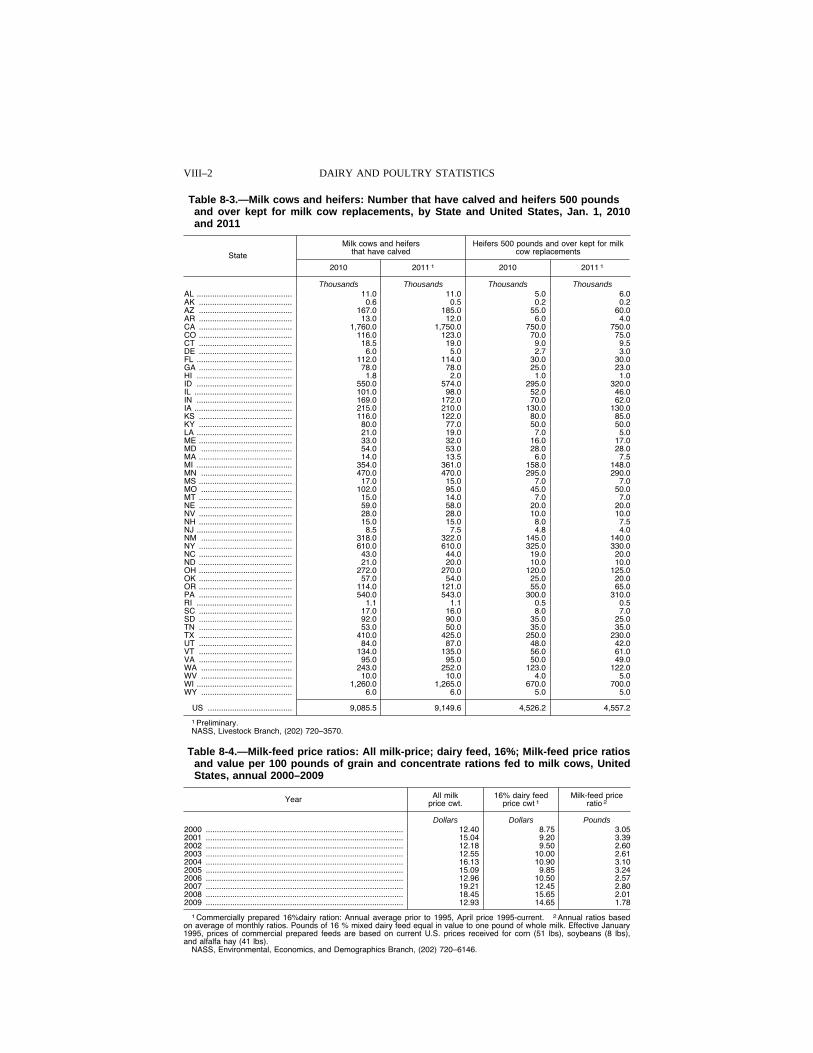
VIII–2 DAIRY AND POULTRY STATISTICS
Table 8-3.—Milk cows and heifers: Number that have calved and heifers 500 pounds and over kept for milk cow replacements, by State and United States, Jan. 1, 2010 and 2011
State
Milk cows and heifers that have calved
Heifers 500 pounds and over kept for milk cow replacements
2010 2011 1 2010 2011 1
Thousands Thousands Thousands Thousands AL ........................................... 11 .0 11 .0 5 .0 6 .0 AK .......................................... 0 .6 0 .5 0 .2 0 .2 AZ .......................................... 167 .0 185 .0 55 .0 60 .0 AR .......................................... 13 .0 12 .0 6 .0 4 .0 CA .......................................... 1,760 .0 1,750 .0 750 .0 750 .0 CO .......................................... 116 .0 123 .0 70 .0 75 .0 CT .......................................... 18 .5 19 .0 9 .0 9 .5 DE .......................................... 6 .0 5 .0 2 .7 3 .0 FL ........................................... 112 .0 114 .0 30 .0 30 .0 GA .......................................... 78 .0 78 .0 25 .0 23 .0 HI ........................................... 1 .8 2 .0 1 .0 1 .0 ID ........................................... 550 .0 574 .0 295 .0 320 .0 IL ............................................ 101 .0 98 .0 52 .0 46 .0 IN ........................................... 169 .0 172 .0 70 .0 62 .0 IA ............................................ 215 .0 210 .0 130 .0 130 .0 KS .......................................... 116 .0 122 .0 80 .0 85 .0 KY .......................................... 80 .0 77 .0 50 .0 50 .0 LA ........................................... 21 .0 19 .0 7 .0 5 .0 ME .......................................... 33 .0 32 .0 16 .0 17 .0 MD ......................................... 54 .0 53 .0 28 .0 28 .0 MA .......................................... 14 .0 13 .5 6 .0 7 .5 MI ........................................... 354 .0 361 .0 158 .0 148 .0 MN ......................................... 470 .0 470 .0 295 .0 290 .0 MS .......................................... 17 .0 15 .0 7 .0 7 .0 MO ......................................... 102 .0 95 .0 45 .0 50 .0 MT .......................................... 15 .0 14 .0 7 .0 7 .0 NE .......................................... 59 .0 58 .0 20 .0 20 .0 NV .......................................... 28 .0 28 .0 10 .0 10 .0 NH .......................................... 15 .0 15 .0 8 .0 7 .5 NJ ........................................... 8 .5 7 .5 4 .8 4 .0 NM ......................................... 318 .0 322 .0 145 .0 140 .0 NY .......................................... 610 .0 610 .0 325 .0 330 .0 NC .......................................... 43 .0 44 .0 19 .0 20 .0 ND .......................................... 21 .0 20 .0 10 .0 10 .0 OH .......................................... 272 .0 270 .0 120 .0 125 .0 OK .......................................... 57 .0 54 .0 25 .0 20 .0 OR .......................................... 114 .0 121 .0 55 .0 65 .0 PA .......................................... 540 .0 543 .0 300 .0 310 .0 RI ........................................... 1 .1 1 .1 0 .5 0 .5 SC .......................................... 17 .0 16 .0 8 .0 7 .0 SD .......................................... 92 .0 90 .0 35 .0 25 .0 TN .......................................... 53 .0 50 .0 35 .0 35 .0 TX .......................................... 410 .0 425 .0 250 .0 230 .0 UT .......................................... 84 .0 87 .0 48 .0 42 .0 VT .......................................... 134 .0 135 .0 56 .0 61 .0 VA .......................................... 95 .0 95 .0 50 .0 49 .0 WA ......................................... 243 .0 252 .0 123 .0 122 .0 WV ......................................... 10 .0 10 .0 4 .0 5 .0 WI ........................................... 1,260 .0 1,265 .0 670 .0 700 .0 WY ......................................... 6 .0 6 .0 5 .0 5 .0
US ...................................... 9,085 .5 9,149 .6 4,526 .2 4,557 .2
1 Preliminary. NASS, Livestock Branch, (202) 720–3570.
Table 8-4.—Milk-feed price ratios: All milk-price; dairy feed, 16%; Milk-feed price ratios and value per 100 pounds of grain and concentrate rations fed to milk cows, United States, annual 2000–2009
Year All milk price cwt.
16% dairy feed price cwt 1
Milk-feed price ratio 2
Dollars Dollars Pounds 2000 ......................................................................................... 12.40 8.75 3.05 2001 ......................................................................................... 15.04 9.20 3.39 2002 ......................................................................................... 12.18 9.50 2.60 2003 ......................................................................................... 12.55 10.00 2.61 2004 ......................................................................................... 16.13 10.90 3.10 2005 ......................................................................................... 15.09 9.85 3.24 2006 ......................................................................................... 12.96 10.50 2.57 2007 ......................................................................................... 19.21 12.45 2.80 2008 ......................................................................................... 18.45 15.65 2.01 2009 ......................................................................................... 12.93 14.65 1.78
1 Commercially prepared 16%dairy ration: Annual average prior to 1995, April price 1995-current. 2 Annual ratios based on average of monthly ratios. Pounds of 16 % mixed dairy feed equal in value to one pound of whole milk. Effective January 1995, prices of commercial prepared feeds are based on current U.S. prices received for corn (51 lbs), soybeans (8 lbs), and alfalfa hay (41 lbs).
NASS, Environmental, Economics, and Demographics Branch, (202) 720–6146.
VerDate Aug 31 2005 17:17 Mar 01, 2012 Jkt 000000 PO 00000 Frm 00002 Fmt 1000 Sfmt 1000 H:\SHARED\DAPP\FPU\AGSTAT\MASTER~2\CHAPTR08\VIII-02.AG8 USDA
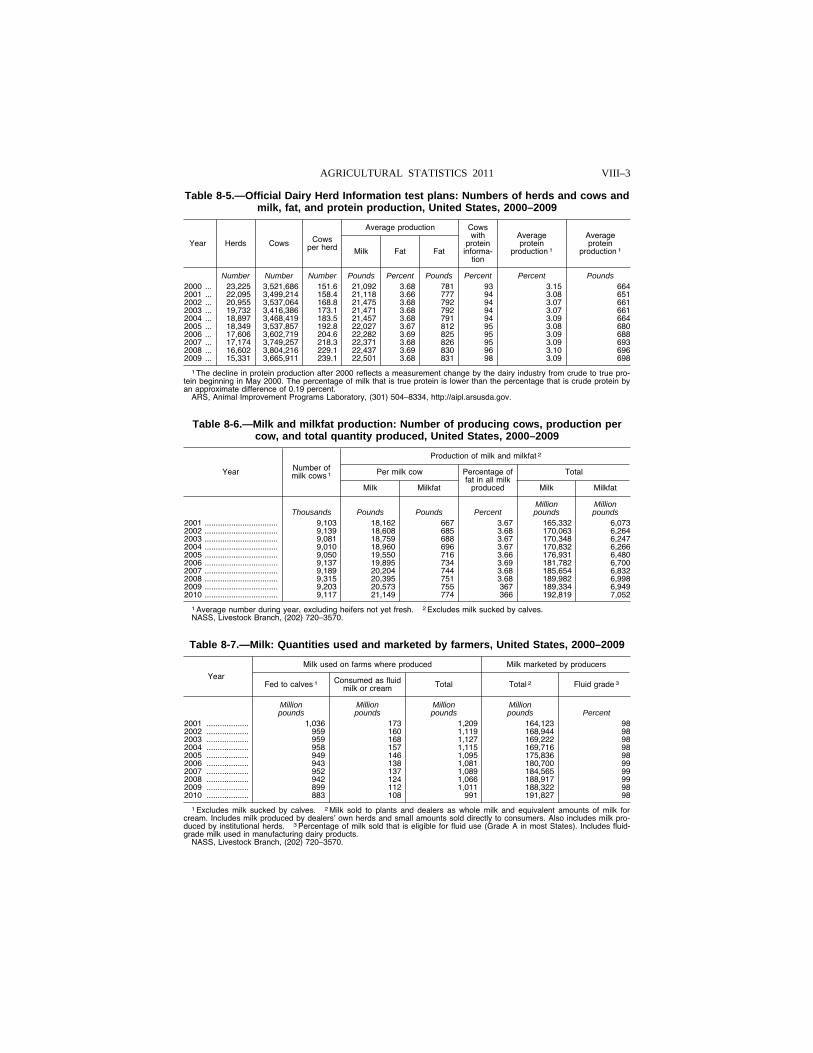
VIII–3 AGRICULTURAL STATISTICS 2011
Table 8-5.—Official Dairy Herd Information test plans: Numbers of herds and cows and milk, fat, and protein production, United States, 2000–2009
Year Herds Cows Cows per herd
Average production Cows with
protein informa-
tion
Average protein
production 1
Average protein
production 1 Milk Fat Fat
Number Number Number Pounds Percent Pounds Percent Percent Pounds 2000 ... 23,225 3,521,686 151.6 21,092 3.68 781 93 3.15 664 2001 ... 22,095 3,499,214 158.4 21,118 3.66 777 94 3.08 651 2002 ... 20,955 3,537,064 168.8 21,475 3.68 792 94 3.07 661 2003 ... 19,732 3,416,386 173.1 21,471 3.68 792 94 3.07 661 2004 ... 18,897 3,468,419 183.5 21,457 3.68 791 94 3.09 664 2005 ... 18,349 3,537,857 192.8 22,027 3.67 812 95 3.08 680 2006 ... 17,606 3,602,719 204.6 22,282 3.69 825 95 3.09 688 2007 ... 17,174 3,749,257 218.3 22,371 3.68 826 95 3.09 693 2008 ... 16,602 3,804,216 229.1 22,437 3.69 830 96 3.10 696 2009 ... 15,331 3,665,911 239.1 22,501 3.68 831 98 3.09 698
1 The decline in protein production after 2000 reflects a measurement change by the dairy industry from crude to true pro-tein beginning in May 2000. The percentage of milk that is true protein is lower than the percentage that is crude protein by an approximate difference of 0.19 percent.
ARS, Animal Improvement Programs Laboratory, (301) 504–8334, http://aipl.arsusda.gov.
Table 8-6.—Milk and milkfat production: Number of producing cows, production per cow, and total quantity produced, United States, 2000–2009
Year Number of milk cows 1
Production of milk and milkfat 2
Per milk cow Percentage of fat in all milk
produced
Total
Milk Milkfat Milk Milkfat
Million Million Thousands Pounds Pounds Percent pounds pounds
2001 ................................. 9,103 18,162 667 3.67 165,332 6,073 2002 ................................. 9,139 18,608 685 3.68 170,063 6,264 2003 ................................. 9,081 18,759 688 3.67 170,348 6,247 2004 ................................. 9,010 18,960 696 3.67 170,832 6,266 2005 ................................. 9,050 19,550 716 3.66 176,931 6,480 2006 ................................. 9,137 19,895 734 3.69 181,782 6,700 2007 ................................. 9,189 20,204 744 3.68 185,654 6,832 2008 ................................. 9,315 20,395 751 3.68 189,982 6,998 2009 ................................. 9,203 20,573 755 367 189,334 6,949 2010 ................................. 9,117 21,149 774 366 192,819 7,052
1 Average number during year, excluding heifers not yet fresh. 2 Excludes milk sucked by calves. NASS, Livestock Branch, (202) 720–3570.
Table 8-7.—Milk: Quantities used and marketed by farmers, United States, 2000–2009
Year
Milk used on farms where produced Milk marketed by producers
Fed to calves 1 Consumed as fluid milk or cream Total Total 2 Fluid grade 3
Million Million Million Million pounds pounds pounds pounds Percent
2001 ................... 1,036 173 1,209 164,123 98 2002 ................... 959 160 1,119 168,944 98 2003 ................... 959 168 1,127 169,222 98 2004 ................... 958 157 1,115 169,716 98 2005 ................... 949 146 1,095 175,836 98 2006 ................... 943 138 1,081 180,700 99 2007 ................... 952 137 1,089 184,565 99 2008 ................... 942 124 1,066 188,917 99 2009 ................... 899 112 1,011 188,322 98 2010 ................... 883 108 991 191,827 98
1 Excludes milk sucked by calves. 2 Milk sold to plants and dealers as whole milk and equivalent amounts of milk for cream. Includes milk produced by dealers’ own herds and small amounts sold directly to consumers. Also includes milk pro-duced by institutional herds. 3 Percentage of milk sold that is eligible for fluid use (Grade A in most States). Includes fluid- grade milk used in manufacturing dairy products.
NASS, Livestock Branch, (202) 720–3570.
VerDate Aug 31 2005 17:17 Mar 01, 2012 Jkt 000000 PO 00000 Frm 00003 Fmt 1000 Sfmt 1000 H:\SHARED\DAPP\FPU\AGSTAT\MASTER~2\CHAPTR08\VIII-07.AG8 USDA
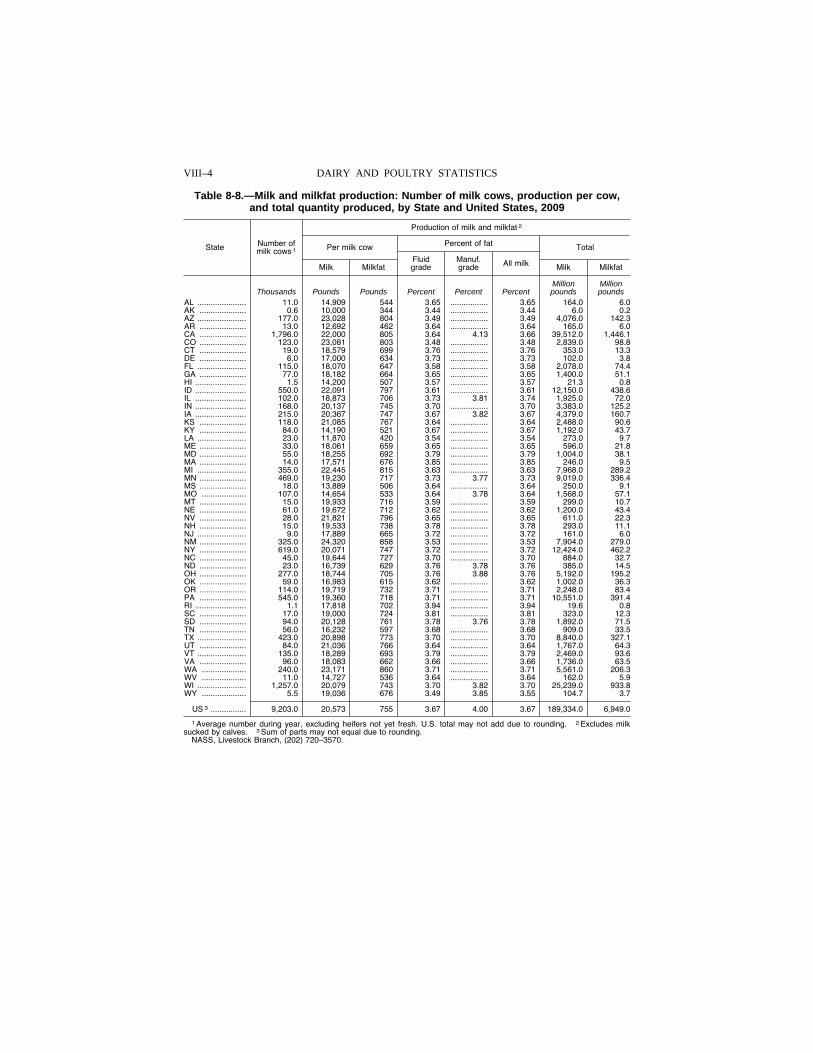
VIII–4 DAIRY AND POULTRY STATISTICS
Table 8-8.—Milk and milkfat production: Number of milk cows, production per cow, and total quantity produced, by State and United States, 2009
State Number of milk cows 1
Production of milk and milkfat 2
Per milk cow Percent of fat Total
Milk Milkfat Fluid grade
Manuf. grade All milk Milk Milkfat
Million Million Thousands Pounds Pounds Percent Percent Percent pounds pounds
AL ...................... 11.0 14,909 544 3.65 ................. 3.65 164.0 6.0 AK ..................... 0.6 10,000 344 3.44 ................. 3.44 6.0 0.2 AZ ...................... 177.0 23,028 804 3.49 ................. 3.49 4,076.0 142.3 AR ..................... 13.0 12,692 462 3.64 ................. 3.64 165.0 6.0 CA ..................... 1,796.0 22,000 805 3.64 4.13 3.66 39,512.0 1,446.1 CO ..................... 123.0 23,081 803 3.48 ................. 3.48 2,839.0 98.8 CT ..................... 19.0 18,579 699 3.76 ................. 3.76 353.0 13.3 DE ..................... 6.0 17,000 634 3.73 ................. 3.73 102.0 3.8 FL ...................... 115.0 18,070 647 3.58 ................. 3.58 2,078.0 74.4 GA ..................... 77.0 18,182 664 3.65 ................. 3.65 1,400.0 51.1 HI ....................... 1.5 14,200 507 3.57 ................. 3.57 21.3 0.8 ID ....................... 550.0 22,091 797 3.61 ................. 3.61 12,150.0 438.6 IL ....................... 102.0 18,873 706 3.73 3.81 3.74 1,925.0 72.0 IN ....................... 168.0 20,137 745 3.70 ................. 3.70 3,383.0 125.2 IA ....................... 215.0 20,367 747 3.67 3.82 3.67 4,379.0 160.7 KS ..................... 118.0 21,085 767 3.64 ................. 3.64 2,488.0 90.6 KY ..................... 84.0 14,190 521 3.67 ................. 3.67 1,192.0 43.7 LA ...................... 23.0 11,870 420 3.54 ................. 3.54 273.0 9.7 ME ..................... 33.0 18,061 659 3.65 ................. 3.65 596.0 21.8 MD ..................... 55.0 18,255 692 3.79 ................. 3.79 1,004.0 38.1 MA ..................... 14.0 17,571 676 3.85 ................. 3.85 246.0 9.5 MI ...................... 355.0 22,445 815 3.63 ................. 3.63 7,968.0 289.2 MN ..................... 469.0 19,230 717 3.73 3.77 3.73 9,019.0 336.4 MS ..................... 18.0 13,889 506 3.64 ................. 3.64 250.0 9.1 MO .................... 107.0 14,654 533 3.64 3.78 3.64 1,568.0 57.1 MT ..................... 15.0 19,933 716 3.59 ................. 3.59 299.0 10.7 NE ..................... 61.0 19,672 712 3.62 ................. 3.62 1,200.0 43.4 NV ..................... 28.0 21,821 796 3.65 ................. 3.65 611.0 22.3 NH ..................... 15.0 19,533 738 3.78 ................. 3.78 293.0 11.1 NJ ...................... 9.0 17,889 665 3.72 ................. 3.72 161.0 6.0 NM ..................... 325.0 24,320 858 3.53 ................. 3.53 7,904.0 279.0 NY ..................... 619.0 20,071 747 3.72 ................. 3.72 12,424.0 462.2 NC ..................... 45.0 19,644 727 3.70 ................. 3.70 884.0 32.7 ND ..................... 23.0 16,739 629 3.76 3.78 3.76 385.0 14.5 OH ..................... 277.0 18,744 705 3.76 3.88 3.76 5,192.0 195.2 OK ..................... 59.0 16,983 615 3.62 ................. 3.62 1,002.0 36.3 OR ..................... 114.0 19,719 732 3.71 ................. 3.71 2,248.0 83.4 PA ..................... 545.0 19,360 718 3.71 ................. 3.71 10,551.0 391.4 RI ....................... 1.1 17,818 702 3.94 ................. 3.94 19.6 0.8 SC ..................... 17.0 19,000 724 3.81 ................. 3.81 323.0 12.3 SD ..................... 94.0 20,128 761 3.78 3.76 3.78 1,892.0 71.5 TN ..................... 56.0 16,232 597 3.68 ................. 3.68 909.0 33.5 TX ...................... 423.0 20,898 773 3.70 ................. 3.70 8,840.0 327.1 UT ..................... 84.0 21,036 766 3.64 ................. 3.64 1,767.0 64.3 VT ...................... 135.0 18,289 693 3.79 ................. 3.79 2,469.0 93.6 VA ..................... 96.0 18,083 662 3.66 ................. 3.66 1,736.0 63.5 WA .................... 240.0 23,171 860 3.71 ................. 3.71 5,561.0 206.3 WV .................... 11.0 14,727 536 3.64 ................. 3.64 162.0 5.9 WI ...................... 1,257.0 20,079 743 3.70 3.82 3.70 25,239.0 933.8 WY .................... 5.5 19,036 676 3.49 3.85 3.55 104.7 3.7
US 3 ................ 9,203.0 20,573 755 3.67 4.00 3.67 189,334.0 6,949.0
1 Average number during year, excluding heifers not yet fresh. U.S. total may not add due to rounding. 2 Excludes milk sucked by calves. 3 Sum of parts may not equal due to rounding.
NASS, Livestock Branch, (202) 720–3570.
VerDate Aug 31 2005 17:17 Mar 01, 2012 Jkt 000000 PO 00000 Frm 00004 Fmt 1000 Sfmt 1000 H:\SHARED\DAPP\FPU\AGSTAT\MASTER~2\CHAPTR08\VIII-08.AG8 USDA

VIII–5 AGRICULTURAL STATISTICS 2011
Table 8-9.—Milk and milkfat production: Number of milk cows, production per cow, and total quantity produced, by State and United States, 2010
State Number of milk cows 1
Production of milk and milkfat 2
Per milk cow Percent of fat Total
Milk Milkfat Fluid grade
Manuf. grade All milk Milk Milkfat
Million Million Thousands Pounds Pounds Percent Percent Percent pounds pounds
AL ...................... 11.0 14,455 529 3.66 ................. 3.66 159.0 5.8 AK ..................... 0.6 11,833 404 3.41 ................. 3.41 7.1 0.2 AZ ...................... 177.0 23,441 820 3.50 ................. 3.50 4,149.0 145.2 AR ..................... 12.0 12,833 468 3.65 ................. 3.65 154.0 5.6 CA ..................... 1,754.0 23,025 843 3.64 4.12 3.66 40,385.0 1,478.1 CO ..................... 119.0 23,664 826 3.49 ................. 3.49 2,816.0 98.3 CT ..................... 19.0 19,263 724 3.76 ................. 3.76 366.0 13.8 DE ..................... 5.3 16,981 654 3.85 ................. 3.85 90.0 3.5 FL ...................... 114.0 18,658 672 3.60 ................. 3.60 2,127.0 76.6 GA ..................... 78.0 17,885 655 3.66 ................. 3.66 1,395.0 51.1 HI ....................... 1.9 13,316 474 3.56 ................. 3.56 25.3 0.9 ID ....................... 564.0 22,658 818 3.61 ................. 3.61 12,779.0 461.3 IL ....................... 100.0 19,170 715 3.72 3.76 3.73 1,917.0 71.5 IN ....................... 169.0 20,320 748 3.68 ................. 3.68 3,434.0 126.4 IA ....................... 209.0 20,751 755 3.64 3.85 3.64 4,337.0 157.9 KS ..................... 119.0 21,000 771 3.67 ................. 3.67 2,499.0 91.7 KY ..................... 78.0 14,833 543 3.66 ................. 3.66 1,157.0 42.3 LA ...................... 20.0 11,750 414 3.52 ................. 3.52 235.0 8.3 ME ..................... 32.0 18,344 682 3.72 ................. 3.72 587.0 21.8 MD ..................... 54.0 18,537 693 3.74 ................. 3.74 1,001.0 37.4 MA ..................... 14.0 17,429 668 3.83 ................. 3.83 244.0 9.3 MI ...................... 358.0 23,260 835 3.59 ................. 3.59 8,327.0 298.9 MN ..................... 470.0 19,366 717 3.70 3.77 3.70 9,102.0 336.8 MS ..................... 17.0 13,118 481 3.67 ................. 3.67 223.0 8.2 MO .................... 99.0 14,596 531 3.63 3.78 3.64 1,445.0 52.6 MT ..................... 14.0 20,643 751 3.64 ................. 3.64 289.0 10.5 NE ..................... 59.0 19,797 729 3.68 ................. 3.68 1,168.0 43.0 NV ..................... 28.0 22,143 784 3.54 ................. 3.54 620.0 21.9 NH ..................... 15.0 19,867 763 3.84 ................. 3.84 298.0 11.4 NJ ...................... 8.0 17,500 646 3.69 ................. 3.69 140.0 5.2 NM ..................... 321.0 24,551 869 3.54 ................. 3.54 7,881.0 279.0 NY ..................... 611.0 20,807 768 3.69 ................. 3.69 12,713.0 469.1 NC ..................... 44.0 19,591 727 3.71 ................. 3.71 862.0 32.0 ND ..................... 21.0 18,286 678 3.70 3.88 3.71 384.0 14.2 OH ..................... 271.0 19,446 725 3.72 3.87 3.73 5,270.0 196.6 OK ..................... 56.0 17,125 623 3.64 ................. 3.64 959.0 34.9 OR ..................... 118.0 20,331 758 3.73 ................. 3.73 2,399.0 89.5 PA ..................... 541.0 19,841 728 3.67 ................. 3.67 10,734.0 393.9 RI ....................... 1.1 17,727 695 3.92 ................. 3.92 19.5 0.8 SC ..................... 16.0 17,875 702 3.93 ................. 3.93 286.0 11.2 SD ..................... 92.0 20,478 766 3.74 3.72 3.74 1,884.0 70.5 TN ..................... 52.0 16,346 600 3.67 ................. 3.67 850.0 31.2 TX ...................... 413.0 21,375 797 3.73 ................. 3.73 8,828.0 329.3 UT ..................... 85.0 21,400 783 3.66 ................. 3.66 1,819.0 66.6 VT ...................... 136.0 18,544 701 3.78 ................. 3.78 2,522.0 95.3 VA ..................... 95.0 18,095 659 3.64 ................. 3.64 1,719.0 62.6 WA .................... 251.0 23,510 877 3.73 ................. 3.73 5,901.0 220.1 WV .................... 10.0 15,700 570 3.63 ................. 3.63 157.0 5.7 WI ...................... 1,262.0 20,630 753 3.65 3.77 3.65 26,035.0 950.3 WY .................... 6.0 20,067 682 3.34 3.85 3.40 120.4 4.1
US 3 ................ 9,117.0 21,149 774 3.65 4.00 3.66 192,819.0 7,052.4
1 Average number during year, excluding heifers not yet fresh. U.S. total may not add due to rounding. 2 Excludes milk sucked by calves. 3 Sum of parts may not equal due to rounding.
NASS, Livestock Branch, (202) 720–3570.
VerDate Aug 31 2005 17:17 Mar 01, 2012 Jkt 000000 PO 00000 Frm 00005 Fmt 1000 Sfmt 1000 H:\SHARED\DAPP\FPU\AGSTAT\MASTER~2\CHAPTR08\VIII-09.AG8 USDA
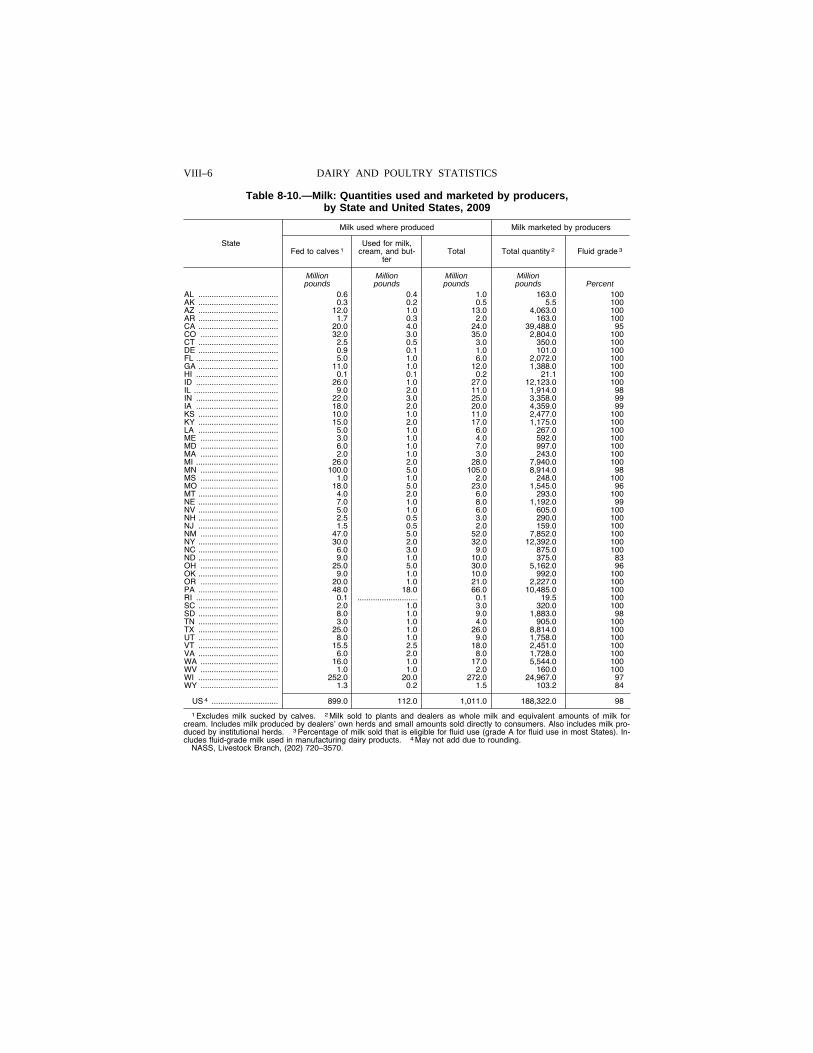
VIII–6 DAIRY AND POULTRY STATISTICS
Table 8-10.—Milk: Quantities used and marketed by producers, by State and United States, 2009
State
Milk used where produced Milk marketed by producers
Fed to calves 1 Used for milk,
cream, and but-ter
Total Total quantity 2 Fluid grade 3
Million Million Million Million pounds pounds pounds pounds Percent
AL .................................... 0 .6 0 .4 1 .0 163 .0 100 AK .................................... 0 .3 0 .2 0 .5 5 .5 100 AZ .................................... 12 .0 1 .0 13 .0 4,063 .0 100 AR .................................... 1 .7 0 .3 2 .0 163 .0 100 CA .................................... 20 .0 4 .0 24 .0 39,488 .0 95 CO ................................... 32 .0 3 .0 35 .0 2,804 .0 100 CT .................................... 2 .5 0 .5 3 .0 350 .0 100 DE .................................... 0 .9 0 .1 1 .0 101 .0 100 FL ..................................... 5 .0 1 .0 6 .0 2,072 .0 100 GA .................................... 11 .0 1 .0 12 .0 1,388 .0 100 HI ..................................... 0 .1 0 .1 0 .2 21 .1 100 ID ..................................... 26 .0 1 .0 27 .0 12,123 .0 100 IL ...................................... 9 .0 2 .0 11 .0 1,914 .0 98 IN ..................................... 22 .0 3 .0 25 .0 3,358 .0 99 IA ..................................... 18 .0 2 .0 20 .0 4,359 .0 99 KS .................................... 10 .0 1 .0 11 .0 2,477 .0 100 KY .................................... 15 .0 2 .0 17 .0 1,175 .0 100 LA .................................... 5 .0 1 .0 6 .0 267 .0 100 ME ................................... 3 .0 1 .0 4 .0 592 .0 100 MD ................................... 6 .0 1 .0 7 .0 997 .0 100 MA ................................... 2 .0 1 .0 3 .0 243 .0 100 MI ..................................... 26 .0 2 .0 28 .0 7,940 .0 100 MN ................................... 100 .0 5 .0 105 .0 8,914 .0 98 MS ................................... 1 .0 1 .0 2 .0 248 .0 100 MO ................................... 18 .0 5 .0 23 .0 1,545 .0 96 MT .................................... 4 .0 2 .0 6 .0 293 .0 100 NE .................................... 7 .0 1 .0 8 .0 1,192 .0 99 NV .................................... 5 .0 1 .0 6 .0 605 .0 100 NH .................................... 2 .5 0 .5 3 .0 290 .0 100 NJ .................................... 1 .5 0 .5 2 .0 159 .0 100 NM ................................... 47 .0 5 .0 52 .0 7,852 .0 100 NY .................................... 30 .0 2 .0 32 .0 12,392 .0 100 NC .................................... 6 .0 3 .0 9 .0 875 .0 100 ND .................................... 9 .0 1 .0 10 .0 375 .0 83 OH ................................... 25 .0 5 .0 30 .0 5,162 .0 96 OK .................................... 9 .0 1 .0 10 .0 992 .0 100 OR ................................... 20 .0 1 .0 21 .0 2,227 .0 100 PA .................................... 48 .0 18 .0 66 .0 10,485 .0 100 RI ..................................... 0 .1 ........................... 0 .1 19 .5 100 SC .................................... 2 .0 1 .0 3 .0 320 .0 100 SD .................................... 8 .0 1 .0 9 .0 1,883 .0 98 TN .................................... 3 .0 1 .0 4 .0 905 .0 100 TX .................................... 25 .0 1 .0 26 .0 8,814 .0 100 UT .................................... 8 .0 1 .0 9 .0 1,758 .0 100 VT .................................... 15 .5 2 .5 18 .0 2,451 .0 100 VA .................................... 6 .0 2 .0 8 .0 1,728 .0 100 WA ................................... 16 .0 1 .0 17 .0 5,544 .0 100 WV ................................... 1 .0 1 .0 2 .0 160 .0 100 WI .................................... 252 .0 20 .0 272 .0 24,967 .0 97 WY ................................... 1 .3 0 .2 1 .5 103 .2 84
US 4 .............................. 899 .0 112 .0 1,011 .0 188,322 .0 98
1 Excludes milk sucked by calves. 2 Milk sold to plants and dealers as whole milk and equivalent amounts of milk for cream. Includes milk produced by dealers’ own herds and small amounts sold directly to consumers. Also includes milk pro-duced by institutional herds. 3 Percentage of milk sold that is eligible for fluid use (grade A for fluid use in most States). In-cludes fluid-grade milk used in manufacturing dairy products. 4 May not add due to rounding.
NASS, Livestock Branch, (202) 720–3570.
VerDate Aug 31 2005 17:17 Mar 01, 2012 Jkt 000000 PO 00000 Frm 00006 Fmt 1000 Sfmt 1000 H:\SHARED\DAPP\FPU\AGSTAT\MASTER~2\CHAPTR08\VIII-10.AG8 USDA
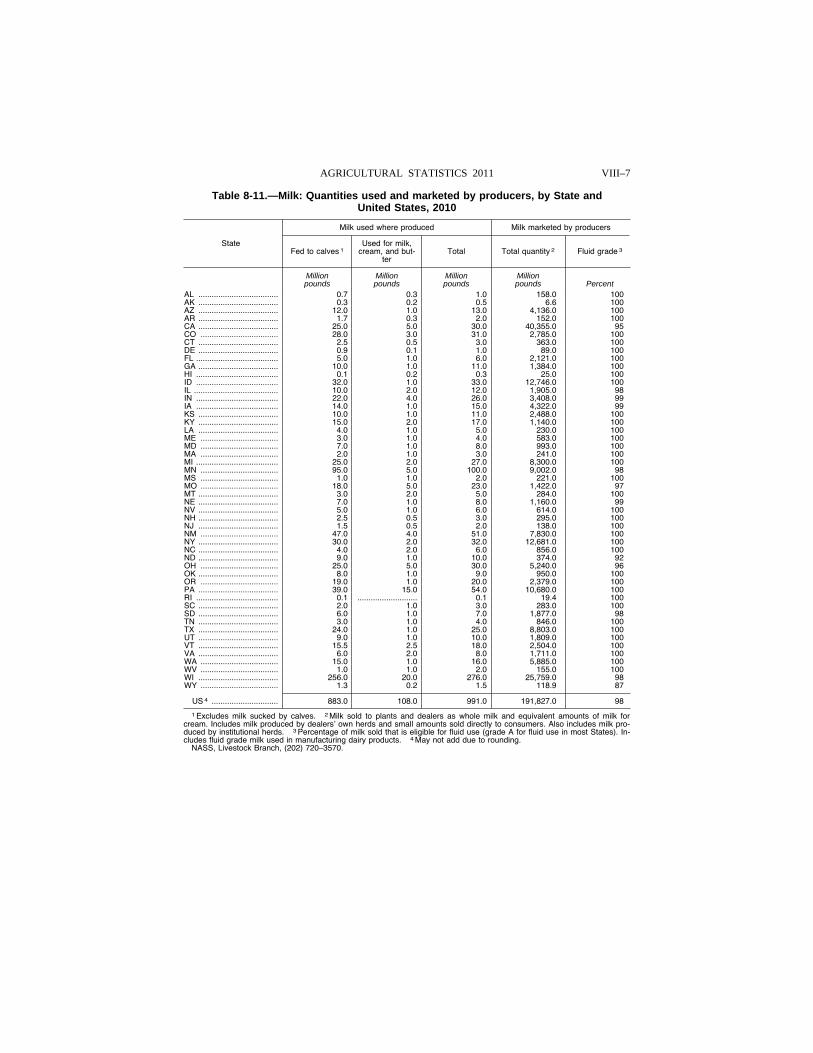
VIII–7 AGRICULTURAL STATISTICS 2011
Table 8-11.—Milk: Quantities used and marketed by producers, by State and United States, 2010
State
Milk used where produced Milk marketed by producers
Fed to calves 1 Used for milk,
cream, and but-ter
Total Total quantity 2 Fluid grade 3
Million Million Million Million pounds pounds pounds pounds Percent
AL .................................... 0 .7 0 .3 1 .0 158 .0 100 AK .................................... 0 .3 0 .2 0 .5 6 .6 100 AZ .................................... 12 .0 1 .0 13 .0 4,136 .0 100 AR .................................... 1 .7 0 .3 2 .0 152 .0 100 CA .................................... 25 .0 5 .0 30 .0 40,355 .0 95 CO ................................... 28 .0 3 .0 31 .0 2,785 .0 100 CT .................................... 2 .5 0 .5 3 .0 363 .0 100 DE .................................... 0 .9 0 .1 1 .0 89 .0 100 FL ..................................... 5 .0 1 .0 6 .0 2,121 .0 100 GA .................................... 10 .0 1 .0 11 .0 1,384 .0 100 HI ..................................... 0 .1 0 .2 0 .3 25 .0 100 ID ..................................... 32 .0 1 .0 33 .0 12,746 .0 100 IL ...................................... 10 .0 2 .0 12 .0 1,905 .0 98 IN ..................................... 22 .0 4 .0 26 .0 3,408 .0 99 IA ..................................... 14 .0 1 .0 15 .0 4,322 .0 99 KS .................................... 10 .0 1 .0 11 .0 2,488 .0 100 KY .................................... 15 .0 2 .0 17 .0 1,140 .0 100 LA .................................... 4 .0 1 .0 5 .0 230 .0 100 ME ................................... 3 .0 1 .0 4 .0 583 .0 100 MD ................................... 7 .0 1 .0 8 .0 993 .0 100 MA ................................... 2 .0 1 .0 3 .0 241 .0 100 MI ..................................... 25 .0 2 .0 27 .0 8,300 .0 100 MN ................................... 95 .0 5 .0 100 .0 9,002 .0 98 MS ................................... 1 .0 1 .0 2 .0 221 .0 100 MO ................................... 18 .0 5 .0 23 .0 1,422 .0 97 MT .................................... 3 .0 2 .0 5 .0 284 .0 100 NE .................................... 7 .0 1 .0 8 .0 1,160 .0 99 NV .................................... 5 .0 1 .0 6 .0 614 .0 100 NH .................................... 2 .5 0 .5 3 .0 295 .0 100 NJ .................................... 1 .5 0 .5 2 .0 138 .0 100 NM ................................... 47 .0 4 .0 51 .0 7,830 .0 100 NY .................................... 30 .0 2 .0 32 .0 12,681 .0 100 NC .................................... 4 .0 2 .0 6 .0 856 .0 100 ND .................................... 9 .0 1 .0 10 .0 374 .0 92 OH ................................... 25 .0 5 .0 30 .0 5,240 .0 96 OK .................................... 8 .0 1 .0 9 .0 950 .0 100 OR ................................... 19 .0 1 .0 20 .0 2,379 .0 100 PA .................................... 39 .0 15 .0 54 .0 10,680 .0 100 RI ..................................... 0 .1 ........................... 0 .1 19 .4 100 SC .................................... 2 .0 1 .0 3 .0 283 .0 100 SD .................................... 6 .0 1 .0 7 .0 1,877 .0 98 TN .................................... 3 .0 1 .0 4 .0 846 .0 100 TX .................................... 24 .0 1 .0 25 .0 8,803 .0 100 UT .................................... 9 .0 1 .0 10 .0 1,809 .0 100 VT .................................... 15 .5 2 .5 18 .0 2,504 .0 100 VA .................................... 6 .0 2 .0 8 .0 1,711 .0 100 WA ................................... 15 .0 1 .0 16 .0 5,885 .0 100 WV ................................... 1 .0 1 .0 2 .0 155 .0 100 WI .................................... 256 .0 20 .0 276 .0 25,759 .0 98 WY ................................... 1 .3 0 .2 1 .5 118 .9 87
US 4 .............................. 883 .0 108 .0 991 .0 191,827 .0 98
1 Excludes milk sucked by calves. 2 Milk sold to plants and dealers as whole milk and equivalent amounts of milk for cream. Includes milk produced by dealers’ own herds and small amounts sold directly to consumers. Also includes milk pro-duced by institutional herds. 3 Percentage of milk sold that is eligible for fluid use (grade A for fluid use in most States). In-cludes fluid grade milk used in manufacturing dairy products. 4 May not add due to rounding.
NASS, Livestock Branch, (202) 720–3570.
VerDate Aug 31 2005 17:17 Mar 01, 2012 Jkt 000000 PO 00000 Frm 00007 Fmt 1000 Sfmt 1000 H:\SHARED\DAPP\FPU\AGSTAT\MASTER~2\CHAPTR08\VIII-1~1.AG8 USDA
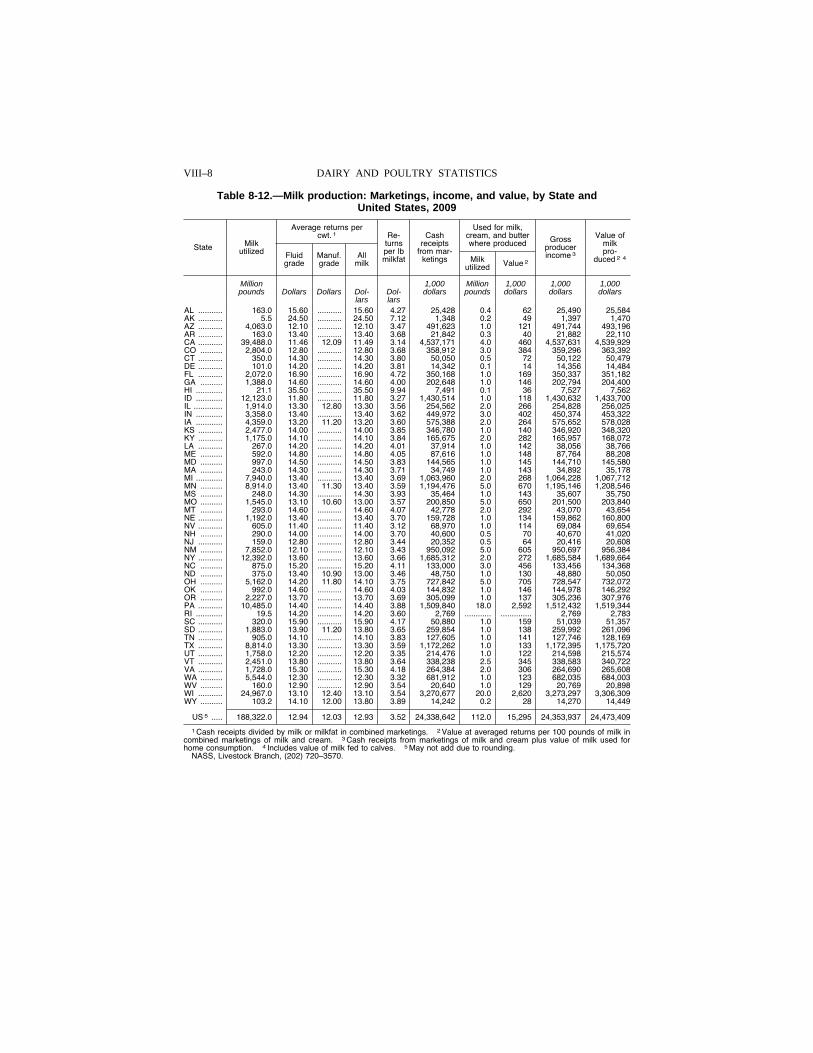
VIII–8 DAIRY AND POULTRY STATISTICS
Table 8-12.—Milk production: Marketings, income, and value, by State and United States, 2009
State Milk utilized
Average returns per cwt. 1 Re-
turns per lb milkfat
Cash receipts
from mar-ketings
Used for milk, cream, and butter where produced Gross
producer income 3
Value of milk pro-
duced 2 4 Fluid grade
Manuf. grade
All milk Milk
utilized Value 2
Million 1,000 Million 1,000 1,000 1,000 pounds Dollars Dollars Dol-
lars Dol-lars
dollars pounds dollars dollars dollars
AL ........... 163.0 15.60 ........... 15.60 4.27 25,428 0.4 62 25,490 25,584 AK ........... 5.5 24.50 ........... 24.50 7.12 1,348 0.2 49 1,397 1,470 AZ ........... 4,063.0 12.10 ........... 12.10 3.47 491,623 1.0 121 491,744 493,196 AR ........... 163.0 13.40 ........... 13.40 3.68 21,842 0.3 40 21,882 22,110 CA ........... 39,488.0 11.46 12.09 11.49 3.14 4,537,171 4.0 460 4,537,631 4,539,929 CO .......... 2,804.0 12.80 ........... 12.80 3.68 358,912 3.0 384 359,296 363,392 CT ........... 350.0 14.30 ........... 14.30 3.80 50,050 0.5 72 50,122 50,479 DE ........... 101.0 14.20 ........... 14.20 3.81 14,342 0.1 14 14,356 14,484 FL ........... 2,072.0 16.90 ........... 16.90 4.72 350,168 1.0 169 350,337 351,182 GA .......... 1,388.0 14.60 ........... 14.60 4.00 202,648 1.0 146 202,794 204,400 HI ............ 21.1 35.50 ........... 35.50 9.94 7,491 0.1 36 7,527 7,562 ID ............ 12,123.0 11.80 ........... 11.80 3.27 1,430,514 1.0 118 1,430,632 1,433,700 IL ............. 1,914.0 13.30 12.80 13.30 3.56 254,562 2.0 266 254,828 256,025 IN ............ 3,358.0 13.40 ........... 13.40 3.62 449,972 3.0 402 450,374 453,322 IA ............ 4,359.0 13.20 11.20 13.20 3.60 575,388 2.0 264 575,652 578,028 KS ........... 2,477.0 14.00 ........... 14.00 3.85 346,780 1.0 140 346,920 348,320 KY ........... 1,175.0 14.10 ........... 14.10 3.84 165,675 2.0 282 165,957 168,072 LA ........... 267.0 14.20 ........... 14.20 4.01 37,914 1.0 142 38,056 38,766 ME .......... 592.0 14.80 ........... 14.80 4.05 87,616 1.0 148 87,764 88,208 MD .......... 997.0 14.50 ........... 14.50 3.83 144,565 1.0 145 144,710 145,580 MA .......... 243.0 14.30 ........... 14.30 3.71 34,749 1.0 143 34,892 35,178 MI ............ 7,940.0 13.40 ........... 13.40 3.69 1,063,960 2.0 268 1,064,228 1,067,712 MN .......... 8,914.0 13.40 11.30 13.40 3.59 1,194,476 5.0 670 1,195,146 1,208,546 MS .......... 248.0 14.30 ........... 14.30 3.93 35,464 1.0 143 35,607 35,750 MO .......... 1,545.0 13.10 10.60 13.00 3.57 200,850 5.0 650 201,500 203,840 MT .......... 293.0 14.60 ........... 14.60 4.07 42,778 2.0 292 43,070 43,654 NE ........... 1,192.0 13.40 ........... 13.40 3.70 159,728 1.0 134 159,862 160,800 NV ........... 605.0 11.40 ........... 11.40 3.12 68,970 1.0 114 69,084 69,654 NH .......... 290.0 14.00 ........... 14.00 3.70 40,600 0.5 70 40,670 41,020 NJ ........... 159.0 12.80 ........... 12.80 3.44 20,352 0.5 64 20,416 20,608 NM .......... 7,852.0 12.10 ........... 12.10 3.43 950,092 5.0 605 950,697 956,384 NY ........... 12,392.0 13.60 ........... 13.60 3.66 1,685,312 2.0 272 1,685,584 1,689,664 NC .......... 875.0 15.20 ........... 15.20 4.11 133,000 3.0 456 133,456 134,368 ND .......... 375.0 13.40 10.90 13.00 3.46 48,750 1.0 130 48,880 50,050 OH .......... 5,162.0 14.20 11.80 14.10 3.75 727,842 5.0 705 728,547 732,072 OK .......... 992.0 14.60 ........... 14.60 4.03 144,832 1.0 146 144,978 146,292 OR .......... 2,227.0 13.70 ........... 13.70 3.69 305,099 1.0 137 305,236 307,976 PA ........... 10,485.0 14.40 ........... 14.40 3.88 1,509,840 18.0 2,592 1,512,432 1,519,344 RI ............ 19.5 14.20 ........... 14.20 3.60 2,769 ............ .............. 2,769 2,783 SC ........... 320.0 15.90 ........... 15.90 4.17 50,880 1.0 159 51,039 51,357 SD ........... 1,883.0 13.90 11.20 13.80 3.65 259,854 1.0 138 259,992 261,096 TN ........... 905.0 14.10 ........... 14.10 3.83 127,605 1.0 141 127,746 128,169 TX ........... 8,814.0 13.30 ........... 13.30 3.59 1,172,262 1.0 133 1,172,395 1,175,720 UT ........... 1,758.0 12.20 ........... 12.20 3.35 214,476 1.0 122 214,598 215,574 VT ........... 2,451.0 13.80 ........... 13.80 3.64 338,238 2.5 345 338,583 340,722 VA ........... 1,728.0 15.30 ........... 15.30 4.18 264,384 2.0 306 264,690 265,608 WA .......... 5,544.0 12.30 ........... 12.30 3.32 681,912 1.0 123 682,035 684,003 WV .......... 160.0 12.90 ........... 12.90 3.54 20,640 1.0 129 20,769 20,898 WI ........... 24,967.0 13.10 12.40 13.10 3.54 3,270,677 20.0 2,620 3,273,297 3,306,309 WY .......... 103.2 14.10 12.00 13.80 3.89 14,242 0.2 28 14,270 14,449
US 5 ..... 188,322.0 12.94 12.03 12.93 3.52 24,338,642 112.0 15,295 24,353,937 24,473,409
1 Cash receipts divided by milk or milkfat in combined marketings. 2 Value at averaged returns per 100 pounds of milk in combined marketings of milk and cream. 3 Cash receipts from marketings of milk and cream plus value of milk used for home consumption. 4 Includes value of milk fed to calves. 5 May not add due to rounding.
NASS, Livestock Branch, (202) 720–3570.
VerDate Aug 31 2005 17:17 Mar 01, 2012 Jkt 000000 PO 00000 Frm 00008 Fmt 1000 Sfmt 1000 H:\SHARED\DAPP\FPU\AGSTAT\MASTER~2\CHAPTR08\VIII-11.AG8 USDA
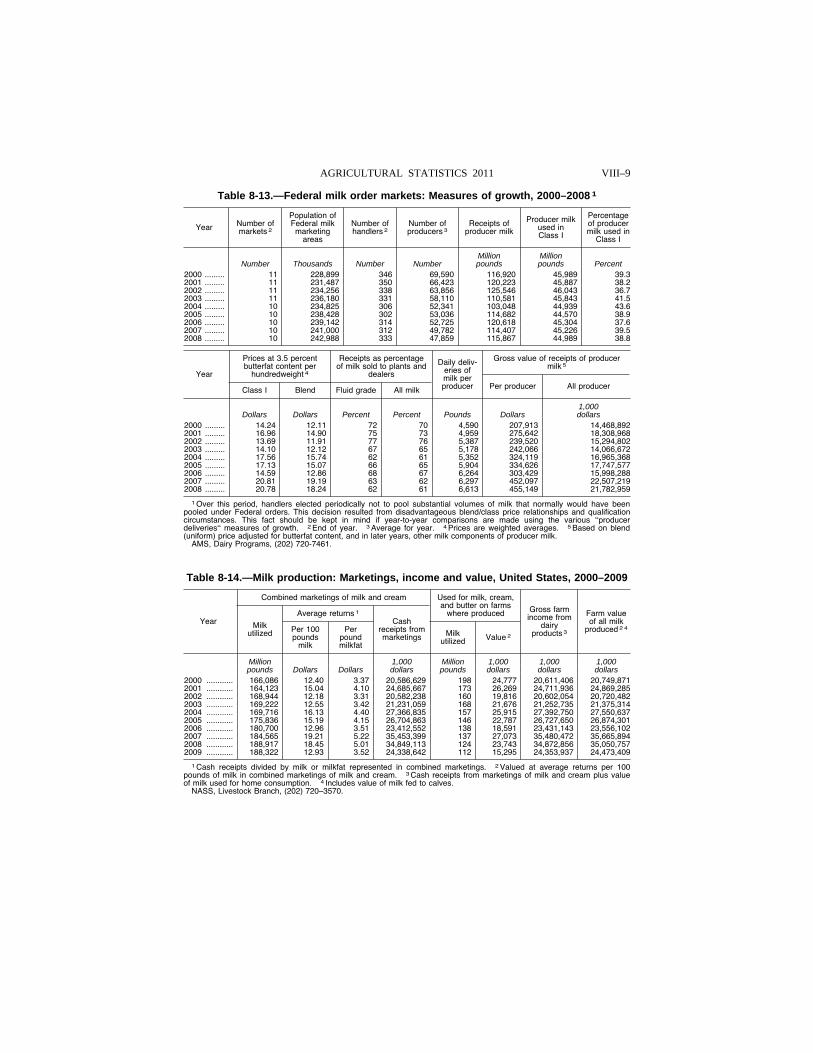
VIII–9 AGRICULTURAL STATISTICS 2011
Table 8-13.—Federal milk order markets: Measures of growth, 2000–2008 1
Year Number of markets 2
Population of Federal milk marketing
areas
Number of handlers 2
Number of producers 3
Receipts of producer milk
Producer milk used in Class I
Percentage of producer milk used in
Class I
Million Million Number Thousands Number Number pounds pounds Percent
2000 ......... 11 228,899 346 69,590 116,920 45,989 39.3 2001 ......... 11 231,487 350 66,423 120,223 45,887 38.2 2002 ......... 11 234,256 338 63,856 125,546 46,043 36.7 2003 ......... 11 236,180 331 58,110 110,581 45,843 41.5 2004 ......... 10 234,825 306 52,341 103,048 44,939 43.6 2005 ......... 10 238,428 302 53,036 114,682 44,570 38.9 2006 ......... 10 239,142 314 52,725 120,618 45,304 37.6 2007 ......... 10 241,000 312 49,782 114,407 45,226 39.5 2008 ......... 10 242,988 333 47,859 115,867 44,989 38.8
Year
Prices at 3.5 percent butterfat content per
hundredweight 4
Receipts as percentage of milk sold to plants and
dealers
Daily deliv-eries of milk per producer
Gross value of receipts of producer milk 5
Class I Blend Fluid grade All milk Per producer All producer
1,000 Dollars Dollars Percent Percent Pounds Dollars dollars
2000 ......... 14.24 12.11 72 70 4,590 207,913 14,468,892 2001 ......... 16.96 14.90 75 73 4,959 275,642 18,308,968 2002 ......... 13.69 11.91 77 76 5,387 239,520 15,294,802 2003 ......... 14.10 12.12 67 65 5,178 242,066 14,066,672 2004 ......... 17.56 15.74 62 61 5,352 324,119 16,965,368 2005 ......... 17.13 15.07 66 65 5,904 334,626 17,747,577 2006 ......... 14.59 12.86 68 67 6,264 303,429 15,998,288 2007 ......... 20.81 19.19 63 62 6,297 452,097 22,507,219 2008 ......... 20.78 18.24 62 61 6,613 455,149 21,782,959
1 Over this period, handlers elected periodically not to pool substantial volumes of milk that normally would have been pooled under Federal orders. This decision resulted from disadvantageous blend/class price relationships and qualification circumstances. This fact should be kept in mind if year-to-year comparisons are made using the various ‘‘producer deliveries‘‘ measures of growth. 2 End of year. 3 Average for year. 4 Prices are weighted averages. 5 Based on blend (uniform) price adjusted for butterfat content, and in later years, other milk components of producer milk.
AMS, Dairy Programs, (202) 720-7461.
Table 8-14.—Milk production: Marketings, income and value, United States, 2000–2009
Year
Combined marketings of milk and cream Used for milk, cream, and butter on farms
where produced Gross farm income from
dairy products 3
Farm value of all milk
produced 2 4 Milk utilized
Average returns 1 Cash
receipts from marketings Milk
utilized Value 2 Per 100 pounds
milk
Per pound milkfat
Million 1,000 Million 1,000 1,000 1,000 pounds Dollars Dollars dollars pounds dollars dollars dollars
2000 ............ 166,086 12.40 3.37 20,586,629 198 24,777 20,611,406 20,749,871 2001 ............ 164,123 15.04 4.10 24,685,667 173 26,269 24,711,936 24,869,285 2002 ............ 168,944 12.18 3.31 20,582,238 160 19,816 20,602,054 20,720,482 2003 ............ 169,222 12.55 3.42 21,231,059 168 21,676 21,252,735 21,375,314 2004 ............ 169,716 16.13 4.40 27,366,835 157 25,915 27,392,750 27,550,637 2005 ............ 175,836 15.19 4.15 26,704,863 146 22,787 26,727,650 26,874,301 2006 ............ 180,700 12.96 3.51 23,412,552 138 18,591 23,431,143 23,556,102 2007 ............ 184,565 19.21 5.22 35,453,399 137 27,073 35,480,472 35,665,894 2008 ............ 188,917 18.45 5.01 34,849,113 124 23,743 34,872,856 35,050,757 2009 ............ 188,322 12.93 3.52 24,338,642 112 15,295 24,353,937 24,473,409
1 Cash receipts divided by milk or milkfat represented in combined marketings. 2 Valued at average returns per 100 pounds of milk in combined marketings of milk and cream. 3 Cash receipts from marketings of milk and cream plus value of milk used for home consumption. 4 Includes value of milk fed to calves.
NASS, Livestock Branch, (202) 720–3570.
VerDate Aug 31 2005 17:17 Mar 01, 2012 Jkt 000000 PO 00000 Frm 00009 Fmt 1000 Sfmt 1000 H:\SHARED\DAPP\FPU\AGSTAT\MASTER~2\CHAPTR08\VIII-12.AG8 USDA
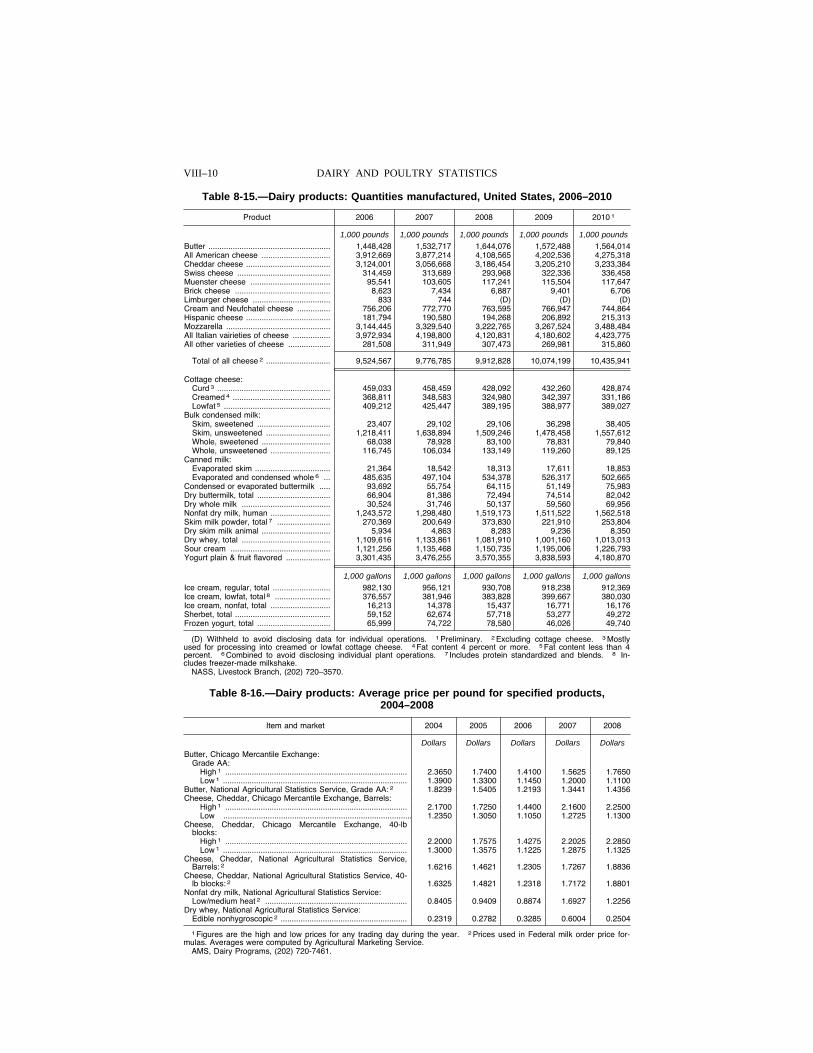
VIII–10 DAIRY AND POULTRY STATISTICS
Table 8-15.—Dairy products: Quantities manufactured, United States, 2006–2010
Product 2006 2007 2008 2009 2010 1
1,000 pounds 1,000 pounds 1,000 pounds 1,000 pounds 1,000 pounds
Butter ....................................................... 1,448,428 1,532,717 1,644,076 1,572,488 1,564,014 All American cheese ............................... 3,912,669 3,877,214 4,108,565 4,202,536 4,275,318 Cheddar cheese ...................................... 3,124,001 3,056,668 3,186,454 3,205,210 3,233,384 Swiss cheese .......................................... 314,459 313,689 293,968 322,336 336,458 Muenster cheese .................................... 95,541 103,605 117,241 115,504 117,647 Brick cheese ........................................... 8,623 7,434 6,887 9,401 6,706 Limburger cheese ................................... 833 744 (D) (D) (D) Cream and Neufchatel cheese ............... 756,206 772,770 763,595 766,947 744,864 Hispanic cheese ...................................... 181,794 190,580 194,268 206,892 215,313 Mozzarella ............................................... 3,144,445 3,329,540 3,222,765 3,267,524 3,488,484 All Italian vairieties of cheese ................. 3,972,934 4,198,800 4,120,831 4,180,602 4,423,775 All other varieties of cheese ................... 281,508 311,949 307,473 269,981 315,860
Total of all cheese 2 ............................. 9,524,567 9,776,785 9,912,828 10,074,199 10,435,941
Cottage cheese: Curd 3 ................................................... 459,033 458,459 428,092 432,260 428,874 Creamed 4 ............................................ 368,811 348,583 324,980 342,397 331,186 Lowfat 5 ................................................ 409,212 425,447 389,195 388,977 389,027
Bulk condensed milk: Skim, sweetened ................................. 23,407 29,102 29,106 36,298 38,405 Skim, unsweetened ............................. 1,218,411 1,638,894 1,509,246 1,478,458 1,557,612 Whole, sweetened ............................... 68,038 78,928 83,100 78,831 79,840 Whole, unsweetened ........................... 116,745 106,034 133,149 119,260 89,125
Canned milk: Evaporated skim .................................. 21,364 18,542 18,313 17,611 18,853 Evaporated and condensed whole 6 ... 485,635 497,104 534,378 526,317 502,665
Condensed or evaporated buttermilk ..... 93,692 55,754 64,115 51,149 75,983 Dry buttermilk, total ................................. 66,904 81,386 72,494 74,514 82,042 Dry whole milk ........................................ 30,524 31,746 50,137 59,560 69,956 Nonfat dry milk, human ........................... 1,243,572 1,298,480 1,519,173 1,511,522 1,562,518 Skim milk powder, total 7 ........................ 270,369 200,649 373,830 221,910 253,804 Dry skim milk animal ............................... 5,934 4,863 8,283 9,236 8,350 Dry whey, total ........................................ 1,109,616 1,133,861 1,081,910 1,001,160 1,013,013 Sour cream ............................................. 1,121,256 1,135,468 1,150,735 1,195,006 1,226,793 Yogurt plain & fruit flavored .................... 3,301,435 3,476,255 3,570,355 3,838,593 4,180,870
1,000 gallons 1,000 gallons 1,000 gallons 1,000 gallons 1,000 gallons
Ice cream, regular, total .......................... 982,130 956,121 930,708 918,238 912,369 Ice cream, lowfat, total 8 ......................... 376,557 381,946 383,828 399,667 380,030 Ice cream, nonfat, total ........................... 16,213 14,378 15,437 16,771 16,176 Sherbet, total ........................................... 59,152 62,674 57,718 53,277 49,272 Frozen yogurt, total ................................. 65,999 74,722 78,580 46,026 49,740
(D) Withheld to avoid disclosing data for individual operations. 1 Preliminary. 2 Excluding cottage cheese. 3 Mostly used for processing into creamed or lowfat cottage cheese. 4 Fat content 4 percent or more. 5 Fat content less than 4 percent. 6 Combined to avoid disclosing individual plant operations. 7 Includes protein standardized and blends. 8 In-cludes freezer-made milkshake.
NASS, Livestock Branch, (202) 720–3570.
Table 8-16.—Dairy products: Average price per pound for specified products, 2004–2008
Item and market 2004 2005 2006 2007 2008
Dollars Dollars Dollars Dollars Dollars Butter, Chicago Mercantile Exchange:
Grade AA: High 1 .................................................................................. 2.3650 1.7400 1.4100 1.5625 1.7650 Low 1 ................................................................................... 1.3900 1.3300 1.1450 1.2000 1.1100
Butter, National Agricultural Statistics Service, Grade AA: 2 1.8239 1.5405 1.2193 1.3441 1.4356 Cheese, Cheddar, Chicago Mercantile Exchange, Barrels:
High 1 .................................................................................. 2.1700 1.7250 1.4400 2.1600 2.2500 Low ..................................................................................... 1.2350 1.3050 1.1050 1.2725 1.1300
Cheese, Cheddar, Chicago Mercantile Exchange, 40-lb blocks:
High 1 .................................................................................. 2.2000 1.7575 1.4275 2.2025 2.2850 Low 1 ................................................................................... 1.3000 1.3575 1.1225 1.2875 1.1325
Cheese, Cheddar, National Agricultural Statistics Service, Barrels: 2 1.6216 1.4621 1.2305 1.7267 1.8836
Cheese, Cheddar, National Agricultural Statistics Service, 40- lb blocks: 2 1.6325 1.4821 1.2318 1.7172 1.8801
Nonfat dry milk, National Agricultural Statistics Service: Low/medium heat 2 ................................................................ 0.8405 0.9409 0.8874 1.6927 1.2256
Dry whey, National Agricultural Statistics Service: Edible nonhygroscopic 2 ......................................................... 0.2319 0.2782 0.3285 0.6004 0.2504
1 Figures are the high and low prices for any trading day during the year. 2 Prices used in Federal milk order price for-mulas. Averages were computed by Agricultural Marketing Service.
AMS, Dairy Programs, (202) 720-7461.
VerDate Aug 31 2005 17:17 Mar 01, 2012 Jkt 000000 PO 00000 Frm 00010 Fmt 1000 Sfmt 1000 H:\SHARED\DAPP\FPU\AGSTAT\MASTER~2\CHAPTR08\VIII-13.AG8 USDA
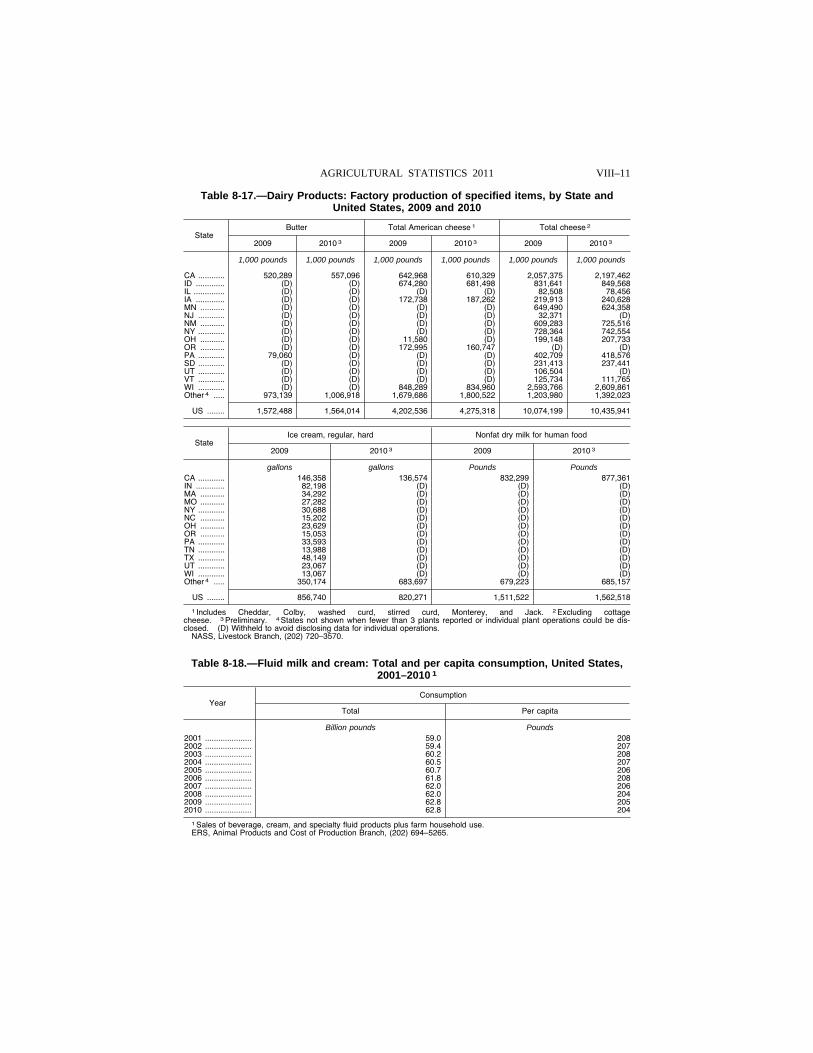
VIII–11 AGRICULTURAL STATISTICS 2011
Table 8-17.—Dairy Products: Factory production of specified items, by State and United States, 2009 and 2010
State Butter Total American cheese 1 Total cheese 2
2009 2010 3 2009 2010 3 2009 2010 3
1,000 pounds 1,000 pounds 1,000 pounds 1,000 pounds 1,000 pounds 1,000 pounds
CA ............ 520,289 557,096 642,968 610,329 2,057,375 2,197,462 ID ............. (D) (D) 674,280 681,498 831,641 849,568 IL .............. (D) (D) (D) (D) 82,508 78,456 IA ............. (D) (D) 172,738 187,262 219,913 240,628 MN ........... (D) (D) (D) (D) 649,490 624,358 NJ ............ (D) (D) (D) (D) 32,371 (D) NM ........... (D) (D) (D) (D) 609,283 725,516 NY ............ (D) (D) (D) (D) 728,364 742,554 OH ........... (D) (D) 11,580 (D) 199,148 207,733 OR ........... (D) (D) 172,995 160,747 (D) (D) PA ............ 79,060 (D) (D) (D) 402,709 418,576 SD ............ (D) (D) (D) (D) 231,413 237,441 UT ............ (D) (D) (D) (D) 106,504 (D) VT ............ (D) (D) (D) (D) 125,734 111,765 WI ............ (D) (D) 848,289 834,960 2,593,766 2,609,861 Other 4 ..... 973,139 1,006,918 1,679,686 1,800,522 1,203,980 1,392,023
US ........ 1,572,488 1,564,014 4,202,536 4,275,318 10,074,199 10,435,941
State Ice cream, regular, hard Nonfat dry milk for human food
2009 2010 3 2009 2010 3
gallons gallons Pounds Pounds CA ............ 146,358 136,574 832,299 877,361 IN ............. 82,198 (D) (D) (D) MA ........... 34,292 (D) (D) (D) MO ........... 27,282 (D) (D) (D) NY ............ 30,688 (D) (D) (D) NC ........... 15,202 (D) (D) (D) OH ........... 23,629 (D) (D) (D) OR ........... 15,053 (D) (D) (D) PA ............ 33,593 (D) (D) (D) TN ............ 13,988 (D) (D) (D) TX ............ 48,149 (D) (D) (D) UT ............ 23,067 (D) (D) (D) WI ............ 13,067 (D) (D) (D) Other 4 ..... 350,174 683,697 679,223 685,157
US ........ 856,740 820,271 1,511,522 1,562,518
1 Includes Cheddar, Colby, washed curd, stirred curd, Monterey, and Jack. 2 Excluding cottage cheese. 3 Preliminary. 4 States not shown when fewer than 3 plants reported or individual plant operations could be dis-closed. (D) Withheld to avoid disclosing data for individual operations.
NASS, Livestock Branch, (202) 720–3570.
Table 8-18.—Fluid milk and cream: Total and per capita consumption, United States, 2001–2010 1
Year Consumption
Total Per capita
Billion pounds Pounds 2001 ..................... 59.0 208 2002 ..................... 59.4 207 2003 ..................... 60.2 208 2004 ..................... 60.5 207 2005 ..................... 60.7 206 2006 ..................... 61.8 208 2007 ..................... 62.0 206 2008 ..................... 62.0 204 2009 ..................... 62.8 205 2010 ..................... 62.8 204
1 Sales of beverage, cream, and specialty fluid products plus farm household use. ERS, Animal Products and Cost of Production Branch, (202) 694–5265.
VerDate Aug 31 2005 17:17 Mar 01, 2012 Jkt 000000 PO 00000 Frm 00011 Fmt 1000 Sfmt 1000 H:\SHARED\DAPP\FPU\AGSTAT\MASTER~2\CHAPTR08\VIII-14.AG8 USDA
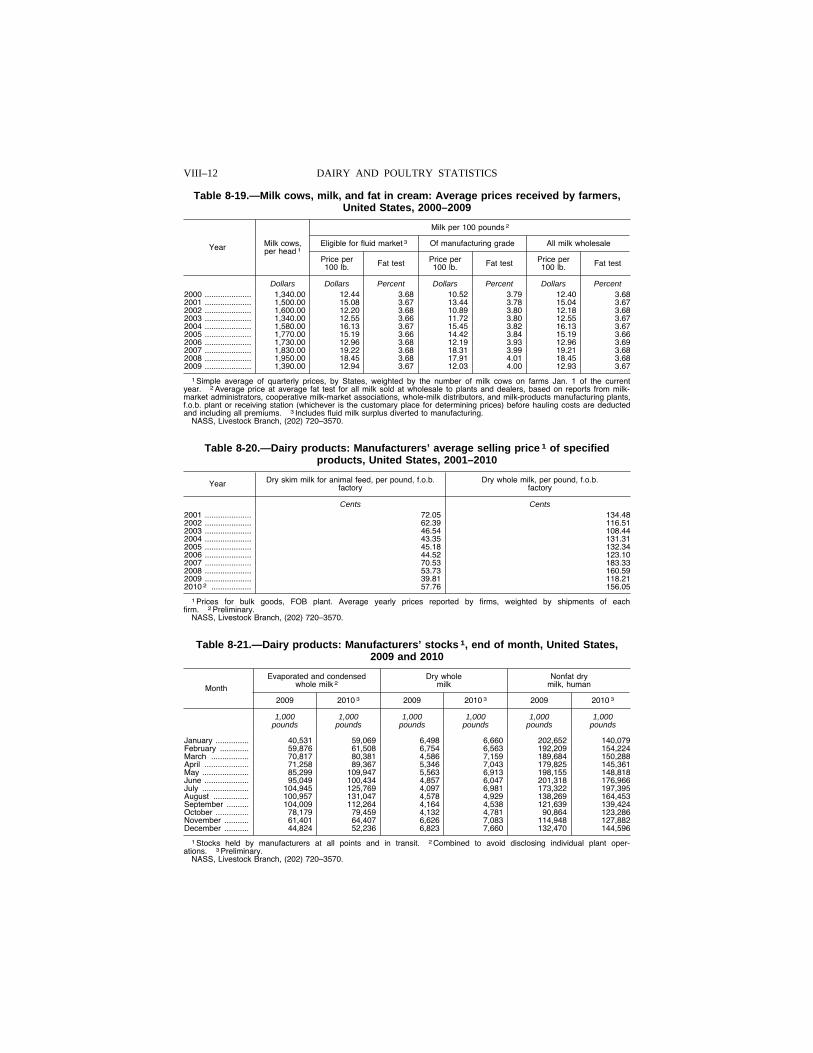
VIII–12 DAIRY AND POULTRY STATISTICS
Table 8-19.—Milk cows, milk, and fat in cream: Average prices received by farmers, United States, 2000–2009
Year Milk cows, per head 1
Milk per 100 pounds 2
Eligible for fluid market 3 Of manufacturing grade All milk wholesale
Price per 100 lb. Fat test Price per
100 lb. Fat test Price per 100 lb. Fat test
Dollars Dollars Percent Dollars Percent Dollars Percent 2000 ..................... 1,340.00 12.44 3.68 10.52 3.79 12.40 3.68 2001 ..................... 1,500.00 15.08 3.67 13.44 3.78 15.04 3.67 2002 ..................... 1,600.00 12.20 3.68 10.89 3.80 12.18 3.68 2003 ..................... 1,340.00 12.55 3.66 11.72 3.80 12.55 3.67 2004 ..................... 1,580.00 16.13 3.67 15.45 3.82 16.13 3.67 2005 ..................... 1,770.00 15.19 3.66 14.42 3.84 15.19 3.66 2006 ..................... 1,730.00 12.96 3.68 12.19 3.93 12.96 3.69 2007 ..................... 1,830.00 19.22 3.68 18.31 3.99 19.21 3.68 2008 ..................... 1,950.00 18.45 3.68 17.91 4.01 18.45 3.68 2009 ..................... 1,390.00 12.94 3.67 12.03 4.00 12.93 3.67
1 Simple average of quarterly prices, by States, weighted by the number of milk cows on farms Jan. 1 of the current year. 2 Average price at average fat test for all milk sold at wholesale to plants and dealers, based on reports from milk- market administrators, cooperative milk-market associations, whole-milk distributors, and milk-products manufacturing plants, f.o.b. plant or receiving station (whichever is the customary place for determining prices) before hauling costs are deducted and including all premiums. 3 Includes fluid milk surplus diverted to manufacturing.
NASS, Livestock Branch, (202) 720–3570.
Table 8-20.—Dairy products: Manufacturers’ average selling price 1 of specified products, United States, 2001–2010
Year Dry skim milk for animal feed, per pound, f.o.b. factory
Dry whole milk, per pound, f.o.b. factory
Cents Cents 2001 ..................... 72.05 134.48 2002 ..................... 62.39 116.51 2003 ..................... 46.54 108.44 2004 ..................... 43.35 131.31 2005 ..................... 45.18 132.34 2006 ..................... 44.52 123.10 2007 ..................... 70.53 183.33 2008 ..................... 53.73 160.59 2009 ..................... 39.81 118.21 2010 2 .................. 57.76 156.05
1 Prices for bulk goods, FOB plant. Average yearly prices reported by firms, weighted by shipments of each firm. 2 Preliminary.
NASS, Livestock Branch, (202) 720–3570.
Table 8-21.—Dairy products: Manufacturers’ stocks 1, end of month, United States, 2009 and 2010
Month
Evaporated and condensed whole milk 2
Dry whole milk
Nonfat dry milk, human
2009 2010 3 2009 2010 3 2009 2010 3
1,000 1,000 1,000 1,000 1,000 1,000 pounds pounds pounds pounds pounds pounds
January ............... 40,531 59,069 6,498 6,660 202,652 140,079 February ............. 59,876 61,508 6,754 6,563 192,209 154,224 March ................. 70,817 80,381 4,586 7,159 189,684 150,288 April .................... 71,258 89,367 5,346 7,043 179,825 145,361 May ..................... 85,299 109,947 5,563 6,913 198,155 148,818 June .................... 95,049 100,434 4,857 6,047 201,318 176,966 July ..................... 104,945 125,769 4,097 6,981 173,322 197,395 August ................ 100,957 131,047 4,578 4,929 138,269 164,453 September .......... 104,009 112,264 4,164 4,538 121,639 139,424 October ............... 78,179 79,459 4,132 4,781 90,864 123,286 November ........... 61,401 64,407 6,626 7,083 114,948 127,882 December ........... 44,824 52,236 6,823 7,660 132,470 144,596
1 Stocks held by manufacturers at all points and in transit. 2 Combined to avoid disclosing individual plant oper-ations. 3 Preliminary.
NASS, Livestock Branch, (202) 720–3570.
VerDate Aug 31 2005 17:17 Mar 01, 2012 Jkt 000000 PO 00000 Frm 00012 Fmt 1000 Sfmt 1000 H:\SHARED\DAPP\FPU\AGSTAT\MASTER~2\CHAPTR08\VIII-15.AG8 USDA
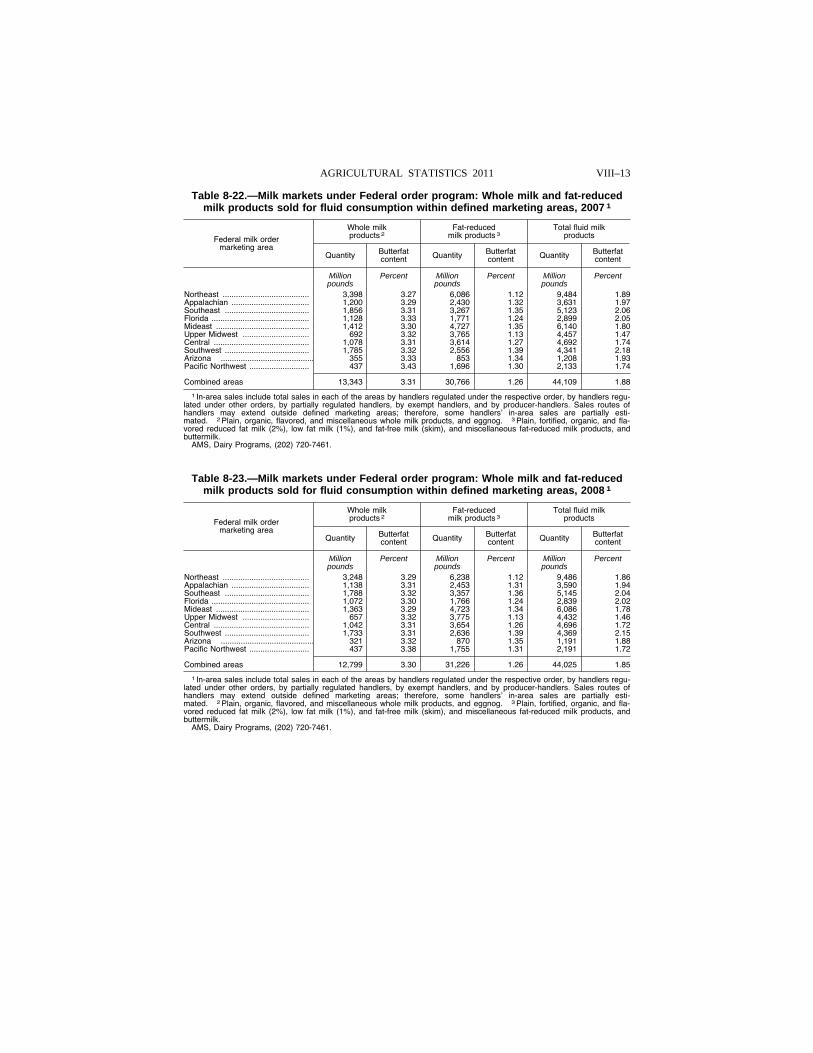
VIII–13 AGRICULTURAL STATISTICS 2011
Table 8-22.—Milk markets under Federal order program: Whole milk and fat-reduced milk products sold for fluid consumption within defined marketing areas, 2007 1
Federal milk order marketing area
Whole milk products 2
Fat-reduced milk products 3
Total fluid milk products
Quantity Butterfat content Quantity Butterfat
content Quantity Butterfat content
Million Percent Million Percent Million Percent pounds pounds pounds
Northeast ....................................... 3,398 3.27 6,086 1.12 9,484 1.89 Appalachian ................................... 1,200 3.29 2,430 1.32 3,631 1.97 Southeast ...................................... 1,856 3.31 3,267 1.35 5,123 2.06 Florida ............................................ 1,128 3.33 1,771 1.24 2,899 2.05 Mideast .......................................... 1,412 3.30 4,727 1.35 6,140 1.80 Upper Midwest .............................. 692 3.32 3,765 1.13 4,457 1.47 Central ........................................... 1,078 3.31 3,614 1.27 4,692 1.74 Southwest ...................................... 1,785 3.32 2,556 1.39 4,341 2.18 Arizona .......................................... 355 3.33 853 1.34 1,208 1.93 Pacific Northwest ........................... 437 3.43 1,696 1.30 2,133 1.74
Combined areas 13,343 3.31 30,766 1.26 44,109 1.88
1 In-area sales include total sales in each of the areas by handlers regulated under the respective order, by handlers regu-lated under other orders, by partially regulated handlers, by exempt handlers, and by producer-handlers. Sales routes of handlers may extend outside defined marketing areas; therefore, some handlers’ in-area sales are partially esti-mated. 2 Plain, organic, flavored, and miscellaneous whole milk products, and eggnog. 3 Plain, fortified, organic, and fla-vored reduced fat milk (2%), low fat milk (1%), and fat-free milk (skim), and miscellaneous fat-reduced milk products, and buttermilk.
AMS, Dairy Programs, (202) 720-7461.
Table 8-23.—Milk markets under Federal order program: Whole milk and fat-reduced milk products sold for fluid consumption within defined marketing areas, 2008 1
Federal milk order marketing area
Whole milk products 2
Fat-reduced milk products 3
Total fluid milk products
Quantity Butterfat content Quantity Butterfat
content Quantity Butterfat content
Million Percent Million Percent Million Percent pounds pounds pounds
Northeast ....................................... 3,248 3.29 6,238 1.12 9,486 1.86 Appalachian ................................... 1,138 3.31 2,453 1.31 3,590 1.94 Southeast ...................................... 1,788 3.32 3,357 1.36 5,145 2.04 Florida ............................................ 1,072 3.30 1,766 1.24 2,839 2.02 Mideast .......................................... 1,363 3.29 4,723 1.34 6,086 1.78 Upper Midwest .............................. 657 3.32 3,775 1.13 4,432 1.46 Central ........................................... 1,042 3.31 3,654 1.26 4,696 1.72 Southwest ...................................... 1,733 3.31 2,636 1.39 4,369 2.15 Arizona .......................................... 321 3.32 870 1.35 1,191 1.88 Pacific Northwest ........................... 437 3.38 1,755 1.31 2,191 1.72
Combined areas 12,799 3.30 31,226 1.26 44,025 1.85
1 In-area sales include total sales in each of the areas by handlers regulated under the respective order, by handlers regu-lated under other orders, by partially regulated handlers, by exempt handlers, and by producer-handlers. Sales routes of handlers may extend outside defined marketing areas; therefore, some handlers’ in-area sales are partially esti-mated. 2 Plain, organic, flavored, and miscellaneous whole milk products, and eggnog. 3 Plain, fortified, organic, and fla-vored reduced fat milk (2%), low fat milk (1%), and fat-free milk (skim), and miscellaneous fat-reduced milk products, and buttermilk.
AMS, Dairy Programs, (202) 720-7461.
VerDate Aug 31 2005 17:17 Mar 01, 2012 Jkt 000000 PO 00000 Frm 00013 Fmt 1000 Sfmt 1000 H:\SHARED\DAPP\FPU\AGSTAT\MASTER~2\CHAPTR08\VIII-16.AG8 USDA
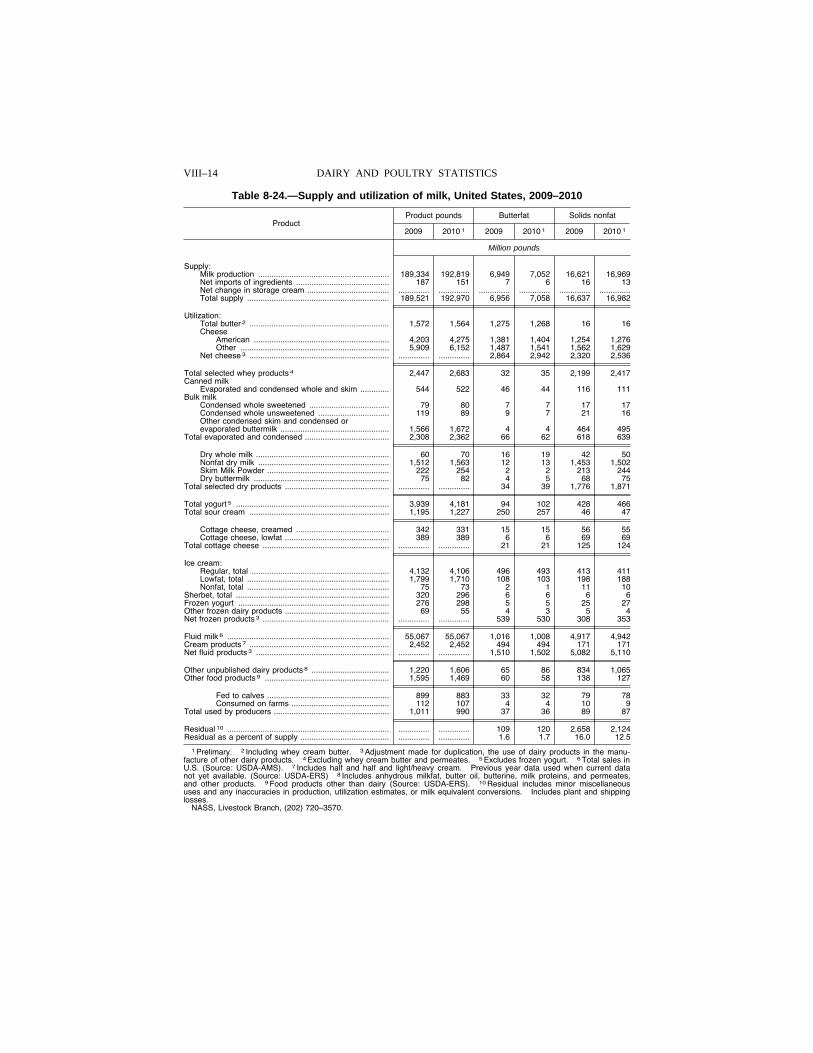
VIII–14 DAIRY AND POULTRY STATISTICS
Table 8-24.—Supply and utilization of milk, United States, 2009–2010
Product Product pounds Butterfat Solids nonfat
2009 2010 1 2009 2010 1 2009 2010 1
Million pounds
Supply: Milk production ........................................................... 189,334 192,819 6,949 7,052 16,621 16,969 Net imports of ingredients .......................................... 187 151 7 6 16 13 Net change in storage cream ..................................... .............. .............. .............. .............. .............. ..............Total supply ................................................................ 189,521 192,970 6,956 7,058 16,637 16,982
Utilization: Total butter 2 ............................................................... 1,572 1,564 1,275 1,268 16 16 Cheese
American ............................................................. 4,203 4,275 1,381 1,404 1,254 1,276 Other ................................................................... 5,909 6,152 1,487 1,541 1,562 1,629
Net cheese 3 ............................................................... .............. .............. 2,864 2,942 2,320 2,536
Total selected whey products 4 2,447 2,683 32 35 2,199 2,417 Canned milk
Evaporated and condensed whole and skim ............. 544 522 46 44 116 111 Bulk milk
Condensed whole sweetened .................................... 79 80 7 7 17 17 Condensed whole unsweetened ................................ 119 89 9 7 21 16 Other condensed skim and condensed or evaporated buttermilk ................................................. 1,566 1,672 4 4 464 495
Total evaporated and condensed ...................................... 2,308 2,362 66 62 618 639
Dry whole milk ............................................................ 60 70 16 19 42 50 Nonfat dry milk ........................................................... 1,512 1,563 12 13 1,453 1,502 Skim Milk Powder ....................................................... 222 254 2 2 213 244 Dry buttermilk ............................................................. 75 82 4 5 68 75
Total selected dry products ............................................... .............. .............. 34 39 1,776 1,871
Total yogurt 5 ..................................................................... 3,939 4,181 94 102 428 466 Total sour cream ............................................................... 1,195 1,227 250 257 46 47
Cottage cheese, creamed .......................................... 342 331 15 15 56 55 Cottage cheese, lowfat ............................................... 389 389 6 6 69 69
Total cottage cheese ......................................................... .............. .............. 21 21 125 124
Ice cream: Regular, total .............................................................. 4,132 4,106 496 493 413 411 Lowfat, total ................................................................ 1,799 1,710 108 103 198 188 Nonfat, total ................................................................ 75 73 2 1 11 10
Sherbet, total ..................................................................... 320 296 6 6 6 6 Frozen yogurt .................................................................... 276 298 5 5 25 27 Other frozen dairy products ............................................... 69 55 4 3 5 4 Net frozen products 3 ......................................................... .............. .............. 539 530 308 353
Fluid milk 6 ......................................................................... 55,067 55,067 1,016 1,008 4,917 4,942 Cream products 7 ............................................................... 2,452 2,452 494 494 171 171 Net fluid products 3 ............................................................ .............. .............. 1,510 1,502 5,082 5,110
Other unpublished dairy products 8 ................................... 1,220 1,606 65 86 834 1,065 Other food products 9 ........................................................ 1,595 1,469 60 58 138 127
Fed to calves ....................................................... 899 883 33 32 79 78 Consumed on farms ............................................ 112 107 4 4 10 9
Total used by producers .................................................... 1,011 990 37 36 89 87
Residual 10 ......................................................................... .............. .............. 109 120 2,658 2,124 Residual as a percent of supply ........................................ .............. .............. 1.6 1.7 16.0 12.5
1 Prelimary. 2 Including whey cream butter. 3 Adjustment made for duplication, the use of dairy products in the manu-facture of other dairy products. 4 Excluding whey cream butter and permeates. 5 Excludes frozen yogurt. 6 Total sales in U.S. (Source: USDA-AMS). 7 Includes half and half and light/heavy cream. Previous year data used when current data not yet available. (Source: USDA-ERS) 8 Includes anhydrous milkfat, butter oil, butterine, milk proteins, and permeates, and other products. 9 Food products other than dairy (Source: USDA-ERS). 10 Residual includes minor miscellaneous uses and any inaccuracies in production, utilization estimates, or milk equivalent conversions. Includes plant and shipping losses.
NASS, Livestock Branch, (202) 720–3570.
VerDate Aug 31 2005 17:17 Mar 01, 2012 Jkt 000000 PO 00000 Frm 00014 Fmt 1000 Sfmt 1000 H:\SHARED\DAPP\FPU\AGSTAT\MASTER~2\CHAPTR08\VIII-17.AG8 USDA
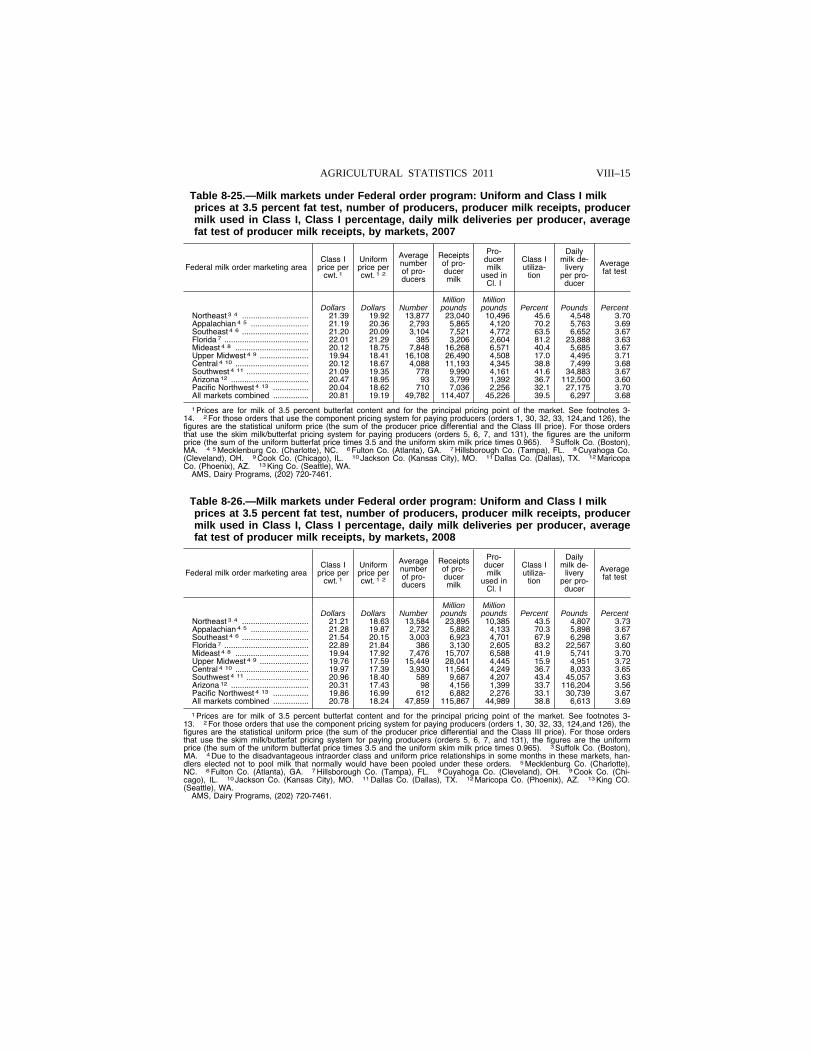
VIII–15 AGRICULTURAL STATISTICS 2011
Table 8-25.—Milk markets under Federal order program: Uniform and Class I milk prices at 3.5 percent fat test, number of producers, producer milk receipts, producer milk used in Class I, Class I percentage, daily milk deliveries per producer, average fat test of producer milk receipts, by markets, 2007
Federal milk order marketing area Class I
price per cwt. 1
Uniform price per cwt. 1 2
Average number of pro-ducers
Receipts of pro-ducer milk
Pro-ducer milk
used in Cl. I
Class I utiliza-
tion
Daily milk de-
livery per pro-ducer
Average fat test
Million Million Dollars Dollars Number pounds pounds Percent Pounds Percent
Northeast 3 4 .............................. 21.39 19.92 13,877 23,040 10,496 45.6 4,548 3.70 Appalachian 4 5 .......................... 21.19 20.36 2,793 5,865 4,120 70.2 5,763 3.69 Southeast 4 6 .............................. 21.20 20.09 3,104 7,521 4,772 63.5 6,652 3.67 Florida 7 ...................................... 22.01 21.29 385 3,206 2,604 81.2 23,888 3.63 Mideast 4 8 ................................. 20.12 18.75 7,848 16,268 6,571 40.4 5,685 3.67 Upper Midwest 4 9 ...................... 19.94 18.41 16,108 26,490 4,508 17.0 4,495 3.71 Central 4 10 ................................. 20.12 18.67 4,088 11,193 4,345 38.8 7,499 3.68 Southwest 4 11 ............................ 21.09 19.35 778 9,990 4,161 41.6 34,883 3.67 Arizona 12 ................................... 20.47 18.95 93 3,799 1,392 36.7 112,500 3.60 Pacific Northwest 4 13 ................ 20.04 18.62 710 7,036 2,256 32.1 27,175 3.70 All markets combined ................ 20.81 19.19 49,782 114,407 45,226 39.5 6,297 3.68
1 Prices are for milk of 3.5 percent butterfat content and for the principal pricing point of the market. See footnotes 3- 14. 2 For those orders that use the component pricing system for paying producers (orders 1, 30, 32, 33, 124,and 126), the figures are the statistical uniform price (the sum of the producer price differential and the Class III price). For those orders that use the skim milk/butterfat pricing system for paying producers (orders 5, 6, 7, and 131), the figures are the uniform price (the sum of the uniform butterfat price times 3.5 and the uniform skim milk price times 0.965). 3 Suffolk Co. (Boston), MA. 4 5 Mecklenburg Co. (Charlotte), NC. 6 Fulton Co. (Atlanta), GA. 7 Hillsborough Co. (Tampa), FL. 8 Cuyahoga Co. (Cleveland), OH. 9 Cook Co. (Chicago), IL. 10 Jackson Co. (Kansas City), MO. 11 Dallas Co. (Dallas), TX. 12 Maricopa Co. (Phoenix), AZ. 13 King Co. (Seattle), WA.
AMS, Dairy Programs, (202) 720-7461.
Table 8-26.—Milk markets under Federal order program: Uniform and Class I milk prices at 3.5 percent fat test, number of producers, producer milk receipts, producer milk used in Class I, Class I percentage, daily milk deliveries per producer, average fat test of producer milk receipts, by markets, 2008
Federal milk order marketing area Class I
price per cwt. 1
Uniform price per cwt. 1 2
Average number of pro-ducers
Receipts of pro-ducer milk
Pro-ducer milk
used in Cl. I
Class I utiliza-
tion
Daily milk de-
livery per pro-ducer
Average fat test
Million Million Dollars Dollars Number pounds pounds Percent Pounds Percent
Northeast 3 4 .............................. 21.21 18.63 13,584 23,895 10,385 43.5 4,807 3.73 Appalachian 4 5 .......................... 21.28 19.87 2,732 5,882 4,133 70.3 5,898 3.67 Southeast 4 6 .............................. 21.54 20.15 3,003 6,923 4,701 67.9 6,298 3.67 Florida 7 ...................................... 22.89 21.84 386 3,130 2,605 83.2 22,567 3.60 Mideast 4 8 ................................. 19.94 17.92 7,476 15,707 6,588 41.9 5,741 3.70 Upper Midwest 4 9 ...................... 19.76 17.59 15,449 28,041 4,445 15.9 4,951 3.72 Central 4 10 ................................. 19.97 17.39 3,930 11,564 4,249 36.7 8,033 3.65 Southwest 4 11 ............................ 20.96 18.40 589 9,687 4,207 43.4 45,057 3.63 Arizona 12 ................................... 20.31 17.43 98 4,156 1,399 33.7 116,204 3.56 Pacific Northwest 4 13 ................ 19.86 16.99 612 6,882 2,276 33.1 30,739 3.67 All markets combined ................ 20.78 18.24 47,859 115,867 44,989 38.8 6,613 3.69
1 Prices are for milk of 3.5 percent butterfat content and for the principal pricing point of the market. See footnotes 3- 13. 2 For those orders that use the component pricing system for paying producers (orders 1, 30, 32, 33, 124,and 126), the figures are the statistical uniform price (the sum of the producer price differential and the Class III price). For those orders that use the skim milk/butterfat pricing system for paying producers (orders 5, 6, 7, and 131), the figures are the uniform price (the sum of the uniform butterfat price times 3.5 and the uniform skim milk price times 0.965). 3 Suffolk Co. (Boston), MA. 4 Due to the disadvantageous intraorder class and uniform price relationships in some months in these markets, han-dlers elected not to pool milk that normally would have been pooled under these orders. 5 Mecklenburg Co. (Charlotte), NC. 6 Fulton Co. (Atlanta), GA. 7 Hillsborough Co. (Tampa), FL. 8 Cuyahoga Co. (Cleveland), OH. 9 Cook Co. (Chi-cago), IL. 10 Jackson Co. (Kansas City), MO. 11 Dallas Co. (Dallas), TX. 12 Maricopa Co. (Phoenix), AZ. 13 King CO. (Seattle), WA.
AMS, Dairy Programs, (202) 720-7461.
VerDate Aug 31 2005 17:17 Mar 01, 2012 Jkt 000000 PO 00000 Frm 00015 Fmt 1000 Sfmt 1000 H:\SHARED\DAPP\FPU\AGSTAT\MASTER~2\CHAPTR08\VIII-18.AG8 USDA
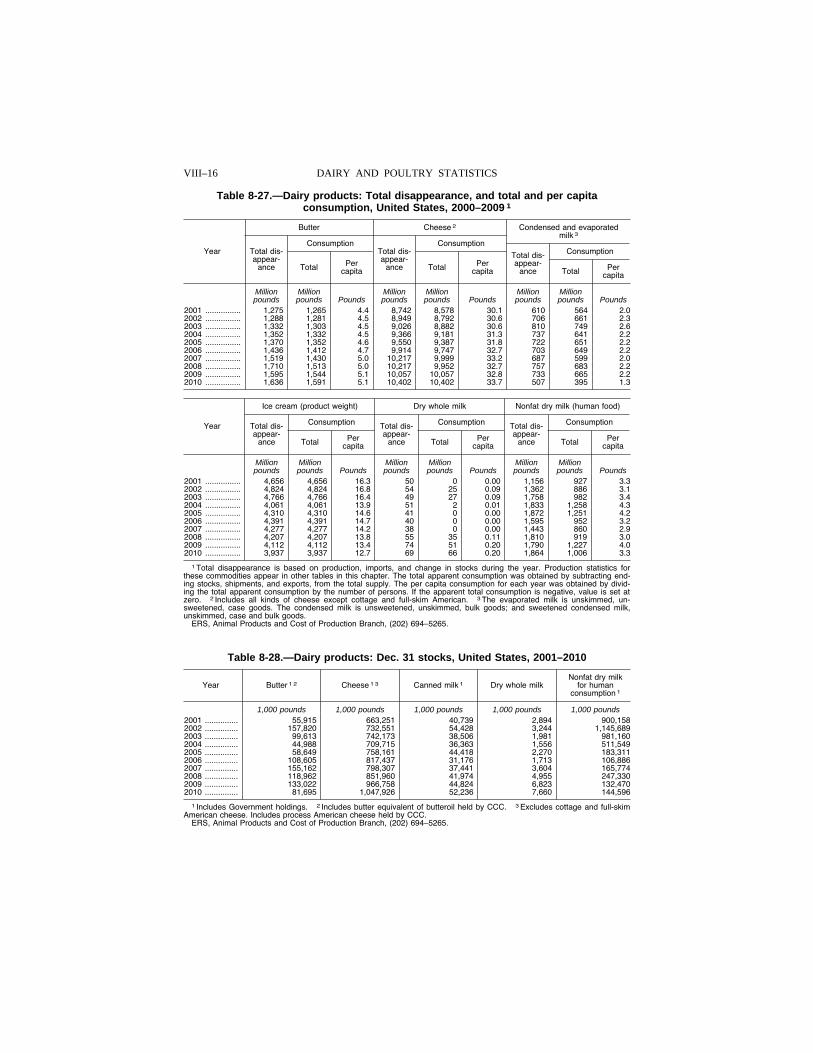
VIII–16 DAIRY AND POULTRY STATISTICS
Table 8-27.—Dairy products: Total disappearance, and total and per capita consumption, United States, 2000–2009 1
Year
Butter Cheese 2 Condensed and evaporated milk 3
Total dis-appear-
ance
Consumption Total dis-appear-
ance
Consumption
Total dis-appear-
ance
Consumption
Total Per capita Total Per
capita Total Per capita
Million Million Million Million Million Million pounds pounds Pounds pounds pounds Pounds pounds pounds Pounds
2001 ................ 1,275 1,265 4.4 8,742 8,578 30.1 610 564 2.0 2002 ................ 1,288 1,281 4.5 8,949 8,792 30.6 706 661 2.3 2003 ................ 1,332 1,303 4.5 9,026 8,882 30.6 810 749 2.6 2004 ................ 1,352 1,332 4.5 9,366 9,181 31.3 737 641 2.2 2005 ................ 1,370 1,352 4.6 9,550 9,387 31.8 722 651 2.2 2006 ................ 1,436 1,412 4.7 9,914 9,747 32.7 703 649 2.2 2007 ................ 1,519 1,430 5.0 10,217 9,999 33.2 687 599 2.0 2008 ................ 1,710 1,513 5.0 10,217 9,952 32.7 757 683 2.2 2009 ................ 1,595 1,544 5.1 10,057 10,057 32.8 733 665 2.2 2010 ................ 1,636 1,591 5.1 10,402 10,402 33.7 507 395 1.3
Year
Ice cream (product weight) Dry whole milk Nonfat dry milk (human food)
Total dis-appear-
ance
Consumption Total dis-appear-
ance
Consumption Total dis-appear-
ance
Consumption
Total Per capita Total Per
capita Total Per capita
Million Million Million Million Million Million pounds pounds Pounds pounds pounds Pounds pounds pounds Pounds
2001 ................ 4,656 4,656 16.3 50 0 0.00 1,156 927 3.3 2002 ................ 4,824 4,824 16.8 54 25 0.09 1,362 886 3.1 2003 ................ 4,766 4,766 16.4 49 27 0.09 1,758 982 3.4 2004 ................ 4,061 4,061 13.9 51 2 0.01 1,833 1,258 4.3 2005 ................ 4,310 4,310 14.6 41 0 0.00 1,872 1,251 4.2 2006 ................ 4,391 4,391 14.7 40 0 0.00 1,595 952 3.2 2007 ................ 4,277 4,277 14.2 38 0 0.00 1,443 860 2.9 2008 ................ 4,207 4,207 13.8 55 35 0.11 1,810 919 3.0 2009 ................ 4,112 4,112 13.4 74 51 0.20 1,790 1,227 4.0 2010 ................ 3,937 3,937 12.7 69 66 0.20 1,864 1,006 3.3
1 Total disappearance is based on production, imports, and change in stocks during the year. Production statistics for these commodities appear in other tables in this chapter. The total apparent consumption was obtained by subtracting end-ing stocks, shipments, and exports, from the total supply. The per capita consumption for each year was obtained by divid-ing the total apparent consumption by the number of persons. If the apparent total consumption is negative, value is set at zero. 2 Includes all kinds of cheese except cottage and full-skim American. 3 The evaporated milk is unskimmed, un-sweetened, case goods. The condensed milk is unsweetened, unskimmed, bulk goods; and sweetened condensed milk, unskimmed, case and bulk goods.
ERS, Animal Products and Cost of Production Branch, (202) 694–5265.
Table 8-28.—Dairy products: Dec. 31 stocks, United States, 2001–2010
Year Butter 1 2 Cheese 1 3 Canned milk 1 Dry whole milk Nonfat dry milk
for human consumption 1
1,000 pounds 1,000 pounds 1,000 pounds 1,000 pounds 1,000 pounds 2001 ............... 55,915 663,251 40,739 2,894 900,158 2002 ............... 157,820 732,551 54,428 3,244 1,145,689 2003 ............... 99,613 742,173 38,506 1,981 981,160 2004 ............... 44,988 709,715 36,363 1,556 511,549 2005 ............... 58,649 758,161 44,418 2,270 183,311 2006 ............... 108,605 817,437 31,176 1,713 106,886 2007 ............... 155,162 798,307 37,441 3,604 165,774 2008 ............... 118,962 851,960 41,974 4,955 247,330 2009 ............... 133,022 966,758 44,824 6,823 132,470 2010 ............... 81,695 1,047,926 52,236 7,660 144,596
1 Includes Government holdings. 2 Includes butter equivalent of butteroil held by CCC. 3 Excludes cottage and full-skim American cheese. Includes process American cheese held by CCC.
ERS, Animal Products and Cost of Production Branch, (202) 694–5265.
VerDate Aug 31 2005 17:17 Mar 01, 2012 Jkt 000000 PO 00000 Frm 00016 Fmt 1000 Sfmt 1000 H:\SHARED\DAPP\FPU\AGSTAT\MASTER~2\CHAPTR08\VIII-19.AG8 USDA
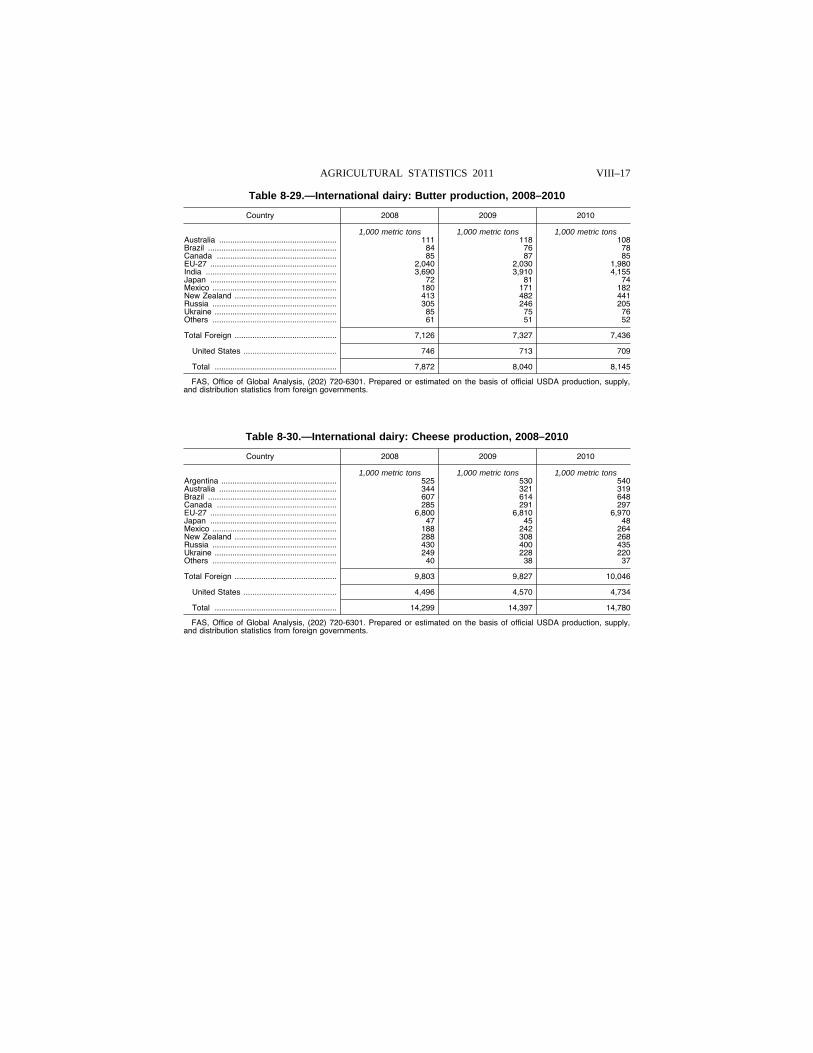
VIII–17 AGRICULTURAL STATISTICS 2011
Table 8-29.—International dairy: Butter production, 2008–2010
Country 2008 2009 2010
1,000 metric tons 1,000 metric tons 1,000 metric tons Australia ..................................................... 111 118 108 Brazil .......................................................... 84 76 78 Canada ...................................................... 85 87 85 EU-27 ......................................................... 2,040 2,030 1,980 India ........................................................... 3,690 3,910 4,155 Japan ......................................................... 72 81 74 Mexico ........................................................ 180 171 182 New Zealand .............................................. 413 482 441 Russia ........................................................ 305 246 205 Ukraine ....................................................... 85 75 76 Others ........................................................ 61 51 52
Total Foreign .............................................. 7,126 7,327 7,436
United States .......................................... 746 713 709
Total ....................................................... 7,872 8,040 8,145
FAS, Office of Global Analysis, (202) 720-6301. Prepared or estimated on the basis of official USDA production, supply, and distribution statistics from foreign governments.
Table 8-30.—International dairy: Cheese production, 2008–2010
Country 2008 2009 2010
1,000 metric tons 1,000 metric tons 1,000 metric tons Argentina .................................................... 525 530 540 Australia ..................................................... 344 321 319 Brazil .......................................................... 607 614 648 Canada ...................................................... 285 291 297 EU-27 ......................................................... 6,800 6,810 6,970 Japan ......................................................... 47 45 48 Mexico ........................................................ 188 242 264 New Zealand .............................................. 288 308 268 Russia ........................................................ 430 400 435 Ukraine ....................................................... 249 228 220 Others ........................................................ 40 38 37
Total Foreign .............................................. 9,803 9,827 10,046
United States .......................................... 4,496 4,570 4,734
Total ....................................................... 14,299 14,397 14,780
FAS, Office of Global Analysis, (202) 720-6301. Prepared or estimated on the basis of official USDA production, supply, and distribution statistics from foreign governments.
VerDate Aug 31 2005 17:17 Mar 01, 2012 Jkt 000000 PO 00000 Frm 00017 Fmt 1000 Sfmt 1000 H:\SHARED\DAPP\FPU\AGSTAT\MASTER~2\CHAPTR08\VIII-20.AG8 USDA
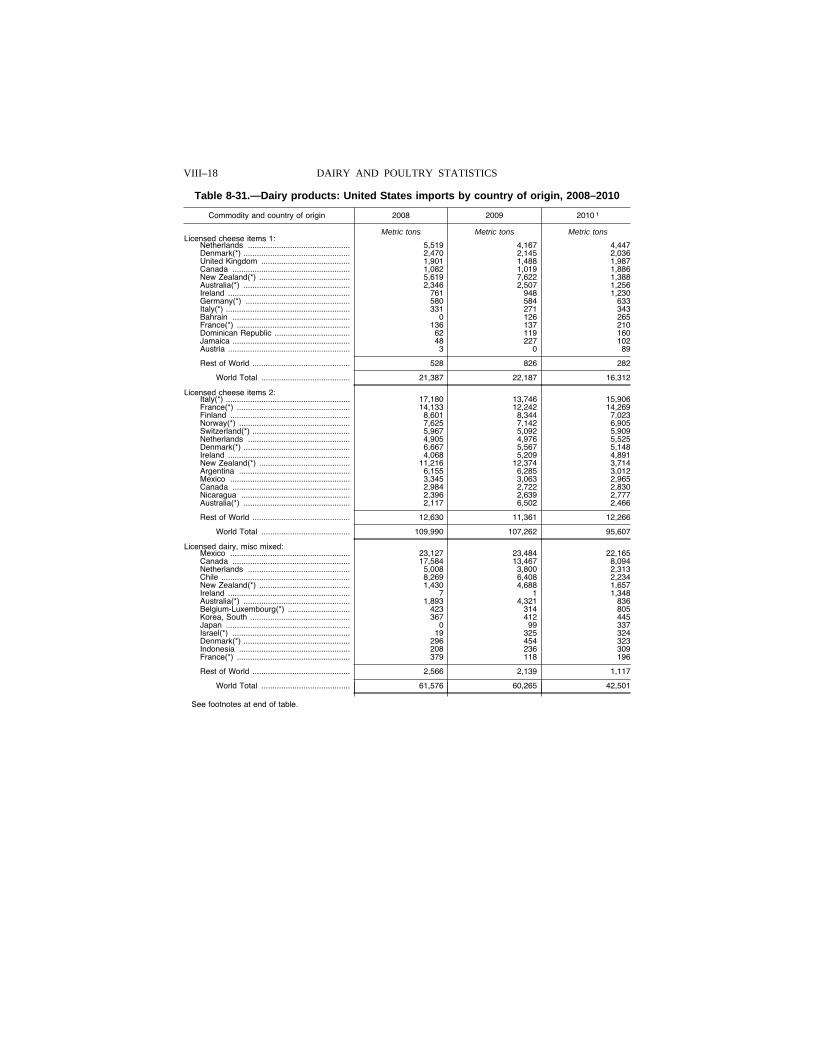
VIII–18 DAIRY AND POULTRY STATISTICS
Table 8-31.—Dairy products: United States imports by country of origin, 2008–2010
Commodity and country of origin 2008 2009 2010 1
Metric tons Metric tons Metric tons Licensed cheese items 1:
Netherlands .............................................. 5,519 4,167 4,447 Denmark(*) ................................................ 2,470 2,145 2,036 United Kingdom ........................................ 1,901 1,488 1,987 Canada ..................................................... 1,082 1,019 1,886 New Zealand(*) ......................................... 5,619 7,622 1,388 Australia(*) ................................................ 2,346 2,507 1,256 Ireland ....................................................... 761 948 1,230 Germany(*) ............................................... 580 584 633 Italy(*) ........................................................ 331 271 343 Bahrain ..................................................... 0 126 265 France(*) ................................................... 136 137 210 Dominican Republic .................................. 62 119 160 Jamaica ..................................................... 48 227 102 Austria ....................................................... 3 0 89
Rest of World ............................................ 528 826 282
World Total ........................................ 21,387 22,187 16,312
Licensed cheese items 2: Italy(*) ........................................................ 17,180 13,746 15,906 France(*) ................................................... 14,133 12,242 14,269 Finland ...................................................... 8,601 8,344 7,023 Norway(*) .................................................. 7,625 7,142 6,905 Switzerland(*) ............................................ 5,967 5,092 5,909 Netherlands .............................................. 4,905 4,976 5,525 Denmark(*) ................................................ 6,667 5,567 5,148 Ireland ....................................................... 4,068 5,209 4,891 New Zealand(*) ......................................... 11,216 12,374 3,714 Argentina .................................................. 6,155 6,285 3,012 Mexico ...................................................... 3,345 3,063 2,965 Canada ..................................................... 2,984 2,722 2,830 Nicaragua ................................................. 2,396 2,639 2,777 Australia(*) ................................................ 2,117 6,502 2,466
Rest of World ............................................ 12,630 11,361 12,266
World Total ........................................ 109,990 107,262 95,607
Licensed dairy, misc mixed: Mexico ...................................................... 23,127 23,484 22,165 Canada ..................................................... 17,584 13,467 8,094 Netherlands .............................................. 5,008 3,800 2,313 Chile .......................................................... 8,269 6,408 2,234 New Zealand(*) ......................................... 1,430 4,688 1,657 Ireland ....................................................... 7 1 1,348 Australia(*) ................................................ 1,893 4,321 836 Belgium-Luxembourg(*) ............................ 423 314 805 Korea, South ............................................. 367 412 445 Japan ........................................................ 0 99 337 Israel(*) ..................................................... 19 325 324 Denmark(*) ................................................ 296 454 323 Indonesia .................................................. 208 236 309 France(*) ................................................... 379 118 196
Rest of World ............................................ 2,566 2,139 1,117
World Total ........................................ 61,576 60,265 42,501
See footnotes at end of table.
VerDate Aug 31 2005 17:17 Mar 01, 2012 Jkt 000000 PO 00000 Frm 00018 Fmt 1000 Sfmt 1000 H:\SHARED\DAPP\FPU\AGSTAT\MASTER~2\CHAPTR08\VIII-21.AG8 USDA
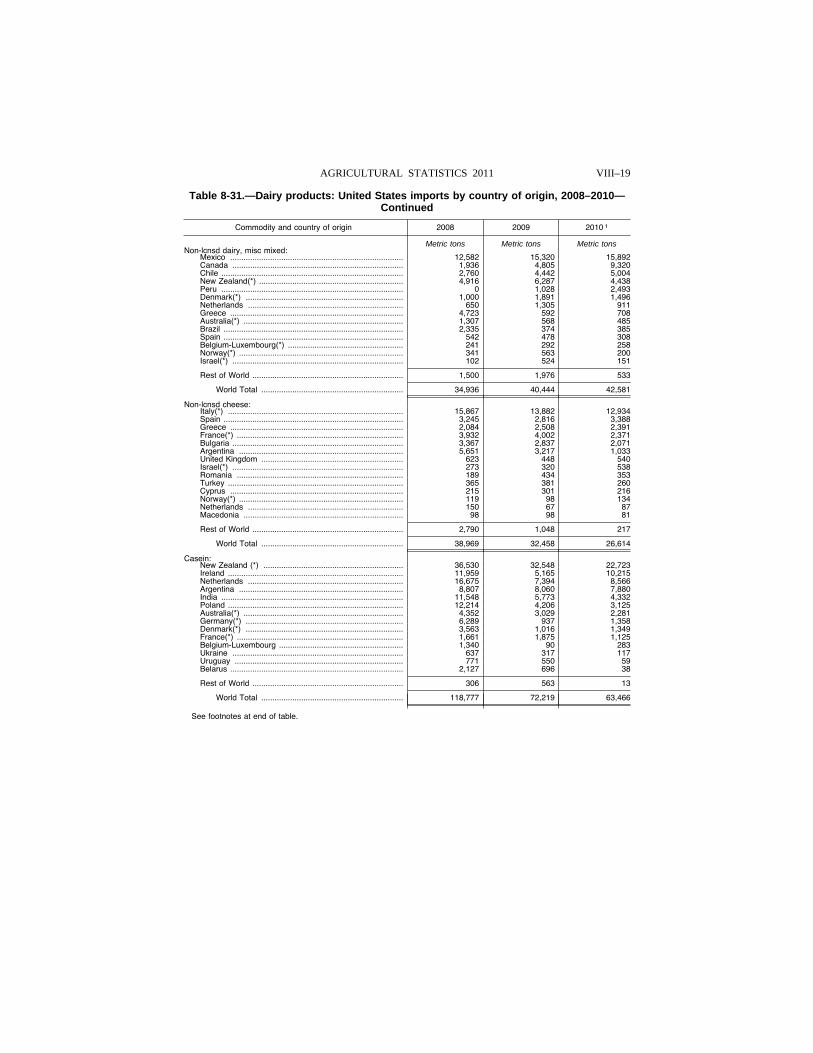
VIII–19 AGRICULTURAL STATISTICS 2011
Table 8-31.—Dairy products: United States imports by country of origin, 2008–2010— Continued
Commodity and country of origin 2008 2009 2010 1
Metric tons Metric tons Metric tons Non-lcnsd dairy, misc mixed:
Mexico .............................................................................. 12,582 15,320 15,892 Canada ............................................................................. 1,936 4,805 9,320 Chile .................................................................................. 2,760 4,442 5,004 New Zealand(*) ................................................................. 4,916 6,287 4,438 Peru .................................................................................. 0 1,028 2,493 Denmark(*) ....................................................................... 1,000 1,891 1,496 Netherlands ...................................................................... 650 1,305 911 Greece .............................................................................. 4,723 592 708 Australia(*) ........................................................................ 1,307 568 485 Brazil ................................................................................. 2,335 374 385 Spain ................................................................................. 542 478 308 Belgium-Luxembourg(*) .................................................... 241 292 258 Norway(*) .......................................................................... 341 563 200 Israel(*) ............................................................................. 102 524 151
Rest of World .................................................................... 1,500 1,976 533
World Total ................................................................ 34,936 40,444 42,581
Non-lcnsd cheese: Italy(*) ............................................................................... 15,867 13,882 12,934 Spain ................................................................................. 3,245 2,816 3,388 Greece .............................................................................. 2,084 2,508 2,391 France(*) ........................................................................... 3,932 4,002 2,371 Bulgaria ............................................................................. 3,367 2,837 2,071 Argentina .......................................................................... 5,651 3,217 1,033 United Kingdom ................................................................ 623 448 540 Israel(*) ............................................................................. 273 320 538 Romania ........................................................................... 189 434 353 Turkey ............................................................................... 365 381 260 Cyprus .............................................................................. 215 301 216 Norway(*) .......................................................................... 119 98 134 Netherlands ...................................................................... 150 67 87 Macedonia ........................................................................ 98 98 81
Rest of World .................................................................... 2,790 1,048 217
World Total ................................................................ 38,969 32,458 26,614
Casein: New Zealand (*) ............................................................... 36,530 32,548 22,723 Ireland ............................................................................... 11,959 5,165 10,215 Netherlands ...................................................................... 16,675 7,394 8,566 Argentina .......................................................................... 8,807 8,060 7,880 India .................................................................................. 11,548 5,773 4,332 Poland ............................................................................... 12,214 4,206 3,125 Australia(*) ........................................................................ 4,352 3,029 2,281 Germany(*) ....................................................................... 6,289 937 1,358 Denmark(*) ....................................................................... 3,563 1,016 1,349 France(*) ........................................................................... 1,661 1,875 1,125 Belgium-Luxembourg ........................................................ 1,340 90 283 Ukraine ............................................................................. 637 317 117 Uruguay ............................................................................ 771 550 59 Belarus .............................................................................. 2,127 696 38
Rest of World .................................................................... 306 563 13
World Total ................................................................ 118,777 72,219 63,466
See footnotes at end of table.
VerDate Aug 31 2005 17:17 Mar 01, 2012 Jkt 000000 PO 00000 Frm 00019 Fmt 1000 Sfmt 1000 H:\SHARED\DAPP\FPU\AGSTAT\MASTER~2\CHAPTR08\VIII-22.AG8 USDA
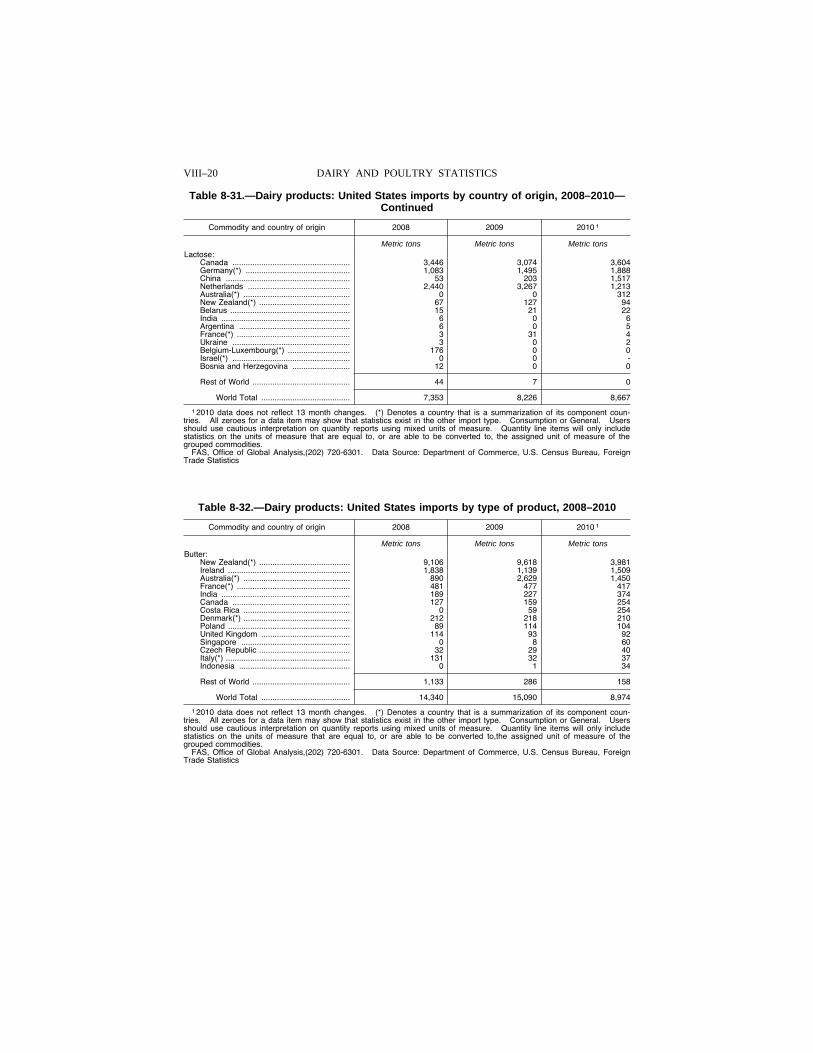
VIII–20 DAIRY AND POULTRY STATISTICS
Table 8-31.—Dairy products: United States imports by country of origin, 2008–2010— Continued
Commodity and country of origin 2008 2009 2010 1
Metric tons Metric tons Metric tons Lactose:
Canada ..................................................... 3,446 3,074 3,604 Germany(*) ............................................... 1,083 1,495 1,888 China ........................................................ 53 203 1,517 Netherlands .............................................. 2,440 3,267 1,213 Australia(*) ................................................ 0 0 312 New Zealand(*) ......................................... 67 127 94 Belarus ...................................................... 15 21 22 India .......................................................... 6 0 6 Argentina .................................................. 6 0 5 France(*) ................................................... 3 31 4 Ukraine ..................................................... 3 0 2 Belgium-Luxembourg(*) ............................ 176 0 0 Israel(*) ..................................................... 0 0 - Bosnia and Herzegovina .......................... 12 0 0
Rest of World ............................................ 44 7 0
World Total ........................................ 7,353 8,226 8,667
1 2010 data does not reflect 13 month changes. (*) Denotes a country that is a summarization of its component coun-tries. All zeroes for a data item may show that statistics exist in the other import type. Consumption or General. Users should use cautious interpretation on quantity reports using mixed units of measure. Quantity line items will only include statistics on the units of measure that are equal to, or are able to be converted to, the assigned unit of measure of the grouped commodities.
FAS, Office of Global Analysis,(202) 720-6301. Data Source: Department of Commerce, U.S. Census Bureau, Foreign Trade Statistics
Table 8-32.—Dairy products: United States imports by type of product, 2008–2010
Commodity and country of origin 2008 2009 2010 1
Metric tons Metric tons Metric tons Butter:
New Zealand(*) ......................................... 9,106 9,618 3,981 Ireland ....................................................... 1,838 1,139 1,509 Australia(*) ................................................ 890 2,629 1,450 France(*) ................................................... 481 477 417 India .......................................................... 189 227 374 Canada ..................................................... 127 159 254 Costa Rica ................................................ 0 59 254 Denmark(*) ................................................ 212 218 210 Poland ....................................................... 89 114 104 United Kingdom ........................................ 114 93 92 Singapore ................................................. 0 8 60 Czech Republic ......................................... 32 29 40 Italy(*) ........................................................ 131 32 37 Indonesia .................................................. 0 1 34
Rest of World ............................................ 1,133 286 158
World Total ........................................ 14,340 15,090 8,974
1 2010 data does not reflect 13 month changes. (*) Denotes a country that is a summarization of its component coun-tries. All zeroes for a data item may show that statistics exist in the other import type. Consumption or General. Users should use cautious interpretation on quantity reports using mixed units of measure. Quantity line items will only include statistics on the units of measure that are equal to, or are able to be converted to,the assigned unit of measure of the grouped commodities.
FAS, Office of Global Analysis,(202) 720-6301. Data Source: Department of Commerce, U.S. Census Bureau, Foreign Trade Statistics
VerDate Aug 31 2005 17:17 Mar 01, 2012 Jkt 000000 PO 00000 Frm 00020 Fmt 1000 Sfmt 1000 H:\SHARED\DAPP\FPU\AGSTAT\MASTER~2\CHAPTR08\VIII-23.AG8 USDA
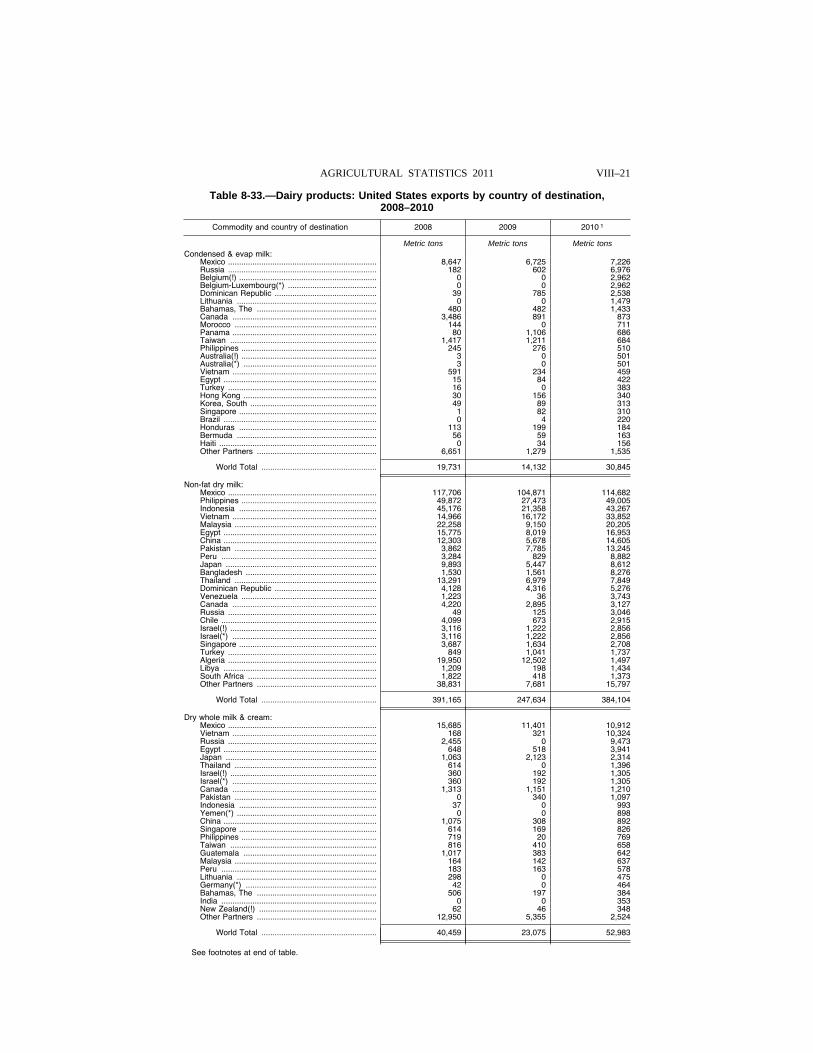
VIII–21 AGRICULTURAL STATISTICS 2011
Table 8-33.—Dairy products: United States exports by country of destination, 2008–2010
Commodity and country of destination 2008 2009 2010 1
Metric tons Metric tons Metric tons Condensed & evap milk:
Mexico ................................................................... 8,647 6,725 7,226 Russia ................................................................... 182 602 6,976 Belgium(!) .............................................................. 0 0 2,962 Belgium-Luxembourg(*) ........................................ 0 0 2,962 Dominican Republic .............................................. 39 785 2,538 Lithuania ............................................................... 0 0 1,479 Bahamas, The ...................................................... 480 482 1,433 Canada ................................................................. 3,486 891 873 Morocco ................................................................ 144 0 711 Panama ................................................................. 80 1,106 686 Taiwan .................................................................. 1,417 1,211 684 Philippines ............................................................. 245 276 510 Australia(!) ............................................................. 3 0 501 Australia(*) ............................................................ 3 0 501 Vietnam ................................................................. 591 234 459 Egypt ..................................................................... 15 84 422 Turkey ................................................................... 16 0 383 Hong Kong ............................................................ 30 156 340 Korea, South ......................................................... 49 89 313 Singapore .............................................................. 1 82 310 Brazil ..................................................................... 0 4 220 Honduras .............................................................. 113 199 184 Bermuda ............................................................... 56 59 163 Haiti ....................................................................... 0 34 156 Other Partners ...................................................... 6,651 1,279 1,535
World Total .................................................... 19,731 14,132 30,845
Non-fat dry milk: Mexico ................................................................... 117,706 104,871 114,682 Philippines ............................................................. 49,872 27,473 49,005 Indonesia .............................................................. 45,176 21,358 43,267 Vietnam ................................................................. 14,966 16,172 33,852 Malaysia ................................................................ 22,258 9,150 20,205 Egypt ..................................................................... 15,775 8,019 16,953 China ..................................................................... 12,303 5,678 14,605 Pakistan ................................................................ 3,862 7,785 13,245 Peru ...................................................................... 3,284 829 8,882 Japan .................................................................... 9,893 5,447 8,612 Bangladesh ........................................................... 1,530 1,561 8,276 Thailand ................................................................ 13,291 6,979 7,849 Dominican Republic .............................................. 4,128 4,316 5,276 Venezuela ............................................................. 1,223 36 3,743 Canada ................................................................. 4,220 2,895 3,127 Russia ................................................................... 49 125 3,046 Chile ...................................................................... 4,099 673 2,915 Israel(!) .................................................................. 3,116 1,222 2,856 Israel(*) ................................................................. 3,116 1,222 2,856 Singapore .............................................................. 3,687 1,634 2,708 Turkey ................................................................... 849 1,041 1,737 Algeria ................................................................... 19,950 12,502 1,497 Libya ..................................................................... 1,209 198 1,434 South Africa .......................................................... 1,822 418 1,373 Other Partners ...................................................... 38,831 7,681 15,797
World Total .................................................... 391,165 247,634 384,104
Dry whole milk & cream: Mexico ................................................................... 15,685 11,401 10,912 Vietnam ................................................................. 168 321 10,324 Russia ................................................................... 2,455 0 9,473 Egypt ..................................................................... 648 518 3,941 Japan .................................................................... 1,063 2,123 2,314 Thailand ................................................................ 614 0 1,396 Israel(!) .................................................................. 360 192 1,305 Israel(*) ................................................................. 360 192 1,305 Canada ................................................................. 1,313 1,151 1,210 Pakistan ................................................................ 0 340 1,097 Indonesia .............................................................. 37 0 993 Yemen(*) ............................................................... 0 0 898 China ..................................................................... 1,075 308 892 Singapore .............................................................. 614 169 826 Philippines ............................................................. 719 20 769 Taiwan .................................................................. 816 410 658 Guatemala ............................................................ 1,017 383 642 Malaysia ................................................................ 164 142 637 Peru ...................................................................... 183 163 578 Lithuania ............................................................... 298 0 475 Germany(*) ........................................................... 42 0 464 Bahamas, The ...................................................... 506 197 384 India ...................................................................... 0 0 353 New Zealand(!) ..................................................... 62 46 348 Other Partners ...................................................... 12,950 5,355 2,524
World Total .................................................... 40,459 23,075 52,983
See footnotes at end of table.
VerDate Aug 31 2005 17:17 Mar 01, 2012 Jkt 000000 PO 00000 Frm 00021 Fmt 1000 Sfmt 1000 H:\SHARED\DAPP\FPU\AGSTAT\MASTER~2\CHAPTR08\VIII-24.AG8 USDA
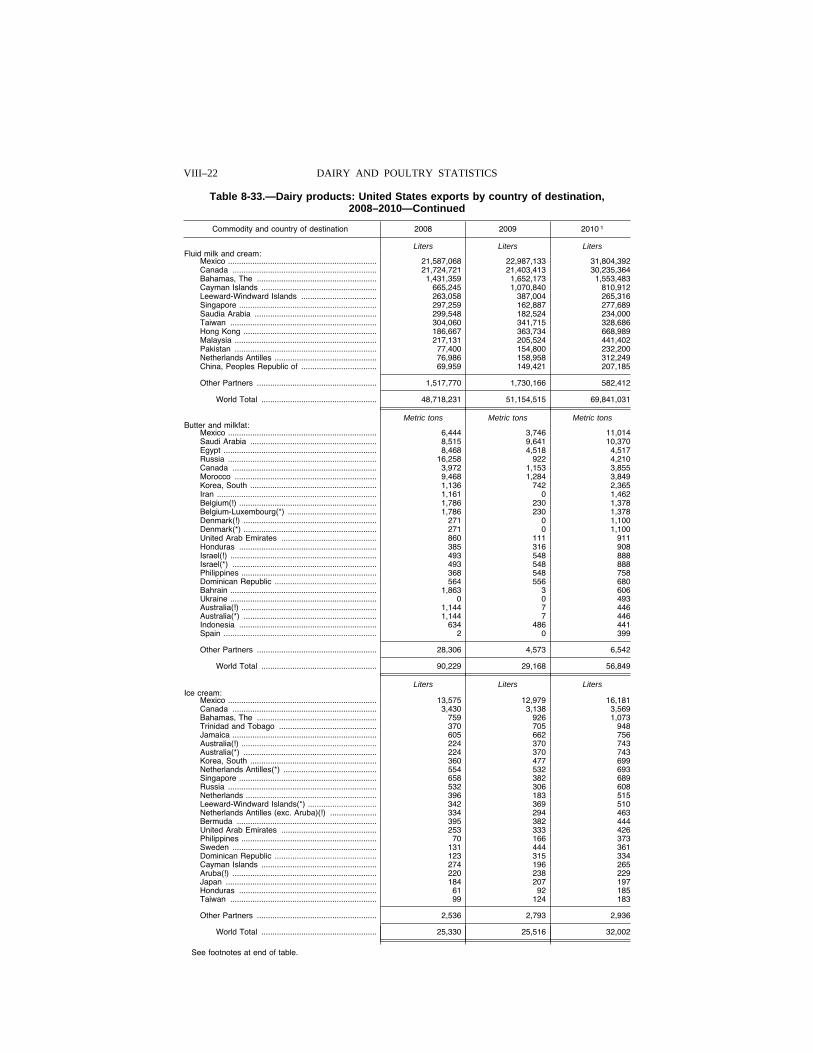
VIII–22 DAIRY AND POULTRY STATISTICS
Table 8-33.—Dairy products: United States exports by country of destination, 2008–2010—Continued
Commodity and country of destination 2008 2009 2010 1
Liters Liters Liters Fluid milk and cream:
Mexico ................................................................... 21,587,068 22,987,133 31,804,392 Canada ................................................................. 21,724,721 21,403,413 30,235,364 Bahamas, The ...................................................... 1,431,359 1,652,173 1,553,483 Cayman Islands .................................................... 665,245 1,070,840 810,912 Leeward-Windward Islands .................................. 263,058 387,004 265,316 Singapore .............................................................. 297,259 162,887 277,689 Saudia Arabia ....................................................... 299,548 182,524 234,000 Taiwan .................................................................. 304,060 341,715 328,686 Hong Kong ............................................................ 186,667 363,734 668,989 Malaysia ................................................................ 217,131 205,524 441,402 Pakistan ................................................................ 77,400 154,800 232,200 Netherlands Antilles .............................................. 76,986 158,958 312,249 China, Peoples Republic of .................................. 69,959 149,421 207,185
Other Partners ...................................................... 1,517,770 1,730,166 582,412
World Total .................................................... 48,718,231 51,154,515 69,841,031
Metric tons Metric tons Metric tons Butter and milkfat:
Mexico ................................................................... 6,444 3,746 11,014 Saudi Arabia ......................................................... 8,515 9,641 10,370 Egypt ..................................................................... 8,468 4,518 4,517 Russia ................................................................... 16,258 922 4,210 Canada ................................................................. 3,972 1,153 3,855 Morocco ................................................................ 9,468 1,284 3,849 Korea, South ......................................................... 1,136 742 2,365 Iran ........................................................................ 1,161 0 1,462 Belgium(!) .............................................................. 1,786 230 1,378 Belgium-Luxembourg(*) ........................................ 1,786 230 1,378 Denmark(!) ............................................................ 271 0 1,100 Denmark(*) ............................................................ 271 0 1,100 United Arab Emirates ........................................... 860 111 911 Honduras .............................................................. 385 316 908 Israel(!) .................................................................. 493 548 888 Israel(*) ................................................................. 493 548 888 Philippines ............................................................. 368 548 758 Dominican Republic .............................................. 564 556 680 Bahrain .................................................................. 1,863 3 606 Ukraine .................................................................. 0 0 493 Australia(!) ............................................................. 1,144 7 446 Australia(*) ............................................................ 1,144 7 446 Indonesia .............................................................. 634 486 441 Spain ..................................................................... 2 0 399
Other Partners ...................................................... 28,306 4,573 6,542
World Total .................................................... 90,229 29,168 56,849
Liters Liters Liters Ice cream:
Mexico ................................................................... 13,575 12,979 16,181 Canada ................................................................. 3,430 3,138 3,569 Bahamas, The ...................................................... 759 926 1,073 Trinidad and Tobago ............................................ 370 705 948 Jamaica ................................................................. 605 662 756 Australia(!) ............................................................. 224 370 743 Australia(*) ............................................................ 224 370 743 Korea, South ......................................................... 360 477 699 Netherlands Antilles(*) .......................................... 554 532 693 Singapore .............................................................. 658 382 689 Russia ................................................................... 532 306 608 Netherlands ........................................................... 396 183 515 Leeward-Windward Islands(*) ............................... 342 369 510 Netherlands Antilles (exc. Aruba)(!) ..................... 334 294 463 Bermuda ............................................................... 395 382 444 United Arab Emirates ........................................... 253 333 426 Philippines ............................................................. 70 166 373 Sweden ................................................................. 131 444 361 Dominican Republic .............................................. 123 315 334 Cayman Islands .................................................... 274 196 265 Aruba(!) ................................................................. 220 238 229 Japan .................................................................... 184 207 197 Honduras .............................................................. 61 92 185 Taiwan .................................................................. 99 124 183
Other Partners ...................................................... 2,536 2,793 2,936
World Total .................................................... 25,330 25,516 32,002
See footnotes at end of table.
VerDate Aug 31 2005 17:17 Mar 01, 2012 Jkt 000000 PO 00000 Frm 00022 Fmt 1000 Sfmt 1000 H:\SHARED\DAPP\FPU\AGSTAT\MASTER~2\CHAPTR08\VIII-25.AG8 USDA
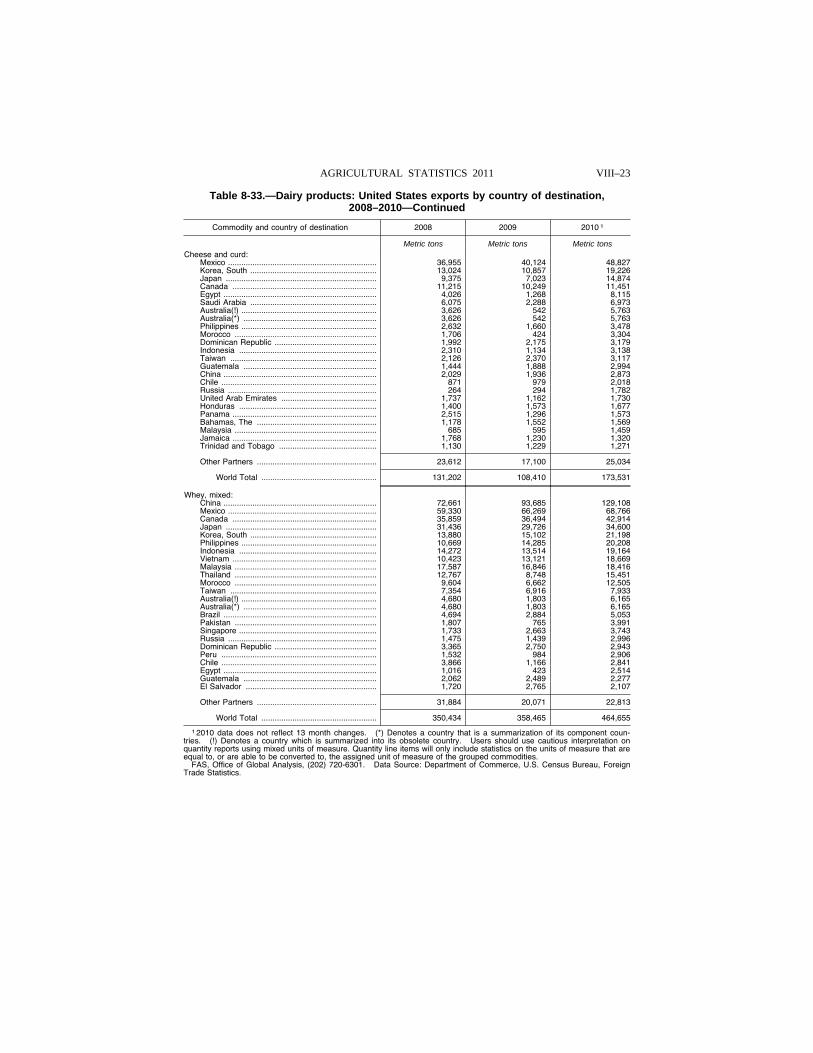
VIII–23 AGRICULTURAL STATISTICS 2011
Table 8-33.—Dairy products: United States exports by country of destination, 2008–2010—Continued
Commodity and country of destination 2008 2009 2010 1
Metric tons Metric tons Metric tons Cheese and curd:
Mexico ................................................................... 36,955 40,124 48,827 Korea, South ......................................................... 13,024 10,857 19,226 Japan .................................................................... 9,375 7,023 14,874 Canada ................................................................. 11,215 10,249 11,451 Egypt ..................................................................... 4,026 1,268 8,115 Saudi Arabia ......................................................... 6,075 2,288 6,973 Australia(!) ............................................................. 3,626 542 5,763 Australia(*) ............................................................ 3,626 542 5,763 Philippines ............................................................. 2,632 1,660 3,478 Morocco ................................................................ 1,706 424 3,304 Dominican Republic .............................................. 1,992 2,175 3,179 Indonesia .............................................................. 2,310 1,134 3,138 Taiwan .................................................................. 2,126 2,370 3,117 Guatemala ............................................................ 1,444 1,888 2,994 China ..................................................................... 2,029 1,936 2,873 Chile ...................................................................... 871 979 2,018 Russia ................................................................... 264 294 1,782 United Arab Emirates ........................................... 1,737 1,162 1,730 Honduras .............................................................. 1,400 1,573 1,677 Panama ................................................................. 2,515 1,296 1,573 Bahamas, The ...................................................... 1,178 1,552 1,569 Malaysia ................................................................ 685 595 1,459 Jamaica ................................................................. 1,768 1,230 1,320 Trinidad and Tobago ............................................ 1,130 1,229 1,271
Other Partners ...................................................... 23,612 17,100 25,034
World Total .................................................... 131,202 108,410 173,531
Whey, mixed: China ..................................................................... 72,661 93,685 129,108 Mexico ................................................................... 59,330 66,269 68,766 Canada ................................................................. 35,859 36,494 42,914 Japan .................................................................... 31,436 29,726 34,600 Korea, South ......................................................... 13,880 15,102 21,198 Philippines ............................................................. 10,669 14,285 20,208 Indonesia .............................................................. 14,272 13,514 19,164 Vietnam ................................................................. 10,423 13,121 18,669 Malaysia ................................................................ 17,587 16,846 18,416 Thailand ................................................................ 12,767 8,748 15,451 Morocco ................................................................ 9,604 6,662 12,505 Taiwan .................................................................. 7,354 6,916 7,933 Australia(!) ............................................................. 4,680 1,803 6,165 Australia(*) ............................................................ 4,680 1,803 6,165 Brazil ..................................................................... 4,694 2,884 5,053 Pakistan ................................................................ 1,807 765 3,991 Singapore .............................................................. 1,733 2,663 3,743 Russia ................................................................... 1,475 1,439 2,996 Dominican Republic .............................................. 3,365 2,750 2,943 Peru ...................................................................... 1,532 984 2,906 Chile ...................................................................... 3,866 1,166 2,841 Egypt ..................................................................... 1,016 423 2,514 Guatemala ............................................................ 2,062 2,489 2,277 El Salvador ........................................................... 1,720 2,765 2,107
Other Partners ...................................................... 31,884 20,071 22,813
World Total .................................................... 350,434 358,465 464,655
1 2010 data does not reflect 13 month changes. (*) Denotes a country that is a summarization of its component coun-tries. (!) Denotes a country which is summarized into its obsolete country. Users should use cautious interpretation on quantity reports using mixed units of measure. Quantity line items will only include statistics on the units of measure that are equal to, or are able to be converted to, the assigned unit of measure of the grouped commodities.
FAS, Office of Global Analysis, (202) 720-6301. Data Source: Department of Commerce, U.S. Census Bureau, Foreign Trade Statistics.
VerDate Aug 31 2005 17:17 Mar 01, 2012 Jkt 000000 PO 00000 Frm 00023 Fmt 1000 Sfmt 1000 H:\SHARED\DAPP\FPU\AGSTAT\MASTER~2\CHAPTR08\VIII-26.AG8 USDA

VIII–24 DAIRY AND POULTRY STATISTICS
Table 8-34.—Dairy products: Price-support operations, United States, 2001–2011
Marketing year beginning Oc-
tober 1
Manufacturing milk per cwt. Product purchase price per pound 1
Support price at national average
milkfat test
Average producer received price Butter 2 Cheddar cheese 3 Nonfat milk, spray
process 4
Dollars Dollars Cents Cents Cents
2001–2002 ..... 9.90 (5)11.47 85.48 113.14 90.00 2002–2003 ..... 9.90 (5)11.10 85.48 113.14 90.00
9.90 (5)11.10 (6)105.00 113.14 (6) 80.00 2003–2004 ..... 9.90 (5)14.95 105.00 113.14 80.00 2004–2005 ..... 9.90 (5)14.76 105.00 113.14 80.00 2005–2006 ..... 9.90 (5)12.57 105.00 113.14 80.00 2006–2007 ..... 9.90 (5)16.62 105.00 113.14 80.00 2007–2008 ..... 9.90 (5)18.83 105.00 113.14 80.00 2008–2009 ..... 9.35 (5)12.56 105.00 113.00 80.00 2009–2010 ..... 10.80 ............................... 105.00 (7)131.00 (7) 92.00
9.35 (5)14.44 105.00 (8)113.00 (8)80.00 2010–2011 ..... 9.35 (9)17.57 105.00 113.00 80.00
1 Announced purchase prices for products in bulk containers. 2 U.S. Grade A or higher, salted, 25-kg blocks. 3 U.S. Grade A or higher, standard moisture basis 40-pound blocks. 4 U.S. Extra Grade, not more than 3.5 percent moisture con-tent. Prices quoted are for product in 25-kg bags. 5 Estimated value of milk used in manufactured products. 6 Effective December 1, 2002. 7 Effective August 1, 2009 through October 31, 2009. 8 Effective November 1, 2009. 9 Publication of Manufacturing Milk prices ended after December 2010. This entry is based on Federal Milk Marketing Order Class III and Class IV prices.
FSA, Dairy, (202) 690–0050
Table 8-35.—Chickens: Inventory number and value, United States, Dec. 1, 2001–2010 1
Year
Layers 1 year old and
older
Layers 20
weeks old but
less than 1 year
Total layers
Pullets
Other chick-ens
All chick-ens
Value per
head
Total value
13 weeks to 20
weeks old
Under 13
weeks old
Total
Thou-sands
Thou-sands
Thou-sands
Thou-sands
Thou-sands
Thou-sands
Thou-sands
Thou-sands
Dollars 1,000 dol-lars
2001 ............ 153,817 186,500 340,317 42,907 52,749 ............. 8,126 444,099 2.41 1,069,335 2002 ............ 153,884 186,325 340,209 39,865 55,424 ............. 8,353 443,851 2.38 1,055,316 2003 ............ (3) (3) 341,099 (3) (3) 100,583 8,477 450,159 2.48 1,116,052 2004 ............ (3) (3) 344,371 (3) (3) 101,794 8,287 454,452 2.48 1,125,672 2005 ............ (3) (3) 349,764 (3) (3) 97,544 8,264 455,572 2.52 1,149,736 2006 ............ (3) (3) 352,316 (3) (3) 97,459 8,038 457,813 2.60 1,189,978 2007 ............ (3) (3) 346,613 (3) (3) 103,816 8,164 458,593 2.95 1,351,549 2008 ............ (3) (3) 339,859 (3) (3) 99,458 7,589 446,906 3.39 1,517,210 2009 ............ (3) (3) 341,005 (3) (3) 102,301 8,487 451,793 3.34 1,507,533 2010 2 .......... (3) (3) 342,451 (3) (3) 104,665 7,390 454,506 3.52 1,599,726
1 Does not include commercial broilers. 2 Preliminary. 3 Not available due to program change. NASS Livestock Branch, (202) 720-3570.
VerDate Aug 31 2005 17:17 Mar 01, 2012 Jkt 000000 PO 00000 Frm 00024 Fmt 1000 Sfmt 1000 H:\SHARED\DAPP\FPU\AGSTAT\MASTER~2\CHAPTR08\VIII-27.AG8 USDA
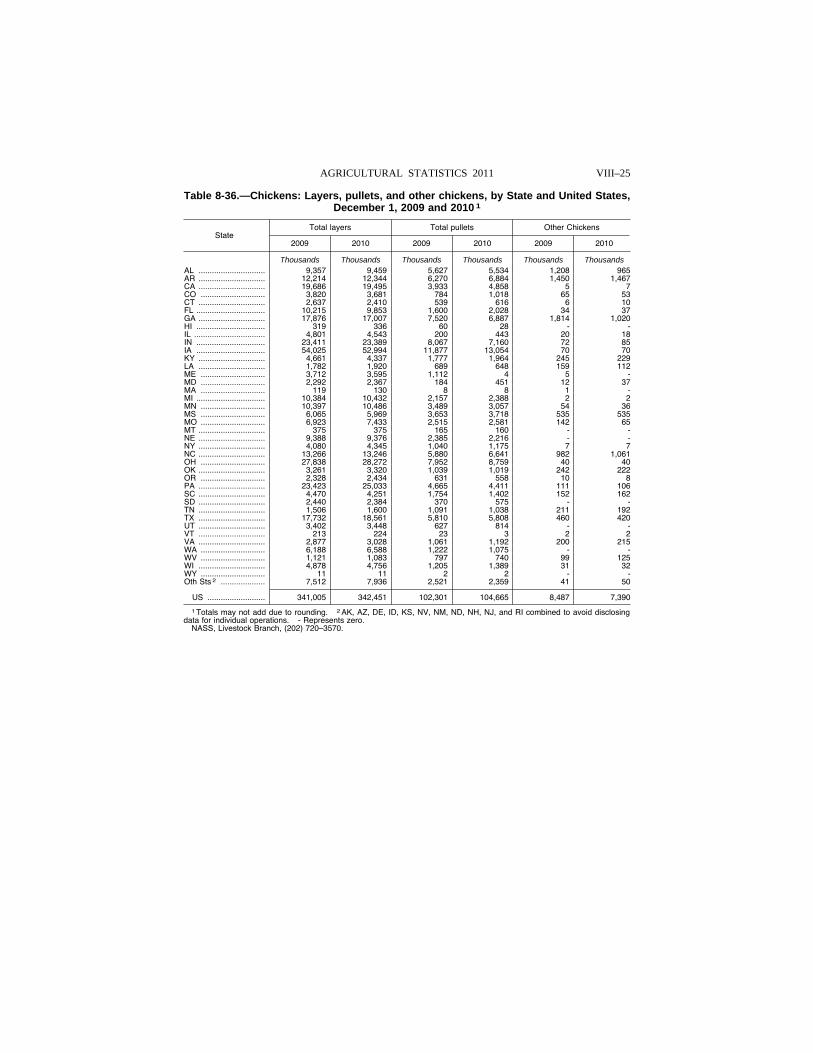
VIII–25 AGRICULTURAL STATISTICS 2011
Table 8-36.—Chickens: Layers, pullets, and other chickens, by State and United States, December 1, 2009 and 2010 1
State Total layers Total pullets Other Chickens
2009 2010 2009 2010 2009 2010
Thousands Thousands Thousands Thousands Thousands Thousands AL .............................. 9,357 9,459 5,627 5,534 1,208 965 AR .............................. 12,214 12,344 6,270 6,884 1,450 1,467 CA .............................. 19,686 19,495 3,933 4,858 5 7 CO ............................. 3,820 3,681 784 1,018 65 53 CT .............................. 2,637 2,410 539 616 6 10 FL ............................... 10,215 9,853 1,600 2,028 34 37 GA .............................. 17,876 17,007 7,520 6,887 1,814 1,020 HI ............................... 319 336 60 28 - - IL ................................ 4,801 4,543 200 443 20 18 IN ............................... 23,411 23,389 8,067 7,160 72 85 IA ............................... 54,025 52,994 11,877 13,054 70 70 KY .............................. 4,661 4,337 1,777 1,964 245 229 LA .............................. 1,782 1,920 689 648 159 112 ME ............................. 3,712 3,595 1,112 4 5 - MD ............................. 2,292 2,367 184 451 12 37 MA ............................. 119 130 8 8 1 - MI ............................... 10,384 10,432 2,157 2,388 2 2 MN ............................. 10,397 10,486 3,489 3,057 54 36 MS ............................. 6,065 5,969 3,653 3,718 535 535 MO ............................. 6,923 7,433 2,515 2,581 142 65 MT .............................. 375 375 165 160 - - NE .............................. 9,388 9,376 2,385 2,216 - - NY .............................. 4,080 4,345 1,040 1,175 7 7 NC .............................. 13,266 13,246 5,880 6,641 982 1,061 OH ............................. 27,838 28,272 7,952 8,759 40 40 OK .............................. 3,261 3,320 1,039 1,019 242 222 OR ............................. 2,328 2,434 631 558 10 8 PA .............................. 23,423 25,033 4,665 4,411 111 106 SC .............................. 4,470 4,251 1,754 1,402 152 162 SD .............................. 2,440 2,384 370 575 - - TN .............................. 1,506 1,600 1,091 1,038 211 192 TX .............................. 17,732 18,561 5,810 5,808 460 420 UT .............................. 3,402 3,448 627 814 - - VT .............................. 213 224 23 3 2 2 VA .............................. 2,877 3,028 1,061 1,192 200 215 WA ............................. 6,188 6,588 1,222 1,075 - - WV ............................. 1,121 1,083 797 740 99 125 WI .............................. 4,878 4,756 1,205 1,389 31 32 WY ............................. 11 11 2 2 - - Oth Sts 2 .................... 7,512 7,936 2,521 2,359 41 50
US .......................... 341,005 342,451 102,301 104,665 8,487 7,390
1 Totals may not add due to rounding. 2 AK, AZ, DE, ID, KS, NV, NM, ND, NH, NJ, and RI combined to avoid disclosing data for individual operations. - Represents zero.
NASS, Livestock Branch, (202) 720–3570.
VerDate Aug 31 2005 17:17 Mar 01, 2012 Jkt 000000 PO 00000 Frm 00025 Fmt 1000 Sfmt 1000 H:\SHARED\DAPP\FPU\AGSTAT\MASTER~2\CHAPTR08\VIII-28.AG8 USDA
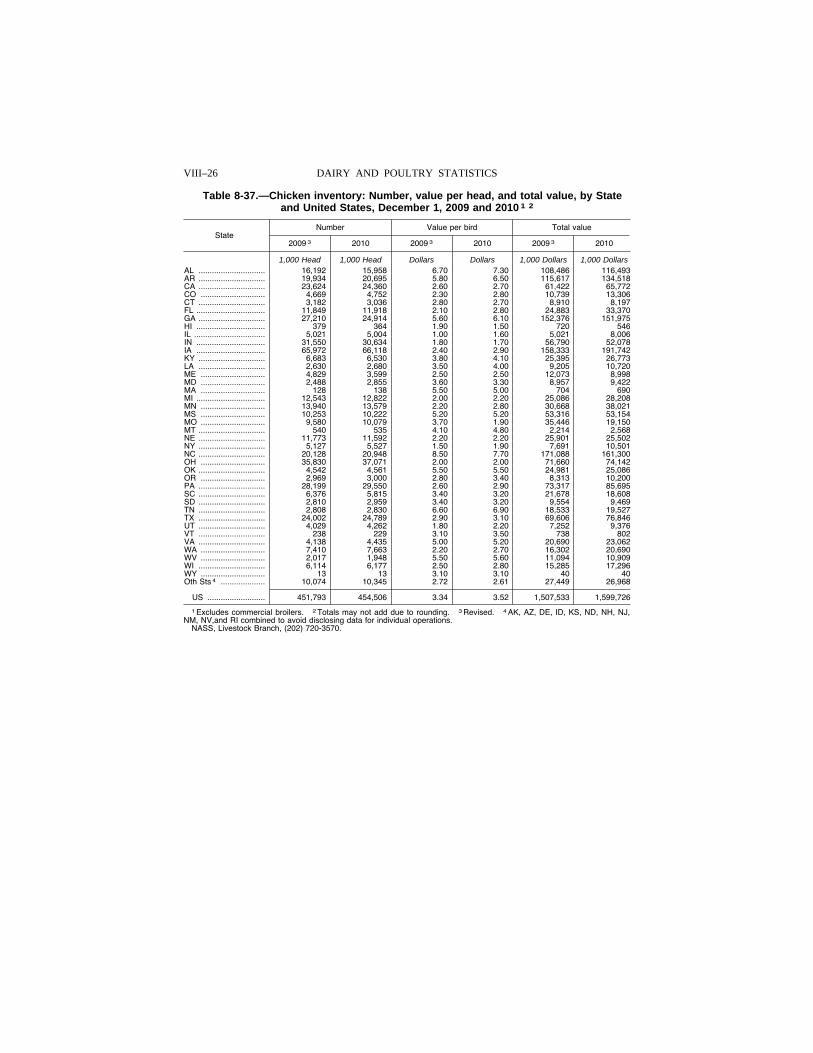
VIII–26 DAIRY AND POULTRY STATISTICS
Table 8-37.—Chicken inventory: Number, value per head, and total value, by State and United States, December 1, 2009 and 2010 1 2
State Number Value per bird Total value
2009 3 2010 2009 3 2010 2009 3 2010
1,000 Head 1,000 Head Dollars Dollars 1,000 Dollars 1,000 Dollars AL .............................. 16,192 15,958 6.70 7.30 108,486 116,493 AR .............................. 19,934 20,695 5.80 6.50 115,617 134,518 CA .............................. 23,624 24,360 2.60 2.70 61,422 65,772 CO ............................. 4,669 4,752 2.30 2.80 10,739 13,306 CT .............................. 3,182 3,036 2.80 2.70 8,910 8,197 FL ............................... 11,849 11,918 2.10 2.80 24,883 33,370 GA .............................. 27,210 24,914 5.60 6.10 152,376 151,975 HI ............................... 379 364 1.90 1.50 720 546 IL ................................ 5,021 5,004 1.00 1.60 5,021 8,006 IN ............................... 31,550 30,634 1.80 1.70 56,790 52,078 IA ............................... 65,972 66,118 2.40 2.90 158,333 191,742 KY .............................. 6,683 6,530 3.80 4.10 25,395 26,773 LA .............................. 2,630 2,680 3.50 4.00 9,205 10,720 ME ............................. 4,829 3,599 2.50 2.50 12,073 8,998 MD ............................. 2,488 2,855 3.60 3.30 8,957 9,422 MA ............................. 128 138 5.50 5.00 704 690 MI ............................... 12,543 12,822 2.00 2.20 25,086 28,208 MN ............................. 13,940 13,579 2.20 2.80 30,668 38,021 MS ............................. 10,253 10,222 5.20 5.20 53,316 53,154 MO ............................. 9,580 10,079 3.70 1.90 35,446 19,150 MT .............................. 540 535 4.10 4.80 2,214 2,568 NE .............................. 11,773 11,592 2.20 2.20 25,901 25,502 NY .............................. 5,127 5,527 1.50 1.90 7,691 10,501 NC .............................. 20,128 20,948 8.50 7.70 171,088 161,300 OH ............................. 35,830 37,071 2.00 2.00 71,660 74,142 OK .............................. 4,542 4,561 5.50 5.50 24,981 25,086 OR ............................. 2,969 3,000 2.80 3.40 8,313 10,200 PA .............................. 28,199 29,550 2.60 2.90 73,317 85,695 SC .............................. 6,376 5,815 3.40 3.20 21,678 18,608 SD .............................. 2,810 2,959 3.40 3.20 9,554 9,469 TN .............................. 2,808 2,830 6.60 6.90 18,533 19,527 TX .............................. 24,002 24,789 2.90 3.10 69,606 76,846 UT .............................. 4,029 4,262 1.80 2.20 7,252 9,376 VT .............................. 238 229 3.10 3.50 738 802 VA .............................. 4,138 4,435 5.00 5.20 20,690 23,062 WA ............................. 7,410 7,663 2.20 2.70 16,302 20,690 WV ............................. 2,017 1,948 5.50 5.60 11,094 10,909 WI .............................. 6,114 6,177 2.50 2.80 15,285 17,296 WY ............................. 13 13 3.10 3.10 40 40 Oth Sts 4 .................... 10,074 10,345 2.72 2.61 27,449 26,968
US .......................... 451,793 454,506 3.34 3.52 1,507,533 1,599,726
1 Excludes commercial broilers. 2 Totals may not add due to rounding. 3 Revised. 4 AK, AZ, DE, ID, KS, ND, NH, NJ, NM, NV,and RI combined to avoid disclosing data for individual operations.
NASS, Livestock Branch, (202) 720-3570.
VerDate Aug 31 2005 17:17 Mar 01, 2012 Jkt 000000 PO 00000 Frm 00026 Fmt 1000 Sfmt 1000 H:\SHARED\DAPP\FPU\AGSTAT\MASTER~2\CHAPTR08\VIII-29.AG8 USDA
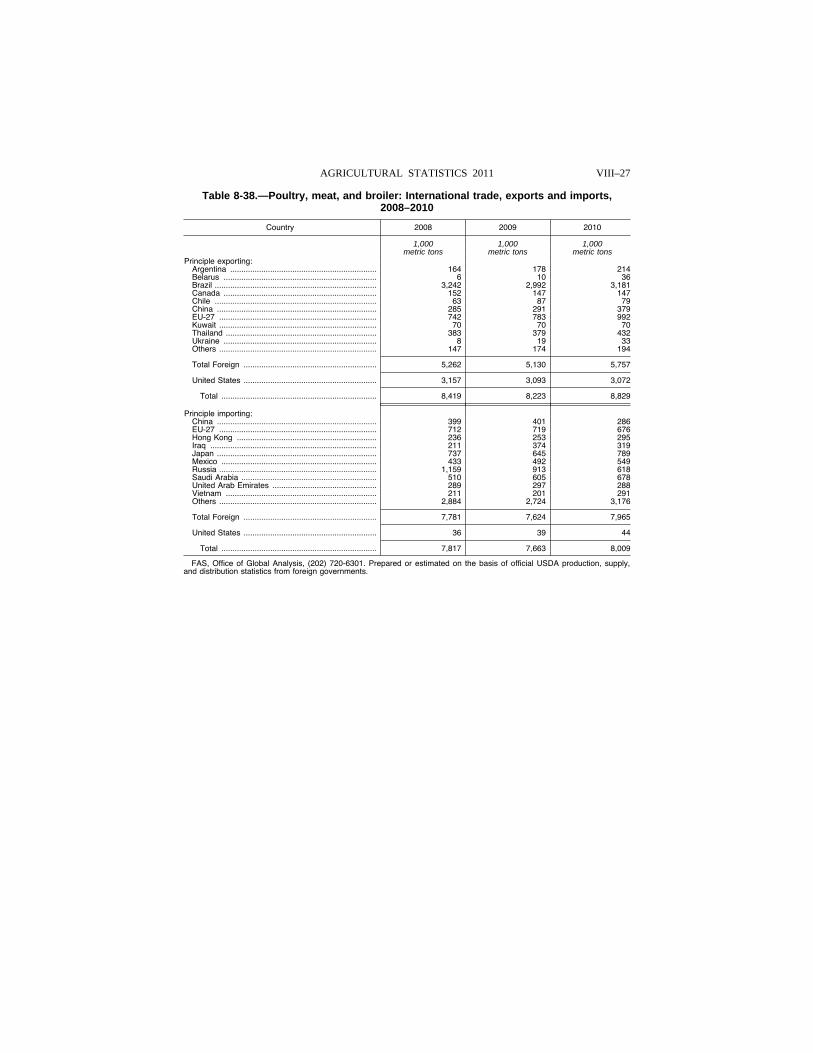
VIII–27 AGRICULTURAL STATISTICS 2011
Table 8-38.—Poultry, meat, and broiler: International trade, exports and imports, 2008–2010
Country 2008 2009 2010
1,000 1,000 1,000 metric tons metric tons metric tons
Principle exporting: Argentina .................................................................. 164 178 214 Belarus ..................................................................... 6 10 36 Brazil ......................................................................... 3,242 2,992 3,181 Canada ..................................................................... 152 147 147 Chile ......................................................................... 63 87 79 China ........................................................................ 285 291 379 EU-27 ....................................................................... 742 783 992 Kuwait ....................................................................... 70 70 70 Thailand .................................................................... 383 379 432 Ukraine ..................................................................... 8 19 33 Others ....................................................................... 147 174 194
Total Foreign ............................................................ 5,262 5,130 5,757
United States ............................................................ 3,157 3,093 3,072
Total ...................................................................... 8,419 8,223 8,829
Principle importing: China ........................................................................ 399 401 286 EU-27 ....................................................................... 712 719 676 Hong Kong ............................................................... 236 253 295 Iraq ........................................................................... 211 374 319 Japan ........................................................................ 737 645 789 Mexico ...................................................................... 433 492 549 Russia ....................................................................... 1,159 913 618 Saudi Arabia ............................................................. 510 605 678 United Arab Emirates ............................................... 289 297 288 Vietnam .................................................................... 211 201 291 Others ....................................................................... 2,884 2,724 3,176
Total Foreign ............................................................ 7,781 7,624 7,965
United States ............................................................ 36 39 44
Total ...................................................................... 7,817 7,663 8,009
FAS, Office of Global Analysis, (202) 720-6301. Prepared or estimated on the basis of official USDA production, supply, and distribution statistics from foreign governments.
VerDate Aug 31 2005 17:17 Mar 01, 2012 Jkt 000000 PO 00000 Frm 00027 Fmt 1000 Sfmt 1000 H:\SHARED\DAPP\FPU\AGSTAT\MASTER~2\CHAPTR08\VIII-30.AG8 USDA
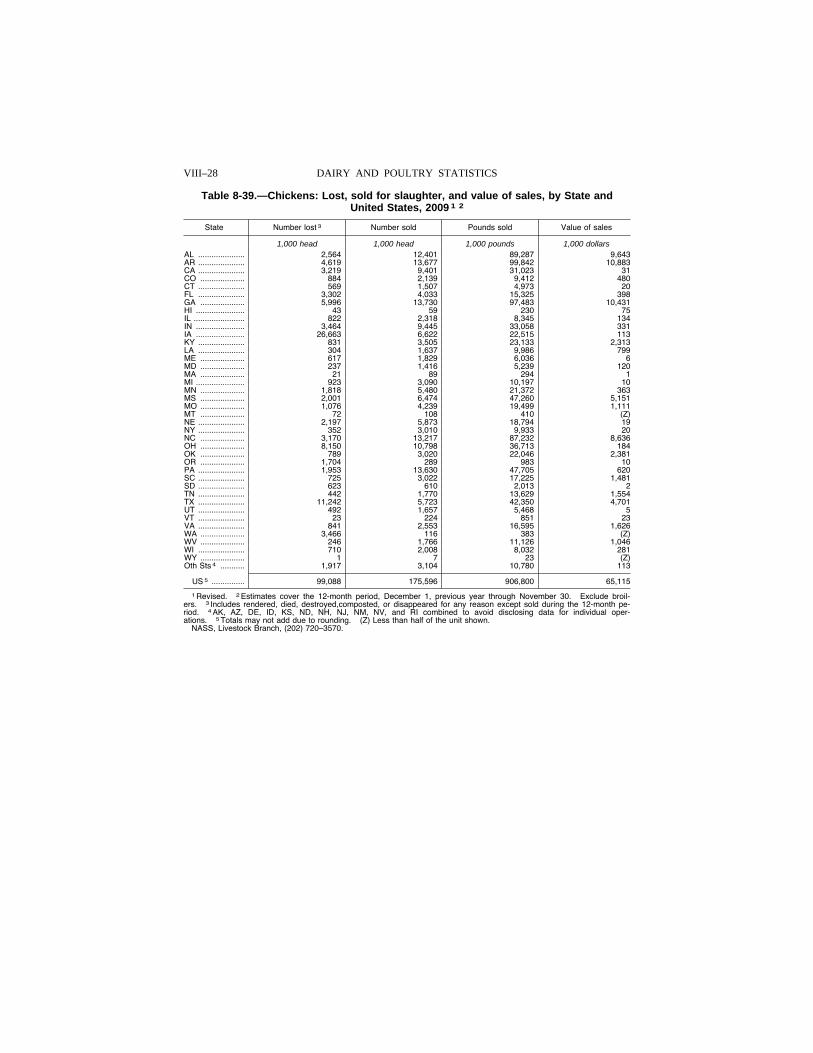
VIII–28 DAIRY AND POULTRY STATISTICS
Table 8-39.—Chickens: Lost, sold for slaughter, and value of sales, by State and United States, 2009 1 2
State Number lost 3 Number sold Pounds sold Value of sales
1,000 head 1,000 head 1,000 pounds 1,000 dollars AL ..................... 2,564 12,401 89,287 9,643 AR ..................... 4,619 13,677 99,842 10,883 CA ..................... 3,219 9,401 31,023 31 CO .................... 884 2,139 9,412 480 CT ..................... 569 1,507 4,973 20 FL ..................... 3,302 4,033 15,325 398 GA .................... 5,996 13,730 97,483 10,431 HI ...................... 43 59 230 75 IL ....................... 822 2,318 8,345 134 IN ...................... 3,464 9,445 33,058 331 IA ...................... 26,663 6,622 22,515 113 KY ..................... 831 3,505 23,133 2,313 LA ..................... 304 1,637 9,986 799 ME .................... 617 1,829 6,036 6 MD .................... 237 1,416 5,239 120 MA .................... 21 89 294 1 MI ...................... 923 3,090 10,197 10 MN .................... 1,818 5,480 21,372 363 MS .................... 2,001 6,474 47,260 5,151 MO .................... 1,076 4,239 19,499 1,111 MT .................... 72 108 410 (Z) NE ..................... 2,197 5,873 18,794 19 NY ..................... 352 3,010 9,933 20 NC .................... 3,170 13,217 87,232 8,636 OH .................... 8,150 10,798 36,713 184 OK .................... 789 3,020 22,046 2,381 OR .................... 1,704 289 983 10 PA ..................... 1,953 13,630 47,705 620 SC ..................... 725 3,022 17,225 1,481 SD ..................... 623 610 2,013 2 TN ..................... 442 1,770 13,629 1,554 TX ..................... 11,242 5,723 42,350 4,701 UT ..................... 492 1,657 5,468 5 VT ..................... 23 224 851 23 VA ..................... 841 2,553 16,595 1,626 WA .................... 3,466 116 383 (Z) WV .................... 246 1,766 11,126 1,046 WI ..................... 710 2,008 8,032 281 WY .................... 1 7 23 (Z) Oth Sts 4 ........... 1,917 3,104 10,780 113
US 5 ............... 99,088 175,596 906,800 65,115
1 Revised. 2 Estimates cover the 12-month period, December 1, previous year through November 30. Exclude broil-ers. 3 Includes rendered, died, destroyed,composted, or disappeared for any reason except sold during the 12-month pe-riod. 4 AK, AZ, DE, ID, KS, ND, NH, NJ, NM, NV, and RI combined to avoid disclosing data for individual oper-ations. 5 Totals may not add due to rounding. (Z) Less than half of the unit shown.
NASS, Livestock Branch, (202) 720–3570.
VerDate Aug 31 2005 17:17 Mar 01, 2012 Jkt 000000 PO 00000 Frm 00028 Fmt 1000 Sfmt 1000 H:\SHARED\DAPP\FPU\AGSTAT\MASTER~2\CHAPTR08\VIII-31.AG8 USDA
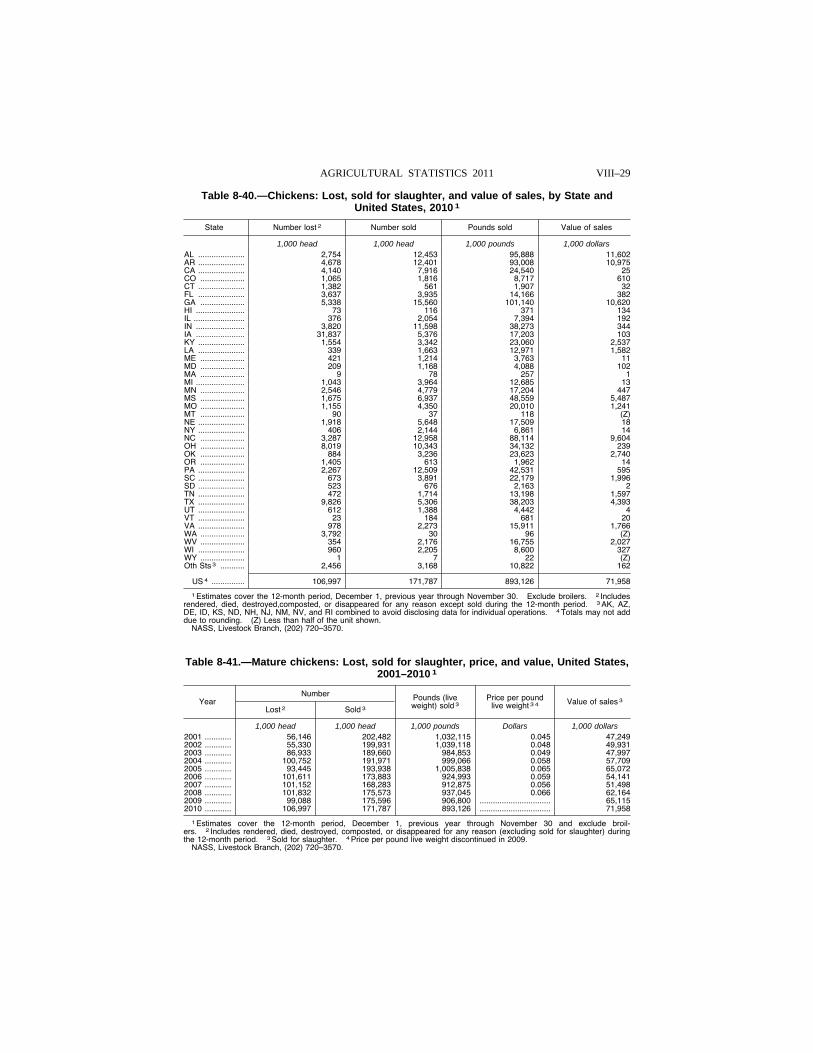
VIII–29 AGRICULTURAL STATISTICS 2011
Table 8-40.—Chickens: Lost, sold for slaughter, and value of sales, by State and United States, 2010 1
State Number lost 2 Number sold Pounds sold Value of sales
1,000 head 1,000 head 1,000 pounds 1,000 dollars AL ..................... 2,754 12,453 95,888 11,602 AR ..................... 4,678 12,401 93,008 10,975 CA ..................... 4,140 7,916 24,540 25 CO .................... 1,065 1,816 8,717 610 CT ..................... 1,382 561 1,907 32 FL ..................... 3,637 3,935 14,166 382 GA .................... 5,338 15,560 101,140 10,620 HI ...................... 73 116 371 134 IL ....................... 376 2,054 7,394 192 IN ...................... 3,820 11,598 38,273 344 IA ...................... 31,837 5,376 17,203 103 KY ..................... 1,554 3,342 23,060 2,537 LA ..................... 339 1,663 12,971 1,582 ME .................... 421 1,214 3,763 11 MD .................... 209 1,168 4,088 102 MA .................... 9 78 257 1 MI ...................... 1,043 3,964 12,685 13 MN .................... 2,546 4,779 17,204 447 MS .................... 1,675 6,937 48,559 5,487 MO .................... 1,155 4,350 20,010 1,241 MT .................... 90 37 118 (Z) NE ..................... 1,918 5,648 17,509 18 NY ..................... 406 2,144 6,861 14 NC .................... 3,287 12,958 88,114 9,604 OH .................... 8,019 10,343 34,132 239 OK .................... 884 3,236 23,623 2,740 OR .................... 1,405 613 1,962 14 PA ..................... 2,267 12,509 42,531 595 SC ..................... 673 3,891 22,179 1,996 SD ..................... 523 676 2,163 2 TN ..................... 472 1,714 13,198 1,597 TX ..................... 9,826 5,306 38,203 4,393 UT ..................... 612 1,388 4,442 4 VT ..................... 23 184 681 20 VA ..................... 978 2,273 15,911 1,766 WA .................... 3,792 30 96 (Z) WV .................... 354 2,176 16,755 2,027 WI ..................... 960 2,205 8,600 327 WY .................... 1 7 22 (Z) Oth Sts 3 ........... 2,456 3,168 10,822 162
US 4 ............... 106,997 171,787 893,126 71,958
1 Estimates cover the 12-month period, December 1, previous year through November 30. Exclude broilers. 2 Includes rendered, died, destroyed,composted, or disappeared for any reason except sold during the 12-month period. 3 AK, AZ, DE, ID, KS, ND, NH, NJ, NM, NV, and RI combined to avoid disclosing data for individual operations. 4 Totals may not add due to rounding. (Z) Less than half of the unit shown.
NASS, Livestock Branch, (202) 720–3570.
Table 8-41.—Mature chickens: Lost, sold for slaughter, price, and value, United States, 2001–2010 1
Year Number Pounds (live
weight) sold 3 Price per pound
live weight 3 4 Value of sales 3 Lost 2 Sold 3
1,000 head 1,000 head 1,000 pounds Dollars 1,000 dollars 2001 ............ 56,146 202,482 1,032,115 0.045 47,249 2002 ............ 55,330 199,931 1,039,118 0.048 49,931 2003 ............ 86,933 189,660 984,853 0.049 47,997 2004 ............ 100,752 191,971 999,066 0.058 57,709 2005 ............ 93,445 193,938 1,005,838 0.065 65,072 2006 ............ 101,611 173,883 924,993 0.059 54,141 2007 ............ 101,152 168,283 912,875 0.056 51,498 2008 ............ 101,832 175,573 937,045 0.066 62,164 2009 ............ 99,088 175,596 906,800 ................................ 65,115 2010 ............ 106,997 171,787 893,126 ................................ 71,958
1 Estimates cover the 12-month period, December 1, previous year through November 30 and exclude broil-ers. 2 Includes rendered, died, destroyed, composted, or disappeared for any reason (excluding sold for slaughter) during the 12-month period. 3 Sold for slaughter. 4 Price per pound live weight discontinued in 2009.
NASS, Livestock Branch, (202) 720–3570.
VerDate Aug 31 2005 17:17 Mar 01, 2012 Jkt 000000 PO 00000 Frm 00029 Fmt 1000 Sfmt 1000 H:\SHARED\DAPP\FPU\AGSTAT\MASTER~2\CHAPTR08\VIII-31B.AG8 USDA
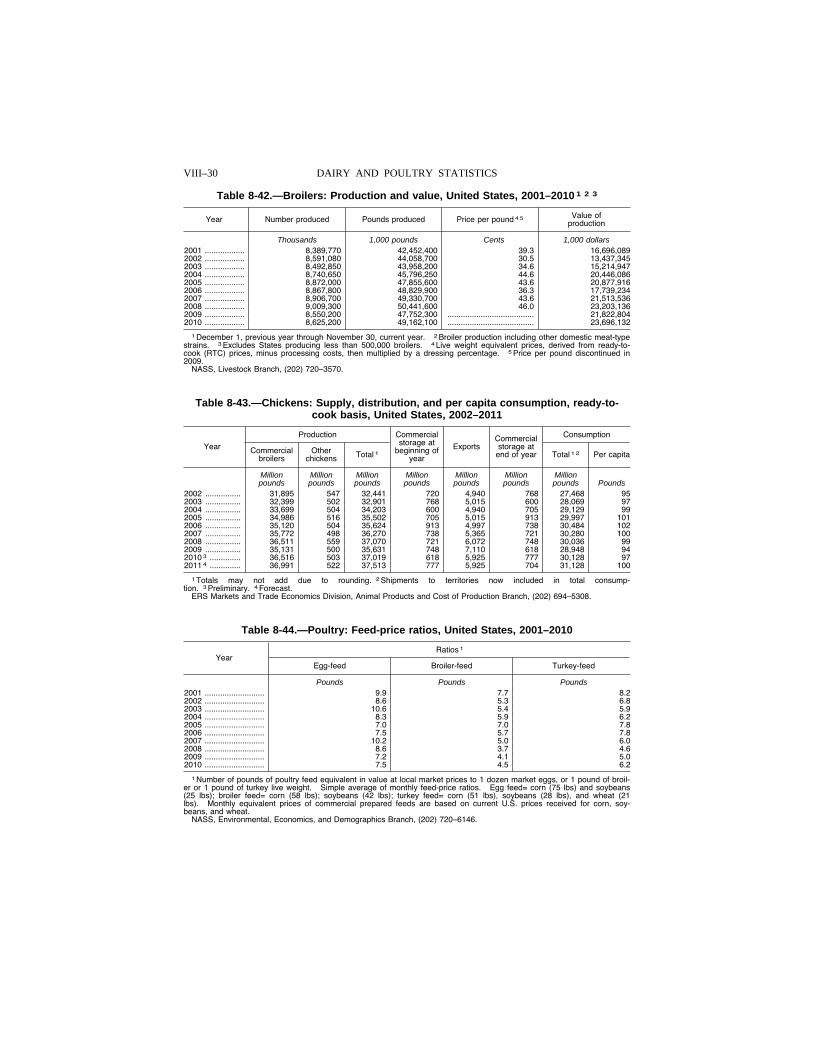
VIII–30 DAIRY AND POULTRY STATISTICS
Table 8-42.—Broilers: Production and value, United States, 2001–2010 1 2 3
Year Number produced Pounds produced Price per pound 4 5 Value of production
Thousands 1,000 pounds Cents 1,000 dollars 2001 .................. 8,389,770 42,452,400 39.3 16,696,089 2002 .................. 8,591,080 44,058,700 30.5 13,437,345 2003 .................. 8,492,850 43,958,200 34.6 15,214,947 2004 .................. 8,740,650 45,796,250 44.6 20,446,086 2005 .................. 8,872,000 47,855,600 43.6 20,877,916 2006 .................. 8,867,800 48,829,900 36.3 17,739,234 2007 .................. 8,906,700 49,330,700 43.6 21,513,536 2008 .................. 9,009,300 50,441,600 46.0 23,203,136 2009 .................. 8,550,200 47,752,300 ....................................... 21,822,804 2010 .................. 8,625,200 49,162,100 ....................................... 23,696,132
1 December 1, previous year through November 30, current year. 2 Broiler production including other domestic meat-type strains. 3 Excludes States producing less than 500,000 broilers. 4 Live weight equivalent prices, derived from ready-to- cook (RTC) prices, minus processing costs, then multiplied by a dressing percentage. 5 Price per pound discontinued in 2009.
NASS, Livestock Branch, (202) 720–3570.
Table 8-43.—Chickens: Supply, distribution, and per capita consumption, ready-to- cook basis, United States, 2002–2011
Year
Production Commercial storage at
beginning of year
Exports Commercial storage at
end of year
Consumption
Commercial broilers
Other chickens Total 1 Total 1 2 Per capita
Million Million Million Million Million Million Million pounds pounds pounds pounds pounds pounds pounds Pounds
2002 ................ 31,895 547 32,441 720 4,940 768 27,468 95 2003 ................ 32,399 502 32,901 768 5,015 600 28,069 97 2004 ................ 33,699 504 34,203 600 4,940 705 29,129 99 2005 ................ 34,986 516 35,502 705 5,015 913 29,997 101 2006 ................ 35,120 504 35,624 913 4,997 738 30,484 102 2007 ................ 35,772 498 36,270 738 5,365 721 30,280 100 2008 ................ 36,511 559 37,070 721 6,072 748 30,036 99 2009 ................ 35,131 500 35,631 748 7,110 618 28,948 94 2010 3 .............. 36,516 503 37,019 618 5,925 777 30,128 97 2011 4 .............. 36,991 522 37,513 777 5,925 704 31,128 100
1 Totals may not add due to rounding. 2 Shipments to territories now included in total consump-tion. 3 Preliminary. 4 Forecast.
ERS Markets and Trade Economics Division, Animal Products and Cost of Production Branch, (202) 694–5308.
Table 8-44.—Poultry: Feed-price ratios, United States, 2001–2010
Year Ratios 1
Egg-feed Broiler-feed Turkey-feed
Pounds Pounds Pounds 2001 ........................... 9.9 7.7 8.2 2002 ........................... 8.6 5.3 6.8 2003 ........................... 10.6 5.4 5.9 2004 ........................... 8.3 5.9 6.2 2005 ........................... 7.0 7.0 7.8 2006 ........................... 7.5 5.7 7.8 2007 ........................... 10.2 5.0 6.0 2008 ........................... 8.6 3.7 4.6 2009 ........................... 7.2 4.1 5.0 2010 ........................... 7.5 4.5 6.2
1 Number of pounds of poultry feed equivalent in value at local market prices to 1 dozen market eggs, or 1 pound of broil-er or 1 pound of turkey live weight. Simple average of monthly feed-price ratios. Egg feed= corn (75 lbs) and soybeans (25 lbs); broiler feed= corn (58 lbs); soybeans (42 lbs); turkey feed= corn (51 lbs), soybeans (28 lbs), and wheat (21 lbs). Monthly equivalent prices of commercial prepared feeds are based on current U.S. prices received for corn, soy-beans, and wheat.
NASS, Environmental, Economics, and Demographics Branch, (202) 720–6146.
VerDate Aug 31 2005 17:17 Mar 01, 2012 Jkt 000000 PO 00000 Frm 00030 Fmt 1000 Sfmt 1000 H:\SHARED\DAPP\FPU\AGSTAT\MASTER~2\CHAPTR08\VIII-32.AG8 USDA
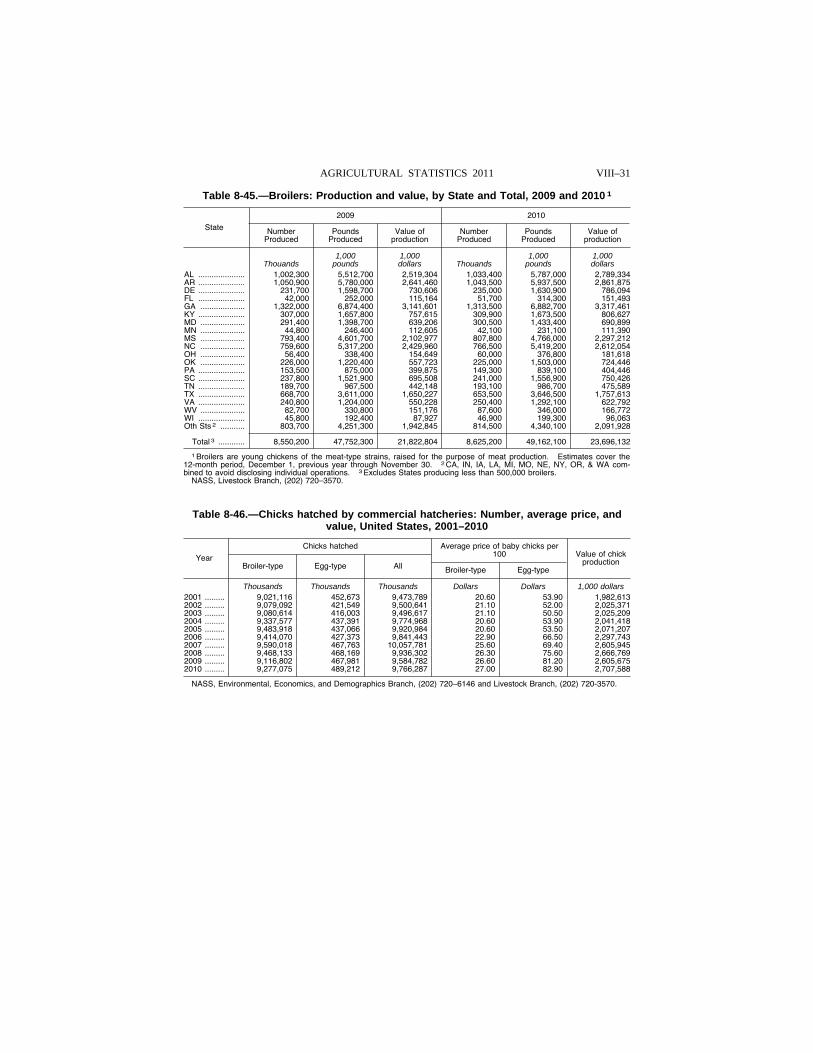
VIII–31 AGRICULTURAL STATISTICS 2011
Table 8-45.—Broilers: Production and value, by State and Total, 2009 and 2010 1
State
2009 2010
Number Produced
Pounds Produced
Value of production
Number Produced
Pounds Produced
Value of production
1,000 1,000 1,000 1,000 Thouands pounds dollars Thouands pounds dollars
AL ..................... 1,002,300 5,512,700 2,519,304 1,033,400 5,787,000 2,789,334 AR ..................... 1,050,900 5,780,000 2,641,460 1,043,500 5,937,500 2,861,875 DE ..................... 231,700 1,598,700 730,606 235,000 1,630,900 786,094 FL ..................... 42,000 252,000 115,164 51,700 314,300 151,493 GA .................... 1,322,000 6,874,400 3,141,601 1,313,500 6,882,700 3,317,461 KY ..................... 307,000 1,657,800 757,615 309,900 1,673,500 806,627 MD .................... 291,400 1,398,700 639,206 300,500 1,433,400 690,899 MN .................... 44,800 246,400 112,605 42,100 231,100 111,390 MS .................... 793,400 4,601,700 2,102,977 807,800 4,766,000 2,297,212 NC .................... 759,600 5,317,200 2,429,960 766,500 5,419,200 2,612,054 OH .................... 56,400 338,400 154,649 60,000 376,800 181,618 OK .................... 226,000 1,220,400 557,723 225,000 1,503,000 724,446 PA ..................... 153,500 875,000 399,875 149,300 839,100 404,446 SC ..................... 237,800 1,521,900 695,508 241,000 1,556,900 750,426 TN ..................... 189,700 967,500 442,148 193,100 986,700 475,589 TX ..................... 668,700 3,611,000 1,650,227 653,500 3,646,500 1,757,613 VA ..................... 240,800 1,204,000 550,228 250,400 1,292,100 622,792 WV .................... 82,700 330,800 151,176 87,600 346,000 166,772 WI ..................... 45,800 192,400 87,927 46,900 199,300 96,063 Oth Sts 2 ........... 803,700 4,251,300 1,942,845 814,500 4,340,100 2,091,928
Total 3 ............ 8,550,200 47,752,300 21,822,804 8,625,200 49,162,100 23,696,132
1 Broilers are young chickens of the meat-type strains, raised for the purpose of meat production. Estimates cover the 12-month period, December 1, previous year through November 30. 2 CA, IN, IA, LA, MI, MO, NE, NY, OR, & WA com-bined to avoid disclosing individual operations. 3 Excludes States producing less than 500,000 broilers.
NASS, Livestock Branch, (202) 720–3570.
Table 8-46.—Chicks hatched by commercial hatcheries: Number, average price, and value, United States, 2001–2010
Year
Chicks hatched Average price of baby chicks per 100 Value of chick
production Broiler-type Egg-type All Broiler-type Egg-type
Thousands Thousands Thousands Dollars Dollars 1,000 dollars 2001 ......... 9,021,116 452,673 9,473,789 20.60 53.90 1,982,613 2002 ......... 9,079,092 421,549 9,500,641 21.10 52.00 2,025,371 2003 ......... 9,080,614 416,003 9,496,617 21.10 50.50 2,025,209 2004 ......... 9,337,577 437,391 9,774,968 20.60 53.90 2,041,418 2005 ......... 9,483,918 437,066 9,920,984 20.60 53.50 2,071,207 2006 ......... 9,414,070 427,373 9,841,443 22.90 66.50 2,297,743 2007 ......... 9,590,018 467,763 10,057,781 25.60 69.40 2,605,945 2008 ......... 9,468,133 468,169 9,936,302 26.30 75.60 2,666,769 2009 ......... 9,116,802 467,981 9,584,782 26.60 81.20 2,605,675 2010 ......... 9,277,075 489,212 9,766,287 27.00 82.90 2,707,588
NASS, Environmental, Economics, and Demographics Branch, (202) 720–6146 and Livestock Branch, (202) 720-3570.
VerDate Aug 31 2005 17:17 Mar 01, 2012 Jkt 000000 PO 00000 Frm 00031 Fmt 1000 Sfmt 1000 H:\SHARED\DAPP\FPU\AGSTAT\MASTER~2\CHAPTR08\VIII-33.AG8 USDA
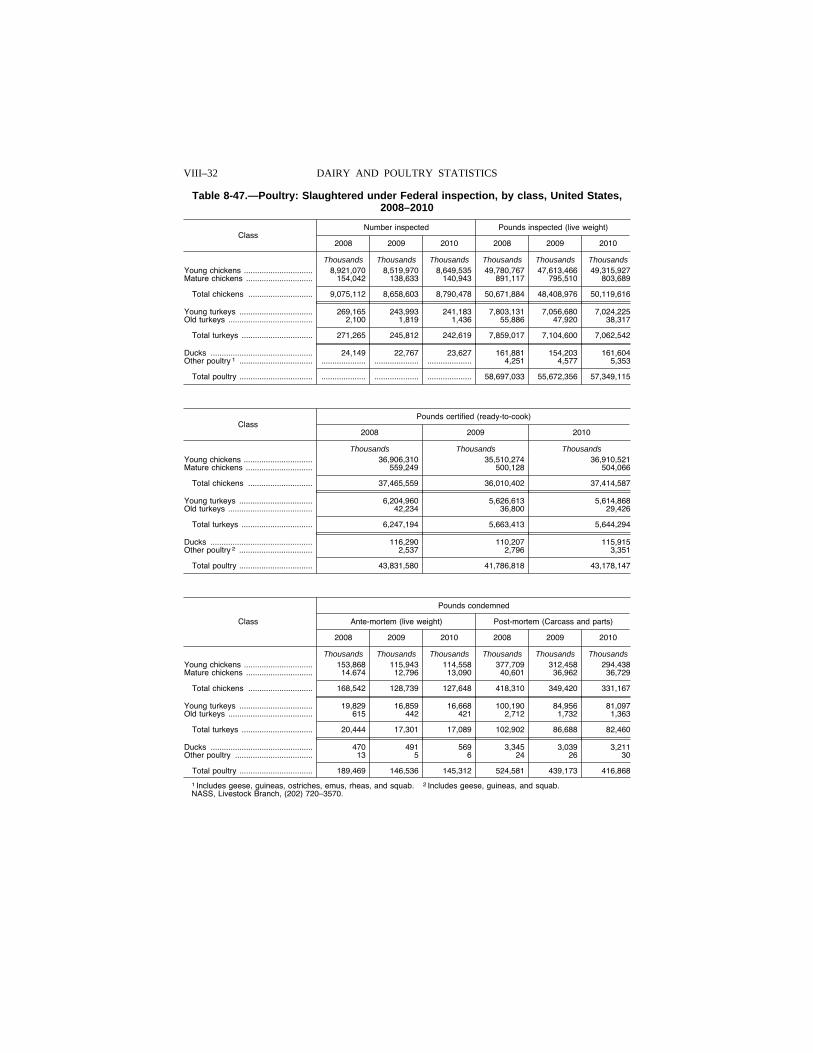
VIII–32 DAIRY AND POULTRY STATISTICS
Table 8-47.—Poultry: Slaughtered under Federal inspection, by class, United States, 2008–2010
Class Number inspected Pounds inspected (live weight)
2008 2009 2010 2008 2009 2010
Thousands Thousands Thousands Thousands Thousands Thousands Young chickens ............................... 8,921,070 8,519,970 8,649,535 49,780,767 47,613,466 49,315,927 Mature chickens .............................. 154,042 138,633 140,943 891,117 795,510 803,689
Total chickens ............................. 9,075,112 8,658,603 8,790,478 50,671,884 48,408,976 50,119,616
Young turkeys ................................. 269,165 243,993 241,183 7,803,131 7,056,680 7,024,225 Old turkeys ...................................... 2,100 1,819 1,436 55,886 47,920 38,317
Total turkeys ................................ 271,265 245,812 242,619 7,859,017 7,104,600 7,062,542
Ducks .............................................. 24,149 22,767 23,627 161,881 154,203 161,604 Other poultry 1 ................................. .................... .................... .................... 4,251 4,577 5,353
Total poultry ................................. .................... .................... .................... 58,697,033 55,672,356 57,349,115
Class Pounds certified (ready-to-cook)
2008 2009 2010
Thousands Thousands Thousands Young chickens ............................... 36,906,310 35,510,274 36,910,521 Mature chickens .............................. 559,249 500,128 504,066
Total chickens ............................. 37,465,559 36,010,402 37,414,587
Young turkeys ................................. 6,204,960 5,626,613 5,614,868 Old turkeys ...................................... 42,234 36,800 29,426
Total turkeys ................................ 6,247,194 5,663,413 5,644,294
Ducks .............................................. 116,290 110,207 115,915 Other poultry 2 ................................. 2,537 2,796 3,351
Total poultry ................................. 43,831,580 41,786,818 43,178,147
Class
Pounds condemned
Ante-mortem (live weight) Post-mortem (Carcass and parts)
2008 2009 2010 2008 2009 2010
Thousands Thousands Thousands Thousands Thousands Thousands Young chickens ............................... 153,868 115,943 114,558 377,709 312,458 294,438 Mature chickens .............................. 14.674 12,796 13,090 40,601 36,962 36,729
Total chickens ............................. 168,542 128,739 127,648 418,310 349,420 331,167
Young turkeys ................................. 19,829 16,859 16,668 100,190 84,956 81,097 Old turkeys ...................................... 615 442 421 2,712 1,732 1,363
Total turkeys ................................ 20,444 17,301 17,089 102,902 86,688 82,460
Ducks .............................................. 470 491 569 3,345 3,039 3,211 Other poultry ................................... 13 5 6 24 26 30
Total poultry ................................. 189,469 146,536 145,312 524,581 439,173 416,868
1 Includes geese, guineas, ostriches, emus, rheas, and squab. 2 Includes geese, guineas, and squab. NASS, Livestock Branch, (202) 720–3570.
VerDate Aug 31 2005 17:17 Mar 01, 2012 Jkt 000000 PO 00000 Frm 00032 Fmt 1000 Sfmt 1000 H:\SHARED\DAPP\FPU\AGSTAT\MASTER~2\CHAPTR08\VIII-34.AG8 USDA
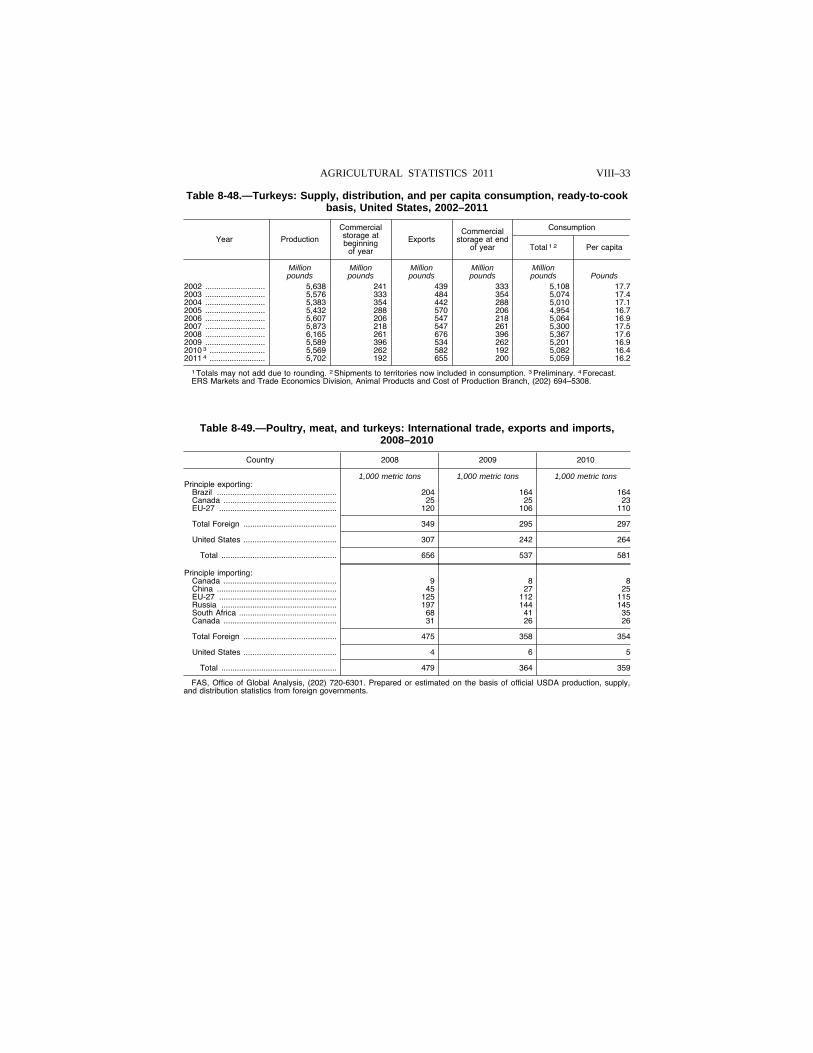
VIII–33 AGRICULTURAL STATISTICS 2011
Table 8-48.—Turkeys: Supply, distribution, and per capita consumption, ready-to-cook basis, United States, 2002–2011
Year Production
Commercial storage at beginning
of year
Exports Commercial
storage at end of year
Consumption
Total 1 2 Per capita
Million Million Million Million Million pounds pounds pounds pounds pounds Pounds
2002 ........................... 5,638 241 439 333 5,108 17.7 2003 ........................... 5,576 333 484 354 5,074 17.4 2004 ........................... 5,383 354 442 288 5,010 17.1 2005 ........................... 5,432 288 570 206 4,954 16.7 2006 ........................... 5,607 206 547 218 5,064 16.9 2007 ........................... 5,873 218 547 261 5,300 17.5 2008 ........................... 6,165 261 676 396 5,367 17.6 2009 ........................... 5,589 396 534 262 5,201 16.9 2010 3 ......................... 5,569 262 582 192 5,082 16.4 2011 4 ......................... 5,702 192 655 200 5,059 16.2
1 Totals may not add due to rounding. 2 Shipments to territories now included in consumption. 3 Preliminary. 4 Forecast. ERS Markets and Trade Economics Division, Animal Products and Cost of Production Branch, (202) 694–5308.
Table 8-49.—Poultry, meat, and turkeys: International trade, exports and imports, 2008–2010
Country 2008 2009 2010
1,000 metric tons 1,000 metric tons 1,000 metric tons Principle exporting:
Brazil ...................................................... 204 164 164 Canada ................................................... 25 25 23 EU-27 ..................................................... 120 106 110
Total Foreign .......................................... 349 295 297
United States .......................................... 307 242 264
Total .................................................... 656 537 581
Principle importing: Canada ................................................... 9 8 8 China ...................................................... 45 27 25 EU-27 ..................................................... 125 112 115 Russia .................................................... 197 144 145 South Africa ............................................ 68 41 35 Canada ................................................... 31 26 26
Total Foreign .......................................... 475 358 354
United States .......................................... 4 6 5
Total .................................................... 479 364 359
FAS, Office of Global Analysis, (202) 720-6301. Prepared or estimated on the basis of official USDA production, supply, and distribution statistics from foreign governments.
VerDate Aug 31 2005 17:17 Mar 01, 2012 Jkt 000000 PO 00000 Frm 00033 Fmt 1000 Sfmt 1000 H:\SHARED\DAPP\FPU\AGSTAT\MASTER~2\CHAPTR08\VIII-35.AG8 USDA
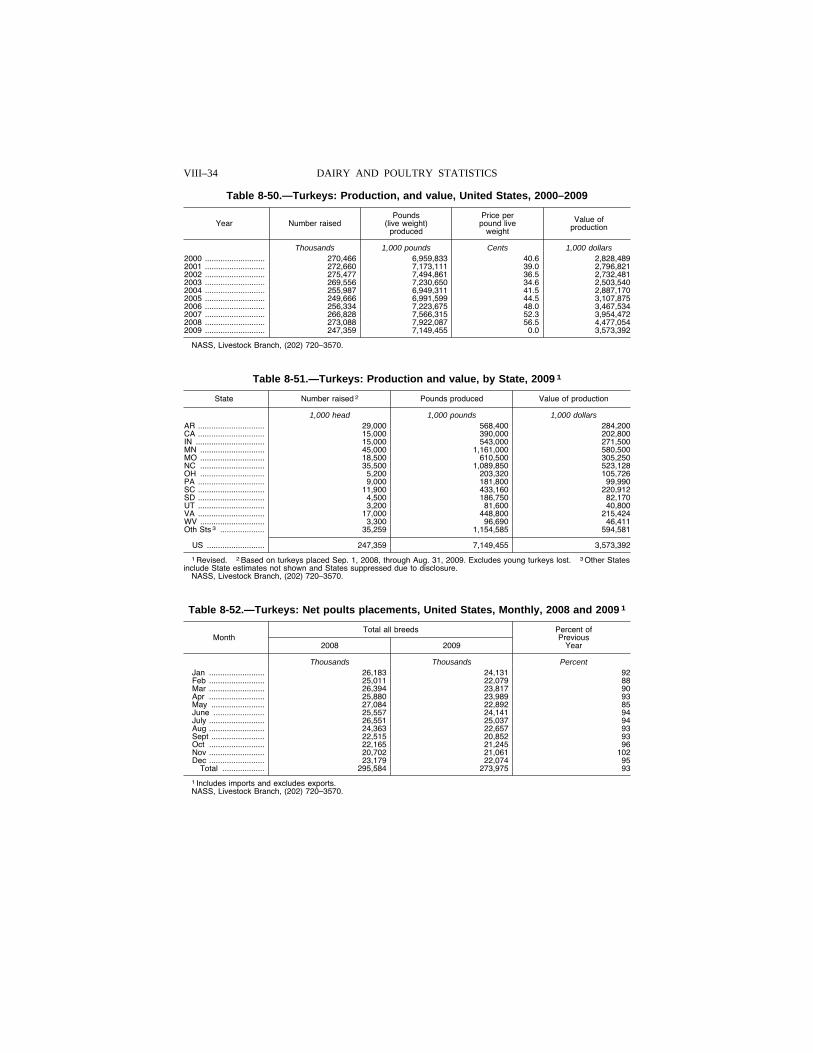
VIII–34 DAIRY AND POULTRY STATISTICS
Table 8-50.—Turkeys: Production, and value, United States, 2000–2009
Year Number raised Pounds
(live weight) produced
Price per pound live
weight
Value of production
Thousands 1,000 pounds Cents 1,000 dollars 2000 ........................... 270,466 6,959,833 40.6 2,828,489 2001 ........................... 272,660 7,173,111 39.0 2,796,821 2002 ........................... 275,477 7,494,861 36.5 2,732,481 2003 ........................... 269,556 7,230,650 34.6 2,503,540 2004 ........................... 255,987 6,949,311 41.5 2,887,170 2005 ........................... 249,666 6,991,599 44.5 3,107,875 2006 ........................... 256,334 7,223,675 48.0 3,467,534 2007 ........................... 266,828 7,566,315 52.3 3,954,472 2008 ........................... 273,088 7,922,087 56.5 4,477,054 2009 ........................... 247,359 7,149,455 0.0 3,573,392
NASS, Livestock Branch, (202) 720–3570.
Table 8-51.—Turkeys: Production and value, by State, 2009 1
State Number raised 2 Pounds produced Value of production
1,000 head 1,000 pounds 1,000 dollars AR .............................. 29,000 568,400 284,200 CA .............................. 15,000 390,000 202,800 IN ............................... 15,000 543,000 271,500 MN ............................. 45,000 1,161,000 580,500 MO ............................. 18,500 610,500 305,250 NC ............................. 35,500 1,089,850 523,128 OH ............................. 5,200 203,320 105,726 PA .............................. 9,000 181,800 99,990 SC .............................. 11,900 433,160 220,912 SD .............................. 4,500 186,750 82,170 UT .............................. 3,200 81,600 40,800 VA .............................. 17,000 448,800 215,424 WV ............................. 3,300 96,690 46,411 Oth Sts 3 .................... 35,259 1,154,585 594,581
US .......................... 247,359 7,149,455 3,573,392
1 Revised. 2 Based on turkeys placed Sep. 1, 2008, through Aug. 31, 2009. Excludes young turkeys lost. 3 Other States include State estimates not shown and States suppressed due to disclosure.
NASS, Livestock Branch, (202) 720–3570.
Table 8-52.—Turkeys: Net poults placements, United States, Monthly, 2008 and 2009 1
Month Total all breeds Percent of
Previous Year 2008 2009
Thousands Thousands Percent Jan ......................... 26,183 24,131 92 Feb ......................... 25,011 22,079 88 Mar ......................... 26,394 23,817 90 Apr ......................... 25,880 23,989 93 May ........................ 27,084 22,892 85 June ....................... 25,557 24,141 94 July ......................... 26,551 25,037 94 Aug ......................... 24,363 22,657 93 Sept ........................ 22,515 20,852 93 Oct ......................... 22,165 21,245 96 Nov ......................... 20,702 21,061 102 Dec ......................... 23,179 22,074 95
Total ................... 295,584 273,975 93
1 Includes imports and excludes exports. NASS, Livestock Branch, (202) 720–3570.
VerDate Aug 31 2005 17:17 Mar 01, 2012 Jkt 000000 PO 00000 Frm 00034 Fmt 1000 Sfmt 1000 H:\SHARED\DAPP\FPU\AGSTAT\MASTER~2\CHAPTR08\VIII-36.AG8 USDA
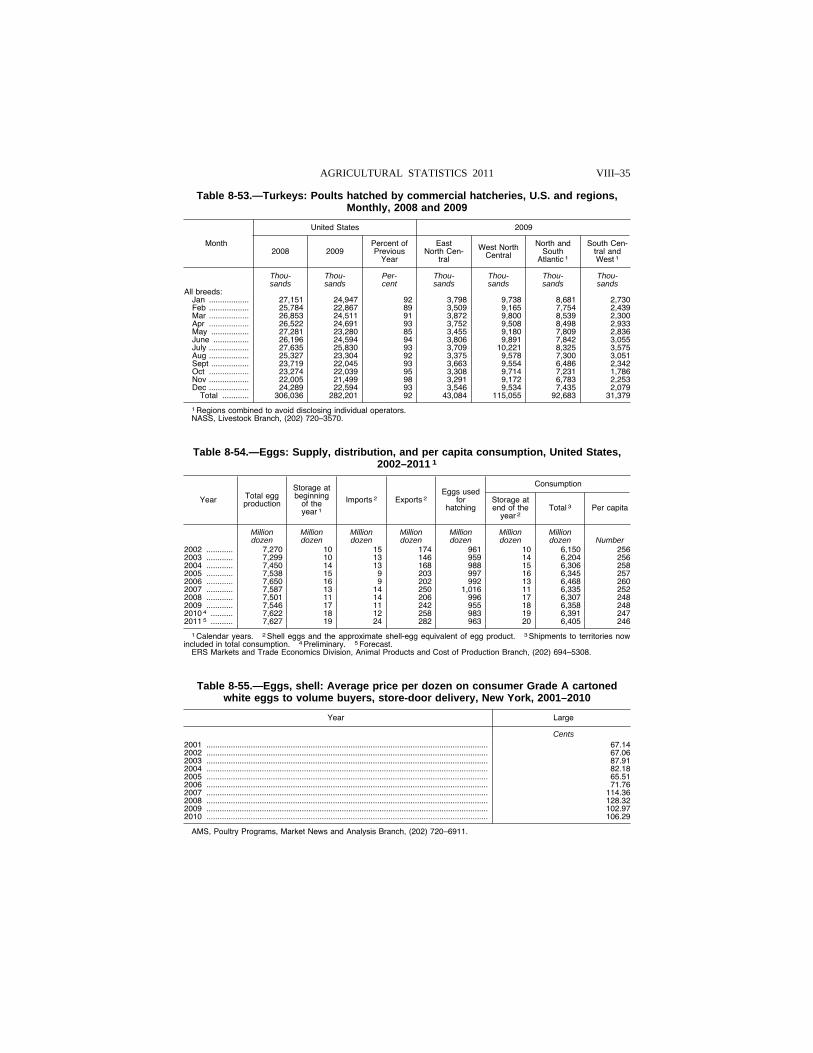
VIII–35 AGRICULTURAL STATISTICS 2011
Table 8-53.—Turkeys: Poults hatched by commercial hatcheries, U.S. and regions, Monthly, 2008 and 2009
Month
United States 2009
2008 2009 Percent of Previous
Year
East North Cen-
tral
West North Central
North and South
Atlantic 1
South Cen-tral and West 1
Thou- Thou- Per- Thou- Thou- Thou- Thou- sands sands cent sands sands sands sands
All breeds: Jan .................. 27,151 24,947 92 3,798 9,738 8,681 2,730 Feb .................. 25,784 22,867 89 3,509 9,165 7,754 2,439 Mar .................. 26,853 24,511 91 3,872 9,800 8,539 2,300 Apr .................. 26,522 24,691 93 3,752 9,508 8,498 2,933 May ................. 27,281 23,280 85 3,455 9,180 7,809 2,836 June ................ 26,196 24,594 94 3,806 9,891 7,842 3,055 July .................. 27,635 25,830 93 3,709 10,221 8,325 3,575 Aug .................. 25,327 23,304 92 3,375 9,578 7,300 3,051 Sept ................. 23,719 22,045 93 3,663 9,554 6,486 2,342 Oct .................. 23,274 22,039 95 3,308 9,714 7,231 1,786 Nov .................. 22,005 21,499 98 3,291 9,172 6,783 2,253 Dec .................. 24,289 22,594 93 3,546 9,534 7,435 2,079
Total ............ 306,036 282,201 92 43,084 115,055 92,683 31,379
1 Regions combined to avoid disclosing individual operators. NASS, Livestock Branch, (202) 720–3570.
Table 8-54.—Eggs: Supply, distribution, and per capita consumption, United States, 2002–2011 1
Year Total egg production
Storage at beginning
of the year 1
Imports 2 Exports 2 Eggs used
for hatching
Consumption
Storage at end of the
year 2 Total 3 Per capita
Million Million Million Million Million Million Million dozen dozen dozen dozen dozen dozen dozen Number
2002 ............ 7,270 10 15 174 961 10 6,150 256 2003 ............ 7,299 10 13 146 959 14 6,204 256 2004 ............ 7,450 14 13 168 988 15 6,306 258 2005 ............ 7,538 15 9 203 997 16 6,345 257 2006 ............ 7,650 16 9 202 992 13 6,468 260 2007 ............ 7,587 13 14 250 1,016 11 6,335 252 2008 ............ 7,501 11 14 206 996 17 6,307 248 2009 ............ 7,546 17 11 242 955 18 6,358 248 2010 4 .......... 7,622 18 12 258 983 19 6,391 247 2011 5 .......... 7,627 19 24 282 963 20 6,405 246
1 Calendar years. 2 Shell eggs and the approximate shell-egg equivalent of egg product. 3 Shipments to territories now included in total consumption. 4 Preliminary. 5 Forecast.
ERS Markets and Trade Economics Division, Animal Products and Cost of Production Branch, (202) 694–5308.
Table 8-55.—Eggs, shell: Average price per dozen on consumer Grade A cartoned white eggs to volume buyers, store-door delivery, New York, 2001–2010
Year Large
Cents 2001 ............................................................................................................................... 67.14 2002 ............................................................................................................................... 67.06 2003 ............................................................................................................................... 87.91 2004 ............................................................................................................................... 82.18 2005 ............................................................................................................................... 65.51 2006 ............................................................................................................................... 71.76 2007 ............................................................................................................................... 114.36 2008 ............................................................................................................................... 128.32 2009 ............................................................................................................................... 102.97 2010 ............................................................................................................................... 106.29
AMS, Poultry Programs, Market News and Analysis Branch, (202) 720–6911.
VerDate Aug 31 2005 17:17 Mar 01, 2012 Jkt 000000 PO 00000 Frm 00035 Fmt 1000 Sfmt 1000 H:\SHARED\DAPP\FPU\AGSTAT\MASTER~2\CHAPTR08\VIII-37.AG8 USDA
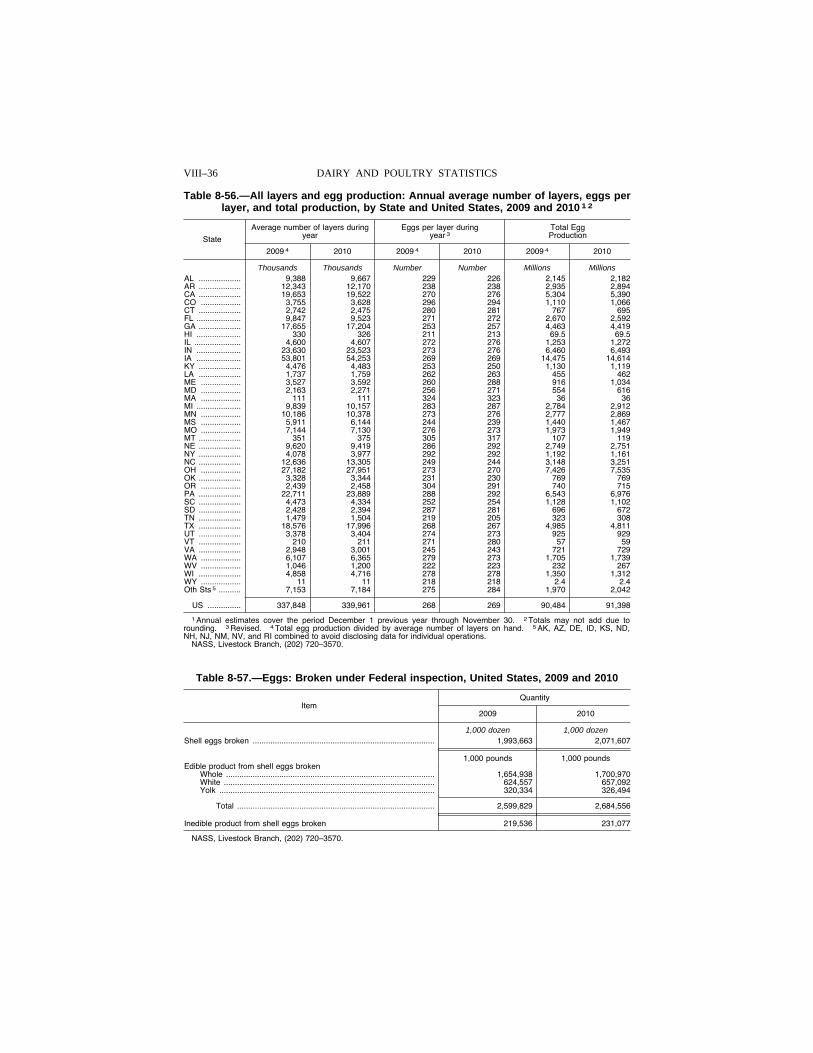
VIII–36 DAIRY AND POULTRY STATISTICS
Table 8-56.—All layers and egg production: Annual average number of layers, eggs per layer, and total production, by State and United States, 2009 and 2010 1 2
State
Average number of layers during year
Eggs per layer during year 3
Total Egg Production
2009 4 2010 2009 4 2010 2009 4 2010
Thousands Thousands Number Number Millions Millions AL ................... 9,388 9,667 229 226 2,145 2,182 AR ................... 12,343 12,170 238 238 2,935 2,894 CA ................... 19,653 19,522 270 276 5,304 5,390 CO .................. 3,755 3,628 296 294 1,110 1,066 CT ................... 2,742 2,475 280 281 767 695 FL .................... 9,847 9,523 271 272 2,670 2,592 GA ................... 17,655 17,204 253 257 4,463 4,419 HI .................... 330 326 211 213 69.5 69.5 IL ..................... 4,600 4,607 272 276 1,253 1,272 IN .................... 23,630 23,523 273 276 6,460 6,493 IA .................... 53,801 54,253 269 269 14,475 14,614 KY ................... 4,476 4,483 253 250 1,130 1,119 LA ................... 1,737 1,759 262 263 455 462 ME .................. 3,527 3,592 260 288 916 1,034 MD .................. 2,163 2,271 256 271 554 616 MA .................. 111 111 324 323 36 36 MI .................... 9,839 10,157 283 287 2,784 2,912 MN .................. 10,186 10,378 273 276 2,777 2,869 MS .................. 5,911 6,144 244 239 1,440 1,467 MO .................. 7,144 7,130 276 273 1,973 1,949 MT ................... 351 375 305 317 107 119 NE ................... 9,620 9,419 286 292 2,749 2,751 NY ................... 4,078 3,977 292 292 1,192 1,161 NC ................... 12,636 13,305 249 244 3,148 3,251 OH .................. 27,182 27,951 273 270 7,426 7,535 OK ................... 3,328 3,344 231 230 769 769 OR .................. 2,439 2,458 304 291 740 715 PA ................... 22,711 23,889 288 292 6,543 6,976 SC ................... 4,473 4,334 252 254 1,128 1,102 SD ................... 2,428 2,394 287 281 696 672 TN ................... 1,479 1,504 219 205 323 308 TX ................... 18,576 17,996 268 267 4,985 4,811 UT ................... 3,378 3,404 274 273 925 929 VT ................... 210 211 271 280 57 59 VA ................... 2,948 3,001 245 243 721 729 WA .................. 6,107 6,365 279 273 1,705 1,739 WV .................. 1,046 1,200 222 223 232 267 WI ................... 4,858 4,716 278 278 1,350 1,312 WY .................. 11 11 218 218 2.4 2.4 Oth Sts 5 .......... 7,153 7,184 275 284 1,970 2,042
US ............... 337,848 339,961 268 269 90,484 91,398
1 Annual estimates cover the period December 1 previous year through November 30. 2 Totals may not add due to rounding. 3 Revised. 4 Total egg production divided by average number of layers on hand. 5 AK, AZ, DE, ID, KS, ND, NH, NJ, NM, NV, and RI combined to avoid disclosing data for individual operations.
NASS, Livestock Branch, (202) 720–3570.
Table 8-57.—Eggs: Broken under Federal inspection, United States, 2009 and 2010
Item Quantity
2009 2010
1,000 dozen 1,000 dozen Shell eggs broken .................................................................................. 1,993,663 2,071,607
1,000 pounds 1,000 pounds Edible product from shell eggs broken
Whole .............................................................................................. 1,654,938 1,700,970 White ............................................................................................... 624,557 657,092 Yolk ................................................................................................. 320,334 326,494
Total ......................................................................................... 2,599,829 2,684,556
Inedible product from shell eggs broken 219,536 231,077
NASS, Livestock Branch, (202) 720–3570.
VerDate Aug 31 2005 17:17 Mar 01, 2012 Jkt 000000 PO 00000 Frm 00036 Fmt 1000 Sfmt 1000 H:\SHARED\DAPP\FPU\AGSTAT\MASTER~2\CHAPTR08\VIII-38.AG8 USDA
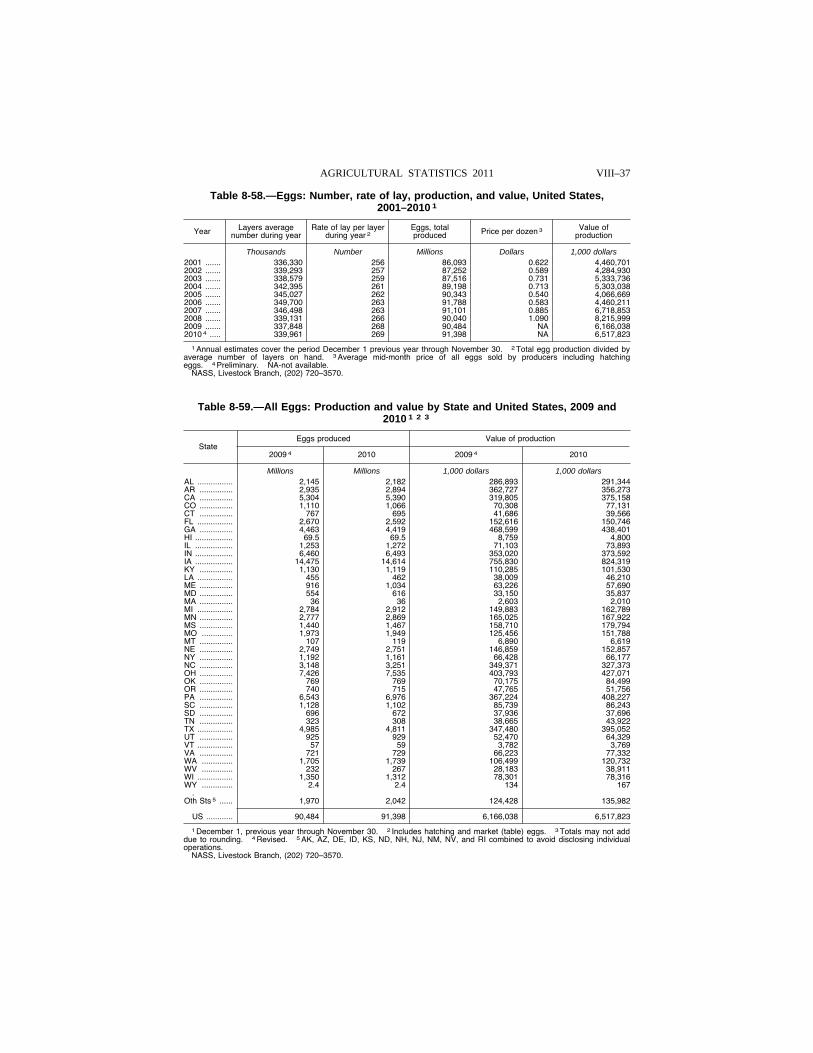
VIII–37 AGRICULTURAL STATISTICS 2011
Table 8-58.—Eggs: Number, rate of lay, production, and value, United States, 2001–2010 1
Year Layers average number during year
Rate of lay per layer during year 2
Eggs, total produced Price per dozen 3 Value of
production
Thousands Number Millions Dollars 1,000 dollars 2001 ....... 336,330 256 86,093 0.622 4,460,701 2002 ....... 339,293 257 87,252 0.589 4,284,930 2003 ....... 338,579 259 87,516 0.731 5,333,736 2004 ....... 342,395 261 89,198 0.713 5,303,038 2005 ....... 345,027 262 90,343 0.540 4,066,669 2006 ....... 349,700 263 91,788 0.583 4,460,211 2007 ....... 346,498 263 91,101 0.885 6,718,853 2008 ....... 339,131 266 90,040 1.090 8,215,999 2009 ....... 337,848 268 90,484 NA 6,166,038 2010 4 ..... 339,961 269 91,398 NA 6,517,823
1 Annual estimates cover the period December 1 previous year through November 30. 2 Total egg production divided by average number of layers on hand. 3 Average mid-month price of all eggs sold by producers including hatching eggs. 4 Preliminary. NA-not available.
NASS, Livestock Branch, (202) 720–3570.
Table 8-59.—All Eggs: Production and value by State and United States, 2009 and 2010 1 2 3
State Eggs produced Value of production
2009 4 2010 2009 4 2010
Millions Millions 1,000 dollars 1,000 dollars AL ................ 2,145 2,182 286,893 291,344 AR ............... 2,935 2,894 362,727 356,273 CA ............... 5,304 5,390 319,805 375,158 CO ............... 1,110 1,066 70,308 77,131 CT ............... 767 695 41,686 39,566 FL ................ 2,670 2,592 152,616 150,746 GA ............... 4,463 4,419 468,599 438,401 HI ................. 69.5 69.5 8,759 4,800 IL ................. 1,253 1,272 71,103 73,893 IN ................. 6,460 6,493 353,020 373,592 IA ................. 14,475 14,614 755,830 824,319 KY ............... 1,130 1,119 110,285 101,530 LA ................ 455 462 38,009 46,210 ME ............... 916 1,034 63,226 57,690 MD ............... 554 616 33,150 35,837 MA ............... 36 36 2,603 2,010 MI ................ 2,784 2,912 149,883 162,789 MN ............... 2,777 2,869 165,025 167,922 MS ............... 1,440 1,467 158,710 179,794 MO .............. 1,973 1,949 125,456 151,788 MT ............... 107 119 6,890 6,619 NE ............... 2,749 2,751 146,859 152,857 NY ............... 1,192 1,161 66,428 66,177 NC ............... 3,148 3,251 349,371 327,373 OH ............... 7,426 7,535 403,793 427,071 OK ............... 769 769 70,175 84,499 OR ............... 740 715 47,765 51,756 PA ............... 6,543 6,976 367,224 408,227 SC ............... 1,128 1,102 85,739 86,243 SD ............... 696 672 37,936 37,696 TN ............... 323 308 38,665 43,922 TX ................ 4,985 4,811 347,480 395,052 UT ............... 925 929 52,470 64,329 VT ................ 57 59 3,782 3,769 VA ............... 721 729 66,223 77,332 WA .............. 1,705 1,739 106,499 120,732 WV .............. 232 267 28,183 38,911 WI ................ 1,350 1,312 78,301 78,316 WY .............. 2.4 2.4 134 167
.Oth Sts 5 ...... 1,970 2,042 124,428 135,982
US ............ 90,484 91,398 6,166,038 6,517,823
1 December 1, previous year through November 30. 2 Includes hatching and market (table) eggs. 3 Totals may not add due to rounding. 4 Revised. 5 AK, AZ, DE, ID, KS, ND, NH, NJ, NM, NV, and RI combined to avoid disclosing individual operations.
NASS, Livestock Branch, (202) 720–3570.
VerDate Aug 31 2005 17:17 Mar 01, 2012 Jkt 000000 PO 00000 Frm 00037 Fmt 1000 Sfmt 1000 H:\SHARED\DAPP\FPU\AGSTAT\MASTER~2\CHAPTR08\VIII-39.AG8 USDA
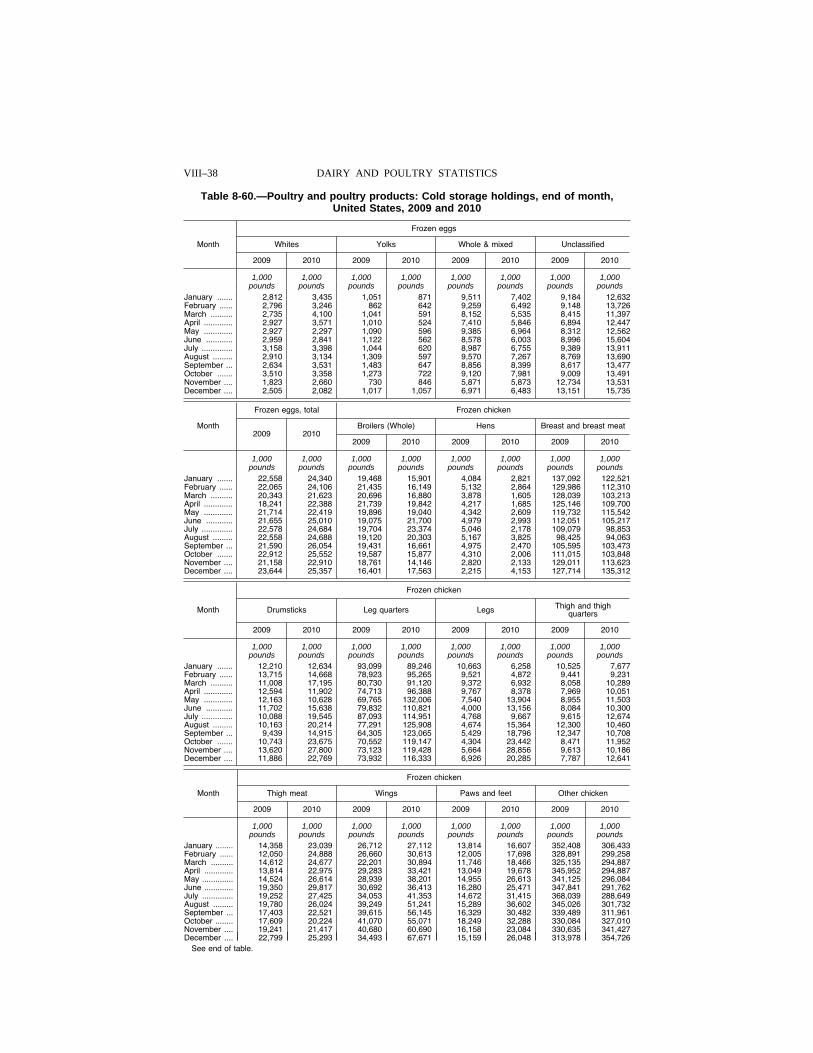
VIII–38 DAIRY AND POULTRY STATISTICS
Table 8-60.—Poultry and poultry products: Cold storage holdings, end of month, United States, 2009 and 2010
Month
Frozen eggs
Whites Yolks Whole & mixed Unclassified
2009 2010 2009 2010 2009 2010 2009 2010
1,000 1,000 1,000 1,000 1,000 1,000 1,000 1,000 pounds pounds pounds pounds pounds pounds pounds pounds
January ....... 2,812 3,435 1,051 871 9,511 7,402 9,184 12,632 February ...... 2,796 3,246 862 642 9,259 6,492 9,148 13,726 March .......... 2,735 4,100 1,041 591 8,152 5,535 8,415 11,397 April ............. 2,927 3,571 1,010 524 7,410 5,846 6,894 12,447 May ............. 2,927 2,297 1,090 596 9,385 6,964 8,312 12,562 June ............ 2,959 2,841 1,122 562 8,578 6,003 8,996 15,604 July .............. 3,158 3,398 1,044 620 8,987 6,755 9,389 13,911 August ......... 2,910 3,134 1,309 597 9,570 7,267 8,769 13,690 September ... 2,634 3,531 1,483 647 8,856 8,399 8,617 13,477 October ....... 3,510 3,358 1,273 722 9,120 7,981 9,009 13,491 November .... 1,823 2,660 730 846 5,871 5,873 12,734 13,531 December .... 2,505 2,082 1,017 1,057 6,971 6,483 13,151 15,735
Month
Frozen eggs, total Frozen chicken
2009 2010 Broilers (Whole) Hens Breast and breast meat
2009 2010 2009 2010 2009 2010
1,000 1,000 1,000 1,000 1,000 1,000 1,000 1,000 pounds pounds pounds pounds pounds pounds pounds pounds
January ....... 22,558 24,340 19,468 15,901 4,084 2,821 137,092 122,521 February ...... 22,065 24,106 21,435 16,149 5,132 2,864 129,986 112,310 March .......... 20,343 21,623 20,696 16,880 3,878 1,605 128,039 103,213 April ............. 18,241 22,388 21,739 19,842 4,217 1,685 125,146 109,700 May ............. 21,714 22,419 19,896 19,040 4,342 2,609 119,732 115,542 June ............ 21,655 25,010 19,075 21,700 4,979 2,993 112,051 105,217 July .............. 22,578 24,684 19,704 23,374 5,046 2,178 109,079 98,853 August ......... 22,558 24,688 19,120 20,303 5,167 3,825 98,425 94,063 September ... 21,590 26,054 19,431 16,661 4,975 2,470 105,595 103,473 October ....... 22,912 25,552 19,587 15,877 4,310 2,006 111,015 103,848 November .... 21,158 22,910 18,761 14,146 2,820 2,133 129,011 113,623 December .... 23,644 25,357 16,401 17,563 2,215 4,153 127,714 135,312
Month
Frozen chicken
Drumsticks Leg quarters Legs Thigh and thigh quarters
2009 2010 2009 2010 2009 2010 2009 2010
1,000 1,000 1,000 1,000 1,000 1,000 1,000 1,000 pounds pounds pounds pounds pounds pounds pounds pounds
January ....... 12,210 12,634 93,099 89,246 10,663 6,258 10,525 7,677 February ...... 13,715 14,668 78,923 95,265 9,521 4,872 9,441 9,231 March .......... 11,008 17,195 80,730 91,120 9,372 6,932 8,058 10,289 April ............. 12,594 11,902 74,713 96,388 9,767 8,378 7,969 10,051 May ............. 12,163 10,628 69,765 132,006 7,540 13,904 8,955 11,503 June ............ 11,702 15,638 79,832 110,821 4,000 13,156 8,084 10,300 July .............. 10,088 19,545 87,093 114,951 4,768 9,667 9,615 12,674 August ......... 10,163 20,214 77,291 125,908 4,674 15,364 12,300 10,460 September ... 9,439 14,915 64,305 123,065 5,429 18,796 12,347 10,708 October ....... 10,743 23,675 70,552 119,147 4,304 23,442 8,471 11,952 November .... 13,620 27,800 73,123 119,428 5,664 28,856 9,613 10,186 December .... 11,886 22,769 73,932 116,333 6,926 20,285 7,787 12,641
Month
Frozen chicken
Thigh meat Wings Paws and feet Other chicken
2009 2010 2009 2010 2009 2010 2009 2010
1,000 1,000 1,000 1,000 1,000 1,000 1,000 1,000 pounds pounds pounds pounds pounds pounds pounds pounds
January ........ 14,358 23,039 26,712 27,112 13,814 16,607 352,408 306,433 February ...... 12,050 24,888 26,660 30,613 12,005 17,698 328,891 299,258 March .......... 14,612 24,677 22,201 30,894 11,746 18,466 325,135 294,887 April ............. 13,814 22,975 29,283 33,421 13,049 19,678 345,952 294,887 May .............. 14,524 26,614 28,939 38,201 14,955 26,613 341,125 296,084 June ............. 19,350 29,817 30,692 36,413 16,280 25,471 347,841 291,762 July .............. 19,252 27,425 34,053 41,353 14,672 31,415 368,039 288,649 August ......... 19,780 26,024 39,249 51,241 15,289 36,602 345,026 301,732 September ... 17,403 22,521 39,615 56,145 16,329 30,482 339,489 311,961 October ........ 17,609 20,224 41,070 55,071 18,249 32,288 330,084 327,010 November .... 19,241 21,417 40,680 60,690 16,158 23,084 330,635 341,427 December .... 22,799 25,293 34,493 67,671 15,159 26,048 313,978 354,726
See end of table.
VerDate Aug 31 2005 17:17 Mar 01, 2012 Jkt 000000 PO 00000 Frm 00038 Fmt 1000 Sfmt 1000 H:\SHARED\DAPP\FPU\AGSTAT\MASTER~2\CHAPTR08\VIII-40.AG8 USDA
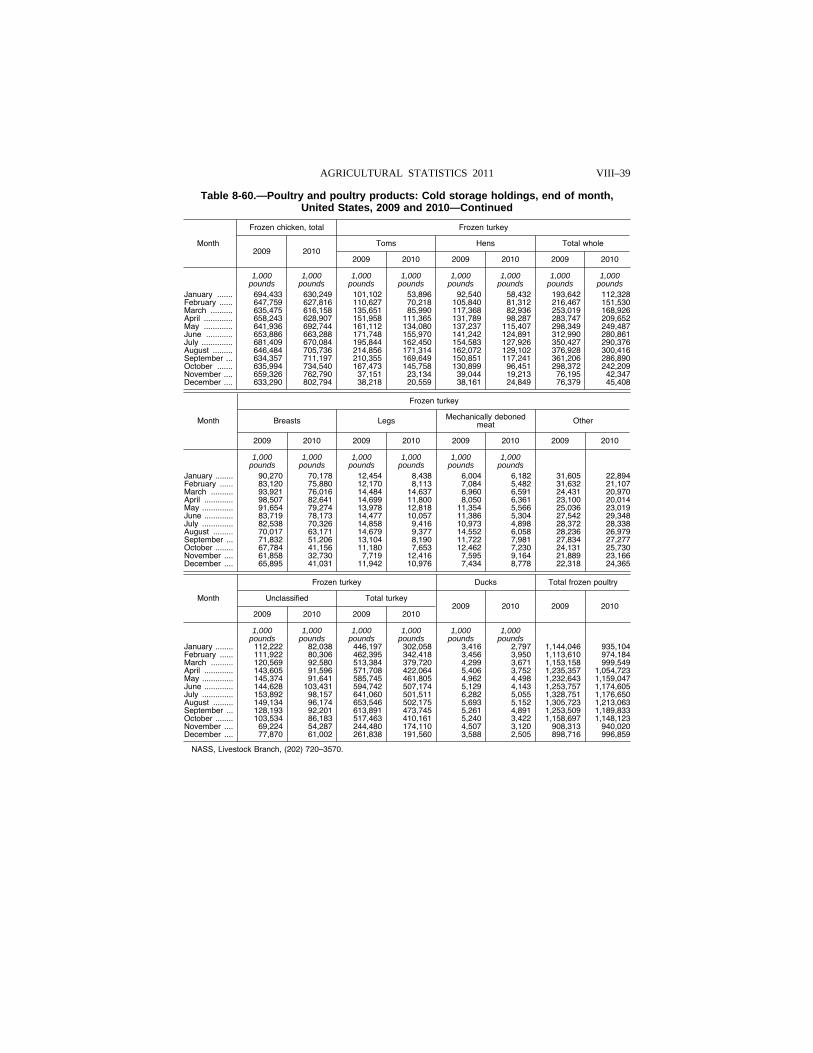
VIII–39 AGRICULTURAL STATISTICS 2011
Table 8-60.—Poultry and poultry products: Cold storage holdings, end of month, United States, 2009 and 2010—Continued
Month
Frozen chicken, total Frozen turkey
2009 2010 Toms Hens Total whole
2009 2010 2009 2010 2009 2010
1,000 1,000 1,000 1,000 1,000 1,000 1,000 1,000 pounds pounds pounds pounds pounds pounds pounds pounds
January ....... 694,433 630,249 101,102 53,896 92,540 58,432 193,642 112,328 February ...... 647,759 627,816 110,627 70,218 105,840 81,312 216,467 151,530 March .......... 635,475 616,158 135,651 85,990 117,368 82,936 253,019 168,926 April ............. 658,243 628,907 151,958 111,365 131,789 98,287 283,747 209,652 May ............. 641,936 692,744 161,112 134,080 137,237 115,407 298,349 249,487 June ............ 653,886 663,288 171,748 155,970 141,242 124,891 312,990 280,861 July .............. 681,409 670,084 195,844 162,450 154,583 127,926 350,427 290,376 August ......... 646,484 705,736 214,856 171,314 162,072 129,102 376,928 300,416 September ... 634,357 711,197 210,355 169,649 150,851 117,241 361,206 286,890 October ....... 635,994 734,540 167,473 145,758 130,899 96,451 298,372 242,209 November .... 659,326 762,790 37,151 23,134 39,044 19,213 76,195 42,347 December .... 633,290 802,794 38,218 20,559 38,161 24,849 76,379 45,408
Month
Frozen turkey
Breasts Legs Mechanically deboned meat Other
2009 2010 2009 2010 2009 2010 2009 2010
1,000 1,000 1,000 1,000 1,000 1,000 pounds pounds pounds pounds pounds pounds
January ........ 90,270 70,178 12,454 8,438 6,004 6,182 31,605 22,894 February ...... 83,120 75,880 12,170 8,113 7,084 5,482 31,632 21,107 March .......... 93,921 76,016 14,484 14,637 6,960 6,591 24,431 20,970 April ............. 98,507 82,641 14,699 11,800 8,050 6,361 23,100 20,014 May .............. 91,654 79,274 13,978 12,818 11,354 5,566 25,036 23,019 June ............. 83,719 78,173 14,477 10,057 11,386 5,304 27,542 29,348 July .............. 82,538 70,326 14,858 9,416 10,973 4,898 28,372 28,338 August ......... 70,017 63,171 14,679 9,377 14,552 6,058 28,236 26,979 September ... 71,832 51,206 13,104 8,190 11,722 7,981 27,834 27,277 October ........ 67,784 41,156 11,180 7,653 12,462 7,230 24,131 25,730 November .... 61,858 32,730 7,719 12,416 7,595 9,164 21,889 23,166 December .... 65,895 41,031 11,942 10,976 7,434 8,778 22,318 24,365
Month
Frozen turkey Ducks Total frozen poultry
Unclassified Total turkey 2009 2010 2009 2010
2009 2010 2009 2010
1,000 1,000 1,000 1,000 1,000 1,000 pounds pounds pounds pounds pounds pounds
January ........ 112,222 82,038 446,197 302,058 3,416 2,797 1,144,046 935,104 February ...... 111,922 80,306 462,395 342,418 3,456 3,950 1,113,610 974,184 March .......... 120,569 92,580 513,384 379,720 4,299 3,671 1,153,158 999,549 April ............. 143,605 91,596 571,708 422,064 5,406 3,752 1,235,357 1,054,723 May .............. 145,374 91,641 585,745 461,805 4,962 4,498 1,232,643 1,159,047 June ............. 144,628 103,431 594,742 507,174 5,129 4,143 1,253,757 1,174,605 July .............. 153,892 98,157 641,060 501,511 6,282 5,055 1,328,751 1,176,650 August ......... 149,134 96,174 653,546 502,175 5,693 5,152 1,305,723 1,213,063 September ... 128,193 92,201 613,891 473,745 5,261 4,891 1,253,509 1,189,833 October ........ 103,534 86,183 517,463 410,161 5,240 3,422 1,158,697 1,148,123 November .... 69,224 54,287 244,480 174,110 4,507 3,120 908,313 940,020 December .... 77,870 61,002 261,838 191,560 3,588 2,505 898,716 996,859
NASS, Livestock Branch, (202) 720–3570.
VerDate Aug 31 2005 17:17 Mar 01, 2012 Jkt 000000 PO 00000 Frm 00039 Fmt 1000 Sfmt 1000 H:\SHARED\DAPP\FPU\AGSTAT\MASTER~2\CHAPTR08\VIII-41.AG8 USDA
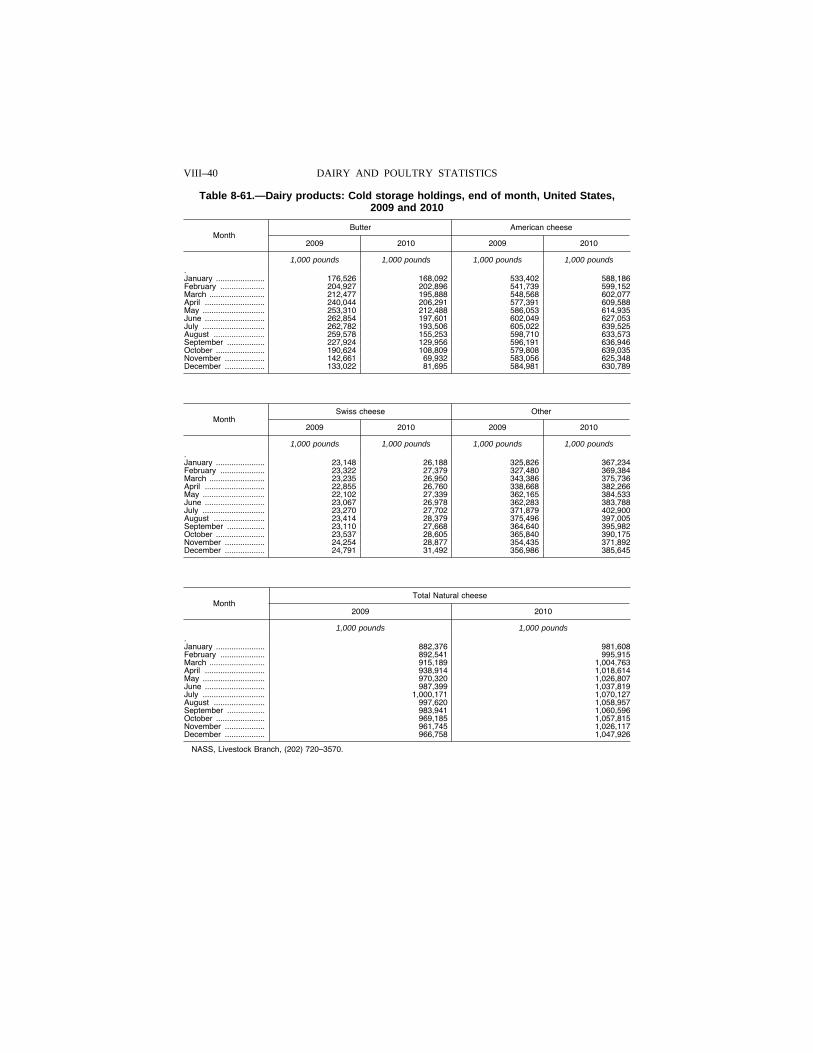
VIII–40 DAIRY AND POULTRY STATISTICS
Table 8-61.—Dairy products: Cold storage holdings, end of month, United States, 2009 and 2010
Month Butter American cheese
2009 2010 2009 2010
1,000 pounds 1,000 pounds 1,000 pounds 1,000 pounds .January ...................... 176,526 168,092 533,402 588,186 February .................... 204,927 202,896 541,739 599,152 March ......................... 212,477 195,888 548,568 602,077 April ........................... 240,044 206,291 577,391 609,588 May ............................ 253,310 212,488 586,053 614,935 June ........................... 262,854 197,601 602,049 627,053 July ............................ 262,782 193,506 605,022 639,525 August ....................... 259,578 155,253 598,710 633,573 September ................. 227,924 129,956 596,191 636,946 October ...................... 190,624 108,809 579,808 639,035 November .................. 142,661 69,932 583,056 625,348 December .................. 133,022 81,695 584,981 630,789
Month Swiss cheese Other
2009 2010 2009 2010
1,000 pounds 1,000 pounds 1,000 pounds 1,000 pounds .January ...................... 23,148 26,188 325,826 367,234 February .................... 23,322 27,379 327,480 369,384 March ......................... 23,235 26,950 343,386 375,736 April ........................... 22,855 26,760 338,668 382,266 May ............................ 22,102 27,339 362,165 384,533 June ........................... 23,067 26,978 362,283 383,788 July ............................ 23,270 27,702 371,879 402,900 August ....................... 23,414 28,379 375,496 397,005 September ................. 23,110 27,668 364,640 395,982 October ...................... 23,537 28,605 365,840 390,175 November .................. 24,254 28,877 354,435 371,892 December .................. 24,791 31,492 356,986 385,645
Month Total Natural cheese
2009 2010
1,000 pounds 1,000 pounds .January ...................... 882,376 981,608 February .................... 892,541 995,915 March ......................... 915,189 1,004,763 April ........................... 938,914 1,018,614 May ............................ 970,320 1,026,807 June ........................... 987,399 1,037,819 July ............................ 1,000,171 1,070,127 August ....................... 997,620 1,058,957 September ................. 983,941 1,060,596 October ...................... 969,185 1,057,815 November .................. 961,745 1,026,117 December .................. 966,758 1,047,926
NASS, Livestock Branch, (202) 720–3570.
VerDate Aug 31 2005 17:17 Mar 01, 2012 Jkt 000000 PO 00000 Frm 00040 Fmt 1000 Sfmt 1000 H:\SHARED\DAPP\FPU\AGSTAT\MASTER~2\CHAPTR08\VIII-42.AG8 USDA
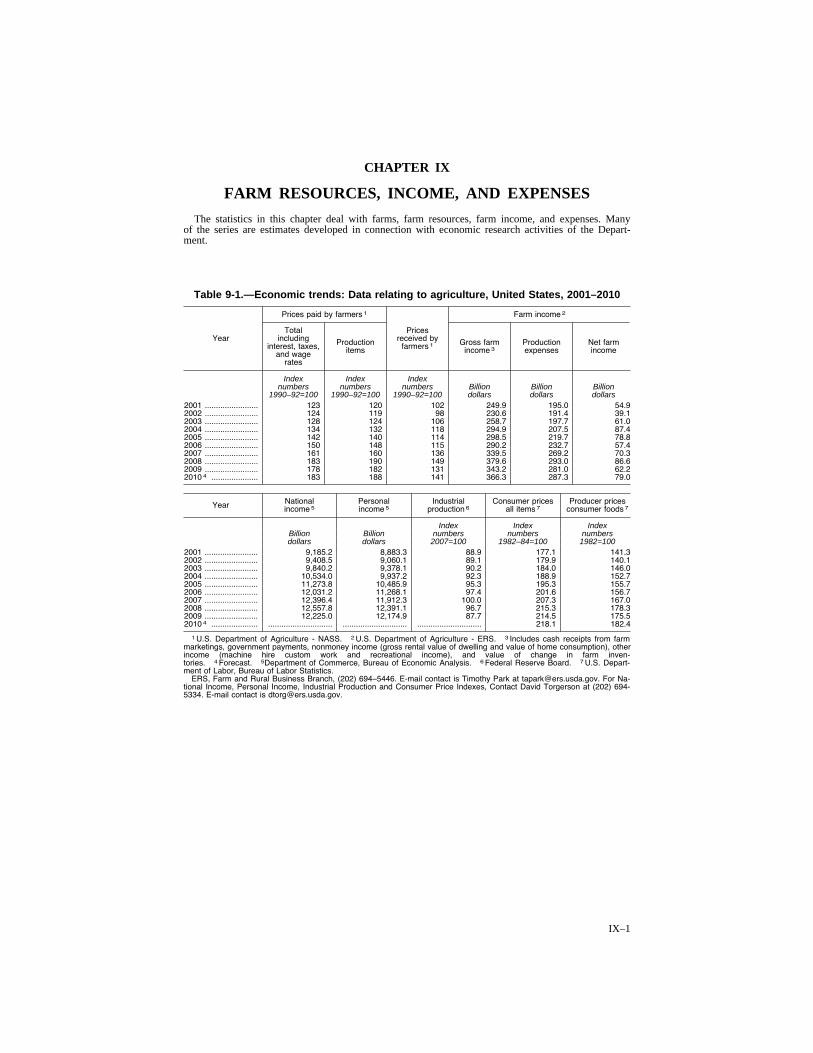
IX–1
CHAPTER IX
FARM RESOURCES, INCOME, AND EXPENSES
The statistics in this chapter deal with farms, farm resources, farm income, and expenses. Many of the series are estimates developed in connection with economic research activities of the Depart-ment.
Table 9-1.—Economic trends: Data relating to agriculture, United States, 2001–2010
Year
Prices paid by farmers 1
Prices received by
farmers 1
Farm income 2
Total including
interest, taxes, and wage
rates
Production items
Gross farm income 3
Production expenses
Net farm income
Index Index Index numbers numbers numbers Billion Billion Billion
1990–92=100 1990–92=100 1990–92=100 dollars dollars dollars 2001 ........................ 123 120 102 249.9 195.0 54.9 2002 ........................ 124 119 98 230.6 191.4 39.1 2003 ........................ 128 124 106 258.7 197.7 61.0 2004 ........................ 134 132 118 294.9 207.5 87.4 2005 ........................ 142 140 114 298.5 219.7 78.8 2006 ........................ 150 148 115 290.2 232.7 57.4 2007 ........................ 161 160 136 339.5 269.2 70.3 2008 ........................ 183 190 149 379.6 293.0 86.6 2009 ........................ 178 182 131 343.2 281.0 62.2 2010 4 ..................... 183 188 141 366.3 287.3 79.0
Year National income 5
Personal income 5
Industrial production 6
Consumer prices all items 7
Producer prices consumer foods 7
Index Index Index Billion Billion numbers numbers numbers dollars dollars 2007=100 1982–84=100 1982=100
2001 ........................ 9,185.2 8,883.3 88.9 177.1 141.3 2002 ........................ 9,408.5 9,060.1 89.1 179.9 140.1 2003 ........................ 9,840.2 9,378.1 90.2 184.0 146.0 2004 ........................ 10,534.0 9,937.2 92.3 188.9 152.7 2005 ........................ 11,273.8 10,485.9 95.3 195.3 155.7 2006 ........................ 12,031.2 11,268.1 97.4 201.6 156.7 2007 ........................ 12,396.4 11,912.3 100.0 207.3 167.0 2008 ........................ 12,557.8 12,391.1 96.7 215.3 178.3 2009 ........................ 12,225.0 12,174.9 87.7 214.5 175.5 2010 4 ..................... ............................. ............................. ............................. 218.1 182.4
1 U.S. Department of Agriculture - NASS. 2 U.S. Department of Agriculture - ERS. 3 Includes cash receipts from farm marketings, government payments, nonmoney income (gross rental value of dwelling and value of home consumption), other income (machine hire custom work and recreational income), and value of change in farm inven-tories. 4 Forecast. 5Department of Commerce, Bureau of Economic Analysis. 6 Federal Reserve Board. 7 U.S. Depart-ment of Labor, Bureau of Labor Statistics.
ERS, Farm and Rural Business Branch, (202) 694–5446. E-mail contact is Timothy Park at [email protected]. For Na-tional Income, Personal Income, Industrial Production and Consumer Price Indexes, Contact David Torgerson at (202) 694- 5334. E-mail contact is [email protected].
VerDate Aug 31 2005 13:44 Mar 01, 2012 Jkt 000000 PO 00000 Frm 00001 Fmt 1001 Sfmt 1001 H:\SHARED\DAPP\FPU\AGSTAT\MASTER~2\CHAPTR09\IX-01.AG8 USDA
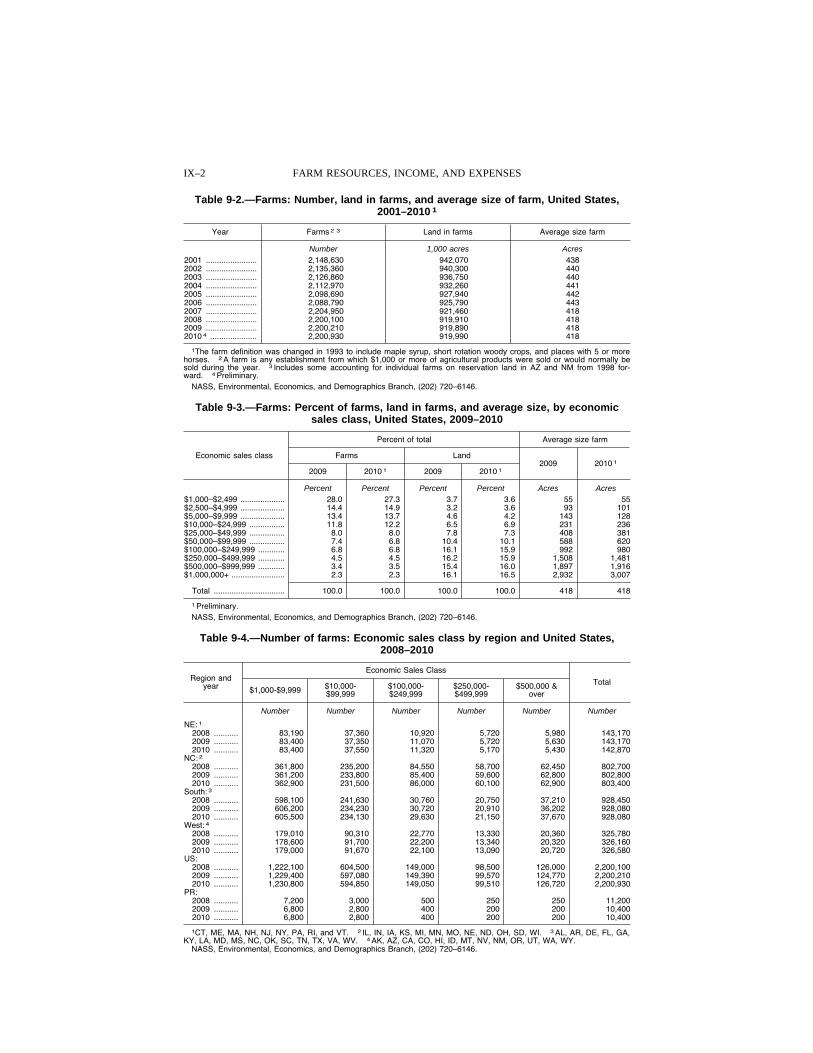
IX–2 FARM RESOURCES, INCOME, AND EXPENSES
Table 9-2.—Farms: Number, land in farms, and average size of farm, United States, 2001–2010 1
Year Farms 2 3 Land in farms Average size farm
Number 1,000 acres Acres 2001 ....................... 2,148,630 942,070 438 2002 ....................... 2,135,360 940,300 440 2003 ....................... 2,126,860 936,750 440 2004 ....................... 2,112,970 932,260 441 2005 ....................... 2,098,690 927,940 442 2006 ....................... 2,088,790 925,790 443 2007 ....................... 2,204,950 921,460 418 2008 ....................... 2,200,100 919,910 418 2009 ....................... 2,200,210 919,890 418 2010 4 ..................... 2,200,930 919,990 418
1The farm definition was changed in 1993 to include maple syrup, short rotation woody crops, and places with 5 or more horses. 2 A farm is any establishment from which $1,000 or more of agricultural products were sold or would normally be sold during the year. 3 Includes some accounting for individual farms on reservation land in AZ and NM from 1998 for-ward. 4 Preliminary.
NASS, Environmental, Economics, and Demographics Branch, (202) 720–6146.
Table 9-3.—Farms: Percent of farms, land in farms, and average size, by economic sales class, United States, 2009–2010
Economic sales class
Percent of total Average size farm
Farms Land 2009 2010 1
2009 2010 1 2009 2010 1
Percent Percent Percent Percent Acres Acres $1,000–$2,499 .................... 28.0 27.3 3.7 3.6 55 55 $2,500–$4,999 .................... 14.4 14.9 3.2 3.6 93 101 $5,000–$9,999 .................... 13.4 13.7 4.6 4.2 143 128 $10,000–$24,999 ................ 11.8 12.2 6.5 6.9 231 236 $25,000–$49,999 ................ 8.0 8.0 7.8 7.3 408 381 $50,000–$99,999 ................ 7.4 6.8 10.4 10.1 588 620 $100,000–$249,999 ............ 6.8 6.8 16.1 15.9 992 980 $250,000–$499,999 ............ 4.5 4.5 16.2 15.9 1,508 1,481 $500,000–$999,999 ............ 3.4 3.5 15.4 16.0 1,897 1,916 $1,000,000+ ........................ 2.3 2.3 16.1 16.5 2,932 3,007
Total ................................ 100.0 100.0 100.0 100.0 418 418
1 Preliminary. NASS, Environmental, Economics, and Demographics Branch, (202) 720–6146.
Table 9-4.—Number of farms: Economic sales class by region and United States, 2008–2010
Region and year
Economic Sales Class
Total $1,000-$9,999 $10,000-
$99,999 $100,000- $249,999
$250,000- $499,999
$500,000 & over
Number Number Number Number Number Number
NE: 1 2008 ........... 83,190 37,360 10,920 5,720 5,980 143,170 2009 ........... 83,400 37,350 11,070 5,720 5,630 143,170 2010 ........... 83,400 37,550 11,320 5,170 5,430 142,870
NC: 2 2008 ........... 361,800 235,200 84,550 58,700 62,450 802,700 2009 ........... 361,200 233,800 85,400 59,600 62,800 802,800 2010 ........... 362,900 231,500 86,000 60,100 62,900 803,400
South: 3 2008 ........... 598,100 241,630 30,760 20,750 37,210 928,450 2009 ........... 606,200 234,230 30,720 20,910 36,202 928,080 2010 ........... 605,500 234,130 29,630 21,150 37,670 928,080
West: 4 2008 ........... 179,010 90,310 22,770 13,330 20,360 325,780 2009 ........... 178,600 91,700 22,200 13,340 20,320 326,160 2010 ........... 179,000 91,670 22,100 13,090 20,720 326,580
US: 2008 ........... 1,222,100 604,500 149,000 98,500 126,000 2,200,100 2009 ........... 1,229,400 597,080 149,390 99,570 124,770 2,200,210 2010 ........... 1,230,800 594,850 149,050 99,510 126,720 2,200,930
PR: 2008 ........... 7,200 3,000 500 250 250 11,200 2009 ........... 6,800 2,800 400 200 200 10,400 2010 ........... 6,800 2,800 400 200 200 10,400
1CT, ME, MA, NH, NJ, NY, PA, RI, and VT. 2 IL, IN, IA, KS, MI, MN, MO, NE, ND, OH, SD, WI. 3 AL, AR, DE, FL, GA, KY, LA, MD, MS, NC, OK, SC, TN, TX, VA, WV. 4 AK, AZ, CA, CO, HI, ID, MT, NV, NM, OR, UT, WA, WY.
NASS, Environmental, Economics, and Demographics Branch, (202) 720–6146.
VerDate Aug 31 2005 13:44 Mar 01, 2012 Jkt 000000 PO 00000 Frm 00002 Fmt 1000 Sfmt 1000 H:\SHARED\DAPP\FPU\AGSTAT\MASTER~2\CHAPTR09\IX-02.AG8 USDA
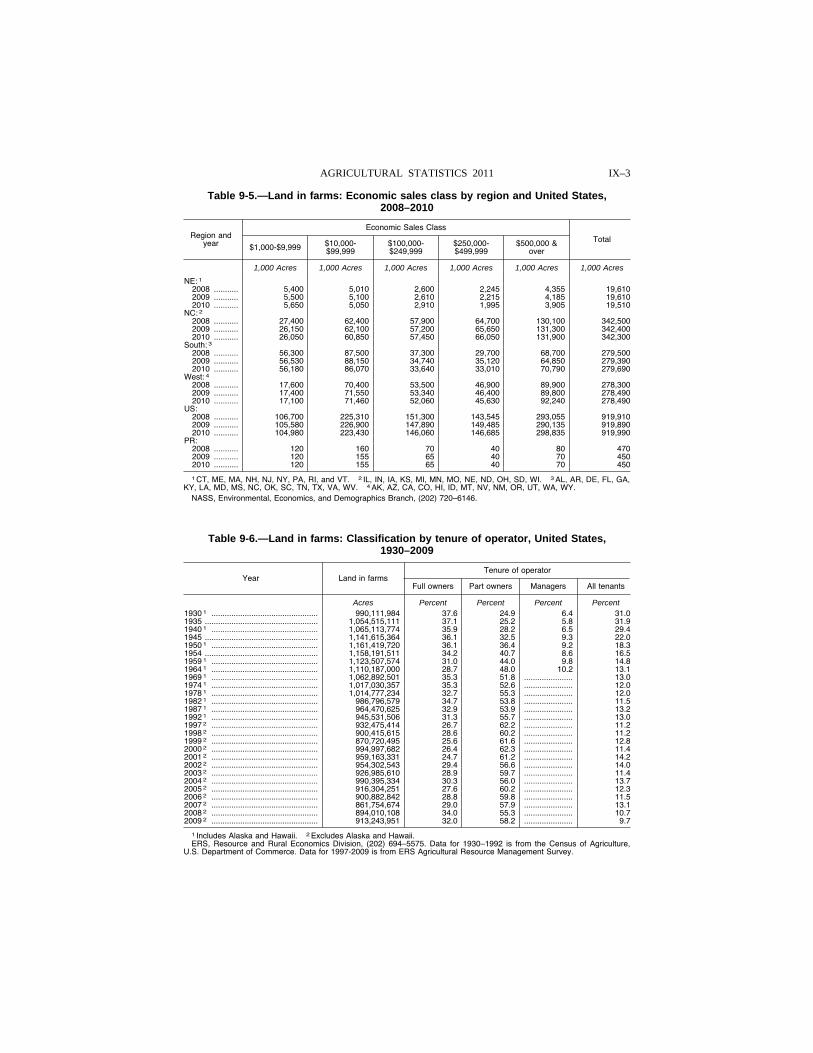
IX–3 AGRICULTURAL STATISTICS 2011
Table 9-5.—Land in farms: Economic sales class by region and United States, 2008–2010
Region and year
Economic Sales Class
Total $1,000-$9,999 $10,000-
$99,999 $100,000- $249,999
$250,000- $499,999
$500,000 & over
1,000 Acres 1,000 Acres 1,000 Acres 1,000 Acres 1,000 Acres 1,000 Acres
NE: 1 2008 ........... 5,400 5,010 2,600 2,245 4,355 19,610 2009 ........... 5,500 5,100 2,610 2,215 4,185 19,610 2010 ........... 5,650 5,050 2,910 1,995 3,905 19,510
NC: 2 2008 ........... 27,400 62,400 57,900 64,700 130,100 342,500 2009 ........... 26,150 62,100 57,200 65,650 131,300 342,400 2010 ........... 26,050 60,850 57,450 66,050 131,900 342,300
South: 3 2008 ........... 56,300 87,500 37,300 29,700 68,700 279,500 2009 ........... 56,530 88,150 34,740 35,120 64,850 279,390 2010 ........... 56,180 86,070 33,640 33,010 70,790 279,690
West: 4 2008 ........... 17,600 70,400 53,500 46,900 89,900 278,300 2009 ........... 17,400 71,550 53,340 46,400 89,800 278,490 2010 ........... 17,100 71,460 52,060 45,630 92,240 278,490
US: 2008 ........... 106,700 225,310 151,300 143,545 293,055 919,910 2009 ........... 105,580 226,900 147,890 149,485 290,135 919,890 2010 ........... 104,980 223,430 146,060 146,685 298,835 919,990
PR: 2008 ........... 120 160 70 40 80 470 2009 ........... 120 155 65 40 70 450 2010 ........... 120 155 65 40 70 450
1 CT, ME, MA, NH, NJ, NY, PA, RI, and VT. 2 IL, IN, IA, KS, MI, MN, MO, NE, ND, OH, SD, WI. 3 AL, AR, DE, FL, GA, KY, LA, MD, MS, NC, OK, SC, TN, TX, VA, WV. 4 AK, AZ, CA, CO, HI, ID, MT, NV, NM, OR, UT, WA, WY.
NASS, Environmental, Economics, and Demographics Branch, (202) 720–6146.
Table 9-6.—Land in farms: Classification by tenure of operator, United States, 1930–2009
Year Land in farms Tenure of operator
Full owners Part owners Managers All tenants
Acres Percent Percent Percent Percent 1930 1 ................................................ 990,111,984 37.6 24.9 6.4 31.0 1935 ................................................... 1,054,515,111 37.1 25.2 5.8 31.9 1940 1 ................................................ 1,065,113,774 35.9 28.2 6.5 29.4 1945 ................................................... 1,141,615,364 36.1 32.5 9.3 22.0 1950 1 ................................................ 1,161,419,720 36.1 36.4 9.2 18.3 1954 ................................................... 1,158,191,511 34.2 40.7 8.6 16.5 1959 1 ................................................ 1,123,507,574 31.0 44.0 9.8 14.8 1964 1 ................................................ 1,110,187,000 28.7 48.0 10.2 13.1 1969 1 ................................................ 1,062,892,501 35.3 51.8 ...................... 13.0 1974 1 ................................................ 1,017,030,357 35.3 52.6 ...................... 12.0 1978 1 ................................................ 1,014,777,234 32.7 55.3 ...................... 12.0 1982 1 ................................................ 986,796,579 34.7 53.8 ...................... 11.5 1987 1 ................................................ 964,470,625 32.9 53.9 ...................... 13.2 1992 1 ................................................ 945,531,506 31.3 55.7 ...................... 13.0 1997 2 ................................................ 932,475,414 26.7 62.2 ...................... 11.2 1998 2 ................................................ 900,415,615 28.6 60.2 ...................... 11.2 1999 2 ................................................ 870,720,495 25.6 61.6 ...................... 12.8 2000 2 ................................................ 994,997,682 26.4 62.3 ...................... 11.4 2001 2 ................................................ 959,163,331 24.7 61.2 ...................... 14.2 2002 2 ................................................ 954,302,543 29.4 56.6 ...................... 14.0 2003 2 ................................................ 926,985,610 28.9 59.7 ...................... 11.4 2004 2 ................................................ 990,395,334 30.3 56.0 ...................... 13.7 2005 2 ................................................ 916,304,251 27.6 60.2 ...................... 12.3 2006 2 ................................................ 900,882,842 28.8 59.8 ...................... 11.5 2007 2 ................................................ 861,754,674 29.0 57.9 ...................... 13.1 2008 2 ................................................ 894,010,108 34.0 55.3 ...................... 10.7 2009 2 ................................................ 913,243,951 32.0 58.2 ...................... 9.7
1 Includes Alaska and Hawaii. 2 Excludes Alaska and Hawaii. ERS, Resource and Rural Economics Division, (202) 694–5575. Data for 1930–1992 is from the Census of Agriculture,
U.S. Department of Commerce. Data for 1997-2009 is from ERS Agricultural Resource Management Survey.
VerDate Aug 31 2005 13:44 Mar 01, 2012 Jkt 000000 PO 00000 Frm 00003 Fmt 1000 Sfmt 1000 H:\SHARED\DAPP\FPU\AGSTAT\MASTER~2\CHAPTR09\IX-03.AG8 USDA
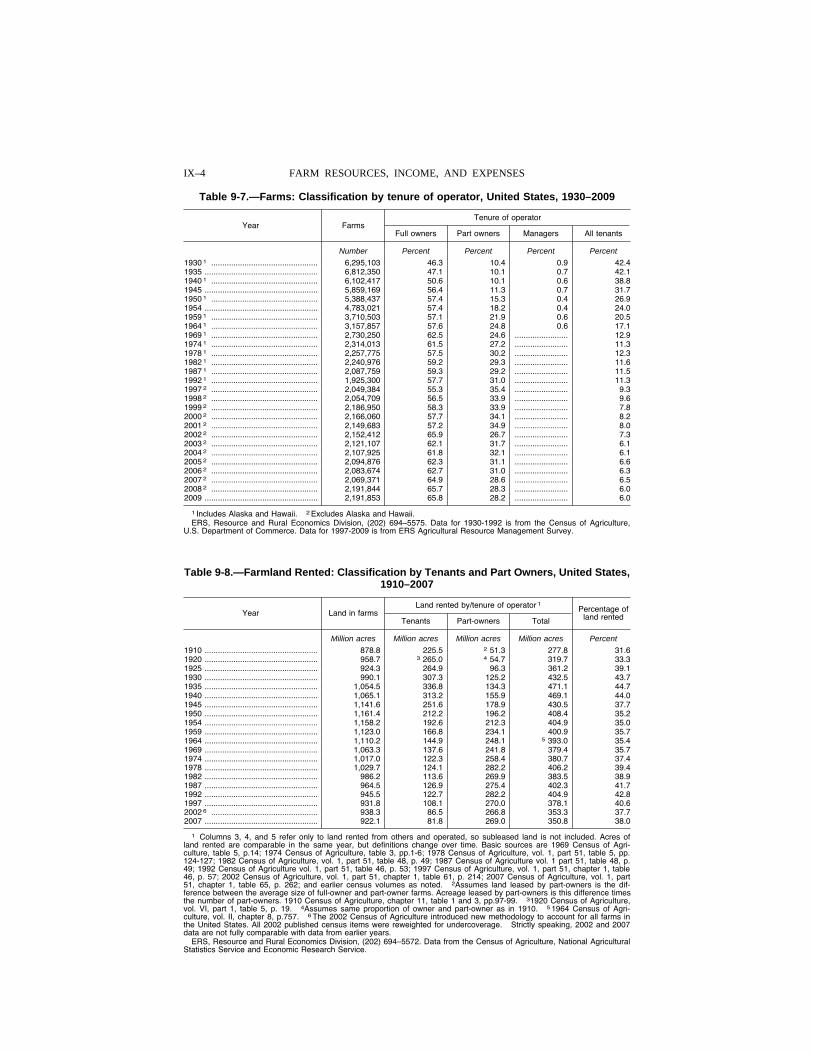
IX–4 FARM RESOURCES, INCOME, AND EXPENSES
Table 9-7.—Farms: Classification by tenure of operator, United States, 1930–2009
Year Farms Tenure of operator
Full owners Part owners Managers All tenants
Number Percent Percent Percent Percent
1930 1 ................................................ 6,295,103 46.3 10.4 0.9 42.4 1935 ................................................... 6,812,350 47.1 10.1 0.7 42.1 1940 1 ................................................ 6,102,417 50.6 10.1 0.6 38.8 1945 ................................................... 5,859,169 56.4 11.3 0.7 31.7 1950 1 ................................................ 5,388,437 57.4 15.3 0.4 26.9 1954 ................................................... 4,783,021 57.4 18.2 0.4 24.0 1959 1 ................................................ 3,710,503 57.1 21.9 0.6 20.5 1964 1 ................................................ 3,157,857 57.6 24.8 0.6 17.1 1969 1 ................................................ 2,730,250 62.5 24.6 ........................ 12.9 1974 1 ................................................ 2,314,013 61.5 27.2 ........................ 11.3 1978 1 ................................................ 2,257,775 57.5 30.2 ........................ 12.3 1982 1 ................................................ 2,240,976 59.2 29.3 ........................ 11.6 1987 1 ................................................ 2,087,759 59.3 29.2 ........................ 11.5 1992 1 ................................................ 1,925,300 57.7 31.0 ........................ 11.3 1997 2 ................................................ 2,049,384 55.3 35.4 ........................ 9.3 1998 2 ................................................ 2,054,709 56.5 33.9 ........................ 9.6 1999 2 ................................................ 2,186,950 58.3 33.9 ........................ 7.8 2000 2 ................................................ 2,166,060 57.7 34.1 ........................ 8.2 2001 2 ................................................ 2,149,683 57.2 34.9 ........................ 8.0 2002 2 ................................................ 2,152,412 65.9 26.7 ........................ 7.3 2003 2 ................................................ 2,121,107 62.1 31.7 ........................ 6.1 2004 2 ................................................ 2,107,925 61.8 32.1 ........................ 6.1 2005 2 ................................................ 2,094,876 62.3 31.1 ........................ 6.6 2006 2 ................................................ 2,083,674 62.7 31.0 ........................ 6.3 2007 2 ................................................ 2,069,371 64.9 28.6 ........................ 6.5 2008 2 ................................................ 2,191,844 65.7 28.3 ........................ 6.0 2009 ................................................... 2,191,853 65.8 28.2 ........................ 6.0
1 Includes Alaska and Hawaii. 2 Excludes Alaska and Hawaii. ERS, Resource and Rural Economics Division, (202) 694–5575. Data for 1930-1992 is from the Census of Agriculture,
U.S. Department of Commerce. Data for 1997-2009 is from ERS Agricultural Resource Management Survey.
Table 9-8.—Farmland Rented: Classification by Tenants and Part Owners, United States, 1910–2007
Year Land in farms Land rented by/tenure of operator 1 Percentage of
land rented Tenants Part-owners Total
Million acres Million acres Million acres Million acres Percent
1910 ................................................... 878.8 225.5 2 51.3 277.8 31.6 1920 ................................................... 958.7 3 265.0 4 54.7 319.7 33.3 1925 ................................................... 924.3 264.9 96.3 361.2 39.1 1930 ................................................... 990.1 307.3 125.2 432.5 43.7 1935 ................................................... 1,054.5 336.8 134.3 471.1 44.7 1940 ................................................... 1,065.1 313.2 155.9 469.1 44.0 1945 ................................................... 1,141.6 251.6 178.9 430.5 37.7 1950 ................................................... 1,161.4 212.2 196.2 408.4 35.2 1954 ................................................... 1,158.2 192.6 212.3 404.9 35.0 1959 ................................................... 1,123.0 166.8 234.1 400.9 35.7 1964 ................................................... 1,110.2 144.9 248.1 5 393.0 35.4 1969 ................................................... 1,063.3 137.6 241.8 379.4 35.7 1974 ................................................... 1,017.0 122.3 258.4 380.7 37.4 1978 ................................................... 1,029.7 124.1 282.2 406.2 39.4 1982 ................................................... 986.2 113.6 269.9 383.5 38.9 1987 ................................................... 964.5 126.9 275.4 402.3 41.7 1992 ................................................... 945.5 122.7 282.2 404.9 42.8 1997 ................................................... 931.8 108.1 270.0 378.1 40.6 2002 6 ................................................ 938.3 86.5 266.8 353.3 37.7 2007 ................................................... 922.1 81.8 269.0 350.8 38.0
1 Columns 3, 4, and 5 refer only to land rented from others and operated, so subleased land is not included. Acres of land rented are comparable in the same year, but definitions change over time. Basic sources are 1969 Census of Agri-culture, table 5, p.14; 1974 Census of Agriculture, table 3, pp.1-6; 1978 Census of Agriculture, vol. 1, part 51, table 5, pp. 124-127; 1982 Census of Agriculture, vol. 1, part 51, table 48, p. 49; 1987 Census of Agriculture vol. 1 part 51, table 48, p. 49; 1992 Census of Agriculture vol. 1, part 51, table 46, p. 53; 1997 Census of Agriculture, vol. 1, part 51, chapter 1, table 46, p. 57; 2002 Census of Agriculture, vol. 1, part 51, chapter 1, table 61, p. 214; 2007 Census of Agriculture, vol. 1, part 51, chapter 1, table 65, p. 262; and earlier census volumes as noted. 2Assumes land leased by part-owners is the dif-ference between the average size of full-owner and part-owner farms. Acreage leased by part-owners is this difference times the number of part-owners. 1910 Census of Agriculture, chapter 11, table 1 and 3, pp.97-99. 31920 Census of Agriculture, vol. VI, part 1, table 5, p. 19. 4Assumes same proportion of owner and part-owner as in 1910. 5 1964 Census of Agri-culture, vol. II, chapter 8, p.757. 6 The 2002 Census of Agriculture introduced new methodology to account for all farms in the United States. All 2002 published census items were reweighted for undercoverage. Strictly speaking, 2002 and 2007 data are not fully comparable with data from earlier years.
ERS, Resource and Rural Economics Division, (202) 694–5572. Data from the Census of Agriculture, National Agricultural Statistics Service and Economic Research Service.
VerDate Aug 31 2005 13:44 Mar 01, 2012 Jkt 000000 PO 00000 Frm 00004 Fmt 1000 Sfmt 1000 H:\SHARED\DAPP\FPU\AGSTAT\MASTER~2\CHAPTR09\IX-04.AG8 USDA
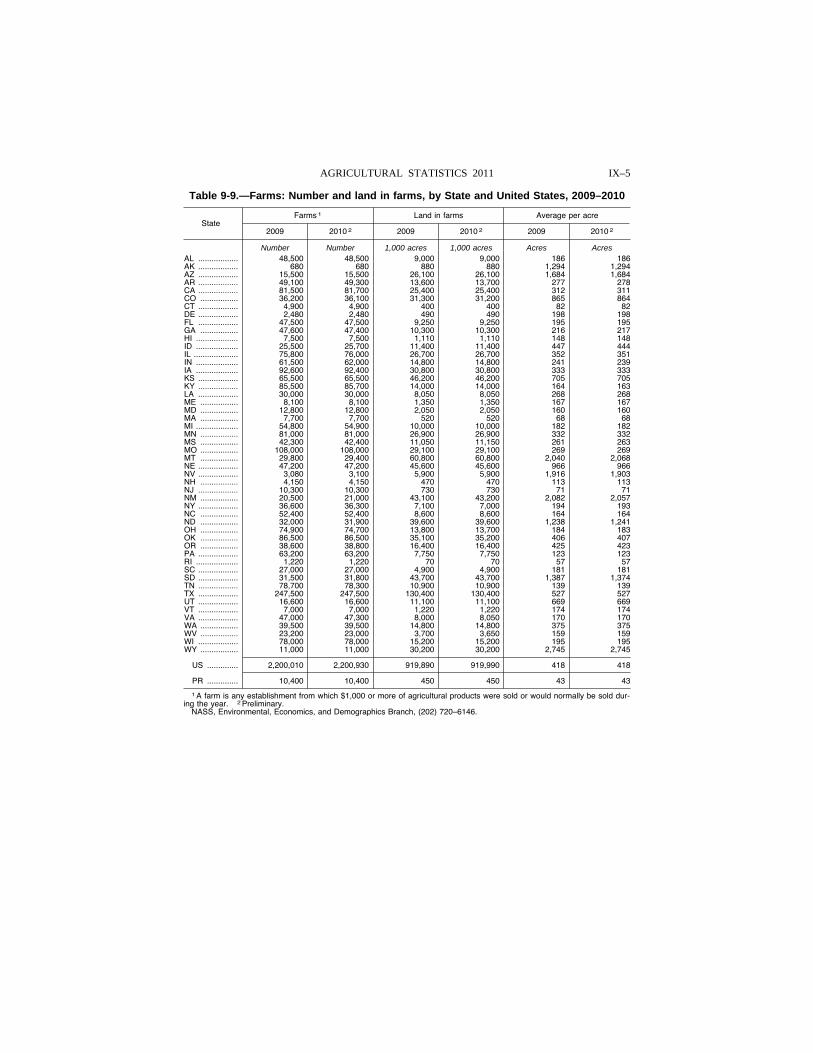
IX–5 AGRICULTURAL STATISTICS 2011
Table 9-9.—Farms: Number and land in farms, by State and United States, 2009–2010
State Farms 1 Land in farms Average per acre
2009 2010 2 2009 2010 2 2009 2010 2
Number Number 1,000 acres 1,000 acres Acres Acres AL .................. 48,500 48,500 9,000 9,000 186 186 AK .................. 680 680 880 880 1,294 1,294 AZ .................. 15,500 15,500 26,100 26,100 1,684 1,684 AR .................. 49,100 49,300 13,600 13,700 277 278 CA .................. 81,500 81,700 25,400 25,400 312 311 CO ................. 36,200 36,100 31,300 31,200 865 864 CT .................. 4,900 4,900 400 400 82 82 DE .................. 2,480 2,480 490 490 198 198 FL .................. 47,500 47,500 9,250 9,250 195 195 GA ................. 47,600 47,400 10,300 10,300 216 217 HI ................... 7,500 7,500 1,110 1,110 148 148 ID ................... 25,500 25,700 11,400 11,400 447 444 IL .................... 75,800 76,000 26,700 26,700 352 351 IN ................... 61,500 62,000 14,800 14,800 241 239 IA ................... 92,600 92,400 30,800 30,800 333 333 KS .................. 65,500 65,500 46,200 46,200 705 705 KY .................. 85,500 85,700 14,000 14,000 164 163 LA .................. 30,000 30,000 8,050 8,050 268 268 ME ................. 8,100 8,100 1,350 1,350 167 167 MD ................. 12,800 12,800 2,050 2,050 160 160 MA ................. 7,700 7,700 520 520 68 68 MI ................... 54,800 54,900 10,000 10,000 182 182 MN ................. 81,000 81,000 26,900 26,900 332 332 MS ................. 42,300 42,400 11,050 11,150 261 263 MO ................. 108,000 108,000 29,100 29,100 269 269 MT ................. 29,800 29,400 60,800 60,800 2,040 2,068 NE .................. 47,200 47,200 45,600 45,600 966 966 NV .................. 3,080 3,100 5,900 5,900 1,916 1,903 NH ................. 4,150 4,150 470 470 113 113 NJ .................. 10,300 10,300 730 730 71 71 NM ................. 20,500 21,000 43,100 43,200 2,082 2,057 NY .................. 36,600 36,300 7,100 7,000 194 193 NC ................. 52,400 52,400 8,600 8,600 164 164 ND ................. 32,000 31,900 39,600 39,600 1,238 1,241 OH ................. 74,900 74,700 13,800 13,700 184 183 OK ................. 86,500 86,500 35,100 35,200 406 407 OR ................. 38,600 38,800 16,400 16,400 425 423 PA .................. 63,200 63,200 7,750 7,750 123 123 RI ................... 1,220 1,220 70 70 57 57 SC .................. 27,000 27,000 4,900 4,900 181 181 SD .................. 31,500 31,800 43,700 43,700 1,387 1,374 TN .................. 78,700 78,300 10,900 10,900 139 139 TX .................. 247,500 247,500 130,400 130,400 527 527 UT .................. 16,600 16,600 11,100 11,100 669 669 VT .................. 7,000 7,000 1,220 1,220 174 174 VA .................. 47,000 47,300 8,000 8,050 170 170 WA ................. 39,500 39,500 14,800 14,800 375 375 WV ................. 23,200 23,000 3,700 3,650 159 159 WI .................. 78,000 78,000 15,200 15,200 195 195 WY ................. 11,000 11,000 30,200 30,200 2,745 2,745
US .............. 2,200,010 2,200,930 919,890 919,990 418 418
PR .............. 10,400 10,400 450 450 43 43
1 A farm is any establishment from which $1,000 or more of agricultural products were sold or would normally be sold dur-ing the year. 2 Preliminary.
NASS, Environmental, Economics, and Demographics Branch, (202) 720–6146.
VerDate Aug 31 2005 13:44 Mar 01, 2012 Jkt 000000 PO 00000 Frm 00005 Fmt 1000 Sfmt 1000 H:\SHARED\DAPP\FPU\AGSTAT\MASTER~2\CHAPTR09\IX-05.AG8 USDA
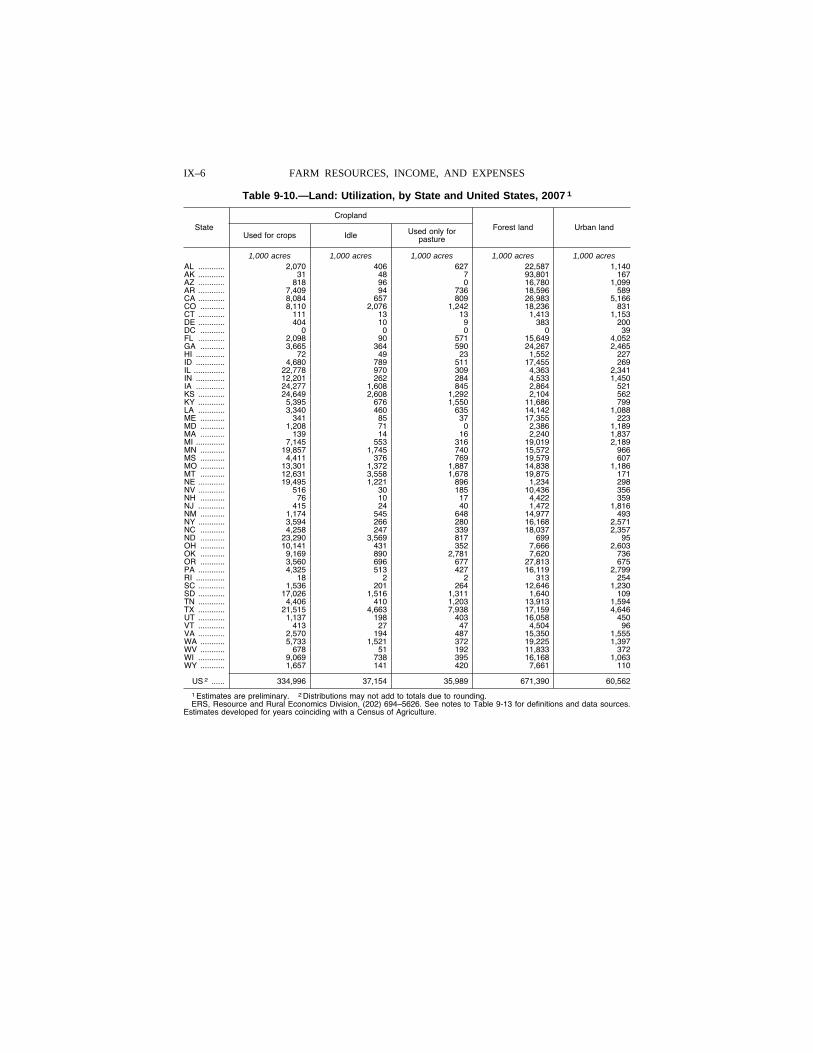
IX–6 FARM RESOURCES, INCOME, AND EXPENSES
Table 9-10.—Land: Utilization, by State and United States, 2007 1
State
Cropland
Forest land Urban land Used for crops Idle Used only for
pasture
1,000 acres 1,000 acres 1,000 acres 1,000 acres 1,000 acres AL ............ 2,070 406 627 22,587 1,140 AK ............ 31 48 7 93,801 167 AZ ............ 818 96 0 16,780 1,099 AR ............ 7,409 94 736 18,596 589 CA ............ 8,084 657 809 26,983 5,166 CO ........... 8,110 2,076 1,242 18,236 831 CT ............ 111 13 13 1,413 1,153 DE ............ 404 10 9 383 200 DC ........... 0 0 0 0 39 FL ............ 2,098 90 571 15,649 4,052 GA ........... 3,665 364 590 24,267 2,465 HI ............. 72 49 23 1,552 227 ID ............. 4,680 789 511 17,455 269 IL .............. 22,778 970 309 4,363 2,341 IN ............. 12,201 262 284 4,533 1,450 IA ............. 24,277 1,608 845 2,864 521 KS ............ 24,649 2,608 1,292 2,104 562 KY ............ 5,395 676 1,550 11,686 799 LA ............ 3,340 460 635 14,142 1,088 ME ........... 341 85 37 17,355 223 MD ........... 1,208 71 0 2,386 1,189 MA ........... 139 14 16 2,240 1,837 MI ............. 7,145 553 316 19,019 2,189 MN ........... 19,857 1,745 740 15,572 966 MS ........... 4,411 376 769 19,579 607 MO ........... 13,301 1,372 1,887 14,838 1,186 MT ........... 12,631 3,558 1,678 19,875 171 NE ............ 19,495 1,221 896 1,234 298 NV ............ 516 30 185 10,436 356 NH ........... 76 10 17 4,422 359 NJ ............ 415 24 40 1,472 1,816 NM ........... 1,174 545 648 14,977 493 NY ............ 3,594 266 280 16,168 2,571 NC ........... 4,258 247 339 18,037 2,357 ND ........... 23,290 3,569 817 699 95 OH ........... 10,141 431 352 7,666 2,603 OK ........... 9,169 890 2,781 7,620 736 OR ........... 3,560 696 677 27,813 675 PA ............ 4,325 513 427 16,119 2,799 RI ............. 18 2 2 313 254 SC ............ 1,536 201 264 12,646 1,230 SD ............ 17,026 1,516 1,311 1,640 109 TN ............ 4,406 410 1,203 13,913 1,594 TX ............ 21,515 4,663 7,938 17,159 4,646 UT ............ 1,137 198 403 16,058 450 VT ............ 413 27 47 4,504 96 VA ............ 2,570 194 487 15,350 1,555 WA ........... 5,733 1,521 372 19,225 1,397 WV ........... 678 51 192 11,833 372 WI ............ 9,069 738 395 16,168 1,063 WY ........... 1,657 141 420 7,661 110
US 2 ...... 334,996 37,154 35,989 671,390 60,562
1 Estimates are preliminary. 2 Distributions may not add to totals due to rounding. ERS, Resource and Rural Economics Division, (202) 694–5626. See notes to Table 9-13 for definitions and data sources.
Estimates developed for years coinciding with a Census of Agriculture.
VerDate Aug 31 2005 13:44 Mar 01, 2012 Jkt 000000 PO 00000 Frm 00006 Fmt 1000 Sfmt 1000 H:\SHARED\DAPP\FPU\AGSTAT\MASTER~2\CHAPTR09\IX-06.AG8 USDA
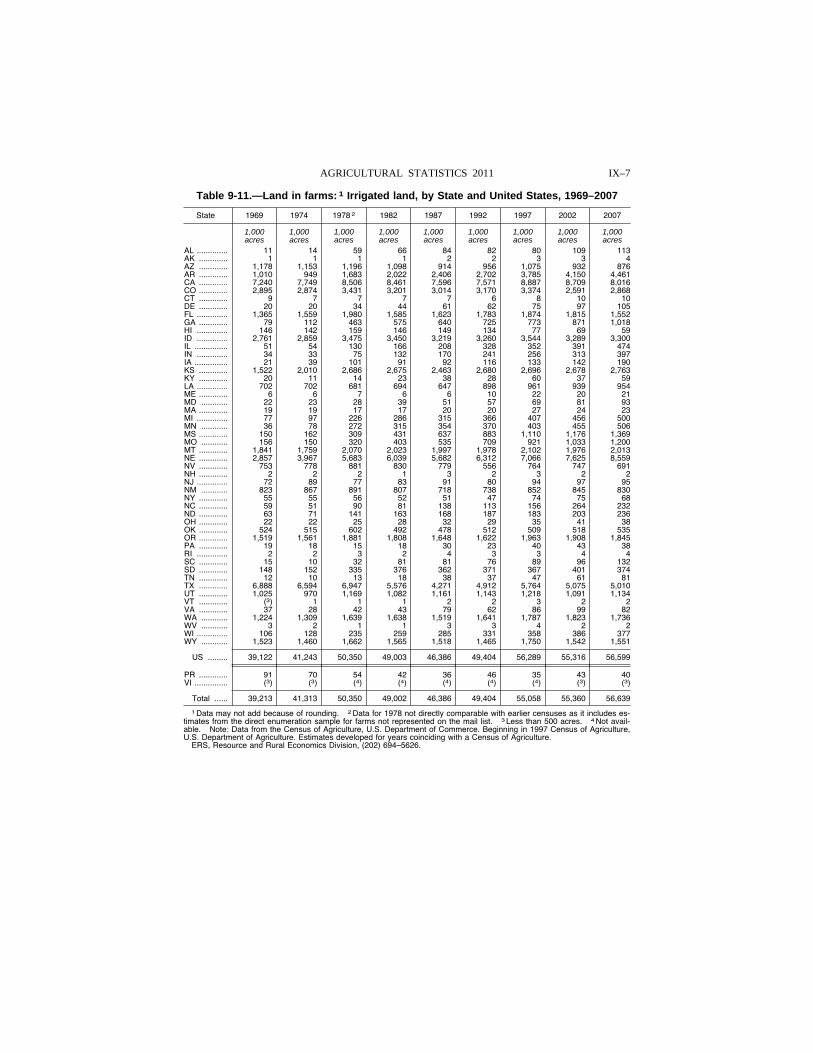
IX–7 AGRICULTURAL STATISTICS 2011
Table 9-11.—Land in farms: 1 Irrigated land, by State and United States, 1969–2007
State 1969 1974 1978 2 1982 1987 1992 1997 2002 2007
1,000 acres
1,000 acres
1,000 acres
1,000 acres
1,000 acres
1,000 acres
1,000 acres
1,000 acres
1,000 acres
AL .............. 11 14 59 66 84 82 80 109 113 AK ............. 1 1 1 1 2 2 3 3 4 AZ ............. 1,178 1,153 1,196 1,098 914 956 1,075 932 876 AR ............. 1,010 949 1,683 2,022 2,406 2,702 3,785 4,150 4,461 CA ............. 7,240 7,749 8,506 8,461 7,596 7,571 8,887 8,709 8,016 CO ............. 2,895 2,874 3,431 3,201 3,014 3,170 3,374 2,591 2,868 CT ............. 9 7 7 7 7 6 8 10 10 DE ............. 20 20 34 44 61 62 75 97 105 FL .............. 1,365 1,559 1,980 1,585 1,623 1,783 1,874 1,815 1,552 GA ............. 79 112 463 575 640 725 773 871 1,018 HI .............. 146 142 159 146 149 134 77 69 59 ID .............. 2,761 2,859 3,475 3,450 3,219 3,260 3,544 3,289 3,300 IL ............... 51 54 130 166 208 328 352 391 474 IN .............. 34 33 75 132 170 241 256 313 397 IA ............... 21 39 101 91 92 116 133 142 190 KS ............. 1,522 2,010 2,686 2,675 2,463 2,680 2,696 2,678 2,763 KY ............. 20 11 14 23 38 28 60 37 59 LA .............. 702 702 681 694 647 898 961 939 954 ME ............. 6 6 7 6 6 10 22 20 21 MD ............ 22 23 28 39 51 57 69 81 93 MA ............. 19 19 17 17 20 20 27 24 23 MI .............. 77 97 226 286 315 366 407 456 500 MN ............ 36 78 272 315 354 370 403 455 506 MS ............. 150 162 309 431 637 883 1,110 1,176 1,369 MO ............ 156 150 320 403 535 709 921 1,033 1,200 MT ............. 1,841 1,759 2,070 2,023 1,997 1,978 2,102 1,976 2,013 NE ............. 2,857 3,967 5,683 6,039 5,682 6,312 7,066 7,625 8,559 NV ............. 753 778 881 830 779 556 764 747 691 NH ............. 2 2 2 1 3 2 3 2 2 NJ .............. 72 89 77 83 91 80 94 97 95 NM ............ 823 867 891 807 718 738 852 845 830 NY ............. 55 55 56 52 51 47 74 75 68 NC ............. 59 51 90 81 138 113 156 264 232 ND ............. 63 71 141 163 168 187 183 203 236 OH ............. 22 22 25 28 32 29 35 41 38 OK ............. 524 515 602 492 478 512 509 518 535 OR ............. 1,519 1,561 1,881 1,808 1,648 1,622 1,963 1,908 1,845 PA ............. 19 18 15 18 30 23 40 43 38 RI .............. 2 2 3 2 4 3 3 4 4 SC ............. 15 10 32 81 81 76 89 96 132 SD ............. 148 152 335 376 362 371 367 401 374 TN ............. 12 10 13 18 38 37 47 61 81 TX ............. 6,888 6,594 6,947 5,576 4,271 4,912 5,764 5,075 5,010 UT ............. 1,025 970 1,169 1,082 1,161 1,143 1,218 1,091 1,134 VT ............. (3) 1 1 1 2 2 3 2 2 VA ............. 37 28 42 43 79 62 86 99 82 WA ............ 1,224 1,309 1,639 1,638 1,519 1,641 1,787 1,823 1,736 WV ............ 3 2 1 1 3 3 4 2 2 WI .............. 106 128 235 259 285 331 358 386 377 WY ............ 1,523 1,460 1,662 1,565 1,518 1,465 1,750 1,542 1,551
US ......... 39,122 41,243 50,350 49,003 46,386 49,404 56,289 55,316 56,599
PR ............. 91 70 54 42 36 46 35 43 40 VI ............... (3) (3) (4) (4) (4) (4) (4) (3) (3)
Total ...... 39,213 41,313 50,350 49,002 46,386 49,404 55,058 55,360 56,639
1 Data may not add because of rounding. 2 Data for 1978 not directly comparable with earlier censuses as it includes es-timates from the direct enumeration sample for farms not represented on the mail list. 3 Less than 500 acres. 4 Not avail-able. Note: Data from the Census of Agriculture, U.S. Department of Commerce. Beginning in 1997 Census of Agriculture, U.S. Department of Agriculture. Estimates developed for years coinciding with a Census of Agriculture.
ERS, Resource and Rural Economics Division, (202) 694–5626.
VerDate Aug 31 2005 13:44 Mar 01, 2012 Jkt 000000 PO 00000 Frm 00007 Fmt 1000 Sfmt 1000 H:\SHARED\DAPP\FPU\AGSTAT\MASTER~2\CHAPTR09\IX-07.AG8 USDA
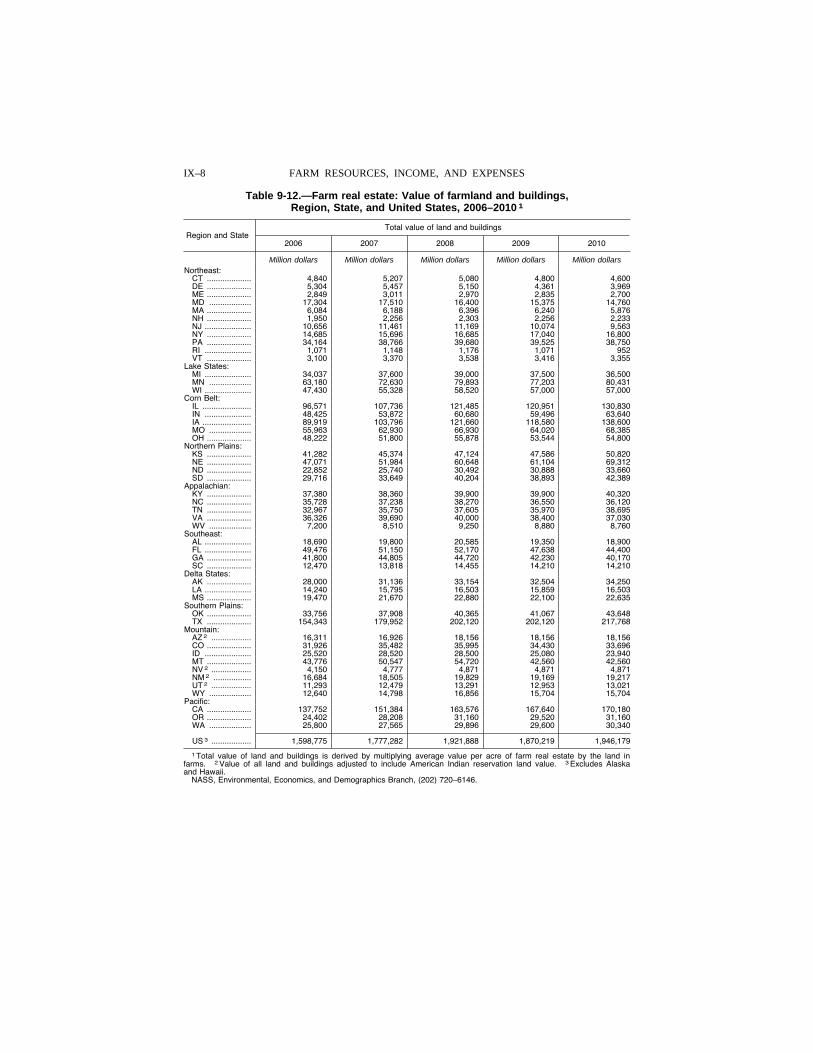
IX–8 FARM RESOURCES, INCOME, AND EXPENSES
Table 9-12.—Farm real estate: Value of farmland and buildings, Region, State, and United States, 2006–2010 1
Region and State Total value of land and buildings
2006 2007 2008 2009 2010
Million dollars Million dollars Million dollars Million dollars Million dollars Northeast:
CT .................... 4,840 5,207 5,080 4,800 4,600 DE .................... 5,304 5,457 5,150 4,361 3,969 ME .................... 2,849 3,011 2,970 2,835 2,700 MD ................... 17,304 17,510 16,400 15,375 14,760 MA .................... 6,084 6,188 6,396 6,240 5,876 NH .................... 1,950 2,256 2,303 2,256 2,233 NJ ..................... 10,656 11,461 11,169 10,074 9,563 NY .................... 14,685 15,696 16,685 17,040 16,800 PA .................... 34,164 38,766 39,680 39,525 38,750 RI ..................... 1,071 1,148 1,176 1,071 952 VT .................... 3,100 3,370 3,538 3,416 3,355
Lake States: MI ..................... 34,037 37,600 39,000 37,500 36,500 MN ................... 63,180 72,630 79,893 77,203 80,431 WI ..................... 47,430 55,328 58,520 57,000 57,000
Corn Belt: IL ...................... 96,571 107,736 121,485 120,951 130,830 IN ..................... 48,425 53,872 60,680 59,496 63,640 IA ...................... 89,919 103,796 121,660 118,580 138,600 MO ................... 55,963 62,930 66,930 64,020 68,385 OH .................... 48,222 51,800 55,878 53,544 54,800
Northern Plains: KS .................... 41,282 45,374 47,124 47,586 50,820 NE .................... 47,071 51,984 60,648 61,104 69,312 ND .................... 22,852 25,740 30,492 30,888 33,660 SD .................... 29,716 33,649 40,204 38,893 42,389
Appalachian: KY .................... 37,380 38,360 39,900 39,900 40,320 NC .................... 35,728 37,238 38,270 36,550 36,120 TN .................... 32,967 35,750 37,605 35,970 38,695 VA .................... 36,326 39,690 40,000 38,400 37,030 WV ................... 7,200 8,510 9,250 8,880 8,760
Southeast: AL ..................... 18,690 19,800 20,585 19,350 18,900 FL ..................... 49,476 51,150 52,170 47,638 44,400 GA .................... 41,800 44,805 44,720 42,230 40,170 SC .................... 12,470 13,818 14,455 14,210 14,210
Delta States: AK .................... 28,000 31,136 33,154 32,504 34,250 LA ..................... 14,240 15,795 16,503 15,859 16,503 MS .................... 19,470 21,670 22,880 22,100 22,635
Southern Plains: OK .................... 33,756 37,908 40,365 41,067 43,648 TX .................... 154,343 179,952 202,120 202,120 217,768
Mountain: AZ 2 .................. 16,311 16,926 18,156 18,156 18,156 CO .................... 31,926 35,482 35,995 34,430 33,696 ID ..................... 25,520 28,520 28,500 25,080 23,940 MT .................... 43,776 50,547 54,720 42,560 42,560 NV 2 .................. 4,150 4,777 4,871 4,871 4,871 NM 2 ................. 16,684 18,505 19,829 19,169 19,217 UT 2 .................. 11,293 12,479 13,291 12,953 13,021 WY ................... 12,640 14,798 16,856 15,704 15,704
Pacific: CA .................... 137,752 151,384 163,576 167,640 170,180 OR .................... 24,402 28,208 31,160 29,520 31,160 WA ................... 25,800 27,565 29,896 29,600 30,340
US 3 .................. 1,598,775 1,777,282 1,921,888 1,870,219 1,946,179
1 Total value of land and buildings is derived by multiplying average value per acre of farm real estate by the land in farms. 2 Value of all land and buildings adjusted to include American Indian reservation land value. 3 Excludes Alaska and Hawaii.
NASS, Environmental, Economics, and Demographics Branch, (202) 720–6146.
VerDate Aug 31 2005 13:44 Mar 01, 2012 Jkt 000000 PO 00000 Frm 00008 Fmt 1000 Sfmt 1000 H:\SHARED\DAPP\FPU\AGSTAT\MASTER~2\CHAPTR09\IX-08.AG8 USDA
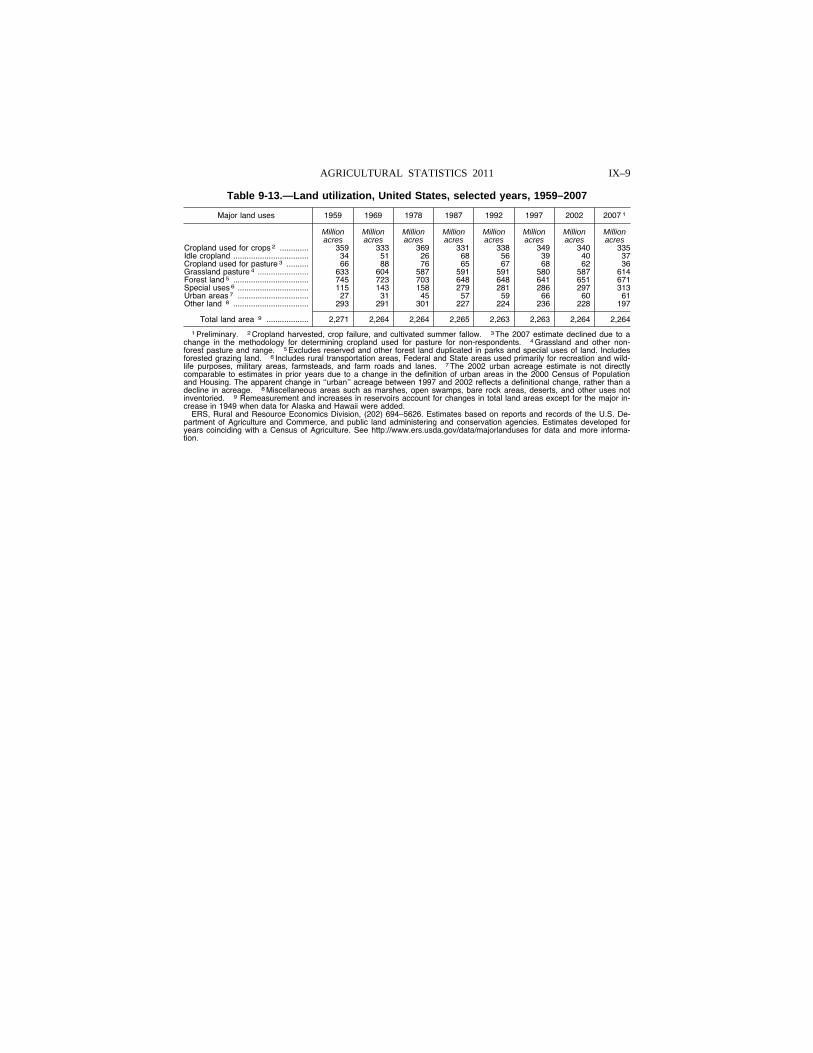
IX–9 AGRICULTURAL STATISTICS 2011
Table 9-13.—Land utilization, United States, selected years, 1959–2007
Major land uses 1959 1969 1978 1987 1992 1997 2002 2007 1
Million Million Million Million Million Million Million Million acres acres acres acres acres acres acres acres
Cropland used for crops 2 ............. 359 333 369 331 338 349 340 335 Idle cropland .................................. 34 51 26 68 56 39 40 37 Cropland used for pasture 3 .......... 66 88 76 65 67 68 62 36 Grassland pasture 4 ....................... 633 604 587 591 591 580 587 614 Forest land 5 .................................. 745 723 703 648 648 641 651 671 Special uses 6 ................................ 115 143 158 279 281 286 297 313 Urban areas 7 ................................ 27 31 45 57 59 66 60 61 Other land 8 .................................. 293 291 301 227 224 236 228 197
Total land area 9 ................... 2,271 2,264 2,264 2,265 2,263 2,263 2,264 2,264
1 Preliminary. 2 Cropland harvested, crop failure, and cultivated summer fallow. 3 The 2007 estimate declined due to a change in the methodology for determining cropland used for pasture for non-respondents. 4 Grassland and other non-forest pasture and range. 5 Excludes reserved and other forest land duplicated in parks and special uses of land. Includes forested grazing land. 6 Includes rural transportation areas, Federal and State areas used primarily for recreation and wild-life purposes, military areas, farmsteads, and farm roads and lanes. 7 The 2002 urban acreage estimate is not directly comparable to estimates in prior years due to a change in the definition of urban areas in the 2000 Census of Population and Housing. The apparent change in ‘‘urban’’ acreage between 1997 and 2002 reflects a definitional change, rather than a decline in acreage. 8 Miscellaneous areas such as marshes, open swamps, bare rock areas, deserts, and other uses not inventoried. 9 Remeasurement and increases in reservoirs account for changes in total land areas except for the major in-crease in 1949 when data for Alaska and Hawaii were added.
ERS, Rural and Resource Economics Division, (202) 694–5626. Estimates based on reports and records of the U.S. De-partment of Agriculture and Commerce, and public land administering and conservation agencies. Estimates developed for years coinciding with a Census of Agriculture. See http://www.ers.usda.gov/data/majorlanduses for data and more informa-tion.
VerDate Aug 31 2005 13:44 Mar 01, 2012 Jkt 000000 PO 00000 Frm 00009 Fmt 1000 Sfmt 1000 H:\SHARED\DAPP\FPU\AGSTAT\MASTER~2\CHAPTR09\IX-09.AG8 USDA
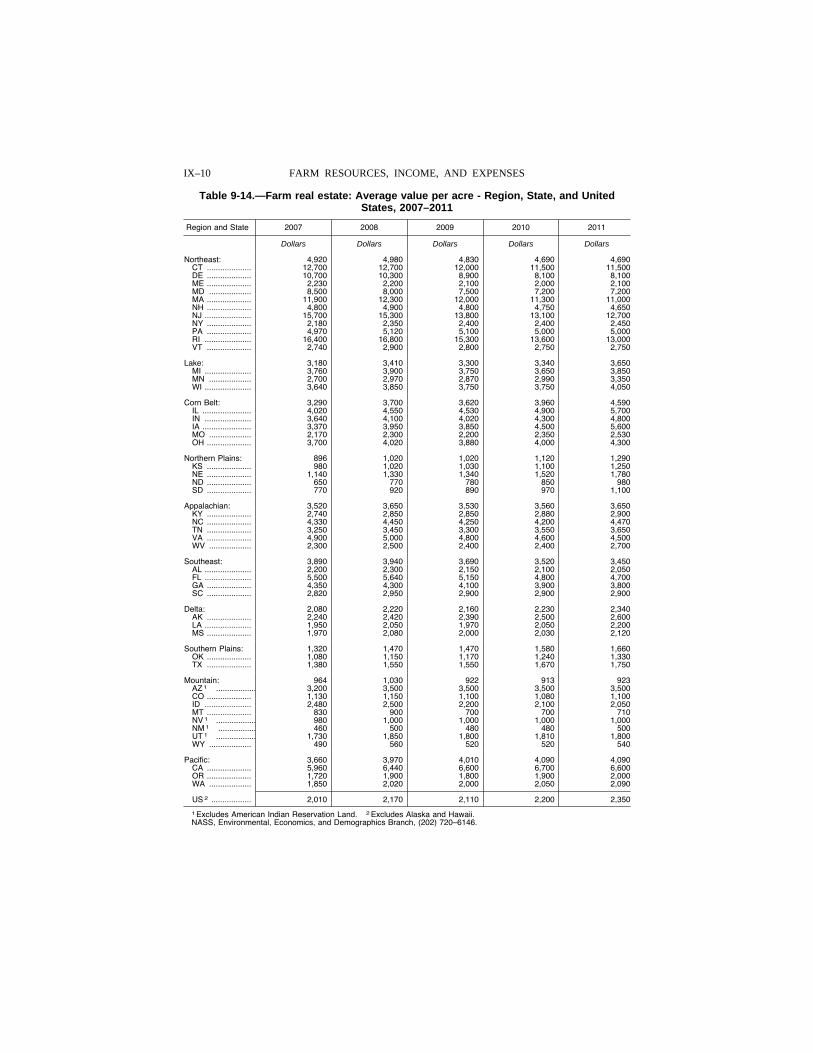
IX–10 FARM RESOURCES, INCOME, AND EXPENSES
Table 9-14.—Farm real estate: Average value per acre - Region, State, and United States, 2007–2011
Region and State 2007 2008 2009 2010 2011
Dollars Dollars Dollars Dollars Dollars
Northeast: 4,920 4,980 4,830 4,690 4,690 CT .................... 12,700 12,700 12,000 11,500 11,500 DE .................... 10,700 10,300 8,900 8,100 8,100 ME .................... 2,230 2,200 2,100 2,000 2,100 MD ................... 8,500 8,000 7,500 7,200 7,200 MA .................... 11,900 12,300 12,000 11,300 11,000 NH .................... 4,800 4,900 4,800 4,750 4,650 NJ ..................... 15,700 15,300 13,800 13,100 12,700 NY .................... 2,180 2,350 2,400 2,400 2,450 PA .................... 4,970 5,120 5,100 5,000 5,000 RI ..................... 16,400 16,800 15,300 13,600 13,000 VT .................... 2,740 2,900 2,800 2,750 2,750
Lake: 3,180 3,410 3,300 3,340 3,650 MI ..................... 3,760 3,900 3,750 3,650 3,850 MN ................... 2,700 2,970 2,870 2,990 3,350 WI ..................... 3,640 3,850 3,750 3,750 4,050
Corn Belt: 3,290 3,700 3,620 3,960 4,590 IL ...................... 4,020 4,550 4,530 4,900 5,700 IN ..................... 3,640 4,100 4,020 4,300 4,800 IA ...................... 3,370 3,950 3,850 4,500 5,600 MO ................... 2,170 2,300 2,200 2,350 2,530 OH .................... 3,700 4,020 3,880 4,000 4,300
Northern Plains: 896 1,020 1,020 1,120 1,290 KS .................... 980 1,020 1,030 1,100 1,250 NE .................... 1,140 1,330 1,340 1,520 1,780 ND .................... 650 770 780 850 980 SD .................... 770 920 890 970 1,100
Appalachian: 3,520 3,650 3,530 3,560 3,650 KY .................... 2,740 2,850 2,850 2,880 2,900 NC .................... 4,330 4,450 4,250 4,200 4,470 TN .................... 3,250 3,450 3,300 3,550 3,650 VA .................... 4,900 5,000 4,800 4,600 4,500 WV ................... 2,300 2,500 2,400 2,400 2,700
Southeast: 3,890 3,940 3,690 3,520 3,450 AL ..................... 2,200 2,300 2,150 2,100 2,050 FL ..................... 5,500 5,640 5,150 4,800 4,700 GA .................... 4,350 4,300 4,100 3,900 3,800 SC .................... 2,820 2,950 2,900 2,900 2,900
Delta: 2,080 2,220 2,160 2,230 2,340 AK .................... 2,240 2,420 2,390 2,500 2,600 LA ..................... 1,950 2,050 1,970 2,050 2,200 MS .................... 1,970 2,080 2,000 2,030 2,120
Southern Plains: 1,320 1,470 1,470 1,580 1,660 OK .................... 1,080 1,150 1,170 1,240 1,330 TX .................... 1,380 1,550 1,550 1,670 1,750
Mountain: 964 1,030 922 913 923 AZ 1 .................. 3,200 3,500 3,500 3,500 3,500 CO .................... 1,130 1,150 1,100 1,080 1,100 ID ..................... 2,480 2,500 2,200 2,100 2,050 MT .................... 830 900 700 700 710 NV 1 .................. 980 1,000 1,000 1,000 1,000 NM 1 ................. 460 500 480 480 500 UT 1 .................. 1,730 1,850 1,800 1,810 1,800 WY ................... 490 560 520 520 540
Pacific: 3,660 3,970 4,010 4,090 4,090 CA .................... 5,960 6,440 6,600 6,700 6,600 OR .................... 1,720 1,900 1,800 1,900 2,000 WA ................... 1,850 2,020 2,000 2,050 2,090
US 2 .................. 2,010 2,170 2,110 2,200 2,350
1 Excludes American Indian Reservation Land. 2 Excludes Alaska and Hawaii. NASS, Environmental, Economics, and Demographics Branch, (202) 720–6146.
VerDate Aug 31 2005 13:44 Mar 01, 2012 Jkt 000000 PO 00000 Frm 00010 Fmt 1000 Sfmt 1000 H:\SHARED\DAPP\FPU\AGSTAT\MASTER~2\CHAPTR09\IX-09_~1.AG8 USDA
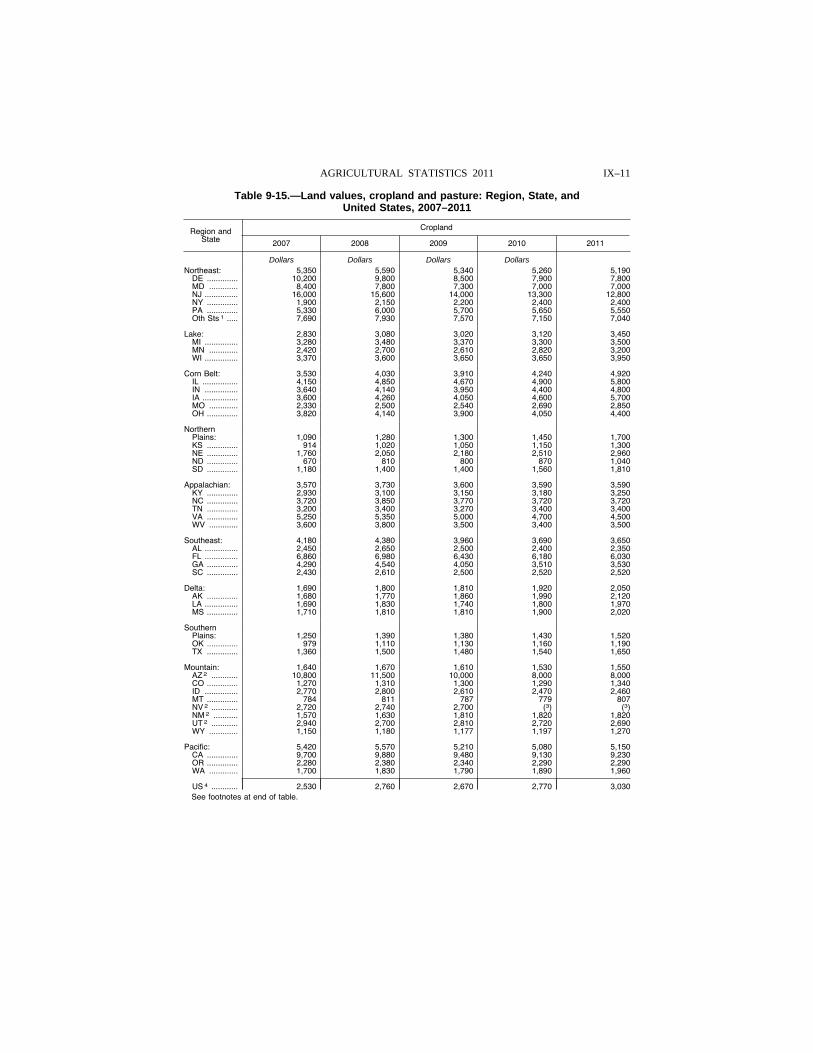
IX–11 AGRICULTURAL STATISTICS 2011
Table 9-15.—Land values, cropland and pasture: Region, State, and United States, 2007–2011
Region and State
Cropland
2007 2008 2009 2010 2011
Dollars Dollars Dollars Dollars Northeast: 5,350 5,590 5,340 5,260 5,190
DE .............. 10,200 9,800 8,500 7,900 7,800 MD ............. 8,400 7,800 7,300 7,000 7,000 NJ ............... 16,000 15,600 14,000 13,300 12,800 NY .............. 1,900 2,150 2,200 2,400 2,400 PA .............. 5,330 6,000 5,700 5,650 5,550 Oth Sts 1 ..... 7,690 7,930 7,570 7,150 7,040
Lake: 2,830 3,080 3,020 3,120 3,450 MI ............... 3,280 3,480 3,370 3,300 3,500 MN ............. 2,420 2,700 2,610 2,820 3,200 WI ............... 3,370 3,600 3,650 3,650 3,950
Corn Belt: 3,530 4,030 3,910 4,240 4,920 IL ................ 4,150 4,850 4,670 4,900 5,800 IN ............... 3,640 4,140 3,950 4,400 4,800 IA ................ 3,600 4,260 4,050 4,600 5,700 MO ............. 2,330 2,500 2,540 2,690 2,850 OH .............. 3,820 4,140 3,900 4,050 4,400
Northern Plains: 1,090 1,280 1,300 1,450 1,700 KS .............. 914 1,020 1,050 1,150 1,300 NE .............. 1,760 2,050 2,180 2,510 2,960 ND .............. 670 810 800 870 1,040 SD .............. 1,180 1,400 1,400 1,560 1,810
Appalachian: 3,570 3,730 3,600 3,590 3,590 KY .............. 2,930 3,100 3,150 3,180 3,250 NC .............. 3,720 3,850 3,770 3,720 3,720 TN .............. 3,200 3,400 3,270 3,400 3,400 VA .............. 5,250 5,350 5,000 4,700 4,500 WV ............. 3,600 3,800 3,500 3,400 3,500
Southeast: 4,180 4,380 3,960 3,690 3,650 AL ............... 2,450 2,650 2,500 2,400 2,350 FL ............... 6,860 6,980 6,430 6,180 6,030 GA .............. 4,290 4,540 4,050 3,510 3,530 SC .............. 2,430 2,610 2,500 2,520 2,520
Delta: 1,690 1,800 1,810 1,920 2,050 AK .............. 1,680 1,770 1,860 1,990 2,120 LA ............... 1,690 1,830 1,740 1,800 1,970 MS .............. 1,710 1,810 1,810 1,900 2,020
Southern Plains: 1,250 1,390 1,380 1,430 1,520 OK .............. 979 1,110 1,130 1,160 1,190 TX .............. 1,360 1,500 1,480 1,540 1,650
Mountain: 1,640 1,670 1,610 1,530 1,550 AZ 2 ............ 10,800 11,500 10,000 8,000 8,000 CO .............. 1,270 1,310 1,300 1,290 1,340 ID ............... 2,770 2,800 2,610 2,470 2,460 MT .............. 784 811 787 779 807 NV 2 ............ 2,720 2,740 2,700 (3) (3) NM 2 ........... 1,570 1,630 1,810 1,820 1,820 UT 2 ............ 2,940 2,700 2,810 2,720 2,690 WY ............. 1,150 1,180 1,177 1,197 1,270
Pacific: 5,420 5,570 5,210 5,080 5,150 CA .............. 9,700 9,880 9,480 9,130 9,230 OR .............. 2,280 2,380 2,340 2,290 2,290 WA ............. 1,700 1,830 1,790 1,890 1,960
US 4 ............ 2,530 2,760 2,670 2,770 3,030 See footnotes at end of table.
VerDate Aug 31 2005 13:44 Mar 01, 2012 Jkt 000000 PO 00000 Frm 00011 Fmt 1000 Sfmt 1000 H:\SHARED\DAPP\FPU\AGSTAT\MASTER~2\CHAPTR09\IX-10.AG8 USDA
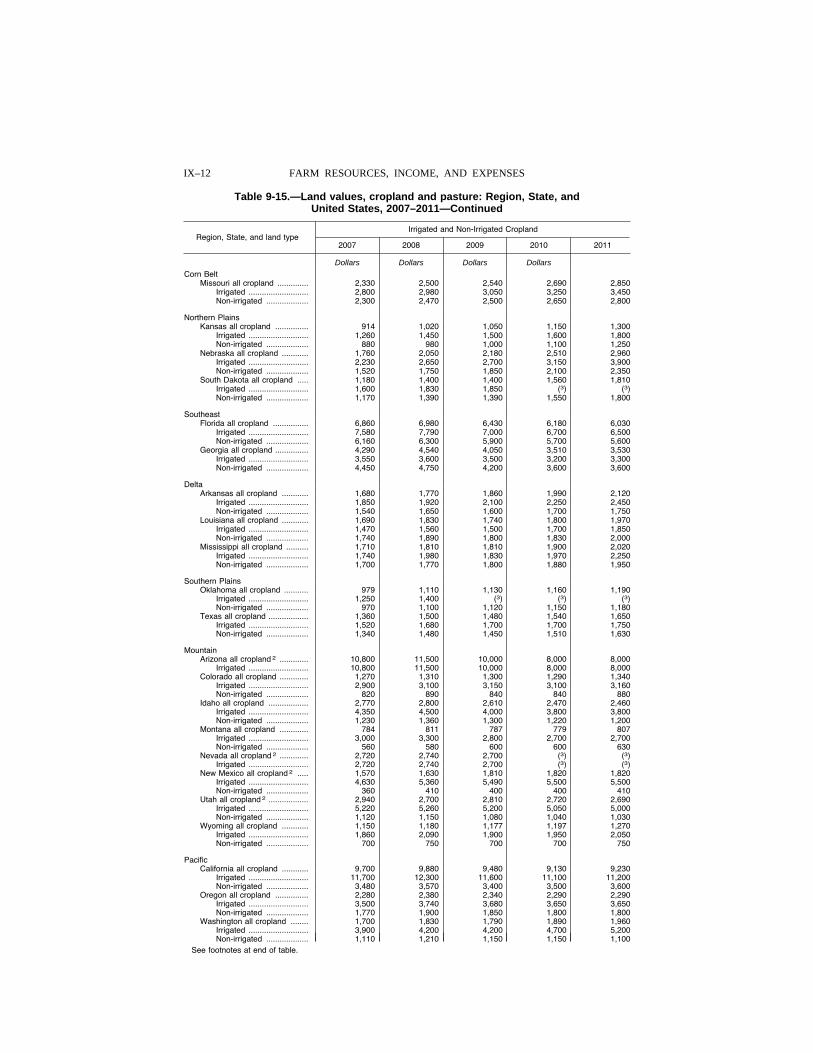
IX–12 FARM RESOURCES, INCOME, AND EXPENSES
Table 9-15.—Land values, cropland and pasture: Region, State, and United States, 2007–2011—Continued
Region, State, and land type Irrigated and Non-Irrigated Cropland
2007 2008 2009 2010 2011
Dollars Dollars Dollars Dollars
Corn Belt Missouri all cropland .............. 2,330 2,500 2,540 2,690 2,850
Irrigated ........................... 2,800 2,980 3,050 3,250 3,450 Non-irrigated ................... 2,300 2,470 2,500 2,650 2,800
Northern Plains Kansas all cropland ............... 914 1,020 1,050 1,150 1,300
Irrigated ........................... 1,260 1,450 1,500 1,600 1,800 Non-irrigated ................... 880 980 1,000 1,100 1,250
Nebraska all cropland ............ 1,760 2,050 2,180 2,510 2,960 Irrigated ........................... 2,230 2,650 2,700 3,150 3,900 Non-irrigated ................... 1,520 1,750 1,850 2,100 2,350
South Dakota all cropland ..... 1,180 1,400 1,400 1,560 1,810 Irrigated ........................... 1,600 1,830 1,850 (3) (3) Non-irrigated ................... 1,170 1,390 1,390 1,550 1,800
Southeast Florida all cropland ................ 6,860 6,980 6,430 6,180 6,030
Irrigated ........................... 7,580 7,790 7,000 6,700 6,500 Non-irrigated ................... 6,160 6,300 5,900 5,700 5,600
Georgia all cropland ............... 4,290 4,540 4,050 3,510 3,530 Irrigated ........................... 3,550 3,600 3,500 3,200 3,300 Non-irrigated ................... 4,450 4,750 4,200 3,600 3,600
Delta Arkansas all cropland ............ 1,680 1,770 1,860 1,990 2,120
Irrigated ........................... 1,850 1,920 2,100 2,250 2,450 Non-irrigated ................... 1,540 1,650 1,600 1,700 1,750
Louisiana all cropland ............ 1,690 1,830 1,740 1,800 1,970 Irrigated ........................... 1,470 1,560 1,500 1,700 1,850 Non-irrigated ................... 1,740 1,890 1,800 1,830 2,000
Mississippi all cropland .......... 1,710 1,810 1,810 1,900 2,020 Irrigated ........................... 1,740 1,980 1,830 1,970 2,250 Non-irrigated ................... 1,700 1,770 1,800 1,880 1,950
Southern Plains Oklahoma all cropland ........... 979 1,110 1,130 1,160 1,190
Irrigated ........................... 1,250 1,400 (3) (3) (3) Non-irrigated ................... 970 1,100 1,120 1,150 1,180
Texas all cropland .................. 1,360 1,500 1,480 1,540 1,650 Irrigated ........................... 1,520 1,680 1,700 1,700 1,750 Non-irrigated ................... 1,340 1,480 1,450 1,510 1,630
Mountain Arizona all cropland 2 ............. 10,800 11,500 10,000 8,000 8,000
Irrigated ........................... 10,800 11,500 10,000 8,000 8,000 Colorado all cropland ............. 1,270 1,310 1,300 1,290 1,340
Irrigated ........................... 2,900 3,100 3,150 3,100 3,160 Non-irrigated ................... 820 890 840 840 880
Idaho all cropland .................. 2,770 2,800 2,610 2,470 2,460 Irrigated ........................... 4,350 4,500 4,000 3,800 3,800 Non-irrigated ................... 1,230 1,360 1,300 1,220 1,200
Montana all cropland ............. 784 811 787 779 807 Irrigated ........................... 3,000 3,300 2,800 2,700 2,700 Non-irrigated ................... 560 580 600 600 630
Nevada all cropland 2 ............. 2,720 2,740 2,700 (3) (3) Irrigated ........................... 2,720 2,740 2,700 (3) (3)
New Mexico all cropland 2 ..... 1,570 1,630 1,810 1,820 1,820 Irrigated ........................... 4,630 5,360 5,490 5,500 5,500 Non-irrigated ................... 360 410 400 400 410
Utah all cropland 2 .................. 2,940 2,700 2,810 2,720 2,690 Irrigated ........................... 5,220 5,260 5,200 5,050 5,000 Non-irrigated ................... 1,120 1,150 1,080 1,040 1,030
Wyoming all cropland ............ 1,150 1,180 1,177 1,197 1,270 Irrigated ........................... 1,860 2,090 1,900 1,950 2,050 Non-irrigated ................... 700 750 700 700 750
Pacific California all cropland ............ 9,700 9,880 9,480 9,130 9,230
Irrigated ........................... 11,700 12,300 11,600 11,100 11,200 Non-irrigated ................... 3,480 3,570 3,400 3,500 3,600
Oregon all cropland ............... 2,280 2,380 2,340 2,290 2,290 Irrigated ........................... 3,500 3,740 3,680 3,650 3,650 Non-irrigated ................... 1,770 1,900 1,850 1,800 1,800
Washington all cropland ........ 1,700 1,830 1,790 1,890 1,960 Irrigated ........................... 3,900 4,200 4,200 4,700 5,200 Non-irrigated ................... 1,110 1,210 1,150 1,150 1,100
See footnotes at end of table.
VerDate Aug 31 2005 13:44 Mar 01, 2012 Jkt 000000 PO 00000 Frm 00012 Fmt 1000 Sfmt 1000 H:\SHARED\DAPP\FPU\AGSTAT\MASTER~2\CHAPTR09\IX-10B.AG8 USDA
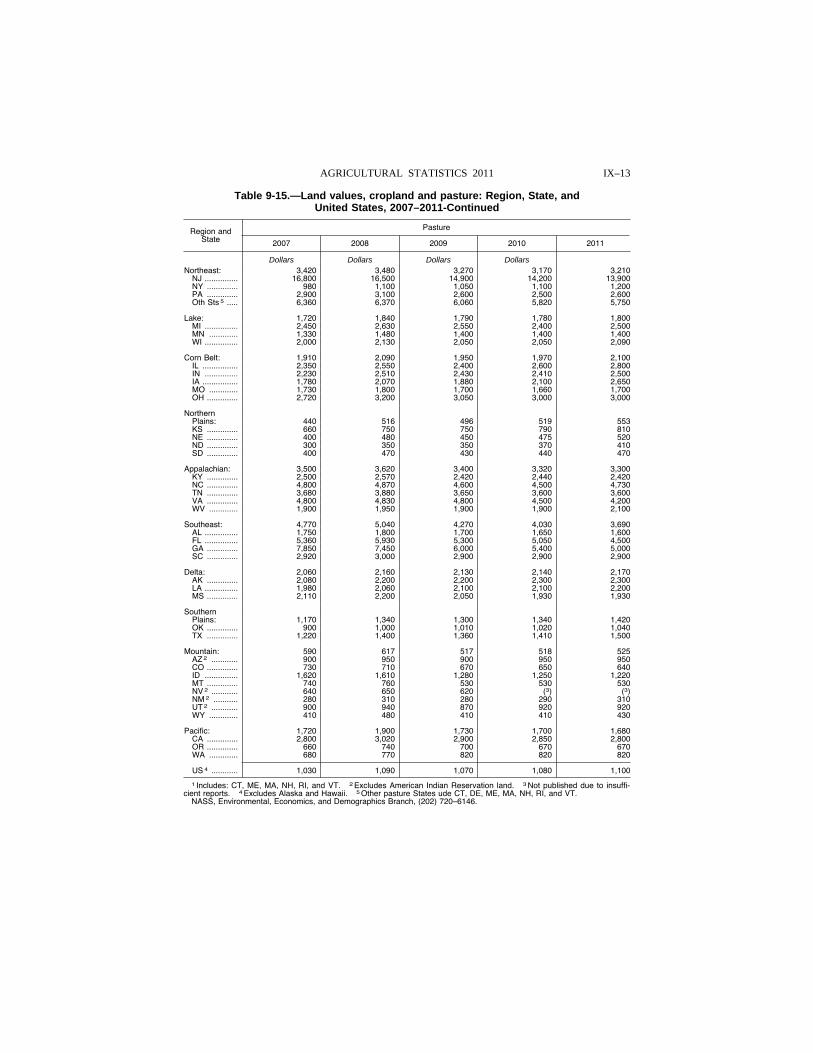
IX–13 AGRICULTURAL STATISTICS 2011
Table 9-15.—Land values, cropland and pasture: Region, State, and United States, 2007–2011-Continued
Region and State
Pasture
2007 2008 2009 2010 2011
Dollars Dollars Dollars Dollars Northeast: 3,420 3,480 3,270 3,170 3,210
NJ ............... 16,800 16,500 14,900 14,200 13,900 NY .............. 980 1,100 1,050 1,100 1,200 PA .............. 2,900 3,100 2,600 2,500 2,600 Oth Sts 5 ..... 6,360 6,370 6,060 5,820 5,750
Lake: 1,720 1,840 1,790 1,780 1,800 MI ............... 2,450 2,630 2,550 2,400 2,500 MN ............. 1,330 1,480 1,400 1,400 1,400 WI ............... 2,000 2,130 2,050 2,050 2,090
Corn Belt: 1,910 2,090 1,950 1,970 2,100 IL ................ 2,350 2,550 2,400 2,600 2,800 IN ............... 2,230 2,510 2,430 2,410 2,500 IA ................ 1,780 2,070 1,880 2,100 2,650 MO ............. 1,730 1,800 1,700 1,660 1,700 OH .............. 2,720 3,200 3,050 3,000 3,000
Northern Plains: 440 516 496 519 553 KS .............. 660 750 750 790 810 NE .............. 400 480 450 475 520 ND .............. 300 350 350 370 410 SD .............. 400 470 430 440 470
Appalachian: 3,500 3,620 3,400 3,320 3,300 KY .............. 2,500 2,570 2,420 2,440 2,420 NC .............. 4,800 4,870 4,600 4,500 4,730 TN .............. 3,680 3,880 3,650 3,600 3,600 VA .............. 4,800 4,830 4,800 4,500 4,200 WV ............. 1,900 1,950 1,900 1,900 2,100
Southeast: 4,770 5,040 4,270 4,030 3,690 AL ............... 1,750 1,800 1,700 1,650 1,600 FL ............... 5,360 5,930 5,300 5,050 4,500 GA .............. 7,850 7,450 6,000 5,400 5,000 SC .............. 2,920 3,000 2,900 2,900 2,900
Delta: 2,060 2,160 2,130 2,140 2,170 AK .............. 2,080 2,200 2,200 2,300 2,300 LA ............... 1,980 2,060 2,100 2,100 2,200 MS .............. 2,110 2,200 2,050 1,930 1,930
Southern Plains: 1,170 1,340 1,300 1,340 1,420 OK .............. 900 1,000 1,010 1,020 1,040 TX .............. 1,220 1,400 1,360 1,410 1,500
Mountain: 590 617 517 518 525 AZ 2 ............ 900 950 900 950 950 CO .............. 730 710 670 650 640 ID ............... 1,620 1,610 1,280 1,250 1,220 MT .............. 740 760 530 530 530 NV 2 ............ 640 650 620 (3) (3) NM 2 ........... 280 310 280 290 310 UT 2 ............ 900 940 870 920 920 WY ............. 410 480 410 410 430
Pacific: 1,720 1,900 1,730 1,700 1,680 CA .............. 2,800 3,020 2,900 2,850 2,800 OR .............. 660 740 700 670 670 WA ............. 680 770 820 820 820
US 4 ............ 1,030 1,090 1,070 1,080 1,100
1 Includes: CT, ME, MA, NH, RI, and VT. 2 Excludes American Indian Reservation land. 3 Not published due to insuffi-cient reports. 4 Excludes Alaska and Hawaii. 5 Other pasture States ude CT, DE, ME, MA, NH, RI, and VT.
NASS, Environmental, Economics, and Demographics Branch, (202) 720–6146.
VerDate Aug 31 2005 13:44 Mar 01, 2012 Jkt 000000 PO 00000 Frm 00013 Fmt 1000 Sfmt 1000 H:\SHARED\DAPP\FPU\AGSTAT\MASTER~2\CHAPTR09\IX-10C.AG8 USDA
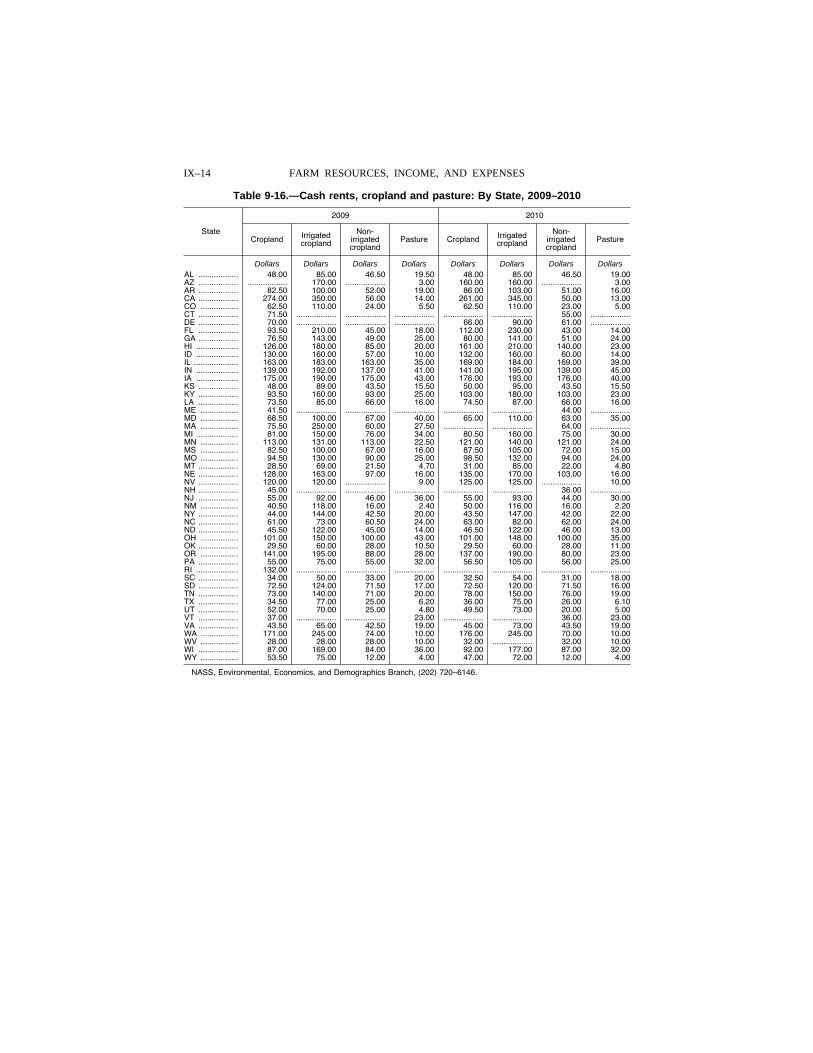
IX–14 FARM RESOURCES, INCOME, AND EXPENSES
Table 9-16.—Cash rents, cropland and pasture: By State, 2009–2010
State
2009 2010
Cropland Irrigated cropland
Non- irrigated cropland
Pasture Cropland Irrigated cropland
Non- irrigated cropland
Pasture
Dollars Dollars Dollars Dollars Dollars Dollars Dollars Dollars AL .................. 48.00 85.00 46.50 19.50 48.00 85.00 46.50 19.00 AZ .................. .................. 170.00 .................. 3.00 160.00 160.00 .................. 3.00 AR .................. 82.50 100.00 52.00 19.00 86.00 103.00 51.00 16.00 CA .................. 274.00 350.00 56.00 14.00 261.00 345.00 50.00 13.00 CO ................. 62.50 110.00 24.00 5.50 62.50 110.00 23.00 5.00 CT .................. 71.50 .................. .................. .................. .................. .................. 55.00 ..................DE .................. 70.00 .................. .................. .................. 66.00 90.00 61.00 ..................FL .................. 93.50 210.00 45.00 18.00 112.00 230.00 43.00 14.00 GA .................. 76.50 143.00 49.00 25.00 80.00 141.00 51.00 24.00 HI ................... 126.00 180.00 85.00 20.00 161.00 210.00 140.00 23.00 ID ................... 130.00 160.00 57.00 10.00 132.00 160.00 60.00 14.00 IL .................... 163.00 183.00 163.00 35.00 169.00 184.00 169.00 39.00 IN ................... 139.00 192.00 137.00 41.00 141.00 195.00 139.00 45.00 IA ................... 175.00 190.00 175.00 43.00 176.00 193.00 176.00 40.00 KS .................. 48.00 89.00 43.50 15.50 50.00 95.00 43.50 15.50 KY .................. 93.50 160.00 93.00 25.00 103.00 180.00 103.00 23.00 LA .................. 73.50 85.00 66.00 16.00 74.50 87.00 66.00 16.00 ME ................. 41.50 .................. .................. .................. .................. .................. 44.00 ..................MD ................. 68.50 100.00 67.00 40.00 65.00 110.00 63.00 35.00 MA ................. 75.50 250.00 60.00 27.50 .................. .................. 64.00 ..................MI ................... 81.00 150.00 76.00 34.00 80.50 160.00 75.00 30.00 MN ................. 113.00 131.00 113.00 22.50 121.00 140.00 121.00 24.00 MS ................. 82.50 100.00 67.00 16.00 87.50 105.00 72.00 15.00 MO ................. 94.50 130.00 90.00 25.00 98.50 132.00 94.00 24.00 MT .................. 28.50 69.00 21.50 4.70 31.00 85.00 22.00 4.80 NE .................. 128.00 163.00 97.00 16.00 135.00 170.00 103.00 16.00 NV .................. 120.00 120.00 .................. 9.00 125.00 125.00 .................. 10.00 NH .................. 45.00 .................. .................. .................. .................. .................. 36.00 ..................NJ .................. 55.00 92.00 46.00 36.00 55.00 93.00 44.00 30.00 NM ................. 40.50 118.00 16.00 2.40 50.00 116.00 16.00 2.20 NY .................. 44.00 144.00 42.50 20.00 43.50 147.00 42.00 22.00 NC .................. 61.00 73.00 60.50 24.00 63.00 82.00 62.00 24.00 ND .................. 45.50 122.00 45.00 14.00 46.50 122.00 46.00 13.00 OH ................. 101.00 150.00 100.00 43.00 101.00 148.00 100.00 35.00 OK .................. 29.50 60.00 28.00 10.50 29.50 60.00 28.00 11.00 OR ................. 141.00 195.00 88.00 28.00 137.00 190.00 80.00 23.00 PA .................. 55.00 75.00 55.00 32.00 56.50 105.00 56.00 25.00 RI ................... 132.00 .................. .................. .................. .................. .................. .................. ..................SC .................. 34.00 50.00 33.00 20.00 32.50 54.00 31.00 18.00 SD .................. 72.50 124.00 71.50 17.00 72.50 120.00 71.50 16.00 TN .................. 73.00 140.00 71.00 20.00 78.00 150.00 76.00 19.00 TX .................. 34.50 77.00 25.00 6.20 36.00 75.00 26.00 6.10 UT .................. 52.00 70.00 25.00 4.80 49.50 73.00 20.00 5.00 VT .................. 37.00 .................. .................. 23.00 .................. .................. 36.00 23.00 VA .................. 43.50 65.00 42.50 19.00 45.00 73.00 43.50 19.00 WA ................. 171.00 245.00 74.00 10.00 176.00 245.00 70.00 10.00 WV ................. 28.00 28.00 28.00 10.00 32.00 .................. 32.00 10.00 WI .................. 87.00 169.00 84.00 36.00 92.00 177.00 87.00 32.00 WY ................. 53.50 75.00 12.00 4.00 47.00 72.00 12.00 4.00
NASS, Environmental, Economics, and Demographics Branch, (202) 720–6146.
VerDate Aug 31 2005 13:44 Mar 01, 2012 Jkt 000000 PO 00000 Frm 00014 Fmt 1000 Sfmt 1000 H:\SHARED\DAPP\FPU\AGSTAT\MASTER~2\CHAPTR09\IX-11.AG8 USDA
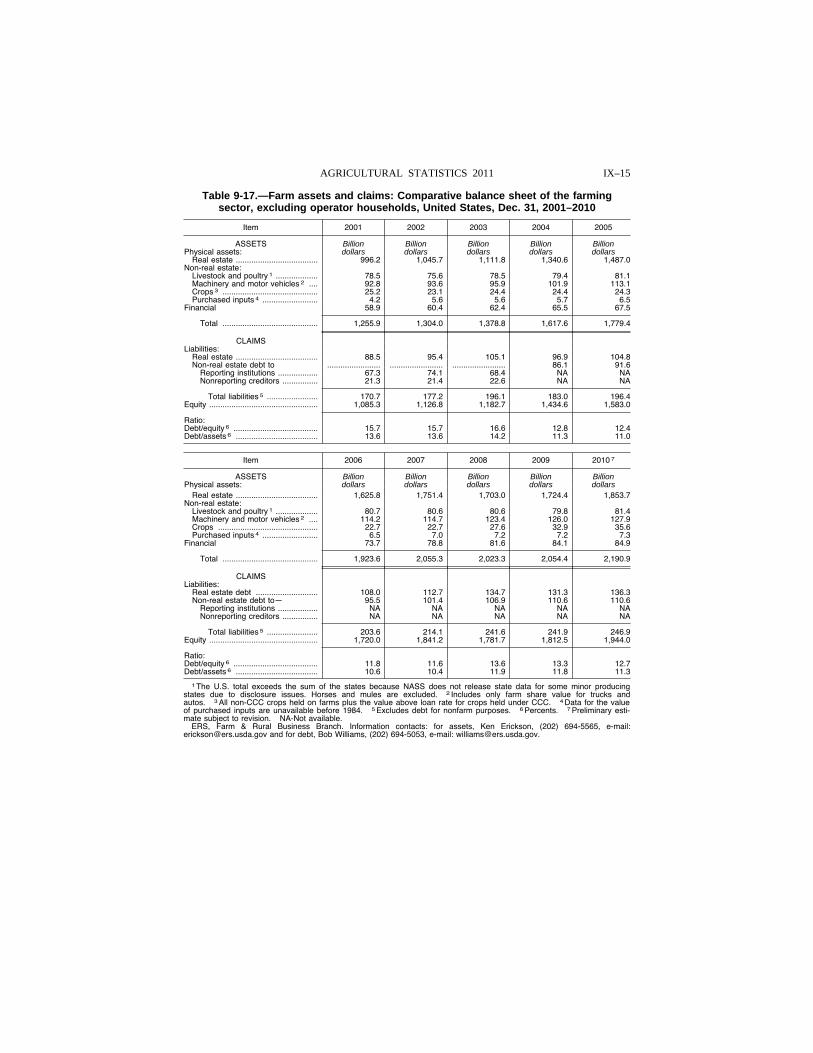
IX–15 AGRICULTURAL STATISTICS 2011
Table 9-17.—Farm assets and claims: Comparative balance sheet of the farming sector, excluding operator households, United States, Dec. 31, 2001–2010
Item 2001 2002 2003 2004 2005
ASSETS Billion Billion Billion Billion Billion Physical assets: dollars dollars dollars dollars dollars
Real estate ..................................... 996.2 1,045.7 1,111.8 1,340.6 1,487.0 Non-real estate:
Livestock and poultry 1 ................... 78.5 75.6 78.5 79.4 81.1 Machinery and motor vehicles 2 .... 92.8 93.6 95.9 101.9 113.1 Crops 3 ........................................... 25.2 23.1 24.4 24.4 24.3 Purchased inputs 4 ......................... 4.2 5.6 5.6 5.7 6.5
Financial 58.9 60.4 62.4 65.5 67.5
Total ........................................... 1,255.9 1,304.0 1,378.8 1,617.6 1,779.4
CLAIMS Liabilities:
Real estate ..................................... 88.5 95.4 105.1 96.9 104.8 Non-real estate debt to ........................ ........................ ........................ 86.1 91.6
Reporting institutions .................. 67.3 74.1 68.4 NA NA Nonreporting creditors ................ 21.3 21.4 22.6 NA NA
Total liabilities 5 ....................... 170.7 177.2 196.1 183.0 196.4 Equity ................................................. 1,085.3 1,126.8 1,182.7 1,434.6 1,583.0
Ratio: Debt/equity 6 ...................................... 15.7 15.7 16.6 12.8 12.4 Debt/assets 6 ..................................... 13.6 13.6 14.2 11.3 11.0
Item 2006 2007 2008 2009 2010 7
ASSETS Billion Billion Billion Billion Billion Physical assets: dollars dollars dollars dollars dollars
Real estate ..................................... 1,625.8 1,751.4 1,703.0 1,724.4 1,853.7 Non-real estate:
Livestock and poultry 1 ................... 80.7 80.6 80.6 79.8 81.4 Machinery and motor vehicles 2 .... 114.2 114.7 123.4 126.0 127.9 Crops ............................................. 22.7 22.7 27.6 32.9 35.6 Purchased inputs 4 ......................... 6.5 7.0 7.2 7.2 7.3
Financial 73.7 78.8 81.6 84.1 84.9
Total ........................................... 1,923.6 2,055.3 2,023.3 2,054.4 2,190.9
CLAIMS Liabilities:
Real estate debt ............................ 108.0 112.7 134.7 131.3 136.3 Non-real estate debt to— 95.5 101.4 106.9 110.6 110.6
Reporting institutions .................. NA NA NA NA NA Nonreporting creditors ................ NA NA NA NA NA
Total liabilities 5 ....................... 203.6 214.1 241.6 241.9 246.9 Equity ................................................. 1,720.0 1,841.2 1,781.7 1,812.5 1,944.0
Ratio: Debt/equity 6 ...................................... 11.8 11.6 13.6 13.3 12.7 Debt/assets 6 ..................................... 10.6 10.4 11.9 11.8 11.3
1 The U.S. total exceeds the sum of the states because NASS does not release state data for some minor producing states due to disclosure issues. Horses and mules are excluded. 2 Includes only farm share value for trucks and autos. 3 All non-CCC crops held on farms plus the value above loan rate for crops held under CCC. 4 Data for the value of purchased inputs are unavailable before 1984. 5 Excludes debt for nonfarm purposes. 6 Percents. 7 Preliminary esti-mate subject to revision. NA-Not available.
ERS, Farm & Rural Business Branch. Information contacts: for assets, Ken Erickson, (202) 694-5565, e-mail: [email protected] and for debt, Bob Williams, (202) 694-5053, e-mail: [email protected].
VerDate Aug 31 2005 13:44 Mar 01, 2012 Jkt 000000 PO 00000 Frm 00015 Fmt 1000 Sfmt 1000 H:\SHARED\DAPP\FPU\AGSTAT\MASTER~2\CHAPTR09\IX-12.AG8 USDA
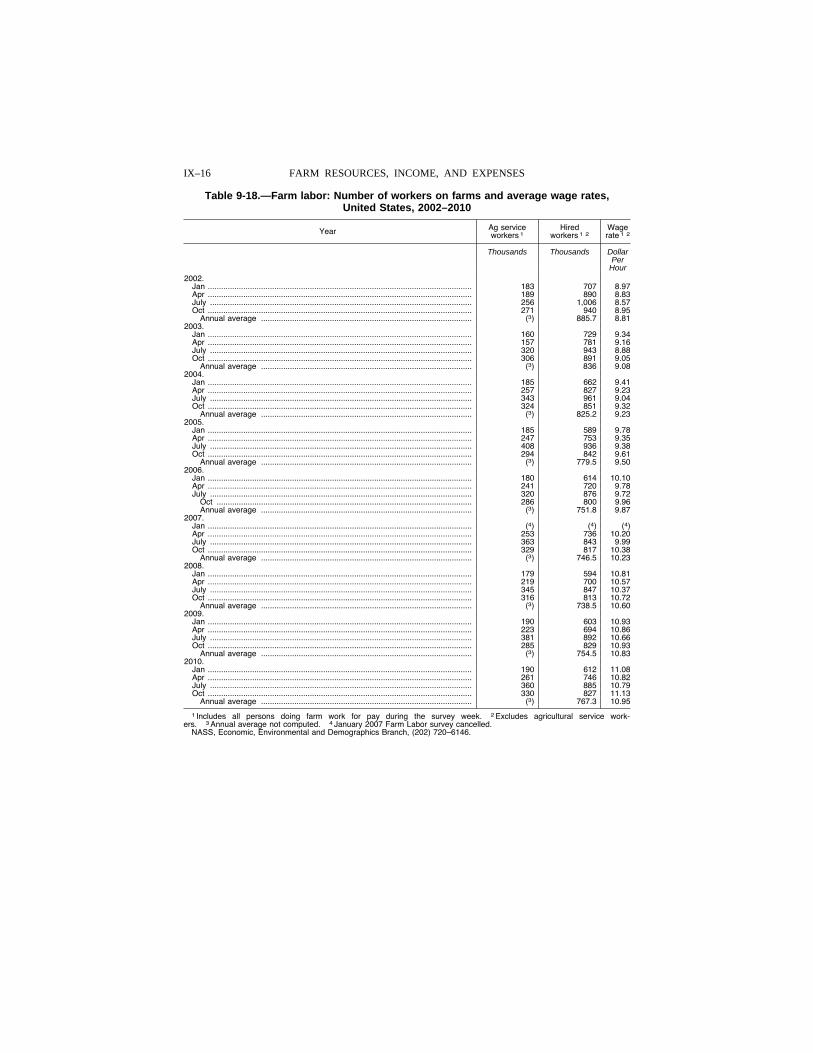
IX–16 FARM RESOURCES, INCOME, AND EXPENSES
Table 9-18.—Farm labor: Number of workers on farms and average wage rates, United States, 2002–2010
Year Ag service workers 1
Hired workers 1 2
Wage rate 1 2
Thousands Thousands Dollar Per
Hour 2002.
Jan ....................................................................................................................... 183 707 8.97 Apr ....................................................................................................................... 189 890 8.83 July ...................................................................................................................... 256 1,006 8.57 Oct ....................................................................................................................... 271 940 8.95
Annual average ............................................................................................... (3) 885.7 8.81 2003.
Jan ....................................................................................................................... 160 729 9.34 Apr ....................................................................................................................... 157 781 9.16 July ...................................................................................................................... 320 943 8.88 Oct ....................................................................................................................... 306 891 9.05
Annual average ............................................................................................... (3) 836 9.08 2004.
Jan ....................................................................................................................... 185 662 9.41 Apr ....................................................................................................................... 257 827 9.23 July ...................................................................................................................... 343 961 9.04 Oct ....................................................................................................................... 324 851 9.32
Annual average ............................................................................................... (3) 825.2 9.23 2005.
Jan ....................................................................................................................... 185 589 9.78 Apr ....................................................................................................................... 247 753 9.35 July ...................................................................................................................... 408 936 9.38 Oct ....................................................................................................................... 294 842 9.61
Annual average ............................................................................................... (3) 779.5 9.50 2006.
Jan ....................................................................................................................... 180 614 10.10 Apr ....................................................................................................................... 241 720 9.78 July ...................................................................................................................... 320 876 9.72
Oct ................................................................................................................... 286 800 9.96 Annual average ............................................................................................... (3) 751.8 9.87
2007.Jan ....................................................................................................................... (4) (4) (4) Apr ....................................................................................................................... 253 736 10.20 July ...................................................................................................................... 363 843 9.99 Oct ....................................................................................................................... 329 817 10.38
Annual average ............................................................................................... (3) 746.5 10.23 2008.
Jan ....................................................................................................................... 179 594 10.81 Apr ....................................................................................................................... 219 700 10.57 July ...................................................................................................................... 345 847 10.37 Oct ....................................................................................................................... 316 813 10.72
Annual average ............................................................................................... (3) 738.5 10.60 2009.
Jan ....................................................................................................................... 190 603 10.93 Apr ....................................................................................................................... 223 694 10.86 July ...................................................................................................................... 381 892 10.66 Oct ....................................................................................................................... 285 829 10.93
Annual average ............................................................................................... (3) 754.5 10.83 2010.
Jan ....................................................................................................................... 190 612 11.08 Apr ....................................................................................................................... 261 746 10.82 July ...................................................................................................................... 360 885 10.79 Oct ....................................................................................................................... 330 827 11.13
Annual average ............................................................................................... (3) 767.3 10.95
1 Includes all persons doing farm work for pay during the survey week. 2 Excludes agricultural service work-ers. 3 Annual average not computed. 4 January 2007 Farm Labor survey cancelled.
NASS, Economic, Environmental and Demographics Branch, (202) 720–6146.
VerDate Aug 31 2005 13:44 Mar 01, 2012 Jkt 000000 PO 00000 Frm 00016 Fmt 1000 Sfmt 1000 H:\SHARED\DAPP\FPU\AGSTAT\MASTER~2\CHAPTR09\IX-13.AG8 USDA
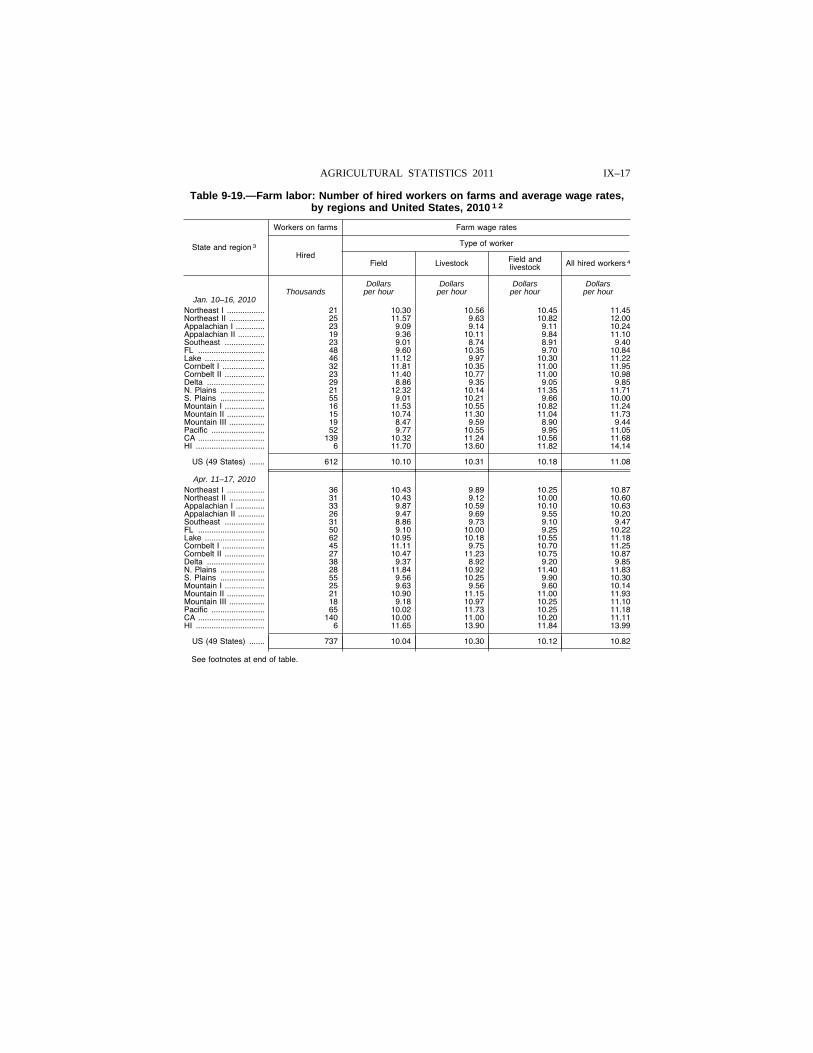
IX–17 AGRICULTURAL STATISTICS 2011
Table 9-19.—Farm labor: Number of hired workers on farms and average wage rates, by regions and United States, 2010 1 2
State and region 3
Workers on farms Farm wage rates
Hired
Type of worker
Field Livestock Field and livestock All hired workers 4
Dollars Dollars Dollars Dollars Thousands per hour per hour per hour per hour
Jan. 10–16, 2010 Northeast I ................. 21 10.30 10.56 10.45 11.45 Northeast II ................ 25 11.57 9.63 10.82 12.00 Appalachian I ............. 23 9.09 9.14 9.11 10.24 Appalachian II ............ 19 9.36 10.11 9.84 11.10 Southeast .................. 23 9.01 8.74 8.91 9.40 FL .............................. 48 9.60 10.35 9.70 10.84 Lake ........................... 46 11.12 9.97 10.30 11.22 Cornbelt I ................... 32 11.81 10.35 11.00 11.95 Cornbelt II .................. 23 11.40 10.77 11.00 10.98 Delta .......................... 29 8.86 9.35 9.05 9.85 N. Plains .................... 21 12.32 10.14 11.35 11.71 S. Plains .................... 55 9.01 10.21 9.66 10.00 Mountain I .................. 16 11.53 10.55 10.82 11.24 Mountain II ................. 15 10.74 11.30 11.04 11.73 Mountain III ................ 19 8.47 9.59 8.90 9.44 Pacific ........................ 52 9.77 10.55 9.95 11.05 CA .............................. 139 10.32 11.24 10.56 11.68 HI ............................... 6 11.70 13.60 11.82 14.14
US (49 States) ....... 612 10.10 10.31 10.18 11.08
Apr. 11–17, 2010 Northeast I ................. 36 10.43 9.89 10.25 10.87 Northeast II ................ 31 10.43 9.12 10.00 10.60 Appalachian I ............. 33 9.87 10.59 10.10 10.63 Appalachian II ............ 26 9.47 9.69 9.55 10.20 Southeast .................. 31 8.86 9.73 9.10 9.47 FL .............................. 50 9.10 10.00 9.25 10.22 Lake ........................... 62 10.95 10.18 10.55 11.18 Cornbelt I ................... 45 11.11 9.75 10.70 11.25 Cornbelt II .................. 27 10.47 11.23 10.75 10.87 Delta .......................... 38 9.37 8.92 9.20 9.85 N. Plains .................... 28 11.84 10.92 11.40 11.83 S. Plains .................... 55 9.56 10.25 9.90 10.30 Mountain I .................. 25 9.63 9.56 9.60 10.14 Mountain II ................. 21 10.90 11.15 11.00 11.93 Mountain III ................ 18 9.18 10.97 10.25 11.10 Pacific ........................ 65 10.02 11.73 10.25 11.18 CA .............................. 140 10.00 11.00 10.20 11.11 HI ............................... 6 11.65 13.90 11.84 13.99
US (49 States) ....... 737 10.04 10.30 10.12 10.82
See footnotes at end of table.
VerDate Aug 31 2005 13:44 Mar 01, 2012 Jkt 000000 PO 00000 Frm 00017 Fmt 1000 Sfmt 1000 H:\SHARED\DAPP\FPU\AGSTAT\MASTER~2\CHAPTR09\IX-14.AG8 USDA
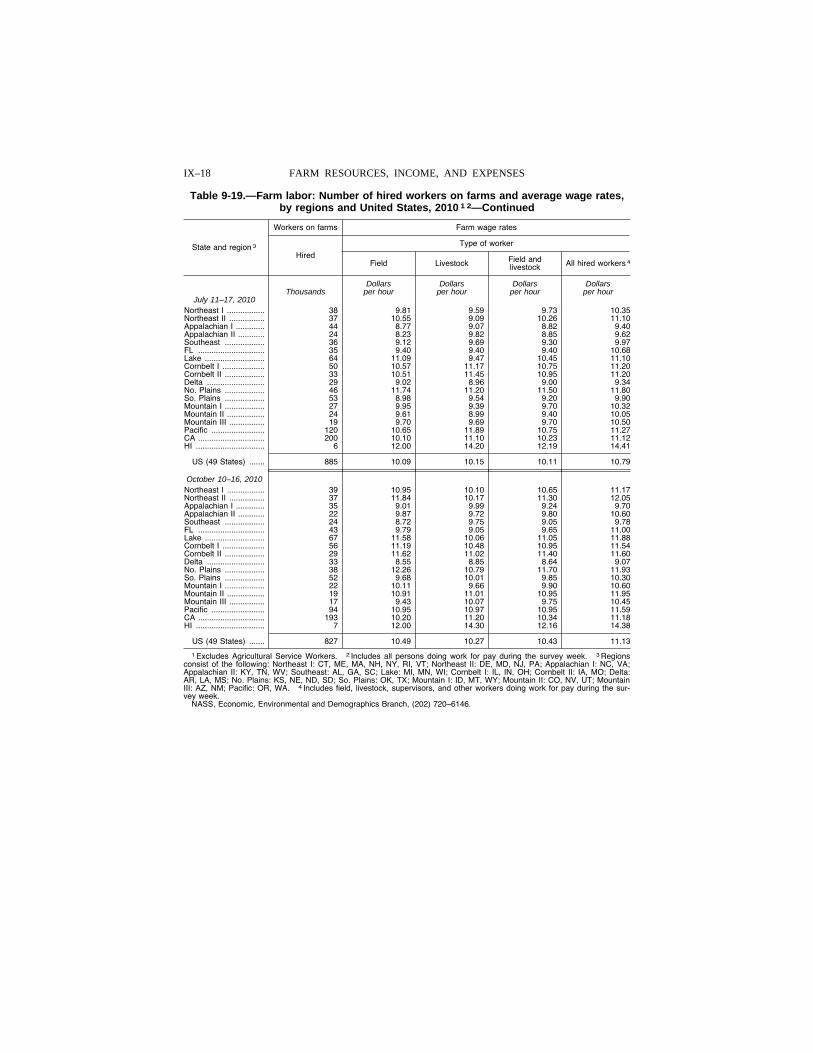
IX–18 FARM RESOURCES, INCOME, AND EXPENSES
Table 9-19.—Farm labor: Number of hired workers on farms and average wage rates, by regions and United States, 2010 1 2—Continued
State and region 3
Workers on farms Farm wage rates
Hired
Type of worker
Field Livestock Field and livestock All hired workers 4
Dollars Dollars Dollars Dollars Thousands per hour per hour per hour per hour
July 11–17, 2010 Northeast I ................. 38 9.81 9.59 9.73 10.35 Northeast II ................ 37 10.55 9.09 10.26 11.10 Appalachian I ............. 44 8.77 9.07 8.82 9.40 Appalachian II ............ 24 8.23 9.82 8.85 9.62 Southeast .................. 36 9.12 9.69 9.30 9.97 FL .............................. 35 9.40 9.40 9.40 10.68 Lake ........................... 64 11.09 9.47 10.45 11.10 Cornbelt I ................... 50 10.57 11.17 10.75 11.20 Cornbelt II .................. 33 10.51 11.45 10.95 11.20 Delta .......................... 29 9.02 8.96 9.00 9.34 No. Plains .................. 46 11.74 11.20 11.50 11.80 So. Plains .................. 53 8.98 9.54 9.20 9.90 Mountain I .................. 27 9.95 9.39 9.70 10.32 Mountain II ................. 24 9.61 8.99 9.40 10.05 Mountain III ................ 19 9.70 9.69 9.70 10.50 Pacific ........................ 120 10.65 11.89 10.75 11.27 CA .............................. 200 10.10 11.10 10.23 11.12 HI ............................... 6 12.00 14.20 12.19 14.41
US (49 States) ....... 885 10.09 10.15 10.11 10.79
October 10–16, 2010 Northeast I ................. 39 10.95 10.10 10.65 11.17 Northeast II ................ 37 11.84 10.17 11.30 12.05 Appalachian I ............. 35 9.01 9.99 9.24 9.70 Appalachian II ............ 22 9.87 9.72 9.80 10.60 Southeast .................. 24 8.72 9.75 9.05 9.78 FL .............................. 43 9.79 9.05 9.65 11.00 Lake ........................... 67 11.58 10.06 11.05 11.88 Cornbelt I ................... 56 11.19 10.48 10.95 11.54 Cornbelt II .................. 29 11.62 11.02 11.40 11.60 Delta .......................... 33 8.55 8.85 8.64 9.07 No. Plains .................. 38 12.26 10.79 11.70 11.93 So. Plains .................. 52 9.68 10.01 9.85 10.30 Mountain I .................. 22 10.11 9.66 9.90 10.60 Mountain II ................. 19 10.91 11.01 10.95 11.95 Mountain III ................ 17 9.43 10.07 9.75 10.45 Pacific ........................ 94 10.95 10.97 10.95 11.59 CA .............................. 193 10.20 11.20 10.34 11.18 HI ............................... 7 12.00 14.30 12.16 14.38
US (49 States) ....... 827 10.49 10.27 10.43 11.13
1 Excludes Agricultural Service Workers. 2 Includes all persons doing work for pay during the survey week. 3 Regions consist of the following: Northeast I: CT, ME, MA, NH, NY, RI, VT; Northeast II: DE, MD, NJ, PA; Appalachian I: NC, VA; Appalachian II: KY, TN, WV; Southeast: AL, GA, SC; Lake: MI, MN, WI; Cornbelt I: IL, IN, OH; Cornbelt II: IA, MO; Delta: AR, LA, MS; No. Plains: KS, NE, ND, SD; So. Plains: OK, TX; Mountain I: ID, MT, WY; Mountain II: CO, NV, UT; Mountain III: AZ, NM; Pacific: OR, WA. 4 Includes field, livestock, supervisors, and other workers doing work for pay during the sur-vey week.
NASS, Economic, Environmental and Demographics Branch, (202) 720–6146.
VerDate Aug 31 2005 13:44 Mar 01, 2012 Jkt 000000 PO 00000 Frm 00018 Fmt 1000 Sfmt 1000 H:\SHARED\DAPP\FPU\AGSTAT\MASTER~2\CHAPTR09\IX-15.AG8 USDA
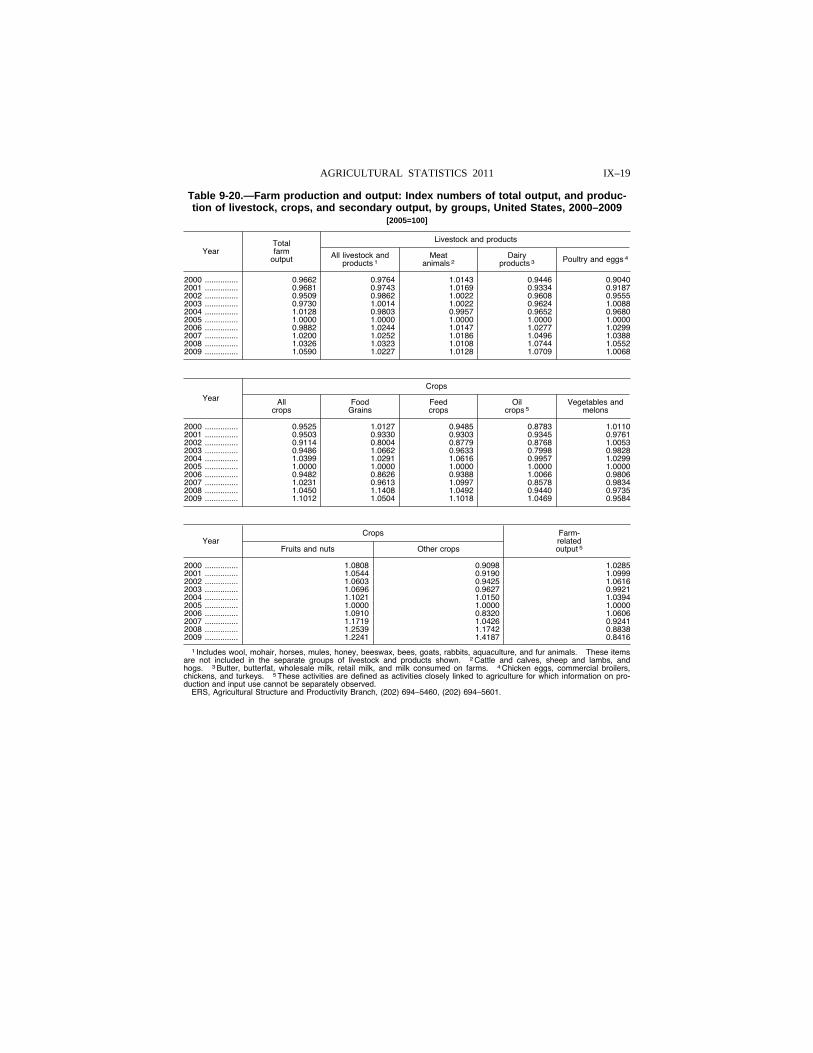
IX–19 AGRICULTURAL STATISTICS 2011
Table 9-20.—Farm production and output: Index numbers of total output, and produc-tion of livestock, crops, and secondary output, by groups, United States, 2000–2009
[2005=100]
Year Total farm
output
Livestock and products
All livestock and products 1
Meat animals 2
Dairy products 3 Poultry and eggs 4
2000 ............... 0.9662 0.9764 1.0143 0.9446 0.9040 2001 ............... 0.9681 0.9743 1.0169 0.9334 0.9187 2002 ............... 0.9509 0.9862 1.0022 0.9608 0.9555 2003 ............... 0.9730 1.0014 1.0022 0.9624 1.0088 2004 ............... 1.0128 0.9803 0.9957 0.9652 0.9680 2005 ............... 1.0000 1.0000 1.0000 1.0000 1.0000 2006 ............... 0.9882 1.0244 1.0147 1.0277 1.0299 2007 ............... 1.0200 1.0252 1.0186 1.0496 1.0388 2008 ............... 1.0326 1.0323 1.0108 1.0744 1.0552 2009 ............... 1.0590 1.0227 1.0128 1.0709 1.0068
Year
Crops
All crops
Food Grains
Feed crops
Oil crops 5
Vegetables and melons
2000 ............... 0.9525 1.0127 0.9485 0.8783 1.0110 2001 ............... 0.9503 0.9330 0.9303 0.9345 0.9761 2002 ............... 0.9114 0.8004 0.8779 0.8768 1.0053 2003 ............... 0.9486 1.0662 0.9633 0.7998 0.9828 2004 ............... 1.0399 1.0291 1.0616 0.9957 1.0299 2005 ............... 1.0000 1.0000 1.0000 1.0000 1.0000 2006 ............... 0.9482 0.8626 0.9388 1.0066 0.9806 2007 ............... 1.0231 0.9613 1.0997 0.8578 0.9834 2008 ............... 1.0450 1.1408 1.0492 0.9440 0.9735 2009 ............... 1.1012 1.0504 1.1018 1.0469 0.9584
Year Crops Farm-
related output 5 Fruits and nuts Other crops
2000 ............... 1.0808 0.9098 1.0285 2001 ............... 1.0544 0.9190 1.0999 2002 ............... 1.0603 0.9425 1.0616 2003 ............... 1.0696 0.9627 0.9921 2004 ............... 1.1021 1.0150 1.0394 2005 ............... 1.0000 1.0000 1.0000 2006 ............... 1.0910 0.8320 1.0606 2007 ............... 1.1719 1.0426 0.9241 2008 ............... 1.2539 1.1742 0.8838 2009 ............... 1.2241 1.4187 0.8416
1 Includes wool, mohair, horses, mules, honey, beeswax, bees, goats, rabbits, aquaculture, and fur animals. These items are not included in the separate groups of livestock and products shown. 2 Cattle and calves, sheep and lambs, and hogs. 3 Butter, butterfat, wholesale milk, retail milk, and milk consumed on farms. 4 Chicken eggs, commercial broilers, chickens, and turkeys. 5 These activities are defined as activities closely linked to agriculture for which information on pro-duction and input use cannot be separately observed.
ERS, Agricultural Structure and Productivity Branch, (202) 694–5460, (202) 694–5601.
VerDate Aug 31 2005 13:44 Mar 01, 2012 Jkt 000000 PO 00000 Frm 00019 Fmt 1000 Sfmt 1000 H:\SHARED\DAPP\FPU\AGSTAT\MASTER~2\CHAPTR09\IX-16.AG8 USDA
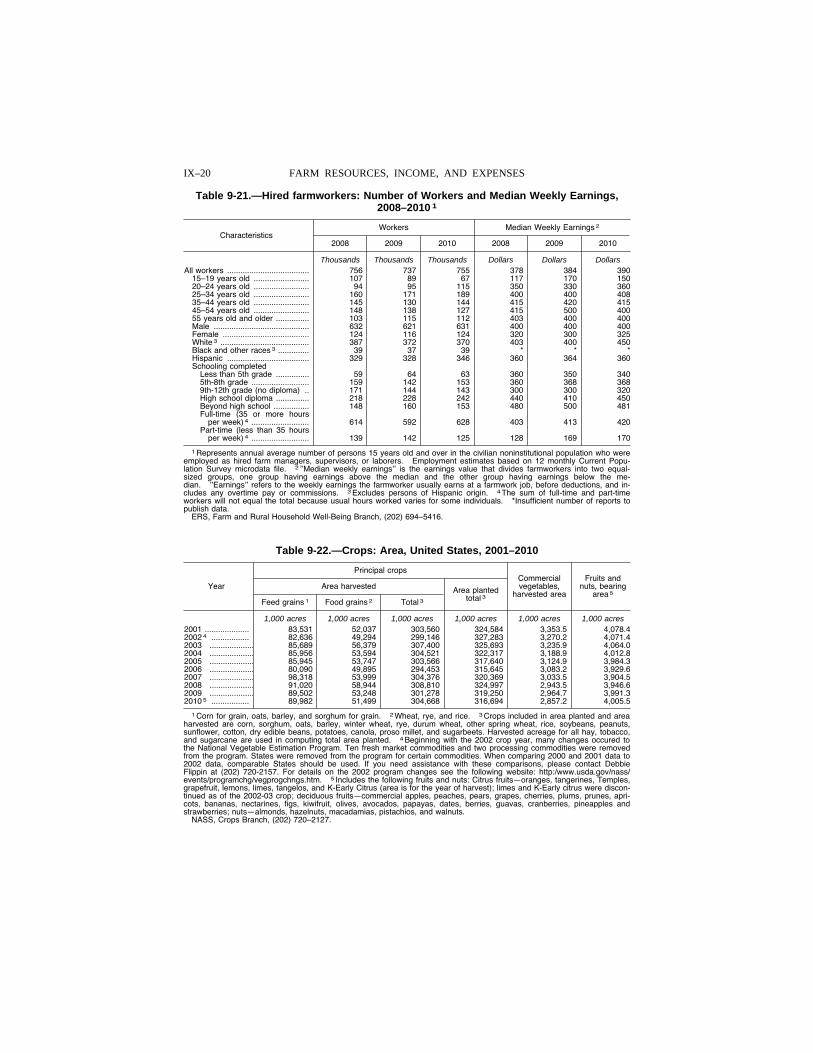
IX–20 FARM RESOURCES, INCOME, AND EXPENSES
Table 9-21.—Hired farmworkers: Number of Workers and Median Weekly Earnings, 2008–2010 1
Characteristics Workers Median Weekly Earnings 2
2008 2009 2010 2008 2009 2010
Thousands Thousands Thousands Dollars Dollars Dollars All workers ..................................... 756 737 755 378 384 390
15–19 years old ......................... 107 89 67 117 170 150 20–24 years old ......................... 94 95 115 350 330 360 25–34 years old ......................... 160 171 189 400 400 408 35–44 years old ......................... 145 130 144 415 420 415 45–54 years old ......................... 148 138 127 415 500 400 55 years old and older ............... 103 115 112 403 400 400 Male ........................................... 632 621 631 400 400 400 Female ....................................... 124 116 124 320 300 325 White 3 ........................................ 387 372 370 403 400 450 Black and other races 3 .............. 39 37 39 * * * Hispanic ..................................... 329 328 346 360 364 360 Schooling completed
Less than 5th grade ............... 59 64 63 360 350 340 5th-8th grade .......................... 159 142 153 360 368 368 9th-12th grade (no diploma) .. 171 144 143 300 300 320 High school diploma ............... 218 228 242 440 410 450 Beyond high school ................ 148 160 153 480 500 481 Full-time (35 or more hours
per week) 4 .......................... 614 592 628 403 413 420 Part-time (less than 35 hours
per week) 4 .......................... 139 142 125 128 169 170
1 Represents annual average number of persons 15 years old and over in the civilian noninstitutional population who were employed as hired farm managers, supervisors, or laborers. Employment estimates based on 12 monthly Current Popu-lation Survey microdata file. 2 ’’Median weekly earnings’’ is the earnings value that divides farmworkers into two equal- sized groups, one group having earnings above the median and the other group having earnings below the me-dian. ’’Earnings’’ refers to the weekly earnings the farmworker usually earns at a farmwork job, before deductions, and in-cludes any overtime pay or commissions. 3 Excludes persons of Hispanic origin. 4 The sum of full-time and part-time workers will not equal the total because usual hours worked varies for some individuals. *Insufficient number of reports to publish data.
ERS, Farm and Rural Household Well-Being Branch, (202) 694–5416.
Table 9-22.—Crops: Area, United States, 2001–2010
Year
Principal crops Commercial vegetables,
harvested area
Fruits and nuts, bearing
area 5 Area harvested Area planted
total 3 Feed grains 1 Food grains 2 Total 3
1,000 acres 1,000 acres 1,000 acres 1,000 acres 1,000 acres 1,000 acres 2001 .................... 83,531 52,037 303,560 324,584 3,353.5 4,078.4 2002 4 ................. 82,636 49,294 299,146 327,283 3,270.2 4,071.4 2003 .................... 85,689 56,379 307,400 325,693 3,235.9 4,064.0 2004 .................... 85,956 53,594 304,521 322,317 3,188.9 4,012.8 2005 .................... 85,945 53,747 303,566 317,640 3,124.9 3,984.3 2006 .................... 80,090 49,895 294,453 315,645 3,083.2 3,929.6 2007 .................... 98,318 53,999 304,376 320,369 3,033.5 3,904.5 2008 .................... 91,020 58,944 308,810 324,997 2,943.5 3,946.6 2009 .................... 89,502 53,248 301,278 319,250 2,964.7 3,991.3 2010 5 ................. 89,982 51,499 304,668 316,694 2,857.2 4,005.5
1 Corn for grain, oats, barley, and sorghum for grain. 2 Wheat, rye, and rice. 3 Crops included in area planted and area harvested are corn, sorghum, oats, barley, winter wheat, rye, durum wheat, other spring wheat, rice, soybeans, peanuts, sunflower, cotton, dry edible beans, potatoes, canola, proso millet, and sugarbeets. Harvested acreage for all hay, tobacco, and sugarcane are used in computing total area planted. 4 Beginning with the 2002 crop year, many changes occured to the National Vegetable Estimation Program. Ten fresh market commodities and two processing commodities were removed from the program. States were removed from the program for certain commodities. When comparing 2000 and 2001 data to 2002 data, comparable States should be used. If you need assistance with these comparisons, please contact Debbie Flippin at (202) 720-2157. For details on the 2002 program changes see the following website: http:/www.usda.gov/nass/ events/programchg/vegprogchngs.htm. 5 Includes the following fruits and nuts: Citrus fruits—oranges, tangerines, Temples, grapefruit, lemons, limes, tangelos, and K-Early Citrus (area is for the year of harvest); limes and K-Early citrus were discon-tinued as of the 2002-03 crop; deciduous fruits—commercial apples, peaches, pears, grapes, cherries, plums, prunes, apri-cots, bananas, nectarines, figs, kiwifruit, olives, avocados, papayas, dates, berries, guavas, cranberries, pineapples and strawberries; nuts—almonds, hazelnuts, macadamias, pistachios, and walnuts.
NASS, Crops Branch, (202) 720–2127.
VerDate Aug 31 2005 13:44 Mar 01, 2012 Jkt 000000 PO 00000 Frm 00020 Fmt 1000 Sfmt 1000 H:\SHARED\DAPP\FPU\AGSTAT\MASTER~2\CHAPTR09\IX-17.AG8 USDA
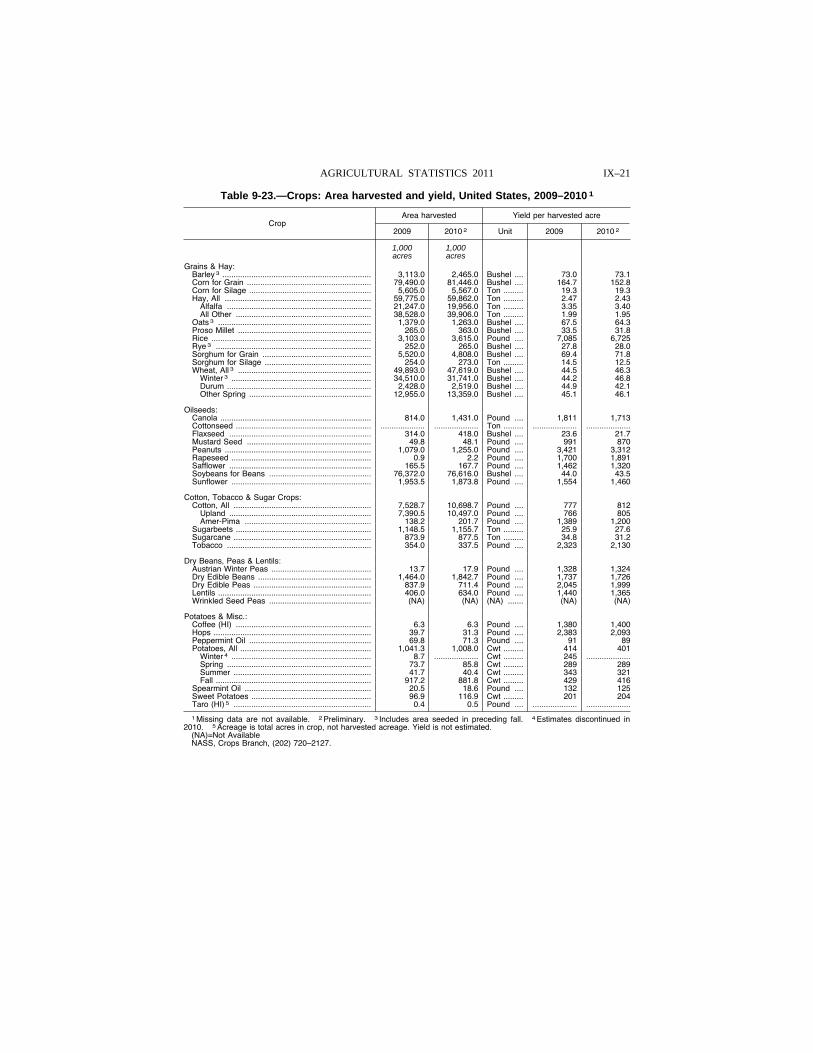
IX–21 AGRICULTURAL STATISTICS 2011
Table 9-23.—Crops: Area harvested and yield, United States, 2009–2010 1
Crop Area harvested Yield per harvested acre
2009 2010 2 Unit 2009 2010 2
1,000 1,000 acres acres
Grains & Hay: Barley 3 ................................................................... 3,113.0 2,465.0 Bushel .... 73.0 73.1 Corn for Grain ........................................................ 79,490.0 81,446.0 Bushel .... 164.7 152.8 Corn for Silage ....................................................... 5,605.0 5,567.0 Ton ......... 19.3 19.3 Hay, All .................................................................. 59,775.0 59,862.0 Ton ......... 2.47 2.43
Alfalfa ................................................................. 21,247.0 19,956.0 Ton ......... 3.35 3.40 All Other ............................................................. 38,528.0 39,906.0 Ton ......... 1.99 1.95
Oats 3 ..................................................................... 1,379.0 1,263.0 Bushel .... 67.5 64.3 Proso Millet ............................................................ 265.0 363.0 Bushel .... 33.5 31.8 Rice ........................................................................ 3,103.0 3,615.0 Pound .... 7,085 6,725 Rye 3 ...................................................................... 252.0 265.0 Bushel .... 27.8 28.0 Sorghum for Grain ................................................. 5,520.0 4,808.0 Bushel .... 69.4 71.8 Sorghum for Silage ................................................ 254.0 273.0 Ton ......... 14.5 12.5 Wheat, All 3 ............................................................ 49,893.0 47,619.0 Bushel .... 44.5 46.3
Winter 3 ............................................................... 34,510.0 31,741.0 Bushel .... 44.2 46.8 Durum ................................................................. 2,428.0 2,519.0 Bushel .... 44.9 42.1 Other Spring ....................................................... 12,955.0 13,359.0 Bushel .... 45.1 46.1
Oilseeds: Canola .................................................................... 814.0 1,431.0 Pound .... 1,811 1,713 Cottonseed ............................................................. .................... .................... Ton ......... .................... ....................Flaxseed ................................................................ 314.0 418.0 Bushel .... 23.6 21.7 Mustard Seed ........................................................ 49.8 48.1 Pound .... 991 870 Peanuts .................................................................. 1,079.0 1,255.0 Pound .... 3,421 3,312 Rapeseed ............................................................... 0.9 2.2 Pound .... 1,700 1,891 Safflower ................................................................ 165.5 167.7 Pound .... 1,462 1,320 Soybeans for Beans .............................................. 76,372.0 76,616.0 Bushel .... 44.0 43.5 Sunflower ............................................................... 1,953.5 1,873.8 Pound .... 1,554 1,460
Cotton, Tobacco & Sugar Crops: Cotton, All .............................................................. 7,528.7 10,698.7 Pound .... 777 812
Upland ................................................................ 7,390.5 10,497.0 Pound .... 766 805 Amer-Pima ......................................................... 138.2 201.7 Pound .... 1,389 1,200
Sugarbeets ............................................................. 1,148.5 1,155.7 Ton ......... 25.9 27.6 Sugarcane .............................................................. 873.9 877.5 Ton ......... 34.8 31.2 Tobacco ................................................................. 354.0 337.5 Pound .... 2,323 2,130
Dry Beans, Peas & Lentils: Austrian Winter Peas ............................................. 13.7 17.9 Pound .... 1,328 1,324 Dry Edible Beans ................................................... 1,464.0 1,842.7 Pound .... 1,737 1,726 Dry Edible Peas ..................................................... 837.9 711.4 Pound .... 2,045 1,999 Lentils ..................................................................... 406.0 634.0 Pound .... 1,440 1,365 Wrinkled Seed Peas .............................................. (NA) (NA) (NA) ....... (NA) (NA)
Potatoes & Misc.: Coffee (HI) ............................................................. 6.3 6.3 Pound .... 1,380 1,400 Hops ....................................................................... 39.7 31.3 Pound .... 2,383 2,093 Peppermint Oil ....................................................... 69.8 71.3 Pound .... 91 89 Potatoes, All ........................................................... 1,041.3 1,008.0 Cwt ......... 414 401
Winter 4 ............................................................... 8.7 .................... Cwt ......... 245 ....................Spring ................................................................. 73.7 85.8 Cwt ......... 289 289 Summer .............................................................. 41.7 40.4 Cwt ......... 343 321 Fall ...................................................................... 917.2 881.8 Cwt ......... 429 416
Spearmint Oil ......................................................... 20.5 18.6 Pound .... 132 125 Sweet Potatoes ...................................................... 96.9 116.9 Cwt ......... 201 204 Taro (HI) 5 .............................................................. 0.4 0.5 Pound .... .................... ....................
1 Missing data are not available. 2 Preliminary. 3 Includes area seeded in preceding fall. 4 Estimates discontinued in 2010. 5 Acreage is total acres in crop, not harvested acreage. Yield is not estimated.
(NA)=Not Available NASS, Crops Branch, (202) 720–2127.
VerDate Aug 31 2005 13:44 Mar 01, 2012 Jkt 000000 PO 00000 Frm 00021 Fmt 1000 Sfmt 1000 H:\SHARED\DAPP\FPU\AGSTAT\MASTER~2\CHAPTR09\IX-18.AG8 USDA
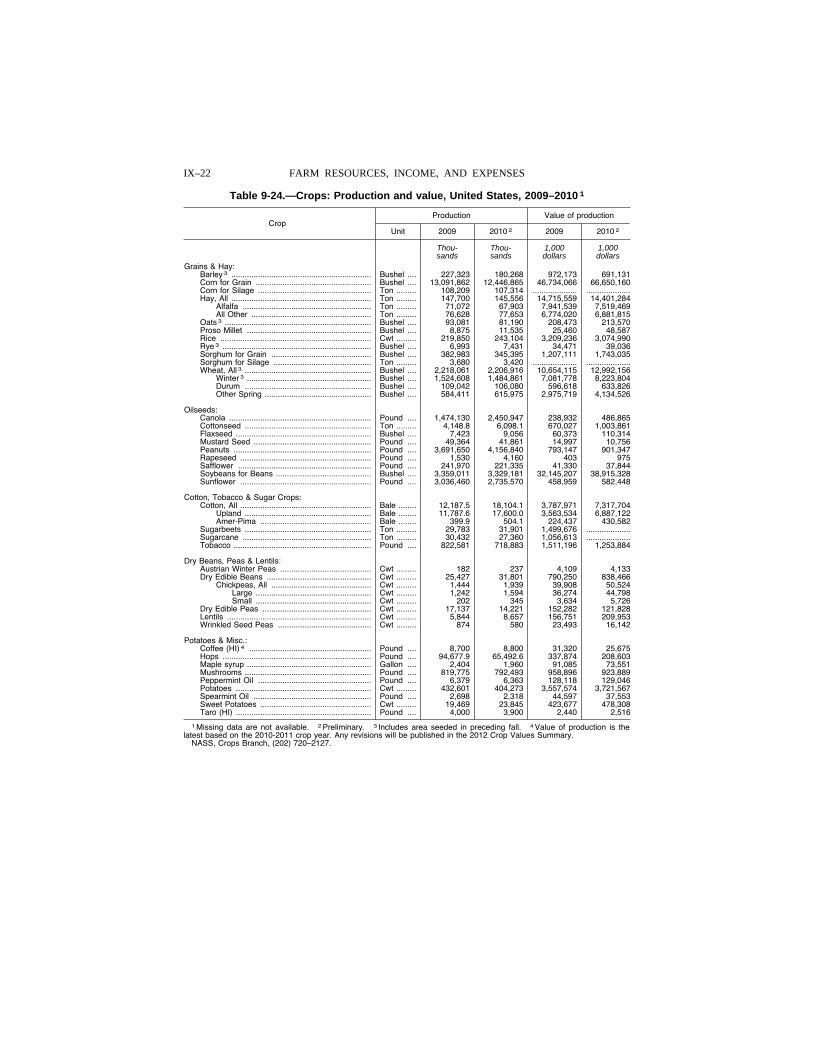
IX–22 FARM RESOURCES, INCOME, AND EXPENSES
Table 9-24.—Crops: Production and value, United States, 2009–2010 1
Crop Production Value of production
Unit 2009 2010 2 2009 2010 2
Thou- Thou- 1,000 1,000 sands sands dollars dollars
Grains & Hay: Barley 3 ............................................................... Bushel .... 227,323 180,268 972,173 691,131 Corn for Grain .................................................... Bushel .... 13,091,862 12,446,865 46,734,066 66,650,160 Corn for Silage ................................................... Ton ......... 108,209 107,314 .................... ....................Hay, All ............................................................... Ton ......... 147,700 145,556 14,715,559 14,401,284
Alfalfa .......................................................... Ton ......... 71,072 67,903 7,941,539 7,519,469 All Other ...................................................... Ton ......... 76,628 77,653 6,774,020 6,881,815
Oats 3 .................................................................. Bushel .... 93,081 81,190 208,473 213,570 Proso Millet ........................................................ Bushel .... 8,875 11,535 25,460 48,587 Rice .................................................................... Cwt ......... 219,850 243,104 3,209,236 3,074,990 Rye 3 ................................................................... Bushel .... 6,993 7,431 34,471 39,036 Sorghum for Grain ............................................. Bushel .... 382,983 345,395 1,207,111 1,743,035 Sorghum for Silage ............................................ Ton ......... 3,680 3,420 .................... ....................Wheat, All 3 ......................................................... Bushel .... 2,218,061 2,206,916 10,654,115 12,992,156
Winter 3 ........................................................ Bushel .... 1,524,608 1,484,861 7,081,778 8,223,804 Durum ......................................................... Bushel .... 109,042 106,080 596,618 633,826 Other Spring ................................................ Bushel .... 584,411 615,975 2,975,719 4,134,526
Oilseeds: Canola ................................................................ Pound .... 1,474,130 2,450,947 238,932 486,865 Cottonseed ......................................................... Ton ......... 4,148.8 6,098.1 670,027 1,003,861 Flaxseed ............................................................. Bushel .... 7,423 9,056 60,373 110,314 Mustard Seed ..................................................... Pound .... 49,364 41,861 14,997 10,756 Peanuts .............................................................. Pound .... 3,691,650 4,156,840 793,147 901,347 Rapeseed ........................................................... Pound .... 1,530 4,160 403 975 Safflower ............................................................ Pound .... 241,970 221,335 41,330 37,844 Soybeans for Beans ........................................... Bushel .... 3,359,011 3,329,181 32,145,207 38,915,328 Sunflower ........................................................... Pound .... 3,036,460 2,735,570 458,959 582,448
Cotton, Tobacco & Sugar Crops: Cotton, All ........................................................... Bale ........ 12,187.5 18,104.1 3,787,971 7,317,704
Upland ......................................................... Bale ........ 11,787.6 17,600.0 3,563,534 6,887,122 Amer-Pima .................................................. Bale ........ 399.9 504.1 224,437 430,582
Sugarbeets ......................................................... Ton ......... 29,783 31,901 1,499,676 ....................Sugarcane .......................................................... Ton ......... 30,432 27,360 1,056,613 ....................Tobacco .............................................................. Pound .... 822,581 718,883 1,511,196 1,253,884
Dry Beans, Peas & Lentils: Austrian Winter Peas ......................................... Cwt ......... 182 237 4,109 4,133 Dry Edible Beans ............................................... Cwt ......... 25,427 31,801 790,250 838,466
Chickpeas, All ............................................. Cwt ......... 1,444 1,939 39,908 50,524 Large .................................................... Cwt ......... 1,242 1,594 36,274 44,798 Small .................................................... Cwt ......... 202 345 3,634 5,726
Dry Edible Peas ................................................. Cwt ......... 17,137 14,221 152,282 121,828 Lentils ................................................................. Cwt ......... 5,844 8,657 156,751 209,953 Wrinkled Seed Peas .......................................... Cwt ......... 874 580 23,493 16,142
Potatoes & Misc.: Coffee (HI) 4 ....................................................... Pound .... 8,700 8,800 31,320 25,675 Hops ................................................................... Pound .... 94,677.9 65,492.6 337,874 208,603 Maple syrup ........................................................ Gallon .... 2,404 1,960 91,085 73,551 Mushrooms ......................................................... Pound .... 819,775 792,493 958,896 923,889 Peppermint Oil ................................................... Pound .... 6,379 6,363 128,118 129,046 Potatoes ............................................................. Cwt ......... 432,601 404,273 3,557,574 3,721,567 Spearmint Oil ..................................................... Pound .... 2,698 2,318 44,597 37,553 Sweet Potatoes .................................................. Cwt ......... 19,469 23,845 423,677 478,308 Taro (HI) ............................................................. Pound .... 4,000 3,900 2,440 2,516
1 Missing data are not available. 2 Preliminary. 3 Includes area seeded in preceding fall. 4 Value of production is the latest based on the 2010-2011 crop year. Any revisions will be published in the 2012 Crop Values Summary.
NASS, Crops Branch, (202) 720–2127.
VerDate Aug 31 2005 13:44 Mar 01, 2012 Jkt 000000 PO 00000 Frm 00022 Fmt 1000 Sfmt 1000 H:\SHARED\DAPP\FPU\AGSTAT\MASTER~2\CHAPTR09\IX-19.AG8 USDA
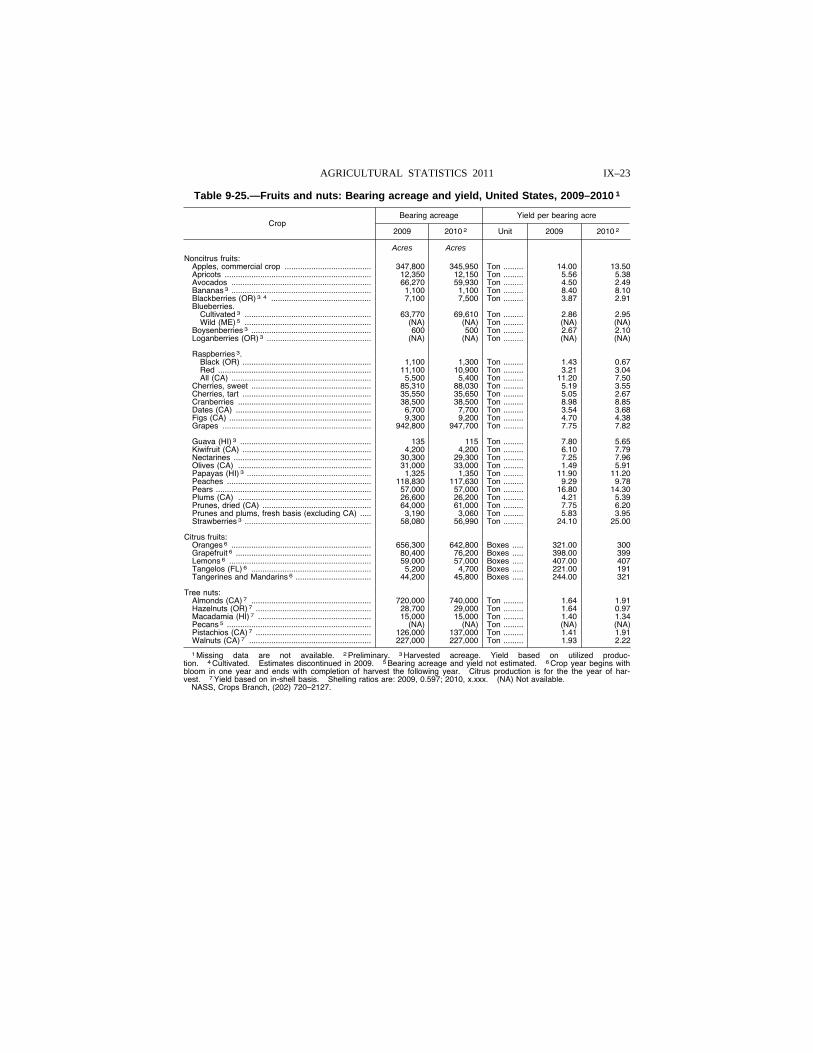
IX–23 AGRICULTURAL STATISTICS 2011
Table 9-25.—Fruits and nuts: Bearing acreage and yield, United States, 2009–2010 1
Crop Bearing acreage Yield per bearing acre
2009 2010 2 Unit 2009 2010 2
Acres Acres Noncitrus fruits:
Apples, commercial crop ....................................... 347,800 345,950 Ton ......... 14.00 13.50 Apricots .................................................................. 12,350 12,150 Ton ......... 5.56 5.38 Avocados ............................................................... 66,270 59,930 Ton ......... 4.50 2.49 Bananas 3 ............................................................... 1,100 1,100 Ton ......... 8.40 8.10 Blackberries (OR) 3 4 ............................................. 7,100 7,500 Ton ......... 3.87 2.91 Blueberries.
Cultivated 3 ......................................................... 63,770 69,610 Ton ......... 2.86 2.95 Wild (ME) 5 ......................................................... (NA) (NA) Ton ......... (NA) (NA)
Boysenberries 3 ...................................................... 600 500 Ton ......... 2.67 2.10 Loganberries (OR) 3 ............................................... (NA) (NA) Ton ......... (NA) (NA)
Raspberries 3.Black (OR) .......................................................... 1,100 1,300 Ton ......... 1.43 0.67 Red ..................................................................... 11,100 10,900 Ton ......... 3.21 3.04 All (CA) ............................................................... 5,500 5,400 Ton ......... 11.20 7.50
Cherries, sweet ...................................................... 85,310 88,030 Ton ......... 5.19 3.55 Cherries, tart .......................................................... 35,550 35,650 Ton ......... 5.05 2.67 Cranberries ............................................................ 38,500 38,500 Ton ......... 8.98 8.85 Dates (CA) ............................................................. 6,700 7,700 Ton ......... 3.54 3.68 Figs (CA) ................................................................ 9,300 9,200 Ton ......... 4.70 4.38 Grapes ................................................................... 942,800 947,700 Ton ......... 7.75 7.82
Guava (HI) 3 ........................................................... 135 115 Ton ......... 7.80 5.65 Kiwifruit (CA) .......................................................... 4,200 4,200 Ton ......... 6.10 7.79 Nectarines .............................................................. 30,300 29,300 Ton ......... 7.25 7.96 Olives (CA) ............................................................ 31,000 33,000 Ton ......... 1.49 5.91 Papayas (HI) 3 ........................................................ 1,325 1,350 Ton ......... 11.90 11.20 Peaches ................................................................. 118,830 117,630 Ton ......... 9.29 9.78 Pears ...................................................................... 57,000 57,000 Ton ......... 16.80 14.30 Plums (CA) ............................................................ 26,600 26,200 Ton ......... 4.21 5.39 Prunes, dried (CA) ................................................. 64,000 61,000 Ton ......... 7.75 6.20 Prunes and plums, fresh basis (excluding CA) ..... 3,190 3,060 Ton ......... 5.83 3.95 Strawberries 3 ......................................................... 58,080 56,990 Ton ......... 24.10 25.00
Citrus fruits: Oranges 6 ............................................................... 656,300 642,800 Boxes ..... 321.00 300 Grapefruit 6 ............................................................. 80,400 76,200 Boxes ..... 398.00 399 Lemons 6 ................................................................ 59,000 57,000 Boxes ..... 407.00 407 Tangelos (FL) 6 ...................................................... 5,200 4,700 Boxes ..... 221.00 191 Tangerines and Mandarins 6 .................................. 44,200 45,800 Boxes ..... 244.00 321
Tree nuts: Almonds (CA) 7 ...................................................... 720,000 740,000 Ton ......... 1.64 1.91 Hazelnuts (OR) 7 .................................................... 28,700 29,000 Ton ......... 1.64 0.97 Macadamia (HI) 7 ................................................... 15,000 15,000 Ton ......... 1.40 1.34 Pecans 5 ................................................................. (NA) (NA) Ton ......... (NA) (NA) Pistachios (CA) 7 .................................................... 126,000 137,000 Ton ......... 1.41 1.91 Walnuts (CA) 7 ....................................................... 227,000 227,000 Ton ......... 1.93 2.22
1 Missing data are not available. 2 Preliminary. 3 Harvested acreage. Yield based on utilized produc-tion. 4 Cultivated. Estimates discontinued in 2009. 5 Bearing acreage and yield not estimated. 6 Crop year begins with bloom in one year and ends with completion of harvest the following year. Citrus production is for the the year of har-vest. 7 Yield based on in-shell basis. Shelling ratios are: 2009, 0.597; 2010, x.xxx. (NA) Not available.
NASS, Crops Branch, (202) 720–2127.
VerDate Aug 31 2005 13:44 Mar 01, 2012 Jkt 000000 PO 00000 Frm 00023 Fmt 1000 Sfmt 1000 H:\SHARED\DAPP\FPU\AGSTAT\MASTER~2\CHAPTR09\IX-20.AG8 USDA
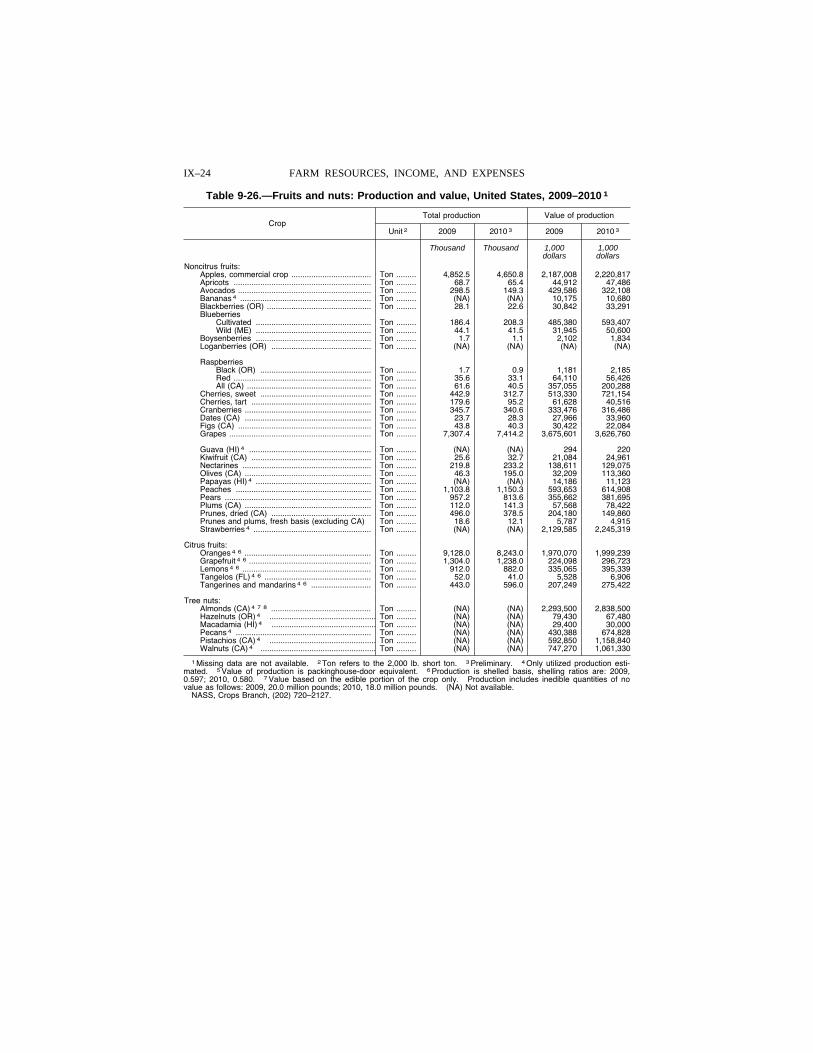
IX–24 FARM RESOURCES, INCOME, AND EXPENSES
Table 9-26.—Fruits and nuts: Production and value, United States, 2009–2010 1
Crop Total production Value of production
Unit 2 2009 2010 3 2009 2010 3
Thousand Thousand 1,000 1,000 dollars dollars
Noncitrus fruits: Apples, commercial crop .................................... Ton ......... 4,852.5 4,650.8 2,187,008 2,220,817 Apricots .............................................................. Ton ......... 68.7 65.4 44,912 47,486 Avocados ............................................................ Ton ......... 298.5 149.3 429,586 322,108 Bananas 4 ........................................................... Ton ......... (NA) (NA) 10,175 10,680 Blackberries (OR) ............................................... Ton ......... 28.1 22.6 30,842 33,291 Blueberries
Cultivated .................................................... Ton ......... 186.4 208.3 485,380 593,407 Wild (ME) .................................................... Ton ......... 44.1 41.5 31,945 50,600
Boysenberries .................................................... Ton ......... 1.7 1.1 2,102 1,834 Loganberries (OR) ............................................. Ton ......... (NA) (NA) (NA) (NA)
Raspberries Black (OR) .................................................. Ton ......... 1.7 0.9 1,181 2,185 Red .............................................................. Ton ......... 35.6 33.1 64,110 56,426 All (CA) ........................................................ Ton ......... 61.6 40.5 357,055 200,288
Cherries, sweet .................................................. Ton ......... 442.9 312.7 513,330 721,154 Cherries, tart ...................................................... Ton ......... 179.6 95.2 61,628 40,516 Cranberries ......................................................... Ton ......... 345.7 340.6 333,476 316,486 Dates (CA) ......................................................... Ton ......... 23.7 28.3 27,966 33,960 Figs (CA) ............................................................ Ton ......... 43.8 40.3 30,422 22,084 Grapes ................................................................ Ton ......... 7,307.4 7,414.2 3,675,601 3,626,760
Guava (HI) 4 ....................................................... Ton ......... (NA) (NA) 294 220 Kiwifruit (CA) ...................................................... Ton ......... 25.6 32.7 21,084 24,961 Nectarines .......................................................... Ton ......... 219.8 233.2 138,611 129,075 Olives (CA) ......................................................... Ton ......... 46.3 195.0 32,209 113,360 Papayas (HI) 4 .................................................... Ton ......... (NA) (NA) 14,186 11,123 Peaches ............................................................. Ton ......... 1,103.8 1,150.3 593,653 614,908 Pears .................................................................. Ton ......... 957.2 813.6 355,662 381,695 Plums (CA) ......................................................... Ton ......... 112.0 141.3 57,568 78,422 Prunes, dried (CA) ............................................. Ton ......... 496.0 378.5 204,180 149,860 Prunes and plums, fresh basis (excluding CA) Ton ......... 18.6 12.1 5,787 4,915 Strawberries 4 ..................................................... Ton ......... (NA) (NA) 2,129,585 2,245,319
Citrus fruits: Oranges 4 6 ......................................................... Ton ......... 9,128.0 8,243.0 1,970,070 1,999,239 Grapefruit 4 6 ....................................................... Ton ......... 1,304.0 1,238.0 224,098 296,723 Lemons 4 6 .......................................................... Ton ......... 912.0 882.0 335,065 395,339 Tangelos (FL) 4 6 ................................................ Ton ......... 52.0 41.0 5,528 6,906 Tangerines and mandarins 4 6 ........................... Ton ......... 443.0 596.0 207,249 275,422
Tree nuts: Almonds (CA) 4 7 8 ............................................. Ton ......... (NA) (NA) 2,293,500 2,838,500 Hazelnuts (OR) 4 ................................................ Ton ......... (NA) (NA) 79,430 67,480 Macadamia (HI) 4 ............................................... Ton ......... (NA) (NA) 29,400 30,000 Pecans 4 ............................................................. Ton ......... (NA) (NA) 430,388 674,828 Pistachios (CA) 4 ................................................ Ton ......... (NA) (NA) 592,850 1,158,840 Walnuts (CA) 4 .................................................... Ton ......... (NA) (NA) 747,270 1,061,330
1 Missing data are not available. 2 Ton refers to the 2,000 lb. short ton. 3 Preliminary. 4 Only utilized production esti-mated. 5 Value of production is packinghouse-door equivalent. 6 Production is shelled basis, shelling ratios are: 2009, 0.597; 2010, 0.580. 7 Value based on the edible portion of the crop only. Production includes inedible quantities of no value as follows: 2009, 20.0 million pounds; 2010, 18.0 million pounds. (NA) Not available.
NASS, Crops Branch, (202) 720–2127.
VerDate Aug 31 2005 13:44 Mar 01, 2012 Jkt 000000 PO 00000 Frm 00024 Fmt 1000 Sfmt 1000 H:\SHARED\DAPP\FPU\AGSTAT\MASTER~2\CHAPTR09\IX-21.AG8 USDA
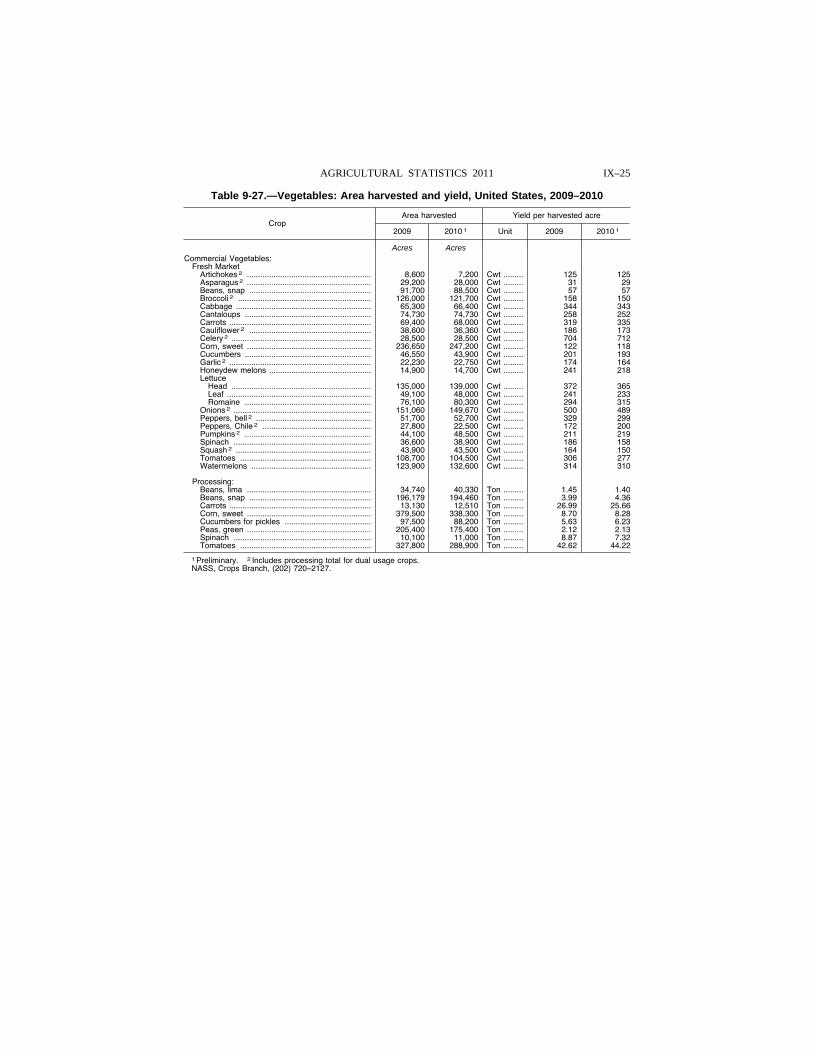
IX–25 AGRICULTURAL STATISTICS 2011
Table 9-27.—Vegetables: Area harvested and yield, United States, 2009–2010
Crop Area harvested Yield per harvested acre
2009 2010 1 Unit 2009 2010 1
Acres Acres Commercial Vegetables:
Fresh Market Artichokes 2 ........................................................ 8,600 7,200 Cwt ......... 125 125 Asparagus 2 ........................................................ 29,200 28,000 Cwt ......... 31 29 Beans, snap ....................................................... 91,700 88,500 Cwt ......... 57 57 Broccoli 2 ............................................................ 126,000 121,700 Cwt ......... 158 150 Cabbage ............................................................. 65,300 66,400 Cwt ......... 344 343 Cantaloups ......................................................... 74,730 74,730 Cwt ......... 258 252 Carrots ................................................................ 69,400 68,000 Cwt ......... 319 335 Cauliflower 2 ....................................................... 38,600 36,360 Cwt ......... 186 173 Celery 2 ............................................................... 28,500 28,500 Cwt ......... 704 712 Corn, sweet ........................................................ 236,650 247,200 Cwt ......... 122 118 Cucumbers ......................................................... 46,550 43,900 Cwt ......... 201 193 Garlic 2 ................................................................ 22,230 22,750 Cwt ......... 174 164 Honeydew melons .............................................. 14,900 14,700 Cwt ......... 241 218 Lettuce
Head ............................................................... 135,000 139,000 Cwt ......... 372 365 Leaf ................................................................. 49,100 48,000 Cwt ......... 241 233 Romaine ......................................................... 76,100 80,300 Cwt ......... 294 315
Onions 2 .............................................................. 151,060 149,670 Cwt ......... 500 489 Peppers, bell 2 .................................................... 51,700 52,700 Cwt ......... 329 299 Peppers, Chile 2 ................................................. 27,800 22,500 Cwt ......... 172 200 Pumpkins 2 ......................................................... 44,100 48,500 Cwt ......... 211 219 Spinach .............................................................. 36,600 38,900 Cwt ......... 186 158 Squash 2 ............................................................. 43,900 43,500 Cwt ......... 164 150 Tomatoes ........................................................... 108,700 104,500 Cwt ......... 306 277 Watermelons ...................................................... 123,900 132,600 Cwt ......... 314 310
Processing: Beans, lima ........................................................ 34,740 40,330 Ton ......... 1.45 1.40 Beans, snap ....................................................... 196,179 194,460 Ton ......... 3.99 4.36 Carrots ................................................................ 13,130 12,510 Ton ......... 26.99 25.66 Corn, sweet ........................................................ 379,500 338,300 Ton ......... 8.70 8.28 Cucumbers for pickles ....................................... 97,500 88,200 Ton ......... 5.63 6.23 Peas, green ........................................................ 205,400 175,400 Ton ......... 2.12 2.13 Spinach .............................................................. 10,100 11,000 Ton ......... 8.87 7.32 Tomatoes ........................................................... 327,800 288,900 Ton ......... 42.62 44.22
1 Preliminary. 2 Includes processing total for dual usage crops. NASS, Crops Branch, (202) 720–2127.
VerDate Aug 31 2005 13:44 Mar 01, 2012 Jkt 000000 PO 00000 Frm 00025 Fmt 1000 Sfmt 1000 H:\SHARED\DAPP\FPU\AGSTAT\MASTER~2\CHAPTR09\IX-22.AG8 USDA
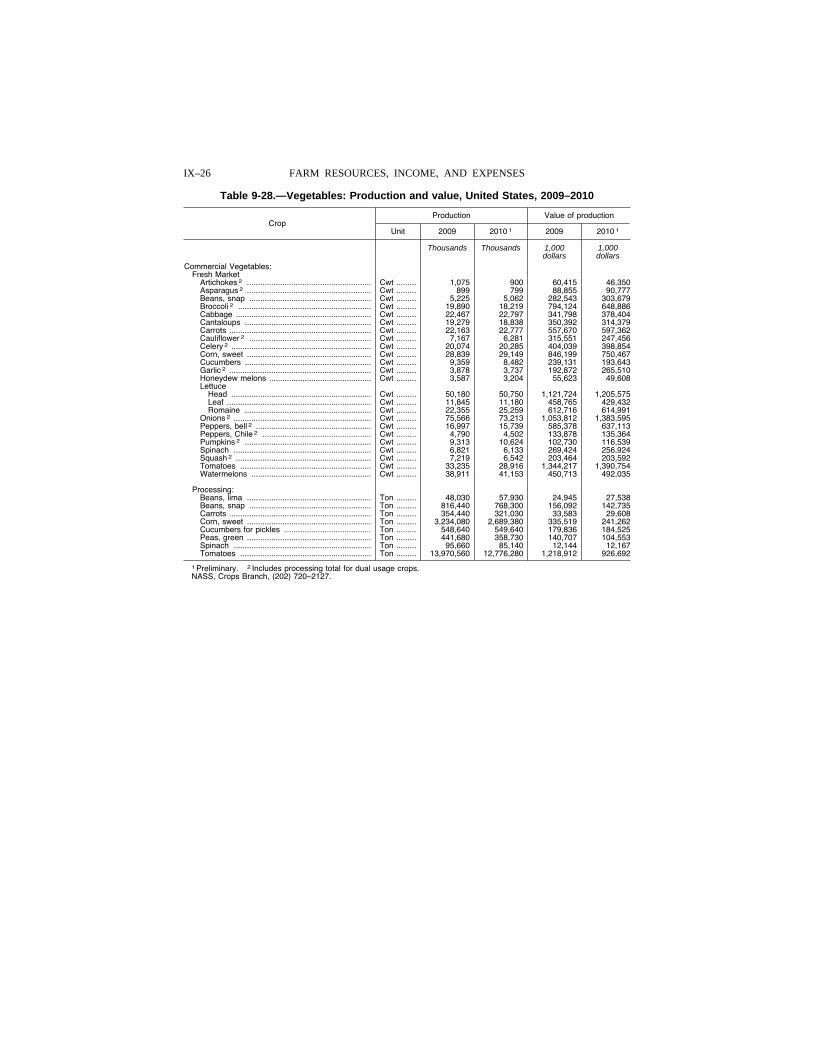
IX–26 FARM RESOURCES, INCOME, AND EXPENSES
Table 9-28.—Vegetables: Production and value, United States, 2009–2010
Crop Production Value of production
Unit 2009 2010 1 2009 2010 1
Thousands Thousands 1,000 1,000 dollars dollars
Commercial Vegetables: Fresh Market
Artichokes 2 ........................................................ Cwt ......... 1,075 900 60,415 46,350 Asparagus 2 ........................................................ Cwt ......... 899 799 88,855 90,777 Beans, snap ....................................................... Cwt ......... 5,225 5,062 282,543 303,679 Broccoli 2 ............................................................ Cwt ......... 19,890 18,219 794,124 648,886 Cabbage ............................................................. Cwt ......... 22,467 22,797 341,798 378,404 Cantaloups ......................................................... Cwt ......... 19,279 18,838 350,392 314,379 Carrots ................................................................ Cwt ......... 22,163 22,777 557,670 597,362 Cauliflower 2 ....................................................... Cwt ......... 7,167 6,281 315,551 247,456 Celery 2 ............................................................... Cwt ......... 20,074 20,285 404,039 398,854 Corn, sweet ........................................................ Cwt ......... 28,839 29,149 846,199 750,467 Cucumbers ......................................................... Cwt ......... 9,359 8,482 239,131 193,643 Garlic 2 ................................................................ Cwt ......... 3,878 3,737 192,872 265,510 Honeydew melons .............................................. Cwt ......... 3,587 3,204 55,623 49,608 Lettuce
Head ............................................................... Cwt ......... 50,180 50,750 1,121,724 1,205,575 Leaf ................................................................. Cwt ......... 11,845 11,180 458,765 429,432 Romaine ......................................................... Cwt ......... 22,355 25,259 612,716 614,991
Onions 2 .............................................................. Cwt ......... 75,566 73,213 1,053,812 1,383,595 Peppers, bell 2 .................................................... Cwt ......... 16,997 15,739 585,378 637,113 Peppers, Chile 2 ................................................. Cwt ......... 4,790 4,502 133,878 135,364 Pumpkins 2 ......................................................... Cwt ......... 9,313 10,624 102,730 116,539 Spinach .............................................................. Cwt ......... 6,821 6,133 269,424 256,924 Squash 2 ............................................................. Cwt ......... 7,219 6,542 203,464 203,592 Tomatoes ........................................................... Cwt ......... 33,235 28,916 1,344,217 1,390,754 Watermelons ...................................................... Cwt ......... 38,911 41,153 450,713 492,035
Processing: Beans, lima ........................................................ Ton ......... 48,030 57,930 24,945 27,538 Beans, snap ....................................................... Ton ......... 816,440 768,300 156,092 142,735 Carrots ................................................................ Ton ......... 354,440 321,030 33,583 29,608 Corn, sweet ........................................................ Ton ......... 3,234,080 2,689,380 335,519 241,262 Cucumbers for pickles ....................................... Ton ......... 548,640 549,640 179,836 184,525 Peas, green ........................................................ Ton ......... 441,680 358,730 140,707 104,553 Spinach .............................................................. Ton ......... 95,660 85,140 12,144 12,167 Tomatoes ........................................................... Ton ......... 13,970,560 12,776,280 1,218,912 926,692
1 Preliminary. 2 Includes processing total for dual usage crops. NASS, Crops Branch, (202) 720–2127.
VerDate Aug 31 2005 13:44 Mar 01, 2012 Jkt 000000 PO 00000 Frm 00026 Fmt 1000 Sfmt 1000 H:\SHARED\DAPP\FPU\AGSTAT\MASTER~2\CHAPTR09\IX-23.AG8 USDA
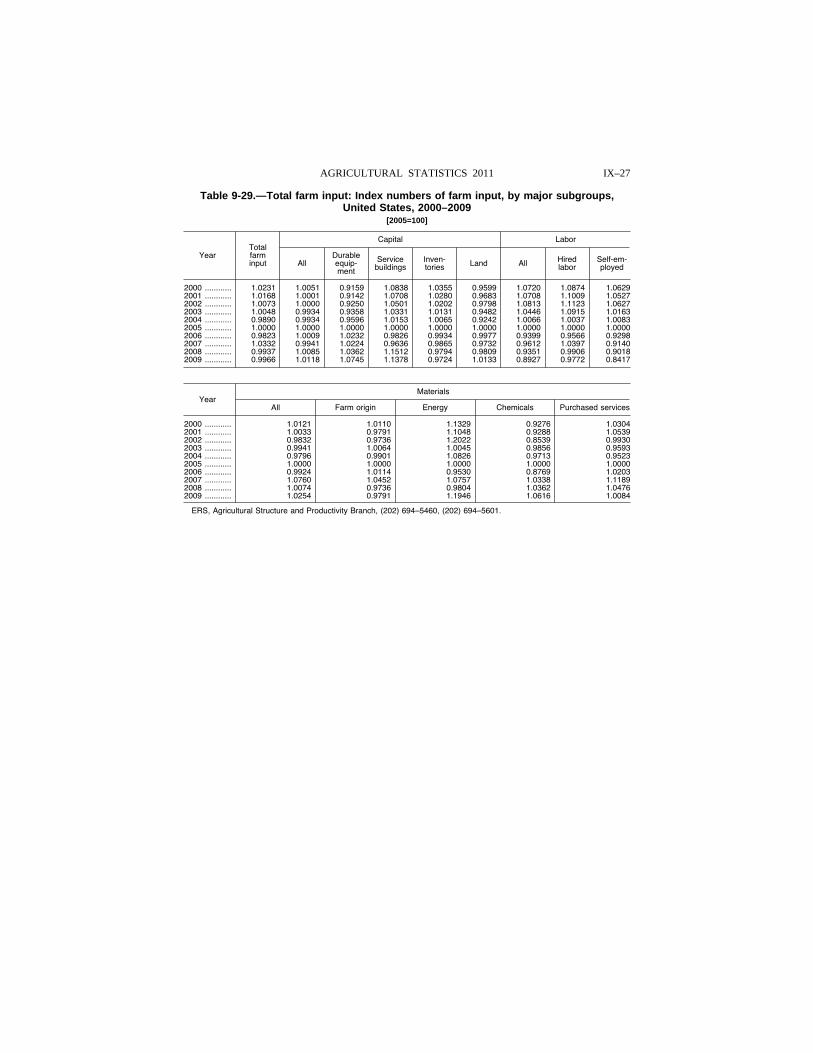
IX–27 AGRICULTURAL STATISTICS 2011
Table 9-29.—Total farm input: Index numbers of farm input, by major subgroups, United States, 2000–2009
[2005=100]
Year Total farm input
Capital Labor
All Durable equip-ment
Service buildings
Inven-tories Land All Hired
labor Self-em-ployed
2000 ............ 1.0231 1.0051 0.9159 1.0838 1.0355 0.9599 1.0720 1.0874 1.0629 2001 ............ 1.0168 1.0001 0.9142 1.0708 1.0280 0.9683 1.0708 1.1009 1.0527 2002 ............ 1.0073 1.0000 0.9250 1.0501 1.0202 0.9798 1.0813 1.1123 1.0627 2003 ............ 1.0048 0.9934 0.9358 1.0331 1.0131 0.9482 1.0446 1.0915 1.0163 2004 ............ 0.9890 0.9934 0.9596 1.0153 1.0065 0.9242 1.0066 1.0037 1.0083 2005 ............ 1.0000 1.0000 1.0000 1.0000 1.0000 1.0000 1.0000 1.0000 1.0000 2006 ............ 0.9823 1.0009 1.0232 0.9826 0.9934 0.9977 0.9399 0.9566 0.9298 2007 ............ 1.0332 0.9941 1.0224 0.9636 0.9865 0.9732 0.9612 1.0397 0.9140 2008 ............ 0.9937 1.0085 1.0362 1.1512 0.9794 0.9809 0.9351 0.9906 0.9018 2009 ............ 0.9966 1.0118 1.0745 1.1378 0.9724 1.0133 0.8927 0.9772 0.8417
Year Materials
All Farm origin Energy Chemicals Purchased services
2000 ............ 1.0121 1.0110 1.1329 0.9276 1.0304 2001 ............ 1.0033 0.9791 1.1048 0.9288 1.0539 2002 ............ 0.9832 0.9736 1.2022 0.8539 0.9930 2003 ............ 0.9941 1.0064 1.0045 0.9856 0.9593 2004 ............ 0.9796 0.9901 1.0826 0.9713 0.9523 2005 ............ 1.0000 1.0000 1.0000 1.0000 1.0000 2006 ............ 0.9924 1.0114 0.9530 0.8769 1.0203 2007 ............ 1.0760 1.0452 1.0757 1.0338 1.1189 2008 ............ 1.0074 0.9736 0.9804 1.0362 1.0476 2009 ............ 1.0254 0.9791 1.1946 1.0616 1.0084
ERS, Agricultural Structure and Productivity Branch, (202) 694–5460, (202) 694–5601.
VerDate Aug 31 2005 13:44 Mar 01, 2012 Jkt 000000 PO 00000 Frm 00027 Fmt 1000 Sfmt 1000 H:\SHARED\DAPP\FPU\AGSTAT\MASTER~2\CHAPTR09\IX-24.AG8 USDA
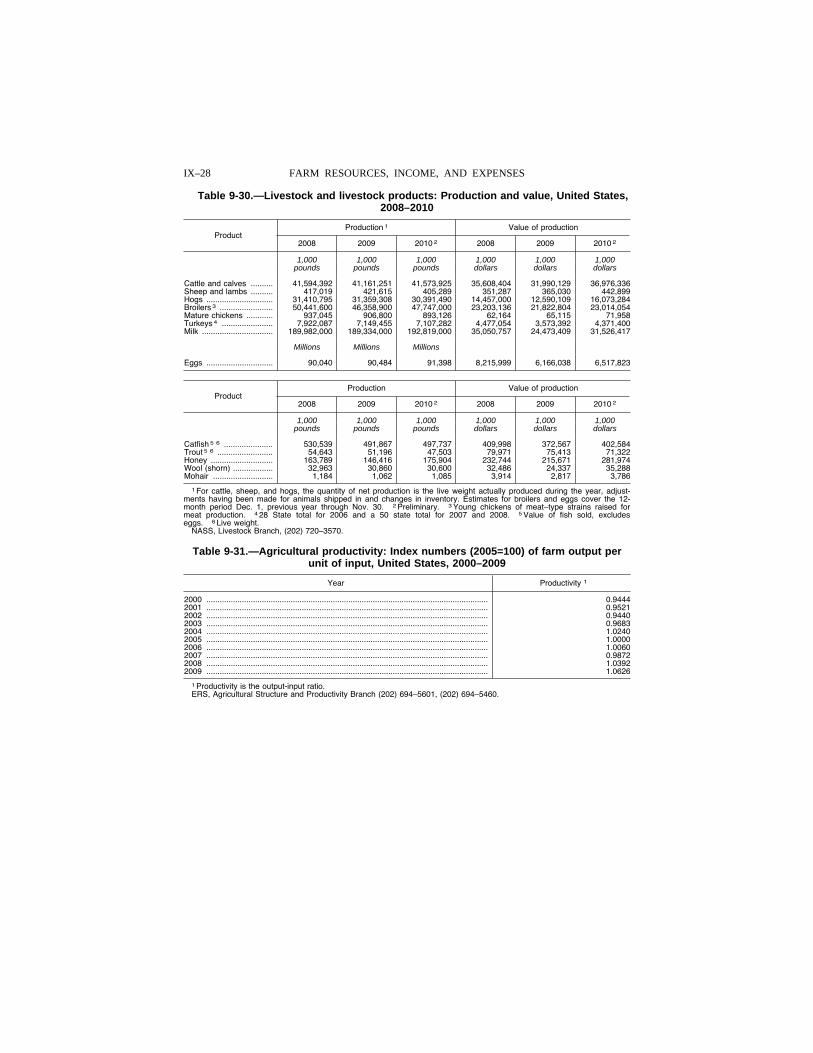
IX–28 FARM RESOURCES, INCOME, AND EXPENSES
Table 9-30.—Livestock and livestock products: Production and value, United States, 2008–2010
Product Production 1 Value of production
2008 2009 2010 2 2008 2009 2010 2
1,000 1,000 1,000 1,000 1,000 1,000 pounds pounds pounds dollars dollars dollars
Cattle and calves .......... 41,594,392 41,161,251 41,573,925 35,608,404 31,990,129 36,976,336 Sheep and lambs .......... 417,019 421,615 405,289 351,287 365,030 442,899 Hogs .............................. 31,410,795 31,359,308 30,391,490 14,457,000 12,590,109 16,073,284 Broilers 3 ........................ 50,441,600 46,358,900 47,747,000 23,203,136 21,822,804 23,014,054 Mature chickens ............ 937,045 906,800 893,126 62,164 65,115 71,958 Turkeys 4 ....................... 7,922,087 7,149,455 7,107,282 4,477,054 3,573,392 4,371,400 Milk ................................ 189,982,000 189,334,000 192,819,000 35,050,757 24,473,409 31,526,417
Millions Millions Millions
Eggs .............................. 90,040 90,484 91,398 8,215,999 6,166,038 6,517,823
Product Production Value of production
2008 2009 2010 2 2008 2009 2010 2
1,000 1,000 1,000 1,000 1,000 1,000 pounds pounds pounds dollars dollars dollars
Catfish 5 6 ...................... 530,539 491,867 497,737 409,998 372,567 402,584 Trout 5 6 ......................... 54,643 51,196 47,503 79,971 75,413 71,322 Honey ............................ 163,789 146,416 175,904 232,744 215,671 281,974 Wool (shorn) .................. 32,963 30,860 30,600 32,486 24,337 35,288 Mohair ........................... 1,184 1,062 1,085 3,914 2,817 3,786
1 For cattle, sheep, and hogs, the quantity of net production is the live weight actually produced during the year, adjust-ments having been made for animals shipped in and changes in inventory. Estimates for broilers and eggs cover the 12- month period Dec. 1, previous year through Nov. 30. 2 Preliminary. 3 Young chickens of meat–type strains raised for meat production. 4 28 State total for 2006 and a 50 state total for 2007 and 2008. 5 Value of fish sold, excludes eggs. 6 Live weight.
NASS, Livestock Branch, (202) 720–3570.
Table 9-31.—Agricultural productivity: Index numbers (2005=100) of farm output per unit of input, United States, 2000–2009
Year Productivity 1
2000 ............................................................................................................................... 0.9444 2001 ............................................................................................................................... 0.9521 2002 ............................................................................................................................... 0.9440 2003 ............................................................................................................................... 0.9683 2004 ............................................................................................................................... 1.0240 2005 ............................................................................................................................... 1.0000 2006 ............................................................................................................................... 1.0060 2007 ............................................................................................................................... 0.9872 2008 ............................................................................................................................... 1.0392 2009 ............................................................................................................................... 1.0626
1 Productivity is the output-input ratio. ERS, Agricultural Structure and Productivity Branch (202) 694–5601, (202) 694–5460.
VerDate Aug 31 2005 13:44 Mar 01, 2012 Jkt 000000 PO 00000 Frm 00028 Fmt 1000 Sfmt 1000 H:\SHARED\DAPP\FPU\AGSTAT\MASTER~2\CHAPTR09\IX-25.AG8 USDA
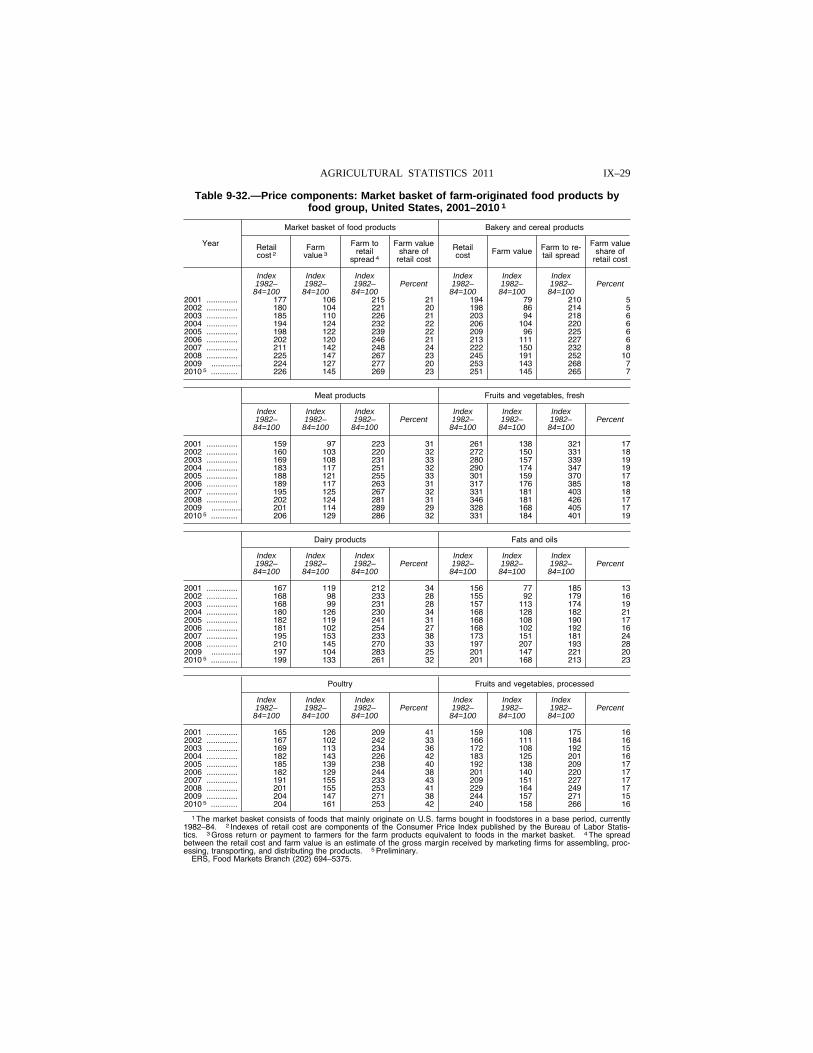
IX–29 AGRICULTURAL STATISTICS 2011
Table 9-32.—Price components: Market basket of farm-originated food products by food group, United States, 2001–2010 1
Year
Market basket of food products Bakery and cereal products
Retail cost 2
Farm value 3
Farm to retail
spread 4
Farm value share of
retail cost
Retail cost Farm value Farm to re-
tail spread
Farm value share of
retail cost
Index Index Index Index Index Index 1982–
84=100 1982–
84=100 1982–
84=100 Percent 1982–
84=100 1982–
84=100 1982–
84=100 Percent
2001 .............. 177 106 215 21 194 79 210 5 2002 .............. 180 104 221 20 198 86 214 5 2003 .............. 185 110 226 21 203 94 218 6 2004 .............. 194 124 232 22 206 104 220 6 2005 .............. 198 122 239 22 209 96 225 6 2006 .............. 202 120 246 21 213 111 227 6 2007 .............. 211 142 248 24 222 150 232 8 2008 .............. 225 147 267 23 245 191 252 10 2009 .............. 224 127 277 20 253 143 268 7 2010 5 ............ 226 145 269 23 251 145 265 7
Meat products Fruits and vegetables, fresh
Index 1982–
84=100
Index 1982–
84=100
Index 1982–
84=100 Percent
Index 1982–
84=100
Index 1982–
84=100
Index 1982–
84=100 Percent
2001 .............. 159 97 223 31 261 138 321 17 2002 .............. 160 103 220 32 272 150 331 18 2003 .............. 169 108 231 33 280 157 339 19 2004 .............. 183 117 251 32 290 174 347 19 2005 .............. 188 121 255 33 301 159 370 17 2006 .............. 189 117 263 31 317 176 385 18 2007 .............. 195 125 267 32 331 181 403 18 2008 .............. 202 124 281 31 346 181 426 17 2009 .............. 201 114 289 29 328 168 405 17 2010 5 ............ 206 129 286 32 331 184 401 19
Dairy products Fats and oils
Index 1982–
84=100
Index 1982–
84=100
Index 1982–
84=100 Percent
Index 1982–
84=100
Index 1982–
84=100
Index 1982–
84=100 Percent
2001 .............. 167 119 212 34 156 77 185 13 2002 .............. 168 98 233 28 155 92 179 16 2003 .............. 168 99 231 28 157 113 174 19 2004 .............. 180 126 230 34 168 128 182 21 2005 .............. 182 119 241 31 168 108 190 17 2006 .............. 181 102 254 27 168 102 192 16 2007 .............. 195 153 233 38 173 151 181 24 2008 .............. 210 145 270 33 197 207 193 28 2009 .............. 197 104 283 25 201 147 221 20 2010 5 ............ 199 133 261 32 201 168 213 23
Poultry Fruits and vegetables, processed
Index 1982–
84=100
Index 1982–
84=100
Index 1982–
84=100 Percent
Index 1982–
84=100
Index 1982–
84=100
Index 1982–
84=100 Percent
2001 .............. 165 126 209 41 159 108 175 16 2002 .............. 167 102 242 33 166 111 184 16 2003 .............. 169 113 234 36 172 108 192 15 2004 .............. 182 143 226 42 183 125 201 16 2005 .............. 185 139 238 40 192 138 209 17 2006 .............. 182 129 244 38 201 140 220 17 2007 .............. 191 155 233 43 209 151 227 17 2008 .............. 201 155 253 41 229 164 249 17 2009 .............. 204 147 271 38 244 157 271 15 2010 5 ............ 204 161 253 42 240 158 266 16
1 The market basket consists of foods that mainly originate on U.S. farms bought in foodstores in a base period, currently 1982–84. 2 Indexes of retail cost are components of the Consumer Price Index published by the Bureau of Labor Statis-tics. 3 Gross return or payment to farmers for the farm products equivalent to foods in the market basket. 4 The spread between the retail cost and farm value is an estimate of the gross margin received by marketing firms for assembling, proc-essing, transporting, and distributing the products. 5 Preliminary.
ERS, Food Markets Branch (202) 694–5375.
VerDate Aug 31 2005 13:44 Mar 01, 2012 Jkt 000000 PO 00000 Frm 00029 Fmt 1000 Sfmt 1000 H:\SHARED\DAPP\FPU\AGSTAT\MASTER~2\CHAPTR09\IX-26.AG8 USDA
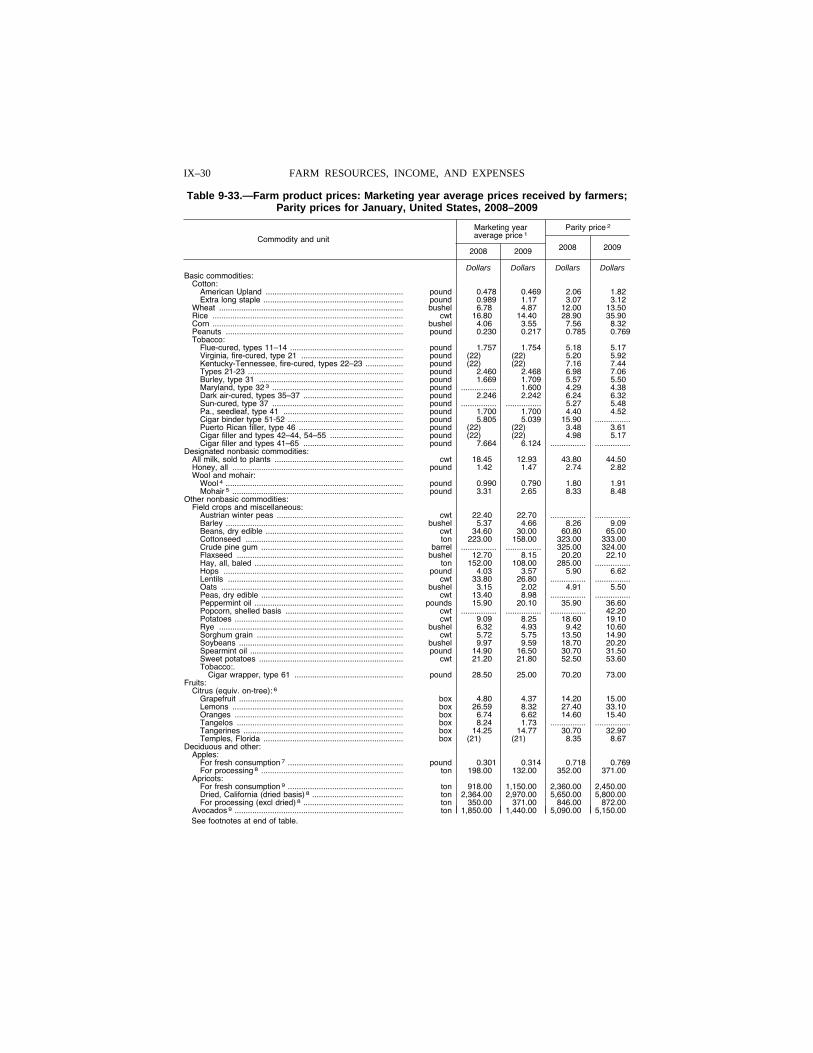
IX–30 FARM RESOURCES, INCOME, AND EXPENSES
Table 9-33.—Farm product prices: Marketing year average prices received by farmers; Parity prices for January, United States, 2008–2009
Commodity and unit
Marketing year average price 1
Parity price 2
2008 2009 2008 2009
Dollars Dollars Dollars Dollars Basic commodities:
Cotton: American Upland .............................................................. pound 0 .478 0 .469 2 .06 1 .82 Extra long staple ............................................................... pound 0 .989 1 .17 3 .07 3 .12
Wheat ................................................................................... bushel 6 .78 4 .87 12 .00 13 .50 Rice ...................................................................................... cwt 16 .80 14 .40 28 .90 35 .90 Corn ...................................................................................... bushel 4 .06 3 .55 7 .56 8 .32 Peanuts ................................................................................ pound 0 .230 0 .217 0 .785 0 .769 Tobacco:
Flue-cured, types 11–14 ................................................... pound 1 .757 1 .754 5 .18 5 .17 Virginia, fire-cured, type 21 .............................................. pound (22) (22) 5 .20 5 .92 Kentucky-Tennessee, fire-cured, types 22–23 ................. pound (22) (22) 7 .16 7 .44 Types 21-23 ...................................................................... pound 2 .460 2 .468 6 .98 7 .06 Burley, type 31 ................................................................. pound 1 .669 1 .709 5 .57 5 .50 Maryland, type 32 3 ........................................................... pound ................ 1 .600 4 .29 4 .38 Dark air-cured, types 35–37 ............................................. pound 2 .246 2 .242 6 .24 6 .32 Sun-cured, type 37 ........................................................... pound ................ ................ 5 .27 5 .48 Pa., seedleaf, type 41 ...................................................... pound 1 .700 1 .700 4 .40 4 .52 Cigar binder type 51-52 .................................................... pound 5 .805 5 .039 15 .90 ................Puerto Rican filler, type 46 ............................................... pound (22) (22) 3 .48 3 .61 Cigar filler and types 42–44, 54–55 ................................. pound (22) (22) 4 .98 5 .17 Cigar filler and types 41–65 ............................................. pound 7 .664 6 .124 ................ ................
Designated nonbasic commodities: All milk, sold to plants .......................................................... cwt 18 .45 12 .93 43 .80 44 .50 Honey, all ............................................................................. pound 1 .42 1 .47 2 .74 2 .82 Wool and mohair:
Wool 4 ................................................................................ pound 0 .990 0 .790 1 .80 1 .91 Mohair 5 ............................................................................. pound 3 .31 2 .65 8 .33 8 .48
Other nonbasic commodities: Field crops and miscellaneous:
Austrian winter peas ......................................................... cwt 22 .40 22 .70 ................ ................Barley ................................................................................ bushel 5 .37 4 .66 8 .26 9 .09 Beans, dry edible .............................................................. cwt 34 .60 30 .00 60 .80 65 .00 Cottonseed ....................................................................... ton 223 .00 158 .00 323 .00 333 .00 Crude pine gum ................................................................ barrel ................ ................ 325 .00 324 .00 Flaxseed ........................................................................... bushel 12 .70 8 .15 20 .20 22 .10 Hay, all, baled ................................................................... ton 152 .00 108 .00 285 .00 ................Hops ................................................................................. pound 4 .03 3 .57 5 .90 6 .62 Lentils ............................................................................... cwt 33 .80 26 .80 ................ ................Oats .................................................................................. bushel 3 .15 2 .02 4 .91 5 .50 Peas, dry edible ................................................................ cwt 13 .40 8 .98 ................ ................Peppermint oil ................................................................... pounds 15 .90 20 .10 35 .90 36 .60 Popcorn, shelled basis ..................................................... cwt ................ ................ ................ 42 .20 Potatoes ............................................................................ cwt 9 .09 8 .25 18 .60 19 .10 Rye ................................................................................... bushel 6 .32 4 .93 9 .42 10 .60 Sorghum grain .................................................................. cwt 5 .72 5 .75 13 .50 14 .90 Soybeans .......................................................................... bushel 9 .97 9 .59 18 .70 20 .20 Spearmint oil ..................................................................... pound 14 .90 16 .50 30 .70 31 .50 Sweet potatoes ................................................................. cwt 21 .20 21 .80 52 .50 53 .60 Tobacco:.
Cigar wrapper, type 61 ................................................. pound 28 .50 25 .00 70 .20 73 .00 Fruits:
Citrus (equiv. on-tree): 6 Grapefruit .......................................................................... box 4 .80 4 .37 14 .20 15 .00 Lemons ............................................................................. box 26 .59 8 .32 27 .40 33 .10 Oranges ............................................................................ box 6 .74 6 .62 14 .60 15 .40 Tangelos ........................................................................... box 8 .24 1 .73 ................ ................Tangerines ........................................................................ box 14 .25 14 .77 30 .70 32 .90 Temples, Florida ............................................................... box (21) (21) 8 .35 8 .67
Deciduous and other: Apples:
For fresh consumption 7 .................................................... pound 0 .301 0 .314 0 .718 0 .769 For processing 8 ................................................................ ton 198 .00 132 .00 352 .00 371 .00
Apricots: For fresh consumption 9 .................................................... ton 918 .00 1,150 .00 2,360 .00 2,450 .00 Dried, California (dried basis) 8 ......................................... ton 2,364 .00 2,970 .00 5,650 .00 5,800 .00 For processing (excl dried) 8 ............................................. ton 350 .00 371 .00 846 .00 872 .00
Avocados 9 ............................................................................ ton 1,850 .00 1,440 .00 5,090 .00 5,150 .00 See footnotes at end of table.
VerDate Aug 31 2005 13:44 Mar 01, 2012 Jkt 000000 PO 00000 Frm 00030 Fmt 1000 Sfmt 1000 H:\SHARED\DAPP\FPU\AGSTAT\MASTER~2\CHAPTR09\IX-27.AG8 USDA
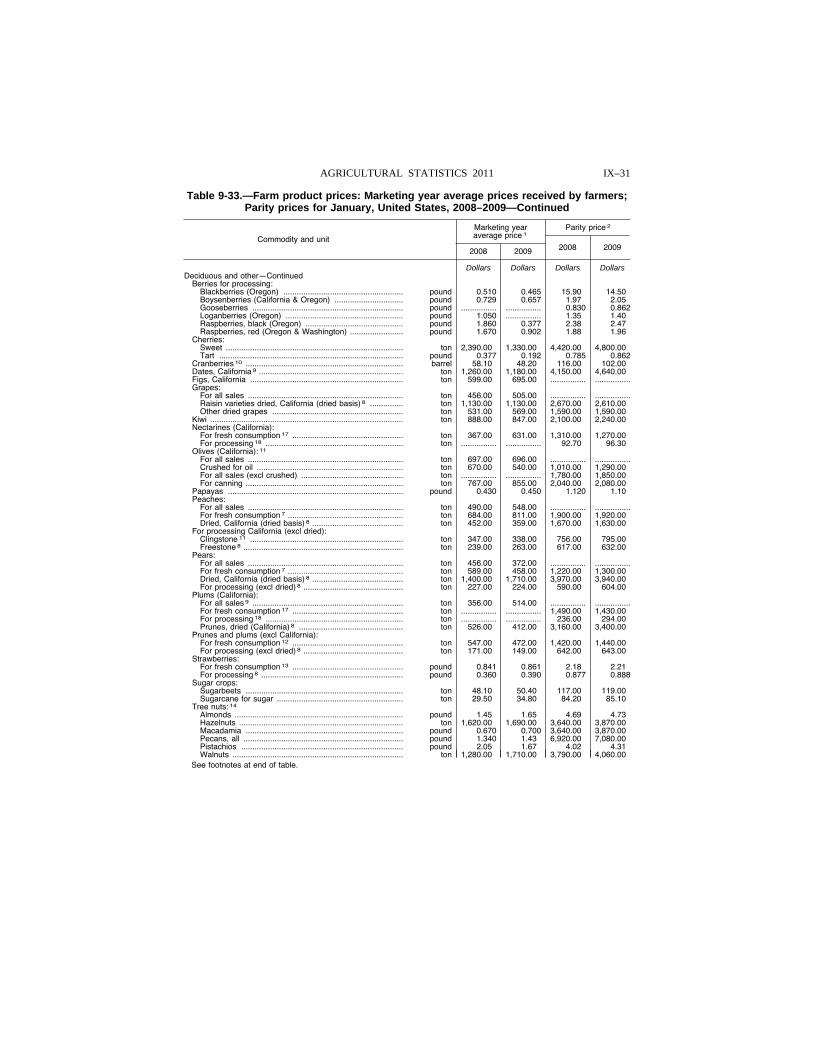
IX–31 AGRICULTURAL STATISTICS 2011
Table 9-33.—Farm product prices: Marketing year average prices received by farmers; Parity prices for January, United States, 2008–2009—Continued
Commodity and unit
Marketing year average price 1
Parity price 2
2008 2009 2008 2009
Dollars Dollars Dollars Dollars Deciduous and other—Continued
Berries for processing: Blackberries (Oregon) ...................................................... pound 0 .510 0 .465 15 .90 14 .50 Boysenberries (California & Oregon) ............................... pound 0 .729 0 .657 1 .97 2 .05 Gooseberries .................................................................... pound ................ ................ 0 .830 0 .862 Loganberries (Oregon) ..................................................... pound 1 .050 ................ 1 .35 1 .40 Raspberries, black (Oregon) ............................................ pound 1 .860 0 .377 2 .38 2 .47 Raspberries, red (Oregon & Washington) ........................ pound 1 .670 0 .902 1 .88 1 .96
Cherries: Sweet ................................................................................ ton 2,390 .00 1,330 .00 4,420 .00 4,800 .00 Tart ................................................................................... pound 0 .377 0 .192 0 .785 0 .862
Cranberries 10 ....................................................................... barrel 58 .10 48 .20 116 .00 102 .00 Dates, California 9 ................................................................. ton 1,260 .00 1,180 .00 4,150 .00 4,640 .00 Figs, California ..................................................................... ton 599 .00 695 .00 ................ ................Grapes:
For all sales ...................................................................... ton 456 .00 505 .00 ................ ................Raisin varieties dried, California (dried basis) 8 ............... ton 1,130 .00 1,130 .00 2,670 .00 2,610 .00 Other dried grapes ........................................................... ton 531 .00 569 .00 1,590 .00 1,590 .00
Kiwi ....................................................................................... ton 888 .00 847 .00 2,100 .00 2,240 .00 Nectarines (California):
For fresh consumption 17 .................................................. ton 367 .00 631 .00 1,310 .00 1,270 .00 For processing 18 .............................................................. ton ................ ................ 92 .70 96 .30
Olives (California): 11 For all sales ...................................................................... ton 697 .00 696 .00 ................ ................Crushed for oil .................................................................. ton 670 .00 540 .00 1,010 .00 1,290 .00 For all sales (excl crushed) .............................................. ton ................ ................ 1,780 .00 1,850 .00 For canning ....................................................................... ton 767 .00 855 .00 2,040 .00 2,080 .00
Papayas ............................................................................... pound 0 .430 0 .450 1 .120 1 .10 Peaches:
For all sales ...................................................................... ton 490 .00 548 .00 ................ ................For fresh consumption 7 .................................................... ton 684 .00 811 .00 1,900 .00 1,920 .00 Dried, California (dried basis) 8 ......................................... ton 452 .00 359 .00 1,670 .00 1,630 .00
For processing California (excl dried): Clingstone 11 ..................................................................... ton 347 .00 338 .00 756 .00 795 .00 Freestone 8 ........................................................................ ton 239 .00 263 .00 617 .00 632 .00
Pears: For all sales ...................................................................... ton 456 .00 372 .00 ................ ................For fresh consumption 7 .................................................... ton 589 .00 458 .00 1,220 .00 1,300 .00 Dried, California (dried basis) 8 ......................................... ton 1,400 .00 1,710 .00 3,970 .00 3,940 .00 For processing (excl dried) 8 ............................................. ton 227 .00 224 .00 590 .00 604 .00
Plums (California): For all sales 9 .................................................................... ton 356 .00 514 .00 ................ ................For fresh consumption 17 .................................................. ton ................ ................ 1,490 .00 1,430 .00 For processing 18 .............................................................. ton ................ ................ 236 .00 294 .00 Prunes, dried (California) 8 ............................................... ton 526 .00 412 .00 3,160 .00 3,400 .00
Prunes and plums (excl California): For fresh consumption 12 .................................................. ton 547 .00 472 .00 1,420 .00 1,440 .00 For processing (excl dried) 8 ............................................. ton 171 .00 149 .00 642 .00 643 .00
Strawberries: For fresh consumption 13 .................................................. pound 0 .841 0 .861 2 .18 2 .21 For processing 8 ................................................................ pound 0 .360 0 .390 0 .877 0 .888
Sugar crops: Sugarbeets ....................................................................... ton 48 .10 50 .40 117 .00 119 .00 Sugarcane for sugar ......................................................... ton 29 .50 34 .80 84 .20 85 .10
Tree nuts: 14 Almonds ............................................................................ pound 1 .45 1 .65 4 .69 4 .73 Hazelnuts .......................................................................... ton 1,620 .00 1,690 .00 3,640 .00 3,870 .00 Macadamia ....................................................................... pound 0 .670 0 .700 3,640 .00 3,870 .00 Pecans, all ........................................................................ pound 1 .340 1 .43 6,920 .00 7,080 .00 Pistachios ......................................................................... pound 2 .05 1 .67 4 .02 4 .31 Walnuts ............................................................................. ton 1,280 .00 1,710 .00 3,790 .00 4,060 .00
See footnotes at end of table.
VerDate Aug 31 2005 13:44 Mar 01, 2012 Jkt 000000 PO 00000 Frm 00031 Fmt 1000 Sfmt 1000 H:\SHARED\DAPP\FPU\AGSTAT\MASTER~2\CHAPTR09\IX-28.AG8 USDA
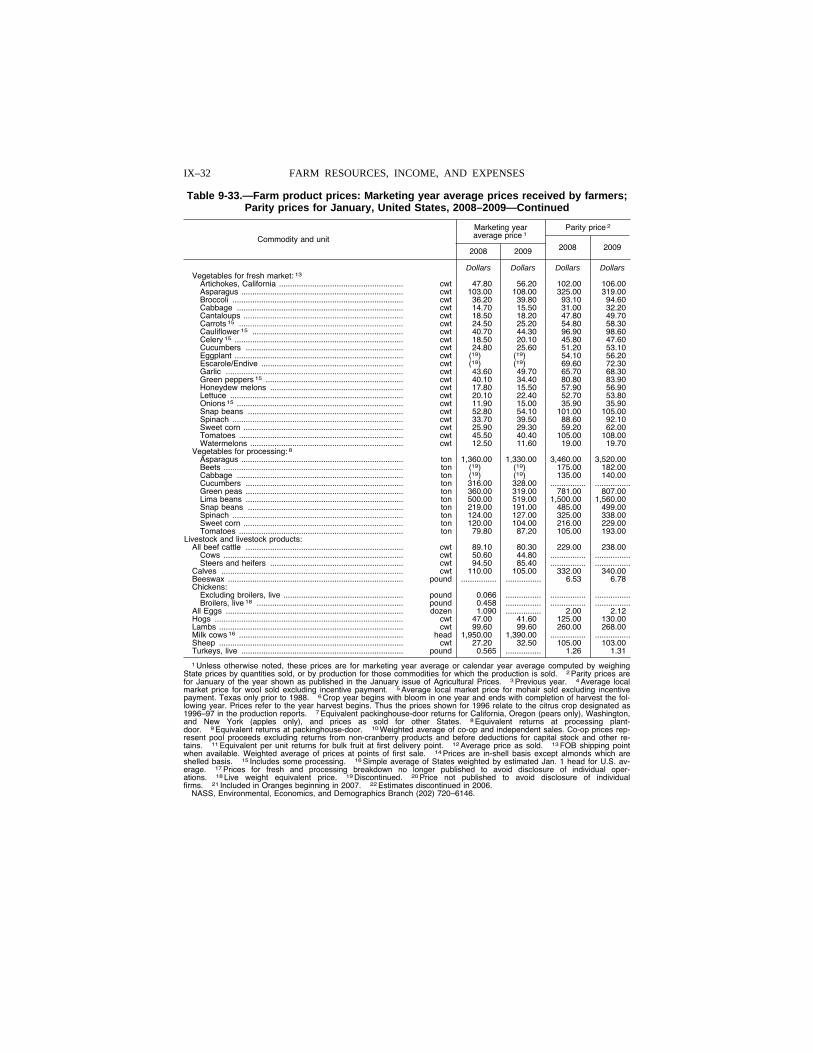
IX–32 FARM RESOURCES, INCOME, AND EXPENSES
Table 9-33.—Farm product prices: Marketing year average prices received by farmers; Parity prices for January, United States, 2008–2009—Continued
Commodity and unit
Marketing year average price 1
Parity price 2
2008 2009 2008 2009
Dollars Dollars Dollars Dollars Vegetables for fresh market: 13
Artichokes, California ........................................................ cwt 47 .80 56 .20 102 .00 106 .00 Asparagus ......................................................................... cwt 103 .00 108 .00 325 .00 319 .00 Broccoli ............................................................................. cwt 36 .20 39 .80 93 .10 94 .60 Cabbage ........................................................................... cwt 14 .70 15 .50 31 .00 32 .20 Cantaloups ........................................................................ cwt 18 .50 18 .20 47 .80 49 .70 Carrots 15 .......................................................................... cwt 24 .50 25 .20 54 .80 58 .30 Cauliflower 15 .................................................................... cwt 40 .70 44 .30 96 .90 98 .60 Celery 15 ............................................................................ cwt 18 .50 20 .10 45 .80 47 .60 Cucumbers ....................................................................... cwt 24 .80 25 .60 51 .20 53 .10 Eggplant ............................................................................ cwt (19) (19) 54 .10 56 .20 Escarole/Endive ................................................................ cwt (19) (19) 69 .60 72 .30 Garlic ................................................................................ cwt 43 .60 49 .70 65 .70 68 .30 Green peppers 15 .............................................................. cwt 40 .10 34 .40 80 .80 83 .90 Honeydew melons ............................................................ cwt 17 .80 15 .50 57 .90 56 .90 Lettuce .............................................................................. cwt 20 .10 22 .40 52 .70 53 .80 Onions 15 ........................................................................... cwt 11 .90 15 .00 35 .90 35 .90 Snap beans ...................................................................... cwt 52 .80 54 .10 101 .00 105 .00 Spinach ............................................................................. cwt 33 .70 39 .50 88 .60 92 .10 Sweet corn ........................................................................ cwt 25 .90 29 .30 59 .20 62 .00 Tomatoes .......................................................................... cwt 45 .50 40 .40 105 .00 108 .00 Watermelons ..................................................................... cwt 12 .50 11 .60 19 .00 19 .70
Vegetables for processing: 8 Asparagus ......................................................................... ton 1,360 .00 1,330 .00 3,460 .00 3,520 .00 Beets ................................................................................. ton (19) (19) 175 .00 182 .00 Cabbage ........................................................................... ton (19) (19) 135 .00 140 .00 Cucumbers ....................................................................... ton 316 .00 328 .00 ................ ................Green peas ....................................................................... ton 360 .00 319 .00 781 .00 807 .00 Lima beans ....................................................................... ton 500 .00 519 .00 1,500 .00 1,560 .00 Snap beans ...................................................................... ton 219 .00 191 .00 485 .00 499 .00 Spinach ............................................................................. ton 124 .00 127 .00 325 .00 338 .00 Sweet corn ........................................................................ ton 120 .00 104 .00 216 .00 229 .00 Tomatoes .......................................................................... ton 79 .80 87 .20 105 .00 193 .00
Livestock and livestock products: All beef cattle ....................................................................... cwt 89 .10 80 .30 229 .00 238 .00
Cows ................................................................................. cwt 50 .60 44 .80 ................ ................Steers and heifers ............................................................ cwt 94 .50 85 .40 ................ ................
Calves .................................................................................. cwt 110 .00 105 .00 332 .00 340 .00 Beeswax ............................................................................... pound ................ ................ 6 .53 6 .78 Chickens:
Excluding broilers, live ...................................................... pound 0 .066 ................ ................ ................Broilers, live 18 .................................................................. pound 0 .458 ................ ................ ................
All Eggs ................................................................................ dozen 1 .090 ................ 2 .00 2 .12 Hogs ..................................................................................... cwt 47 .00 41 .60 125 .00 130 .00 Lambs ................................................................................... cwt 99 .60 99 .60 260 .00 268 .00 Milk cows 16 .......................................................................... head 1,950 .00 1,390 .00 ................ ................Sheep ................................................................................... cwt 27 .20 32 .50 105 .00 103 .00 Turkeys, live ......................................................................... pound 0 .565 ................ 1 .26 1 .31
1 Unless otherwise noted, these prices are for marketing year average or calendar year average computed by weighing State prices by quantities sold, or by production for those commodities for which the production is sold. 2 Parity prices are for January of the year shown as published in the January issue of Agricultural Prices. 3 Previous year. 4 Average local market price for wool sold excluding incentive payment. 5 Average local market price for mohair sold excluding incentive payment. Texas only prior to 1988. 6 Crop year begins with bloom in one year and ends with completion of harvest the fol-lowing year. Prices refer to the year harvest begins. Thus the prices shown for 1996 relate to the citrus crop designated as 1996–97 in the production reports. 7 Equivalent packinghouse-door returns for California, Oregon (pears only), Washington, and New York (apples only), and prices as sold for other States. 8 Equivalent returns at processing plant- door. 9 Equivalent returns at packinghouse-door. 10 Weighted average of co-op and independent sales. Co-op prices rep-resent pool proceeds excluding returns from non-cranberry products and before deductions for capital stock and other re-tains. 11 Equivalent per unit returns for bulk fruit at first delivery point. 12 Average price as sold. 13 FOB shipping point when available. Weighted average of prices at points of first sale. 14 Prices are in-shell basis except almonds which are shelled basis. 15 Includes some processing. 16 Simple average of States weighted by estimated Jan. 1 head for U.S. av-erage. 17 Prices for fresh and processing breakdown no longer published to avoid disclosure of individual oper-ations. 18 Live weight equivalent price. 19 Discontinued. 20 Price not published to avoid disclosure of individual firms. 21 Included in Oranges beginning in 2007. 22 Estimates discontinued in 2006.
NASS, Environmental, Economics, and Demographics Branch (202) 720–6146.
VerDate Aug 31 2005 13:44 Mar 01, 2012 Jkt 000000 PO 00000 Frm 00032 Fmt 1000 Sfmt 1000 H:\SHARED\DAPP\FPU\AGSTAT\MASTER~2\CHAPTR09\IX-29.AG8 USDA
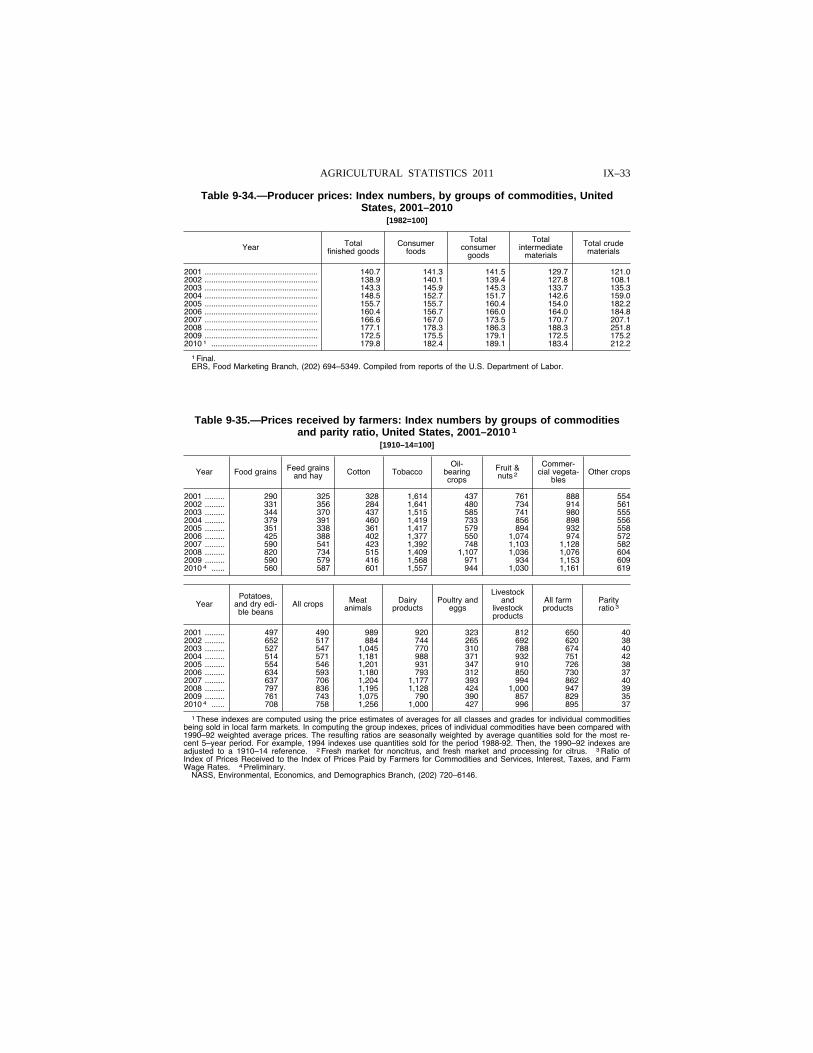
IX–33 AGRICULTURAL STATISTICS 2011
Table 9-34.—Producer prices: Index numbers, by groups of commodities, United States, 2001–2010
[1982=100]
Year Total finished goods
Consumer foods
Total consumer
goods
Total intermediate
materials
Total crude materials
2001 ................................................... 140.7 141.3 141.5 129.7 121.0 2002 ................................................... 138.9 140.1 139.4 127.8 108.1 2003 ................................................... 143.3 145.9 145.3 133.7 135.3 2004 ................................................... 148.5 152.7 151.7 142.6 159.0 2005 ................................................... 155.7 155.7 160.4 154.0 182.2 2006 ................................................... 160.4 156.7 166.0 164.0 184.8 2007 ................................................... 166.6 167.0 173.5 170.7 207.1 2008 ................................................... 177.1 178.3 186.3 188.3 251.8 2009 ................................................... 172.5 175.5 179.1 172.5 175.2 2010 1 ................................................ 179.8 182.4 189.1 183.4 212.2
1 Final. ERS, Food Marketing Branch, (202) 694–5349. Compiled from reports of the U.S. Department of Labor.
Table 9-35.—Prices received by farmers: Index numbers by groups of commodities and parity ratio, United States, 2001–2010 1
[1910–14=100]
Year Food grains Feed grains and hay Cotton Tobacco
Oil- bearing crops
Fruit & nuts 2
Commer-cial vegeta-
bles Other crops
2001 ......... 290 325 328 1,614 437 761 888 554 2002 ......... 331 356 284 1,641 480 734 914 561 2003 ......... 344 370 437 1,515 585 741 980 555 2004 ......... 379 391 460 1,419 733 856 898 556 2005 ......... 351 338 361 1,417 579 894 932 558 2006 ......... 425 388 402 1,377 550 1,074 974 572 2007 ......... 590 541 423 1,392 748 1,103 1,128 582 2008 ......... 820 734 515 1,409 1,107 1,036 1,076 604 2009 ......... 590 579 416 1,568 971 934 1,153 609 2010 4 ...... 560 587 601 1,557 944 1,030 1,161 619
Year Potatoes,
and dry edi-ble beans
All crops Meat animals
Dairy products
Poultry and eggs
Livestock and
livestock products
All farm products
Parity ratio 3
2001 ......... 497 490 989 920 323 812 650 40 2002 ......... 652 517 884 744 265 692 620 38 2003 ......... 527 547 1,045 770 310 788 674 40 2004 ......... 514 571 1,181 988 371 932 751 42 2005 ......... 554 546 1,201 931 347 910 726 38 2006 ......... 634 593 1,180 793 312 850 730 37 2007 ......... 637 706 1,204 1,177 393 994 862 40 2008 ......... 797 836 1,195 1,128 424 1,000 947 39 2009 ......... 761 743 1,075 790 390 857 829 35 2010 4 ...... 708 758 1,256 1,000 427 996 895 37
1 These indexes are computed using the price estimates of averages for all classes and grades for individual commodities being sold in local farm markets. In computing the group indexes, prices of individual commodities have been compared with 1990–92 weighted average prices. The resulting ratios are seasonally weighted by average quantities sold for the most re-cent 5–year period. For example, 1994 indexes use quantities sold for the period 1988-92. Then, the 1990–92 indexes are adjusted to a 1910–14 reference. 2 Fresh market for noncitrus, and fresh market and processing for citrus. 3 Ratio of Index of Prices Received to the Index of Prices Paid by Farmers for Commodities and Services, Interest, Taxes, and Farm Wage Rates. 4 Preliminary.
NASS, Environmental, Economics, and Demographics Branch, (202) 720–6146.
VerDate Aug 31 2005 13:44 Mar 01, 2012 Jkt 000000 PO 00000 Frm 00033 Fmt 1000 Sfmt 1000 H:\SHARED\DAPP\FPU\AGSTAT\MASTER~2\CHAPTR09\IX-30.AG8 USDA
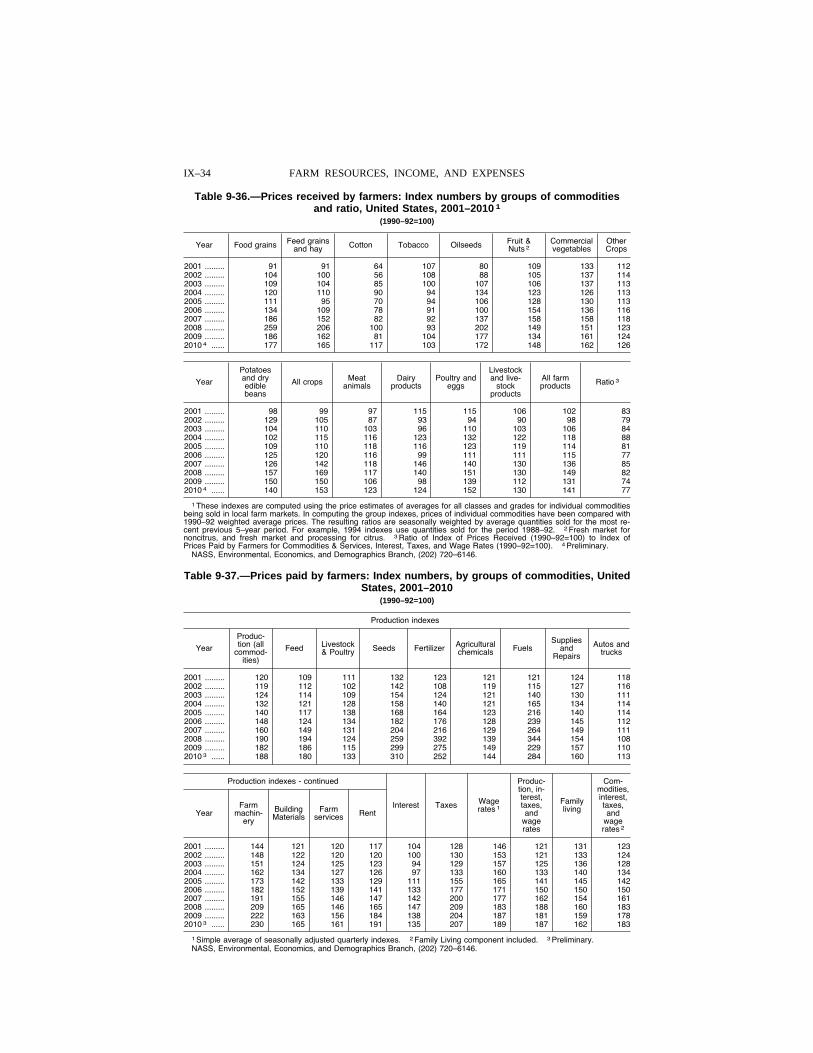
IX–34 FARM RESOURCES, INCOME, AND EXPENSES
Table 9-36.—Prices received by farmers: Index numbers by groups of commodities and ratio, United States, 2001–2010 1
(1990–92=100)
Year Food grains Feed grains and hay Cotton Tobacco Oilseeds Fruit &
Nuts 2 Commercial vegetables
Other Crops
2001 ......... 91 91 64 107 80 109 133 112 2002 ......... 104 100 56 108 88 105 137 114 2003 ......... 109 104 85 100 107 106 137 113 2004 ......... 120 110 90 94 134 123 126 113 2005 ......... 111 95 70 94 106 128 130 113 2006 ......... 134 109 78 91 100 154 136 116 2007 ......... 186 152 82 92 137 158 158 118 2008 ......... 259 206 100 93 202 149 151 123 2009 ......... 186 162 81 104 177 134 161 124 2010 4 ...... 177 165 117 103 172 148 162 126
Year
Potatoes and dry edible beans
All crops Meat animals
Dairy products
Poultry and eggs
Livestock and live-
stock products
All farm products Ratio 3
2001 ......... 98 99 97 115 115 106 102 83 2002 ......... 129 105 87 93 94 90 98 79 2003 ......... 104 110 103 96 110 103 106 84 2004 ......... 102 115 116 123 132 122 118 88 2005 ......... 109 110 118 116 123 119 114 81 2006 ......... 125 120 116 99 111 111 115 77 2007 ......... 126 142 118 146 140 130 136 85 2008 ......... 157 169 117 140 151 130 149 82 2009 ......... 150 150 106 98 139 112 131 74 2010 4 ...... 140 153 123 124 152 130 141 77
1 These indexes are computed using the price estimates of averages for all classes and grades for individual commodities being sold in local farm markets. In computing the group indexes, prices of individual commodities have been compared with 1990–92 weighted average prices. The resulting ratios are seasonally weighted by average quantities sold for the most re-cent previous 5–year period. For example, 1994 indexes use quantities sold for the period 1988–92. 2 Fresh market for noncitrus, and fresh market and processing for citrus. 3 Ratio of Index of Prices Received (1990–92=100) to Index of Prices Paid by Farmers for Commodities & Services, Interest, Taxes, and Wage Rates (1990–92=100). 4 Preliminary.
NASS, Environmental, Economics, and Demographics Branch, (202) 720–6146.
Table 9-37.—Prices paid by farmers: Index numbers, by groups of commodities, United States, 2001–2010
(1990–92=100)
Production indexes
Year
Produc-tion (all
commod-ities)
Feed Livestock & Poultry Seeds Fertilizer Agricultural
chemicals Fuels Supplies
and Repairs
Autos and trucks
2001 ......... 120 109 111 132 123 121 121 124 118 2002 ......... 119 112 102 142 108 119 115 127 116 2003 ......... 124 114 109 154 124 121 140 130 111 2004 ......... 132 121 128 158 140 121 165 134 114 2005 ......... 140 117 138 168 164 123 216 140 114 2006 ......... 148 124 134 182 176 128 239 145 112 2007 ......... 160 149 131 204 216 129 264 149 111 2008 ......... 190 194 124 259 392 139 344 154 108 2009 ......... 182 186 115 299 275 149 229 157 110 2010 3 ...... 188 180 133 310 252 144 284 160 113
Production indexes - continued
Interest Taxes Wage rates 1
Produc-tion, in-terest, taxes, and
wage rates
Family living
Com-modities, interest, taxes, and
wage rates 2
Year Farm
machin-ery
Building Materials
Farm services Rent
2001 ......... 144 121 120 117 104 128 146 121 131 123 2002 ......... 148 122 120 120 100 130 153 121 133 124 2003 ......... 151 124 125 123 94 129 157 125 136 128 2004 ......... 162 134 127 126 97 133 160 133 140 134 2005 ......... 173 142 133 129 111 155 165 141 145 142 2006 ......... 182 152 139 141 133 177 171 150 150 150 2007 ......... 191 155 146 147 142 200 177 162 154 161 2008 ......... 209 165 146 165 147 209 183 188 160 183 2009 ......... 222 163 156 184 138 204 187 181 159 178 2010 3 ...... 230 165 161 191 135 207 189 187 162 183
1 Simple average of seasonally adjusted quarterly indexes. 2 Family Living component included. 3 Preliminary. NASS, Environmental, Economics, and Demographics Branch, (202) 720–6146.
VerDate Aug 31 2005 13:44 Mar 01, 2012 Jkt 000000 PO 00000 Frm 00034 Fmt 1000 Sfmt 1000 H:\SHARED\DAPP\FPU\AGSTAT\MASTER~2\CHAPTR09\IX-31.AG8 USDA
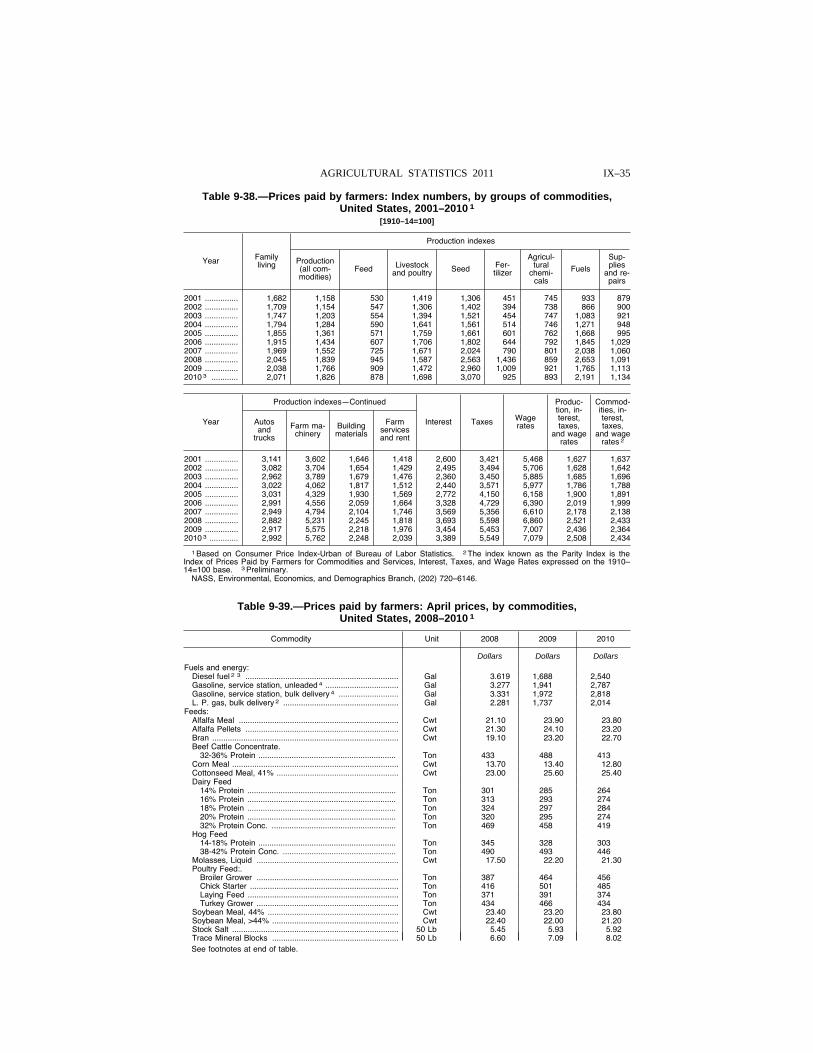
IX–35 AGRICULTURAL STATISTICS 2011
Table 9-38.—Prices paid by farmers: Index numbers, by groups of commodities, United States, 2001–2010 1
[1910–14=100]
Year Family living
Production indexes
Production (all com-modities)
Feed Livestock and poultry Seed Fer-
tilizer
Agricul-tural
chemi-cals
Fuels
Sup-plies
and re-pairs
2001 ............... 1,682 1,158 530 1,419 1,306 451 745 933 879 2002 ............... 1,709 1,154 547 1,306 1,402 394 738 866 900 2003 ............... 1,747 1,203 554 1,394 1,521 454 747 1,083 921 2004 ............... 1,794 1,284 590 1,641 1,561 514 746 1,271 948 2005 ............... 1,855 1,361 571 1,759 1,661 601 762 1,668 995 2006 ............... 1,915 1,434 607 1,706 1,802 644 792 1,845 1,029 2007 ............... 1,969 1,552 725 1,671 2,024 790 801 2,038 1,060 2008 ............... 2,045 1,839 945 1,587 2,563 1,436 859 2,653 1,091 2009 ............... 2,038 1,766 909 1,472 2,960 1,009 921 1,765 1,113 2010 3 ............ 2,071 1,826 878 1,698 3,070 925 893 2,191 1,134
Year
Production indexes—Continued
Interest Taxes Wage rates
Produc-tion, in-terest, taxes,
and wage rates
Commod-ities, in-terest, taxes,
and wage rates 2
Autos and
trucks
Farm ma-chinery
Building materials
Farm services and rent
2001 ............... 3,141 3,602 1,646 1,418 2,600 3,421 5,468 1,627 1,637 2002 ............... 3,082 3,704 1,654 1,429 2,495 3,494 5,706 1,628 1,642 2003 ............... 2,962 3,789 1,679 1,476 2,360 3,450 5,885 1,685 1,696 2004 ............... 3,022 4,062 1,817 1,512 2,440 3,571 5,977 1,786 1,788 2005 ............... 3,031 4,329 1,930 1,569 2,772 4,150 6,158 1,900 1,891 2006 ............... 2,991 4,556 2,059 1,664 3,328 4,729 6,390 2,019 1,999 2007 ............... 2,949 4,794 2,104 1,746 3,569 5,356 6,610 2,178 2,138 2008 ............... 2,882 5,231 2,245 1,818 3,693 5,598 6,860 2,521 2,433 2009 ............... 2,917 5,575 2,218 1,976 3,454 5,453 7,007 2,436 2,364 2010 3 ............. 2,992 5,762 2,248 2,039 3,389 5,549 7,079 2,508 2,434
1 Based on Consumer Price Index-Urban of Bureau of Labor Statistics. 2 The index known as the Parity Index is the Index of Prices Paid by Farmers for Commodities and Services, Interest, Taxes, and Wage Rates expressed on the 1910– 14=100 base. 3 Preliminary.
NASS, Environmental, Economics, and Demographics Branch, (202) 720–6146.
Table 9-39.—Prices paid by farmers: April prices, by commodities, United States, 2008–2010 1
Commodity Unit 2008 2009 2010
Dollars Dollars Dollars Fuels and energy:
Diesel fuel 2 3 ..................................................................... Gal 3 .619 1,688 2,540 Gasoline, service station, unleaded 4 ................................. Gal 3 .277 1,941 2,787 Gasoline, service station, bulk delivery 4 ........................... Gal 3 .331 1,972 2,818 L. P. gas, bulk delivery 2 .................................................... Gal 2 .281 1,737 2,014
Feeds: Alfalfa Meal ........................................................................ Cwt 21 .10 23 .90 23 .80 Alfalfa Pellets ..................................................................... Cwt 21 .30 24 .10 23 .20 Bran .................................................................................... Cwt 19 .10 23 .20 22 .70 Beef Cattle Concentrate.
32-36% Protein .............................................................. Ton 433 488 413 Corn Meal ........................................................................... Cwt 13 .70 13 .40 12 .80 Cottonseed Meal, 41% ....................................................... Cwt 23 .00 25 .60 25 .40 Dairy Feed
14% Protein ................................................................... Ton 301 285 264 16% Protein ................................................................... Ton 313 293 274 18% Protein ................................................................... Ton 324 297 284 20% Protein ................................................................... Ton 320 295 274 32% Protein Conc. ........................................................ Ton 469 458 419
Hog Feed 14-18% Protein .............................................................. Ton 345 328 303 38-42% Protein Conc. ................................................... Ton 490 493 446
Molasses, Liquid ................................................................ Cwt 17 .50 22 .20 21 .30 Poultry Feed:.
Broiler Grower ................................................................ Ton 387 464 456 Chick Starter ................................................................... Ton 416 501 485 Laying Feed .................................................................... Ton 371 391 374 Turkey Grower ................................................................ Ton 434 466 434
Soybean Meal, 44% ........................................................... Cwt 23 .40 23 .20 23 .80 Soybean Meal, >44% ......................................................... Cwt 22 .40 22 .00 21 .20 Stock Salt ........................................................................... 50 Lb 5 .45 5 .93 5 .92 Trace Mineral Blocks ......................................................... 50 Lb 6 .60 7 .09 8 .02 See footnotes at end of table.
VerDate Aug 31 2005 13:44 Mar 01, 2012 Jkt 000000 PO 00000 Frm 00035 Fmt 1000 Sfmt 1000 H:\SHARED\DAPP\FPU\AGSTAT\MASTER~2\CHAPTR09\IX-32.AG8 USDA
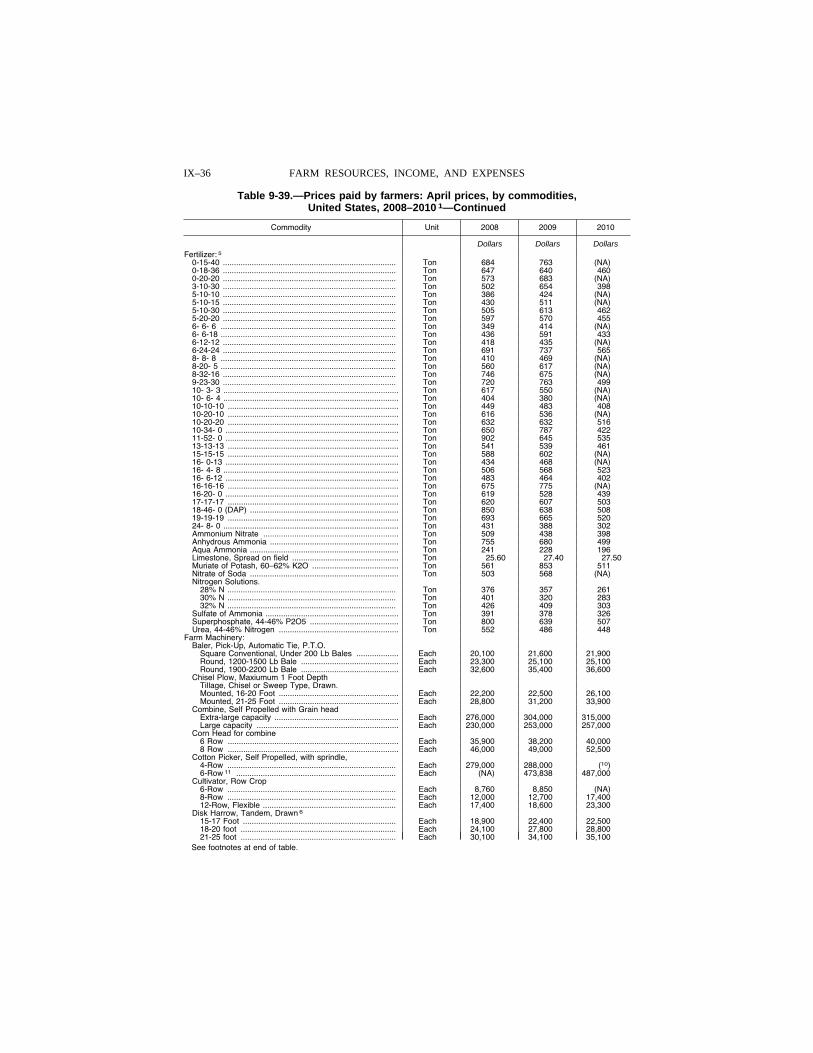
IX–36 FARM RESOURCES, INCOME, AND EXPENSES
Table 9-39.—Prices paid by farmers: April prices, by commodities, United States, 2008–2010 1—Continued
Commodity Unit 2008 2009 2010
Dollars Dollars Dollars Fertilizer: 5
0-15-40 .............................................................................. Ton 684 763 (NA) 0-18-36 .............................................................................. Ton 647 640 460 0-20-20 .............................................................................. Ton 573 683 (NA) 3-10-30 .............................................................................. Ton 502 654 398 5-10-10 .............................................................................. Ton 386 424 (NA) 5-10-15 .............................................................................. Ton 430 511 (NA) 5-10-30 .............................................................................. Ton 505 613 462 5-20-20 .............................................................................. Ton 597 570 455 6- 6- 6 ............................................................................... Ton 349 414 (NA) 6- 6-18 ............................................................................... Ton 436 591 433 6-12-12 .............................................................................. Ton 418 435 (NA) 6-24-24 .............................................................................. Ton 691 737 565 8- 8- 8 ............................................................................... Ton 410 469 (NA) 8-20- 5 ............................................................................... Ton 560 617 (NA) 8-32-16 .............................................................................. Ton 746 675 (NA) 9-23-30 .............................................................................. Ton 720 763 499 10- 3- 3 ............................................................................... Ton 617 550 (NA) 10- 6- 4 ............................................................................... Ton 404 380 (NA) 10-10-10 ............................................................................. Ton 449 483 408 10-20-10 ............................................................................. Ton 616 536 (NA) 10-20-20 ............................................................................. Ton 632 632 516 10-34- 0 .............................................................................. Ton 650 787 422 11-52- 0 .............................................................................. Ton 902 645 535 13-13-13 ............................................................................. Ton 541 539 461 15-15-15 ............................................................................. Ton 588 602 (NA) 16- 0-13 .............................................................................. Ton 434 468 (NA) 16- 4- 8 ............................................................................... Ton 506 568 523 16- 6-12 .............................................................................. Ton 483 464 402 16-16-16 ............................................................................. Ton 675 775 (NA) 16-20- 0 .............................................................................. Ton 619 528 439 17-17-17 ............................................................................. Ton 620 607 503 18-46- 0 (DAP) ................................................................... Ton 850 638 508 19-19-19 ............................................................................. Ton 693 665 520 24- 8- 0 ............................................................................... Ton 431 388 302 Ammonium Nitrate ............................................................. Ton 509 438 398 Anhydrous Ammonia .......................................................... Ton 755 680 499 Aqua Ammonia ................................................................... Ton 241 228 196 Limestone, Spread on field ................................................ Ton 25 .60 27 .40 27 .50 Muriate of Potash, 60–62% K2O ....................................... Ton 561 853 511 Nitrate of Soda ................................................................... Ton 503 568 (NA) Nitrogen Solutions.
28% N ............................................................................ Ton 376 357 261 30% N ............................................................................ Ton 401 320 283 32% N ............................................................................ Ton 426 409 303
Sulfate of Ammonia ............................................................ Ton 391 378 326 Superphosphate, 44-46% P2O5 ........................................ Ton 800 639 507 Urea, 44-46% Nitrogen ...................................................... Ton 552 486 448
Farm Machinery: Baler, Pick-Up, Automatic Tie, P.T.O.
Square Conventional, Under 200 Lb Bales ................... Each 20,100 21,600 21,900 Round, 1200-1500 Lb Bale ............................................ Each 23,300 25,100 25,100 Round, 1900-2200 Lb Bale ............................................ Each 32,600 35,400 36,600
Chisel Plow, Maxiumum 1 Foot Depth Tillage, Chisel or Sweep Type, Drawn.Mounted, 16-20 Foot ...................................................... Each 22,200 22,500 26,100 Mounted, 21-25 Foot ...................................................... Each 28,800 31,200 33,900
Combine, Self Propelled with Grain head Extra-large capacity ........................................................ Each 276,000 304,000 315,000 Large capacity ................................................................ Each 230,000 253,000 257,000
Corn Head for combine 6 Row ............................................................................. Each 35,900 38,200 40,000 8 Row ............................................................................. Each 46,000 49,000 52,500
Cotton Picker, Self Propelled, with sprindle, 4-Row ............................................................................ Each 279,000 288,000 (10) 6-Row 11 ........................................................................ Each (NA) 473,838 487,000
Cultivator, Row Crop 6-Row ............................................................................ Each 8,760 8,850 (NA) 8-Row ............................................................................ Each 12,000 12,700 17,400 12-Row, Flexible ............................................................ Each 17,400 18,600 23,300
Disk Harrow, Tandem, Drawn 6 15-17 Foot ..................................................................... Each 18,900 22,400 22,500 18-20 foot ...................................................................... Each 24,100 27,800 28,800 21-25 foot ...................................................................... Each 30,100 34,100 35,100
See footnotes at end of table.
VerDate Aug 31 2005 13:44 Mar 01, 2012 Jkt 000000 PO 00000 Frm 00036 Fmt 1000 Sfmt 1000 H:\SHARED\DAPP\FPU\AGSTAT\MASTER~2\CHAPTR09\IX-33.AG8 USDA
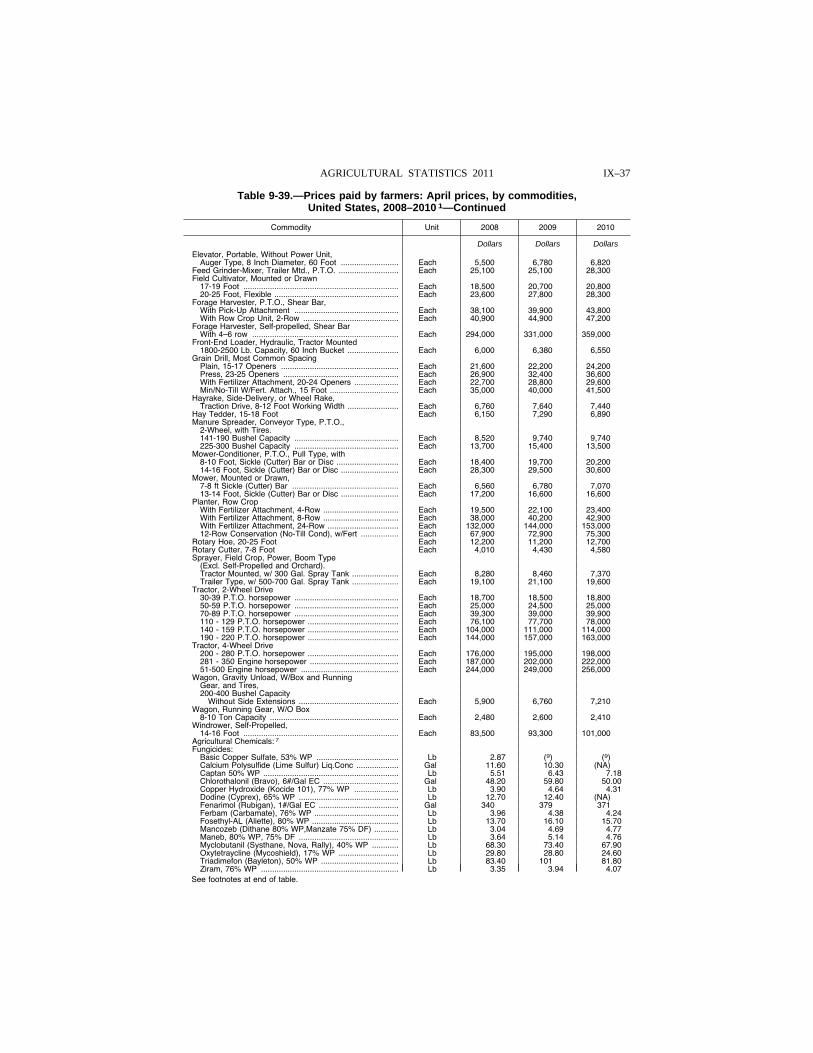
IX–37 AGRICULTURAL STATISTICS 2011
Table 9-39.—Prices paid by farmers: April prices, by commodities, United States, 2008–2010 1—Continued
Commodity Unit 2008 2009 2010
Dollars Dollars Dollars Elevator, Portable, Without Power Unit,
Auger Type, 8 Inch Diameter, 60 Foot .......................... Each 5,500 6,780 6,820 Feed Grinder-Mixer, Trailer Mtd., P.T.O. ........................... Each 25,100 25,100 28,300 Field Cultivator, Mounted or Drawn
17-19 Foot ...................................................................... Each 18,500 20,700 20,800 20-25 Foot, Flexible ........................................................ Each 23,600 27,800 28,300
Forage Harvester, P.T.O., Shear Bar, With Pick-Up Attachment ............................................... Each 38,100 39,900 43,800 With Row Crop Unit, 2-Row ........................................... Each 40,900 44,900 47,200
Forage Harvester, Self-propelled, Shear Bar With 4–6 row .................................................................. Each 294,000 331,000 359,000
Front-End Loader, Hydraulic, Tractor Mounted 1800-2500 Lb. Capacity, 60 Inch Bucket ....................... Each 6,000 6,380 6,550
Grain Drill, Most Common Spacing Plain, 15-17 Openers ..................................................... Each 21,600 22,200 24,200 Press, 23-25 Openers .................................................... Each 26,900 32,400 36,600 With Fertilizer Attachment, 20-24 Openers .................... Each 22,700 28,800 29,600 Min/No-Till W/Fert. Attach., 15 Foot ............................... Each 35,000 40,000 41,500
Hayrake, Side-Delivery, or Wheel Rake, Traction Drive, 8-12 Foot Working Width ....................... Each 6,760 7,640 7,440
Hay Tedder, 15-18 Foot Each 6,150 7,290 6,890 Manure Spreader, Conveyor Type, P.T.O.,
2-Wheel, with Tires.141-190 Bushel Capacity ............................................... Each 8,520 9,740 9,740 225-300 Bushel Capacity ............................................... Each 13,700 15,400 13,500
Mower-Conditioner, P.T.O., Pull Type, with 8-10 Foot, Sickle (Cutter) Bar or Disc ............................ Each 18,400 19,700 20,200 14-16 Foot, Sickle (Cutter) Bar or Disc .......................... Each 28,300 29,500 30,600
Mower, Mounted or Drawn, 7-8 ft Sickle (Cutter) Bar ................................................ Each 6,560 6,780 7,070 13-14 Foot, Sickle (Cutter) Bar or Disc .......................... Each 17,200 16,600 16,600
Planter, Row Crop With Fertilizer Attachment, 4-Row .................................. Each 19,500 22,100 23,400 With Fertilizer Attachment, 8-Row .................................. Each 38,000 40,200 42,900 With Fertilizer Attachment, 24-Row ................................ Each 132,000 144,000 153,000 12-Row Conservation (No-Till Cond), w/Fert ................. Each 67,900 72,900 75,300
Rotary Hoe, 20-25 Foot Each 12,200 11,200 12,700 Rotary Cutter, 7-8 Foot Each 4,010 4,430 4,580 Sprayer, Field Crop, Power, Boom Type
(Excl. Self-Propelled and Orchard).Tractor Mounted, w/ 300 Gal. Spray Tank ..................... Each 8,280 8,460 7,370 Trailer Type, w/ 500-700 Gal. Spray Tank ..................... Each 19,100 21,100 19,600
Tractor, 2-Wheel Drive 30-39 P.T.O. horsepower ............................................... Each 18,700 18,500 18,800 50-59 P.T.O. horsepower ............................................... Each 25,000 24,500 25,000 70-89 P.T.O. horsepower ............................................... Each 39,300 39,000 39,900 110 - 129 P.T.O. horsepower ......................................... Each 76,100 77,700 78,000 140 - 159 P.T.O. horsepower ......................................... Each 104,000 111,000 114,000 190 - 220 P.T.O. horsepower ......................................... Each 144,000 157,000 163,000
Tractor, 4-Wheel Drive 200 - 280 P.T.O. horsepower ......................................... Each 176,000 195,000 198,000 281 - 350 Engine horsepower ........................................ Each 187,000 202,000 222,000 51-500 Engine horsepower ............................................ Each 244,000 249,000 256,000
Wagon, Gravity Unload, W/Box and Running Gear, and Tires, 200-400 Bushel Capacity
Without Side Extensions ............................................. Each 5,900 6,760 7,210 Wagon, Running Gear, W/O Box
8-10 Ton Capacity .......................................................... Each 2,480 2,600 2,410 Windrower, Self-Propelled,
14-16 Foot ...................................................................... Each 83,500 93,300 101,000 Agricultural Chemicals: 7 Fungicides:
Basic Copper Sulfate, 53% WP ..................................... Lb 2 .87 (9) (9) Calcium Polysulfide (Lime Sulfur) Liq.Conc ................... Gal 11 .60 10 .30 (NA) Captan 50% WP ............................................................. Lb 5 .51 6 .43 7 .18 Chlorothalonil (Bravo), 6#/Gal EC .................................. Gal 48 .20 59 .80 50 .00 Copper Hydroxide (Kocide 101), 77% WP .................... Lb 3 .90 4 .64 4 .31 Dodine (Cyprex), 65% WP ............................................. Lb 12 .70 12 .40 (NA) Fenarimol (Rubigan), 1#/Gal EC .................................... Gal 340 379 371 Ferbam (Carbamate), 76% WP ...................................... Lb 3 .96 4 .38 4 .24 Fosethyl-AL (Aliette), 80% WP ....................................... Lb 13 .70 16 .10 15 .70 Mancozeb (Dithane 80% WP,Manzate 75% DF) ........... Lb 3 .04 4 .69 4 .77 Maneb, 80% WP, 75% DF ............................................. Lb 3 .64 5 .14 4 .76 Myclobutanil (Systhane, Nova, Rally), 40% WP ............ Lb 68 .30 73 .40 67 .90 Oxytetraycline (Mycoshield), 17% WP ........................... Lb 29 .80 28 .80 24 .60 Triadimefon (Bayleton), 50% WP ................................... Lb 83 .40 101 81 .80 Ziram, 76% WP .............................................................. Lb 3 .35 3 .94 4 .07
See footnotes at end of table.
VerDate Aug 31 2005 13:44 Mar 01, 2012 Jkt 000000 PO 00000 Frm 00037 Fmt 1000 Sfmt 1000 H:\SHARED\DAPP\FPU\AGSTAT\MASTER~2\CHAPTR09\IX-34.AG8 USDA
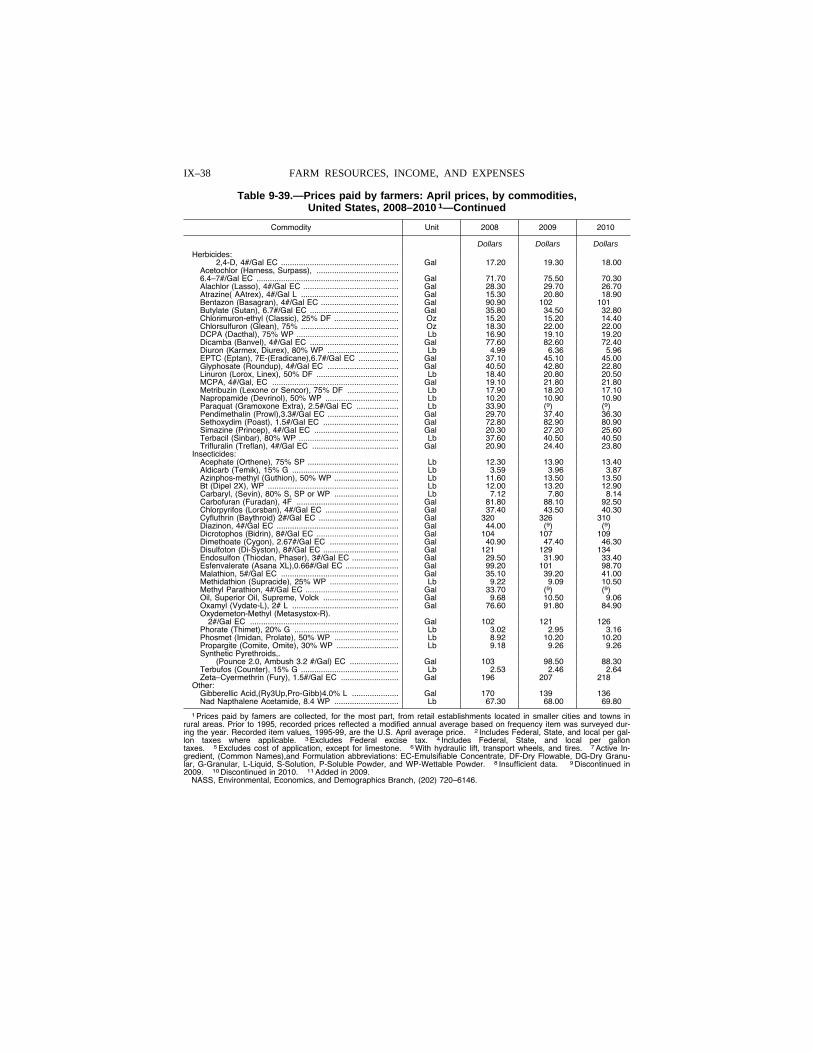
IX–38 FARM RESOURCES, INCOME, AND EXPENSES
Table 9-39.—Prices paid by farmers: April prices, by commodities, United States, 2008–2010 1—Continued
Commodity Unit 2008 2009 2010
Dollars Dollars Dollars Herbicides:
2,4-D, 4#/Gal EC ..................................................... Gal 17 .20 19 .30 18 .00 Acetochlor (Harness, Surpass), .....................................6.4–7#/Gal EC ................................................................ Gal 71 .70 75 .50 70 .30 Alachlor (Lasso), 4#/Gal EC ........................................... Gal 28 .30 29 .70 26 .70 Atrazine( AAtrex), 4#/Gal L ............................................ Gal 15 .30 20 .80 18 .90 Bentazon (Basagran), 4#/Gal EC ................................... Gal 90 .90 102 101 Butylate (Sutan), 6.7#/Gal EC ........................................ Gal 35 .80 34 .50 32 .80 Chlorimuron-ethyl (Classic), 25% DF ............................. Oz 15 .20 15 .20 14 .40 Chlorsulfuron (Glean), 75% ............................................ Oz 18 .30 22 .00 22 .00 DCPA (Dacthal), 75% WP .............................................. Lb 16 .90 19 .10 19 .20 Dicamba (Banvel), 4#/Gal EC ........................................ Gal 77 .60 82 .60 72 .40 Diuron (Karmex, Diurex), 80% WP ................................ Lb 4 .99 6 .36 5 .96 EPTC (Eptan), 7E-(Eradicane),6.7#/Gal EC .................. Gal 37 .10 45 .10 45 .00 Glyphosate (Roundup), 4#/Gal EC ................................ Gal 40 .50 42 .80 22 .80 Linuron (Lorox, Linex), 50% DF ..................................... Lb 18 .40 20 .80 20 .50 MCPA, 4#/Gal, EC ......................................................... Gal 19 .10 21 .80 21 .80 Metribuzin (Lexone or Sencor), 75% DF ....................... Lb 17 .90 18 .20 17 .10 Napropamide (Devrinol), 50% WP ................................. Lb 10 .20 10 .90 10 .90 Paraquat (Gramoxone Extra), 2.5#/Gal EC ................... Lb 33 .90 (9) (9) Pendimethalin (Prowl),3.3#/Gal EC ................................ Gal 29 .70 37 .40 36 .30 Sethoxydim (Poast), 1.5#/Gal EC .................................. Gal 72 .80 82 .90 80 .90 Simazine (Princep), 4#/Gal EC ...................................... Gal 20 .30 27 .20 25 .60 Terbacil (Sinbar), 80% WP ............................................. Lb 37 .60 40 .50 40 .50 Trifluralin (Treflan), 4#/Gal EC ....................................... Gal 20 .90 24 .40 23 .80
Insecticides: Acephate (Orthene), 75% SP ......................................... Lb 12 .30 13 .90 13 .40 Aldicarb (Temik), 15% G ................................................ Lb 3 .59 3 .96 3 .87 Azinphos-methyl (Guthion), 50% WP ............................. Lb 11 .60 13 .50 13 .50 Bt (Dipel 2X), WP ........................................................... Lb 12 .00 13 .20 12 .90 Carbaryl, (Sevin), 80% S, SP or WP ............................. Lb 7 .12 7 .80 8 .14 Carbofuran (Furadan), 4F .............................................. Gal 81 .80 88 .10 92 .50 Chlorpyrifos (Lorsban), 4#/Gal EC ................................. Gal 37 .40 43 .50 40 .30 Cyfluthrin (Baythroid) 2#/Gal EC .................................... Gal 320 326 310 Diazinon, 4#/Gal EC ....................................................... Gal 44 .00 (9) (9) Dicrotophos (Bidrin), 8#/Gal EC ..................................... Gal 104 107 109 Dimethoate (Cygon), 2.67#/Gal EC ............................... Gal 40 .90 47 .40 46 .30 Disulfoton (Di-Syston), 8#/Gal EC .................................. Gal 121 129 134 Endosulfon (Thiodan, Phaser), 3#/Gal EC ..................... Gal 29 .50 31 .90 33 .40 Esfenvalerate (Asana XL),0.66#/Gal EC ........................ Gal 99 .20 101 98 .70 Malathion, 5#/Gal EC ..................................................... Gal 35 .10 39 .20 41 .00 Methidathion (Supracide), 25% WP ............................... Lb 9 .22 9 .09 10 .50 Methyl Parathion, 4#/Gal EC .......................................... Gal 33 .70 (9) (9) Oil, Superior Oil, Supreme, Volck .................................. Gal 9 .68 10 .50 9 .06 Oxamyl (Vydate-L), 2# L ................................................ Gal 76 .60 91 .80 84 .90 Oxydemeton-Methyl (Metasystox-R).
2#/Gal EC ................................................................... Gal 102 121 126 Phorate (Thimet), 20% G ............................................... Lb 3 .02 2 .95 3 .16 Phosmet (Imidan, Prolate), 50% WP ............................. Lb 8 .92 10 .20 10 .20 Propargite (Comite, Omite), 30% WP ............................ Lb 9 .18 9 .26 9 .26 Synthetic Pyrethroids,.
(Pounce 2.0, Ambush 3.2 #/Gal) EC ...................... Gal 103 98 .50 88 .30 Terbufos (Counter), 15% G ............................................ Lb 2 .53 2 .46 2 .64 Zeta–Cyermethrin (Fury), 1.5#/Gal EC .......................... Gal 196 207 218
Other: Gibberellic Acid,(Ry3Up,Pro-Gibb)4.0% L ..................... Gal 170 139 136 Nad Napthalene Acetamide, 8.4 WP ............................. Lb 67 .30 68 .00 69 .80
1 Prices paid by famers are collected, for the most part, from retail establishments located in smaller cities and towns in rural areas. Prior to 1995, recorded prices reflected a modified annual average based on frequency item was surveyed dur-ing the year. Recorded item values, 1995-99, are the U.S. April average price. 2 Includes Federal, State, and local per gal-lon taxes where applicable. 3 Excludes Federal excise tax. 4 Includes Federal, State, and local per gallon taxes. 5 Excludes cost of application, except for limestone. 6 With hydraulic lift, transport wheels, and tires. 7 Active In-gredient, (Common Names),and Formulation abbreviations: EC-Emulsifiable Concentrate, DF-Dry Flowable, DG-Dry Granu-lar, G-Granular, L-Liquid, S-Solution, P-Soluble Powder, and WP-Wettable Powder. 8 Insufficient data. 9 Discontinued in 2009. 10 Discontinued in 2010. 11 Added in 2009.
NASS, Environmental, Economics, and Demographics Branch, (202) 720–6146.
VerDate Aug 31 2005 13:44 Mar 01, 2012 Jkt 000000 PO 00000 Frm 00038 Fmt 1000 Sfmt 1000 H:\SHARED\DAPP\FPU\AGSTAT\MASTER~2\CHAPTR09\IX-35.AG8 USDA
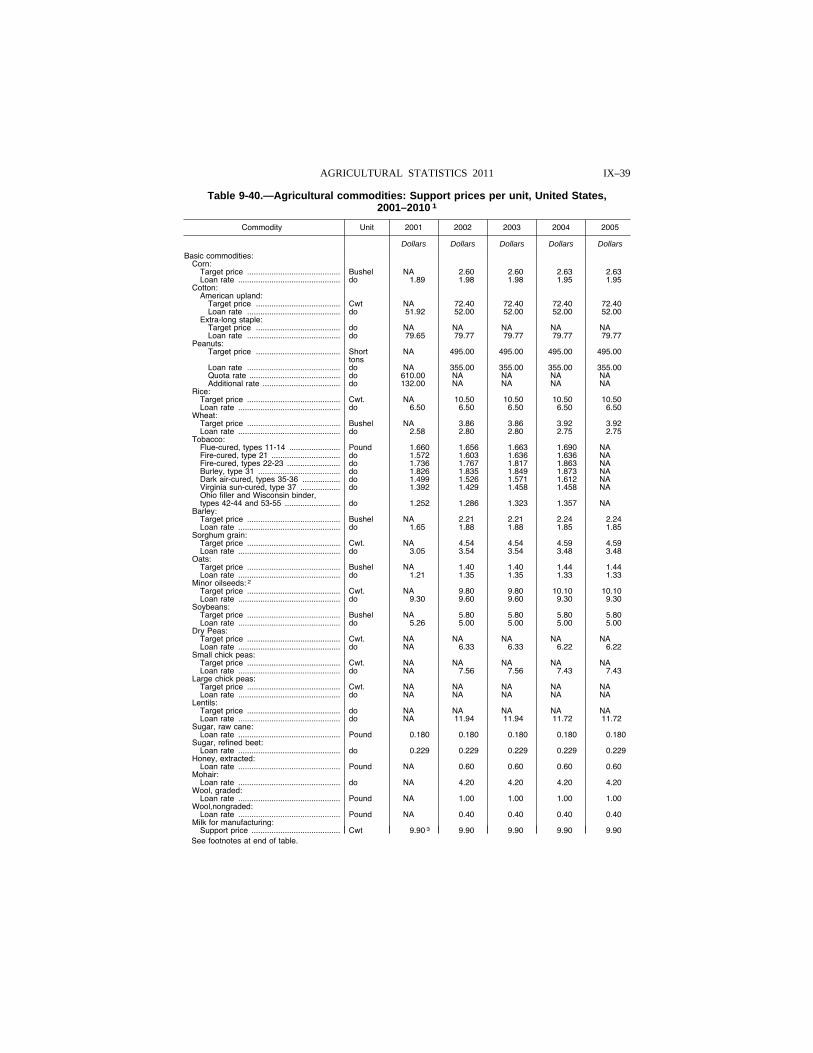
IX–39 AGRICULTURAL STATISTICS 2011
Table 9-40.—Agricultural commodities: Support prices per unit, United States, 2001–2010 1
Commodity Unit 2001 2002 2003 2004 2005
Dollars Dollars Dollars Dollars Dollars
Basic commodities: Corn:
Target price .......................................... Bushel NA 2 .60 2 .60 2 .63 2 .63 Loan rate .............................................. do 1 .89 1 .98 1 .98 1 .95 1 .95
Cotton: American upland:
Target price ...................................... Cwt NA 72 .40 72 .40 72 .40 72 .40 Loan rate .......................................... do 51 .92 52 .00 52 .00 52 .00 52 .00
Extra-long staple: Target price ...................................... do NA NA NA NA NA Loan rate .......................................... do 79 .65 79 .77 79 .77 79 .77 79 .77
Peanuts: Target price ...................................... Short
tons NA 495 .00 495 .00 495 .00 495 .00
Loan rate .......................................... do NA 355 .00 355 .00 355 .00 355 .00 Quota rate ......................................... do 610 .00 NA NA NA NA Additional rate ................................... do 132 .00 NA NA NA NA
Rice: Target price .......................................... Cwt. NA 10 .50 10 .50 10 .50 10 .50 Loan rate .............................................. do 6 .50 6 .50 6 .50 6 .50 6 .50
Wheat: Target price .......................................... Bushel NA 3 .86 3 .86 3 .92 3 .92 Loan rate .............................................. do 2 .58 2 .80 2 .80 2 .75 2 .75
Tobacco: Flue-cured, types 11-14 ....................... Pound 1 .660 1 .656 1 .663 1 .690 NA Fire-cured, type 21 ............................... do 1 .572 1 .603 1 .636 1 .636 NA Fire-cured, types 22-23 ........................ do 1 .736 1 .767 1 .817 1 .863 NA Burley, type 31 ..................................... do 1 .826 1 .835 1 .849 1 .873 NA Dark air-cured, types 35-36 ................. do 1 .499 1 .526 1 .571 1 .612 NA Virginia sun-cured, type 37 .................. do 1 .392 1 .429 1 .458 1 .458 NA Ohio filler and Wisconsin binder, types 42-44 and 53-55 ......................... do 1 .252 1 .286 1 .323 1 .357 NA
Barley: Target price .......................................... Bushel NA 2 .21 2 .21 2 .24 2 .24 Loan rate .............................................. do 1 .65 1 .88 1 .88 1 .85 1 .85
Sorghum grain: Target price .......................................... Cwt. NA 4 .54 4 .54 4 .59 4 .59 Loan rate .............................................. do 3 .05 3 .54 3 .54 3 .48 3 .48
Oats: Target price .......................................... Bushel NA 1 .40 1 .40 1 .44 1 .44 Loan rate .............................................. do 1 .21 1 .35 1 .35 1 .33 1 .33
Minor oilseeds: 2 Target price .......................................... Cwt. NA 9 .80 9 .80 10 .10 10 .10 Loan rate .............................................. do 9 .30 9 .60 9 .60 9 .30 9 .30
Soybeans: Target price .......................................... Bushel NA 5 .80 5 .80 5 .80 5 .80 Loan rate .............................................. do 5 .26 5 .00 5 .00 5 .00 5 .00
Dry Peas: Target price .......................................... Cwt. NA NA NA NA NA Loan rate .............................................. do NA 6 .33 6 .33 6 .22 6 .22
Small chick peas: Target price .......................................... Cwt. NA NA NA NA NA Loan rate .............................................. do NA 7 .56 7 .56 7 .43 7 .43
Large chick peas: Target price .......................................... Cwt. NA NA NA NA NA Loan rate .............................................. do NA NA NA NA NA
Lentils: Target price .......................................... do NA NA NA NA NA Loan rate .............................................. do NA 11 .94 11 .94 11 .72 11 .72
Sugar, raw cane: Loan rate .............................................. Pound 0 .180 0 .180 0 .180 0 .180 0 .180
Sugar, refined beet: Loan rate .............................................. do 0 .229 0 .229 0 .229 0 .229 0 .229
Honey, extracted: Loan rate .............................................. Pound NA 0 .60 0 .60 0 .60 0 .60
Mohair: Loan rate .............................................. do NA 4 .20 4 .20 4 .20 4 .20
Wool, graded: Loan rate .............................................. Pound NA 1 .00 1 .00 1 .00 1 .00
Wool,nongraded: Loan rate .............................................. Pound NA 0 .40 0 .40 0 .40 0 .40
Milk for manufacturing: Support price ........................................ Cwt 9 .90 3 9 .90 9 .90 9 .90 9 .90
See footnotes at end of table.
VerDate Aug 31 2005 13:44 Mar 01, 2012 Jkt 000000 PO 00000 Frm 00039 Fmt 1000 Sfmt 1000 H:\SHARED\DAPP\FPU\AGSTAT\MASTER~2\CHAPTR09\IX-36.AG8 USDA
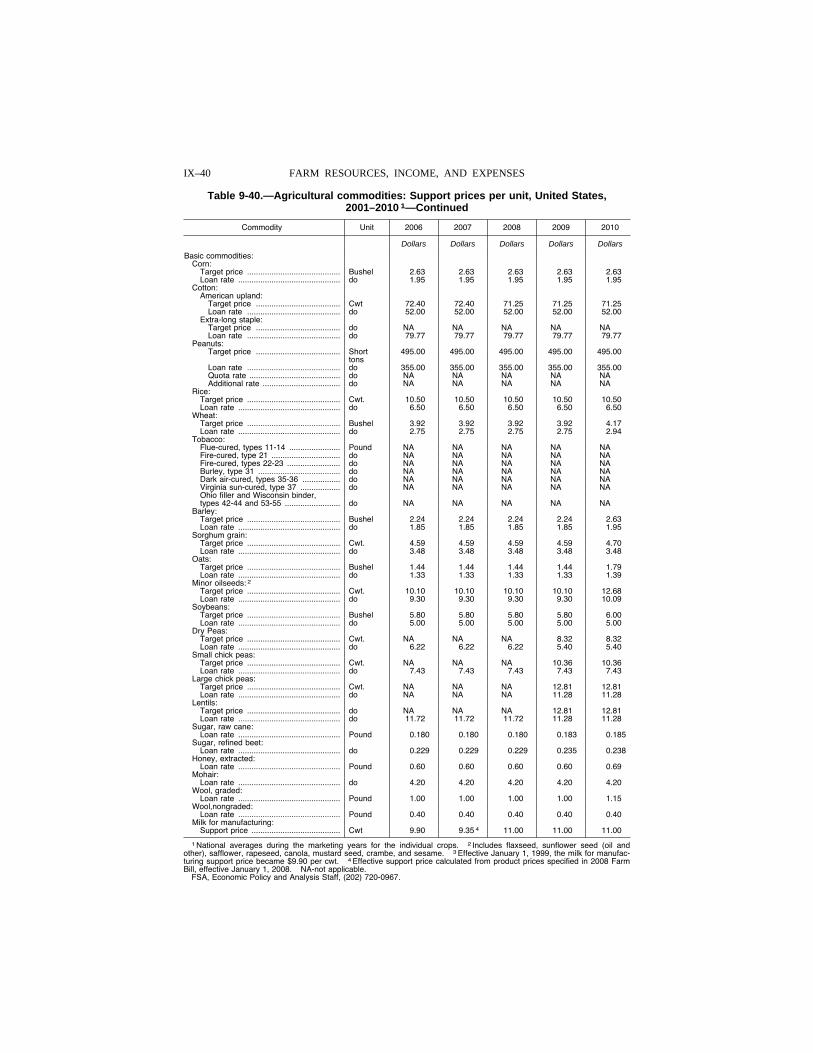
IX–40 FARM RESOURCES, INCOME, AND EXPENSES
Table 9-40.—Agricultural commodities: Support prices per unit, United States, 2001–2010 1—Continued
Commodity Unit 2006 2007 2008 2009 2010
Dollars Dollars Dollars Dollars Dollars
Basic commodities: Corn:
Target price .......................................... Bushel 2 .63 2 .63 2 .63 2 .63 2 .63 Loan rate .............................................. do 1 .95 1 .95 1 .95 1 .95 1 .95
Cotton: American upland:
Target price ...................................... Cwt 72 .40 72 .40 71 .25 71 .25 71 .25 Loan rate .......................................... do 52 .00 52 .00 52 .00 52 .00 52 .00
Extra-long staple: Target price ...................................... do NA NA NA NA NA Loan rate .......................................... do 79 .77 79 .77 79 .77 79 .77 79 .77
Peanuts: Target price ...................................... Short
tons 495 .00 495 .00 495 .00 495 .00 495 .00
Loan rate .......................................... do 355 .00 355 .00 355 .00 355 .00 355 .00 Quota rate ......................................... do NA NA NA NA NA Additional rate ................................... do NA NA NA NA NA
Rice: Target price .......................................... Cwt. 10 .50 10 .50 10 .50 10 .50 10 .50 Loan rate .............................................. do 6 .50 6 .50 6 .50 6 .50 6 .50
Wheat: Target price .......................................... Bushel 3 .92 3 .92 3 .92 3 .92 4 .17 Loan rate .............................................. do 2 .75 2 .75 2 .75 2 .75 2 .94
Tobacco: Flue-cured, types 11-14 ....................... Pound NA NA NA NA NA Fire-cured, type 21 ............................... do NA NA NA NA NA Fire-cured, types 22-23 ........................ do NA NA NA NA NA Burley, type 31 ..................................... do NA NA NA NA NA Dark air-cured, types 35-36 ................. do NA NA NA NA NA Virginia sun-cured, type 37 .................. do NA NA NA NA NA Ohio filler and Wisconsin binder, types 42-44 and 53-55 ......................... do NA NA NA NA NA
Barley: Target price .......................................... Bushel 2 .24 2 .24 2 .24 2 .24 2 .63 Loan rate .............................................. do 1 .85 1 .85 1 .85 1 .85 1 .95
Sorghum grain: Target price .......................................... Cwt. 4 .59 4 .59 4 .59 4 .59 4 .70 Loan rate .............................................. do 3 .48 3 .48 3 .48 3 .48 3 .48
Oats: Target price .......................................... Bushel 1 .44 1 .44 1 .44 1 .44 1 .79 Loan rate .............................................. do 1 .33 1 .33 1 .33 1 .33 1 .39
Minor oilseeds: 2 Target price .......................................... Cwt. 10 .10 10 .10 10 .10 10 .10 12 .68 Loan rate .............................................. do 9 .30 9 .30 9 .30 9 .30 10 .09
Soybeans: Target price .......................................... Bushel 5 .80 5 .80 5 .80 5 .80 6 .00 Loan rate .............................................. do 5 .00 5 .00 5 .00 5 .00 5 .00
Dry Peas: Target price .......................................... Cwt. NA NA NA 8 .32 8 .32 Loan rate .............................................. do 6 .22 6 .22 6 .22 5 .40 5 .40
Small chick peas: Target price .......................................... Cwt. NA NA NA 10 .36 10 .36 Loan rate .............................................. do 7 .43 7 .43 7 .43 7 .43 7 .43
Large chick peas: Target price .......................................... Cwt. NA NA NA 12 .81 12 .81 Loan rate .............................................. do NA NA NA 11 .28 11 .28
Lentils: Target price .......................................... do NA NA NA 12 .81 12 .81 Loan rate .............................................. do 11 .72 11 .72 11 .72 11 .28 11 .28
Sugar, raw cane: Loan rate .............................................. Pound 0 .180 0 .180 0 .180 0 .183 0 .185
Sugar, refined beet: Loan rate .............................................. do 0 .229 0 .229 0 .229 0 .235 0 .238
Honey, extracted: Loan rate .............................................. Pound 0 .60 0 .60 0 .60 0 .60 0 .69
Mohair: Loan rate .............................................. do 4 .20 4 .20 4 .20 4 .20 4 .20
Wool, graded: Loan rate .............................................. Pound 1 .00 1 .00 1 .00 1 .00 1 .15
Wool,nongraded: Loan rate .............................................. Pound 0 .40 0 .40 0 .40 0 .40 0 .40
Milk for manufacturing: Support price ........................................ Cwt 9 .90 9 .35 4 11 .00 11 .00 11 .00
1 National averages during the marketing years for the individual crops. 2 Includes flaxseed, sunflower seed (oil and other), safflower, rapeseed, canola, mustard seed, crambe, and sesame. 3 Effective January 1, 1999, the milk for manufac-turing support price became $9.90 per cwt. 4 Effective support price calculated from product prices specified in 2008 Farm Bill, effective January 1, 2008. NA-not applicable.
FSA, Economic Policy and Analysis Staff, (202) 720-0967.
VerDate Aug 31 2005 13:44 Mar 01, 2012 Jkt 000000 PO 00000 Frm 00040 Fmt 1000 Sfmt 1000 H:\SHARED\DAPP\FPU\AGSTAT\MASTER~2\CHAPTR09\IX-37.AG8 USDA
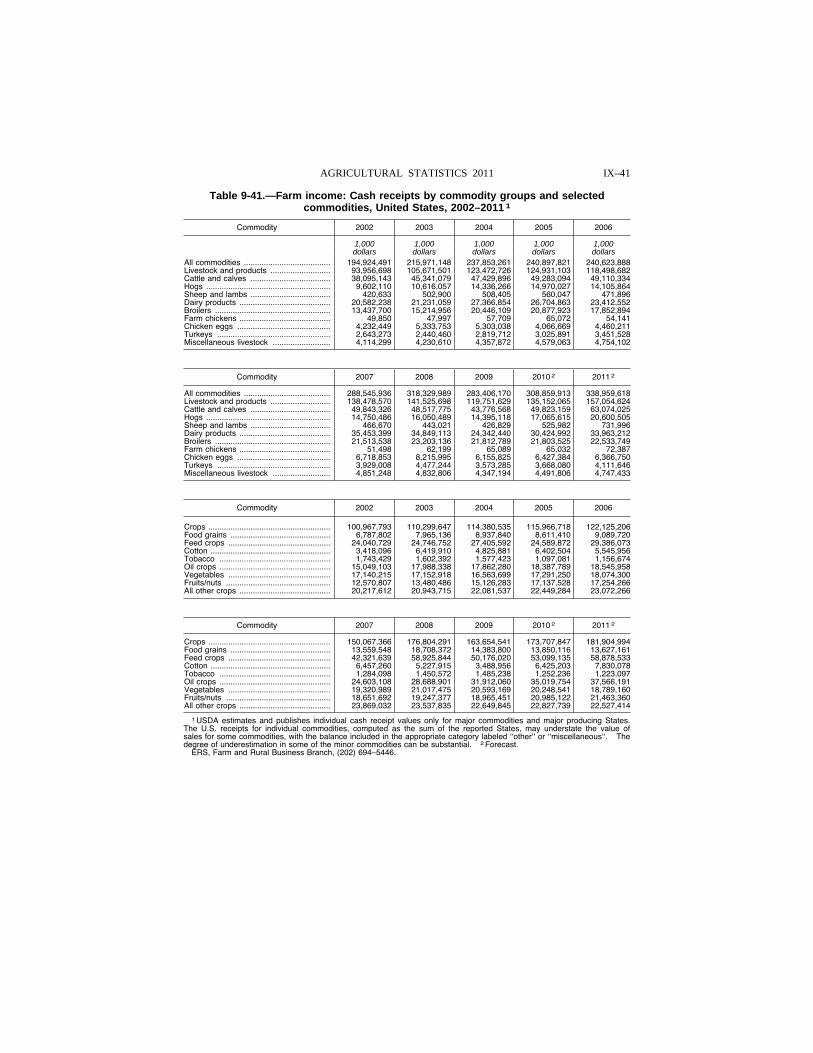
IX–41 AGRICULTURAL STATISTICS 2011
Table 9-41.—Farm income: Cash receipts by commodity groups and selected commodities, United States, 2002–2011 1
Commodity 2002 2003 2004 2005 2006
1,000 1,000 1,000 1,000 1,000 dollars dollars dollars dollars dollars
All commodities ....................................... 194,924,491 215,971,148 237,853,261 240,897,821 240,623,888 Livestock and products ........................... 93,956,698 105,671,501 123,472,726 124,931,103 118,498,682 Cattle and calves .................................... 38,095,143 45,341,079 47,429,896 49,283,094 49,110,334 Hogs ........................................................ 9,602,110 10,616,057 14,336,266 14,970,027 14,105,864 Sheep and lambs .................................... 420,633 502,900 508,405 560,047 471,896 Dairy products ......................................... 20,582,238 21,231,059 27,366,854 26,704,863 23,412,552 Broilers .................................................... 13,437,700 15,214,956 20,446,109 20,877,923 17,852,894 Farm chickens ......................................... 49,850 47,997 57,709 65,072 54,141 Chicken eggs .......................................... 4,232,449 5,333,753 5,303,038 4,066,669 4,460,211 Turkeys ................................................... 2,643,273 2,440,460 2,819,712 3,025,891 3,451,528 Miscellaneous livestock .......................... 4,114,299 4,230,610 4,357,872 4,579,063 4,754,102
Commodity 2007 2008 2009 2010 2 2011 2
All commodities ....................................... 288,545,936 318,329,989 283,406,170 308,859,913 338,959,618 Livestock and products ........................... 138,478,570 141,525,698 119,751,629 135,152,065 157,054,624 Cattle and calves .................................... 49,843,326 48,517,775 43,776,568 49,823,159 63,074,025 Hogs ........................................................ 14,750,486 16,050,489 14,395,118 17,065,615 20,600,505 Sheep and lambs .................................... 466,670 443,021 426,829 525,982 731,996 Dairy products ......................................... 35,453,399 34,849,113 24,342,440 30,424,992 33,963,212 Broilers .................................................... 21,513,538 23,203,136 21,812,789 21,803,525 22,533,749 Farm chickens ......................................... 51,498 62,199 65,089 65,032 72,387 Chicken eggs .......................................... 6,718,853 8,215,995 6,155,825 6,427,384 6,366,750 Turkeys ................................................... 3,929,008 4,477,244 3,573,285 3,668,080 4,111,646 Miscellaneous livestock .......................... 4,851,248 4,832,806 4,347,194 4,491,806 4,747,433
Commodity 2002 2003 2004 2005 2006
Crops ....................................................... 100,967,793 110,299,647 114,380,535 115,966,718 122,125,206 Food grains ............................................. 6,787,802 7,965,136 8,937,840 8,611,410 9,089,720 Feed crops .............................................. 24,040,729 24,746,752 27,405,592 24,589,872 29,386,073 Cotton ...................................................... 3,418,096 6,419,910 4,825,881 6,402,504 5,545,956 Tobacco .................................................. 1,743,429 1,602,392 1,577,423 1,097,081 1,156,674 Oil crops .................................................. 15,049,103 17,988,338 17,862,280 18,387,789 18,545,958 Vegetables .............................................. 17,140,215 17,152,918 16,563,699 17,291,250 18,074,300 Fruits/nuts ............................................... 12,570,807 13,480,486 15,126,283 17,137,528 17,254,266 All other crops ......................................... 20,217,612 20,943,715 22,081,537 22,449,284 23,072,266
Commodity 2007 2008 2009 2010 2 2011 2
Crops ....................................................... 150,067,366 176,804,291 163,654,541 173,707,847 181,904,994 Food grains ............................................. 13,559,548 18,708,372 14,383,800 13,850,116 13,627,161 Feed crops .............................................. 42,321,639 58,925,844 50,176,020 53,099,135 58,878,533 Cotton ...................................................... 6,457,260 5,227,915 3,488,956 6,425,203 7,830,078 Tobacco .................................................. 1,284,098 1,450,572 1,485,238 1,252,236 1,223,097 Oil crops .................................................. 24,603,108 28,688,901 31,912,060 35,019,754 37,566,191 Vegetables .............................................. 19,320,989 21,017,475 20,593,169 20,248,541 18,789,160 Fruits/nuts ............................................... 18,651,692 19,247,377 18,965,451 20,985,122 21,463,360 All other crops ......................................... 23,869,032 23,537,835 22,649,845 22,827,739 22,527,414
1 USDA estimates and publishes individual cash receipt values only for major commodities and major producing States. The U.S. receipts for individual commodities, computed as the sum of the reported States, may understate the value of sales for some commodities, with the balance included in the appropriate category labeled ‘‘other‘‘ or ‘‘miscellaneous‘‘. The degree of underestimation in some of the minor commodities can be substantial. 2 Forecast.
ERS, Farm and Rural Business Branch, (202) 694–5446.
VerDate Aug 31 2005 13:44 Mar 01, 2012 Jkt 000000 PO 00000 Frm 00041 Fmt 1000 Sfmt 1000 H:\SHARED\DAPP\FPU\AGSTAT\MASTER~2\CHAPTR09\IX-38.AG8 USDA
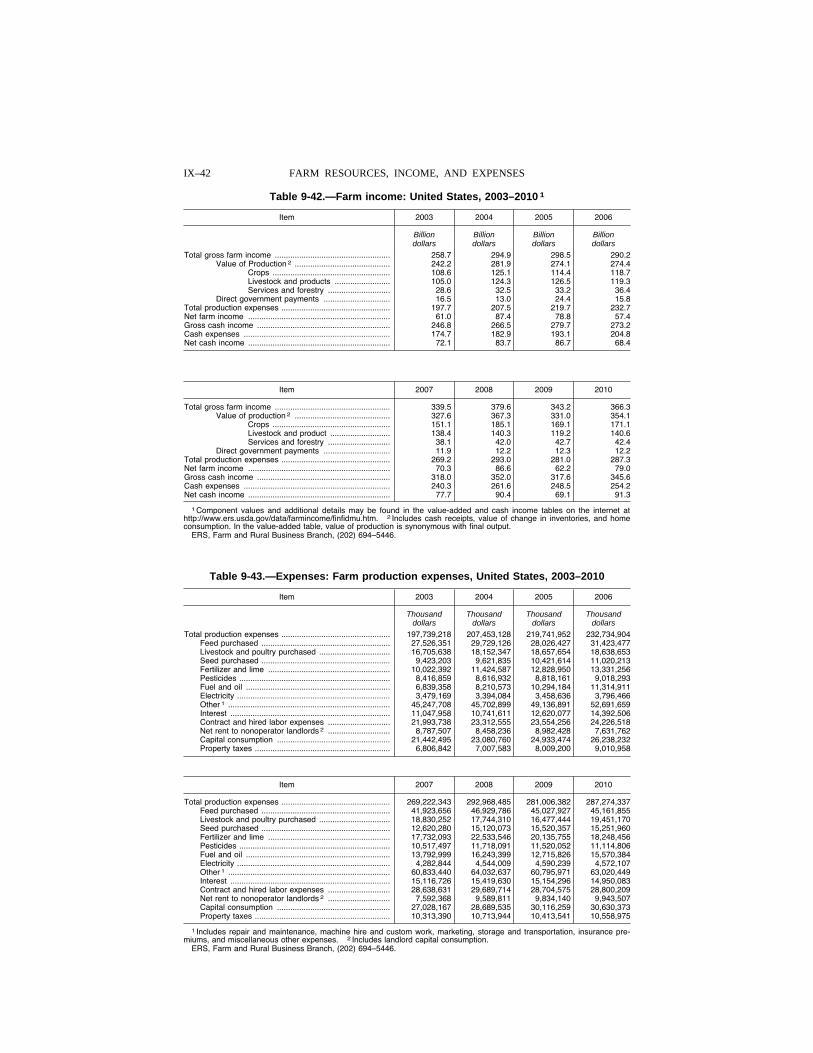
IX–42 FARM RESOURCES, INCOME, AND EXPENSES
Table 9-42.—Farm income: United States, 2003–2010 1
Item 2003 2004 2005 2006
Billion Billion Billion Billion dollars dollars dollars dollars
Total gross farm income .................................................... 258.7 294.9 298.5 290.2 Value of Production 2 ........................................... 242.2 281.9 274.1 274.4
Crops ..................................................... 108.6 125.1 114.4 118.7 Livestock and products ......................... 105.0 124.3 126.5 119.3 Services and forestry ............................ 28.6 32.5 33.2 36.4
Direct government payments .............................. 16.5 13.0 24.4 15.8 Total production expenses ................................................. 197.7 207.5 219.7 232.7 Net farm income ................................................................ 61.0 87.4 78.8 57.4 Gross cash income ............................................................ 246.8 266.5 279.7 273.2 Cash expenses .................................................................. 174.7 182.9 193.1 204.8 Net cash income ................................................................ 72.1 83.7 86.7 68.4
Item 2007 2008 2009 2010
Total gross farm income .................................................... 339.5 379.6 343.2 366.3 Value of production 2 ........................................... 327.6 367.3 331.0 354.1
Crops ..................................................... 151.1 185.1 169.1 171.1 Livestock and product ........................... 138.4 140.3 119.2 140.6 Services and forestry ............................ 38.1 42.0 42.7 42.4
Direct government payments .............................. 11.9 12.2 12.3 12.2 Total production expenses ................................................. 269.2 293.0 281.0 287.3 Net farm income ................................................................ 70.3 86.6 62.2 79.0 Gross cash income ............................................................ 318.0 352.0 317.6 345.6 Cash expenses .................................................................. 240.3 261.6 248.5 254.2 Net cash income ................................................................ 77.7 90.4 69.1 91.3
1 Component values and additional details may be found in the value-added and cash income tables on the internet at http://www.ers.usda.gov/data/farmincome/finfidmu.htm. 2 Includes cash receipts, value of change in inventories, and home consumption. In the value-added table, value of production is synonymous with final output.
ERS, Farm and Rural Business Branch, (202) 694–5446.
Table 9-43.—Expenses: Farm production expenses, United States, 2003–2010
Item 2003 2004 2005 2006
Thousand Thousand Thousand Thousand dollars dollars dollars dollars
Total production expenses ................................................. 197,739,218 207,453,128 219,741,952 232,734,904 Feed purchased .......................................................... 27,526,351 29,729,126 28,026,427 31,423,477 Livestock and poultry purchased ................................ 16,705,638 18,152,347 18,657,654 18,638,653 Seed purchased .......................................................... 9,423,203 9,621,835 10,421,614 11,020,213 Fertilizer and lime ....................................................... 10,022,392 11,424,587 12,828,950 13,331,256 Pesticides .................................................................... 8,416,859 8,616,932 8,818,161 9,018,293 Fuel and oil ................................................................. 6,839,358 8,210,573 10,294,184 11,314,911 Electricity ..................................................................... 3,479,169 3,394,084 3,458,636 3,796,466 Other 1 ......................................................................... 45,247,708 45,702,899 49,136,891 52,691,659 Interest ........................................................................ 11,047,958 10,741,611 12,620,077 14,392,506 Contract and hired labor expenses ............................ 21,993,738 23,312,555 23,554,256 24,226,518 Net rent to nonoperator landlords 2 ............................ 8,787,507 8,458,236 8,982,428 7,631,762 Capital consumption ................................................... 21,442,495 23,080,760 24,933,474 26,238,232 Property taxes ............................................................. 6,806,842 7,007,583 8,009,200 9,010,958
Item 2007 2008 2009 2010
Total production expenses ................................................. 269,222,343 292,968,485 281,006,382 287,274,337 Feed purchased .......................................................... 41,923,656 46,929,786 45,027,927 45,161,855 Livestock and poultry purchased ................................ 18,830,252 17,744,310 16,477,444 19,451,170 Seed purchased .......................................................... 12,620,280 15,120,073 15,520,357 15,251,960 Fertilizer and lime ....................................................... 17,732,093 22,533,546 20,135,755 18,248,456 Pesticides .................................................................... 10,517,497 11,718,091 11,520,052 11,114,806 Fuel and oil ................................................................. 13,792,999 16,243,399 12,715,826 15,570,384 Electricity ..................................................................... 4,282,844 4,544,009 4,590,239 4,572,107 Other 1 ......................................................................... 60,833,440 64,032,637 60,795,971 63,020,449 Interest ........................................................................ 15,116,726 15,419,630 15,154,296 14,950,083 Contract and hired labor expenses ............................ 28,638,631 29,689,714 28,704,575 28,800,209 Net rent to nonoperator landlords 2 ............................ 7,592,368 9,589,811 9,834,140 9,943,507 Capital consumption ................................................... 27,028,167 28,689,535 30,116,259 30,630,373 Property taxes ............................................................. 10,313,390 10,713,944 10,413,541 10,558,975
1 Includes repair and maintenance, machine hire and custom work, marketing, storage and transportation, insurance pre-miums, and miscellaneous other expenses. 2 Includes landlord capital consumption.
ERS, Farm and Rural Business Branch, (202) 694–5446.
VerDate Aug 31 2005 13:44 Mar 01, 2012 Jkt 000000 PO 00000 Frm 00042 Fmt 1000 Sfmt 1000 H:\SHARED\DAPP\FPU\AGSTAT\MASTER~2\CHAPTR09\IX-39.AG8 USDA
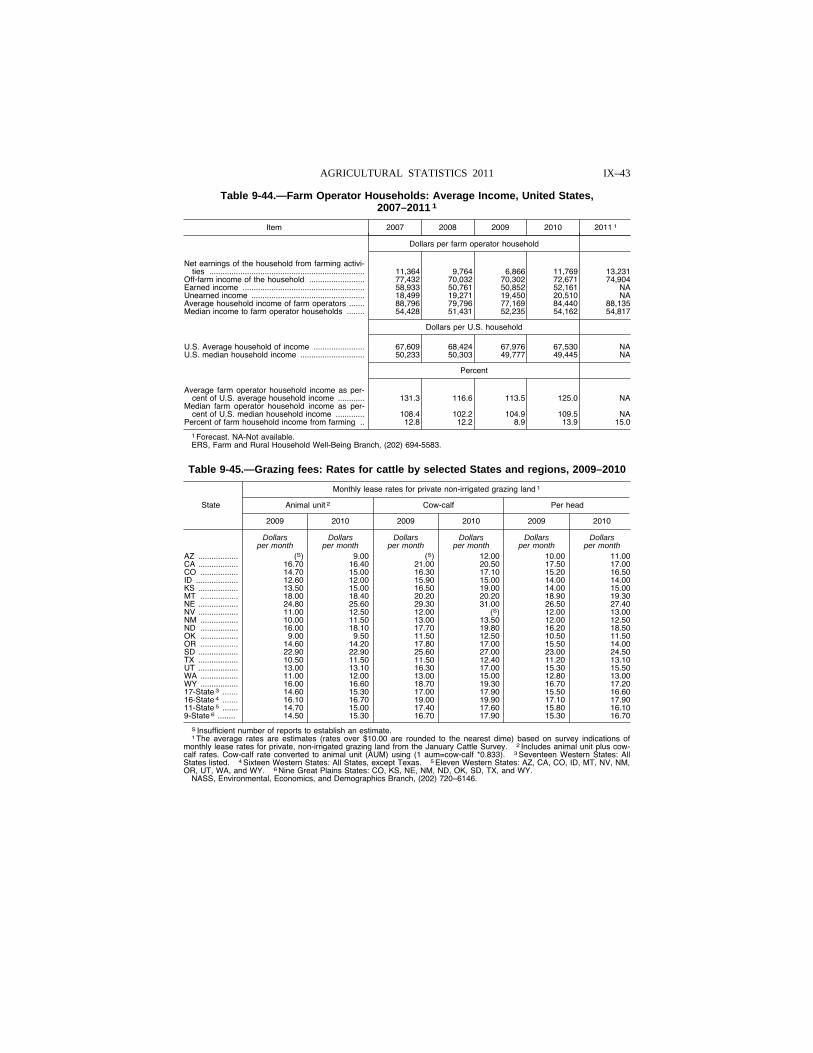
IX–43 AGRICULTURAL STATISTICS 2011
Table 9-44.—Farm Operator Households: Average Income, United States, 2007–2011 1
Item 2007 2008 2009 2010 2011 1
Dollars per farm operator household
Net earnings of the household from farming activi-ties ...................................................................... 11,364 9,764 6,866 11,769 13,231
Off-farm income of the household ......................... 77,432 70,032 70,302 72,671 74,904 Earned income ....................................................... 58,933 50,761 50,852 52,161 NA Unearned income ................................................... 18,499 19,271 19,450 20,510 NA Average household income of farm operators ....... 88,796 79,796 77,169 84,440 88,135 Median income to farm operator households ........ 54,428 51,431 52,235 54,162 54,817
Dollars per U.S. household
U.S. Average household of income ....................... 67,609 68,424 67,976 67,530 NA U.S. median household income ............................. 50,233 50,303 49,777 49,445 NA
Percent
Average farm operator household income as per-cent of U.S. average household income ............ 131.3 116.6 113.5 125.0 NA
Median farm operator household income as per-cent of U.S. median household income ............. 108.4 102.2 104.9 109.5 NA
Percent of farm household income from farming .. 12.8 12.2 8.9 13.9 15.0
1 Forecast. NA-Not available. ERS, Farm and Rural Household Well-Being Branch, (202) 694-5583.
Table 9-45.—Grazing fees: Rates for cattle by selected States and regions, 2009–2010
State
Monthly lease rates for private non-irrigated grazing land 1
Animal unit 2 Cow-calf Per head
2009 2010 2009 2010 2009 2010
Dollars Dollars Dollars Dollars Dollars Dollars per month per month per month per month per month per month
AZ .................. (S) 9.00 (S) 12.00 10.00 11.00 CA .................. 16.70 16.40 21.00 20.50 17.50 17.00 CO ................. 14.70 15.00 16.30 17.10 15.20 16.50 ID ................... 12.60 12.00 15.90 15.00 14.00 14.00 KS .................. 13.50 15.00 16.50 19.00 14.00 15.00 MT ................. 18.00 18.40 20.20 20.20 18.90 19.30 NE .................. 24.80 25.60 29.30 31.00 26.50 27.40 NV .................. 11.00 12.50 12.00 (S) 12.00 13.00 NM ................. 10.00 11.50 13.00 13.50 12.00 12.50 ND ................. 16.00 18.10 17.70 19.80 16.20 18.50 OK ................. 9.00 9.50 11.50 12.50 10.50 11.50 OR ................. 14.60 14.20 17.80 17.00 15.50 14.00 SD .................. 22.90 22.90 25.60 27.00 23.00 24.50 TX .................. 10.50 11.50 11.50 12.40 11.20 13.10 UT .................. 13.00 13.10 16.30 17.00 15.30 15.50 WA ................. 11.00 12.00 13.00 15.00 12.80 13.00 WY ................. 16.00 16.60 18.70 19.30 16.70 17.20 17-State 3 ....... 14.60 15.30 17.00 17.90 15.50 16.60 16-State 4 ....... 16.10 16.70 19.00 19.90 17.10 17.90 11-State 5 ....... 14.70 15.00 17.40 17.60 15.80 16.10 9-State 6 ........ 14.50 15.30 16.70 17.90 15.30 16.70
S Insufficient number of reports to establish an estimate. 1 The average rates are estimates (rates over $10.00 are rounded to the nearest dime) based on survey indications of
monthly lease rates for private, non-irrigated grazing land from the January Cattle Survey. 2 Includes animal unit plus cow- calf rates. Cow-calf rate converted to animal unit (AUM) using (1 aum=cow-calf *0.833). 3 Seventeen Western States: All States listed. 4 Sixteen Western States: All States, except Texas. 5 Eleven Western States: AZ, CA, CO, ID, MT, NV, NM, OR, UT, WA, and WY. 6 Nine Great Plains States: CO, KS, NE, NM, ND, OK, SD, TX, and WY.
NASS, Environmental, Economics, and Demographics Branch, (202) 720–6146.
VerDate Aug 31 2005 13:44 Mar 01, 2012 Jkt 000000 PO 00000 Frm 00043 Fmt 1000 Sfmt 1000 H:\SHARED\DAPP\FPU\AGSTAT\MASTER~2\CHAPTR09\IX-41.AG8 USDA

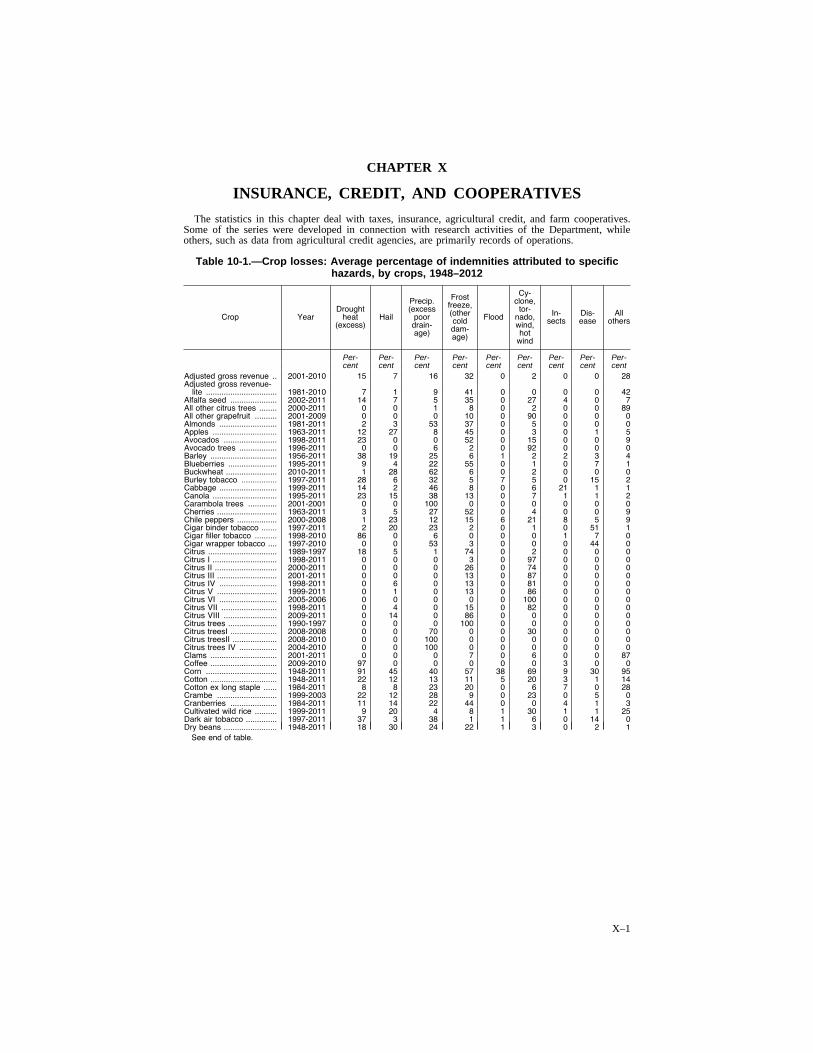
X–1
CHAPTER X
INSURANCE, CREDIT, AND COOPERATIVES
The statistics in this chapter deal with taxes, insurance, agricultural credit, and farm cooperatives. Some of the series were developed in connection with research activities of the Department, while others, such as data from agricultural credit agencies, are primarily records of operations.
Table 10-1.—Crop losses: Average percentage of indemnities attributed to specific hazards, by crops, 1948–2012
Crop Year Drought
heat (excess)
Hail
Precip. (excess
poor drain-age)
Frost freeze, (other cold dam-age)
Flood
Cy-clone,
tor-nado, wind, hot
wind
In-sects
Dis-ease
All others
Per- Per- Per- Per- Per- Per- Per- Per- Per- cent cent cent cent cent cent cent cent cent
Adjusted gross revenue .. 2001-2010 15 7 16 32 0 2 0 0 28 Adjusted gross revenue-
lite ................................ 1981-2010 7 1 9 41 0 0 0 0 42 Alfalfa seed ..................... 2002-2011 14 7 5 35 0 27 4 0 7 All other citrus trees ........ 2000-2011 0 0 1 8 0 2 0 0 89 All other grapefruit .......... 2001-2009 0 0 0 10 0 90 0 0 0 Almonds .......................... 1981-2011 2 3 53 37 0 5 0 0 0 Apples ............................. 1963-2011 12 27 8 45 0 3 0 1 5 Avocados ........................ 1998-2011 23 0 0 52 0 15 0 0 9 Avocado trees ................. 1996-2011 0 0 6 2 0 92 0 0 0 Barley .............................. 1956-2011 38 19 25 6 1 2 2 3 4 Blueberries ...................... 1995-2011 9 4 22 55 0 1 0 7 1 Buckwheat ....................... 2010-2011 1 28 62 6 0 2 0 0 0 Burley tobacco ................ 1997-2011 28 6 32 5 7 5 0 15 2 Cabbage .......................... 1999-2011 14 2 46 8 0 6 21 1 1 Canola ............................. 1995-2011 23 15 38 13 0 7 1 1 2 Carambola trees ............. 2001-2001 0 0 100 0 0 0 0 0 0 Cherries ........................... 1963-2011 3 5 27 52 0 4 0 0 9 Chile peppers .................. 2000-2008 1 23 12 15 6 21 8 5 9 Cigar binder tobacco ....... 1997-2011 2 20 23 2 0 1 0 51 1 Cigar filler tobacco .......... 1998-2010 86 0 6 0 0 0 1 7 0 Cigar wrapper tobacco .... 1997-2010 0 0 53 3 0 0 0 44 0 Citrus ............................... 1989-1997 18 5 1 74 0 2 0 0 0 Citrus I ............................. 1998-2011 0 0 0 3 0 97 0 0 0 Citrus II ............................ 2000-2011 0 0 0 26 0 74 0 0 0 Citrus III ........................... 2001-2011 0 0 0 13 0 87 0 0 0 Citrus IV .......................... 1998-2011 0 6 0 13 0 81 0 0 0 Citrus V ........................... 1999-2011 0 1 0 13 0 86 0 0 0 Citrus VI .......................... 2005-2006 0 0 0 0 0 100 0 0 0 Citrus VII ......................... 1998-2011 0 4 0 15 0 82 0 0 0 Citrus VIII ........................ 2009-2011 0 14 0 86 0 0 0 0 0 Citrus trees ...................... 1990-1997 0 0 0 100 0 0 0 0 0 Citrus treesI ..................... 2008-2008 0 0 70 0 0 30 0 0 0 Citrus treesII .................... 2008-2010 0 0 100 0 0 0 0 0 0 Citrus trees IV ................. 2004-2010 0 0 100 0 0 0 0 0 0 Clams .............................. 2001-2011 0 0 0 7 0 6 0 0 87 Coffee .............................. 2009-2010 97 0 0 0 0 0 3 0 0 Corn ................................ 1948-2011 91 45 40 57 38 69 9 30 95 Cotton .............................. 1948-2011 22 12 13 11 5 20 3 1 14 Cotton ex long staple ...... 1984-2011 8 8 23 20 0 6 7 0 28 Crambe ........................... 1999-2003 22 12 28 9 0 23 0 5 0 Cranberries ..................... 1984-2011 11 14 22 44 0 0 4 1 3 Cultivated wild rice .......... 1999-2011 9 20 4 8 1 30 1 1 25 Dark air tobacco .............. 1997-2011 37 3 38 1 1 6 0 14 0 Dry beans ........................ 1948-2011 18 30 24 22 1 3 0 2 1
See end of table.
VerDate Aug 31 2005 14:46 Feb 28, 2012 Jkt 000000 PO 00000 Frm 00001 Fmt 1001 Sfmt 1001 H:\SHARED\DAPP\FPU\AGSTAT\MASTER~2\CHAPTR10\X-01.AG8 USDA
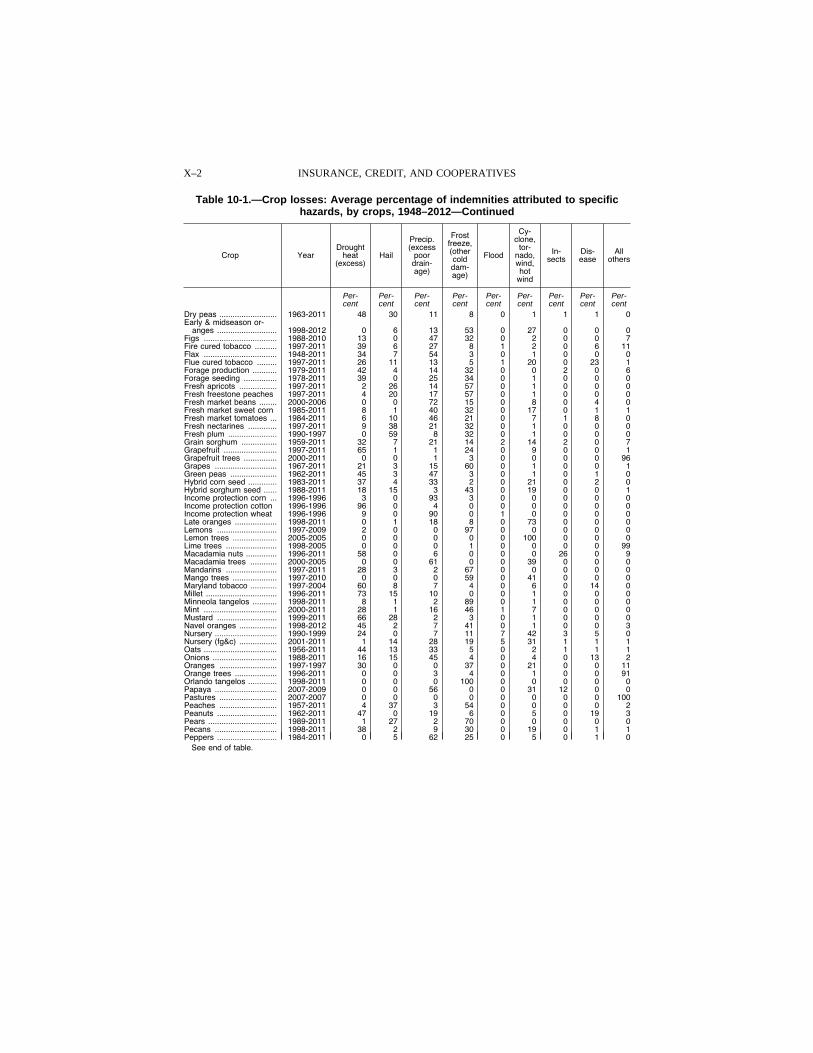
X–2 INSURANCE, CREDIT, AND COOPERATIVES
Table 10-1.—Crop losses: Average percentage of indemnities attributed to specific hazards, by crops, 1948–2012—Continued
Crop Year Drought
heat (excess)
Hail
Precip. (excess
poor drain-age)
Frost freeze, (other cold dam-age)
Flood
Cy-clone,
tor-nado, wind, hot
wind
In-sects
Dis-ease
All others
Per- Per- Per- Per- Per- Per- Per- Per- Per- cent cent cent cent cent cent cent cent cent
Dry peas .......................... 1963-2011 48 30 11 8 0 1 1 1 0 Early & midseason or-
anges ........................... 1998-2012 0 6 13 53 0 27 0 0 0 Figs ................................. 1988-2010 13 0 47 32 0 2 0 0 7 Fire cured tobacco .......... 1997-2011 39 6 27 8 1 2 0 6 11 Flax ................................. 1948-2011 34 7 54 3 0 1 0 0 0 Flue cured tobacco ......... 1997-2011 26 11 13 5 1 20 0 23 1 Forage production ........... 1979-2011 42 4 14 32 0 0 2 0 6 Forage seeding ............... 1978-2011 39 0 25 34 0 1 0 0 0 Fresh apricots ................. 1997-2011 2 26 14 57 0 1 0 0 0 Fresh freestone peaches 1997-2011 4 20 17 57 0 1 0 0 0 Fresh market beans ........ 2000-2006 0 0 72 15 0 8 0 4 0 Fresh market sweet corn 1985-2011 8 1 40 32 0 17 0 1 1 Fresh market tomatoes ... 1984-2011 6 10 46 21 0 7 1 8 0 Fresh nectarines ............. 1997-2011 9 38 21 32 0 1 0 0 0 Fresh plum ...................... 1990-1997 0 59 8 32 0 1 0 0 0 Grain sorghum ................ 1959-2011 32 7 21 14 2 14 2 0 7 Grapefruit ........................ 1997-2011 65 1 1 24 0 9 0 0 1 Grapefruit trees ............... 2000-2011 0 0 1 3 0 0 0 0 96 Grapes ............................ 1967-2011 21 3 15 60 0 1 0 0 1 Green peas ..................... 1962-2011 45 3 47 3 0 1 0 1 0 Hybrid corn seed ............. 1983-2011 37 4 33 2 0 21 0 2 0 Hybrid sorghum seed ...... 1988-2011 18 15 3 43 0 19 0 0 1 Income protection corn ... 1996-1996 3 0 93 3 0 0 0 0 0 Income protection cotton 1996-1996 96 0 4 0 0 0 0 0 0 Income protection wheat 1996-1996 9 0 90 0 1 0 0 0 0 Late oranges ................... 1998-2011 0 1 18 8 0 73 0 0 0 Lemons ........................... 1997-2009 2 0 0 97 0 0 0 0 0 Lemon trees .................... 2005-2005 0 0 0 0 0 100 0 0 0 Lime trees ....................... 1998-2005 0 0 0 1 0 0 0 0 99 Macadamia nuts .............. 1996-2011 58 0 6 0 0 0 26 0 9 Macadamia trees ............ 2000-2005 0 0 61 0 0 39 0 0 0 Mandarins ....................... 1997-2011 28 3 2 67 0 0 0 0 0 Mango trees .................... 1997-2010 0 0 0 59 0 41 0 0 0 Maryland tobacco ............ 1997-2004 60 8 7 4 0 6 0 14 0 Millet ................................ 1996-2011 73 15 10 0 0 1 0 0 0 Minneola tangelos ........... 1998-2011 8 1 2 89 0 1 0 0 0 Mint ................................. 2000-2011 28 1 16 46 1 7 0 0 0 Mustard ........................... 1999-2011 66 28 2 3 0 1 0 0 0 Navel oranges ................. 1998-2012 45 2 7 41 0 1 0 0 3 Nursery ............................ 1990-1999 24 0 7 11 7 42 3 5 0 Nursery (fg&c) ................. 2001-2011 1 14 28 19 5 31 1 1 1 Oats ................................. 1956-2011 44 13 33 5 0 2 1 1 1 Onions ............................. 1988-2011 16 15 45 4 0 4 0 13 2 Oranges .......................... 1997-1997 30 0 0 37 0 21 0 0 11 Orange trees ................... 1996-2011 0 0 3 4 0 1 0 0 91 Orlando tangelos ............. 1998-2011 0 0 0 100 0 0 0 0 0 Papaya ............................ 2007-2009 0 0 56 0 0 31 12 0 0 Pastures .......................... 2007-2007 0 0 0 0 0 0 0 0 100 Peaches .......................... 1957-2011 4 37 3 54 0 0 0 0 2 Peanuts ........................... 1962-2011 47 0 19 6 0 5 0 19 3 Pears ............................... 1989-2011 1 27 2 70 0 0 0 0 0 Pecans ............................ 1998-2011 38 2 9 30 0 19 0 1 1 Peppers ........................... 1984-2011 0 5 62 25 0 5 0 1 0
See end of table.
VerDate Aug 31 2005 14:46 Feb 28, 2012 Jkt 000000 PO 00000 Frm 00002 Fmt 1000 Sfmt 1000 H:\SHARED\DAPP\FPU\AGSTAT\MASTER~2\CHAPTR10\X-02.AG8 USDA
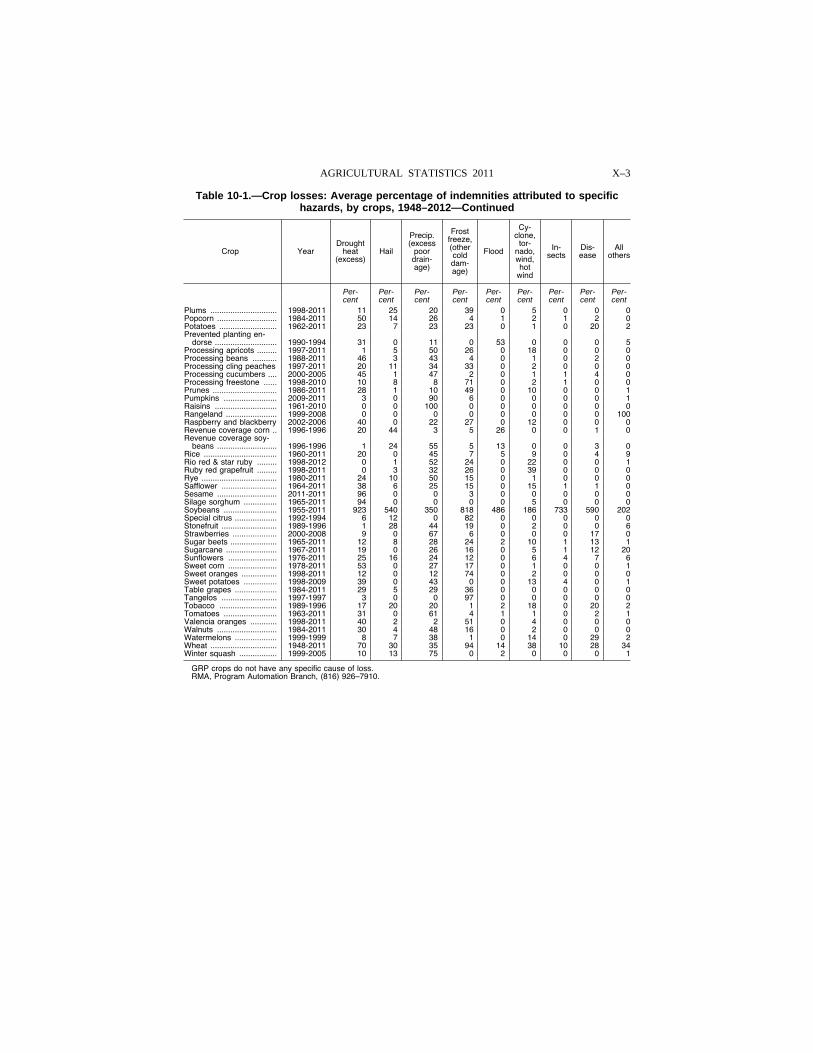
X–3 AGRICULTURAL STATISTICS 2011
Table 10-1.—Crop losses: Average percentage of indemnities attributed to specific hazards, by crops, 1948–2012—Continued
Crop Year Drought
heat (excess)
Hail
Precip. (excess
poor drain-age)
Frost freeze, (other cold dam-age)
Flood
Cy-clone,
tor-nado, wind, hot
wind
In-sects
Dis-ease
All others
Per- Per- Per- Per- Per- Per- Per- Per- Per- cent cent cent cent cent cent cent cent cent
Plums .............................. 1998-2011 11 25 20 39 0 5 0 0 0 Popcorn ........................... 1984-2011 50 14 26 4 1 2 1 2 0 Potatoes .......................... 1962-2011 23 7 23 23 0 1 0 20 2 Prevented planting en-
dorse ............................ 1990-1994 31 0 11 0 53 0 0 0 5 Processing apricots ......... 1997-2011 1 5 50 26 0 18 0 0 0 Processing beans ........... 1988-2011 46 3 43 4 0 1 0 2 0 Processing cling peaches 1997-2011 20 11 34 33 0 2 0 0 0 Processing cucumbers .... 2000-2005 45 1 47 2 0 1 1 4 0 Processing freestone ...... 1998-2010 10 8 8 71 0 2 1 0 0 Prunes ............................. 1986-2011 28 1 10 49 0 10 0 0 1 Pumpkins ........................ 2009-2011 3 0 90 6 0 0 0 0 1 Raisins ............................ 1961-2010 0 0 100 0 0 0 0 0 0 Rangeland ....................... 1999-2008 0 0 0 0 0 0 0 0 100 Raspberry and blackberry 2002-2006 40 0 22 27 0 12 0 0 0 Revenue coverage corn .. 1996-1996 20 44 3 5 26 0 0 1 0 Revenue coverage soy-
beans ........................... 1996-1996 1 24 55 5 13 0 0 3 0 Rice ................................. 1960-2011 20 0 45 7 5 9 0 4 9 Rio red & star ruby ......... 1998-2012 0 1 52 24 0 22 0 0 1 Ruby red grapefruit ......... 1998-2011 0 3 32 26 0 39 0 0 0 Rye .................................. 1980-2011 24 10 50 15 0 1 0 0 0 Safflower ......................... 1964-2011 38 6 25 15 0 15 1 1 0 Sesame ........................... 2011-2011 96 0 0 3 0 0 0 0 0 Silage sorghum ............... 1965-2011 94 0 0 0 0 5 0 0 0 Soybeans ........................ 1955-2011 923 540 350 818 486 186 733 590 202 Special citrus ................... 1992-1994 6 12 0 82 0 0 0 0 0 Stonefruit ......................... 1989-1996 1 28 44 19 0 2 0 0 6 Strawberries .................... 2000-2008 9 0 67 6 0 0 0 17 0 Sugar beets ..................... 1965-2011 12 8 28 24 2 10 1 13 1 Sugarcane ....................... 1967-2011 19 0 26 16 0 5 1 12 20 Sunflowers ...................... 1976-2011 25 16 24 12 0 6 4 7 6 Sweet corn ...................... 1978-2011 53 0 27 17 0 1 0 0 1 Sweet oranges ................ 1998-2011 12 0 12 74 0 2 0 0 0 Sweet potatoes ............... 1998-2009 39 0 43 0 0 13 4 0 1 Table grapes ................... 1984-2011 29 5 29 36 0 0 0 0 0 Tangelos ......................... 1997-1997 3 0 0 97 0 0 0 0 0 Tobacco .......................... 1989-1996 17 20 20 1 2 18 0 20 2 Tomatoes ........................ 1963-2011 31 0 61 4 1 1 0 2 1 Valencia oranges ............ 1998-2011 40 2 2 51 0 4 0 0 0 Walnuts ........................... 1984-2011 30 4 48 16 0 2 0 0 0 Watermelons ................... 1999-1999 8 7 38 1 0 14 0 29 2 Wheat .............................. 1948-2011 70 30 35 94 14 38 10 28 34 Winter squash ................. 1999-2005 10 13 75 0 2 0 0 0 1
GRP crops do not have any specific cause of loss. RMA, Program Automation Branch, (816) 926–7910.
VerDate Aug 31 2005 14:46 Feb 28, 2012 Jkt 000000 PO 00000 Frm 00003 Fmt 1000 Sfmt 1000 H:\SHARED\DAPP\FPU\AGSTAT\MASTER~2\CHAPTR10\X-03.AG8 USDA
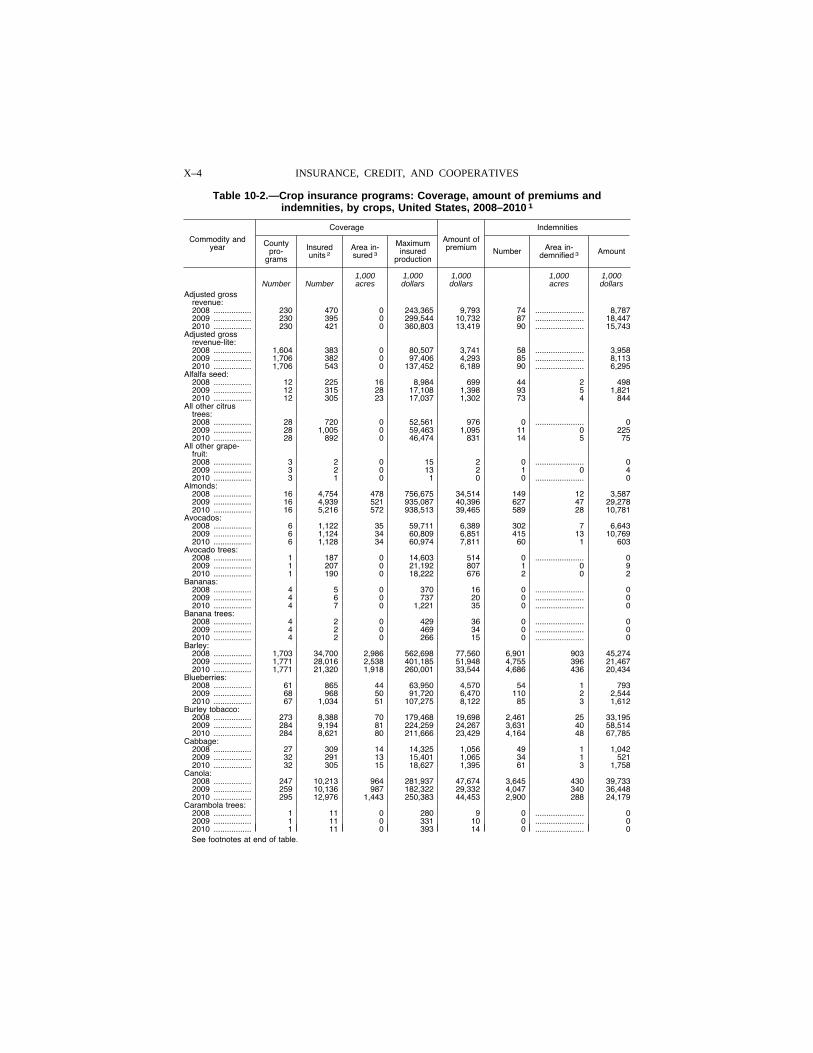
X–4 INSURANCE, CREDIT, AND COOPERATIVES
Table 10-2.—Crop insurance programs: Coverage, amount of premiums and indemnities, by crops, United States, 2008–2010 1
Commodity and year
Coverage
Amount of premium
Indemnities
County pro-
grams
Insured units 2
Area in- sured 3
Maximum insured
production Number Area in-
demnified 3 Amount
1,000 1,000 1,000 1,000 1,000 Number Number acres dollars dollars acres dollars
Adjusted gross revenue: 2008 ................. 230 470 0 243,365 9,793 74 ...................... 8,787 2009 ................. 230 395 0 299,544 10,732 87 ...................... 18,447 2010 ................. 230 421 0 360,803 13,419 90 ...................... 15,743
Adjusted gross revenue-lite: 2008 ................. 1,604 383 0 80,507 3,741 58 ...................... 3,958 2009 ................. 1,706 382 0 97,406 4,293 85 ...................... 8,113 2010 ................. 1,706 543 0 137,452 6,189 90 ...................... 6,295
Alfalfa seed: 2008 ................. 12 225 16 8,984 699 44 2 498 2009 ................. 12 315 28 17,108 1,398 93 5 1,821 2010 ................. 12 305 23 17,037 1,302 73 4 844
All other citrus trees: 2008 ................. 28 720 0 52,561 976 0 ...................... 0 2009 ................. 28 1,005 0 59,463 1,095 11 0 225 2010 ................. 28 892 0 46,474 831 14 5 75
All other grape-fruit: 2008 ................. 3 2 0 15 2 0 ...................... 0 2009 ................. 3 2 0 13 2 1 0 4 2010 ................. 3 1 0 1 0 0 ...................... 0
Almonds: 2008 ................. 16 4,754 478 756,675 34,514 149 12 3,587 2009 ................. 16 4,939 521 935,087 40,396 627 47 29,278 2010 ................. 16 5,216 572 938,513 39,465 589 28 10,781
Avocados: 2008 ................. 6 1,122 35 59,711 6,389 302 7 6,643 2009 ................. 6 1,124 34 60,809 6,851 415 13 10,769 2010 ................. 6 1,128 34 60,974 7,811 60 1 603
Avocado trees: 2008 ................. 1 187 0 14,603 514 0 ...................... 0 2009 ................. 1 207 0 21,192 807 1 0 9 2010 ................. 1 190 0 18,222 676 2 0 2
Bananas: 2008 ................. 4 5 0 370 16 0 ...................... 0 2009 ................. 4 6 0 737 20 0 ...................... 0 2010 ................. 4 7 0 1,221 35 0 ...................... 0
Banana trees: 2008 ................. 4 2 0 429 36 0 ...................... 0 2009 ................. 4 2 0 469 34 0 ...................... 0 2010 ................. 4 2 0 266 15 0 ...................... 0
Barley: 2008 ................. 1,703 34,700 2,986 562,698 77,560 6,901 903 45,274 2009 ................. 1,771 28,016 2,538 401,185 51,948 4,755 396 21,467 2010 ................. 1,771 21,320 1,918 260,001 33,544 4,686 436 20,434
Blueberries: 2008 ................. 61 865 44 63,950 4,570 54 1 793 2009 ................. 68 968 50 91,720 6,470 110 2 2,544 2010 ................. 67 1,034 51 107,275 8,122 85 3 1,612
Burley tobacco: 2008 ................. 273 8,388 70 179,468 19,698 2,461 25 33,195 2009 ................. 284 9,194 81 224,259 24,267 3,631 40 58,514 2010 ................. 284 8,621 80 211,666 23,429 4,164 48 67,785
Cabbage: 2008 ................. 27 309 14 14,325 1,056 49 1 1,042 2009 ................. 32 291 13 15,401 1,065 34 1 521 2010 ................. 32 305 15 18,627 1,395 61 3 1,758
Canola: 2008 ................. 247 10,213 964 281,937 47,674 3,645 430 39,733 2009 ................. 259 10,136 987 182,322 29,332 4,047 340 36,448 2010 ................. 295 12,976 1,443 250,383 44,453 2,900 288 24,179
Carambola trees: 2008 ................. 1 11 0 280 9 0 ...................... 0 2009 ................. 1 11 0 331 10 0 ...................... 0 2010 ................. 1 11 0 393 14 0 ...................... 0 See footnotes at end of table.
VerDate Aug 31 2005 14:46 Feb 28, 2012 Jkt 000000 PO 00000 Frm 00004 Fmt 1000 Sfmt 1000 H:\SHARED\DAPP\FPU\AGSTAT\MASTER~2\CHAPTR10\X-04.AG8 USDA
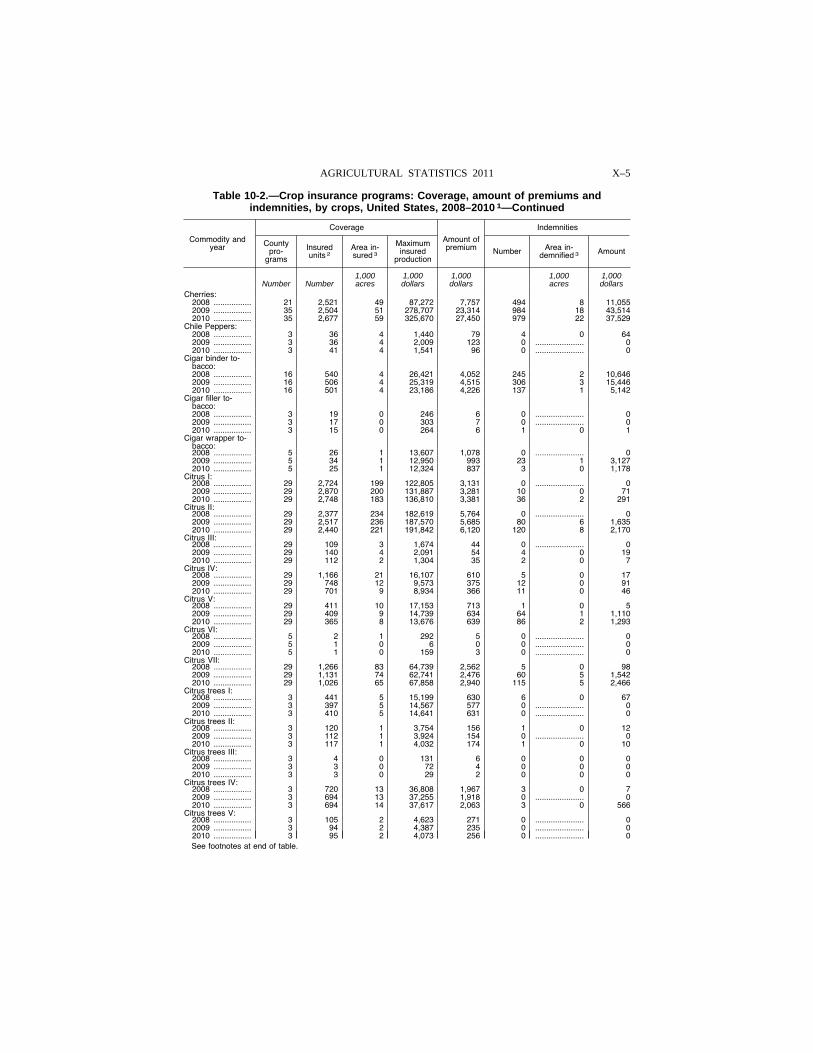
X–5 AGRICULTURAL STATISTICS 2011
Table 10-2.—Crop insurance programs: Coverage, amount of premiums and indemnities, by crops, United States, 2008–2010 1—Continued
Commodity and year
Coverage
Amount of premium
Indemnities
County pro-
grams
Insured units 2
Area in- sured 3
Maximum insured
production Number Area in-
demnified 3 Amount
1,000 1,000 1,000 1,000 1,000 Number Number acres dollars dollars acres dollars
Cherries: 2008 ................. 21 2,521 49 87,272 7,757 494 8 11,055 2009 ................. 35 2,504 51 278,707 23,314 984 18 43,514 2010 ................. 35 2,677 59 325,670 27,450 979 22 37,529
Chile Peppers: 2008 ................. 3 36 4 1,440 79 4 0 64 2009 ................. 3 36 4 2,009 123 0 ...................... 0 2010 ................. 3 41 4 1,541 96 0 ...................... 0
Cigar binder to-bacco: 2008 ................. 16 540 4 26,421 4,052 245 2 10,646 2009 ................. 16 506 4 25,319 4,515 306 3 15,446 2010 ................. 16 501 4 23,186 4,226 137 1 5,142
Cigar filler to-bacco: 2008 ................. 3 19 0 246 6 0 ...................... 0 2009 ................. 3 17 0 303 7 0 ...................... 0 2010 ................. 3 15 0 264 6 1 0 1
Cigar wrapper to-bacco: 2008 ................. 5 26 1 13,607 1,078 0 ...................... 0 2009 ................. 5 34 1 12,950 993 23 1 3,127 2010 ................. 5 25 1 12,324 837 3 0 1,178
Citrus I: 2008 ................. 29 2,724 199 122,805 3,131 0 ...................... 0 2009 ................. 29 2,870 200 131,887 3,281 10 0 71 2010 ................. 29 2,748 183 136,810 3,381 36 2 291
Citrus II: 2008 ................. 29 2,377 234 182,619 5,764 0 ...................... 0 2009 ................. 29 2,517 236 187,570 5,685 80 6 1,635 2010 ................. 29 2,440 221 191,842 6,120 120 8 2,170
Citrus III: 2008 ................. 29 109 3 1,674 44 0 ...................... 0 2009 ................. 29 140 4 2,091 54 4 0 19 2010 ................. 29 112 2 1,304 35 2 0 7
Citrus IV: 2008 ................. 29 1,166 21 16,107 610 5 0 17 2009 ................. 29 748 12 9,573 375 12 0 91 2010 ................. 29 701 9 8,934 366 11 0 46
Citrus V: 2008 ................. 29 411 10 17,153 713 1 0 5 2009 ................. 29 409 9 14,739 634 64 1 1,110 2010 ................. 29 365 8 13,676 639 86 2 1,293
Citrus VI: 2008 ................. 5 2 1 292 5 0 ...................... 0 2009 ................. 5 1 0 6 0 0 ...................... 0 2010 ................. 5 1 0 159 3 0 ...................... 0
Citrus VII: 2008 ................. 29 1,266 83 64,739 2,562 5 0 98 2009 ................. 29 1,131 74 62,741 2,476 60 5 1,542 2010 ................. 29 1,026 65 67,858 2,940 115 5 2,466
Citrus trees I: 2008 ................. 3 441 5 15,199 630 6 0 67 2009 ................. 3 397 5 14,567 577 0 ...................... 0 2010 ................. 3 410 5 14,641 631 0 ...................... 0
Citrus trees II: 2008 ................. 3 120 1 3,754 156 1 0 12 2009 ................. 3 112 1 3,924 154 0 ...................... 0 2010 ................. 3 117 1 4,032 174 1 0 10
Citrus trees III: 2008 ................. 3 4 0 131 6 0 0 0 2009 ................. 3 3 0 72 4 0 0 0 2010 ................. 3 3 0 29 2 0 0 0
Citrus trees IV: 2008 ................. 3 720 13 36,808 1,967 3 0 7 2009 ................. 3 694 13 37,255 1,918 0 ...................... 0 2010 ................. 3 694 14 37,617 2,063 3 0 566
Citrus trees V: 2008 ................. 3 105 2 4,623 271 0 ...................... 0 2009 ................. 3 94 2 4,387 235 0 ...................... 0 2010 ................. 3 95 2 4,073 256 0 ...................... 0 See footnotes at end of table.
VerDate Aug 31 2005 14:46 Feb 28, 2012 Jkt 000000 PO 00000 Frm 00005 Fmt 1000 Sfmt 1000 H:\SHARED\DAPP\FPU\AGSTAT\MASTER~2\CHAPTR10\X-05.AG8 USDA
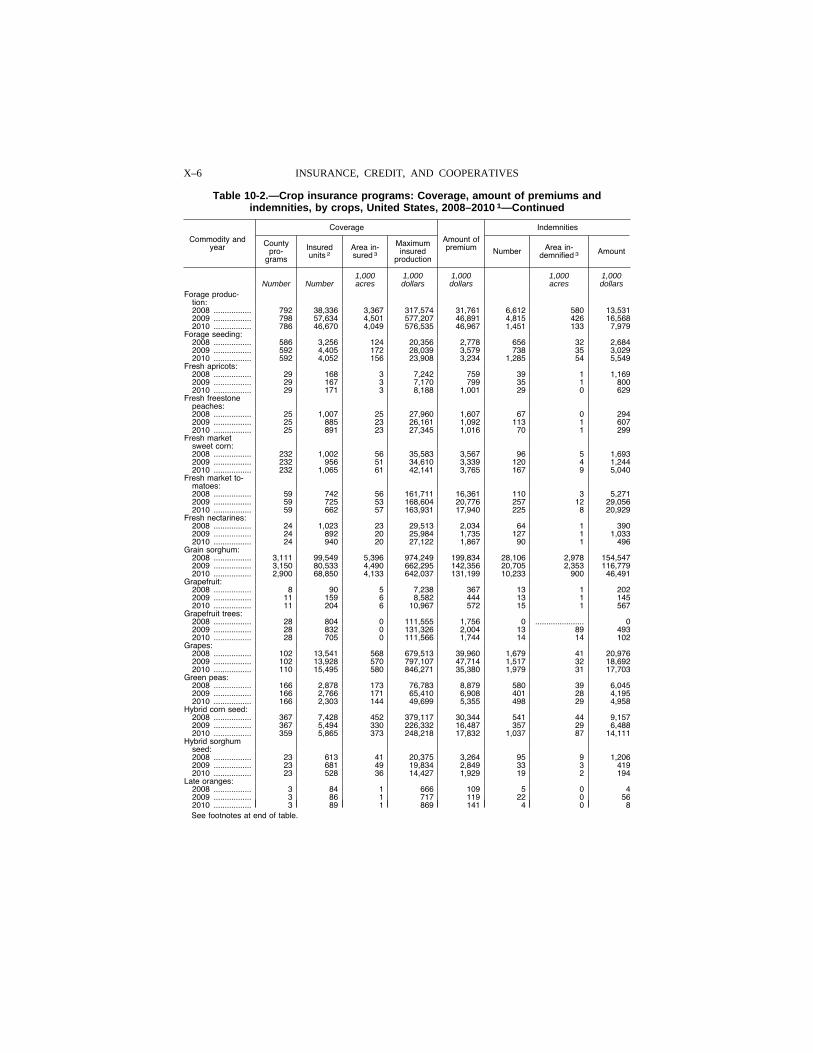
X–6 INSURANCE, CREDIT, AND COOPERATIVES
Table 10-2.—Crop insurance programs: Coverage, amount of premiums and indemnities, by crops, United States, 2008–2010 1—Continued
Commodity and year
Coverage
Amount of premium
Indemnities
County pro-
grams
Insured units 2
Area in- sured 3
Maximum insured
production Number Area in-
demnified 3 Amount
1,000 1,000 1,000 1,000 1,000 Number Number acres dollars dollars acres dollars
Forage produc-tion: 2008 ................. 792 38,336 3,367 317,574 31,761 6,612 580 13,531 2009 ................. 798 57,634 4,501 577,207 46,891 4,815 426 16,568 2010 ................. 786 46,670 4,049 576,535 46,967 1,451 133 7,979
Forage seeding: 2008 ................. 586 3,256 124 20,356 2,778 656 32 2,684 2009 ................. 592 4,405 172 28,039 3,579 738 35 3,029 2010 ................. 592 4,052 156 23,908 3,234 1,285 54 5,549
Fresh apricots: 2008 ................. 29 168 3 7,242 759 39 1 1,169 2009 ................. 29 167 3 7,170 799 35 1 800 2010 ................. 29 171 3 8,188 1,001 29 0 629
Fresh freestone peaches: 2008 ................. 25 1,007 25 27,960 1,607 67 0 294 2009 ................. 25 885 23 26,161 1,092 113 1 607 2010 ................. 25 891 23 27,345 1,016 70 1 299
Fresh market sweet corn: 2008 ................. 232 1,002 56 35,583 3,567 96 5 1,693 2009 ................. 232 956 51 34,610 3,339 120 4 1,244 2010 ................. 232 1,065 61 42,141 3,765 167 9 5,040
Fresh market to-matoes: 2008 ................. 59 742 56 161,711 16,361 110 3 5,271 2009 ................. 59 725 53 168,604 20,776 257 12 29,056 2010 ................. 59 662 57 163,931 17,940 225 8 20,929
Fresh nectarines: 2008 ................. 24 1,023 23 29,513 2,034 64 1 390 2009 ................. 24 892 20 25,984 1,735 127 1 1,033 2010 ................. 24 940 20 27,122 1,867 90 1 496
Grain sorghum: 2008 ................. 3,111 99,549 5,396 974,249 199,834 28,106 2,978 154,547 2009 ................. 3,150 80,533 4,490 662,295 142,356 20,705 2,353 116,779 2010 ................. 2,900 68,850 4,133 642,037 131,199 10,233 900 46,491
Grapefruit: 2008 ................. 8 90 5 7,238 367 13 1 202 2009 ................. 11 159 6 8,582 444 13 1 145 2010 ................. 11 204 6 10,967 572 15 1 567
Grapefruit trees: 2008 ................. 28 804 0 111,555 1,756 0 ...................... 0 2009 ................. 28 832 0 131,326 2,004 13 89 493 2010 ................. 28 705 0 111,566 1,744 14 14 102
Grapes: 2008 ................. 102 13,541 568 679,513 39,960 1,679 41 20,976 2009 ................. 102 13,928 570 797,107 47,714 1,517 32 18,692 2010 ................. 110 15,495 580 846,271 35,380 1,979 31 17,703
Green peas: 2008 ................. 166 2,878 173 76,783 8,879 580 39 6,045 2009 ................. 166 2,766 171 65,410 6,908 401 28 4,195 2010 ................. 166 2,303 144 49,699 5,355 498 29 4,958
Hybrid corn seed: 2008 ................. 367 7,428 452 379,117 30,344 541 44 9,157 2009 ................. 367 5,494 330 226,332 16,487 357 29 6,488 2010 ................. 359 5,865 373 248,218 17,832 1,037 87 14,111
Hybrid sorghum seed: 2008 ................. 23 613 41 20,375 3,264 95 9 1,206 2009 ................. 23 681 49 19,834 2,849 33 3 419 2010 ................. 23 528 36 14,427 1,929 19 2 194
Late oranges: 2008 ................. 3 84 1 666 109 5 0 4 2009 ................. 3 86 1 717 119 22 0 56 2010 ................. 3 89 1 869 141 4 0 8 See footnotes at end of table.
VerDate Aug 31 2005 14:46 Feb 28, 2012 Jkt 000000 PO 00000 Frm 00006 Fmt 1000 Sfmt 1000 H:\SHARED\DAPP\FPU\AGSTAT\MASTER~2\CHAPTR10\X-07.AG8 USDA
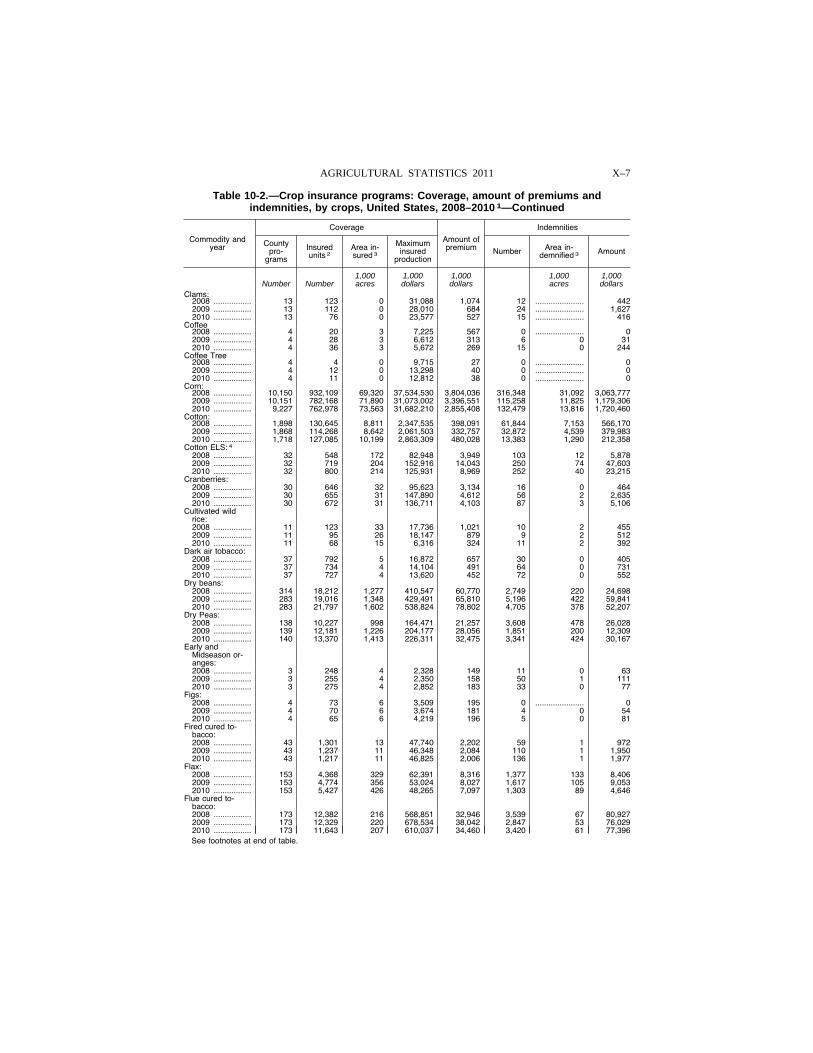
X–7 AGRICULTURAL STATISTICS 2011
Table 10-2.—Crop insurance programs: Coverage, amount of premiums and indemnities, by crops, United States, 2008–2010 1—Continued
Commodity and year
Coverage
Amount of premium
Indemnities
County pro-
grams
Insured units 2
Area in- sured 3
Maximum insured
production Number Area in-
demnified 3 Amount
1,000 1,000 1,000 1,000 1,000 Number Number acres dollars dollars acres dollars
Clams: 2008 ................. 13 123 0 31,088 1,074 12 ...................... 442 2009 ................. 13 112 0 28,010 684 24 ...................... 1,627 2010 ................. 13 76 0 23,577 527 15 ...................... 416
Coffee 2008 ................. 4 20 3 7,225 567 0 ...................... 0 2009 ................. 4 28 3 6,612 313 6 0 31 2010 ................. 4 36 3 5,672 269 15 0 244
Coffee Tree 2008 ................. 4 4 0 9,715 27 0 ...................... 0 2009 ................. 4 12 0 13,298 40 0 ...................... 0 2010 ................. 4 11 0 12,812 38 0 ...................... 0
Corn: 2008 ................. 10,150 932,109 69,320 37,534,530 3,804,036 316,348 31,092 3,063,777 2009 ................. 10,151 782,168 71,890 31,073,002 3,396,551 115,258 11,825 1,179,306 2010 ................. 9,227 762,978 73,563 31,682,210 2,855,408 132,479 13,816 1,720,460
Cotton: 2008 ................. 1,898 130,645 8,811 2,347,535 398,091 61,844 7,153 566,170 2009 ................. 1,868 114,268 8,642 2,061,503 332,757 32,872 4,539 379,983 2010 ................. 1,718 127,085 10,199 2,863,309 480,028 13,383 1,290 212,358
Cotton ELS: 4 2008 ................. 32 548 172 82,948 3,949 103 12 5,878 2009 ................. 32 719 204 152,916 14,043 250 74 47,603 2010 ................. 32 800 214 125,931 8,969 252 40 23,215
Cranberries: 2008 ................. 30 646 32 95,623 3,134 16 0 464 2009 ................. 30 655 31 147,890 4,612 56 2 2,635 2010 ................. 30 672 31 136,711 4,103 87 3 5,106
Cultivated wild rice: 2008 ................. 11 123 33 17,736 1,021 10 2 455 2009 ................. 11 95 26 18,147 879 9 2 512 2010 ................. 11 68 15 6,316 324 11 2 392
Dark air tobacco: 2008 ................. 37 792 5 16,872 657 30 0 405 2009 ................. 37 734 4 14,104 491 64 0 731 2010 ................. 37 727 4 13,620 452 72 0 552
Dry beans: 2008 ................. 314 18,212 1,277 410,547 60,770 2,749 220 24,698 2009 ................. 283 19,016 1,348 429,491 65,810 5,196 422 59,841 2010 ................. 283 21,797 1,602 538,824 78,802 4,705 378 52,207
Dry Peas: 2008 ................. 138 10,227 998 164,471 21,257 3,608 478 26,028 2009 ................. 139 12,181 1,226 204,177 28,056 1,851 200 12,309 2010 ................. 140 13,370 1,413 226,311 32,475 3,341 424 30,167
Early and Midseason or-anges: 2008 ................. 3 248 4 2,328 149 11 0 63 2009 ................. 3 255 4 2,350 158 50 1 111 2010 ................. 3 275 4 2,852 183 33 0 77
Figs: 2008 ................. 4 73 6 3,509 195 0 ...................... 0 2009 ................. 4 70 6 3,674 181 4 0 54 2010 ................. 4 65 6 4,219 196 5 0 81
Fired cured to-bacco: 2008 ................. 43 1,301 13 47,740 2,202 59 1 972 2009 ................. 43 1,237 11 46,348 2,084 110 1 1,950 2010 ................. 43 1,217 11 46,825 2,006 136 1 1,977
Flax: 2008 ................. 153 4,368 329 62,391 8,316 1,377 133 8,406 2009 ................. 153 4,774 356 53,024 8,027 1,617 105 9,053 2010 ................. 153 5,427 426 48,265 7,097 1,303 89 4,646
Flue cured to-bacco: 2008 ................. 173 12,382 216 568,851 32,946 3,539 67 80,927 2009 ................. 173 12,329 220 678,534 38,042 2,847 53 76,029 2010 ................. 173 11,643 207 610,037 34,460 3,420 61 77,396 See footnotes at end of table.
VerDate Aug 31 2005 14:46 Feb 28, 2012 Jkt 000000 PO 00000 Frm 00007 Fmt 1000 Sfmt 1000 H:\SHARED\DAPP\FPU\AGSTAT\MASTER~2\CHAPTR10\X-06.AG8 USDA
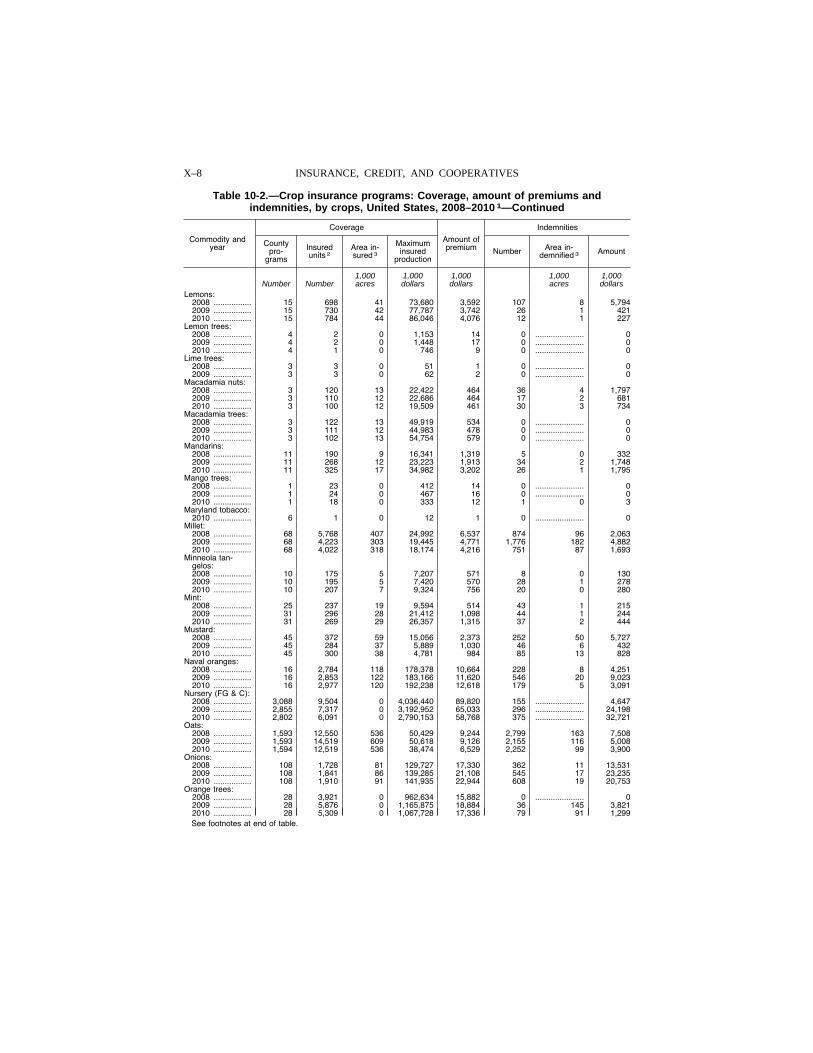
X–8 INSURANCE, CREDIT, AND COOPERATIVES
Table 10-2.—Crop insurance programs: Coverage, amount of premiums and indemnities, by crops, United States, 2008–2010 1—Continued
Commodity and year
Coverage
Amount of premium
Indemnities
County pro-
grams
Insured units 2
Area in- sured 3
Maximum insured
production Number Area in-
demnified 3 Amount
1,000 1,000 1,000 1,000 1,000 Number Number acres dollars dollars acres dollars
Lemons: 2008 ................. 15 698 41 73,680 3,592 107 8 5,794 2009 ................. 15 730 42 77,787 3,742 26 1 421 2010 ................. 15 784 44 86,046 4,076 12 1 227
Lemon trees: 2008 ................. 4 2 0 1,153 14 0 ...................... 0 2009 ................. 4 2 0 1,448 17 0 ...................... 0 2010 ................. 4 1 0 746 9 0 ...................... 0
Lime trees: 2008 ................. 3 3 0 51 1 0 ...................... 0 2009 ................. 3 3 0 62 2 0 ...................... 0
Macadamia nuts: 2008 ................. 3 120 13 22,422 464 36 4 1,797 2009 ................. 3 110 12 22,686 464 17 2 681 2010 ................. 3 100 12 19,509 461 30 3 734
Macadamia trees: 2008 ................. 3 122 13 49,919 534 0 ...................... 0 2009 ................. 3 111 12 44,983 478 0 ...................... 0 2010 ................. 3 102 13 54,754 579 0 ...................... 0
Mandarins: 2008 ................. 11 190 9 16,341 1,319 5 0 332 2009 ................. 11 268 12 23,223 1,913 34 2 1,748 2010 ................. 11 325 17 34,982 3,202 26 1 1,795
Mango trees: 2008 ................. 1 23 0 412 14 0 ...................... 0 2009 ................. 1 24 0 467 16 0 ...................... 0 2010 ................. 1 18 0 333 12 1 0 3
Maryland tobacco: 2010 ................. 6 1 0 12 1 0 ...................... 0
Millet: 2008 ................. 68 5,768 407 24,992 6,537 874 96 2,063 2009 ................. 68 4,223 303 19,445 4,771 1,776 182 4,882 2010 ................. 68 4,022 318 18,174 4,216 751 87 1,693
Minneola tan-gelos: 2008 ................. 10 175 5 7,207 571 8 0 130 2009 ................. 10 195 5 7,420 570 28 1 278 2010 ................. 10 207 7 9,324 756 20 0 280
Mint: 2008 ................. 25 237 19 9,594 514 43 1 215 2009 ................. 31 296 28 21,412 1,098 44 1 244 2010 ................. 31 269 29 26,357 1,315 37 2 444
Mustard: 2008 ................. 45 372 59 15,056 2,373 252 50 5,727 2009 ................. 45 284 37 5,889 1,030 46 6 432 2010 ................. 45 300 38 4,781 984 85 13 828
Naval oranges: 2008 ................. 16 2,784 118 178,378 10,664 228 8 4,251 2009 ................. 16 2,853 122 183,166 11,620 546 20 9,023 2010 ................. 16 2,977 120 192,238 12,618 179 5 3,091
Nursery (FG & C): 2008 ................. 3,088 9,504 0 4,036,440 89,820 155 ...................... 4,647 2009 ................. 2,855 7,317 0 3,192,952 65,033 296 ...................... 24,198 2010 ................. 2,802 6,091 0 2,790,153 58,768 375 ...................... 32,721
Oats: 2008 ................. 1,593 12,550 536 50,429 9,244 2,799 163 7,508 2009 ................. 1,593 14,519 609 50,618 9,126 2,155 116 5,008 2010 ................. 1,594 12,519 536 38,474 6,529 2,252 99 3,900
Onions: 2008 ................. 108 1,728 81 129,727 17,330 362 11 13,531 2009 ................. 108 1,841 86 139,285 21,108 545 17 23,235 2010 ................. 108 1,910 91 141,935 22,944 608 19 20,753
Orange trees: 2008 ................. 28 3,921 0 962,634 15,882 0 ...................... 0 2009 ................. 28 5,876 0 1,165,875 18,884 36 145 3,821 2010 ................. 28 5,309 0 1,067,728 17,336 79 91 1,299 See footnotes at end of table.
VerDate Aug 31 2005 14:46 Feb 28, 2012 Jkt 000000 PO 00000 Frm 00008 Fmt 1000 Sfmt 1000 H:\SHARED\DAPP\FPU\AGSTAT\MASTER~2\CHAPTR10\X-08.AG8 USDA
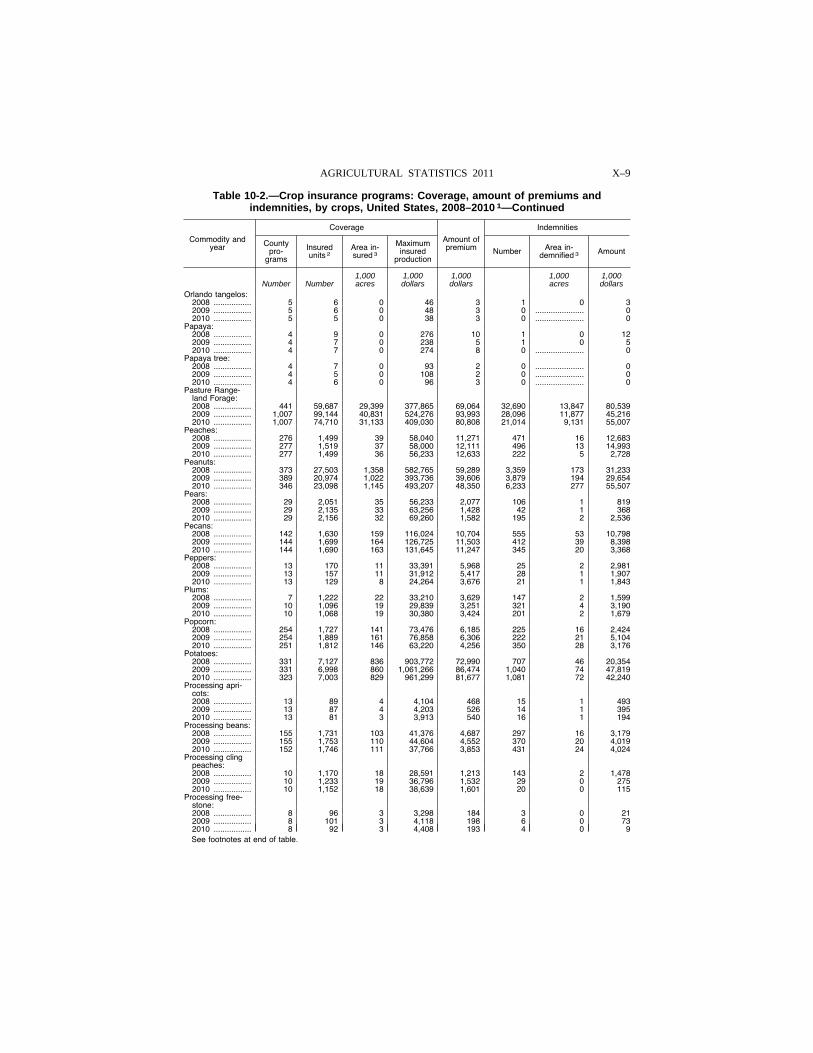
X–9 AGRICULTURAL STATISTICS 2011
Table 10-2.—Crop insurance programs: Coverage, amount of premiums and indemnities, by crops, United States, 2008–2010 1—Continued
Commodity and year
Coverage
Amount of premium
Indemnities
County pro-
grams
Insured units 2
Area in- sured 3
Maximum insured
production Number Area in-
demnified 3 Amount
1,000 1,000 1,000 1,000 1,000 Number Number acres dollars dollars acres dollars
Orlando tangelos: 2008 ................. 5 6 0 46 3 1 0 3 2009 ................. 5 6 0 48 3 0 ...................... 0 2010 ................. 5 5 0 38 3 0 ...................... 0
Papaya: 2008 ................. 4 9 0 276 10 1 0 12 2009 ................. 4 7 0 238 5 1 0 5 2010 ................. 4 7 0 274 8 0 ...................... 0
Papaya tree: 2008 ................. 4 7 0 93 2 0 ...................... 0 2009 ................. 4 5 0 108 2 0 ...................... 0 2010 ................. 4 6 0 96 3 0 ...................... 0
Pasture Range-land Forage: 2008 ................. 441 59,687 29,399 377,865 69,064 32,690 13,847 80,539 2009 ................. 1,007 99,144 40,831 524,276 93,993 28,096 11,877 45,216 2010 ................. 1,007 74,710 31,133 409,030 80,808 21,014 9,131 55,007
Peaches: 2008 ................. 276 1,499 39 58,040 11,271 471 16 12,683 2009 ................. 277 1,519 37 58,000 12,111 496 13 14,993 2010 ................. 277 1,499 36 56,233 12,633 222 5 2,728
Peanuts: 2008 ................. 373 27,503 1,358 582,765 59,289 3,359 173 31,233 2009 ................. 389 20,974 1,022 393,736 39,606 3,879 194 29,654 2010 ................. 346 23,098 1,145 493,207 48,350 6,233 277 55,507
Pears: 2008 ................. 29 2,051 35 56,233 2,077 106 1 819 2009 ................. 29 2,135 33 63,256 1,428 42 1 368 2010 ................. 29 2,156 32 69,260 1,582 195 2 2,536
Pecans: 2008 ................. 142 1,630 159 116,024 10,704 555 53 10,798 2009 ................. 144 1,699 164 126,725 11,503 412 39 8,398 2010 ................. 144 1,690 163 131,645 11,247 345 20 3,368
Peppers: 2008 ................. 13 170 11 33,391 5,968 25 2 2,981 2009 ................. 13 157 11 31,912 5,417 28 1 1,907 2010 ................. 13 129 8 24,264 3,676 21 1 1,843
Plums: 2008 ................. 7 1,222 22 33,210 3,629 147 2 1,599 2009 ................. 10 1,096 19 29,839 3,251 321 4 3,190 2010 ................. 10 1,068 19 30,380 3,424 201 2 1,679
Popcorn: 2008 ................. 254 1,727 141 73,476 6,185 225 16 2,424 2009 ................. 254 1,889 161 76,858 6,306 222 21 5,104 2010 ................. 251 1,812 146 63,220 4,256 350 28 3,176
Potatoes: 2008 ................. 331 7,127 836 903,772 72,990 707 46 20,354 2009 ................. 331 6,998 860 1,061,266 86,474 1,040 74 47,819 2010 ................. 323 7,003 829 961,299 81,677 1,081 72 42,240
Processing apri-cots: 2008 ................. 13 89 4 4,104 468 15 1 493 2009 ................. 13 87 4 4,203 526 14 1 395 2010 ................. 13 81 3 3,913 540 16 1 194
Processing beans: 2008 ................. 155 1,731 103 41,376 4,687 297 16 3,179 2009 ................. 155 1,753 110 44,604 4,552 370 20 4,019 2010 ................. 152 1,746 111 37,766 3,853 431 24 4,024
Processing cling peaches: 2008 ................. 10 1,170 18 28,591 1,213 143 2 1,478 2009 ................. 10 1,233 19 36,796 1,532 29 0 275 2010 ................. 10 1,152 18 38,639 1,601 20 0 115
Processing free-stone: 2008 ................. 8 96 3 3,298 184 3 0 21 2009 ................. 8 101 3 4,118 198 6 0 73 2010 ................. 8 92 3 4,408 193 4 0 9 See footnotes at end of table.
VerDate Aug 31 2005 14:46 Feb 28, 2012 Jkt 000000 PO 00000 Frm 00009 Fmt 1000 Sfmt 1000 H:\SHARED\DAPP\FPU\AGSTAT\MASTER~2\CHAPTR10\X-09.AG8 USDA
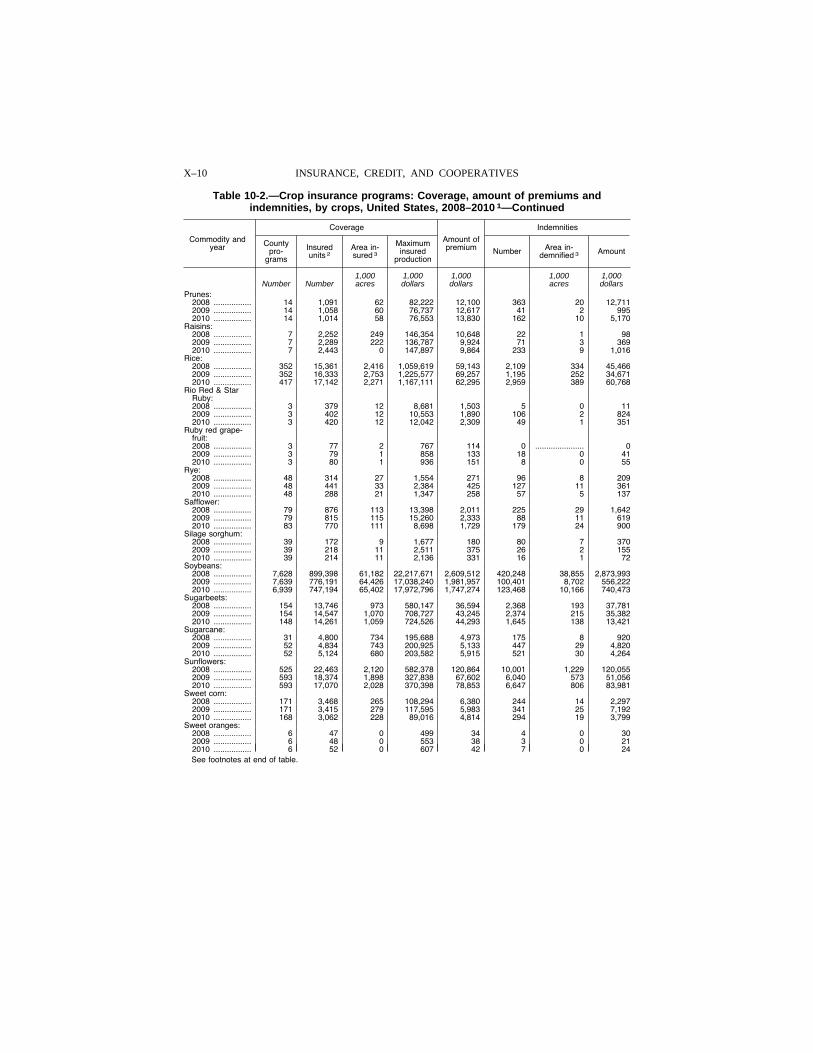
X–10 INSURANCE, CREDIT, AND COOPERATIVES
Table 10-2.—Crop insurance programs: Coverage, amount of premiums and indemnities, by crops, United States, 2008–2010 1—Continued
Commodity and year
Coverage
Amount of premium
Indemnities
County pro-
grams
Insured units 2
Area in- sured 3
Maximum insured
production Number Area in-
demnified 3 Amount
1,000 1,000 1,000 1,000 1,000 Number Number acres dollars dollars acres dollars
Prunes: 2008 ................. 14 1,091 62 82,222 12,100 363 20 12,711 2009 ................. 14 1,058 60 76,737 12,617 41 2 995 2010 ................. 14 1,014 58 76,553 13,830 162 10 5,170
Raisins: 2008 ................. 7 2,252 249 146,354 10,648 22 1 98 2009 ................. 7 2,289 222 136,787 9,924 71 3 369 2010 ................. 7 2,443 0 147,897 9,864 233 9 1,016
Rice: 2008 ................. 352 15,361 2,416 1,059,619 59,143 2,109 334 45,466 2009 ................. 352 16,333 2,753 1,225,577 69,257 1,195 252 34,671 2010 ................. 417 17,142 2,271 1,167,111 62,295 2,959 389 60,768
Rio Red & Star Ruby: 2008 ................. 3 379 12 8,681 1,503 5 0 11 2009 ................. 3 402 12 10,553 1,890 106 2 824 2010 ................. 3 420 12 12,042 2,309 49 1 351
Ruby red grape-fruit: 2008 ................. 3 77 2 767 114 0 ...................... 0 2009 ................. 3 79 1 858 133 18 0 41 2010 ................. 3 80 1 936 151 8 0 55
Rye: 2008 ................. 48 314 27 1,554 271 96 8 209 2009 ................. 48 441 33 2,384 425 127 11 361 2010 ................. 48 288 21 1,347 258 57 5 137
Safflower: 2008 ................. 79 876 113 13,398 2,011 225 29 1,642 2009 ................. 79 815 115 15,260 2,333 88 11 619 2010 ................. 83 770 111 8,698 1,729 179 24 900
Silage sorghum: 2008 ................. 39 172 9 1,677 180 80 7 370 2009 ................. 39 218 11 2,511 375 26 2 155 2010 ................. 39 214 11 2,136 331 16 1 72
Soybeans: 2008 ................. 7,628 899,398 61,182 22,217,671 2,609,512 420,248 38,855 2,873,993 2009 ................. 7,639 776,191 64,426 17,038,240 1,981,957 100,401 8,702 556,222 2010 ................. 6,939 747,194 65,402 17,972,796 1,747,274 123,468 10,166 740,473
Sugarbeets: 2008 ................. 154 13,746 973 580,147 36,594 2,368 193 37,781 2009 ................. 154 14,547 1,070 708,727 43,245 2,374 215 35,382 2010 ................. 148 14,261 1,059 724,526 44,293 1,645 138 13,421
Sugarcane: 2008 ................. 31 4,800 734 195,688 4,973 175 8 920 2009 ................. 52 4,834 743 200,925 5,133 447 29 4,820 2010 ................. 52 5,124 680 203,582 5,915 521 30 4,264
Sunflowers: 2008 ................. 525 22,463 2,120 582,378 120,864 10,001 1,229 120,055 2009 ................. 593 18,374 1,898 327,838 67,602 6,040 573 51,056 2010 ................. 593 17,070 2,028 370,398 78,853 6,647 806 83,981
Sweet corn: 2008 ................. 171 3,468 265 108,294 6,380 244 14 2,297 2009 ................. 171 3,415 279 117,595 5,983 341 25 7,192 2010 ................. 168 3,062 228 89,016 4,814 294 19 3,799
Sweet oranges: 2008 ................. 6 47 0 499 34 4 0 30 2009 ................. 6 48 0 553 38 3 0 21 2010 ................. 6 52 0 607 42 7 0 24 See footnotes at end of table.
VerDate Aug 31 2005 14:46 Feb 28, 2012 Jkt 000000 PO 00000 Frm 00010 Fmt 1000 Sfmt 1000 H:\SHARED\DAPP\FPU\AGSTAT\MASTER~2\CHAPTR10\X-10.AG8 USDA
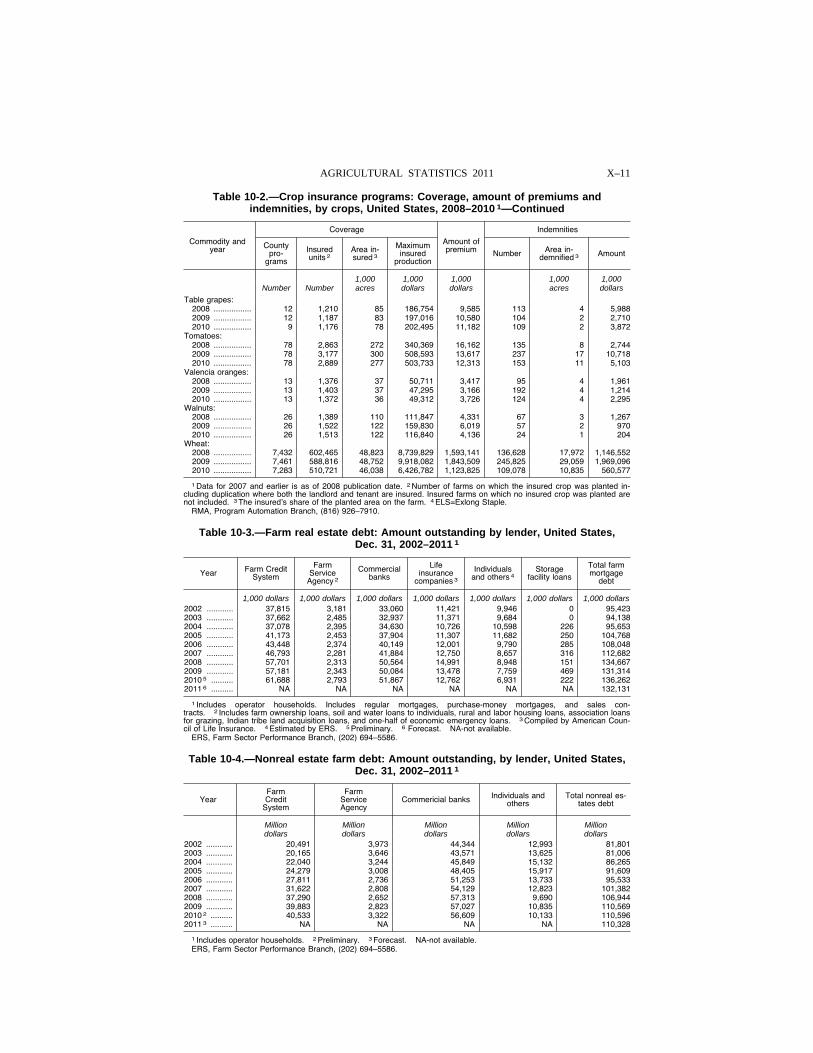
X–11 AGRICULTURAL STATISTICS 2011
Table 10-2.—Crop insurance programs: Coverage, amount of premiums and indemnities, by crops, United States, 2008–2010 1—Continued
Commodity and year
Coverage
Amount of premium
Indemnities
County pro-
grams
Insured units 2
Area in- sured 3
Maximum insured
production Number Area in-
demnified 3 Amount
1,000 1,000 1,000 1,000 1,000 Number Number acres dollars dollars acres dollars
Table grapes: 2008 ................. 12 1,210 85 186,754 9,585 113 4 5,988 2009 ................. 12 1,187 83 197,016 10,580 104 2 2,710 2010 ................. 9 1,176 78 202,495 11,182 109 2 3,872
Tomatoes: 2008 ................. 78 2,863 272 340,369 16,162 135 8 2,744 2009 ................. 78 3,177 300 508,593 13,617 237 17 10,718 2010 ................. 78 2,889 277 503,733 12,313 153 11 5,103
Valencia oranges: 2008 ................. 13 1,376 37 50,711 3,417 95 4 1,961 2009 ................. 13 1,403 37 47,295 3,166 192 4 1,214 2010 ................. 13 1,372 36 49,312 3,726 124 4 2,295
Walnuts: 2008 ................. 26 1,389 110 111,847 4,331 67 3 1,267 2009 ................. 26 1,522 122 159,830 6,019 57 2 970 2010 ................. 26 1,513 122 116,840 4,136 24 1 204
Wheat: 2008 ................. 7,432 602,465 48,823 8,739,829 1,593,141 136,628 17,972 1,146,552 2009 ................. 7,461 588,816 48,752 9,918,082 1,843,509 245,825 29,059 1,969,096 2010 ................. 7,283 510,721 46,038 6,426,782 1,123,825 109,078 10,835 560,577
1 Data for 2007 and earlier is as of 2008 publication date. 2 Number of farms on which the insured crop was planted in-cluding duplication where both the landlord and tenant are insured. Insured farms on which no insured crop was planted are not included. 3 The insured’s share of the planted area on the farm. 4 ELS=Exlong Staple.
RMA, Program Automation Branch, (816) 926–7910.
Table 10-3.—Farm real estate debt: Amount outstanding by lender, United States, Dec. 31, 2002–2011 1
Year Farm Credit System
Farm Service
Agency 2
Commercial banks
Life insurance
companies 3
Individuals and others 4
Storage facility loans
Total farm mortgage
debt
1,000 dollars 1,000 dollars 1,000 dollars 1,000 dollars 1,000 dollars 1,000 dollars 1,000 dollars 2002 ............ 37,815 3,181 33,060 11,421 9,946 0 95,423 2003 ............ 37,662 2,485 32,937 11,371 9,684 0 94,138 2004 ............ 37,078 2,395 34,630 10,726 10,598 226 95,653 2005 ............ 41,173 2,453 37,904 11,307 11,682 250 104,768 2006 ............ 43,448 2,374 40,149 12,001 9,790 285 108,048 2007 ............ 46,793 2,281 41,884 12,750 8,657 316 112,682 2008 ............ 57,701 2,313 50,564 14,991 8,948 151 134,667 2009 ............ 57,181 2,343 50,084 13,478 7,759 469 131,314 2010 5 .......... 61,688 2,793 51,867 12,762 6,931 222 136,262 2011 6 .......... NA NA NA NA NA NA 132,131
1 Includes operator households. Includes regular mortgages, purchase-money mortgages, and sales con-tracts. 2 Includes farm ownership loans, soil and water loans to individuals, rural and labor housing loans, association loans for grazing, Indian tribe land acquisition loans, and one-half of economic emergency loans. 3 Compiled by American Coun-cil of Life Insurance. 4 Estimated by ERS. 5 Preliminary. 6 Forecast. NA-not available.
ERS, Farm Sector Performance Branch, (202) 694–5586.
Table 10-4.—Nonreal estate farm debt: Amount outstanding, by lender, United States, Dec. 31, 2002–2011 1
Year Farm Credit
System
Farm Service Agency
Commericial banks Individuals and others
Total nonreal es-tates debt
Million Million Million Million Million dollars dollars dollars dollars dollars
2002 ............ 20,491 3,973 44,344 12,993 81,801 2003 ............ 20,165 3,646 43,571 13,625 81,006 2004 ............ 22,040 3,244 45,849 15,132 86,265 2005 ............ 24,279 3,008 48,405 15,917 91,609 2006 ............ 27,811 2,736 51,253 13,733 95,533 2007 ............ 31,622 2,808 54,129 12,823 101,382 2008 ............ 37,290 2,652 57,313 9,690 106,944 2009 ............ 39,883 2,823 57,027 10,835 110,569 2010 2 .......... 40,533 3,322 56,609 10,133 110,596 2011 3 .......... NA NA NA NA 110,328
1 Includes operator households. 2 Preliminary. 3 Forecast. NA-not available. ERS, Farm Sector Performance Branch, (202) 694–5586.
VerDate Aug 31 2005 14:46 Feb 28, 2012 Jkt 000000 PO 00000 Frm 00011 Fmt 1000 Sfmt 1000 H:\SHARED\DAPP\FPU\AGSTAT\MASTER~2\CHAPTR10\X-11.AG8 USDA
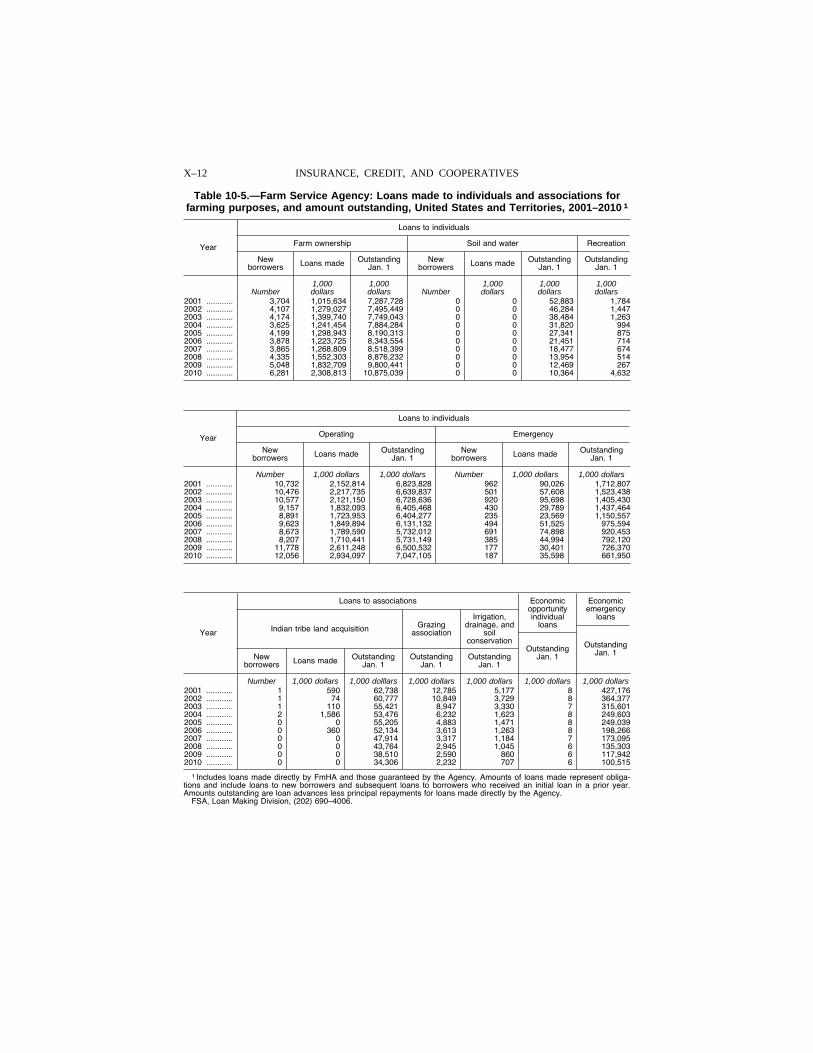
X–12 INSURANCE, CREDIT, AND COOPERATIVES
Table 10-5.—Farm Service Agency: Loans made to individuals and associations for farming purposes, and amount outstanding, United States and Territories, 2001–2010 1
Year
Loans to individuals
Farm ownership Soil and water Recreation
New borrowers Loans made Outstanding
Jan. 1 New
borrowers Loans made Outstanding Jan. 1
Outstanding Jan. 1
1,000 1,000 1,000 1,000 1,000 Number dollars dollars Number dollars dollars dollars
2001 ............ 3,704 1,015,634 7,287,728 0 0 52,883 1,784 2002 ............ 4,107 1,279,027 7,495,449 0 0 46,284 1,447 2003 ............ 4,174 1,399,740 7,749,043 0 0 38,484 1,263 2004 ............ 3,625 1,241,454 7,884,284 0 0 31,820 994 2005 ............ 4,199 1,298,943 8,190,313 0 0 27,341 875 2006 ............ 3,878 1,223,725 8,343,554 0 0 21,451 714 2007 ............ 3,865 1,268,809 8,518,399 0 0 18,477 674 2008 ............ 4,335 1,552,303 8,876,232 0 0 13,954 514 2009 ............ 5,048 1,832,709 9,800,441 0 0 12,469 267 2010 ............ 6,281 2,308,813 10,875,039 0 0 10,364 4,632
Year
Loans to individuals
Operating Emergency
New borrowers Loans made Outstanding
Jan. 1 New
borrowers Loans made Outstanding Jan. 1
Number 1,000 dollars 1,000 dollars Number 1,000 dollars 1,000 dollars 2001 ............ 10,732 2,152,814 6,823,828 962 90,026 1,712,807 2002 ............ 10,476 2,217,735 6,639,837 501 57,608 1,523,438 2003 ............ 10,577 2,121,150 6,728,636 920 95,698 1,405,430 2004 ............ 9,157 1,832,093 6,405,468 430 29,789 1,437,464 2005 ............ 8,891 1,723,953 6,404,277 235 23,569 1,150,557 2006 ............ 9,623 1,849,894 6,131,132 494 51,525 975,594 2007 ............ 8,673 1,789,590 5,732,012 691 74,898 920,453 2008 ............ 8,207 1,710,441 5,731,149 385 44,994 792,120 2009 ............ 11,778 2,611,248 6,500,532 177 30,401 726,370 2010 ............ 12,056 2,934,097 7,047,105 187 35,598 661,950
Year
Loans to associations Economic opportunity individual
loans
Economic emergency
loans
Indian tribe land acquisition Grazing association
Irrigation, drainage, and
soil conservation
Outstanding Jan. 1
Outstanding Jan. 1 New
borrowers Loans made Outstanding Jan. 1
Outstanding Jan. 1
Outstanding Jan. 1
Number 1,000 dollars 1,000 dolllars 1,000 dollars 1,000 dollars 1,000 dollars 1,000 dollars 2001 ............ 1 590 62,738 12,785 5,177 8 427,176 2002 ............ 1 74 60,777 10,849 3,729 8 364,377 2003 ............ 1 110 55,421 8,947 3,330 7 315,601 2004 ............ 2 1,586 53,476 6,232 1,623 8 249,603 2005 ............ 0 0 55,205 4,883 1,471 8 249,039 2006 ............ 0 360 52,134 3,613 1,263 8 198,266 2007 ............ 0 0 47,914 3,317 1,184 7 173,095 2008 ............ 0 0 43,764 2,945 1,045 6 135,303 2009 ............ 0 0 38,510 2,590 860 6 117,942 2010 ............ 0 0 34,306 2,232 707 6 100,515
1 Includes loans made directly by FmHA and those guaranteed by the Agency. Amounts of loans made represent obliga-tions and include loans to new borrowers and subsequent loans to borrowers who received an initial loan in a prior year. Amounts outstanding are loan advances less principal repayments for loans made directly by the Agency.
FSA, Loan Making Division, (202) 690–4006.
VerDate Aug 31 2005 14:46 Feb 28, 2012 Jkt 000000 PO 00000 Frm 00012 Fmt 1000 Sfmt 1000 H:\SHARED\DAPP\FPU\AGSTAT\MASTER~2\CHAPTR10\X-12.AG8 USDA
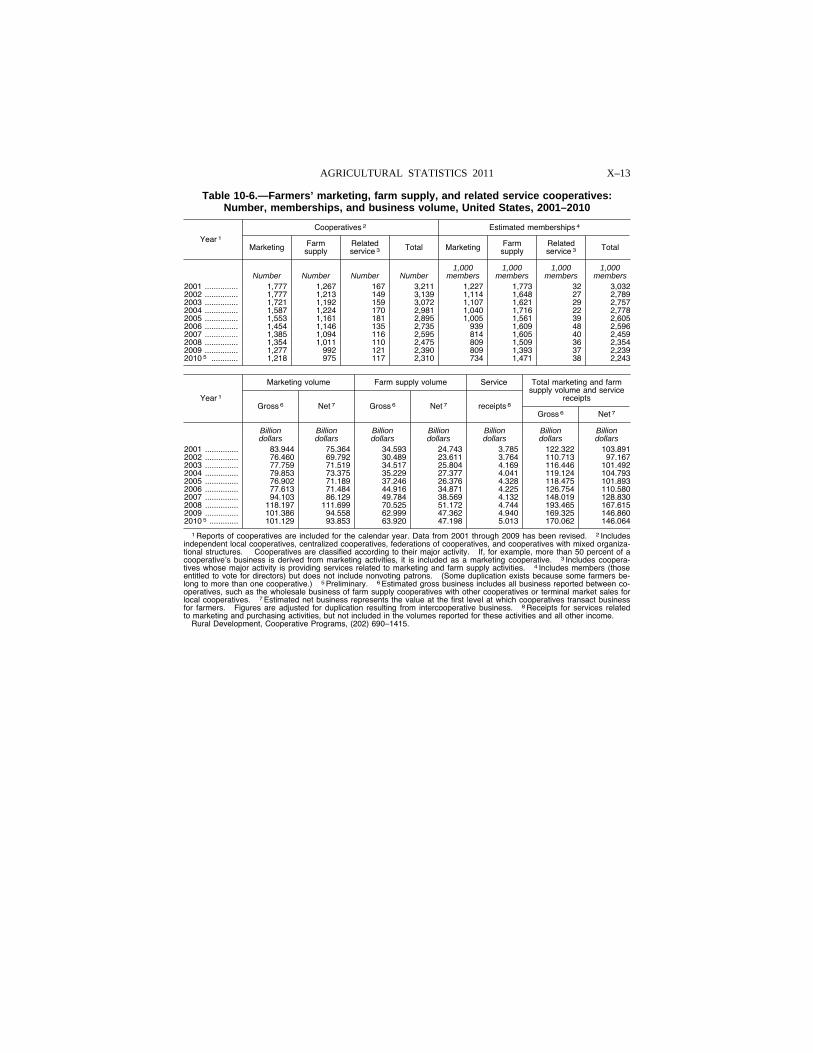
X–13 AGRICULTURAL STATISTICS 2011
Table 10-6.—Farmers’ marketing, farm supply, and related service cooperatives: Number, memberships, and business volume, United States, 2001–2010
Year 1
Cooperatives 2 Estimated memberships 4
Marketing Farm supply
Related service 3 Total Marketing Farm
supply Related service 3 Total
1,000 1,000 1,000 1,000 Number Number Number Number members members members members
2001 ............... 1,777 1,267 167 3,211 1,227 1,773 32 3,032 2002 ............... 1,777 1,213 149 3,139 1,114 1,648 27 2,789 2003 ............... 1,721 1,192 159 3,072 1,107 1,621 29 2,757 2004 ............... 1,587 1,224 170 2,981 1,040 1,716 22 2,778 2005 ............... 1,553 1,161 181 2,895 1,005 1,561 39 2,605 2006 ............... 1,454 1,146 135 2,735 939 1,609 48 2,596 2007 ............... 1,385 1,094 116 2,595 814 1,605 40 2,459 2008 ............... 1,354 1,011 110 2,475 809 1,509 36 2,354 2009 ............... 1,277 992 121 2,390 809 1,393 37 2,239 2010 5 ............ 1,218 975 117 2,310 734 1,471 38 2,243
Year 1
Marketing volume Farm supply volume Service Total marketing and farm supply volume and service
receipts Gross 6 Net 7 Gross 6 Net 7 receipts 8
Gross 6 Net 7
Billion Billion Billion Billion Billion Billion Billion dollars dollars dollars dollars dollars dollars dollars
2001 ............... 83.944 75.364 34.593 24.743 3.785 122.322 103.891 2002 ............... 76.460 69.792 30.489 23.611 3.764 110.713 97.167 2003 ............... 77.759 71.519 34.517 25.804 4.169 116.446 101.492 2004 ............... 79.853 73.375 35.229 27.377 4.041 119.124 104.793 2005 ............... 76.902 71.189 37.246 26.376 4.328 118.475 101.893 2006 ............... 77.613 71.484 44.916 34.871 4.225 126.754 110.580 2007 ............... 94.103 86.129 49.784 38.569 4.132 148.019 128.830 2008 ............... 118.197 111.699 70.525 51.172 4.744 193.465 167.615 2009 ............... 101.386 94.558 62.999 47.362 4.940 169.325 146.860 2010 5 ............. 101.129 93.853 63.920 47.198 5.013 170.062 146.064
1 Reports of cooperatives are included for the calendar year. Data from 2001 through 2009 has been revised. 2 Includes independent local cooperatives, centralized cooperatives, federations of cooperatives, and cooperatives with mixed organiza-tional structures. Cooperatives are classified according to their major activity. If, for example, more than 50 percent of a cooperative’s business is derived from marketing activities, it is included as a marketing cooperative. 3 Includes coopera-tives whose major activity is providing services related to marketing and farm supply activities. 4 Includes members (those entitled to vote for directors) but does not include nonvoting patrons. (Some duplication exists because some farmers be-long to more than one cooperative.) 5 Preliminary. 6 Estimated gross business includes all business reported between co-operatives, such as the wholesale business of farm supply cooperatives with other cooperatives or terminal market sales for local cooperatives. 7 Estimated net business represents the value at the first level at which cooperatives transact business for farmers. Figures are adjusted for duplication resulting from intercooperative business. 8 Receipts for services related to marketing and purchasing activities, but not included in the volumes reported for these activities and all other income.
Rural Development, Cooperative Programs, (202) 690–1415.
VerDate Aug 31 2005 14:46 Feb 28, 2012 Jkt 000000 PO 00000 Frm 00013 Fmt 1000 Sfmt 1000 H:\SHARED\DAPP\FPU\AGSTAT\MASTER~2\CHAPTR10\X-13.AG8 USDA
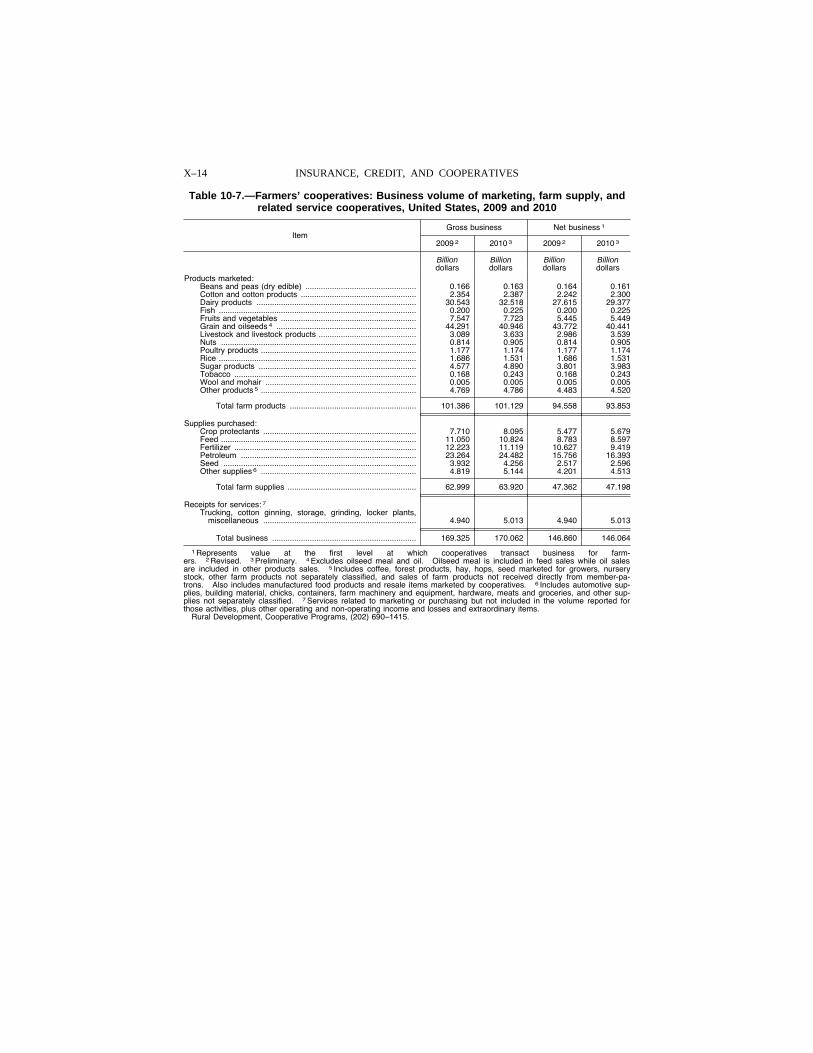
X–14 INSURANCE, CREDIT, AND COOPERATIVES
Table 10-7.—Farmers’ cooperatives: Business volume of marketing, farm supply, and related service cooperatives, United States, 2009 and 2010
Item Gross business Net business 1
2009 2 2010 3 2009 2 2010 3
Billion dollars
Billion dollars
Billion dollars
Billion dollars
Products marketed: Beans and peas (dry edible) .................................................. 0.166 0.163 0.164 0.161 Cotton and cotton products .................................................... 2.354 2.387 2.242 2.300 Dairy products ........................................................................ 30.543 32.518 27.615 29.377 Fish ......................................................................................... 0.200 0.225 0.200 0.225 Fruits and vegetables ............................................................. 7.547 7.723 5.445 5.449 Grain and oilseeds 4 ............................................................... 44.291 40.946 43.772 40.441 Livestock and livestock products ............................................ 3.089 3.633 2.986 3.539 Nuts ........................................................................................ 0.814 0.905 0.814 0.905 Poultry products ...................................................................... 1.177 1.174 1.177 1.174 Rice ......................................................................................... 1.686 1.531 1.686 1.531 Sugar products ....................................................................... 4.577 4.890 3.801 3.983 Tobacco .................................................................................. 0.168 0.243 0.168 0.243 Wool and mohair .................................................................... 0.005 0.005 0.005 0.005 Other products 5 ...................................................................... 4.769 4.786 4.483 4.520
Total farm products ......................................................... 101.386 101.129 94.558 93.853
Supplies purchased: Crop protectants ..................................................................... 7.710 8.095 5.477 5.679 Feed ........................................................................................ 11.050 10.824 8.783 8.597 Fertilizer .................................................................................. 12.223 11.119 10.627 9.419 Petroleum ............................................................................... 23.264 24.482 15.756 16.393 Seed ....................................................................................... 3.932 4.256 2.517 2.596 Other supplies 6 ...................................................................... 4.819 5.144 4.201 4.513
Total farm supplies .......................................................... 62.999 63.920 47.362 47.198
Receipts for services: 7 Trucking, cotton ginning, storage, grinding, locker plants,
miscellaneous ..................................................................... 4.940 5.013 4.940 5.013
Total business ................................................................. 169.325 170.062 146.860 146.064
1 Represents value at the first level at which cooperatives transact business for farm-ers. 2 Revised. 3 Preliminary. 4 Excludes oilseed meal and oil. Oilseed meal is included in feed sales while oil sales are included in other products sales. 5 Includes coffee, forest products, hay, hops, seed marketed for growers, nursery stock, other farm products not separately classified, and sales of farm products not received directly from member-pa-trons. Also includes manufactured food products and resale items marketed by cooperatives. 6 Includes automotive sup-plies, building material, chicks, containers, farm machinery and equipment, hardware, meats and groceries, and other sup-plies not separately classified. 7 Services related to marketing or purchasing but not included in the volume reported for those activities, plus other operating and non-operating income and losses and extraordinary items.
Rural Development, Cooperative Programs, (202) 690–1415.
VerDate Aug 31 2005 14:46 Feb 28, 2012 Jkt 000000 PO 00000 Frm 00014 Fmt 1000 Sfmt 1000 H:\SHARED\DAPP\FPU\AGSTAT\MASTER~2\CHAPTR10\X-14.AG8 USDA
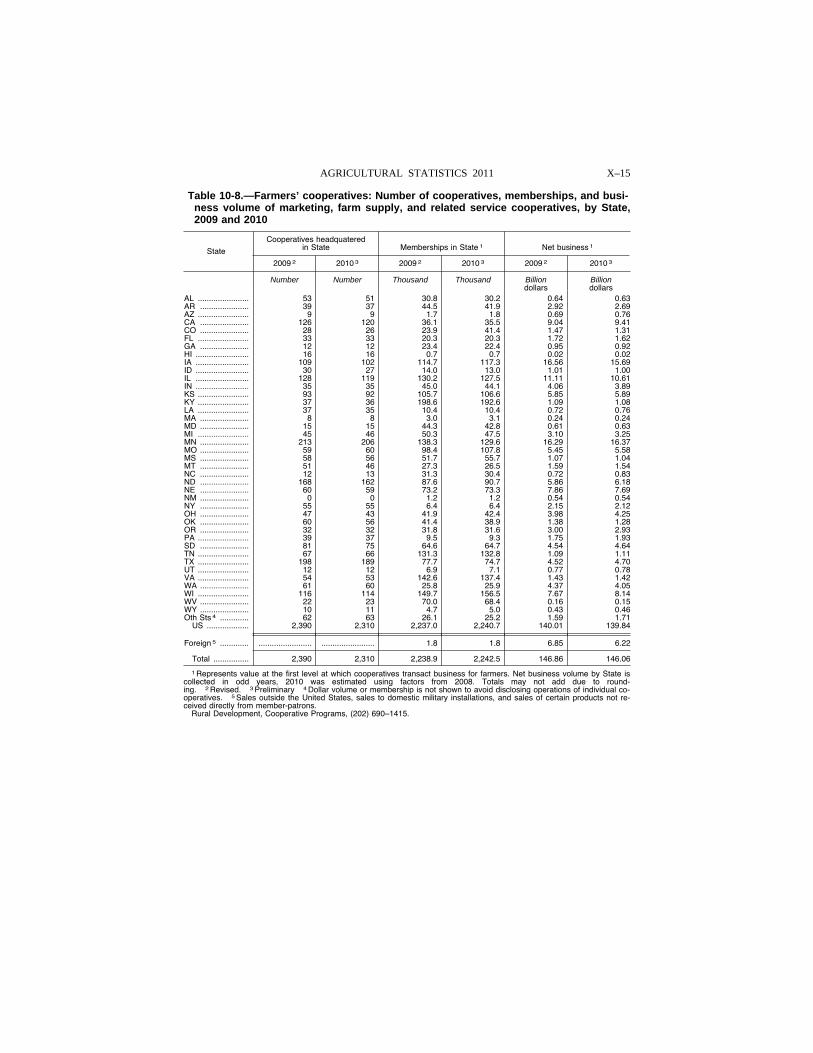
X–15 AGRICULTURAL STATISTICS 2011
Table 10-8.—Farmers’ cooperatives: Number of cooperatives, memberships, and busi-ness volume of marketing, farm supply, and related service cooperatives, by State, 2009 and 2010
State
Cooperatives headquatered in State Memberships in State 1 Net business 1
2009 2 2010 3 2009 2 2010 3 2009 2 2010 3
Number Number Thousand Thousand Billion dollars
Billion dollars
AL ....................... 53 51 30.8 30.2 0.64 0.63 AR ...................... 39 37 44.5 41.9 2.92 2.69 AZ ....................... 9 9 1.7 1.8 0.69 0.76 CA ...................... 126 120 36.1 35.5 9.04 9.41 CO ...................... 28 26 23.9 41.4 1.47 1.31 FL ....................... 33 33 20.3 20.3 1.72 1.62 GA ...................... 12 12 23.4 22.4 0.95 0.92 HI ........................ 16 16 0.7 0.7 0.02 0.02 IA ........................ 109 102 114.7 117.3 16.56 15.69 ID ........................ 30 27 14.0 13.0 1.01 1.00 IL ........................ 128 119 130.2 127.5 11.11 10.61 IN ........................ 35 35 45.0 44.1 4.06 3.89 KS ....................... 93 92 105.7 106.6 5.85 5.89 KY ....................... 37 36 198.6 192.6 1.09 1.08 LA ....................... 37 35 10.4 10.4 0.72 0.76 MA ...................... 8 8 3.0 3.1 0.24 0.24 MD ...................... 15 15 44.3 42.8 0.61 0.63 MI ....................... 45 46 50.3 47.5 3.10 3.25 MN ...................... 213 206 138.3 129.6 16.29 16.37 MO ...................... 59 60 98.4 107.8 5.45 5.58 MS ...................... 58 56 51.7 55.7 1.07 1.04 MT ...................... 51 46 27.3 26.5 1.59 1.54 NC ...................... 12 13 31.3 30.4 0.72 0.83 ND ...................... 168 162 87.6 90.7 5.86 6.18 NE ...................... 60 59 73.2 73.3 7.86 7.69 NM ...................... 0 0 1.2 1.2 0.54 0.54 NY ...................... 55 55 6.4 6.4 2.15 2.12 OH ...................... 47 43 41.9 42.4 3.98 4.25 OK ...................... 60 56 41.4 38.9 1.38 1.28 OR ...................... 32 32 31.8 31.6 3.00 2.93 PA ....................... 39 37 9.5 9.3 1.75 1.93 SD ...................... 81 75 64.6 64.7 4.54 4.64 TN ....................... 67 66 131.3 132.8 1.09 1.11 TX ....................... 198 189 77.7 74.7 4.52 4.70 UT ....................... 12 12 6.9 7.1 0.77 0.78 VA ....................... 54 53 142.6 137.4 1.43 1.42 WA ...................... 61 60 25.8 25.9 4.37 4.05 WI ....................... 116 114 149.7 156.5 7.67 8.14 WV ...................... 22 23 70.0 68.4 0.16 0.15 WY ...................... 10 11 4.7 5.0 0.43 0.46 Oth Sts 4 ............. 62 63 26.1 25.2 1.59 1.71
US ................... 2,390 2,310 2,237.0 2,240.7 140.01 139.84
Foreign 5 ............. ........................ ........................ 1.8 1.8 6.85 6.22
Total ................ 2,390 2,310 2,238.9 2,242.5 146.86 146.06
1 Represents value at the first level at which cooperatives transact business for farmers. Net business volume by State is collected in odd years, 2010 was estimated using factors from 2008. Totals may not add due to round-ing. 2 Revised. 3 Preliminary 4 Dollar volume or membership is not shown to avoid disclosing operations of individual co-operatives. 5 Sales outside the United States, sales to domestic military installations, and sales of certain products not re-ceived directly from member-patrons.
Rural Development, Cooperative Programs, (202) 690–1415.
VerDate Aug 31 2005 14:46 Feb 28, 2012 Jkt 000000 PO 00000 Frm 00015 Fmt 1000 Sfmt 1000 H:\SHARED\DAPP\FPU\AGSTAT\MASTER~2\CHAPTR10\X-15.AG8 USDA
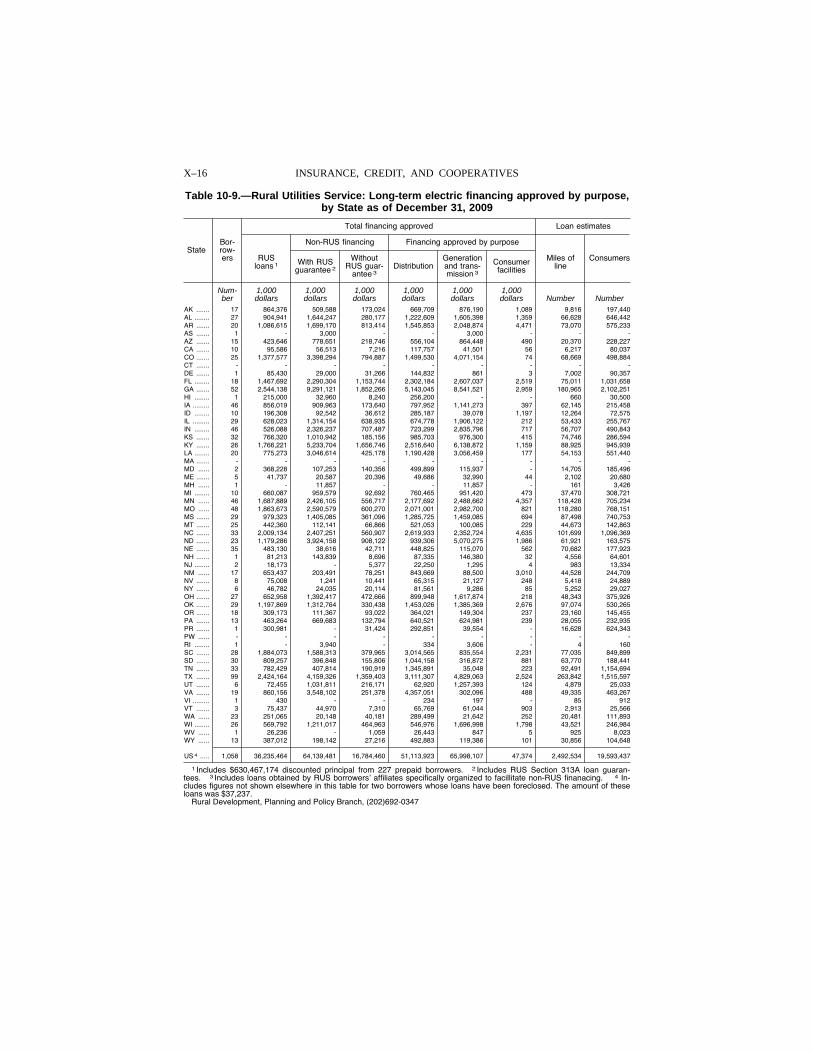
X–16 INSURANCE, CREDIT, AND COOPERATIVES
Table 10-9.—Rural Utilities Service: Long-term electric financing approved by purpose, by State as of December 31, 2009
State Bor-row-ers
Total financing approved Loan estimates
RUS loans 1
Non-RUS financing Financing approved by purpose
Miles of line
Consumers With RUS guarantee 2
Without RUS guar-
antee 3 Distribution
Generation and trans-mission 3
Consumer facilities
Num- 1,000 1,000 1,000 1,000 1,000 1,000 ber dollars dollars dollars dollars dollars dollars Number Number
AK ....... 17 864,376 509,588 173,024 669,709 876,190 1,089 9,816 197,440 AL ........ 27 904,941 1,644,247 280,177 1,222,609 1,605,398 1,359 66,628 646,442 AR ....... 20 1,086,615 1,699,170 813,414 1,545,853 2,048,874 4,471 73,070 575,233 AS ....... 1 - 3,000 - - 3,000 - - - AZ ....... 15 423,646 778,651 218,746 556,104 864,448 490 20,370 228,227 CA ....... 10 95,586 56,513 7,216 117,757 41,501 56 6,217 80,037 CO ....... 25 1,377,577 3,398,294 794,887 1,499,530 4,071,154 74 68,669 498,884 CT ....... - - - - - - - - - DE ....... 1 85,430 29,000 31,266 144,832 861 3 7,002 90,357 FL ........ 18 1,467,692 2,290,304 1,153,744 2,302,184 2,607,037 2,519 75,011 1,031,658 GA ....... 52 2,544,138 9,291,121 1,852,266 5,143,045 8,541,521 2,959 180,965 2,102,251 HI ........ 1 215,000 32,960 8,240 256,200 - - 660 30,500 IA ......... 46 856,019 909,963 173,640 797,952 1,141,273 397 62,145 215,458 ID ........ 10 196,308 92,542 36,612 285,187 39,078 1,197 12,264 72,575 IL ......... 29 628,023 1,314,154 638,935 674,778 1,906,122 212 53,433 255,767 IN ........ 46 526,088 2,326,237 707,487 723,299 2,835,796 717 56,707 490,843 KS ....... 32 766,320 1,010,942 185,156 985,703 976,300 415 74,746 286,594 KY ....... 26 1,766,221 5,233,704 1,656,746 2,516,640 6,138,872 1,159 88,925 945,939 LA ........ 20 775,273 3,046,614 425,178 1,190,428 3,056,459 177 54,153 551,440 MA ....... - - - - - - - - - MD ...... 2 368,228 107,253 140,356 499,899 115,937 - 14,705 185,496 ME ....... 5 41,737 20,587 20,396 49,686 32,990 44 2,102 20,680 MH ...... 1 - 11,857 - - 11,857 - 161 3,426 MI ........ 10 660,087 959,579 92,692 760,465 951,420 473 37,470 308,721 MN ...... 46 1,687,889 2,426,105 556,717 2,177,692 2,488,662 4,357 118,428 705,234 MO ...... 48 1,863,673 2,590,579 600,270 2,071,001 2,982,700 821 118,280 768,151 MS ....... 29 979,323 1,405,085 361,096 1,285,725 1,459,085 694 87,498 740,753 MT ....... 25 442,360 112,141 66,866 521,053 100,085 229 44,673 142,863 NC ....... 33 2,009,134 2,407,251 560,907 2,619,933 2,352,724 4,635 101,699 1,096,369 ND ....... 23 1,179,286 3,924,158 908,122 939,306 5,070,275 1,986 61,921 163,575 NE ....... 35 483,130 38,616 42,711 448,825 115,070 562 70,682 177,923 NH ....... 1 81,213 143,839 8,696 87,335 146,380 32 4,556 64,601 NJ ........ 2 18,173 - 5,377 22,250 1,295 4 983 13,334 NM ...... 17 653,437 203,491 78,251 843,669 88,500 3,010 44,528 244,709 NV ....... 8 75,008 1,241 10,441 65,315 21,127 248 5,418 24,889 NY ....... 6 46,782 24,035 20,114 81,561 9,286 85 5,252 29,027 OH ....... 27 652,958 1,392,417 472,666 899,948 1,617,874 218 48,343 375,926 OK ....... 29 1,197,869 1,312,764 330,438 1,453,026 1,385,369 2,676 97,074 530,265 OR ....... 18 309,173 111,367 93,022 364,021 149,304 237 23,160 145,455 PA ....... 13 463,264 669,683 132,794 640,521 624,981 239 28,055 232,935 PR ....... 1 300,981 - 31,424 292,851 39,554 - 16,628 624,343 PW ...... - - - - - - - - - RI ........ 1 - 3,940 - 334 3,606 - 4 160 SC ....... 28 1,884,073 1,588,313 379,965 3,014,565 835,554 2,231 77,035 849,899 SD ....... 30 809,257 396,848 155,806 1,044,158 316,872 881 63,770 188,441 TN ....... 33 782,429 407,814 190,919 1,345,891 35,048 223 92,491 1,154,694 TX ....... 99 2,424,164 4,159,326 1,359,403 3,111,307 4,829,063 2,524 263,842 1,515,597 UT ....... 6 72,455 1,031,811 216,171 62,920 1,257,393 124 4,879 25,033 VA ....... 19 860,156 3,548,102 251,378 4,357,051 302,096 488 49,335 463,267 VI ......... 1 430 - - 234 197 - 85 912 VT ....... 3 75,437 44,970 7,310 65,769 61,044 903 2,913 25,566 WA ...... 23 251,065 20,148 40,181 289,499 21,642 252 20,481 111,893 WI ........ 26 569,792 1,211,017 464,963 546,976 1,696,998 1,798 43,521 246,984 WV ...... 1 26,236 - 1,059 26,443 847 5 925 8,023 WY ...... 13 387,012 198,142 27,216 492,883 119,386 101 30,856 104,648
US 4 ..... 1,058 36,235,464 64,139,481 16,784,460 51,113,923 65,998,107 47,374 2,492,534 19,593,437
1 Includes $630,467,174 discounted principal from 227 prepaid borrowers. 2 Includes RUS Section 313A loan guaran-tees. 3 Includes loans obtained by RUS borrowers’ affiliates specifically organized to facillitate non-RUS finanacing. 4 In-cludes figures not shown elsewhere in this table for two borrowers whose loans have been foreclosed. The amount of these loans was $37,237.
Rural Development, Planning and Policy Branch, (202)692-0347
VerDate Aug 31 2005 14:46 Feb 28, 2012 Jkt 000000 PO 00000 Frm 00016 Fmt 1000 Sfmt 1000 H:\SHARED\DAPP\FPU\AGSTAT\MASTER~2\CHAPTR10\X-16.AG8 USDA
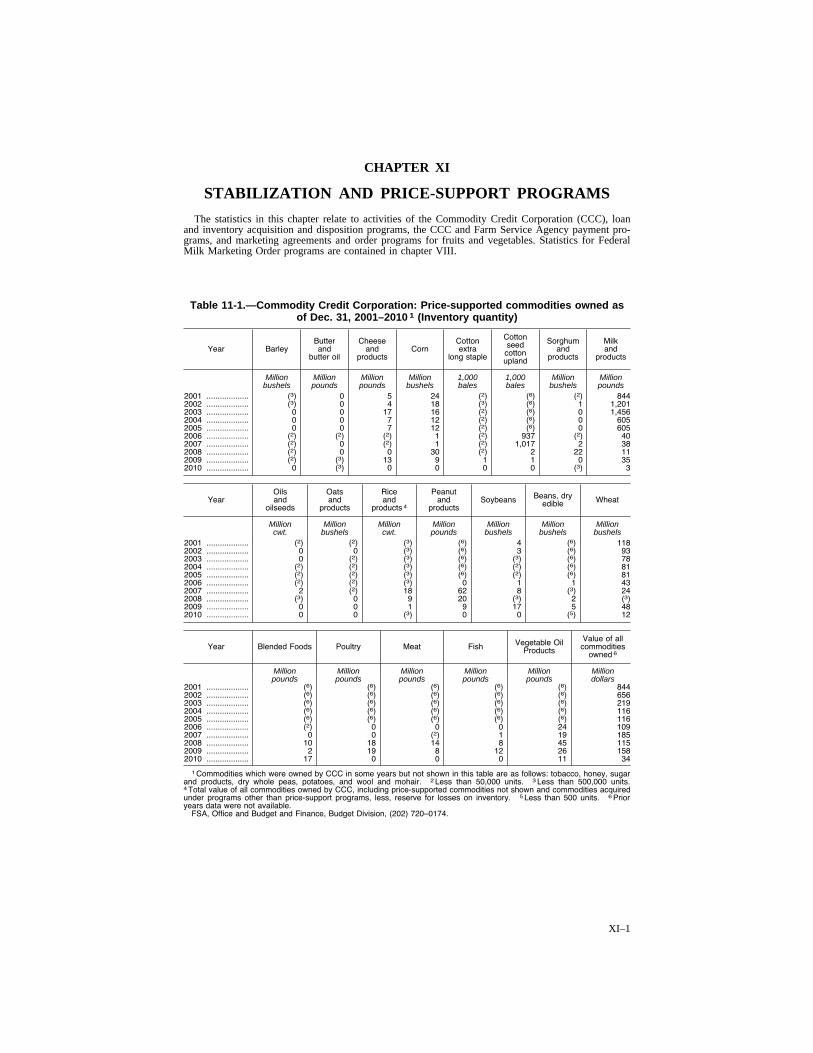
XI–1
CHAPTER XI
STABILIZATION AND PRICE-SUPPORT PROGRAMS
The statistics in this chapter relate to activities of the Commodity Credit Corporation (CCC), loan and inventory acquisition and disposition programs, the CCC and Farm Service Agency payment pro-grams, and marketing agreements and order programs for fruits and vegetables. Statistics for Federal Milk Marketing Order programs are contained in chapter VIII.
Table 11-1.—Commodity Credit Corporation: Price-supported commodities owned as of Dec. 31, 2001–2010 1 (Inventory quantity)
Year Barley Butter and
butter oil
Cheese and
products Corn
Cotton extra
long staple
Cotton seed
cotton upland
Sorghum and
products
Milk and
products
Million Million Million Million 1,000 1,000 Million Million bushels pounds pounds bushels bales bales bushels pounds
2001 ................... (3) 0 5 24 (2) (6) (2) 844 2002 ................... (3) 0 4 18 (3) (6) 1 1,201 2003 ................... 0 0 17 16 (2) (6) 0 1,456 2004 ................... 0 0 7 12 (2) (6) 0 605 2005 ................... 0 0 7 12 (2) (6) 0 605 2006 ................... (2) (2) (2) 1 (2) 937 (2) 40 2007 ................... (2) 0 (2) 1 (2) 1,017 2 38 2008 ................... (2) 0 0 30 (2) 2 22 11 2009 ................... (2) (3) 13 9 1 1 0 35 2010 ................... 0 (3) 0 0 0 0 (3) 3
Year Oils and
oilseeds
Oats and
products
Rice and
products 4
Peanut and
products Soybeans Beans, dry
edible Wheat
Million Million Million Million Million Million Million cwt. bushels cwt. pounds bushels bushels bushels
2001 ................... (2) (2) (3) (6) 4 (6) 118 2002 ................... 0 0 (3) (6) 3 (6) 93 2003 ................... 0 (2) (3) (6) (3) (6) 78 2004 ................... (2) (2) (3) (6) (2) (6) 81 2005 ................... (2) (2) (3) (6) (2) (6) 81 2006 ................... (2) (2) (3) 0 1 1 43 2007 ................... 2 (2) 18 62 8 (3) 24 2008 ................... (3) 0 9 20 (3) 2 (3) 2009 ................... 0 0 1 9 17 5 48 2010 ................... 0 0 (3) 0 0 (5) 12
Year Blended Foods Poultry Meat Fish Vegetable Oil Products
Value of all commodities
owned 6
Million Million Million Million Million Million pounds pounds pounds pounds pounds dollars
2001 ................... (6) (6) (6) (6) (6) 844 2002 ................... (6) (6) (6) (6) (6) 656 2003 ................... (6) (6) (6) (6) (6) 219 2004 ................... (6) (6) (6) (6) (6) 116 2005 ................... (6) (6) (6) (6) (6) 116 2006 ................... (2) 0 0 0 24 109 2007 ................... 0 0 (2) 1 19 185 2008 ................... 10 18 14 8 45 115 2009 ................... 2 19 8 12 26 158 2010 ................... 17 0 0 0 11 34
1 Commodities which were owned by CCC in some years but not shown in this table are as follows: tobacco, honey, sugar and products, dry whole peas, potatoes, and wool and mohair. 2 Less than 50,000 units. 3 Less than 500,000 units. 4 Total value of all commodities owned by CCC, including price-supported commodities not shown and commodities acquired under programs other than price-support programs, less, reserve for losses on inventory. 5 Less than 500 units. 6 Prior years data were not available.
FSA, Office and Budget and Finance, Budget Division, (202) 720–0174.
VerDate Aug 31 2005 10:37 Feb 29, 2012 Jkt 000000 PO 00000 Frm 00001 Fmt 1001 Sfmt 1001 H:\SHARED\DAPP\FPU\AGSTAT\MASTER~2\CHAPTR11\XI-01.AG8 USDA
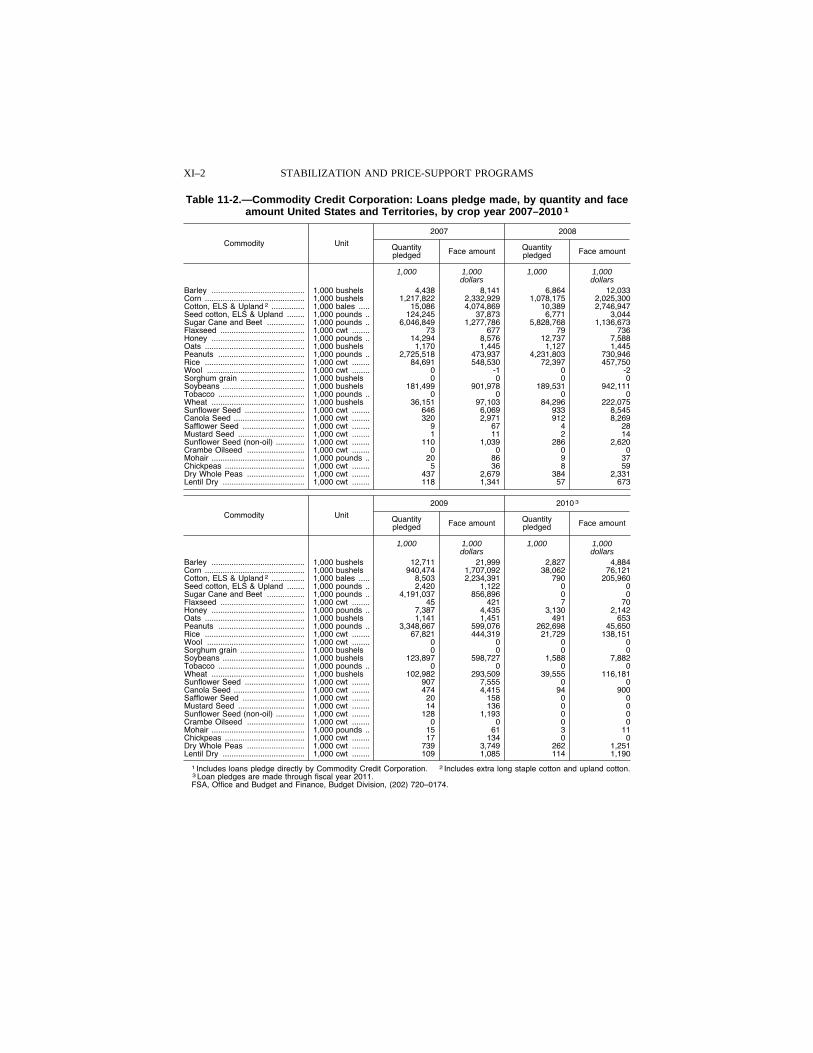
XI–2 STABILIZATION AND PRICE-SUPPORT PROGRAMS
Table 11-2.—Commodity Credit Corporation: Loans pledge made, by quantity and face amount United States and Territories, by crop year 2007–2010 1
Commodity Unit
2007 2008
Quantity pledged Face amount Quantity
pledged Face amount
1,000 1,000 1,000 1,000 dollars dollars
Barley .......................................... 1,000 bushels 4,438 8,141 6,864 12,033 Corn ............................................. 1,000 bushels 1,217,822 2,332,929 1,078,175 2,025,300 Cotton, ELS & Upland 2 ............... 1,000 bales ..... 15,086 4,074,869 10,389 2,746,947 Seed cotton, ELS & Upland ........ 1,000 pounds .. 124,245 37,873 6,771 3,044 Sugar Cane and Beet ................. 1,000 pounds .. 6,046,849 1,277,786 5,828,768 1,136,673 Flaxseed ...................................... 1,000 cwt ........ 73 677 79 736 Honey .......................................... 1,000 pounds .. 14,294 8,576 12,737 7,588 Oats ............................................. 1,000 bushels 1,170 1,445 1,127 1,445 Peanuts ....................................... 1,000 pounds .. 2,725,518 473,937 4,231,803 730,946 Rice ............................................. 1,000 cwt ........ 84,691 548,530 72,397 457,750 Wool ............................................ 1,000 cwt ........ 0 -1 0 -2 Sorghum grain ............................. 1,000 bushels 0 0 0 0 Soybeans ..................................... 1,000 bushels 181,499 901,978 189,531 942,111 Tobacco ....................................... 1,000 pounds .. 0 0 0 0 Wheat .......................................... 1,000 bushels 36,151 97,103 84,296 222,075 Sunflower Seed ........................... 1,000 cwt ........ 646 6,069 933 8,545 Canola Seed ................................ 1,000 cwt ........ 320 2,971 912 8,269 Safflower Seed ............................ 1,000 cwt ........ 9 67 4 28 Mustard Seed .............................. 1,000 cwt ........ 1 11 2 14 Sunflower Seed (non-oil) ............. 1,000 cwt ........ 110 1,039 286 2,620 Crambe Oilseed .......................... 1,000 cwt ........ 0 0 0 0 Mohair .......................................... 1,000 pounds .. 20 86 9 37 Chickpeas .................................... 1,000 cwt ........ 5 36 8 59 Dry Whole Peas .......................... 1,000 cwt ........ 437 2,679 384 2,331 Lentil Dry ..................................... 1,000 cwt ........ 118 1,341 57 673
Commodity Unit
2009 2010 3
Quantity pledged Face amount Quantity
pledged Face amount
1,000 1,000 1,000 1,000 dollars dollars
Barley .......................................... 1,000 bushels 12,711 21,999 2,827 4,884 Corn ............................................. 1,000 bushels 940,474 1,707,092 38,062 76,121 Cotton, ELS & Upland 2 ............... 1,000 bales ..... 8,503 2,234,391 790 205,960 Seed cotton, ELS & Upland ........ 1,000 pounds .. 2,420 1,122 0 0 Sugar Cane and Beet ................. 1,000 pounds .. 4,191,037 856,896 0 0 Flaxseed ...................................... 1,000 cwt ........ 45 421 7 70 Honey .......................................... 1,000 pounds .. 7,387 4,435 3,130 2,142 Oats ............................................. 1,000 bushels 1,141 1,451 491 653 Peanuts ....................................... 1,000 pounds .. 3,348,667 599,076 262,698 45,650 Rice ............................................. 1,000 cwt ........ 67,821 444,319 21,729 138,151 Wool ............................................ 1,000 cwt ........ 0 0 0 0 Sorghum grain ............................. 1,000 bushels 0 0 0 0 Soybeans ..................................... 1,000 bushels 123,897 598,727 1,588 7,882 Tobacco ....................................... 1,000 pounds .. 0 0 0 0 Wheat .......................................... 1,000 bushels 102,982 293,509 39,555 116,181 Sunflower Seed ........................... 1,000 cwt ........ 907 7,555 0 0 Canola Seed ................................ 1,000 cwt ........ 474 4,415 94 900 Safflower Seed ............................ 1,000 cwt ........ 20 158 0 0 Mustard Seed .............................. 1,000 cwt ........ 14 136 0 0 Sunflower Seed (non-oil) ............. 1,000 cwt ........ 128 1,193 0 0 Crambe Oilseed .......................... 1,000 cwt ........ 0 0 0 0 Mohair .......................................... 1,000 pounds .. 15 61 3 11 Chickpeas .................................... 1,000 cwt ........ 17 134 0 0 Dry Whole Peas .......................... 1,000 cwt ........ 739 3,749 262 1,251 Lentil Dry ..................................... 1,000 cwt ........ 109 1,085 114 1,190
1 Includes loans pledge directly by Commodity Credit Corporation. 2 Includes extra long staple cotton and upland cotton. 3 Loan pledges are made through fiscal year 2011. FSA, Office and Budget and Finance, Budget Division, (202) 720–0174.
VerDate Aug 31 2005 10:37 Feb 29, 2012 Jkt 000000 PO 00000 Frm 00002 Fmt 1000 Sfmt 1000 H:\SHARED\DAPP\FPU\AGSTAT\MASTER~2\CHAPTR11\XI-02.AG8 USDA
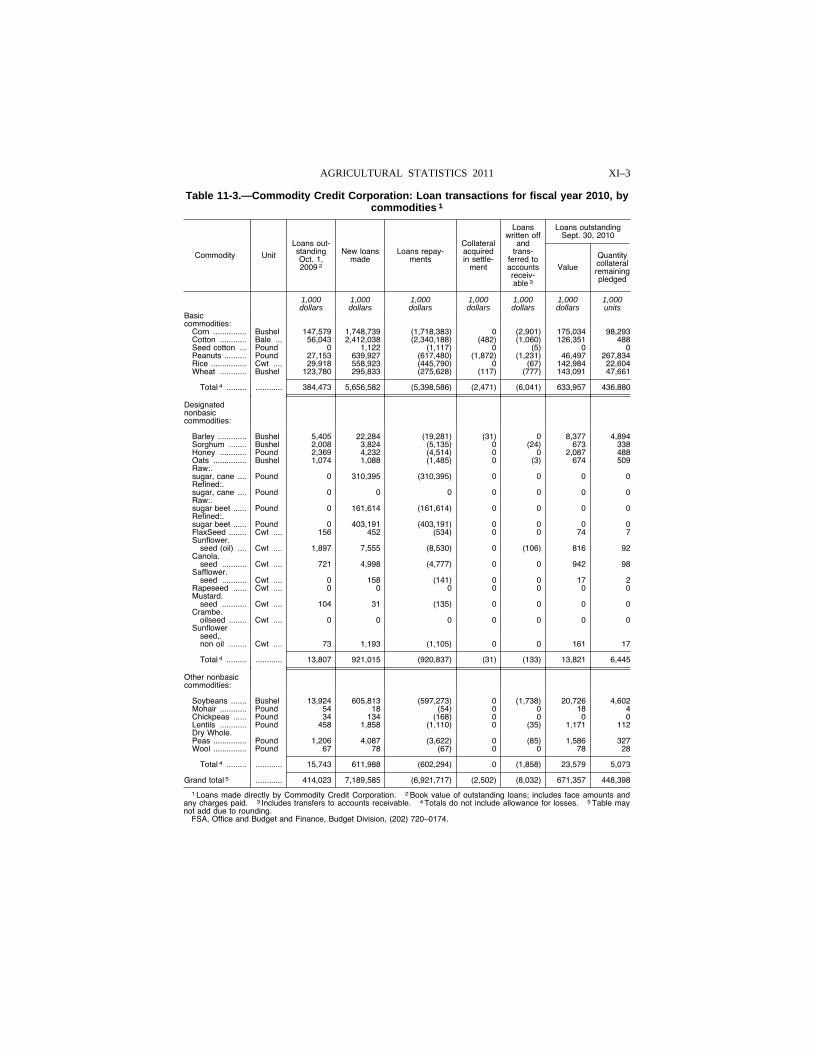
XI–3 AGRICULTURAL STATISTICS 2011
Table 11-3.—Commodity Credit Corporation: Loan transactions for fiscal year 2010, by commodities 1
Commodity Unit
Loans out-standing Oct. 1, 2009 2
New loans made
Loans repay-ments
Collateral acquired in settle-
ment
Loans written off
and trans-
ferred to accounts receiv-able 3
Loans outstanding Sept. 30, 2010
Value
Quantity collateral remaining pledged
1,000 1,000 1,000 1,000 1,000 1,000 1,000 dollars dollars dollars dollars dollars dollars units
Basic commodities:
Corn ............... Bushel 147,579 1,748,739 (1,718,383) 0 (2,901) 175,034 98,293 Cotton ............ Bale ... 56,043 2,412,038 (2,340,188) (482) (1,060) 126,351 488 Seed cotton ... Pound 0 1,122 (1,117) 0 (5) 0 0 Peanuts .......... Pound 27,153 639,927 (617,480) (1,872) (1,231) 46,497 267,834 Rice ................ Cwt .... 29,918 558,923 (445,790) 0 (67) 142,984 22,604 Wheat ............ Bushel 123,780 295,833 (275,628) (117) (777) 143,091 47,661
Total 4 ......... ............ 384,473 5,656,582 (5,398,586) (2,471) (6,041) 633,957 436,880
Designated nonbasic commodities:
Barley ............. Bushel 5,405 22,284 (19,281) (31) 0 8,377 4,894 Sorghum ........ Bushel 2,008 3,824 (5,135) 0 (24) 673 338 Honey ............ Pound 2,369 4,232 (4,514) 0 0 2,087 488 Oats ............... Bushel 1,074 1,088 (1,485) 0 (3) 674 509 Raw:.sugar, cane .... Pound 0 310,395 (310,395) 0 0 0 0 Refined:.sugar, cane .... Pound 0 0 0 0 0 0 0 Raw:.sugar beet ...... Pound 0 161,614 (161,614) 0 0 0 0 Refined:.sugar beet ...... Pound 0 403,191 (403,191) 0 0 0 0 FlaxSeed ........ Cwt .... 156 452 (534) 0 0 74 7 Sunflower.
seed (oil) .... Cwt .... 1,897 7,555 (8,530) 0 (106) 816 92 Canola.
seed ........... Cwt .... 721 4,998 (4,777) 0 0 942 98 Safflower.
seed ........... Cwt .... 0 158 (141) 0 0 17 2 Rapeseed ...... Cwt .... 0 0 0 0 0 0 0 Mustard.
seed ........... Cwt .... 104 31 (135) 0 0 0 0 Crambe.
oilseed ........ Cwt .... 0 0 0 0 0 0 0 Sunflower
seed,.non oil ........ Cwt .... 73 1,193 (1,105) 0 0 161 17
Total 4 ......... ............ 13,807 921,015 (920,837) (31) (133) 13,821 6,445
Other nonbasic commodities:
Soybeans ....... Bushel 13,924 605,813 (597,273) 0 (1,738) 20,726 4,602 Mohair ............ Pound 54 18 (54) 0 0 18 4 Chickpeas ...... Pound 34 134 (168) 0 0 0 0 Lentils ............ Pound 458 1,858 (1,110) 0 (35) 1,171 112 Dry Whole.Peas ............... Pound 1,206 4,087 (3,622) 0 (85) 1,586 327 Wool ............... Pound 67 78 (67) 0 0 78 28
Total 4 ......... ............ 15,743 611,988 (602,294) 0 (1,858) 23,579 5,073
Grand total 5 ............ 414,023 7,189,585 (6,921,717) (2,502) (8,032) 671,357 448,398
1 Loans made directly by Commodity Credit Corporation. 2 Book value of outstanding loans; includes face amounts and any charges paid. 3 Includes transfers to accounts receivable. 4 Totals do not include allowance for losses. 5 Table may not add due to rounding.
FSA, Office and Budget and Finance, Budget Division, (202) 720–0174.
VerDate Aug 31 2005 10:37 Feb 29, 2012 Jkt 000000 PO 00000 Frm 00003 Fmt 1000 Sfmt 1000 H:\SHARED\DAPP\FPU\AGSTAT\MASTER~2\CHAPTR11\XI-03.AG8 USDA
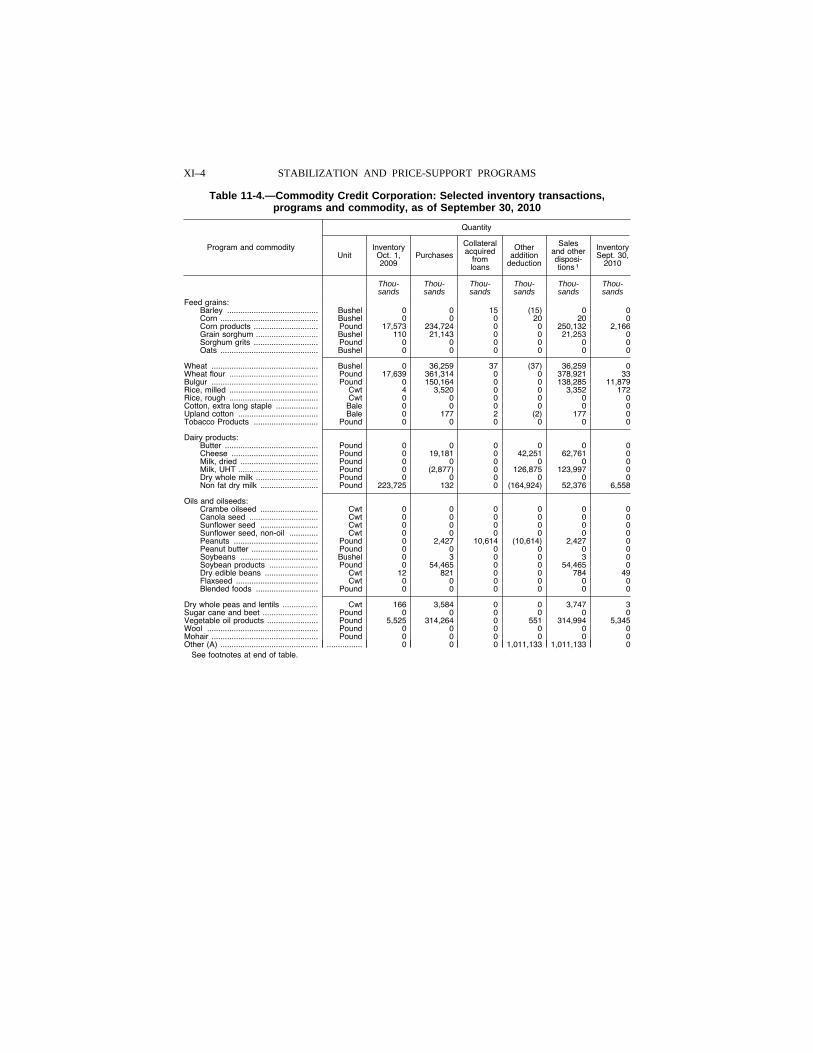
XI–4 STABILIZATION AND PRICE-SUPPORT PROGRAMS
Table 11-4.—Commodity Credit Corporation: Selected inventory transactions, programs and commodity, as of September 30, 2010
Program and commodity
Quantity
Unit Inventory Oct. 1, 2009
Purchases
Collateral acquired
from loans
Other addition
deduction
Sales and other disposi-tions 1
Inventory Sept. 30,
2010
Thou-sands
Thou-sands
Thou-sands
Thou-sands
Thou-sands
Thou-sands
Feed grains: Barley ......................................... Bushel 0 0 15 (15) 0 0 Corn ............................................ Bushel 0 0 0 20 20 0 Corn products ............................. Pound 17,573 234,724 0 0 250,132 2,166 Grain sorghum ............................ Bushel 110 21,143 0 0 21,253 0 Sorghum grits ............................. Pound 0 0 0 0 0 0 Oats ............................................ Bushel 0 0 0 0 0 0
Wheat ................................................ Bushel 0 36,259 37 (37) 36,259 0 Wheat flour ........................................ Pound 17,639 361,314 0 0 378,921 33 Bulgur ................................................ Pound 0 150,164 0 0 138,285 11,879 Rice, milled ........................................ Cwt 4 3,520 0 0 3,352 172 Rice, rough ........................................ Cwt 0 0 0 0 0 0 Cotton, extra long staple ................... Bale 0 0 0 0 0 0 Upland cotton .................................... Bale 0 177 2 (2) 177 0 Tobacco Products ............................. Pound 0 0 0 0 0 0
Dairy products: Butter .......................................... Pound 0 0 0 0 0 0 Cheese ....................................... Pound 0 19,181 0 42,251 62,761 0 Milk, dried ................................... Pound 0 0 0 0 0 0 Milk, UHT .................................... Pound 0 (2,877) 0 126,875 123,997 0 Dry whole milk ............................ Pound 0 0 0 0 0 0 Non fat dry milk .......................... Pound 223,725 132 0 (164,924) 52,376 6,558
Oils and oilseeds: Crambe oilseed .......................... Cwt 0 0 0 0 0 0 Canola seed ............................... Cwt 0 0 0 0 0 0 Sunflower seed .......................... Cwt 0 0 0 0 0 0 Sunflower seed, non-oil ............. Cwt 0 0 0 0 0 0 Peanuts ...................................... Pound 0 2,427 10,614 (10,614) 2,427 0 Peanut butter .............................. Pound 0 0 0 0 0 0 Soybeans ................................... Bushel 0 3 0 0 3 0 Soybean products ...................... Pound 0 54,465 0 0 54,465 0 Dry edible beans ........................ Cwt 12 821 0 0 784 49 Flaxseed ..................................... Cwt 0 0 0 0 0 0 Blended foods ............................ Pound 0 0 0 0 0 0
Dry whole peas and lentils ................ Cwt 166 3,584 0 0 3,747 3 Sugar cane and beet ......................... Pound 0 0 0 0 0 0 Vegetable oil products ....................... Pound 5,525 314,264 0 551 314,994 5,345 Wool .................................................. Pound 0 0 0 0 0 0 Mohair ................................................ Pound 0 0 0 0 0 0 Other (A) ............................................ ................ 0 0 0 1,011,133 1,011,133 0
See footnotes at end of table.
VerDate Aug 31 2005 10:37 Feb 29, 2012 Jkt 000000 PO 00000 Frm 00004 Fmt 1000 Sfmt 1000 H:\SHARED\DAPP\FPU\AGSTAT\MASTER~2\CHAPTR11\XI-04.AG8 USDA
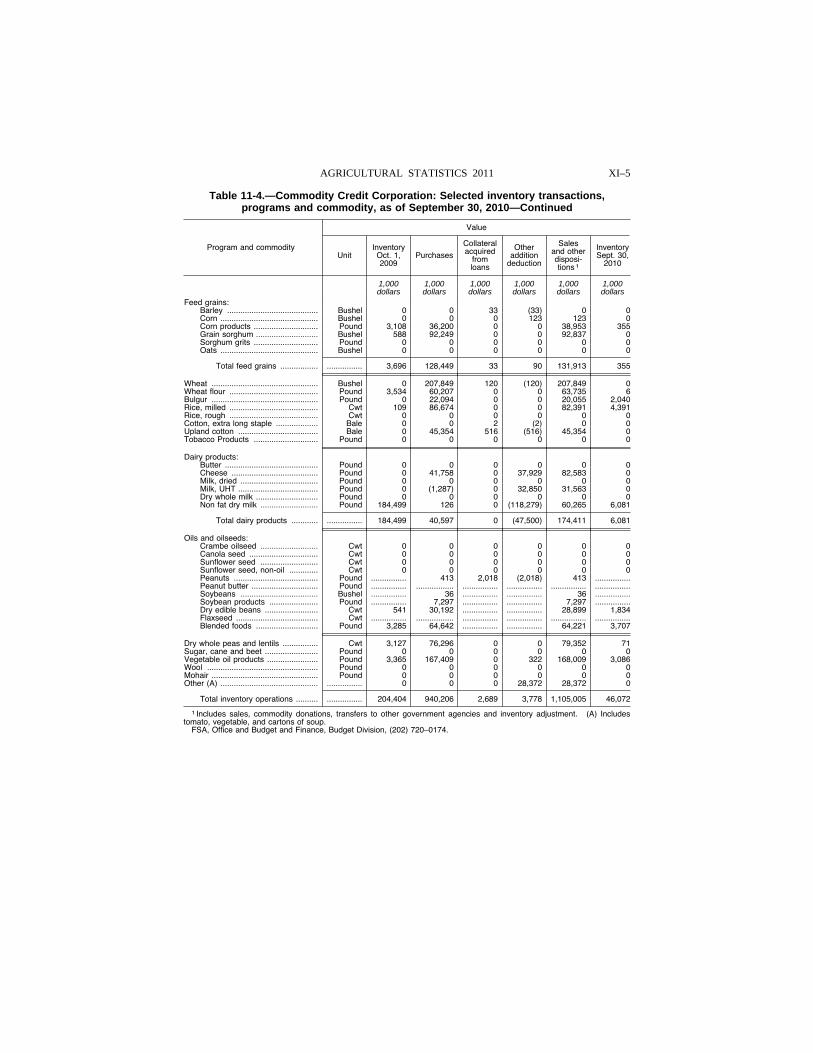
XI–5 AGRICULTURAL STATISTICS 2011
Table 11-4.—Commodity Credit Corporation: Selected inventory transactions, programs and commodity, as of September 30, 2010—Continued
Program and commodity
Value
Unit Inventory Oct. 1, 2009
Purchases
Collateral acquired
from loans
Other addition
deduction
Sales and other disposi-tions 1
Inventory Sept. 30,
2010
1,000 1,000 1,000 1,000 1,000 1,000 dollars dollars dollars dollars dollars dollars
Feed grains: Barley ......................................... Bushel 0 0 33 (33) 0 0 Corn ............................................ Bushel 0 0 0 123 123 0 Corn products ............................. Pound 3,108 36,200 0 0 38,953 355 Grain sorghum ............................ Bushel 588 92,249 0 0 92,837 0 Sorghum grits ............................. Pound 0 0 0 0 0 0 Oats ............................................ Bushel 0 0 0 0 0 0
Total feed grains ................. ................ 3,696 128,449 33 90 131,913 355
Wheat ................................................ Bushel 0 207,849 120 (120) 207,849 0 Wheat flour ........................................ Pound 3,534 60,207 0 0 63,735 6 Bulgur ................................................ Pound 0 22,094 0 0 20,055 2,040 Rice, milled ........................................ Cwt 109 86,674 0 0 82,391 4,391 Rice, rough ........................................ Cwt 0 0 0 0 0 0 Cotton, extra long staple ................... Bale 0 0 2 (2) 0 0 Upland cotton .................................... Bale 0 45,354 516 (516) 45,354 0 Tobacco Products ............................. Pound 0 0 0 0 0 0
Dairy products: Butter .......................................... Pound 0 0 0 0 0 0 Cheese ....................................... Pound 0 41,758 0 37,929 82,583 0 Milk, dried ................................... Pound 0 0 0 0 0 0 Milk, UHT .................................... Pound 0 (1,287) 0 32,850 31,563 0 Dry whole milk ............................ Pound 0 0 0 0 0 0 Non fat dry milk .......................... Pound 184,499 126 0 (118,279) 60,265 6,081
Total dairy products ............ ................ 184,499 40,597 0 (47,500) 174,411 6,081
Oils and oilseeds: Crambe oilseed .......................... Cwt 0 0 0 0 0 0 Canola seed ............................... Cwt 0 0 0 0 0 0 Sunflower seed .......................... Cwt 0 0 0 0 0 0 Sunflower seed, non-oil ............. Cwt 0 0 0 0 0 0 Peanuts ...................................... Pound ................ 413 2,018 (2,018) 413 ................Peanut butter .............................. Pound ................ ................. ................ ................ ................ ................Soybeans ................................... Bushel ................ 36 ................ ................ 36 ................Soybean products ...................... Pound ................ 7,297 ................ ................ 7,297 ................Dry edible beans ........................ Cwt 541 30,192 ................ ................ 28,899 1,834 Flaxseed ..................................... Cwt ................ ................. ................ ................ ................ ................Blended foods ............................ Pound 3,285 64,642 ................ ................ 64,221 3,707
Dry whole peas and lentils ................ Cwt 3,127 76,296 0 0 79,352 71 Sugar, cane and beet ........................ Pound 0 0 0 0 0 0 Vegetable oil products ....................... Pound 3,365 167,409 0 322 168,009 3,086 Wool .................................................. Pound 0 0 0 0 0 0 Mohair ................................................ Pound 0 0 0 0 0 0 Other (A) ............................................ ................ 0 0 0 28,372 28,372 0
Total inventory operations .......... ................ 204,404 940,206 2,689 3,778 1,105,005 46,072
1 Includes sales, commodity donations, transfers to other government agencies and inventory adjustment. (A) Includes tomato, vegetable, and cartons of soup.
FSA, Office and Budget and Finance, Budget Division, (202) 720–0174.
VerDate Aug 31 2005 10:37 Feb 29, 2012 Jkt 000000 PO 00000 Frm 00005 Fmt 1000 Sfmt 1000 H:\SHARED\DAPP\FPU\AGSTAT\MASTER~2\CHAPTR11\XI-05.AG8 USDA
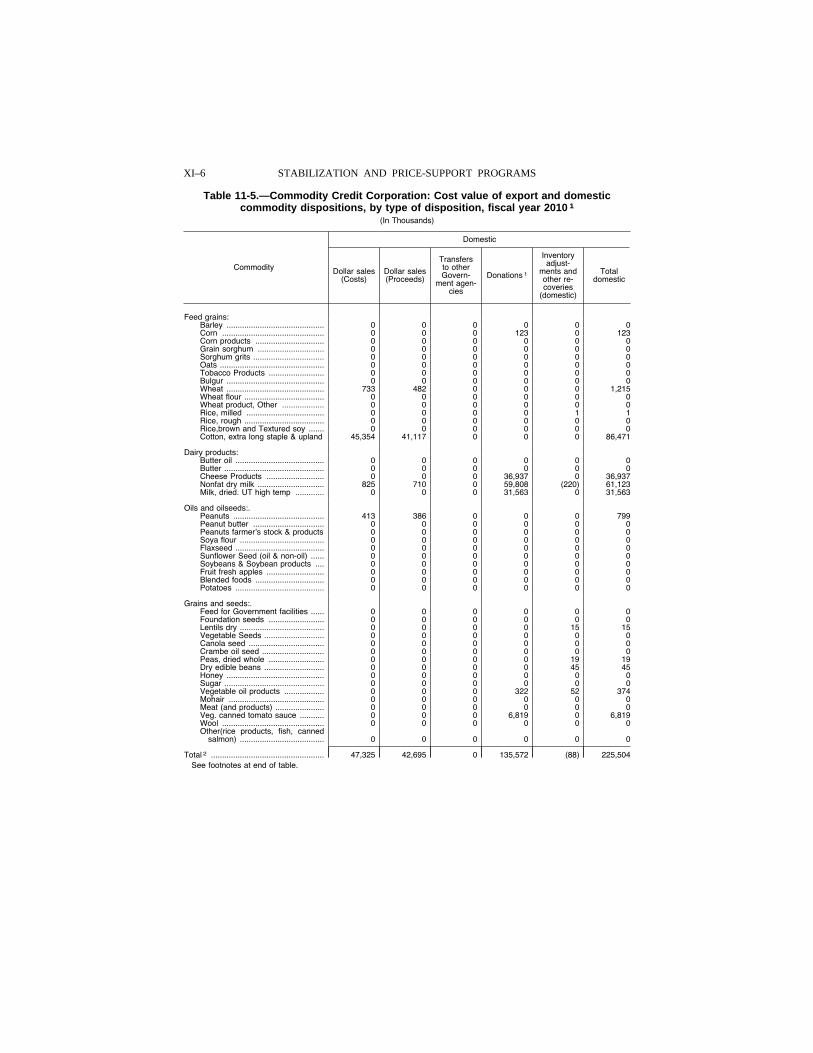
XI–6 STABILIZATION AND PRICE-SUPPORT PROGRAMS
Table 11-5.—Commodity Credit Corporation: Cost value of export and domestic commodity dispositions, by type of disposition, fiscal year 2010 1
(In Thousands)
Commodity
Domestic
Dollar sales (Costs)
Dollar sales (Proceeds)
Transfers to other Govern-
ment agen-cies
Donations 1
Inventory adjust-
ments and other re-coveries
(domestic)
Total domestic
Feed grains: Barley ............................................ 0 0 0 0 0 0 Corn .............................................. 0 0 0 123 0 123 Corn products ............................... 0 0 0 0 0 0 Grain sorghum .............................. 0 0 0 0 0 0 Sorghum grits ................................ 0 0 0 0 0 0 Oats ............................................... 0 0 0 0 0 0 Tobacco Products ......................... 0 0 0 0 0 0 Bulgur ............................................ 0 0 0 0 0 0 Wheat ............................................ 733 482 0 0 0 1,215 Wheat flour .................................... 0 0 0 0 0 0 Wheat product, Other ................... 0 0 0 0 0 0 Rice, milled ................................... 0 0 0 0 1 1 Rice, rough .................................... 0 0 0 0 0 0 Rice,brown and Textured soy ....... 0 0 0 0 0 0 Cotton, extra long staple & upland 45,354 41,117 0 0 0 86,471
Dairy products: Butter oil ........................................ 0 0 0 0 0 0 Butter ............................................. 0 0 0 0 0 0 Cheese Products .......................... 0 0 0 36,937 0 36,937 Nonfat dry milk .............................. 825 710 0 59,808 (220) 61,123 Milk, dried. UT high temp ............. 0 0 0 31,563 0 31,563
Oils and oilseeds:.Peanuts ......................................... 413 386 0 0 0 799 Peanut butter ................................ 0 0 0 0 0 0 Peanuts farmer’s stock & products 0 0 0 0 0 0 Soya flour ...................................... 0 0 0 0 0 0 Flaxseed ........................................ 0 0 0 0 0 0 Sunflower Seed (oil & non-oil) ...... 0 0 0 0 0 0 Soybeans & Soybean products .... 0 0 0 0 0 0 Fruit fresh apples .......................... 0 0 0 0 0 0 Blended foods ............................... 0 0 0 0 0 0 Potatoes ........................................ 0 0 0 0 0 0
Grains and seeds:.Feed for Government facilities ...... 0 0 0 0 0 0 Foundation seeds ......................... 0 0 0 0 0 0 Lentils dry ...................................... 0 0 0 0 15 15 Vegetable Seeds ........................... 0 0 0 0 0 0 Canola seed .................................. 0 0 0 0 0 0 Crambe oil seed ............................ 0 0 0 0 0 0 Peas, dried whole ......................... 0 0 0 0 19 19 Dry edible beans ........................... 0 0 0 0 45 45 Honey ............................................ 0 0 0 0 0 0 Sugar ............................................. 0 0 0 0 0 0 Vegetable oil products .................. 0 0 0 322 52 374 Mohair ........................................... 0 0 0 0 0 0 Meat (and products) ...................... 0 0 0 0 0 0 Veg. canned tomato sauce ........... 0 0 0 6,819 0 6,819 Wool .............................................. 0 0 0 0 0 0 Other(rice products, fish, canned
salmon) ...................................... 0 0 0 0 0 0
Total 2 ................................................... 47,325 42,695 0 135,572 (88) 225,504 See footnotes at end of table.
VerDate Aug 31 2005 10:37 Feb 29, 2012 Jkt 000000 PO 00000 Frm 00006 Fmt 1000 Sfmt 1000 H:\SHARED\DAPP\FPU\AGSTAT\MASTER~2\CHAPTR11\XI-06.AG8 USDA
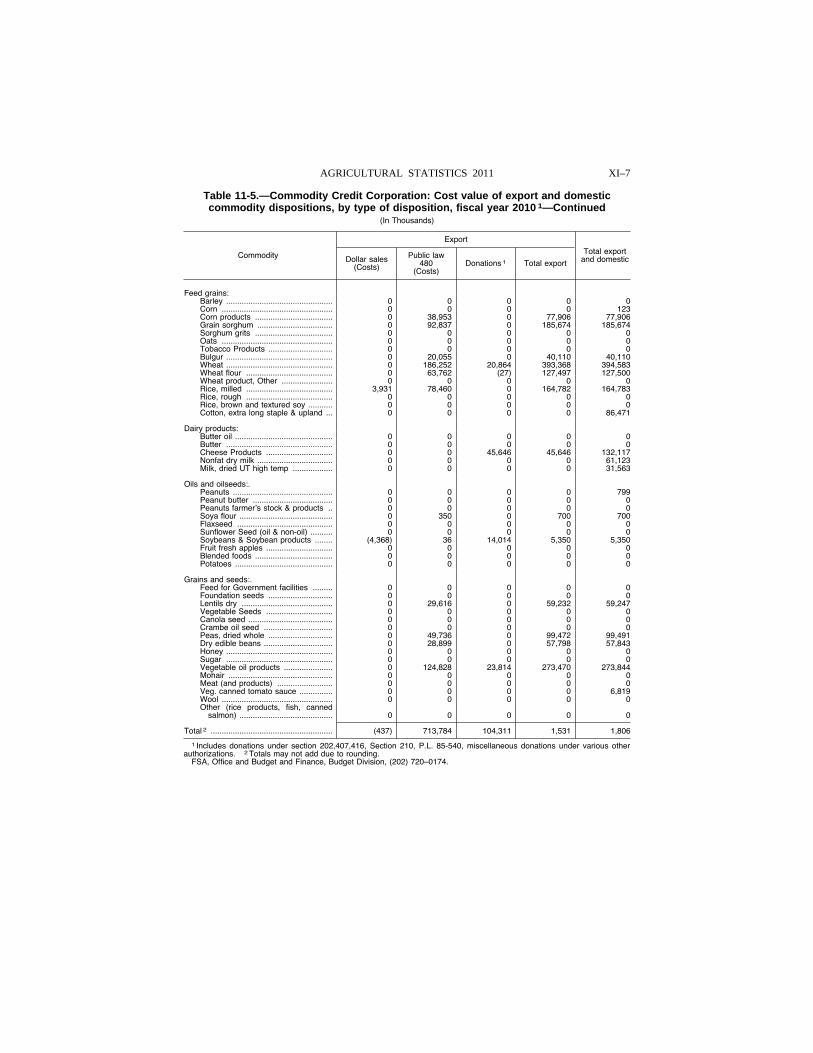
XI–7 AGRICULTURAL STATISTICS 2011
Table 11-5.—Commodity Credit Corporation: Cost value of export and domestic commodity dispositions, by type of disposition, fiscal year 2010 1—Continued
(In Thousands)
Commodity
Export
Total export and domestic Dollar sales
(Costs)
Public law 480
(Costs) Donations 1 Total export
Feed grains: Barley ................................................ 0 0 0 0 0 Corn .................................................. 0 0 0 0 123 Corn products ................................... 0 38,953 0 77,906 77,906 Grain sorghum .................................. 0 92,837 0 185,674 185,674 Sorghum grits ................................... 0 0 0 0 0 Oats .................................................. 0 0 0 0 0 Tobacco Products ............................. 0 0 0 0 0 Bulgur ................................................ 0 20,055 0 40,110 40,110 Wheat ................................................ 0 186,252 20,864 393,368 394,583 Wheat flour ....................................... 0 63,762 (27) 127,497 127,500 Wheat product, Other ....................... 0 0 0 0 0 Rice, milled ....................................... 3,931 78,460 0 164,782 164,783 Rice, rough ....................................... 0 0 0 0 0 Rice, brown and textured soy ........... 0 0 0 0 0 Cotton, extra long staple & upland ... 0 0 0 0 86,471
Dairy products: Butter oil ............................................ 0 0 0 0 0 Butter ................................................ 0 0 0 0 0 Cheese Products .............................. 0 0 45,646 45,646 132,117 Nonfat dry milk .................................. 0 0 0 0 61,123 Milk, dried UT high temp .................. 0 0 0 0 31,563
Oils and oilseeds:.Peanuts ............................................. 0 0 0 0 799 Peanut butter .................................... 0 0 0 0 0 Peanuts farmer’s stock & products .. 0 0 0 0 0 Soya flour .......................................... 0 350 0 700 700 Flaxseed ........................................... 0 0 0 0 0 Sunflower Seed (oil & non-oil) .......... 0 0 0 0 0 Soybeans & Soybean products ........ (4,368) 36 14,014 5,350 5,350 Fruit fresh apples .............................. 0 0 0 0 0 Blended foods ................................... 0 0 0 0 0 Potatoes ............................................ 0 0 0 0 0
Grains and seeds:.Feed for Government facilities ......... 0 0 0 0 0 Foundation seeds ............................. 0 0 0 0 0 Lentils dry ......................................... 0 29,616 0 59,232 59,247 Vegetable Seeds .............................. 0 0 0 0 0 Canola seed ...................................... 0 0 0 0 0 Crambe oil seed ............................... 0 0 0 0 0 Peas, dried whole ............................. 0 49,736 0 99,472 99,491 Dry edible beans ............................... 0 28,899 0 57,798 57,843 Honey ................................................ 0 0 0 0 0 Sugar ................................................ 0 0 0 0 0 Vegetable oil products ...................... 0 124,828 23,814 273,470 273,844 Mohair ............................................... 0 0 0 0 0 Meat (and products) ......................... 0 0 0 0 0 Veg. canned tomato sauce ............... 0 0 0 0 6,819 Wool .................................................. 0 0 0 0 0 Other (rice products, fish, canned
salmon) .......................................... 0 0 0 0 0
Total 2 ....................................................... (437) 713,784 104,311 1,531 1,806
1 Includes donations under section 202,407,416, Section 210, P.L. 85-540, miscellaneous donations under various other authorizations. 2 Totals may not add due to rounding.
FSA, Office and Budget and Finance, Budget Division, (202) 720–0174.
VerDate Aug 31 2005 10:37 Feb 29, 2012 Jkt 000000 PO 00000 Frm 00007 Fmt 1000 Sfmt 1000 H:\SHARED\DAPP\FPU\AGSTAT\MASTER~2\CHAPTR11\XI-07.AG8 USDA
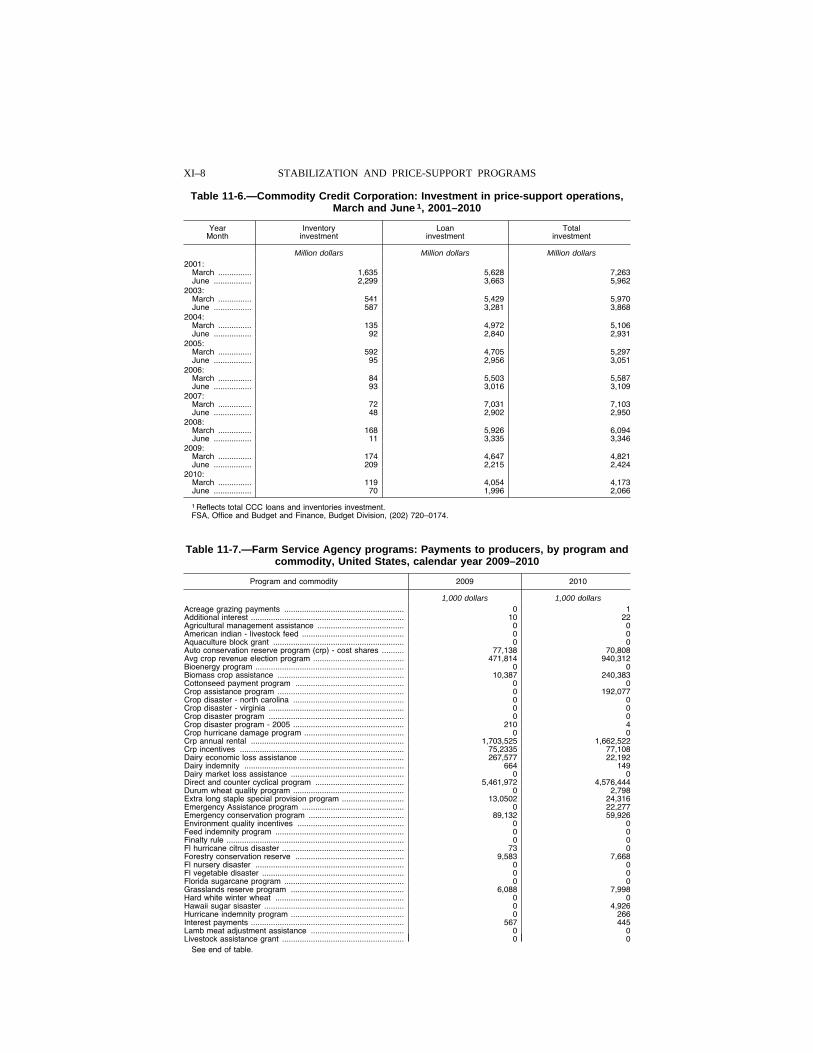
XI–8 STABILIZATION AND PRICE-SUPPORT PROGRAMS
Table 11-6.—Commodity Credit Corporation: Investment in price-support operations, March and June 1, 2001–2010
Year Month
Inventory investment
Loan investment
Total investment
Million dollars Million dollars Million dollars 2001:
March ............... 1,635 5,628 7,263 June ................. 2,299 3,663 5,962
2003: March ............... 541 5,429 5,970 June ................. 587 3,281 3,868
2004: March ............... 135 4,972 5,106 June ................. 92 2,840 2,931
2005: March ............... 592 4,705 5,297 June ................. 95 2,956 3,051
2006: March ............... 84 5,503 5,587 June ................. 93 3,016 3,109
2007: March ............... 72 7,031 7,103 June ................. 48 2,902 2,950
2008: March ............... 168 5,926 6,094 June ................. 11 3,335 3,346
2009: March ............... 174 4,647 4,821 June ................. 209 2,215 2,424
2010: March ............... 119 4,054 4,173 June ................. 70 1,996 2,066
1 Reflects total CCC loans and inventories investment. FSA, Office and Budget and Finance, Budget Division, (202) 720–0174.
Table 11-7.—Farm Service Agency programs: Payments to producers, by program and commodity, United States, calendar year 2009–2010
Program and commodity 2009 2010
1,000 dollars 1,000 dollars Acreage grazing payments ...................................................... 0 1 Additional interest ..................................................................... 10 22 Agricultural management assistance ....................................... 0 0 American indian - livestock feed .............................................. 0 0 Aquaculture block grant ........................................................... 0 0 Auto conservation reserve program (crp) - cost shares .......... 77,138 70,808 Avg crop revenue election program ......................................... 471,814 940,312 Bioenergy program ................................................................... 0 0 Biomass crop assistance ......................................................... 10,387 240,383 Cottonseed payment program ................................................. 0 0 Crop assistance program ......................................................... 0 192,077 Crop disaster - north carolina .................................................. 0 0 Crop disaster - virginia ............................................................. 0 0 Crop disaster program ............................................................. 0 0 Crop disaster program - 2005 .................................................. 210 4 Crop hurricane damage program ............................................. 0 0 Crp annual rental ..................................................................... 1,703,525 1,662,522 Crp incentives .......................................................................... 75,2335 77,108 Dairy economic loss assistance ............................................... 267,577 22,192 Dairy indemnity ........................................................................ 664 149 Dairy market loss assistance ................................................... 0 0 Direct and counter cyclical program ........................................ 5,461,972 4,576,444 Durum wheat quality program .................................................. 0 2,798 Extra long staple special provision program ............................ 13,0502 24,316 Emergency Assistance program .............................................. 0 22,277 Emergency conservation program ........................................... 89,132 59,926 Environment quality incentives ................................................ 0 0 Feed indemnity program .......................................................... 0 0 Finalty rule ................................................................................ 0 0 Fl hurricane citrus disaster ....................................................... 73 0 Forestry conservation reserve ................................................. 9,583 7,668 Fl nursery disaster ................................................................... 0 0 Fl vegetable disaster ................................................................ 0 0 Florida sugarcane program ...................................................... 0 0 Grasslands reserve program ................................................... 6,088 7,998 Hard white winter wheat .......................................................... 0 0 Hawaii sugar sisaster ............................................................... 0 4,926 Hurricane indemnity program ................................................... 0 266 Interest payments ..................................................................... 567 445 Lamb meat adjustment assistance .......................................... 0 0 Livestock assistance grant ....................................................... 0 0
See end of table.
VerDate Aug 31 2005 10:37 Feb 29, 2012 Jkt 000000 PO 00000 Frm 00008 Fmt 1000 Sfmt 1000 H:\SHARED\DAPP\FPU\AGSTAT\MASTER~2\CHAPTR11\XI-08.AG8 USDA
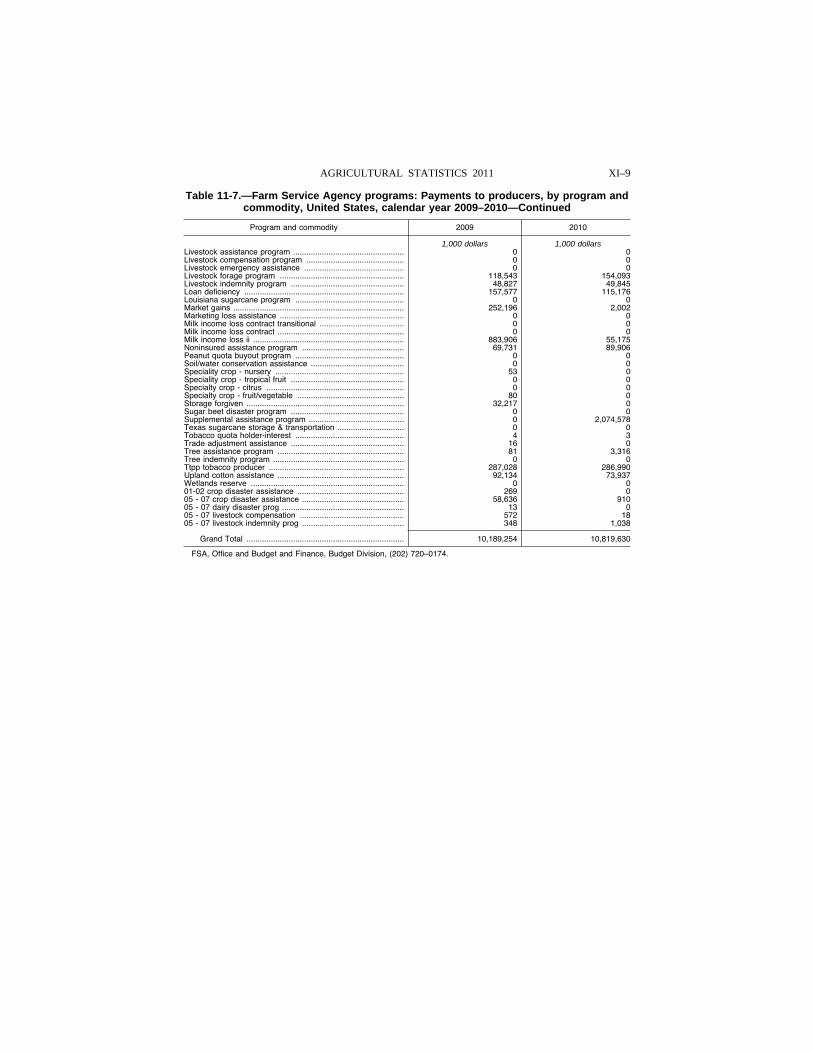
XI–9 AGRICULTURAL STATISTICS 2011
Table 11-7.—Farm Service Agency programs: Payments to producers, by program and commodity, United States, calendar year 2009–2010—Continued
Program and commodity 2009 2010
1,000 dollars 1,000 dollars Livestock assistance program .................................................. 0 0 Livestock compensation program ............................................ 0 0 Livestock emergency assistance ............................................. 0 0 Livestock forage program ........................................................ 118,543 154,093 Livestock indemnity program ................................................... 48,827 49,845 Loan deficiency ........................................................................ 157,577 115,176 Louisiana sugarcane program ................................................. 0 0 Market gains ............................................................................. 252,196 2,002 Marketing loss assistance ........................................................ 0 0 Milk income loss contract transitional ...................................... 0 0 Milk income loss contract ......................................................... 0 0 Milk income loss ii .................................................................... 883,906 55,175 Noninsured assistance program .............................................. 69,731 89,906 Peanut quota buyout program ................................................. 0 0 Soil/water conservation assistance .......................................... 0 0 Speciality crop - nursery .......................................................... 53 0 Speciality crop - tropical fruit ................................................... 0 0 Specialty crop - citrus .............................................................. 0 0 Specialty crop - fruit/vegetable ................................................ 80 0 Storage forgiven ....................................................................... 32,217 0 Sugar beet disaster program ................................................... 0 0 Supplemental assistance program ........................................... 0 2,074,578 Texas sugarcane storage & transportation .............................. 0 0 Tobacco quota holder-interest ................................................. 4 3 Trade adjustment assistance ................................................... 16 0 Tree assistance program ......................................................... 81 3,316 Tree indemnity program ........................................................... 0 0 Ttpp tobacco producer ............................................................. 287,028 286,990 Upland cotton assistance ......................................................... 92,134 73,937 Wetlands reserve ..................................................................... 0 0 01-02 crop disaster assistance ................................................ 269 0 05 - 07 crop disaster assistance .............................................. 58,636 910 05 - 07 dairy disaster prog ....................................................... 13 0 05 - 07 livestock compensation ............................................... 572 18 05 - 07 livestock indemnity prog .............................................. 348 1,038
Grand Total ....................................................................... 10,189,254 10,819,630
FSA, Office and Budget and Finance, Budget Division, (202) 720–0174.
VerDate Aug 31 2005 10:37 Feb 29, 2012 Jkt 000000 PO 00000 Frm 00009 Fmt 1000 Sfmt 1000 H:\SHARED\DAPP\FPU\AGSTAT\MASTER~2\CHAPTR11\XI-09.AG8 USDA
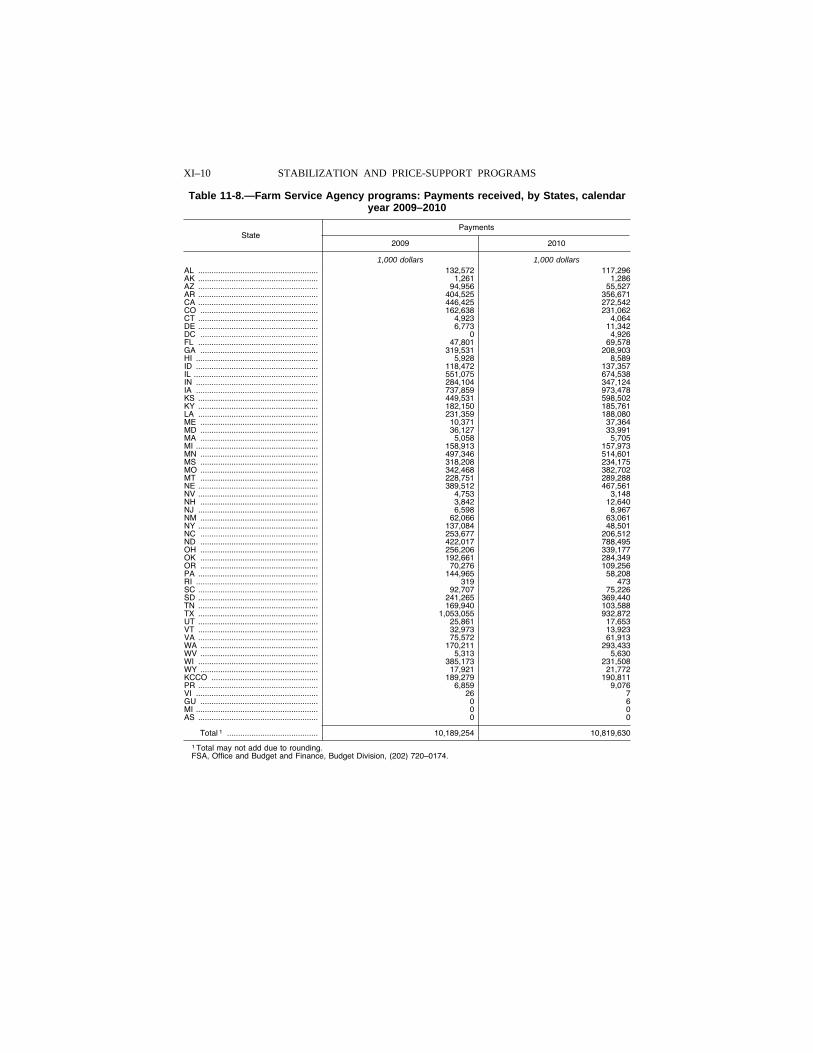
XI–10 STABILIZATION AND PRICE-SUPPORT PROGRAMS
Table 11-8.—Farm Service Agency programs: Payments received, by States, calendar year 2009–2010
State Payments
2009 2010
1,000 dollars 1,000 dollars AL ...................................................... 132,572 117,296 AK ...................................................... 1,261 1,286 AZ ...................................................... 94,956 55,527 AR ...................................................... 404,525 356,671 CA ...................................................... 446,425 272,542 CO ..................................................... 162,638 231,062 CT ...................................................... 4,923 4,064 DE ...................................................... 6,773 11,342 DC ..................................................... 0 4,926 FL ...................................................... 47,801 69,578 GA ..................................................... 319,531 208,903 HI ....................................................... 5,928 8,589 ID ....................................................... 118,472 137,357 IL ........................................................ 551,075 674,538 IN ....................................................... 284,104 347,124 IA ....................................................... 737,859 973,478 KS ...................................................... 449,531 598,502 KY ...................................................... 182,150 185,761 LA ...................................................... 231,359 188,080 ME ..................................................... 10,371 37,364 MD ..................................................... 36,127 33,991 MA ..................................................... 5,058 5,705 MI ....................................................... 158,913 157,973 MN ..................................................... 497,346 514,601 MS ..................................................... 318,208 234,175 MO ..................................................... 342,468 382,702 MT ..................................................... 228,751 289,288 NE ...................................................... 389,512 467,561 NV ...................................................... 4,753 3,148 NH ..................................................... 3,842 12,640 NJ ...................................................... 6,598 8,967 NM ..................................................... 62,066 63,061 NY ...................................................... 137,084 48,501 NC ..................................................... 253,677 206,512 ND ..................................................... 422,017 788,495 OH ..................................................... 256,206 339,177 OK ..................................................... 192,661 284,349 OR ..................................................... 70,276 109,256 PA ...................................................... 144,965 58,208 RI ....................................................... 319 473 SC ...................................................... 92,707 75,226 SD ...................................................... 241,265 369,440 TN ...................................................... 169,940 103,588 TX ...................................................... 1,053,055 932,872 UT ...................................................... 25,861 17,653 VT ...................................................... 32,973 13,923 VA ...................................................... 75,572 61,913 WA ..................................................... 170,211 293,433 WV ..................................................... 5,313 5,630 WI ...................................................... 385,173 231,508 WY ..................................................... 17,921 21,772 KCCO ................................................ 189,279 190,811 PR ...................................................... 6,859 9,076 VI ....................................................... 26 7 GU ..................................................... 0 6 MI ....................................................... 0 0 AS ...................................................... 0 0
Total 1 ......................................... 10,189,254 10,819,630
1 Total may not add due to rounding. FSA, Office and Budget and Finance, Budget Division, (202) 720–0174.
VerDate Aug 31 2005 10:37 Feb 29, 2012 Jkt 000000 PO 00000 Frm 00010 Fmt 1000 Sfmt 1000 H:\SHARED\DAPP\FPU\AGSTAT\MASTER~2\CHAPTR11\XI-10.AG8 USDA
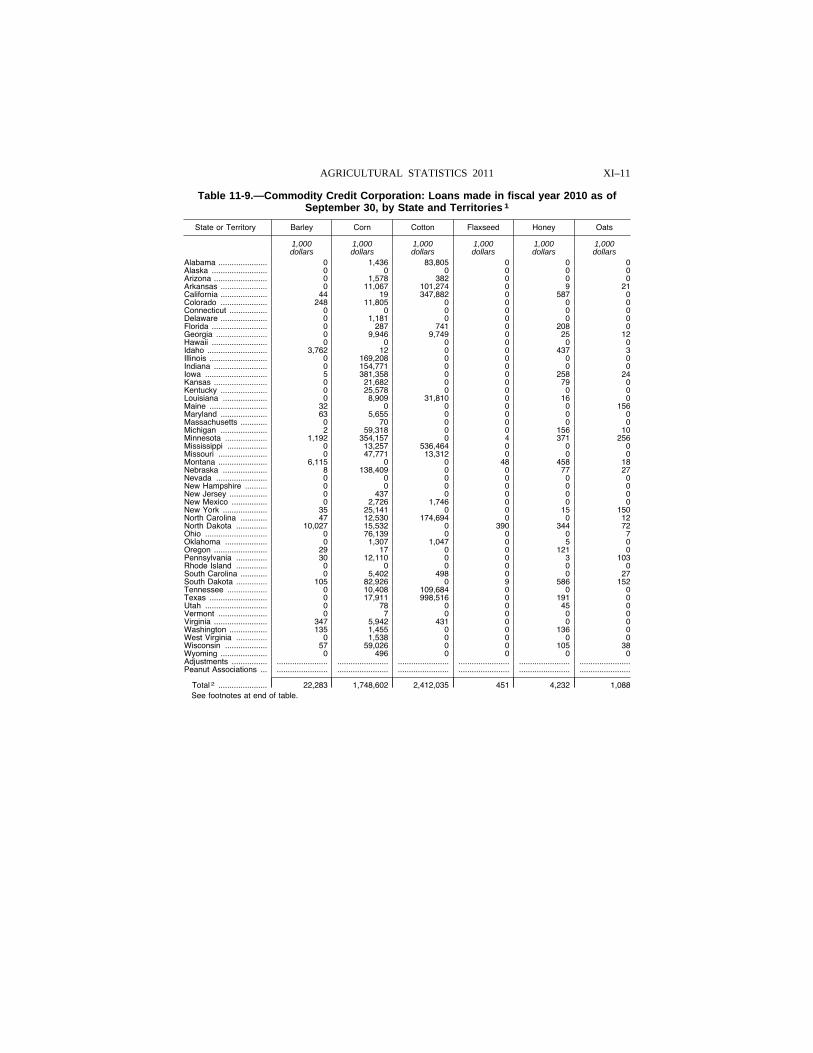
XI–11 AGRICULTURAL STATISTICS 2011
Table 11-9.—Commodity Credit Corporation: Loans made in fiscal year 2010 as of September 30, by State and Territories 1
State or Territory Barley Corn Cotton Flaxseed Honey Oats
1,000 1,000 1,000 1,000 1,000 1,000 dollars dollars dollars dollars dollars dollars
Alabama ...................... 0 1,436 83,805 0 0 0 Alaska ......................... 0 0 0 0 0 0 Arizona ........................ 0 1,578 382 0 0 0 Arkansas ..................... 0 11,067 101,274 0 9 21 California ..................... 44 19 347,882 0 587 0 Colorado ..................... 248 11,805 0 0 0 0 Connecticut ................. 0 0 0 0 0 0 Delaware ..................... 0 1,181 0 0 0 0 Florida ......................... 0 287 741 0 208 0 Georgia ....................... 0 9,946 9,749 0 25 12 Hawaii ......................... 0 0 0 0 0 0 Idaho ........................... 3,762 12 0 0 437 3 Illinois .......................... 0 169,208 0 0 0 0 Indiana ........................ 0 154,771 0 0 0 0 Iowa ............................ 5 381,358 0 0 258 24 Kansas ........................ 0 21,682 0 0 79 0 Kentucky ..................... 0 25,578 0 0 0 0 Louisiana .................... 0 8,909 31,810 0 16 0 Maine .......................... 32 0 0 0 0 156 Maryland ..................... 63 5,655 0 0 0 0 Massachusetts ............ 0 70 0 0 0 0 Michigan ..................... 2 59,318 0 0 156 10 Minnesota ................... 1,192 354,157 0 4 371 256 Mississippi .................. 0 13,257 536,464 0 0 0 Missouri ...................... 0 47,771 13,312 0 0 0 Montana ...................... 6,115 0 0 48 458 18 Nebraska .................... 8 138,409 0 0 77 27 Nevada ....................... 0 0 0 0 0 0 New Hampshire .......... 0 0 0 0 0 0 New Jersey ................. 0 437 0 0 0 0 New Mexico ................ 0 2,726 1,746 0 0 0 New York .................... 35 25,141 0 0 15 150 North Carolina ............ 47 12,530 174,694 0 0 12 North Dakota .............. 10,027 15,532 0 390 344 72 Ohio ............................ 0 76,139 0 0 0 7 Oklahoma ................... 0 1,307 1,047 0 5 0 Oregon ........................ 29 17 0 0 121 0 Pennsylvania .............. 30 12,110 0 0 3 103 Rhode Island .............. 0 0 0 0 0 0 South Carolina ............ 0 5,402 498 0 0 27 South Dakota .............. 105 82,926 0 9 586 152 Tennessee .................. 0 10,408 109,684 0 0 0 Texas .......................... 0 17,911 998,516 0 191 0 Utah ............................ 0 78 0 0 45 0 Vermont ...................... 0 7 0 0 0 0 Virginia ........................ 347 5,942 431 0 0 0 Washington ................. 135 1,455 0 0 136 0 West Virginia .............. 0 1,538 0 0 0 0 Wisconsin ................... 57 59,026 0 0 105 38 Wyoming ..................... 0 496 0 0 0 0 Adjustments ................ ....................... ....................... ....................... ....................... ....................... .......................Peanut Associations ... ....................... ....................... ....................... ....................... ....................... .......................
Total 2 ...................... 22,283 1,748,602 2,412,035 451 4,232 1,088 See footnotes at end of table.
VerDate Aug 31 2005 10:37 Feb 29, 2012 Jkt 000000 PO 00000 Frm 00011 Fmt 1000 Sfmt 1000 H:\SHARED\DAPP\FPU\AGSTAT\MASTER~2\CHAPTR11\XI-11.AG8 USDA
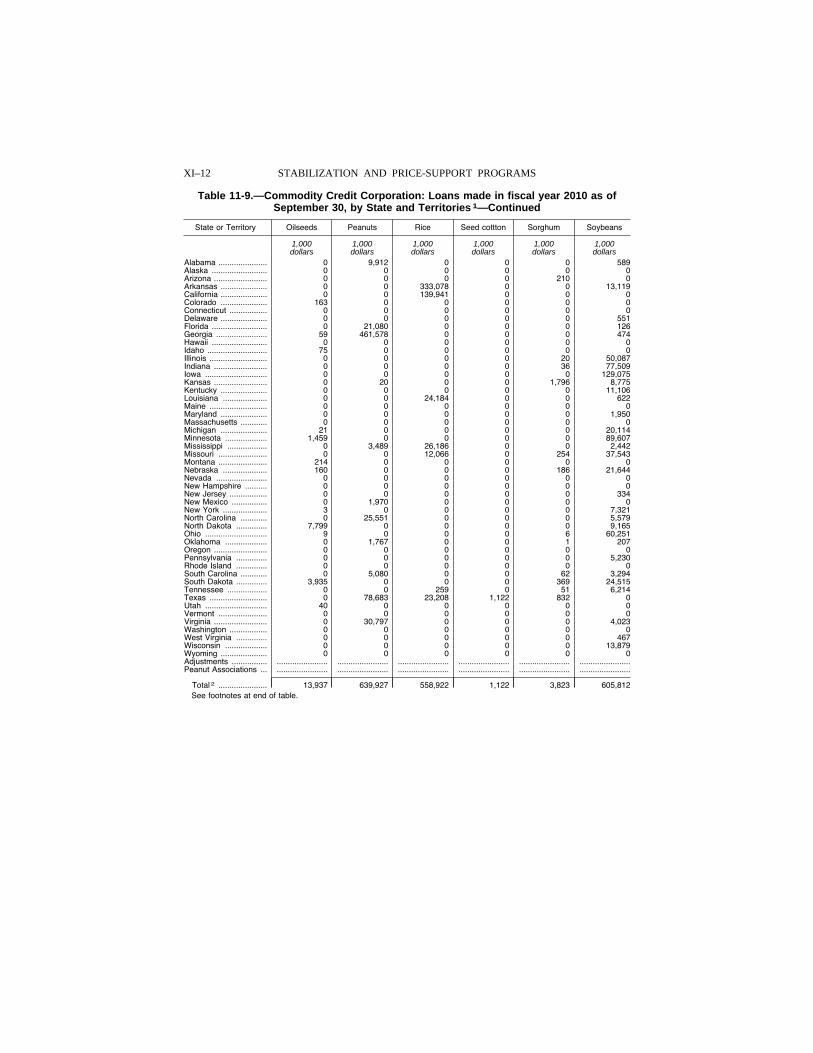
XI–12 STABILIZATION AND PRICE-SUPPORT PROGRAMS
Table 11-9.—Commodity Credit Corporation: Loans made in fiscal year 2010 as of September 30, by State and Territories 1—Continued
State or Territory Oilseeds Peanuts Rice Seed cottton Sorghum Soybeans
1,000 1,000 1,000 1,000 1,000 1,000 dollars dollars dollars dollars dollars dollars
Alabama ...................... 0 9,912 0 0 0 589 Alaska ......................... 0 0 0 0 0 0 Arizona ........................ 0 0 0 0 210 0 Arkansas ..................... 0 0 333,078 0 0 13,119 California ..................... 0 0 139,941 0 0 0 Colorado ..................... 163 0 0 0 0 0 Connecticut ................. 0 0 0 0 0 0 Delaware ..................... 0 0 0 0 0 551 Florida ......................... 0 21,080 0 0 0 126 Georgia ....................... 59 461,578 0 0 0 474 Hawaii ......................... 0 0 0 0 0 0 Idaho ........................... 75 0 0 0 0 0 Illinois .......................... 0 0 0 0 20 50,087 Indiana ........................ 0 0 0 0 36 77,509 Iowa ............................ 0 0 0 0 0 129,075 Kansas ........................ 0 20 0 0 1,796 8,775 Kentucky ..................... 0 0 0 0 0 11,106 Louisiana .................... 0 0 24,184 0 0 622 Maine .......................... 0 0 0 0 0 0 Maryland ..................... 0 0 0 0 0 1,950 Massachusetts ............ 0 0 0 0 0 0 Michigan ..................... 21 0 0 0 0 20,114 Minnesota ................... 1,459 0 0 0 0 89,607 Mississippi .................. 0 3,489 26,186 0 0 2,442 Missouri ...................... 0 0 12,066 0 254 37,543 Montana ...................... 214 0 0 0 0 0 Nebraska .................... 160 0 0 0 186 21,644 Nevada ....................... 0 0 0 0 0 0 New Hampshire .......... 0 0 0 0 0 0 New Jersey ................. 0 0 0 0 0 334 New Mexico ................ 0 1,970 0 0 0 0 New York .................... 3 0 0 0 0 7,321 North Carolina ............ 0 25,551 0 0 0 5,579 North Dakota .............. 7,799 0 0 0 0 9,165 Ohio ............................ 9 0 0 0 6 60,251 Oklahoma ................... 0 1,767 0 0 1 207 Oregon ........................ 0 0 0 0 0 0 Pennsylvania .............. 0 0 0 0 0 5,230 Rhode Island .............. 0 0 0 0 0 0 South Carolina ............ 0 5,080 0 0 62 3,294 South Dakota .............. 3,935 0 0 0 369 24,515 Tennessee .................. 0 0 259 0 51 6,214 Texas .......................... 0 78,683 23,208 1,122 832 0 Utah ............................ 40 0 0 0 0 0 Vermont ...................... 0 0 0 0 0 0 Virginia ........................ 0 30,797 0 0 0 4,023 Washington ................. 0 0 0 0 0 0 West Virginia .............. 0 0 0 0 0 467 Wisconsin ................... 0 0 0 0 0 13,879 Wyoming ..................... 0 0 0 0 0 0 Adjustments ................ ....................... ....................... ....................... ....................... ....................... .......................Peanut Associations ... ....................... ....................... ....................... ....................... ....................... .......................
Total 2 ...................... 13,937 639,927 558,922 1,122 3,823 605,812 See footnotes at end of table.
VerDate Aug 31 2005 10:37 Feb 29, 2012 Jkt 000000 PO 00000 Frm 00012 Fmt 1000 Sfmt 1000 H:\SHARED\DAPP\FPU\AGSTAT\MASTER~2\CHAPTR11\XI-12.AG8 USDA
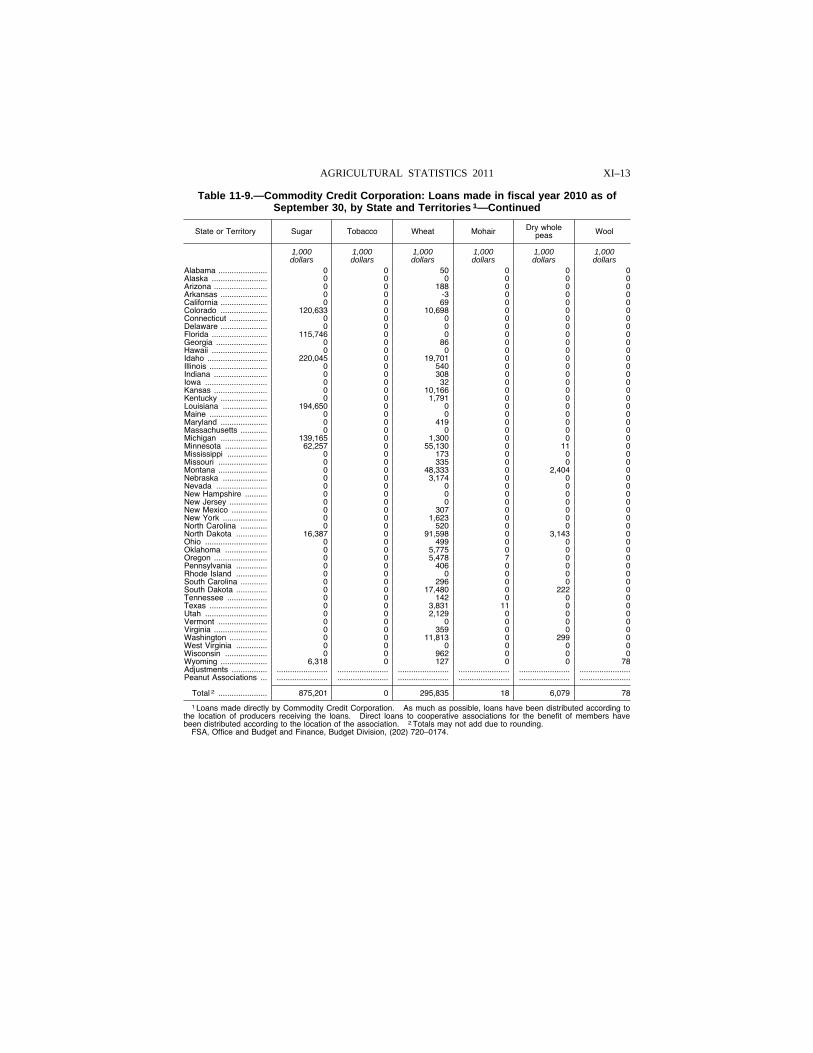
XI–13 AGRICULTURAL STATISTICS 2011
Table 11-9.—Commodity Credit Corporation: Loans made in fiscal year 2010 as of September 30, by State and Territories 1—Continued
State or Territory Sugar Tobacco Wheat Mohair Dry whole peas Wool
1,000 1,000 1,000 1,000 1,000 1,000 dollars dollars dollars dollars dollars dollars
Alabama ...................... 0 0 50 0 0 0 Alaska ......................... 0 0 0 0 0 0 Arizona ........................ 0 0 188 0 0 0 Arkansas ..................... 0 0 -3 0 0 0 California ..................... 0 0 69 0 0 0 Colorado ..................... 120,633 0 10,698 0 0 0 Connecticut ................. 0 0 0 0 0 0 Delaware ..................... 0 0 0 0 0 0 Florida ......................... 115,746 0 0 0 0 0 Georgia ....................... 0 0 86 0 0 0 Hawaii ......................... 0 0 0 0 0 0 Idaho ........................... 220,045 0 19,701 0 0 0 Illinois .......................... 0 0 540 0 0 0 Indiana ........................ 0 0 308 0 0 0 Iowa ............................ 0 0 32 0 0 0 Kansas ........................ 0 0 10,166 0 0 0 Kentucky ..................... 0 0 1,791 0 0 0 Louisiana .................... 194,650 0 0 0 0 0 Maine .......................... 0 0 0 0 0 0 Maryland ..................... 0 0 419 0 0 0 Massachusetts ............ 0 0 0 0 0 0 Michigan ..................... 139,165 0 1,300 0 0 0 Minnesota ................... 62,257 0 55,130 0 11 0 Mississippi .................. 0 0 173 0 0 0 Missouri ...................... 0 0 335 0 0 0 Montana ...................... 0 0 48,333 0 2,404 0 Nebraska .................... 0 0 3,174 0 0 0 Nevada ....................... 0 0 0 0 0 0 New Hampshire .......... 0 0 0 0 0 0 New Jersey ................. 0 0 0 0 0 0 New Mexico ................ 0 0 307 0 0 0 New York .................... 0 0 1,623 0 0 0 North Carolina ............ 0 0 520 0 0 0 North Dakota .............. 16,387 0 91,598 0 3,143 0 Ohio ............................ 0 0 499 0 0 0 Oklahoma ................... 0 0 5,775 0 0 0 Oregon ........................ 0 0 5,478 7 0 0 Pennsylvania .............. 0 0 406 0 0 0 Rhode Island .............. 0 0 0 0 0 0 South Carolina ............ 0 0 296 0 0 0 South Dakota .............. 0 0 17,480 0 222 0 Tennessee .................. 0 0 142 0 0 0 Texas .......................... 0 0 3,831 11 0 0 Utah ............................ 0 0 2,129 0 0 0 Vermont ...................... 0 0 0 0 0 0 Virginia ........................ 0 0 359 0 0 0 Washington ................. 0 0 11,813 0 299 0 West Virginia .............. 0 0 0 0 0 0 Wisconsin ................... 0 0 962 0 0 0 Wyoming ..................... 6,318 0 127 0 0 78 Adjustments ................ ....................... ....................... ....................... ....................... ....................... .......................Peanut Associations ... ....................... ....................... ....................... ....................... ....................... .......................
Total 2 ...................... 875,201 0 295,835 18 6,079 78
1 Loans made directly by Commodity Credit Corporation. As much as possible, loans have been distributed according to the location of producers receiving the loans. Direct loans to cooperative associations for the benefit of members have been distributed according to the location of the association. 2 Totals may not add due to rounding.
FSA, Office and Budget and Finance, Budget Division, (202) 720–0174.
VerDate Aug 31 2005 10:37 Feb 29, 2012 Jkt 000000 PO 00000 Frm 00013 Fmt 1000 Sfmt 1000 H:\SHARED\DAPP\FPU\AGSTAT\MASTER~2\CHAPTR11\XI-13.AG8 USDA
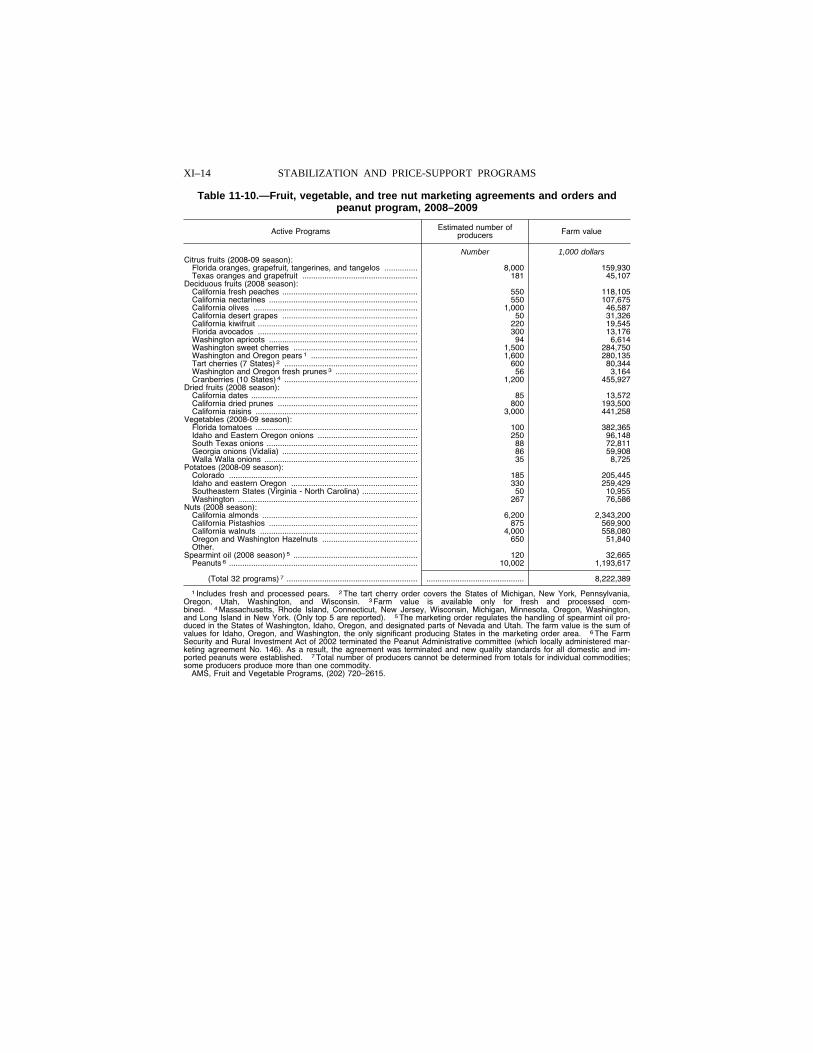
XI–14 STABILIZATION AND PRICE-SUPPORT PROGRAMS
Table 11-10.—Fruit, vegetable, and tree nut marketing agreements and orders and peanut program, 2008–2009
Active Programs Estimated number of producers Farm value
Number 1,000 dollars Citrus fruits (2008-09 season):
Florida oranges, grapefruit, tangerines, and tangelos ............... 8,000 159,930 Texas oranges and grapefruit .................................................... 181 45,107
Deciduous fruits (2008 season): California fresh peaches ............................................................. 550 118,105 California nectarines ................................................................... 550 107,675 California olives .......................................................................... 1,000 46,587 California desert grapes ............................................................. 50 31,326 California kiwifruit ........................................................................ 220 19,545 Florida avocados ........................................................................ 300 13,176 Washington apricots ................................................................... 94 6,614 Washington sweet cherries ........................................................ 1,500 284,750 Washington and Oregon pears 1 ................................................ 1,600 280,135 Tart cherries (7 States) 2 ............................................................ 600 80,344 Washington and Oregon fresh prunes 3 ..................................... 56 3,164 Cranberries (10 States) 4 ............................................................ 1,200 455,927
Dried fruits (2008 season): California dates ........................................................................... 85 13,572 California dried prunes ............................................................... 800 193,500 California raisins ......................................................................... 3,000 441,258
Vegetables (2008-09 season): Florida tomatoes ......................................................................... 100 382,365 Idaho and Eastern Oregon onions ............................................. 250 96,148 South Texas onions .................................................................... 88 72,811 Georgia onions (Vidalia) ............................................................. 86 59,908 Walla Walla onions ..................................................................... 35 8,725
Potatoes (2008-09 season): Colorado ..................................................................................... 185 205,445 Idaho and eastern Oregon ......................................................... 330 259,429 Southeastern States (Virginia - North Carolina) ......................... 50 10,955 Washington ................................................................................. 267 76,586
Nuts (2008 season): California almonds ...................................................................... 6,200 2,343,200 California Pistashios ................................................................... 875 569,900 California walnuts ....................................................................... 4,000 558,080 Oregon and Washington Hazelnuts ........................................... 650 51,840 Other.
Spearmint oil (2008 season) 5 ........................................................ 120 32,665 Peanuts 6 ..................................................................................... 10,002 1,193,617
(Total 32 programs) 7 ........................................................... ............................................ 8,222,389
1 Includes fresh and processed pears. 2 The tart cherry order covers the States of Michigan, New York, Pennsylvania, Oregon, Utah, Washington, and Wisconsin. 3 Farm value is available only for fresh and processed com-bined. 4 Massachusetts, Rhode Island, Connecticut, New Jersey, Wisconsin, Michigan, Minnesota, Oregon, Washington, and Long Island in New York. (Only top 5 are reported). 5 The marketing order regulates the handling of spearmint oil pro-duced in the States of Washington, Idaho, Oregon, and designated parts of Nevada and Utah. The farm value is the sum of values for Idaho, Oregon, and Washington, the only significant producing States in the marketing order area. 6 The Farm Security and Rural Investment Act of 2002 terminated the Peanut Administrative committee (which locally administered mar-keting agreement No. 146). As a result, the agreement was terminated and new quality standards for all domestic and im-ported peanuts were established. 7 Total number of producers cannot be determined from totals for individual commodities; some producers produce more than one commodity.
AMS, Fruit and Vegetable Programs, (202) 720–2615.
VerDate Aug 31 2005 10:37 Feb 29, 2012 Jkt 000000 PO 00000 Frm 00014 Fmt 1000 Sfmt 1000 H:\SHARED\DAPP\FPU\AGSTAT\MASTER~2\CHAPTR11\XI-14.AG8 USDA
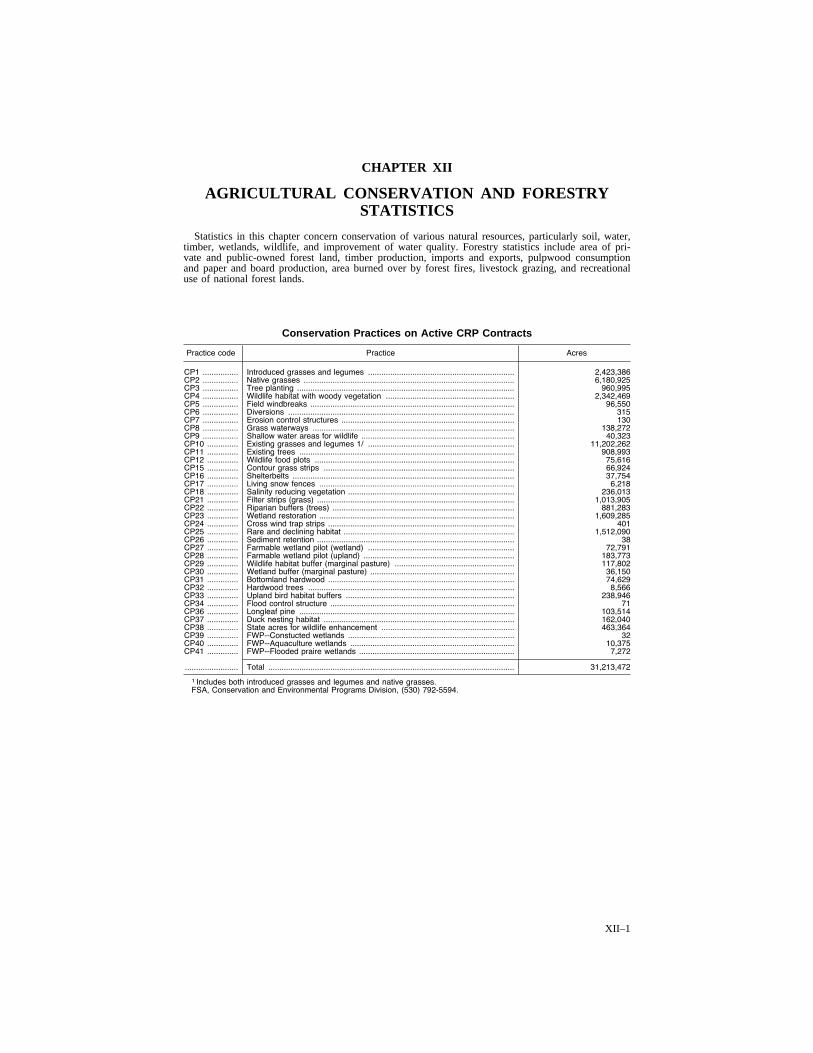
XII–1
CHAPTER XII
AGRICULTURAL CONSERVATION AND FORESTRY STATISTICS
Statistics in this chapter concern conservation of various natural resources, particularly soil, water, timber, wetlands, wildlife, and improvement of water quality. Forestry statistics include area of pri-vate and public-owned forest land, timber production, imports and exports, pulpwood consumption and paper and board production, area burned over by forest fires, livestock grazing, and recreational use of national forest lands.
Conservation Practices on Active CRP Contracts
Practice code Practice Acres
CP1 ................ Introduced grasses and legumes .................................................................. 2,423,386 CP2 ................ Native grasses ............................................................................................... 6,180,925 CP3 ................ Tree planting .................................................................................................. 960,995 CP4 ................ Wildlife habitat with woody vegetation .......................................................... 2,342,469 CP5 ................ Field windbreaks ............................................................................................ 96,550 CP6 ................ Diversions ...................................................................................................... 315 CP7 ................ Erosion control structures .............................................................................. 130 CP8 ................ Grass waterways ........................................................................................... 138,272 CP9 ................ Shallow water areas for wildlife ..................................................................... 40,323 CP10 .............. Existing grasses and legumes 1/ .................................................................. 11,202,262 CP11 .............. Existing trees ................................................................................................. 908,993 CP12 .............. Wildlife food plots .......................................................................................... 75,616 CP15 .............. Contour grass strips ...................................................................................... 66,924 CP16 .............. Shelterbelts .................................................................................................... 37,754 CP17 .............. Living snow fences ........................................................................................ 6,218 CP18 .............. Salinity reducing vegetation ........................................................................... 236,013 CP21 .............. Filter strips (grass) ......................................................................................... 1,013,905 CP22 .............. Riparian buffers (trees) .................................................................................. 881,283 CP23 .............. Wetland restoration ........................................................................................ 1,609,285 CP24 .............. Cross wind trap strips .................................................................................... 401 CP25 .............. Rare and declining habitat ............................................................................. 1,512,090 CP26 .............. Sediment retention ......................................................................................... 38 CP27 .............. Farmable wetland pilot (wetland) .................................................................. 72,791 CP28 .............. Farmable wetland pilot (upland) .................................................................... 183,773 CP29 .............. Wildlife habitat buffer (marginal pasture) ...................................................... 117,802 CP30 .............. Wetland buffer (marginal pasture) ................................................................. 36,150 CP31 .............. Bottomland hardwood .................................................................................... 74,629 CP32 .............. Hardwood trees ............................................................................................. 8,566 CP33 .............. Upland bird habitat buffers ............................................................................ 238,946 CP34 .............. Flood control structure ................................................................................... 71 CP36 .............. Longleaf pine ................................................................................................. 103,514 CP37 .............. Duck nesting habitat ...................................................................................... 162,040 CP38 .............. State acres for wildlife enhancement ............................................................ 463,364 CP39 .............. FWP--Constucted wetlands ........................................................................... 32 CP40 .............. FWP--Aquaculture wetlands .......................................................................... 10,375 CP41 .............. FWP--Flooded praire wetlands ...................................................................... 7,272
........................ Total ............................................................................................................... 31,213,472
1 Includes both introduced grasses and legumes and native grasses. FSA, Conservation and Environmental Programs Division, (530) 792-5594.
VerDate Aug 31 2005 13:44 Mar 01, 2012 Jkt 000000 PO 00000 Frm 00001 Fmt 1001 Sfmt 1001 H:\SHARED\DAPP\FPU\AGSTAT\MASTER~2\CHAPTR12\PAGE1.AG8 USDA
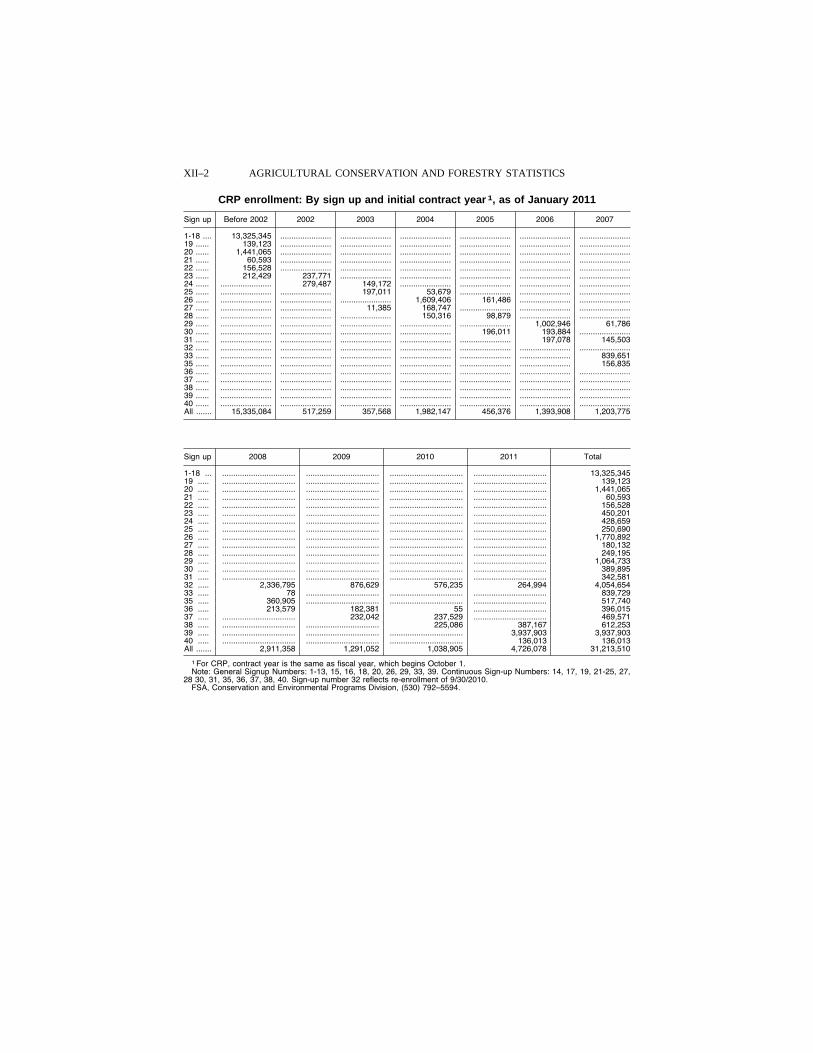
XII–2 AGRICULTURAL CONSERVATION AND FORESTRY STATISTICS
CRP enrollment: By sign up and initial contract year 1, as of January 2011
Sign up Before 2002 2002 2003 2004 2005 2006 2007
1-18 .... 13,325,345 ....................... ....................... ....................... ....................... ....................... .......................19 ...... 139,123 ....................... ....................... ....................... ....................... ....................... .......................20 ...... 1,441,065 ....................... ....................... ....................... ....................... ....................... .......................21 ...... 60,593 ....................... ....................... ....................... ....................... ....................... .......................22 ...... 156,528 ....................... ....................... ....................... ....................... ....................... .......................23 ...... 212,429 237,771 ....................... ....................... ....................... ....................... .......................24 ...... ....................... 279,487 149,172 ....................... ....................... ....................... .......................25 ...... ....................... ....................... 197,011 53,679 ....................... ....................... .......................26 ...... ....................... ....................... ....................... 1,609,406 161,486 ....................... .......................27 ...... ....................... ....................... 11,385 168,747 ....................... ....................... .......................28 ...... ....................... ....................... ....................... 150,316 98,879 ....................... .......................29 ...... ....................... ....................... ....................... ....................... ....................... 1,002,946 61,786 30 ...... ....................... ....................... ....................... ....................... 196,011 193,884 .......................31 ...... ....................... ....................... ....................... ....................... ....................... 197,078 145,503 32 ...... ....................... ....................... ....................... ....................... ....................... ....................... .......................33 ...... ....................... ....................... ....................... ....................... ....................... ....................... 839,651 35 ...... ....................... ....................... ....................... ....................... ....................... ....................... 156,835 36 ...... ....................... ....................... ....................... ....................... ....................... ....................... .......................37 ...... ....................... ....................... ....................... ....................... ....................... ....................... .......................38 ...... ....................... ....................... ....................... ....................... ....................... ....................... .......................39 ...... ....................... ....................... ....................... ....................... ....................... ....................... .......................40 ...... ....................... ....................... ....................... ....................... ....................... ....................... .......................All ....... 15,335,084 517,259 357,568 1,982,147 456,376 1,393,908 1,203,775
Sign up 2008 2009 2010 2011 Total
1-18 ... ................................. ................................. ................................. ................................. 13,325,345 19 ..... ................................. ................................. ................................. ................................. 139,123 20 ..... ................................. ................................. ................................. ................................. 1,441,065 21 ..... ................................. ................................. ................................. ................................. 60,593 22 ..... ................................. ................................. ................................. ................................. 156,528 23 ..... ................................. ................................. ................................. ................................. 450,201 24 ..... ................................. ................................. ................................. ................................. 428,659 25 ..... ................................. ................................. ................................. ................................. 250,690 26 ..... ................................. ................................. ................................. ................................. 1,770,892 27 ..... ................................. ................................. ................................. ................................. 180,132 28 ..... ................................. ................................. ................................. ................................. 249,195 29 ..... ................................. ................................. ................................. ................................. 1,064,733 30 ..... ................................. ................................. ................................. ................................. 389,895 31 ..... ................................. ................................. ................................. ................................. 342,581 32 ..... 2,336,795 876,629 576,235 264,994 4,054,654 33 ..... 78 ................................. ................................. ................................. 839,729 35 ..... 360,905 ................................. ................................. ................................. 517,740 36 ..... 213,579 182,381 55 ................................. 396,015 37 ..... ................................. 232,042 237,529 ................................. 469,571 38 ..... ................................. ................................. 225,086 387,167 612,253 39 ..... ................................. ................................. ................................. 3,937,903 3,937,903 40 ..... ................................. ................................. ................................. 136,013 136,013 All ....... 2,911,358 1,291,052 1,038,905 4,726,078 31,213,510
1 For CRP, contract year is the same as fiscal year, which begins October 1. Note: General Signup Numbers: 1-13, 15, 16, 18, 20, 26, 29, 33, 39. Continuous Sign-up Numbers: 14, 17, 19, 21-25, 27,
28 30, 31, 35, 36, 37, 38, 40. Sign-up number 32 reflects re-enrollment of 9/30/2010. FSA, Conservation and Environmental Programs Division, (530) 792–5594.
VerDate Aug 31 2005 13:44 Mar 01, 2012 Jkt 000000 PO 00000 Frm 00002 Fmt 1000 Sfmt 1000 H:\SHARED\DAPP\FPU\AGSTAT\MASTER~2\CHAPTR12\PAGE2.AG8 USDA
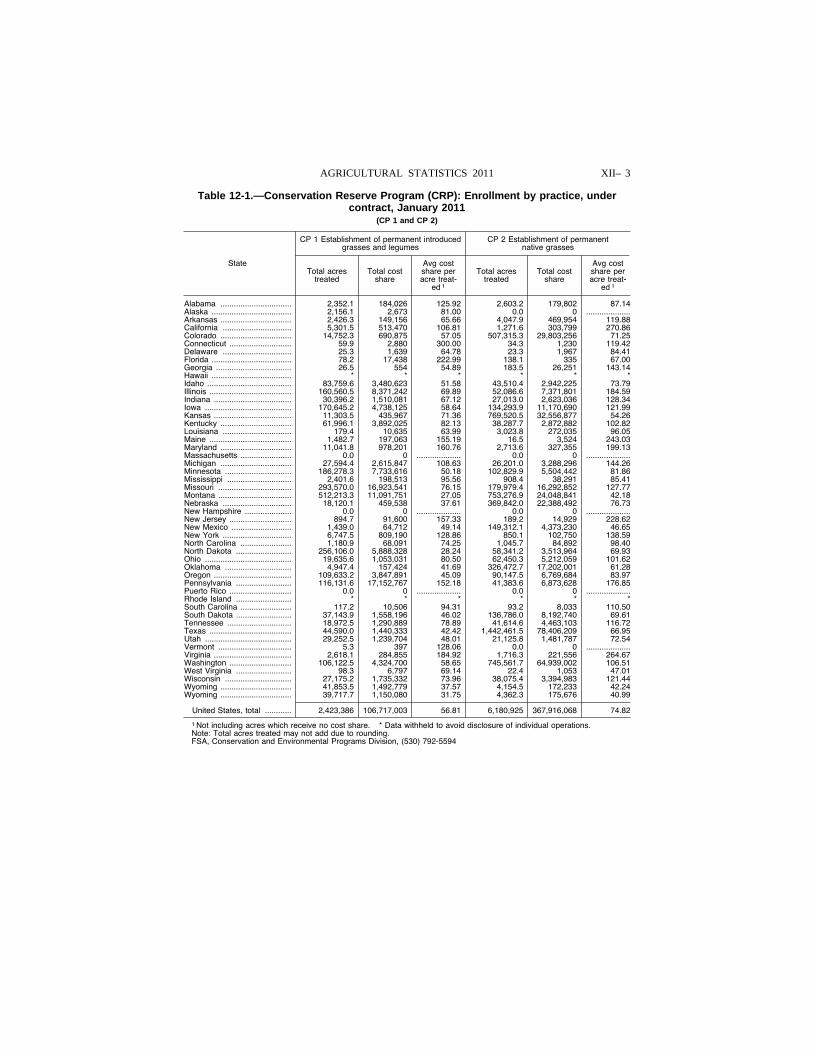
XII– 3 AGRICULTURAL STATISTICS 2011
Table 12-1.—Conservation Reserve Program (CRP): Enrollment by practice, under contract, January 2011
(CP 1 and CP 2)
State
CP 1 Establishment of permanent introduced grasses and legumes
CP 2 Establishment of permanent native grasses
Total acres treated
Total cost share
Avg cost share per acre treat-
ed 1
Total acres treated
Total cost share
Avg cost share per acre treat-
ed 1
Alabama ................................ 2,352.1 184,026 125.92 2,603.2 179,802 87.14 Alaska .................................... 2,156.1 2,673 81.00 0.0 0 ....................Arkansas ................................ 2,426.3 149,156 65.66 4,047.9 469,954 119.88 California ............................... 5,301.5 513,470 106.81 1,271.6 303,799 270.86 Colorado ................................ 14,752.3 690,875 57.05 507,315.3 29,803,256 71.25 Connecticut ............................ 59.9 2,880 300.00 34.3 1,230 119.42 Delaware ............................... 25.3 1,639 64.78 23.3 1,967 84.41 Florida .................................... 78.2 17,438 222.99 138.1 335 67.00 Georgia .................................. 26.5 554 54.89 183.5 26,251 143.14 Hawaii .................................... * * * * * * Idaho ...................................... 83,759.6 3,480,623 51.58 43,510.4 2,942,225 73.79 Illinois ..................................... 160,560.5 8,371,242 69.89 52,086.6 7,371,801 184.59 Indiana ................................... 30,396.2 1,510,081 67.12 27,013.0 2,623,036 128.34 Iowa ....................................... 170,645.2 4,738,125 58.64 134,293.9 11,170,690 121.99 Kansas ................................... 11,303.5 435,967 71.36 769,520.5 32,556,877 54.26 Kentucky ................................ 61,996.1 3,892,025 82.13 38,287.7 2,872,882 102.82 Louisiana ............................... 179.4 10,635 63.99 3,023.8 272,035 96.05 Maine ..................................... 1,482.7 197,063 155.19 16.5 3,524 243.03 Maryland ................................ 11,041.8 978,201 160.76 2,713.6 327,355 199.13 Massachusetts ....................... 0.0 0 .................... 0.0 0 ....................Michigan ................................ 27,594.4 2,615,847 108.63 26,201.0 3,288,296 144.26 Minnesota .............................. 186,278.3 7,733,616 50.18 102,829.9 5,504,442 81.86 Mississippi ............................. 2,401.6 198,513 95.56 908.4 38,291 85.41 Missouri ................................. 293,570.0 16,923,541 76.15 179,979.4 16,292,852 127.77 Montana ................................. 512,213.3 11,091,751 27.05 753,276.9 24,048,841 42.18 Nebraska ............................... 18,120.1 459,538 37.61 369,842.0 22,388,492 76.73 New Hampshire ..................... 0.0 0 .................... 0.0 0 ....................New Jersey ............................ 894.7 91,600 157.33 189.2 14,929 228.62 New Mexico ........................... 1,439.0 64,712 49.14 149,312.1 4,373,230 46.65 New York ............................... 6,747.5 809,190 128.86 850.1 102,750 138.59 North Carolina ....................... 1,180.9 68,091 74.25 1,045.7 84,892 98.40 North Dakota ......................... 256,106.0 5,888,328 28.24 58,341.2 3,513,964 69.93 Ohio ....................................... 19,635.6 1,053,031 80.50 62,450.3 5,212,059 101.62 Oklahoma .............................. 4,947.4 157,424 41.69 326,472.7 17,202,001 61.28 Oregon ................................... 109,633.2 3,847,891 45.09 90,147.5 6,769,684 83.97 Pennsylvania ......................... 116,131.6 17,152,767 152.18 41,383.6 6,873,628 176.85 Puerto Rico ............................ 0.0 0 .................... 0.0 0 ....................Rhode Island ......................... * * * * * * South Carolina ....................... 117.2 10,506 94.31 93.2 8,033 110.50 South Dakota ......................... 37,143.9 1,558,196 46.02 136,786.0 8,192,740 69.61 Tennessee ............................. 18,972.5 1,290,889 78.89 41,614.6 4,463,103 116.72 Texas ..................................... 44,590.0 1,440,333 42.42 1,442,461.5 78,406,209 66.95 Utah ....................................... 29,252.5 1,239,704 48.01 21,125.8 1,481,787 72.54 Vermont ................................. 5.3 397 128.06 0.0 0 ....................Virginia ................................... 2,618.1 284,855 184.92 1,716.3 221,556 264.67 Washington ............................ 106,122.5 4,324,700 58.65 745,561.7 64,939,002 106.51 West Virginia ......................... 98.3 6,797 69.14 22.4 1,053 47.01 Wisconsin .............................. 27,175.2 1,735,332 73.96 38,075.4 3,394,983 121.44 Wyoming ................................ 41,853.5 1,492,779 37.57 4,154.5 172,233 42.24 Wyoming ................................ 39,717.7 1,150,080 31.75 4,362.3 175,676 40.99
United States, total ............ 2,423,386 106,717,003 56.81 6,180,925 367,916,068 74.82
1 Not including acres which receive no cost share. * Data withheld to avoid disclosure of individual operations. Note: Total acres treated may not add due to rounding. FSA, Conservation and Environmental Programs Division, (530) 792-5594
VerDate Aug 31 2005 13:44 Mar 01, 2012 Jkt 000000 PO 00000 Frm 00003 Fmt 1000 Sfmt 1000 H:\SHARED\DAPP\FPU\AGSTAT\MASTER~2\CHAPTR12\TABLE1.AG8 USDA
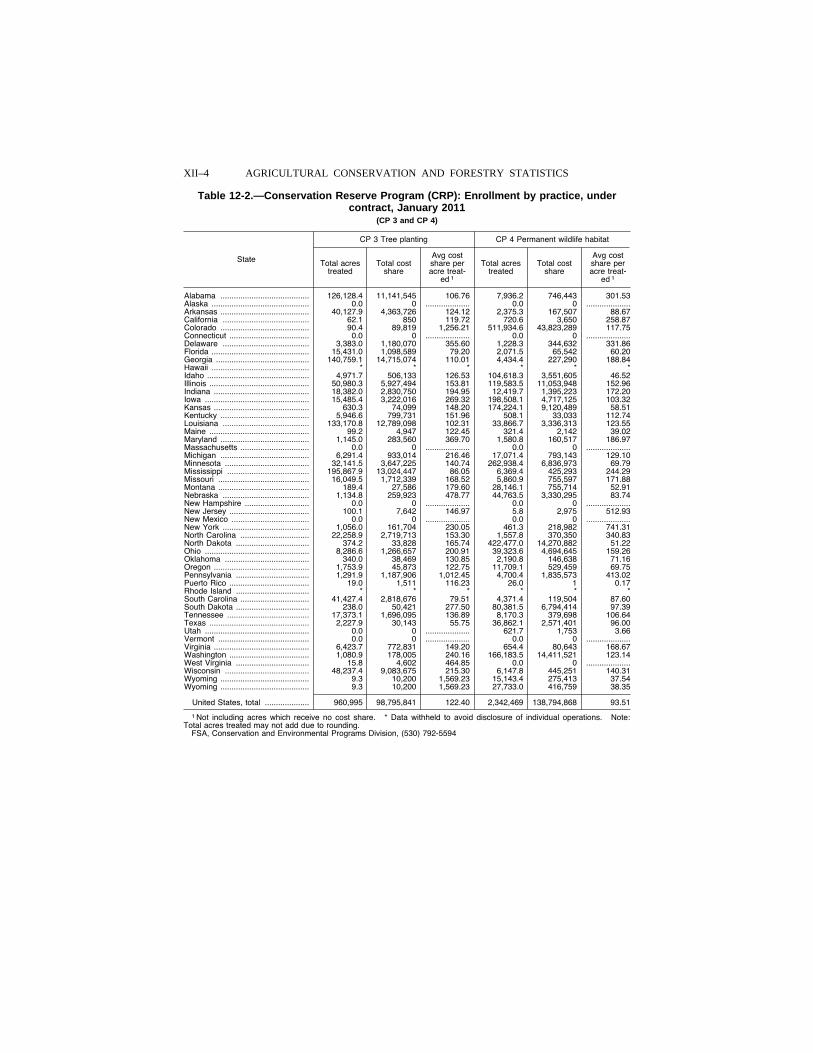
XII–4 AGRICULTURAL CONSERVATION AND FORESTRY STATISTICS
Table 12-2.—Conservation Reserve Program (CRP): Enrollment by practice, under contract, January 2011
(CP 3 and CP 4)
State
CP 3 Tree planting CP 4 Permanent wildlife habitat
Total acres treated
Total cost share
Avg cost share per acre treat-
ed 1
Total acres treated
Total cost share
Avg cost share per acre treat-
ed 1
Alabama ........................................ 126,128.4 11,141,545 106.76 7,936.2 746,443 301.53 Alaska ............................................ 0.0 0 .................... 0.0 0 ....................Arkansas ........................................ 40,127.9 4,363,726 124.12 2,375.3 167,507 88.67 California ....................................... 62.1 850 119.72 720.6 3,650 258.87 Colorado ........................................ 90.4 89,819 1,256.21 511,934.6 43,823,289 117.75 Connecticut .................................... 0.0 0 .................... 0.0 0 ....................Delaware ....................................... 3,383.0 1,180,070 355.60 1,228.3 344,632 331.86 Florida ............................................ 15,431.0 1,098,589 79.20 2,071.5 65,542 60.20 Georgia .......................................... 140,759.1 14,715,074 110.01 4,434.4 227,290 188.84 Hawaii ............................................ * * * * * * Idaho .............................................. 4,971.7 506,133 126.53 104,618.3 3,551,605 46.52 Illinois ............................................. 50,980.3 5,927,494 153.81 119,583.5 11,053,948 152.96 Indiana ........................................... 18,382.0 2,830,750 194.95 12,419.7 1,395,223 172.20 Iowa ............................................... 15,485.4 3,222,016 269.32 198,508.1 4,717,125 103.32 Kansas ........................................... 630.3 74,099 148.20 174,224.1 9,120,489 58.51 Kentucky ........................................ 5,946.6 799,731 151.96 508.1 33,033 112.74 Louisiana ....................................... 133,170.8 12,789,098 102.31 33,866.7 3,336,313 123.55 Maine ............................................. 99.2 4,947 122.45 321.4 2,142 39.02 Maryland ........................................ 1,145.0 283,560 369.70 1,580.8 160,517 186.97 Massachusetts ............................... 0.0 0 .................... 0.0 0 ....................Michigan ........................................ 6,291.4 933,014 216.46 17,071.4 793,143 129.10 Minnesota ...................................... 32,141.5 3,647,225 140.74 262,938.4 6,836,973 69.79 Mississippi ..................................... 195,867.9 13,024,447 86.05 6,369.4 425,293 244.29 Missouri ......................................... 16,049.5 1,712,339 168.52 5,860.9 755,597 171.88 Montana ......................................... 189.4 27,586 179.60 28,146.1 755,714 52.91 Nebraska ....................................... 1,134.8 259,923 478.77 44,763.5 3,330,295 83.74 New Hampshire ............................. 0.0 0 .................... 0.0 0 ....................New Jersey .................................... 100.1 7,642 146.97 5.8 2,975 512.93 New Mexico ................................... 0.0 0 .................... 0.0 0 ....................New York ....................................... 1,056.0 161,704 230.05 461.3 218,982 741.31 North Carolina ............................... 22,258.9 2,719,713 153.30 1,557.8 370,350 340.83 North Dakota ................................. 374.2 33,828 165.74 422,477.0 14,270,882 51.22 Ohio ............................................... 8,286.6 1,266,657 200.91 39,323.6 4,694,645 159.26 Oklahoma ...................................... 340.0 38,469 130.85 2,190.8 146,638 71.16 Oregon ........................................... 1,753.9 45,873 122.75 11,709.1 529,459 69.75 Pennsylvania ................................. 1,291.9 1,187,906 1,012.45 4,700.4 1,835,573 413.02 Puerto Rico .................................... 19.0 1,511 116.23 26.0 1 0.17 Rhode Island ................................. * * * * * * South Carolina ............................... 41,427.4 2,818,676 79.51 4,371.4 119,504 87.60 South Dakota ................................. 238.0 50,421 277.50 80,381.5 6,794,414 97.39 Tennessee ..................................... 17,373.1 1,696,095 136.89 8,170.3 379,698 106.64 Texas ............................................. 2,227.9 30,143 55.75 36,862.1 2,571,401 96.00 Utah ............................................... 0.0 0 .................... 621.7 1,753 3.66 Vermont ......................................... 0.0 0 .................... 0.0 0 ....................Virginia ........................................... 6,423.7 772,831 149.20 654.4 80,643 168.67 Washington .................................... 1,080.9 178,005 240.16 166,183.5 14,411,521 123.14 West Virginia ................................. 15.8 4,602 464.85 0.0 0 ....................Wisconsin ...................................... 48,237.4 9,083,675 215.30 6,147.8 445,251 140.31 Wyoming ........................................ 9.3 10,200 1,569.23 15,143.4 275,413 37.54 Wyoming ........................................ 9.3 10,200 1,569.23 27,733.0 416,759 38.35
United States, total .................... 960,995 98,795,841 122.40 2,342,469 138,794,868 93.51
1 Not including acres which receive no cost share. * Data withheld to avoid disclosure of individual operations. Note: Total acres treated may not add due to rounding.
FSA, Conservation and Environmental Programs Division, (530) 792-5594
VerDate Aug 31 2005 13:44 Mar 01, 2012 Jkt 000000 PO 00000 Frm 00004 Fmt 1000 Sfmt 1000 H:\SHARED\DAPP\FPU\AGSTAT\MASTER~2\CHAPTR12\TABLE2.AG8 USDA
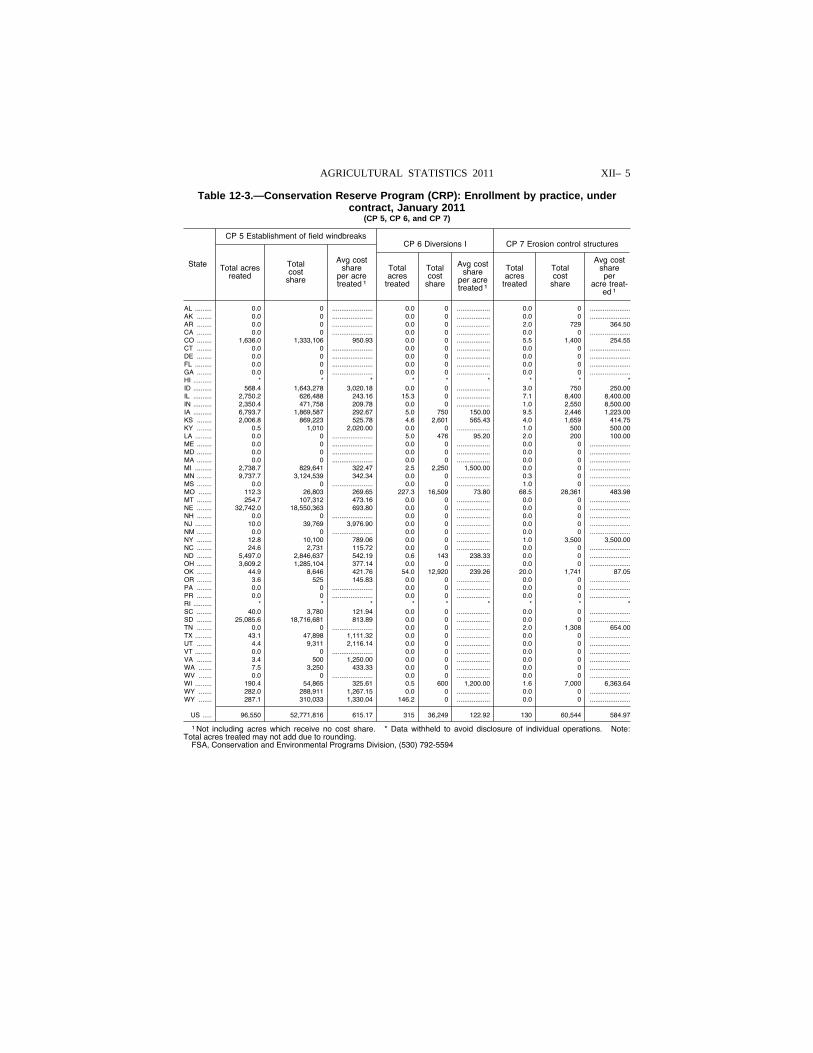
XII– 5 AGRICULTURAL STATISTICS 2011
Table 12-3.—Conservation Reserve Program (CRP): Enrollment by practice, under contract, January 2011
(CP 5, CP 6, and CP 7)
State
CP 5 Establishment of field windbreaks CP 6 Diversions I CP 7 Erosion control structures
Total acres reated
Total cost
share
Avg cost share
per acre treated 1
Total acres
treated
Total cost
share
Avg cost share
per acre treated 1
Total acres
treated
Total cost
share
Avg cost share per
acre treat-ed 1
AL ......... 0.0 0 ...................... 0.0 0 .................. 0.0 0 ......................AK ........ 0.0 0 ...................... 0.0 0 .................. 0.0 0 ......................AR ........ 0.0 0 ...................... 0.0 0 .................. 2.0 729 364.50 CA ........ 0.0 0 ...................... 0.0 0 .................. 0.0 0 ......................CO ........ 1,636.0 1,333,106 950.93 0.0 0 .................. 5.5 1,400 254.55 CT ........ 0.0 0 ...................... 0.0 0 .................. 0.0 0 ......................DE ........ 0.0 0 ...................... 0.0 0 .................. 0.0 0 ......................FL ......... 0.0 0 ...................... 0.0 0 .................. 0.0 0 ......................GA ........ 0.0 0 ...................... 0.0 0 .................. 0.0 0 ......................HI .......... * * * * * * * * * ID .......... 568.4 1,643,278 3,020.18 0.0 0 .................. 3.0 750 250.00 IL .......... 2,750.2 626,488 243.16 15.3 0 .................. 7.1 8,400 8,400.00 IN .......... 2,350.4 471,758 209.78 0.0 0 .................. 1.0 2,550 8,500.00 IA .......... 6,793.7 1,869,587 292.67 5.0 750 150.00 9.5 2,446 1,223.00 KS ........ 2,006.8 869,223 525.78 4.6 2,601 565.43 4.0 1,659 414.75 KY ........ 0.5 1,010 2,020.00 0.0 0 .................. 1.0 500 500.00 LA ......... 0.0 0 ...................... 5.0 476 95.20 2.0 200 100.00 ME ........ 0.0 0 ...................... 0.0 0 .................. 0.0 0 ......................MD ........ 0.0 0 ...................... 0.0 0 .................. 0.0 0 ......................MA ........ 0.0 0 ...................... 0.0 0 .................. 0.0 0 ......................MI ......... 2,738.7 829,641 322.47 2.5 2,250 1,500.00 0.0 0 ......................MN ........ 9,737.7 3,124,539 342.34 0.0 0 .................. 0.3 0 ......................MS ........ 0.0 0 ...................... 0.0 0 .................. 1.0 0 ......................MO ....... 112.3 26,803 269.65 227.3 16,509 73.80 68.5 28,361 483.98 MT ........ 254.7 107,312 473.16 0.0 0 .................. 0.0 0 ......................NE ........ 32,742.0 18,550,363 693.80 0.0 0 .................. 0.0 0 ......................NH ........ 0.0 0 ...................... 0.0 0 .................. 0.0 0 ......................NJ ......... 10.0 39,769 3,976.90 0.0 0 .................. 0.0 0 ......................NM ........ 0.0 0 ...................... 0.0 0 .................. 0.0 0 ......................NY ........ 12.8 10,100 789.06 0.0 0 .................. 1.0 3,500 3,500.00 NC ........ 24.6 2,731 115.72 0.0 0 .................. 0.0 0 ......................ND ........ 5,497.0 2,846,637 542.19 0.6 143 238.33 0.0 0 ......................OH ........ 3,609.2 1,285,104 377.14 0.0 0 .................. 0.0 0 ......................OK ........ 44.9 8,646 421.76 54.0 12,920 239.26 20.0 1,741 87.05 OR ........ 3.6 525 145.83 0.0 0 .................. 0.0 0 ......................PA ........ 0.0 0 ...................... 0.0 0 .................. 0.0 0 ......................PR ........ 0.0 0 ...................... 0.0 0 .................. 0.0 0 ......................RI .......... * * * * * * * * * SC ........ 40.0 3,780 121.94 0.0 0 .................. 0.0 0 ......................SD ........ 25,085.6 18,716,681 813.89 0.0 0 .................. 0.0 0 ......................TN ........ 0.0 0 ...................... 0.0 0 .................. 2.0 1,308 654.00 TX ......... 43.1 47,898 1,111.32 0.0 0 .................. 0.0 0 ......................UT ........ 4.4 9,311 2,116.14 0.0 0 .................. 0.0 0 ......................VT ......... 0.0 0 ...................... 0.0 0 .................. 0.0 0 ......................VA ........ 3.4 500 1,250.00 0.0 0 .................. 0.0 0 ......................WA ....... 7.5 3,250 433.33 0.0 0 .................. 0.0 0 ......................WV ....... 0.0 0 ...................... 0.0 0 .................. 0.0 0 ......................WI ......... 190.4 54,865 325.61 0.5 600 1,200.00 1.6 7,000 6,363.64 WY ....... 282.0 288,911 1,267.15 0.0 0 .................. 0.0 0 ......................WY ....... 287.1 310,033 1,330.04 146.2 0 .................. 0.0 0 ......................
US ..... 96,550 52,771,816 615.17 315 36,249 122.92 130 60,544 584.97
1 Not including acres which receive no cost share. * Data withheld to avoid disclosure of individual operations. Note: Total acres treated may not add due to rounding.
FSA, Conservation and Environmental Programs Division, (530) 792-5594
VerDate Aug 31 2005 13:44 Mar 01, 2012 Jkt 000000 PO 00000 Frm 00005 Fmt 1000 Sfmt 1000 H:\SHARED\DAPP\FPU\AGSTAT\MASTER~2\CHAPTR12\TABLE3.AG8 USDA
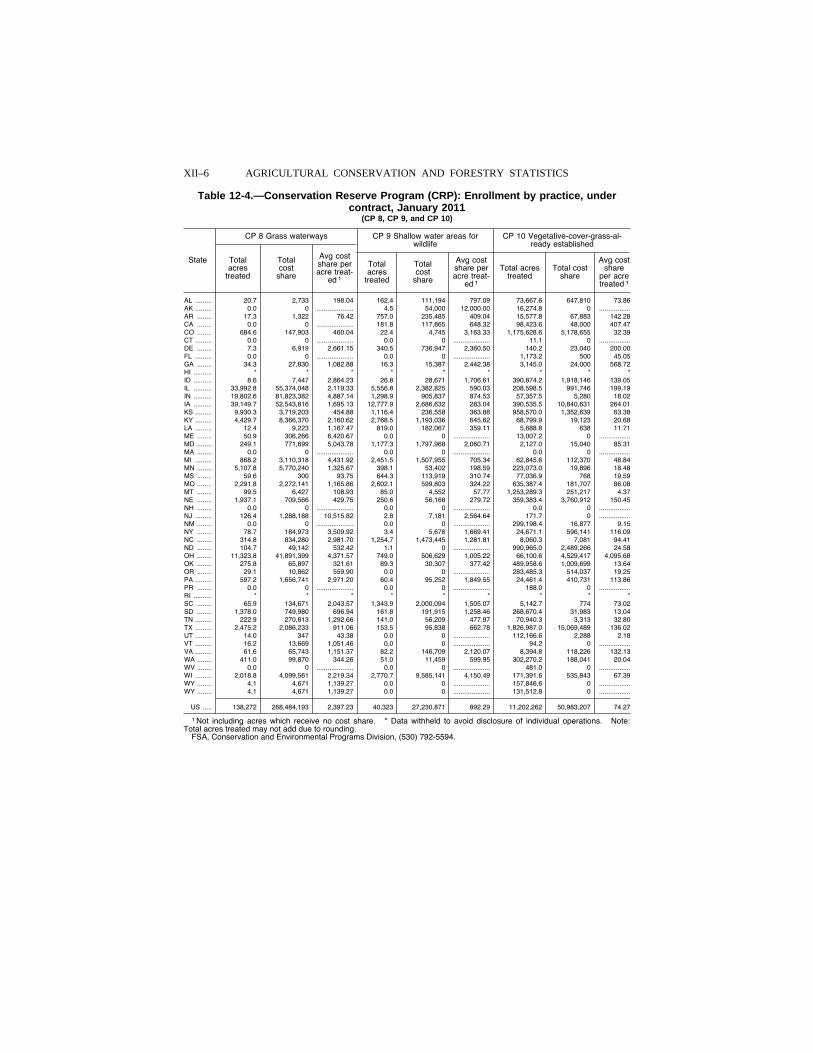
XII–6 AGRICULTURAL CONSERVATION AND FORESTRY STATISTICS
Table 12-4.—Conservation Reserve Program (CRP): Enrollment by practice, under contract, January 2011
(CP 8, CP 9, and CP 10)
State
CP 8 Grass waterways CP 9 Shallow water areas for wildlife
CP 10 Vegetative-cover-grass-al-ready established
Total acres
treated
Total cost
share
Avg cost share per acre treat-
ed 1
Total acres
treated
Total cost
share
Avg cost share per acre treat-
ed 1
Total acres treated
Total cost share
Avg cost share
per acre treated 1
AL ......... 20.7 2,733 198.04 162.4 111,194 797.09 73,667.6 647,810 73.86 AK ......... 0.0 0 .................... 4.5 54,000 12,000.00 16,274.8 0 .................AR ........ 17.3 1,322 76.42 757.0 235,485 409.04 15,577.8 67,883 142.28 CA ........ 0.0 0 .................... 181.8 117,865 648.32 98,423.6 48,000 407.47 CO ........ 684.6 147,903 460.04 22.4 4,745 3,163.33 1,175,628.6 5,178,655 32.39 CT ......... 0.0 0 .................... 0.0 0 .................... 11.1 0 .................DE ........ 7.3 6,919 2,661.15 340.5 736,947 2,360.50 140.2 23,040 200.00 FL ......... 0.0 0 .................... 0.0 0 .................... 1,173.2 500 45.05 GA ........ 34.3 27,830 1,082.88 16.3 15,387 2,442.38 3,145.0 24,000 568.72 HI .......... * * * * * * * * * ID .......... 8.6 7,447 2,864.23 26.8 28,671 1,706.61 390,874.2 1,918,146 139.05 IL .......... 33,992.8 55,374,048 2,119.33 5,556.8 2,382,825 590.03 208,598.5 991,746 199.19 IN .......... 19,802.6 81,823,382 4,887.14 1,298.9 905,837 874.53 57,357.5 5,280 18.02 IA .......... 39,149.7 52,543,816 1,695.13 12,777.9 2,686,632 283.04 390,535.5 10,840,631 264.01 KS ......... 9,930.3 3,719,203 454.88 1,116.4 236,558 363.88 958,570.0 1,352,639 63.38 KY ......... 4,429.7 8,366,370 2,160.62 2,768.5 1,193,036 645.62 68,799.9 19,123 20.68 LA ......... 12.4 9,223 1,167.47 819.0 182,067 359.11 5,688.8 638 11.71 ME ........ 50.9 306,266 6,420.67 0.0 0 .................... 13,007.2 0 .................MD ........ 249.1 771,699 5,043.78 1,177.3 1,797,968 2,060.71 2,127.0 15,040 85.31 MA ........ 0.0 0 .................... 0.0 0 .................... 0.0 0 .................MI ......... 868.2 3,110,318 4,431.92 2,451.5 1,507,955 705.34 62,845.6 112,370 48.84 MN ........ 5,107.8 5,770,240 1,325.67 398.1 53,402 198.59 223,073.0 19,896 18.48 MS ........ 59.6 300 93.75 644.3 113,919 310.74 77,036.9 768 19.59 MO ........ 2,291.8 2,272,141 1,165.86 2,602.1 599,803 324.22 635,387.4 181,707 86.08 MT ........ 99.5 6,427 108.93 85.0 4,552 57.77 1,253,289.3 251,217 4.37 NE ........ 1,937.1 709,566 429.75 250.6 56,168 279.72 359,383.4 3,760,912 150.45 NH ........ 0.0 0 .................... 0.0 0 .................... 0.0 0 .................NJ ......... 126.4 1,288,188 10,515.82 2.8 7,181 2,564.64 171.7 0 .................NM ........ 0.0 0 .................... 0.0 0 .................... 299,198.4 16,877 9.15 NY ........ 78.7 184,973 3,509.92 3.4 5,676 1,669.41 24,671.1 596,141 116.09 NC ........ 314.8 834,280 2,981.70 1,254.7 1,473,445 1,281.81 8,060.3 7,081 94.41 ND ........ 104.7 49,142 532.42 1.1 0 .................... 990,965.0 2,489,266 24.58 OH ........ 11,323.8 41,891,399 4,371.57 749.0 506,629 1,005.22 66,100.6 4,529,417 4,095.68 OK ........ 275.8 65,897 321.61 89.3 30,307 377.42 489,958.6 1,009,699 13.64 OR ........ 29.1 10,862 559.90 0.0 0 .................... 283,485.3 514,037 19.25 PA ......... 597.2 1,656,741 2,971.20 60.4 95,252 1,849.55 24,461.4 410,731 113.86 PR ........ 0.0 0 .................... 0.0 0 .................... 188.0 0 .................RI .......... * * * * * * * * * SC ........ 65.9 134,671 2,043.57 1,343.9 2,000,094 1,505.07 5,142.7 774 73.02 SD ........ 1,378.0 749,980 696.94 161.8 191,915 1,258.46 268,670.4 31,983 13.04 TN ......... 222.9 270,813 1,292.66 141.0 56,209 477.97 70,940.3 3,313 32.80 TX ......... 2,475.2 2,086,233 911.06 153.5 95,838 662.78 1,826,987.0 15,069,489 136.02 UT ......... 14.0 347 43.38 0.0 0 .................... 112,166.6 2,288 2.18 VT ......... 16.2 13,669 1,051.46 0.0 0 .................... 94.2 0 .................VA ......... 61.6 65,743 1,151.37 82.2 146,709 2,120.07 8,394.8 118,226 132.13 WA ........ 411.0 99,870 344.26 51.0 11,459 599.95 302,270.2 188,041 20.04 WV ........ 0.0 0 .................... 0.0 0 .................... 481.0 0 .................WI ......... 2,018.8 4,099,561 2,219.34 2,770.7 9,585,141 4,150.49 171,391.6 535,843 67.39 WY ........ 4.1 4,671 1,139.27 0.0 0 .................... 157,846.6 0 .................WY ........ 4.1 4,671 1,139.27 0.0 0 .................... 131,512.8 0 .................
US ..... 138,272 268,484,193 2,397.23 40,323 27,230,871 892.29 11,202,262 50,983,207 74.27
1 Not including acres which receive no cost share. * Data withheld to avoid disclosure of individual operations. Note: Total acres treated may not add due to rounding.
FSA, Conservation and Environmental Programs Division, (530) 792-5594.
VerDate Aug 31 2005 13:44 Mar 01, 2012 Jkt 000000 PO 00000 Frm 00006 Fmt 1000 Sfmt 1000 H:\SHARED\DAPP\FPU\AGSTAT\MASTER~2\CHAPTR12\TABLE4.AG8 USDA
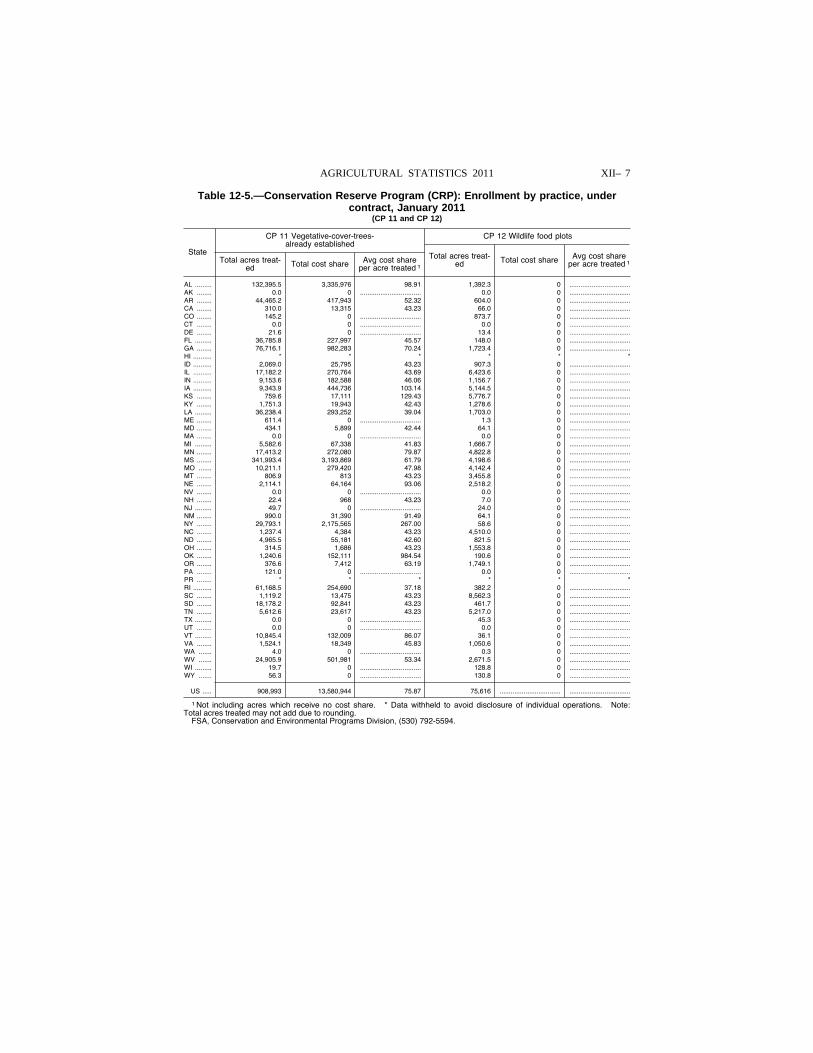
XII– 7 AGRICULTURAL STATISTICS 2011
Table 12-5.—Conservation Reserve Program (CRP): Enrollment by practice, under contract, January 2011
(CP 11 and CP 12)
State
CP 11 Vegetative-cover-trees- already established
CP 12 Wildlife food plots
Total acres treat-ed Total cost share Avg cost share
per acre treated 1
Total acres treat-ed Total cost share Avg cost share
per acre treated 1
AL ......... 132,395.5 3,335,976 98.91 1,392.3 0 .................................AK ........ 0.0 0 ................................. 0.0 0 .................................AR ........ 44,465.2 417,943 52.32 604.0 0 .................................CA ........ 310.0 13,315 43.23 66.0 0 .................................CO ........ 145.2 0 ................................. 873.7 0 .................................CT ........ 0.0 0 ................................. 0.0 0 .................................DE ........ 21.6 0 ................................. 13.4 0 .................................FL ......... 36,785.8 227,997 45.57 148.0 0 .................................GA ........ 76,716.1 982,283 70.24 1,723.4 0 .................................HI .......... * * * * * * ID .......... 2,069.0 25,795 43.23 907.3 0 .................................IL .......... 17,182.2 270,764 43.69 6,423.6 0 .................................IN .......... 9,153.6 182,588 46.06 1,156.7 0 .................................IA .......... 9,343.9 444,736 103.14 5,144.5 0 .................................KS ........ 759.6 17,111 129.43 5,776.7 0 .................................KY ........ 1,751.3 19,943 42.43 1,278.6 0 .................................LA ......... 36,238.4 293,252 39.04 1,703.0 0 .................................ME ........ 611.4 0 ................................. 1.3 0 .................................MD ........ 434.1 5,899 42.44 64.1 0 .................................MA ........ 0.0 0 ................................. 0.0 0 .................................MI ......... 5,582.6 67,338 41.83 1,666.7 0 .................................MN ........ 17,413.2 272,080 79.87 4,822.8 0 .................................MS ........ 341,993.4 3,193,869 61.79 4,198.6 0 .................................MO ....... 10,211.1 279,420 47.98 4,142.4 0 .................................MT ........ 806.9 813 43.23 3,455.8 0 .................................NE ........ 2,114.1 64,164 93.06 2,518.2 0 .................................NV ........ 0.0 0 ................................. 0.0 0 .................................NH ........ 22.4 968 43.23 7.0 0 .................................NJ ......... 49.7 0 ................................. 24.0 0 .................................NM ........ 990.0 31,390 91.49 64.1 0 .................................NY ........ 29,793.1 2,175,565 267.00 58.6 0 .................................NC ........ 1,237.4 4,384 43.23 4,510.0 0 .................................ND ........ 4,965.5 55,181 42.60 821.5 0 .................................OH ........ 314.5 1,686 43.23 1,553.8 0 .................................OK ........ 1,240.6 152,111 984.54 190.6 0 .................................OR ........ 376.6 7,412 63.19 1,749.1 0 .................................PA ........ 121.0 0 ................................. 0.0 0 .................................PR ........ * * * * * * RI .......... 61,168.5 254,690 37.18 382.2 0 .................................SC ........ 1,119.2 13,475 43.23 8,562.3 0 .................................SD ........ 18,178.2 92,841 43.23 461.7 0 .................................TN ........ 5,612.6 23,617 43.23 5,217.0 0 .................................TX ......... 0.0 0 ................................. 45.3 0 .................................UT ........ 0.0 0 ................................. 0.0 0 .................................VT ......... 10,845.4 132,009 86.07 36.1 0 .................................VA ........ 1,524.1 18,349 45.83 1,050.6 0 .................................WA ....... 4.0 0 ................................. 0.3 0 .................................WV ....... 24,905.9 501,981 53.34 2,671.5 0 .................................WI ......... 19.7 0 ................................. 128.8 0 .................................WY ....... 56.3 0 ................................. 130.8 0 .................................
US ..... 908,993 13,580,944 75.87 75,616 ................................. .................................
1 Not including acres which receive no cost share. * Data withheld to avoid disclosure of individual operations. Note: Total acres treated may not add due to rounding.
FSA, Conservation and Environmental Programs Division, (530) 792-5594.
VerDate Aug 31 2005 13:44 Mar 01, 2012 Jkt 000000 PO 00000 Frm 00007 Fmt 1000 Sfmt 1000 H:\SHARED\DAPP\FPU\AGSTAT\MASTER~2\CHAPTR12\TABLE5.AG8 USDA
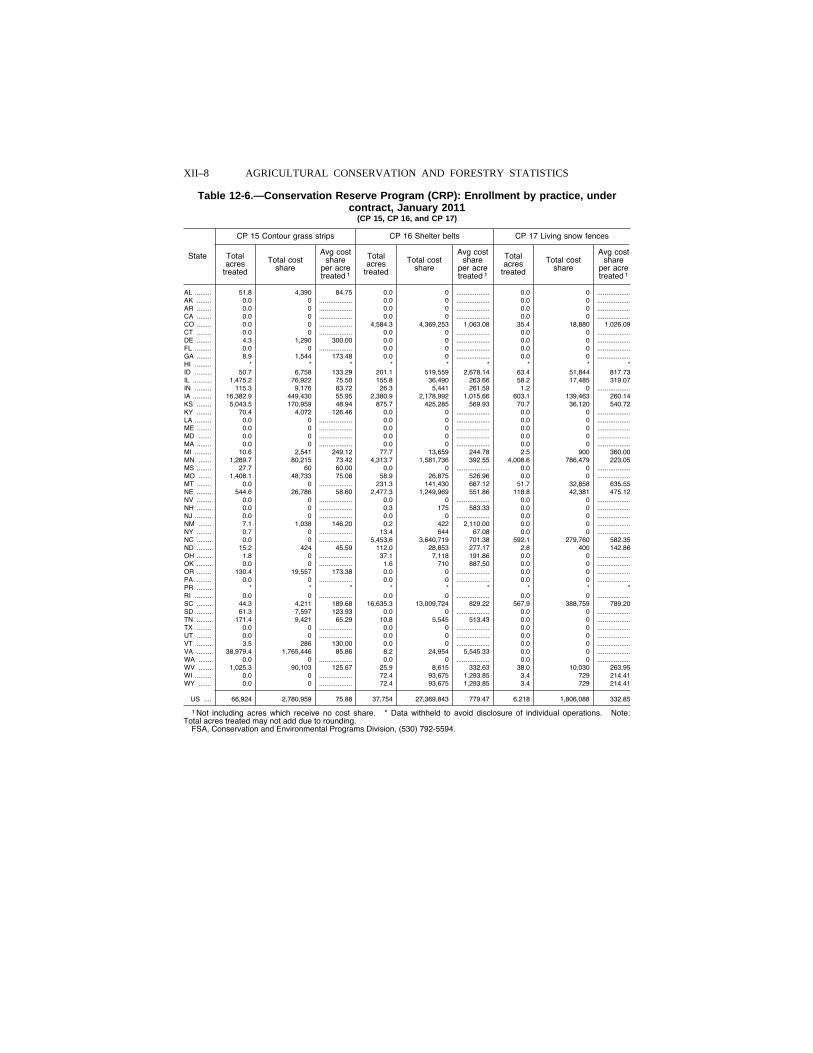
XII–8 AGRICULTURAL CONSERVATION AND FORESTRY STATISTICS
Table 12-6.—Conservation Reserve Program (CRP): Enrollment by practice, under contract, January 2011
(CP 15, CP 16, and CP 17)
State
CP 15 Contour grass strips CP 16 Shelter belts CP 17 Living snow fences
Total acres
treated
Total cost share
Avg cost share
per acre treated 1
Total acres
treated
Total cost share
Avg cost share
per acre treated 1
Total acres
treated
Total cost share
Avg cost share
per acre treated 1
AL ......... 51.8 4,390 84.75 0.0 0 .................. 0.0 0 ..................AK ........ 0.0 0 .................. 0.0 0 .................. 0.0 0 ..................AR ........ 0.0 0 .................. 0.0 0 .................. 0.0 0 ..................CA ........ 0.0 0 .................. 0.0 0 .................. 0.0 0 ..................CO ........ 0.0 0 .................. 4,584.3 4,369,253 1,063.08 35.4 18,880 1,026.09 CT ........ 0.0 0 .................. 0.0 0 .................. 0.0 0 ..................DE ........ 4.3 1,290 300.00 0.0 0 .................. 0.0 0 ..................FL ......... 0.0 0 .................. 0.0 0 .................. 0.0 0 ..................GA ........ 8.9 1,544 173.48 0.0 0 .................. 0.0 0 ..................HI ......... * * * * * * * * * ID ......... 50.7 6,758 133.29 201.1 519,559 2,678.14 63.4 51,844 817.73 IL .......... 1,475.2 76,922 75.50 155.8 36,490 263.66 58.2 17,485 319.07 IN ......... 115.3 9,176 83.72 26.3 5,441 261.59 1.2 0 ..................IA .......... 16,382.9 449,430 55.95 2,380.9 2,178,992 1,015.66 603.1 139,463 260.14 KS ........ 5,043.5 170,959 48.94 875.7 425,285 569.93 70.7 36,120 540.72 KY ........ 70.4 4,072 126.46 0.0 0 .................. 0.0 0 ..................LA ......... 0.0 0 .................. 0.0 0 .................. 0.0 0 ..................ME ........ 0.0 0 .................. 0.0 0 .................. 0.0 0 ..................MD ....... 0.0 0 .................. 0.0 0 .................. 0.0 0 ..................MA ........ 0.0 0 .................. 0.0 0 .................. 0.0 0 ..................MI ......... 10.6 2,541 249.12 77.7 13,659 244.78 2.5 900 360.00 MN ....... 1,289.7 80,215 73.42 4,313.7 1,581,736 392.55 4,008.6 786,479 223.05 MS ........ 27.7 60 60.00 0.0 0 .................. 0.0 0 ..................MO ....... 1,408.1 48,733 75.08 58.9 26,875 526.96 0.0 0 ..................MT ........ 0.0 0 .................. 231.3 141,430 667.12 51.7 32,858 635.55 NE ........ 544.6 26,786 58.60 2,477.3 1,249,969 551.86 118.8 42,381 475.12 NV ........ 0.0 0 .................. 0.0 0 .................. 0.0 0 ..................NH ........ 0.0 0 .................. 0.3 175 583.33 0.0 0 ..................NJ ......... 0.0 0 .................. 0.0 0 .................. 0.0 0 ..................NM ....... 7.1 1,038 146.20 0.2 422 2,110.00 0.0 0 ..................NY ........ 0.7 0 .................. 13.4 644 67.08 0.0 0 ..................NC ........ 0.0 0 .................. 5,453.6 3,640,719 701.38 592.1 279,760 582.35 ND ........ 15.2 424 45.59 112.0 28,853 277.17 2.8 400 142.86 OH ........ 1.8 0 .................. 37.1 7,118 191.86 0.0 0 ..................OK ........ 0.0 0 .................. 1.6 710 887.50 0.0 0 ..................OR ........ 130.4 19,557 173.38 0.0 0 .................. 0.0 0 ..................PA ........ 0.0 0 .................. 0.0 0 .................. 0.0 0 ..................PR ........ * * * * * * * * * RI ......... 0.0 0 .................. 0.0 0 .................. 0.0 0 ..................SC ........ 44.3 4,211 189.68 16,635.3 13,009,724 829.22 567.9 388,759 789.20 SD ........ 61.3 7,597 123.93 0.0 0 .................. 0.0 0 ..................TN ........ 171.4 9,421 65.29 10.8 5,545 513.43 0.0 0 ..................TX ........ 0.0 0 .................. 0.0 0 .................. 0.0 0 ..................UT ........ 0.0 0 .................. 0.0 0 .................. 0.0 0 ..................VT ........ 3.5 286 130.00 0.0 0 .................. 0.0 0 ..................VA ........ 38,979.4 1,765,446 85.86 8.2 24,954 5,545.33 0.0 0 ..................WA ....... 0.0 0 .................. 0.0 0 .................. 0.0 0 ..................WV ....... 1,025.3 90,103 125.67 25.9 8,615 332.63 38.0 10,030 263.95 WI ......... 0.0 0 .................. 72.4 93,675 1,293.85 3.4 729 214.41 WY ....... 0.0 0 .................. 72.4 93,675 1,293.85 3.4 729 214.41
US .... 66,924 2,780,959 75.88 37,754 27,369,843 779.47 6,218 1,806,088 332.85
1 Not including acres which receive no cost share. * Data withheld to avoid disclosure of individual operations. Note: Total acres treated may not add due to rounding.
FSA, Conservation and Environmental Programs Division, (530) 792-5594.
VerDate Aug 31 2005 13:44 Mar 01, 2012 Jkt 000000 PO 00000 Frm 00008 Fmt 1000 Sfmt 1000 H:\SHARED\DAPP\FPU\AGSTAT\MASTER~2\CHAPTR12\TABLE6.AG8 USDA
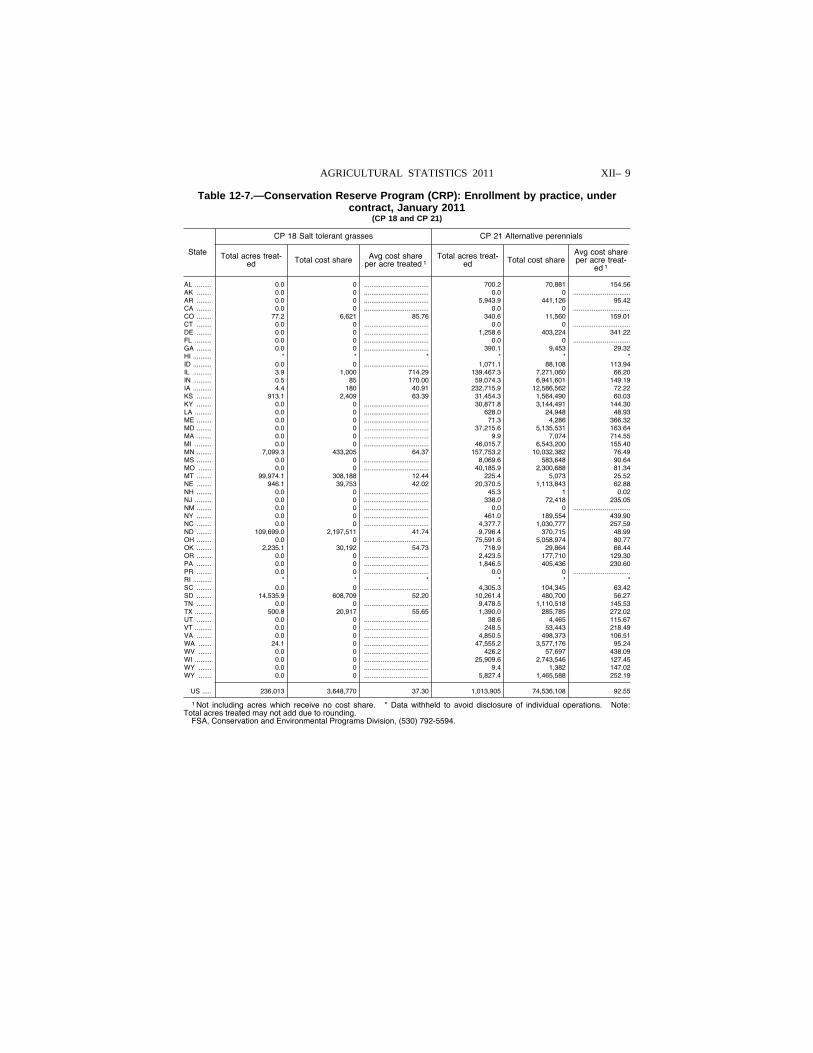
XII– 9 AGRICULTURAL STATISTICS 2011
Table 12-7.—Conservation Reserve Program (CRP): Enrollment by practice, under contract, January 2011
(CP 18 and CP 21)
State
CP 18 Salt tolerant grasses CP 21 Alternative perennials
Total acres treat-ed Total cost share Avg cost share
per acre treated 1 Total acres treat-
ed Total cost share Avg cost share per acre treat-
ed 1
AL ......... 0.0 0 ................................... 700.2 70,881 154.56 AK ........ 0.0 0 ................................... 0.0 0 ...............................AR ........ 0.0 0 ................................... 5,943.9 441,126 95.42 CA ........ 0.0 0 ................................... 0.0 0 ...............................CO ........ 77.2 6,621 85.76 340.6 11,560 159.01 CT ........ 0.0 0 ................................... 0.0 0 ...............................DE ........ 0.0 0 ................................... 1,258.6 403,224 341.22 FL ......... 0.0 0 ................................... 0.0 0 ...............................GA ........ 0.0 0 ................................... 390.1 9,453 29.32 HI .......... * * * * * * ID .......... 0.0 0 ................................... 1,071.1 88,108 113.94 IL .......... 3.9 1,000 714.29 139,467.3 7,271,060 66.20 IN .......... 0.5 85 170.00 59,074.3 6,941,601 149.19 IA .......... 4.4 180 40.91 232,715.9 12,586,562 72.22 KS ........ 913.1 2,409 63.39 31,454.3 1,564,490 60.03 KY ........ 0.0 0 ................................... 30,871.8 3,144,491 144.30 LA ......... 0.0 0 ................................... 628.0 24,948 48.93 ME ........ 0.0 0 ................................... 71.3 4,286 366.32 MD ........ 0.0 0 ................................... 37,215.6 5,135,531 163.64 MA ........ 0.0 0 ................................... 9.9 7,074 714.55 MI ......... 0.0 0 ................................... 46,015.7 6,543,200 155.40 MN ........ 7,099.3 433,205 64.37 157,753.2 10,032,382 76.49 MS ........ 0.0 0 ................................... 8,069.6 583,648 90.64 MO ....... 0.0 0 ................................... 40,185.9 2,300,688 81.34 MT ........ 99,974.1 308,188 12.44 225.4 5,073 25.52 NE ........ 946.1 39,753 42.02 20,370.5 1,113,843 62.88 NH ........ 0.0 0 ................................... 45.3 1 0.02 NJ ......... 0.0 0 ................................... 338.0 72,418 235.05 NM ........ 0.0 0 ................................... 0.0 0 ...............................NY ........ 0.0 0 ................................... 461.0 189,554 439.90 NC ........ 0.0 0 ................................... 4,377.7 1,030,777 257.59 ND ........ 109,699.0 2,197,511 41.74 9,796.4 370,715 48.99 OH ........ 0.0 0 ................................... 75,591.6 5,058,974 80.77 OK ........ 2,235.1 30,192 54.73 718.9 29,864 66.44 OR ........ 0.0 0 ................................... 2,423.5 177,710 129.30 PA ........ 0.0 0 ................................... 1,846.5 405,436 230.60 PR ........ 0.0 0 ................................... 0.0 0 ...............................RI .......... * * * * * * SC ........ 0.0 0 ................................... 4,305.3 104,345 63.42 SD ........ 14,535.9 608,709 52.20 10,261.4 480,700 56.27 TN ........ 0.0 0 ................................... 9,478.5 1,110,518 145.53 TX ......... 500.8 20,917 55.65 1,390.0 285,785 272.02 UT ........ 0.0 0 ................................... 38.6 4,465 115.67 VT ......... 0.0 0 ................................... 248.5 53,443 218.49 VA ........ 0.0 0 ................................... 4,850.5 498,373 106.51 WA ....... 24.1 0 ................................... 47,555.2 3,577,176 95.24 WV ....... 0.0 0 ................................... 426.2 57,697 438.09 WI ......... 0.0 0 ................................... 25,909.6 2,743,546 127.45 WY ....... 0.0 0 ................................... 9.4 1,382 147.02 WY ....... 0.0 0 ................................... 5,827.4 1,465,588 252.19
US ..... 236,013 3,648,770 37.30 1,013,905 74,536,108 92.55
1 Not including acres which receive no cost share. * Data withheld to avoid disclosure of individual operations. Note: Total acres treated may not add due to rounding.
FSA, Conservation and Environmental Programs Division, (530) 792-5594.
VerDate Aug 31 2005 13:44 Mar 01, 2012 Jkt 000000 PO 00000 Frm 00009 Fmt 1000 Sfmt 1000 H:\SHARED\DAPP\FPU\AGSTAT\MASTER~2\CHAPTR12\TABLE7.AG8 USDA
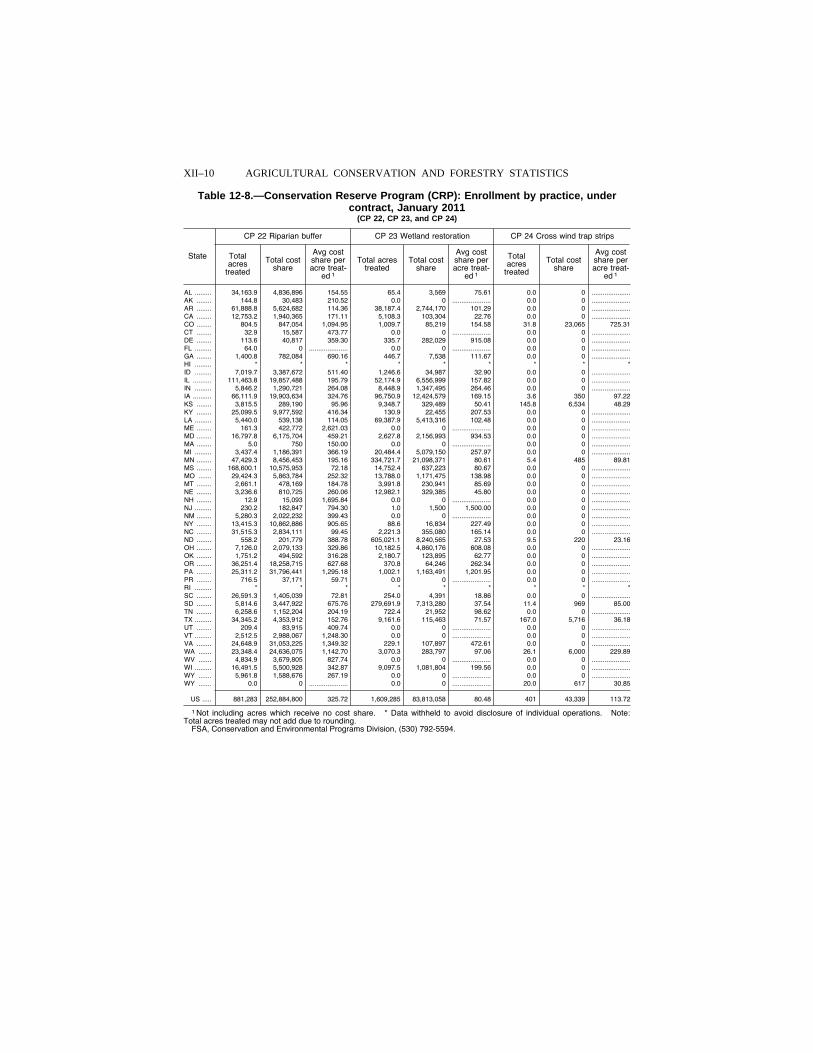
XII–10 AGRICULTURAL CONSERVATION AND FORESTRY STATISTICS
Table 12-8.—Conservation Reserve Program (CRP): Enrollment by practice, under contract, January 2011
(CP 22, CP 23, and CP 24)
State
CP 22 Riparian buffer CP 23 Wetland restoration CP 24 Cross wind trap strips
Total acres
treated
Total cost share
Avg cost share per acre treat-
ed 1
Total acres treated
Total cost share
Avg cost share per acre treat-
ed 1
Total acres
treated
Total cost share
Avg cost share per acre treat-
ed 1
AL ......... 34,163.9 4,836,896 154.55 65.4 3,569 75.61 0.0 0 .....................AK ........ 144.8 30,483 210.52 0.0 0 ..................... 0.0 0 .....................AR ........ 61,888.8 5,624,682 114.36 38,187.4 2,744,170 101.29 0.0 0 .....................CA ........ 12,753.2 1,940,365 171.11 5,108.3 103,304 22.76 0.0 0 .....................CO ........ 804.5 847,054 1,094.95 1,009.7 85,219 154.58 31.8 23,065 725.31 CT ........ 32.9 15,587 473.77 0.0 0 ..................... 0.0 0 .....................DE ........ 113.6 40,817 359.30 335.7 282,029 915.08 0.0 0 .....................FL ......... 64.0 0 ..................... 0.0 0 ..................... 0.0 0 .....................GA ........ 1,400.8 782,084 690.16 446.7 7,538 111.67 0.0 0 .....................HI ......... * * * * * * * * * ID ......... 7,019.7 3,387,672 511.40 1,246.6 34,987 32.90 0.0 0 .....................IL .......... 111,463.8 19,857,488 195.79 52,174.9 6,556,999 157.82 0.0 0 .....................IN ......... 5,846.2 1,290,721 264.08 8,448.9 1,347,495 264.46 0.0 0 .....................IA .......... 66,111.9 19,903,634 324.76 96,750.9 12,424,579 169.15 3.6 350 97.22 KS ........ 3,815.5 289,190 95.96 9,348.7 329,489 50.41 145.8 6,534 48.29 KY ........ 25,099.5 9,977,592 416.34 130.9 22,455 207.53 0.0 0 .....................LA ......... 5,440.0 539,138 114.05 69,387.9 5,413,316 102.48 0.0 0 .....................ME ........ 161.3 422,772 2,621.03 0.0 0 ..................... 0.0 0 .....................MD ........ 16,797.8 6,175,704 459.21 2,627.8 2,156,993 934.53 0.0 0 .....................MA ........ 5.0 750 150.00 0.0 0 ..................... 0.0 0 .....................MI ......... 3,437.4 1,186,391 366.19 20,484.4 5,079,150 257.97 0.0 0 .....................MN ........ 47,429.3 8,456,453 195.16 334,721.7 21,098,371 80.61 5.4 485 89.81 MS ........ 168,600.1 10,575,953 72.18 14,752.4 637,223 80.67 0.0 0 .....................MO ....... 29,424.3 5,863,784 252.32 13,788.0 1,171,475 138.98 0.0 0 .....................MT ........ 2,661.1 478,169 184.78 3,991.8 230,941 85.69 0.0 0 .....................NE ........ 3,236.6 810,725 260.06 12,982.1 329,385 45.80 0.0 0 .....................NH ........ 12.9 15,093 1,695.84 0.0 0 ..................... 0.0 0 .....................NJ ......... 230.2 182,847 794.30 1.0 1,500 1,500.00 0.0 0 .....................NM ........ 5,280.3 2,022,232 399.43 0.0 0 ..................... 0.0 0 .....................NY ........ 13,415.3 10,862,886 905.65 88.6 16,834 227.49 0.0 0 .....................NC ........ 31,515.3 2,834,111 99.45 2,221.3 355,080 165.14 0.0 0 .....................ND ........ 558.2 201,779 388.78 605,021.1 8,240,565 27.53 9.5 220 23.16 OH ........ 7,126.0 2,079,133 329.86 10,182.5 4,860,176 608.08 0.0 0 .....................OK ........ 1,751.2 494,592 316.28 2,180.7 123,895 62.77 0.0 0 .....................OR ........ 36,251.4 18,258,715 627.68 370.8 64,246 262.34 0.0 0 .....................PA ........ 25,311.2 31,796,441 1,295.18 1,002.1 1,163,491 1,201.95 0.0 0 .....................PR ........ 716.5 37,171 59.71 0.0 0 ..................... 0.0 0 .....................RI ......... * * * * * * * * * SC ........ 26,591.3 1,405,039 72.81 254.0 4,391 18.86 0.0 0 .....................SD ........ 5,814.6 3,447,922 675.76 279,691.9 7,313,280 37.54 11.4 969 85.00 TN ........ 6,258.6 1,152,204 204.19 722.4 21,952 98.62 0.0 0 .....................TX ......... 34,345.2 4,353,912 152.76 9,161.6 115,463 71.57 167.0 5,716 36.18 UT ........ 209.4 83,915 409.74 0.0 0 ..................... 0.0 0 .....................VT ......... 2,512.5 2,988,067 1,248.30 0.0 0 ..................... 0.0 0 .....................VA ........ 24,648.9 31,053,225 1,349.32 229.1 107,897 472.61 0.0 0 .....................WA ....... 23,348.4 24,636,075 1,142.70 3,070.3 283,797 97.06 26.1 6,000 229.89 WV ....... 4,834.9 3,679,805 827.74 0.0 0 ..................... 0.0 0 .....................WI ......... 16,491.5 5,500,928 342.87 9,097.5 1,081,804 199.56 0.0 0 .....................WY ....... 5,961.8 1,588,676 267.19 0.0 0 ..................... 0.0 0 .....................WY ....... 0.0 0 ..................... 0.0 0 ..................... 20.0 617 30.85
US ..... 881,283 252,884,800 325.72 1,609,285 83,813,058 80.48 401 43,339 113.72
1 Not including acres which receive no cost share. * Data withheld to avoid disclosure of individual operations. Note: Total acres treated may not add due to rounding.
FSA, Conservation and Environmental Programs Division, (530) 792-5594.
VerDate Aug 31 2005 13:44 Mar 01, 2012 Jkt 000000 PO 00000 Frm 00010 Fmt 1000 Sfmt 1000 H:\SHARED\DAPP\FPU\AGSTAT\MASTER~2\CHAPTR12\TABLE8.AG8 USDA
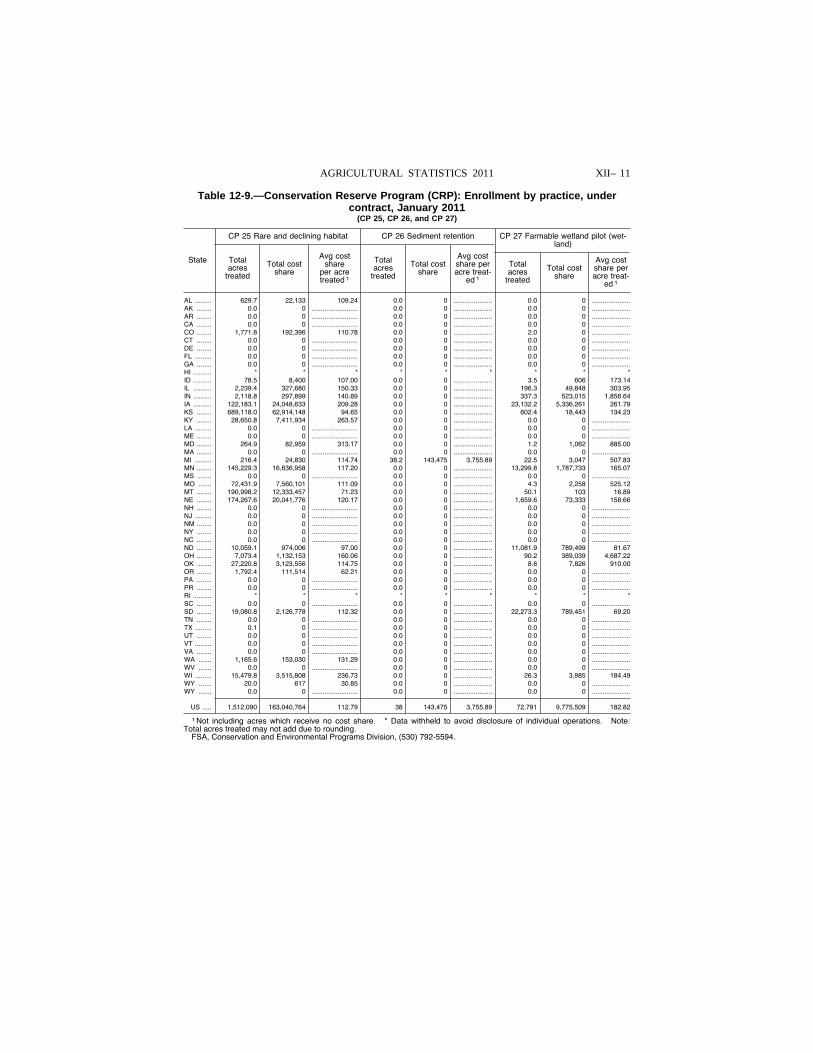
XII– 11 AGRICULTURAL STATISTICS 2011
Table 12-9.—Conservation Reserve Program (CRP): Enrollment by practice, under contract, January 2011
(CP 25, CP 26, and CP 27)
State
CP 25 Rare and declining habitat CP 26 Sediment retention CP 27 Farmable wetland pilot (wet-land)
Total acres
treated
Total cost share
Avg cost share
per acre treated 1
Total acres
treated
Total cost share
Avg cost share per acre treat-
ed 1
Total acres
treated
Total cost share
Avg cost share per acre treat-
ed 1
AL ......... 629.7 22,133 109.24 0.0 0 ..................... 0.0 0 .....................AK ........ 0.0 0 ......................... 0.0 0 ..................... 0.0 0 .....................AR ........ 0.0 0 ......................... 0.0 0 ..................... 0.0 0 .....................CA ........ 0.0 0 ......................... 0.0 0 ..................... 0.0 0 .....................CO ........ 1,771.8 192,396 110.78 0.0 0 ..................... 2.0 0 .....................CT ........ 0.0 0 ......................... 0.0 0 ..................... 0.0 0 .....................DE ........ 0.0 0 ......................... 0.0 0 ..................... 0.0 0 .....................FL ......... 0.0 0 ......................... 0.0 0 ..................... 0.0 0 .....................GA ........ 0.0 0 ......................... 0.0 0 ..................... 0.0 0 .....................HI .......... * * * * * * * * * ID .......... 78.5 8,400 107.00 0.0 0 ..................... 3.5 606 173.14 IL .......... 2,239.4 327,680 150.33 0.0 0 ..................... 196.3 49,848 303.95 IN .......... 2,118.8 297,899 140.89 0.0 0 ..................... 337.3 523,015 1,856.64 IA .......... 122,183.1 24,048,633 209.28 0.0 0 ..................... 23,132.2 5,336,261 261.79 KS ........ 689,118.0 62,914,148 94.65 0.0 0 ..................... 602.4 18,443 134.23 KY ........ 28,650.8 7,411,934 263.57 0.0 0 ..................... 0.0 0 .....................LA ......... 0.0 0 ......................... 0.0 0 ..................... 0.0 0 .....................ME ........ 0.0 0 ......................... 0.0 0 ..................... 0.0 0 .....................MD ........ 264.9 82,959 313.17 0.0 0 ..................... 1.2 1,062 885.00 MA ........ 0.0 0 ......................... 0.0 0 ..................... 0.0 0 .....................MI ......... 216.4 24,830 114.74 38.2 143,475 3,755.89 22.5 3,047 507.83 MN ........ 145,229.3 16,636,958 117.20 0.0 0 ..................... 13,299.8 1,787,733 165.07 MS ........ 0.0 0 ......................... 0.0 0 ..................... 0.0 0 .....................MO ....... 72,431.9 7,560,101 111.09 0.0 0 ..................... 4.3 2,258 525.12 MT ........ 190,998.2 12,333,457 71.23 0.0 0 ..................... 50.1 103 16.89 NE ........ 174,267.6 20,041,776 120.17 0.0 0 ..................... 1,659.6 73,333 158.66 NH ........ 0.0 0 ......................... 0.0 0 ..................... 0.0 0 .....................NJ ......... 0.0 0 ......................... 0.0 0 ..................... 0.0 0 .....................NM ........ 0.0 0 ......................... 0.0 0 ..................... 0.0 0 .....................NY ........ 0.0 0 ......................... 0.0 0 ..................... 0.0 0 .....................NC ........ 0.0 0 ......................... 0.0 0 ..................... 0.0 0 .....................ND ........ 10,059.1 974,006 97.00 0.0 0 ..................... 11,081.9 789,499 81.67 OH ........ 7,073.4 1,132,153 160.06 0.0 0 ..................... 90.2 389,039 4,687.22 OK ........ 27,220.8 3,123,556 114.75 0.0 0 ..................... 8.6 7,826 910.00 OR ........ 1,792.4 111,514 62.21 0.0 0 ..................... 0.0 0 .....................PA ........ 0.0 0 ......................... 0.0 0 ..................... 0.0 0 .....................PR ........ 0.0 0 ......................... 0.0 0 ..................... 0.0 0 .....................RI .......... * * * * * * * * * SC ........ 0.0 0 ......................... 0.0 0 ..................... 0.0 0 .....................SD ........ 19,080.8 2,126,778 112.32 0.0 0 ..................... 22,273.3 789,451 69.20 TN ........ 0.0 0 ......................... 0.0 0 ..................... 0.0 0 .....................TX ......... 0.1 0 ......................... 0.0 0 ..................... 0.0 0 .....................UT ........ 0.0 0 ......................... 0.0 0 ..................... 0.0 0 .....................VT ......... 0.0 0 ......................... 0.0 0 ..................... 0.0 0 .....................VA ........ 0.0 0 ......................... 0.0 0 ..................... 0.0 0 .....................WA ....... 1,165.6 153,030 131.29 0.0 0 ..................... 0.0 0 .....................WV ....... 0.0 0 ......................... 0.0 0 ..................... 0.0 0 .....................WI ......... 15,479.8 3,515,808 236.73 0.0 0 ..................... 26.3 3,985 184.49 WY ....... 20.0 617 30.85 0.0 0 ..................... 0.0 0 .....................WY ....... 0.0 0 ......................... 0.0 0 ..................... 0.0 0 .....................
US ..... 1,512,090 163,040,764 112.79 38 143,475 3,755.89 72,791 9,775,509 182.82
1 Not including acres which receive no cost share. * Data withheld to avoid disclosure of individual operations. Note: Total acres treated may not add due to rounding.
FSA, Conservation and Environmental Programs Division, (530) 792-5594.
VerDate Aug 31 2005 13:44 Mar 01, 2012 Jkt 000000 PO 00000 Frm 00011 Fmt 1000 Sfmt 1000 H:\SHARED\DAPP\FPU\AGSTAT\MASTER~2\CHAPTR12\TABLE9.AG8 USDA
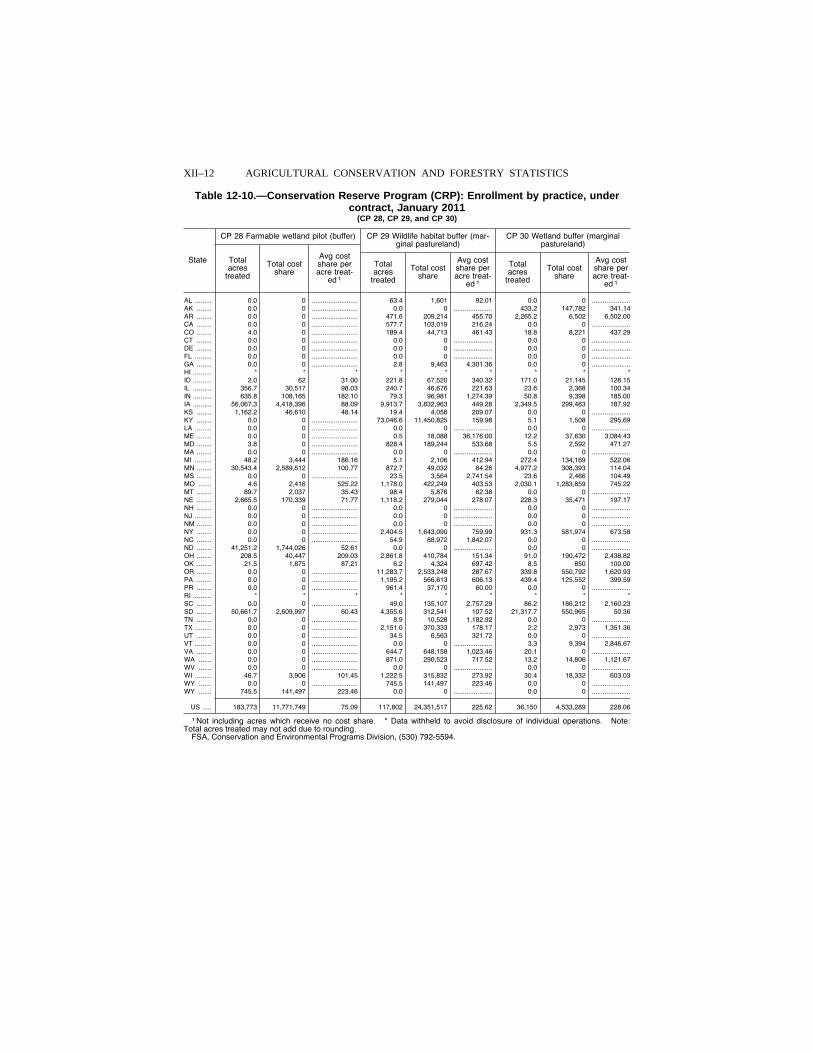
XII–12 AGRICULTURAL CONSERVATION AND FORESTRY STATISTICS
Table 12-10.—Conservation Reserve Program (CRP): Enrollment by practice, under contract, January 2011
(CP 28, CP 29, and CP 30)
State
CP 28 Farmable wetland pilot (buffer) CP 29 Wildlife habitat buffer (mar-ginal pastureland)
CP 30 Wetland buffer (marginal pastureland)
Total acres
treated
Total cost share
Avg cost share per acre treat-
ed 1
Total acres
treated
Total cost share
Avg cost share per acre treat-
ed 1
Total acres
treated
Total cost share
Avg cost share per acre treat-
ed 1
AL ......... 0.0 0 ......................... 63.4 1,601 92.01 0.0 0 .....................AK ........ 0.0 0 ......................... 0.0 0 ..................... 433.2 147,782 341.14 AR ........ 0.0 0 ......................... 471.6 209,214 455.70 2,265.2 6,502 6,502.00 CA ........ 0.0 0 ......................... 577.7 103,019 216.24 0.0 0 .....................CO ........ 4.0 0 ......................... 189.4 44,713 461.43 18.8 8,221 437.29 CT ........ 0.0 0 ......................... 0.0 0 ..................... 0.0 0 .....................DE ........ 0.0 0 ......................... 0.0 0 ..................... 0.0 0 .....................FL ......... 0.0 0 ......................... 0.0 0 ..................... 0.0 0 .....................GA ........ 0.0 0 ......................... 2.8 9,463 4,301.36 0.0 0 .....................HI .......... * * * * * * * * * ID .......... 2.0 62 31.00 221.8 67,520 340.32 171.0 21,145 128.15 IL .......... 356.7 30,517 98.03 240.7 46,676 221.63 23.6 2,368 100.34 IN .......... 635.8 108,165 182.10 79.3 96,981 1,274.39 50.8 9,398 185.00 IA .......... 56,067.3 4,418,396 88.09 9,913.7 3,832,963 449.28 2,349.5 299,463 187.92 KS ........ 1,162.2 46,610 48.14 19.4 4,056 209.07 0.0 0 .....................KY ........ 0.0 0 ......................... 73,046.6 11,450,825 159.98 5.1 1,508 295.69 LA ......... 0.0 0 ......................... 0.0 0 ..................... 0.0 0 .....................ME ........ 0.0 0 ......................... 0.5 18,088 36,176.00 12.2 37,630 3,084.43 MD ........ 3.8 0 ......................... 828.4 189,244 533.68 5.5 2,592 471.27 MA ........ 0.0 0 ......................... 0.0 0 ..................... 0.0 0 .....................MI ......... 48.2 3,444 186.16 5.1 2,106 412.94 272.4 134,169 522.06 MN ........ 30,543.4 2,589,512 100.77 872.7 49,032 84.26 4,977.2 308,393 114.04 MS ........ 0.0 0 ......................... 23.5 3,564 2,741.54 23.6 2,466 104.49 MO ....... 4.6 2,416 525.22 1,178.0 422,249 403.53 2,030.1 1,283,859 745.22 MT ........ 89.7 2,037 35.43 98.4 5,876 62.38 0.0 0 .....................NE ........ 2,665.5 170,339 71.77 1,118.2 279,044 278.07 228.3 35,471 197.17 NH ........ 0.0 0 ......................... 0.0 0 ..................... 0.0 0 .....................NJ ......... 0.0 0 ......................... 0.0 0 ..................... 0.0 0 .....................NM ........ 0.0 0 ......................... 0.0 0 ..................... 0.0 0 .....................NY ........ 0.0 0 ......................... 2,404.5 1,643,090 759.99 931.3 581,974 673.58 NC ........ 0.0 0 ......................... 54.9 88,972 1,842.07 0.0 0 .....................ND ........ 41,251.2 1,744,026 52.61 0.0 0 ..................... 0.0 0 .....................OH ........ 208.5 40,447 209.03 2,861.8 410,784 151.34 91.0 190,472 2,438.82 OK ........ 21.5 1,875 87.21 6.2 4,324 697.42 8.5 850 100.00 OR ........ 0.0 0 ......................... 11,283.7 2,533,248 287.67 339.8 550,792 1,620.93 PA ........ 0.0 0 ......................... 1,195.2 566,613 606.13 439.4 125,552 399.59 PR ........ 0.0 0 ......................... 961.4 37,170 60.00 0.0 0 .....................RI .......... * * * * * * * * * SC ........ 0.0 0 ......................... 49.0 135,107 2,757.29 86.2 186,212 2,160.23 SD ........ 50,661.7 2,609,997 60.43 4,355.6 312,541 107.52 21,317.7 550,965 50.36 TN ........ 0.0 0 ......................... 8.9 10,528 1,182.92 0.0 0 .....................TX ......... 0.0 0 ......................... 2,151.0 370,333 178.17 2.2 2,973 1,351.36 UT ........ 0.0 0 ......................... 34.5 6,563 321.72 0.0 0 .....................VT ......... 0.0 0 ......................... 0.0 0 ..................... 3.3 9,394 2,846.67 VA ........ 0.0 0 ......................... 644.7 648,158 1,023.46 20.1 0 .....................WA ....... 0.0 0 ......................... 871.0 290,523 717.52 13.2 14,806 1,121.67 WV ....... 0.0 0 ......................... 0.0 0 ..................... 0.0 0 .....................WI ......... 46.7 3,906 101.45 1,222.5 315,832 273.92 30.4 18,332 603.03 WY ....... 0.0 0 ......................... 745.5 141,497 223.46 0.0 0 .....................WY ....... 745.5 141,497 223.46 0.0 0 ..................... 0.0 0 .....................
US ..... 183,773 11,771,749 75.09 117,802 24,351,517 225.62 36,150 4,533,289 228.06
1 Not including acres which receive no cost share. * Data withheld to avoid disclosure of individual operations. Note: Total acres treated may not add due to rounding.
FSA, Conservation and Environmental Programs Division, (530) 792-5594.
VerDate Aug 31 2005 13:44 Mar 01, 2012 Jkt 000000 PO 00000 Frm 00012 Fmt 1000 Sfmt 1000 H:\SHARED\DAPP\FPU\AGSTAT\MASTER~2\CHAPTR12\TABLE10.AG8 USDA
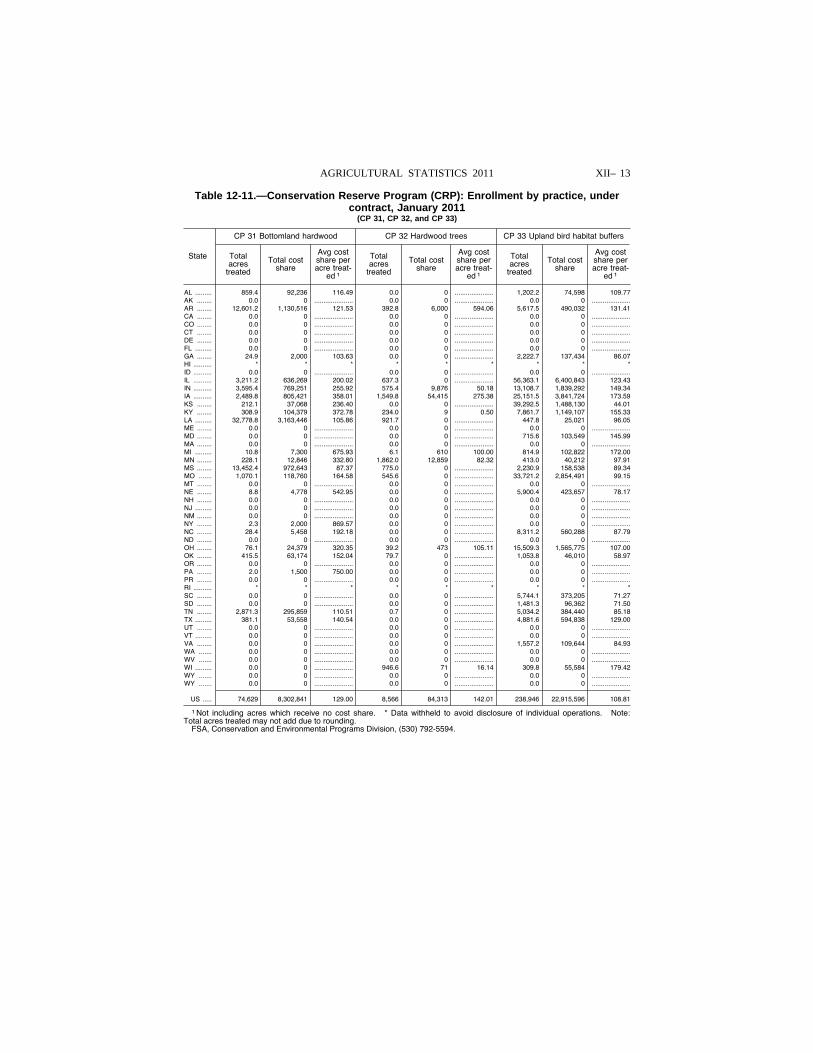
XII– 13 AGRICULTURAL STATISTICS 2011
Table 12-11.—Conservation Reserve Program (CRP): Enrollment by practice, under contract, January 2011
(CP 31, CP 32, and CP 33)
State
CP 31 Bottomland hardwood CP 32 Hardwood trees CP 33 Upland bird habitat buffers
Total acres
treated
Total cost share
Avg cost share per acre treat-
ed 1
Total acres
treated
Total cost share
Avg cost share per acre treat-
ed 1
Total acres
treated
Total cost share
Avg cost share per acre treat-
ed 1
AL ......... 859.4 92,236 116.49 0.0 0 ..................... 1,202.2 74,598 109.77 AK ........ 0.0 0 ..................... 0.0 0 ..................... 0.0 0 .....................AR ........ 12,601.2 1,130,516 121.53 392.8 6,000 594.06 5,617.5 490,032 131.41 CA ........ 0.0 0 ..................... 0.0 0 ..................... 0.0 0 .....................CO ........ 0.0 0 ..................... 0.0 0 ..................... 0.0 0 .....................CT ........ 0.0 0 ..................... 0.0 0 ..................... 0.0 0 .....................DE ........ 0.0 0 ..................... 0.0 0 ..................... 0.0 0 .....................FL ......... 0.0 0 ..................... 0.0 0 ..................... 0.0 0 .....................GA ........ 24.9 2,000 103.63 0.0 0 ..................... 2,222.7 137,434 86.07 HI .......... * * * * * * * * * ID .......... 0.0 0 ..................... 0.0 0 ..................... 0.0 0 .....................IL .......... 3,211.2 636,269 200.02 637.3 0 ..................... 56,363.1 6,400,843 123.43 IN .......... 3,595.4 769,251 255.92 575.4 9,876 50.18 13,108.7 1,839,292 149.34 IA .......... 2,489.8 805,421 358.01 1,549.8 54,415 275.38 25,151.5 3,841,724 173.59 KS ........ 212.1 37,068 236.40 0.0 0 ..................... 39,292.5 1,488,130 44.01 KY ........ 308.9 104,379 372.78 234.0 9 0.50 7,861.7 1,149,107 155.33 LA ......... 32,778.8 3,163,446 105.86 921.7 0 ..................... 447.8 25,021 96.05 ME ........ 0.0 0 ..................... 0.0 0 ..................... 0.0 0 .....................MD ........ 0.0 0 ..................... 0.0 0 ..................... 715.6 103,549 145.99 MA ........ 0.0 0 ..................... 0.0 0 ..................... 0.0 0 .....................MI ......... 10.8 7,300 675.93 6.1 610 100.00 814.9 102,822 172.00 MN ........ 228.1 12,846 332.80 1,862.0 12,859 82.32 413.0 40,212 97.91 MS ........ 13,452.4 972,643 87.37 775.0 0 ..................... 2,230.9 158,538 89.34 MO ....... 1,070.1 118,760 164.58 545.6 0 ..................... 33,721.2 2,854,491 99.15 MT ........ 0.0 0 ..................... 0.0 0 ..................... 0.0 0 .....................NE ........ 8.8 4,778 542.95 0.0 0 ..................... 5,900.4 423,657 78.17 NH ........ 0.0 0 ..................... 0.0 0 ..................... 0.0 0 .....................NJ ......... 0.0 0 ..................... 0.0 0 ..................... 0.0 0 .....................NM ........ 0.0 0 ..................... 0.0 0 ..................... 0.0 0 .....................NY ........ 2.3 2,000 869.57 0.0 0 ..................... 0.0 0 .....................NC ........ 28.4 5,458 192.18 0.0 0 ..................... 8,311.2 560,288 87.79 ND ........ 0.0 0 ..................... 0.0 0 ..................... 0.0 0 .....................OH ........ 76.1 24,379 320.35 39.2 473 105.11 15,509.3 1,565,775 107.00 OK ........ 415.5 63,174 152.04 79.7 0 ..................... 1,053.8 46,010 58.97 OR ........ 0.0 0 ..................... 0.0 0 ..................... 0.0 0 .....................PA ........ 2.0 1,500 750.00 0.0 0 ..................... 0.0 0 .....................PR ........ 0.0 0 ..................... 0.0 0 ..................... 0.0 0 .....................RI .......... * * * * * * * * * SC ........ 0.0 0 ..................... 0.0 0 ..................... 5,744.1 373,205 71.27 SD ........ 0.0 0 ..................... 0.0 0 ..................... 1,481.3 96,362 71.50 TN ........ 2,871.3 295,859 110.51 0.7 0 ..................... 5,034.2 384,440 85.18 TX ......... 381.1 53,558 140.54 0.0 0 ..................... 4,881.6 594,838 129.00 UT ........ 0.0 0 ..................... 0.0 0 ..................... 0.0 0 .....................VT ......... 0.0 0 ..................... 0.0 0 ..................... 0.0 0 .....................VA ........ 0.0 0 ..................... 0.0 0 ..................... 1,557.2 109,644 84.93 WA ....... 0.0 0 ..................... 0.0 0 ..................... 0.0 0 .....................WV ....... 0.0 0 ..................... 0.0 0 ..................... 0.0 0 .....................WI ......... 0.0 0 ..................... 946.6 71 16.14 309.8 55,584 179.42 WY ....... 0.0 0 ..................... 0.0 0 ..................... 0.0 0 .....................WY ....... 0.0 0 ..................... 0.0 0 ..................... 0.0 0 .....................
US ..... 74,629 8,302,841 129.00 8,566 84,313 142.01 238,946 22,915,596 108.81
1 Not including acres which receive no cost share. * Data withheld to avoid disclosure of individual operations. Note: Total acres treated may not add due to rounding.
FSA, Conservation and Environmental Programs Division, (530) 792-5594.
VerDate Aug 31 2005 13:44 Mar 01, 2012 Jkt 000000 PO 00000 Frm 00013 Fmt 1000 Sfmt 1000 H:\SHARED\DAPP\FPU\AGSTAT\MASTER~2\CHAPTR12\TABLE11.AG8 USDA
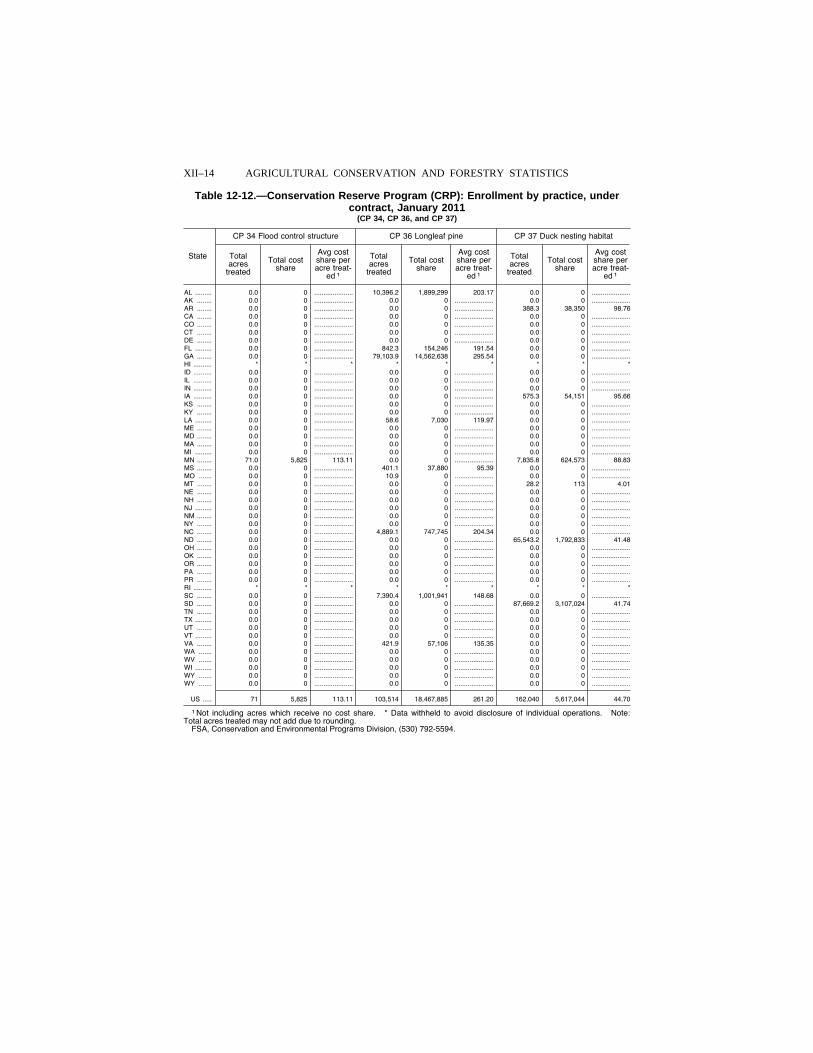
XII–14 AGRICULTURAL CONSERVATION AND FORESTRY STATISTICS
Table 12-12.—Conservation Reserve Program (CRP): Enrollment by practice, under contract, January 2011
(CP 34, CP 36, and CP 37)
State
CP 34 Flood control structure CP 36 Longleaf pine CP 37 Duck nesting habitat
Total acres
treated
Total cost share
Avg cost share per acre treat-
ed 1
Total acres
treated
Total cost share
Avg cost share per acre treat-
ed 1
Total acres
treated
Total cost share
Avg cost share per acre treat-
ed 1
AL ......... 0.0 0 ..................... 10,396.2 1,899,299 203.17 0.0 0 .....................AK ........ 0.0 0 ..................... 0.0 0 ..................... 0.0 0 .....................AR ........ 0.0 0 ..................... 0.0 0 ..................... 388.3 38,350 98.76 CA ........ 0.0 0 ..................... 0.0 0 ..................... 0.0 0 .....................CO ........ 0.0 0 ..................... 0.0 0 ..................... 0.0 0 .....................CT ........ 0.0 0 ..................... 0.0 0 ..................... 0.0 0 .....................DE ........ 0.0 0 ..................... 0.0 0 ..................... 0.0 0 .....................FL ......... 0.0 0 ..................... 842.3 154,246 191.54 0.0 0 .....................GA ........ 0.0 0 ..................... 79,103.9 14,562,638 295.54 0.0 0 .....................HI .......... * * * * * * * * * ID .......... 0.0 0 ..................... 0.0 0 ..................... 0.0 0 .....................IL .......... 0.0 0 ..................... 0.0 0 ..................... 0.0 0 .....................IN .......... 0.0 0 ..................... 0.0 0 ..................... 0.0 0 .....................IA .......... 0.0 0 ..................... 0.0 0 ..................... 575.3 54,151 95.66 KS ........ 0.0 0 ..................... 0.0 0 ..................... 0.0 0 .....................KY ........ 0.0 0 ..................... 0.0 0 ..................... 0.0 0 .....................LA ......... 0.0 0 ..................... 58.6 7,030 119.97 0.0 0 .....................ME ........ 0.0 0 ..................... 0.0 0 ..................... 0.0 0 .....................MD ........ 0.0 0 ..................... 0.0 0 ..................... 0.0 0 .....................MA ........ 0.0 0 ..................... 0.0 0 ..................... 0.0 0 .....................MI ......... 0.0 0 ..................... 0.0 0 ..................... 0.0 0 .....................MN ........ 71.0 5,825 113.11 0.0 0 ..................... 7,835.8 624,573 88.83 MS ........ 0.0 0 ..................... 401.1 37,880 95.39 0.0 0 .....................MO ....... 0.0 0 ..................... 10.9 0 ..................... 0.0 0 .....................MT ........ 0.0 0 ..................... 0.0 0 ..................... 28.2 113 4.01 NE ........ 0.0 0 ..................... 0.0 0 ..................... 0.0 0 .....................NH ........ 0.0 0 ..................... 0.0 0 ..................... 0.0 0 .....................NJ ......... 0.0 0 ..................... 0.0 0 ..................... 0.0 0 .....................NM ........ 0.0 0 ..................... 0.0 0 ..................... 0.0 0 .....................NY ........ 0.0 0 ..................... 0.0 0 ..................... 0.0 0 .....................NC ........ 0.0 0 ..................... 4,889.1 747,745 204.34 0.0 0 .....................ND ........ 0.0 0 ..................... 0.0 0 ..................... 65,543.2 1,792,833 41.48 OH ........ 0.0 0 ..................... 0.0 0 ..................... 0.0 0 .....................OK ........ 0.0 0 ..................... 0.0 0 ..................... 0.0 0 .....................OR ........ 0.0 0 ..................... 0.0 0 ..................... 0.0 0 .....................PA ........ 0.0 0 ..................... 0.0 0 ..................... 0.0 0 .....................PR ........ 0.0 0 ..................... 0.0 0 ..................... 0.0 0 .....................RI .......... * * * * * * * * * SC ........ 0.0 0 ..................... 7,390.4 1,001,941 148.68 0.0 0 .....................SD ........ 0.0 0 ..................... 0.0 0 ..................... 87,669.2 3,107,024 41.74 TN ........ 0.0 0 ..................... 0.0 0 ..................... 0.0 0 .....................TX ......... 0.0 0 ..................... 0.0 0 ..................... 0.0 0 .....................UT ........ 0.0 0 ..................... 0.0 0 ..................... 0.0 0 .....................VT ......... 0.0 0 ..................... 0.0 0 ..................... 0.0 0 .....................VA ........ 0.0 0 ..................... 421.9 57,106 135.35 0.0 0 .....................WA ....... 0.0 0 ..................... 0.0 0 ..................... 0.0 0 .....................WV ....... 0.0 0 ..................... 0.0 0 ..................... 0.0 0 .....................WI ......... 0.0 0 ..................... 0.0 0 ..................... 0.0 0 .....................WY ....... 0.0 0 ..................... 0.0 0 ..................... 0.0 0 .....................WY ....... 0.0 0 ..................... 0.0 0 ..................... 0.0 0 .....................
US ..... 71 5,825 113.11 103,514 18,467,885 261.20 162,040 5,617,044 44.70
1 Not including acres which receive no cost share. * Data withheld to avoid disclosure of individual operations. Note: Total acres treated may not add due to rounding.
FSA, Conservation and Environmental Programs Division, (530) 792-5594.
VerDate Aug 31 2005 13:44 Mar 01, 2012 Jkt 000000 PO 00000 Frm 00014 Fmt 1000 Sfmt 1000 H:\SHARED\DAPP\FPU\AGSTAT\MASTER~2\CHAPTR12\TABLE12.AG8 USDA
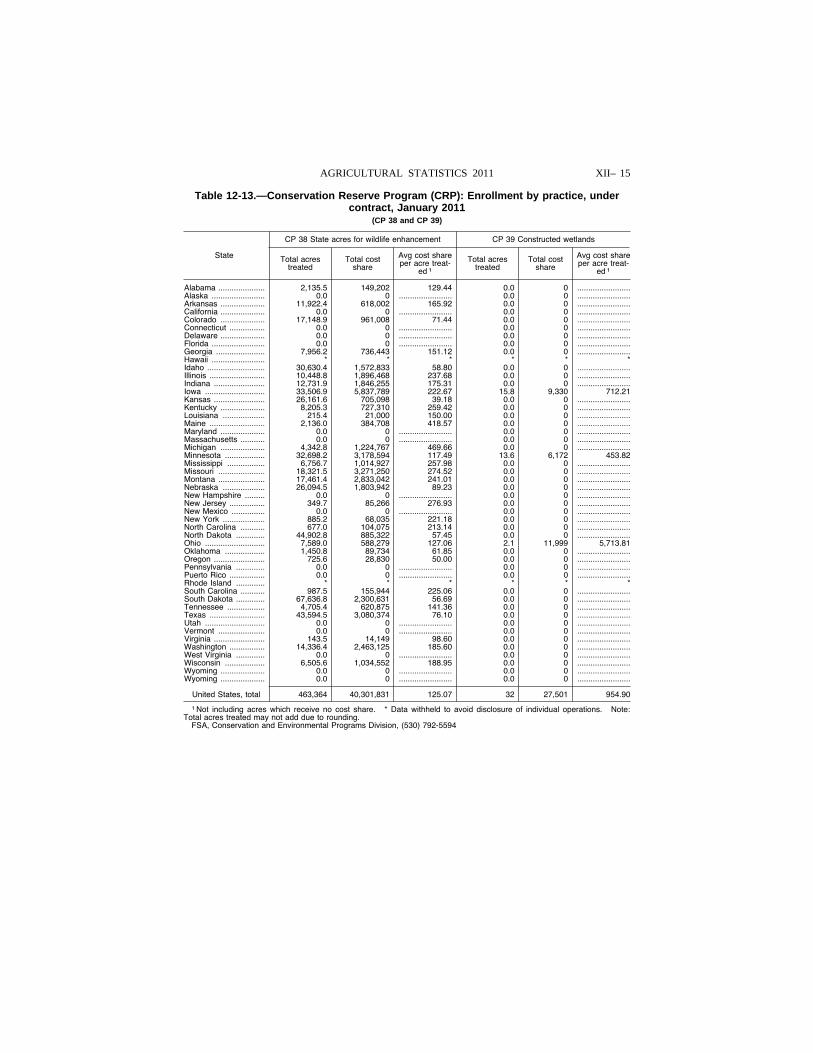
XII– 15 AGRICULTURAL STATISTICS 2011
Table 12-13.—Conservation Reserve Program (CRP): Enrollment by practice, under contract, January 2011
(CP 38 and CP 39)
State
CP 38 State acres for wildlife enhancement CP 39 Constructed wetlands
Total acres treated
Total cost share
Avg cost share per acre treat-
ed 1
Total acres treated
Total cost share
Avg cost share per acre treat-
ed 1
Alabama ..................... 2,135.5 149,202 129.44 0.0 0 ........................Alaska ........................ 0.0 0 ........................ 0.0 0 ........................Arkansas .................... 11,922.4 618,002 165.92 0.0 0 ........................California .................... 0.0 0 ........................ 0.0 0 ........................Colorado .................... 17,148.9 961,008 71.44 0.0 0 ........................Connecticut ................ 0.0 0 ........................ 0.0 0 ........................Delaware .................... 0.0 0 ........................ 0.0 0 ........................Florida ........................ 0.0 0 ........................ 0.0 0 ........................Georgia ...................... 7,956.2 736,443 151.12 0.0 0 ........................Hawaii ........................ * * * * * * Idaho .......................... 30,630.4 1,572,833 58.80 0.0 0 ........................Illinois ......................... 10,448.8 1,896,468 237.68 0.0 0 ........................Indiana ....................... 12,731.9 1,846,255 175.31 0.0 0 ........................Iowa ........................... 33,506.9 5,837,789 222.67 15.8 9,330 712.21 Kansas ....................... 26,161.6 705,098 39.18 0.0 0 ........................Kentucky .................... 8,205.3 727,310 259.42 0.0 0 ........................Louisiana ................... 215.4 21,000 150.00 0.0 0 ........................Maine ......................... 2,136.0 384,708 418.57 0.0 0 ........................Maryland .................... 0.0 0 ........................ 0.0 0 ........................Massachusetts ........... 0.0 0 ........................ 0.0 0 ........................Michigan .................... 4,342.8 1,224,767 469.66 0.0 0 ........................Minnesota .................. 32,698.2 3,178,594 117.49 13.6 6,172 453.82 Mississippi ................. 6,756.7 1,014,927 257.98 0.0 0 ........................Missouri ..................... 18,321.5 3,271,250 274.52 0.0 0 ........................Montana ..................... 17,461.4 2,833,042 241.01 0.0 0 ........................Nebraska ................... 26,094.5 1,803,942 89.23 0.0 0 ........................New Hampshire ......... 0.0 0 ........................ 0.0 0 ........................New Jersey ................ 349.7 85,266 276.93 0.0 0 ........................New Mexico ............... 0.0 0 ........................ 0.0 0 ........................New York ................... 885.2 68,035 221.18 0.0 0 ........................North Carolina ........... 677.0 104,075 213.14 0.0 0 ........................North Dakota ............. 44,902.8 885,322 57.45 0.0 0 ........................Ohio ........................... 7,589.0 588,279 127.06 2.1 11,999 5,713.81 Oklahoma .................. 1,450.8 89,734 61.85 0.0 0 ........................Oregon ....................... 725.6 28,830 50.00 0.0 0 ........................Pennsylvania ............. 0.0 0 ........................ 0.0 0 ........................Puerto Rico ................ 0.0 0 ........................ 0.0 0 ........................Rhode Island ............. * * * * * * South Carolina ........... 987.5 155,944 225.06 0.0 0 ........................South Dakota ............. 67,636.8 2,300,631 56.69 0.0 0 ........................Tennessee ................. 4,705.4 620,875 141.36 0.0 0 ........................Texas ......................... 43,594.5 3,080,374 76.10 0.0 0 ........................Utah ........................... 0.0 0 ........................ 0.0 0 ........................Vermont ..................... 0.0 0 ........................ 0.0 0 ........................Virginia ....................... 143.5 14,149 98.60 0.0 0 ........................Washington ................ 14,336.4 2,463,125 185.60 0.0 0 ........................West Virginia ............. 0.0 0 ........................ 0.0 0 ........................Wisconsin .................. 6,505.6 1,034,552 188.95 0.0 0 ........................Wyoming .................... 0.0 0 ........................ 0.0 0 ........................Wyoming .................... 0.0 0 ........................ 0.0 0 ........................
United States, total 463,364 40,301,831 125.07 32 27,501 954.90
1 Not including acres which receive no cost share. * Data withheld to avoid disclosure of individual operations. Note: Total acres treated may not add due to rounding.
FSA, Conservation and Environmental Programs Division, (530) 792-5594
VerDate Aug 31 2005 13:44 Mar 01, 2012 Jkt 000000 PO 00000 Frm 00015 Fmt 1000 Sfmt 1000 H:\SHARED\DAPP\FPU\AGSTAT\MASTER~2\CHAPTR12\TABLE13.AG8 USDA
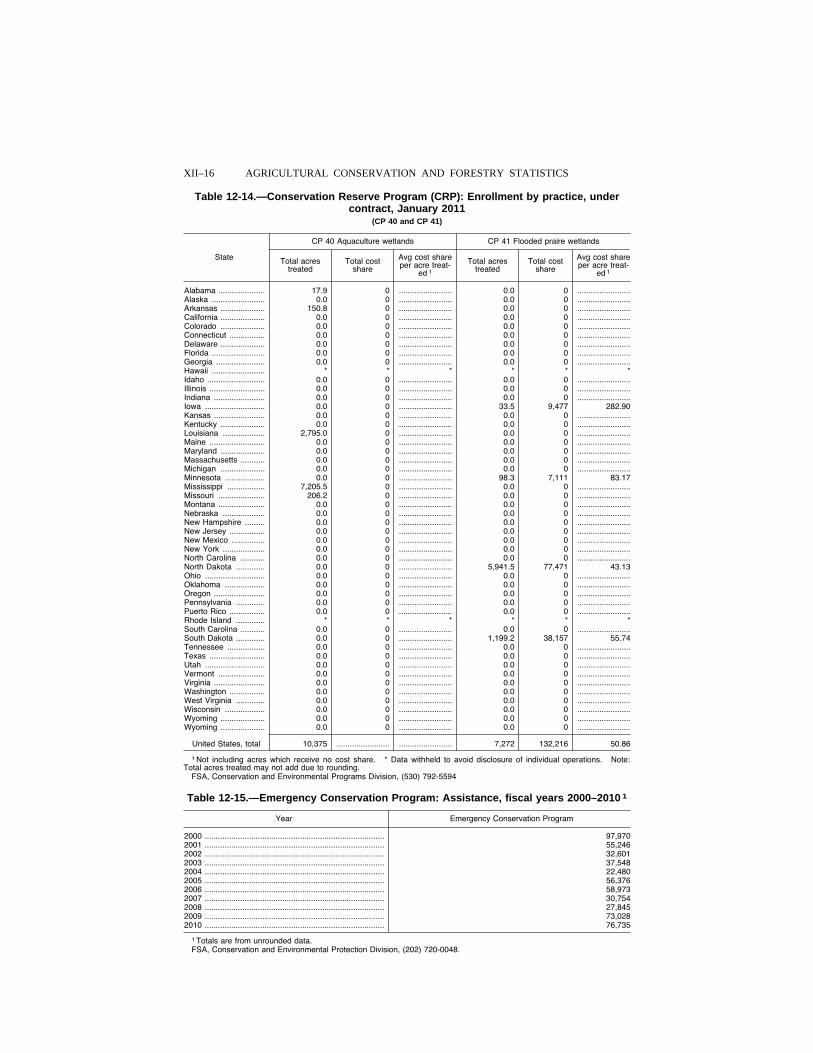
XII–16 AGRICULTURAL CONSERVATION AND FORESTRY STATISTICS
Table 12-14.—Conservation Reserve Program (CRP): Enrollment by practice, under contract, January 2011
(CP 40 and CP 41)
State
CP 40 Aquaculture wetlands CP 41 Flooded praire wetlands
Total acres treated
Total cost share
Avg cost share per acre treat-
ed 1
Total acres treated
Total cost share
Avg cost share per acre treat-
ed 1
Alabama ..................... 17.9 0 ........................ 0.0 0 ........................Alaska ........................ 0.0 0 ........................ 0.0 0 ........................Arkansas .................... 150.8 0 ........................ 0.0 0 ........................California .................... 0.0 0 ........................ 0.0 0 ........................Colorado .................... 0.0 0 ........................ 0.0 0 ........................Connecticut ................ 0.0 0 ........................ 0.0 0 ........................Delaware .................... 0.0 0 ........................ 0.0 0 ........................Florida ........................ 0.0 0 ........................ 0.0 0 ........................Georgia ...................... 0.0 0 ........................ 0.0 0 ........................Hawaii ........................ * * * * * * Idaho .......................... 0.0 0 ........................ 0.0 0 ........................Illinois ......................... 0.0 0 ........................ 0.0 0 ........................Indiana ....................... 0.0 0 ........................ 0.0 0 ........................Iowa ........................... 0.0 0 ........................ 33.5 9,477 282.90 Kansas ....................... 0.0 0 ........................ 0.0 0 ........................Kentucky .................... 0.0 0 ........................ 0.0 0 ........................Louisiana ................... 2,795.0 0 ........................ 0.0 0 ........................Maine ......................... 0.0 0 ........................ 0.0 0 ........................Maryland .................... 0.0 0 ........................ 0.0 0 ........................Massachusetts ........... 0.0 0 ........................ 0.0 0 ........................Michigan .................... 0.0 0 ........................ 0.0 0 ........................Minnesota .................. 0.0 0 ........................ 98.3 7,111 83.17 Mississippi ................. 7,205.5 0 ........................ 0.0 0 ........................Missouri ..................... 206.2 0 ........................ 0.0 0 ........................Montana ..................... 0.0 0 ........................ 0.0 0 ........................Nebraska ................... 0.0 0 ........................ 0.0 0 ........................New Hampshire ......... 0.0 0 ........................ 0.0 0 ........................New Jersey ................ 0.0 0 ........................ 0.0 0 ........................New Mexico ............... 0.0 0 ........................ 0.0 0 ........................New York ................... 0.0 0 ........................ 0.0 0 ........................North Carolina ........... 0.0 0 ........................ 0.0 0 ........................North Dakota ............. 0.0 0 ........................ 5,941.5 77,471 43.13 Ohio ........................... 0.0 0 ........................ 0.0 0 ........................Oklahoma .................. 0.0 0 ........................ 0.0 0 ........................Oregon ....................... 0.0 0 ........................ 0.0 0 ........................Pennsylvania ............. 0.0 0 ........................ 0.0 0 ........................Puerto Rico ................ 0.0 0 ........................ 0.0 0 ........................Rhode Island ............. * * * * * * South Carolina ........... 0.0 0 ........................ 0.0 0 ........................South Dakota ............. 0.0 0 ........................ 1,199.2 38,157 55.74 Tennessee ................. 0.0 0 ........................ 0.0 0 ........................Texas ......................... 0.0 0 ........................ 0.0 0 ........................Utah ........................... 0.0 0 ........................ 0.0 0 ........................Vermont ..................... 0.0 0 ........................ 0.0 0 ........................Virginia ....................... 0.0 0 ........................ 0.0 0 ........................Washington ................ 0.0 0 ........................ 0.0 0 ........................West Virginia ............. 0.0 0 ........................ 0.0 0 ........................Wisconsin .................. 0.0 0 ........................ 0.0 0 ........................Wyoming .................... 0.0 0 ........................ 0.0 0 ........................Wyoming .................... 0.0 0 ........................ 0.0 0 ........................
United States, total 10,375 ........................ ........................ 7,272 132,216 50.86
1 Not including acres which receive no cost share. * Data withheld to avoid disclosure of individual operations. Note: Total acres treated may not add due to rounding.
FSA, Conservation and Environmental Programs Division, (530) 792-5594
Table 12-15.—Emergency Conservation Program: Assistance, fiscal years 2000–2010 1
Year Emergency Conservation Program
2000 ................................................................................. 97,970 2001 ................................................................................. 55,246 2002 ................................................................................. 32,601 2003 ................................................................................. 37,548 2004 ................................................................................. 22,480 2005 ................................................................................. 56,376 2006 ................................................................................. 58,973 2007 ................................................................................. 30,754 2008 ................................................................................. 27,845 2009 ................................................................................. 73,028 2010 ................................................................................. 76,735
1 Totals are from unrounded data. FSA, Conservation and Environmental Protection Division, (202) 720-0048.
VerDate Aug 31 2005 13:44 Mar 01, 2012 Jkt 000000 PO 00000 Frm 00016 Fmt 1000 Sfmt 1000 H:\SHARED\DAPP\FPU\AGSTAT\MASTER~2\CHAPTR12\TABLE14.AG8 USDA
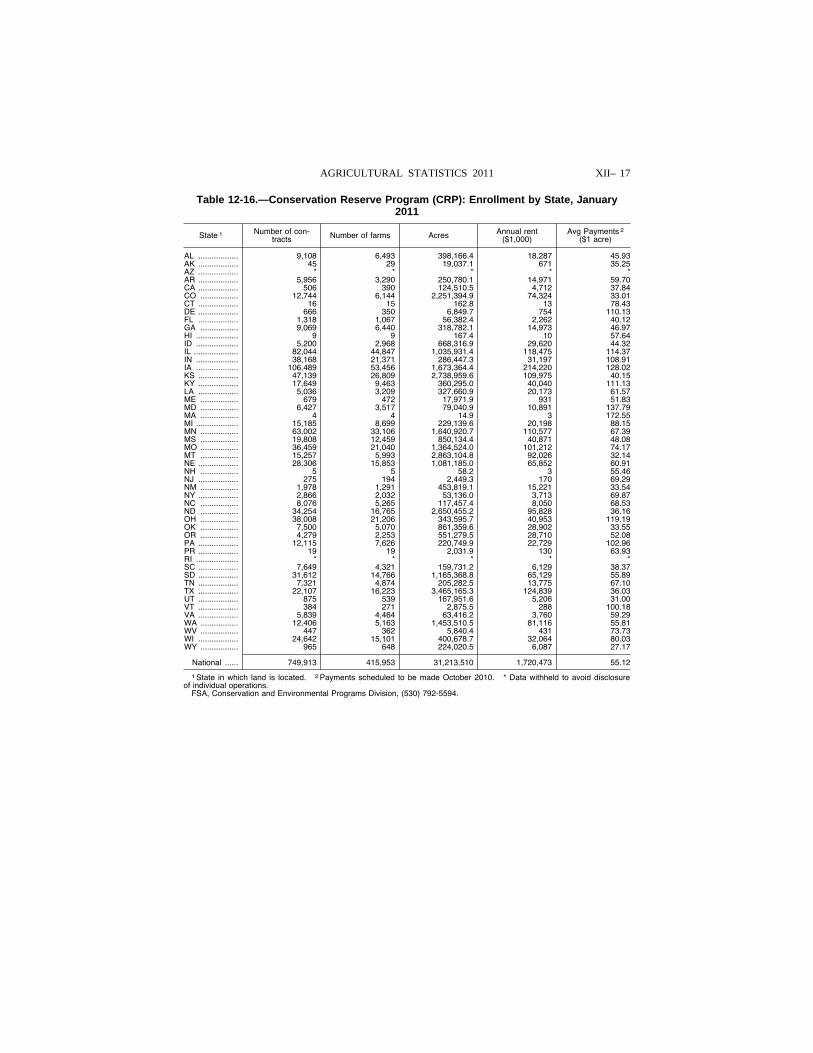
XII– 17 AGRICULTURAL STATISTICS 2011
Table 12-16.—Conservation Reserve Program (CRP): Enrollment by State, January 2011
State 1 Number of con-tracts Number of farms Acres Annual rent
($1,000) Avg Payments 2
($1 acre)
AL .................. 9,108 6,493 398,166.4 18,287 45.93 AK .................. 45 29 19,037.1 671 35.25 AZ .................. * * * * * AR .................. 5,956 3,290 250,780.1 14,971 59.70 CA .................. 506 390 124,510.5 4,712 37.84 CO ................. 12,744 6,144 2,251,394.9 74,324 33.01 CT .................. 16 15 162.8 13 78.43 DE .................. 666 350 6,849.7 754 110.13 FL .................. 1,318 1,067 56,382.4 2,262 40.12 GA ................. 9,069 6,440 318,782.1 14,973 46.97 HI ................... 9 9 167.4 10 57.64 ID ................... 5,200 2,968 668,316.9 29,620 44.32 IL .................... 82,044 44,847 1,035,931.4 118,475 114.37 IN ................... 38,168 21,371 286,447.3 31,197 108.91 IA ................... 106,489 53,456 1,673,364.4 214,220 128.02 KS .................. 47,139 26,809 2,738,959.6 109,975 40.15 KY .................. 17,649 9,463 360,295.0 40,040 111.13 LA .................. 5,036 3,209 327,660.9 20,173 61.57 ME ................. 679 472 17,971.9 931 51.83 MD ................. 6,427 3,517 79,040.9 10,891 137.79 MA ................. 4 4 14.9 3 172.55 MI ................... 15,185 8,699 229,139.6 20,198 88.15 MN ................. 63,002 33,106 1,640,920.7 110,577 67.39 MS ................. 19,808 12,459 850,134.4 40,871 48.08 MO ................. 36,459 21,040 1,364,524.0 101,212 74.17 MT ................. 15,257 5,993 2,863,104.8 92,026 32.14 NE .................. 28,306 15,853 1,081,185.0 65,852 60.91 NH ................. 5 5 58.2 3 55.46 NJ .................. 275 194 2,449.3 170 69.29 NM ................. 1,978 1,291 453,819.1 15,221 33.54 NY .................. 2,866 2,032 53,136.0 3,713 69.87 NC ................. 8,076 5,265 117,457.4 8,050 68.53 ND ................. 34,254 16,765 2,650,455.2 95,828 36.16 OH ................. 38,008 21,206 343,595.7 40,953 119.19 OK ................. 7,500 5,070 861,359.6 28,902 33.55 OR ................. 4,279 2,253 551,279.5 28,710 52.08 PA .................. 12,115 7,626 220,749.9 22,729 102.96 PR .................. 19 19 2,031.9 130 63.93 RI ................... * * * * * SC .................. 7,649 4,321 159,731.2 6,129 38.37 SD .................. 31,612 14,766 1,165,368.8 65,129 55.89 TN .................. 7,321 4,874 205,282.5 13,775 67.10 TX .................. 22,107 16,223 3,465,165.3 124,839 36.03 UT .................. 875 539 167,951.6 5,206 31.00 VT .................. 384 271 2,875.5 288 100.18 VA .................. 5,839 4,464 63,416.2 3,760 59.29 WA ................. 12,406 5,163 1,453,510.5 81,116 55.81 WV ................. 447 362 5,840.4 431 73.73 WI .................. 24,642 15,101 400,678.7 32,064 80.03 WY ................. 965 648 224,020.5 6,087 27.17
National ...... 749,913 415,953 31,213,510 1,720,473 55.12
1 State in which land is located. 2 Payments scheduled to be made October 2010. * Data withheld to avoid disclosure of individual operations.
FSA, Conservation and Environmental Programs Division, (530) 792-5594.
VerDate Aug 31 2005 13:44 Mar 01, 2012 Jkt 000000 PO 00000 Frm 00017 Fmt 1000 Sfmt 1000 H:\SHARED\DAPP\FPU\AGSTAT\MASTER~2\CHAPTR12\TABLE16.AG8 USDA
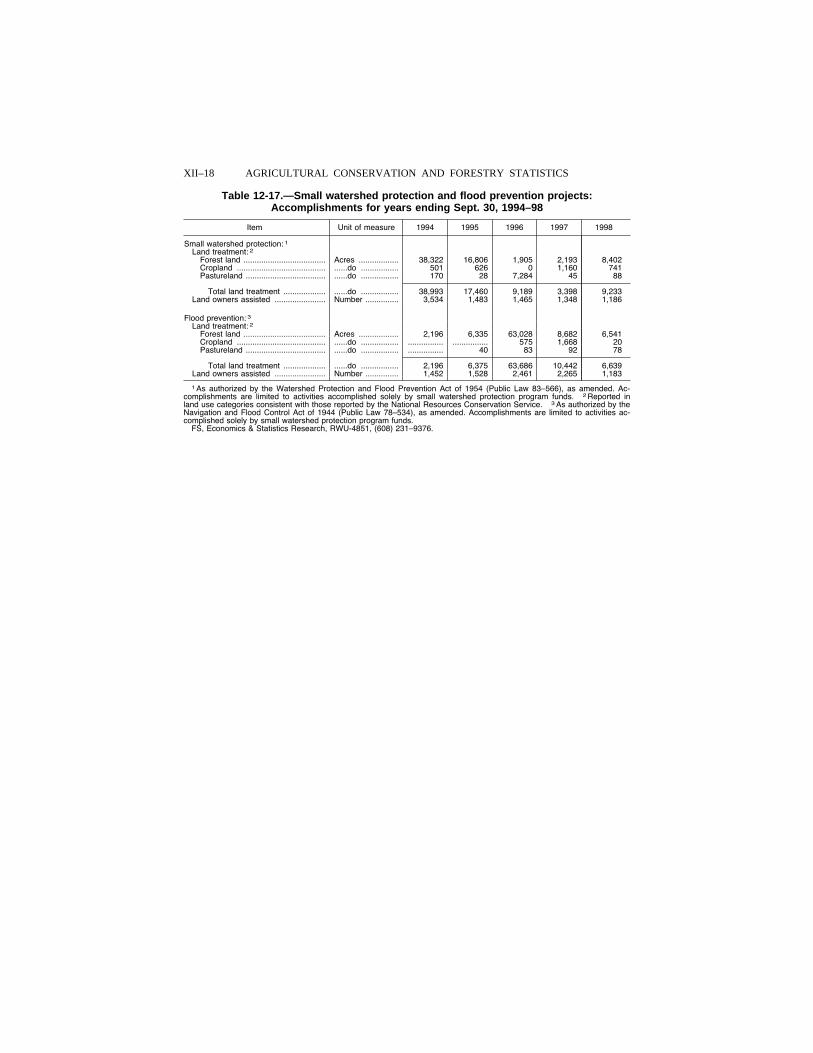
XII–18 AGRICULTURAL CONSERVATION AND FORESTRY STATISTICS
Table 12-17.—Small watershed protection and flood prevention projects: Accomplishments for years ending Sept. 30, 1994–98
Item Unit of measure 1994 1995 1996 1997 1998
Small watershed protection: 1 Land treatment: 2
Forest land ..................................... Acres .................. 38,322 16,806 1,905 2,193 8,402 Cropland ........................................ ......do ................. 501 626 0 1,160 741 Pastureland .................................... ......do ................. 170 28 7,284 45 88
Total land treatment ................... ......do ................. 38,993 17,460 9,189 3,398 9,233 Land owners assisted ....................... Number ............... 3,534 1,483 1,465 1,348 1,186
Flood prevention: 3 Land treatment: 2
Forest land ..................................... Acres .................. 2,196 6,335 63,028 8,682 6,541 Cropland ........................................ ......do ................. ................ ................ 575 1,668 20 Pastureland .................................... ......do ................. ................ 40 83 92 78
Total land treatment ................... ......do ................. 2,196 6,375 63,686 10,442 6,639 Land owners assisted ....................... Number ............... 1,452 1,528 2,461 2,265 1,183
1 As authorized by the Watershed Protection and Flood Prevention Act of 1954 (Public Law 83–566), as amended. Ac-complishments are limited to activities accomplished solely by small watershed protection program funds. 2 Reported in land use categories consistent with those reported by the National Resources Conservation Service. 3 As authorized by the Navigation and Flood Control Act of 1944 (Public Law 78–534), as amended. Accomplishments are limited to activities ac-complished solely by small watershed protection program funds.
FS, Economics & Statistics Research, RWU-4851, (608) 231–9376.
VerDate Aug 31 2005 13:44 Mar 01, 2012 Jkt 000000 PO 00000 Frm 00018 Fmt 1000 Sfmt 1000 H:\SHARED\DAPP\FPU\AGSTAT\MASTER~2\CHAPTR12\TABLE17.AG8 USDA
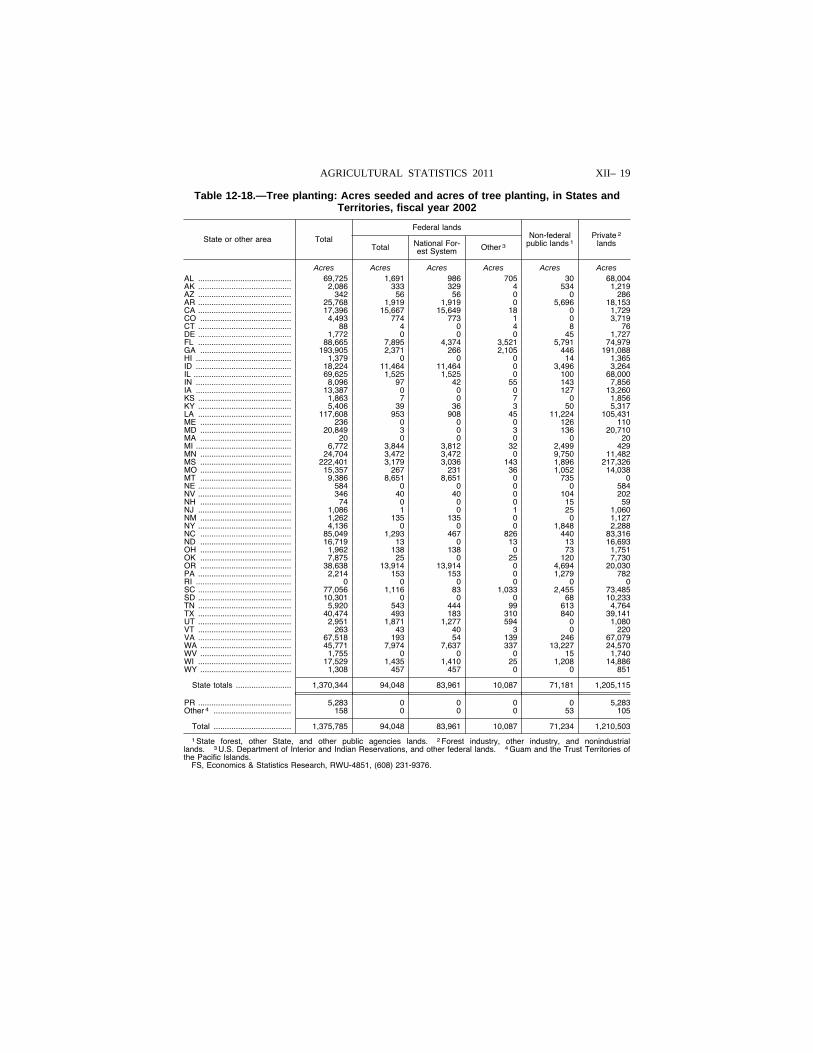
XII– 19 AGRICULTURAL STATISTICS 2011
Table 12-18.—Tree planting: Acres seeded and acres of tree planting, in States and Territories, fiscal year 2002
State or other area Total
Federal lands Non-federal
public lands 1 Private 2
lands Total National For-est System Other 3
Acres Acres Acres Acres Acres Acres AL .......................................... 69,725 1,691 986 705 30 68,004 AK .......................................... 2,086 333 329 4 534 1,219 AZ .......................................... 342 56 56 0 0 286 AR .......................................... 25,768 1,919 1,919 0 5,696 18,153 CA .......................................... 17,396 15,667 15,649 18 0 1,729 CO ......................................... 4,493 774 773 1 0 3,719 CT .......................................... 88 4 0 4 8 76 DE .......................................... 1,772 0 0 0 45 1,727 FL .......................................... 88,665 7,895 4,374 3,521 5,791 74,979 GA ......................................... 193,905 2,371 266 2,105 446 191,088 HI ........................................... 1,379 0 0 0 14 1,365 ID ........................................... 18,224 11,464 11,464 0 3,496 3,264 IL ............................................ 69,625 1,525 1,525 0 100 68,000 IN ........................................... 8,096 97 42 55 143 7,856 IA ........................................... 13,387 0 0 0 127 13,260 KS .......................................... 1,863 7 0 7 0 1,856 KY .......................................... 5,406 39 36 3 50 5,317 LA .......................................... 117,608 953 908 45 11,224 105,431 ME ......................................... 236 0 0 0 126 110 MD ......................................... 20,849 3 0 3 136 20,710 MA ......................................... 20 0 0 0 0 20 MI ........................................... 6,772 3,844 3,812 32 2,499 429 MN ......................................... 24,704 3,472 3,472 0 9,750 11,482 MS ......................................... 222,401 3,179 3,036 143 1,896 217,326 MO ......................................... 15,357 267 231 36 1,052 14,038 MT ......................................... 9,386 8,651 8,651 0 735 0 NE .......................................... 584 0 0 0 0 584 NV .......................................... 346 40 40 0 104 202 NH ......................................... 74 0 0 0 15 59 NJ .......................................... 1,086 1 0 1 25 1,060 NM ......................................... 1,262 135 135 0 0 1,127 NY .......................................... 4,136 0 0 0 1,848 2,288 NC ......................................... 85,049 1,293 467 826 440 83,316 ND ......................................... 16,719 13 0 13 13 16,693 OH ......................................... 1,962 138 138 0 73 1,751 OK ......................................... 7,875 25 0 25 120 7,730 OR ......................................... 38,638 13,914 13,914 0 4,694 20,030 PA .......................................... 2,214 153 153 0 1,279 782 RI ........................................... 0 0 0 0 0 0 SC .......................................... 77,056 1,116 83 1,033 2,455 73,485 SD .......................................... 10,301 0 0 0 68 10,233 TN .......................................... 5,920 543 444 99 613 4,764 TX .......................................... 40,474 493 183 310 840 39,141 UT .......................................... 2,951 1,871 1,277 594 0 1,080 VT .......................................... 263 43 40 3 0 220 VA .......................................... 67,518 193 54 139 246 67,079 WA ......................................... 45,771 7,974 7,637 337 13,227 24,570 WV ......................................... 1,755 0 0 0 15 1,740 WI .......................................... 17,529 1,435 1,410 25 1,208 14,886 WY ......................................... 1,308 457 457 0 0 851
State totals ......................... 1,370,344 94,048 83,961 10,087 71,181 1,205,115
PR .......................................... 5,283 0 0 0 0 5,283 Other 4 ................................... 158 0 0 0 53 105
Total ................................... 1,375,785 94,048 83,961 10,087 71,234 1,210,503
1 State forest, other State, and other public agencies lands. 2 Forest industry, other industry, and nonindustrial lands. 3 U.S. Department of Interior and Indian Reservations, and other federal lands. 4 Guam and the Trust Territories of the Pacific Islands.
FS, Economics & Statistics Research, RWU-4851, (608) 231-9376.
VerDate Aug 31 2005 13:44 Mar 01, 2012 Jkt 000000 PO 00000 Frm 00019 Fmt 1000 Sfmt 1000 H:\SHARED\DAPP\FPU\AGSTAT\MASTER~2\CHAPTR12\TABLE18.AG8 USDA
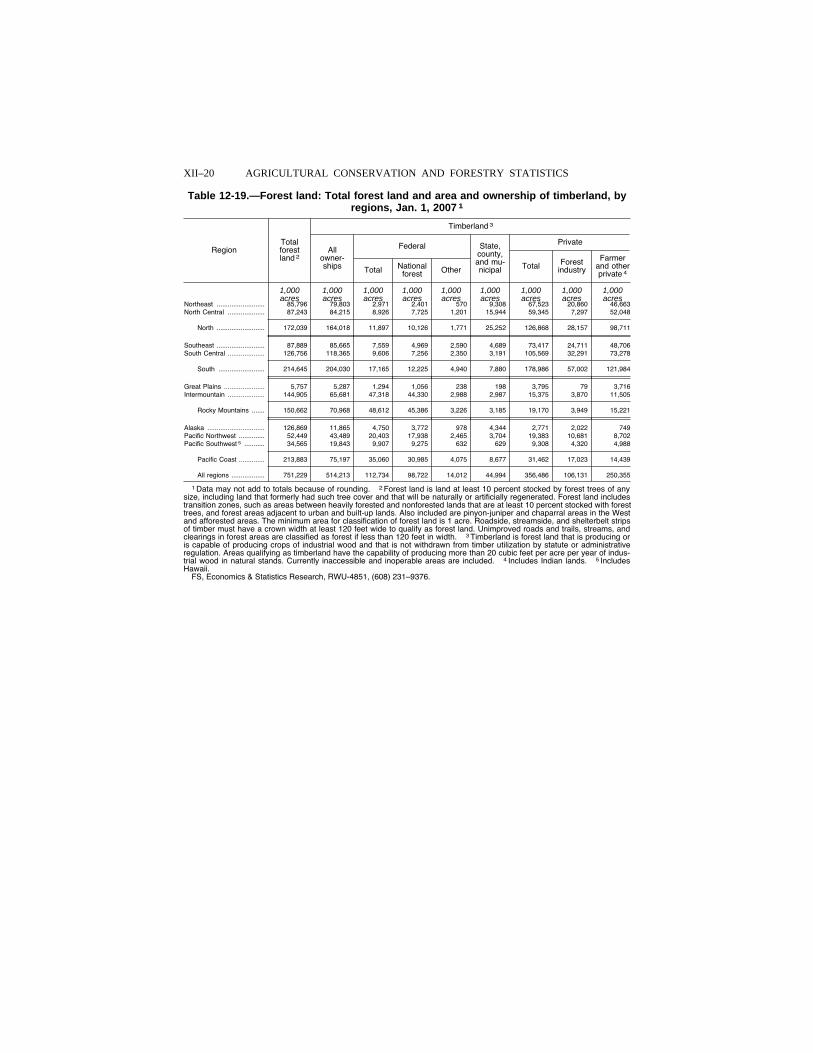
XII–20 AGRICULTURAL CONSERVATION AND FORESTRY STATISTICS
Table 12-19.—Forest land: Total forest land and area and ownership of timberland, by regions, Jan. 1, 2007 1
Region Total forest land 2
Timberland 3
All owner- ships
Federal State, county, and mu-nicipal
Private
Total National forest Other Total Forest
industry
Farmer and other private 4
1,000 1,000 1,000 1,000 1,000 1,000 1,000 1,000 1,000 acres acres acres acres acres acres acres acres acres
Northeast .......................... 85,796 79,803 2,971 2,401 570 9,308 67,523 20,860 46,663 North Central .................... 87,243 84,215 8,926 7,725 1,201 15,944 59,345 7,297 52,048
North .......................... 172,039 164,018 11,897 10,126 1,771 25,252 126,868 28,157 98,711
Southeast .......................... 87,889 85,665 7,559 4,969 2,590 4,689 73,417 24,711 48,706 South Central .................... 126,756 118,365 9,606 7,256 2,350 3,191 105,569 32,291 73,278
South ......................... 214,645 204,030 17,165 12,225 4,940 7,880 178,986 57,002 121,984
Great Plains ...................... 5,757 5,287 1,294 1,056 238 198 3,795 79 3,716 Intermountain .................... 144,905 65,681 47,318 44,330 2,988 2,987 15,375 3,870 11,505
Rocky Mountains ....... 150,662 70,968 48,612 45,386 3,226 3,185 19,170 3,949 15,221
Alaska ............................... 126,869 11,865 4,750 3,772 978 4,344 2,771 2,022 749 Pacific Northwest .............. 52,449 43,489 20,403 17,938 2,465 3,704 19,383 10,681 8,702 Pacific Southwest 5 ........... 34,565 19,843 9,907 9,275 632 629 9,308 4,320 4,988
Pacific Coast .............. 213,883 75,197 35,060 30,985 4,075 8,677 31,462 17,023 14,439
All regions .................. 751,229 514,213 112,734 98,722 14,012 44,994 356,486 106,131 250,355
1 Data may not add to totals because of rounding. 2 Forest land is land at least 10 percent stocked by forest trees of any size, including land that formerly had such tree cover and that will be naturally or artificially regenerated. Forest land includes transition zones, such as areas between heavily forested and nonforested lands that are at least 10 percent stocked with forest trees, and forest areas adjacent to urban and built-up lands. Also included are pinyon-juniper and chaparral areas in the West and afforested areas. The minimum area for classification of forest land is 1 acre. Roadside, streamside, and shelterbelt strips of timber must have a crown width at least 120 feet wide to qualify as forest land. Unimproved roads and trails, streams, and clearings in forest areas are classified as forest if less than 120 feet in width. 3 Timberland is forest land that is producing or is capable of producing crops of industrial wood and that is not withdrawn from timber utilization by statute or administrative regulation. Areas qualifying as timberland have the capability of producing more than 20 cubic feet per acre per year of indus-trial wood in natural stands. Currently inaccessible and inoperable areas are included. 4 Includes Indian lands. 5 Includes Hawaii.
FS, Economics & Statistics Research, RWU-4851, (608) 231–9376.
VerDate Aug 31 2005 13:44 Mar 01, 2012 Jkt 000000 PO 00000 Frm 00020 Fmt 1000 Sfmt 1000 H:\SHARED\DAPP\FPU\AGSTAT\MASTER~2\CHAPTR12\TABLE19.AG8 USDA
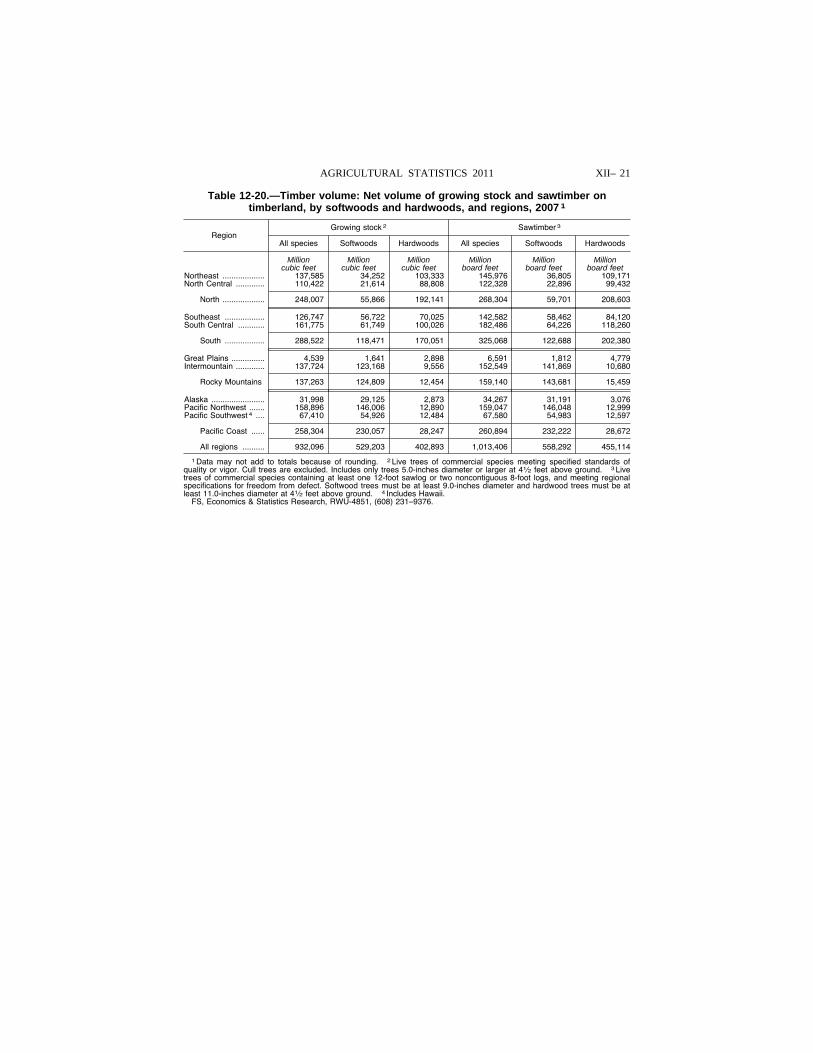
XII– 21 AGRICULTURAL STATISTICS 2011
Table 12-20.—Timber volume: Net volume of growing stock and sawtimber on timberland, by softwoods and hardwoods, and regions, 2007 1
Region Growing stock 2 Sawtimber 3
All species Softwoods Hardwoods All species Softwoods Hardwoods
Million Million Million Million Million Million cubic feet cubic feet cubic feet board feet board feet board feet
Northeast ................... 137,585 34,252 103,333 145,976 36,805 109,171 North Central ............. 110,422 21,614 88,808 122,328 22,896 99,432
North ................... 248,007 55,866 192,141 268,304 59,701 208,603
Southeast .................. 126,747 56,722 70,025 142,582 58,462 84,120 South Central ............ 161,775 61,749 100,026 182,486 64,226 118,260
South .................. 288,522 118,471 170,051 325,068 122,688 202,380
Great Plains ............... 4,539 1,641 2,898 6,591 1,812 4,779 Intermountain ............. 137,724 123,168 9,556 152,549 141,869 10,680
Rocky Mountains 137,263 124,809 12,454 159,140 143,681 15,459
Alaska ........................ 31,998 29,125 2,873 34,267 31,191 3,076 Pacific Northwest ....... 158,896 146,006 12,890 159,047 146,048 12,999 Pacific Southwest 4 .... 67,410 54,926 12,484 67,580 54,983 12,597
Pacific Coast ...... 258,304 230,057 28,247 260,894 232,222 28,672
All regions .......... 932,096 529,203 402,893 1,013,406 558,292 455,114
1 Data may not add to totals because of rounding. 2 Live trees of commercial species meeting specified standards of quality or vigor. Cull trees are excluded. Includes only trees 5.0-inches diameter or larger at 41⁄2 feet above ground. 3 Live trees of commercial species containing at least one 12-foot sawlog or two noncontiguous 8-foot logs, and meeting regional specifications for freedom from defect. Softwood trees must be at least 9.0-inches diameter and hardwood trees must be at least 11.0-inches diameter at 41⁄2 feet above ground. 4 Includes Hawaii.
FS, Economics & Statistics Research, RWU-4851, (608) 231–9376.
VerDate Aug 31 2005 13:44 Mar 01, 2012 Jkt 000000 PO 00000 Frm 00021 Fmt 1000 Sfmt 1000 H:\SHARED\DAPP\FPU\AGSTAT\MASTER~2\CHAPTR12\TABLE20.AG8 USDA
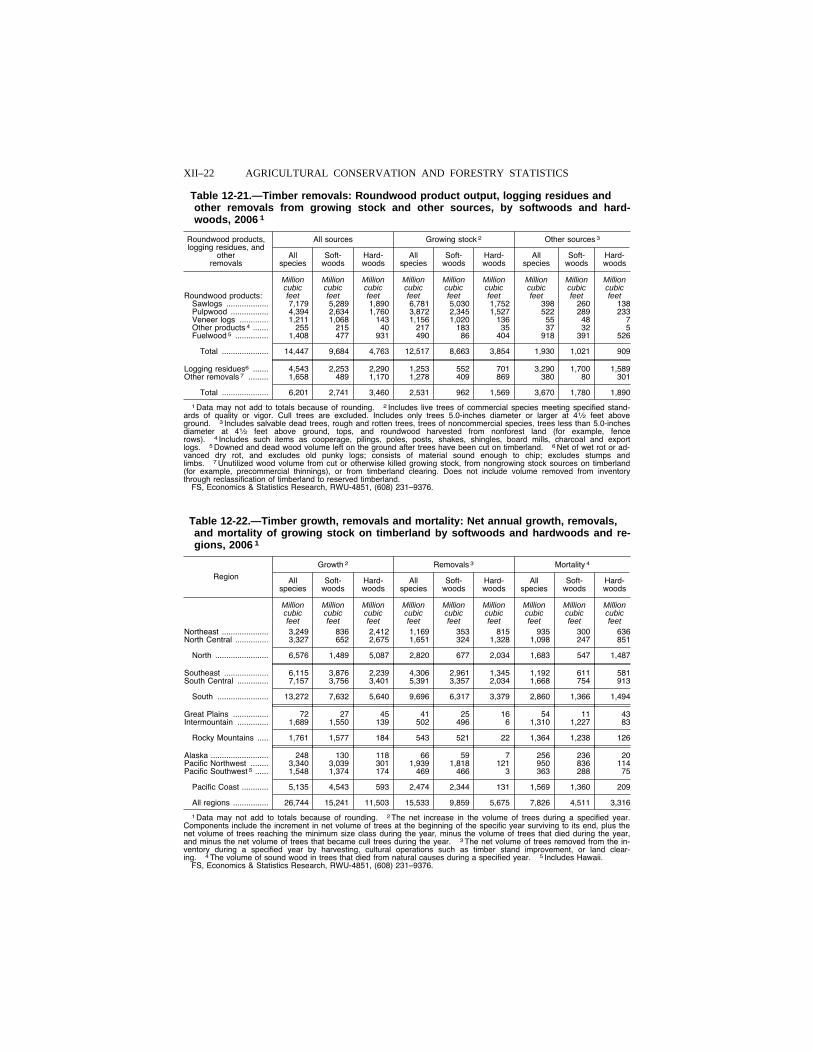
XII–22 AGRICULTURAL CONSERVATION AND FORESTRY STATISTICS
Table 12-21.—Timber removals: Roundwood product output, logging residues and other removals from growing stock and other sources, by softwoods and hard-woods, 2006 1
Roundwood products, logging residues, and
other removals
All sources Growing stock 2 Other sources 3
All species
Soft- woods
Hard-woods
All species
Soft- woods
Hard-woods
All species
Soft- woods
Hard-woods
Million Million Million Million Million Million Million Million Million cubic cubic cubic cubic cubic cubic cubic cubic cubic
Roundwood products: feet feet feet feet feet feet feet feet feet Sawlogs ................... 7,179 5,289 1,890 6,781 5,030 1,752 398 260 138 Pulpwood ................. 4,394 2,634 1,760 3,872 2,345 1,527 522 289 233 Veneer logs ............. 1,211 1,068 143 1,156 1,020 136 55 48 7 Other products 4 ....... 255 215 40 217 183 35 37 32 5 Fuelwood 5 ............... 1,408 477 931 490 86 404 918 391 526
Total ..................... 14,447 9,684 4,763 12,517 8,663 3,854 1,930 1,021 909
Logging residues6 ....... 4,543 2,253 2,290 1,253 552 701 3,290 1,700 1,589 Other removals 7 ......... 1,658 489 1,170 1,278 409 869 380 80 301
Total ..................... 6,201 2,741 3,460 2,531 962 1,569 3,670 1,780 1,890
1 Data may not add to totals because of rounding. 2 Includes live trees of commercial species meeting specified stand-ards of quality or vigor. Cull trees are excluded. Includes only trees 5.0-inches diameter or larger at 41⁄2 feet above ground. 3 Includes salvable dead trees, rough and rotten trees, trees of noncommercial species, trees less than 5.0-inches diameter at 41⁄2 feet above ground, tops, and roundwood harvested from nonforest land (for example, fence rows). 4 Includes such items as cooperage, pilings, poles, posts, shakes, shingles, board mills, charcoal and export logs. 5 Downed and dead wood volume left on the ground after trees have been cut on timberland. 6 Net of wet rot or ad-vanced dry rot, and excludes old punky logs; consists of material sound enough to chip; excludes stumps and limbs. 7 Unutilized wood volume from cut or otherwise killed growing stock, from nongrowing stock sources on timberland (for example, precommercial thinnings), or from timberland clearing. Does not include volume removed from inventory through reclassification of timberland to reserved timberland.
FS, Economics & Statistics Research, RWU-4851, (608) 231–9376.
Table 12-22.—Timber growth, removals and mortality: Net annual growth, removals, and mortality of growing stock on timberland by softwoods and hardwoods and re-gions, 2006 1
Region
Growth 2 Removals 3 Mortality 4
All species
Soft- woods
Hard-woods
All species
Soft- woods
Hard-woods
All species
Soft- woods
Hard-woods
Million Million Million Million Million Million Million Million Million cubic cubic cubic cubic cubic cubic cubic cubic cubic feet feet feet feet feet feet feet feet feet
Northeast ..................... 3,249 836 2,412 1,169 353 815 935 300 636 North Central ............... 3,327 652 2,675 1,651 324 1,328 1,098 247 851
North ........................ 6,576 1,489 5,087 2,820 677 2,034 1,683 547 1,487
Southeast .................... 6,115 3,876 2,239 4,306 2,961 1,345 1,192 611 581 South Central .............. 7,157 3,756 3,401 5,391 3,357 2,034 1,668 754 913
South ....................... 13,272 7,632 5,640 9,696 6,317 3,379 2,860 1,366 1,494
Great Plains ................ 72 27 45 41 25 16 54 11 43 Intermountain .............. 1,689 1,550 139 502 496 6 1,310 1,227 83
Rocky Mountains ..... 1,761 1,577 184 543 521 22 1,364 1,238 126
Alaska .......................... 248 130 118 66 59 7 256 236 20 Pacific Northwest ........ 3,340 3,039 301 1,939 1,818 121 950 836 114 Pacific Southwest 5 ...... 1,548 1,374 174 469 466 3 363 288 75
Pacific Coast ............ 5,135 4,543 593 2,474 2,344 131 1,569 1,360 209
All regions ................ 26,744 15,241 11,503 15,533 9,859 5,675 7,826 4,511 3,316
1 Data may not add to totals because of rounding. 2 The net increase in the volume of trees during a specified year. Components include the increment in net volume of trees at the beginning of the specific year surviving to its end, plus the net volume of trees reaching the minimum size class during the year, minus the volume of trees that died during the year, and minus the net volume of trees that became cull trees during the year. 3 The net volume of trees removed from the in-ventory during a specified year by harvesting, cultural operations such as timber stand improvement, or land clear-ing. 4 The volume of sound wood in trees that died from natural causes during a specified year. 5 Includes Hawaii.
FS, Economics & Statistics Research, RWU-4851, (608) 231–9376.
VerDate Aug 31 2005 13:44 Mar 01, 2012 Jkt 000000 PO 00000 Frm 00022 Fmt 1000 Sfmt 1000 H:\SHARED\DAPP\FPU\AGSTAT\MASTER~2\CHAPTR12\TABLE21.AG8 USDA
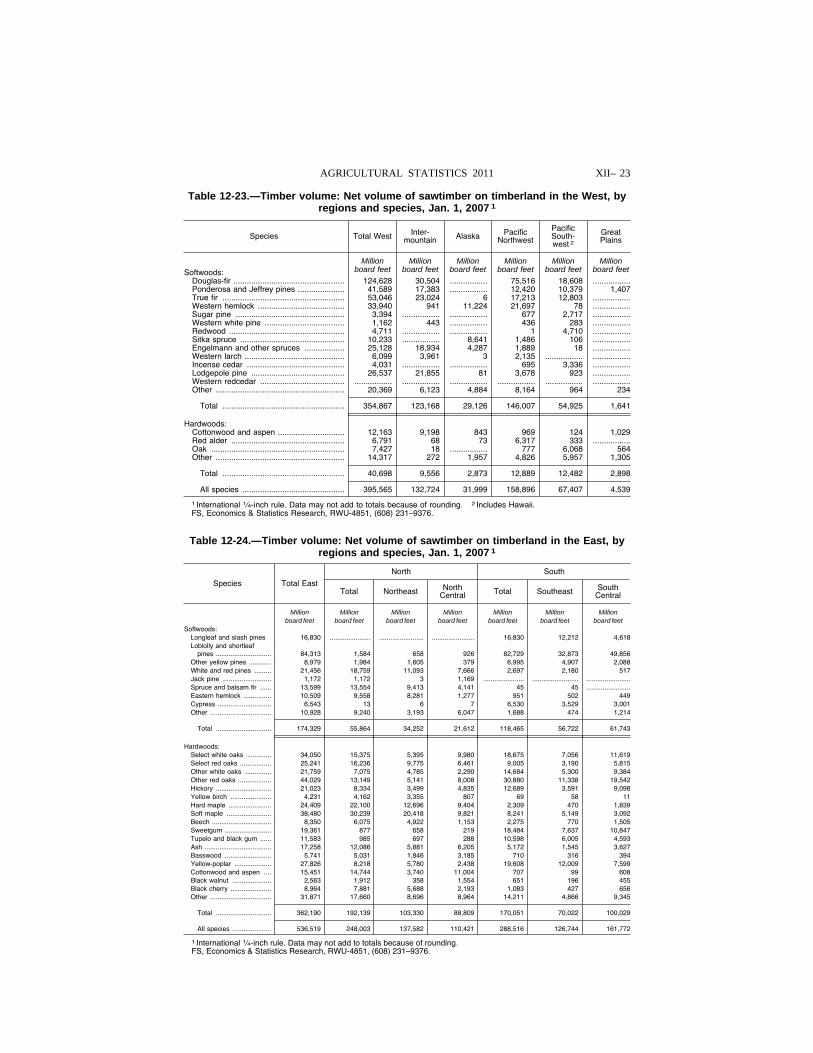
XII– 23 AGRICULTURAL STATISTICS 2011
Table 12-23.—Timber volume: Net volume of sawtimber on timberland in the West, by regions and species, Jan. 1, 2007 1
Species Total West Inter-mountain Alaska Pacific
Northwest
Pacific South-west 2
Great Plains
Million Million Million Million Million Million board feet board feet board feet board feet board feet board feet Softwoods:
Douglas-fir .................................................. 124,628 30,504 ................. 75,516 18,608 .................Ponderosa and Jeffrey pines ..................... 41,589 17,383 ................. 12,420 10,379 1,407 True fir ....................................................... 53,046 23,024 6 17,213 12,803 .................Western hemlock ....................................... 33,940 941 11,224 21,697 78 .................Sugar pine ................................................. 3,394 ................. ................. 677 2,717 .................Western white pine .................................... 1,162 443 ................. 436 283 .................Redwood .................................................... 4,711 ................. ................. 1 4,710 .................Sitka spruce ............................................... 10,233 ................. 8,641 1,486 106 .................Engelmann and other spruces .................. 25,128 18,934 4,287 1,889 18 .................Western larch ............................................. 6,099 3,961 3 2,135 ................. .................Incense cedar ............................................ 4,031 ................. ................. 695 3,336 .................Lodgepole pine .......................................... 26,537 21,855 81 3,678 923 .................Western redcedar ...................................... ................. ................. ................. ................. ................. .................Other .......................................................... 20,369 6,123 4,884 8,164 964 234
Total ....................................................... 354,867 123,168 29,126 146,007 54,925 1,641
Hardwoods: Cottonwood and aspen .............................. 12,163 9,198 843 969 124 1,029 Red alder ................................................... 6,791 68 73 6,317 333 .................Oak ............................................................ 7,427 18 ................. 777 6,068 564 Other .......................................................... 14,317 272 1,957 4,826 5,957 1,305
Total ....................................................... 40,698 9,556 2,873 12,889 12,482 2,898
All species .............................................. 395,565 132,724 31,999 158,896 67,407 4,539
1 International 1⁄4-inch rule. Data may not add to totals because of rounding. 2 Includes Hawaii. FS, Economics & Statistics Research, RWU-4851, (608) 231–9376.
Table 12-24.—Timber volume: Net volume of sawtimber on timberland in the East, by regions and species, Jan. 1, 2007 1
Species Total East
North South
Total Northeast North Central Total Southeast South
Central
Million Million Million Million Million Million Million board feet board feet board feet board feet board feet board feet board feet
Softwoods: Longleaf and slash pines 16,830 ...................... ........................ ....................... 16,830 12,212 4,618 Loblolly and shortleaf
pines .............................. 84,313 1,584 658 926 82,729 32,873 49,856 Other yellow pines ............ 8,979 1,984 1,605 379 6,995 4,907 2,088 White and red pines ......... 21,456 18,759 11,093 7,666 2,697 2,180 517 Jack pine .......................... 1,172 1,172 3 1,169 ...................... ......................... ........................Spruce and balsam fir ...... 13,599 13,554 9,413 4,141 45 45 ........................Eastern hemlock ............... 10,509 9,558 8,281 1,277 951 502 449 Cypress ............................. 6,543 13 6 7 6,530 3,529 3,001 Other ................................. 10,928 9,240 3,193 6,047 1,688 474 1,214
Total .............................. 174,329 55,864 34,252 21,612 118,465 56,722 61,743
Hardwoods: Select white oaks ............. 34,050 15,375 5,395 9,980 18,675 7,056 11,619 Select red oaks ................. 25,241 16,236 9,775 6,461 9,005 3,190 5,815 Other white oaks .............. 21,759 7,075 4,785 2,290 14,684 5,300 9,384 Other red oaks .................. 44,029 13,149 5,141 8,008 30,880 11,338 19,542 Hickory .............................. 21,023 8,334 3,499 4,835 12,689 3,591 9,098 Yellow birch ...................... 4,231 4,162 3,355 807 69 58 11 Hard maple ....................... 24,409 22,100 12,696 9,404 2,309 470 1,839 Soft maple ........................ 38,480 30,239 20,418 9,821 8,241 5,149 3,092 Beech ................................ 8,350 6,075 4,922 1,153 2,275 770 1,505 Sweetgum ......................... 19,361 877 658 219 18,484 7,637 10,847 Tupelo and black gum ...... 11,583 985 697 288 10,598 6,005 4,593 Ash .................................... 17,258 12,086 5,881 6,205 5,172 1,545 3,627 Basswood ......................... 5,741 5,031 1,846 3,185 710 316 394 Yellow-poplar .................... 27,826 8,218 5,780 2,438 19,608 12,009 7,599 Cottonwood and aspen .... 15,451 14,744 3,740 11,004 707 99 608 Black walnut ..................... 2,563 1,912 358 1,554 651 196 455 Black cherry ...................... 8,964 7,881 5,688 2,193 1,083 427 656 Other ................................. 31,871 17,660 8,696 8,964 14,211 4,866 9,345
Total .............................. 362,190 192,139 103,330 88,809 170,051 70,022 100,029
All species ..................... 536,519 248,003 137,582 110,421 288,516 126,744 161,772
1 International 1⁄4-inch rule. Data may not add to totals because of rounding. FS, Economics & Statistics Research, RWU-4851, (608) 231–9376.
VerDate Aug 31 2005 13:44 Mar 01, 2012 Jkt 000000 PO 00000 Frm 00023 Fmt 1000 Sfmt 1000 H:\SHARED\DAPP\FPU\AGSTAT\MASTER~2\CHAPTR12\TABLE23.AG8 USDA
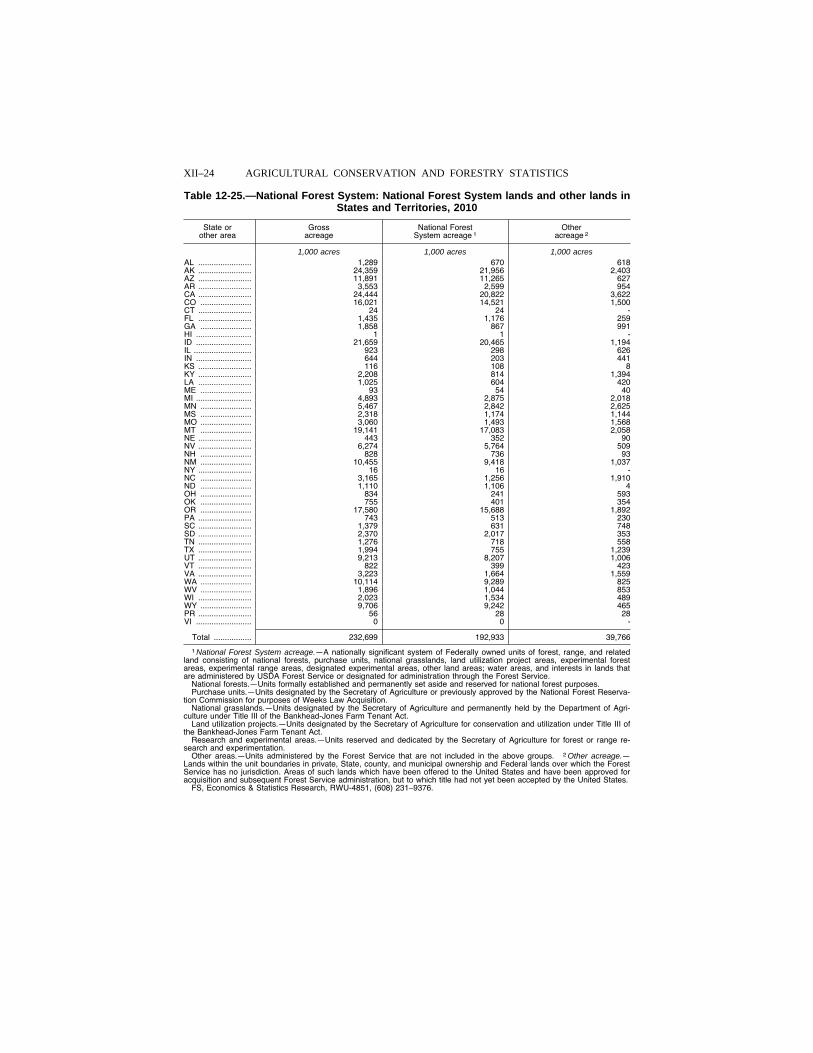
XII–24 AGRICULTURAL CONSERVATION AND FORESTRY STATISTICS
Table 12-25.—National Forest System: National Forest System lands and other lands in States and Territories, 2010
State or other area
Gross acreage
National Forest System acreage 1
Other acreage 2
1,000 acres 1,000 acres 1,000 acres AL ........................ 1,289 670 618 AK ........................ 24,359 21,956 2,403 AZ ........................ 11,891 11,265 627 AR ........................ 3,553 2,599 954 CA ........................ 24,444 20,822 3,622 CO ....................... 16,021 14,521 1,500 CT ........................ 24 24 - FL ........................ 1,435 1,176 259 GA ....................... 1,858 867 991 HI ......................... 1 1 - ID ......................... 21,659 20,465 1,194 IL .......................... 923 298 626 IN ......................... 644 203 441 KS ........................ 116 108 8 KY ........................ 2,208 814 1,394 LA ........................ 1,025 604 420 ME ....................... 93 54 40 MI ......................... 4,893 2,875 2,018 MN ....................... 5,467 2,842 2,625 MS ....................... 2,318 1,174 1,144 MO ....................... 3,060 1,493 1,568 MT ....................... 19,141 17,083 2,058 NE ........................ 443 352 90 NV ........................ 6,274 5,764 509 NH ....................... 828 736 93 NM ....................... 10,455 9,418 1,037 NY ........................ 16 16 - NC ....................... 3,165 1,256 1,910 ND ....................... 1,110 1,106 4 OH ....................... 834 241 593 OK ....................... 755 401 354 OR ....................... 17,580 15,688 1,892 PA ........................ 743 513 230 SC ........................ 1,379 631 748 SD ........................ 2,370 2,017 353 TN ........................ 1,276 718 558 TX ........................ 1,994 755 1,239 UT ........................ 9,213 8,207 1,006 VT ........................ 822 399 423 VA ........................ 3,223 1,664 1,559 WA ....................... 10,114 9,289 825 WV ....................... 1,896 1,044 853 WI ........................ 2,023 1,534 489 WY ....................... 9,706 9,242 465 PR ........................ 56 28 28 VI ......................... 0 0 -
Total ................. 232,699 192,933 39,766
1 National Forest System acreage.—A nationally significant system of Federally owned units of forest, range, and related land consisting of national forests, purchase units, national grasslands, land utilization project areas, experimental forest areas, experimental range areas, designated experimental areas, other land areas; water areas, and interests in lands that are administered by USDA Forest Service or designated for administration through the Forest Service.
National forests.—Units formally established and permanently set aside and reserved for national forest purposes. Purchase units.—Units designated by the Secretary of Agriculture or previously approved by the National Forest Reserva-
tion Commission for purposes of Weeks Law Acquisition. National grasslands.—Units designated by the Secretary of Agriculture and permanently held by the Department of Agri-
culture under Title III of the Bankhead-Jones Farm Tenant Act. Land utilization projects.—Units designated by the Secretary of Agriculture for conservation and utilization under Title III of
the Bankhead-Jones Farm Tenant Act. Research and experimental areas.—Units reserved and dedicated by the Secretary of Agriculture for forest or range re-
search and experimentation. Other areas.—Units administered by the Forest Service that are not included in the above groups. 2 Other acreage.—
Lands within the unit boundaries in private, State, county, and municipal ownership and Federal lands over which the Forest Service has no jurisdiction. Areas of such lands which have been offered to the United States and have been approved for acquisition and subsequent Forest Service administration, but to which title had not yet been accepted by the United States.
FS, Economics & Statistics Research, RWU-4851, (608) 231–9376.
VerDate Aug 31 2005 13:44 Mar 01, 2012 Jkt 000000 PO 00000 Frm 00024 Fmt 1000 Sfmt 1000 H:\SHARED\DAPP\FPU\AGSTAT\MASTER~2\CHAPTR12\TABLE25.AG8 USDA
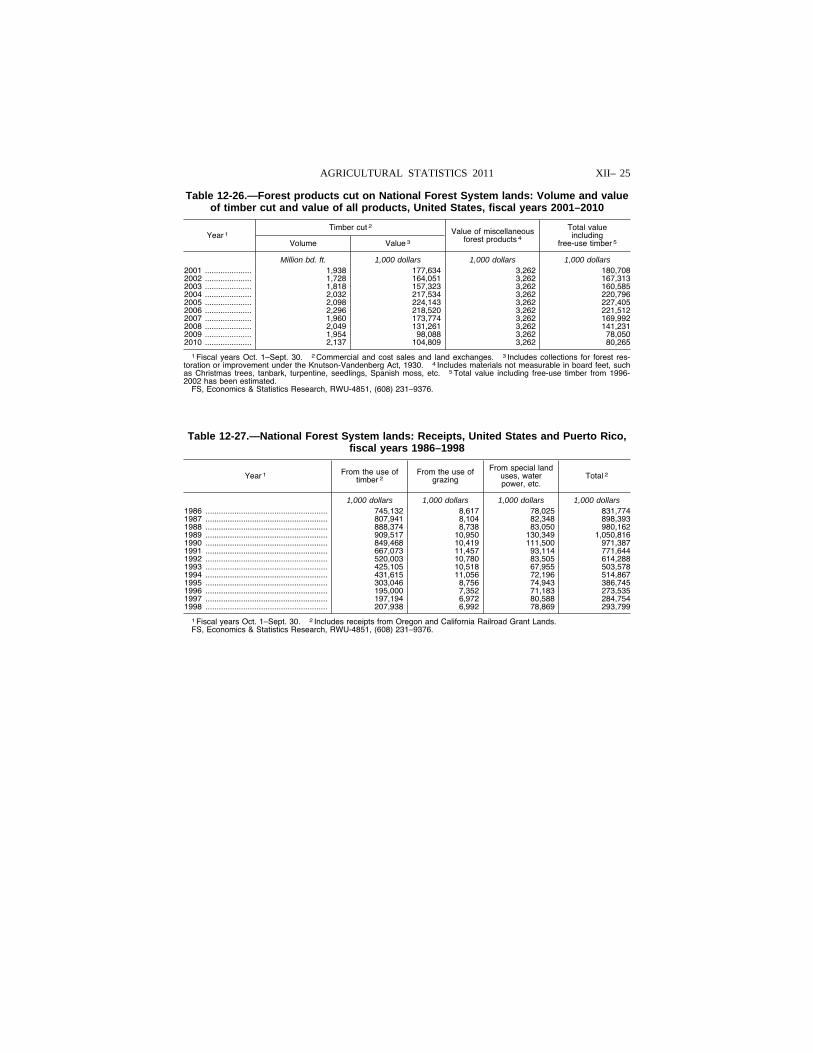
XII– 25 AGRICULTURAL STATISTICS 2011
Table 12-26.—Forest products cut on National Forest System lands: Volume and value of timber cut and value of all products, United States, fiscal years 2001–2010
Year 1 Timber cut 2 Value of miscellaneous
forest products 4
Total value including
free-use timber 5 Volume Value 3
Million bd. ft. 1,000 dollars 1,000 dollars 1,000 dollars 2001 ..................... 1,938 177,634 3,262 180,708 2002 ..................... 1,728 164,051 3,262 167,313 2003 ..................... 1,818 157,323 3,262 160,585 2004 ..................... 2,032 217,534 3,262 220,796 2005 ..................... 2,098 224,143 3,262 227,405 2006 ..................... 2,296 218,520 3,262 221,512 2007 ..................... 1,960 173,774 3,262 169,992 2008 ..................... 2,049 131,261 3,262 141,231 2009 ..................... 1,954 98,088 3,262 78,050 2010 ..................... 2,137 104,809 3,262 80,265
1 Fiscal years Oct. 1–Sept. 30. 2 Commercial and cost sales and land exchanges. 3 Includes collections for forest res-toration or improvement under the Knutson-Vandenberg Act, 1930. 4 Includes materials not measurable in board feet, such as Christmas trees, tanbark, turpentine, seedlings, Spanish moss, etc. 5 Total value including free-use timber from 1996- 2002 has been estimated.
FS, Economics & Statistics Research, RWU-4851, (608) 231–9376.
Table 12-27.—National Forest System lands: Receipts, United States and Puerto Rico, fiscal years 1986–1998
Year 1 From the use of timber 2
From the use of grazing
From special land uses, water power, etc.
Total 2
1,000 dollars 1,000 dollars 1,000 dollars 1,000 dollars 1986 ....................................................... 745,132 8,617 78,025 831,774 1987 ....................................................... 807,941 8,104 82,348 898,393 1988 ....................................................... 888,374 8,738 83,050 980,162 1989 ....................................................... 909,517 10,950 130,349 1,050,816 1990 ....................................................... 849,468 10,419 111,500 971,387 1991 ....................................................... 667,073 11,457 93,114 771,644 1992 ....................................................... 520,003 10,780 83,505 614,288 1993 ....................................................... 425,105 10,518 67,955 503,578 1994 ....................................................... 431,615 11,056 72,196 514,867 1995 ....................................................... 303,046 8,756 74,943 386,745 1996 ....................................................... 195,000 7,352 71,183 273,535 1997 ....................................................... 197,194 6,972 80,588 284,754 1998 ....................................................... 207,938 6,992 78,869 293,799
1 Fiscal years Oct. 1–Sept. 30. 2 Includes receipts from Oregon and California Railroad Grant Lands. FS, Economics & Statistics Research, RWU-4851, (608) 231–9376.
VerDate Aug 31 2005 13:44 Mar 01, 2012 Jkt 000000 PO 00000 Frm 00025 Fmt 1000 Sfmt 1000 H:\SHARED\DAPP\FPU\AGSTAT\MASTER~2\CHAPTR12\TABLE26.AG8 USDA
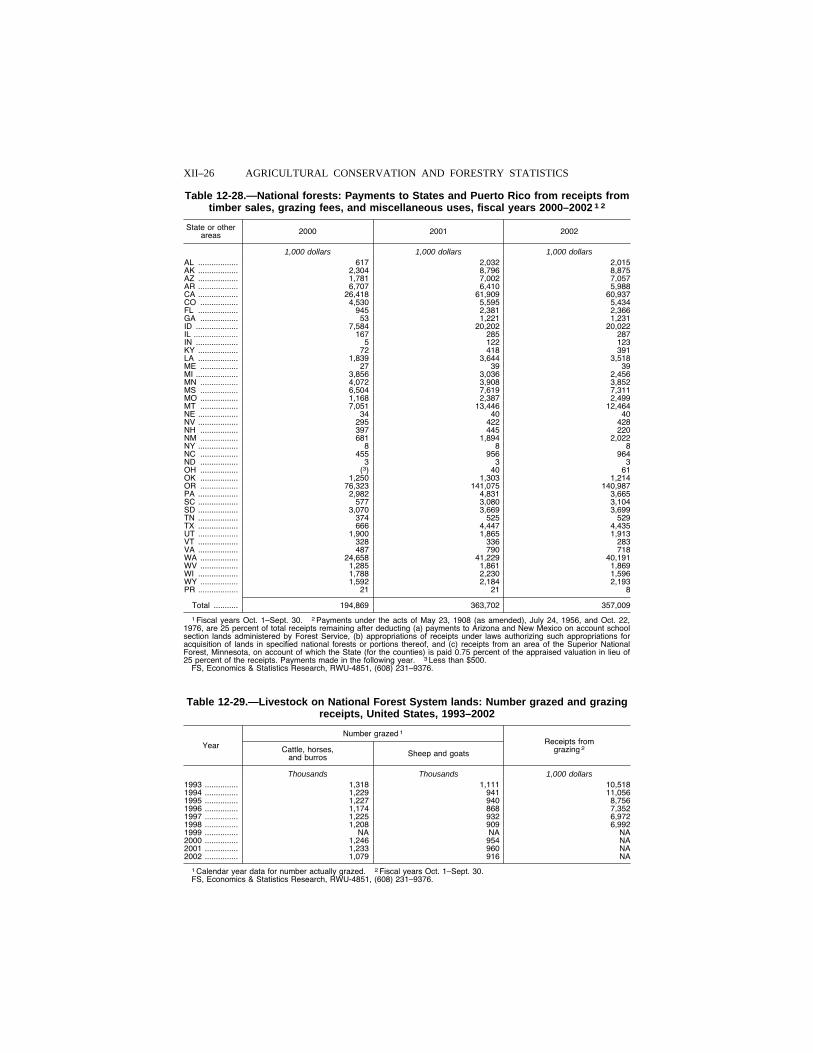
XII–26 AGRICULTURAL CONSERVATION AND FORESTRY STATISTICS
Table 12-28.—National forests: Payments to States and Puerto Rico from receipts from timber sales, grazing fees, and miscellaneous uses, fiscal years 2000–2002 1 2
State or other areas 2000 2001 2002
1,000 dollars 1,000 dollars 1,000 dollars AL .................. 617 2,032 2,015 AK .................. 2,304 8,796 8,875 AZ .................. 1,781 7,002 7,057 AR .................. 6,707 6,410 5,988 CA .................. 26,418 61,909 60,937 CO ................. 4,530 5,595 5,434 FL .................. 945 2,381 2,366 GA ................. 53 1,221 1,231 ID ................... 7,584 20,202 20,022 IL .................... 167 285 287 IN ................... 5 122 123 KY .................. 72 418 391 LA .................. 1,839 3,644 3,518 ME ................. 27 39 39 MI ................... 3,856 3,036 2,456 MN ................. 4,072 3,908 3,852 MS ................. 6,504 7,619 7,311 MO ................. 1,168 2,387 2,499 MT ................. 7,051 13,446 12,464 NE .................. 34 40 40 NV .................. 295 422 428 NH ................. 397 445 220 NM ................. 681 1,894 2,022 NY .................. 8 8 8 NC ................. 455 956 964 ND ................. 3 3 3 OH ................. (3) 40 61 OK ................. 1,250 1,303 1,214 OR ................. 76,323 141,075 140,987 PA .................. 2,982 4,831 3,665 SC .................. 577 3,080 3,104 SD .................. 3,070 3,669 3,699 TN .................. 374 525 529 TX .................. 666 4,447 4,435 UT .................. 1,900 1,865 1,913 VT .................. 328 336 283 VA .................. 487 790 718 WA ................. 24,658 41,229 40,191 WV ................. 1,285 1,861 1,869 WI .................. 1,788 2,230 1,596 WY ................. 1,592 2,184 2,193 PR .................. 21 21 8
Total ........... 194,869 363,702 357,009
1 Fiscal years Oct. 1–Sept. 30. 2 Payments under the acts of May 23, 1908 (as amended), July 24, 1956, and Oct. 22, 1976, are 25 percent of total receipts remaining after deducting (a) payments to Arizona and New Mexico on account school section lands administered by Forest Service, (b) appropriations of receipts under laws authorizing such appropriations for acquisition of lands in specified national forests or portions thereof, and (c) receipts from an area of the Superior National Forest, Minnesota, on account of which the State (for the counties) is paid 0.75 percent of the appraised valuation in lieu of 25 percent of the receipts. Payments made in the following year. 3 Less than $500.
FS, Economics & Statistics Research, RWU-4851, (608) 231–9376.
Table 12-29.—Livestock on National Forest System lands: Number grazed and grazing receipts, United States, 1993–2002
Year
Number grazed 1 Receipts from
grazing 2 Cattle, horses, and burros Sheep and goats
Thousands Thousands 1,000 dollars 1993 ............... 1,318 1,111 10,518 1994 ............... 1,229 941 11,056 1995 ............... 1,227 940 8,756 1996 ............... 1,174 868 7,352 1997 ............... 1,225 932 6,972 1998 ............... 1,208 909 6,992 1999 ............... NA NA NA 2000 ............... 1,246 954 NA 2001 ............... 1,233 960 NA 2002 ............... 1,079 916 NA
1 Calendar year data for number actually grazed. 2 Fiscal years Oct. 1–Sept. 30. FS, Economics & Statistics Research, RWU-4851, (608) 231–9376.
VerDate Aug 31 2005 13:44 Mar 01, 2012 Jkt 000000 PO 00000 Frm 00026 Fmt 1000 Sfmt 1000 H:\SHARED\DAPP\FPU\AGSTAT\MASTER~2\CHAPTR12\TABLE27.AG8 USDA
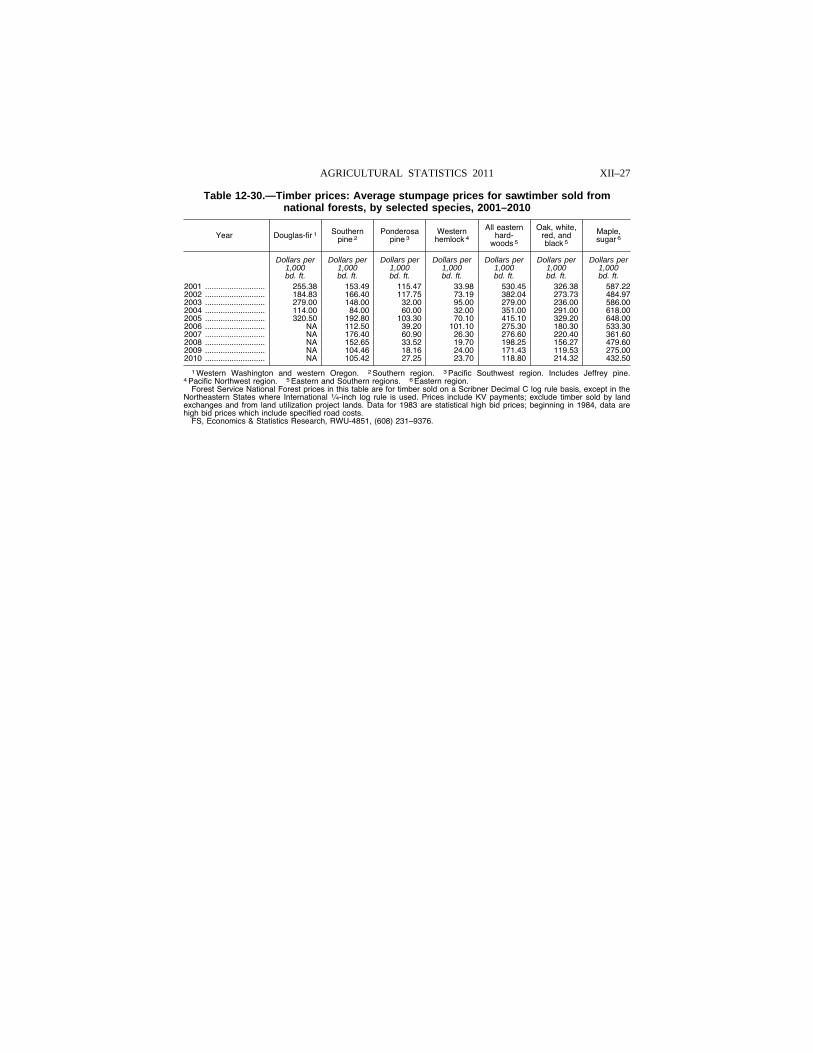
XII–27 AGRICULTURAL STATISTICS 2011
Table 12-30.—Timber prices: Average stumpage prices for sawtimber sold from national forests, by selected species, 2001–2010
Year Douglas-fir 1 Southern pine 2
Ponderosa pine 3
Western hemlock 4
All eastern hard-
woods 5
Oak, white, red, and black 5
Maple, sugar 6
Dollars per Dollars per Dollars per Dollars per Dollars per Dollars per Dollars per 1,000 1,000 1,000 1,000 1,000 1,000 1,000 bd. ft. bd. ft. bd. ft. bd. ft. bd. ft. bd. ft. bd. ft.
2001 ........................... 255.38 153.49 115.47 33.98 530.45 326.38 587.22 2002 ........................... 184.83 166.40 117.75 73.19 382.04 273.73 484.97 2003 ........................... 279.00 148.00 32.00 95.00 279.00 236.00 586.00 2004 ........................... 114.00 84.00 60.00 32.00 351.00 291.00 618.00 2005 ........................... 320.50 192.80 103.30 70.10 415.10 329.20 648.00 2006 ........................... NA 112.50 39.20 101.10 275.30 180.30 533.30 2007 ........................... NA 176.40 60.90 26.30 276.60 220.40 361.60 2008 ........................... NA 152.65 33.52 19.70 198.25 156.27 479.60 2009 ........................... NA 104.46 18.16 24.00 171.43 119.53 275.00 2010 ........................... NA 105.42 27.25 23.70 118.80 214.32 432.50
1 Western Washington and western Oregon. 2 Southern region. 3 Pacific Southwest region. Includes Jeffrey pine. 4 Pacific Northwest region. 5 Eastern and Southern regions. 6 Eastern region.
Forest Service National Forest prices in this table are for timber sold on a Scribner Decimal C log rule basis, except in the Northeastern States where International 1⁄4-inch log rule is used. Prices include KV payments; exclude timber sold by land exchanges and from land utilization project lands. Data for 1983 are statistical high bid prices; beginning in 1984, data are high bid prices which include specified road costs.
FS, Economics & Statistics Research, RWU-4851, (608) 231–9376.
VerDate Aug 31 2005 13:44 Mar 01, 2012 Jkt 000000 PO 00000 Frm 00027 Fmt 1000 Sfmt 1000 H:\SHARED\DAPP\FPU\AGSTAT\MASTER~2\CHAPTR12\TABLE29.AG8 USDA
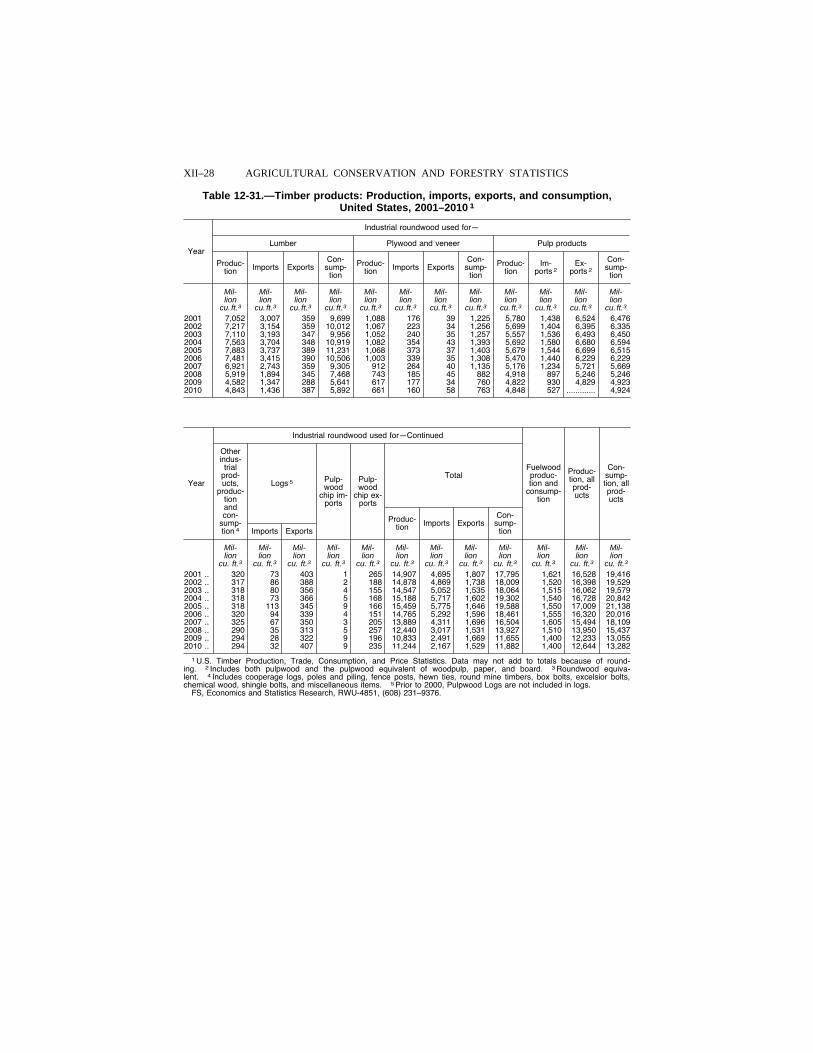
XII–28 AGRICULTURAL CONSERVATION AND FORESTRY STATISTICS
Table 12-31.—Timber products: Production, imports, exports, and consumption, United States, 2001–2010 1
Year
Industrial roundwood used for—
Lumber Plywood and veneer Pulp products
Produc-tion Imports Exports
Con-sump-
tion
Produc-tion Imports Exports
Con-sump-
tion
Produc-tion
Im-ports 2
Ex-ports 2
Con-sump-
tion
Mil- Mil- Mil- Mil- Mil- Mil- Mil- Mil- Mil- Mil- Mil- Mil- lion lion lion lion lion lion lion lion lion lion lion lion
cu. ft.3 cu. ft.3 cu. ft.3 cu. ft.3 cu. ft.3 cu. ft.3 cu. ft.3 cu. ft.3 cu. ft.3 cu. ft.3 cu. ft.3 cu. ft.3 2001 7,052 3,007 359 9,699 1,088 176 39 1,225 5,780 1,438 6,524 6,476 2002 7,217 3,154 359 10,012 1,067 223 34 1,256 5,699 1,404 6,395 6,335 2003 7,110 3,193 347 9,956 1,052 240 35 1,257 5,557 1,536 6,493 6,450 2004 7,563 3,704 348 10,919 1,082 354 43 1,393 5,692 1,580 6,680 6,594 2005 7,883 3,737 389 11,231 1,068 373 37 1,403 5,679 1,544 6,699 6,515 2006 7,481 3,415 390 10,506 1,003 339 35 1,308 5,470 1,440 6,229 6,229 2007 6,921 2,743 359 9,305 912 264 40 1,135 5,176 1,234 5,721 5,669 2008 5,919 1,894 345 7,468 743 185 45 882 4,918 897 5,246 5,246 2009 4,582 1,347 288 5,641 617 177 34 760 4,822 930 4,829 4,923 2010 4,843 1,436 387 5,892 661 160 58 763 4,848 527 ............. 4,924
Year
Industrial roundwood used for—Continued
Fuelwood produc-tion and
consump-tion
Produc-tion, all prod-ucts
Con-sump-tion, all prod-ucts
Other indus-
trial prod-ucts,
produc-tion and con-
sump-tion 4
Logs 5 Pulp-wood
chip im-ports
Pulp-wood
chip ex-ports
Total
Imports Exports
Produc-tion Imports Exports
Con-sump-
tion
Mil- Mil- Mil- Mil- Mil- Mil- Mil- Mil- Mil- Mil- Mil- Mil- lion lion lion lion lion lion lion lion lion lion lion lion
cu. ft.3 cu. ft.3 cu. ft.3 cu. ft.3 cu. ft.3 cu. ft.3 cu. ft.3 cu. ft.3 cu. ft.3 cu. ft.3 cu. ft.3 cu. ft.3 2001 .. 320 73 403 1 265 14,907 4,695 1,807 17,795 1,621 16,528 19,416 2002 .. 317 86 388 2 188 14,878 4,869 1,738 18,009 1,520 16,398 19,529 2003 .. 318 80 356 4 155 14,547 5,052 1,535 18,064 1,515 16,062 19,579 2004 .. 318 73 366 5 168 15,188 5,717 1,602 19,302 1,540 16,728 20,842 2005 .. 318 113 345 9 166 15,459 5,775 1,646 19,588 1,550 17,009 21,138 2006 .. 320 94 339 4 151 14,765 5,292 1,596 18,461 1,555 16,320 20,016 2007 .. 325 67 350 3 205 13,889 4,311 1,696 16,504 1,605 15,494 18,109 2008 .. 290 35 313 5 257 12,440 3,017 1,531 13,927 1,510 13,950 15,437 2009 .. 294 28 322 9 196 10,833 2,491 1,669 11,655 1,400 12,233 13,055 2010 .. 294 32 407 9 235 11,244 2,167 1,529 11,882 1,400 12,644 13,282
1 U.S. Timber Production, Trade, Consumption, and Price Statistics. Data may not add to totals because of round-ing. 2 Includes both pulpwood and the pulpwood equivalent of woodpulp, paper, and board. 3 Roundwood equiva-lent. 4 Includes cooperage logs, poles and piling, fence posts, hewn ties, round mine timbers, box bolts, excelsior bolts, chemical wood, shingle bolts, and miscellaneous items. 5 Prior to 2000, Pulpwood Logs are not included in logs.
FS, Economics and Statistics Research, RWU-4851, (608) 231–9376.
VerDate Aug 31 2005 13:44 Mar 01, 2012 Jkt 000000 PO 00000 Frm 00028 Fmt 1000 Sfmt 1000 H:\SHARED\DAPP\FPU\AGSTAT\MASTER~2\CHAPTR12\TABLE30.AG8 USDA
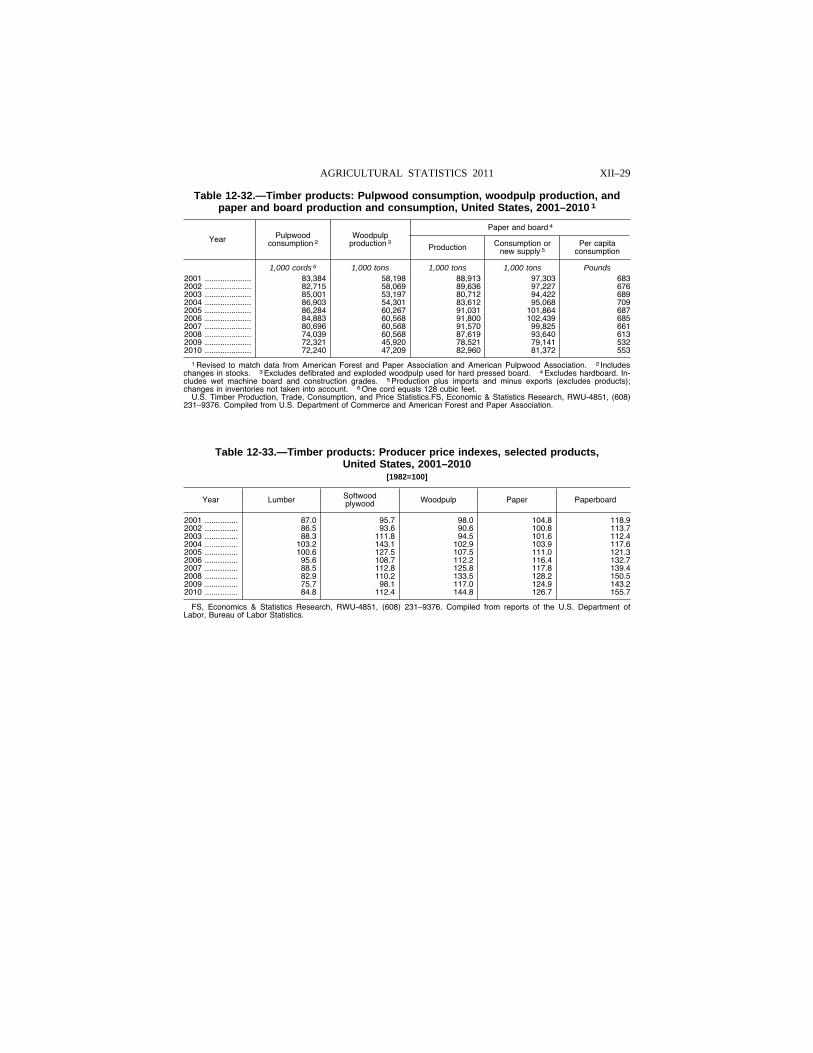
XII–29 AGRICULTURAL STATISTICS 2011
Table 12-32.—Timber products: Pulpwood consumption, woodpulp production, and paper and board production and consumption, United States, 2001–2010 1
Year Pulpwood consumption 2
Woodpulp production 3
Paper and board 4
Production Consumption or new supply 5
Per capita consumption
1,000 cords 6 1,000 tons 1,000 tons 1,000 tons Pounds 2001 ..................... 83,384 58,198 88,913 97,303 683 2002 ..................... 82,715 58,069 89,636 97,227 676 2003 ..................... 85,001 53,197 80,712 94,422 689 2004 ..................... 86,903 54,301 83,612 95,068 709 2005 ..................... 86,284 60,267 91,031 101,864 687 2006 ..................... 84,883 60,568 91,800 102,439 685 2007 ..................... 80,696 60,568 91,570 99,825 661 2008 ..................... 74,039 60,568 87,619 93,640 613 2009 ..................... 72,321 45,920 78,521 79,141 532 2010 ..................... 72,240 47,209 82,960 81,372 553
1 Revised to match data from American Forest and Paper Association and American Pulpwood Association. 2 Includes changes in stocks. 3 Excludes defibrated and exploded woodpulp used for hard pressed board. 4 Excludes hardboard. In-cludes wet machine board and construction grades. 5 Production plus imports and minus exports (excludes products); changes in inventories not taken into account. 6 One cord equals 128 cubic feet.
U.S. Timber Production, Trade, Consumption, and Price Statistics.FS, Economic & Statistics Research, RWU-4851, (608) 231–9376. Compiled from U.S. Department of Commerce and American Forest and Paper Association.
Table 12-33.—Timber products: Producer price indexes, selected products, United States, 2001–2010
[1982=100]
Year Lumber Softwood plywood Woodpulp Paper Paperboard
2001 ............... 87.0 95.7 98.0 104.8 118.9 2002 ............... 86.5 93.6 90.6 100.8 113.7 2003 ............... 88.3 111.8 94.5 101.6 112.4 2004 ............... 103.2 143.1 102.9 103.9 117.6 2005 ............... 100.6 127.5 107.5 111.0 121.3 2006 ............... 95.6 108.7 112.2 116.4 132.7 2007 ............... 88.5 112.8 125.8 117.8 139.4 2008 ............... 82.9 110.2 133.5 128.2 150.5 2009 ............... 75.7 98.1 117.0 124.9 143.2 2010 ............... 84.8 112.4 144.8 126.7 155.7
FS, Economics & Statistics Research, RWU-4851, (608) 231–9376. Compiled from reports of the U.S. Department of Labor, Bureau of Labor Statistics.
VerDate Aug 31 2005 13:44 Mar 01, 2012 Jkt 000000 PO 00000 Frm 00029 Fmt 1000 Sfmt 1000 H:\SHARED\DAPP\FPU\AGSTAT\MASTER~2\CHAPTR12\TABLE31.AG8 USDA
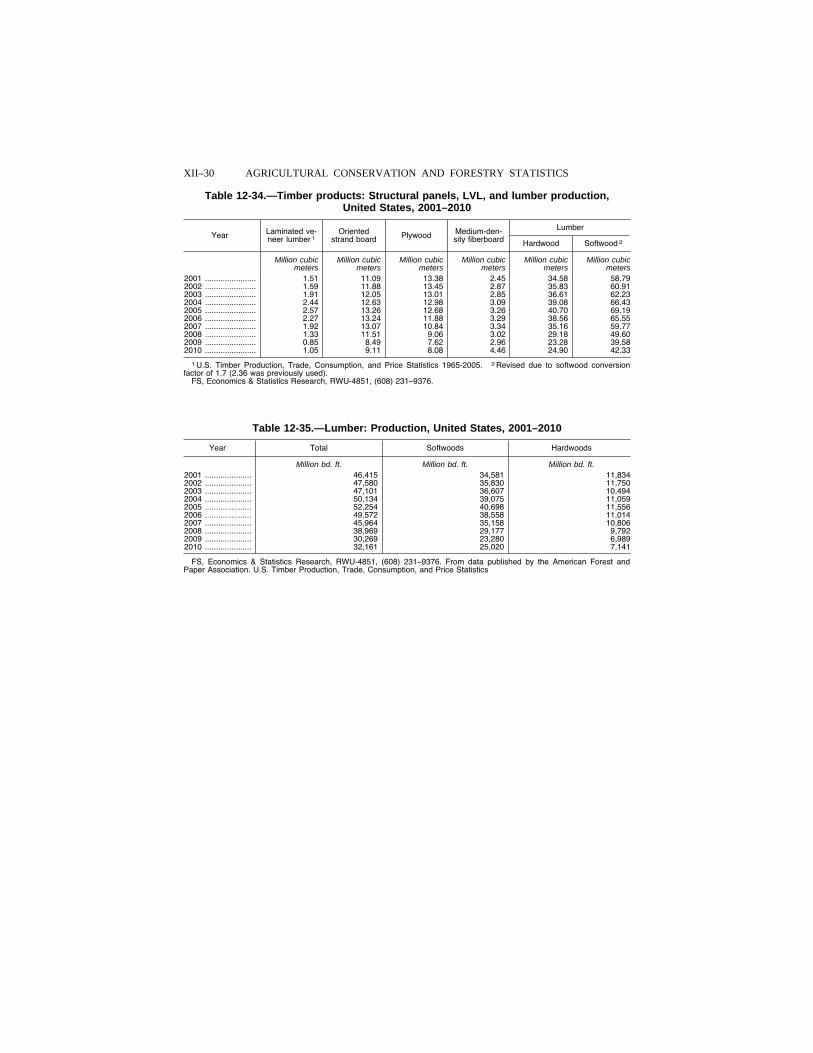
XII–30 AGRICULTURAL CONSERVATION AND FORESTRY STATISTICS
Table 12-34.—Timber products: Structural panels, LVL, and lumber production, United States, 2001–2010
Year Laminated ve-neer lumber 1
Oriented strand board Plywood Medium-den-
sity fiberboard
Lumber
Hardwood Softwood 2
Million cubic Million cubic Million cubic Million cubic Million cubic Million cubic meters meters meters meters meters meters
2001 ....................... 1.51 11.09 13.38 2.45 34.58 58.79 2002 ....................... 1.59 11.88 13.45 2.87 35.83 60.91 2003 ....................... 1.91 12.05 13.01 2.85 36.61 62.23 2004 ....................... 2.44 12.63 12.98 3.09 39.08 66.43 2005 ....................... 2.57 13.26 12.68 3.26 40.70 69.19 2006 ....................... 2.27 13.24 11.88 3.29 38.56 65.55 2007 ....................... 1.92 13.07 10.84 3.34 35.16 59.77 2008 ....................... 1.33 11.51 9.06 3.02 29.18 49.60 2009 ....................... 0.85 8.49 7.62 2.96 23.28 39.58 2010 ....................... 1.05 9.11 8.08 4.46 24.90 42.33
1 U.S. Timber Production, Trade, Consumption, and Price Statistics 1965-2005. 2 Revised due to softwood conversion factor of 1.7 (2.36 was previously used).
FS, Economics & Statistics Research, RWU-4851, (608) 231–9376.
Table 12-35.—Lumber: Production, United States, 2001–2010
Year Total Softwoods Hardwoods
Million bd. ft. Million bd. ft. Million bd. ft. 2001 ..................... 46,415 34,581 11,834 2002 ..................... 47,580 35,830 11,750 2003 ..................... 47,101 36,607 10,494 2004 ..................... 50,134 39,075 11,059 2005 ..................... 52,254 40,698 11,556 2006 ..................... 49,572 38,558 11,014 2007 ..................... 45,964 35,158 10,806 2008 ..................... 38,969 29,177 9,792 2009 ..................... 30,269 23,280 6,989 2010 ..................... 32,161 25,020 7,141
FS, Economics & Statistics Research, RWU-4851, (608) 231–9376. From data published by the American Forest and Paper Association. U.S. Timber Production, Trade, Consumption, and Price Statistics
VerDate Aug 31 2005 13:44 Mar 01, 2012 Jkt 000000 PO 00000 Frm 00030 Fmt 1000 Sfmt 1000 H:\SHARED\DAPP\FPU\AGSTAT\MASTER~2\CHAPTR12\TABLE33.AG8 USDA
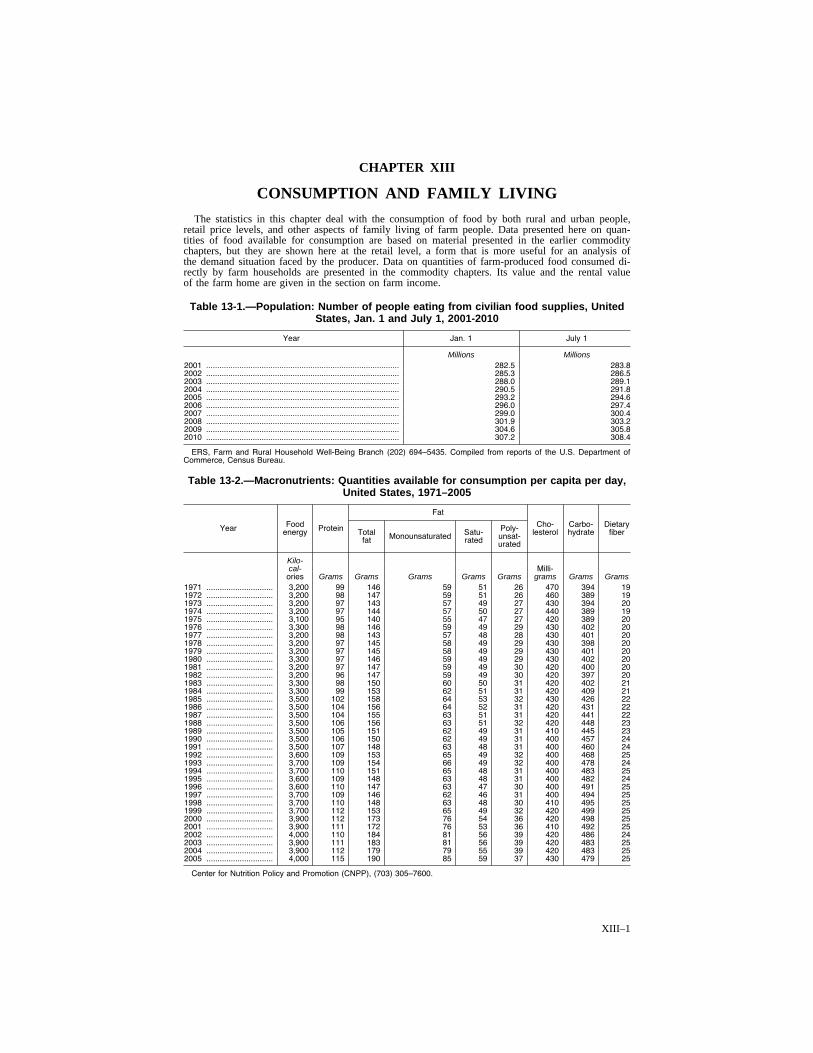
XIII–1
CHAPTER XIII
CONSUMPTION AND FAMILY LIVING
The statistics in this chapter deal with the consumption of food by both rural and urban people, retail price levels, and other aspects of family living of farm people. Data presented here on quan-tities of food available for consumption are based on material presented in the earlier commodity chapters, but they are shown here at the retail level, a form that is more useful for an analysis of the demand situation faced by the producer. Data on quantities of farm-produced food consumed di-rectly by farm households are presented in the commodity chapters. Its value and the rental value of the farm home are given in the section on farm income.
Table 13-1.—Population: Number of people eating from civilian food supplies, United States, Jan. 1 and July 1, 2001-2010
Year Jan. 1 July 1
Millions Millions 2001 ....................................................................................... 282.5 283.8 2002 ....................................................................................... 285.3 286.5 2003 ....................................................................................... 288.0 289.1 2004 ....................................................................................... 290.5 291.8 2005 ....................................................................................... 293.2 294.6 2006 ....................................................................................... 296.0 297.4 2007 ....................................................................................... 299.0 300.4 2008 ....................................................................................... 301.9 303.2 2009 ....................................................................................... 304.6 305.8 2010 ....................................................................................... 307.2 308.4
ERS, Farm and Rural Household Well-Being Branch (202) 694–5435. Compiled from reports of the U.S. Department of Commerce, Census Bureau.
Table 13-2.—Macronutrients: Quantities available for consumption per capita per day, United States, 1971–2005
Year Food energy Protein
Fat
Cho-lesterol
Carbo-hydrate
Dietary fiber Total
fat Monounsaturated Satu-rated
Poly-unsat-urated
Kilo- cal- Milli-
ories Grams Grams Grams Grams Grams grams Grams Grams 1971 .............................. 3,200 99 146 59 51 26 470 394 19 1972 .............................. 3,200 98 147 59 51 26 460 389 19 1973 .............................. 3,200 97 143 57 49 27 430 394 20 1974 .............................. 3,200 97 144 57 50 27 440 389 19 1975 .............................. 3,100 95 140 55 47 27 420 389 20 1976 .............................. 3,300 98 146 59 49 29 430 402 20 1977 .............................. 3,200 98 143 57 48 28 430 401 20 1978 .............................. 3,200 97 145 58 49 29 430 398 20 1979 .............................. 3,200 97 145 58 49 29 430 401 20 1980 .............................. 3,300 97 146 59 49 29 430 402 20 1981 .............................. 3,200 97 147 59 49 30 420 400 20 1982 .............................. 3,200 96 147 59 49 30 420 397 20 1983 .............................. 3,300 98 150 60 50 31 420 402 21 1984 .............................. 3,300 99 153 62 51 31 420 409 21 1985 .............................. 3,500 102 158 64 53 32 430 426 22 1986 .............................. 3,500 104 156 64 52 31 420 431 22 1987 .............................. 3,500 104 155 63 51 31 420 441 22 1988 .............................. 3,500 106 156 63 51 32 420 448 23 1989 .............................. 3,500 105 151 62 49 31 410 445 23 1990 .............................. 3,500 106 150 62 49 31 400 457 24 1991 .............................. 3,500 107 148 63 48 31 400 460 24 1992 .............................. 3,600 109 153 65 49 32 400 468 25 1993 .............................. 3,700 109 154 66 49 32 400 478 24 1994 .............................. 3,700 110 151 65 48 31 400 483 25 1995 .............................. 3,600 109 148 63 48 31 400 482 24 1996 .............................. 3,600 110 147 63 47 30 400 491 25 1997 .............................. 3,700 109 146 62 46 31 400 494 25 1998 .............................. 3,700 110 148 63 48 30 410 495 25 1999 .............................. 3,700 112 153 65 49 32 420 499 25 2000 .............................. 3,900 112 173 76 54 36 420 498 25 2001 .............................. 3,900 111 172 76 53 36 410 492 25 2002 .............................. 4,000 110 184 81 56 39 420 486 24 2003 .............................. 3,900 111 183 81 56 39 420 483 25 2004 .............................. 3,900 112 179 79 55 39 420 483 25 2005 .............................. 4,000 115 190 85 59 37 430 479 25
Center for Nutrition Policy and Promotion (CNPP), (703) 305–7600.
VerDate Aug 31 2005 10:44 Feb 29, 2012 Jkt 000000 PO 00000 Frm 00001 Fmt 1001 Sfmt 1001 H:\SHARED\DAPP\FPU\AGSTAT\MASTER~2\CHAPTR13\XIII-01.AG8 USDA
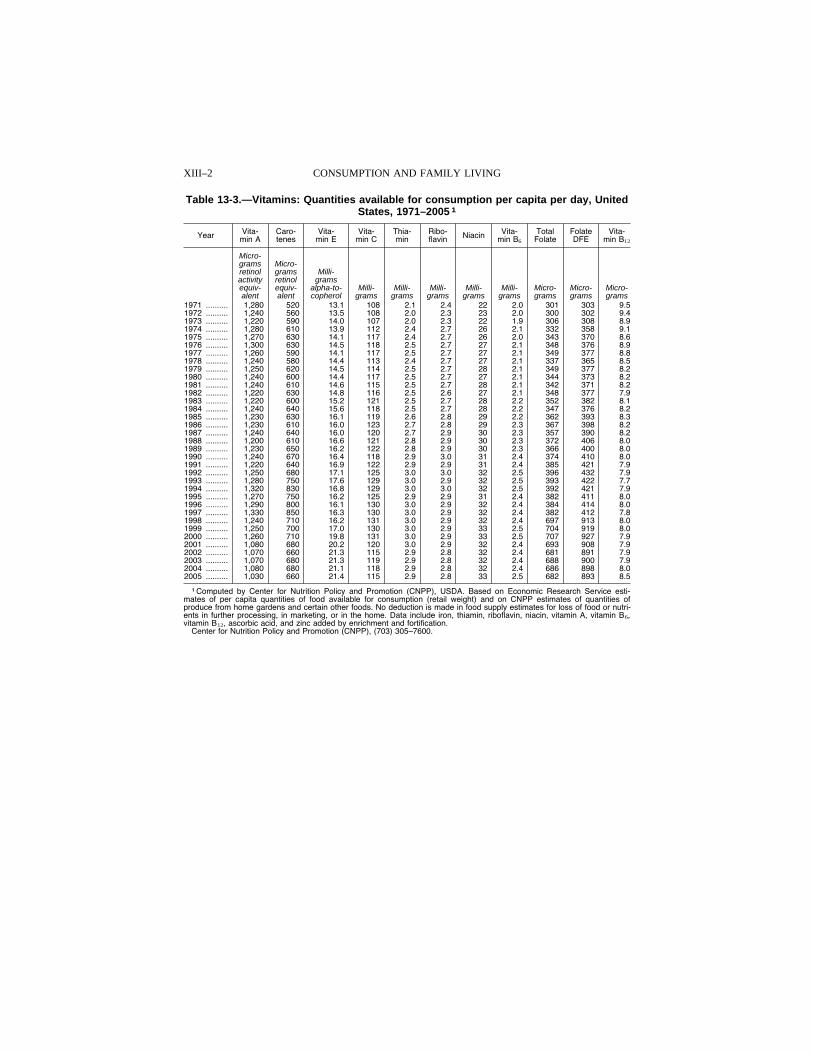
XIII–2 CONSUMPTION AND FAMILY LIVING
Table 13-3.—Vitamins: Quantities available for consumption per capita per day, United States, 1971–2005 1
Year Vita- min A
Caro- tenes
Vita- min E
Vita- min C
Thia- min
Ribo- flavin Niacin Vita-
min B6 Total Folate
Folate DFE
Vita- min B12
Micro- grams retinol activity equiv- alent
Micro- grams retinol equiv- alent
Milli- grams
alpha-to-copherol
Milli- grams
Milli- grams
Milli- grams
Milli- grams
Milli- grams
Micro- grams
Micro- grams
Micro- grams
1971 .......... 1,280 520 13.1 108 2.1 2.4 22 2.0 301 303 9.5 1972 .......... 1,240 560 13.5 108 2.0 2.3 23 2.0 300 302 9.4 1973 .......... 1,220 590 14.0 107 2.0 2.3 22 1.9 306 308 8.9 1974 .......... 1,280 610 13.9 112 2.4 2.7 26 2.1 332 358 9.1 1975 .......... 1,270 630 14.1 117 2.4 2.7 26 2.0 343 370 8.6 1976 .......... 1,300 630 14.5 118 2.5 2.7 27 2.1 348 376 8.9 1977 .......... 1,260 590 14.1 117 2.5 2.7 27 2.1 349 377 8.8 1978 .......... 1,240 580 14.4 113 2.4 2.7 27 2.1 337 365 8.5 1979 .......... 1,250 620 14.5 114 2.5 2.7 28 2.1 349 377 8.2 1980 .......... 1,240 600 14.4 117 2.5 2.7 27 2.1 344 373 8.2 1981 .......... 1,240 610 14.6 115 2.5 2.7 28 2.1 342 371 8.2 1982 .......... 1,220 630 14.8 116 2.5 2.6 27 2.1 348 377 7.9 1983 .......... 1,220 600 15.2 121 2.5 2.7 28 2.2 352 382 8.1 1984 .......... 1,240 640 15.6 118 2.5 2.7 28 2.2 347 376 8.2 1985 .......... 1,230 630 16.1 119 2.6 2.8 29 2.2 362 393 8.3 1986 .......... 1,230 610 16.0 123 2.7 2.8 29 2.3 367 398 8.2 1987 .......... 1,240 640 16.0 120 2.7 2.9 30 2.3 357 390 8.2 1988 .......... 1,200 610 16.6 121 2.8 2.9 30 2.3 372 406 8.0 1989 .......... 1,230 650 16.2 122 2.8 2.9 30 2.3 366 400 8.0 1990 .......... 1,240 670 16.4 118 2.9 3.0 31 2.4 374 410 8.0 1991 .......... 1,220 640 16.9 122 2.9 2.9 31 2.4 385 421 7.9 1992 .......... 1,250 680 17.1 125 3.0 3.0 32 2.5 396 432 7.9 1993 .......... 1,280 750 17.6 129 3.0 2.9 32 2.5 393 422 7.7 1994 .......... 1,320 830 16.8 129 3.0 3.0 32 2.5 392 421 7.9 1995 .......... 1,270 750 16.2 125 2.9 2.9 31 2.4 382 411 8.0 1996 .......... 1,290 800 16.1 130 3.0 2.9 32 2.4 384 414 8.0 1997 .......... 1,330 850 16.3 130 3.0 2.9 32 2.4 382 412 7.8 1998 .......... 1,240 710 16.2 131 3.0 2.9 32 2.4 697 913 8.0 1999 .......... 1,250 700 17.0 130 3.0 2.9 33 2.5 704 919 8.0 2000 .......... 1,260 710 19.8 131 3.0 2.9 33 2.5 707 927 7.9 2001 .......... 1,080 680 20.2 120 3.0 2.9 32 2.4 693 908 7.9 2002 .......... 1,070 660 21.3 115 2.9 2.8 32 2.4 681 891 7.9 2003 .......... 1,070 680 21.3 119 2.9 2.8 32 2.4 688 900 7.9 2004 .......... 1,080 680 21.1 118 2.9 2.8 32 2.4 686 898 8.0 2005 .......... 1,030 660 21.4 115 2.9 2.8 33 2.5 682 893 8.5
1 Computed by Center for Nutrition Policy and Promotion (CNPP), USDA. Based on Economic Research Service esti-mates of per capita quantities of food available for consumption (retail weight) and on CNPP estimates of quantities of produce from home gardens and certain other foods. No deduction is made in food supply estimates for loss of food or nutri-ents in further processing, in marketing, or in the home. Data include iron, thiamin, riboflavin, niacin, vitamin A, vitamin B6, vitamin B12, ascorbic acid, and zinc added by enrichment and fortification.
Center for Nutrition Policy and Promotion (CNPP), (703) 305–7600.
VerDate Aug 31 2005 10:44 Feb 29, 2012 Jkt 000000 PO 00000 Frm 00002 Fmt 1000 Sfmt 1000 H:\SHARED\DAPP\FPU\AGSTAT\MASTER~2\CHAPTR13\XIII-02.AG8 USDA
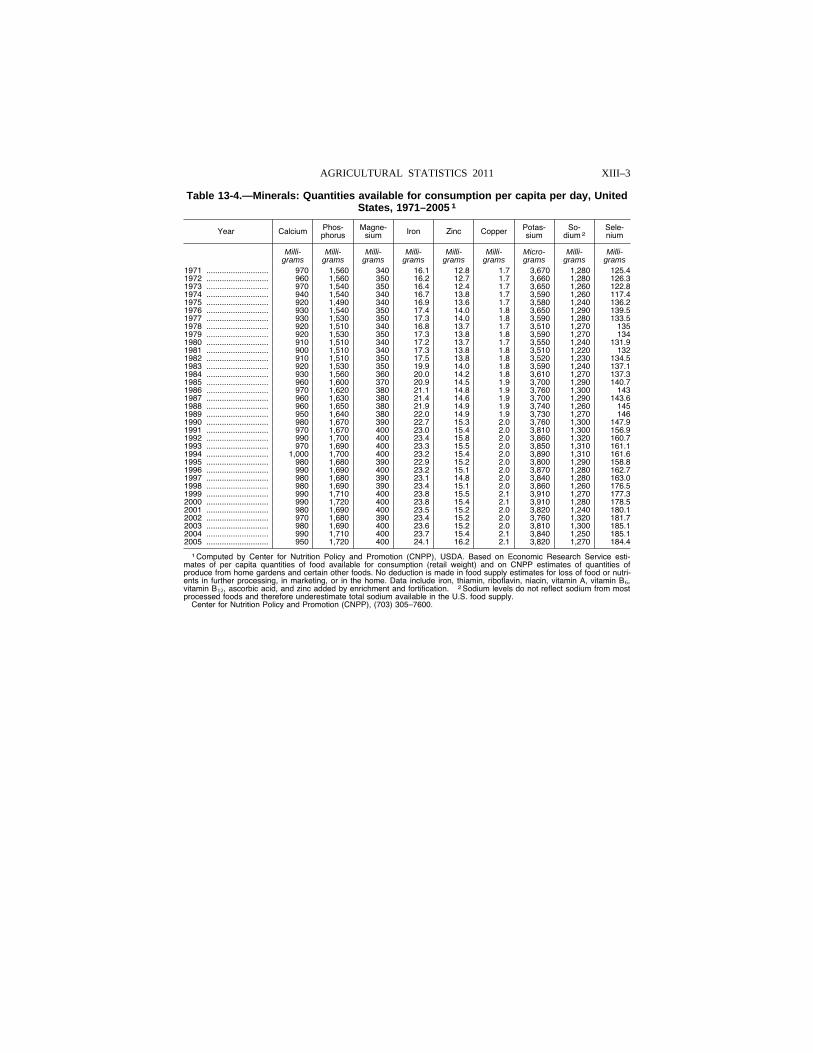
XIII–3 AGRICULTURAL STATISTICS 2011
Table 13-4.—Minerals: Quantities available for consumption per capita per day, United States, 1971–2005 1
Year Calcium Phos-phorus
Magne-sium Iron Zinc Copper Potas-
sium So-
dium 2 Sele-nium
Milli- grams
Milli- grams
Milli- grams
Milli- grams
Milli- grams
Milli- grams
Micro- grams
Milli- grams
Milli- grams
1971 ............................ 970 1,560 340 16.1 12.8 1.7 3,670 1,280 125.4 1972 ............................ 960 1,560 350 16.2 12.7 1.7 3,660 1,280 126.3 1973 ............................ 970 1,540 350 16.4 12.4 1.7 3,650 1,260 122.8 1974 ............................ 940 1,540 340 16.7 13.8 1.7 3,590 1,260 117.4 1975 ............................ 920 1,490 340 16.9 13.6 1.7 3,580 1,240 136.2 1976 ............................ 930 1,540 350 17.4 14.0 1.8 3,650 1,290 139.5 1977 ............................ 930 1,530 350 17.3 14.0 1.8 3,590 1,280 133.5 1978 ............................ 920 1,510 340 16.8 13.7 1.7 3,510 1,270 135 1979 ............................ 920 1,530 350 17.3 13.8 1.8 3,590 1,270 134 1980 ............................ 910 1,510 340 17.2 13.7 1.7 3,550 1,240 131.9 1981 ............................ 900 1,510 340 17.3 13.8 1.8 3,510 1,220 132 1982 ............................ 910 1,510 350 17.5 13.8 1.8 3,520 1,230 134.5 1983 ............................ 920 1,530 350 19.9 14.0 1.8 3,590 1,240 137.1 1984 ............................ 930 1,560 360 20.0 14.2 1.8 3,610 1,270 137.3 1985 ............................ 960 1,600 370 20.9 14.5 1.9 3,700 1,290 140.7 1986 ............................ 970 1,620 380 21.1 14.8 1.9 3,760 1,300 143 1987 ............................ 960 1,630 380 21.4 14.6 1.9 3,700 1,290 143.6 1988 ............................ 960 1,650 380 21.9 14.9 1.9 3,740 1,260 145 1989 ............................ 950 1,640 380 22.0 14.9 1.9 3,730 1,270 146 1990 ............................ 980 1,670 390 22.7 15.3 2.0 3,760 1,300 147.9 1991 ............................ 970 1,670 400 23.0 15.4 2.0 3,810 1,300 156.9 1992 ............................ 990 1,700 400 23.4 15.8 2.0 3,860 1,320 160.7 1993 ............................ 970 1,690 400 23.3 15.5 2.0 3,850 1,310 161.1 1994 ............................ 1,000 1,700 400 23.2 15.4 2.0 3,890 1,310 161.6 1995 ............................ 980 1,680 390 22.9 15.2 2.0 3,800 1,290 158.8 1996 ............................ 990 1,690 400 23.2 15.1 2.0 3,870 1,280 162.7 1997 ............................ 980 1,680 390 23.1 14.8 2.0 3,840 1,280 163.0 1998 ............................ 980 1,690 390 23.4 15.1 2.0 3,860 1,260 176.5 1999 ............................ 990 1,710 400 23.8 15.5 2.1 3,910 1,270 177.3 2000 ............................ 990 1,720 400 23.8 15.4 2.1 3,910 1,280 178.5 2001 ............................ 980 1,690 400 23.5 15.2 2.0 3,820 1,240 180.1 2002 ............................ 970 1,680 390 23.4 15.2 2.0 3,760 1,320 181.7 2003 ............................ 980 1,690 400 23.6 15.2 2.0 3,810 1,300 185.1 2004 ............................ 990 1,710 400 23.7 15.4 2.1 3,840 1,250 185.1 2005 ............................ 950 1,720 400 24.1 16.2 2.1 3,820 1,270 184.4
1 Computed by Center for Nutrition Policy and Promotion (CNPP), USDA. Based on Economic Research Service esti-mates of per capita quantities of food available for consumption (retail weight) and on CNPP estimates of quantities of produce from home gardens and certain other foods. No deduction is made in food supply estimates for loss of food or nutri-ents in further processing, in marketing, or in the home. Data include iron, thiamin, riboflavin, niacin, vitamin A, vitamin B6, vitamin B12, ascorbic acid, and zinc added by enrichment and fortification. 2 Sodium levels do not reflect sodium from most processed foods and therefore underestimate total sodium available in the U.S. food supply.
Center for Nutrition Policy and Promotion (CNPP), (703) 305–7600.
VerDate Aug 31 2005 10:44 Feb 29, 2012 Jkt 000000 PO 00000 Frm 00003 Fmt 1000 Sfmt 1000 H:\SHARED\DAPP\FPU\AGSTAT\MASTER~2\CHAPTR13\XIII-03.AG8 USDA
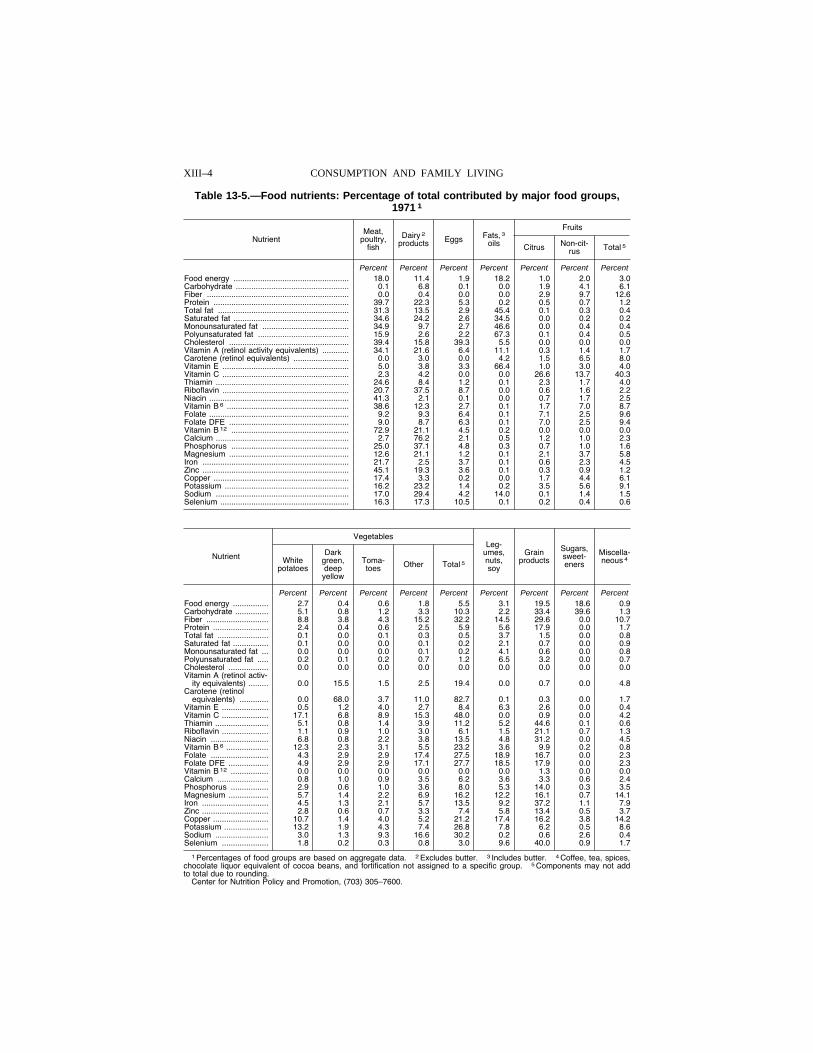
XIII–4 CONSUMPTION AND FAMILY LIVING
Table 13-5.—Food nutrients: Percentage of total contributed by major food groups, 1971 1
Nutrient Meat,
poultry, fish
Dairy 2 products Eggs Fats, 3
oils
Fruits
Citrus Non-cit-rus Total 5
Percent Percent Percent Percent Percent Percent Percent Food energy .................................................... 18.0 11.4 1.9 18.2 1.0 2.0 3.0 Carbohydrate ................................................... 0.1 6.8 0.1 0.0 1.9 4.1 6.1 Fiber ................................................................ 0.0 0.4 0.0 0.0 2.9 9.7 12.6 Protein ............................................................. 39.7 22.3 5.3 0.2 0.5 0.7 1.2 Total fat ........................................................... 31.3 13.5 2.9 45.4 0.1 0.3 0.4 Saturated fat .................................................... 34.6 24.2 2.6 34.5 0.0 0.2 0.2 Monounsaturated fat ....................................... 34.9 9.7 2.7 46.6 0.0 0.4 0.4 Polyunsaturated fat ......................................... 15.9 2.6 2.2 67.3 0.1 0.4 0.5 Cholesterol ...................................................... 39.4 15.8 39.3 5.5 0.0 0.0 0.0 Vitamin A (retinol activity equivalents) ............ 34.1 21.6 6.4 11.1 0.3 1.4 1.7 Carotene (retinol equivalents) ......................... 0.0 3.0 0.0 4.2 1.5 6.5 8.0 Vitamin E ......................................................... 5.0 3.8 3.3 66.4 1.0 3.0 4.0 Vitamin C ......................................................... 2.3 4.2 0.0 0.0 26.6 13.7 40.3 Thiamin ............................................................ 24.6 8.4 1.2 0.1 2.3 1.7 4.0 Riboflavin ......................................................... 20.7 37.5 8.7 0.0 0.6 1.6 2.2 Niacin ............................................................... 41.3 2.1 0.1 0.0 0.7 1.7 2.5 Vitamin B 6 ....................................................... 38.6 12.3 2.7 0.1 1.7 7.0 8.7 Folate ............................................................... 9.2 9.3 6.4 0.1 7.1 2.5 9.6 Folate DFE ...................................................... 9.0 8.7 6.3 0.1 7.0 2.5 9.4 Vitamin B 12 ..................................................... 72.9 21.1 4.5 0.2 0.0 0.0 0.0 Calcium ............................................................ 2.7 76.2 2.1 0.5 1.2 1.0 2.3 Phosphorus ..................................................... 25.0 37.1 4.8 0.3 0.7 1.0 1.6 Magnesium ...................................................... 12.6 21.1 1.2 0.1 2.1 3.7 5.8 Iron .................................................................. 21.7 2.5 3.7 0.1 0.6 2.3 4.5 Zinc .................................................................. 45.1 19.3 3.6 0.1 0.3 0.9 1.2 Copper ............................................................. 17.4 3.3 0.2 0.0 1.7 4.4 6.1 Potassium ........................................................ 16.2 23.2 1.4 0.2 3.5 5.6 9.1 Sodium ............................................................ 17.0 29.4 4.2 14.0 0.1 1.4 1.5 Selenium .......................................................... 16.3 17.3 10.5 0.1 0.2 0.4 0.6
Nutrient
Vegetables Leg-
umes, nuts, soy
Grain products
Sugars, sweet-eners
Miscella-neous 4 White
potatoes
Dark green, deep yellow
Toma-toes Other Total 5
Percent Percent Percent Percent Percent Percent Percent Percent Percent Food energy ................ 2.7 0.4 0.6 1.8 5.5 3.1 19.5 18.6 0.9 Carbohydrate ............... 5.1 0.8 1.2 3.3 10.3 2.2 33.4 39.6 1.3 Fiber ............................ 8.8 3.8 4.3 15.2 32.2 14.5 29.6 0.0 10.7 Protein ......................... 2.4 0.4 0.6 2.5 5.9 5.6 17.9 0.0 1.7 Total fat ....................... 0.1 0.0 0.1 0.3 0.5 3.7 1.5 0.0 0.8 Saturated fat ................ 0.1 0.0 0.0 0.1 0.2 2.1 0.7 0.0 0.9 Monounsaturated fat ... 0.0 0.0 0.0 0.1 0.2 4.1 0.6 0.0 0.8 Polyunsaturated fat ..... 0.2 0.1 0.2 0.7 1.2 6.5 3.2 0.0 0.7 Cholesterol .................. 0.0 0.0 0.0 0.0 0.0 0.0 0.0 0.0 0.0 Vitamin A (retinol activ-
ity equivalents) ......... 0.0 15.5 1.5 2.5 19.4 0.0 0.7 0.0 4.8 Carotene (retinol
equivalents) ............. 0.0 68.0 3.7 11.0 82.7 0.1 0.3 0.0 1.7 Vitamin E ..................... 0.5 1.2 4.0 2.7 8.4 6.3 2.6 0.0 0.4 Vitamin C ..................... 17.1 6.8 8.9 15.3 48.0 0.0 0.9 0.0 4.2 Thiamin ........................ 5.1 0.8 1.4 3.9 11.2 5.2 44.6 0.1 0.6 Riboflavin ..................... 1.1 0.9 1.0 3.0 6.1 1.5 21.1 0.7 1.3 Niacin .......................... 6.8 0.8 2.2 3.8 13.5 4.8 31.2 0.0 4.5 Vitamin B 6 ................... 12.3 2.3 3.1 5.5 23.2 3.6 9.9 0.2 0.8 Folate .......................... 4.3 2.9 2.9 17.4 27.5 18.9 16.7 0.0 2.3 Folate DFE .................. 4.9 2.9 2.9 17.1 27.7 18.5 17.9 0.0 2.3 Vitamin B 12 ................. 0.0 0.0 0.0 0.0 0.0 0.0 1.3 0.0 0.0 Calcium ....................... 0.8 1.0 0.9 3.5 6.2 3.6 3.3 0.6 2.4 Phosphorus ................. 2.9 0.6 1.0 3.6 8.0 5.3 14.0 0.3 3.5 Magnesium .................. 5.7 1.4 2.2 6.9 16.2 12.2 16.1 0.7 14.1 Iron .............................. 4.5 1.3 2.1 5.7 13.5 9.2 37.2 1.1 7.9 Zinc .............................. 2.8 0.6 0.7 3.3 7.4 5.8 13.4 0.5 3.7 Copper ......................... 10.7 1.4 4.0 5.2 21.2 17.4 16.2 3.8 14.2 Potassium .................... 13.2 1.9 4.3 7.4 26.8 7.8 6.2 0.5 8.6 Sodium ........................ 3.0 1.3 9.3 16.6 30.2 0.2 0.6 2.6 0.4 Selenium ..................... 1.8 0.2 0.3 0.8 3.0 9.6 40.0 0.9 1.7
1 Percentages of food groups are based on aggregate data. 2 Excludes butter. 3 Includes butter. 4 Coffee, tea, spices, chocolate liquor equivalent of cocoa beans, and fortification not assigned to a specific group. 5 Components may not add to total due to rounding.
Center for Nutrition Policy and Promotion, (703) 305–7600.
VerDate Aug 31 2005 10:44 Feb 29, 2012 Jkt 000000 PO 00000 Frm 00004 Fmt 1000 Sfmt 1000 H:\SHARED\DAPP\FPU\AGSTAT\MASTER~2\CHAPTR13\XIII-04.AG8 USDA
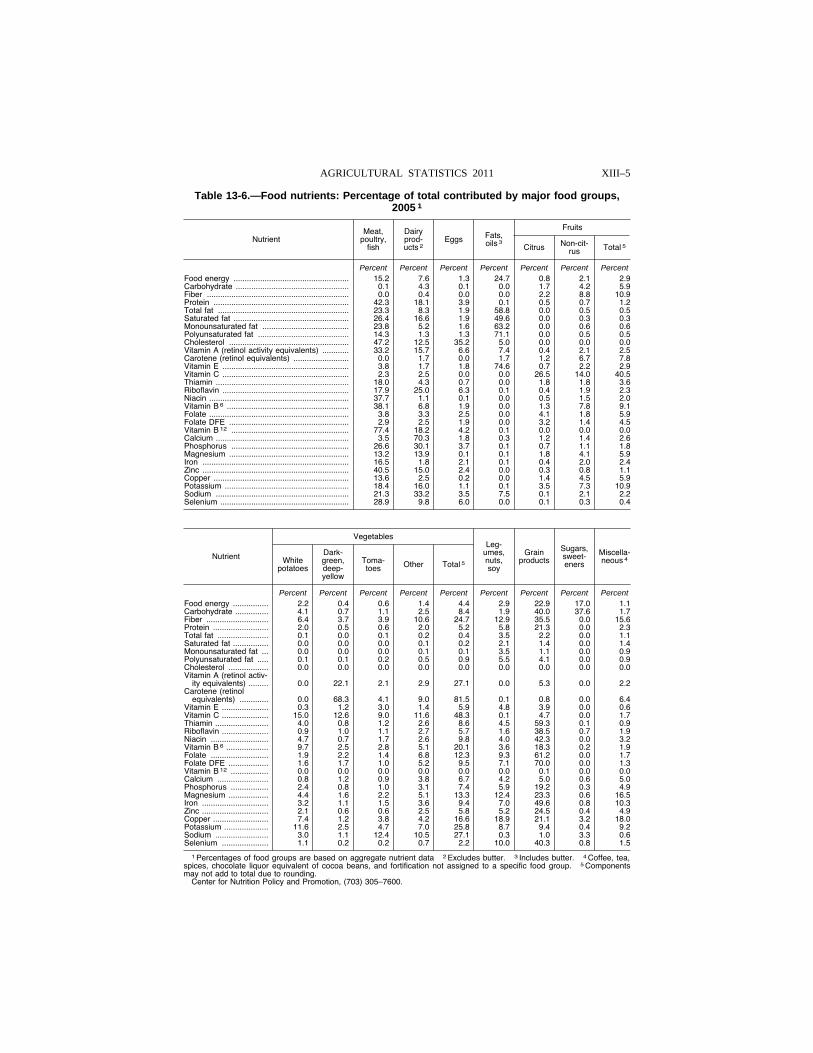
XIII–5 AGRICULTURAL STATISTICS 2011
Table 13-6.—Food nutrients: Percentage of total contributed by major food groups, 2005 1
Nutrient Meat,
poultry, fish
Dairy prod-ucts 2
Eggs Fats, oils 3
Fruits
Citrus Non-cit-rus Total 5
Percent Percent Percent Percent Percent Percent Percent Food energy .................................................... 15.2 7.6 1.3 24.7 0.8 2.1 2.9 Carbohydrate ................................................... 0.1 4.3 0.1 0.0 1.7 4.2 5.9 Fiber ................................................................ 0.0 0.4 0.0 0.0 2.2 8.8 10.9 Protein ............................................................. 42.3 18.1 3.9 0.1 0.5 0.7 1.2 Total fat ........................................................... 23.3 8.3 1.9 58.8 0.0 0.5 0.5 Saturated fat .................................................... 26.4 16.6 1.9 49.6 0.0 0.3 0.3 Monounsaturated fat ....................................... 23.8 5.2 1.6 63.2 0.0 0.6 0.6 Polyunsaturated fat ......................................... 14.3 1.3 1.3 71.1 0.0 0.5 0.5 Cholesterol ...................................................... 47.2 12.5 35.2 5.0 0.0 0.0 0.0 Vitamin A (retinol activity equivalents) ............ 33.2 15.7 6.6 7.4 0.4 2.1 2.5 Carotene (retinol equivalents) ......................... 0.0 1.7 0.0 1.7 1.2 6.7 7.8 Vitamin E ......................................................... 3.8 1.7 1.8 74.6 0.7 2.2 2.9 Vitamin C ......................................................... 2.3 2.5 0.0 0.0 26.5 14.0 40.5 Thiamin ............................................................ 18.0 4.3 0.7 0.0 1.8 1.8 3.6 Riboflavin ......................................................... 17.9 25.0 6.3 0.1 0.4 1.9 2.3 Niacin ............................................................... 37.7 1.1 0.1 0.0 0.5 1.5 2.0 Vitamin B 6 ....................................................... 38.1 6.8 1.9 0.0 1.3 7.8 9.1 Folate ............................................................... 3.8 3.3 2.5 0.0 4.1 1.8 5.9 Folate DFE ...................................................... 2.9 2.5 1.9 0.0 3.2 1.4 4.5 Vitamin B 12 ..................................................... 77.4 18.2 4.2 0.1 0.0 0.0 0.0 Calcium ............................................................ 3.5 70.3 1.8 0.3 1.2 1.4 2.6 Phosphorus ..................................................... 26.6 30.1 3.7 0.1 0.7 1.1 1.8 Magnesium ...................................................... 13.2 13.9 0.1 0.1 1.8 4.1 5.9 Iron .................................................................. 16.5 1.8 2.1 0.1 0.4 2.0 2.4 Zinc .................................................................. 40.5 15.0 2.4 0.0 0.3 0.8 1.1 Copper ............................................................. 13.6 2.5 0.2 0.0 1.4 4.5 5.9 Potassium ........................................................ 18.4 16.0 1.1 0.1 3.5 7.3 10.9 Sodium ............................................................ 21.3 33.2 3.5 7.5 0.1 2.1 2.2 Selenium .......................................................... 28.9 9.8 6.0 0.0 0.1 0.3 0.4
Nutrient
Vegetables Leg-
umes, nuts, soy
Grain products
Sugars, sweet-eners
Miscella-neous 4 White
potatoes
Dark- green, deep- yellow
Toma-toes Other Total 5
Percent Percent Percent Percent Percent Percent Percent Percent Percent Food energy ................ 2.2 0.4 0.6 1.4 4.4 2.9 22.9 17.0 1.1 Carbohydrate ............... 4.1 0.7 1.1 2.5 8.4 1.9 40.0 37.6 1.7 Fiber ............................ 6.4 3.7 3.9 10.6 24.7 12.9 35.5 0.0 15.6 Protein ......................... 2.0 0.5 0.6 2.0 5.2 5.8 21.3 0.0 2.3 Total fat ....................... 0.1 0.0 0.1 0.2 0.4 3.5 2.2 0.0 1.1 Saturated fat ................ 0.0 0.0 0.0 0.1 0.2 2.1 1.4 0.0 1.4 Monounsaturated fat ... 0.0 0.0 0.0 0.1 0.1 3.5 1.1 0.0 0.9 Polyunsaturated fat ..... 0.1 0.1 0.2 0.5 0.9 5.5 4.1 0.0 0.9 Cholesterol .................. 0.0 0.0 0.0 0.0 0.0 0.0 0.0 0.0 0.0 Vitamin A (retinol activ-
ity equivalents) ......... 0.0 22.1 2.1 2.9 27.1 0.0 5.3 0.0 2.2 Carotene (retinol
equivalents) ............. 0.0 68.3 4.1 9.0 81.5 0.1 0.8 0.0 6.4 Vitamin E ..................... 0.3 1.2 3.0 1.4 5.9 4.8 3.9 0.0 0.6 Vitamin C ..................... 15.0 12.6 9.0 11.6 48.3 0.1 4.7 0.0 1.7 Thiamin ........................ 4.0 0.8 1.2 2.6 8.6 4.5 59.3 0.1 0.9 Riboflavin ..................... 0.9 1.0 1.1 2.7 5.7 1.6 38.5 0.7 1.9 Niacin .......................... 4.7 0.7 1.7 2.6 9.8 4.0 42.3 0.0 3.2 Vitamin B 6 ................... 9.7 2.5 2.8 5.1 20.1 3.6 18.3 0.2 1.9 Folate .......................... 1.9 2.2 1.4 6.8 12.3 9.3 61.2 0.0 1.7 Folate DFE .................. 1.6 1.7 1.0 5.2 9.5 7.1 70.0 0.0 1.3 Vitamin B 12 ................. 0.0 0.0 0.0 0.0 0.0 0.0 0.1 0.0 0.0 Calcium ....................... 0.8 1.2 0.9 3.8 6.7 4.2 5.0 0.6 5.0 Phosphorus ................. 2.4 0.8 1.0 3.1 7.4 5.9 19.2 0.3 4.9 Magnesium .................. 4.4 1.6 2.2 5.1 13.3 12.4 23.3 0.6 16.5 Iron .............................. 3.2 1.1 1.5 3.6 9.4 7.0 49.6 0.8 10.3 Zinc .............................. 2.1 0.6 0.6 2.5 5.8 5.2 24.5 0.4 4.9 Copper ......................... 7.4 1.2 3.8 4.2 16.6 18.9 21.1 3.2 18.0 Potassium .................... 11.6 2.5 4.7 7.0 25.8 8.7 9.4 0.4 9.2 Sodium ........................ 3.0 1.1 12.4 10.5 27.1 0.3 1.0 3.3 0.6 Selenium ..................... 1.1 0.2 0.2 0.7 2.2 10.0 40.3 0.8 1.5
1 Percentages of food groups are based on aggregate nutrient data 2 Excludes butter. 3 Includes butter. 4 Coffee, tea, spices, chocolate liquor equivalent of cocoa beans, and fortification not assigned to a specific food group. 5 Components may not add to total due to rounding.
Center for Nutrition Policy and Promotion, (703) 305–7600.
VerDate Aug 31 2005 10:44 Feb 29, 2012 Jkt 000000 PO 00000 Frm 00005 Fmt 1000 Sfmt 1000 H:\SHARED\DAPP\FPU\AGSTAT\MASTER~2\CHAPTR13\XIII-05.AG8 USDA
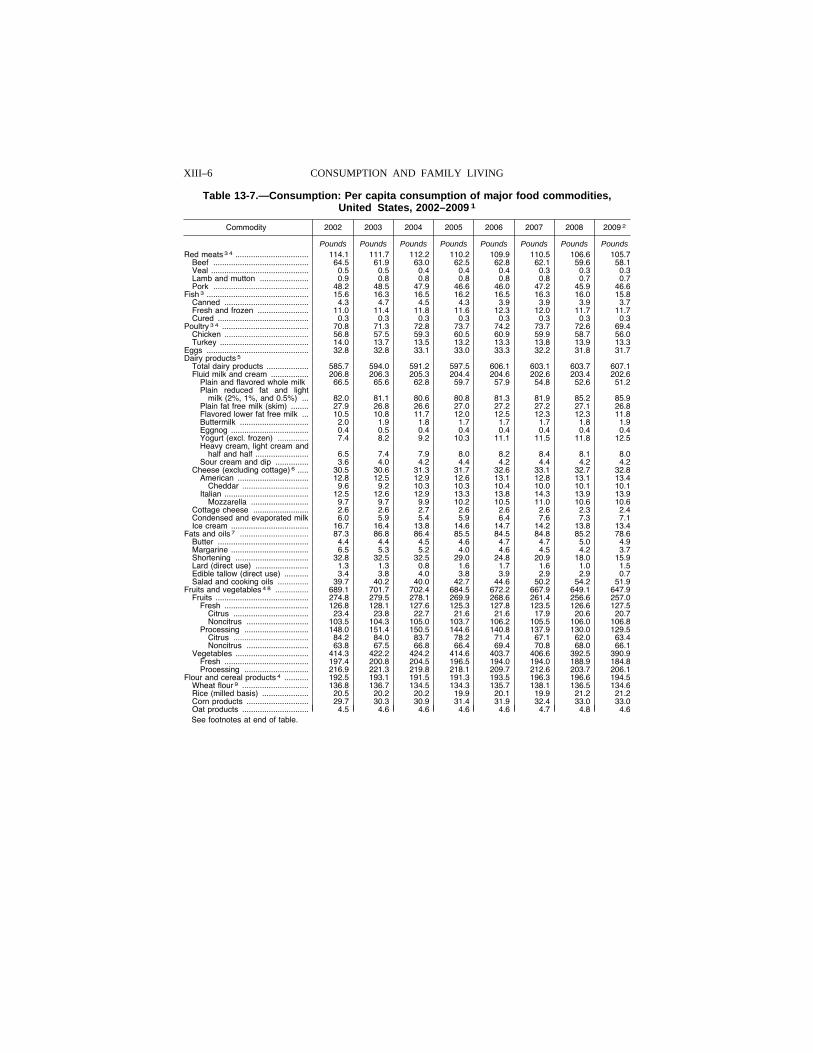
XIII–6 CONSUMPTION AND FAMILY LIVING
Table 13-7.—Consumption: Per capita consumption of major food commodities, United States, 2002–2009 1
Commodity 2002 2003 2004 2005 2006 2007 2008 2009 2
Pounds Pounds Pounds Pounds Pounds Pounds Pounds Pounds Red meats 3 4 ................................. 114.1 111.7 112.2 110.2 109.9 110.5 106.6 105.7
Beef ........................................... 64.5 61.9 63.0 62.5 62.8 62.1 59.6 58.1 Veal ............................................ 0.5 0.5 0.4 0.4 0.4 0.3 0.3 0.3 Lamb and mutton ...................... 0.9 0.8 0.8 0.8 0.8 0.8 0.7 0.7 Pork ........................................... 48.2 48.5 47.9 46.6 46.0 47.2 45.9 46.6
Fish 3 .............................................. 15.6 16.3 16.5 16.2 16.5 16.3 16.0 15.8 Canned ...................................... 4.3 4.7 4.5 4.3 3.9 3.9 3.9 3.7 Fresh and frozen ....................... 11.0 11.4 11.8 11.6 12.3 12.0 11.7 11.7 Cured ......................................... 0.3 0.3 0.3 0.3 0.3 0.3 0.3 0.3
Poultry 3 4 ....................................... 70.8 71.3 72.8 73.7 74.2 73.7 72.6 69.4 Chicken ...................................... 56.8 57.5 59.3 60.5 60.9 59.9 58.7 56.0 Turkey ........................................ 14.0 13.7 13.5 13.2 13.3 13.8 13.9 13.3
Eggs .............................................. 32.8 32.8 33.1 33.0 33.3 32.2 31.8 31.7 Dairy products 5
Total dairy products ................... 585.7 594.0 591.2 597.5 606.1 603.1 603.7 607.1 Fluid milk and cream ................. 206.8 206.3 205.3 204.4 204.6 202.6 203.4 202.6
Plain and flavored whole milk 66.5 65.6 62.8 59.7 57.9 54.8 52.6 51.2 Plain reduced fat and light
milk (2%, 1%, and 0.5%) ... 82.0 81.1 80.6 80.8 81.3 81.9 85.2 85.9 Plain fat free milk (skim) ........ 27.9 26.8 26.6 27.0 27.2 27.2 27.1 26.8 Flavored lower fat free milk ... 10.5 10.8 11.7 12.0 12.5 12.3 12.3 11.8 Buttermilk ............................... 2.0 1.9 1.8 1.7 1.7 1.7 1.8 1.9 Eggnog ................................... 0.4 0.5 0.4 0.4 0.4 0.4 0.4 0.4 Yogurt (excl. frozen) .............. 7.4 8.2 9.2 10.3 11.1 11.5 11.8 12.5 Heavy cream, light cream and
half and half ........................ 6.5 7.4 7.9 8.0 8.2 8.4 8.1 8.0 Sour cream and dip ............... 3.6 4.0 4.2 4.4 4.2 4.4 4.2 4.2
Cheese (excluding cottage) 6 ..... 30.5 30.6 31.3 31.7 32.6 33.1 32.7 32.8 American ................................ 12.8 12.5 12.9 12.6 13.1 12.8 13.1 13.4
Cheddar .............................. 9.6 9.2 10.3 10.3 10.4 10.0 10.1 10.1 Italian ...................................... 12.5 12.6 12.9 13.3 13.8 14.3 13.9 13.9
Mozzarella .......................... 9.7 9.7 9.9 10.2 10.5 11.0 10.6 10.6 Cottage cheese ......................... 2.6 2.6 2.7 2.6 2.6 2.6 2.3 2.4 Condensed and evaporated milk 6.0 5.9 5.4 5.9 6.4 7.6 7.3 7.1 Ice cream ................................... 16.7 16.4 13.8 14.6 14.7 14.2 13.8 13.4
Fats and oils 7 ............................... 87.3 86.8 86.4 85.5 84.5 84.8 85.2 78.6 Butter ......................................... 4.4 4.4 4.5 4.6 4.7 4.7 5.0 4.9 Margarine ................................... 6.5 5.3 5.2 4.0 4.6 4.5 4.2 3.7 Shortening ................................. 32.8 32.5 32.5 29.0 24.8 20.9 18.0 15.9 Lard (direct use) ........................ 1.3 1.3 0.8 1.6 1.7 1.6 1.0 1.5 Edible tallow (direct use) ........... 3.4 3.8 4.0 3.8 3.9 2.9 2.9 0.7 Salad and cooking oils .............. 39.7 40.2 40.0 42.7 44.6 50.2 54.2 51.9
Fruits and vegetables 4 8 ............... 689.1 701.7 702.4 684.5 672.2 667.9 649.1 647.9 Fruits .......................................... 274.8 279.5 278.1 269.9 268.6 261.4 256.6 257.0
Fresh ...................................... 126.8 128.1 127.6 125.3 127.8 123.5 126.6 127.5 Citrus .................................. 23.4 23.8 22.7 21.6 21.6 17.9 20.6 20.7 Noncitrus ............................ 103.5 104.3 105.0 103.7 106.2 105.5 106.0 106.8
Processing ............................. 148.0 151.4 150.5 144.6 140.8 137.9 130.0 129.5 Citrus .................................. 84.2 84.0 83.7 78.2 71.4 67.1 62.0 63.4 Noncitrus ............................ 63.8 67.5 66.8 66.4 69.4 70.8 68.0 66.1
Vegetables ................................. 414.3 422.2 424.2 414.6 403.7 406.6 392.5 390.9 Fresh ...................................... 197.4 200.8 204.5 196.5 194.0 194.0 188.9 184.8 Processing ............................. 216.9 221.3 219.8 218.1 209.7 212.6 203.7 206.1
Flour and cereal products 4 ........... 192.5 193.1 191.5 191.3 193.5 196.3 196.6 194.5 Wheat flour 9 .............................. 136.8 136.7 134.5 134.3 135.7 138.1 136.5 134.6 Rice (milled basis) ..................... 20.5 20.2 20.2 19.9 20.1 19.9 21.2 21.2 Corn products ............................ 29.7 30.3 30.9 31.4 31.9 32.4 33.0 33.0 Oat products .............................. 4.5 4.6 4.6 4.6 4.6 4.7 4.8 4.6 See footnotes at end of table.
VerDate Aug 31 2005 10:44 Feb 29, 2012 Jkt 000000 PO 00000 Frm 00006 Fmt 1000 Sfmt 1000 H:\SHARED\DAPP\FPU\AGSTAT\MASTER~2\CHAPTR13\XIII-06.AG8 USDA
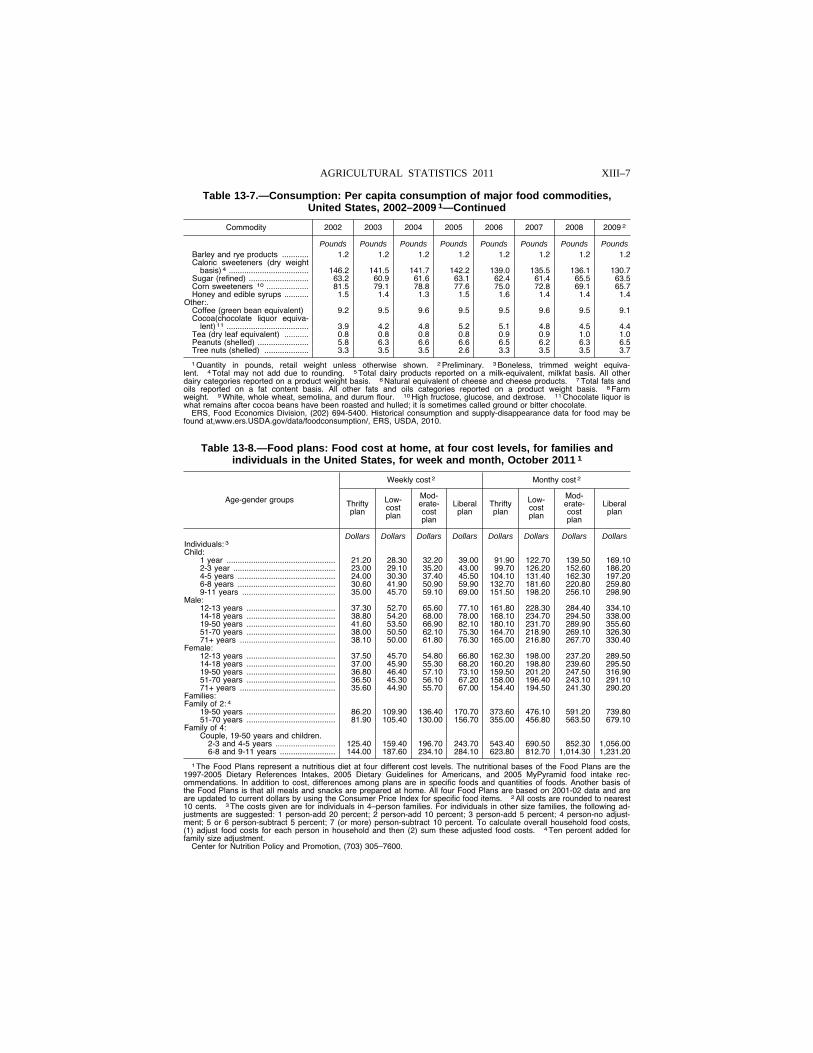
XIII–7 AGRICULTURAL STATISTICS 2011
Table 13-7.—Consumption: Per capita consumption of major food commodities, United States, 2002–2009 1—Continued
Commodity 2002 2003 2004 2005 2006 2007 2008 2009 2
Pounds Pounds Pounds Pounds Pounds Pounds Pounds Pounds Barley and rye products ............ 1.2 1.2 1.2 1.2 1.2 1.2 1.2 1.2 Caloric sweeteners (dry weight
basis) 4 .................................... 146.2 141.5 141.7 142.2 139.0 135.5 136.1 130.7 Sugar (refined) ........................... 63.2 60.9 61.6 63.1 62.4 61.4 65.5 63.5 Corn sweeteners 10 ................... 81.5 79.1 78.8 77.6 75.0 72.8 69.1 65.7 Honey and edible syrups ........... 1.5 1.4 1.3 1.5 1.6 1.4 1.4 1.4
Other:.Coffee (green bean equivalent) 9.2 9.5 9.6 9.5 9.5 9.6 9.5 9.1 Cocoa(chocolate liquor equiva-
lent) 11 ..................................... 3.9 4.2 4.8 5.2 5.1 4.8 4.5 4.4 Tea (dry leaf equivalent) ........... 0.8 0.8 0.8 0.8 0.9 0.9 1.0 1.0 Peanuts (shelled) ....................... 5.8 6.3 6.6 6.6 6.5 6.2 6.3 6.5 Tree nuts (shelled) .................... 3.3 3.5 3.5 2.6 3.3 3.5 3.5 3.7
1 Quantity in pounds, retail weight unless otherwise shown. 2 Preliminary. 3 Boneless, trimmed weight equiva-lent. 4 Total may not add due to rounding. 5 Total dairy products reported on a milk-equivalent, milkfat basis. All other dairy categories reported on a product weight basis. 6 Natural equivalent of cheese and cheese products. 7 Total fats and oils reported on a fat content basis. All other fats and oils categories reported on a product weight basis. 8 Farm weight. 9 White, whole wheat, semolina, and durum flour. 10 High fructose, glucose, and dextrose. 11 Chocolate liquor is what remains after cocoa beans have been roasted and hulled; it is sometimes called ground or bitter chocolate.
ERS, Food Economics Division, (202) 694-5400. Historical consumption and supply-disappearance data for food may be found at,www.ers.USDA.gov/data/foodconsumption/, ERS, USDA, 2010.
Table 13-8.—Food plans: Food cost at home, at four cost levels, for families and individuals in the United States, for week and month, October 2011 1
Age-gender groups
Weekly cost 2 Monthy cost 2
Thrifty plan
Low- cost plan
Mod-erate- cost plan
Liberal plan
Thrifty plan
Low- cost plan
Mod-erate- cost plan
Liberal plan
Dollars Dollars Dollars Dollars Dollars Dollars Dollars Dollars Individuals: 3 Child:
1 year ................................................. 21.20 28.30 32.20 39.00 91.90 122.70 139.50 169.10 2-3 year .............................................. 23.00 29.10 35.20 43.00 99.70 126.20 152.60 186.20 4-5 years ............................................ 24.00 30.30 37.40 45.50 104.10 131.40 162.30 197.20 6-8 years ............................................ 30.60 41.90 50.90 59.90 132.70 181.60 220.80 259.80 9-11 years .......................................... 35.00 45.70 59.10 69.00 151.50 198.20 256.10 298.90
Male: 12-13 years ........................................ 37.30 52.70 65.60 77.10 161.80 228.30 284.40 334.10 14-18 years ........................................ 38.80 54.20 68.00 78.00 168.10 234.70 294.50 338.00 19-50 years ........................................ 41.60 53.50 66.90 82.10 180.10 231.70 289.90 355.60 51-70 years ........................................ 38.00 50.50 62.10 75.30 164.70 218.90 269.10 326.30 71+ years ........................................... 38.10 50.00 61.80 76.30 165.00 216.80 267.70 330.40
Female: 12-13 years ........................................ 37.50 45.70 54.80 66.80 162.30 198.00 237.20 289.50 14-18 years ........................................ 37.00 45.90 55.30 68.20 160.20 198.80 239.60 295.50 19-50 years ........................................ 36.80 46.40 57.10 73.10 159.50 201.20 247.50 316.90 51-70 years ........................................ 36.50 45.30 56.10 67.20 158.00 196.40 243.10 291.10 71+ years ........................................... 35.60 44.90 55.70 67.00 154.40 194.50 241.30 290.20
Families: Family of 2: 4
19-50 years ........................................ 86.20 109.90 136.40 170.70 373.60 476.10 591.20 739.80 51-70 years ........................................ 81.90 105.40 130.00 156.70 355.00 456.80 563.50 679.10
Family of 4: Couple, 19-50 years and children.
2-3 and 4-5 years ........................... 125.40 159.40 196.70 243.70 543.40 690.50 852.30 1,056.00 6-8 and 9-11 years ......................... 144.00 187.60 234.10 284.10 623.80 812.70 1,014.30 1,231.20
1 The Food Plans represent a nutritious diet at four different cost levels. The nutritional bases of the Food Plans are the 1997-2005 Dietary References Intakes, 2005 Dietary Guidelines for Americans, and 2005 MyPyramid food intake rec-ommendations. In addition to cost, differences among plans are in specific foods and quantities of foods. Another basis of the Food Plans is that all meals and snacks are prepared at home. All four Food Plans are based on 2001-02 data and are are updated to current dollars by using the Consumer Price Index for specific food items. 2 All costs are rounded to nearest 10 cents. 3 The costs given are for individuals in 4–person families. For individuals in other size families, the following ad-justments are suggested: 1 person-add 20 percent; 2 person-add 10 percent; 3 person-add 5 percent; 4 person-no adjust-ment; 5 or 6 person-subtract 5 percent; 7 (or more) person-subtract 10 percent. To calculate overall household food costs, (1) adjust food costs for each person in household and then (2) sum these adjusted food costs. 4 Ten percent added for family size adjustment.
Center for Nutrition Policy and Promotion, (703) 305–7600.
VerDate Aug 31 2005 10:44 Feb 29, 2012 Jkt 000000 PO 00000 Frm 00007 Fmt 1000 Sfmt 1000 H:\SHARED\DAPP\FPU\AGSTAT\MASTER~2\CHAPTR13\XIII-07.AG8 USDA
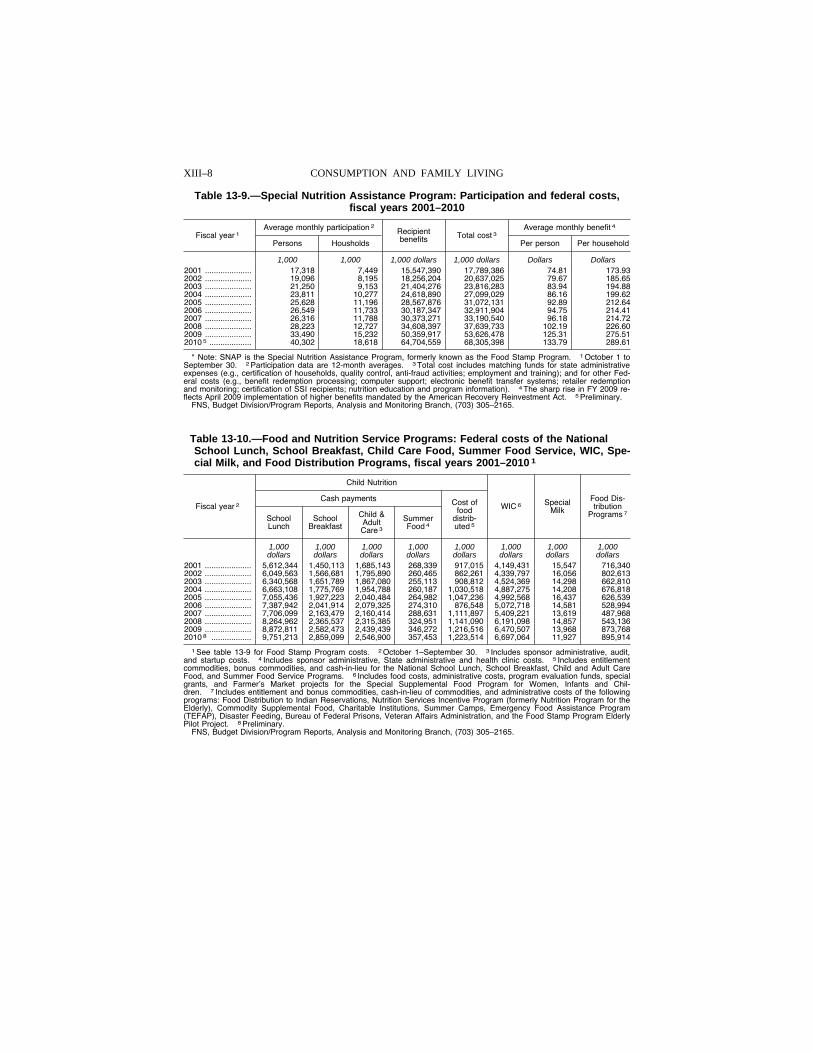
XIII–8 CONSUMPTION AND FAMILY LIVING
Table 13-9.—Special Nutrition Assistance Program: Participation and federal costs, fiscal years 2001–2010
Fiscal year 1 Average monthly participation 2 Recipient
benefits Total cost 3 Average monthly benefit 4
Persons Housholds Per person Per household
1,000 1,000 1,000 dollars 1,000 dollars Dollars Dollars 2001 ..................... 17,318 7,449 15,547,390 17,789,386 74.81 173.93 2002 ..................... 19,096 8,195 18,256,204 20,637,025 79.67 185.65 2003 ..................... 21,250 9,153 21,404,276 23,816,283 83.94 194.88 2004 ..................... 23,811 10,277 24,618,890 27,099,029 86.16 199.62 2005 ..................... 25,628 11,196 28,567,876 31,072,131 92.89 212.64 2006 ..................... 26,549 11,733 30,187,347 32,911,904 94.75 214.41 2007 ..................... 26,316 11,788 30,373,271 33,190,540 96.18 214.72 2008 ..................... 28,223 12,727 34,608,397 37,639,733 102.19 226.60 2009 ..................... 33,490 15,232 50,359,917 53,626,478 125.31 275.51 2010 5 ................... 40,302 18,618 64,704,559 68,305,398 133.79 289.61
* Note: SNAP is the Special Nutrition Assistance Program, formerly known as the Food Stamp Program. 1 October 1 to September 30. 2 Participation data are 12-month averages. 3 Total cost includes matching funds for state administrative expenses (e.g., certification of households, quality control, anti-fraud activities; employment and training); and for other Fed-eral costs (e.g., benefit redemption processing; computer support; electronic benefit transfer systems; retailer redemption and monitoring; certification of SSI recipients; nutrition education and program information). 4 The sharp rise in FY 2009 re-flects April 2009 implementation of higher benefits mandated by the American Recovery Reinvestment Act. 5 Preliminary.
FNS, Budget Division/Program Reports, Analysis and Monitoring Branch, (703) 305–2165.
Table 13-10.—Food and Nutrition Service Programs: Federal costs of the National School Lunch, School Breakfast, Child Care Food, Summer Food Service, WIC, Spe-cial Milk, and Food Distribution Programs, fiscal years 2001–2010 1
Fiscal year 2
Child Nutrition
WIC 6 Special Milk
Food Dis-tribution
Programs 7
Cash payments Cost of food
distrib-uted 5
School Lunch
School Breakfast
Child & Adult Care 3
Summer Food 4
1,000 1,000 1,000 1,000 1,000 1,000 1,000 1,000 dollars dollars dollars dollars dollars dollars dollars dollars
2001 ..................... 5,612,344 1,450,113 1,685,143 268,339 917,015 4,149,431 15,547 716,340 2002 ..................... 6,049,563 1,566,681 1,795,890 260,465 862,261 4,339,797 16,056 802,613 2003 ..................... 6,340,568 1,651,789 1,867,080 255,113 908,812 4,524,369 14,298 662,810 2004 ..................... 6,663,108 1,775,769 1,954,788 260,187 1,030,518 4,887,275 14,208 676,818 2005 ..................... 7,055,436 1,927,223 2,040,484 264,982 1,047,236 4,992,568 16,437 626,539 2006 ..................... 7,387,942 2,041,914 2,079,325 274,310 876,548 5,072,718 14,581 528,994 2007 ..................... 7,706,099 2,163,479 2,160,414 288,631 1,111,897 5,409,221 13,619 487,968 2008 ..................... 8,264,962 2,365,537 2,315,385 324,951 1,141,090 6,191,098 14,857 543,136 2009 ..................... 8,872,811 2,582,473 2,439,439 346,272 1,216,516 6,470,507 13,968 873,768 2010 8 .................. 9,751,213 2,859,099 2,546,900 357,453 1,223,514 6,697,064 11,927 895,914
1 See table 13-9 for Food Stamp Program costs. 2 October 1–September 30. 3 Includes sponsor administrative, audit, and startup costs. 4 Includes sponsor administrative, State administrative and health clinic costs. 5 Includes entitlement commodities, bonus commodities, and cash-in-lieu for the National School Lunch, School Breakfast, Child and Adult Care Food, and Summer Food Service Programs. 6 Includes food costs, administrative costs, program evaluation funds, special grants, and Farmer’s Market projects for the Special Supplemental Food Program for Women, Infants and Chil-dren. 7 Includes entitlement and bonus commodities, cash-in-lieu of commodities, and administrative costs of the following programs: Food Distribution to Indian Reservations, Nutrition Services Incentive Program (formerly Nutrition Program for the Elderly), Commodity Supplemental Food, Charitable Institutions, Summer Camps, Emergency Food Assistance Program (TEFAP), Disaster Feeding, Bureau of Federal Prisons, Veteran Affairs Administration, and the Food Stamp Program Elderly Pilot Project. 8 Preliminary.
FNS, Budget Division/Program Reports, Analysis and Monitoring Branch, (703) 305–2165.
VerDate Aug 31 2005 10:44 Feb 29, 2012 Jkt 000000 PO 00000 Frm 00008 Fmt 1000 Sfmt 1000 H:\SHARED\DAPP\FPU\AGSTAT\MASTER~2\CHAPTR13\XIII-08.AG8 USDA
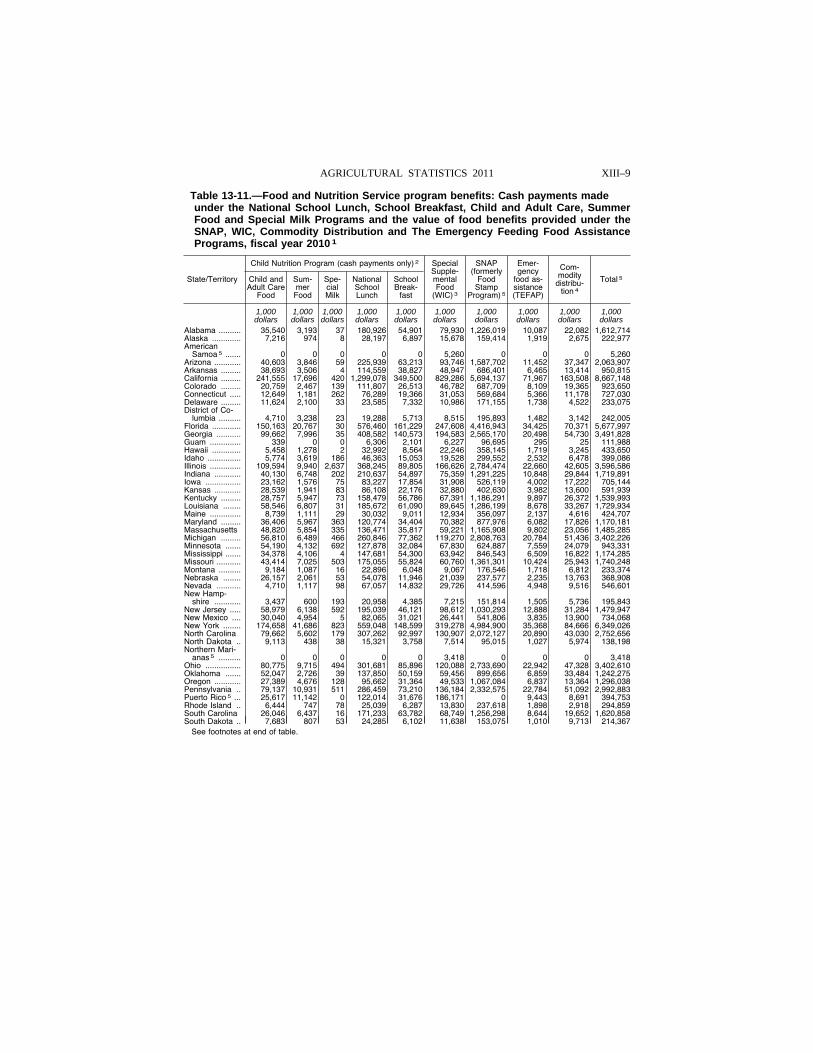
XIII–9 AGRICULTURAL STATISTICS 2011
Table 13-11.—Food and Nutrition Service program benefits: Cash payments made under the National School Lunch, School Breakfast, Child and Adult Care, Summer Food and Special Milk Programs and the value of food benefits provided under the SNAP, WIC, Commodity Distribution and The Emergency Feeding Food Assistance Programs, fiscal year 2010 1
State/Territory
Child Nutrition Program (cash payments only) 2 Special Supple-mental Food
(WIC) 3
SNAP (formerly
Food Stamp
Program) 5
Emer-gency
food as-sistance (TEFAP)
Com-modity
distribu-tion 4
Total 5 Child and Adult Care
Food
Sum-mer Food
Spe-cial Milk
National School Lunch
School Break-
fast
1,000 1,000 1,000 1,000 1,000 1,000 1,000 1,000 1,000 1,000 dollars dollars dollars dollars dollars dollars dollars dollars dollars dollars
Alabama .......... 35,540 3,193 37 180,926 54,901 79,930 1,226,019 10,087 22,082 1,612,714 Alaska ............. 7,216 974 8 28,197 6,897 15,678 159,414 1,919 2,675 222,977 American
Samoa 5 ....... 0 0 0 0 0 5,260 0 0 0 5,260 Arizona ............ 40,603 3,846 59 225,939 63,213 93,746 1,587,702 11,452 37,347 2,063,907 Arkansas ......... 38,693 3,506 4 114,559 38,827 48,947 686,401 6,465 13,414 950,815 California ......... 241,555 17,696 420 1,299,078 349,500 829,286 5,694,137 71,967 163,508 8,667,148 Colorado ......... 20,759 2,467 139 111,807 26,513 46,782 687,709 8,109 19,365 923,650 Connecticut ..... 12,649 1,181 262 76,289 19,366 31,053 569,684 5,366 11,178 727,030 Delaware ......... 11,624 2,100 33 23,585 7,332 10,986 171,155 1,738 4,522 233,075 District of Co-
lumbia .......... 4,710 3,238 23 19,288 5,713 8,515 195,893 1,482 3,142 242,005 Florida ............. 150,163 20,767 30 576,460 161,229 247,608 4,416,943 34,425 70,371 5,677,997 Georgia ........... 99,662 7,996 35 408,582 140,573 194,583 2,565,170 20,498 54,730 3,491,828 Guam .............. 339 0 0 6,306 2,101 6,227 96,695 295 25 111,988 Hawaii ............. 5,458 1,278 2 32,992 8,564 22,246 358,145 1,719 3,245 433,650 Idaho ............... 5,774 3,619 186 46,363 15,053 19,528 299,552 2,532 6,478 399,086 Illinois .............. 109,594 9,940 2,637 368,245 89,805 166,626 2,784,474 22,660 42,605 3,596,586 Indiana ............ 40,130 6,748 202 210,637 54,897 75,359 1,291,225 10,848 29,844 1,719,891 Iowa ................ 23,162 1,576 75 83,227 17,854 31,908 526,119 4,002 17,222 705,144 Kansas ............ 28,539 1,941 83 86,108 22,176 32,880 402,630 3,982 13,600 591,939 Kentucky ......... 28,757 5,947 73 158,479 56,786 67,391 1,186,291 9,897 26,372 1,539,993 Louisiana ........ 58,546 6,807 31 185,672 61,090 89,645 1,286,199 8,678 33,267 1,729,934 Maine .............. 8,739 1,111 29 30,032 9,011 12,934 356,097 2,137 4,616 424,707 Maryland ......... 36,406 5,967 363 120,774 34,404 70,382 877,976 6,082 17,826 1,170,181 Massachusetts 48,820 5,854 335 136,471 35,817 59,221 1,165,908 9,802 23,056 1,485,285 Michigan ......... 56,810 6,489 466 260,846 77,362 119,270 2,808,763 20,784 51,436 3,402,226 Minnesota ....... 54,190 4,132 692 127,878 32,084 67,830 624,887 7,559 24,079 943,331 Mississippi ....... 34,378 4,106 4 147,681 54,300 63,942 846,543 6,509 16,822 1,174,285 Missouri ........... 43,414 7,025 503 175,055 55,824 60,760 1,361,301 10,424 25,943 1,740,248 Montana .......... 9,184 1,087 16 22,896 6,048 9,067 176,546 1,718 6,812 233,374 Nebraska ........ 26,157 2,061 53 54,078 11,946 21,039 237,577 2,235 13,763 368,908 Nevada ........... 4,710 1,117 98 67,057 14,832 29,726 414,596 4,948 9,516 546,601 New Hamp-
shire ............ 3,437 600 193 20,958 4,385 7,215 151,814 1,505 5,736 195,843 New Jersey ..... 58,979 6,138 592 195,039 46,121 98,612 1,030,293 12,888 31,284 1,479,947 New Mexico .... 30,040 4,954 5 82,065 31,021 26,441 541,806 3,835 13,900 734,068 New York ........ 174,658 41,686 823 559,048 148,599 319,278 4,984,900 35,368 84,666 6,349,026 North Carolina 79,662 5,602 179 307,262 92,997 130,907 2,072,127 20,890 43,030 2,752,656 North Dakota .. 9,113 438 38 15,321 3,758 7,514 95,015 1,027 5,974 138,198 Northern Mari-
anas 5 .......... 0 0 0 0 0 3,418 0 0 0 3,418 Ohio ................ 80,775 9,715 494 301,681 85,896 120,088 2,733,690 22,942 47,328 3,402,610 Oklahoma ....... 52,047 2,726 39 137,850 50,159 59,456 899,656 6,859 33,484 1,242,275 Oregon ............ 27,389 4,676 128 95,662 31,364 49,533 1,067,084 6,837 13,364 1,296,038 Pennsylvania .. 79,137 10,931 511 286,459 73,210 136,184 2,332,575 22,784 51,092 2,992,883 Puerto Rico 5 ... 25,617 11,142 0 122,014 31,676 186,171 0 9,443 8,691 394,753 Rhode Island .. 6,444 747 78 25,039 6,287 13,830 237,618 1,898 2,918 294,859 South Carolina 26,046 6,437 16 171,233 63,782 68,749 1,256,298 8,644 19,652 1,620,858 South Dakota .. 7,683 807 53 24,285 6,102 11,638 153,075 1,010 9,713 214,367
See footnotes at end of table.
VerDate Aug 31 2005 10:44 Feb 29, 2012 Jkt 000000 PO 00000 Frm 00009 Fmt 1000 Sfmt 1000 H:\SHARED\DAPP\FPU\AGSTAT\MASTER~2\CHAPTR13\XIII-09.AG8 USDA
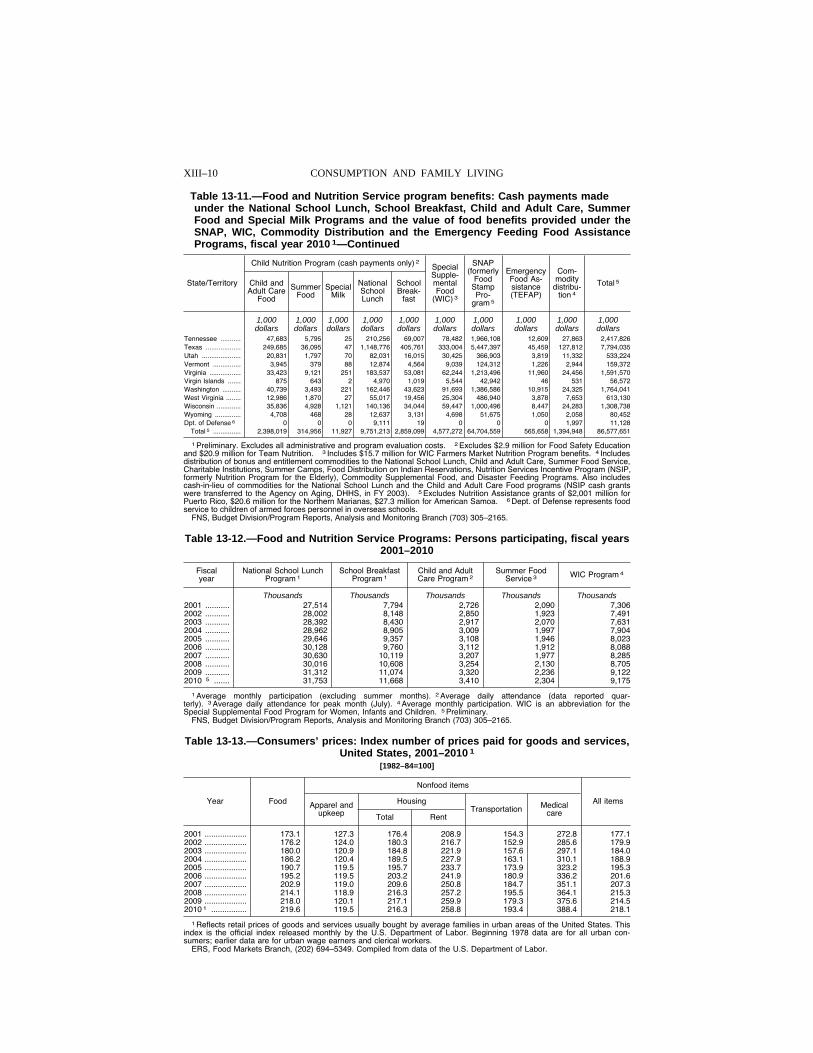
XIII–10 CONSUMPTION AND FAMILY LIVING
Table 13-11.—Food and Nutrition Service program benefits: Cash payments made under the National School Lunch, School Breakfast, Child and Adult Care, Summer Food and Special Milk Programs and the value of food benefits provided under the SNAP, WIC, Commodity Distribution and the Emergency Feeding Food Assistance Programs, fiscal year 2010 1—Continued
State/Territory
Child Nutrition Program (cash payments only) 2 Special Supple-mental Food
(WIC) 3
SNAP (formerly
Food Stamp Pro-
gram 5
Emergency Food As-sistance (TEFAP)
Com-modity
distribu-tion 4
Total 5 Child and Adult Care
Food
Summer Food
Special Milk
National School Lunch
School Break-
fast
1,000 1,000 1,000 1,000 1,000 1,000 1,000 1,000 1,000 1,000 dollars dollars dollars dollars dollars dollars dollars dollars dollars dollars
Tennessee ........... 47,683 5,795 25 210,256 69,007 78,482 1,966,108 12,609 27,863 2,417,826 Texas ................... 249,685 36,095 47 1,148,776 405,761 333,004 5,447,397 45,459 127,812 7,794,035 Utah ..................... 20,831 1,797 70 82,031 16,015 30,425 366,903 3,819 11,332 533,224 Vermont ............... 3,945 379 88 12,874 4,564 9,039 124,312 1,226 2,944 159,372 Virginia ................. 33,423 9,121 251 183,537 53,081 62,244 1,213,496 11,960 24,456 1,591,570 Virgin Islands ....... 875 643 2 4,970 1,019 5,544 42,942 46 531 56,572 Washington .......... 40,739 3,493 221 162,446 43,623 91,693 1,386,586 10,915 24,325 1,764,041 West Virginia ........ 12,986 1,870 27 55,017 19,456 25,304 486,940 3,878 7,653 613,130 Wisconsin ............. 35,836 4,928 1,121 140,136 34,044 59,447 1,000,496 8,447 24,283 1,308,738 Wyoming .............. 4,708 468 28 12,637 3,131 4,698 51,675 1,050 2,058 80,452 Dpt. of Defense 6 0 0 0 9,111 19 0 0 0 1,997 11,128
Total 5 ............... 2,398,019 314,956 11,927 9,751,213 2,859,099 4,577,272 64,704,559 565,658 1,394,948 86,577,651
1 Preliminary. Excludes all administrative and program evaluation costs. 2 Excludes $2.9 million for Food Safety Education and $20.9 million for Team Nutrition. 3 Includes $15.7 million for WIC Farmers Market Nutrition Program benefits. 4 Includes distribution of bonus and entitlement commodities to the National School Lunch, Child and Adult Care, Summer Food Service, Charitable Institutions, Summer Camps, Food Distribution on Indian Reservations, Nutrition Services Incentive Program (NSIP, formerly Nutrition Program for the Elderly), Commodity Supplemental Food, and Disaster Feeding Programs. Also includes cash-in-lieu of commodities for the National School Lunch and the Child and Adult Care Food programs (NSIP cash grants were transferred to the Agency on Aging, DHHS, in FY 2003). 5 Excludes Nutrition Assistance grants of $2,001 million for Puerto Rico, $20.6 million for the Northern Marianas, $27.3 million for American Samoa. 6 Dept. of Defense represents food service to children of armed forces personnel in overseas schools.
FNS, Budget Division/Program Reports, Analysis and Monitoring Branch (703) 305–2165.
Table 13-12.—Food and Nutrition Service Programs: Persons participating, fiscal years 2001–2010
Fiscal year
National School Lunch Program 1
School Breakfast Program 1
Child and Adult Care Program 2
Summer Food Service 3 WIC Program 4
Thousands Thousands Thousands Thousands Thousands 2001 ........... 27,514 7,794 2,726 2,090 7,306 2002 ........... 28,002 8,148 2,850 1,923 7,491 2003 ........... 28,392 8,430 2,917 2,070 7,631 2004 ........... 28,962 8,905 3,009 1,997 7,904 2005 ........... 29,646 9,357 3,108 1,946 8,023 2006 ........... 30,128 9,760 3,112 1,912 8,088 2007 ........... 30,630 10,119 3,207 1,977 8,285 2008 ........... 30,016 10,608 3,254 2,130 8,705 2009 ........... 31,312 11,074 3,320 2,236 9,122 2010 5 ....... 31,753 11,668 3,410 2,304 9,175
1 Average monthly participation (excluding summer months). 2 Average daily attendance (data reported quar-terly). 3 Average daily attendance for peak month (July). 4 Average monthly participation. WIC is an abbreviation for the Special Supplemental Food Program for Women, Infants and Children. 5 Preliminary.
FNS, Budget Division/Program Reports, Analysis and Monitoring Branch (703) 305–2165.
Table 13-13.—Consumers’ prices: Index number of prices paid for goods and services, United States, 2001–2010 1
[1982–84=100]
Year Food
Nonfood items
All items Apparel and upkeep
Housing Transportation Medical
care Total Rent
2001 ................... 173.1 127.3 176.4 208.9 154.3 272.8 177.1 2002 ................... 176.2 124.0 180.3 216.7 152.9 285.6 179.9 2003 ................... 180.0 120.9 184.8 221.9 157.6 297.1 184.0 2004 ................... 186.2 120.4 189.5 227.9 163.1 310.1 188.9 2005 ................... 190.7 119.5 195.7 233.7 173.9 323.2 195.3 2006 ................... 195.2 119.5 203.2 241.9 180.9 336.2 201.6 2007 ................... 202.9 119.0 209.6 250.8 184.7 351.1 207.3 2008 ................... 214.1 118.9 216.3 257.2 195.5 364.1 215.3 2009 ................... 218.0 120.1 217.1 259.9 179.3 375.6 214.5 2010 1 ................ 219.6 119.5 216.3 258.8 193.4 388.4 218.1
1 Reflects retail prices of goods and services usually bought by average families in urban areas of the United States. This index is the official index released monthly by the U.S. Department of Labor. Beginning 1978 data are for all urban con-sumers; earlier data are for urban wage earners and clerical workers.
ERS, Food Markets Branch, (202) 694–5349. Compiled from data of the U.S. Department of Labor.
VerDate Aug 31 2005 10:44 Feb 29, 2012 Jkt 000000 PO 00000 Frm 00010 Fmt 1000 Sfmt 1000 H:\SHARED\DAPP\FPU\AGSTAT\MASTER~2\CHAPTR13\XIII-10.AG8 USDA
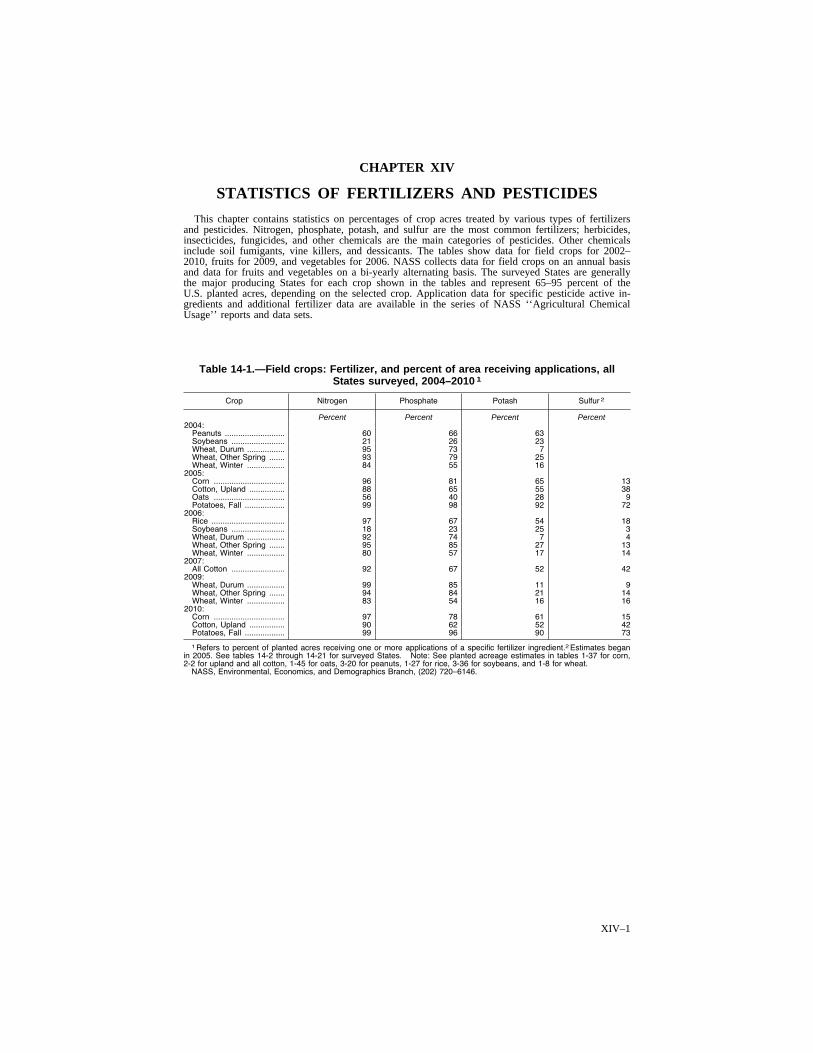
XIV–1
CHAPTER XIV
STATISTICS OF FERTILIZERS AND PESTICIDES
This chapter contains statistics on percentages of crop acres treated by various types of fertilizers and pesticides. Nitrogen, phosphate, potash, and sulfur are the most common fertilizers; herbicides, insecticides, fungicides, and other chemicals are the main categories of pesticides. Other chemicals include soil fumigants, vine killers, and dessicants. The tables show data for field crops for 2002– 2010, fruits for 2009, and vegetables for 2006. NASS collects data for field crops on an annual basis and data for fruits and vegetables on a bi-yearly alternating basis. The surveyed States are generally the major producing States for each crop shown in the tables and represent 65–95 percent of the U.S. planted acres, depending on the selected crop. Application data for specific pesticide active in-gredients and additional fertilizer data are available in the series of NASS ‘‘Agricultural Chemical Usage’’ reports and data sets.
Table 14-1.—Field crops: Fertilizer, and percent of area receiving applications, all States surveyed, 2004–2010 1
Crop Nitrogen Phosphate Potash Sulfur 2
Percent Percent Percent Percent 2004:
Peanuts ........................... 60 66 63 Soybeans ........................ 21 26 23 Wheat, Durum ................. 95 73 7 Wheat, Other Spring ....... 93 79 25 Wheat, Winter ................. 84 55 16
2005: Corn ................................ 96 81 65 13 Cotton, Upland ................ 88 65 55 38 Oats ................................ 56 40 28 9 Potatoes, Fall .................. 99 98 92 72
2006: Rice ................................. 97 67 54 18 Soybeans ........................ 18 23 25 3 Wheat, Durum ................. 92 74 7 4 Wheat, Other Spring ....... 95 85 27 13 Wheat, Winter ................. 80 57 17 14
2007: All Cotton ........................ 92 67 52 42
2009: Wheat, Durum ................. 99 85 11 9 Wheat, Other Spring ....... 94 84 21 14 Wheat, Winter ................. 83 54 16 16
2010: Corn ................................ 97 78 61 15 Cotton, Upland ................ 90 62 52 42 Potatoes, Fall .................. 99 96 90 73
1 Refers to percent of planted acres receiving one or more applications of a specific fertilizer ingredient.2 Estimates began in 2005. See tables 14-2 through 14-21 for surveyed States. Note: See planted acreage estimates in tables 1-37 for corn, 2-2 for upland and all cotton, 1-45 for oats, 3-20 for peanuts, 1-27 for rice, 3-36 for soybeans, and 1-8 for wheat.
NASS, Environmental, Economics, and Demographics Branch, (202) 720–6146.
VerDate Aug 31 2005 15:07 Mar 01, 2012 Jkt 000000 PO 00000 Frm 00001 Fmt 1001 Sfmt 1001 H:\SHARED\DAPP\FPU\AGSTAT\MASTER~2\CHAPTR14\XIV-01.AG8 USDA
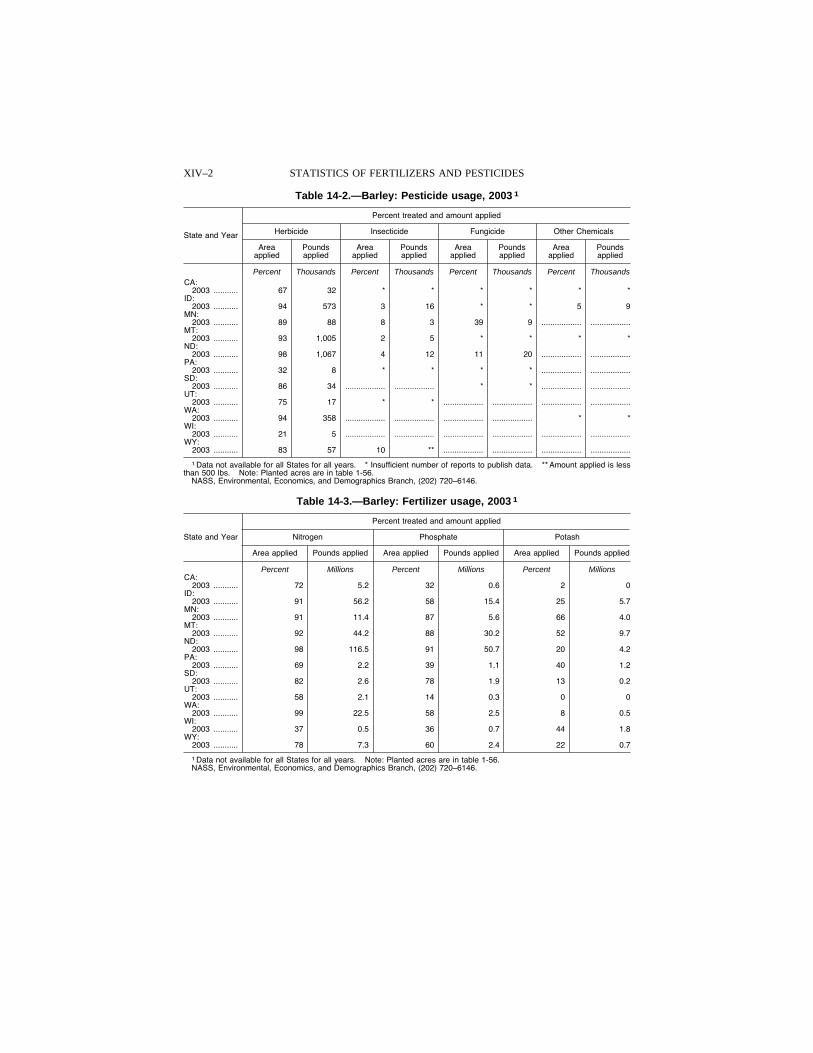
XIV–2 STATISTICS OF FERTILIZERS AND PESTICIDES
Table 14-2.—Barley: Pesticide usage, 2003 1
State and Year
Percent treated and amount applied
Herbicide Insecticide Fungicide Other Chemicals
Area applied
Pounds applied
Area applied
Pounds applied
Area applied
Pounds applied
Area applied
Pounds applied
Percent Thousands Percent Thousands Percent Thousands Percent Thousands CA:
2003 ........... 67 32 * * * * * * ID:
2003 ........... 94 573 3 16 * * 5 9 MN:
2003 ........... 89 88 8 3 39 9 .................. ..................MT:
2003 ........... 93 1,005 2 5 * * * * ND:
2003 ........... 98 1,067 4 12 11 20 .................. ..................PA:
2003 ........... 32 8 * * * * .................. ..................SD:
2003 ........... 86 34 .................. .................. * * .................. ..................UT:
2003 ........... 75 17 * * .................. .................. .................. ..................WA:
2003 ........... 94 358 .................. .................. .................. .................. * * WI:
2003 ........... 21 5 .................. .................. .................. .................. .................. ..................WY:
2003 ........... 83 57 10 ** .................. .................. .................. ..................
1 Data not available for all States for all years. * Insufficient number of reports to publish data. ** Amount applied is less than 500 lbs. Note: Planted acres are in table 1-56.
NASS, Environmental, Economics, and Demographics Branch, (202) 720–6146.
Table 14-3.—Barley: Fertilizer usage, 2003 1
State and Year
Percent treated and amount applied
Nitrogen Phosphate Potash
Area applied Pounds applied Area applied Pounds applied Area applied Pounds applied
Percent Millions Percent Millions Percent Millions CA:
2003 ........... 72 5.2 32 0.6 2 0 ID:
2003 ........... 91 56.2 58 15.4 25 5.7 MN:
2003 ........... 91 11.4 87 5.6 66 4.0 MT:
2003 ........... 92 44.2 88 30.2 52 9.7 ND:
2003 ........... 98 116.5 91 50.7 20 4.2 PA:
2003 ........... 69 2.2 39 1.1 40 1.2 SD:
2003 ........... 82 2.6 78 1.9 13 0.2 UT:
2003 ........... 58 2.1 14 0.3 0 0 WA:
2003 ........... 99 22.5 58 2.5 8 0.5 WI:
2003 ........... 37 0.5 36 0.7 44 1.8 WY:
2003 ........... 78 7.3 60 2.4 22 0.7
1 Data not available for all States for all years. Note: Planted acres are in table 1-56. NASS, Environmental, Economics, and Demographics Branch, (202) 720–6146.
VerDate Aug 31 2005 15:07 Mar 01, 2012 Jkt 000000 PO 00000 Frm 00002 Fmt 1000 Sfmt 1000 H:\SHARED\DAPP\FPU\AGSTAT\MASTER~2\CHAPTR14\XIV-02.AG8 USDA
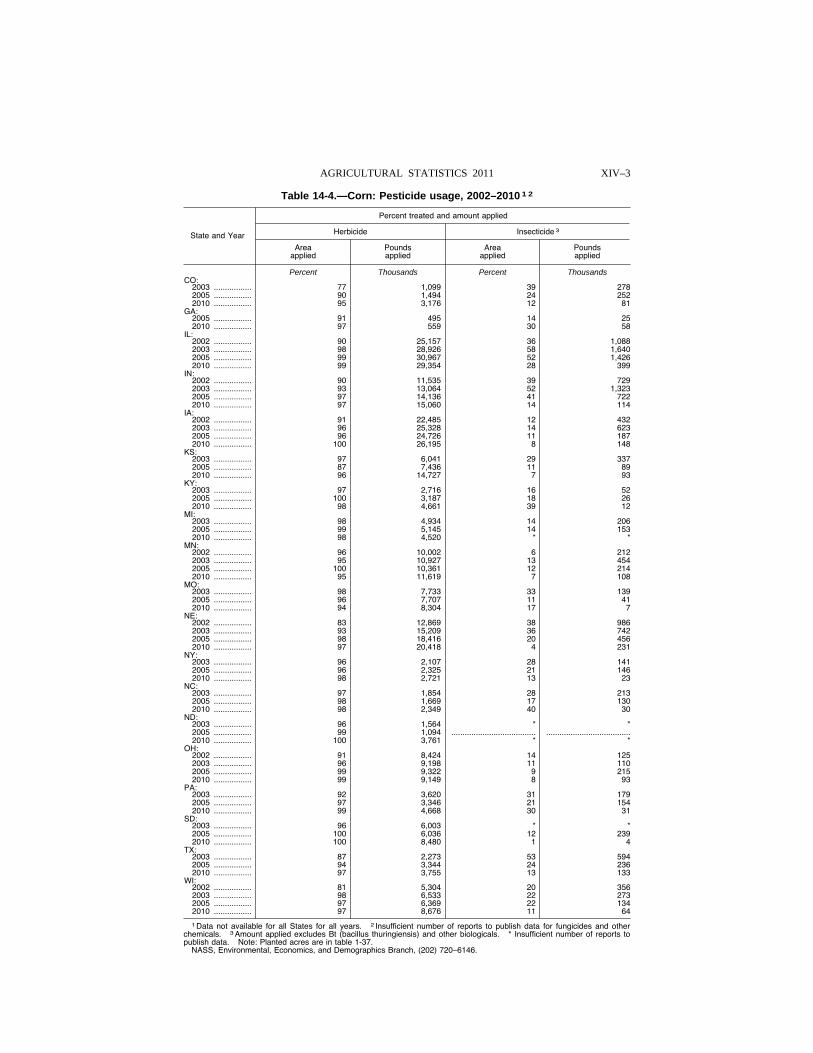
XIV–3 AGRICULTURAL STATISTICS 2011
Table 14-4.—Corn: Pesticide usage, 2002–2010 1 2
State and Year
Percent treated and amount applied
Herbicide Insecticide 3
Area applied
Pounds applied
Area applied
Pounds applied
Percent Thousands Percent Thousands CO:
2003 ................. 77 1,099 39 278 2005 ................. 90 1,494 24 252 2010 ................. 95 3,176 12 81
GA: 2005 ................. 91 495 14 25 2010 ................. 97 559 30 58
IL: 2002 ................. 90 25,157 36 1,088 2003 ................. 98 28,926 58 1,640 2005 ................. 99 30,967 52 1,426 2010 ................. 99 29,354 28 399
IN: 2002 ................. 90 11,535 39 729 2003 ................. 93 13,064 52 1,323 2005 ................. 97 14,136 41 722 2010 ................. 97 15,060 14 114
IA: 2002 ................. 91 22,485 12 432 2003 ................. 96 25,328 14 623 2005 ................. 96 24,726 11 187 2010 ................. 100 26,195 8 148
KS: 2003 ................. 97 6,041 29 337 2005 ................. 87 7,436 11 89 2010 ................. 96 14,727 7 93
KY: 2003 ................. 97 2,716 16 52 2005 ................. 100 3,187 18 26 2010 ................. 98 4,661 39 12
MI: 2003 ................. 98 4,934 14 206 2005 ................. 99 5,145 14 153 2010 ................. 98 4,520 * *
MN: 2002 ................. 96 10,002 6 212 2003 ................. 95 10,927 13 454 2005 ................. 100 10,361 12 214 2010 ................. 95 11,619 7 108
MO: 2003 ................. 98 7,733 33 139 2005 ................. 96 7,707 11 41 2010 ................. 94 8,304 17 7
NE: 2002 ................. 83 12,869 38 986 2003 ................. 93 15,209 36 742 2005 ................. 98 18,416 20 456 2010 ................. 97 20,418 4 231
NY: 2003 ................. 96 2,107 28 141 2005 ................. 96 2,325 21 146 2010 ................. 98 2,721 13 23
NC: 2003 ................. 97 1,854 28 213 2005 ................. 98 1,669 17 130 2010 ................. 98 2,349 40 30
ND: 2003 ................. 96 1,564 * * 2005 ................. 99 1,094 ...................................... ......................................2010 ................. 100 3,761 * *
OH: 2002 ................. 91 8,424 14 125 2003 ................. 96 9,198 11 110 2005 ................. 99 9,322 9 215 2010 ................. 99 9,149 8 93
PA: 2003 ................. 92 3,620 31 179 2005 ................. 97 3,346 21 154 2010 ................. 99 4,668 30 31
SD: 2003 ................. 96 6,003 * * 2005 ................. 100 6,036 12 239 2010 ................. 100 8,480 1 4
TX: 2003 ................. 87 2,273 53 594 2005 ................. 94 3,344 24 236 2010 ................. 97 3,755 13 133
WI: 2002 ................. 81 5,304 20 356 2003 ................. 98 6,533 22 273 2005 ................. 97 6,369 22 134 2010 ................. 97 8,676 11 64
1 Data not available for all States for all years. 2 Insufficient number of reports to publish data for fungicides and other chemicals. 3 Amount applied excludes Bt (bacillus thuringiensis) and other biologicals. * Insufficient number of reports to publish data. Note: Planted acres are in table 1-37.
NASS, Environmental, Economics, and Demographics Branch, (202) 720–6146.
VerDate Aug 31 2005 15:07 Mar 01, 2012 Jkt 000000 PO 00000 Frm 00003 Fmt 1000 Sfmt 1000 H:\SHARED\DAPP\FPU\AGSTAT\MASTER~2\CHAPTR14\XIV-03.AG8 USDA
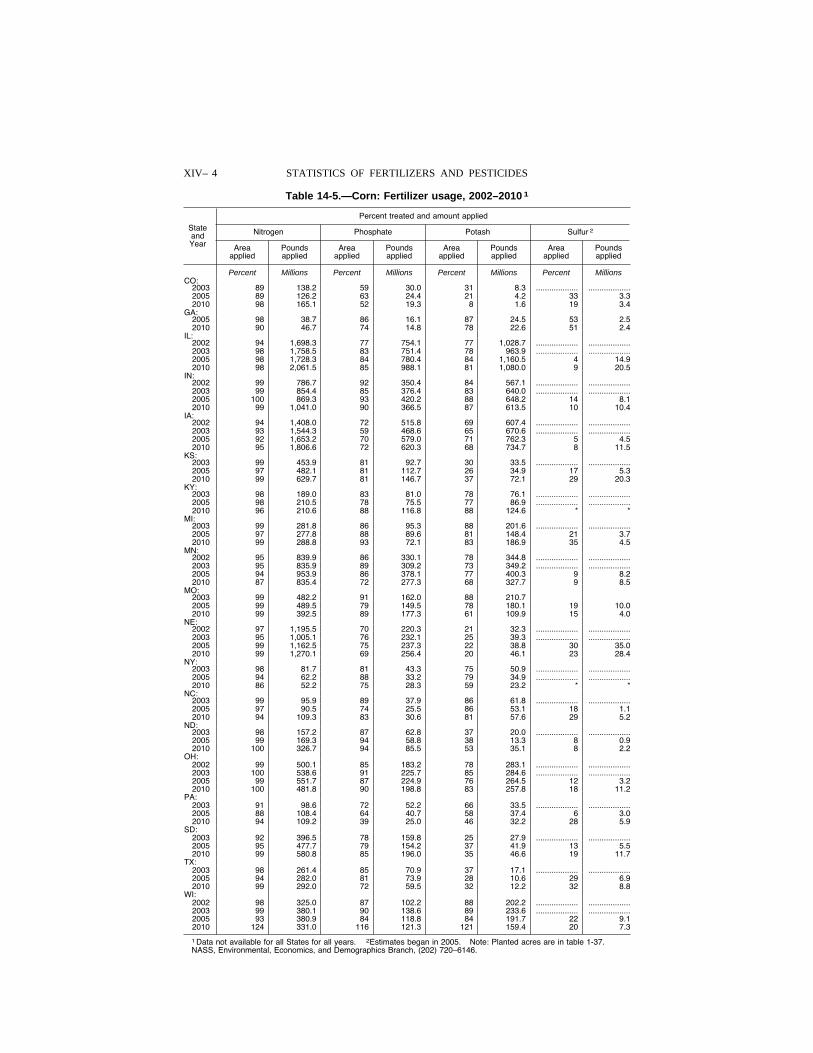
XIV– 4 STATISTICS OF FERTILIZERS AND PESTICIDES
Table 14-5.—Corn: Fertilizer usage, 2002–2010 1
State and Year
Percent treated and amount applied
Nitrogen Phosphate Potash Sulfur 2
Area applied
Pounds applied
Area applied
Pounds applied
Area applied
Pounds applied
Area applied
Pounds applied
Percent Millions Percent Millions Percent Millions Percent Millions CO:
2003 89 138.2 59 30.0 31 8.3 ................... ...................2005 89 126.2 63 24.4 21 4.2 33 3.3 2010 98 165.1 52 19.3 8 1.6 19 3.4
GA: 2005 98 38.7 86 16.1 87 24.5 53 2.5 2010 90 46.7 74 14.8 78 22.6 51 2.4
IL: 2002 94 1,698.3 77 754.1 77 1,028.7 ................... ...................2003 98 1,758.5 83 751.4 78 963.9 ................... ...................2005 98 1,728.3 84 780.4 84 1,160.5 4 14.9 2010 98 2,061.5 85 988.1 81 1,080.0 9 20.5
IN: 2002 99 786.7 92 350.4 84 567.1 ................... ...................2003 99 854.4 85 376.4 83 640.0 ................... ...................2005 100 869.3 93 420.2 88 648.2 14 8.1 2010 99 1,041.0 90 366.5 87 613.5 10 10.4
IA: 2002 94 1,408.0 72 515.8 69 607.4 ................... ...................2003 93 1,544.3 59 468.6 65 670.6 ................... ...................2005 92 1,653.2 70 579.0 71 762.3 5 4.5 2010 95 1,806.6 72 620.3 68 734.7 8 11.5
KS: 2003 99 453.9 81 92.7 30 33.5 ................... ...................2005 97 482.1 81 112.7 26 34.9 17 5.3 2010 99 629.7 81 146.7 37 72.1 29 20.3
KY: 2003 98 189.0 83 81.0 78 76.1 ................... ...................2005 98 210.5 78 75.5 77 86.9 ................... ...................2010 96 210.6 88 116.8 88 124.6 * *
MI: 2003 99 281.8 86 95.3 88 201.6 ................... ...................2005 97 277.8 88 89.6 81 148.4 21 3.7 2010 99 288.8 93 72.1 83 186.9 35 4.5
MN: 2002 95 839.9 86 330.1 78 344.8 ................... ...................2003 95 835.9 89 309.2 73 349.2 ................... ...................2005 94 953.9 86 378.1 77 400.3 9 8.2 2010 87 835.4 72 277.3 68 327.7 9 8.5
MO: 2003 99 482.2 91 162.0 88 210.7 2005 99 489.5 79 149.5 78 180.1 19 10.0 2010 99 392.5 89 177.3 61 109.9 15 4.0
NE: 2002 97 1,195.5 70 220.3 21 32.3 ................... ...................2003 95 1,005.1 76 232.1 25 39.3 ................... ...................2005 99 1,162.5 75 237.3 22 38.8 30 35.0 2010 99 1,270.1 69 256.4 20 46.1 23 28.4
NY: 2003 98 81.7 81 43.3 75 50.9 ................... ...................2005 94 62.2 88 33.2 79 34.9 ................... ...................2010 86 52.2 75 28.3 59 23.2 * *
NC: 2003 99 95.9 89 37.9 86 61.8 ................... ...................2005 97 90.5 74 25.5 86 53.1 18 1.1 2010 94 109.3 83 30.6 81 57.6 29 5.2
ND: 2003 98 157.2 87 62.8 37 20.0 ................... ...................2005 99 169.3 94 58.8 38 13.3 8 0.9 2010 100 326.7 94 85.5 53 35.1 8 2.2
OH: 2002 99 500.1 85 183.2 78 283.1 ................... ...................2003 100 538.6 91 225.7 85 284.6 ................... ...................2005 99 551.7 87 224.9 76 264.5 12 3.2 2010 100 481.8 90 198.8 83 257.8 18 11.2
PA: 2003 91 98.6 72 52.2 66 33.5 ................... ...................2005 88 108.4 64 40.7 58 37.4 6 3.0 2010 94 109.2 39 25.0 46 32.2 28 5.9
SD: 2003 92 396.5 78 159.8 25 27.9 ................... ...................2005 95 477.7 79 154.2 37 41.9 13 5.5 2010 99 580.8 85 196.0 35 46.6 19 11.7
TX: 2003 98 261.4 85 70.9 37 17.1 ................... ...................2005 94 282.0 81 73.9 28 10.6 29 6.9 2010 99 292.0 72 59.5 32 12.2 32 8.8
WI: 2002 98 325.0 87 102.2 88 202.2 ................... ...................2003 99 380.1 90 138.6 89 233.6 ................... ...................2005 93 380.9 84 118.8 84 191.7 22 9.1 2010 124 331.0 116 121.3 121 159.4 20 7.3
1 Data not available for all States for all years. 2Estimates began in 2005. Note: Planted acres are in table 1-37. NASS, Environmental, Economics, and Demographics Branch, (202) 720–6146.
VerDate Aug 31 2005 15:07 Mar 01, 2012 Jkt 000000 PO 00000 Frm 00004 Fmt 1000 Sfmt 1000 H:\SHARED\DAPP\FPU\AGSTAT\MASTER~2\CHAPTR14\XIV-04.AG8 USDA
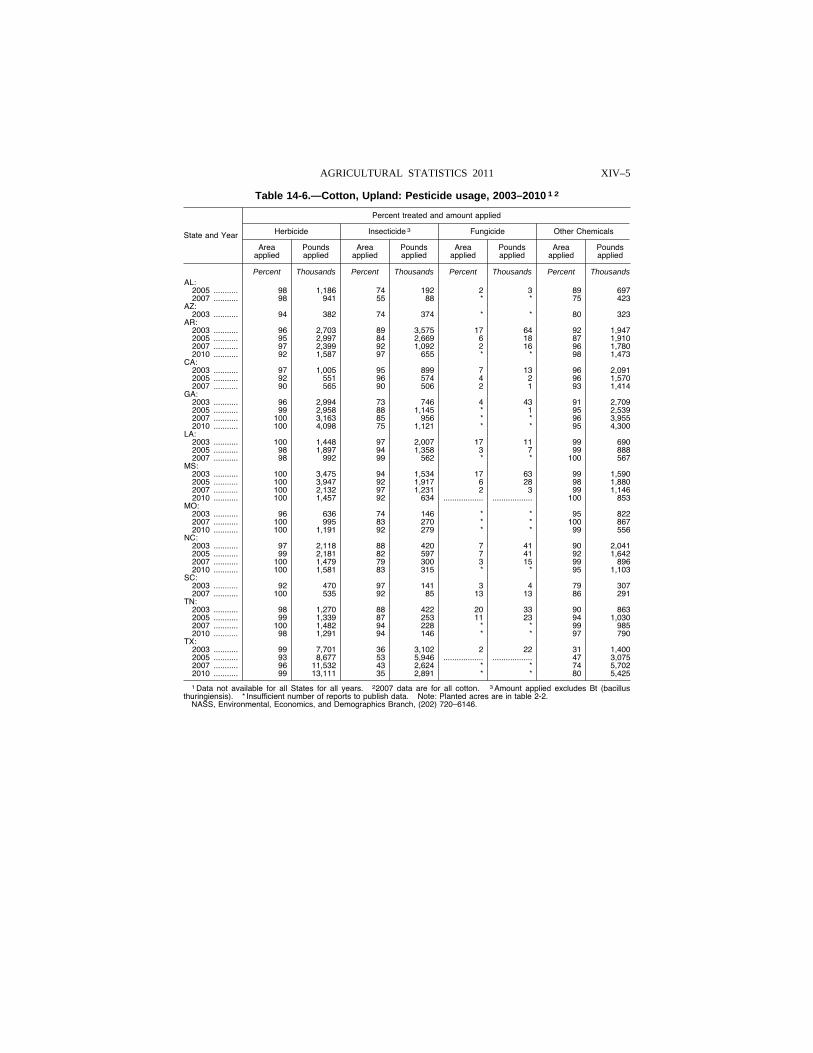
XIV–5 AGRICULTURAL STATISTICS 2011
Table 14-6.—Cotton, Upland: Pesticide usage, 2003–2010 1 2
State and Year
Percent treated and amount applied
Herbicide Insecticide 3 Fungicide Other Chemicals
Area applied
Pounds applied
Area applied
Pounds applied
Area applied
Pounds applied
Area applied
Pounds applied
Percent Thousands Percent Thousands Percent Thousands Percent Thousands AL:
2005 ........... 98 1,186 74 192 2 3 89 697 2007 ........... 98 941 55 88 * * 75 423
AZ: 2003 ........... 94 382 74 374 * * 80 323
AR: 2003 ........... 96 2,703 89 3,575 17 64 92 1,947 2005 ........... 95 2,997 84 2,669 6 18 87 1,910 2007 ........... 97 2,399 92 1,092 2 16 96 1,780 2010 ........... 92 1,587 97 655 * * 98 1,473
CA: 2003 ........... 97 1,005 95 899 7 13 96 2,091 2005 ........... 92 551 96 574 4 2 96 1,570 2007 ........... 90 565 90 506 2 1 93 1,414
GA: 2003 ........... 96 2,994 73 746 4 43 91 2,709 2005 ........... 99 2,958 88 1,145 * 1 95 2,539 2007 ........... 100 3,163 85 956 * * 96 3,955 2010 ........... 100 4,098 75 1,121 * * 95 4,300
LA: 2003 ........... 100 1,448 97 2,007 17 11 99 690 2005 ........... 98 1,897 94 1,358 3 7 99 888 2007 ........... 98 992 99 562 * * 100 567
MS: 2003 ........... 100 3,475 94 1,534 17 63 99 1,590 2005 ........... 100 3,947 92 1,917 6 28 98 1,880 2007 ........... 100 2,132 97 1,231 2 3 99 1,146 2010 ........... 100 1,457 92 634 .................. .................. 100 853
MO: 2003 ........... 96 636 74 146 * * 95 822 2007 ........... 100 995 83 270 * * 100 867 2010 ........... 100 1,191 92 279 * * 99 556
NC: 2003 ........... 97 2,118 88 420 7 41 90 2,041 2005 ........... 99 2,181 82 597 7 41 92 1,642 2007 ........... 100 1,479 79 300 3 15 99 896 2010 ........... 100 1,581 83 315 * * 95 1,103
SC: 2003 ........... 92 470 97 141 3 4 79 307 2007 ........... 100 535 92 85 13 13 86 291
TN: 2003 ........... 98 1,270 88 422 20 33 90 863 2005 ........... 99 1,339 87 253 11 23 94 1,030 2007 ........... 100 1,482 94 228 * * 99 985 2010 ........... 98 1,291 94 146 * * 97 790
TX: 2003 ........... 99 7,701 36 3,102 2 22 31 1,400 2005 ........... 93 8,677 53 5,946 .................. .................. 47 3,075 2007 ........... 96 11,532 43 2,624 * * 74 5,702 2010 ........... 99 13,111 35 2,891 * * 80 5,425
1 Data not available for all States for all years. 22007 data are for all cotton. 3 Amount applied excludes Bt (bacillus thuringiensis). * Insufficient number of reports to publish data. Note: Planted acres are in table 2-2.
NASS, Environmental, Economics, and Demographics Branch, (202) 720–6146.
VerDate Aug 31 2005 15:07 Mar 01, 2012 Jkt 000000 PO 00000 Frm 00005 Fmt 1000 Sfmt 1000 H:\SHARED\DAPP\FPU\AGSTAT\MASTER~2\CHAPTR14\XIV-05.AG8 USDA
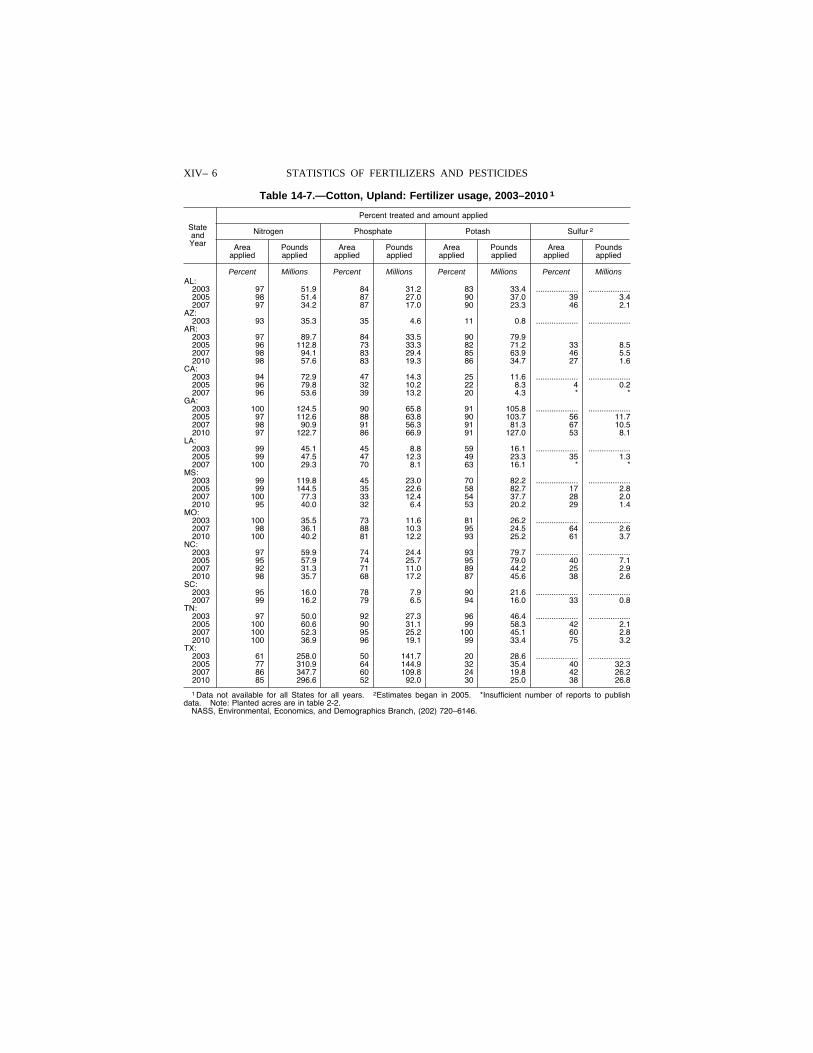
XIV– 6 STATISTICS OF FERTILIZERS AND PESTICIDES
Table 14-7.—Cotton, Upland: Fertilizer usage, 2003–2010 1
State and Year
Percent treated and amount applied
Nitrogen Phosphate Potash Sulfur 2
Area applied
Pounds applied
Area applied
Pounds applied
Area applied
Pounds applied
Area applied
Pounds applied
Percent Millions Percent Millions Percent Millions Percent Millions AL:
2003 97 51.9 84 31.2 83 33.4 ................... ...................2005 98 51.4 87 27.0 90 37.0 39 3.4 2007 97 34.2 87 17.0 90 23.3 46 2.1
AZ: 2003 93 35.3 35 4.6 11 0.8 ................... ...................
AR: 2003 97 89.7 84 33.5 90 79.9 2005 96 112.8 73 33.3 82 71.2 33 8.5 2007 98 94.1 83 29.4 85 63.9 46 5.5 2010 98 57.6 83 19.3 86 34.7 27 1.6
CA: 2003 94 72.9 47 14.3 25 11.6 ................... ...................2005 96 79.8 32 10.2 22 8.3 4 0.2 2007 96 53.6 39 13.2 20 4.3 * *
GA: 2003 100 124.5 90 65.8 91 105.8 ................... ...................2005 97 112.6 88 63.8 90 103.7 56 11.7 2007 98 90.9 91 56.3 91 81.3 67 10.5 2010 97 122.7 86 66.9 91 127.0 53 8.1
LA: 2003 99 45.1 45 8.8 59 16.1 ................... ...................2005 99 47.5 47 12.3 49 23.3 35 1.3 2007 100 29.3 70 8.1 63 16.1 * *
MS: 2003 99 119.8 45 23.0 70 82.2 ................... ...................2005 99 144.5 35 22.6 58 82.7 17 2.8 2007 100 77.3 33 12.4 54 37.7 28 2.0 2010 95 40.0 32 6.4 53 20.2 29 1.4
MO: 2003 100 35.5 73 11.6 81 26.2 ................... ...................2007 98 36.1 88 10.3 95 24.5 64 2.6 2010 100 40.2 81 12.2 93 25.2 61 3.7
NC: 2003 97 59.9 74 24.4 93 79.7 ................... ...................2005 95 57.9 74 25.7 95 79.0 40 7.1 2007 92 31.3 71 11.0 89 44.2 25 2.9 2010 98 35.7 68 17.2 87 45.6 38 2.6
SC: 2003 95 16.0 78 7.9 90 21.6 ................... ...................2007 99 16.2 79 6.5 94 16.0 33 0.8
TN: 2003 97 50.0 92 27.3 96 46.4 ................... ...................2005 100 60.6 90 31.1 99 58.3 42 2.1 2007 100 52.3 95 25.2 100 45.1 60 2.8 2010 100 36.9 96 19.1 99 33.4 75 3.2
TX: 2003 61 258.0 50 141.7 20 28.6 ................... ...................2005 77 310.9 64 144.9 32 35.4 40 32.3 2007 86 347.7 60 109.8 24 19.8 42 26.2 2010 85 296.6 52 92.0 30 25.0 38 26.8
1 Data not available for all States for all years. 2Estimates began in 2005. *Insufficient number of reports to publish data. Note: Planted acres are in table 2-2.
NASS, Environmental, Economics, and Demographics Branch, (202) 720–6146.
VerDate Aug 31 2005 15:07 Mar 01, 2012 Jkt 000000 PO 00000 Frm 00006 Fmt 1000 Sfmt 1000 H:\SHARED\DAPP\FPU\AGSTAT\MASTER~2\CHAPTR14\XIV-06.AG8 USDA
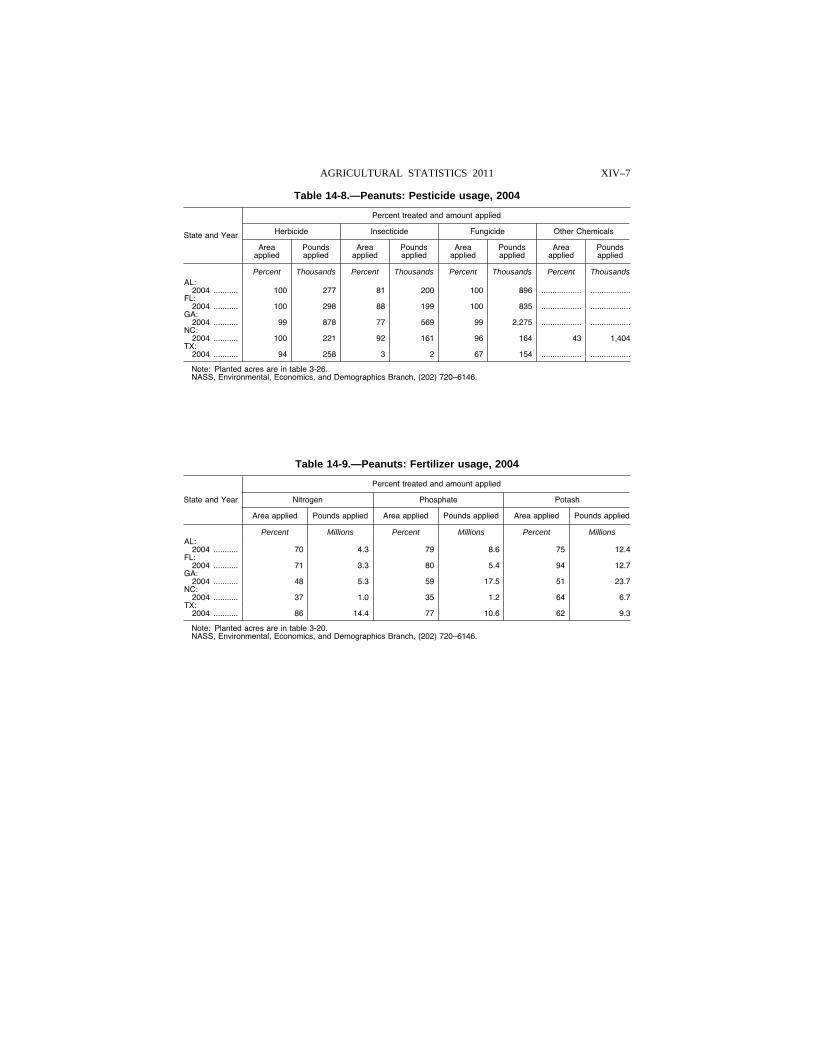
XIV–7 AGRICULTURAL STATISTICS 2011
Table 14-8.—Peanuts: Pesticide usage, 2004
State and Year
Percent treated and amount applied
Herbicide Insecticide Fungicide Other Chemicals
Area applied
Pounds applied
Area applied
Pounds applied
Area applied
Pounds applied
Area applied
Pounds applied
Percent Thousands Percent Thousands Percent Thousands Percent Thousands AL:
2004 ........... 100 277 81 200 100 896 .................. ..................FL:
2004 ........... 100 298 88 199 100 835 .................. ..................GA:
2004 ........... 99 878 77 569 99 2,275 .................. ..................NC:
2004 ........... 100 221 92 161 96 164 43 1,404 TX:
2004 ........... 94 258 3 2 67 154 .................. ..................
Note: Planted acres are in table 3-26. NASS, Environmental, Economics, and Demographics Branch, (202) 720–6146.
Table 14-9.—Peanuts: Fertilizer usage, 2004
State and Year
Percent treated and amount applied
Nitrogen Phosphate Potash
Area applied Pounds applied Area applied Pounds applied Area applied Pounds applied
Percent Millions Percent Millions Percent Millions AL:
2004 ........... 70 4.3 79 8.6 75 12.4 FL:
2004 ........... 71 3.3 80 5.4 94 12.7 GA:
2004 ........... 48 5.3 59 17.5 51 23.7 NC:
2004 ........... 37 1.0 35 1.2 64 6.7 TX:
2004 ........... 86 14.4 77 10.6 62 9.3
Note: Planted acres are in table 3-20. NASS, Environmental, Economics, and Demographics Branch, (202) 720–6146.
VerDate Aug 31 2005 15:07 Mar 01, 2012 Jkt 000000 PO 00000 Frm 00007 Fmt 1000 Sfmt 1000 H:\SHARED\DAPP\FPU\AGSTAT\MASTER~2\CHAPTR14\XIV-07.AG8 USDA
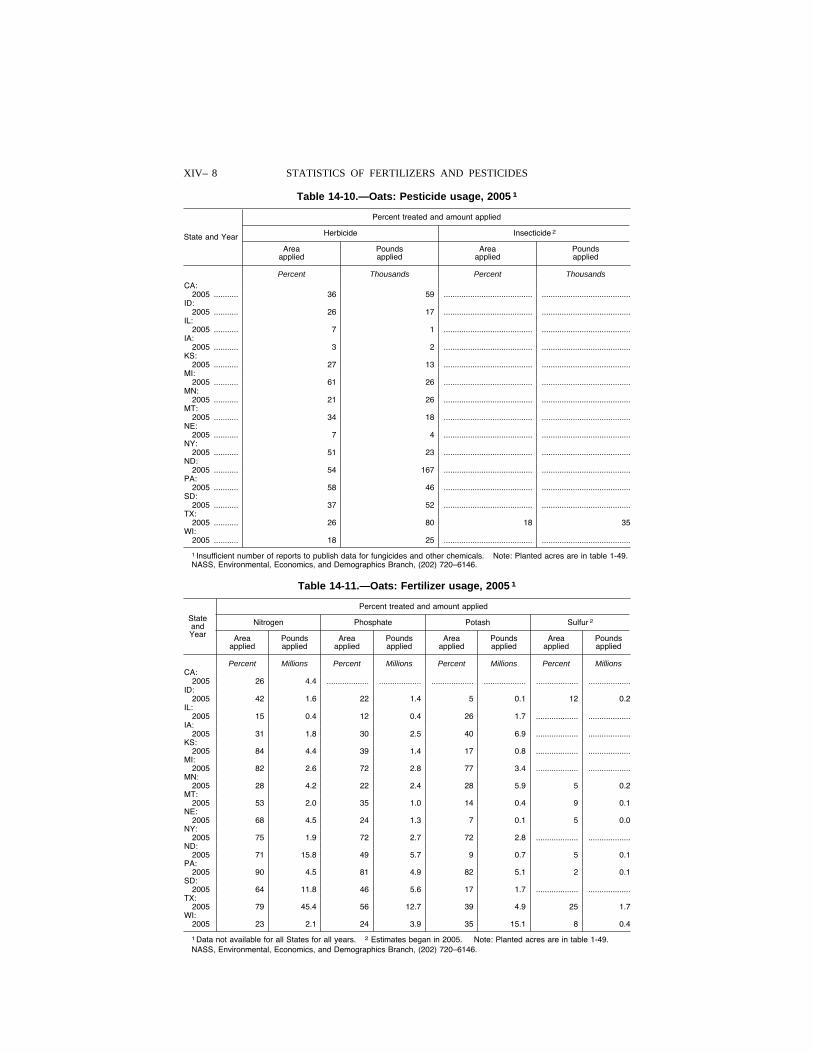
XIV– 8 STATISTICS OF FERTILIZERS AND PESTICIDES
Table 14-10.—Oats: Pesticide usage, 2005 1
State and Year
Percent treated and amount applied
Herbicide Insecticide 2
Area applied
Pounds applied
Area applied
Pounds applied
Percent Thousands Percent Thousands CA:
2005 ........... 36 59 ........................................ ........................................ID:
2005 ........... 26 17 ........................................ ........................................IL:
2005 ........... 7 1 ........................................ ........................................IA:
2005 ........... 3 2 ........................................ ........................................KS:
2005 ........... 27 13 ........................................ ........................................MI:
2005 ........... 61 26 ........................................ ........................................MN:
2005 ........... 21 26 ........................................ ........................................MT:
2005 ........... 34 18 ........................................ ........................................NE:
2005 ........... 7 4 ........................................ ........................................NY:
2005 ........... 51 23 ........................................ ........................................ND:
2005 ........... 54 167 ........................................ ........................................PA:
2005 ........... 58 46 ........................................ ........................................SD:
2005 ........... 37 52 ........................................ ........................................TX:
2005 ........... 26 80 18 35 WI:
2005 ........... 18 25 ........................................ ........................................
1 Insufficient number of reports to publish data for fungicides and other chemicals. Note: Planted acres are in table 1-49. NASS, Environmental, Economics, and Demographics Branch, (202) 720–6146.
Table 14-11.—Oats: Fertilizer usage, 2005 1
State and Year
Percent treated and amount applied
Nitrogen Phosphate Potash Sulfur 2
Area applied
Pounds applied
Area applied
Pounds applied
Area applied
Pounds applied
Area applied
Pounds applied
Percent Millions Percent Millions Percent Millions Percent Millions CA:
2005 26 4.4 ................... ................... ................... ................... ................... ...................ID:
2005 42 1.6 22 1.4 5 0.1 12 0.2 IL:
2005 15 0.4 12 0.4 26 1.7 ................... ...................IA:
2005 31 1.8 30 2.5 40 6.9 ................... ...................KS:
2005 84 4.4 39 1.4 17 0.8 ................... ...................MI:
2005 82 2.6 72 2.8 77 3.4 ................... ...................MN:
2005 28 4.2 22 2.4 28 5.9 5 0.2 MT:
2005 53 2.0 35 1.0 14 0.4 9 0.1 NE:
2005 68 4.5 24 1.3 7 0.1 5 0.0 NY:
2005 75 1.9 72 2.7 72 2.8 ................... ...................ND:
2005 71 15.8 49 5.7 9 0.7 5 0.1 PA:
2005 90 4.5 81 4.9 82 5.1 2 0.1 SD:
2005 64 11.8 46 5.6 17 1.7 ................... ...................TX:
2005 79 45.4 56 12.7 39 4.9 25 1.7 WI:
2005 23 2.1 24 3.9 35 15.1 8 0.4
1 Data not available for all States for all years. 2 Estimates began in 2005. Note: Planted acres are in table 1-49. NASS, Environmental, Economics, and Demographics Branch, (202) 720–6146.
VerDate Aug 31 2005 15:07 Mar 01, 2012 Jkt 000000 PO 00000 Frm 00008 Fmt 1000 Sfmt 1000 H:\SHARED\DAPP\FPU\AGSTAT\MASTER~2\CHAPTR14\XIV-08.AG8 USDA
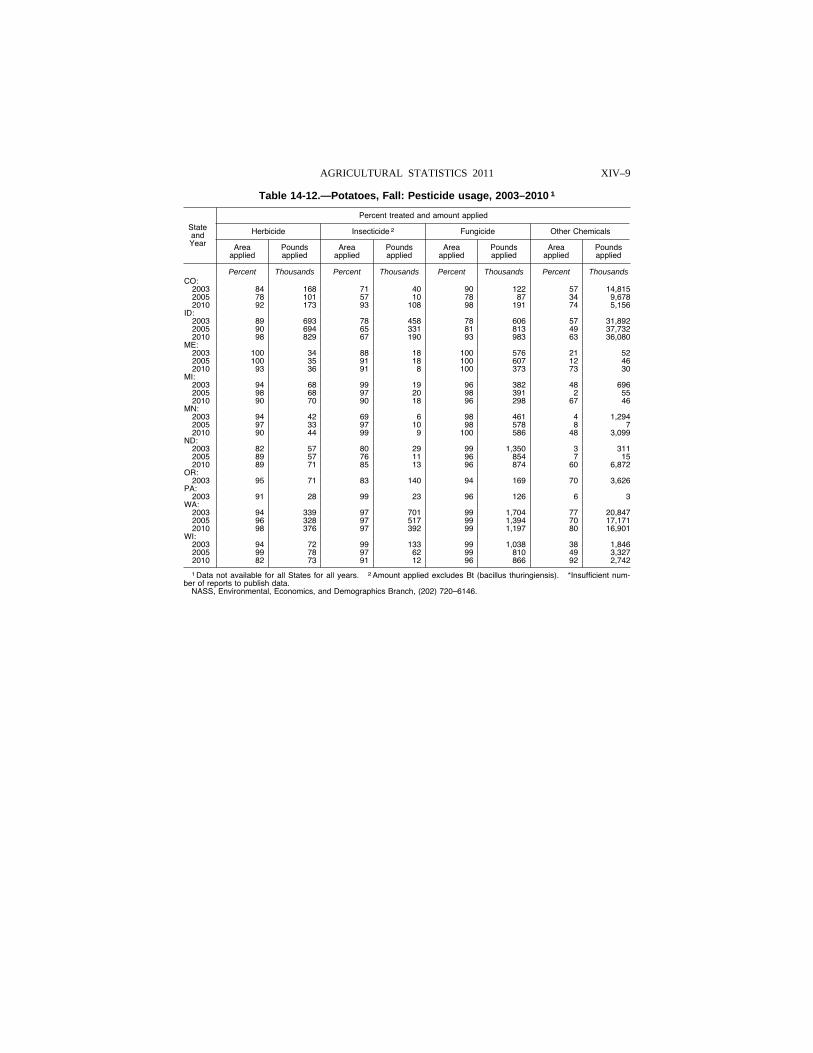
XIV–9 AGRICULTURAL STATISTICS 2011
Table 14-12.—Potatoes, Fall: Pesticide usage, 2003–2010 1
State and Year
Percent treated and amount applied
Herbicide Insecticide 2 Fungicide Other Chemicals
Area applied
Pounds applied
Area applied
Pounds applied
Area applied
Pounds applied
Area applied
Pounds applied
Percent Thousands Percent Thousands Percent Thousands Percent Thousands CO:
2003 84 168 71 40 90 122 57 14,815 2005 78 101 57 10 78 87 34 9,678 2010 92 173 93 108 98 191 74 5,156
ID: 2003 89 693 78 458 78 606 57 31,892 2005 90 694 65 331 81 813 49 37,732 2010 98 829 67 190 93 983 63 36,080
ME: 2003 100 34 88 18 100 576 21 52 2005 100 35 91 18 100 607 12 46 2010 93 36 91 8 100 373 73 30
MI: 2003 94 68 99 19 96 382 48 696 2005 98 68 97 20 98 391 2 55 2010 90 70 90 18 96 298 67 46
MN: 2003 94 42 69 6 98 461 4 1,294 2005 97 33 97 10 98 578 8 7 2010 90 44 99 9 100 586 48 3,099
ND: 2003 82 57 80 29 99 1,350 3 311 2005 89 57 76 11 96 854 7 15 2010 89 71 85 13 96 874 60 6,872
OR: 2003 95 71 83 140 94 169 70 3,626
PA: 2003 91 28 99 23 96 126 6 3
WA: 2003 94 339 97 701 99 1,704 77 20,847 2005 96 328 97 517 99 1,394 70 17,171 2010 98 376 97 392 99 1,197 80 16,901
WI: 2003 94 72 99 133 99 1,038 38 1,846 2005 99 78 97 62 99 810 49 3,327 2010 82 73 91 12 96 866 92 2,742
1 Data not available for all States for all years. 2 Amount applied excludes Bt (bacillus thuringiensis). *Insufficient num-ber of reports to publish data.
NASS, Environmental, Economics, and Demographics Branch, (202) 720–6146.
VerDate Aug 31 2005 15:07 Mar 01, 2012 Jkt 000000 PO 00000 Frm 00009 Fmt 1000 Sfmt 1000 H:\SHARED\DAPP\FPU\AGSTAT\MASTER~2\CHAPTR14\XIV-09.AG8 USDA
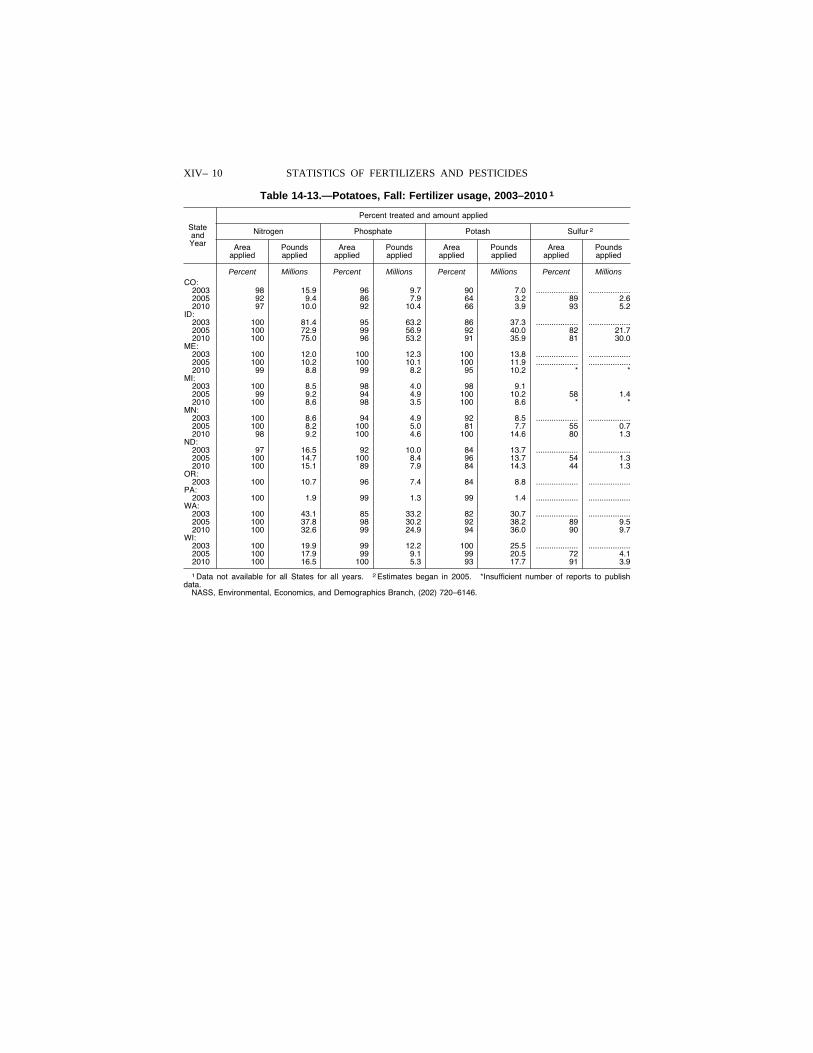
XIV– 10 STATISTICS OF FERTILIZERS AND PESTICIDES
Table 14-13.—Potatoes, Fall: Fertilizer usage, 2003–2010 1
State and Year
Percent treated and amount applied
Nitrogen Phosphate Potash Sulfur 2
Area applied
Pounds applied
Area applied
Pounds applied
Area applied
Pounds applied
Area applied
Pounds applied
Percent Millions Percent Millions Percent Millions Percent Millions CO:
2003 98 15.9 96 9.7 90 7.0 ................... ...................2005 92 9.4 86 7.9 64 3.2 89 2.6 2010 97 10.0 92 10.4 66 3.9 93 5.2
ID: 2003 100 81.4 95 63.2 86 37.3 ................... ...................2005 100 72.9 99 56.9 92 40.0 82 21.7 2010 100 75.0 96 53.2 91 35.9 81 30.0
ME: 2003 100 12.0 100 12.3 100 13.8 ................... ...................2005 100 10.2 100 10.1 100 11.9 ................... ...................2010 99 8.8 99 8.2 95 10.2 * *
MI: 2003 100 8.5 98 4.0 98 9.1 2005 99 9.2 94 4.9 100 10.2 58 1.4 2010 100 8.6 98 3.5 100 8.6 * *
MN: 2003 100 8.6 94 4.9 92 8.5 ................... ...................2005 100 8.2 100 5.0 81 7.7 55 0.7 2010 98 9.2 100 4.6 100 14.6 80 1.3
ND: 2003 97 16.5 92 10.0 84 13.7 ................... ...................2005 100 14.7 100 8.4 96 13.7 54 1.3 2010 100 15.1 89 7.9 84 14.3 44 1.3
OR: 2003 100 10.7 96 7.4 84 8.8 ................... ...................
PA: 2003 100 1.9 99 1.3 99 1.4 ................... ...................
WA: 2003 100 43.1 85 33.2 82 30.7 ................... ...................2005 100 37.8 98 30.2 92 38.2 89 9.5 2010 100 32.6 99 24.9 94 36.0 90 9.7
WI: 2003 100 19.9 99 12.2 100 25.5 ................... ...................2005 100 17.9 99 9.1 99 20.5 72 4.1 2010 100 16.5 100 5.3 93 17.7 91 3.9
1 Data not available for all States for all years. 2 Estimates began in 2005. *Insufficient number of reports to publish data.
NASS, Environmental, Economics, and Demographics Branch, (202) 720–6146.
VerDate Aug 31 2005 15:07 Mar 01, 2012 Jkt 000000 PO 00000 Frm 00010 Fmt 1000 Sfmt 1000 H:\SHARED\DAPP\FPU\AGSTAT\MASTER~2\CHAPTR14\XIV-10.AG8 USDA
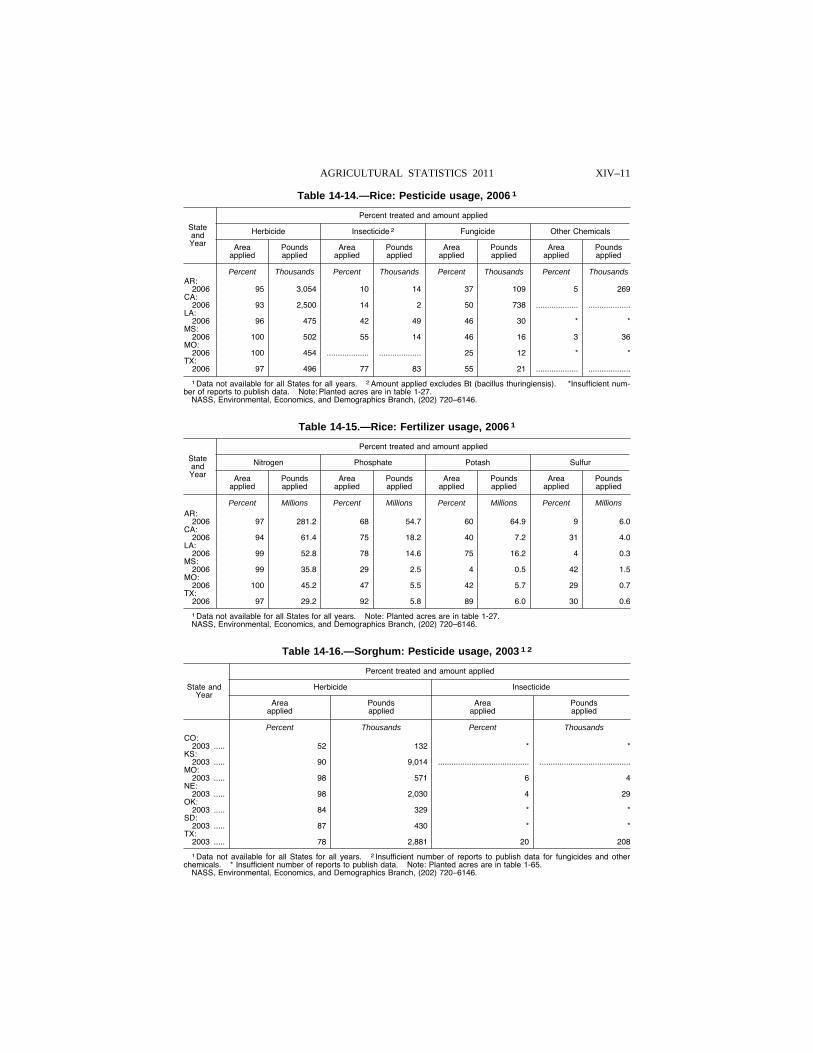
XIV–11 AGRICULTURAL STATISTICS 2011
Table 14-14.—Rice: Pesticide usage, 2006 1
State and Year
Percent treated and amount applied
Herbicide Insecticide 2 Fungicide Other Chemicals
Area applied
Pounds applied
Area applied
Pounds applied
Area applied
Pounds applied
Area applied
Pounds applied
Percent Thousands Percent Thousands Percent Thousands Percent Thousands AR:
2006 95 3,054 10 14 37 109 5 269 CA:
2006 93 2,500 14 2 50 738 ................... ...................LA:
2006 96 475 42 49 46 30 * * MS:
2006 100 502 55 14 46 16 3 36 MO:
2006 100 454 ................... ................... 25 12 * * TX:
2006 97 496 77 83 55 21 ................... ...................
1 Data not available for all States for all years. 2 Amount applied excludes Bt (bacillus thuringiensis). *Insufficient num-ber of reports to publish data. Note: Planted acres are in table 1-27.
NASS, Environmental, Economics, and Demographics Branch, (202) 720–6146.
Table 14-15.—Rice: Fertilizer usage, 2006 1
State and Year
Percent treated and amount applied
Nitrogen Phosphate Potash Sulfur
Area applied
Pounds applied
Area applied
Pounds applied
Area applied
Pounds applied
Area applied
Pounds applied
Percent Millions Percent Millions Percent Millions Percent Millions AR:
2006 97 281.2 68 54.7 60 64.9 9 6.0 CA:
2006 94 61.4 75 18.2 40 7.2 31 4.0 LA:
2006 99 52.8 78 14.6 75 16.2 4 0.3 MS:
2006 99 35.8 29 2.5 4 0.5 42 1.5 MO:
2006 100 45.2 47 5.5 42 5.7 29 0.7 TX:
2006 97 29.2 92 5.8 89 6.0 30 0.6
1 Data not available for all States for all years. Note: Planted acres are in table 1-27. NASS, Environmental, Economics, and Demographics Branch, (202) 720–6146.
Table 14-16.—Sorghum: Pesticide usage, 2003 1 2
State and Year
Percent treated and amount applied
Herbicide Insecticide
Area applied
Pounds applied
Area applied
Pounds applied
Percent Thousands Percent Thousands CO:
2003 ..... 52 132 * * KS:
2003 ..... 90 9,014 ......................................... .........................................MO:
2003 ..... 98 571 6 4 NE:
2003 ..... 98 2,030 4 29 OK:
2003 ..... 84 329 * * SD:
2003 ..... 87 430 * * TX:
2003 ..... 78 2,881 20 208
1 Data not available for all States for all years. 2 Insufficient number of reports to publish data for fungicides and other chemicals. * Insufficient number of reports to publish data. Note: Planted acres are in table 1-65.
NASS, Environmental, Economics, and Demographics Branch, (202) 720–6146.
VerDate Aug 31 2005 15:07 Mar 01, 2012 Jkt 000000 PO 00000 Frm 00011 Fmt 1000 Sfmt 1000 H:\SHARED\DAPP\FPU\AGSTAT\MASTER~2\CHAPTR14\XIV-11.AG8 USDA
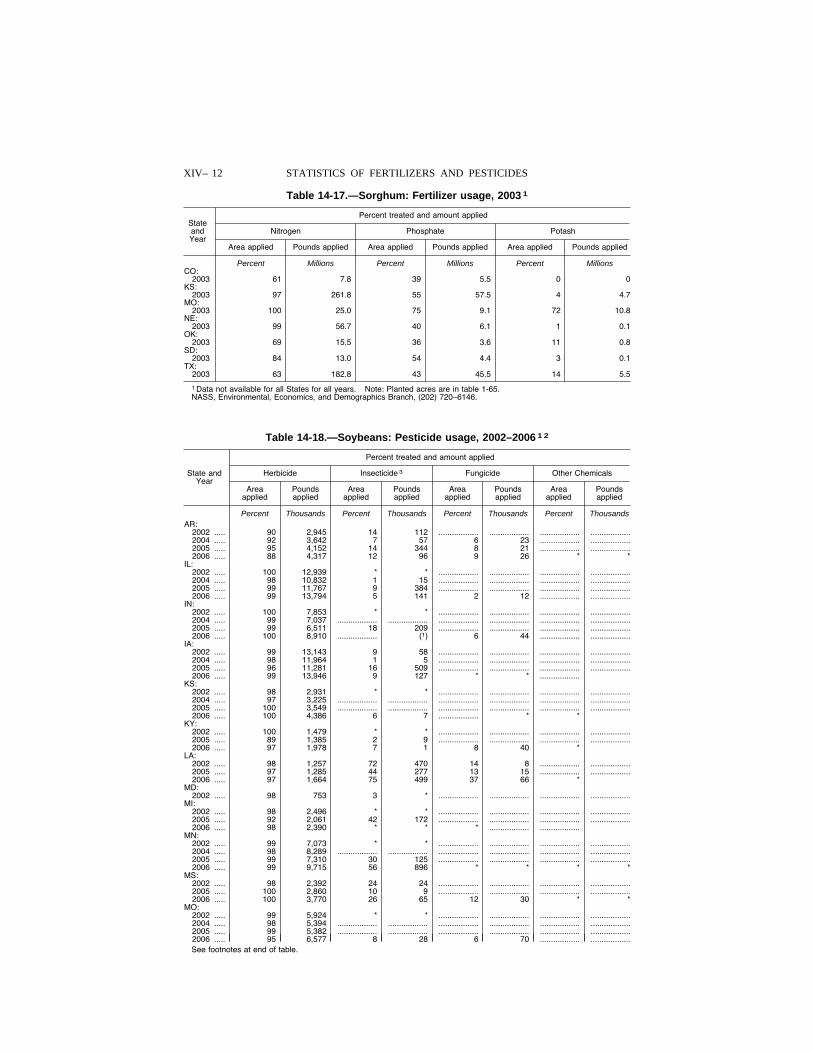
XIV– 12 STATISTICS OF FERTILIZERS AND PESTICIDES
Table 14-17.—Sorghum: Fertilizer usage, 2003 1
State and Year
Percent treated and amount applied
Nitrogen Phosphate Potash
Area applied Pounds applied Area applied Pounds applied Area applied Pounds applied
Percent Millions Percent Millions Percent Millions CO:
2003 61 7.8 39 5.5 0 0 KS:
2003 97 261.8 55 57.5 4 4.7 MO:
2003 100 25.0 75 9.1 72 10.8 NE:
2003 99 56.7 40 6.1 1 0.1 OK:
2003 69 15.5 36 3.6 11 0.8 SD:
2003 84 13.0 54 4.4 3 0.1 TX:
2003 63 182.8 43 45.5 14 5.5
1 Data not available for all States for all years. Note: Planted acres are in table 1-65. NASS, Environmental, Economics, and Demographics Branch, (202) 720–6146.
Table 14-18.—Soybeans: Pesticide usage, 2002–2006 1 2
State and Year
Percent treated and amount applied
Herbicide Insecticide 3 Fungicide Other Chemicals
Area applied
Pounds applied
Area applied
Pounds applied
Area applied
Pounds applied
Area applied
Pounds applied
Percent Thousands Percent Thousands Percent Thousands Percent Thousands AR:
2002 ..... 90 2,945 14 112 .................. .................. .................. ..................2004 ..... 92 3,642 7 57 6 23 .................. ..................2005 ..... 95 4,152 14 344 8 21 .................. ..................2006 ..... 88 4,317 12 96 9 26 * *
IL: 2002 ..... 100 12,939 * * .................. .................. .................. ..................2004 ..... 98 10,832 1 15 .................. .................. .................. ..................2005 ..... 99 11,767 9 384 .................. .................. .................. ..................2006 ..... 99 13,794 5 141 2 12 .................. ..................
IN: 2002 ..... 100 7,853 * * .................. .................. .................. ..................2004 ..... 99 7,037 .................. .................. .................. .................. .................. ..................2005 ..... 99 6,511 18 209 .................. .................. .................. ..................2006 ..... 100 8,910 .................. (1) 6 44 .................. ..................
IA: 2002 ..... 99 13,143 9 58 .................. .................. .................. ..................2004 ..... 98 11,964 1 5 .................. .................. .................. ..................2005 ..... 96 11,281 16 509 .................. .................. .................. ..................2006 ..... 99 13,946 9 127 * * ..................
KS: 2002 ..... 98 2,931 * * .................. .................. .................. ..................2004 ..... 97 3,225 .................. .................. .................. .................. .................. ..................2005 ..... 100 3,549 .................. .................. .................. .................. .................. ..................2006 ..... 100 4,386 6 7 .................. * *
KY: 2002 ..... 100 1,479 * * .................. .................. .................. ..................2005 ..... 89 1,385 2 9 .................. .................. .................. ..................2006 ..... 97 1,978 7 1 8 40 *
LA: 2002 ..... 98 1,257 72 470 14 8 .................. ..................2005 ..... 97 1,285 44 277 13 15 .................. ..................2006 ..... 97 1,664 75 499 37 66 *
MD: 2002 ..... 98 753 3 * .................. .................. .................. ..................
MI: 2002 ..... 98 2,496 * * .................. .................. .................. ..................2005 ..... 92 2,061 42 172 .................. .................. .................. ..................2006 ..... 98 2,390 * * * .................. ..................
MN: 2002 ..... 99 7,073 * * .................. .................. .................. ..................2004 ..... 98 8,289 .................. .................. .................. .................. .................. ..................2005 ..... 99 7,310 30 125 .................. .................. .................. ..................2006 ..... 99 9,715 56 896 * * * *
MS: 2002 ..... 98 2,392 24 24 .................. .................. .................. ..................2005 ..... 100 2,860 10 9 .................. .................. .................. ..................2006 ..... 100 3,770 26 65 12 30 * *
MO: 2002 ..... 99 5,924 * * .................. .................. .................. ..................2004 ..... 98 5,394 .................. .................. .................. .................. .................. ..................2005 ..... 99 5,382 .................. .................. .................. .................. .................. ..................2006 ..... 95 6,577 8 28 6 70 .................. ..................See footnotes at end of table.
VerDate Aug 31 2005 15:07 Mar 01, 2012 Jkt 000000 PO 00000 Frm 00012 Fmt 1000 Sfmt 1000 H:\SHARED\DAPP\FPU\AGSTAT\MASTER~2\CHAPTR14\XIV-13.AG8 USDA
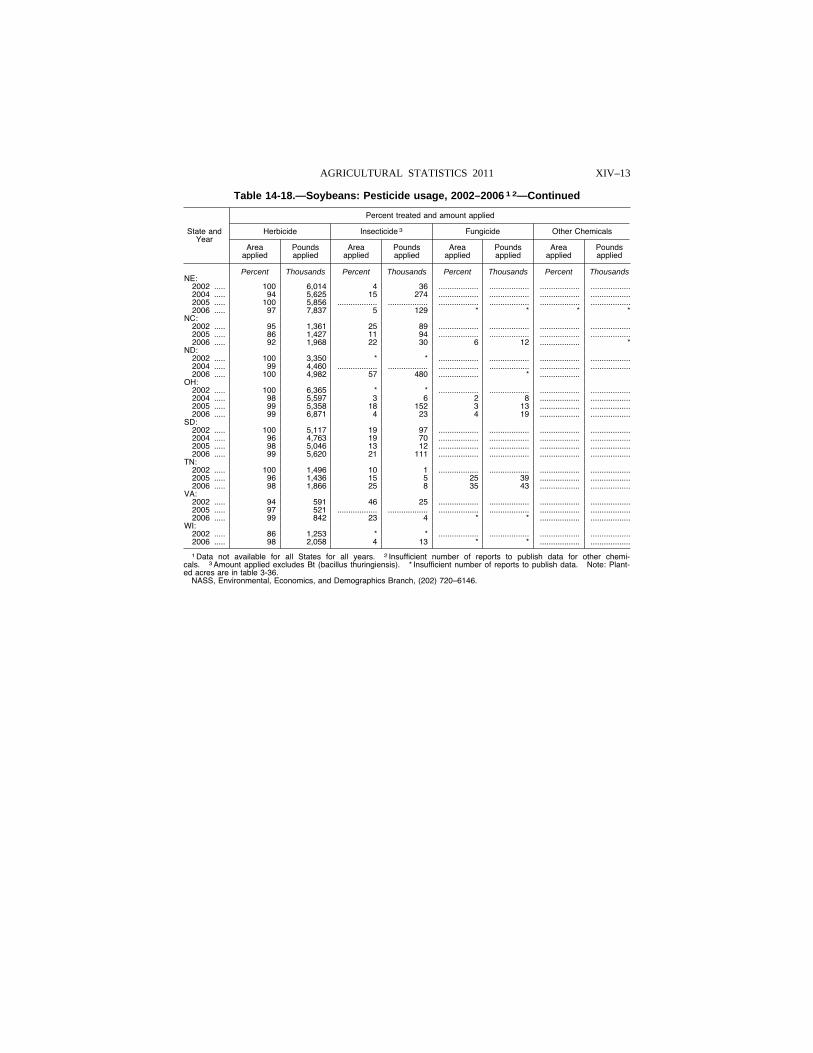
XIV–13 AGRICULTURAL STATISTICS 2011
Table 14-18.—Soybeans: Pesticide usage, 2002–2006 1 2—Continued
State and Year
Percent treated and amount applied
Herbicide Insecticide 3 Fungicide Other Chemicals
Area applied
Pounds applied
Area applied
Pounds applied
Area applied
Pounds applied
Area applied
Pounds applied
Percent Thousands Percent Thousands Percent Thousands Percent Thousands NE:
2002 ..... 100 6,014 4 36 .................. .................. .................. ..................2004 ..... 94 5,625 15 274 .................. .................. .................. ..................2005 ..... 100 5,856 .................. .................. .................. .................. .................. ..................2006 ..... 97 7,837 5 129 * * * *
NC: 2002 ..... 95 1,361 25 89 .................. .................. .................. ..................2005 ..... 86 1,427 11 94 .................. .................. .................. ..................2006 ..... 92 1,968 22 30 6 12 .................. *
ND: 2002 ..... 100 3,350 * * .................. .................. .................. ..................2004 ..... 99 4,460 .................. .................. .................. .................. .................. ..................2006 ..... 100 4,982 57 480 .................. * ..................
OH: 2002 ..... 100 6,365 * * .................. .................. .................. ..................2004 ..... 98 5,597 3 6 2 8 .................. ..................2005 ..... 99 5,358 18 152 3 13 .................. ..................2006 ..... 99 6,871 4 23 4 19 .................. ..................
SD: 2002 ..... 100 5,117 19 97 .................. .................. .................. ..................2004 ..... 96 4,763 19 70 .................. .................. .................. ..................2005 ..... 98 5,046 13 12 .................. .................. .................. ..................2006 ..... 99 5,620 21 111 .................. .................. .................. ..................
TN: 2002 ..... 100 1,496 10 1 .................. .................. .................. ..................2005 ..... 96 1,436 15 5 25 39 .................. ..................2006 ..... 98 1,866 25 8 35 43 .................. ..................
VA: 2002 ..... 94 591 46 25 .................. .................. .................. ..................2005 ..... 97 521 .................. .................. .................. .................. .................. ..................2006 ..... 99 842 23 4 * * .................. ..................
WI: 2002 ..... 86 1,253 * * .................. .................. .................. ..................2006 ..... 98 2,058 4 13 * * .................. ..................
1 Data not available for all States for all years. 2 Insufficient number of reports to publish data for other chemi-cals. 3 Amount applied excludes Bt (bacillus thuringiensis). * Insufficient number of reports to publish data. Note: Plant-ed acres are in table 3-36.
NASS, Environmental, Economics, and Demographics Branch, (202) 720–6146.
VerDate Aug 31 2005 15:07 Mar 01, 2012 Jkt 000000 PO 00000 Frm 00013 Fmt 1000 Sfmt 1000 H:\SHARED\DAPP\FPU\AGSTAT\MASTER~2\CHAPTR14\XIV-13B.AG8 USDA
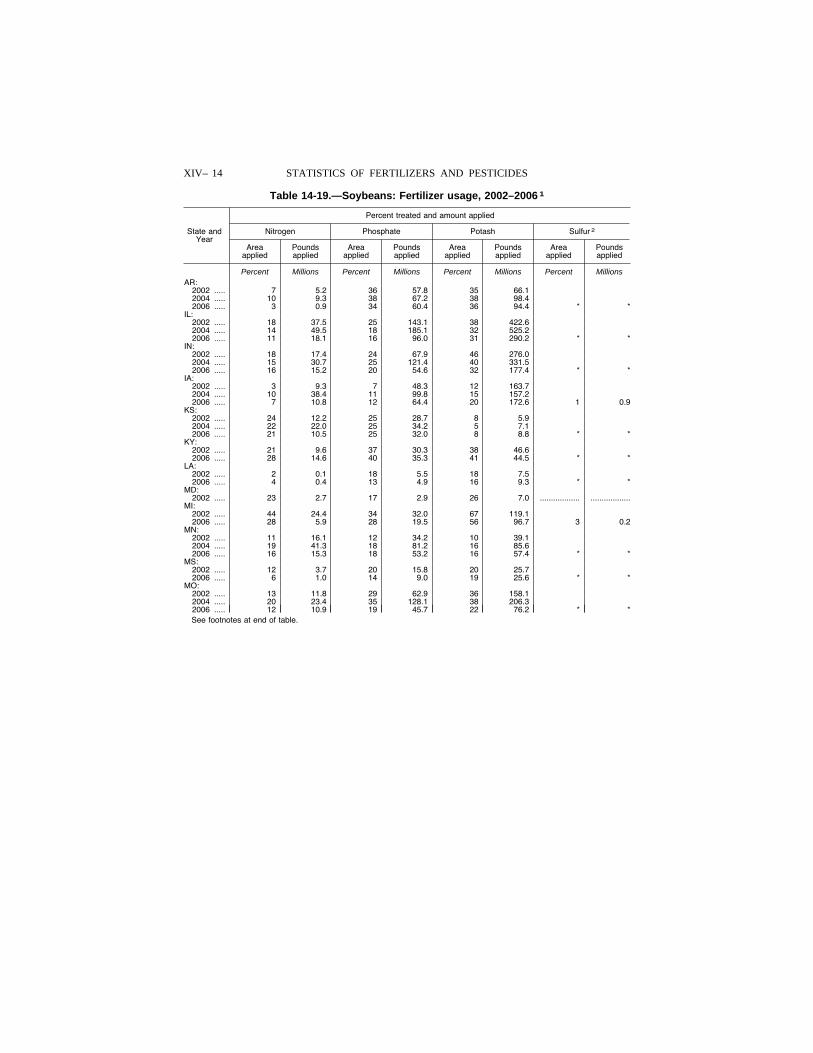
XIV– 14 STATISTICS OF FERTILIZERS AND PESTICIDES
Table 14-19.—Soybeans: Fertilizer usage, 2002–2006 1
State and Year
Percent treated and amount applied
Nitrogen Phosphate Potash Sulfur 2
Area applied
Pounds applied
Area applied
Pounds applied
Area applied
Pounds applied
Area applied
Pounds applied
Percent Millions Percent Millions Percent Millions Percent Millions AR:
2002 ..... 7 5.2 36 57.8 35 66.1 2004 ..... 10 9.3 38 67.2 38 98.4 2006 ..... 3 0.9 34 60.4 36 94.4 * *
IL: 2002 ..... 18 37.5 25 143.1 38 422.6 2004 ..... 14 49.5 18 185.1 32 525.2 2006 ..... 11 18.1 16 96.0 31 290.2 * *
IN: 2002 ..... 18 17.4 24 67.9 46 276.0 2004 ..... 15 30.7 25 121.4 40 331.5 2006 ..... 16 15.2 20 54.6 32 177.4 * *
IA: 2002 ..... 3 9.3 7 48.3 12 163.7 2004 ..... 10 38.4 11 99.8 15 157.2 2006 ..... 7 10.8 12 64.4 20 172.6 1 0.9
KS: 2002 ..... 24 12.2 25 28.7 8 5.9 2004 ..... 22 22.0 25 34.2 5 7.1 2006 ..... 21 10.5 25 32.0 8 8.8 * *
KY: 2002 ..... 21 9.6 37 30.3 38 46.6 2006 ..... 28 14.6 40 35.3 41 44.5 * *
LA: 2002 ..... 2 0.1 18 5.5 18 7.5 2006 ..... 4 0.4 13 4.9 16 9.3 * *
MD: 2002 ..... 23 2.7 17 2.9 26 7.0 .................. ..................
MI: 2002 ..... 44 24.4 34 32.0 67 119.1 2006 ..... 28 5.9 28 19.5 56 96.7 3 0.2
MN: 2002 ..... 11 16.1 12 34.2 10 39.1 2004 ..... 19 41.3 18 81.2 16 85.6 2006 ..... 16 15.3 18 53.2 16 57.4 * *
MS: 2002 ..... 12 3.7 20 15.8 20 25.7 2006 ..... 6 1.0 14 9.0 19 25.6 * *
MO: 2002 ..... 13 11.8 29 62.9 36 158.1 2004 ..... 20 23.4 35 128.1 38 206.3 2006 ..... 12 10.9 19 45.7 22 76.2 * * See footnotes at end of table.
VerDate Aug 31 2005 15:07 Mar 01, 2012 Jkt 000000 PO 00000 Frm 00014 Fmt 1000 Sfmt 1000 H:\SHARED\DAPP\FPU\AGSTAT\MASTER~2\CHAPTR14\XIV-14.AG8 USDA
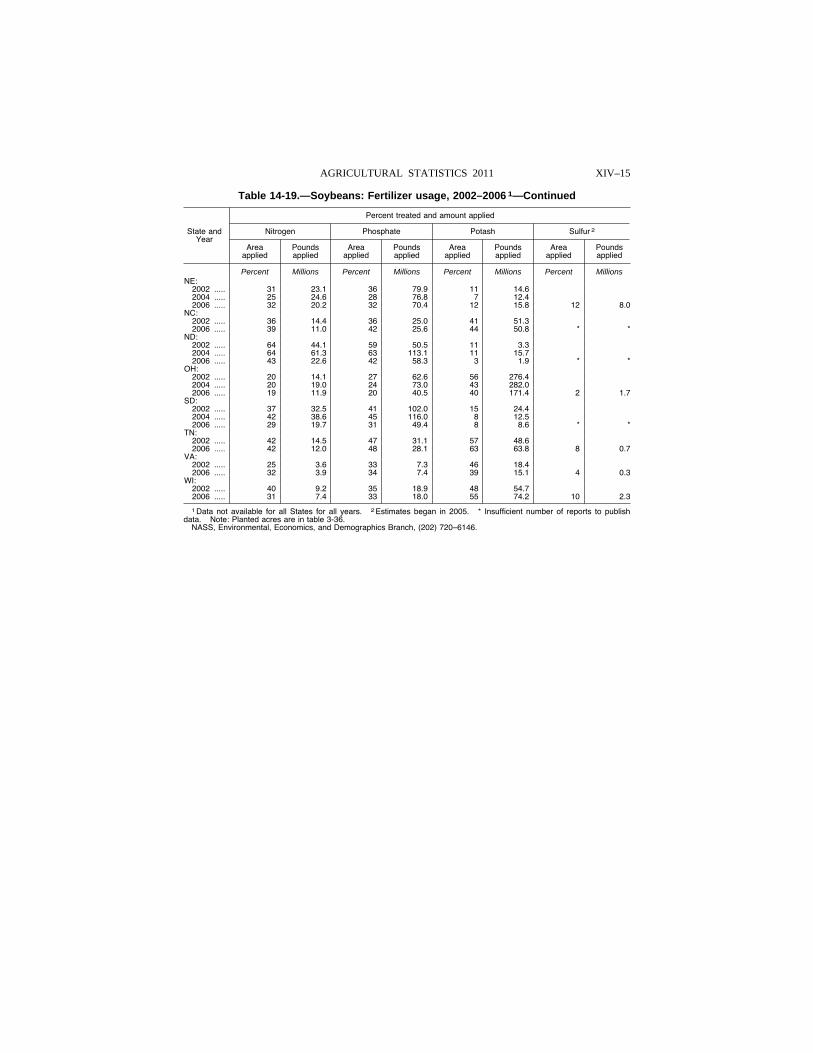
XIV–15 AGRICULTURAL STATISTICS 2011
Table 14-19.—Soybeans: Fertilizer usage, 2002–2006 1—Continued
State and Year
Percent treated and amount applied
Nitrogen Phosphate Potash Sulfur 2
Area applied
Pounds applied
Area applied
Pounds applied
Area applied
Pounds applied
Area applied
Pounds applied
Percent Millions Percent Millions Percent Millions Percent Millions NE:
2002 ..... 31 23.1 36 79.9 11 14.6 2004 ..... 25 24.6 28 76.8 7 12.4 2006 ..... 32 20.2 32 70.4 12 15.8 12 8.0
NC: 2002 ..... 36 14.4 36 25.0 41 51.3 2006 ..... 39 11.0 42 25.6 44 50.8 * *
ND: 2002 ..... 64 44.1 59 50.5 11 3.3 2004 ..... 64 61.3 63 113.1 11 15.7 2006 ..... 43 22.6 42 58.3 3 1.9 * *
OH: 2002 ..... 20 14.1 27 62.6 56 276.4 2004 ..... 20 19.0 24 73.0 43 282.0 2006 ..... 19 11.9 20 40.5 40 171.4 2 1.7
SD: 2002 ..... 37 32.5 41 102.0 15 24.4 2004 ..... 42 38.6 45 116.0 8 12.5 2006 ..... 29 19.7 31 49.4 8 8.6 * *
TN: 2002 ..... 42 14.5 47 31.1 57 48.6 2006 ..... 42 12.0 48 28.1 63 63.8 8 0.7
VA: 2002 ..... 25 3.6 33 7.3 46 18.4 2006 ..... 32 3.9 34 7.4 39 15.1 4 0.3
WI: 2002 ..... 40 9.2 35 18.9 48 54.7 2006 ..... 31 7.4 33 18.0 55 74.2 10 2.3
1 Data not available for all States for all years. 2 Estimates began in 2005. * Insufficient number of reports to publish data. Note: Planted acres are in table 3-36.
NASS, Environmental, Economics, and Demographics Branch, (202) 720–6146.
VerDate Aug 31 2005 15:07 Mar 01, 2012 Jkt 000000 PO 00000 Frm 00015 Fmt 1000 Sfmt 1000 H:\SHARED\DAPP\FPU\AGSTAT\MASTER~2\CHAPTR14\XIV-15.AG8 USDA
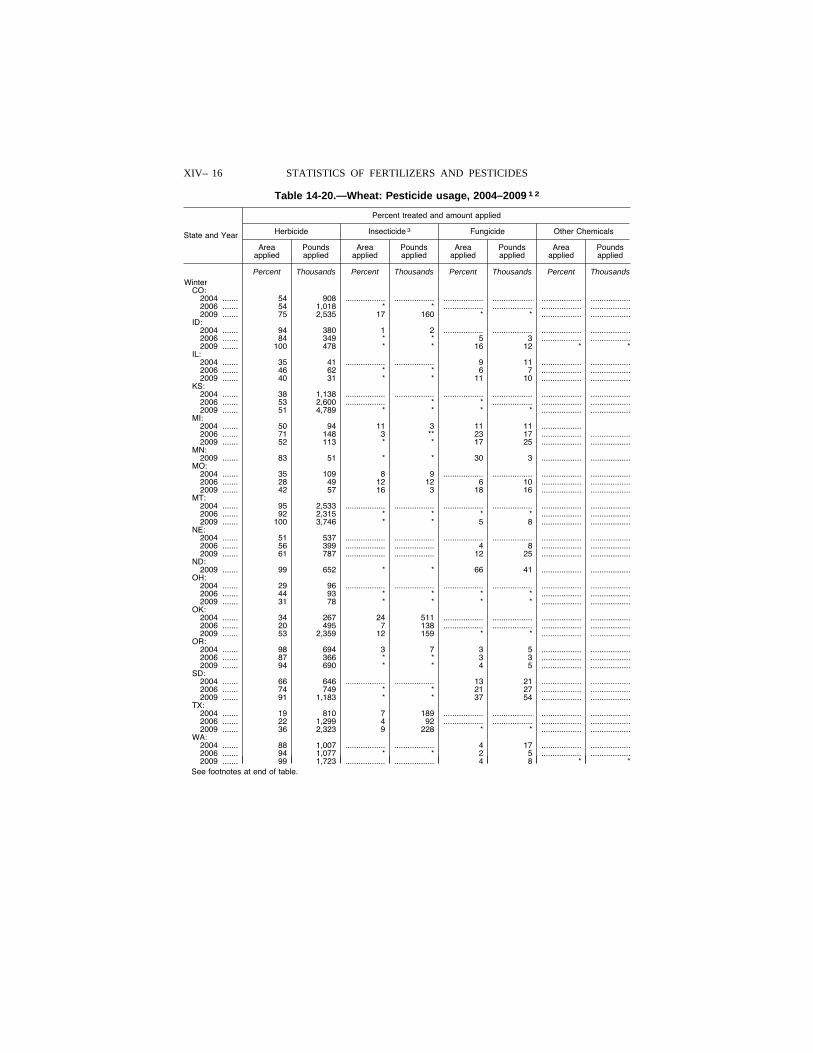
XIV– 16 STATISTICS OF FERTILIZERS AND PESTICIDES
Table 14-20.—Wheat: Pesticide usage, 2004–2009 1 2
State and Year
Percent treated and amount applied
Herbicide Insecticide 3 Fungicide Other Chemicals
Area applied
Pounds applied
Area applied
Pounds applied
Area applied
Pounds applied
Area applied
Pounds applied
Percent Thousands Percent Thousands Percent Thousands Percent Thousands Winter
CO: 2004 ....... 54 908 .................. .................. .................. .................. .................. ..................2006 ....... 54 1,018 * * .................. .................. .................. ..................2009 ....... 75 2,535 17 160 * * .................. ..................
ID: 2004 ....... 94 380 1 2 .................. .................. .................. ..................2006 ....... 84 349 * * 5 3 .................. ..................2009 ....... 100 478 * * 16 12 * *
IL: 2004 ....... 35 41 .................. .................. 9 11 .................. ..................2006 ....... 46 62 * * 6 7 .................. ..................2009 ....... 40 31 * * 11 10 .................. ..................
KS: 2004 ....... 38 1,138 .................. .................. .................. .................. .................. ..................2006 ....... 53 2,600 .................. * * .................. .................. ..................2009 ....... 51 4,789 * * * * .................. ..................
MI: 2004 ....... 50 94 11 3 11 11 ..................2006 ....... 71 148 3 ** 23 17 .................. ..................2009 ....... 52 113 * * 17 25 .................. ..................
MN: 2009 ....... 83 51 * * 30 3 .................. ..................
MO: 2004 ....... 35 109 8 9 .................. .................. .................. ..................2006 ....... 28 49 12 12 6 10 .................. ..................2009 ....... 42 57 16 3 18 16 .................. ..................
MT: 2004 ....... 95 2,533 .................. .................. .................. .................. .................. ..................2006 ....... 92 2,315 * * * * .................. ..................2009 ....... 100 3,746 * * 5 8 .................. ..................
NE: 2004 ....... 51 537 .................. .................. .................. .................. .................. ..................2006 ....... 56 399 .................. .................. 4 8 .................. ..................2009 ....... 61 787 .................. .................. 12 25 .................. ..................
ND: 2009 ....... 99 652 * * 66 41 .................. ..................
OH: 2004 ....... 29 96 .................. .................. .................. .................. .................. ..................2006 ....... 44 93 * * * * .................. ..................2009 ....... 31 78 * * * * .................. ..................
OK: 2004 ....... 34 267 24 511 .................. .................. .................. ..................2006 ....... 20 495 7 138 .................. .................. .................. ..................2009 ....... 53 2,359 12 159 * * .................. ..................
OR: 2004 ....... 98 694 3 7 3 5 .................. ..................2006 ....... 87 366 * * 3 3 .................. ..................2009 ....... 94 690 * * 4 5 .................. ..................
SD: 2004 ....... 66 646 .................. .................. 13 21 .................. ..................2006 ....... 74 749 * * 21 27 .................. ..................2009 ....... 91 1,183 * * 37 54 .................. ..................
TX: 2004 ....... 19 810 7 189 .................. .................. .................. ..................2006 ....... 22 1,299 4 92 .................. .................. .................. ..................2009 ....... 36 2,323 9 228 * * .................. ..................
WA: 2004 ....... 88 1,007 .................. .................. 4 17 .................. ..................2006 ....... 94 1,077 * * 2 5 .................. ..................2009 ....... 99 1,723 .................. .................. 4 8 * *
See footnotes at end of table.
VerDate Aug 31 2005 15:07 Mar 01, 2012 Jkt 000000 PO 00000 Frm 00016 Fmt 1000 Sfmt 1000 H:\SHARED\DAPP\FPU\AGSTAT\MASTER~2\CHAPTR14\XIV-16.AG8 USDA
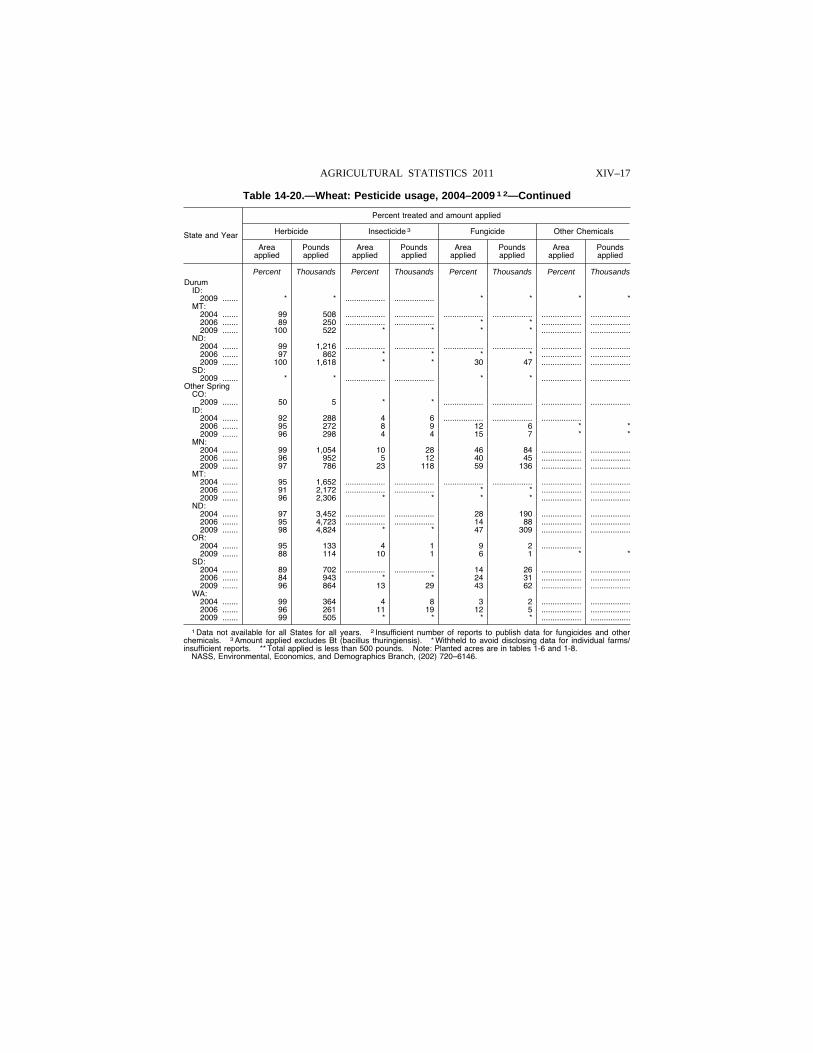
XIV–17 AGRICULTURAL STATISTICS 2011
Table 14-20.—Wheat: Pesticide usage, 2004–2009 1 2—Continued
State and Year
Percent treated and amount applied
Herbicide Insecticide 3 Fungicide Other Chemicals
Area applied
Pounds applied
Area applied
Pounds applied
Area applied
Pounds applied
Area applied
Pounds applied
Percent Thousands Percent Thousands Percent Thousands Percent Thousands Durum
ID: 2009 ....... * * .................. .................. * * * *
MT: 2004 ....... 99 508 .................. .................. .................. .................. .................. ..................2006 ....... 89 250 .................. .................. * * .................. ..................2009 ....... 100 522 * * * * .................. ..................
ND: 2004 ....... 99 1,216 .................. .................. .................. .................. .................. ..................2006 ....... 97 862 * * * * .................. ..................2009 ....... 100 1,618 * * 30 47 .................. ..................
SD: 2009 ....... * * .................. .................. * * .................. ..................
Other Spring CO:
2009 ....... 50 5 * * .................. .................. .................. ..................ID:
2004 ....... 92 288 4 6 .................. .................. ..................2006 ....... 95 272 8 9 12 6 * * 2009 ....... 96 298 4 4 15 7 * *
MN: 2004 ....... 99 1,054 10 28 46 84 .................. ..................2006 ....... 96 952 5 12 40 45 .................. ..................2009 ....... 97 786 23 118 59 136 .................. ..................
MT: 2004 ....... 95 1,652 .................. .................. .................. .................. .................. ..................2006 ....... 91 2,172 .................. .................. * * .................. ..................2009 ....... 96 2,306 * * * * .................. ..................
ND: 2004 ....... 97 3,452 .................. .................. 28 190 .................. ..................2006 ....... 95 4,723 .................. .................. 14 88 .................. ..................2009 ....... 98 4,824 * * 47 309 .................. ..................
OR: 2004 ....... 95 133 4 1 9 2 ..................2009 ....... 88 114 10 1 6 1 * *
SD: 2004 ....... 89 702 .................. .................. 14 26 .................. ..................2006 ....... 84 943 * * 24 31 .................. ..................2009 ....... 96 864 13 29 43 62 .................. ..................
WA: 2004 ....... 99 364 4 8 3 2 .................. ..................2006 ....... 96 261 11 19 12 5 .................. ..................2009 ....... 99 505 * * * * .................. ..................
1 Data not available for all States for all years. 2 Insufficient number of reports to publish data for fungicides and other chemicals. 3 Amount applied excludes Bt (bacillus thuringiensis). * Withheld to avoid disclosing data for individual farms/ insufficient reports. ** Total applied is less than 500 pounds. Note: Planted acres are in tables 1-6 and 1-8.
NASS, Environmental, Economics, and Demographics Branch, (202) 720–6146.
VerDate Aug 31 2005 15:07 Mar 01, 2012 Jkt 000000 PO 00000 Frm 00017 Fmt 1000 Sfmt 1000 H:\SHARED\DAPP\FPU\AGSTAT\MASTER~2\CHAPTR14\XIV-17.AG8 USDA
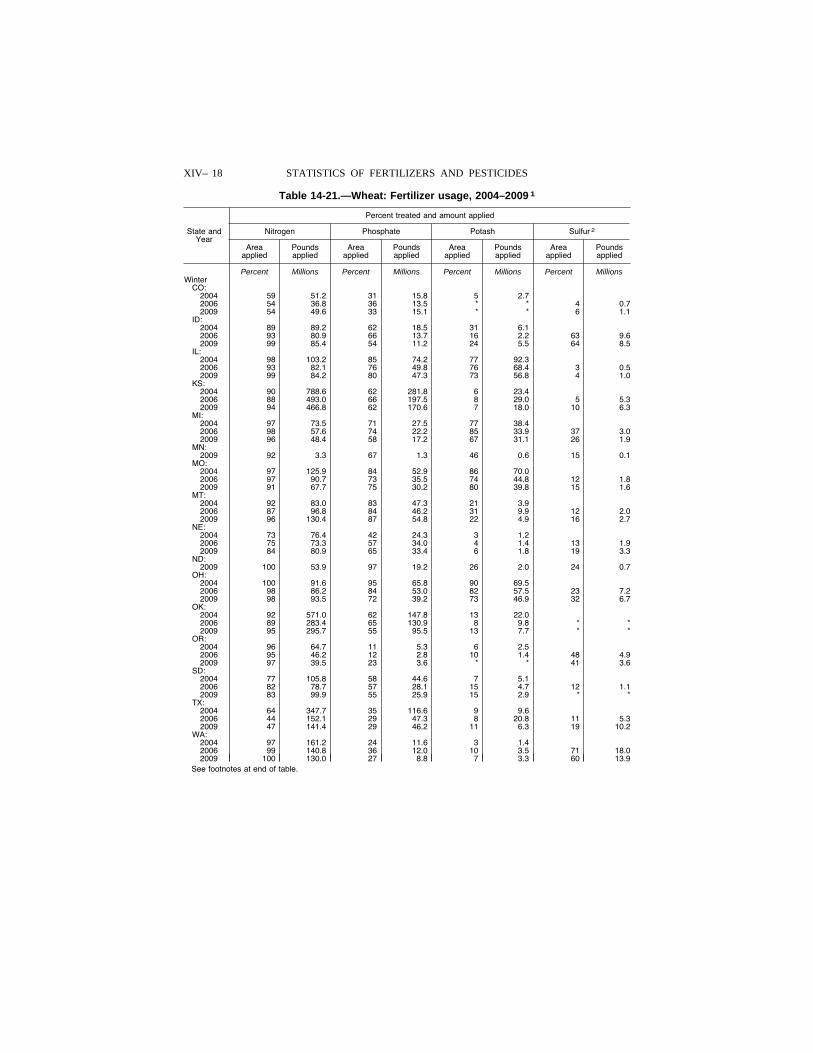
XIV– 18 STATISTICS OF FERTILIZERS AND PESTICIDES
Table 14-21.—Wheat: Fertilizer usage, 2004–2009 1
State and Year
Percent treated and amount applied
Nitrogen Phosphate Potash Sulfur 2
Area applied
Pounds applied
Area applied
Pounds applied
Area applied
Pounds applied
Area applied
Pounds applied
Percent Millions Percent Millions Percent Millions Percent Millions Winter
CO: 2004 59 51.2 31 15.8 5 2.7 2006 54 36.8 36 13.5 * * 4 0.7 2009 54 49.6 33 15.1 * * 6 1.1
ID: 2004 89 89.2 62 18.5 31 6.1 2006 93 80.9 66 13.7 16 2.2 63 9.6 2009 99 85.4 54 11.2 24 5.5 64 8.5
IL: 2004 98 103.2 85 74.2 77 92.3 2006 93 82.1 76 49.8 76 68.4 3 0.5 2009 99 84.2 80 47.3 73 56.8 4 1.0
KS: 2004 90 788.6 62 281.8 6 23.4 2006 88 493.0 66 197.5 8 29.0 5 5.3 2009 94 466.8 62 170.6 7 18.0 10 6.3
MI: 2004 97 73.5 71 27.5 77 38.4 2006 98 57.6 74 22.2 85 33.9 37 3.0 2009 96 48.4 58 17.2 67 31.1 26 1.9
MN: 2009 92 3.3 67 1.3 46 0.6 15 0.1
MO: 2004 97 125.9 84 52.9 86 70.0 2006 97 90.7 73 35.5 74 44.8 12 1.8 2009 91 67.7 75 30.2 80 39.8 15 1.6
MT: 2004 92 83.0 83 47.3 21 3.9 2006 87 96.8 84 46.2 31 9.9 12 2.0 2009 96 130.4 87 54.8 22 4.9 16 2.7
NE: 2004 73 76.4 42 24.3 3 1.2 2006 75 73.3 57 34.0 4 1.4 13 1.9 2009 84 80.9 65 33.4 6 1.8 19 3.3
ND: 2009 100 53.9 97 19.2 26 2.0 24 0.7
OH: 2004 100 91.6 95 65.8 90 69.5 2006 98 86.2 84 53.0 82 57.5 23 7.2 2009 98 93.5 72 39.2 73 46.9 32 6.7
OK: 2004 92 571.0 62 147.8 13 22.0 2006 89 283.4 65 130.9 8 9.8 * * 2009 95 295.7 55 95.5 13 7.7 * *
OR: 2004 96 64.7 11 5.3 6 2.5 2006 95 46.2 12 2.8 10 1.4 48 4.9 2009 97 39.5 23 3.6 * * 41 3.6
SD: 2004 77 105.8 58 44.6 7 5.1 2006 82 78.7 57 28.1 15 4.7 12 1.1 2009 83 99.9 55 25.9 15 2.9 * *
TX: 2004 64 347.7 35 116.6 9 9.6 2006 44 152.1 29 47.3 8 20.8 11 5.3 2009 47 141.4 29 46.2 11 6.3 19 10.2
WA: 2004 97 161.2 24 11.6 3 1.4 2006 99 140.8 36 12.0 10 3.5 71 18.0 2009 100 130.0 27 8.8 7 3.3 60 13.9
See footnotes at end of table.
VerDate Aug 31 2005 15:07 Mar 01, 2012 Jkt 000000 PO 00000 Frm 00018 Fmt 1000 Sfmt 1000 H:\SHARED\DAPP\FPU\AGSTAT\MASTER~2\CHAPTR14\XIV-18.AG8 USDA
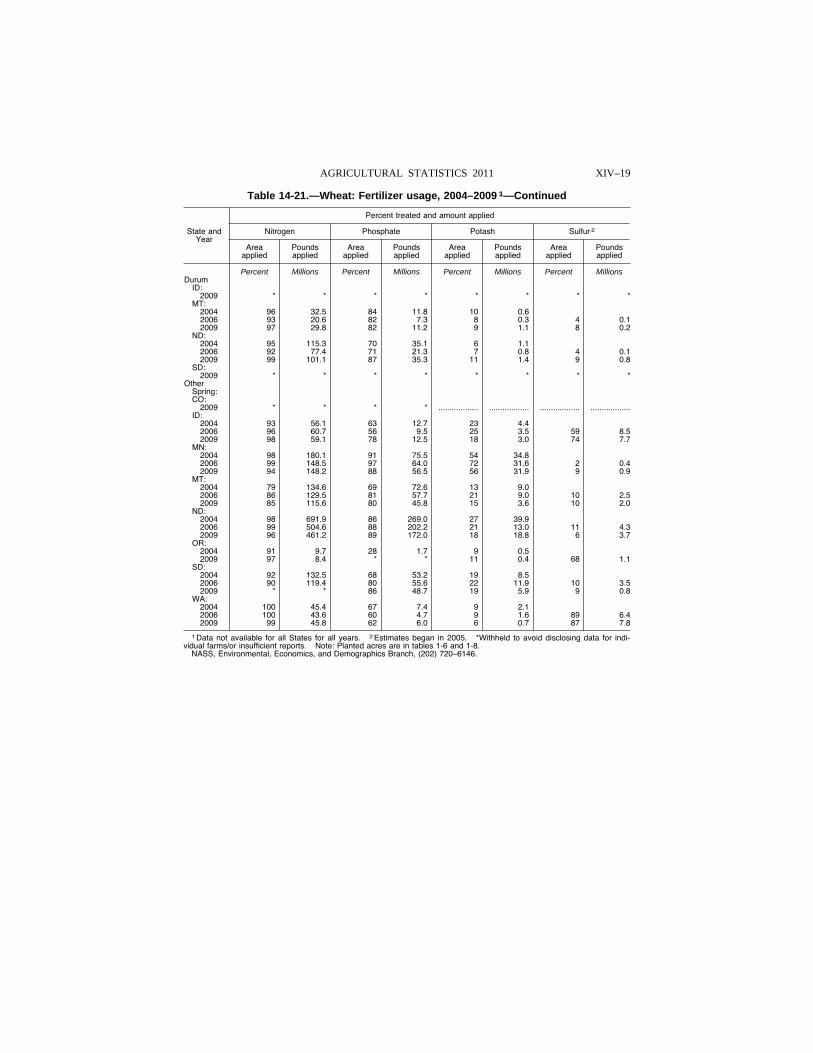
XIV–19 AGRICULTURAL STATISTICS 2011
Table 14-21.—Wheat: Fertilizer usage, 2004–2009 1—Continued
State and Year
Percent treated and amount applied
Nitrogen Phosphate Potash Sulfur 2
Area applied
Pounds applied
Area applied
Pounds applied
Area applied
Pounds applied
Area applied
Pounds applied
Percent Millions Percent Millions Percent Millions Percent Millions Durum
ID: 2009 * * * * * * * *
MT: 2004 96 32.5 84 11.8 10 0.6 2006 93 20.6 82 7.3 8 0.3 4 0.1 2009 97 29.8 82 11.2 9 1.1 8 0.2
ND: 2004 95 115.3 70 35.1 6 1.1 2006 92 77.4 71 21.3 7 0.8 4 0.1 2009 99 101.1 87 35.3 11 1.4 9 0.8
SD: 2009 * * * * * * * *
Other Spring: CO:
2009 * * * * .................. .................. .................. ..................ID:
2004 93 56.1 63 12.7 23 4.4 2006 96 60.7 56 9.5 25 3.5 59 8.5 2009 98 59.1 78 12.5 18 3.0 74 7.7
MN: 2004 98 180.1 91 75.5 54 34.8 2006 99 148.5 97 64.0 72 31.6 2 0.4 2009 94 148.2 88 56.5 56 31.9 9 0.9
MT: 2004 79 134.6 69 72.6 13 9.0 2006 86 129.5 81 57.7 21 9.0 10 2.5 2009 85 115.6 80 45.8 15 3.6 10 2.0
ND: 2004 98 691.9 86 269.0 27 39.9 2006 99 504.6 88 202.2 21 13.0 11 4.3 2009 96 461.2 89 172.0 18 18.8 6 3.7
OR: 2004 91 9.7 28 1.7 9 0.5 2009 97 8.4 * * 11 0.4 68 1.1
SD: 2004 92 132.5 68 53.2 19 8.5 2006 90 119.4 80 55.6 22 11.9 10 3.5 2009 * * 86 48.7 19 5.9 9 0.8
WA: 2004 100 45.4 67 7.4 9 2.1 2006 100 43.6 60 4.7 9 1.6 89 6.4 2009 99 45.8 62 6.0 6 0.7 87 7.8
1 Data not available for all States for all years. 2 Estimates began in 2005. *Withheld to avoid disclosing data for indi-vidual farms/or insufficient reports. Note: Planted acres are in tables 1-6 and 1-8.
NASS, Environmental, Economics, and Demographics Branch, (202) 720–6146.
VerDate Aug 31 2005 15:07 Mar 01, 2012 Jkt 000000 PO 00000 Frm 00019 Fmt 1000 Sfmt 1000 H:\SHARED\DAPP\FPU\AGSTAT\MASTER~2\CHAPTR14\XIV-19.AG8 USDA
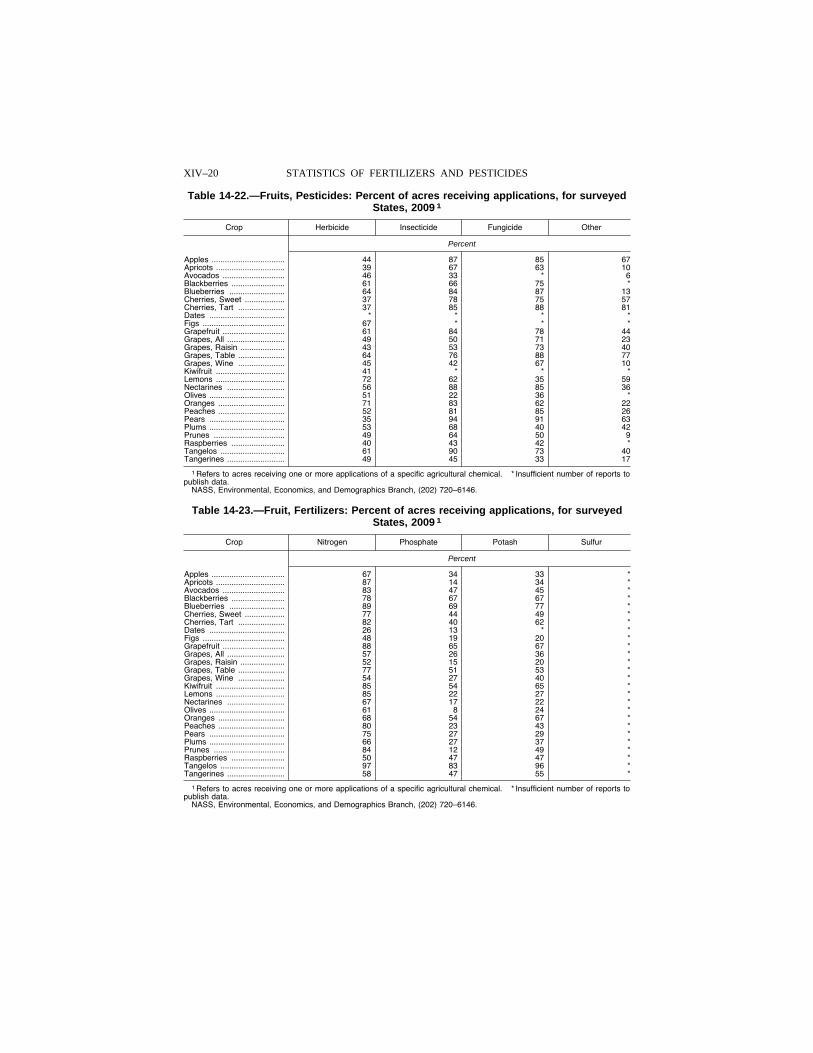
XIV–20 STATISTICS OF FERTILIZERS AND PESTICIDES
Table 14-22.—Fruits, Pesticides: Percent of acres receiving applications, for surveyed States, 2009 1
Crop Herbicide Insecticide Fungicide Other
Percent
Apples ................................. 44 87 85 67 Apricots ............................... 39 67 63 10 Avocados ............................ 46 33 * 6 Blackberries ........................ 61 66 75 * Blueberries ......................... 64 84 87 13 Cherries, Sweet .................. 37 78 75 57 Cherries, Tart ..................... 37 85 88 81 Dates .................................. * * * * Figs ..................................... 67 * * * Grapefruit ............................ 61 84 78 44 Grapes, All .......................... 49 50 71 23 Grapes, Raisin .................... 43 53 73 40 Grapes, Table ..................... 64 76 88 77 Grapes, Wine ..................... 45 42 67 10 Kiwifruit ............................... 41 * * * Lemons ............................... 72 62 35 59 Nectarines .......................... 56 88 85 36 Olives .................................. 51 22 36 * Oranges .............................. 71 83 62 22 Peaches .............................. 52 81 85 26 Pears .................................. 35 94 91 63 Plums .................................. 53 68 40 42 Prunes ................................ 49 64 50 9 Raspberries ........................ 40 43 42 * Tangelos ............................. 61 90 73 40 Tangerines .......................... 49 45 33 17
1 Refers to acres receiving one or more applications of a specific agricultural chemical. * Insufficient number of reports to publish data.
NASS, Environmental, Economics, and Demographics Branch, (202) 720–6146.
Table 14-23.—Fruit, Fertilizers: Percent of acres receiving applications, for surveyed States, 2009 1
Crop Nitrogen Phosphate Potash Sulfur
Percent
Apples ................................. 67 34 33 * Apricots ............................... 87 14 34 * Avocados ............................ 83 47 45 * Blackberries ........................ 78 67 67 * Blueberries ......................... 89 69 77 * Cherries, Sweet .................. 77 44 49 * Cherries, Tart ..................... 82 40 62 * Dates .................................. 26 13 * * Figs ..................................... 48 19 20 * Grapefruit ............................ 88 65 67 * Grapes, All .......................... 57 26 36 * Grapes, Raisin .................... 52 15 20 * Grapes, Table ..................... 77 51 53 * Grapes, Wine ..................... 54 27 40 * Kiwifruit ............................... 85 54 65 * Lemons ............................... 85 22 27 * Nectarines .......................... 67 17 22 * Olives .................................. 61 8 24 * Oranges .............................. 68 54 67 * Peaches .............................. 80 23 43 * Pears .................................. 75 27 29 * Plums .................................. 66 27 37 * Prunes ................................ 84 12 49 * Raspberries ........................ 50 47 47 * Tangelos ............................. 97 83 96 * Tangerines .......................... 58 47 55 *
1 Refers to acres receiving one or more applications of a specific agricultural chemical. * Insufficient number of reports to publish data.
NASS, Environmental, Economics, and Demographics Branch, (202) 720–6146.
VerDate Aug 31 2005 15:07 Mar 01, 2012 Jkt 000000 PO 00000 Frm 00020 Fmt 1000 Sfmt 1000 H:\SHARED\DAPP\FPU\AGSTAT\MASTER~2\CHAPTR14\XIV-20.AG8 USDA
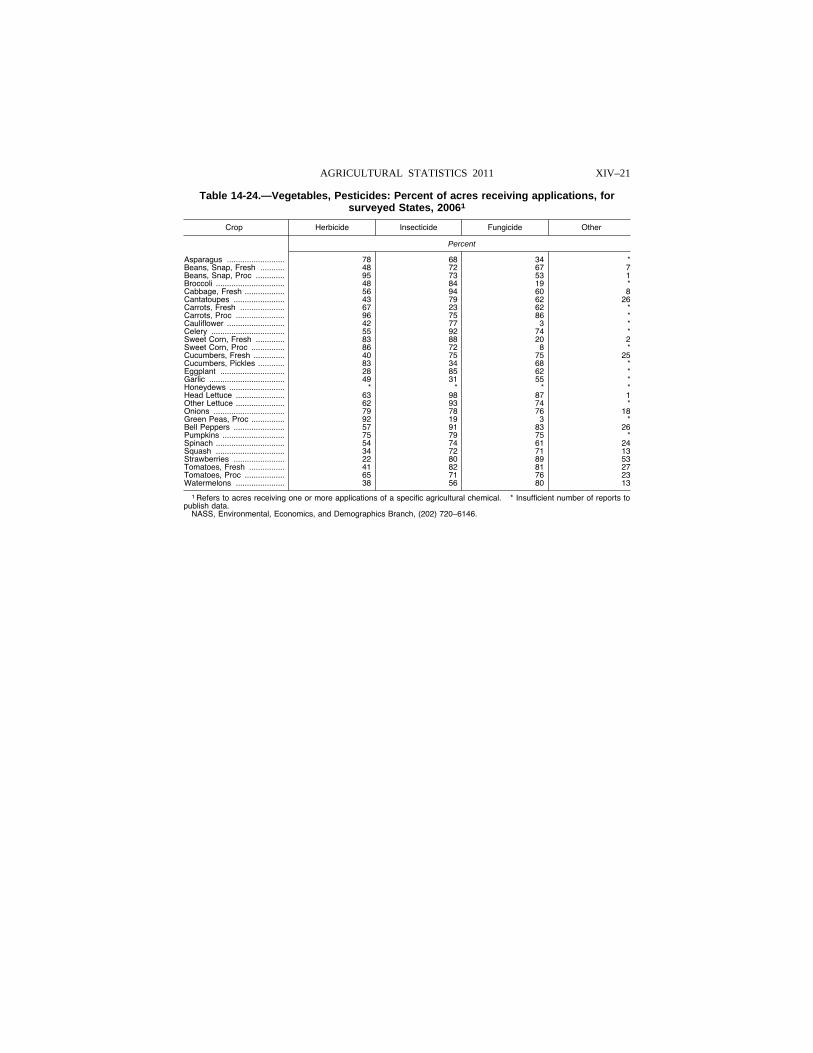
XIV–21 AGRICULTURAL STATISTICS 2011
Table 14-24.—Vegetables, Pesticides: Percent of acres receiving applications, for surveyed States, 20061
Crop Herbicide Insecticide Fungicide Other
Percent
Asparagus .......................... 78 68 34 * Beans, Snap, Fresh ........... 48 72 67 7 Beans, Snap, Proc ............. 95 73 53 1 Broccoli ............................... 48 84 19 * Cabbage, Fresh .................. 56 94 60 8 Cantatoupes ....................... 43 79 62 26 Carrots, Fresh .................... 67 23 62 * Carrots, Proc ...................... 96 75 86 * Cauliflower .......................... 42 77 3 * Celery ................................. 55 92 74 * Sweet Corn, Fresh ............. 83 88 20 2 Sweet Corn, Proc ............... 86 72 8 * Cucumbers, Fresh .............. 40 75 75 25 Cucumbers, Pickles ............ 83 34 68 * Eggplant ............................. 28 85 62 * Garlic .................................. 49 31 55 * Honeydews ......................... * * * * Head Lettuce ...................... 63 98 87 1 Other Lettuce ...................... 62 93 74 * Onions ................................ 79 78 76 18 Green Peas, Proc ............... 92 19 3 * Bell Peppers ....................... 57 91 83 26 Pumpkins ............................ 75 79 75 * Spinach ............................... 54 74 61 24 Squash ............................... 34 72 71 13 Strawberries ....................... 22 80 89 53 Tomatoes, Fresh ................ 41 82 81 27 Tomatoes, Proc .................. 65 71 76 23 Watermelons ...................... 38 56 80 13
1 Refers to acres receiving one or more applications of a specific agricultural chemical. * Insufficient number of reports to publish data.
NASS, Environmental, Economics, and Demographics Branch, (202) 720–6146.
VerDate Aug 31 2005 15:07 Mar 01, 2012 Jkt 000000 PO 00000 Frm 00021 Fmt 1000 Sfmt 1000 H:\SHARED\DAPP\FPU\AGSTAT\MASTER~2\CHAPTR14\XIV-21.AG8 USDA
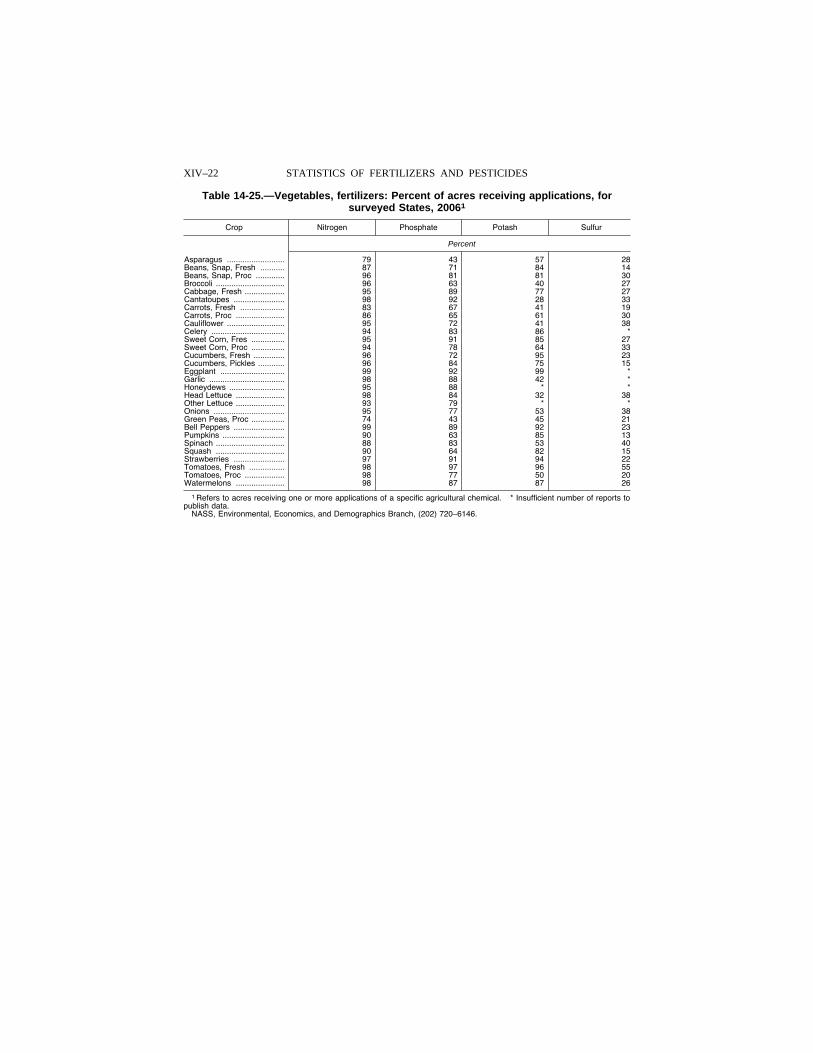
XIV–22 STATISTICS OF FERTILIZERS AND PESTICIDES
Table 14-25.—Vegetables, fertilizers: Percent of acres receiving applications, for surveyed States, 20061
Crop Nitrogen Phosphate Potash Sulfur
Percent
Asparagus .......................... 79 43 57 28 Beans, Snap, Fresh ........... 87 71 84 14 Beans, Snap, Proc ............. 96 81 81 30 Broccoli ............................... 96 63 40 27 Cabbage, Fresh .................. 95 89 77 27 Cantatoupes ....................... 98 92 28 33 Carrots, Fresh .................... 83 67 41 19 Carrots, Proc ...................... 86 65 61 30 Cauliflower .......................... 95 72 41 38 Celery ................................. 94 83 86 * Sweet Corn, Fres ............... 95 91 85 27 Sweet Corn, Proc ............... 94 78 64 33 Cucumbers, Fresh .............. 96 72 95 23 Cucumbers, Pickles ............ 96 84 75 15 Eggplant ............................. 99 92 99 * Garlic .................................. 98 88 42 * Honeydews ......................... 95 88 * * Head Lettuce ...................... 98 84 32 38 Other Lettuce ...................... 93 79 * * Onions ................................ 95 77 53 38 Green Peas, Proc ............... 74 43 45 21 Bell Peppers ....................... 99 89 92 23 Pumpkins ............................ 90 63 85 13 Spinach ............................... 88 83 53 40 Squash ............................... 90 64 82 15 Strawberries ....................... 97 91 94 22 Tomatoes, Fresh ................ 98 97 96 55 Tomatoes, Proc .................. 98 77 50 20 Watermelons ...................... 98 87 87 26
1 Refers to acres receiving one or more applications of a specific agricultural chemical. * Insufficient number of reports to publish data.
NASS, Environmental, Economics, and Demographics Branch, (202) 720–6146.
VerDate Aug 31 2005 15:07 Mar 01, 2012 Jkt 000000 PO 00000 Frm 00022 Fmt 1000 Sfmt 1000 H:\SHARED\DAPP\FPU\AGSTAT\MASTER~2\CHAPTR14\XIV-22.AG8 USDA
XV–1
CHAPTER XV
MISCELLANEOUS AGRICULTURAL STATISTICS This chapter contains miscellaneous data which do not fit into the preceding chapters. Included
here are summary tables on foreign trade in agricultural products; statistics on fishery products; tables on refrigerated warehouses; and statistics on crops in Alaska.
Foreign Agricultural Trade Statistics
Agricultural products, sometimes referred to as food and fiber products, cover a broad range of goods from unprocessed bulk commodities like soybeans, feed corn and wheat to highly-processed, high-value foods and beverages like sausages, bakery goods, ice cream, or beer sold in retail stores and restaurants. All of the products found in Chapters 1-24 (except for fishery products in Chapter 3) of the U.S. Harmonized Tariff Schedule are considered agricultural products. These products gen-erally fall into the following categories: grains, animal feeds, and grain products (like bread and pasta); oilseeds and oilseed products (like canola oil); livestock, poultry and dairy products including live animals, meats, eggs, and feathers; horticultural products including all fresh and processed fruits, vegetables, tree nuts, as well as nursery products and beer and wine; unmanufactured tobacco; and tropical products like sugar, cocoa, and coffee. Certain other products are considered ‘‘agricultural,’’ the most significant of which are essential oils (Chapter 33), raw rubber (Chapter 40), raw animal hides and skins (Chapter 41), and wool and cotton (Chapters 51-52). Manufactured products derived from plants or animals, but which are not considered ‘‘agricultural’’ are cotton yarn, textiles and clothing; leather and leather articles of apparel; and cigarettes and spirits.
U.S. foreign agricultural trade statistics are based on documents filed by exporters and importers and compiled by the Bureau of the Census. Puerto Rico is a Customs district within the U.S. Cus-toms territory, and its trade with foreign countries is included in U.S. export and import statistics. U.S. export and import statistics include merchandise trade between the U.S. Virgin Islands and for-eign countries even though the Virgin Islands of the United States are not officially a part of the U.S. Customs territory.
Data on trade of other U.S. outlying possessions with foreign countries is not compiled by the United States. Export statistics are fully compiled on shipments to all countries, except Canada, where the value of commodities classified under each individual Schedule B number is over $2,500. Value data for such commodities valued under $2,501 are estimated for individual countries using factors based on the ratios of low-valued shipments to individual country totals for past periods. The estimates for low-valued shipments are shown under a single Schedule B number and are omitted from the statistics for the detailed commodity classifications. Shipments valued under $2,501 to all countries, except Canada, represent slightly less that 2.5 percent of the monthly value of U.S. exports to those countries. As a result of the data exchange between the United States and Canada, the United States has adopted the Canadian import exemption level for its export statistics on shipments to Can-ada. The Canadian import exemption level is based on total value per shipment rather than value per commodity classification line item.
The export value, the value at the port of exportation, is based on the selling price and includes inland freight, insurance, and other charges to the port. The country of destination is the country of ultimate destination or where the commodities are consumed or further processed. When the ship-per does not know the ultimate destination, the shipments are credited to the last country, as known at the time of shipment from the United States.
Agricultural products, like manufactured goods, are often transhipped from the one country to an-other. Shippers are asked to identify the ultimate destination of a shipment. However, transhipment points are often recorded as the ultimate destination even though the actual point of consumption may be in a neighboring state. Thus, exports to countries which act as transhipment points are gen-erally overstated, while exports to neighboring countries are often understated. Major world transhipment points include the Netherlands, Hong Kong, and Singapore. In such cases, exports are over reported for the Netherlands, but under reported for Germany, Belgium and the United King-dom. They are overstated to Hong Kong, but under reported to China, and they are overstated to Singapore, but understated to Malaysia and Indonesia. After the collapse of communism in Eastern Europe and Russia, Germany and the Baltic countries became important transhipment points to those countries farther east.
Imports for consumption are a combination of entries for immediate consumption and withdrawals from warehouses for consumption. The import value, defined generally as the market value in the foreign country, excludes import duties, ocean freight, and marine insurance. The country of origin is defined as the country where the commodities were grown or processed. Where the country of origin is not known, the imports are credited to the country of shipment.
Import statistics are fully compiled on shipments valued over $1,250. Value data for shipments valued under $1,251 are not required to be reported on formal entries. They are estimated for indi-vidual countries using factors based on the ratios of low-valued shipments to individual country totals for past periods. The estimates for low-valued shipments are shown under a single HTS number. The total value excluded represents slightly less than 1 percent of the monthly import value.
VerDate Aug 31 2005 16:11 Mar 01, 2012 Jkt 000000 PO 00000 Frm 00001 Fmt 1001 Sfmt 1001 H:\SHARED\DAPP\FPU\AGSTAT\MASTER~2\CHAPTR15\XV-01.AG8 USDA
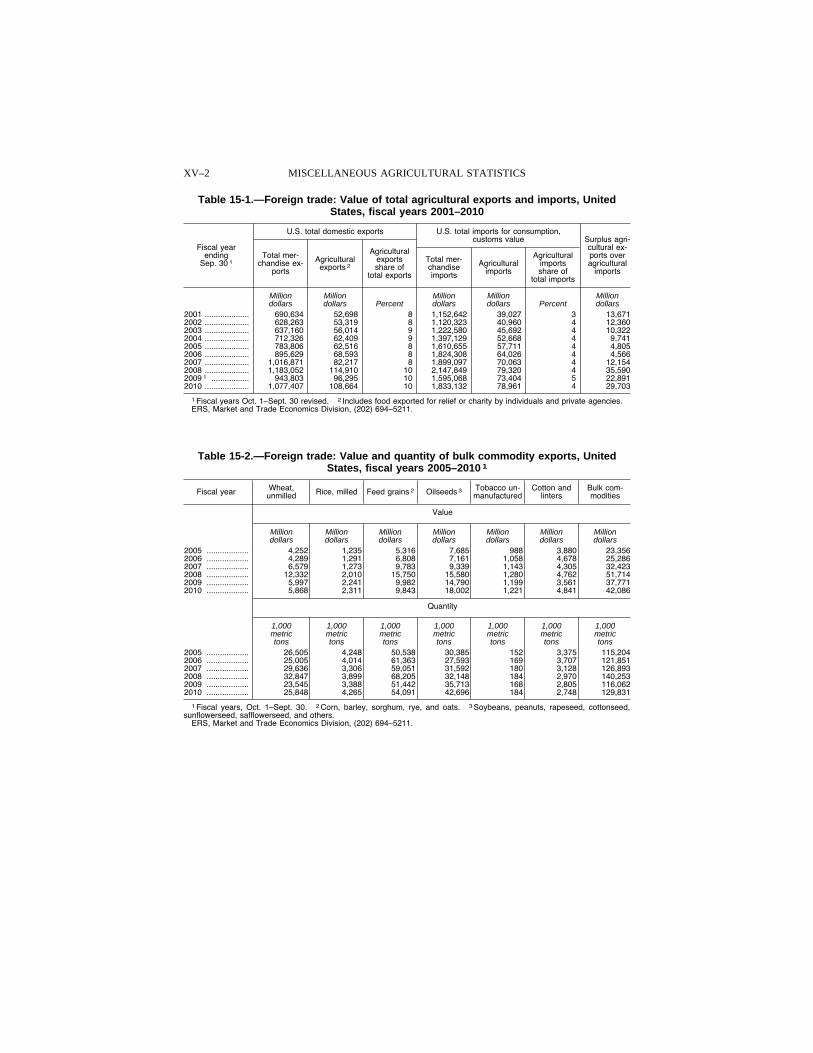
XV–2 MISCELLANEOUS AGRICULTURAL STATISTICS
Table 15-1.—Foreign trade: Value of total agricultural exports and imports, United States, fiscal years 2001–2010
Fiscal year ending
Sep. 30 1
U.S. total domestic exports U.S. total imports for consumption, customs value Surplus agri-
cultural ex-ports over agricultural
imports
Total mer-chandise ex-
ports
Agricultural exports 2
Agricultural exports share of
total exports
Total mer-chandise imports
Agricultural imports
Agricultural imports share of
total imports
Million Million Million Million Million dollars dollars Percent dollars dollars Percent dollars
2001 .................... 690,634 52,698 8 1,152,642 39,027 3 13,671 2002 .................... 628,263 53,319 8 1,120,323 40,960 4 12,360 2003 .................... 637,160 56,014 9 1,222,580 45,692 4 10,322 2004 .................... 712,326 62,409 9 1,397,129 52,668 4 9,741 2005 .................... 783,806 62,516 8 1,610,655 57,711 4 4,805 2006 .................... 895,629 68,593 8 1,824,308 64,026 4 4,566 2007 .................... 1,016,871 82,217 8 1,899,097 70,063 4 12,154 2008 .................... 1,183,052 114,910 10 2,147,849 79,320 4 35,590 2009 1 ................. 943,803 96,295 10 1,595,068 73,404 5 22,891 2010 .................... 1,077,407 108,664 10 1,833,132 78,961 4 29,703
1 Fiscal years Oct. 1–Sept. 30 revised. 2 Includes food exported for relief or charity by individuals and private agencies. ERS, Market and Trade Economics Division, (202) 694–5211.
Table 15-2.—Foreign trade: Value and quantity of bulk commodity exports, United States, fiscal years 2005–2010 1
Fiscal year Wheat, unmilled Rice, milled Feed grains 2 Oilseeds 3 Tobacco un-
manufactured Cotton and
linters Bulk com-modities
Value
Million Million Million Million Million Million Million dollars dollars dollars dollars dollars dollars dollars
2005 ................... 4,252 1,235 5,316 7,685 988 3,880 23,356 2006 ................... 4,289 1,291 6,808 7,161 1,058 4,678 25,286 2007 ................... 6,579 1,273 9,783 9,339 1,143 4,305 32,423 2008 ................... 12,332 2,010 15,750 15,580 1,280 4,762 51,714 2009 ................... 5,997 2,241 9,982 14,790 1,199 3,561 37,771 2010 ................... 5,868 2,311 9,843 18,002 1,221 4,841 42,086
Quantity
1,000 1,000 1,000 1,000 1,000 1,000 1,000 metric metric metric metric metric metric metric tons tons tons tons tons tons tons
2005 ................... 26,505 4,248 50,538 30,385 152 3,375 115,204 2006 ................... 25,005 4,014 61,363 27,593 169 3,707 121,851 2007 ................... 29,636 3,306 59,051 31,592 180 3,128 126,893 2008 ................... 32,847 3,899 68,205 32,148 184 2,970 140,253 2009 ................... 23,545 3,388 51,442 35,713 168 2,805 116,062 2010 ................... 25,848 4,265 54,091 42,696 184 2,748 129,831
1 Fiscal years, Oct. 1–Sept. 30. 2 Corn, barley, sorghum, rye, and oats. 3 Soybeans, peanuts, rapeseed, cottonseed, sunflowerseed, safflowerseed, and others.
ERS, Market and Trade Economics Division, (202) 694–5211.
VerDate Aug 31 2005 16:11 Mar 01, 2012 Jkt 000000 PO 00000 Frm 00002 Fmt 1000 Sfmt 1000 H:\SHARED\DAPP\FPU\AGSTAT\MASTER~2\CHAPTR15\XV-02.AG8 USDA
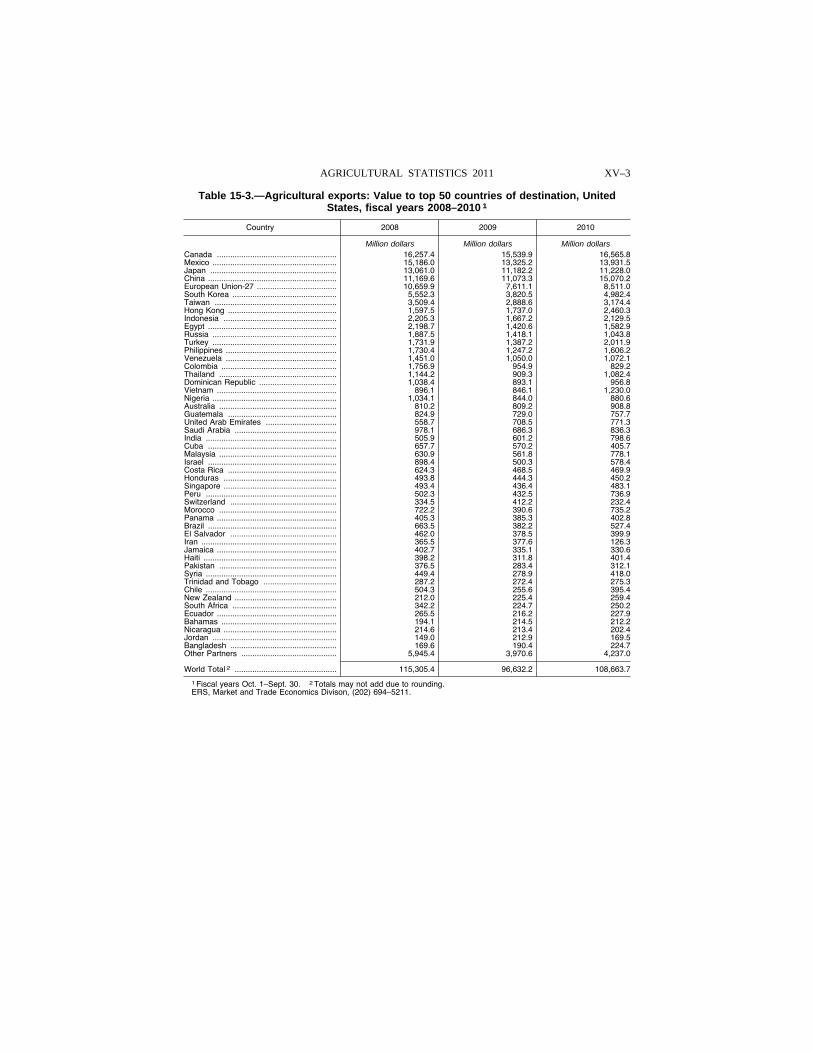
XV–3 AGRICULTURAL STATISTICS 2011
Table 15-3.—Agricultural exports: Value to top 50 countries of destination, United States, fiscal years 2008–2010 1
Country 2008 2009 2010
Million dollars Million dollars Million dollars Canada ...................................................... 16,257.4 15,539.9 16,565.8 Mexico ........................................................ 15,186.0 13,325.2 13,931.5 Japan ......................................................... 13,061.0 11,182.2 11,228.0 China .......................................................... 11,169.6 11,073.3 15,070.2 European Union-27 .................................... 10,659.9 7,611.1 8,511.0 South Korea ............................................... 5,552.3 3,820.5 4,982.4 Taiwan ....................................................... 3,509.4 2,888.6 3,174.4 Hong Kong ................................................. 1,597.5 1,737.0 2,460.3 Indonesia ................................................... 2,205.3 1,667.2 2,129.5 Egypt .......................................................... 2,198.7 1,420.6 1,582.9 Russia ........................................................ 1,887.5 1,418.1 1,043.8 Turkey ........................................................ 1,731.9 1,387.2 2,011.9 Philippines .................................................. 1,730.4 1,247.2 1,606.2 Venezuela .................................................. 1,451.0 1,050.0 1,072.1 Colombia .................................................... 1,756.9 954.9 829.2 Thailand ..................................................... 1,144.2 909.3 1,082.4 Dominican Republic ................................... 1,038.4 893.1 956.8 Vietnam ...................................................... 896.1 846.1 1,230.0 Nigeria ........................................................ 1,034.1 844.0 880.6 Australia ..................................................... 810.2 809.2 908.8 Guatemala ................................................. 824.9 729.0 757.7 United Arab Emirates ................................ 558.7 708.5 771.3 Saudi Arabia .............................................. 978.1 686.3 836.3 India ........................................................... 505.9 601.2 798.6 Cuba .......................................................... 657.7 570.2 405.7 Malaysia ..................................................... 630.9 561.8 778.1 Israel .......................................................... 898.4 500.3 578.4 Costa Rica ................................................. 624.3 468.5 469.9 Honduras ................................................... 493.8 444.3 450.2 Singapore ................................................... 493.4 436.4 483.1 Peru ........................................................... 502.3 432.5 736.9 Switzerland ................................................ 334.5 412.2 232.4 Morocco ..................................................... 722.2 390.6 735.2 Panama ...................................................... 405.3 385.3 402.8 Brazil .......................................................... 663.5 382.2 527.4 El Salvador ................................................ 462.0 378.5 399.9 Iran ............................................................. 365.5 377.6 126.3 Jamaica ...................................................... 402.7 335.1 330.6 Haiti ............................................................ 398.2 311.8 401.4 Pakistan ..................................................... 376.5 283.4 312.1 Syria ........................................................... 449.4 278.9 418.0 Trinidad and Tobago ................................. 287.2 272.4 275.3 Chile ........................................................... 504.3 255.6 395.4 New Zealand .............................................. 212.0 225.4 259.4 South Africa ............................................... 342.2 224.7 250.2 Ecuador ...................................................... 265.5 216.2 227.9 Bahamas .................................................... 194.1 214.5 212.2 Nicaragua ................................................... 214.6 213.4 202.4 Jordan ........................................................ 149.0 212.9 169.5 Bangladesh ................................................ 169.6 190.4 224.7 Other Partners ........................................... 5,945.4 3,970.6 4,237.0
World Total 2 .............................................. 115,305.4 96,632.2 108,663.7
1 Fiscal years Oct. 1–Sept. 30. 2 Totals may not add due to rounding. ERS, Market and Trade Economics Divison, (202) 694–5211.
VerDate Aug 31 2005 16:11 Mar 01, 2012 Jkt 000000 PO 00000 Frm 00003 Fmt 1000 Sfmt 1000 H:\SHARED\DAPP\FPU\AGSTAT\MASTER~2\CHAPTR15\XV-03.AG8 USDA
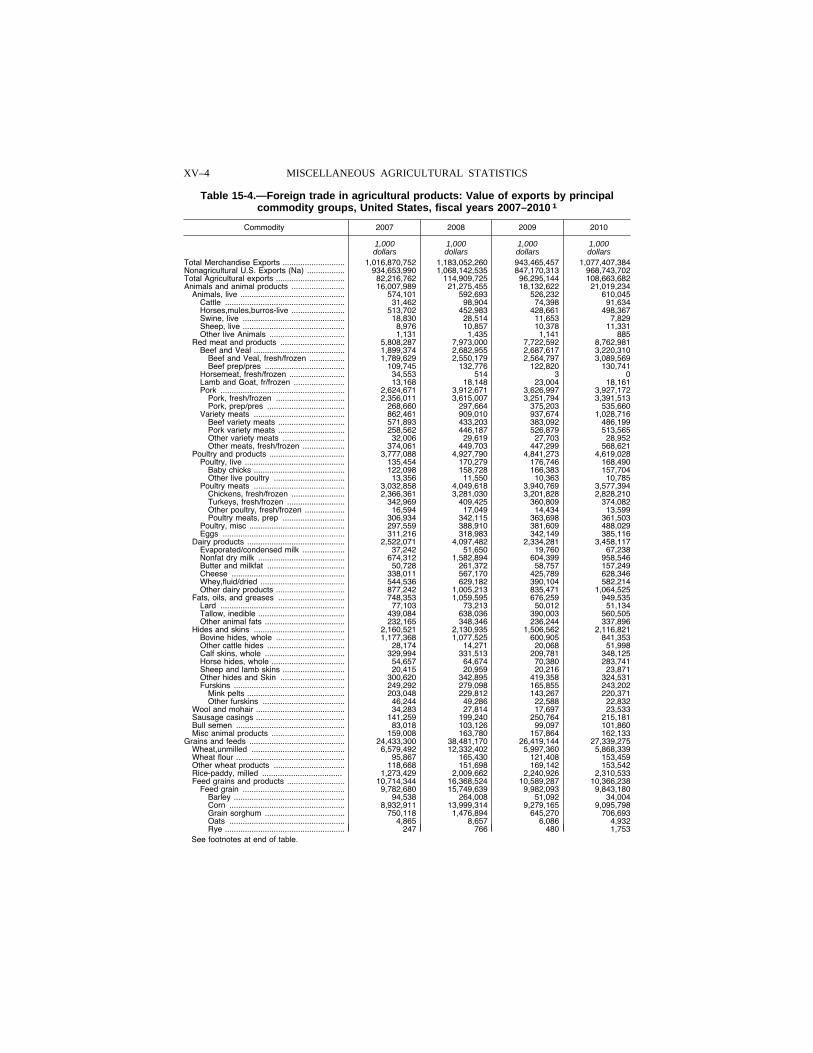
XV–4 MISCELLANEOUS AGRICULTURAL STATISTICS
Table 15-4.—Foreign trade in agricultural products: Value of exports by principal commodity groups, United States, fiscal years 2007–2010 1
Commodity 2007 2008 2009 2010
1,000 1,000 1,000 1,000 dollars dollars dollars dollars
Total Merchandise Exports ............................ 1,016,870,752 1,183,052,260 943,465,457 1,077,407,384 Nonagricultural U.S. Exports (Na) ................. 934,653,990 1,068,142,535 847,170,313 968,743,702 Total Agricultural exports ............................... 82,216,762 114,909,725 96,295,144 108,663,682 Animals and animal products ........................ 16,007,989 21,275,455 18,132,622 21,019,234
Animals, live ............................................... 574,101 592,693 526,232 610,045 Cattle ...................................................... 31,462 98,904 74,398 91,634 Horses,mules,burros-live ........................ 513,702 452,983 428,661 498,367 Swine, live .............................................. 18,830 28,514 11,653 7,829 Sheep, live .............................................. 8,976 10,857 10,378 11,331 Other live Animals .................................. 1,131 1,435 1,141 885
Red meat and products ............................. 5,808,287 7,973,000 7,722,592 8,762,981 Beef and Veal ......................................... 1,899,374 2,682,955 2,687,617 3,220,310
Beef and Veal, fresh/frozen ................ 1,789,629 2,550,179 2,564,797 3,089,569 Beef prep/pres .................................... 109,745 132,776 122,820 130,741
Horsemeat, fresh/frozen ......................... 34,553 514 3 0 Lamb and Goat, fr/frozen ....................... 13,168 18,148 23,004 18,161 Pork ........................................................ 2,624,671 3,912,671 3,626,997 3,927,172
Pork, fresh/frozen ............................... 2,356,011 3,615,007 3,251,794 3,391,513 Pork, prep/pres ................................... 268,660 297,664 375,203 535,660
Variety meats ......................................... 862,461 909,010 937,674 1,028,716 Beef variety meats .............................. 571,893 433,203 383,092 486,199 Pork variety meats .............................. 258,562 446,187 526,879 513,565 Other variety meats ............................ 32,006 29,619 27,703 28,952 Other meats, fresh/frozen ................... 374,061 449,703 447,299 568,621
Poultry and products .................................. 3,777,088 4,927,790 4,841,273 4,619,028 Poultry, live ............................................. 135,454 170,279 176,746 168,490
Baby chicks ......................................... 122,098 158,728 166,383 157,704 Other live poultry ................................ 13,356 11,550 10,363 10,785
Poultry meats ......................................... 3,032,858 4,049,618 3,940,769 3,577,394 Chickens, fresh/frozen ........................ 2,366,361 3,281,030 3,201,828 2,828,210 Turkeys, fresh/frozen .......................... 342,969 409,425 360,809 374,082 Other poultry, fresh/frozen .................. 16,594 17,049 14,434 13,599 Poultry meats, prep ............................ 306,934 342,115 363,698 361,503
Poultry, misc ........................................... 297,559 388,910 381,609 488,029 Eggs ....................................................... 311,216 318,983 342,149 385,116
Dairy products ............................................ 2,522,071 4,097,482 2,334,281 3,458,117 Evaporated/condensed milk ................... 37,242 51,650 19,760 67,238 Nonfat dry milk ....................................... 674,312 1,582,894 604,399 958,546 Butter and milkfat ................................... 50,728 261,372 58,757 157,249 Cheese ................................................... 338,011 567,170 425,789 628,346 Whey,fluid/dried ...................................... 544,536 629,182 390,104 582,214 Other dairy products ............................... 877,242 1,005,213 835,471 1,064,525
Fats, oils, and greases .............................. 748,353 1,059,595 676,259 949,535 Lard ........................................................ 77,103 73,213 50,012 51,134 Tallow, inedible ....................................... 439,084 638,036 390,003 560,505 Other animal fats .................................... 232,165 348,346 236,244 337,896
Hides and skins ......................................... 2,160,521 2,130,935 1,506,562 2,116,821 Bovine hides, whole ............................... 1,177,368 1,077,525 600,905 841,353 Other cattle hides ................................... 28,174 14,271 20,068 51,998 Calf skins, whole .................................... 329,994 331,513 209,781 348,125 Horse hides, whole ................................. 54,657 64,674 70,380 283,741 Sheep and lamb skins ............................ 20,415 20,959 20,216 23,871 Other hides and Skin ............................. 300,620 342,895 419,358 324,531 Furskins .................................................. 249,292 279,098 165,855 243,202
Mink pelts ............................................ 203,048 229,812 143,267 220,371 Other furskins ..................................... 46,244 49,286 22,588 22,832
Wool and mohair ........................................ 34,283 27,814 17,697 23,533 Sausage casings ........................................ 141,259 199,240 250,764 215,181 Bull semen ................................................. 83,018 103,126 99,097 101,860 Misc animal products ................................. 159,008 163,780 157,864 162,133
Grains and feeds ........................................... 24,433,300 38,481,170 26,419,144 27,339,275 Wheat,unmilled .......................................... 6,579,492 12,332,402 5,997,360 5,868,339 Wheat flour ................................................. 95,867 165,430 121,408 153,459 Other wheat products ................................ 118,668 151,698 169,142 153,542 Rice-paddy, milled .................................... 1,273,429 2,009,662 2,240,926 2,310,533 Feed grains and products .......................... 10,714,344 16,368,524 10,589,287 10,366,238
Feed grain .............................................. 9,782,680 15,749,639 9,982,093 9,843,180 Barley .................................................. 94,538 264,008 51,092 34,004 Corn .................................................... 8,932,911 13,999,314 9,279,165 9,095,798 Grain sorghum .................................... 750,118 1,476,894 645,270 706,693 Oats .................................................... 4,865 8,657 6,086 4,932 Rye ...................................................... 247 766 480 1,753
See footnotes at end of table.
VerDate Aug 31 2005 16:11 Mar 01, 2012 Jkt 000000 PO 00000 Frm 00004 Fmt 1000 Sfmt 1000 H:\SHARED\DAPP\FPU\AGSTAT\MASTER~2\CHAPTR15\XV-04.AG8 USDA
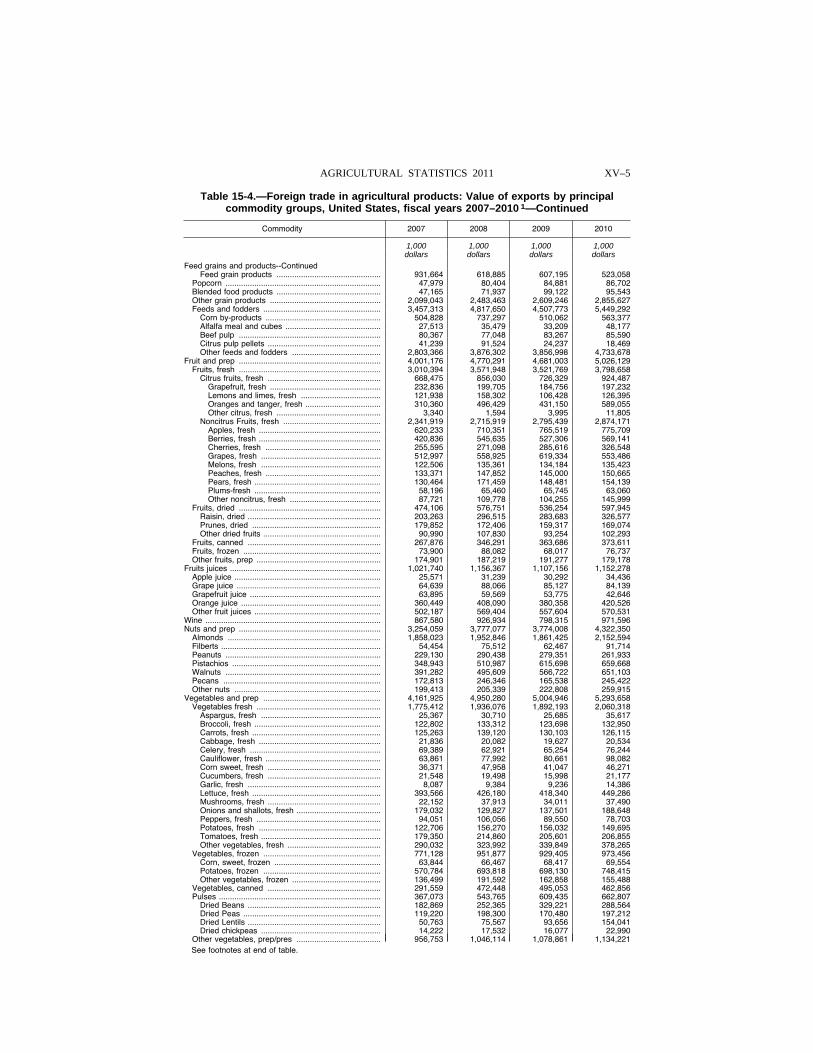
XV–5 AGRICULTURAL STATISTICS 2011
Table 15-4.—Foreign trade in agricultural products: Value of exports by principal commodity groups, United States, fiscal years 2007–2010 1—Continued
Commodity 2007 2008 2009 2010
1,000 1,000 1,000 1,000 dollars dollars dollars dollars
Feed grains and products--Continued Feed grain products ............................................... 931,664 618,885 607,195 523,058
Popcorn ...................................................................... 47,979 80,404 84,881 86,702 Blended food products ............................................... 47,165 71,937 99,122 95,543 Other grain products .................................................. 2,099,043 2,483,463 2,609,246 2,855,627 Feeds and fodders ..................................................... 3,457,313 4,817,650 4,507,773 5,449,292
Corn by-products .................................................... 504,828 737,297 510,062 563,377 Alfalfa meal and cubes ........................................... 27,513 35,479 33,209 48,177 Beef pulp ................................................................ 80,367 77,048 83,267 85,590 Citrus pulp pellets ................................................... 41,239 91,524 24,237 18,469 Other feeds and fodders ........................................ 2,803,366 3,876,302 3,856,998 4,733,678
Fruit and prep ................................................................ 4,001,176 4,770,291 4,681,003 5,026,129 Fruits, fresh ................................................................ 3,010,394 3,571,948 3,521,769 3,798,658
Citrus fruits, fresh ................................................... 668,475 856,030 726,329 924,487 Grapefruit, fresh .................................................. 232,836 199,705 184,756 197,232 Lemons and limes, fresh .................................... 121,938 158,302 106,428 126,395 Oranges and tanger, fresh .................................. 310,360 496,429 431,150 589,055 Other citrus, fresh ............................................... 3,340 1,594 3,995 11,805
Noncitrus Fruits, fresh ............................................ 2,341,919 2,715,919 2,795,439 2,874,171 Apples, fresh ....................................................... 620,233 710,351 765,519 775,709 Berries, fresh ....................................................... 420,836 545,635 527,306 569,141 Cherries, fresh .................................................... 255,595 271,098 285,616 326,548 Grapes, fresh ...................................................... 512,997 558,925 619,334 553,486 Melons, fresh ...................................................... 122,506 135,361 134,184 135,423 Peaches, fresh .................................................... 133,371 147,852 145,000 150,665 Pears, fresh ......................................................... 130,464 171,459 148,481 154,139 Plums-fresh ......................................................... 58,196 65,460 65,745 63,060 Other noncitrus, fresh ......................................... 87,721 109,778 104,255 145,999
Fruits, dried ................................................................ 474,106 576,751 536,254 597,945 Raisin, dried ............................................................ 203,263 296,515 283,683 326,577 Prunes, dried .......................................................... 179,852 172,406 159,317 169,074 Other dried fruits ..................................................... 90,990 107,830 93,254 102,293
Fruits, canned ............................................................ 267,876 346,291 363,686 373,611 Fruits, frozen .............................................................. 73,900 88,082 68,017 76,737 Other fruits, prep ........................................................ 174,901 187,219 191,277 179,178
Fruits juices .................................................................... 1,021,740 1,156,367 1,107,156 1,152,278 Apple juice .................................................................. 25,571 31,239 30,292 34,436 Grape juice ................................................................. 64,639 88,066 85,127 84,139 Grapefruit juice ........................................................... 63,895 59,569 53,775 42,646 Orange juice ............................................................... 360,449 408,090 380,358 420,526 Other fruit juices ......................................................... 502,187 569,404 557,604 570,531
Wine ............................................................................... 867,580 926,934 798,315 971,596 Nuts and prep ................................................................ 3,254,059 3,777,077 3,774,008 4,322,350
Almonds ..................................................................... 1,858,023 1,952,846 1,861,425 2,152,594 Filberts ........................................................................ 54,454 75,512 62,467 91,714 Peanuts ...................................................................... 229,130 290,438 279,351 261,933 Pistachios ................................................................... 348,943 510,987 615,698 659,668 Walnuts ...................................................................... 391,282 495,609 566,722 651,103 Pecans ....................................................................... 172,813 246,346 165,538 245,422 Other nuts .................................................................. 199,413 205,339 222,808 259,915
Vegetables and prep ..................................................... 4,161,925 4,950,280 5,004,946 5,293,658 Vegetables fresh ........................................................ 1,775,412 1,936,076 1,892,193 2,060,318
Aspargus, fresh ...................................................... 25,367 30,710 25,685 35,617 Broccoli, fresh ......................................................... 122,802 133,312 123,698 132,950 Carrots, fresh .......................................................... 125,263 139,120 130,103 126,115 Cabbage, fresh ....................................................... 21,836 20,082 19,627 20,534 Celery, fresh ........................................................... 69,389 62,921 65,254 76,244 Cauliflower, fresh .................................................... 63,861 77,992 80,661 98,082 Corn sweet, fresh ................................................... 36,371 47,958 41,047 46,271 Cucumbers, fresh ................................................... 21,548 19,498 15,998 21,177 Garlic, fresh ............................................................ 8,087 9,384 9,236 14,386 Lettuce, fresh .......................................................... 393,566 426,180 418,340 449,286 Mushrooms, fresh ................................................... 22,152 37,913 34,011 37,490 Onions and shallots, fresh ...................................... 179,032 129,827 137,501 188,648 Peppers, fresh ........................................................ 94,051 106,056 89,550 78,703 Potatoes, fresh ....................................................... 122,706 156,270 156,032 149,695 Tomatoes, fresh ...................................................... 179,350 214,860 205,601 206,855 Other vegetables, fresh .......................................... 290,032 323,992 339,849 378,265
Vegetables, frozen ..................................................... 771,128 951,877 929,405 973,456 Corn, sweet, frozen ................................................ 63,844 66,467 68,417 69,554 Potatoes, frozen ..................................................... 570,784 693,818 698,130 748,415 Other vegetables, frozen ........................................ 136,499 191,592 162,858 155,488
Vegetables, canned ................................................... 291,559 472,448 495,053 462,856 Pulses ......................................................................... 367,073 543,765 609,435 662,807
Dried Beans ............................................................ 182,869 252,365 329,221 288,564 Dried Peas .............................................................. 119,220 198,300 170,480 197,212 Dried Lentils ............................................................ 50,763 75,567 93,656 154,041 Dried chickpeas ...................................................... 14,222 17,532 16,077 22,990
Other vegetables, prep/pres ...................................... 956,753 1,046,114 1,078,861 1,134,221 See footnotes at end of table.
VerDate Aug 31 2005 16:11 Mar 01, 2012 Jkt 000000 PO 00000 Frm 00005 Fmt 1000 Sfmt 1000 H:\SHARED\DAPP\FPU\AGSTAT\MASTER~2\CHAPTR15\XV-05.AG8 USDA
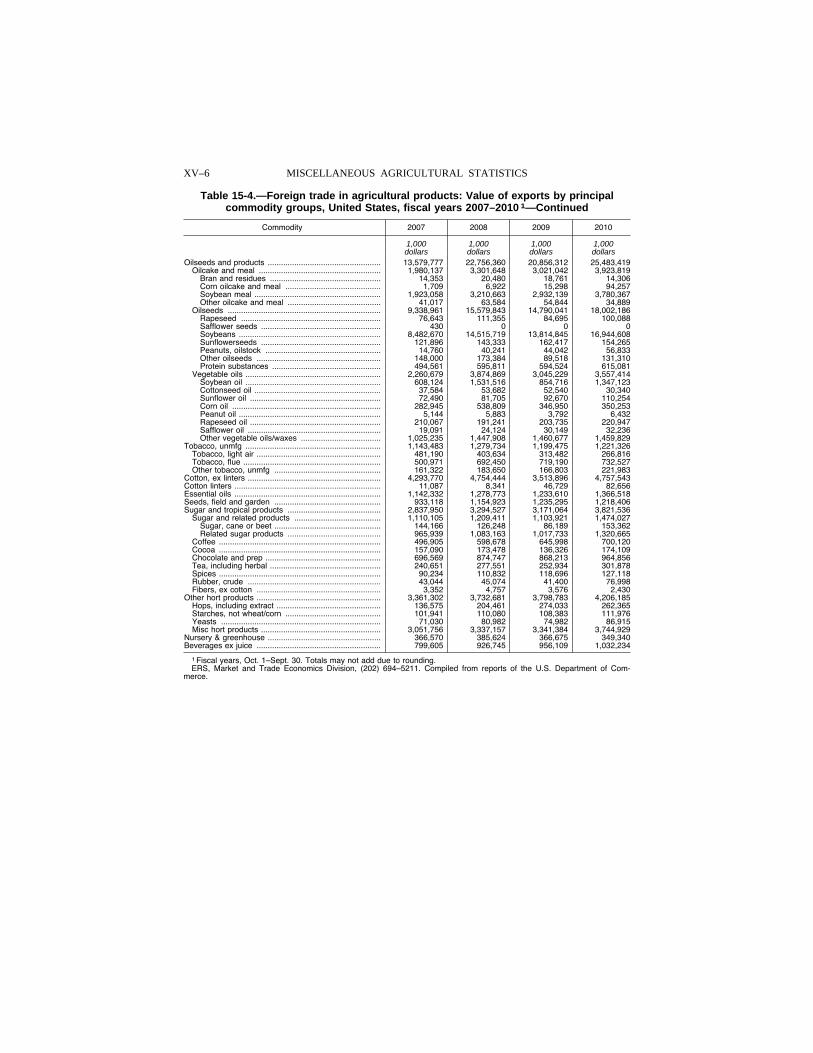
XV–6 MISCELLANEOUS AGRICULTURAL STATISTICS
Table 15-4.—Foreign trade in agricultural products: Value of exports by principal commodity groups, United States, fiscal years 2007–2010 1—Continued
Commodity 2007 2008 2009 2010
1,000 1,000 1,000 1,000 dollars dollars dollars dollars
Oilseeds and products ................................................... 13,579,777 22,756,360 20,856,312 25,483,419 Oilcake and meal ....................................................... 1,980,137 3,301,648 3,021,042 3,923,819
Bran and residues .................................................. 14,353 20,480 18,761 14,306 Corn oilcake and meal ........................................... 1,709 6,922 15,298 94,257 Soybean meal ......................................................... 1,923,058 3,210,663 2,932,139 3,780,367 Other oilcake and meal .......................................... 41,017 63,584 54,844 34,889
Oilseeds ..................................................................... 9,338,961 15,579,843 14,790,041 18,002,186 Rapeseed ............................................................... 76,643 111,355 84,695 100,088 Safflower seeds ...................................................... 430 0 0 0 Soybeans ................................................................ 8,482,670 14,515,719 13,814,845 16,944,608 Sunflowerseeds ...................................................... 121,896 143,333 162,417 154,265 Peanuts, oilstock .................................................... 14,760 40,241 44,042 56,833 Other oilseeds ........................................................ 148,000 173,384 89,518 131,310 Protein substances ................................................. 494,561 595,811 594,524 615,081
Vegetable oils ............................................................. 2,260,679 3,874,869 3,045,229 3,557,414 Soybean oil ............................................................. 608,124 1,531,516 854,716 1,347,123 Cottonseed oil ......................................................... 37,584 53,682 52,540 30,340 Sunflower oil ........................................................... 72,490 81,705 92,670 110,254 Corn oil ................................................................... 282,945 538,809 346,950 350,253 Peanut oil ................................................................ 5,144 5,883 3,792 6,432 Rapeseed oil ........................................................... 210,067 191,241 203,735 220,947 Safflower oil ............................................................ 19,091 24,124 30,149 32,236 Other vegetable oils/waxes .................................... 1,025,235 1,447,908 1,460,677 1,459,829
Tobacco, unmfg ............................................................. 1,143,483 1,279,734 1,199,475 1,221,326 Tobacco, light air ........................................................ 481,190 403,634 313,482 266,816 Tobacco, flue .............................................................. 500,971 692,450 719,190 732,527 Other tobacco, unmfg ................................................ 161,322 183,650 166,803 221,983
Cotton, ex linters ............................................................ 4,293,770 4,754,444 3,513,896 4,757,543 Cotton linters .................................................................. 11,087 8,341 46,729 82,656 Essential oils .................................................................. 1,142,332 1,278,773 1,233,610 1,366,518 Seeds, field and garden ................................................ 933,118 1,154,923 1,235,295 1,218,406 Sugar and tropical products .......................................... 2,837,950 3,294,527 3,171,064 3,821,536
Sugar and related products ....................................... 1,110,105 1,209,411 1,103,921 1,474,027 Sugar, cane or beet ................................................ 144,166 126,248 86,189 153,362 Related sugar products .......................................... 965,939 1,083,163 1,017,733 1,320,665
Coffee ......................................................................... 496,905 598,678 645,998 700,120 Cocoa ......................................................................... 157,090 173,478 136,326 174,109 Chocolate and prep .................................................... 696,569 874,747 868,213 964,856 Tea, including herbal .................................................. 240,651 277,551 252,934 301,878 Spices ......................................................................... 90,234 110,832 118,696 127,118 Rubber, crude ............................................................ 43,044 45,074 41,400 76,998 Fibers, ex cotton ........................................................ 3,352 4,757 3,576 2,430
Other hort products ........................................................ 3,361,302 3,732,681 3,798,783 4,206,185 Hops, including extract ............................................... 136,575 204,461 274,033 262,365 Starches, not wheat/corn ........................................... 101,941 110,080 108,383 111,976 Yeasts ........................................................................ 71,030 80,982 74,982 86,915 Misc hort products ...................................................... 3,051,756 3,337,157 3,341,384 3,744,929
Nursery & greenhouse ................................................... 366,570 385,624 366,675 349,340 Beverages ex juice ........................................................ 799,605 926,745 956,109 1,032,234
1 Fiscal years, Oct. 1–Sept. 30. Totals may not add due to rounding. ERS, Market and Trade Economics Division, (202) 694–5211. Compiled from reports of the U.S. Department of Com-
merce.
VerDate Aug 31 2005 16:11 Mar 01, 2012 Jkt 000000 PO 00000 Frm 00006 Fmt 1000 Sfmt 1000 H:\SHARED\DAPP\FPU\AGSTAT\MASTER~2\CHAPTR15\XV-06.AG8 USDA
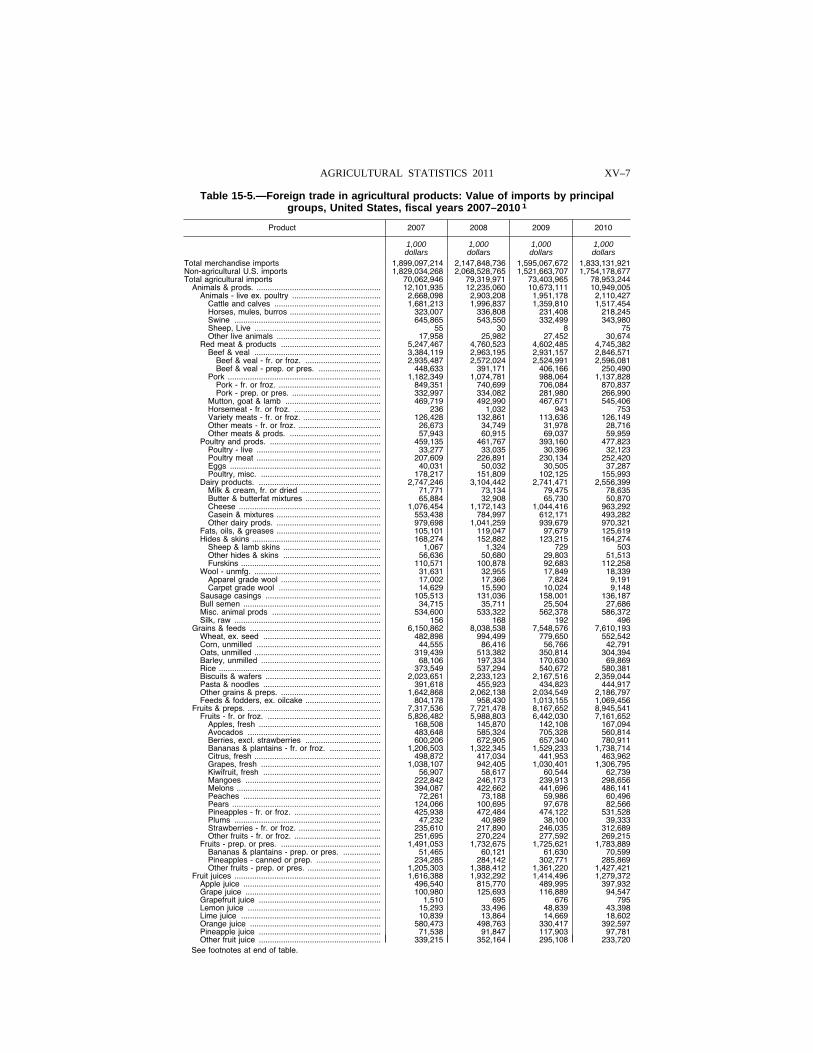
XV–7 AGRICULTURAL STATISTICS 2011
Table 15-5.—Foreign trade in agricultural products: Value of imports by principal groups, United States, fiscal years 2007–2010 1
Product 2007 2008 2009 2010
1,000 1,000 1,000 1,000 dollars dollars dollars dollars
Total merchandise imports 1,899,097,214 2,147,848,736 1,595,067,672 1,833,131,921 Non-agricultural U.S. imports 1,829,034,268 2,068,528,765 1,521,663,707 1,754,178,677 Total agricultural imports 70,062,946 79,319,971 73,403,965 78,953,244
Animals & prods. ........................................................ 12,101,935 12,235,060 10,673,111 10,949,005 Animals - live ex. poultry ........................................ 2,668,098 2,903,208 1,951,178 2,110,427
Cattle and calves ................................................ 1,681,213 1,996,837 1,359,810 1,517,454 Horses, mules, burros ......................................... 323,007 336,808 231,408 218,245 Swine .................................................................. 645,865 543,550 332,499 343,980 Sheep, Live ......................................................... 55 30 8 75 Other live animals ............................................... 17,958 25,982 27,452 30,674
Red meat & products ............................................. 5,247,467 4,760,523 4,602,485 4,745,382 Beef & veal ......................................................... 3,384,119 2,963,195 2,931,157 2,846,571
Beef & veal - fr. or froz. .................................. 2,935,487 2,572,024 2,524,991 2,596,081 Beef & veal - prep. or pres. ............................ 448,633 391,171 406,166 250,490
Pork ..................................................................... 1,182,349 1,074,781 988,064 1,137,828 Pork - fr. or froz. .............................................. 849,351 740,699 706,084 870,837 Pork - prep. or pres. ........................................ 332,997 334,082 281,980 266,990
Mutton, goat & lamb ........................................... 469,719 492,990 467,671 545,406 Horsemeat - fr. or froz. ....................................... 236 1,032 943 753 Variety meats - fr. or froz. ................................... 126,428 132,861 113,636 126,149 Other meats - fr. or froz. ..................................... 26,673 34,749 31,978 28,716 Other meats & prods. ......................................... 57,943 60,915 69,037 59,959
Poultry and prods. .................................................. 459,135 461,767 393,160 477,823 Poultry - live ........................................................ 33,277 33,035 30,396 32,123 Poultry meat ........................................................ 207,609 226,891 230,134 252,420 Eggs .................................................................... 40,031 50,032 30,505 37,287 Poultry, misc. ...................................................... 178,217 151,809 102,125 155,993
Dairy products. ....................................................... 2,747,246 3,104,442 2,741,471 2,556,399 Milk & cream, fr. or dried .................................... 71,771 73,134 79,475 78,635 Butter & butterfat mixtures .................................. 65,884 32,908 65,730 50,870 Cheese ................................................................ 1,076,454 1,172,143 1,044,416 963,292 Casein & mixtures ............................................... 553,438 784,997 612,171 493,282 Other dairy prods. ............................................... 979,698 1,041,259 939,679 970,321
Fats, oils, & greases ............................................... 105,101 119,047 97,679 125,619 Hides & skins .......................................................... 168,274 152,882 123,215 164,274
Sheep & lamb skins ............................................ 1,067 1,324 729 503 Other hides & skins ............................................ 56,636 50,680 29,803 51,513 Furskins ............................................................... 110,571 100,878 92,683 112,258
Wool - unmfg. ......................................................... 31,631 32,955 17,849 18,339 Apparel grade wool ............................................. 17,002 17,366 7,824 9,191 Carpet grade wool .............................................. 14,629 15,590 10,024 9,148
Sausage casings .................................................... 105,513 131,036 158,001 136,187 Bull semen .............................................................. 34,715 35,711 25,504 27,686 Misc. animal prods ................................................. 534,600 533,322 562,378 586,372 Silk, raw .................................................................. 156 168 192 496
Grains & feeds ........................................................... 6,150,862 8,038,538 7,548,576 7,610,193 Wheat, ex. seed ..................................................... 482,898 994,499 779,650 552,542 Corn, unmilled ........................................................ 44,555 86,416 56,766 42,791 Oats, unmilled ......................................................... 319,439 513,382 350,814 304,394 Barley, unmilled ...................................................... 68,106 197,334 170,630 69,869 Rice ......................................................................... 373,549 537,294 540,672 580,381 Biscuits & wafers .................................................... 2,023,651 2,233,123 2,167,516 2,359,044 Pasta & noodles ..................................................... 391,618 455,923 434,823 444,917 Other grains & preps. ............................................. 1,642,868 2,062,138 2,034,549 2,186,797 Feeds & fodders, ex. oilcake .................................. 804,178 958,430 1,013,155 1,069,456
Fruits & preps. ............................................................ 7,317,536 7,721,478 8,167,652 8,945,541 Fruits - fr. or froz. ................................................... 5,826,482 5,988,803 6,442,030 7,161,652
Apples, fresh ....................................................... 168,508 145,870 142,108 167,094 Avocados ............................................................ 483,648 585,324 705,328 560,814 Berries, excl. strawberries .................................. 600,206 672,905 657,340 780,911 Bananas & plantains - fr. or froz. ....................... 1,206,503 1,322,345 1,529,233 1,738,714 Citrus, fresh ......................................................... 498,872 417,034 441,953 463,962 Grapes, fresh ...................................................... 1,038,107 942,405 1,030,401 1,306,795 Kiwifruit, fresh ..................................................... 56,907 58,617 60,544 62,739 Mangoes ............................................................. 222,842 246,173 239,913 298,656 Melons ................................................................. 394,087 422,662 441,696 486,141 Peaches .............................................................. 72,261 73,188 59,986 60,496 Pears ................................................................... 124,066 100,695 97,678 82,566 Pineapples - fr. or froz. ....................................... 425,938 472,484 474,122 531,528 Plums .................................................................. 47,232 40,989 38,100 39,333 Strawberries - fr. or froz. ..................................... 235,610 217,890 246,035 312,689 Other fruits - fr. or froz. ....................................... 251,695 270,224 277,592 269,215
Fruits - prep. or pres. ............................................. 1,491,053 1,732,675 1,725,621 1,783,889 Bananas & plantains - prep. or pres. ................. 51,465 60,121 61,630 70,599 Pineapples - canned or prep. ............................. 234,285 284,142 302,771 285,869 Other fruits - prep. or pres. ................................. 1,205,303 1,388,412 1,361,220 1,427,421
Fruit juices .................................................................. 1,616,388 1,932,292 1,414,496 1,279,372 Apple juice .............................................................. 496,540 815,770 489,995 397,932 Grape juice ............................................................. 100,980 125,693 116,889 94,547 Grapefruit juice ....................................................... 1,510 695 676 795 Lemon juice ............................................................ 15,293 33,496 48,839 43,398 Lime juice ............................................................... 10,839 13,864 14,669 18,602 Orange juice ........................................................... 580,473 498,763 330,417 392,597 Pineapple juice ....................................................... 71,538 91,847 117,903 97,781 Other fruit juice ....................................................... 339,215 352,164 295,108 233,720
See footnotes at end of table.
VerDate Aug 31 2005 16:11 Mar 01, 2012 Jkt 000000 PO 00000 Frm 00007 Fmt 1000 Sfmt 1000 H:\SHARED\DAPP\FPU\AGSTAT\MASTER~2\CHAPTR15\XV-07.AG8 USDA
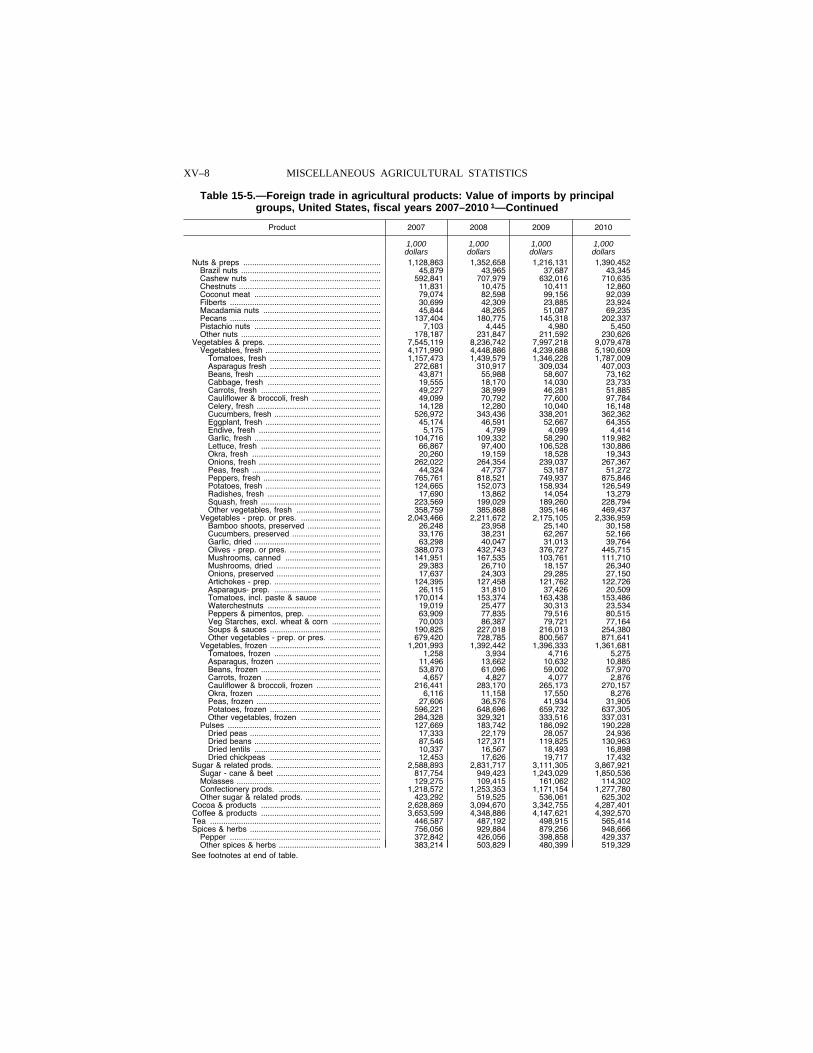
XV–8 MISCELLANEOUS AGRICULTURAL STATISTICS
Table 15-5.—Foreign trade in agricultural products: Value of imports by principal groups, United States, fiscal years 2007–2010 1—Continued
Product 2007 2008 2009 2010
1,000 1,000 1,000 1,000 dollars dollars dollars dollars
Nuts & preps .............................................................. 1,128,863 1,352,658 1,216,131 1,390,452 Brazil nuts ............................................................... 45,879 43,965 37,687 43,345 Cashew nuts ........................................................... 592,841 707,979 632,016 710,635 Chestnuts ................................................................ 11,831 10,475 10,411 12,860 Coconut meat ......................................................... 79,074 82,598 99,156 92,039 Filberts .................................................................... 30,699 42,309 23,885 23,924 Macadamia nuts ..................................................... 45,844 48,265 51,087 69,235 Pecans .................................................................... 137,404 180,775 145,318 202,337 Pistachio nuts ......................................................... 7,103 4,445 4,980 5,450 Other nuts ............................................................... 178,187 231,847 211,592 230,626
Vegetables & preps. ................................................... 7,545,119 8,236,742 7,997,218 9,079,478 Vegetables, fresh .................................................... 4,171,990 4,448,886 4,239,688 5,190,609
Tomatoes, fresh .................................................. 1,157,473 1,439,579 1,346,228 1,787,009 Asparagus fresh .................................................. 272,681 310,917 309,034 407,003 Beans, fresh ........................................................ 43,871 55,988 58,607 73,162 Cabbage, fresh ................................................... 19,555 18,170 14,030 23,733 Carrots, fresh ...................................................... 49,227 38,999 46,281 51,885 Cauliflower & broccoli, fresh ............................... 49,099 70,792 77,600 97,784 Celery, fresh ........................................................ 14,128 12,280 10,040 16,148 Cucumbers, fresh ................................................ 526,972 343,436 338,201 362,362 Eggplant, fresh .................................................... 45,174 46,591 52,667 64,355 Endive, fresh ....................................................... 5,175 4,799 4,099 4,414 Garlic, fresh ......................................................... 104,716 109,332 58,290 119,982 Lettuce, fresh ...................................................... 66,867 97,400 106,528 130,886 Okra, fresh .......................................................... 20,260 19,159 18,528 19,343 Onions, fresh ....................................................... 262,022 264,354 239,037 267,367 Peas, fresh .......................................................... 44,324 47,737 53,187 51,272 Peppers, fresh ..................................................... 765,761 818,521 749,937 875,846 Potatoes, fresh .................................................... 124,665 152,073 158,934 126,549 Radishes, fresh ................................................... 17,690 13,862 14,054 13,279 Squash, fresh ...................................................... 223,569 199,029 189,260 228,794 Other vegetables, fresh ...................................... 358,759 385,868 395,146 469,437
Vegetables - prep. or pres. .................................... 2,043,466 2,211,672 2,175,105 2,336,959 Bamboo shoots, preserved ................................. 26,248 23,958 25,140 30,158 Cucumbers, preserved ........................................ 33,176 38,231 62,267 52,166 Garlic, dried ......................................................... 63,298 40,047 31,013 39,764 Olives - prep. or pres. ......................................... 388,073 432,743 376,727 445,715 Mushrooms, canned ........................................... 141,951 167,535 103,761 111,710 Mushrooms, dried ............................................... 29,383 26,710 18,157 26,340 Onions, preserved ............................................... 17,637 24,303 29,285 27,150 Artichokes - prep. ................................................ 124,395 127,458 121,762 122,726 Asparagus- prep. ................................................ 26,115 31,810 37,426 20,509 Tomatoes, incl. paste & sauce ........................... 170,014 153,374 163,438 153,486 Waterchestnuts ................................................... 19,019 25,477 30,313 23,534 Peppers & pimentos, prep. ................................. 63,909 77,835 79,516 80,515 Veg Starches, excl. wheat & corn ...................... 70,003 86,387 79,721 77,164 Soups & sauces .................................................. 190,825 227,018 216,013 254,380 Other vegetables - prep. or pres. ....................... 679,420 728,785 800,567 871,641
Vegetables, frozen .................................................. 1,201,993 1,392,442 1,396,333 1,361,681 Tomatoes, frozen ................................................ 1,258 3,934 4,716 5,275 Asparagus, frozen ............................................... 11,496 13,662 10,632 10,885 Beans, frozen ...................................................... 53,870 61,096 59,002 57,970 Carrots, frozen .................................................... 4,657 4,827 4,077 2,876 Cauliflower & broccoli, frozen ............................. 216,441 283,170 265,173 270,157 Okra, frozen ........................................................ 6,116 11,158 17,550 8,276 Peas, frozen ........................................................ 27,606 36,576 41,934 31,905 Potatoes, frozen .................................................. 596,221 648,696 659,732 637,305 Other vegetables, frozen .................................... 284,328 329,321 333,516 337,031
Pulses ..................................................................... 127,669 183,742 186,092 190,228 Dried peas ........................................................... 17,333 22,179 28,057 24,936 Dried beans ......................................................... 87,546 127,371 119,825 130,963 Dried lentils ......................................................... 10,337 16,567 18,493 16,898 Dried chickpeas .................................................. 12,453 17,626 19,717 17,432
Sugar & related prods. ............................................... 2,588,893 2,831,717 3,111,305 3,867,921 Sugar - cane & beet ............................................... 817,754 949,423 1,243,029 1,850,536 Molasses ................................................................. 129,275 109,415 161,062 114,302 Confectionery prods. .............................................. 1,218,572 1,253,353 1,171,154 1,277,780 Other sugar & related prods. .................................. 423,292 519,525 536,061 625,302
Cocoa & products ...................................................... 2,628,869 3,094,670 3,342,755 4,287,401 Coffee & products ...................................................... 3,653,599 4,348,886 4,147,621 4,392,570 Tea ............................................................................. 446,587 487,192 498,915 565,414 Spices & herbs ........................................................... 756,056 929,884 879,256 948,666
Pepper .................................................................... 372,842 426,056 398,858 429,337 Other spices & herbs .............................................. 383,214 503,829 480,399 519,329
See footnotes at end of table.
VerDate Aug 31 2005 16:11 Mar 01, 2012 Jkt 000000 PO 00000 Frm 00008 Fmt 1000 Sfmt 1000 H:\SHARED\DAPP\FPU\AGSTAT\MASTER~2\CHAPTR15\XV-08.AG8 USDA
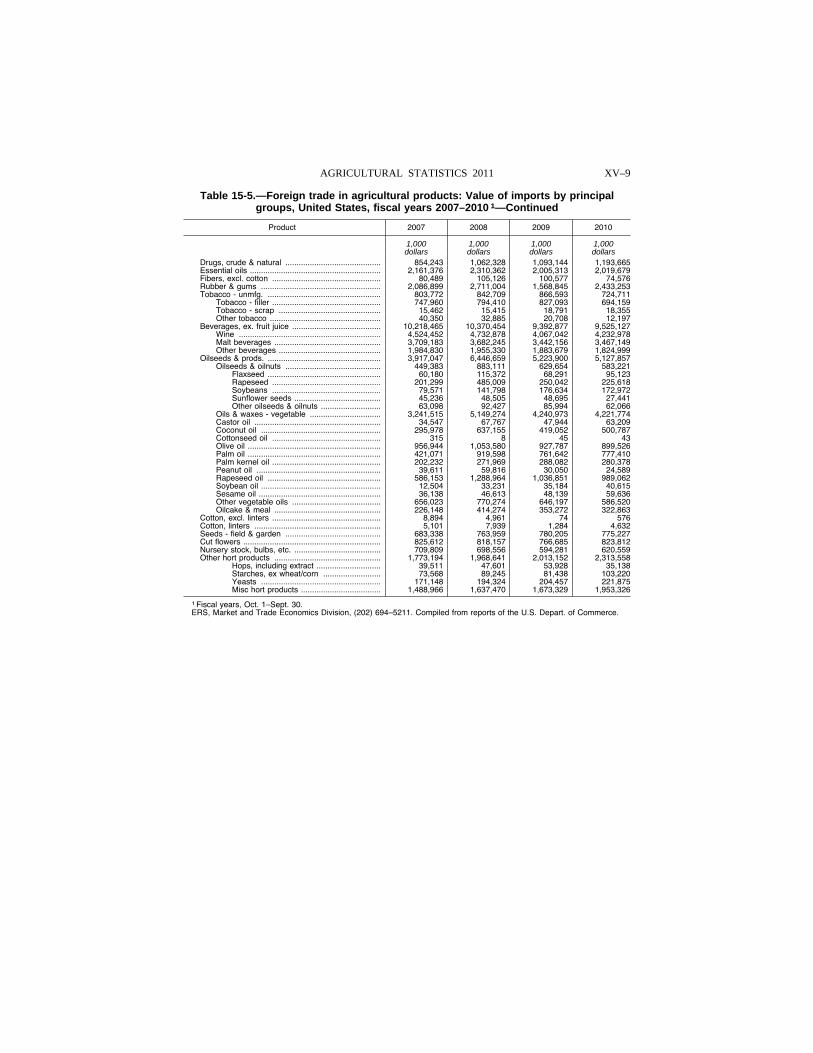
XV–9 AGRICULTURAL STATISTICS 2011
Table 15-5.—Foreign trade in agricultural products: Value of imports by principal groups, United States, fiscal years 2007–2010 1—Continued
Product 2007 2008 2009 2010
1,000 1,000 1,000 1,000 dollars dollars dollars dollars
Drugs, crude & natural ........................................... 854,243 1,062,328 1,093,144 1,193,665 Essential oils ........................................................... 2,161,376 2,310,362 2,005,313 2,019,679 Fibers, excl. cotton ................................................. 80,489 105,126 100,577 74,576 Rubber & gums ...................................................... 2,086,899 2,711,004 1,568,845 2,433,253 Tobacco - unmfg. ................................................... 803,772 842,709 866,593 724,711
Tobacco - filler ................................................. 747,960 794,410 827,093 694,159 Tobacco - scrap .............................................. 15,462 15,415 18,791 18,355 Other tobacco .................................................. 40,350 32,885 20,708 12,197
Beverages, ex. fruit juice ........................................ 10,218,465 10,370,454 9,392,877 9,525,127 Wine ................................................................ 4,524,452 4,732,878 4,067,042 4,232,978 Malt beverages ................................................ 3,709,183 3,682,245 3,442,156 3,467,149 Other beverages .............................................. 1,984,830 1,955,330 1,883,679 1,824,999
Oilseeds & prods. ................................................... 3,917,047 6,446,659 5,223,900 5,127,857 Oilseeds & oilnuts ........................................... 449,383 883,111 629,654 583,221
Flaxseed ................................................... 60,180 115,372 68,291 95,123 Rapeseed ................................................. 201,299 485,009 250,042 225,618 Soybeans ................................................. 79,571 141,798 176,634 172,972 Sunflower seeds ....................................... 45,236 48,505 48,695 27,441 Other oilseeds & oilnuts ........................... 63,098 92,427 85,994 62,066
Oils & waxes - vegetable ................................ 3,241,515 5,149,274 4,240,973 4,221,774 Castor oil ......................................................... 34,547 67,767 47,944 63,209 Coconut oil ...................................................... 295,978 637,155 419,052 500,787 Cottonseed oil ................................................. 315 8 45 43 Olive oil ............................................................ 956,944 1,053,580 927,787 899,526 Palm oil ............................................................ 421,071 919,598 761,642 777,410 Palm kernel oil ................................................. 202,232 271,969 288,082 280,378 Peanut oil ........................................................ 39,611 59,816 30,050 24,589 Rapeseed oil ................................................... 586,153 1,288,964 1,036,851 989,062 Soybean oil ...................................................... 12,504 33,231 35,184 40,615 Sesame oil ....................................................... 36,138 46,613 48,139 59,636 Other vegetable oils ........................................ 656,023 770,274 646,197 586,520 Oilcake & meal ................................................ 226,148 414,274 353,272 322,863
Cotton, excl. linters ................................................. 8,894 4,961 74 576 Cotton, linters ......................................................... 5,101 7,939 1,284 4,632 Seeds - field & garden ........................................... 683,338 763,959 780,205 775,227 Cut flowers .............................................................. 825,612 818,157 766,685 823,812 Nursery stock, bulbs, etc. ....................................... 709,809 698,556 594,281 620,559 Other hort products ................................................ 1,773,194 1,968,641 2,013,152 2,313,558
Hops, including extract ............................. 39,511 47,601 53,928 35,138 Starches, ex wheat/corn .......................... 73,568 89,245 81,438 103,220 Yeasts ...................................................... 171,148 194,324 204,457 221,875 Misc hort products .................................... 1,488,966 1,637,470 1,673,329 1,953,326
1 Fiscal years, Oct. 1–Sept. 30. ERS, Market and Trade Economics Division, (202) 694–5211. Compiled from reports of the U.S. Depart. of Commerce.
VerDate Aug 31 2005 16:11 Mar 01, 2012 Jkt 000000 PO 00000 Frm 00009 Fmt 1000 Sfmt 1000 H:\SHARED\DAPP\FPU\AGSTAT\MASTER~2\CHAPTR15\XV-09.AG8 USDA
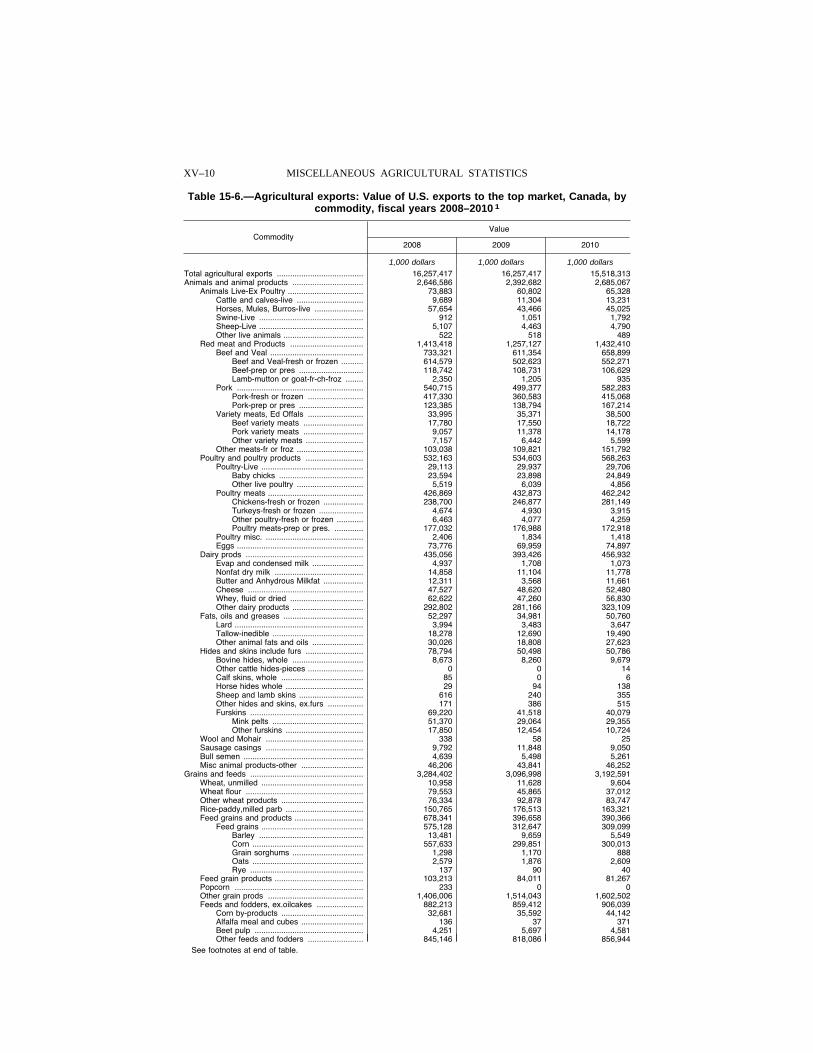
XV–10 MISCELLANEOUS AGRICULTURAL STATISTICS
Table 15-6.—Agricultural exports: Value of U.S. exports to the top market, Canada, by commodity, fiscal years 2008–2010 1
Commodity Value
2008 2009 2010
1,000 dollars 1,000 dollars 1,000 dollars Total agricultural exports ....................................... 16,257,417 16,257,417 15,518,313 Animals and animal products ................................ 2,646,586 2,392,682 2,685,067
Animals Live-Ex Poultry .................................. 73,883 60,802 65,328 Cattle and calves-live .............................. 9,689 11,304 13,231 Horses, Mules, Burros-live ...................... 57,654 43,466 45,025 Swine-Live ............................................... 912 1,051 1,792 Sheep-Live ............................................... 5,107 4,463 4,790 Other live animals .................................... 522 518 489
Red meat and Products ................................. 1,413,418 1,257,127 1,432,410 Beef and Veal .......................................... 733,321 611,354 658,899
Beef and Veal-fresh or frozen .......... 614,579 502,623 552,271 Beef-prep or pres ............................. 118,742 108,731 106,629 Lamb-mutton or goat-fr-ch-froz ........ 2,350 1,205 935
Pork ......................................................... 540,715 499,377 582,283 Pork-fresh or frozen ......................... 417,330 360,583 415,068 Pork-prep or pres ............................. 123,385 138,794 167,214
Variety meats, Ed Offals ......................... 33,995 35,371 38,500 Beef variety meats ........................... 17,780 17,550 18,722 Pork variety meats ........................... 9,057 11,378 14,178 Other variety meats .......................... 7,157 6,442 5,599
Other meats-fr or froz .............................. 103,038 109,821 151,792 Poultry and poultry products .......................... 532,163 534,603 568,263
Poultry-Live .............................................. 29,113 29,937 29,706 Baby chicks ...................................... 23,594 23,898 24,849 Other live poultry .............................. 5,519 6,039 4,856
Poultry meats ........................................... 426,869 432,873 462,242 Chickens-fresh or frozen .................. 238,700 246,877 281,149 Turkeys-fresh or frozen .................... 4,674 4,930 3,915 Other poultry-fresh or frozen ............ 6,463 4,077 4,259 Poultry meats-prep or pres. ............. 177,032 176,988 172,918
Poultry misc. ............................................ 2,406 1,834 1,418 Eggs ......................................................... 73,776 69,959 74,897
Dairy prods ..................................................... 435,056 393,426 456,932 Evap and condensed milk ....................... 4,937 1,708 1,073 Nonfat dry milk ........................................ 14,858 11,104 11,778 Butter and Anhydrous Milkfat .................. 12,311 3,568 11,661 Cheese .................................................... 47,527 48,620 52,480 Whey, fluid or dried ................................. 62,622 47,260 56,830 Other dairy products ................................ 292,802 281,166 323,109
Fats, oils and greases .................................... 52,297 34,981 50,760 Lard .......................................................... 3,994 3,483 3,647 Tallow-inedible ......................................... 18,278 12,690 19,490 Other animal fats and oils ....................... 30,026 18,808 27,623
Hides and skins include furs .......................... 78,794 50,498 50,786 Bovine hides, whole ................................ 8,673 8,260 9,679 Other cattle hides-pieces ......................... 0 0 14 Calf skins, whole ..................................... 85 0 6 Horse hides whole ................................... 29 94 138 Sheep and lamb skins ............................. 616 240 355 Other hides and skins, ex.furs ................ 171 386 515 Furskins ................................................... 69,220 41,518 40,079
Mink pelts ......................................... 51,370 29,064 29,355 Other furskins ................................... 17,850 12,454 10,724
Wool and Mohair ............................................ 338 58 25 Sausage casings ............................................ 9,792 11,848 9,050 Bull semen ...................................................... 4,639 5,498 5,261 Misc animal products-other ............................ 46,206 43,841 46,252
Grains and feeds ................................................... 3,284,402 3,096,998 3,192,591 Wheat, unmilled .............................................. 10,958 11,628 9,604 Wheat flour ..................................................... 79,553 45,865 37,012 Other wheat products ..................................... 76,334 92,878 83,747 Rice-paddy,milled parb ................................... 150,765 176,513 163,321 Feed grains and products ............................... 678,341 396,658 390,366
Feed grains .............................................. 575,128 312,647 309,099 Barley ............................................... 13,481 9,659 5,549 Corn .................................................. 557,633 299,851 300,013 Grain sorghums ................................ 1,298 1,170 888 Oats .................................................. 2,579 1,876 2,609 Rye ................................................... 137 90 40
Feed grain products ........................................ 103,213 84,011 81,267 Popcorn .......................................................... 233 0 0 Other grain prods ........................................... 1,406,006 1,514,043 1,602,502 Feeds and fodders, ex.oilcakes ..................... 882,213 859,412 906,039
Corn by-products ..................................... 32,681 35,592 44,142 Alfalfa meal and cubes ............................ 136 37 371 Beet pulp ................................................. 4,251 5,697 4,581 Other feeds and fodders ......................... 845,146 818,086 856,944
See footnotes at end of table.
VerDate Aug 31 2005 16:11 Mar 01, 2012 Jkt 000000 PO 00000 Frm 00010 Fmt 1000 Sfmt 1000 H:\SHARED\DAPP\FPU\AGSTAT\MASTER~2\CHAPTR15\XV-10.AG8 USDA
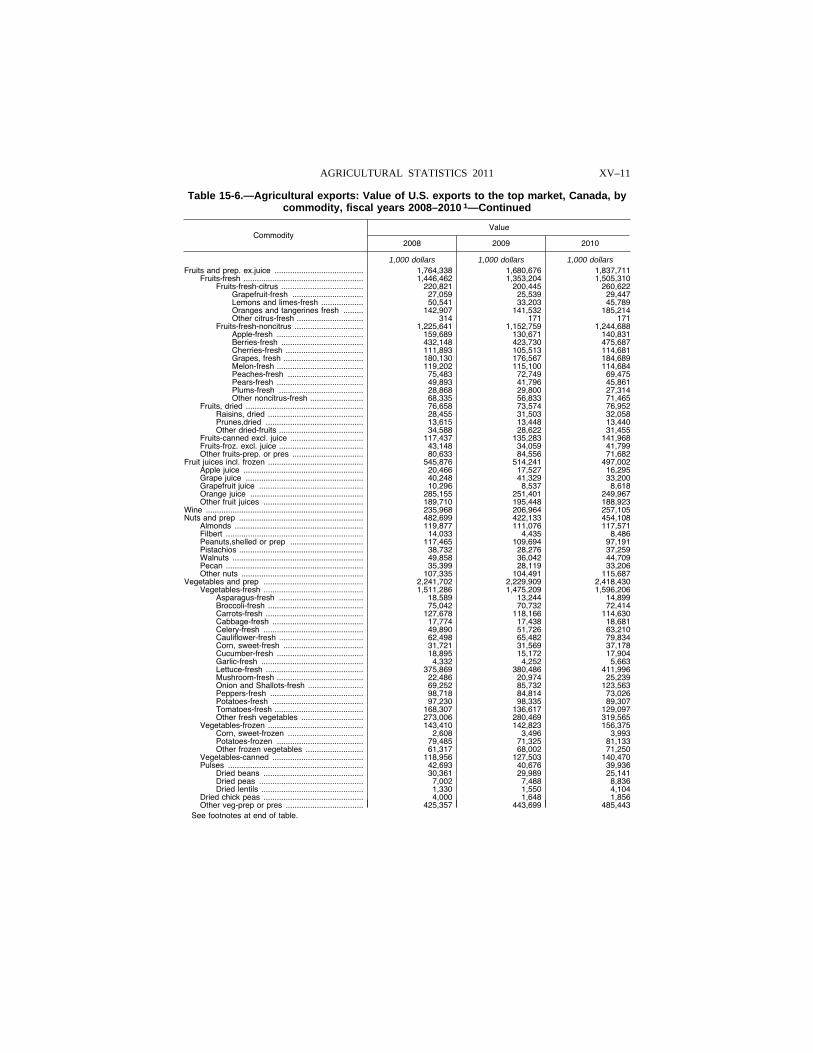
XV–11 AGRICULTURAL STATISTICS 2011
Table 15-6.—Agricultural exports: Value of U.S. exports to the top market, Canada, by commodity, fiscal years 2008–2010 1—Continued
Commodity Value
2008 2009 2010
1,000 dollars 1,000 dollars 1,000 dollars Fruits and prep. ex.juice ........................................ 1,764,338 1,680,676 1,837,711
Fruits-fresh ...................................................... 1,446,462 1,353,204 1,505,310 Fruits-fresh-citrus ..................................... 220,821 200,445 260,622
Grapefruit-fresh ................................ 27,059 25,539 29,447 Lemons and limes-fresh ................... 50,541 33,203 45,789 Oranges and tangerines fresh ......... 142,907 141,532 185,214 Other citrus-fresh .............................. 314 171 171
Fruits-fresh-noncitrus ............................... 1,225,641 1,152,759 1,244,688 Apple-fresh ....................................... 159,689 130,671 140,831 Berries-fresh ..................................... 432,148 423,730 475,687 Cherries-fresh ................................... 111,893 105,513 114,681 Grapes, fresh .................................... 180,130 176,567 184,689 Melon-fresh ....................................... 119,202 115,100 114,684 Peaches-fresh .................................. 75,483 72,749 69,475 Pears-fresh ....................................... 49,893 41,796 45,861 Plums-fresh ...................................... 28,868 29,800 27,314 Other noncitrus-fresh ........................ 68,335 56,833 71,465
Fruits, dried ..................................................... 76,658 73,574 76,952 Raisins, dried ........................................... 28,455 31,503 32,058 Prunes,dried ............................................ 13,615 13,448 13,440 Other dried-fruits ...................................... 34,588 28,622 31,455
Fruits-canned excl. juice ................................. 117,437 135,283 141,968 Fruits-froz. excl. juice ...................................... 43,148 34,059 41,799 Other fruits-prep. or pres ................................ 80,633 84,556 71,682
Fruit juices incl. frozen ........................................... 545,876 514,241 497,002 Apple juice ...................................................... 20,466 17,527 16,295 Grape juice ..................................................... 40,248 41,329 33,200 Grapefruit juice ............................................... 10,296 8,537 8,618 Orange juice ................................................... 285,155 251,401 249,967 Other fruit juices ............................................. 189,710 195,448 188,923
Wine ....................................................................... 235,968 206,964 257,105 Nuts and prep ........................................................ 482,699 422,133 454,108
Almonds .......................................................... 119,877 111,076 117,571 Filbert .............................................................. 14,033 4,435 8,486 Peanuts,shelled or prep ................................. 117,465 109,694 97,191 Pistachios ........................................................ 38,732 28,276 37,259 Walnuts ........................................................... 49,858 36,042 44,709 Pecan .............................................................. 35,399 28,119 33,206 Other nuts ....................................................... 107,335 104,491 115,687
Vegetables and prep ............................................. 2,241,702 2,229,909 2,418,430 Vegetables-fresh ............................................. 1,511,286 1,475,209 1,596,206
Asparagus-fresh ...................................... 18,589 13,244 14,899 Broccoli-fresh ........................................... 75,042 70,732 72,414 Carrots-fresh ............................................ 127,678 118,166 114,630 Cabbage-fresh ......................................... 17,774 17,438 18,681 Celery-fresh ............................................. 49,890 51,726 63,210 Cauliflower-fresh ...................................... 62,498 65,482 79,834 Corn, sweet-fresh .................................... 31,721 31,569 37,178 Cucumber-fresh ....................................... 18,895 15,172 17,904 Garlic-fresh .............................................. 4,332 4,252 5,663 Lettuce-fresh ............................................ 375,869 380,486 411,996 Mushroom-fresh ....................................... 22,486 20,974 25,239 Onion and Shallots-fresh ......................... 69,252 85,732 123,563 Peppers-fresh .......................................... 98,718 84,814 73,026 Potatoes-fresh ......................................... 97,230 98,335 89,307 Tomatoes-fresh ........................................ 168,307 136,617 129,097 Other fresh vegetables ............................ 273,006 280,469 319,565
Vegetables-frozen ........................................... 143,410 142,823 156,375 Corn, sweet-frozen .................................. 2,608 3,496 3,993 Potatoes-frozen ....................................... 79,485 71,325 81,133 Other frozen vegetables .......................... 61,317 68,002 71,250
Vegetables-canned ......................................... 118,956 127,503 140,470 Pulses ............................................................. 42,693 40,676 39,936
Dried beans ............................................. 30,361 29,989 25,141 Dried peas ............................................... 7,002 7,488 8,836 Dried lentils .............................................. 1,330 1,550 4,104
Dried chick peas ............................................. 4,000 1,648 1,856 Other veg-prep or pres ................................... 425,357 443,699 485,443
See footnotes at end of table.
VerDate Aug 31 2005 16:11 Mar 01, 2012 Jkt 000000 PO 00000 Frm 00011 Fmt 1000 Sfmt 1000 H:\SHARED\DAPP\FPU\AGSTAT\MASTER~2\CHAPTR15\XV-11.AG8 USDA
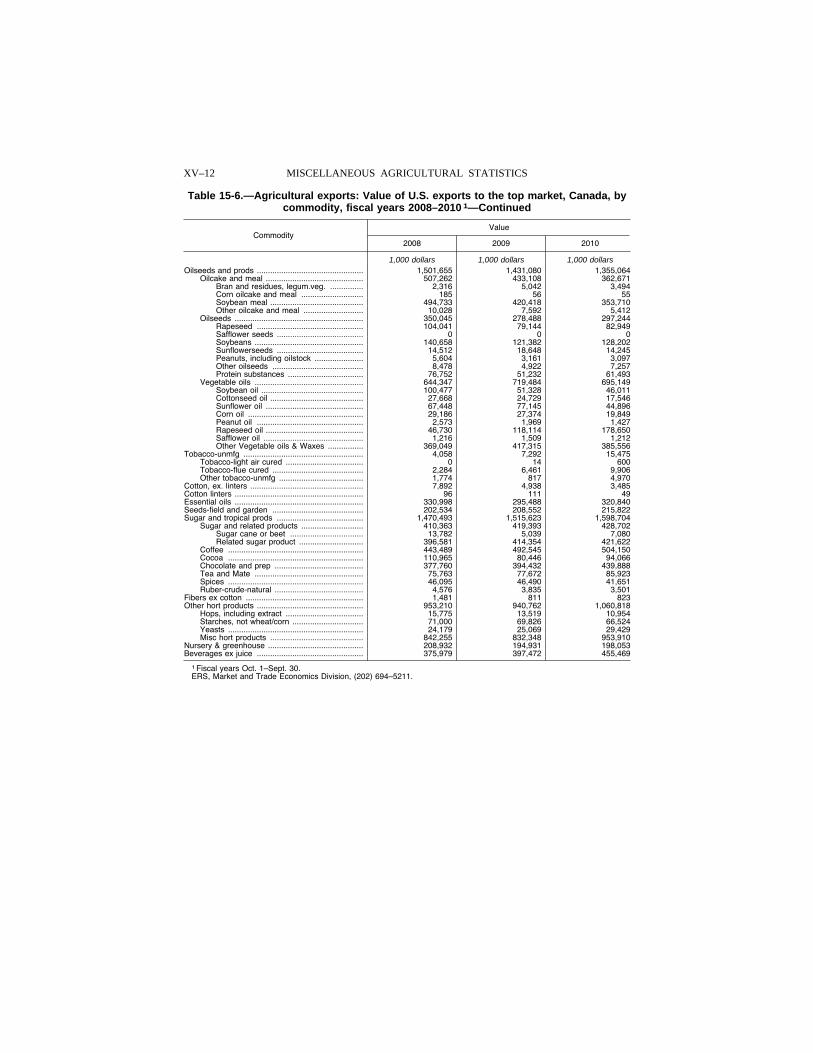
XV–12 MISCELLANEOUS AGRICULTURAL STATISTICS
Table 15-6.—Agricultural exports: Value of U.S. exports to the top market, Canada, by commodity, fiscal years 2008–2010 1—Continued
Commodity Value
2008 2009 2010
1,000 dollars 1,000 dollars 1,000 dollars Oilseeds and prods ................................................ 1,501,655 1,431,080 1,355,064
Oilcake and meal ............................................ 507,262 433,108 362,671 Bran and residues, legum.veg. ............... 2,316 5,042 3,494 Corn oilcake and meal ............................ 185 56 55 Soybean meal .......................................... 494,733 420,418 353,710 Other oilcake and meal ........................... 10,028 7,592 5,412
Oilseeds .......................................................... 350,045 278,488 297,244 Rapeseed ................................................ 104,041 79,144 82,949 Safflower seeds ....................................... 0 0 0 Soybeans ................................................. 140,658 121,382 128,202 Sunflowerseeds ....................................... 14,512 18,648 14,245 Peanuts, including oilstock ...................... 5,604 3,161 3,097 Other oilseeds ......................................... 8,478 4,922 7,257 Protein substances .................................. 76,752 51,232 61,493
Vegetable oils ................................................. 644,347 719,484 695,149 Soybean oil .............................................. 100,477 51,328 46,011 Cottonseed oil .......................................... 27,668 24,729 17,546 Sunflower oil ............................................ 67,448 77,145 44,896 Corn oil .................................................... 29,186 27,374 19,849 Peanut oil ................................................ 2,573 1,969 1,427 Rapeseed oil ............................................ 46,730 118,114 178,650 Safflower oil ............................................. 1,216 1,509 1,212 Other Vegetable oils & Waxes ................ 369,049 417,315 385,556
Tobacco-unmfg ...................................................... 4,058 7,292 15,475 Tobacco-light air cured ................................... 0 14 600 Tobacco-flue cured ......................................... 2,284 6,461 9,906 Other tobacco-unmfg ...................................... 1,774 817 4,970
Cotton, ex. linters ................................................... 7,892 4,938 3,485 Cotton linters .......................................................... 96 111 49 Essential oils .......................................................... 330,998 295,488 320,840 Seeds-field and garden ......................................... 202,534 208,552 215,822 Sugar and tropical prods ....................................... 1,470,493 1,515,623 1,598,704
Sugar and related products ............................ 410,363 419,393 428,702 Sugar cane or beet ................................. 13,782 5,039 7,080 Related sugar product ............................. 396,581 414,354 421,622
Coffee ............................................................. 443,489 492,545 504,150 Cocoa ............................................................. 110,965 80,446 94,066 Chocolate and prep ........................................ 377,760 394,432 439,888 Tea and Mate ................................................. 75,763 77,672 85,923 Spices ............................................................. 46,095 46,490 41,651 Ruber-crude-natural ........................................ 4,576 3,835 3,501
Fibers ex cotton ..................................................... 1,481 811 823 Other hort products ................................................ 953,210 940,762 1,060,818
Hops, including extract ................................... 15,775 13,519 10,954 Starches, not wheat/corn ................................ 71,000 69,826 66,524 Yeasts ............................................................. 24,179 25,069 29,429 Misc hort products .......................................... 842,255 832,348 953,910
Nursery & greenhouse ........................................... 208,932 194,931 198,053 Beverages ex juice ................................................ 375,979 397,472 455,469
1 Fiscal years Oct. 1–Sept. 30. ERS, Market and Trade Economics Division, (202) 694–5211.
VerDate Aug 31 2005 16:11 Mar 01, 2012 Jkt 000000 PO 00000 Frm 00012 Fmt 1000 Sfmt 1000 H:\SHARED\DAPP\FPU\AGSTAT\MASTER~2\CHAPTR15\XV-12.AG8 USDA
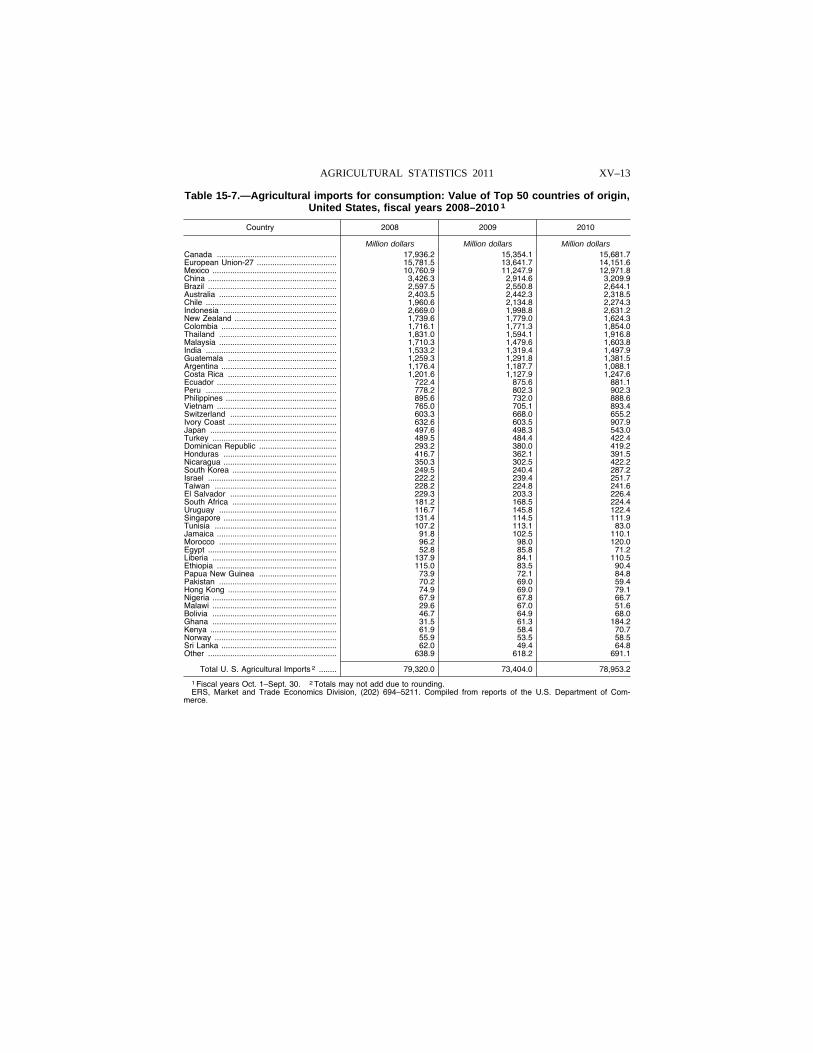
XV–13 AGRICULTURAL STATISTICS 2011
Table 15-7.—Agricultural imports for consumption: Value of Top 50 countries of origin, United States, fiscal years 2008–2010 1
Country 2008 2009 2010
Million dollars Million dollars Million dollars Canada ...................................................... 17,936.2 15,354.1 15,681.7 European Union-27 .................................... 15,781.5 13,641.7 14,151.6 Mexico ........................................................ 10,760.9 11,247.9 12,971.8 China .......................................................... 3,426.3 2,914.6 3,209.9 Brazil .......................................................... 2,597.5 2,550.8 2,644.1 Australia ..................................................... 2,403.5 2,442.3 2,318.5 Chile ........................................................... 1,960.6 2,134.8 2,274.3 Indonesia ................................................... 2,669.0 1,998.8 2,631.2 New Zealand .............................................. 1,739.6 1,779.0 1,624.3 Colombia .................................................... 1,716.1 1,771.3 1,854.0 Thailand ..................................................... 1,831.0 1,594.1 1,916.8 Malaysia ..................................................... 1,710.3 1,479.6 1,603.8 India ........................................................... 1,533.2 1,319.4 1,497.9 Guatemala ................................................. 1,259.3 1,291.8 1,381.5 Argentina .................................................... 1,176.4 1,187.7 1,088.1 Costa Rica ................................................. 1,201.6 1,127.9 1,247.6 Ecuador ...................................................... 722.4 875.6 881.1 Peru ........................................................... 778.2 802.3 902.3 Philippines .................................................. 895.6 732.0 888.6 Vietnam ...................................................... 765.0 705.1 893.4 Switzerland ................................................ 603.3 668.0 655.2 Ivory Coast ................................................. 632.6 603.5 907.9 Japan ......................................................... 497.6 498.3 543.0 Turkey ........................................................ 489.5 484.4 422.4 Dominican Republic ................................... 293.2 380.0 419.2 Honduras ................................................... 416.7 362.1 391.5 Nicaragua ................................................... 350.3 302.5 422.2 South Korea ............................................... 249.5 240.4 287.2 Israel .......................................................... 222.2 239.4 251.7 Taiwan ....................................................... 228.2 224.8 241.6 El Salvador ................................................ 229.3 203.3 226.4 South Africa ............................................... 181.2 168.5 224.4 Uruguay ..................................................... 116.7 145.8 122.4 Singapore ................................................... 131.4 114.5 111.9 Tunisia ....................................................... 107.2 113.1 83.0 Jamaica ...................................................... 91.8 102.5 110.1 Morocco ..................................................... 96.2 98.0 120.0 Egypt .......................................................... 52.8 85.8 71.2 Liberia ........................................................ 137.9 84.1 110.5 Ethiopia ...................................................... 115.0 83.5 90.4 Papua New Guinea ................................... 73.9 72.1 84.8 Pakistan ..................................................... 70.2 69.0 59.4 Hong Kong ................................................. 74.9 69.0 79.1 Nigeria ........................................................ 67.9 67.8 66.7 Malawi ........................................................ 29.6 67.0 51.6 Bolivia ........................................................ 46.7 64.9 68.0 Ghana ........................................................ 31.5 61.3 184.2 Kenya ......................................................... 61.9 58.4 70.7 Norway ....................................................... 55.9 53.5 58.5 Sri Lanka .................................................... 62.0 49.4 64.8 Other .......................................................... 638.9 618.2 691.1
Total U. S. Agricultural Imports 2 ........ 79,320.0 73,404.0 78,953.2
1 Fiscal years Oct. 1–Sept. 30. 2 Totals may not add due to rounding. ERS, Market and Trade Economics Division, (202) 694–5211. Compiled from reports of the U.S. Department of Com-
merce.
VerDate Aug 31 2005 16:11 Mar 01, 2012 Jkt 000000 PO 00000 Frm 00013 Fmt 1000 Sfmt 1000 H:\SHARED\DAPP\FPU\AGSTAT\MASTER~2\CHAPTR15\XV-13.AG8 USDA
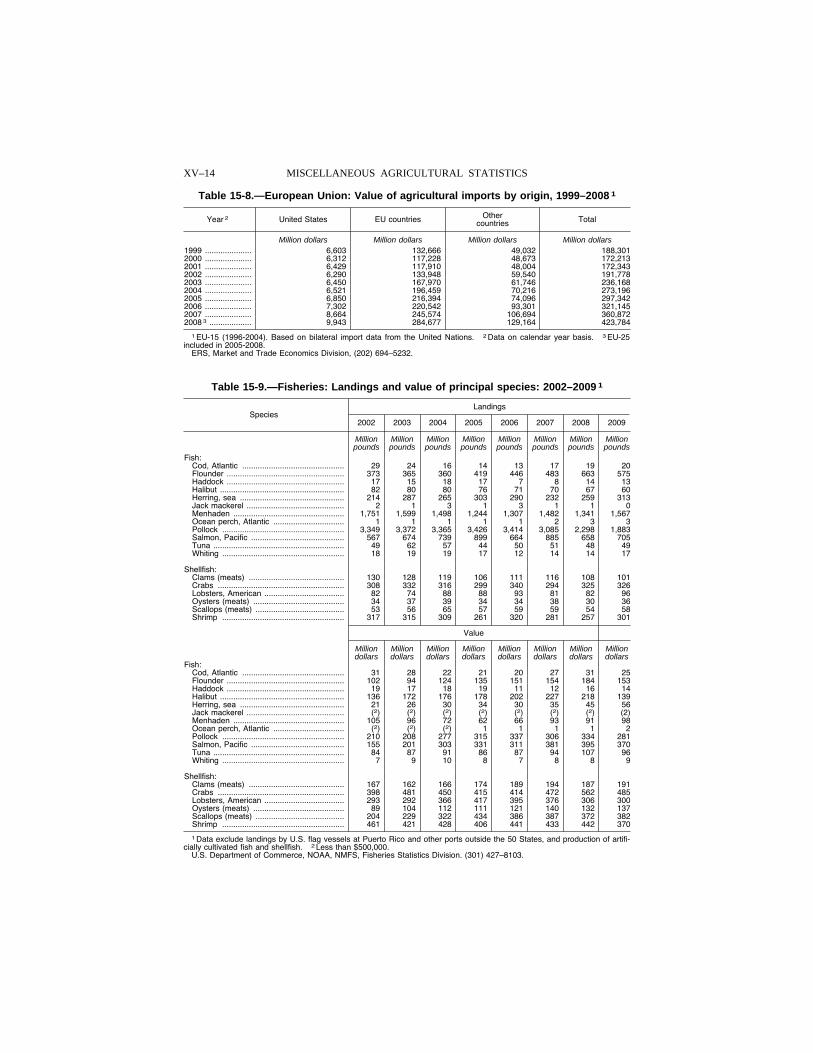
XV–14 MISCELLANEOUS AGRICULTURAL STATISTICS
Table 15-8.—European Union: Value of agricultural imports by origin, 1999–2008 1
Year 2 United States EU countries Other countries Total
Million dollars Million dollars Million dollars Million dollars 1999 ..................... 6,603 132,666 49,032 188,301 2000 ..................... 6,312 117,228 48,673 172,213 2001 ..................... 6,429 117,910 48,004 172,343 2002 ..................... 6,290 133,948 59,540 191,778 2003 ..................... 6,450 167,970 61,746 236,168 2004 ..................... 6,521 196,459 70,216 273,196 2005 ..................... 6,850 216,394 74,096 297,342 2006 ..................... 7,302 220,542 93,301 321,145 2007 ..................... 8,664 245,574 106,694 360,872 2008 3 ................... 9,943 284,677 129,164 423,784
1 EU-15 (1996-2004). Based on bilateral import data from the United Nations. 2 Data on calendar year basis. 3 EU-25 included in 2005-2008.
ERS, Market and Trade Economics Division, (202) 694–5232.
Table 15-9.—Fisheries: Landings and value of principal species: 2002–2009 1
Species Landings
2002 2003 2004 2005 2006 2007 2008 2009
Million Million Million Million Million Million Million Million pounds pounds pounds pounds pounds pounds pounds pounds
Fish: Cod, Atlantic .............................................. 29 24 16 14 13 17 19 20 Flounder ..................................................... 373 365 360 419 446 483 663 575 Haddock ..................................................... 17 15 18 17 7 8 14 13 Halibut ........................................................ 82 80 80 76 71 70 67 60 Herring, sea ............................................... 214 287 265 303 290 232 259 313 Jack mackerel ............................................ 2 1 3 1 3 1 1 0 Menhaden .................................................. 1,751 1,599 1,498 1,244 1,307 1,482 1,341 1,567 Ocean perch, Atlantic ................................ 1 1 1 1 1 2 3 3 Pollock ....................................................... 3,349 3,372 3,365 3,426 3,414 3,085 2,298 1,883 Salmon, Pacific .......................................... 567 674 739 899 664 885 658 705 Tuna ........................................................... 49 62 57 44 50 51 48 49 Whiting ....................................................... 18 19 19 17 12 14 14 17
Shellfish: Clams (meats) ........................................... 130 128 119 106 111 116 108 101 Crabs ......................................................... 308 332 316 299 340 294 325 326 Lobsters, American .................................... 82 74 88 88 93 81 82 96 Oysters (meats) ......................................... 34 37 39 34 34 38 30 36 Scallops (meats) ........................................ 53 56 65 57 59 59 54 58 Shrimp ....................................................... 317 315 309 261 320 281 257 301
Value
Million Million Million Million Million Million Million Million dollars dollars dollars dollars dollars dollars dollars dollars
Fish: Cod, Atlantic .............................................. 31 28 22 21 20 27 31 25 Flounder ..................................................... 102 94 124 135 151 154 184 153 Haddock ..................................................... 19 17 18 19 11 12 16 14 Halibut ........................................................ 136 172 176 178 202 227 218 139 Herring, sea ............................................... 21 26 30 34 30 35 45 56 Jack mackerel ............................................ (2) (2) (2) (2) (2) (2) (2) (2) Menhaden .................................................. 105 96 72 62 66 93 91 98 Ocean perch, Atlantic ................................ (2) (2) (2) 1 1 1 1 2 Pollock ....................................................... 210 208 277 315 337 306 334 281 Salmon, Pacific .......................................... 155 201 303 331 311 381 395 370 Tuna ........................................................... 84 87 91 86 87 94 107 96 Whiting ....................................................... 7 9 10 8 7 8 8 9
Shellfish: Clams (meats) ........................................... 167 162 166 174 189 194 187 191 Crabs ......................................................... 398 481 450 415 414 472 562 485 Lobsters, American .................................... 293 292 366 417 395 376 306 300 Oysters (meats) ......................................... 89 104 112 111 121 140 132 137 Scallops (meats) ........................................ 204 229 322 434 386 387 372 382 Shrimp ....................................................... 461 421 428 406 441 433 442 370
1 Data exclude landings by U.S. flag vessels at Puerto Rico and other ports outside the 50 States, and production of artifi-cially cultivated fish and shellfish. 2 Less than $500,000.
U.S. Department of Commerce, NOAA, NMFS, Fisheries Statistics Division. (301) 427–8103.
VerDate Aug 31 2005 16:11 Mar 01, 2012 Jkt 000000 PO 00000 Frm 00014 Fmt 1000 Sfmt 1000 H:\SHARED\DAPP\FPU\AGSTAT\MASTER~2\CHAPTR15\XV-14.AG8 USDA
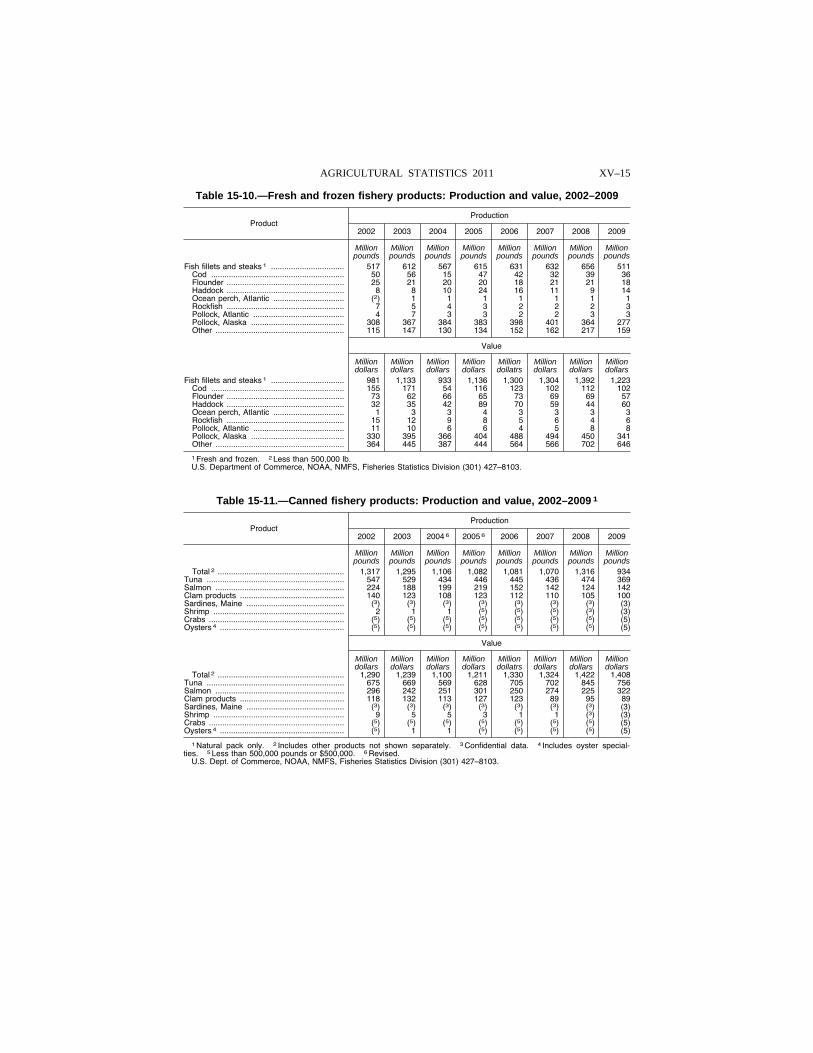
XV–15 AGRICULTURAL STATISTICS 2011
Table 15-10.—Fresh and frozen fishery products: Production and value, 2002–2009
Product Production
2002 2003 2004 2005 2006 2007 2008 2009
Million Million Million Million Million Million Million Million pounds pounds pounds pounds pounds pounds pounds pounds
Fish fillets and steaks 1 ................................. 517 612 567 615 631 632 656 511 Cod ............................................................ 50 56 15 47 42 32 39 36 Flounder ..................................................... 25 21 20 20 18 21 21 18 Haddock ..................................................... 8 8 10 24 16 11 9 14 Ocean perch, Atlantic ................................ (2) 1 1 1 1 1 1 1 Rockfish ..................................................... 7 5 4 3 2 2 2 3 Pollock, Atlantic ......................................... 4 7 3 3 2 2 3 3 Pollock, Alaska .......................................... 308 367 384 383 398 401 364 277 Other .......................................................... 115 147 130 134 152 162 217 159
Value
Million Million Million Million Million Million Million Million dollars dollars dollars dollars dollatrs dollars dollars dollars
Fish fillets and steaks 1 ................................. 981 1,133 933 1,136 1,300 1,304 1,392 1,223 Cod ............................................................ 155 171 54 116 123 102 112 102 Flounder ..................................................... 73 62 66 65 73 69 69 57 Haddock ..................................................... 32 35 42 89 70 59 44 60 Ocean perch, Atlantic ................................ 1 3 3 4 3 3 3 3 Rockfish ..................................................... 15 12 9 8 5 6 4 6 Pollock, Atlantic ......................................... 11 10 6 6 4 5 8 8 Pollock, Alaska .......................................... 330 395 366 404 488 494 450 341 Other .......................................................... 364 445 387 444 564 566 702 646
1 Fresh and frozen. 2 Less than 500,000 lb. U.S. Department of Commerce, NOAA, NMFS, Fisheries Statistics Division (301) 427–8103.
Table 15-11.—Canned fishery products: Production and value, 2002–2009 1
Product Production
2002 2003 2004 6 2005 6 2006 2007 2008 2009
Million Million Million Million Million Million Million Million pounds pounds pounds pounds pounds pounds pounds pounds
Total 2 ......................................................... 1,317 1,295 1,106 1,082 1,081 1,070 1,316 934 Tuna .............................................................. 547 529 434 446 445 436 474 369 Salmon .......................................................... 224 188 199 219 152 142 124 142 Clam products ............................................... 140 123 108 123 112 110 105 100 Sardines, Maine ............................................ (3) (3) (3) (3) (3) (3) (3) (3) Shrimp ........................................................... 2 1 1 (5) (5) (5) (3) (3) Crabs ............................................................. (5) (5) (5) (5) (5) (5) (5) (5) Oysters 4 ........................................................ (5) (5) (5) (5) (5) (5) (5) (5)
Value
Million Million Million Million Million Million Million Million dollars dollars dollars dollars dollatrs dollars dollars dollars
Total 2 ......................................................... 1,290 1,239 1,100 1,211 1,330 1,324 1,422 1,408 Tuna .............................................................. 675 669 569 628 705 702 845 756 Salmon .......................................................... 296 242 251 301 250 274 225 322 Clam products ............................................... 118 132 113 127 123 89 95 89 Sardines, Maine ............................................ (3) (3) (3) (3) (3) (3) (3) (3) Shrimp ........................................................... 9 5 5 3 1 1 (3) (3) Crabs ............................................................. (5) (5) (5) (5) (5) (5) (5) (5) Oysters 4 ........................................................ (5) 1 1 (5) (5) (5) (5) (5)
1 Natural pack only. 2 Includes other products not shown separately. 3 Confidential data. 4 Includes oyster special-ties. 5 Less than 500,000 pounds or $500,000. 6 Revised.
U.S. Dept. of Commerce, NOAA, NMFS, Fisheries Statistics Division (301) 427–8103.
VerDate Aug 31 2005 16:11 Mar 01, 2012 Jkt 000000 PO 00000 Frm 00015 Fmt 1000 Sfmt 1000 H:\SHARED\DAPP\FPU\AGSTAT\MASTER~2\CHAPTR15\XV-15.AG8 USDA
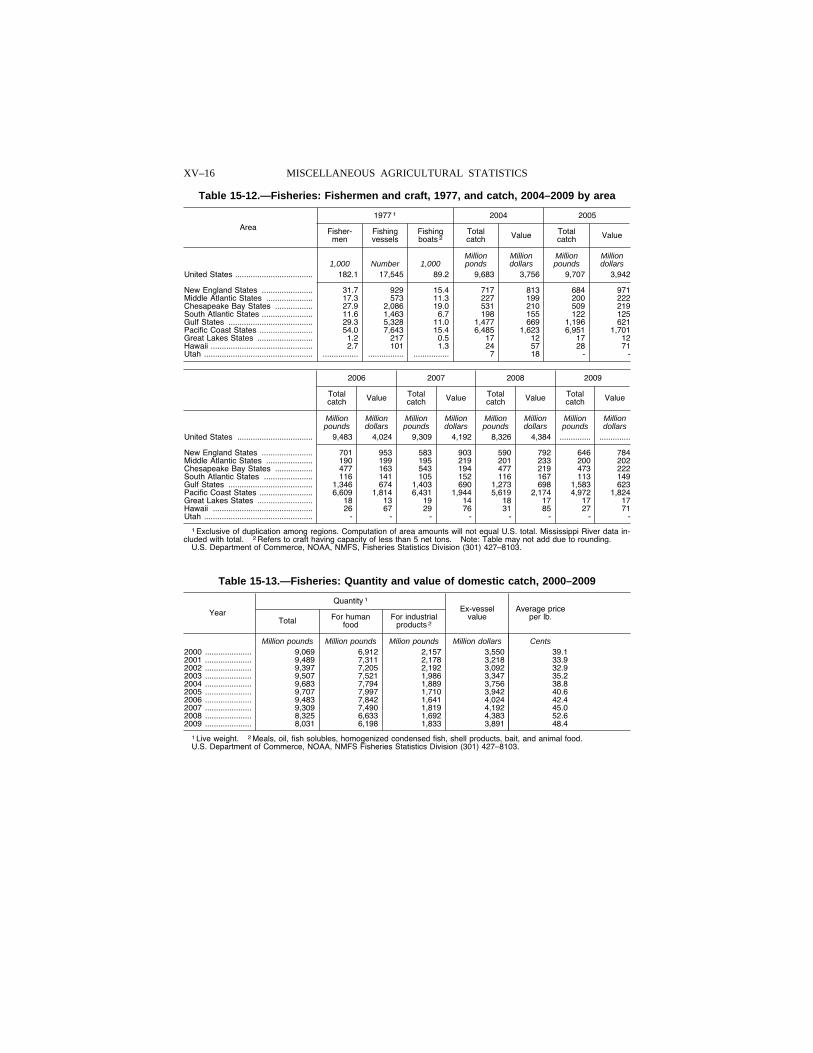
XV–16 MISCELLANEOUS AGRICULTURAL STATISTICS
Table 15-12.—Fisheries: Fishermen and craft, 1977, and catch, 2004–2009 by area
Area
1977 1 2004 2005
Fisher-men
Fishing vessels
Fishing boats 2
Total catch Value Total
catch Value
Million Million Million Million 1,000 Number 1,000 ponds dollars pounds dollars
United States ................................... 182.1 17,545 89.2 9,683 3,756 9,707 3,942
New England States ....................... 31.7 929 15.4 717 813 684 971 Middle Atlantic States ..................... 17.3 573 11.3 227 199 200 222 Chesapeake Bay States ................. 27.9 2,086 19.0 531 210 509 219 South Atlantic States ....................... 11.6 1,463 6.7 198 155 122 125 Gulf States ...................................... 29.3 5,328 11.0 1,477 669 1,196 621 Pacific Coast States ........................ 54.0 7,643 15.4 6,485 1,623 6,951 1,701 Great Lakes States ......................... 1.2 217 0.5 17 12 17 12 Hawaii .............................................. 2.7 101 1.3 24 57 28 71 Utah ................................................. ................ ................ ................ 7 18 - -
2006 2007 2008 2009
Total catch Value Total
catch Value Total catch Value Total
catch Value
Million Million Million Million Million Million Million Million pounds dollars pounds dollars pounds dollars pounds dollars
United States .................................. 9,483 4,024 9,309 4,192 8,326 4,384 .............. ..............
New England States ....................... 701 953 583 903 590 792 646 784 Middle Atlantic States ..................... 190 199 195 219 201 233 200 202 Chesapeake Bay States ................. 477 163 543 194 477 219 473 222 South Atlantic States ...................... 116 141 105 152 116 167 113 149 Gulf States ...................................... 1,346 674 1,403 690 1,273 698 1,583 623 Pacific Coast States ........................ 6,609 1,814 6,431 1,944 5,619 2,174 4,972 1,824 Great Lakes States ......................... 18 13 19 14 18 17 17 17 Hawaii ............................................. 26 67 29 76 31 85 27 71 Utah ................................................. - - - - - - - -
1 Exclusive of duplication among regions. Computation of area amounts will not equal U.S. total. Mississippi River data in-cluded with total. 2 Refers to craft having capacity of less than 5 net tons. Note: Table may not add due to rounding.
U.S. Department of Commerce, NOAA, NMFS, Fisheries Statistics Division (301) 427–8103.
Table 15-13.—Fisheries: Quantity and value of domestic catch, 2000–2009
Year
Quantity 1 Ex-vessel
value Average price
per lb. Total For human food
For industrial products 2
Million pounds Million pounds Milion pounds Million dollars Cents 2000 ..................... 9,069 6,912 2,157 3,550 39.1 2001 ..................... 9,489 7,311 2,178 3,218 33.9 2002 ..................... 9,397 7,205 2,192 3,092 32.9 2003 ..................... 9,507 7,521 1,986 3,347 35.2 2004 ..................... 9,683 7,794 1,889 3,756 38.8 2005 ..................... 9,707 7,997 1,710 3,942 40.6 2006 ..................... 9,483 7,842 1,641 4,024 42.4 2007 ..................... 9,309 7,490 1,819 4,192 45.0 2008 ..................... 8,325 6,633 1,692 4,383 52.6 2009 ..................... 8,031 6,198 1,833 3,891 48.4
1 Live weight. 2 Meals, oil, fish solubles, homogenized condensed fish, shell products, bait, and animal food. U.S. Department of Commerce, NOAA, NMFS Fisheries Statistics Division (301) 427–8103.
VerDate Aug 31 2005 16:11 Mar 01, 2012 Jkt 000000 PO 00000 Frm 00016 Fmt 1000 Sfmt 1000 H:\SHARED\DAPP\FPU\AGSTAT\MASTER~2\CHAPTR15\XV-16.AG8 USDA
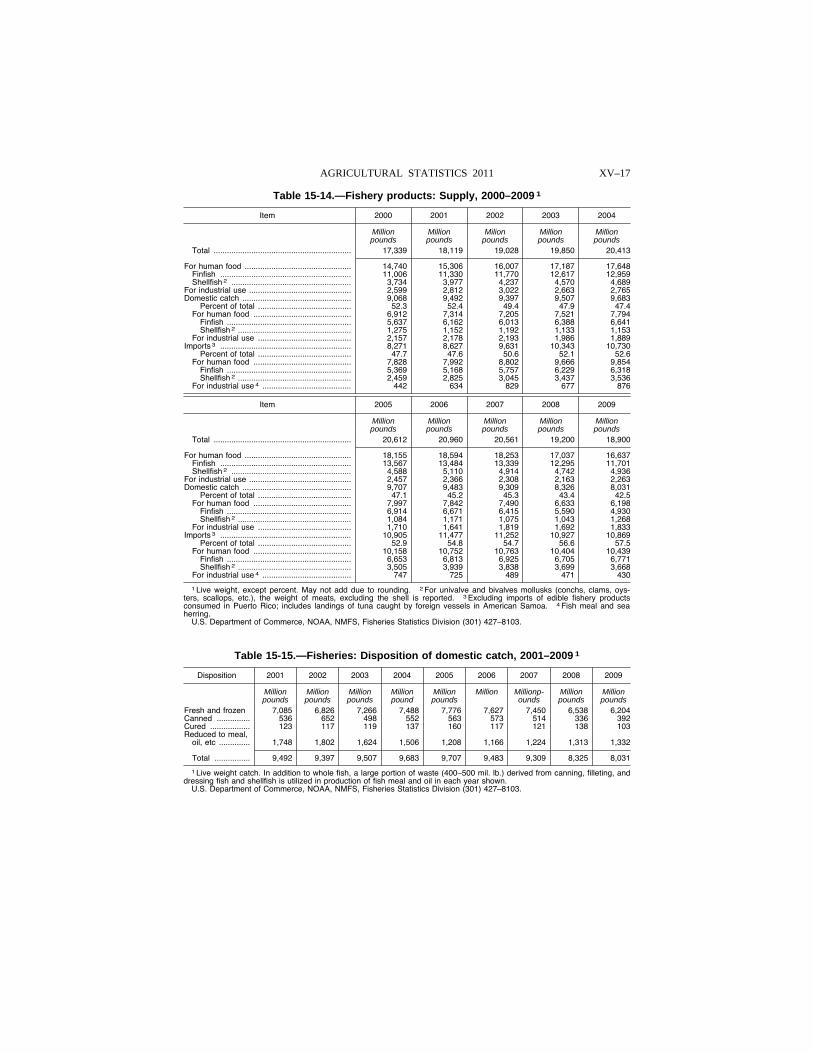
XV–17 AGRICULTURAL STATISTICS 2011
Table 15-14.—Fishery products: Supply, 2000–2009 1
Item 2000 2001 2002 2003 2004
Million pounds
Million pounds
Milion pounds
Million pounds
Million pounds
Total .............................................................. 17,339 18,119 19,028 19,850 20,413
For human food ................................................ 14,740 15,306 16,007 17,187 17,648 Finfish ........................................................... 11,006 11,330 11,770 12,617 12,959 Shellfish 2 ...................................................... 3,734 3,977 4,237 4,570 4,689
For industrial use .............................................. 2,599 2,812 3,022 2,663 2,765 Domestic catch ................................................. 9,068 9,492 9,397 9,507 9,683
Percent of total .......................................... 52.3 52.4 49.4 47.9 47.4 For human food ............................................ 6,912 7,314 7,205 7,521 7,794
Finfish ........................................................ 5,637 6,162 6,013 6,388 6,641 Shellfish 2 ................................................... 1,275 1,152 1,192 1,133 1,153
For industrial use .......................................... 2,157 2,178 2,193 1,986 1,889 Imports 3 ........................................................... 8,271 8,627 9,631 10,343 10,730
Percent of total .......................................... 47.7 47.6 50.6 52.1 52.6 For human food ............................................ 7,828 7,992 8,802 9,666 9,854
Finfish ........................................................ 5,369 5,168 5,757 6,229 6,318 Shellfish 2 ................................................... 2,459 2,825 3,045 3,437 3,536
For industrial use 4 ........................................ 442 634 829 677 876
Item 2005 2006 2007 2008 2009
Million pounds
Million pounds
Million pounds
Million pounds
Million pounds
Total .............................................................. 20,612 20,960 20,561 19,200 18,900
For human food ................................................ 18,155 18,594 18,253 17,037 16,637 Finfish ........................................................... 13,567 13,484 13,339 12,295 11,701 Shellfish 2 ...................................................... 4,588 5,110 4,914 4,742 4,936
For industrial use .............................................. 2,457 2,366 2,308 2,163 2,263 Domestic catch ................................................. 9,707 9,483 9,309 8,326 8,031
Percent of total .......................................... 47.1 45.2 45.3 43.4 42.5 For human food ............................................ 7,997 7,842 7,490 6,633 6,198
Finfish ........................................................ 6,914 6,671 6,415 5,590 4,930 Shellfish 2 ................................................... 1,084 1,171 1,075 1,043 1,268
For industrial use .......................................... 1,710 1,641 1,819 1,692 1,833 Imports 3 ........................................................... 10,905 11,477 11,252 10,927 10,869
Percent of total .......................................... 52.9 54.8 54.7 56.6 57.5 For human food ............................................ 10,158 10,752 10,763 10,404 10,439
Finfish ........................................................ 6,653 6,813 6,925 6,705 6,771 Shellfish 2 ................................................... 3,505 3,939 3,838 3,699 3,668
For industrial use 4 ........................................ 747 725 489 471 430
1 Live weight, except percent. May not add due to rounding. 2 For univalve and bivalves mollusks (conchs, clams, oys-ters, scallops, etc.), the weight of meats, excluding the shell is reported. 3 Excluding imports of edible fishery products consumed in Puerto Rico; includes landings of tuna caught by foreign vessels in American Samoa. 4 Fish meal and sea herring.
U.S. Department of Commerce, NOAA, NMFS, Fisheries Statistics Division (301) 427–8103.
Table 15-15.—Fisheries: Disposition of domestic catch, 2001–2009 1
Disposition 2001 2002 2003 2004 2005 2006 2007 2008 2009
Million pounds
Million pounds
Million pounds
Million pound
Million pounds
Million Millionp-ounds
Million pounds
Million pounds
Fresh and frozen 7,085 6,826 7,266 7,488 7,776 7,627 7,450 6,538 6,204 Canned ............... 536 652 498 552 563 573 514 336 392 Cured .................. 123 117 119 137 160 117 121 138 103 Reduced to meal,
oil, etc .............. 1,748 1,802 1,624 1,506 1,208 1,166 1,224 1,313 1,332
Total ................ 9,492 9,397 9,507 9,683 9,707 9,483 9,309 8,325 8,031
1 Live weight catch. In addition to whole fish, a large portion of waste (400–500 mil. lb.) derived from canning, filleting, and dressing fish and shellfish is utilized in production of fish meal and oil in each year shown.
U.S. Department of Commerce, NOAA, NMFS, Fisheries Statistics Division (301) 427–8103.
VerDate Aug 31 2005 16:11 Mar 01, 2012 Jkt 000000 PO 00000 Frm 00017 Fmt 1000 Sfmt 1000 H:\SHARED\DAPP\FPU\AGSTAT\MASTER~2\CHAPTR15\XV-17.AG8 USDA
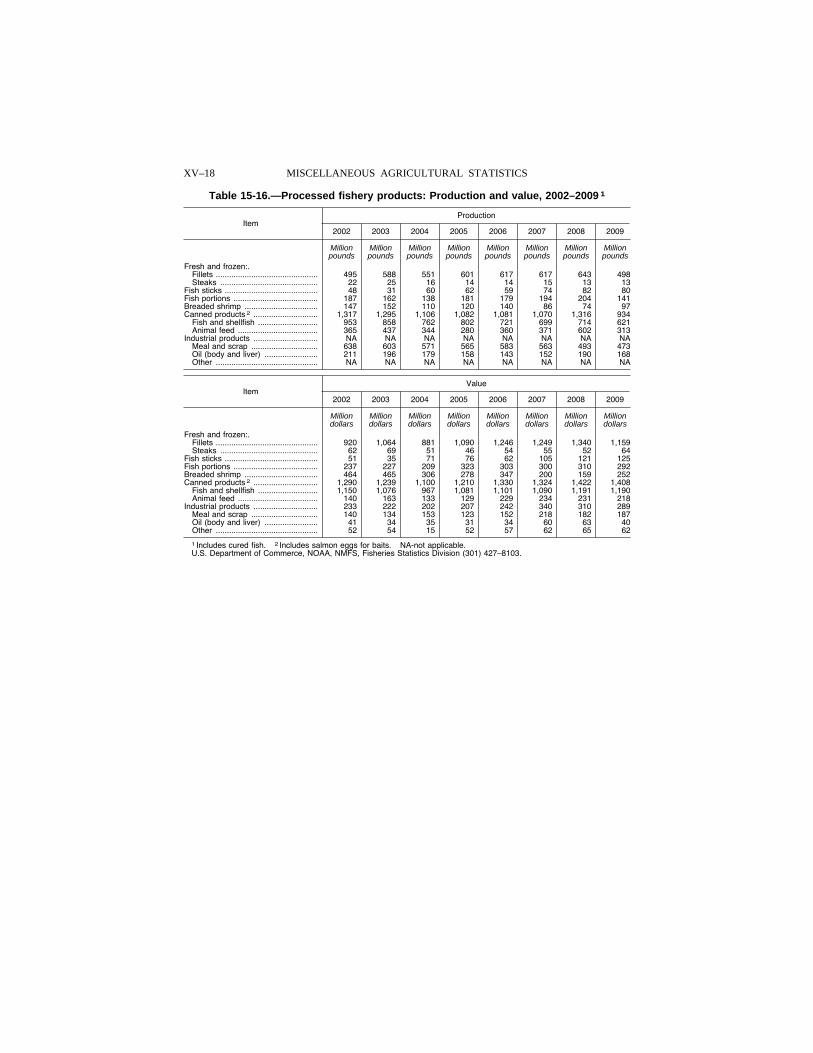
XV–18 MISCELLANEOUS AGRICULTURAL STATISTICS
Table 15-16.—Processed fishery products: Production and value, 2002–2009 1
Item Production
2002 2003 2004 2005 2006 2007 2008 2009
Million pounds
Million pounds
Million pounds
Million pounds
Million pounds
Million pounds
Million pounds
Million pounds
Fresh and frozen:.Fillets .............................................. 495 588 551 601 617 617 643 498 Steaks ............................................ 22 25 16 14 14 15 13 13
Fish sticks .......................................... 48 31 60 62 59 74 82 80 Fish portions ...................................... 187 162 138 181 179 194 204 141 Breaded shrimp ................................. 147 152 110 120 140 86 74 97 Canned products 2 ............................. 1,317 1,295 1,106 1,082 1,081 1,070 1,316 934
Fish and shellfish ........................... 953 858 762 802 721 699 714 621 Animal feed .................................... 365 437 344 280 360 371 602 313
Industrial products ............................. NA NA NA NA NA NA NA NA Meal and scrap .............................. 638 603 571 565 583 563 493 473 Oil (body and liver) ........................ 211 196 179 158 143 152 190 168 Other .............................................. NA NA NA NA NA NA NA NA
Item Value
2002 2003 2004 2005 2006 2007 2008 2009
Million dollars
Million dollars
Million dollars
Million dollars
Million dollars
Million dollars
Million dollars
Million dollars
Fresh and frozen:.Fillets .............................................. 920 1,064 881 1,090 1,246 1,249 1,340 1,159 Steaks ............................................ 62 69 51 46 54 55 52 64
Fish sticks .......................................... 51 35 71 76 62 105 121 125 Fish portions ...................................... 237 227 209 323 303 300 310 292 Breaded shrimp ................................. 464 465 306 278 347 200 159 252 Canned products 2 ............................. 1,290 1,239 1,100 1,210 1,330 1,324 1,422 1,408
Fish and shellfish ........................... 1,150 1,076 967 1,081 1,101 1,090 1,191 1,190 Animal feed .................................... 140 163 133 129 229 234 231 218
Industrial products ............................. 233 222 202 207 242 340 310 289 Meal and scrap .............................. 140 134 153 123 152 218 182 187 Oil (body and liver) ........................ 41 34 35 31 34 60 63 40 Other .............................................. 52 54 15 52 57 62 65 62
1 Includes cured fish. 2 Includes salmon eggs for baits. NA-not applicable. U.S. Department of Commerce, NOAA, NMFS, Fisheries Statistics Division (301) 427–8103.
VerDate Aug 31 2005 16:11 Mar 01, 2012 Jkt 000000 PO 00000 Frm 00018 Fmt 1000 Sfmt 1000 H:\SHARED\DAPP\FPU\AGSTAT\MASTER~2\CHAPTR15\XV-18.AG8 USDA
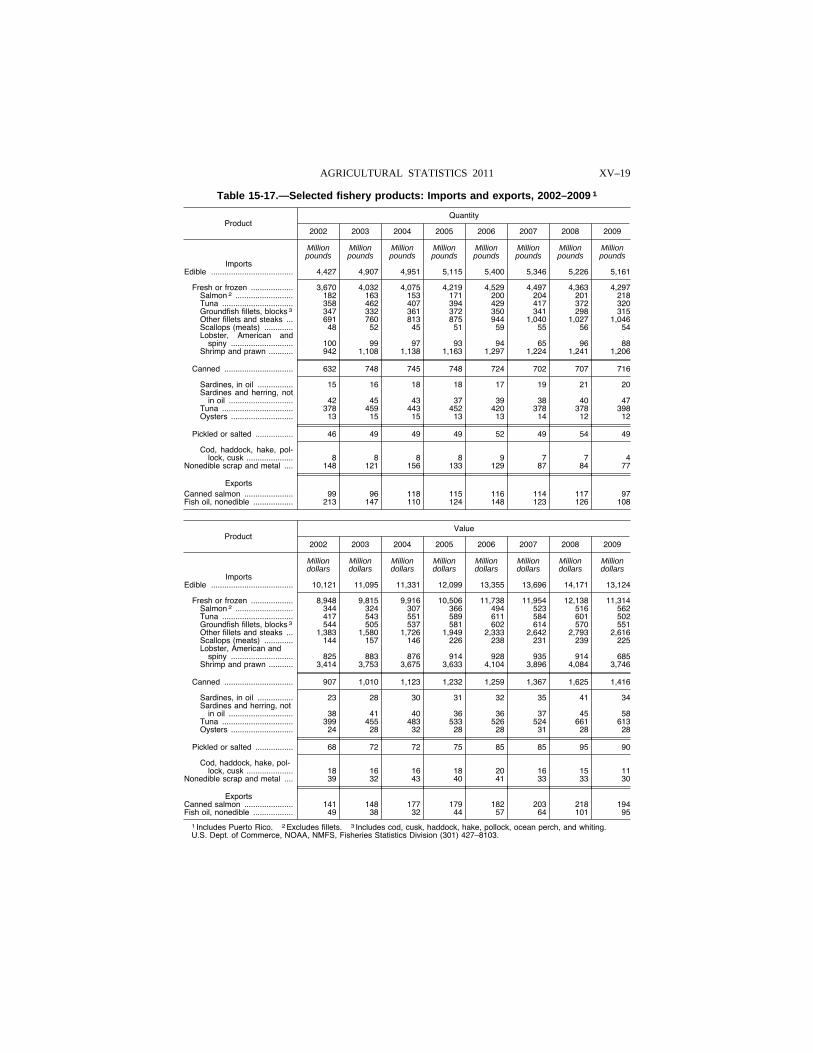
XV–19 AGRICULTURAL STATISTICS 2011
Table 15-17.—Selected fishery products: Imports and exports, 2002–2009 1
Product Quantity
2002 2003 2004 2005 2006 2007 2008 2009
Million pounds
Million pounds
Million pounds
Million pounds
Million pounds
Million pounds
Million pounds
Million pounds
Imports Edible ..................................... 4,427 4,907 4,951 5,115 5,400 5,346 5,226 5,161
Fresh or frozen ................... 3,670 4,032 4,075 4,219 4,529 4,497 4,363 4,297 Salmon 2 .......................... 182 163 153 171 200 204 201 218 Tuna ................................ 358 462 407 394 429 417 372 320 Groundfish fillets, blocks 3 347 332 361 372 350 341 298 315 Other fillets and steaks ... 691 760 813 875 944 1,040 1,027 1,046 Scallops (meats) ............. 48 52 45 51 59 55 56 54 Lobster, American and
spiny ............................ 100 99 97 93 94 65 96 88 Shrimp and prawn ........... 942 1,108 1,138 1,163 1,297 1,224 1,241 1,206
Canned ............................... 632 748 745 748 724 702 707 716
Sardines, in oil ................ 15 16 18 18 17 19 21 20 Sardines and herring, not
in oil ............................. 42 45 43 37 39 38 40 47 Tuna ................................ 378 459 443 452 420 378 378 398 Oysters ............................ 13 15 15 13 13 14 12 12
Pickled or salted ................. 46 49 49 49 52 49 54 49
Cod, haddock, hake, pol-lock, cusk ..................... 8 8 8 8 9 7 7 4
Nonedible scrap and metal .... 148 121 156 133 129 87 84 77
Exports Canned salmon ...................... 99 96 118 115 116 114 117 97 Fish oil, nonedible .................. 213 147 110 124 148 123 126 108
Product Value
2002 2003 2004 2005 2006 2007 2008 2009
Million dollars
Million dollars
Million dollars
Million dollars
Million dollars
Million dollars
Million dollars
Million dollars
Imports Edible ..................................... 10,121 11,095 11,331 12,099 13,355 13,696 14,171 13,124
Fresh or frozen ................... 8,948 9,815 9,916 10,506 11,738 11,954 12,138 11,314 Salmon 2 .......................... 344 324 307 366 494 523 516 562 Tuna ................................ 417 543 551 589 611 584 601 502 Groundfish fillets, blocks 3 544 505 537 581 602 614 570 551 Other fillets and steaks ... 1,383 1,580 1,726 1,949 2,333 2,642 2,793 2,616 Scallops (meats) ............. 144 157 146 226 238 231 239 225 Lobster, American and
spiny ............................ 825 883 876 914 928 935 914 685 Shrimp and prawn ........... 3,414 3,753 3,675 3,633 4,104 3,896 4,084 3,746
Canned ............................... 907 1,010 1,123 1,232 1,259 1,367 1,625 1,416
Sardines, in oil ................ 23 28 30 31 32 35 41 34 Sardines and herring, not
in oil ............................. 38 41 40 36 36 37 45 58 Tuna ................................ 399 455 483 533 526 524 661 613 Oysters ............................ 24 28 32 28 28 31 28 28
Pickled or salted ................. 68 72 72 75 85 85 95 90
Cod, haddock, hake, pol-lock, cusk ..................... 18 16 16 18 20 16 15 11
Nonedible scrap and metal .... 39 32 43 40 41 33 33 30
Exports Canned salmon ...................... 141 148 177 179 182 203 218 194 Fish oil, nonedible .................. 49 38 32 44 57 64 101 95
1 Includes Puerto Rico. 2 Excludes fillets. 3 Includes cod, cusk, haddock, hake, pollock, ocean perch, and whiting. U.S. Dept. of Commerce, NOAA, NMFS, Fisheries Statistics Division (301) 427–8103.
VerDate Aug 31 2005 16:11 Mar 01, 2012 Jkt 000000 PO 00000 Frm 00019 Fmt 1000 Sfmt 1000 H:\SHARED\DAPP\FPU\AGSTAT\MASTER~2\CHAPTR15\XV-19.AG8 USDA
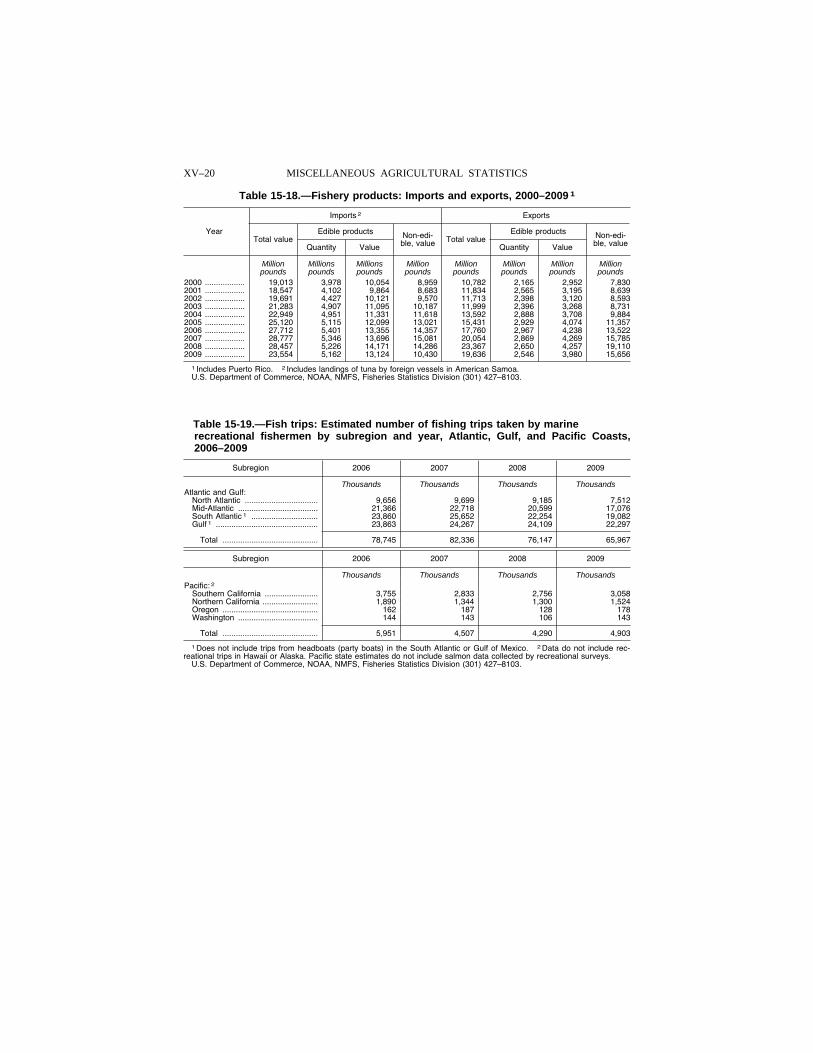
XV–20 MISCELLANEOUS AGRICULTURAL STATISTICS
Table 15-18.—Fishery products: Imports and exports, 2000–2009 1
Year
Imports 2 Exports
Total value Edible products Non-edi-
ble, value Total value Edible products Non-edi-
ble, value Quantity Value Quantity Value
Million pounds
Millions pounds
Millions pounds
Million pounds
Million pounds
Million pounds
Million pounds
Million pounds
2000 .................. 19,013 3,978 10,054 8,959 10,782 2,165 2,952 7,830 2001 .................. 18,547 4,102 9,864 8,683 11,834 2,565 3,195 8,639 2002 .................. 19,691 4,427 10,121 9,570 11,713 2,398 3,120 8,593 2003 .................. 21,283 4,907 11,095 10,187 11,999 2,396 3,268 8,731 2004 .................. 22,949 4,951 11,331 11,618 13,592 2,888 3,708 9,884 2005 .................. 25,120 5,115 12,099 13,021 15,431 2,929 4,074 11,357 2006 .................. 27,712 5,401 13,355 14,357 17,760 2,967 4,238 13,522 2007 .................. 28,777 5,346 13,696 15,081 20,054 2,869 4,269 15,785 2008 .................. 28,457 5,226 14,171 14,286 23,367 2,650 4,257 19,110 2009 .................. 23,554 5,162 13,124 10,430 19,636 2,546 3,980 15,656
1 Includes Puerto Rico. 2 Includes landings of tuna by foreign vessels in American Samoa. U.S. Department of Commerce, NOAA, NMFS, Fisheries Statistics Division (301) 427–8103.
Table 15-19.—Fish trips: Estimated number of fishing trips taken by marine recreational fishermen by subregion and year, Atlantic, Gulf, and Pacific Coasts, 2006–2009
Subregion 2006 2007 2008 2009
Thousands Thousands Thousands Thousands Atlantic and Gulf:
North Atlantic ................................. 9,656 9,699 9,185 7,512 Mid-Atlantic .................................... 21,366 22,718 20,599 17,076 South Atlantic 1 .............................. 23,860 25,652 22,254 19,082 Gulf 1 .............................................. 23,863 24,267 24,109 22,297
Total ........................................... 78,745 82,336 76,147 65,967
Subregion 2006 2007 2008 2009
Thousands Thousands Thousands Thousands Pacific: 2
Southern California ........................ 3,755 2,833 2,756 3,058 Northern California ......................... 1,890 1,344 1,300 1,524 Oregon ........................................... 162 187 128 178 Washington .................................... 144 143 106 143
Total ........................................... 5,951 4,507 4,290 4,903
1 Does not include trips from headboats (party boats) in the South Atlantic or Gulf of Mexico. 2 Data do not include rec-reational trips in Hawaii or Alaska. Pacific state estimates do not include salmon data collected by recreational surveys.
U.S. Department of Commerce, NOAA, NMFS, Fisheries Statistics Division (301) 427–8103.
VerDate Aug 31 2005 16:11 Mar 01, 2012 Jkt 000000 PO 00000 Frm 00020 Fmt 1000 Sfmt 1000 H:\SHARED\DAPP\FPU\AGSTAT\MASTER~2\CHAPTR15\XV-20.AG8 USDA
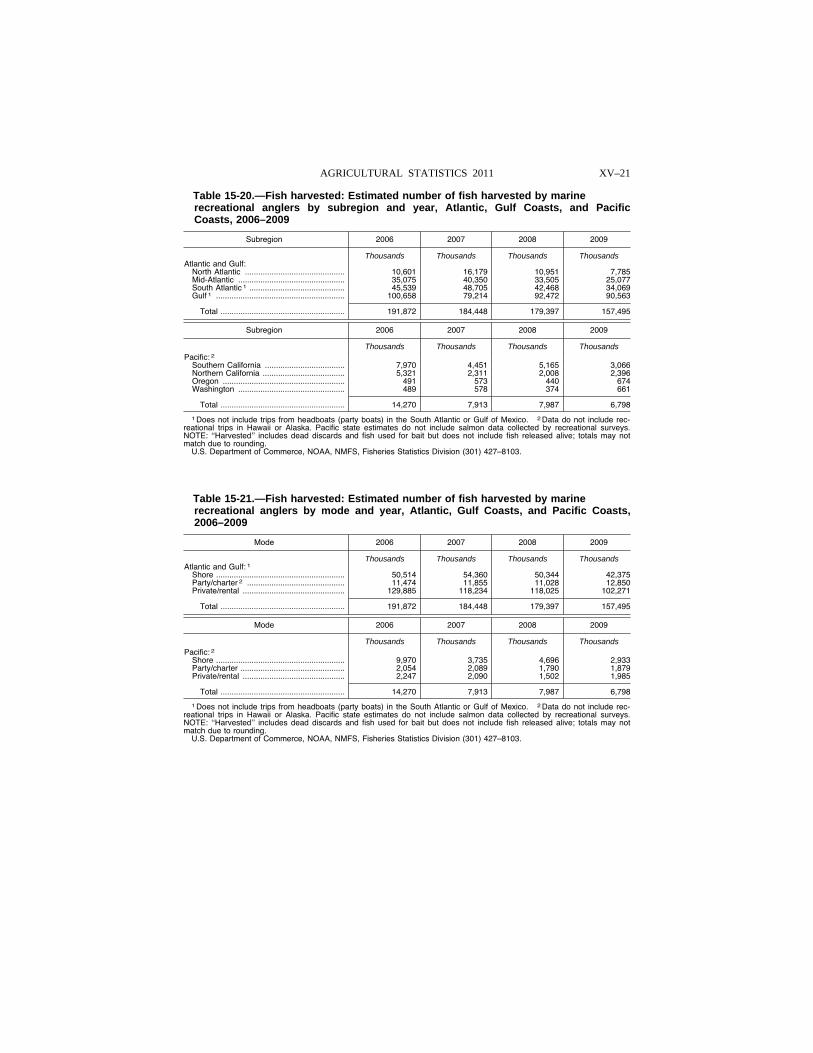
XV–21 AGRICULTURAL STATISTICS 2011
Table 15-20.—Fish harvested: Estimated number of fish harvested by marine recreational anglers by subregion and year, Atlantic, Gulf Coasts, and Pacific Coasts, 2006–2009
Subregion 2006 2007 2008 2009
Thousands Thousands Thousands Thousands Atlantic and Gulf:
North Atlantic ............................................. 10,601 16,179 10,951 7,785 Mid-Atlantic ................................................ 35,075 40,350 33,505 25,077 South Atlantic 1 ........................................... 45,539 48,705 42,468 34,069 Gulf 1 .......................................................... 100,658 79,214 92,472 90,563
Total ........................................................ 191,872 184,448 179,397 157,495
Subregion 2006 2007 2008 2009
Thousands Thousands Thousands Thousands Pacific: 2
Southern California .................................... 7,970 4,451 5,165 3,066 Northern California ..................................... 5,321 2,311 2,008 2,396 Oregon ....................................................... 491 573 440 674 Washington ................................................ 489 578 374 661
Total ........................................................ 14,270 7,913 7,987 6,798
1 Does not include trips from headboats (party boats) in the South Atlantic or Gulf of Mexico. 2 Data do not include rec-reational trips in Hawaii or Alaska. Pacific state estimates do not include salmon data collected by recreational surveys. NOTE: ‘‘Harvested’’ includes dead discards and fish used for bait but does not include fish released alive; totals may not match due to rounding.
U.S. Department of Commerce, NOAA, NMFS, Fisheries Statistics Division (301) 427–8103.
Table 15-21.—Fish harvested: Estimated number of fish harvested by marine recreational anglers by mode and year, Atlantic, Gulf Coasts, and Pacific Coasts, 2006–2009
Mode 2006 2007 2008 2009
Thousands Thousands Thousands Thousands Atlantic and Gulf: 1
Shore .......................................................... 50,514 54,360 50,344 42,375 Party/charter 2 ............................................ 11,474 11,855 11,028 12,850 Private/rental .............................................. 129,885 118,234 118,025 102,271
Total ........................................................ 191,872 184,448 179,397 157,495
Mode 2006 2007 2008 2009
Thousands Thousands Thousands Thousands Pacific: 2
Shore .......................................................... 9,970 3,735 4,696 2,933 Party/charter ............................................... 2,054 2,089 1,790 1,879 Private/rental .............................................. 2,247 2,090 1,502 1,985
Total ........................................................ 14,270 7,913 7,987 6,798
1 Does not include trips from headboats (party boats) in the South Atlantic or Gulf of Mexico. 2 Data do not include rec-reational trips in Hawaii or Alaska. Pacific state estimates do not include salmon data collected by recreational surveys. NOTE: ‘‘Harvested’’ includes dead discards and fish used for bait but does not include fish released alive; totals may not match due to rounding.
U.S. Department of Commerce, NOAA, NMFS, Fisheries Statistics Division (301) 427–8103.
VerDate Aug 31 2005 16:11 Mar 01, 2012 Jkt 000000 PO 00000 Frm 00021 Fmt 1000 Sfmt 1000 H:\SHARED\DAPP\FPU\AGSTAT\MASTER~2\CHAPTR15\XV-21.AG8 USDA