Embed Size (px)
Citation preview
California
AgriculturalStatisticsReview
2013-2014
Foreword .........................................................................................1
Agricultural Statistical Overview ........................................2
Farm Facts .............................................................................3
Land Values/Cash Rents ..................................................3
Top Commodities ...............................................................3
Weather Highlights for 2011 ..........................................3
Global Marketplace ...........................................................7
County Statistical Data ..........................................................18
Notes to the Agricultural Commissioners’ Data ..18
California Timber Industry ...........................................19
Field Crops ...................................................................................27
Floriculture..................................................................................51
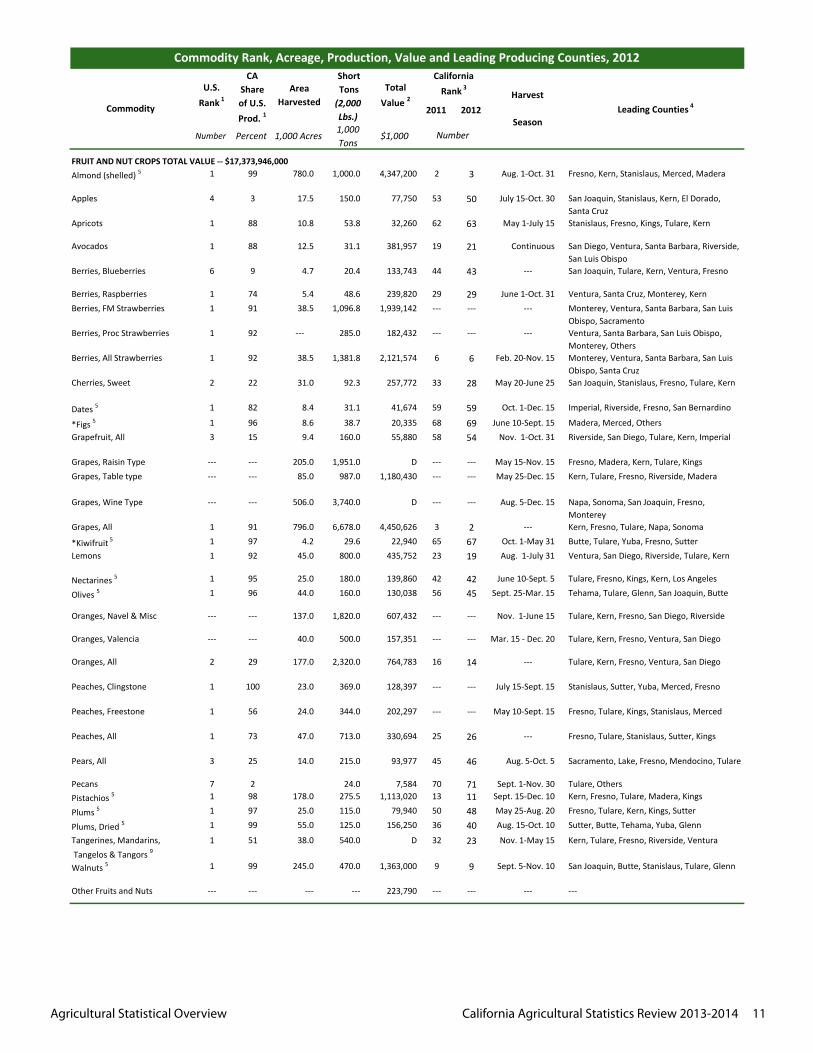
Fruit and Nut Crops .................................................................56
Grape Crush ................................................................................81
Grape Crush Report Overview ...................................81
Summary of Grape Tonnages and Prices ................81
Leading Grape Varieties and Districts ......................82
Livestock and Dairy ................................................................86
Vegetable and Melon Crops .............................................104
California Agricultural Exports .......................................117
Methodology ..................................................................117
Agricultural Statistics Review, 2013-2014 Table of Contents
State of CaliforniaEdmund G. Brown Jr., Governor
California Department of Food and AgricultureKaren Ross, Secretary
Office of Public Affairs1220 N StreetSacramento, CA 95814916.654.0462www.cdfa.ca.gov/statistics
ACKNOWLEDGEMENTS
CDFA Marketing DivisionKevin Masuhara, Director
California Agricultural Statistics ServiceVic Tolomeo, DirectorSarah Hoffman, Deputy DirectorKelly Krug, Deputy Director
Agricultural Export StatisticsUC Davis, Agricultural Issues Center
PHOTO CREDITSCourtesy of Ag Natural Photography
California
Agricultural Statistical Overview California Agricultural Statistics Review 2013-2014 1
Foreword
A s we present the finalized statistics for California Agriculture for 2012, what’s foremost in reader’s minds is the historic drought we’re facing for the coming year. Certainly, our dependence on precipitation has resounded this year like never before: the 2013-2014 winter season in California is the driest on record… .
Somewhat reassuring, though, is the important role the agricultural community has served in determining and shepherding a fair and effective state water policy. A previous generation of agricultural producers, along with other great visionaries, deserves credit for developing a water collection, storage and conveyance system based on good stewardship principles that has allowed agriculture and the state’s economy to flourish.
For 2012, California’s agricultural production value amounted to $44.7 billion—an increase of $1.7 billion over the previous year. Exports increased as well—to $18.18 billion, representing an increase of $1.41 billion over the previous year!
The bounty and diversity of commodities produced in California make up only a part of the story—California agriculture adapts technology in ways that increase production while conserving resources. This demonstrates leadership in environmentally sustainable practices and lessens impacts on precious resources.
I think we’re all reminded now, given the seriousness of the drought affecting us, that we might not always realize year-to-year increases in agricultural production; we’re depending on adequate annual precipitation and effective water policy for that. So, let’s continue to do our part to not only conserve resources, but let’s also remember the essential role of California’s agricultural community in building a greater future for all.
To the many who have made this report possible, thank you, and I look forward to partnering with you for this coming year.
Yours truly,
Karen Ross, SecretaryCalifornia Department of Food and Agriculture
Agricultural Statistical Overview California Agricultural Statistics Review 2013-2014 2
Agricultural Statistical Overview
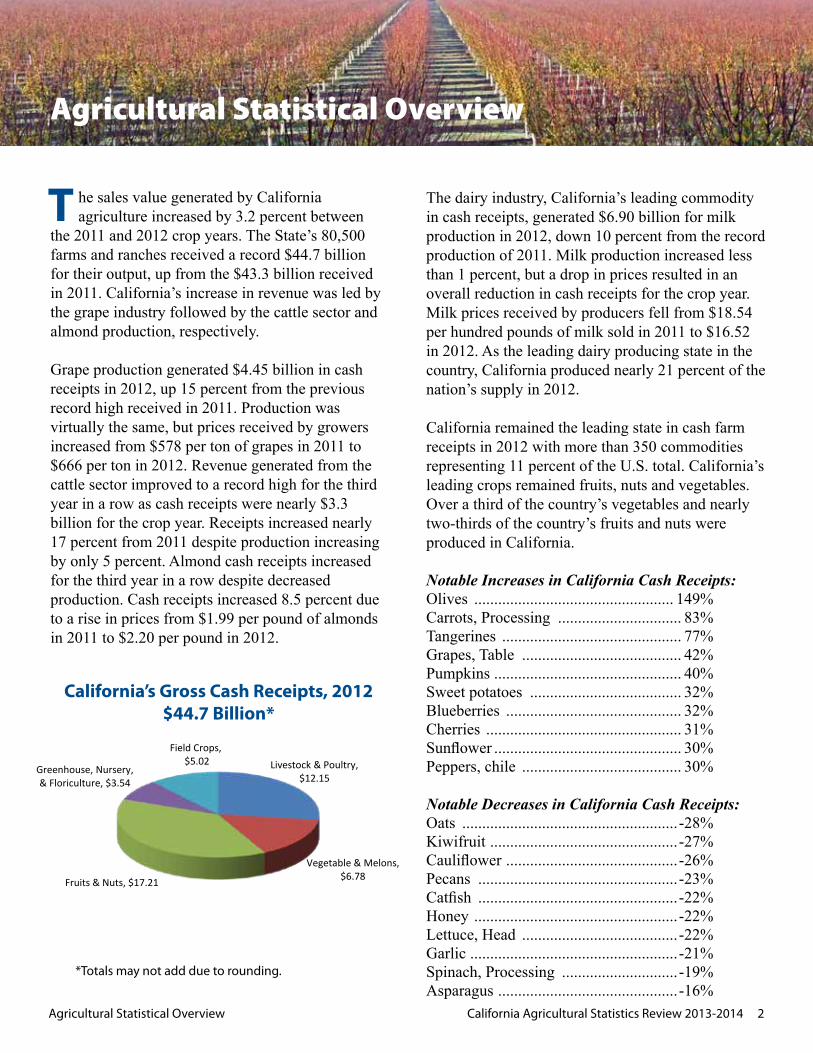
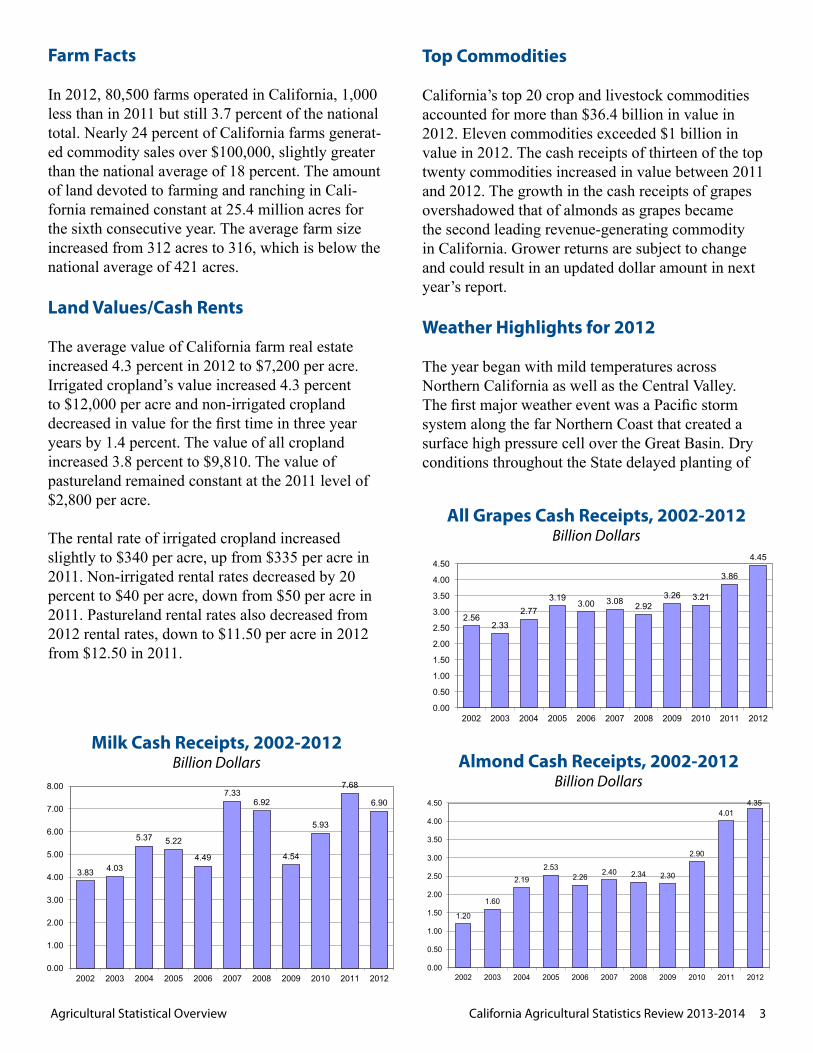
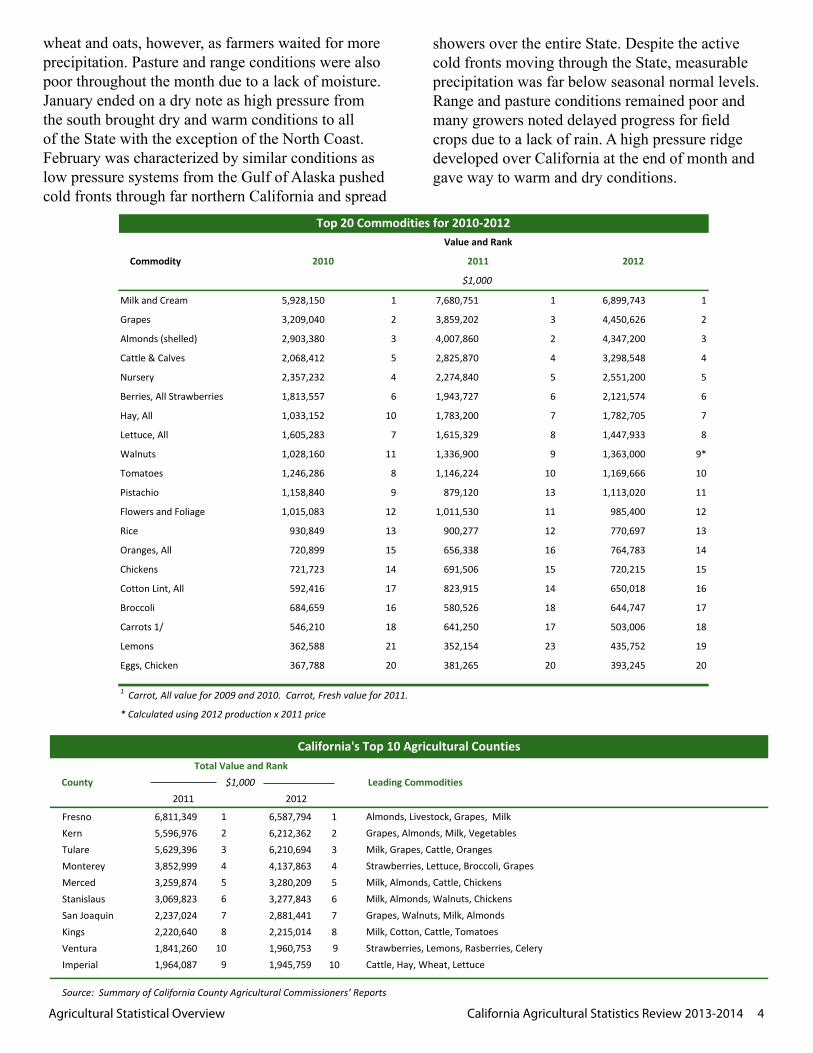
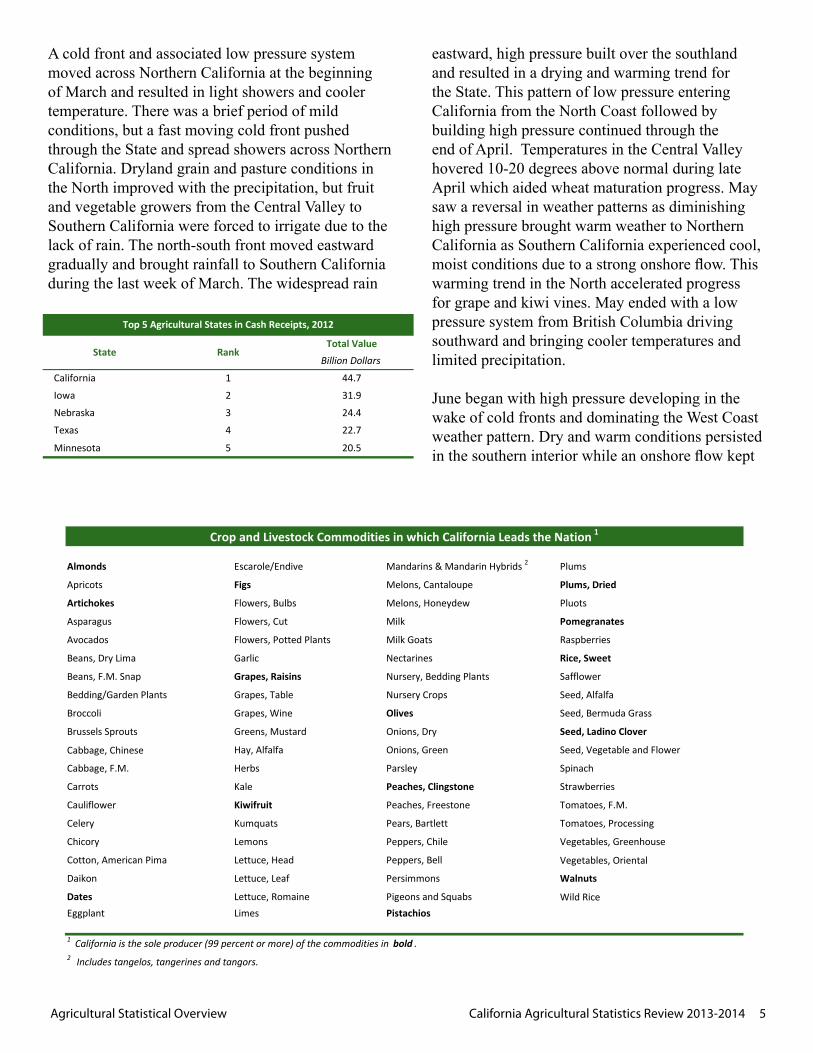
he sales value generated by California agriculture increased by 3.2 percent between the 2011 and 2012 crop years. The State’s 80,500 farms and ranches received a record $44.7 billion for their output, up from the $43.3 billion received in 2011. California’s increase in revenue was led by the grape industry followed by the cattle sector and almond production, respectively.
Grape production generated $4.45 billion in cash receipts in 2012, up 15 percent from the previous record high received in 2011. Production was virtually the same, but prices received by growers increased from $578 per ton of grapes in 2011 to $666 per ton in 2012. Revenue generated from the cattle sector improved to a record high for the third year in a row as cash receipts were nearly $3.3 billion for the crop year. Receipts increased nearly 17 percent from 2011 despite production increasing by only 5 percent. Almond cash receipts increased for the third year in a row despite decreased production. Cash receipts increased 8.5 percent due to a rise in prices from $1.99 per pound of almonds in 2011 to $2.20 per pound in 2012.
The dairy industry, California’s leading commodity in cash receipts, generated $6.90 billion for milk production in 2012, down 10 percent from the record production of 2011. Milk production increased less than 1 percent, but a drop in prices resulted in an overall reduction in cash receipts for the crop year. Milk prices received by producers fell from $18.54 per hundred pounds of milk sold in 2011 to $16.52 in 2012. As the leading dairy producing state in the country, California produced nearly 21 percent of the nation’s supply in 2012.
California remained the leading state in cash farm receipts in 2012 with more than 350 commodities representing 11 percent of the U.S. total. California’s leading crops remained fruits, nuts and vegetables. Over a third of the country’s vegetables and nearly two-thirds of the country’s fruits and nuts were produced in California.
Notable Increases in California Cash Receipts:Olives .................................................. 149%Carrots, Processing ............................... 83%Tangerines ............................................. 77%Grapes, Table ........................................ 42%Pumpkins ............................................... 40%Sweet potatoes ...................................... 32%Blueberries ............................................ 32%Cherries ................................................. 31%Sunflower ............................................... 30%Peppers, chile ........................................ 30%
Notable Decreases in California Cash Receipts:Oats ......................................................-28%Kiwifruit ...............................................-27%Cauliflower ...........................................-26%Pecans ..................................................-23%Catfish ..................................................-22%Honey ...................................................-22%Lettuce, Head .......................................-22%Garlic ....................................................-21%Spinach, Processing .............................-19%Asparagus .............................................-16%
T
Livestock & Poultry, $12.15
Vegetable & Melons, $6.78 Fruits & Nuts, $17.21
Greenhouse, Nursery, & Floriculture, $3.54
Field Crops, $5.02
California's Gross Cash Receipts 2012Total = $44.7 Billion 1
1 Totals may not add due to rounding.
California’s Gross Cash Receipts, 2012$44.7 Billion*
*Totals may not add due to rounding.
Agricultural Statistical Overview California Agricultural Statistics Review 2013-2014 3
Farm Facts
In 2012, 80,500 farms operated in California, 1,000 less than in 2011 but still 3.7 percent of the national total. Nearly 24 percent of California farms generat-ed commodity sales over $100,000, slightly greater than the national average of 18 percent. The amount of land devoted to farming and ranching in Cali-fornia remained constant at 25.4 million acres for the sixth consecutive year. The average farm size increased from 312 acres to 316, which is below the national average of 421 acres.
Land Values/Cash Rents
The average value of California farm real estate increased 4.3 percent in 2012 to $7,200 per acre. Irrigated cropland’s value increased 4.3 percent to $12,000 per acre and non-irrigated cropland decreased in value for the first time in three year years by 1.4 percent. The value of all cropland increased 3.8 percent to $9,810. The value of pastureland remained constant at the 2011 level of $2,800 per acre.
The rental rate of irrigated cropland increased slightly to $340 per acre, up from $335 per acre in 2011. Non-irrigated rental rates decreased by 20 percent to $40 per acre, down from $50 per acre in 2011. Pastureland rental rates also decreased from 2012 rental rates, down to $11.50 per acre in 2012 from $12.50 in 2011.
Top Commodities
California’s top 20 crop and livestock commodities accounted for more than $36.4 billion in value in 2012. Eleven commodities exceeded $1 billion in value in 2012. The cash receipts of thirteen of the top twenty commodities increased in value between 2011 and 2012. The growth in the cash receipts of grapes overshadowed that of almonds as grapes became the second leading revenue-generating commodity in California. Grower returns are subject to change and could result in an updated dollar amount in next year’s report. Weather Highlights for 2012
The year began with mild temperatures across Northern California as well as the Central Valley. The first major weather event was a Pacific storm system along the far Northern Coast that created a surface high pressure cell over the Great Basin. Dry conditions throughout the State delayed planting of
3.83 4.03
5.37 5.22
4.49
7.33 6.92
4.54
5.93
7.68
6.90
0.00
1.00
2.00
3.00
4.00
5.00
6.00
7.00
8.00
2002 2003 2004 2005 2006 2007 2008 2009 2010 2011 2012
Milk Cash Receipts, 2002-2012 Billion Dollars
Milk Cash Receipts, 2002-2012Billion Dollars Almond Cash Receipts, 2002-2012
Billion Dollars
2.56 2.33
2.77 3.19
3.00 3.08 2.92 3.26 3.21
3.86
4.45
0.00
0.50
1.00
1.50
2.00
2.50
3.00
3.50
4.00
4.50
2002 2003 2004 2005 2006 2007 2008 2009 2010 2011 2012
All Grapes Cash Receipts, 2002-2012 Billion Dollars
1.20
1.60
2.19 2.53
2.26 2.40 2.34 2.30
2.90
4.01 4.35
0.00
0.50
1.00
1.50
2.00
2.50
3.00
3.50
4.00
4.50
2002 2003 2004 2005 2006 2007 2008 2009 2010 2011 2012
Almond Cash Receipts, 2002-2012 Billion Dollars
All Grapes Cash Receipts, 2002-2012Billion Dollars
Agricultural Statistical Overview California Agricultural Statistics Review 2013-2014 4
wheat and oats, however, as farmers waited for more precipitation. Pasture and range conditions were also poor throughout the month due to a lack of moisture. January ended on a dry note as high pressure from the south brought dry and warm conditions to all of the State with the exception of the North Coast. February was characterized by similar conditions as low pressure systems from the Gulf of Alaska pushed cold fronts through far northern California and spread
showers over the entire State. Despite the active cold fronts moving through the State, measurable precipitation was far below seasonal normal levels. Range and pasture conditions remained poor and many growers noted delayed progress for field crops due to a lack of rain. A high pressure ridge developed over California at the end of month and gave way to warm and dry conditions.
Milk and Cream 5,928,150 1 7,680,751 1 6,899,743 1
Grapes 3,209,040 2 3,859,202 3 4,450,626 2
Almonds (shelled) 2,903,380 3 4,007,860 2 4,347,200 3
Cattle & Calves 2,068,412 5 2,825,870 4 3,298,548 4
Nursery 2,357,232 4 2,274,840 5 2,551,200 5
Berries, All Strawberries 1,813,557 6 1,943,727 6 2,121,574 6
Hay, All 1,033,152 10 1,783,200 7 1,782,705 7
Lettuce, All 1,605,283 7 1,615,329 8 1,447,933 8
Walnuts 1,028,160 11 1,336,900 9 1,363,000 9*
Tomatoes 1,246,286 8 1,146,224 10 1,169,666 10
Pistachio 1,158,840 9 879,120 13 1,113,020 11
Flowers and Foliage 1,015,083 12 1,011,530 11 985,400 12
Rice 930,849 13 900,277 12 770,697 13
Oranges, All 720,899 15 656,338 16 764,783 14
Chickens 721,723 14 691,506 15 720,215 15
Cotton Lint, All 592,416 17 823,915 14 650,018 16
Broccoli 684,659 16 580,526 18 644,747 17
Carrots 1/ 546,210 18 641,250 17 503,006 18
Lemons 362,588 21 352,154 23 435,752 19
Eggs, Chicken 367,788 20 381,265 20 393,245 20
* Calculated using 2012 production x 2011 price
1 Carrot, All value for 2009 and 2010. Carrot, Fresh value for 2011.
Commodity 2010 2011
Top 20 Commodities for 2010-2012Value and Rank
2012
$1,000
Fresno 6,811,349 1 6,587,794 1 Almonds, Livestock, Grapes, MilkKern 5,596,976 2 6,212,362 2 Grapes, Almonds, Milk, VegetablesTulare 5,629,396 3 6,210,694 3 Milk, Grapes, Cattle, OrangesMonterey 3,852,999 4 4,137,863 4 Strawberries, Lettuce, Broccoli, GrapesMerced 3,259,874 5 3,280,209 5 Milk, Almonds, Cattle, ChickensStanislaus 3,069,823 6 3,277,843 6 Milk, Almonds, Walnuts, ChickensSan Joaquin 2,237,024 7 2,881,441 7 Grapes, Walnuts, Milk, AlmondsKings 2,220,640 8 2,215,014 8 Milk, Cotton, Cattle, TomatoesVentura 1,841,260 10 1,960,753 9 Strawberries, Lemons, Rasberries, CeleryImperial 1,964,087 9 1,945,759 10 Cattle, Hay, Wheat, Lettuce
Source: Summary of California County Agricultural Commissioners’ Reports
County Leading Commodities
California's Top 10 Agricultural CountiesTotal Value and Rank
$1,000 2011 2012
Agricultural Statistical Overview California Agricultural Statistics Review 2013-2014 5
Almonds Escarole/Endive Mandarins & Mandarin Hybrids 2 Plums
Apricots Figs Melons, Cantaloupe Plums, Dried
Artichokes Flowers, Bulbs Melons, Honeydew Pluots
Asparagus Flowers, Cut Milk Pomegranates
Avocados Flowers, Potted Plants Milk Goats Raspberries
Beans, Dry Lima Garlic Nectarines Rice, Sweet
Beans, F.M. Snap Grapes, Raisins Nursery, Bedding Plants Safflower
Bedding/Garden Plants Grapes, Table Nursery Crops Seed, Alfalfa
Broccoli Grapes, Wine Olives Seed, Bermuda Grass
Brussels Sprouts Greens, Mustard Onions, Dry Seed, Ladino Clover
Cabbage, Chinese Hay, Alfalfa Onions, Green Seed, Vegetable and Flower
Cabbage, F.M. Herbs Parsley Spinach
Carrots Kale Peaches, Clingstone Strawberries
Cauliflower Kiwifruit Peaches, Freestone Tomatoes, F.M.
Celery Kumquats Pears, Bartlett Tomatoes, Processing
Chicory Lemons Peppers, Chile Vegetables, Greenhouse
Cotton, American Pima Lettuce, Head Peppers, Bell Vegetables, Oriental
Daikon Lettuce, Leaf Persimmons Walnuts
Dates Lettuce, Romaine Pigeons and Squabs Wild RiceEggplant Limes Pistachios
Crop and Livestock Commodities in which California Leads the Nation 1
1 California is the sole producer (99 percent or more) of the commodities in bold .2 Includes tangelos, tangerines and tangors.
A cold front and associated low pressure system moved across Northern California at the beginning of March and resulted in light showers and cooler temperature. There was a brief period of mild conditions, but a fast moving cold front pushed through the State and spread showers across Northern California. Dryland grain and pasture conditions in the North improved with the precipitation, but fruit and vegetable growers from the Central Valley to Southern California were forced to irrigate due to the lack of rain. The north-south front moved eastward gradually and brought rainfall to Southern California during the last week of March. The widespread rain
eastward, high pressure built over the southland and resulted in a drying and warming trend for the State. This pattern of low pressure entering California from the North Coast followed by building high pressure continued through the end of April. Temperatures in the Central Valley hovered 10-20 degrees above normal during late April which aided wheat maturation progress. May saw a reversal in weather patterns as diminishing high pressure brought warm weather to Northern California as Southern California experienced cool, moist conditions due to a strong onshore flow. This warming trend in the North accelerated progress for grape and kiwi vines. May ended with a low pressure system from British Columbia driving southward and bringing cooler temperatures and limited precipitation.
June began with high pressure developing in the wake of cold fronts and dominating the West Coast weather pattern. Dry and warm conditions persisted in the southern interior while an onshore flow kept Minnesota 5 20.5
Iowa 2 31.9
Nebraska 3 24.4
Texas 4 22.7
1 44.7
RankState
Top 5 Agricultural States in Cash Receipts, 2012
Total ValueBillion Dollars
California
Agricultural Statistical Overview California Agricultural Statistics Review 2013-2014 6
temperatures mild in the southern coastal region. The dry and warm conditions aided in the development of field crops and vegetables but resulted in deterioration of rangeland and pasture. Temperatures in the Imperial and Central Valleys remained above normal through the end of June. July began with a State wide warming trend that resulted in above normal temperatures from Southern California to the northern Central Valley. This slowed the development of fruits and deteriorated rangeland and pasture conditions. A monsoonal flow of moisture from Baja California characterized the end of July as precipitation was observed across the Southland up to the Central Valley and into the Sierra Nevada mountains.
As the monsoonal flow exited California at the end of July, high pressure settled in its wake and brought above normal temperatures to the State at the beginning of August. Temperatures remained above normal and aided in the development of many field crops but deteriorated pasture conditions. As the month progressed, isolated thunderstorms occurred from the Imperial Valley up through the Sierra Nevadas into the Lake Tahoe region. Thunderstorm activity and gusty winds characterized the end of August. Mild temperatures in Northern California brought about the beginning of September as temperatures reached triple digits in Southern California. Conditions were ideal for drying corn for grain and grapes for raisins, but further deteriorated pasture and rangeland. Moisture from the South combined with the high pressure system, resulting in scattered thunderstorms and cooler temperatures throughout the State. With the exception of some gusty winds and periods of slightly cooler temperatures brought on by a low pressure system from the Pacific Northwest, conditions were warm and dry through the end of the month.
From the end of September through the first week of October, temperatures remained high across interior California. A low pressure system eventually moved in from the North Coast and brought rain, cooler air and thunderstorm activity to the Bay Area and Central Coast as it slid southward toward Southern California. The rain event allowed farmers to plant small grains and improved rangeland conditions. A high pressure system developed in the place of
the exiting low and brought dry and mild weather for roughly a week. Relief came in the form of remnants of Hurricane Paul as higher humidity and showers spread across the Southland. The end of October was characterized by widespread precipitation and thunderstorm activity that moved through the State from the Gulf of Alaska.
Warm and dry conditions characterized the first weeks of November until a low pressure system from the Gulf of Alaska swept through California during the middle of the month. As a result, precipitation spread across the State as well as the first frost of the year to interior Northern California. The precipitation increased soil moisture and aided in the development of small grains as well as improving rangeland conditions. The remainder of the month alternated between a dry atmosphere and an ensuing low pressure system that brought widespread rain. December began with warm and wet storms across Northern California and light precipitation to the South. Around the middle of the month, a cold front entered California and brought moderate precipitation. Although the rain delayed pruning and weeding for fruit growers, it was extremely beneficial to the development of vegetables and small grains. December ended with strong storms pushing through the West Coast. As many as three storms moved across California and brought precipitation to close out the year.
Agricultural Statistical Overview California Agricultural Statistics Review 2013-2014 7
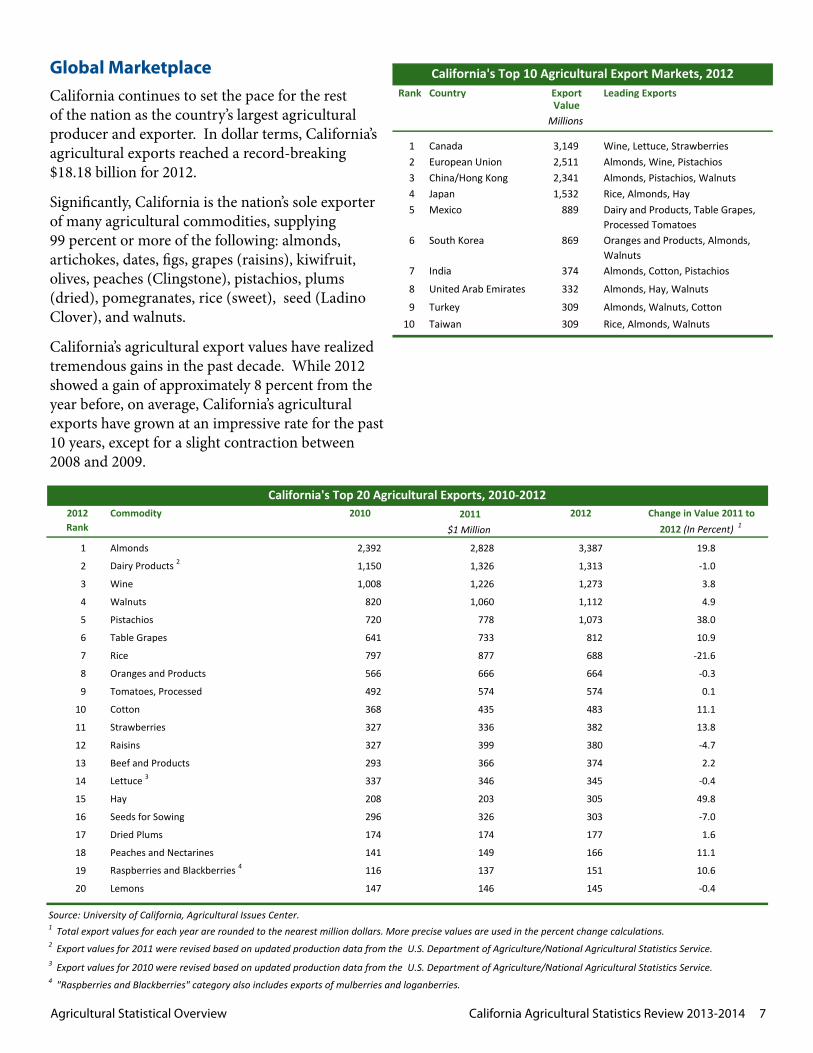
Global Marketplace
California continues to set the pace for the rest of the nation as the country’s largest agricultural producer and exporter. In dollar terms, California’s agricultural exports reached a record-breaking $18.18 billion for 2012.
Significantly, California is the nation’s sole exporter of many agricultural commodities, supplying 99 percent or more of the following: almonds, artichokes, dates, figs, grapes (raisins), kiwifruit, olives, peaches (Clingstone), pistachios, plums (dried), pomegranates, rice (sweet), seed (Ladino Clover), and walnuts.
California’s agricultural export values have realized tremendous gains in the past decade. While 2012 showed a gain of approximately 8 percent from the year before, on average, California’s agricultural exports have grown at an impressive rate for the past 10 years, except for a slight contraction between 2008 and 2009.
Rank Country Export Leading ExportsValue
Millions
1 Canada 3,149 Wine, Lettuce, Strawberries2 European Union 2,511 Almonds, Wine, Pistachios3 China/Hong Kong 2,341 Almonds, Pistachios, Walnuts4 Japan 1,532 Rice, Almonds, Hay5 Mexico 889 Dairy and Products, Table Grapes,
Processed Tomatoes6 South Korea 869 Oranges and Products, Almonds,
Walnuts7 India 374 Almonds, Cotton, Pistachios
8 United Arab Emirates 332 Almonds, Hay, Walnuts
9 Turkey 309 Almonds, Walnuts, Cotton10 Taiwan 309 Rice, Almonds, Walnuts
California's Top 10 Agricultural Export Markets, 2012
2011$1 Million
1 Almonds 2,392 2,828 3,387 19.8
2 Dairy Products 2 1,150 1,326 1,313 -1.0
3 Wine 1,008 1,226 1,273 3.8
4 Walnuts 820 1,060 1,112 4.9
5 Pistachios 720 778 1,073 38.0
6 Table Grapes 641 733 812 10.9
7 Rice 797 877 688 -21.6
8 Oranges and Products 566 666 664 -0.3
9 Tomatoes, Processed 492 574 574 0.1
10 Cotton 368 435 483 11.1
11 Strawberries 327 336 382 13.8
12 Raisins 327 399 380 -4.7
13 Beef and Products 293 366 374 2.2
14 Lettuce 3 337 346 345 -0.4
15 Hay 208 203 305 49.8
16 Seeds for Sowing 296 326 303 -7.0
17 Dried Plums 174 174 177 1.6
18 Peaches and Nectarines 141 149 166 11.1
19 Raspberries and Blackberries 4 116 137 151 10.6
20 Lemons 147 146 145 -0.4
Source: University of California, Agricultural Issues Center.1 Total export values for each year are rounded to the nearest million dollars. More precise values are used in the percent change calculations. 2 Export values for 2011 were revised based on updated production data from the U.S. Department of Agriculture/National Agricultural Statistics Service.3 Export values for 2010 were revised based on updated production data from the U.S. Department of Agriculture/National Agricultural Statistics Service.4 "Raspberries and Blackberries" category also includes exports of mulberries and loganberries.
California's Top 20 Agricultural Exports, 2010-20122012Rank
Commodity 2010 2012 Change in Value 2011 to 2012 (In Percent) 1
Agricultural Statistical Overview California Agricultural Statistics Review 2013-2014 8
2011 2012 2010 2011 2012
$1,000
FIELD CROPS VEGETABLE CROPS
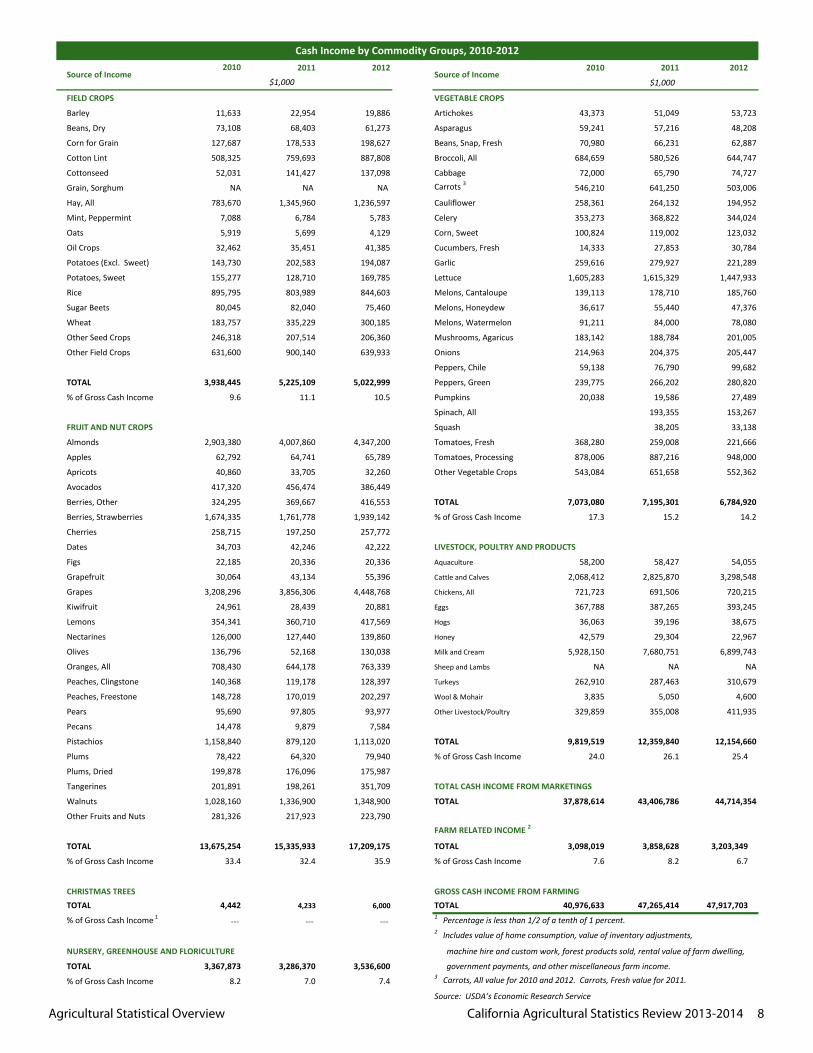
Barley 22,954 19,886 Artichokes 43,373 51,049 53,723
Beans, Dry 68,403 61,273 Asparagus 59,241 57,216 48,208
Corn for Grain 178,533 198,627 Beans, Snap, Fresh 70,980 66,231 62,887
Cotton Lint 759,693 887,808 Broccoli, All 684,659 580,526 644,747
Cottonseed 141,427 137,098 Cabbage 72,000 65,790 74,727
Grain, Sorghum NA NA Carrots 3 546,210 641,250 503,006
Hay, All 1,345,960 1,236,597 Cauliflower 258,361 264,132 194,952
Mint, Peppermint 6,784 5,783 Celery 353,273 368,822 344,024
Oats 5,699 4,129 Corn, Sweet 100,824 119,002 123,032
Oil Crops 35,451 41,385 Cucumbers, Fresh 14,333 27,853 30,784
Potatoes (Excl. Sweet) 202,583 194,087 Garlic 259,616 279,927 221,289
Potatoes, Sweet 128,710 169,785 Lettuce 1,605,283 1,615,329 1,447,933
Rice 803,989 844,603 Melons, Cantaloupe 139,113 178,710 185,760
Sugar Beets 82,040 75,460 Melons, Honeydew 36,617 55,440 47,376
Wheat 335,229 300,185 Melons, Watermelon 91,211 84,000 78,080
Other Seed Crops 207,514 206,360 Mushrooms, Agaricus 183,142 188,784 201,005
Other Field Crops 900,140 639,933 Onions 214,963 204,375 205,447
Peppers, Chile 59,138 76,790 99,682
TOTAL 5,225,109 5,022,999 Peppers, Green 239,775 266,202 280,820
% of Gross Cash Income 11.1 10.5 Pumpkins 20,038 19,586 27,489
Spinach, All 193,355 153,267
FRUIT AND NUT CROPS Squash 38,205 33,138
Almonds 4,007,860 4,347,200 Tomatoes, Fresh 368,280 259,008 221,666
Apples 64,741 65,789 Tomatoes, Processing 878,006 887,216 948,000
Apricots 33,705 32,260 Other Vegetable Crops 543,084 651,658 552,362
Avocados 456,474 386,449
Berries, Other 369,667 416,553 TOTAL 7,073,080 7,195,301 6,784,920
Berries, Strawberries 1,761,778 1,939,142 % of Gross Cash Income 17.3 15.2 14.2
Cherries 197,250 257,772
Dates 42,246 42,222 LIVESTOCK, POULTRY AND PRODUCTS
Figs 20,336 20,336 Aquaculture 58,200 58,427 54,055
Grapefruit 43,134 55,396 Cattle and Calves 2,068,412 2,825,870 3,298,548
Grapes 3,856,306 4,448,768 Chickens, All 721,723 691,506 720,215
Kiwifruit 28,439 20,881 Eggs 367,788 387,265 393,245
Lemons 360,710 417,569 Hogs 36,063 39,196 38,675
Nectarines 127,440 139,860 Honey 42,579 29,304 22,967
Olives 52,168 130,038 Milk and Cream 5,928,150 7,680,751 6,899,743
Oranges, All 644,178 763,339 Sheep and Lambs NA NA NA
Peaches, Clingstone 119,178 128,397 Turkeys 262,910 287,463 310,679
Peaches, Freestone 170,019 202,297 Wool & Mohair 3,835 5,050 4,600
Pears 97,805 93,977 Other Livestock/Poultry 329,859 355,008 411,935
Pecans 9,879 7,584
Pistachios 879,120 1,113,020 TOTAL 9,819,519 12,359,840 12,154,660
Plums 64,320 79,940 % of Gross Cash Income 24.0 26.1 25.4
Plums, Dried 176,096 175,987
Tangerines 198,261 351,709 TOTAL CASH INCOME FROM MARKETINGS
Walnuts 1,336,900 1,348,900 TOTAL 37,878,614 43,406,786 44,714,354
Other Fruits and Nuts 217,923 223,790FARM RELATED INCOME 2
TOTAL 15,335,933 17,209,175 TOTAL 3,098,019 3,858,628 3,203,349
% of Gross Cash Income 32.4 35.9 % of Gross Cash Income 7.6 8.2 6.7
CHRISTMAS TREES GROSS CASH INCOME FROM FARMINGTOTAL 4,233 6,000 TOTAL 40,976,633 47,265,414 47,917,703
% of Gross Cash Income 1 --- --- 1 Percentage is less than 1/2 of a tenth of 1 percent.2 Includes value of home consumption, value of inventory adjustments,
NURSERY, GREENHOUSE AND FLORICULTURE machine hire and custom work, forest products sold, rental value of farm dwelling,
TOTAL 3,286,370 3,536,600 government payments, and other miscellaneous farm income.
% of Gross Cash Income 7.0 7.4 3 Carrots, All value for 2010 and 2012. Carrots, Fresh value for 2011.
Source: USDA’s Economic Research Service
13,675,254
33.4
1,158,840
78,422
199,878
201,891
1,028,160
---
3,367,873
8.2
4,442
14,478
22,185
30,064
3,208,296
24,961
354,341
126,000
136,796
708,430
140,368
148,728
95,690
281,326
34,703
3,938,445
9.6
2,903,380
62,792
40,860
417,320
324,295
1,674,335
258,715
783,670
7,088
5,919
32,462
143,730
155,277
895,795
80,045
183,757
246,318
631,600
NA
Cash Income by Commodity Groups, 2010-2012
Source of Income2010
Source of Income$1,000
11,633
73,108
127,687
508,325
52,031
Agricultural Statistical Overview California Agricultural Statistics Review 2013-2014 9
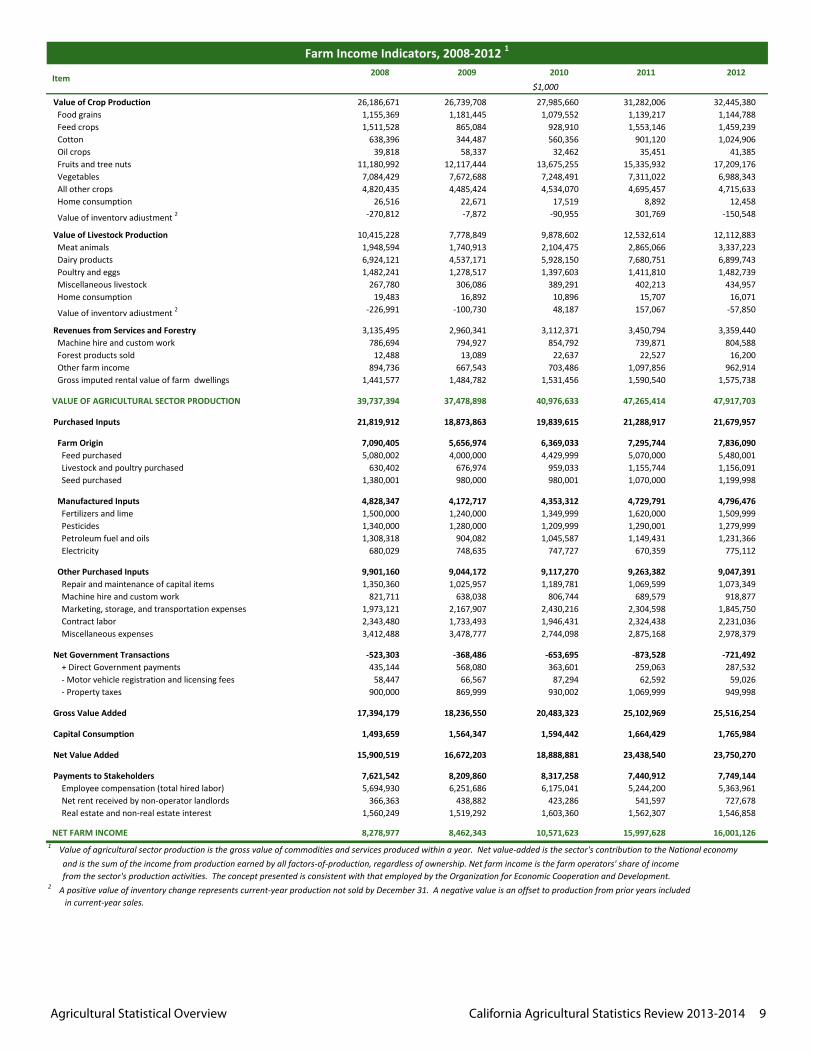
2008 2009 2010 2011 2012
Value of Crop Production 26,186,671 26,739,708 27,985,660 31,282,006 32,445,380 Food grains 1,155,369 1,181,445 1,079,552 1,139,217 1,144,788 Feed crops 1,511,528 865,084 928,910 1,553,146 1,459,239 Cotton 638,396 344,487 560,356 901,120 1,024,906 Oil crops 39,818 58,337 32,462 35,451 41,385 Fruits and tree nuts 11,180,992 12,117,444 13,675,255 15,335,932 17,209,176 Vegetables 7,084,429 7,672,688 7,248,491 7,311,022 6,988,343 All other crops 4,820,435 4,485,424 4,534,070 4,695,457 4,715,633 Home consumption 26,516 22,671 17,519 8,892 12,458
Value of inventory adjustment 2 -270,812 -7,872 -90,955 301,769 -150,548
Value of Livestock Production 10,415,228 7,778,849 9,878,602 12,532,614 12,112,883 Meat animals 1,948,594 1,740,913 2,104,475 2,865,066 3,337,223 Dairy products 6,924,121 4,537,171 5,928,150 7,680,751 6,899,743 Poultry and eggs 1,482,241 1,278,517 1,397,603 1,411,810 1,482,739 Miscellaneous livestock 267,780 306,086 389,291 402,213 434,957 Home consumption 19,483 16,892 10,896 15,707 16,071
Value of inventory adjustment 2 -226,991 -100,730 48,187 157,067 -57,850
Revenues from Services and Forestry 3,135,495 2,960,341 3,112,371 3,450,794 3,359,440 Machine hire and custom work 786,694 794,927 854,792 739,871 804,588 Forest products sold 12,488 13,089 22,637 22,527 16,200 Other farm income 894,736 667,543 703,486 1,097,856 962,914 Gross imputed rental value of farm dwellings 1,441,577 1,484,782 1,531,456 1,590,540 1,575,738
VALUE OF AGRICULTURAL SECTOR PRODUCTION 39,737,394 37,478,898 40,976,633 47,265,414 47,917,703
Purchased Inputs 21,819,912 18,873,863 19,839,615 21,288,917 21,679,957
Farm Origin 7,090,405 5,656,974 6,369,033 7,295,744 7,836,090 Feed purchased 5,080,002 4,000,000 4,429,999 5,070,000 5,480,001 Livestock and poultry purchased 630,402 676,974 959,033 1,155,744 1,156,091 Seed purchased 1,380,001 980,000 980,001 1,070,000 1,199,998
Manufactured Inputs 4,828,347 4,172,717 4,353,312 4,729,791 4,796,476 Fertilizers and lime 1,500,000 1,240,000 1,349,999 1,620,000 1,509,999 Pesticides 1,340,000 1,280,000 1,209,999 1,290,001 1,279,999 Petroleum fuel and oils 1,308,318 904,082 1,045,587 1,149,431 1,231,366 Electricity 680,029 748,635 747,727 670,359 775,112
Other Purchased Inputs 9,901,160 9,044,172 9,117,270 9,263,382 9,047,391 Repair and maintenance of capital items 1,350,360 1,025,957 1,189,781 1,069,599 1,073,349 Machine hire and custom work 821,711 638,038 806,744 689,579 918,877 Marketing, storage, and transportation expenses 1,973,121 2,167,907 2,430,216 2,304,598 1,845,750 Contract labor 2,343,480 1,733,493 1,946,431 2,324,438 2,231,036 Miscellaneous expenses 3,412,488 3,478,777 2,744,098 2,875,168 2,978,379
Net Government Transactions -523,303 -368,486 -653,695 -873,528 -721,492 + Direct Government payments 435,144 568,080 363,601 259,063 287,532 - Motor vehicle registration and licensing fees 58,447 66,567 87,294 62,592 59,026 - Property taxes 900,000 869,999 930,002 1,069,999 949,998
Gross Value Added 17,394,179 18,236,550 20,483,323 25,102,969 25,516,254
Capital Consumption 1,493,659 1,564,347 1,594,442 1,664,429 1,765,984
Net Value Added 15,900,519 16,672,203 18,888,881 23,438,540 23,750,270
Payments to Stakeholders 7,621,542 8,209,860 8,317,258 7,440,912 7,749,144 Employee compensation (total hired labor) 5,694,930 6,251,686 6,175,041 5,244,200 5,363,961 Net rent received by non-operator landlords 366,363 438,882 423,286 541,597 727,678 Real estate and non-real estate interest 1,560,249 1,519,292 1,603,360 1,562,307 1,546,858
8,278,977 8,462,343 10,571,623 15,997,628 16,001,1261 Value of agricultural sector production is the gross value of commodities and services produced within a year. Net value-added is the sector's contribution to the National economy and is the sum of the income from production earned by all factors-of-production, regardless of ownership. Net farm income is the farm operators' share of income from the sector's production activities. The concept presented is consistent with that employed by the Organization for Economic Cooperation and Development.
in current-year sales.
Item
Farm Income Indicators, 2008-2012 1
$1,000
NET FARM INCOME
2 A positive value of inventory change represents current-year production not sold by December 31. A negative value is an offset to production from prior years included
Agricultural Statistical Overview California Agricultural Statistics Review 2013-2014 10
2011 2012
Number Percent 1,000 Acres1,000 Tons
$1,000
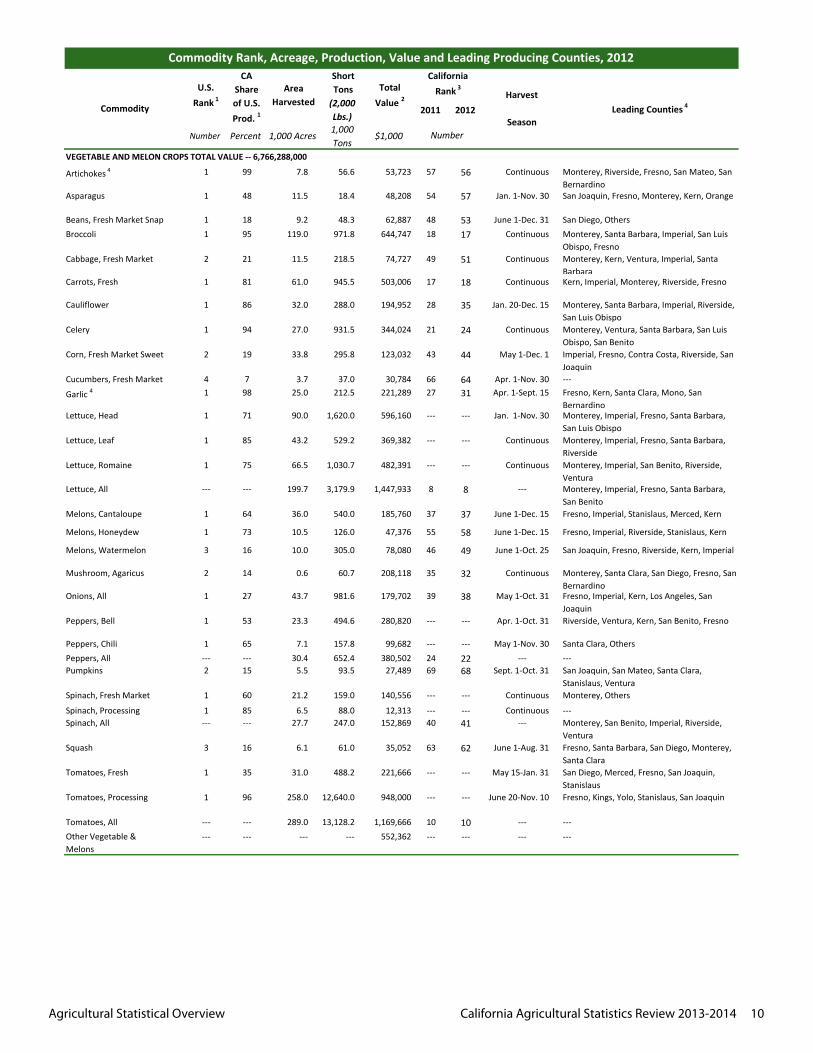
Artichokes 4 1 99 7.8 56.6 53,723 57 56 Continuous Monterey, Riverside, Fresno, San Mateo, San Bernardino
Asparagus 1 48 11.5 18.4 48,208 54 57 Jan. 1-Nov. 30 San Joaquin, Fresno, Monterey, Kern, Orange
Beans, Fresh Market Snap 1 18 9.2 48.3 62,887 48 53 June 1-Dec. 31 San Diego, OthersBroccoli 1 95 119.0 971.8 644,747 18 17 Continuous Monterey, Santa Barbara, Imperial, San Luis
Obispo, FresnoCabbage, Fresh Market 2 21 11.5 218.5 74,727 49 51 Continuous Monterey, Kern, Ventura, Imperial, Santa
BarbaraCarrots, Fresh 1 81 61.0 945.5 503,006 17 18 Continuous Kern, Imperial, Monterey, Riverside, Fresno
Cauliflower 1 86 32.0 288.0 194,952 28 35 Jan. 20-Dec. 15 Monterey, Santa Barbara, Imperial, Riverside, San Luis Obispo
Celery 1 94 27.0 931.5 344,024 21 24 Continuous Monterey, Ventura, Santa Barbara, San Luis Obispo, San Benito
Corn, Fresh Market Sweet 2 19 33.8 295.8 123,032 43 44 May 1-Dec. 1 Imperial, Fresno, Contra Costa, Riverside, San Joaquin
Cucumbers, Fresh Market 4 7 3.7 37.0 30,784 66 64 Apr. 1-Nov. 30 ---
Garlic 4 1 98 25.0 212.5 221,289 27 31 Apr. 1-Sept. 15 Fresno, Kern, Santa Clara, Mono, San Bernardino
Lettuce, Head 1 71 90.0 1,620.0 596,160 --- --- Jan. 1-Nov. 30 Monterey, Imperial, Fresno, Santa Barbara, San Luis Obispo
Lettuce, Leaf 1 85 43.2 529.2 369,382 --- --- Continuous Monterey, Imperial, Fresno, Santa Barbara, Riverside
Lettuce, Romaine 1 75 66.5 1,030.7 482,391 --- --- Continuous Monterey, Imperial, San Benito, Riverside, Ventura
Lettuce, All --- --- 199.7 3,179.9 1,447,933 8 8 --- Monterey, Imperial, Fresno, Santa Barbara, San Benito
Melons, Cantaloupe 1 64 36.0 540.0 185,760 37 37 June 1-Dec. 15 Fresno, Imperial, Stanislaus, Merced, Kern
Melons, Honeydew 1 73 10.5 126.0 47,376 55 58 June 1-Dec. 15 Fresno, Imperial, Riverside, Stanislaus, Kern
Melons, Watermelon 3 16 10.0 305.0 78,080 46 49 June 1-Oct. 25 San Joaquin, Fresno, Riverside, Kern, Imperial
Mushroom, Agaricus 2 14 0.6 60.7 208,118 35 32 Continuous Monterey, Santa Clara, San Diego, Fresno, San Bernardino
Onions, All 1 27 43.7 981.6 179,702 39 38 May 1-Oct. 31 Fresno, Imperial, Kern, Los Angeles, San Joaquin
Peppers, Bell 1 53 23.3 494.6 280,820 --- --- Apr. 1-Oct. 31 Riverside, Ventura, Kern, San Benito, Fresno
Peppers, Chili 1 65 7.1 157.8 99,682 --- --- May 1-Nov. 30 Santa Clara, OthersPeppers, All --- --- 30.4 652.4 380,502 24 22 --- ---Pumpkins 2 15 5.5 93.5 27,489 69 68 Sept. 1-Oct. 31 San Joaquin, San Mateo, Santa Clara,
Stanislaus, VenturaSpinach, Fresh Market 1 60 21.2 159.0 140,556 --- --- Continuous Monterey, Others
Spinach, Processing 1 85 6.5 88.0 12,313 --- --- Continuous ---Spinach, All --- --- 27.7 247.0 152,869 40 41 --- Monterey, San Benito, Imperial, Riverside,
VenturaSquash 3 16 6.1 61.0 35,052 63 62 June 1-Aug. 31 Fresno, Santa Barbara, San Diego, Monterey,
Santa ClaraTomatoes, Fresh 1 35 31.0 488.2 221,666 --- --- May 15-Jan. 31 San Diego, Merced, Fresno, San Joaquin,
StanislausTomatoes, Processing 1 96 258.0 12,640.0 948,000 --- --- June 20-Nov. 10 Fresno, Kings, Yolo, Stanislaus, San Joaquin
Tomatoes, All --- --- 289.0 13,128.2 1,169,666 10 10 --- ---Other Vegetable & Melons
--- --- --- --- 552,362 --- --- --- ---
Number
VEGETABLE AND MELON CROPS TOTAL VALUE -- 6,766,288,000
Commodity Rank, Acreage, Production, Value and Leading Producing Counties, 2012
Commodity
U.S. Rank 1
CA Share of U.S. Prod. 1
Area Harvested
Short Tons (2,000Lbs.)
Total Value 2
California Rank 3
Harvest
SeasonLeading Counties 4
Agricultural Statistical Overview California Agricultural Statistics Review 2013-2014 11
2011 2012
Number Percent 1,000 Acres1,000 Tons
$1,000 Number
Commodity Rank, Acreage, Production, Value and Leading Producing Counties, 2012
Commodity
U.S. Rank 1
CA Share of U.S. Prod. 1
Area Harvested
Short Tons (2,000Lbs.)
Total Value 2
California Rank 3
Harvest
SeasonLeading Counties 4
Almond (shelled) 5 1 99 780.0 1,000.0 4,347,200 2 3 Aug. 1-Oct. 31 Fresno, Kern, Stanislaus, Merced, Madera
Apples 4 3 17.5 150.0 77,750 53 50 July 15-Oct. 30 San Joaquin, Stanislaus, Kern, El Dorado, Santa Cruz
Apricots 1 88 10.8 53.8 32,260 62 63 May 1-July 15 Stanislaus, Fresno, Kings, Tulare, Kern
Avocados 1 88 12.5 31.1 381,957 19 21 Continuous San Diego, Ventura, Santa Barbara, Riverside, San Luis Obispo
Berries, Blueberries 6 9 4.7 20.4 133,743 44 43 --- San Joaquin, Tulare, Kern, Ventura, Fresno
Berries, Raspberries 1 74 5.4 48.6 239,820 29 29 June 1-Oct. 31 Ventura, Santa Cruz, Monterey, KernBerries, FM Strawberries 1 91 38.5 1,096.8 1,939,142 --- --- --- Monterey, Ventura, Santa Barbara, San Luis
Obispo, SacramentoBerries, Proc Strawberries 1 92 --- 285.0 182,432 --- --- --- Ventura, Santa Barbara, San Luis Obispo,
Monterey, OthersBerries, All Strawberries 1 92 38.5 1,381.8 2,121,574 6 6 Feb. 20-Nov. 15 Monterey, Ventura, Santa Barbara, San Luis
Obispo, Santa CruzCherries, Sweet 2 22 31.0 92.3 257,772 33 28 May 20-June 25 San Joaquin, Stanislaus, Fresno, Tulare, Kern
Dates 5 1 82 8.4 31.1 41,674 59 59 Oct. 1-Dec. 15 Imperial, Riverside, Fresno, San Bernardino
*Figs 5 1 96 8.6 38.7 20,335 68 69 June 10-Sept. 15 Madera, Merced, OthersGrapefruit, All 3 15 9.4 160.0 55,880 58 54 Nov. 1-Oct. 31 Riverside, San Diego, Tulare, Kern, Imperial
Grapes, Raisin Type --- --- 205.0 1,951.0 D --- --- May 15-Nov. 15 Fresno, Madera, Kern, Tulare, KingsGrapes, Table type --- --- 85.0 987.0 1,180,430 --- --- May 25-Dec. 15 Kern, Tulare, Fresno, Riverside, Madera
Grapes, Wine Type --- --- 506.0 3,740.0 D --- --- Aug. 5-Dec. 15 Napa, Sonoma, San Joaquin, Fresno, Monterey
Grapes, All 1 91 796.0 6,678.0 4,450,626 3 2 --- Kern, Fresno, Tulare, Napa, Sonoma
*Kiwifruit 5 1 97 4.2 29.6 22,940 65 67 Oct. 1-May 31 Butte, Tulare, Yuba, Fresno, SutterLemons 1 92 45.0 800.0 435,752 23 19 Aug. 1-July 31 Ventura, San Diego, Riverside, Tulare, Kern
Nectarines 5 1 95 25.0 180.0 139,860 42 42 June 10-Sept. 5 Tulare, Fresno, Kings, Kern, Los Angeles
Olives 5 1 96 44.0 160.0 130,038 56 45 Sept. 25-Mar. 15 Tehama, Tulare, Glenn, San Joaquin, Butte
Oranges, Navel & Misc --- --- 137.0 1,820.0 607,432 --- --- Nov. 1-June 15 Tulare, Kern, Fresno, San Diego, Riverside
Oranges, Valencia --- --- 40.0 500.0 157,351 --- --- Mar. 15 - Dec. 20 Tulare, Kern, Fresno, Ventura, San Diego
Oranges, All 2 29 177.0 2,320.0 764,783 16 14 --- Tulare, Kern, Fresno, Ventura, San Diego
Peaches, Clingstone 1 100 23.0 369.0 128,397 --- --- July 15-Sept. 15 Stanislaus, Sutter, Yuba, Merced, Fresno
Peaches, Freestone 1 56 24.0 344.0 202,297 --- --- May 10-Sept. 15 Fresno, Tulare, Kings, Stanislaus, Merced
Peaches, All 1 73 47.0 713.0 330,694 25 26 --- Fresno, Tulare, Stanislaus, Sutter, Kings
Pears, All 3 25 14.0 215.0 93,977 45 46 Aug. 5-Oct. 5 Sacramento, Lake, Fresno, Mendocino, Tulare
Pecans 7 2 24.0 7,584 70 71 Sept. 1-Nov. 30 Tulare, OthersPistachios 5 1 98 178.0 275.5 1,113,020 13 11 Sept. 15-Dec. 10 Kern, Fresno, Tulare, Madera, Kings
Plums 5 1 97 25.0 115.0 79,940 50 48 May 25-Aug. 20 Fresno, Tulare, Kern, Kings, Sutter
Plums, Dried 5 1 99 55.0 125.0 156,250 36 40 Aug. 15-Oct. 10 Sutter, Butte, Tehama, Yuba, Glenn
Tangerines, Mandarins, Tangelos & Tangors 9
1 51 38.0 540.0 D 32 23 Nov. 1-May 15 Kern, Tulare, Fresno, Riverside, Ventura
Walnuts 5 1 99 245.0 470.0 1,363,000 9 9 Sept. 5-Nov. 10 San Joaquin, Butte, Stanislaus, Tulare, Glenn
Other Fruits and Nuts --- --- --- --- 223,790 --- --- --- ---
FRUIT AND NUT CROPS TOTAL VALUE -- $17,373,946,000
Agricultural Statistical Overview California Agricultural Statistics Review 2013-2014 12
2011 2012
Number Percent 1,000 Acres1,000 Tons
$1,000 Number
Commodity Rank, Acreage, Production, Value and Leading Producing Counties, 2012
Commodity
U.S. Rank 1
CA Share of U.S. Prod. 1
Area Harvested
Short Tons (2,000Lbs.)
Total Value 2
California Rank 3
Harvest
SeasonLeading Counties 4
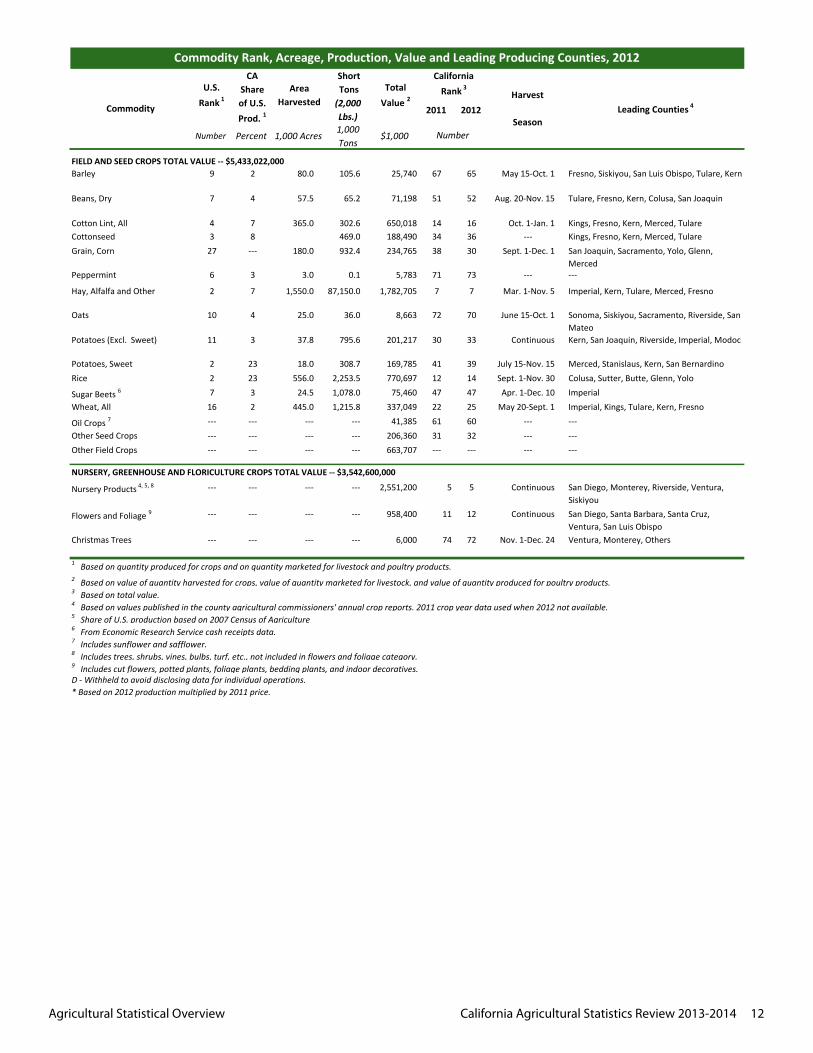
Barley 9 2 80.0 105.6 25,740 67 65 May 15-Oct. 1 Fresno, Siskiyou, San Luis Obispo, Tulare, Kern
Beans, Dry 7 4 57.5 65.2 71,198 51 52 Aug. 20-Nov. 15 Tulare, Fresno, Kern, Colusa, San Joaquin
Cotton Lint, All 4 7 365.0 302.6 650,018 14 16 Oct. 1-Jan. 1 Kings, Fresno, Kern, Merced, TulareCottonseed 3 8 469.0 188,490 34 36 --- Kings, Fresno, Kern, Merced, TulareGrain, Corn 27 --- 180.0 932.4 234,765 38 30 Sept. 1-Dec. 1 San Joaquin, Sacramento, Yolo, Glenn,
MercedPeppermint 6 3 3.0 0.1 5,783 71 73 --- ---
Hay, Alfalfa and Other 2 7 1,550.0 87,150.0 1,782,705 7 7 Mar. 1-Nov. 5 Imperial, Kern, Tulare, Merced, Fresno
Oats 10 4 25.0 36.0 8,663 72 70 June 15-Oct. 1 Sonoma, Siskiyou, Sacramento, Riverside, San Mateo
Potatoes (Excl. Sweet) 11 3 37.8 795.6 201,217 30 33 Continuous Kern, San Joaquin, Riverside, Imperial, Modoc
Potatoes, Sweet 2 23 18.0 308.7 169,785 41 39 July 15-Nov. 15 Merced, Stanislaus, Kern, San BernardinoRice 2 23 556.0 2,253.5 770,697 12 14 Sept. 1-Nov. 30 Colusa, Sutter, Butte, Glenn, Yolo
Sugar Beets 6 7 3 24.5 1,078.0 75,460 47 47 Apr. 1-Dec. 10 Imperial Wheat, All 16 2 445.0 1,215.8 337,049 22 25 May 20-Sept. 1 Imperial, Kings, Tulare, Kern, Fresno
Oil Crops 7 --- --- --- --- 41,385 61 60 --- ---Other Seed Crops --- --- --- --- 206,360 31 32 --- ---Other Field Crops --- --- --- --- 663,707 --- --- --- ---
Nursery Products 4, 5, 8 --- --- --- --- 2,551,200 5 5 Continuous San Diego, Monterey, Riverside, Ventura, Siskiyou
Flowers and Foliage 9 --- --- --- --- 958,400 11 12 Continuous San Diego, Santa Barbara, Santa Cruz, Ventura, San Luis Obispo
Christmas Trees --- --- --- --- 6,000 74 72 Nov. 1-Dec. 24 Ventura, Monterey, Others
D - Withheld to avoid disclosing data for individual operations.* Based on 2012 production multiplied by 2011 price.
FIELD AND SEED CROPS TOTAL VALUE -- $5,433,022,000
6 From Economic Research Service cash receipts data.7 Includes sunflower and safflower. 8 Includes trees, shrubs, vines, bulbs, turf, etc., not included in flowers and foliage category. 9 Includes cut flowers, potted plants, foliage plants, bedding plants, and indoor decoratives.
NURSERY, GREENHOUSE AND FLORICULTURE CROPS TOTAL VALUE -- $3,542,600,000
1 Based on quantity produced for crops and on quantity marketed for livestock and poultry products. 2 Based on value of quantity harvested for crops, value of quantity marketed for livestock, and value of quantity produced for poultry products. 3 Based on total value.4 Based on values published in the county agricultural commissioners' annual crop reports. 2011 crop year data used when 2012 not available. 5 Share of U.S. production based on 2007 Census of Agriculture
Agricultural Statistical Overview California Agricultural Statistics Review 2013-2014 13
CommodityU.S.
Rank 1CA Share of U.S. Prod.
Marketings Cash Receipts 2
2011 2012
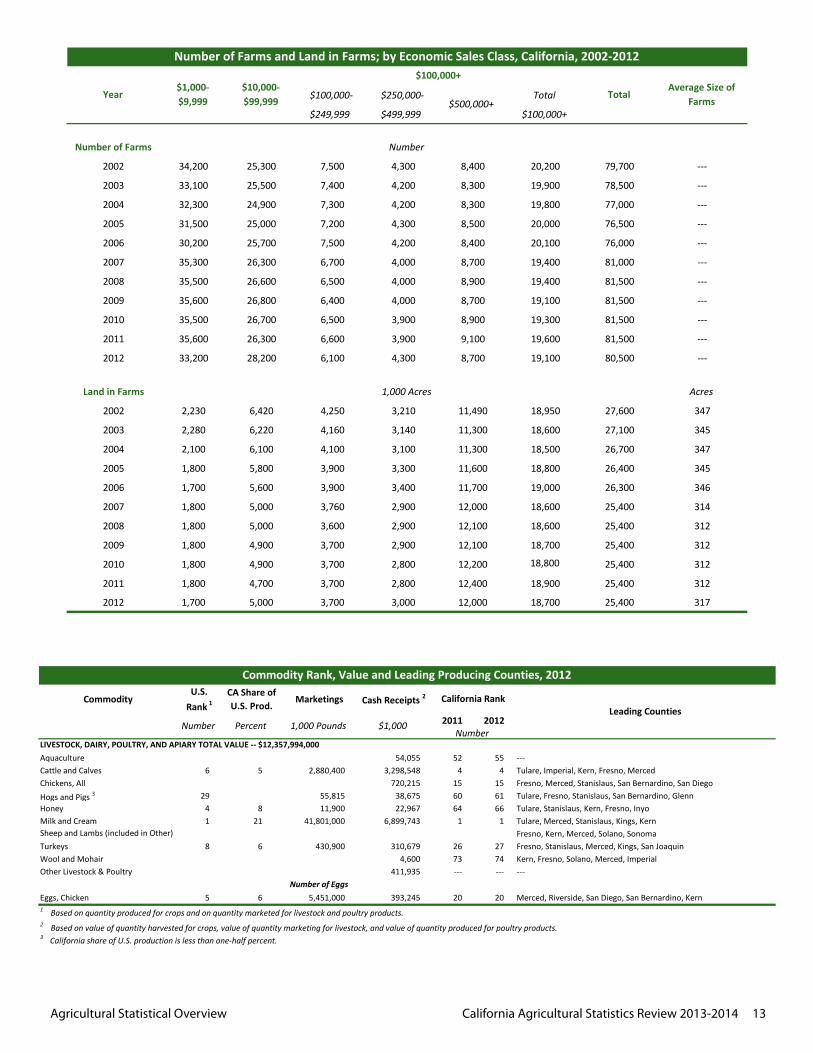
Aquaculture 54,055 52 55 ---Cattle and Calves 6 5 2,880,400 3,298,548 4 4 Tulare, Imperial, Kern, Fresno, MercedChickens, All 720,215 15 15 Fresno, Merced, Stanislaus, San Bernardino, San DiegoHogs and Pigs 3 29 55,815 38,675 60 61 Tulare, Fresno, Stanislaus, San Bernardino, GlennHoney 4 8 11,900 22,967 64 66 Tulare, Stanislaus, Kern, Fresno, InyoMilk and Cream 1 21 41,801,000 6,899,743 1 1 Tulare, Merced, Stanislaus, Kings, Kern
Fresno, Kern, Merced, Solano, SonomaTurkeys 8 6 430,900 310,679 26 27 Fresno, Stanislaus, Merced, Kings, San JoaquinWool and Mohair 4,600 73 74 Kern, Fresno, Solano, Merced, ImperialOther Livestock & Poultry 411,935 --- --- ---
Number of EggsEggs, Chicken 5 6 5,451,000 393,245 20 20 Merced, Riverside, San Diego, San Bernardino, Kern
2 Based on value of quantity harvested for crops, value of quantity marketing for livestock, and value of quantity produced for poultry products.
1 Based on quantity produced for crops and on quantity marketed for livestock and poultry products.
3 California share of U.S. production is less than one-half percent.
Commodity Rank, Value and Leading Producing Counties, 2012
$1,000 1,000 PoundsPercentNumber
California RankLeading Counties
NumberLIVESTOCK, DAIRY, POULTRY, AND APIARY TOTAL VALUE -- $12,357,994,000
Sheep and Lambs (included in Other)
$100,000- $250,000- Total
$249,999 $499,999 $100,000+
Number of Farms
2002 34,200 25,300 7,500 4,300 8,400 20,200 79,700 ---
2003 33,100 25,500 7,400 4,200 8,300 19,900 78,500 ---
2004 32,300 24,900 7,300 4,200 8,300 19,800 77,000 ---
2005 31,500 25,000 7,200 4,300 8,500 20,000 76,500 ---
2006 30,200 25,700 7,500 4,200 8,400 20,100 76,000 ---
2007 35,300 26,300 6,700 4,000 8,700 19,400 81,000 ---
2008 35,500 26,600 6,500 4,000 8,900 19,400 81,500 ---
2009 35,600 26,800 6,400 4,000 8,700 19,100 81,500 ---
2010 35,500 26,700 6,500 3,900 8,900 19,300 81,500 ---
2011 35,600 26,300 6,600 3,900 9,100 19,600 81,500 ---
2012 33,200 28,200 6,100 4,300 8,700 19,100 80,500 ---
Land in Farms Acres
2002 2,230 6,420 4,250 3,210 11,490 18,950 27,600 347
2003 2,280 6,220 4,160 3,140 11,300 18,600 27,100 345
2004 2,100 6,100 4,100 3,100 11,300 18,500 26,700 347
2005 1,800 5,800 3,900 3,300 11,600 18,800 26,400 345
2006 1,700 5,600 3,900 3,400 11,700 19,000 26,300 346
2007 1,800 5,000 3,760 2,900 12,000 18,600 25,400 314
2008 1,800 5,000 3,600 2,900 12,100 18,600 25,400 312
2009 1,800 4,900 3,700 2,900 12,100 18,700 25,400 312
2010 1,800 4,900 3,700 2,800 12,200 18,800 25,400 312
2011 1,800 4,700 3,700 2,800 12,400 18,900 25,400 312
2012 1,700 5,000 3,700 3,000 12,000 18,700 25,400 317
Average Size of Farms
Number of Farms and Land in Farms; by Economic Sales Class, California, 2002-2012$100,000+
1,000 Acres
Year$1,000- $9,999
$10,000-$99,999
Total$500,000+
Number
Agricultural Statistical Overview California Agricultural Statistics Review 2013-2014 14
Total Value
2011 2012 $1,000
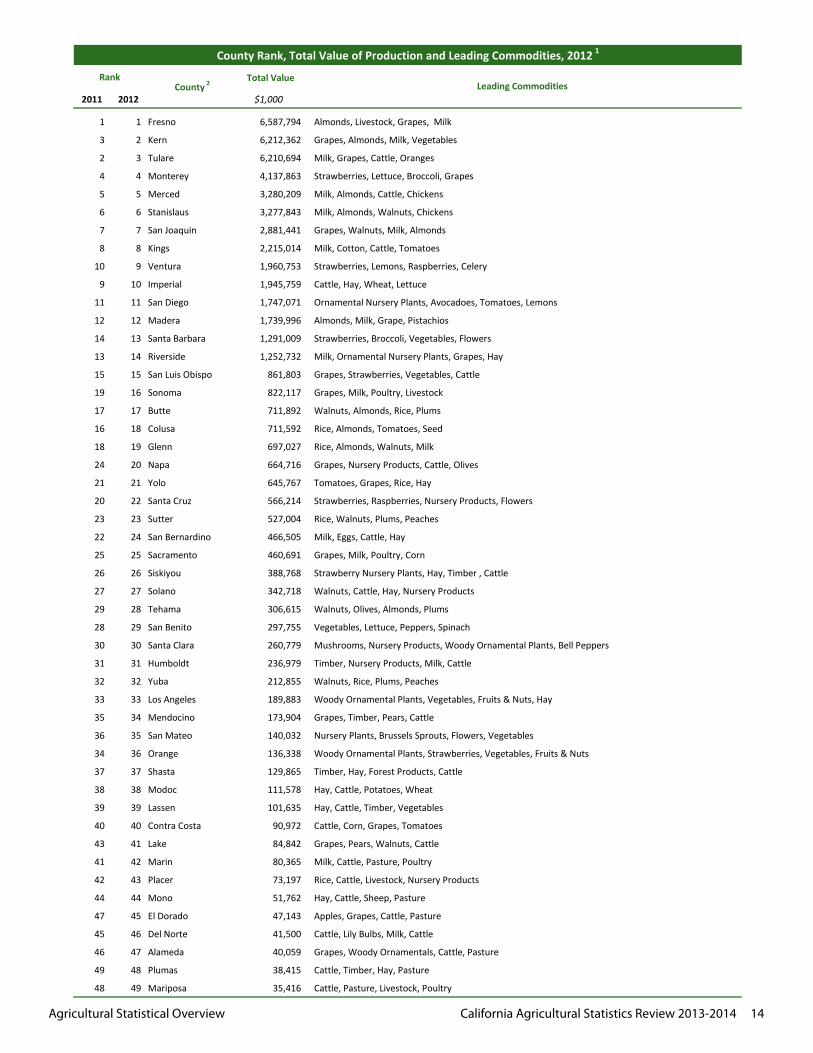
1 1 Fresno 6,587,794 Almonds, Livestock, Grapes, Milk
3 2 Kern 6,212,362 Grapes, Almonds, Milk, Vegetables
2 3 Tulare 6,210,694 Milk, Grapes, Cattle, Oranges
4 4 Monterey 4,137,863 Strawberries, Lettuce, Broccoli, Grapes
5 5 Merced 3,280,209 Milk, Almonds, Cattle, Chickens
6 6 Stanislaus 3,277,843 Milk, Almonds, Walnuts, Chickens
7 7 San Joaquin 2,881,441 Grapes, Walnuts, Milk, Almonds
8 8 Kings 2,215,014 Milk, Cotton, Cattle, Tomatoes
10 9 Ventura 1,960,753 Strawberries, Lemons, Raspberries, Celery
9 10 Imperial 1,945,759 Cattle, Hay, Wheat, Lettuce
11 11 San Diego 1,747,071 Ornamental Nursery Plants, Avocadoes, Tomatoes, Lemons
12 12 Madera 1,739,996 Almonds, Milk, Grape, Pistachios
14 13 Santa Barbara 1,291,009 Strawberries, Broccoli, Vegetables, Flowers
13 14 Riverside 1,252,732 Milk, Ornamental Nursery Plants, Grapes, Hay
15 15 San Luis Obispo 861,803 Grapes, Strawberries, Vegetables, Cattle
19 16 Sonoma 822,117 Grapes, Milk, Poultry, Livestock
17 17 Butte 711,892 Walnuts, Almonds, Rice, Plums
16 18 Colusa 711,592 Rice, Almonds, Tomatoes, Seed
18 19 Glenn 697,027 Rice, Almonds, Walnuts, Milk
24 20 Napa 664,716 Grapes, Nursery Products, Cattle, Olives
21 21 Yolo 645,767 Tomatoes, Grapes, Rice, Hay
20 22 Santa Cruz 566,214 Strawberries, Raspberries, Nursery Products, Flowers
23 23 Sutter 527,004 Rice, Walnuts, Plums, Peaches
22 24 San Bernardino 466,505 Milk, Eggs, Cattle, Hay
25 25 Sacramento 460,691 Grapes, Milk, Poultry, Corn
26 26 Siskiyou 388,768 Strawberry Nursery Plants, Hay, Timber , Cattle
27 27 Solano 342,718 Walnuts, Cattle, Hay, Nursery Products
29 28 Tehama 306,615 Walnuts, Olives, Almonds, Plums
28 29 San Benito 297,755 Vegetables, Lettuce, Peppers, Spinach
30 30 Santa Clara 260,779 Mushrooms, Nursery Products, Woody Ornamental Plants, Bell Peppers
31 31 Humboldt 236,979 Timber, Nursery Products, Milk, Cattle
32 32 Yuba 212,855 Walnuts, Rice, Plums, Peaches
33 33 Los Angeles 189,883 Woody Ornamental Plants, Vegetables, Fruits & Nuts, Hay
35 34 Mendocino 173,904 Grapes, Timber, Pears, Cattle
36 35 San Mateo 140,032 Nursery Plants, Brussels Sprouts, Flowers, Vegetables
34 36 Orange 136,338 Woody Ornamental Plants, Strawberries, Vegetables, Fruits & Nuts
37 37 Shasta 129,865 Timber, Hay, Forest Products, Cattle
38 38 Modoc 111,578 Hay, Cattle, Potatoes, Wheat
39 39 Lassen 101,635 Hay, Cattle, Timber, Vegetables
40 40 Contra Costa 90,972 Cattle, Corn, Grapes, Tomatoes
43 41 Lake 84,842 Grapes, Pears, Walnuts, Cattle
41 42 Marin 80,365 Milk, Cattle, Pasture, Poultry
42 43 Placer 73,197 Rice, Cattle, Livestock, Nursery Products
44 44 Mono 51,762 Hay, Cattle, Sheep, Pasture
47 45 El Dorado 47,143 Apples, Grapes, Cattle, Pasture
45 46 Del Norte 41,500 Cattle, Lily Bulbs, Milk, Cattle
46 47 Alameda 40,059 Grapes, Woody Ornamentals, Cattle, Pasture
49 48 Plumas 38,415 Cattle, Timber, Hay, Pasture
48 49 Mariposa 35,416 Cattle, Pasture, Livestock, Poultry
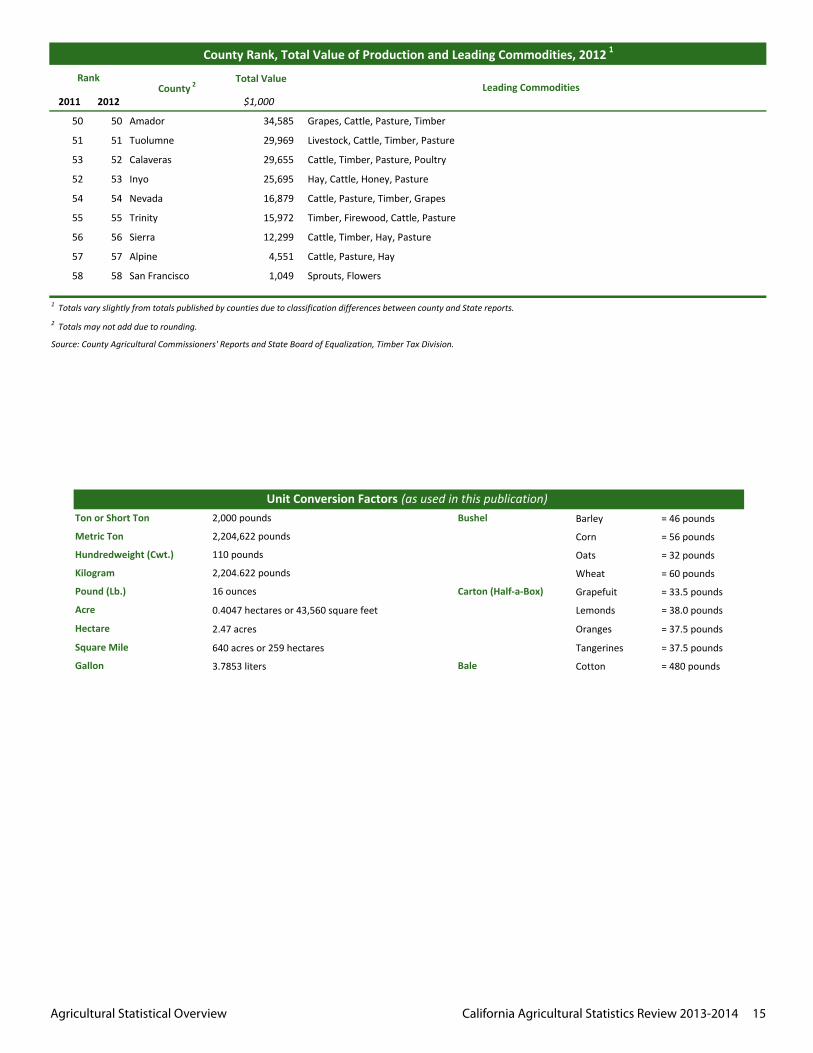
County Rank, Total Value of Production and Leading Commodities, 2012 1
RankCounty 2 Leading Commodities
Agricultural Statistical Overview California Agricultural Statistics Review 2013-2014 15
Barley = 46 pounds
Corn = 56 pounds
Oats = 32 pounds
Wheat = 60 pounds
Grapefuit = 33.5 pounds
0.4047 hectares or 43,560 square feet Lemonds = 38.0 pounds
2.47 acres Oranges = 37.5 pounds
640 acres or 259 hectares Tangerines = 37.5 pounds
3.7853 liters Cotton = 480 pounds
Square Mile
Gallon
Pound (Lb.) 16 ounces
Acre
Hectare
Hundredweight (Cwt.) 110 pounds
Kilogram 2,204.622 pounds
Bale
Unit Conversion Factors (as used in this publication)Bushel
Carton (Half-a-Box)
Ton or Short Ton 2,000 pounds
Metric Ton 2,204,622 pounds
Total Value
2011 2012 $1,000
County Rank, Total Value of Production and Leading Commodities, 2012 1
RankCounty 2 Leading Commodities
50 50 Amador 34,585 Grapes, Cattle, Pasture, Timber
51 51 Tuolumne 29,969 Livestock, Cattle, Timber, Pasture
53 52 Calaveras 29,655 Cattle, Timber, Pasture, Poultry
52 53 Inyo 25,695 Hay, Cattle, Honey, Pasture
54 54 Nevada 16,879 Cattle, Pasture, Timber, Grapes
55 55 Trinity 15,972 Timber, Firewood, Cattle, Pasture
56 56 Sierra 12,299 Cattle, Timber, Hay, Pasture
57 57 Alpine 4,551 Cattle, Pasture, Hay
58 58 San Francisco 1,049 Sprouts, Flowers
Source: County Agricultural Commissioners' Reports and State Board of Equalization, Timber Tax Division.
2 Totals may not add due to rounding.
1 Totals vary slightly from totals published by counties due to classification differences between county and State reports.
Agricultural Statistical Overview California Agricultural Statistics Review 2013-2014 16
Precipitation Precipitation
Inches Inches Inches
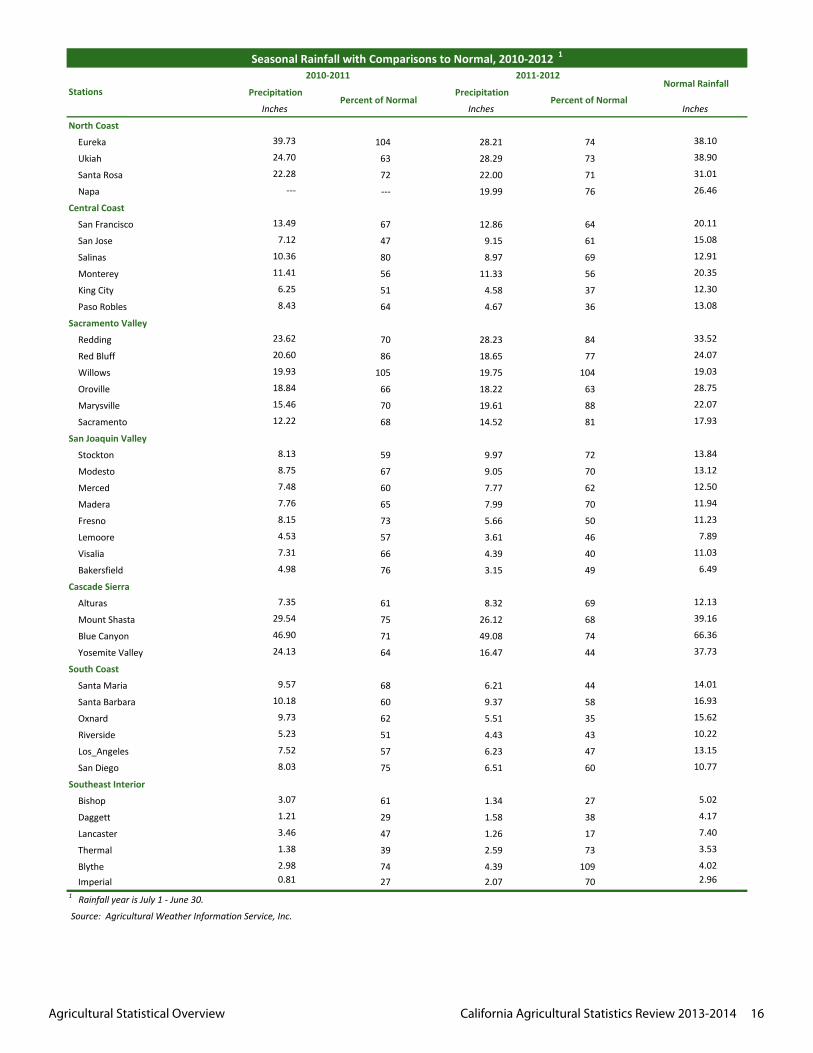
North Coast
Eureka 39.73 104 28.21 74 38.10
Ukiah 24.70 63 28.29 73 38.90
Santa Rosa 22.28 72 22.00 71 31.01
Napa --- --- 19.99 76 26.46
Central Coast
San Francisco 13.49 67 12.86 64 20.11
San Jose 7.12 47 9.15 61 15.08
Salinas 10.36 80 8.97 69 12.91
Monterey 11.41 56 11.33 56 20.35
King City 6.25 51 4.58 37 12.30
Paso Robles 8.43 64 4.67 36 13.08
Sacramento Valley
Redding 23.62 70 28.23 84 33.52
Red Bluff 20.60 86 18.65 77 24.07
Willows 19.93 105 19.75 104 19.03
Oroville 18.84 66 18.22 63 28.75
Marysville 15.46 70 19.61 88 22.07
Sacramento 12.22 68 14.52 81 17.93
San Joaquin Valley
Stockton 8.13 59 9.97 72 13.84
Modesto 8.75 67 9.05 70 13.12
Merced 7.48 60 7.77 62 12.50
Madera 7.76 65 7.99 70 11.94
Fresno 8.15 73 5.66 50 11.23
Lemoore 4.53 57 3.61 46 7.89
Visalia 7.31 66 4.39 40 11.03
Bakersfield 4.98 76 3.15 49 6.49
Cascade Sierra
Alturas 7.35 61 8.32 69 12.13
Mount Shasta 29.54 75 26.12 68 39.16
Blue Canyon 46.90 71 49.08 74 66.36
Yosemite Valley 24.13 64 16.47 44 37.73
South Coast
Santa Maria 9.57 68 6.21 44 14.01
Santa Barbara 10.18 60 9.37 58 16.93
Oxnard 9.73 62 5.51 35 15.62
Riverside 5.23 51 4.43 43 10.22
Los_Angeles 7.52 57 6.23 47 13.15
San Diego 8.03 75 6.51 60 10.77
Southeast Interior
Bishop 3.07 61 1.34 27 5.02
Daggett 1.21 29 1.58 38 4.17
Lancaster 3.46 47 1.26 17 7.40
Thermal 1.38 39 2.59 73 3.53
Blythe 2.98 74 4.39 109 4.02
Imperial 0.81 27 2.07 70 2.961 Rainfall year is July 1 ‐ June 30.
Source: Agricultural Weather Information Service, Inc.
Seasonal Rainfall with Comparisons to Normal, 2010-2012 1
Stations
2011-2012Normal Rainfall
Percent of Normal Percent of Normal
2010-2011
Agricultural Statistical Overview California Agricultural Statistics Review 2013-2014 17
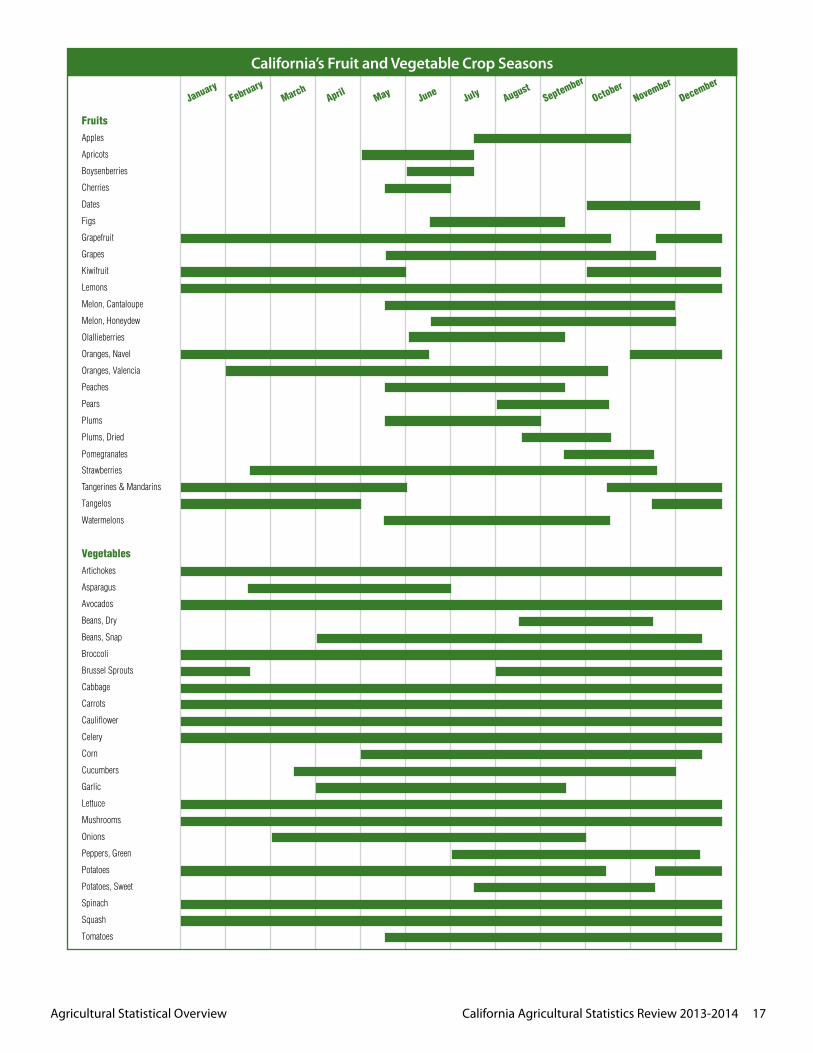
Vegetables
Artichokes
Asparagus
Avocados
Beans, Dry
Beans, Snap
Broccoli
Brussel Sprouts
Cabbage
Carrots
Cauliflower
Celery
Corn
Cucumbers
Garlic
Lettuce
Mushrooms
Onions
Peppers, Green
Potatoes
Potatoes, Sweet
Spinach
Squash
Tomatoes
Fruits
Apples
Apricots
Boysenberries
Cherries
Dates
Figs
Grapefruit
Grapes
Kiwifruit
Lemons
Melon, Cantaloupe
Melon, Honeydew
Olallieberries
Oranges, Navel
Oranges, Valencia
Peaches
Pears
Plums
Plums, Dried
Strawberries
Tangerines & Mandarins
Tangelos
Watermelons
JanuaryFebruary
MarchApril May June
July AugustSeptember
OctoberNovember
December
Pomegranates
California’s Fruit and Vegetable Crop Seasons
County Statistical Data California Agricultural Statistics Review 2013-2014 18
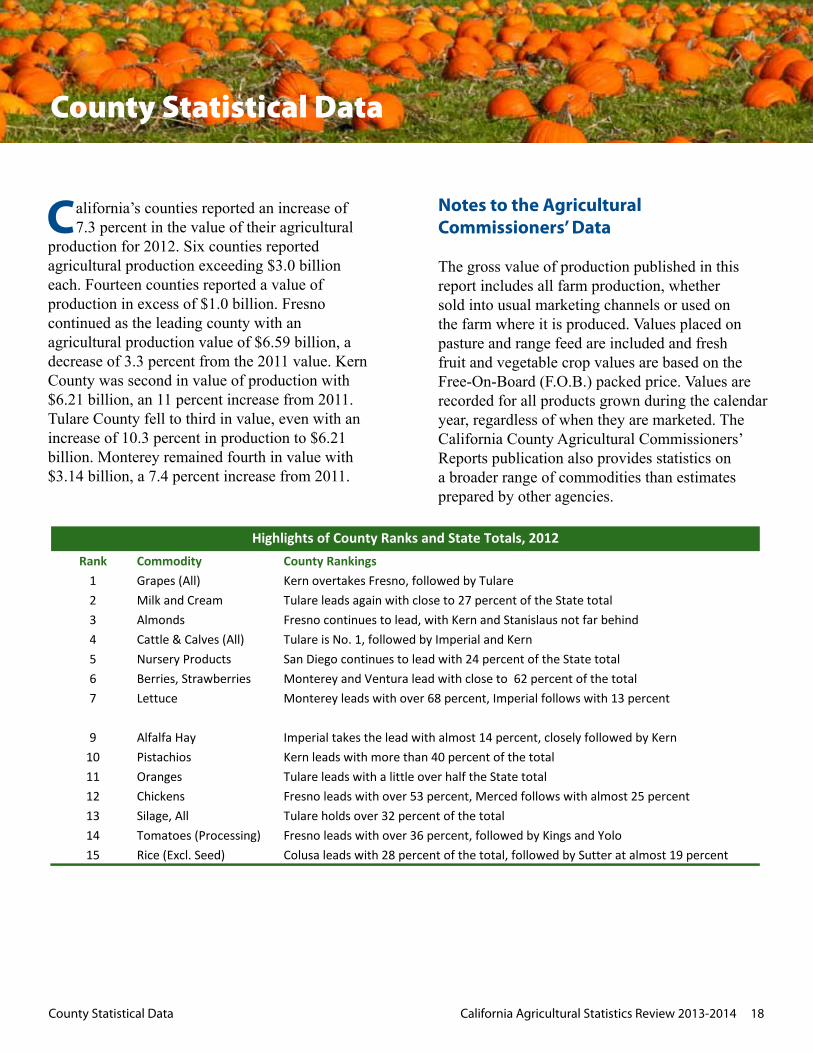
alifornia’s counties reported an increase of 7.3 percent in the value of their agricultural production for 2012. Six counties reported agricultural production exceeding $3.0 billion each. Fourteen counties reported a value of production in excess of $1.0 billion. Fresno continued as the leading county with an agricultural production value of $6.59 billion, a decrease of 3.3 percent from the 2011 value. Kern County was second in value of production with $6.21 billion, an 11 percent increase from 2011. Tulare County fell to third in value, even with an increase of 10.3 percent in production to $6.21 billion. Monterey remained fourth in value with $3.14 billion, a 7.4 percent increase from 2011.
Notes to the Agricultural Commissioners’ Data
The gross value of production published in this report includes all farm production, whether sold into usual marketing channels or used on the farm where it is produced. Values placed on pasture and range feed are included and fresh fruit and vegetable crop values are based on the Free-On-Board (F.O.B.) packed price. Values are recorded for all products grown during the calendar year, regardless of when they are marketed. The California County Agricultural Commissioners’ Reports publication also provides statistics on a broader range of commodities than estimates prepared by other agencies.
C
County Statistical Data
Rank Commodity County Rankings1 Grapes (All) Kern overtakes Fresno, followed by Tulare2 Milk and Cream Tulare leads again with close to 27 percent of the State total3 Almonds Fresno continues to lead, with Kern and Stanislaus not far behind4 Cattle & Calves (All) Tulare is No. 1, followed by Imperial and Kern5 Nursery Products San Diego continues to lead with 24 percent of the State total6 Berries, Strawberries Monterey and Ventura lead with close to 62 percent of the total7 Lettuce Monterey leads with over 68 percent, Imperial follows with 13 percent
9 Alfalfa Hay Imperial takes the lead with almost 14 percent, closely followed by Kern 10 Pistachios Kern leads with more than 40 percent of the total11 Oranges Tulare leads with a little over half the State total12 Chickens Fresno leads with over 53 percent, Merced follows with almost 25 percent13 Silage, All Tulare holds over 32 percent of the total14 Tomatoes (Processing) Fresno leads with over 36 percent, followed by Kings and Yolo 15 Rice (Excl. Seed) Colusa leads with 28 percent of the total, followed by Sutter at almost 19 percent
Highlights of County Ranks and State Totals, 2012
8
County Statistical Data California Agricultural Statistics Review 2013-2014 19
Because of these concepts, the State total for gross dollar values summarized in this report differs from the cash receipts to farmers estimated by USDA’s National Agricultural Statistics Service, Pacific Region-California. The larger total value reported by Agricultural Commissioners results from the different definitions used in estimating total value of production rather than cash receipts to producers.
Some counties include timber as a part of their crop report, following the pattern set by the California County Agricultural Commissioners and Sealers Association (CACASA). Since it is not comparable to earlier county summaries, timber has not been made a part of the main tables of this summary. The total 2012 value of production reported by the counties, including timber, is $55.7 billion, up 7.3 percent from last year. At $62.6 million, Humboldt
County leads the State with 23.4 percent of the State’s total timber value.
County Agricultural Commissioners’ Reports
Copies of individual County Agricultural Commissioners’ Reports may be requested or obtained directly from each County Agricultural Commissioner’s Office. For your convenience, a listing is included at the end of this report. Many of the counties publish the reports on their websites free-of-charge.
USDA’s National Agricultural Statistics Service, Pacific Regional Office publications are available free-of-charge on the internet at: www.nass.usda.gov/ca.
Total Agricultural Value(Including Timber)
Million Bd. Ft. $1,000 $1,000 Percent1 Humboldt 221,617 236,979 62,557 26.42 Shasta 185,799 129,865 36,931 28.43 Siskiyou 144,874 388,768 30,768 7.94 Mendocino 121,850 173,904 28,940 16.65 Plumas 84,652 38,415 13,669 35.6
1 Timber volume and value data are from the State Board of Equalization, Timber Tax Division.
California’s Leading Timber Counties, 2012 1
Timber Rank
CountyTimber Volume Timber Value
Timber Percentage of Total Agricultural Value Within County
County Statistical Data California Agricultural Statistics Review 2013-2014 20
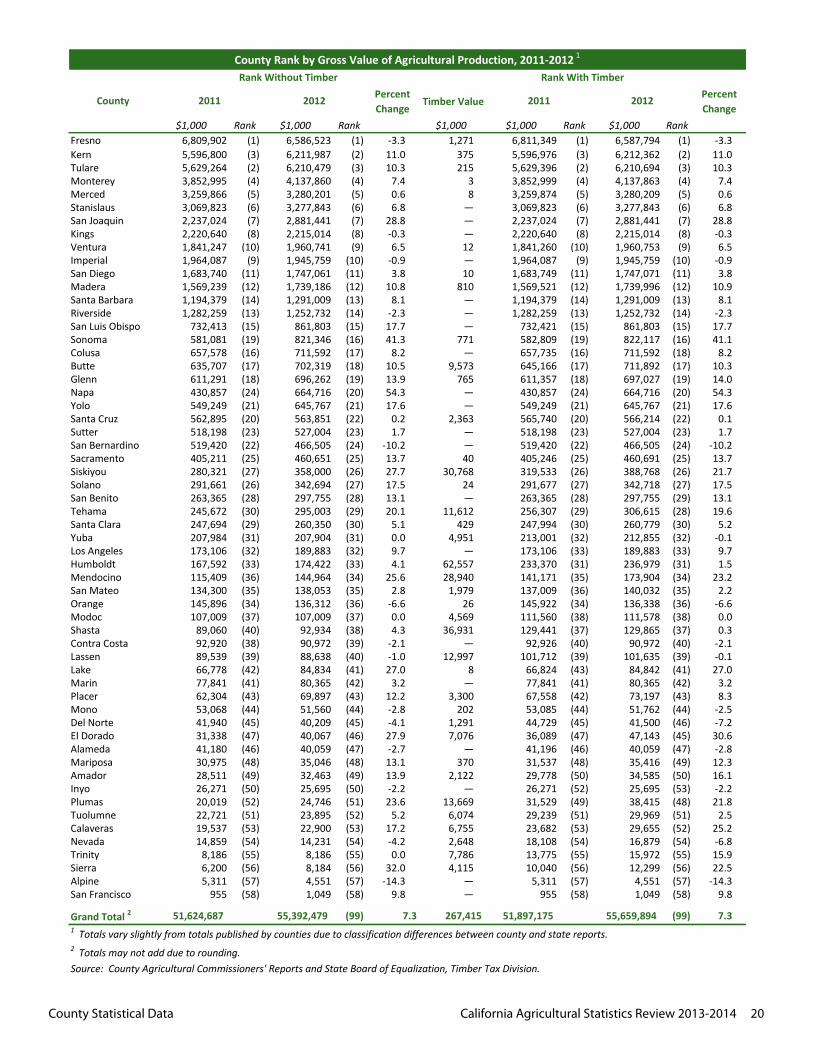
Percent Change
Timber ValuePercent Change
$1,000 Rank $1,000 Rank $1,000 $1,000 Rank $1,000 RankFresno 6,809,902 (1) 6,586,523 (1) -3.3 1,271 6,811,349 (1) 6,587,794 (1) -3.3Kern 5,596,800 (3) 6,211,987 (2) 11.0 375 5,596,976 (3) 6,212,362 (2) 11.0Tulare 5,629,264 (2) 6,210,479 (3) 10.3 215 5,629,396 (2) 6,210,694 (3) 10.3Monterey 3,852,995 (4) 4,137,860 (4) 7.4 3 3,852,999 (4) 4,137,863 (4) 7.4Merced 3,259,866 (5) 3,280,201 (5) 0.6 8 3,259,874 (5) 3,280,209 (5) 0.6Stanislaus 3,069,823 (6) 3,277,843 (6) 6.8 — 3,069,823 (6) 3,277,843 (6) 6.8San Joaquin 2,237,024 (7) 2,881,441 (7) 28.8 — 2,237,024 (7) 2,881,441 (7) 28.8Kings 2,220,640 (8) 2,215,014 (8) -0.3 — 2,220,640 (8) 2,215,014 (8) -0.3Ventura 1,841,247 (10) 1,960,741 (9) 6.5 12 1,841,260 (10) 1,960,753 (9) 6.5Imperial 1,964,087 (9) 1,945,759 (10) -0.9 — 1,964,087 (9) 1,945,759 (10) -0.9San Diego 1,683,740 (11) 1,747,061 (11) 3.8 10 1,683,749 (11) 1,747,071 (11) 3.8Madera 1,569,239 (12) 1,739,186 (12) 10.8 810 1,569,521 (12) 1,739,996 (12) 10.9Santa Barbara 1,194,379 (14) 1,291,009 (13) 8.1 — 1,194,379 (14) 1,291,009 (13) 8.1Riverside 1,282,259 (13) 1,252,732 (14) -2.3 — 1,282,259 (13) 1,252,732 (14) -2.3San Luis Obispo 732,413 (15) 861,803 (15) 17.7 — 732,421 (15) 861,803 (15) 17.7Sonoma 581,081 (19) 821,346 (16) 41.3 771 582,809 (19) 822,117 (16) 41.1Colusa 657,578 (16) 711,592 (17) 8.2 — 657,735 (16) 711,592 (18) 8.2Butte 635,707 (17) 702,319 (18) 10.5 9,573 645,166 (17) 711,892 (17) 10.3Glenn 611,291 (18) 696,262 (19) 13.9 765 611,357 (18) 697,027 (19) 14.0Napa 430,857 (24) 664,716 (20) 54.3 — 430,857 (24) 664,716 (20) 54.3Yolo 549,249 (21) 645,767 (21) 17.6 — 549,249 (21) 645,767 (21) 17.6Santa Cruz 562,895 (20) 563,851 (22) 0.2 2,363 565,740 (20) 566,214 (22) 0.1Sutter 518,198 (23) 527,004 (23) 1.7 — 518,198 (23) 527,004 (23) 1.7San Bernardino 519,420 (22) 466,505 (24) -10.2 — 519,420 (22) 466,505 (24) -10.2Sacramento 405,211 (25) 460,651 (25) 13.7 40 405,246 (25) 460,691 (25) 13.7Siskiyou 280,321 (27) 358,000 (26) 27.7 30,768 319,533 (26) 388,768 (26) 21.7Solano 291,661 (26) 342,694 (27) 17.5 24 291,677 (27) 342,718 (27) 17.5San Benito 263,365 (28) 297,755 (28) 13.1 — 263,365 (28) 297,755 (29) 13.1Tehama 245,672 (30) 295,003 (29) 20.1 11,612 256,307 (29) 306,615 (28) 19.6Santa Clara 247,694 (29) 260,350 (30) 5.1 429 247,994 (30) 260,779 (30) 5.2Yuba 207,984 (31) 207,904 (31) 0.0 4,951 213,001 (32) 212,855 (32) -0.1Los Angeles 173,106 (32) 189,883 (32) 9.7 — 173,106 (33) 189,883 (33) 9.7Humboldt 167,592 (33) 174,422 (33) 4.1 62,557 233,370 (31) 236,979 (31) 1.5Mendocino 115,409 (36) 144,964 (34) 25.6 28,940 141,171 (35) 173,904 (34) 23.2San Mateo 134,300 (35) 138,053 (35) 2.8 1,979 137,009 (36) 140,032 (35) 2.2Orange 145,896 (34) 136,312 (36) -6.6 26 145,922 (34) 136,338 (36) -6.6Modoc 107,009 (37) 107,009 (37) 0.0 4,569 111,560 (38) 111,578 (38) 0.0Shasta 89,060 (40) 92,934 (38) 4.3 36,931 129,441 (37) 129,865 (37) 0.3Contra Costa 92,920 (38) 90,972 (39) -2.1 — 92,926 (40) 90,972 (40) -2.1Lassen 89,539 (39) 88,638 (40) -1.0 12,997 101,712 (39) 101,635 (39) -0.1Lake 66,778 (42) 84,834 (41) 27.0 8 66,824 (43) 84,842 (41) 27.0Marin 77,841 (41) 80,365 (42) 3.2 — 77,841 (41) 80,365 (42) 3.2Placer 62,304 (43) 69,897 (43) 12.2 3,300 67,558 (42) 73,197 (43) 8.3Mono 53,068 (44) 51,560 (44) -2.8 202 53,085 (44) 51,762 (44) -2.5Del Norte 41,940 (45) 40,209 (45) -4.1 1,291 44,729 (45) 41,500 (46) -7.2El Dorado 31,338 (47) 40,067 (46) 27.9 7,076 36,089 (47) 47,143 (45) 30.6Alameda 41,180 (46) 40,059 (47) -2.7 — 41,196 (46) 40,059 (47) -2.8Mariposa 30,975 (48) 35,046 (48) 13.1 370 31,537 (48) 35,416 (49) 12.3Amador 28,511 (49) 32,463 (49) 13.9 2,122 29,778 (50) 34,585 (50) 16.1Inyo 26,271 (50) 25,695 (50) -2.2 — 26,271 (52) 25,695 (53) -2.2Plumas 20,019 (52) 24,746 (51) 23.6 13,669 31,529 (49) 38,415 (48) 21.8Tuolumne 22,721 (51) 23,895 (52) 5.2 6,074 29,239 (51) 29,969 (51) 2.5Calaveras 19,537 (53) 22,900 (53) 17.2 6,755 23,682 (53) 29,655 (52) 25.2Nevada 14,859 (54) 14,231 (54) -4.2 2,648 18,108 (54) 16,879 (54) -6.8Trinity 8,186 (55) 8,186 (55) 0.0 7,786 13,775 (55) 15,972 (55) 15.9Sierra 6,200 (56) 8,184 (56) 32.0 4,115 10,040 (56) 12,299 (56) 22.5Alpine 5,311 (57) 4,551 (57) -14.3 — 5,311 (57) 4,551 (57) -14.3San Francisco 955 (58) 1,049 (58) 9.8 — 955 (58) 1,049 (58) 9.8
Grand Total 2 51,624,687 55,392,479 (99) 7.3 267,415 51,897,175 55,659,894 (99) 7.3
2 Totals may not add due to rounding.
County Rank by Gross Value of Agricultural Production, 2011-2012 1
Rank With Timber
2011
1 Totals vary slightly from totals published by counties due to classification differences between county and state reports.
Source: County Agricultural Commissioners' Reports and State Board of Equalization, Timber Tax Division.
County
Rank Without Timber
2011 2012 2012
County Statistical Data California Agricultural Statistics Review 2013-2014 21
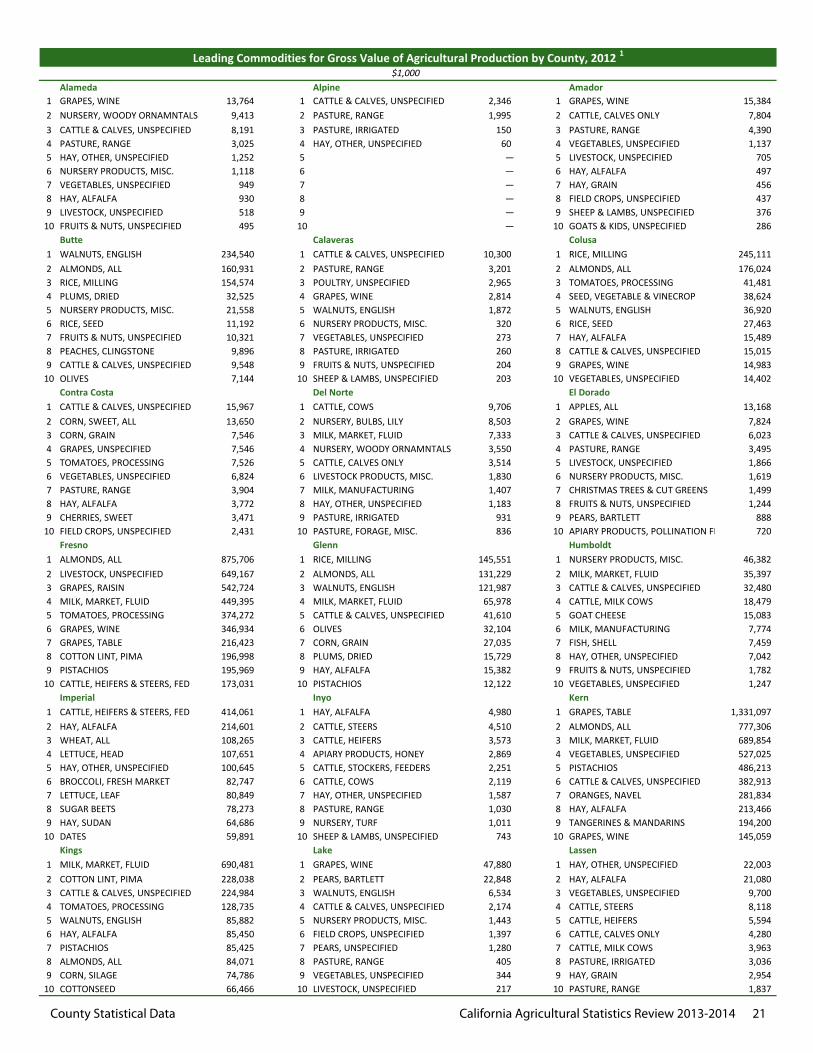
Alameda Alpine Amador 1 GRAPES, WINE 13,764 1 CATTLE & CALVES, UNSPECIFIED 2,346 1 GRAPES, WINE 15,384 2 NURSERY, WOODY ORNAMNTALS 9,413 2 PASTURE, RANGE 1,995 2 CATTLE, CALVES ONLY 7,804 3 CATTLE & CALVES, UNSPECIFIED 8,191 3 PASTURE, IRRIGATED 150 3 PASTURE, RANGE 4,390 4 PASTURE, RANGE 3,025 4 HAY, OTHER, UNSPECIFIED 60 4 VEGETABLES, UNSPECIFIED 1,137 5 HAY, OTHER, UNSPECIFIED 1,252 5 — 5 LIVESTOCK, UNSPECIFIED 705 6 NURSERY PRODUCTS, MISC. 1,118 6 — 6 HAY, ALFALFA 497 7 VEGETABLES, UNSPECIFIED 949 7 — 7 HAY, GRAIN 456 8 HAY, ALFALFA 930 8 — 8 FIELD CROPS, UNSPECIFIED 437 9 LIVESTOCK, UNSPECIFIED 518 9 — 9 SHEEP & LAMBS, UNSPECIFIED 376
10 FRUITS & NUTS, UNSPECIFIED 495 10 — 10 GOATS & KIDS, UNSPECIFIED 286 Butte Calaveras Colusa 1 WALNUTS, ENGLISH 234,540 1 CATTLE & CALVES, UNSPECIFIED 10,300 1 RICE, MILLING 245,111 2 ALMONDS, ALL 160,931 2 PASTURE, RANGE 3,201 2 ALMONDS, ALL 176,024 3 RICE, MILLING 154,574 3 POULTRY, UNSPECIFIED 2,965 3 TOMATOES, PROCESSING 41,481 4 PLUMS, DRIED 32,525 4 GRAPES, WINE 2,814 4 SEED, VEGETABLE & VINECROP 38,624 5 NURSERY PRODUCTS, MISC. 21,558 5 WALNUTS, ENGLISH 1,872 5 WALNUTS, ENGLISH 36,920 6 RICE, SEED 11,192 6 NURSERY PRODUCTS, MISC. 320 6 RICE, SEED 27,463 7 FRUITS & NUTS, UNSPECIFIED 10,321 7 VEGETABLES, UNSPECIFIED 273 7 HAY, ALFALFA 15,489 8 PEACHES, CLINGSTONE 9,896 8 PASTURE, IRRIGATED 260 8 CATTLE & CALVES, UNSPECIFIED 15,015 9 CATTLE & CALVES, UNSPECIFIED 9,548 9 FRUITS & NUTS, UNSPECIFIED 204 9 GRAPES, WINE 14,983
10 OLIVES 7,144 10 SHEEP & LAMBS, UNSPECIFIED 203 10 VEGETABLES, UNSPECIFIED 14,402 Contra Costa Del Norte El Dorado 1 CATTLE & CALVES, UNSPECIFIED 15,967 1 CATTLE, COWS 9,706 1 APPLES, ALL 13,168 2 CORN, SWEET, ALL 13,650 2 NURSERY, BULBS, LILY 8,503 2 GRAPES, WINE 7,824 3 CORN, GRAIN 7,546 3 MILK, MARKET, FLUID 7,333 3 CATTLE & CALVES, UNSPECIFIED 6,023 4 GRAPES, UNSPECIFIED 7,546 4 NURSERY, WOODY ORNAMNTALS 3,550 4 PASTURE, RANGE 3,495 5 TOMATOES, PROCESSING 7,526 5 CATTLE, CALVES ONLY 3,514 5 LIVESTOCK, UNSPECIFIED 1,866 6 VEGETABLES, UNSPECIFIED 6,824 6 LIVESTOCK PRODUCTS, MISC. 1,830 6 NURSERY PRODUCTS, MISC. 1,619 7 PASTURE, RANGE 3,904 7 MILK, MANUFACTURING 1,407 7 CHRISTMAS TREES & CUT GREENS 1,499 8 HAY, ALFALFA 3,772 8 HAY, OTHER, UNSPECIFIED 1,183 8 FRUITS & NUTS, UNSPECIFIED 1,244 9 CHERRIES, SWEET 3,471 9 PASTURE, IRRIGATED 931 9 PEARS, BARTLETT 888
10 FIELD CROPS, UNSPECIFIED 2,431 10 PASTURE, FORAGE, MISC. 836 10 APIARY PRODUCTS, POLLINATION FEES 720 Fresno Glenn Humboldt 1 ALMONDS, ALL 875,706 1 RICE, MILLING 145,551 1 NURSERY PRODUCTS, MISC. 46,382 2 LIVESTOCK, UNSPECIFIED 649,167 2 ALMONDS, ALL 131,229 2 MILK, MARKET, FLUID 35,397 3 GRAPES, RAISIN 542,724 3 WALNUTS, ENGLISH 121,987 3 CATTLE & CALVES, UNSPECIFIED 32,480 4 MILK, MARKET, FLUID 449,395 4 MILK, MARKET, FLUID 65,978 4 CATTLE, MILK COWS 18,479 5 TOMATOES, PROCESSING 374,272 5 CATTLE & CALVES, UNSPECIFIED 41,610 5 GOAT CHEESE 15,083 6 GRAPES, WINE 346,934 6 OLIVES 32,104 6 MILK, MANUFACTURING 7,774 7 GRAPES, TABLE 216,423 7 CORN, GRAIN 27,035 7 FISH, SHELL 7,459 8 COTTON LINT, PIMA 196,998 8 PLUMS, DRIED 15,729 8 HAY, OTHER, UNSPECIFIED 7,042 9 PISTACHIOS 195,969 9 HAY, ALFALFA 15,382 9 FRUITS & NUTS, UNSPECIFIED 1,782
10 CATTLE, HEIFERS & STEERS, FED 173,031 10 PISTACHIOS 12,122 10 VEGETABLES, UNSPECIFIED 1,247 Imperial Inyo Kern 1 CATTLE, HEIFERS & STEERS, FED 414,061 1 HAY, ALFALFA 4,980 1 GRAPES, TABLE 1,331,097 2 HAY, ALFALFA 214,601 2 CATTLE, STEERS 4,510 2 ALMONDS, ALL 777,306 3 WHEAT, ALL 108,265 3 CATTLE, HEIFERS 3,573 3 MILK, MARKET, FLUID 689,854 4 LETTUCE, HEAD 107,651 4 APIARY PRODUCTS, HONEY 2,869 4 VEGETABLES, UNSPECIFIED 527,025 5 HAY, OTHER, UNSPECIFIED 100,645 5 CATTLE, STOCKERS, FEEDERS 2,251 5 PISTACHIOS 486,213 6 BROCCOLI, FRESH MARKET 82,747 6 CATTLE, COWS 2,119 6 CATTLE & CALVES, UNSPECIFIED 382,913 7 LETTUCE, LEAF 80,849 7 HAY, OTHER, UNSPECIFIED 1,587 7 ORANGES, NAVEL 281,834 8 SUGAR BEETS 78,273 8 PASTURE, RANGE 1,030 8 HAY, ALFALFA 213,466 9 HAY, SUDAN 64,686 9 NURSERY, TURF 1,011 9 TANGERINES & MANDARINS 194,200
10 DATES 59,891 10 SHEEP & LAMBS, UNSPECIFIED 743 10 GRAPES, WINE 145,059 Kings Lake Lassen 1 MILK, MARKET, FLUID 690,481 1 GRAPES, WINE 47,880 1 HAY, OTHER, UNSPECIFIED 22,003 2 COTTON LINT, PIMA 228,038 2 PEARS, BARTLETT 22,848 2 HAY, ALFALFA 21,080 3 CATTLE & CALVES, UNSPECIFIED 224,984 3 WALNUTS, ENGLISH 6,534 3 VEGETABLES, UNSPECIFIED 9,700 4 TOMATOES, PROCESSING 128,735 4 CATTLE & CALVES, UNSPECIFIED 2,174 4 CATTLE, STEERS 8,118 5 WALNUTS, ENGLISH 85,882 5 NURSERY PRODUCTS, MISC. 1,443 5 CATTLE, HEIFERS 5,594 6 HAY, ALFALFA 85,450 6 FIELD CROPS, UNSPECIFIED 1,397 6 CATTLE, CALVES ONLY 4,280 7 PISTACHIOS 85,425 7 PEARS, UNSPECIFIED 1,280 7 CATTLE, MILK COWS 3,963 8 ALMONDS, ALL 84,071 8 PASTURE, RANGE 405 8 PASTURE, IRRIGATED 3,036 9 CORN, SILAGE 74,786 9 VEGETABLES, UNSPECIFIED 344 9 HAY, GRAIN 2,954
10 COTTONSEED 66,466 10 LIVESTOCK, UNSPECIFIED 217 10 PASTURE, RANGE 1,837
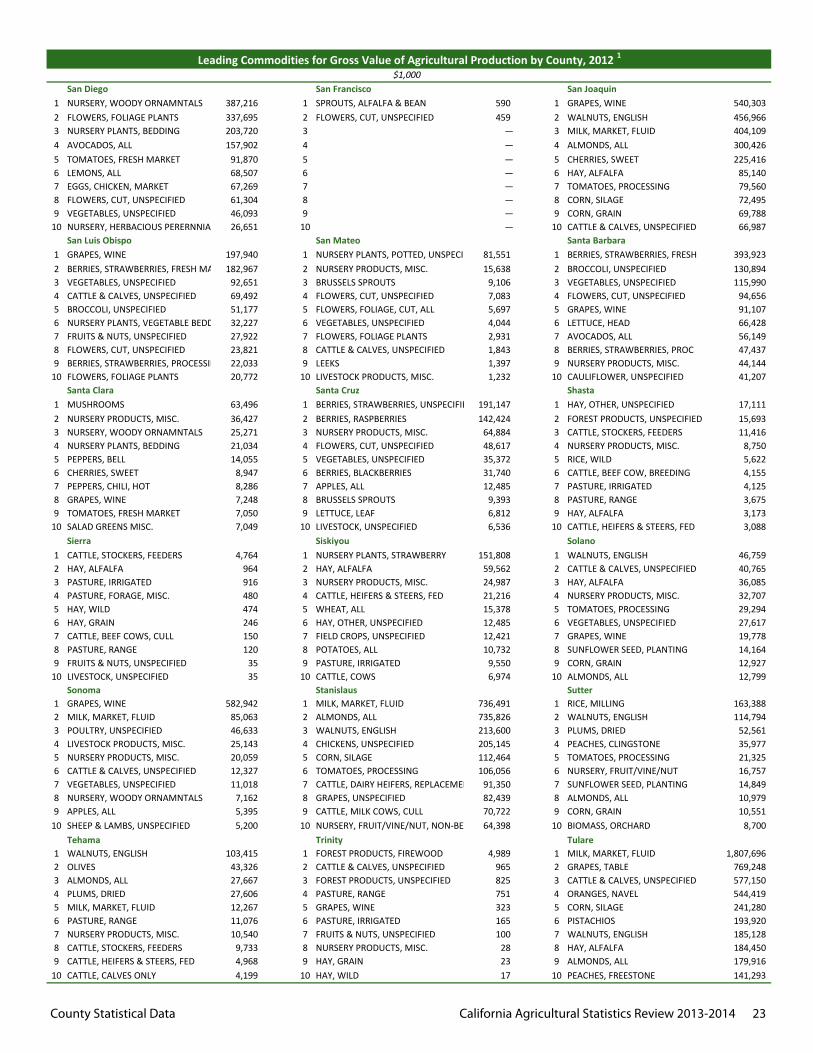
Leading Commodities for Gross Value of Agricultural Production by County, 2012 1
$1,000
County Statistical Data California Agricultural Statistics Review 2013-2014 22
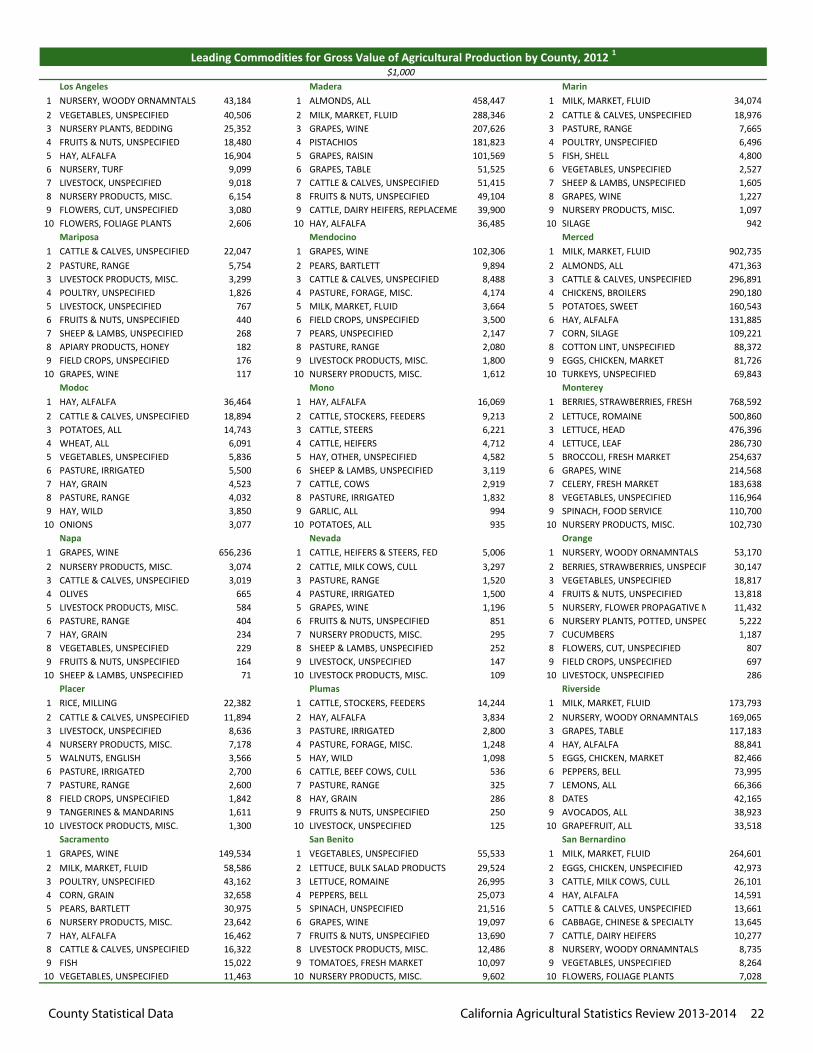
Leading Commodities for Gross Value of Agricultural Production by County, 2012 1
$1,000 Los Angeles Madera Marin 1 NURSERY, WOODY ORNAMNTALS 43,184 1 ALMONDS, ALL 458,447 1 MILK, MARKET, FLUID 34,074 2 VEGETABLES, UNSPECIFIED 40,506 2 MILK, MARKET, FLUID 288,346 2 CATTLE & CALVES, UNSPECIFIED 18,976 3 NURSERY PLANTS, BEDDING 25,352 3 GRAPES, WINE 207,626 3 PASTURE, RANGE 7,665 4 FRUITS & NUTS, UNSPECIFIED 18,480 4 PISTACHIOS 181,823 4 POULTRY, UNSPECIFIED 6,496 5 HAY, ALFALFA 16,904 5 GRAPES, RAISIN 101,569 5 FISH, SHELL 4,800 6 NURSERY, TURF 9,099 6 GRAPES, TABLE 51,525 6 VEGETABLES, UNSPECIFIED 2,527 7 LIVESTOCK, UNSPECIFIED 9,018 7 CATTLE & CALVES, UNSPECIFIED 51,415 7 SHEEP & LAMBS, UNSPECIFIED 1,605 8 NURSERY PRODUCTS, MISC. 6,154 8 FRUITS & NUTS, UNSPECIFIED 49,104 8 GRAPES, WINE 1,227 9 FLOWERS, CUT, UNSPECIFIED 3,080 9 CATTLE, DAIRY HEIFERS, REPLACEMENT 39,900 9 NURSERY PRODUCTS, MISC. 1,097
10 FLOWERS, FOLIAGE PLANTS 2,606 10 HAY, ALFALFA 36,485 10 SILAGE 942 Mariposa Mendocino Merced 1 CATTLE & CALVES, UNSPECIFIED 22,047 1 GRAPES, WINE 102,306 1 MILK, MARKET, FLUID 902,735 2 PASTURE, RANGE 5,754 2 PEARS, BARTLETT 9,894 2 ALMONDS, ALL 471,363 3 LIVESTOCK PRODUCTS, MISC. 3,299 3 CATTLE & CALVES, UNSPECIFIED 8,488 3 CATTLE & CALVES, UNSPECIFIED 296,891 4 POULTRY, UNSPECIFIED 1,826 4 PASTURE, FORAGE, MISC. 4,174 4 CHICKENS, BROILERS 290,180 5 LIVESTOCK, UNSPECIFIED 767 5 MILK, MARKET, FLUID 3,664 5 POTATOES, SWEET 160,543 6 FRUITS & NUTS, UNSPECIFIED 440 6 FIELD CROPS, UNSPECIFIED 3,500 6 HAY, ALFALFA 131,885 7 SHEEP & LAMBS, UNSPECIFIED 268 7 PEARS, UNSPECIFIED 2,147 7 CORN, SILAGE 109,221 8 APIARY PRODUCTS, HONEY 182 8 PASTURE, RANGE 2,080 8 COTTON LINT, UNSPECIFIED 88,372 9 FIELD CROPS, UNSPECIFIED 176 9 LIVESTOCK PRODUCTS, MISC. 1,800 9 EGGS, CHICKEN, MARKET 81,726
10 GRAPES, WINE 117 10 NURSERY PRODUCTS, MISC. 1,612 10 TURKEYS, UNSPECIFIED 69,843 Modoc Mono Monterey 1 HAY, ALFALFA 36,464 1 HAY, ALFALFA 16,069 1 BERRIES, STRAWBERRIES, FRESH 768,592 2 CATTLE & CALVES, UNSPECIFIED 18,894 2 CATTLE, STOCKERS, FEEDERS 9,213 2 LETTUCE, ROMAINE 500,860 3 POTATOES, ALL 14,743 3 CATTLE, STEERS 6,221 3 LETTUCE, HEAD 476,396 4 WHEAT, ALL 6,091 4 CATTLE, HEIFERS 4,712 4 LETTUCE, LEAF 286,730 5 VEGETABLES, UNSPECIFIED 5,836 5 HAY, OTHER, UNSPECIFIED 4,582 5 BROCCOLI, FRESH MARKET 254,637 6 PASTURE, IRRIGATED 5,500 6 SHEEP & LAMBS, UNSPECIFIED 3,119 6 GRAPES, WINE 214,568 7 HAY, GRAIN 4,523 7 CATTLE, COWS 2,919 7 CELERY, FRESH MARKET 183,638 8 PASTURE, RANGE 4,032 8 PASTURE, IRRIGATED 1,832 8 VEGETABLES, UNSPECIFIED 116,964 9 HAY, WILD 3,850 9 GARLIC, ALL 994 9 SPINACH, FOOD SERVICE 110,700
10 ONIONS 3,077 10 POTATOES, ALL 935 10 NURSERY PRODUCTS, MISC. 102,730 Napa Nevada Orange 1 GRAPES, WINE 656,236 1 CATTLE, HEIFERS & STEERS, FED 5,006 1 NURSERY, WOODY ORNAMNTALS 53,170 2 NURSERY PRODUCTS, MISC. 3,074 2 CATTLE, MILK COWS, CULL 3,297 2 BERRIES, STRAWBERRIES, UNSPECIFIED 30,147 3 CATTLE & CALVES, UNSPECIFIED 3,019 3 PASTURE, RANGE 1,520 3 VEGETABLES, UNSPECIFIED 18,817 4 OLIVES 665 4 PASTURE, IRRIGATED 1,500 4 FRUITS & NUTS, UNSPECIFIED 13,818 5 LIVESTOCK PRODUCTS, MISC. 584 5 GRAPES, WINE 1,196 5 NURSERY, FLOWER PROPAGATIVE MATERIALS11,432 6 PASTURE, RANGE 404 6 FRUITS & NUTS, UNSPECIFIED 851 6 NURSERY PLANTS, POTTED, UNSPECIFIED 5,222 7 HAY, GRAIN 234 7 NURSERY PRODUCTS, MISC. 295 7 CUCUMBERS 1,187 8 VEGETABLES, UNSPECIFIED 229 8 SHEEP & LAMBS, UNSPECIFIED 252 8 FLOWERS, CUT, UNSPECIFIED 807 9 FRUITS & NUTS, UNSPECIFIED 164 9 LIVESTOCK, UNSPECIFIED 147 9 FIELD CROPS, UNSPECIFIED 697
10 SHEEP & LAMBS, UNSPECIFIED 71 10 LIVESTOCK PRODUCTS, MISC. 109 10 LIVESTOCK, UNSPECIFIED 286 Placer Plumas Riverside 1 RICE, MILLING 22,382 1 CATTLE, STOCKERS, FEEDERS 14,244 1 MILK, MARKET, FLUID 173,793 2 CATTLE & CALVES, UNSPECIFIED 11,894 2 HAY, ALFALFA 3,834 2 NURSERY, WOODY ORNAMNTALS 169,065 3 LIVESTOCK, UNSPECIFIED 8,636 3 PASTURE, IRRIGATED 2,800 3 GRAPES, TABLE 117,183 4 NURSERY PRODUCTS, MISC. 7,178 4 PASTURE, FORAGE, MISC. 1,248 4 HAY, ALFALFA 88,841 5 WALNUTS, ENGLISH 3,566 5 HAY, WILD 1,098 5 EGGS, CHICKEN, MARKET 82,466 6 PASTURE, IRRIGATED 2,700 6 CATTLE, BEEF COWS, CULL 536 6 PEPPERS, BELL 73,995 7 PASTURE, RANGE 2,600 7 PASTURE, RANGE 325 7 LEMONS, ALL 66,366 8 FIELD CROPS, UNSPECIFIED 1,842 8 HAY, GRAIN 286 8 DATES 42,165 9 TANGERINES & MANDARINS 1,611 9 FRUITS & NUTS, UNSPECIFIED 250 9 AVOCADOS, ALL 38,923
10 LIVESTOCK PRODUCTS, MISC. 1,300 10 LIVESTOCK, UNSPECIFIED 125 10 GRAPEFRUIT, ALL 33,518 Sacramento San Benito San Bernardino 1 GRAPES, WINE 149,534 1 VEGETABLES, UNSPECIFIED 55,533 1 MILK, MARKET, FLUID 264,601 2 MILK, MARKET, FLUID 58,586 2 LETTUCE, BULK SALAD PRODUCTS 29,524 2 EGGS, CHICKEN, UNSPECIFIED 42,973 3 POULTRY, UNSPECIFIED 43,162 3 LETTUCE, ROMAINE 26,995 3 CATTLE, MILK COWS, CULL 26,101 4 CORN, GRAIN 32,658 4 PEPPERS, BELL 25,073 4 HAY, ALFALFA 14,591 5 PEARS, BARTLETT 30,975 5 SPINACH, UNSPECIFIED 21,516 5 CATTLE & CALVES, UNSPECIFIED 13,661 6 NURSERY PRODUCTS, MISC. 23,642 6 GRAPES, WINE 19,097 6 CABBAGE, CHINESE & SPECIALTY 13,645 7 HAY, ALFALFA 16,462 7 FRUITS & NUTS, UNSPECIFIED 13,690 7 CATTLE, DAIRY HEIFERS 10,277 8 CATTLE & CALVES, UNSPECIFIED 16,322 8 LIVESTOCK PRODUCTS, MISC. 12,486 8 NURSERY, WOODY ORNAMNTALS 8,735 9 FISH 15,022 9 TOMATOES, FRESH MARKET 10,097 9 VEGETABLES, UNSPECIFIED 8,264
10 VEGETABLES, UNSPECIFIED 11,463 10 NURSERY PRODUCTS, MISC. 9,602 10 FLOWERS, FOLIAGE PLANTS 7,028
County Statistical Data California Agricultural Statistics Review 2013-2014 23
Leading Commodities for Gross Value of Agricultural Production by County, 2012 1
$1,000 San Diego San Francisco San Joaquin 1 NURSERY, WOODY ORNAMNTALS 387,216 1 SPROUTS, ALFALFA & BEAN 590 1 GRAPES, WINE 540,303 2 FLOWERS, FOLIAGE PLANTS 337,695 2 FLOWERS, CUT, UNSPECIFIED 459 2 WALNUTS, ENGLISH 456,966 3 NURSERY PLANTS, BEDDING 203,720 3 — 3 MILK, MARKET, FLUID 404,109 4 AVOCADOS, ALL 157,902 4 — 4 ALMONDS, ALL 300,426 5 TOMATOES, FRESH MARKET 91,870 5 — 5 CHERRIES, SWEET 225,416 6 LEMONS, ALL 68,507 6 — 6 HAY, ALFALFA 85,140 7 EGGS, CHICKEN, MARKET 67,269 7 — 7 TOMATOES, PROCESSING 79,560 8 FLOWERS, CUT, UNSPECIFIED 61,304 8 — 8 CORN, SILAGE 72,495 9 VEGETABLES, UNSPECIFIED 46,093 9 — 9 CORN, GRAIN 69,788
10 NURSERY, HERBACIOUS PERERNNIALS 26,651 10 — 10 CATTLE & CALVES, UNSPECIFIED 66,987 San Luis Obispo San Mateo Santa Barbara 1 GRAPES, WINE 197,940 1 NURSERY PLANTS, POTTED, UNSPECIFIED 81,551 1 BERRIES, STRAWBERRIES, FRESH 393,923 2 BERRIES, STRAWBERRIES, FRESH MARKET182,967 2 NURSERY PRODUCTS, MISC. 15,638 2 BROCCOLI, UNSPECIFIED 130,894 3 VEGETABLES, UNSPECIFIED 92,651 3 BRUSSELS SPROUTS 9,106 3 VEGETABLES, UNSPECIFIED 115,990 4 CATTLE & CALVES, UNSPECIFIED 69,492 4 FLOWERS, CUT, UNSPECIFIED 7,083 4 FLOWERS, CUT, UNSPECIFIED 94,656 5 BROCCOLI, UNSPECIFIED 51,177 5 FLOWERS, FOLIAGE, CUT, ALL 5,697 5 GRAPES, WINE 91,107 6 NURSERY PLANTS, VEGETABLE BEDDING 32,227 6 VEGETABLES, UNSPECIFIED 4,044 6 LETTUCE, HEAD 66,428 7 FRUITS & NUTS, UNSPECIFIED 27,922 7 FLOWERS, FOLIAGE PLANTS 2,931 7 AVOCADOS, ALL 56,149 8 FLOWERS, CUT, UNSPECIFIED 23,821 8 CATTLE & CALVES, UNSPECIFIED 1,843 8 BERRIES, STRAWBERRIES, PROC 47,437 9 BERRIES, STRAWBERRIES, PROCESSING 22,033 9 LEEKS 1,397 9 NURSERY PRODUCTS, MISC. 44,144
10 FLOWERS, FOLIAGE PLANTS 20,772 10 LIVESTOCK PRODUCTS, MISC. 1,232 10 CAULIFLOWER, UNSPECIFIED 41,207 Santa Clara Santa Cruz Shasta 1 MUSHROOMS 63,496 1 BERRIES, STRAWBERRIES, UNSPECIFIED 191,147 1 HAY, OTHER, UNSPECIFIED 17,111 2 NURSERY PRODUCTS, MISC. 36,427 2 BERRIES, RASPBERRIES 142,424 2 FOREST PRODUCTS, UNSPECIFIED 15,693 3 NURSERY, WOODY ORNAMNTALS 25,271 3 NURSERY PRODUCTS, MISC. 64,884 3 CATTLE, STOCKERS, FEEDERS 11,416 4 NURSERY PLANTS, BEDDING 21,034 4 FLOWERS, CUT, UNSPECIFIED 48,617 4 NURSERY PRODUCTS, MISC. 8,750 5 PEPPERS, BELL 14,055 5 VEGETABLES, UNSPECIFIED 35,372 5 RICE, WILD 5,622 6 CHERRIES, SWEET 8,947 6 BERRIES, BLACKBERRIES 31,740 6 CATTLE, BEEF COW, BREEDING 4,155 7 PEPPERS, CHILI, HOT 8,286 7 APPLES, ALL 12,485 7 PASTURE, IRRIGATED 4,125 8 GRAPES, WINE 7,248 8 BRUSSELS SPROUTS 9,393 8 PASTURE, RANGE 3,675 9 TOMATOES, FRESH MARKET 7,050 9 LETTUCE, LEAF 6,812 9 HAY, ALFALFA 3,173
10 SALAD GREENS MISC. 7,049 10 LIVESTOCK, UNSPECIFIED 6,536 10 CATTLE, HEIFERS & STEERS, FED 3,088 Sierra Siskiyou Solano 1 CATTLE, STOCKERS, FEEDERS 4,764 1 NURSERY PLANTS, STRAWBERRY 151,808 1 WALNUTS, ENGLISH 46,759 2 HAY, ALFALFA 964 2 HAY, ALFALFA 59,562 2 CATTLE & CALVES, UNSPECIFIED 40,765 3 PASTURE, IRRIGATED 916 3 NURSERY PRODUCTS, MISC. 24,987 3 HAY, ALFALFA 36,085 4 PASTURE, FORAGE, MISC. 480 4 CATTLE, HEIFERS & STEERS, FED 21,216 4 NURSERY PRODUCTS, MISC. 32,707 5 HAY, WILD 474 5 WHEAT, ALL 15,378 5 TOMATOES, PROCESSING 29,294 6 HAY, GRAIN 246 6 HAY, OTHER, UNSPECIFIED 12,485 6 VEGETABLES, UNSPECIFIED 27,617 7 CATTLE, BEEF COWS, CULL 150 7 FIELD CROPS, UNSPECIFIED 12,421 7 GRAPES, WINE 19,778 8 PASTURE, RANGE 120 8 POTATOES, ALL 10,732 8 SUNFLOWER SEED, PLANTING 14,164 9 FRUITS & NUTS, UNSPECIFIED 35 9 PASTURE, IRRIGATED 9,550 9 CORN, GRAIN 12,927
10 LIVESTOCK, UNSPECIFIED 35 10 CATTLE, COWS 6,974 10 ALMONDS, ALL 12,799 Sonoma Stanislaus Sutter 1 GRAPES, WINE 582,942 1 MILK, MARKET, FLUID 736,491 1 RICE, MILLING 163,388 2 MILK, MARKET, FLUID 85,063 2 ALMONDS, ALL 735,826 2 WALNUTS, ENGLISH 114,794 3 POULTRY, UNSPECIFIED 46,633 3 WALNUTS, ENGLISH 213,600 3 PLUMS, DRIED 52,561 4 LIVESTOCK PRODUCTS, MISC. 25,143 4 CHICKENS, UNSPECIFIED 205,145 4 PEACHES, CLINGSTONE 35,977 5 NURSERY PRODUCTS, MISC. 20,059 5 CORN, SILAGE 112,464 5 TOMATOES, PROCESSING 21,325 6 CATTLE & CALVES, UNSPECIFIED 12,327 6 TOMATOES, PROCESSING 106,056 6 NURSERY, FRUIT/VINE/NUT 16,757 7 VEGETABLES, UNSPECIFIED 11,018 7 CATTLE, DAIRY HEIFERS, REPLACEMENT 91,350 7 SUNFLOWER SEED, PLANTING 14,849 8 NURSERY, WOODY ORNAMNTALS 7,162 8 GRAPES, UNSPECIFIED 82,439 8 ALMONDS, ALL 10,979 9 APPLES, ALL 5,395 9 CATTLE, MILK COWS, CULL 70,722 9 CORN, GRAIN 10,551
10 SHEEP & LAMBS, UNSPECIFIED 5,200 10 NURSERY, FRUIT/VINE/NUT, NON-BEARING64,398 10 BIOMASS, ORCHARD 8,700 Tehama Trinity Tulare 1 WALNUTS, ENGLISH 103,415 1 FOREST PRODUCTS, FIREWOOD 4,989 1 MILK, MARKET, FLUID 1,807,696 2 OLIVES 43,326 2 CATTLE & CALVES, UNSPECIFIED 965 2 GRAPES, TABLE 769,248 3 ALMONDS, ALL 27,667 3 FOREST PRODUCTS, UNSPECIFIED 825 3 CATTLE & CALVES, UNSPECIFIED 577,150 4 PLUMS, DRIED 27,606 4 PASTURE, RANGE 751 4 ORANGES, NAVEL 544,419 5 MILK, MARKET, FLUID 12,267 5 GRAPES, WINE 323 5 CORN, SILAGE 241,280 6 PASTURE, RANGE 11,076 6 PASTURE, IRRIGATED 165 6 PISTACHIOS 193,920 7 NURSERY PRODUCTS, MISC. 10,540 7 FRUITS & NUTS, UNSPECIFIED 100 7 WALNUTS, ENGLISH 185,128 8 CATTLE, STOCKERS, FEEDERS 9,733 8 NURSERY PRODUCTS, MISC. 28 8 HAY, ALFALFA 184,450 9 CATTLE, HEIFERS & STEERS, FED 4,968 9 HAY, GRAIN 23 9 ALMONDS, ALL 179,916
10 CATTLE, CALVES ONLY 4,199 10 HAY, WILD 17 10 PEACHES, FREESTONE 141,293
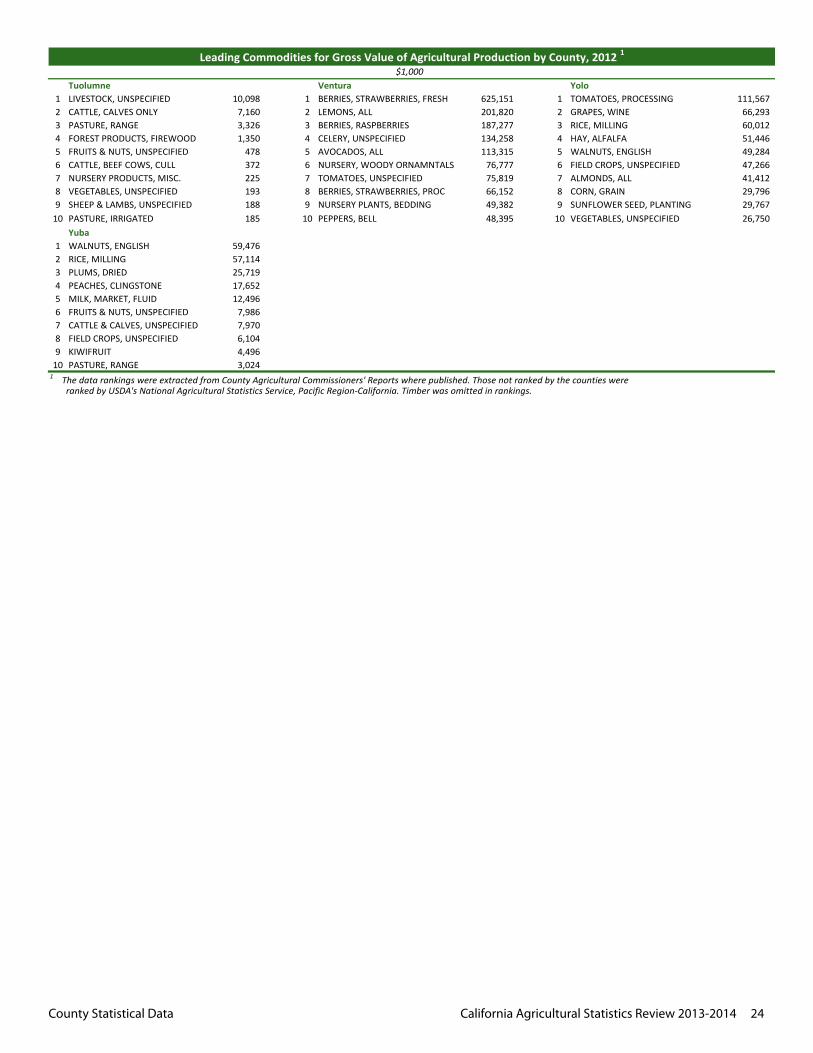
County Statistical Data California Agricultural Statistics Review 2013-2014 24
Leading Commodities for Gross Value of Agricultural Production by County, 2012 1
$1,000 Tuolumne Ventura Yolo 1 LIVESTOCK, UNSPECIFIED 10,098 1 BERRIES, STRAWBERRIES, FRESH 625,151 1 TOMATOES, PROCESSING 111,567 2 CATTLE, CALVES ONLY 7,160 2 LEMONS, ALL 201,820 2 GRAPES, WINE 66,293 3 PASTURE, RANGE 3,326 3 BERRIES, RASPBERRIES 187,277 3 RICE, MILLING 60,012 4 FOREST PRODUCTS, FIREWOOD 1,350 4 CELERY, UNSPECIFIED 134,258 4 HAY, ALFALFA 51,446 5 FRUITS & NUTS, UNSPECIFIED 478 5 AVOCADOS, ALL 113,315 5 WALNUTS, ENGLISH 49,284 6 CATTLE, BEEF COWS, CULL 372 6 NURSERY, WOODY ORNAMNTALS 76,777 6 FIELD CROPS, UNSPECIFIED 47,266 7 NURSERY PRODUCTS, MISC. 225 7 TOMATOES, UNSPECIFIED 75,819 7 ALMONDS, ALL 41,412 8 VEGETABLES, UNSPECIFIED 193 8 BERRIES, STRAWBERRIES, PROC 66,152 8 CORN, GRAIN 29,796 9 SHEEP & LAMBS, UNSPECIFIED 188 9 NURSERY PLANTS, BEDDING 49,382 9 SUNFLOWER SEED, PLANTING 29,767
10 PASTURE, IRRIGATED 185 10 PEPPERS, BELL 48,395 10 VEGETABLES, UNSPECIFIED 26,750 Yuba 1 WALNUTS, ENGLISH 59,476 2 RICE, MILLING 57,114 3 PLUMS, DRIED 25,719 4 PEACHES, CLINGSTONE 17,652 5 MILK, MARKET, FLUID 12,496 6 FRUITS & NUTS, UNSPECIFIED 7,986 7 CATTLE & CALVES, UNSPECIFIED 7,970 8 FIELD CROPS, UNSPECIFIED 6,104 9 KIWIFRUIT 4,496
10 PASTURE, RANGE 3,024 1 The data rankings were extracted from County Agricultural Commissioners' Reports where published. Those not ranked by the counties were ranked by USDA's National Agricultural Statistics Service, Pacific Region-California. Timber was omitted in rankings.
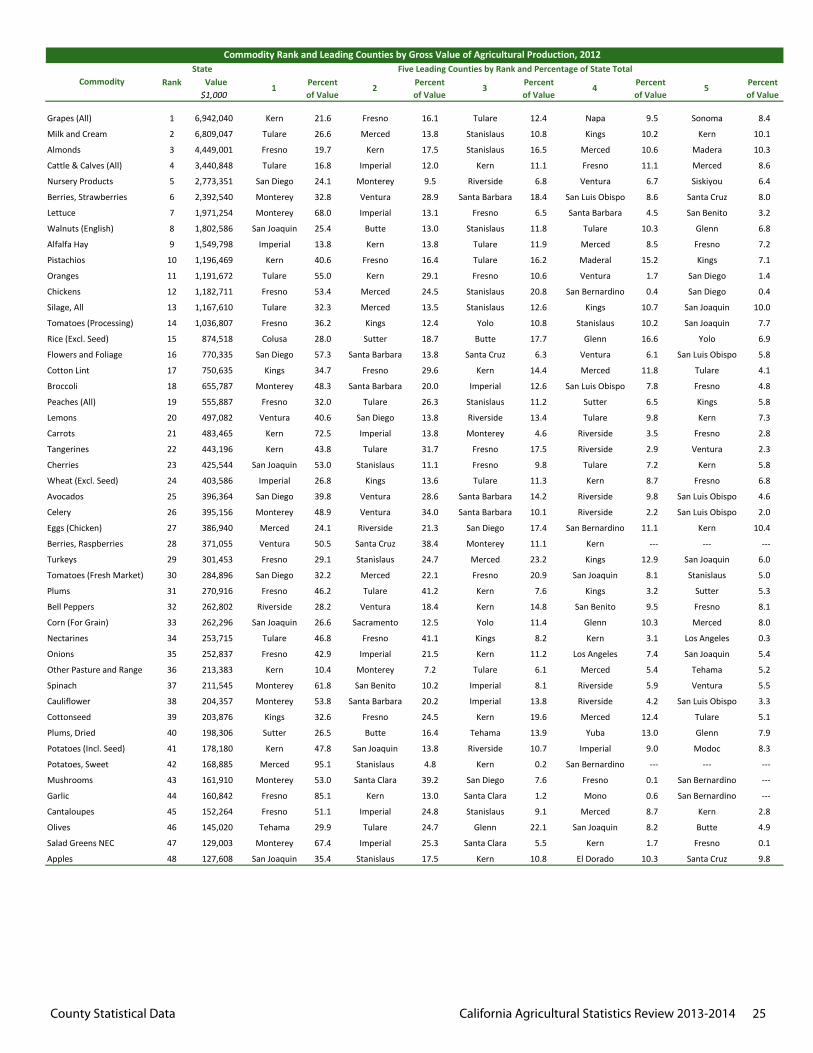
County Statistical Data California Agricultural Statistics Review 2013-2014 25
Value$1,000
Grapes (All) 1 6,942,040 Kern 21.6 Fresno 16.1 Tulare 12.4 Napa 9.5 Sonoma 8.4
Milk and Cream 2 6,809,047 Tulare 26.6 Merced 13.8 Stanislaus 10.8 Kings 10.2 Kern 10.1
Almonds 3 4,449,001 Fresno 19.7 Kern 17.5 Stanislaus 16.5 Merced 10.6 Madera 10.3
Cattle & Calves (All) 4 3,440,848 Tulare 16.8 Imperial 12.0 Kern 11.1 Fresno 11.1 Merced 8.6
Nursery Products 5 2,773,351 San Diego 24.1 Monterey 9.5 Riverside 6.8 Ventura 6.7 Siskiyou 6.4
Berries, Strawberries 6 2,392,540 Monterey 32.8 Ventura 28.9 Santa Barbara 18.4 San Luis Obispo 8.6 Santa Cruz 8.0
Lettuce 7 1,971,254 Monterey 68.0 Imperial 13.1 Fresno 6.5 Santa Barbara 4.5 San Benito 3.2
Walnuts (English) 8 1,802,586 San Joaquin 25.4 Butte 13.0 Stanislaus 11.8 Tulare 10.3 Glenn 6.8
Alfalfa Hay 9 1,549,798 Imperial 13.8 Kern 13.8 Tulare 11.9 Merced 8.5 Fresno 7.2
Pistachios 10 1,196,469 Kern 40.6 Fresno 16.4 Tulare 16.2 Maderal 15.2 Kings 7.1
Oranges 11 1,191,672 Tulare 55.0 Kern 29.1 Fresno 10.6 Ventura 1.7 San Diego 1.4
Chickens 12 1,182,711 Fresno 53.4 Merced 24.5 Stanislaus 20.8 San Bernardino 0.4 San Diego 0.4
Silage, All 13 1,167,610 Tulare 32.3 Merced 13.5 Stanislaus 12.6 Kings 10.7 San Joaquin 10.0
Tomatoes (Processing) 14 1,036,807 Fresno 36.2 Kings 12.4 Yolo 10.8 Stanislaus 10.2 San Joaquin 7.7
Rice (Excl. Seed) 15 874,518 Colusa 28.0 Sutter 18.7 Butte 17.7 Glenn 16.6 Yolo 6.9
Flowers and Foliage 16 770,335 San Diego 57.3 Santa Barbara 13.8 Santa Cruz 6.3 Ventura 6.1 San Luis Obispo 5.8
Cotton Lint 17 750,635 Kings 34.7 Fresno 29.6 Kern 14.4 Merced 11.8 Tulare 4.1
Broccoli 18 655,787 Monterey 48.3 Santa Barbara 20.0 Imperial 12.6 San Luis Obispo 7.8 Fresno 4.8
Peaches (All) 19 555,887 Fresno 32.0 Tulare 26.3 Stanislaus 11.2 Sutter 6.5 Kings 5.8
Lemons 20 497,082 Ventura 40.6 San Diego 13.8 Riverside 13.4 Tulare 9.8 Kern 7.3
Carrots 21 483,465 Kern 72.5 Imperial 13.8 Monterey 4.6 Riverside 3.5 Fresno 2.8
Tangerines 22 443,196 Kern 43.8 Tulare 31.7 Fresno 17.5 Riverside 2.9 Ventura 2.3
Cherries 23 425,544 San Joaquin 53.0 Stanislaus 11.1 Fresno 9.8 Tulare 7.2 Kern 5.8
Wheat (Excl. Seed) 24 403,586 Imperial 26.8 Kings 13.6 Tulare 11.3 Kern 8.7 Fresno 6.8
Avocados 25 396,364 San Diego 39.8 Ventura 28.6 Santa Barbara 14.2 Riverside 9.8 San Luis Obispo 4.6
Celery 26 395,156 Monterey 48.9 Ventura 34.0 Santa Barbara 10.1 Riverside 2.2 San Luis Obispo 2.0
Eggs (Chicken) 27 386,940 Merced 24.1 Riverside 21.3 San Diego 17.4 San Bernardino 11.1 Kern 10.4
Berries, Raspberries 28 371,055 Ventura 50.5 Santa Cruz 38.4 Monterey 11.1 Kern --- --- ---
Turkeys 29 301,453 Fresno 29.1 Stanislaus 24.7 Merced 23.2 Kings 12.9 San Joaquin 6.0
Tomatoes (Fresh Market) 30 284,896 San Diego 32.2 Merced 22.1 Fresno 20.9 San Joaquin 8.1 Stanislaus 5.0
Plums 31 270,916 Fresno 46.2 Tulare 41.2 Kern 7.6 Kings 3.2 Sutter 5.3
Bell Peppers 32 262,802 Riverside 28.2 Ventura 18.4 Kern 14.8 San Benito 9.5 Fresno 8.1
Corn (For Grain) 33 262,296 San Joaquin 26.6 Sacramento 12.5 Yolo 11.4 Glenn 10.3 Merced 8.0
Nectarines 34 253,715 Tulare 46.8 Fresno 41.1 Kings 8.2 Kern 3.1 Los Angeles 0.3
Onions 35 252,837 Fresno 42.9 Imperial 21.5 Kern 11.2 Los Angeles 7.4 San Joaquin 5.4
Other Pasture and Range 36 213,383 Kern 10.4 Monterey 7.2 Tulare 6.1 Merced 5.4 Tehama 5.2
Spinach 37 211,545 Monterey 61.8 San Benito 10.2 Imperial 8.1 Riverside 5.9 Ventura 5.5
Cauliflower 38 204,357 Monterey 53.8 Santa Barbara 20.2 Imperial 13.8 Riverside 4.2 San Luis Obispo 3.3
Cottonseed 39 203,876 Kings 32.6 Fresno 24.5 Kern 19.6 Merced 12.4 Tulare 5.1
Plums, Dried 40 198,306 Sutter 26.5 Butte 16.4 Tehama 13.9 Yuba 13.0 Glenn 7.9
Potatoes (Incl. Seed) 41 178,180 Kern 47.8 San Joaquin 13.8 Riverside 10.7 Imperial 9.0 Modoc 8.3
Potatoes, Sweet 42 168,885 Merced 95.1 Stanislaus 4.8 Kern 0.2 San Bernardino --- --- ---
Mushrooms 43 161,910 Monterey 53.0 Santa Clara 39.2 San Diego 7.6 Fresno 0.1 San Bernardino ---
Garlic 44 160,842 Fresno 85.1 Kern 13.0 Santa Clara 1.2 Mono 0.6 San Bernardino ---
Cantaloupes 45 152,264 Fresno 51.1 Imperial 24.8 Stanislaus 9.1 Merced 8.7 Kern 2.8
Olives 46 145,020 Tehama 29.9 Tulare 24.7 Glenn 22.1 San Joaquin 8.2 Butte 4.9
Salad Greens NEC 47 129,003 Monterey 67.4 Imperial 25.3 Santa Clara 5.5 Kern 1.7 Fresno 0.1
Apples 48 127,608 San Joaquin 35.4 Stanislaus 17.5 Kern 10.8 El Dorado 10.3 Santa Cruz 9.8
4 5Commodity
StateRank 1 2 3 Percent
of Value
Commodity Rank and Leading Counties by Gross Value of Agricultural Production, 2012 Five Leading Counties by Rank and Percentage of State Total
Percentof Value
Percentof Value
Percentof Value
Percentof Value
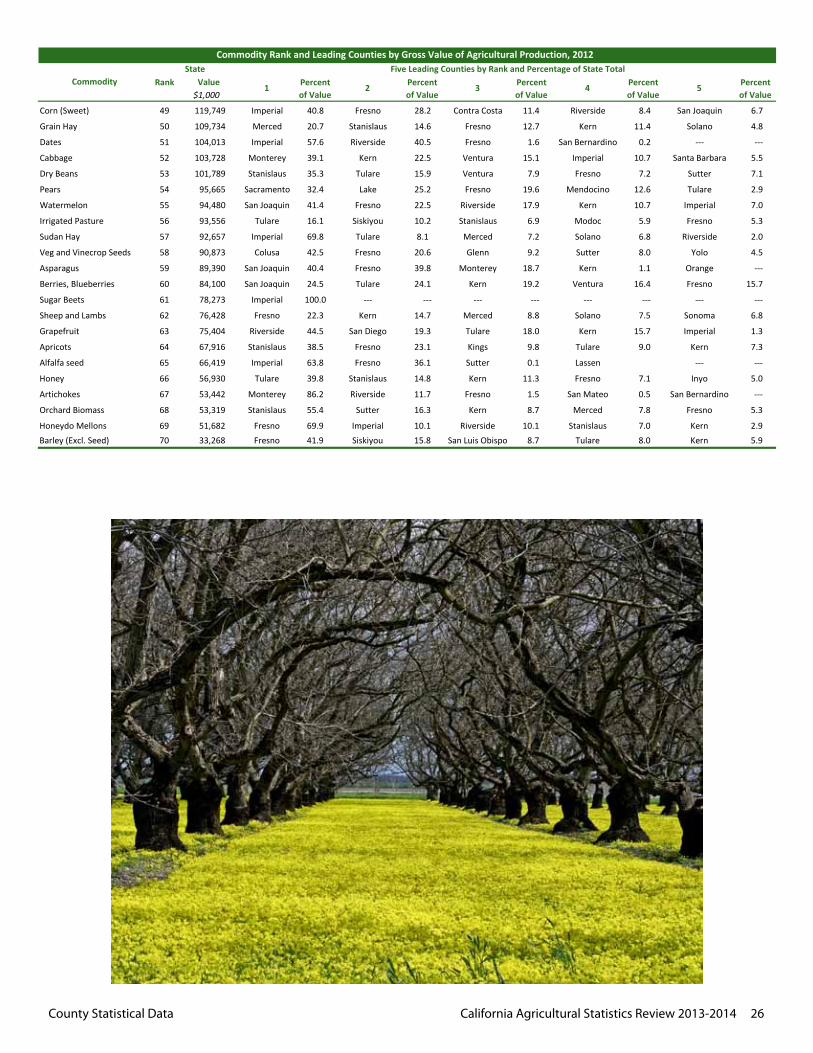
County Statistical Data California Agricultural Statistics Review 2013-2014 26
Value$1,000
4 5Commodity
StateRank 1 2 3 Percent
of Value
Commodity Rank and Leading Counties by Gross Value of Agricultural Production, 2012 Five Leading Counties by Rank and Percentage of State Total
Percentof Value
Percentof Value
Percentof Value
Percentof Value
Corn (Sweet) 49 119,749 Imperial 40.8 Fresno 28.2 Contra Costa 11.4 Riverside 8.4 San Joaquin 6.7
Grain Hay 50 109,734 Merced 20.7 Stanislaus 14.6 Fresno 12.7 Kern 11.4 Solano 4.8
Dates 51 104,013 Imperial 57.6 Riverside 40.5 Fresno 1.6 San Bernardino 0.2 --- ---
Cabbage 52 103,728 Monterey 39.1 Kern 22.5 Ventura 15.1 Imperial 10.7 Santa Barbara 5.5
Dry Beans 53 101,789 Stanislaus 35.3 Tulare 15.9 Ventura 7.9 Fresno 7.2 Sutter 7.1
Pears 54 95,665 Sacramento 32.4 Lake 25.2 Fresno 19.6 Mendocino 12.6 Tulare 2.9
Watermelon 55 94,480 San Joaquin 41.4 Fresno 22.5 Riverside 17.9 Kern 10.7 Imperial 7.0
Irrigated Pasture 56 93,556 Tulare 16.1 Siskiyou 10.2 Stanislaus 6.9 Modoc 5.9 Fresno 5.3
Sudan Hay 57 92,657 Imperial 69.8 Tulare 8.1 Merced 7.2 Solano 6.8 Riverside 2.0
Veg and Vinecrop Seeds 58 90,873 Colusa 42.5 Fresno 20.6 Glenn 9.2 Sutter 8.0 Yolo 4.5
Asparagus 59 89,390 San Joaquin 40.4 Fresno 39.8 Monterey 18.7 Kern 1.1 Orange ---
Berries, Blueberries 60 84,100 San Joaquin 24.5 Tulare 24.1 Kern 19.2 Ventura 16.4 Fresno 15.7
Sugar Beets 61 78,273 Imperial 100.0 --- --- --- --- --- --- --- ---
Sheep and Lambs 62 76,428 Fresno 22.3 Kern 14.7 Merced 8.8 Solano 7.5 Sonoma 6.8
Grapefruit 63 75,404 Riverside 44.5 San Diego 19.3 Tulare 18.0 Kern 15.7 Imperial 1.3
Apricots 64 67,916 Stanislaus 38.5 Fresno 23.1 Kings 9.8 Tulare 9.0 Kern 7.3
Alfalfa seed 65 66,419 Imperial 63.8 Fresno 36.1 Sutter 0.1 Lassen --- ---
Honey 66 56,930 Tulare 39.8 Stanislaus 14.8 Kern 11.3 Fresno 7.1 Inyo 5.0
Artichokes 67 53,442 Monterey 86.2 Riverside 11.7 Fresno 1.5 San Mateo 0.5 San Bernardino ---
Orchard Biomass 68 53,319 Stanislaus 55.4 Sutter 16.3 Kern 8.7 Merced 7.8 Fresno 5.3
Honeydo Mellons 69 51,682 Fresno 69.9 Imperial 10.1 Riverside 10.1 Stanislaus 7.0 Kern 2.9Barley (Excl. Seed) 70 33,268 Fresno 41.9 Siskiyou 15.8 San Luis Obispo 8.7 Tulare 8.0 Kern 5.9
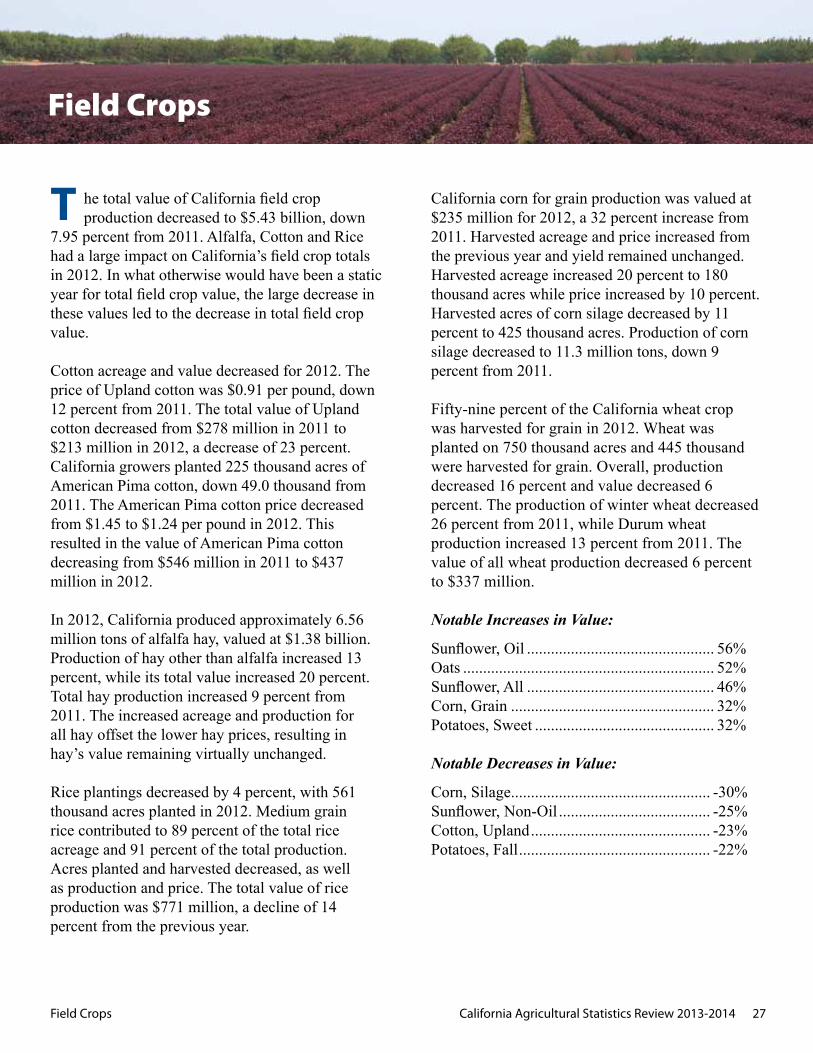
Field Crops California Agricultural Statistics Review 2013-2014 27
he total value of California field crop production decreased to $5.43 billion, down
7.95 percent from 2011. Alfalfa, Cotton and Rice had a large impact on California’s field crop totals in 2012. In what otherwise would have been a static year for total field crop value, the large decrease in these values led to the decrease in total field crop value.
Cotton acreage and value decreased for 2012. The price of Upland cotton was $0.91 per pound, down 12 percent from 2011. The total value of Upland cotton decreased from $278 million in 2011 to $213 million in 2012, a decrease of 23 percent. California growers planted 225 thousand acres of American Pima cotton, down 49.0 thousand from 2011. The American Pima cotton price decreased from $1.45 to $1.24 per pound in 2012. This resulted in the value of American Pima cotton decreasing from $546 million in 2011 to $437 million in 2012.
In 2012, California produced approximately 6.56 million tons of alfalfa hay, valued at $1.38 billion. Production of hay other than alfalfa increased 13 percent, while its total value increased 20 percent. Total hay production increased 9 percent from 2011. The increased acreage and production for all hay offset the lower hay prices, resulting in hay’s value remaining virtually unchanged.
Rice plantings decreased by 4 percent, with 561 thousand acres planted in 2012. Medium grain rice contributed to 89 percent of the total rice acreage and 91 percent of the total production. Acres planted and harvested decreased, as well as production and price. The total value of rice production was $771 million, a decline of 14 percent from the previous year.
California corn for grain production was valued at $235 million for 2012, a 32 percent increase from 2011. Harvested acreage and price increased from the previous year and yield remained unchanged. Harvested acreage increased 20 percent to 180 thousand acres while price increased by 10 percent. Harvested acres of corn silage decreased by 11 percent to 425 thousand acres. Production of corn silage decreased to 11.3 million tons, down 9 percent from 2011.
Fifty-nine percent of the California wheat crop was harvested for grain in 2012. Wheat was planted on 750 thousand acres and 445 thousand were harvested for grain. Overall, production decreased 16 percent and value decreased 6 percent. The production of winter wheat decreased 26 percent from 2011, while Durum wheat production increased 13 percent from 2011. The value of all wheat production decreased 6 percent to $337 million.
Notable Increases in Value:
Sunflower, Oil ............................................... 56%Oats ............................................................... 52%Sunflower, All ............................................... 46%Corn, Grain ................................................... 32%Potatoes, Sweet ............................................. 32%
Notable Decreases in Value:
Corn, Silage .................................................. -30%Sunflower, Non-Oil ...................................... -25%Cotton, Upland ............................................. -23%Potatoes, Fall ................................................ -22%
T
Field Crops
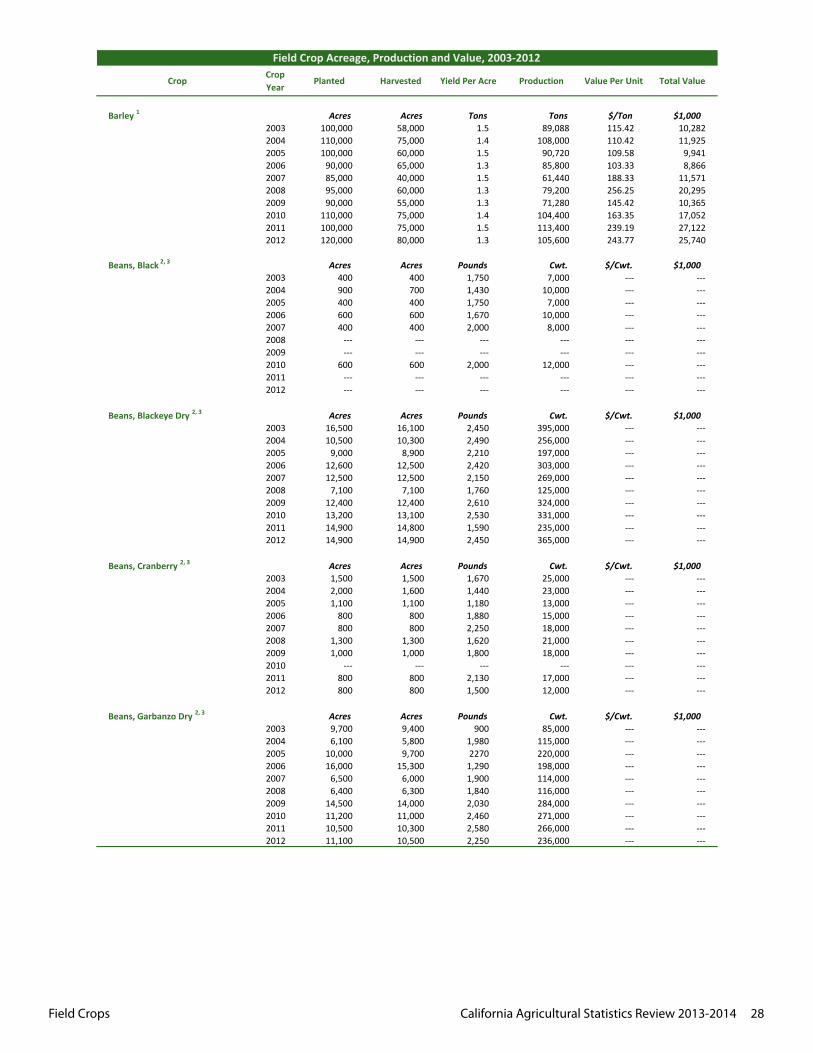
Field Crops California Agricultural Statistics Review 2013-2014 28
CropCrop Year
Planted Harvested Yield Per Acre Production Value Per Unit Total Value
Barley 1 Acres Acres Tons Tons $/Ton $1,0002003 100,000 58,000 1.5 89,088 115.42 10,2822004 110,000 75,000 1.4 108,000 110.42 11,9252005 100,000 60,000 1.5 90,720 109.58 9,9412006 90,000 65,000 1.3 85,800 103.33 8,8662007 85,000 40,000 1.5 61,440 188.33 11,5712008 95,000 60,000 1.3 79,200 256.25 20,2952009 90,000 55,000 1.3 71,280 145.42 10,3652010 110,000 75,000 1.4 104,400 163.35 17,0522011 100,000 75,000 1.5 113,400 239.19 27,1222012 120,000 80,000 1.3 105,600 243.77 25,740
Beans, Black 2, 3 Acres Acres Pounds Cwt. $/Cwt. $1,0002003 400 400 1,750 7,000 ‐‐‐ ‐‐‐2004 900 700 1,430 10,000 ‐‐‐ ‐‐‐2005 400 400 1,750 7,000 ‐‐‐ ‐‐‐2006 600 600 1,670 10,000 ‐‐‐ ‐‐‐2007 400 400 2,000 8,000 ‐‐‐ ‐‐‐2008 ‐‐‐ ‐‐‐ ‐‐‐ ‐‐‐ ‐‐‐ ‐‐‐2009 ‐‐‐ ‐‐‐ ‐‐‐ ‐‐‐ ‐‐‐ ‐‐‐2010 600 600 2,000 12,000 ‐‐‐ ‐‐‐2011 ‐‐‐ ‐‐‐ ‐‐‐ ‐‐‐ ‐‐‐ ‐‐‐2012 ‐‐‐ ‐‐‐ ‐‐‐ ‐‐‐ ‐‐‐ ‐‐‐
Beans, Blackeye Dry 2, 3 Acres Acres Pounds Cwt. $/Cwt. $1,0002003 16,500 16,100 2,450 395,000 ‐‐‐ ‐‐‐2004 10,500 10,300 2,490 256,000 ‐‐‐ ‐‐‐2005 9,000 8,900 2,210 197,000 ‐‐‐ ‐‐‐2006 12,600 12,500 2,420 303,000 ‐‐‐ ‐‐‐2007 12,500 12,500 2,150 269,000 ‐‐‐ ‐‐‐2008 7,100 7,100 1,760 125,000 ‐‐‐ ‐‐‐2009 12,400 12,400 2,610 324,000 ‐‐‐ ‐‐‐2010 13,200 13,100 2,530 331,000 ‐‐‐ ‐‐‐2011 14,900 14,800 1,590 235,000 ‐‐‐ ‐‐‐2012 14,900 14,900 2,450 365,000 ‐‐‐ ‐‐‐
Beans, Cranberry 2, 3 Acres Acres Pounds Cwt. $/Cwt. $1,0002003 1,500 1,500 1,670 25,000 ‐‐‐ ‐‐‐2004 2,000 1,600 1,440 23,000 ‐‐‐ ‐‐‐2005 1,100 1,100 1,180 13,000 ‐‐‐ ‐‐‐2006 800 800 1,880 15,000 ‐‐‐ ‐‐‐2007 800 800 2,250 18,000 ‐‐‐ ‐‐‐2008 1,300 1,300 1,620 21,000 ‐‐‐ ‐‐‐2009 1,000 1,000 1,800 18,000 ‐‐‐ ‐‐‐2010 ‐‐‐ ‐‐‐ ‐‐‐ ‐‐‐ ‐‐‐ ‐‐‐2011 800 800 2,130 17,000 ‐‐‐ ‐‐‐2012 800 800 1,500 12,000 ‐‐‐ ‐‐‐
Beans, Garbanzo Dry 2, 3 Acres Acres Pounds Cwt. $/Cwt. $1,0002003 9,700 9,400 900 85,000 ‐‐‐ ‐‐‐2004 6,100 5,800 1,980 115,000 ‐‐‐ ‐‐‐2005 10,000 9,700 2270 220,000 ‐‐‐ ‐‐‐2006 16,000 15,300 1,290 198,000 ‐‐‐ ‐‐‐2007 6,500 6,000 1,900 114,000 ‐‐‐ ‐‐‐2008 6,400 6,300 1,840 116,000 ‐‐‐ ‐‐‐2009 14,500 14,000 2,030 284,000 ‐‐‐ ‐‐‐2010 11,200 11,000 2,460 271,000 ‐‐‐ ‐‐‐2011 10,500 10,300 2,580 266,000 ‐‐‐ ‐‐‐2012 11,100 10,500 2,250 236,000 ‐‐‐ ‐‐‐
Field Crop Acreage, Production and Value, 2003‐2012
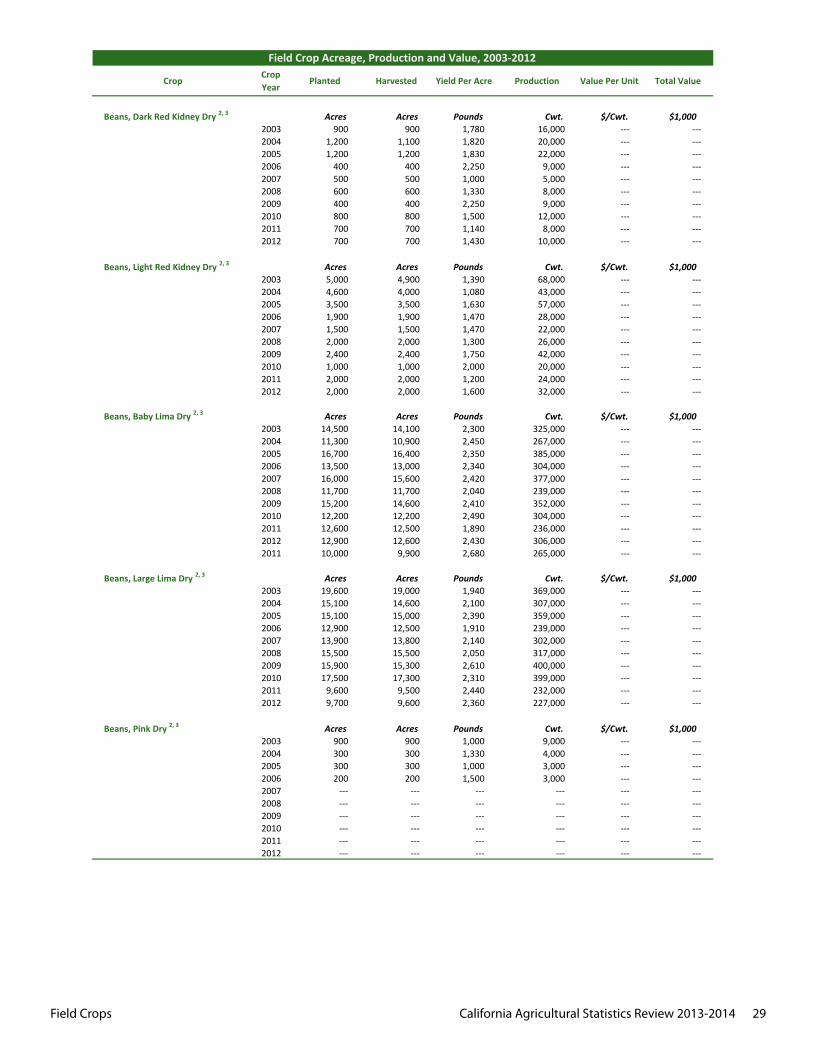
Field Crops California Agricultural Statistics Review 2013-2014 29
CropCrop Year
Planted Harvested Yield Per Acre Production Value Per Unit Total Value
Field Crop Acreage, Production and Value, 2003‐2012
Beans, Dark Red Kidney Dry 2, 3 Acres Acres Pounds Cwt. $/Cwt. $1,0002003 900 900 1,780 16,000 ‐‐‐ ‐‐‐2004 1,200 1,100 1,820 20,000 ‐‐‐ ‐‐‐2005 1,200 1,200 1,830 22,000 ‐‐‐ ‐‐‐2006 400 400 2,250 9,000 ‐‐‐ ‐‐‐2007 500 500 1,000 5,000 ‐‐‐ ‐‐‐2008 600 600 1,330 8,000 ‐‐‐ ‐‐‐2009 400 400 2,250 9,000 ‐‐‐ ‐‐‐2010 800 800 1,500 12,000 ‐‐‐ ‐‐‐2011 700 700 1,140 8,000 ‐‐‐ ‐‐‐2012 700 700 1,430 10,000 ‐‐‐ ‐‐‐
Beans, Light Red Kidney Dry 2, 3 Acres Acres Pounds Cwt. $/Cwt. $1,0002003 5,000 4,900 1,390 68,000 ‐‐‐ ‐‐‐2004 4,600 4,000 1,080 43,000 ‐‐‐ ‐‐‐2005 3,500 3,500 1,630 57,000 ‐‐‐ ‐‐‐2006 1,900 1,900 1,470 28,000 ‐‐‐ ‐‐‐2007 1,500 1,500 1,470 22,000 ‐‐‐ ‐‐‐2008 2,000 2,000 1,300 26,000 ‐‐‐ ‐‐‐2009 2,400 2,400 1,750 42,000 ‐‐‐ ‐‐‐2010 1,000 1,000 2,000 20,000 ‐‐‐ ‐‐‐2011 2,000 2,000 1,200 24,000 ‐‐‐ ‐‐‐2012 2,000 2,000 1,600 32,000 ‐‐‐ ‐‐‐
Beans, Baby Lima Dry 2, 3 Acres Acres Pounds Cwt. $/Cwt. $1,0002003 14,500 14,100 2,300 325,000 ‐‐‐ ‐‐‐2004 11,300 10,900 2,450 267,000 ‐‐‐ ‐‐‐2005 16,700 16,400 2,350 385,000 ‐‐‐ ‐‐‐2006 13,500 13,000 2,340 304,000 ‐‐‐ ‐‐‐2007 16,000 15,600 2,420 377,000 ‐‐‐ ‐‐‐2008 11,700 11,700 2,040 239,000 ‐‐‐ ‐‐‐2009 15,200 14,600 2,410 352,000 ‐‐‐ ‐‐‐2010 12,200 12,200 2,490 304,000 ‐‐‐ ‐‐‐2011 12,600 12,500 1,890 236,000 ‐‐‐ ‐‐‐2012 12,900 12,600 2,430 306,000 ‐‐‐ ‐‐‐2011 10,000 9,900 2,680 265,000 ‐‐‐ ‐‐‐
Beans, Large Lima Dry 2, 3 Acres Acres Pounds Cwt. $/Cwt. $1,0002003 19,600 19,000 1,940 369,000 ‐‐‐ ‐‐‐2004 15,100 14,600 2,100 307,000 ‐‐‐ ‐‐‐2005 15,100 15,000 2,390 359,000 ‐‐‐ ‐‐‐2006 12,900 12,500 1,910 239,000 ‐‐‐ ‐‐‐2007 13,900 13,800 2,140 302,000 ‐‐‐ ‐‐‐2008 15,500 15,500 2,050 317,000 ‐‐‐ ‐‐‐2009 15,900 15,300 2,610 400,000 ‐‐‐ ‐‐‐2010 17,500 17,300 2,310 399,000 ‐‐‐ ‐‐‐2011 9,600 9,500 2,440 232,000 ‐‐‐ ‐‐‐2012 9,700 9,600 2,360 227,000 ‐‐‐ ‐‐‐
Beans, Pink Dry 2, 3 Acres Acres Pounds Cwt. $/Cwt. $1,0002003 900 900 1,000 9,000 ‐‐‐ ‐‐‐2004 300 300 1,330 4,000 ‐‐‐ ‐‐‐2005 300 300 1,000 3,000 ‐‐‐ ‐‐‐2006 200 200 1,500 3,000 ‐‐‐ ‐‐‐2007 ‐‐‐ ‐‐‐ ‐‐‐ ‐‐‐ ‐‐‐ ‐‐‐2008 ‐‐‐ ‐‐‐ ‐‐‐ ‐‐‐ ‐‐‐ ‐‐‐2009 ‐‐‐ ‐‐‐ ‐‐‐ ‐‐‐ ‐‐‐ ‐‐‐2010 ‐‐‐ ‐‐‐ ‐‐‐ ‐‐‐ ‐‐‐ ‐‐‐2011 ‐‐‐ ‐‐‐ ‐‐‐ ‐‐‐ ‐‐‐ ‐‐‐2012 ‐‐‐ ‐‐‐ ‐‐‐ ‐‐‐ ‐‐‐ ‐‐‐
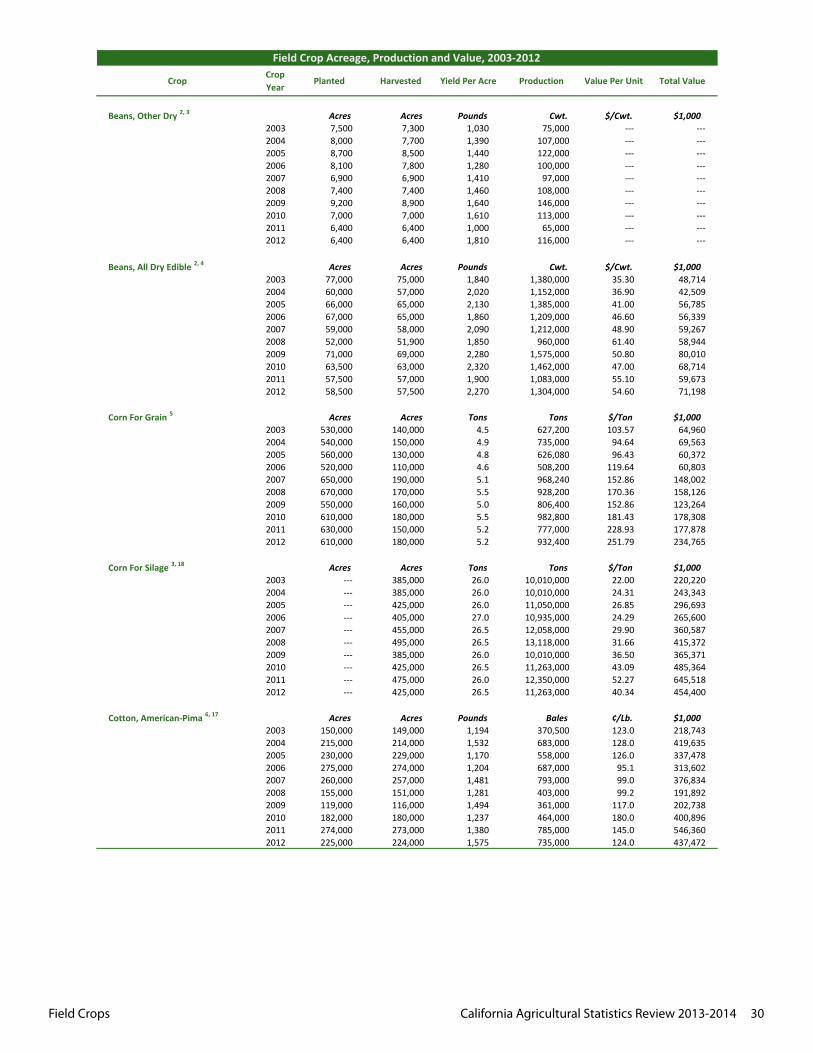
Field Crops California Agricultural Statistics Review 2013-2014 30
CropCrop Year
Planted Harvested Yield Per Acre Production Value Per Unit Total Value
Field Crop Acreage, Production and Value, 2003‐2012
Beans, Other Dry 2, 3 Acres Acres Pounds Cwt. $/Cwt. $1,0002003 7,500 7,300 1,030 75,000 ‐‐‐ ‐‐‐2004 8,000 7,700 1,390 107,000 ‐‐‐ ‐‐‐2005 8,700 8,500 1,440 122,000 ‐‐‐ ‐‐‐2006 8,100 7,800 1,280 100,000 ‐‐‐ ‐‐‐2007 6,900 6,900 1,410 97,000 ‐‐‐ ‐‐‐2008 7,400 7,400 1,460 108,000 ‐‐‐ ‐‐‐2009 9,200 8,900 1,640 146,000 ‐‐‐ ‐‐‐2010 7,000 7,000 1,610 113,000 ‐‐‐ ‐‐‐2011 6,400 6,400 1,000 65,000 ‐‐‐ ‐‐‐2012 6,400 6,400 1,810 116,000 ‐‐‐ ‐‐‐
Beans, All Dry Edible 2, 4 Acres Acres Pounds Cwt. $/Cwt. $1,0002003 77,000 75,000 1,840 1,380,000 35.30 48,7142004 60,000 57,000 2,020 1,152,000 36.90 42,5092005 66,000 65,000 2,130 1,385,000 41.00 56,7852006 67,000 65,000 1,860 1,209,000 46.60 56,3392007 59,000 58,000 2,090 1,212,000 48.90 59,2672008 52,000 51,900 1,850 960,000 61.40 58,9442009 71,000 69,000 2,280 1,575,000 50.80 80,0102010 63,500 63,000 2,320 1,462,000 47.00 68,7142011 57,500 57,000 1,900 1,083,000 55.10 59,6732012 58,500 57,500 2,270 1,304,000 54.60 71,198
Corn For Grain 5 Acres Acres Tons Tons $/Ton $1,0002003 530,000 140,000 4.5 627,200 103.57 64,9602004 540,000 150,000 4.9 735,000 94.64 69,5632005 560,000 130,000 4.8 626,080 96.43 60,3722006 520,000 110,000 4.6 508,200 119.64 60,8032007 650,000 190,000 5.1 968,240 152.86 148,0022008 670,000 170,000 5.5 928,200 170.36 158,1262009 550,000 160,000 5.0 806,400 152.86 123,2642010 610,000 180,000 5.5 982,800 181.43 178,3082011 630,000 150,000 5.2 777,000 228.93 177,8782012 610,000 180,000 5.2 932,400 251.79 234,765
Corn For Silage 3, 18 Acres Acres Tons Tons $/Ton $1,0002003 ‐‐‐ 385,000 26.0 10,010,000 22.00 220,2202004 ‐‐‐ 385,000 26.0 10,010,000 24.31 243,3432005 ‐‐‐ 425,000 26.0 11,050,000 26.85 296,6932006 ‐‐‐ 405,000 27.0 10,935,000 24.29 265,6002007 ‐‐‐ 455,000 26.5 12,058,000 29.90 360,5872008 ‐‐‐ 495,000 26.5 13,118,000 31.66 415,3722009 ‐‐‐ 385,000 26.0 10,010,000 36.50 365,3712010 ‐‐‐ 425,000 26.5 11,263,000 43.09 485,3642011 ‐‐‐ 475,000 26.0 12,350,000 52.27 645,5182012 ‐‐‐ 425,000 26.5 11,263,000 40.34 454,400
Cotton, American‐Pima 6, 17 Acres Acres Pounds Bales ¢/Lb. $1,0002003 150,000 149,000 1,194 370,500 123.0 218,7432004 215,000 214,000 1,532 683,000 128.0 419,6352005 230,000 229,000 1,170 558,000 126.0 337,4782006 275,000 274,000 1,204 687,000 95.1 313,6022007 260,000 257,000 1,481 793,000 99.0 376,8342008 155,000 151,000 1,281 403,000 99.2 191,8922009 119,000 116,000 1,494 361,000 117.0 202,7382010 182,000 180,000 1,237 464,000 180.0 400,8962011 274,000 273,000 1,380 785,000 145.0 546,3602012 225,000 224,000 1,575 735,000 124.0 437,472
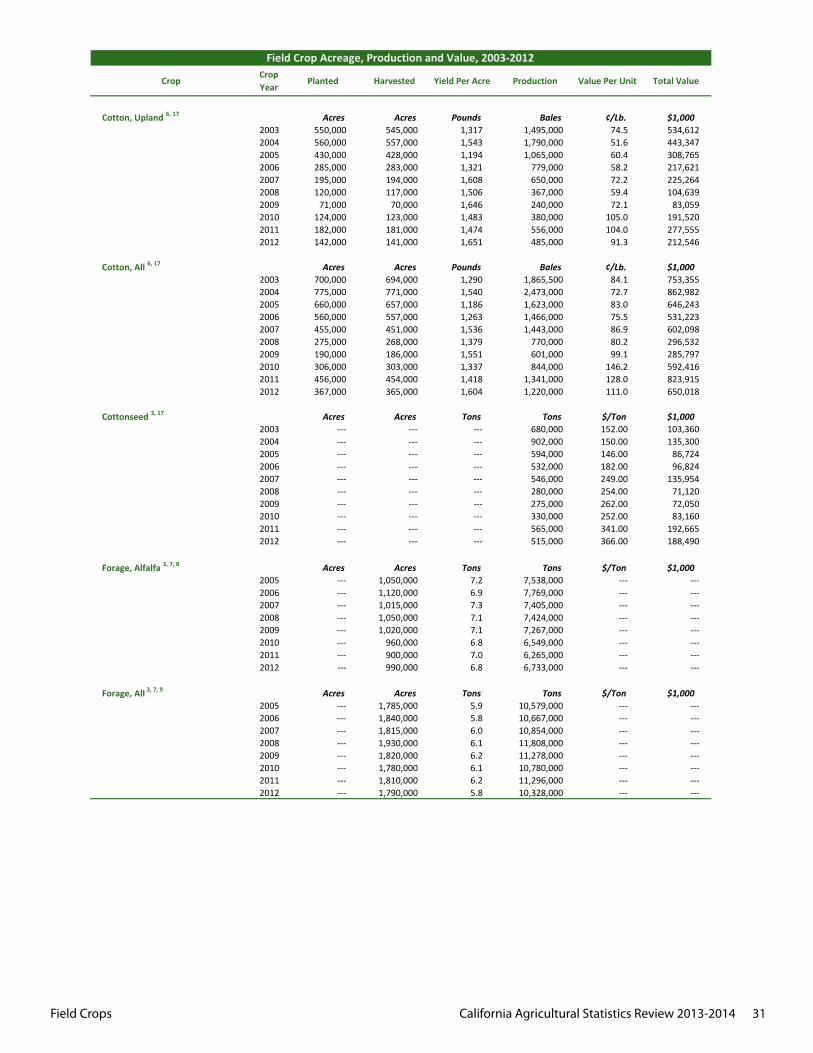
Field Crops California Agricultural Statistics Review 2013-2014 31
CropCrop Year
Planted Harvested Yield Per Acre Production Value Per Unit Total Value
Field Crop Acreage, Production and Value, 2003‐2012
Cotton, Upland 6, 17 Acres Acres Pounds Bales ¢/Lb. $1,0002003 550,000 545,000 1,317 1,495,000 74.5 534,6122004 560,000 557,000 1,543 1,790,000 51.6 443,3472005 430,000 428,000 1,194 1,065,000 60.4 308,7652006 285,000 283,000 1,321 779,000 58.2 217,6212007 195,000 194,000 1,608 650,000 72.2 225,2642008 120,000 117,000 1,506 367,000 59.4 104,6392009 71,000 70,000 1,646 240,000 72.1 83,0592010 124,000 123,000 1,483 380,000 105.0 191,5202011 182,000 181,000 1,474 556,000 104.0 277,5552012 142,000 141,000 1,651 485,000 91.3 212,546
Cotton, All 6, 17 Acres Acres Pounds Bales ¢/Lb. $1,0002003 700,000 694,000 1,290 1,865,500 84.1 753,3552004 775,000 771,000 1,540 2,473,000 72.7 862,9822005 660,000 657,000 1,186 1,623,000 83.0 646,2432006 560,000 557,000 1,263 1,466,000 75.5 531,2232007 455,000 451,000 1,536 1,443,000 86.9 602,0982008 275,000 268,000 1,379 770,000 80.2 296,5322009 190,000 186,000 1,551 601,000 99.1 285,7972010 306,000 303,000 1,337 844,000 146.2 592,4162011 456,000 454,000 1,418 1,341,000 128.0 823,9152012 367,000 365,000 1,604 1,220,000 111.0 650,018
Cottonseed 3, 17 Acres Acres Tons Tons $/Ton $1,0002003 ‐‐‐ ‐‐‐ ‐‐‐ 680,000 152.00 103,3602004 ‐‐‐ ‐‐‐ ‐‐‐ 902,000 150.00 135,3002005 ‐‐‐ ‐‐‐ ‐‐‐ 594,000 146.00 86,7242006 ‐‐‐ ‐‐‐ ‐‐‐ 532,000 182.00 96,8242007 ‐‐‐ ‐‐‐ ‐‐‐ 546,000 249.00 135,9542008 ‐‐‐ ‐‐‐ ‐‐‐ 280,000 254.00 71,1202009 ‐‐‐ ‐‐‐ ‐‐‐ 275,000 262.00 72,0502010 ‐‐‐ ‐‐‐ ‐‐‐ 330,000 252.00 83,1602011 ‐‐‐ ‐‐‐ ‐‐‐ 565,000 341.00 192,6652012 ‐‐‐ ‐‐‐ ‐‐‐ 515,000 366.00 188,490
Forage, Alfalfa 3, 7, 8 Acres Acres Tons Tons $/Ton $1,0002005 ‐‐‐ 1,050,000 7.2 7,538,000 ‐‐‐ ‐‐‐2006 ‐‐‐ 1,120,000 6.9 7,769,000 ‐‐‐ ‐‐‐2007 ‐‐‐ 1,015,000 7.3 7,405,000 ‐‐‐ ‐‐‐2008 ‐‐‐ 1,050,000 7.1 7,424,000 ‐‐‐ ‐‐‐2009 ‐‐‐ 1,020,000 7.1 7,267,000 ‐‐‐ ‐‐‐2010 ‐‐‐ 960,000 6.8 6,549,000 ‐‐‐ ‐‐‐2011 ‐‐‐ 900,000 7.0 6,265,000 ‐‐‐ ‐‐‐2012 ‐‐‐ 990,000 6.8 6,733,000 ‐‐‐ ‐‐‐
Forage, All 3, 7, 9 Acres Acres Tons Tons $/Ton $1,0002005 ‐‐‐ 1,785,000 5.9 10,579,000 ‐‐‐ ‐‐‐2006 ‐‐‐ 1,840,000 5.8 10,667,000 ‐‐‐ ‐‐‐2007 ‐‐‐ 1,815,000 6.0 10,854,000 ‐‐‐ ‐‐‐2008 ‐‐‐ 1,930,000 6.1 11,808,000 ‐‐‐ ‐‐‐2009 ‐‐‐ 1,820,000 6.2 11,278,000 ‐‐‐ ‐‐‐2010 ‐‐‐ 1,780,000 6.1 10,780,000 ‐‐‐ ‐‐‐2011 ‐‐‐ 1,810,000 6.2 11,296,000 ‐‐‐ ‐‐‐2012 ‐‐‐ 1,790,000 5.8 10,328,000 ‐‐‐ ‐‐‐
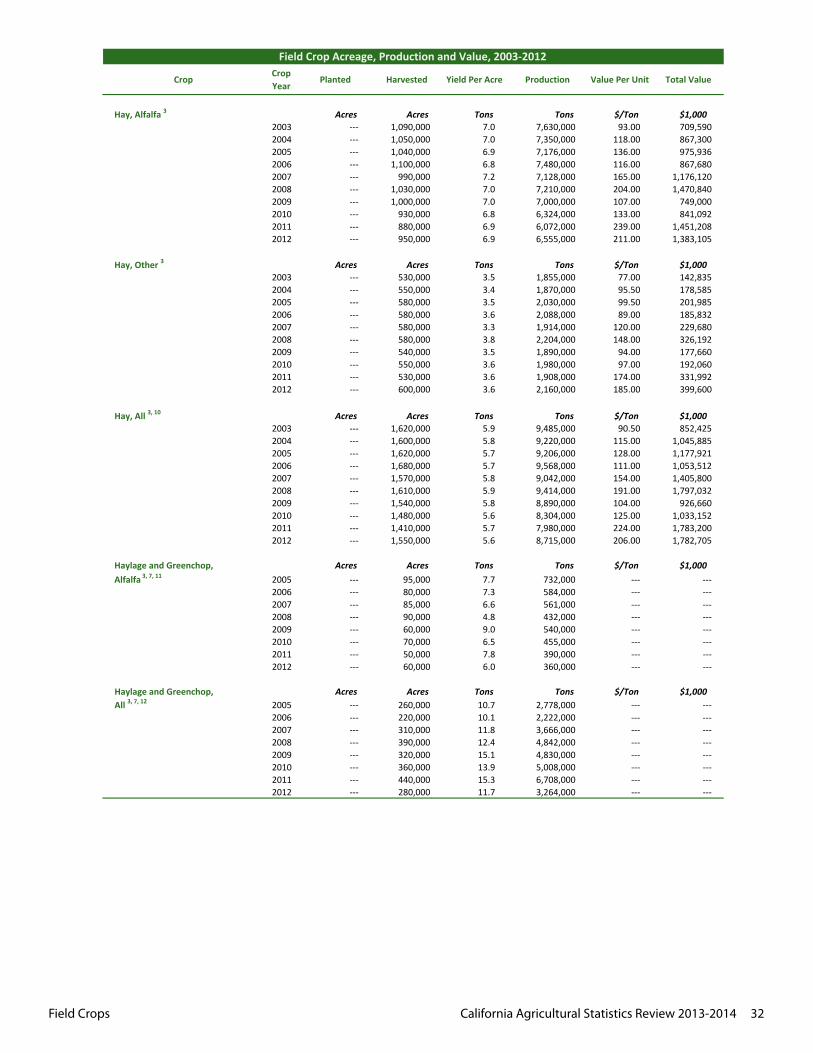
Field Crops California Agricultural Statistics Review 2013-2014 32
CropCrop Year
Planted Harvested Yield Per Acre Production Value Per Unit Total Value
Field Crop Acreage, Production and Value, 2003‐2012
Hay, Alfalfa 3 Acres Acres Tons Tons $/Ton $1,0002003 ‐‐‐ 1,090,000 7.0 7,630,000 93.00 709,5902004 ‐‐‐ 1,050,000 7.0 7,350,000 118.00 867,3002005 ‐‐‐ 1,040,000 6.9 7,176,000 136.00 975,9362006 ‐‐‐ 1,100,000 6.8 7,480,000 116.00 867,6802007 ‐‐‐ 990,000 7.2 7,128,000 165.00 1,176,1202008 ‐‐‐ 1,030,000 7.0 7,210,000 204.00 1,470,8402009 ‐‐‐ 1,000,000 7.0 7,000,000 107.00 749,0002010 ‐‐‐ 930,000 6.8 6,324,000 133.00 841,0922011 ‐‐‐ 880,000 6.9 6,072,000 239.00 1,451,2082012 ‐‐‐ 950,000 6.9 6,555,000 211.00 1,383,105
Hay, Other 3 Acres Acres Tons Tons $/Ton $1,000
2003 ‐‐‐ 530,000 3.5 1,855,000 77.00 142,8352004 ‐‐‐ 550,000 3.4 1,870,000 95.50 178,5852005 ‐‐‐ 580,000 3.5 2,030,000 99.50 201,9852006 ‐‐‐ 580,000 3.6 2,088,000 89.00 185,8322007 ‐‐‐ 580,000 3.3 1,914,000 120.00 229,6802008 ‐‐‐ 580,000 3.8 2,204,000 148.00 326,1922009 ‐‐‐ 540,000 3.5 1,890,000 94.00 177,6602010 ‐‐‐ 550,000 3.6 1,980,000 97.00 192,0602011 ‐‐‐ 530,000 3.6 1,908,000 174.00 331,9922012 ‐‐‐ 600,000 3.6 2,160,000 185.00 399,600
Hay, All 3, 10 Acres Acres Tons Tons $/Ton $1,0002003 ‐‐‐ 1,620,000 5.9 9,485,000 90.50 852,4252004 ‐‐‐ 1,600,000 5.8 9,220,000 115.00 1,045,8852005 ‐‐‐ 1,620,000 5.7 9,206,000 128.00 1,177,9212006 ‐‐‐ 1,680,000 5.7 9,568,000 111.00 1,053,5122007 ‐‐‐ 1,570,000 5.8 9,042,000 154.00 1,405,8002008 ‐‐‐ 1,610,000 5.9 9,414,000 191.00 1,797,0322009 ‐‐‐ 1,540,000 5.8 8,890,000 104.00 926,6602010 ‐‐‐ 1,480,000 5.6 8,304,000 125.00 1,033,1522011 ‐‐‐ 1,410,000 5.7 7,980,000 224.00 1,783,2002012 ‐‐‐ 1,550,000 5.6 8,715,000 206.00 1,782,705
Haylage and Greenchop, Acres Acres Tons Tons $/Ton $1,000Alfalfa 3, 7, 11 2005 ‐‐‐ 95,000 7.7 732,000 ‐‐‐ ‐‐‐
2006 ‐‐‐ 80,000 7.3 584,000 ‐‐‐ ‐‐‐2007 ‐‐‐ 85,000 6.6 561,000 ‐‐‐ ‐‐‐2008 ‐‐‐ 90,000 4.8 432,000 ‐‐‐ ‐‐‐2009 ‐‐‐ 60,000 9.0 540,000 ‐‐‐ ‐‐‐2010 ‐‐‐ 70,000 6.5 455,000 ‐‐‐ ‐‐‐2011 ‐‐‐ 50,000 7.8 390,000 ‐‐‐ ‐‐‐2012 ‐‐‐ 60,000 6.0 360,000 ‐‐‐ ‐‐‐
Haylage and Greenchop, Acres Acres Tons Tons $/Ton $1,000All 3, 7, 12 2005 ‐‐‐ 260,000 10.7 2,778,000 ‐‐‐ ‐‐‐
2006 ‐‐‐ 220,000 10.1 2,222,000 ‐‐‐ ‐‐‐2007 ‐‐‐ 310,000 11.8 3,666,000 ‐‐‐ ‐‐‐2008 ‐‐‐ 390,000 12.4 4,842,000 ‐‐‐ ‐‐‐2009 ‐‐‐ 320,000 15.1 4,830,000 ‐‐‐ ‐‐‐2010 ‐‐‐ 360,000 13.9 5,008,000 ‐‐‐ ‐‐‐2011 ‐‐‐ 440,000 15.3 6,708,000 ‐‐‐ ‐‐‐2012 ‐‐‐ 280,000 11.7 3,264,000 ‐‐‐ ‐‐‐
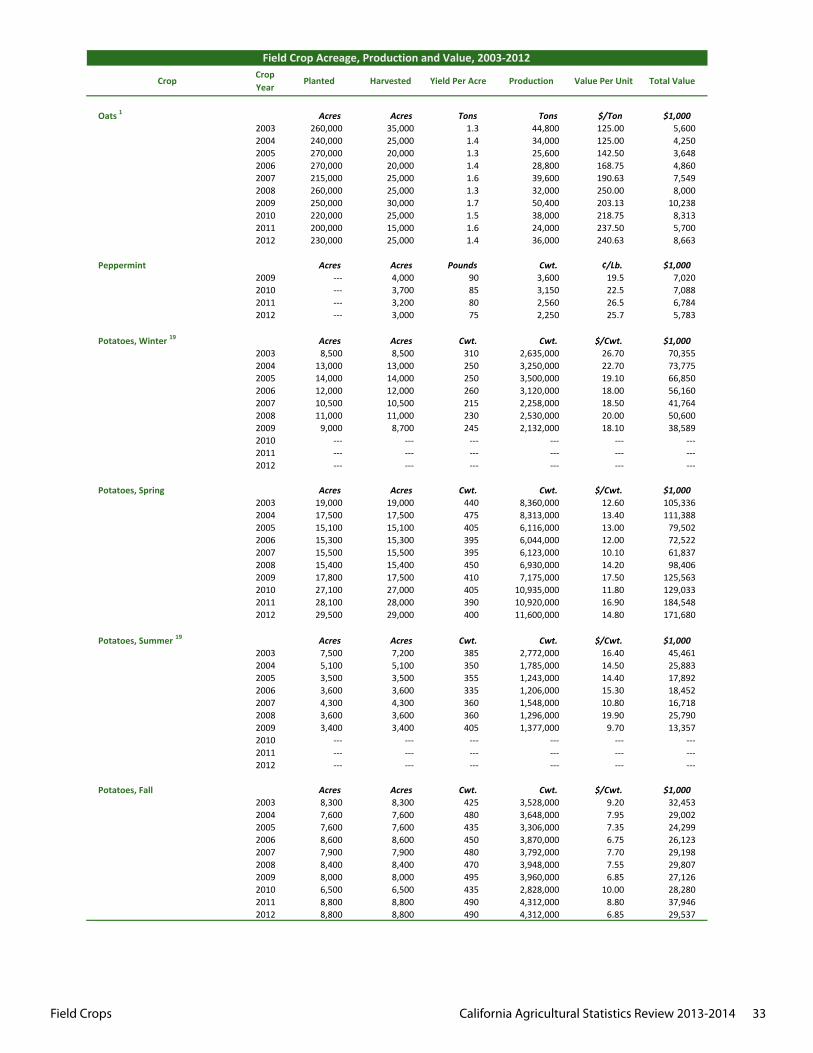
Field Crops California Agricultural Statistics Review 2013-2014 33
CropCrop Year
Planted Harvested Yield Per Acre Production Value Per Unit Total Value
Field Crop Acreage, Production and Value, 2003‐2012
Oats 1 Acres Acres Tons Tons $/Ton $1,0002003 260,000 35,000 1.3 44,800 125.00 5,6002004 240,000 25,000 1.4 34,000 125.00 4,2502005 270,000 20,000 1.3 25,600 142.50 3,6482006 270,000 20,000 1.4 28,800 168.75 4,8602007 215,000 25,000 1.6 39,600 190.63 7,5492008 260,000 25,000 1.3 32,000 250.00 8,0002009 250,000 30,000 1.7 50,400 203.13 10,2382010 220,000 25,000 1.5 38,000 218.75 8,3132011 200,000 15,000 1.6 24,000 237.50 5,7002012 230,000 25,000 1.4 36,000 240.63 8,663
Peppermint Acres Acres Pounds Cwt. ¢/Lb. $1,0002009 ‐‐‐ 4,000 90 3,600 19.5 7,0202010 ‐‐‐ 3,700 85 3,150 22.5 7,0882011 ‐‐‐ 3,200 80 2,560 26.5 6,7842012 ‐‐‐ 3,000 75 2,250 25.7 5,783
Potatoes, Winter 19 Acres Acres Cwt. Cwt. $/Cwt. $1,0002003 8,500 8,500 310 2,635,000 26.70 70,3552004 13,000 13,000 250 3,250,000 22.70 73,7752005 14,000 14,000 250 3,500,000 19.10 66,8502006 12,000 12,000 260 3,120,000 18.00 56,1602007 10,500 10,500 215 2,258,000 18.50 41,7642008 11,000 11,000 230 2,530,000 20.00 50,6002009 9,000 8,700 245 2,132,000 18.10 38,5892010 ‐‐‐ ‐‐‐ ‐‐‐ ‐‐‐ ‐‐‐ ‐‐‐2011 ‐‐‐ ‐‐‐ ‐‐‐ ‐‐‐ ‐‐‐ ‐‐‐2012 ‐‐‐ ‐‐‐ ‐‐‐ ‐‐‐ ‐‐‐ ‐‐‐
Potatoes, Spring Acres Acres Cwt. Cwt. $/Cwt. $1,0002003 19,000 19,000 440 8,360,000 12.60 105,3362004 17,500 17,500 475 8,313,000 13.40 111,3882005 15,100 15,100 405 6,116,000 13.00 79,5022006 15,300 15,300 395 6,044,000 12.00 72,5222007 15,500 15,500 395 6,123,000 10.10 61,8372008 15,400 15,400 450 6,930,000 14.20 98,4062009 17,800 17,500 410 7,175,000 17.50 125,5632010 27,100 27,000 405 10,935,000 11.80 129,0332011 28,100 28,000 390 10,920,000 16.90 184,5482012 29,500 29,000 400 11,600,000 14.80 171,680
Potatoes, Summer 19 Acres Acres Cwt. Cwt. $/Cwt. $1,0002003 7,500 7,200 385 2,772,000 16.40 45,4612004 5,100 5,100 350 1,785,000 14.50 25,8832005 3,500 3,500 355 1,243,000 14.40 17,8922006 3,600 3,600 335 1,206,000 15.30 18,4522007 4,300 4,300 360 1,548,000 10.80 16,7182008 3,600 3,600 360 1,296,000 19.90 25,7902009 3,400 3,400 405 1,377,000 9.70 13,3572010 ‐‐‐ ‐‐‐ ‐‐‐ ‐‐‐ ‐‐‐ ‐‐‐2011 ‐‐‐ ‐‐‐ ‐‐‐ ‐‐‐ ‐‐‐ ‐‐‐2012 ‐‐‐ ‐‐‐ ‐‐‐ ‐‐‐ ‐‐‐ ‐‐‐
Potatoes, Fall Acres Acres Cwt. Cwt. $/Cwt. $1,0002003 8,300 8,300 425 3,528,000 9.20 32,4532004 7,600 7,600 480 3,648,000 7.95 29,0022005 7,600 7,600 435 3,306,000 7.35 24,2992006 8,600 8,600 450 3,870,000 6.75 26,1232007 7,900 7,900 480 3,792,000 7.70 29,1982008 8,400 8,400 470 3,948,000 7.55 29,8072009 8,000 8,000 495 3,960,000 6.85 27,1262010 6,500 6,500 435 2,828,000 10.00 28,2802011 8,800 8,800 490 4,312,000 8.80 37,9462012 8,800 8,800 490 4,312,000 6.85 29,537
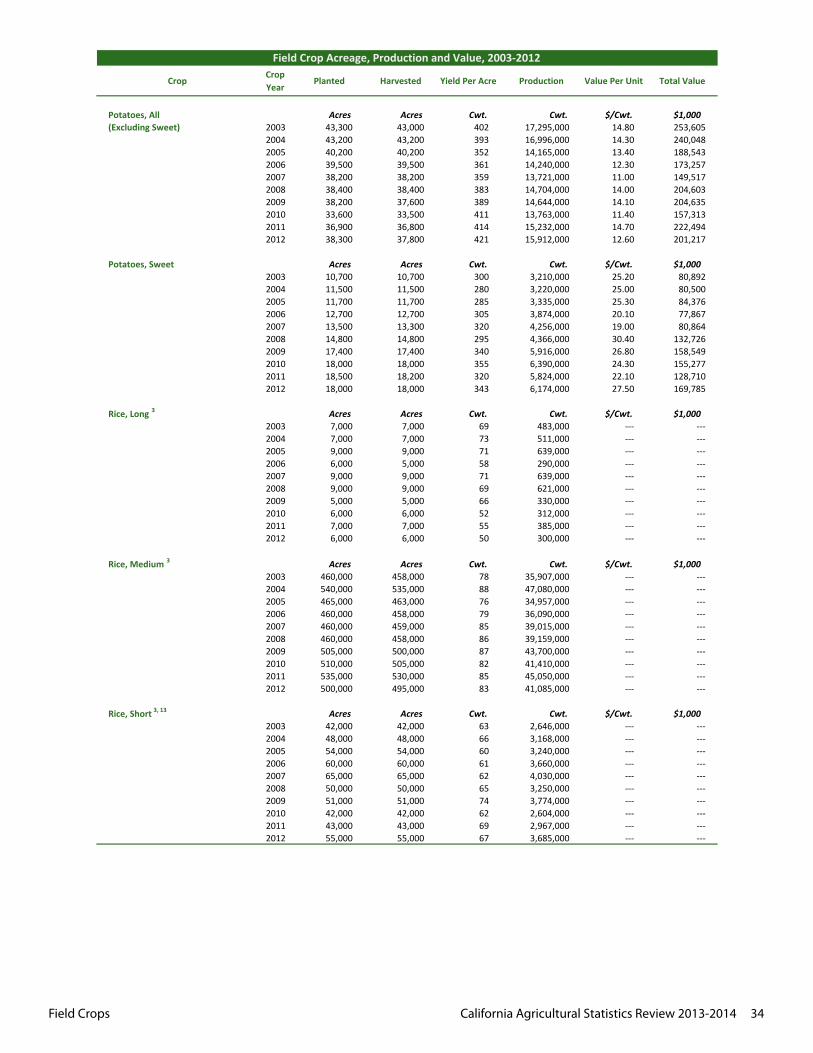
Field Crops California Agricultural Statistics Review 2013-2014 34
CropCrop Year
Planted Harvested Yield Per Acre Production Value Per Unit Total Value
Field Crop Acreage, Production and Value, 2003‐2012
Potatoes, All Acres Acres Cwt. Cwt. $/Cwt. $1,000(Excluding Sweet) 2003 43,300 43,000 402 17,295,000 14.80 253,605
2004 43,200 43,200 393 16,996,000 14.30 240,0482005 40,200 40,200 352 14,165,000 13.40 188,5432006 39,500 39,500 361 14,240,000 12.30 173,2572007 38,200 38,200 359 13,721,000 11.00 149,5172008 38,400 38,400 383 14,704,000 14.00 204,6032009 38,200 37,600 389 14,644,000 14.10 204,6352010 33,600 33,500 411 13,763,000 11.40 157,3132011 36,900 36,800 414 15,232,000 14.70 222,4942012 38,300 37,800 421 15,912,000 12.60 201,217
Potatoes, Sweet Acres Acres Cwt. Cwt. $/Cwt. $1,0002003 10,700 10,700 300 3,210,000 25.20 80,8922004 11,500 11,500 280 3,220,000 25.00 80,5002005 11,700 11,700 285 3,335,000 25.30 84,3762006 12,700 12,700 305 3,874,000 20.10 77,8672007 13,500 13,300 320 4,256,000 19.00 80,8642008 14,800 14,800 295 4,366,000 30.40 132,7262009 17,400 17,400 340 5,916,000 26.80 158,5492010 18,000 18,000 355 6,390,000 24.30 155,2772011 18,500 18,200 320 5,824,000 22.10 128,7102012 18,000 18,000 343 6,174,000 27.50 169,785
Rice, Long 3 Acres Acres Cwt. Cwt. $/Cwt. $1,0002003 7,000 7,000 69 483,000 ‐‐‐ ‐‐‐2004 7,000 7,000 73 511,000 ‐‐‐ ‐‐‐2005 9,000 9,000 71 639,000 ‐‐‐ ‐‐‐2006 6,000 5,000 58 290,000 ‐‐‐ ‐‐‐2007 9,000 9,000 71 639,000 ‐‐‐ ‐‐‐2008 9,000 9,000 69 621,000 ‐‐‐ ‐‐‐2009 5,000 5,000 66 330,000 ‐‐‐ ‐‐‐2010 6,000 6,000 52 312,000 ‐‐‐ ‐‐‐2011 7,000 7,000 55 385,000 ‐‐‐ ‐‐‐2012 6,000 6,000 50 300,000 ‐‐‐ ‐‐‐
Rice, Medium 3 Acres Acres Cwt. Cwt. $/Cwt. $1,0002003 460,000 458,000 78 35,907,000 ‐‐‐ ‐‐‐2004 540,000 535,000 88 47,080,000 ‐‐‐ ‐‐‐2005 465,000 463,000 76 34,957,000 ‐‐‐ ‐‐‐2006 460,000 458,000 79 36,090,000 ‐‐‐ ‐‐‐2007 460,000 459,000 85 39,015,000 ‐‐‐ ‐‐‐2008 460,000 458,000 86 39,159,000 ‐‐‐ ‐‐‐2009 505,000 500,000 87 43,700,000 ‐‐‐ ‐‐‐2010 510,000 505,000 82 41,410,000 ‐‐‐ ‐‐‐2011 535,000 530,000 85 45,050,000 ‐‐‐ ‐‐‐2012 500,000 495,000 83 41,085,000 ‐‐‐ ‐‐‐
Rice, Short 3, 13 Acres Acres Cwt. Cwt. $/Cwt. $1,0002003 42,000 42,000 63 2,646,000 ‐‐‐ ‐‐‐2004 48,000 48,000 66 3,168,000 ‐‐‐ ‐‐‐2005 54,000 54,000 60 3,240,000 ‐‐‐ ‐‐‐2006 60,000 60,000 61 3,660,000 ‐‐‐ ‐‐‐2007 65,000 65,000 62 4,030,000 ‐‐‐ ‐‐‐2008 50,000 50,000 65 3,250,000 ‐‐‐ ‐‐‐2009 51,000 51,000 74 3,774,000 ‐‐‐ ‐‐‐2010 42,000 42,000 62 2,604,000 ‐‐‐ ‐‐‐2011 43,000 43,000 69 2,967,000 ‐‐‐ ‐‐‐2012 55,000 55,000 67 3,685,000 ‐‐‐ ‐‐‐
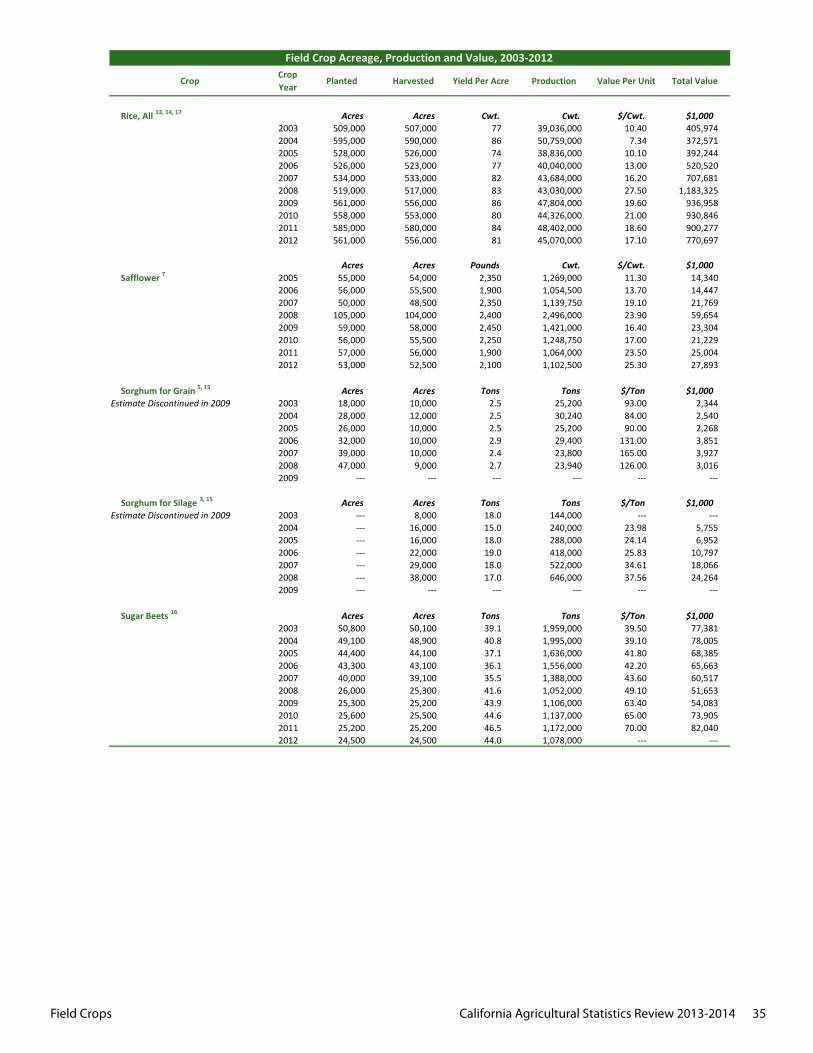
Field Crops California Agricultural Statistics Review 2013-2014 35
CropCrop Year
Planted Harvested Yield Per Acre Production Value Per Unit Total Value
Field Crop Acreage, Production and Value, 2003‐2012
Rice, All 13, 14, 17 Acres Acres Cwt. Cwt. $/Cwt. $1,0002003 509,000 507,000 77 39,036,000 10.40 405,9742004 595,000 590,000 86 50,759,000 7.34 372,5712005 528,000 526,000 74 38,836,000 10.10 392,2442006 526,000 523,000 77 40,040,000 13.00 520,5202007 534,000 533,000 82 43,684,000 16.20 707,6812008 519,000 517,000 83 43,030,000 27.50 1,183,3252009 561,000 556,000 86 47,804,000 19.60 936,9582010 558,000 553,000 80 44,326,000 21.00 930,8462011 585,000 580,000 84 48,402,000 18.60 900,2772012 561,000 556,000 81 45,070,000 17.10 770,697
Acres Acres Pounds Cwt. $/Cwt. $1,000Safflower 7 2005 55,000 54,000 2,350 1,269,000 11.30 14,340
2006 56,000 55,500 1,900 1,054,500 13.70 14,4472007 50,000 48,500 2,350 1,139,750 19.10 21,7692008 105,000 104,000 2,400 2,496,000 23.90 59,6542009 59,000 58,000 2,450 1,421,000 16.40 23,3042010 56,000 55,500 2,250 1,248,750 17.00 21,2292011 57,000 56,000 1,900 1,064,000 23.50 25,0042012 53,000 52,500 2,100 1,102,500 25.30 27,893
Sorghum for Grain 5, 15 Acres Acres Tons Tons $/Ton $1,000Estimate Discontinued in 2009 2003 18,000 10,000 2.5 25,200 93.00 2,344
2004 28,000 12,000 2.5 30,240 84.00 2,5402005 26,000 10,000 2.5 25,200 90.00 2,2682006 32,000 10,000 2.9 29,400 131.00 3,8512007 39,000 10,000 2.4 23,800 165.00 3,9272008 47,000 9,000 2.7 23,940 126.00 3,0162009 ‐‐‐ ‐‐‐ ‐‐‐ ‐‐‐ ‐‐‐ ‐‐‐
Sorghum for Silage 3, 15 Acres Acres Tons Tons $/Ton $1,000Estimate Discontinued in 2009 2003 ‐‐‐ 8,000 18.0 144,000 ‐‐‐ ‐‐‐
2004 ‐‐‐ 16,000 15.0 240,000 23.98 5,7552005 ‐‐‐ 16,000 18.0 288,000 24.14 6,9522006 ‐‐‐ 22,000 19.0 418,000 25.83 10,7972007 ‐‐‐ 29,000 18.0 522,000 34.61 18,0662008 ‐‐‐ 38,000 17.0 646,000 37.56 24,2642009 ‐‐‐ ‐‐‐ ‐‐‐ ‐‐‐ ‐‐‐ ‐‐‐
Sugar Beets 16 Acres Acres Tons Tons $/Ton $1,0002003 50,800 50,100 39.1 1,959,000 39.50 77,3812004 49,100 48,900 40.8 1,995,000 39.10 78,0052005 44,400 44,100 37.1 1,636,000 41.80 68,3852006 43,300 43,100 36.1 1,556,000 42.20 65,6632007 40,000 39,100 35.5 1,388,000 43.60 60,5172008 26,000 25,300 41.6 1,052,000 49.10 51,6532009 25,300 25,200 43.9 1,106,000 63.40 54,0832010 25,600 25,500 44.6 1,137,000 65.00 73,9052011 25,200 25,200 46.5 1,172,000 70.00 82,0402012 24,500 24,500 44.0 1,078,000 ‐‐‐ ‐‐‐
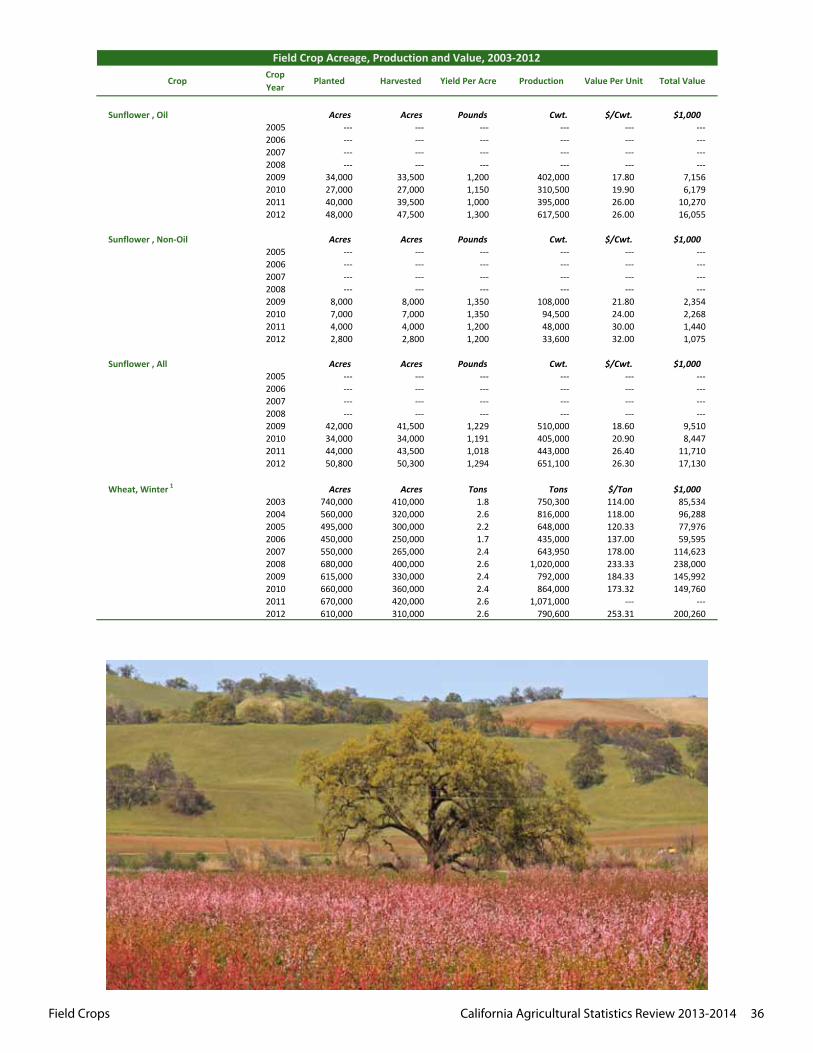
Field Crops California Agricultural Statistics Review 2013-2014 36
CropCrop Year
Planted Harvested Yield Per Acre Production Value Per Unit Total Value
Field Crop Acreage, Production and Value, 2003‐2012
Sunflower , Oil Acres Acres Pounds Cwt. $/Cwt. $1,0002005 ‐‐‐ ‐‐‐ ‐‐‐ ‐‐‐ ‐‐‐ ‐‐‐2006 ‐‐‐ ‐‐‐ ‐‐‐ ‐‐‐ ‐‐‐ ‐‐‐2007 ‐‐‐ ‐‐‐ ‐‐‐ ‐‐‐ ‐‐‐ ‐‐‐2008 ‐‐‐ ‐‐‐ ‐‐‐ ‐‐‐ ‐‐‐ ‐‐‐2009 34,000 33,500 1,200 402,000 17.80 7,1562010 27,000 27,000 1,150 310,500 19.90 6,1792011 40,000 39,500 1,000 395,000 26.00 10,2702012 48,000 47,500 1,300 617,500 26.00 16,055
Sunflower , Non‐Oil Acres Acres Pounds Cwt. $/Cwt. $1,0002005 ‐‐‐ ‐‐‐ ‐‐‐ ‐‐‐ ‐‐‐ ‐‐‐2006 ‐‐‐ ‐‐‐ ‐‐‐ ‐‐‐ ‐‐‐ ‐‐‐2007 ‐‐‐ ‐‐‐ ‐‐‐ ‐‐‐ ‐‐‐ ‐‐‐2008 ‐‐‐ ‐‐‐ ‐‐‐ ‐‐‐ ‐‐‐ ‐‐‐2009 8,000 8,000 1,350 108,000 21.80 2,3542010 7,000 7,000 1,350 94,500 24.00 2,2682011 4,000 4,000 1,200 48,000 30.00 1,4402012 2,800 2,800 1,200 33,600 32.00 1,075
Sunflower , All Acres Acres Pounds Cwt. $/Cwt. $1,0002005 ‐‐‐ ‐‐‐ ‐‐‐ ‐‐‐ ‐‐‐ ‐‐‐2006 ‐‐‐ ‐‐‐ ‐‐‐ ‐‐‐ ‐‐‐ ‐‐‐2007 ‐‐‐ ‐‐‐ ‐‐‐ ‐‐‐ ‐‐‐ ‐‐‐2008 ‐‐‐ ‐‐‐ ‐‐‐ ‐‐‐ ‐‐‐ ‐‐‐2009 42,000 41,500 1,229 510,000 18.60 9,5102010 34,000 34,000 1,191 405,000 20.90 8,4472011 44,000 43,500 1,018 443,000 26.40 11,7102012 50,800 50,300 1,294 651,100 26.30 17,130
Wheat, Winter 1 Acres Acres Tons Tons $/Ton $1,0002003 740,000 410,000 1.8 750,300 114.00 85,5342004 560,000 320,000 2.6 816,000 118.00 96,2882005 495,000 300,000 2.2 648,000 120.33 77,9762006 450,000 250,000 1.7 435,000 137.00 59,5952007 550,000 265,000 2.4 643,950 178.00 114,6232008 680,000 400,000 2.6 1,020,000 233.33 238,0002009 615,000 330,000 2.4 792,000 184.33 145,9922010 660,000 360,000 2.4 864,000 173.32 149,7602011 670,000 420,000 2.6 1,071,000 ‐‐‐ ‐‐‐2012 610,000 310,000 2.6 790,600 253.31 200,260
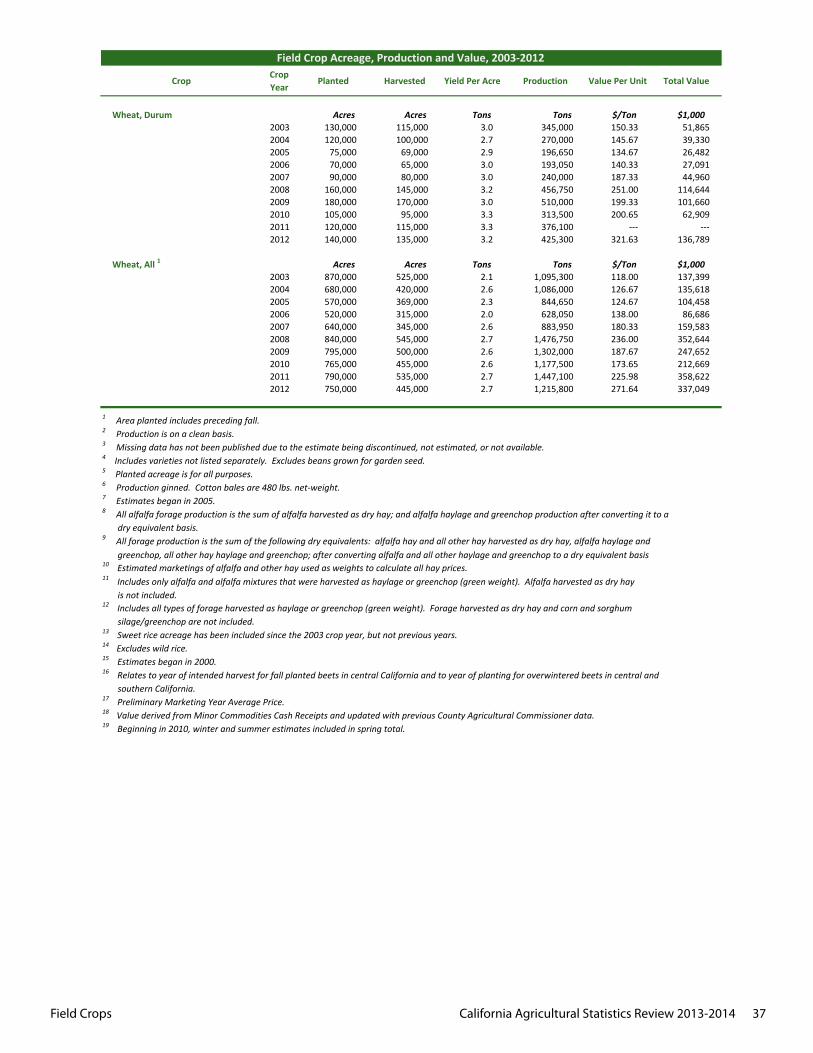
Field Crops California Agricultural Statistics Review 2013-2014 37
CropCrop Year
Planted Harvested Yield Per Acre Production Value Per Unit Total Value
Field Crop Acreage, Production and Value, 2003‐2012
Wheat, Durum Acres Acres Tons Tons $/Ton $1,0002003 130,000 115,000 3.0 345,000 150.33 51,8652004 120,000 100,000 2.7 270,000 145.67 39,3302005 75,000 69,000 2.9 196,650 134.67 26,4822006 70,000 65,000 3.0 193,050 140.33 27,0912007 90,000 80,000 3.0 240,000 187.33 44,9602008 160,000 145,000 3.2 456,750 251.00 114,6442009 180,000 170,000 3.0 510,000 199.33 101,6602010 105,000 95,000 3.3 313,500 200.65 62,9092011 120,000 115,000 3.3 376,100 ‐‐‐ ‐‐‐2012 140,000 135,000 3.2 425,300 321.63 136,789
Wheat, All 1 Acres Acres Tons Tons $/Ton $1,0002003 870,000 525,000 2.1 1,095,300 118.00 137,3992004 680,000 420,000 2.6 1,086,000 126.67 135,6182005 570,000 369,000 2.3 844,650 124.67 104,4582006 520,000 315,000 2.0 628,050 138.00 86,6862007 640,000 345,000 2.6 883,950 180.33 159,5832008 840,000 545,000 2.7 1,476,750 236.00 352,6442009 795,000 500,000 2.6 1,302,000 187.67 247,6522010 765,000 455,000 2.6 1,177,500 173.65 212,6692011 790,000 535,000 2.7 1,447,100 225.98 358,6222012 750,000 445,000 2.7 1,215,800 271.64 337,049
greenchop, all other hay haylage and greenchop; after converting alfalfa and all other haylage and greenchop to a dry equivalent basis
11 Includes only alfalfa and alfalfa mixtures that were harvested as haylage or greenchop (green weight). Alfalfa harvested as dry hay is not included.12 Includes all types of forage harvested as haylage or greenchop (green weight). Forage harvested as dry hay and corn and sorghum
16 Relates to year of intended harvest for fall planted beets in central California and to year of planting for overwintered beets in central and
1 Area planted includes preceding fall.2 Production is on a clean basis.3 Missing data has not been published due to the estimate being discontinued, not estimated, or not available.4 Includes varieties not listed separately. Excludes beans grown for garden seed.
10 Estimated marketings of alfalfa and other hay used as weights to calculate all hay prices.
5 Planted acreage is for all purposes.6 Production ginned. Cotton bales are 480 lbs. net‐weight.7 Estimates began in 2005.
dry equivalent basis.
8 All alfalfa forage production is the sum of alfalfa harvested as dry hay; and alfalfa haylage and greenchop production after converting it to a
9 All forage production is the sum of the following dry equivalents: alfalfa hay and all other hay harvested as dry hay, alfalfa haylage and
southern California.17 Preliminary Marketing Year Average Price.18 Value derived from Minor Commodities Cash Receipts and updated with previous County Agricultural Commissioner data.19 Beginning in 2010, winter and summer estimates included in spring total.
silage/greenchop are not included.13 Sweet rice acreage has been included since the 2003 crop year, but not previous years.14 Excludes wild rice.15 Estimates began in 2000.
Field Crops California Agricultural Statistics Review 2013-2014 38
CropCrop Year
Jan. Feb. Mar. Apr. May June July Aug. Sept. Oct. Nov. Dec.
Barley 1
2003 ‐‐‐ ‐‐‐ ‐‐‐ ‐‐‐ ‐‐‐ 117.00 113.00 110.00 ‐‐‐ 126.00 ‐‐‐ ‐‐‐2004 ‐‐‐ ‐‐‐ ‐‐‐ ‐‐‐ ‐‐‐ 115.00 118.00 ‐‐‐ ‐‐‐ ‐‐‐ ‐‐‐ ‐‐‐2005 ‐‐‐ ‐‐‐ ‐‐‐ ‐‐‐ ‐‐‐ ‐‐‐ ‐‐‐ 95.00 ‐‐‐ ‐‐‐ ‐‐‐ ‐‐‐2006 118.00 ‐‐‐ ‐‐‐ ‐‐‐ 120.00 99.60 ‐‐‐ 110.00 ‐‐‐ ‐‐‐ ‐‐‐ ‐‐‐2007 ‐‐‐ ‐‐‐ ‐‐‐ ‐‐‐ ‐‐‐ 155.00 ‐‐‐ ‐‐‐ ‐‐‐ ‐‐‐ ‐‐‐ ‐‐‐2008 ‐‐‐ ‐‐‐ ‐‐‐ ‐‐‐ ‐‐‐ ‐‐‐ ‐‐‐ ‐‐‐ ‐‐‐ ‐‐‐ ‐‐‐ ‐‐‐2009 ‐‐‐ ‐‐‐ ‐‐‐ ‐‐‐ ‐‐‐ ‐‐‐ ‐‐‐ ‐‐‐ ‐‐‐ ‐‐‐ ‐‐‐ ‐‐‐2010 ‐‐‐ ‐‐‐ ‐‐‐ ‐‐‐ ‐‐‐ ‐‐‐ 138.00 ‐‐‐ ‐‐‐ ‐‐‐ ‐‐‐ ‐‐‐2011 ‐‐‐ ‐‐‐ ‐‐‐ ‐‐‐ 249.00 232.00 245.00 ‐‐‐ ‐‐‐ ‐‐‐ ‐‐‐ ‐‐‐2012 ‐‐‐ ‐‐‐ ‐‐‐ ‐‐‐ ‐‐‐ ‐‐‐ ‐‐‐ ‐‐‐ ‐‐‐ ‐‐‐ ‐‐‐ ‐‐‐
Beans, Dry Edible 1
2003 32.50 32.60 36.30 35.00 35.40 35.70 34.20 29.60 32.00 41.10 35.20 35.602004 35.00 32.50 36.30 34.80 31.10 34.50 35.80 36.30 35.80 38.70 36.80 38.402005 40.70 37.00 37.20 37.90 35.50 39.80 35.10 ‐‐‐ 30.40 37.80 46.40 44.802006 40.00 42.80 44.50 42.60 42.30 41.40 38.20 41.30 38.30 49.10 48.10 54.002007 43.70 47.80 56.20 42.50 36.90 42.70 43.00 36.30 39.00 ‐‐‐ 46.90 49.202008 45.10 47.30 ‐‐‐ ‐‐‐ 47.70 ‐‐‐ 49.10 ‐‐‐ 53.00 ‐‐‐ 64.10 66.702009 67.10 58.50 66.80 61.00 ‐‐‐ ‐‐‐ ‐‐‐ ‐‐‐ 46.30 44.40 54.70 56.802010 58.50 60.00 ‐‐‐ ‐‐‐ 49.30 43.00 40.60 52.00 44.60 42.70 53.50 43.702011 50.60 47.90 46.90 45.70 ‐‐‐ 49.60 48.20 ‐‐‐ 55.00 57.90 67.40 51.202012 ‐‐‐ 50.30 56.30 49.40 50.80 ‐‐‐ 52.60 ‐‐‐ ‐‐‐ 51.70 54.70 56.60
2003 ‐‐‐ 58.4 59.1 ‐‐‐ ‐‐‐ ‐‐‐ ‐‐‐ ‐‐‐ 68.6 78.2 76.1 75.02004 69.6 72.6 70.3 68.2 ‐‐‐ ‐‐‐ ‐‐‐ ‐‐‐ ‐‐‐ ‐‐‐ 53.5 51.52005 51.1 49.8 ‐‐‐ ‐‐‐ 51.7 ‐‐‐ ‐‐‐ ‐‐‐ 54.7 60.6 57.4 67.92006 61.0 58.9 61.2 62.4 60.0 ‐‐‐ ‐‐‐ ‐‐‐ ‐‐‐ ‐‐‐ 53.8 67.62007 58.0 64.0 59.3 ‐‐‐ 55.7 ‐‐‐ 56.6 ‐‐‐ ‐‐‐ ‐‐‐ ‐‐‐ ‐‐‐2008 ‐‐‐ 73.4 ‐‐‐ ‐‐‐ ‐‐‐ ‐‐‐ ‐‐‐ ‐‐‐ ‐‐‐ ‐‐‐ ‐‐‐ ‐‐‐2009 ‐‐‐ ‐‐‐ 58.9 62.3 ‐‐‐ ‐‐‐ ‐‐‐ ‐‐‐ ‐‐‐ 70.9 ‐‐‐ ‐‐‐2010 ‐‐‐ 65.1 73.9 72.6 70.8 ‐‐‐ ‐‐‐ 74.1 88.7 92.3 108.0 119.02011 116.0 122.0 185.0 ‐‐‐ 94.4 91.4 91.4 ‐‐‐ ‐‐‐ 109.0 119.0 118.02012 96.3 ‐‐‐ ‐‐‐ ‐‐‐ ‐‐‐ ‐‐‐ ‐‐‐ ‐‐‐ ‐‐‐ 89.8 ‐‐‐ 91.9
Cottonseed 1, 2
2003 ‐‐‐ ‐‐‐ ‐‐‐ ‐‐‐ ‐‐‐ ‐‐‐ ‐‐‐ ‐‐‐ ‐‐‐ 184.00 158.00 153.002004 ‐‐‐ 150.00 ‐‐‐ ‐‐‐ ‐‐‐ ‐‐‐ ‐‐‐ ‐‐‐ ‐‐‐ 161.00 144.00 155.002005 145.00 ‐‐‐ ‐‐‐ ‐‐‐ ‐‐‐ ‐‐‐ ‐‐‐ ‐‐‐ ‐‐‐ 169.00 149.00 136.002006 ‐‐‐ ‐‐‐ ‐‐‐ ‐‐‐ ‐‐‐ ‐‐‐ ‐‐‐ ‐‐‐ ‐‐‐ 194.00 184.00 201.002007 153.00 158.00 ‐‐‐ ‐‐‐ ‐‐‐ ‐‐‐ ‐‐‐ ‐‐‐ ‐‐‐ 246.00 ‐‐‐ ‐‐‐2008 ‐‐‐ ‐‐‐ ‐‐‐ ‐‐‐ ‐‐‐ ‐‐‐ ‐‐‐ ‐‐‐ ‐‐‐ ‐‐‐ 277.00 243.002009 199.00 228.00 ‐‐‐ ‐‐‐ ‐‐‐ ‐‐‐ ‐‐‐ ‐‐‐ ‐‐‐ ‐‐‐ 253.00 279.002010 ‐‐‐ ‐‐‐ ‐‐‐ ‐‐‐ ‐‐‐ ‐‐‐ ‐‐‐ ‐‐‐ ‐‐‐ ‐‐‐ 274.00 ‐‐‐2011 ‐‐‐ ‐‐‐ ‐‐‐ ‐‐‐ ‐‐‐ ‐‐‐ ‐‐‐ ‐‐‐ ‐‐‐ 299.00 360.00 350.002012 340.00 ‐‐‐ ‐‐‐ ‐‐‐ ‐‐‐ ‐‐‐ ‐‐‐ ‐‐‐ ‐‐‐ 390.00 365.00 369.00
Hay, Alfalfa (Baled)2003 99.00 102.00 99.00 99.00 97.00 90.00 85.00 86.00 88.00 94.00 98.00 89.002004 89.00 97.00 105.00 126.00 122.00 115.00 109.00 109.00 113.00 119.00 122.00 119.002005 121.00 131.00 133.00 141.00 144.00 134.00 134.00 131.00 135.00 139.00 142.00 138.002006 135.00 136.00 141.00 134.00 124.00 111.00 103.00 105.00 108.00 114.00 116.00 118.002007 125.00 135.00 150.00 164.00 165.00 163.00 159.00 156.00 164.00 172.00 169.00 170.002008 182.00 208.00 212.00 221.00 218.00 218.00 213.00 210.00 203.00 203.00 181.00 159.002009 163.00 145.00 129.00 133.00 119.00 109.00 99.00 96.00 97.00 104.00 102.00 104.002010 115.00 109.00 118.00 122.00 123.00 121.00 118.00 118.00 128.00 127.00 135.00 147.002011 161.00 183.00 240.00 242.00 244.00 237.00 232.00 235.00 237.00 240.00 239.00 240.002012 243.00 250.00 245.00 235.00 220.00 208.00 205.00 201.00 205.00 210.00 210.00 212.00
Cotton Lint, Upland 1
Field Crop Monthly Average Prices Received, 2003‐2012
$/Cwt.
¢/Lb.
$/Ton
$/Ton
$/Ton
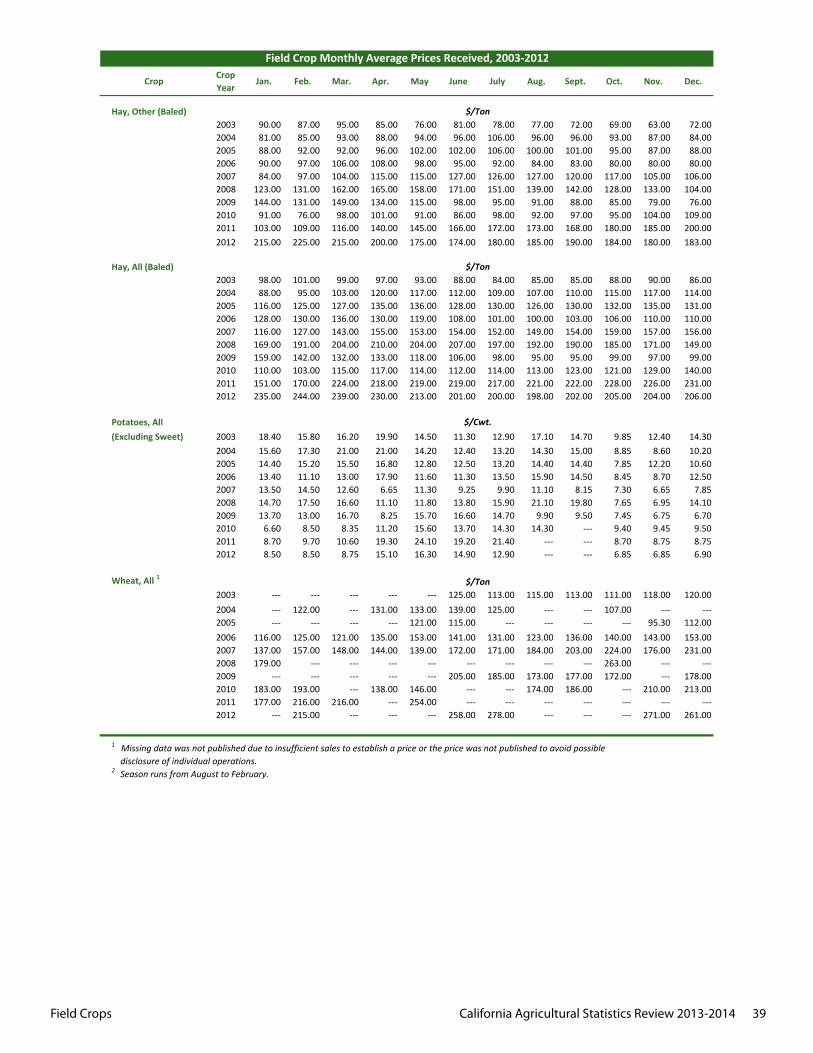
Field Crops California Agricultural Statistics Review 2013-2014 39
CropCrop Year
Jan. Feb. Mar. Apr. May June July Aug. Sept. Oct. Nov. Dec.
Field Crop Monthly Average Prices Received, 2003‐2012
Hay, Other (Baled)2003 90.00 87.00 95.00 85.00 76.00 81.00 78.00 77.00 72.00 69.00 63.00 72.002004 81.00 85.00 93.00 88.00 94.00 96.00 106.00 96.00 96.00 93.00 87.00 84.002005 88.00 92.00 92.00 96.00 102.00 102.00 106.00 100.00 101.00 95.00 87.00 88.002006 90.00 97.00 106.00 108.00 98.00 95.00 92.00 84.00 83.00 80.00 80.00 80.002007 84.00 97.00 104.00 115.00 115.00 127.00 126.00 127.00 120.00 117.00 105.00 106.002008 123.00 131.00 162.00 165.00 158.00 171.00 151.00 139.00 142.00 128.00 133.00 104.002009 144.00 131.00 149.00 134.00 115.00 98.00 95.00 91.00 88.00 85.00 79.00 76.002010 91.00 76.00 98.00 101.00 91.00 86.00 98.00 92.00 97.00 95.00 104.00 109.002011 103.00 109.00 116.00 140.00 145.00 166.00 172.00 173.00 168.00 180.00 185.00 200.002012 215.00 225.00 215.00 200.00 175.00 174.00 180.00 185.00 190.00 184.00 180.00 183.00
Hay, All (Baled)2003 98.00 101.00 99.00 97.00 93.00 88.00 84.00 85.00 85.00 88.00 90.00 86.002004 88.00 95.00 103.00 120.00 117.00 112.00 109.00 107.00 110.00 115.00 117.00 114.002005 116.00 125.00 127.00 135.00 136.00 128.00 130.00 126.00 130.00 132.00 135.00 131.002006 128.00 130.00 136.00 130.00 119.00 108.00 101.00 100.00 103.00 106.00 110.00 110.002007 116.00 127.00 143.00 155.00 153.00 154.00 152.00 149.00 154.00 159.00 157.00 156.002008 169.00 191.00 204.00 210.00 204.00 207.00 197.00 192.00 190.00 185.00 171.00 149.002009 159.00 142.00 132.00 133.00 118.00 106.00 98.00 95.00 95.00 99.00 97.00 99.002010 110.00 103.00 115.00 117.00 114.00 112.00 114.00 113.00 123.00 121.00 129.00 140.002011 151.00 170.00 224.00 218.00 219.00 219.00 217.00 221.00 222.00 228.00 226.00 231.002012 235.00 244.00 239.00 230.00 213.00 201.00 200.00 198.00 202.00 205.00 204.00 206.00
Potatoes, All(Excluding Sweet) 2003 18.40 15.80 16.20 19.90 14.50 11.30 12.90 17.10 14.70 9.85 12.40 14.30
2004 15.60 17.30 21.00 21.00 14.20 12.40 13.20 14.30 15.00 8.85 8.60 10.202005 14.40 15.20 15.50 16.80 12.80 12.50 13.20 14.40 14.40 7.85 12.20 10.602006 13.40 11.10 13.00 17.90 11.60 11.30 13.50 15.90 14.50 8.45 8.70 12.502007 13.50 14.50 12.60 6.65 11.30 9.25 9.90 11.10 8.15 7.30 6.65 7.852008 14.70 17.50 16.60 11.10 11.80 13.80 15.90 21.10 19.80 7.65 6.95 14.102009 13.70 13.00 16.70 8.25 15.70 16.60 14.70 9.90 9.50 7.45 6.75 6.702010 6.60 8.50 8.35 11.20 15.60 13.70 14.30 14.30 ‐‐‐ 9.40 9.45 9.502011 8.70 9.70 10.60 19.30 24.10 19.20 21.40 ‐‐‐ ‐‐‐ 8.70 8.75 8.752012 8.50 8.50 8.75 15.10 16.30 14.90 12.90 ‐‐‐ ‐‐‐ 6.85 6.85 6.90
Wheat, All 1
2003 ‐‐‐ ‐‐‐ ‐‐‐ ‐‐‐ ‐‐‐ 125.00 113.00 115.00 113.00 111.00 118.00 120.002004 ‐‐‐ 122.00 ‐‐‐ 131.00 133.00 139.00 125.00 ‐‐‐ ‐‐‐ 107.00 ‐‐‐ ‐‐‐2005 ‐‐‐ ‐‐‐ ‐‐‐ ‐‐‐ 121.00 115.00 ‐‐‐ ‐‐‐ ‐‐‐ ‐‐‐ 95.30 112.002006 116.00 125.00 121.00 135.00 153.00 141.00 131.00 123.00 136.00 140.00 143.00 153.002007 137.00 157.00 148.00 144.00 139.00 172.00 171.00 184.00 203.00 224.00 176.00 231.002008 179.00 ‐‐‐ ‐‐‐ ‐‐‐ ‐‐‐ ‐‐‐ ‐‐‐ ‐‐‐ ‐‐‐ 263.00 ‐‐‐ ‐‐‐2009 ‐‐‐ ‐‐‐ ‐‐‐ ‐‐‐ ‐‐‐ 205.00 185.00 173.00 177.00 172.00 ‐‐‐ 178.002010 183.00 193.00 ‐‐‐ 138.00 146.00 ‐‐‐ ‐‐‐ 174.00 186.00 ‐‐‐ 210.00 213.002011 177.00 216.00 216.00 ‐‐‐ 254.00 ‐‐‐ ‐‐‐ ‐‐‐ ‐‐‐ ‐‐‐ ‐‐‐ ‐‐‐2012 ‐‐‐ 215.00 ‐‐‐ ‐‐‐ ‐‐‐ 258.00 278.00 ‐‐‐ ‐‐‐ ‐‐‐ 271.00 261.00
2 Season runs from August to February. disclosure of individual operations.
1 Missing data was not published due to insufficient sales to establish a price or the price was not published to avoid possible
$/Ton
$/Cwt.
$/Ton
$/Ton
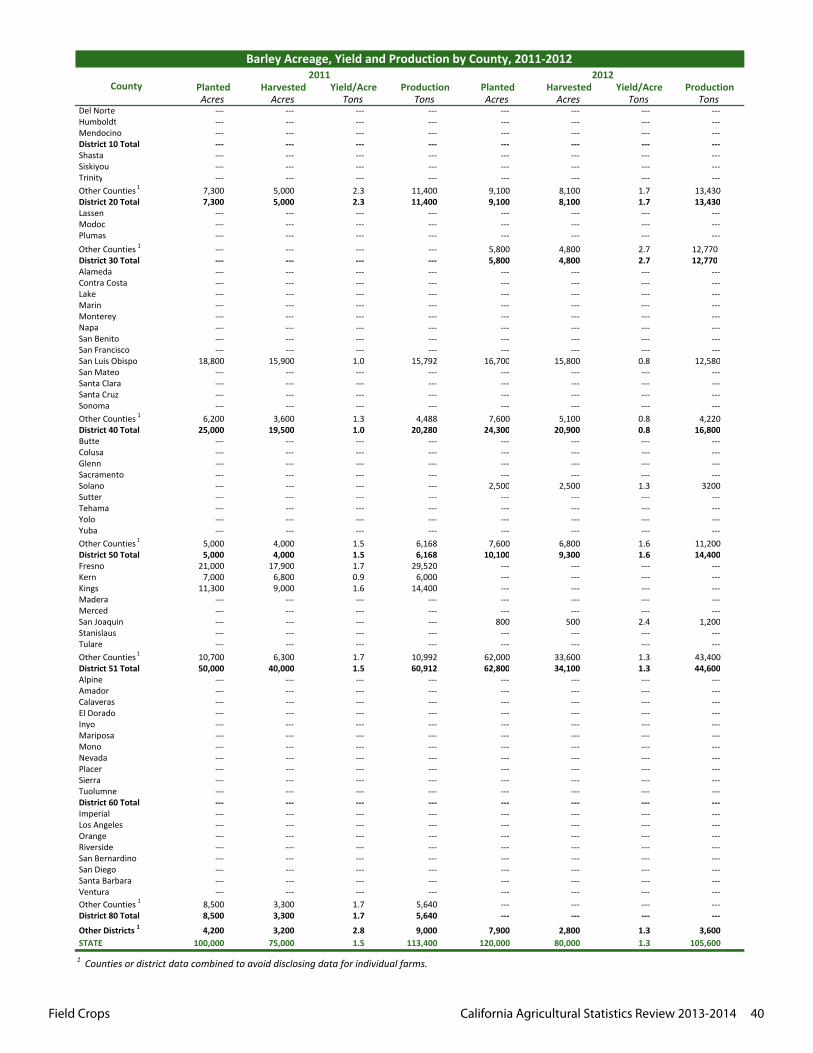
Field Crops California Agricultural Statistics Review 2013-2014 40
Planted Harvested Yield/Acre Production Planted Harvested Yield/Acre ProductionAcres Acres Tons Tons Acres Acres Tons Tons
Del Norte ‐‐‐ ‐‐‐ ‐‐‐ ‐‐‐ ‐‐‐ ‐‐‐ ‐‐‐ ‐‐‐ Humboldt ‐‐‐ ‐‐‐ ‐‐‐ ‐‐‐ ‐‐‐ ‐‐‐ ‐‐‐ ‐‐‐ Mendocino ‐‐‐ ‐‐‐ ‐‐‐ ‐‐‐ ‐‐‐ ‐‐‐ ‐‐‐ ‐‐‐ District 10 Total ‐‐‐ ‐‐‐ ‐‐‐ ‐‐‐ ‐‐‐ ‐‐‐ ‐‐‐ ‐‐‐ Shasta ‐‐‐ ‐‐‐ ‐‐‐ ‐‐‐ ‐‐‐ ‐‐‐ ‐‐‐ ‐‐‐ Siskiyou ‐‐‐ ‐‐‐ ‐‐‐ ‐‐‐ ‐‐‐ ‐‐‐ ‐‐‐ ‐‐‐ Trinity ‐‐‐ ‐‐‐ ‐‐‐ ‐‐‐ ‐‐‐ ‐‐‐ ‐‐‐ ‐‐‐ Other Counties 1 7,300 5,000 2.3 11,400 9,100 8,100 1.7 13,430 District 20 Total 7,300 5,000 2.3 11,400 9,100 8,100 1.7 13,430 Lassen ‐‐‐ ‐‐‐ ‐‐‐ ‐‐‐ ‐‐‐ ‐‐‐ ‐‐‐ ‐‐‐ Modoc ‐‐‐ ‐‐‐ ‐‐‐ ‐‐‐ ‐‐‐ ‐‐‐ ‐‐‐ ‐‐‐ Plumas ‐‐‐ ‐‐‐ ‐‐‐ ‐‐‐ ‐‐‐ ‐‐‐ ‐‐‐ ‐‐‐ Other Counties 1 ‐‐‐ ‐‐‐ ‐‐‐ ‐‐‐ 5,800 4,800 2.7 12,770 District 30 Total ‐‐‐ ‐‐‐ ‐‐‐ ‐‐‐ 5,800 4,800 2.7 12,770 Alameda ‐‐‐ ‐‐‐ ‐‐‐ ‐‐‐ ‐‐‐ ‐‐‐ ‐‐‐ ‐‐‐ Contra Costa ‐‐‐ ‐‐‐ ‐‐‐ ‐‐‐ ‐‐‐ ‐‐‐ ‐‐‐ ‐‐‐ Lake ‐‐‐ ‐‐‐ ‐‐‐ ‐‐‐ ‐‐‐ ‐‐‐ ‐‐‐ ‐‐‐ Marin ‐‐‐ ‐‐‐ ‐‐‐ ‐‐‐ ‐‐‐ ‐‐‐ ‐‐‐ ‐‐‐ Monterey ‐‐‐ ‐‐‐ ‐‐‐ ‐‐‐ ‐‐‐ ‐‐‐ ‐‐‐ ‐‐‐ Napa ‐‐‐ ‐‐‐ ‐‐‐ ‐‐‐ ‐‐‐ ‐‐‐ ‐‐‐ ‐‐‐ San Benito ‐‐‐ ‐‐‐ ‐‐‐ ‐‐‐ ‐‐‐ ‐‐‐ ‐‐‐ ‐‐‐ San Francisco ‐‐‐ ‐‐‐ ‐‐‐ ‐‐‐ ‐‐‐ ‐‐‐ ‐‐‐ ‐‐‐ San Luis Obispo 18,800 15,900 1.0 15,792 16,700 15,800 0.8 12,580 San Mateo ‐‐‐ ‐‐‐ ‐‐‐ ‐‐‐ ‐‐‐ ‐‐‐ ‐‐‐ ‐‐‐ Santa Clara ‐‐‐ ‐‐‐ ‐‐‐ ‐‐‐ ‐‐‐ ‐‐‐ ‐‐‐ ‐‐‐ Santa Cruz ‐‐‐ ‐‐‐ ‐‐‐ ‐‐‐ ‐‐‐ ‐‐‐ ‐‐‐ ‐‐‐ Sonoma ‐‐‐ ‐‐‐ ‐‐‐ ‐‐‐ ‐‐‐ ‐‐‐ ‐‐‐ ‐‐‐ Other Counties 1 6,200 3,600 1.3 4,488 7,600 5,100 0.8 4,220 District 40 Total 25,000 19,500 1.0 20,280 24,300 20,900 0.8 16,800 Butte ‐‐‐ ‐‐‐ ‐‐‐ ‐‐‐ ‐‐‐ ‐‐‐ ‐‐‐ ‐‐‐ Colusa ‐‐‐ ‐‐‐ ‐‐‐ ‐‐‐ ‐‐‐ ‐‐‐ ‐‐‐ ‐‐‐ Glenn ‐‐‐ ‐‐‐ ‐‐‐ ‐‐‐ ‐‐‐ ‐‐‐ ‐‐‐ ‐‐‐ Sacramento ‐‐‐ ‐‐‐ ‐‐‐ ‐‐‐ ‐‐‐ ‐‐‐ ‐‐‐ ‐‐‐ Solano ‐‐‐ ‐‐‐ ‐‐‐ ‐‐‐ 2,500 2,500 1.3 3200 Sutter ‐‐‐ ‐‐‐ ‐‐‐ ‐‐‐ ‐‐‐ ‐‐‐ ‐‐‐ ‐‐‐ Tehama ‐‐‐ ‐‐‐ ‐‐‐ ‐‐‐ ‐‐‐ ‐‐‐ ‐‐‐ ‐‐‐ Yolo ‐‐‐ ‐‐‐ ‐‐‐ ‐‐‐ ‐‐‐ ‐‐‐ ‐‐‐ ‐‐‐ Yuba ‐‐‐ ‐‐‐ ‐‐‐ ‐‐‐ ‐‐‐ ‐‐‐ ‐‐‐ ‐‐‐ Other Counties 1 5,000 4,000 1.5 6,168 7,600 6,800 1.6 11,200 District 50 Total 5,000 4,000 1.5 6,168 10,100 9,300 1.6 14,400 Fresno 21,000 17,900 1.7 29,520 ‐‐‐ ‐‐‐ ‐‐‐ ‐‐‐ Kern 7,000 6,800 0.9 6,000 ‐‐‐ ‐‐‐ ‐‐‐ ‐‐‐ Kings 11,300 9,000 1.6 14,400 ‐‐‐ ‐‐‐ ‐‐‐ ‐‐‐ Madera ‐‐‐ ‐‐‐ ‐‐‐ ‐‐‐ ‐‐‐ ‐‐‐ ‐‐‐ ‐‐‐ Merced ‐‐‐ ‐‐‐ ‐‐‐ ‐‐‐ ‐‐‐ ‐‐‐ ‐‐‐ ‐‐‐ San Joaquin ‐‐‐ ‐‐‐ ‐‐‐ ‐‐‐ 800 500 2.4 1,200 Stanislaus ‐‐‐ ‐‐‐ ‐‐‐ ‐‐‐ ‐‐‐ ‐‐‐ ‐‐‐ ‐‐‐ Tulare ‐‐‐ ‐‐‐ ‐‐‐ ‐‐‐ ‐‐‐ ‐‐‐ ‐‐‐ ‐‐‐ Other Counties 1 10,700 6,300 1.7 10,992 62,000 33,600 1.3 43,400 District 51 Total 50,000 40,000 1.5 60,912 62,800 34,100 1.3 44,600 Alpine ‐‐‐ ‐‐‐ ‐‐‐ ‐‐‐ ‐‐‐ ‐‐‐ ‐‐‐ ‐‐‐ Amador ‐‐‐ ‐‐‐ ‐‐‐ ‐‐‐ ‐‐‐ ‐‐‐ ‐‐‐ ‐‐‐ Calaveras ‐‐‐ ‐‐‐ ‐‐‐ ‐‐‐ ‐‐‐ ‐‐‐ ‐‐‐ ‐‐‐ El Dorado ‐‐‐ ‐‐‐ ‐‐‐ ‐‐‐ ‐‐‐ ‐‐‐ ‐‐‐ ‐‐‐ Inyo ‐‐‐ ‐‐‐ ‐‐‐ ‐‐‐ ‐‐‐ ‐‐‐ ‐‐‐ ‐‐‐ Mariposa ‐‐‐ ‐‐‐ ‐‐‐ ‐‐‐ ‐‐‐ ‐‐‐ ‐‐‐ ‐‐‐ Mono ‐‐‐ ‐‐‐ ‐‐‐ ‐‐‐ ‐‐‐ ‐‐‐ ‐‐‐ ‐‐‐ Nevada ‐‐‐ ‐‐‐ ‐‐‐ ‐‐‐ ‐‐‐ ‐‐‐ ‐‐‐ ‐‐‐ Placer ‐‐‐ ‐‐‐ ‐‐‐ ‐‐‐ ‐‐‐ ‐‐‐ ‐‐‐ ‐‐‐ Sierra ‐‐‐ ‐‐‐ ‐‐‐ ‐‐‐ ‐‐‐ ‐‐‐ ‐‐‐ ‐‐‐ Tuolumne ‐‐‐ ‐‐‐ ‐‐‐ ‐‐‐ ‐‐‐ ‐‐‐ ‐‐‐ ‐‐‐ District 60 Total ‐‐‐ ‐‐‐ ‐‐‐ ‐‐‐ ‐‐‐ ‐‐‐ ‐‐‐ ‐‐‐ Imperial ‐‐‐ ‐‐‐ ‐‐‐ ‐‐‐ ‐‐‐ ‐‐‐ ‐‐‐ ‐‐‐ Los Angeles ‐‐‐ ‐‐‐ ‐‐‐ ‐‐‐ ‐‐‐ ‐‐‐ ‐‐‐ ‐‐‐ Orange ‐‐‐ ‐‐‐ ‐‐‐ ‐‐‐ ‐‐‐ ‐‐‐ ‐‐‐ ‐‐‐ Riverside ‐‐‐ ‐‐‐ ‐‐‐ ‐‐‐ ‐‐‐ ‐‐‐ ‐‐‐ ‐‐‐ San Bernardino ‐‐‐ ‐‐‐ ‐‐‐ ‐‐‐ ‐‐‐ ‐‐‐ ‐‐‐ ‐‐‐ San Diego ‐‐‐ ‐‐‐ ‐‐‐ ‐‐‐ ‐‐‐ ‐‐‐ ‐‐‐ ‐‐‐ Santa Barbara ‐‐‐ ‐‐‐ ‐‐‐ ‐‐‐ ‐‐‐ ‐‐‐ ‐‐‐ ‐‐‐ Ventura ‐‐‐ ‐‐‐ ‐‐‐ ‐‐‐ ‐‐‐ ‐‐‐ ‐‐‐ ‐‐‐ Other Counties 1 8,500 3,300 1.7 5,640 ‐‐‐ ‐‐‐ ‐‐‐ ‐‐‐ District 80 Total 8,500 3,300 1.7 5,640 ‐‐‐ ‐‐‐ ‐‐‐ ‐‐‐
Other Districts 1 4,200 3,200 2.8 9,000 7,900 2,800 1.3 3,600 STATE 100,000 75,000 1.5 113,400 120,000 80,000 1.3 105,600
2012Barley Acreage, Yield and Production by County, 2011‐2012
County
1 Counties or district data combined to avoid disclosing data for individual farms.
2011
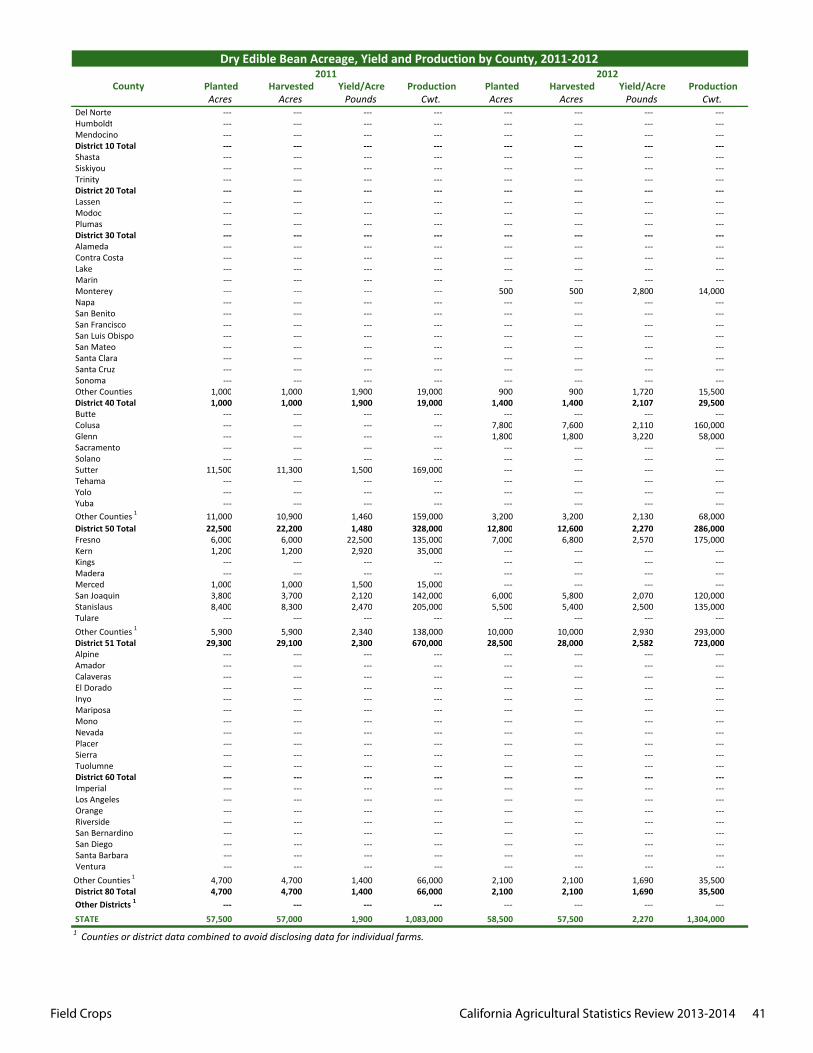
Field Crops California Agricultural Statistics Review 2013-2014 41
Planted Harvested Yield/Acre Production Planted Harvested Yield/Acre ProductionAcres Acres Pounds Cwt. Acres Acres Pounds Cwt.
Del Norte ‐‐‐ ‐‐‐ ‐‐‐ ‐‐‐ ‐‐‐ ‐‐‐ ‐‐‐ ‐‐‐ Humboldt ‐‐‐ ‐‐‐ ‐‐‐ ‐‐‐ ‐‐‐ ‐‐‐ ‐‐‐ ‐‐‐ Mendocino ‐‐‐ ‐‐‐ ‐‐‐ ‐‐‐ ‐‐‐ ‐‐‐ ‐‐‐ ‐‐‐ District 10 Total ‐‐‐ ‐‐‐ ‐‐‐ ‐‐‐ ‐‐‐ ‐‐‐ ‐‐‐ ‐‐‐ Shasta ‐‐‐ ‐‐‐ ‐‐‐ ‐‐‐ ‐‐‐ ‐‐‐ ‐‐‐ ‐‐‐ Siskiyou ‐‐‐ ‐‐‐ ‐‐‐ ‐‐‐ ‐‐‐ ‐‐‐ ‐‐‐ ‐‐‐ Trinity ‐‐‐ ‐‐‐ ‐‐‐ ‐‐‐ ‐‐‐ ‐‐‐ ‐‐‐ ‐‐‐ District 20 Total ‐‐‐ ‐‐‐ ‐‐‐ ‐‐‐ ‐‐‐ ‐‐‐ ‐‐‐ ‐‐‐ Lassen ‐‐‐ ‐‐‐ ‐‐‐ ‐‐‐ ‐‐‐ ‐‐‐ ‐‐‐ ‐‐‐ Modoc ‐‐‐ ‐‐‐ ‐‐‐ ‐‐‐ ‐‐‐ ‐‐‐ ‐‐‐ ‐‐‐ Plumas ‐‐‐ ‐‐‐ ‐‐‐ ‐‐‐ ‐‐‐ ‐‐‐ ‐‐‐ ‐‐‐ District 30 Total ‐‐‐ ‐‐‐ ‐‐‐ ‐‐‐ ‐‐‐ ‐‐‐ ‐‐‐ ‐‐‐ Alameda ‐‐‐ ‐‐‐ ‐‐‐ ‐‐‐ ‐‐‐ ‐‐‐ ‐‐‐ ‐‐‐ Contra Costa ‐‐‐ ‐‐‐ ‐‐‐ ‐‐‐ ‐‐‐ ‐‐‐ ‐‐‐ ‐‐‐ Lake ‐‐‐ ‐‐‐ ‐‐‐ ‐‐‐ ‐‐‐ ‐‐‐ ‐‐‐ ‐‐‐ Marin ‐‐‐ ‐‐‐ ‐‐‐ ‐‐‐ ‐‐‐ ‐‐‐ ‐‐‐ ‐‐‐ Monterey ‐‐‐ ‐‐‐ ‐‐‐ ‐‐‐ 500 500 2,800 14,000 Napa ‐‐‐ ‐‐‐ ‐‐‐ ‐‐‐ ‐‐‐ ‐‐‐ ‐‐‐ ‐‐‐ San Benito ‐‐‐ ‐‐‐ ‐‐‐ ‐‐‐ ‐‐‐ ‐‐‐ ‐‐‐ ‐‐‐ San Francisco ‐‐‐ ‐‐‐ ‐‐‐ ‐‐‐ ‐‐‐ ‐‐‐ ‐‐‐ ‐‐‐ San Luis Obispo ‐‐‐ ‐‐‐ ‐‐‐ ‐‐‐ ‐‐‐ ‐‐‐ ‐‐‐ ‐‐‐ San Mateo ‐‐‐ ‐‐‐ ‐‐‐ ‐‐‐ ‐‐‐ ‐‐‐ ‐‐‐ ‐‐‐ Santa Clara ‐‐‐ ‐‐‐ ‐‐‐ ‐‐‐ ‐‐‐ ‐‐‐ ‐‐‐ ‐‐‐ Santa Cruz ‐‐‐ ‐‐‐ ‐‐‐ ‐‐‐ ‐‐‐ ‐‐‐ ‐‐‐ ‐‐‐ Sonoma ‐‐‐ ‐‐‐ ‐‐‐ ‐‐‐ ‐‐‐ ‐‐‐ ‐‐‐ ‐‐‐ Other Counties 1,000 1,000 1,900 19,000 900 900 1,720 15,500 District 40 Total 1,000 1,000 1,900 19,000 1,400 1,400 2,107 29,500 Butte ‐‐‐ ‐‐‐ ‐‐‐ ‐‐‐ ‐‐‐ ‐‐‐ ‐‐‐ ‐‐‐ Colusa ‐‐‐ ‐‐‐ ‐‐‐ ‐‐‐ 7,800 7,600 2,110 160,000 Glenn ‐‐‐ ‐‐‐ ‐‐‐ ‐‐‐ 1,800 1,800 3,220 58,000 Sacramento ‐‐‐ ‐‐‐ ‐‐‐ ‐‐‐ ‐‐‐ ‐‐‐ ‐‐‐ ‐‐‐ Solano ‐‐‐ ‐‐‐ ‐‐‐ ‐‐‐ ‐‐‐ ‐‐‐ ‐‐‐ ‐‐‐ Sutter 11,500 11,300 1,500 169,000 ‐‐‐ ‐‐‐ ‐‐‐ ‐‐‐ Tehama ‐‐‐ ‐‐‐ ‐‐‐ ‐‐‐ ‐‐‐ ‐‐‐ ‐‐‐ ‐‐‐ Yolo ‐‐‐ ‐‐‐ ‐‐‐ ‐‐‐ ‐‐‐ ‐‐‐ ‐‐‐ ‐‐‐ Yuba ‐‐‐ ‐‐‐ ‐‐‐ ‐‐‐ ‐‐‐ ‐‐‐ ‐‐‐ ‐‐‐ Other Counties 1 11,000 10,900 1,460 159,000 3,200 3,200 2,130 68,000 District 50 Total 22,500 22,200 1,480 328,000 12,800 12,600 2,270 286,000 Fresno 6,000 6,000 22,500 135,000 7,000 6,800 2,570 175,000 Kern 1,200 1,200 2,920 35,000 ‐‐‐ ‐‐‐ ‐‐‐ ‐‐‐ Kings ‐‐‐ ‐‐‐ ‐‐‐ ‐‐‐ ‐‐‐ ‐‐‐ ‐‐‐ ‐‐‐ Madera ‐‐‐ ‐‐‐ ‐‐‐ ‐‐‐ ‐‐‐ ‐‐‐ ‐‐‐ ‐‐‐ Merced 1,000 1,000 1,500 15,000 ‐‐‐ ‐‐‐ ‐‐‐ ‐‐‐ San Joaquin 3,800 3,700 2,120 142,000 6,000 5,800 2,070 120,000 Stanislaus 8,400 8,300 2,470 205,000 5,500 5,400 2,500 135,000 Tulare ‐‐‐ ‐‐‐ ‐‐‐ ‐‐‐ ‐‐‐ ‐‐‐ ‐‐‐ ‐‐‐ Other Counties 1 5,900 5,900 2,340 138,000 10,000 10,000 2,930 293,000 District 51 Total 29,300 29,100 2,300 670,000 28,500 28,000 2,582 723,000 Alpine ‐‐‐ ‐‐‐ ‐‐‐ ‐‐‐ ‐‐‐ ‐‐‐ ‐‐‐ ‐‐‐ Amador ‐‐‐ ‐‐‐ ‐‐‐ ‐‐‐ ‐‐‐ ‐‐‐ ‐‐‐ ‐‐‐ Calaveras ‐‐‐ ‐‐‐ ‐‐‐ ‐‐‐ ‐‐‐ ‐‐‐ ‐‐‐ ‐‐‐ El Dorado ‐‐‐ ‐‐‐ ‐‐‐ ‐‐‐ ‐‐‐ ‐‐‐ ‐‐‐ ‐‐‐ Inyo ‐‐‐ ‐‐‐ ‐‐‐ ‐‐‐ ‐‐‐ ‐‐‐ ‐‐‐ ‐‐‐ Mariposa ‐‐‐ ‐‐‐ ‐‐‐ ‐‐‐ ‐‐‐ ‐‐‐ ‐‐‐ ‐‐‐ Mono ‐‐‐ ‐‐‐ ‐‐‐ ‐‐‐ ‐‐‐ ‐‐‐ ‐‐‐ ‐‐‐ Nevada ‐‐‐ ‐‐‐ ‐‐‐ ‐‐‐ ‐‐‐ ‐‐‐ ‐‐‐ ‐‐‐ Placer ‐‐‐ ‐‐‐ ‐‐‐ ‐‐‐ ‐‐‐ ‐‐‐ ‐‐‐ ‐‐‐ Sierra ‐‐‐ ‐‐‐ ‐‐‐ ‐‐‐ ‐‐‐ ‐‐‐ ‐‐‐ ‐‐‐ Tuolumne ‐‐‐ ‐‐‐ ‐‐‐ ‐‐‐ ‐‐‐ ‐‐‐ ‐‐‐ ‐‐‐ District 60 Total ‐‐‐ ‐‐‐ ‐‐‐ ‐‐‐ ‐‐‐ ‐‐‐ ‐‐‐ ‐‐‐ Imperial ‐‐‐ ‐‐‐ ‐‐‐ ‐‐‐ ‐‐‐ ‐‐‐ ‐‐‐ ‐‐‐ Los Angeles ‐‐‐ ‐‐‐ ‐‐‐ ‐‐‐ ‐‐‐ ‐‐‐ ‐‐‐ ‐‐‐ Orange ‐‐‐ ‐‐‐ ‐‐‐ ‐‐‐ ‐‐‐ ‐‐‐ ‐‐‐ ‐‐‐ Riverside ‐‐‐ ‐‐‐ ‐‐‐ ‐‐‐ ‐‐‐ ‐‐‐ ‐‐‐ ‐‐‐ San Bernardino ‐‐‐ ‐‐‐ ‐‐‐ ‐‐‐ ‐‐‐ ‐‐‐ ‐‐‐ ‐‐‐ San Diego ‐‐‐ ‐‐‐ ‐‐‐ ‐‐‐ ‐‐‐ ‐‐‐ ‐‐‐ ‐‐‐ Santa Barbara ‐‐‐ ‐‐‐ ‐‐‐ ‐‐‐ ‐‐‐ ‐‐‐ ‐‐‐ ‐‐‐ Ventura ‐‐‐ ‐‐‐ ‐‐‐ ‐‐‐ ‐‐‐ ‐‐‐ ‐‐‐ ‐‐‐Other Counties 1 4,700 4,700 1,400 66,000 2,100 2,100 1,690 35,500 District 80 Total 4,700 4,700 1,400 66,000 2,100 2,100 1,690 35,500 Other Districts 1 ‐‐‐ ‐‐‐ ‐‐‐ ‐‐‐ ‐‐‐ ‐‐‐ ‐‐‐ ‐‐‐ STATE 57,500 57,000 1,900 1,083,000 58,500 57,500 2,270 1,304,000
Dry Edible Bean Acreage, Yield and Production by County, 2011‐20122011 2012
County
1 Counties or district data combined to avoid disclosing data for individual farms.
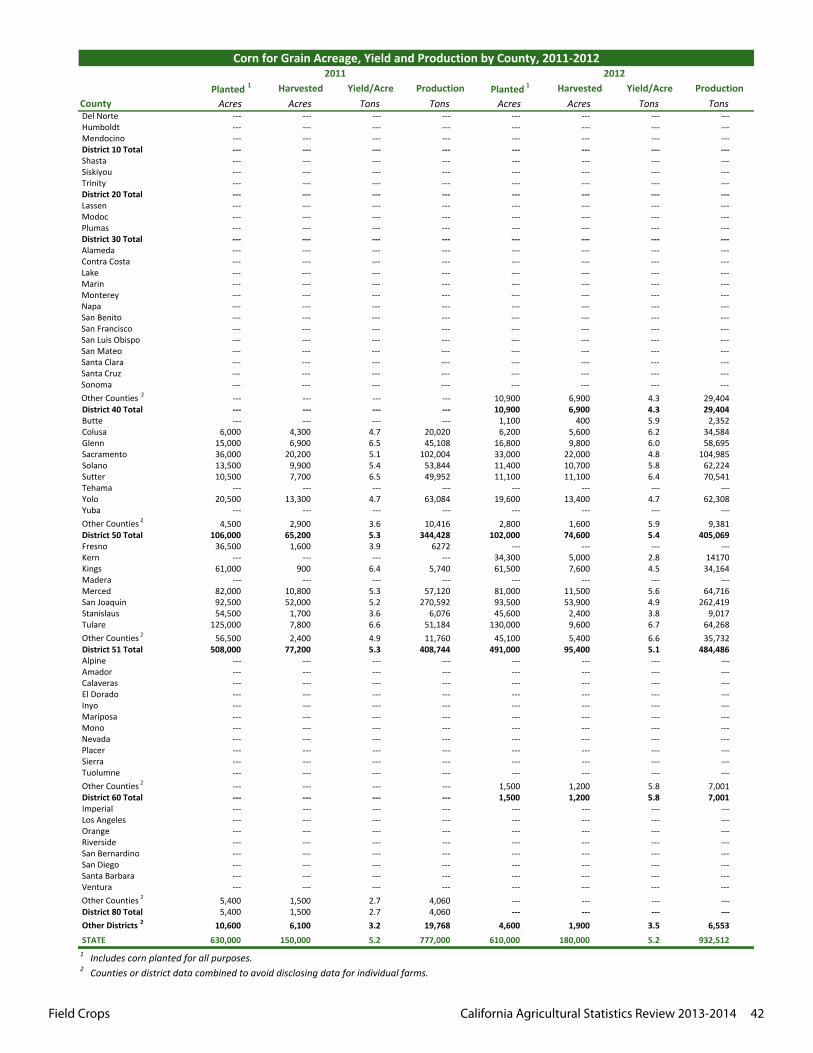
Field Crops California Agricultural Statistics Review 2013-2014 42
Planted 1 Harvested Yield/Acre Production Planted 1 Harvested Yield/Acre ProductionAcres Acres Tons Tons Acres Acres Tons Tons
Del Norte ‐‐‐ ‐‐‐ ‐‐‐ ‐‐‐ ‐‐‐ ‐‐‐ ‐‐‐ ‐‐‐ Humboldt ‐‐‐ ‐‐‐ ‐‐‐ ‐‐‐ ‐‐‐ ‐‐‐ ‐‐‐ ‐‐‐ Mendocino ‐‐‐ ‐‐‐ ‐‐‐ ‐‐‐ ‐‐‐ ‐‐‐ ‐‐‐ ‐‐‐ District 10 Total ‐‐‐ ‐‐‐ ‐‐‐ ‐‐‐ ‐‐‐ ‐‐‐ ‐‐‐ ‐‐‐ Shasta ‐‐‐ ‐‐‐ ‐‐‐ ‐‐‐ ‐‐‐ ‐‐‐ ‐‐‐ ‐‐‐ Siskiyou ‐‐‐ ‐‐‐ ‐‐‐ ‐‐‐ ‐‐‐ ‐‐‐ ‐‐‐ ‐‐‐ Trinity ‐‐‐ ‐‐‐ ‐‐‐ ‐‐‐ ‐‐‐ ‐‐‐ ‐‐‐ ‐‐‐ District 20 Total ‐‐‐ ‐‐‐ ‐‐‐ ‐‐‐ ‐‐‐ ‐‐‐ ‐‐‐ ‐‐‐ Lassen ‐‐‐ ‐‐‐ ‐‐‐ ‐‐‐ ‐‐‐ ‐‐‐ ‐‐‐ ‐‐‐ Modoc ‐‐‐ ‐‐‐ ‐‐‐ ‐‐‐ ‐‐‐ ‐‐‐ ‐‐‐ ‐‐‐ Plumas ‐‐‐ ‐‐‐ ‐‐‐ ‐‐‐ ‐‐‐ ‐‐‐ ‐‐‐ ‐‐‐ District 30 Total ‐‐‐ ‐‐‐ ‐‐‐ ‐‐‐ ‐‐‐ ‐‐‐ ‐‐‐ ‐‐‐ Alameda ‐‐‐ ‐‐‐ ‐‐‐ ‐‐‐ ‐‐‐ ‐‐‐ ‐‐‐ ‐‐‐ Contra Costa ‐‐‐ ‐‐‐ ‐‐‐ ‐‐‐ ‐‐‐ ‐‐‐ ‐‐‐ ‐‐‐ Lake ‐‐‐ ‐‐‐ ‐‐‐ ‐‐‐ ‐‐‐ ‐‐‐ ‐‐‐ ‐‐‐ Marin ‐‐‐ ‐‐‐ ‐‐‐ ‐‐‐ ‐‐‐ ‐‐‐ ‐‐‐ ‐‐‐ Monterey ‐‐‐ ‐‐‐ ‐‐‐ ‐‐‐ ‐‐‐ ‐‐‐ ‐‐‐ ‐‐‐ Napa ‐‐‐ ‐‐‐ ‐‐‐ ‐‐‐ ‐‐‐ ‐‐‐ ‐‐‐ ‐‐‐ San Benito ‐‐‐ ‐‐‐ ‐‐‐ ‐‐‐ ‐‐‐ ‐‐‐ ‐‐‐ ‐‐‐ San Francisco ‐‐‐ ‐‐‐ ‐‐‐ ‐‐‐ ‐‐‐ ‐‐‐ ‐‐‐ ‐‐‐ San Luis Obispo ‐‐‐ ‐‐‐ ‐‐‐ ‐‐‐ ‐‐‐ ‐‐‐ ‐‐‐ ‐‐‐ San Mateo ‐‐‐ ‐‐‐ ‐‐‐ ‐‐‐ ‐‐‐ ‐‐‐ ‐‐‐ ‐‐‐ Santa Clara ‐‐‐ ‐‐‐ ‐‐‐ ‐‐‐ ‐‐‐ ‐‐‐ ‐‐‐ ‐‐‐ Santa Cruz ‐‐‐ ‐‐‐ ‐‐‐ ‐‐‐ ‐‐‐ ‐‐‐ ‐‐‐ ‐‐‐ Sonoma ‐‐‐ ‐‐‐ ‐‐‐ ‐‐‐ ‐‐‐ ‐‐‐ ‐‐‐ ‐‐‐ Other Counties 2 ‐‐‐ ‐‐‐ ‐‐‐ ‐‐‐ 10,900 6,900 4.3 29,404 District 40 Total ‐‐‐ ‐‐‐ ‐‐‐ ‐‐‐ 10,900 6,900 4.3 29,404 Butte ‐‐‐ ‐‐‐ ‐‐‐ ‐‐‐ 1,100 400 5.9 2,352 Colusa 6,000 4,300 4.7 20,020 6,200 5,600 6.2 34,584 Glenn 15,000 6,900 6.5 45,108 16,800 9,800 6.0 58,695 Sacramento 36,000 20,200 5.1 102,004 33,000 22,000 4.8 104,985 Solano 13,500 9,900 5.4 53,844 11,400 10,700 5.8 62,224 Sutter 10,500 7,700 6.5 49,952 11,100 11,100 6.4 70,541 Tehama ‐‐‐ ‐‐‐ ‐‐‐ ‐‐‐ ‐‐‐ ‐‐‐ ‐‐‐ ‐‐‐ Yolo 20,500 13,300 4.7 63,084 19,600 13,400 4.7 62,308 Yuba ‐‐‐ ‐‐‐ ‐‐‐ ‐‐‐ ‐‐‐ ‐‐‐ ‐‐‐ ‐‐‐ Other Counties 2 4,500 2,900 3.6 10,416 2,800 1,600 5.9 9,381 District 50 Total 106,000 65,200 5.3 344,428 102,000 74,600 5.4 405,069 Fresno 36,500 1,600 3.9 6272 ‐‐‐ ‐‐‐ ‐‐‐ ‐‐‐ Kern ‐‐‐ ‐‐‐ ‐‐‐ ‐‐‐ 34,300 5,000 2.8 14170 Kings 61,000 900 6.4 5,740 61,500 7,600 4.5 34,164 Madera ‐‐‐ ‐‐‐ ‐‐‐ ‐‐‐ ‐‐‐ ‐‐‐ ‐‐‐ ‐‐‐ Merced 82,000 10,800 5.3 57,120 81,000 11,500 5.6 64,716 San Joaquin 92,500 52,000 5.2 270,592 93,500 53,900 4.9 262,419 Stanislaus 54,500 1,700 3.6 6,076 45,600 2,400 3.8 9,017 Tulare 125,000 7,800 6.6 51,184 130,000 9,600 6.7 64,268 Other Counties 2 56,500 2,400 4.9 11,760 45,100 5,400 6.6 35,732 District 51 Total 508,000 77,200 5.3 408,744 491,000 95,400 5.1 484,486 Alpine ‐‐‐ ‐‐‐ ‐‐‐ ‐‐‐ ‐‐‐ ‐‐‐ ‐‐‐ ‐‐‐ Amador ‐‐‐ ‐‐‐ ‐‐‐ ‐‐‐ ‐‐‐ ‐‐‐ ‐‐‐ ‐‐‐ Calaveras ‐‐‐ ‐‐‐ ‐‐‐ ‐‐‐ ‐‐‐ ‐‐‐ ‐‐‐ ‐‐‐ El Dorado ‐‐‐ ‐‐‐ ‐‐‐ ‐‐‐ ‐‐‐ ‐‐‐ ‐‐‐ ‐‐‐ Inyo ‐‐‐ ‐‐‐ ‐‐‐ ‐‐‐ ‐‐‐ ‐‐‐ ‐‐‐ ‐‐‐ Mariposa ‐‐‐ ‐‐‐ ‐‐‐ ‐‐‐ ‐‐‐ ‐‐‐ ‐‐‐ ‐‐‐ Mono ‐‐‐ ‐‐‐ ‐‐‐ ‐‐‐ ‐‐‐ ‐‐‐ ‐‐‐ ‐‐‐ Nevada ‐‐‐ ‐‐‐ ‐‐‐ ‐‐‐ ‐‐‐ ‐‐‐ ‐‐‐ ‐‐‐ Placer ‐‐‐ ‐‐‐ ‐‐‐ ‐‐‐ ‐‐‐ ‐‐‐ ‐‐‐ ‐‐‐ Sierra ‐‐‐ ‐‐‐ ‐‐‐ ‐‐‐ ‐‐‐ ‐‐‐ ‐‐‐ ‐‐‐ Tuolumne ‐‐‐ ‐‐‐ ‐‐‐ ‐‐‐ ‐‐‐ ‐‐‐ ‐‐‐ ‐‐‐ Other Counties 2 ‐‐‐ ‐‐‐ ‐‐‐ ‐‐‐ 1,500 1,200 5.8 7,001 District 60 Total ‐‐‐ ‐‐‐ ‐‐‐ ‐‐‐ 1,500 1,200 5.8 7,001 Imperial ‐‐‐ ‐‐‐ ‐‐‐ ‐‐‐ ‐‐‐ ‐‐‐ ‐‐‐ ‐‐‐ Los Angeles ‐‐‐ ‐‐‐ ‐‐‐ ‐‐‐ ‐‐‐ ‐‐‐ ‐‐‐ ‐‐‐ Orange ‐‐‐ ‐‐‐ ‐‐‐ ‐‐‐ ‐‐‐ ‐‐‐ ‐‐‐ ‐‐‐ Riverside ‐‐‐ ‐‐‐ ‐‐‐ ‐‐‐ ‐‐‐ ‐‐‐ ‐‐‐ ‐‐‐ San Bernardino ‐‐‐ ‐‐‐ ‐‐‐ ‐‐‐ ‐‐‐ ‐‐‐ ‐‐‐ ‐‐‐ San Diego ‐‐‐ ‐‐‐ ‐‐‐ ‐‐‐ ‐‐‐ ‐‐‐ ‐‐‐ ‐‐‐ Santa Barbara ‐‐‐ ‐‐‐ ‐‐‐ ‐‐‐ ‐‐‐ ‐‐‐ ‐‐‐ ‐‐‐ Ventura ‐‐‐ ‐‐‐ ‐‐‐ ‐‐‐ ‐‐‐ ‐‐‐ ‐‐‐ ‐‐‐ Other Counties 2 5,400 1,500 2.7 4,060 ‐‐‐ ‐‐‐ ‐‐‐ ‐‐‐ District 80 Total 5,400 1,500 2.7 4,060 ‐‐‐ ‐‐‐ ‐‐‐ ‐‐‐ Other Districts 2 10,600 6,100 3.2 19,768 4,600 1,900 3.5 6,553 STATE 630,000 150,000 5.2 777,000 610,000 180,000 5.2 932,5121 Includes corn planted for all purposes.2 Counties or district data combined to avoid disclosing data for individual farms.
Corn for Grain Acreage, Yield and Production by County, 2011‐201220122011
County
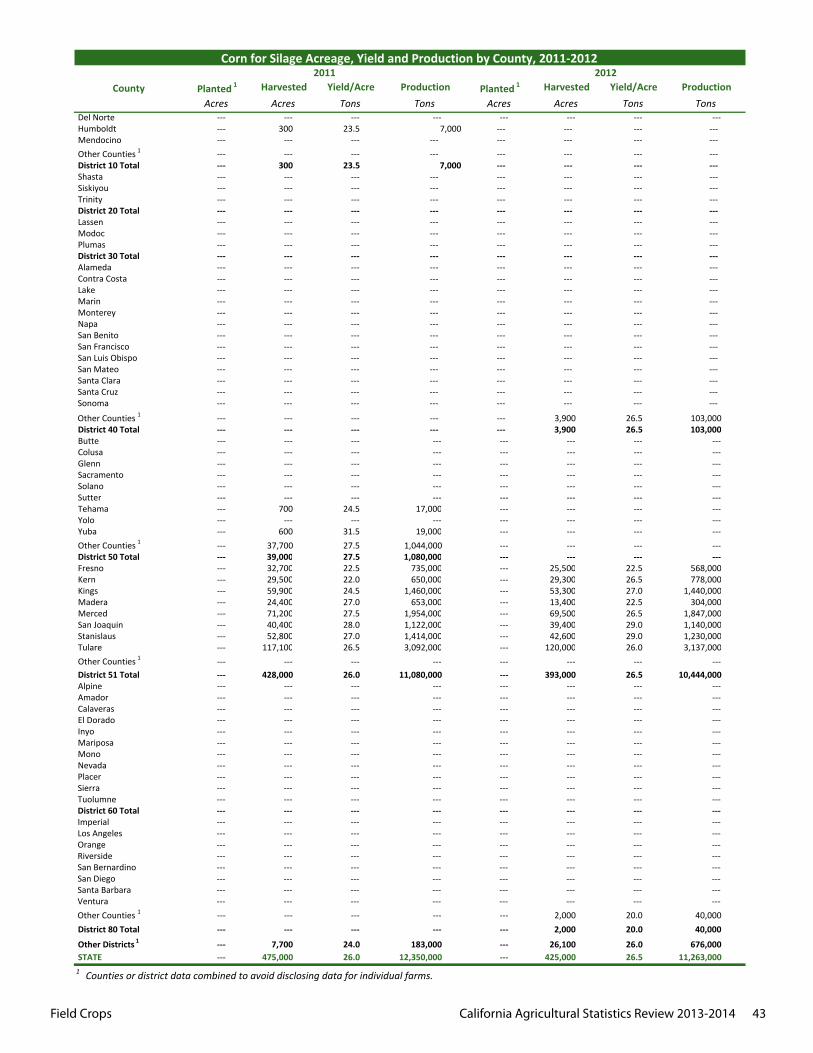
Field Crops California Agricultural Statistics Review 2013-2014 43
Planted 1 Harvested Yield/Acre Production Planted 1 Harvested Yield/Acre ProductionAcres Acres Tons Tons Acres Acres Tons Tons
Del Norte ‐‐‐ ‐‐‐ ‐‐‐ ‐‐‐ ‐‐‐ ‐‐‐ ‐‐‐ ‐‐‐ Humboldt ‐‐‐ 300 23.5 7,000 ‐‐‐ ‐‐‐ ‐‐‐ ‐‐‐ Mendocino ‐‐‐ ‐‐‐ ‐‐‐ ‐‐‐ ‐‐‐ ‐‐‐ ‐‐‐ ‐‐‐ Other Counties 1 ‐‐‐ ‐‐‐ ‐‐‐ ‐‐‐ ‐‐‐ ‐‐‐ ‐‐‐ ‐‐‐ District 10 Total ‐‐‐ 300 23.5 7,000 ‐‐‐ ‐‐‐ ‐‐‐ ‐‐‐ Shasta ‐‐‐ ‐‐‐ ‐‐‐ ‐‐‐ ‐‐‐ ‐‐‐ ‐‐‐ ‐‐‐ Siskiyou ‐‐‐ ‐‐‐ ‐‐‐ ‐‐‐ ‐‐‐ ‐‐‐ ‐‐‐ ‐‐‐ Trinity ‐‐‐ ‐‐‐ ‐‐‐ ‐‐‐ ‐‐‐ ‐‐‐ ‐‐‐ ‐‐‐ District 20 Total ‐‐‐ ‐‐‐ ‐‐‐ ‐‐‐ ‐‐‐ ‐‐‐ ‐‐‐ ‐‐‐ Lassen ‐‐‐ ‐‐‐ ‐‐‐ ‐‐‐ ‐‐‐ ‐‐‐ ‐‐‐ ‐‐‐ Modoc ‐‐‐ ‐‐‐ ‐‐‐ ‐‐‐ ‐‐‐ ‐‐‐ ‐‐‐ ‐‐‐ Plumas ‐‐‐ ‐‐‐ ‐‐‐ ‐‐‐ ‐‐‐ ‐‐‐ ‐‐‐ ‐‐‐ District 30 Total ‐‐‐ ‐‐‐ ‐‐‐ ‐‐‐ ‐‐‐ ‐‐‐ ‐‐‐ ‐‐‐ Alameda ‐‐‐ ‐‐‐ ‐‐‐ ‐‐‐ ‐‐‐ ‐‐‐ ‐‐‐ ‐‐‐ Contra Costa ‐‐‐ ‐‐‐ ‐‐‐ ‐‐‐ ‐‐‐ ‐‐‐ ‐‐‐ ‐‐‐ Lake ‐‐‐ ‐‐‐ ‐‐‐ ‐‐‐ ‐‐‐ ‐‐‐ ‐‐‐ ‐‐‐ Marin ‐‐‐ ‐‐‐ ‐‐‐ ‐‐‐ ‐‐‐ ‐‐‐ ‐‐‐ ‐‐‐ Monterey ‐‐‐ ‐‐‐ ‐‐‐ ‐‐‐ ‐‐‐ ‐‐‐ ‐‐‐ ‐‐‐ Napa ‐‐‐ ‐‐‐ ‐‐‐ ‐‐‐ ‐‐‐ ‐‐‐ ‐‐‐ ‐‐‐ San Benito ‐‐‐ ‐‐‐ ‐‐‐ ‐‐‐ ‐‐‐ ‐‐‐ ‐‐‐ ‐‐‐ San Francisco ‐‐‐ ‐‐‐ ‐‐‐ ‐‐‐ ‐‐‐ ‐‐‐ ‐‐‐ ‐‐‐ San Luis Obispo ‐‐‐ ‐‐‐ ‐‐‐ ‐‐‐ ‐‐‐ ‐‐‐ ‐‐‐ ‐‐‐ San Mateo ‐‐‐ ‐‐‐ ‐‐‐ ‐‐‐ ‐‐‐ ‐‐‐ ‐‐‐ ‐‐‐ Santa Clara ‐‐‐ ‐‐‐ ‐‐‐ ‐‐‐ ‐‐‐ ‐‐‐ ‐‐‐ ‐‐‐ Santa Cruz ‐‐‐ ‐‐‐ ‐‐‐ ‐‐‐ ‐‐‐ ‐‐‐ ‐‐‐ ‐‐‐ Sonoma ‐‐‐ ‐‐‐ ‐‐‐ ‐‐‐ ‐‐‐ ‐‐‐ ‐‐‐ ‐‐‐
Other Counties 1 ‐‐‐ ‐‐‐ ‐‐‐ ‐‐‐ ‐‐‐ 3,900 26.5 103,000 District 40 Total ‐‐‐ ‐‐‐ ‐‐‐ ‐‐‐ ‐‐‐ 3,900 26.5 103,000 Butte ‐‐‐ ‐‐‐ ‐‐‐ ‐‐‐ ‐‐‐ ‐‐‐ ‐‐‐ ‐‐‐ Colusa ‐‐‐ ‐‐‐ ‐‐‐ ‐‐‐ ‐‐‐ ‐‐‐ ‐‐‐ ‐‐‐ Glenn ‐‐‐ ‐‐‐ ‐‐‐ ‐‐‐ ‐‐‐ ‐‐‐ ‐‐‐ ‐‐‐ Sacramento ‐‐‐ ‐‐‐ ‐‐‐ ‐‐‐ ‐‐‐ ‐‐‐ ‐‐‐ ‐‐‐ Solano ‐‐‐ ‐‐‐ ‐‐‐ ‐‐‐ ‐‐‐ ‐‐‐ ‐‐‐ ‐‐‐ Sutter ‐‐‐ ‐‐‐ ‐‐‐ ‐‐‐ ‐‐‐ ‐‐‐ ‐‐‐ ‐‐‐ Tehama ‐‐‐ 700 24.5 17,000 ‐‐‐ ‐‐‐ ‐‐‐ ‐‐‐ Yolo ‐‐‐ ‐‐‐ ‐‐‐ ‐‐‐ ‐‐‐ ‐‐‐ ‐‐‐ ‐‐‐ Yuba ‐‐‐ 600 31.5 19,000 ‐‐‐ ‐‐‐ ‐‐‐ ‐‐‐ Other Counties 1 ‐‐‐ 37,700 27.5 1,044,000 ‐‐‐ ‐‐‐ ‐‐‐ ‐‐‐ District 50 Total ‐‐‐ 39,000 27.5 1,080,000 ‐‐‐ ‐‐‐ ‐‐‐ ‐‐‐ Fresno ‐‐‐ 32,700 22.5 735,000 ‐‐‐ 25,500 22.5 568,000 Kern ‐‐‐ 29,500 22.0 650,000 ‐‐‐ 29,300 26.5 778,000 Kings ‐‐‐ 59,900 24.5 1,460,000 ‐‐‐ 53,300 27.0 1,440,000 Madera ‐‐‐ 24,400 27.0 653,000 ‐‐‐ 13,400 22.5 304,000 Merced ‐‐‐ 71,200 27.5 1,954,000 ‐‐‐ 69,500 26.5 1,847,000 San Joaquin ‐‐‐ 40,400 28.0 1,122,000 ‐‐‐ 39,400 29.0 1,140,000 Stanislaus ‐‐‐ 52,800 27.0 1,414,000 ‐‐‐ 42,600 29.0 1,230,000 Tulare ‐‐‐ 117,100 26.5 3,092,000 ‐‐‐ 120,000 26.0 3,137,000 Other Counties 1 ‐‐‐ ‐‐‐ ‐‐‐ ‐‐‐ ‐‐‐ ‐‐‐ ‐‐‐ ‐‐‐ District 51 Total ‐‐‐ 428,000 26.0 11,080,000 ‐‐‐ 393,000 26.5 10,444,000 Alpine ‐‐‐ ‐‐‐ ‐‐‐ ‐‐‐ ‐‐‐ ‐‐‐ ‐‐‐ ‐‐‐ Amador ‐‐‐ ‐‐‐ ‐‐‐ ‐‐‐ ‐‐‐ ‐‐‐ ‐‐‐ ‐‐‐ Calaveras ‐‐‐ ‐‐‐ ‐‐‐ ‐‐‐ ‐‐‐ ‐‐‐ ‐‐‐ ‐‐‐ El Dorado ‐‐‐ ‐‐‐ ‐‐‐ ‐‐‐ ‐‐‐ ‐‐‐ ‐‐‐ ‐‐‐ Inyo ‐‐‐ ‐‐‐ ‐‐‐ ‐‐‐ ‐‐‐ ‐‐‐ ‐‐‐ ‐‐‐ Mariposa ‐‐‐ ‐‐‐ ‐‐‐ ‐‐‐ ‐‐‐ ‐‐‐ ‐‐‐ ‐‐‐ Mono ‐‐‐ ‐‐‐ ‐‐‐ ‐‐‐ ‐‐‐ ‐‐‐ ‐‐‐ ‐‐‐ Nevada ‐‐‐ ‐‐‐ ‐‐‐ ‐‐‐ ‐‐‐ ‐‐‐ ‐‐‐ ‐‐‐ Placer ‐‐‐ ‐‐‐ ‐‐‐ ‐‐‐ ‐‐‐ ‐‐‐ ‐‐‐ ‐‐‐ Sierra ‐‐‐ ‐‐‐ ‐‐‐ ‐‐‐ ‐‐‐ ‐‐‐ ‐‐‐ ‐‐‐ Tuolumne ‐‐‐ ‐‐‐ ‐‐‐ ‐‐‐ ‐‐‐ ‐‐‐ ‐‐‐ ‐‐‐ District 60 Total ‐‐‐ ‐‐‐ ‐‐‐ ‐‐‐ ‐‐‐ ‐‐‐ ‐‐‐ ‐‐‐ Imperial ‐‐‐ ‐‐‐ ‐‐‐ ‐‐‐ ‐‐‐ ‐‐‐ ‐‐‐ ‐‐‐ Los Angeles ‐‐‐ ‐‐‐ ‐‐‐ ‐‐‐ ‐‐‐ ‐‐‐ ‐‐‐ ‐‐‐ Orange ‐‐‐ ‐‐‐ ‐‐‐ ‐‐‐ ‐‐‐ ‐‐‐ ‐‐‐ ‐‐‐ Riverside ‐‐‐ ‐‐‐ ‐‐‐ ‐‐‐ ‐‐‐ ‐‐‐ ‐‐‐ ‐‐‐ San Bernardino ‐‐‐ ‐‐‐ ‐‐‐ ‐‐‐ ‐‐‐ ‐‐‐ ‐‐‐ ‐‐‐ San Diego ‐‐‐ ‐‐‐ ‐‐‐ ‐‐‐ ‐‐‐ ‐‐‐ ‐‐‐ ‐‐‐ Santa Barbara ‐‐‐ ‐‐‐ ‐‐‐ ‐‐‐ ‐‐‐ ‐‐‐ ‐‐‐ ‐‐‐ Ventura ‐‐‐ ‐‐‐ ‐‐‐ ‐‐‐ ‐‐‐ ‐‐‐ ‐‐‐ ‐‐‐ Other Counties 1 ‐‐‐ ‐‐‐ ‐‐‐ ‐‐‐ ‐‐‐ 2,000 20.0 40,000 District 80 Total ‐‐‐ ‐‐‐ ‐‐‐ ‐‐‐ ‐‐‐ 2,000 20.0 40,000
Other Districts 1 ‐‐‐ 7,700 24.0 183,000 ‐‐‐ 26,100 26.0 676,000 STATE ‐‐‐ 475,000 26.0 12,350,000 ‐‐‐ 425,000 26.5 11,263,000
2011 2012Corn for Silage Acreage, Yield and Production by County, 2011‐2012
County
1 Counties or district data combined to avoid disclosing data for individual farms.
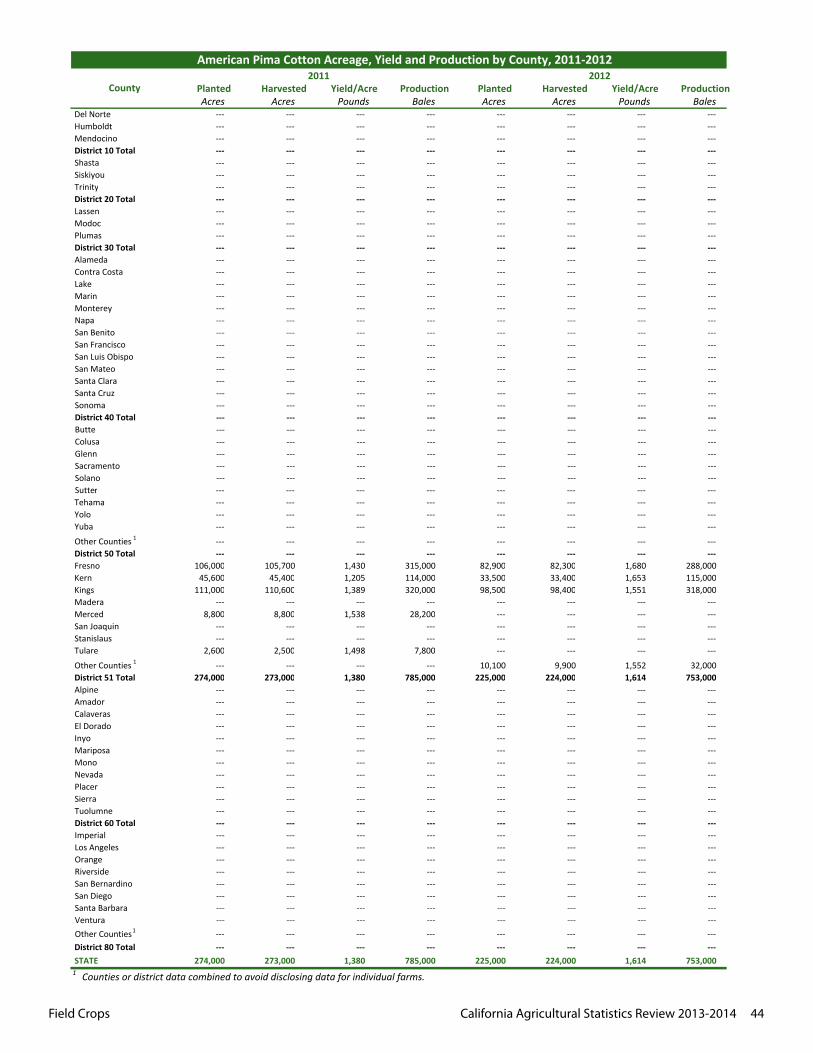
Field Crops California Agricultural Statistics Review 2013-2014 44
Planted Harvested Yield/Acre Production Planted Harvested Yield/Acre ProductionAcres Acres Pounds Bales Acres Acres Pounds Bales
Del Norte ‐‐‐ ‐‐‐ ‐‐‐ ‐‐‐ ‐‐‐ ‐‐‐ ‐‐‐ ‐‐‐ Humboldt ‐‐‐ ‐‐‐ ‐‐‐ ‐‐‐ ‐‐‐ ‐‐‐ ‐‐‐ ‐‐‐ Mendocino ‐‐‐ ‐‐‐ ‐‐‐ ‐‐‐ ‐‐‐ ‐‐‐ ‐‐‐ ‐‐‐ District 10 Total ‐‐‐ ‐‐‐ ‐‐‐ ‐‐‐ ‐‐‐ ‐‐‐ ‐‐‐ ‐‐‐ Shasta ‐‐‐ ‐‐‐ ‐‐‐ ‐‐‐ ‐‐‐ ‐‐‐ ‐‐‐ ‐‐‐ Siskiyou ‐‐‐ ‐‐‐ ‐‐‐ ‐‐‐ ‐‐‐ ‐‐‐ ‐‐‐ ‐‐‐ Trinity ‐‐‐ ‐‐‐ ‐‐‐ ‐‐‐ ‐‐‐ ‐‐‐ ‐‐‐ ‐‐‐ District 20 Total ‐‐‐ ‐‐‐ ‐‐‐ ‐‐‐ ‐‐‐ ‐‐‐ ‐‐‐ ‐‐‐ Lassen ‐‐‐ ‐‐‐ ‐‐‐ ‐‐‐ ‐‐‐ ‐‐‐ ‐‐‐ ‐‐‐ Modoc ‐‐‐ ‐‐‐ ‐‐‐ ‐‐‐ ‐‐‐ ‐‐‐ ‐‐‐ ‐‐‐ Plumas ‐‐‐ ‐‐‐ ‐‐‐ ‐‐‐ ‐‐‐ ‐‐‐ ‐‐‐ ‐‐‐ District 30 Total ‐‐‐ ‐‐‐ ‐‐‐ ‐‐‐ ‐‐‐ ‐‐‐ ‐‐‐ ‐‐‐ Alameda ‐‐‐ ‐‐‐ ‐‐‐ ‐‐‐ ‐‐‐ ‐‐‐ ‐‐‐ ‐‐‐ Contra Costa ‐‐‐ ‐‐‐ ‐‐‐ ‐‐‐ ‐‐‐ ‐‐‐ ‐‐‐ ‐‐‐ Lake ‐‐‐ ‐‐‐ ‐‐‐ ‐‐‐ ‐‐‐ ‐‐‐ ‐‐‐ ‐‐‐ Marin ‐‐‐ ‐‐‐ ‐‐‐ ‐‐‐ ‐‐‐ ‐‐‐ ‐‐‐ ‐‐‐ Monterey ‐‐‐ ‐‐‐ ‐‐‐ ‐‐‐ ‐‐‐ ‐‐‐ ‐‐‐ ‐‐‐ Napa ‐‐‐ ‐‐‐ ‐‐‐ ‐‐‐ ‐‐‐ ‐‐‐ ‐‐‐ ‐‐‐ San Benito ‐‐‐ ‐‐‐ ‐‐‐ ‐‐‐ ‐‐‐ ‐‐‐ ‐‐‐ ‐‐‐ San Francisco ‐‐‐ ‐‐‐ ‐‐‐ ‐‐‐ ‐‐‐ ‐‐‐ ‐‐‐ ‐‐‐ San Luis Obispo ‐‐‐ ‐‐‐ ‐‐‐ ‐‐‐ ‐‐‐ ‐‐‐ ‐‐‐ ‐‐‐ San Mateo ‐‐‐ ‐‐‐ ‐‐‐ ‐‐‐ ‐‐‐ ‐‐‐ ‐‐‐ ‐‐‐ Santa Clara ‐‐‐ ‐‐‐ ‐‐‐ ‐‐‐ ‐‐‐ ‐‐‐ ‐‐‐ ‐‐‐ Santa Cruz ‐‐‐ ‐‐‐ ‐‐‐ ‐‐‐ ‐‐‐ ‐‐‐ ‐‐‐ ‐‐‐ Sonoma ‐‐‐ ‐‐‐ ‐‐‐ ‐‐‐ ‐‐‐ ‐‐‐ ‐‐‐ ‐‐‐ District 40 Total ‐‐‐ ‐‐‐ ‐‐‐ ‐‐‐ ‐‐‐ ‐‐‐ ‐‐‐ ‐‐‐ Butte ‐‐‐ ‐‐‐ ‐‐‐ ‐‐‐ ‐‐‐ ‐‐‐ ‐‐‐ ‐‐‐ Colusa ‐‐‐ ‐‐‐ ‐‐‐ ‐‐‐ ‐‐‐ ‐‐‐ ‐‐‐ ‐‐‐ Glenn ‐‐‐ ‐‐‐ ‐‐‐ ‐‐‐ ‐‐‐ ‐‐‐ ‐‐‐ ‐‐‐ Sacramento ‐‐‐ ‐‐‐ ‐‐‐ ‐‐‐ ‐‐‐ ‐‐‐ ‐‐‐ ‐‐‐ Solano ‐‐‐ ‐‐‐ ‐‐‐ ‐‐‐ ‐‐‐ ‐‐‐ ‐‐‐ ‐‐‐ Sutter ‐‐‐ ‐‐‐ ‐‐‐ ‐‐‐ ‐‐‐ ‐‐‐ ‐‐‐ ‐‐‐ Tehama ‐‐‐ ‐‐‐ ‐‐‐ ‐‐‐ ‐‐‐ ‐‐‐ ‐‐‐ ‐‐‐ Yolo ‐‐‐ ‐‐‐ ‐‐‐ ‐‐‐ ‐‐‐ ‐‐‐ ‐‐‐ ‐‐‐ Yuba ‐‐‐ ‐‐‐ ‐‐‐ ‐‐‐ ‐‐‐ ‐‐‐ ‐‐‐ ‐‐‐
Other Counties 1 ‐‐‐ ‐‐‐ ‐‐‐ ‐‐‐ ‐‐‐ ‐‐‐ ‐‐‐ ‐‐‐ District 50 Total ‐‐‐ ‐‐‐ ‐‐‐ ‐‐‐ ‐‐‐ ‐‐‐ ‐‐‐ ‐‐‐ Fresno 106,000 105,700 1,430 315,000 82,900 82,300 1,680 288,000 Kern 45,600 45,400 1,205 114,000 33,500 33,400 1,653 115,000 Kings 111,000 110,600 1,389 320,000 98,500 98,400 1,551 318,000 Madera ‐‐‐ ‐‐‐ ‐‐‐ ‐‐‐ ‐‐‐ ‐‐‐ ‐‐‐ ‐‐‐ Merced 8,800 8,800 1,538 28,200 ‐‐‐ ‐‐‐ ‐‐‐ ‐‐‐ San Joaquin ‐‐‐ ‐‐‐ ‐‐‐ ‐‐‐ ‐‐‐ ‐‐‐ ‐‐‐ ‐‐‐ Stanislaus ‐‐‐ ‐‐‐ ‐‐‐ ‐‐‐ ‐‐‐ ‐‐‐ ‐‐‐ ‐‐‐ Tulare 2,600 2,500 1,498 7,800 ‐‐‐ ‐‐‐ ‐‐‐ ‐‐‐
Other Counties 1 ‐‐‐ ‐‐‐ ‐‐‐ ‐‐‐ 10,100 9,900 1,552 32,000 District 51 Total 274,000 273,000 1,380 785,000 225,000 224,000 1,614 753,000 Alpine ‐‐‐ ‐‐‐ ‐‐‐ ‐‐‐ ‐‐‐ ‐‐‐ ‐‐‐ ‐‐‐ Amador ‐‐‐ ‐‐‐ ‐‐‐ ‐‐‐ ‐‐‐ ‐‐‐ ‐‐‐ ‐‐‐ Calaveras ‐‐‐ ‐‐‐ ‐‐‐ ‐‐‐ ‐‐‐ ‐‐‐ ‐‐‐ ‐‐‐ El Dorado ‐‐‐ ‐‐‐ ‐‐‐ ‐‐‐ ‐‐‐ ‐‐‐ ‐‐‐ ‐‐‐ Inyo ‐‐‐ ‐‐‐ ‐‐‐ ‐‐‐ ‐‐‐ ‐‐‐ ‐‐‐ ‐‐‐ Mariposa ‐‐‐ ‐‐‐ ‐‐‐ ‐‐‐ ‐‐‐ ‐‐‐ ‐‐‐ ‐‐‐ Mono ‐‐‐ ‐‐‐ ‐‐‐ ‐‐‐ ‐‐‐ ‐‐‐ ‐‐‐ ‐‐‐ Nevada ‐‐‐ ‐‐‐ ‐‐‐ ‐‐‐ ‐‐‐ ‐‐‐ ‐‐‐ ‐‐‐ Placer ‐‐‐ ‐‐‐ ‐‐‐ ‐‐‐ ‐‐‐ ‐‐‐ ‐‐‐ ‐‐‐ Sierra ‐‐‐ ‐‐‐ ‐‐‐ ‐‐‐ ‐‐‐ ‐‐‐ ‐‐‐ ‐‐‐ Tuolumne ‐‐‐ ‐‐‐ ‐‐‐ ‐‐‐ ‐‐‐ ‐‐‐ ‐‐‐ ‐‐‐ District 60 Total ‐‐‐ ‐‐‐ ‐‐‐ ‐‐‐ ‐‐‐ ‐‐‐ ‐‐‐ ‐‐‐ Imperial ‐‐‐ ‐‐‐ ‐‐‐ ‐‐‐ ‐‐‐ ‐‐‐ ‐‐‐ ‐‐‐ Los Angeles ‐‐‐ ‐‐‐ ‐‐‐ ‐‐‐ ‐‐‐ ‐‐‐ ‐‐‐ ‐‐‐ Orange ‐‐‐ ‐‐‐ ‐‐‐ ‐‐‐ ‐‐‐ ‐‐‐ ‐‐‐ ‐‐‐ Riverside ‐‐‐ ‐‐‐ ‐‐‐ ‐‐‐ ‐‐‐ ‐‐‐ ‐‐‐ ‐‐‐ San Bernardino ‐‐‐ ‐‐‐ ‐‐‐ ‐‐‐ ‐‐‐ ‐‐‐ ‐‐‐ ‐‐‐ San Diego ‐‐‐ ‐‐‐ ‐‐‐ ‐‐‐ ‐‐‐ ‐‐‐ ‐‐‐ ‐‐‐ Santa Barbara ‐‐‐ ‐‐‐ ‐‐‐ ‐‐‐ ‐‐‐ ‐‐‐ ‐‐‐ ‐‐‐ Ventura ‐‐‐ ‐‐‐ ‐‐‐ ‐‐‐ ‐‐‐ ‐‐‐ ‐‐‐ ‐‐‐ Other Counties 1 ‐‐‐ ‐‐‐ ‐‐‐ ‐‐‐ ‐‐‐ ‐‐‐ ‐‐‐ ‐‐‐ District 80 Total ‐‐‐ ‐‐‐ ‐‐‐ ‐‐‐ ‐‐‐ ‐‐‐ ‐‐‐ ‐‐‐ STATE 274,000 273,000 1,380 785,000 225,000 224,000 1,614 753,0001 Counties or district data combined to avoid disclosing data for individual farms.
American Pima Cotton Acreage, Yield and Production by County, 2011‐20122011 2012
County
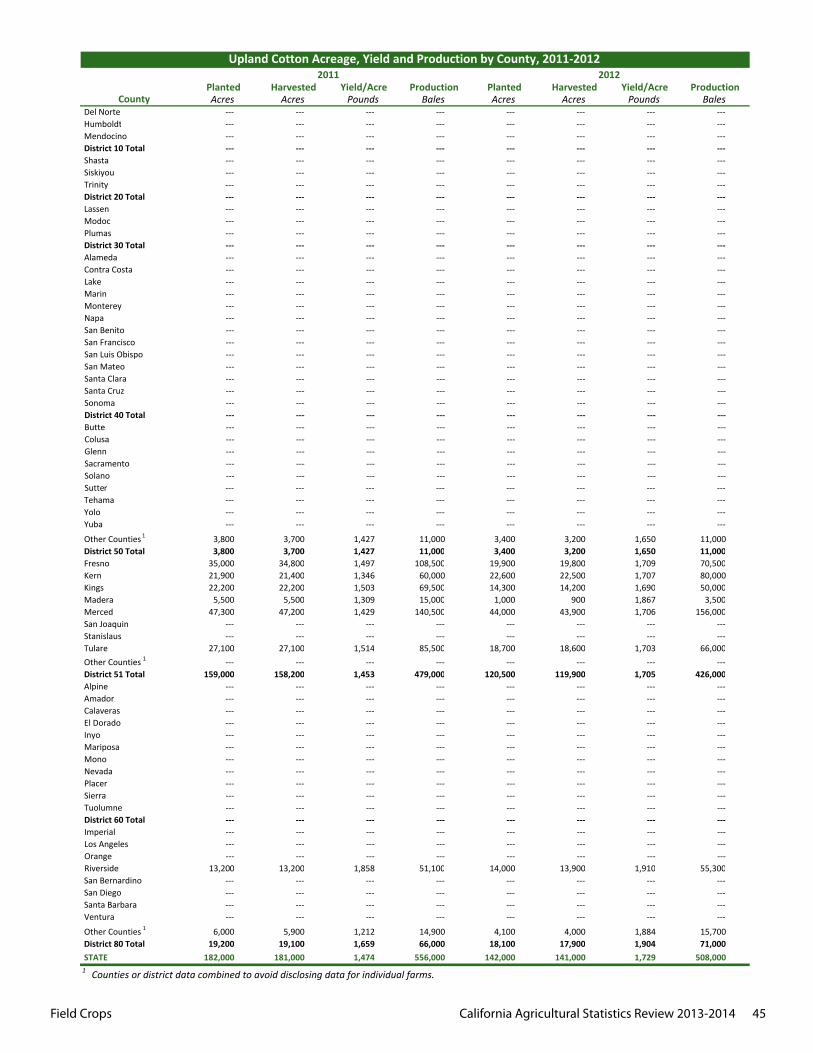
Field Crops California Agricultural Statistics Review 2013-2014 45
Planted Harvested Yield/Acre Production Planted Harvested Yield/Acre ProductionAcres Acres Pounds Bales Acres Acres Pounds Bales
Del Norte ‐‐‐ ‐‐‐ ‐‐‐ ‐‐‐ ‐‐‐ ‐‐‐ ‐‐‐ ‐‐‐ Humboldt ‐‐‐ ‐‐‐ ‐‐‐ ‐‐‐ ‐‐‐ ‐‐‐ ‐‐‐ ‐‐‐ Mendocino ‐‐‐ ‐‐‐ ‐‐‐ ‐‐‐ ‐‐‐ ‐‐‐ ‐‐‐ ‐‐‐ District 10 Total ‐‐‐ ‐‐‐ ‐‐‐ ‐‐‐ ‐‐‐ ‐‐‐ ‐‐‐ ‐‐‐ Shasta ‐‐‐ ‐‐‐ ‐‐‐ ‐‐‐ ‐‐‐ ‐‐‐ ‐‐‐ ‐‐‐ Siskiyou ‐‐‐ ‐‐‐ ‐‐‐ ‐‐‐ ‐‐‐ ‐‐‐ ‐‐‐ ‐‐‐ Trinity ‐‐‐ ‐‐‐ ‐‐‐ ‐‐‐ ‐‐‐ ‐‐‐ ‐‐‐ ‐‐‐ District 20 Total ‐‐‐ ‐‐‐ ‐‐‐ ‐‐‐ ‐‐‐ ‐‐‐ ‐‐‐ ‐‐‐ Lassen ‐‐‐ ‐‐‐ ‐‐‐ ‐‐‐ ‐‐‐ ‐‐‐ ‐‐‐ ‐‐‐ Modoc ‐‐‐ ‐‐‐ ‐‐‐ ‐‐‐ ‐‐‐ ‐‐‐ ‐‐‐ ‐‐‐ Plumas ‐‐‐ ‐‐‐ ‐‐‐ ‐‐‐ ‐‐‐ ‐‐‐ ‐‐‐ ‐‐‐ District 30 Total ‐‐‐ ‐‐‐ ‐‐‐ ‐‐‐ ‐‐‐ ‐‐‐ ‐‐‐ ‐‐‐ Alameda ‐‐‐ ‐‐‐ ‐‐‐ ‐‐‐ ‐‐‐ ‐‐‐ ‐‐‐ ‐‐‐ Contra Costa ‐‐‐ ‐‐‐ ‐‐‐ ‐‐‐ ‐‐‐ ‐‐‐ ‐‐‐ ‐‐‐ Lake ‐‐‐ ‐‐‐ ‐‐‐ ‐‐‐ ‐‐‐ ‐‐‐ ‐‐‐ ‐‐‐ Marin ‐‐‐ ‐‐‐ ‐‐‐ ‐‐‐ ‐‐‐ ‐‐‐ ‐‐‐ ‐‐‐ Monterey ‐‐‐ ‐‐‐ ‐‐‐ ‐‐‐ ‐‐‐ ‐‐‐ ‐‐‐ ‐‐‐ Napa ‐‐‐ ‐‐‐ ‐‐‐ ‐‐‐ ‐‐‐ ‐‐‐ ‐‐‐ ‐‐‐ San Benito ‐‐‐ ‐‐‐ ‐‐‐ ‐‐‐ ‐‐‐ ‐‐‐ ‐‐‐ ‐‐‐ San Francisco ‐‐‐ ‐‐‐ ‐‐‐ ‐‐‐ ‐‐‐ ‐‐‐ ‐‐‐ ‐‐‐ San Luis Obispo ‐‐‐ ‐‐‐ ‐‐‐ ‐‐‐ ‐‐‐ ‐‐‐ ‐‐‐ ‐‐‐ San Mateo ‐‐‐ ‐‐‐ ‐‐‐ ‐‐‐ ‐‐‐ ‐‐‐ ‐‐‐ ‐‐‐ Santa Clara ‐‐‐ ‐‐‐ ‐‐‐ ‐‐‐ ‐‐‐ ‐‐‐ ‐‐‐ ‐‐‐ Santa Cruz ‐‐‐ ‐‐‐ ‐‐‐ ‐‐‐ ‐‐‐ ‐‐‐ ‐‐‐ ‐‐‐ Sonoma ‐‐‐ ‐‐‐ ‐‐‐ ‐‐‐ ‐‐‐ ‐‐‐ ‐‐‐ ‐‐‐ District 40 Total ‐‐‐ ‐‐‐ ‐‐‐ ‐‐‐ ‐‐‐ ‐‐‐ ‐‐‐ ‐‐‐ Butte ‐‐‐ ‐‐‐ ‐‐‐ ‐‐‐ ‐‐‐ ‐‐‐ ‐‐‐ ‐‐‐ Colusa ‐‐‐ ‐‐‐ ‐‐‐ ‐‐‐ ‐‐‐ ‐‐‐ ‐‐‐ ‐‐‐ Glenn ‐‐‐ ‐‐‐ ‐‐‐ ‐‐‐ ‐‐‐ ‐‐‐ ‐‐‐ ‐‐‐ Sacramento ‐‐‐ ‐‐‐ ‐‐‐ ‐‐‐ ‐‐‐ ‐‐‐ ‐‐‐ ‐‐‐ Solano ‐‐‐ ‐‐‐ ‐‐‐ ‐‐‐ ‐‐‐ ‐‐‐ ‐‐‐ ‐‐‐ Sutter ‐‐‐ ‐‐‐ ‐‐‐ ‐‐‐ ‐‐‐ ‐‐‐ ‐‐‐ ‐‐‐ Tehama ‐‐‐ ‐‐‐ ‐‐‐ ‐‐‐ ‐‐‐ ‐‐‐ ‐‐‐ ‐‐‐ Yolo ‐‐‐ ‐‐‐ ‐‐‐ ‐‐‐ ‐‐‐ ‐‐‐ ‐‐‐ ‐‐‐ Yuba ‐‐‐ ‐‐‐ ‐‐‐ ‐‐‐ ‐‐‐ ‐‐‐ ‐‐‐ ‐‐‐
Other Counties 1 3,800 3,700 1,427 11,000 3,400 3,200 1,650 11,000 District 50 Total 3,800 3,700 1,427 11,000 3,400 3,200 1,650 11,000 Fresno 35,000 34,800 1,497 108,500 19,900 19,800 1,709 70,500 Kern 21,900 21,400 1,346 60,000 22,600 22,500 1,707 80,000 Kings 22,200 22,200 1,503 69,500 14,300 14,200 1,690 50,000 Madera 5,500 5,500 1,309 15,000 1,000 900 1,867 3,500 Merced 47,300 47,200 1,429 140,500 44,000 43,900 1,706 156,000 San Joaquin ‐‐‐ ‐‐‐ ‐‐‐ ‐‐‐ ‐‐‐ ‐‐‐ ‐‐‐ ‐‐‐ Stanislaus ‐‐‐ ‐‐‐ ‐‐‐ ‐‐‐ ‐‐‐ ‐‐‐ ‐‐‐ ‐‐‐ Tulare 27,100 27,100 1,514 85,500 18,700 18,600 1,703 66,000 Other Counties 1 ‐‐‐ ‐‐‐ ‐‐‐ ‐‐‐ ‐‐‐ ‐‐‐ ‐‐‐ ‐‐‐ District 51 Total 159,000 158,200 1,453 479,000 120,500 119,900 1,705 426,000 Alpine ‐‐‐ ‐‐‐ ‐‐‐ ‐‐‐ ‐‐‐ ‐‐‐ ‐‐‐ ‐‐‐ Amador ‐‐‐ ‐‐‐ ‐‐‐ ‐‐‐ ‐‐‐ ‐‐‐ ‐‐‐ ‐‐‐ Calaveras ‐‐‐ ‐‐‐ ‐‐‐ ‐‐‐ ‐‐‐ ‐‐‐ ‐‐‐ ‐‐‐ El Dorado ‐‐‐ ‐‐‐ ‐‐‐ ‐‐‐ ‐‐‐ ‐‐‐ ‐‐‐ ‐‐‐ Inyo ‐‐‐ ‐‐‐ ‐‐‐ ‐‐‐ ‐‐‐ ‐‐‐ ‐‐‐ ‐‐‐ Mariposa ‐‐‐ ‐‐‐ ‐‐‐ ‐‐‐ ‐‐‐ ‐‐‐ ‐‐‐ ‐‐‐ Mono ‐‐‐ ‐‐‐ ‐‐‐ ‐‐‐ ‐‐‐ ‐‐‐ ‐‐‐ ‐‐‐ Nevada ‐‐‐ ‐‐‐ ‐‐‐ ‐‐‐ ‐‐‐ ‐‐‐ ‐‐‐ ‐‐‐ Placer ‐‐‐ ‐‐‐ ‐‐‐ ‐‐‐ ‐‐‐ ‐‐‐ ‐‐‐ ‐‐‐ Sierra ‐‐‐ ‐‐‐ ‐‐‐ ‐‐‐ ‐‐‐ ‐‐‐ ‐‐‐ ‐‐‐ Tuolumne ‐‐‐ ‐‐‐ ‐‐‐ ‐‐‐ ‐‐‐ ‐‐‐ ‐‐‐ ‐‐‐ District 60 Total ‐‐‐ ‐‐‐ ‐‐‐ ‐‐‐ ‐‐‐ ‐‐‐ ‐‐‐ ‐‐‐ Imperial ‐‐‐ ‐‐‐ ‐‐‐ ‐‐‐ ‐‐‐ ‐‐‐ ‐‐‐ ‐‐‐ Los Angeles ‐‐‐ ‐‐‐ ‐‐‐ ‐‐‐ ‐‐‐ ‐‐‐ ‐‐‐ ‐‐‐ Orange ‐‐‐ ‐‐‐ ‐‐‐ ‐‐‐ ‐‐‐ ‐‐‐ ‐‐‐ ‐‐‐ Riverside 13,200 13,200 1,858 51,100 14,000 13,900 1,910 55,300 San Bernardino ‐‐‐ ‐‐‐ ‐‐‐ ‐‐‐ ‐‐‐ ‐‐‐ ‐‐‐ ‐‐‐ San Diego ‐‐‐ ‐‐‐ ‐‐‐ ‐‐‐ ‐‐‐ ‐‐‐ ‐‐‐ ‐‐‐ Santa Barbara ‐‐‐ ‐‐‐ ‐‐‐ ‐‐‐ ‐‐‐ ‐‐‐ ‐‐‐ ‐‐‐ Ventura ‐‐‐ ‐‐‐ ‐‐‐ ‐‐‐ ‐‐‐ ‐‐‐ ‐‐‐ ‐‐‐
Other Counties 1 6,000 5,900 1,212 14,900 4,100 4,000 1,884 15,700 District 80 Total 19,200 19,100 1,659 66,000 18,100 17,900 1,904 71,000 STATE 182,000 181,000 1,474 556,000 142,000 141,000 1,729 508,000
Upland Cotton Acreage, Yield and Production by County, 2011‐2012
1 Counties or district data combined to avoid disclosing data for individual farms.
County
2011 2012
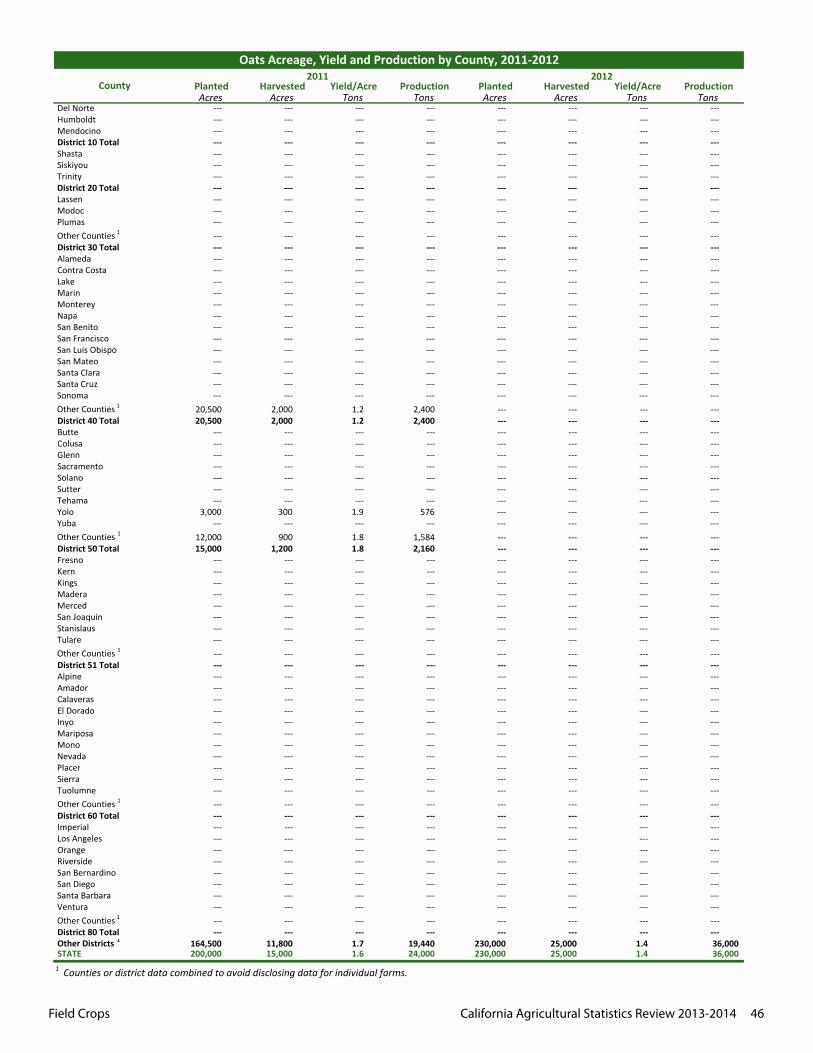
Field Crops California Agricultural Statistics Review 2013-2014 46
Planted Harvested Yield/Acre Production Planted Harvested Yield/Acre ProductionAcres Acres Tons Tons Acres Acres Tons Tons
Del Norte ‐‐‐ ‐‐‐ ‐‐‐ ‐‐‐ ‐‐‐ ‐‐‐ ‐‐‐ ‐‐‐ Humboldt ‐‐‐ ‐‐‐ ‐‐‐ ‐‐‐ ‐‐‐ ‐‐‐ ‐‐‐ ‐‐‐ Mendocino ‐‐‐ ‐‐‐ ‐‐‐ ‐‐‐ ‐‐‐ ‐‐‐ ‐‐‐ ‐‐‐ District 10 Total ‐‐‐ ‐‐‐ ‐‐‐ ‐‐‐ ‐‐‐ ‐‐‐ ‐‐‐ ‐‐‐ Shasta ‐‐‐ ‐‐‐ ‐‐‐ ‐‐‐ ‐‐‐ ‐‐‐ ‐‐‐ ‐‐‐ Siskiyou ‐‐‐ ‐‐‐ ‐‐‐ ‐‐‐ ‐‐‐ ‐‐‐ ‐‐‐ ‐‐‐ Trinity ‐‐‐ ‐‐‐ ‐‐‐ ‐‐‐ ‐‐‐ ‐‐‐ ‐‐‐ ‐‐‐ District 20 Total ‐‐‐ ‐‐‐ ‐‐‐ ‐‐‐ ‐‐‐ ‐‐‐ ‐‐‐ ‐‐‐ Lassen ‐‐‐ ‐‐‐ ‐‐‐ ‐‐‐ ‐‐‐ ‐‐‐ ‐‐‐ ‐‐‐ Modoc ‐‐‐ ‐‐‐ ‐‐‐ ‐‐‐ ‐‐‐ ‐‐‐ ‐‐‐ ‐‐‐ Plumas ‐‐‐ ‐‐‐ ‐‐‐ ‐‐‐ ‐‐‐ ‐‐‐ ‐‐‐ ‐‐‐ Other Counties 1 ‐‐‐ ‐‐‐ ‐‐‐ ‐‐‐ ‐‐‐ ‐‐‐ ‐‐‐ ‐‐‐ District 30 Total ‐‐‐ ‐‐‐ ‐‐‐ ‐‐‐ ‐‐‐ ‐‐‐ ‐‐‐ ‐‐‐ Alameda ‐‐‐ ‐‐‐ ‐‐‐ ‐‐‐ ‐‐‐ ‐‐‐ ‐‐‐ ‐‐‐ Contra Costa ‐‐‐ ‐‐‐ ‐‐‐ ‐‐‐ ‐‐‐ ‐‐‐ ‐‐‐ ‐‐‐ Lake ‐‐‐ ‐‐‐ ‐‐‐ ‐‐‐ ‐‐‐ ‐‐‐ ‐‐‐ ‐‐‐ Marin ‐‐‐ ‐‐‐ ‐‐‐ ‐‐‐ ‐‐‐ ‐‐‐ ‐‐‐ ‐‐‐ Monterey ‐‐‐ ‐‐‐ ‐‐‐ ‐‐‐ ‐‐‐ ‐‐‐ ‐‐‐ ‐‐‐ Napa ‐‐‐ ‐‐‐ ‐‐‐ ‐‐‐ ‐‐‐ ‐‐‐ ‐‐‐ ‐‐‐ San Benito ‐‐‐ ‐‐‐ ‐‐‐ ‐‐‐ ‐‐‐ ‐‐‐ ‐‐‐ ‐‐‐ San Francisco ‐‐‐ ‐‐‐ ‐‐‐ ‐‐‐ ‐‐‐ ‐‐‐ ‐‐‐ ‐‐‐ San Luis Obispo ‐‐‐ ‐‐‐ ‐‐‐ ‐‐‐ ‐‐‐ ‐‐‐ ‐‐‐ ‐‐‐ San Mateo ‐‐‐ ‐‐‐ ‐‐‐ ‐‐‐ ‐‐‐ ‐‐‐ ‐‐‐ ‐‐‐ Santa Clara ‐‐‐ ‐‐‐ ‐‐‐ ‐‐‐ ‐‐‐ ‐‐‐ ‐‐‐ ‐‐‐ Santa Cruz ‐‐‐ ‐‐‐ ‐‐‐ ‐‐‐ ‐‐‐ ‐‐‐ ‐‐‐ ‐‐‐ Sonoma ‐‐‐ ‐‐‐ ‐‐‐ ‐‐‐ ‐‐‐ ‐‐‐ ‐‐‐ ‐‐‐ Other Counties 1 20,500 2,000 1.2 2,400 ‐‐‐ ‐‐‐ ‐‐‐ ‐‐‐ District 40 Total 20,500 2,000 1.2 2,400 ‐‐‐ ‐‐‐ ‐‐‐ ‐‐‐ Butte ‐‐‐ ‐‐‐ ‐‐‐ ‐‐‐ ‐‐‐ ‐‐‐ ‐‐‐ ‐‐‐ Colusa ‐‐‐ ‐‐‐ ‐‐‐ ‐‐‐ ‐‐‐ ‐‐‐ ‐‐‐ ‐‐‐ Glenn ‐‐‐ ‐‐‐ ‐‐‐ ‐‐‐ ‐‐‐ ‐‐‐ ‐‐‐ ‐‐‐ Sacramento ‐‐‐ ‐‐‐ ‐‐‐ ‐‐‐ ‐‐‐ ‐‐‐ ‐‐‐ ‐‐‐ Solano ‐‐‐ ‐‐‐ ‐‐‐ ‐‐‐ ‐‐‐ ‐‐‐ ‐‐‐ ‐‐‐ Sutter ‐‐‐ ‐‐‐ ‐‐‐ ‐‐‐ ‐‐‐ ‐‐‐ ‐‐‐ ‐‐‐ Tehama ‐‐‐ ‐‐‐ ‐‐‐ ‐‐‐ ‐‐‐ ‐‐‐ ‐‐‐ ‐‐‐ Yolo 3,000 300 1.9 576 ‐‐‐ ‐‐‐ ‐‐‐ ‐‐‐ Yuba ‐‐‐ ‐‐‐ ‐‐‐ ‐‐‐ ‐‐‐ ‐‐‐ ‐‐‐ ‐‐‐ Other Counties 1 12,000 900 1.8 1,584 ‐‐‐ ‐‐‐ ‐‐‐ ‐‐‐ District 50 Total 15,000 1,200 1.8 2,160 ‐‐‐ ‐‐‐ ‐‐‐ ‐‐‐ Fresno ‐‐‐ ‐‐‐ ‐‐‐ ‐‐‐ ‐‐‐ ‐‐‐ ‐‐‐ ‐‐‐ Kern ‐‐‐ ‐‐‐ ‐‐‐ ‐‐‐ ‐‐‐ ‐‐‐ ‐‐‐ ‐‐‐ Kings ‐‐‐ ‐‐‐ ‐‐‐ ‐‐‐ ‐‐‐ ‐‐‐ ‐‐‐ ‐‐‐ Madera ‐‐‐ ‐‐‐ ‐‐‐ ‐‐‐ ‐‐‐ ‐‐‐ ‐‐‐ ‐‐‐ Merced ‐‐‐ ‐‐‐ ‐‐‐ ‐‐‐ ‐‐‐ ‐‐‐ ‐‐‐ ‐‐‐ San Joaquin ‐‐‐ ‐‐‐ ‐‐‐ ‐‐‐ ‐‐‐ ‐‐‐ ‐‐‐ ‐‐‐ Stanislaus ‐‐‐ ‐‐‐ ‐‐‐ ‐‐‐ ‐‐‐ ‐‐‐ ‐‐‐ ‐‐‐ Tulare ‐‐‐ ‐‐‐ ‐‐‐ ‐‐‐ ‐‐‐ ‐‐‐ ‐‐‐ ‐‐‐ Other Counties 1 ‐‐‐ ‐‐‐ ‐‐‐ ‐‐‐ ‐‐‐ ‐‐‐ ‐‐‐ ‐‐‐ District 51 Total ‐‐‐ ‐‐‐ ‐‐‐ ‐‐‐ ‐‐‐ ‐‐‐ ‐‐‐ ‐‐‐ Alpine ‐‐‐ ‐‐‐ ‐‐‐ ‐‐‐ ‐‐‐ ‐‐‐ ‐‐‐ ‐‐‐ Amador ‐‐‐ ‐‐‐ ‐‐‐ ‐‐‐ ‐‐‐ ‐‐‐ ‐‐‐ ‐‐‐ Calaveras ‐‐‐ ‐‐‐ ‐‐‐ ‐‐‐ ‐‐‐ ‐‐‐ ‐‐‐ ‐‐‐ El Dorado ‐‐‐ ‐‐‐ ‐‐‐ ‐‐‐ ‐‐‐ ‐‐‐ ‐‐‐ ‐‐‐ Inyo ‐‐‐ ‐‐‐ ‐‐‐ ‐‐‐ ‐‐‐ ‐‐‐ ‐‐‐ ‐‐‐ Mariposa ‐‐‐ ‐‐‐ ‐‐‐ ‐‐‐ ‐‐‐ ‐‐‐ ‐‐‐ ‐‐‐ Mono ‐‐‐ ‐‐‐ ‐‐‐ ‐‐‐ ‐‐‐ ‐‐‐ ‐‐‐ ‐‐‐ Nevada ‐‐‐ ‐‐‐ ‐‐‐ ‐‐‐ ‐‐‐ ‐‐‐ ‐‐‐ ‐‐‐ Placer ‐‐‐ ‐‐‐ ‐‐‐ ‐‐‐ ‐‐‐ ‐‐‐ ‐‐‐ ‐‐‐ Sierra ‐‐‐ ‐‐‐ ‐‐‐ ‐‐‐ ‐‐‐ ‐‐‐ ‐‐‐ ‐‐‐ Tuolumne ‐‐‐ ‐‐‐ ‐‐‐ ‐‐‐ ‐‐‐ ‐‐‐ ‐‐‐ ‐‐‐ Other Counties 1 ‐‐‐ ‐‐‐ ‐‐‐ ‐‐‐ ‐‐‐ ‐‐‐ ‐‐‐ ‐‐‐ District 60 Total ‐‐‐ ‐‐‐ ‐‐‐ ‐‐‐ ‐‐‐ ‐‐‐ ‐‐‐ ‐‐‐ Imperial ‐‐‐ ‐‐‐ ‐‐‐ ‐‐‐ ‐‐‐ ‐‐‐ ‐‐‐ ‐‐‐ Los Angeles ‐‐‐ ‐‐‐ ‐‐‐ ‐‐‐ ‐‐‐ ‐‐‐ ‐‐‐ ‐‐‐ Orange ‐‐‐ ‐‐‐ ‐‐‐ ‐‐‐ ‐‐‐ ‐‐‐ ‐‐‐ ‐‐‐ Riverside ‐‐‐ ‐‐‐ ‐‐‐ ‐‐‐ ‐‐‐ ‐‐‐ ‐‐‐ ‐‐‐ San Bernardino ‐‐‐ ‐‐‐ ‐‐‐ ‐‐‐ ‐‐‐ ‐‐‐ ‐‐‐ ‐‐‐ San Diego ‐‐‐ ‐‐‐ ‐‐‐ ‐‐‐ ‐‐‐ ‐‐‐ ‐‐‐ ‐‐‐ Santa Barbara ‐‐‐ ‐‐‐ ‐‐‐ ‐‐‐ ‐‐‐ ‐‐‐ ‐‐‐ ‐‐‐ Ventura ‐‐‐ ‐‐‐ ‐‐‐ ‐‐‐ ‐‐‐ ‐‐‐ ‐‐‐ ‐‐‐ Other Counties 1 ‐‐‐ ‐‐‐ ‐‐‐ ‐‐‐ ‐‐‐ ‐‐‐ ‐‐‐ ‐‐‐ District 80 Total ‐‐‐ ‐‐‐ ‐‐‐ ‐‐‐ ‐‐‐ ‐‐‐ ‐‐‐ ‐‐‐ Other Districts 1 164,500 11,800 1.7 19,440 230,000 25,000 1.4 36,000 STATE 200,000 15,000 1.6 24,000 230,000 25,000 1.4 36,000 1 Counties or district data combined to avoid disclosing data for individual farms.
2011Oats Acreage, Yield and Production by County, 2011‐2012
County2012
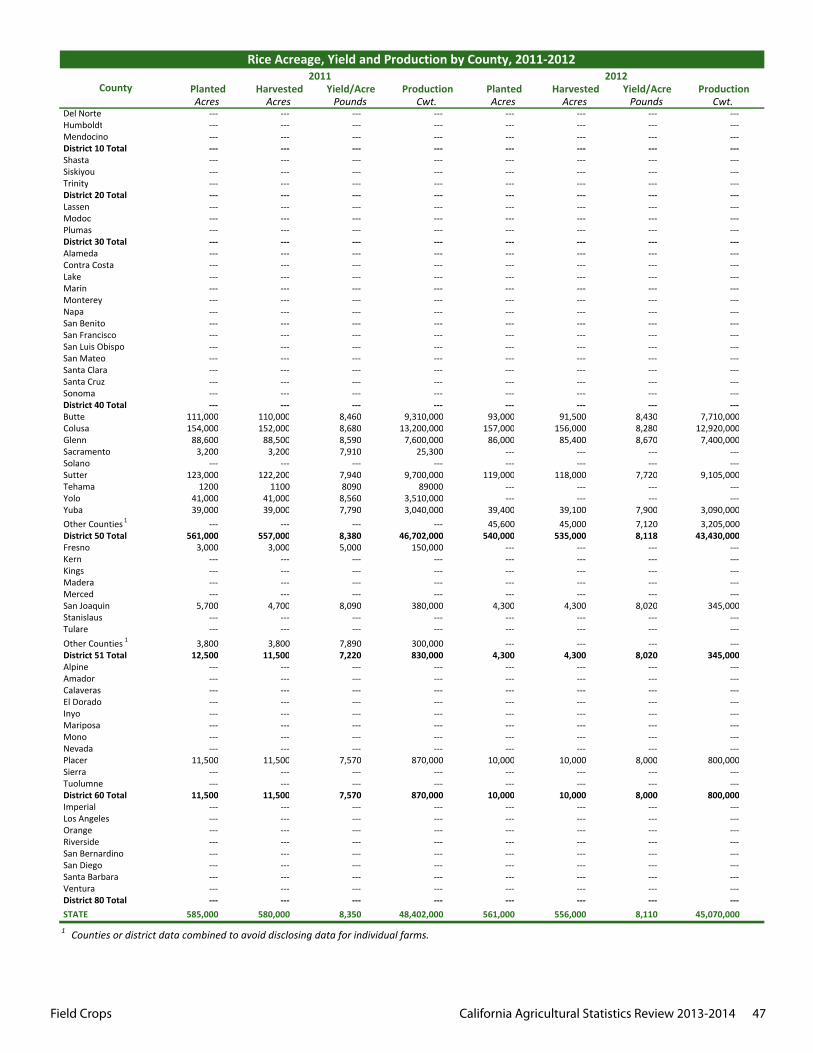
Field Crops California Agricultural Statistics Review 2013-2014 47
Planted Harvested Yield/Acre Production Planted Harvested Yield/Acre ProductionAcres Acres Pounds Cwt. Acres Acres Pounds Cwt.
Del Norte ‐‐‐ ‐‐‐ ‐‐‐ ‐‐‐ ‐‐‐ ‐‐‐ ‐‐‐ ‐‐‐ Humboldt ‐‐‐ ‐‐‐ ‐‐‐ ‐‐‐ ‐‐‐ ‐‐‐ ‐‐‐ ‐‐‐ Mendocino ‐‐‐ ‐‐‐ ‐‐‐ ‐‐‐ ‐‐‐ ‐‐‐ ‐‐‐ ‐‐‐ District 10 Total ‐‐‐ ‐‐‐ ‐‐‐ ‐‐‐ ‐‐‐ ‐‐‐ ‐‐‐ ‐‐‐ Shasta ‐‐‐ ‐‐‐ ‐‐‐ ‐‐‐ ‐‐‐ ‐‐‐ ‐‐‐ ‐‐‐ Siskiyou ‐‐‐ ‐‐‐ ‐‐‐ ‐‐‐ ‐‐‐ ‐‐‐ ‐‐‐ ‐‐‐ Trinity ‐‐‐ ‐‐‐ ‐‐‐ ‐‐‐ ‐‐‐ ‐‐‐ ‐‐‐ ‐‐‐ District 20 Total ‐‐‐ ‐‐‐ ‐‐‐ ‐‐‐ ‐‐‐ ‐‐‐ ‐‐‐ ‐‐‐ Lassen ‐‐‐ ‐‐‐ ‐‐‐ ‐‐‐ ‐‐‐ ‐‐‐ ‐‐‐ ‐‐‐ Modoc ‐‐‐ ‐‐‐ ‐‐‐ ‐‐‐ ‐‐‐ ‐‐‐ ‐‐‐ ‐‐‐ Plumas ‐‐‐ ‐‐‐ ‐‐‐ ‐‐‐ ‐‐‐ ‐‐‐ ‐‐‐ ‐‐‐ District 30 Total ‐‐‐ ‐‐‐ ‐‐‐ ‐‐‐ ‐‐‐ ‐‐‐ ‐‐‐ ‐‐‐ Alameda ‐‐‐ ‐‐‐ ‐‐‐ ‐‐‐ ‐‐‐ ‐‐‐ ‐‐‐ ‐‐‐ Contra Costa ‐‐‐ ‐‐‐ ‐‐‐ ‐‐‐ ‐‐‐ ‐‐‐ ‐‐‐ ‐‐‐ Lake ‐‐‐ ‐‐‐ ‐‐‐ ‐‐‐ ‐‐‐ ‐‐‐ ‐‐‐ ‐‐‐ Marin ‐‐‐ ‐‐‐ ‐‐‐ ‐‐‐ ‐‐‐ ‐‐‐ ‐‐‐ ‐‐‐ Monterey ‐‐‐ ‐‐‐ ‐‐‐ ‐‐‐ ‐‐‐ ‐‐‐ ‐‐‐ ‐‐‐ Napa ‐‐‐ ‐‐‐ ‐‐‐ ‐‐‐ ‐‐‐ ‐‐‐ ‐‐‐ ‐‐‐ San Benito ‐‐‐ ‐‐‐ ‐‐‐ ‐‐‐ ‐‐‐ ‐‐‐ ‐‐‐ ‐‐‐ San Francisco ‐‐‐ ‐‐‐ ‐‐‐ ‐‐‐ ‐‐‐ ‐‐‐ ‐‐‐ ‐‐‐ San Luis Obispo ‐‐‐ ‐‐‐ ‐‐‐ ‐‐‐ ‐‐‐ ‐‐‐ ‐‐‐ ‐‐‐ San Mateo ‐‐‐ ‐‐‐ ‐‐‐ ‐‐‐ ‐‐‐ ‐‐‐ ‐‐‐ ‐‐‐ Santa Clara ‐‐‐ ‐‐‐ ‐‐‐ ‐‐‐ ‐‐‐ ‐‐‐ ‐‐‐ ‐‐‐ Santa Cruz ‐‐‐ ‐‐‐ ‐‐‐ ‐‐‐ ‐‐‐ ‐‐‐ ‐‐‐ ‐‐‐ Sonoma ‐‐‐ ‐‐‐ ‐‐‐ ‐‐‐ ‐‐‐ ‐‐‐ ‐‐‐ ‐‐‐ District 40 Total ‐‐‐ ‐‐‐ ‐‐‐ ‐‐‐ ‐‐‐ ‐‐‐ ‐‐‐ ‐‐‐ Butte 111,000 110,000 8,460 9,310,000 93,000 91,500 8,430 7,710,000 Colusa 154,000 152,000 8,680 13,200,000 157,000 156,000 8,280 12,920,000 Glenn 88,600 88,500 8,590 7,600,000 86,000 85,400 8,670 7,400,000 Sacramento 3,200 3,200 7,910 25,300 ‐‐‐ ‐‐‐ ‐‐‐ ‐‐‐ Solano ‐‐‐ ‐‐‐ ‐‐‐ ‐‐‐ ‐‐‐ ‐‐‐ ‐‐‐ ‐‐‐ Sutter 123,000 122,200 7,940 9,700,000 119,000 118,000 7,720 9,105,000 Tehama 1200 1100 8090 89000 ‐‐‐ ‐‐‐ ‐‐‐ ‐‐‐ Yolo 41,000 41,000 8,560 3,510,000 ‐‐‐ ‐‐‐ ‐‐‐ ‐‐‐ Yuba 39,000 39,000 7,790 3,040,000 39,400 39,100 7,900 3,090,000 Other Counties 1 ‐‐‐ ‐‐‐ ‐‐‐ ‐‐‐ 45,600 45,000 7,120 3,205,000 District 50 Total 561,000 557,000 8,380 46,702,000 540,000 535,000 8,118 43,430,000 Fresno 3,000 3,000 5,000 150,000 ‐‐‐ ‐‐‐ ‐‐‐ ‐‐‐ Kern ‐‐‐ ‐‐‐ ‐‐‐ ‐‐‐ ‐‐‐ ‐‐‐ ‐‐‐ ‐‐‐ Kings ‐‐‐ ‐‐‐ ‐‐‐ ‐‐‐ ‐‐‐ ‐‐‐ ‐‐‐ ‐‐‐ Madera ‐‐‐ ‐‐‐ ‐‐‐ ‐‐‐ ‐‐‐ ‐‐‐ ‐‐‐ ‐‐‐ Merced ‐‐‐ ‐‐‐ ‐‐‐ ‐‐‐ ‐‐‐ ‐‐‐ ‐‐‐ ‐‐‐ San Joaquin 5,700 4,700 8,090 380,000 4,300 4,300 8,020 345,000 Stanislaus ‐‐‐ ‐‐‐ ‐‐‐ ‐‐‐ ‐‐‐ ‐‐‐ ‐‐‐ ‐‐‐ Tulare ‐‐‐ ‐‐‐ ‐‐‐ ‐‐‐ ‐‐‐ ‐‐‐ ‐‐‐ ‐‐‐ Other Counties 1 3,800 3,800 7,890 300,000 ‐‐‐ ‐‐‐ ‐‐‐ ‐‐‐ District 51 Total 12,500 11,500 7,220 830,000 4,300 4,300 8,020 345,000 Alpine ‐‐‐ ‐‐‐ ‐‐‐ ‐‐‐ ‐‐‐ ‐‐‐ ‐‐‐ ‐‐‐ Amador ‐‐‐ ‐‐‐ ‐‐‐ ‐‐‐ ‐‐‐ ‐‐‐ ‐‐‐ ‐‐‐ Calaveras ‐‐‐ ‐‐‐ ‐‐‐ ‐‐‐ ‐‐‐ ‐‐‐ ‐‐‐ ‐‐‐ El Dorado ‐‐‐ ‐‐‐ ‐‐‐ ‐‐‐ ‐‐‐ ‐‐‐ ‐‐‐ ‐‐‐ Inyo ‐‐‐ ‐‐‐ ‐‐‐ ‐‐‐ ‐‐‐ ‐‐‐ ‐‐‐ ‐‐‐ Mariposa ‐‐‐ ‐‐‐ ‐‐‐ ‐‐‐ ‐‐‐ ‐‐‐ ‐‐‐ ‐‐‐ Mono ‐‐‐ ‐‐‐ ‐‐‐ ‐‐‐ ‐‐‐ ‐‐‐ ‐‐‐ ‐‐‐ Nevada ‐‐‐ ‐‐‐ ‐‐‐ ‐‐‐ ‐‐‐ ‐‐‐ ‐‐‐ ‐‐‐ Placer 11,500 11,500 7,570 870,000 10,000 10,000 8,000 800,000 Sierra ‐‐‐ ‐‐‐ ‐‐‐ ‐‐‐ ‐‐‐ ‐‐‐ ‐‐‐ ‐‐‐ Tuolumne ‐‐‐ ‐‐‐ ‐‐‐ ‐‐‐ ‐‐‐ ‐‐‐ ‐‐‐ ‐‐‐ District 60 Total 11,500 11,500 7,570 870,000 10,000 10,000 8,000 800,000 Imperial ‐‐‐ ‐‐‐ ‐‐‐ ‐‐‐ ‐‐‐ ‐‐‐ ‐‐‐ ‐‐‐ Los Angeles ‐‐‐ ‐‐‐ ‐‐‐ ‐‐‐ ‐‐‐ ‐‐‐ ‐‐‐ ‐‐‐ Orange ‐‐‐ ‐‐‐ ‐‐‐ ‐‐‐ ‐‐‐ ‐‐‐ ‐‐‐ ‐‐‐ Riverside ‐‐‐ ‐‐‐ ‐‐‐ ‐‐‐ ‐‐‐ ‐‐‐ ‐‐‐ ‐‐‐ San Bernardino ‐‐‐ ‐‐‐ ‐‐‐ ‐‐‐ ‐‐‐ ‐‐‐ ‐‐‐ ‐‐‐ San Diego ‐‐‐ ‐‐‐ ‐‐‐ ‐‐‐ ‐‐‐ ‐‐‐ ‐‐‐ ‐‐‐ Santa Barbara ‐‐‐ ‐‐‐ ‐‐‐ ‐‐‐ ‐‐‐ ‐‐‐ ‐‐‐ ‐‐‐ Ventura ‐‐‐ ‐‐‐ ‐‐‐ ‐‐‐ ‐‐‐ ‐‐‐ ‐‐‐ ‐‐‐ District 80 Total ‐‐‐ ‐‐‐ ‐‐‐ ‐‐‐ ‐‐‐ ‐‐‐ ‐‐‐ ‐‐‐ STATE 585,000 580,000 8,350 48,402,000 561,000 556,000 8,110 45,070,000
Rice Acreage, Yield and Production by County, 2011‐20122011 2012
County
1 Counties or district data combined to avoid disclosing data for individual farms.
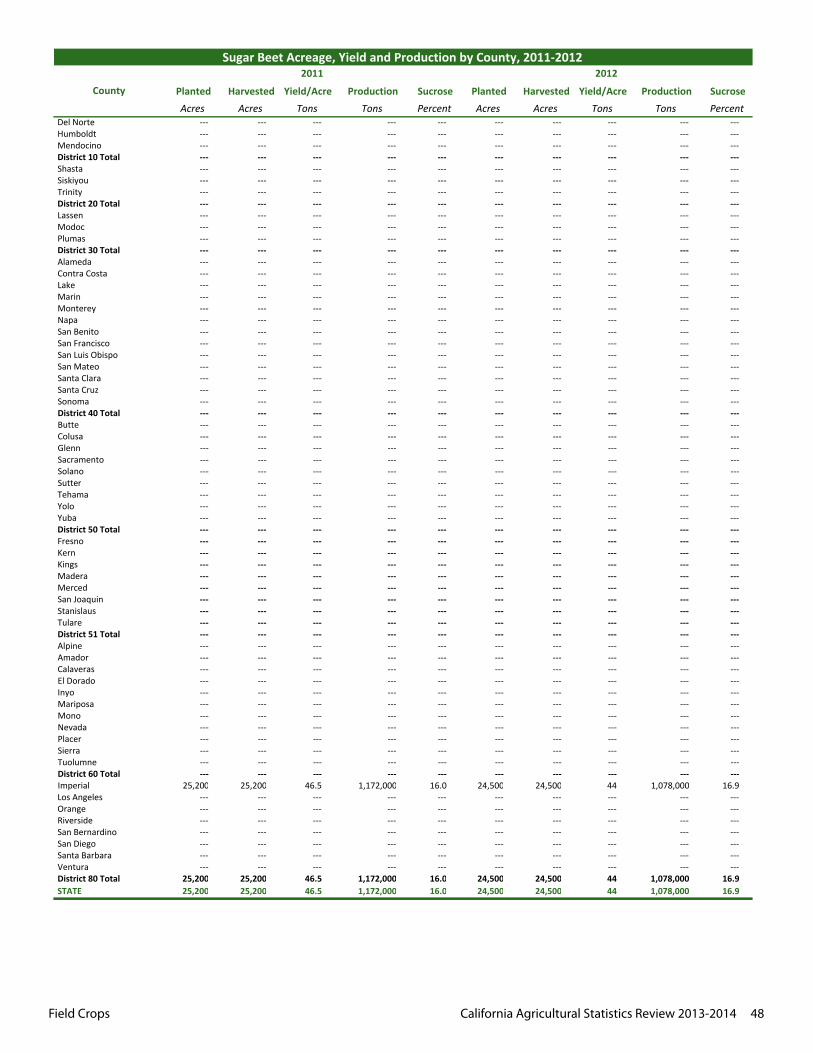
Field Crops California Agricultural Statistics Review 2013-2014 48
Planted Harvested Yield/Acre Production Sucrose Planted Harvested Yield/Acre Production SucroseAcres Acres Tons Tons Percent Acres Acres Tons Tons Percent
Del Norte ‐‐‐ ‐‐‐ ‐‐‐ ‐‐‐ ‐‐‐ ‐‐‐ ‐‐‐ ‐‐‐ ‐‐‐ ‐‐‐ Humboldt ‐‐‐ ‐‐‐ ‐‐‐ ‐‐‐ ‐‐‐ ‐‐‐ ‐‐‐ ‐‐‐ ‐‐‐ ‐‐‐ Mendocino ‐‐‐ ‐‐‐ ‐‐‐ ‐‐‐ ‐‐‐ ‐‐‐ ‐‐‐ ‐‐‐ ‐‐‐ ‐‐‐ District 10 Total ‐‐‐ ‐‐‐ ‐‐‐ ‐‐‐ ‐‐‐ ‐‐‐ ‐‐‐ ‐‐‐ ‐‐‐ ‐‐‐ Shasta ‐‐‐ ‐‐‐ ‐‐‐ ‐‐‐ ‐‐‐ ‐‐‐ ‐‐‐ ‐‐‐ ‐‐‐ ‐‐‐ Siskiyou ‐‐‐ ‐‐‐ ‐‐‐ ‐‐‐ ‐‐‐ ‐‐‐ ‐‐‐ ‐‐‐ ‐‐‐ ‐‐‐ Trinity ‐‐‐ ‐‐‐ ‐‐‐ ‐‐‐ ‐‐‐ ‐‐‐ ‐‐‐ ‐‐‐ ‐‐‐ ‐‐‐ District 20 Total ‐‐‐ ‐‐‐ ‐‐‐ ‐‐‐ ‐‐‐ ‐‐‐ ‐‐‐ ‐‐‐ ‐‐‐ ‐‐‐ Lassen ‐‐‐ ‐‐‐ ‐‐‐ ‐‐‐ ‐‐‐ ‐‐‐ ‐‐‐ ‐‐‐ ‐‐‐ ‐‐‐ Modoc ‐‐‐ ‐‐‐ ‐‐‐ ‐‐‐ ‐‐‐ ‐‐‐ ‐‐‐ ‐‐‐ ‐‐‐ ‐‐‐ Plumas ‐‐‐ ‐‐‐ ‐‐‐ ‐‐‐ ‐‐‐ ‐‐‐ ‐‐‐ ‐‐‐ ‐‐‐ ‐‐‐ District 30 Total ‐‐‐ ‐‐‐ ‐‐‐ ‐‐‐ ‐‐‐ ‐‐‐ ‐‐‐ ‐‐‐ ‐‐‐ ‐‐‐ Alameda ‐‐‐ ‐‐‐ ‐‐‐ ‐‐‐ ‐‐‐ ‐‐‐ ‐‐‐ ‐‐‐ ‐‐‐ ‐‐‐ Contra Costa ‐‐‐ ‐‐‐ ‐‐‐ ‐‐‐ ‐‐‐ ‐‐‐ ‐‐‐ ‐‐‐ ‐‐‐ ‐‐‐ Lake ‐‐‐ ‐‐‐ ‐‐‐ ‐‐‐ ‐‐‐ ‐‐‐ ‐‐‐ ‐‐‐ ‐‐‐ ‐‐‐ Marin ‐‐‐ ‐‐‐ ‐‐‐ ‐‐‐ ‐‐‐ ‐‐‐ ‐‐‐ ‐‐‐ ‐‐‐ ‐‐‐ Monterey ‐‐‐ ‐‐‐ ‐‐‐ ‐‐‐ ‐‐‐ ‐‐‐ ‐‐‐ ‐‐‐ ‐‐‐ ‐‐‐ Napa ‐‐‐ ‐‐‐ ‐‐‐ ‐‐‐ ‐‐‐ ‐‐‐ ‐‐‐ ‐‐‐ ‐‐‐ ‐‐‐ San Benito ‐‐‐ ‐‐‐ ‐‐‐ ‐‐‐ ‐‐‐ ‐‐‐ ‐‐‐ ‐‐‐ ‐‐‐ ‐‐‐ San Francisco ‐‐‐ ‐‐‐ ‐‐‐ ‐‐‐ ‐‐‐ ‐‐‐ ‐‐‐ ‐‐‐ ‐‐‐ ‐‐‐ San Luis Obispo ‐‐‐ ‐‐‐ ‐‐‐ ‐‐‐ ‐‐‐ ‐‐‐ ‐‐‐ ‐‐‐ ‐‐‐ ‐‐‐ San Mateo ‐‐‐ ‐‐‐ ‐‐‐ ‐‐‐ ‐‐‐ ‐‐‐ ‐‐‐ ‐‐‐ ‐‐‐ ‐‐‐ Santa Clara ‐‐‐ ‐‐‐ ‐‐‐ ‐‐‐ ‐‐‐ ‐‐‐ ‐‐‐ ‐‐‐ ‐‐‐ ‐‐‐ Santa Cruz ‐‐‐ ‐‐‐ ‐‐‐ ‐‐‐ ‐‐‐ ‐‐‐ ‐‐‐ ‐‐‐ ‐‐‐ ‐‐‐ Sonoma ‐‐‐ ‐‐‐ ‐‐‐ ‐‐‐ ‐‐‐ ‐‐‐ ‐‐‐ ‐‐‐ ‐‐‐ ‐‐‐ District 40 Total ‐‐‐ ‐‐‐ ‐‐‐ ‐‐‐ ‐‐‐ ‐‐‐ ‐‐‐ ‐‐‐ ‐‐‐ ‐‐‐ Butte ‐‐‐ ‐‐‐ ‐‐‐ ‐‐‐ ‐‐‐ ‐‐‐ ‐‐‐ ‐‐‐ ‐‐‐ ‐‐‐ Colusa ‐‐‐ ‐‐‐ ‐‐‐ ‐‐‐ ‐‐‐ ‐‐‐ ‐‐‐ ‐‐‐ ‐‐‐ ‐‐‐ Glenn ‐‐‐ ‐‐‐ ‐‐‐ ‐‐‐ ‐‐‐ ‐‐‐ ‐‐‐ ‐‐‐ ‐‐‐ ‐‐‐ Sacramento ‐‐‐ ‐‐‐ ‐‐‐ ‐‐‐ ‐‐‐ ‐‐‐ ‐‐‐ ‐‐‐ ‐‐‐ ‐‐‐ Solano ‐‐‐ ‐‐‐ ‐‐‐ ‐‐‐ ‐‐‐ ‐‐‐ ‐‐‐ ‐‐‐ ‐‐‐ ‐‐‐ Sutter ‐‐‐ ‐‐‐ ‐‐‐ ‐‐‐ ‐‐‐ ‐‐‐ ‐‐‐ ‐‐‐ ‐‐‐ ‐‐‐ Tehama ‐‐‐ ‐‐‐ ‐‐‐ ‐‐‐ ‐‐‐ ‐‐‐ ‐‐‐ ‐‐‐ ‐‐‐ ‐‐‐ Yolo ‐‐‐ ‐‐‐ ‐‐‐ ‐‐‐ ‐‐‐ ‐‐‐ ‐‐‐ ‐‐‐ ‐‐‐ ‐‐‐ Yuba ‐‐‐ ‐‐‐ ‐‐‐ ‐‐‐ ‐‐‐ ‐‐‐ ‐‐‐ ‐‐‐ ‐‐‐ ‐‐‐ District 50 Total ‐‐‐ ‐‐‐ ‐‐‐ ‐‐‐ ‐‐‐ ‐‐‐ ‐‐‐ ‐‐‐ ‐‐‐ ‐‐‐ Fresno ‐‐‐ ‐‐‐ ‐‐‐ ‐‐‐ ‐‐‐ ‐‐‐ ‐‐‐ ‐‐‐ ‐‐‐ ‐‐‐ Kern ‐‐‐ ‐‐‐ ‐‐‐ ‐‐‐ ‐‐‐ ‐‐‐ ‐‐‐ ‐‐‐ ‐‐‐ ‐‐‐ Kings ‐‐‐ ‐‐‐ ‐‐‐ ‐‐‐ ‐‐‐ ‐‐‐ ‐‐‐ ‐‐‐ ‐‐‐ ‐‐‐ Madera ‐‐‐ ‐‐‐ ‐‐‐ ‐‐‐ ‐‐‐ ‐‐‐ ‐‐‐ ‐‐‐ ‐‐‐ ‐‐‐ Merced ‐‐‐ ‐‐‐ ‐‐‐ ‐‐‐ ‐‐‐ ‐‐‐ ‐‐‐ ‐‐‐ ‐‐‐ ‐‐‐ San Joaquin ‐‐‐ ‐‐‐ ‐‐‐ ‐‐‐ ‐‐‐ ‐‐‐ ‐‐‐ ‐‐‐ ‐‐‐ ‐‐‐ Stanislaus ‐‐‐ ‐‐‐ ‐‐‐ ‐‐‐ ‐‐‐ ‐‐‐ ‐‐‐ ‐‐‐ ‐‐‐ ‐‐‐ Tulare ‐‐‐ ‐‐‐ ‐‐‐ ‐‐‐ ‐‐‐ ‐‐‐ ‐‐‐ ‐‐‐ ‐‐‐ ‐‐‐ District 51 Total ‐‐‐ ‐‐‐ ‐‐‐ ‐‐‐ ‐‐‐ ‐‐‐ ‐‐‐ ‐‐‐ ‐‐‐ ‐‐‐ Alpine ‐‐‐ ‐‐‐ ‐‐‐ ‐‐‐ ‐‐‐ ‐‐‐ ‐‐‐ ‐‐‐ ‐‐‐ ‐‐‐ Amador ‐‐‐ ‐‐‐ ‐‐‐ ‐‐‐ ‐‐‐ ‐‐‐ ‐‐‐ ‐‐‐ ‐‐‐ ‐‐‐ Calaveras ‐‐‐ ‐‐‐ ‐‐‐ ‐‐‐ ‐‐‐ ‐‐‐ ‐‐‐ ‐‐‐ ‐‐‐ ‐‐‐ El Dorado ‐‐‐ ‐‐‐ ‐‐‐ ‐‐‐ ‐‐‐ ‐‐‐ ‐‐‐ ‐‐‐ ‐‐‐ ‐‐‐ Inyo ‐‐‐ ‐‐‐ ‐‐‐ ‐‐‐ ‐‐‐ ‐‐‐ ‐‐‐ ‐‐‐ ‐‐‐ ‐‐‐ Mariposa ‐‐‐ ‐‐‐ ‐‐‐ ‐‐‐ ‐‐‐ ‐‐‐ ‐‐‐ ‐‐‐ ‐‐‐ ‐‐‐ Mono ‐‐‐ ‐‐‐ ‐‐‐ ‐‐‐ ‐‐‐ ‐‐‐ ‐‐‐ ‐‐‐ ‐‐‐ ‐‐‐ Nevada ‐‐‐ ‐‐‐ ‐‐‐ ‐‐‐ ‐‐‐ ‐‐‐ ‐‐‐ ‐‐‐ ‐‐‐ ‐‐‐ Placer ‐‐‐ ‐‐‐ ‐‐‐ ‐‐‐ ‐‐‐ ‐‐‐ ‐‐‐ ‐‐‐ ‐‐‐ ‐‐‐ Sierra ‐‐‐ ‐‐‐ ‐‐‐ ‐‐‐ ‐‐‐ ‐‐‐ ‐‐‐ ‐‐‐ ‐‐‐ ‐‐‐ Tuolumne ‐‐‐ ‐‐‐ ‐‐‐ ‐‐‐ ‐‐‐ ‐‐‐ ‐‐‐ ‐‐‐ ‐‐‐ ‐‐‐ District 60 Total ‐‐‐ ‐‐‐ ‐‐‐ ‐‐‐ ‐‐‐ ‐‐‐ ‐‐‐ ‐‐‐ ‐‐‐ ‐‐‐ Imperial 25,200 25,200 46.5 1,172,000 16.0 24,500 24,500 44 1,078,000 16.9 Los Angeles ‐‐‐ ‐‐‐ ‐‐‐ ‐‐‐ ‐‐‐ ‐‐‐ ‐‐‐ ‐‐‐ ‐‐‐ ‐‐‐ Orange ‐‐‐ ‐‐‐ ‐‐‐ ‐‐‐ ‐‐‐ ‐‐‐ ‐‐‐ ‐‐‐ ‐‐‐ ‐‐‐ Riverside ‐‐‐ ‐‐‐ ‐‐‐ ‐‐‐ ‐‐‐ ‐‐‐ ‐‐‐ ‐‐‐ ‐‐‐ ‐‐‐ San Bernardino ‐‐‐ ‐‐‐ ‐‐‐ ‐‐‐ ‐‐‐ ‐‐‐ ‐‐‐ ‐‐‐ ‐‐‐ ‐‐‐ San Diego ‐‐‐ ‐‐‐ ‐‐‐ ‐‐‐ ‐‐‐ ‐‐‐ ‐‐‐ ‐‐‐ ‐‐‐ ‐‐‐ Santa Barbara ‐‐‐ ‐‐‐ ‐‐‐ ‐‐‐ ‐‐‐ ‐‐‐ ‐‐‐ ‐‐‐ ‐‐‐ ‐‐‐ Ventura ‐‐‐ ‐‐‐ ‐‐‐ ‐‐‐ ‐‐‐ ‐‐‐ ‐‐‐ ‐‐‐ ‐‐‐ ‐‐‐ District 80 Total 25,200 25,200 46.5 1,172,000 16.0 24,500 24,500 44 1,078,000 16.9 STATE 25,200 25,200 46.5 1,172,000 16.0 24,500 24,500 44 1,078,000 16.9
Sugar Beet Acreage, Yield and Production by County, 2011‐20122011 2012
County
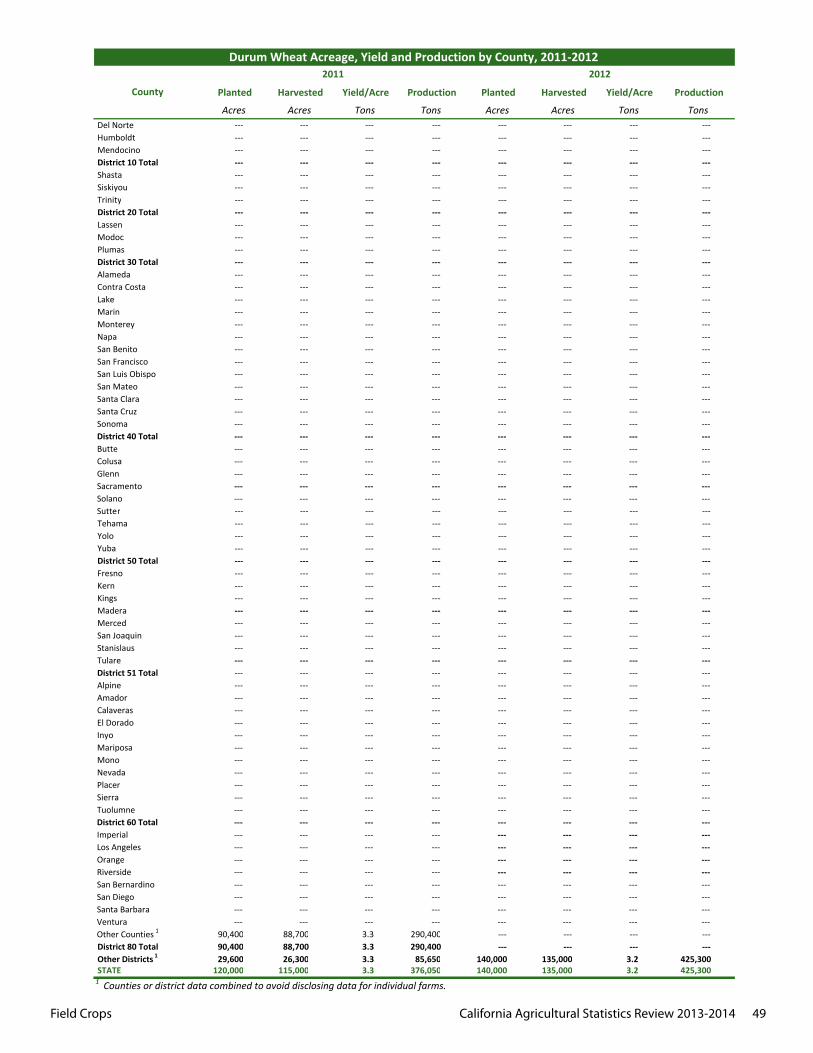
Field Crops California Agricultural Statistics Review 2013-2014 49
Planted Harvested Yield/Acre Production Planted Harvested Yield/Acre Production
Acres Acres Tons Tons Acres Acres Tons Tons Del Norte ‐‐‐ ‐‐‐ ‐‐‐ ‐‐‐ ‐‐‐ ‐‐‐ ‐‐‐ ‐‐‐ Humboldt ‐‐‐ ‐‐‐ ‐‐‐ ‐‐‐ ‐‐‐ ‐‐‐ ‐‐‐ ‐‐‐ Mendocino ‐‐‐ ‐‐‐ ‐‐‐ ‐‐‐ ‐‐‐ ‐‐‐ ‐‐‐ ‐‐‐ District 10 Total ‐‐‐ ‐‐‐ ‐‐‐ ‐‐‐ ‐‐‐ ‐‐‐ ‐‐‐ ‐‐‐ Shasta ‐‐‐ ‐‐‐ ‐‐‐ ‐‐‐ ‐‐‐ ‐‐‐ ‐‐‐ ‐‐‐ Siskiyou ‐‐‐ ‐‐‐ ‐‐‐ ‐‐‐ ‐‐‐ ‐‐‐ ‐‐‐ ‐‐‐ Trinity ‐‐‐ ‐‐‐ ‐‐‐ ‐‐‐ ‐‐‐ ‐‐‐ ‐‐‐ ‐‐‐ District 20 Total ‐‐‐ ‐‐‐ ‐‐‐ ‐‐‐ ‐‐‐ ‐‐‐ ‐‐‐ ‐‐‐ Lassen ‐‐‐ ‐‐‐ ‐‐‐ ‐‐‐ ‐‐‐ ‐‐‐ ‐‐‐ ‐‐‐ Modoc ‐‐‐ ‐‐‐ ‐‐‐ ‐‐‐ ‐‐‐ ‐‐‐ ‐‐‐ ‐‐‐ Plumas ‐‐‐ ‐‐‐ ‐‐‐ ‐‐‐ ‐‐‐ ‐‐‐ ‐‐‐ ‐‐‐ District 30 Total ‐‐‐ ‐‐‐ ‐‐‐ ‐‐‐ ‐‐‐ ‐‐‐ ‐‐‐ ‐‐‐ Alameda ‐‐‐ ‐‐‐ ‐‐‐ ‐‐‐ ‐‐‐ ‐‐‐ ‐‐‐ ‐‐‐ Contra Costa ‐‐‐ ‐‐‐ ‐‐‐ ‐‐‐ ‐‐‐ ‐‐‐ ‐‐‐ ‐‐‐ Lake ‐‐‐ ‐‐‐ ‐‐‐ ‐‐‐ ‐‐‐ ‐‐‐ ‐‐‐ ‐‐‐ Marin ‐‐‐ ‐‐‐ ‐‐‐ ‐‐‐ ‐‐‐ ‐‐‐ ‐‐‐ ‐‐‐ Monterey ‐‐‐ ‐‐‐ ‐‐‐ ‐‐‐ ‐‐‐ ‐‐‐ ‐‐‐ ‐‐‐ Napa ‐‐‐ ‐‐‐ ‐‐‐ ‐‐‐ ‐‐‐ ‐‐‐ ‐‐‐ ‐‐‐ San Benito ‐‐‐ ‐‐‐ ‐‐‐ ‐‐‐ ‐‐‐ ‐‐‐ ‐‐‐ ‐‐‐ San Francisco ‐‐‐ ‐‐‐ ‐‐‐ ‐‐‐ ‐‐‐ ‐‐‐ ‐‐‐ ‐‐‐ San Luis Obispo ‐‐‐ ‐‐‐ ‐‐‐ ‐‐‐ ‐‐‐ ‐‐‐ ‐‐‐ ‐‐‐ San Mateo ‐‐‐ ‐‐‐ ‐‐‐ ‐‐‐ ‐‐‐ ‐‐‐ ‐‐‐ ‐‐‐ Santa Clara ‐‐‐ ‐‐‐ ‐‐‐ ‐‐‐ ‐‐‐ ‐‐‐ ‐‐‐ ‐‐‐ Santa Cruz ‐‐‐ ‐‐‐ ‐‐‐ ‐‐‐ ‐‐‐ ‐‐‐ ‐‐‐ ‐‐‐ Sonoma ‐‐‐ ‐‐‐ ‐‐‐ ‐‐‐ ‐‐‐ ‐‐‐ ‐‐‐ ‐‐‐ District 40 Total ‐‐‐ ‐‐‐ ‐‐‐ ‐‐‐ ‐‐‐ ‐‐‐ ‐‐‐ ‐‐‐ Butte ‐‐‐ ‐‐‐ ‐‐‐ ‐‐‐ ‐‐‐ ‐‐‐ ‐‐‐ ‐‐‐ Colusa ‐‐‐ ‐‐‐ ‐‐‐ ‐‐‐ ‐‐‐ ‐‐‐ ‐‐‐ ‐‐‐ Glenn ‐‐‐ ‐‐‐ ‐‐‐ ‐‐‐ ‐‐‐ ‐‐‐ ‐‐‐ ‐‐‐ Sacramento ‐‐‐ ‐‐‐ ‐‐‐ ‐‐‐ ‐‐‐ ‐‐‐ ‐‐‐ ‐‐‐ Solano ‐‐‐ ‐‐‐ ‐‐‐ ‐‐‐ ‐‐‐ ‐‐‐ ‐‐‐ ‐‐‐ Sutter ‐‐‐ ‐‐‐ ‐‐‐ ‐‐‐ ‐‐‐ ‐‐‐ ‐‐‐ ‐‐‐ Tehama ‐‐‐ ‐‐‐ ‐‐‐ ‐‐‐ ‐‐‐ ‐‐‐ ‐‐‐ ‐‐‐ Yolo ‐‐‐ ‐‐‐ ‐‐‐ ‐‐‐ ‐‐‐ ‐‐‐ ‐‐‐ ‐‐‐ Yuba ‐‐‐ ‐‐‐ ‐‐‐ ‐‐‐ ‐‐‐ ‐‐‐ ‐‐‐ ‐‐‐ District 50 Total ‐‐‐ ‐‐‐ ‐‐‐ ‐‐‐ ‐‐‐ ‐‐‐ ‐‐‐ ‐‐‐ Fresno ‐‐‐ ‐‐‐ ‐‐‐ ‐‐‐ ‐‐‐ ‐‐‐ ‐‐‐ ‐‐‐ Kern ‐‐‐ ‐‐‐ ‐‐‐ ‐‐‐ ‐‐‐ ‐‐‐ ‐‐‐ ‐‐‐ Kings ‐‐‐ ‐‐‐ ‐‐‐ ‐‐‐ ‐‐‐ ‐‐‐ ‐‐‐ ‐‐‐ Madera ‐‐‐ ‐‐‐ ‐‐‐ ‐‐‐ ‐‐‐ ‐‐‐ ‐‐‐ ‐‐‐ Merced ‐‐‐ ‐‐‐ ‐‐‐ ‐‐‐ ‐‐‐ ‐‐‐ ‐‐‐ ‐‐‐ San Joaquin ‐‐‐ ‐‐‐ ‐‐‐ ‐‐‐ ‐‐‐ ‐‐‐ ‐‐‐ ‐‐‐ Stanislaus ‐‐‐ ‐‐‐ ‐‐‐ ‐‐‐ ‐‐‐ ‐‐‐ ‐‐‐ ‐‐‐ Tulare ‐‐‐ ‐‐‐ ‐‐‐ ‐‐‐ ‐‐‐ ‐‐‐ ‐‐‐ ‐‐‐ District 51 Total ‐‐‐ ‐‐‐ ‐‐‐ ‐‐‐ ‐‐‐ ‐‐‐ ‐‐‐ ‐‐‐ Alpine ‐‐‐ ‐‐‐ ‐‐‐ ‐‐‐ ‐‐‐ ‐‐‐ ‐‐‐ ‐‐‐ Amador ‐‐‐ ‐‐‐ ‐‐‐ ‐‐‐ ‐‐‐ ‐‐‐ ‐‐‐ ‐‐‐ Calaveras ‐‐‐ ‐‐‐ ‐‐‐ ‐‐‐ ‐‐‐ ‐‐‐ ‐‐‐ ‐‐‐ El Dorado ‐‐‐ ‐‐‐ ‐‐‐ ‐‐‐ ‐‐‐ ‐‐‐ ‐‐‐ ‐‐‐ Inyo ‐‐‐ ‐‐‐ ‐‐‐ ‐‐‐ ‐‐‐ ‐‐‐ ‐‐‐ ‐‐‐ Mariposa ‐‐‐ ‐‐‐ ‐‐‐ ‐‐‐ ‐‐‐ ‐‐‐ ‐‐‐ ‐‐‐ Mono ‐‐‐ ‐‐‐ ‐‐‐ ‐‐‐ ‐‐‐ ‐‐‐ ‐‐‐ ‐‐‐ Nevada ‐‐‐ ‐‐‐ ‐‐‐ ‐‐‐ ‐‐‐ ‐‐‐ ‐‐‐ ‐‐‐ Placer ‐‐‐ ‐‐‐ ‐‐‐ ‐‐‐ ‐‐‐ ‐‐‐ ‐‐‐ ‐‐‐ Sierra ‐‐‐ ‐‐‐ ‐‐‐ ‐‐‐ ‐‐‐ ‐‐‐ ‐‐‐ ‐‐‐ Tuolumne ‐‐‐ ‐‐‐ ‐‐‐ ‐‐‐ ‐‐‐ ‐‐‐ ‐‐‐ ‐‐‐ District 60 Total ‐‐‐ ‐‐‐ ‐‐‐ ‐‐‐ ‐‐‐ ‐‐‐ ‐‐‐ ‐‐‐ Imperial ‐‐‐ ‐‐‐ ‐‐‐ ‐‐‐ ‐‐‐ ‐‐‐ ‐‐‐ ‐‐‐ Los Angeles ‐‐‐ ‐‐‐ ‐‐‐ ‐‐‐ ‐‐‐ ‐‐‐ ‐‐‐ ‐‐‐ Orange ‐‐‐ ‐‐‐ ‐‐‐ ‐‐‐ ‐‐‐ ‐‐‐ ‐‐‐ ‐‐‐ Riverside ‐‐‐ ‐‐‐ ‐‐‐ ‐‐‐ ‐‐‐ ‐‐‐ ‐‐‐ ‐‐‐ San Bernardino ‐‐‐ ‐‐‐ ‐‐‐ ‐‐‐ ‐‐‐ ‐‐‐ ‐‐‐ ‐‐‐ San Diego ‐‐‐ ‐‐‐ ‐‐‐ ‐‐‐ ‐‐‐ ‐‐‐ ‐‐‐ ‐‐‐ Santa Barbara ‐‐‐ ‐‐‐ ‐‐‐ ‐‐‐ ‐‐‐ ‐‐‐ ‐‐‐ ‐‐‐ Ventura ‐‐‐ ‐‐‐ ‐‐‐ ‐‐‐ ‐‐‐ ‐‐‐ ‐‐‐ ‐‐‐ Other Counties 1 90,400 88,700 3.3 290,400 ‐‐‐ ‐‐‐ ‐‐‐ ‐‐‐ District 80 Total 90,400 88,700 3.3 290,400 ‐‐‐ ‐‐‐ ‐‐‐ ‐‐‐ Other Districts 1 29,600 26,300 3.3 85,650 140,000 135,000 3.2 425,300 STATE 120,000 115,000 3.3 376,050 140,000 135,000 3.2 425,300
Durum Wheat Acreage, Yield and Production by County, 2011‐2012
County
2011 2012
1 Counties or district data combined to avoid disclosing data for individual farms.
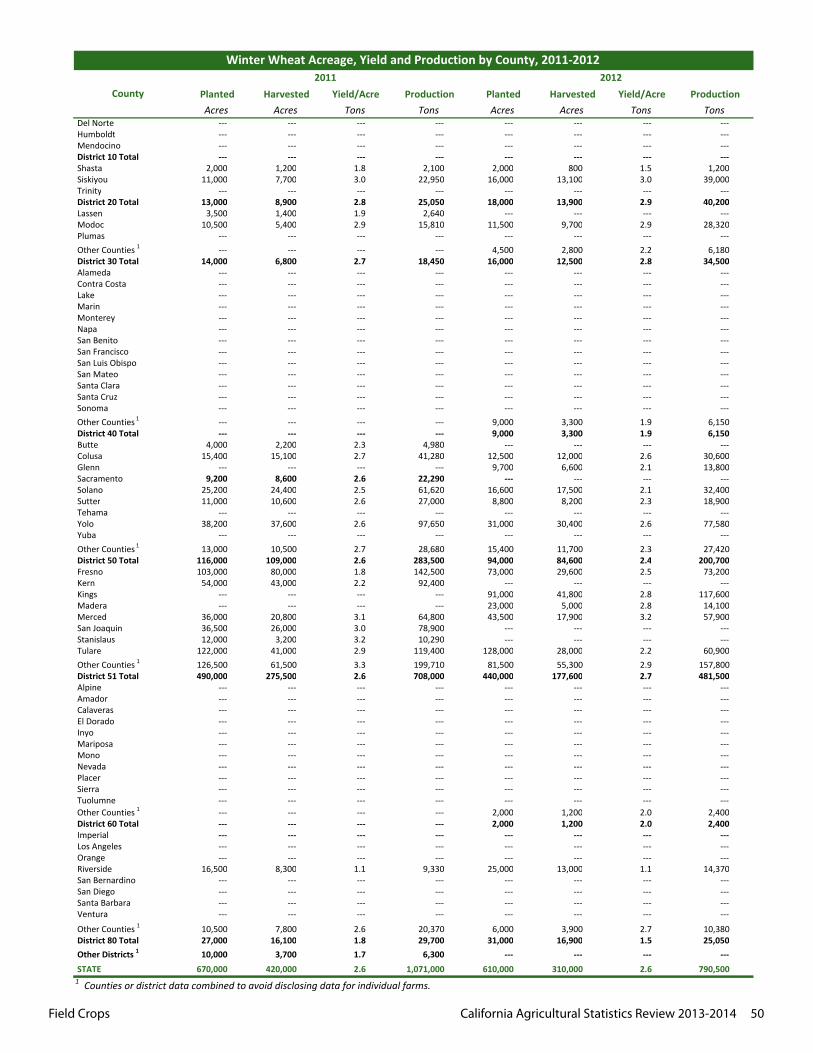
Field Crops California Agricultural Statistics Review 2013-2014 50
Planted Harvested Yield/Acre Production Planted Harvested Yield/Acre ProductionAcres Acres Tons Tons Acres Acres Tons Tons
Del Norte ‐‐‐ ‐‐‐ ‐‐‐ ‐‐‐ ‐‐‐ ‐‐‐ ‐‐‐ ‐‐‐ Humboldt ‐‐‐ ‐‐‐ ‐‐‐ ‐‐‐ ‐‐‐ ‐‐‐ ‐‐‐ ‐‐‐ Mendocino ‐‐‐ ‐‐‐ ‐‐‐ ‐‐‐ ‐‐‐ ‐‐‐ ‐‐‐ ‐‐‐ District 10 Total ‐‐‐ ‐‐‐ ‐‐‐ ‐‐‐ ‐‐‐ ‐‐‐ ‐‐‐ ‐‐‐ Shasta 2,000 1,200 1.8 2,100 2,000 800 1.5 1,200 Siskiyou 11,000 7,700 3.0 22,950 16,000 13,100 3.0 39,000 Trinity ‐‐‐ ‐‐‐ ‐‐‐ ‐‐‐ ‐‐‐ ‐‐‐ ‐‐‐ ‐‐‐ District 20 Total 13,000 8,900 2.8 25,050 18,000 13,900 2.9 40,200 Lassen 3,500 1,400 1.9 2,640 ‐‐‐ ‐‐‐ ‐‐‐ ‐‐‐ Modoc 10,500 5,400 2.9 15,810 11,500 9,700 2.9 28,320 Plumas ‐‐‐ ‐‐‐ ‐‐‐ ‐‐‐ ‐‐‐ ‐‐‐ ‐‐‐ ‐‐‐ Other Counties 1 ‐‐‐ ‐‐‐ ‐‐‐ ‐‐‐ 4,500 2,800 2.2 6,180 District 30 Total 14,000 6,800 2.7 18,450 16,000 12,500 2.8 34,500 Alameda ‐‐‐ ‐‐‐ ‐‐‐ ‐‐‐ ‐‐‐ ‐‐‐ ‐‐‐ ‐‐‐ Contra Costa ‐‐‐ ‐‐‐ ‐‐‐ ‐‐‐ ‐‐‐ ‐‐‐ ‐‐‐ ‐‐‐ Lake ‐‐‐ ‐‐‐ ‐‐‐ ‐‐‐ ‐‐‐ ‐‐‐ ‐‐‐ ‐‐‐ Marin ‐‐‐ ‐‐‐ ‐‐‐ ‐‐‐ ‐‐‐ ‐‐‐ ‐‐‐ ‐‐‐ Monterey ‐‐‐ ‐‐‐ ‐‐‐ ‐‐‐ ‐‐‐ ‐‐‐ ‐‐‐ ‐‐‐ Napa ‐‐‐ ‐‐‐ ‐‐‐ ‐‐‐ ‐‐‐ ‐‐‐ ‐‐‐ ‐‐‐ San Benito ‐‐‐ ‐‐‐ ‐‐‐ ‐‐‐ ‐‐‐ ‐‐‐ ‐‐‐ ‐‐‐ San Francisco ‐‐‐ ‐‐‐ ‐‐‐ ‐‐‐ ‐‐‐ ‐‐‐ ‐‐‐ ‐‐‐ San Luis Obispo ‐‐‐ ‐‐‐ ‐‐‐ ‐‐‐ ‐‐‐ ‐‐‐ ‐‐‐ ‐‐‐ San Mateo ‐‐‐ ‐‐‐ ‐‐‐ ‐‐‐ ‐‐‐ ‐‐‐ ‐‐‐ ‐‐‐ Santa Clara ‐‐‐ ‐‐‐ ‐‐‐ ‐‐‐ ‐‐‐ ‐‐‐ ‐‐‐ ‐‐‐ Santa Cruz ‐‐‐ ‐‐‐ ‐‐‐ ‐‐‐ ‐‐‐ ‐‐‐ ‐‐‐ ‐‐‐ Sonoma ‐‐‐ ‐‐‐ ‐‐‐ ‐‐‐ ‐‐‐ ‐‐‐ ‐‐‐ ‐‐‐ Other Counties 1 ‐‐‐ ‐‐‐ ‐‐‐ ‐‐‐ 9,000 3,300 1.9 6,150 District 40 Total ‐‐‐ ‐‐‐ ‐‐‐ ‐‐‐ 9,000 3,300 1.9 6,150 Butte 4,000 2,200 2.3 4,980 ‐‐‐ ‐‐‐ ‐‐‐ ‐‐‐ Colusa 15,400 15,100 2.7 41,280 12,500 12,000 2.6 30,600 Glenn ‐‐‐ ‐‐‐ ‐‐‐ ‐‐‐ 9,700 6,600 2.1 13,800 Sacramento 9,200 8,600 2.6 22,290 ‐‐‐ ‐‐‐ ‐‐‐ ‐‐‐ Solano 25,200 24,400 2.5 61,620 16,600 17,500 2.1 32,400 Sutter 11,000 10,600 2.6 27,000 8,800 8,200 2.3 18,900 Tehama ‐‐‐ ‐‐‐ ‐‐‐ ‐‐‐ ‐‐‐ ‐‐‐ ‐‐‐ ‐‐‐ Yolo 38,200 37,600 2.6 97,650 31,000 30,400 2.6 77,580 Yuba ‐‐‐ ‐‐‐ ‐‐‐ ‐‐‐ ‐‐‐ ‐‐‐ ‐‐‐ ‐‐‐ Other Counties 1 13,000 10,500 2.7 28,680 15,400 11,700 2.3 27,420 District 50 Total 116,000 109,000 2.6 283,500 94,000 84,600 2.4 200,700 Fresno 103,000 80,000 1.8 142,500 73,000 29,600 2.5 73,200 Kern 54,000 43,000 2.2 92,400 ‐‐‐ ‐‐‐ ‐‐‐ ‐‐‐ Kings ‐‐‐ ‐‐‐ ‐‐‐ ‐‐‐ 91,000 41,800 2.8 117,600 Madera ‐‐‐ ‐‐‐ ‐‐‐ ‐‐‐ 23,000 5,000 2.8 14,100 Merced 36,000 20,800 3.1 64,800 43,500 17,900 3.2 57,900 San Joaquin 36,500 26,000 3.0 78,900 ‐‐‐ ‐‐‐ ‐‐‐ ‐‐‐ Stanislaus 12,000 3,200 3.2 10,290 ‐‐‐ ‐‐‐ ‐‐‐ ‐‐‐ Tulare 122,000 41,000 2.9 119,400 128,000 28,000 2.2 60,900 Other Counties 1 126,500 61,500 3.3 199,710 81,500 55,300 2.9 157,800 District 51 Total 490,000 275,500 2.6 708,000 440,000 177,600 2.7 481,500 Alpine ‐‐‐ ‐‐‐ ‐‐‐ ‐‐‐ ‐‐‐ ‐‐‐ ‐‐‐ ‐‐‐ Amador ‐‐‐ ‐‐‐ ‐‐‐ ‐‐‐ ‐‐‐ ‐‐‐ ‐‐‐ ‐‐‐ Calaveras ‐‐‐ ‐‐‐ ‐‐‐ ‐‐‐ ‐‐‐ ‐‐‐ ‐‐‐ ‐‐‐ El Dorado ‐‐‐ ‐‐‐ ‐‐‐ ‐‐‐ ‐‐‐ ‐‐‐ ‐‐‐ ‐‐‐ Inyo ‐‐‐ ‐‐‐ ‐‐‐ ‐‐‐ ‐‐‐ ‐‐‐ ‐‐‐ ‐‐‐ Mariposa ‐‐‐ ‐‐‐ ‐‐‐ ‐‐‐ ‐‐‐ ‐‐‐ ‐‐‐ ‐‐‐ Mono ‐‐‐ ‐‐‐ ‐‐‐ ‐‐‐ ‐‐‐ ‐‐‐ ‐‐‐ ‐‐‐ Nevada ‐‐‐ ‐‐‐ ‐‐‐ ‐‐‐ ‐‐‐ ‐‐‐ ‐‐‐ ‐‐‐ Placer ‐‐‐ ‐‐‐ ‐‐‐ ‐‐‐ ‐‐‐ ‐‐‐ ‐‐‐ ‐‐‐ Sierra ‐‐‐ ‐‐‐ ‐‐‐ ‐‐‐ ‐‐‐ ‐‐‐ ‐‐‐ ‐‐‐ Tuolumne ‐‐‐ ‐‐‐ ‐‐‐ ‐‐‐ ‐‐‐ ‐‐‐ ‐‐‐ ‐‐‐ Other Counties 1 ‐‐‐ ‐‐‐ ‐‐‐ ‐‐‐ 2,000 1,200 2.0 2,400 District 60 Total ‐‐‐ ‐‐‐ ‐‐‐ ‐‐‐ 2,000 1,200 2.0 2,400 Imperial ‐‐‐ ‐‐‐ ‐‐‐ ‐‐‐ ‐‐‐ ‐‐‐ ‐‐‐ ‐‐‐ Los Angeles ‐‐‐ ‐‐‐ ‐‐‐ ‐‐‐ ‐‐‐ ‐‐‐ ‐‐‐ ‐‐‐ Orange ‐‐‐ ‐‐‐ ‐‐‐ ‐‐‐ ‐‐‐ ‐‐‐ ‐‐‐ ‐‐‐ Riverside 16,500 8,300 1.1 9,330 25,000 13,000 1.1 14,370 San Bernardino ‐‐‐ ‐‐‐ ‐‐‐ ‐‐‐ ‐‐‐ ‐‐‐ ‐‐‐ ‐‐‐ San Diego ‐‐‐ ‐‐‐ ‐‐‐ ‐‐‐ ‐‐‐ ‐‐‐ ‐‐‐ ‐‐‐ Santa Barbara ‐‐‐ ‐‐‐ ‐‐‐ ‐‐‐ ‐‐‐ ‐‐‐ ‐‐‐ ‐‐‐ Ventura ‐‐‐ ‐‐‐ ‐‐‐ ‐‐‐ ‐‐‐ ‐‐‐ ‐‐‐ ‐‐‐
Other Counties 1 10,500 7,800 2.6 20,370 6,000 3,900 2.7 10,380 District 80 Total 27,000 16,100 1.8 29,700 31,000 16,900 1.5 25,050 Other Districts 1 10,000 3,700 1.7 6,300 ‐‐‐ ‐‐‐ ‐‐‐ ‐‐‐ STATE 670,000 420,000 2.6 1,071,000 610,000 310,000 2.6 790,500
Winter Wheat Acreage, Yield and Production by County, 2011‐2012
County2011 2012
1 Counties or district data combined to avoid disclosing data for individual farms.
Floriculture California Agricultural Statistics Review 2013-2014 51
alifornia’s floriculture crop leads the nation with a value of $974 million in sales, for
operations with more than $100,000 in sales, comprising 24.4 percent of the U.S. total wholesale value. Sales slightly decreased 3 percent from the 2011 total. California producers decreased from 384 in 2011 to 371 in 2012.
For operations with more than $100,000 in sales, California accounted for 16 percent of the total value of Total Bedding and Garden plants, the highest-valued crop category in the 15-state program. The wholesale value of California-grown bedding and garden plants at $306 million in 2012 was virtually unchanged from 2011.
California also leads the country in potted flowering plant value for 2012, with a total value of $245 million wholesale, up less than one percent from the 2011 valuation. California accounted for 40 percent of the 15-state total wholesale value reported.
California was the dominant state in cut flower production, accounting for about 76 percent of the total cut flower wholesale value. The $261 million in value for 2012 was down 6 percent from the 2011 valuation of $278 million.
C
Floriculture
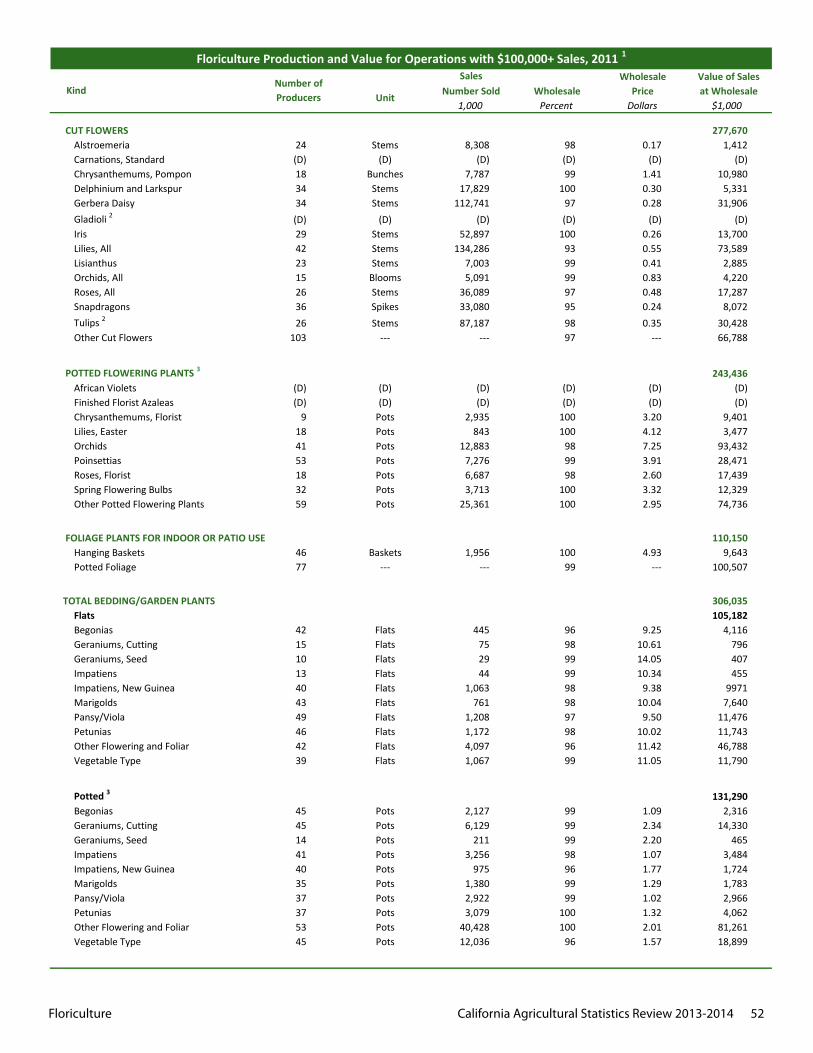
Floriculture California Agricultural Statistics Review 2013-2014 52
Wholesale Value of Sales Number Sold Wholesale Price at Wholesale
1,000 Percent Dollars $1,000
CUT FLOWERS 277,670Alstroemeria 24 Stems 8,308 98 0.17 1,412Carnations, Standard (D) (D) (D) (D) (D) (D)Chrysanthemums, Pompon 18 Bunches 7,787 99 1.41 10,980Delphinium and Larkspur 34 Stems 17,829 100 0.30 5,331Gerbera Daisy 34 Stems 112,741 97 0.28 31,906Gladioli 2 (D) (D) (D) (D) (D) (D)Iris 29 Stems 52,897 100 0.26 13,700Lilies, All 42 Stems 134,286 93 0.55 73,589Lisianthus 23 Stems 7,003 99 0.41 2,885Orchids, All 15 Blooms 5,091 99 0.83 4,220Roses, All 26 Stems 36,089 97 0.48 17,287Snapdragons 36 Spikes 33,080 95 0.24 8,072Tulips 2 26 Stems 87,187 98 0.35 30,428Other Cut Flowers 103 --- --- 97 --- 66,788
POTTED FLOWERING PLANTS 3 243,436African Violets (D) (D) (D) (D) (D) (D)Finished Florist Azaleas (D) (D) (D) (D) (D) (D)Chrysanthemums, Florist 9 Pots 2,935 100 3.20 9,401Lilies, Easter 18 Pots 843 100 4.12 3,477Orchids 41 Pots 12,883 98 7.25 93,432Poinsettias 53 Pots 7,276 99 3.91 28,471Roses, Florist 18 Pots 6,687 98 2.60 17,439Spring Flowering Bulbs 32 Pots 3,713 100 3.32 12,329Other Potted Flowering Plants 59 Pots 25,361 100 2.95 74,736
FOLIAGE PLANTS FOR INDOOR OR PATIO USE 110,150Hanging Baskets 46 Baskets 1,956 100 4.93 9,643Potted Foliage 77 --- --- 99 --- 100,507
TOTAL BEDDING/GARDEN PLANTS 306,035Flats 105,182Begonias 42 Flats 445 96 9.25 4,116Geraniums, Cutting 15 Flats 75 98 10.61 796Geraniums, Seed 10 Flats 29 99 14.05 407Impatiens 13 Flats 44 99 10.34 455Impatiens, New Guinea 40 Flats 1,063 98 9.38 9971Marigolds 43 Flats 761 98 10.04 7,640Pansy/Viola 49 Flats 1,208 97 9.50 11,476Petunias 46 Flats 1,172 98 10.02 11,743Other Flowering and Foliar 42 Flats 4,097 96 11.42 46,788Vegetable Type 39 Flats 1,067 99 11.05 11,790
Potted 3 131,290Begonias 45 Pots 2,127 99 1.09 2,316Geraniums, Cutting 45 Pots 6,129 99 2.34 14,330Geraniums, Seed 14 Pots 211 99 2.20 465Impatiens 41 Pots 3,256 98 1.07 3,484Impatiens, New Guinea 40 Pots 975 96 1.77 1,724Marigolds 35 Pots 1,380 99 1.29 1,783Pansy/Viola 37 Pots 2,922 99 1.02 2,966Petunias 37 Pots 3,079 100 1.32 4,062Other Flowering and Foliar 53 Pots 40,428 100 2.01 81,261Vegetable Type 45 Pots 12,036 96 1.57 18,899
Floriculture Production and Value for Operations with $100,000+ Sales, 2011 1
KindNumber of Producers
Sales
Unit
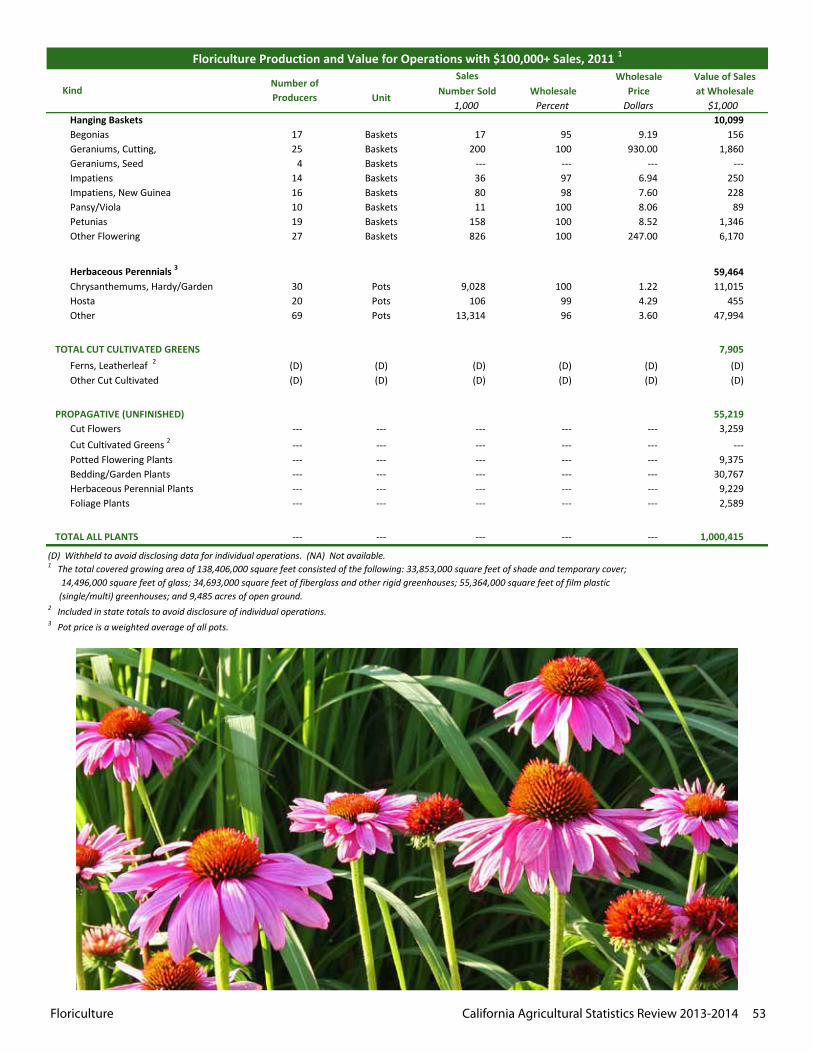
Floriculture California Agricultural Statistics Review 2013-2014 53
Wholesale Value of Sales Number Sold Wholesale Price at Wholesale
1,000 Percent Dollars $1,000
Floriculture Production and Value for Operations with $100,000+ Sales, 2011 1
KindNumber of Producers
Sales
Unit
Hanging Baskets 10,099Begonias 17 Baskets 17 95 9.19 156Geraniums, Cutting, 25 Baskets 200 100 930.00 1,860Geraniums, Seed 4 Baskets --- --- --- ---Impatiens 14 Baskets 36 97 6.94 250Impatiens, New Guinea 16 Baskets 80 98 7.60 228Pansy/Viola 10 Baskets 11 100 8.06 89Petunias 19 Baskets 158 100 8.52 1,346Other Flowering 27 Baskets 826 100 247.00 6,170
Herbaceous Perennials 3 59,464Chrysanthemums, Hardy/Garden 30 Pots 9,028 100 1.22 11,015Hosta 20 Pots 106 99 4.29 455Other 69 Pots 13,314 96 3.60 47,994
TOTAL CUT CULTIVATED GREENS 7,905Ferns, Leatherleaf 2 (D) (D) (D) (D) (D) (D)Other Cut Cultivated (D) (D) (D) (D) (D) (D)
PROPAGATIVE (UNFINISHED) 55,219Cut Flowers --- --- --- --- --- 3,259Cut Cultivated Greens 2 --- --- --- --- --- ---Potted Flowering Plants --- --- --- --- --- 9,375Bedding/Garden Plants --- --- --- --- --- 30,767Herbaceous Perennial Plants --- --- --- --- --- 9,229Foliage Plants --- --- --- --- --- 2,589
TOTAL ALL PLANTS --- --- --- --- --- 1,000,415
2 Included in state totals to avoid disclosure of individual operations.3 Pot price is a weighted average of all pots.
(D) Withheld to avoid disclosing data for individual operations. (NA) Not available.1 The total covered growing area of 138,406,000 square feet consisted of the following: 33,853,000 square feet of shade and temporary cover; 14,496,000 square feet of glass; 34,693,000 square feet of fiberglass and other rigid greenhouses; 55,364,000 square feet of film plastic (single/multi) greenhouses; and 9,485 acres of open ground.
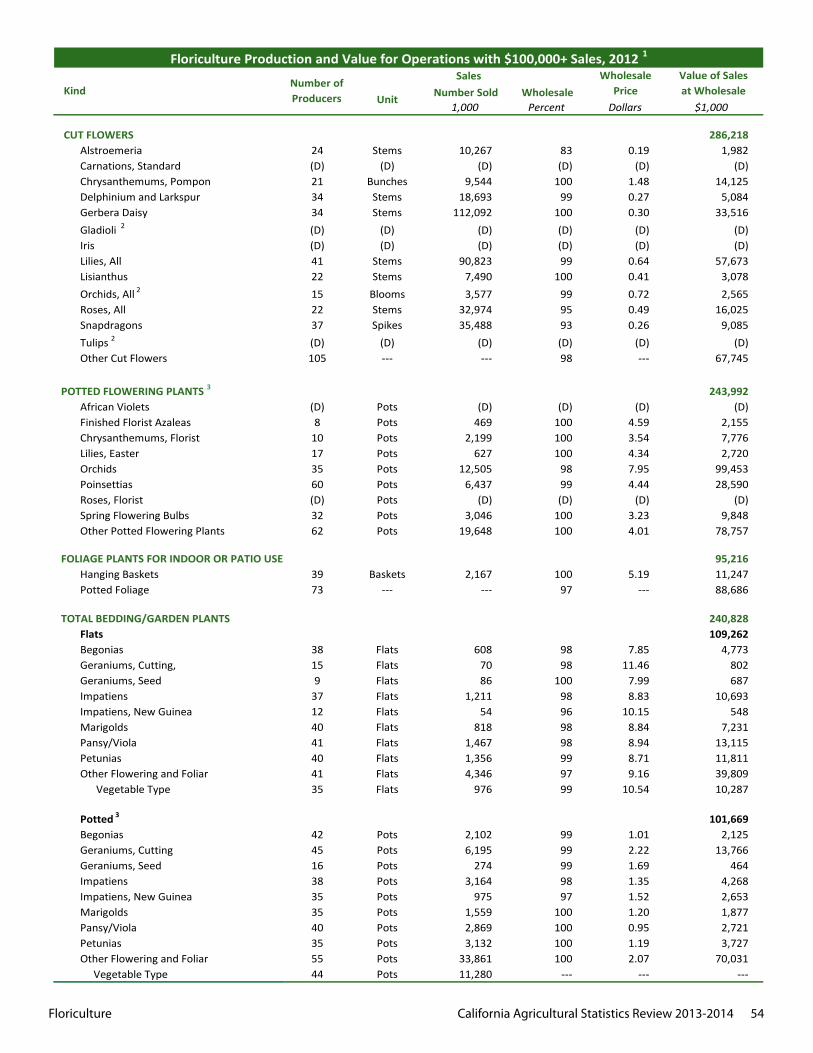
Floriculture California Agricultural Statistics Review 2013-2014 54
Number Sold Wholesale1,000 Percent Dollars $1,000
286,21824 Stems 10,267 83 0.19 1,982(D) (D) (D) (D) (D) (D)21 Bunches 9,544 100 1.48 14,12534 Stems 18,693 99 0.27 5,08434 Stems 112,092 100 0.30 33,516(D) (D) (D) (D) (D) (D)(D) (D) (D) (D) (D) (D)41 Stems 90,823 99 0.64 57,67322 Stems 7,490 100 0.41 3,07815 Blooms 3,577 99 0.72 2,56522 Stems 32,974 95 0.49 16,02537 Spikes 35,488 93 0.26 9,085(D) (D) (D) (D) (D) (D)105 --- --- 98 --- 67,745
243,992(D) Pots (D) (D) (D) (D)8 Pots 469 100 4.59 2,155
10 Pots 2,199 100 3.54 7,77617 Pots 627 100 4.34 2,72035 Pots 12,505 98 7.95 99,45360 Pots 6,437 99 4.44 28,590(D) Pots (D) (D) (D) (D)32 Pots 3,046 100 3.23 9,84862 Pots 19,648 100 4.01 78,757
FOLIAGE PLANTS FOR INDOOR OR PATIO USE 95,21639 Baskets 2,167 100 5.19 11,24773 --- --- 97 --- 88,686
240,828109,262
38 Flats 608 98 7.85 4,77315 Flats 70 98 11.46 8029 Flats 86 100 7.99 687
37 Flats 1,211 98 8.83 10,69312 Flats 54 96 10.15 54840 Flats 818 98 8.84 7,23141 Flats 1,467 98 8.94 13,11540 Flats 1,356 99 8.71 11,81141 Flats 4,346 97 9.16 39,80935 Flats 976 99 10.54 10,287
101,66942 Pots 2,102 99 1.01 2,12545 Pots 6,195 99 2.22 13,76616 Pots 274 99 1.69 46438 Pots 3,164 98 1.35 4,26835 Pots 975 97 1.52 2,65335 Pots 1,559 100 1.20 1,87740 Pots 2,869 100 0.95 2,72135 Pots 3,132 100 1.19 3,72755 Pots 33,861 100 2.07 70,03144 Pots 11,280 --- --- ---
AlstroemeriaCarnations, StandardChrysanthemums, Pompon
Roses, AllSnapdragonsTulips 2
Other Cut Flowers
POTTED FLOWERING PLANTS 3
Delphinium and LarkspurGerbera DaisyGladioli 2
Iris Lilies, AllLisianthus
Poinsettias
Orchids, All 2
Floriculture Production and Value for Operations with $100,000+ Sales, 2012 1
Number of Producers
Sales
Unit Kind
CUT FLOWERS
WholesalePrice
Value of Salesat Wholesale
Roses, FloristSpring Flowering BulbsOther Potted Flowering Plants
Hanging BasketsPotted Foliage
African VioletsFinished Florist Azaleas Chrysanthemums, FloristLilies, EasterOrchids
TOTAL BEDDING/GARDEN PLANTSFlatsBegoniasGeraniums, Cutting,Geraniums, SeedImpatiensImpatiens, New GuineaMarigoldsPansy/ViolaPetuniasOther Flowering and Foliar Vegetable Type
Potted 3
BegoniasGeraniums, CuttingGeraniums, SeedImpatiensImpatiens, New Guinea MarigoldsPansy/ViolaPetuniasOther Flowering and Foliar Vegetable Type
Floriculture California Agricultural Statistics Review 2013-2014 55
Number Sold Wholesale1,000 Percent Dollars $1,000
Floriculture Production and Value for Operations with $100,000+ Sales, 2012 1
Number of Producers
Sales
Unit Kind
WholesalePrice
Value of Salesat Wholesale
10,68921 Baskets 32 96 9.66 30927 Baskets 208 100 9.02 1,8768 7 7 94 8.87 62
14 Baskets 40 93 6.49 26018 Baskets 47 97 7.93 373(D) (D) (D) (D) (D) (D)9 Baskets 11 99 7.17 79
21 Baskets 158 99 8.48 1,34029 Baskets 814 99 7.85 6,390
60,50834 Pots 4,772 100 1.76 8,41519 Pots 107 100 3.88 41574 Pots 16,331 97 3.16 51,678
8,4855 Bunches 13 86 2.12 28
37 N/A N/A (D) N/A 8,457
66,231--- --- --- --- --- (D)--- --- --- --- --- (D)--- --- --- --- --- 8,657--- --- --- --- --- 40,234--- --- --- --- --- 10,471--- --- --- --- --- 3,436
--- --- --- --- --- 1,001,478
3 Pot price is a weighted average of all pots.
PROPAGATIVE (UNFINISHED)Cut FlowersCut Cultivated Greens 2
Potted Flowering Plants
Herbaceous Perennial PlantsFoliage Plants
TOTAL ALL PLANTS
(D)Withheld to avoid disclosure of individual operations. (NA) Not available.1 The total covered growing area of 130,288,000 square feet consisted of the following: 30,013,000 square feet of shade and temporary cover; 13,560,000 square feet of glass; 34,103,000 square feet of fiberglass and other rigid greenhouses; 52,612,000 square feet of film plastic (single/multi) greenhouses; and 9,204 acres of open ground. 2 Included in state totals to avoid disclosure of individual operations.
Hanging Baskets
Chrysanthemums, Hardy/Garden HostaOther
TOTAL CUT CULTIVATED GREENS
Bedding/Garden Plants
Ferns, Leatherleaf 2
Other Cut Cultivated
Marigolds
PetuniasOther Flowering
Herbaceous Perennials 3
BegoniasGeraniums, CuttingGeraniums, SeedImpatiensImpatiens, New Guinea
Pansy/Viola
Fruit and Nut Crops California Agricultural Statistics Review 2013-2014 56 Fruit and Nut Crops
alifornia accounts for 65 percent of the U.S. non-citrus fruit and nut production and 73 percent of the national value. Of the citrus crops, California accounts for 30 percent of the U.S. citrus production and 42 percent of the national value. In total, the state produced 16.7 million tons of fruit and nuts, 52 percent of the national total, up 1 percent from 2011. The state’s total value of all fruits and nuts in 2012 was $18.7 billion, up 20 percent from 2011.
In 2011, for the first time ever, almonds overtook grapes as the top valued fruit and nut crop in California. In 2012, grapes came back and reclaimed their number one spot, topping $5 billion in production value. Almonds were a close second at over $4.8 billion. California grapes accounted for over 90 percent of the United States utilized grape production in 2012. California is the top raisin producer in the world. Crops with record California production in 2012 were mandarins, pistachios, strawberries, and wine grapes. California accounted for all or nearly all the national production of almonds, dates, figs, kiwifruit, olives, Clingstone peaches, pistachios, dried plums, raisins, and walnuts.
According to the USDA’s Economic Research Service, California continued to be the number one exporter of agricultural commodities in the United States in 2012. Tree nuts were the number one agricultural export for California, followed by fruit and vegetables. Fruit and nut exports accounted for over 50 percent of the value of all California agricultural exports.
The United States is among the top producers and consumers of fruit and tree nuts in the world. The typical American consumes around 286 pounds of fruit and tree nuts (fresh and processed products) each year. Oranges, grapes, apples, and bananas
are the most popular fruit while almonds, walnuts, and pecans are the most preferred tree nuts. Per capita consumption of fruits and tree nuts is the third-largest among major food groups, after dairy products and vegetables.
The nation’s largest fruit producing states are California, Florida and Washington. California accounts for over half of the harvested fruit acreage in the country.
The value of U.S. tree nut production in 2012 was over $7 billion in value, with almonds, walnuts, pistachios and pecans accounting for most of the sales. California is the nation’s number one producer of tree nuts. For almonds and pistachios, California is the number one producer in the world, producing over 80 percent of the world’s almonds and around 40 percent of the world’s pistachios. Almonds are close to $5 billion per year in value, pistachios were well over $1 billion, while walnuts were over $1.5 billion for the first time in 2012. Over 90 percent of the U.S. tree nut production was harvested from Golden State orchards in 2012.
Notable Increases in California Production:
Olives…. .............................................. 125%Avocados…. ........................................... 53%Cherries, Sweet…. ................................. 36%Pecans…. ............................................... 30%Pistachios…. .......................................... 24%Grapes, Wine…. ..................................... 20%
Notable Decreases in California Production:
Plums......................................................28%Kiwifruit .................................................21%Nectarines ..............................................17%Grapes, Raisin ........................................16%
C
Fruit and Nut Crops
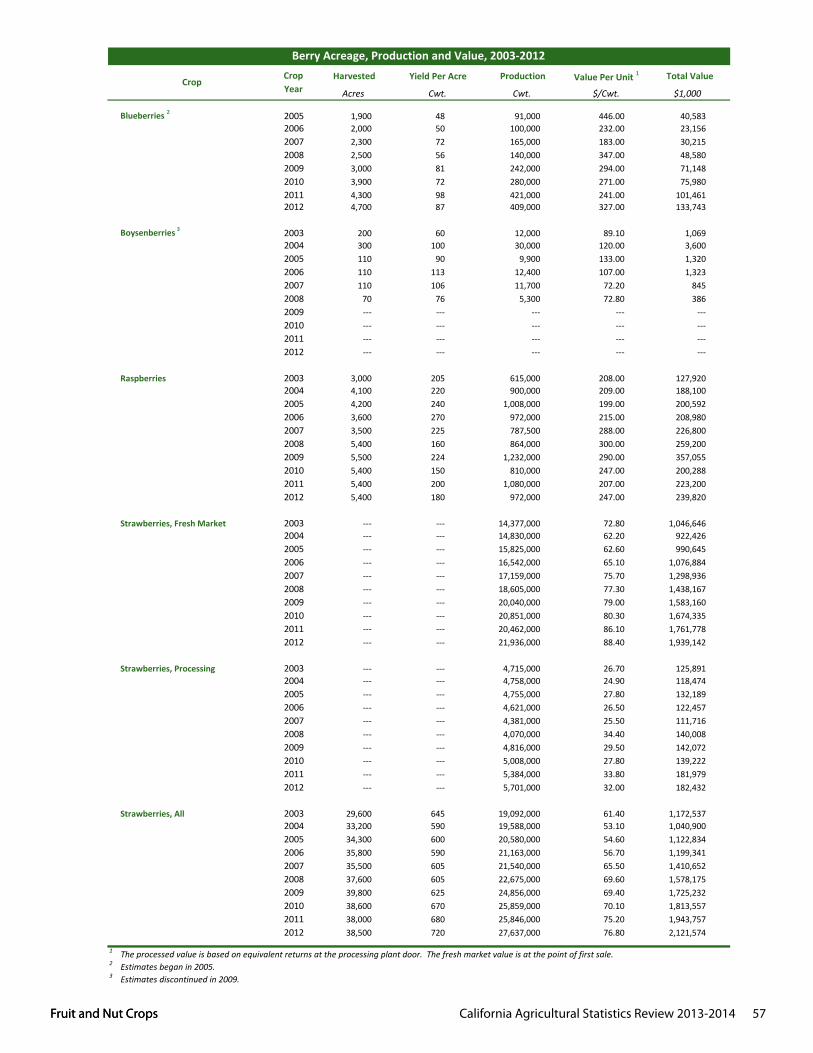
Fruit and Nut Crops California Agricultural Statistics Review 2013-2014 57 Fruit and Nut Crops
Harvested Yield Per Acre Production Value Per Unit 1 Total Value
Acres Cwt. Cwt. $/Cwt. $1,000
Blueberries 2 2005 1,900 48 91,000 446.00 40,5832006 2,000 50 100,000 232.00 23,1562007 2,300 72 165,000 183.00 30,2152008 2,500 56 140,000 347.00 48,5802009 3,000 81 242,000 294.00 71,1482010 3,900 72 280,000 271.00 75,9802011 4,300 98 421,000 241.00 101,4612012 4,700 87 409,000 327.00 133,743
Boysenberries 3 2003 200 60 12,000 89.10 1,0692004 300 100 30,000 120.00 3,6002005 110 90 9,900 133.00 1,3202006 110 113 12,400 107.00 1,3232007 110 106 11,700 72.20 8452008 70 76 5,300 72.80 3862009 --- --- --- --- ---2010 --- --- --- --- ---2011 --- --- --- --- ---2012 --- --- --- --- ---
Raspberries 2003 3,000 205 615,000 208.00 127,9202004 4,100 220 900,000 209.00 188,1002005 4,200 240 1,008,000 199.00 200,5922006 3,600 270 972,000 215.00 208,9802007 3,500 225 787,500 288.00 226,8002008 5,400 160 864,000 300.00 259,2002009 5,500 224 1,232,000 290.00 357,0552010 5,400 150 810,000 247.00 200,2882011 5,400 200 1,080,000 207.00 223,2002012 5,400 180 972,000 247.00 239,820
Strawberries, Fresh Market 2003 --- --- 14,377,000 72.80 1,046,6462004 --- --- 14,830,000 62.20 922,4262005 --- --- 15,825,000 62.60 990,6452006 --- --- 16,542,000 65.10 1,076,8842007 --- --- 17,159,000 75.70 1,298,9362008 --- --- 18,605,000 77.30 1,438,1672009 --- --- 20,040,000 79.00 1,583,1602010 --- --- 20,851,000 80.30 1,674,3352011 --- --- 20,462,000 86.10 1,761,7782012 --- --- 21,936,000 88.40 1,939,142
Strawberries, Processing 2003 --- --- 4,715,000 26.70 125,8912004 --- --- 4,758,000 24.90 118,4742005 --- --- 4,755,000 27.80 132,1892006 --- --- 4,621,000 26.50 122,4572007 --- --- 4,381,000 25.50 111,7162008 --- --- 4,070,000 34.40 140,0082009 --- --- 4,816,000 29.50 142,0722010 --- --- 5,008,000 27.80 139,2222011 --- --- 5,384,000 33.80 181,9792012 --- --- 5,701,000 32.00 182,432
Strawberries, All 2003 29,600 645 19,092,000 61.40 1,172,5372004 33,200 590 19,588,000 53.10 1,040,9002005 34,300 600 20,580,000 54.60 1,122,8342006 35,800 590 21,163,000 56.70 1,199,3412007 35,500 605 21,540,000 65.50 1,410,6522008 37,600 605 22,675,000 69.60 1,578,1752009 39,800 625 24,856,000 69.40 1,725,2322010 38,600 670 25,859,000 70.10 1,813,5572011 38,000 680 25,846,000 75.20 1,943,7572012 38,500 720 27,637,000 76.80 2,121,574
3 Estimates discontinued in 2009.
Berry Acreage, Production and Value, 2003-2012Crop Year
Crop
2 Estimates began in 2005.
1 The processed value is based on equivalent returns at the processing plant door. The fresh market value is at the point of first sale.
Fruit and Nut Crops California Agricultural Statistics Review 2013-2014 58 Fruit and Nut Crops
Jan. Feb. Mar. Apr. May June July Aug. Sept. Oct. Nov. Dec.Season
Average
2003 105.00 92.70 71.30 69.50 64.20 58.20 66.60 68.10 86.80 100.00 165.00 --- 72.802004 127.00 120.00 58.00 44.00 54.70 56.20 50.40 65.20 84.00 84.80 164.00 154.00 62.202005 114.00 110.00 62.00 54.00 59.00 55.00 56.00 66.00 70.00 57.00 77.00 154.00 62.602006 96.10 90.10 63.80 59.80 61.80 51.40 64.00 63.70 77.60 72.90 96.10 --- 65.102007 133.00 115.00 88.40 64.20 68.60 66.10 53.00 93.30 57.40 80.00 137.00 162.00 75.702008 185.00 107.00 95.20 65.50 83.30 61.90 65.90 91.00 70.10 72.00 87.60 215.00 77.302009 104.00 122.00 89.30 78.90 76.10 62.80 74.80 73.50 75.00 108.00 87.60 142.00 79.002010 187.00 150.00 88.40 66.90 78.90 67.70 62.00 81.70 73.30 87.60 139.00 206.00 80.302011 154.00 122.00 96.90 93.50 80.80 72.70 89.20 78.90 87.60 66.90 84.40 152.00 86.102012 122.00 115.00 105.00 94.40 82.70 74.40 74.00 85.00 87.60 90.10 139.00 168.00 88.40
$/Cwt
Crop Year
Strawberry Monthly and Season Average Prices Received, 2003-2012 1
1 Prices are average received at point of first sale.
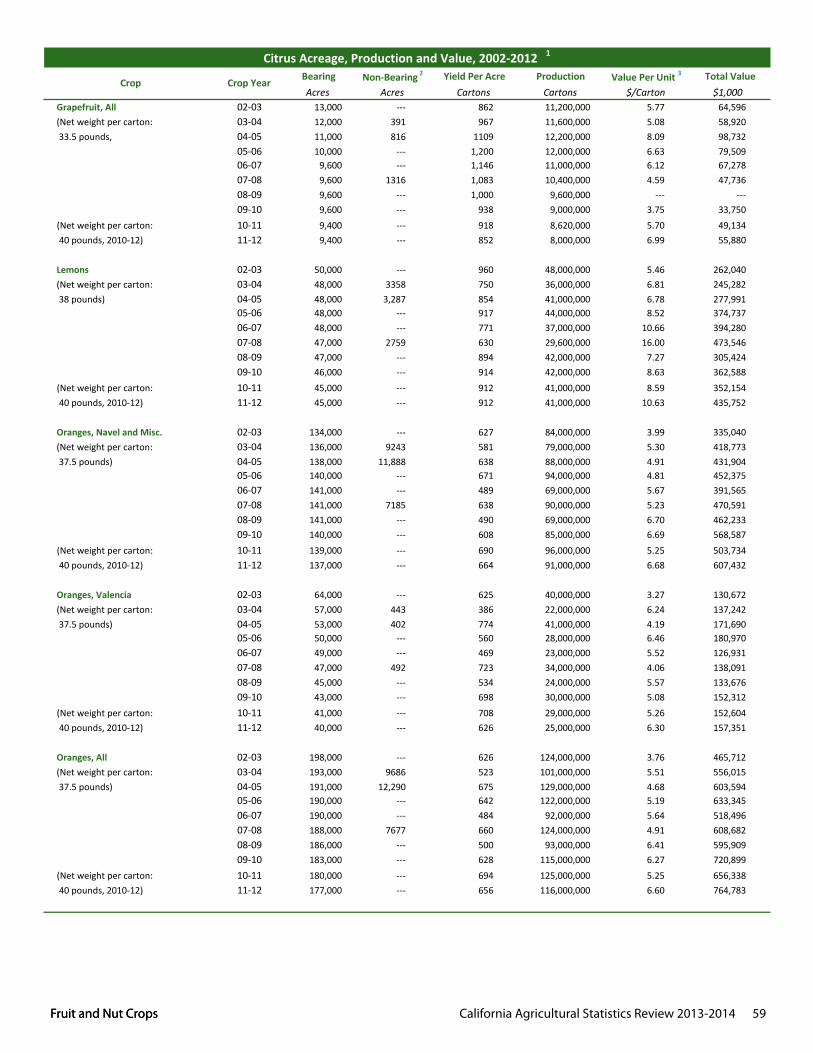
Fruit and Nut Crops California Agricultural Statistics Review 2013-2014 59 Fruit and Nut Crops
Bearing Non-Bearing 2 Yield Per Acre Production Value Per Unit 3 Total ValueAcres Acres Cartons Cartons $/Carton $1,000
Grapefruit, All 02-03 13,000 --- 862 11,200,000 5.77 64,596(Net weight per carton: 03-04 12,000 391 967 11,600,000 5.08 58,920 33.5 pounds, 04-05 11,000 816 1109 12,200,000 8.09 98,732
05-06 10,000 --- 1,200 12,000,000 6.63 79,50906-07 9,600 --- 1,146 11,000,000 6.12 67,27807-08 9,600 1316 1,083 10,400,000 4.59 47,73608-09 9,600 --- 1,000 9,600,000 --- ---09-10 9,600 --- 938 9,000,000 3.75 33,750
(Net weight per carton: 10-11 9,400 --- 918 8,620,000 5.70 49,134 40 pounds, 2010-12) 11-12 9,400 --- 852 8,000,000 6.99 55,880
Lemons 02-03 50,000 --- 960 48,000,000 5.46 262,040(Net weight per carton: 03-04 48,000 3358 750 36,000,000 6.81 245,282 38 pounds) 04-05 48,000 3,287 854 41,000,000 6.78 277,991
05-06 48,000 --- 917 44,000,000 8.52 374,73706-07 48,000 --- 771 37,000,000 10.66 394,28007-08 47,000 2759 630 29,600,000 16.00 473,54608-09 47,000 --- 894 42,000,000 7.27 305,42409-10 46,000 --- 914 42,000,000 8.63 362,588
(Net weight per carton: 10-11 45,000 --- 912 41,000,000 8.59 352,154 40 pounds, 2010-12) 11-12 45,000 --- 912 41,000,000 10.63 435,752
Oranges, Navel and Misc. 02-03 134,000 --- 627 84,000,000 3.99 335,040(Net weight per carton: 03-04 136,000 9243 581 79,000,000 5.30 418,773 37.5 pounds) 04-05 138,000 11,888 638 88,000,000 4.91 431,904
05-06 140,000 --- 671 94,000,000 4.81 452,37506-07 141,000 --- 489 69,000,000 5.67 391,56507-08 141,000 7185 638 90,000,000 5.23 470,59108-09 141,000 --- 490 69,000,000 6.70 462,23309-10 140,000 --- 608 85,000,000 6.69 568,587
(Net weight per carton: 10-11 139,000 --- 690 96,000,000 5.25 503,734 40 pounds, 2010-12) 11-12 137,000 --- 664 91,000,000 6.68 607,432
Oranges, Valencia 02-03 64,000 --- 625 40,000,000 3.27 130,672(Net weight per carton: 03-04 57,000 443 386 22,000,000 6.24 137,242 37.5 pounds) 04-05 53,000 402 774 41,000,000 4.19 171,690
05-06 50,000 --- 560 28,000,000 6.46 180,97006-07 49,000 --- 469 23,000,000 5.52 126,93107-08 47,000 492 723 34,000,000 4.06 138,09108-09 45,000 --- 534 24,000,000 5.57 133,67609-10 43,000 --- 698 30,000,000 5.08 152,312
(Net weight per carton: 10-11 41,000 --- 708 29,000,000 5.26 152,604 40 pounds, 2010-12) 11-12 40,000 --- 626 25,000,000 6.30 157,351
Oranges, All 02-03 198,000 --- 626 124,000,000 3.76 465,712(Net weight per carton: 03-04 193,000 9686 523 101,000,000 5.51 556,015 37.5 pounds) 04-05 191,000 12,290 675 129,000,000 4.68 603,594
05-06 190,000 --- 642 122,000,000 5.19 633,34506-07 190,000 --- 484 92,000,000 5.64 518,49607-08 188,000 7677 660 124,000,000 4.91 608,68208-09 186,000 --- 500 93,000,000 6.41 595,90909-10 183,000 --- 628 115,000,000 6.27 720,899
(Net weight per carton: 10-11 180,000 --- 694 125,000,000 5.25 656,338 40 pounds, 2010-12) 11-12 177,000 --- 656 116,000,000 6.60 764,783
Citrus Acreage, Production and Value, 2002-2012 1
Crop Crop Year
Fruit and Nut Crops California Agricultural Statistics Review 2013-2014 60 Fruit and Nut Crops
Bearing Non-Bearing 2 Yield Per Acre Production Value Per Unit 3 Total ValueAcres Acres Cartons Cartons $/Carton $1,000
Citrus Acreage, Production and Value, 2002-2012 1
Crop Crop Year
Mandarins and Mandarin 02-03 11,000 --- 509 5,600,000 7.90 44,202Hybrids (Includes Tangelos, 03-04 12,000 7,691 367 4,400,000 7.55 33,222Tangerines and Tangors) 04-05 13,000 11,834 446 5,800,000 9.21 53,432(Net weight per carton: 05-06 15,000 --- 480 7,200,000 8.21 59,134 37.5 pounds) 06-07 19,000 --- 368 7,000,000 11.02 77,152
07-08 23,000 5,707 583 13,400,000 12.58 168,62308-09 27,000 --- 496 13,400,000 --- ---09-10 30,000 --- 660 19,800,000 --- ---
(Net weight per carton: 10-11 33,000 --- 642 21,200,000 --- --- 40 pounds, 2010-12) 11-12 38,000 --- 568 21,600,000 --- ---
3 Equivalent packinghouse door returns.
1 Missing data not published to avoid disclosure of individual operations.2 Non-bearing shown only in year when acreage surveys were conducted.
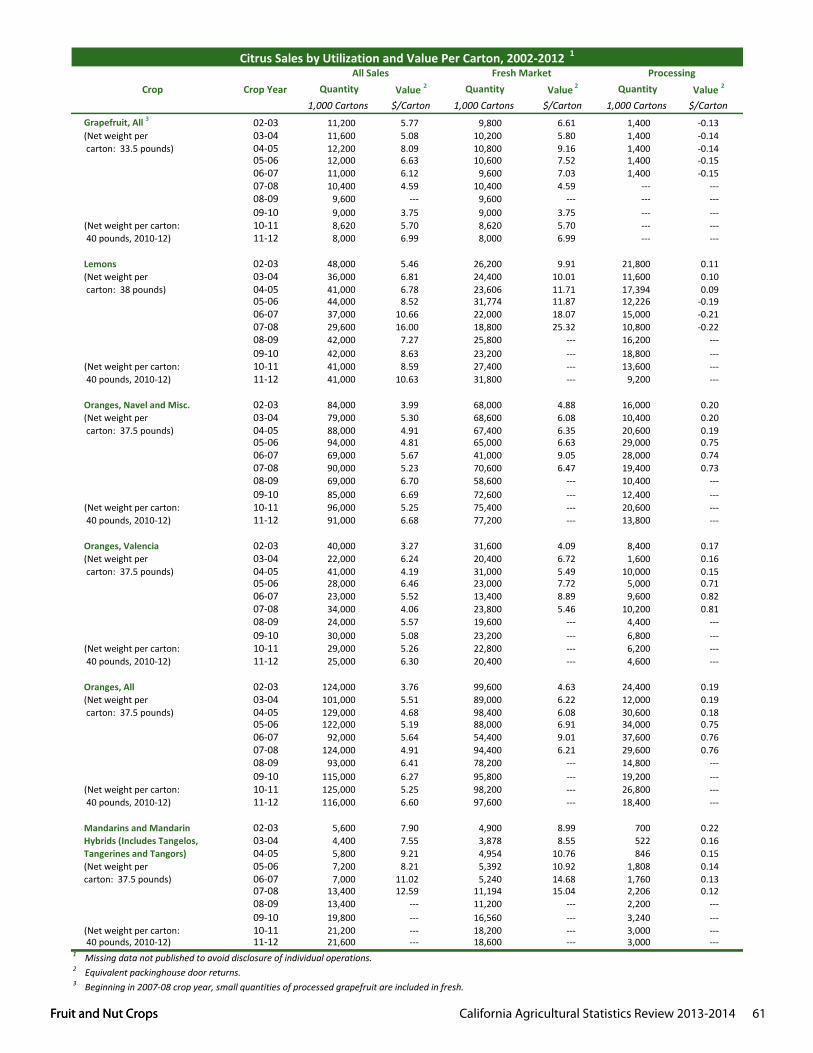
Fruit and Nut Crops California Agricultural Statistics Review 2013-2014 61 Fruit and Nut Crops
Quantity Value 2 Quantity Value 2 Quantity Value 2
1,000 Cartons $/Carton 1,000 Cartons $/Carton 1,000 Cartons $/CartonGrapefruit, All 3 02-03 11,200 5.77 9,800 6.61 1,400 -0.13(Net weight per 03-04 11,600 5.08 10,200 5.80 1,400 -0.14 carton: 33.5 pounds) 04-05 12,200 8.09 10,800 9.16 1,400 -0.14
05-06 12,000 6.63 10,600 7.52 1,400 -0.1506-07 11,000 6.12 9,600 7.03 1,400 -0.1507-08 10,400 4.59 10,400 4.59 --- ---08-09 9,600 --- 9,600 --- --- ---09-10 9,000 3.75 9,000 3.75 --- ---
(Net weight per carton: 10-11 8,620 5.70 8,620 5.70 --- --- 40 pounds, 2010-12) 11-12 8,000 6.99 8,000 6.99 --- ---
Lemons 02-03 48,000 5.46 26,200 9.91 21,800 0.11(Net weight per 03-04 36,000 6.81 24,400 10.01 11,600 0.10 carton: 38 pounds) 04-05 41,000 6.78 23,606 11.71 17,394 0.09
05-06 44,000 8.52 31,774 11.87 12,226 -0.1906-07 37,000 10.66 22,000 18.07 15,000 -0.2107-08 29,600 16.00 18,800 25.32 10,800 -0.2208-09 42,000 7.27 25,800 --- 16,200 ---09-10 42,000 8.63 23,200 --- 18,800 ---
(Net weight per carton: 10-11 41,000 8.59 27,400 --- 13,600 --- 40 pounds, 2010-12) 11-12 41,000 10.63 31,800 --- 9,200 ---
Oranges, Navel and Misc. 02-03 84,000 3.99 68,000 4.88 16,000 0.20(Net weight per 03-04 79,000 5.30 68,600 6.08 10,400 0.20 carton: 37.5 pounds) 04-05 88,000 4.91 67,400 6.35 20,600 0.19
05-06 94,000 4.81 65,000 6.63 29,000 0.7506-07 69,000 5.67 41,000 9.05 28,000 0.7407-08 90,000 5.23 70,600 6.47 19,400 0.7308-09 69,000 6.70 58,600 --- 10,400 ---09-10 85,000 6.69 72,600 --- 12,400 ---
(Net weight per carton: 10-11 96,000 5.25 75,400 --- 20,600 --- 40 pounds, 2010-12) 11-12 91,000 6.68 77,200 --- 13,800 ---
Oranges, Valencia 02-03 40,000 3.27 31,600 4.09 8,400 0.17(Net weight per 03-04 22,000 6.24 20,400 6.72 1,600 0.16 carton: 37.5 pounds) 04-05 41,000 4.19 31,000 5.49 10,000 0.15
05-06 28,000 6.46 23,000 7.72 5,000 0.7106-07 23,000 5.52 13,400 8.89 9,600 0.8207-08 34,000 4.06 23,800 5.46 10,200 0.8108-09 24,000 5.57 19,600 --- 4,400 ---09-10 30,000 5.08 23,200 --- 6,800 ---
(Net weight per carton: 10-11 29,000 5.26 22,800 --- 6,200 --- 40 pounds, 2010-12) 11-12 25,000 6.30 20,400 --- 4,600 ---
Oranges, All 02-03 124,000 3.76 99,600 4.63 24,400 0.19(Net weight per 03-04 101,000 5.51 89,000 6.22 12,000 0.19 carton: 37.5 pounds) 04-05 129,000 4.68 98,400 6.08 30,600 0.18
05-06 122,000 5.19 88,000 6.91 34,000 0.7506-07 92,000 5.64 54,400 9.01 37,600 0.7607-08 124,000 4.91 94,400 6.21 29,600 0.7608-09 93,000 6.41 78,200 --- 14,800 ---09-10 115,000 6.27 95,800 --- 19,200 ---
(Net weight per carton: 10-11 125,000 5.25 98,200 --- 26,800 --- 40 pounds, 2010-12) 11-12 116,000 6.60 97,600 --- 18,400 ---
Mandarins and Mandarin 02-03 5,600 7.90 4,900 8.99 700 0.22Hybrids (Includes Tangelos, 03-04 4,400 7.55 3,878 8.55 522 0.16Tangerines and Tangors) 04-05 5,800 9.21 4,954 10.76 846 0.15(Net weight per 05-06 7,200 8.21 5,392 10.92 1,808 0.14carton: 37.5 pounds) 06-07 7,000 11.02 5,240 14.68 1,760 0.13
07-08 13,400 12.59 11,194 15.04 2,206 0.1208-09 13,400 --- 11,200 --- 2,200 ---09-10 19,800 --- 16,560 --- 3,240 ---
(Net weight per carton: 10-11 21,200 --- 18,200 --- 3,000 --- 40 pounds, 2010-12) 11-12 21,600 --- 18,600 --- 3,000 ---1 Missing data not published to avoid disclosure of individual operations.2 Equivalent packinghouse door returns.3 Beginning in 2007-08 crop year, small quantities of processed grapefruit are included in fresh.
Citrus Sales by Utilization and Value Per Carton, 2002-2012 1
Crop Crop YearAll Sales Fresh Market Processing
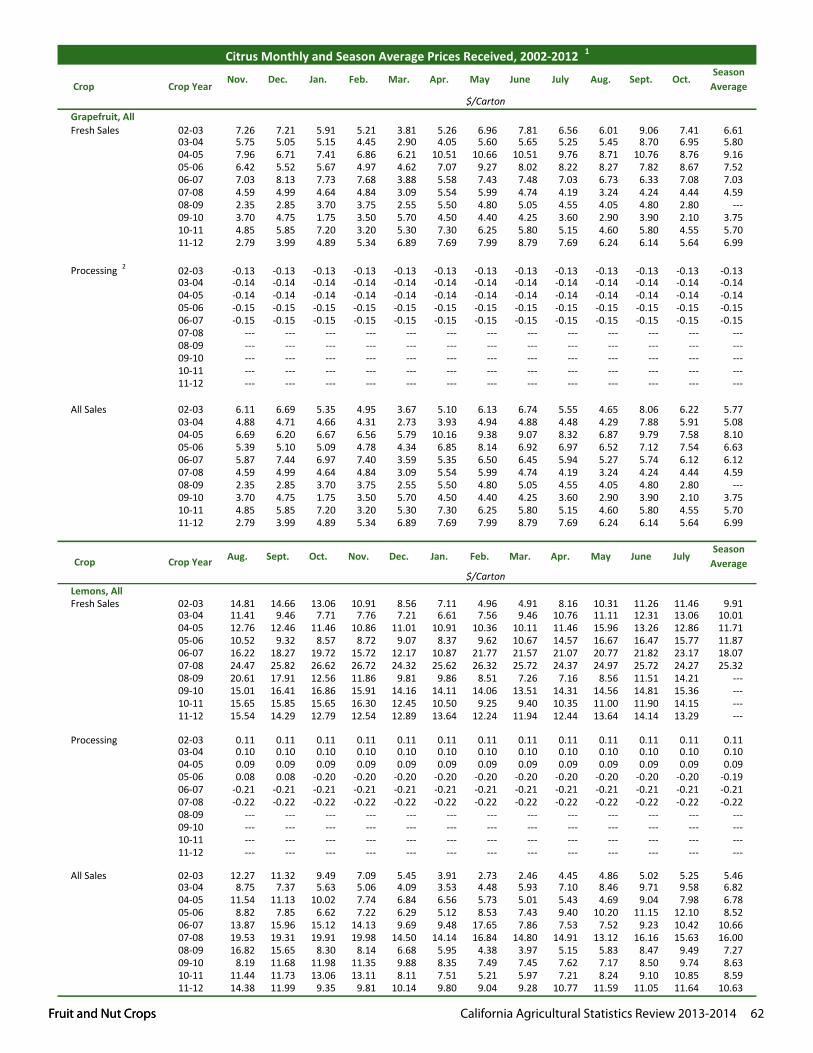
Fruit and Nut Crops California Agricultural Statistics Review 2013-2014 62 Fruit and Nut Crops
Nov. Dec. Jan. Feb. Mar. Apr. May June July Aug. Sept. Oct.Season
Average
Grapefruit, AllFresh Sales 02-03 7.26 7.21 5.91 5.21 3.81 5.26 6.96 7.81 6.56 6.01 9.06 7.41 6.61
03-04 5.75 5.05 5.15 4.45 2.90 4.05 5.60 5.65 5.25 5.45 8.70 6.95 5.8004-05 7.96 6.71 7.41 6.86 6.21 10.51 10.66 10.51 9.76 8.71 10.76 8.76 9.1605-06 6.42 5.52 5.67 4.97 4.62 7.07 9.27 8.02 8.22 8.27 7.82 8.67 7.5206-07 7.03 8.13 7.73 7.68 3.88 5.58 7.43 7.48 7.03 6.73 6.33 7.08 7.0307-08 4.59 4.99 4.64 4.84 3.09 5.54 5.99 4.74 4.19 3.24 4.24 4.44 4.5908-09 2.35 2.85 3.70 3.75 2.55 5.50 4.80 5.05 4.55 4.05 4.80 2.80 ---09-10 3.70 4.75 1.75 3.50 5.70 4.50 4.40 4.25 3.60 2.90 3.90 2.10 3.7510-11 4.85 5.85 7.20 3.20 5.30 7.30 6.25 5.80 5.15 4.60 5.80 4.55 5.7011-12 2.79 3.99 4.89 5.34 6.89 7.69 7.99 8.79 7.69 6.24 6.14 5.64 6.99
Processing 2 02-03 -0.13 -0.13 -0.13 -0.13 -0.13 -0.13 -0.13 -0.13 -0.13 -0.13 -0.13 -0.13 -0.1303-04 -0.14 -0.14 -0.14 -0.14 -0.14 -0.14 -0.14 -0.14 -0.14 -0.14 -0.14 -0.14 -0.1404-05 -0.14 -0.14 -0.14 -0.14 -0.14 -0.14 -0.14 -0.14 -0.14 -0.14 -0.14 -0.14 -0.1405-06 -0.15 -0.15 -0.15 -0.15 -0.15 -0.15 -0.15 -0.15 -0.15 -0.15 -0.15 -0.15 -0.1506-07 -0.15 -0.15 -0.15 -0.15 -0.15 -0.15 -0.15 -0.15 -0.15 -0.15 -0.15 -0.15 -0.1507-08 --- --- --- --- --- --- --- --- --- --- --- --- ---08-09 --- --- --- --- --- --- --- --- --- --- --- --- ---09-10 --- --- --- --- --- --- --- --- --- --- --- --- ---10-11 --- --- --- --- --- --- --- --- --- --- --- --- ---11-12 --- --- --- --- --- --- --- --- --- --- --- --- ---
All Sales 02-03 6.11 6.69 5.35 4.95 3.67 5.10 6.13 6.74 5.55 4.65 8.06 6.22 5.7703-04 4.88 4.71 4.66 4.31 2.73 3.93 4.94 4.88 4.48 4.29 7.88 5.91 5.0804-05 6.69 6.20 6.67 6.56 5.79 10.16 9.38 9.07 8.32 6.87 9.79 7.58 8.1005-06 5.39 5.10 5.09 4.78 4.34 6.85 8.14 6.92 6.97 6.52 7.12 7.54 6.6306-07 5.87 7.44 6.97 7.40 3.59 5.35 6.50 6.45 5.94 5.27 5.74 6.12 6.1207-08 4.59 4.99 4.64 4.84 3.09 5.54 5.99 4.74 4.19 3.24 4.24 4.44 4.5908-09 2.35 2.85 3.70 3.75 2.55 5.50 4.80 5.05 4.55 4.05 4.80 2.80 ---09-10 3.70 4.75 1.75 3.50 5.70 4.50 4.40 4.25 3.60 2.90 3.90 2.10 3.7510-11 4.85 5.85 7.20 3.20 5.30 7.30 6.25 5.80 5.15 4.60 5.80 4.55 5.7011-12 2.79 3.99 4.89 5.34 6.89 7.69 7.99 8.79 7.69 6.24 6.14 5.64 6.99
Aug. Sept. Oct. Nov. Dec. Jan. Feb. Mar. Apr. May June JulySeason
Average
Lemons, AllFresh Sales 02-03 14.81 14.66 13.06 10.91 8.56 7.11 4.96 4.91 8.16 10.31 11.26 11.46 9.91
03-04 11.41 9.46 7.71 7.76 7.21 6.61 7.56 9.46 10.76 11.11 12.31 13.06 10.0104-05 12.76 12.46 11.46 10.86 11.01 10.91 10.36 10.11 11.46 15.96 13.26 12.86 11.7105-06 10.52 9.32 8.57 8.72 9.07 8.37 9.62 10.67 14.57 16.67 16.47 15.77 11.8706-07 16.22 18.27 19.72 15.72 12.17 10.87 21.77 21.57 21.07 20.77 21.82 23.17 18.0707-08 24.47 25.82 26.62 26.72 24.32 25.62 26.32 25.72 24.37 24.97 25.72 24.27 25.3208-09 20.61 17.91 12.56 11.86 9.81 9.86 8.51 7.26 7.16 8.56 11.51 14.21 ---09-10 15.01 16.41 16.86 15.91 14.16 14.11 14.06 13.51 14.31 14.56 14.81 15.36 ---10-11 15.65 15.85 15.65 16.30 12.45 10.50 9.25 9.40 10.35 11.00 11.90 14.15 ---11-12 15.54 14.29 12.79 12.54 12.89 13.64 12.24 11.94 12.44 13.64 14.14 13.29 ---
Processing 02-03 0.11 0.11 0.11 0.11 0.11 0.11 0.11 0.11 0.11 0.11 0.11 0.11 0.1103-04 0.10 0.10 0.10 0.10 0.10 0.10 0.10 0.10 0.10 0.10 0.10 0.10 0.1004-05 0.09 0.09 0.09 0.09 0.09 0.09 0.09 0.09 0.09 0.09 0.09 0.09 0.0905-06 0.08 0.08 -0.20 -0.20 -0.20 -0.20 -0.20 -0.20 -0.20 -0.20 -0.20 -0.20 -0.1906-07 -0.21 -0.21 -0.21 -0.21 -0.21 -0.21 -0.21 -0.21 -0.21 -0.21 -0.21 -0.21 -0.2107-08 -0.22 -0.22 -0.22 -0.22 -0.22 -0.22 -0.22 -0.22 -0.22 -0.22 -0.22 -0.22 -0.2208-09 --- --- --- --- --- --- --- --- --- --- --- --- ---09-10 --- --- --- --- --- --- --- --- --- --- --- --- ---10-11 --- --- --- --- --- --- --- --- --- --- --- --- ---11-12 --- --- --- --- --- --- --- --- --- --- --- --- ---
All Sales 02-03 12.27 11.32 9.49 7.09 5.45 3.91 2.73 2.46 4.45 4.86 5.02 5.25 5.4603-04 8.75 7.37 5.63 5.06 4.09 3.53 4.48 5.93 7.10 8.46 9.71 9.58 6.8204-05 11.54 11.13 10.02 7.74 6.84 6.56 5.73 5.01 5.43 4.69 9.04 7.98 6.7805-06 8.82 7.85 6.62 7.22 6.29 5.12 8.53 7.43 9.40 10.20 11.15 12.10 8.5206-07 13.87 15.96 15.12 14.13 9.69 9.48 17.65 7.86 7.53 7.52 9.23 10.42 10.6607-08 19.53 19.31 19.91 19.98 14.50 14.14 16.84 14.80 14.91 13.12 16.16 15.63 16.0008-09 16.82 15.65 8.30 8.14 6.68 5.95 4.38 3.97 5.15 5.83 8.47 9.49 7.2709-10 8.19 11.68 11.98 11.35 9.88 8.35 7.49 7.45 7.62 7.17 8.50 9.74 8.6310-11 11.44 11.73 13.06 13.11 8.11 7.51 5.21 5.97 7.21 8.24 9.10 10.85 8.5911-12 14.38 11.99 9.35 9.81 10.14 9.80 9.04 9.28 10.77 11.59 11.05 11.64 10.63
Citrus Monthly and Season Average Prices Received, 2002-2012 1
Crop$/Carton
Crop Year
Crop Crop Year$/Carton
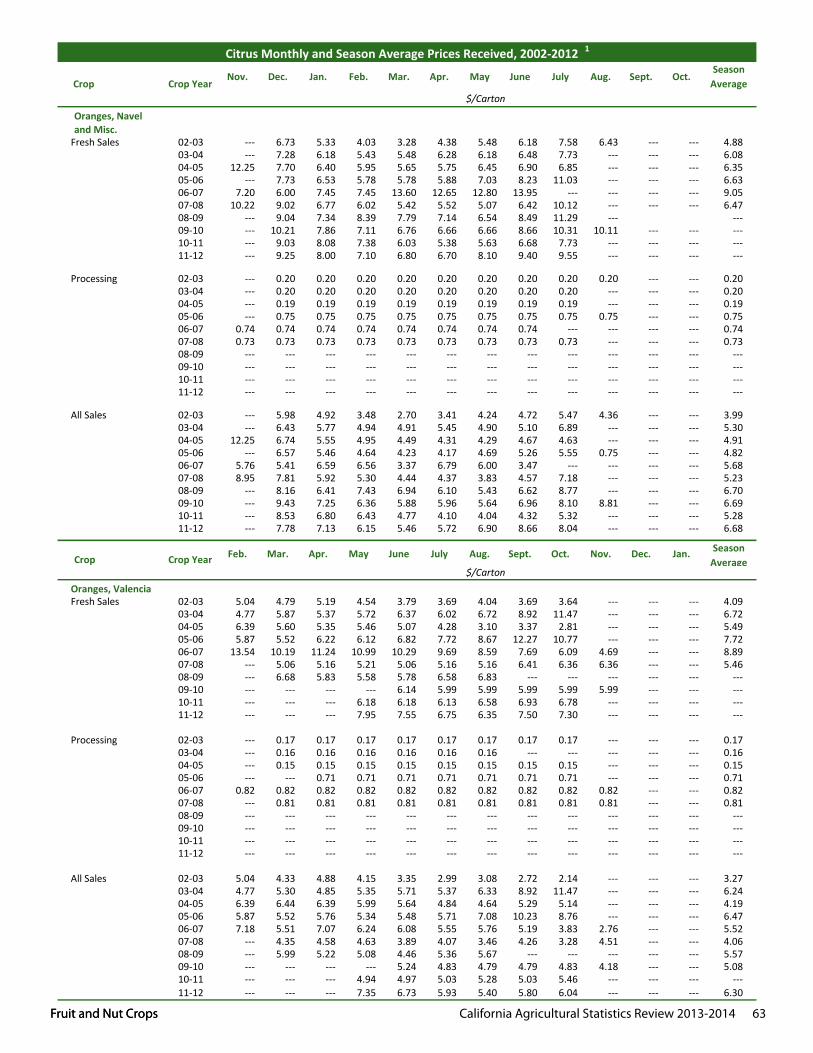
Fruit and Nut Crops California Agricultural Statistics Review 2013-2014 63 Fruit and Nut Crops
Nov. Dec. Jan. Feb. Mar. Apr. May June July Aug. Sept. Oct.Season
Average
Citrus Monthly and Season Average Prices Received, 2002-2012 1
Crop$/Carton
Crop Year
Oranges, Navel and Misc.
Fresh Sales 02-03 --- 6.73 5.33 4.03 3.28 4.38 5.48 6.18 7.58 6.43 --- --- 4.8803-04 --- 7.28 6.18 5.43 5.48 6.28 6.18 6.48 7.73 --- --- --- 6.0804-05 12.25 7.70 6.40 5.95 5.65 5.75 6.45 6.90 6.85 --- --- --- 6.3505-06 --- 7.73 6.53 5.78 5.78 5.88 7.03 8.23 11.03 --- --- --- 6.6306-07 7.20 6.00 7.45 7.45 13.60 12.65 12.80 13.95 --- --- --- --- 9.0507-08 10.22 9.02 6.77 6.02 5.42 5.52 5.07 6.42 10.12 --- --- --- 6.4708-09 --- 9.04 7.34 8.39 7.79 7.14 6.54 8.49 11.29 --- ---09-10 --- 10.21 7.86 7.11 6.76 6.66 6.66 8.66 10.31 10.11 --- --- ---10-11 --- 9.03 8.08 7.38 6.03 5.38 5.63 6.68 7.73 --- --- --- ---11-12 --- 9.25 8.00 7.10 6.80 6.70 8.10 9.40 9.55 --- --- --- ---
Processing 02-03 --- 0.20 0.20 0.20 0.20 0.20 0.20 0.20 0.20 0.20 --- --- 0.2003-04 --- 0.20 0.20 0.20 0.20 0.20 0.20 0.20 0.20 --- --- --- 0.2004-05 --- 0.19 0.19 0.19 0.19 0.19 0.19 0.19 0.19 --- --- --- 0.1905-06 --- 0.75 0.75 0.75 0.75 0.75 0.75 0.75 0.75 0.75 --- --- 0.7506-07 0.74 0.74 0.74 0.74 0.74 0.74 0.74 0.74 --- --- --- --- 0.7407-08 0.73 0.73 0.73 0.73 0.73 0.73 0.73 0.73 0.73 --- --- --- 0.7308-09 --- --- --- --- --- --- --- --- --- --- --- --- ---09-10 --- --- --- --- --- --- --- --- --- --- --- --- ---10-11 --- --- --- --- --- --- --- --- --- --- --- --- ---11-12 --- --- --- --- --- --- --- --- --- --- --- --- ---
All Sales 02-03 --- 5.98 4.92 3.48 2.70 3.41 4.24 4.72 5.47 4.36 --- --- 3.9903-04 --- 6.43 5.77 4.94 4.91 5.45 4.90 5.10 6.89 --- --- --- 5.3004-05 12.25 6.74 5.55 4.95 4.49 4.31 4.29 4.67 4.63 --- --- --- 4.9105-06 --- 6.57 5.46 4.64 4.23 4.17 4.69 5.26 5.55 0.75 --- --- 4.8206-07 5.76 5.41 6.59 6.56 3.37 6.79 6.00 3.47 --- --- --- --- 5.6807-08 8.95 7.81 5.92 5.30 4.44 4.37 3.83 4.57 7.18 --- --- --- 5.2308-09 --- 8.16 6.41 7.43 6.94 6.10 5.43 6.62 8.77 --- --- --- 6.7009-10 --- 9.43 7.25 6.36 5.88 5.96 5.64 6.96 8.10 8.81 --- --- 6.6910-11 --- 8.53 6.80 6.43 4.77 4.10 4.04 4.32 5.32 --- --- --- 5.2811-12 --- 7.78 7.13 6.15 5.46 5.72 6.90 8.66 8.04 --- --- --- 6.68
Feb. Mar. Apr. May June July Aug. Sept. Oct. Nov. Dec. Jan. Season Average
Oranges, ValenciaFresh Sales 02-03 5.04 4.79 5.19 4.54 3.79 3.69 4.04 3.69 3.64 --- --- --- 4.09
03-04 4.77 5.87 5.37 5.72 6.37 6.02 6.72 8.92 11.47 --- --- --- 6.7204-05 6.39 5.60 5.35 5.46 5.07 4.28 3.10 3.37 2.81 --- --- --- 5.4905-06 5.87 5.52 6.22 6.12 6.82 7.72 8.67 12.27 10.77 --- --- --- 7.7206-07 13.54 10.19 11.24 10.99 10.29 9.69 8.59 7.69 6.09 4.69 --- --- 8.8907-08 --- 5.06 5.16 5.21 5.06 5.16 5.16 6.41 6.36 6.36 --- --- 5.4608-09 --- 6.68 5.83 5.58 5.78 6.58 6.83 --- --- --- --- --- ---09-10 --- --- --- --- 6.14 5.99 5.99 5.99 5.99 5.99 --- --- ---10-11 --- --- --- 6.18 6.18 6.13 6.58 6.93 6.78 --- --- --- ---11-12 --- --- --- 7.95 7.55 6.75 6.35 7.50 7.30 --- --- --- ---
Processing 02-03 --- 0.17 0.17 0.17 0.17 0.17 0.17 0.17 0.17 --- --- --- 0.1703-04 --- 0.16 0.16 0.16 0.16 0.16 0.16 --- --- --- --- --- 0.1604-05 --- 0.15 0.15 0.15 0.15 0.15 0.15 0.15 0.15 --- --- --- 0.1505-06 --- --- 0.71 0.71 0.71 0.71 0.71 0.71 0.71 --- --- --- 0.7106-07 0.82 0.82 0.82 0.82 0.82 0.82 0.82 0.82 0.82 0.82 --- --- 0.8207-08 --- 0.81 0.81 0.81 0.81 0.81 0.81 0.81 0.81 0.81 --- --- 0.8108-09 --- --- --- --- --- --- --- --- --- --- --- --- ---09-10 --- --- --- --- --- --- --- --- --- --- --- --- ---10-11 --- --- --- --- --- --- --- --- --- --- --- --- ---11-12 --- --- --- --- --- --- --- --- --- --- --- --- ---
All Sales 02-03 5.04 4.33 4.88 4.15 3.35 2.99 3.08 2.72 2.14 --- --- --- 3.2703-04 4.77 5.30 4.85 5.35 5.71 5.37 6.33 8.92 11.47 --- --- --- 6.2404-05 6.39 6.44 6.39 5.99 5.64 4.84 4.64 5.29 5.14 --- --- --- 4.1905-06 5.87 5.52 5.76 5.34 5.48 5.71 7.08 10.23 8.76 --- --- --- 6.4706-07 7.18 5.51 7.07 6.24 6.08 5.55 5.76 5.19 3.83 2.76 --- --- 5.5207-08 --- 4.35 4.58 4.63 3.89 4.07 3.46 4.26 3.28 4.51 --- --- 4.0608-09 --- 5.99 5.22 5.08 4.46 5.36 5.67 --- --- --- --- --- 5.5709-10 --- --- --- --- 5.24 4.83 4.79 4.79 4.83 4.18 --- --- 5.0810-11 --- --- --- 4.94 4.97 5.03 5.28 5.03 5.46 --- --- --- ---11-12 --- --- --- 7.35 6.73 5.93 5.40 5.80 6.04 --- --- --- 6.30
Crop Crop Year$/Carton
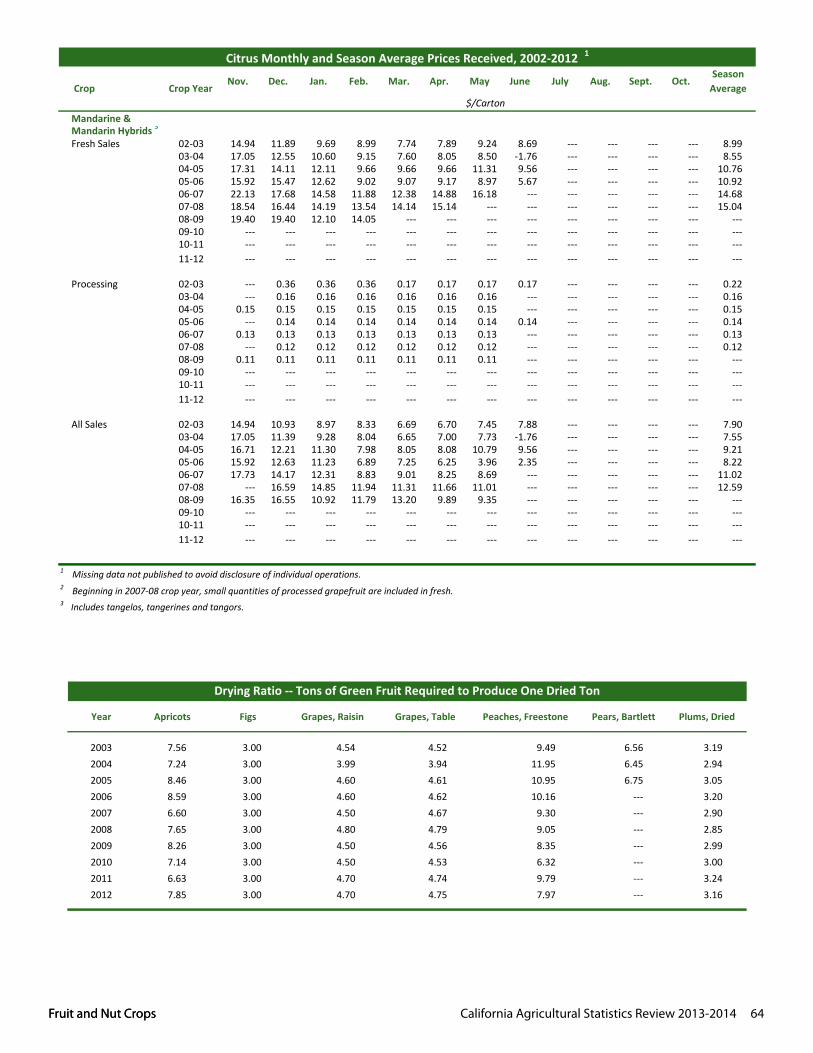
Fruit and Nut Crops California Agricultural Statistics Review 2013-2014 64 Fruit and Nut Crops
Nov. Dec. Jan. Feb. Mar. Apr. May June July Aug. Sept. Oct.Season
Average
Citrus Monthly and Season Average Prices Received, 2002-2012 1
Crop$/Carton
Crop Year
Mandarine &Mandarin Hybrids 3
Fresh Sales 02-03 14.94 11.89 9.69 8.99 7.74 7.89 9.24 8.69 --- --- --- --- 8.9903-04 17.05 12.55 10.60 9.15 7.60 8.05 8.50 -1.76 --- --- --- --- 8.5504-05 17.31 14.11 12.11 9.66 9.66 9.66 11.31 9.56 --- --- --- --- 10.7605-06 15.92 15.47 12.62 9.02 9.07 9.17 8.97 5.67 --- --- --- --- 10.9206-07 22.13 17.68 14.58 11.88 12.38 14.88 16.18 --- --- --- --- --- 14.6807-08 18.54 16.44 14.19 13.54 14.14 15.14 --- --- --- --- --- --- 15.0408-09 19.40 19.40 12.10 14.05 --- --- --- --- --- --- --- --- ---09-10 --- --- --- --- --- --- --- --- --- --- --- --- ---10-11 --- --- --- --- --- --- --- --- --- --- --- --- ---11-12 --- --- --- --- --- --- --- --- --- --- --- --- ---
Processing 02-03 --- 0.36 0.36 0.36 0.17 0.17 0.17 0.17 --- --- --- --- 0.2203-04 --- 0.16 0.16 0.16 0.16 0.16 0.16 --- --- --- --- --- 0.1604-05 0.15 0.15 0.15 0.15 0.15 0.15 0.15 --- --- --- --- --- 0.1505-06 --- 0.14 0.14 0.14 0.14 0.14 0.14 0.14 --- --- --- --- 0.1406-07 0.13 0.13 0.13 0.13 0.13 0.13 0.13 --- --- --- --- --- 0.1307-08 --- 0.12 0.12 0.12 0.12 0.12 0.12 --- --- --- --- --- 0.1208-09 0.11 0.11 0.11 0.11 0.11 0.11 0.11 --- --- --- --- --- ---09-10 --- --- --- --- --- --- --- --- --- --- --- --- ---10-11 --- --- --- --- --- --- --- --- --- --- --- --- ---11-12 --- --- --- --- --- --- --- --- --- --- --- --- ---
All Sales 02-03 14.94 10.93 8.97 8.33 6.69 6.70 7.45 7.88 --- --- --- --- 7.9003-04 17.05 11.39 9.28 8.04 6.65 7.00 7.73 -1.76 --- --- --- --- 7.5504-05 16.71 12.21 11.30 7.98 8.05 8.08 10.79 9.56 --- --- --- --- 9.2105-06 15.92 12.63 11.23 6.89 7.25 6.25 3.96 2.35 --- --- --- --- 8.2206-07 17.73 14.17 12.31 8.83 9.01 8.25 8.69 --- --- --- --- --- 11.0207-08 --- 16.59 14.85 11.94 11.31 11.66 11.01 --- --- --- --- --- 12.5908-09 16.35 16.55 10.92 11.79 13.20 9.89 9.35 --- --- --- --- --- ---09-10 --- --- --- --- --- --- --- --- --- --- --- --- ---10-11 --- --- --- --- --- --- --- --- --- --- --- --- ---11-12 --- --- --- --- --- --- --- --- --- --- --- --- ---
1 Missing data not published to avoid disclosure of individual operations.2 Beginning in 2007-08 crop year, small quantities of processed grapefruit are included in fresh.3 Includes tangelos, tangerines and tangors.
Year Apricots Figs Grapes, Raisin Grapes, Table Peaches, Freestone Pears, Bartlett Plums, Dried
2003 7.56 3.00 4.54 4.52 9.49 6.56 3.192004 7.24 3.00 3.99 3.94 11.95 6.45 2.942005 8.46 3.00 4.60 4.61 10.95 6.75 3.052006 8.59 3.00 4.60 4.62 10.16 --- 3.202007 6.60 3.00 4.50 4.67 9.30 --- 2.902008 7.65 3.00 4.80 4.79 9.05 --- 2.852009 8.26 3.00 4.50 4.56 8.35 --- 2.992010 7.14 3.00 4.50 4.53 6.32 --- 3.002011 6.63 3.00 4.70 4.74 9.79 --- 3.242012 7.85 3.00 4.70 4.75 7.97 --- 3.16
Drying Ratio -- Tons of Green Fruit Required to Produce One Dried Ton
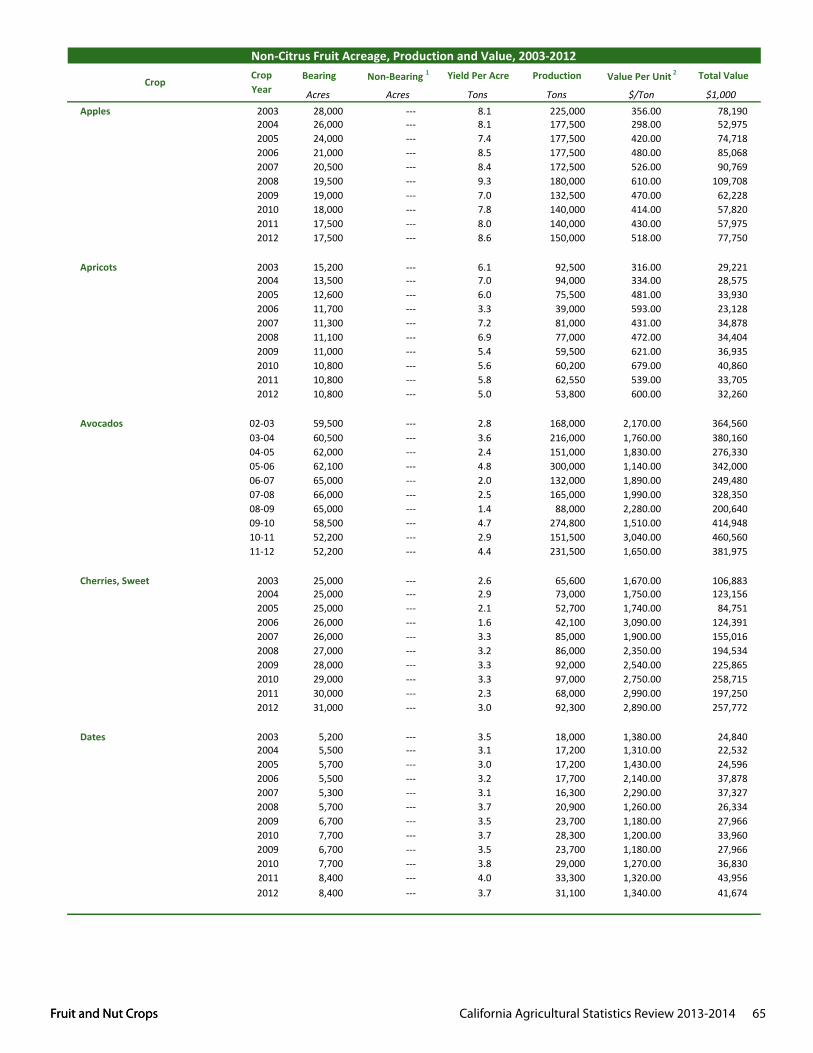
Fruit and Nut Crops California Agricultural Statistics Review 2013-2014 65 Fruit and Nut Crops
Bearing Non-Bearing 1 Yield Per Acre Production Value Per Unit 2 Total Value
Acres Acres Tons Tons $/Ton $1,000Apples 2003 28,000 --- 8.1 225,000 356.00 78,190
2004 26,000 --- 8.1 177,500 298.00 52,9752005 24,000 --- 7.4 177,500 420.00 74,7182006 21,000 --- 8.5 177,500 480.00 85,0682007 20,500 --- 8.4 172,500 526.00 90,7692008 19,500 --- 9.3 180,000 610.00 109,7082009 19,000 --- 7.0 132,500 470.00 62,2282010 18,000 --- 7.8 140,000 414.00 57,8202011 17,500 --- 8.0 140,000 430.00 57,9752012 17,500 --- 8.6 150,000 518.00 77,750
Apricots 2003 15,200 --- 6.1 92,500 316.00 29,2212004 13,500 --- 7.0 94,000 334.00 28,5752005 12,600 --- 6.0 75,500 481.00 33,9302006 11,700 --- 3.3 39,000 593.00 23,1282007 11,300 --- 7.2 81,000 431.00 34,8782008 11,100 --- 6.9 77,000 472.00 34,4042009 11,000 --- 5.4 59,500 621.00 36,9352010 10,800 --- 5.6 60,200 679.00 40,8602011 10,800 --- 5.8 62,550 539.00 33,7052012 10,800 --- 5.0 53,800 600.00 32,260
Avocados 02-03 59,500 --- 2.8 168,000 2,170.00 364,56003-04 60,500 --- 3.6 216,000 1,760.00 380,16004-05 62,000 --- 2.4 151,000 1,830.00 276,33005-06 62,100 --- 4.8 300,000 1,140.00 342,00006-07 65,000 --- 2.0 132,000 1,890.00 249,48007-08 66,000 --- 2.5 165,000 1,990.00 328,35008-09 65,000 --- 1.4 88,000 2,280.00 200,64009-10 58,500 --- 4.7 274,800 1,510.00 414,94810-11 52,200 --- 2.9 151,500 3,040.00 460,56011-12 52,200 --- 4.4 231,500 1,650.00 381,975
Cherries, Sweet 2003 25,000 --- 2.6 65,600 1,670.00 106,8832004 25,000 --- 2.9 73,000 1,750.00 123,1562005 25,000 --- 2.1 52,700 1,740.00 84,7512006 26,000 --- 1.6 42,100 3,090.00 124,3912007 26,000 --- 3.3 85,000 1,900.00 155,0162008 27,000 --- 3.2 86,000 2,350.00 194,5342009 28,000 --- 3.3 92,000 2,540.00 225,8652010 29,000 --- 3.3 97,000 2,750.00 258,7152011 30,000 --- 2.3 68,000 2,990.00 197,2502012 31,000 --- 3.0 92,300 2,890.00 257,772
Dates 2003 5,200 --- 3.5 18,000 1,380.00 24,8402004 5,500 --- 3.1 17,200 1,310.00 22,5322005 5,700 --- 3.0 17,200 1,430.00 24,5962006 5,500 --- 3.2 17,700 2,140.00 37,8782007 5,300 --- 3.1 16,300 2,290.00 37,3272008 5,700 --- 3.7 20,900 1,260.00 26,3342009 6,700 --- 3.5 23,700 1,180.00 27,9662010 7,700 --- 3.7 28,300 1,200.00 33,9602009 6,700 --- 3.5 23,700 1,180.00 27,9662010 7,700 --- 3.8 29,000 1,270.00 36,8302011 8,400 --- 4.0 33,300 1,320.00 43,9562012 8,400 --- 3.7 31,100 1,340.00 41,674
Non-Citrus Fruit Acreage, Production and Value, 2003-2012
CropCrop Year
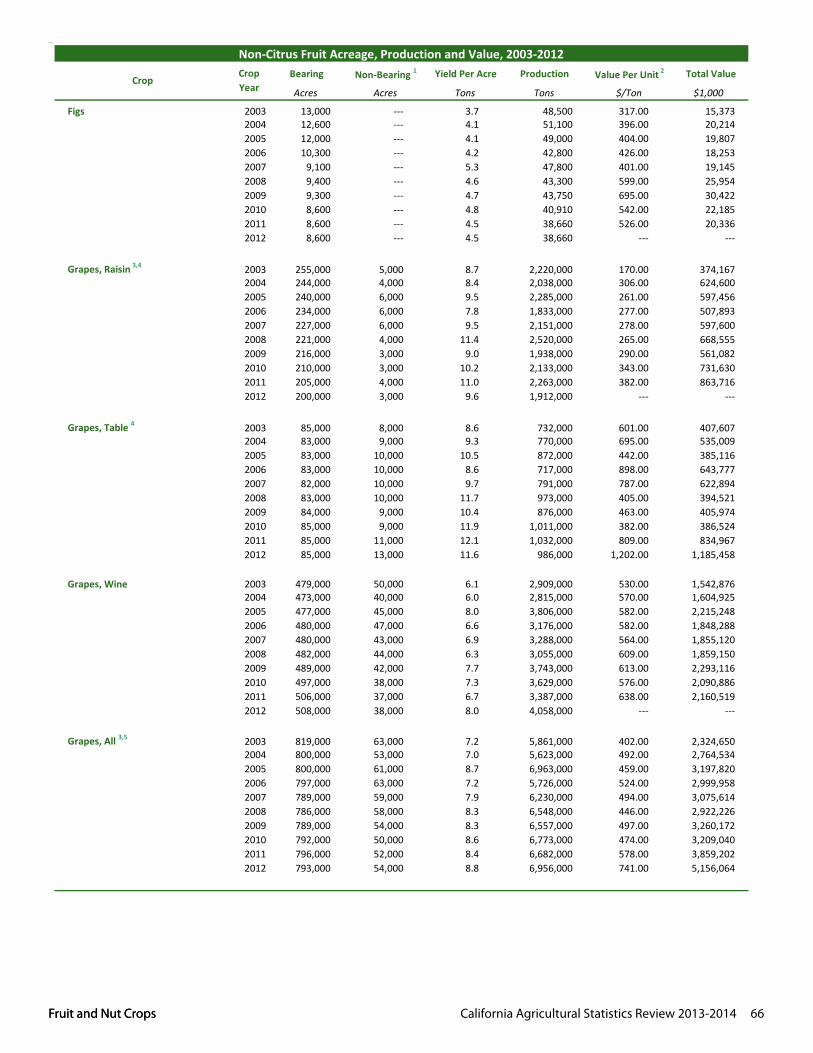
Fruit and Nut Crops California Agricultural Statistics Review 2013-2014 66 Fruit and Nut Crops
Bearing Non-Bearing 1 Yield Per Acre Production Value Per Unit 2 Total Value
Acres Acres Tons Tons $/Ton $1,000
Non-Citrus Fruit Acreage, Production and Value, 2003-2012
Crop Crop Year
Figs 2003 13,000 --- 3.7 48,500 317.00 15,3732004 12,600 --- 4.1 51,100 396.00 20,2142005 12,000 --- 4.1 49,000 404.00 19,8072006 10,300 --- 4.2 42,800 426.00 18,2532007 9,100 --- 5.3 47,800 401.00 19,1452008 9,400 --- 4.6 43,300 599.00 25,9542009 9,300 --- 4.7 43,750 695.00 30,4222010 8,600 --- 4.8 40,910 542.00 22,1852011 8,600 --- 4.5 38,660 526.00 20,3362012 8,600 --- 4.5 38,660 --- ---
Grapes, Raisin 3,4 2003 255,000 5,000 8.7 2,220,000 170.00 374,1672004 244,000 4,000 8.4 2,038,000 306.00 624,6002005 240,000 6,000 9.5 2,285,000 261.00 597,4562006 234,000 6,000 7.8 1,833,000 277.00 507,8932007 227,000 6,000 9.5 2,151,000 278.00 597,6002008 221,000 4,000 11.4 2,520,000 265.00 668,5552009 216,000 3,000 9.0 1,938,000 290.00 561,0822010 210,000 3,000 10.2 2,133,000 343.00 731,6302011 205,000 4,000 11.0 2,263,000 382.00 863,7162012 200,000 3,000 9.6 1,912,000 --- ---
Grapes, Table 4 2003 85,000 8,000 8.6 732,000 601.00 407,6072004 83,000 9,000 9.3 770,000 695.00 535,0092005 83,000 10,000 10.5 872,000 442.00 385,1162006 83,000 10,000 8.6 717,000 898.00 643,7772007 82,000 10,000 9.7 791,000 787.00 622,8942008 83,000 10,000 11.7 973,000 405.00 394,5212009 84,000 9,000 10.4 876,000 463.00 405,9742010 85,000 9,000 11.9 1,011,000 382.00 386,5242011 85,000 11,000 12.1 1,032,000 809.00 834,9672012 85,000 13,000 11.6 986,000 1,202.00 1,185,458
Grapes, Wine 2003 479,000 50,000 6.1 2,909,000 530.00 1,542,8762004 473,000 40,000 6.0 2,815,000 570.00 1,604,9252005 477,000 45,000 8.0 3,806,000 582.00 2,215,2482006 480,000 47,000 6.6 3,176,000 582.00 1,848,2882007 480,000 43,000 6.9 3,288,000 564.00 1,855,1202008 482,000 44,000 6.3 3,055,000 609.00 1,859,1502009 489,000 42,000 7.7 3,743,000 613.00 2,293,1162010 497,000 38,000 7.3 3,629,000 576.00 2,090,8862011 506,000 37,000 6.7 3,387,000 638.00 2,160,5192012 508,000 38,000 8.0 4,058,000 --- ---
Grapes, All 3,5 2003 819,000 63,000 7.2 5,861,000 402.00 2,324,6502004 800,000 53,000 7.0 5,623,000 492.00 2,764,5342005 800,000 61,000 8.7 6,963,000 459.00 3,197,8202006 797,000 63,000 7.2 5,726,000 524.00 2,999,9582007 789,000 59,000 7.9 6,230,000 494.00 3,075,6142008 786,000 58,000 8.3 6,548,000 446.00 2,922,2262009 789,000 54,000 8.3 6,557,000 497.00 3,260,1722010 792,000 50,000 8.6 6,773,000 474.00 3,209,0402011 796,000 52,000 8.4 6,682,000 578.00 3,859,2022012 793,000 54,000 8.8 6,956,000 741.00 5,156,064
Bearing Non-Bearing 1 Yield Per Acre Production Value Per Unit 2 Total Value
Acres Acres Tons Tons $/Ton $1,000
Non-Citrus Fruit Acreage, Production and Value, 2003-2012
CropCrop Year
Figs 2003 13,000 --- 3.7 48,500 317.00 15,3732004 12,600 --- 4.1 51,100 396.00 20,2142005 12,000 --- 4.1 49,000 404.00 19,8072006 10,300 --- 4.2 42,800 426.00 18,2532007 9,100 --- 5.3 47,800 401.00 19,1452008 9,400 --- 4.6 43,300 599.00 25,9542009 9,300 --- 4.7 43,750 695.00 30,4222010 8,600 --- 4.8 40,910 542.00 22,1852011 8,600 --- 4.5 38,660 526.00 20,3362012 8,600 --- 4.5 38,660 --- ---
Grapes, Raisin 3,4 2003 255,000 5,000 8.7 2,220,000 170.00 374,1672004 244,000 4,000 8.4 2,038,000 306.00 624,6002005 240,000 6,000 9.5 2,285,000 261.00 597,4562006 234,000 6,000 7.8 1,833,000 277.00 507,8932007 227,000 6,000 9.5 2,151,000 278.00 597,6002008 221,000 4,000 11.4 2,520,000 265.00 668,5552009 216,000 3,000 9.0 1,938,000 290.00 561,0822010 210,000 3,000 10.2 2,133,000 343.00 731,6302011 205,000 4,000 11.0 2,263,000 382.00 863,7162012 200,000 3,000 9.6 1,912,000 --- ---
Grapes, Table 4 2003 85,000 8,000 8.6 732,000 601.00 407,6072004 83,000 9,000 9.3 770,000 695.00 535,0092005 83,000 10,000 10.5 872,000 442.00 385,1162006 83,000 10,000 8.6 717,000 898.00 643,7772007 82,000 10,000 9.7 791,000 787.00 622,8942008 83,000 10,000 11.7 973,000 405.00 394,5212009 84,000 9,000 10.4 876,000 463.00 405,9742010 85,000 9,000 11.9 1,011,000 382.00 386,5242011 85,000 11,000 12.1 1,032,000 809.00 834,9672012 85,000 13,000 11.6 986,000 1,202.00 1,185,458
Grapes, Wine 2003 479,000 50,000 6.1 2,909,000 530.00 1,542,8762004 473,000 40,000 6.0 2,815,000 570.00 1,604,9252005 477,000 45,000 8.0 3,806,000 582.00 2,215,2482006 480,000 47,000 6.6 3,176,000 582.00 1,848,2882007 480,000 43,000 6.9 3,288,000 564.00 1,855,1202008 482,000 44,000 6.3 3,055,000 609.00 1,859,1502009 489,000 42,000 7.7 3,743,000 613.00 2,293,1162010 497,000 38,000 7.3 3,629,000 576.00 2,090,8862011 506,000 37,000 6.7 3,387,000 638.00 2,160,5192012 508,000 38,000 8.0 4,058,000 --- ---
Grapes, All 3,5 2003 819,000 63,000 7.2 5,861,000 402.00 2,324,6502004 800,000 53,000 7.0 5,623,000 492.00 2,764,5342005 800,000 61,000 8.7 6,963,000 459.00 3,197,8202006 797,000 63,000 7.2 5,726,000 524.00 2,999,9582007 789,000 59,000 7.9 6,230,000 494.00 3,075,6142008 786,000 58,000 8.3 6,548,000 446.00 2,922,2262009 789,000 54,000 8.3 6,557,000 497.00 3,260,1722010 792,000 50,000 8.6 6,773,000 474.00 3,209,0402011 796,000 52,000 8.4 6,682,000 578.00 3,859,2022012 793,000 54,000 8.8 6,956,000 741.00 5,156,064
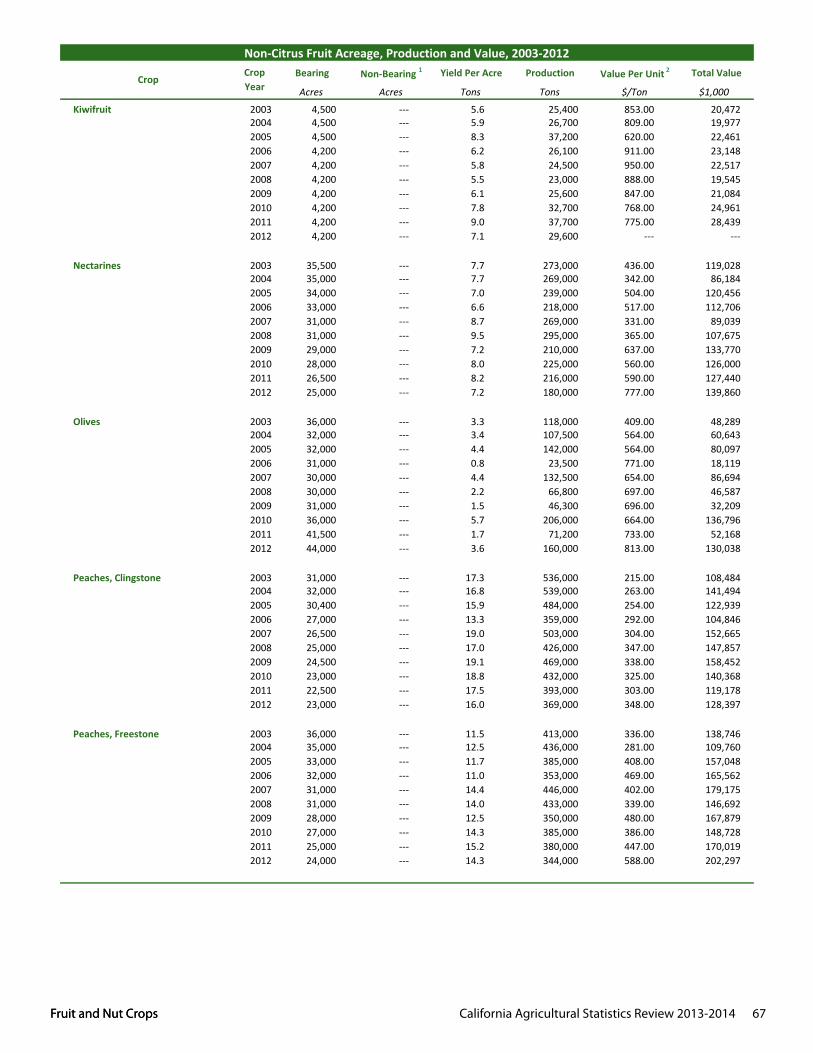
Fruit and Nut Crops California Agricultural Statistics Review 2013-2014 67 Fruit and Nut Crops
Bearing Non-Bearing 1 Yield Per Acre Production Value Per Unit 2 Total Value
Acres Acres Tons Tons $/Ton $1,000
Non-Citrus Fruit Acreage, Production and Value, 2003-2012
CropCrop Year
Kiwifruit 2003 4,500 --- 5.6 25,400 853.00 20,4722004 4,500 --- 5.9 26,700 809.00 19,9772005 4,500 --- 8.3 37,200 620.00 22,4612006 4,200 --- 6.2 26,100 911.00 23,1482007 4,200 --- 5.8 24,500 950.00 22,5172008 4,200 --- 5.5 23,000 888.00 19,5452009 4,200 --- 6.1 25,600 847.00 21,0842010 4,200 --- 7.8 32,700 768.00 24,9612011 4,200 --- 9.0 37,700 775.00 28,4392012 4,200 --- 7.1 29,600 --- ---
Nectarines 2003 35,500 --- 7.7 273,000 436.00 119,0282004 35,000 --- 7.7 269,000 342.00 86,1842005 34,000 --- 7.0 239,000 504.00 120,4562006 33,000 --- 6.6 218,000 517.00 112,7062007 31,000 --- 8.7 269,000 331.00 89,0392008 31,000 --- 9.5 295,000 365.00 107,6752009 29,000 --- 7.2 210,000 637.00 133,7702010 28,000 --- 8.0 225,000 560.00 126,0002011 26,500 --- 8.2 216,000 590.00 127,4402012 25,000 --- 7.2 180,000 777.00 139,860
Olives 2003 36,000 --- 3.3 118,000 409.00 48,2892004 32,000 --- 3.4 107,500 564.00 60,6432005 32,000 --- 4.4 142,000 564.00 80,0972006 31,000 --- 0.8 23,500 771.00 18,1192007 30,000 --- 4.4 132,500 654.00 86,6942008 30,000 --- 2.2 66,800 697.00 46,5872009 31,000 --- 1.5 46,300 696.00 32,2092010 36,000 --- 5.7 206,000 664.00 136,7962011 41,500 --- 1.7 71,200 733.00 52,1682012 44,000 --- 3.6 160,000 813.00 130,038
Peaches, Clingstone 2003 31,000 --- 17.3 536,000 215.00 108,4842004 32,000 --- 16.8 539,000 263.00 141,4942005 30,400 --- 15.9 484,000 254.00 122,9392006 27,000 --- 13.3 359,000 292.00 104,8462007 26,500 --- 19.0 503,000 304.00 152,6652008 25,000 --- 17.0 426,000 347.00 147,8572009 24,500 --- 19.1 469,000 338.00 158,4522010 23,000 --- 18.8 432,000 325.00 140,3682011 22,500 --- 17.5 393,000 303.00 119,1782012 23,000 --- 16.0 369,000 348.00 128,397
Peaches, Freestone 2003 36,000 --- 11.5 413,000 336.00 138,7462004 35,000 --- 12.5 436,000 281.00 109,7602005 33,000 --- 11.7 385,000 408.00 157,0482006 32,000 --- 11.0 353,000 469.00 165,5622007 31,000 --- 14.4 446,000 402.00 179,1752008 31,000 --- 14.0 433,000 339.00 146,6922009 28,000 --- 12.5 350,000 480.00 167,8792010 27,000 --- 14.3 385,000 386.00 148,7282011 25,000 --- 15.2 380,000 447.00 170,0192012 24,000 --- 14.3 344,000 588.00 202,297
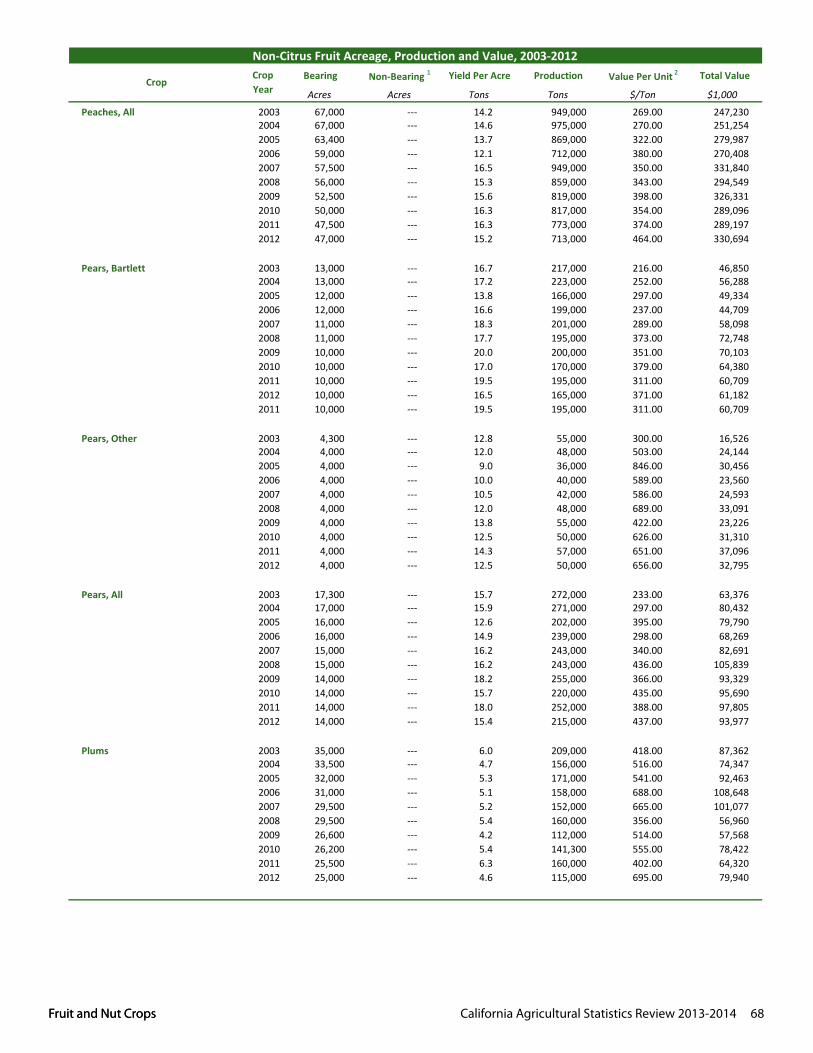
Fruit and Nut Crops California Agricultural Statistics Review 2013-2014 68 Fruit and Nut Crops
Bearing Non-Bearing 1 Yield Per Acre Production Value Per Unit 2 Total Value
Acres Acres Tons Tons $/Ton $1,000
Non-Citrus Fruit Acreage, Production and Value, 2003-2012
CropCrop Year
Peaches, All 2003 67,000 --- 14.2 949,000 269.00 247,2302004 67,000 --- 14.6 975,000 270.00 251,2542005 63,400 --- 13.7 869,000 322.00 279,9872006 59,000 --- 12.1 712,000 380.00 270,4082007 57,500 --- 16.5 949,000 350.00 331,8402008 56,000 --- 15.3 859,000 343.00 294,5492009 52,500 --- 15.6 819,000 398.00 326,3312010 50,000 --- 16.3 817,000 354.00 289,0962011 47,500 --- 16.3 773,000 374.00 289,1972012 47,000 --- 15.2 713,000 464.00 330,694
Pears, Bartlett 2003 13,000 --- 16.7 217,000 216.00 46,8502004 13,000 --- 17.2 223,000 252.00 56,2882005 12,000 --- 13.8 166,000 297.00 49,3342006 12,000 --- 16.6 199,000 237.00 44,7092007 11,000 --- 18.3 201,000 289.00 58,0982008 11,000 --- 17.7 195,000 373.00 72,7482009 10,000 --- 20.0 200,000 351.00 70,1032010 10,000 --- 17.0 170,000 379.00 64,3802011 10,000 --- 19.5 195,000 311.00 60,7092012 10,000 --- 16.5 165,000 371.00 61,1822011 10,000 --- 19.5 195,000 311.00 60,709
Pears, Other 2003 4,300 --- 12.8 55,000 300.00 16,5262004 4,000 --- 12.0 48,000 503.00 24,1442005 4,000 --- 9.0 36,000 846.00 30,4562006 4,000 --- 10.0 40,000 589.00 23,5602007 4,000 --- 10.5 42,000 586.00 24,5932008 4,000 --- 12.0 48,000 689.00 33,0912009 4,000 --- 13.8 55,000 422.00 23,2262010 4,000 --- 12.5 50,000 626.00 31,3102011 4,000 --- 14.3 57,000 651.00 37,0962012 4,000 --- 12.5 50,000 656.00 32,795
Pears, All 2003 17,300 --- 15.7 272,000 233.00 63,3762004 17,000 --- 15.9 271,000 297.00 80,4322005 16,000 --- 12.6 202,000 395.00 79,7902006 16,000 --- 14.9 239,000 298.00 68,2692007 15,000 --- 16.2 243,000 340.00 82,6912008 15,000 --- 16.2 243,000 436.00 105,8392009 14,000 --- 18.2 255,000 366.00 93,3292010 14,000 --- 15.7 220,000 435.00 95,6902011 14,000 --- 18.0 252,000 388.00 97,8052012 14,000 --- 15.4 215,000 437.00 93,977
Plums 2003 35,000 --- 6.0 209,000 418.00 87,3622004 33,500 --- 4.7 156,000 516.00 74,3472005 32,000 --- 5.3 171,000 541.00 92,4632006 31,000 --- 5.1 158,000 688.00 108,6482007 29,500 --- 5.2 152,000 665.00 101,0772008 29,500 --- 5.4 160,000 356.00 56,9602009 26,600 --- 4.2 112,000 514.00 57,5682010 26,200 --- 5.4 141,300 555.00 78,4222011 25,500 --- 6.3 160,000 402.00 64,3202012 25,000 --- 4.6 115,000 695.00 79,940
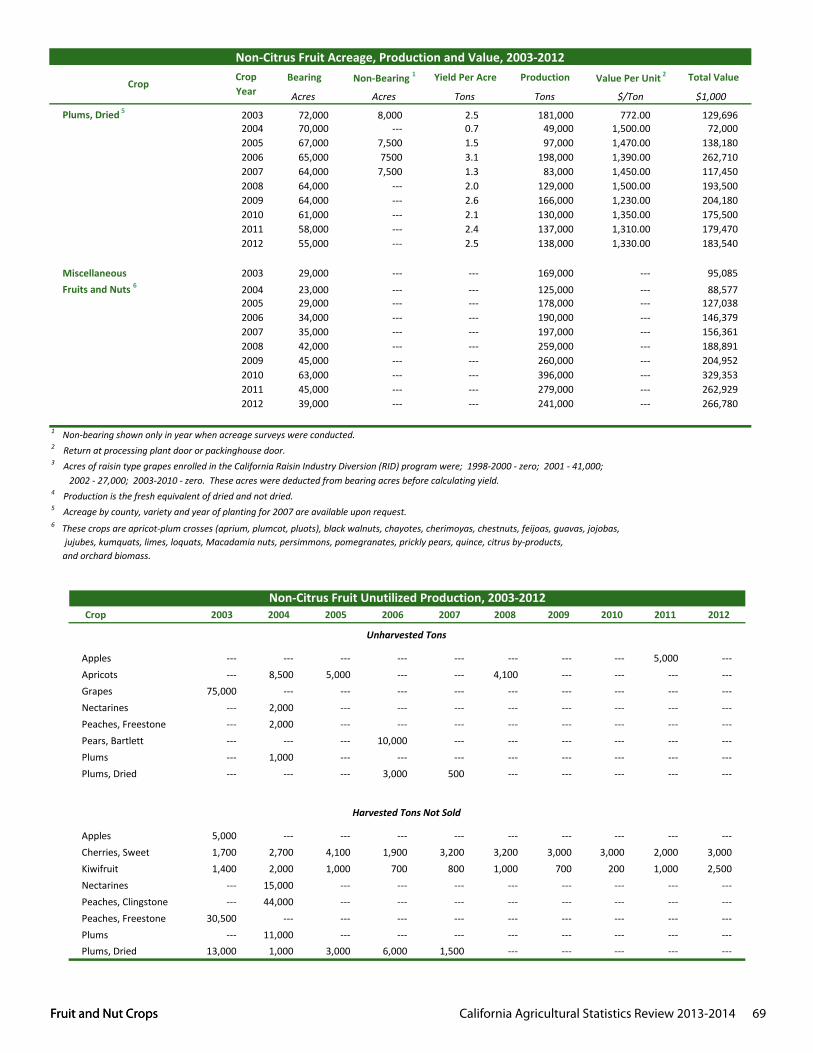
Fruit and Nut Crops California Agricultural Statistics Review 2013-2014 69 Fruit and Nut Crops
Bearing Non-Bearing 1 Yield Per Acre Production Value Per Unit 2 Total Value
Acres Acres Tons Tons $/Ton $1,000
Non-Citrus Fruit Acreage, Production and Value, 2003-2012
CropCrop Year
Plums, Dried 5 2003 72,000 8,000 2.5 181,000 772.00 129,6962004 70,000 --- 0.7 49,000 1,500.00 72,0002005 67,000 7,500 1.5 97,000 1,470.00 138,1802006 65,000 7500 3.1 198,000 1,390.00 262,7102007 64,000 7,500 1.3 83,000 1,450.00 117,4502008 64,000 --- 2.0 129,000 1,500.00 193,5002009 64,000 --- 2.6 166,000 1,230.00 204,1802010 61,000 --- 2.1 130,000 1,350.00 175,5002011 58,000 --- 2.4 137,000 1,310.00 179,4702012 55,000 --- 2.5 138,000 1,330.00 183,540
Miscellaneous 2003 29,000 --- --- 169,000 --- 95,085Fruits and Nuts 6 2004 23,000 --- --- 125,000 --- 88,577
2005 29,000 --- --- 178,000 --- 127,0382006 34,000 --- --- 190,000 --- 146,3792007 35,000 --- --- 197,000 --- 156,3612008 42,000 --- --- 259,000 --- 188,8912009 45,000 --- --- 260,000 --- 204,9522010 63,000 --- --- 396,000 --- 329,3532011 45,000 --- --- 279,000 --- 262,9292012 39,000 --- --- 241,000 --- 266,780
1 Non-bearing shown only in year when acreage surveys were conducted.2 Return at processing plant door or packinghouse door.3 Acres of raisin type grapes enrolled in the California Raisin Industry Diversion (RID) program were; 1998-2000 - zero; 2001 - 41,000; 2002 - 27,000; 2003-2010 - zero. These acres were deducted from bearing acres before calculating yield.4 Production is the fresh equivalent of dried and not dried.5 Acreage by county, variety and year of planting for 2007 are available upon request.6 These crops are apricot-plum crosses (aprium, plumcot, pluots), black walnuts, chayotes, cherimoyas, chestnuts, feijoas, guavas, jojobas, jujubes, kumquats, limes, loquats, Macadamia nuts, persimmons, pomegranates, prickly pears, quince, citrus by-products, and orchard biomass.
Crop 2003 2004 2005 2006 2007 2008 2009 2010 2011 2012
Apples --- --- --- --- --- --- --- --- 5,000 ---Apricots --- 8,500 5,000 --- --- 4,100 --- --- --- ---Grapes 75,000 --- --- --- --- --- --- --- --- ---Nectarines --- 2,000 --- --- --- --- --- --- --- ---Peaches, Freestone --- 2,000 --- --- --- --- --- --- --- ---Pears, Bartlett --- --- --- 10,000 --- --- --- --- --- ---Plums --- 1,000 --- --- --- --- --- --- --- ---Plums, Dried --- --- --- 3,000 500 --- --- --- --- ---
Apples 5,000 --- --- --- --- --- --- --- --- ---Cherries, Sweet 1,700 2,700 4,100 1,900 3,200 3,200 3,000 3,000 2,000 3,000Kiwifruit 1,400 2,000 1,000 700 800 1,000 700 200 1,000 2,500Nectarines --- 15,000 --- --- --- --- --- --- --- ---Peaches, Clingstone --- 44,000 --- --- --- --- --- --- --- ---Peaches, Freestone 30,500 --- --- --- --- --- --- --- --- ---Plums --- 11,000 --- --- --- --- --- --- --- ---Plums, Dried 13,000 1,000 3,000 6,000 1,500 --- --- --- --- ---
Non-Citrus Fruit Unutilized Production, 2003-2012
Harvested Tons Not Sold
Unharvested Tons
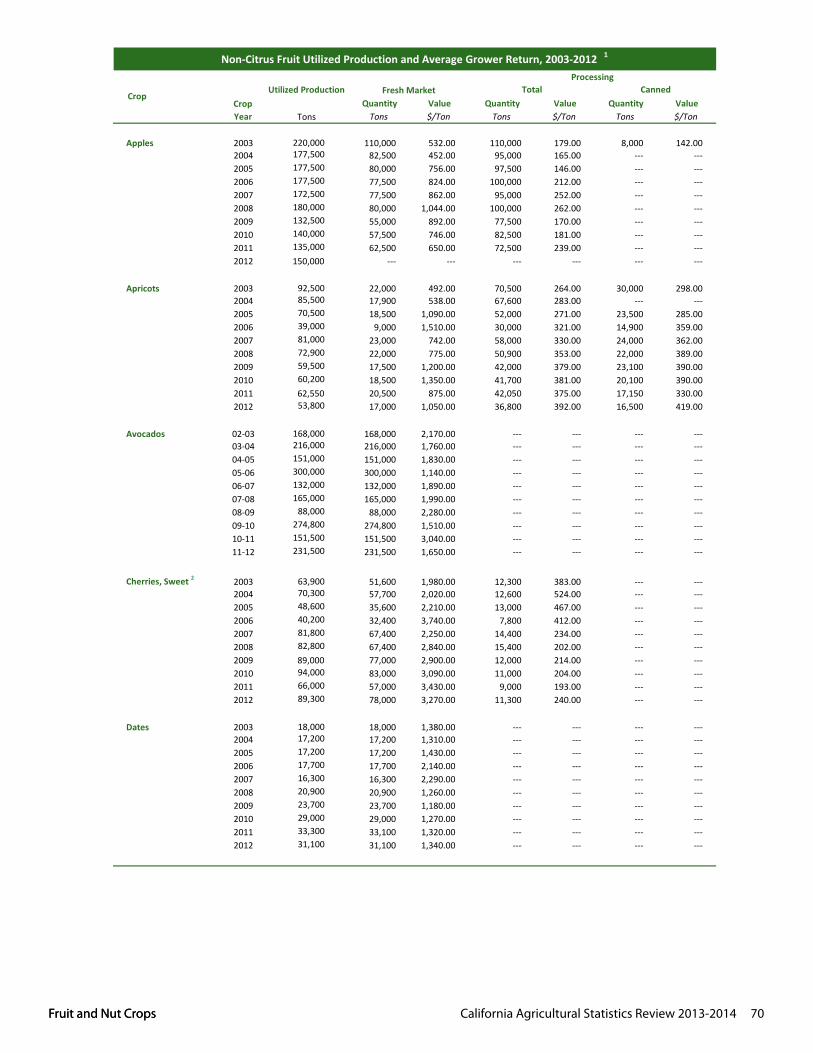
Fruit and Nut Crops California Agricultural Statistics Review 2013-2014 70 Fruit and Nut Crops
Quantity Value Quantity Value Quantity ValueTons Tons $/Ton Tons $/Ton Tons $/Ton
Apples 2003 220,000 110,000 532.00 110,000 179.00 8,000 142.002004 177,500 82,500 452.00 95,000 165.00 --- ---2005 177,500 80,000 756.00 97,500 146.00 --- ---2006 177,500 77,500 824.00 100,000 212.00 --- ---2007 172,500 77,500 862.00 95,000 252.00 --- ---2008 180,000 80,000 1,044.00 100,000 262.00 --- ---2009 132,500 55,000 892.00 77,500 170.00 --- ---2010 140,000 57,500 746.00 82,500 181.00 --- ---2011 135,000 62,500 650.00 72,500 239.00 --- ---2012 150,000 --- --- --- --- --- ---
Apricots 2003 92,500 22,000 492.00 70,500 264.00 30,000 298.002004 85,500 17,900 538.00 67,600 283.00 --- ---2005 70,500 18,500 1,090.00 52,000 271.00 23,500 285.002006 39,000 9,000 1,510.00 30,000 321.00 14,900 359.002007 81,000 23,000 742.00 58,000 330.00 24,000 362.002008 72,900 22,000 775.00 50,900 353.00 22,000 389.002009 59,500 17,500 1,200.00 42,000 379.00 23,100 390.002010 60,200 18,500 1,350.00 41,700 381.00 20,100 390.002011 62,550 20,500 875.00 42,050 375.00 17,150 330.002012 53,800 17,000 1,050.00 36,800 392.00 16,500 419.00
Avocados 02-03 168,000 168,000 2,170.00 --- --- --- ---03-04 216,000 216,000 1,760.00 --- --- --- ---04-05 151,000 151,000 1,830.00 --- --- --- ---05-06 300,000 300,000 1,140.00 --- --- --- ---06-07 132,000 132,000 1,890.00 --- --- --- ---07-08 165,000 165,000 1,990.00 --- --- --- ---08-09 88,000 88,000 2,280.00 --- --- --- ---09-10 274,800 274,800 1,510.00 --- --- --- ---10-11 151,500 151,500 3,040.00 --- --- --- ---11-12 231,500 231,500 1,650.00 --- --- --- ---
Cherries, Sweet 2 2003 63,900 51,600 1,980.00 12,300 383.00 --- ---2004 70,300 57,700 2,020.00 12,600 524.00 --- ---2005 48,600 35,600 2,210.00 13,000 467.00 --- ---2006 40,200 32,400 3,740.00 7,800 412.00 --- ---2007 81,800 67,400 2,250.00 14,400 234.00 --- ---2008 82,800 67,400 2,840.00 15,400 202.00 --- ---2009 89,000 77,000 2,900.00 12,000 214.00 --- ---2010 94,000 83,000 3,090.00 11,000 204.00 --- ---2011 66,000 57,000 3,430.00 9,000 193.00 --- ---2012 89,300 78,000 3,270.00 11,300 240.00 --- ---
Dates 2003 18,000 18,000 1,380.00 --- --- --- ---2004 17,200 17,200 1,310.00 --- --- --- ---2005 17,200 17,200 1,430.00 --- --- --- ---2006 17,700 17,700 2,140.00 --- --- --- ---2007 16,300 16,300 2,290.00 --- --- --- ---2008 20,900 20,900 1,260.00 --- --- --- ---2009 23,700 23,700 1,180.00 --- --- --- ---2010 29,000 29,000 1,270.00 --- --- --- ---2011 33,300 33,100 1,320.00 --- --- --- ---2012 31,100 31,100 1,340.00 --- --- --- ---
Crop Year
Crop
Non-Citrus Fruit Utilized Production and Average Grower Return, 2003-2012 1
CannedUtilized Production Fresh Market TotalProcessing
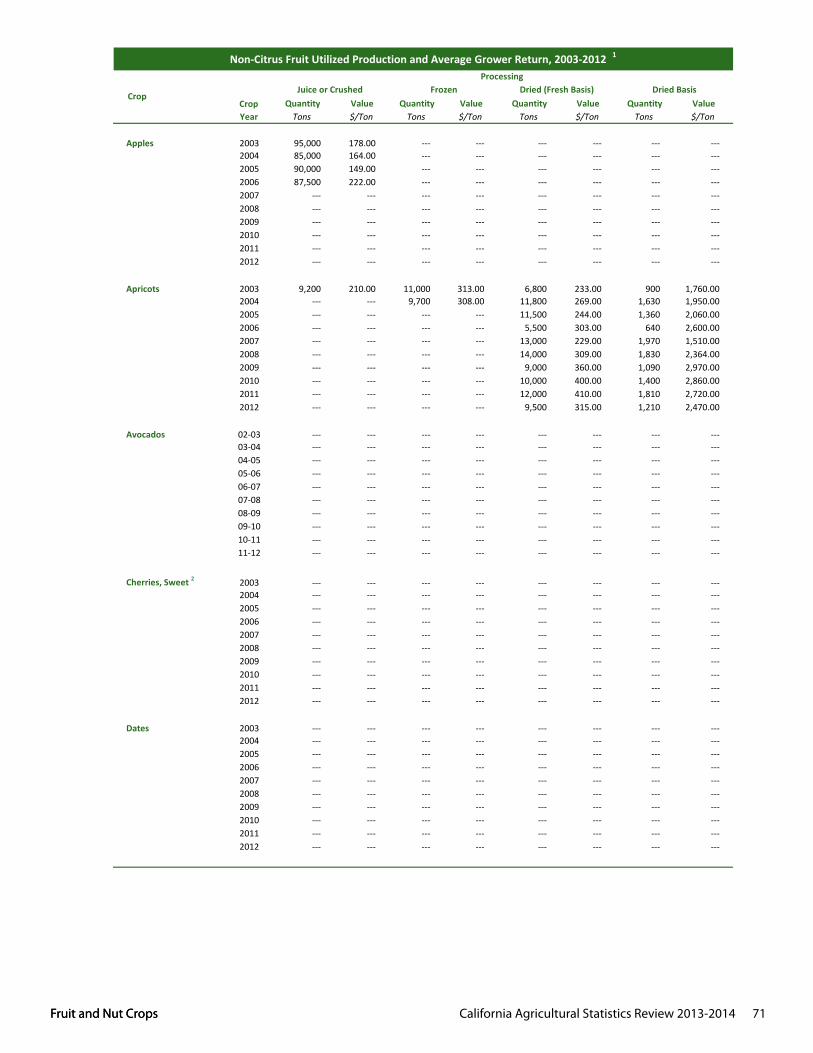
Fruit and Nut Crops California Agricultural Statistics Review 2013-2014 71 Fruit and Nut Crops
Quantity Value Quantity Value Quantity Value Quantity ValueTons $/Ton Tons $/Ton Tons $/Ton Tons $/Ton
Apples 2003 95,000 178.00 --- --- --- --- --- ---2004 85,000 164.00 --- --- --- --- --- ---2005 90,000 149.00 --- --- --- --- --- ---2006 87,500 222.00 --- --- --- --- --- ---2007 --- --- --- --- --- --- --- ---2008 --- --- --- --- --- --- --- ---2009 --- --- --- --- --- --- --- ---2010 --- --- --- --- --- --- --- ---2011 --- --- --- --- --- --- --- ---2012 --- --- --- --- --- --- --- ---
Apricots 2003 9,200 210.00 11,000 313.00 6,800 233.00 900 1,760.002004 --- --- 9,700 308.00 11,800 269.00 1,630 1,950.002005 --- --- --- --- 11,500 244.00 1,360 2,060.002006 --- --- --- --- 5,500 303.00 640 2,600.002007 --- --- --- --- 13,000 229.00 1,970 1,510.002008 --- --- --- --- 14,000 309.00 1,830 2,364.002009 --- --- --- --- 9,000 360.00 1,090 2,970.002010 --- --- --- --- 10,000 400.00 1,400 2,860.002011 --- --- --- --- 12,000 410.00 1,810 2,720.002012 --- --- --- --- 9,500 315.00 1,210 2,470.00
Avocados 02-03 --- --- --- --- --- --- --- ---03-04 --- --- --- --- --- --- --- ---04-05 --- --- --- --- --- --- --- ---05-06 --- --- --- --- --- --- --- ---06-07 --- --- --- --- --- --- --- ---07-08 --- --- --- --- --- --- --- ---08-09 --- --- --- --- --- --- --- ---09-10 --- --- --- --- --- --- --- ---10-11 --- --- --- --- --- --- --- ---11-12 --- --- --- --- --- --- --- ---
Cherries, Sweet 2 2003 --- --- --- --- --- --- --- ---2004 --- --- --- --- --- --- --- ---2005 --- --- --- --- --- --- --- ---2006 --- --- --- --- --- --- --- ---2007 --- --- --- --- --- --- --- ---2008 --- --- --- --- --- --- --- ---2009 --- --- --- --- --- --- --- ---2010 --- --- --- --- --- --- --- ---2011 --- --- --- --- --- --- --- ---2012 --- --- --- --- --- --- --- ---
Dates 2003 --- --- --- --- --- --- --- ---2004 --- --- --- --- --- --- --- ---2005 --- --- --- --- --- --- --- ---2006 --- --- --- --- --- --- --- ---2007 --- --- --- --- --- --- --- ---2008 --- --- --- --- --- --- --- ---2009 --- --- --- --- --- --- --- ---2010 --- --- --- --- --- --- --- ---2011 --- --- --- --- --- --- --- ---2012 --- --- --- --- --- --- --- ---
Dried (Fresh Basis)
Non-Citrus Fruit Utilized Production and Average Grower Return, 2003-2012 1
CropCrop Year
Juice or Crushed Dried BasisProcessing
Frozen
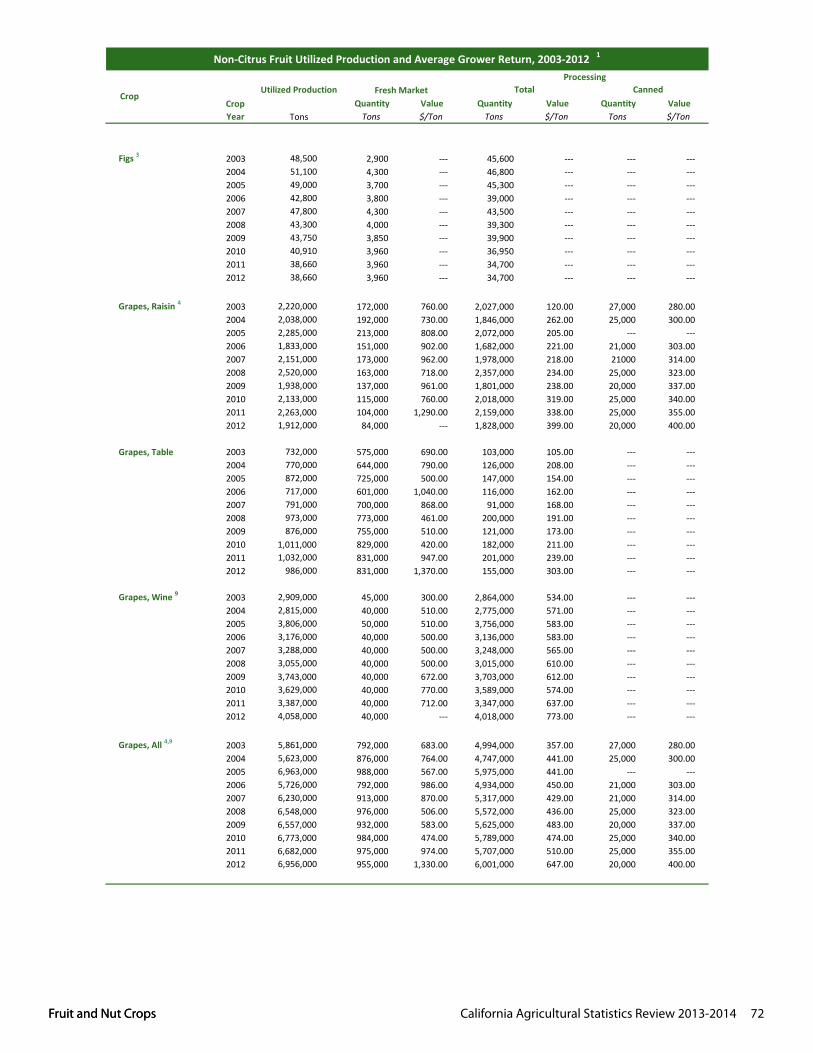
Fruit and Nut Crops California Agricultural Statistics Review 2013-2014 72 Fruit and Nut Crops
Quantity Value Quantity Value Quantity ValueTons Tons $/Ton Tons $/Ton Tons $/Ton
Crop Year
Crop
Non-Citrus Fruit Utilized Production and Average Grower Return, 2003-2012 1
CannedUtilized Production Fresh Market TotalProcessing
Figs 3 2003 48,500 2,900 --- 45,600 --- --- ---2004 51,100 4,300 --- 46,800 --- --- ---2005 49,000 3,700 --- 45,300 --- --- ---2006 42,800 3,800 --- 39,000 --- --- ---2007 47,800 4,300 --- 43,500 --- --- ---2008 43,300 4,000 --- 39,300 --- --- ---2009 43,750 3,850 --- 39,900 --- --- ---2010 40,910 3,960 --- 36,950 --- --- ---2011 38,660 3,960 --- 34,700 --- --- ---2012 38,660 3,960 --- 34,700 --- --- ---
Grapes, Raisin 4 2003 2,220,000 172,000 760.00 2,027,000 120.00 27,000 280.002004 2,038,000 192,000 730.00 1,846,000 262.00 25,000 300.002005 2,285,000 213,000 808.00 2,072,000 205.00 --- ---2006 1,833,000 151,000 902.00 1,682,000 221.00 21,000 303.002007 2,151,000 173,000 962.00 1,978,000 218.00 21000 314.002008 2,520,000 163,000 718.00 2,357,000 234.00 25,000 323.002009 1,938,000 137,000 961.00 1,801,000 238.00 20,000 337.002010 2,133,000 115,000 760.00 2,018,000 319.00 25,000 340.002011 2,263,000 104,000 1,290.00 2,159,000 338.00 25,000 355.002012 1,912,000 84,000 --- 1,828,000 399.00 20,000 400.00
Grapes, Table 2003 732,000 575,000 690.00 103,000 105.00 --- ---2004 770,000 644,000 790.00 126,000 208.00 --- ---2005 872,000 725,000 500.00 147,000 154.00 --- ---2006 717,000 601,000 1,040.00 116,000 162.00 --- ---2007 791,000 700,000 868.00 91,000 168.00 --- ---2008 973,000 773,000 461.00 200,000 191.00 --- ---2009 876,000 755,000 510.00 121,000 173.00 --- ---2010 1,011,000 829,000 420.00 182,000 211.00 --- ---2011 1,032,000 831,000 947.00 201,000 239.00 --- ---2012 986,000 831,000 1,370.00 155,000 303.00 --- ---
Grapes, Wine 9 2003 2,909,000 45,000 300.00 2,864,000 534.00 --- ---2004 2,815,000 40,000 510.00 2,775,000 571.00 --- ---2005 3,806,000 50,000 510.00 3,756,000 583.00 --- ---2006 3,176,000 40,000 500.00 3,136,000 583.00 --- ---2007 3,288,000 40,000 500.00 3,248,000 565.00 --- ---2008 3,055,000 40,000 500.00 3,015,000 610.00 --- ---2009 3,743,000 40,000 672.00 3,703,000 612.00 --- ---2010 3,629,000 40,000 770.00 3,589,000 574.00 --- ---2011 3,387,000 40,000 712.00 3,347,000 637.00 --- ---2012 4,058,000 40,000 --- 4,018,000 773.00 --- ---
Grapes, All 4,9 2003 5,861,000 792,000 683.00 4,994,000 357.00 27,000 280.002004 5,623,000 876,000 764.00 4,747,000 441.00 25,000 300.002005 6,963,000 988,000 567.00 5,975,000 441.00 --- ---2006 5,726,000 792,000 986.00 4,934,000 450.00 21,000 303.002007 6,230,000 913,000 870.00 5,317,000 429.00 21,000 314.002008 6,548,000 976,000 506.00 5,572,000 436.00 25,000 323.002009 6,557,000 932,000 583.00 5,625,000 483.00 20,000 337.002010 6,773,000 984,000 474.00 5,789,000 474.00 25,000 340.002011 6,682,000 975,000 974.00 5,707,000 510.00 25,000 355.002012 6,956,000 955,000 1,330.00 6,001,000 647.00 20,000 400.00
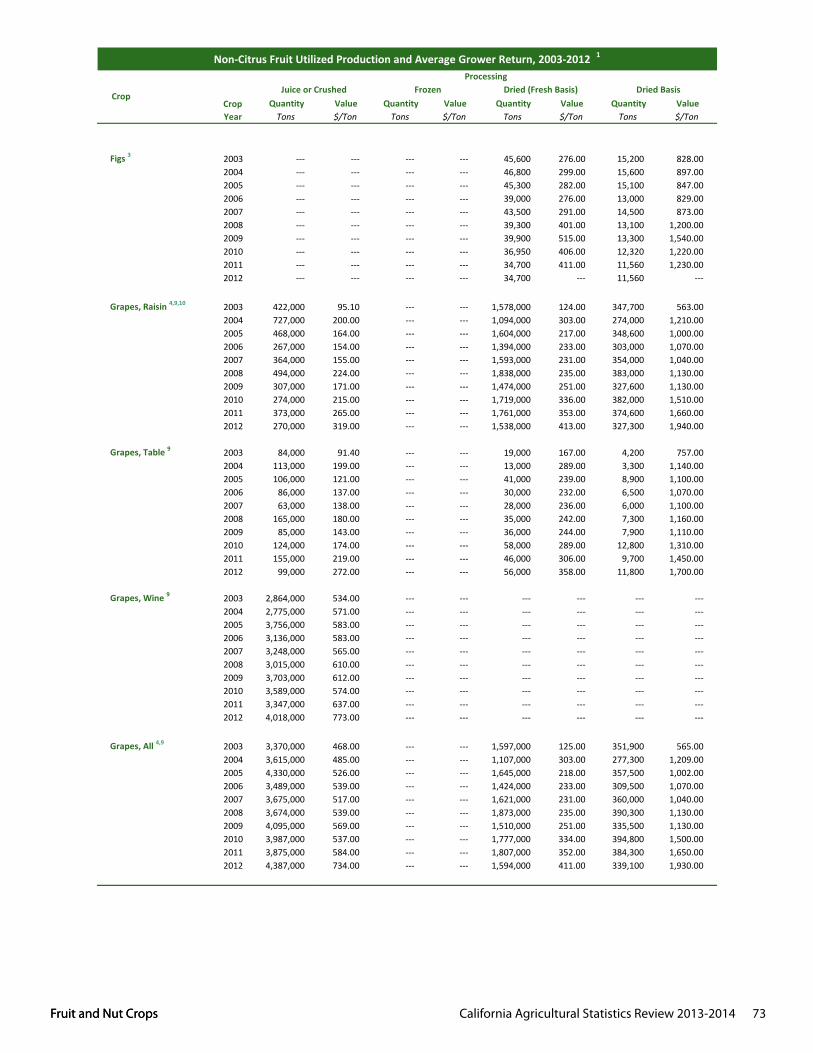
Fruit and Nut Crops California Agricultural Statistics Review 2013-2014 73 Fruit and Nut Crops
Quantity Value Quantity Value Quantity Value Quantity ValueTons $/Ton Tons $/Ton Tons $/Ton Tons $/Ton
Dried (Fresh Basis)
Non-Citrus Fruit Utilized Production and Average Grower Return, 2003-2012 1
CropCrop Year
Juice or Crushed Dried BasisProcessing
Frozen
Figs 3 2003 --- --- --- --- 45,600 276.00 15,200 828.002004 --- --- --- --- 46,800 299.00 15,600 897.002005 --- --- --- --- 45,300 282.00 15,100 847.002006 --- --- --- --- 39,000 276.00 13,000 829.002007 --- --- --- --- 43,500 291.00 14,500 873.002008 --- --- --- --- 39,300 401.00 13,100 1,200.002009 --- --- --- --- 39,900 515.00 13,300 1,540.002010 --- --- --- --- 36,950 406.00 12,320 1,220.002011 --- --- --- --- 34,700 411.00 11,560 1,230.002012 --- --- --- --- 34,700 --- 11,560 ---
Grapes, Raisin 4,9,10 2003 422,000 95.10 --- --- 1,578,000 124.00 347,700 563.002004 727,000 200.00 --- --- 1,094,000 303.00 274,000 1,210.002005 468,000 164.00 --- --- 1,604,000 217.00 348,600 1,000.002006 267,000 154.00 --- --- 1,394,000 233.00 303,000 1,070.002007 364,000 155.00 --- --- 1,593,000 231.00 354,000 1,040.002008 494,000 224.00 --- --- 1,838,000 235.00 383,000 1,130.002009 307,000 171.00 --- --- 1,474,000 251.00 327,600 1,130.002010 274,000 215.00 --- --- 1,719,000 336.00 382,000 1,510.002011 373,000 265.00 --- --- 1,761,000 353.00 374,600 1,660.002012 270,000 319.00 --- --- 1,538,000 413.00 327,300 1,940.00
Grapes, Table 9 2003 84,000 91.40 --- --- 19,000 167.00 4,200 757.002004 113,000 199.00 --- --- 13,000 289.00 3,300 1,140.002005 106,000 121.00 --- --- 41,000 239.00 8,900 1,100.002006 86,000 137.00 --- --- 30,000 232.00 6,500 1,070.002007 63,000 138.00 --- --- 28,000 236.00 6,000 1,100.002008 165,000 180.00 --- --- 35,000 242.00 7,300 1,160.002009 85,000 143.00 --- --- 36,000 244.00 7,900 1,110.002010 124,000 174.00 --- --- 58,000 289.00 12,800 1,310.002011 155,000 219.00 --- --- 46,000 306.00 9,700 1,450.002012 99,000 272.00 --- --- 56,000 358.00 11,800 1,700.00
Grapes, Wine 9 2003 2,864,000 534.00 --- --- --- --- --- ---2004 2,775,000 571.00 --- --- --- --- --- ---2005 3,756,000 583.00 --- --- --- --- --- ---2006 3,136,000 583.00 --- --- --- --- --- ---2007 3,248,000 565.00 --- --- --- --- --- ---2008 3,015,000 610.00 --- --- --- --- --- ---2009 3,703,000 612.00 --- --- --- --- --- ---2010 3,589,000 574.00 --- --- --- --- --- ---2011 3,347,000 637.00 --- --- --- --- --- ---2012 4,018,000 773.00 --- --- --- --- --- ---
Grapes, All 4,9 2003 3,370,000 468.00 --- --- 1,597,000 125.00 351,900 565.002004 3,615,000 485.00 --- --- 1,107,000 303.00 277,300 1,209.002005 4,330,000 526.00 --- --- 1,645,000 218.00 357,500 1,002.002006 3,489,000 539.00 --- --- 1,424,000 233.00 309,500 1,070.002007 3,675,000 517.00 --- --- 1,621,000 231.00 360,000 1,040.002008 3,674,000 539.00 --- --- 1,873,000 235.00 390,300 1,130.002009 4,095,000 569.00 --- --- 1,510,000 251.00 335,500 1,130.002010 3,987,000 537.00 --- --- 1,777,000 334.00 394,800 1,500.002011 3,875,000 584.00 --- --- 1,807,000 352.00 384,300 1,650.002012 4,387,000 734.00 --- --- 1,594,000 411.00 339,100 1,930.00
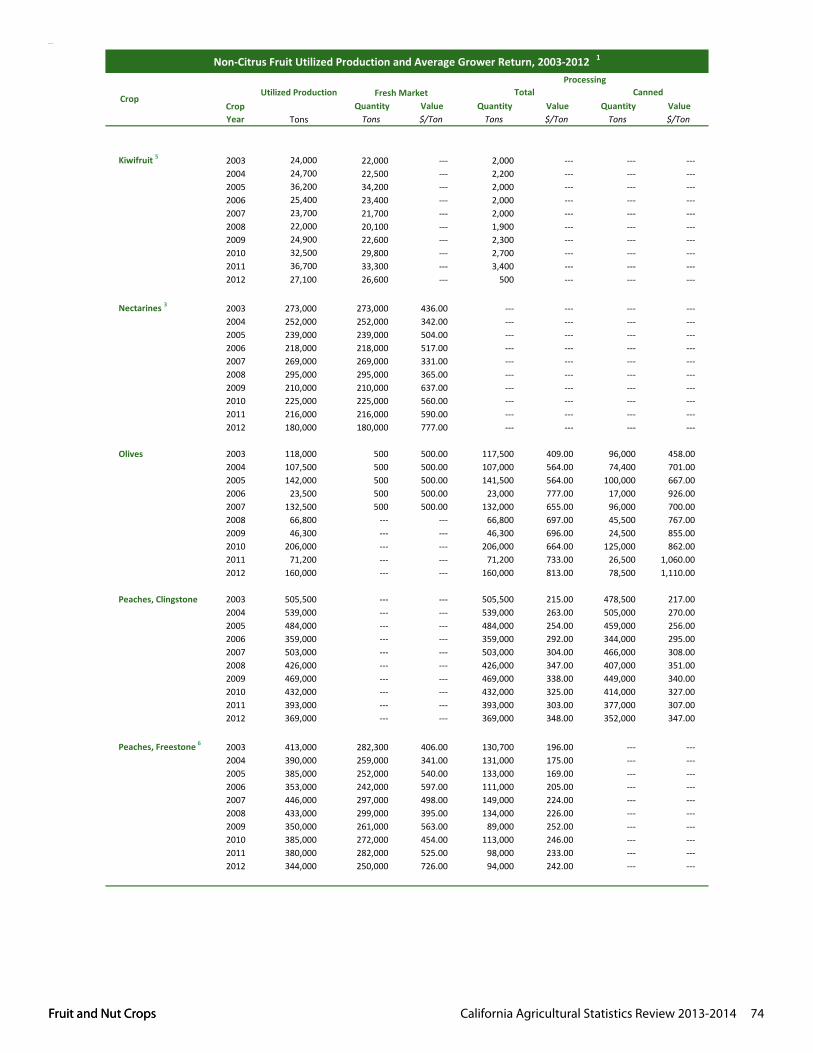
Fruit and Nut Crops California Agricultural Statistics Review 2013-2014 74 Fruit and Nut Crops
Quantity Value Quantity Value Quantity Value Quantity ValueTons $/Ton Tons $/Ton Tons $/Ton Tons $/Ton
Dried (Fresh Basis)
Non-Citrus Fruit Utilized Production and Average Grower Return, 2003-2012 1
Crop Crop Year
Juice or Crushed Dried BasisProcessingFrozen
Kiwifruit 5 2003 --- --- --- --- --- --- --- ---2004 --- --- --- --- --- --- --- ---2005 --- --- --- --- --- --- --- ---2006 --- --- --- --- --- --- --- ---2007 --- --- --- --- --- --- --- ---2008 --- --- --- --- --- --- --- ---2009 --- --- --- --- --- --- --- ---2010 --- --- --- --- --- --- --- ---2011 --- --- --- --- --- --- --- ---2012 --- --- --- --- --- --- --- ---
Nectarines 3 2003 --- --- --- --- --- --- --- ---2004 --- --- --- --- --- --- --- ---2005 --- --- --- --- --- --- --- ---2006 --- --- --- --- --- --- --- ---2007 --- --- --- --- --- --- --- ---2008 --- --- --- --- --- --- --- ---2009 --- --- --- --- --- --- --- ---2010 --- --- --- --- --- --- --- ---2011 --- --- --- --- --- --- --- ---2012 --- --- --- --- --- --- --- ---
Olives 2003 7,500 238.00 --- --- 10,500 215.00 3,500 8.002004 11,500 361.00 --- --- 16,100 252.00 5,000 6.002005 14,000 526.00 --- --- 21,200 271.00 6,300 6.002006 4,000 405.00 --- --- 1,500 335.00 500 7.002007 12,000 775.00 --- --- 20,000 496.00 4,000 6.002008 14,000 670.00 --- --- 6,000 382.00 1,300 12.002009 20,000 540.00 --- --- 1,500 306.00 300 8.002010 36,000 532.00 --- --- 37,000 270.00 8,000 -12.002011 42,000 556.00 --- --- 2,200 333.00 500 -13.002012 74,000 550.00 --- --- 6,400 346.00 1,100 -10.00
Peaches, Clingstone 2003 --- --- --- --- --- --- --- ---2004 --- --- --- --- --- --- --- ---2005 --- --- --- --- --- --- --- ---2006 --- --- --- --- --- --- --- ---2007 --- --- --- --- --- --- --- ---2008 --- --- --- --- --- --- --- ---2009 --- --- --- --- --- --- --- ---2010 --- --- --- --- --- --- --- ---2011 --- --- --- --- --- --- --- ---2012 --- --- --- --- --- --- --- ---
Peaches, Freestone 6 2003 --- --- 95,950 211.00 10,150 47.00 1,070 446.002004 --- --- 86,600 211.00 10,400 32.00 870 382.002005 --- --- 82,800 202.00 12,700 46.00 1,160 504.002006 --- --- 84,100 209.00 13,100 79.00 1,290 802.002007 --- --- 107,900 249.00 12,700 57.00 1,365 530.002008 --- --- 95,100 251.00 9,500 50.00 1,050 452.002009 --- --- 70,300 255.00 7,100 43.00 850 359.002010 --- --- 87,600 252.00 12,700 44.00 2,010 278.002011 --- --- 84,600 240.00 4,600 42.00 470 411.002012 --- --- 75,200 245.00 9,800 41.00 1,230 327.00
UndersizeLimited
Quantity Value Quantity Value Quantity ValueTons Tons $/Ton Tons $/Ton Tons $/Ton
Crop Year
Crop
Non-Citrus Fruit Utilized Production and Average Grower Return, 2003-2012 1
CannedUtilized Production Fresh Market TotalProcessing
Kiwifruit 5 2003 24,000 22,000 --- 2,000 --- --- ---2004 24,700 22,500 --- 2,200 --- --- ---2005 36,200 34,200 --- 2,000 --- --- ---2006 25,400 23,400 --- 2,000 --- --- ---2007 23,700 21,700 --- 2,000 --- --- ---2008 22,000 20,100 --- 1,900 --- --- ---2009 24,900 22,600 --- 2,300 --- --- ---2010 32,500 29,800 --- 2,700 --- --- ---2011 36,700 33,300 --- 3,400 --- --- ---2012 27,100 26,600 --- 500 --- --- ---
Nectarines 3 2003 273,000 273,000 436.00 --- --- --- ---2004 252,000 252,000 342.00 --- --- --- ---2005 239,000 239,000 504.00 --- --- --- ---2006 218,000 218,000 517.00 --- --- --- ---2007 269,000 269,000 331.00 --- --- --- ---2008 295,000 295,000 365.00 --- --- --- ---2009 210,000 210,000 637.00 --- --- --- ---2010 225,000 225,000 560.00 --- --- --- ---2011 216,000 216,000 590.00 --- --- --- ---2012 180,000 180,000 777.00 --- --- --- ---
Olives 2003 118,000 500 500.00 117,500 409.00 96,000 458.002004 107,500 500 500.00 107,000 564.00 74,400 701.002005 142,000 500 500.00 141,500 564.00 100,000 667.002006 23,500 500 500.00 23,000 777.00 17,000 926.002007 132,500 500 500.00 132,000 655.00 96,000 700.002008 66,800 --- --- 66,800 697.00 45,500 767.002009 46,300 --- --- 46,300 696.00 24,500 855.002010 206,000 --- --- 206,000 664.00 125,000 862.002011 71,200 --- --- 71,200 733.00 26,500 1,060.002012 160,000 --- --- 160,000 813.00 78,500 1,110.00
Peaches, Clingstone 2003 505,500 --- --- 505,500 215.00 478,500 217.002004 539,000 --- --- 539,000 263.00 505,000 270.002005 484,000 --- --- 484,000 254.00 459,000 256.002006 359,000 --- --- 359,000 292.00 344,000 295.002007 503,000 --- --- 503,000 304.00 466,000 308.002008 426,000 --- --- 426,000 347.00 407,000 351.002009 469,000 --- --- 469,000 338.00 449,000 340.002010 432,000 --- --- 432,000 325.00 414,000 327.002011 393,000 --- --- 393,000 303.00 377,000 307.002012 369,000 --- --- 369,000 348.00 352,000 347.00
Peaches, Freestone 6 2003 413,000 282,300 406.00 130,700 196.00 --- ---2004 390,000 259,000 341.00 131,000 175.00 --- ---2005 385,000 252,000 540.00 133,000 169.00 --- ---2006 353,000 242,000 597.00 111,000 205.00 --- ---2007 446,000 297,000 498.00 149,000 224.00 --- ---2008 433,000 299,000 395.00 134,000 226.00 --- ---2009 350,000 261,000 563.00 89,000 252.00 --- ---2010 385,000 272,000 454.00 113,000 246.00 --- ---2011 380,000 282,000 525.00 98,000 233.00 --- ---2012 344,000 250,000 726.00 94,000 242.00 --- ---
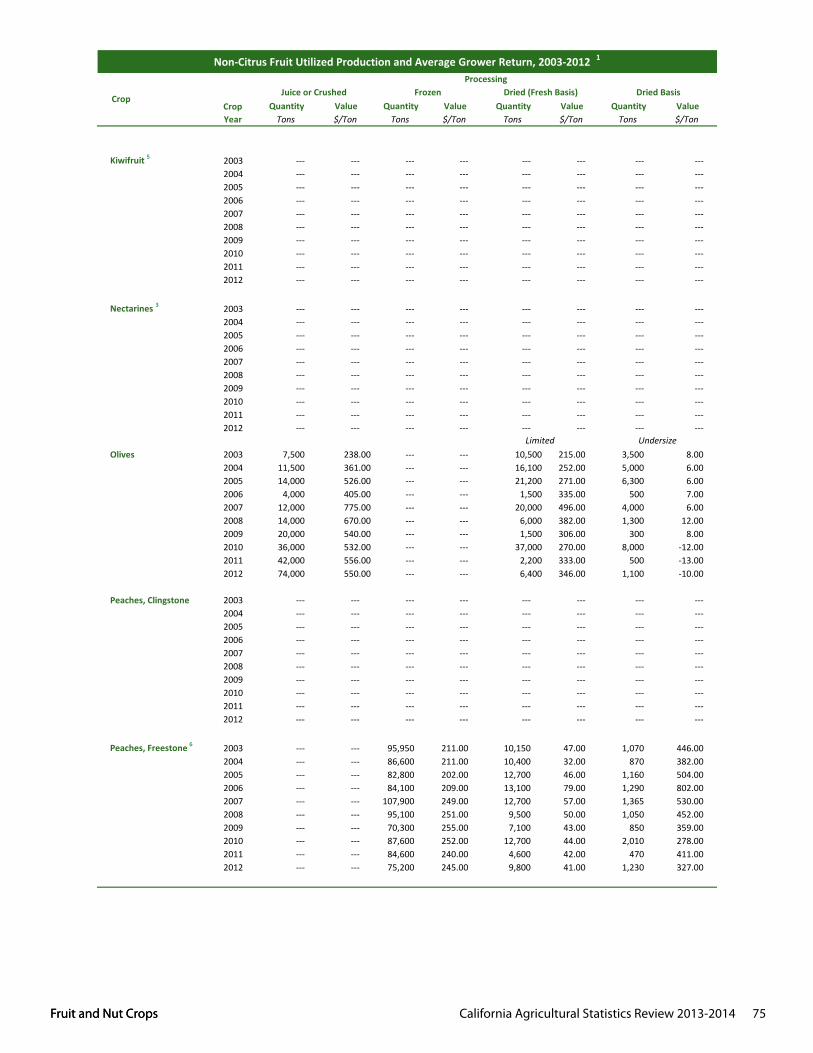
Fruit and Nut Crops California Agricultural Statistics Review 2013-2014 75 Fruit and Nut Crops
Quantity Value Quantity Value Quantity Value Quantity ValueTons $/Ton Tons $/Ton Tons $/Ton Tons $/Ton
Dried (Fresh Basis)
Non-Citrus Fruit Utilized Production and Average Grower Return, 2003-2012 1
CropCrop Year
Juice or Crushed Dried BasisProcessing
Frozen
Kiwifruit 5 2003 --- --- --- --- --- --- --- ---2004 --- --- --- --- --- --- --- ---2005 --- --- --- --- --- --- --- ---2006 --- --- --- --- --- --- --- ---2007 --- --- --- --- --- --- --- ---2008 --- --- --- --- --- --- --- ---2009 --- --- --- --- --- --- --- ---2010 --- --- --- --- --- --- --- ---2011 --- --- --- --- --- --- --- ---2012 --- --- --- --- --- --- --- ---
Nectarines 3 2003 --- --- --- --- --- --- --- ---2004 --- --- --- --- --- --- --- ---2005 --- --- --- --- --- --- --- ---2006 --- --- --- --- --- --- --- ---2007 --- --- --- --- --- --- --- ---2008 --- --- --- --- --- --- --- ---2009 --- --- --- --- --- --- --- ---2010 --- --- --- --- --- --- --- ---2011 --- --- --- --- --- --- --- ---2012 --- --- --- --- --- --- --- ---
Olives 2003 7,500 238.00 --- --- 10,500 215.00 3,500 8.002004 11,500 361.00 --- --- 16,100 252.00 5,000 6.002005 14,000 526.00 --- --- 21,200 271.00 6,300 6.002006 4,000 405.00 --- --- 1,500 335.00 500 7.002007 12,000 775.00 --- --- 20,000 496.00 4,000 6.002008 14,000 670.00 --- --- 6,000 382.00 1,300 12.002009 20,000 540.00 --- --- 1,500 306.00 300 8.002010 36,000 532.00 --- --- 37,000 270.00 8,000 -12.002011 42,000 556.00 --- --- 2,200 333.00 500 -13.002012 74,000 550.00 --- --- 6,400 346.00 1,100 -10.00
Peaches, Clingstone 2003 --- --- --- --- --- --- --- ---2004 --- --- --- --- --- --- --- ---2005 --- --- --- --- --- --- --- ---2006 --- --- --- --- --- --- --- ---2007 --- --- --- --- --- --- --- ---2008 --- --- --- --- --- --- --- ---2009 --- --- --- --- --- --- --- ---2010 --- --- --- --- --- --- --- ---2011 --- --- --- --- --- --- --- ---2012 --- --- --- --- --- --- --- ---
Peaches, Freestone 6 2003 --- --- 95,950 211.00 10,150 47.00 1,070 446.002004 --- --- 86,600 211.00 10,400 32.00 870 382.002005 --- --- 82,800 202.00 12,700 46.00 1,160 504.002006 --- --- 84,100 209.00 13,100 79.00 1,290 802.002007 --- --- 107,900 249.00 12,700 57.00 1,365 530.002008 --- --- 95,100 251.00 9,500 50.00 1,050 452.002009 --- --- 70,300 255.00 7,100 43.00 850 359.002010 --- --- 87,600 252.00 12,700 44.00 2,010 278.002011 --- --- 84,600 240.00 4,600 42.00 470 411.002012 --- --- 75,200 245.00 9,800 41.00 1,230 327.00
UndersizeLimited
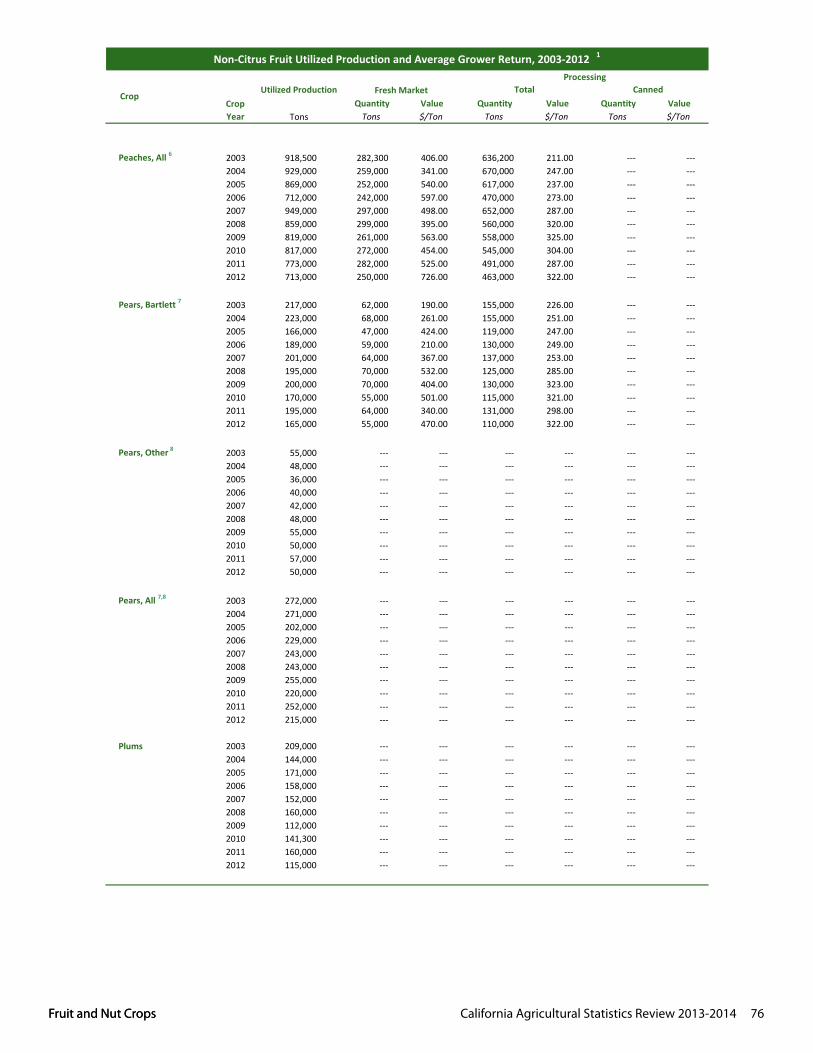
Fruit and Nut Crops California Agricultural Statistics Review 2013-2014 76 Fruit and Nut Crops
Quantity Value Quantity Value Quantity ValueTons Tons $/Ton Tons $/Ton Tons $/Ton
Crop Year
Crop
Non-Citrus Fruit Utilized Production and Average Grower Return, 2003-2012 1
CannedUtilized Production Fresh Market TotalProcessing
Peaches, All 6 2003 918,500 282,300 406.00 636,200 211.00 --- ---2004 929,000 259,000 341.00 670,000 247.00 --- ---2005 869,000 252,000 540.00 617,000 237.00 --- ---2006 712,000 242,000 597.00 470,000 273.00 --- ---2007 949,000 297,000 498.00 652,000 287.00 --- ---2008 859,000 299,000 395.00 560,000 320.00 --- ---2009 819,000 261,000 563.00 558,000 325.00 --- ---2010 817,000 272,000 454.00 545,000 304.00 --- ---2011 773,000 282,000 525.00 491,000 287.00 --- ---2012 713,000 250,000 726.00 463,000 322.00 --- ---
Pears, Bartlett 7 2003 217,000 62,000 190.00 155,000 226.00 --- ---2004 223,000 68,000 261.00 155,000 251.00 --- ---2005 166,000 47,000 424.00 119,000 247.00 --- ---2006 189,000 59,000 210.00 130,000 249.00 --- ---2007 201,000 64,000 367.00 137,000 253.00 --- ---2008 195,000 70,000 532.00 125,000 285.00 --- ---2009 200,000 70,000 404.00 130,000 323.00 --- ---2010 170,000 55,000 501.00 115,000 321.00 --- ---2011 195,000 64,000 340.00 131,000 298.00 --- ---2012 165,000 55,000 470.00 110,000 322.00 --- ---
Pears, Other 8 2003 55,000 --- --- --- --- --- ---2004 48,000 --- --- --- --- --- ---2005 36,000 --- --- --- --- --- ---2006 40,000 --- --- --- --- --- ---2007 42,000 --- --- --- --- --- ---2008 48,000 --- --- --- --- --- ---2009 55,000 --- --- --- --- --- ---2010 50,000 --- --- --- --- --- ---2011 57,000 --- --- --- --- --- ---2012 50,000 --- --- --- --- --- ---
Pears, All 7,8 2003 272,000 --- --- --- --- --- ---2004 271,000 --- --- --- --- --- ---2005 202,000 --- --- --- --- --- ---2006 229,000 --- --- --- --- --- ---2007 243,000 --- --- --- --- --- ---2008 243,000 --- --- --- --- --- ---2009 255,000 --- --- --- --- --- ---2010 220,000 --- --- --- --- --- ---2011 252,000 --- --- --- --- --- ---2012 215,000 --- --- --- --- --- ---
Plums 2003 209,000 --- --- --- --- --- ---2004 144,000 --- --- --- --- --- ---2005 171,000 --- --- --- --- --- ---2006 158,000 --- --- --- --- --- ---2007 152,000 --- --- --- --- --- ---2008 160,000 --- --- --- --- --- ---2009 112,000 --- --- --- --- --- ---2010 141,300 --- --- --- --- --- ---2011 160,000 --- --- --- --- --- ---2012 115,000 --- --- --- --- --- ---
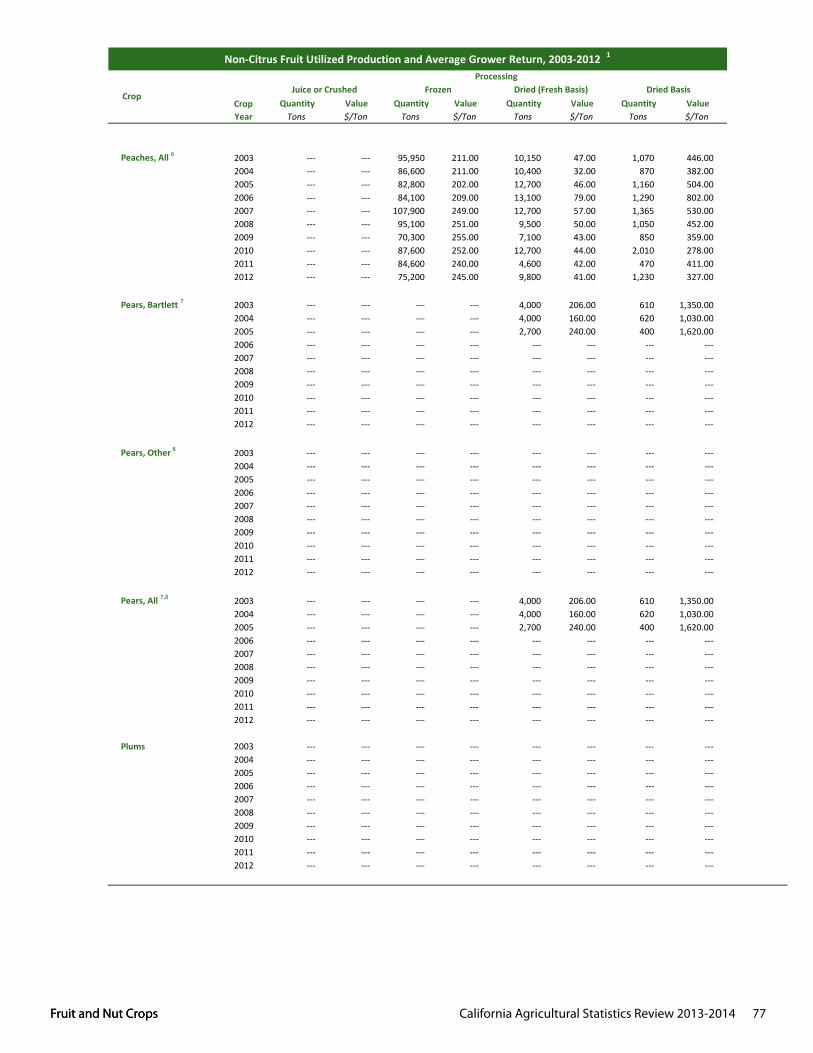
Fruit and Nut Crops California Agricultural Statistics Review 2013-2014 77 Fruit and Nut Crops
Quantity Value Quantity Value Quantity Value Quantity ValueTons $/Ton Tons $/Ton Tons $/Ton Tons $/Ton
Dried (Fresh Basis)
Non-Citrus Fruit Utilized Production and Average Grower Return, 2003-2012 1
CropCrop Year
Juice or Crushed Dried BasisProcessing
Frozen
Peaches, All 6 2003 --- --- 95,950 211.00 10,150 47.00 1,070 446.002004 --- --- 86,600 211.00 10,400 32.00 870 382.002005 --- --- 82,800 202.00 12,700 46.00 1,160 504.002006 --- --- 84,100 209.00 13,100 79.00 1,290 802.002007 --- --- 107,900 249.00 12,700 57.00 1,365 530.002008 --- --- 95,100 251.00 9,500 50.00 1,050 452.002009 --- --- 70,300 255.00 7,100 43.00 850 359.002010 --- --- 87,600 252.00 12,700 44.00 2,010 278.002011 --- --- 84,600 240.00 4,600 42.00 470 411.002012 --- --- 75,200 245.00 9,800 41.00 1,230 327.00
Pears, Bartlett 7 2003 --- --- --- --- 4,000 206.00 610 1,350.002004 --- --- --- --- 4,000 160.00 620 1,030.002005 --- --- --- --- 2,700 240.00 400 1,620.002006 --- --- --- --- --- --- --- ---2007 --- --- --- --- --- --- --- ---2008 --- --- --- --- --- --- --- ---2009 --- --- --- --- --- --- --- ---2010 --- --- --- --- --- --- --- ---2011 --- --- --- --- --- --- --- ---2012 --- --- --- --- --- --- --- ---
Pears, Other 8 2003 --- --- --- --- --- --- --- ---2004 --- --- --- --- --- --- --- ---2005 --- --- --- --- --- --- --- ---2006 --- --- --- --- --- --- --- ---2007 --- --- --- --- --- --- --- ---2008 --- --- --- --- --- --- --- ---2009 --- --- --- --- --- --- --- ---2010 --- --- --- --- --- --- --- ---2011 --- --- --- --- --- --- --- ---2012 --- --- --- --- --- --- --- ---
Pears, All 7,8 2003 --- --- --- --- 4,000 206.00 610 1,350.002004 --- --- --- --- 4,000 160.00 620 1,030.002005 --- --- --- --- 2,700 240.00 400 1,620.002006 --- --- --- --- --- --- --- ---2007 --- --- --- --- --- --- --- ---2008 --- --- --- --- --- --- --- ---2009 --- --- --- --- --- --- --- ---2010 --- --- --- --- --- --- --- ---2011 --- --- --- --- --- --- --- ---2012 --- --- --- --- --- --- --- ---
Plums 2003 --- --- --- --- --- --- --- ---2004 --- --- --- --- --- --- --- ---2005 --- --- --- --- --- --- --- ---2006 --- --- --- --- --- --- --- ---2007 --- --- --- --- --- --- --- ---2008 --- --- --- --- --- --- --- ---2009 --- --- --- --- --- --- --- ---2010 --- --- --- --- --- --- --- ---2011 --- --- --- --- --- --- --- ---2012 --- --- --- --- --- --- --- ---
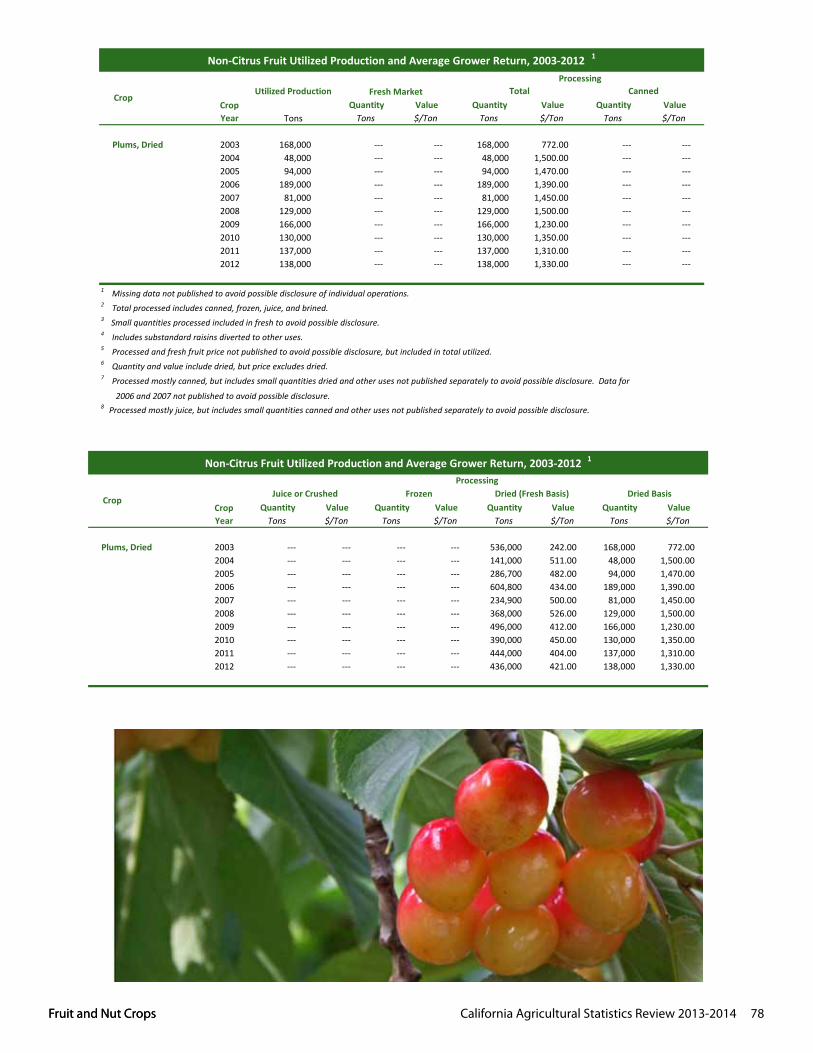
Fruit and Nut Crops California Agricultural Statistics Review 2013-2014 78 Fruit and Nut Crops
Quantity Value Quantity Value Quantity ValueTons Tons $/Ton Tons $/Ton Tons $/Ton
Crop Year
Crop
Non-Citrus Fruit Utilized Production and Average Grower Return, 2003-2012 1
CannedUtilized Production Fresh Market TotalProcessing
Plums, Dried 2003 168,000 --- --- 168,000 772.00 --- ---2004 48,000 --- --- 48,000 1,500.00 --- ---2005 94,000 --- --- 94,000 1,470.00 --- ---2006 189,000 --- --- 189,000 1,390.00 --- ---2007 81,000 --- --- 81,000 1,450.00 --- ---2008 129,000 --- --- 129,000 1,500.00 --- ---2009 166,000 --- --- 166,000 1,230.00 --- ---2010 130,000 --- --- 130,000 1,350.00 --- ---2011 137,000 --- --- 137,000 1,310.00 --- ---2012 138,000 --- --- 138,000 1,330.00 --- ---
1 Missing data not published to avoid possible disclosure of individual operations.2 Total processed includes canned, frozen, juice, and brined.3 Small quantities processed included in fresh to avoid possible disclosure.4 Includes substandard raisins diverted to other uses.5 Processed and fresh fruit price not published to avoid possible disclosure, but included in total utilized.6 Quantity and value include dried, but price excludes dried.7 Processed mostly canned, but includes small quantities dried and other uses not published separately to avoid possible disclosure. Data for
2006 and 2007 not published to avoid possible disclosure.8 Processed mostly juice, but includes small quantities canned and other uses not published separately to avoid possible disclosure.
Quantity Value Quantity Value Quantity Value Quantity ValueTons $/Ton Tons $/Ton Tons $/Ton Tons $/Ton
Dried (Fresh Basis)
Non-Citrus Fruit Utilized Production and Average Grower Return, 2003-2012 1
CropCrop Year
Juice or Crushed Dried BasisProcessing
Frozen
Plums, Dried 2003 --- --- --- --- 536,000 242.00 168,000 772.002004 --- --- --- --- 141,000 511.00 48,000 1,500.002005 --- --- --- --- 286,700 482.00 94,000 1,470.002006 --- --- --- --- 604,800 434.00 189,000 1,390.002007 --- --- --- --- 234,900 500.00 81,000 1,450.002008 --- --- --- --- 368,000 526.00 129,000 1,500.002009 --- --- --- --- 496,000 412.00 166,000 1,230.002010 --- --- --- --- 390,000 450.00 130,000 1,350.002011 --- --- --- --- 444,000 404.00 137,000 1,310.002012 --- --- --- --- 436,000 421.00 138,000 1,330.00
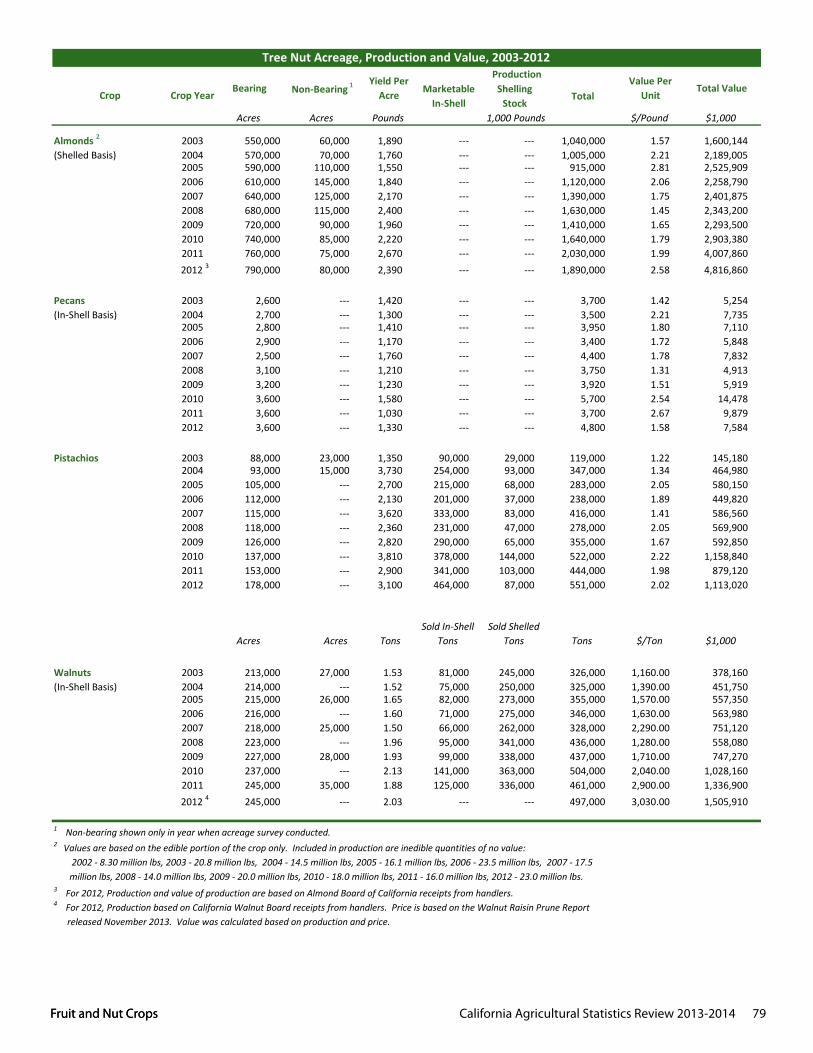
Fruit and Nut Crops California Agricultural Statistics Review 2013-2014 79 Fruit and Nut Crops
Marketable In-Shell
Shelling Stock
Total
Acres Acres Pounds $/Pound $1,000
Almonds 2 2003 550,000 60,000 1,890 --- --- 1,040,000 1.57 1,600,144(Shelled Basis) 2004 570,000 70,000 1,760 --- --- 1,005,000 2.21 2,189,005
2005 590,000 110,000 1,550 --- --- 915,000 2.81 2,525,9092006 610,000 145,000 1,840 --- --- 1,120,000 2.06 2,258,7902007 640,000 125,000 2,170 --- --- 1,390,000 1.75 2,401,8752008 680,000 115,000 2,400 --- --- 1,630,000 1.45 2,343,2002009 720,000 90,000 1,960 --- --- 1,410,000 1.65 2,293,5002010 740,000 85,000 2,220 --- --- 1,640,000 1.79 2,903,3802011 760,000 75,000 2,670 --- --- 2,030,000 1.99 4,007,860
2012 3 790,000 80,000 2,390 --- --- 1,890,000 2.58 4,816,860
Pecans 2003 2,600 --- 1,420 --- --- 3,700 1.42 5,254(In-Shell Basis) 2004 2,700 --- 1,300 --- --- 3,500 2.21 7,735
2005 2,800 --- 1,410 --- --- 3,950 1.80 7,1102006 2,900 --- 1,170 --- --- 3,400 1.72 5,8482007 2,500 --- 1,760 --- --- 4,400 1.78 7,8322008 3,100 --- 1,210 --- --- 3,750 1.31 4,9132009 3,200 --- 1,230 --- --- 3,920 1.51 5,9192010 3,600 --- 1,580 --- --- 5,700 2.54 14,4782011 3,600 --- 1,030 --- --- 3,700 2.67 9,8792012 3,600 --- 1,330 --- --- 4,800 1.58 7,584
Pistachios 2003 88,000 23,000 1,350 90,000 29,000 119,000 1.22 145,1802004 93,000 15,000 3,730 254,000 93,000 347,000 1.34 464,9802005 105,000 --- 2,700 215,000 68,000 283,000 2.05 580,1502006 112,000 --- 2,130 201,000 37,000 238,000 1.89 449,8202007 115,000 --- 3,620 333,000 83,000 416,000 1.41 586,5602008 118,000 --- 2,360 231,000 47,000 278,000 2.05 569,9002009 126,000 --- 2,820 290,000 65,000 355,000 1.67 592,8502010 137,000 --- 3,810 378,000 144,000 522,000 2.22 1,158,8402011 153,000 --- 2,900 341,000 103,000 444,000 1.98 879,1202012 178,000 --- 3,100 464,000 87,000 551,000 2.02 1,113,020
Sold In-Shell Sold ShelledAcres Acres Tons Tons Tons Tons $/Ton $1,000
Walnuts 2003 213,000 27,000 1.53 81,000 245,000 326,000 1,160.00 378,160(In-Shell Basis) 2004 214,000 --- 1.52 75,000 250,000 325,000 1,390.00 451,750
2005 215,000 26,000 1.65 82,000 273,000 355,000 1,570.00 557,3502006 216,000 --- 1.60 71,000 275,000 346,000 1,630.00 563,9802007 218,000 25,000 1.50 66,000 262,000 328,000 2,290.00 751,1202008 223,000 --- 1.96 95,000 341,000 436,000 1,280.00 558,0802009 227,000 28,000 1.93 99,000 338,000 437,000 1,710.00 747,2702010 237,000 --- 2.13 141,000 363,000 504,000 2,040.00 1,028,1602011 245,000 35,000 1.88 125,000 336,000 461,000 2,900.00 1,336,900
2012 4 245,000 --- 2.03 --- --- 497,000 3,030.00 1,505,910
4 For 2012, Production based on California Walnut Board receipts from handlers. Price is based on the Walnut Raisin Prune Report released November 2013. Value was calculated based on production and price.
3 For 2012, Production and value of production are based on Almond Board of California receipts from handlers.
Tree Nut Acreage, Production and Value, 2003-2012
Crop Crop YearBearing Non-Bearing 1 Yield Per
AcreValue Per
UnitTotal Value
Production
1,000 Pounds
1 Non-bearing shown only in year when acreage survey conducted.2 Values are based on the edible portion of the crop only. Included in production are inedible quantities of no value: 2002 - 8.30 million lbs, 2003 - 20.8 million lbs, 2004 - 14.5 million lbs, 2005 - 16.1 million lbs, 2006 - 23.5 million lbs, 2007 - 17.5 million lbs, 2008 - 14.0 million lbs, 2009 - 20.0 million lbs, 2010 - 18.0 million lbs, 2011 - 16.0 million lbs, 2012 - 23.0 million lbs.
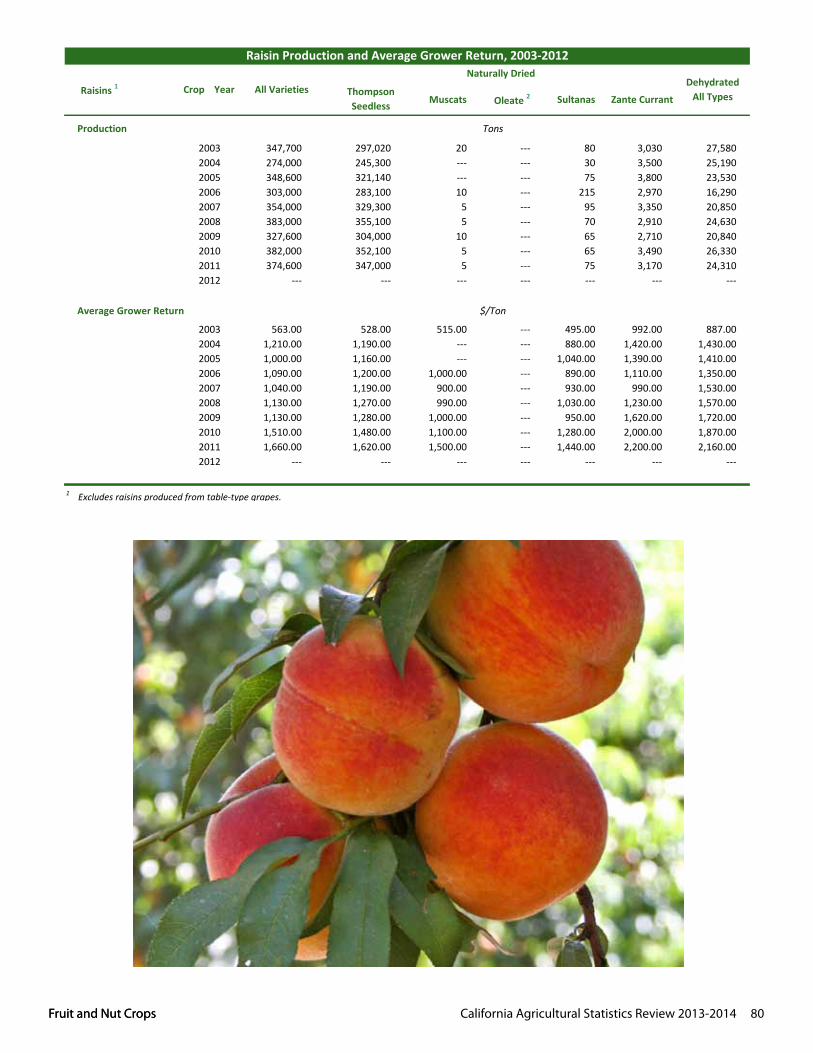
Fruit and Nut Crops California Agricultural Statistics Review 2013-2014 80 Fruit and Nut Crops
Muscats Oleate 2 Sultanas Zante Currant
Production
2003 20 --- 80 3,030 27,5802004 --- --- 30 3,500 25,1902005 --- --- 75 3,800 23,5302006 10 --- 215 2,970 16,2902007 5 --- 95 3,350 20,8502008 5 --- 70 2,910 24,6302009 10 --- 65 2,710 20,8402010 5 --- 65 3,490 26,3302011 5 --- 75 3,170 24,3102012 --- --- --- --- ---
2003 515.00 --- 495.00 992.00 887.002004 --- --- 880.00 1,420.00 1,430.002005 --- --- 1,040.00 1,390.00 1,410.002006 1,000.00 --- 890.00 1,110.00 1,350.002007 900.00 --- 930.00 990.00 1,530.002008 990.00 --- 1,030.00 1,230.00 1,570.002009 1,000.00 --- 950.00 1,620.00 1,720.002010 1,100.00 --- 1,280.00 2,000.00 1,870.002011 1,500.00 --- 1,440.00 2,200.00 2,160.002012 --- --- --- --- ---
Dehydrated All Types
Raisin Production and Average Grower Return, 2003-2012
Raisins 1 Crop Year All VarietiesNaturally Dried
Thompson Seedless
1,210.001,000.001,090.00
1 Excludes raisins produced from table-type grapes.2 Miscellaneous seedless grapes with Oleate applied.
1,040.001,130.001,130.00
1,270.001,280.00
Average Grower Return $/Ton
304,000
Tons
327,600
---
352,100347,000
---
297,020245,300321,140283,100329,300355,100
347,700274,000348,600303,000354,000383,000
382,000374,600
563.00
1,480.001,620.00
---
1,510.001,660.00
---
528.001,190.001,160.001,200.001,190.00
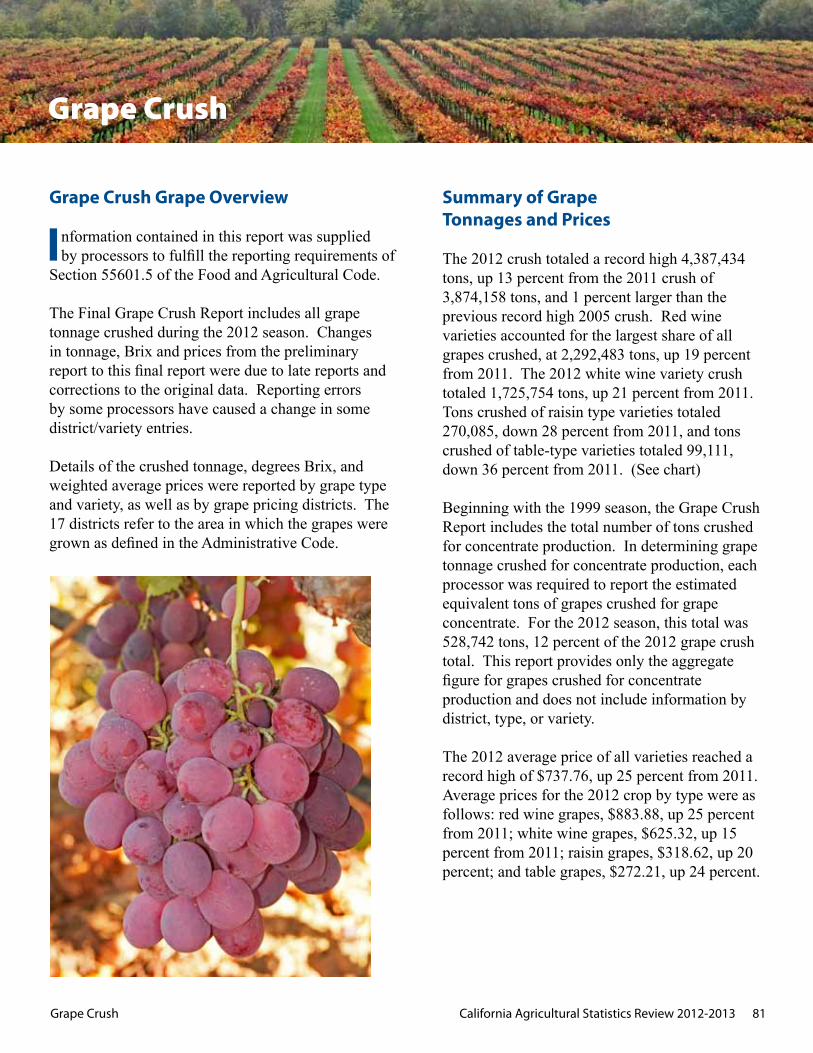
Grape Crush California Agricultural Statistics Review 2012-2013 81
Grape Crush Grape Overview
nformation contained in this report was supplied by processors to fulfill the reporting requirements of Section 55601.5 of the Food and Agricultural Code.
The Final Grape Crush Report includes all grape tonnage crushed during the 2012 season. Changes in tonnage, Brix and prices from the preliminary report to this final report were due to late reports and corrections to the original data. Reporting errors by some processors have caused a change in some district/variety entries. Details of the crushed tonnage, degrees Brix, and weighted average prices were reported by grape type and variety, as well as by grape pricing districts. The 17 districts refer to the area in which the grapes were grown as defined in the Administrative Code.
Summary of GrapeTonnages and Prices
The 2012 crush totaled a record high 4,387,434 tons, up 13 percent from the 2011 crush of 3,874,158 tons, and 1 percent larger than the previous record high 2005 crush. Red wine varieties accounted for the largest share of all grapes crushed, at 2,292,483 tons, up 19 percent from 2011. The 2012 white wine variety crush totaled 1,725,754 tons, up 21 percent from 2011. Tons crushed of raisin type varieties totaled 270,085, down 28 percent from 2011, and tons crushed of table-type varieties totaled 99,111, down 36 percent from 2011. (See chart)
Beginning with the 1999 season, the Grape Crush Report includes the total number of tons crushed for concentrate production. In determining grape tonnage crushed for concentrate production, each processor was required to report the estimated equivalent tons of grapes crushed for grape concentrate. For the 2012 season, this total was 528,742 tons, 12 percent of the 2012 grape crush total. This report provides only the aggregate figure for grapes crushed for concentrate production and does not include information by district, type, or variety.
The 2012 average price of all varieties reached a record high of $737.76, up 25 percent from 2011. Average prices for the 2012 crop by type were as follows: red wine grapes, $883.88, up 25 percent from 2011; white wine grapes, $625.32, up 15 percent from 2011; raisin grapes, $318.62, up 20 percent; and table grapes, $272.21, up 24 percent.
Grape Crush
I
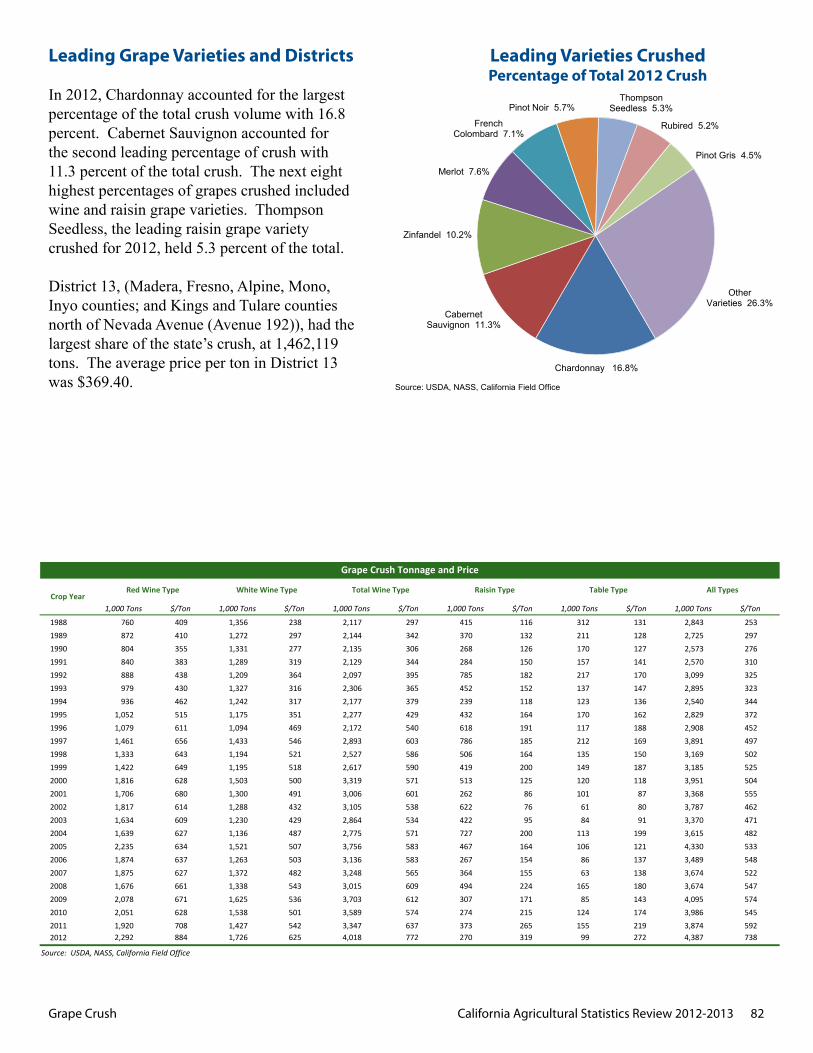
Grape Crush California Agricultural Statistics Review 2012-2013 82
Leading Grape Varieties and Districts
In 2012, Chardonnay accounted for the largest percentage of the total crush volume with 16.8 percent. Cabernet Sauvignon accounted for the second leading percentage of crush with 11.3 percent of the total crush. The next eight highest percentages of grapes crushed included wine and raisin grape varieties. Thompson Seedless, the leading raisin grape variety crushed for 2012, held 5.3 percent of the total.
District 13, (Madera, Fresno, Alpine, Mono, Inyo counties; and Kings and Tulare counties north of Nevada Avenue (Avenue 192)), had the largest share of the state’s crush, at 1,462,119 tons. The average price per ton in District 13 was $369.40.
Chardonnay 16.8%
Cabernet Sauvignon 11.3%
Zinfandel 10.2%
Merlot 7.6%
French Colombard 7.1%
Pinot Noir 5.7% Thompson
Seedless 5.3%
Rubired 5.2%
Pinot Gris 4.5%
Other Varieties 26.3%
Leading Varieties Crushed PERCENT OF TOTAL 2012 CRUSH
Source: USDA, NASS, California Field Office
Leading Varieties CrushedPercentage of Total 2012 Crush
1,000 Tons $/Ton 1,000 Tons $/Ton 1,000 Tons $/Ton 1,000 Tons $/Ton 1,000 Tons $/Ton 1,000 Tons $/Ton
1988 760 409 1,356 238 2,117 297 415 116 312 131 2,843 2531989 872 410 1,272 297 2,144 342 370 132 211 128 2,725 2971990 804 355 1,331 277 2,135 306 268 126 170 127 2,573 2761991 840 383 1,289 319 2,129 344 284 150 157 141 2,570 3101992 888 438 1,209 364 2,097 395 785 182 217 170 3,099 3251993 979 430 1,327 316 2,306 365 452 152 137 147 2,895 3231994 936 462 1,242 317 2,177 379 239 118 123 136 2,540 3441995 1,052 515 1,175 351 2,277 429 432 164 170 162 2,829 3721996 1,079 611 1,094 469 2,172 540 618 191 117 188 2,908 4521997 1,461 656 1,433 546 2,893 603 786 185 212 169 3,891 4971998 1,333 643 1,194 521 2,527 586 506 164 135 150 3,169 5021999 1,422 649 1,195 518 2,617 590 419 200 149 187 3,185 5252000 1,816 628 1,503 500 3,319 571 513 125 120 118 3,951 5042001 1,706 680 1,300 491 3,006 601 262 86 101 87 3,368 5552002 1,817 614 1,288 432 3,105 538 622 76 61 80 3,787 4622003 1,634 609 1,230 429 2,864 534 422 95 84 91 3,370 4712004 1,639 627 1,136 487 2,775 571 727 200 113 199 3,615 4822005 2,235 634 1,521 507 3,756 583 467 164 106 121 4,330 5332006 1,874 637 1,263 503 3,136 583 267 154 86 137 3,489 5482007 1,875 627 1,372 482 3,248 565 364 155 63 138 3,674 5222008 1,676 661 1,338 543 3,015 609 494 224 165 180 3,674 5472009 2,078 671 1,625 536 3,703 612 307 171 85 143 4,095 5742010 2,051 628 1,538 501 3,589 574 274 215 124 174 3,986 5452011 1,920 708 1,427 542 3,347 637 373 265 155 219 3,874 5922012 2,292 884 1,726 625 4,018 772 270 319 99 272 4,387 738
Source: USDA, NASS, California Field Office
Grape Crush Tonnage and Price
Table Type All TypesCrop Year
Red Wine Type White Wine Type Total Wine Type Raisin Type
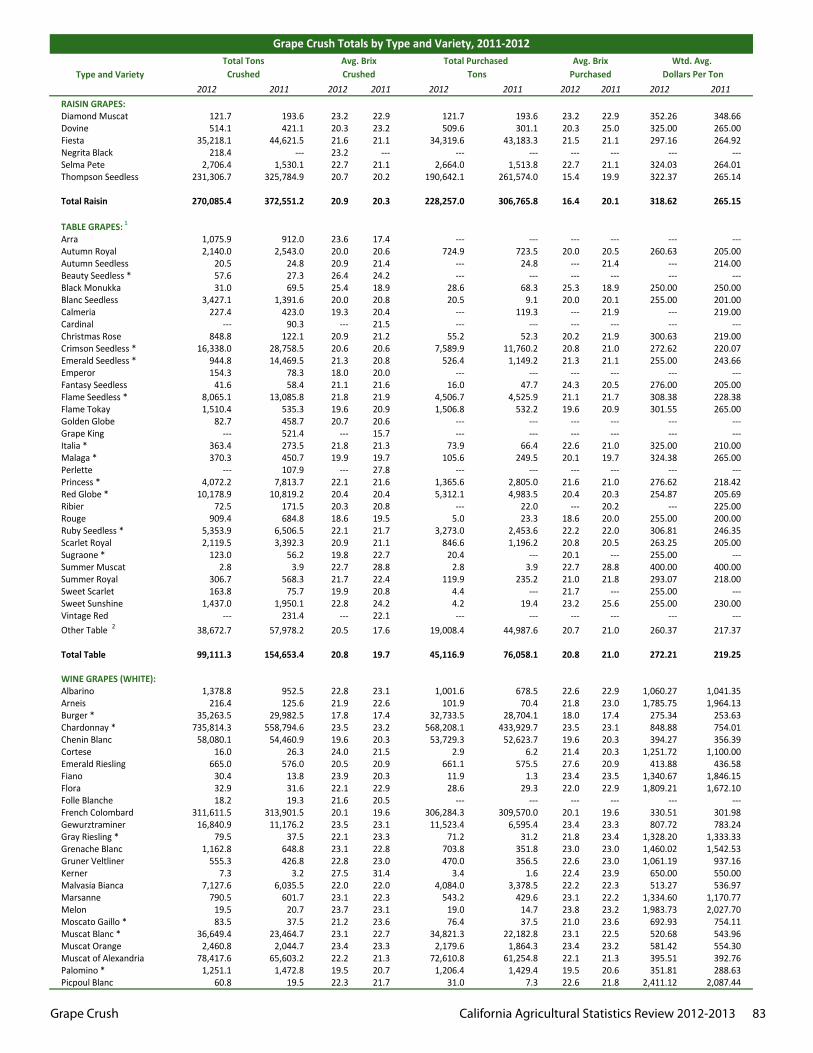
Grape Crush California Agricultural Statistics Review 2012-2013 83
2012 2011 2012 2011 2012 2011 2012 2011 2012 2011RAISIN GRAPES:Diamond Muscat 121.7 193.6 23.2 22.9 121.7 193.6 23.2 22.9 352.26 348.66Dovine 514.1 421.1 20.3 23.2 509.6 301.1 20.3 25.0 325.00 265.00Fiesta 35,218.1 44,621.5 21.6 21.1 34,319.6 43,183.3 21.5 21.1 297.16 264.92Negrita Black 218.4 --- 23.2 --- --- --- --- --- --- ---Selma Pete 2,706.4 1,530.1 22.7 21.1 2,664.0 1,513.8 22.7 21.1 324.03 264.01Thompson Seedless 231,306.7 325,784.9 20.7 20.2 190,642.1 261,574.0 15.4 19.9 322.37 265.14
Total Raisin 270,085.4 372,551.2 20.9 20.3 228,257.0 306,765.8 16.4 20.1 318.62 265.15 TABLE GRAPES: 1
Arra 1,075.9 912.0 23.6 17.4 --- --- --- --- --- ---Autumn Royal 2,140.0 2,543.0 20.0 20.6 724.9 723.5 20.0 20.5 260.63 205.00Autumn Seedless 20.5 24.8 20.9 21.4 --- 24.8 --- 21.4 --- 214.00Beauty Seedless * 57.6 27.3 26.4 24.2 --- --- --- --- --- ---Black Monukka 31.0 69.5 25.4 18.9 28.6 68.3 25.3 18.9 250.00 250.00Blanc Seedless 3,427.1 1,391.6 20.0 20.8 20.5 9.1 20.0 20.1 255.00 201.00Calmeria 227.4 423.0 19.3 20.4 --- 119.3 --- 21.9 --- 219.00Cardinal --- 90.3 --- 21.5 --- --- --- --- --- ---Christmas Rose 848.8 122.1 20.9 21.2 55.2 52.3 20.2 21.9 300.63 219.00Crimson Seedless * 16,338.0 28,758.5 20.6 20.6 7,589.9 11,760.2 20.8 21.0 272.62 220.07Emerald Seedless * 944.8 14,469.5 21.3 20.8 526.4 1,149.2 21.3 21.1 255.00 243.66Emperor 154.3 78.3 18.0 20.0 --- --- --- --- --- ---Fantasy Seedless 41.6 58.4 21.1 21.6 16.0 47.7 24.3 20.5 276.00 205.00Flame Seedless * 8,065.1 13,085.8 21.8 21.9 4,506.7 4,525.9 21.1 21.7 308.38 228.38Flame Tokay 1,510.4 535.3 19.6 20.9 1,506.8 532.2 19.6 20.9 301.55 265.00Golden Globe 82.7 458.7 20.7 20.6 --- --- --- --- --- ---Grape King --- 521.4 --- 15.7 --- --- --- --- --- ---Italia * 363.4 273.5 21.8 21.3 73.9 66.4 22.6 21.0 325.00 210.00Malaga * 370.3 450.7 19.9 19.7 105.6 249.5 20.1 19.7 324.38 265.00Perlette --- 107.9 --- 27.8 --- --- --- --- --- ---Princess * 4,072.2 7,813.7 22.1 21.6 1,365.6 2,805.0 21.6 21.0 276.62 218.42Red Globe * 10,178.9 10,819.2 20.4 20.4 5,312.1 4,983.5 20.4 20.3 254.87 205.69Ribier 72.5 171.5 20.3 20.8 --- 22.0 --- 20.2 --- 225.00Rouge 909.4 684.8 18.6 19.5 5.0 23.3 18.6 20.0 255.00 200.00Ruby Seedless * 5,353.9 6,506.5 22.1 21.7 3,273.0 2,453.6 22.2 22.0 306.81 246.35Scarlet Royal 2,119.5 3,392.3 20.9 21.1 846.6 1,196.2 20.8 20.5 263.25 205.00Sugraone * 123.0 56.2 19.8 22.7 20.4 --- 20.1 --- 255.00 ---Summer Muscat 2.8 3.9 22.7 28.8 2.8 3.9 22.7 28.8 400.00 400.00Summer Royal 306.7 568.3 21.7 22.4 119.9 235.2 21.0 21.8 293.07 218.00Sweet Scarlet 163.8 75.7 19.9 20.8 4.4 --- 21.7 --- 255.00 ---Sweet Sunshine 1,437.0 1,950.1 22.8 24.2 4.2 19.4 23.2 25.6 255.00 230.00Vintage Red --- 231.4 --- 22.1 --- --- --- --- --- ---Other Table 2 38,672.7 57,978.2 20.5 17.6 19,008.4 44,987.6 20.7 21.0 260.37 217.37
Total Table 99,111.3 154,653.4 20.8 19.7 45,116.9 76,058.1 20.8 21.0 272.21 219.25 WINE GRAPES (WHITE):Albarino 1,378.8 952.5 22.8 23.1 1,001.6 678.5 22.6 22.9 1,060.27 1,041.35Arneis 216.4 125.6 21.9 22.6 101.9 70.4 21.8 23.0 1,785.75 1,964.13Burger * 35,263.5 29,982.5 17.8 17.4 32,733.5 28,704.1 18.0 17.4 275.34 253.63Chardonnay * 735,814.3 558,794.6 23.5 23.2 568,208.1 433,929.7 23.5 23.1 848.88 754.01Chenin Blanc 58,080.1 54,460.9 19.6 20.3 53,729.3 52,623.7 19.6 20.3 394.27 356.39Cortese 16.0 26.3 24.0 21.5 2.9 6.2 21.4 20.3 1,251.72 1,100.00Emerald Riesling 665.0 576.0 20.5 20.9 661.1 575.5 27.6 20.9 413.88 436.58Fiano 30.4 13.8 23.9 20.3 11.9 1.3 23.4 23.5 1,340.67 1,846.15Flora 32.9 31.6 22.1 22.9 28.6 29.3 22.0 22.9 1,809.21 1,672.10Folle Blanche 18.2 19.3 21.6 20.5 --- --- --- --- --- ---French Colombard 311,611.5 313,901.5 20.1 19.6 306,284.3 309,570.0 20.1 19.6 330.51 301.98Gewurztraminer 16,840.9 11,176.2 23.5 23.1 11,523.4 6,595.4 23.4 23.3 807.72 783.24Gray Riesling * 79.5 37.5 22.1 23.3 71.2 31.2 21.8 23.4 1,328.20 1,333.33Grenache Blanc 1,162.8 648.8 23.1 22.8 703.8 351.8 23.0 23.0 1,460.02 1,542.53Gruner Veltliner 555.3 426.8 22.8 23.0 470.0 356.5 22.6 23.0 1,061.19 937.16Kerner 7.3 3.2 27.5 31.4 3.4 1.6 22.4 23.9 650.00 550.00Malvasia Bianca 7,127.6 6,035.5 22.0 22.0 4,084.0 3,378.5 22.2 22.3 513.27 536.97Marsanne 790.5 601.7 23.1 22.3 543.2 429.6 23.1 22.2 1,334.60 1,170.77Melon 19.5 20.7 23.7 23.1 19.0 14.7 23.8 23.2 1,983.73 2,027.70Moscato Gaillo * 83.5 37.5 21.2 23.6 76.4 37.5 21.0 23.6 692.93 754.11Muscat Blanc * 36,649.4 23,464.7 23.1 22.7 34,821.3 22,182.8 23.1 22.5 520.68 543.96Muscat Orange 2,460.8 2,044.7 23.4 23.3 2,179.6 1,864.3 23.4 23.2 581.42 554.30Muscat of Alexandria 78,417.6 65,603.2 22.2 21.3 72,610.8 61,254.8 22.1 21.3 395.51 392.76Palomino * 1,251.1 1,472.8 19.5 20.7 1,206.4 1,429.4 19.5 20.6 351.81 288.63Picpoul Blanc 60.8 19.5 22.3 21.7 31.0 7.3 22.6 21.8 2,411.12 2,087.44
Grape Crush Totals by Type and Variety, 2011-2012
Type and VarietyTotal Tons
CrushedAvg. Brix Crushed
Total Purchased Tons
Avg. Brix Purchased
Wtd. Avg. Dollars Per Ton
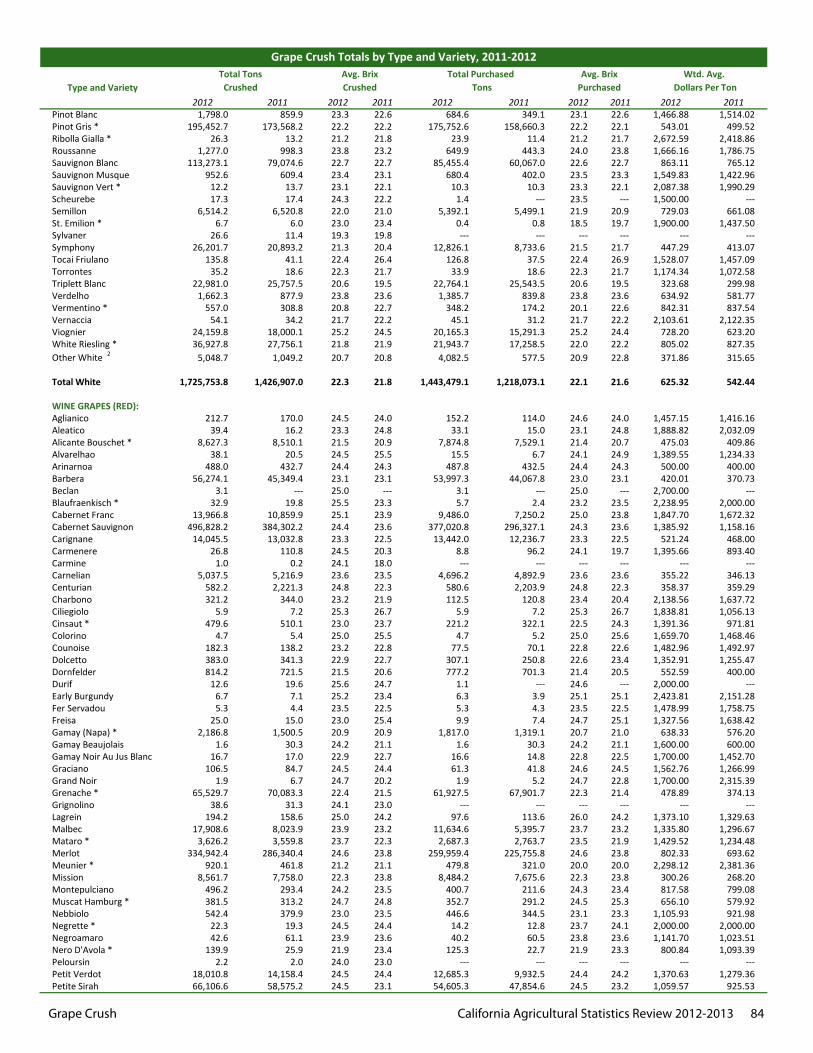
Grape Crush California Agricultural Statistics Review 2012-2013 84
2012 2011 2012 2011 2012 2011 2012 2011 2012 2011
Grape Crush Totals by Type and Variety, 2011-2012
Type and VarietyTotal Tons
CrushedAvg. Brix Crushed
Total Purchased Tons
Avg. Brix Purchased
Wtd. Avg. Dollars Per Ton
Pinot Blanc 1,798.0 859.9 23.3 22.6 684.6 349.1 23.1 22.6 1,466.88 1,514.02Pinot Gris * 195,452.7 173,568.2 22.2 22.2 175,752.6 158,660.3 22.2 22.1 543.01 499.52Ribolla Gialla * 26.3 13.2 21.2 21.8 23.9 11.4 21.2 21.7 2,672.59 2,418.86Roussanne 1,277.0 998.3 23.8 23.2 649.9 443.3 24.0 23.8 1,666.16 1,786.75Sauvignon Blanc 113,273.1 79,074.6 22.7 22.7 85,455.4 60,067.0 22.6 22.7 863.11 765.12Sauvignon Musque 952.6 609.4 23.4 23.1 680.4 402.0 23.5 23.3 1,549.83 1,422.96Sauvignon Vert * 12.2 13.7 23.1 22.1 10.3 10.3 23.3 22.1 2,087.38 1,990.29Scheurebe 17.3 17.4 24.3 22.2 1.4 --- 23.5 --- 1,500.00 ---Semillon 6,514.2 6,520.8 22.0 21.0 5,392.1 5,499.1 21.9 20.9 729.03 661.08St. Emilion * 6.7 6.0 23.0 23.4 0.4 0.8 18.5 19.7 1,900.00 1,437.50Sylvaner 26.6 11.4 19.3 19.8 --- --- --- --- --- ---Symphony 26,201.7 20,893.2 21.3 20.4 12,826.1 8,733.6 21.5 21.7 447.29 413.07Tocai Friulano 135.8 41.1 22.4 26.4 126.8 37.5 22.4 26.9 1,528.07 1,457.09Torrontes 35.2 18.6 22.3 21.7 33.9 18.6 22.3 21.7 1,174.34 1,072.58Triplett Blanc 22,981.0 25,757.5 20.6 19.5 22,764.1 25,543.5 20.6 19.5 323.68 299.98Verdelho 1,662.3 877.9 23.8 23.6 1,385.7 839.8 23.8 23.6 634.92 581.77Vermentino * 557.0 308.8 20.8 22.7 348.2 174.2 20.1 22.6 842.31 837.54Vernaccia 54.1 34.2 21.7 22.2 45.1 31.2 21.7 22.2 2,103.61 2,122.35Viognier 24,159.8 18,000.1 25.2 24.5 20,165.3 15,291.3 25.2 24.4 728.20 623.20White Riesling * 36,927.8 27,756.1 21.8 21.9 21,943.7 17,258.5 22.0 22.2 805.02 827.35Other White 2 5,048.7 1,049.2 20.7 20.8 4,082.5 577.5 20.9 22.8 371.86 315.65
Total White 1,725,753.8 1,426,907.0 22.3 21.8 1,443,479.1 1,218,073.1 22.1 21.6 625.32 542.44 WINE GRAPES (RED):Aglianico 212.7 170.0 24.5 24.0 152.2 114.0 24.6 24.0 1,457.15 1,416.16Aleatico 39.4 16.2 23.3 24.8 33.1 15.0 23.1 24.8 1,888.82 2,032.09Alicante Bouschet * 8,627.3 8,510.1 21.5 20.9 7,874.8 7,529.1 21.4 20.7 475.03 409.86Alvarelhao 38.1 20.5 24.5 25.5 15.5 6.7 24.1 24.9 1,389.55 1,234.33Arinarnoa 488.0 432.7 24.4 24.3 487.8 432.5 24.4 24.3 500.00 400.00Barbera 56,274.1 45,349.4 23.1 23.1 53,997.3 44,067.8 23.0 23.1 420.01 370.73Beclan 3.1 --- 25.0 --- 3.1 --- 25.0 --- 2,700.00 ---Blaufraenkisch * 32.9 19.8 25.5 23.3 5.7 2.4 23.2 23.5 2,238.95 2,000.00Cabernet Franc 13,966.8 10,859.9 25.1 23.9 9,486.0 7,250.2 25.0 23.8 1,847.70 1,672.32Cabernet Sauvignon 496,828.2 384,302.2 24.4 23.6 377,020.8 296,327.1 24.3 23.6 1,385.92 1,158.16Carignane 14,045.5 13,032.8 23.3 22.5 13,442.0 12,236.7 23.3 22.5 521.24 468.00Carmenere 26.8 110.8 24.5 20.3 8.8 96.2 24.1 19.7 1,395.66 893.40Carmine 1.0 0.2 24.1 18.0 --- --- --- --- --- ---Carnelian 5,037.5 5,216.9 23.6 23.5 4,696.2 4,892.9 23.6 23.6 355.22 346.13Centurian 582.2 2,221.3 24.8 22.3 580.6 2,203.9 24.8 22.3 358.37 359.29Charbono 321.2 344.0 23.2 21.9 112.5 120.8 23.4 20.4 2,138.56 1,637.72Ciliegiolo 5.9 7.2 25.3 26.7 5.9 7.2 25.3 26.7 1,838.81 1,056.13Cinsaut * 479.6 510.1 23.0 23.7 221.2 322.1 22.5 24.3 1,391.36 971.81Colorino 4.7 5.4 25.0 25.5 4.7 5.2 25.0 25.6 1,659.70 1,468.46Counoise 182.3 138.2 23.2 22.8 77.5 70.1 22.8 22.6 1,482.96 1,492.97Dolcetto 383.0 341.3 22.9 22.7 307.1 250.8 22.6 23.4 1,352.91 1,255.47Dornfelder 814.2 721.5 21.5 20.6 777.2 701.3 21.4 20.5 552.59 400.00Durif 12.6 19.6 25.6 24.7 1.1 --- 24.6 --- 2,000.00 ---Early Burgundy 6.7 7.1 25.2 23.4 6.3 3.9 25.1 25.1 2,423.81 2,151.28Fer Servadou 5.3 4.4 23.5 22.5 5.3 4.3 23.5 22.5 1,478.99 1,758.75Freisa 25.0 15.0 23.0 25.4 9.9 7.4 24.7 25.1 1,327.56 1,638.42Gamay (Napa) * 2,186.8 1,500.5 20.9 20.9 1,817.0 1,319.1 20.7 21.0 638.33 576.20Gamay Beaujolais 1.6 30.3 24.2 21.1 1.6 30.3 24.2 21.1 1,600.00 600.00Gamay Noir Au Jus Blanc 16.7 17.0 22.9 22.7 16.6 14.8 22.8 22.5 1,700.00 1,452.70Graciano 106.5 84.7 24.5 24.4 61.3 41.8 24.6 24.5 1,562.76 1,266.99Grand Noir 1.9 6.7 24.7 20.2 1.9 5.2 24.7 22.8 1,700.00 2,315.39Grenache * 65,529.7 70,083.3 22.4 21.5 61,927.5 67,901.7 22.3 21.4 478.89 374.13Grignolino 38.6 31.3 24.1 23.0 --- --- --- --- --- ---Lagrein 194.2 158.6 25.0 24.2 97.6 113.6 26.0 24.2 1,373.10 1,329.63Malbec 17,908.6 8,023.9 23.9 23.2 11,634.6 5,395.7 23.7 23.2 1,335.80 1,296.67Mataro * 3,626.2 3,559.8 23.7 22.3 2,687.3 2,763.7 23.5 21.9 1,429.52 1,234.48Merlot 334,942.4 286,340.4 24.6 23.8 259,959.4 225,755.8 24.6 23.8 802.33 693.62Meunier * 920.1 461.8 21.2 21.1 479.8 321.0 20.0 20.0 2,298.12 2,381.36Mission 8,561.7 7,758.0 22.3 23.8 8,484.2 7,675.6 22.3 23.8 300.26 268.20Montepulciano 496.2 293.4 24.2 23.5 400.7 211.6 24.3 23.4 817.58 799.08Muscat Hamburg * 381.5 313.2 24.7 24.8 352.7 291.2 24.5 25.3 656.10 579.92Nebbiolo 542.4 379.9 23.0 23.5 446.6 344.5 23.1 23.3 1,105.93 921.98Negrette * 22.3 19.3 24.5 24.4 14.2 12.8 23.7 24.1 2,000.00 2,000.00Negroamaro 42.6 61.1 23.9 23.6 40.2 60.5 23.8 23.6 1,141.70 1,023.51Nero D'Avola * 139.9 25.9 21.9 23.4 125.3 22.7 21.9 23.3 800.84 1,093.39Peloursin 2.2 2.0 24.0 23.0 --- --- --- --- --- ---Petit Verdot 18,010.8 14,158.4 24.5 24.4 12,685.3 9,932.5 24.4 24.2 1,370.63 1,279.36Petite Sirah 66,106.6 58,575.2 24.5 23.1 54,605.3 47,854.6 24.5 23.2 1,059.57 925.53
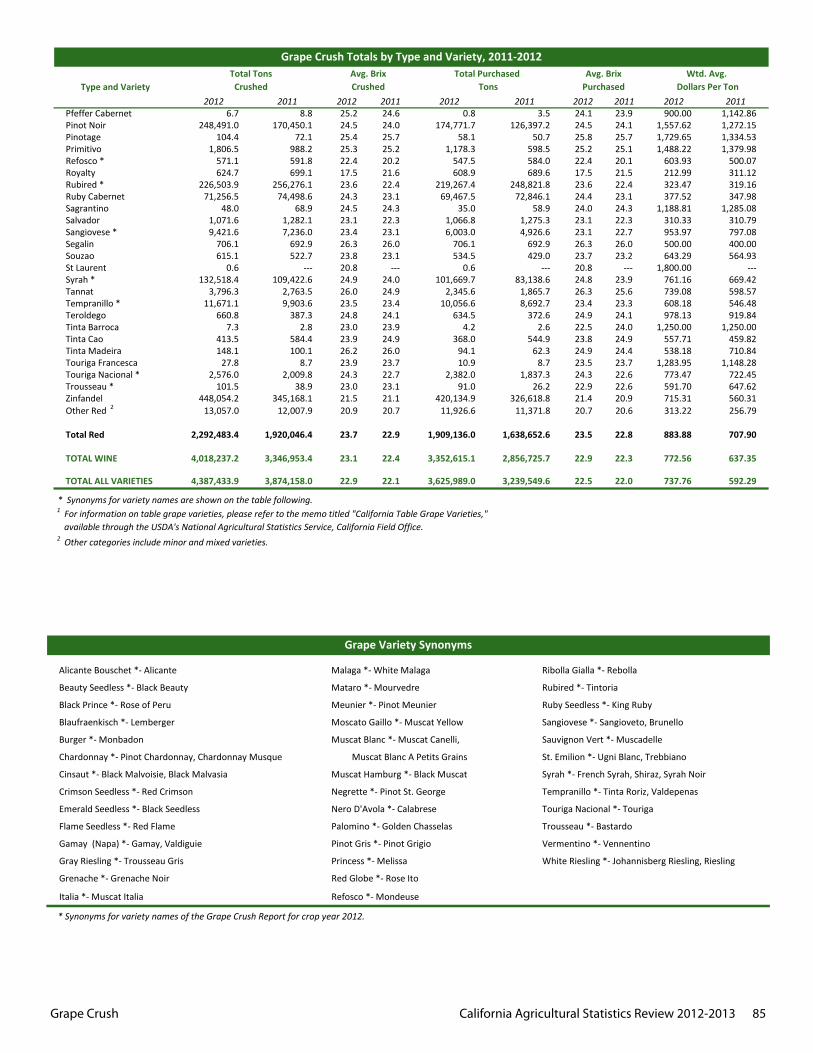
Grape Crush California Agricultural Statistics Review 2012-2013 85
2012 2011 2012 2011 2012 2011 2012 2011 2012 2011
Grape Crush Totals by Type and Variety, 2011-2012
Type and VarietyTotal Tons
CrushedAvg. Brix Crushed
Total Purchased Tons
Avg. Brix Purchased
Wtd. Avg. Dollars Per Ton
Pfeffer Cabernet 6.7 8.8 25.2 24.6 0.8 3.5 24.1 23.9 900.00 1,142.86Pinot Noir 248,491.0 170,450.1 24.5 24.0 174,771.7 126,397.2 24.5 24.1 1,557.62 1,272.15Pinotage 104.4 72.1 25.4 25.7 58.1 50.7 25.8 25.7 1,729.65 1,334.53Primitivo 1,806.5 988.2 25.3 25.2 1,178.3 598.5 25.2 25.1 1,488.22 1,379.98Refosco * 571.1 591.8 22.4 20.2 547.5 584.0 22.4 20.1 603.93 500.07Royalty 624.7 699.1 17.5 21.6 608.9 689.6 17.5 21.5 212.99 311.12Rubired * 226,503.9 256,276.1 23.6 22.4 219,267.4 248,821.8 23.6 22.4 323.47 319.16Ruby Cabernet 71,256.5 74,498.6 24.3 23.1 69,467.5 72,846.1 24.4 23.1 377.52 347.98Sagrantino 48.0 68.9 24.5 24.3 35.0 58.9 24.0 24.3 1,188.81 1,285.08Salvador 1,071.6 1,282.1 23.1 22.3 1,066.8 1,275.3 23.1 22.3 310.33 310.79Sangiovese * 9,421.6 7,236.0 23.4 23.1 6,003.0 4,926.6 23.1 22.7 953.97 797.08Segalin 706.1 692.9 26.3 26.0 706.1 692.9 26.3 26.0 500.00 400.00Souzao 615.1 522.7 23.8 23.1 534.5 429.0 23.7 23.2 643.29 564.93St Laurent 0.6 --- 20.8 --- 0.6 --- 20.8 --- 1,800.00 ---Syrah * 132,518.4 109,422.6 24.9 24.0 101,669.7 83,138.6 24.8 23.9 761.16 669.42Tannat 3,796.3 2,763.5 26.0 24.9 2,345.6 1,865.7 26.3 25.6 739.08 598.57Tempranillo * 11,671.1 9,903.6 23.5 23.4 10,056.6 8,692.7 23.4 23.3 608.18 546.48Teroldego 660.8 387.3 24.8 24.1 634.5 372.6 24.9 24.1 978.13 919.84Tinta Barroca 7.3 2.8 23.0 23.9 4.2 2.6 22.5 24.0 1,250.00 1,250.00Tinta Cao 413.5 584.4 23.9 24.9 368.0 544.9 23.8 24.9 557.71 459.82Tinta Madeira 148.1 100.1 26.2 26.0 94.1 62.3 24.9 24.4 538.18 710.84Touriga Francesca 27.8 8.7 23.9 23.7 10.9 8.7 23.5 23.7 1,283.95 1,148.28Touriga Nacional * 2,576.0 2,009.8 24.3 22.7 2,382.0 1,837.3 24.3 22.6 773.47 722.45Trousseau * 101.5 38.9 23.0 23.1 91.0 26.2 22.9 22.6 591.70 647.62Zinfandel 448,054.2 345,168.1 21.5 21.1 420,134.9 326,618.8 21.4 20.9 715.31 560.31Other Red 2 13,057.0 12,007.9 20.9 20.7 11,926.6 11,371.8 20.7 20.6 313.22 256.79
Total Red 2,292,483.4 1,920,046.4 23.7 22.9 1,909,136.0 1,638,652.6 23.5 22.8 883.88 707.90 TOTAL WINE 4,018,237.2 3,346,953.4 23.1 22.4 3,352,615.1 2,856,725.7 22.9 22.3 772.56 637.35 TOTAL ALL VARIETIES 4,387,433.9 3,874,158.0 22.9 22.1 3,625,989.0 3,239,549.6 22.5 22.0 737.76 592.29
* Synonyms for variety names are shown on the table following.
2 Other categories include minor and mixed varieties.
1 For information on table grape varieties, please refer to the memo titled "California Table Grape Varieties," available through the USDA's National Agricultural Statistics Service, California Field Office.
Alicante Bouschet *- Alicante Malaga *- White Malaga Ribolla Gialla *- Rebolla
Beauty Seedless *- Black Beauty Mataro *- Mourvedre Rubired *- Tintoria
Black Prince *- Rose of Peru Meunier *- Pinot Meunier Ruby Seedless *- King Ruby
Blaufraenkisch *- Lemberger Moscato Gaillo *- Muscat Yellow Sangiovese *- Sangioveto, Brunello
Burger *- Monbadon Muscat Blanc *- Muscat Canelli, Sauvignon Vert *- Muscadelle
Chardonnay *- Pinot Chardonnay, Chardonnay Musque Muscat Blanc A Petits Grains St. Emilion *- Ugni Blanc, Trebbiano
Cinsaut *- Black Malvoisie, Black Malvasia Muscat Hamburg *- Black Muscat Syrah *- French Syrah, Shiraz, Syrah Noir
Crimson Seedless *- Red Crimson Negrette *- Pinot St. George Tempranillo *- Tinta Roriz, Valdepenas
Emerald Seedless *- Black Seedless Nero D'Avola *- Calabrese Touriga Nacional *- Touriga
Flame Seedless *- Red Flame Palomino *- Golden Chasselas Trousseau *- Bastardo
Gamay (Napa) *- Gamay, Valdiguie Pinot Gris *- Pinot Grigio Vermentino *- Vennentino
Gray Riesling *- Trousseau Gris Princess *- Melissa White Riesling *- Johannisberg Riesling, Riesling
Grenache *- Grenache Noir Red Globe *- Rose Ito
Italia *- Muscat Italia Refosco *- Mondeuse
* Synonyms for variety names of the Grape Crush Report for crop year 2012.
Grape Variety Synonyms
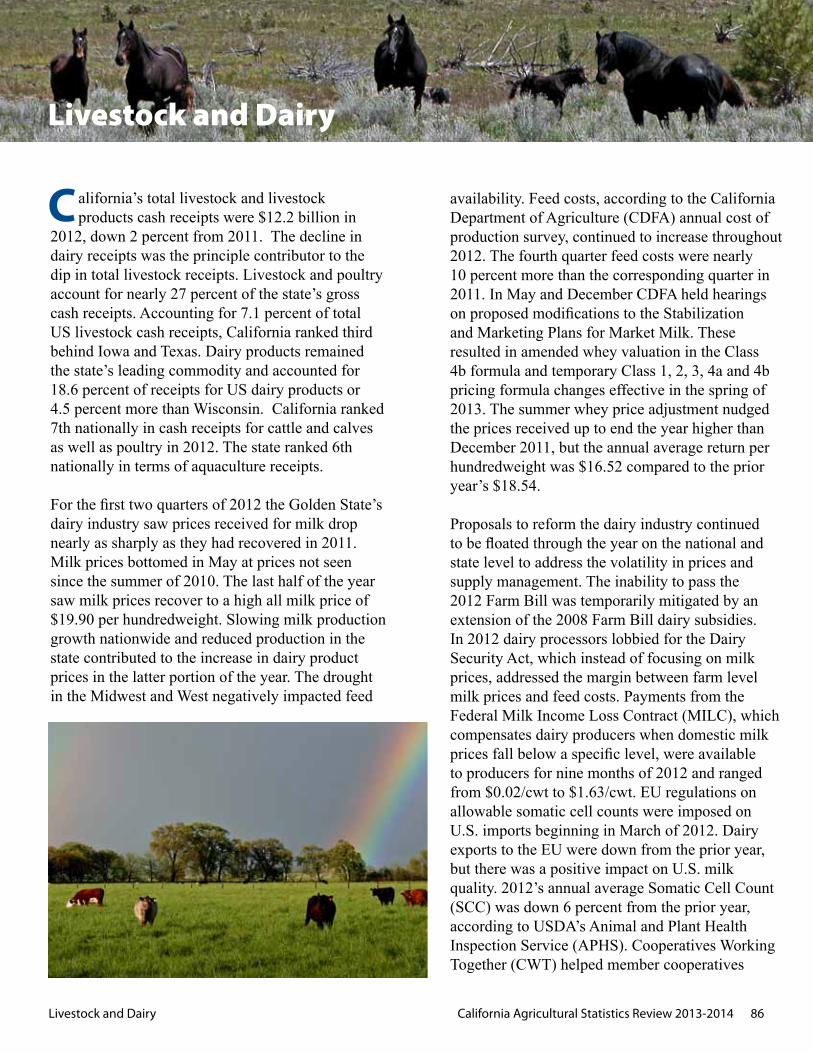
Livestock and Dairy California Agricultural Statistics Review 2013-2014 86
alifornia’s total livestock and livestock products cash receipts were $12.2 billion in 2012, down 2 percent from 2011. The decline in dairy receipts was the principle contributor to the dip in total livestock receipts. Livestock and poultry account for nearly 27 percent of the state’s gross cash receipts. Accounting for 7.1 percent of total US livestock cash receipts, California ranked third behind Iowa and Texas. Dairy products remained the state’s leading commodity and accounted for 18.6 percent of receipts for US dairy products or 4.5 percent more than Wisconsin. California ranked 7th nationally in cash receipts for cattle and calves as well as poultry in 2012. The state ranked 6th nationally in terms of aquaculture receipts. For the first two quarters of 2012 the Golden State’s dairy industry saw prices received for milk drop nearly as sharply as they had recovered in 2011. Milk prices bottomed in May at prices not seen since the summer of 2010. The last half of the year saw milk prices recover to a high all milk price of $19.90 per hundredweight. Slowing milk production growth nationwide and reduced production in the state contributed to the increase in dairy product prices in the latter portion of the year. The drought in the Midwest and West negatively impacted feed
availability. Feed costs, according to the California Department of Agriculture (CDFA) annual cost of production survey, continued to increase throughout 2012. The fourth quarter feed costs were nearly 10 percent more than the corresponding quarter in 2011. In May and December CDFA held hearings on proposed modifications to the Stabilization and Marketing Plans for Market Milk. These resulted in amended whey valuation in the Class 4b formula and temporary Class 1, 2, 3, 4a and 4b pricing formula changes effective in the spring of 2013. The summer whey price adjustment nudged the prices received up to end the year higher than December 2011, but the annual average return per hundredweight was $16.52 compared to the prior year’s $18.54.
Proposals to reform the dairy industry continued to be floated through the year on the national and state level to address the volatility in prices and supply management. The inability to pass the 2012 Farm Bill was temporarily mitigated by an extension of the 2008 Farm Bill dairy subsidies. In 2012 dairy processors lobbied for the Dairy Security Act, which instead of focusing on milk prices, addressed the margin between farm level milk prices and feed costs. Payments from the Federal Milk Income Loss Contract (MILC), which compensates dairy producers when domestic milk prices fall below a specific level, were available to producers for nine months of 2012 and ranged from $0.02/cwt to $1.63/cwt. EU regulations on allowable somatic cell counts were imposed on U.S. imports beginning in March of 2012. Dairy exports to the EU were down from the prior year, but there was a positive impact on U.S. milk quality. 2012’s annual average Somatic Cell Count (SCC) was down 6 percent from the prior year, according to USDA’s Animal and Plant Health Inspection Service (APHS). Cooperatives Working Together (CWT) helped member cooperatives
Livestock and Dairy
C
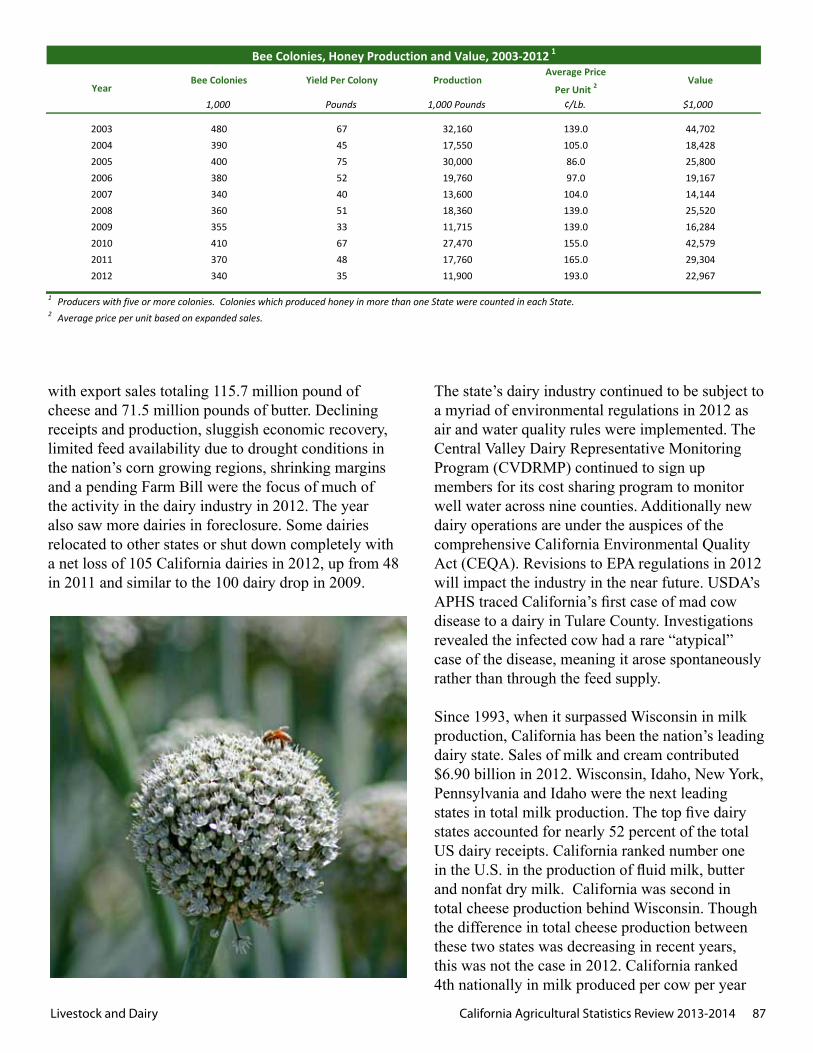
Livestock and Dairy California Agricultural Statistics Review 2013-2014 87
with export sales totaling 115.7 million pound of cheese and 71.5 million pounds of butter. Declining receipts and production, sluggish economic recovery, limited feed availability due to drought conditions in the nation’s corn growing regions, shrinking margins and a pending Farm Bill were the focus of much of the activity in the dairy industry in 2012. The year also saw more dairies in foreclosure. Some dairies relocated to other states or shut down completely with a net loss of 105 California dairies in 2012, up from 48 in 2011 and similar to the 100 dairy drop in 2009.
The state’s dairy industry continued to be subject to a myriad of environmental regulations in 2012 as air and water quality rules were implemented. The Central Valley Dairy Representative Monitoring Program (CVDRMP) continued to sign up members for its cost sharing program to monitor well water across nine counties. Additionally new dairy operations are under the auspices of the comprehensive California Environmental Quality Act (CEQA). Revisions to EPA regulations in 2012 will impact the industry in the near future. USDA’s APHS traced California’s first case of mad cow disease to a dairy in Tulare County. Investigations revealed the infected cow had a rare “atypical” case of the disease, meaning it arose spontaneously rather than through the feed supply.
Since 1993, when it surpassed Wisconsin in milk production, California has been the nation’s leading dairy state. Sales of milk and cream contributed $6.90 billion in 2012. Wisconsin, Idaho, New York, Pennsylvania and Idaho were the next leading states in total milk production. The top five dairy states accounted for nearly 52 percent of the total US dairy receipts. California ranked number one in the U.S. in the production of fluid milk, butter and nonfat dry milk. California was second in total cheese production behind Wisconsin. Though the difference in total cheese production between these two states was decreasing in recent years, this was not the case in 2012. California ranked 4th nationally in milk produced per cow per year
Bee Colonies, Honey Production and Value, 2003-2012 1
32,160 139.0
YearBee Colonies Yield Per Colony Production
Average PriceValue
Per Unit 2
1,000 Pounds 1,000 Pounds ¢/Lb. $1,000
44,70218,428
2005 400 75 30,000 86.02004 390 45 17,550 105.02003 480 67
14,1442006 380 52 19,760 97.0 19,1672007 340 40 13,600 104.0
25,800
16,2842008 360 51 18,360 139.0 25,5202009 355 33 11,715 139.0
29,3042010 410 67 27,470 155.0 42,5792011 370 48 17,760 165.0
1 Producers with five or more colonies. Colonies which produced honey in more than one State were counted in each State.2 Average price per unit based on expanded sales.
22,9672012 340 35 11,900 193.0
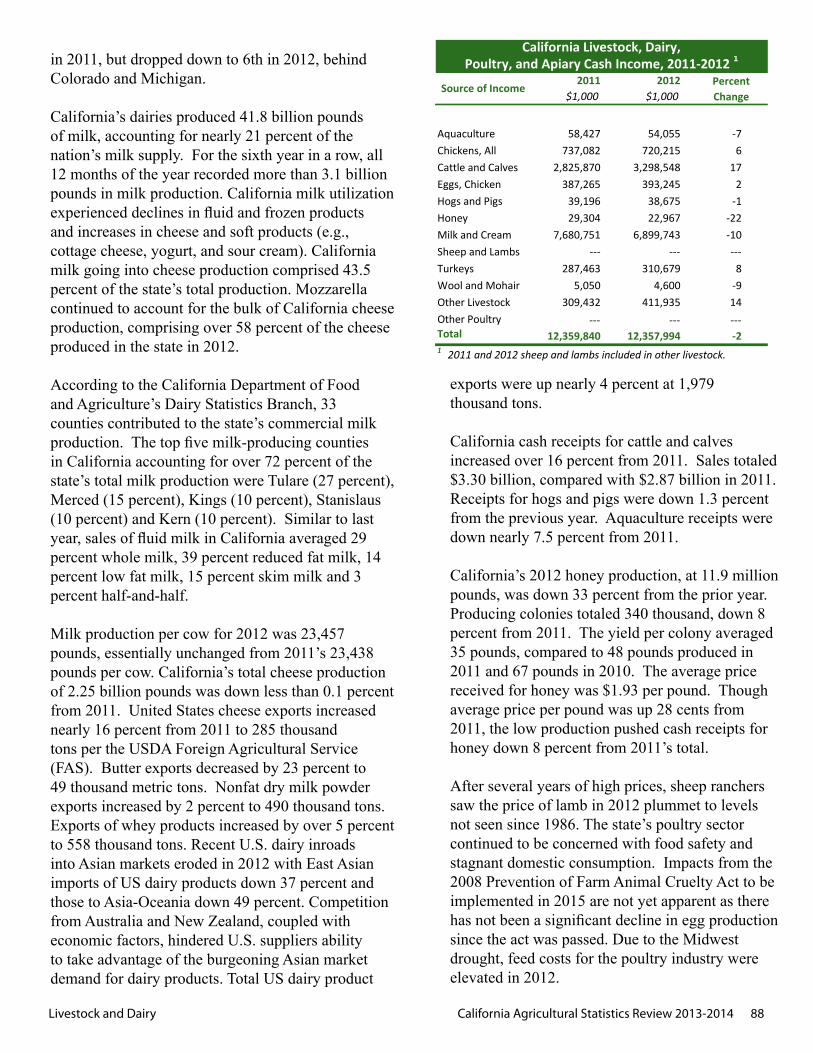
Livestock and Dairy California Agricultural Statistics Review 2013-2014 88
in 2011, but dropped down to 6th in 2012, behind Colorado and Michigan.
California’s dairies produced 41.8 billion pounds of milk, accounting for nearly 21 percent of the nation’s milk supply. For the sixth year in a row, all 12 months of the year recorded more than 3.1 billion pounds in milk production. California milk utilization experienced declines in fluid and frozen products and increases in cheese and soft products (e.g., cottage cheese, yogurt, and sour cream). California milk going into cheese production comprised 43.5 percent of the state’s total production. Mozzarella continued to account for the bulk of California cheese production, comprising over 58 percent of the cheese produced in the state in 2012.
According to the California Department of Food and Agriculture’s Dairy Statistics Branch, 33 counties contributed to the state’s commercial milk production. The top five milk-producing counties in California accounting for over 72 percent of the state’s total milk production were Tulare (27 percent), Merced (15 percent), Kings (10 percent), Stanislaus (10 percent) and Kern (10 percent). Similar to last year, sales of fluid milk in California averaged 29 percent whole milk, 39 percent reduced fat milk, 14 percent low fat milk, 15 percent skim milk and 3 percent half-and-half.
Milk production per cow for 2012 was 23,457 pounds, essentially unchanged from 2011’s 23,438 pounds per cow. California’s total cheese production of 2.25 billion pounds was down less than 0.1 percent from 2011. United States cheese exports increased nearly 16 percent from 2011 to 285 thousand tons per the USDA Foreign Agricultural Service (FAS). Butter exports decreased by 23 percent to 49 thousand metric tons. Nonfat dry milk powder exports increased by 2 percent to 490 thousand tons. Exports of whey products increased by over 5 percent to 558 thousand tons. Recent U.S. dairy inroads into Asian markets eroded in 2012 with East Asian imports of US dairy products down 37 percent and those to Asia-Oceania down 49 percent. Competition from Australia and New Zealand, coupled with economic factors, hindered U.S. suppliers ability to take advantage of the burgeoning Asian market demand for dairy products. Total US dairy product
exports were up nearly 4 percent at 1,979 thousand tons.
California cash receipts for cattle and calves increased over 16 percent from 2011. Sales totaled $3.30 billion, compared with $2.87 billion in 2011. Receipts for hogs and pigs were down 1.3 percent from the previous year. Aquaculture receipts were down nearly 7.5 percent from 2011.
California’s 2012 honey production, at 11.9 million pounds, was down 33 percent from the prior year. Producing colonies totaled 340 thousand, down 8 percent from 2011. The yield per colony averaged 35 pounds, compared to 48 pounds produced in 2011 and 67 pounds in 2010. The average price received for honey was $1.93 per pound. Though average price per pound was up 28 cents from 2011, the low production pushed cash receipts for honey down 8 percent from 2011’s total. After several years of high prices, sheep ranchers saw the price of lamb in 2012 plummet to levels not seen since 1986. The state’s poultry sector continued to be concerned with food safety and stagnant domestic consumption. Impacts from the 2008 Prevention of Farm Animal Cruelty Act to be implemented in 2015 are not yet apparent as there has not been a significant decline in egg production since the act was passed. Due to the Midwest drought, feed costs for the poultry industry were elevated in 2012.
2011 2012$1,000 $1,000
Aquaculture 58,427 54,055 -7Chickens, All 737,082 720,215 6Cattle and Calves 2,825,870 3,298,548 17Eggs, Chicken 387,265 393,245 2Hogs and Pigs 39,196 38,675 -1Honey 29,304 22,967 -22Milk and Cream 7,680,751 6,899,743 -10Sheep and Lambs --- --- ---Turkeys 287,463 310,679 8Wool and Mohair 5,050 4,600 -9Other Livestock 309,432 411,935 14Other Poultry --- --- ---Total 12,359,840 12,357,994 -2
California Livestock, Dairy, Poultry, and Apiary Cash Income, 2011-2012 1
Source of Income
1 2011 and 2012 sheep and lambs included in other livestock.
PercentChange
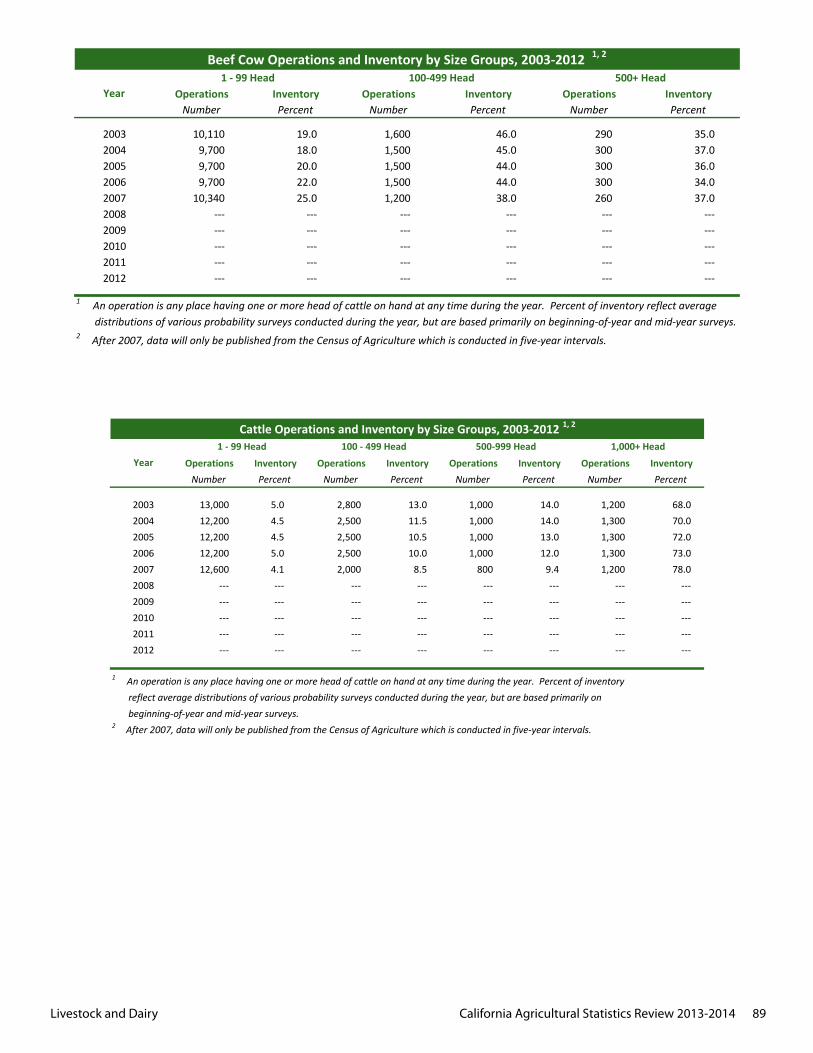
Livestock and Dairy California Agricultural Statistics Review 2013-2014 89
Operations Inventory Operations Inventory Operations InventoryNumber Percent Number Percent Number Percent
2003 10,110 19.0 1,600 46.0 290 35.02004 9,700 18.0 1,500 45.0 300 37.02005 9,700 20.0 1,500 44.0 300 36.02006 9,700 22.0 1,500 44.0 300 34.02007 10,340 25.0 1,200 38.0 260 37.02008 --- --- --- --- --- ---2009 --- --- --- --- --- ---2010 --- --- --- --- --- ---2011 --- --- --- --- --- ---2012 --- --- --- --- --- ---
2 After 2007, data will only be published from the Census of Agriculture which is conducted in five-year intervals.
1 An operation is any place having one or more head of cattle on hand at any time during the year. Percent of inventory reflect average distributions of various probability surveys conducted during the year, but are based primarily on beginning-of-year and mid-year surveys.
Beef Cow Operations and Inventory by Size Groups, 2003-2012 1, 2
Year1 - 99 Head 100-499 Head 500+ Head
Operations Inventory Operations Inventory Operations Inventory Operations InventoryNumber Percent Number Percent Number Percent Number Percent
2003 13,000 5.0 2,800 13.0 1,000 14.0 1,200 68.02004 12,200 4.5 2,500 11.5 1,000 14.0 1,300 70.02005 12,200 4.5 2,500 10.5 1,000 13.0 1,300 72.02006 12,200 5.0 2,500 10.0 1,000 12.0 1,300 73.02007 12,600 4.1 2,000 8.5 800 9.4 1,200 78.02008 --- --- --- --- --- --- --- ---2009 --- --- --- --- --- --- --- ---2010 --- --- --- --- --- --- --- ---2011 --- --- --- --- --- --- --- ---2012 --- --- --- --- --- --- --- ---
1 An operation is any place having one or more head of cattle on hand at any time during the year. Percent of inventory reflect average distributions of various probability surveys conducted during the year, but are based primarily on beginning-of-year and mid-year surveys.2 After 2007, data will only be published from the Census of Agriculture which is conducted in five-year intervals.
Cattle Operations and Inventory by Size Groups, 2003-2012 1, 2
Year1 - 99 Head 100 - 499 Head 500-999 Head 1,000+ Head
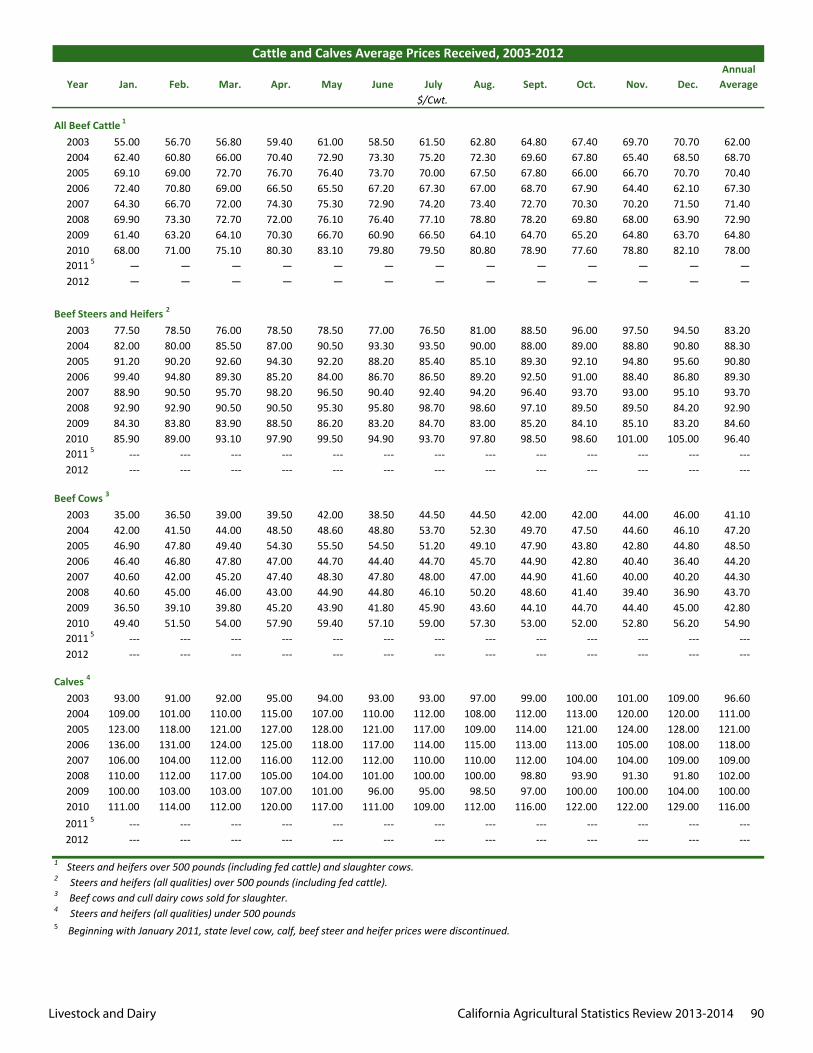
Livestock and Dairy California Agricultural Statistics Review 2013-2014 90
Jan. Feb. Mar. Apr. May June July Aug. Sept. Oct. Nov. Dec.Annual
Average
2003 55.00 56.70 56.80 59.40 61.00 58.50 61.50 62.80 64.80 67.40 69.70 70.70 62.002004 62.40 60.80 66.00 70.40 72.90 73.30 75.20 72.30 69.60 67.80 65.40 68.50 68.702005 69.10 69.00 72.70 76.70 76.40 73.70 70.00 67.50 67.80 66.00 66.70 70.70 70.402006 72.40 70.80 69.00 66.50 65.50 67.20 67.30 67.00 68.70 67.90 64.40 62.10 67.302007 64.30 66.70 72.00 74.30 75.30 72.90 74.20 73.40 72.70 70.30 70.20 71.50 71.402008 69.90 73.30 72.70 72.00 76.10 76.40 77.10 78.80 78.20 69.80 68.00 63.90 72.902009 61.40 63.20 64.10 70.30 66.70 60.90 66.50 64.10 64.70 65.20 64.80 63.70 64.802010 68.00 71.00 75.10 80.30 83.10 79.80 79.50 80.80 78.90 77.60 78.80 82.10 78.00
2011 5 — — — — — — — — — — — — —2012 — — — — — — — — — — — — —
2003 77.50 78.50 76.00 78.50 78.50 77.00 76.50 81.00 88.50 96.00 97.50 94.50 83.202004 82.00 80.00 85.50 87.00 90.50 93.30 93.50 90.00 88.00 89.00 88.80 90.80 88.302005 91.20 90.20 92.60 94.30 92.20 88.20 85.40 85.10 89.30 92.10 94.80 95.60 90.802006 99.40 94.80 89.30 85.20 84.00 86.70 86.50 89.20 92.50 91.00 88.40 86.80 89.302007 88.90 90.50 95.70 98.20 96.50 90.40 92.40 94.20 96.40 93.70 93.00 95.10 93.702008 92.90 92.90 90.50 90.50 95.30 95.80 98.70 98.60 97.10 89.50 89.50 84.20 92.902009 84.30 83.80 83.90 88.50 86.20 83.20 84.70 83.00 85.20 84.10 85.10 83.20 84.602010 85.90 89.00 93.10 97.90 99.50 94.90 93.70 97.80 98.50 98.60 101.00 105.00 96.402011 5 --- --- --- --- --- --- --- --- --- --- --- --- ---2012 --- --- --- --- --- --- --- --- --- --- --- --- ---
2003 35.00 36.50 39.00 39.50 42.00 38.50 44.50 44.50 42.00 42.00 44.00 46.00 41.102004 42.00 41.50 44.00 48.50 48.60 48.80 53.70 52.30 49.70 47.50 44.60 46.10 47.202005 46.90 47.80 49.40 54.30 55.50 54.50 51.20 49.10 47.90 43.80 42.80 44.80 48.502006 46.40 46.80 47.80 47.00 44.70 44.40 44.70 45.70 44.90 42.80 40.40 36.40 44.202007 40.60 42.00 45.20 47.40 48.30 47.80 48.00 47.00 44.90 41.60 40.00 40.20 44.302008 40.60 45.00 46.00 43.00 44.90 44.80 46.10 50.20 48.60 41.40 39.40 36.90 43.702009 36.50 39.10 39.80 45.20 43.90 41.80 45.90 43.60 44.10 44.70 44.40 45.00 42.802010 49.40 51.50 54.00 57.90 59.40 57.10 59.00 57.30 53.00 52.00 52.80 56.20 54.902011 5 --- --- --- --- --- --- --- --- --- --- --- --- ---2012 --- --- --- --- --- --- --- --- --- --- --- --- ---
2003 93.00 91.00 92.00 95.00 94.00 93.00 93.00 97.00 99.00 100.00 101.00 109.00 96.602004 109.00 101.00 110.00 115.00 107.00 110.00 112.00 108.00 112.00 113.00 120.00 120.00 111.002005 123.00 118.00 121.00 127.00 128.00 121.00 117.00 109.00 114.00 121.00 124.00 128.00 121.002006 136.00 131.00 124.00 125.00 118.00 117.00 114.00 115.00 113.00 113.00 105.00 108.00 118.002007 106.00 104.00 112.00 116.00 112.00 112.00 110.00 110.00 112.00 104.00 104.00 109.00 109.002008 110.00 112.00 117.00 105.00 104.00 101.00 100.00 100.00 98.80 93.90 91.30 91.80 102.002009 100.00 103.00 103.00 107.00 101.00 96.00 95.00 98.50 97.00 100.00 100.00 104.00 100.002010 111.00 114.00 112.00 120.00 117.00 111.00 109.00 112.00 116.00 122.00 122.00 129.00 116.002011 5 --- --- --- --- --- --- --- --- --- --- --- --- ---2012 --- --- --- --- --- --- --- --- --- --- --- --- ---
5 Beginning with January 2011, state level cow, calf, beef steer and heifer prices were discontinued.
4 Steers and heifers (all qualities) under 500 pounds
$/Cwt.Year
Cattle and Calves Average Prices Received, 2003-2012
1 Steers and heifers over 500 pounds (including fed cattle) and slaughter cows.2 Steers and heifers (all qualities) over 500 pounds (including fed cattle).3 Beef cows and cull dairy cows sold for slaughter.
All Beef Cattle 1
Beef Steers and Heifers 2
Beef Cows 3
Calves 4
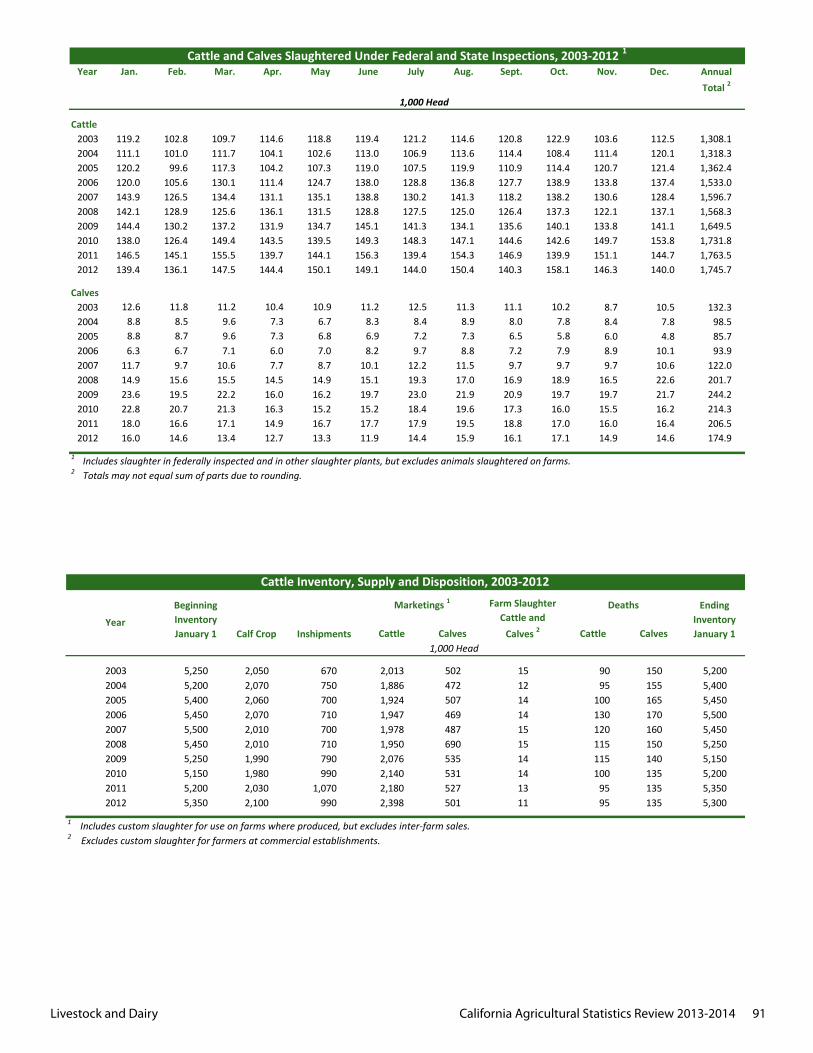
Livestock and Dairy California Agricultural Statistics Review 2013-2014 91
Jan. Feb. Mar. Apr. May June July Aug. Sept. Oct. Nov. Dec. Annual Total 2
Cattle2003 119.2 102.8 109.7 114.6 118.8 119.4 121.2 114.6 120.8 122.9 103.6 112.5 1,308.12004 111.1 101.0 111.7 104.1 102.6 113.0 106.9 113.6 114.4 108.4 111.4 120.1 1,318.32005 120.2 99.6 117.3 104.2 107.3 119.0 107.5 119.9 110.9 114.4 120.7 121.4 1,362.42006 120.0 105.6 130.1 111.4 124.7 138.0 128.8 136.8 127.7 138.9 133.8 137.4 1,533.02007 143.9 126.5 134.4 131.1 135.1 138.8 130.2 141.3 118.2 138.2 130.6 128.4 1,596.72008 142.1 128.9 125.6 136.1 131.5 128.8 127.5 125.0 126.4 137.3 122.1 137.1 1,568.32009 144.4 130.2 137.2 131.9 134.7 145.1 141.3 134.1 135.6 140.1 133.8 141.1 1,649.52010 138.0 126.4 149.4 143.5 139.5 149.3 148.3 147.1 144.6 142.6 149.7 153.8 1,731.82011 146.5 145.1 155.5 139.7 144.1 156.3 139.4 154.3 146.9 139.9 151.1 144.7 1,763.52012 139.4 136.1 147.5 144.4 150.1 149.1 144.0 150.4 140.3 158.1 146.3 140.0 1,745.7
Calves2003 12.6 11.8 11.2 10.4 10.9 11.2 12.5 11.3 11.1 10.2 8.7 10.5 132.32004 8.8 8.5 9.6 7.3 6.7 8.3 8.4 8.9 8.0 7.8 8.4 7.8 98.52005 8.8 8.7 9.6 7.3 6.8 6.9 7.2 7.3 6.5 5.8 6.0 4.8 85.72006 6.3 6.7 7.1 6.0 7.0 8.2 9.7 8.8 7.2 7.9 8.9 10.1 93.92007 11.7 9.7 10.6 7.7 8.7 10.1 12.2 11.5 9.7 9.7 9.7 10.6 122.02008 14.9 15.6 15.5 14.5 14.9 15.1 19.3 17.0 16.9 18.9 16.5 22.6 201.72009 23.6 19.5 22.2 16.0 16.2 19.7 23.0 21.9 20.9 19.7 19.7 21.7 244.22010 22.8 20.7 21.3 16.3 15.2 15.2 18.4 19.6 17.3 16.0 15.5 16.2 214.32011 18.0 16.6 17.1 14.9 16.7 17.7 17.9 19.5 18.8 17.0 16.0 16.4 206.52012 16.0 14.6 13.4 12.7 13.3 11.9 14.4 15.9 16.1 17.1 14.9 14.6 174.9
Cattle and Calves Slaughtered Under Federal and State Inspections, 2003-2012 1
1,000 Head
Year
1 Includes slaughter in federally inspected and in other slaughter plants, but excludes animals slaughtered on farms.2 Totals may not equal sum of parts due to rounding.
Cattle Calves Cattle Calves
5,250 2,050 670 2,013 502 15 90 150 5,2005,200 2,070 750 1,886 472 12 95 155 5,4005,400 2,060 700 1,924 507 14 100 165 5,4505,450 2,070 710 1,947 469 14 130 170 5,5005,500 2,010 700 1,978 487 15 120 160 5,4505,450 2,010 710 1,950 690 15 115 150 5,2505,250 1,990 790 2,076 535 14 115 140 5,1505,150 1,980 990 2,140 531 14 100 135 5,2005,200 2,030 1,070 2,180 527 13 95 135 5,3505,350 2,100 990 2,398 501 11 95 135 5,300
2 Excludes custom slaughter for farmers at commercial establishments.
Ending Inventory January 1
Deaths
Cattle Inventory, Supply and Disposition, 2003-2012
Beginning Inventory January 1 Calf Crop Inshipments
Year
1,000 Head
Marketings 1 Farm Slaughter Cattle and
Calves 2
1 Includes custom slaughter for use on farms where produced, but excludes inter-farm sales.
20082009201020112012
200320042005
20072006
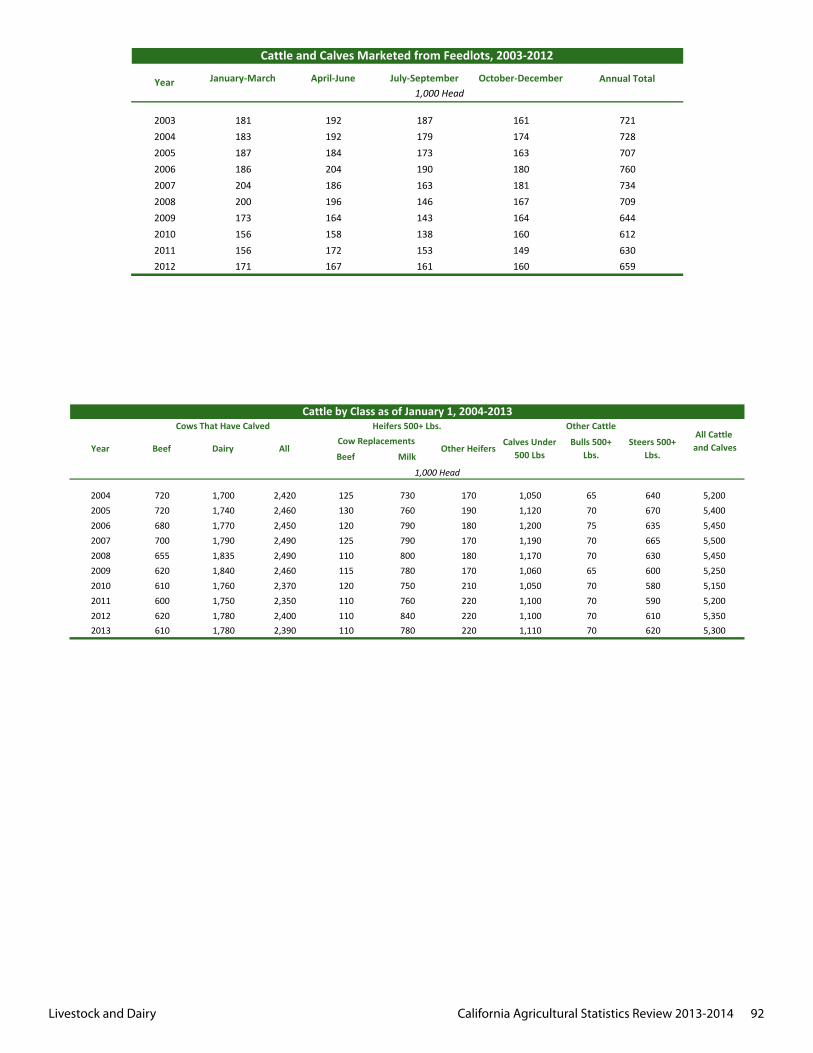
Livestock and Dairy California Agricultural Statistics Review 2013-2014 92
Beef Milk
2004 720 1,700 2,420 125 730 170 1,050 65 640 5,2002005 720 1,740 2,460 130 760 190 1,120 70 670 5,4002006 680 1,770 2,450 120 790 180 1,200 75 635 5,4502007 700 1,790 2,490 125 790 170 1,190 70 665 5,5002008 655 1,835 2,490 110 800 180 1,170 70 630 5,4502009 620 1,840 2,460 115 780 170 1,060 65 600 5,2502010 610 1,760 2,370 120 750 210 1,050 70 580 5,1502011 600 1,750 2,350 110 760 220 1,100 70 590 5,2002012 620 1,780 2,400 110 840 220 1,100 70 610 5,3502013 610 1,780 2,390 110 780 220 1,110 70 620 5,300
Cattle by Class as of January 1, 2004-2013
Year
Cows That Have Calved Heifers 500+ Lbs. Other CattleAll Cattle
and CalvesBeef Dairy AllCow Replacements
Other HeifersCalves Under
500 LbsBulls 500+
Lbs.Steers 500+
Lbs.
1,000 Head
January-March April-June July-September October-December
2003 181 192 187 1612004 183 192 179 1742005 187 184 173 1632006 186 204 190 1802007 204 186 163 1812008 200 196 146 1672009 173 164 143 1642010 156 158 138 1602011 156 172 153 1492012 171 167 161 160
728
Cattle and Calves Marketed from Feedlots, 2003-2012
Year Annual Total1,000 Head
721
630659
707760734709644612
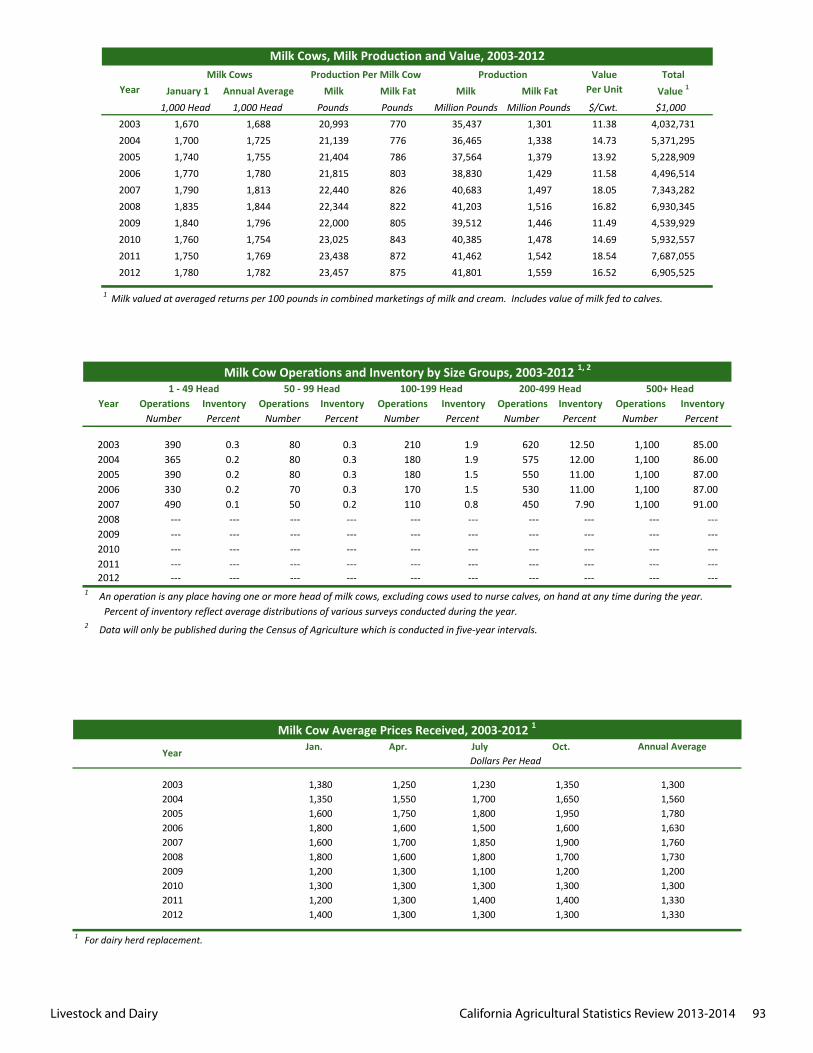
Livestock and Dairy California Agricultural Statistics Review 2013-2014 93
Value Total January 1 Annual Average Milk Milk Fat Milk Milk Fat Per Unit Value 1
1,000 Head 1,000 Head Pounds Pounds Million Pounds Million Pounds $/Cwt. $1,0002003 1,670 1,688 20,993 770 35,437 1,301 11.38 4,032,7312004 1,700 1,725 21,139 776 36,465 1,338 14.73 5,371,2952005 1,740 1,755 21,404 786 37,564 1,379 13.92 5,228,9092006 1,770 1,780 21,815 803 38,830 1,429 11.58 4,496,5142007 1,790 1,813 22,440 826 40,683 1,497 18.05 7,343,2822008 1,835 1,844 22,344 822 41,203 1,516 16.82 6,930,3452009 1,840 1,796 22,000 805 39,512 1,446 11.49 4,539,9292010 1,760 1,754 23,025 843 40,385 1,478 14.69 5,932,5572011 1,750 1,769 23,438 872 41,462 1,542 18.54 7,687,0552012 1,780 1,782 23,457 875 41,801 1,559 16.52 6,905,525
1 Milk valued at averaged returns per 100 pounds in combined marketings of milk and cream. Includes value of milk fed to calves.
Milk Cows, Milk Production and Value, 2003-2012
YearMilk Cows Production Per Milk Cow Production
Jan. Apr. July Oct.
2003 1,380 1,250 1,230 1,3502004 1,350 1,550 1,700 1,6502005 1,600 1,750 1,800 1,9502006 1,800 1,600 1,500 1,6002007 1,600 1,700 1,850 1,9002008 1,800 1,600 1,800 1,7002009 1,200 1,300 1,100 1,2002010 1,300 1,300 1,300 1,3002011 1,200 1,300 1,400 1,4002012 1,400 1,300 1,300 1,300
1,3001,560
Milk Cow Average Prices Received, 2003-2012 1
Dollars Per HeadAnnual AverageYear
1,780
1,3001,330
1 For dairy herd replacement.
1,6301,7601,7301,200
1,330
1 An operation is any place having one or more head of milk cows, excluding cows used to nurse calves, on hand at any time during the year. Percent of inventory reflect average distributions of various surveys conducted during the year.2 Data will only be published during the Census of Agriculture which is conducted in five-year intervals.
---
0.30.3
---
20042005200620072008
1.587.00
180170110
---
Percent
86.00
Inventory Inventory
1,100
Percent
1.91.9
--------- ------
87.00
--- ------
0.8
------
91.001,1001,100
------
--- --- --- ------ --- --- --- --- ------
Number
2011--- ---
--- ---
1,100
11.0011.0012.0012.50
--- ------
7.90
550530450
---
1,100
2012--- --- --- --- ---
Number
210
---490
---
390365
80800.2
0.3
---0.10.20.2
20092010
2003
807050
Year1 - 49 Head
--- ------
390330
---
1.5
InventoryPercent
OperationsOperationsNumber
Inventory
------
------
0.2
50 - 99 HeadMilk Cow Operations and Inventory by Size Groups, 2003-2012 1, 2
Operations
1800.30.3 620
575
NumberInventoryPercent
OperationsPercent
85.00
OperationsNumber
100-199 Head 200-499 Head 500+ Head
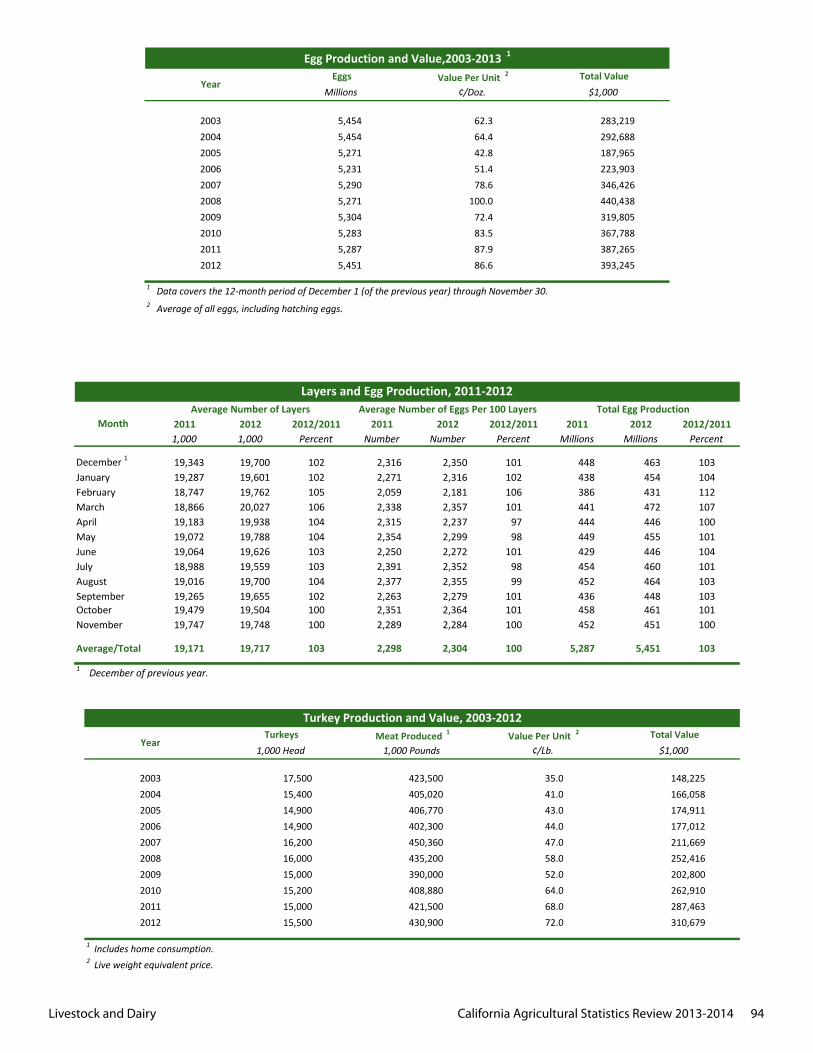
Livestock and Dairy California Agricultural Statistics Review 2013-2014 94
2 Average of all eggs, including hatching eggs.
2011 5,287 87.9 387,2652012 5,451 86.6 393,245
2010 5,283 83.5 367,788
1 Data covers the 12-month period of December 1 (of the previous year) through November 30.
2008 5,271 100.0 440,4382009 5,304 72.4 319,805
2006 5,231 51.4 223,9032007 5,290 78.6 346,426
2004 5,454 64.4 292,6882005 5,271 42.8 187,965
2003 5,454 62.3 283,219
Egg Production and Value,2003-2013 1
YearEggs Value Per Unit 2 Total Value
Millions ¢/Doz. $1,000
2011 2012 2012/2011 2011 2012 2012/2011 2011 2012 2012/20111,000 1,000 Percent Number Number Percent Millions Millions Percent
December 1 19,343 19,700 102 2,316 2,350 101 448 463 103January 19,287 19,601 102 2,271 2,316 102 438 454 104February 18,747 19,762 105 2,059 2,181 106 386 431 112March 18,866 20,027 106 2,338 2,357 101 441 472 107April 19,183 19,938 104 2,315 2,237 97 444 446 100May 19,072 19,788 104 2,354 2,299 98 449 455 101June 19,064 19,626 103 2,250 2,272 101 429 446 104July 18,988 19,559 103 2,391 2,352 98 454 460 101August 19,016 19,700 104 2,377 2,355 99 452 464 103September 19,265 19,655 102 2,263 2,279 101 436 448 103October 19,479 19,504 100 2,351 2,364 101 458 461 101November 19,747 19,748 100 2,289 2,284 100 452 451 100
Average/Total 19,171 19,717 103 2,298 2,304 100 5,287 5,451 103
Average Number of Layers Average Number of Eggs Per 100 Layers Total Egg Production
Layers and Egg Production, 2011-2012
1 December of previous year.
Month
1 Includes home consumption.2 Live weight equivalent price.
2011 15,000 421,500 68.0 287,4632012 15,500 430,900 72.0 310,679
2009 15,000 390,000 52.0 202,8002010 15,200 408,880 64.0 262,910
2007 16,200 450,360 47.0 211,6692008 16,000 435,200 58.0 252,416
2005 14,900 406,770 43.0 174,9112006 14,900 402,300 44.0 177,012
2003 17,500 423,500 35.0 148,2252004 15,400 405,020 41.0 166,058
Turkey Production and Value, 2003-2012
YearTurkeys Meat Produced 1 Value Per Unit 2 Total Value
1,000 Head 1,000 Pounds ¢/Lb. $1,000
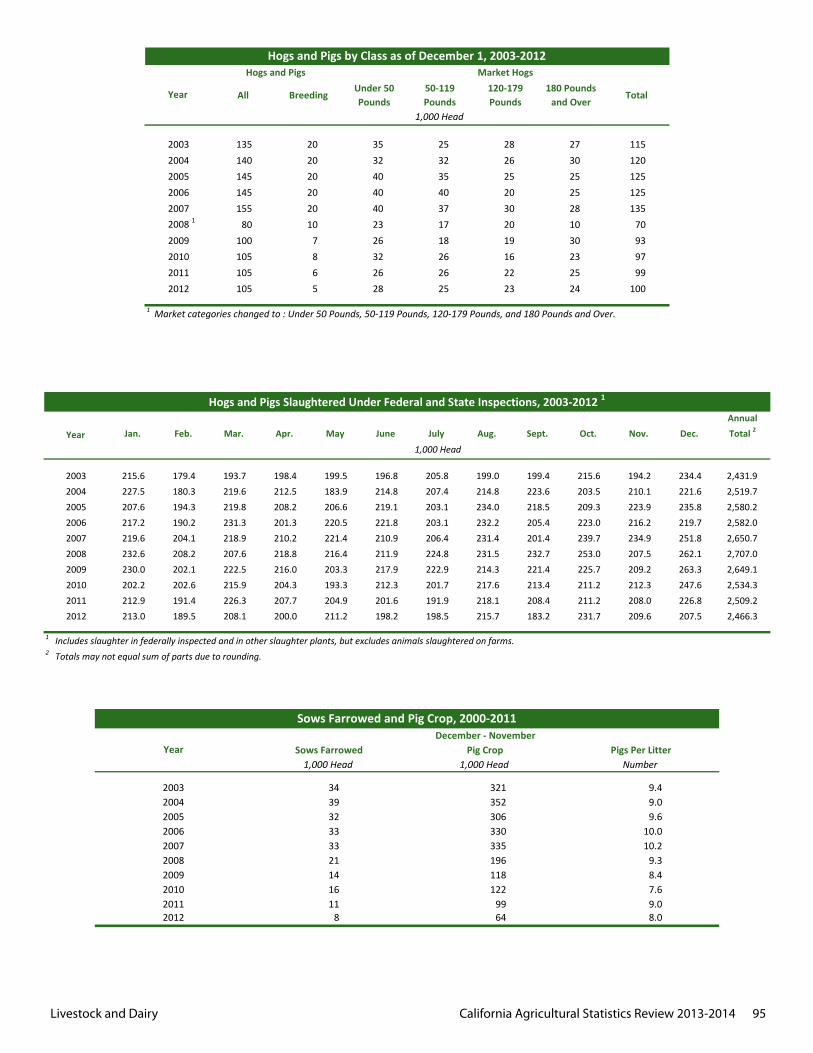
Livestock and Dairy California Agricultural Statistics Review 2013-2014 95
All BreedingUnder 50 Pounds
50-119 Pounds
120-179 Pounds
180 Pounds and Over
Total
2003 135 20 35 25 28 27 1152004 140 20 32 32 26 30 1202005 145 20 40 35 25 25 1252006 145 20 40 40 20 25 1252007 155 20 40 37 30 28 1352008 1 80 10 23 17 20 10 702009 100 7 26 18 19 30 932010 105 8 32 26 16 23 972011 105 6 26 26 22 25 992012 105 5 28 25 23 24 100
1 Market categories changed to : Under 50 Pounds, 50-119 Pounds, 120-179 Pounds, and 180 Pounds and Over.
Hogs and Pigs by Class as of December 1, 2003-2012
Year
Hogs and Pigs Market Hogs
1,000 Head
Jan. Feb. Mar. Apr. May June July Aug. Sept. Oct. Nov. Dec.Annual Total 2
2003 215.6 179.4 193.7 198.4 199.5 196.8 205.8 199.0 199.4 215.6 194.2 234.4 2,431.92004 227.5 180.3 219.6 212.5 183.9 214.8 207.4 214.8 223.6 203.5 210.1 221.6 2,519.72005 207.6 194.3 219.8 208.2 206.6 219.1 203.1 234.0 218.5 209.3 223.9 235.8 2,580.22006 217.2 190.2 231.3 201.3 220.5 221.8 203.1 232.2 205.4 223.0 216.2 219.7 2,582.02007 219.6 204.1 218.9 210.2 221.4 210.9 206.4 231.4 201.4 239.7 234.9 251.8 2,650.72008 232.6 208.2 207.6 218.8 216.4 211.9 224.8 231.5 232.7 253.0 207.5 262.1 2,707.02009 230.0 202.1 222.5 216.0 203.3 217.9 222.9 214.3 221.4 225.7 209.2 263.3 2,649.12010 202.2 202.6 215.9 204.3 193.3 212.3 201.7 217.6 213.4 211.2 212.3 247.6 2,534.32011 212.9 191.4 226.3 207.7 204.9 201.6 191.9 218.1 208.4 211.2 208.0 226.8 2,509.22012 213.0 189.5 208.1 200.0 211.2 198.2 198.5 215.7 183.2 231.7 209.6 207.5 2,466.3
1 Includes slaughter in federally inspected and in other slaughter plants, but excludes animals slaughtered on farms.2 Totals may not equal sum of parts due to rounding.
Hogs and Pigs Slaughtered Under Federal and State Inspections, 2003-2012 1
Year1,000 Head
2006
112011 9.099122 7.6
9.38.4
196335330
2010
2007
162009
2133
392003 321
118
10.0
14
9.632200533
2008
9.4352306
10.2
2012 8 64 8.0
Sows Farrowed and Pig Crop, 2000-2011
Pigs Per LitterYearDecember - November
9.0
Sows Farrowed1,000 Head1,000 Head
Pig CropNumber
342004
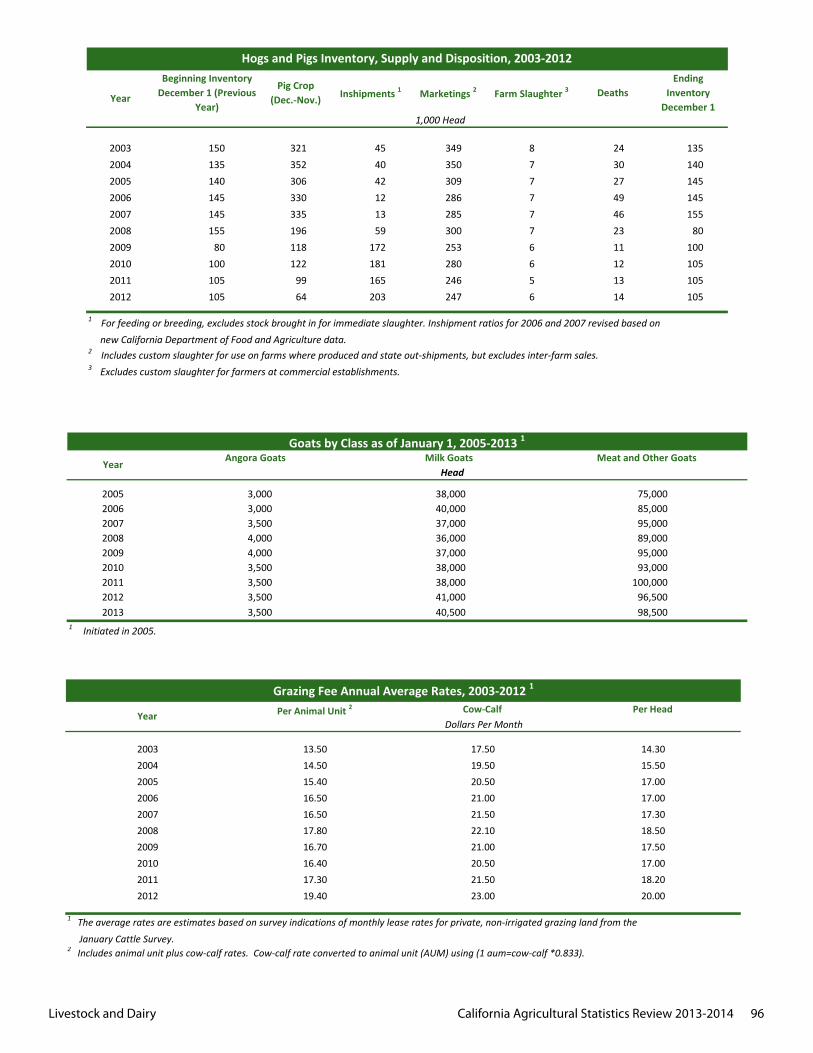
Livestock and Dairy California Agricultural Statistics Review 2013-2014 96
1 The average rates are estimates based on survey indications of monthly lease rates for private, non-irrigated grazing land from the
2 Includes animal unit plus cow-calf rates. Cow-calf rate converted to animal unit (AUM) using (1 aum=cow-calf *0.833). January Cattle Survey.
16.70 21.00 17.50
21.00
22.10 18.5017.80200920082007 16.50 21.50 17.302006 16.50
Grazing Fee Annual Average Rates, 2003-2012 1
Year Per Animal Unit 2 Cow-Calf Per HeadDollars Per Month
14.3020042003 13.50 17.50
14.50 19.50 15.502005 15.40 20.50 17.00
17.00
201020112012
16.4017.3019.40
20.5021.5023.00
17.0018.2020.00
1 Initiated in 2005.
200520062007
2009
3,0003,000
95,000
2010 3,500 38,000 93,000
36,000
2013 3,500 40,500
Goats by Class as of January 1, 2005-2013 1
3,500
4,000 95,000
38,00040,00037,000
37,000
85,00075,000
Meat and Other GoatsMilk GoatsAngora GoatsYear
Head
2008
2012
89,0004,000
98,5003,500 41,000 96,500
2011 3,500 38,000 100,000
Beginning Inventory December 1 (Previous
Year)
Pig Crop (Dec.-Nov.) Inshipments 1 Marketings 2 Farm Slaughter 3 Deaths
Ending Inventory
December 1
2003 150 321 45 349 8 24 1352004 135 352 40 350 7 30 1402005 140 306 42 309 7 27 1452006 145 330 12 286 7 49 1452007 145 335 13 285 7 46 1552008 155 196 59 300 7 23 802009 80 118 172 253 6 11 1002010 100 122 181 280 6 12 1052011 105 99 165 246 5 13 1052012 105 64 203 247 6 14 105
3 Excludes custom slaughter for farmers at commercial establishments.
Hogs and Pigs Inventory, Supply and Disposition, 2003-2012
Year
1,000 Head
1 For feeding or breeding, excludes stock brought in for immediate slaughter. Inshipment ratios for 2006 and 2007 revised based on new California Department of Food and Agriculture data.2 Includes custom slaughter for use on farms where produced and state out-shipments, but excludes inter-farm sales.
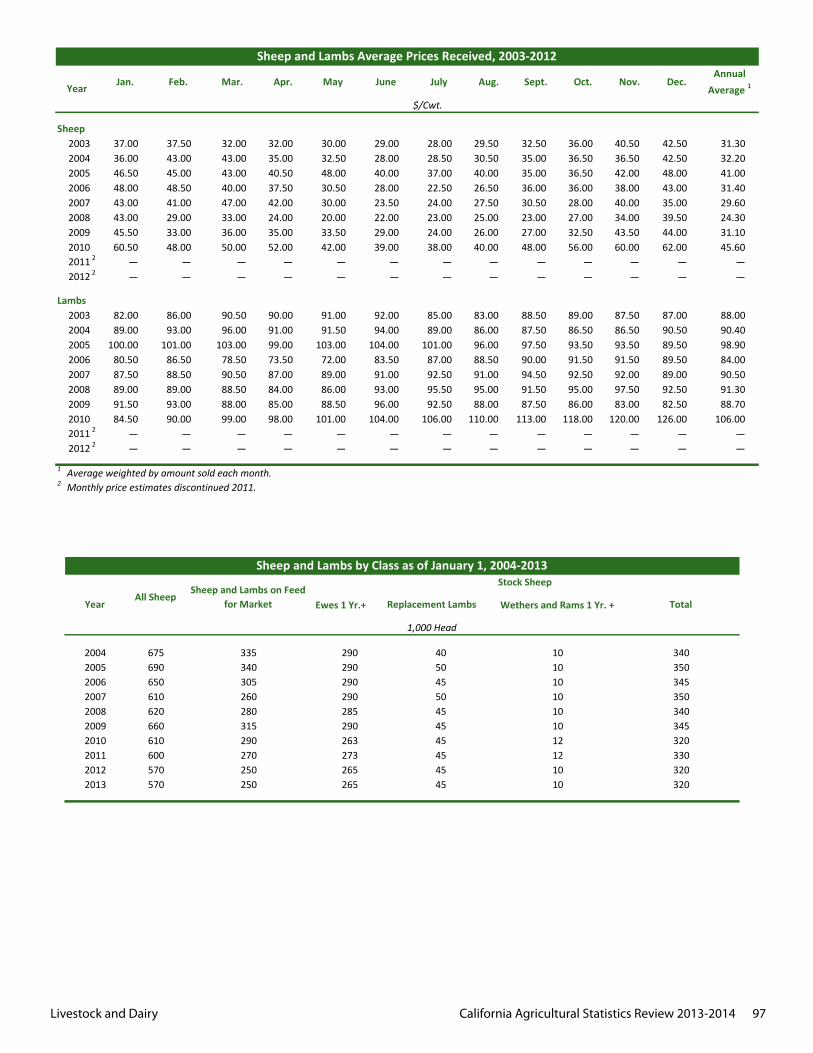
Livestock and Dairy California Agricultural Statistics Review 2013-2014 97
Ewes 1 Yr.+ Wethers and Rams 1 Yr. +
2004 675 290 102005 690 290 102006 650 290 102007 610 290 102008 620 285 102009 660 290 102010 610 263 122011 600 273 122012 570 265 102013 570 265 10
290270250250
340305260280315
Sheep and Lambs by Class as of January 1, 2004-2013
4050
4550
340350345350340345320330320320
All SheepSheep and Lambs on Feed
for Market Replacement Lambs
Stock Sheep
TotalYear
1,000 Head
454545
45
4545
335
Jan. Feb. Mar. Apr. May June July Aug. Sept. Oct. Nov. Dec.Annual
Average 1
Sheep2003 37.00 37.50 32.00 32.00 30.00 29.00 28.00 29.50 32.50 36.00 40.50 42.50 31.302004 36.00 43.00 43.00 35.00 32.50 28.00 28.50 30.50 35.00 36.50 36.50 42.50 32.202005 46.50 45.00 43.00 40.50 48.00 40.00 37.00 40.00 35.00 36.50 42.00 48.00 41.002006 48.00 48.50 40.00 37.50 30.50 28.00 22.50 26.50 36.00 36.00 38.00 43.00 31.402007 43.00 41.00 47.00 42.00 30.00 23.50 24.00 27.50 30.50 28.00 40.00 35.00 29.602008 43.00 29.00 33.00 24.00 20.00 22.00 23.00 25.00 23.00 27.00 34.00 39.50 24.302009 45.50 33.00 36.00 35.00 33.50 29.00 24.00 26.00 27.00 32.50 43.50 44.00 31.102010 60.50 48.00 50.00 52.00 42.00 39.00 38.00 40.00 48.00 56.00 60.00 62.00 45.602011 2 — — — — — — — — — — — — —2012 2 — — — — — — — — — — — — —
Lambs2003 82.00 86.00 90.50 90.00 91.00 92.00 85.00 83.00 88.50 89.00 87.50 87.00 88.002004 89.00 93.00 96.00 91.00 91.50 94.00 89.00 86.00 87.50 86.50 86.50 90.50 90.402005 100.00 101.00 103.00 99.00 103.00 104.00 101.00 96.00 97.50 93.50 93.50 89.50 98.902006 80.50 86.50 78.50 73.50 72.00 83.50 87.00 88.50 90.00 91.50 91.50 89.50 84.002007 87.50 88.50 90.50 87.00 89.00 91.00 92.50 91.00 94.50 92.50 92.00 89.00 90.502008 89.00 89.00 88.50 84.00 86.00 93.00 95.50 95.00 91.50 95.00 97.50 92.50 91.302009 91.50 93.00 88.00 85.00 88.50 96.00 92.50 88.00 87.50 86.00 83.00 82.50 88.702010 84.50 90.00 99.00 98.00 101.00 104.00 106.00 110.00 113.00 118.00 120.00 126.00 106.002011 2 — — — — — — — — — — — — —2012 2 — — — — — — — — — — — — —
2 Monthly price estimates discontinued 2011.
Sheep and Lambs Average Prices Received, 2003-2012
Year$/Cwt.
1 Average weighted by amount sold each month.
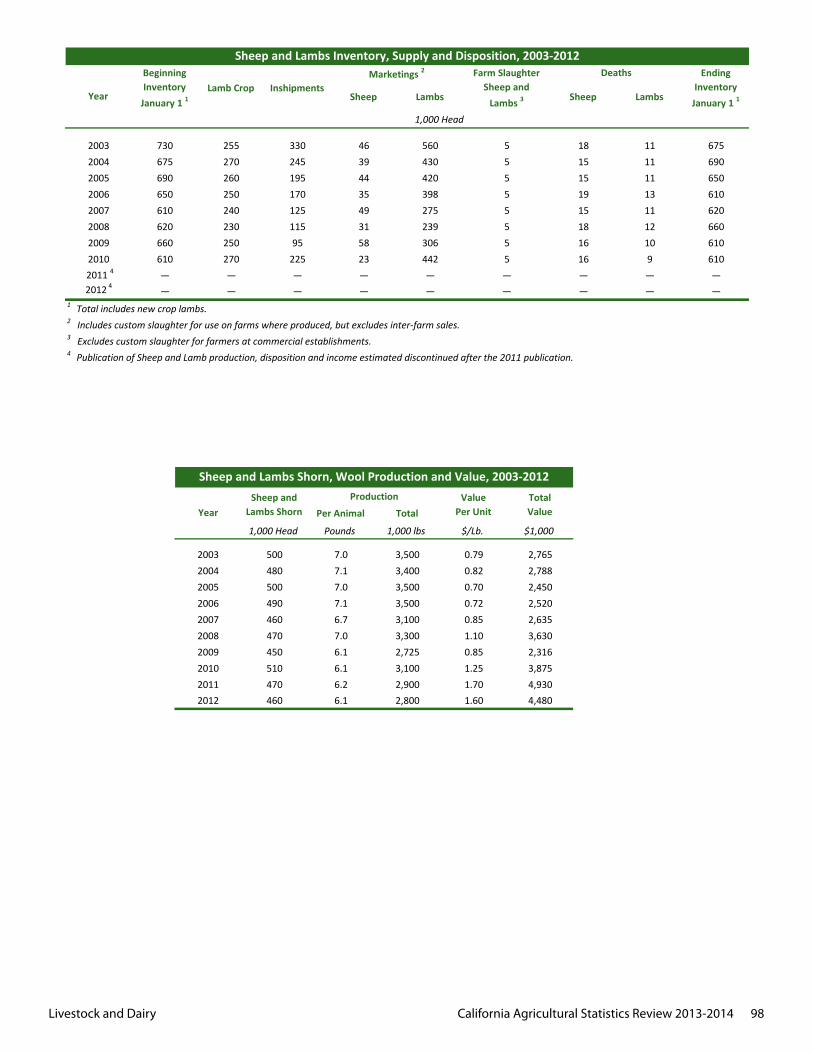
Livestock and Dairy California Agricultural Statistics Review 2013-2014 98
Per Animal Total
1,000 Head Pounds 1,000 lbs $/Lb. $1,000
2003 500 7.0 3,500 0.79 2,7652004 480 7.1 3,400 0.82 2,7882005 500 7.0 3,500 0.70 2,4502006 490 7.1 3,500 0.72 2,5202007 460 6.7 3,100 0.85 2,6352008 470 7.0 3,300 1.10 3,6302009 450 6.1 2,725 0.85 2,3162010 510 6.1 3,100 1.25 3,8752011 470 6.2 2,900 1.70 4,9302012 460 6.1 2,800 1.60 4,480
Sheep and Lambs Shorn, Wool Production and Value, 2003-2012
YearProductionSheep and
Lambs ShornTotalValue
ValuePer Unit
Sheep Lambs Sheep Lambs
2003 730 255 330 46 560 5 18 11 6752004 675 270 245 39 430 5 15 11 6902005 690 260 195 44 420 5 15 11 6502006 650 250 170 35 398 5 19 13 6102007 610 240 125 49 275 5 15 11 6202008 620 230 115 31 239 5 18 12 6602009 660 250 95 58 306 5 16 10 6102010 610 270 225 23 442 5 16 9 610
2011 4 — — — — — — — — —2012 4
— — — — — — — — —
4 Publication of Sheep and Lamb production, disposition and income estimated discontinued after the 2011 publication.
1 Total includes new crop lambs.2 Includes custom slaughter for use on farms where produced, but excludes inter-farm sales.3 Excludes custom slaughter for farmers at commercial establishments.
Sheep and Lambs Inventory, Supply and Disposition, 2003-2012
Year
Beginning Inventory
January 1 1Lamb Crop Inshipments
Marketings 2 Farm Slaughter Sheep and
Lambs 3
Deaths Ending Inventory
January 1 1
1,000 Head
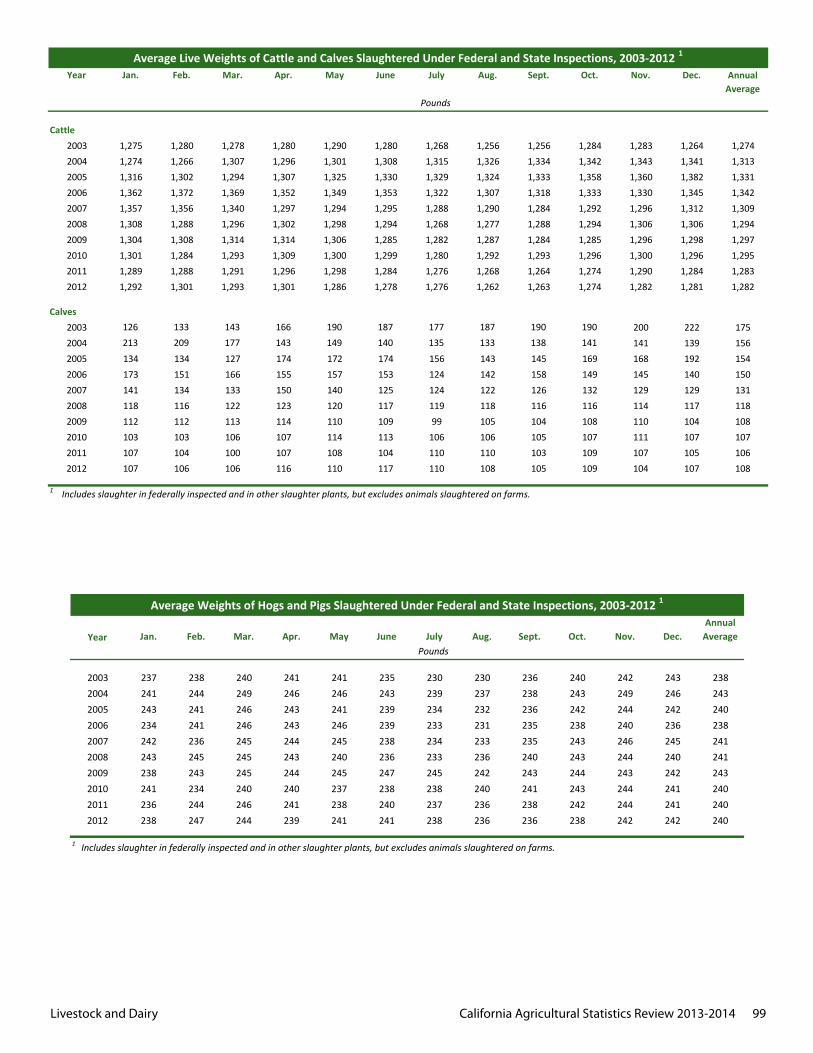
Livestock and Dairy California Agricultural Statistics Review 2013-2014 99
Jan. Feb. Mar. Apr. May June July Aug. Sept. Oct. Nov. Dec.Annual
Average
2003 237 238 240 241 241 235 230 230 236 240 242 243 2382004 241 244 249 246 246 243 239 237 238 243 249 246 2432005 243 241 246 243 241 239 234 232 236 242 244 242 2402006 234 241 246 243 246 239 233 231 235 238 240 236 2382007 242 236 245 244 245 238 234 233 235 243 246 245 2412008 243 245 245 243 240 236 233 236 240 243 244 240 2412009 238 243 245 244 245 247 245 242 243 244 243 242 2432010 241 234 240 240 237 238 238 240 241 243 244 241 2402011 236 244 246 241 238 240 237 236 238 242 244 241 2402012 238 247 244 239 241 241 238 236 236 238 242 242 240
Average Weights of Hogs and Pigs Slaughtered Under Federal and State Inspections, 2003-2012 1
YearPounds
1 Includes slaughter in federally inspected and in other slaughter plants, but excludes animals slaughtered on farms.
Jan. Feb. Mar. Apr. May June July Aug. Sept. Oct. Nov. Dec. Annual Average
Cattle2003 1,275 1,280 1,278 1,280 1,290 1,280 1,268 1,256 1,256 1,284 1,283 1,264 1,2742004 1,274 1,266 1,307 1,296 1,301 1,308 1,315 1,326 1,334 1,342 1,343 1,341 1,3132005 1,316 1,302 1,294 1,307 1,325 1,330 1,329 1,324 1,333 1,358 1,360 1,382 1,3312006 1,362 1,372 1,369 1,352 1,349 1,353 1,322 1,307 1,318 1,333 1,330 1,345 1,3422007 1,357 1,356 1,340 1,297 1,294 1,295 1,288 1,290 1,284 1,292 1,296 1,312 1,3092008 1,308 1,288 1,296 1,302 1,298 1,294 1,268 1,277 1,288 1,294 1,306 1,306 1,2942009 1,304 1,308 1,314 1,314 1,306 1,285 1,282 1,287 1,284 1,285 1,296 1,298 1,2972010 1,301 1,284 1,293 1,309 1,300 1,299 1,280 1,292 1,293 1,296 1,300 1,296 1,2952011 1,289 1,288 1,291 1,296 1,298 1,284 1,276 1,268 1,264 1,274 1,290 1,284 1,2832012 1,292 1,301 1,293 1,301 1,286 1,278 1,276 1,262 1,263 1,274 1,282 1,281 1,282
Calves2003 126 133 143 166 190 187 177 187 190 190 200 222 1752004 213 209 177 143 149 140 135 133 138 141 141 139 1562005 134 134 127 174 172 174 156 143 145 169 168 192 1542006 173 151 166 155 157 153 124 142 158 149 145 140 1502007 141 134 133 150 140 125 124 122 126 132 129 129 1312008 118 116 122 123 120 117 119 118 116 116 114 117 1182009 112 112 113 114 110 109 99 105 104 108 110 104 1082010 103 103 106 107 114 113 106 106 105 107 111 107 1072011 107 104 100 107 108 104 110 110 103 109 107 105 1062012 107 106 106 116 110 117 110 108 105 109 104 107 108
Average Live Weights of Cattle and Calves Slaughtered Under Federal and State Inspections, 2003-2012 1
Year
Pounds
1 Includes slaughter in federally inspected and in other slaughter plants, but excludes animals slaughtered on farms.
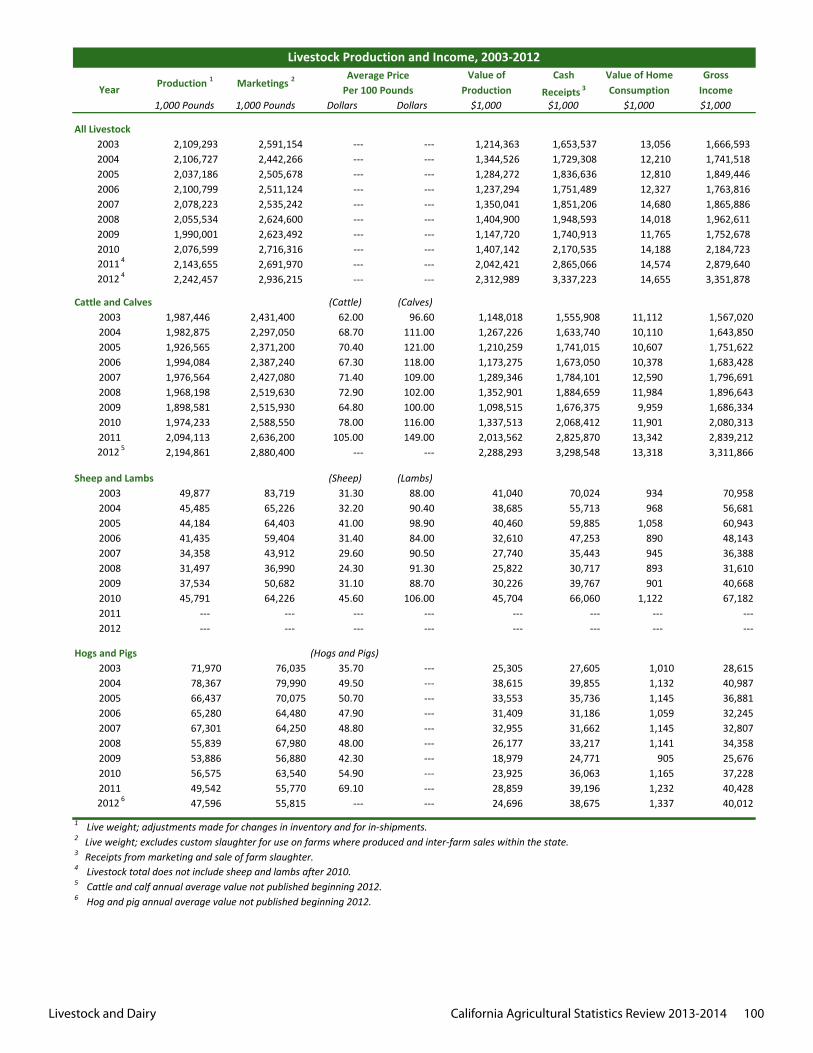
Livestock and Dairy California Agricultural Statistics Review 2013-2014 100
Value of Cash Value of Home GrossProduction Receipts 3 Consumption Income
1,000 Pounds 1,000 Pounds Dollars Dollars $1,000 $1,000 $1,000 $1,000
All Livestock2003 2,109,293 2,591,154 --- --- 1,214,363 1,653,537 13,056 1,666,593 2004 2,106,727 2,442,266 --- --- 1,344,526 1,729,308 12,210 1,741,518 2005 2,037,186 2,505,678 --- --- 1,284,272 1,836,636 12,810 1,849,446 2006 2,100,799 2,511,124 --- --- 1,237,294 1,751,489 12,327 1,763,816 2007 2,078,223 2,535,242 --- --- 1,350,041 1,851,206 14,680 1,865,886 2008 2,055,534 2,624,600 --- --- 1,404,900 1,948,593 14,018 1,962,611 2009 1,990,001 2,623,492 --- --- 1,147,720 1,740,913 11,765 1,752,678 2010 2,076,599 2,716,316 --- --- 1,407,142 2,170,535 14,188 2,184,723 2011 4 2,143,655 2,691,970 --- --- 2,042,421 2,865,066 14,574 2,879,640 2012 4 2,242,457 2,936,215 --- --- 2,312,989 3,337,223 14,655 3,351,878
Cattle and Calves (Cattle) (Calves)2003 1,987,446 2,431,400 62.00 96.60 1,148,018 1,555,908 11,112 1,567,0202004 1,982,875 2,297,050 68.70 111.00 1,267,226 1,633,740 10,110 1,643,8502005 1,926,565 2,371,200 70.40 121.00 1,210,259 1,741,015 10,607 1,751,6222006 1,994,084 2,387,240 67.30 118.00 1,173,275 1,673,050 10,378 1,683,4282007 1,976,564 2,427,080 71.40 109.00 1,289,346 1,784,101 12,590 1,796,6912008 1,968,198 2,519,630 72.90 102.00 1,352,901 1,884,659 11,984 1,896,6432009 1,898,581 2,515,930 64.80 100.00 1,098,515 1,676,375 9,959 1,686,3342010 1,974,233 2,588,550 78.00 116.00 1,337,513 2,068,412 11,901 2,080,3132011 2,094,113 2,636,200 105.00 149.00 2,013,562 2,825,870 13,342 2,839,212
2012 5 2,194,861 2,880,400 --- --- 2,288,293 3,298,548 13,318 3,311,866
Sheep and Lambs (Sheep) (Lambs)2003 49,877 83,719 31.30 88.00 41,040 70,024 934 70,9582004 45,485 65,226 32.20 90.40 38,685 55,713 968 56,6812005 44,184 64,403 41.00 98.90 40,460 59,885 1,058 60,9432006 41,435 59,404 31.40 84.00 32,610 47,253 890 48,1432007 34,358 43,912 29.60 90.50 27,740 35,443 945 36,3882008 31,497 36,990 24.30 91.30 25,822 30,717 893 31,6102009 37,534 50,682 31.10 88.70 30,226 39,767 901 40,6682010 45,791 64,226 45.60 106.00 45,704 66,060 1,122 67,1822011 --- --- --- --- --- --- --- ---2012 --- --- --- --- --- --- --- ---
Hogs and Pigs (Hogs and Pigs)2003 71,970 76,035 35.70 --- 25,305 27,605 1,010 28,6152004 78,367 79,990 49.50 --- 38,615 39,855 1,132 40,9872005 66,437 70,075 50.70 --- 33,553 35,736 1,145 36,8812006 65,280 64,480 47.90 --- 31,409 31,186 1,059 32,2452007 67,301 64,250 48.80 --- 32,955 31,662 1,145 32,8072008 55,839 67,980 48.00 --- 26,177 33,217 1,141 34,3582009 53,886 56,880 42.30 --- 18,979 24,771 905 25,6762010 56,575 63,540 54.90 --- 23,925 36,063 1,165 37,2282011 49,542 55,770 69.10 --- 28,859 39,196 1,232 40,428
2012 6 47,596 55,815 --- --- 24,696 38,675 1,337 40,012
4 Livestock total does not include sheep and lambs after 2010.5 Cattle and calf annual average value not published beginning 2012.6 Hog and pig annual average value not published beginning 2012.
2 Live weight; excludes custom slaughter for use on farms where produced and inter-farm sales within the state.3 Receipts from marketing and sale of farm slaughter.
Production 1 Marketings 2
Livestock Production and Income, 2003-2012Average Price
Per 100 PoundsYear
1 Live weight; adjustments made for changes in inventory and for in-shipments.
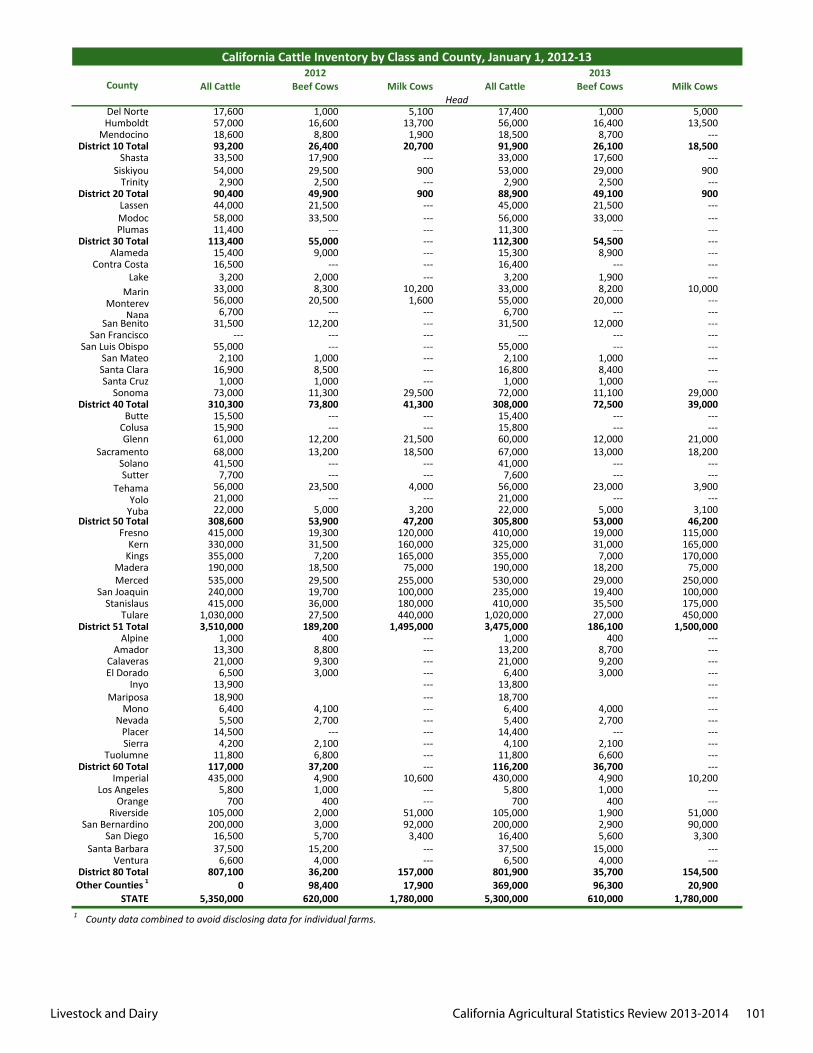
Livestock and Dairy California Agricultural Statistics Review 2013-2014 101
All Cattle Beef Cows Milk Cows All Cattle Beef Cows Milk Cows
Del Norte 17,600 1,000 5,100 17,400 1,000 5,000Humboldt 57,000 16,600 13,700 56,000 16,400 13,500
Mendocino 18,600 8,800 1,900 18,500 8,700 ---District 10 Total 93,200 26,400 20,700 91,900 26,100 18,500
Shasta 33,500 17,900 --- 33,000 17,600 ---Siskiyou 54,000 29,500 900 53,000 29,000 900
Trinity 2,900 2,500 --- 2,900 2,500 ---District 20 Total 90,400 49,900 900 88,900 49,100 900
Lassen 44,000 21,500 --- 45,000 21,500 ---Modoc 58,000 33,500 --- 56,000 33,000 ---Plumas 11,400 --- --- 11,300 --- ---
District 30 Total 113,400 55,000 --- 112,300 54,500 ---Alameda 15,400 9,000 --- 15,300 8,900 ---
Contra Costa 16,500 --- --- 16,400 --- ---Lake 3,200 2,000 --- 3,200 1,900 ---
Marin 33,000 8,300 10,200 33,000 8,200 10,000Monterey 56,000 20,500 1,600 55,000 20,000 ---
Napa 6,700 --- --- 6,700 --- ---San Benito 31,500 12,200 --- 31,500 12,000 ---
San Francisco --- --- --- --- --- ---San Luis Obispo 55,000 --- --- 55,000 --- ---
San Mateo 2,100 1,000 --- 2,100 1,000 ---Santa Clara 16,900 8,500 --- 16,800 8,400 ---Santa Cruz 1,000 1,000 --- 1,000 1,000 ---
Sonoma 73,000 11,300 29,500 72,000 11,100 29,000District 40 Total 310,300 73,800 41,300 308,000 72,500 39,000
Butte 15,500 --- --- 15,400 --- ---Colusa 15,900 --- --- 15,800 --- ---Glenn 61,000 12,200 21,500 60,000 12,000 21,000
Sacramento 68,000 13,200 18,500 67,000 13,000 18,200Solano 41,500 --- --- 41,000 --- ---Sutter 7,700 --- --- 7,600 --- ---
Tehama 56,000 23,500 4,000 56,000 23,000 3,900Yolo 21,000 --- --- 21,000 --- ---
Yuba 22,000 5,000 3,200 22,000 5,000 3,100District 50 Total 308,600 53,900 47,200 305,800 53,000 46,200
Fresno 415,000 19,300 120,000 410,000 19,000 115,000Kern 330,000 31,500 160,000 325,000 31,000 165,000
Kings 355,000 7,200 165,000 355,000 7,000 170,000Madera 190,000 18,500 75,000 190,000 18,200 75,000Merced 535,000 29,500 255,000 530,000 29,000 250,000
San Joaquin 240,000 19,700 100,000 235,000 19,400 100,000Stanislaus 415,000 36,000 180,000 410,000 35,500 175,000
Tulare 1,030,000 27,500 440,000 1,020,000 27,000 450,000District 51 Total 3,510,000 189,200 1,495,000 3,475,000 186,100 1,500,000
Alpine 1,000 400 --- 1,000 400 ---Amador 13,300 8,800 --- 13,200 8,700 ---
Calaveras 21,000 9,300 --- 21,000 9,200 ---El Dorado 6,500 3,000 --- 6,400 3,000 ---
Inyo 13,900 --- 13,800 ---Mariposa 18,900 --- 18,700 ---
Mono 6,400 4,100 --- 6,400 4,000 ---Nevada 5,500 2,700 --- 5,400 2,700 ---
Placer 14,500 --- --- 14,400 --- ---Sierra 4,200 2,100 --- 4,100 2,100 ---
Tuolumne 11,800 6,800 --- 11,800 6,600 ---District 60 Total 117,000 37,200 --- 116,200 36,700 ---
Imperial 435,000 4,900 10,600 430,000 4,900 10,200Los Angeles 5,800 1,000 --- 5,800 1,000 ---
Orange 700 400 --- 700 400 ---Riverside 105,000 2,000 51,000 105,000 1,900 51,000
San Bernardino 200,000 3,000 92,000 200,000 2,900 90,000San Diego 16,500 5,700 3,400 16,400 5,600 3,300
Santa Barbara 37,500 15,200 --- 37,500 15,000 ---Ventura 6,600 4,000 --- 6,500 4,000 ---
District 80 Total 807,100 36,200 157,000 801,900 35,700 154,500Other Counties 1 0 98,400 17,900 369,000 96,300 20,900
STATE 5,350,000 620,000 1,780,000 5,300,000 610,000 1,780,0001 County data combined to avoid disclosing data for individual farms.
California Cattle Inventory by Class and County, January 1, 2012-132012 2013
HeadCounty
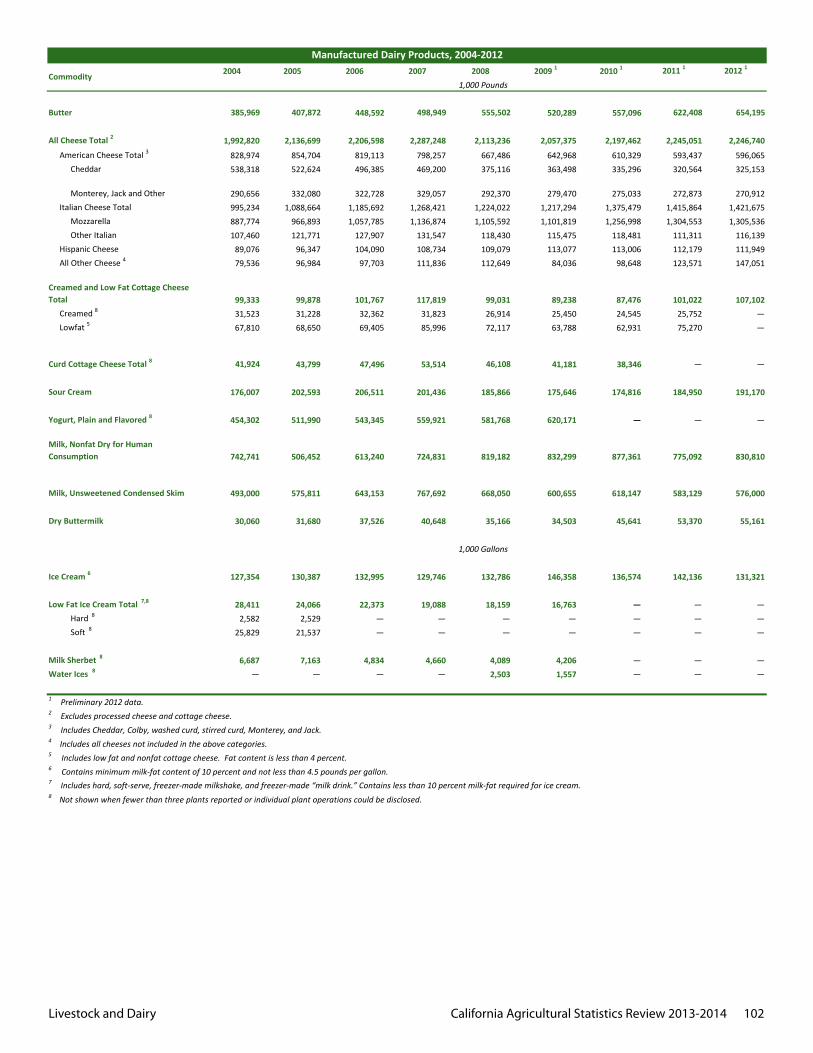
Livestock and Dairy California Agricultural Statistics Review 2013-2014 102
2004 2005 2007 2008 2011 1 2012 1
Butter 385,969 407,872 498,949 555,502 622,408 654,195
All Cheese Total 2 1,992,820 2,136,699 2,287,248 2,113,236 2,245,051 2,246,740
American Cheese Total 3 828,974 854,704 798,257 667,486 593,437 596,065Cheddar 538,318 522,624 469,200 375,116 320,564 325,153
Monterey, Jack and Other 290,656 332,080 329,057 292,370 272,873 270,912Italian Cheese Total 995,234 1,088,664 1,268,421 1,224,022 1,415,864 1,421,675
Mozzarella 887,774 966,893 1,136,874 1,105,592 1,304,553 1,305,536Other Italian 107,460 121,771 131,547 118,430 111,311 116,139
Hispanic Cheese 89,076 96,347 108,734 109,079 112,179 111,949All Other Cheese 4 79,536 96,984 111,836 112,649 123,571 147,051
Creamed and Low Fat Cottage Cheese Total 99,333 99,878 117,819 99,031 101,022 107,102
Creamed 8 31,523 31,228 31,823 26,914 25,752 —Lowfat 5 67,810 68,650 85,996 72,117 75,270 —
Curd Cottage Cheese Total 8 41,924 43,799 53,514 46,108 — —
Sour Cream 176,007 202,593 201,436 185,866 184,950 191,170
Yogurt, Plain and Flavored 8 454,302 511,990 559,921 581,768 — —
Milk, Nonfat Dry for Human Consumption 742,741 506,452 724,831 819,182 775,092 830,810
Milk, Unsweetened Condensed Skim 493,000 575,811 767,692 668,050 583,129 576,000
Dry Buttermilk 30,060 31,680 40,648 35,166 53,370 55,161
Ice Cream 6 127,354 130,387 129,746 132,786 142,136 131,321
Low Fat Ice Cream Total 7,8 28,411 24,066 19,088 18,159 — —Hard 8 2,582 2,529 — — — —Soft 8 25,829 21,537 — — — —
Milk Sherbet 8 6,687 7,163 4,660 4,089 — —Water Ices 8 — — — 2,503 — —
7 Includes hard, soft-serve, freezer-made milkshake, and freezer-made “milk drink.” Contains less than 10 percent milk-fat required for ice cream.
643,153
613,240
543,345
206,511
610,329
Manufactured Dairy Products, 2004-2012
1,000 Pounds
32,362101,767
97,703104,090127,907
2009 1 2010 1
275,033
87,47625,450 24,545
1,375,4791,101,819 1,256,998
115,475 118,481
363,498 335,296
37,526 34,503
—
6 Contains minimum milk-fat content of 10 percent and not less than 4.5 pounds per gallon.
8 Not shown when fewer than three plants reported or individual plant operations could be disclosed.
Commodity 2006
448,592
2,206,598
322,7281,185,6921,057,785
1,217,294
819,113496,385
642,968
4 Includes all cheeses not included in the above categories.5 Includes low fat and nonfat cottage cheese. Fat content is less than 4 percent.
69,405
47,496
279,470
520,289 557,096
2,057,375 2,197,462
62,931
113,00684,036 98,648
174,816175,646
89,238
113,077
63,788
—
41,181 38,346
620,171
45,641
832,299 877,361
146,358 136,574
618,147600,655
1,000 Gallons
22,373—— —
132,995
16,763 ——
3 Includes Cheddar, Colby, washed curd, stirred curd, Monterey, and Jack.
—
4,206 —
1 Preliminary 2012 data.2 Excludes processed cheese and cottage cheese.
4,834— 1,557 —
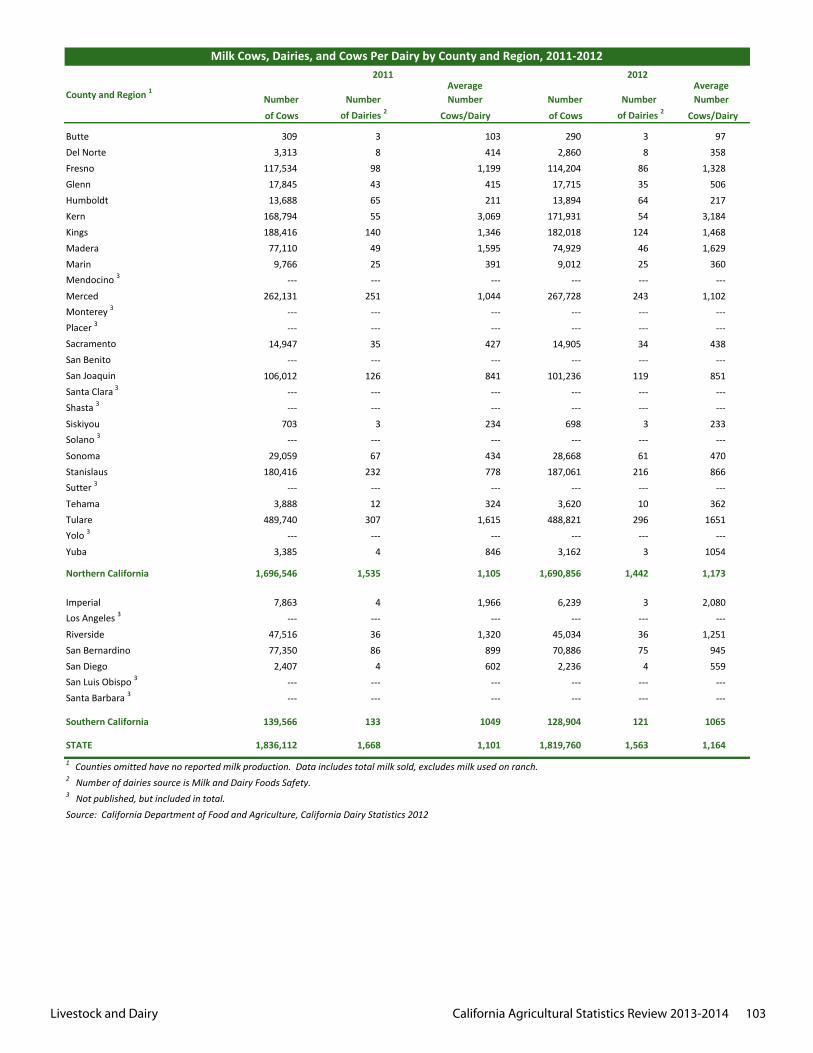
Livestock and Dairy California Agricultural Statistics Review 2013-2014 103
Number NumberAverage Number Number Number
AverageNumber
of Cows of Dairies 2 Cows/Dairy of Cows of Dairies 2 Cows/Dairy
Butte 309 3 103 290 3 97Del Norte 3,313 8 414 2,860 8 358Fresno 117,534 98 1,199 114,204 86 1,328Glenn 17,845 43 415 17,715 35 506Humboldt 13,688 65 211 13,894 64 217Kern 168,794 55 3,069 171,931 54 3,184Kings 188,416 140 1,346 182,018 124 1,468Madera 77,110 49 1,595 74,929 46 1,629Marin 9,766 25 391 9,012 25 360Mendocino 3 --- --- --- --- --- ---Merced 262,131 251 1,044 267,728 243 1,102Monterey 3 --- --- --- --- --- ---Placer 3 --- --- --- --- --- ---Sacramento 14,947 35 427 14,905 34 438San Benito --- --- --- --- --- ---San Joaquin 106,012 126 841 101,236 119 851Santa Clara 3 --- --- --- --- --- ---Shasta 3 --- --- --- --- --- ---Siskiyou 703 3 234 698 3 233Solano 3 --- --- --- --- --- ---Sonoma 29,059 67 434 28,668 61 470Stanislaus 180,416 232 778 187,061 216 866Sutter 3 --- --- --- --- --- ---Tehama 3,888 12 324 3,620 10 362Tulare 489,740 307 1,615 488,821 296 1651Yolo 3 --- --- --- --- --- ---Yuba 3,385 4 846 3,162 3 1054
Northern California 1,696,546 1,535 1,105 1,690,856 1,442 1,173
Imperial 7,863 4 1,966 6,239 3 2,080Los Angeles 3 --- --- --- --- --- ---Riverside 47,516 36 1,320 45,034 36 1,251San Bernardino 77,350 86 899 70,886 75 945San Diego 2,407 4 602 2,236 4 559San Luis Obispo 3 --- --- --- --- --- ---Santa Barbara 3 --- --- --- --- --- ---
Southern California 139,566 133 1049 128,904 121 1065
STATE 1,836,112 1,668 1,101 1,819,760 1,563 1,164
3 Not published, but included in total.Source: California Department of Food and Agriculture, California Dairy Statistics 2012
Milk Cows, Dairies, and Cows Per Dairy by County and Region, 2011-2012
County and Region 12011 2012
1 Counties omitted have no reported milk production. Data includes total milk sold, excludes milk used on ranch.2 Number of dairies source is Milk and Dairy Foods Safety.
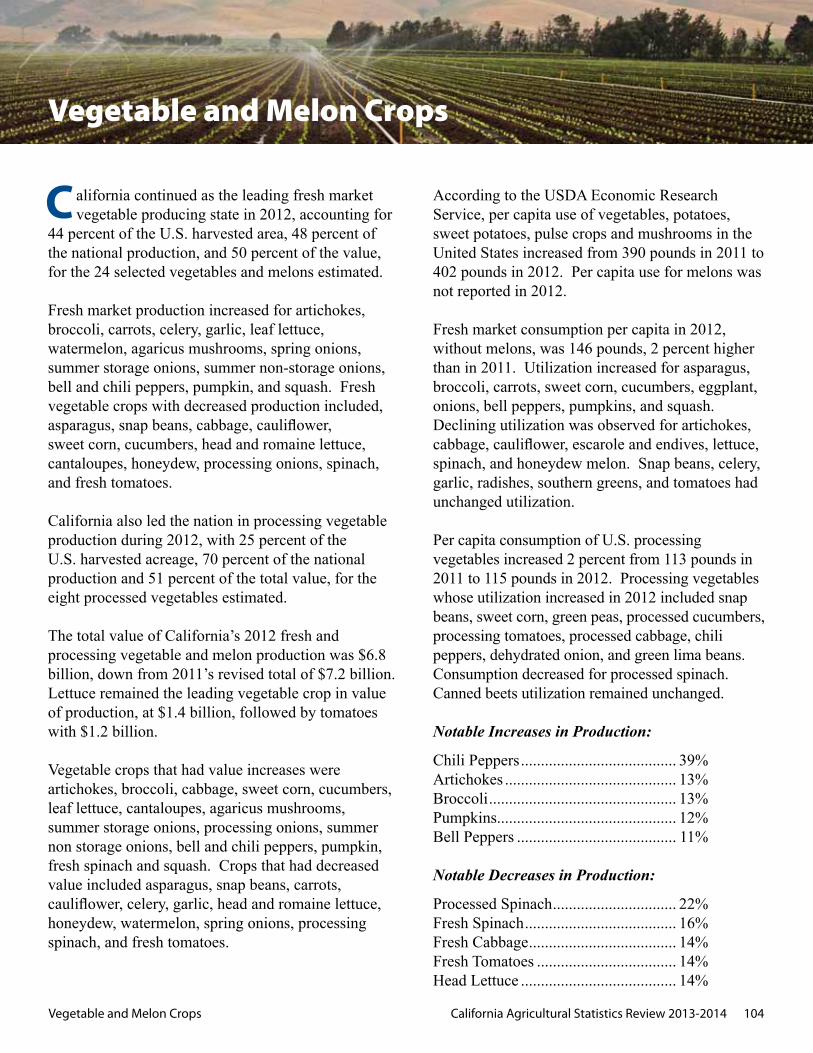
Vegetable and Melon Crops California Agricultural Statistics Review 2013-2014 104
alifornia continued as the leading fresh market vegetable producing state in 2012, accounting for
44 percent of the U.S. harvested area, 48 percent of the national production, and 50 percent of the value, for the 24 selected vegetables and melons estimated.
Fresh market production increased for artichokes, broccoli, carrots, celery, garlic, leaf lettuce, watermelon, agaricus mushrooms, spring onions, summer storage onions, summer non-storage onions, bell and chili peppers, pumpkin, and squash. Fresh vegetable crops with decreased production included, asparagus, snap beans, cabbage, cauliflower, sweet corn, cucumbers, head and romaine lettuce, cantaloupes, honeydew, processing onions, spinach, and fresh tomatoes.
California also led the nation in processing vegetable production during 2012, with 25 percent of the U.S. harvested acreage, 70 percent of the national production and 51 percent of the total value, for the eight processed vegetables estimated.
The total value of California’s 2012 fresh and processing vegetable and melon production was $6.8 billion, down from 2011’s revised total of $7.2 billion. Lettuce remained the leading vegetable crop in value of production, at $1.4 billion, followed by tomatoes with $1.2 billion.
Vegetable crops that had value increases were artichokes, broccoli, cabbage, sweet corn, cucumbers, leaf lettuce, cantaloupes, agaricus mushrooms, summer storage onions, processing onions, summer non storage onions, bell and chili peppers, pumpkin, fresh spinach and squash. Crops that had decreased value included asparagus, snap beans, carrots, cauliflower, celery, garlic, head and romaine lettuce, honeydew, watermelon, spring onions, processing spinach, and fresh tomatoes.
According to the USDA Economic Research Service, per capita use of vegetables, potatoes, sweet potatoes, pulse crops and mushrooms in the United States increased from 390 pounds in 2011 to 402 pounds in 2012. Per capita use for melons was not reported in 2012.
Fresh market consumption per capita in 2012, without melons, was 146 pounds, 2 percent higher than in 2011. Utilization increased for asparagus, broccoli, carrots, sweet corn, cucumbers, eggplant, onions, bell peppers, pumpkins, and squash. Declining utilization was observed for artichokes, cabbage, cauliflower, escarole and endives, lettuce, spinach, and honeydew melon. Snap beans, celery, garlic, radishes, southern greens, and tomatoes had unchanged utilization.
Per capita consumption of U.S. processing vegetables increased 2 percent from 113 pounds in 2011 to 115 pounds in 2012. Processing vegetables whose utilization increased in 2012 included snap beans, sweet corn, green peas, processed cucumbers, processing tomatoes, processed cabbage, chili peppers, dehydrated onion, and green lima beans. Consumption decreased for processed spinach. Canned beets utilization remained unchanged.
Notable Increases in Production:
Chili Peppers ....................................... 39%Artichokes ........................................... 13%Broccoli ............................................... 13%Pumpkins............................................. 12%Bell Peppers ........................................ 11%
Notable Decreases in Production:
Processed Spinach ............................... 22%Fresh Spinach ...................................... 16%Fresh Cabbage ..................................... 14%Fresh Tomatoes ................................... 14%Head Lettuce ....................................... 14%
Vegetable and Melon Crops
C

Vegetable and Melon Crops California Agricultural Statistics Review 2013-2014 105
Planted Harvested Yield Per Acre Production Value Per Unit 1 Total Value
Acres Acres Cwt. Cwt. $/Cwt. $1,000
Artichokes 2003 7,200 7,200 140 1,008,000 75.10 75,7012004 7,500 7,500 110 825,000 45.10 37,208
2005 7,900 7,900 110 869,000 45.40 39,453
2006 8,700 8,700 135 1,175,000 42.00 49,350
2007 9,600 9,600 110 1,056,000 55.00 58,080
2008 8,800 8,800 130 1,144,000 47.80 54,683
2009 8,600 8,600 125 1,075,000 56.20 60,415
2010 7,200 7,200 120 864,000 50.20 43,373
2011 7,400 7,400 135 999,000 51.10 51,049
2012 7,800 7,800 145 1,131,000 47.50 53,723
Asparagus 2 2003 29,000 27,000 34 918,000 122.00 111,9962004 36,000 34,000 35 1,190,000 89.30 106,267
2005 25,000 24,100 32 770,000 105.00 80,850
2006 23,500 22,500 23 518,000 118.00 61,124
2007 20,800 20,000 29 580,000 121.00 70,180
2008 15,000 14,500 29 421,000 125.00 52,625
2009 13,000 12,500 32 400,000 130.00 52,000
2010 12,000 11,500 35 403,000 147.00 59,2412011 12,000 11,500 33 384,000 149.00 57,216
2012 12,000 11,500 32 368,000 131.00 48,208
Beans, Fresh Market Snap 2003 5,800 5,800 100 580,000 55.70 32,306
2004 6,800 6,800 100 680,000 66.80 45,4242005 8,000 8,000 90 720,000 64.90 46,728
2006 7,700 7,500 80 600,000 63.50 38,100
2007 6,900 6,800 105 714,000 67.70 48,338
2008 5,900 5,800 105 609,000 66.50 40,499
2009 9,800 9,600 110 1,056,000 66.90 70,646
2010 10,000 10,000 105 1,050,000 67.60 70,980
2011 9,000 9,000 110 990,000 66.90 66,231
2012 9,200 9,200 105 966,000 65.10 62,887
Broccoli 2 2003 117,500 117,500 150 17,625,000 31.90 562,8122004 117,000 117,000 150 17,550,000 32.00 562,217
2005 117,000 116,000 150 17,400,000 28.10 489,338
2006 120,000 119,000 145 17,255,000 33.70 580,844
2007 119,000 118,000 150 17,700,000 35.40 626,325
2008 117,000 116,000 160 18,560,000 35.70 663,319
2009 118,000 117,000 160 18,720,000 40.10 750,600
2010 125,000 123,000 150 18,245,000 37.50 684,659
2011 118,000 116,000 150 17,213,000 33.70 580,5262012 121,000 119,000 165 19,436,000 33.20 644,747
Vegetable and Melon Acreage, Production and Value, 2003‐2012
CropCrop Year
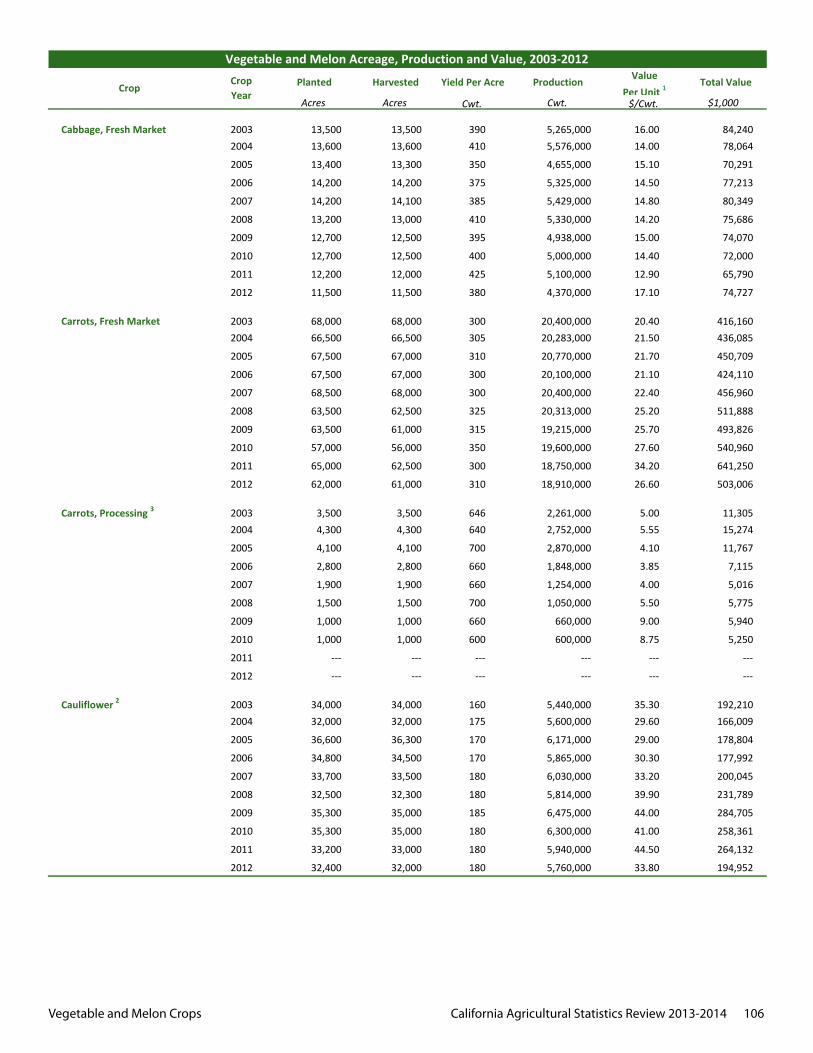
Vegetable and Melon Crops California Agricultural Statistics Review 2013-2014 106
Planted Harvested Yield Per Acre Production Value Per Unit 1 Total Value
Acres Acres Cwt. Cwt. $/Cwt. $1,000
Vegetable and Melon Acreage, Production and Value, 2003‐2012
CropCrop Year
Cabbage, Fresh Market 2003 13,500 13,500 390 5,265,000 16.00 84,2402004 13,600 13,600 410 5,576,000 14.00 78,064
2005 13,400 13,300 350 4,655,000 15.10 70,291
2006 14,200 14,200 375 5,325,000 14.50 77,213
2007 14,200 14,100 385 5,429,000 14.80 80,349
2008 13,200 13,000 410 5,330,000 14.20 75,686
2009 12,700 12,500 395 4,938,000 15.00 74,070
2010 12,700 12,500 400 5,000,000 14.40 72,000
2011 12,200 12,000 425 5,100,000 12.90 65,790
2012 11,500 11,500 380 4,370,000 17.10 74,727
Carrots, Fresh Market 2003 68,000 68,000 300 20,400,000 20.40 416,1602004 66,500 66,500 305 20,283,000 21.50 436,085
2005 67,500 67,000 310 20,770,000 21.70 450,709
2006 67,500 67,000 300 20,100,000 21.10 424,110
2007 68,500 68,000 300 20,400,000 22.40 456,960
2008 63,500 62,500 325 20,313,000 25.20 511,888
2009 63,500 61,000 315 19,215,000 25.70 493,826
2010 57,000 56,000 350 19,600,000 27.60 540,960
2011 65,000 62,500 300 18,750,000 34.20 641,250
2012 62,000 61,000 310 18,910,000 26.60 503,006
Carrots, Processing 3 2003 3,500 3,500 646 2,261,000 5.00 11,3052004 4,300 4,300 640 2,752,000 5.55 15,274
2005 4,100 4,100 700 2,870,000 4.10 11,767
2006 2,800 2,800 660 1,848,000 3.85 7,115
2007 1,900 1,900 660 1,254,000 4.00 5,016
2008 1,500 1,500 700 1,050,000 5.50 5,775
2009 1,000 1,000 660 660,000 9.00 5,940
2010 1,000 1,000 600 600,000 8.75 5,250
2011 ‐‐‐ ‐‐‐ ‐‐‐ ‐‐‐ ‐‐‐ ‐‐‐
2012 ‐‐‐ ‐‐‐ ‐‐‐ ‐‐‐ ‐‐‐ ‐‐‐
Cauliflower 2 2003 34,000 34,000 160 5,440,000 35.30 192,2102004 32,000 32,000 175 5,600,000 29.60 166,009
2005 36,600 36,300 170 6,171,000 29.00 178,804
2006 34,800 34,500 170 5,865,000 30.30 177,992
2007 33,700 33,500 180 6,030,000 33.20 200,045
2008 32,500 32,300 180 5,814,000 39.90 231,789
2009 35,300 35,000 185 6,475,000 44.00 284,705
2010 35,300 35,000 180 6,300,000 41.00 258,361
2011 33,200 33,000 180 5,940,000 44.50 264,132
2012 32,400 32,000 180 5,760,000 33.80 194,952
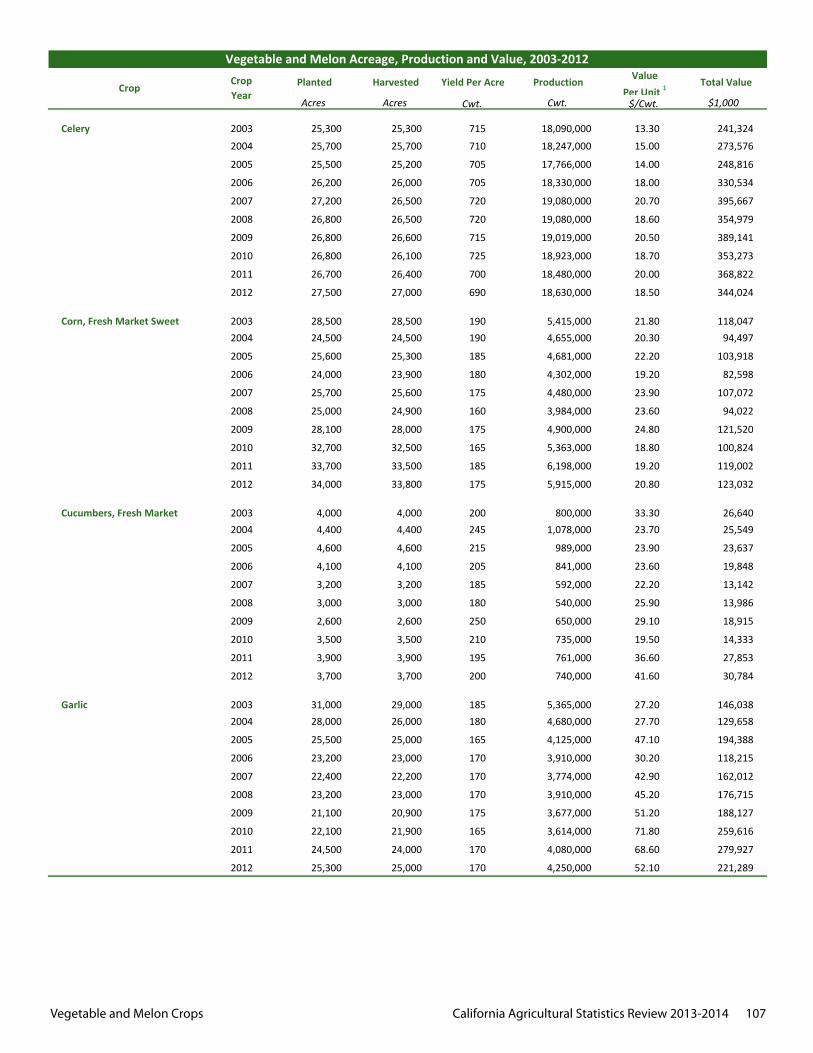
Vegetable and Melon Crops California Agricultural Statistics Review 2013-2014 107
Planted Harvested Yield Per Acre Production Value Per Unit 1 Total Value
Acres Acres Cwt. Cwt. $/Cwt. $1,000
Vegetable and Melon Acreage, Production and Value, 2003‐2012
CropCrop Year
Celery 2003 25,300 25,300 715 18,090,000 13.30 241,324
2004 25,700 25,700 710 18,247,000 15.00 273,576
2005 25,500 25,200 705 17,766,000 14.00 248,816
2006 26,200 26,000 705 18,330,000 18.00 330,534
2007 27,200 26,500 720 19,080,000 20.70 395,667
2008 26,800 26,500 720 19,080,000 18.60 354,979
2009 26,800 26,600 715 19,019,000 20.50 389,141
2010 26,800 26,100 725 18,923,000 18.70 353,273
2011 26,700 26,400 700 18,480,000 20.00 368,822
2012 27,500 27,000 690 18,630,000 18.50 344,024
Corn, Fresh Market Sweet 2003 28,500 28,500 190 5,415,000 21.80 118,0472004 24,500 24,500 190 4,655,000 20.30 94,497
2005 25,600 25,300 185 4,681,000 22.20 103,918
2006 24,000 23,900 180 4,302,000 19.20 82,598
2007 25,700 25,600 175 4,480,000 23.90 107,072
2008 25,000 24,900 160 3,984,000 23.60 94,022
2009 28,100 28,000 175 4,900,000 24.80 121,520
2010 32,700 32,500 165 5,363,000 18.80 100,824
2011 33,700 33,500 185 6,198,000 19.20 119,002
2012 34,000 33,800 175 5,915,000 20.80 123,032
Cucumbers, Fresh Market 2003 4,000 4,000 200 800,000 33.30 26,6402004 4,400 4,400 245 1,078,000 23.70 25,549
2005 4,600 4,600 215 989,000 23.90 23,637
2006 4,100 4,100 205 841,000 23.60 19,848
2007 3,200 3,200 185 592,000 22.20 13,142
2008 3,000 3,000 180 540,000 25.90 13,986
2009 2,600 2,600 250 650,000 29.10 18,915
2010 3,500 3,500 210 735,000 19.50 14,333
2011 3,900 3,900 195 761,000 36.60 27,853
2012 3,700 3,700 200 740,000 41.60 30,784
Garlic 2003 31,000 29,000 185 5,365,000 27.20 146,0382004 28,000 26,000 180 4,680,000 27.70 129,658
2005 25,500 25,000 165 4,125,000 47.10 194,388
2006 23,200 23,000 170 3,910,000 30.20 118,215
2007 22,400 22,200 170 3,774,000 42.90 162,012
2008 23,200 23,000 170 3,910,000 45.20 176,715
2009 21,100 20,900 175 3,677,000 51.20 188,127
2010 22,100 21,900 165 3,614,000 71.80 259,616
2011 24,500 24,000 170 4,080,000 68.60 279,927
2012 25,300 25,000 170 4,250,000 52.10 221,289
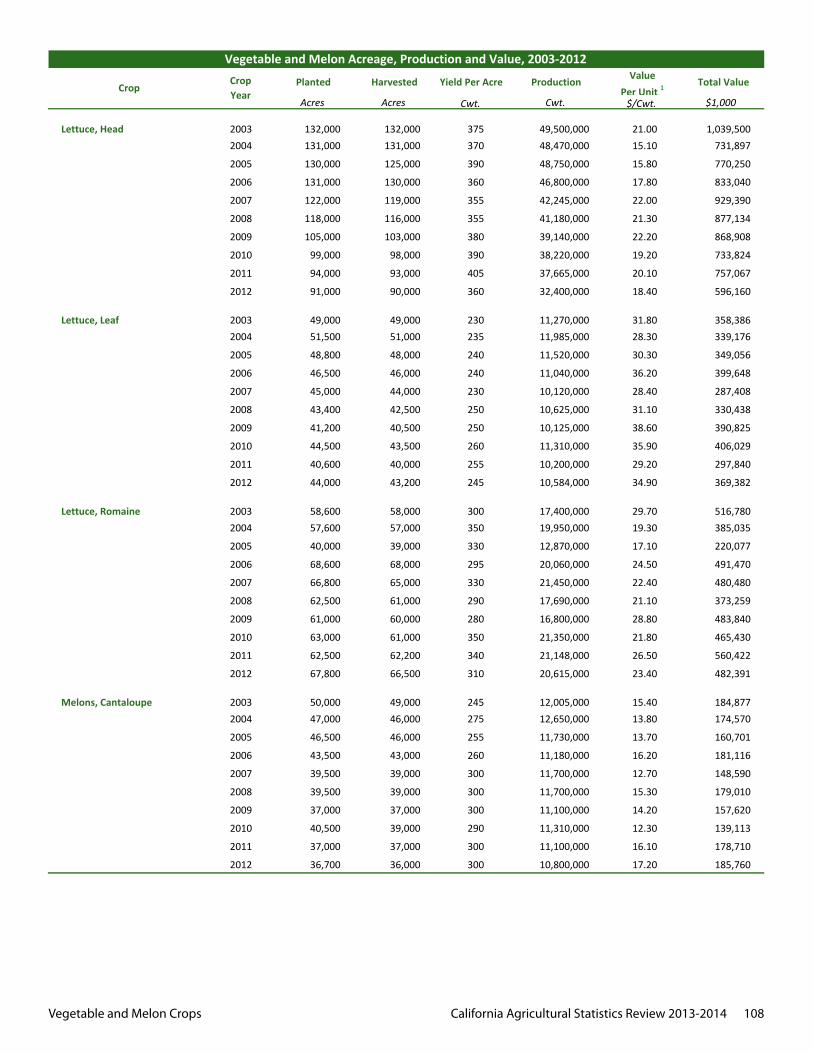
Vegetable and Melon Crops California Agricultural Statistics Review 2013-2014 108
Planted Harvested Yield Per Acre Production Value Per Unit 1 Total Value
Acres Acres Cwt. Cwt. $/Cwt. $1,000
Vegetable and Melon Acreage, Production and Value, 2003‐2012
CropCrop Year
Lettuce, Head 2003 132,000 132,000 375 49,500,000 21.00 1,039,5002004 131,000 131,000 370 48,470,000 15.10 731,897
2005 130,000 125,000 390 48,750,000 15.80 770,250
2006 131,000 130,000 360 46,800,000 17.80 833,040
2007 122,000 119,000 355 42,245,000 22.00 929,390
2008 118,000 116,000 355 41,180,000 21.30 877,134
2009 105,000 103,000 380 39,140,000 22.20 868,908
2010 99,000 98,000 390 38,220,000 19.20 733,824
2011 94,000 93,000 405 37,665,000 20.10 757,067
2012 91,000 90,000 360 32,400,000 18.40 596,160
Lettuce, Leaf 2003 49,000 49,000 230 11,270,000 31.80 358,3862004 51,500 51,000 235 11,985,000 28.30 339,176
2005 48,800 48,000 240 11,520,000 30.30 349,056
2006 46,500 46,000 240 11,040,000 36.20 399,648
2007 45,000 44,000 230 10,120,000 28.40 287,408
2008 43,400 42,500 250 10,625,000 31.10 330,438
2009 41,200 40,500 250 10,125,000 38.60 390,825
2010 44,500 43,500 260 11,310,000 35.90 406,029
2011 40,600 40,000 255 10,200,000 29.20 297,840
2012 44,000 43,200 245 10,584,000 34.90 369,382
Lettuce, Romaine 2003 58,600 58,000 300 17,400,000 29.70 516,7802004 57,600 57,000 350 19,950,000 19.30 385,035
2005 40,000 39,000 330 12,870,000 17.10 220,077
2006 68,600 68,000 295 20,060,000 24.50 491,470
2007 66,800 65,000 330 21,450,000 22.40 480,480
2008 62,500 61,000 290 17,690,000 21.10 373,259
2009 61,000 60,000 280 16,800,000 28.80 483,840
2010 63,000 61,000 350 21,350,000 21.80 465,430
2011 62,500 62,200 340 21,148,000 26.50 560,422
2012 67,800 66,500 310 20,615,000 23.40 482,391
Melons, Cantaloupe 2003 50,000 49,000 245 12,005,000 15.40 184,8772004 47,000 46,000 275 12,650,000 13.80 174,570
2005 46,500 46,000 255 11,730,000 13.70 160,701
2006 43,500 43,000 260 11,180,000 16.20 181,116
2007 39,500 39,000 300 11,700,000 12.70 148,590
2008 39,500 39,000 300 11,700,000 15.30 179,010
2009 37,000 37,000 300 11,100,000 14.20 157,620
2010 40,500 39,000 290 11,310,000 12.30 139,113
2011 37,000 37,000 300 11,100,000 16.10 178,710
2012 36,700 36,000 300 10,800,000 17.20 185,760
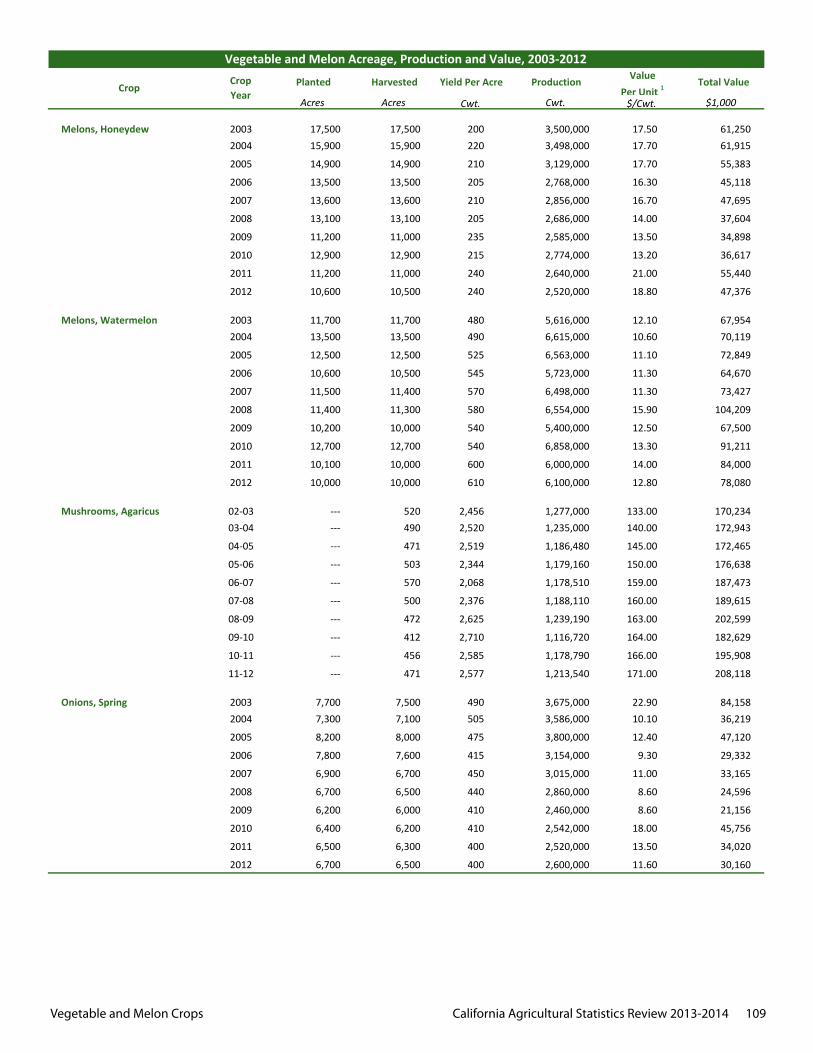
Vegetable and Melon Crops California Agricultural Statistics Review 2013-2014 109
Planted Harvested Yield Per Acre Production Value Per Unit 1 Total Value
Acres Acres Cwt. Cwt. $/Cwt. $1,000
Vegetable and Melon Acreage, Production and Value, 2003‐2012
CropCrop Year
Melons, Honeydew 2003 17,500 17,500 200 3,500,000 17.50 61,2502004 15,900 15,900 220 3,498,000 17.70 61,915
2005 14,900 14,900 210 3,129,000 17.70 55,383
2006 13,500 13,500 205 2,768,000 16.30 45,118
2007 13,600 13,600 210 2,856,000 16.70 47,695
2008 13,100 13,100 205 2,686,000 14.00 37,604
2009 11,200 11,000 235 2,585,000 13.50 34,898
2010 12,900 12,900 215 2,774,000 13.20 36,617
2011 11,200 11,000 240 2,640,000 21.00 55,440
2012 10,600 10,500 240 2,520,000 18.80 47,376
Melons, Watermelon 2003 11,700 11,700 480 5,616,000 12.10 67,9542004 13,500 13,500 490 6,615,000 10.60 70,119
2005 12,500 12,500 525 6,563,000 11.10 72,849
2006 10,600 10,500 545 5,723,000 11.30 64,670
2007 11,500 11,400 570 6,498,000 11.30 73,427
2008 11,400 11,300 580 6,554,000 15.90 104,209
2009 10,200 10,000 540 5,400,000 12.50 67,500
2010 12,700 12,700 540 6,858,000 13.30 91,211
2011 10,100 10,000 600 6,000,000 14.00 84,000
2012 10,000 10,000 610 6,100,000 12.80 78,080
Mushrooms, Agaricus 02‐03 ‐‐‐ 520 2,456 1,277,000 133.00 170,23403‐04 ‐‐‐ 490 2,520 1,235,000 140.00 172,943
04‐05 ‐‐‐ 471 2,519 1,186,480 145.00 172,465
05‐06 ‐‐‐ 503 2,344 1,179,160 150.00 176,638
06‐07 ‐‐‐ 570 2,068 1,178,510 159.00 187,473
07‐08 ‐‐‐ 500 2,376 1,188,110 160.00 189,615
08‐09 ‐‐‐ 472 2,625 1,239,190 163.00 202,599
09‐10 ‐‐‐ 412 2,710 1,116,720 164.00 182,629
10‐11 ‐‐‐ 456 2,585 1,178,790 166.00 195,908
11‐12 ‐‐‐ 471 2,577 1,213,540 171.00 208,118
Onions, Spring 2003 7,700 7,500 490 3,675,000 22.90 84,1582004 7,300 7,100 505 3,586,000 10.10 36,219
2005 8,200 8,000 475 3,800,000 12.40 47,120
2006 7,800 7,600 415 3,154,000 9.30 29,332
2007 6,900 6,700 450 3,015,000 11.00 33,165
2008 6,700 6,500 440 2,860,000 8.60 24,596
2009 6,200 6,000 410 2,460,000 8.60 21,156
2010 6,400 6,200 410 2,542,000 18.00 45,756
2011 6,500 6,300 400 2,520,000 13.50 34,020
2012 6,700 6,500 400 2,600,000 11.60 30,160
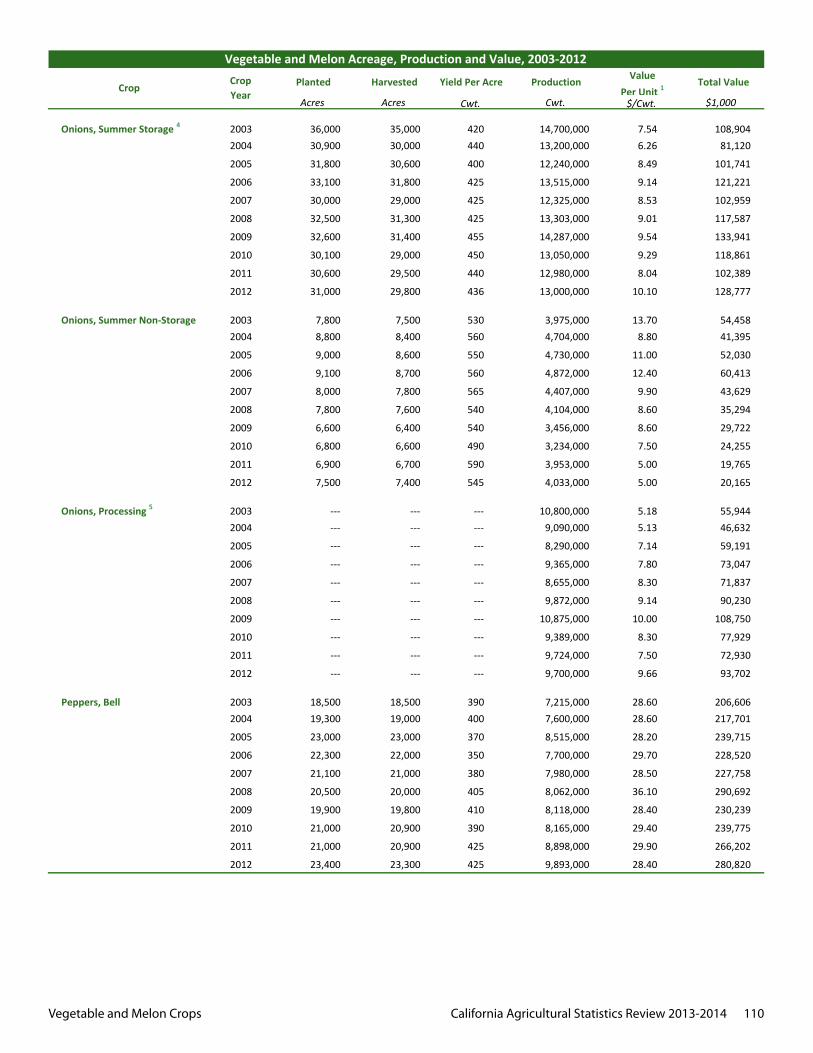
Vegetable and Melon Crops California Agricultural Statistics Review 2013-2014 110
Planted Harvested Yield Per Acre Production Value Per Unit 1 Total Value
Acres Acres Cwt. Cwt. $/Cwt. $1,000
Vegetable and Melon Acreage, Production and Value, 2003‐2012
CropCrop Year
Onions, Summer Storage 4 2003 36,000 35,000 420 14,700,000 7.54 108,9042004 30,900 30,000 440 13,200,000 6.26 81,120
2005 31,800 30,600 400 12,240,000 8.49 101,741
2006 33,100 31,800 425 13,515,000 9.14 121,221
2007 30,000 29,000 425 12,325,000 8.53 102,959
2008 32,500 31,300 425 13,303,000 9.01 117,587
2009 32,600 31,400 455 14,287,000 9.54 133,941
2010 30,100 29,000 450 13,050,000 9.29 118,861
2011 30,600 29,500 440 12,980,000 8.04 102,389
2012 31,000 29,800 436 13,000,000 10.10 128,777
Onions, Summer Non‐Storage 2003 7,800 7,500 530 3,975,000 13.70 54,4582004 8,800 8,400 560 4,704,000 8.80 41,395
2005 9,000 8,600 550 4,730,000 11.00 52,030
2006 9,100 8,700 560 4,872,000 12.40 60,413
2007 8,000 7,800 565 4,407,000 9.90 43,629
2008 7,800 7,600 540 4,104,000 8.60 35,294
2009 6,600 6,400 540 3,456,000 8.60 29,722
2010 6,800 6,600 490 3,234,000 7.50 24,255
2011 6,900 6,700 590 3,953,000 5.00 19,765
2012 7,500 7,400 545 4,033,000 5.00 20,165
Onions, Processing 5 2003 ‐‐‐ ‐‐‐ ‐‐‐ 10,800,000 5.18 55,9442004 ‐‐‐ ‐‐‐ ‐‐‐ 9,090,000 5.13 46,632
2005 ‐‐‐ ‐‐‐ ‐‐‐ 8,290,000 7.14 59,191
2006 ‐‐‐ ‐‐‐ ‐‐‐ 9,365,000 7.80 73,047
2007 ‐‐‐ ‐‐‐ ‐‐‐ 8,655,000 8.30 71,837
2008 ‐‐‐ ‐‐‐ ‐‐‐ 9,872,000 9.14 90,230
2009 ‐‐‐ ‐‐‐ ‐‐‐ 10,875,000 10.00 108,750
2010 ‐‐‐ ‐‐‐ ‐‐‐ 9,389,000 8.30 77,929
2011 ‐‐‐ ‐‐‐ ‐‐‐ 9,724,000 7.50 72,930
2012 ‐‐‐ ‐‐‐ ‐‐‐ 9,700,000 9.66 93,702
Peppers, Bell 2003 18,500 18,500 390 7,215,000 28.60 206,6062004 19,300 19,000 400 7,600,000 28.60 217,701
2005 23,000 23,000 370 8,515,000 28.20 239,715
2006 22,300 22,000 350 7,700,000 29.70 228,520
2007 21,100 21,000 380 7,980,000 28.50 227,758
2008 20,500 20,000 405 8,062,000 36.10 290,692
2009 19,900 19,800 410 8,118,000 28.40 230,239
2010 21,000 20,900 390 8,165,000 29.40 239,775
2011 21,000 20,900 425 8,898,000 29.90 266,202
2012 23,400 23,300 425 9,893,000 28.40 280,820
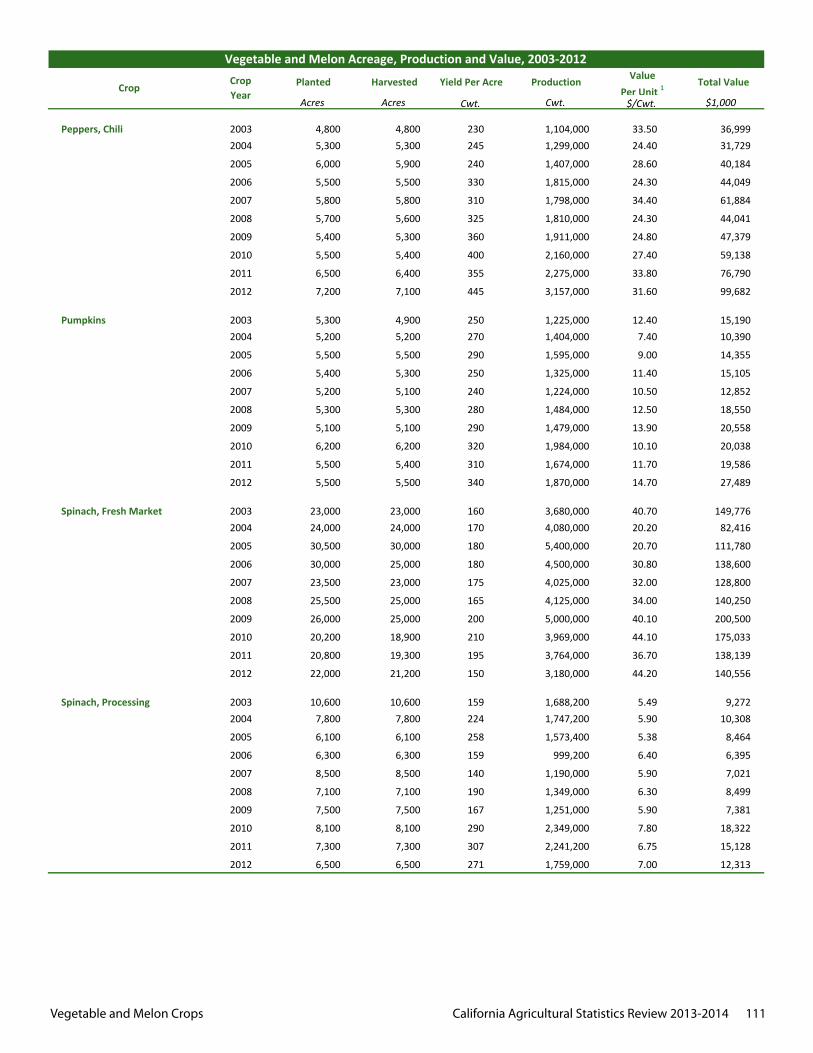
Vegetable and Melon Crops California Agricultural Statistics Review 2013-2014 111
Planted Harvested Yield Per Acre Production Value Per Unit 1 Total Value
Acres Acres Cwt. Cwt. $/Cwt. $1,000
Vegetable and Melon Acreage, Production and Value, 2003‐2012
CropCrop Year
Peppers, Chili 2003 4,800 4,800 230 1,104,000 33.50 36,9992004 5,300 5,300 245 1,299,000 24.40 31,729
2005 6,000 5,900 240 1,407,000 28.60 40,184
2006 5,500 5,500 330 1,815,000 24.30 44,049
2007 5,800 5,800 310 1,798,000 34.40 61,884
2008 5,700 5,600 325 1,810,000 24.30 44,041
2009 5,400 5,300 360 1,911,000 24.80 47,379
2010 5,500 5,400 400 2,160,000 27.40 59,138
2011 6,500 6,400 355 2,275,000 33.80 76,790
2012 7,200 7,100 445 3,157,000 31.60 99,682
Pumpkins 2003 5,300 4,900 250 1,225,000 12.40 15,1902004 5,200 5,200 270 1,404,000 7.40 10,390
2005 5,500 5,500 290 1,595,000 9.00 14,355
2006 5,400 5,300 250 1,325,000 11.40 15,105
2007 5,200 5,100 240 1,224,000 10.50 12,852
2008 5,300 5,300 280 1,484,000 12.50 18,550
2009 5,100 5,100 290 1,479,000 13.90 20,558
2010 6,200 6,200 320 1,984,000 10.10 20,038
2011 5,500 5,400 310 1,674,000 11.70 19,586
2012 5,500 5,500 340 1,870,000 14.70 27,489
Spinach, Fresh Market 2003 23,000 23,000 160 3,680,000 40.70 149,7762004 24,000 24,000 170 4,080,000 20.20 82,416
2005 30,500 30,000 180 5,400,000 20.70 111,780
2006 30,000 25,000 180 4,500,000 30.80 138,600
2007 23,500 23,000 175 4,025,000 32.00 128,800
2008 25,500 25,000 165 4,125,000 34.00 140,250
2009 26,000 25,000 200 5,000,000 40.10 200,500
2010 20,200 18,900 210 3,969,000 44.10 175,033
2011 20,800 19,300 195 3,764,000 36.70 138,139
2012 22,000 21,200 150 3,180,000 44.20 140,556
Spinach, Processing 2003 10,600 10,600 159 1,688,200 5.49 9,2722004 7,800 7,800 224 1,747,200 5.90 10,308
2005 6,100 6,100 258 1,573,400 5.38 8,464
2006 6,300 6,300 159 999,200 6.40 6,395
2007 8,500 8,500 140 1,190,000 5.90 7,021
2008 7,100 7,100 190 1,349,000 6.30 8,499
2009 7,500 7,500 167 1,251,000 5.90 7,381
2010 8,100 8,100 290 2,349,000 7.80 18,322
2011 7,300 7,300 307 2,241,200 6.75 15,128
2012 6,500 6,500 271 1,759,000 7.00 12,313
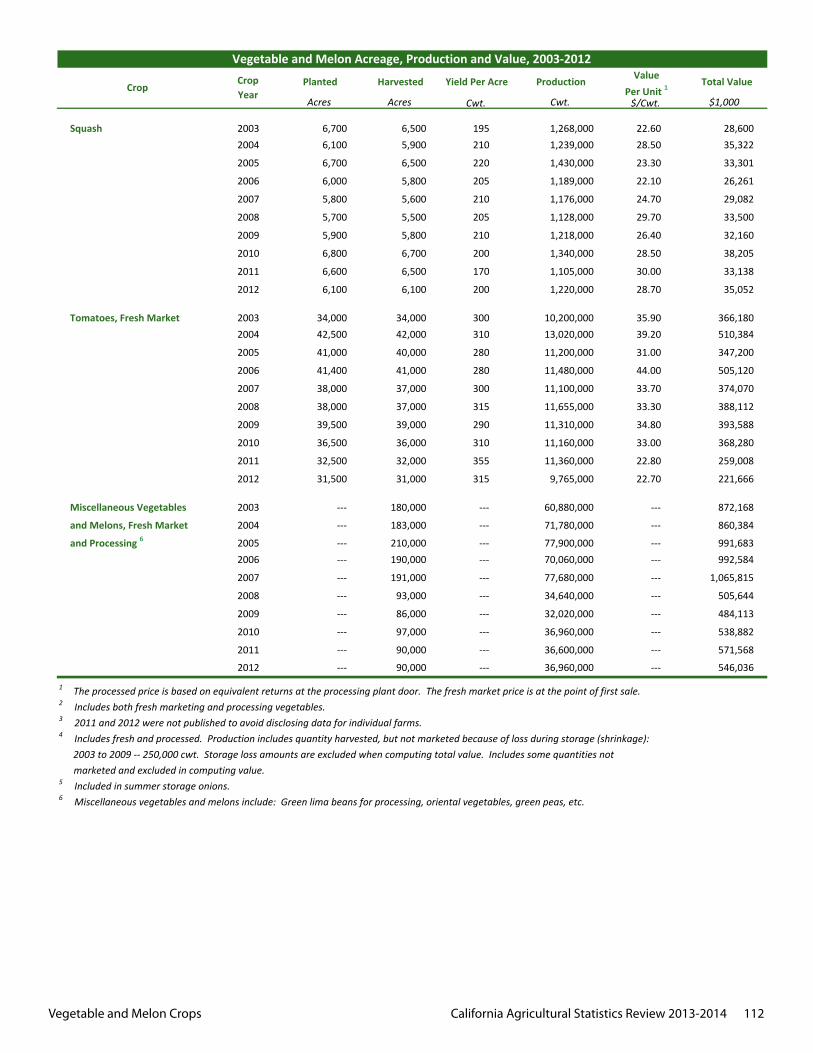
Vegetable and Melon Crops California Agricultural Statistics Review 2013-2014 112
Planted Harvested Yield Per Acre Production Value Per Unit 1 Total Value
Acres Acres Cwt. Cwt. $/Cwt. $1,000
Vegetable and Melon Acreage, Production and Value, 2003‐2012
CropCrop Year
Squash 2003 6,700 6,500 195 1,268,000 22.60 28,6002004 6,100 5,900 210 1,239,000 28.50 35,322
2005 6,700 6,500 220 1,430,000 23.30 33,301
2006 6,000 5,800 205 1,189,000 22.10 26,261
2007 5,800 5,600 210 1,176,000 24.70 29,082
2008 5,700 5,500 205 1,128,000 29.70 33,500
2009 5,900 5,800 210 1,218,000 26.40 32,160
2010 6,800 6,700 200 1,340,000 28.50 38,205
2011 6,600 6,500 170 1,105,000 30.00 33,138
2012 6,100 6,100 200 1,220,000 28.70 35,052
Tomatoes, Fresh Market 2003 34,000 34,000 300 10,200,000 35.90 366,1802004 42,500 42,000 310 13,020,000 39.20 510,384
2005 41,000 40,000 280 11,200,000 31.00 347,200
2006 41,400 41,000 280 11,480,000 44.00 505,120
2007 38,000 37,000 300 11,100,000 33.70 374,070
2008 38,000 37,000 315 11,655,000 33.30 388,112
2009 39,500 39,000 290 11,310,000 34.80 393,588
2010 36,500 36,000 310 11,160,000 33.00 368,280
2011 32,500 32,000 355 11,360,000 22.80 259,008
2012 31,500 31,000 315 9,765,000 22.70 221,666
Miscellaneous Vegetables 2003 ‐‐‐ 180,000 ‐‐‐ 60,880,000 ‐‐‐ 872,168
and Melons, Fresh Market 2004 ‐‐‐ 183,000 ‐‐‐ 71,780,000 ‐‐‐ 860,384
and Processing 6 2005 ‐‐‐ 210,000 ‐‐‐ 77,900,000 ‐‐‐ 991,6832006 ‐‐‐ 190,000 ‐‐‐ 70,060,000 ‐‐‐ 992,584
2007 ‐‐‐ 191,000 ‐‐‐ 77,680,000 ‐‐‐ 1,065,815
2008 ‐‐‐ 93,000 ‐‐‐ 34,640,000 ‐‐‐ 505,644
2009 ‐‐‐ 86,000 ‐‐‐ 32,020,000 ‐‐‐ 484,113
2010 ‐‐‐ 97,000 ‐‐‐ 36,960,000 ‐‐‐ 538,882
2011 ‐‐‐ 90,000 ‐‐‐ 36,600,000 ‐‐‐ 571,568
2012 ‐‐‐ 90,000 ‐‐‐ 36,960,000 ‐‐‐ 546,036
5 Included in summer storage onions.6 Miscellaneous vegetables and melons include: Green lima beans for processing, oriental vegetables, green peas, etc.
4 Includes fresh and processed. Production includes quantity harvested, but not marketed because of loss during storage (shrinkage): 2003 to 2009 ‐‐ 250,000 cwt. Storage loss amounts are excluded when computing total value. Includes some quantities not marketed and excluded in computing value.
1 The processed price is based on equivalent returns at the processing plant door. The fresh market price is at the point of first sale.2 Includes both fresh marketing and processing vegetables.3 2011 and 2012 were not published to avoid disclosing data for individual farms.
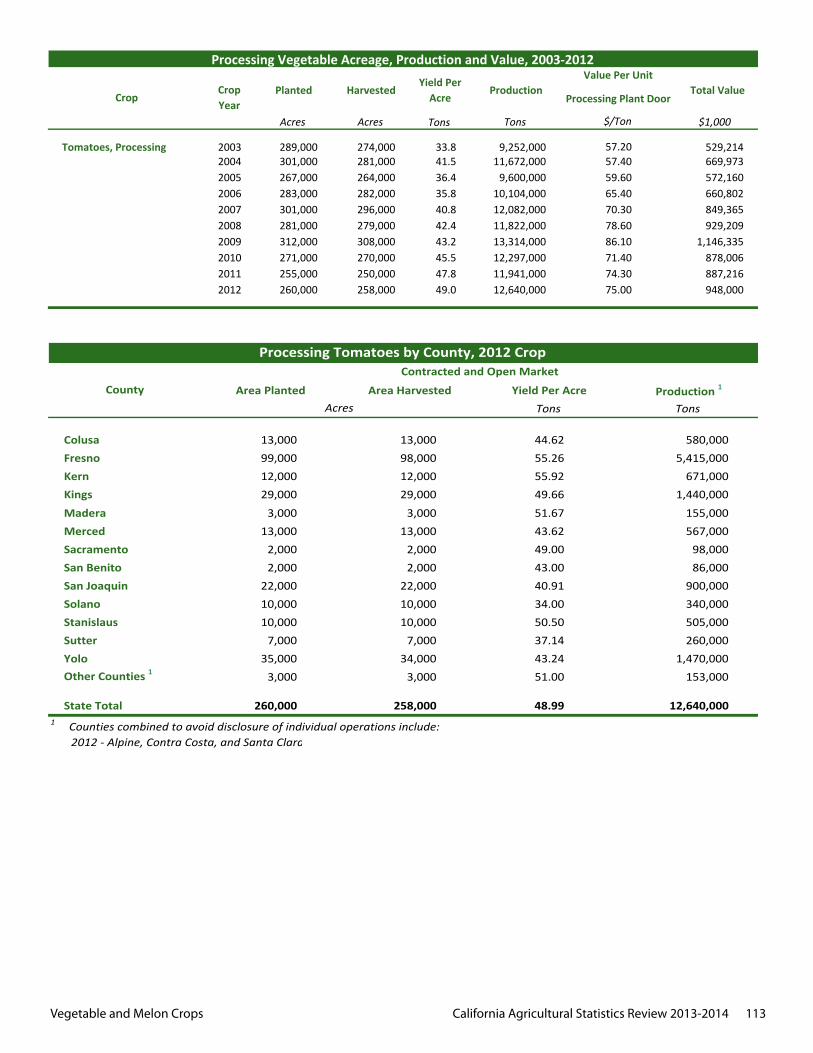
Vegetable and Melon Crops California Agricultural Statistics Review 2013-2014 113
Acres Acres Tons Tons $1,000
Tomatoes, Processing 2003 289,000 274,000 33.8 9,252,000 529,2142004 301,000 281,000 41.5 11,672,000 669,9732005 267,000 264,000 36.4 9,600,000 572,1602006 283,000 282,000 35.8 10,104,000 660,8022007 301,000 296,000 40.8 12,082,000 849,3652008 281,000 279,000 42.4 11,822,000 929,2092009 312,000 308,000 43.2 13,314,000 1,146,3352010 271,000 270,000 45.5 12,297,000 878,0062011 255,000 250,000 47.8 11,941,000 887,2162012 260,000 258,000 49.0 12,640,000 948,000
57.2057.4059.6065.40
Total ValueValue Per Unit
Processing Vegetable Acreage, Production and Value, 2003‐2012
CropCrop Year
Planted HarvestedYield Per Acre
ProductionProcessing Plant Door
$/Ton
75.00
70.3078.6086.1071.4074.30
Area Planted Area Harvested Yield Per Acre Production 1
Tons Tons
Colusa 13,000 13,000 44.62 580,000Fresno 99,000 98,000 55.26 5,415,000Kern 12,000 12,000 55.92 671,000Kings 29,000 29,000 49.66 1,440,000Madera 3,000 3,000 51.67 155,000Merced 13,000 13,000 43.62 567,000Sacramento 2,000 2,000 49.00 98,000San Benito 2,000 2,000 43.00 86,000San Joaquin 22,000 22,000 40.91 900,000Solano 10,000 10,000 34.00 340,000Stanislaus 10,000 10,000 50.50 505,000Sutter 7,000 7,000 37.14 260,000Yolo 35,000 34,000 43.24 1,470,000Other Counties 1 3,000 3,000 51.00 153,000
State Total 260,000 258,000 48.99 12,640,000
2012 ‐ Alpine, Contra Costa, and Santa Clara
Processing Tomatoes by County, 2012 CropContracted and Open Market
CountyAcres
1 Counties combined to avoid disclosure of individual operations include:
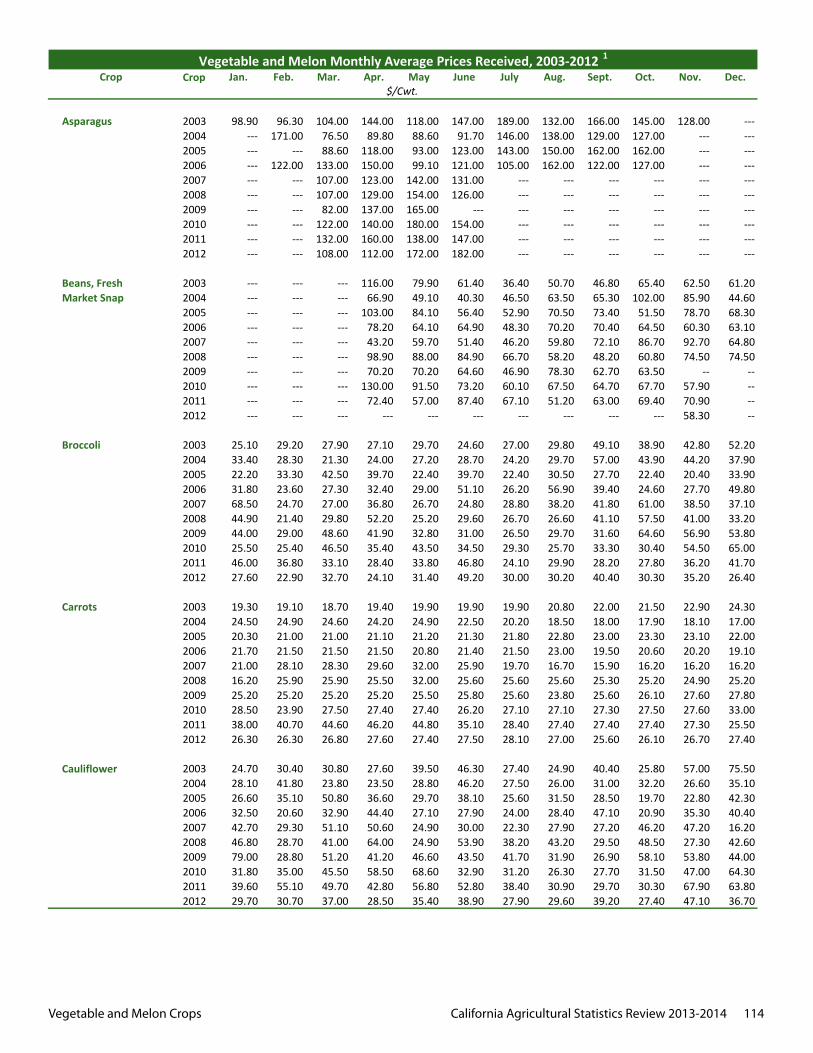
Vegetable and Melon Crops California Agricultural Statistics Review 2013-2014 114
Crop Crop Jan. Feb. Mar. Apr. May June July Aug. Sept. Oct. Nov. Dec.
Asparagus 2003 98.90 96.30 104.00 144.00 118.00 147.00 189.00 132.00 166.00 145.00 128.00 ‐‐‐2004 ‐‐‐ 171.00 76.50 89.80 88.60 91.70 146.00 138.00 129.00 127.00 ‐‐‐ ‐‐‐2005 ‐‐‐ ‐‐‐ 88.60 118.00 93.00 123.00 143.00 150.00 162.00 162.00 ‐‐‐ ‐‐‐2006 ‐‐‐ 122.00 133.00 150.00 99.10 121.00 105.00 162.00 122.00 127.00 ‐‐‐ ‐‐‐2007 ‐‐‐ ‐‐‐ 107.00 123.00 142.00 131.00 ‐‐‐ ‐‐‐ ‐‐‐ ‐‐‐ ‐‐‐ ‐‐‐2008 ‐‐‐ ‐‐‐ 107.00 129.00 154.00 126.00 ‐‐‐ ‐‐‐ ‐‐‐ ‐‐‐ ‐‐‐ ‐‐‐2009 ‐‐‐ ‐‐‐ 82.00 137.00 165.00 ‐‐‐ ‐‐‐ ‐‐‐ ‐‐‐ ‐‐‐ ‐‐‐ ‐‐‐2010 ‐‐‐ ‐‐‐ 122.00 140.00 180.00 154.00 ‐‐‐ ‐‐‐ ‐‐‐ ‐‐‐ ‐‐‐ ‐‐‐2011 ‐‐‐ ‐‐‐ 132.00 160.00 138.00 147.00 ‐‐‐ ‐‐‐ ‐‐‐ ‐‐‐ ‐‐‐ ‐‐‐2012 ‐‐‐ ‐‐‐ 108.00 112.00 172.00 182.00 ‐‐‐ ‐‐‐ ‐‐‐ ‐‐‐ ‐‐‐ ‐‐‐
Beans, Fresh 2003 ‐‐‐ ‐‐‐ ‐‐‐ 116.00 79.90 61.40 36.40 50.70 46.80 65.40 62.50 61.20Market Snap 2004 ‐‐‐ ‐‐‐ ‐‐‐ 66.90 49.10 40.30 46.50 63.50 65.30 102.00 85.90 44.60
2005 ‐‐‐ ‐‐‐ ‐‐‐ 103.00 84.10 56.40 52.90 70.50 73.40 51.50 78.70 68.302006 ‐‐‐ ‐‐‐ ‐‐‐ 78.20 64.10 64.90 48.30 70.20 70.40 64.50 60.30 63.102007 ‐‐‐ ‐‐‐ ‐‐‐ 43.20 59.70 51.40 46.20 59.80 72.10 86.70 92.70 64.802008 ‐‐‐ ‐‐‐ ‐‐‐ 98.90 88.00 84.90 66.70 58.20 48.20 60.80 74.50 74.502009 ‐‐‐ ‐‐‐ ‐‐‐ 70.20 70.20 64.60 46.90 78.30 62.70 63.50 ‐‐ ‐‐2010 ‐‐‐ ‐‐‐ ‐‐‐ 130.00 91.50 73.20 60.10 67.50 64.70 67.70 57.90 ‐‐2011 ‐‐‐ ‐‐‐ ‐‐‐ 72.40 57.00 87.40 67.10 51.20 63.00 69.40 70.90 ‐‐2012 ‐‐‐ ‐‐‐ ‐‐‐ ‐‐‐ ‐‐‐ ‐‐‐ ‐‐‐ ‐‐‐ ‐‐‐ ‐‐‐ 58.30 ‐‐
Broccoli 2003 25.10 29.20 27.90 27.10 29.70 24.60 27.00 29.80 49.10 38.90 42.80 52.202004 33.40 28.30 21.30 24.00 27.20 28.70 24.20 29.70 57.00 43.90 44.20 37.902005 22.20 33.30 42.50 39.70 22.40 39.70 22.40 30.50 27.70 22.40 20.40 33.902006 31.80 23.60 27.30 32.40 29.00 51.10 26.20 56.90 39.40 24.60 27.70 49.802007 68.50 24.70 27.00 36.80 26.70 24.80 28.80 38.20 41.80 61.00 38.50 37.102008 44.90 21.40 29.80 52.20 25.20 29.60 26.70 26.60 41.10 57.50 41.00 33.202009 44.00 29.00 48.60 41.90 32.80 31.00 26.50 29.70 31.60 64.60 56.90 53.802010 25.50 25.40 46.50 35.40 43.50 34.50 29.30 25.70 33.30 30.40 54.50 65.002011 46.00 36.80 33.10 28.40 33.80 46.80 24.10 29.90 28.20 27.80 36.20 41.702012 27.60 22.90 32.70 24.10 31.40 49.20 30.00 30.20 40.40 30.30 35.20 26.40
Carrots 2003 19.30 19.10 18.70 19.40 19.90 19.90 19.90 20.80 22.00 21.50 22.90 24.302004 24.50 24.90 24.60 24.20 24.90 22.50 20.20 18.50 18.00 17.90 18.10 17.002005 20.30 21.00 21.00 21.10 21.20 21.30 21.80 22.80 23.00 23.30 23.10 22.002006 21.70 21.50 21.50 21.50 20.80 21.40 21.50 23.00 19.50 20.60 20.20 19.102007 21.00 28.10 28.30 29.60 32.00 25.90 19.70 16.70 15.90 16.20 16.20 16.202008 16.20 25.90 25.90 25.50 32.00 25.60 25.60 25.60 25.30 25.20 24.90 25.202009 25.20 25.20 25.20 25.20 25.50 25.80 25.60 23.80 25.60 26.10 27.60 27.802010 28.50 23.90 27.50 27.40 27.40 26.20 27.10 27.10 27.30 27.50 27.60 33.002011 38.00 40.70 44.60 46.20 44.80 35.10 28.40 27.40 27.40 27.40 27.30 25.502012 26.30 26.30 26.80 27.60 27.40 27.50 28.10 27.00 25.60 26.10 26.70 27.40
Cauliflower 2003 24.70 30.40 30.80 27.60 39.50 46.30 27.40 24.90 40.40 25.80 57.00 75.502004 28.10 41.80 23.80 23.50 28.80 46.20 27.50 26.00 31.00 32.20 26.60 35.102005 26.60 35.10 50.80 36.60 29.70 38.10 25.60 31.50 28.50 19.70 22.80 42.302006 32.50 20.60 32.90 44.40 27.10 27.90 24.00 28.40 47.10 20.90 35.30 40.402007 42.70 29.30 51.10 50.60 24.90 30.00 22.30 27.90 27.20 46.20 47.20 16.202008 46.80 28.70 41.00 64.00 24.90 53.90 38.20 43.20 29.50 48.50 27.30 42.602009 79.00 28.80 51.20 41.20 46.60 43.50 41.70 31.90 26.90 58.10 53.80 44.002010 31.80 35.00 45.50 58.50 68.60 32.90 31.20 26.30 27.70 31.50 47.00 64.302011 39.60 55.10 49.70 42.80 56.80 52.80 38.40 30.90 29.70 30.30 67.90 63.802012 29.70 30.70 37.00 28.50 35.40 38.90 27.90 29.60 39.20 27.40 47.10 36.70
Vegetable and Melon Monthly Average Prices Received, 2003‐2012 1
$/Cwt.
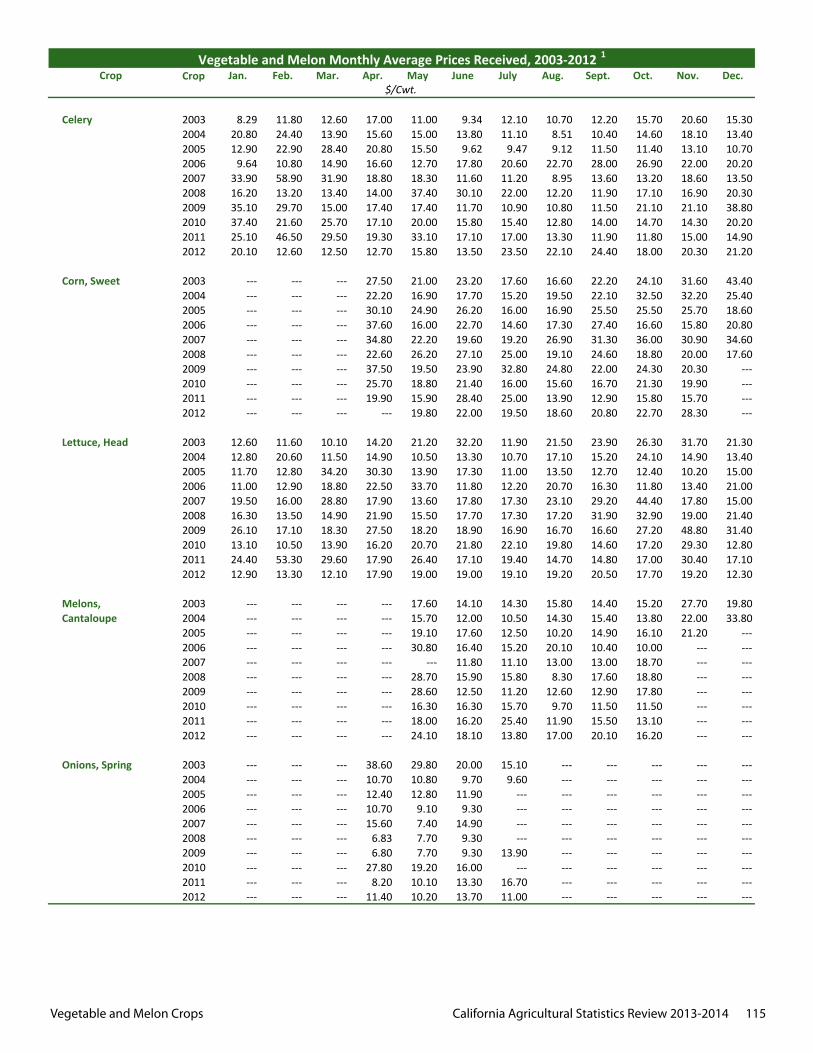
Vegetable and Melon Crops California Agricultural Statistics Review 2013-2014 115
Crop Crop Jan. Feb. Mar. Apr. May June July Aug. Sept. Oct. Nov. Dec.Vegetable and Melon Monthly Average Prices Received, 2003‐2012 1
$/Cwt.
Celery 2003 8.29 11.80 12.60 17.00 11.00 9.34 12.10 10.70 12.20 15.70 20.60 15.302004 20.80 24.40 13.90 15.60 15.00 13.80 11.10 8.51 10.40 14.60 18.10 13.402005 12.90 22.90 28.40 20.80 15.50 9.62 9.47 9.12 11.50 11.40 13.10 10.702006 9.64 10.80 14.90 16.60 12.70 17.80 20.60 22.70 28.00 26.90 22.00 20.202007 33.90 58.90 31.90 18.80 18.30 11.60 11.20 8.95 13.60 13.20 18.60 13.502008 16.20 13.20 13.40 14.00 37.40 30.10 22.00 12.20 11.90 17.10 16.90 20.302009 35.10 29.70 15.00 17.40 17.40 11.70 10.90 10.80 11.50 21.10 21.10 38.802010 37.40 21.60 25.70 17.10 20.00 15.80 15.40 12.80 14.00 14.70 14.30 20.202011 25.10 46.50 29.50 19.30 33.10 17.10 17.00 13.30 11.90 11.80 15.00 14.902012 20.10 12.60 12.50 12.70 15.80 13.50 23.50 22.10 24.40 18.00 20.30 21.20
Corn, Sweet 2003 ‐‐‐ ‐‐‐ ‐‐‐ 27.50 21.00 23.20 17.60 16.60 22.20 24.10 31.60 43.402004 ‐‐‐ ‐‐‐ ‐‐‐ 22.20 16.90 17.70 15.20 19.50 22.10 32.50 32.20 25.402005 ‐‐‐ ‐‐‐ ‐‐‐ 30.10 24.90 26.20 16.00 16.90 25.50 25.50 25.70 18.602006 ‐‐‐ ‐‐‐ ‐‐‐ 37.60 16.00 22.70 14.60 17.30 27.40 16.60 15.80 20.802007 ‐‐‐ ‐‐‐ ‐‐‐ 34.80 22.20 19.60 19.20 26.90 31.30 36.00 30.90 34.602008 ‐‐‐ ‐‐‐ ‐‐‐ 22.60 26.20 27.10 25.00 19.10 24.60 18.80 20.00 17.602009 ‐‐‐ ‐‐‐ ‐‐‐ 37.50 19.50 23.90 32.80 24.80 22.00 24.30 20.30 ‐‐‐2010 ‐‐‐ ‐‐‐ ‐‐‐ 25.70 18.80 21.40 16.00 15.60 16.70 21.30 19.90 ‐‐‐2011 ‐‐‐ ‐‐‐ ‐‐‐ 19.90 15.90 28.40 25.00 13.90 12.90 15.80 15.70 ‐‐‐2012 ‐‐‐ ‐‐‐ ‐‐‐ ‐‐‐ 19.80 22.00 19.50 18.60 20.80 22.70 28.30 ‐‐‐
Lettuce, Head 2003 12.60 11.60 10.10 14.20 21.20 32.20 11.90 21.50 23.90 26.30 31.70 21.302004 12.80 20.60 11.50 14.90 10.50 13.30 10.70 17.10 15.20 24.10 14.90 13.402005 11.70 12.80 34.20 30.30 13.90 17.30 11.00 13.50 12.70 12.40 10.20 15.002006 11.00 12.90 18.80 22.50 33.70 11.80 12.20 20.70 16.30 11.80 13.40 21.002007 19.50 16.00 28.80 17.90 13.60 17.80 17.30 23.10 29.20 44.40 17.80 15.002008 16.30 13.50 14.90 21.90 15.50 17.70 17.30 17.20 31.90 32.90 19.00 21.402009 26.10 17.10 18.30 27.50 18.20 18.90 16.90 16.70 16.60 27.20 48.80 31.402010 13.10 10.50 13.90 16.20 20.70 21.80 22.10 19.80 14.60 17.20 29.30 12.802011 24.40 53.30 29.60 17.90 26.40 17.10 19.40 14.70 14.80 17.00 30.40 17.102012 12.90 13.30 12.10 17.90 19.00 19.00 19.10 19.20 20.50 17.70 19.20 12.30
Melons, 2003 ‐‐‐ ‐‐‐ ‐‐‐ ‐‐‐ 17.60 14.10 14.30 15.80 14.40 15.20 27.70 19.80Cantaloupe 2004 ‐‐‐ ‐‐‐ ‐‐‐ ‐‐‐ 15.70 12.00 10.50 14.30 15.40 13.80 22.00 33.80
2005 ‐‐‐ ‐‐‐ ‐‐‐ ‐‐‐ 19.10 17.60 12.50 10.20 14.90 16.10 21.20 ‐‐‐2006 ‐‐‐ ‐‐‐ ‐‐‐ ‐‐‐ 30.80 16.40 15.20 20.10 10.40 10.00 ‐‐‐ ‐‐‐2007 ‐‐‐ ‐‐‐ ‐‐‐ ‐‐‐ ‐‐‐ 11.80 11.10 13.00 13.00 18.70 ‐‐‐ ‐‐‐2008 ‐‐‐ ‐‐‐ ‐‐‐ ‐‐‐ 28.70 15.90 15.80 8.30 17.60 18.80 ‐‐‐ ‐‐‐2009 ‐‐‐ ‐‐‐ ‐‐‐ ‐‐‐ 28.60 12.50 11.20 12.60 12.90 17.80 ‐‐‐ ‐‐‐2010 ‐‐‐ ‐‐‐ ‐‐‐ ‐‐‐ 16.30 16.30 15.70 9.70 11.50 11.50 ‐‐‐ ‐‐‐2011 ‐‐‐ ‐‐‐ ‐‐‐ ‐‐‐ 18.00 16.20 25.40 11.90 15.50 13.10 ‐‐‐ ‐‐‐2012 ‐‐‐ ‐‐‐ ‐‐‐ ‐‐‐ 24.10 18.10 13.80 17.00 20.10 16.20 ‐‐‐ ‐‐‐
Onions, Spring 2003 ‐‐‐ ‐‐‐ ‐‐‐ 38.60 29.80 20.00 15.10 ‐‐‐ ‐‐‐ ‐‐‐ ‐‐‐ ‐‐‐2004 ‐‐‐ ‐‐‐ ‐‐‐ 10.70 10.80 9.70 9.60 ‐‐‐ ‐‐‐ ‐‐‐ ‐‐‐ ‐‐‐2005 ‐‐‐ ‐‐‐ ‐‐‐ 12.40 12.80 11.90 ‐‐‐ ‐‐‐ ‐‐‐ ‐‐‐ ‐‐‐ ‐‐‐2006 ‐‐‐ ‐‐‐ ‐‐‐ 10.70 9.10 9.30 ‐‐‐ ‐‐‐ ‐‐‐ ‐‐‐ ‐‐‐ ‐‐‐2007 ‐‐‐ ‐‐‐ ‐‐‐ 15.60 7.40 14.90 ‐‐‐ ‐‐‐ ‐‐‐ ‐‐‐ ‐‐‐ ‐‐‐2008 ‐‐‐ ‐‐‐ ‐‐‐ 6.83 7.70 9.30 ‐‐‐ ‐‐‐ ‐‐‐ ‐‐‐ ‐‐‐ ‐‐‐2009 ‐‐‐ ‐‐‐ ‐‐‐ 6.80 7.70 9.30 13.90 ‐‐‐ ‐‐‐ ‐‐‐ ‐‐‐ ‐‐‐2010 ‐‐‐ ‐‐‐ ‐‐‐ 27.80 19.20 16.00 ‐‐‐ ‐‐‐ ‐‐‐ ‐‐‐ ‐‐‐ ‐‐‐2011 ‐‐‐ ‐‐‐ ‐‐‐ 8.20 10.10 13.30 16.70 ‐‐‐ ‐‐‐ ‐‐‐ ‐‐‐ ‐‐‐2012 ‐‐‐ ‐‐‐ ‐‐‐ 11.40 10.20 13.70 11.00 ‐‐‐ ‐‐‐ ‐‐‐ ‐‐‐ ‐‐‐
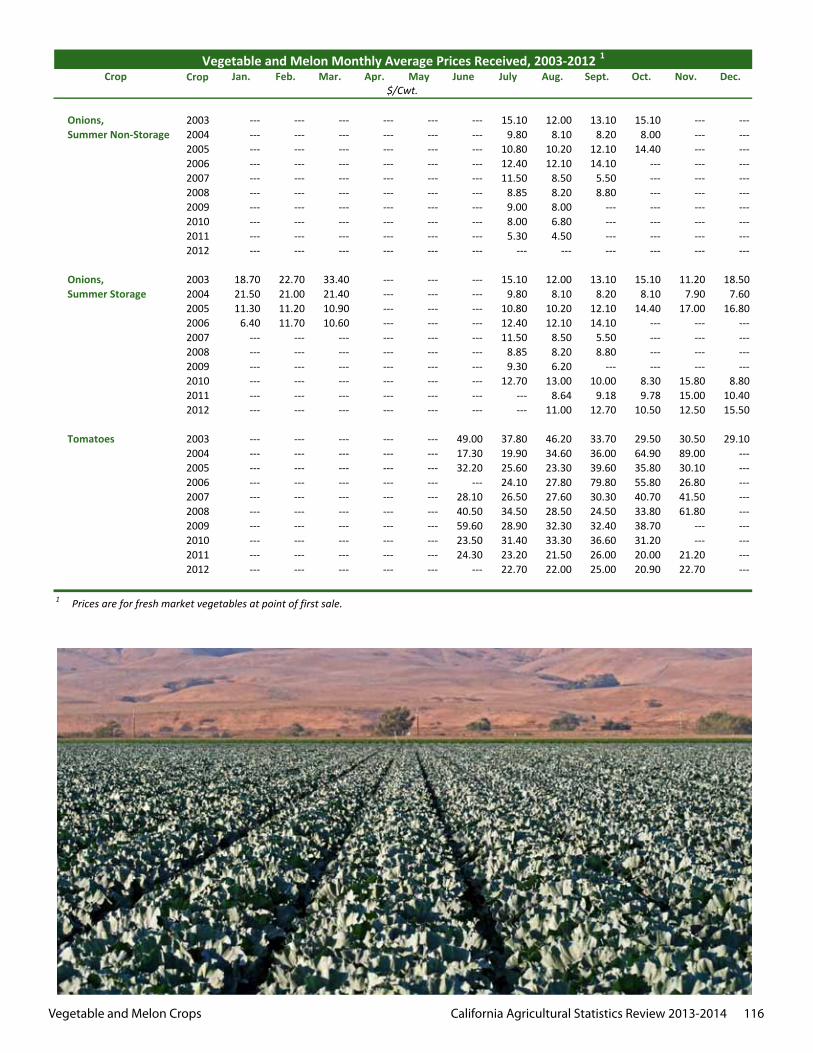
Vegetable and Melon Crops California Agricultural Statistics Review 2013-2014 116
Crop Crop Jan. Feb. Mar. Apr. May June July Aug. Sept. Oct. Nov. Dec.Vegetable and Melon Monthly Average Prices Received, 2003‐2012 1
$/Cwt.
Onions, 2003 ‐‐‐ ‐‐‐ ‐‐‐ ‐‐‐ ‐‐‐ ‐‐‐ 15.10 12.00 13.10 15.10 ‐‐‐ ‐‐‐Summer Non‐Storage 2004 ‐‐‐ ‐‐‐ ‐‐‐ ‐‐‐ ‐‐‐ ‐‐‐ 9.80 8.10 8.20 8.00 ‐‐‐ ‐‐‐
2005 ‐‐‐ ‐‐‐ ‐‐‐ ‐‐‐ ‐‐‐ ‐‐‐ 10.80 10.20 12.10 14.40 ‐‐‐ ‐‐‐2006 ‐‐‐ ‐‐‐ ‐‐‐ ‐‐‐ ‐‐‐ ‐‐‐ 12.40 12.10 14.10 ‐‐‐ ‐‐‐ ‐‐‐2007 ‐‐‐ ‐‐‐ ‐‐‐ ‐‐‐ ‐‐‐ ‐‐‐ 11.50 8.50 5.50 ‐‐‐ ‐‐‐ ‐‐‐2008 ‐‐‐ ‐‐‐ ‐‐‐ ‐‐‐ ‐‐‐ ‐‐‐ 8.85 8.20 8.80 ‐‐‐ ‐‐‐ ‐‐‐2009 ‐‐‐ ‐‐‐ ‐‐‐ ‐‐‐ ‐‐‐ ‐‐‐ 9.00 8.00 ‐‐‐ ‐‐‐ ‐‐‐ ‐‐‐2010 ‐‐‐ ‐‐‐ ‐‐‐ ‐‐‐ ‐‐‐ ‐‐‐ 8.00 6.80 ‐‐‐ ‐‐‐ ‐‐‐ ‐‐‐2011 ‐‐‐ ‐‐‐ ‐‐‐ ‐‐‐ ‐‐‐ ‐‐‐ 5.30 4.50 ‐‐‐ ‐‐‐ ‐‐‐ ‐‐‐2012 ‐‐‐ ‐‐‐ ‐‐‐ ‐‐‐ ‐‐‐ ‐‐‐ ‐‐‐ ‐‐‐ ‐‐‐ ‐‐‐ ‐‐‐ ‐‐‐
Onions, 2003 18.70 22.70 33.40 ‐‐‐ ‐‐‐ ‐‐‐ 15.10 12.00 13.10 15.10 11.20 18.50Summer Storage 2004 21.50 21.00 21.40 ‐‐‐ ‐‐‐ ‐‐‐ 9.80 8.10 8.20 8.10 7.90 7.60
2005 11.30 11.20 10.90 ‐‐‐ ‐‐‐ ‐‐‐ 10.80 10.20 12.10 14.40 17.00 16.802006 6.40 11.70 10.60 ‐‐‐ ‐‐‐ ‐‐‐ 12.40 12.10 14.10 ‐‐‐ ‐‐‐ ‐‐‐2007 ‐‐‐ ‐‐‐ ‐‐‐ ‐‐‐ ‐‐‐ ‐‐‐ 11.50 8.50 5.50 ‐‐‐ ‐‐‐ ‐‐‐2008 ‐‐‐ ‐‐‐ ‐‐‐ ‐‐‐ ‐‐‐ ‐‐‐ 8.85 8.20 8.80 ‐‐‐ ‐‐‐ ‐‐‐2009 ‐‐‐ ‐‐‐ ‐‐‐ ‐‐‐ ‐‐‐ ‐‐‐ 9.30 6.20 ‐‐‐ ‐‐‐ ‐‐‐ ‐‐‐2010 ‐‐‐ ‐‐‐ ‐‐‐ ‐‐‐ ‐‐‐ ‐‐‐ 12.70 13.00 10.00 8.30 15.80 8.802011 ‐‐‐ ‐‐‐ ‐‐‐ ‐‐‐ ‐‐‐ ‐‐‐ ‐‐‐ 8.64 9.18 9.78 15.00 10.402012 ‐‐‐ ‐‐‐ ‐‐‐ ‐‐‐ ‐‐‐ ‐‐‐ ‐‐‐ 11.00 12.70 10.50 12.50 15.50
Tomatoes 2003 ‐‐‐ ‐‐‐ ‐‐‐ ‐‐‐ ‐‐‐ 49.00 37.80 46.20 33.70 29.50 30.50 29.102004 ‐‐‐ ‐‐‐ ‐‐‐ ‐‐‐ ‐‐‐ 17.30 19.90 34.60 36.00 64.90 89.00 ‐‐‐2005 ‐‐‐ ‐‐‐ ‐‐‐ ‐‐‐ ‐‐‐ 32.20 25.60 23.30 39.60 35.80 30.10 ‐‐‐2006 ‐‐‐ ‐‐‐ ‐‐‐ ‐‐‐ ‐‐‐ ‐‐‐ 24.10 27.80 79.80 55.80 26.80 ‐‐‐2007 ‐‐‐ ‐‐‐ ‐‐‐ ‐‐‐ ‐‐‐ 28.10 26.50 27.60 30.30 40.70 41.50 ‐‐‐2008 ‐‐‐ ‐‐‐ ‐‐‐ ‐‐‐ ‐‐‐ 40.50 34.50 28.50 24.50 33.80 61.80 ‐‐‐2009 ‐‐‐ ‐‐‐ ‐‐‐ ‐‐‐ ‐‐‐ 59.60 28.90 32.30 32.40 38.70 ‐‐‐ ‐‐‐2010 ‐‐‐ ‐‐‐ ‐‐‐ ‐‐‐ ‐‐‐ 23.50 31.40 33.30 36.60 31.20 ‐‐‐ ‐‐‐2011 ‐‐‐ ‐‐‐ ‐‐‐ ‐‐‐ ‐‐‐ 24.30 23.20 21.50 26.00 20.00 21.20 ‐‐‐2012 ‐‐‐ ‐‐‐ ‐‐‐ ‐‐‐ ‐‐‐ ‐‐‐ 22.70 22.00 25.00 20.90 22.70 ‐‐‐
1 Prices are for fresh market vegetables at point of first sale.
California Agricultural Exports California Agricultural Statistics Review 2013-2014 117
n 2012, California agricultural exports reached $ $18.18 billion, representing a 8 percent increase over the previous year. As indicated by the table below, California’s agricultural exports have grown at an impressive pace for the past 10 years except for a slight contraction between 2008 and 2009.
California Agricultural Export Values, 2002-2012 Year Export Value in $Billions 2012 $18.18 2011 $16.77* 2010 $14.75* 2009 $12.44 2008 $12.90 2007 $11.17 2006 $9.82 2005 $9.37 2004 $8.24 2003 $7.50 2002 $6.55
I Exports of almonds continued to be the top commodity from California, with a value of $3.39 billion in foreign sales. Dairy and dairy products ranked second to almonds with a California total export value of $1.31 billion, a one percent decrease over 2011.
The leading 57 export commodities accounted for $15.77 billion, or 87 percent of total agricultural exports, while the remaining 13 percent of exports were associated with “other products and mixtures.” Of the top 57 commodities, 30 experienced an increase in export value of 5 percent or greater.
California’s share of total U. S. agricultural exports for 2012 was 12.9 percent or slightly more than the 12.3 percent share reported last year. California’s top 10 export destinations—Canada, European Union, China/Hong Kong, Japan, Mexico, South Korea, India, United Arab Emirates, Turkey, and Taiwan, accounted for 69 percent of the 2012 export value. Export values to China and Taiwan grew 20 percent or more as compared to 2011.
Methodology
Data to compute agricultural exports are derived from official government sources, published industry sources, and unpublished information from the government and the industry. Export quantities and values of the whole U.S. and California port districts are from the Department of Commerce (DOC) trade data posted on the United States International Trade Commission (USITC) online database (http://dataweb.usitc.gov/). Canadian import (value) data are from Strategis Canada’s online database (http://strategis.ic.gc.ca/engdoc/main.html). If the California export price is not available for a particular product, we use the U.S. average export price for that commodity in order to provide a dollar value for exports.
*Note: the total export value for 2010 and 2011 was revised upward slightly from previously published totals due to availability of improved data on production.
California Agricultural Exports
California Agricultural Exports California Agricultural Statistics Review 2013-2014 118
Production quantities and values are from various National Agricultural Statistics Service (NASS), Economic Research Service (ERS), and Agricultural Marketing Service (AMS) publications. A share of the raw data provided in these USDA service publications are released as a preliminary report early in the calendar year followed by a more accurate final report released at a later date. For accuracy, The University of California Agricultural Issues Center (AIC) export estimates use data from final USDA reports. Due to the US budget sequestration in 2013 a final report of production quantities and values of non-citrus fruits and nuts was not released. Estimates of 2012 California exports of non-citrus fruit and nuts were calculated using preliminary crop data. AIC exports estimates use different methods from other sources, such as ERS. The ERS estimates are based on a state's national share of production of the exported commodity. The ERS method assumes that,
for any particular commodity, a state's share of U.S. production equals that state's share of U.S. exports. Other sources use geographic port data, without direct links to where the product originated. The AIC export figures correspond to commodities that have been produced on farms and ranches within California. Products originated in another state and exported via California ports are not included in these statistics.
In most cases, AIC reports exports at the individual commodity level. For instance, exports of a given fruit in fresh, canned, and dried forms are summed and listed under the name of the fruit, although the method for fresh fruit exports may differ from the method used for canned and dried fruit. The ratio of quantity exported to quantity produced is given on a farm weight basis. That means, for example, that wine is converted back into fresh grapes. Standard conversion factors published by the USDA are applied.
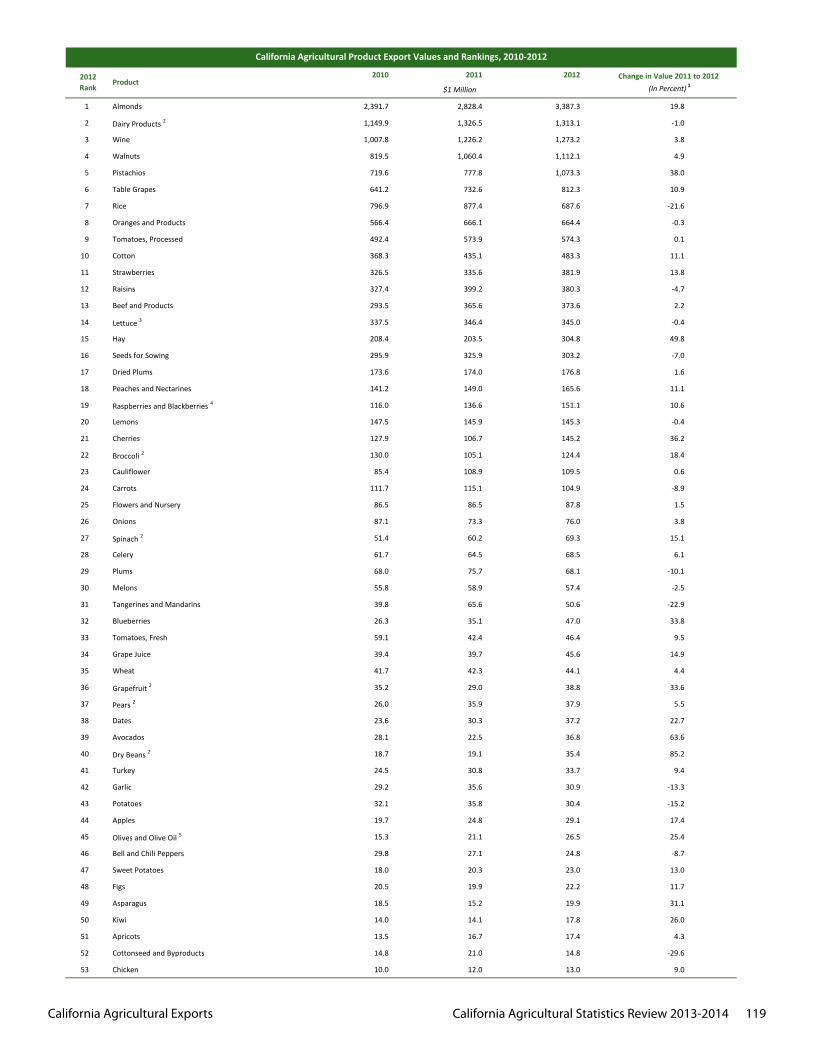
California Agricultural Exports California Agricultural Statistics Review 2013-2014 119
2010 2011 2012
1 Almonds 2,391.7 2,828.4 3,387.3 19.8
2 Dairy Products 2 1,149.9 1,326.5 1,313.1 -1.0
3 Wine 1,007.8 1,226.2 1,273.2 3.8
4 Walnuts 819.5 1,060.4 1,112.1 4.9
5 Pistachios 719.6 777.8 1,073.3 38.0
6 Table Grapes 641.2 732.6 812.3 10.9
7 Rice 796.9 877.4 687.6 -21.6
8 Oranges and Products 566.4 666.1 664.4 -0.3
9 Tomatoes, Processed 492.4 573.9 574.3 0.1
10 Cotton 368.3 435.1 483.3 11.1
11 Strawberries 326.5 335.6 381.9 13.8
12 Raisins 327.4 399.2 380.3 -4.7
13 Beef and Products 293.5 365.6 373.6 2.2
14 Lettuce 3 337.5 346.4 345.0 -0.4
15 Hay 208.4 203.5 304.8 49.8
16 Seeds for Sowing 295.9 325.9 303.2 -7.0
17 Dried Plums 173.6 174.0 176.8 1.6
18 Peaches and Nectarines 141.2 149.0 165.6 11.1
19 Raspberries and Blackberries 4 116.0 136.6 151.1 10.6
20 Lemons 147.5 145.9 145.3 -0.4
21 Cherries 127.9 106.7 145.2 36.2
22 Broccoli 2 130.0 105.1 124.4 18.4
23 Cauliflower 85.4 108.9 109.5 0.6
24 Carrots 111.7 115.1 104.9 -8.9
25 Flowers and Nursery 86.5 86.5 87.8 1.5
26 Onions 87.1 73.3 76.0 3.8
27 Spinach 2 51.4 60.2 69.3 15.1
28 Celery 61.7 64.5 68.5 6.1
29 Plums 68.0 75.7 68.1 -10.1
30 Melons 55.8 58.9 57.4 -2.5
31 Tangerines and Mandarins 39.8 65.6 50.6 -22.9
32 Blueberries 26.3 35.1 47.0 33.8
33 Tomatoes, Fresh 59.1 42.4 46.4 9.5
34 Grape Juice 39.4 39.7 45.6 14.9
35 Wheat 41.7 42.3 44.1 4.4
36 Grapefruit 2 35.2 29.0 38.8 33.6
37 Pears 2 26.0 35.9 37.9 5.5
38 Dates 23.6 30.3 37.2 22.7
39 Avocados 28.1 22.5 36.8 63.6
40 Dry Beans 2 18.7 19.1 35.4 85.2
41 Turkey 24.5 30.8 33.7 9.4
42 Garlic 29.2 35.6 30.9 -13.3
43 Potatoes 32.1 35.8 30.4 -15.2
44 Apples 19.7 24.8 29.1 17.4
45 Olives and Olive Oil 5 15.3 21.1 26.5 25.4
46 Bell and Chili Peppers 29.8 27.1 24.8 -8.7
47 Sweet Potatoes 18.0 20.3 23.0 13.0
48 Figs 20.5 19.9 22.2 11.7
49 Asparagus 18.5 15.2 19.9 31.1
50 Kiwi 14.0 14.1 17.8 26.0
51 Apricots 13.5 16.7 17.4 4.3
52 Cottonseed and Byproducts 14.8 21.0 14.8 -29.6
53 Chicken 10.0 12.0 13.0 9.0
California Agricultural Product Export Values and Rankings, 2010-2012
$1 Million
Change in Value 2011 to 2012 (In Percent) 1Product
2012Rank
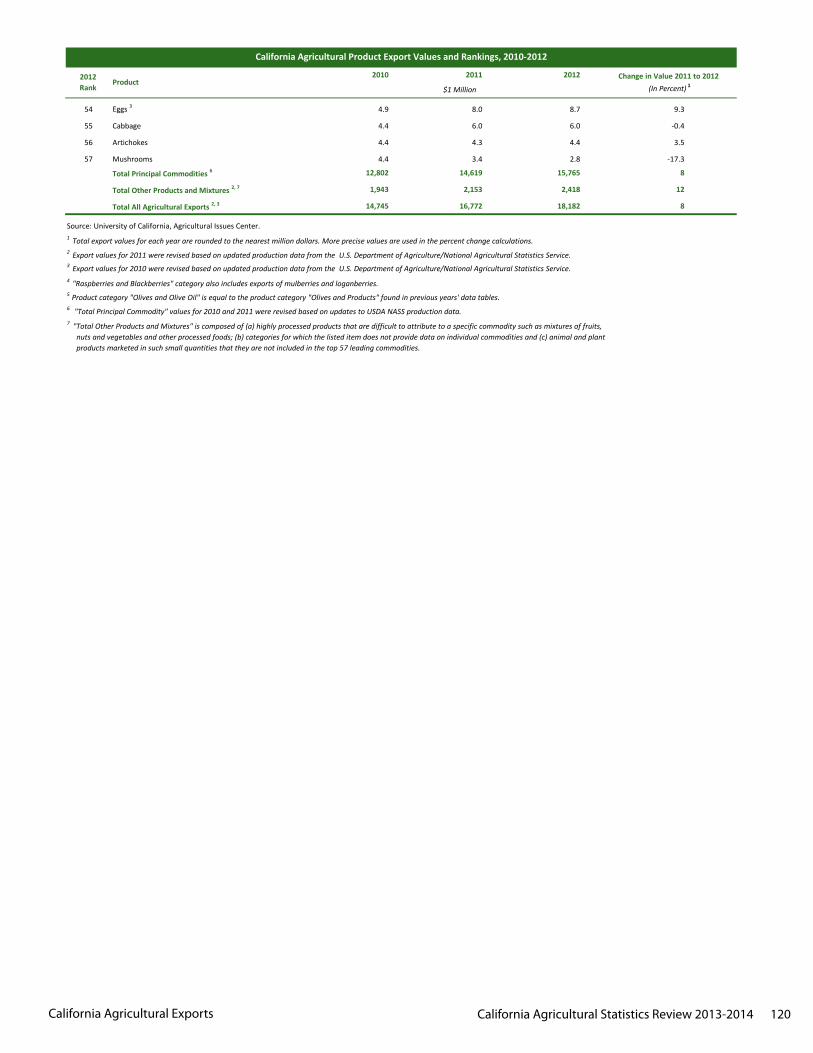
California Agricultural Exports California Agricultural Statistics Review 2013-2014 120
2010 2011 2012
California Agricultural Product Export Values and Rankings, 2010-2012
$1 Million
Change in Value 2011 to 2012 (In Percent) 1Product
2012Rank
54 Eggs 3 4.9 8.0 8.7 9.3
55 Cabbage 4.4 6.0 6.0 -0.4
56 Artichokes 4.4 4.3 4.4 3.5
57 Mushrooms 4.4 3.4 2.8 -17.3
Total Principal Commodities 6 12,802 14,619 15,765 8
Total Other Products and Mixtures 2, 7 1,943 2,153 2,418 12
Total All Agricultural Exports 2, 3 14,745 16,772 18,182 8
Source: University of California, Agricultural Issues Center.
3 Export values for 2010 were revised based on updated production data from the U.S. Department of Agriculture/National Agricultural Statistics Service.
7 "Total Other Products and Mixtures" is composed of (a) highly processed products that are difficult to attribute to a specific commodity such as mixtures of fruits, nuts and vegetables and other processed foods; (b) categories for which the listed item does not provide data on individual commodities and (c) animal and plant products marketed in such small quantities that they are not included in the top 57 leading commodities.
5 Product category "Olives and Olive Oil" is equal to the product category "Olives and Products" found in previous years' data tables.
4 "Raspberries and Blackberries" category also includes exports of mulberries and loganberries.
2 Export values for 2011 were revised based on updated production data from the U.S. Department of Agriculture/National Agricultural Statistics Service.
6 "Total Principal Commodity" values for 2010 and 2011 were revised based on updates to USDA NASS production data.
1 Total export values for each year are rounded to the nearest million dollars. More precise values are used in the percent change calculations.
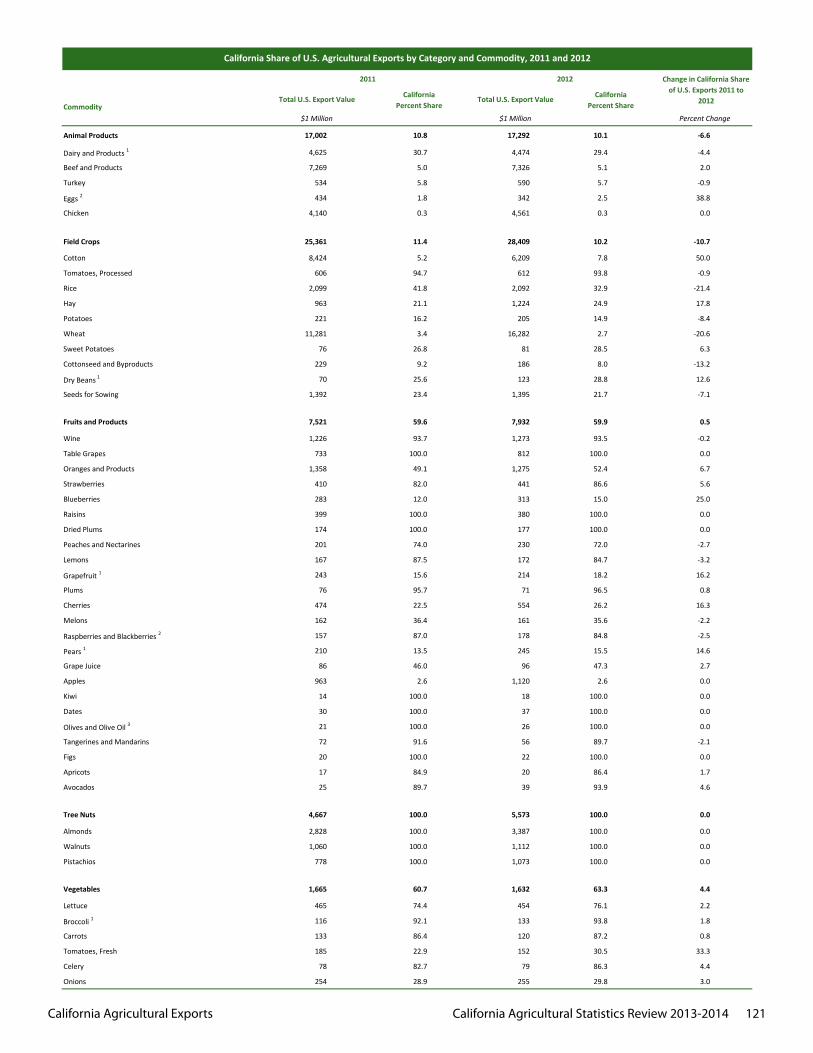
California Agricultural Exports California Agricultural Statistics Review 2013-2014 121
$1 Million $1 Million Percent Change
Animal Products 17,002 10.8 17,292 10.1 -6.6
Dairy and Products 1 4,625 30.7 4,474 29.4 -4.4
Beef and Products 7,269 5.0 7,326 5.1 2.0
Turkey 534 5.8 590 5.7 -0.9
Eggs 2 434 1.8 342 2.5 38.8
Chicken 4,140 0.3 4,561 0.3 0.0
Field Crops 25,361 11.4 28,409 10.2 -10.7
Cotton 8,424 5.2 6,209 7.8 50.0
Tomatoes, Processed 606 94.7 612 93.8 -0.9
Rice 2,099 41.8 2,092 32.9 -21.4
Hay 963 21.1 1,224 24.9 17.8
Potatoes 221 16.2 205 14.9 -8.4
Wheat 11,281 3.4 16,282 2.7 -20.6
Sweet Potatoes 76 26.8 81 28.5 6.3
Cottonseed and Byproducts 229 9.2 186 8.0 -13.2
Dry Beans 1 70 25.6 123 28.8 12.6
Seeds for Sowing 1,392 23.4 1,395 21.7 -7.1
Fruits and Products 7,521 59.6 7,932 59.9 0.5
Wine 1,226 93.7 1,273 93.5 -0.2
Table Grapes 733 100.0 812 100.0 0.0
Oranges and Products 1,358 49.1 1,275 52.4 6.7
Strawberries 410 82.0 441 86.6 5.6
Blueberries 283 12.0 313 15.0 25.0
Raisins 399 100.0 380 100.0 0.0
Dried Plums 174 100.0 177 100.0 0.0
Peaches and Nectarines 201 74.0 230 72.0 -2.7
Lemons 167 87.5 172 84.7 -3.2
Grapefruit 1 243 15.6 214 18.2 16.2
Plums 76 95.7 71 96.5 0.8
Cherries 474 22.5 554 26.2 16.3
Melons 162 36.4 161 35.6 -2.2
Raspberries and Blackberries 2 157 87.0 178 84.8 -2.5
Pears 1 210 13.5 245 15.5 14.6
Grape Juice 86 46.0 96 47.3 2.7
Apples 963 2.6 1,120 2.6 0.0
Kiwi 14 100.0 18 100.0 0.0
Dates 30 100.0 37 100.0 0.0
Olives and Olive Oil 3 21 100.0 26 100.0 0.0
Tangerines and Mandarins 72 91.6 56 89.7 -2.1
Figs 20 100.0 22 100.0 0.0
Apricots 17 84.9 20 86.4 1.7
Avocados 25 89.7 39 93.9 4.6
Tree Nuts 4,667 100.0 5,573 100.0 0.0
Almonds 2,828 100.0 3,387 100.0 0.0
Walnuts 1,060 100.0 1,112 100.0 0.0
Pistachios 778 100.0 1,073 100.0 0.0
Vegetables 1,665 60.7 1,632 63.3 4.4
Lettuce 465 74.4 454 76.1 2.2
Broccoli 1 116 92.1 133 93.8 1.8
Carrots 133 86.4 120 87.2 0.8
Tomatoes, Fresh 185 22.9 152 30.5 33.3
Celery 78 82.7 79 86.3 4.4
Onions 254 28.9 255 29.8 3.0
California Share of U.S. Agricultural Exports by Category and Commodity, 2011 and 2012
Change in California Share of U.S. Exports 2011 to
2012
2011
CaliforniaPercent Share
Total U.S. Export Value
2012
Total U.S. Export Value California Percent Share Commodity
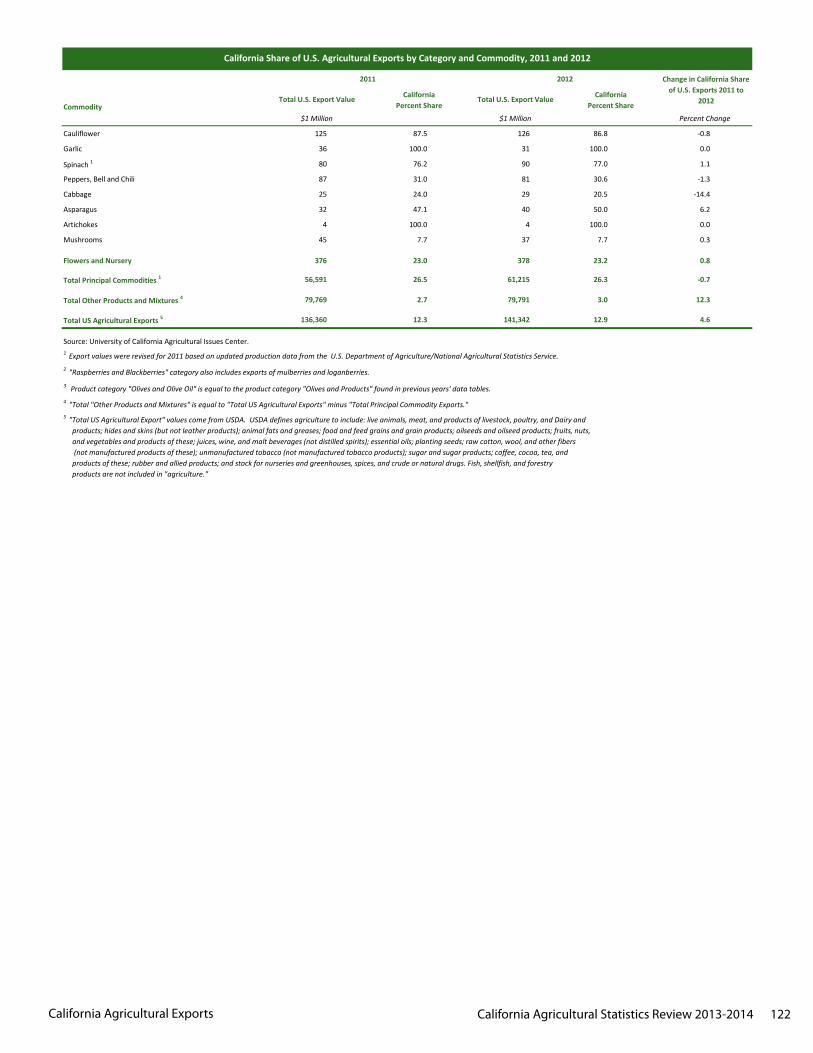
California Agricultural Exports California Agricultural Statistics Review 2013-2014 122
$1 Million $1 Million Percent Change
California Share of U.S. Agricultural Exports by Category and Commodity, 2011 and 2012
Change in California Share of U.S. Exports 2011 to
2012
2011
CaliforniaPercent Share
Total U.S. Export Value
2012
Total U.S. Export Value California Percent Share Commodity
Cauliflower 125 87.5 126 86.8 -0.8
Garlic 36 100.0 31 100.0 0.0
Spinach 1 80 76.2 90 77.0 1.1
Peppers, Bell and Chili 87 31.0 81 30.6 -1.3
Cabbage 25 24.0 29 20.5 -14.4
Asparagus 32 47.1 40 50.0 6.2
Artichokes 4 100.0 4 100.0 0.0
Mushrooms 45 7.7 37 7.7 0.3
Flowers and Nursery 376 23.0 378 23.2 0.8
Total Principal Commodities 1 56,591 26.5 61,215 26.3 -0.7
Total Other Products and Mixtures 4 79,769 2.7 79,791 3.0 12.3
Total US Agricultural Exports 5 136,360 12.3 141,342 12.9 4.6
Source: University of California Agricultural Issues Center.
4 "Total "Other Products and Mixtures" is equal to "Total US Agricultural Exports" minus "Total Principal Commodity Exports."
3 Product category "Olives and Olive Oil" is equal to the product category "Olives and Products" found in previous years' data tables.
2 "Raspberries and Blackberries" category also includes exports of mulberries and loganberries.
1 Export values were revised for 2011 based on updated production data from the U.S. Department of Agriculture/National Agricultural Statistics Service.
5 "Total US Agricultural Export" values come from USDA. USDA defines agriculture to include: live animals, meat, and products of livestock, poultry, and Dairy and products; hides and skins (but not leather products); animal fats and greases; food and feed grains and grain products; oilseeds and oilseed products; fruits, nuts, and vegetables and products of these; juices, wine, and malt beverages (not distilled spirits); essential oils; planting seeds; raw cotton, wool, and other fibers (not manufactured products of these); unmanufactured tobacco (not manufactured tobacco products); sugar and sugar products; coffee, cocoa, tea, and products of these; rubber and allied products; and stock for nurseries and greenhouses, spices, and crude or natural drugs. Fish, shellfish, and forestry products are not included in "agriculture."
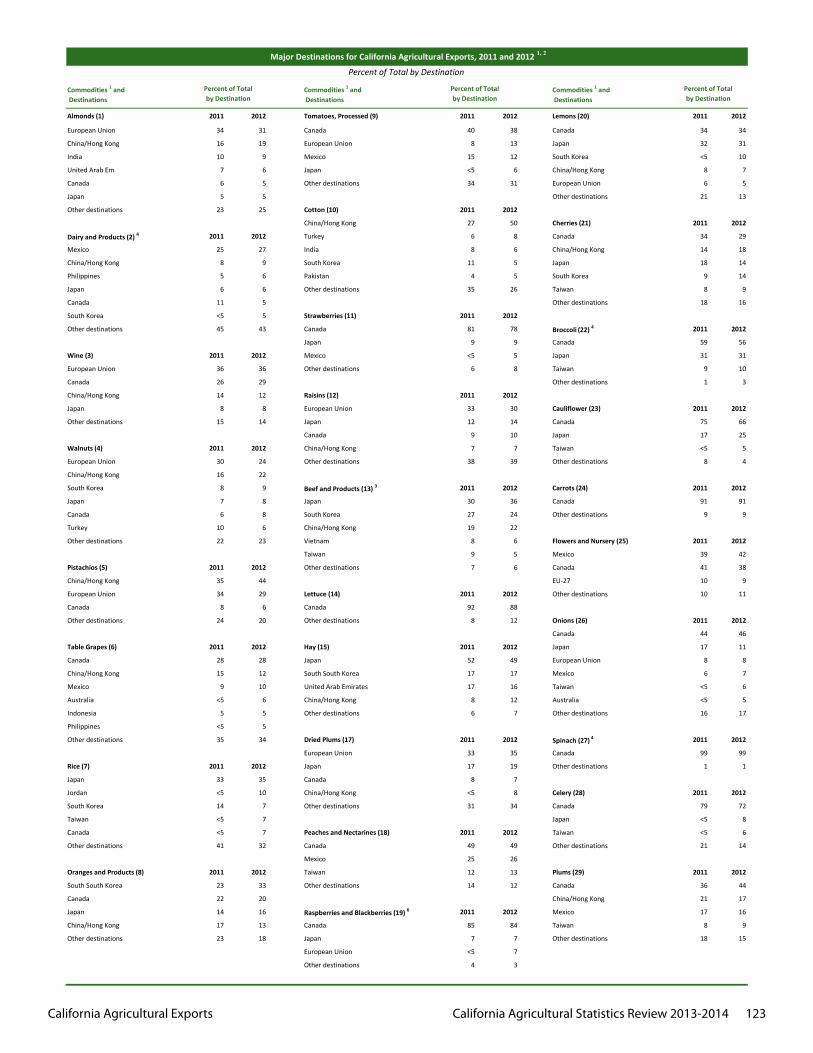
California Agricultural Exports California Agricultural Statistics Review 2013-2014 123
Commodities 1 and Destinations
Commodities 1 and Destinations
Commodities 1 and Destinations
Almonds (1) 2011 2012 Tomatoes, Processed (9) 2011 2012 Lemons (20) 2011 2012
European Union 34 31 Canada 40 38 Canada 34 34
China/Hong Kong 16 19 European Union 8 13 Japan 32 31
India 10 9 Mexico 15 12 South Korea <5 10
United Arab Em 7 6 Japan <5 6 China/Hong Kong 8 7
Canada 6 5 Other destinations 34 31 European Union 6 5
Japan 5 5 Other destinations 21 13
Other destinations 23 25 Cotton (10) 2011 2012
China/Hong Kong 27 50 Cherries (21) 2011 2012
Dairy and Products (2) 4 2011 2012 Turkey 6 8 Canada 34 29
Mexico 25 27 India 8 6 China/Hong Kong 14 18
China/Hong Kong 8 9 South Korea 11 5 Japan 18 14
Philippines 5 6 Pakistan 4 5 South Korea 9 14
Japan 6 6 Other destinations 35 26 Taiwan 8 9
Canada 11 5 Other destinations 18 16
South Korea <5 5 Strawberries (11) 2011 2012
Other destinations 45 43 Canada 81 78 Broccoli (22) 4 2011 2012
Japan 9 9 Canada 59 56
Wine (3) 2011 2012 Mexico <5 5 Japan 31 31
European Union 36 36 Other destinations 6 8 Taiwan 9 10
Canada 26 29 Other destinations 1 3
China/Hong Kong 14 12 Raisins (12) 2011 2012
Japan 8 8 European Union 33 30 Cauliflower (23) 2011 2012
Other destinations 15 14 Japan 12 14 Canada 75 66
Canada 9 10 Japan 17 25
Walnuts (4) 2011 2012 China/Hong Kong 7 7 Taiwan <5 5
European Union 30 24 Other destinations 38 39 Other destinations 8 4
China/Hong Kong 16 22
South Korea 8 9 Beef and Products (13) 3 2011 2012 Carrots (24) 2011 2012
Japan 7 8 Japan 30 36 Canada 91 91
Canada 6 8 South Korea 27 24 Other destinations 9 9
Turkey 10 6 China/Hong Kong 19 22
Other destinations 22 23 Vietnam 8 6 Flowers and Nursery (25) 2011 2012
Taiwan 9 5 Mexico 39 42
Pistachios (5) 2011 2012 Other destinations 7 6 Canada 41 38
China/Hong Kong 35 44 EU-27 10 9
European Union 34 29 Lettuce (14) 2011 2012 Other destinations 10 11
Canada 8 6 Canada 92 88
Other destinations 24 20 Other destinations 8 12 Onions (26) 2011 2012
Canada 44 46
Table Grapes (6) 2011 2012 Hay (15) 2011 2012 Japan 17 11
Canada 28 28 Japan 52 49 European Union 8 8
China/Hong Kong 15 12 South South Korea 17 17 Mexico 6 7
Mexico 9 10 United Arab Emirates 17 16 Taiwan <5 6
Australia <5 6 China/Hong Kong 8 12 Australia <5 5
Indonesia 5 5 Other destinations 6 7 Other destinations 16 17
Philippines <5 5
Other destinations 35 34 Dried Plums (17) 2011 2012 Spinach (27) 4 2011 2012
European Union 33 35 Canada 99 99
Rice (7) 2011 2012 Japan 17 19 Other destinations 1 1
Japan 33 35 Canada 8 7
Jordan <5 10 China/Hong Kong <5 8 Celery (28) 2011 2012
South Korea 14 7 Other destinations 31 34 Canada 79 72
Taiwan <5 7 Japan <5 8
Canada <5 7 Peaches and Nectarines (18) 2011 2012 Taiwan <5 6
Other destinations 41 32 Canada 49 49 Other destinations 21 14
Mexico 25 26
Oranges and Products (8) 2011 2012 Taiwan 12 13 Plums (29) 2011 2012
South South Korea 23 33 Other destinations 14 12 Canada 36 44
Canada 22 20 China/Hong Kong 21 17
Japan 14 16 Raspberries and Blackberries (19) 6 2011 2012 Mexico 17 16
China/Hong Kong 17 13 Canada 85 84 Taiwan 8 9
Other destinations 23 18 Japan 7 7 Other destinations 18 15
European Union <5 7
Other destinations 4 3
Major Destinations for California Agricultural Exports, 2011 and 2012 1, 2
Percent of Total by Destination
Percent of Total by Destination
Percent of Total by Destination
Percent of Total by Destination
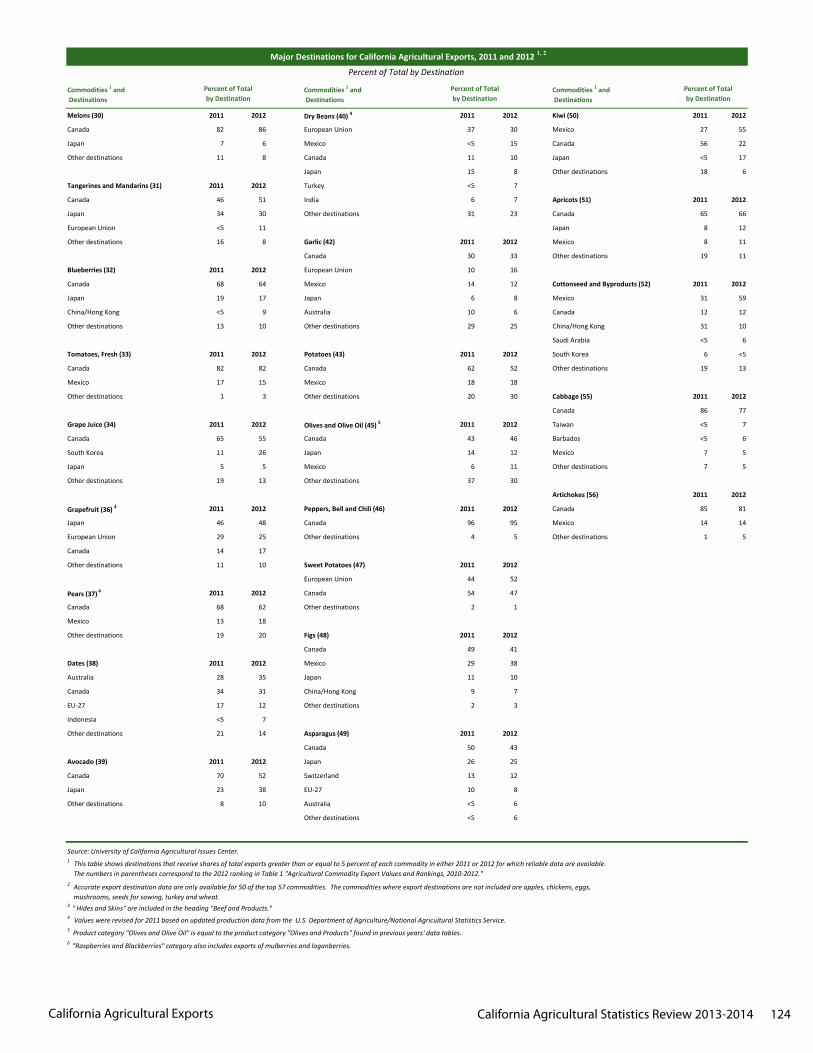
California Agricultural Exports California Agricultural Statistics Review 2013-2014 124
Commodities 1 and Destinations
Commodities 1 and Destinations
Commodities 1 and Destinations
Major Destinations for California Agricultural Exports, 2011 and 2012 1, 2
Percent of Total by Destination
Percent of Total by Destination
Percent of Total by Destination
Percent of Total by Destination
Melons (30) 2011 2012 Dry Beans (40) 4 2011 2012 Kiwi (50) 2011 2012
Canada 82 86 European Union 37 30 Mexico 27 55
Japan 7 6 Mexico <5 15 Canada 56 22
Other destinations 11 8 Canada 11 10 Japan <5 17
Japan 15 8 Other destinations 18 6
Tangerines and Mandarins (31) 2011 2012 Turkey <5 7
Canada 46 51 India 6 7 Apricots (51) 2011 2012
Japan 34 30 Other destinations 31 23 Canada 65 66
European Union <5 11 Japan 8 12
Other destinations 16 8 Garlic (42) 2011 2012 Mexico 8 11
Canada 30 33 Other destinations 19 11
Blueberries (32) 2011 2012 European Union 10 16
Canada 68 64 Mexico 14 12 Cottonseed and Byproducts (52) 2011 2012
Japan 19 17 Japan 6 8 Mexico 31 59
China/Hong Kong <5 9 Australia 10 6 Canada 12 12
Other destinations 13 10 Other destinations 29 25 China/Hong Kong 31 10
Saudi Arabia <5 6
Tomatoes, Fresh (33) 2011 2012 Potatoes (43) 2011 2012 South Korea 6 <5
Canada 82 82 Canada 62 52 Other destinations 19 13
Mexico 17 15 Mexico 18 18
Other destinations 1 3 Other destinations 20 30 Cabbage (55) 2011 2012
Canada 86 77
Grape Juice (34) 2011 2012 Olives and Olive Oil (45) 5 2011 2012 Taiwan <5 7
Canada 65 55 Canada 43 46 Barbados <5 6
South Korea 11 26 Japan 14 12 Mexico 7 5
Japan 5 5 Mexico 6 11 Other destinations 7 5
Other destinations 19 13 Other destinations 37 30
Artichokes (56) 2011 2012
Grapefruit (36) 4 2011 2012 Peppers, Bell and Chili (46) 2011 2012 Canada 85 81
Japan 46 48 Canada 96 95 Mexico 14 14
European Union 29 25 Other destinations 4 5 Other destinations 1 5
Canada 14 17
Other destinations 11 10 Sweet Potatoes (47) 2011 2012
European Union 44 52
Pears (37) 4 2011 2012 Canada 54 47
Canada 68 62 Other destinations 2 1
Mexico 13 18
Other destinations 19 20 Figs (48) 2011 2012
Canada 49 41
Dates (38) 2011 2012 Mexico 29 38
Australia 28 35 Japan 11 10
Canada 34 31 China/Hong Kong 9 7
EU-27 17 12 Other destinations 2 3
Indonesia <5 7
Other destinations 21 14 Asparagus (49) 2011 2012
Canada 50 43
Avocado (39) 2011 2012 Japan 26 25
Canada 70 52 Switzerland 13 12
Japan 23 38 EU-27 10 8
Other destinations 8 10 Australia <5 6
Other destinations <5 6
Source: University of California Agricultural Issues Center.
6 "Raspberries and Blackberries" category also includes exports of mulberries and loganberries.
1 This table shows destinations that receive shares of total exports greater than or equal to 5 percent of each commodity in either 2011 or 2012 for which reliable data are available. The numbers in parentheses correspond to the 2012 ranking in Table 1 "Agricultural Commodity Export Values and Rankings, 2010-2012."2 Accurate export destination data are only available for 50 of the top 57 commodities. The commodities where export destinations are not included are apples, chickens, eggs, mushrooms, seeds for sowing, turkey and wheat.3 " Hides and Skins" are included in the heading "Beef and Products." 4 Values were revised for 2011 based on updated production data from the U.S. Department of Agriculture/National Agricultural Statistics Service. 5 Product category "Olives and Olive Oil" is equal to the product category "Olives and Products" found in previous years' data tables.
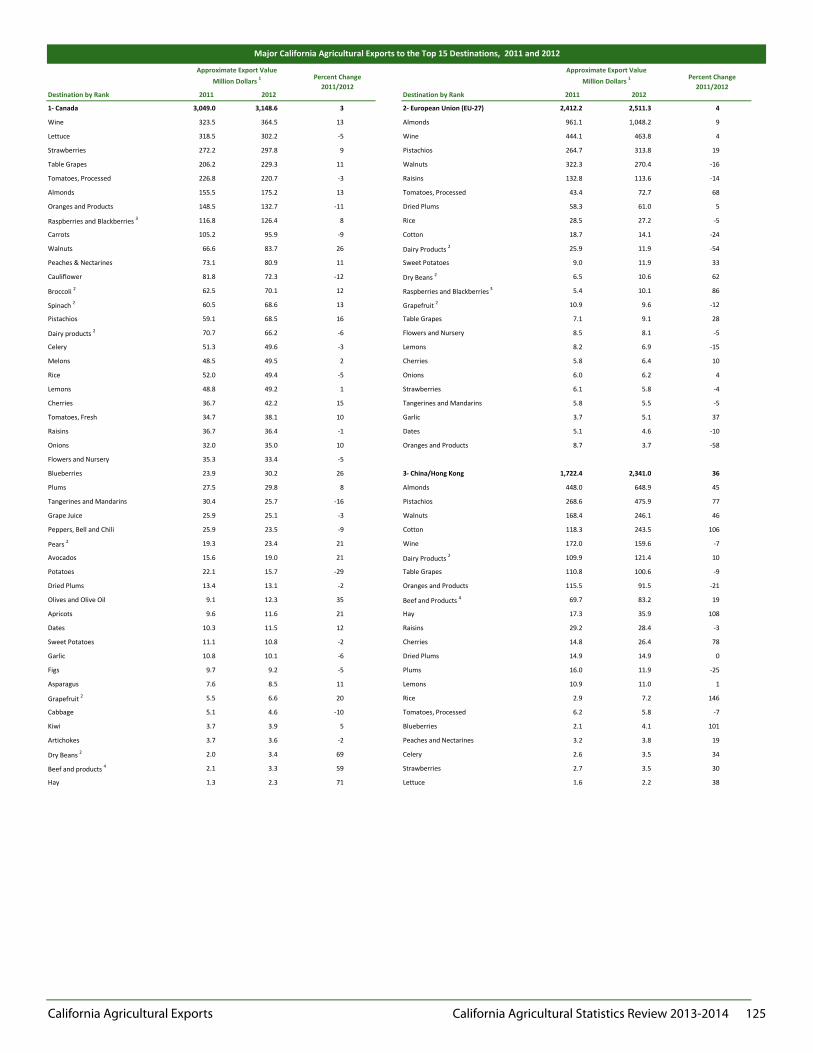
California Agricultural Exports California Agricultural Statistics Review 2013-2014 125
Destination by Rank 2011 2012 Destination by Rank 2011 20121- Canada 3,049.0 3,148.6 3 2- European Union (EU-27) 2,412.2 2,511.3 4
Wine 323.5 364.5 13 Almonds 961.1 1,048.2 9
Lettuce 318.5 302.2 -5 Wine 444.1 463.8 4
Strawberries 272.2 297.8 9 Pistachios 264.7 313.8 19
Table Grapes 206.2 229.3 11 Walnuts 322.3 270.4 -16
Tomatoes, Processed 226.8 220.7 -3 Raisins 132.8 113.6 -14
Almonds 155.5 175.2 13 Tomatoes, Processed 43.4 72.7 68
Oranges and Products 148.5 132.7 -11 Dried Plums 58.3 61.0 5
Raspberries and Blackberries 3 116.8 126.4 8 Rice 28.5 27.2 -5
Carrots 105.2 95.9 -9 Cotton 18.7 14.1 -24
Walnuts 66.6 83.7 26 Dairy Products 2 25.9 11.9 -54
Peaches & Nectarines 73.1 80.9 11 Sweet Potatoes 9.0 11.9 33
Cauliflower 81.8 72.3 -12 Dry Beans 2 6.5 10.6 62
Broccoli 2 62.5 70.1 12 Raspberries and Blackberries 3 5.4 10.1 86
Spinach 2 60.5 68.6 13 Grapefruit 2 10.9 9.6 -12
Pistachios 59.1 68.5 16 Table Grapes 7.1 9.1 28
Dairy products 2 70.7 66.2 -6 Flowers and Nursery 8.5 8.1 -5
Celery 51.3 49.6 -3 Lemons 8.2 6.9 -15
Melons 48.5 49.5 2 Cherries 5.8 6.4 10
Rice 52.0 49.4 -5 Onions 6.0 6.2 4
Lemons 48.8 49.2 1 Strawberries 6.1 5.8 -4
Cherries 36.7 42.2 15 Tangerines and Mandarins 5.8 5.5 -5
Tomatoes, Fresh 34.7 38.1 10 Garlic 3.7 5.1 37
Raisins 36.7 36.4 -1 Dates 5.1 4.6 -10
Onions 32.0 35.0 10 Oranges and Products 8.7 3.7 -58
Flowers and Nursery 35.3 33.4 -5
Blueberries 23.9 30.2 26 3- China/Hong Kong 1,722.4 2,341.0 36
Plums 27.5 29.8 8 Almonds 448.0 648.9 45
Tangerines and Mandarins 30.4 25.7 -16 Pistachios 268.6 475.9 77
Grape Juice 25.9 25.1 -3 Walnuts 168.4 246.1 46
Peppers, Bell and Chili 25.9 23.5 -9 Cotton 118.3 243.5 106
Pears 2 19.3 23.4 21 Wine 172.0 159.6 -7
Avocados 15.6 19.0 21 Dairy Products 2 109.9 121.4 10
Potatoes 22.1 15.7 -29 Table Grapes 110.8 100.6 -9
Dried Plums 13.4 13.1 -2 Oranges and Products 115.5 91.5 -21
Olives and Olive Oil 9.1 12.3 35 Beef and Products 4 69.7 83.2 19
Apricots 9.6 11.6 21 Hay 17.3 35.9 108
Dates 10.3 11.5 12 Raisins 29.2 28.4 -3
Sweet Potatoes 11.1 10.8 -2 Cherries 14.8 26.4 78
Garlic 10.8 10.1 -6 Dried Plums 14.9 14.9 0
Figs 9.7 9.2 -5 Plums 16.0 11.9 -25
Asparagus 7.6 8.5 11 Lemons 10.9 11.0 1
Grapefruit 2 5.5 6.6 20 Rice 2.9 7.2 146
Cabbage 5.1 4.6 -10 Tomatoes, Processed 6.2 5.8 -7
Kiwi 3.7 3.9 5 Blueberries 2.1 4.1 101
Artichokes 3.7 3.6 -2 Peaches and Nectarines 3.2 3.8 19
Dry Beans 2 2.0 3.4 69 Celery 2.6 3.5 34
Beef and products 4 2.1 3.3 59 Strawberries 2.7 3.5 30
Hay 1.3 2.3 71 Lettuce 1.6 2.2 38
Major California Agricultural Exports to the Top 15 Destinations, 2011 and 2012
Approximate Export Value Million Dollars 1 Percent Change2011/2012
Approximate Export Value Million Dollars 1 Percent Change2011/2012
Destination by Rank 2011 2012 Destination by Rank 2011 2012
1- Canada 3,049.0 3,148.6 3 2- European Union (EU-27) 2,412.2 2,511.3 4
Wine 323.5 364.5 13 Almonds 961.1 1,048.2 9
Lettuce 318.5 302.2 -5 Wine 444.1 463.8 4
Strawberries 272.2 297.8 9 Pistachios 264.7 313.8 19
Table Grapes 206.2 229.3 11 Walnuts 322.3 270.4 -16
Tomatoes, Processed 226.8 220.7 -3 Raisins 132.8 113.6 -14
Almonds 155.5 175.2 13 Tomatoes, Processed 43.4 72.7 68
Oranges and Products 148.5 132.7 -11 Dried Plums 58.3 61.0 5
Raspberries and Blackberries 3 116.8 126.4 8 Rice 28.5 27.2 -5
Carrots 105.2 95.9 -9 Cotton 18.7 14.1 -24
Walnuts 66.6 83.7 26 Dairy Products 2 25.9 11.9 -54
Peaches & Nectarines 73.1 80.9 11 Sweet Potatoes 9.0 11.9 33
Cauliflower 81.8 72.3 -12 Dry Beans 2 6.5 10.6 62
Broccoli 2 62.5 70.1 12 Raspberries and Blackberries 3 5.4 10.1 86
Spinach 2 60.5 68.6 13 Grapefruit 2 10.9 9.6 -12
Pistachios 59.1 68.5 16 Table Grapes 7.1 9.1 28
Dairy products 2 70.7 66.2 -6 Flowers and Nursery 8.5 8.1 -5
Celery 51.3 49.6 -3 Lemons 8.2 6.9 -15
Melons 48.5 49.5 2 Cherries 5.8 6.4 10
Rice 52.0 49.4 -5 Onions 6.0 6.2 4
Lemons 48.8 49.2 1 Strawberries 6.1 5.8 -4
Cherries 36.7 42.2 15 Tangerines and Mandarins 5.8 5.5 -5
Tomatoes, Fresh 34.7 38.1 10 Garlic 3.7 5.1 37
Raisins 36.7 36.4 -1 Dates 5.1 4.6 -10
Onions 32.0 35.0 10 Oranges and Products 8.7 3.7 -58
Flowers and Nursery 35.3 33.4 -5
Blueberries 23.9 30.2 26 3- China/Hong Kong 1,722.4 2,341.0 36
Plums 27.5 29.8 8 Almonds 448.0 648.9 45
Tangerines and Mandarins 30.4 25.7 -16 Pistachios 268.6 475.9 77
Grape Juice 25.9 25.1 -3 Walnuts 168.4 246.1 46
Peppers, Bell and Chili 25.9 23.5 -9 Cotton 118.3 243.5 106
Pears 2 19.3 23.4 21 Wine 172.0 159.6 -7
Avocados 15.6 19.0 21 Dairy Products 2 109.9 121.4 10
Potatoes 22.1 15.7 -29 Table Grapes 110.8 100.6 -9
Dried Plums 13.4 13.1 -2 Oranges and Products 115.5 91.5 -21
Olives and Olive Oil 9.1 12.3 35 Beef and Products 4 69.7 83.2 19
Apricots 9.6 11.6 21 Hay 17.3 35.9 108
Dates 10.3 11.5 12 Raisins 29.2 28.4 -3
Sweet Potatoes 11.1 10.8 -2 Cherries 14.8 26.4 78
Garlic 10.8 10.1 -6 Dried Plums 14.9 14.9 0
Figs 9.7 9.2 -5 Plums 16.0 11.9 -25
Asparagus 7.6 8.5 11 Lemons 10.9 11.0 1
Grapefruit 2 5.5 6.6 20 Rice 2.9 7.2 146
Cabbage 5.1 4.6 -10 Tomatoes, Processed 6.2 5.8 -7
Kiwi 3.7 3.9 5 Blueberries 2.1 4.1 101
Artichokes 3.7 3.6 -2 Peaches and Nectarines 3.2 3.8 19
Dry Beans 2 2.0 3.4 69 Celery 2.6 3.5 34
Beef and products 4 2.1 3.3 59 Strawberries 2.7 3.5 30
Hay 1.3 2.3 71 Lettuce 1.6 2.2 38
Major California Agricultural Exports to the Top 15 Destinations, 2011 and 2012
Approximate Export Value Million Dollars 1 Percent Change
2011/2012
Approximate Export Value Million Dollars 1 Percent Change
2011/2012
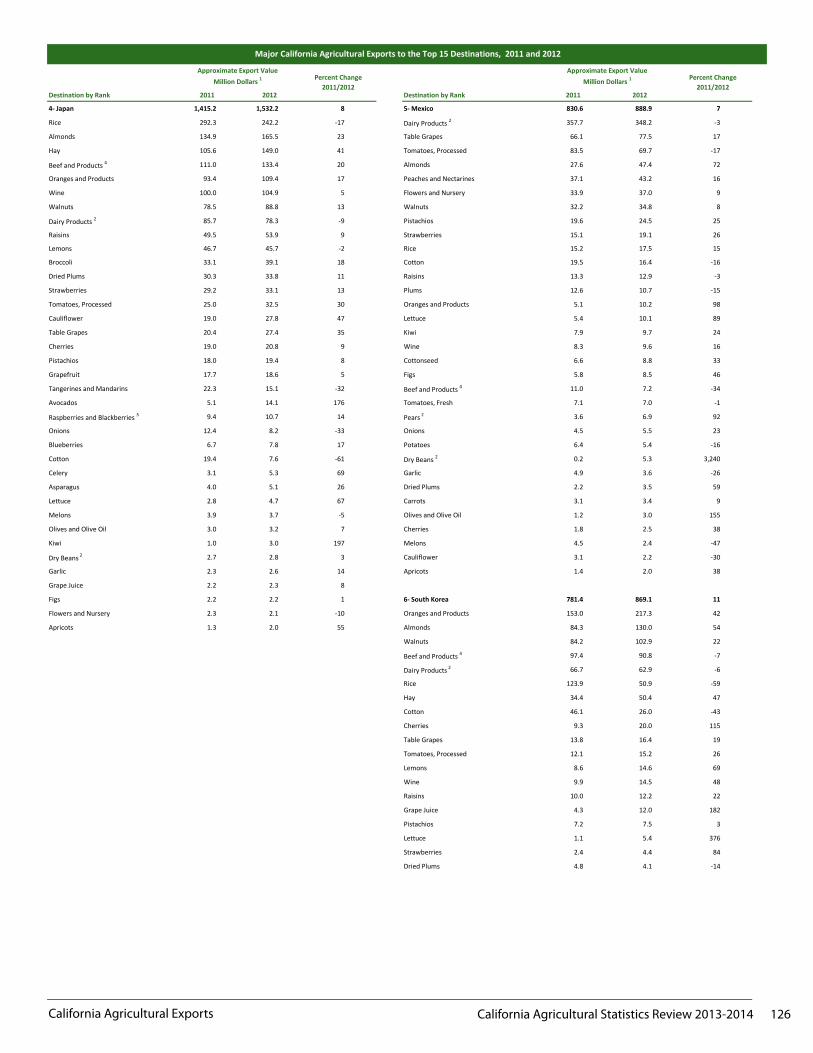
California Agricultural Exports California Agricultural Statistics Review 2013-2014 126
Destination by Rank 2011 2012 Destination by Rank 2011 2012
Major California Agricultural Exports to the Top 15 Destinations, 2011 and 2012
Approximate Export Value Million Dollars 1 Percent Change
2011/2012
Approximate Export Value Million Dollars 1 Percent Change
2011/2012
4- Japan 1,415.2 1,532.2 8 5- Mexico 830.6 888.9 7
Rice 292.3 242.2 -17 Dairy Products 2 357.7 348.2 -3
Almonds 134.9 165.5 23 Table Grapes 66.1 77.5 17
Hay 105.6 149.0 41 Tomatoes, Processed 83.5 69.7 -17
Beef and Products 4 111.0 133.4 20 Almonds 27.6 47.4 72
Oranges and Products 93.4 109.4 17 Peaches and Nectarines 37.1 43.2 16
Wine 100.0 104.9 5 Flowers and Nursery 33.9 37.0 9
Walnuts 78.5 88.8 13 Walnuts 32.2 34.8 8
Dairy Products 2 85.7 78.3 -9 Pistachios 19.6 24.5 25
Raisins 49.5 53.9 9 Strawberries 15.1 19.1 26
Lemons 46.7 45.7 -2 Rice 15.2 17.5 15
Broccoli 33.1 39.1 18 Cotton 19.5 16.4 -16
Dried Plums 30.3 33.8 11 Raisins 13.3 12.9 -3
Strawberries 29.2 33.1 13 Plums 12.6 10.7 -15
Tomatoes, Processed 25.0 32.5 30 Oranges and Products 5.1 10.2 98
Cauliflower 19.0 27.8 47 Lettuce 5.4 10.1 89
Table Grapes 20.4 27.4 35 Kiwi 7.9 9.7 24
Cherries 19.0 20.8 9 Wine 8.3 9.6 16
Pistachios 18.0 19.4 8 Cottonseed 6.6 8.8 33
Grapefruit 17.7 18.6 5 Figs 5.8 8.5 46
Tangerines and Mandarins 22.3 15.1 -32 Beef and Products 4 11.0 7.2 -34
Avocados 5.1 14.1 176 Tomatoes, Fresh 7.1 7.0 -1
Raspberries and Blackberries 3 9.4 10.7 14 Pears 2 3.6 6.9 92
Onions 12.4 8.2 -33 Onions 4.5 5.5 23
Blueberries 6.7 7.8 17 Potatoes 6.4 5.4 -16
Cotton 19.4 7.6 -61 Dry Beans 2 0.2 5.3 3,240
Celery 3.1 5.3 69 Garlic 4.9 3.6 -26
Asparagus 4.0 5.1 26 Dried Plums 2.2 3.5 59
Lettuce 2.8 4.7 67 Carrots 3.1 3.4 9
Melons 3.9 3.7 -5 Olives and Olive Oil 1.2 3.0 155
Olives and Olive Oil 3.0 3.2 7 Cherries 1.8 2.5 38
Kiwi 1.0 3.0 197 Melons 4.5 2.4 -47
Dry Beans 2 2.7 2.8 3 Cauliflower 3.1 2.2 -30
Garlic 2.3 2.6 14 Apricots 1.4 2.0 38
Grape Juice 2.2 2.3 8
Figs 2.2 2.2 1 6- South Korea 781.4 869.1 11
Flowers and Nursery 2.3 2.1 -10 Oranges and Products 153.0 217.3 42
Apricots 1.3 2.0 55 Almonds 84.3 130.0 54
Walnuts 84.2 102.9 22
Beef and Products 4 97.4 90.8 -7
Dairy Products 2 66.7 62.9 -6
Rice 123.9 50.9 -59
Hay 34.4 50.4 47
Cotton 46.1 26.0 -43
Cherries 9.3 20.0 115
Table Grapes 13.8 16.4 19
Tomatoes, Processed 12.1 15.2 26
Lemons 8.6 14.6 69
Wine 9.9 14.5 48
Raisins 10.0 12.2 22
Grape Juice 4.3 12.0 182
Pistachios 7.2 7.5 3
Lettuce 1.1 5.4 376
Strawberries 2.4 4.4 84
Dried Plums 4.8 4.1 -14
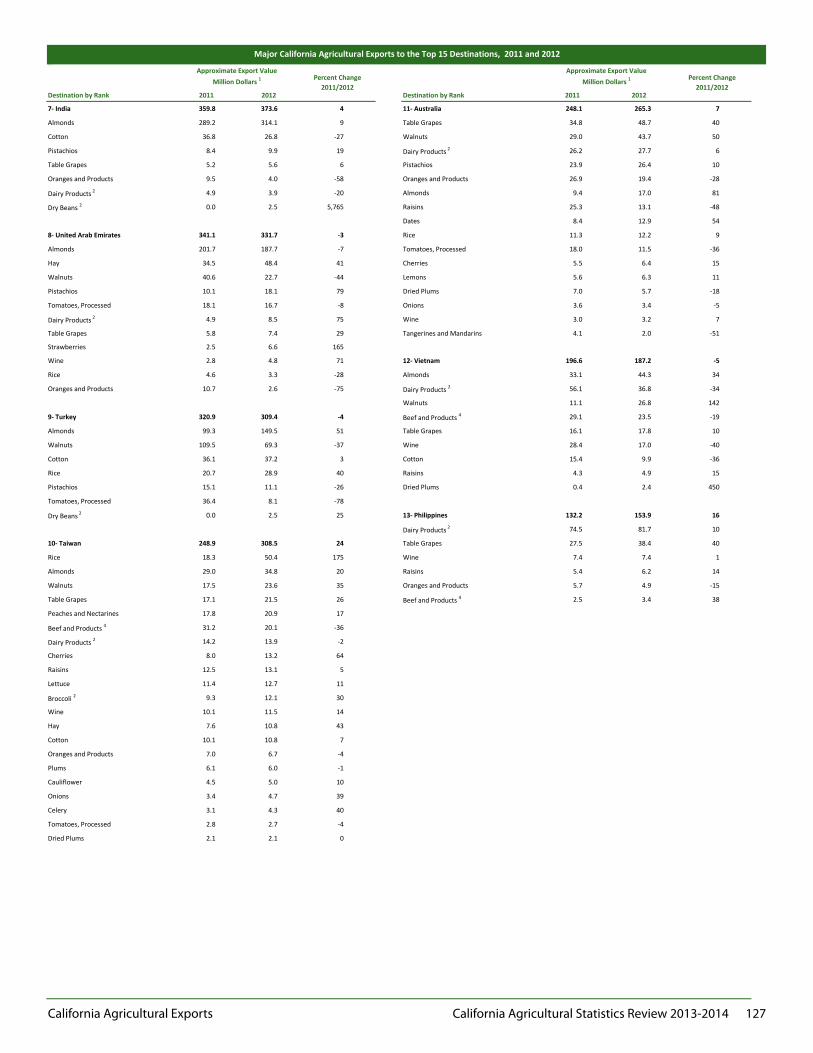
California Agricultural Exports California Agricultural Statistics Review 2013-2014 127
Destination by Rank 2011 2012 Destination by Rank 2011 2012
Major California Agricultural Exports to the Top 15 Destinations, 2011 and 2012
Approximate Export Value Million Dollars 1 Percent Change
2011/2012
Approximate Export Value Million Dollars 1 Percent Change
2011/2012
7- India 359.8 373.6 4 11- Australia 248.1 265.3 7
Almonds 289.2 314.1 9 Table Grapes 34.8 48.7 40
Cotton 36.8 26.8 -27 Walnuts 29.0 43.7 50
Pistachios 8.4 9.9 19 Dairy Products 2 26.2 27.7 6
Table Grapes 5.2 5.6 6 Pistachios 23.9 26.4 10
Oranges and Products 9.5 4.0 -58 Oranges and Products 26.9 19.4 -28
Dairy Products 2 4.9 3.9 -20 Almonds 9.4 17.0 81
Dry Beans 2 0.0 2.5 5,765 Raisins 25.3 13.1 -48
Dates 8.4 12.9 54
8- United Arab Emirates 341.1 331.7 -3 Rice 11.3 12.2 9
Almonds 201.7 187.7 -7 Tomatoes, Processed 18.0 11.5 -36
Hay 34.5 48.4 41 Cherries 5.5 6.4 15
Walnuts 40.6 22.7 -44 Lemons 5.6 6.3 11
Pistachios 10.1 18.1 79 Dried Plums 7.0 5.7 -18
Tomatoes, Processed 18.1 16.7 -8 Onions 3.6 3.4 -5
Dairy Products 2 4.9 8.5 75 Wine 3.0 3.2 7
Table Grapes 5.8 7.4 29 Tangerines and Mandarins 4.1 2.0 -51
Strawberries 2.5 6.6 165
Wine 2.8 4.8 71 12- Vietnam 196.6 187.2 -5
Rice 4.6 3.3 -28 Almonds 33.1 44.3 34
Oranges and Products 10.7 2.6 -75 Dairy Products 2 56.1 36.8 -34
Walnuts 11.1 26.8 142
9- Turkey 320.9 309.4 -4 Beef and Products 4 29.1 23.5 -19
Almonds 99.3 149.5 51 Table Grapes 16.1 17.8 10
Walnuts 109.5 69.3 -37 Wine 28.4 17.0 -40
Cotton 36.1 37.2 3 Cotton 15.4 9.9 -36
Rice 20.7 28.9 40 Raisins 4.3 4.9 15
Pistachios 15.1 11.1 -26 Dried Plums 0.4 2.4 450
Tomatoes, Processed 36.4 8.1 -78
Dry Beans 2 0.0 2.5 25 13- Philippines 132.2 153.9 16
Dairy Products 2 74.5 81.7 10
10- Taiwan 248.9 308.5 24 Table Grapes 27.5 38.4 40
Rice 18.3 50.4 175 Wine 7.4 7.4 1
Almonds 29.0 34.8 20 Raisins 5.4 6.2 14
Walnuts 17.5 23.6 35 Oranges and Products 5.7 4.9 -15
Table Grapes 17.1 21.5 26 Beef and Products 4 2.5 3.4 38
Peaches and Nectarines 17.8 20.9 17
Beef and Products 4 31.2 20.1 -36
Dairy Products 2 14.2 13.9 -2
Cherries 8.0 13.2 64
Raisins 12.5 13.1 5
Lettuce 11.4 12.7 11
Broccoli 2 9.3 12.1 30
Wine 10.1 11.5 14
Hay 7.6 10.8 43
Cotton 10.1 10.8 7
Oranges and Products 7.0 6.7 -4
Plums 6.1 6.0 -1
Cauliflower 4.5 5.0 10
Onions 3.4 4.7 39
Celery 3.1 4.3 40
Tomatoes, Processed 2.8 2.7 -4
Dried Plums 2.1 2.1 0
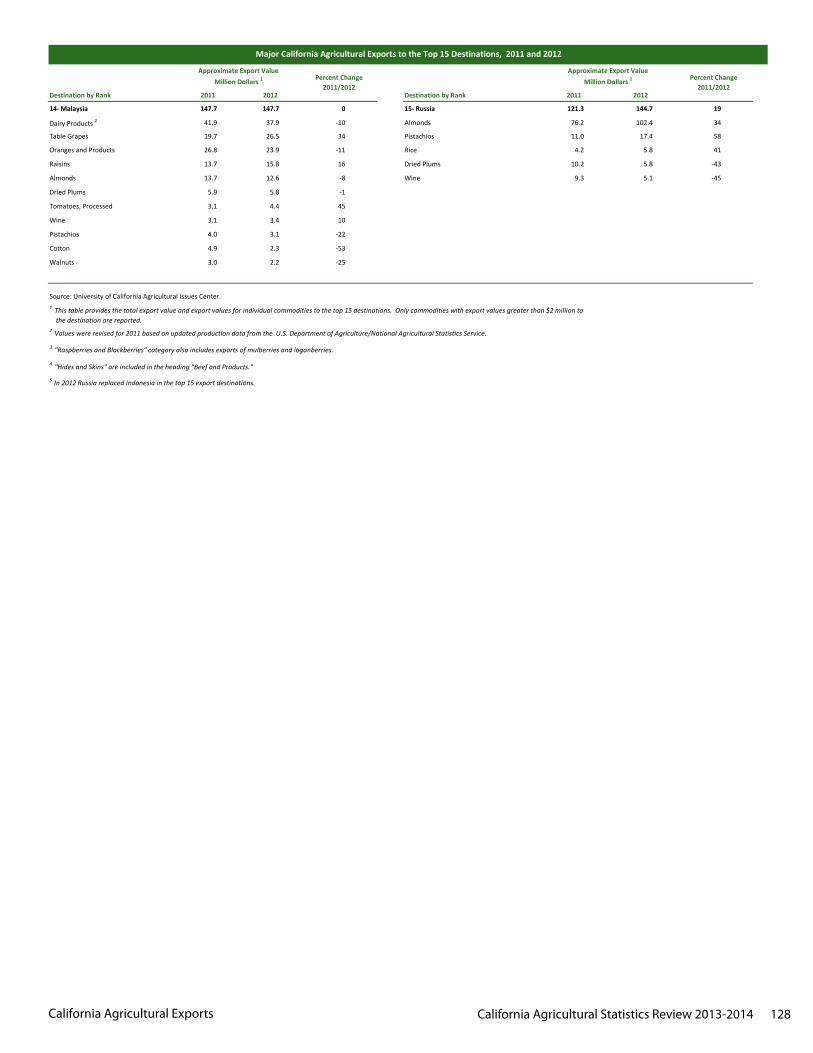
California Agricultural Exports California Agricultural Statistics Review 2013-2014 128
Destination by Rank 2011 2012 Destination by Rank 2011 2012
Major California Agricultural Exports to the Top 15 Destinations, 2011 and 2012
Approximate Export Value Million Dollars 1 Percent Change
2011/2012
Approximate Export Value Million Dollars 1 Percent Change
2011/2012
14- Malaysia 147.7 147.7 0 15- Russia 121.3 144.7 19
Dairy Products 2 41.9 37.9 -10 Almonds 76.2 102.4 34
Table Grapes 19.7 26.5 34 Pistachios 11.0 17.4 58
Oranges and Products 26.8 23.9 -11 Rice 4.2 5.8 41
Raisins 13.7 15.8 16 Dried Plums 10.2 5.8 -43
Almonds 13.7 12.6 -8 Wine 9.3 5.1 -45
Dried Plums 5.9 5.8 -1
Tomatoes, Processed 3.1 4.4 45
Wine 3.1 3.4 10
Pistachios 4.0 3.1 -22
Cotton 4.9 2.3 -53
Walnuts 3.0 2.2 -25
2 Values were revised for 2011 based on updated production data from the U.S. Department of Agriculture/National Agricultural Statistics Service.
3 "Raspberries and Blackberries" category also includes exports of mulberries and loganberries.
4 "Hides and Skins" are included in the heading "Beef and Products."
5 In 2012 Russia replaced Indonesia in the top 15 export destinations.
Source: University of California Agricultural Issues Center.1 This table provides the total export value and export values for individual commodities to the top 15 destinations. Only commodities with export values greater than $2 million to the destination are reported.
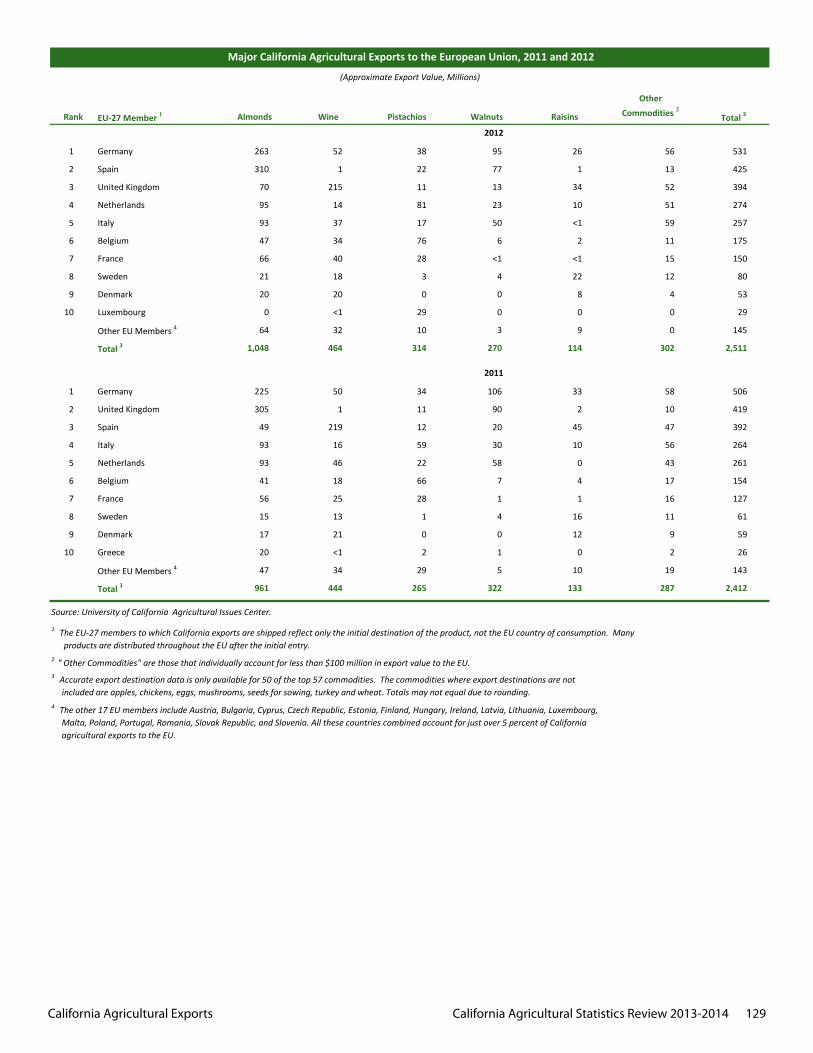
California Agricultural Exports California Agricultural Statistics Review 2013-2014 129
Rank EU-27 Member 1 Almonds Wine Pistachios Walnuts Raisins Total 3
1 Germany 263 52 38 95 26 56 531
2 Spain 310 1 22 77 1 13 425
3 United Kingdom 70 215 11 13 34 52 394
4 Netherlands 95 14 81 23 10 51 274
5 Italy 93 37 17 50 <1 59 257
6 Belgium 47 34 76 6 2 11 175
7 France 66 40 28 <1 <1 15 150
8 Sweden 21 18 3 4 22 12 80
9 Denmark 20 20 0 0 8 4 53
10 Luxembourg 0 <1 29 0 0 0 29
Other EU Members 4 64 32 10 3 9 0 145
Total 3 1,048 464 314 270 114 302 2,511
1 Germany 225 50 34 106 33 58 506
2 United Kingdom 305 1 11 90 2 10 419
3 Spain 49 219 12 20 45 47 392
4 Italy 93 16 59 30 10 56 264
5 Netherlands 93 46 22 58 0 43 261
6 Belgium 41 18 66 7 4 17 154
7 France 56 25 28 1 1 16 127
8 Sweden 15 13 1 4 16 11 61
9 Denmark 17 21 0 0 12 9 59
10 Greece 20 <1 2 1 0 2 26
Other EU Members 4 47 34 29 5 10 19 143
Total 3 961 444 265 322 133 287 2,412
4 The other 17 EU members include Austria, Bulgaria, Cyprus, Czech Republic, Estonia, Finland, Hungary, Ireland, Latvia, Lithuania, Luxembourg, Malta, Poland, Portugal, Romania, Slovak Republic, and Slovenia. All these countries combined account for just over 5 percent of California agricultural exports to the EU.
Major California Agricultural Exports to the European Union, 2011 and 2012
(Approximate Export Value, Millions)
Other Commodities 2
2011
3 Accurate export destination data is only available for 50 of the top 57 commodities. The commodities where export destinations are not included are apples, chickens, eggs, mushrooms, seeds for sowing, turkey and wheat. Totals may not equal due to rounding.
1 The EU-27 members to which California exports are shipped reflect only the initial destination of the product, not the EU country of consumption. Many products are distributed throughout the EU after the initial entry.
Source: University of California Agricultural Issues Center.
2 " Other Commodities" are those that individually account for less than $100 million in export value to the EU.
2012
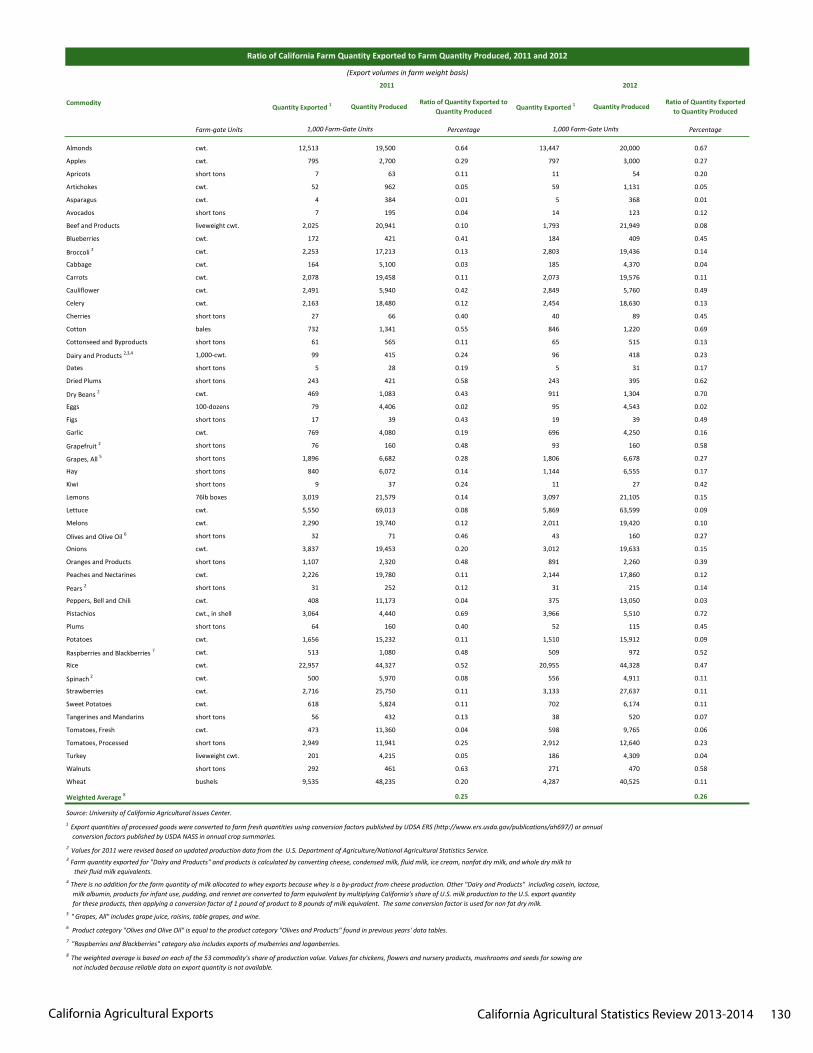
California Agricultural Exports California Agricultural Statistics Review 2013-2014 130
Farm-gate Units Percentage Percentage
Almonds cwt. 12,513 19,500 0.64 13,447 20,000 0.67
Apples cwt. 795 2,700 0.29 797 3,000 0.27
Apricots short tons 7 63 0.11 11 54 0.20
Artichokes cwt. 52 962 0.05 59 1,131 0.05
Asparagus cwt. 4 384 0.01 5 368 0.01
Avocados short tons 7 195 0.04 14 123 0.12
Beef and Products liveweight cwt. 2,025 20,941 0.10 1,793 21,949 0.08
Blueberries cwt. 172 421 0.41 184 409 0.45
Broccoli 2 cwt. 2,253 17,213 0.13 2,803 19,436 0.14
Cabbage cwt. 164 5,100 0.03 185 4,370 0.04
Carrots cwt. 2,078 19,458 0.11 2,073 19,576 0.11
Cauliflower cwt. 2,491 5,940 0.42 2,849 5,760 0.49
Celery cwt. 2,163 18,480 0.12 2,454 18,630 0.13
Cherries short tons 27 66 0.40 40 89 0.45
Cotton bales 732 1,341 0.55 846 1,220 0.69
Cottonseed and Byproducts short tons 61 565 0.11 65 515 0.13
Dairy and Products 2,3,4 1,000-cwt. 99 415 0.24 96 418 0.23
Dates short tons 5 28 0.19 5 31 0.17
Dried Plums short tons 243 421 0.58 243 395 0.62
Dry Beans 2 cwt. 469 1,083 0.43 911 1,304 0.70
Eggs 100-dozens 79 4,406 0.02 95 4,543 0.02
Figs short tons 17 39 0.43 19 39 0.49
Garlic cwt. 769 4,080 0.19 696 4,250 0.16
Grapefruit 2 short tons 76 160 0.48 93 160 0.58
Grapes, All 5 short tons 1,896 6,682 0.28 1,806 6,678 0.27
Hay short tons 840 6,072 0.14 1,144 6,555 0.17
Kiwi short tons 9 37 0.24 11 27 0.42
Lemons 76lb boxes 3,019 21,579 0.14 3,097 21,105 0.15
Lettuce cwt. 5,550 69,013 0.08 5,869 63,599 0.09
Melons cwt. 2,290 19,740 0.12 2,011 19,420 0.10
Olives and Olive Oil 6 short tons 32 71 0.46 43 160 0.27
Onions cwt. 3,837 19,453 0.20 3,012 19,633 0.15
Oranges and Products short tons 1,107 2,320 0.48 891 2,260 0.39
Peaches and Nectarines cwt. 2,226 19,780 0.11 2,144 17,860 0.12
Pears 2 short tons 31 252 0.12 31 215 0.14
Peppers, Bell and Chili cwt. 408 11,173 0.04 375 13,050 0.03
Pistachios cwt., in shell 3,064 4,440 0.69 3,966 5,510 0.72
Plums short tons 64 160 0.40 52 115 0.45
Potatoes cwt. 1,656 15,232 0.11 1,510 15,912 0.09
Raspberries and Blackberries 7 cwt. 513 1,080 0.48 509 972 0.52
Rice cwt. 22,957 44,327 0.52 20,955 44,328 0.47
Spinach 2 cwt. 500 5,970 0.08 556 4,911 0.11
Strawberries cwt. 2,716 25,750 0.11 3,133 27,637 0.11
Sweet Potatoes cwt. 618 5,824 0.11 702 6,174 0.11
Tangerines and Mandarins short tons 56 432 0.13 38 520 0.07
Tomatoes, Fresh cwt. 473 11,360 0.04 598 9,765 0.06
Tomatoes, Processed short tons 2,949 11,941 0.25 2,912 12,640 0.23
Turkey liveweight cwt. 201 4,215 0.05 186 4,309 0.04
Walnuts short tons 292 461 0.63 271 470 0.58
Wheat bushels 9,535 48,235 0.20 4,287 40,525 0.11
Weighted Average 8 0.25 0.26
Source: University of California Agricultural Issues Center.
2 Values for 2011 were revised based on updated production data from the U.S. Department of Agriculture/National Agricultural Statistics Service.
6 Product category "Olives and Olive Oil" is equal to the product category "Olives and Products" found in previous years' data tables.7 "Raspberries and Blackberries" category also includes exports of mulberries and loganberries.
5 " Grapes, All" includes grape juice, raisins, table grapes, and wine.
3 Farm quantity exported for "Dairy and Products" and products is calculated by converting cheese, condensed milk, fluid milk, ice cream, nonfat dry milk, and whole dry milk to their fluid milk equivalents.
2011
1,000 Farm-Gate Units
Ratio of Quantity Exported to Quantity Produced
2012
Ratio of Quantity Exported to Quantity Produced
1,000 Farm-Gate Units
1 Export quantities of processed goods were converted to farm fresh quantities using conversion factors published by UDSA ERS (http://www.ers.usda.gov/publications/ah697/) or annual conversion factors published by USDA NASS in annual crop summaries.
4 There is no addition for the farm quantity of milk allocated to whey exports because whey is a by-product from cheese production. Other "Dairy and Products" including casein, lactose, milk albumin, products for infant use, pudding, and rennet are converted to farm equivalent by multiplying California's share of U.S. milk production to the U.S. export quantity for these products, then applying a conversion factor of 1 pound of product to 8 pounds of milk equivalent. The same conversion factor is used for non fat dry milk.
8 The weighted average is based on each of the 53 commodity's share of production value. Values for chickens, flowers and nursery products, mushrooms and seeds for sowing are not included because reliable data on export quantity is not available.
Ratio of California Farm Quantity Exported to Farm Quantity Produced, 2011 and 2012
(Export volumes in farm weight basis)
Quantity Exported 1 Quantity ProducedQuantity ProducedQuantity Exported 1Commodity