Embed Size (px)
Citation preview
J. Basic. Appl. Sci. Res., 6(2)15-23, 2016
© 2016, TextRoad Publication
ISSN 2090-4304
Journal of Basic and Applied
Scientific Research www.textroad.com
*Corresponding Author: Agus Rudyanto, Doctoral Program on Department of Water Resources< Faculty of Engineering,
University of Brawijaya, East Java of Indonesia. Email: [email protected]
Dynamics System Modelling of Sustainable Water Resources Management
Due to the Regional Spatial
(Case Study on Batam Island of Riau Islands, Indonesia)
Agus Rudyanto1* and Suhardjono2
1Doctoral Program on Department of Water Resources, Faculty of Engineering, University of Brawijaya,
Malang, East Java of Indonesia
2Lecturer on Department of Water Resources, Faculty of Engineering, University of Brawijaya, Malang,
East Java of Indonesia Received: November 19, 2015
Accepted: February 1, 2016
ABSTRACT
Dynamics system approach is as a paradigma and a tool for helping towards thinking systematically. However,
the system is using the graphycally diagram software of cause-reason loop to describe a system. Design of
reservoir operation has a depended characteristic of one to another. There is non linier feedback and delay effect
as the spesific problem of dynamics system. This research intends to give the overall illustration that has
transparant characteristic, flexible, and to be developed easily; to be able to show the counter intuitive due to the
behaviour through the analysis of model structure; to show the trade-off compromi and leaverage point. Design
of reservoir operation can be seen as a process of policy analysis and the steps of analysis by using system
approcah is as follow: structure development, selection of policy variable, selection of policy evaluation
indicator, and simulation of dynamics system. Case study is on Batam Island. Result shows that approached
method of dynamics system can be applied for simulating some scenarios of water allocation policy on
sustainable water resources management such as by giving proportional water due to the water volume in
resrevoir. This model can also analyze the effect of reservoir sedimentation on supply performance of fresh
water demand.
KEYWORDS: water resources management, dynamics system, water allocation design
INTRODUCTION
Reservoir is as a made water storage which has a function to store water on rainy season and using it on
dray season. Reservoir operation determine how big the obtained usage of reservoir and that is as a system with
a sub-system of water availability. Reservoir operation determines how far the usage of reservoir will be
obtained such as a system with sub-system of water availability for some water demands in the downstream of
reservoir, electrical energy generation, and physical condition of reservoir, institutional and aspiration of
interesting owner. The sub-systems are affecting each to another.
Tasrif [1] said that the methodology of dynamics system was developed since once there was introduced
by Jay W. Forrester in about 1950 and it was centred in Massachusetts Institute of Technology (MIT), USA.
Based on the name, this method has high relation with the questions about the trend of complex dynamics
system such as the behavior that is generated by the system due to the run-time. The usage of this methodology
is more emphasized to the aims on the development of our understanding about how the behavior system
presents from the structure. This understanding is very important on effective policy design.
The problem that can accurately be modlled by using the methodology of dynamics system is if it has
dynamics characteristic such as the change to time and it has phenomena structure that has minimal of one feed
back structure. There is not like the other methodology which studies the problem by deviding it into small
parts. Dynamics system sees the overall problems and to understand how the whole unsures in a system interacts
one to another. This research presents the application of approaching to dynamics system on sustainable
management of water resources.
MATERIALS AND METHODS
Systematic system and thinking Ackoff and Emery [2] defines that system is as a group of unsures that inter related each to another and
there is no part which is not related to another one. According to Caratti et.al [3], system thinking is started by
Norbert Wiener in 1948 due to the cybernatics science and by being the feedbacks that can be used to explain
the behavior of human, animal, and machine. In addition, Bertalanffy in 1968 with the theory of system can
15
Rudyanto et al., 2016
apply on the problem of engineering, biology, and social system. Peter Senge (1990) presents that system
thinking is to see the dependent relation that to influence and to be influenced or the feedback but not causal
which is only one way. This approach is to see the processes of change, continued process, and not insidential
potrets. System thinking has an effort to understand the structure in system. Anderson et.al [1] says that system
thinking is the difference among event, pattern, and structure which is presented as in Table 1 below.
Table 1 Event, patters, and structue [4] Action Time orientation Method
to understand
Spesific question
Events Reaction Now To see the event How to handle the problem
now?
Patterns Adaptation To analyze the pattern of
event
How is the pattern and the
trend?
Structure Making change Incoming period Causal loop diagram What structure that causes
the pattern?
Dynamics system
Forrester [5] expresses that dynamics system ia a theory about the system of structure. as a group of tools
for presenting complex system, and to analyze the dynamics behavior. The important benefit of this approach ia
to describe the system of structure, to see how the unsures of system are inter-related, and trying to change some
relations if a decision is entered in dynamics system, the relation between structure and behavior based on the
feed-back concept of information and control [6]. In further, causal loop diagram presents the feed-back
mechanism which strengthen (positive causal loop) or delete (negative causal loop) for a change of system
variable [7]. The relation between system thinking and dynamics system is expressed by Caulfield and Maj [8]
that dynamics system ia as a tool to help system thinking by using diagram to describe system such as causal
loop diagram which is used in dynamics system since 1970 and it can be used for discussing and development of
computer modelling.
Simulation of dynamics system
Prodnovic and Simonovic [9] presents that the approach of dynamics syystem which expresses the system
structure as a diagram is can be used for communicating with the other side and finding the intervention of high
leverage to solve problem. The tool of this approach is causal loop, behavior over time grapgh, stock and flow
diagram, system archetypes and DSS generator: Dynamo, Powersim, Stells, Madonna which are as object
oriented program. The simulation program is completed by graphic facility for presenting the system structure in
simple form, easy to be understood, and can be used for solving the problem on management of water resources
that is non-linier relation.
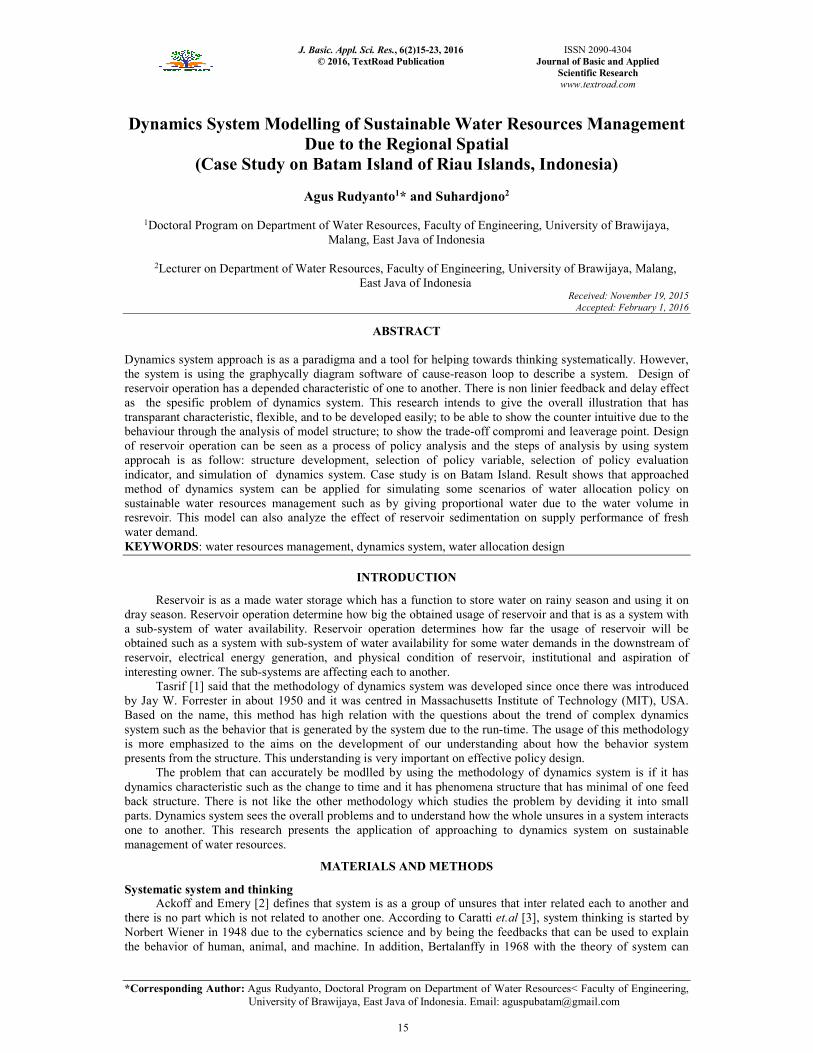
Dynamics system consists of stock, flow, converter, and vonnector. Stock presents how is the condition
and the accumulation of resource such as to present the population growth and number area of irrigation. Flow
presents the action, how is happened something that is measured by rate. Converter is functioned for
accomodating the input and making output. However, connection presents the relation between stock and flow
with converter. Figure 1 presents stock, floe, convector, and connection.
Figure 1 Stock, flow, converter, and connection
16
J. Basic. Appl. Sci. Res., 6(2)15-23, 2016
RESULTS AND DISCUSSION
Condition of study location
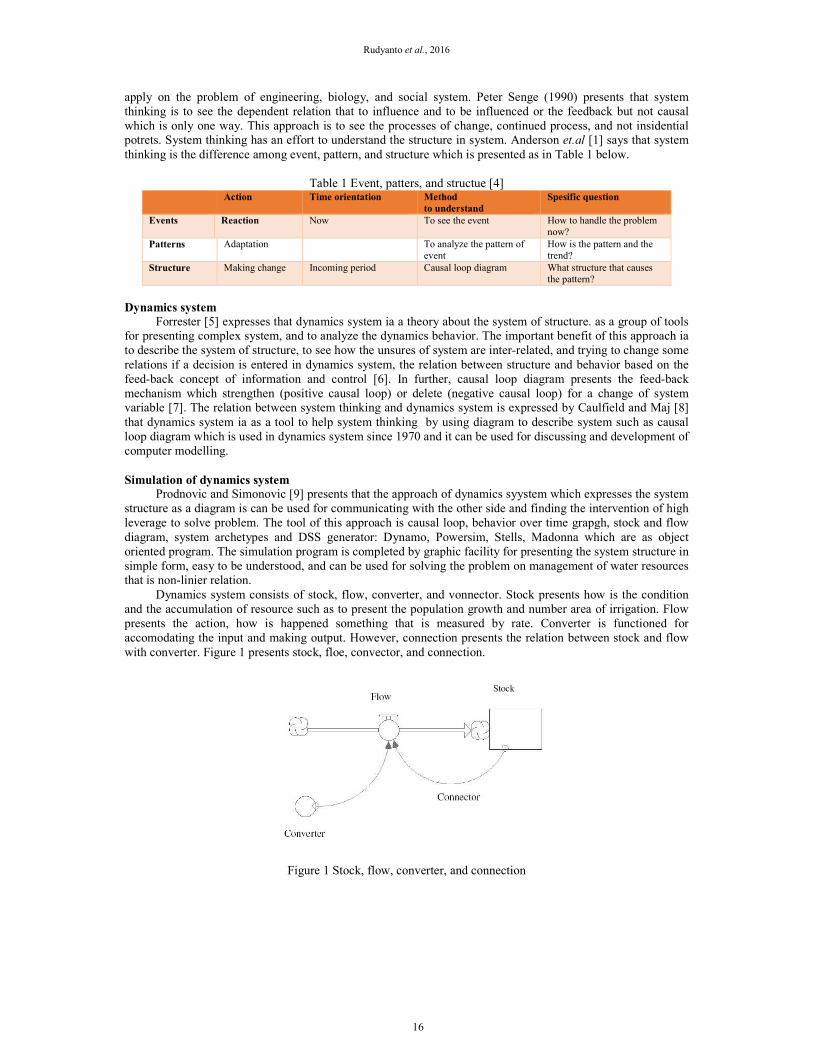
Location of study includes river area of Batam Island especially and Riau Islands generally. Based on the
decision of Indonesia Republic President No 12 in 2012 about Determination of River Area, the Province of
Riau is divided into four river areas as follow:
1. River area of Batam – Bintan Islands (01.34.A3)
2. River area of Karimun Islands (01.32.C)
3. River area of Lingga – Singkep Islands (01.33.C)
4. River area of Natuna – Anambas Islands (01.35.C)
Batam-Rempang-Galang (Barelang) where is located in river area of Batam-Bintan Islands have been
determined by Indonesian Government Decision as the free trade and harbour zone. For supporting this xone,
there is needed some supporting facilities especially enough fresh water for fullfiling society and industrial
demands. Projection in 2019, Batam city has 1.85 millions population with fresh water demand of 5.999 litres
per-second. However, supply capacity of fresh water from the reservoirs in Batam is 5.564 litres per-second (by
noted that North Sei Galang is built in 2018). Thus, there is fresh water deficit of 4.35 litres per-second.
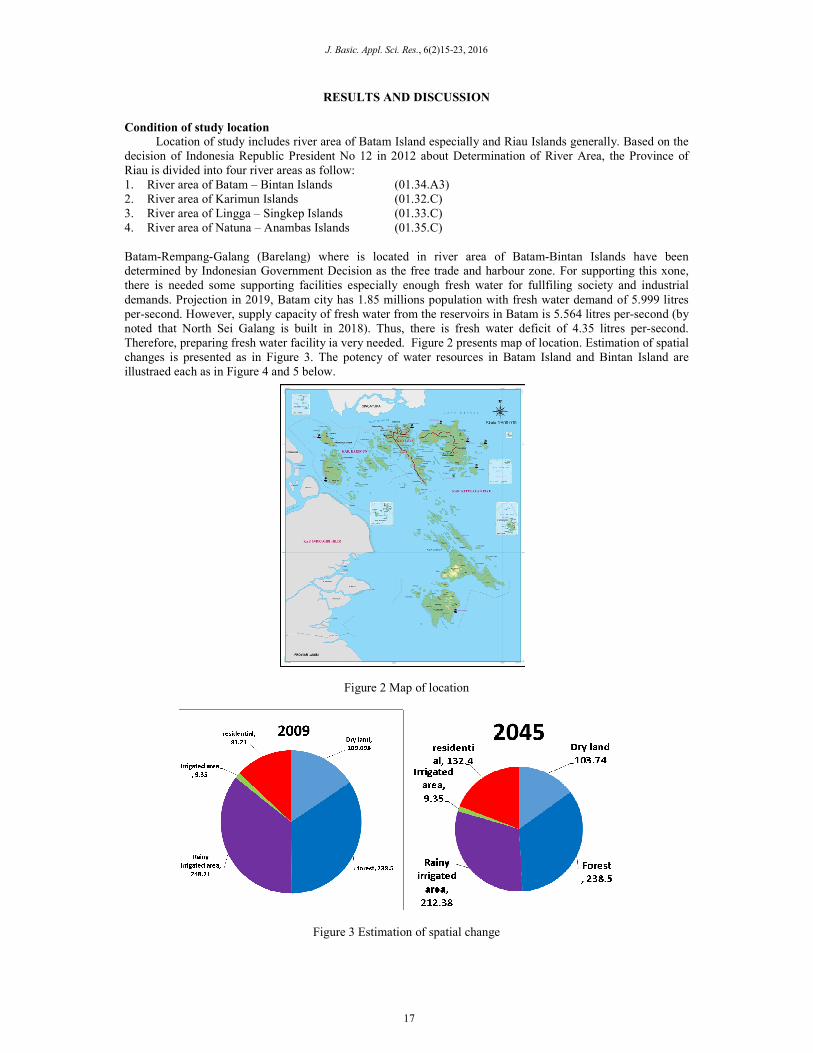
Therefore, preparing fresh water facility ia very needed. Figure 2 presents map of location. Estimation of spatial
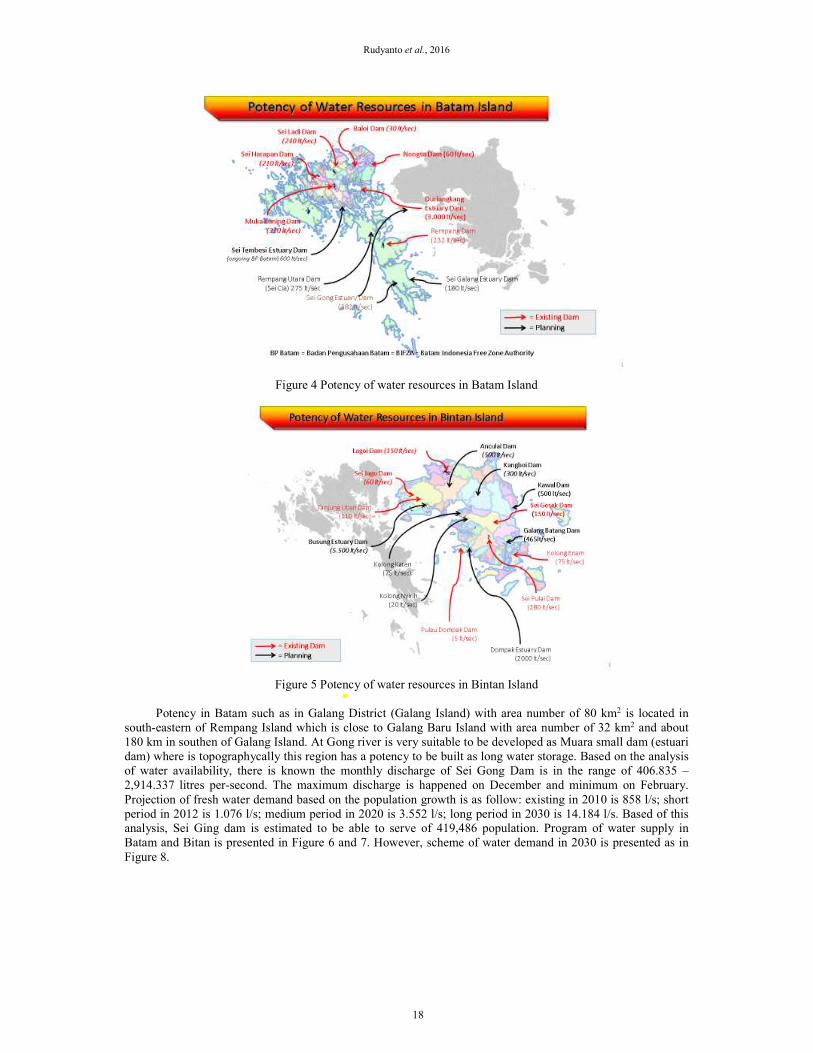
changes is presented as in Figure 3. The potency of water resources in Batam Island and Bintan Island are
illustraed each as in Figure 4 and 5 below.
Figure 2 Map of location
Figure 3 Estimation of spatial change
17
Rudyanto et al., 2016
Figure 4 Potency of water resources in Batam Island
Figure 5 Potency of water resources in Bintan Island
Potency in Batam such as in Galang District (Galang Island) with area number of 80 km2 is located in
south-eastern of Rempang Island which is close to Galang Baru Island with area number of 32 km2 and about
180 km in southen of Galang Island. At Gong river is very suitable to be developed as Muara small dam (estuari
dam) where is topographycally this region has a potency to be built as long water storage. Based on the analysis
of water availability, there is known the monthly discharge of Sei Gong Dam is in the range of 406.835 –
2,914.337 litres per-second. The maximum discharge is happened on December and minimum on February.
Projection of fresh water demand based on the population growth is as follow: existing in 2010 is 858 l/s; short
period in 2012 is 1.076 l/s; medium period in 2020 is 3.552 l/s; long period in 2030 is 14.184 l/s. Based of this
analysis, Sei Ging dam is estimated to be able to serve of 419,486 population. Program of water supply in
Batam and Bitan is presented in Figure 6 and 7. However, scheme of water demand in 2030 is presented as in
Figure 8.
18

J. Basic. Appl. Sci. Res., 6(2)15-23, 2016
Figure 6 Program of water supply in Batam
Figure 7 Program of water supply in Bintan
Figure 8 Scheme of water demand in 2030
19

Rudyanto et al., 2016
The approach of dynamics system in Riau Islands
According to Simonovic and Fahmy [10], based on the policy analysis of water resources management,
the steps to be carried out are as follow: 1) development of structure; 2) selection of policy variable; 3) selection
of policy evaluation indicator; and 4) simulation of dynamics system. Development of structure is presebted by
causal loop diagram as in Figure 9. There is inflow water to estuari dam and water in estuari is as water supply.
Fresh water demand includes for household, city, and industry. Optional policy variable in this case is outflow
water from reservoir which can be changed dur to the policy that is applied. However, the indicator of policy
evaluation is fullfiling water demand and syability of water level on the whole reservoirs in Batam and Bintan
Island.
Figure 9 Sample of causal loop diagram in Sel Gong Estuary Dam
Simulation of dynamics system
Based on the causal loop diagram as above, then there is carried out dynamics system modelling by using
program packet of Powersim study 7 and it presents as in Figure 10. The modelling is carried out by using 3
units of stock such as expressing the population of Batam City and the growth, water storage in Sei Gong
estuary dam, and volume of sediment that enters to the dam. The addition of population in Batam City is
modelled based on the population growth rate of 12% per-year. However, for Sei Gong estuary dam, there is
inflow from monthly data of analysis result on dependable discharge and outflow from reservoir which is
depending on the policy being applied. Water demand which is modelled is for fulfilling fresh water demand in
Batam city by the index of 100 litres pere-capita per-day and the amount is adding due to the growing of
population.
Scenario of reservoir operation
The scenario of reservoir operation consists of 3 models such as: 1) Scenario 1: fulfilling fresh water
demand with the target of 419,486 population; 2) Scenario 2: fulfilling fresh water demand with the target on
75% of the beginning target; and 3) Scenario 3: fulfilling fresh water demand with the target on 65% of the
beginning target.
- -
Target of service
Fresh water demand
Sei Gong Estuary Dam
sedimentation
population Population growth rate
20
J. Basic. Appl. Sci. Res., 6(2)15-23, 2016
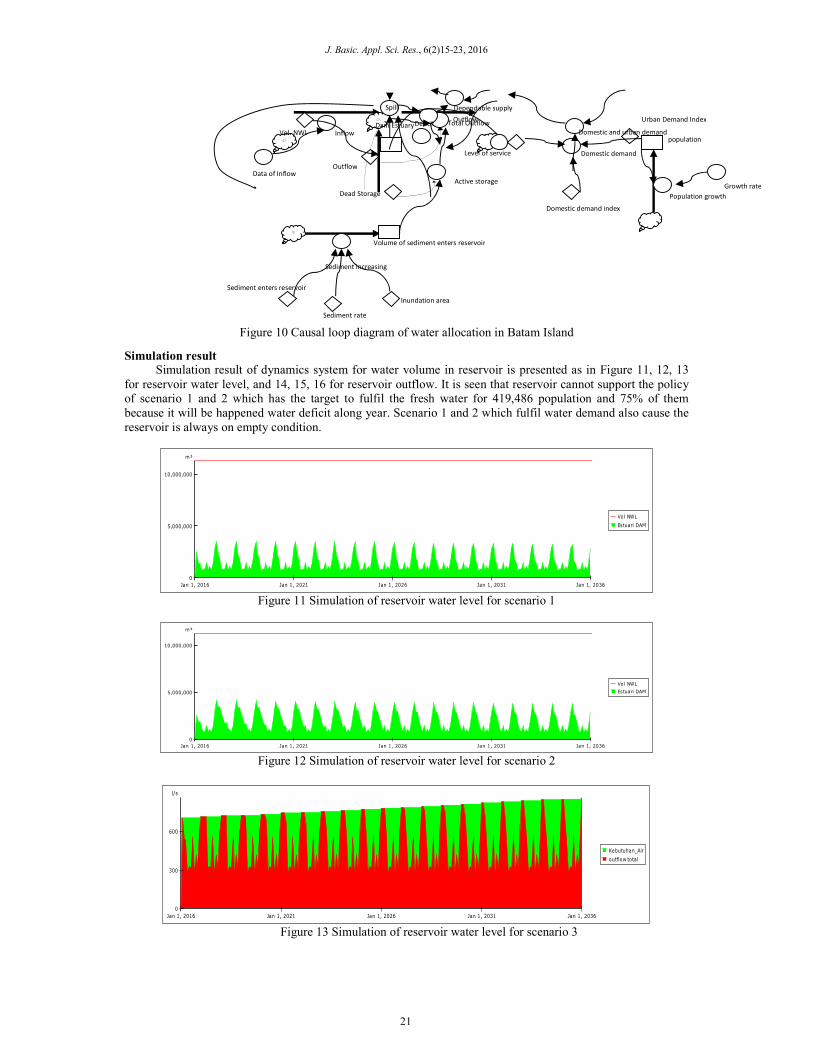
Figure 10 Causal loop diagram of water allocation in Batam Island
Simulation result
Simulation result of dynamics system for water volume in reservoir is presented as in Figure 11, 12, 13
for reservoir water level, and 14, 15, 16 for reservoir outflow. It is seen that reservoir cannot support the policy
of scenario 1 and 2 which has the target to fulfil the fresh water for 419,486 population and 75% of them
because it will be happened water deficit along year. Scenario 1 and 2 which fulfil water demand also cause the
reservoir is always on empty condition.
Jan 1, 2016 Jan 1, 2021 Jan 1, 2026 Jan 1, 2031 Jan 1, 2036
0
5,000,000
10,000,000
m³
Vol NWL
Estuari DAM
Figure 11 Simulation of reservoir water level for scenario 1
Jan 1, 2016 Jan 1, 2021 Jan 1, 2026 Jan 1, 2031 Jan 1, 2036
0
5,000,000
10,000,000
m³
Vol NWL
Estuari DAM
Figure 12 Simulation of reservoir water level for scenario 2
Jan 1, 2016 Jan 1, 2021 Jan 1, 2026 Jan 1, 2031 Jan 1, 2036
0
300
600
l/s
Kebutuhan_Air
outflow total
Figure 13 Simulation of reservoir water level for scenario 3
Volume of sediment enters reservoir
Inundation area
Sediment increasing
Sediment rate
Sediment enters reservoir
Dead Storage
Active storage
Outflow
Inflow
Data of Inflow
Vol. NWL
Spill
Deficit
Dependable supply
Total Outflow Outflow Urban Demand Index
Domestic and urban demand
Domestic demand Level of service
Domestic demand index
Growth rate
Population growth
population
Dam Estuary
21
Rudyanto et al., 2016
Jan 1, 2016 Jan 1, 2021 Jan 1, 2026 Jan 1, 2031 Jan 1, 2036
0
100
200
300
400
500
600
l/s
Kebutuhan_Air
outflow
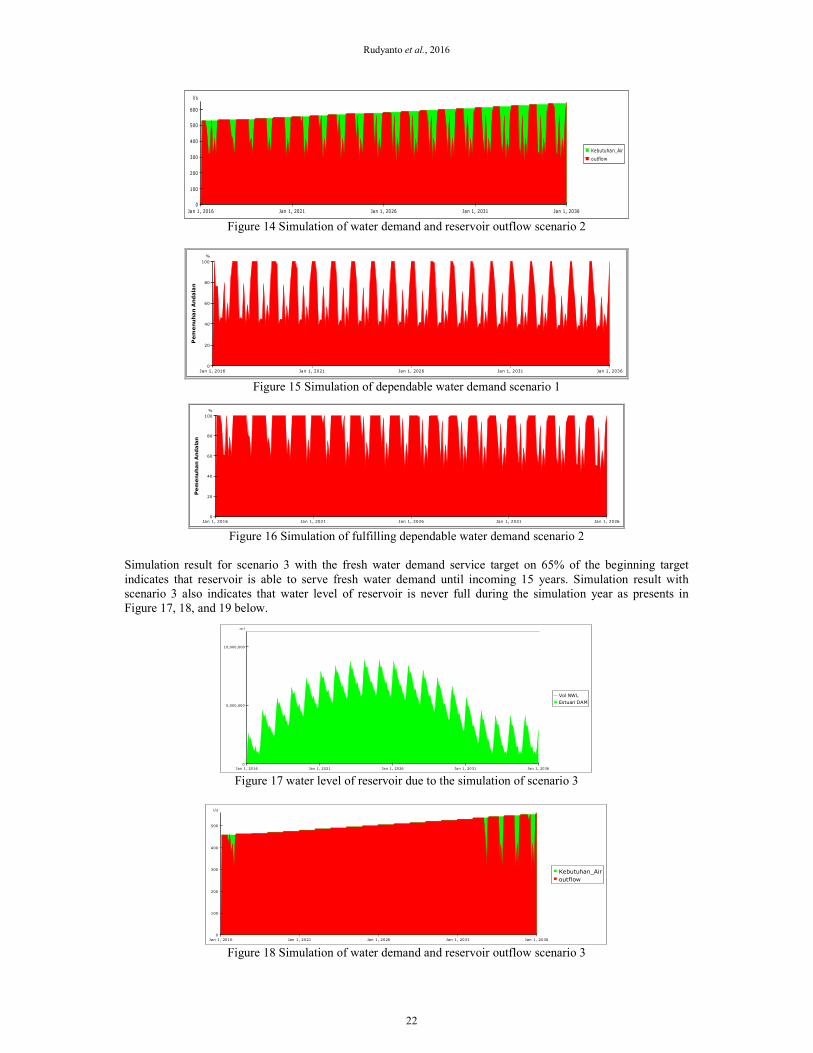
Figure 14 Simulation of water demand and reservoir outflow scenario 2
Jan 1, 2016 Jan 1, 2021 Jan 1, 2026 Jan 1, 2031 Jan 1, 2036
0
20
40
60
80
100
%
Pem
enu
ha
n A
nd
ala
n
Figure 15 Simulation of dependable water demand scenario 1
Jan 1, 2016 Jan 1, 2021 Jan 1, 2026 Jan 1, 2031 Jan 1, 2036
0
20
40
60
80
100
%
Pe
me
nu
ha
n A
nd
ala
n
Figure 16 Simulation of fulfilling dependable water demand scenario 2
Simulation result for scenario 3 with the fresh water demand service target on 65% of the beginning target
indicates that reservoir is able to serve fresh water demand until incoming 15 years. Simulation result with
scenario 3 also indicates that water level of reservoir is never full during the simulation year as presents in
Figure 17, 18, and 19 below.
Jan 1, 2016 Jan 1, 2021 Jan 1, 2026 Jan 1, 2031 Jan 1, 2036
0
5,000,000
10,000,000
m³
Vol NWL
Estuari DAM
Figure 17 water level of reservoir due to the simulation of scenario 3
Jan 1, 2016 Jan 1, 2021 Jan 1, 2026 Jan 1, 2031 Jan 1, 2036
0
100
200
300
400
500
l/s
Kebutuhan_Air
outflow
Figure 18 Simulation of water demand and reservoir outflow scenario 3
22

J. Basic. Appl. Sci. Res., 6(2)15-23, 2016
Jan 1, 2016 Jan 1, 2021 Jan 1, 2026 Jan 1, 2031 Jan 1, 2036
0
20
40
60
80
100
%
Pe
me
nu
ha
n A
nd
ala
n
Figure 19 Fullfilling dependable water demand with scenario 3
CONCLUSION
The benefit by using the approach of dynamics system is as follow: a) giving the overall illustration; b)
having transparent characteristic; c) being able to show counter intuitive thing due to a behavior through the
analysis of model structure; and d) being able to show the trade-off and leverage point. Some benefits above can
make the approach of dynamics system is able to be applied for simulating many scenarios of water allocation
policy. The scenario of reservoir operation which supports the sustainability of water supply is by giving water
proportional to the water volume in reservoir.
REFERENCES
1. Tasrif, M., 2010. An Introduction to Policy Analysis Using System Dynamics Methodology, Bahan Kuliah
Program Magister Studi Pembangunan Sekolah Arsitektur, Perencanaan, dan Pengembangan Kebijakan
ITB.
2. Ackoff RL, dan Emery FE, 1972. On Purposeful Systems, Aldine Atherton, Chicago.
3. Caratti, P, J Ravetz, M Alvarez, dan W Schade. 2005. Bringing Sustainable Development vision into
evaluation practice: a “ flexible framework ” toolkit for assessing and benchmarking sustainability
performance of European regions
4. Anderson, Virginia and Lauren Johnson, 1997: Systems Thinking Basics: From Concepts to Causal Loops,
Pegasus Communications, Inc. MA USA
5. Forrester, Jay W., 1961. Industrial Dynamics, Waltham, MA: Pegasus Communications. 464 pp
6. Simonovic, S. P., dan M. J. Bender, 1996. Collaborative planning support system; An approach for
determining evaluation criteria, J. Hydrol., 177(3-4), 237-251.
7. Sterman, John D. 2000. Business Dynamics: Systems Thinking and Modeling for a Complex World.
McGraw Hill Higher Education..
8. Caulfield CW, Maj SP, 2001. A case for Systems Thinking and System Dynamics, in: Proceedings of IEEE
International Conference on Systems, Man, and Cybernetics, vol 5, pp 2793-2798.
9. Prodanovic, Predrag, dan Slobodan P Simonovic. 2010. An Operational Model for Support of Integrated
Watershed Management. Water Resources management: 1161-1194
10. Simonovic, Slobodan P., dan HussamFahmy. 1999. A new modelling approach for water resources policy
analysis. Water Resources Research 35, no. 1:295
23


![[Agus Isnantio Rahmadi-BLU] - Agus Isnantio Rahmadi](https://img.pdfslide.net/doc/110x75/5695d0151a28ab9b0290e140/agus-isnantio-rahmadi-blu-agus-isnantio-rahmadi.jpg)


