Embed Size (px)
Citation preview
Comments on the Petition to Add n-Propyl Bromide to the List of Hazardous Air Pollutants Regulated under § 112 of the Clean Air Act Prepared for Chisenhall, Nestrud & Julian, P.A. 400 W. Capitol, Suite 2840 Little Rock, AR 72201 May 7, 2015
i G:\Projects\215034_Albemarle\TextProc\r050715n.docx
Table of Contents
Page
1 Introduction ........................................................................................................................ 1
2 Comments on the Petitioner's Estimation of the Inhalation Unit Risk Factor ................... 2 2.1 Inhalation Unit Risk Factor ...................................................................................... 2 2.2 Human Relevance of Petitioner's Inhalation Unit Risk Factor ................................ 5 2.3 Human Relevance of NTP Results ........................................................................... 6 2.4 Additional Supporting Toxicity Information ......................................................... 11 2.5 Requirements for Peer Review of Risk Criteria..................................................... 11 2.6 Conclusions on the Petitioner's Cancer Risk Assessment ..................................... 11
3 Comments on the Petitioner's Air Modeling Analysis and Risk Assessment.................... 13 3.1 The Exponent Assessment Is Based on Highly Uncertain Emissions
Estimates and, in Some Cases, Outdated Emissions Assumptions ....................... 13 3.2 Exponent Used an Outdated Version of US EPA's HEM-3 Model ......................... 15 3.3 The Exponent Assessment Has Other Significant Limitations That
Contribute to the Unreliability of Its Findings ...................................................... 16 3.4 Revisions to the Exponent Assessment That Correct for Limitations and
Inaccuracies Demonstrate Significantly Different Maximum Individual Cancer Risk Estimates ........................................................................................... 17
3.5 HEM-3 Modeling for Additional Facilities Using nPB Yields Maximum Individual Cancer Risks at Census Block Receptors That Are Less Than 1 in 1 Million ................................................................................................................... 20
3.6 Conclusions on the Petitioner's Air Modeling Analysis and Risk Assessment ...... 22
4 References ........................................................................................................................ 24 Attachment A Benchmark Dose Software Output Attachment B Letter Regarding Additional Mutagenicity Data
ii G:\Projects\215034_Albemarle\TextProc\r050715n.docx
List of Tables
Table 2.1 Summary of Significant Carcinogenic Effects from NTP (2011)
Table 2.2 Validation of the IUR for Mouse Lung Tumors
Table 2.3 Risk Levels for nPB
Table 2.4 Summary of In vitro Mutagenicity Results for nPB
Table 2.5 Summary of In vivo Mutagenicity Results for nPB
Table 3.1 Inputs and Parameters for HEM-3 Modeling
Table 3.2 Estimated Maximum Individual Lifetime Cancer Risk Per Million at a Census Block Receptor
Table 3.3 Estimated Lifetime Cancer Risks in Census Blocks Surrounding Superior Tube
Table 3.4 Estimated Lifetime Cancer Risks in Census Blocks Surrounding Fabrication Company A
Table 3.5 Estimated Lifetime Cancer Risks in Census Blocks Surrounding Fabrication Company B
Table 3.6 Estimated Lifetime Cancer Risks in Census Blocks Surrounding Massachusetts Dry Cleaner
Table 3.7 Estimated Lifetime Cancer Risks in Census Blocks Surrounding Virginia Dry Cleaner
Table 3.8 Inputs and Parameters for HEM-3 Modeling of New Jersey Dry Cleaner
Table 3.9 Maximum Individual Lifetime Cancer Risk Per Million at a Census Block Receptor for New Jersey Dry Cleaner
Table 3.10 Lifetime Cancer Risks in Census Blocks Surrounding New Jersey Dry Cleaner

iii G:\Projects\215034_Albemarle\TextProc\r050715n.docx
Abbreviations
AERMOD American Meteorological Society/US EPA Regulatory Model BMCL10 95% Lower Confidence Limit on the Benchmark Concentration with 10%
Extra Risk BMDS Benchmark Dose Software CAA Clean Air Act DAF Dosimetric Adjustment Factor DNA Deoxyribonucleic Acid HAP Hazardous Air Pollutant HEC Human Equivalent Concentration HEM-3 Human Exposure Model HHE Health Hazard Evaluation HPBL Human Peripheral Blood Lymphocyte IRIS Integrated Risk Information System IUR Inhalation Unit Risk Factor mM Millimolar NIOSH National Institute for Occupational Safety and Health nPB n-Propyl Bromide NTP National Toxicology Program OECD Organisation for Economic Co-operation and Development PBPK Physiologically Based Pharmacokinetic POD Point of Departure ppb Parts Per Billion ppm Parts Per Million RGDR Relative Gas Dose Ratio TCE Trichloroethylene US EPA United States Environmental Protection Agency VOC Volatile Organic Compound
1 G:\Projects\215034_Albemarle\TextProc\r050715n.docx
1 Introduction
On January 21, 2015, the United States Environmental Protection Agency (US EPA) announced the receipt of a complete petition requesting the chemical n-Propyl Bromide (nPB, CAS#106-94-5) be added to the list of hazardous air pollutants (HAPs) listed in section 112(b)(1) of the Clean Air Act (CAA) (CFR Vol. 80, No. 25, 6676-6679; Docket ID No. EPA-HQ-OAR-2014-0471). US EPA indicated that petitioners referenced the chemical and physical properties of nPB, the potential for the chemical to cause adverse health effects, and the estimated cancer incidence from modeled air emissions from five facilities that use nPB. US EPA has solicited comments on the technical merits of this information. Gradient performed a critical evaluation of the methodologies and assumptions used by the petitioners to support the conclusions regarding estimated cancer risks from inhalation exposure to nPB (Patton Boggs, 2010; Exponent, 2012). Specifically, we focused on the validity of the methods used to evaluate the carcinogenic potency of nPB and the air modeling analyses conducted to estimate ambient air concentrations from facilities using nPB. We found that substantial portions of both the cancer hazard and exposure estimates are overstated or not adequately detailed by the petitioners, calling into question whether the petition to list nPB as a HAP is adequately supported.

2 G:\Projects\215034_Albemarle\TextProc\r050715n.docx
2 Comments on the Petitioner's Estimation of the Inhalation Unit Risk Factor
The following sections provide several technical comments related to the petitioner's evaluation of the potential carcinogenicity of nPB and the quantitative methods used to estimate cancer risks. These comments include an evaluation of the inhalation unit risk factor (IUR) that forms the basis of the HAP petition, a review of the weight of evidence for the endpoint selected as the basis for the cancer risk estimates, and a summary of the additional scientific information that is now available for nPB. 2.1 Inhalation Unit Risk Factor
The petitioners focused on the only existing in vivo carcinogenicity bioassay (performed by the National Toxicology Program [NTP]) to develop an IUR (Patton Boggs, 2010; Exponent, 2012; NTP, 2011). NTP (2011) examined male and female rats (F344/N) and mice (B6C3F1) exposed to nPB in air for 6 hours per day, 5 days per week, for 105 weeks. Air concentrations were 0, 125, 250, or 500 parts per million (ppm) for rats and 0, 62.5, 125, or 250 ppm for mice. NTP reported significant neoplastic effects in the large intestine of male and female rats, the skin of male rats, and the lungs of females mice (see Table 2.1). The petitioners developed IURs based on the incidence of alveolar/bronchial adenomas and carcinomas in mice – 1.95 × 10⁻⁶ per parts per billion (ppb) (Patton Boggs, 2010) or 1.85 × 10⁻⁶ per ppb (Exponent, 2012). Exponent (2012) reported a final IUR (converted to a human equivalent concentration [HEC]) of 2 × 10⁻⁶ per μg/m3 for use in quantitative risk assessments.
Table 2.1 Summary of Significant Carcinogenic Effects from NTP (2011 )
Endpoint Test Species Dose (ppm)
Incidence/Number of Test Animals (Rate%)
Large intestine: Adenomas (colon or rectum)
Male F344/N Rats
0 125 250 500
0/50 (0%) [0/349 (0%)]a 0/50 (0%) 2/50 (4%) 1/50 (2%)
Large intestine: Adenomas (colon or rectum)
Female F344/N Rats
0 125 250 500
0/50 (0%) [0/350 (0%)]a 1/50 (2%) 2/50 (4%)
5/50 (10%) Skin: Keratoacanthoma, basal cell adenoma, basal cell carcinoma, or squamous cell carcinoma
Male F344/N Rats
0 125 250 500
1/50 (2%) [19/349 (5.5%)]a 7/50 (14%) 9/50 (18%)
10/50 (20%) Lung: Alveolar/bronchiolar adenomas and carcinomas
Female B6C3F1 Mice
0 62.5 125 250
1/50 (2%) [27/350 (7.7%)]a 9/50 (18%) 8/50 (16%)
14/50 (28%) Notes: NTP = National Toxicology Program; ppm = Parts Per Million. (a) Historical control incidence presented from inhalation studies as reported by NTP (2011).

3 G:\Projects\215034_Albemarle\TextProc\r050715n.docx
Gradient reviewed and attempted to replicate the petitioner's IURs using the same NTP incidence data (for alveolar/bronchial adenomas and carcinomas in mice) and the current version of US EPA's Benchmark Dose Software (BMDS) (V2.6) (see Attachment A). We followed the standard US EPA approach for developing IURs, as described in relevant guidance documents (US EPA 1994, 2009, 2012a,b). According to US EPA's default approach for extrapolating experimental animal data to HECs (US EPA, 2009, 2012b), the animal data should be adjusted for continuous exposure and lung dosimetry differences between the test species and humans. Gradient found that the petitioner's IUR calculation incorporated an adjustment for continuous exposure but failed to make any adjustment for dosimetry. According to US EPA (2009), the point of departure (POD) from an animal study obtained from dose-response modeling (i.e., the 95% lower confidence limit on the benchmark concentration with 10% extra risk, BMCL10), should be extrapolated to an HEC by multiplying the POD (i.e., BMCL10) by a dosimetric adjustment factor (DAF). The DAF is equivalent to the relative gas dose ratio (RGDR), which quantifies the differences, between test animals and humans, in chemical uptake in the target area of the respiratory system. This dosimetric adjustment is necessary to account for differences in the respiratory tracts of rodents as compared with humans. The DAF is estimated based on the test animal species and the type of gas under investigation. Gas categories and corresponding methods of DAF calculation are described by US EPA (1994, 2009, 2012b). The boiling point of nPB is 70.3°C, and the water solubility of nPB is 0.25 g/100 ml (at 20°C), which means it is slightly water soluble. Based on the NTP study results, nPB exhibits both respiratory and extra-respiratory toxicity (NTP, 2011). Therefore, we treated nPB as a Category 2 gas when calculating DAFs. The cancer endpoint evaluated (alveolar/bronchial adenomas and carcinomas in mice) is primarily observed in the terminal bronchioles located in the thoracic region of the respiratory system. Following the default methods defined by US EPA (1994, 2009, 2012b), the DAF is calculated according to the following equation:
𝐷𝐴𝐹 =
𝑉𝑒−𝑎𝑛𝑖𝑚𝑎𝑙𝑆𝐴ℎ𝑢𝑚𝑎𝑛𝑉𝑒−ℎ𝑢𝑚𝑎𝑛𝑆𝐴ℎ𝑢𝑚𝑎𝑛
=0.041 𝐿/𝑚𝑖𝑛
503.5 𝑐𝑚2
13.8 𝐿/𝑚𝑖𝑛543,200 𝑐𝑚2
= 3.21
where: DAF = Dosimetric adjustment factor (for the thoracic region) Ve-animal = Mouse (female) ventilation rate (0.041 L/min) SAanimal = Surface area of the thoracic region of mouse lung (503.5 cm2) Ve--human = Human ventilation rate (13.8 L/min) SA-human = Surface area of the thoracic region of the human lung (543,200 cm2) (Note that default values were obtained from US EPA, 1994, 2009, 2012b.) Following the aforementioned methods, we validated the dose-response analysis performed by Exponent (2012). The BMCL10 that was estimated using the multistage cancer model was confirmed to be 54.1 ppm; a similar value of 55 ppm was also reported (using a quantal-linear model) by Wheeler and Bailer (2012). Further, Exponent correctly included an adjustment for continuous exposure:
𝐵𝑀𝐶𝐿10 𝐻𝐸𝐶 = 54.1 𝑝𝑝𝑚 (𝑚𝑔/𝐿) ×24 ℎ𝑜𝑢𝑟𝑠6 ℎ𝑜𝑢𝑟𝑠
×7 𝑑𝑎𝑦𝑠5 𝑑𝑎𝑦𝑠
×122.99 𝑔 𝑛𝑃𝐵/𝑚𝑜𝑙𝑒
24.45 𝐿/𝑚𝑜𝑙𝑒= 48.6 𝑚𝑔/𝑚3
However, including the DAF yields a different BMCL10 HEC:
𝐵𝑀𝐶𝐿10 𝐻𝐸𝐶 = 48.6 𝑚𝑔/𝑚3 × 3.21 𝐷𝐴𝐹 = 155.9 𝑚𝑔/𝑚3
4 G:\Projects\215034_Albemarle\TextProc\r050715n.docx
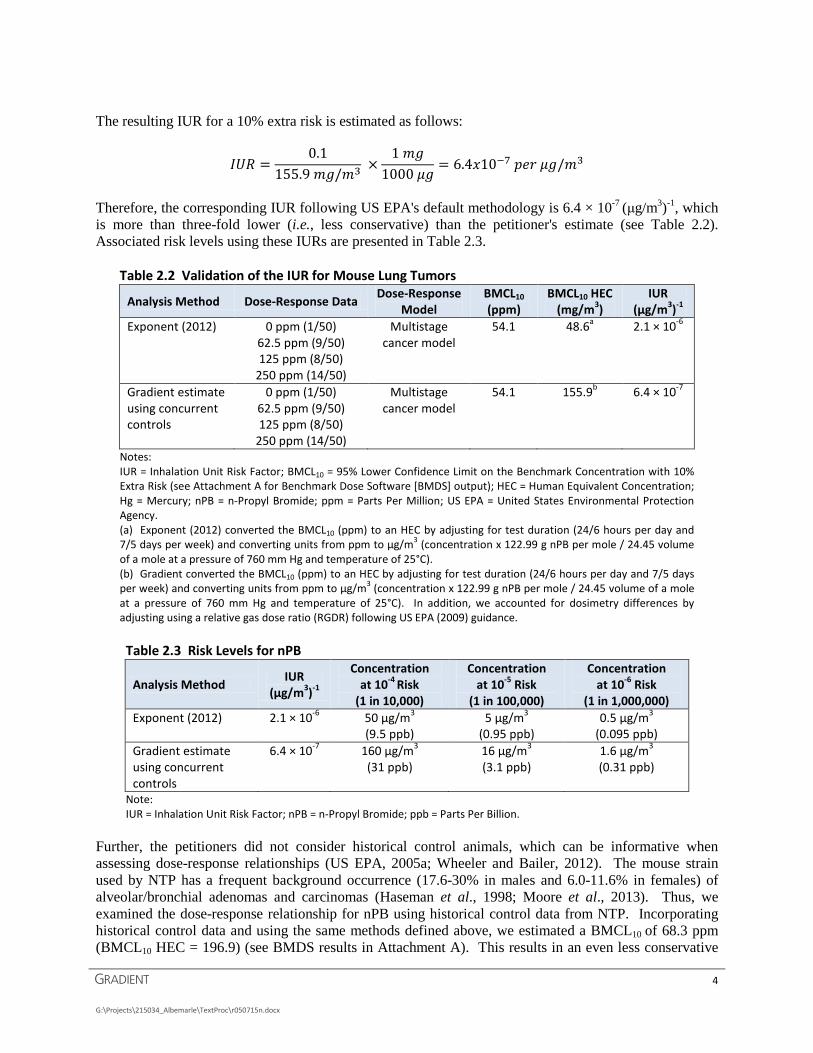
The resulting IUR for a 10% extra risk is estimated as follows:
𝐼𝑈𝑅 =0.1
155.9 𝑚𝑔/𝑚3 ×1 𝑚𝑔
1000 𝜇𝑔= 6.4𝑥10−7 𝑝𝑒𝑟 𝜇𝑔/𝑚3
Therefore, the corresponding IUR following US EPA's default methodology is 6.4 × 10⁻⁷ (μg/m3)-1, which is more than three-fold lower (i.e., less conservative) than the petitioner's estimate (see Table 2.2). Associated risk levels using these IURs are presented in Table 2.3.
Table 2.2 Validation of the IUR for Mouse Lung Tumors
Analysis Method Dose-Response Data Dose-Response Model
BMCL10 (ppm)
BMCL10 HEC (mg/m3)
IUR (μg/m3)-1
Exponent (2012) 0 ppm (1/50) 62.5 ppm (9/50) 125 ppm (8/50)
250 ppm (14/50)
Multistage cancer model
54.1 48.6a 2.1 × 10⁻⁶
Gradient estimate using concurrent controls
0 ppm (1/50) 62.5 ppm (9/50) 125 ppm (8/50)
250 ppm (14/50)
Multistage cancer model
54.1 155.9b 6.4 × 10⁻⁷
Notes: IUR = Inhalation Unit Risk Factor; BMCL10 = 95% Lower Confidence Limit on the Benchmark Concentration with 10% Extra Risk (see Attachment A for Benchmark Dose Software [BMDS] output); HEC = Human Equivalent Concentration; Hg = Mercury; nPB = n-Propyl Bromide; ppm = Parts Per Million; US EPA = United States Environmental Protection Agency. (a) Exponent (2012) converted the BMCL10 (ppm) to an HEC by adjusting for test duration (24/6 hours per day and 7/5 days per week) and converting units from ppm to μg/m3 (concentration x 122.99 g nPB per mole / 24.45 volume of a mole at a pressure of 760 mm Hg and temperature of 25°C). (b) Gradient converted the BMCL10 (ppm) to an HEC by adjusting for test duration (24/6 hours per day and 7/5 days per week) and converting units from ppm to μg/m3 (concentration x 122.99 g nPB per mole / 24.45 volume of a mole at a pressure of 760 mm Hg and temperature of 25°C). In addition, we accounted for dosimetry differences by adjusting using a relative gas dose ratio (RGDR) following US EPA (2009) guidance.
Table 2.3 Risk Levels for nPB
Analysis Method IUR (μg/m3)-1
Concentration at 10-4 Risk
(1 in 10,000)
Concentration at 10-5 Risk
(1 in 100,000)
Concentration at 10-6 Risk
(1 in 1,000,000) Exponent (2012) 2.1 × 10⁻⁶ 50 μg/m3
(9.5 ppb) 5 μg/m3
(0.95 ppb) 0.5 μg/m3
(0.095 ppb) Gradient estimate using concurrent controls
6.4 × 10⁻⁷ 160 μg/m3 (31 ppb)
16 μg/m3 (3.1 ppb)
1.6 μg/m3 (0.31 ppb)
Note: IUR = Inhalation Unit Risk Factor; nPB = n-Propyl Bromide; ppb = Parts Per Billion.
Further, the petitioners did not consider historical control animals, which can be informative when assessing dose-response relationships (US EPA, 2005a; Wheeler and Bailer, 2012). The mouse strain used by NTP has a frequent background occurrence (17.6-30% in males and 6.0-11.6% in females) of alveolar/bronchial adenomas and carcinomas (Haseman et al., 1998; Moore et al., 2013). Thus, we examined the dose-response relationship for nPB using historical control data from NTP. Incorporating historical control data and using the same methods defined above, we estimated a BMCL10 of 68.3 ppm (BMCL10 HEC = 196.9) (see BMDS results in Attachment A). This results in an even less conservative

5 G:\Projects\215034_Albemarle\TextProc\r050715n.docx
IUR (5.1 × 10⁻⁷ per μg/m3). We conclude that the petitioners' IURs are inaccurate and overly conservative, due to their failure to consider background incidence rates or incorporate dosimetric adjustments (per US EPA guidance). 2.2 Human Relevance of Petitioner's Inhalation Unit Risk Factor
The petitioners' risk assessment is based on alveolar/bronchiolar adenomas and carcinomas in B6C3F1 mice, reported by NTP (2011). The petitioners suggest, "there are no reasons to assume that the mode, or modes, of action by which tumors are induced by nPB are not relevant to man" (Patton Boggs, 2010). However, the supporting information that the petitioners include for this statement lacks an analysis of the human relevance of the mouse lung tumors or any other cancer endpoint. US EPA (2005a) recommends collecting relevant information on the mode of action (i.e., the key biological events leading to the adverse health effect) when evaluating chemical hazards. US EPA's Guidelines for Carcinogen Risk Assessment recommends evaluating whether:
1. The hypothesized mode of action is sufficiently supported in test animals;
2. The hypothesized mode of action is relevant to humans; and
3. Sensitive populations or lifestages are susceptible to the hypothesized mode of action (US EPA, 2005a).
These considerations are necessary to characterize the overall weight of evidence to support the hypothesis for causation of a health effect from exposure to a chemical. Further, the process for evaluating these questions during cancer risk assessment and the development of toxicological criteria (e.g., reference concentrations, reference doses, and IUR estimates) under the Integrated Risk Information System (IRIS) is required by US EPA (2005a, 2013). This particular mouse tumor type (alveolar/bronchiolar adenomas and carcinomas) has been reviewed and debated for a number of chemical compounds and was the subject of a 2014 technical workshop sponsored by US EPA (see reviews by US EPA, 2014; Cruzan et al., 2009; Edler et al., 2014; Moore et al., 2013). For example, relevant information is available for nPB to explore the aforementioned mode-of-action questions: The results of the NTP (2011; Morgan et al., 2011) study for nPB yielded inconsistent results
across test species (mice and rats). NTP reported a significant increase in alveolar/bronchial adenomas or carcinomas in female mice, but no significant changes in male mice or male and female rats. NTP (Moore et al., 2013) performed a review of this tumor type for all NTP studies conducted over 30 years and found that the incidence of these lesions (relative to background) is greater in female mice than in male mice. Further, NTP (Moore et al., 2013) suggested that female mice may have a limited capacity for tumor defense or repair and a greater susceptibility to environmental stressors, and that their tumor response may be age-dependent. Thus, due to the sensitivity of female mice, there is a potential for this endpoint to over-predict a carcinogenic response in humans.
Similarly inconsistent results between rodent species have been noted for other volatile organic chemicals (e.g., naphthalene, styrene, ethylbenzene, cumene), which has led to investigations on the human relevance of mouse lung tumors (US EPA, 2014; Cruzan et al., 2009). During the US EPA workshop deliberations, key differences were noted between mice, rats, and humans with respect to lung physiology, metabolism (pharmacokinetics and pharmacodynamics), and genotoxicity (US EPA, 2014).
6 G:\Projects\215034_Albemarle\TextProc\r050715n.docx
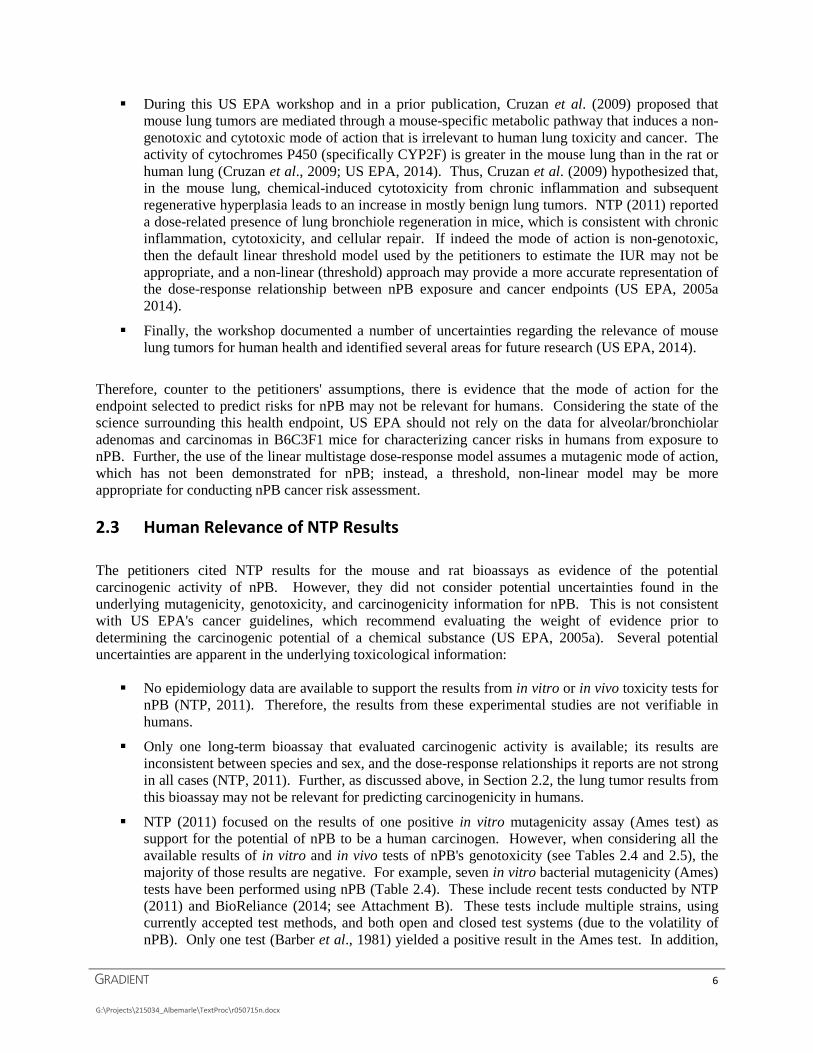
During this US EPA workshop and in a prior publication, Cruzan et al. (2009) proposed that mouse lung tumors are mediated through a mouse-specific metabolic pathway that induces a non-genotoxic and cytotoxic mode of action that is irrelevant to human lung toxicity and cancer. The activity of cytochromes P450 (specifically CYP2F) is greater in the mouse lung than in the rat or human lung (Cruzan et al., 2009; US EPA, 2014). Thus, Cruzan et al. (2009) hypothesized that, in the mouse lung, chemical-induced cytotoxicity from chronic inflammation and subsequent regenerative hyperplasia leads to an increase in mostly benign lung tumors. NTP (2011) reported a dose-related presence of lung bronchiole regeneration in mice, which is consistent with chronic inflammation, cytotoxicity, and cellular repair. If indeed the mode of action is non-genotoxic, then the default linear threshold model used by the petitioners to estimate the IUR may not be appropriate, and a non-linear (threshold) approach may provide a more accurate representation of the dose-response relationship between nPB exposure and cancer endpoints (US EPA, 2005a 2014).
Finally, the workshop documented a number of uncertainties regarding the relevance of mouse lung tumors for human health and identified several areas for future research (US EPA, 2014).
Therefore, counter to the petitioners' assumptions, there is evidence that the mode of action for the endpoint selected to predict risks for nPB may not be relevant for humans. Considering the state of the science surrounding this health endpoint, US EPA should not rely on the data for alveolar/bronchiolar adenomas and carcinomas in B6C3F1 mice for characterizing cancer risks in humans from exposure to nPB. Further, the use of the linear multistage dose-response model assumes a mutagenic mode of action, which has not been demonstrated for nPB; instead, a threshold, non-linear model may be more appropriate for conducting nPB cancer risk assessment. 2.3 Human Relevance of NTP Results
The petitioners cited NTP results for the mouse and rat bioassays as evidence of the potential carcinogenic activity of nPB. However, they did not consider potential uncertainties found in the underlying mutagenicity, genotoxicity, and carcinogenicity information for nPB. This is not consistent with US EPA's cancer guidelines, which recommend evaluating the weight of evidence prior to determining the carcinogenic potential of a chemical substance (US EPA, 2005a). Several potential uncertainties are apparent in the underlying toxicological information: No epidemiology data are available to support the results from in vitro or in vivo toxicity tests for
nPB (NTP, 2011). Therefore, the results from these experimental studies are not verifiable in humans.
Only one long-term bioassay that evaluated carcinogenic activity is available; its results are inconsistent between species and sex, and the dose-response relationships it reports are not strong in all cases (NTP, 2011). Further, as discussed above, in Section 2.2, the lung tumor results from this bioassay may not be relevant for predicting carcinogenicity in humans.
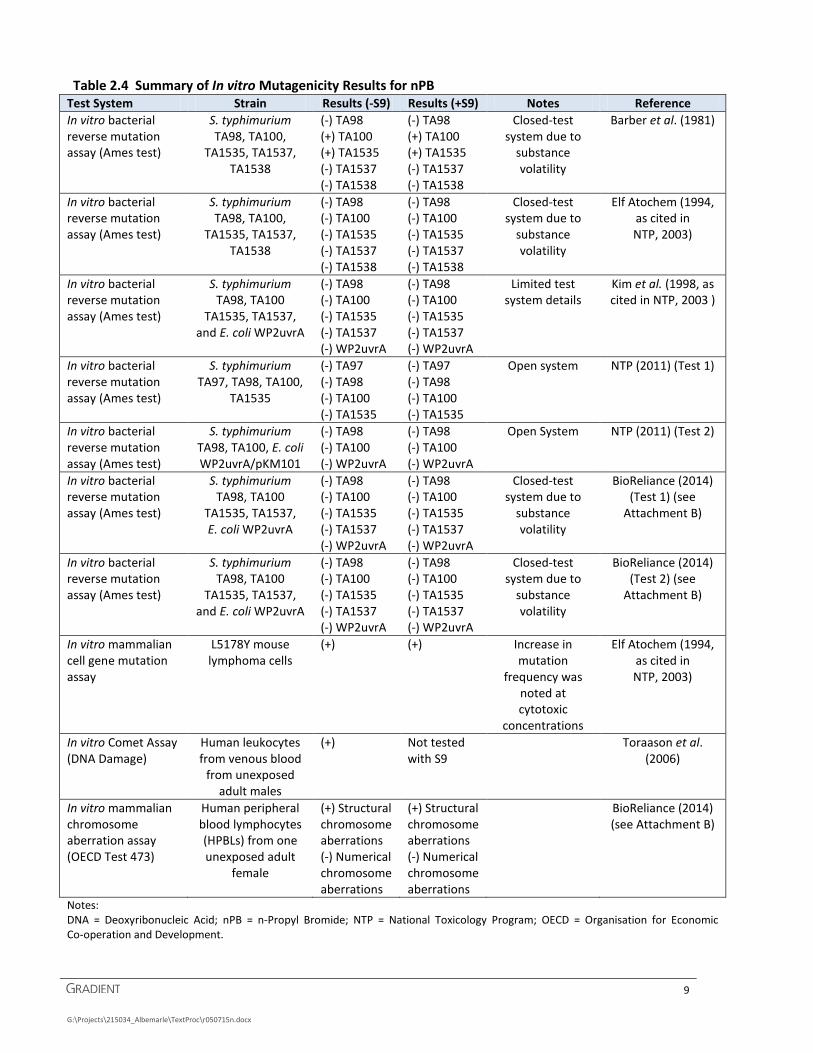
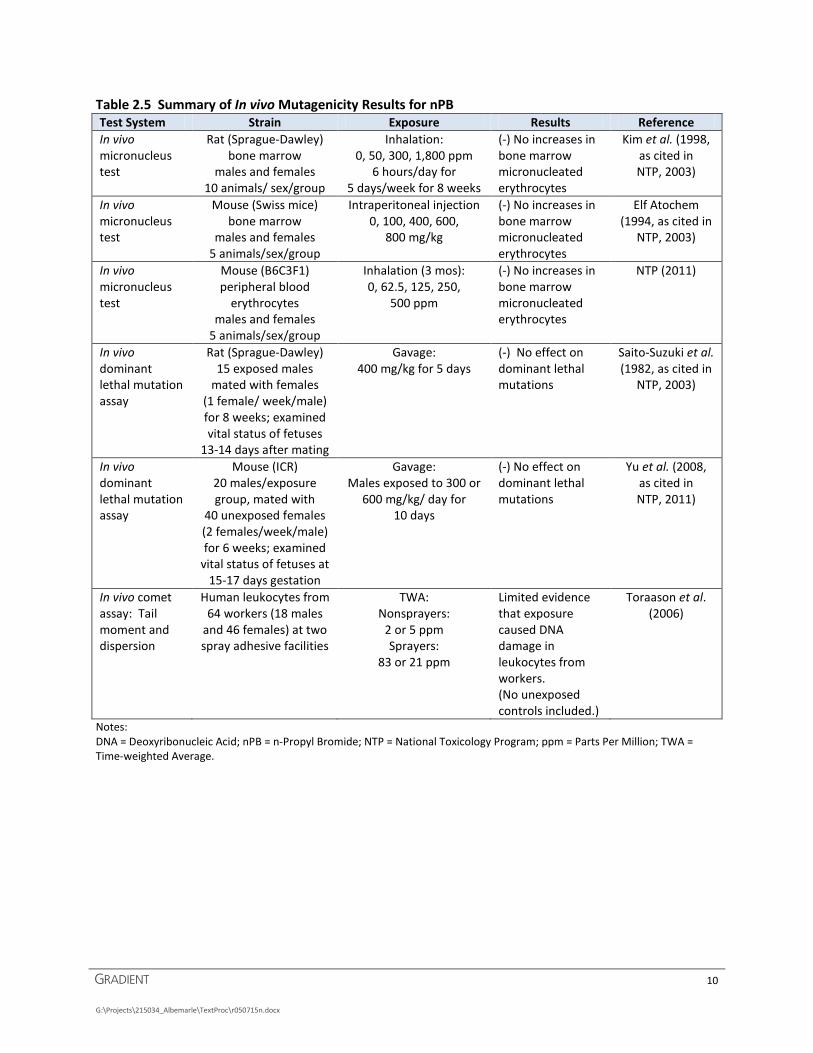
NTP (2011) focused on the results of one positive in vitro mutagenicity assay (Ames test) as support for the potential of nPB to be a human carcinogen. However, when considering all the available results of in vitro and in vivo tests of nPB's genotoxicity (see Tables 2.4 and 2.5), the majority of those results are negative. For example, seven in vitro bacterial mutagenicity (Ames) tests have been performed using nPB (Table 2.4). These include recent tests conducted by NTP (2011) and BioReliance (2014; see Attachment B). These tests include multiple strains, using currently accepted test methods, and both open and closed test systems (due to the volatility of nPB). Only one test (Barber et al., 1981) yielded a positive result in the Ames test. In addition,
7 G:\Projects\215034_Albemarle\TextProc\r050715n.docx
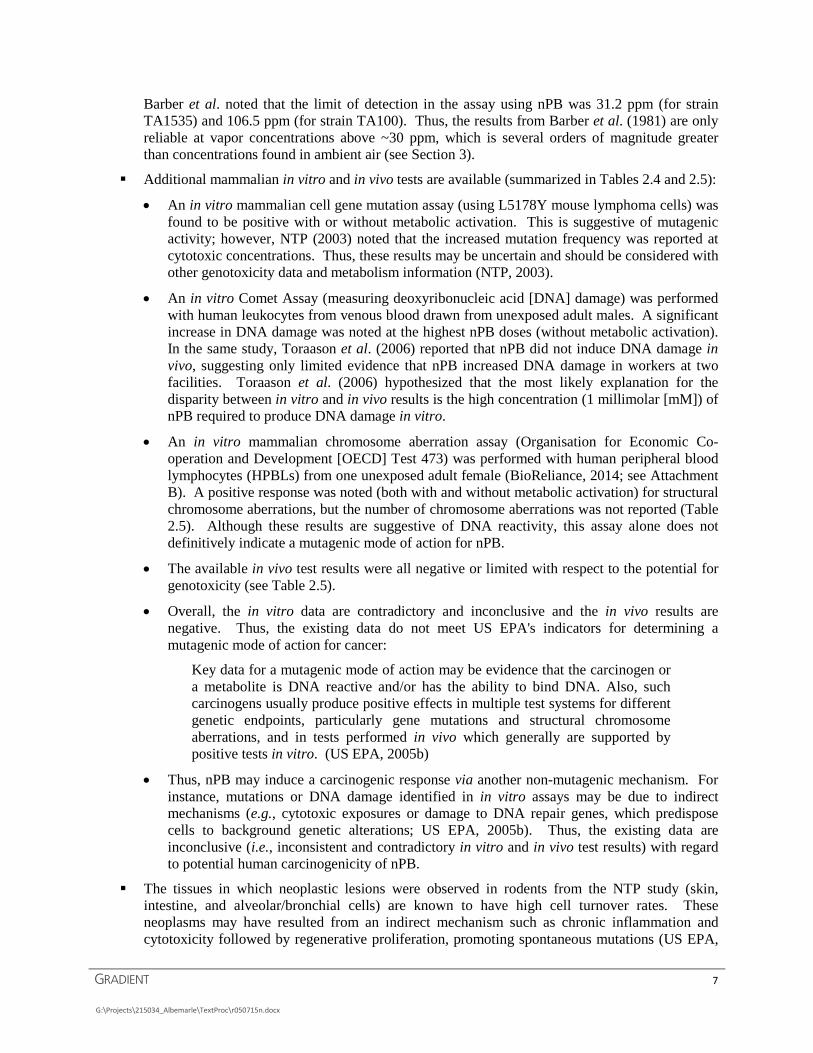
Barber et al. noted that the limit of detection in the assay using nPB was 31.2 ppm (for strain TA1535) and 106.5 ppm (for strain TA100). Thus, the results from Barber et al. (1981) are only reliable at vapor concentrations above ~30 ppm, which is several orders of magnitude greater than concentrations found in ambient air (see Section 3).
Additional mammalian in vitro and in vivo tests are available (summarized in Tables 2.4 and 2.5):
• An in vitro mammalian cell gene mutation assay (using L5178Y mouse lymphoma cells) was found to be positive with or without metabolic activation. This is suggestive of mutagenic activity; however, NTP (2003) noted that the increased mutation frequency was reported at cytotoxic concentrations. Thus, these results may be uncertain and should be considered with other genotoxicity data and metabolism information (NTP, 2003).
• An in vitro Comet Assay (measuring deoxyribonucleic acid [DNA] damage) was performed with human leukocytes from venous blood drawn from unexposed adult males. A significant increase in DNA damage was noted at the highest nPB doses (without metabolic activation). In the same study, Toraason et al. (2006) reported that nPB did not induce DNA damage in vivo, suggesting only limited evidence that nPB increased DNA damage in workers at two facilities. Toraason et al. (2006) hypothesized that the most likely explanation for the disparity between in vitro and in vivo results is the high concentration (1 millimolar [mM]) of nPB required to produce DNA damage in vitro.
• An in vitro mammalian chromosome aberration assay (Organisation for Economic Co-operation and Development [OECD] Test 473) was performed with human peripheral blood lymphocytes (HPBLs) from one unexposed adult female (BioReliance, 2014; see Attachment B). A positive response was noted (both with and without metabolic activation) for structural chromosome aberrations, but the number of chromosome aberrations was not reported (Table 2.5). Although these results are suggestive of DNA reactivity, this assay alone does not definitively indicate a mutagenic mode of action for nPB.
• The available in vivo test results were all negative or limited with respect to the potential for genotoxicity (see Table 2.5).
• Overall, the in vitro data are contradictory and inconclusive and the in vivo results are negative. Thus, the existing data do not meet US EPA's indicators for determining a mutagenic mode of action for cancer:
Key data for a mutagenic mode of action may be evidence that the carcinogen or a metabolite is DNA reactive and/or has the ability to bind DNA. Also, such carcinogens usually produce positive effects in multiple test systems for different genetic endpoints, particularly gene mutations and structural chromosome aberrations, and in tests performed in vivo which generally are supported by positive tests in vitro. (US EPA, 2005b)
• Thus, nPB may induce a carcinogenic response via another non-mutagenic mechanism. For instance, mutations or DNA damage identified in in vitro assays may be due to indirect mechanisms (e.g., cytotoxic exposures or damage to DNA repair genes, which predispose cells to background genetic alterations; US EPA, 2005b). Thus, the existing data are inconclusive (i.e., inconsistent and contradictory in vitro and in vivo test results) with regard to potential human carcinogenicity of nPB.
The tissues in which neoplastic lesions were observed in rodents from the NTP study (skin, intestine, and alveolar/bronchial cells) are known to have high cell turnover rates. These neoplasms may have resulted from an indirect mechanism such as chronic inflammation and cytotoxicity followed by regenerative proliferation, promoting spontaneous mutations (US EPA,
8 G:\Projects\215034_Albemarle\TextProc\r050715n.docx
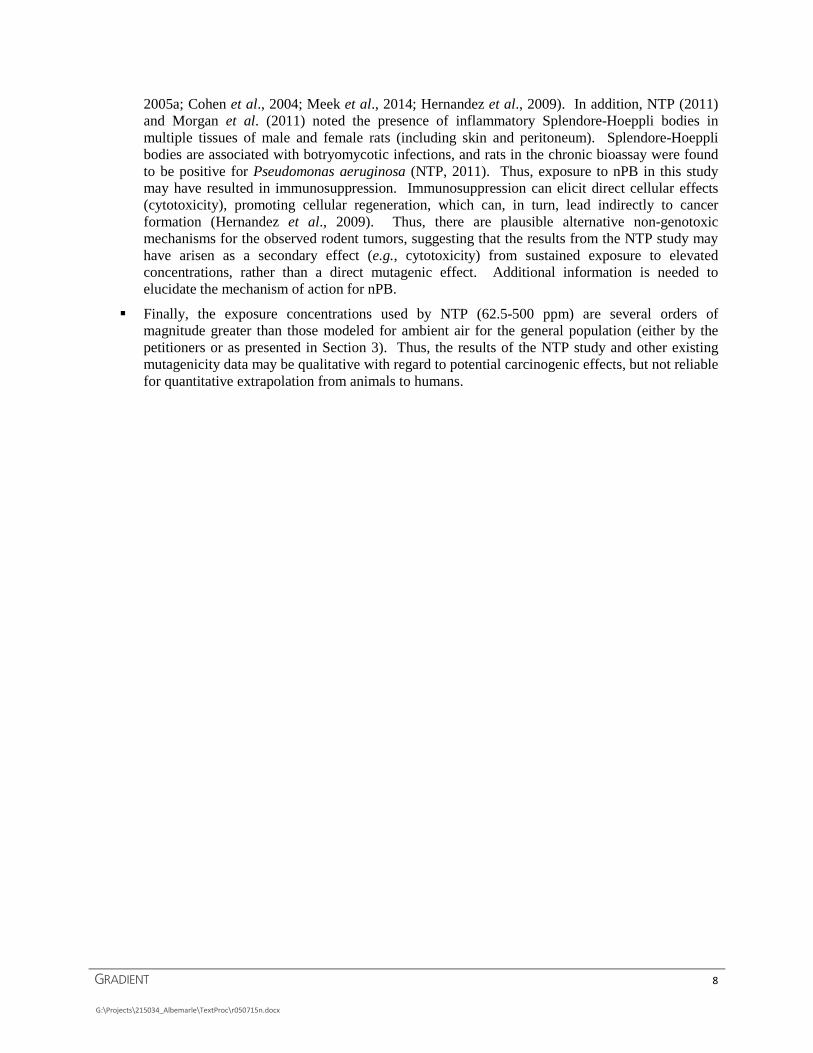
2005a; Cohen et al., 2004; Meek et al., 2014; Hernandez et al., 2009). In addition, NTP (2011) and Morgan et al. (2011) noted the presence of inflammatory Splendore-Hoeppli bodies in multiple tissues of male and female rats (including skin and peritoneum). Splendore-Hoeppli bodies are associated with botryomycotic infections, and rats in the chronic bioassay were found to be positive for Pseudomonas aeruginosa (NTP, 2011). Thus, exposure to nPB in this study may have resulted in immunosuppression. Immunosuppression can elicit direct cellular effects (cytotoxicity), promoting cellular regeneration, which can, in turn, lead indirectly to cancer formation (Hernandez et al., 2009). Thus, there are plausible alternative non-genotoxic mechanisms for the observed rodent tumors, suggesting that the results from the NTP study may have arisen as a secondary effect (e.g., cytotoxicity) from sustained exposure to elevated concentrations, rather than a direct mutagenic effect. Additional information is needed to elucidate the mechanism of action for nPB.
Finally, the exposure concentrations used by NTP (62.5-500 ppm) are several orders of magnitude greater than those modeled for ambient air for the general population (either by the petitioners or as presented in Section 3). Thus, the results of the NTP study and other existing mutagenicity data may be qualitative with regard to potential carcinogenic effects, but not reliable for quantitative extrapolation from animals to humans.
9 G:\Projects\215034_Albemarle\TextProc\r050715n.docx
Table 2.4 Summary of In vitro Mutagenicity Results for nPB Test System Strain Results (-S9) Results (+S9) Notes Reference In vitro bacterial reverse mutation assay (Ames test)
S. typhimurium TA98, TA100,
TA1535, TA1537, TA1538
(-) TA98 (+) TA100 (+) TA1535 (-) TA1537 (-) TA1538
(-) TA98 (+) TA100 (+) TA1535 (-) TA1537 (-) TA1538
Closed-test system due to
substance volatility
Barber et al. (1981)
In vitro bacterial reverse mutation assay (Ames test)
S. typhimurium TA98, TA100,
TA1535, TA1537, TA1538
(-) TA98 (-) TA100 (-) TA1535 (-) TA1537 (-) TA1538
(-) TA98 (-) TA100 (-) TA1535 (-) TA1537 (-) TA1538
Closed-test system due to
substance volatility
Elf Atochem (1994, as cited in NTP, 2003)
In vitro bacterial reverse mutation assay (Ames test)
S. typhimurium TA98, TA100
TA1535, TA1537, and E. coli WP2uvrA
(-) TA98 (-) TA100 (-) TA1535 (-) TA1537 (-) WP2uvrA
(-) TA98 (-) TA100 (-) TA1535 (-) TA1537 (-) WP2uvrA
Limited test system details
Kim et al. (1998, as cited in NTP, 2003 )
In vitro bacterial reverse mutation assay (Ames test)
S. typhimurium TA97, TA98, TA100,
TA1535
(-) TA97 (-) TA98 (-) TA100 (-) TA1535
(-) TA97 (-) TA98 (-) TA100 (-) TA1535
Open system NTP (2011) (Test 1)
In vitro bacterial reverse mutation assay (Ames test)
S. typhimurium TA98, TA100, E. coli WP2uvrA/pKM101
(-) TA98 (-) TA100 (-) WP2uvrA
(-) TA98 (-) TA100 (-) WP2uvrA
Open System NTP (2011) (Test 2)
In vitro bacterial reverse mutation assay (Ames test)
S. typhimurium TA98, TA100
TA1535, TA1537, E. coli WP2uvrA
(-) TA98 (-) TA100 (-) TA1535 (-) TA1537 (-) WP2uvrA
(-) TA98 (-) TA100 (-) TA1535 (-) TA1537 (-) WP2uvrA
Closed-test system due to
substance volatility
BioReliance (2014) (Test 1) (see
Attachment B)
In vitro bacterial reverse mutation assay (Ames test)
S. typhimurium TA98, TA100
TA1535, TA1537, and E. coli WP2uvrA
(-) TA98 (-) TA100 (-) TA1535 (-) TA1537 (-) WP2uvrA
(-) TA98 (-) TA100 (-) TA1535 (-) TA1537 (-) WP2uvrA
Closed-test system due to
substance volatility
BioReliance (2014) (Test 2) (see
Attachment B)
In vitro mammalian cell gene mutation assay
L5178Y mouse lymphoma cells
(+) (+) Increase in mutation
frequency was noted at cytotoxic
concentrations
Elf Atochem (1994, as cited in NTP, 2003)
In vitro Comet Assay (DNA Damage)
Human leukocytes from venous blood
from unexposed adult males
(+) Not tested with S9
Toraason et al. (2006)
In vitro mammalian chromosome aberration assay (OECD Test 473)
Human peripheral blood lymphocytes (HPBLs) from one unexposed adult
female
(+) Structural chromosome aberrations (-) Numerical chromosome aberrations
(+) Structural chromosome aberrations (-) Numerical chromosome aberrations
BioReliance (2014) (see Attachment B)
Notes: DNA = Deoxyribonucleic Acid; nPB = n-Propyl Bromide; NTP = National Toxicology Program; OECD = Organisation for Economic Co-operation and Development.
10 G:\Projects\215034_Albemarle\TextProc\r050715n.docx
Table 2.5 Summary of In vivo Mutagenicity Results for nPB Test System Strain Exposure Results Reference In vivo micronucleus test
Rat (Sprague-Dawley) bone marrow
males and females 10 animals/ sex/group
Inhalation: 0, 50, 300, 1,800 ppm
6 hours/day for 5 days/week for 8 weeks
(-) No increases in bone marrow micronucleated erythrocytes
Kim et al. (1998, as cited in NTP, 2003)
In vivo micronucleus test
Mouse (Swiss mice) bone marrow
males and females 5 animals/sex/group
Intraperitoneal injection 0, 100, 400, 600,
800 mg/kg
(-) No increases in bone marrow micronucleated erythrocytes
Elf Atochem (1994, as cited in
NTP, 2003)
In vivo micronucleus test
Mouse (B6C3F1) peripheral blood
erythrocytes males and females
5 animals/sex/group
Inhalation (3 mos): 0, 62.5, 125, 250,
500 ppm
(-) No increases in bone marrow micronucleated erythrocytes
NTP (2011)
In vivo dominant lethal mutation assay
Rat (Sprague-Dawley) 15 exposed males
mated with females (1 female/ week/male) for 8 weeks; examined vital status of fetuses
13-14 days after mating
Gavage: 400 mg/kg for 5 days
(-) No effect on dominant lethal mutations
Saito-Suzuki et al. (1982, as cited in
NTP, 2003)
In vivo dominant lethal mutation assay
Mouse (ICR) 20 males/exposure group, mated with
40 unexposed females (2 females/week/male) for 6 weeks; examined
vital status of fetuses at 15-17 days gestation
Gavage: Males exposed to 300 or
600 mg/kg/ day for 10 days
(-) No effect on dominant lethal mutations
Yu et al. (2008, as cited in NTP, 2011)
In vivo comet assay: Tail moment and dispersion
Human leukocytes from 64 workers (18 males
and 46 females) at two spray adhesive facilities
TWA: Nonsprayers:
2 or 5 ppm Sprayers:
83 or 21 ppm
Limited evidence that exposure caused DNA damage in leukocytes from workers. (No unexposed controls included.)
Toraason et al. (2006)
Notes: DNA = Deoxyribonucleic Acid; nPB = n-Propyl Bromide; NTP = National Toxicology Program; ppm = Parts Per Million; TWA = Time-weighted Average.
11 G:\Projects\215034_Albemarle\TextProc\r050715n.docx
2.4 Additional Supporting Toxicity Information
The petitioners suggest that information on the pharmacokinetics of nPB are lacking and argue for larger uncertainty factors to be incorporated into the development of toxicity criteria (i.e., reference concentrations) (Patton Boggs, 2010). US EPA previously developed a draft reference concentration for industrial exposure to nPB based on a two-generation inhalation study of nPB (ICF, 2002). Several uncertainty factors were incorporated into that original assessment, which may be refined based on new information. Several studies indicate that there are species and sex differences regarding the metabolism of
nPB via hepatic cytochrome P450 (CYP2E1) and glutathione (Garner et al., 2006, 2015; Garner and Yu, 2014; Lee et al., 2010; Liu et al., 2009; Kim et al., 1999). This information can aid in the development of data-supported uncertainty factors.
Recently, physiologically based pharmacokinetic (PBPK) models were developed to evaluate nPB metabolism in rats and humans (Garner et al., 2015; Garner and Yu, 2014). These models provide quantitative estimates of metabolic parameters that could be used to refine the development of toxicological thresholds for human health risk assessment. These initial PBPK models were performed using elevated exposure concentration (20-2700 ppm) not typically found in ambient air. In addition, the species and sex differences in metabolism were not fully accounted for in the existing analysis by Garner et al. (2015). However, this PBPK model could be modified to incorporate more realistic exposure estimates and differences in nPB metabolism to examine internal doses in humans to refine dose-response assessments for nPB.
Finally, alternative dose-response modeling efforts have been performed using existing toxicity information that may inform future risk assessments for nPB (Moon et al., 2015; Wheeler and Bailer, 2012; Stelljes and Wood, 2004).
Overall, substantial new information is now available for nPB and should be incorporated into US EPA's development of toxicity criteria for nPB. 2.5 Requirements for Peer Review of Risk Criteria
US EPA's IRIS program revised its process for developing chemical health assessments in 2013 (after submission of the nPB petition). The IRIS process requires a rigorous peer and public review of health assessments and the development of toxicity criteria (US EPA, 2013). As of this writing, none of the risk thresholds for nPB are final or have undergone a scientific or public peer review per the new IRIS program guidelines. Therefore, any existing draft risk criteria (e.g., IURs) do not meet these requirements and may not be reliable for characterizing risks. The risk estimates in the petition for listing nPB as a HAP do not represent the scientific consensus on nPB and should not be relied upon until a full scientific review (corresponding to the requirements established under the IRIS program) can be performed on the underlying toxicological information. 2.6 Conclusions on the Petitioner's Cancer Risk Assessment
We have demonstrated that the cancer risk assessment performed by the petitioners does not fully consider the available scientific information on nPB. The quantitative dose-response assessment used to estimate cancer risks was not calculated in accordance with US EPA's recommended methods and results in overly conservative estimates of risk. Further, the cancer type selected by the petitioners (mouse lung
12 G:\Projects\215034_Albemarle\TextProc\r050715n.docx
tumors) may represent an endpoint that is mouse-specific and not relevant for predicting cancer incidence in humans. The underlying genotoxicity, mutagenicity, and carcinogenicity database for nPB is contradictory and provides limited information for assessing human carcinogenicity. Uncertainties in the underlying toxicity information should have been considered when the petitioners modeled nPB cancer risks. While NTP (2011) currently classifies nPB as "reasonably anticipated to be a human carcinogen," neither NTP nor US EPA has provided a full weight-of-evidence analysis of the underlying mechanistic and toxicological considerations discussed above. We conclude that the predicted cancer risks calculated by the petitioners (see Section 3) reflect conservative assumptions that are likely to result in overestimates of potential risk to populations exposed to nPB in ambient air. Further, we conclude that the existing information on nPB does not fully support the determination that nPB is a human carcinogen, because no relevant human data are available and there are limited in vitro and in vivo data available to determine nPB's mode of action.

13 G:\Projects\215034_Albemarle\TextProc\r050715n.docx
3 Comments on the Petitioner's Air Modeling Analysis and Risk Assessment
The petitioners funded an air modeling study of the potential cancer risks associated with ambient air emissions of nPB (Exponent, 2012). This study used US EPA's Human Exposure Model (HEM-3) to estimate the ambient air concentrations and associated cancer risks from nPB emissions in the areas surrounding five facilities. The facilities modeled were: Superior Tube, a narrow tube manufacturer in Collegeville, Pennsylvania that uses nPB as a degreaser; a sofa cushion fabrication company in Thomasville, North Carolina and a seat cushion fabrication company in Mooresville, North Carolina that both use nPB as a spray adhesive; and two dry cleaners that were assumed to use nPB as a dry cleaning chemical – namely, a dry cleaner in Alexandria, Virginia, and a dry cleaner in Waltham, Massachusetts. In keeping with the Exponent (2012) report, we refer throughout this document to the Thomasville, North Carolina manufacturing company as "Fabrication Company A" and the Mooresville, North Carolina manufacturing company as "Fabrication Company B." Exponent (2012) found that there was a greater than 1 in 1 million cancer risk at receptor locations 100 or 170 meters from each of the five facilities and also found maximum individual cancer risks in excess of 1 in 1 million at nearby census blocks for four of the five facilities modeled (all except Fabrication Company A). However, as discussed below, this air modeling study has a number of limitations and shortcomings that resulted in overestimated cancer risks, including the use of outdated and uncertain emissions, the use of an outdated version of HEM-3, the use of incorrect modeling parameters, and the modeling of non-representative facilities. These limitations are in addition to Exponent's use of an inappropriate IUR for nPB, which served to inflate their cancer risk estimates. Even with the various limitations and shortcomings that generally contributed to overestimated cancer risks, it is important to note that Exponent (2012) found no populations with estimated cancer risks greater than or equal to 1 in 100,000 and relatively small populations with estimated cancer risks ≥ 1 in 1 million (1571, 0, 166, 1057, and 7 people for the Superior Tube facility, Fabrication Company A, Fabrication Company B, the Virginia dry cleaner, and the Massachusetts dry cleaner, respectively). 3.1 The Exponent Assessment Is Based on Highly Uncertain Emissions
Estimates and, in Some Cases, Outdated Emissions Assumptions
Exponent (2012) did not have recent nPB emissions data for any of the five facilities modeled, and therefore, they used various types of available information to develop estimates of those facilities' emissions. However, this ad hoc approach resulted in highly uncertain emissions estimates that, in some cases, were based on outdated information. For the Superior Tube facility, where nPB is used in degreasing operations, Exponent estimated that nPB emissions were 35 tons/year, based on volatile organic compound (VOC) emissions reported by the facility to the State of Pennsylvania after the known date when the facility switched from using trichloroethylene (TCE) to nPB for degreasing. The VOC emissions from the Superior Tube facility varied between 34 and 46 tons/year during 2008-2010, and, based on this information, Exponent selected an emissions rate of 35 tons/year. However, based on 2013 VOC usage data for the Superior Tube facility, Trinity Consultants (2015) estimated nPB emissions of 59.46 tons/year; thus, the Exponent emissions estimate was likely lower than actual current emissions.
14 G:\Projects\215034_Albemarle\TextProc\r050715n.docx
For Fabrication Companies A and B, Exponent developed nPB emissions estimates using data from National Institute for Occupational Safety and Health (NIOSH) health hazard evaluations (HHEs) conducted at the two facilities between 1998 and 2001. Both fabrication companies improved the capture of emissions at spray booths between the initial and final NIOSH HHEs, and the Exponent emissions were estimated based on data collected after these improvements. Exponent estimated that nPB emissions were 2.8 and 18 tons/year at Fabrication Companies A and B, respectively, based on measurements of hood exhaust flow rates, breathing zone nPB concentrations, and a set of assumptions (e.g., emissions occurring over an 8-hour work day, with the facility operating 250 days/year). However, Exponent's emissions estimates for Fabrication Companies A and B are outdated, because the HHEs were conducted over 10 years ago. In addition, the breathing zone concentrations used by Exponent may not realistically represent nPB concentrations in air emitted from the fabrication company buildings; average measurements of nPB concentrations in building interiors would likely be more representative of the actual emissions from the fabrication companies. Exponent also estimated that each fabrication company emitted an additional 10% of the total nPB as fugitive emissions, although there are no data to support this assumed quantity of fugitive emissions. (Note that this unsupported assumption of 10% fugitive emissions was used by Exponent for modeling each of the five facilities.) While no nPB usage data are available for Fabrication Company A due to its total VOC emissions falling below North Carolina's reporting threshold of 5 tons/year, Trinity Consultants (2015) obtained more recent data on Fabrication Company B's nPB usage, which confirm the inaccuracy of the Exponent emissions estimate for this facility. Based on Fabrication Company B's (Custom Products) actual emission inventory filings in 2004, 2009, and 2013, nPB usage decreased from 22,497 pounds (11.2 tons) to 11,355 pounds (5.7 tons) between 2004 and 2009 and then from 11,355 pounds (5.7 tons) to 1,354 pounds (0.68 tons) between 2009 and 2013 (Trinity Consultants, 2015). Even if it is conservatively assumed that all nPB used at Fabrication Company B is emitted, actual nPB emissions from this facility are expected to be, at most, about 3.8% of the Exponent estimate, confirming that improved workplace practices since the NIOSH HHEs have served to reduce nPB emissions from the use of nPB-based spray adhesives. Exponent estimated that each of the dry cleaners emitted 2.6 tons/year of nPB based on personal communication with Dr. James D. Blando in relation to the Blando et al. (2010) manuscript, which reported nPB exposure measurements at several dry cleaners in New Jersey. Exponent (2012) stated that, "this estimate is very consistent with a permit issued by the Ohio Environmental Protection Agency, which specified that a dry cleaner using nPB (Briang Garment Care, LLC DBA Capitol Cleaners #180) limit annual emissions to 2.6 tons per year." However, instead of modeling the impact of nPB emissions from these dry cleaners, which were known to use nPB as a solvent, Exponent chose to use the estimated emissions to model nPB risk at two other dry cleaners: Zoots in Waltham, Massachusetts and Presto Valet in Alexandria, Virginia. According to their websites, Zoots uses a non-perchloroethylene solvent that is completely biodegradable (www.zoots.com/greener-cleaner; accessed 20 April 2015),1
1 Gradient contacted Zoots and confirmed that the Zoots chain of dry cleaners, including its facility in Waltham, uses a hydrocarbon solvent (DF2000), together with professional wet cleaning, in their dry cleaning process (ZOOTS Customer Care, 2015).
and Presto Valet is a certified user of GreenEarth Cleaning®, which is an environmentally safe solvent (www.prestovalet.net; accessed 20 April 2015). In addition, an independent assessment of the dry cleaning machines used at the New Jersey and Ohio dry cleaners found that the maximum possible nPB usage would be 1.3 tons/year, half of the yearly emissions estimated by Exponent (Trinity Consultants, 2015). Given this information, an nPB emissions estimate of 1.3 tons/year would be a conservative estimate of maximum emissions, because this estimate assumes that there are no emission controls, and therefore, that the usage of nPB is equivalent to nPB emissions. Moreover, actual nPB emissions from
15 G:\Projects\215034_Albemarle\TextProc\r050715n.docx
the only dry cleaner facility identified in the Exponent report that currently uses nPB solvent are estimated to be 1.1 tons per year (Trinity Consultants, 2015). 3.2 Exponent Used an Outdated Version of US EPA's HEM-3 Model
HEM-3 is a US EPA-recommended model for HAP risk assessments that combines air dispersion modeling from the American Meteorological Society/US EPA Regulatory Model (AERMOD) with census and chemical health effects data to estimate population risks and health hazards. Exponent (2012) used the outdated version 1.1.0 of this model in their analysis of hypothetical cancer risks from nPB near the five facilities. The newest HEM-3 v1.3.1 improves on v1.1.0 through the use of a newer version of AERMOD, access to a larger set of meteorological data, access to more recent census data, and improved methods for modeling source emission dispersion. There have been seven updates to AERMOD since the version used in HEM-3 v1.1.0. As detailed on the US EPA Technology Transfer Network webpage,2
the version of AERMOD used in the newest HEM-3 model (AERMOD v13350) includes numerous enhancements and updates when compared to the version used in HEM-3 v1.1.0 (AERMOD v07026). Some of the major upgrades that were implemented between the AERMOD versions that are likely to impact nPB modeling include: updated parameterizations, to address meteorological transitions between daytime and nighttime in urban areas; modifications to the use of building downwash effects within AERMOD; and adjustments to the parameterization of wind speeds, to align AERMOD with typical wind speed input data. Each of these changes likely impacts the accuracy of the HEM-3 modeling of nPB dispersion from the source facilities to the surrounding communities.
HEM-3 v1.3.1 has access to an expanded and more representative set of meteorological data. HEM-3 v1.1.0 had access to meteorological data for 120 stations, while HEM-3 v1.3.1 accesses data from over 800 stations (EC/R, 2014). This indicates that the meteorological data used to model air dispersion in HEM-3 v1.3.1 are more likely to be representative of the actual conditions at the modeled location. In addition, HEM-3 v1.3.1 uses 2011 meteorological data, instead of the 1991 meteorological data used by v1.1.0. The 2011 data were prepared using an updated version of the AERMOD meteorological data processer, AERMET, and therefore are more accurate than the 1991 data. HEM-3 v1.3.1 can access both 2000 and 2010 census data, while v1.1.0 could only access 2000 census data. There was a 9.7% increase in the US population reported in the 2010 census compared to the 2000 census (US Census Bureau, 2011) and a 35% increase in the number of census blocks (US Census Bureau, 2010). This indicates that HEM-3 v1.1.0 likely underestimated the true population risks; use of HEM-3 v1.3.1 with the 2010 census data allows for the prediction of more representative population risks. Finally, HEM-3 v1.3.1 has improved methods for modeling the dispersion of pollutants from the different types of air emission sources (EC/R, 2014). For example, HEM-3 v1.1.0 used an AERMOD dispersion method called FASTALL that simplified the dispersion algorithms, while v1.3.1 uses the complete set of AERMOD dispersion algorithms. In addition, HEM-3 v1.3.1 includes the capability to model emissions that vary temporally (i.e., during specified hours, days, and seasons), while v1.1.0 necessitated the use of constant emission rates throughout the modeled time period – i.e., rather than modeling emissions for just the hours of operation at the facilities when nPB emissions are expected to occur, Exponent (2012) averaged emissions across the entire modeling period. In Section 3.3, below, we further discuss the implications of this modeling simplification.
2 http://www.epa.gov/ttn/scram/dispersion_prefrec.htm. Accessed 20 April 2015.
16 G:\Projects\215034_Albemarle\TextProc\r050715n.docx
Overall, there were significant improvements between HEM-3 v1.1.0 and v1.3.1 that are likely to greatly impact estimation of population risks. In other words, the newer HEM-3 version provides more robust estimates of hypothetical cancer risks from nPB ambient air emissions. 3.3 The Exponent Assessment Has Other Significant Limitations That
Contribute to the Unreliability of Its Findings
As described in previous sections, significant limitations and shortcoming of the Exponent (2012) assessment include the use of an incorrect IUR (Section 2), uncertain or incorrect estimated emissions for the modeled facilities (Section 3.1), modeling of facilities that do not use nPB (Section 3.1), and the use of an outdated version of the HEM-3 model (Section 3.2). In this section, we discuss several additional limitations and shortcomings associated with Exponent's nPB cancer risk assessment, including that Exponent incorrectly parameterized the emission rates of the facilities and presented cancer risk estimates at receptors that may not be in populated areas. Exponent modeled nPB emissions at all five facilities using constant daily emission rates, because the outdated version of HEM-3 that they used (v.1.1.0) did not allow for temporal variation of emissions. Their report states that, "One limitation with HEM-3 is that users cannot specify emissions over only part of the day (e.g., an 8-hour work shift) and only on work days. Therefore, a constant daily emission rate was assumed. This limitation is not expected to have a significant impact on the model result" (Exponent, 2012, p. 12). However, under general atmospheric conditions, there is a diurnal cycle that transitions between a nighttime stable atmospheric layer and a daytime convective mixed layer in the lower atmosphere. Stable conditions inhibit the dispersion of pollutants, and, therefore, modeled nPB emissions for nighttime periods (i.e., outside the standard 8-hour work shift) are likely to disperse more slowly than during daytime periods. Thus, it is more realistic to include the correct temporal variation of nPB emissions in HEM-3. Exponent also modeled each of the five facilities using rural area dispersion coefficients, but for these facilities, it is more appropriate to use urban dispersion coefficients. The urban dispersion coefficients differ from the rural coefficients in that they account for the enhanced turbulence in the nighttime urban boundary layer, which is caused by the urban heat island effect (US EPA, 2005c). US EPA designed HEM-3 v1.3.1 to identify whether the nearest census block is designated as urban or rural and to use this classification as the default for the dispersion coefficients (EC/R, 2014). Using this built-in feature of HEM-3, all five facilities should be modeled with urban dispersion coefficients. Exponent also incorrectly parameterized the nPB emission sources of the Superior Tube facility. They assumed that there were three circular vents at the facility that extended two meters above the rooftop, each with a diameter of 0.5 m (Exponent, 2012). An independent assessment found that there are only two rooftop vents at this facility that are positioned several hundred feet away from the locations indicated in the Exponent report (Peronti, as cited in Hammond, 2015a). In addition, this independent assessment found that the vents extend 5 feet (1.524 m) above the rooftop, and have dimensions of 20 × 14 inches (0.51 × 0.36 m) (Peronti, as cited in Hammond, 2015a). HEM-3 output can be used to estimate risk at varying distances from facilities. Exponent (2012) primarily focused on cancer risk estimates at receptors in a user-specified polar grid surrounding the five facilities, with polar grid rings starting at 100 or 170 m from the facilities. These data can be misleading, because they are based on an assumption that the polar receptors reflect population receptor locations that can be used to represent individual cancer risks. Instead, it is more realistic to focus on individual cancer risk estimates for known population receptor locations, such as census blocks surrounding the facilities. In fact, the HEM-3 User's Guide states that "HEM-3 generally estimates maximum individual risks and
17 G:\Projects\215034_Albemarle\TextProc\r050715n.docx
hazard indices… using concentrations calculated at census blocks" (EC/R, 2014). Exponent (2012, Table 14) presents a comparison of the maximum nPB cancer risk estimates for polar grid and census block receptors surrounding the five facilities. This table shows that the maximum estimated risks for their user-specified polar grid receptors are always greater than the maximum risks for the census block receptors, highlighting the fact that risks are likely overestimated when the polar grid receptors are used. 3.4 Revisions to the Exponent Assessment That Correct for Limitations and
Inaccuracies Demonstrate Significantly Different Maximum Individual Cancer Risk Estimates
We conducted an independent HEM-3 model assessment of the hypothetical cancer risks, due to estimated nPB ambient air emissions at the five facilities identified by Exponent (2012). These model runs corrected many of the limitations and issues associated with the Exponent model runs, which are detailed above. In our revised model runs, we use the Gradient-calculated IUR of 6.4 × 10⁻⁷ (μg/m3)-1,
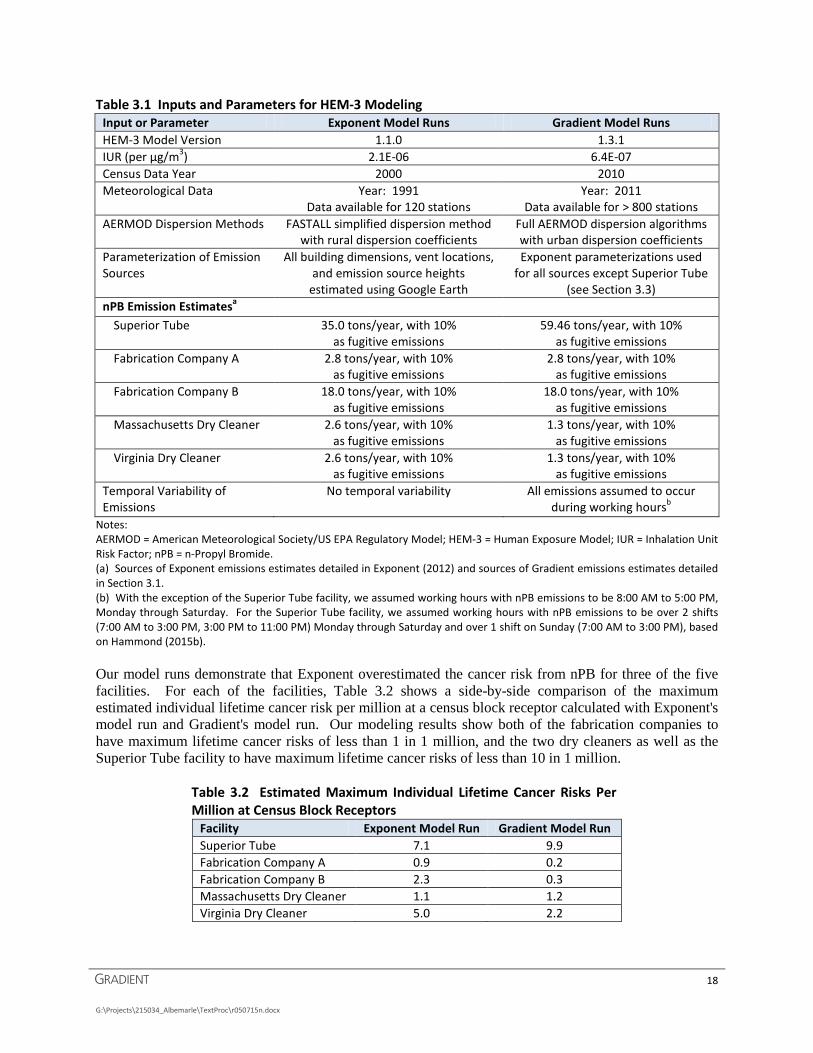
which is based on the NTP (2011) incidence data for alveolar/bronchial adenomas and carcinomas in mice and incorporates dosimetric adjustments that were lacking in the Exponent-calculated IUR (see Section 2.1); however, as noted in Section 2.6, we concluded that the existing information does not fully support the determination that nPB is a human carcinogen, because no relevant human data are available, and there are limited in vitro and in vivo data available to support the delineation of nPB's mode of action. In other words, the use of this revised IUR may result in overestimates of potential cancer risks to populations exposed to nPB in ambient air, given that nPB may not increase human cancer risks at ambient concentration levels. Importantly, due to a lack of available information about the facilities and their emissions, we were not able to correct for all of the limitations and uncertainties in the Exponent modeling assessment; for example, we assumed that 10% of total facility nPB emissions were fugitive emissions, and we also generally used Exponent's assumptions regarding vent locations and parameters. Also, as discussed in Section 3.1, Exponent overestimated the emissions for Fabrication Company B; however, we conservatively modeled this facility using the Exponent emissions. Table 3.1 summarizes the differences between the Exponent model runs and our model runs. Some of these differences would be expected to result in greater estimated lifetime cancer risk from nPB, and some would be expected to result in lesser estimated lifetime cancer risk from nPB.
18 G:\Projects\215034_Albemarle\TextProc\r050715n.docx
Table 3.1 Inputs and Parameters for HEM-3 Modeling Input or Parameter Exponent Model Runs Gradient Model Runs HEM-3 Model Version 1.1.0 1.3.1 IUR (per μg/m3) 2.1E-06 6.4E-07 Census Data Year 2000 2010 Meteorological Data Year: 1991
Data available for 120 stations Year: 2011
Data available for > 800 stations AERMOD Dispersion Methods FASTALL simplified dispersion method
with rural dispersion coefficients Full AERMOD dispersion algorithms with urban dispersion coefficients
Parameterization of Emission Sources
All building dimensions, vent locations, and emission source heights
estimated using Google Earth
Exponent parameterizations used for all sources except Superior Tube
(see Section 3.3) nPB Emission Estimatesa
Superior Tube 35.0 tons/year, with 10% as fugitive emissions
59.46 tons/year, with 10% as fugitive emissions
Fabrication Company A 2.8 tons/year, with 10% as fugitive emissions
2.8 tons/year, with 10% as fugitive emissions
Fabrication Company B 18.0 tons/year, with 10% as fugitive emissions
18.0 tons/year, with 10% as fugitive emissions
Massachusetts Dry Cleaner 2.6 tons/year, with 10% as fugitive emissions
1.3 tons/year, with 10% as fugitive emissions
Virginia Dry Cleaner 2.6 tons/year, with 10% as fugitive emissions
1.3 tons/year, with 10% as fugitive emissions
Temporal Variability of Emissions
No temporal variability All emissions assumed to occur during working hoursb
Notes: AERMOD = American Meteorological Society/US EPA Regulatory Model; HEM-3 = Human Exposure Model; IUR = Inhalation Unit Risk Factor; nPB = n-Propyl Bromide. (a) Sources of Exponent emissions estimates detailed in Exponent (2012) and sources of Gradient emissions estimates detailed in Section 3.1. (b) With the exception of the Superior Tube facility, we assumed working hours with nPB emissions to be 8:00 AM to 5:00 PM, Monday through Saturday. For the Superior Tube facility, we assumed working hours with nPB emissions to be over 2 shifts (7:00 AM to 3:00 PM, 3:00 PM to 11:00 PM) Monday through Saturday and over 1 shift on Sunday (7:00 AM to 3:00 PM), based on Hammond (2015b). Our model runs demonstrate that Exponent overestimated the cancer risk from nPB for three of the five facilities. For each of the facilities, Table 3.2 shows a side-by-side comparison of the maximum estimated individual lifetime cancer risk per million at a census block receptor calculated with Exponent's model run and Gradient's model run. Our modeling results show both of the fabrication companies to have maximum lifetime cancer risks of less than 1 in 1 million, and the two dry cleaners as well as the Superior Tube facility to have maximum lifetime cancer risks of less than 10 in 1 million.
Table 3.2 Estimated Maximum Individual Lifetime Cancer Risks Per Million at Census Block Receptors
Facility Exponent Model Run Gradient Model Run Superior Tube 7.1 9.9 Fabrication Company A 0.9 0.2 Fabrication Company B 2.3 0.3 Massachusetts Dry Cleaner 1.1 1.2 Virginia Dry Cleaner 5.0 2.2
19 G:\Projects\215034_Albemarle\TextProc\r050715n.docx
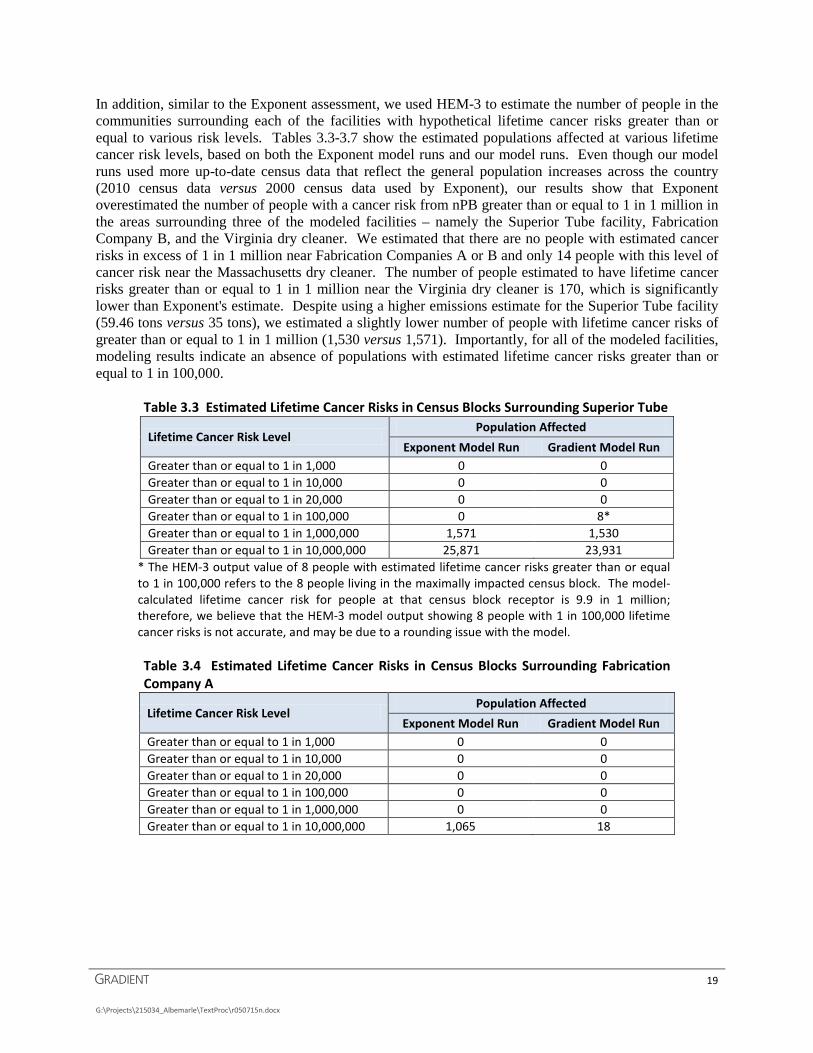
In addition, similar to the Exponent assessment, we used HEM-3 to estimate the number of people in the communities surrounding each of the facilities with hypothetical lifetime cancer risks greater than or equal to various risk levels. Tables 3.3-3.7 show the estimated populations affected at various lifetime cancer risk levels, based on both the Exponent model runs and our model runs. Even though our model runs used more up-to-date census data that reflect the general population increases across the country (2010 census data versus 2000 census data used by Exponent), our results show that Exponent overestimated the number of people with a cancer risk from nPB greater than or equal to 1 in 1 million in the areas surrounding three of the modeled facilities – namely the Superior Tube facility, Fabrication Company B, and the Virginia dry cleaner. We estimated that there are no people with estimated cancer risks in excess of 1 in 1 million near Fabrication Companies A or B and only 14 people with this level of cancer risk near the Massachusetts dry cleaner. The number of people estimated to have lifetime cancer risks greater than or equal to 1 in 1 million near the Virginia dry cleaner is 170, which is significantly lower than Exponent's estimate. Despite using a higher emissions estimate for the Superior Tube facility (59.46 tons versus 35 tons), we estimated a slightly lower number of people with lifetime cancer risks of greater than or equal to 1 in 1 million (1,530 versus 1,571). Importantly, for all of the modeled facilities, modeling results indicate an absence of populations with estimated lifetime cancer risks greater than or equal to 1 in 100,000.
Table 3.3 Estimated Lifetime Cancer Risks in Census Blocks Surrounding Superior Tube
Lifetime Cancer Risk Level Population Affected
Exponent Model Run Gradient Model Run Greater than or equal to 1 in 1,000 0 0 Greater than or equal to 1 in 10,000 0 0 Greater than or equal to 1 in 20,000 0 0 Greater than or equal to 1 in 100,000 0 8* Greater than or equal to 1 in 1,000,000 1,571 1,530 Greater than or equal to 1 in 10,000,000 25,871 23,931
* The HEM-3 output value of 8 people with estimated lifetime cancer risks greater than or equal to 1 in 100,000 refers to the 8 people living in the maximally impacted census block. The model-calculated lifetime cancer risk for people at that census block receptor is 9.9 in 1 million; therefore, we believe that the HEM-3 model output showing 8 people with 1 in 100,000 lifetime cancer risks is not accurate, and may be due to a rounding issue with the model.
Table 3.4 Estimated Lifetime Cancer Risks in Census Blocks Surrounding Fabrication Company A
Lifetime Cancer Risk Level Population Affected
Exponent Model Run Gradient Model Run Greater than or equal to 1 in 1,000 0 0 Greater than or equal to 1 in 10,000 0 0 Greater than or equal to 1 in 20,000 0 0 Greater than or equal to 1 in 100,000 0 0 Greater than or equal to 1 in 1,000,000 0 0 Greater than or equal to 1 in 10,000,000 1,065 18
20 G:\Projects\215034_Albemarle\TextProc\r050715n.docx
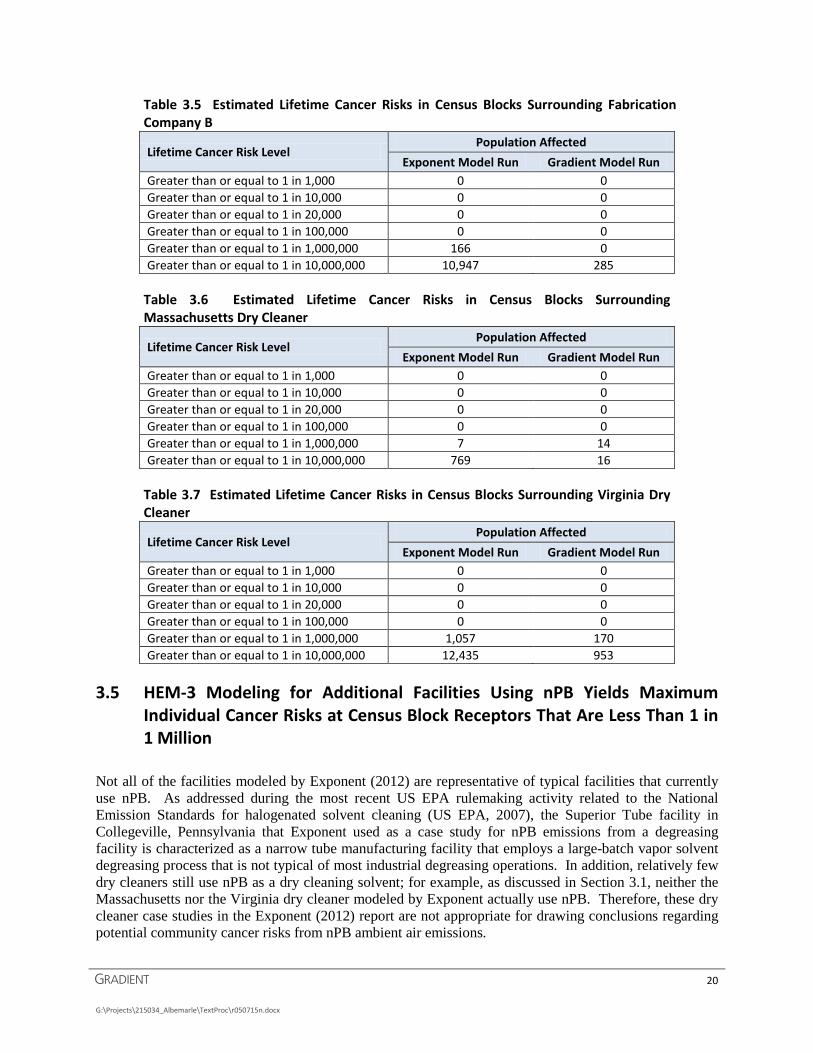
Table 3.5 Estimated Lifetime Cancer Risks in Census Blocks Surrounding Fabrication Company B
Lifetime Cancer Risk Level Population Affected
Exponent Model Run Gradient Model Run Greater than or equal to 1 in 1,000 0 0 Greater than or equal to 1 in 10,000 0 0 Greater than or equal to 1 in 20,000 0 0 Greater than or equal to 1 in 100,000 0 0 Greater than or equal to 1 in 1,000,000 166 0 Greater than or equal to 1 in 10,000,000 10,947 285
Table 3.6 Estimated Lifetime Cancer Risks in Census Blocks Surrounding Massachusetts Dry Cleaner
Lifetime Cancer Risk Level Population Affected
Exponent Model Run Gradient Model Run Greater than or equal to 1 in 1,000 0 0 Greater than or equal to 1 in 10,000 0 0 Greater than or equal to 1 in 20,000 0 0 Greater than or equal to 1 in 100,000 0 0 Greater than or equal to 1 in 1,000,000 7 14 Greater than or equal to 1 in 10,000,000 769 16
Table 3.7 Estimated Lifetime Cancer Risks in Census Blocks Surrounding Virginia Dry Cleaner
Lifetime Cancer Risk Level Population Affected
Exponent Model Run Gradient Model Run Greater than or equal to 1 in 1,000 0 0 Greater than or equal to 1 in 10,000 0 0 Greater than or equal to 1 in 20,000 0 0 Greater than or equal to 1 in 100,000 0 0 Greater than or equal to 1 in 1,000,000 1,057 170 Greater than or equal to 1 in 10,000,000 12,435 953
3.5 HEM-3 Modeling for Additional Facilities Using nPB Yields Maximum
Individual Cancer Risks at Census Block Receptors That Are Less Than 1 in 1 Million
Not all of the facilities modeled by Exponent (2012) are representative of typical facilities that currently use nPB. As addressed during the most recent US EPA rulemaking activity related to the National Emission Standards for halogenated solvent cleaning (US EPA, 2007), the Superior Tube facility in Collegeville, Pennsylvania that Exponent used as a case study for nPB emissions from a degreasing facility is characterized as a narrow tube manufacturing facility that employs a large-batch vapor solvent degreasing process that is not typical of most industrial degreasing operations. In addition, relatively few dry cleaners still use nPB as a dry cleaning solvent; for example, as discussed in Section 3.1, neither the Massachusetts nor the Virginia dry cleaner modeled by Exponent actually use nPB. Therefore, these dry cleaner case studies in the Exponent (2012) report are not appropriate for drawing conclusions regarding potential community cancer risks from nPB ambient air emissions.
21 G:\Projects\215034_Albemarle\TextProc\r050715n.docx
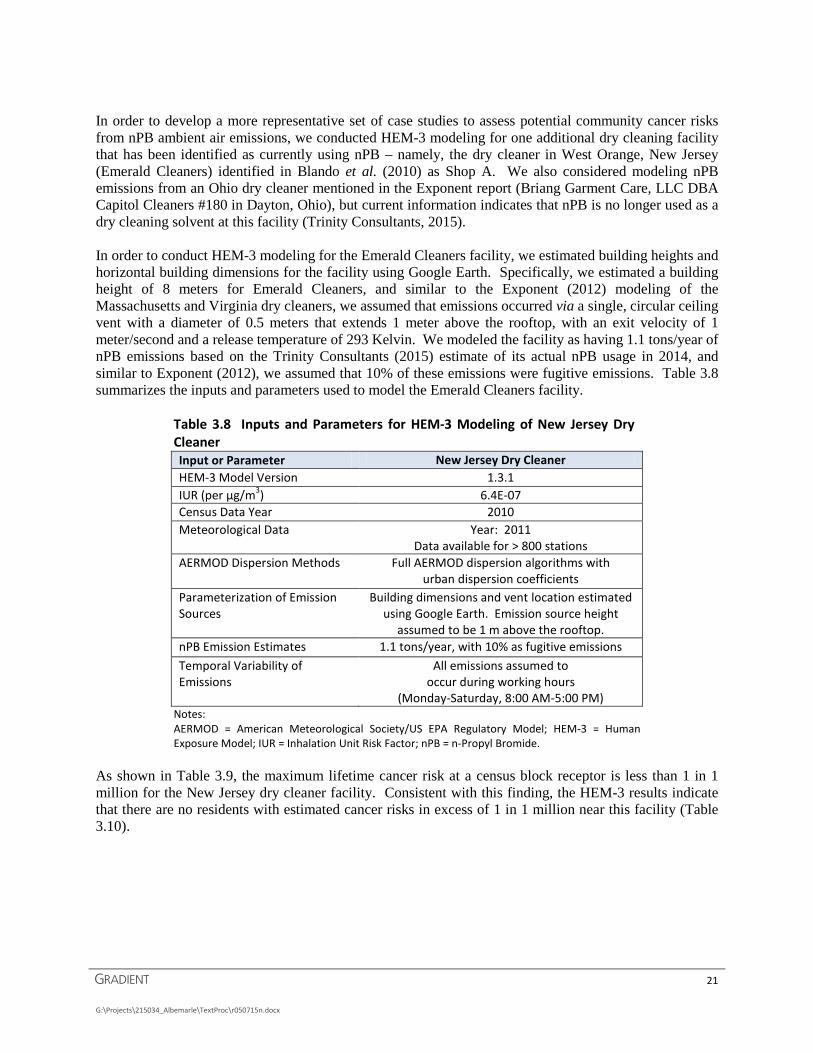
In order to develop a more representative set of case studies to assess potential community cancer risks from nPB ambient air emissions, we conducted HEM-3 modeling for one additional dry cleaning facility that has been identified as currently using nPB – namely, the dry cleaner in West Orange, New Jersey (Emerald Cleaners) identified in Blando et al. (2010) as Shop A. We also considered modeling nPB emissions from an Ohio dry cleaner mentioned in the Exponent report (Briang Garment Care, LLC DBA Capitol Cleaners #180 in Dayton, Ohio), but current information indicates that nPB is no longer used as a dry cleaning solvent at this facility (Trinity Consultants, 2015). In order to conduct HEM-3 modeling for the Emerald Cleaners facility, we estimated building heights and horizontal building dimensions for the facility using Google Earth. Specifically, we estimated a building height of 8 meters for Emerald Cleaners, and similar to the Exponent (2012) modeling of the Massachusetts and Virginia dry cleaners, we assumed that emissions occurred via a single, circular ceiling vent with a diameter of 0.5 meters that extends 1 meter above the rooftop, with an exit velocity of 1 meter/second and a release temperature of 293 Kelvin. We modeled the facility as having 1.1 tons/year of nPB emissions based on the Trinity Consultants (2015) estimate of its actual nPB usage in 2014, and similar to Exponent (2012), we assumed that 10% of these emissions were fugitive emissions. Table 3.8 summarizes the inputs and parameters used to model the Emerald Cleaners facility.
Table 3.8 Inputs and Parameters for HEM-3 Modeling of New Jersey Dry Cleaner Input or Parameter New Jersey Dry Cleaner HEM-3 Model Version 1.3.1 IUR (per μg/m3) 6.4E-07 Census Data Year 2010 Meteorological Data Year: 2011
Data available for > 800 stations AERMOD Dispersion Methods Full AERMOD dispersion algorithms with
urban dispersion coefficients Parameterization of Emission Sources
Building dimensions and vent location estimated using Google Earth. Emission source height
assumed to be 1 m above the rooftop. nPB Emission Estimates 1.1 tons/year, with 10% as fugitive emissions Temporal Variability of Emissions
All emissions assumed to occur during working hours
(Monday-Saturday, 8:00 AM-5:00 PM) Notes: AERMOD = American Meteorological Society/US EPA Regulatory Model; HEM-3 = Human Exposure Model; IUR = Inhalation Unit Risk Factor; nPB = n-Propyl Bromide.
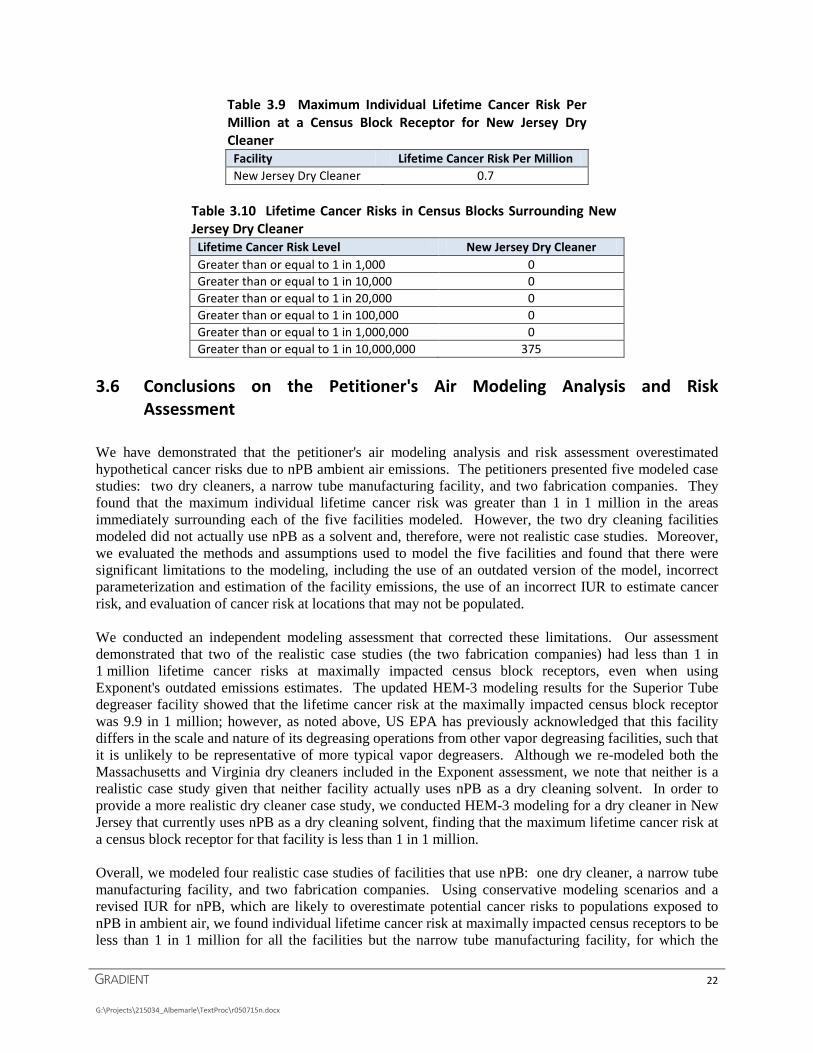
As shown in Table 3.9, the maximum lifetime cancer risk at a census block receptor is less than 1 in 1 million for the New Jersey dry cleaner facility. Consistent with this finding, the HEM-3 results indicate that there are no residents with estimated cancer risks in excess of 1 in 1 million near this facility (Table 3.10).
22 G:\Projects\215034_Albemarle\TextProc\r050715n.docx
Table 3.9 Maximum Individual Lifetime Cancer Risk Per Million at a Census Block Receptor for New Jersey Dry Cleaner
Facility Lifetime Cancer Risk Per Million New Jersey Dry Cleaner 0.7
Table 3.10 Lifetime Cancer Risks in Census Blocks Surrounding New Jersey Dry Cleaner
Lifetime Cancer Risk Level New Jersey Dry Cleaner Greater than or equal to 1 in 1,000 0 Greater than or equal to 1 in 10,000 0 Greater than or equal to 1 in 20,000 0 Greater than or equal to 1 in 100,000 0 Greater than or equal to 1 in 1,000,000 0 Greater than or equal to 1 in 10,000,000 375
3.6 Conclusions on the Petitioner's Air Modeling Analysis and Risk
Assessment
We have demonstrated that the petitioner's air modeling analysis and risk assessment overestimated hypothetical cancer risks due to nPB ambient air emissions. The petitioners presented five modeled case studies: two dry cleaners, a narrow tube manufacturing facility, and two fabrication companies. They found that the maximum individual lifetime cancer risk was greater than 1 in 1 million in the areas immediately surrounding each of the five facilities modeled. However, the two dry cleaning facilities modeled did not actually use nPB as a solvent and, therefore, were not realistic case studies. Moreover, we evaluated the methods and assumptions used to model the five facilities and found that there were significant limitations to the modeling, including the use of an outdated version of the model, incorrect parameterization and estimation of the facility emissions, the use of an incorrect IUR to estimate cancer risk, and evaluation of cancer risk at locations that may not be populated. We conducted an independent modeling assessment that corrected these limitations. Our assessment demonstrated that two of the realistic case studies (the two fabrication companies) had less than 1 in 1 million lifetime cancer risks at maximally impacted census block receptors, even when using Exponent's outdated emissions estimates. The updated HEM-3 modeling results for the Superior Tube degreaser facility showed that the lifetime cancer risk at the maximally impacted census block receptor was 9.9 in 1 million; however, as noted above, US EPA has previously acknowledged that this facility differs in the scale and nature of its degreasing operations from other vapor degreasing facilities, such that it is unlikely to be representative of more typical vapor degreasers. Although we re-modeled both the Massachusetts and Virginia dry cleaners included in the Exponent assessment, we note that neither is a realistic case study given that neither facility actually uses nPB as a dry cleaning solvent. In order to provide a more realistic dry cleaner case study, we conducted HEM-3 modeling for a dry cleaner in New Jersey that currently uses nPB as a dry cleaning solvent, finding that the maximum lifetime cancer risk at a census block receptor for that facility is less than 1 in 1 million. Overall, we modeled four realistic case studies of facilities that use nPB: one dry cleaner, a narrow tube manufacturing facility, and two fabrication companies. Using conservative modeling scenarios and a revised IUR for nPB, which are likely to overestimate potential cancer risks to populations exposed to nPB in ambient air, we found individual lifetime cancer risk at maximally impacted census receptors to be less than 1 in 1 million for all the facilities but the narrow tube manufacturing facility, for which the
23 G:\Projects\215034_Albemarle\TextProc\r050715n.docx
maximum individual lifetime cancer risk remains below 10 in 1 million. We thus conclude that estimated lifetime cancer risks associated with nPB air emissions are well within US EPA's acceptable cancer risk range of 1 in 1 million to 1 in 10,000 (10-6 to 10-4).
24 G:\Projects\215034_Albemarle\TextProc\r050715n.docx
4 References
Barber, ED; Donish, WH; Mueller, KR. 1981. "A procedure for the quantitative measurement of the mutagenicity of volatile liquids in the Ames Salmonella/microsome assay." Mutat. Res. 90(1):31-48.
Blando, JD; Schill, DP; De La Cruz, MP; Zhang, L; Zhang, J. 2010. "Preliminary study of propyl bromide exposure among New Jersey dry cleaners as a result of a pending ban on perchloroethylene." J. Air Waste Manag. Assoc. 60(9):1049-1056. doi: 10.3155/1047-3289.60.9.1049.
Cohen, SM; Klaunig, J; Meek, ME; Hill, RN; Pastoor, T; Lehman-McKeeman, L; Bucher, J; Longfellow, DG; Seed, J; Dellarco, V; Fenner-Crisp, P; Patton, D. 2004. "Evaluating the human relevance of chemically-induced animal tumors." Toxicol. Sci. 78:181-186.
Cruzan, G; Bus, J; Banton, M; Gingell, R; Carlson, G. 2009. "Mouse specific lung tumors from CYP2F2-mediated cytotoxic metabolism: An endpoint/toxic response where data from multiple chemicals converge to support a mode of action." Regul. Toxicol. Pharmacol. 55(2):205-218.
EC/R Inc. (EC/R). 2014. "The HEM-3 User's Guide: Instructions for Using the Human Exposure Model Version 1.3.1 (AERMOD version) for Single Facility Modeling." Chapel Hill, NC. Report to US EPA, Office of Air Quality Planning & Standards, 93p., April.
Edler, L; Hart, A; Greaves, P; Carthew, P; Coulet, M; Boobis, A; Williams, GM; Smith, B. 2014. "Selection of appropriate tumour data sets for Benchmark Dose Modelling (BMD) and derivation of a Margin of Exposure (MoE) for substances that are genotoxic and carcinogenic: Considerations of biological relevance of tumour type, data quality and uncertainty assessment." Food Chem. Toxicol. 70:264-289. doi: 10.1016/j.fct.2013.10.030.
Exponent. 2012. "Risks Associated with Point Source Emissions of n-Propyl Bromide." Alexandria, VA. Report to Halogenated Solvents Industry Alliance, Inc., Arlington, VA, 31p., November 19.
Garner, CE; Liang, S; Yig, L; Yu, X. 2015. "Physiologically based pharmacokinetic modeling for 1-bromopropane in F344 rats using gas uptake inhalation experiments." Toxicol. Sci. doi: 10.1093/toxsci/kfv018.
Garner, CE; Sumner, SC; Davis, JG; Burgess, JP; Yueh, Y; Demeter, J; Zhan, Q; Valentine, J; Jeffcoat, AR; Burka, LT; Mathews, JM. 2006. "Metabolism and disposition of 1-bromopropane in rats and mice following inhalation or intravenous administration." Toxicol. Appl. Pharmacol. 215(1):23-36. doi: 10.1016/j.taap.2006.01.010.
Garner, CE; Yu, X. 2014. "Species and sex-dependent toxicokinetics of 1-bromopropane: The role of hepatic cytochrome P450 oxidation and glutathione (GSH)." Xenobiotica 44(7):644-656. doi: 10.3109/00498254.2013.879624.
Hammond, MC. [Land Air Water Legal Solutions LLC]. 2015a. Email correspondence to C. Nestrud (Chisenhall, Nestrud & Julian, P.A.) re: nPB follow-up [STC's environmental manager, John Peronti's evaluation of Figure 2 on page 13 of the Exponent report]. 2p, April 6.
25 G:\Projects\215034_Albemarle\TextProc\r050715n.docx
Hammond, MC. [Land Air Water Legal Solutions LLC]. 2015b. Personal communication to C. Long (Gradient). May 6.
Haseman, JK; Hailey, JR; Morris, RW. 1998. "Spontaneous neoplasm incidences in Fischer 344 rats and B6C3F1 mice in two-year carcinogenicity studies: A National Toxicology Program update." Toxicol. Pathol. 26(3):428-441. doi: 10.1177/019262339802600318.
Hernandez, LG; van Steeg, H; Luijten, M; van Benthem, J. 2009. "Mechanisms of non-genotoxic carcinogens and importance of a weight of evidence approach." Mutat. Res. 682(2-3):94-109.
ICF Consulting (ICF). 2002. "Acceptable Industrial Exposure Limit for N-Propyl Bromide (Draft Final)." Submitted to US EPA Docket. EPA-HQ-OAR-2002-0064-0007, 31p., May.
Kim, K-W; Kim, HY; Park, SS; Jeong, HS; Park, SH; Lee, JY; Jeong, JH; Moon, YH. 1999. "Gender differences in activity and induction of hepatic microsomal cytochrome P-450 by 1-bromopropane in Sprague-Dawley rats." J. Biochem. Mol. Biol. 83:229-236.
Lee, SK; Kang, MJ; Jeon, TW; Ha, HW; Yoo, JW; Ko, GS; Kang, W; Jeong, HG; Lyoo, WS; Jeong, TC. 2010. "Role of metabolism in 1-bromopropane-induced hepatotoxicity in mice." J. Toxicol. Environ. Health A 73(21-22):1431-1440. doi: 10.1080/15287394.2010.511546.
Liu, F; Ichihara, S; Mohideen, SS; Sai, U; Kitoh, J; Ichihara, G. 2009. "Comparative study on susceptibility to 1-bromopropane in three mice strains." Toxicol. Sci. 112(1):100-110. doi: 10.1093/toxsci/kfp173.
Meek, ME; Boobis, A; Cote, I; Dellarco, V; Fotakis, G; Munn, S; Seed, J; Vickers, C. 2014. "New developments in the evolution and application of the WHO/IPCS framework on mode of action/species concordance analysis." J. Appl. Toxicol. 34(1):1-18. doi: 10.1002/jat.2949.
Moon, H-I; Shin, S; Byeon, S-H. 2015. "Exposure monitoring and health risk assessment of 1-bromopropane as a cleaning solvent in the workplace." Hum. Ecol. Risk Assess. 21(3):744-752. doi: 10.1080/10807039.2014.926203.
Moore, NP; McFadden, LG; Landenberger, BD; Thomas, J. 2013. "Gender differences in the incidence of background and chemically induced primary pulmonary neoplasms in B6C3F1 mice: A retrospective analysis of the National Toxicology Program (NTP) carcinogenicity bioassays." Exp. Toxicol. Pathol. 65(7-8):1109-1115. doi: 10.1016/j.etp.2013.05.001.
Morgan, DL; Nyska, A; Harbo, SJ; Grumbein, SL; Dill, JA; Roycroft, JH; Kissling, GE; Cesta, MF. 2011. "Multisite carcinogenicity and respiratory toxicity of inhaled 1-bromopropane in rats and mice." Toxicol. Pathol. 39:938-948. doi: 10.1177/0192623311416374.
National Toxicology Program (NTP). 2003. "NTP-CERHR Monograph on the Potential Human Reproductive and Developmental Effects of 1-Bromopropane." Center for the Evaluation of Risks to Human Production, NIH Publication No. 04-4479, 88p., October.
National Toxicology Program (NTP). 2011. "Toxicology and Carcinogenesis Studies of 1-Bromopropane (CAS No. 106-94-5) in F344/N Rats and B6C3F1 Mice (Inhalation Studies)." NTP TR 564, NIH Publication No. 11-5906, 195p., August.

26 G:\Projects\215034_Albemarle\TextProc\r050715n.docx
Patton Boggs LLP. 2010. "Petition to Add n-Propyl Bromide to List of Hazardous Air Pollutants Regulated under § 112 of the Clean Air Act." Washington, DC. Report to Halogenated Solvents Industry Alliance, Inc., Arlington, VA. Submitted to US EPA Docket. EPA-HQ-OAR-2014-0471-0013, 31p., October 28.
Stelljes, ME; Wood, RR. 2004. "Development of an occupational exposure limit for n-propylbromide using benchmark dose methods." Regul. Toxicol. Pharmacol. 40(2):136-150. doi: 10.1016/j.yrtph.2004.06.006.
Toraason, M; Lynch, DW; DeBord, DG; Singh, N; Krieg, E; Butler, MA; Toennis, CA; Nemhauser, JB. 2006. "DNA damage in leukocytes of workers occupationally exposed to 1-bromopropane." Mutat. Res. 603(1):1-14. doi: 10.1016/j.mrgentox.2005.08.015.
Trinity Consultants. 2015. "Emission Report, NPB Response - Addendum." Report to Albemarle, LLC. 21p., May.
US Census Bureau. 2010. "Changes in the Number of Census Blocks, 2000-2010." C1010BR-01, 5p. Accessed at http://www2.census.gov/geo/pdfs/maps-data/data/changes_census_blocks_2000_2010.pdf.
US Census Bureau. 2011. "Population Distribution and Change: 2000 to 2010." C1010BR-01, 12p., March. Accessed at http://www.census.gov/prod/cen2010/briefs/c2010br-01.pdf.
US EPA. 1994. "Methods for Derivation of Inhalation Reference Concentrations and Application of Inhalation Dosimetry." Environmental Criteria and Assessment Office, Research Triangle Park, NC, EPA-600/8-90/066F, October.
US EPA. 2005a. "Guidelines for Carcinogen Risk Assessment (Final)." Risk Assessment Forum, EPA/630/P-03/001F. 166p., March.
US EPA. 2005b. "Supplemental guidance for assessing susceptibility from early-life exposure to carcinogens (Final)." Risk Assessment Forum, EPA-630/R-03/003F. 125p., March.
US EPA. 2005c. "Revision to the Guidelines on Air Quality Models: Adoption of a preferred general purpose (flat and complex terrain) dispersion model and other revisions (Final rule)." Fed. Reg. 70(216):68218-68261, November 9.
US EPA. 2009. "Risk Assessment Guidance for Superfund (RAGS). Volume I: Human Health Evaluation Manual (Part F, Supplemental Guidance for Inhalation Risk Assessment) (Final)." Office of Superfund Remediation and Technology Innovation, EPA-540-R-070-002, 68p., January.
US EPA. 2007. "National emission standards for hazardous air pollutants: Halogenated solvent cleaning (Final rule)." Fed. Reg. 72(85):25138-25159. 40 CFR 63, May 3.
US EPA. 2012a. "Benchmark Dose Technical Guidance." Risk Assessment Forum, EPA/100/R-12/001. 99p., June.
US EPA. 2012b. "Advances in Inhalation Gas Dosimetry for Derivation of a Reference Concentration (RfC) and Use in Risk Assessment (Final)." EPA/600/R-12/044. 140p., September.
27 G:\Projects\215034_Albemarle\TextProc\r050715n.docx
US EPA. 2013. "Process for Developing IRIS Health Assessments." Accessed at http://epa.gov/iris/process.htm.
US EPA. 2014. "Summary Report: State-of-the-Science Workshop on Chemically-Induced Mouse Lung Tumors: Applications to Human Health Assessments." National Center for Environmental Assessment (NCEA), EPA/600/R-14/002, 129p., December.
Wheeler, M; Bailer, AJ. 2012. "Monotonic Bayesian semiparametric benchmark dose analysis." Risk Anal. 32(7):1207-1218. doi: 10.1111/j.1539-6924.2011.01786.x.
ZOOTS Customer Care. 2015. Email to C. Long (Gradient) re: Environmentally SAFE Cleaning. March 19.
G:\Projects\215034_Albemarle\TextProc\r050715n.docx
Attachment A
Benchmark Dose Software Output
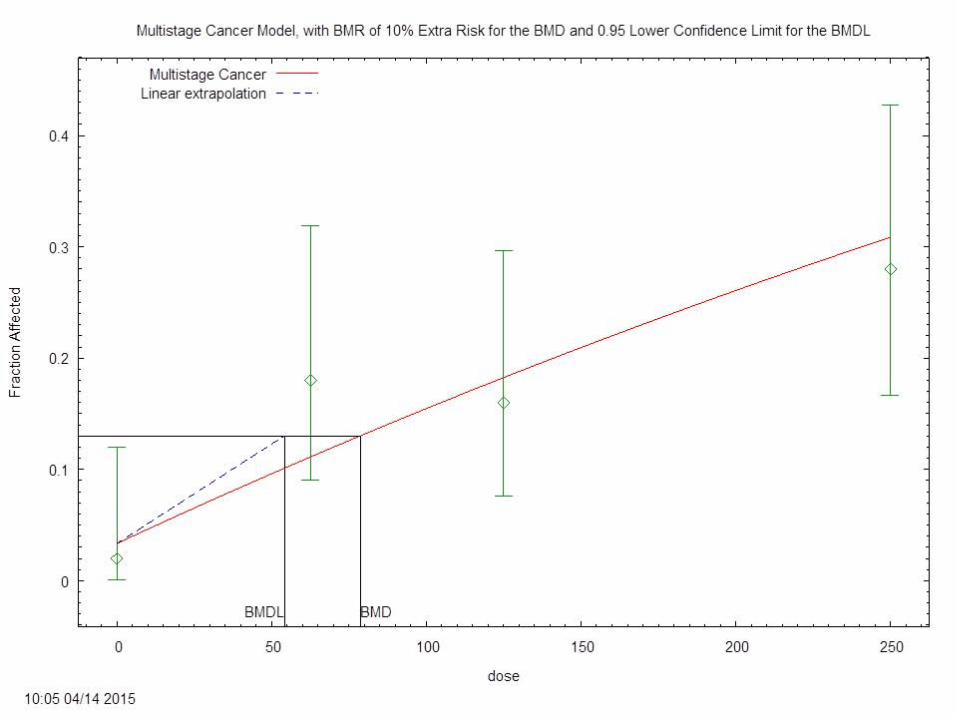
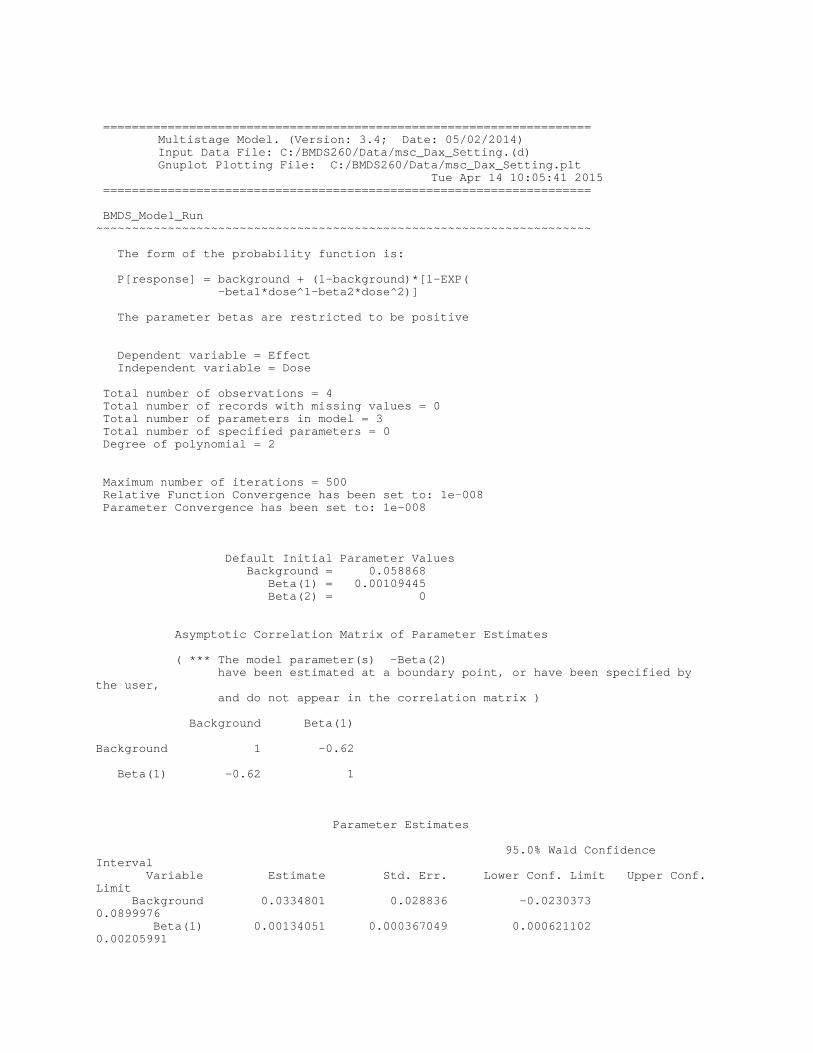
==================================================================== Multistage Model. (Version: 3.4; Date: 05/02/2014) Input Data File: C:/BMDS260/Data/msc_Dax_Setting.(d) Gnuplot Plotting File: C:/BMDS260/Data/msc_Dax_Setting.plt Tue Apr 14 10:05:41 2015 ====================================================================
BMDS_Model_Run ~~~~~~~~~~~~~~~~~~~~~~~~~~~~~~~~~~~~~~~~~~~~~~~~~~~~~~~~~~~~~~~~~~~~~ The form of the probability function is:
P[response] = background + (1-background)*[1-EXP( -beta1*dose^1-beta2*dose^2)]
The parameter betas are restricted to be positive
Dependent variable = Effect Independent variable = Dose
Total number of observations = 4 Total number of records with missing values = 0 Total number of parameters in model = 3 Total number of specified parameters = 0 Degree of polynomial = 2
Maximum number of iterations = 500 Relative Function Convergence has been set to: 1e-008 Parameter Convergence has been set to: 1e-008
Default Initial Parameter Values Background = 0.058868 Beta(1) = 0.00109445 Beta(2) = 0
Asymptotic Correlation Matrix of Parameter Estimates
( *** The model parameter(s) -Beta(2) have been estimated at a boundary point, or have been specified by the user, and do not appear in the correlation matrix )
Background Beta(1)
Background 1 -0.62
Beta(1) -0.62 1
Parameter Estimates
95.0% Wald Confidence Interval Variable Estimate Std. Err. Lower Conf. Limit Upper Conf. Limit Background 0.0334801 0.028836 -0.0230373 0.0899976 Beta(1) 0.00134051 0.000367049 0.000621102 0.00205991
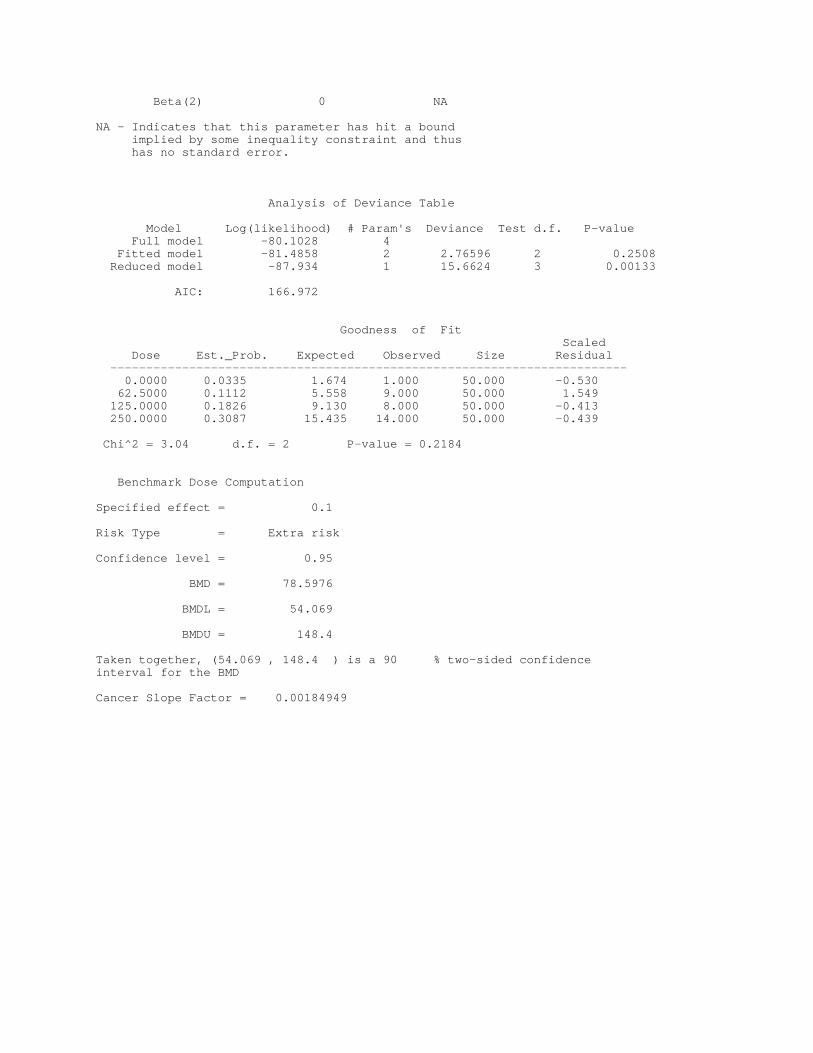
Beta(2) 0 NA
NA - Indicates that this parameter has hit a bound implied by some inequality constraint and thus has no standard error.
Analysis of Deviance Table
Model Log(likelihood) # Param's Deviance Test d.f. P-value Full model -80.1028 4 Fitted model -81.4858 2 2.76596 2 0.2508 Reduced model -87.934 1 15.6624 3 0.00133
AIC: 166.972
Goodness of Fit Scaled Dose Est._Prob. Expected Observed Size Residual ------------------------------------------------------------------------ 0.0000 0.0335 1.674 1.000 50.000 -0.530 62.5000 0.1112 5.558 9.000 50.000 1.549 125.0000 0.1826 9.130 8.000 50.000 -0.413 250.0000 0.3087 15.435 14.000 50.000 -0.439
Chi^2 = 3.04 d.f. = 2 P-value = 0.2184
Benchmark Dose Computation
Specified effect = 0.1
Risk Type = Extra risk
Confidence level = 0.95
BMD = 78.5976
BMDL = 54.069
BMDU = 148.4
Taken together, (54.069 , 148.4 ) is a 90 % two-sided confidenceinterval for the BMD
Cancer Slope Factor = 0.00184949
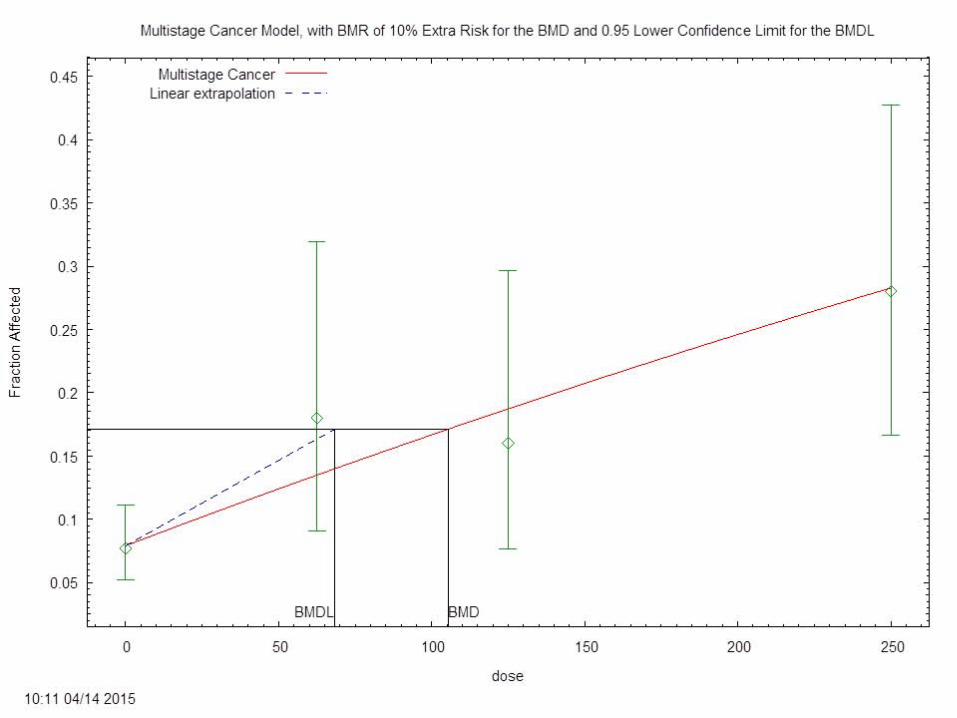

==================================================================== Multistage Model. (Version: 3.4; Date: 05/02/2014) Input Data File: C:/BMDS260/Data/msc_Dax_Setting.(d) Gnuplot Plotting File: C:/BMDS260/Data/msc_Dax_Setting.plt Tue Apr 14 10:11:00 2015 ====================================================================
BMDS_Model_Run ~~~~~~~~~~~~~~~~~~~~~~~~~~~~~~~~~~~~~~~~~~~~~~~~~~~~~~~~~~~~~~~~~~~~~ The form of the probability function is:
P[response] = background + (1-background)*[1-EXP( -beta1*dose^1-beta2*dose^2)]
The parameter betas are restricted to be positive
Dependent variable = Effect Independent variable = Dose
Total number of observations = 4 Total number of records with missing values = 0 Total number of parameters in model = 3 Total number of specified parameters = 0 Degree of polynomial = 2
Maximum number of iterations = 500 Relative Function Convergence has been set to: 1e-008 Parameter Convergence has been set to: 1e-008
Default Initial Parameter Values Background = 0.0928427 Beta(1) = 0.000878318 Beta(2) = 9.2249e-008
Asymptotic Correlation Matrix of Parameter Estimates
( *** The model parameter(s) -Beta(2) have been estimated at a boundary point, or have been specified by the user, and do not appear in the correlation matrix )
Background Beta(1)
Background 1 -0.34
Beta(1) -0.34 1
Parameter Estimates
95.0% Wald Confidence Interval Variable Estimate Std. Err. Lower Conf. Limit Upper Conf. Limit Background 0.0791461 0.0142511 0.0512145 0.107078 Beta(1) 0.00100047 0.000301516 0.000409506 0.00159143
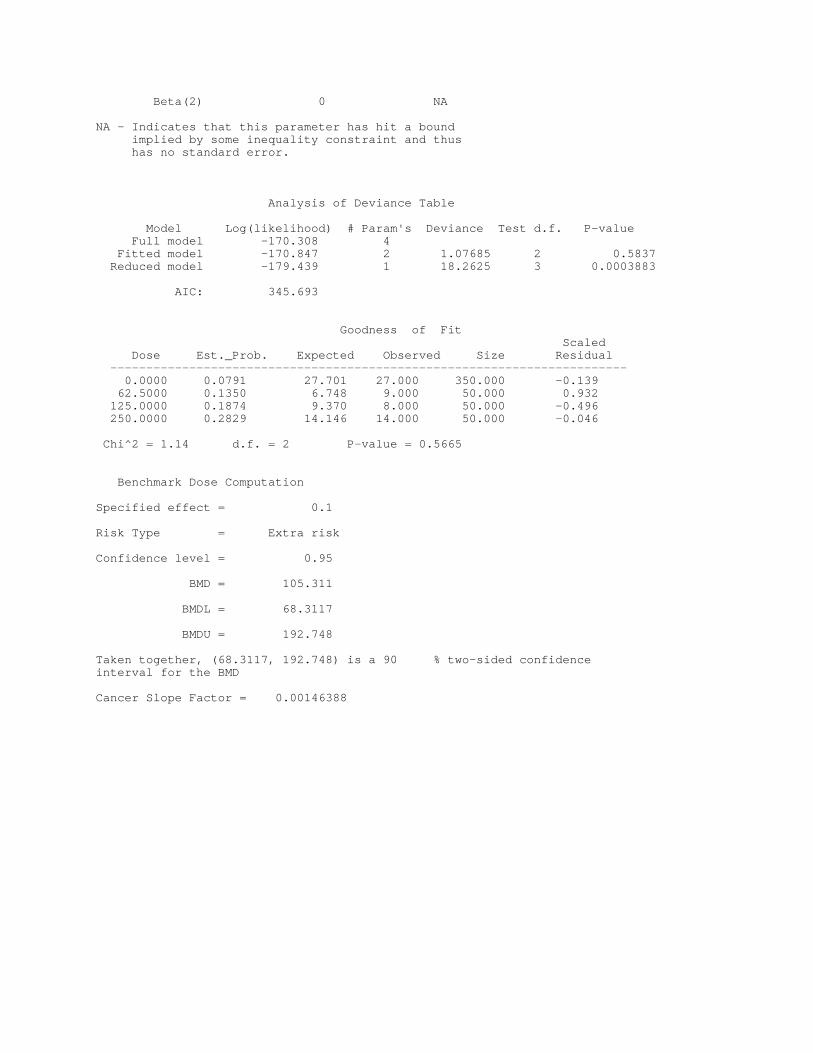
Beta(2) 0 NA
NA - Indicates that this parameter has hit a bound implied by some inequality constraint and thus has no standard error.
Analysis of Deviance Table
Model Log(likelihood) # Param's Deviance Test d.f. P-value Full model -170.308 4 Fitted model -170.847 2 1.07685 2 0.5837 Reduced model -179.439 1 18.2625 3 0.0003883
AIC: 345.693
Goodness of Fit Scaled Dose Est._Prob. Expected Observed Size Residual ------------------------------------------------------------------------ 0.0000 0.0791 27.701 27.000 350.000 -0.139 62.5000 0.1350 6.748 9.000 50.000 0.932 125.0000 0.1874 9.370 8.000 50.000 -0.496 250.0000 0.2829 14.146 14.000 50.000 -0.046
Chi^2 = 1.14 d.f. = 2 P-value = 0.5665
Benchmark Dose Computation
Specified effect = 0.1
Risk Type = Extra risk
Confidence level = 0.95
BMD = 105.311
BMDL = 68.3117
BMDU = 192.748
Taken together, (68.3117, 192.748) is a 90 % two-sided confidenceinterval for the BMD
Cancer Slope Factor = 0.00146388
G:\Projects\215034_Albemarle\TextProc\r050715n.docx
Attachment B
Letter Regarding Additional Mutagenicity Data