Embed Size (px)
Citation preview

Combination notes: market segmentation and equity transfer
Albert Schaber
Discussion Paper 2008-6
This version: December 2008
LMU
LUDWIG-MAXIMILIANS-UNIVERSITÄT MÜNCHEN MUNICH SCHOOL OF MANAGEMENT
Online at http://epub.ub.uni-muenchen.de/
Combination notes: market segmentation andequity transfer
Albert Schaber∗
Ludwig-Maximilians-University
This version: December 1, 2008
Abstract
This paper empirically analyzes a particular type of notes observed insecuritization transactions: combination notes. Combination notes are formedby combining parts of two or more tranches of securitization transactions,where one part usually consists of a share of the first loss piece. It is analyzedwhether combination notes are purely demand driven, or whether combinationnotes also appear to be structured to enable equity transfer. Results indicatethat combination notes serve both purposes: market segmentation severelydetermines the structuring of combination notes, but risk transfer needs seemto be catered by combination notes as well. Further, an analysis of launchspreads indicates, that the observed equity transfer via combination notes hasan impact on the pricing of the ordinary tranches of each deal. This papermakes use of unique data on 126 deals containing 1385 tranches, thereof 398combination notes.
1 Introduction
Securitization of assets can be characterized by two prevailing structural elements.Several assets are assembled (pooling) to collateralize securities that are sold to fi-nancial markets in different tranches (tranching), with the principle of subordinationusually being applied. The resulting notes are called asset backed securities (ABS).Securitization grew tremendously in the last decade, with different types of assetsbeing securitized. The main categories are the securitization of mortgages (RMBS,CMBS), the securitization of consumer assets, and the securitization of debt claims(CDOs).1 This paper focuses on one special note issued in securitization transac-tions: combination notes (also called combo notes). A combination note (CN) is
∗Full address and affiliation: Institute of Capital Market Research and Finance, Munich Schoolof Management, Ludwig-Maximilians-University, Schackstr. 4, 80539 Munich, Germany. Com-ments should be addressed to [email protected], or +49/89/21802145. I thank Dr. MarcoKrohn, HypoVereinsbank/UniCredit Global Research, for providing the data used in this studyand for numerous helpful comments.
1The securitization of consumer asset is sometimes referred to as ABS, such as the securitization ofassets in general.
1
constructed by combining parts of two or more tranches of a securitization transac-tion.2 Usually, but not in every case, a CN comprises a share of the first loss piece(FLP), which is the most junior security of a securitization transaction, also knownas equity piece or junior security. The creation of combination notes is not partof the original structuring process, which means that “plain vanilla” tranches arecreated first given the estimated portfolio loss distribution of the underlying assetportfolio, and combination notes result from combining parts of two or more of the“plain vanilla” tranches after their structure was determined. Furthermore, mostCNs carry a rating assigned by one of the dominating rating agencies, and theirexistence is observed by market participants.
However, if capital markets were perfect and complete, neither combination notesnor securitization in general could add value to a firm. But market frictions exist,which can make securitization and also the creation of combination notes value cre-ating.3 From an originator’s point of view, securitization in general can serve threemain purposes: raising funds, risk transfer, and arbitrage. Considering combinationnotes in particular, several of these motivations might drive their issuance. Combi-nation notes possibly facilitate equity transfer, which becomes more important dueto the new regulatory framework Basel II.4 But also asset managers that issue man-aged CDO transactions and that are not necessarily regulated, will prefer to transferequity rather to retain it. On the one hand, asset managers’ capital is limited. Sell-ing a share of the FLP allows them to structure larger transactions respectively toincrease their leverage or to increase their turnover. On the other hand, asset man-agers generate a substantial part of their income via fees, and therefore will preferto transfer equity risk to market participants. From an investor’s perspective, com-bination notes can facilitate the access to a certain risk-return profile, that mightotherwise not be accessible due to investment restrictions, be them internal or exter-nal. Combination notes allow to participate in the residual income of securitizationtransactions, with the investment usually being rated at least investment grade, andthe risk often being concentrated in the interest stream of the note but not in theprincipal amount.
While the above motives drive securitization in the market, their security de-sign has been addressed in several theoretical contributions focusing on transactioncosts, market incompleteness, and asymmetric information. To begin with, pooling
2According to Standard & Poor’s, 2002, p. 143, CNs can also comprise parts of tranches of differentdeals, which however was not observed for any CN in the data used here. A structure that wasobserved three out of 398 times was the combination of equity with OATs (obligation assimilabledu tresor, a French government bond).
3See Bluhm / Overbeck / Wagner, 2003, pp. 253-263 for a detailed description of originator andinvestor benefits of CDOs, Merchant (2004) for an introduction to the investor’s point of view onCDO equity, and Brennan / Hein / Poon (2008) for an analysis of arbitrage CDOs.
4Under the new regulatory framework (“International Convergence of Capital Management andCapital Standards - A Revised Framework”), the distorting incentives to sell high quality assetswhile retaining low quality assets were mitigated in order to stop regulatory capital arbitrage. SeeBasel Committee on Banking Supervision, 2004, §§ 538-643, for the treatment of securitizationtransactions. As a result, selling the FLP has become more common in recent years, see Inter-national Monetary Fund, 2006, p. 56 and Fitch Ratings, 2005, p. 6. The extent to which equitypieces have been sold is so far unknown to regulators, greater transparency is discussed by marketparticipants, see Fitch Ratings (2008).
2
of assets can reduce costs, when the trading of individual loans is costly.5 Gauret al. (2003) analyze market incompleteness and focus on a market where somebut not all assets can be priced uniquely. They show that singling out new cashflow profiles increases market spanning, which is rewarded by a premium. Theirresults apply to securitization, where the optimal structure arises from the issuer’soptimization. Problems due to information asymmetries can arise both ex-ante andex-post. Ex-ante, the originator can be tempted to choose a poor average assetquality for the underlying asset pool, which bears the risk of adverse selection andhence market failure. Articles focusing on ex-ante asymmetries are Boot / Thakor(1993), Riddiough (1997), DeMarzo (2005), and Plantin (2004). Ex-post, investorsof securitization transactions face moral hazard in case the value of the asset pool isa function of the originator’s unobservable monitoring activity. Articles focusing onex-post asymmetries include Gorton / Pennacchi (1995), Gorton / Souleles (2005),and Schaber (2008a). One stylized result of most of the above articles is the sug-gestion to retain the first loss piece in order to either send an appropriate signalto the market concerning asset pool quality in an adverse selection setting, or toprovide the originator with the required incentives to mitigate moral hazard. Theneed to retain the FLP is relaxed in Plantin (2004) and Schaber (2008a). Plantin(2004) is the first to point out explicitly, that the FLP can be sold to sophisticatedinvestors in case information production on the FLP is profitable to them—a resultin line with Boot and Thakor (1993) but more specifically tailored to securitizationtransactions. Schaber (2008a) uses a repeated game argument to show that, eventhough the FLP is not retained, incentives to monitor the FLP can be maintainedfor the originator in a moral hazard setting.
Given that combination notes commonly comprise a share of the FLP, this pa-per is the first to analyze observed equity transfer in asset securitization empirically.Existing empirical evidence on securitization is still scarce, with Firla-Cuchra /Jenkinson (2005), Firla-Cuchra (2005), and Franke / Weber (2007) being the mostimportant contributions for this research.6 Firla-Cuchra / Jenkinson (2005) focus onthe impact of market segmentation and asymmetric information on tranching andpricing of ABS, while Firla-Cuchra (2005) focuses on launch spreads only. Franke /Weber (2007) strongly focus on the impact of the underlying assets’ quality onstructural choices of CDO transactions such as the size of the FLP, the number oftranches, and the choice between true sale and synthetic structures. To my knowl-edge, combination notes so far have not been subject of closer examination, neitherfrom academia, nor from market participants. The purpose of this article is toexplore the properties of combination notes empirically in the context of existingevidence. Combination notes are interesting for various reasons. First, given combi-nation notes commonly comprise some share of the first loss piece, equity transfer canbe estimated. Second, rating of combination notes requires a closer examination, asthe underlying share of equity is commonly not rated and rating methodologies varyfor combination notes. Third, the tranching decision on combination notes can yieldimportant insights. It can provide evidence, whether combination notes seem to be
5See Duffie / Garleanu, 2001, p. 42, for a short discussion on transaction costs.6For an extended version of Franke / Weber (2007) in English language see Franke / Herrmann /Weber (2007).
3
strongly demand driven, i.e. are structured to cater segmented markets, or equallyreduce information asymmetries. Fourth, the structuring decision of the overall dealcan reveal, whether combination notes are used as equity transfer vehicle. Fifth,the analysis of launch spreads can reveal whether the presence of combination noteshas an impact on the pricing of securitization transactions. And sixth, combinationnotes are complex securities, and provide a venue for an analysis of the success offinancial innovations.
This paper is unique, as it is the first to analyze combination notes, based on amanually collected dataset. It is also the first paper to shed some light on equitypiece issuance, as general data on the distribution of equity pieces is not available.The paper is organized as follows. In section 2, research questions are formulated.Section 3 provides a description of the data and general insights on combinationnotes. Section 4 contains the empirical analysis. Section 5 concludes with a summaryof major results.
2 Derivation of hypotheses on the structuring and
impact of combination notes
The research questions formulated in this section can be grouped in two major blocks.One block addresses the question to which extend combination notes are tailoredto investor needs and hence cater segmented markets, or if they equally resolveinformation asymmetries. The other block focuses on the risk transfer associatedwith combination notes. A minor research question focuses on the success of financialinnovations, with CNs being an example for complex securities issued only in recentyears. Different explorative hypotheses are lined out in the following.
Combination notes are securities that have special risk return properties andmight face markets that are not very deep. The existence of limited demand capacitycan make tranching beneficial as it might reduce price discounts or be even necessaryto market CNs at all. Additionally, limited demand capacity might also place anupper bound on the transferability of equity of a single deal. This leads to thefollowing hypotheses:
H1 : The number of combination notes increases with the absolute com-bination note volume in the deal.
H2 : The relative size of the combination notes in a deal will be negativelyrelated to the overall size of the deal.
Taken together, H1 and H2 also imply a rather constant size of each singlecombination note. Aside, it can be suspected, that combination notes will carrya rating of at least investment grade, which will be elaborated in section 3. Ifcombination notes were structured to reduce asymmetric information, combinationnotes should be tranched more given information asymmetries are higher, whichleads to hypothesis 3:
H3 : The number of new rating classes added to the original numberof rating classes by structuring combination notes will increase with in-creasing information asymmetries.
4

Rating classes is a term first introduced by Firla-Cuchra / Jenkinson (2005)and is the number of differently rated tranches in a deal. The difference between theoverall number of tranches of a deal and the number of rating classes is called marketclasses, i.e. tranches that do not provide new information in terms of rating to capitalmarkets and that are primarily structured to be marketable.7 However, as the plainvanilla tranches are structured first, their tranching should reveal most informationon the underlying loss distribution, and their repackaging in a combination note isnot expected to release additional information on the loss distribution. Therefore,H3 is expected to be rejected.
Combination notes are a means to transfer equity. It shall hence be analyzed,whether risk transfer can be identified as a driver for the structuring and issuance ofcombination notes. Given combination notes are constructed to transfer equity risk,combination notes will be especially valuable when the quality of the underlyingassets is comparably low and the FLP hence proportionally large. Furthermore,the share of equity comprised in combination notes cannot be increased arbitrarilyin order to preserve marketability of the CN and to be able to obtain a rating onthe CN. Selling more equity will therefore require to sell a larger combination note.Together, this results in hypothesis 4:
H4 : The relative size of the combination notes in a deal will be increasingwith decreasing quality of the underlying assets.
The existence of combination notes is observed by market participants. As themajority of combination notes contains a fraction of the FLP, market participantshave reasonable evidence to notice equity transfer. From the market participants’perspective, equity transfer is a positive signal on the deal structure: someone isdirecting his funds to the most subordinate tranche of the deal, which protects allother tranches issued in the deal. This positive signal can have an impact on pricing,and results in hypothesis 5:
H5 : Launch spreads on the plain vanilla tranches decrease with an in-crease in observed equity transfer.
Combination notes result from combining two or more non-trivial assets, andare therefore themselves complex securities. It can be argued that experience andreputation is necessary to successfully issue financial innovations such as combinationnotes, which results in hypothesis 6:
H6 : Combination notes are issued by experienced institutions with apositive track record on the market.
7To take an example, a transaction with two AAA tranches, one AA+ tranche, two AA tranches, oneBBB tranche and one not rated FLP has four rating classes and three market classes. Market classescan however differ in other characteristics than rating such as currency and maturity. Throughoutthe paper, rating letters according to S&P and Fitch Ratings are used, which could equally bereplaced by those of Moody’s.
5
The above hypotheses will be tested in section 4. Given data availability, hypoth-esis 6 will only be discussed in section 3 and not tested in depth. Methodologically,the analysis will follow Firla-Cuchra / Jenkinson (2005) and Firla-Cuchra (2005)where possible in order to produce comparable results in this young field of empiri-cal research.
3 Data description and combination note proper-
ties
3.1 General descriptive statistics
I use a unique dataset on European transactions, where the core data was compiledfrom an internal database at HypoVereinsbank/UniCredit Global Markets, which isfed by different sources such as Moody’s, Fitch, Standard & Poor’s, Bloomberg, andReuters. Various variables concerning combination notes were manually collectedusing pre-sale and new issue reports by Moody’s, Standard & Poor’s, and Fitch.Overall, 130 deals that comprise 1433 tranches, thereof 406 combination notes, couldbe identified. This dataset spans a period from July 2002 until September 2007 andshould cover the majority of combination notes issued in Europe in that period,however, notes that did not appear in any publication cannot be identified. Out ofthese deals, four were identified as outliers and removed from the data.8 The datareduces to 126 deals, 1385 tranches, thereof 398 combination notes. All deals arebacked by loans or bonds, with the majority (97) being leveraged loan securitizations,and the remainder being securitizations of ABS, mixed assets, CLOs, high yieldbonds, and SME loans. The overall volume of these deals levels at 56.6 e billion,thereof 4.9 e billion equity.9 Sponsors of these transactions are banks as well asasset managers.
Some information could be gathered on the asset managers involved in the deals.Fitch publishes a CDO asset manager rating (CAM). These ratings were assembledfor the asset managers involved in the data where available, and translated into anumerical value, ranging from 7 (best) to 1 (worst).10 These values were comparedto all available Fitch CAM ratings, as reported in table 1. Doing so, it is assumedthat all of the asset managers rated by Fitch Ratings are active on the CDO market.
8The outliers were removed for the following reasons. One deal was, due to super senior swaps,extraordinarily large with a deal volume of 2.9 e billion, which is three times larger than thesecond biggest deal in the data. One deal is a CFO, hence a securitization of hedge fund and/orprivate equity assets, that differs remarkably in its structure by having a FLP that covers 38% ofthe deal volume. Two deals comprise extraordinarily large combination notes that cover 60% and75% of the deal volume, with the third largest relative CN size being 35%, which however is theCFO just mentioned to be excluded as well. The fourth largest relative CN size is at 24% only, sothat the exclusion of these outliers seems reasonable.
9In case tranches have been issued in dollars, the dollar amounts have been converted to euros usingthe corresponding exchange rate.
10The exact mapping is as follows: CAM1=7, CAM1−=6, CAM2+=5, CAM2=4, CAM2−=3,CAM3=2 and CAM4=1. Fitch CAM ratings were collected from the Fitch web page in November2007. The approach taken is rather crude, as ratings collected in November 2007 were used for thedata ranging from 2002 to 2007, CAM rating migrations were therefore not taken into account.
6
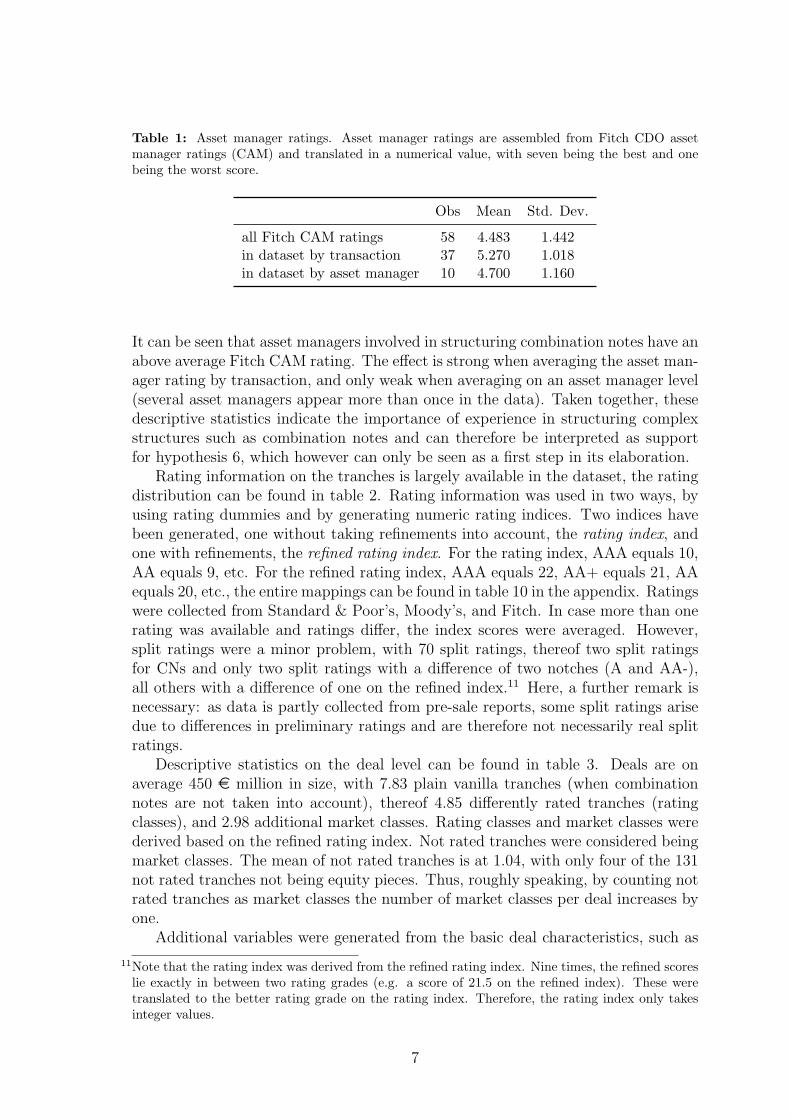
Table 1: Asset manager ratings. Asset manager ratings are assembled from Fitch CDO assetmanager ratings (CAM) and translated in a numerical value, with seven being the best and onebeing the worst score.
Obs Mean Std. Dev.
all Fitch CAM ratings 58 4.483 1.442in dataset by transaction 37 5.270 1.018in dataset by asset manager 10 4.700 1.160
It can be seen that asset managers involved in structuring combination notes have anabove average Fitch CAM rating. The effect is strong when averaging the asset man-ager rating by transaction, and only weak when averaging on an asset manager level(several asset managers appear more than once in the data). Taken together, thesedescriptive statistics indicate the importance of experience in structuring complexstructures such as combination notes and can therefore be interpreted as supportfor hypothesis 6, which however can only be seen as a first step in its elaboration.
Rating information on the tranches is largely available in the dataset, the ratingdistribution can be found in table 2. Rating information was used in two ways, byusing rating dummies and by generating numeric rating indices. Two indices havebeen generated, one without taking refinements into account, the rating index, andone with refinements, the refined rating index. For the rating index, AAA equals 10,AA equals 9, etc. For the refined rating index, AAA equals 22, AA+ equals 21, AAequals 20, etc., the entire mappings can be found in table 10 in the appendix. Ratingswere collected from Standard & Poor’s, Moody’s, and Fitch. In case more than onerating was available and ratings differ, the index scores were averaged. However,split ratings were a minor problem, with 70 split ratings, thereof two split ratingsfor CNs and only two split ratings with a difference of two notches (A and AA-),all others with a difference of one on the refined index.11 Here, a further remark isnecessary: as data is partly collected from pre-sale reports, some split ratings arisedue to differences in preliminary ratings and are therefore not necessarily real splitratings.
Descriptive statistics on the deal level can be found in table 3. Deals are onaverage 450 e million in size, with 7.83 plain vanilla tranches (when combinationnotes are not taken into account), thereof 4.85 differently rated tranches (ratingclasses), and 2.98 additional market classes. Rating classes and market classes werederived based on the refined rating index. Not rated tranches were considered beingmarket classes. The mean of not rated tranches is at 1.04, with only four of the 131not rated tranches not being equity pieces. Thus, roughly speaking, by counting notrated tranches as market classes the number of market classes per deal increases byone.
Additional variables were generated from the basic deal characteristics, such as
11Note that the rating index was derived from the refined rating index. Nine times, the refined scoreslie exactly in between two rating grades (e.g. a score of 21.5 on the refined index). These weretranslated to the better rating grade on the rating index. Therefore, the rating index only takesinteger values.
7
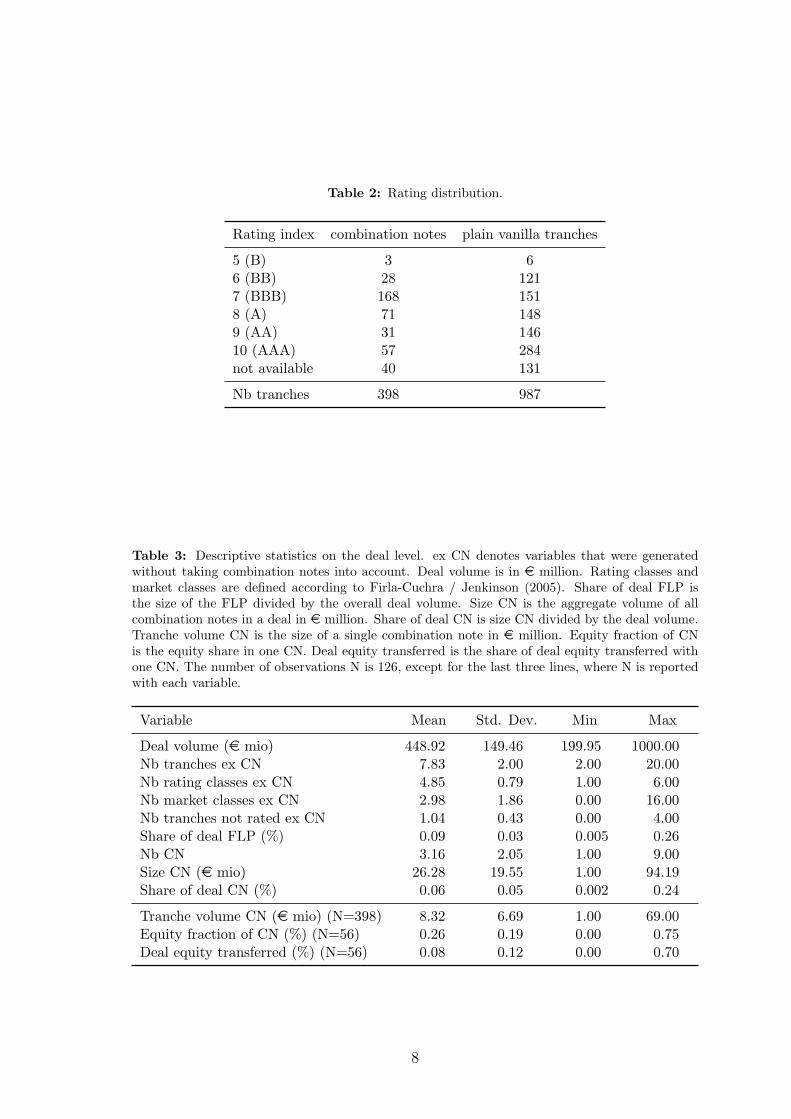
Table 2: Rating distribution.
Rating index combination notes plain vanilla tranches
5 (B) 3 66 (BB) 28 1217 (BBB) 168 1518 (A) 71 1489 (AA) 31 14610 (AAA) 57 284not available 40 131
Nb tranches 398 987
Table 3: Descriptive statistics on the deal level. ex CN denotes variables that were generatedwithout taking combination notes into account. Deal volume is in e million. Rating classes andmarket classes are defined according to Firla-Cuchra / Jenkinson (2005). Share of deal FLP isthe size of the FLP divided by the overall deal volume. Size CN is the aggregate volume of allcombination notes in a deal in e million. Share of deal CN is size CN divided by the deal volume.Tranche volume CN is the size of a single combination note in e million. Equity fraction of CNis the equity share in one CN. Deal equity transferred is the share of deal equity transferred withone CN. The number of observations N is 126, except for the last three lines, where N is reportedwith each variable.
Variable Mean Std. Dev. Min Max
Deal volume (e mio) 448.92 149.46 199.95 1000.00Nb tranches ex CN 7.83 2.00 2.00 20.00Nb rating classes ex CN 4.85 0.79 1.00 6.00Nb market classes ex CN 2.98 1.86 0.00 16.00Nb tranches not rated ex CN 1.04 0.43 0.00 4.00Share of deal FLP (%) 0.09 0.03 0.005 0.26Nb CN 3.16 2.05 1.00 9.00Size CN (e mio) 26.28 19.55 1.00 94.19Share of deal CN (%) 0.06 0.05 0.002 0.24
Tranche volume CN (e mio) (N=398) 8.32 6.69 1.00 69.00Equity fraction of CN (%) (N=56) 0.26 0.19 0.00 0.75Deal equity transferred (%) (N=56) 0.08 0.12 0.00 0.70
8
an average rating score for the combination notes per deal, weighted average ratingfactors per deal, and a quarter index. The average combination note rating perdeal is the value weighted average of the combination notes’ rating using the ratingindex. However, when at least one CN rating is missing in a deal, the averageCN rating is not calculated, as an average of the remaining CN ratings must notnecessarily be a good proxy for all CN ratings in a deal. All CN ratings per deal andtherefore the average CN rating are available for 98 deals.12 The weighted averagerating factor (WARF) per deal is based on rating factors published by Moody’sand is used as proxy for the quality of the underlying assets. While the WARFpublished by Moody’s relies on the individual loans of the underlying asset pool,the WARF derived here relies on the ratings of the tranches of each deal, as moredetailed information on the underlying asset pool is not available. The rating factorsprovided by Moody’s are derived from idealized default probabilities that dependon ratings and maturities.13 I use rating factors for 10-year maturities (tabulated intable 10 in the appendix) and calculate the value weighted average of the tranches’rating factors for each deal, without taking the combination notes into account.The not rated first loss positions are treated as if rated CCC, as the lowest ratedtranche in the dataset is rated B. As the relationship of ratings to the rating factorsis non-linear, lower rated securities have a stronger impact on the WARF, whichresults in a better differentiation of the WARF compared to using a measure suchas the average rating. In the empirical analysis, the WARF is rescaled by takingthe natural logarithm, which results in lnWARF as proxy for the quality of theunderlying asset pool.14 A higher lnWARF indicates lower asset pool quality. Thequarter index is a variable that captures the time structure of the dataset. It is setto one for the quarter of the first observation in the data (July 2002), increases byone each quarter, and ends at 21 for the quarter of the last observation in the data(September 2007).
3.2 Exploring the properties of combination notes
The number of combination notes issued per deal is 3.16 on average, the (aggregate)volume issued via combination notes per deal is 26.28 e million on average. Asingle combination note has a volume of 8.32 e million on average, combinationnotes account for 6% of the deal volume on average. Ratings on CNs differ and canaddress a rated balance that can differ from the principal balance, further ratingscan address timely payment of interest and principal, ultimate payment of interest
12To make this more clear, consider a deal having three combination notes of equal size, two of thembeing rated AA, the third being not rated. When not considering the non rated CN, the averageCN rating for that deal would be nine, however, the non rated CN could be of BB-quality, theaverage CN rating should rather level at eight. Therefore, the average CN rating is only calculatedwhen a rating is available for all CNs in a deal.
13A tabulation of the idealized default probabilities can for example be found in Moody’s, 2003,p. 19. Rating factors are derived by dividing the default probabilities by the default probabilityof an Aaa rated security of the same maturity. A rating factor of 80 hence indicates that theprobability of default is 80 times higher than the probability of default for an Aaa rated securitywith equal maturity.
14Equally, the WARF could be retranslated into a rating using table 10, taking the natural logarithmhowever makes better use of the available information.
9

and principal, or ultimate payment of principal only.15 Rating information is largelyavailable on combination notes, as can be seen from table 2. Interestingly, only 31combination notes are rated below investment grade, the majority of CNs (60%) israted either BBB or A. The rating distribution of CNs can be seen as a first indicatorthat combination notes are tailored to specific investor needs, as a significant shareof investors is likely to be obliged to hold only investment grade securities, be it dueto internal or external constraints. Given an investor is liable to bank regulation,CNs will likely have required a risk weight of 100% under Basel I, which might haveimplied regulatory capital arbitrage. Under Basel II, the treatment of CNs dependson the specific structural features of each CN.
For 56 combination notes, that belong to 25 different deals, data on the actualnote composition could be gathered. For theses 56 CNs the average share of equitycomprised in one CN is 26%, and the average fraction of deal-equity transferredwith one CN is 8%. Taking this last number, roughly 25% of each deal’s equity wastransferred, which results in an estimate for the overall equity transfer of 1.24 ebillion for the 126 deals (3.16 CNs per deal × 8% of deal equity per CN × 4.9 ebillion in overall equity).
Interestingly, 12 out of these 56 combination notes did not contain any equityand three times no equity was transferred via combination notes on the deal levelat all. These three deals all only comprised one CN, two of them with a mix of Aand BBB rated tranches, one with a mix of BBB and BB rated tranches. Especiallythe creation of the two CNs composed of shares of A and BBB rated tranches ispuzzling, as not even a non investment grade security is transformed to investmentgrade, which is the case for the CN composed of BBB and BB rated tranches, as all ofthese 12 combination notes were at least rated investment grade. Most combinationnotes (47) were composed by parts of two tranches, five CNs were composed byparts of three tranches, two CNs by parts of four and equally two by parts of fivetranches.
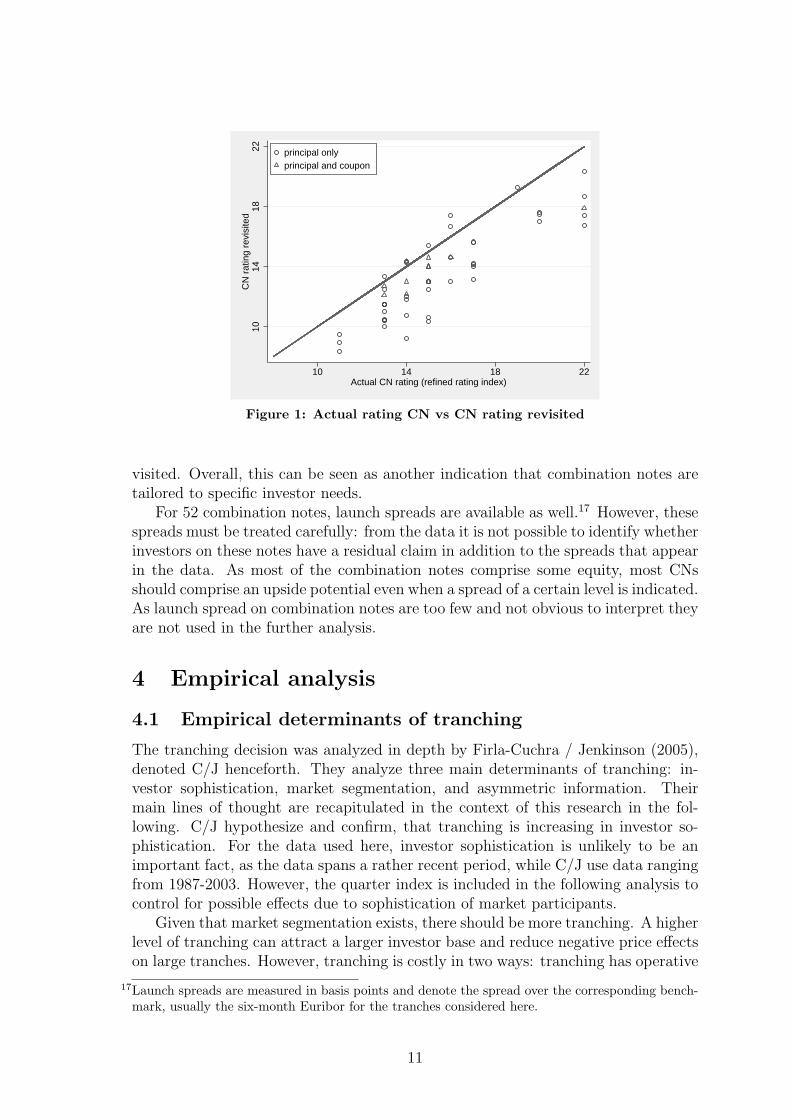
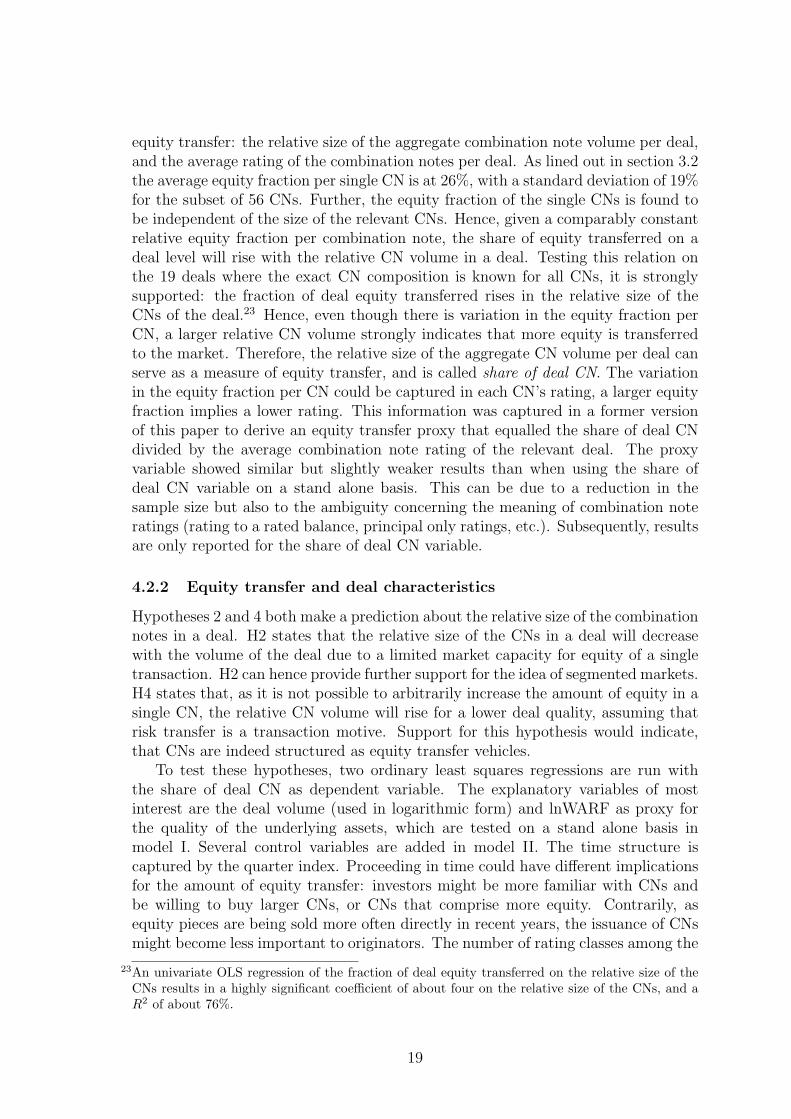
For all of these 56 combination notes, the rating is available. This rating is com-pared with a manually generated rating, the CN rating revisited. The CN ratingrevisited is the value weighted average of the CN components’ ratings, based on therefined rating index.16 In figure 1 the CN rating revisited is plotted against the truecombination note rating. It can be seen that the actual rating for most combinationnotes is better than the manually calculated rating. Furthermore, none of the pointslies substantially above the main diagonal. The dots are furthermore distinguishedby the type of rating that is shown on the x-axis. Circles represent ratings that areassigned to the ultimate repayment of principal only, whereas triangles representratings that are assigned to the ultimate payment of principal and a rated coupon.Consistently, the ratings that include the coupon, are closer to the main diagonal,hence they are not substantially better than the manually derived CN rating re-
15For the rating agencies’ approaches see Standard & Poor’s (2004), Moody’s Investors Service (2004),and Fitch Ratings (2007).
16A value of five is assigned to the FLP on the refined index, as the lowest rating in the data is asingle B, which corresponds to eight on the refined rating index, and the FLP is considered beingone entire notch down the rating scale. To take an example, a CN that consists of 30% AA, 30%BBB, and 40% equity is assigned a CN rating revisited of 0.3×20+0.3×14+0.4×5=12.2.
10
1014
1822
CN
rat
ing
revi
site
d
10 14 18 22Actual CN rating (refined rating index)
principal onlyprincipal and coupon
Figure 1: Actual rating CN vs CN rating revisited
visited. Overall, this can be seen as another indication that combination notes aretailored to specific investor needs.
For 52 combination notes, launch spreads are available as well.17 However, thesespreads must be treated carefully: from the data it is not possible to identify whetherinvestors on these notes have a residual claim in addition to the spreads that appearin the data. As most of the combination notes comprise some equity, most CNsshould comprise an upside potential even when a spread of a certain level is indicated.As launch spread on combination notes are too few and not obvious to interpret theyare not used in the further analysis.
4 Empirical analysis
4.1 Empirical determinants of tranching
The tranching decision was analyzed in depth by Firla-Cuchra / Jenkinson (2005),denoted C/J henceforth. They analyze three main determinants of tranching: in-vestor sophistication, market segmentation, and asymmetric information. Theirmain lines of thought are recapitulated in the context of this research in the fol-lowing. C/J hypothesize and confirm, that tranching is increasing in investor so-phistication. For the data used here, investor sophistication is unlikely to be animportant fact, as the data spans a rather recent period, while C/J use data rangingfrom 1987-2003. However, the quarter index is included in the following analysis tocontrol for possible effects due to sophistication of market participants.
Given that market segmentation exists, there should be more tranching. A higherlevel of tranching can attract a larger investor base and reduce negative price effectson large tranches. However, tranching is costly in two ways: tranching has operative
17Launch spreads are measured in basis points and denote the spread over the corresponding bench-mark, usually the six-month Euribor for the tranches considered here.
11
costs, for example legal costs and fees being due to rating agencies. Second, tranchingcan also be costly in terms of post issue liquidity, as small tranches might not bemarketable on secondary markets. C/J use the deal size to proxy for these effectsof market segmentation. Large deals should be tranched more to be marketable onthe primary market, small deals should be tranched less to keep costs down andto maintain post issue liquidity. This relation is confirmed by C/J and expectedto hold here as well. However, opposed to C/J I believe that the lower degree oftranching of small deals is rather associated with primary market activities, not postissue liquidity on secondary markets: in case tranches become too small, marketing(from the originator’s perspective) and research (from an investor’s perspective) isnot cost efficient. The natural logarithm of the deal size (in units of millions) willbe included in the analysis to control for these effects.18
Concerning information asymmetries, C/J hypothesize, that a higher degree ofasymmetric information should be associated with a larger number of tranches, espe-cially of differently rated tranches. A higher number of rating classes releases moreinformation on the underlying pool quality and therefore reduces information asym-metries. C/J construct an index that proxies the degree of information asymmetries,by ranking the different types of underlying asset classes according to their variabil-ity of launch spreads. Franke / Weber (2007) assume, that information asymmetriesare higher for CLO transactions than for CBOs and use a CLO dummy as proxyvariable for information asymmetries. As only very few transactions are classifiedas CLOs in the sense of Franke and Weber in this data, I instead use a leverageloan dummy, which is one in case the underlying assets are leveraged loans. For theleveraged loan dummy it can be argued similarly to a CLO dummy: information onleveraged loans underlying a securitization transaction are likely to be more difficultto obtain than information on publicly traded bonds or on tranches of CLOs andCDOs, the two other important types of underlying in the dataset. Comparing thevolatility of launch spreads of the leveraged loan transactions to the volatility oflaunch spreads of the remainder of the dataset reveals that the volatility is higheramong the leveraged loan securitizations. The volatility of launch spreads is cal-culated as the mean of the volatilities of launch spreads calculated per full letterrating grade. Furthermore, the ordering is not sensitive to the choice of a valueweighted or equally weighted mean across the rating grades. Hence, the leveragedloan dummy is consistent with both the approach chosen by C/J and by Franke /Weber. Additionally, a level-management dummy is used as alternative proxy forinformation problems. The level-management dummy is one in case the deal is fullymanaged. For fully managed transactions, information problems tend to be morepronounced due to hidden action problems.
Several control variables are employed by C/J such as the quality of the un-derlying asset pool, actual bond market conditions, and WALs on the deal level(value weighted average of tranche WALs). The impact of the asset pool qualityis ambiguous. While C/J hypothesize a positive relationship for the pool qualityand the number of rating classes, a negative relationship is assumed by Franke /Weber (2007). Both C/J and Franke / Weber find some but limited support for
18All the natural logarithms on tranche and deal volumes are taken on the values in units of millions,i.e. for a deal of size 100 e million Ln deal volume equals Ln(100).
12
their hypotheses. Schaber (2008b), based on a transactions cost driven hypothesis,finds support for an increasing number of rating classes given a decrease in assetpool quality. Concerning the actual bond market conditions, C/J argue that severebond market conditions require a more pronounced catering of investor needs andhence imply a higher number of market classes. C/J find that for a steep yieldcurve less rating classes and more market classes are issued. In the following, thelnWARF will be used to control for deal quality, while bond market conditions arecaptured by using the yield of ten year AAA Euroland government bonds providedby Datastream and the difference between ten year and two year AAA Eurolandgovernment bond yields. As the average WAL is available only for a subset of thedata, it is not used in the following specifications, but results are robust to addingthe average WAL.
Subsequently, three tranching decisions will be analyzed. First, tranching is ana-lyzed without taking the combination notes into account, which serves as a referencecase to C/J and to the further analysis. Thereafter, tranching within the combi-nation notes and the tranching of combination notes in the deal context will beanalyzed. The tranching decision within the combination notes of a deal can pro-vide evidence on market segmentation, the tranching decision of combination notesin the deal context might shed light on the reduction of information asymmetries.The tranching decision is analyzed by running ordered logistic regressions. Someof the analyzed numbers of tranches are unequally distributed at the lower and thehigher end. In that case, numbers of tranches below the 10% and above the 90%quantiles of the data are grouped together at the 10% respectively 90% quantilesof the relevant number of tranches. Further, the subsequently presented regressionsdo not violate the parallel regression assumption inherent to ordered logistic regres-sion. As a further robustness test, poisson regressions have been run, with the majorresults being unchanged.
4.1.1 The benchmark case - tranching of plain vanilla tranches
The analysis of tranching without taking the combination notes into account shouldreveal results similar to C/J. However, models on the overall number of tranches andthe number of market classes are not of statistical significance, which is probably dueto the small sample size (126 deals compared to 1605 in C/J). Therefore, only theregression of the number of rating classes on all of the explanatory variables linedout above is reported in table 4. Only the leveraged loan dummy and the slope ofthe yield curve turn out statistically significant at the 5% level. The coefficient onthe leveraged loan dummy, given it proxies for information asymmetries, shows theexpected sign. When it is replaced by the fully-managed dummy, the coefficient onthe fully-managed dummy is positive as well, but statistically not significant, whilethe coefficient on the lnWARF increases in size and turns statistically significant atthe 1% level (not reported). Thus, the LL dummy could also proxy for a lower assetpool quality that is not captured in the lnWARF, and is associated with a higherdegree of tranching, see Schaber (2008b). Hence, there is some but limited evidencethat information asymmetries drive the creation of differently rated tranches, as wellas there is some but limited evidence, that the number of differently rated tranches
13
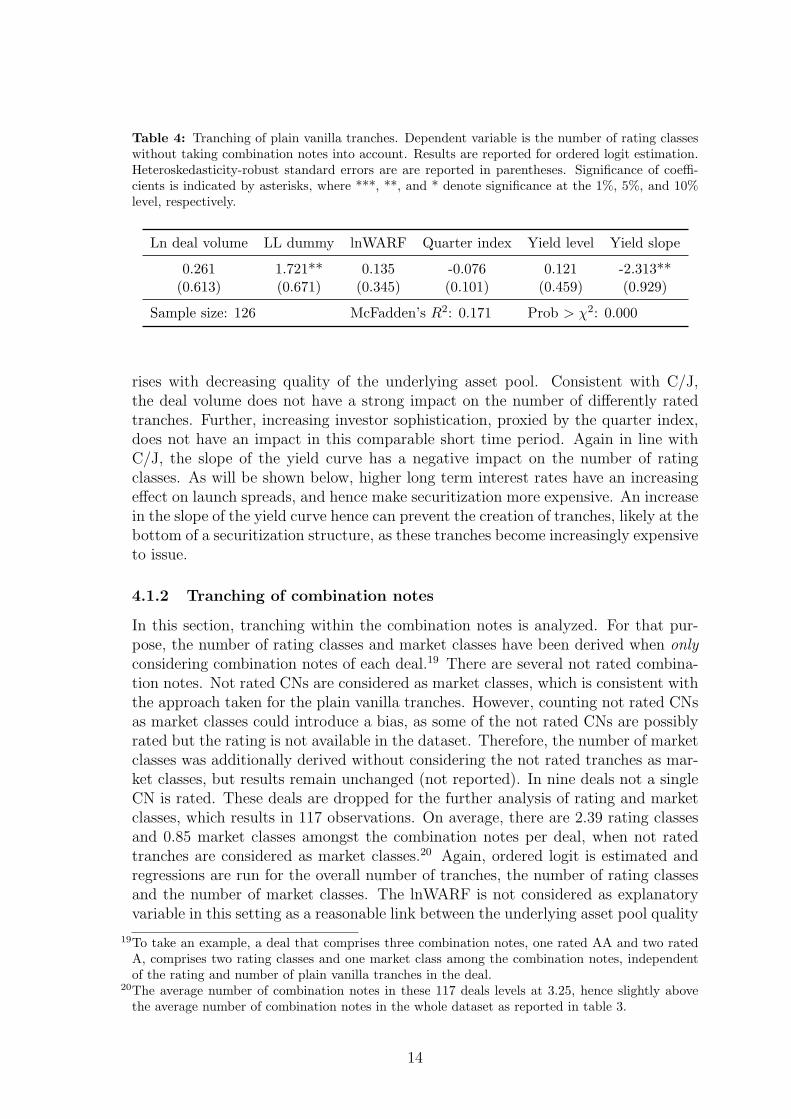
Table 4: Tranching of plain vanilla tranches. Dependent variable is the number of rating classeswithout taking combination notes into account. Results are reported for ordered logit estimation.Heteroskedasticity-robust standard errors are are reported in parentheses. Significance of coeffi-cients is indicated by asterisks, where ***, **, and * denote significance at the 1%, 5%, and 10%level, respectively.
Ln deal volume LL dummy lnWARF Quarter index Yield level Yield slope
0.261 1.721** 0.135 -0.076 0.121 -2.313**(0.613) (0.671) (0.345) (0.101) (0.459) (0.929)
Sample size: 126 McFadden’s R2: 0.171 Prob > χ2: 0.000
rises with decreasing quality of the underlying asset pool. Consistent with C/J,the deal volume does not have a strong impact on the number of differently ratedtranches. Further, increasing investor sophistication, proxied by the quarter index,does not have an impact in this comparable short time period. Again in line withC/J, the slope of the yield curve has a negative impact on the number of ratingclasses. As will be shown below, higher long term interest rates have an increasingeffect on launch spreads, and hence make securitization more expensive. An increasein the slope of the yield curve hence can prevent the creation of tranches, likely at thebottom of a securitization structure, as these tranches become increasingly expensiveto issue.
4.1.2 Tranching of combination notes
In this section, tranching within the combination notes is analyzed. For that pur-pose, the number of rating classes and market classes have been derived when onlyconsidering combination notes of each deal.19 There are several not rated combina-tion notes. Not rated CNs are considered as market classes, which is consistent withthe approach taken for the plain vanilla tranches. However, counting not rated CNsas market classes could introduce a bias, as some of the not rated CNs are possiblyrated but the rating is not available in the dataset. Therefore, the number of marketclasses was additionally derived without considering the not rated tranches as mar-ket classes, but results remain unchanged (not reported). In nine deals not a singleCN is rated. These deals are dropped for the further analysis of rating and marketclasses, which results in 117 observations. On average, there are 2.39 rating classesand 0.85 market classes amongst the combination notes per deal, when not ratedtranches are considered as market classes.20 Again, ordered logit is estimated andregressions are run for the overall number of tranches, the number of rating classesand the number of market classes. The lnWARF is not considered as explanatoryvariable in this setting as a reasonable link between the underlying asset pool quality
19To take an example, a deal that comprises three combination notes, one rated AA and two ratedA, comprises two rating classes and one market class among the combination notes, independentof the rating and number of plain vanilla tranches in the deal.
20The average number of combination notes in these 117 deals levels at 3.25, hence slightly abovethe average number of combination notes in the whole dataset as reported in table 3.
14

and the tranching decision within CNs cannot be established.As stated in hypothesis 1, the number of combination notes is expected to rise
with the absolute volume of combination notes in a deal. This relation should holdfor the number of rating and market classes, but be stronger for the number ofmarket classes, given there exists a negative relation for the size of a CN and itsmarketability. The data strongly supports this hypothesis, as can be seen fromtable 5. The coefficients on the aggregate CN volume are highly significant and ofthe expected sign for all the different dependent variables, and are larger for marketclasses than for rating classes. Predicted probabilities show that for small aggregateCN volumes the probability for only a single combination note and hence for asingle rating class is very high, while in that case obviously a very high probabilityis assigned to zero market classes. Probabilities for higher numbers of rating andmarket classes rise with rising aggregate combination note volumes.21
As reported above, the leveraged loan dummy is associated with a higher num-ber of plain vanilla rating classes. This must not hold for the tranching withincombination notes for two reasons. First, combination notes are a combinationof plain vanilla tranches and should therefore not reveal additional information onthe underlying loss distribution. Second, the rating classes considered here are notnecessarily unique ratings in the deal, as only the tranching within the CNs is con-sidered. However, the coefficient on the LL dummy is positive and significant forthe overall number of CNs and for the number of rating classes among the CNs. Apossible explanation is that a higher degree of tranching on the level of plain vanillatranches is associated with a higher degree of tranching of CNs, which will also besupported in the next section. Another explanation might be, that the average qual-ity of the underlying assets in leveraged loan securitization is below the quality ofthe remaining transactions in the data, and lower quality assets are only marketablein smaller tranches. Adding the lnWARF to the model does remove the significancefrom the LL dummy for the second model (rating classes), while the coefficient onthe lnWARF is positive and significant on the 10% level (not reported). The othertwo models are not substantially altered by adding the lnWARF. Investor sophisti-cation, proxied by the quarter index, did not help to explain tranching in the sectionabove. For combination notes, an increasing number of combination notes could beexpected with the quarter index, as the market for combination notes might not havebeen as mature in 2002 as the securitization market in general, which however is notsupported by the data. Again, it is controlled for the interest rate environment byusing the slope and the level of the yield curve. Consistent with the results derivedon plain vanilla tranching, the level of long term yields has a negative, statisticallyweak, impact on the number of all CNs and the number of rating classes.
21For a more detailed understanding, the following table presents predicted probabilities for thenumber of rating classes. Several discrete values of Ln size CN are evaluated, while all othervariables of the model (model 2 in table 5) are held at their mean (the mean of size CN is at26.28 e million, Ln(26.28) ≈ 3.27):
P (y = 1 | x) P (y = 2 | x) P (y = 3 | x) P (y = 4 | x)
Ln size CN = 1 0.9678 0.7382 0.2093 0.0242Ln size CN = 2 0.027 0.2089 0.4175 0.1119Ln size CN = 3 0.0044 0.0438 0.2838 0.3524Ln size CN = 4 0.0009 0.0091 0.0895 0.5115
15
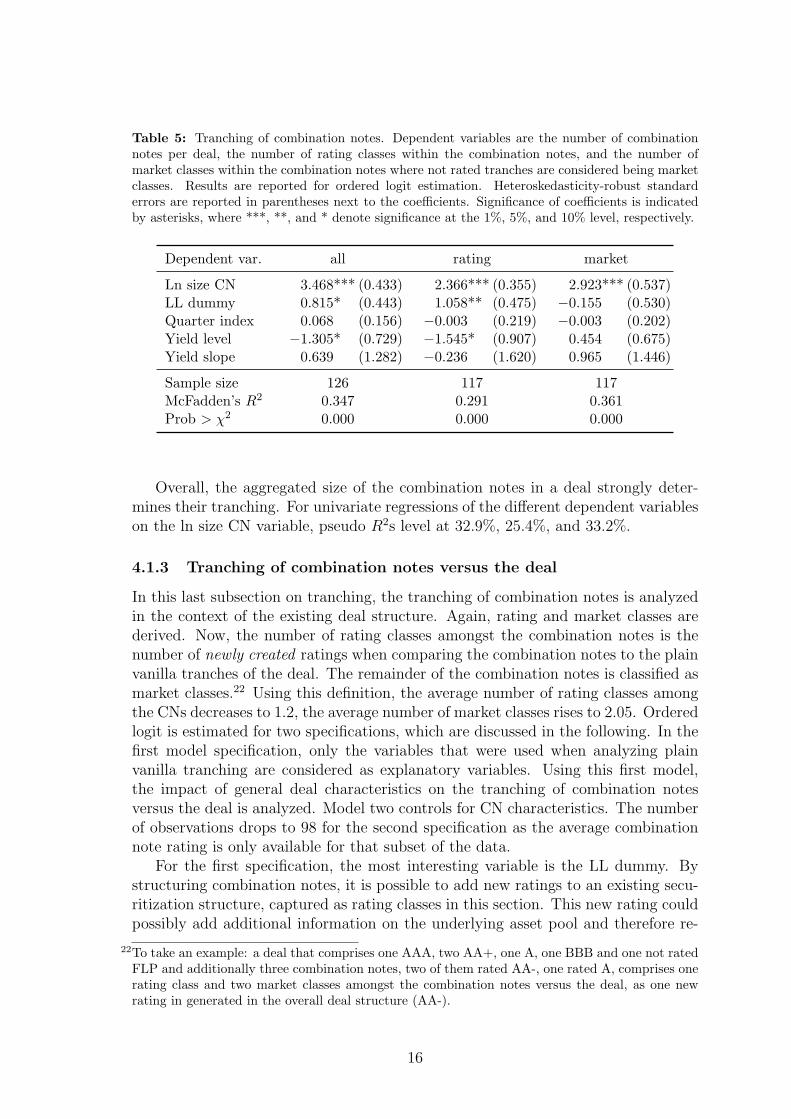
Table 5: Tranching of combination notes. Dependent variables are the number of combinationnotes per deal, the number of rating classes within the combination notes, and the number ofmarket classes within the combination notes where not rated tranches are considered being marketclasses. Results are reported for ordered logit estimation. Heteroskedasticity-robust standarderrors are reported in parentheses next to the coefficients. Significance of coefficients is indicatedby asterisks, where ***, **, and * denote significance at the 1%, 5%, and 10% level, respectively.
Dependent var. all rating market
Ln size CN 3.468*** (0.433) 2.366*** (0.355) 2.923*** (0.537)LL dummy 0.815* (0.443) 1.058** (0.475) −0.155 (0.530)Quarter index 0.068 (0.156) −0.003 (0.219) −0.003 (0.202)Yield level −1.305* (0.729) −1.545* (0.907) 0.454 (0.675)Yield slope 0.639 (1.282) −0.236 (1.620) 0.965 (1.446)
Sample size 126 117 117McFadden’s R2 0.347 0.291 0.361Prob > χ2 0.000 0.000 0.000
Overall, the aggregated size of the combination notes in a deal strongly deter-mines their tranching. For univariate regressions of the different dependent variableson the ln size CN variable, pseudo R2s level at 32.9%, 25.4%, and 33.2%.
4.1.3 Tranching of combination notes versus the deal
In this last subsection on tranching, the tranching of combination notes is analyzedin the context of the existing deal structure. Again, rating and market classes arederived. Now, the number of rating classes amongst the combination notes is thenumber of newly created ratings when comparing the combination notes to the plainvanilla tranches of the deal. The remainder of the combination notes is classified asmarket classes.22 Using this definition, the average number of rating classes amongthe CNs decreases to 1.2, the average number of market classes rises to 2.05. Orderedlogit is estimated for two specifications, which are discussed in the following. In thefirst model specification, only the variables that were used when analyzing plainvanilla tranching are considered as explanatory variables. Using this first model,the impact of general deal characteristics on the tranching of combination notesversus the deal is analyzed. Model two controls for CN characteristics. The numberof observations drops to 98 for the second specification as the average combinationnote rating is only available for that subset of the data.
For the first specification, the most interesting variable is the LL dummy. Bystructuring combination notes, it is possible to add new ratings to an existing secu-ritization structure, captured as rating classes in this section. This new rating couldpossibly add additional information on the underlying asset pool and therefore re-
22To take an example: a deal that comprises one AAA, two AA+, one A, one BBB and one not ratedFLP and additionally three combination notes, two of them rated AA-, one rated A, comprises onerating class and two market classes amongst the combination notes versus the deal, as one newrating in generated in the overall deal structure (AA-).
16
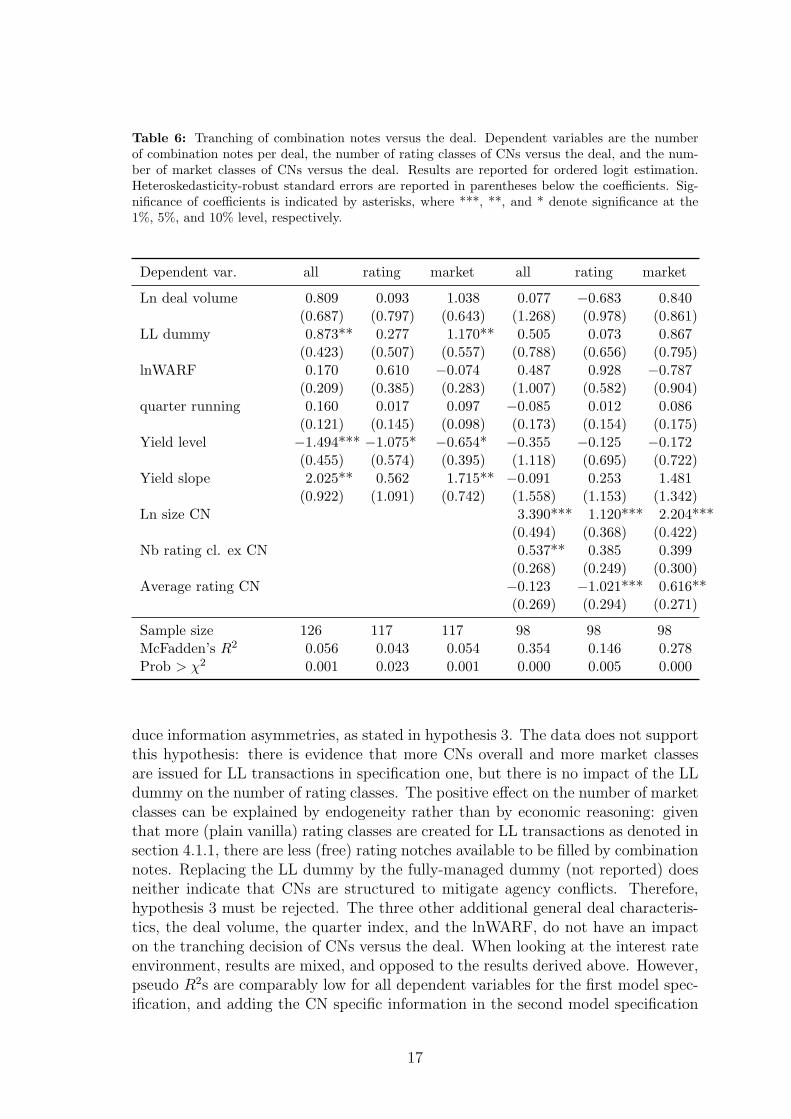
Table 6: Tranching of combination notes versus the deal. Dependent variables are the numberof combination notes per deal, the number of rating classes of CNs versus the deal, and the num-ber of market classes of CNs versus the deal. Results are reported for ordered logit estimation.Heteroskedasticity-robust standard errors are reported in parentheses below the coefficients. Sig-nificance of coefficients is indicated by asterisks, where ***, **, and * denote significance at the1%, 5%, and 10% level, respectively.
Dependent var. all rating market all rating market
Ln deal volume 0.809 0.093 1.038 0.077 −0.683 0.840(0.687) (0.797) (0.643) (1.268) (0.978) (0.861)
LL dummy 0.873** 0.277 1.170** 0.505 0.073 0.867(0.423) (0.507) (0.557) (0.788) (0.656) (0.795)
lnWARF 0.170 0.610 −0.074 0.487 0.928 −0.787(0.209) (0.385) (0.283) (1.007) (0.582) (0.904)
quarter running 0.160 0.017 0.097 −0.085 0.012 0.086(0.121) (0.145) (0.098) (0.173) (0.154) (0.175)
Yield level −1.494*** −1.075* −0.654* −0.355 −0.125 −0.172(0.455) (0.574) (0.395) (1.118) (0.695) (0.722)
Yield slope 2.025** 0.562 1.715** −0.091 0.253 1.481(0.922) (1.091) (0.742) (1.558) (1.153) (1.342)
Ln size CN 3.390*** 1.120*** 2.204***(0.494) (0.368) (0.422)
Nb rating cl. ex CN 0.537** 0.385 0.399(0.268) (0.249) (0.300)
Average rating CN −0.123 −1.021*** 0.616**(0.269) (0.294) (0.271)
Sample size 126 117 117 98 98 98McFadden’s R2 0.056 0.043 0.054 0.354 0.146 0.278Prob > χ2 0.001 0.023 0.001 0.000 0.005 0.000
duce information asymmetries, as stated in hypothesis 3. The data does not supportthis hypothesis: there is evidence that more CNs overall and more market classesare issued for LL transactions in specification one, but there is no impact of the LLdummy on the number of rating classes. The positive effect on the number of marketclasses can be explained by endogeneity rather than by economic reasoning: giventhat more (plain vanilla) rating classes are created for LL transactions as denoted insection 4.1.1, there are less (free) rating notches available to be filled by combinationnotes. Replacing the LL dummy by the fully-managed dummy (not reported) doesneither indicate that CNs are structured to mitigate agency conflicts. Therefore,hypothesis 3 must be rejected. The three other additional general deal characteris-tics, the deal volume, the quarter index, and the lnWARF, do not have an impacton the tranching decision of CNs versus the deal. When looking at the interest rateenvironment, results are mixed, and opposed to the results derived above. However,pseudo R2s are comparably low for all dependent variables for the first model spec-ification, and adding the CN specific information in the second model specification
17

removes all statistical significance from the coefficients of the first model.In the second model it is controlled for the aggregate CN volume, the average
rating of the combination notes, and the number of rating classes among the plainvanilla tranches. The pseudo R2 rises sharply, the three variables have strong ex-planatory power. The size of the aggregate CN volume again is the dominatingvariable. The average combination note rating is endogenous in nature, but stillhelpful. As indicated by the coefficients, a high average CN rating implies less rat-ing and more market classes among the CNs versus the plain vanilla tranches. Giventhat the rating distribution for the plain vanilla tranches is skewed towards high rat-ing grades (more than 50% of all plain vanilla tranches are rated AA- or better, 32%are rated AAA), it is by definition less likely to generate a new rating class when therating assigned to the CN is high. New ratings are more likely to arise for lower ratedcombination notes. The number of rating classes among the plain vanilla tranchesis also endogenous in nature: given a high number of rating classes among the plainvanilla tranches the likelihood for creating a new rating class by a CN should fall.For the overall number of CNs, a positive relation can be observed with the numberof rating classes among the plain vanilla tranches. Hence, sophisticated structuringof the deal is associated with the creation of more CNs. Surprisingly, the numberof rating classes of the CNs versus the deal does not decreases with a rising numberof rating classes among the plain vanilla tranches. Apparently the effect of a ris-ing number of CNs outweighs the endogeneity of a higher number of rating classesamong the plain vanilla tranches (less gaps to fill).
Summarizing the results, combination notes seem not to be structured to solveinformation asymmetries, hypothesis 3 can be rejected. Contrary, strong supportis found for hypothesis 1: tranching of combination notes is almost entirely drivenby segmentation effects. This result suggests, that combination notes are only mar-ketable below a certain size and implies a fairly constant absolute size of combinationnotes. As noted above, the average volume of a single CN is at 8.32 e million, witha standard deviation of only 6.69 e million, a minimum value of 1 e million, amaximum of 69 e million, and the 95%-percentile at 20 e million. Additionally,the more sophisticated the original structuring of the deal, the higher the numberof CNs. New rating classes versus the deal arise mainly at low ratings. There is noevidence that CNs are specifically tailored to fill rating gaps among the plain vanillarating classes.
4.2 Combination notes and risk transfer
4.2.1 Measuring equity transfer
It was shown above, that CNs are mainly structured to cater segmented demand,but not to transmit additional information on the underlying asset pool by theirtranching. From an originator’s perspective, combination notes mainly are a meansto repackage and transfer equity. As noted above, for a subset of the data theexact composition of combination notes is available, with an average deal equitytransfer of 8% by each single CN. To be able to test hypotheses concerning the equitytransfer via combination notes such as H2, H4, and H5 for the entire dataset, a riskrespectively equity transfer proxy is necessary. Two variables capture the amount of
18
equity transfer: the relative size of the aggregate combination note volume per deal,and the average rating of the combination notes per deal. As lined out in section 3.2the average equity fraction per single CN is at 26%, with a standard deviation of 19%for the subset of 56 CNs. Further, the equity fraction of the single CNs is found tobe independent of the size of the relevant CNs. Hence, given a comparably constantrelative equity fraction per combination note, the share of equity transferred on adeal level will rise with the relative CN volume in a deal. Testing this relation onthe 19 deals where the exact CN composition is known for all CNs, it is stronglysupported: the fraction of deal equity transferred rises in the relative size of theCNs of the deal.23 Hence, even though there is variation in the equity fraction perCN, a larger relative CN volume strongly indicates that more equity is transferredto the market. Therefore, the relative size of the aggregate CN volume per deal canserve as a measure of equity transfer, and is called share of deal CN. The variationin the equity fraction per CN could be captured in each CN’s rating, a larger equityfraction implies a lower rating. This information was captured in a former versionof this paper to derive an equity transfer proxy that equalled the share of deal CNdivided by the average combination note rating of the relevant deal. The proxyvariable showed similar but slightly weaker results than when using the share ofdeal CN variable on a stand alone basis. This can be due to a reduction in thesample size but also to the ambiguity concerning the meaning of combination noteratings (rating to a rated balance, principal only ratings, etc.). Subsequently, resultsare only reported for the share of deal CN variable.
4.2.2 Equity transfer and deal characteristics
Hypotheses 2 and 4 both make a prediction about the relative size of the combinationnotes in a deal. H2 states that the relative size of the CNs in a deal will decreasewith the volume of the deal due to a limited market capacity for equity of a singletransaction. H2 can hence provide further support for the idea of segmented markets.H4 states that, as it is not possible to arbitrarily increase the amount of equity in asingle CN, the relative CN volume will rise for a lower deal quality, assuming thatrisk transfer is a transaction motive. Support for this hypothesis would indicate,that CNs are indeed structured as equity transfer vehicles.
To test these hypotheses, two ordinary least squares regressions are run withthe share of deal CN as dependent variable. The explanatory variables of mostinterest are the deal volume (used in logarithmic form) and lnWARF as proxy forthe quality of the underlying assets, which are tested on a stand alone basis inmodel I. Several control variables are added in model II. The time structure iscaptured by the quarter index. Proceeding in time could have different implicationsfor the amount of equity transfer: investors might be more familiar with CNs andbe willing to buy larger CNs, or CNs that comprise more equity. Contrarily, asequity pieces are being sold more often directly in recent years, the issuance of CNsmight become less important to originators. The number of rating classes among the
23An univariate OLS regression of the fraction of deal equity transferred on the relative size of theCNs results in a highly significant coefficient of about four on the relative size of the CNs, and aR2 of about 76%.
19
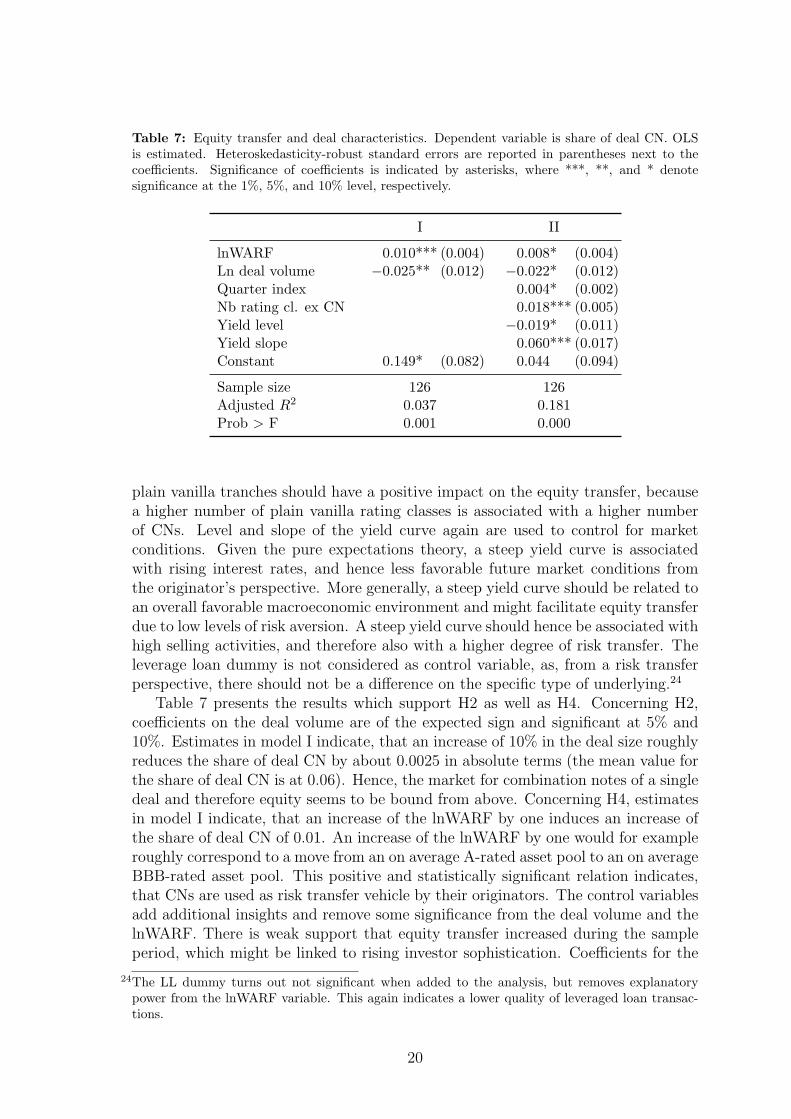
Table 7: Equity transfer and deal characteristics. Dependent variable is share of deal CN. OLSis estimated. Heteroskedasticity-robust standard errors are reported in parentheses next to thecoefficients. Significance of coefficients is indicated by asterisks, where ***, **, and * denotesignificance at the 1%, 5%, and 10% level, respectively.
I II
lnWARF 0.010*** (0.004) 0.008* (0.004)Ln deal volume −0.025** (0.012) −0.022* (0.012)Quarter index 0.004* (0.002)Nb rating cl. ex CN 0.018*** (0.005)Yield level −0.019* (0.011)Yield slope 0.060*** (0.017)Constant 0.149* (0.082) 0.044 (0.094)
Sample size 126 126Adjusted R2 0.037 0.181Prob > F 0.001 0.000
plain vanilla tranches should have a positive impact on the equity transfer, becausea higher number of plain vanilla rating classes is associated with a higher numberof CNs. Level and slope of the yield curve again are used to control for marketconditions. Given the pure expectations theory, a steep yield curve is associatedwith rising interest rates, and hence less favorable future market conditions fromthe originator’s perspective. More generally, a steep yield curve should be related toan overall favorable macroeconomic environment and might facilitate equity transferdue to low levels of risk aversion. A steep yield curve should hence be associated withhigh selling activities, and therefore also with a higher degree of risk transfer. Theleverage loan dummy is not considered as control variable, as, from a risk transferperspective, there should not be a difference on the specific type of underlying.24
Table 7 presents the results which support H2 as well as H4. Concerning H2,coefficients on the deal volume are of the expected sign and significant at 5% and10%. Estimates in model I indicate, that an increase of 10% in the deal size roughlyreduces the share of deal CN by about 0.0025 in absolute terms (the mean value forthe share of deal CN is at 0.06). Hence, the market for combination notes of a singledeal and therefore equity seems to be bound from above. Concerning H4, estimatesin model I indicate, that an increase of the lnWARF by one induces an increase ofthe share of deal CN of 0.01. An increase of the lnWARF by one would for exampleroughly correspond to a move from an on average A-rated asset pool to an on averageBBB-rated asset pool. This positive and statistically significant relation indicates,that CNs are used as risk transfer vehicle by their originators. The control variablesadd additional insights and remove some significance from the deal volume and thelnWARF. There is weak support that equity transfer increased during the sampleperiod, which might be linked to rising investor sophistication. Coefficients for the
24The LL dummy turns out not significant when added to the analysis, but removes explanatorypower from the lnWARF variable. This again indicates a lower quality of leveraged loan transac-tions.
20
number of plain vanilla rating classes and the slope of the yield curve are as expectedand highly significant. The number of plain vanilla rating classes and the slope ofthe yield curve explain a substantial fraction of the variation: when only using thesetwo variables as explanatory variables, adjusted R2 levels at 13.6%. Dropping boththe deal volume and lnWARF from model II reduces the adjusted R2 to 15.8%.
Several robustness checks have been performed and are lined out in the following,but not reported. The lnWARF was replaced by the relative size of the FLP. Therelative size of the FLP equally is a proxy for a lower deal quality, however notas comprehensive as the lnWARF. Coefficients on the relative size of the FLP arepositive, hence in line with H4, but not statistically significant in most specifications.Equivalent regressions have been run on the subsample of 19 deals where the trueCN compositions are available, with the volume of equity truly transferred via CNsas a share of the overall deal volume as dependent variable. Signs of all coefficientsremain unchanged, coefficients in model I loose their significance, significance ofcoefficients in model II either remains at the levels reported in table 7 or increases.Further, given that the share of deal CN variable is a fractional dependent variable,a generalized linear model following Papke and Wooldridge (1996) was estimated,using a logit link and the binomial family. Results remain almost unchanged, thesignificance of the coefficient on the deal amount increases to the 5% level in modelII. Marginal effects evaluated at the means of the regressors are very close to thecoefficients obtained using OLS. Overall, even though the control variables explaina substantial fraction of variation in the data, the coefficients on the deal amountand the lnWARF have the expected sign, are statistically significant, and robust toalternative model specifications.
4.2.3 Equity transfer and launch spreads
Empirical literature on bond spreads grew strongly in recent years, with several arti-cles focussing on corporate bonds.25 Studies on the pricing of asset backed securitiesare still rare. Boudoukh et al. (1997) examine the pricing of MBS by the leveland slope of the yield curve. Scheicher (2008) examines spread changes on CDSindex tranches of the iTraxx and the CDX. Longstaff and Rajan (2008) decomposeCDX spreads into three major components: idiosyncratic risk, sector default risk,and systemic risk. The two closest related studies to the analysis presented here areFirla-Cuchra (2005) and Firla-Cuchra and Jenkinson (2005) (C/J). Both focus onlaunch spreads of ABS in level form, just as the remainder of this section will do.Firla-Cuchra (2005) finds that launch spreads are well described by credit ratingswithout refinements, but variables associated with liquidity, market segmentation,distribution efforts, and the prevailing legal regime can explain further variation inlaunch spreads. C/J analyze the impact of tranching on pricing of ABS. They findthat a higher number of predicted rating classes reduces launch spreads, while it iscontrolled for all common pricing factors.
The purpose of this section is to examine whether the amount of observed equitytransfer proxied via combination note properties has an impact on the pricing of plain
25See for example Duffee (1998), Elton et al. (2001), Collin-Dufresne et al. (2001), Perraudin /Taylor (2003), Campbell / Taksler (2003), Driessen (2005) and Amato / Remolona (2005).
21

vanilla securities, hence hypothesis 5 is tested. Combination notes are observed bymarket participants, and could be a positive signal to plain vanilla tranche investors:some other market participant is directing funds towards a share of the FLP, themost subordinate security of the deal, that protects other investors. An investmentin that security by a market participant could hence be interpreted as quality signalfor the deal in general, and hence imply lower launch spreads. Again, the shareof deal CN variable is used to measure the equity transfer. Methodologically, thefollowing analysis is equivalent to C/J and Firla-Cuchra (2005). The majority butnot all explanatory variables used in C/J and Firla-Cuchra (2005) are used in thisstudy. Dependent variable is the natural logarithm of launch spreads, with almostall launch spreads referring to Euribor. Combination notes, equity pieces, fixed rateissues, zero bonds, and super senior swaps are excluded from the analysis, whichreduces the data to 766 floating rate notes. The origination spread is available on718 of these floaters, belonging to 124 deals. Two different approaches are takenin the following. First, all launch spreads are analyzed in a pooled regression, thetranche’s rating is captured by rating dummies or the refined rating index. Second,tranches are organized according to their rating and launch spreads are analyzedwithin the different rating categories to derive a better understanding of pricingfactors beyond ratings.
For the first approach, seven models are estimated by OLS, considering threegroups of explanatory variables: credit rating information, interest rate parame-ters, and deal respectively tranche specific information. Standard errors are het-eroskedasticity robust, and the estimation of standard errors accounts for the fact,that tranches are not necessarily independent within a deal, but independent fordifferent deals. Results are reported in table 8. Model I only uses rating dummieswithout refinements, with A being the omitted credit rating. Rating dummies werederived from the rating index, and are hence based on average ratings in case differ-ing ratings from more than one agency were available. All coefficients are significantat 0.1%. Comparing the results to Firla-Cuchra (2005), R2 is significantly higher,at about 90%, while Firla-Cuchra reports an R2 of 71.9% when only controllingfor rating.26 This strong difference could be due to two reasons: while the dataused here is very homogeneous in types of underlying assets and the time period iscomparably short, data used by Firla-Cuchra spans over 16 years and is based onvarious underlyings. However, even when controlling for the time dimension andtypes of underlying, but also for deal characteristics and market conditions, R2sreported by Firla-Cuchra and C/J are clearly below the 90% reached here. Thereason for the high level of R2 observed here might be that even within the categoryof collateralized debt obligations, the underlying is very homogeneous in the datawith 97 leveraged loan deals out of 126 deals. Model II adds the share of deal CNvariable. Given H5 holds, the sign on the coefficient should be negative, which isconfirmed by the data, however the coefficient is not statistically significant and theR2 remains unchanged.
The second set of controls are the level and slope of the yield curve, again mea-sured by the 10 year yield on AAA Euroland government bonds provided by Datas-tream and the difference in 10-2 year yields, both used on a weekly basis and in units
26See Firla-Cuchra, 2005, p. 14, model III.
22
of percentage points. Using this specification, the two year yield is also fully incor-porated in the analysis, captured in the slope variable when holding the ten yearyield fixed. Model III adds these two interest rate parameters to model I. R2 rises byabout 5%, coefficients are significant at 0.1%. The interpretation of coefficients needsto be done carefully. An absolute increase in the two year yield of 10 basis points(i.e. a decrease of the slope keeping the ten year yield fixed) leads to a reduction oflaunch spreads of about 3.8%. This is consistent with empirical findings by Duffee(1998) and with the contingent claims analysis on corporate bonds by Longstaff andSchwartz (1995). Contrary, an increase of 10 basis points on the ten year yield isassociated with launch spreads being about 6% higher, considering the coefficientson the level and the slope holding the two year yield fixed. These results on the longterm yield and the slope differ from existing evidence. The slope of the yield curveis rather expected to have a negative effect on credit spreads: a steep yield curve isassociated with a sound economic climate, with implies comparably high recoveryrates and thus lower credit spreads. Further, following the expectations theory, asteep yield curve is associated with rising future short rates, which should result inlower credit spreads due to the results obtained by Longstaff and Schwartz (1995).27
This negative relation is confirmed by Duffee (1998), as he finds a negative coeffi-cient for increases in long term yields. Campbell and Taksler (2003) find only limitedsupport with changing sign for the coefficients on the slope. Collin-Dufresne et al.(2001) find a strong negative relation between long term interest rates and bondspreads, but only weak statistical significance for the slope coefficient. Scheicher(2008) finds mixed and comparably weak results concerning the impact of changesin the level and the slope of the yield curve on changes of index tranche spreads.Coefficients are only significant for the level of the yield curve and only when it iscontrolled for the time period of the subprime crisis, furthermore coefficients differfor the iTraxx and the CDX. Firla-Cuchra’s results also differ from the results ob-tained here. Firla-Cuchra uses the ten year yield and 10-2 year swap yields. In thatspecification, he finds a negative coefficient on the slope for most model specifica-tions, indicating a positive impact of higher short term interest on launch spreads.Looking at the level and slope together, Firla-Cuchra’s results indicate a negativeimpact of higher long term interest rates on launch spreads. Coefficients howeverare not significant when only focussing on CDOs.28 Results from C/J are similarto those from Firla-Cuchra (2005).29 Given the differences to my results concerningthe level and the slope of the yield curve and its impact on launch spreads, I testedthe relationship on a comprehensive dataset of CDO origination spreads containingover 3000 observations, results remain similar to the results presented in tables 8and 9. Theses differences, especially to the findings by Firla-Cuchra, highlight theneed for further research on the pricing of bundled credit risk on primary markets.
27See Collin-Dufresne et al. (2001) for these arguments.28See Firla-Cuchra, 2005, p. 20, table 5, model V.29Firla-Cuchra additionally controls for interest rate volatility to capture possible effects of the value
of prepayment options on the launch spread. Prepayments are not an issue for the data of EuropeanCDOs used here, the interest rate volatility is thus not considered.
23
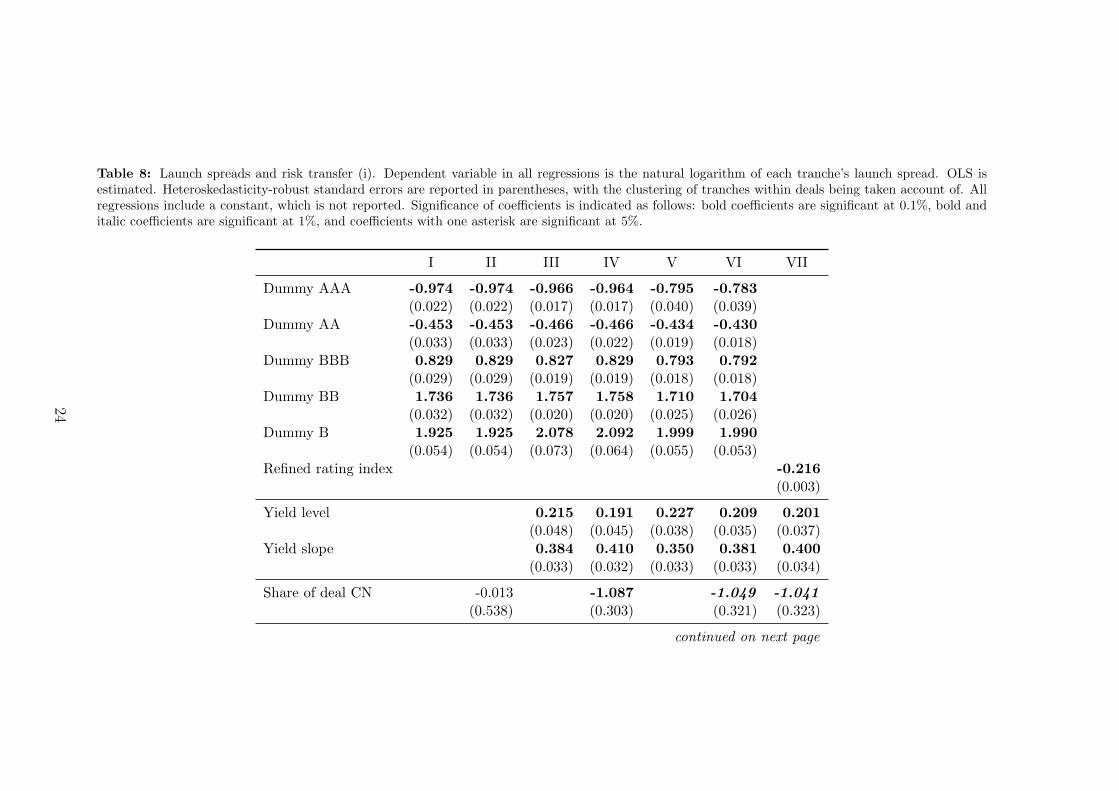
Table 8: Launch spreads and risk transfer (i). Dependent variable in all regressions is the natural logarithm of each tranche’s launch spread. OLS isestimated. Heteroskedasticity-robust standard errors are reported in parentheses, with the clustering of tranches within deals being taken account of. Allregressions include a constant, which is not reported. Significance of coefficients is indicated as follows: bold coefficients are significant at 0.1%, bold anditalic coefficients are significant at 1%, and coefficients with one asterisk are significant at 5%.
I II III IV V VI VII
Dummy AAA -0.974 -0.974 -0.966 -0.964 -0.795 -0.783(0.022) (0.022) (0.017) (0.017) (0.040) (0.039)
Dummy AA -0.453 -0.453 -0.466 -0.466 -0.434 -0.430(0.033) (0.033) (0.023) (0.022) (0.019) (0.018)
Dummy BBB 0.829 0.829 0.827 0.829 0.793 0.792(0.029) (0.029) (0.019) (0.019) (0.018) (0.018)
Dummy BB 1.736 1.736 1.757 1.758 1.710 1.704(0.032) (0.032) (0.020) (0.020) (0.025) (0.026)
Dummy B 1.925 1.925 2.078 2.092 1.999 1.990(0.054) (0.054) (0.073) (0.064) (0.055) (0.053)
Refined rating index -0.216(0.003)
Yield level 0.215 0.191 0.227 0.209 0.201(0.048) (0.045) (0.038) (0.035) (0.037)
Yield slope 0.384 0.410 0.350 0.381 0.400(0.033) (0.032) (0.033) (0.033) (0.034)
Share of deal CN -0.013 -1.087 -1.049 -1.041(0.538) (0.303) (0.321) (0.323)
continued on next page
24
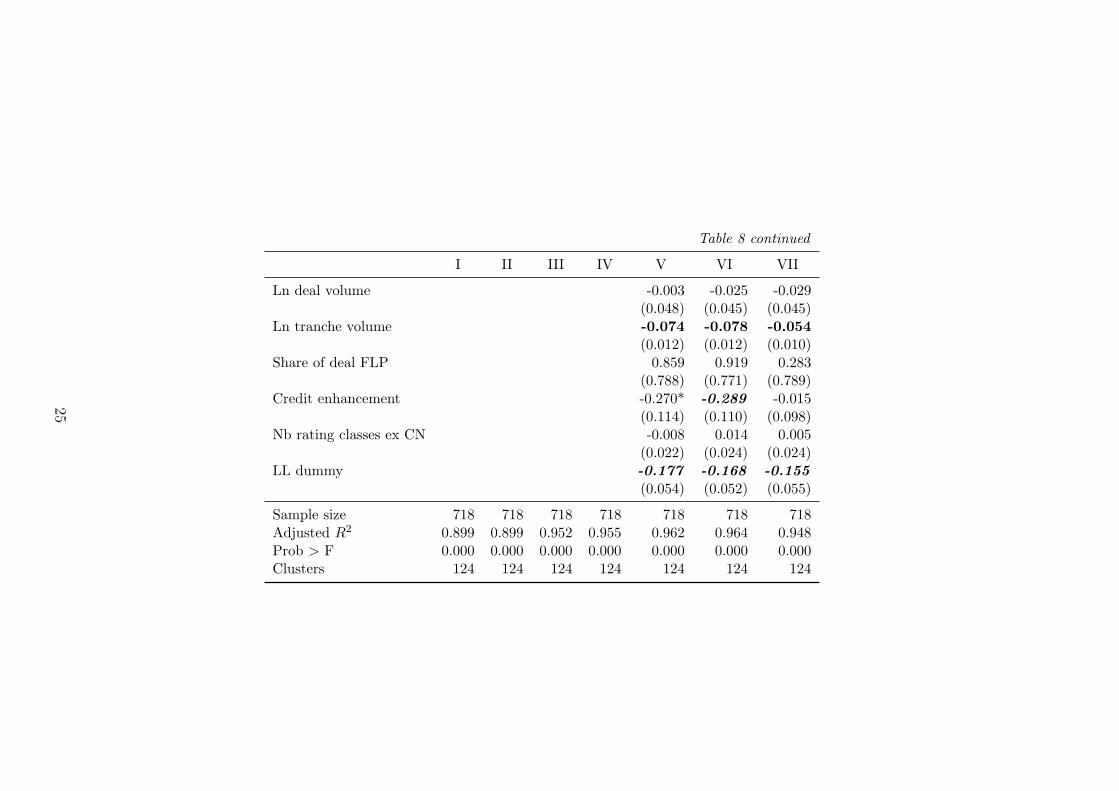
Table 8 continued
I II III IV V VI VII
Ln deal volume -0.003 -0.025 -0.029(0.048) (0.045) (0.045)
Ln tranche volume -0.074 -0.078 -0.054(0.012) (0.012) (0.010)
Share of deal FLP 0.859 0.919 0.283(0.788) (0.771) (0.789)
Credit enhancement -0.270* -0.289 -0.015(0.114) (0.110) (0.098)
Nb rating classes ex CN -0.008 0.014 0.005(0.022) (0.024) (0.024)
LL dummy -0.177 -0.168 -0.155(0.054) (0.052) (0.055)
Sample size 718 718 718 718 718 718 718Adjusted R2 0.899 0.899 0.952 0.955 0.962 0.964 0.948Prob > F 0.000 0.000 0.000 0.000 0.000 0.000 0.000Clusters 124 124 124 124 124 124 124
25
Reconsidering equity transfer and launch spreads, the share of deal CN variableis again added to the regression in model IV. The coefficient on the share of dealCN has the predicted negative sign and is significant at 0.1%. An increase of therelative aggregate CN volume in a deal by 0.01 implies a decrease of launch spreadsof approximately 1.1%. However the R2 remains almost unchanged.
The last set of control variables are deal and tranche specific information andare added in model V. It is controlled for the size of the deal a tranche belongsto and the size of each tranche itself. The deal and tranche size can possibly havetwo opposing impacts: while a large deal or tranche might be more difficult tomarket and hence more expensive to place in segmented markets, the liquidity oflarge deals or tranches on secondary markets will be greater. Firla-Cuchra (2005)finds a negative coefficient on the overall deal volume but a positive coefficient onthe tranche size, which indicates that on a tranche level there is a negative effectof demand on price (i.e. higher launch spreads), but that on the deal level theliquidity effect is dominant.30 Results found here indicate that the liquidity effect isdominating on the tranche level as well, as all coefficients are highly significant andof negative sign. Coefficients on the deal size are negative as well, but not significantin any specification.
Furthermore it is controlled for the share of the FLP on the deal, the level ofcredit enhancements, the number of plain vanilla rating classes, and the leveragedloan dummy. The share of the FLP on the overall deal volume could have a similarimpact as the share of the CNs on the deal volume: a bigger first loss position allowsmore defaults to happen until a plain vanilla tranche is hit. However, as the creditratings basically arise from the structuring process and hence also from the size ofthe FLP, the variable is not expected to have explanatory power, which is confirmedby the data.
There are various possibilities of credit enhancements in securitization trans-actions.31 The credit enhancement captured here is the fraction of the deal sub-ordinated to the relevant tranche of interest. Information captured in the creditenhancement is hence closely related to the rank in deal of the relevant tranche,therefore only the credit enhancement is used. The credit enhancement capturesadditional information, that is not captured in the credit rating, as even within arating category, enhancement levels can differ according to the rank in deal. A nega-tive coefficient is expected as a higher enhancement level indicates higher protectionin case of defaults in the underlying asset pool. Credit enhancement is significanton 5% and 1% in models V and VI and of the expected sign.
C/J show that the number of rating classes has a negative impact on launchspreads. While they predict the number of rating classes from an ordered logitmodel on the optimal number of rating classes, the actual number of rating classesis used here. The findings of C/J are not supported by the dataset used here, whichis also robust to using the predicted number of rating classes (not reported).
Finally, it is controlled for the LL dummy, given the large fraction of leveragedloans in the dataset. The LL dummy is significant at the 1% level and has a negativesign. This negative effect on launch spreads could be due to the higher degree
30See Firla-Cuchra, 2005, p. 23, table 6.31See Hein (2006) for a simulation-based analysis of internal credit enhancements.
26
of tranching found for leveraged loan transactions. But as this effect should becaptured in the number of rating classes, the negative coefficient is surprising, evenmore so as the LL dummy is also supposed to proxy for information asymmetries.However, due to missing values on the weighted average life (WAL) of the securities,it was not controlled for the WAL, even though the WAL should be of importancewhen analyzing launch spreads. The analysis was equally performed when usingthe subsample where the WAL is available (not reported), the sample size reducesto 610 tranches. The WAL is significant for some specifications with a negativecoefficient, and removes explanatory power from the LL dummy in models V-VII.The remaining results are almost unchanged.
Again, the share of deal CN variable is added to the set of explanatory variablesin model VI and is significant at 1%, while coefficients on all other variables and theR2 are not largely affected.
In model VII, the rating dummies are dropped and instead the refined ratingindex is used, capturing more information than the full letter grade rating dum-mies but on a linear scale. This inclusion of rating refinements removes the size ofthe coefficient on the credit enhancement and its significance, while there are nosubstantial changes on the other coefficients.
Summarizing the findings up to this point, four observations can be made. First,rating without refinements explains almost all variation in launch spreads. Second,the level and slope of the yield curve further help to explain launch spreads. However,the effects of the interest rate environment are not fully in line with existing literatureand merit further investigation. Third, the equity transfer proxy has the expectedsign, and is statistically significant in three out of four specifications. However, themaximum increase in adjusted R2 by adding the equity transfer proxy is only in thedimension of three-tenth of a percent. And fourth, results on the control variablesare in line with expectations.
To better disentangle the effect of observed equity transfer via combination noteson launch spreads, data is rearranged by the rating categories AAA to BB (only sixtranches are rated single B), and the regressions are run again within each ratinggroup. Results are reported in table 9. All explanatory variables are consideredagain, however the beforehand dominating rating information is eliminated by thisgrouping of data.
Several observations are of interest: the coefficient on the tranche volume is onlystrongly present for AAA-rated securities. This indicates, that on a tranche levelpost issue liquidity matters for senior securities only, while markets for lower ratedsecurities seem to be segmented and the placement of large tranches not beneficialfrom an issuer perspective. Additionally, the deal volume has a negative impacton lower rated tranches, significant for A rated securities. Hence, there is someevidence, that for not AAA rated tranches, the marketability is increasing with theoverall deal volume. Further, the credit enhancement is equally only an importantdeterminant of launch spreads for AAA rated securities. This result is puzzling,as the credit enhancement should capture additional information versus the creditrating. Inspecting the data reveals, that variation within the credit enhancementis only substantial for AAA rated securities, and credit enhancement levels becomemore and more similar when moving down the rating grades. Hence, while for senior
27
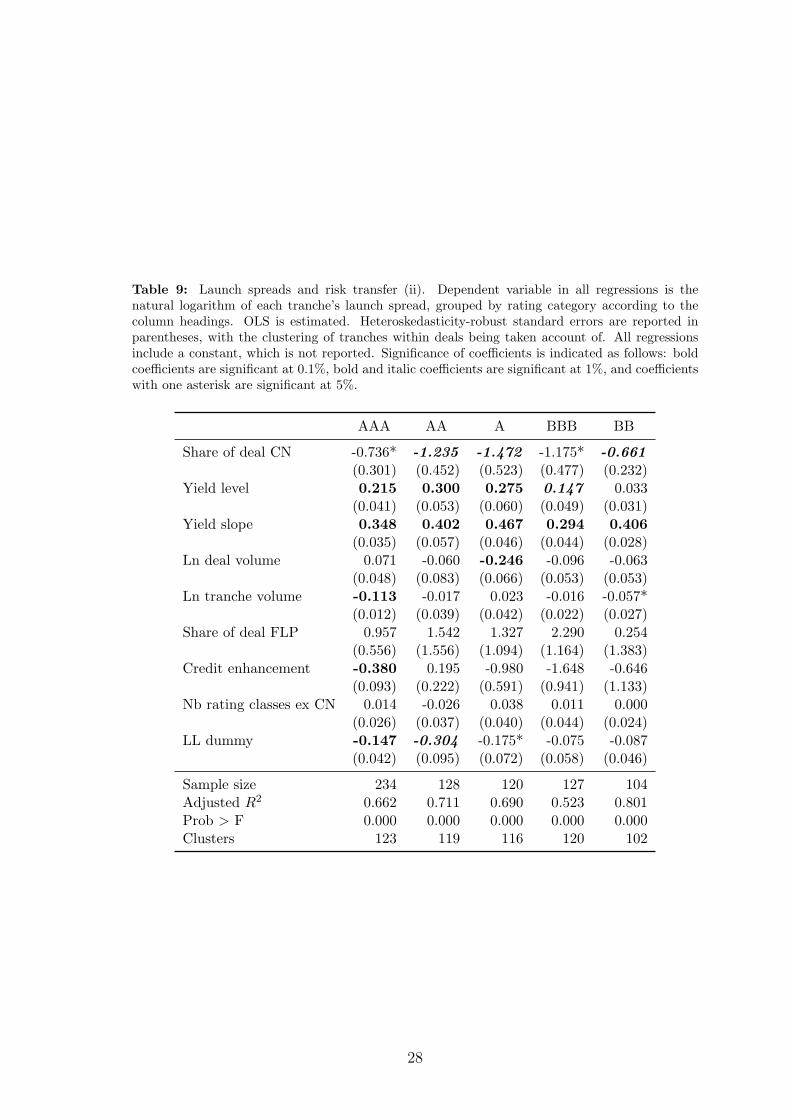
Table 9: Launch spreads and risk transfer (ii). Dependent variable in all regressions is thenatural logarithm of each tranche’s launch spread, grouped by rating category according to thecolumn headings. OLS is estimated. Heteroskedasticity-robust standard errors are reported inparentheses, with the clustering of tranches within deals being taken account of. All regressionsinclude a constant, which is not reported. Significance of coefficients is indicated as follows: boldcoefficients are significant at 0.1%, bold and italic coefficients are significant at 1%, and coefficientswith one asterisk are significant at 5%.
AAA AA A BBB BB
Share of deal CN -0.736* -1.235 -1.472 -1.175* -0.661(0.301) (0.452) (0.523) (0.477) (0.232)
Yield level 0.215 0.300 0.275 0.147 0.033(0.041) (0.053) (0.060) (0.049) (0.031)
Yield slope 0.348 0.402 0.467 0.294 0.406(0.035) (0.057) (0.046) (0.044) (0.028)
Ln deal volume 0.071 -0.060 -0.246 -0.096 -0.063(0.048) (0.083) (0.066) (0.053) (0.053)
Ln tranche volume -0.113 -0.017 0.023 -0.016 -0.057*(0.012) (0.039) (0.042) (0.022) (0.027)
Share of deal FLP 0.957 1.542 1.327 2.290 0.254(0.556) (1.556) (1.094) (1.164) (1.383)
Credit enhancement -0.380 0.195 -0.980 -1.648 -0.646(0.093) (0.222) (0.591) (0.941) (1.133)
Nb rating classes ex CN 0.014 -0.026 0.038 0.011 0.000(0.026) (0.037) (0.040) (0.044) (0.024)
LL dummy -0.147 -0.304 -0.175* -0.075 -0.087(0.042) (0.095) (0.072) (0.058) (0.046)
Sample size 234 128 120 127 104Adjusted R2 0.662 0.711 0.690 0.523 0.801Prob > F 0.000 0.000 0.000 0.000 0.000Clusters 123 119 116 120 102
28

securities the level of subordination is determined not exclusively by the rating,rating alone seems to capture subordination for lower rated tranches. The negativeimpact of the LL dummy on launch spreads is confirmed for AAA, AA, and A-ratedsecurities.
When looking at the equity transfer proxy, results previously obtained in table 8are confirmed. Coefficients are all negative and significant at 1% and 5%. Adding theWAL to the explanatory variables removes statistical significance from the coefficienton the share of deal CN for AAA rated securities, and increases the significanceof the coefficient for BBB rated securities to the 1% level (not reported). Theinterpretation is as follows: the further subordinated a security, the higher the riskof being hit by defaults in the underlying asset pool. The positive quality signalhence gains importance for lower rated securities, while the effect on senior securitiesis limited. Economically, an increase of the relative aggregate CN volume by 0.01implies a decrease of launch spreads in the range of 0.66-1.47%, as indicated bythe coefficients in table 9 and in line with the results from table 8. However, thesize of the coefficients is not steadily increasing with decreasing rating. Opposedto the analysis above, adding the share of deal CN variable to the analysis nowincreases adjusted R2 noticeable. All regression were equally run without the equitytransfer proxies (not reported). Adding the share of deal CN to the analysis increasesadjusted R2 going from AAA to BB by 0.9%, 1.6%, 2.4%, 3.1%, and 0.9%.
Overall, results indicate that the degree of equity transfer via the issuance ofcombination notes is observed by market participants and has a positive impact onpricing from the issuer’s perspective as launch spreads decrease with rising equitytransfer. However, credit ratings explain the large majority of variation in launchspreads, the observed equity transfer only has a minor impact.
5 Conclusion
This is the first empirical paper to focus on combination notes issued in securitizationtransactions. Several results are derived. Considering the descriptive statistics, theamount of overall equity transfer was estimated based on a subsample of the datawhere the exact combination note compositions are available: on average, aboutthree combination notes are issued per deal, each containing a fraction of 8% dealequity. Together, this implies an equity transfer of 1.24 e billion of overall 4.9e billion equity via combination notes for the 126 deals considered here. Alsofor the subsample, the rating of the combination notes is reconsidered: ratingsassigned by the rating agencies are better than the value weighted averages of thesingle components’ ratings. However, some of the assigned ratings are principal onlyratings, and some ratings are assigned to a so-called rated balance only.
Tranching of combination notes is entirely driven by segmented demand for thesesecurities. When focusing on the tranching decision within the combination notes ofa deal, the aggregate volume of the combination notes in that deal is the predominantexplanatory variable. When analyzing the tranching decision of combination noteson the deal level, no evidence can be found that tranching of combination notesreduces information asymmetries. Results on the benchmark case, the tranching
29

decision among the plain vanilla tranches, are overall in line with existing literature,however weak in the statistical evidence due to the comparably small sample size.Furthermore, there is support that the market for combination notes of a single dealand therefore also equity of a single deal is limited in size, indicated by a negativerelation of the overall deal volume and the relative size of combination notes perdeal.
Further, equity transfer can be identified as driver for the issuance of combi-nation notes, as the relative size of the combination notes in a deal increases thelower the quality of the deal. Moreover, equity transfer via combination notes isobserved and accounted for by market participants: an impact of equity transferproxied by combination note properties on launch spreads of plain vanilla tranchesis detected. However, the predominant pricing factor for the securities consideredhere is the credit rating without refinements. The equity transfer information canexplain variations in launch spreads when securities are grouped according to theirrating, such that pricing factors beyond the credit rating are captured. This refinedanalysis reveals that observed equity transfer reduces launch spreads especially forsecurities not rated AAA, while the post issue liquidity effect associated with a largertranche size and the credit enhancement only have an impact on the launch spreadsof AAA rated securities. Further, there is some but weak support that the overalldeal volume reduces launch spreads for mezzanine securities.
Besides the results described above, several aspects still deserve closer examina-tion. On a descriptive level, a link between issuer sophistication and the issuanceof combination notes was established. The analysis of this relation could be ex-tended and generalized by integrating proxies for issuer reputation in the analysisof launch spreads. Also, results on the interest rate environment and its impacton launch spreads are mixed when compared to the literature on changes in bondspreads. Differences are possibly due to the specific characteristics of the underlyingassets analyzed here, but merit closer examination. More generally, a comprehensivedataset on the issuance or retention of equity pieces in securitization transactionswould allow several interesting research projects. However, the equity piece distri-bution is unknown even to regulators, and market participants are so far reluctantto release this confidential information.
30
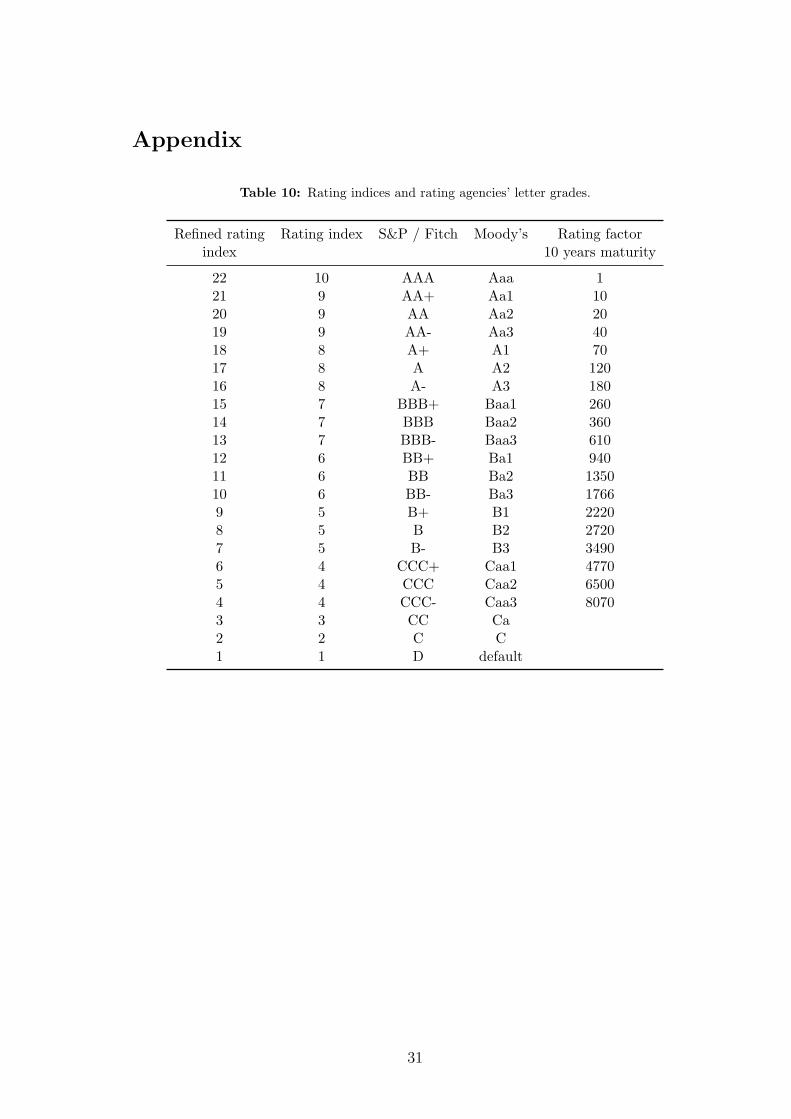
Appendix
Table 10: Rating indices and rating agencies’ letter grades.
Refined rating Rating index S&P / Fitch Moody’s Rating factorindex 10 years maturity
22 10 AAA Aaa 121 9 AA+ Aa1 1020 9 AA Aa2 2019 9 AA- Aa3 4018 8 A+ A1 7017 8 A A2 12016 8 A- A3 18015 7 BBB+ Baa1 26014 7 BBB Baa2 36013 7 BBB- Baa3 61012 6 BB+ Ba1 94011 6 BB Ba2 135010 6 BB- Ba3 17669 5 B+ B1 22208 5 B B2 27207 5 B- B3 34906 4 CCC+ Caa1 47705 4 CCC Caa2 65004 4 CCC- Caa3 80703 3 CC Ca2 2 C C1 1 D default
31

References
Amato, Jeffery / Remolona, Eli (2005): The pricing of unexpected credit losses,Working Paper No. 190, Bank for International Settlements, Basel.
Basel Committee on Banking Supervision (2004): International convergenceof capital measurement and capital standards - A revised framework, Basel.
Bluhm, Christian / Overbeck, Ludger / Wagner, Christoph (2003): Anintroduction to credit risk modeling, London.
Boot, Arnoud / Thakor, Anjan (1993): Security design, in: Journal of Finance,Vol. 48, Pg. 1349–1378.
Boudoukh, Jacob / Whitelaw, Robert / Richardson, Matthew / Stanton,Richard (1997): Pricing mortgage-backed securities in a multifactor interest rateenvironment: A multivariate density estimation approach, in: Review of FinancialStudies, Vol. 10, Pg. 405–446.
Brennan, Michael / Hein, Julia / Poon, Ser-Huang (2008): Tranching andpooling, Working Paper, UCLA.
Campbell, John / Taksler, Glen (2003): Equity volatility and corporate bondyields, in: Journal of Finance, Vol. 58, Pg. 2321–2349.
Collin-Dufresne, Pierre / Goldstein, Robert / Martin, Spencer (2001): Thedeterminants of credit spread changes, in: Journal of Finance, Vol. 56, Pg. 2177–2207.
DeMarzo, Peter (2005): The pooling and tranching of securities: A model ofinformed intermediation, in: Review of Financial Studies, Vol. 18, Pg. 1–35.
Driessen, Joost (2005): Is default event risk priced in corporate bonds?, in: Re-view of Financial Studies, Vol. 18, Pg. 165–195.
Duffee, Gregory (1998): The relation between treasury yields and corporate bondyield spreads, in: Journal of Finance, Vol. 53, Pg. 2225–2241.
Duffie, Darell / Garleanu, Nicolae (2001): Risk and valuation of collateralizeddebt obligations, in: Financial Analysts Journal, Vol. January/February, Pg. 41–59.
Elton, Edwin / Gruber, Martin / Agrawal, Deepak / Mann, Christopher(2001): Explaining the rate spread on corporate bonds, in: Journal of Finance,Vol. 56, Pg. 247–277.
Firla-Cuchra, Maciej (2005): Explaining launch spreads on structured bonds,Working Paper, University of Oxford.
Firla-Cuchra, Maciej / Jenkinson, Tim (2005): Security design in the realworld: Why are securitization issues tranched?, Working Paper, University ofOxford.
32

Fitch Ratings (2005): Hedge funds: An emerging force in the global credit mar-kets, New York.
Fitch Ratings (2007): Equity and combination notes in cash flow CDOs, NewYork.
Fitch Ratings (2008): Exposure draft: Retaining equity piece risk – Enhancingtransparency, New York.
Franke, Gunter / Herrmann, Markus / Weber, Thomas (2007): Informationasymmetries and securitization design, Working Paper, University of Konstanz.
Franke, Gunter / Weber, Thomas (2007): Wie werden Collateralized DebtObligation-Transaktionen gestaltet?, in: Schmalenbachs Zeitschrift fur betrieb-swirtschaftliche Forschung, Vol. 57/7 (Sonderheft), Pg. 95–123.
Gaur, Vishal / Seshadri, Sridhar / Subrahmanyam, Marti (2003): Marketincompleteness and super value additivity: Implications for securitization, Work-ing Paper, Stern School of Business, New York.
Gorton, Gary / Pennacchi, George (1995): Banks and loan sales: Marketingnonmarketable assets, in: Journal of Monetary Economics, Vol. 35, Pg. 389–411.
Gorton, Gary / Souleles, Nicholas (2005): Special purpose vehicles and secu-ritization, Working Paper, Wharton School, Pennsylvania.
Hein, Julia (2006): Optimization of credit enhancements in collateralized loanobligations: The role of loss allocation and reserve account, Working Paper, Uni-versity of Konstanz.
International Monetary Fund (2006): Global financial stability report. Marketdevelopments and issues, Washington D.C., April 2006.
Longstaff, Francis / Schwartz, Eduardo (1995): A simple approach to valuingrisky fixed and floating rate debt, in: Journal of Finance, Vol. 50, Pg. 789–819.
Longstaff, Francis / Rajan, Arvind (2008): An empirical analysis of the pricingof collateralized debt obligations, in: Journal of Finance, Vol. 63, Pg. 529–563.
Merchant, Shanker (2004): The CDO equity: An emerging class of alternativeinvestments, in: Journal of Alternative Investments, Vol. 7, Winter 2004, Pg. 47–58.
Moody’s Investors Service (2003): Moody’s approach to rating synthetic CDOs,New York.
Moody’s Investors Service (2004): Using the structured note methodology torate CDO combo-notes, New York.
Papke, Leslie / Wooldridge, Jeffrey (1996): Econometric methods for frac-tional response variables with an application to 401(K) plan participation rates,in: Journal of Applied Econometrics, Vol. 11, Pg. 619–632.
33

Perraudin, William / Taylor, Alex (2003): Liquidity and bond market spreads,Working Paper, Bank of England.
Plantin, Guillaume (2004): Tranching. Working Paper, Tepper School of Busi-ness, Pennsylvania.
Riddiough, Timothy (1997): Optimal design and governance of asset-backedsecurities, in: Journal of Financial Intermediation, Vol. 6, Pg. 121–153.
Schaber, Albert (2008a): Selling or retaining the first loss piece in securitizationtransactions, unpublished Working Paper, Ludwig-Maximilians-University.
Schaber, Albert (2008b): Asset pool quality and tranching of CDOs, WorkingPaper, Ludwig-Maximilians-University.
Scheicher, Martin (2008): How has CDO market pricing changed during the tur-moil? Evidence from CDS index tranches, ECB Working Paper No. 910, Frank-furt.
Standard & Poor’s (2002): Global cash flow and synthetic CDO criteria, NewYork.
Standard & Poor’s (2004): CDO spotlight: Issues in rating combination notesin cash flow CDOs, New York.
34