Embed Size (px)
Citation preview

ALTERNATIVE SOLUTIONS FOR WASTEWATERTREATMENT IN U.S.-MEXICO BORDER COLONIAS:
AN ANALYSIS FROM SOCIO-ECONOMIC ANDTECHNOLOGICAL PERSPECTIVES
Authors: Joshua Graae, Shannon Keithley, Mimi Luc,Justin Pawl, Daniel Wilson
Faculty Advisors: Dr. Linda Fernandez, Dr. Arturo Keller
Bren School of EnvironmentalScience and Management
University of California atSanta Barbara
June 1998

TABLE OF CONTENTS
Preface……………………………………………………………………………………………………………………….iExecutive Summary.………………………………………………………………………………………………………..ii
1.0 Introduction1.1 Background…………………………………………………………………………………...1.2 Goals………………………………………………………………………………………….1.3 Case Study / Site Characteristics……………………………………………………………..
1.3.1 Expected Demand………………………………………………………………1.3.2 Physical Setting of El Paso / Ciudad Juarez……………………………………1.3.3 Characteristics of the East Clint Area.
2.0 Research Methods……………………………………………………………………………………..2.1 Technologies for Wastewater Treatment…………………………………………………….2.2 Evaluative Criteria……………………………………………………………………………
2.2.1 Physical Constraints……………………………………………………………2.2.2 Economic Constraints………………………………………………………….2.2.3 Technological Constraints……………………………………………………..
3.0 Treatment System Alternatives………………………………………………………………………...3.1 Sand Filters……………………………………………………………………………………
3.1.1 Basic Description……………………………………………………………….3.1.1.1 Sand Filter Elements………………………………………………….3.1.1.2 Sand Filter Operation…………………………………………………
3.1.2 Preliminary Design……………………………………………………………..3.1.3 Evaluation of Sand Filtration…………………….…………………….………
3.1.3.1 Physical Constraints…………………….……………………………3.1.3.2 Economic Constraints…………………….…………………………..3.1.3.3 Technological Constraints…………………….………………………
3.2 On-Site Septic Systems………………………………………………………………………..3.2.1 Basic Description………………………………………………………………3.2.2 Evaluation of Septic Systems…………………………………………………..
3.2.2.1 Physical Constraints…………………………………………………..3.2.2.2 Economic Constraints………………………………………………...3.2.2.3 Technological Constraints…………………………………………….
3.3 Stabilization Ponds…………………………………………………………………………….3.3.1 Basic Description………………………………………………………………3.3.2 Preliminary Design…………………………………………………………….3.3.2 Evaluation of Stabilization Ponds……………………………………………...3.3.2.1 Physical Constraints……………………………………………………………
3.3.2.2 Economic Constraints………………………………………………..3.3.2.3 Technological Constraints……………………………………………
3.4 Trickling Filter System with Mechanical Pre- and Post-treatment……………………………3.4.1 Basic Description………………………………………………………………3.4.2 Preliminary Design……………………………………………………………..3.4.3 Evaluation of Trickling Filter Systems…………………………………………
3.4.3.1 Physical Constraints…………………………………………………..3.4.3.2 Economic Constraints………………………………………………...3.4.3.3 Technological Constraints…………………………………………….
3.5 Wetlands…………………………………………………………………………………….…3.5.1 Basic Description………………………………………………………………
116789
11
121214162124
31313131323333333539
444448485052
57576064646769
73738087878890
9696

3.5.5.1 Treatment Wetlands…………………………………………………..3.5.1.2 Use of Natural vs. Constructed Wetlands…………………………….3.5.1.3 Pollutant Removal Mechanisms in Treatment Wetland………………3.5.1.4 Free-Water Surface Wetlands (FWS)………………………………...3.5.1.5 Sub-Surface Flow System Wetlands (SFS)…………………………..3.5.1.6 Comparison of FWS and SFS Wetland Systems……………………..
3.5.2 Preliminary Design……………………………………………………………..3.5.3 Evaluation of Constructed Wetland Systems………………………………….
3.5.3.1 Physical Constraints…………………………………………………..3.5.3.2 Economic Constraints………………………………………………...3.5.3.3 Technological Constraints…………………………………………….
4.0 Comparative Analysis…………………………………………………………………………………...4.1 Sensitivity Analysis……………………………………………………………………...
5.0 Recommended Technology……………………………………………………………………………..
6.0 Discussion and Conclusions…………………………………………………………………………….6.1 Transferability of Evaluative Framework………………………………………………..6.2 Growth Impacts…………………………………………………………………………..6.3 Recommendations for Future Work……………………………………………………...
7.0 References……………………………………………………………………………………………….
LIST OF FIGURES1.1 U.S. – Mexico Border Region……………………………………………………………………..1.2 Disease Incidence Rates (per 100,000 people)…………………………………………………….1.3 Study Region………………………………………………………………………………………3.1.1 Cross Section of Typical Below-Grade Sand Filter……………………………………………….3.2.1 Septic Tank………………………………………………………………………………………...3.2.2 Septic Tank and Associated Drain Field…………………………………………………………..3.3.1 Schematic Representation of a Stabilization Pond………………………………………………...3.3.2 kt values vs. Percent Remaining for Various Dispersion Factors…………………………………3.4.1 Preliminary Treatment Unit (Static Screen)……………………………………………………….3.4.2 Biological Trickling Filter Unit……………………………………………………………………3.4.3 Clarifier……………………………………………………………………………………………3.4.4 Entire Trickling Filter System……………………………………………………………………..3.5.1 Constructed Wetland Treatment Systems…………………………………………………………4.0.1 Comparison of Raw and Weighted Scores………………………………………………………...
LIST OF TABLES3.1.1 Scoring Summary of Sand Filtration………………………………………………………………3.2.1 Scoring Summary of Septic Tanks………………………………………………………………..3.3.1 Scoring Summary of Stabilization Ponds………………………………………………………….3.4.1 Scoring Summary of Trickling Filter……………………………………………………………...3.5.1 Design Guidelines for Constructed Wetlands……………………………………………………..3.5.2 Typical Media Characteristics for Sub-Surface Flow Wetlands…………………………………..3.5.3 Effluent Characteristics of Constructed Treatment Wetlands……………………………………..3.5.4 Construction Costs for a 6-acre SFS Wetland……………………………………………………..3.5.5 Scoring Summary of SSF Wetlands……………………………………………………………….4.1.1 Sensitivity Analysis………………………………………………………………………………..
96969899
100100102107107111115
120124
128
130130131133
134
357
32444658628182858697
120
42557194
102103107112118126

i
PREFACE
The Bren School of Environmental Science and Management was founded on the
principle that decisions that affect natural resources and environmental quality should be based
on rational economic and social policies, and sound scientific priciples. As part of the School’s
curriculum, all master’s students are required to participate in and complete a group project that
combines social and natural sciences to address a significant world problem. Some of the current
projects include: examining decommissioning of dams in the U.S.; reducing greenhouse gases
through carbon sequestration in forests; and coastal wetlands watershed management. Our
project focuses on various ways of providing wastewater treatment to a rural, low-income
population and develops a decision-making framework that can be utilized in similar situations
throughout the U.S.-Mexico border region.
Lack of adequate wastewater treatment in the colonias (rural settlements) of the border
region is a serious problem that has resulted in severe human and environmental health impacts.
In El Paso County, water-borne diseases such as hepatitis-A and shigellosis occur at
approximately four times the national rate. During the dry season, there are periods when the
flow of the Rio Grande consists more of wastewater effluent than natural water. While efforts
are being made by various governmental and non-governmental organizations to remedy these
problems, practical, near-term solutions have not been sufficiently developed for treating
wastewater in colonias. Our efforts address this problem and offer an approaching that integrates
economic, sociological, scientific and technical considerations. This document is a specific
recommendation for a particular site, and a general framework to guide decision making in
colonias throughout the border region.

ii
EXECUTIVE SUMMARY
Inadequate wastewater treatment often leads to severe water quality and public health
problems. Its effects are very pronounced in the low-income, rural subdivisions along the U.S.-
Mexico border. These communities, called colonias, typically have no electricity, running water,
or plumbing for waste disposal, are characterized by high disease incidence rate, and have a
migratory population which contributes to the diffusion of health problems and public concern in
both the U.S. and Mexico. The border pair cities of El Paso, Texas, and Ciudad Juarez,
Chihuahua, are representative of the situation for many large and small communities along the
U.S.-Mexico border. The additional issues of rapid population growth and a scarce water supply
compound these problems in this region.
This study has developed a transferable/adjustable framework, employing a set of socio-
economic, physical and technological criteria, for selecting wastewater treatment alternatives for
low-income communities. Using this framework, we have identified an appropriate wastewater
treatment system for a set of five colonias located in the El Paso/Ciudad Juarez border region.
In our analysis, we investigated five low-cost, low-technology alternatives to traditional
wastewater treatment service, including pond systems, constructed wetlands, on-site septic
systems, slow sand filtration, and trickling filter systems. Based on this assessment, we
recommend a constructed wetland system for the case study site.
Our framework, along with the case study results and design of the recommended system,
will be provided to planning and funding organizations in the study region. Among the recipients
are the Lower Valley Water District Authority (LVWDA), the El Paso Interreligious Sponsoring
Organization (EPISO), and the Texas Water Development Board (TWDB).
1
1.0 INTRODUCTION
1.1 Background
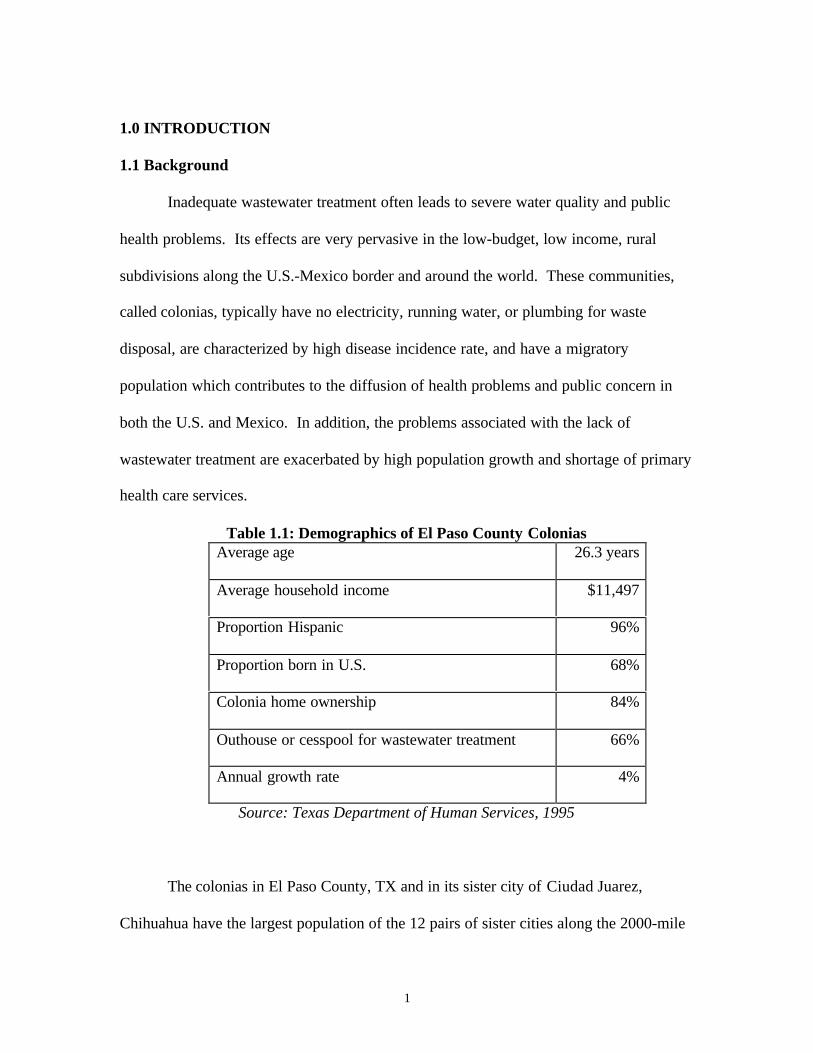
Inadequate wastewater treatment often leads to severe water quality and public
health problems. Its effects are very pervasive in the low-budget, low income, rural
subdivisions along the U.S.-Mexico border and around the world. These communities,
called colonias, typically have no electricity, running water, or plumbing for waste
disposal, are characterized by high disease incidence rate, and have a migratory
population which contributes to the diffusion of health problems and public concern in
both the U.S. and Mexico. In addition, the problems associated with the lack of
wastewater treatment are exacerbated by high population growth and shortage of primary
health care services.
Table 1.1: Demographics of El Paso County ColoniasAverage age 26.3 years
Average household income $11,497
Proportion Hispanic 96%
Proportion born in U.S. 68%
Colonia home ownership 84%
Outhouse or cesspool for wastewater treatment 66%
Annual growth rate 4%
Source: Texas Department of Human Services, 1995
The colonias in El Paso County, TX and in its sister city of Ciudad Juarez,
Chihuahua have the largest population of the 12 pairs of sister cities along the 2000-mile

2
U.S.-Mexico border (Figure 1.1). The population of El Paso County colonias is young
and predominantly Hispanic (Table 1.1). The border zone in this area is highly porous, as
indicated by the large proportion of individuals born outside the U.S. The high
percentage of colonia home ownership suggests that the residents of these areas are likely
to have a vested interest in improving their standard of living. Currently, about two-
thirds of the population still relies on inadequate wastewater treatment systems such as
outhouses and cesspools. Despite poor living standards, the region continues to
experience growth at 4% per year.

3
Figure 1.1 U.S. – Mexico Border Region
4
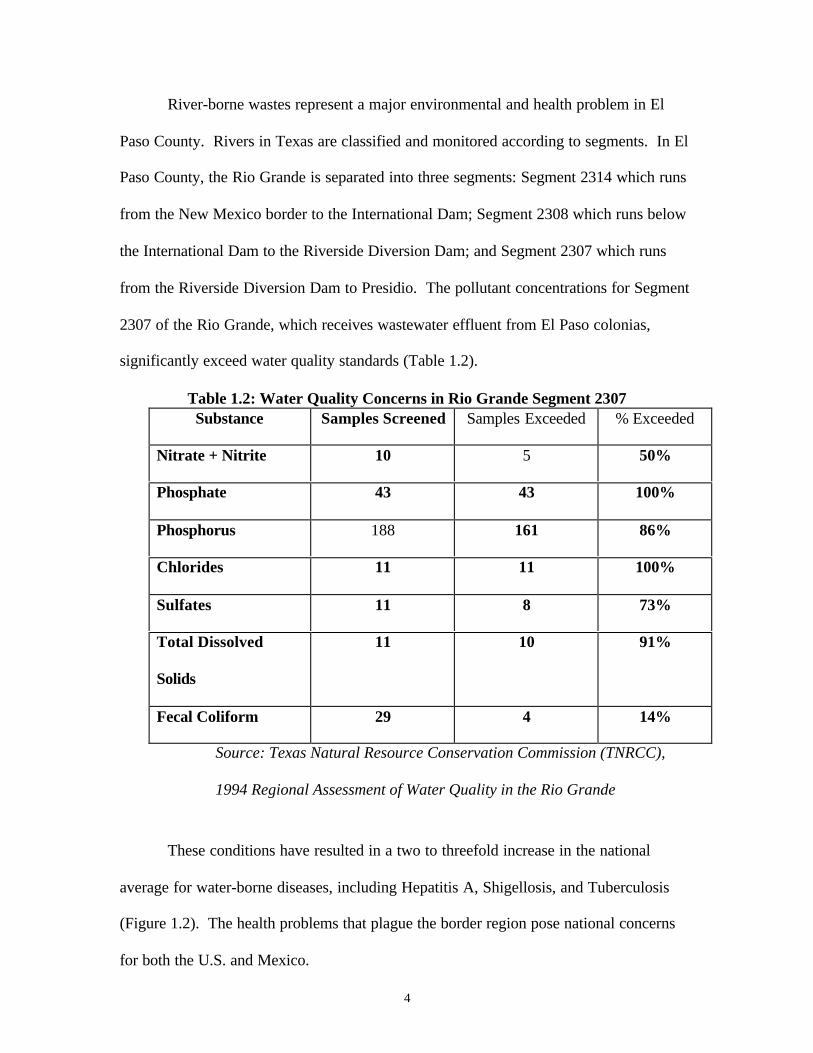
River-borne wastes represent a major environmental and health problem in El
Paso County. Rivers in Texas are classified and monitored according to segments. In El
Paso County, the Rio Grande is separated into three segments: Segment 2314 which runs
from the New Mexico border to the International Dam; Segment 2308 which runs below
the International Dam to the Riverside Diversion Dam; and Segment 2307 which runs
from the Riverside Diversion Dam to Presidio. The pollutant concentrations for Segment
2307 of the Rio Grande, which receives wastewater effluent from El Paso colonias,
significantly exceed water quality standards (Table 1.2).
Table 1.2: Water Quality Concerns in Rio Grande Segment 2307Substance Samples Screened Samples Exceeded % Exceeded
Nitrate + Nitrite 10 5 50%
Phosphate 43 43 100%
Phosphorus 188 161 86%
Chlorides 11 11 100%
Sulfates 11 8 73%
Total Dissolved
Solids
11 10 91%
Fecal Coliform 29 4 14%
Source: Texas Natural Resource Conservation Commission (TNRCC),
1994 Regional Assessment of Water Quality in the Rio Grande
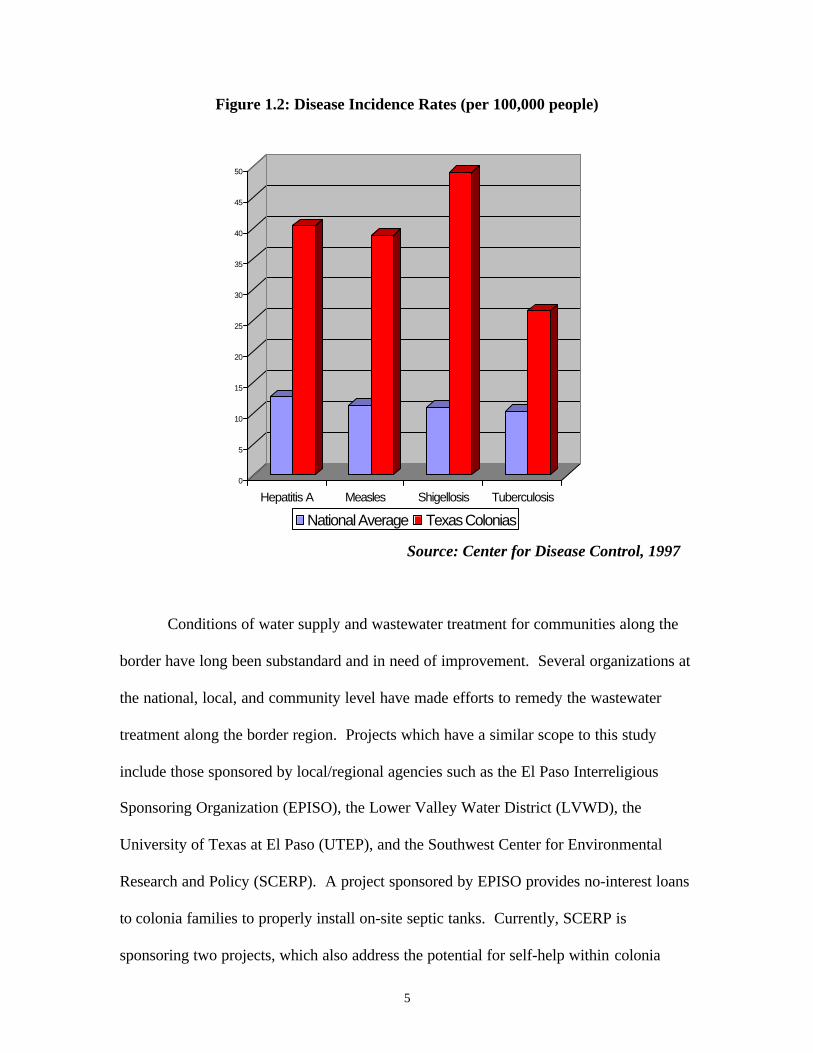
These conditions have resulted in a two to threefold increase in the national
average for water-borne diseases, including Hepatitis A, Shigellosis, and Tuberculosis
(Figure 1.2). The health problems that plague the border region pose national concerns
for both the U.S. and Mexico.
5
Figure 1.2: Disease Incidence Rates (per 100,000 people)
Source: Center for Disease Control, 1997
Conditions of water supply and wastewater treatment for communities along the
border have long been substandard and in need of improvement. Several organizations at
the national, local, and community level have made efforts to remedy the wastewater
treatment along the border region. Projects which have a similar scope to this study
include those sponsored by local/regional agencies such as the El Paso Interreligious
Sponsoring Organization (EPISO), the Lower Valley Water District (LVWD), the
University of Texas at El Paso (UTEP), and the Southwest Center for Environmental
Research and Policy (SCERP). A project sponsored by EPISO provides no-interest loans
to colonia families to properly install on-site septic tanks. Currently, SCERP is
sponsoring two projects, which also address the potential for self-help within colonia
0
5
10
15
20
25
30
35
40
45
50
Hepatitis A Measles Shigellosis Tuberculosis
National Average Texas Colonias

6
communities. One project, “Low-Tech Strategy to Treat and Reuse Effluent on the U.S.-
Mexico Border” examines the feasibility of linking several natural treatment systems
together to treat and recharge wastewater for the border city of Nogales, Arizona/Sonora.
The other, “A Pilot Study for an Integrated Waste Treatment and Disposal System Along
the U.S./Mexico Border: Ojinaga Community as a Prototype” is evaluating the effect of
wastewater application on the growth of woody biomass species. This study also
proposes to develop a model system to be transferable to small communities in Latin
America and to calculate the economic impact of the sale of biomass for wood chip
production as a mechanism for financing the treatment system.
1.2 GoalsSimilar to the projects discussed above, this study will attempt to create a
community-based system for implementing and administering a wastewater treatment
system. We will also attempt to address the potential for self-help within these
communities. Whereas a standardized process for selecting wastewater treatment
solutions in previous studies has been lacking, this study will develop a protocol for
evaluating of the range of alternative treatment systems prior to making a site-specific
recommendation.
The objectives of this study are: (1) to develop a transferable/adjustable
framework that employs a set of socio-economic, physical, and technological criteria to
select wastewater treatment alternatives for low-income communities; and (2) to use this
framework to identify an appropriate wastewater treatment system for a set of five
colonias located in the El Paso, Texas/Ciudad Juarez, Chihuahua border region.

7
1.3 Case Study Site CharacteristicsThe area of interest in this study focuses on 5 colonias located in the Lower
Valley region in an area called East Clint (Figure 1.3). These colonias are representative
of the situation for many large and small communities along the U.S.-Mexico border. In
addition, these colonias lie outside of the area slated to receive wastewater treatment
service from the local water district. Planning for a traditional wastewater treatment
system for this area will not begin until at least the year 2005.
Figure 1.3
8
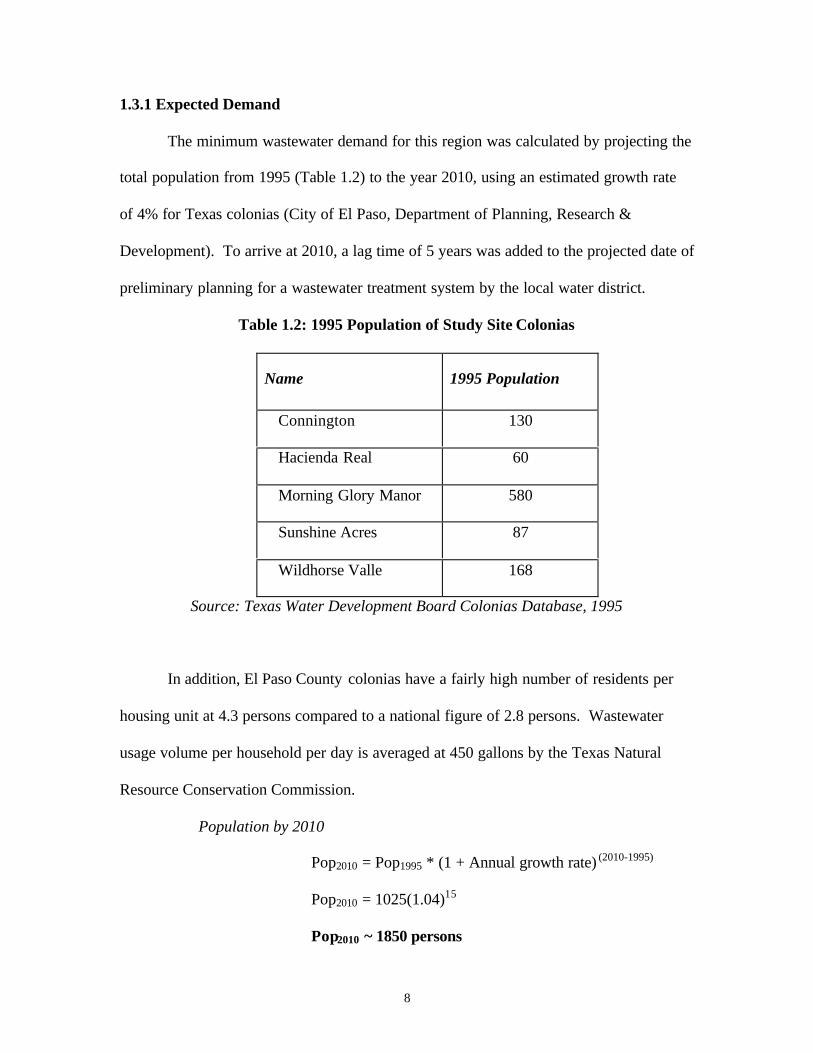
1.3.1 Expected Demand
The minimum wastewater demand for this region was calculated by projecting the
total population from 1995 (Table 1.2) to the year 2010, using an estimated growth rate
of 4% for Texas colonias (City of El Paso, Department of Planning, Research &
Development). To arrive at 2010, a lag time of 5 years was added to the projected date of
preliminary planning for a wastewater treatment system by the local water district.
Table 1.2: 1995 Population of Study Site Colonias
Name 1995 Population
Connington 130
Hacienda Real 60
Morning Glory Manor 580
Sunshine Acres 87
Wildhorse Valle 168
Source: Texas Water Development Board Colonias Database, 1995
In addition, El Paso County colonias have a fairly high number of residents per
housing unit at 4.3 persons compared to a national figure of 2.8 persons. Wastewater
usage volume per household per day is averaged at 450 gallons by the Texas Natural
Resource Conservation Commission.
Population by 2010
Pop2010 = Pop1995 * (1 + Annual growth rate) (2010-1995)
Pop2010 = 1025(1.04)15
Pop2010 ~ 1850 persons

9
Minimum wastewater demand
Volume = 450 gallons/day/household * 1850 persons/4.3 persons/household
Volume ~ 194,000 GPD
1.3.2 Physical Setting of El Paso County and Ciudad Juarez
To achieve the goal of identifying an appropriate wastewater treatment system for
the five study site colonias, the physical and economic characteristics of this region must
first be analyzed. This baseline assessment will constrain the evaluations of low-cost,
low-technology wastewater treatment alternatives.
Physiography:
The cities of El Paso and Ciudad Juarez lie in northernmost part of the El Paso-
Juarez Valley, an alluvial basin bounded to the north by the Franklin Mountains (north-
south trending, elevation 7,192 ft) and to the southwest by the Sierra de Juarez (north-
south trending). The Rio Grande traverses the valley along a northwest-southeast axis, at
an elevation of approximately 3,500 ft above sea level. Alluvial benchlands (elevation
approximately 4,000 ft) on which a majority of the urban areas lie, flank the river
between adjacent mountain ranges.
Soils:
The soils in this region vary from fine, sandy loam subsoil; loamy, very fine sand
to silty clay loam in the Rio Grande flood plain; shallow to very shallow soils over
caliche on or near the foot slopes of the Franklin Mountains; hard caliche or deep soils

10
with a silt loam subsoil on alluvial fans and foot slopes of the Hueco Mountains; and
steep and very steep rocky areas and very shallow stony soils in the Hueco Mountains.
The nature of the soil is important in selecting possible sites for septic tank
absorption fields and identifying limiting soil properties to be considered in design and
installation. The degree of soil limitation is expressed as "slight", meaning soils are
generally favorable for the specified use; "moderate", meaning unfavorable, but
limitations may be overcome; and "severe", meaning soil conditions are so unfavorable
that the facilities would not be feasible. Of El Paso County’s 676,683 acres, 59.5% have
soils considered severe, 3.9% moderate, and 24.2% slight. The remaining percent of El
Paso County is on the flood plain of the Rio Grande.
Geology and Hydrology:
The principal aquifer in the El Paso-Ciudad Juarez area is known as the Hueco
Bolson and is the main water source for El Paso-Ciudad Juarez. It is composed mainly of
poorly sorted fluvial deposits of sand, gravel, silt and clay lenses. At the southern base of
the Franklin Mountains, near the city of El Paso, the aquifer reaches a depth of 9000 ft.
On top of the Hueco Bolson lies a shallow layer of river sediments known as the Rio
Grande Alluvium, a water bearing layer that is influenced by the discharge of the Rio
Grande. The direction of groundwater flow and water table depth for both of these
aquifers has been seriously affected by groundwater withdrawals (Nunez, 1997 and
Cordoba et al., 1969).

11
Climate:
The region has an arid climate with hot, sunny summers and cooler winters. The
January and June highs and lows range from 29.4 to 68.4° F (-1.4 to 20.2° C) and 56.1 to
96.5° F (13.4 to 35.8° C). Humidity is low. Wind speed is fairly high at 9.2 to 12 mph,
accompanied by frequent dust and sandstorms. Rainfall is scarce, with an average of
8.81 inches per year. The wettest month is September with an average of 1.70 inches and
the driest is April, with an average of 0.20 inches. Due to low rainfall, hot summers and
mild winters, evaporation in this area exceeds precipitation by a factor of ten.
1.3.3 Characteristics of the East Clint Area
The East Clint area consists of rolling, sandy hills, influenced by deposits of the
Rio Grande and erosion from the Hueco Scarp. Windblown sand and dunes are
abundant. Although land use in this area has been dominated by agriculture, there is a
recent a trend towards increasing residential land use.
The major hydrological elements include surface water drainageways, which are
typically contaminated by illegal trash and solid waste disposal, and the Rio Grande. The
water quality in the Rio Grande is severely degraded in this region. Groundwater
resources are often contaminated by outflows of cesspools, poorly operated septic tanks
and leach fields.
Economic considerations in these colonias include high unemployment rates and
an average household income of $11,497. Employment is concentrated in agriculture,
manufacturing, and retail trade.

12
2.0 RESEARCH METHODS
This study provides a systematic analysis of five wastewater treatment
alternatives for East Clint area colonias. First, a list of low-cost, low-technology
alternative technologies is presented; five are selected for site-specific evaluation. These
include septic systems, sand filtration, stabilization ponds, trickling filter system and
wetlands. Next, a set of technical and socio-economic criteria is developed for the
evaluation of these alternatives based on a scoring system. The comparative analysis
includes a sensitivity test in which several of these criteria are weighted against each
other. A recommendation is made for the East Clint colonias based upon the results of
this analysis. The transferability of this framework is discussed in the last sections of this
document.
2.1 Technologies for Wastewater Treatment
We have investigated a number of low-cost, low-technology wastewater treatment
alternatives that have potential to be employed at both the selected site and other sites in
the El Paso/Ciudad Juarez region. A rapid screening of the wastewater treatment
technologies based on cost of treatment was used to eliminate a large number of
technologies from our study. Some of the treatment methods considered in the initial
screening are listed below:
• Land application
• Constructed treatment wetlands
• Sand filtration
• Trickling filters

13
• Aerated and facultative lagoons
• Stabilization ponds
• Imhoff tanks
• On-site septic systems
• Subsurface injection
• Aquatic plant and/or animal systems
• Activated sludge processes
We provide here an in-depth investigation of five treatment methods that span a
range of low-cost options available to the colonias. The technologies assessed herein
include: (1) pond systems, (2) constructed wetlands, (3) on-site septic systems, (4) sand
filtration, and (5) a trickling filter with mechanical pre-treatment. These systems were
chosen based upon our initial assessment of cost and also a preliminary judgment of
technological complexity and feasibility. The selected systems are, in general, simpler in
design and operation than most conventional processes and require minimal external
energy sources to maintain the major treatment responses. These characteristics are
important when implementing a treatment system in a community where economic
resources and technological skills may be lacking.
14
2.2 Evaluative Criteria
Ten criteria were developed to thoroughly assess the applicability of each
technology for given socioeconomic and physical environments. The criteria have been
developed to identify and quantify the variables that could potentially restrict a given
technology’s implementation. For some criteria’s categories, it has been necessary to
develop an additional detailed level of analysis.
Use of the criteria allows objective assessment of a given wastewater treatment
technology in time and space given the following parameters: wastewater treatment
efficiency, surrounding physical environment, legal and socioeconomic considerations,
technological feasibility, adaptability and complexity, and viable lifetime. Section C lists
and explains how each of the ten categories is applied as well as its respective sub
categories.
Each category has a range of scores developed by analysis of the pertinent
constraints imposed on system implementation. The scores are designed for each
category based upon the most relevant indicator of robustness. The higher the score, the
better the technology manages assessed with that indicator of constraint. A score of zero
(0) represents an unacceptable value. In the case of binary ratings (categories seven and
eight), a no response is rated one (1) and not zero since the technology may not meet the
requirement in question, it may still be a viable and robust alternative. A two-page
summary of the scoring is located in a table at the end of each treatment alternative’s
evaluation section.
The Lower Valley Water District, the El Paso water and wastewater treatment
agency, currently has no plans to join these Colonias to the central wastewater treatment

15
system at least until 2005. We have therefore conservatively chosen fifteen years to
represent the likely lifetime that the wastewater treatment technology must operate
independently.
The evaluative criteria were developed for this analysis based on criteria used in
similar studies and BECC’s “Guidelines for Project Submission and Criteria for Project
Certification”. Similar criteria were used in Appropriate Sanitation Alternatives: A
Technical and Economic Appraisal (Gunnerson, 1982).
BECC’s document includes guidelines that correspond with permitting, operation
and maintenance, technical feasibility, cost, and ecological impacts evaluative criteria
employed in this study for analyzing wastewater treatment alternatives. BECC’s
document does not utilize quantitative categories for these criteria, but merely questions
what impact the proposed treatment system will have. In contrast, this study quantifies
evaluative criteria when possible to generate data for comparing various technologies.
Gunnerson’s study does not attempt to quantify each technology’s effectiveness
with respect to each category either. Rather, he qualitatively ranks each technology. A
comparison of Gunnerson’s criteria and those used in this study is contained in Table 2.1.
.

16
Table 2.1: A Comparison of Criteria Used by Gunnerson with Those In This Study
Appropriate Sanitation Alternatives: A
Technical and Economic Appraisal—
Criteria
Comparable Criteria Employed in this Analysis
Construction Cost Capital Cost
Operating Cost Operation and Maintenance Cost for 20 Years
Ease of Construction Technological Feasibility
Water Requirement Compatibility with Existing Infrastructure
Required Soil Conditions Compatibility with Physical Environment
Reuse Potential and Health Benefits Amount and Type of Pollutant/Pathogen Removed
Institutional Requirement Permitting
Source: Gunnerson, 1982
The criteria used in this analysis include those criteria used in Gunnerson, and in
fact, exceed the level of detail used by him. By expanding on his criteria, this analysis is
able to more clearly compare competing technologies.
2.2.1 Physical Constraints
Physical constraints criteria include both the ability of the proposed wastewater
treatment system to remove pollutants and pathogens from household effluent and the
system’s compatibility with the local physical environment.

17
1. Amount and Type of Pollutants/Pathogens Removed
The amount of pollutants and pathogens removed, usually measured as a
volumetric percentage, relates directly to human health and ecological impacts of treated
wastewater. Water contaminated with sewage can spread parasites, such as pathogenic
bacteria, protozoa, gastrointestinal helminths and enteric viruses. Untreated wastewater
in many low-income areas is simply discharged into the nearest waterbody where it can
cause deleterious human and ecological effects.
Although treated water entering a water body will have residual levels of
pollutants and pathogens, the effluent pollutant concentrations must meet the local or
regional applicable discharge standards. The proposed wastewater treatment system must
decrease the amount of pathogens and pollutants such that human contact with the treated
water will not result in a disease incidence rate that exceeds local standards. If the
treatment system cannot, or is not designed to, treat water to this level, the effluent water
must be discharged in areas with low potential for human contact.
This study evaluates the removal efficiencies of proposed wastewater treatment
systems in regards to Biological Oxygen Demand (BOD5), Total Suspended Solids
(TSS), Total Nitrogen (N), Fecal Coliform and Viruses. The Texas Natural Resource
Conservation Commission (TNRCC) currently evaluates permit applications for
wastewater treatment systems based on effluent levels of these pollutants because of their
potential ecological effects (Metcalf and Eddy, 1991):
• Biological Oxygen Demand is comprised mostly of carbohydrates, proteins and
fats. Biodegradable organics are measured primarily in terms of BOD5 and
Chemical Oxygen Demand. If discharged to the environment in high
18
concentrations, their biological stabilization can lead to the depletion of natural
oxygen resources and to the development of anaerobic conditions which can have
significant ecological impact. Anaerboic water cannot sustain fish and other flora
and fauna.
• Excessive concentrations of TSS may lead to development of sludge deposits and
anaerobic conditions when untreated wastewater is discharged in the aquatic
environment.
• Nutrients such as Nitrogen and Phosphorous are essential for growth. When
discharged to the aquatic environment in excessive concentrations these nutrients
may lead to the growth of undesirable aquatic life resulting in eutrophication.
Eutrophication is the rapid growth of algal populations which, when they expire,
burden the water with dead algae. Aerobic microbial decomposition of the dead
algae consumes dissolved oxygen, which can result in anaerobic water. When
discharged in excessive amounts on land they can also lead to the pollution of
groundwater. Note: Phosphorous is not assessed in this study because there is
currently no effluent standard for this nutrient.
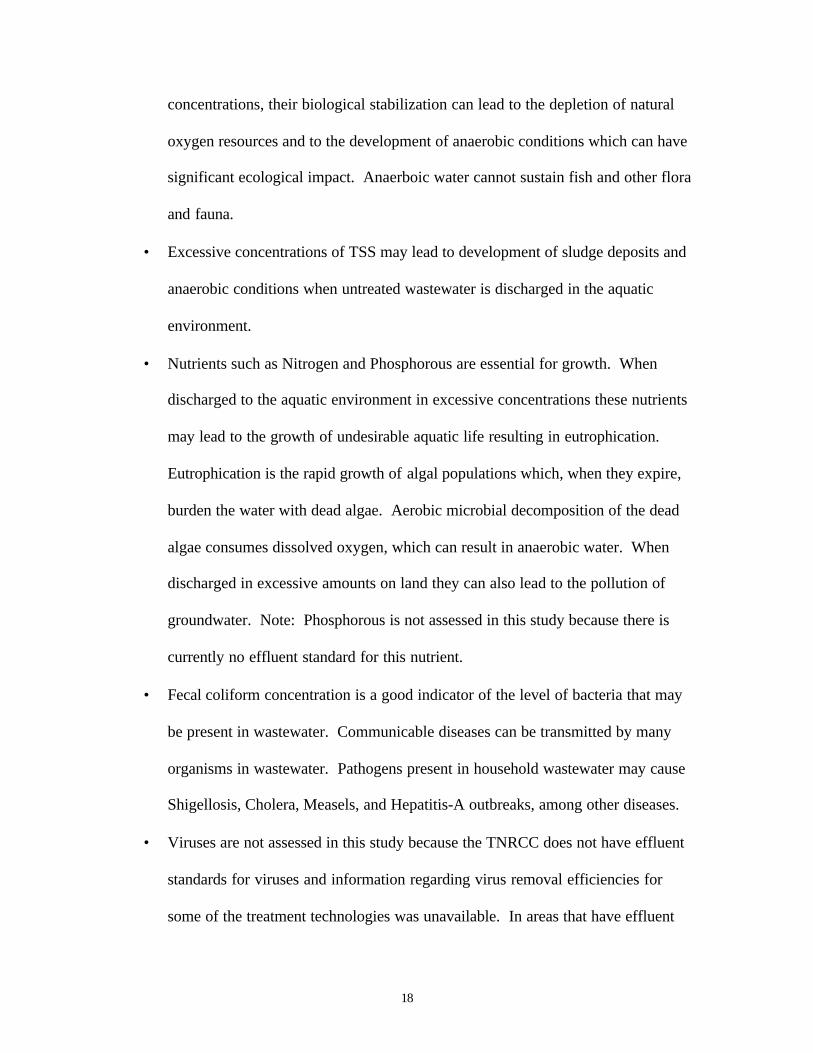
• Fecal coliform concentration is a good indicator of the level of bacteria that may
be present in wastewater. Communicable diseases can be transmitted by many
organisms in wastewater. Pathogens present in household wastewater may cause
Shigellosis, Cholera, Measels, and Hepatitis-A outbreaks, among other diseases.
• Viruses are not assessed in this study because the TNRCC does not have effluent
standards for viruses and information regarding virus removal efficiencies for
some of the treatment technologies was unavailable. In areas that have effluent
19
requirements for viruses, virus removal efficiencies of proposed technologies
should be addressed.
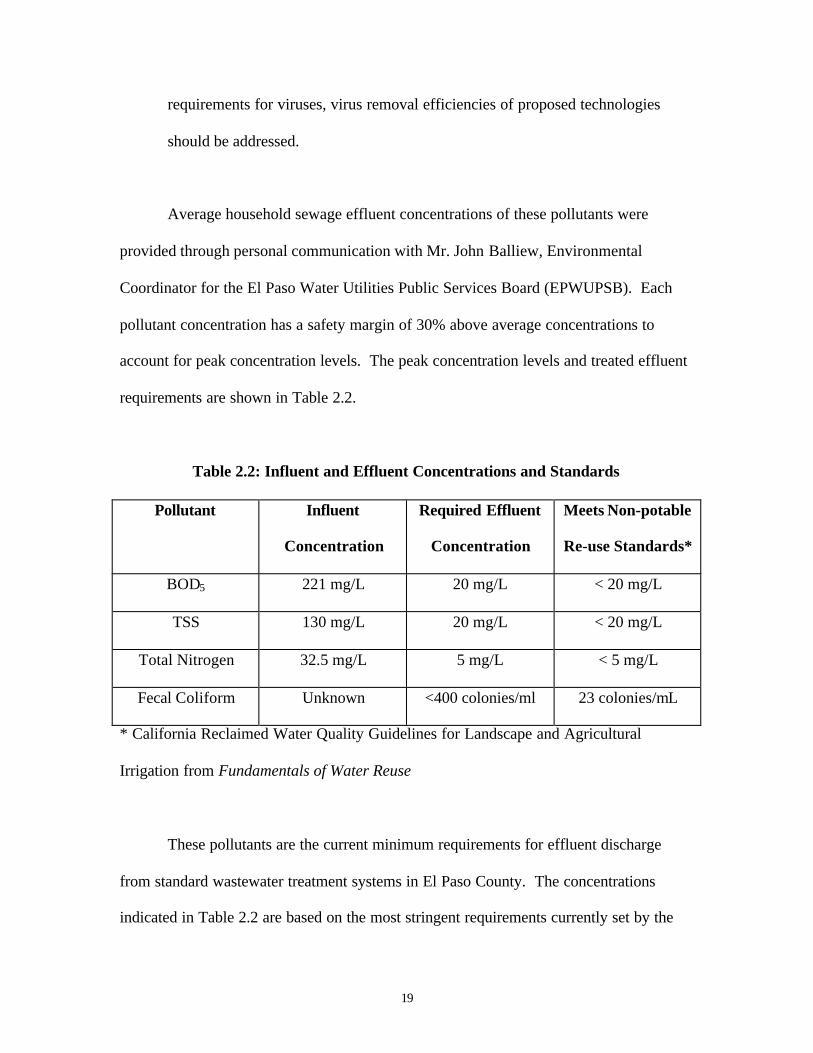
Average household sewage effluent concentrations of these pollutants were
provided through personal communication with Mr. John Balliew, Environmental
Coordinator for the El Paso Water Utilities Public Services Board (EPWUPSB). Each
pollutant concentration has a safety margin of 30% above average concentrations to
account for peak concentration levels. The peak concentration levels and treated effluent
requirements are shown in Table 2.2.
Table 2.2: Influent and Effluent Concentrations and Standards
Pollutant Influent
Concentration
Required Effluent
Concentration
Meets Non-potable
Re-use Standards*
BOD5 221 mg/L 20 mg/L < 20 mg/L
TSS 130 mg/L 20 mg/L < 20 mg/L
Total Nitrogen 32.5 mg/L 5 mg/L < 5 mg/L
Fecal Coliform Unknown <400 colonies/ml 23 colonies/mL
* California Reclaimed Water Quality Guidelines for Landscape and Agricultural
Irrigation from Fundamentals of Water Reuse
These pollutants are the current minimum requirements for effluent discharge
from standard wastewater treatment systems in El Paso County. The concentrations
indicated in Table 2.2 are based on the most stringent requirements currently set by the

20
EPWUPSB. Many of the effluent pollutant concentrations for wastewater treatment
systems in El Paso County are determined on a case-by-case basis.
A score of zero indicates that the system does not meet effluent standards.
Systems that treat wastewater to meet effluent standards are scored a one. Systems that
treat wastewater to non-potable water quality are scored a two. The additional points
indicate that the treated water may have economic value for reuse as either non-potable
water or potable water. Systems that treat wastewater to potable quality receive the
maximum score of three points.
2. Compatibility with Physical Environment
The compatibility of a proposed wastewater treatment system with the
environment in which it will be used is paramount to successful treatment of household
effluent. This study evaluates each treatment technology with regard to spatial, climatic
and hydrogeologic parameters of the proposed area for use. Seven criteria are evaluated
based on the technology’s degree of compatibility with the local environment.
The Existing Land Use criterion is a measure of the availability of local land upon
which to situate the wastewater treatment technology. Some technologies require more
land than others and thus in areas where land is scarce, certain technologies may be
infeasible. The Precipitation and Temperature criteria evaluate the compatibility of each
technology with the average local precipitation and temperature. The Topography
criteria assesses the compatibility of each technology with local topographical features.
This criteria is of importance because some treatment systems can be operated using
gravity instead of pumps, thus saving both capital and operation and maintenance costs.

21
The Soils, Groundwater and Surface Water criteria evaluate the compatibility of each
technology with local hydrogeologic parameters. Each technology is given a score based
on its compatibility with each parameter. A score of zero indicates the treatment system
is incompatible with local hydrogeologic conditions. A score of one indicates that the
treatment system may require additional design and/or equipment to be compatible with
local soils, groundwater and surface water features. A score of two indicates that either
the local topography will optimize performance of the wastewater treatment system or
that topography has no bearing on its operation.
2.2.2 Economic Constraints
Those criteria considered in the category of Economic Constraints are intended to
evaluate how the cost of the proposed wastewater treatment technology will affect the
people it is intended to help.
3. Costs per Household
The cost per household is the total capital cost and operations and maintenance
costs of the technology divided by the 238 households that are currently in place. This
study, based on current growth rates, anticipates that 15 years from now there will be 430
total households in the study area. Additional households and population will decrease
the cost per household in the future.
It is assumed that households are constrained by their ability to pay, rather than
their willingness to pay to have their sewage treated. The benchmark value of $1,200
dollars per household is based on the amount in low interest loans that the El Paso

22
Interreligious Sponsoring Organization (EPISO) currently allocates to each house. The
amount of $1200 that families are currently willing to accept in loans is a realistic market
indicator of households’ ability to pay for wastewater treatment. The average household
income is $11,497, indicating that families cannot afford to incur much debt. This
criteria was further divided based on doubling and tripling the amount above families’
abilities to pay for wastewater treatment based on the benchmark value of $1200. Given
the financial constraints in the area, additional cost above ability to pay makes the
treatment technology less affordable and therefore less realistic to implement. As the
cost of the system per household rises, the score, based on affordability, decreases. Score
3 indicates the technology is below the $1,200 benchmark. Score 2 indicates the
technology costs between $1,201 and $2,400 per household. Score 1 indicates the
technology costs between $2,401 and $3,600 per household. Score 0 indicates the cost
per household of the technology exceeds the benchmark by more than a factor of 3 (i.e.
the technology costs exceed $3,601).
4. Opportunity Cost
The Opportunity Cost criterion is a measure of what the land could be used for in
the absence of a treatment facility. According to the El Paso County Tax Assessor,
agricultural land sells for $17,000 per acre ($42,500 per hectare) in El Paso County.
Technologies requiring larger land areas subdue land that could be utilized in other
ventures, e.g. agriculture. Qualitatively evaluating individual technologies’ land
requirements penalizes treatment technologies that require larger land areas compared to
those requiring less land. The criterion was divided into 4 categories, which rank each

23
technology based on the technology’s calculated footprint. The footprint of each
technology was calculated based on a sewage influent rate of 450 gallons per day per
household (the footprint area of each technology will change rapidly for different sewage
influent rates). Score 3 indicates the technology has a footprint of less than 5 acres (2.1
hectares). Score 2 indicates the technology has a footprint of 6 to 20 acres (2.5 to 8.3
hectares). Score 1 indicates the technology has a footprint of 21 to 99 acres (8.8 to 41.3
hectares). Score 0 indicates the technology has a footprint of greater than 100 acres (41.7
hectares).
5. Permitting
The Permitting criteria are another indicator of cost of a proposed wastewater
treatment technology. Systems considered “standard” by the TNRCC require
significantly less paperwork and formal design than those considered non-standard.
Plans for a system designated as non-standard by the TNRCC must be completed by a
Professional Engineer or Registered Sanitarian (TNRCC, 1997). The owner of the
property may submit plans for a standard system. Furthermore, the cost to permit a
standard system is $200 per household while that of a non-standard system is $400 per
household (Sanchez, 1998). Thus the costs associated with design permitting are higher
for a non-standard system than for a standard system. This relationship accounts for the
higher score of a technology that is standard versus one that is not standard or non-
permittable.

24
2.2.3 Technological Constraints
Technological Constraints address physical requirements and limitations that each
technology is subject to. This category relates the engineering aspects of each technology
to the surrounding environment. Instead of investigating limitations of a particular
treatment system given specific climatic, hydrologic, and geologic parameters (e.g.
Compatibility with Physical Environment), this category surveys the flexibility of and
requirements to efficiently operate a particular treatment system. Three categories
comprise the heading Technological Constraints.
6. Technological Feasibility
Technological Feasibility, comprised of three sub-categories, addresses specific,
potentially limiting input requirements. These requirements include energy, water, and
hardware and essentially deal with the mechanics within the system. It is rated from a
low of one (1) to a high of three (3). A one represents that the technology’s demand for
the particular resource is high. A high resource need may limit the implementation of a
particular technology since additional investments may be required (e.g. pumps). A two
represents that the technology’s requirement demands are medium. A three represents
that the technology’s requirement demands are low. A low resource need is an excellent
indicator for implementability across different regions.
Water Requirement evaluates how dependent the treatment system is upon water
for sustaining operational efficiency. If components of the system must have constant
and controlled water circulation (e.g. sand or plastic media), some elements of the
treatment process may become affected or fail. For example, organic matter-digesting

25
facultative aerobic bacteria will perish without a constant supply of oxygenated water and
their element of the treatment process might stop. If this dependency is very high and the
treatment system requires both water input (in addition to the wastestream) and
recirculating the water within the system to achieve acceptable removal efficiency, it is
rated one (1). If the treatment system has one or more components dependent upon water
circulation but can achieve proper wetting and removal efficiencies by either
recirculating or importing water, but not necessarily both, it is rated two (2). If the water
requirement is low, it indicates that the treatment system operates acceptably without
either water flow-requirement and is rated three (3).
Energy Input Requirement evaluates the degree that the technology requires
electrical energy input for efficient operation. This requirement is critical if (without
sufficient elevation gradient) pumps are required for wastewater circulation to and/or
within the treatment facility. A high energy requirement, rated one (1), indicates that the
facility must tap into a commercial electric utility grid. A medium energy requirement,
rated two (2), indicates that additional energy needs may be met with on-site pumps.
These pumps may be alternatively powered (e.g. solar or diesel/gas generator) and
provide energy to supply hydraulic head. A low energy requirement, rated three (3),
indicates that efficient operation of the system is not dependent upon energy input.
Technological Complexity evaluates the system’s dependence on mechanical
components. The degree of dependence is associated with the risk of system operational
failure should one or more components fail. If the system does not have components and
therefore is not susceptible to hardware failure, it is rated low (1). If the treatment system
remains operationally efficient for a reasonable amount of time after a component fails,
26
allowing the system operators several days to a week to locate and repair the inoperable
component, it is rated medium (2). A complex technology requires immediate attention
to avoid a significant decrease in operational efficiency, and is therefore rated high (3).
7. Compatibility with Existing Infrastructure
Compatibility with Existing Infrastructure, comprised of two sub-categories,
provides specific indices for transferring this analysis framework to other regions. This
category analyzes both if the technology is dependent upon the region’s infrastructure
and the region’s ability to support the treatment technology in question. This category is
scored as a binary response with either a rating of one (1) representing yes or two (2)
representing no and provides a measure to indicate whether or not that technology is
constrained by the resource in question. This becomes a critical consideration if the
region does not have the infrastructure to support these requirements.
Off-site Water Dependence evaluates both whether the waste stream needs to be
transported from the source to the treatment facility. If the technology requires
connecting wastewater flow from multiple households, can it do so without
infrastructure-provided water input?
Connectable to Sewer Line evaluates ease of routing the treated effluent to either
a central collection system or removal site (e.g. Rio Grande) in the event that a municipal
sewer is constructed. If the effluent is dispersed and not easily collected for re-routing
(e.g. drain field), the technology is rated no (not connectable to a sewer line). A yes
rating indicates that the effluent is contained and easily collected for routing offsite (e.g.
final effluent comes out of a pipe).

27
8. Expandability
Expandability, comprised of three sub-categories, evaluates the technology’s
flexibility for upgrading and increasing capacity. The ability to expand is particularly
important in regions that experience population growth resulting in increased wastewater
volumes and consequent need for treatment system enlargement. This category is rated
binarily; either no or yes. No indicates that for the given constraints, the technology is
not easily expandable; yes indicates that the technology is easily expandable.
Modular evaluates whether or not additional stages may be added to the existing
system at a later date. Not modular, rated one (1), indicates that the treatment system is
constrained to operate within the original design and construction, and addition of
replicate units is not feasible. If the treatment system operates with stages or
components, and if additionally constructed components are not only connectable but
perform at the same removal efficiency level as the originals, then it is rated two (2).
Economies of Scale evaluates if the cost to increase the technology’s size (to increase
influent capacity) will marginally decrease. No economies of scale, rated one (1),
indicates that the cost to construct a larger system will not marginally decrease when
compared to multiple smaller units. When economies of scale of expansion exist, the
capital and operating costs marginally decrease with increasing treatment capacity and is
rated two (2).
Constant Operating Efficiency evaluates how increasing the treatment size and
corresponding influent capacity affects constant operational efficiency and subsequent
influent removal. Efficiency loss, rated one (1), indicates that more labor and/or
expertise is required to maintain treatment standards. Constant efficiency, rated two (2),

28
indicates that treatment removal efficiency is not affected by increasing treatment
capacity.
9. Lifetime
Lifetime evaluates how long is the projected useful lifespan of the technology. As
each region may or may not be slated to receive sewer hookup to central wastewater
treatment plants, it is critical that implemented systems operate efficiently until the
expected sewer hookup date. We have chosen our scale to indicate the length of time that
the particular wastewater treatment technology must operate in the absence of sewer
connection. The Lower Valley Water District has no plans to join these Colonias to the
central wastewater treatment system at least until 2005. We have therefore
conservatively chosen fifteen years to represent the likely time that the wastewater
treatment technology must operate independently. A duration of one (0-14 years), rated
one (1), indicates that the technology does not meet the conservative expected lifetime of
required operating duration. A duration of (15-20 years), rated two (2), indicates
acceptable operational duration, given this region’s requirements. Greater than 20 years,
rated three (3), indicates that the technology might indefinitely sustain the community’s
wastewater treatment needs.
10. Operation and Maintenance
Operation and Maintenance, comprised of four sub-categories, evaluates the
technologies’ needs for supporting efficient long-term performance. This category is
scored according to frequency of hands-on support for each sub-category. For this

29
category, each sub-category represents specific requirements. The less frequent the
specific requirements must be performed to support long-term operational efficiency, the
higher the score. Daily, scored one (1), indicates high maintenance cost. Should the
community not have available resources or ability to service these individual tasks on a
daily basis, this demand might hinder or obstruct the technology’s treatment efficiency.
For each sub-category, as the score increases from one (1) to five (5), the task periodicity
decreases and indicates a reduction of required on-site effort. A score of one (1) is for
daily need, two (2) is weekly need, three (3) is monthly need, four (4) is yearly need, and
five (5) is never or may include a one-time event at the time of system start-up.
On-site Expertise measures what frequency a trained technician/chemist is
required onsite to maintain operational efficiency.
Water Replacement measures at what frequency water must be replaced in the
treatment facility. Since operational efficiency is dependent upon allowing the
mechanical and/or biological stages to perform unhindered, and since storage capacities
are limited, this sub-category is an indicator of sensitivity of backing up the system and
obstructing the technology’s performance.
Solids Removal measures the frequency the solids must be removed from the
treatment facility for the same reasons as water replacement.
Hardware Replacement measures the frequency that hardware from any
serviceable parts must be replaced. For example, seals and gaskets from pumps must be
replaced annually.

30
Effort Needed to Prevent Fouling measures the frequency that the system must be
attended to for sustained operational efficiency. The level of effort gauges required
human maintenance.

31
3.0 TREATMENT SYSTEM ALTERNATIVES
3.1 Sand Filters
3.1.1 Basic Description
Intermittent and slow sand water filtration are simple water treatment processes that have
been utilized for centuries. Traditionally sand filters have been used for polishing drinking water
from sources such as rivers and lakes, and are still used in cities such as London and Amsterdam.
Sand filter treatment of wastewater, however, is a relatively new development. Sand filters used
in conjunction with septic tanks have proven to be an effective treatment method where soil
conditions preclude the use of septic drain fields and research being conducted on sloping sand
filters is showing great promise (http://www.tuns.ca/wwater/altern/ssf.htm, 1997). Additionally,
new hybrid systems that employ such features as microporous membranes are being developed
and tested with promising results (Cluff, 1992). This study examines the use of simple sand
filters in conjunction with a primary treatment such as a septic tank or holding tank. The
evaluation of costs and performance reported here encompass the primary (anaerobic) treatment
provided by the septic or holding tank as well as the secondary (anaerobic) treatment provided
by the sand filter.
3.1.1.1 Sand Filter Elements
Sand filter components consist of a filter box, inlet and outlet plumbing, sand, gravel, and a
monitoring port (figure 3.1.1). The box is usually constructed of ferroconcrete, cinderblocks or
is simply an excavated area lined with an impervious geotextile. The bottom of the box is lined
with gravel and then filled with sand. Influent enters from a pipe at the top of the box, percolates
through the sand and gravel, and then leaves the box through an outlet at the bottom of the

32
opposite side. This outlet may be below grade and drain directly to the soil, or may be above
grade and drain into a pipe that leads to a drainage trench or other effluent collector. If the filter
drains directly to the subsurface soil, a monitoring port should be included in the design. This is
simply a pipe placed vertically near the drain side of the filter that allows water samples to be
retrieved for testing.
Figure 3.1.1 Cross section of typical below-grade sand filter
Source: Metcalf and Eddy, 1991
3.1.1.2 Sand Filter Operation
Sand filtration combines physical, chemical and biological processes to improve water
quality. Influent enters the filter at the top and slowly percolates through the porous sand/gravel
medium. As it passes through the filter, pollutants are chemically and physically sorbed by the
sand and biodegraded by colonies of bacteria. This one-step process is highly effective at
removing hazardous contaminants such as fecal coliform and viruses, as well as treating common
wastewater constituents such as ammonia and organic matter.

33
3.1.2 Preliminary Design
To handle a wastewater loading rate of 450 gallons (1,703 liters) per day and comply
with TNRCC regulations, the sand filter for this study has been designed with 375 square feet
(35 square meters) of surface area and a depth of 4 feet (1.2 meters). To keep costs down, this
filter employs a liner rather than a hard (ferroconcrete) box. The geometry of the filter may vary
to accommodate different situations, but the overall filter area must be preserved. For example, a
filter box of 37.5 by 10 feet (11.4 by 3 meters) might be typical, but a 54 by 7 foot (16.5 by 2.1
meter) box would also be acceptable. When built above grade, the filter would be covered by a
corrugated tin or plywood roof. If built below grade, it would be covered by a layer of gravel
and a surface layer of soil.
3.1.3 Evaluation of Sand Filtration
3.1.3.1 Physical Constraints
1. Amount and type of pathogen removed
The scoring summary for sand filtration is in TABLE 3.1.1. Sand filtration is highly
effective at removing pollutants and pathogens and meets all TNRCC standards for effluent
discharge. BOD5 is reduced to much less than 2 mg/L by a sloping sand filter according to one
study (SSF, 1997) and reduced to less than 5 mg/L by a standard sand filter according to another
study (Ball, 1991). These same two studies report a reduction of total suspended solids to much
less than 10 mg/L and less than 5 mg/L, respectively. Nitrogen, in the form of ammonia is
reduced much less than 0.05 mg/L by the sloping filter, and to less than 1 mg/L by the standard
one. Many studies have been done to assess the coliform removal rates of sand filters, and most
report removal rates between 95-100% (Visscher, 1990, Farooq, 1994). There is a dearth of

34
literature on the removal efficiency of phosphate or viruses using sand filtration; however, one
study reports “virtually complete [virus] removal” (Visscher, 1990).
2. Compatibility with Physical Environment
Sand filters are well suited to semi-arid environments such as the Southwest, and are
compatible with the social aspects of colonias. Their relatively small size and ability to control
wastewater in a discrete space (as opposed to septic drainfields, for example) make them ideal
for areas where land parcels are small and potential for contamination of agricultural land or
drinking water wells are serious concerns. For these reasons, sand filters receive a high score for
the criteria “compatibility with existing land use”.
With respect to precipitation, sand filters again receives a high score. Since the filter
units are self contained and isolated from the surrounding soil, major rain events and minor
flooding would not interfere with their functionality. Filter beds are often designed to be open at
the top, but adding a cover would prevent rainwater from entering the filter and also prevent
algae from growing on the filter surface by eliminating the incidence of light upon it. This could
be done at a nominal extra cost.
Temperature affects the biological activity in the filter, and hence its performance.
Higher temperatures promote faster bacterial growth, hence faster breakdown of organic matter,
and greater nitrogen removal rates. In El Paso County, temperatures are consistently high during
the summer, but during winter months temperatures can drop drastically for extended periods.
These low temperature intervals may affect filter performance, but do not preclude their use, as
temperatures within the filter will be moderated by the insulating properties of the filter walls

35
and surrounding soil, the temperature of the influent, and metabolic activity which generates
heat.
The topography at the study site is very flat and therefore not ideal for sand filters.
Topography does not directly affect filter performance, but does require that the influent be
pumped to the filter from a holding or septic tank. In areas with sloping topography, the filter
can be gravity fed, which completely eliminates the need for external energy inputs. For this
site, however, pumping would likely be necessary, so sand filters receive a medium score for this
criterion.
One of the main design benefits of sand filters is that they are isolated from the
surrounding environment by the filter walls. This means that, among other things, they are not
constrained by soil conditions. In fact, sand filtration of wastewater was developed in response
to soil conditions that made other treatment methods ineffective (Pell, 1989; Metcalf, 1991), and
is often used in conjunction with septic tanks in situations where drainfields do not function
properly. This is especially relevant at our study site, where soil conditions may hamper the
effectiveness of infiltration methods such as septic systems and sand filtration therefore receives
a high score for this criterion. Compatibility of sand filtration with surface and groundwater also
receive high scores for this reason; since the wastewater is isolated from outside water bodies,
they are not affected.
3.1.3.2 Economic Constraints
3. Cost per Household
Costs cited for the construction of sand filtration systems very widely, but are usually
quoted in the $2000-$5000 range for individual household systems
(http://www.tuns.ca/wwater/altern/ssf.htm, 1997; Paramasivam, 1981). These figures are for

36
systems that employ cement filter boxes, however, and are much more expensive than lined pits.
Using filter construction specifications for lined pits from the TNRCC and construction price
estimates from the Midwestern United States (D. Kammel, Minnesota/Wisconsin Engineering
Notes, 1998), the following cost estimate can be made:
site excavation 70 cubic yards @ $1.60/ cu yd $87liner material 660 square feet @ $0.65/sq ft $429filter sand 42 cubic yards @ $6.50/cu yd $273filter gravel 14 cubic yards @ $6.50/cu yd $91plumbing valves and pipes $200holding tank 1000 gallon, prefab. $540
--------- total cost (1998 dollars) $1620
This estimate includes labor for excavation, placement of filter media and placement of
the holding tank. It does not include installation of the filter bed liner or the plumbing, both of
which are simple procedures that could probably be carried out by the homeowner. Hiring a
professional to perform these tasks may add as much as $300 to the cost and if a pump is
required, an additional $200-$300 may be added to the cost. Using locally available materials
(sand and gravel) could significantly lower the cost. For sites with existing septic systems with
drainfields that are failing, sand filters can be added and the holding tank price can be subtracted
from the cost (as the septic tank performs the same function). In most situations, however, the
total cost per household remains in the $2101-$2400 range. Local labor rates are probably lower
than in the Midwest, so this estimate may be slightly high for the study region.
Operation and maintenance costs are low for sand filters. General maintenance involves
occasional removal and replacement of the top few inches of filter sand. This is accomplished
by simply scraping the surface of the filter with a shovel, and does not require specialized skill.
For filters that rely on a pump for their influent supply, occasional maintenance of the pump may
be necessary. This may include replacing parts of perhaps replacing the entire pump at some

37
point in the filter’s lifetime. It is unlikely, however, that even in this circumstance, filter
maintenance costs would exceed a few hundred dollars over twenty years.
Costs Under Different Influent Loading Rates
The preliminary design and cost calculation above is based on an influent loading rate of
450 gallons per household per day. Designing for this rate is mandated by the TNRCC, but in it
may be possible to obtain permitting variances that allow for different loading rates (it is
interesting to note that in Sweden, permitting specifications call for filter areas one-third the size
of those required by the TNRCC (Pell, 1989)). To assess the effect of lower loading rates on
sand filter design and cost, the following calculations were performed based on the average
national daily water usage for a suburban family of five (300 gallons (1136 liters) per day) as
well as a generous estimate of per household water usage in colonias without running water (50
gallons (189 liters) per day) (Earl, 1998). Using the labor and material prices quoted above, the
costs to build 250 square foot (76 square meter) sand filter able to treat 300 gallons (1136 liters)
per day can be computed as follows:
site excavation 37 cubic yards @ $1.60/ cu yd $59liner material 445 square feet @ $0.65/sq ft $290filter sand 28 cubic yards @ $6.50/cu yd $182filter gravel 9 cubic yards @ $6.50/cu yd $59plumbing valves and pipes $150holding tank 1000 gallon, prefab. $370
--------- total cost (1998 dollars) $1110
Similarly, a 4 feet (1.2 meter) deep, 40 square foot (12 square meter) sand filter able to
treat 50 gallons (189 liters) of wastewater per day would cost:
site excavation 4.4 cubic yards @ $1.60/ cu yd $7liner material 146 square feet @ $0.65/sq ft $95

38
filter sand 4 cubic yards @ $6.50/cu yd $26filter gravel 1 cubic yards @ $6.50/cu yd $6.50plumbing valves and pipes $50holding tank 500 gallon, prefab. $240.50
--------- total cost (1998 dollars) $ 425
4. Opportunity Cost
To treat the daily wastewater flow from a domestic source, sand filters should be
designed with surface in square feet equal to the loading rate divided by 1.2 (TNRCC OSSF
p.94). For colonias in West Texas with an average household size of five persons, this
corresponds to a loading rate of 450 gallons per day per unit, and a filter size of 375 square feet.
Opportunity cost, based on a land value $17,000 per acre ($42,000 per hectare), are relatively
low for sand filters and can be computed by dividing the total daily loading rate (193,500 gallons
for 430 households) by 1.2 and converting to acres. This results in a total filter area of 3.7 acres
(1.5 hectares). Therefore the total opportunity cost for the colonia would be 3.7 * $17,000, or
$62,900. This translates to a per household cost of only $146, or $29 per person.
5. Permitting
Under TNRCC’s OSSF Rule, sand filters are considered standard treatment technology
when used in conjunction with septic tanks, and are permitted as such. They must, however,
meet materials, loading rate, minimum surface area, minimum bed thickness, filter bed
containment and underdrain standards.

39
3.1.3.3 Technological Constraints
6. Technological Feasibility
Sand filters do not require any additional water inputs beyond that of the influent stream
and therefore receive a high score for this criterion. When topography permits, influent to sand
filters can be gravity fed and no energy input is required. For areas with low topography, sand
filters can be buried below grade to avoid the need to pump the influent. Excavation, however,
can be costly and it may be more practical to install a pump and absorb the cost of running it
intermittently. Since the study site has low topography, one of these options would be necessary
and therefore sand filtration receives a medium score for “energy input requirement”. With
regard to the more subjective criterion of “technological complexity”, sand filtration receives a
low score. While it is more complex than a simple drainfield, for example, sand filters generally
have no moving parts and can be easily maintained using traditional tools and a minimum of
specialized skill. In the case of our study site, an above ground sand filter would require an
influent pump, which might change its “technological complexity” score to medium.
7. Compatibility with Existing Infrastructure
Sand filtration systems do not require constant power to operate, though as mentioned
above, may require an intermittent power source to operate a pump. Should pumping be
necessary, and electricity is not available at the site, it is conceivable that a solar, gas, or battery
powered pump could be used. Therefore electricity is not an infrastructural requirement. A
constant source of running water is not required for sand filter operation as wastewater collected
in the septic or holding tank is the sole source of influent to the filter. While a flush toilet would

40
likely reduce holding tank residence time and increase the rate at which effluent is treated, it is
not necessary. Connecting to a sewer line should be simply a matter of running the outlet pipe to
sewer pipe, and would not require any serious modification of the system.
8. Expandability
Sand filters are modular in that they can be added unit by unit to ramp up treatment
capacity as the population grows. If the loading rate eventually exceeds a filter’s maximum
capacity, the filter can be expanded by adding walls and filter medium. This is less expensive
than constructing a complete, new filter, as common walls can be utilized to reduce materials
costs and minimize footprint.
Since sand filters are likely to be utilized in the same manner as septic systems, (that is,
as a separate unit for each household), additional land acquisition should not be necessary in the
case where a filter needs to be expanded. If large sand filters are being used on a communal
basis, however, and the community wishes to build an additional large filter, then the purchase of
additional land may be required for the project. Large filters are generally not advised though, as
the economy of scale is reduced to the point that they become less competitive than other
treatment techniques (Visscher, 1990).
9. Lifetime
There are a few matters to consider when examining the lifetime of sand filters. These
include the design period and population dynamics, and the structural longevity. The first issue
applies mainly to filters that might be constructed for communal use. In this case, population
growth should be factored in and the unit should be designed to accommodate the population for
41
ten to fifteen years. Designing for periods beyond that is likely to be economically inefficient
(Visscher, 1990). When being designed on an individual household basis, one needs to consider
the maximum number of people likely to be living in the home. This number is usually
constrained by the size of the house (e.g. number of bedrooms), so the lifetime of the sand filter
may be indefinite. This stems from the idea that while the community may be growing in size,
the number of individuals per household may remain relatively constant.
When built to TNRCC specifications, the sand filter should remain structurally sound for
many years, exceeding the 20+ year criteria. The ASAE reports sand filters operating without
major malfunctions for periods of up to 40 years (Mancl and Peeples, 1991).
10. Operation and Maintenance
Sand filter maintenance is a simple procedure consisting of period inspection and
occasional resanding. With minimal training, owners can inspect the filter box for leaks and
inlet/outlet valves for fouling. Sand replacement is usually only necessary when an algae layer
forms on the filter surface. In this situation, the layer is scraped off using a shovel and some
sand is replaced. Having a cover over the filter eliminates this problem. Water replacement and
solids removal are not necessary and hardware replacement would be limited to replacing
malfunctioning valves or pumps. If quality hardware is used, the system should be quite reliable
and require only a minimum of maintenance. It would be desirable to test the effluent quality
periodically to insure that the filter is operating efficiently, but is not considered critical.

42
TABLE 3.3.1 Treatment Alternative: SAND FILTRATIONPHYSICAL CONSTRAINTS:
1. Amount & Type of Pollutant/Pathogen Removed: Does Not M
eet Sta
ndards
Meets E
ffluent
Standa
rds
Meets N
on-Pot
able R
e-Use
Meets Po
table R
e-Use
0 1 2 3 BOD5 X
TSS XN X
Total Coliform XViruses X
TOTAL: 6 / 15
2. Compatability with Physical Environment: Not Com
patible
Compat
ible
Ideal
0 1 2 Existing Land Use X
Precipitation XTemperature XTopography X
Soils XGround Water XSurface Water X
TOTAL: 12/14
ECONOMIC CONSTRAINTS:
3. Costs ($ per Household): $3601
+
$2401
- $3600
$1201
- $2400
0 - $12
00
0 1 2 3Capital X
Operation & Maintenance X
TOTAL: 5/6
4. Opportunity Costs: 100 acr
es +
21 - 99
acres
6 - 20
acres
0 - 5 a
cres
0 1 2 3X
TOTAL: 3 / 3
5. Permitting: Not Perm
ittable
Permitab
le; Not S
td
Permitab
le; Std
0 1 2X
TOTAL: 2 / 2

43
TECHNOLOGICAL CONSTRAINTS
6. Technological Feasibility: High Medium
Low
1 2 3Water Input Requirement X
Energy Input Requirement XTechnological Complexity X
TOTAL: 8 / 9
7. Compatability with Existing Infrastructure: No Yes
1 2Independence from Off-Site Water X
Connectable to Sewer Line X
TOTAL: 4 / 4
8. Expandability: No Yes
1 2Modular X
Economies of Scale X Removal Efficiency Maintained X
TOTAL: 5 / 6
9. Lifetime (years): 0 - 14
15 - 20
20 +
1 2 3X
TOTAL: 3 / 3
10. Operation and Maintenance: Daily Weekly
Monthly
Yearly
None In
Projec
t Lifet
ime
1 2 3 4 5On-Site Expertise X
Water Replacement XSolids Removal X
Hardware Replacement XEffort Needed to Prevent Fouling X
TOTAL: 22 / 25
RAW SCORE: 70 / 87

44
3.2 On-Site Septic Systems
3.2.1 Basic Description
Septic systems treat domestic wastewater in up to three different redox environments that
form as the system develops. The first redox zone consists of the septic tank and a “biological
mat”. This zone is characterized as anaerobic due to low dissolved oxygen concentrations. The
second redox environment is the aerobic zone, consisting of unsaturated sediments of the leach
field. The third redox zone is anaerobic and only forms in saturated or near-saturated soils
beneath the aerobic environment.
The first anaerobic zone performs both physical and biochemical treatment of the waste
waster. Physical treatment occurs as larger particles are removed from the wastewater stream.
Denser-than-water molecules will sink to the bottom of the tank where they form a sludge. The
floating particles will collect on hanging barriers in the tank and form a scum. Sludge and scum
must be periodically pumped from the septic tank and disposed of at a landfill or sewage
treatment plant. The septic tank is pictured in Figure 3.2.1.
Figure 3.2.1: Septic Tank
Source: http://www.inspect.com/septbook.htm, 1998
45
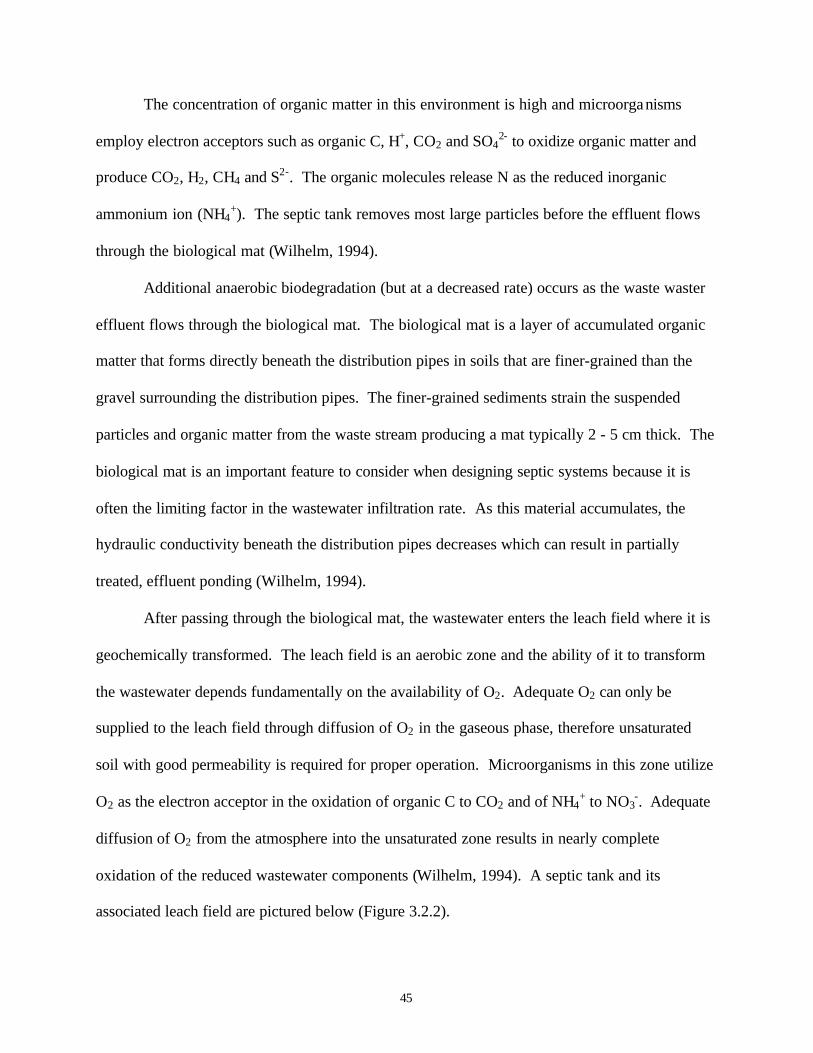
The concentration of organic matter in this environment is high and microorganisms
employ electron acceptors such as organic C, H+, CO2 and SO42- to oxidize organic matter and
produce CO2, H2, CH4 and S2-. The organic molecules release N as the reduced inorganic
ammonium ion (NH4+). The septic tank removes most large particles before the effluent flows
through the biological mat (Wilhelm, 1994).
Additional anaerobic biodegradation (but at a decreased rate) occurs as the waste waster
effluent flows through the biological mat. The biological mat is a layer of accumulated organic
matter that forms directly beneath the distribution pipes in soils that are finer-grained than the
gravel surrounding the distribution pipes. The finer-grained sediments strain the suspended
particles and organic matter from the waste stream producing a mat typically 2 - 5 cm thick. The
biological mat is an important feature to consider when designing septic systems because it is
often the limiting factor in the wastewater infiltration rate. As this material accumulates, the
hydraulic conductivity beneath the distribution pipes decreases which can result in partially
treated, effluent ponding (Wilhelm, 1994).
After passing through the biological mat, the wastewater enters the leach field where it is
geochemically transformed. The leach field is an aerobic zone and the ability of it to transform
the wastewater depends fundamentally on the availability of O2. Adequate O2 can only be
supplied to the leach field through diffusion of O2 in the gaseous phase, therefore unsaturated
soil with good permeability is required for proper operation. Microorganisms in this zone utilize
O2 as the electron acceptor in the oxidation of organic C to CO2 and of NH4+ to NO3
-. Adequate
diffusion of O2 from the atmosphere into the unsaturated zone results in nearly complete
oxidation of the reduced wastewater components (Wilhelm, 1994). A septic tank and its
associated leach field are pictured below (Figure 3.2.2).

46
Figure 3.2.2: Septic Tank and Associated Drain Field
Source: Willhelm, 1994
In some septic systems a secondary anaerobic zone will form which is capable of
removing potentially hazardous NO3- formed in the aerobic zone. Nitrate released into the
vadose zone has the potential to migrate into the groundwater and discharge into a nearby
waterbody. As discussed earlier, nitrogen is a good nutrient and when discharged into a
waterbody can lead to eutrophication. Denitrification of the NO3- to N2 is caused by bacteria
commonly found in anaerobic subsurface environments. The environments tend to occur near
saturated or near-saturated sediments because of the limited dissolution rate of O2 from air to
water and subsequent diffusion into water. In ground water settings, the most common limitation
to denitrification is a lack of labile organic carbon (Wilhelm, 1994).
Wastewater components other than those mentioned above are strongly influenced by the
large changes in redox and pH conditions occurring in the different reaction zones of the septic
system. The majority of phosphate is normally removed within a few meters of the distribution

47
pipes, however residual phosphate will remain in the effluent water percolating through the soil
horizon. Trace metal cations such as Cu, Cr, Pb and Zn usually remain in the septic tank because
they form insoluble sulfides. Metals that tend toward soluble forms such as Mn and Ni will pass
through the septic tank. Some of these metals may precipitate as hydroxides depending on the
oxic environment in the unsaturated zone. However, low pH conditions below a septic system
will retard hydroxide formation and may mobilize metals present naturally in the sediments.
Low pH conditions could potentially be adjusted by adding a base, such as lime, to the leach
field (Wilhelm, 1994).
Pathogenic bacteria and viruses present in domestic wastewater are capable of
propagating disease if ingested. The subsurface survival rate of bacteria and viruses declines
with increasing temperature and decreasing soil moisture. This implies that unsaturated
conditions beneath a septic system are desirable for control of bacteria and viruses (and supply of
O2 to facilitate aerobic biochemical degradation of the waste). Pathogenic bacteria do not
survive well under these variable redox conditions.
48
3.2.2 Evaluation of Septic Systems
3.2.2.1 Physical Constraints
1. Amount and Type of Pollutant/Pathogen Removed
The scoring summary for septic systems is in TABLE 3.2.1. Septic systems do not meet
all TNRCC standards for effluent discharge, including the requirements for BOD5, TSS, and total
nitrogen. Septic systems meet the TNRCC discharge requirement for total coliform. Septic
system removal efficiencies are presented below (Metcalf and Eddy, 1991):
4. 33 - 62% of influent BOD5 at influent concentrations of 210 - 530 mg/L
5. 78 - 85% of influent TSS at influent concentrations of 237 - 600 mg/L
6. 28 - 25% of influent Total Nitrogen at influent concentrations of 35 - 85 mg/L
7. >99% of influent Fecal Coliform
2. Compatibility with Physical Environment
Septic systems have the potential to work well in arid environments such as the
Southwest, and are currently used throughout the El Paso region. Existing land use in the area
consists of residential and agricultural use. Septic systems require a relatively large drainage
area (i.e. leach field) and sufficient area for drainage is a major concern with septic systems.
Furthermore, potential contamination of agricultural land and drinking water wells from septic
tank effluent are also serious concerns. For these reasons septic tanks receive a low score for the
criteria “compatibility with existing land use”.
With respect to precipitation, septic systems receive a medium score. During storm
events or flooding, leach fields may become saturated and result in ponding of partially treated
sewage. Ponding results in increased exposure risk for humans and the possibility of
contaminating nearby waterbodies and adjacent land spreading disease.
49
Septic systems’ performance is robust within most temperature ranges. The tank and
leach field are buried several feet beneath the surface and the overlying earth acts as an insulator.
However, extreme cold events can potentially slow biodegradation of effluent in the leach field.
In El Paso County, temperatures are consistently high in the summer, but during the winter
months periods of very low temperatures may persist. Septic systems receive a medium score
for the “temperature” criteria.
The topography of the study area is generally flat which facilitates excavation of septic
system drainage trenches. Septic systems can be gravity-driven and thus sloping trenches during
construction will allow for ideal operation in this region.
Groundwater is expected to occur at a depth of about 5.5 feet in this area (Soil
Conservation Service, 1998). The depth to groundwater does not pose a significant problem to
the use of septic systems given adequate soils. The depth to groundwater is also amenable to the
formation of an aerobic zone beneath the drainage pipes.
Soils in the study area are classified by the USDA as Class II and Class III. Although
slightly different designs are required for each soil type, both soil types are compatible with the
use of septic systems. Site specific soil surveys should be conducted prior to implementing a
septic system. If soils are found to be incompatible with septic systems, a septic system and
slow sand filter could be combined to provide sufficient pollutant removal efficiencies.
Surface water, other than the occasional ponding due to storm events, is not present in the
study area. Thus septic systems are considered compatible with respect to the criteria of “surface
water”.
The TNRCC has established criteria for standard subsurface disposal methods that
include topography, subsoil texture, subsoil structure, soil depth, restrictive horizon groundwater
50
and flood hazard factors (TNRCC). Available information indicates that septic systems and
other standard subsurface disposal methods are compatible with site conditions found in the
study area.
3.2.2.2 Economic Constraints
3. Cost per Household
The current average cost estimate for installation of a septic system is $1950 per
household (El Paso County Health and Environmental Department [EPCHED], 1998). This
estimate includes the septic tank capital costs and labor for installation.
Septic systems, when used correctly, need very little upkeep. Hence operation and
maintenance costs for septic systems are low. The only operation and maintenance cost
associated with properly operated septic systems is annual sludge removal (EPCHED, 1998).
According to the EPCHED, the cost of sludge removal is $35-40 per event. The operation and
maintenance cost associated with the 15-year lifetime of this project is $525-$600.
4. Opportunity Cost
The size of the septic tank and the area required for the associated leach field are
designated by the TNRCC. Three values of effluent volume are employed in this study. The
value required by the TNRCC for permitting for a single-family dwelling with 5 bedrooms is 450
gallons per day [gpd] (1703 L/day). The value given by the TNRCC for a single-family dwelling
with 3 bedrooms is 300 gpd (1136 L/day). A third value of 50 gpd (189 L/day) is included as an
estimate of per household water usage in colonias without running water (Earl, 1998). These
values were used to determine both the size of the septic tank and the required area of the

51
associated leach field. Furthermore, calculations were made for both Class II and Class III soils,
as soil classification is an important component in determining leach field drainage area.
Given an effluent of 450 gpd (1703 L/day), the area required for the leach field in Class II
and Class III soils is 1800 ft2 (166 m2) and 2250 ft2 (208 m2) per household, respectively. This
corresponds to about 18 acres (7.2 ha) and 22 acres (9.0 ha), respectively, of land required to
service the projected 430 homes in the study area. Opportunity cost, based on a land value of
$17,000 per acre ($42,500 per ha), ranges from $301,920 to $377,570 to install septic systems
for all projected households in the study area. The calculations following TNRCC guidelines for
sewage flow of 450 gpd are shown below.
Q = average daily sewage flow in gallons per day
Ra = soil application rate in gallons per square foot per day
Ra = 0.25 for Class II soils (TNRCC, 1998)
Ra = 0.20 for Class III soils (TNRCC, 1998)
Class II soils
Class II soils
2180025.0
450ft
gpdRaQ
A ===
2225020.0
450 ftgpdRaQA ===

52
Given an effluent of 300 gpd (1136 L/day), the area required for the leach field in Class II
and Class III soils is 1200 ft2 (110 m2) and 1500 ft2 (139 m2), respectively. This corresponds to
about 12 acres (4.8 ha) and 15 acres (6.0 ha), respectively, of land required to service the
projected 430 homes in the study area. Opportunity cost ranges from $201,450 to $251,770.
Given an effluent of 50 gpd (189 L/day), the area required for the leach field in Class II
and Class III soils is 200 ft2 (18.5 m2) and 1000 ft2 (93 m2), respectively. This corresponds to
about 2 acres (0.002 ha) and 9.9 acres (0.01 ha), respectively, of land required to service all
projected households in the study area. Opportunity cost ranges from $34,000 to $168,300.
It should be noted that the opportunity cost in this study is based on the cost of
agricultural land, and since the septic tanks and leach fields would likely be located on
residential parcels, the actual opportunity cost may be greater. However, the cost is not expected
to be significantly greater because colonias are built on marginal land where official zoning
requirements are absent and no other use is viable.
According to the TNRCC’s OSSF Rule, gravel-less septic systems are considered a
proprietary treatment technology and are permitted as such. Septic systems receive a score of 2
for this criterion. These systems must, however, be designed according to specifications of the
TNRCC OSSF rules.
3.2.2.3 Technological Constraints
6. Technological Feasibility
Septic systems do not require any additional water inputs, other than that of the influent
stream and thus scores highly for this criterion. Septic systems, in this study, can utilize gravity
as a means of moving the fluid, thus no energy input is required. Furthermore, septic systems

53
have no moving parts. For the subjective criterion of “technological complexity,” septic systems
receive a score of 3, corresponding to low technological complexity.
7. Compatibility with Existing Infrastructure
Septic systems do not require additional water to move sewage to the treatment
components of the system (i.e. septic tank and leach field. Much of the sewage biodegradation
takes place in the leach field where the effluent is widely dispersed. Connecting the sewer line to
the septic tank would result in only partially treated water and trying to collect the effluent once
it has been treated in the leach field is impractical.
8. Expandability
Septic systems are modular in nature, in that one septic system serves one household.
However, if a household’s loading rate exceeds the effluent volume that the septic system was
designed for, the system will fail. Thus, septic systems can handle increased volumes up to a
critical point, but should the effluent volume exceed that point the system must be redesigned
and replaced. Furthermore, an increase in population density could result in an insufficient area
available for the leach fields. Septic systems are assigned a high score for this criteria, but one
must consider the effect of increased loading on the individual septic systems.
In the case where expansion is necessary, more land will be required to allow for proper
drainage in the leach field. Simply increasing the size of the leach field, however, without
concurrently increasing the size of the septic tank will only be effective for small increases in
effluent volume. When the effluent volume is increased significantly, from 300 gpd (1136
54
L/day) to 450 gpd (1703 L/day) for example, a larger septic tank is required. Thus septic
systems are not considered to have an economy of scale.
Septic systems have higher removal efficiencies for increased influent pollutant
concentrations according to data presented in Section V.B.1. Thus septic systems, although they
do not meet the pollutant standards for a majority of the criteria, maintain removal efficiencies
for most pollutants and pathogens analyzed in this study.
9. Lifetime
Properly operated (not overloaded) and maintained (annual sludge removal) septic
systems can operate without failing for more than 20 years (EPCHED, 1998).
10. Operation and Maintenance
Septic system maintenance is a simple procedure consisting of knowledge of the system’s
capabilities and annual sludge removal. There are no daily activities associated with septic
systems, other than not exceeding the effluent volume that the system is designed for. On-site
expertise is required annually to remove sludge and prevent fouling of the system. If the system
fails, on-site expertise is required for each failure event, but without failure, nothing more than
annual service is required. Water replacement is not necessary and hardware replacement would
be limited to replacing broken PVC pipe.

55
TABLE 3.2.1 Treatment Alternative: SEPTIC TANKS
PHYSICAL CONSTRAINTS:
1. Amount & Type of Pollutant/Pathogen Removed: Does Not M
eet Sta
ndards
Meets Ef
fluent S
tandar
ds
Meets N
on-Po
table R
e-Use
Meets Po
table R
e-Use
0 1 2 3 BOD5 X
TSS XN X
Total Coliform XViruses X
TOTAL: 1 / 15
2. Compatability with Physical Environment: Not Com
patible
Compati
ble
Ideal
0 1 2 Existing Land Use X
Precipitation XTemperature XTopography X
Soils XGround Water XSurface Water X
TOTAL: 8 / 14
ECONOMIC CONSTRAINTS:
3. Costs ($ per Household): $3601
+
$2401
- $3600
$1201
- $2400
0 - $12
00
0 1 2 3Capital X
Operation & Maintenance X
TOTAL: 5 / 6
4. Opportunity Costs: 100 ac
res +
21 - 99
acres
6 - 20
acres
0 - 5 ac
res
0 1 2 3X
TOTAL: 2 / 3
5. Permitting: Not Per
mittable
Permitab
le; Not S
td
Permitab
le; Std
0 1 22
TOTAL: 2 / 2

56
TECHNOLOGICAL CONSTRAINTS
6. Technological Feasibility: High Medium
Low
1 2 3Water Input Requirement X
Energy Input Requirement XTechnological Complexity X
TOTAL: 8 / 9
7. Compatability with Existing Infrastructure: No Yes
1 2Independence from Off-Site Water X
Connectable to Sewer Line X
TOTAL: 3 / 4
8. Expandability: No Yes
1 2Modular X
Economies of Scale XRemoval Efficiency Maintained X
TOTAL: 5 / 6
9. Lifetime (years): 0 - 14
15 - 20
20 +
1 2 3X
TOTAL: 3 / 3
10. Operation and Maintenance: Daily Weekly
Monthly
Yearly
None In
Projec
t Lifet
ime
1 2 3 4 5On-Site Expertise X
Water Replacement XSolids Removal X
Hardware Replacement XEffort Needed to Prevent Fouling
TOTAL: 22 / 25
RAW SCORE: 59 / 87

57
3.3 Stabilization Ponds
3.3.1 Basic Description
Waste stabilization ponds, or lagoons, provide a cheap alternative to conventional
processes where the main objective of a wastewater treatment is not the removal of BOD but the
removal of excreted pathogenic microorganisms which pose the threat of infection from a wide
range of water-related diseases. However, ponds are still capable of producing an effluent with a
low BOD and nutrient concentration.
Stabilization ponds have been used for treatment of wastewater for over 3,000 years.
Today there are almost 7,000 ponds in use in the United States for the treatment of wastewater
(Task Force on Natural Systems, 1990). Lagoons, or stabilization ponds, treat wastewater
through the use of sunlight, wind, algae, and oxygen. In stabilization ponds, wastewater enters
the pond at a single point, either in the middle or at the edge. Algae grow in the pond by taking
energy from sunlight and using up the carbon dioxide and inorganics released by bacteria. The
algae releases oxygen for the use by the bacteria.
Lagoons are usually deeper than ponds. Unaerated or facultative lagoons are usually 3 to
5 ft deep and use aerobic and facultative bacteria to break down the organic material in the
wastewater. Oxygen is furnished by algae during photosynthesis and is transferred by wind
action. A facultative pond generally has an aerobic zone near the surface, an aerobic and
anaerobic zone (facultative) in the middle depth, and an anaerobic zone at the bottom (Figure
3.3.1).

58
Figure 3.3.1: Schematic Representation of a Stabilization Pond
Source: Metcalf & Eddy, 1991
In an aerated lagoon, aeration equipment is installed to provide additional oxygen. Air
may be supplied by a compressor through tubes installed in the lagoon bottom or by mechanical
aerators installed at the surface. Aerated ponds are deeper, ranging from 10 to18 ft (3 to 5.5 m)
and smaller than facultative or unaerated lagoons. However, due the shallow depth of the water
table in the study area at 5.5 ft (1.7 m), only unaerated or facultative lagoons and ponds are
considered.

59
Advantages of facultative lagoons include the following points:
• Lagoons are simple to operate -- effective automatic operation with minimum monitoring
• Lagoons are relatively easy to commission -- given a relatively close source of suitable
viable sludge
• Lagoons are on the low end of costs per volume of water treated, on a capital and
operating costs basis
• The effect of odor impact can be readily controlled by covering the anaerobic areas,
designing for aerobic or mildly facultative conditions, or applying aeration
• The sludge harvested from desludging operations is relatively stable and can be dried
atmospherically without significant odor generation
• Wetlands can readily be coupled with lagoon systems for effluent polishing
• Lagoons can achieve high levels of disinfection
Disadvantages of these systems include:
(a) Lagoons required large land area for implementation
(b) Only about 80% maximum BOD removal is possible
(c) Lagoons are strongly affected by atmospheric conditions -- temperature is the greatest
factor. The atmospheric temperature generally has a noticeable effect on the
operating temperature of the ponds. The effect of temperature is most significant
where the winter temperatures are very low.
(d) Unsightly and/or odorous scum accumulations may occur. Steps such as surface
skimming or the addition of microbiological products can be taken to attempt to
combat the problem.
(e) Acquired experience can be quite site specific and only moderately transferable
(f) Some limitations appear to exist regarding nutrient removal in lagoons. In particular
nitrogen removal in cold climates is a concern

60
3.3.2 Preliminary Design
The design of stabilization ponds is considered to be the least well-defined of all the
biological treatment process designs. Although there are numerous proposed methods of design
given in the literature, a wide variance is usually found between them (Metcalf & Eddy, 1991).
In general, principal design parameters include hydraulic detention time, basin depth, pond
dispersion factor and ranges in temperature.
The following design procedure was adapted from Metcalf & Eddy (1991) following the
first-order removal-rate method developed by Wehner and Wilhelm and modified by
Thirumurthi:
S/So = (4a exp(1/2d))/(1+a)2 exp(a/2d) - (1-a)2 exp (-a/2d)
where
S = effluent substrate concentration
So = influent substrate concentration
a = (1 +4ktd)-2
d = dispersion factor
k = first-order reaction constant
t = detention time
Thirumurthi prepared the chart shown in Figure 3.3.2. The dimensionless term kt is plotted
versus the percentage of substrate (usually BOD5) remaining, for dispersion numbers varying
from zero for an ideal plug flow unit to infinity for a completely mixed unit. Dispersion numbers
measured in wastewater stabilization ponds range from 0.1 to 2.0, with most values less than 1.0
(Metcalf & Eddy, 1991).
To design a stabilization pond to treat a wastewater flow of 194,000 gpd (25,934 ft3/d),
the following design criteria must be determined:
• Summer liquid temperature

61
• Winter liquid temperature
• Overall first-order BOD5 removal-rate constant
• Temperature coefficient
• Pond depth
• Pond dispersion factor
• Overall BOD5 removal efficiency
Step 1. Determine the kt value.
The BOD5 overall removal efficiency for stabilization ponds ranges between 70-90%
(Horan, 1990). Taking the midpoint of this range, the overall removal efficiency is estimated to
be 80%. A typical value for pond dispersion factor for facultative stabilization ponds is
estimated at 0.5, approximately half of the value for a well-mixed aerobic pond (Task Force on
Natural Systems, 1990). From the Thirumurthi chart, the value of kt for a dispersion factor of
0.5 and a BOD5 removal of 80% is 2.4.

62
Figure 3.3.2: Values of kt in the Wehner and Wilhelm Equation vs. Percent Remaining forVarious Dispersion Factors
Source: Metcalf & Eddy, 1991
Step 2. The temperature coefficient for summer and winter conditions.
A typical value for the temperature coefficient for stabilization ponds is 1.06 (Metcalf &
Eddy, 1991). The summer liquid temperature and winter liquid temperature are taken from the
maximum and minimum averages for 1997 from a wastewater treatment plant in the El Paso area
(Balliew, 1998). The values are 30 and 12° Celsius, respectively.
Step 3. Determine the detention time for winter and summer conditions.
A. Winter: k12 = (0.25/d)[(1.06)12-20] = 0.248/d
B. Summer: k30 = (0.25/d)[(1.06)30-20] = 0.448/d
Step 4. Determine the detention time for winter and summer conditions.
(a) Winter: tW = kt/k12
tW ~ 10 days

63
(b) Summer: ts = kt/k30
ts ~ 6 days
Step 5. Determine pond volumes and surface requirements.
With a longer detention time, winter conditions control the design parameters.
Volume = (194,000 gpd)(10 days)(1 ft3/7.48 gal)
Volume ~ 260,000 ft3 (7,400 m3)
Optimal pond depth for this region is estimated at 4 ft (1.2 m) due to the height of the
groundwater table at 5.5 ft (1.7 m).
Surface area = (260,000 ft3/4 ft)(acre/43,560 ft3)
Surface area ~ 1.5 acres (0.6 ha)

64
3.3.3 Evaluation of Stabilization Ponds
3.3.3.1 Physical Constraints
1. Amount and Type of Pollutant/Pathogen Removed
The scoring summary for stabilization ponds is in TABLE 3.3.1. Removal efficiencies
for stabilization ponds vary widely. Since they are a natural process, a complex biological
ecosystem develops within ponds. Consequently, despite the fact that they are the simplest form
of wastewater treatment system, ponds are the most poorly understood in terms of the reactions
which take place within them (Horan, 1990). Typical removal efficiencies for stabilization
ponds are given below (Table 3.3.1). These values represent empirically derived averages.
Table 3.3.1: Stabilization Ponds Removal Efficiencies
Pollutants RemovalEfficiency
InfluentConcentration
Effluent Concentration EffluentStandards
BOD5 80% 221 mg/L 44 mg/L 20 mg/LTSS N/A 130 mg/L 100 mg/L 20 mg/LNitrogen 99% 32.5 mg/L 0.3 mg/L 5 mg/LTotal Coliform N/A N/A 10,000 colonies/mL <400 colonies/mL
For BOD5, TSS, and total coliform, ponds removal efficiencies are not sufficient to meet
the effluent standards required in the study area. However, stabilization ponds can be combined
with other systems to improve the quality of effluent. Additional polishing systems include
intermittent sand filtration, rock filters and wetlands (Horan, 1990). However, since this study is
considering these technologies individually, ponds alone are not capable of meeting 3 of the 4
required pollutant removal standards.
Nitrogen removal meets effluent standards. However, ponds are strongly affected by
atmospheric conditions, most noticeably temperature. Low temperature can shift the balance in

65
anaerobic bacteria towards the volatile acid producers and affect performance. In particular
nitrogen removal in cold climate is a concern and can reduce the efficiency of nitrogen removal
to 40 - 50% (Task Force on Natural Systems, 1990). Given this consideration, ponds may not be
capable of meeting any of the required effluent standards.
2. Compatibility with Physical Environment
Topography:
Ponds require the availability of flat or gently undulating site to keep earthwork costs to a
minimum. Since the major item of construction in a stabilization pond is earthwork, every
consideration has to be given to keep this cost to a minimum by avoiding excavation in rock, by
balancing cut and fill volumes, and by stepping ponds in case of steeply sloping land (Kolarik,
1995). The topography of the study area is generally flat and does not present problems for the
construction of ponds.
Soils:
Soils in the study area generally have low permeability, which is beneficial for pond
construction. A relatively impervious soil formation would help to avoid percolation. However,
solids deposited slowly seal the pond bottom and once the pond has sealed itself, the percolation
rate will attain a low steady rate. In case of very porous soils like sandy gravel some steps may
be taken to artificially seal the pond bottom by using clay or other lining material (Horan, 1995).
Groundwater:
Knowledge of groundwater table at the proposed site of pond construction helps to decide
the elevation of the pond since it is essential that the pond elevation is kept well above the
groundwater table, at least 1 to 2 ft (0.3 to 0.6 m). The water table at the proposed site occurs at

66
5.5 ft (1.7 m). Thus, the optimal pond depth for this region was determined to be at 4 ft (1.2 m).
Pond and groundwater table should be kept at a distance for the following considerations: (i)
groundwater pollution from percolation; (ii) difficulty of excavation and making embarkments
and (iii) possible reduction in removal efficiency of the pond due to the reduction in the
detention time brought about by entry of ground water.
Flood Hazard/Surface Waters:
The placement of a stabilization pond should not occur within the 100-yr floodplain, as
restricted by state and local policies. In addition, surface water in the area is limited to the Rio
Grande, which is dry most of the year in this region. Surface water considerations do not present
a problem for pond construction.
Precipitation:
Excessive rainfall, as with flooding, presents the problem of overflow. In addition,
rainfall implies cloudiness and limited sunlight, which may decrease the efficiency of the system.
annual precipitation is low in this region. However, the annual precipitation rate for this region
is low and does not present a problem for pond usage.
Temperature:
Lagoons and ponds are strongly affected by atmospheric conditions, especially air
temperature. The air temperature generally has a noticeable effect on the operating temperature
of the ponds. The effect of temperature is most significant where winter temperatures are very
low. For example, low temperatures can shift the balance in anaerobic bacteria towards the
volatile acid producers and affect performance (Kolarik, 1995).

67
Existing Land Use:
Stabilization ponds, like other sewage treatment systems, should be located as far from
the present and future residential and commercial developments as is economically feasible.
Ponds are generally located 1000 to 1300 ft (300-400 m) from residences, although many are
located much closer (Kolarik, 1995). Although well designed and operated ponds should give no
odor problems, wind should not be directed towards the inhabited area.
3.3.3.2 Economic Constraints
3. Cost per Household
Capital costs for construction of stabilization ponds were estimated using the cost base
extracted from technical reports distributed by the EPA (Horan, 1990). The following
relationship was found for actual construction cost versus design flow for stabilization ponds:
C = (1.31 x 10⁶) Q0.77
where Q is in million gallons per day
C = (1.31 x 10⁶) (0.194 mgd)0.77
C ~ $371,000
Non-construction costs were estimated to be approximately 50% of the construction costs total
and include such cost categories as administration/legal, land development, bond interest,
indirect costs, equipment, and inspection (Horan, 1990). Adjusting for non-construction costs,
capital costs for stabilization ponds were calculated to be ~ $556,500. This total divided by ~430
households in the study area resulted in a cost of approximately $1300/household for
construction and implementation of a stabilization pond in this region.

68
4. Opportunity Cost
The preliminary design for the study area estimated that approximately 1.5 acres (0.6 ha)
would be required for the projected daily inflow of 194,000 gallons. Agricultural land costs for
the Lower Valley region of El Paso County is estimated at approximately $17,000 per acre,
resulting in an opportunity cost for land use of approximately $25,000. This cost however
should not be considered the total opportunity cost of using this land area for a wastewater
treatment system, since it does not include the opportunity costs associated with loss revenues
from sales of cash crops. In addition, the buffer area between the stabilization pond and
residential areas must also be considered.
Additional considerations for error in these cost estimates include the overestimation of
the 194,000 gpd influent value. This value was calculated using the wastewater demand value of
450 gpd per household provided by the TNRCC. However, according to Dr. Duncan Earle, an
anthropologist working in Texas colonias, the wastewater usage per household may be as low as
30 gpd (Earle, 1998). This conclusion is based on the fact that these colonias are not connected
to municipal water service and are dependent on trucked-in water.
Therefore, preliminary designs and opportunity cost estimates were also calculated for
flow rates of 300 gpd per household and 50 gpd per household. The total wastewater demands
using these new flow rates are 129,000 gpd and 21,500 gpd, respectively. To treat 129,000 gpd,
the land requirement for a stabilization pond is 1.0 acre (0.4 ha), with an opportunity cost of
$17,000. At a demand level of 21,500 gpd, the stabilization pond need only be 0.2 acre (0.07
ha), with an opportunity cost of $3,400.
69
5. Permitting
In general, stabilization ponds meet necessary requirements for the National Pollutant
Discharge Elimination System (NPDES) permitting program for BOD and SS for continuous
flow systems (Zickefoose, 1977). Ponds also meet TNRCC guidelines for permitting.
3.3.3.3 Technological Constraints
6. Technological Feasibility
A major advantage of a stabilization pond is the minimal requirement for additional
inputs. No energy or water is necessary to transport the waste stream. Stabilization ponds are
also simple to operate effectively with minimum monitoring.
7. Compatibility with Existing Infrastructure
In theory, effluent from a pond system may flow directly into a central collection system
or municipal sewage network. However, given that the removal efficiencies of stabilization
pond had failed to meet a majority of the required effluent standards, this may not be appropriate
in practice.
8. Expandability
It is relatively simple to upgrade existing ponds and lagoons by adding more cells.
However, cost of construction and the integrity of the buffering zone must be considered.

70
9. Lifetime
The service life of a stabilization pond is estimated at 30 years or more (Zickefoose,
1977).
10. Operation and Maintenance
The goals of operation and maintenance for stabilization ponds include scheduled checks
for signs of any build-up of scum on pond surface, burrowing animals, anaerobic conditions,
water grown weeds, dike erosion, dike leakage, and ice buildup in winter. These checks are
recommended on a monthly basis. A check for anaerobic conditions involves the maintenance of
wave action on the surface water when wind is blowing. The absence of good wave action may
indicate anaerobic conditions or an oily surface. In addition, weeds should not be growing in the
water nor tall weeds on the bank, since this may also prevent wave action (Zickefoose, 1977).
Settled solids on pond bottom may require annual clean-out.

71
TABLE 3.3.1 Treatment Alternative: STABILIZATION PONDS
PHYSICAL CONSTRAINTS:
1. Amount & Type of Pollutant/Pathogen Removed: Does Not M
eet Sta
ndards
Meets E
ffluent
Standa
rds
Meets N
on-Pot
able R
e-Use
Meets P
otable
Re-Use
0 1 2 3 BOD5 X
TSS XN X
Total Coliform XViruses X
TOTAL: 1 / 15
2. Compatability with Physical Environment: Not Com
patible
Compat
ible
Ideal
0 1 2 Existing Land Use X
Precipitation XTemperature XTopography X
Soils XGround Water XSurface Water X
TOTAL: 12 / 14
ECONOMIC CONSTRAINTS:
3. Costs ($ per Household): $3601
+
$2401
- $3600
$1201
- $2400
0 - $12
00
0 1 2 3Capital X
Operation & Maintenance X
TOTAL: 5 / 6
4. Opportunity Costs: 100 acr
es +
21 - 99
acres
6 - 20
acres
0 - 5 ac
res
0 1 2 3X
TOTAL: 3 / 3
5. Permitting: Not Perm
ittable
Permitab
le; Not S
td
Permitab
le; Std
0 1 2X
TOTAL: 1 / 2

72
TECHNOLOGICAL CONSTRAINTS
6. Technological Feasibility: High Medium
Low
1 2 3Water Input Requirement X
Energy Input Requirement XTechnological Complexity X
TOTAL: 8 / 9
7. Compatability with Existing Infrastructure: No Yes
1 2Independence from Off-Site Water X
Connectable to Sewer Line X
TOTAL: 4 / 4
8. Expandability: No Yes
1 2Modular X
Economies of Scale XRemoval Efficiency Maintained X
TOTAL: 6 / 6
9. Lifetime (years): 0 - 14
15 - 20
20 +
1 2 3X
TOTAL: 3 / 3
10. Operation and Maintenance: Daily Weekly
Monthly
Yearly
None In
Projec
t Lifet
ime
1 2 3 4 5On-Site Expertise X
Water Replacement XSolids Removal X
Hardware Replacement XEffort Needed to Prevent Fouling X
TOTAL: 22 / 25
RAW SCORE: 65 / 87

73
3.4 Trickling Filter System with Mechanical Pre- and Post-treatment
3.4.1 Basic Description
The trickling filter system is a wastewater treatment technology that couples biological and
mechanical filtration to effectively reduce BOD and TSS. Trickling filters are capable of
achieving BOD and TSS removal efficiency greater than 80% producing an effluent suitable for
reclamation (landscape irrigation and soil conditioning). At an incremental cost, addition of
other treatment components (e.g. wetlands, ponds and sand filters) boosts overall removal rates
of BOD and TSS to more than 90% creating a water source acceptable for human contact
(Luecke and Rentaria, 1997).
The four main steps that this combination technology utilizes for wastewater treatment are
pre-treatment, primary treatment, secondary treatment (trickling filter towers), and settling
(clarifier). Preliminary treatment occurs as the wastewater passes through bar screens located at
the entrance of the grit removal channel. At this point, potentially obstructive large objects and
particles are separated so as not to obstruct the subsequent treatment units. After preliminary
treatment, the wastewater is stored in an aerated surge tank for continual and controlled
wastewater release through the system.
The primary treatment occurs by means of a static stainless-steel fine-wire mesh screen
that functions as a solids separator. Its main function is to remove large solids (> 0.5 mm
(0.02”)). As the influent flows over the angled screen (Figure 3.4), water passes through the
mesh and solids accumulate on the surface. Depending on the influent characteristics (i.e.
organic loading and grease concentration), solids are collected up to several times a day by
brushing or spraying, and removed for landfill or composting. Water accumulates below in a
collector and is routed to the secondary treatment unit. The screen also aids in controlling odors

74
by increasing the influent’s dissolved oxygen. This passive aeration initiates the flocculation of
colloidal particles augmenting their eventual settling in the clarifier (Luecke and Rentaria, 1997).
After passing through the sieve, the influent is routed to the trickling filter for secondary
treatment (Figure 3.5). Trickling filters have been used to provide biological wastewater
treatment for nearly 100 years air (Liu and Liptak, 1997). The modern trickling filter consists of
a bed of a highly permeable medium to which microorganisms are attached and through which
wastewater is percolated or trickled – hence the name. Although trickling filters are designed
with a variety of shapes, sizes and operating modes, all units operate in essentially the same
manner. Water is distributed by a series of sprinklers placed in a tube header on each of the
towers maximizing the wetted surface area per amount of sprayed water (Luecke and Rentaria,
1997). The treated wastewater is contacted with a large area of media colonized with
microorganisms. The system is ventilated ensuring maintenance of aerobic conditions within the
bacterial culture (Vaughan and Holder, 1984).
Trickling filters are classified by their hydraulic loadings (volume rate of flow). Typical
hydraulic loadings for low-rate (without recirculation) and high-rate (with recirculation) trickling
filters are 1.17-3.52 and 9.39-37.55 m3/m2-day, respectively (Liu and Liptak, 1997). Wastewater
treatment facilities commonly use two-stage trickling filters for treating high-BOD wastewater
and achieving nitrification at hydraulic loadings comparable to those for high-rate trickling filters
(Tebbutt 1992). The effluent from a low-rate two-stage trickling filter is usually low in BOD
and well nitrified (Metcalf & Eddy, 1991). Overall treatment efficiency is affected by variability
in the strength and composition of wastes, the effect of temperature and season, and the way in
which the complex ecological system within the tickling filter is affected by these and other
changes (Vaughan and Holder, 1984).

75
The ideal medium used in a trickling filter should have the following properties: high
specific surface area, high void space, light weight, biological inertness, chemical resistance,
mechanical durability and low cost. Trickling filter media include redwood palettes, river rock,
slag, ceramic, steel and polypropylene saddles and rings, and plastic cross-flow sheets. In rock-
filled trickling filters, the size of the rock typically varies from 25 to 100 mm (1 to 4 in) in
diameter. The depth of the rock varies with each particular design but usually ranges from 0.9 to
2.5 m (3 to 8.25 ft) and averages 1.8 m (6 ft). Rock filter beds are usually circular, and the liquid
wastewater is distributed over the top of the bed by a rotary distributor. Trickling filters that use
plastic media have been built with depths varying from 3.6 to 11 m (12 to 36 ft). Three types of
plastic media are commonly used: vertical-flow packing, cross-flow packing, and a variety of
random packings (Metcalf & Eddy, 1991).
Since lightweight, highly permeable plastic media with a large specific surface area
ensures unhindered movement of wastewater and air and is more conducive to microorganism
buildup (Metcalf & Eddy, 1991), it is reported to be highly effective for BOD and TSS removal
over a range of loadings (Harrison and Daigger 1987). Because plastic media are considerably
lighter than rock, furnace slag and wood, the trickling filter housings may be constructed taller
without compromising foundational integrity. Maintaining high treatment surface area with a
smaller footprint reduces land requirements.
The modern trickling tower (or series of towers) often contains sheets arranged in a
cross-flow configuration. The sheets are constructed from lightweight corrugated plastic
(polyvinyl chloride [PVC]) that form self-stacking blocks with 95% voids (Metcalf & Eddy,
1991). The plastic sheets, glued together in a diamond shaped beehive pattern, provide high
surface area for microorganism attachment. Organic material from the liquid is adsorbed onto the

76
biological film (slime layer). In the outer portions of the biological slime layer (0.1 to 0.2 mm),
the organic material is degraded by aerobic microorganisms. The essential processes are mass
transport and biodegradation (Vaughan and Holder, 1984).
During warm weather periods, only the upper part of the trickling filter may be active due
to the higher reaction rate per unit area. Sudden temperature drops may cause ammonium
breakthrough since the growth may not be developed in the entire depth of the filter. Therefore,
to overcome the major disadvantage of this problem, Boller and Gujer (1986) suggest to operate
two trickling filters whereby their sequence should be inversed once per week to obtain
homogenous biomass distribution throughout the reactors.
As the microorganisms grow and the slime layer increases in thickness, the available
oxygen is consumed and the adsorbed organic matter is metabolized before it can reach the
microorganisms near the media face. As a result of having no external organic source available
for cellular carbon, the microorganisms near the media face enter into an endogenous phase of
growth and lose their ability to cling to the media surface. The liquid then washes the slime off
the media, and a new slime layer starts to grow. This phenomenon of losing the slime layer is
called “sloughing” and is primarily a function of the organic and hydraulic loading on the filter.
The hydraulic loading (volumetric flow rate) accounts for shear velocities, and the organic
loading (concentration of cellular carbon) accounts for the rate of metabolism in the slime layer.
In modern trickling filters, the hydraulic loading rate is adjusted to maintain a slime layer of
uniform thickness.
By properly managing the hydraulic loading rate, it has been possible to maintain a thinner
biomass layer consistently, with a concomitant improvement in performance, and to avoid the
periodic sloughing phenomenon often observed in most rock-type trickling filters (Metcalf and
77
Eddy, 1991). Up to a certain hydraulic loading, the greater the surface area the greater the
influent BOD and total suspended solids (TSS) removal efficiency. A similar relationship exists
with the removal efficiency and organic loading. At a certain point, the bacteria are saturated
and eventually become overloaded with organic material. At that point, removal efficiency is
only marginally increased (Gujer and Boller, 1986).
Solids separation, an important part of the trickling-filter process, is needed for removal of
suspended solids sloughed off during periods of unloading with low-rate filters and for removal of lesser
amounts of solids sloughed off continuously by high-rate filters. From the trickling filter, the
wastewater is collected below and either flows or is pumped up to the clarifier, a circular settling basin
which elicits the removal of large and heavily sloughed biological solids or humus. Since clarifiers do
not provide thickening functions, their design is similar to primary settling tanks. The overflow rates are
17,000 to 25,500 l/m2-day (400 to 600 gal/ft2-day) at average flow and 42500 to 51,000 l/m2-day (1000
to 1200 gal/ft2-day) at peak flow, respectively (Liu and Liptak, 1997). The overflow rate is based on the
plant (influent) flow plus the recirculation flow minus the underflow (Metcalf & Eddy, 1991). Clarifier
depths range from 3 to 5 m (10 to 16 ft).
An Environmental Defense Fund / Colegio de la Frontera Norte partnership wastewater treatment
project in Tijuana, Baja, Mexico designed their clarifier as a 45o hopper that allows solids collection to
occur without the use of mechanical scrapers. This fiberglass cylinder was designed and fabricated
using the mold from a small agricultural storage silo and modified to include a conical bottom. The
design allows for ease in removal of the solids from the bottom and water from the top (Leucke and
Renteria, 1997). The organic sludge is drained through an outlet tube placed in the lower part of the
device by hydrostatic pressure in the water tank and then placed in an anaerobic digester. Water in the
upper portion is drained to a spillway that conveys it to the storage facility where it may be used for
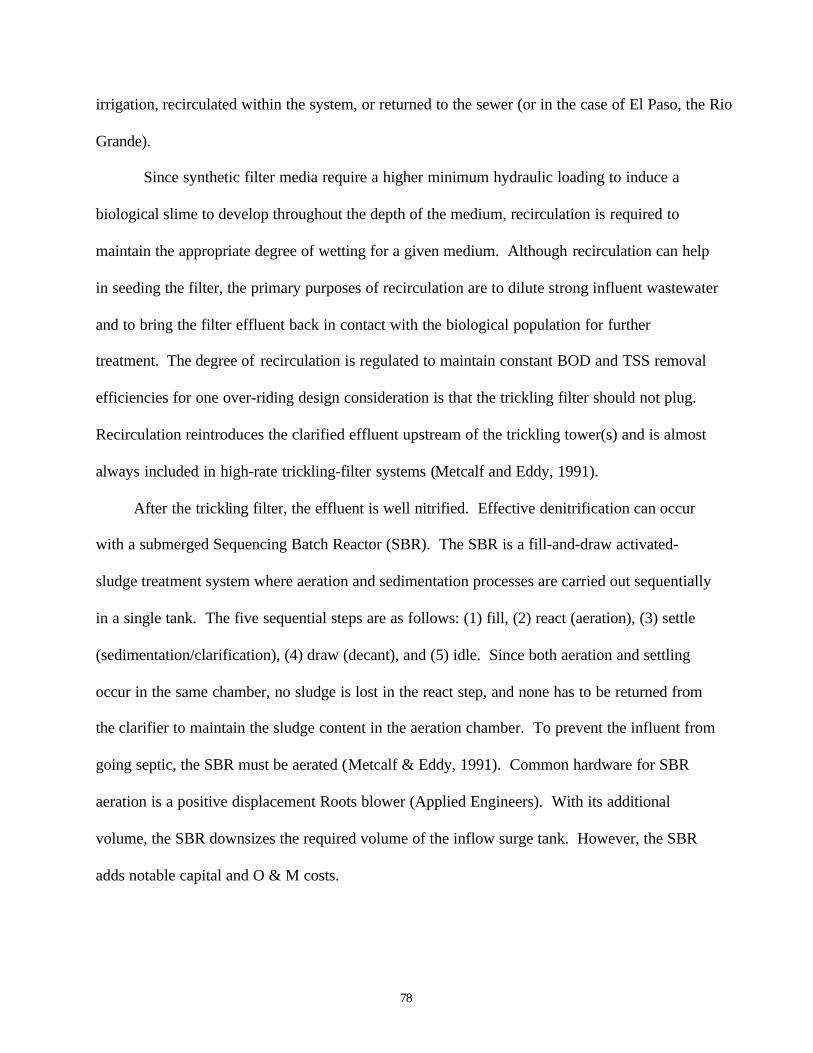
78
irrigation, recirculated within the system, or returned to the sewer (or in the case of El Paso, the Rio
Grande).
Since synthetic filter media require a higher minimum hydraulic loading to induce a
biological slime to develop throughout the depth of the medium, recirculation is required to
maintain the appropriate degree of wetting for a given medium. Although recirculation can help
in seeding the filter, the primary purposes of recirculation are to dilute strong influent wastewater
and to bring the filter effluent back in contact with the biological population for further
treatment. The degree of recirculation is regulated to maintain constant BOD and TSS removal
efficiencies for one over-riding design consideration is that the trickling filter should not plug.
Recirculation reintroduces the clarified effluent upstream of the trickling tower(s) and is almost
always included in high-rate trickling-filter systems (Metcalf and Eddy, 1991).
After the trickling filter, the effluent is well nitrified. Effective denitrification can occur
with a submerged Sequencing Batch Reactor (SBR). The SBR is a fill-and-draw activated-
sludge treatment system where aeration and sedimentation processes are carried out sequentially
in a single tank. The five sequential steps are as follows: (1) fill, (2) react (aeration), (3) settle
(sedimentation/clarification), (4) draw (decant), and (5) idle. Since both aeration and settling
occur in the same chamber, no sludge is lost in the react step, and none has to be returned from
the clarifier to maintain the sludge content in the aeration chamber. To prevent the influent from
going septic, the SBR must be aerated (Metcalf & Eddy, 1991). Common hardware for SBR
aeration is a positive displacement Roots blower (Applied Engineers). With its additional
volume, the SBR downsizes the required volume of the inflow surge tank. However, the SBR
adds notable capital and O & M costs.

79
Before irrigating human-consumptive food crops with treated effluent, the effluent must
be disinfected. The standard method for disinfection is effluent detention with chlorine contact
for 120 min (SB S.1316, 1996). Storing the treated effluent in a final reservoir will allow a
controlled water release dependent upon irrigation demand.
If there is a demand for non-potable irrigation water, this facility can be self-financing, as
in the case of the EcoParque and its resale of treated water to Tijuana’s water utility. Tijuana is
an interesting case study since a viable market has been created for sale of recycled wastewater.
The sale of the wastewater to the city municipality (for 75% of the cost of potable water) creates
an additional demand for treating wastewater by irrigating “green” areas (that are not in direct
human contact) such as center dividers and parks (Luecke and Renteria, 1994). Similar to our
study area in Southern El Paso County, the Ecoparque system is only operated with domestic
wastewater as influent.

80
3.4.2 Preliminary Design
Based on the requirements for operational efficiency of a trickling filter designed to
operate at 750,000 l/day (525 l/min; 140 gal/min), the proposed system is designed with the
following elements: surge tank, preliminary treatment, biological aerobic trickling filtration,
settling (clarifier), recirculation, and sequential batch reactor (SBR). The design for effluent of
suitable quality for landscape irrigation and fiber crops is based on maintaining efficient removal
at both initial and the fifteen year projected peak loading rates.
In order to ensure proper dosing rates for maintaining slime wetness and organic matter-
removal efficiencies, prior to treatment the wastewater influent will be stored in a square,
concrete 9m2 (30 ft2) holding (surge) tank. The surge tank’s primary duty is to receive,
temporarily store and continuously release influent so that the following treatment units are
provided with a constant influent supply. The surge tank also eliminates overflow effects during
peak influent periods. To prevent the standing wastewater influent from becoming septic, this
surge tank must be aerated. This may be achieved with a diffuser and a rotary positive
displacement-type blower. The aeration occurs at 0.021 m3/min per 1000 l (3 ft3/min per 1000
gal). To save operational costs, the blower may operate with a timer on a 20% duty cycle.
To minimize technological expertise required for operation and maintenance, the
preliminary treatment unit (which receives the influent and strains and removes the solids and
grit) will be comprised of a static screen (Figure 3.4.1). Because the upstream surge tank
reduces the stochastic nature of influent volume, the static screen may be designed to
accommodate the mean flow instead of the peak flow. Therefore, the adequate size for this static
screen should be 1 m wide by 2 m long (3 by 6 ft) (Allied Engineers, 1998). The screen may be

81
cleaned by either brushing or spraying from once to four times daily. This frequency depends on
the influent’s grease and organic content.
Figure 3.4.1: Preliminary Treatment Unit (Static Screen)
Source: Luecke and Renteria, 1997
The second stage-trickling filter unit (Figure 3.4.2) will be comprised of two separate
towers with plastic medium since it has higher removal efficiency than rock and requires lighter
foundations. Given the choice of plastic media, cross-flow sheets have been chosen since they
are more easily installed than loose plastic saddles and rings. Additionally, for the required
wastewater, the sheets are essentially the same cost as the loose media ($145 to 165 per m3; $4 to
$4.50 per ft3).
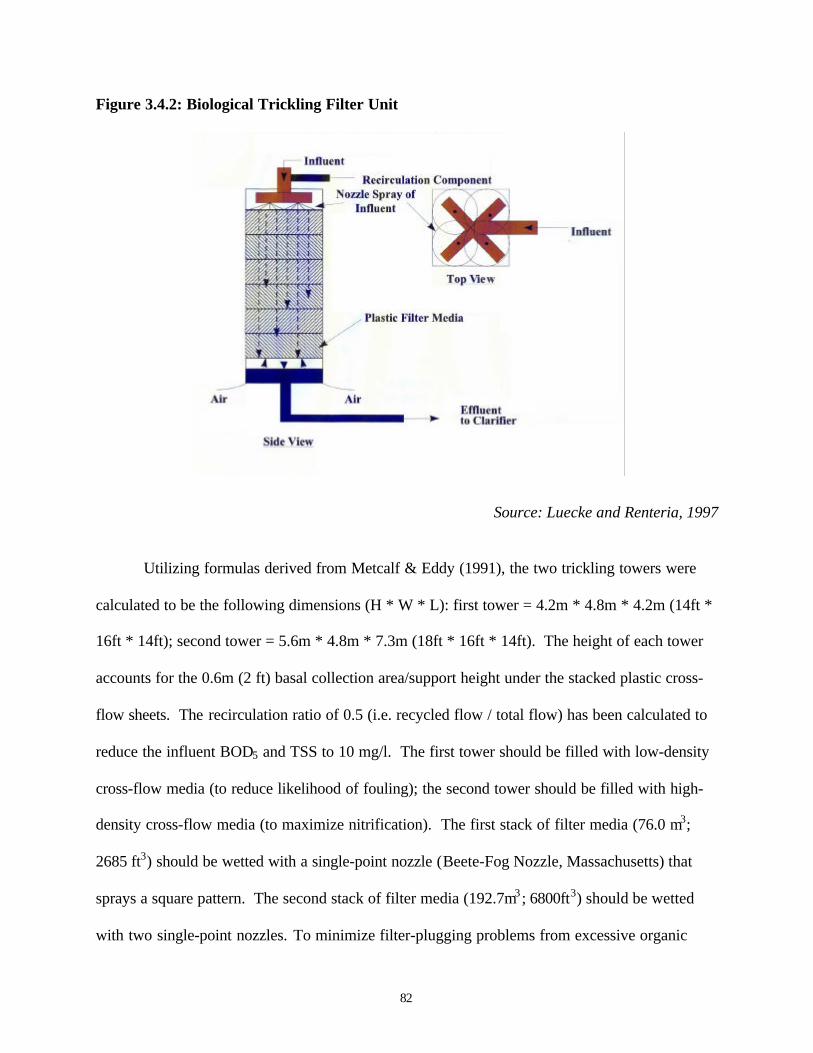
82
Figure 3.4.2: Biological Trickling Filter Unit
Source: Luecke and Renteria, 1997
Utilizing formulas derived from Metcalf & Eddy (1991), the two trickling towers were
calculated to be the following dimensions (H * W * L): first tower = 4.2m * 4.8m * 4.2m (14ft *
16ft * 14ft); second tower = 5.6m * 4.8m * 7.3m (18ft * 16ft * 14ft). The height of each tower
accounts for the 0.6m (2 ft) basal collection area/support height under the stacked plastic cross-
flow sheets. The recirculation ratio of 0.5 (i.e. recycled flow / total flow) has been calculated to
reduce the influent BOD5 and TSS to 10 mg/l. The first tower should be filled with low-density
cross-flow media (to reduce likelihood of fouling); the second tower should be filled with high-
density cross-flow media (to maximize nitrification). The first stack of filter media (76.0 m3;
2685 ft3) should be wetted with a single-point nozzle (Beete-Fog Nozzle, Massachusetts) that
sprays a square pattern. The second stack of filter media (192.7m3 ; 6800ft3) should be wetted
with two single-point nozzles. To minimize filter-plugging problems from excessive organic
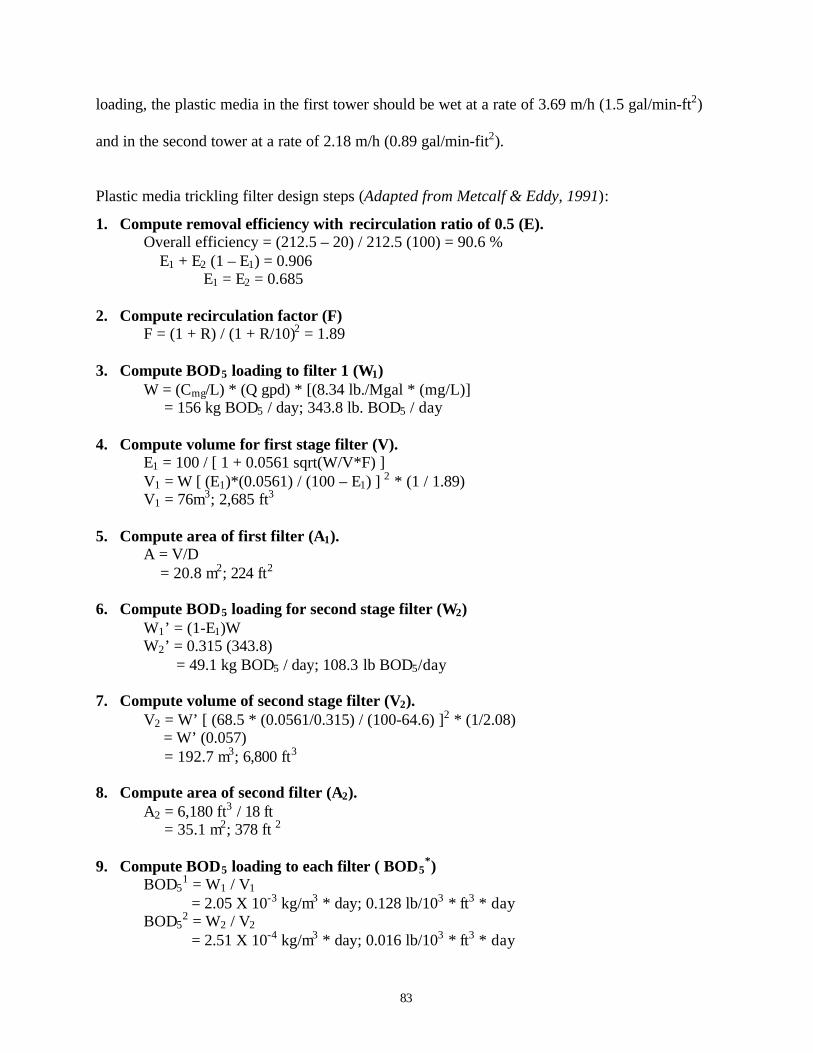
83
loading, the plastic media in the first tower should be wet at a rate of 3.69 m/h (1.5 gal/min-ft2)
and in the second tower at a rate of 2.18 m/h (0.89 gal/min-fit2).
Plastic media trickling filter design steps (Adapted from Metcalf & Eddy, 1991):
1. Compute removal efficiency with recirculation ratio of 0.5 (E).Overall efficiency = (212.5 – 20) / 212.5 (100) = 90.6 % E1 + E2 (1 – E1) = 0.906
E1 = E2 = 0.685
2. Compute recirculation factor (F)F = (1 + R) / (1 + R/10)2 = 1.89
3. Compute BOD5 loading to filter 1 (W1)W = (Cmg/L) * (Q gpd) * [(8.34 lb./Mgal * (mg/L)] = 156 kg BOD5 / day; 343.8 lb. BOD5 / day
4. Compute volume for first stage filter (V).E1 = 100 / [ 1 + 0.0561 sqrt(W/V*F) ]V1 = W [ (E1)*(0.0561) / (100 – E1) ] 2 * (1 / 1.89)V1 = 76m3; 2,685 ft3
5. Compute area of first filter (A1).A = V/D = 20.8 m2; 224 ft2
6. Compute BOD5 loading for second stage filter (W2)W1’ = (1-E1)WW2’ = 0.315 (343.8) = 49.1 kg BOD5 / day; 108.3 lb BOD5/day
7. Compute volume of second stage filter (V2).V2 = W’ [ (68.5 * (0.0561/0.315) / (100-64.6) ]2 * (1/2.08) = W’ (0.057) = 192.7 m3; 6,800 ft3
8. Compute area of second filter (A2).A2 = 6,180 ft3 / 18 ft = 35.1 m2; 378 ft 2
9. Compute BOD5 loading to each filter ( BOD5*)
BOD51 = W1 / V1
= 2.05 X 10⁻³ kg/m3 * day; 0.128 lb/103 * ft3 * dayBOD5
2 = W2 / V2
= 2.51 X 10⁻⁴ kg/m3 * day; 0.016 lb/103 * ft3 * day

84
10. Compute hydraulic loading to each filter (H*).H = [ (1 + R) (Qd / 1440 m/d) ] / (A)H1 = (2.5)(135gpm) / (224ft2) = 3.69 m/h; 1.51 gal/ft2 * minH2 = (2.5)(135gpm) / (378ft2) = 2.18 m/h; 0.89 gal/ft2 * min
11. Summary dimensions for plastic media at design flowrate (H * W * L).First stage filter: 12ft * 16ft * 14ftSecond stage filter: 18ft * 16ft * 24ft
12. Summary dimensions for plastic media at flowrate of 20 gal/day * house (H * W * L).First stage filter: 6ft * 4ft * 5ftSecond stage filter: 12ft * 5ft * 5ft
Since odor is tolerated (Earle, 1998), construction and materials costs may be saved at the
expense of not completely containing odor. The trickling filter sidewalls may be built with
concrete instead of airtight polyethylene-molded cylinders and plastered on the inside. With a
simple concrete box design, natural air convection will occur with vents/holes at the bottom. A
porous underdrain system at the bottom of the filter is necessary to collect treated effluent and
circulate air (Liu and Liptak, 1997).
From the trickling filter, the collected effluent should be routed to a clarifier (Figure
3.4.3) where the remaining solids may be separated and removed from the wastewater. The
clarifier design as utilized by the Ecoparque project is effective and cost efficient at solids
removal. With an upstream surge tank, the clarifier may be 9 m (30 ft) in diameter and 3.65 m
(12 ft) deep and settles 16,800 l per day-m2 (400 gal per day-ft2). The top (round) section may
be 2.2 m high (7.25 ft) and the bottom (upside down–conical section) may be 1.44 m (4.75 ft).
The influent retention time should be less than or equal to 2 hours to avoid uncontrolled
denitrification (Ardic, et. al., 1994).

85
Figure 3.4.3: Clarifier
Source: Luecke and Renteria, 1997
From the clarifier, the effluent will be recirculated through the two trickling filter towers
to maintain biotic slime wetness, dilute concentrated influent and compensate for winter
temperature-reduced bacterial metabolic activity. For the given BOD and TSS influent levels of
212.5 mg/l and 125 mg/l, respectively, the recirculation ratio will be 0.5. The effluent will be
denitrified in the Sequential Batch Reactor (SBR). The SBR can be constructed as a square
concrete tank 10.5m (34.5 ft) per side, 3.6m high (12 ft) high, with 400m3 (26,700 ft3) volume.
From the SBR, the effluent will proceed to the final surge tank, also a square concrete tank 9.9m
(32.3 ft) per side, 3.6m (12 ft) high, with 350 m3 (23,400 ft3) volume. Combined, the SBR and
final surge tank can store a full day’s volume of effluent at maximum design flowrate.
The entire system is displayed in Figure 3.4.4.

86
FIGURE 3.4.4: Entire Trickling Filter with Mechanical Pretreatment System
Source: Luecke and Renteria, 1997
If the effluent is used for irrigating human-contacted food crops, it must be disinfected.
since this adds permitting issues, and capital and operation/maintenance costs, we are not
including this in the design.
The power required to raise the influent at each treatment unit may be supplied with self-
priming pumps with 2 hp motors (Allied Engineers). These pumps draw two kW each per year.

87
3.4.3 Evaluation of Trickling Filter Systems
3.4.3.1 Physical Constraints
1. Amount and Type of Pollutant/Pathogen Removed
The scoring summary for the trickling filter is in TABLE 3.4.1. As designed, this
combination trickling filter system should support BOD5 and TSS effluent levels of 10 mg/L,
corresponding to removal efficiency of greater than 90%. A similarly designed wastewater
treatment system in Tijuana, Ecoparque, reported removal efficiencies of BOD and TSS up to
80% (Luecke and Rentaria, 1997). Since the trickling filter effluent is suitable for reclamation
for landscape irrigation and soil conditioning, this technology receives a high rating. Although
addition of other treatment components (e.g. wetlands, ponds, and sand) is projected to boost
overall removal rates of BOD and TSS to greater than 90%, this design is evaluated without the
additional components.
With the addition of the Sequential Batch Reactor (SBR), the effluent will be sufficiently
denitrified for its discharge to the Rio Grande (or sewer) and therefore meets standards.
Although the literature reports that trickling filters reduce total coliform by up to 60%
(Tremblay, et. al, 1996), the reduction is not enough to meet effluent standards. Without post
treatment exposure to chlorine, viruses and are not reduced.
2. Compatibility with Physical Environment
Due to the nature of this combination treatment facility’s design, it is not
significantly affected by many potentially limiting environmental variables and therefore
receives high ratings. Because the wastewater flows entirely within the enclosed components
and associated hardware, this system neither affects nor is affected by Soils, Groundwater or

88
Surface Water. Although the surge tanks (pre and post), hydrasieve, trickling filter, clarifier and
SBR are designed not-enclosed, the wastewater influent temperature buffers the treatment
efficiency from fluctuating winter/summer air temperatures. The El Paso region’s Precipitation
will not appreciably affect operational functionality of any of the units (Allied Engineers, 1998).
Although sunlight will cause algal growth in the top foot or so of the uncovered trickling towers,
the algae will not affect either the hydraulic or organic loading rates. Therefore for all of these
variables, this technology receives highest ratings.
The principle physical factor limiting operational functionality is topography, or in El
Paso’s case, the lack of an appreciable elevation gradient. Since the wastewater must be raised
to the top of each of the units, energy must be applied via submerged pumps. Although capital
and operational costs will increase with no available hydraulic head, the problem is
surmountable. Therefore, topography is hindering but not limiting.
3.4.3.2 Economic Constraints
3. Cost per Household
Because southern El Paso’s rural population is comprised of low-density colonias, the
exact location of the facility is not as constrained. Subsequently, it is not necessary for the
combination-trickling filter system’s odor to dictate the treatment system design. For this
reason, capital cost may be reduced without sacrificing operational efficiency.
Since the majority of the system’s units may be open, they may be constructed with inexpensive
materials such as concrete. When labor is readily available and respective costs low, this design
is appropriate and reduces initial expenditures for purchasing system hardware. This treatment
system receives a high score for capital costs but a medium score for operating costs.

89
The fixed capital costs (filter media, pumps, etc.) are as follows (Allied Engineers, 1998):
Preliminary treatment screen : $ 6,000Cross-flow PVC filter media @ $4-4.50 / ft3 : $39,500Spray nozzles, pumps, blowers : $ 4,500Sequential Batch Reactor : $42,000Two trickling towers : $22,000Two surge tanks : $20,000Fiberglass clarifier(s) : $20,000Associated plumbing, hardware, concrete : $42,000
Labor (installation) : $13,000Land : $17,000Other : $50,000
Estimated Capital Total : $300-$350,000
Therefore, the estimated Capital Cost / Household is between $700 and $820.
The operational costs per household, summed over the lifecycle of the treatment facility, is
between $3000 and $3700. This is based on estimates from both the reported annual operation
and maintenance cost for Ecoparque at $65,000/year (BECCNet, 1998) and an estimate (which
includes electricity) provided by Allied Engineers (1998) at $80,000/year.
4. Opportunity Cost
Footprint is reduced by constructing the treatment units vertically. The required footprint
for the two 9m2 (30ft2)surge tanks, the side by side trickling filters at 4.2m X 4.8m and 7.3m X
4.8m (14ft X 16ft and 24ft X 16ft), the static screen at 1.8m X 3m (6 ft X 10 ft), the 9m diameter
clarifier (30ft), the 9m2 (30ft2) SBR, and the associated plumbing and hardware has been
calculated between 250 and 300 m2 (2700-3230 ft2). Thus, the Opportunity Costs category
receives a high rating because the facility can be adequately housed on land size between one
and five acres.

90
5. Permitting
This combination-treatment technology is not recognized by the local authorities as
standard. Because this system efficiently reduces BOD and TSS and complies with the Tijuana
urban development program published in the state official register on February 3, 1995
(BECCNet, 1998), which is based on:
ú Political Constitution of the United States of Mexico.
ú Human Settlements General Act (1993).
ú Baja California State Urban Development Act (1994).
ú State Planning Act.
ú Political Constitution of the State of Baja California.
ú Environmental Balance and Protection General A
this technology is permittable but not standard.
3.4.3.3 Technological Constraints
6. Technological Feasibility
Since the facultative aerobic bacteria’s environment in the trickling filter towers must be
constantly wetted, it is necessary for water to be controlled and circulated through the system.
Should the bacteria be deprived of oxygenated water, the system operational efficiency will
significantly decrease. In addition, while the system recovers from this shock, a lag will occur
before the system returns to a normal level of operational efficiency. To prevent system shock,
influent water must be continuously regulated.

91
In El Paso, a region absent of appreciable and useful elevation, this treatment technology
requires one blower and seven pumps to circulate the wastewater up to the top of the various
components. The high Energy Input Requirement may be supplied by on-site generators or from
the electric utility grid.
This type of combination mechanical / biological treatment technology requires a
complex assemblage of both units and associated hardware. Although materials and capital costs
may be reduced by simplifying design and construction materials, each of the components are
essential for maintaining operational with efficient wastewater pollutant removal. The hardware
requirements of the stainless steel screen, the honeycomb cross-flow plastic media, the
submerged pumps, the blower, the nozzles and the weirs and valves are extensive. If one of
these units fail, the system’s removal efficiency is jeopardized. Although the system is relatively
complex, since it does not utilize ozonation or UV-sterilizations, the system’s Technological
Complexity is rated medium.
7. Compatibility with Existing Infrastructure
Although the aerobic bacteria require constant wetting and a continual source of organic
cellular carbon, the system’s operation efficiency will not be compromised with an influent
volume of 515 l/min (135 gal/min) and the system is independent from off-site water. Should a
central sewer line be constructed, the effluent, stored in a final reservoir, is easily connected to
the system.
8. Expandability

92
As this treatment technology is highly modular, influent capacity expansion is readily
obtained by adding new stage sub units and connecting with appropriate plumbing. As the
number of stages and sub units of each stage increases, the demand for an extensive pumping
system concurrently increases. Since expanding vertically may increase the system treatment
capacity, the initial amount of land provides enough space to accommodate additional
components.
Economies of Scale are realized because it is more cost effective to build one central
treatment facility than multiple smaller facilities. A considerable portion of the initial costs is
labor costs of constructing the components and associated hardware. It would be more cost
effective to either increase the size of the components or increase the number of sub units on one
site rather than constructing smaller components on multiple sites.
Provided that adequate surface area of media is available for bacterial growth, the
removal efficiency is not significantly different across the range of system sizes.
9. Lifetime
Since the materials are inert (concrete, plastic and fiberglass), if the facility is routinely
maintained and hardware is replaced according to a maintenance plan, the operational efficiency
will remain high and this treatment facility should operate for more than 20 years.
10. Operation and Maintenance
To ensure optimal operational efficiency, a trained operator is required to perform
various daily tests to ensure that no components are overloaded. Critical parameters monitored
are hydraulic loading rates and organic loading rates. This extensive daily testing reduces the

93
tendency to decrease maximum operational efficiency. If the hydraulic loading is too high, the
influent will flow around the primary treatment screen contributing to fouling the downstream
treatment units. If the organic loading is too high, the bacteria in the secondary treatment unit
will be unable to completely process the waste stream. Thus, on-site expertise is scored with the
lowest value.
As influent is continuously entering the system, effluent must be removed so the
plumbing capacity is not overloaded. The higher the hydraulic or organic loading rates, the
greater the amount of solids will accumulate. These solids must be removed on a daily basis to
avoid backing up the settling system and plug the trickling filter media.
In addition, various components must be routinely serviced. The servicing routine is
required to prevent fouling and to sustain operational efficiency. The periodicity is often
dependent upon amount of grease in the influent. The following is the required routine schedule:
ú Inflow screen clean up – daily
ú Microscreen clean up – at least twice a day
ú Trickling filters’ sprinkler manifold check up
ú Post-filter flow meter readings
ú Draining sludge from settling tank according to operation requirements and organic loading
ú Re-circulation equipment check up
ú Raking and analyzing samples as required by law to fill the corresponding log and to correct
process flaws
For all ten evaluative criteria, the trickling filter combination system received a cumulative
score of 46 out of a possible 87.

94
TABLE 3.4.1 Treatment Alternative: TRICKLING FILTER
PHYSICAL CONSTRAINTS:
1. Amount & Type of Pollutant/Pathogen Removed: Does Not M
eet Sta
ndards
Meets Ef
fluent S
tandar
ds
Meets Non-
Potabl
e Re-U
se
Meets Po
table R
e-Use
0 1 2 3 BOD5 X
TSS XN X
Total Coliform XViruses X
TOTAL: 3 / 15
2. Compatability with Physical Environment: Not Com
patible
Compat
ible
Ideal
0 1 2 Existing Land Use X
Precipitation XTemperature XTopography X
Soils XGround Water XSurface Water X
TOTAL: 13 / 14
ECONOMIC CONSTRAINTS:
3. Costs ($ per Household): $3601
+
$2401
- $3600
$1201
- $2400
0 - $12
00
0 1 2 3Capital X
Operation & Maintenance X
TOTAL: 3 / 6
4. Opportunity Costs: 100 acr
es +
21 - 99
acres
6 - 20
acres
0 - 5 a
cres
0 1 2 3X
TOTAL: 3 / 3
5. Permitting: Not Perm
ittable
Permitab
le; Not S
td
Permitab
le; Std
0 1 2X
TOTAL: 1 / 2

95
TECHNOLOGICAL CONSTRAINTS
6. Technological Feasibility: High Medium
Low
1 2 3Water Input Requirement X
Energy Input Requirement XTechnological Complexity X
TOTAL: 4 / 9
7. Compatability with Existing Infrastructure: No Yes
1 2Independence from Off-Site Water X
Connectable to Sewer Line X
TOTAL: 2 / 4
8. Expandability: No Yes
1 2Modular X
Economies of Scale XRemoval Efficiency Maintained X
TOTAL: 6 / 6
9. Lifetime (years): 0 - 14
15 - 20
20 +
1 2 3X
TOTAL: 3 / 3
10. Operation and Maintenance: Daily Weekly
Monthly
Yearly
None In
Projec
t Lifet
ime
1 2 3 4 5On-Site Expertise X
Water Replacement XSolids Removal X
Hardware Replacement XEffort Needed to Prevent Fouling X
TOTAL: 8 / 25
RAW SCORE: 46 / 87
96
3.5 Wetlands
3.5.1 Basic Description
3.5.1.1 Treatment Wetlands
For our purposes, a wetland can be defined as land where the water surface is near the
ground surface for long enough each year to maintain saturated soil conditions, along with the
related vegetation (Reed et al., 1995). The major wetlands types are often categorized as
swamps, bogs or marshes. In swamps, trees are the dominant type of vegetation, bogs are
characterized by mosses and peat, and marshes by grasses and emergent macrophytes. All three
types of wetlands have been used for wastewater treatment, but the majority of currently
operational systems are in the marsh category (Reed et al., 1995).
Full-scale wetland treatment systems are being used routinely to treat municipal,
industrial, and agricultural wastewaters, agricultural and urban runoff, landfill leachate, and acid
mine drainage waters. However, the designs for these systems (more than 500 in operation in
North America by 1994, and over 1000 worldwide) are still highly individualistic and variable
(Kadlec and Knight, 1996).
3.5.1.2 Use of Natural vs. Constructed Wetlands
Use of natural wetlands for direct waste treatment may create significant public and
environmental concerns. Preservation of the remaining wetlands in the United States has
become a major issue, and the habitat values in these existing natural wetlands would be altered
by the introduction of the higher nutrient levels commonly associated with wastewater effluents.
Use of natural wetlands for this purpose also creates significant engineering problems affecting
performance of the system (Reed et al., 1995).
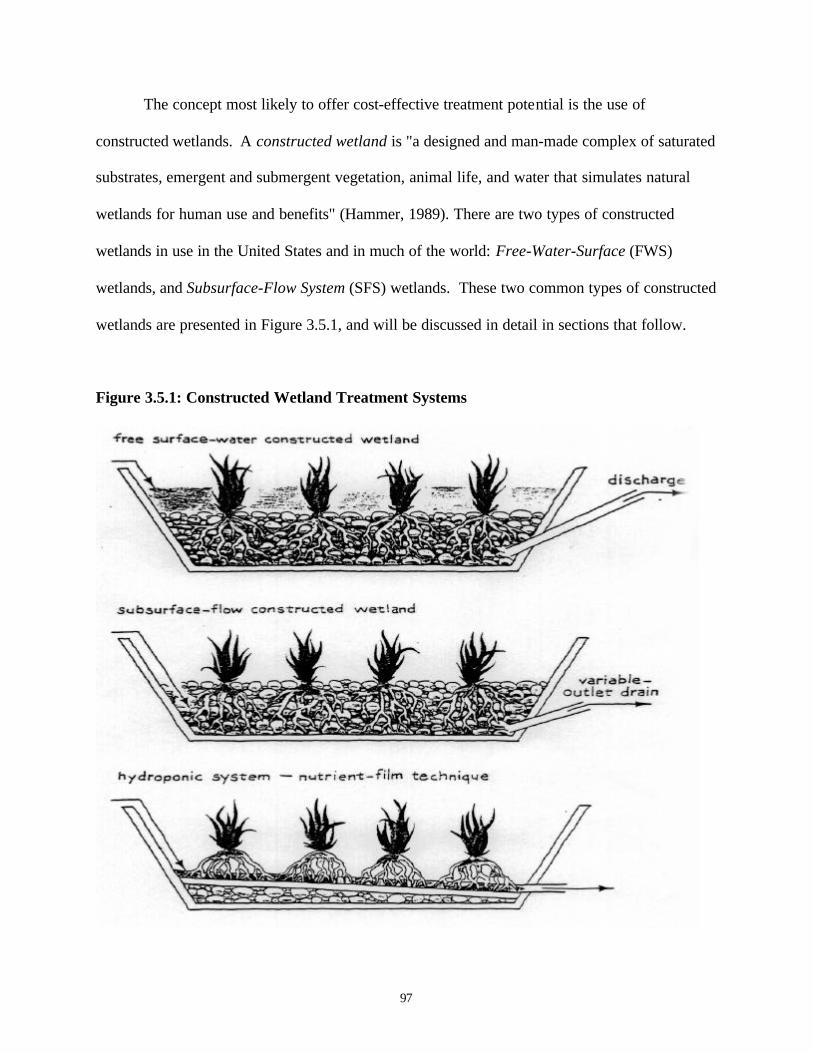
97
The concept most likely to offer cost-effective treatment potential is the use of
constructed wetlands. A constructed wetland is "a designed and man-made complex of saturated
substrates, emergent and submergent vegetation, animal life, and water that simulates natural
wetlands for human use and benefits" (Hammer, 1989). There are two types of constructed
wetlands in use in the United States and in much of the world: Free-Water-Surface (FWS)
wetlands, and Subsurface-Flow System (SFS) wetlands. These two common types of constructed
wetlands are presented in Figure 3.5.1, and will be discussed in detail in sections that follow.
Figure 3.5.1: Constructed Wetland Treatment Systems
98
Constructing a wetland where one did not exist before avoids the regulatory and
environmental entanglements associated with natural wetlands and allows design of the wetland
for optimum wastewater treatment. Typically, a constructed wetland should perform better than
a natural wetland of equal area, since the bottom can be carefully graded and the hydraulic
regime in the system is controlled (Reed et al., 1995). Process reliability is also improved in a
constructed wetland because the vegetation and other system components can be managed as
required. For these reasons, we consider only constructed wetlands in this analysis.
3.5.1.3 Pollutant Removal Mechanisms in Treatment Wetlands
Since wetlands have a higher rate of biological activity than most ecosystems, they can
transform many of the common pollutants that occur in conventional wastewater into harmless
by-products or essential nutrients that can be used for additional biological productivity. These
pollutant transformations can be obtained for the relatively low cost of earthwork, piping,
pumping and a few concrete structures. Wetlands are one of the least expensive treatment
systems to operate and maintain (Kadlec and Knight, 1996). Because of the natural
environmental energies at work in a wetland treatment system, minimal fossil fuel energy (for
pumping systems, if needed) and no chemicals are necessary.
Permanently water-covered or water saturated conditions in wetlands markedly reduce
gas exchange rates between the sediments and the atmosphere (Brix, 1993). As a result, the
sediments become largely anoxic or anaerobic. The rates of decomposition and mineralization of
large quantities of organic matter produced by the primary producers within the wetlands are
significantly reduced under anaerobic conditions, and organic matter tends to accumulate on the
sediment surface (Schlesinger, 1991). The resultant organic sediments have very low bulk
99
density, a high water holding capacity and a very high cation exchange capacity (Brix, 1993).
Furthermore, the layers of litter overlying the sediments and the emergent macrophytes
themselves provide a huge surface area for attached microbial growth. Wetlands, therefore, have
high potential to accumulate and transform organic material and nutrients.
3.5.1.4 Free-Water-Surface Wetlands
A Free-Water-Surface (FWS) constructed wetland mimics a natural wetland in that water
principally flows above the ground surface, as shallow sheetflow, through a more or less dense
growth of emergent wetland plants (Kadlec and Knight, 1996). In FWS wetlands, the water
surface is exposed to the atmosphere; the bed contains emergent aquatic vegetation, a layer of
soil serves as rooting media, and appropriate inlet and outlet structures are employed. The bed of
the FWS wetland is lined, if necessary, to protect the groundwater from seepage.
The water depth in this type of wetland can range from a few centimeters to 0.8 m or
more, depending on the purpose of the wetland. A normal operating depth of 0.3 m (1 ft) is
typical. Design flows for FWS wetlands typically range from approximately 4 m3/d (1000 gpd)
to over 75,000 m3/d (20 mgd) (Reed et al., 1995).
Wetland vegetation plays an integral role in treatment by transferring oxygen through the
roots and rhizome systems to the bottom of the treatment basins and providing a medium beneath
the water surface for the attachment of microorganisms that perform most of the biological
treatment. Emergent plants, those rooted in soil or granular support medium that emerge or
penetrate the water surface, are used in wetland systems. The plants most frequently used in
constructed wetlands include cattails, reeds, rushes, bulrushes, and sedges. All of these plants
are ubiquitous and tolerate freezing conditions (Metcalf & Eddy, 1991).
100
3.5.1.5 Subsurface-Flow System Wetlands
Subsurface Flow System (SFS) wetlands are designed to create subsurface flow through a
permeable medium, keeping the water below the surface, thereby helping to avoid the
development of odors and other nuisance problems. Such systems have also been referred to as
"root-zone systems," "rock-reed-filters," and "vegetated submerged bed systems" (EPA, 1993).
The media used (typically soil, rough sand, gravel or crushed rock) greatly affect the
hydraulics of the system. The SFS wetland basin is excavated and filled with the porous media,
and treats wastewater by passing it horizontally or vertically through the media, which is planted
with emergent macrophytic plants (Kadlec and Knight, 1996). The same species of vegetation
are used as in FWS wetlands, but in the SFS case the vegetation is planted in the upper part of
the porous media. Microbial attachment sites are located on the surface of the media and on the
roots of the wetland plants. The basin can be lined with clay or plastic, if necessary, to protect
groundwater quality. The depth of the media is typically 0.3-0.6 m (1-2 ft). Existing systems of
this type range from those serving single-family dwellings to large-scale municipal systems
(Reed et al., 1995). The largest operational SFS system in the United States is in Crowley,
Louisiana, with a design!flow of 13,000 m3/d (3.5 mgd) (Reed et al., 1995).
3.5.1.6 Comparison of FWS and SFS Wetland Systems
There are several advantages to the use of SFS wetlands over FWS wetland systems. The
biological reactions in both types of wetlands are believed to be due to attached growth
organisms. Since the gravel media in a SFS system provides more surface area (in the pore
spaces in the media) than is found in FWS wetland substrates, the microbes in the gravel bed will
have higher reaction rates and therefore SFS wetland systems can be smaller in areal extent.

101
Since the water surface is below the top of the media and not exposed, the SFS type system
typically does not have mosquito problems, which can be an issue for FWS wetlands in some
locations. Additionally, since the water surface is not exposed in a SFS wetland, there are less
public access issues (for example, children and pets are not exposed to open areas of
wastewater), and this type of wetland is often used as a component in on-site treatment/disposal
systems for schools, parks, public and commercial buildings, etc. (Reed et al., 1995). The SFS
type of wetland system can also provide greater thermal protection in cold climates, since the
water surface is below the top of the gravel and is less susceptible to air temperatures.
The potential advantages of the SFS concept over the FWS systems may be offset if the
relative cost to procure, deliver and place the gravel media in the bed of a large system is high,
even if the total area required will be less than for a FWS system. It is unlikely that the SFS
system would be cost competitive with the FWS system for projects with a design flow in excess
of 4000 m3 /d (Reed et al., 1995). The feasibility for lesser flows would depend on local land
costs, the type of liner (if required), and on the type of media used in the SFS system. In many
cases, though, the advantages of the SFS concept would outweigh the cost factors for small
systems. In the majority of cases, the utilization of SFS wetlands is preferred over the FWS type
for on-site systems to treat domestic wastewaters (Reed et al., 1995).
For these reasons, we have chosen to analyze the SFS-type wetland for compatibility with
conditions at our study site. To preserve economies of scale, we will discuss the system in terms
of a single SFS wetland to treat wastewater from our projected buildout of households (430
households by 2010), instead of as a series wetlands for smaller groups or individual households.

102
3.5.2 Preliminary Design
The principal design parameters for constructed wetland systems include hydraulic
detention time, basin depth, basin geometry (width and length), BOD5 loading rate, and
hydraulic-loading rate. Table 3.5.1 presents typical ranges of these parameters that are suggested
for wetland design.
Table 3.5.1: Design Guidelines for Constructed Wetlandsa
Design ParameterUnit
Type of SystemFWS SFS
Hydraulic detention time d 4 –15 4 –15Water depth ft 0.3 - 2.0 1.0 - 2.5
BOD5 loading rate Lb/acre ⋅ d < 60 < 60Hydraulic-loading rate Mgal/acre ⋅ d 0.015 - 0.050 0.015 - 0.050
Specific area Acre/(Mgal/d) 67 – 20 67 – 20
a Adapted from Metcalf & Eddy, 1991; U.S. EPA, 1988.Note: ft x 0.3048 = m lb/acre ⋅ d x 1.1209 = kg/ha ⋅ d Mgal/acre ⋅ d x 0.9354 = m3/m2 ⋅ d acre/(Mgal/d) x 0.1069 = ha/(103m3/d)
Taking these parameters into consideration, as well as the influent characteristics of the
waste stream from our study area, a subsurface-flow-system (SFS) wetland basin can be
designed for the selected site. The following design procedure is adapted from Metcalf & Eddy
(1991).
SFS Constructed Wetland - Design Steps
1. Select basin depth (d).
The important characteristics of the plants related to design are the optimum depth of
water for FWS systems and the depth of the rhizome and root penetration for SFS wetlands.
Following are some general characteristics of emergent macrophytes regularly used in
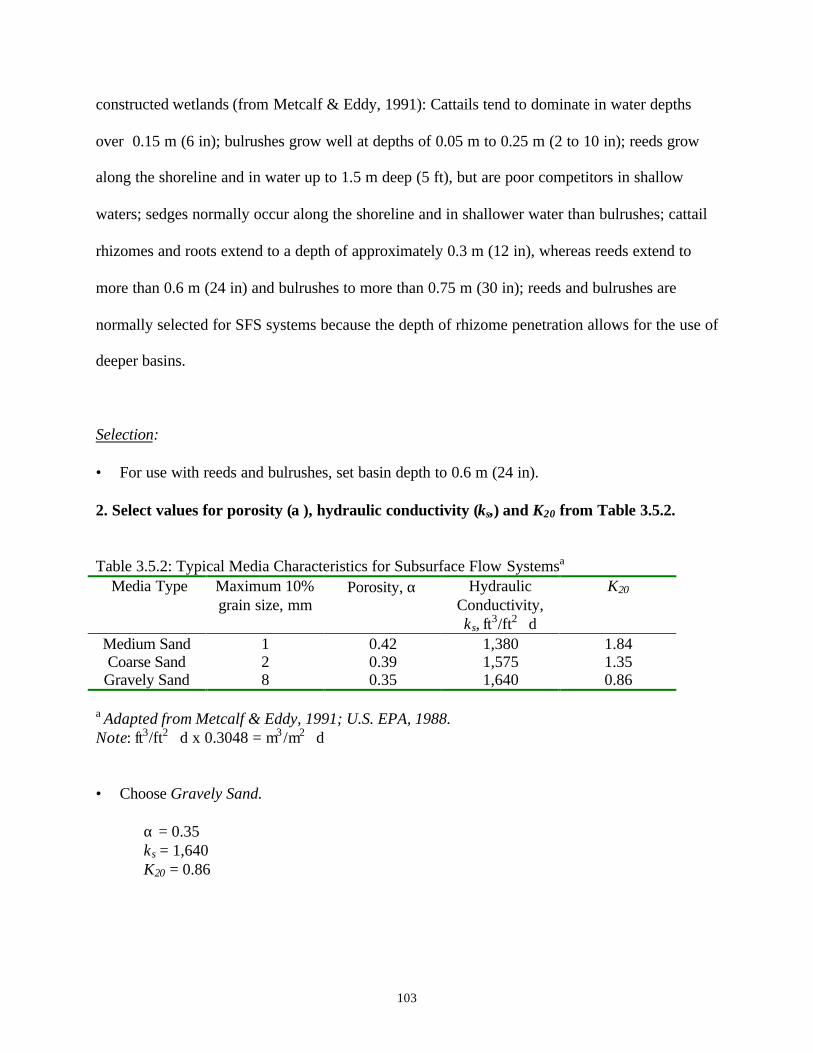
103
constructed wetlands (from Metcalf & Eddy, 1991): Cattails tend to dominate in water depths
over 0.15 m (6 in); bulrushes grow well at depths of 0.05 m to 0.25 m (2 to 10 in); reeds grow
along the shoreline and in water up to 1.5 m deep (5 ft), but are poor competitors in shallow
waters; sedges normally occur along the shoreline and in shallower water than bulrushes; cattail
rhizomes and roots extend to a depth of approximately 0.3 m (12 in), whereas reeds extend to
more than 0.6 m (24 in) and bulrushes to more than 0.75 m (30 in); reeds and bulrushes are
normally selected for SFS systems because the depth of rhizome penetration allows for the use of
deeper basins.
Selection:
• For use with reeds and bulrushes, set basin depth to 0.6 m (24 in).
2. Select values for porosity (α ), hydraulic conductivity (ks,) and K20 from Table 3.5.2.
Table 3.5.2: Typical Media Characteristics for Subsurface Flow Systemsa
Media Type Maximum 10%grain size, mm
Porosity, α HydraulicConductivity,ks, ft3/ft2 ⋅ d
K20
Medium Sand 1 0.42 1,380 1.84Coarse Sand 2 0.39 1,575 1.35Gravely Sand 8 0.35 1,640 0.86
a Adapted from Metcalf & Eddy, 1991; U.S. EPA, 1988.Note: ft3/ft2 ⋅ d x 0.3048 = m3 /m2 ⋅ d
• Choose Gravely Sand.
α = 0.35ks = 1,640K20 = 0.86

104
3. Determine the value of KT at minimum water temperature (assume 10°C).
KT = temperature-dependent first-order biodegradation rate constant, d-1
KT = K20 (1.1)(T-20) , T in °C.
• KT = 0.86 (1.1) (10-20) = 0.33 d-1
4. Determine pore-space detention time (t’).
t’ = (-ln Ce/Co) / KT
Ce = effluent BOD5 concentration, mg/l (≤20 mg/l required to meet effluent standard) Co = influent BOD5 concentration, mg/l (approximately 221 mg/l peak concentration) • t’ = [-ln (20 mg/l)/(221 mg/l)] / 0.33 d-1 = 7.3 d
5. Determine cross-sectional area (Ac).
Ac = Q / ks S
Q = average flowrate through systems [(Q in + Q out)/2], ft3/d S = slope of basin, ft/ft = .01 Est. = 194,000 gpd = 25934 ft3/d = Q
• Ac = (25934 ft3/d) / [(1,640 ft3/ft2 ⋅ d)(.01)] = 1581 ft2
6. Determine basin width (W).
W = Ac/d
d = depth of basin, ft
• W = 1581 ft2 / 2.0 ft = 790.5 ft
7. Determine basin length (L).
L = t’Q / Wdα
• L = [(7.3 d)(25934 ft3/d)] / [(790.5 ft)(2.0 ft)(0.35)] = 342 ft 8. Determine required surface area (As).
As = L x W
• As = [(342 ft)(790.5 ft)] / 43,560 ft2/acre = 6.2 acres
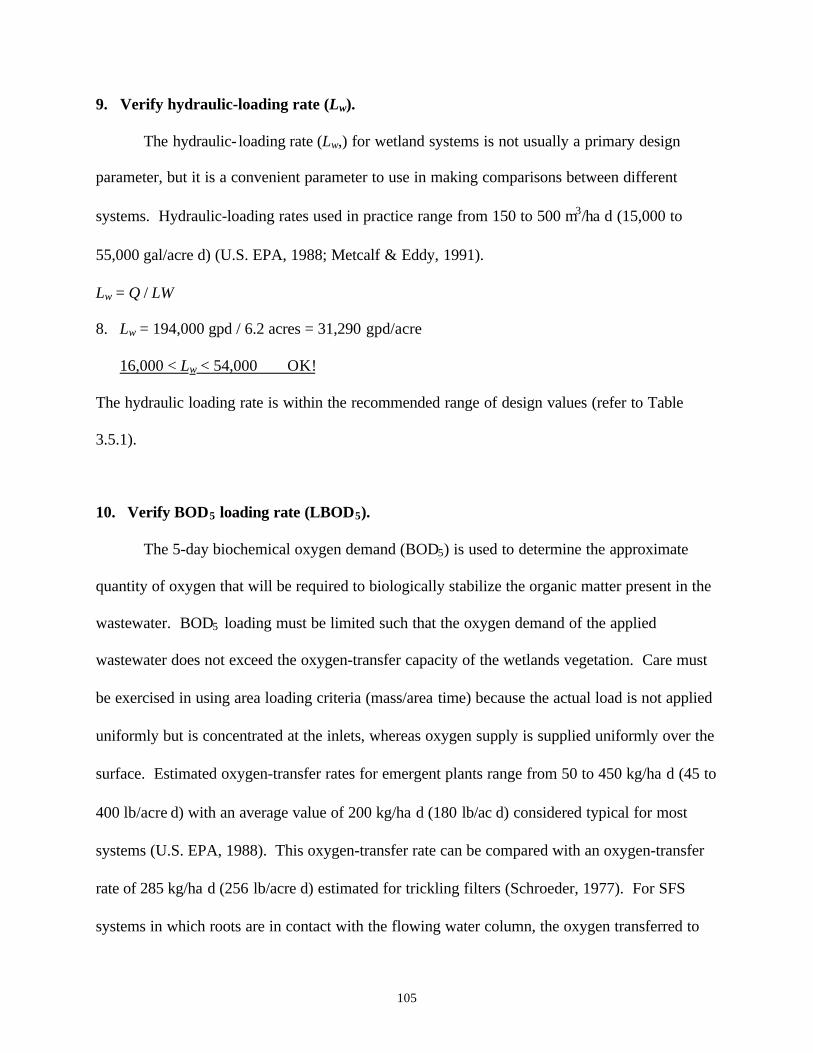
105
9. Verify hydraulic-loading rate (Lw).
The hydraulic- loading rate (Lw,) for wetland systems is not usually a primary design
parameter, but it is a convenient parameter to use in making comparisons between different
systems. Hydraulic-loading rates used in practice range from 150 to 500 m3/ha ⋅d (15,000 to
55,000 gal/acre⋅d) (U.S. EPA, 1988; Metcalf & Eddy, 1991).
Lw = Q / LW
8. Lw = 194,000 gpd / 6.2 acres = 31,290 gpd/acre
16,000 < Lw < 54,000 OK!
The hydraulic loading rate is within the recommended range of design values (refer to Table
3.5.1).
10. Verify BOD5 loading rate (LBOD5).
The 5-day biochemical oxygen demand (BOD5) is used to determine the approximate
quantity of oxygen that will be required to biologically stabilize the organic matter present in the
wastewater. BOD5 loading must be limited such that the oxygen demand of the applied
wastewater does not exceed the oxygen-transfer capacity of the wetlands vegetation. Care must
be exercised in using area loading criteria (mass/area⋅time) because the actual load is not applied
uniformly but is concentrated at the inlets, whereas oxygen supply is supplied uniformly over the
surface. Estimated oxygen-transfer rates for emergent plants range from 50 to 450 kg/ha ⋅d (45 to
400 lb/acre⋅d) with an average value of 200 kg/ha ⋅d (180 lb/ac⋅d) considered typical for most
systems (U.S. EPA, 1988). This oxygen-transfer rate can be compared with an oxygen-transfer
rate of 285 kg/ha ⋅d (256 lb/acre⋅d) estimated for trickling filters (Schroeder, 1977). For SFS
systems in which roots are in contact with the flowing water column, the oxygen transferred to

106
the root system will be available to attached organisms that degrade the soluble BOD in the
water column.
The oxygen requirement must be determined on the basis of ultimate oxygen demand
(BODu). Based on a BODu:BOD5 ratio of 1:5, the maximum BOD5 loading rate for SFS systems
should be limited to 133 kg/ha ⋅d (120 lb/acre⋅d). An upper limit of 110 kg/ha⋅d (100 lb/acre⋅d) is
typically recommended (Water Pollution Control Federation, 1990). Since the BOD load is
concentrated at the inlet of the system, it is further recommended that the design BODu loading
rate should not exceed one-half the oxygen-transfer rate (Reed et al., 1995; EPA, 1988). Based
on this criterion and a BODu:BOD5 ratio of 1:5, the maximum BOD5 loading rate should be
limited to 66.5 kg/ha ⋅d (60 lb/acre⋅d). For a system treating wastewaters with a significant
fraction of settleable organic solids, the loading must be even less or distributed along the length
of the basin by step feeding to avoid anaerobic conditions at the head of the basins (Metcalf &
Eddy, 1991).
LBOD5 = QCo
• LBOD5 = (0.194 Mgal/d)(221 mg/l)(8.34 lb/Mgal)(mg/l) = 358 lb/d
358 lb/d / 6.2 acres = 58 lb BOD5 / acre⋅d LBOD5 < 60 OK!
The BOD5 loading rate is within the recommended range of design values (refer to Table 3.5.1).
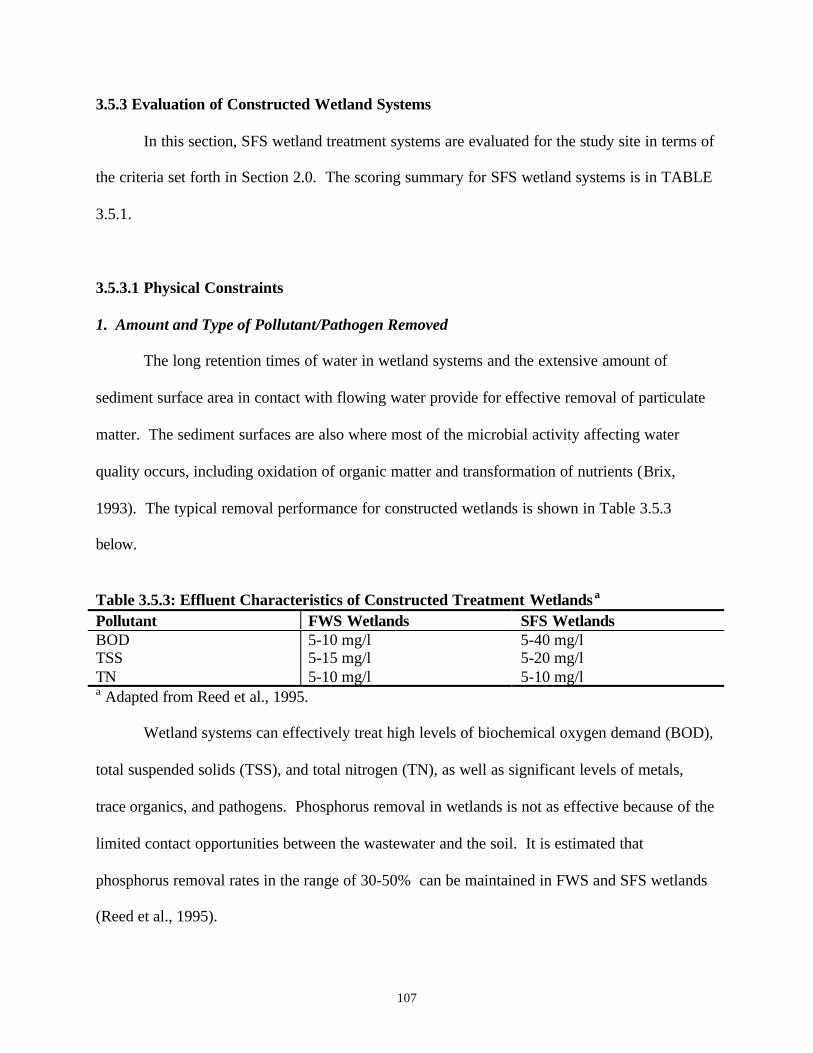
107
3.5.3 Evaluation of Constructed Wetland Systems
In this section, SFS wetland treatment systems are evaluated for the study site in terms of
the criteria set forth in Section 2.0. The scoring summary for SFS wetland systems is in TABLE
3.5.1.
3.5.3.1 Physical Constraints
1. Amount and Type of Pollutant/Pathogen Removed
The long retention times of water in wetland systems and the extensive amount of
sediment surface area in contact with flowing water provide for effective removal of particulate
matter. The sediment surfaces are also where most of the microbial activity affecting water
quality occurs, including oxidation of organic matter and transformation of nutrients (Brix,
1993). The typical removal performance for constructed wetlands is shown in Table 3.5.3
below.
Table 3.5.3: Effluent Characteristics of Constructed Treatment Wetlands a
Pollutant FWS Wetlands SFS WetlandsBOD 5-10 mg/l 5-40 mg/lTSS 5-15 mg/l 5-20 mg/lTN 5-10 mg/l 5-10 mg/la Adapted from Reed et al., 1995.
Wetland systems can effectively treat high levels of biochemical oxygen demand (BOD),
total suspended solids (TSS), and total nitrogen (TN), as well as significant levels of metals,
trace organics, and pathogens. Phosphorus removal in wetlands is not as effective because of the
limited contact opportunities between the wastewater and the soil. It is estimated that
phosphorus removal rates in the range of 30-50% can be maintained in FWS and SFS wetlands
(Reed et al., 1995).

108
The removal of settleable organics is very rapid in all wetland systems. BOD5 effluent
values of less than 20 mg/l are normally achieved regardless of the input concentration (Kadlec
and Knight, 1996; Reed et al., 1995). Input-output comparisons of TSS demonstrated similar
results, with effluent values consistently below the 20 mg/l level, regardless of influent values
(Kadlec and Knight, 1996; Reed et al., 1995). TSS removal rates generally range from 86 to
94% (Reed et al., 1995).
Nitrogen removal in wetlands is also very effective in both FWS and SFS wetland
systems. Although plant uptake of nitrogen does occur, only a minor fraction of the total
nitrogen is removed by plant uptake mechanisms in these systems (Reed et al., 1995). Total
nitrogen removal in constructed wetlands, however, can range up to 79% (Knight et al., 1993).
Organic N is initially removed as TSS, and then undergoes decomposition or mineralization and
releases ammonia to the water (Reed et al., 1995). The major removal pathway for ammonia in
constructed wetlands is thought to be biological nitrification (where conditions are aerobic)
followed by denitrification under anoxic conditions; the removal of nitrate (NO3) also occurs via
biological denitrification (Reed et al., 1995), releasing it as N2.
Wetlands seem to be effective at retaining significant loads of several trace metals.
Sustainable wetland uptake occurs primarily in the wetland sediments, however the storage
capacity of the wetland soils and biota will likely be exceeded with high influent loading rates
(Kadlec and Knight, 1996). Observations from two SFS wetlands (Hardin, KY, and Santee, CA)
revealed nearly complete metal removal rates (>99%) (Reed et al., 1995). High trace metal loads
are not expected in domestic wastewaters, such as from our study site.
Wastewater is a hostile environment for pathogenic organisms, and such factors as
natural die-off, temperature fluctuations, ultraviolet light, unfavorable water chemistry,

109
predation, and sedimentation cause pathogen populations to decline. The average viral content
of domestic sewage in the U.S. is about 7000 particles per liter. Many of the processes that
reduce pathogen populations in natural pond treatment systems should be even more effective in
wetland treatment systems due to the additional filtration provided by the plants and litter layer
in a wetland (Kadlec and Knight, 1996; Reed et al., 1995). Reported bacterial population
reductions range from 91 to 99% (Kadlec and Knight, 1996). Virus removal tends to closely
correlate with removal of suspended solids, therefore design criteria that enhance suspended
solids removal also are likely to enhance virus removal. Conventional disinfection following
wetland treatment is capable of essentially removing viruses entirely, though in most observed
wetland systems virus removal rates range from 92 to 99% (Kadlec and Knight, 1996).
2. Compatibility with Physical Environment
Site characteristics that must be considered in wetland system design include topography,
soil characteristics, depth to groundwater, existing land use, flood hazard, and climate.
Topography:
Level to slightly sloping, uniform topography is preferred for wetland sites because FWS
systems are generally designed with level basins or channels, and SFS systems are normally
designed and constructed with slopes of 1% or slightly more (Metcalf & Eddy, 1991). Although
basins may be constructed on steeper sloping or uneven sites, the amount of earthwork required
will affect the cost of the system. Thus, slope grades for wetland sites are normally less than 5%
(Metcalf & Eddy, 1991). The topography of the study site is generally flat, and as such an ideal
location with respect to topography may most likely be found for a wetland system in the study
area.

110
Soils:
Sites with slowly-permeable (< 0.20 in/h) surface soils or subsurface layers are most
desirable for wetland systems because the objective is to treat the wastewater in the water layer
above the soil profile (Metcalf & Eddy, 1991). Percolation losses through the soil profile should
be minimized. Sites with rapidly-permeable soils may be used for small systems by constructing
basins with clay or artificial liners (Metcalf & Eddy, 1991).
The soils in the El Paso region generally have low permeability. It is reported that there
is a widespread clay layer at a depth of 20-40 inches in the study area, providing suitable
conditions for a wetland system and negating the need for an expensive basin liner.
Additionally, surface soils in a wetland system will tend to seal with time due to deposition of
solids and growth of bacterial slimes. Permeabilities of native soils may be reduced further by
compacting during construction.
Groundwater:
The depth of soil to groundwater should be a minimum of 0.3 to 0.6 m (1 to 2 ft) to allow
sufficient distance for treatment of any percolate entering the groundwater and to avoid
waterlogging of the root zone (Metcalf & Eddy, 1991). Groundwater in the study area region is
expected to occur at a depth of approximately 5.5 feet (Lopez, 1998) and is thus ideal for
wetland systems.
Flood Hazard/Surface Waters:
Wetland sites should be located outside of floodplains, due to state and local policies
discouraging construction in such areas. Significant surface water in the area is limited to the
Rio Grande, and therefore locating a suitable site for a wetland system, avoiding surface water
drainageways, should not be a difficult task.

111
Existing Land Use:
Preferred wetland sites are on open space or agricultural lands, especially those near
existing wetlands. Constructed wetlands can enhance existing natural wetlands by providing
additional wildlife habitat and, in some cases, by providing a more consistent water supply
(Metcalf & Eddy, 1991). Land use near the study site is dominated by open space and
agriculture, with intermittent small-scale residential communities. These land use conditions are
ideal for siting a wetland treatment system.
Climate:
The use of wetland systems in cold climates is possible. The FWS system in Listowel,
Ontario, is operated year-round with wastewater temperatures as low as 3°C (Metcalf & Eddy,
1991). The temperature conditions in the El Paso region (ranging from extremes of -1.4 to 35.8
°C) should not present undue stress to a constructed wetland system. The thermal protection
provided by the gravel surface of a SFS wetland system should be sufficient to ensure system
function during extreme weather events in the study area.
3.5.3.2 Economic Constraints
3. Cost per Household
The major cost factors for FWS wetlands include the land, a liner (not necessary for the
conditions at our study site), and the size of the dikes or berms proposed for the system. The
costs of a FWS system could range from $75,000 to $170,000 per hectare ($30,000 to $70,000
per acre), depending on these factors. In addition to these components, the gravel media for SFS
wetlands might elevate costs per unit area to around 50% higher, depending upon the local cost
of aggregate. However, since the SFS wetland will require a smaller land area to treat the same
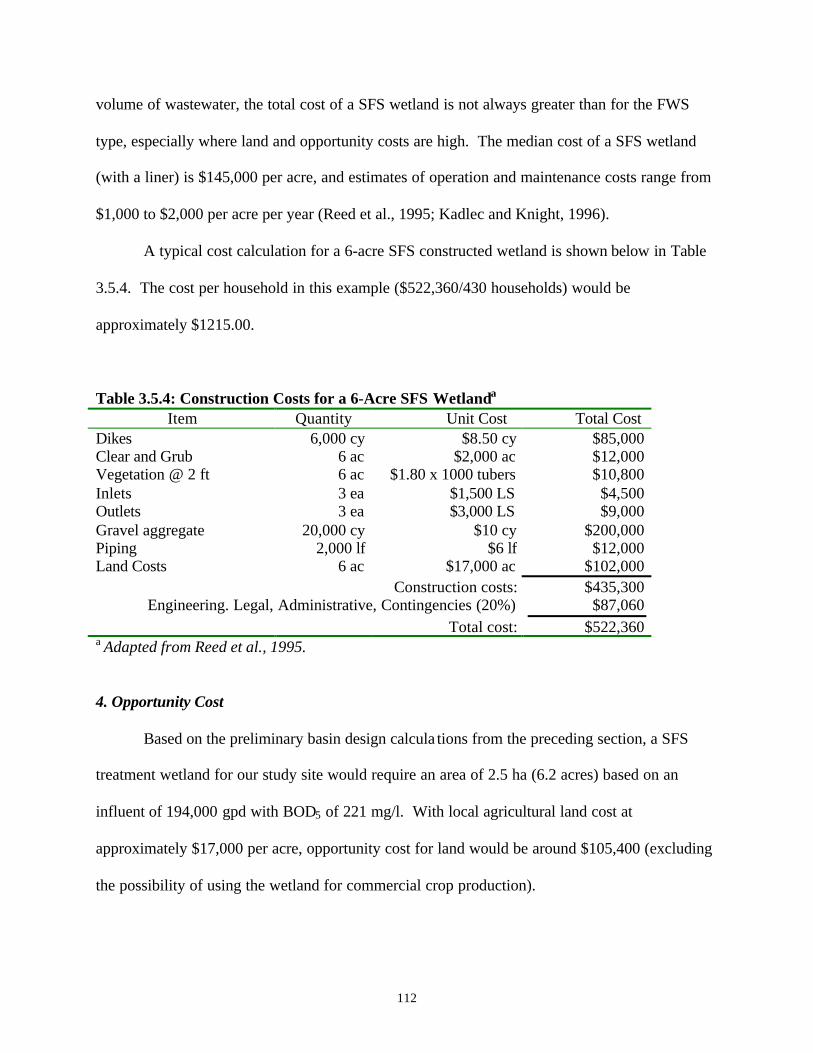
112
volume of wastewater, the total cost of a SFS wetland is not always greater than for the FWS
type, especially where land and opportunity costs are high. The median cost of a SFS wetland
(with a liner) is $145,000 per acre, and estimates of operation and maintenance costs range from
$1,000 to $2,000 per acre per year (Reed et al., 1995; Kadlec and Knight, 1996).
A typical cost calculation for a 6-acre SFS constructed wetland is shown below in Table
3.5.4. The cost per household in this example ($522,360/430 households) would be
approximately $1215.00.
Table 3.5.4: Construction Costs for a 6-Acre SFS Wetlanda
Item Quantity Unit Cost Total CostDikes 6,000 cy $8.50 cy $85,000Clear and Grub 6 ac $2,000 ac $12,000Vegetation @ 2 ft 6 ac $1.80 x 1000 tubers $10,800Inlets 3 ea $1,500 LS $4,500Outlets 3 ea $3,000 LS $9,000Gravel aggregate 20,000 cy $10 cy $200,000Piping 2,000 lf $6 lf $12,000Land Costs 6 ac $17,000 ac $102,000
Construction costs: $435,300Engineering. Legal, Administrative, Contingencies (20%) $87,060
Total cost: $522,360a Adapted from Reed et al., 1995.
4. Opportunity Cost
Based on the preliminary basin design calcula tions from the preceding section, a SFS
treatment wetland for our study site would require an area of 2.5 ha (6.2 acres) based on an
influent of 194,000 gpd with BOD5 of 221 mg/l. With local agricultural land cost at
approximately $17,000 per acre, opportunity cost for land would be around $105,400 (excluding
the possibility of using the wetland for commercial crop production).

113
The 194,000 gpd influent figure was calculated based upon maximum area growth in the
study area to 430 households, and a wastewater production of 450 gpd per household (TNRCC
suggested design flow). This projected per household flow rate, however, may be unreasonably
high for our study site. The colonias in our study area are not connected to municipal water
service and rely heavily on trucked-in water for domestic usage. In light of the restricted water
supply, a more realistic estimate of wastewater generated per household may range as low as 30
gpd (Earle, 1998).
In order to assess the alternative treatment systems at flow rates that may reflect the
actual conditions more accurately, we have done preliminary basin design calculations for flow
rates of 300 gpd per household and 50 gpd per household. The total flows to be treated at these
rates are 129,000 gpd and 21,500 gpd, respectively.
Calculating for a SFS wetland treating 129,000 gpd, the land requirement is 1.7 ha (4.1
acres), for an opportunity cost of $69,700. For a design flow of 21,500 gpd, the land requirement
for a SFS wetland is only 0.3 ha (0.7 acre), for an opportunity cost of approximately $12,000.
5. Permitting
Wastewater treatment and disposal are regulated by an ever-increasing number of federal,
state, and local laws, rules, ordinances, and standards. In some cases, the most challenging part
of implementing a wetland treatment project is complying with regulations through the
permitting process. A detailed knowledge of the pertinent regulations is essential to evaluate the
feasibility of a wetland treatment project.
114
Federal Regulations :
The law that most directly affects the permitting and implementation of wetland systems
in the U.S. is the Clean Water Act and its amendments. The National Environmental Policy Act
(NEPA) and the Endangered Species Act (ESA) may also affect the permitting of wetland
treatment systems in some instances.
Section 402 of the Clean Water Act created the National Pollutant Discharge Elimination
System (NPDES) permitting program. An NPDES permit is required for nearly all point source
discharges of water or wastewater into waters of the U.S. NPDES permit limits are determined
from the limitations of the receiving waters. The U.S.EPA oversees preparation, issuance and
enforcement of NPDES permits in the state of Texas (Kadlec and Knight, 1996).
Executive Order 11988 directs federal agencies to avoid direct or indirect support of
development within floodplain areas. The purpose of this policy is to reduce the risk of
economic losses due to flooding, minimize the impacts of floods on human safety and health,
and preserve the beneficial values of floodplains. This order covers many constructed wetlands
and nearly all natural wetland treatment systems because of their dependence on nearby
receiving waters (Kadlec and Knight, 1996).
State Regulations :
In 1991, the Texas Water Commission (TWC) published guidelines for the design and
construction of constructed wetlands for wastewater treatment (Kadlec and Knight, 1996). These
guidelines set minimal acceptable standards for system design and construction, provide
recommendations for project implementation, and demonstrate the acceptance of constructed
wetlands as a viable treatment technology.

115
3.5.3.3 Technological Constraints
6. Technological Feasibility
Treatment wetlands do not require any additional water inputs beyond that of the influent
stream in order to operate. When topography permits, influent to treatment wetlands can be fed
by gravity with no required energy input. Constructed wetlands are simple, with no moving
parts or chemical inputs, and thus are technologically feasible for the study site.
The minimum level of preapplication treatment for wetland systems should be primary
treatment, short detention-time aerated ponds, or the equivalent (Metcalf & Eddy, 1991: Reed et
al., 1995). Treatment beyond this level depends on the effluent requirements and the removal
capability of the wetland system. Use of oxidation ponds or lagoons that generate high
concentrations of algae should be avoided prior to wetland treatment because algae removal
through wetlands is inconsistent (Metcalf & Eddy, 1991).
7. Compatibility with Existing Infrastructure
Constructed wetlands are compatible with the existing infrastructure and planning efforts
in the study area. Wetlands do not require additional water inputs from municipal water systems
for conveyance to and through the wetland system. Effluent from constructed wetlands can be
directed from the wetland outflow structures into a central collection system or sewerage
network, if desired. Because there is no existing sewerage or wastewater treatment in the study
area, nor are there current plans to install such systems in the study area within the timeframe of
our study (to the year 2010), a constructed wetland treatment system at the study site is
compatible with regional planning objectives.
116
8. Expandability
Compartmentalization of treatment wetlands into cells is a standard design feature, thus
facilitating expandability of the system simply by adding another treatment cell. Multiple flow
paths within the wetland system allow the manipulation of the influent loading rate to account
for varying inflow water quality (Kadlec and Knight, 1996). Cells can be drained alternately for
purposes of replanting, rodent control, harvesting or burning of vegetation, leak patching, or
other operational controls.
9. Lifetime
It is estimated that about 1000 managed wetland systems are currently in operation, for a
variety of purposes, on a worldwide basis. At least half of those are in the United States. A
database of systems in North America was prepared for the EPA in 1993 (Knight et al., 1993).
A project lifespan of 50 years is characteristic of constructed wetlands and has been
demonstrated in the United States (Kadlec and Knight, 1996). Both the Billion Marsh (Spangler
et al., 1976) and the Great Meadows Marsh (Yonika et al., 1979) operated for over 70 years, and
in later years were shown to have retained treatment efficiency (Kadlec and Knight, 1996).
10. Operation and Maintenance
The routine operation and maintenance (O&M) procedures for constructed wetland
treatment systems is fairly simple, and the sum total of the O&M activities is relatively
inexpensive. No chemical purchases or inputs are involved. There is no need for highly trained
personnel, nor are there significant time requirements for the necessary semi-skilled employees.
Mowing of the grass on the dikes and regular inspections for damage from burrowing rodents are
117
the major tasks. Mowing is primarily a matter of aesthetics, with secondary emphasis on visual
detection of snakes (Kadlec & Knight, 1996). Disease and insect infestation of the wetland's
vegetation can cause problems, but has not been experienced at operational constructed wetlands
in the United States (Reed et al., 1995).
Sooner or later, sediment accumulation will require some sort of removal activity or
reconfiguration of the wetland, but based on current experience, such maintenance will be on the
schedule of decades unless there is an unusually high content of settleable solids in the incoming
water (Kadlec and Knight, 1996).
Routine harvest of vegetation is not required for wetland systems, especially for SFS
(Metcalf & Eddy, 1991; Reed et al., 1995). However, dry grasses in FWS systems are burned off
periodically to maintain free-flow conditions and to prevent channeling of the flow (Metcalf &
Eddy, 1991). Removal of the plant biomass for nutrient removal is generally not practical.
Mosquitoes are a common inhabitant of natural wetlands, and their presence in FWS
constructed wetlands is to be expected. For FWS systems, mosquitoes can be controlled with
insecticides or mosquito-eating fish (Reed et al., 1995). Mosquito breeding should not be a
problem in SFS systems, providing the system is designed to prevent mosquito access to the
subsurface water zone. The surface can be covered with pea gravel or coarse sand to achieve this
purpose (Metcalf & Eddy, 1991).

118
TABLE 3.5.5 Treatment Alternative: SFS WETLANDS
PHYSICAL CONSTRAINTS:
1. Amount & Type of Pollutant/Pathogen Removed: Does Not M
eet Sta
ndards
Meets E
ffluent
Standa
rds
Meets N
on-Po
table R
e-Use
Meets P
otable
Re-Use
0 1 2 3 BOD5 X
TSS XN X
Total Coliform XViruses X
TOTAL: 7 / 15
2. Compatability with Physical Environment: Not Com
patible
Compat
ible
Ideal
0 1 2 Existing Land Use X
Precipitation XTemperature XTopography X
Soils XGround Water XSurface Water X
TOTAL: 12 / 14
ECONOMIC CONSTRAINTS:
3. Costs ($ per Household): $3601
+
$2401
- $3600
$1201
- $2400
0 - $12
00
0 1 2 3Capital X
Operation & Maintenance X
TOTAL: 5 / 6
4. Opportunity Costs: 100 ac
res +
21 - 99
acres
6 - 20
acres
0 - 5 a
cres
0 1 2 3X
TOTAL: 2 / 3
5. Permitting: Not Perm
ittable
Permitab
le; Not S
td
Permitab
le; Std
0 1 2X
TOTAL: 1 / 2

119
TECHNOLOGICAL CONSTRAINTS
6. Technological Feasibility: High Medium
Low
1 2 3Water Input Requirement X
Energy Input Requirement XTechnological Complexity X
TOTAL: 8 / 9
7. Compatability with Existing Infrastructure: No Yes
1 2Independence from Off-Site Water X
Connectable to Sewer Line X
TOTAL: 4 / 4
8. Expandability: No Yes
1 2Modular X
Economies of Scale XRemoval Efficiency Maintained X
TOTAL: 6 / 6
9. Lifetime (years): 0 - 14
15 - 20
20 +
1 2 3X
TOTAL: 3 / 3
10. Operation and Maintenance: Daily Weekly
Monthly
Yearly
None In
Projec
t Lifet
ime
1 2 3 4 5On-Site Expertise X
Water Replacement XSolids Removal X
Hardware Replacement XEffort Needed to Prevent Fouling XX
TOTAL: 24 / 25
RAW SCORE: 72 / 87

120
4.0 COMPARATIVE ANALYSIS
The following section compares the different wastewater treatment technologies with the
scores they received based on our selection criteria. While different technologies present
different strengths and weaknesses, their overall performance consistently repeats a pattern in
which constructed wetlands receives the highest overall score, followed closely by sand filters.
Septic systems, and stabilization ponds receive medium scores, and combination trickling filters
receives lower scores (Figure 4.0.1). Even under different weighting scenarios, the variance
between the scores of the top four technologies remains relatively small (10 to 15 percentage
points). In contrast to these four competitive technologies, combination trickling filters
consistently receive the lowest score and show a significantly larger difference from the high
scoring technology (25 to 33 percentage points). This pattern is preserved under the weighted
scenarios; the relative performance of the different technologies is unaffected, but the variation
between scores is slightly reduced. The criteria that appear to have the greatest influence on the
overall scores of the technologies are pollution removal, technological feasibility, and operation
and maintenance.
FIGURE 4.0.1 Technology Performance: Comparison of Raw and Weighted Scores
0
10
20
30
40
50
60
70
80
90
100
raw econ tech health
wetlands sand ponds septic trickling

121
The first criterion, pollutant/pathogen removal, shows a distinct separation of
performance levels between two groups of technologies, with constructed wetlands and sand
filters performing well, and septic systems, settling ponds and combination trickling filters
performing poorly. Wetlands and sand filters receive scores of 7 and 6 respectively, while
combination trickling filters receive a score of 2 and septic systems and settling ponds each
receive a score of 1. The latter three technologies do not meet local effluent standards for several
pollutants, and therefore might be rejected on that basis alone. However, as discharge standards
vary with locale, they may be appropriate in other regions where their strengths could outweigh
their weaknesses. It should also be noted that if a chlorination treatment stage is added to the
combination trickling filter process, its contaminant removal performance improves significantly
and would likely meet effluent standards given the additional treatment.
With respect to compatibility with the physical environment, all technologies performed
well (none were rated as incompatible). Combination trickling filters received the highest score
(13), while ponds, sand filters and wetlands all received scores of 12. Septic systems, however,
received a relatively low score of 8. This was due to the fact that the other technologies were
considered ideally suited to the environment in many respects, while septic systems were merely
considered compatible.
Four of the technologies examined fell into the same cost category of $1,201-2,400
capital cost and all technologies fell within the $0-1,200 category for lifetime operation and
maintenance costs. The technology that had the lowest capital cost was the combination
trickling filter, which fell within the $0-1,200 category. While an effort was made to choose low-
cost technologies for this study, this grouping may indicate that smaller ranges should be applied
to these criteria. The estimated capital cost for a trickling filter system was $820 per household,

122
followed by constructed wetlands at $1,215 per household, ponds at $1,300 per household, sand
filters at $1,620 per household and septic systems at $1,950 per household. Surprisingly, the
highest initial cost was associated with septic systems, which is the standard treatment
technology for this area.
It is important to note that while the relatively complex trickling filter had the lowest
capital cost, its annual operation and maintenance costs were quite high, at over $150 per
household per year ($3000-3700 per household over 20 years), which clearly off-sets initial
savings. The technology with the lowest operation and maintenance costs was sand filtration.
Operation and maintenance costs associated with sand filters can be considered negligible, since
maintenance can be performed by the owner and would probably only require a few hours of
labor per year. Septic systems and constructed wetlands also have low operation and
maintenance costs, estimated at $40 and $28 per household per year, respectively. While no
precise figure is given for the operation and maintenance costs associated with treatment ponds,
they are expected to cost less than $60 per household per year (<$1200 over 20 years).
Opportunity costs associated with the technologies examined were generally low, except
for constructed wetlands and septic systems, whose opportunity costs were in the midrange due
to their larger area. Of the five technologies, only septic systems and sand filters are considered
standard by the TNRCC (TNRCC, 1997). Therefore, considering only the economic constraints
and the permitting costs, sand filters receive the highest score. Ignoring the permitting process,
ponds, sand filters and combination trickling filters all perform equally, with wetlands and septic
systems rating lower due to their opportunity costs.
Under the technological criteria, most of the treatment technologies received fairly high
scores, with the exception being combination trickling filters, which received lower scores due to

123
their low technological feasibility and moderately high technological complexity. Septic systems
received a slightly lower score than ponds, wetlands and sand filters due to their lack of economy
of scale. Sand filters are also different in economies of scale, and therefore received a slightly
lower score than ponds and wetlands. Out of 19 possible points for the technological feasibility,
technological complexity, and expandability criteria, ponds and wetlands received 18 points
(95%), sand filters received 17 points (89%), septic systems received 16 points (84%) and
combination filters received 12 points (63%).
All technologies performed equally with respect to lifetime. Each received a score of 3
out of 3, indicating that all were expected to last 20 years or more, which corresponds to the
project duration.
Constructed wetlands have the lowest operation and maintenance requirements, and
therefore received the highest score (24 out of 25) for this criterion. Septic systems, ponds and
sand filters all received equal, relatively high (22 out of 25) scores. Combination trickling filters,
with their daily maintenance requirements, performed poorly in this category, receiving 8 out of
25 possible points.

124
4.1 Sensitivity Analysis
In the sensitivity analysis, weighting factors were applied to the raw scores of certain
criteria to simulate scenarios whereby different criteria would have a greater influence on the
overall score of each technology. For example, if opportunity costs were considered especially
important in a given colonia, that criterion could be given a greater weight. This would serve to
favor technologies that had comparatively better opportunity cost scores, even if/when they were
outperformed in other criteria.
In this study, criteria were selected and weighted to represent different economic,
technical and health scenarios. The criteria weighted more heavily for the economic scenario
included capital (construction) costs and opportunity costs. The criteria weighted more heavily
for the technological scenario included compatibility with the physical environment,
technological feasibility and operation and maintenance. For the environmental/human health
scenario, the amount and type of pollutant removal was weighted more heavily. In all cases, a
weighting factor of two was used. The results of these three weighted scenarios did not differ
greatly from the results based on the raw scores (table 4.1.1). Under each weighting scenario
(economic weighting, technical weighting and health weighting) the overall scores followed the
same ordinal pattern, with wetlands receiving the highest score followed by sand filters,
treatment ponds, septic tanks and trickling filters. In some cases, using a different weighting
factor would have resulted in a different technology receiving the highest score. For example, if
a weighting factor of three or greater was applied to the opportunity cost, sand filters would have
received a higher overall score than wetlands.
The results of the sensitivity analysis indicate that wetlands can be recommended as a
treatment technology with a high degree of confidence. This study also demonstrates the

125
usefulness of the scoring and weighting methodology and its applicability to different scenarios
where certain criteria need to be optimized.

126
TABLE 4.1.1 SENSITIVITY ANALYSIS1. No Weighting
2. Economic Weighting
3. Technicial Weighting4. Human helath Weighting
1. NO WEIGHT: SAND FILTER SEPTIC TANKS PONDS TRICKLING WETLANDS
Evaluative Criteria Max Raw Score % Raw Score % Raw Score % Raw Score % Raw Score %1. Pollutant/Pathogen 15 6 40% 1 7% 1 7% 3 20% 7 47%2. Physical Environment 14 12 86% 8 57% 12 86% 13 93% 12 86%3. Costs / Household 6 5 83% 5 83% 5 83% 3 50% 5 83%4. Opportunity Cost 3 3 100% 2 67% 3 100% 3 100% 2 67%5. Permitting 2 2 100% 2 100% 1 50% 1 50% 1 50%6. Tech. Feasibility 9 8 89% 8 89% 8 89% 4 44% 8 89%7. Compat. Exist. Infrastr. 4 4 100% 3 75% 4 100% 2 50% 4 100%8. Expandability 6 5 83% 5 83% 6 100% 6 100% 6 100%9. Lifetime 3 3 100% 3 100% 3 100% 3 100% 3 100%10. O & M 25 22 88% 22 88% 22 88% 8 32% 24 96%
Total Possible 87 70 80% 59 68% 65 75% 46 53% 72 83%
2. ECON WEIGHT: SAND FILTER SEPTIC TANKS PONDS TRICKLING WETLANDS
Evaluative Criteria Max Raw Score % Raw Score % Raw Score % Raw Score % Raw Score %1. Pollutant/Pathogen 15 6 40% 1 7% 1 7% 3 20% 7 47%2. Physical Environment 14 12 86% 8 57% 12 86% 13 93% 12 86%3. Costs / Household 2 * 12 10 83% 10 83% 10 83% 6 50% 10 83%4. Opportunity Cost 2 * 6 6 100% 4 67% 6 100% 6 100% 4 67%5. Permitting 2 2 100% 2 100% 1 50% 1 50% 1 50%6. Tech. Feasibility 9 8 89% 8 89% 8 89% 4 44% 8 89%7. Compat. Exist. Infrastr. 4 4 100% 3 75% 4 100% 2 50% 4 100%8. Expandability 6 5 83% 5 83% 6 100% 6 100% 6 100%9. Lifetime 3 3 100% 3 100% 3 100% 3 100% 3 100%10. O & M 25 22 88% 22 88% 22 88% 8 32% 24 96%
Total Possible 96 78 81% 66 69% 73 76% 52 54% 79 82%
3. TECHNICAL WEIGHT: SAND FILTER SEPTIC TANKS PONDS TRICKLING WETLANDS
Evaluative Criteria Max Raw Score % Raw Score % Raw Score % Raw Score % Raw Score %1. Pollutant/Pathogen 15 6 40% 1 7% 1 7% 3 20% 7 47%2. Physical Environment 2 * 28 24 86% 16 57% 24 86% 26 93% 24 86%3. Costs / Household 6 5 83% 5 83% 5 83% 3 50% 5 83%4. Opportunity Cost 3 3 100% 2 67% 3 100% 3 100% 2 67%5. Permitting 2 2 100% 2 100% 1 50% 1 50% 1 50%6. Tech. Feasibility 2 * 18 16 89% 16 89% 16 89% 8 44% 16 89%7. Compat. Exist. Infrastr. 2 * 8 8 100% 6 75% 8 100% 4 50% 8 100%8. Expandability 6 5 83% 5 83% 6 100% 6 100% 6 100%9. Lifetime 3 3 100% 3 100% 3 100% 3 100% 3 100%10. O & M 2 * 50 44 88% 44 88% 44 88% 16 32% 48 96%
Total Possible 139 116 83% 100 72% 111 80% 73 53% 120 86%
4. HEALTH WEIGHT: SAND FILTER SEPTIC TANKS PONDS TRICKLING WETLANDS
Evaluative Criteria Max Raw Score % Raw Score % Raw Score % Raw Score % Raw Score %1. Pollutant/Pathogen 2 * 30 12 40% 2 7% 2 7% 6 20% 14 47%2. Physical Environment 14 12 86% 8 57% 12 86% 13 93% 12 86%3. Costs / Household 6 5 83% 5 83% 5 83% 3 50% 5 83%4. Opportunity Cost 3 3 100% 2 67% 3 100% 3 100% 2 67%5. Permitting 2 2 100% 2 100% 1 50% 1 50% 1 50%6. Tech. Feasibility 9 8 89% 8 89% 8 89% 4 44% 8 89%7. Compat. Exist. Infrastr. 4 4 100% 3 75% 4 100% 2 50% 4 100%8. Expandability 6 5 83% 5 83% 6 100% 6 100% 6 100%9. Lifetime 3 3 100% 3 100% 3 100% 3 100% 3 100%10. O & M 25 22 88% 22 88% 22 88% 8 32% 24 96%
Total Possible 102 76 75% 60 59% 66 65% 49 48% 79 77%

127
4.2 Results
From the analysis of the raw and weighted scores, a common pattern emerges in which
constructed wetlands outperform the other technologies. Following close behind wetlands is
sand filtration, which is followed in turn by settling ponds, septic systems and trickling filters
respectively. The largest differences in scores arise from pollutant/pathogen removal,
technological feasibility and operation and maintenance criteria. Several technologies (ponds,
septic systems and combination trickling filters) do not pass the primary effluent standards and
receive low scores for that criterion. Additionally, much of the variance between the different
technologies’ scores is explained by the poor performance of trickling filters in the technological
feasibility and operation and maintenance criteria. Eliminating that technology from the
analysis, or improving its pollutant removal efficiency score would result in less variance
between the overall scores.
128
5.0 RECOMMENDED TECHNOLOGY
Based on the comparative analysis, the recommended wastewater treatment technology
for this group of colonias in El Paso County is constructed wetlands. Under the raw and
weighted scores, wetlands consistently provide the highest overall ratings, pointing to the
robustness of the technology as well as the methodology used to assess it. The particular
strengths of wetlands are seen in their pollutant removal efficiency, high compatibility with the
physical environment, low technological complexity and low operation and maintenance
requirements. Weaknesses include their relatively high opportunity cost and non-standard
permitting classification.
Issues that are not explicitly addressed by the scoring method used in this study include
the relative advantages and disadvantages of individual, privately owned systems (such as sand
filters or septic systems), versus those of collective, community owned (and/or operated) systems
(such as settling ponds or constructed wetlands). One advantage of individual systems is their
low capital costs; they can be constructed on an individual basis as households obtain sufficient
capital to install a system, while community-based systems require a larger lump sum of money
for construction. Another advantage of individual systems is their appeal to homeowners; many
colonia homeowners would prefer to own their own systems rather than participate in collective
ownership (Earle, 1998). Advantages of community systems can include additional benefits to
wastewater treatment, such as development of parks around constructed wetlands and the
positive public relations a land developer may enjoy as a result of a successful, high-visibility
project. These issues must be considered on a site-to-site basis, as social values vary among
communities. However, a good indication of what technologies would be appropriate can be

129
obtained using the scoring methods presented here. This information, combined with
information on local social dispositions should result in an optimal recommendation.

130
6.0 DISCUSSION AND CONCLUSIONS
6.1 Transferability of Evaluative Framework
The goals of this study are: first, to deliver an adjustable framework for analyzing
appropriate wastewater treatment alternatives that is transferable to other locales with similar
infrastructure needs and economic conditions; and second, to identify an appropriate low-cost,
low-technology wastewater treatment system for the selected colonias. The ten criteria
developed herein for evaluating the appropriateness of a treatment method, in their essence, have
universal value. The physical, technological and economic constraints of implementing a
particular treatment system must be considered regardless of geographic location or socio-
economic conditions.
Where appropriate, the scoring subcategories within each category have been stated in
qualitative terms to render rankings of alternatives; this allows flexibility in determining the
value of an alternative relative to the other alternatives being considered for each specific
location and its unique set of constraints. Where it is possible to quantitatively evaluate
categories, such as with economic considerations and performance standards, specific values are
calculated and scored. The value ranges for each score can be adjusted and/or expanded to meet
the data requirements of the specific site or community.
The framework compels the user to make initial evaluative judgments at the outset (when
choosing which or how many treatment alternatives to investigate), which tailors the study to
individual needs. If at the end of the analysis none of the investigated alternatives is found to
satisfactorily achieve the specific objectives for the study site, the user has the prerogative to test
additional alternatives.
131
6.2 Growth Impacts
A concern of this study is that improving the sanitation in one area of colonias could
result in an increased rate of migration to the improved area. A rapidly increasing population in
the improved area has the potential to negate any benefits resulting from implementing the
recommended treatment system. A large influx of people could overload the system resulting in
insufficient removal efficiencies. If this were to occur, it could result in a situation in which
residents are in an even worse position. For example, the new situation has the potential to place
a greater number of people, at a higher density, without sufficient wastewater treatment.
However, based on past research, it appears that social values and economic reality will
prevent this situation from occurring. A study conducted in 1980, offered colonias residents the
option of moving to public housing that contained good drinking water and sewage service. The
study found that 67% of people presented with this offer declined to move (Duncan Earle, 1998).
The reason most often cited was that they owned the land they currently lived on and were
unwilling to give it up.
Another reason improved sewage treatment is not expected to significantly increase local
population, above the 4% present growth rate, is that the residents cannot afford to purchase land
with sewage hook-ups. Colonias are areas with little capital and cheap labor. The average
income is only $11, 497 and locals are unwilling to expend extra money to prevent the chance of
illness. Rather their priorities are jobs and job training. Unemployment is real, but illness from
poor water quality may or may not happen. Therefore, residents will spend the lowest amount of
money they can to obtain a piece of land that they may own (Earle, 1998).
The current strategy of connecting colonias to the municipal system with a high flat fee
for service results in inefficient use of water and induces precarious subleasing arrangements

132
with more than one family per lot in order to pay the high flat fee. The alternative wastewater
treatment systems proposed in this study would not promote this kind of activity due to the
appropriate use of available labor for construction and maintenance of the systems and the ability
of each household to pay the marginal cost of using wastewater treatment that induces efficient
use (Earle, 1998).
133
6.3 Recommendations for Future Work
The evaluative framework developed for selecting appropriate wastewater treatment
methods is comprehensive in approach, yet additional features would enhance its usefulness as a
policymaking tool. There are many benefits to be gained from wastewater treatment that are not
incorporated into this study. For example, the environmental and health benefits of treated
wastewater (and the healthcare costs associated with untreated wastewater) are not quantified in
this study. Additionally, potential revenue from agricultural production and other reclaimed
water uses, as well as the aesthetic or recreational value of a particular alternative, are
unaccounted for. A cost-benefit analysis of the treatment alternatives including these ancillary
benefits would provide a more complete basis for decision-making.
To fine-tune the evaluative framework, the criteria could be applied for other locations
along the U.S.-Mexico border, or for communities with similar needs in other areas around the
world. Investigating additional study sites would test the transferability of the evaluative
framework and assess its universal effectiveness. It would be useful to study how the outcome
of the analysis changes as different criteria are weighted in each study location. Due to the
specific socio-political, physical and economic conditions of each study site, the criteria will
rank differently in importance in each situation. Knowing in which situations to apply specific
weighting combinations would be another area for future study.

134
7.0 REFERENCES
Allied Engineers. Personal communication with Bob Hill. March 09 and 10, 1998.
Ardic, J.M, C. Fayoux, Y. Lesty, and P. Brisset. Sludge retention times distribution in a clarifier:a key point for population dynamics and nutrients removal control. Water Science Technology,v.29, n.7, pp. 57-60. 1994.
BECCNet. Border Environmental Cooperation Commission Internet news postinghttp://cocef.interjuarez.com/ecopar-ing.html. 1997.
Brix, H. "Wastewater Treatment in Constructed Wetlands: System Design, Removal Processes,and Treatment Performance." Chapter 2, pp. 9-22, in G.A. Moshiri (Ed.), Constructed Wetlandsfor Water Quality Improvement. Boca Raton: Lewis Publishers, 1993.
Butcher, Samuel S., et al., eds. Global Biogeochemical Cycles. 2nd ed. San Diego: AcademicPress, 1994.
Cheremisinoff, P.N. Handbook of Water and Wastewater Treatment Technology. MarcelDekker, Inc., 1995.
Cordoba, Diego A., Shoemaker, John, and Wengerd, Sherman A., eds. Guidebook of the BorderRegion. Twentieth Field Conference of the New Mexico Geological Society: 1969.
Cluff, B.C., “Slow Sand/Nanofiltration Treatment for Secondary Treated Wastewater”,Desalination, Vol. 88, 1992.
Earle, Duncan, PhD. Director, Border Studies Institute, University of Texas at El Paso. Personalcommunication, 17 March 1998.
EDF Letter. Vol. 25, no.1. Jan 1994.
Droste, R. Theory and Practice of Water and Wastewater Treatment. John Wiley & Sons, Inc.,1997.
Gearhart, R.J., S. Wilbur, J. Williams, D. Hull, B. Finney, and S. Sundberg. Final Report City ofArcata Marsh Pilot Project Effluent Quality Results-System Design and Management, ProjectReport C-06-2270, City of Arcata, CA, Department of Public Works. Arcata: 1983.
Gujer, W., and M. Boller. Water Research. v.20, n.11, p.1353. 1986.
Hammer, Donald A., ed.. Constructed Wetlands for Wastewater Treatment: Municipal,Industrial and Agricultural. Chelsea: Lewis Publishers, 1989.
Harrison, J.R. and G.T. Daigger. A comparison of trickling filter media. Journal Water Poll.Control. Fed. Vol. 59, n. 679. 1987.
135
Horan, N.J. Biological Wastewater Treatment Systems: Theory and Operation. John Wiley &Sons, 1990.
Kadlec, Robert H., and Robert L. Knight. Treatment Wetlands. Chelsea: Lewis Publishers,1996.
Knight, R.L., Ruble, R.W., Kadlec, R.H., and S.C. Reed. Database: North American Wetlandsfor Water Quality Treatment. Phase II Report. Prepared for U.S. EPA, September 1993.
Kolarik, L.O., A.J. Priestley. Modern Techniques in Water and Wastewater Treatment. CSIROPublishing, 1995.
Lamb, B.E., Gold, A.J, Loomis, G.W., McKiel, C.G.. “Nitrogen Removal for On-Site SewageDisposal – A Recirculating Filter Rock Tank Design”, Transactions of the ASAE, Vol. 33, No. 2,1990.
Liu, D.H.F, and G.G. Liptàk. Environmental Engineers Handbook, 2nd Ed. Lewis Publishers.Boca Raton, Fl. 1431 pp. 1997.
Luecke, D.F., C. de la Parra. From Pollution to Park. California Coast and Ocean. Vol. 10, no.1, pp 7-14. 1994.
Luecke, D.F., C. de la Parra. Ecoparque: An Innovative Low-Tech Approach for Water Use andResource Enhancement in the Tijuana River Valley. Final Draft. EDF Publications. 1997.
Mancl, K.M., Peeples, J.A. One Hundred Years Later: Reviewing the Work of the MassachusettsState Board of Health on the Intermittent Sand Filtration of Wastewater from SmallCommunities. On Site Wastewater Treatment – Proceedings of the Sixth National Symposiumon Individual and Small Community Sewage Systems. American Society of Engineers, Chicago:1991.
Moreno-Cardenas Engineers, Inc., “BECC Project Application”, 1996.
Moshiri, Gerald A., ed. Constructed Wetlands for Water Quality Improvement. Boca Raton:Lewis Publishers, 1993.
Paramasivam, R., Mhaisalkar, V.A., Berthouex, P.M., “Slow Sand Filter Design andConstruction in Developing Countries”, Journal of the American Water Works Association, Apr.,1981.
Pell, M., Nyberg, F., “Infiltration of Wastewater in a Newly Started Pilot Sand Filter System: I.Reduction of Organic Matter and Phosphorus”, Journal of Environmental Quality, Vol. 18, Oct.-Dec., 1989.
Reed, Sherwood C., Ronald W. Crites, and E. Joe Middlebrooks. Natural Systems for WasteManagement and Treatment . 2nd ed. San Francisco: McGraw-Hill, 1995.

136
SB S.1316. 1996. Senate Safe Drinking Water Act. Jan 15 1996.
Schlesinger, William H. Biogeochemistry: An Analysis of Global Change. 2nd ed. San Diego:Academic Press, 1997.
Schroeder, E.D. Water and Wastewater Treatment. McGraw-Hill. New York: 1977.Task Force on Natural Systems. Natural Systems for Wastewater Treatment. Water PollutionControl Federation, 1990.
Tchobanoglous, G., and F.L. Burton, Metcalf & Eddy, Inc. Wastewater Engineering: Treatment,Disposal, Reuse. 3rd ed. New York: McGraw-Hill, 1991.
Texas Natural Resource Conservation Commission, On-Site Sewage Facilities Workshops.Austin: TNRCC, 1997.
The Consortium for Decentralized Wastewater Technology and Management.http://www.tuns.ca/wwater/altern/ssf.htm. 10/23/1996.
Tillman, G.M. Wastewater Treatment: Troubleshooting and Problem Solving. Ann Arbor Press,1996.
Tremblay, M.C., Lessard, P., Lausie, M.C. Removal of fecal coliform in a trickling biofiltrationprocess. Environmental Technology, v.17, n.10, pp. 1083-1092. 1996.
U.S.EPA. Constructed Wetlands for Wastewater Treatment and Wildlife Habitat. EPA832-R-93-005, September 1993.
U.S.EPA. Design Manual for Constructed Wetlands and Floating Aquatic Plant Systems forMunicipal Wastewater Treatment. EPA625/1-88-022, Cincinnati: September. 1988.
Vaughan, M., and G. A. Holder. Substrate removal in the trickling filter process. Journal WaterPollution Control Federation; v. 56, p. 417. 1984.
Visscher, J.T., “Slow Sand Filtration: Design, Operation and Maintenance”, Journal of theAmerican Water Works Association, June, 1990.
Water Pollution Control Federation. Natural Systems for Wastewater Treatment, Manual ofPractice FD-16. Alexandria: February 1990.
Wilhelm, Sheryl R., Schiff, Sherry L., and Cherry, John A., “Biogeochemical Evolution ofDomestic Waste Water in Septic Systems: 1. Conceptual Model”, Ground Water, Vol. 32, No.6, 1994.

137
Wright, Richard D., Hepner, George, and Brown, Chrstopher, Geographic Information Systemsfor Mexico-United States Border Environmental Research and Management. San Diego:Institute for Regional Studies of the Californias, 1994.
Zickefoose, Chuck and R. B. Joe Hayes. Stabilization Ponds: Operations Manual. Office ofWater Program Operations, U.S. EPA, 1977.
http://www.edf.org/pubs/EDFLetter/1994/Jan/b_sewage.html
http://www.inspect-ny.com/septbook.htm, updated 02/19/98
http://cs.utep.edu/elpaso/glance.html#weather

138