Embed Size (px)
Citation preview
AN ECONOMETRIC ANALYSIS OF ZAMBIAN INDUSTRIAL
ELECTRICITY DEMAND
Chama Yoram Chama
Master of Philosophy in Environmental and Development Economics
Department of Economics, Faculty of Social Sciences
UNIVERSITY OF OSLO
FEBRUARY 2012
II
ABSTRACT
The purpose of this thesis is twofold: to examine the electricity use in Zambia’s mining
industry by focusing on own-price, cross price and index of mining production elasticities of
demand and on structural changes in demand patterns over the time period 1980-2008; and to
expose any energy efficiency development in Zambia’s mining industry. In this respected the
study tested three hypotheses: (i) Electricity own-price changes have no significant impact on
mining industrial electricity demand, (ii) diesel prices changes have no significant impact on
mining industrial electricity demand; and (iii) there was no energy efficiency developments
Zambia’s mining industry during the period 1980-2008.
Data on three independent variables or predictors (average electricity prices, the diesel price
and the index of mining production) and the independent variable (total annual electricity
used by the mines) were collected from various databases (mainly from Zambia Central
Statistics Office, U.S. Energy Information Administration, and the Zambia Energy Regulation
Board). Also, interviews were conducted with respondents from four mines in Zambia
(Lumwana Mine, Konkola Copper Mines, Kansanshi Mine, and Sino-Metals). Both statistical
and non statistical methods were employed to analyse the data. The Statistical Package for
Social Sciences (SPSS) was used to estimate the long-run mining industry electricity demand
equation for Zambia.
The study finds long run electricity own price elasticity of -0.06; cross price elasticity of
0.031; and index of mining production elasticity of 0.154. The signs on all three elasticities
are as predicted by theory. Both cross-price and index of mining production elasticities are
found to be statistically significant at pre-selected regression alpha of 0.05. However, own
price elasticity is statistically insignificant. The coefficient of determination of 0.518 entails
that model is useful and the small p-value (0.000a) makes the model statistically significant.
Whereas electricity own-price have insignificant long run impact on mining industrial
electricity demand, diesel price have long run significant impact on mining industrial
electricity demand.
The study also finds that there were minimal developments in the efficient use of electricity in
the mining industry during the period 1980-2008. These included removal of import duty on
energy efficient equipment; introduction of incentive pricing policies, load management
programmes, electricity reduction programmes, information dissemination of demand-side

III
management, and changes in machinery or equipment by the mines in order to comply with
Zambia environmental standards. The major barrier to energy efficient developments in
mining industry during the period 1980-2008 seems to have been the absence of both national
policy on energy efficiency and mine policy on energy efficiency.
IV
DEDICATION
To the Almighty God
“For in him we live, and move, and have our being; as certain also of your own poets have
said, “For we are also his offspring”.
To my “little angels”, Bupe Faith Namutula Chama, Yoram Chama (Junior), and Thabo
Chama… the love, the phenomenon, and the splendor of my life!
And exclusively to my wife, Sibeso Likando Chama, without whose support I would not be at
University of Oslo. She has been the one who most believed in me, many times more than
myself. God brought us together.

V
ACKNOWLEDGEMENT
I would like to express my sincere gratitude to Professor Finn Førsund at the Faculty of
Socials Sciences, Department of Economics of the University of Oslo for being my study
supervisor. Without his constant guidance, support and facilitation, this study would not have
yielded the results it has. Also, my special thanks go to all the study respondents, mainly from
Lumwana Mine; Chinese-owned mine, Sino Metals; Kansanshi Mine; and Konkola Copper
Mines. I also thank the respondents from the Zambia Energy regulation Board and Zambia
Electricity Supply Corporation Limited (ZESCO). Specifically, I thank them for their patience
and interest to grant me time to interview them.
Kaya Sverre, I thank you for superb administration and coordination of the highly valued
master programme Environmental and Development Economics. Ingunn Skjerve, thank you
so much for your splendid administrative and coordination skills.
Any misunderstandings, misprints and mistakes in this thesis are certainly my liability alone.
God bless you all, and thank you very much!
Chama Yoram Chama
Oslo, Norway – February 2012
VI
TABLE OF CONTENT
ABSTRACT…… ..................................................................................................................... II
DEDICATION… .................................................................................................................... IV
ACKNOWLEDGEMENT ...................................................................................................... V
TABLE OF CONTENT ......................................................................................................... VI
LIST OF TABLES, FIGURES AND BOXES ...................................................................... X
ABBREVIATIONS AND ACRONYMS .............................................................................. XI
CHAPTER 1 INTRODUCTION .................................................................................... 13
1.1. INTRODUCTION ..................................................................................................... 13
1.2. BACKGROUND TO THE STUDY .......................................................................... 13
1.3. STUDY PURPOSE AND HYPOTHESES ............................................................... 17
1.3.1. Study purpose ..................................................................................................... 17
1.3.2. Study hypothesis ................................................................................................ 17
1.4. SIGNIFICANCE OF THE STUDY .......................................................................... 18
1.5. THESIS OUTLINE ................................................................................................... 19
1.6. CHAPTER SUMMARY ........................................................................................... 19
CHAPTER 2 ZAMBIA’S ELECTRICTY MARKET .................................................. 20
2.1 INTRODUCTION ..................................................................................................... 20
2.2 NATIONAL POLICY AND LEGISLATION .......................................................... 20
2.2.1 The Ministry of Energy and Water Development .............................................. 20
2.2.2 National Energy Policy ...................................................................................... 20
2.2.3 National development plans ............................................................................... 21
2.2.4 The Energy Regulation Board of Zambia .......................................................... 21
2.2.5 The Rural Electrification Authority of Zambia .................................................. 21
2.2.6 Other legislations ................................................................................................ 22
2.2.7 Effectiveness of the Ministry of Energy and Water Development .................... 22
2.3 ZAMBIA’S ENERGY SUBSECTORS .................................................................... 23
2.3.1 Wood fuel sub-sector ......................................................................................... 23
2.3.2 Coal .................................................................................................................... 24
2.3.3 Petroleum ........................................................................................................... 24
2.3.4 Renewable energy .............................................................................................. 24
2.3.5 Nuclear energy ................................................................................................... 25
VII
2.4 ELECTRICITY SUPPLIERS .................................................................................... 25
2.4.1 Zambia Electricity Supply Corporation Limited ................................................ 25
2.4.2 Copperbelt Energy Company ............................................................................. 26
2.4.3 Lunsemfwa Hydro Power Company: ................................................................. 26
2.4.4 Zengamina Mini-Hydro Power Company .......................................................... 26
2.4.5 Northwestern Energy Corporation Ltd ............................................................... 27
2.5 ELECTRICITY DEMAND ....................................................................................... 27
2.5.1 Annual national maximum demand ................................................................... 27
2.5.2 Electricity consumption by sector ...................................................................... 28
2.5.3 The main drivers of electricity demand and deficit in Zambia .......................... 29
2.5.4 Electricity tariffs in Zambia ............................................................................... 30
2.6 CHALLENGES FACING THE ELECTRICITY MARKET .................................... 32
2.6.1 Capital Investment Requirements ...................................................................... 32
2.6.2 Sub-Economic Tariffs ........................................................................................ 32
2.6.3 Government interference .................................................................................... 33
2.6.4 Monopolization of the electricity market ........................................................... 33
2.6.5 Utility inefficiencies ........................................................................................... 34
2.6.6 Lack of demand side management ..................................................................... 35
2.7 CHAPTER SUMMARY ........................................................................................... 35
CHAPTER 3 INDUSTRIAL SECTOR IN ZAMBIA .................................................. 37
3.1 INTRODUCTION ..................................................................................................... 37
3.2 CONCEPTUALIZING THE INDUSTRY IN ZAMBIA .......................................... 37
3.3 MINING SECTOR .................................................................................................... 38
3.3.1 Minerals found in Zambia .................................................................................. 38
3.3.2 The Copper mines in Zambia ............................................................................. 39
3.3.3 Mineral processing and electricity use ............................................................... 40
3.4 MANUFACTURING SECTOR ................................................................................ 41
3.5 CHAPTER SUMMARY ........................................................................................... 43
CHAPTER 4 LITERATURE REVIEW ........................................................................ 45
4.1 INTRODUCTION ..................................................................................................... 45
4.2 INDUSTRIAL ELECTRICITY DEMAND .............................................................. 45
4.2.1 General literature on industrial electricity demand ............................................ 45
4.2.2 Literature on industrial electricity demand in Zambia ....................................... 51
VIII
4.3 ENERGY EFFICIENCY IN INDUSTRIES ............................................................. 53
4.3.1 General literature on energy efficiency in industries ......................................... 53
4.3.2 Literature on efficient use of electricity in industry sector in Zambia ............... 57
4.4 CHAPTER SUMMARY ........................................................................................... 58
CHAPTER 5 METHODOLOGY ................................................................................... 59
5.1 INTRODUCTION ..................................................................................................... 59
5.2 THEORY OF FACTOR DEMAND.......................................................................... 59
5.2.1 Theories and laws in economics ......................................................................... 59
5.2.2 The law of demand ............................................................................................. 60
5.2.1 Theoretical model ............................................................................................... 64
5.3 ECONOMETRIC MODEL SPECIFICATION......................................................... 65
5.3.1 Econometric model ............................................................................................ 65
5.3.2 Description of the Variables ............................................................................... 66
5.4 DATA SET DESCRIPTION ..................................................................................... 67
5.4.1 Data summaries .................................................................................................. 67
5.4.2 Data sources ....................................................................................................... 69
5.5 CHAPTER SUMMARY ........................................................................................... 70
CHAPTER 6 RESULTS AND DISCUSSION ............................................................... 72
6.1 INTRODUCTION ..................................................................................................... 72
6.2 REGRESSIONS ........................................................................................................ 72
6.2.1 Results ................................................................................................................ 72
6.2.2 Discussion .......................................................................................................... 76
6.3 DEVELOPMENTS IN ENERGY EFFICIENCY ..................................................... 78
6.3.1 Results ................................................................................................................ 78
6.3.2 Discussion .......................................................................................................... 87
6.4 CHAPTER SUMMARY ........................................................................................... 90
CHAPTER 7 CONCLUSSIONS, IMPLICATIONS AND RECOMMEDATIONS .. 92
7.1 INTRODUCTION ..................................................................................................... 92
7.2 CONCLUSIONS ....................................................................................................... 92
7.2.1 Electricity demand by the mining industry ........................................................ 92
7.2.2 Developments in energy efficiency in mining sector ......................................... 94
7.3 POSSIBLE POLICY AND PRACTICAL IMPLICATIONS OF THIS STUDY ..... 95
7.3.1 Implications for the government of Zambia ....................................................... 95
IX
7.3.2 Implications for electricity utilities in Zambia ................................................... 95
7.3.3 Implications for mining industry ........................................................................ 96
7.4 STUDY LIMITATIONS ........................................................................................... 96
7.5 RECOMMENDATIONS........................................................................................... 97
7.5.1 Government of the Republic of Zambia ............................................................. 97
7.5.2 ZESCO and other electricity utilities ................................................................. 97
7.5.3 Mines .................................................................................................................. 98
7.5.4 Future research ................................................................................................... 98
REFERENCES… ................................................................................................................... 99
APPENDICES… .................................................................................................................. 105
X
LIST OF TABLES, FIGURES AND BOXES
Tables
TABLE 1: ZESCO GENERATION ASSETS AND CAPACITY 1980- 2008 ...................................................................................... 25
TABLE 2: ANNUAL NATIONAL ELECTRICITY MAXIMUM DEMAND IN MW IN THE SADC REGION ............................................. 28
TABLE 3: ELECTRICITY CONSUMPTION BY SECTOR IN 2008 ..................................................................................................... 28
TABLE 4: INSTALLED VERSUS PEAK DEMAND ELECTRICITY CAPACITY IN SAPP ...................................................................... 29
TABLE 5: ELECTRICITY TARIFFS FOR SAPP COUNTRIES IN 2007 .............................................................................................. 31
TABLE 6: SUMMARY STATISTICS ON ELASTICITIES FOR THE STUDIES THAT USE DYNAMIC MODELS .......................................... 46
TABLE 7: SUMMARY OF STUDIES ON ELECTRICITY IN ZAMBIA ................................................................................................. 51
TABLE 8: APPROVED MULTI-YEAR ELECTRICTY TARIFF ADJUSTMENT RATES ........................................................................... 52
TABLE 9: CLASSIFICATION OF BARRIERS TO ENERGY EFFICIENCY ........................................................................................... 55
TABLE 10: MATHEMATICAL FORMS OF DEMAND EQUATIONS ..................................................................................................... 62
TABLE 11: DATA ON VARIABLES .............................................................................................................................................. 68
TABLE 12: DESCRIPTIVE STATISTICS OF THE VARIABLES ........................................................................................................... 68
TABLE 13: SOURCES OF DATA .................................................................................................................................................. 69
TABLE 14: DATA ON ENERGY EFFICIENCY DEVELOPMENTS IN INDUSTRIES ................................................................................. 69
TABLE 15: COEFFICIENTS FROM REGRESSION OUTPUT USING ENTER METHOD ............................................................................ 72
TABLE 16: MODEL SUMMARY .................................................................................................................................................. 74
TABLE 17: ANOVA RESULTS .................................................................................................................................................. 75
Figures
FIGURE 1: ZAMBIA’S ENERGY CONSUMPTION BY SUBSECTOR IN 2006 ...................................................................................... 23
FIGURE 2: DIAGRAMMATIC CONCEPTUALISATION OF ZAMBIA’S INDUSTRY ............................................................................... 37
FIGURE 3: A BASIC COPPER MINE PROCESS -FROM MINE TO METAL ........................................................................................... 41
FIGURE 4: DEMAND CURVE ..................................................................................................................................................... 60
FIGURE 5: SHIFTS IN DEMAND CURVE WHEN INCOME INCREASES .............................................................................................. 61
FIGURE 6: INTERPRETING COEFFICIENTS OF LINEAR AND POWER FORMS.................................................................................... 63
FIGURE 7: THE NORMAL PLOT - HISTOGRAM ........................................................................................................................... 75
XI
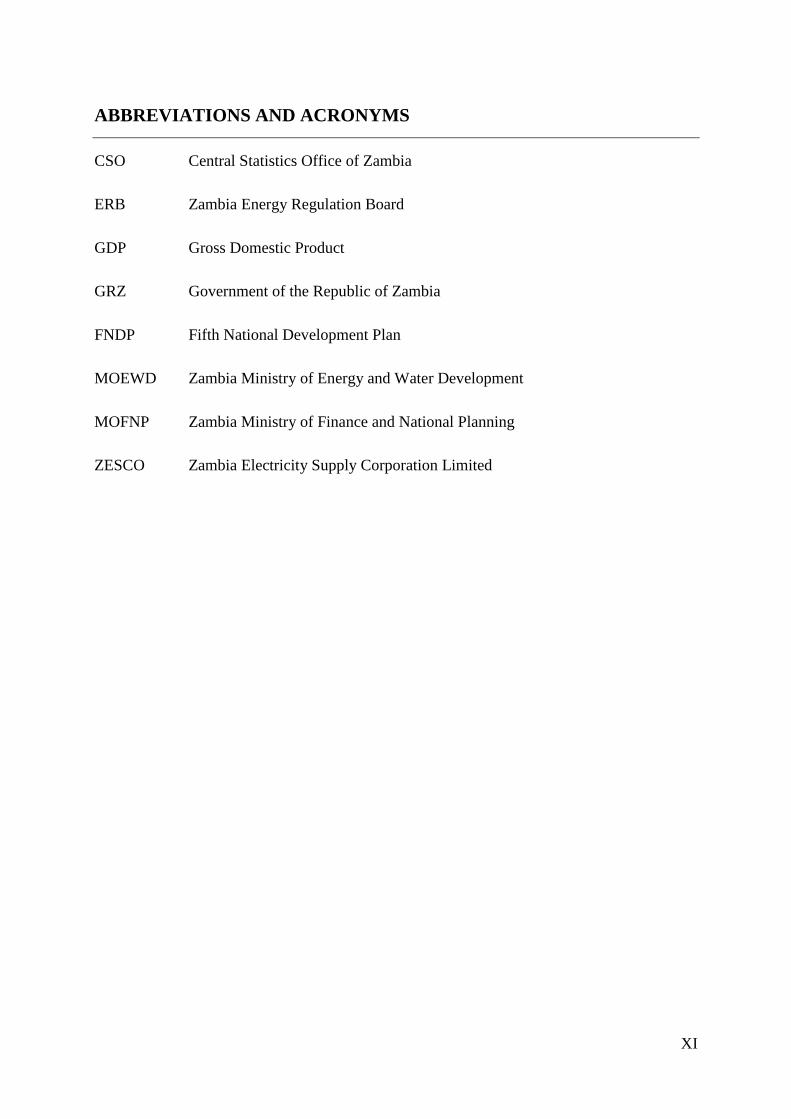
ABBREVIATIONS AND ACRONYMS
CSO Central Statistics Office of Zambia
ERB Zambia Energy Regulation Board
GDP Gross Domestic Product
GRZ Government of the Republic of Zambia
FNDP Fifth National Development Plan
MOEWD Zambia Ministry of Energy and Water Development
MOFNP Zambia Ministry of Finance and National Planning
ZESCO Zambia Electricity Supply Corporation Limited

XII
13
CHAPTER 1 INTRODUCTION
1.1. INTRODUCTION
This study focused on examining the electricity use in Zambia’s mining industry by
estimating the electricity demand function using historic data for the period 1980-2008, and
exposing any energy efficiency development in the mining industry.
This introductorily chapter is organised as follows: Section 1.2 presents the background to the
study; Section 1.3 states the study purpose and hypothesis; Section 1.4 gives the significance
of the study; and Section 1.5 presents the thesis outline.
1.2. BACKGROUND TO THE STUDY
Zambia, a landlocked country in Southern Africa, is bordered by the Democratic Republic of
the Congo, Tanzania, Malawi, Mozambique, Zimbabwe, Botswana and Namibia, and Angola.
The mainstay of Zambia’s economy is the mining industry, which is dominated by large
copper mines. Currently, Zambia is Africa’s largest copper producer, and its mining industry
is still growing due to the favourable investment environment. China is the biggest investor
in the mining industry in Zambia.
Significantly, Zambia’s mining industry by its nature is electricity intensive and uses over 50
per cent of the national total annual electricity. Intensive use of electricity applies to both the
extraction and processing of minerals because most on-and-off activities (such as smelting
and leaching) and continuous activities (such as mine dewatering, lighting and ventilation)
heavily depend on electricity. The major suppliers of electricity to the mining industry are
the Zambia Electricity Supply Corporation Limited (ZESCO) and the Copperbelt Energy
Corporation (CEC). However, each mine has standby diesel-driven generators for emergency
supply of electricity.
In electricity demand in Zambia had been increasing and in 2006 the Government of the
Republic of Zambia (GRZ) announced that the electricity demand growth was estimated at
100 MW per annum, and projected that the country would experience a power deficit by
2008. As predicted, the country started experiencing power deficits in 20081. The deficits
were blamed on the limited installed capacity, which was a mere 1786 MW in 2008. Zambia
1 Electricity deficit in Zambia is mainly a peak-time-use concept. The installed capacity is not sufficient during
peak hour periods.
14
has, however, huge hydropower resource potential standing at an estimated 6,000 MW. The
implication of the power deficits on Zambia as a nation was that several national goals such
accelerating economic growth, protecting the environmental, reducing poverty, and achieving
the Millennium Development Goals (MOFNP, 2006) might not be achieved.
The GRZ quickly responded to the power shortage problem by first, defining the national
vision of electricity market in Zambia and second, commissioning several activities aimed at
reducing power shortages. The national vision on electricity market was six-fold: (i) access to
electricity by all customers; (ii) available electricity demand fully met; (iii) supply of reliable
and quality electricity in an efficient manner; (iv) increased investment in electricity sector;
(iv) protection of consumer interests; (v) ensuring cost reflective electricity tariffs; and (vi)
demand-side management to improve efficient use.
Among the activities GRZ deemed necessary in the realization of the aforementioned vision
was to increase research and development. Specifically, GRZ in 2006 documented that
research and development in the energy sector would be a priority during the “Fifth National
Development Plan” period 2006-2010 (MOFNP, 2006). This high profile declaration signified
the necessity of econometric studies on electricity market in informing GRZ interventions.
Lorde et al. (2010) illuminates that econometric analysis of the relationship between energy
consumption by industries is rarely conducted for purely empirical interest, but mainly for
significant policy implications. For example, an econometric study by Akinlo (2008) on
Energy consumption and economic growth: Evidence from 11 Sub-Sahara African countries,
concludes that “each country should formulate appropriate energy conservation policies
taking into cognizance of her peculiar condition”.
That research and development in the energy sector would be a priority during the Fifth
National Development Plan was not a mere symbolic statement by GRZ. A landmark study to
inform GRZ on “ensuring cost reflective electricity tariffs” was completed in 2007 by IPA
Energy Consulting. However, this study focused solely on the supply side of the electricity
market and neglected the demand-side. In short, the study did not consider how electricity
demand would be affected by the increasing electricity prices to make them cost reflective.
Econometric studies on demand-side of electricity market are important in informing
government policy on pricing. For instance, member countries of the Southern African Power
Pool (SAPP) have conducted econometric studies on electricity-demand. For example, the
number of econometric studies on electricity demand in South Africa has increased in recent
years. The recent studies include: “Aggregate demand for electricity in South Africa: An
analysis using the bounds testing approach to cointegration” (Amusa et al., 2009);
15
“Electricity consumption and economic growth in South Africa: A trivariate causality test”
(Odhiambo, 2009); Aggregate electricity demand in South Africa: Conditional forecasts to
2030 (Inglesi, 2010); “The evolution of price elasticity of electricity demand in South Africa:
A Kalman filter application” (Inglesi, 2011); and “South Africa’s electricity consumption: A
sectoral decomposition analysis” (Inglesi-Lotz and Blignaut, 2011). These studies have not
only informed the pricing policies in South Africa, but have also challenged the bases for
increasing the electricity prices in South Africa. Amusa et al. (2009), for instance, found
electricity prices having an insignificant effect on aggregate electricity demand, and they
stressed that future pricing policies in South Africa must ensure that electricity prices are cost
reflective and enhance efficiency of electricity supply and use.
In addition, several studies outside Africa have analysed exogenous and endogenous drivers
for efficient use of electricity in industries. Exogenous factors include the price of electricity
the amount of electricity available; national energy efficiency policies and laws; research and
development; international trade (transfer of technologies). The endogenous drivers include
effective energy efficient policies and strategies of a firm; organisational culture; energy
management systems; energy efficiency investment - for example, changes in machinery,
equipment and technology; changes in machinery and equipment; training activities;
voluntary audit; major product/process related technological changes, whether or not
introduced as part of public/private national and the R&D programmes; optimization of
production capacity and production level; conversion of industrial business - in terms of both
products and processes (Gillingham et al 2009; Martinez 2009; World Energy Council 2010).
As well, there is rich literature on the ‘benefits of the efficient use of electricity in industries
(see, for example, Morvaj and Bukarica 2010; Baumgartner and Muggli 1996; Howland and
Murrow 2009; World Energy Council 2010). Indeed, GRZ is equally aware about the many
benefits of the efficient use of electricity.
However, having a good vision of electricity market is not good enough if a vision is not
implemented. The GRZ declaration of increased research on energy sector has been one sided.
The electricity supply-side has been studied and the demand side neglected. Additionally, the
activities initiated by GRZ and ZESCO to improve efficient use of electricity in industries are
reported not to have been fully utilised by industries. An amplification of these two issues
seems significant.
First, the prominent electricity supply-side study called the “Cost of Service Study”, was
conducted during the period 2006-2007 by IPA Energy Consulting (UK-based firm). The
16
study was a major component of the Project sponsored by the World Bank and Swedish
International Development Agency (SIDA) to strengthen the capacity of the Energy
Regulation Board (ERB). Specifically, the study aimed at helping both ZESCO and ERB to
develop a deeper understanding of ZESCO’s cost structure, cost drivers, and its revenue
requirements that need to be reflected in appropriate tariff levels so that ZESCO could meet
the Government‘s commercialization objectives and therefore its supply obligations in the
future (IPA Energy Consulting, 2007). Based on the outcomes of “Cost of Service Study” and
in the presence of a widespread consensus among various stakeholders on the need for ERB to
reject ZESCO’s application for upward adjustment of electricity tariff rates by 66 per cent,
electricity tariffs were adjusted upwards in 2008.
There is no proof of any studies that were conducted before and after adjustment of electricity
tariff rates to estimate the effects of price adjustments on electricity demand by industry,
residential or commercial consumers of electricity. GRZ should cherish a timely
recommendation by European Union of the Electricity Industry [EURELECTRIC] (2011) that
policy makers should exercise care to avoid imposing higher costs on customers that can
dampen economic growth.
Second, I have already indicated the activities initiated by GRZ and ZESCO to improve
efficient use of electricity in industries are reported not to have been fully utilised by
industries. Sisala (2008), former director for ZESCO, exposed that Zambia can save up to
145MW a year just from the use of energy efficient bulbs by consumers. Sisala goes on to
explain that ZESCO, at utility level, had implemented following energy management
activities: (i) free of charge energy audits to consumers and (ii) Time of Use (TOU) tariff for
Maximum Demand (MD) consumers. All electricity consumed during the off-peak time
period was subjected to a 25 per cent discount on energy charges and a 50 per cent discount
on capacity charges. All electricity consumed during the peak time period attracts a surcharge
of 25 per cent penalty on both energy and capacity charges. To the contrary, Sisala concludes
that industries made low use of two service introduced by ZESCO. In addition, Zambia
cannot point to any study that exposes any developments in the efficient use of electricity in
the mining industry.
Significantly, lack of econometric studies of Zambia’s industrial electricity demand and non-
exposure of any energy efficiency development in the Zambian industry is a serious omission.
It is serious particularly when put into consideration that econometric analyses of industrial
electricity demand and the exposure of any energy efficiency development in the Zambian
industry are not merely issues of empirical interest, but issues that have significant policy
17
implications, and significant bearing the growth of the Zambian economy. If these issues are
not dealt with the seriousness they deserve, opportunities that would have otherwise been
available for making electricity in Zambia become an engine for development will become
foreclosed. This in the long run will make it difficult for Zambia to sustain continued
economic development.
In the light of foregoing background, the urgent need for econometric studies of electricity
demand and its efficient use in the mines in Zambia can not be overemphasised. This study,
though primarily academic, is a springboard for such studies on Zambia. On this note, I will
state the purpose and the hypotheses of this study in the next section.
1.3. STUDY PURPOSE AND HYPOTHESES
1.3.1. Study purpose
The study purpose is twofold: to examine the electricity use in Zambia’s mining industry by
focusing on own-price, cross price and index of mining production elasticities of electricity
demand and on structural changes in demand patterns over the time period 1980-2008; and to
expose any energy efficiency development in Zambia’s mining industry.
The study focuses on the mining as opposed to both “mining and manufacturing” sectors
because the mining industry is the biggest consumer of electricity in Zambia. This is rightly
stated by the Zambia Energy Regulation Board (ERB) as follows:
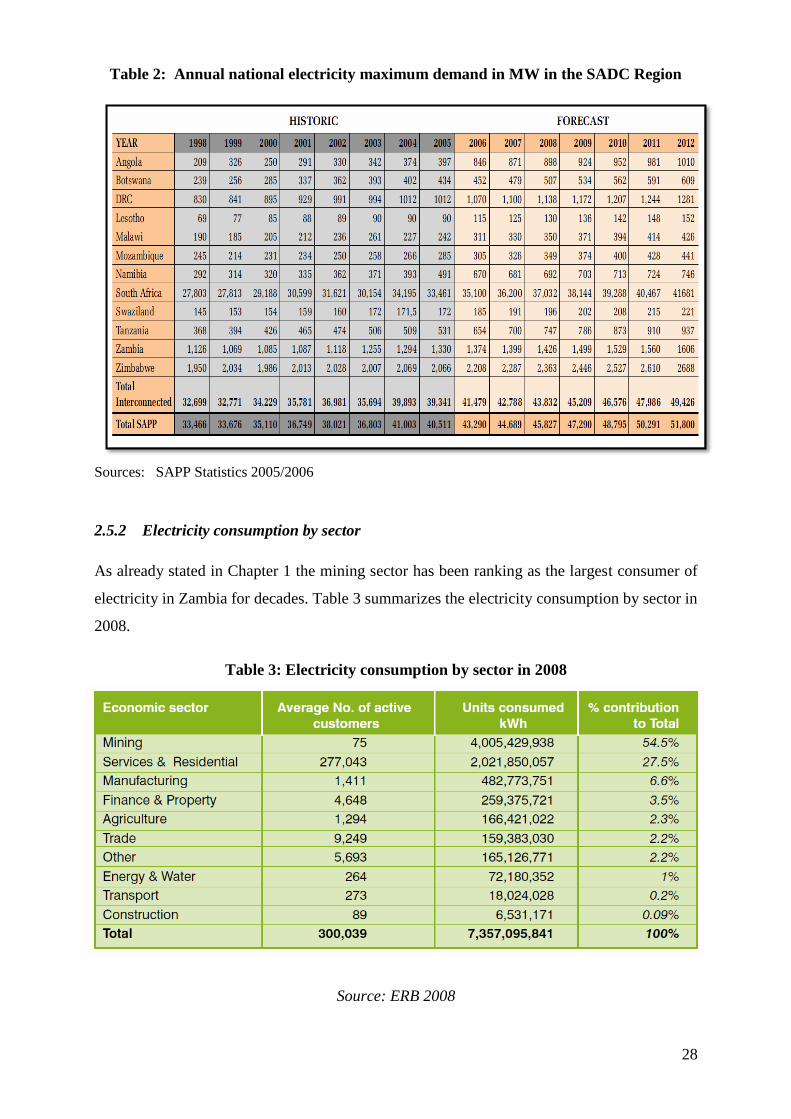
The Mining sector continues to rank as the biggest consumer of power taking up about
54.5% of total consumption. This is followed by the Services sector which includes
Residential consumers at 27.5%, followed by Manufacturing (6.6%) and Finance and
Property (3.5%); Energy and Water (1%); Construction (0.09%) and Transport (0.2%)
(ERB 2009: 7).
1.3.2. Study hypothesis
Based on the aforementioned study purpose and the literature review presented in Chapter 4,
this study tested the following hypotheses using data on mining in Zambia.
18
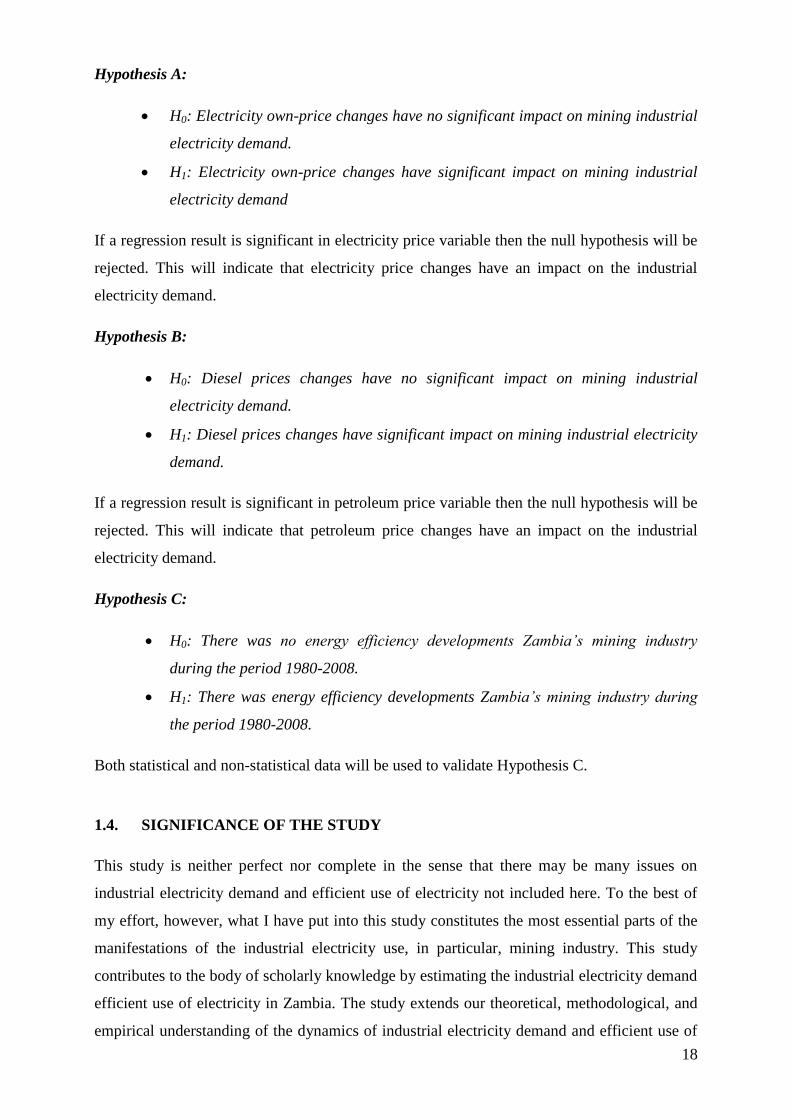
Hypothesis A:
H0: Electricity own-price changes have no significant impact on mining industrial
electricity demand.
H1: Electricity own-price changes have significant impact on mining industrial
electricity demand
If a regression result is significant in electricity price variable then the null hypothesis will be
rejected. This will indicate that electricity price changes have an impact on the industrial
electricity demand.
Hypothesis B:
H0: Diesel prices changes have no significant impact on mining industrial
electricity demand.
H1: Diesel prices changes have significant impact on mining industrial electricity
demand.
If a regression result is significant in petroleum price variable then the null hypothesis will be
rejected. This will indicate that petroleum price changes have an impact on the industrial
electricity demand.
Hypothesis C:
H0: There was no energy efficiency developments Zambia’s mining industry
during the period 1980-2008.
H1: There was energy efficiency developments Zambia’s mining industry during
the period 1980-2008.
Both statistical and non-statistical data will be used to validate Hypothesis C.
1.4. SIGNIFICANCE OF THE STUDY
This study is neither perfect nor complete in the sense that there may be many issues on
industrial electricity demand and efficient use of electricity not included here. To the best of
my effort, however, what I have put into this study constitutes the most essential parts of the
manifestations of the industrial electricity use, in particular, mining industry. This study
contributes to the body of scholarly knowledge by estimating the industrial electricity demand
efficient use of electricity in Zambia. The study extends our theoretical, methodological, and
empirical understanding of the dynamics of industrial electricity demand and efficient use of
19
electricity, topics not previously addressed on Zambia. Optimistically, being the first of its
kind on Zambia, this study provides a basis for further study and exploration as well as
stimulates better understanding of the industrial electricity demand and efficient use of
electricity in industries.
1.5. THESIS OUTLINE
This introductory chapter has covered the background to the study; the study purpose and
hypothesis; and the significance of the study. The remaining six chapters are organized as
follows. Chapter 2 discusses Zambia’s electricity sector and Chapter 3 covers Zambia’s
industry sector. Chapter 4 presents the literature review. Chapter 5 (methodology) presents
the theory of demand; a theoretical model; econometric model, and data set description.
Chapter 6 presents and discusses empirical results. Finally, chapter 7 presents a summary of
the key findings; highlights the important policy implications; highpoints the study
limitations; and suggests the future extension of the study.
1.6. CHAPTER SUMMARY
In this chapter, I have demonstrated that although GRZ places a premium on increased
research and development in addressing inefficiency problems in the electricity market, yet
the demand side of electricity market in terms industrial electricity demand and efficient use
of electricity in industries in Zambia have not been researched. One prominent study on the
electricity supply-side was conducted between 1980 and 2008 to justify the need to increase
electricity tariffs in Zambia so that they become cost reflective.
In this light, this study aims at examining the electricity use in Zambia’s mining industry by
focusing on price and output elasticities of electricity demand and on structural changes in
demand patterns over the time period 1990-2008; and to expose any energy efficiency
development in Zambia’s mining industry. Three hypotheses have been developed: (i) the
electricity own-price changes have no significant impact on mining industrial electricity
demand; (ii) the prices of diesel (the expected substitute of electricity) have no significant
impact on mining industrial electricity demand; and that (iii) there were no energy efficiency
developments Zambia’s mining industry during the period 1980-2008.
Being the first of its kind, this study on econometric analysis of Zambia’s mining industry
electricity use and developments in electricity efficiency both academically and practically
significant. On this note, I will present Zambia’s electricity market in the next chapter.
20
CHAPTER 2 ZAMBIA’S ELECTRICTY MARKET
2.1 INTRODUCTION
In the previous chapter I covered the background to the study; the study purpose and
hypotheses; the significance of the study; and the thesis outline. In this chapter I will describe
Zambia’s electricity market. I will proceed as follows: Section 2.2 outlines the national policy
and legislation; Section 2.3 highlights the energy subsectors in Zambia; Section 2.4 states the
electricity suppliers in Zambia; Section 2.5 discusses the electricity demand in Zambia;
Section 2.6 states the challenges in the electricity marketing in Zambia; and Section 2.7 gives
the chapter summary.
2.2 NATIONAL POLICY AND LEGISLATION
2.2.1 The Ministry of Energy and Water Development
The Zambian Ministry of Energy and Water Development (MOEWD), comprising two
Departments (Energy and Water departments), is responsible for the formulation and
implementation of policy in the energy sector. MOEWD has several objectives to Achieve:
articulate and implement Policy on Energy; formulate programs for the development of the
Energy sector; ensure that there are efficient and reliable supplies of energy for socio-
economic development; integrate the Energy sector into the national and regional
development strategies; and regulate the Energy sector through appropriate legislation
including the development of new laws and bye-laws (MOEWD 2011).
2.2.2 National Energy Policy
In 1994 Zambia adopted the National Energy Policy (NEP) with a twofold aim: (i) to
strengthen the management and coordination of energy sector activities at national level, and
(ii) to advance the efficiency and effectiveness of service delivery by the boards and utilities
in the energy sector and institutional level. Consequently, appropriate pieces of legislation in
the form of the Energy Regulation Act, Rural Electrification Act and amended Electricity Act
have been enacted. These pieces of legislation have led to the formation of the Energy
Regulation Board and the Rural Electrification Authority.
21
2.2.3 National development plans
The Fifth National Development Plan – (FNDP 2006-2010) and Sixth National Development
Plan (SNDP 2011-2015) have provided national strategic direction of the energy sector in
Zambia. During the FNDP period, the vision and goal concerning the energy sector were
stated as follows:
The vision is: Universal access to clean, reliable and affordable energy at the lowest total
economic, financial, social and environmental cost consistent with national development
goals by 2030.
The goal is: To ensure availability and accessibility to adequate and reliable supply of
energy from various sources at the lowest total economic, social and environmental cost
consistent with national development goals of sustained growth, employment generation
and poverty reduction (MOFNP 2006: 134).
During the SNDP the vision for the energy sector mentioned in the FNDP remained
unchanged. However, the goal was quantified: (i) An increase of at least 1,000 Mw (50 per
cent) to the 2010 electricity generation capacity of 1,900 Mw; (ii) An increase of rural access
to electricity from 3.5 per cent to at least 15 per cent and national access from 22 per cent to
40 per cent; and (iii) An increase of over 100 per cent in the existing petroleum bulk storage
facilities in order to achieve 30 days petroleum strategic stock.
2.2.4 The Energy Regulation Board of Zambia
The ERB is a legal entity established under the Energy Regulation Act of 1995, Chapter 436
of the Laws of Zambia. The role of the ERB is that of balancing the needs of undertakings
with the needs of energy consumers. The Board has the responsibility to ensure that utilities
earn a reasonable rate of return on their investments that is necessary to provide a quality
service at affordable prices to the consumer. In order to carry out this role, the ERB, among
other functions, ensures that all energy utilities in the sector are licensed, monitors levels and
structures of competition, investigates and remedies consumer complaints.
2.2.5 The Rural Electrification Authority of Zambia
The REA is a legal entity established under the Rural Electrification Act of 2003 of the Laws
of Zambia, whose summary is stated as follows:
22
An Act to establish the Rural Electrification Authority and to define its functions; to
establish the Rural Electrification Fund; and to provide for matters connected with or
incidental to the foregoing.
2.2.6 Other legislations
In addition to Energy Regulation Act of 1995 and Rural Electrification Act of 2003, Zambia
has Electricity of 1995, Electricity (Amendment) Act of 2003, and Petroleum Act of 1930.
The Electricity Act of 1995 empowers ERB to regulate the generation, transmission,
distribution and supply of electricity. The empowerment of ERB by the Electricity Act can be
demonstrated by quoting Section 3 which reads as follows:
Subject of subsection (2) and the Energy Regulation Act, no person shall establish or
carryon any undertaking unless in accordance with this Act and the Energy Regulation
Act.
The Electricity (Amendment) Act of 2003 addresses the shortcomings of the Principal
Electricity Act of 1995. The Petroleum Act of 1930 makes the provision for regulating the
importation, conveyance and storage of petroleum and other inflammable oils and liquids.
The ERB regulates petroleum in Zambia.
2.2.7 Effectiveness of the Ministry of Energy and Water Development
Among the many functions of MOEWD is to integrate the Energy sector into the national and
regional development strategies. To the contrary, various sector development plans contained
in both the Zambia’s Fifth and sixth National Development plans have not addressed energy
requirements. In addition, MOEWD (2010) admitted having done very little in steering
energy management efforts in the country:
Energy Management refers to the control and use of energy efficiently in industry and
domestic applications aimed at reducing energy consumption without sacrificing
productivity or increasing costs. At present, very little is being done in the area of energy
management (MOEWD 2010).
All things being constant, it is proper to speculate that either MOEWD has a weak
infrastructural power in providing economic agents with incentives to engage in energy
efficiency activities , or the Government simply makes symbolic policies (Jansen 2001) partly
because the Zambia Constitution, according to Hansungule (2007), render any national policy
23
a mere document with no legal back-up. Referring to the Fifth National Development Plan
document, a Zambia based professor, Hansungule states as follows:
FNDP is not a legally binding covenant even if it is tempting to perceive it as such
between the rulers and the ruled. This is why it can use or its drafters can afford to use the
loftiest of terms because legalistically speaking, there is no fear they will be legally held
accountable to it. There is no intention on the part of the government to open itself to
legal suits based on promises in the Plan (Hansungule 2007: 5).
2.3 ZAMBIA’S ENERGY SUBSECTORS
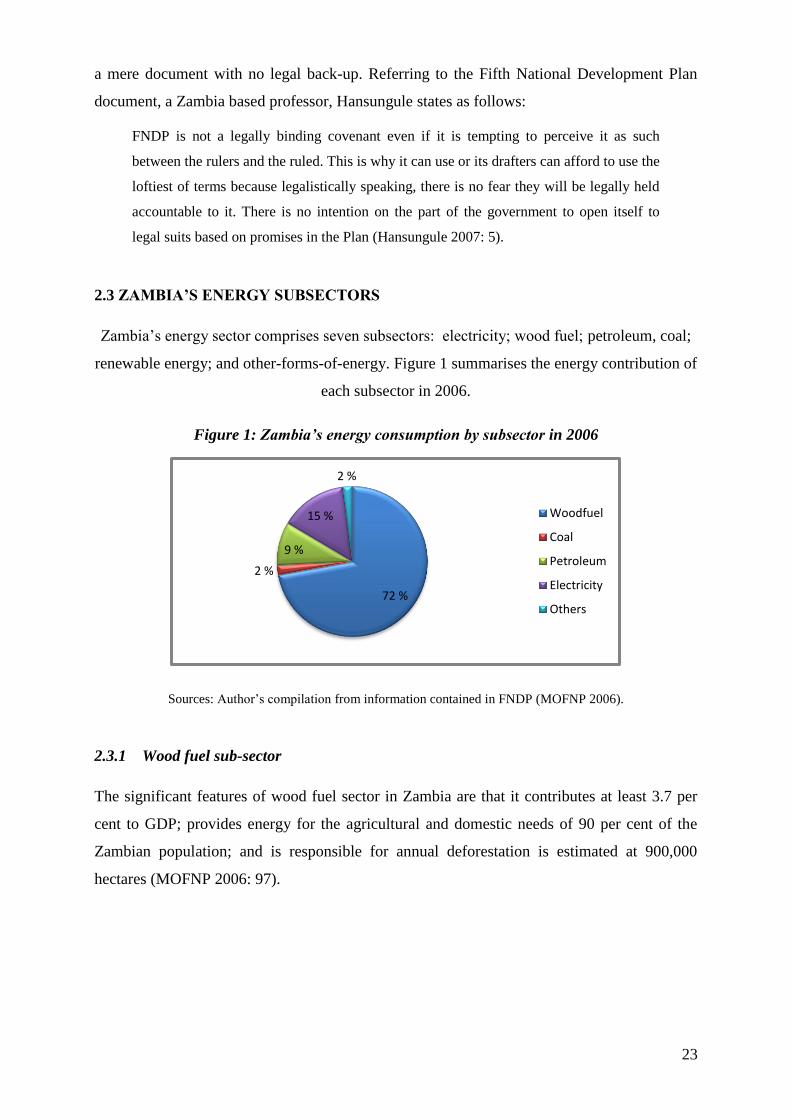
Zambia’s energy sector comprises seven subsectors: electricity; wood fuel; petroleum, coal;
renewable energy; and other-forms-of-energy. Figure 1 summarises the energy contribution of
each subsector in 2006.
Figure 1: Zambia’s energy consumption by subsector in 2006
Sources: Author’s compilation from information contained in FNDP (MOFNP 2006).
2.3.1 Wood fuel sub-sector
The significant features of wood fuel sector in Zambia are that it contributes at least 3.7 per
cent to GDP; provides energy for the agricultural and domestic needs of 90 per cent of the
Zambian population; and is responsible for annual deforestation is estimated at 900,000
hectares (MOFNP 2006: 97).
72 %
2 %
9 %
15 %
2 %
Woodfuel
Coal
Petroleum
Electricity
Others
24
2.3.2 Coal
On coal the highlights GRZ explains as follows:
Proven coal deposits are estimated to be over 30 million tons. Probable coal reserves at
Luangwa North, Luano, Lukusashi in the Luangwa Valley and Kahare, Chunga, Lubaba
in the Western trough system are believed to be in the region of several hundred million
tons though more exploration work is required to ascertain the exact nature and extent of
the deposits. Currently Zambia has two coalmines. The major one [Maamba Collieries]
was once government owned and has a capacity of 1 million tons per year. However,
despite the large reserves, the contribution of coal to total energy has been declining over
the years due to the lack of capitalization in the industry that resulted in production
constraints at the main mine and also the reduced demand in the mining industry
(MOEWD, 2010).
Despite the acknowledgement of the problems associated with coal mining, the Government
have did not state any envisaged solutions during the Fifth National Development Plan period
2.3.3 Petroleum
Zambia has no known oil or gas reserves and therefore no upstream oil industry. It imports all
its petroleum requirements, which contribute 9% to the national energy demand. Petroleum is
a key input in the Mining and Transport sectors. Zambia’s conventional infrastructure for
petroleum import and processing include the 1,706-kilometre pipeline which runs from Dar-
es-Salaam in Tanzania to Ndola, a Petroleum Refinery with a design capacity of 800, 000 tons
per annum and the Ndola Fuel Terminal (MOEWD 2010).
2.3.4 Renewable energy
The renewable energy sources in Zambia, as stated by MOEWD (2010), are increasingly
being used but still remain insignificant in terms of contribution to the total national energy
supply. The Renewable energy sources in Zambia include the following: solar (thermal and
photovoltaic); mini/microhydro; biomass (agricultural wastes, forestry waste,
industrial/municipal organic wastes, energy crops and products and animal waste);
geothermal, and wind. These sources have great potential for electricity production and use in
the transport sector.
25
2.3.5 Nuclear energy
Although Zambia has uranium deposits, yet the nuclear energy is not developed. However,
interest in Zambian uranium has been growing for a number of years. The Government has in
fact passed a law allowing foreign companies to exploit uranium on a large scale, with the aim
of diversifying its mining sector, which is too heavily dependent on copper, and so enhancing
economic development.
2.4 ELECTRICITY SUPPLIERS
In Zambia, the year 2008 saw the number of electricity companies increase to five from the
four already existing ones: Zambia Electricity Supply Corporation Limited (ZESCO),
Copperbelt Energy Corporation Plc (CEC), Lunsemfwa Hydro Power Company (LHPC) and
Zengamina Hydro Power Company (ZHPC). North-western Energy Company Ltd (NEC)
situated in North-western Province, was the new company which began operations in 2008.
2.4.1 Zambia Electricity Supply Corporation Limited
ZESCO, a parasternal company established in 1970, with an arms-length relationship with
GRZ, manages electricity supply in Zambia under the Performance Contract that was signed
between GRZ and ZESCO in 1996. The contract defines the commercialization issues and
other operational benchmarks for ZESCO over the contract period of three (3) renewable
years.
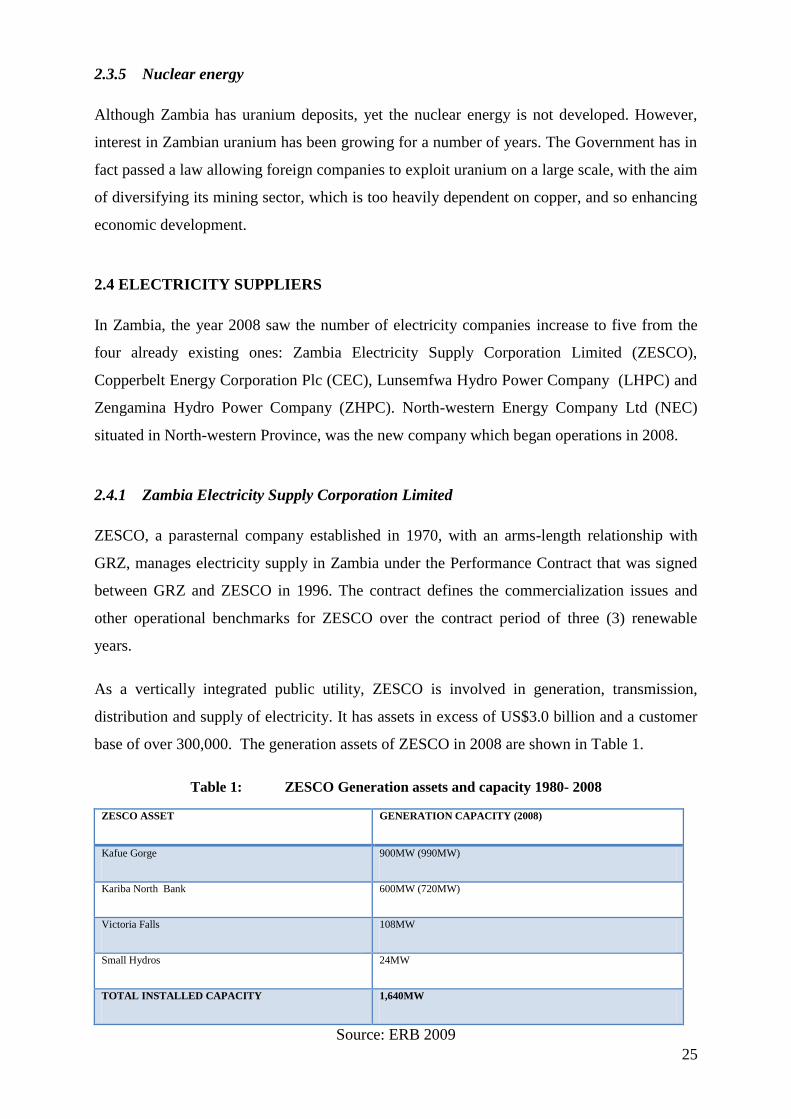
As a vertically integrated public utility, ZESCO is involved in generation, transmission,
distribution and supply of electricity. It has assets in excess of US$3.0 billion and a customer
base of over 300,000. The generation assets of ZESCO in 2008 are shown in Table 1.
Table 1: ZESCO Generation assets and capacity 1980- 2008
ZESCO ASSET GENERATION CAPACITY (2008)
Kafue Gorge 900MW (990MW)
Kariba North Bank 600MW (720MW)
Victoria Falls 108MW
Small Hydros 24MW
TOTAL INSTALLED CAPACITY 1,640MW
Source: ERB 2009
26
ZESCO annual turnover in 2008 was US$300million and had to total of 3,900 employees
with a customer/employee ratio of 80. In the same year, ZESCO sold about 9,450GWh, of
which 50 per cent was sold to Copperbelt Energy Corporation (CEC) and other mining
customers and five per cent exports to regional markets.
2.4.2 Copperbelt Energy Company
CEC is a privately owned corporation involved in the transmission and distribution of
electricity to the Mines. CEC owns 80MW Gas Turbines located on the Copperbelt Province
of Zambia. In addition, CEC has BSA with ZESCO to Purchase Power and Sell to Copperbelt
Mines (Ex-ZCCM). CEC continued to be the major supplier of power to the mines on the
Copperbelt province.
During 2008, CEC Plc. reduced power supply to the mines by 16 per cent of their normal
demand of 530MW because of generation shortfall by ZESCO. Towards the end of the year
the reductions were also attributed to the scaling down of mining activities at Luanshya
Copper Mines (LCM) and Chambeshi Metals which were placed under care and maintenance.
CEC in partnership with Swiss mining giant Glencore International AG had expressed interest
to develop Kafue Gorge Lower at a cost of US$1.5 billion. CEC also wheels about 2,709MW
on behalf of ZESCO’s Copperbelt loads as well as 210MW in respect of SNEL exports to
SAPP. In 2008, CEC’s demand was projected to increase to about 750 – 800 MW by 2010
(ERB 2009).
2.4.3 Lunsemfwa Hydro Power Company:
Lunsemfwa Hydro Power Company is the only independent power producer in the electricity
industry connected to the ZESCO transmission system. It has only two customers: ZESCO
Ltd and Chiman Manganese mine of Kabwe. In 2008, generation sent out from the two power
stations was recorded at 309,035MWh for energy while capacity was recorded at 437,792
kVA. Total sales to ZESCO were 287,385 MWh in energy and 436,851Kw in capacity (ERB
2009).
2.4.4 Zengamina Mini-Hydro Power Company
Zengamina Hydro Power Company, a new mini hydro station situated in North-Western
province of Zambia, has a network of about 35 km of high voltage and 10 km of low voltage
27
lines. Its customers include Kalene Mission Hospital, traditional chiefs’ palaces, schools and
clinics were prioritized for connection to the mini hydro grid and Ikelenge Township
Electricity Demand in Zambia (ERB 2009).
2.4.5 Northwestern Energy Corporation Ltd
Northwestern Energy Corporation Ltd (NEC) was licenced by the ERB in 2008 to distribute
and supply electricity to residential, commercial and light industrial customers at Lumwana in
the Northwestern Province of Zambia. NEC and ZESCO entered into a fifteen (15) years Bulk
Supply Agreement (BSA) for the maximum demand supply of 2MVA. ZESCO began energy
supplies to NEC in October 2008 with aggregate sales of 1,050 MWh up to the end of the year
2008 (ERB 2009).
2.5 ELECTRICITY DEMAND
2.5.1 Annual national maximum demand
The electricity access rates at national level in 2008 was 22 per cent which translated to 49.3
per cent in urban areas and only 3.2 per cent in rural areas for a population of 12 million
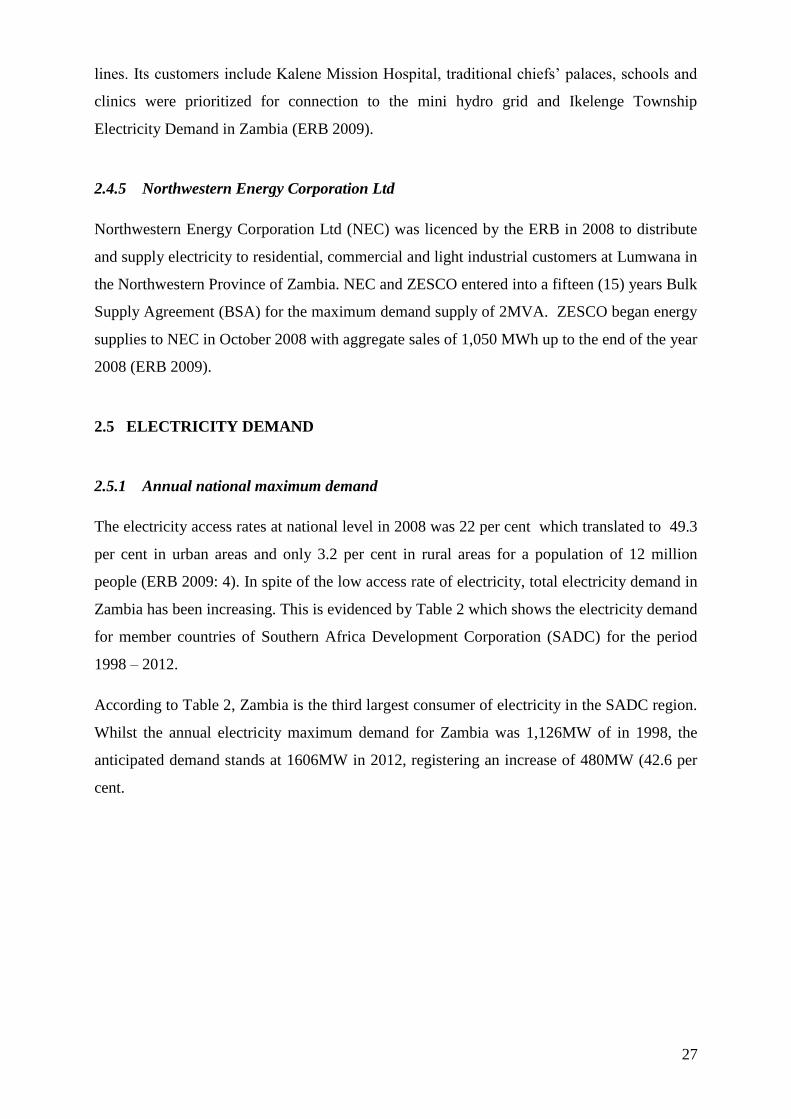
people (ERB 2009: 4). In spite of the low access rate of electricity, total electricity demand in
Zambia has been increasing. This is evidenced by Table 2 which shows the electricity demand
for member countries of Southern Africa Development Corporation (SADC) for the period
1998 – 2012.
According to Table 2, Zambia is the third largest consumer of electricity in the SADC region.
Whilst the annual electricity maximum demand for Zambia was 1,126MW of in 1998, the
anticipated demand stands at 1606MW in 2012, registering an increase of 480MW (42.6 per
cent.
28
Table 2: Annual national electricity maximum demand in MW in the SADC Region
Sources: SAPP Statistics 2005/2006
2.5.2 Electricity consumption by sector
As already stated in Chapter 1 the mining sector has been ranking as the largest consumer of
electricity in Zambia for decades. Table 3 summarizes the electricity consumption by sector in
2008.
Table 3: Electricity consumption by sector in 2008
Source: ERB 2008
29
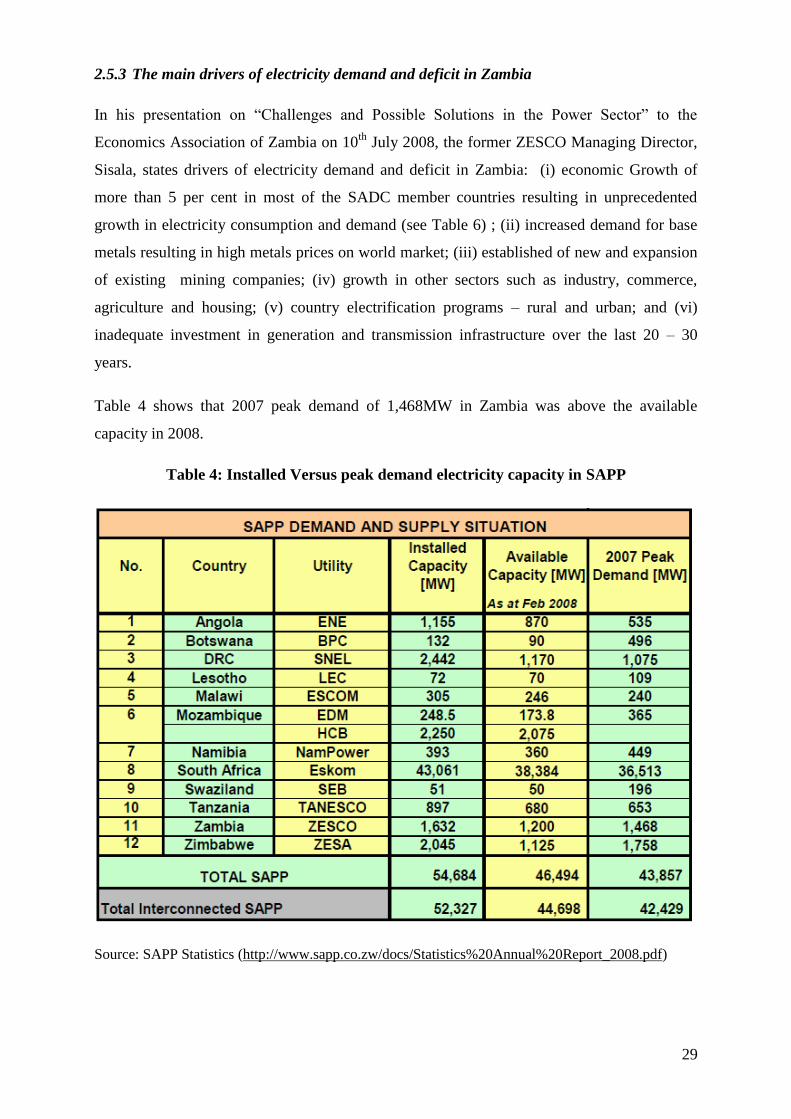
2.5.3 The main drivers of electricity demand and deficit in Zambia
In his presentation on “Challenges and Possible Solutions in the Power Sector” to the
Economics Association of Zambia on 10th
July 2008, the former ZESCO Managing Director,
Sisala, states drivers of electricity demand and deficit in Zambia: (i) economic Growth of
more than 5 per cent in most of the SADC member countries resulting in unprecedented
growth in electricity consumption and demand (see Table 6) ; (ii) increased demand for base
metals resulting in high metals prices on world market; (iii) established of new and expansion
of existing mining companies; (iv) growth in other sectors such as industry, commerce,
agriculture and housing; (v) country electrification programs – rural and urban; and (vi)
inadequate investment in generation and transmission infrastructure over the last 20 – 30
years.
Table 4 shows that 2007 peak demand of 1,468MW in Zambia was above the available
capacity in 2008.
Table 4: Installed Versus peak demand electricity capacity in SAPP
Source: SAPP Statistics (http://www.sapp.co.zw/docs/Statistics%20Annual%20Report_2008.pdf)
30
2.5.4 Electricity tariffs in Zambia
2.5.4.1 The role of tariffs
The ERB Head Engineer, James Manda (2010) explains that the role of tariffs in Zambia is
fourfold: (i) to inform customers about costs for new use of electricity; (ii) to contribute to
the optimal use of existing facilities; (iii) to cover the costs of the electric power companies;
and (iv) to create balance between supply and demand of electricity.
2.5.4.2 Three major types of electricity tariffs in Zambia
These are: Bulk supply tariffs, Export tariffs and Retail Tariffs. Bulk supply tariffs apply to
large scale customers such as the Copperbelt Energy Corporation. The export tariffs, as the
name suggests, apply to electricity sold outside Zambia. Both bulk supply and export tariffs
are negotiated between supplier and buyer and are typically governed by long-term contracts.
The retail tariffs are further categorized into Residential Tariffs (metered and unmetered
households), Commercial Tariffs, Social Services Tariffs (such as tariffs for hospitals), and
Maximum Demand Tariffs (mainly targeted at industrial and mining sector).
In addition to the above types of tariffs, Zambia, in July 2002, introduced Famers tariffs,
special tariffs aimed at encouraging primarily crop production through irrigation.
2.5.4.3 Cost effectiveness of electricity tariffs in Zambia
That electricity tariffs in Zambia are not cost effective is indisputable when one studies the
2007 report on “Cost of Service Study” on commercialization of ZESCO. The study was
conducted by IPA Energy Consulting, a Scottish company, over a time period of 12 months in
collaboration with ZESCO and the ERB. This study was a major component of the Project
sponsored by the World Bank and Swedish International Development Agency (SIDA) to
strengthen the capacity of the ERB. One of the findings of the study is that ZESCO under-
prices the mining load. IPA (2007: 8) reports as follows:
As the Cost of Service Study progressed, we also became aware of the problem of under
pricing the mining load, which currently represents 50% of total consumption in Zambia.
Not only is the existing CEC contract under priced relative to the Cost of Service, but so
are the new contracts ZESCO is entering into with new retail mining loads. In fact, it
appears that ZESCO is selling to new retail mining loads at prices lower than its
wholesale price to CEC. This raises the question as to whether ZESCO is engaging in an
31
anti-competitive practice by intentionally selling at retail lower than it sells at wholesale
in order to undercut CEC.
The negative implications of this problem are rightly stated by IPA Energy Consulting (2007:
9): (i) GRZ as ZESCO’s shareholder may be required to contribute this US$ 926 million to
keep ZESCO whole if the under pricing is allowed to continue; (ii) alternatively, tariffs for the
residential customer group would have to pay about 30 per cent more than their fair share of
Revenue Requirements in order to continue this subsidy to the mines; (The Residential
customer group is the only one with enough consumption over which the burden of this cross
subsidy could feasibly be spread.); and (iii) the physical system will continue to degrade for
lack of funding, and load shedding would likely increase substantially because the mines take
priority service on a 24/7 basis (IPA 2007: 10).
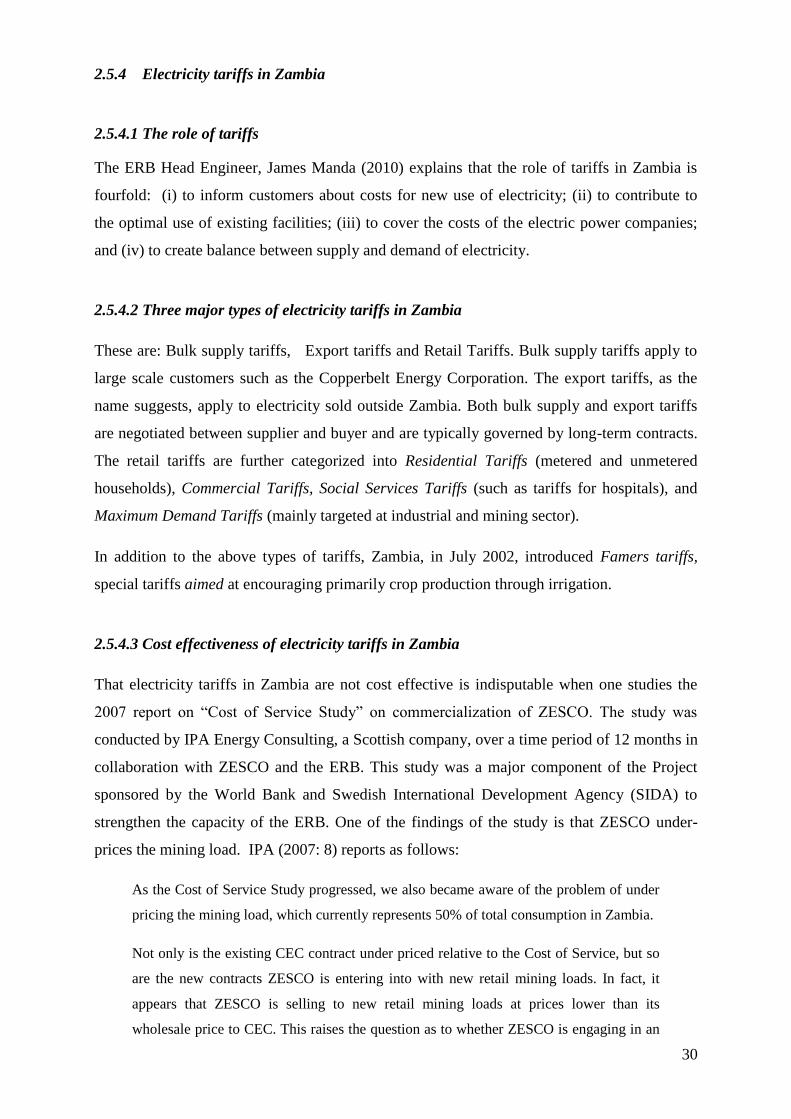
At region level, Zambia has the lowest electricity tariffs among 14 Africa countries most of
which are members of Southern African Power Pool (SAPP). Table 5 shows the comparison
of electricity tariffs within the 14 Africa countries.
Table 5: Electricity tariffs for SAPP countries in 2007
Source: Sisala (2008)
It is clear from Table 5 that apart from Zimbabwe and Angola, Zambia had the lowest
electricity tariffs in 2007.
Amidst these low tariffs, it is hard to reflect if ZESCO would be able to raise or support new
investment for system expansion if the mining contracts and agreements cannot be rebased to
reflect cost efficient tariffs.
UTILITY COUNTRY CURRENCY DOMESTIC (kWh)
COMMERCIAL (kWh)
INDUSTRIAL (kWh)
BPC BOTSWANA USCents/kWh) 6.2 6.1 4.2 CEB MAURITIUS USCents/kWh) 12 18.9 7.2 EDM MOZAMBIQUE USCents/kWh) 11 1.4 5.3 ENE ANGOLA USCents/kWh) 3.7 3.9 2.2 ESCOM MALAWI USCents/kWh) 3.6 6.3 3.9 Eskom SOUTH AFRICA USCents/kWh) 6.1 6.0 2.2 KPLC KENYA USCents/kWh) 9.4 11.4 8.3 LEC LESOTHO USCents/kWh) 6.9 9.6 4.3 NamPower NAMIBIA USCents/kWh) 10.8 10.2 7.0 SEB SWAZILAND USCents/kWh) 6.9 8.4 5.0 TANESCO TANZANIA USCents/kWh) 7.5 8.2 6.3 UMEME UGANDA USCents/kWh) 23 22.6 10.9 ZESA ZIMBABWE USCents/kWh) 0.7 0.5 0.3 ZESCO ZAMBIA USCents/kWh) 2.5 3.7 2.6 REG. AVERAGE SADELEC USCents/kWh) 6.4 8.4 5.0
32
2.5.4.4 Electricity debt collection and debtor-days
As a common practice worldwide, utilities usually supply electricity and later send invoices to
consumers, indicating the period within which the electricity bills must be settled. The
number of days a customer of electricity is given by the electricity supplier to settle the debts
is referred to as “Debtor days”. “Debtors days” in Zambia are more than those in any other
Southern African countries. For example between 2005 and 2006, the debtor days in Zambia
were 207 whereas in South Africa were 22 days (SAPP 2006).
2.6 CHALLENGES FACING THE ELECTRICITY MARKET
From the preceding discussion it is clear that the Zambia electricity market is faced with
management and structural weaknesses among which are: (i) problems related to capital
investment requirements, (ii) Sub-economic tariffs, (iii) government interference, (iv) the
monopolization of the market by ZESCO, (iv) utility inefficiency, and (v) lack of demand side
management.
2.6.1 Capital Investment Requirements
The electric power project requirements are a source of concern in Zambia. Sisala (2008)
observes that power projects in Zambia (i) have long gestation periods, (ii) are subjected to
cumbersome pre-feasibility and feasibility studies plus Environmental Impact Assessments,
(iii) have long implementation periods (usually 5 to 7 years), (iv) require huge capital outlay,
(v) are characterized by long payback periods contrary to the private sector demands of short
term returns, and (vii) compete for capital with more lucrative projects with short term
returns.
2.6.2 Sub-Economic Tariffs
As already discussed, electricity tariffs in Zambia are too low and not cost reflective. Raising
electricity tariffs to make them cost effective is a very sensitive political issue in Zambia.
Attempts to increase tariffs have been opposed on the ground that the cost of doing business
especially for those businesses that are energy intensive will be higher. Compounding this
problem is the inability by Zambia to attract private investment in the electricity sub-sector
which has been attributed to Zambia having one of the lowest tariffs in the region. The
estimated value of investment that Zambia needs to attract within 5 years in order to attain a
generation capacity of 4,500MW is US$6 billion (ZESCO 2009).
33
2.6.3 Government interference
Although Government intervention has been positive in wanting to address power shortages,
yet it has failed to create a competitive electricity market partly because of its gross failure to
commercialize ZESCO and by its heavy tolerance of sub-economic tariffs.
The efforts by utilities to raise electricity tariffs are to large extended prevented by the current
legal system in Zambia, which is dominated by the Government interference. The entire
Section 8 of the Electricity Act Chapter 433 of the Laws of Zambia empowers ERB to either
confirm the proposed variation in electricity tariffs by suppliers of electricity , or order that
the proposed variation shall not be made or order the operator of the undertaking to make
such other variation as the Board considers fit.
ON several accounts, GRZ has been accused of its gross failure to manage ZESCO and its of
ZESCO to advance its political agenda. In 2009, for example, an article on “ZESCO
Blackouts is MMD Failure” by Zambian Union blamed the Government as follows:
ZESCO’s failure to deliver is due to misguided government energy goals and lack of
effective political leadership. The MMD government has not prioritized to fix the
electricity supply crisis to avoid blackouts and save government spending on importing
power.
In a nutshell, appropriate Government intervention is necessary, though not sufficient, to
revitalize the electricity market in Zambia.
2.6.4 Monopolization of the electricity market
As already highlighted, ZESCO is the biggest electricity utility in Zambia, owning most of the
generation, transmission and distribution assets. That Zambians have urged Government to
review the monopolization of ZESCO has been on political agenda for decades. On 4 May
1999, for example, an article on “ZCC to probe ZESCO monopoly” in the national
newspaper, Times of Zambia, reported as follows:
The Zambia Competition Commission (ZCC) is looking forward to engaging an
independent consultant to ascertain the extent of abuse of monopoly by Zambia
Electricity Supply Corporation (ZESCO). ZCC executive director Mr. George Lipimile
confirmed this in an interview saying the action has been necessitated by recent
complaints from the Zambia National Farmers Union (ZNFU).
34
In 2009 an article on “ZESCO Blackouts is MMD Failure” by Zambian Union stresses that
ZESCO enjoys market monopoly and revenue to update its grid system; unless that revenue is
misappropriated for personal and political interests.
Although the economic theory entails that in the presence of market power suppliers have the
ability to set prices above the cost of the last unit produced, yet this is not the case with
ZESCO monopoly mainly because electricity prices are largely determined by ERB.
2.6.5 Utility inefficiencies
The largest utility, ZESCO, has been unable to invest in new generation capacity because it
lacks resources. In addition, the utility has been run inefficiently and finds it difficult to
borrow from international financial institutions. The inability to access funds and not being
able to generate sufficient internal resources has led to the delay in maintenance programs
which has affected the quality of supply. This has resulted in the persistence of the power
deficit. In addition, ZESCO costs have been escalating over the years with the highest portion
of their cost of distribution being staff costs. ERB (2007) reports as follows:
We found that during the financial year ended 31st March 2007, labour costs were the
biggest component of operating costs which contributed 49%. The proportion of labour
costs to the total budget is way beyond acceptable international levels which is about
30%. We therefore find that there is an urgent need for ZESCO to begin reducing its
labour cost and in this regard have decided to adjust this labour cost contribution to
operating costs to 40% for 2008, 35% for 2009 and 30% for 2010 after excluding
extraordinary cots like electricity imports, loan interest rates and taxation.
That the efficiency and accountability of ZESCO is questionable has resulted in the resistance
to an increase in tariffs by the business community. International Monetary Fund (IMF) has
strongly admitted that ZESCO is financially unviable and incapable of mobilizing resources
owing to its bad track record and even though it managed to increase its tariffs it would still
be unviable.
Statistics show that that the total receivables for ZESCO appear to be increasing yearly. For
example, total receivables increased from 35% of turnover in January 2008 to 61 per cent of
turnover in September 2008. The target for transmission losses was met for 2008.
Transmission losses were at 4.5 per cent while distribution losses are above 33 per cent.
Though the utility has been commercialized its internal operations leave much to be desired.
35
As a result ZESCO is perceived badly by the business community who feel that the utility
should first clean up its act before requesting for any increase in tariffs (ZESCO 2008).
2.6.6 Lack of demand side management
As already highlighted, electricity demand side management is lacking in Zambia for various
reasons. In addition, Zambia does not have a deliberate policy on energy efficiency, a
reflection of non commitment on the part of the Government to steer the nation towards
energy management; and the energy services introduced by ZESCO (free of charge energy
audits to consumers; and Time of Use tariff for Maximum Demand consumers) have not been
used by consumers (Sisala 2008).
2.7 CHAPTER SUMMARY
In this chapter I have key issues on electricity market in Zambia. Frist, Zambia has a national
policy and legislative framework on electricity: the 1994 National Energy Policy; the Fifth
and Sixth National Development Plan; Energy Regulation Act of 1995; the Rural
Electrification Act of 2003; the Electricity of 1995; the Electricity (Amendment) Act of 2003,
and Petroleum Act of 1930.
Second, electricity is one of the seven subsectors of the energy sector in Zambia. Other
subsectors are wood fuel, electricity, petroleum, coal, renewable energy, and other forms of
energy. Wood fuel consumption commands the largest consumption, followed by electricity
and then Petroleum.
Third, there are currently three suppliers of electricity in Zambia: Zambia Electricity Supply
Corporation Limited; Copperbelt Energy Corporation; and Lunsemfwa Hydro Power
Company; Zengamina Hydro Power Company; and North-western Energy Company Ltd
situated in North-western Province. However, ZESCO - a vertically integrated public utility,
involved in generation, transmission, distribution and supply of electricity - dominates the
market.
Fourth, annual electricity maximum demand in Zambia has been increasing. The main drivers
of increased electricity demand and deficit in Zambia include Economic Growth of more than
five per cent in most of the SADC member countries resulting in unprecedented growth in
electricity consumption and demand; increased demand for base metals resulting in high
metals prices on world market; establishment of new and expansion of existing mining
36
companies; growth in other sectors such as industry, commerce, agriculture and housing;
country wide electrification programs – rural and urban; and inadequate investment in
generation and transmission infrastructure over the last 20 – 30 years. However, the increased
demand electricity as been coupled with power deficits in electricity staring 2008.
Fifth, the mining in Zambia is the largest consumer of electricity, accounting for more than
50%.
Sixth, electricity tariffs in Zambia are not cost effective and the mines are under prised by
ZESCO, an act whose continuation over the next 10 years could result in a US$926 million
deficit relative to ZESCO’s revenue. In addition to low tariffs, Zambia has more debtor days
(207 days) than any other country in the Southern African.
Lastly, energy subsector in Zambia, especially the electricity subsector, faces several
challenges: the problems related to capital investment requirements; sub-economic electricity
tariffs; government interference in setting electricity tariffs; monopolization of the electricity
market by one entity (ZESCO); utility inefficiency; and weak demand side management.
In the next chapter I will describe Zambia’s industry and its linkages with the electricity.
37
CHAPTER 3 INDUSTRIAL SECTOR IN ZAMBIA
3.1 INTRODUCTION
The industry (comprising mining sector and the manufacturing sector) is the backbone of
Zambia's economic structure. When Zambia shifted from a one-party state to a multi-party
state in 1991 four ideologies were introduced in its industry: (i) privatization (transfer of state
owned companies and industries to private individuals and companies in order to encourage
competition and increase efficiency in the industry); (ii) liquidation of companies (bringing
unprofitable state owned companies and businesses to an end); (iii) liberalization of the
economy (absence of government intervention in businesses); and (iv) withdrawal of subsides
from loss making companies and introduction of cost sharing measures.
This chapter describes the industry in Zambia. In particular, Section 3.2 presents a graphical
illustration of the industry in Zambia; Section 3.3 describes relevant issues on mining sector;
Section 3.4 describes the manufacturing sector, and Section 3.5 provides the chapter
summary.
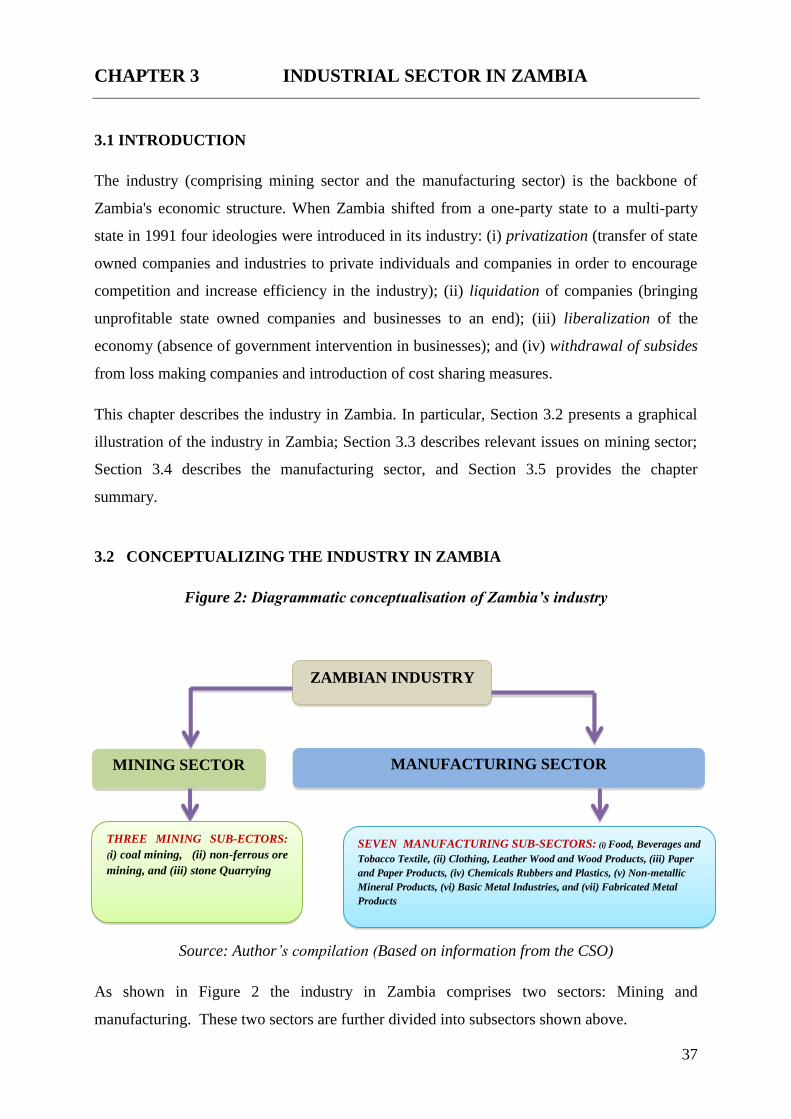
3.2 CONCEPTUALIZING THE INDUSTRY IN ZAMBIA
Figure 2: Diagrammatic conceptualisation of Zambia’s industry
Source: Author’s compilation (Based on information from the CSO)
As shown in Figure 2 the industry in Zambia comprises two sectors: Mining and
manufacturing. These two sectors are further divided into subsectors shown above.
ZAMBIAN INDUSTRY
MINING SECTOR MANUFACTURING SECTOR
THREE MINING SUB-ECTORS: (i) coal mining, (ii) non-ferrous ore
mining, and (iii) stone Quarrying
SEVEN MANUFACTURING SUB-SECTORS: (i) Food, Beverages and
Tobacco Textile, (ii) Clothing, Leather Wood and Wood Products, (iii) Paper
and Paper Products, (iv) Chemicals Rubbers and Plastics, (v) Non-metallic
Mineral Products, (vi) Basic Metal Industries, and (vii) Fabricated Metal
Products
38
3.3 MINING SECTOR
In recent years the mining sector in Zambia has experienced rapid growth and it is hoped that
more mines will be opened. Zambian government explains as follows:
The mining industry has experienced exceptional growth averaging 9 per cent per annum
in the last decade and prospects for further development are enormous. The sector will,
therefore, continue to be a major driver of growth, while also providing impetus for value
addition through the creation and expansion of the manufacturing industry. In addition,
this is expected to create spill over effects through development of necessary
infrastructure, especially those related to roads, railways, border facilities and reliable
electricity supply. This will be complimented by redesigning of policies so as to
encourage and attract private investment in exploration, re-investment and development
of new mines through a stable and attractive fiscal and regulatory regime (Ministry of
Finance, Planning and National Development 2010: 10) .
Zambia has potential for the expansion of the mining sector because it has many minerals
deposits and a steady investment environment. At present, Zambia is the largest producer of
copper in Africa. Sophie Chung, an analyst at Wood Mackenzie unit Brook Hunt (as quoted
by Mining Review 11th
July 2011) explains that if all the planned projects take off, Zambia is
expected to overtake Australia and Indonesia to become the fifth-largest copper-producing
country in the world by 2013. Chung goes on to add that Zambia’s “positive” investment
climate sets it apart from its neighbours. In addition, many mining companies in Zambia have
managed to enter into extremely good development deals in their contracts. The agreements
include incentives such as favourable power rates and unrestricted ownership (Lushinga, an
economist at the Economics Association of Zambia, as quoted by Mining Review 11th
July
2011).
3.3.1 Minerals found in Zambia
Zambia has an enormous amount of metals, gemstones, industrial minerals and potential
energy resources, including coal, hydrocarbons and uranium. For several years, Zambia’s
economy has been based on mining, predominantly copper and cobalt. In fact, the minerals in
Zambia comprise three categories: industrial minerals, dimension stones and metal (base)
stones. Industrial minerals include, coal (in the Mid-Zambezi Rift Valley); limestone (in
Lusaka, Southern, North Western, Northern and Luapula Provinces); phosphate (in Eastern
Province); silica sand (in Kapiri Mposhi); barite ( in Luwingu, Lundazi and Chirundu
districts); corundum (in Rufunsa area); fluorite (in Siavonga district); graphite (in Lundazi
39
and Chama districts); and Uranium (in Western and North-western provinces). Dimensions
stones in Zambia are the marble, granite and slate stones. Granite and marble are used in
building construction. Slates are used as used for paving, panelling, floor tiles and for high-
quality slate in architectural work. The main base minerals in Zambia are Cobalt, Copper,
Silver, Gold, Tin and Zinc.
Although, I have stated a lot of minerals above, I should emphasize that copper mining is the
lifeblood of Zambia’s economy, contributing nearly three-quarters of its foreign exchange
earnings.
3.3.2 The Copper mines in Zambia
China is the biggest investor in the mining sector in Zambia. China has sunk more than $2
billion into the sector. There are four Chinese-run copper mining companies in Zambia, all
subsidiaries of China Non-Ferrous Metals Mining Corporation (CNMC), a state-owned
enterprise: (i) Chambishi for Non-Ferrous China Africa (NFCA); (ii) Sino Metals Leach
Zambia (Sino Metals), a copper processing plant; (iii) Chambishi Copper Smelter (CCS), a
copper smelting plant; and (iv) China Luanshya Mine (CLM), an underground and open-cast
mining operation.
Other mining firms in Zambia include Canada's First Quantum Minerals and Barrick Gold
(own Kansanshi Copper and Gold mines in North-western Province, and Bwana Mkubwa
mine on the Copperbelt Province); Australia's Equinox Minerals (own Lumwana Mine),
London-listed commodity giant Glencore and Vedanta Resources (own Konkola Copper
mines), and South Africa's Metorex.
The Chinese investments in Zambian mining sector have raised great concern to human rights
activists. The Human Rights Watch (HRW) Director, Daniel Bekele (as quoted by BBC News
Africa, December 3, 2011), commended that China's significant investment in Zambia's
copper mining industry can benefit both Chinese and Zambians. Bekele went on to expose
that the miners in Chinese-run companies have been subject to abusive health, safety, and
labour conditions and long-time government indifference. The research by HRW (2011)
detailed persistent abuses in Chinese-run mines, including poor health and safety conditions,
and regular 12-hour and even 18-hour shifts involving arduous labour, all in violation of
Zambian law. The report cites an example in which 11 workers were shot and injured during a
pay dispute at a Chinese-run mine in 2010 and that five others were hurt during a similar
confrontation at a different mine in 2005. The report further illuminates that miners had to
40
work 12-hour shifts often in fume-filled tunnels and sometimes shifts were 18 hours long;
contrary to the Zambian law, which limits shifts to eight hours.
Significant to this study is that the mining sector is the largest consumer of electricity in
Zambia. Mining processes are electricity-intensive. Implicitly, electricity demand in mines is
likely to be inelastic. Also any interruption in electricity supply impacts the mines negatively.
For example, the power blackout on June 18, 2011 was reported to have negatively impacted
mine operations. This blackout, reported as the first of its kind since 2009, made copper
producers lose revenue amounting to millions of US dollars. The day after the blackout
Vedanta's Konkola mine, one of the country's largest, stated that its employees were still
working to pump out underground water that had flooded the mine during the blackout.
Similarly, First Quantum's Bwana Mkubwa mine stated that a lot of their electrical equipment
was damaged because of unstable supply when the power was restored - but they were yet to
calculate the full extent of the losses (Mfula, as quoted by Reuters on June 19, 2010).
In general, electricity is a necessary input in the copper mines Zambia.
3.3.3 Mineral processing and electricity use
As a major base metal mining country of over 80 years standing, Zambia has over the years
developed an extensive and impressive array of processing facilities. The processes include
ore mining process; beneficiation process (crushing and separating ore into valuable
substances or waste by any of a variety of techniques); smelting process; and refining process
into metals prior to export. In addition, the leaching process helps recover cobalt from the
slurry, and mined gemstones are processed in lapidaries. For example, Zambia Emerald
Industries Limited has developed to one of the largest emerald processing and cutting plants
in the world with over 50 cutters under one roof. Electricity is an important input in these
processes.
Figure 3 shows the basic copper mine process, from ore extraction to metal. The copper ore
from a mine is blasted, loaded and transported to the primary crushers (crushers usually run
on electricity). Then the ore is crushed and screened, with the fine sulphide ore to froth
flotation cells for recovery of copper (here electricity is used). The coarser ore goes to the
heap leach, where the copper is subjected to a dilute sulphuric acid solution to dissolve the
copper. Then the leach solution holding the dissolved copper is exposed to a process called
solvent extraction (SX) (here electricity is used). The SX process concentrates and purifies
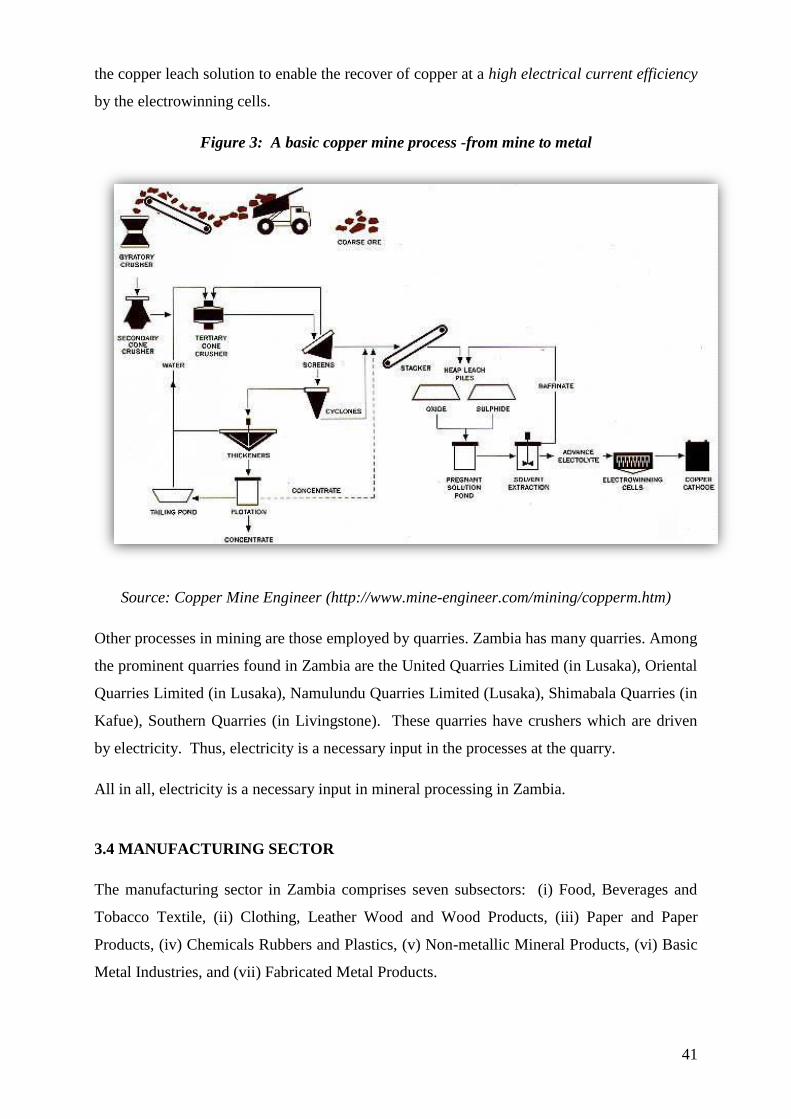
41
the copper leach solution to enable the recover of copper at a high electrical current efficiency
by the electrowinning cells.
Figure 3: A basic copper mine process -from mine to metal
Source: Copper Mine Engineer (http://www.mine-engineer.com/mining/copperm.htm)
Other processes in mining are those employed by quarries. Zambia has many quarries. Among
the prominent quarries found in Zambia are the United Quarries Limited (in Lusaka), Oriental
Quarries Limited (in Lusaka), Namulundu Quarries Limited (Lusaka), Shimabala Quarries (in
Kafue), Southern Quarries (in Livingstone). These quarries have crushers which are driven
by electricity. Thus, electricity is a necessary input in the processes at the quarry.
All in all, electricity is a necessary input in mineral processing in Zambia.
3.4 MANUFACTURING SECTOR
The manufacturing sector in Zambia comprises seven subsectors: (i) Food, Beverages and
Tobacco Textile, (ii) Clothing, Leather Wood and Wood Products, (iii) Paper and Paper
Products, (iv) Chemicals Rubbers and Plastics, (v) Non-metallic Mineral Products, (vi) Basic
Metal Industries, and (vii) Fabricated Metal Products.
42
Regarding the role of manufacturing in Zambia’s economy during the period 2010-2015, GRZ
states that main thrust during the SNDP period will be to facilitate the up-scaling of the
manufacturing sector towards higher value addition and upgrade capacity in the provision of
related services. Emphasis will be placed on transforming industrial businesses and
complementary services particularly MSMEs into strong value-creating entities (MOFNP
2010: 133)
The government goes on to indicate its displeasure with the manufacturing sector’s
contribution to GDP during the period 2006-2010: 10.2 per cent against the target of 15 per
cent. Also government was not impressed with the sector’s annual growth during the same
period: an average of 3.3 per cent was achieved against the projected growth of 7.5 per cent In
short, the growth rate of the manufacturing sector declined from 5.8 per cent in 2006 to 2.5
per cent in 2009 (MOFNP 2010: 133).
Generally, the causes of the decline in the performance of the manufacturing sector are many.
The government first place the blame of overall decline in the manufacturing sector on
significant drops in productivity in the textiles and clothing, leather and leather products and
fabricated metals sub-sectors. They suspect that this drop in productivity was largely due to
the high cost of doing business; reduced demand for locally produced products and the impact
of the global economic crisis.
The government second blames a lot of factors for the decline in the performance of the
manufacturing sector: high cost of doing business largely on account of poor physical
infrastructure and high production costs; disruptions in power supply; low investments in
Research and Development; obsolete technology; high cost of borrowing; limited
standardisation and quality assurance; and limited human capital and skills required to run the
manufacturing industry on a sustainable basis (MOFNP 2010: 135).
Having interacted with the Zambia market since my childhood, I am of the opinion that the
decline in the performance of the manufacturing sector is partly due to the religiously-low-
priced goods imported from Asian countries. In fact, cheap goods from China have attracted
worldwide attention and court cases. On 25 October 2011, for example, China initiated a court
case against the United States at the World Trade Organization on Tuesday, arguing that U.S.
anti-dumping measures on imports of diamond saw blades and frozen warm-water shrimp
were invalid. The United States had previously placed anti-dumping duties on imports of the
products from China, claiming that they are deliberately priced below the market and killing
off U.S. competition. Similarly, on 28th
October 2011 a World Trade Organization panel
largely backed China in a complaint about European Union import duties on Chinese
43
footwear. The case is the second brought by China against the EU at the WTO. In July 2011,
China won a similar case against EU duties on what Europe said were unfairly cheap Chinese
screws and bolts.
However, not all subsectors in the manufacturing sector have performed poorly. The food and
beverages sub-sector, for example, grew and sustained the sector’s contribution to the total
GDP during the period 2005-2010. This growth is linked to increased investments resulting
from companies expanding their plant and the proliferation of stream of industries which
process edible oils.
To address the problems in the manufacturing sector, the government has stated its strategic
will be to strengthen and widen the country’s manufacturing base with emphasis on backward
and forward linkages given the country’s wide resource base. This will require intensifying
the development of the resource-based industries, with the aim to optimise and add value to
the country’s natural resources. In line with the strategic focus of the Plan, emphasis will be to
enhance competitiveness of manufacturing through infrastructure and human development to
support growth of the sector (MOFNP 2010: 135).
In sum, the significance of the above discussion to this study is that most of the production
processes within various subsectors of manufacturing sector in Zambia use electricity. It is
also cardinal to know the effect of aggregation of the manufacturing subsectors on the
interpretations of the study results.
3.5 CHAPTER SUMMARY
This chapter has presented salient issues on both the mining and manufacturing sectors of
Zambia’s industry. Zambia is the largest copper producer in Africa. The Chinese investment,
whose operations have criticized as not upholding the human rights, dominates the mining
sector. Significantly, mining is an electricity-intensive sector and the highest consumer of
electricity in the Zambia.
The manufacturing industry comprises seven subsectors, ranging from Food, Beverages and
Tobacco Textile, to Fabricated Metal Products. During the last decade, the sector’s
contribution to the GDP has declined contrary to the expectation of the government. Reasons
for this state of affairs are varied: high cost of doing business; reduced demand for locally
produced products and the impact of the global economic crisis. The government has
formulated strategies to boost the sector. Significantly, many processes in manufacturing
44
sector depend on electricity. In addition, the presented trends illuminate my interpretation of
the study results.
45
CHAPTER 4 LITERATURE REVIEW
4.1 INTRODUCTION
This chapter presents literature related to the study purpose: to examine the electricity demand
in Zambia’s industry by focusing on price and output elasticities of electricity demand and
structural changes in demand patterns over the period 1980-2008; and to expose any energy
efficiency development in the Zambian industry. In this regard, there are four contemporary
literatures within which this study may be placed: (i) general literature on industrial electricity
modelling; (ii) general literature on energy efficiency in industries; and (iv) literature on
efficient use of electricity in industry sector in Zambia.
The sources of literature include the recommended study materials for the program I am
enrolled in at the University of Oslo (Master of Philosophy in Environmental and
Development Economics); published books, mainly from the University of Oslo Library;
scientific online journals; Zambia Electricity Supply Corporation Limited (ZESCO) and
Zambia Energy Regulation Board (ERB); and several databases including the US Energy
Information Agency.
Undeniably, literature on industrial electricity demand as well as energy efficiency in
industries is extensive and has become more complicated with the passage of time. This
complication demands me to put the literature in context. To do so, I proceed as follows:
Section 4.2 presents the literature on industrial electricity demand; Section 4.3 covers
literature on energy efficiency in industries in; and lastly, Section 4.4 provide the chapter
summary.
4.2 INDUSTRIAL ELECTRICITY DEMAND
4.2.1 General literature on industrial electricity demand
There is rich literature on energy demand modelling, in general, and on industrial electricity
demand modelling, in particular. Several studies on industrial electricity demand have been
conducted at various aggregation levels, on various times and using different models and
variables.
Certainly, the models for studying electricity demand have evolved. Morana (2007) on
“Factor demand modelling: the theory and the practice” explains the two key innovations that
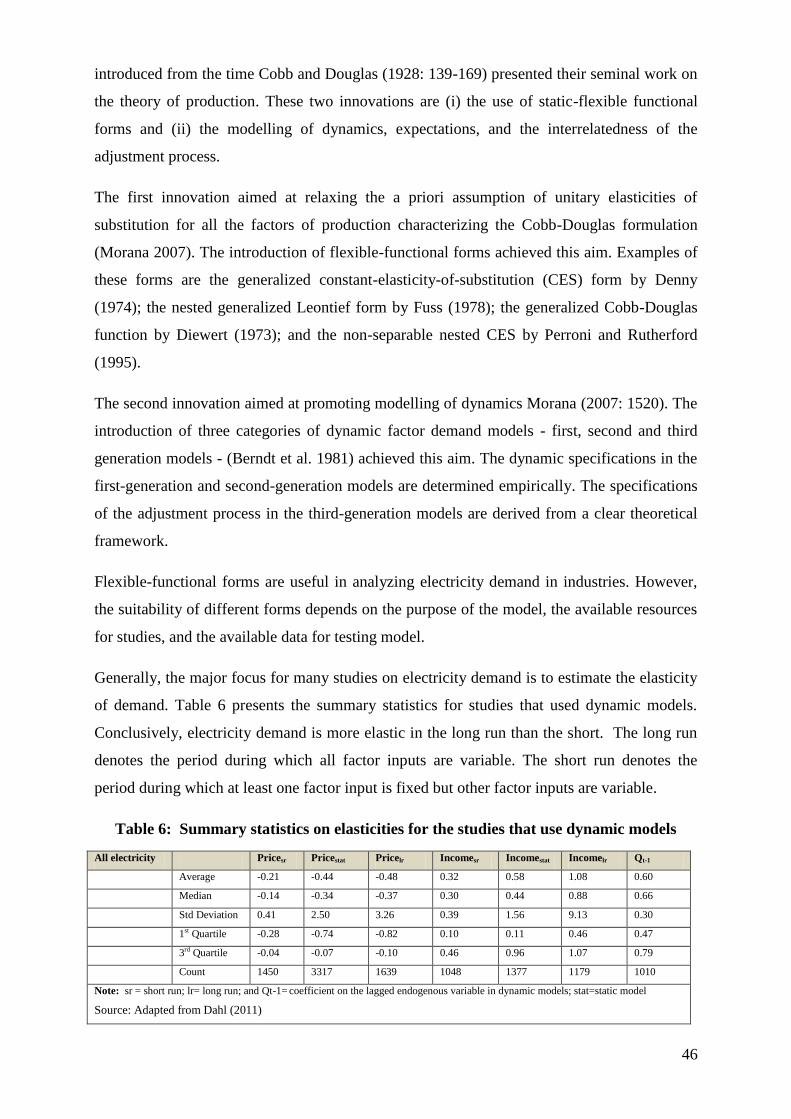
46
introduced from the time Cobb and Douglas (1928: 139-169) presented their seminal work on
the theory of production. These two innovations are (i) the use of static-flexible functional
forms and (ii) the modelling of dynamics, expectations, and the interrelatedness of the
adjustment process.
The first innovation aimed at relaxing the a priori assumption of unitary elasticities of
substitution for all the factors of production characterizing the Cobb-Douglas formulation
(Morana 2007). The introduction of flexible-functional forms achieved this aim. Examples of
these forms are the generalized constant-elasticity-of-substitution (CES) form by Denny
(1974); the nested generalized Leontief form by Fuss (1978); the generalized Cobb-Douglas
function by Diewert (1973); and the non-separable nested CES by Perroni and Rutherford
(1995).
The second innovation aimed at promoting modelling of dynamics Morana (2007: 1520). The
introduction of three categories of dynamic factor demand models - first, second and third
generation models - (Berndt et al. 1981) achieved this aim. The dynamic specifications in the
first-generation and second-generation models are determined empirically. The specifications
of the adjustment process in the third-generation models are derived from a clear theoretical
framework.
Flexible-functional forms are useful in analyzing electricity demand in industries. However,
the suitability of different forms depends on the purpose of the model, the available resources
for studies, and the available data for testing model.
Generally, the major focus for many studies on electricity demand is to estimate the elasticity
of demand. Table 6 presents the summary statistics for studies that used dynamic models.
Conclusively, electricity demand is more elastic in the long run than the short. The long run
denotes the period during which all factor inputs are variable. The short run denotes the
period during which at least one factor input is fixed but other factor inputs are variable.
Table 6: Summary statistics on elasticities for the studies that use dynamic models
All electricity Pricesr Pricestat Pricelr Incomesr Incomestat Incomelr Qt-1
Average -0.21 -0.44 -0.48 0.32 0.58 1.08 0.60
Median -0.14 -0.34 -0.37 0.30 0.44 0.88 0.66
Std Deviation 0.41 2.50 3.26 0.39 1.56 9.13 0.30
1st Quartile -0.28 -0.74 -0.82 0.10 0.11 0.46 0.47
3rd Quartile -0.04 -0.07 -0.10 0.46 0.96 1.07 0.79
Count 1450 3317 1639 1048 1377 1179 1010
Note: sr = short run; lr= long run; and Qt-1= coefficient on the lagged endogenous variable in dynamic models; stat=static model
Source: Adapted from Dahl (2011)
47
In Table 6, the median elasticities for both income and price are in the inelastic region with
averages all a bit more elastic. The median elasticities for all but Qt-1 are less elastic than the
means with the discrepancy largest for the long run for both price and income. Both the
average and median estimates suggest a less elastic response to price than to income.
Certainly, Table 6 does not provide detailed information on the issues surrounding
explanatory variables that have been modelled frequently in industrial electricity demand.
Thus, the remaining part of this section focuses on the both the explanatory variables and the
key findings of several studies on industrial electricity modelling.
First, studies have revealed that electricity demand response to changes in electricity price
vary across industries (see, for example, Lafferty et al. 2001; Wolak and Patrick 1996).
Lafferty et al. (2001: 13) explain that price elasticity of electricity demand vary widely across
different industries and as such, a region cannot expect demand response from the industrial
sector to match that of another region unless the mix of industries is similar. Similarly, Wolak
and Patrick (1996) estimated the customer-level demand for electricity by industrial and
commercial customers purchasing electricity according to half-hourly energy prices from the
England and Wales electricity market. They found that price elasticities varied considerably
across industries.
Second, many previous studies have indicated that weather conditions and the time of use of
electricity have a considerable effect on electricity demand in industries (see, for instance, Fan
and Hyndman 2010; Cebula and Herder 2010; Hansen 2004). Fan and Hyndman (2010)
evaluated the historic South Australian price elasticity, focusing on the relationship between
price and demand quantities at each half-hour of the day. They attempted to determine
whether there is any variation in price sensitivity with the time of day, and to estimate the
form of any relationships that might exist in South Australia. They found that the overall price
elasticity ranged from -0.363 to -0.428, with strongest price responsiveness approximately at
the peak period; around 4 O’clock in the afternoon for summer and 7 O’clock in the evening
for winter.
Cebula and Herder (2010) employed the three panel two-stage least squares (P2SLS) in
identifying key economic factors and other conditions that have influenced the per customer
commercial and industrial consumption of electricity in the U.S. for the period 2002 through
2005. They found that per customer commercial and industrial electricity consumption is an
increasing function of the annual number of cooling degree days and the peak summer
electricity generating capacity.
48
Similarly, Hansen (2004) analysed the aggregate spot-price elasticities for 8 different regions
in Norway. Price elasticities for different weekdays and load periods were estimated. Hansen
found that the long run price elasticities for the regions were in the range from 0 to -0.12 in
the winter season, and between 0.12 and -0.05 in the summer season. Thus, in Norway, more
electricity is demanded in winter than summer.
In general, there is strong seasonality in the electricity demand, especially in high frequency
data such as daily or monthly. Stochastic seasonality, as revealed by Engle et al. (1989),
results in the inconsistent estimation of the parameters in a regression. However, such
inconsistency problem can be overcome by filtering the data: either by altering data
periodicity (for instance, from daily or monthly to annual data), or by taking differences of the
variables in the seasonal frequencies (Chang and Martinez-Chombo 2003: 9). Alternatively,
seasonality can be directly modelled by choosing a variable that captures the seasonal
component of the electricity demand. Temperature related-measures such as the number of
heating and cooling days per period and the average temperature are standard candidates for
such variable.
Third, studies have shown that inter-fuel substitution, especially between oil and electricity, is
an ancient interest to both economists and politicians, especially for evaluating sustainability
capacities and in approximating the economic cost of environmental policies. However, there
are mixed results from earlier studies on inter-fuel substitution by industries. Some studies
(see for example Fuss 1977; Deshpande 1966; and Steinberg 1954) have shown little inter-
fuel substitution. In contrast, some studies (see, for example, Halverson 1976; Griffin 1977);
and Uri 1977) have suggested significant amount of inter-fuel substitution.
In general, recent studies have shown potentials for inter-fuel substitution (see, for example,
Bölük and Koç 2010; Førsund 2007: 10; Stern 2009). Bölük and Koç (2010) modelled factor
demand for manufacturing sector in Turkey by estimating a translog cost function with four
factors (capital, labour, intermediate input and electricity) for the period 1980–2001. They
found that substitution possibilities existed between electricity and intermediate input.
Implicitly, changes in the price of intermediate input can affect electricity demand.
Førsund (2007: 10) notes that in industries boilers can be run on alternative energy sources
including electricity and that can be switched from one source to another in a relatively short
time.
Stern (2009) conducted a meta-analysis of studies done on inter-fuel substitution in industrial
sector. Stein sampled 47 studies in manufacturing industry or manufacturing sub-industries, or
49
in the macro-economy of a variety of developed and developing countries. Meta-regressions
for the six shadow elasticities of substitution between coal, oil, gas and electricity were
estimated. Stein found that oil–electricity and gas–electricity shadow elasticities of
substitution were significantly greater than unity.
Some studies that have compared the possibilities for inter-fuel substitutability in the long-run
and than short run indicate that more inter-fuel substitutability possibilities exist in the long
run than the short run. Stern (2009), for example, concluded that the typical definitions of
elasticities of substitution are founded on long-run responses and, consequently, long-run
estimates are desirable. In this respect, panel data studies tend to find more inter-fuel
substitutability than time-series studies because panel data is associated with long-run
elasticities and time-series data short-run elasticities. Specifically, Bacon (1992) after
surveying some of the early studies of inter-fuel substitution elasticities in the OECD
countries concluded that panel data studies tend to find more inter-fuel substitutability
(measured by fuels’ cross-price elasticities) than time-series studies.
In a nutshell, whether electricity can be substituted for other fuels mainly depend on the
nature of the country’s electricity sector. Generally, many studies that have found the price of
substitute significant in their analysis subscribe to the assumption that fuels, such as diesel,
present perfect substitutability with electricity and that their prices are affordable and
preferred rather than electricity (Anderson and Hsiao 1982; Anderson and Pomfret 2002;).
Fourth, the time trend variable as been used widely in the industrial electricity demand models
(see, for example, Dimitropoulos, Hunt and Judge 2005; Hunt, Judge and Ninomiya 1999).
Dimitropoulos, Hunt and Judge (2005) estimated the underlying energy demand trends using
annual data for the UK from 1967-2002. They employed the structural time series model
(STSM) approach. They confirmed that important non-linear and stochastic trends are present
as a result of technical change and other exogenous factors driving demand, and that a failure
to account for these trends will lead to biased estimates of the long-run price and income
elasticities. They established that, provided these effects are allowed for, the estimated long-
run elasticities are robust to the different data frequencies used in the modelling. Thus a time
trend variable is important in electricity modelling.
Literature informs us that technical progress in electricity use does not forever exhibit a
deterministic trend pattern as the conventional model assumes. Hunt, Judge and Ninomiya
(1999), for example, have argued that the deterministic time trend, as a conventional model,
fails to predict the precise role of technical progress in estimated energy demand functions.
50
They go on to argue that a conventional deterministic trend model cannot be accepted by the
data for a number of energy types. To substantiate their argument, Hunt, Judge and Ninomiya
estimated the energy demand functions for a variety of energy types for the UK using
unadjusted quarterly data. They found that technical progress in energy usage does not
always exhibit a deterministic trend pattern as the conventional model assumes. It often
fluctuates over time and is likely to be influenced by an array of exogenous factors but also by
changes in prices of energy.
Last, there are mixed study results on whether income elasticities are bigger than price
elasticities of industrial electricity demand. As already seen in the summary statistics in Table
2 show, average income elasticity is greater than price elasticity. However, some individual
studies have shown that income elasticity is less than price elasticity (see, for example, Baxter
and Rees 1968; Inglesi 2008; Dilaver and Hunt 2010).
Baxter and Rees (1968) estimated electricity demand by industry on quarterly time series data
for the U.K. using a dynamic model. They found that the electricity demand tended to be
more price than income elastic.
Inglesi (2008) conducted a study to specify the variables that explain the electricity demand in
South Africa and to forecast electricity demand by creating a model using the Engle–Granger
methodology for co-integration and Error Correction models. She found that the long-term
elasticity of price (-0.55) was bigger than that of income (0.42), although they were both
estimated to be inelastic.
Dilaver and Hunt (2010) applied the structural time series technique to annual data over the
period 1960 to 2008 to forecast the future Turkish industrial electricity demand. They
investigate the relationship between Turkish industrial electricity consumption, industrial
value added and electricity prices. They found that the long-term elasticity of price (-.16) was
bigger than that of income (0.15). They further forecast Turkish industrial electricity demand
somewhere between 97 and 148 TWh by 2020.
In sum, the general literature on industrial electricity demand discussed above is relevant to
the current study in the study because they have covered most of the explanatory variables
this study has used: price of electricity, price of fuel, and time trend. Having stated so, I will
now proceed to review literature on industrial electricity demand in Zambia.
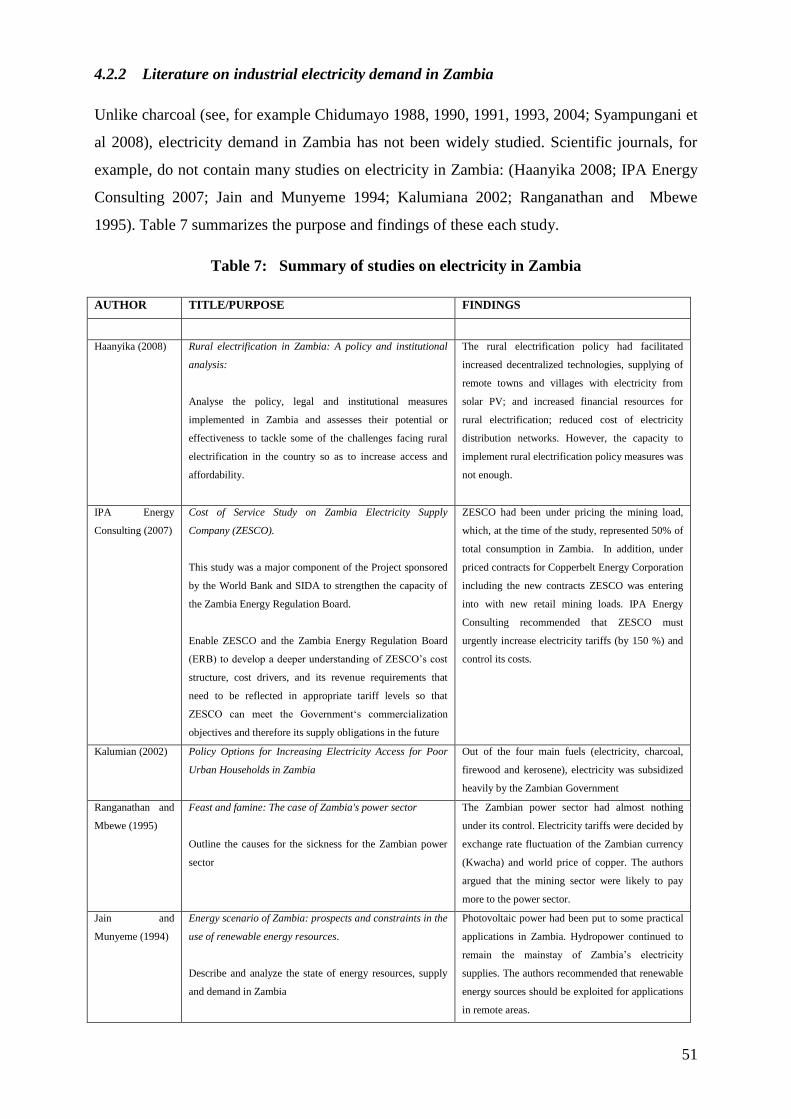
51
4.2.2 Literature on industrial electricity demand in Zambia
Unlike charcoal (see, for example Chidumayo 1988, 1990, 1991, 1993, 2004; Syampungani et
al 2008), electricity demand in Zambia has not been widely studied. Scientific journals, for
example, do not contain many studies on electricity in Zambia: (Haanyika 2008; IPA Energy
Consulting 2007; Jain and Munyeme 1994; Kalumiana 2002; Ranganathan and Mbewe
1995). Table 7 summarizes the purpose and findings of these each study.
Table 7: Summary of studies on electricity in Zambia
AUTHOR TITLE/PURPOSE FINDINGS
Haanyika (2008) Rural electrification in Zambia: A policy and institutional
analysis:
Analyse the policy, legal and institutional measures
implemented in Zambia and assesses their potential or
effectiveness to tackle some of the challenges facing rural
electrification in the country so as to increase access and
affordability.
The rural electrification policy had facilitated
increased decentralized technologies, supplying of
remote towns and villages with electricity from
solar PV; and increased financial resources for
rural electrification; reduced cost of electricity
distribution networks. However, the capacity to
implement rural electrification policy measures was
not enough.
IPA Energy
Consulting (2007)
Cost of Service Study on Zambia Electricity Supply
Company (ZESCO).
This study was a major component of the Project sponsored
by the World Bank and SIDA to strengthen the capacity of
the Zambia Energy Regulation Board.
Enable ZESCO and the Zambia Energy Regulation Board
(ERB) to develop a deeper understanding of ZESCO’s cost
structure, cost drivers, and its revenue requirements that
need to be reflected in appropriate tariff levels so that
ZESCO can meet the Government‘s commercialization
objectives and therefore its supply obligations in the future
ZESCO had been under pricing the mining load,
which, at the time of the study, represented 50% of
total consumption in Zambia. In addition, under
priced contracts for Copperbelt Energy Corporation
including the new contracts ZESCO was entering
into with new retail mining loads. IPA Energy
Consulting recommended that ZESCO must
urgently increase electricity tariffs (by 150 %) and
control its costs.
Kalumian (2002) Policy Options for Increasing Electricity Access for Poor
Urban Households in Zambia
Out of the four main fuels (electricity, charcoal,
firewood and kerosene), electricity was subsidized
heavily by the Zambian Government
Ranganathan and
Mbewe (1995)
Feast and famine: The case of Zambia's power sector
Outline the causes for the sickness for the Zambian power
sector
The Zambian power sector had almost nothing
under its control. Electricity tariffs were decided by
exchange rate fluctuation of the Zambian currency
(Kwacha) and world price of copper. The authors
argued that the mining sector were likely to pay
more to the power sector.
Jain and
Munyeme (1994)
Energy scenario of Zambia: prospects and constraints in the
use of renewable energy resources.
Describe and analyze the state of energy resources, supply
and demand in Zambia
Photovoltaic power had been put to some practical
applications in Zambia. Hydropower continued to
remain the mainstay of Zambia’s electricity
supplies. The authors recommended that renewable
energy sources should be exploited for applications
in remote areas.
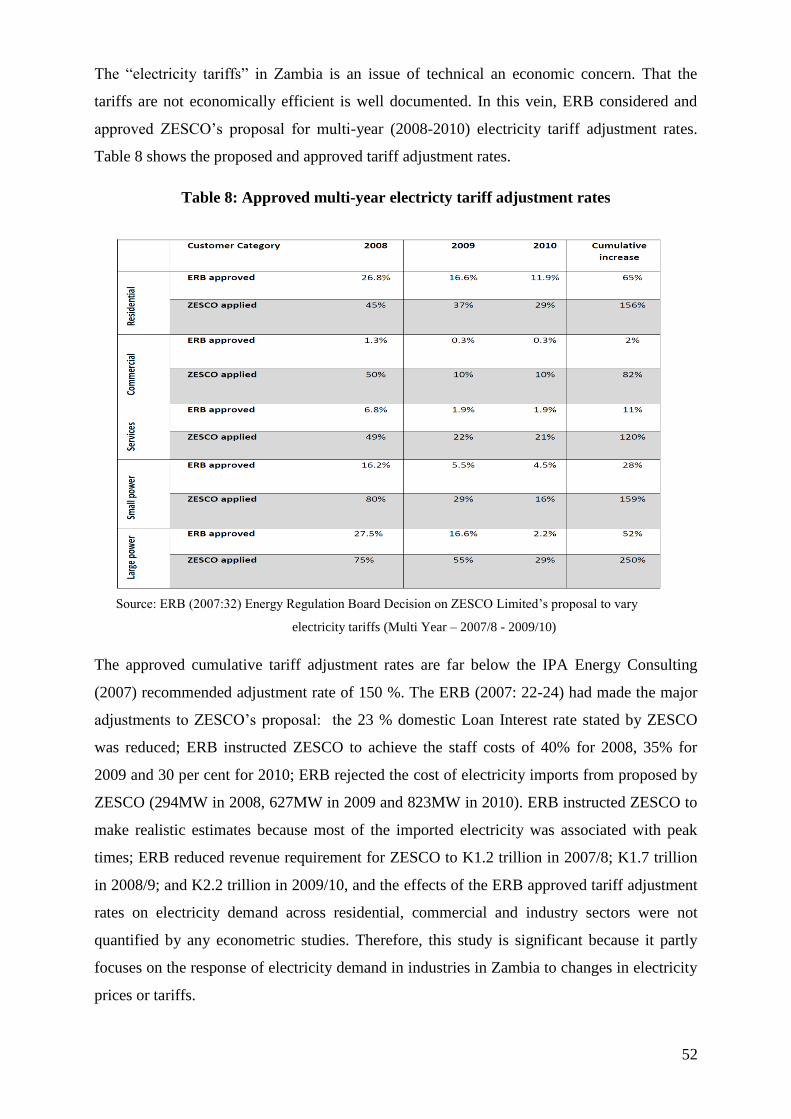
52
The “electricity tariffs” in Zambia is an issue of technical an economic concern. That the
tariffs are not economically efficient is well documented. In this vein, ERB considered and
approved ZESCO’s proposal for multi-year (2008-2010) electricity tariff adjustment rates.
Table 8 shows the proposed and approved tariff adjustment rates.
Table 8: Approved multi-year electricty tariff adjustment rates
Source: ERB (2007:32) Energy Regulation Board Decision on ZESCO Limited’s proposal to vary
electricity tariffs (Multi Year – 2007/8 - 2009/10)
The approved cumulative tariff adjustment rates are far below the IPA Energy Consulting
(2007) recommended adjustment rate of 150 %. The ERB (2007: 22-24) had made the major
adjustments to ZESCO’s proposal: the 23 % domestic Loan Interest rate stated by ZESCO
was reduced; ERB instructed ZESCO to achieve the staff costs of 40% for 2008, 35% for
2009 and 30 per cent for 2010; ERB rejected the cost of electricity imports from proposed by
ZESCO (294MW in 2008, 627MW in 2009 and 823MW in 2010). ERB instructed ZESCO to
make realistic estimates because most of the imported electricity was associated with peak
times; ERB reduced revenue requirement for ZESCO to K1.2 trillion in 2007/8; K1.7 trillion
in 2008/9; and K2.2 trillion in 2009/10, and the effects of the ERB approved tariff adjustment
rates on electricity demand across residential, commercial and industry sectors were not
quantified by any econometric studies. Therefore, this study is significant because it partly
focuses on the response of electricity demand in industries in Zambia to changes in electricity
prices or tariffs.
53
4.3 ENERGY EFFICIENCY IN INDUSTRIES
In this section I have presented general literature on energy efficiency in industries and
specific literature on energy efficiency in industries in Zambia. Section 3.3.1 has first define
energy and energy efficiency, and presented the benefits of energy efficiency to industries; the
energy efficiency gap; barriers to energy efficiency in industries; internal measures and
actions the industries would consider increasing energy efficiency performance; energy
efficiency technologies in industries; and energy efficiency policies. In Section 3.3.2 has
presented specific studies on industrial electricity demand in Zambia.
4.3.1 General literature on energy efficiency in industries
First, in production theory the term efficiency is twofold: technical efficiency and economic
efficiency. Wilkinson (2005) contrasts the two terms as follows:
[Technical efficiency] means that a firm is producing the maximum output from given
quantities of inputs. Any production function assumes that a firm is operating at technical
efficiency. It follows from this that a given output may be produced in many ways, each
one of which may be technically efficient; in other words, that output is the maximum
output that can be produced from each different combination of inputs (Wilkinson 2005:
205).
[Economic efficiency] involves producing a given output at least cost. This usually
involves a unique combination of inputs, the levels of these inputs depending on their
substitutability and complementarity, and also on their prices (Wilkinson 2005: 205).
In this vein, energy efficiency in electricity can be view from both technical and economic
perceptive. Generally, energy efficiency simply refers to “the energy services provided per
unit of energy input” (Gillingham, Newell and Palmer 2009: 1). However, the World Energy
Council explains that energy efficiency has a broader meaning to economists:
…it encompasses all changes that result in decreasing the amount of energy used to
produce one unit of economic activity (e.g. the energy used per unit of GDP or value
added). In that case, energy efficiency is associated with economic efficiency and
includes all kind of technological, behavioural and economic changes that reduce the
amount of energy consumed per unit of GDP (World Energy Council 2010: 5).
Second, the neoclassical theory of the firm has been a key framework for many studies on
energy efficiency in industries. This theory, according to DeCanio (1993), regards firms as
knowledgeable, rational players that steadily maximize profits subject to the constraints
54
imposed by technology, public policy, and prevailing market conditions. Further, the theory
asserts that the technological and financial aspects of a firm are the driving force behind
decisions regarding technology adoption, and not firm’s characteristics such as relative size,
product lines, corporate earnings, and location (Howarth et al. 2000). However, some studies
have nullified neoclassical theory of the firm (see, for example, DeCanio and Watkins 1998).
Third, energy efficiency is regarded as a means to achieve overall efficient resource allocation
rather than the end in itself. For example, Morvaj and Bukarica (2010) consider energy
efficiency as a powerful tool for combating climate change. In addition, several studies have
validated the benefits of energy efficiency to industries (see, for example, Baumgartner and
Muggli 1996; Blok et al 1996; Howland and Murrow 2009; World Energy Council 2010).
On why the world should be interested in improving energy efficiency, for instance in
electricity use, the World Energy Council elaborates that improving energy efficiency will
have two benefits: (i) supply more consumers using the same electricity production capacity,
which is often the main constraint in many countries of Africa and Asia, and (ii) slow down
the electricity demand growth, and reduce the investment required for the growth of the
electricity sector; this is particularly significant in countries with high growth of the electricity
demand, such as China and many South East Asian countries.
Baumgartner and Muggli (1996) in their study of efficiency improvements of crosscutting
technologies in Swiss industry estimated savings of 15–35 per cent for electrical and
mechanical drives over the next 10–15 years. Similarly, Blok et al. (1996) projected the
economic efficiency improvements for Dutch light industry in 2000 (relative to 1990) at 30
per cent (with a 5 per cent discount rate) and 27 per cent (with a 10 per cent discount rate).
Goto (1996) studied that the energy efficiency improvements through 2010 for several
energy-intensive industries in Japan study and found that energy savings for iron and steel
ranged from 10 to 12 per cent, for chemicals from five to 10 per cent, for cement production
from two to eight per cent, and for pulp and paper from six to 18 per cent.
Howland and Murrow (2009) quantified the macroeconomic impacts of increased energy
efficiency investments in New England. They employed a multi-state policy-forecasting
model and analysed efficiency programs for electricity, natural gas, and unregulated fuels.
They found that the benefits from increased efficiency investments in New England were
significant for each fuel type. They go on to predict that increasing efficiency program
investments in all six states they studied over 15 years (US$16.8 billion invested by program
administrators) would increase economic activity by US$162 billion (2008 dollars).
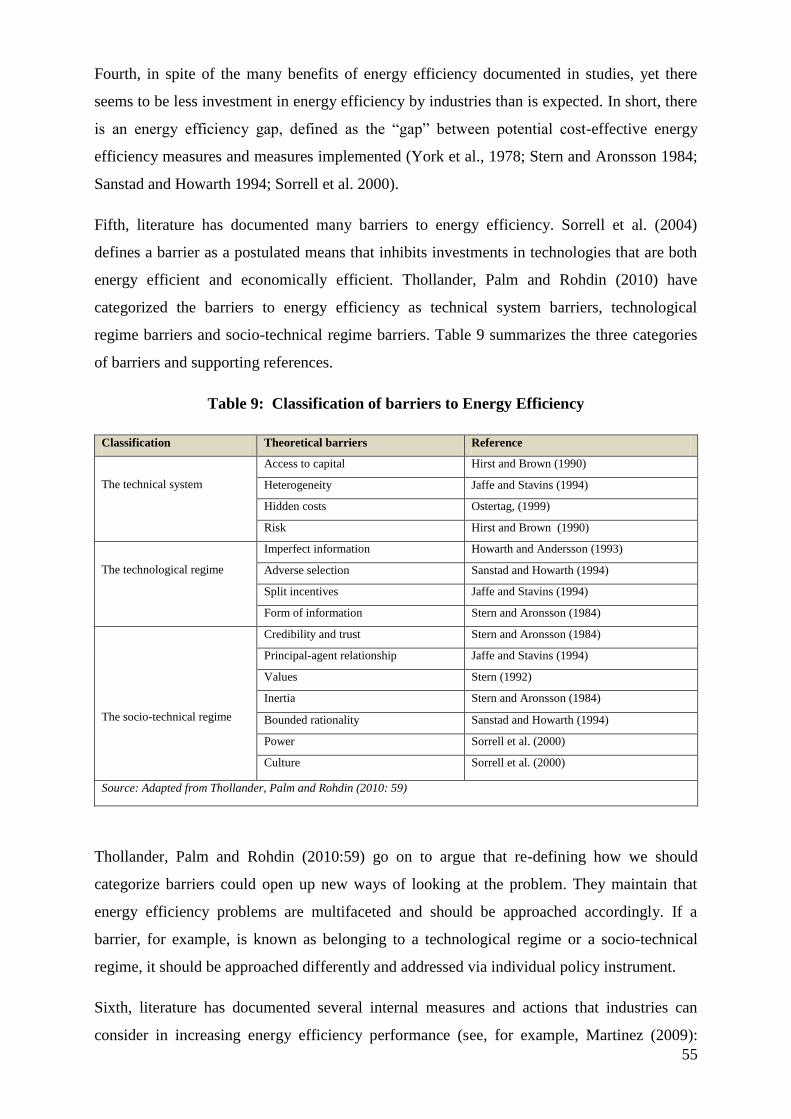
55
Fourth, in spite of the many benefits of energy efficiency documented in studies, yet there
seems to be less investment in energy efficiency by industries than is expected. In short, there
is an energy efficiency gap, defined as the “gap” between potential cost-effective energy
efficiency measures and measures implemented (York et al., 1978; Stern and Aronsson 1984;
Sanstad and Howarth 1994; Sorrell et al. 2000).
Fifth, literature has documented many barriers to energy efficiency. Sorrell et al. (2004)
defines a barrier as a postulated means that inhibits investments in technologies that are both
energy efficient and economically efficient. Thollander, Palm and Rohdin (2010) have
categorized the barriers to energy efficiency as technical system barriers, technological
regime barriers and socio-technical regime barriers. Table 9 summarizes the three categories
of barriers and supporting references.
Table 9: Classification of barriers to Energy Efficiency
Classification Theoretical barriers Reference
The technical system
Access to capital Hirst and Brown (1990)
Heterogeneity Jaffe and Stavins (1994)
Hidden costs Ostertag, (1999)
Risk Hirst and Brown (1990)
The technological regime
Imperfect information Howarth and Andersson (1993)
Adverse selection Sanstad and Howarth (1994)
Split incentives Jaffe and Stavins (1994)
Form of information Stern and Aronsson (1984)
The socio-technical regime
Credibility and trust Stern and Aronsson (1984)
Principal-agent relationship Jaffe and Stavins (1994)
Values Stern (1992)
Inertia Stern and Aronsson (1984)
Bounded rationality Sanstad and Howarth (1994)
Power Sorrell et al. (2000)
Culture Sorrell et al. (2000)
Source: Adapted from Thollander, Palm and Rohdin (2010: 59)
Thollander, Palm and Rohdin (2010:59) go on to argue that re-defining how we should
categorize barriers could open up new ways of looking at the problem. They maintain that
energy efficiency problems are multifaceted and should be approached accordingly. If a
barrier, for example, is known as belonging to a technological regime or a socio-technical
regime, it should be approached differently and addressed via individual policy instrument.
Sixth, literature has documented several internal measures and actions that industries can
consider in increasing energy efficiency performance (see, for example, Martinez (2009):
56
energy management systems; energy efficiency investment (for example, changes in
machinery, equipment and technology); changes in machinery and equipment; training
activities; voluntary audit; major product/process related technological changes, whether or
not introduced as part of public/private national and the R&D programmes; optimization of
production capacity and production level; conversion of industrial business - in terms of both
products and processes.
Seventh, literature documents that activities such as electricity metering, controlling, and
optimal regulation can lead to efficiency improvements of up to 15 per cent in most industrial
processes (see, for example, Vakulko and Zlobin 1997).
Last, literature has repeatedly documented that effective energy efficiency policies are
significant in promoting industry energy efficiency (see, for example, Gillingham et al 2009:
Martinez 2009; World Energy Council 2010). Gillingham et al. (2009: 24) maintain that
effective energy efficiency policies have two features: they must reduce the barriers to energy
efficiency, and they must be cost effective. Martinez (2009) affirms that effective energy
efficiency policies in manufacturing industries are those that utilize legal and fiscal
instruments to generate supporting framework conditions as well as targeted programs in
many fields such as R&D, technological change, market transformation, information,
education, and dissemination of best practice.
In this vein, the World Energy Council (2010: 6) explain that the main objective of policy
measures is to create the necessary conditions to speed up the development and the
deployment of market efficient equipment, through information for and communication with
final consumers; economic support though subsidies or tax reduction; deployment of specific
financing mechanisms; regulation for appliances, equipment and building, regulation
imposing energy savings requirements for consumers and for utilities; R&D and
dissemination of expertise in the field of energy efficiency.
Captivatingly, two major criticisms have been levelled against most studies on energy
efficiency policies: (i) “free riders” are not always accurately accounted for in econometric
assessments (see, for example, Joskow and Marron 1992), and (ii) policy evaluations either
ignore or improperly account for the rebound effect, such that energy efficiency
improvements decrease the marginal cost of energy services, in so doing increasing demand
and stimulating less-than-proportional reductions in energy use (Gillingham et al. 2006).
57
4.3.2 Literature on efficient use of electricity in industry sector in Zambia
As already stated, one of the two aims for this study is to expose any energy efficiency
developments or improvements in the industry in Zambia. Energy efficiency improvements,
according to the World Energy Council (2010: 4), refer to a reduction in the energy used for a
given service (heating, lighting, etc.) or level of activity.
My search for publications on energy efficiency in industries in Zambia was a difficult quest.
Plainly, I did not find research publications that specifically address energy efficiency in
industries in Zambia. However, the report on “World Energy Assessment Report and the
challenge of sustainability” (UNDP 2000) stated that in 28 small and medium size industries
in Zambia the energy potential savings are between 15 and 30 per cent.
In addition, the outcomes of the activities by ZESCO and the Government to foster efficient
use of electricity in industry in Zambia have not been documented. Sisala (2008), for
example, in his presentation on “Challenges and Possible Solutions in the Power Sector in
Zambia” exposed that ZESCO had started helping the industry sector in Zambia to implement
energy saving measurers: installing electric motor optimisers on big motors; using variable
speed drives for pulley coupled drives; installing power factor correction equipment
(capacitor banks); not starting all industrial machines at the same time to avoid creating local
peak loads; arresting all compressed air leaks; insulating all steam pipes correctly; and
installing floor mounted capacitor banks.
The Zambian government removed import duty on energy saving equipment and energy
generating equipment in 2008 to promote the efficient use of electricity by industries
(International Business Development [DIBD] 2011). The removal of import duty is one of
several forms of rendering the economic support for the purchase of energy efficient
equipment and devices. Other forms, according to (World Energy Council 2010: 6), include
loans, subsidies, and tax credits).
Nevertheless, apart from the aforementioned energy serving potential in 28 small and medium
size industries in Zambia, no other outcomes of the stated ZESCO and Government efforts in
improving efficient use of electricity in the industry sector have been documented or
published. Lack of such documentation makes the current study useful in exposing
improvements in the efficient use of electricity in the industries in Zambia.
58
4.4 CHAPTER SUMMARY
This chapter has reviewed general literature on industrial electricity demand, specific
literature on industrial electricity in Zambia, and literature on energy efficiency in industry.
First, the chapter has exposed several pertinent issues on electricity demand in industries:
electricity demand elasticity is great in the long run than the short run; electricity demand
response to changes in electricity price vary across industries; weather conditions and the time
of use of electricity have a substantial impact on electricity demand in industries; potentials
for inter-fuel substitution occur; the time trend variable as been used widely in the industrial
electricity demand models; and there are mixed research results on whether income
elasticities are bigger than price elasticities of industrial electricity demand
Second, studies on industrial electricity demand in Zambia are seemingly insignificant, and
the effects of the increases in electricity tariff on electricity demand across residential,
commercial and industry sectors were not quantified using econometrics.
Third, although barriers to energy efficiency in industries (categorized as technical system
barriers, technological system barriers and socio-technical system barriers) exist and make the
energy efficiency gap, yet industries can consider several internal measures and actions to
increase the energy efficiency performance. In addition, several studies have placed a
premium on effective and appropriate energy efficiency policies for reducing the barriers to
energy efficiency industries.
Lastly, ZESCO and the Government of the Republic of Zambia have implemented several
efforts for improving the efficient use of electricity in the industry. Nevertheless, the results of
such efforts have not been exposed or published.
59
CHAPTER 5 METHODOLOGY
5.1 INTRODUCTION
In the previous chapter I presented the literature review. In this chapter I will present the
methodology of the study. I have arranged this chapter as follows: Section 5.2 presents the
theory of factor demand; Section 5.3 specifies the econometric model; Section 5.4 describes
that data set; and Section 5.5 gives a summary of the chapter.
5.2 THEORY OF FACTOR DEMAND
5.2.1 Theories and laws in economics
Theories are abstractions that attempt to avoid unnecessary detail in order to expose only
the essential elements of observable behaviour (Webster 2003: 5). Theories are formally
expressed using models. Models in economics may take the form of diagrams, graphs, or
mathematical statements that summarize the relationship between and among two or more
variables.
Frequently, more than one theory explains any given economic phenomenon. Therefore, good
theories should be chosen over bad ones. Good theories predict with greater accuracy than
“bad” theories. Webster (2003: 6) affirms that a theory that predicts an event with greater
accuracy must replace alternative theories, no matter how well those theories may have
predicted the same event in the past. Understandably, simpler models tend to predict better
than more complicated ones (Webster 2003: 6).
Usually, two common errors characterize theories (Webster 2003: 6-7): (i) the fallacy of post
hoc, ergo propter hoc (literally, “after this, therefore because of this”), and the fallacy of
composition (a wrong conclusion that is true for a part is necessarily true for the whole).
Generally, theories differ from laws. The difference is based on their ability to make accurate
predictions. Laws inherently predict events with absolute certainty. They are statements of
fact about the real world or the relationships that are constant in accordance with specified
underlying assumptions. Theories are merely attempts to explain or predict the behavior of
objects or events in the real world. Theories cannot predict events with complete accuracy
(Webster 2003: 8-9).
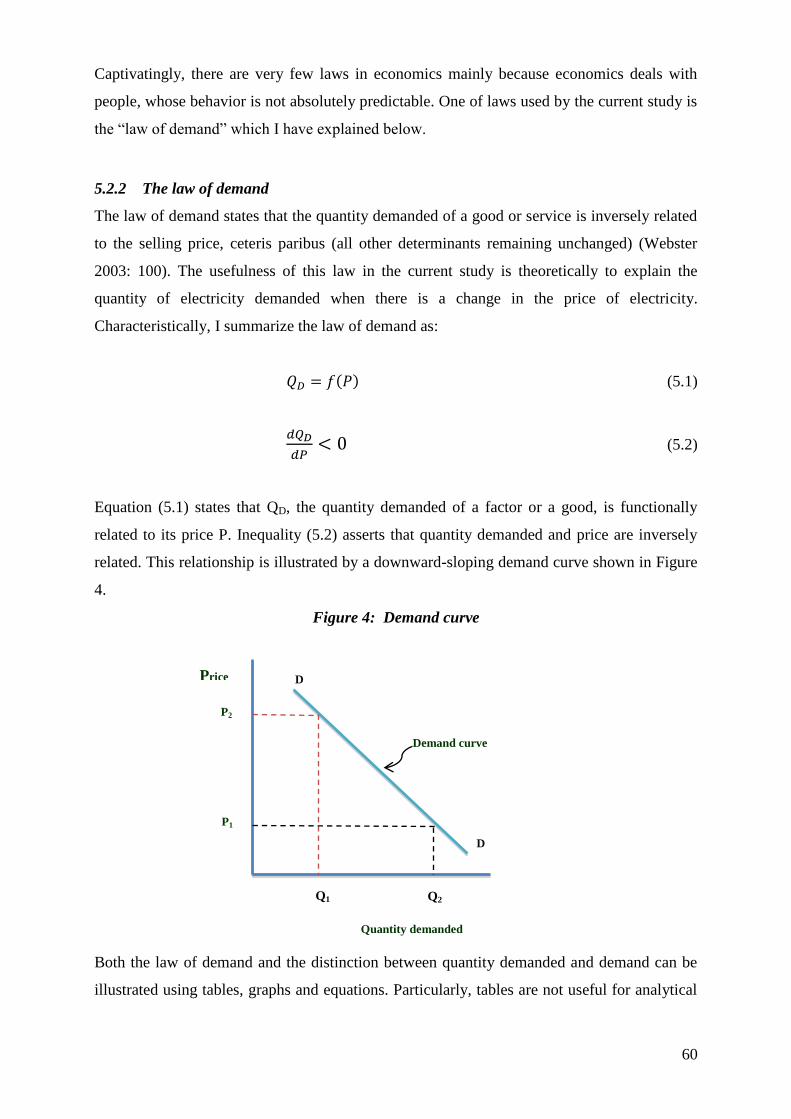
60
Captivatingly, there are very few laws in economics mainly because economics deals with
people, whose behavior is not absolutely predictable. One of laws used by the current study is
the “law of demand” which I have explained below.
5.2.2 The law of demand
The law of demand states that the quantity demanded of a good or service is inversely related
to the selling price, ceteris paribus (all other determinants remaining unchanged) (Webster
2003: 100). The usefulness of this law in the current study is theoretically to explain the
quantity of electricity demanded when there is a change in the price of electricity.
Characteristically, I summarize the law of demand as:
( ) (5.1)
(5.2)
Equation (5.1) states that QD, the quantity demanded of a factor or a good, is functionally
related to its price P. Inequality (5.2) asserts that quantity demanded and price are inversely
related. This relationship is illustrated by a downward-sloping demand curve shown in Figure
4.
Figure 4: Demand curve
Both the law of demand and the distinction between quantity demanded and demand can be
illustrated using tables, graphs and equations. Particularly, tables are not useful for analytical
Quantity demanded
Price
Q1 Q2
D
D
Demand curve
P1
P2
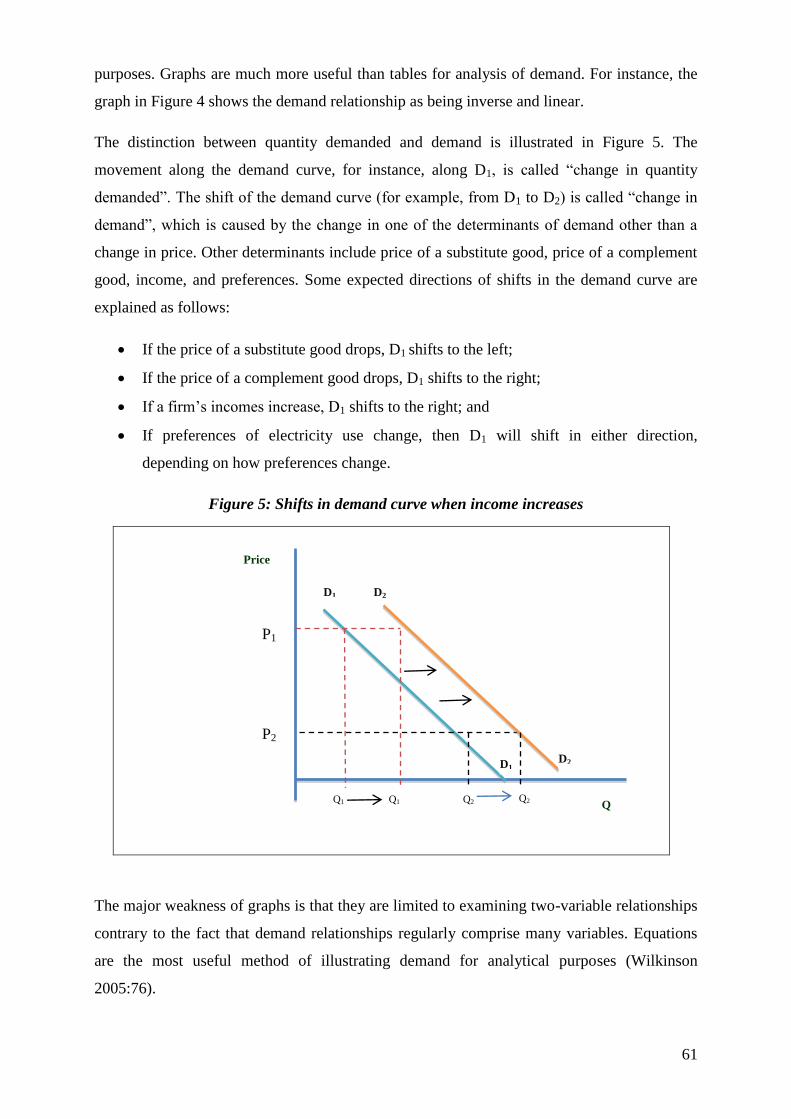
61
purposes. Graphs are much more useful than tables for analysis of demand. For instance, the
graph in Figure 4 shows the demand relationship as being inverse and linear.
The distinction between quantity demanded and demand is illustrated in Figure 5. The
movement along the demand curve, for instance, along D1, is called “change in quantity
demanded”. The shift of the demand curve (for example, from D1 to D2) is called “change in
demand”, which is caused by the change in one of the determinants of demand other than a
change in price. Other determinants include price of a substitute good, price of a complement
good, income, and preferences. Some expected directions of shifts in the demand curve are
explained as follows:
If the price of a substitute good drops, D1 shifts to the left;
If the price of a complement good drops, D1 shifts to the right;
If a firm’s incomes increase, D1 shifts to the right; and
If preferences of electricity use change, then D1 will shift in either direction,
depending on how preferences change.
Figure 5: Shifts in demand curve when income increases
The major weakness of graphs is that they are limited to examining two-variable relationships
contrary to the fact that demand relationships regularly comprise many variables. Equations
are the most useful method of illustrating demand for analytical purposes (Wilkinson
2005:76).
Q
Price
Q1 Q2
D1
D1 D2
D2
Q1
P1
P2
Q2
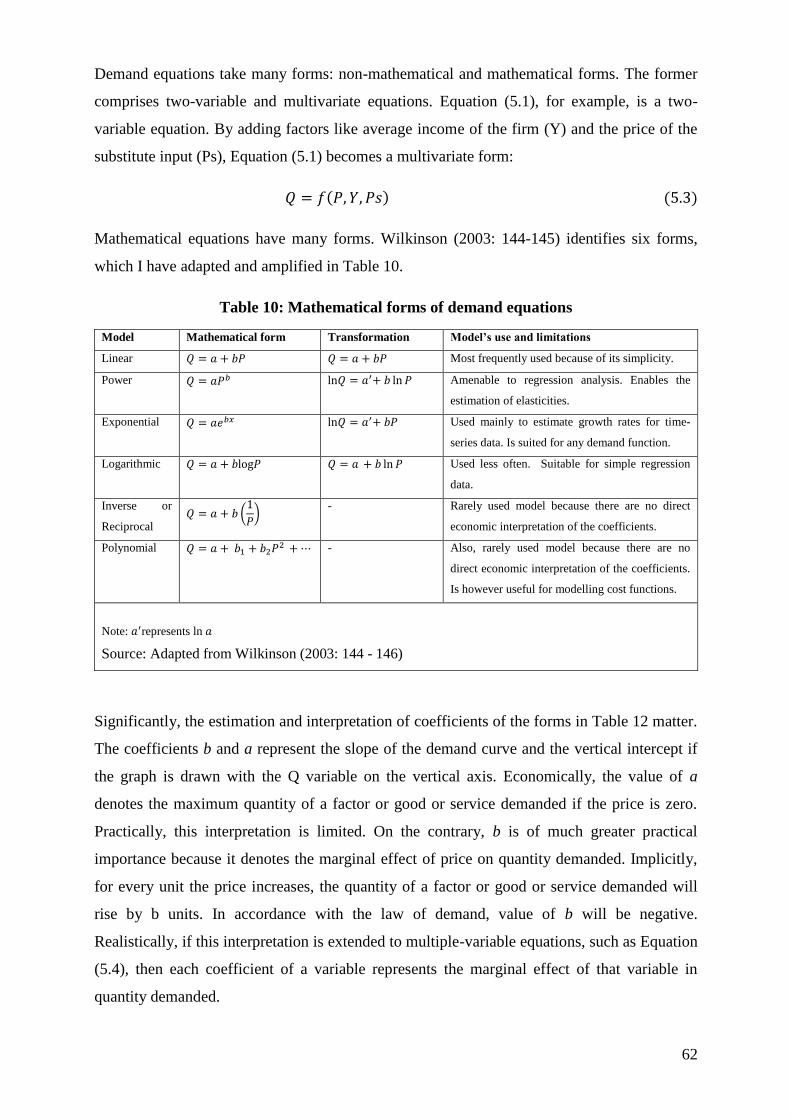
62
Demand equations take many forms: non-mathematical and mathematical forms. The former
comprises two-variable and multivariate equations. Equation (5.1), for example, is a two-
variable equation. By adding factors like average income of the firm (Y) and the price of the
substitute input (Ps), Equation (5.1) becomes a multivariate form:
( ) ( )
Mathematical equations have many forms. Wilkinson (2003: 144-145) identifies six forms,
which I have adapted and amplified in Table 10.
Table 10: Mathematical forms of demand equations
Model Mathematical form Transformation Model’s use and limitations
Linear Most frequently used because of its simplicity.
Power Amenable to regression analysis. Enables the
estimation of elasticities.
Exponential Used mainly to estimate growth rates for time-
series data. Is suited for any demand function.
Logarithmic Used less often. Suitable for simple regression
data.
Inverse or
Reciprocal (
)
- Rarely used model because there are no direct
economic interpretation of the coefficients.
Polynomial - Also, rarely used model because there are no
direct economic interpretation of the coefficients.
Is however useful for modelling cost functions.
Note: represents ln
Source: Adapted from Wilkinson (2003: 144 - 146)
Significantly, the estimation and interpretation of coefficients of the forms in Table 12 matter.
The coefficients b and a represent the slope of the demand curve and the vertical intercept if
the graph is drawn with the Q variable on the vertical axis. Economically, the value of a
denotes the maximum quantity of a factor or good or service demanded if the price is zero.
Practically, this interpretation is limited. On the contrary, b is of much greater practical
importance because it denotes the marginal effect of price on quantity demanded. Implicitly,
for every unit the price increases, the quantity of a factor or good or service demanded will
rise by b units. In accordance with the law of demand, value of b will be negative.
Realistically, if this interpretation is extended to multiple-variable equations, such as Equation
(5.4), then each coefficient of a variable represents the marginal effect of that variable in
quantity demanded.
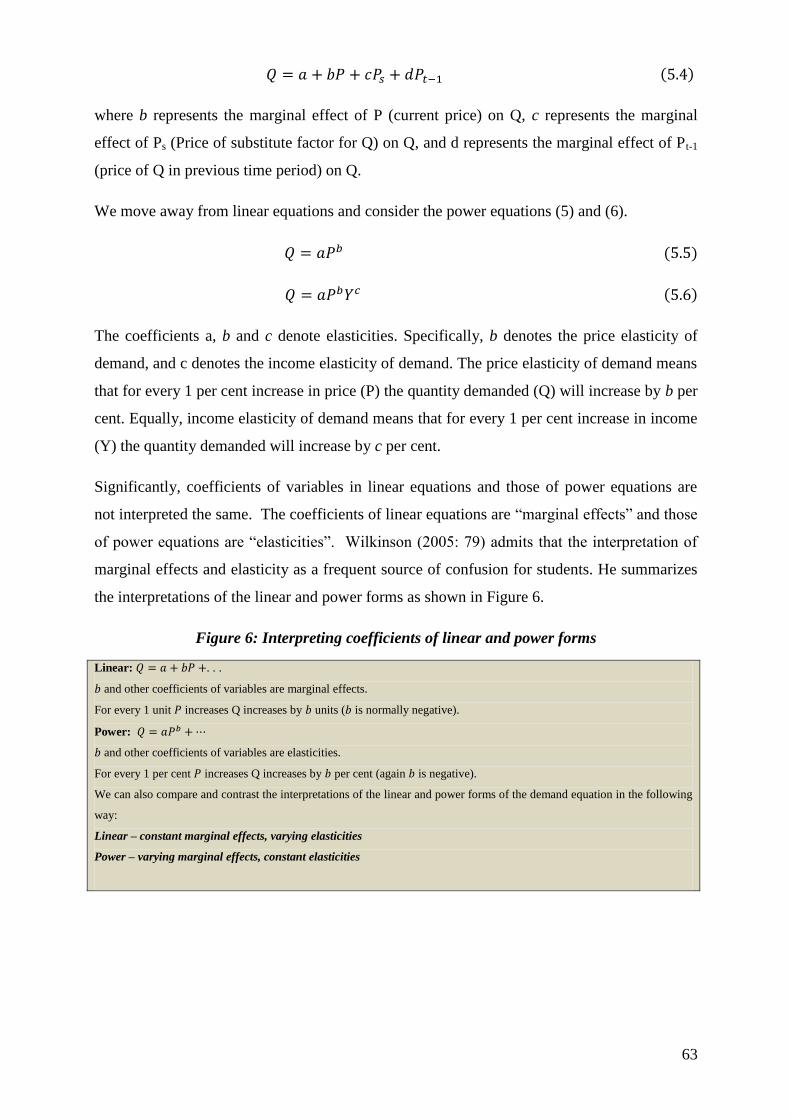
63
( )
where b represents the marginal effect of P (current price) on Q, c represents the marginal
effect of Ps (Price of substitute factor for Q) on Q, and d represents the marginal effect of Pt-1
(price of Q in previous time period) on Q.
We move away from linear equations and consider the power equations (5) and (6).
( )
( )
The coefficients a, b and c denote elasticities. Specifically, b denotes the price elasticity of
demand, and c denotes the income elasticity of demand. The price elasticity of demand means
that for every 1 per cent increase in price (P) the quantity demanded (Q) will increase by b per
cent. Equally, income elasticity of demand means that for every 1 per cent increase in income
(Y) the quantity demanded will increase by c per cent.
Significantly, coefficients of variables in linear equations and those of power equations are
not interpreted the same. The coefficients of linear equations are “marginal effects” and those
of power equations are “elasticities”. Wilkinson (2005: 79) admits that the interpretation of
marginal effects and elasticity as a frequent source of confusion for students. He summarizes
the interpretations of the linear and power forms as shown in Figure 6.
Figure 6: Interpreting coefficients of linear and power forms
Linear: . . .
and other coefficients of variables are marginal effects.
For every 1 unit increases Q increases by units ( is normally negative).
Power:
and other coefficients of variables are elasticities.
For every 1 per cent increases Q increases by per cent (again is negative).
We can also compare and contrast the interpretations of the linear and power forms of the demand equation in the following
way:
Linear – constant marginal effects, varying elasticities
Power – varying marginal effects, constant elasticities
64
The above information on coefficient interpretation is relevant to the current study. Implicitly,
the marginal effects of explanatory variables on the Zambian industrial electricity demand
will be treated as varying and their elasticities as constant.
Having introduced and illustrated some aspects of the theory and the law of demand, I will
proceed to specify a theoretical model for the study.
5.2.1 Theoretical model
Electricity is a major input in the industrial processes in Zambia. The cost theory of the firm
entails that each firm in the industry sector in Zambia aims at minimizing the input costs.
Bjørner (et al., 2001) explains that if all firms consider the price of electricity and other
factors as exogenous and that each firm minimizes its production costs, then demand for
electricity can be expressed as a function of the price of the factor inputs and the level of
production. In this vein, the problem for mines is the minimization of their production costs in
the short term, subject to their production function (technology):
(5.7)
( )
is electricity
is fuel (diesel of HFO)
is the mine’s production level of the final compound product,
is other inputs that are essential in the production process
is the price of electricity
is the price of fuel (diesel of HFO)
is the price of other inputs, and
is the mine’s fixed costs. The stock of capital remains constant (and implies only
fixed costs) given the short-term analysis
is the mine’s capital which determines .
Solving problem (5.7), I get the mine’s cost function and I can now distinguish between fixed
costs (FC) and variable costs (VC):
( ) ( ) ( ) (5.8)
65
I apply Shepard’s Lemma and derive the demand function for electricity as:
( )
( )
( ) ( )
I suppose that, in the period under consideration, electricity and fuel are separable from other
inputs so that the relationships between electricity and fuel with other inputs are neutral in
terms of price. Therefore, I can now exclude the price of other inputs from the model.
Furthermore, I suppose that the price of the final composite product remains constant and that
the electricity demand function depends on the production level. This would be equivalent to
functional dependence on the production value.
Having obtained the theoretical demand function for electricity, I will proceed to specify the
econometric model and explain the variables included in the model and the reasons for their
inclusion.
5.3 ECONOMETRIC MODEL SPECIFICATION
5.3.1 Econometric model
While there is no agreement in the literature about the most suitable functional form, most of
the studies that use individual demand equations adopt a linear or logarithmic form. I choose
to use a logarithmic specification, because the estimated coefficients are equivalent to the
elasticities and, as such, it is assumed that they are constant. I will use the Ordinary Least
Squares (OLS) regression to estimate the function. I assemble the variables in a log linear
function as follows:
TEUM is the total industrial electricity used by the mines - the dependent variable;
α0 is the constant;
α1 is the own price elasticity,
α2 is the cross elasticity with respect to the price of diesel or HFO;
α3 is the total mining index of industrial production elasticity;
AVEP is the average annual price of electricity;
DPP is the diesel pump price;
IMP is the mining industrial of production;
66
is the idiosyncratic error term
5.3.2 Description of the Variables
As already indicated in the previous chapter, several researchers have modelled industrial
electricity demand using various variables: energy costs, production levels, cross prices, and
number of establishments, time trend, time of use, and weather conditions. In the current
study I have considered such experience and I restrict the variables to price of electricity,
cross price of oil, index of mining production. I have not included dummy variables for the
simple reason that logarithms cannot be applied to dummy variables since one cannot take the
logarithm of zero.
5.3.3 TEUM ( total annual industrial electricity used by the mines)
The total industrial electricity use is the dependent variable. From the literature review and the
economic theories already discussed, industrial electricity demand is a function of many
variables. However, this study aims at explaining total industrial electricity use in Zambia as a
function of PEL (Price of electricity), POIL (Price of oil, in this case diesel), and IMP (index of
mining production). The unit measure of this variable was billion kWh.
5.3.3.1 AVEP (The annual average price of electricity)
Price of electricity, as stated in the theory of factor demand and the law of demand, is an
important variable in the present model. It is expected that when the unit price of electricity is
increased, the industry respond by using electricity more efficiently, that is, by implementing
electricity conservation and management measures. We expect a negative coefficient on price
of electricity indicating that when price of electricity increases by one per cent the quantity of
electricity demanded decreases. The unit measure of this variable was the Zambia
Kwacha/kWh.
5.3.3.2 DPP (Diesel Pump Price)
Heavy fuel oil (HFO) and diesel are most accessible substitutes for electricity in Zambia
industries, especially in the mining heating and drying processes. Therefore, the current model
includes weighted average prices or HFO and diesel with an anticipation that when HFO and
diesel prices are increased, most processes within the mining industry will respond by
switching to electricity and vice versa. The switch from oil to electricity use should be more
67
in the long run than in the short run. The unit measure for this variable was the average annual
diesel price (Zambian kwacha/litre, or simply the diesel pump price).
5.3.3.3 IMP (Index of mining production index)
Zambia has a wide range of mining products. Thus, it is enormously difficult to use only
physical mining products to specify the production level. For this reason, this study uses the
monetary value of mine products instead of the number of mine products. Specifically, Index
of mining production index is used. It is an index aimed at reflecting the change in the
quantum or the physical volume of the output of the industrial sectors of the economy with
respect to time. In this vein, it is expected that the total value of final products will have a
proportional relationship with electricity consumption in the mining industry. Higher
production index would imply greater rates of electricity consumption. Thus the coefficient on
industrial production index is expected to be positive indicating that the total electricity
demand increases when industrial production index increases by one per cent.
5.4 DATA SET DESCRIPTION
In this section I have summarised and outlined the sources of the data. I used time-series data
on the mining industry in Zambia. The industry comprises three sub sectors, namely coal
mining, non-ferrous ore mining and stone quarrying.
5.4.1 Data summaries
The data on the electricity prices, fuel prices and index of mining production for the period
1980-2008 is summarized in Table 11. The data is presented in the log form.
I have used the Microsoft Excel to obtain the descriptive statistics presented in Table 12.
Standard deviation values in Table 12 simply show how much variation or dispersion of the
data points from their average mean. The interpretation is that a low standard deviation shows
that the data points are very close to the mean, but high standard deviation shows that the data
are spread out over a large array of values.
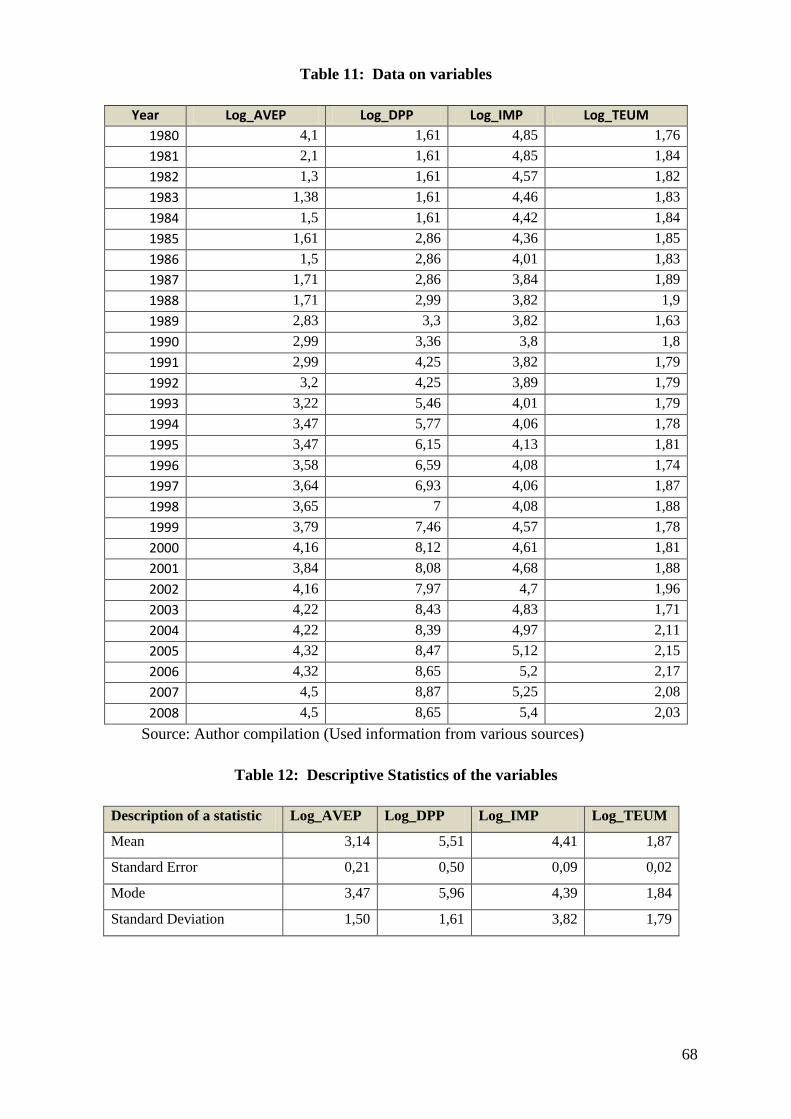
68
Table 11: Data on variables
Year Log_AVEP Log_DPP Log_IMP Log_TEUM
1980 4,1 1,61 4,85 1,76
1981 2,1 1,61 4,85 1,84
1982 1,3 1,61 4,57 1,82
1983 1,38 1,61 4,46 1,83
1984 1,5 1,61 4,42 1,84
1985 1,61 2,86 4,36 1,85
1986 1,5 2,86 4,01 1,83
1987 1,71 2,86 3,84 1,89
1988 1,71 2,99 3,82 1,9
1989 2,83 3,3 3,82 1,63
1990 2,99 3,36 3,8 1,8
1991 2,99 4,25 3,82 1,79
1992 3,2 4,25 3,89 1,79
1993 3,22 5,46 4,01 1,79
1994 3,47 5,77 4,06 1,78
1995 3,47 6,15 4,13 1,81
1996 3,58 6,59 4,08 1,74
1997 3,64 6,93 4,06 1,87
1998 3,65 7 4,08 1,88
1999 3,79 7,46 4,57 1,78
2000 4,16 8,12 4,61 1,81
2001 3,84 8,08 4,68 1,88
2002 4,16 7,97 4,7 1,96
2003 4,22 8,43 4,83 1,71
2004 4,22 8,39 4,97 2,11
2005 4,32 8,47 5,12 2,15
2006 4,32 8,65 5,2 2,17
2007 4,5 8,87 5,25 2,08
2008 4,5 8,65 5,4 2,03
Source: Author compilation (Used information from various sources)
Table 12: Descriptive Statistics of the variables
Description of a statistic Log_AVEP Log_DPP Log_IMP Log_TEUM
Mean 3,14 5,51 4,41 1,87
Standard Error 0,21 0,50 0,09 0,02
Mode 3,47 5,96 4,39 1,84
Standard Deviation 1,50 1,61 3,82 1,79
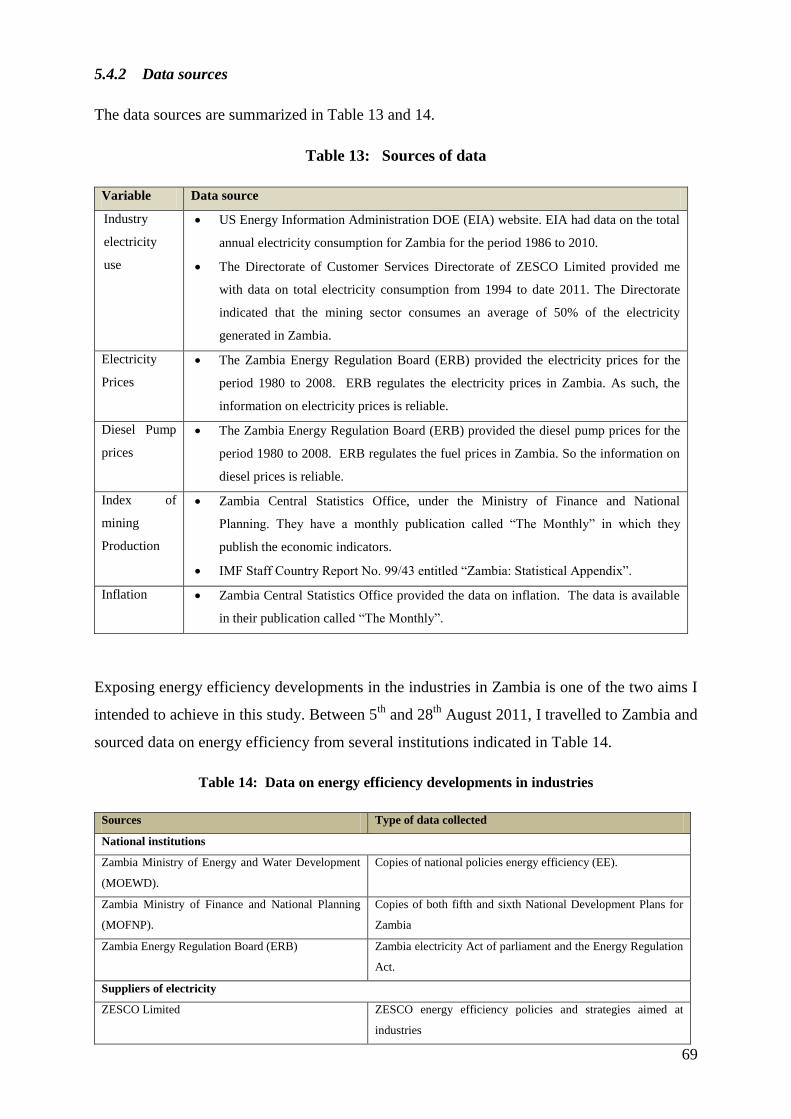
69
5.4.2 Data sources
The data sources are summarized in Table 13 and 14.
Table 13: Sources of data
Variable Data source
Industry
electricity
use
US Energy Information Administration DOE (EIA) website. EIA had data on the total
annual electricity consumption for Zambia for the period 1986 to 2010.
The Directorate of Customer Services Directorate of ZESCO Limited provided me
with data on total electricity consumption from 1994 to date 2011. The Directorate
indicated that the mining sector consumes an average of 50% of the electricity
generated in Zambia.
Electricity
Prices
The Zambia Energy Regulation Board (ERB) provided the electricity prices for the
period 1980 to 2008. ERB regulates the electricity prices in Zambia. As such, the
information on electricity prices is reliable.
Diesel Pump
prices
The Zambia Energy Regulation Board (ERB) provided the diesel pump prices for the
period 1980 to 2008. ERB regulates the fuel prices in Zambia. So the information on
diesel prices is reliable.
Index of
mining
Production
Zambia Central Statistics Office, under the Ministry of Finance and National
Planning. They have a monthly publication called “The Monthly” in which they
publish the economic indicators.
IMF Staff Country Report No. 99/43 entitled “Zambia: Statistical Appendix”.
Inflation Zambia Central Statistics Office provided the data on inflation. The data is available
in their publication called “The Monthly”.
Exposing energy efficiency developments in the industries in Zambia is one of the two aims I
intended to achieve in this study. Between 5th
and 28th
August 2011, I travelled to Zambia and
sourced data on energy efficiency from several institutions indicated in Table 14.
Table 14: Data on energy efficiency developments in industries
Sources Type of data collected
National institutions
Zambia Ministry of Energy and Water Development
(MOEWD).
Copies of national policies energy efficiency (EE).
Zambia Ministry of Finance and National Planning
(MOFNP).
Copies of both fifth and sixth National Development Plans for
Zambia
Zambia Energy Regulation Board (ERB) Zambia electricity Act of parliament and the Energy Regulation
Act.
Suppliers of electricity
ZESCO Limited ZESCO energy efficiency policies and strategies aimed at
industries
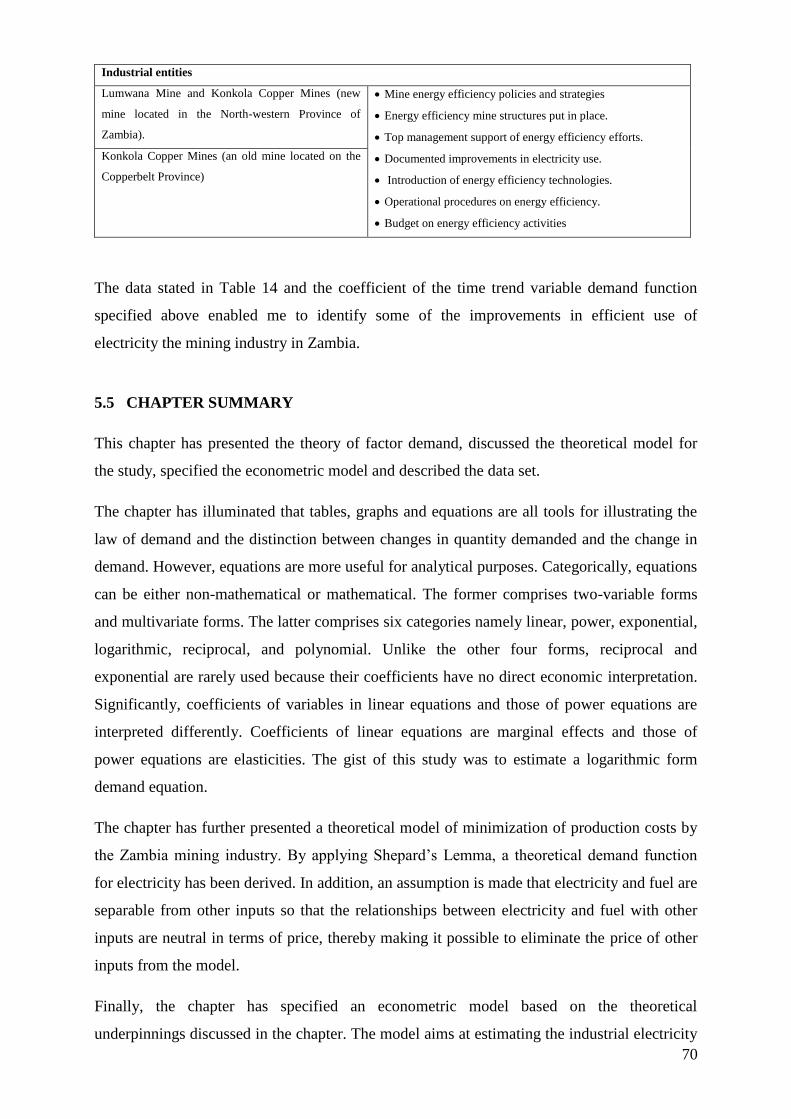
70
Industrial entities
Lumwana Mine and Konkola Copper Mines (new
mine located in the North-western Province of
Zambia).
Mine energy efficiency policies and strategies
Energy efficiency mine structures put in place.
Top management support of energy efficiency efforts.
Documented improvements in electricity use.
Introduction of energy efficiency technologies.
Operational procedures on energy efficiency.
Budget on energy efficiency activities
Konkola Copper Mines (an old mine located on the
Copperbelt Province)
The data stated in Table 14 and the coefficient of the time trend variable demand function
specified above enabled me to identify some of the improvements in efficient use of
electricity the mining industry in Zambia.
5.5 CHAPTER SUMMARY
This chapter has presented the theory of factor demand, discussed the theoretical model for
the study, specified the econometric model and described the data set.
The chapter has illuminated that tables, graphs and equations are all tools for illustrating the
law of demand and the distinction between changes in quantity demanded and the change in
demand. However, equations are more useful for analytical purposes. Categorically, equations
can be either non-mathematical or mathematical. The former comprises two-variable forms
and multivariate forms. The latter comprises six categories namely linear, power, exponential,
logarithmic, reciprocal, and polynomial. Unlike the other four forms, reciprocal and
exponential are rarely used because their coefficients have no direct economic interpretation.
Significantly, coefficients of variables in linear equations and those of power equations are
interpreted differently. Coefficients of linear equations are marginal effects and those of
power equations are elasticities. The gist of this study was to estimate a logarithmic form
demand equation.
The chapter has further presented a theoretical model of minimization of production costs by
the Zambia mining industry. By applying Shepard’s Lemma, a theoretical demand function
for electricity has been derived. In addition, an assumption is made that electricity and fuel are
separable from other inputs so that the relationships between electricity and fuel with other
inputs are neutral in terms of price, thereby making it possible to eliminate the price of other
inputs from the model.
Finally, the chapter has specified an econometric model based on the theoretical
underpinnings discussed in the chapter. The model aims at estimating the industrial electricity

71
demand has a function of electricity prices, diesel prices, total mining index of production,
inflation, the electricity intense share for the mines, and the time trend. The variables and
rationale for including them in the model have been presented. Last, data have been presented,
their statistics described and their sources outlined. On this note, the next chapter will present
the results of the data analysis.
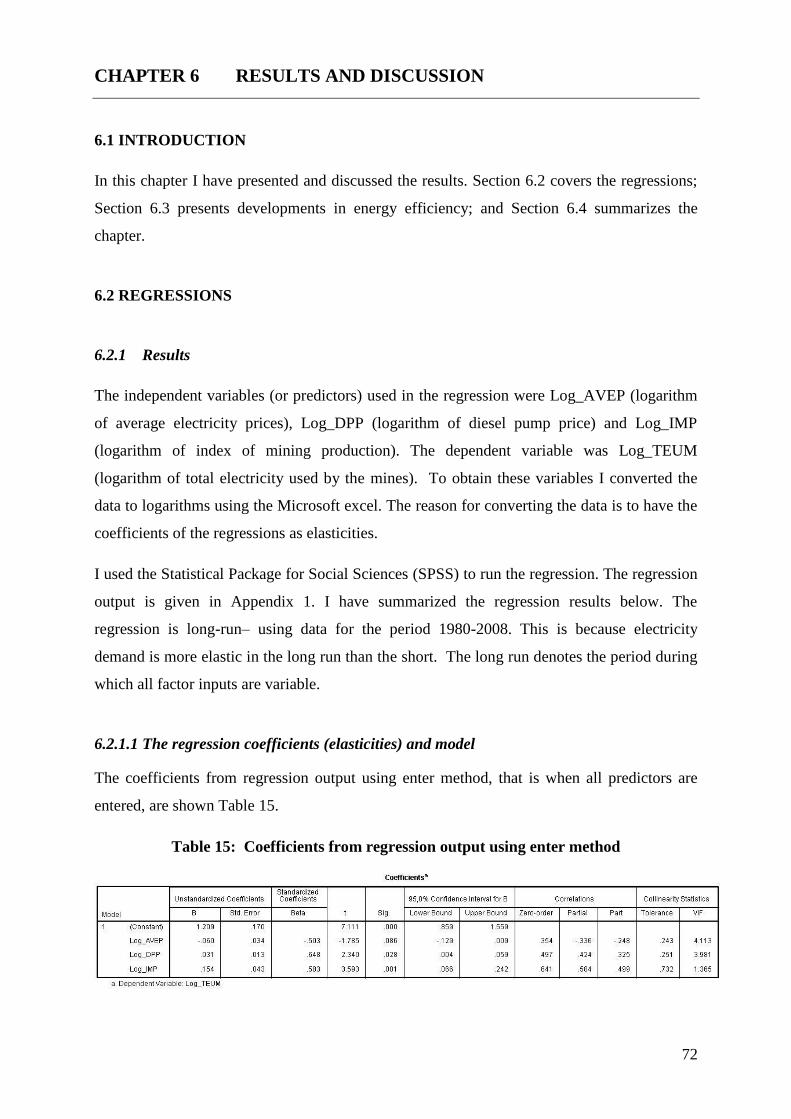
72
CHAPTER 6 RESULTS AND DISCUSSION
6.1 INTRODUCTION
In this chapter I have presented and discussed the results. Section 6.2 covers the regressions;
Section 6.3 presents developments in energy efficiency; and Section 6.4 summarizes the
chapter.
6.2 REGRESSIONS
6.2.1 Results
The independent variables (or predictors) used in the regression were Log_AVEP (logarithm
of average electricity prices), Log_DPP (logarithm of diesel pump price) and Log_IMP
(logarithm of index of mining production). The dependent variable was Log_TEUM
(logarithm of total electricity used by the mines). To obtain these variables I converted the
data to logarithms using the Microsoft excel. The reason for converting the data is to have the
coefficients of the regressions as elasticities.
I used the Statistical Package for Social Sciences (SPSS) to run the regression. The regression
output is given in Appendix 1. I have summarized the regression results below. The
regression is long-run– using data for the period 1980-2008. This is because electricity
demand is more elastic in the long run than the short. The long run denotes the period during
which all factor inputs are variable.
6.2.1.1 The regression coefficients (elasticities) and model
The coefficients from regression output using enter method, that is when all predictors are
entered, are shown Table 15.
Table 15: Coefficients from regression output using enter method
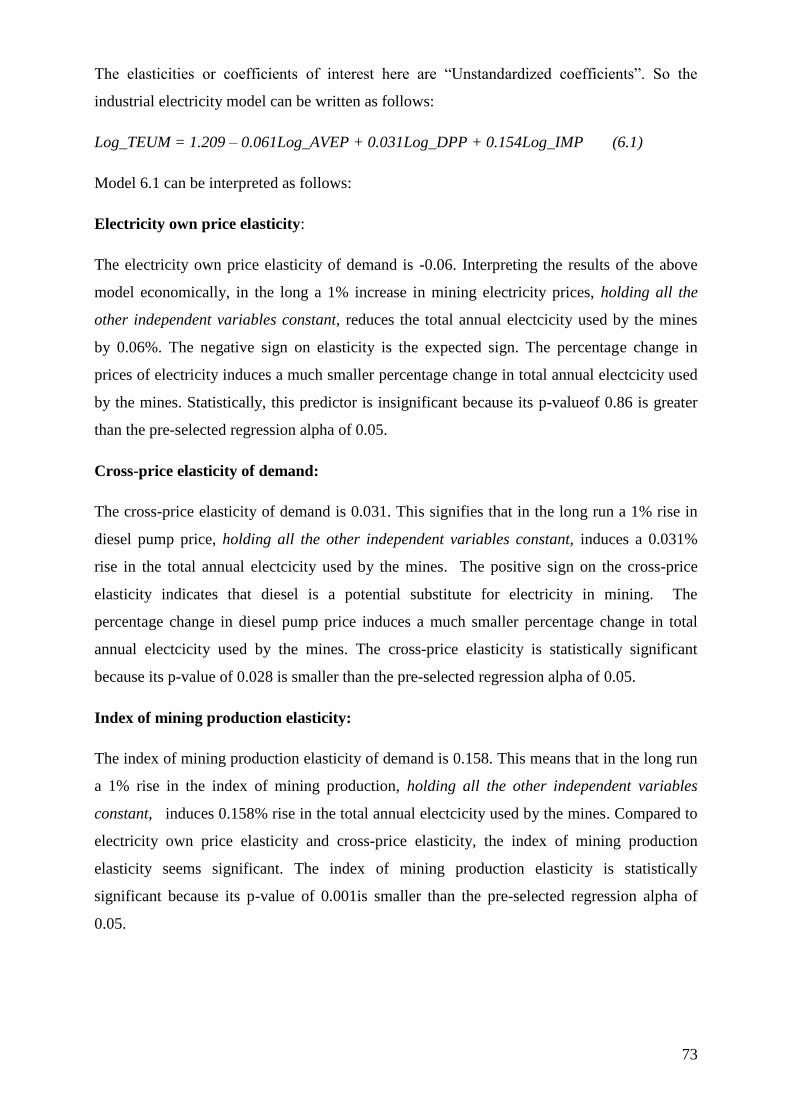
73
The elasticities or coefficients of interest here are “Unstandardized coefficients”. So the
industrial electricity model can be written as follows:
Log_TEUM = 1.209 – 0.061Log_AVEP + 0.031Log_DPP + 0.154Log_IMP (6.1)
Model 6.1 can be interpreted as follows:
Electricity own price elasticity:
The electricity own price elasticity of demand is -0.06. Interpreting the results of the above
model economically, in the long a 1% increase in mining electricity prices, holding all the
other independent variables constant, reduces the total annual electcicity used by the mines
by 0.06%. The negative sign on elasticity is the expected sign. The percentage change in
prices of electricity induces a much smaller percentage change in total annual electcicity used
by the mines. Statistically, this predictor is insignificant because its p-valueof 0.86 is greater
than the pre-selected regression alpha of 0.05.
Cross-price elasticity of demand:
The cross-price elasticity of demand is 0.031. This signifies that in the long run a 1% rise in
diesel pump price, holding all the other independent variables constant, induces a 0.031%
rise in the total annual electcicity used by the mines. The positive sign on the cross-price
elasticity indicates that diesel is a potential substitute for electricity in mining. The
percentage change in diesel pump price induces a much smaller percentage change in total
annual electcicity used by the mines. The cross-price elasticity is statistically significant
because its p-value of 0.028 is smaller than the pre-selected regression alpha of 0.05.
Index of mining production elasticity:
The index of mining production elasticity of demand is 0.158. This means that in the long run
a 1% rise in the index of mining production, holding all the other independent variables
constant, induces 0.158% rise in the total annual electcicity used by the mines. Compared to
electricity own price elasticity and cross-price elasticity, the index of mining production
elasticity seems significant. The index of mining production elasticity is statistically
significant because its p-value of 0.001is smaller than the pre-selected regression alpha of
0.05.
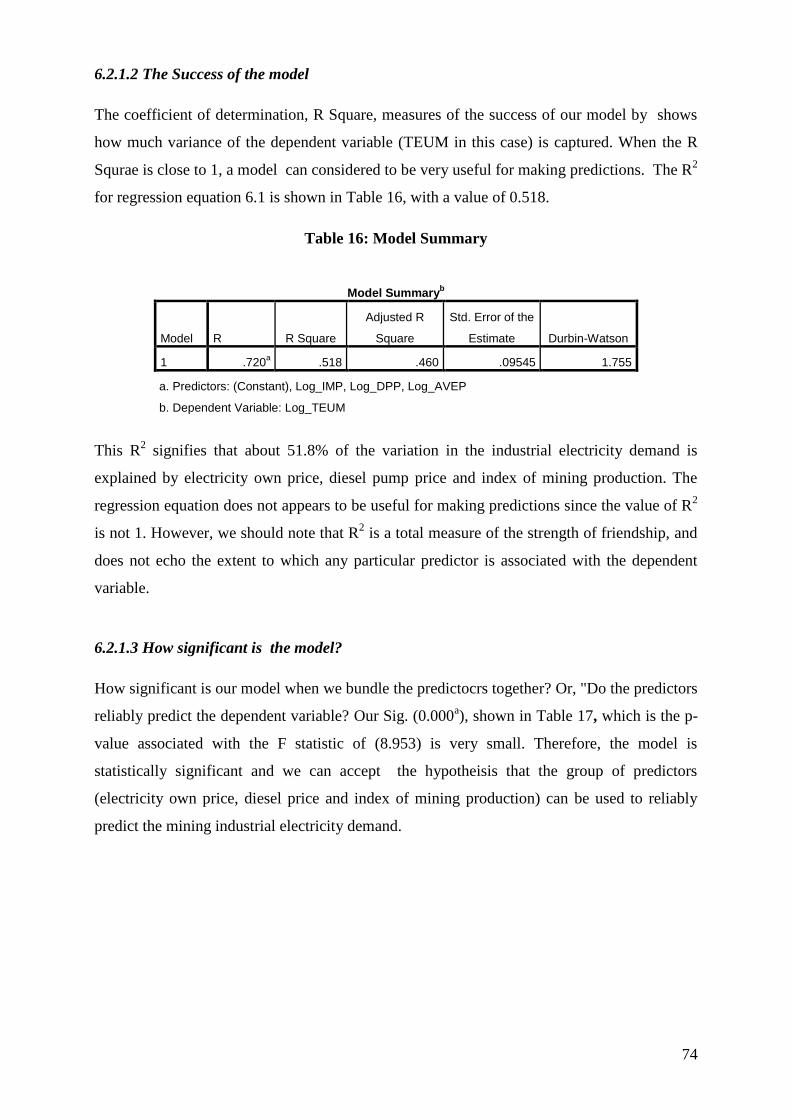
74
6.2.1.2 The Success of the model
The coefficient of determination, R Square, measures of the success of our model by shows
how much variance of the dependent variable (TEUM in this case) is captured. When the R
Squrae is close to 1, a model can considered to be very useful for making predictions. The R2
for regression equation 6.1 is shown in Table 16, with a value of 0.518.
Table 16: Model Summary
Model Summaryb
Model R R Square
Adjusted R
Square
Std. Error of the
Estimate Durbin-Watson
1 .720a .518 .460 .09545 1.755
a. Predictors: (Constant), Log_IMP, Log_DPP, Log_AVEP
b. Dependent Variable: Log_TEUM
This R2 signifies that about 51.8% of the variation in the industrial electricity demand is
explained by electricity own price, diesel pump price and index of mining production. The
regression equation does not appears to be useful for making predictions since the value of R2
is not 1. However, we should note that R2 is a total measure of the strength of friendship, and
does not echo the extent to which any particular predictor is associated with the dependent
variable.
6.2.1.3 How significant is the model?
How significant is our model when we bundle the predictocrs together? Or, "Do the predictors
reliably predict the dependent variable? Our Sig. (0.000a), shown in Table 17, which is the p-
value associated with the F statistic of (8.953) is very small. Therefore, the model is
statistically significant and we can accept the hypotheisis that the group of predictors
(electricity own price, diesel price and index of mining production) can be used to reliably
predict the mining industrial electricity demand.
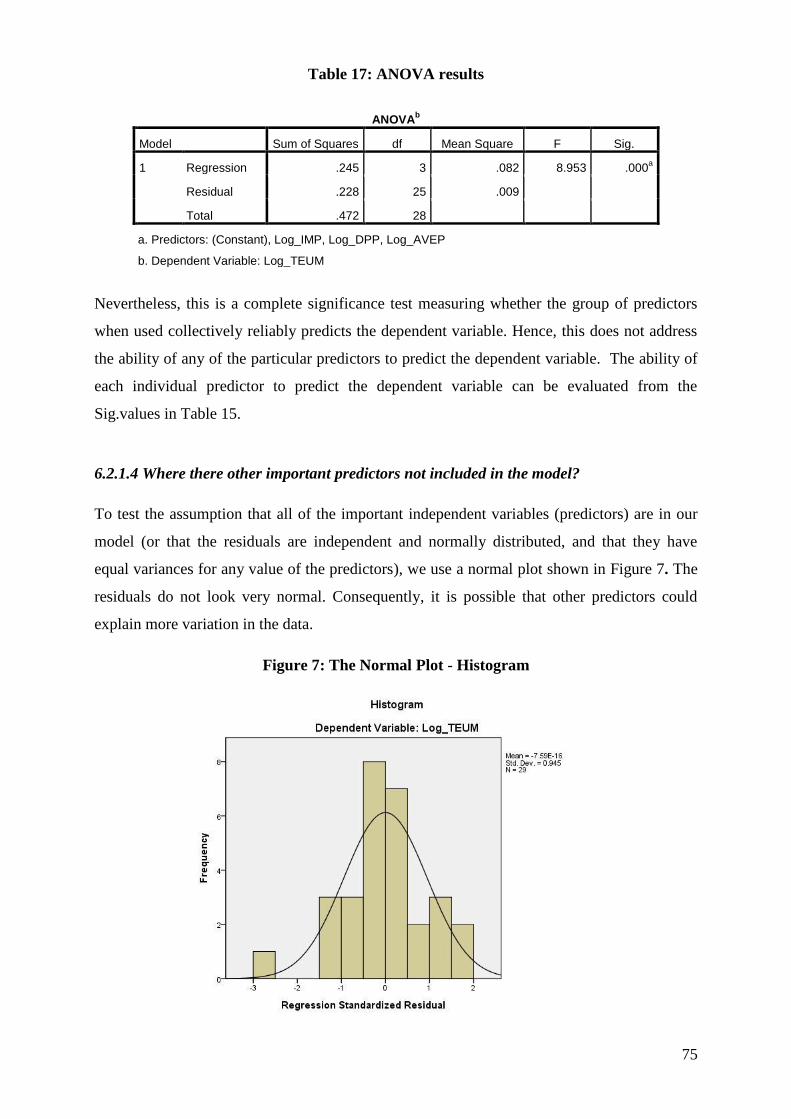
75
Table 17: ANOVA results
ANOVAb
Model Sum of Squares df Mean Square F Sig.
1 Regression .245 3 .082 8.953 .000a
Residual .228 25 .009
Total .472 28
a. Predictors: (Constant), Log_IMP, Log_DPP, Log_AVEP
b. Dependent Variable: Log_TEUM
Nevertheless, this is a complete significance test measuring whether the group of predictors
when used collectively reliably predicts the dependent variable. Hence, this does not address
the ability of any of the particular predictors to predict the dependent variable. The ability of
each individual predictor to predict the dependent variable can be evaluated from the
Sig.values in Table 15.
6.2.1.4 Where there other important predictors not included in the model?
To test the assumption that all of the important independent variables (predictors) are in our
model (or that the residuals are independent and normally distributed, and that they have
equal variances for any value of the predictors), we use a normal plot shown in Figure 7. The
residuals do not look very normal. Consequently, it is possible that other predictors could
explain more variation in the data.
Figure 7: The Normal Plot - Histogram
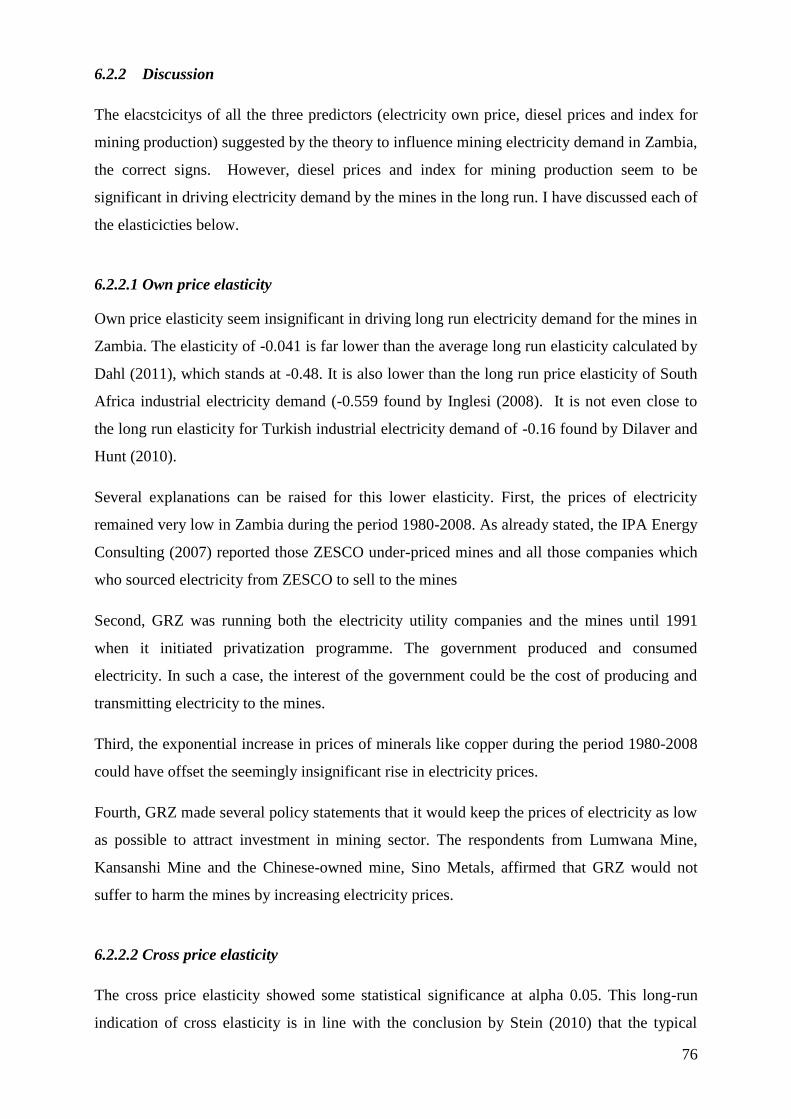
76
6.2.2 Discussion
The elacstcicitys of all the three predictors (electricity own price, diesel prices and index for
mining production) suggested by the theory to influence mining electricity demand in Zambia,
the correct signs. However, diesel prices and index for mining production seem to be
significant in driving electricity demand by the mines in the long run. I have discussed each of
the elasticicties below.
6.2.2.1 Own price elasticity
Own price elasticity seem insignificant in driving long run electricity demand for the mines in
Zambia. The elasticity of -0.041 is far lower than the average long run elasticity calculated by
Dahl (2011), which stands at -0.48. It is also lower than the long run price elasticity of South
Africa industrial electricity demand (-0.559 found by Inglesi (2008). It is not even close to
the long run elasticity for Turkish industrial electricity demand of -0.16 found by Dilaver and
Hunt (2010).
Several explanations can be raised for this lower elasticity. First, the prices of electricity
remained very low in Zambia during the period 1980-2008. As already stated, the IPA Energy
Consulting (2007) reported those ZESCO under-priced mines and all those companies which
who sourced electricity from ZESCO to sell to the mines
Second, GRZ was running both the electricity utility companies and the mines until 1991
when it initiated privatization programme. The government produced and consumed
electricity. In such a case, the interest of the government could be the cost of producing and
transmitting electricity to the mines.
Third, the exponential increase in prices of minerals like copper during the period 1980-2008
could have offset the seemingly insignificant rise in electricity prices.
Fourth, GRZ made several policy statements that it would keep the prices of electricity as low
as possible to attract investment in mining sector. The respondents from Lumwana Mine,
Kansanshi Mine and the Chinese-owned mine, Sino Metals, affirmed that GRZ would not
suffer to harm the mines by increasing electricity prices.
6.2.2.2 Cross price elasticity
The cross price elasticity showed some statistical significance at alpha 0.05. This long-run
indication of cross elasticity is in line with the conclusion by Stein (2010) that the typical
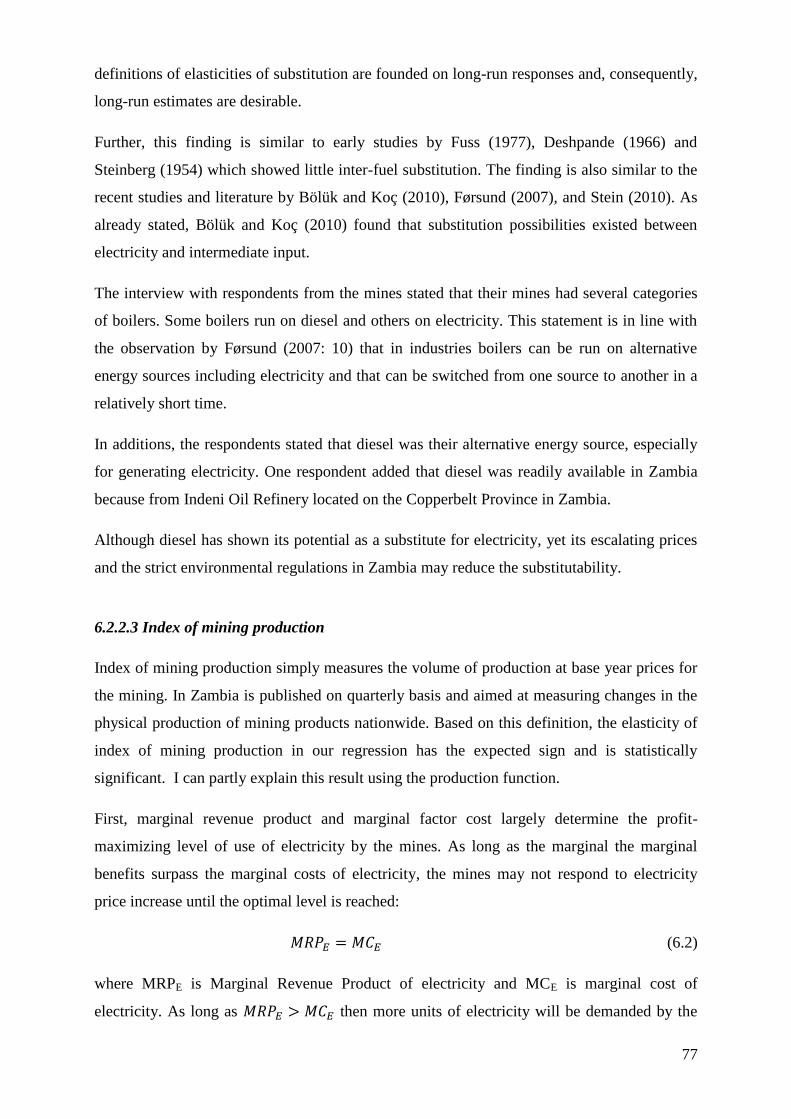
77
definitions of elasticities of substitution are founded on long-run responses and, consequently,
long-run estimates are desirable.
Further, this finding is similar to early studies by Fuss (1977), Deshpande (1966) and
Steinberg (1954) which showed little inter-fuel substitution. The finding is also similar to the
recent studies and literature by Bölük and Koç (2010), Førsund (2007), and Stein (2010). As
already stated, Bölük and Koç (2010) found that substitution possibilities existed between
electricity and intermediate input.
The interview with respondents from the mines stated that their mines had several categories
of boilers. Some boilers run on diesel and others on electricity. This statement is in line with
the observation by Førsund (2007: 10) that in industries boilers can be run on alternative
energy sources including electricity and that can be switched from one source to another in a
relatively short time.
In additions, the respondents stated that diesel was their alternative energy source, especially
for generating electricity. One respondent added that diesel was readily available in Zambia
because from Indeni Oil Refinery located on the Copperbelt Province in Zambia.
Although diesel has shown its potential as a substitute for electricity, yet its escalating prices
and the strict environmental regulations in Zambia may reduce the substitutability.
6.2.2.3 Index of mining production
Index of mining production simply measures the volume of production at base year prices for
the mining. In Zambia is published on quarterly basis and aimed at measuring changes in the
physical production of mining products nationwide. Based on this definition, the elasticity of
index of mining production in our regression has the expected sign and is statistically
significant. I can partly explain this result using the production function.
First, marginal revenue product and marginal factor cost largely determine the profit-
maximizing level of use of electricity by the mines. As long as the marginal the marginal
benefits surpass the marginal costs of electricity, the mines may not respond to electricity
price increase until the optimal level is reached:
(6.2)
where MRPE is Marginal Revenue Product of electricity and MCE is marginal cost of
electricity. As long as then more units of electricity will be demanded by the
78
mines. However, beyond the level any extra unit of electricity consumed
becomes a cost to the mine, that is .
Second, the role of electricity in mining is vital. I can say “No electricity no copper mining”.
Mining in Zambia cannot simply function without electricity. So the volume of production is
related to the amount of electricity used.
6.3 DEVELOPMENTS IN ENERGY EFFICIENCY
6.3.1 Results
6.3.1.1 The role played by GRZ
I accessed GRZ energy efficiency development with regards to national policies and strategies
that for energy efficiency in mining industries Policies.
I focused on energy efficiency developments within the context of (i) pricing and tax policies;
(ii) for energy efficiency institutional frameworks; (iii) for energy efficiency activities –
packages versus single activities; (iv) for energy efficiency private-public partnerships; (v) for
energy efficiency regulations (are regulations well planned, regularly strengthened and well
enforced?); (vi) GRZ leading by example in for energy efficiency; (vii) promotion of for
energy efficiency innovations in Zambia; (viii) GRZ focus on all for energy efficiency
potential areas; (ix) Monitoring and Evaluation for energy efficiency; and (x) mainstreaming
of energy efficiency in sectoral policies.
Developments in incentive Pricing and tax policies:
Incentive fiscal and pricing policies are the most efficient way of internalising long-term costs
and benefits in the market. In this vein GRZ has been conscious on pricing of electricity in
Zambia and has documented that high import duty on for energy efficiency industrial
equipment and a progressive increase of electricity prices even at a low rate, broadcasted
publicly, can have, in the long-term, a large impact on technological innovation and for
energy efficiency.
In this regard, the period under study 1980-2008 witnessed three major developments towards
promotions of energy efficiency in mining industry. First, GRZ, through ERB, managed to
keep prices of electricity for the mining industry very low. Second, GRZ removed import
duty on energy saving equipment and energy generating equipment in 2008. Third, GRZ
79
through ZESCO and ERB introduced a Time of Use (TOU) tariff. Mines like any other
industrial firm could subscribe to the tariff on a voluntary basis. However, GRZ reported that
the subscription of mines to TOU had been very low.
Developing a favourable and stable energy efficiency institutional framework:
Here a necessary assumption was that a proper regulatory framework with an energy
efficiency law and official quantitative targets for energy efficiency improvement could
provide a long lasting context for energy efficiency policies and avoid the negative effect of
“stop and start” actions. Did Zambia have such a regulatory framework during the period
1980-2008?
I interviewed one official from ERB and one from MWED and analysed various GRZ
documents on energy efficiency institutions in Zambia. Zambia did not have a stand-alone
energy efficiency institution. Nevertheless, the Zambian law mandated ERB to monitor
electricity utilities for energy efficiency. In addition, there was no legal document stating that
ERB should monitor users of electricity such as the mines.
Developing the private-public partnerships for energy efficiency:
Practically, for energy efficiency activities are costly. Therefore, public-private partnerships
are a necessary part of public policy on energy efficiency to complement public funds. In this
regard, this study aimed at finding out whether GRZ had brought in some incentives (such as
soft interest rates, tax credits, etc.) or mandatory targets (like quotas or commitments) during
the period 1980-2008. I based this aim on the assumption that Zambia had a stable regulatory
environment, which is a necessary condition for involvement of the private sector.
The main incentive for private-public partnership provided by GRZ during the period 1980-
2008 was the removal of the import-duty on energy efficiency equipment. Concerning
mandatory targets, the environmental licences issued to the mines by the Environmental
Council of Zambia, specified the emission limits and the penalties if a violation occurred. The
emission limits and penalties implicitly forced the mines to improve on energy efficiency
either by acquiring energy efficiency equipment, which are also associated with low gas
emissions.
During study interviews I asked the respondent from Lumwana Mine to explain whether
Lumwana Mine had partnered with GRZ on energy efficiency. The respondent, illuminated as
follows:
80
“You should understand that Environmental Council of Zambia has given us emission
limits for gasses and effluent discharge. So these conditions forces us to install energy
efficient equipped. The major advantage we have is that our mine is new and all our
equipment are energy efficient…”
Developing in for energy efficiency regulations:
Three activities are deemed necessary in developing for energy efficiency regulations. First, it
is prudent for policy makers to give sufficient notice to mines when future for energy
efficiency regulations are being planned, so that mines can adapt in advance to future
regulations, especially with respect to mandatory efficiency standards. If Zambia introduced
for energy efficiency related regulations during 1980-2008, where the mines given sufficient
notice?
Second, to remain effective, energy efficiency standards must be regularly updated. So, how
regular did Zambia update energy efficiency regulations during the period 1980-2008?
Third, regulations on energy efficiency are effective as long as they are really enforced. To
what extent did Zambia enforce energy efficiency related regulations during the period 1980-
2008?
The two respondents, one from the Ministry of Water and Energy Development and the other
from ERB revealed that policy makers in Zambia gave sufficient notice to the consumers of
electricity during the reveal of regulations. The respondent from ERB explained as follows:
“We cannot reveal the regulations without informing the people we regulate. That would
be tantamount to professional immorality. In fact, when revealing any piece of
regulations here in Zambia, we publish our intentions in national newspapers and
through radio and TV programmes. Also, we publish notices in government gazettes”.
On how regular Zambia updated for energy efficiency standards or any for energy efficiency
related regulations, there was a general view across the respondents that updating any for
energy efficiency related regulations were done only when the need to update them arose”.
Zambian public sector leading by example in for energy efficiency:
How involved was Zambia’s public sector on the promoting a market for energy efficient
equipment and services? Did the public sector itself procure and use energy efficient
equipment as a proof that the public sector can contribute to promotion and consolidation of a
market for energy efficient equipment and services? Was Zambia’s public sector involved at
all levels of for energy efficiency related decisions: national, provincial and district.
81
In response to the above questions, the respondent from the MWED was opinionated that
Zambia’s public sector could not be a leading example in for energy efficiency that mines
could emulate because the public sector did not run mines in Zambia.
There was a general agreement across respondents from the mines that Zambia’s public sector
did not cherish for energy efficiency in its operations. A respondent from Kansanshi
explained as follows:
“If public sector in your questions refers to the Zambian government, then I’m afraid to
say that energy efficiency does not exit. Of course we have heard ZESCO advertising on
TV about the benefits of saving electricity, but at the same time we are told that ZESCO
has not improved efficiency in the transmission of electricity. So to me government is
not leading as an example at all…”
Promoting for energy efficiency innovations in Zambia’s mining sector:
Had Zambia promoted innovative high impact measures using the experience of the most
advanced policies such as efficiency standards for mine operations; energy performance
contracting; reduced or credit tax on energy efficient equipment; and energy efficiency
obligations?
According to GRZ documents, the period 1980-2008 was characterized with no efficiency
standards for mine operations; no energy performance contracting; and no energy efficiency
obligations for the mines. However, GRZ had removed import duty on energy efficient
equipment but did not put a burn on importation of non-energy efficient equipment.
Did the regulatory bodies such as the Mines Safety Department and the Environmental
Council of Zambia promote the efficiency use of electricity in the mines?
In response to the above question, the respondent from MSD just read to the MSD mission to
me as follows:
“To formulate, monitor and maintain legislation regarding the safe and sustainable
exploration and exploitation of mineral resources and the safe manufacture,
transportation, use, storage, destruction, exportation and importation of civil
explosives for the maximum benefit for the people of Zambia”.
The respondent further added as follows:
“See, we are a government department, which means we only implement that which
the law says we should implement. So “bwana” (Sir), MSD is not legally
empowered to regulate energy efficiency in mines”.
82
The ECZ respondent observed that although ECZ’s prime concern with the mines was
environment, yet the enforcement of environment laws on mines must have contributed to
their acquisition of energy efficient equipment. The respondent had a strong conviction that
energy saving equipment emitted little pollutants. The respondent, however, was concerned
that the relatively low penalties for violating emission standards, and low electricity tariffs for
the mines were strong incentives for some mines to continue using use non-energy saving
equipment.
Addressing all mining activities with energy saving potential:
A functioning mine comprises several activities that use electricity. This implies that an
effective for energy efficiency policy would address all industrial activities with energy
saving potentials. Have Zambia’s for energy efficiency related polices addressed all energy
saving potential activities in the mine?
When asked to explain whether the Zambia’s for energy efficiency related polices addressed
all energy saving potential activities in the mine, the respondent from the Ministry of Water
and Energy Development cautioned as follows:
“As government, we do not have a specific policy on energy efficiency. So what
answer do expect from me? I suggest that you ask the mines if they have addressed all
the areas where they can save energy”.
The respondent from the ERB indicated ERB had deposited energy saving tips on its website.
However, the 6-page document on energy saving tips addressed residential consumers of
electricity. Document comprised nine themes: heating/insulation; geyser; lighting;
cooking/baking; ironing; refrigeration/fridge; heating; other appliances; and general.
Developing Energy Efficiency M&E system for mines
Many countries were increasingly using energy efficiency indicators to monitor targets of
energy efficiency gains. Most governments set quantitative targets required to monitor the
progress attained annually.
Did Zambia set quantitative targets required to monitor the for energy efficiency progress in
the mines during the period under review, 1980-2008? Had Zambia developed data collection
to improve energy efficiency assessments? Were the basic minimum data requirements
defined to allow relevant assessment of for energy efficiency in each mine and across mine
comparisons? Mines around Zambia could benefit from the exchange of information and
experiences on the “best measures” of saving energy.
83
During the period, under review (1980-2008) Zambia had not set the quantitative targets
required to monitor the energy efficiency progress in the mines; not collected data to improve
energy efficiency assessments; and not defined basic minimum data requirements for
evaluation of energy efficiency in each mine and across mine comparisons.
Specifically, Zambia’s National Energy Policy and the Fifth National Development Plan did
not mention any quantitative targets required to monitor the energy efficiency progress in the
mines. Also, my interviews with ERB and MWED revealed that the government had not set
targets for energy saving. In addition, national energy policy and the Fifth National
Development Plan had no defined minimum data requirements for energy efficiency
evaluation. Furthermore, there was an consensus across the respondents that mines could
benefit from exchange of information on EE. However, there were no systematic government
efforts to promote energy efficiency information sharing between mines.
Mainstreaming energy efficiency in Zambia’s sectoral policies
Here I started with the assumption that: An integration of energy efficiency policy and other
public policies will make the blend of market instruments more efficient. Therefore, it was
economically desirable if all the main sectoral public policies in Zambia had incorporated
energy efficiency during the period under review.
In this vein, I analysed two sectoral policies (the Mineral Policy and Strategy for Zambia, and
National Policy on Environment) and the Sectoral plans in the Zambia’s Fifth National
Development Plan, 2006-2010.
I found out that in the Mineral Policy and Strategy for Zambia document, the term energy or
electricity never appeared. Similarly, energy issues were not mainstreamed in several Sectoral
plans contained in Zambia’s Fifth National Development Plan, 2006-2010.
However, the National Policy on Environment (NPE) had mainstreamed energy efficiency.
Specifically, its Chapter 9 (The Energy Sector) states the objective of the sector as follows:
“To meet national energy needs with increased efficiency and environmental
sustainability”.
Furthermore, NPE states one of its objectives as to “promote energy saving and renewable
energy technologies.
6.3.1.2 The role played by electricity utilities
84
Was there any need for electricity utilities to concern themselves with the demand side
management of electricity in Zambia during the period 1980-2008? The answer is, yes. Yes
in the sense that demand-side management refers to actions taken on the customer's side of
the meter to change the amount or timing of electricity consumption. Hence, demand side
management, according to USA Department of Energy (2007 maximizes end-use efficiency
to avoid or postpone the construction of new power generating plants.
Theoretically, I investigated the level of engagement of ZESCO in five activities I deemed
necessary to promote energy efficiency in the mines: (i) incentive pricing policies; (ii) Load
management programmes, (iii) electricity efficiency rebates, (iv) electricity reduction
programmes, and (v) information dissemination of demand side management.
Incentive pricing policies:
The research on “Cost of ZESCO”, conducted by IPA Energy Consulting (2007) reviewed
that during the period under review, ZESCO had kept the electricity prices, especially for the
mines, very low. As already stated under literature review ZESCO had been under-pricing the
mines.
Load management programmes:
Not until 2008, ZESCO changed the electricity load pattern and encouraged less demand at
peak times and peak rates. Specifically, ZESCO introduced a Time of Use (TOU) tariff for
Maximum Demand consumers, mainly the mines. ZESCO charged all electricity used during
the off-peak time period with a discount of a 25% discount on energy charges and a 50%
discount on capacity charges. All electricity used during the peak time period attracted a
surcharge of 25% penalty on both energy and capacity charges.
ZESCO expected mines to take advantage of the TOU. To the contrarily, the TOU tariff was
not widely being used. ZESCO emphasized that the TOU tariff was not mandatory for
Maximum Demand consumers.
Electricity efficiency rebates:
No electricity rebates were given to the mines for use of energy-efficient products and
equipment, which in most cases use far less electricity than their equivalent older models. A
respondent from ZESCO explained that during the period under review ZESCO had managed
to convince the government to remove import duty on energy efficient equipment.
85
Electricity reduction programmes.
When asked to state whether ZESCO had introduced any electricity reduction programmes for
the mines during 1980-2008, the respondent explained that ZESCO had introduced
awareness-raising, training and education programmes. In addition, ZESCO had advocated for
efficient lighting in the mines, and helped mines to install electric meters.
According to Sisaala (2008), ZESCO had initiated programmes to enable the mines (i) install
electric motor optimisers on big motors, (ii) use variable speed drives for pulley coupled
drives, (ii) install power factor correction equipment (capacitor banks) (iv) do not start all
your machines at the same time to avoid creating local peak loads, (v) arrest all compressed
air leaks, (vi) insulate all steam pipes correctly, (vii) install intelligent motor controllers, and
(viii) floor mounted Capacitor Bank to Reduce KVA input and save up to 15% energy
Information Dissemination of demand-side management:
ZESCO conducted awareness campaigns on promoting user benefits and explained no
cost/low cost actions. Furthermore, ZESCO marketed energy efficiency programmes by
personal contacts with CEO’s of the mines in Zambia; and through the media (radio,
television and newspapers). The respondent from the mines elaborated as follows:
“We have been proactive disseminating information on energy savings. We
know that mines here in Zambia are the biggest consumer of electricity. If the
mines use electricity efficiently then ZESCO will have less electrical system
emergencies. So our continuous campaign for mines in Zambia to reduce on
electricity use is good”.
6.3.1.3 The role played by the mines
Knowledge about energy efficiency and its benefits:
During the study interviews, I asked each respondent from the mines to indicate whether the
mine top management understood the concept of energy efficiency, its benefits to the mines,
and the energy efficiency actions that the mine could take to actualize the benefits.
All the five respondents admitted that the mine top management understood the energy
efficiency concept and its benefits. On what energy efficiency actions the mine could take to
actualize the benefits, the respondents from Lumwana Mine and Kansanshi Mine emphasized
86
simply said “energy efficiency policy”. He respondent from Lumwana Mine explained as
follows:
“When it comes to our mine operations, policy is very important. If I take you
right now round the different sections of the mine, you will realize that we
keep to written procedures in all the activities. To me energy efficiency
without a written mine policy is a folk story”.
The respondent from Sino metals argued that since the mine’s prime goal is profit
maximization or cost reduction, there was need for the mine to be convinced that energy
efficiency actions will either reduce the costs or maximize the mine profits. The respondent
further explained as follows:
“If energy efficiency could pay in the short-run, every mine in Zambia could
be talking about it. But we are told that efficiency will profit the mine in the
long run. But how long is the long run? SO for me as long as the government
does not entice mines to invest in energy efficiency, then forget it comrade”.
The respondent from Konkola Copper Mines (KCM) explained that although KCM had no
written policy on energy efficiency, yet the its upholding of modern mining technology and
compliance with Zambia emissions standards had forced the mine engage itself in energy
efficiency activities. The respondent elaborated as follows:
“The Environmental Council of Zambia provides us with air permits and other
permits. These permits provide emission limits. To meet these limits KCM has
been replacing old equipment and with new energy saving equipment. For
example, ZESCO helped us install motor optimisers, capacitor banks, and
intelligent motor controllers. You should also understand that some buyers of
copper abroad inquire as to whether we use environmentally friendly
technologies, which to me are associated with low energy intake. I may say
much, but we need a long way to go”.
Mine energy efficiency policies:
All the respondents admitted not having come across of a stand-alone energy efficiency mine
policy. When asked why no energy efficiency policy, the respondent from Lumwana mine
responded with a question: “Mr. Researcher, why doesn’t the Zambian government have a
policy on energy efficiency mattered?
87
Top management support of energy efficiency efforts:
The general view from the respondents was that mine top management supported those
energy efficiency activities imposed on mines by the law enforcers like the Environmental
Council of Zambia. In addition, the respondent from Lumwana Mine added that top
management had Lumwana Mine had on several occasions considered and approved budgets
for training officers in energy efficiency.
6.3.2 Discussion
6.3.2.1 The role played by GRZ
The results show that GRZ had played a significant role in promoting the efficient use of
electricity in the mines in Zambia by removing import duty on energy efficient equipment.
This one act is not sufficient to bring about efficient use of electricity by the mines. Besides,
apart from new mines (Kansanshi Mine, Lumwana Mine and Kafue Nickel Mine), other old
mines were still using old technology associated with energy inefficiency.
The results also indicate that Zambia no national policy on energy efficiency. This renders the
role of GRZ in steering energy efficiency in mines as seemingly weak. As already stated in
literature review, an effective energy efficiency policy is significant in promoting industry
energy efficiency (Gillingham et al 2009: Martinez 2009; World Energy Council 2010).
That GRZ, as a regulator and promoter of energy efficiency in mines, must have a policy is
indisputable. Energy efficiency in mines is not a mere one-activity issue but a bundle of
activities, whose complexity needs a clear nation policy. In this regard, the World Energy
Council (2010: 6) explains that the main objective of policy measures is to create the
necessary conditions to speed up the development and the deployment of market efficient
equipment, through information for and communication with final consumers; economic
support though subsidies or tax reduction; deployment of specific financing mechanisms;
regulation for appliances, equipment and building, regulation imposing energy savings
requirements for consumers and for utilities; R&D and dissemination of expertise in the field
of energy efficiency.
In addition, most of the barriers in energy efficiency faced by the mines could have been
addressed by national policies. Gillingham et al. (2009: 24) maintain that effective energy
efficiency policies reduce the barriers.
88
In sum, GRZ could have achieved more developments in energy efficiency in mines during
the period 1980-2008 in the presence of an effective national energy efficiency policy.
6.3.2.2 The role played by electricity utilities
The results show that electricity utilities like ZESCO had been active in promoting efficient
use of electricity helping the mines through incentive pricing policies; load management
programmes; electricity reduction programmes; and information dissemination of demand-
side management.
The general scenario is that despite all the efforts by ZESCO, the efficient use of electricity in
the mines remained relatively low during the period 1980-2008.
First, the reasonable justification for keeping electricity tariffs very low during the period
review was to woe investments in mining sector and not to promote energy efficiency. As
already stated in literature review (Baxter and Rees 1968; Inglesi 2008; Dilaver and Hunt
2010) electricity demand is price sensitive. Hence, GRZ might have feared that increases in
electricity tariffs for mines would have discouraged foreigners to invest in the mining sector
in Zambia.
In literature review I stated that that a study by IPA Energy Consulting (2007) revealed that
ZESCO had been under pricing the mining load, which, at the time of the study, represented
50% of total consumption in Zambia. In addition, ZESCO under-priced contracts for
Copperbelt Energy Corporation and new contracts ZESCO was entering into with new retail
mining loads. To that effect, IPA Energy Consulting recommended that ZESCO must
urgently increase electricity tariffs (by 150 %) and control its costs.
Second, time of use of electricity have a considerable effect on electricity demand in
industries (Fan and Hyndman 2010; Cebula and Herder 2010; Hansen 2004). To that effect,
ZESCO had introduced TOU electricity. That the mines in Zambia did not make use of TOU
tariffs may not be astounding. A respondent from one of the four mines I sampled revealed
that electricity costs were negligible compared to the returns:
“I don’t know what is wrong with our government. I participate in the costing of mine
inputs. The cost of electricity is not an issue. We just instruct accounts to pay. We are
more concerned about transport costs. So wanting us to shift our operations to other
times of the day is not profitable at all. So we are comfortable and we do not need TOU
this time. May be in future…”
89
Indeed, ZESCO introduced TOU with good intensions. However, TOU was not a strong
incentive during the period 1980-2008. If the changes in profits for adopting TOU were
negligible, mines had not would not use TOU. In addition, adopting TOU is based on the
assumption that the costs of other mining inputs are constant across all times of the day.
However, shifting operations to night times might have increased labour costs through
increased wage rate – wage rate at night was higher than the daytime wage rate in most mines
in Zambia.
6.3.2.3 The role played by mines
The results have shown that mines instituted minimal deliberate internal measures and actions
to increase their energy efficiency performance. What coerced some mines to make changes
in machinery and equipment was the requirement to meet the environmental standards under
the Environmental Council of Zambia. The mines could have gone beyond changing
machinery and equipment. In her study, Martinez (2009) recommended several internal
measures and actions to increase energy efficiency performance: energy management
systems; energy efficiency investment; changes in machinery and equipment; training
activities; voluntary audit; major product/process related technological changes, whether or
not introduced as part of public/private national and the R&D programmes; optimization of
production capacity and production level; conversion of industrial business - in terms of both
products and processes.
Using Martinez’s recommended actions as benchmarks, it is clear that the mines in Zambia
did not perform well in energy efficiency during the period under review. The mines had
knowledge about the benefits of energy efficiency activities. In fact, all the respondents from
the mines agreed that their respective mines knew what energy efficiency was, and that
investment in energy efficiency could benefit the mines in the long run. To the contrary,
mines were reluctant to implement energy efficiency activities. In short, there was a big
“energy efficiency gap”, whose definition is already stated in literature review as the “gap”
between potential cost-effective energy efficiency measures and measures implemented (York
et al., 1978; Stern and Aronsson 1984; Sanstad and Howarth 1994; Sorrell et al. 2000;
Schleich and Gruber 2008).
It is cardinal to explain the energy efficiency gap in mines in Zambia within the context of the
barriers. From the results it is certain that barriers to energy efficiency in the mines were
mixture of three categories of barriers postulated by Thollander et al. (2010): technical system
barriers, technological regime barriers and socio-technical regime barriers. Compounding
90
these barriers was lack of energy efficiency policies (national and mine level) to address the
barriers. Thollander et al. (2010) have argued that different regimes of barriers should be
approached differently and addressed via individual policy instruments. In general, effective
energy efficiency policies are significant in promoting industry energy efficiency (Gillingham
et al 2009: Martinez 2009; World Energy Council 2010). To the contrary, both GRZ and the
mines had no necessary policy instruments to address the barriers to energy efficiency.
6.4 CHAPTER SUMMARY
This chapter has presented and discussed the results of the regressions and the developments
in efficient use of electricity in the mining industry in Zambia.
The predictors used in long run regressions were Log_AVEP (logarithm of average electricity
prices), Log_DPP (logarithm of diesel pump price) and Log_IMP (logarithm of index of
mining production). The dependent variable was Log_TEUM (logarithm of total electricity
used by the mines). The long run regression results indicate electricity own price elasticity of
demand of -0.06; cross-price elasticity of demand of 0.031; and index of mining production
elasticity of demand is 0.154. The signs on all three elasticities are as predicted by theory.
Whereas, both cross-price elasticity and index of mining production elasticity are found to be
statistically significant at pre-selected regression alpha of 0.05, yet elelctcicity own price
elasticity is insignificant.
The predicted model has a coefficient of determination of 0.518, which signifies that about
52% of the variation in the industrial electricity demand is explained by electricity own price,
diesel pump price and index of mining production. In addition, the p-value associated with the
F statistic of is very small, implying that predictors (electricity own price, diesel price and
index of mining production) may be used to reliably predict the total annual electcicity
demended by the mines.
With regards to developments in efficient use of electricity, GRZ had played a significant role
in promoting the efficient use of electricity in the mines in Zambia by removing import duty
on energy efficient equipment. However, Zambia had no national policy on energy efficiency
to steer energy efficiency in mines and to address the barriers in energy efficiency faced by
the mines.
Electricity utilities like ZESCO had been active in promoting efficient use of electricity by
helping the mines through incentive pricing policies; load management programmes;
electricity reduction programmes; and information dissemination of demand-side
91
management. Despite all the efforts by ZESCO, the efficient use of electricity in the mines
remained relatively low during the period 1980-2008. Even well-intended and targeted
programmes, such TOU electricity tariffs, were not adopted by the mines.
During the period under study, the mines instituted minimal deliberate internal measures and
actions to increase their energy efficiency performance. What coerced some mines to make
changes in machinery and equipment was the requirement to meet the environmental
standards under the Environmental Council of Zambia.
92
CHAPTER 7 CONCLUSSIONS, IMPLICATIONS AND
RECOMMEDATIONS
7.1 INTRODUCTION
This chapter presents study conclusions, implications and recommendations. Section 7.2
summarizes and concludes salient points emanating from Chapter 6. Section 7.3 presents
some of the possible policy and practical implications of this study. Section 7.4 presents study
limitations, and finally Section 7.5 presents recommendations.
7.2 CONCLUSIONS
7.2.1 Electricity demand by the mining industry
7.2.1.1 Summary of the findings
The study used three predictors in the long run regression: Log_AVEP (logarithm of average
electricity prices), Log_DPP (logarithm of diesel pump price) and Log_IMP (logarithm of
index of mining production). The dependent variable was Log_TEUM (logarithm of total
electricity used by the mines). The long run regression results indicate that electricity own
price elasticity of demand of -0.06; cross-price elasticity of demand of 0.031; and index of
mining production elasticity of demand is 0.154. The signs on all three elasticities are as
predicted by theory. Whereas, both cross-price elasticity and index of mining production
elasticity are found to be statistically significant at pre-selected regression alpha of 0.05, yet
own price elasticity is insignificant.
The predicted model has a coefficient of determination of 0.518, which signifies that about
52% of the variation in the industrial electricity demand is explained by electricity own price,
diesel pump price and index of mining production. In addition, the p-value associated with
this F (8.953) is very small, an indication that the predictors (electricity own price, diesel
price and index of mining production) can be used to reliably predict science the mining
industrial electricity demand.
93
7.2.1.2 Conclusions
First, Hypothesis A of this study states as follows:
H0: Electricity own-price changes have no significant impact on mining industrial
electricity demand.
H1: Electricity own-price changes have significant impact on mining industrial
electricity demand.
The study assumption was to reject the null hypothesis if a regression result is significant in
electricity price variable then. Therefore, in the light of the above summary and the
presentations in Chapter 6, I hereby accept the null hypothesis (H0) and reject the alternative
hypothesis (H1). As already explained, the electricity prices for the mines were seemingly
very low during the period 1980-2008.
Second, Hypothesis B of this study states as follows:
H0: Diesel prices changes have no significant impact on mining industrial
electricity demand.
H1: Diesel prices changes have significant impact on mining industrial electricity
demand.
The study proposition with regards to Hypothesis B is that if a regression result is significant
in petroleum price variable then the null hypothesis will be rejected. This will indicate that
petroleum price changes have an impact on the industrial electricity demand.
Therefore, based on the above summary and the presentations in Chapter 6, I hereby reject
the null hypothesis (H0) and reject the alternative hypothesis (H1). As already explained,
cross price is statistically significant. Its p-value of 0.022 is less that the pre-selected alpha of
0.05.
Third, coefficient of determination of 0.518, entails that model is useful. About 52% of the
variation in the industrial electricity demand is explained by electricity own price, diesel
pump price and index of mining production.
Fourth, the small p-value (0.000a) ssociated with this F (8.953) makes the model statistically
significant. The the group of predictors (electricity own price, diesel price and index of
mining production) can be used to reliably predict the mining industrial electricity demand.
94
7.2.2 Developments in energy efficiency in mining sector
7.2.2.1 Summary of the findings
The main findings of the study on the developments in energy efficiency in the mining
industry during the period 1980-2008 are summarized as follows:
The GRZ had played a significant role in promoting the efficient use of electricity in
the mines in Zambia by (i) removing import duty on energy efficient equipment; (ii)
enforcing emissions standards contained in the Environmental Protection and
Pollution Control Act of 1990 of the laws of Zambia.
However, GRZ did not have a no stand-alone national policy on energy efficiency to
steer the mining industry towards improvements in energy efficiency.
The major electricity utility, ZESCO, had been active in promoting efficient use of
electricity helping the mines through incentive pricing policies; load management
programmes; electricity reduction programmes; and dissemination of information
about the demand side management of electricity. ZESCO kept electricity tariffs very
low during the period review and introduced TOU tariffs in 2008.
The mines employed some internal measures and actions to increase their energy
efficiency performance. These measures were mainly the changes in machinery and
equipment to meet the environmental standards under the Environmental Protection
and Pollution control Act of the laws of Zambia. The mines did not implement other
measures that are significant in promoting energy efficiency: (i) energy management
systems; (ii) energy efficiency investment; (ii) voluntary energy efficiency audits; and
(iii) R&D programmes on energy efficiency.
Like GRZ, the mines did not have stand-alone policies on energy efficiency.
7.2.2.2 Conclusions
Hypothesis C of this study states as follows:
H0: There were no developments in energy efficiency in the Zambia mining
industry between 1980 and 2008.
H1: There were developments in energy efficiency in the Zambia mining industry
between 1980 and 2008.
95
In the light of the above summary and the presentations in Chapter 6, I hereby reject the null
hypothesis (H0) and accept the alternative hypothesis (H1).
However, I should note that the developments in energy efficiency during the period 1980-
2008 minimal compared to the revealed energy saving potential in the mining sector in
Zambia. Therefore, had both the government and the mines put in place, implemented, and
monitored the policies on energy efficiency, the developments in energy efficiency in the
mining industry could have been significant.
7.3 POSSIBLE POLICY AND PRACTICAL IMPLICATIONS OF THIS STUDY
7.3.1 Implications for the government of Zambia
The results of this study have twofold implications for GRZ: (i) to policy the demand-side-
management of energy (ii) and focus on macroeconomic factors affecting electricity demand
for the mines. Regarding the former implication, GRZ should evaluate its effectiveness in
promoting energy efficiency in the absence of a national policy on energy efficiency; the role
of energy efficiency regulations; consider the implications of the seemingly low import duties
on non-energy efficient equipment; reflect on the implication of introduction of a burn on
importation of energy inefficient equipment; and consider and quantify the benefits of
mainstreaming energy efficiency in sector plans.
In this vein, the findings of this study may help to substantiate the need for GRZ to steer
demand-side electricity management.
7.3.2 Implications for electricity utilities in Zambia
The study implications for ZESCO are twofold: (i) ZESCO’s effects on electricity demand for
the mines, and (ii) the role ZESCO can play in promoting energy efficiency.
Based on the aforementioned study findings ZESCO is expected to grasp the impact of its
proposed future electricity prices on electricity demand for mines. Equally, ZESCO should
consider the economic or econometric implications of under-pricing the mines.
Considering the study findings on energy efficiency it is prudent for ZESCO need to consider
several issues: Is there need for a clear policy to define the role of ZESCO should play in
promoting energy efficiency in the mines? Has ZESCO been quantifying the energy saving
benefits accrued from implemented several activities? Why was TOU programme not fully
used by the mines? In which ways can ZESCO partner with other stakeholders in promoting
96
efficient use of electricity efficiency in mines? Are there other incentives packages of
electricity efficiency that ZESCO can consider?
7.3.3 Implications for mining industry
The study findings have some implications for the mines. First, the mines should understand
that electricity demand may not remain inelastic forever, because the suppliers of electricity
were determined to make upward adjustments in electricity prices. In addition, the study by
IPA Consulting had recommended that ZESCO should stop under-pricing the mines.
Second, the reported developments in efficient use of electricity by the mines were externally
driven, mainly by the emission permits from the Environmental Council of Zambia. In this
case, mines should have internally driven measures for improving the efficient use of
electricity.
7.4 STUDY LIMITATIONS
The first limitation of this study is that the extensive and complex phenomenon of industrial
electricity demand has been studied from a rather narrow empirical perspective of using only
the mining sector of the Zambia industry. Such a study design limits the generalization of
study results.
The second limitation arise from limiting the study to a period 1980-2008, and using only few
mines as case studies to uncover developments in energy efficiency in mining industry.
Understanding electricity demand from the 1950s, when the first mines in Zambia were
established, and including other mines as case studies would no doubt have been fruitful.
The third limitation is that this study focused on the demand side management of electricity,
an energy subsector in Zambia that has not been studied. In that case, there was not sufficient
reference literature. Therefore, this study has no previous studies on Zambia whose findings
could have been validated.
Finally, for additional data collection, I travelled to Zambia on 5th
August 2011 and conducted
interview between 7th
and 28th
August 2011. This period was relatively short because of
financial constraint, (I was a self sponsored student with seemingly little income). During this
short period Zambia was preparing for its tripartite elections that were held in September
2011. For that and other reasons, many mines had their Chief Executive Offices (CEO’s)
travelled out of Zambia. My aim was to interview mine CEO’s to get rich data for the study. I
97
reduced the number of mines to be interviewed from 7 to 4. Further, having returned to
Norway from Zambia, I made follow ups for data clarifications and more using emails and the
phone. The responses from these two means of communication had not been prompt. The
delays in accessing more data forced me to prolong the completion of the thesis.
7.5 RECOMMENDATIONS
Based on the above conclusions, implications, and limitations, I make the following
recommendations for GRZ, Mines and ZESCO (and other electricity utilities) and the future
studies.
7.5.1 Government of the Republic of Zambia
GRZ should consider doing the following:
Define the role of energy efficiency in national development and have a stand-alone
policy on energy efficiency.
Establish national instruments on energy efficiency. Specifically, EE regulations can
be established under Energy Regulation Act.
Put in place a deliberate policy on integration of EE issues in national sector-based
plans. In this way, sectors would identify how their operations are related to and can
be influenced by electricity.
Harmonize national policies in order to maximize the contribution of electricity to
economic development.
7.5.2 ZESCO and other electricity utilities
Electricity utilities should do the following:
Continue advising mines on efficient use of electricity.
Introduce rebates on installation of electricity efficient equipment.
Install electric meters to all mining entities for monitoring
98
7.5.3 Mines
The mines should do the following:
Formulate, implement and monitor mine energy efficiency policy that will spell out
the mine energy management systems; energy efficiency investment; voluntary energy
efficiency audits; and R&D programmes on energy efficiency.
Develop and support an energy efficiency culture.
7.5.4 Future research
This study has revealed pertinent issues surrounding the mining industrial electricity demand
in Zambia and the developments in energy efficiency during the period 1980-2008. My
longing therefore is not to paint a picture that this study ends up in the future, but that the
future itself must extend this study. To that effect, I recommend that:
Future econometric studies may use data for entire industrial sector in Zambia, that is
data for both mining and manufacturing sectors.
Whilst this study employed data for the period 1980-2008, future studies may use data
dating from 1950s when the mining started in Zambia.
Whereas the focus of this study was Zambia, and specifcally on GRZ, ZESCO and
Mines, future studies could extend the focus to include other member countries of the
Southern Africa Power Pool.
99
REFERENCES
Akinlo, A. E. (2008): “Energy consumption and economic growth: Evidence from 11 Sub-
Sahara African countries”, Energy Economics 30, 2391–2400.
Amusa, H., K. Amusa, and R. Mabugu (2009): “Aggregate demand for electricity in South
Africa: An analysis using the bounds testing approach to cointegration”, Energy Economics
37 (5), 4167-4175.
Anderson, K.H. and R. Pomfret (2002): “Relative living standards in new market economies:
evidence from Central Asian household surveys”, Journal of Comparative Economics 30 (4),
683–708.
Anderson, T.W. and C. Hsiao (1982): “Formulation and Estimation of Dynamic Models using
Panel Data”, Journal of Econometrics 18, 47-82.
Bacon, R. (1992): “Measuring the possibilities of interfuel substitution”, Policy Research
Working Paper Series 1031. The World Bank: Washington, DC.
Baumgartner, W. and C. Muggli. (1996): “Perspectives of Energy Demand of the Industrial
Sector: Scenarios I to III, 1990–2030 [in German]”, Federal Office of Energy, Bern,
Switzerland.
Baxter, R.E., and R. Rees (1968): “Analysis of Industrial Demand for Electricity”, Economic
Journal 78 (310), 277-298.
Berndt, E.R., C.I. Morrison and G.C. Watkins (1981): “Dynamic models of energy demand:
an assessment and comparison”, in Modelling and Measuring Natural Resources Substitution,
E.R. Berndt and B.C. Field eds., MIT Press, Cambridge, 259-289.
Blok, K., W.C. Turkenburg, W. Eichhammer, U. Farinelli and T.B. Johansson (1996):
“Overview of Energy RD&D Options for a Sustainable Future”, European Commission,
Luxembourg.
Bölük, G. and A.A Koç (2010): “Electricity demand of manufacturing sector in Turkey: A
translog cost approach”, Energy Economics 32, 609–615.
Cebula, R.J. and N. Herder (2010): “An Empirical Analysis of Determinants of Commercial
and Industrial Electricity Consumption”, Business and Economics Journal BEJ-7.
Chang, Y. and E. Martinez-Chombo (2003): “Electricity demand analysis using cointegration
and error-correction models with time varying parameters: the Mexican case”, Working paper
presented to the Department of Economics, Rice University.
Chidumayo, E. N. (1988): “A re-assessment of effects of fire on miombo regeneration in the
Zambian Copperbelt”, Journal of Tropical Ecology 4, 361–372.
Chidumayo, E. N. (1997): Miombo Ecology and Management. An Introduction. London:
Intermediate Technology Publications.
Chidumayo, E. N. (2002): “Changes in the miombo woodland structure under different land
tenure and use systems in central Zambia”, Journal of Biogeography 29, 1619–1626.
Chidumayo, E. N. (2004): “Development of Brachystegia-Julbernardia woodland after clear-
felling in central Zambia: Evidence of high resilience”, Applied Vegetation Science 7, 237–
242.
100
Cobb, C. and P. Douglas (1928): “A theory of production”, American Economic Review 18,
139-165.
Copper Mining Engineer (2004): Mining Industry Information. Accessed January 3, 2011.
http://www.mine-engineer.com/mining/copperm.htm.
Dahl, C. (2011): “A Global Survey of Electricity Demand Elasticities”, A paper presented at
presentation at 34th IAEE International Conference: Institutions, Efficiency and Evolving
Energy Technologies, June 19-23, 2011, at the Stockholm School of Economics, Sweden.
DeCanio, S.J. (1993): “Barriers within Firms to Energy-Efficient Investments”, Energy Policy
21, 906-914.
DeCanio, S.J. and W.E. Watkins (1998): “Investment in energy efficiency: do the
characteristics of firms matter?” The Review of Economics and Statistics 80 (1), 95-107.
Denny, M. (1974): “The relationship between functional forms for the production system”,
Canadian Journal of Economics 7, 21-31.
Deshpande, M.V. (1966): Elements of electrical power station design. London: Isaac Pitman.
Diewert, W.E. (1973): “Separability and a generalization of the Cobb Douglas cost,
production and indirect utility functions”, Research Branch, Department of Manpower and
Immigration, Ottawa.
Dilaver, Z. and L.C. Hunt (2010): “Modelling and Forecasting Turkish Residential Electricity
Demand”, Surrey Energy Economics Centre.
Dimitropoulos, J., L.C. Hunt and G. Judge (2005): “Estimating underlying energy demand
trends using UK annual data”, Applied Economics Letters 12 (4), 239–244.
Engle, R.F., C.W.J. Granger and J.J. Hallman (1989): “Merging short- and long-run forecasts.
An application of seasonal cointegration to monthly electricity sales forecasting”, Journal of
Econometrics 40, 45-62.
European Union of the Electricity Industry (2011): Regulations for smart grids.
EURELECTRIC.
Fan, S. and R. Hyndman (2010): “The price elasticity of electricity demand in South
Australia”, Energy Policy 39 (6), 3709-19.
Førsund, F.R. (2007): Hydropower Economics. Springer.
Fuss, M. A. (1978): “The structure of technology over time: a model for testing the Putty-
Clay hypothesis”, Econometrica 45, 1797-1821.
Fuss, M.A. (1977): “The Demand for Energy in Canadian Manufacturing”, Journal of
Econometrics 5.
Gillingham, K., R.G. Newell and K. Palmer (2009): “Energy Efficiency Economics and
Policy”, Discussion Paper 09-13, Resources for the Future, Washington, DC.
Goto, N. (1996): “Macroeconomic and Sectorial Impacts of Carbon Taxation: A Case Study
for the Japanese Economy”, in A. Amano, ed., Global Warming, Carbon Limitation and
Economic Development. National Institute for Environmental Studies and Environment
Agency of Japan, Centre for Global Environmental Research, Tokyo.
101
Government of the Republic of Zambia (1990): Environmental Protection and Pollution
Control Act 1990. Lusaka: Government Printers.
Government of the Republic of Zambia (1995): Electricity Act 1995. Lusaka: Government
Printers.
Government of the Republic of Zambia (1995): Energy Regulation Act 1995. Lusaka:
Government Printers.
Government of the Republic of Zambia (1995): Petroleum Act 1930. Lusaka: Government
Printers.
Government of the Republic of Zambia (2003): Electricity (Amendment) Act 2003. Lusaka:
Government Printers.
Government of the Republic of Zambia (2003): Rural Electrification Act 2003. Lusaka:
Government Printers.
Griffin, J.M. (1977): “Inter-fuel substitution possibilities: A translog model of energy
application of inter-country data”, International Economic Review 18, 755-70.
Haanyika, C.M. (2006): “Rural electrification policy and institutional linkages”, Energy
Policy 34, 2977–2993.
Halvorsen, R. (1976): Energy Substitution in U.S. Manufacturing. Unpublished manuscript,
University of Washington and National Bureau of Economic Research.
Hansen, V.P. (2004): “Regional electricity spot price responses in Norway”, Statistics
Norway, Research Department. Accessed December 13, 2010.
http://www.ssb.no/emner/10/08/doc_200413/doc_200413.pdf
Hansugule, M. (2007): Analysis of Zambia’s Fifth National Development Plan. Lusaka:
Zambia Land Alliance.
Hirst, E. and M.A. Brown (1990): Closing the efficiency gap: barriers to the efficient use of
energy. Resources, Conservation and Recycling 3 (4), 267-281.
Howarth, R. and B. Andersson (1993): “Market barriers to energy efficiency”, Energy
Economics 15 (4), 262-272.
Howarth, R.B., B.M Haddad and B. Paton (2000): “The Economics of Energy Efficiency:
Insights from Voluntary Participation Programs”, Energy Policy 28, 477–86.
Howland, J. and D. Murrow (2009): Energy Efficiency: Engine of Economic Growth A
Macroeconomic Modelling Assessment. Rockport: Environment Northeast.
Hunt, L.C., G. Judge and Y. Ninomiya (1999): “Modelling technical progress: An application
of the stochastic trend model to UK energy demand”, British Institute of Energy Economics
Conference Paper.
Inglesi-Lotz, R. (2010): “Aggregate electricity demand in South Africa: Conditional forecasts
to 2030”, Applied Energy 87, 197–204.
Inglesi-Lotz, R. (2011): “South Africa’s electricity consumption: A sectoral decomposition
analysis”, Applied Energy 88, 4779–4784.
Inglesi-Lotz, R. (2011): “The evolution of price elasticity of electricity demand in South
Africa: A Kalman filter application”, Energy Policy, 39, 3690–3696.
102
IPA Energy Consulting (2007): Revised ZESCO’s Cost of Service (Task 13): Capability and
Capacity strengthening of the Energy Regulation Board, Report to the ERB. Lusaka.
Jaffe, A.B. and R.N. Stavins (1994): “The energy efficiency gap: what does it mean?” Energy
Policy 22 (10), 60-71.
Joskow, P. L. (2008): Challenges for Creating a Comprehensive National Electricity Policy.
MIT-CEEPR.
Joskow, P.L. and D.B. Marron (1992): “What Does a Negawatt Really Cost? Evidence from
Utility Conservation Programs”, The Energy Journal 13(4), 41-74.
Kalumiana, O. (2002): “Policy Options for Increasing Electricity Access for Poor Urban
Households in Zambia”, AFREPREN, Nairobi.
Lafferty, R., D. Hunger, J. Ballard, G. Mahrenholz, D. Mead, and D. Bandera (2001):
“Demand Responsiveness in Electricity Markets”. Accessed January 13, 2010.
http://www.naseo.org/committees/energyproduction/documents/demand_responsiveness_in_e
lectricity_markets.pdf
Lorde,T., K. Waithe and B. Francis (2010): “The importance of electrical energy for
economic growth in Barbados”, Energy Economics 32, 1411–1420.
Martínez, C. I. P. (2009): “Energy efficiency developments in the manufacturing industries of
Germany and Colombia 1998–2005”, Energy for Sustainable Development 13, 189–201.
Mfula, C. (2010): “Output back at most Zambia mines after blackout”. Reuters. June 19,
2011. Accessed May 2, 2010.
http://cn.reuters.com/article/swissMktRpt/idCNLDE65I03120100619.
Mining Review Reporter (2011): “Zambia set to enter world’s top five copper producers”,
Mining Review. 11 July 2011. Accessed December 11, 2010.
http://beta.miningreview.com/Zambia/set/enter/world/top/five/copper/producers.
Morana, C. (2007): “Factor demand modelling: the theory and the practice”, Applied
Mathematical Sciences 1, (31), 1519 – 1549.
Morvaj, Z. and V. Bukarica (2010): “Immediate challenge of combating climate change:
effective implementation of energy efficiency policies”, Paper accepted for 21st World
Energy Congress, 12-16 September 2010 in Montreal.
Munyeme, G. and P.C. Jain (1984): “Energy scenario of Zambia: prospects and constraints in
the use of renewable energy resources”, Renew Energy 5 (5–8), 1363–70
Odhiambo, N. M. (2009): “Electricity consumption and economic growth in South Africa: A
trivariate causality test”, Energy Economics 31 (5), 635-640.
Ostertag, K. (1999): “Transaction Costs of Raising Energy Efficiency”, in Proceedings of the
2007 IEA international Workshop on Technologies to Reduce Greenhouse gas Emissions:
Engineering-Economic Analyses of Conserved Energy and Carbon. Washington DC, 5-7 May
1999.
Perroni, C., and T.F. Rutherford (1995): “A comparison of the performance of flexible
functional forms for use in applied general equilibrium modelling”, Computational
Economics 11, 245-263.
103
Ranganathan, V. and A.C. Mbewe (1995): “Feast and Famine: The Case of Zambia’s Power
Sector”, Energy Policy 23 (12), 1093-1096.
Reuter’s reporter (2011): “China takes U.S. to WTO court over shrimp, saw blades”, Reuters,
October 25, 2011. Accessed November 3, 2011
http://af.reuters.com/article/commoditiesNews/idAFL5E7LP39P20111025 .
Sanstad, A. and R. Howarth (1994): “‘Normal’ markets, market imperfections and energy
efficiency”, Energy Policy 10, 811-818.
Sisala, R.P. (2008): “Challenges and Possible Solutions in the Power Sector”, A Presentation
to the Economics Association of Zambia on July 10, 2008 in Lusaka.
Sorrell, S., J. Schleich, S. Scott, E. O’Malley, F. Trace, E. Boede, K. Ostertag and P. Radgen
(2000): “Reducing Barriers to Energy Efficiency in Public and Private Organizations”.
Accessed January 3, 2010: http://www.sussex.ac.uk/Units/spru/publications/reports/barriers/final.html
Southern African Power Pool (2006): Year 2006 Statistics. Accessed November 3, 2010.
http://www.sapp.co.zw/docs/R7%20-%20Statistics%20Report%202007.pdf
Southern African Power Pool (2008): Year 2008 Statistics. Accessed June, 7 2011.
(http://www.sapp.co.zw/docs/Statistics%20Annual%20Report_2008.pdf)
Steinberg, M. J. (1954): “Economy Loading”, in B. Skrotzki (ed.), Electric System Operation.
New York: McGraw-Hill, 258-311.
Stern, D.I. (2009): Interfuel substitution: a meta-analysis. Munich Personal RePEc Archive.
Stern, P.C. (1992): “What Psychology Knows About Energy Conservation”, American
Psychologist 47 (10), 1224-1232.
Stern, P.C. and E. Aronson (1984, Eds): Energy Use: The Human Dimension. New York:
W.H Freeman.
Syampungani, S., P.W. Chirwa, F.K. Akinnifesi, G. Sileshi and O.C. Ajayi (2009): “The
miombo woodlands at the cross roads: Potential threats, sustainable livelihoods, policy gaps
and challenges”, Natural Resources Forum 33, 150–159.
Thollander, P., J. Palm and P. Rohdin (2010): Categorizing Barriers to Energy Efficiency: an
Interdisciplinary Perspective. InTech.
Times Reporter (2010): “ZCC to probe ZESCO monopoly”, Times of Zambia. May 4, 1999.
Accessed January 13, 2010. http://allafrica.com/stories/199905040025.html.
United Nations Development Programme (2001): World Energy Assessment Report and the
challenge of sustainability 2000. UNDP.
Uri, N.D. (1977): “Regional Interfuel Substitution by Electric Utilities in the United States”,
Journal of Regional Science 17, 217-226.
Vakulko, A.G. and A.A. Zlobin (1997): “Energy Saving Measures in Electricity Supply
Systems of Industrial Enterprises.” Vestnik Glavgosenergonadzora Rossii 1, Moscow.
Wester, J.L. (2003): Managerial Economics. Emerald Group Publishing.
Wilkinson, N. (2005): Managerial Economics: A problem solving approach. Cambridge:
Cambridge University Press.
104
Wolak, F.A. and R.H. Patrick (1996): "The Impact of Market Rules and Market Structure on
the Price Determination Process in the England and Wales Electricity Market”, NBER
Working Paper 8248, National Bureau of Economic Research, Cambridge MA, April 2001.
World Energy Council (2010): Energy Efficiency: A Recipe for Success. London: World
Energy Council.
York, C.M., C. Blumstein, B. Krieg and L. Schipper (1978): Bibliography in institutional
barriers to energy conservation. Berkeley: Lawrence Berkeley Laboratory and University of
California.
Zambia Energy Regulation Board (2007): Energy Regulation Board Decision on ZESCO
Limited Proposal to vary electricity tariffs (Multi year: 2007/8 - 2009/10). Lusaka: ERB.
Zambia Energy Regulation Board (2009): Energy Sector Report 2008. Lusaka: ERB
Zambia Ministry of finance and National Planning (2006): Fifth National Development Plan -
2006 - 2010. Lusaka: MOFNP.
Zambia Ministry of finance and National Planning (2006): Sixth National Development Plan -
2011 - 2016. Lusaka: MOFNP
Zambia Electricity Supply Corporation Limited (2009): ZESCO Annual Report-2008. Lusaka:
ZESCO.
Zambian Union (2011): “ZESCO Blackouts is MMD Failure”. September 4, 2009. Accessed
14 May 2011.http://zambianunion.blogspot.com/2009/09/zesco-blackouts-is-mmd-
failure.html.
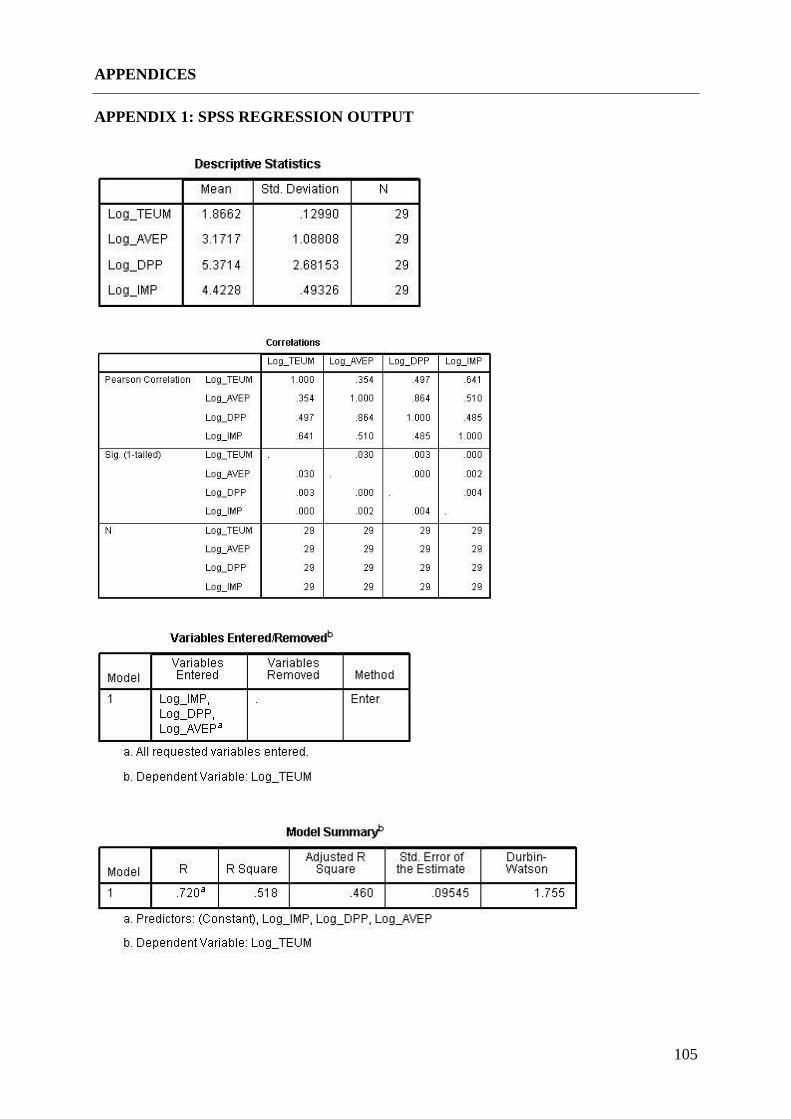
105
APPENDICES
APPENDIX 1: SPSS REGRESSION OUTPUT
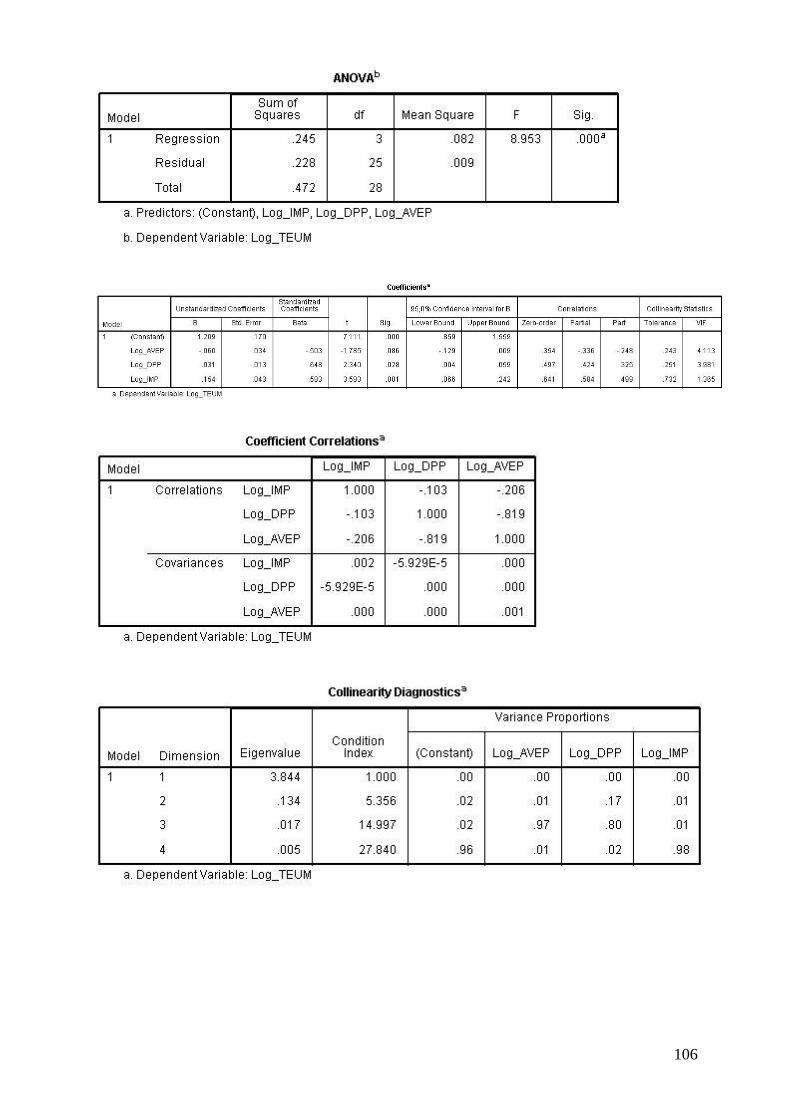
106
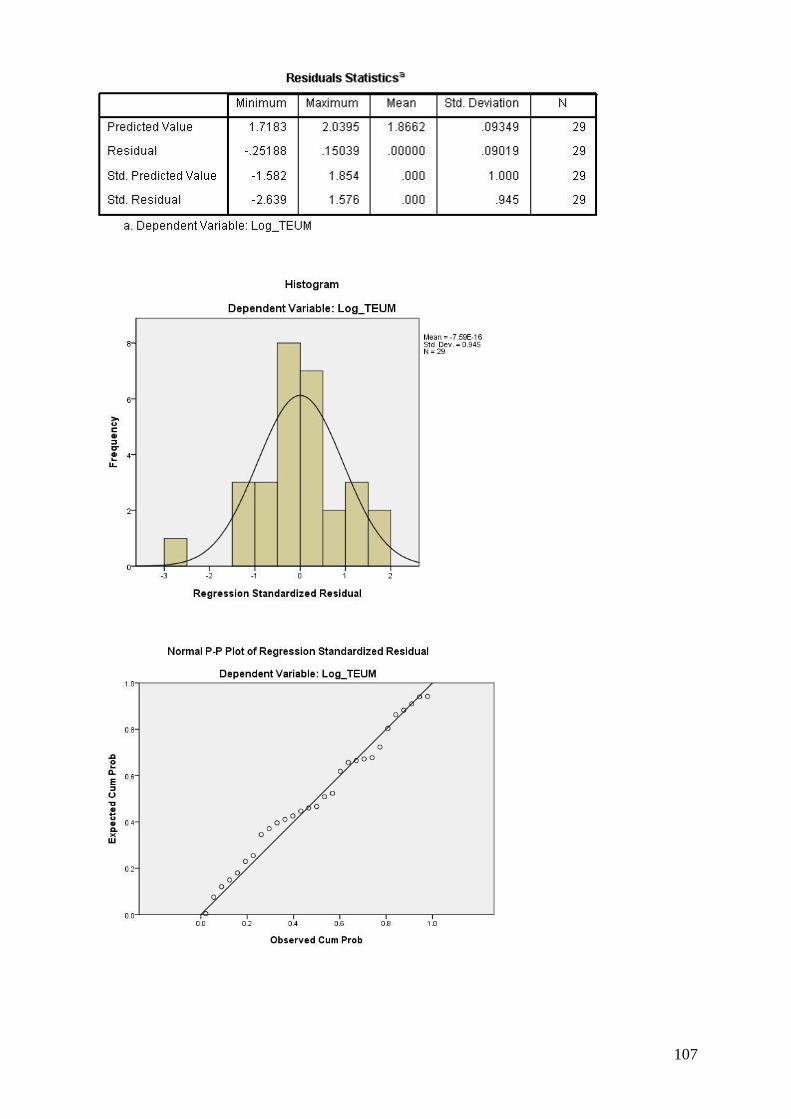
107
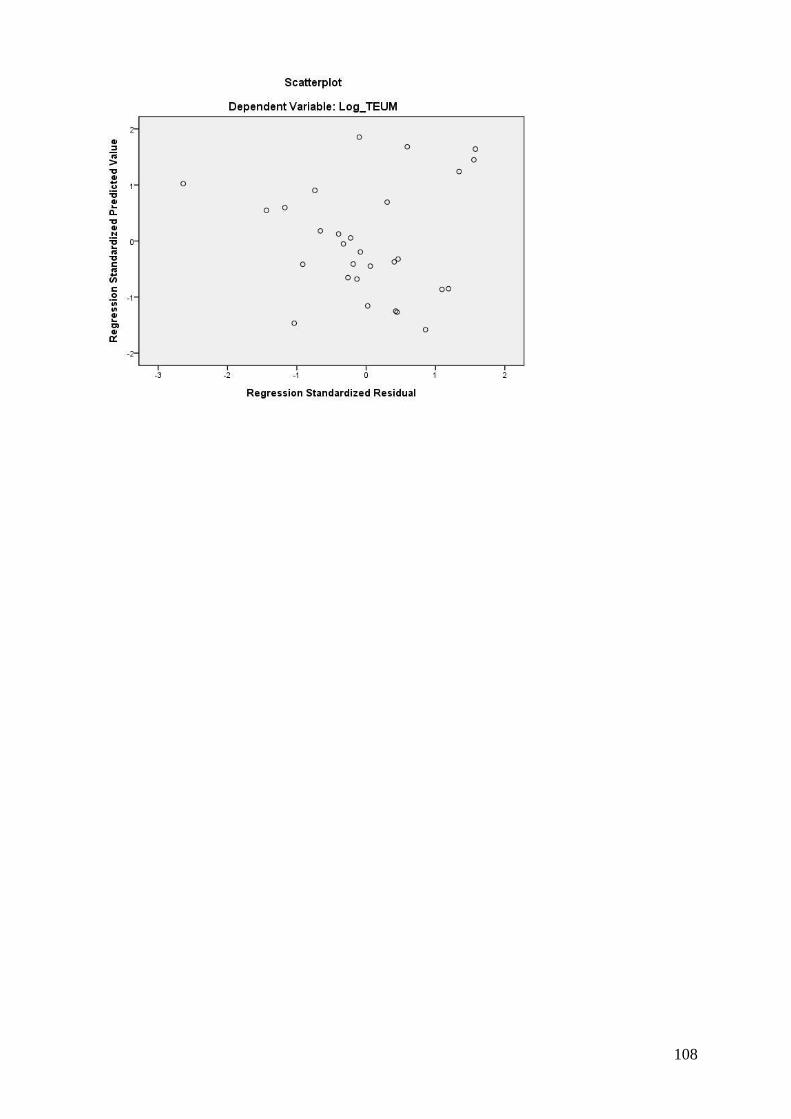
108