Embed Size (px)
Citation preview
An Ectopic Synthesis of the Melanin in the Adipocytes of the Morbidly Obese Subjects
A dissertation submitted in partial fulfillment of the requirements for the degree of Doctor of Philosophy at George Mason University
By
Manpreet Kaur Randhawa Bachelor of Science
Punjab Agriculture University, 1999
Director: Dr. Ancha Baranova Department of Molecular and Microbiology
Summer Semester 2008 George Mason University
Fairfax, VA

ii
DEDICATION
This thesis is dedicated to my parent in laws Prem Singh and Harbhajan Kaur Randhawa
who have been a source of encouragement and inspiration thorough out my studies. This thesis is dedicated to my parents Gurdev Singh and Narinder Kaur Dhillon
who introduced to me the joy of reading from birth, enabling such a study to take place today. This thesis is dedicated to my dear husband Harpal Singh Randhawa
Thanks for providing me strength, courage and support that urged me to strive to achieve my goals in my life. This thesis is dedicated to my lovely sons Akashdeep Singh Randhawa
Swaraj Singh Randhawa
There were many times when this thesis took me away from precious moments with them. They teach me about unconditional love. This thesis is dedicated to other family members and friends who have contributed in thought, work and support to this project.

iii
ACKNOWLEDGEMENTS
I am profoundly grateful to my thesis advisor, Dr Ancha Baranova, whose tolerance, patience, guidance and encouragement helped me throughout the study. This thesis would not have been possible without her support and unfailing patience. She is a very sincere and generous with her knowledge, availability, compassion, wisdom, challenge and feedback.
Special thanks go to Tom Huff who devoted his time and guidance to provide me
with his valuable contributions. Special thanks go to my thesis committee for their patience and diligence in reviewing my thesis.
Thanks goes to those graduate students in functional genomics lab who
contributed time and effort in facilitating and providing the scientific environment for this project, especially to Mohammed Jarrar, Subashini Iyer, Ganiraju Manyam and Aybike Birerdinc.
I would like to thank and recognize Rochelle Collantes and Shoba Gowder for
their contribution and help in providing samples, performing some experiments and parts of the statistical data analysis in this project.
I would also like to separately acknowledge the outstanding and special
contribution of Dr. Vincent Hearing and Dr. Julio Valenca who supported my study. I am indebted to them for their help and expertise that they have provided me for the completion of my project.
iv
TABLE OF CONTENTS
Page
List of Table…................................................................................................................vii List of Figures….............................................................................................................viii List of abbreviations and symbols…...............................................................................x Abstract…........................................................................................................................xiii
1-Introduction…..............................................................................................................1
2-Chapter I. Obesity….....................................................................................................4
A) Morphology of adipose tissue…...........................................................................5
• Adipose tissue changes in obesity…...........................................................6
B) Correlation between obesity, level of melanocortins and metabolic disorders….8
• Obesity and inflammation….......................................................................9
• Leptin…......................................................................................................11
• Adiponectin………………………………………….................................13
• Resistin…....................................................................................................15
• Cytokines…………....................................................................................16
C) Underlying pathology behind inflammation….....................................................20
• Lipid peroxidation & Reactive oxygen species.............................................20
• Hypoxia.........................................................................................................21
v
D) Cutaneous manifestation of obesity…..................................................................23
E) Melanocortins…....................................................................................................25
• POMC…......................................................................................................25
• Melanocortin receptors…............................................................................29
• Central action of α-MSH….........................................................................33
• Peripheral action of α-MSH…...................................................................34
3-Chapter II. Pigmentation…...........................................................................................36
A) Cutaneous pigmentation…...................................................................................37
B) Structure of skin…................................................................................................38
B) Types of the melanin.............................................................................................40
• Melanocytic melanin…........................................................................................40
• Melanocytic extracutaneous melanin…...............................................................41
• Extracutaneous Non-melanocytic melanin….......................................................45
• Non melanin pigments…......................................................................................47
C) Properties of the melanin…...................................................................................49
D) Origin of melanocytes….......................................................................................52
E) Melanosomes and their biogenesis…....................................................................55
F) Genetics of pigmentation…...................................................................................58
G) Regulatory pathways in melanogenesis….............................................................64
4-Chapter III. Hypothesis and Research Objectives…....................................................73
5-Chapter IV. Research Design and Protocol…..............................................................81
A) Patient tissue samples……..................................................................................81
vi
B) Cultivation and maintenance of cell lines…........................................................81
C) Methods and procedures…...................................................................................84
• Real Time-PCR….........................................................................................84
• Western blotting…........................................................................................93
• Protein activity assays…………...................................................................96
• Histochemical Stainings…...........................................................................100
• LC-MS Analysis of Pyrrole-2,3,5-tricarboxylic acid (PTCA)…………….112
7-Chapter V. Results…...................................................................................................115
• A study of melanogenesis in human adipose tissue…................................116
• A summary of attempts to develop an invitro model of adipocytic
melnaogenesis…..........................................................................................147
8-Chapter VI. Discussion…............................................................................................156
References……............................................................................................................167
vii
LIST OF TABLES
Table Page
1) Classification of BMI according to World Health Organization…............................8 2) Primers designed for real-time PCR analysis of the murine 3T3-L1 cell line............91 3) Primers designed for human cell lines and tissues…..................................................91 4) Raw cpm C14 values for 14 days, 21 days differentiated adipocytes….......................155
viii
LIST OF FIGURES
Figure Page
1) Adipose tissue as a source of inflammation................................................................11 2) Post-translational processing of POMC….................................................................29 3) Structure of skin…......................................................................................................39 4) Structure of hair and its various developmental stages...............................................44 5) Follicular and epidermal melanogenesis pathway……..............................................62 6) Melanogenesis signal transduction pathways….........................................................72 7) Primer design using Primer3 software........................................................................89 8) Net primer software to check the compatibility of the designed primers……...........90 9) Agarose gel used to confirm the integrity of the RNA...............................................118 10) Agarose gel electrophoresis used to assess the specificity of the PCR primers.......119 11) The melt curve characteristics of real-time PCR......................................................120 12) Real-time PCR curves with the adjusted threshold……………………...................122 13) MC1R, TYR, TYRP1 and TYRP2 transcripts analyzed by real-time PCR..............123 14) PCR quantification curve for 18S..............................................................................124 15) In situ hybridization of a human TYR RNA probe...................................................126 16) Immunohistochemical staining for TYR protein expression....................................130 17) DAB staining for TYR protein expression................................................................132
ix
18) Western blot to register TYR expression in adipose tissue.......................................134 19) C14 assay to confirm tyrosianse activity in adipose tissue........................................136 20) Masson-Fontana for staining melanin pigment …....................................................138 21) Spectrophotometric measurement…….....................................................................141 22) Standard calibration graph generated by HPLC analysis of PTCA….......................142 23) LC-UV-MS method to detect melanin in adipose extracts.............................….......144 24) Relative abundance of TYR transcripts in 3T3-L1 cell line .....................................148 25) Relative abundance of TYR transcripts in human adipocyte cell line......................150 26) L-DOPA assay to register tyrosinase activity in 3T3-L1 cell line............................152 27) Immunohistochemical staining for human TYR in human adipocyte cell line.........153
x
LIST OF ABBREVIATIONS AND SYMBOLS
Abbreviations Full form
6BH4........................ (6R)-R-L-erythro 5,6,7,8 tetrahydrobiopterin dihydrochoride AC….........................Adenylate cyclase ACTH…....................Adrenocorticotropin AgRP.........................Agouti-related peptide AMD..........................Age-related macular degeneration BCA...........................Bicinchoninic acid BCL2..........................B-cell leukemia/lymphoma 2 b-HLH-LZ..................Basic-helix-loop-helix-leucine-zipper family BMI............................Basal metabolic index cAMP........................Cyclic adenosine monophosphate CART........................Cocaine- and amphetamine regulated transcript CNS...........................Central nervous system CO2...........................Carbondioxide COMT.......................Catechol-O-methyltransferase CPE............................Caboxypeptidase E CREB.........................cAMP response element-binding CRP...........................C-reactive protein CT.............................Cycle threshold DA.............................Dopamine DAB…......................3,3'-Diaminobenzidine tetrahydrochloride DA-αMSH ................Desacetyl α-MSH Dct.............................Dopachrome tautomerase DHI…........................5, 6-Dihydroxyindole DHICA…..................5, 6-Dihydroxyindole carboxylic acid DMEM......................Dulbecco's Modified Eagle's Medium DNA..........................Deoxy ribonucleic acid DTT...........................Dithiothreitol E 10.5........................Embryonic day 10.5 ELISA.......................Enzyme-linked immunosorbant assay Endo H......................Endoglycosidase H EPI-NAFLD..............Epidemiology of Nonalcoholic Fatty Liver Disease ER.............................Endoplasmic reticulumn ERK.......................... Extracellualr-signal regulated ET-1..........................Endothelin-1
xi
ETBR........................Endothelin-B receptor FBS............................Fetal bovine serum FGF............................Fibroblast growth factor GSH..........................Glutathione GSK3β .....................Glycogen synthase kinase-3β GTP...........................Guanosine-5'-triphosphate HIF-1..........................Hypoxia inducible factor-1 HPLC.........................High-performance liquid chromatography IBMX..........................Isobutylmethyl xanthine ICAM-1......................Iintercellular cell-adhesion molecule-1 IgE..............................Immunoglobulin E IGF............................. Insulin-like growth factor IL.................................Interleukin LAM............................Lymphangioleiomyomatosis LDL.............................Low density lipoprotein L-DOPA…................3, 4-L-dihydroxyphenylalanine LEF 1/TCF..................Lymphoid enhancer-binding factor 1 LF................................Lipofuscin LPH.............................Lipotropin LPL….........................Lipoprotein lipase LPS.............................Lipopolysaccharide MAPK.........................Mitogen-activated protein kinase MCH............................Melanin concentrating hormone MCP-1.........................Monocyte chemoattractant protein 1 MCR............................Melanocortin receptor MIF..............................Macrophage migration inhibitory factor MIF.............................Migration inhibitory factor MITF...........................Microphthalmia-associated transcription factor MM..............................Malignant melanoma MMP............................Matrix metalloproteinases mRNA.........................Messenger ribonucleic acid MS...............................Metabolic syndrome NCC.............................Neural crest cells NF-kB .........................Nuclear Factor κB NGF.............................Nerve growth factor NM..............................Neuromelanin ob/ob...........................Obese/obese OCA...........................Oculocutaneous albinisms OCT...........................Optimal cutting temperature ONECUT-2................One cut domain 2 p90RSK......................p90 ribosomal S6 kinase PAI-1.........................Plasminogen activator inhibitor-1 PAM...........................Peptidyl α-amidating mono-oxygenase PAR2........................ Protease acitivated receptor 2
xii
PAX3..........................Paired box gene 3 PBS............................Phosphate Buffered Saline PC............................. Prohormone convertase PCR...........................Polymerase chain reaction PD...............................Parkinson disease PKA.......................... Protein kinase A PKC-β ...................... Protein kinase C-β PNGaseF....................Peptide: N-glycosidase F PNS............................Peripheral nervous system POMC....................... Proopiomelanoocortin PPAR/RXR................Peroxisome proliferator-activated receptors /retinoid X receptor PTCA.........................Pyrrole-2,3,5-tricarboxylic acid PUFA........................Polysaturated fatty acids QTL...........................Quantitative trait locus ROS............................Reactive oxygen species RPE............................Retinal pigment epithelium RSK............................Ribosomal S6 kinase SCF.............................Stem cell factor SDS-PAGE.................Sodium dodecyl sulfate polyacrylamide gel electrophoresis SN...............................Substantia nigra SRY............................Sex determining region Y -box 10 (SOX 10) STAT3........................Signal transducer and activator of transcription 3 TF...............................Transcription factor TGF-β.........................Transforming growth factor- β TH................................Tyrosine hydroxylase TIMP..........................Tissue inhibitor of metalloproteinases TNF-α.........................Tumor necrosis factor-α TRP.............................Tyrosinase related protein TYR.............................Tyrosinase TYRP1........................Tyrosinase related protein 1 TYRP2........................Tyrosinase related protein 2 UV................................Ultraviolet VEGF...........................Vascular endothelial growthfactor VLDL...........................Very Low-Density Lipoprotein α, γ, β-MSH .................α, γ, β-melanocyte stimulating hormone
ABSTRACT
AN ECTOPIC SYNTHESIS OF THE MELANIN IN THE ADIPOCYTES OF THE MORBIDLY OBESE SUBJECTS
Manpreet Randhawa, PhD. George Mason University, 2008 Dissertation Director: Dr. Ancha Baranova
Melanocortins produced from the post-translational processing of pro-
opiomelanocortin (POMC) are regulators of pigmentation in the hair and skin and are
also critical for proper maintenance of energy balance. Particularly, α-MSH is a
melanocortin ligand involved in the control of both pigmentation in skin and energy
homeostasis through various subtypes of the melanocortin receptors present both in the
skin and the adipose tissue. Expression profiling of 40,173 individual cDNA clones with
RNA from visceral adipose samples showed statistically significant overexpression of
genes encoding tyrosinase-related protein 1 (TYRP1), dopachrome tautomerase
(DCT/TYRP2), melanosome transport protein RAB27a and Melan-A (MLANA). These
findings lead to the following two hypotheses:
1) Melanin biosynthesis pathway is functional in adipose tissue and is excessively
stimulated in morbid obesity.
2) Melanogenesis may be stimulated in morbidly obese individuals due to high
levels of α-MSH.
Fontana-Masson staining performed on the adipose tissue registered the presence
of a black pigment in the periphery of the adipocytes. Granules of the pigment were
found in higher quantities in visceral adipocytes from obese individuals as compared to
samples from lean subjects. An LC/MS/UV analysis of the chemical composition of the
pigment proved that these granules contain melanin.
The expression of the TYR, TYRP1, TYRP2, MITF and MC1R genes involved in
melanogenesis was studied by real time PCR in adipose tissue samples obtained from
morbidly obese and from lean subjects. The expression level of TYR, encoding the rate-
limiting enzyme required for the conversion of L-DOPA to dopachrome, was found to be
expressed at much higher levels in obese subjects as compared to lean subjects whereas
no expression was registered in liver and gastric tissues. The other genes showed the
same pattern as TYR, but the differences were less pronounced as compared to TYR. The
expression of TYR was further localized to the adipocytes as determined by in situ
hybridization of adipose tissue slides, where TYR was found only in the periphery of the
cell.
The study of the expression of tyrosinase protein in adipose tissue by Western
blotting revealed properly folded and mature tyrosinase homodimer of 140kDa. The
presence of the tyrosinase as well as TYRP1 and TYRP2 proteins were confirmed in the
human adipocytes by immunohistochemistry. A substantial difference has been seen
between adipose samples of obese and lean subjects, with more tyrosinase in adipocytes
from obese samples. The biological activity of TYR was evaluated by C14 assay that
showed increased enzyme activity in the adipose tissue from morbidly obese subjects as
compared to lean subjects, whereas no activity was found in gastric and liver tissue
samples.
Both murine 3T3-L1 adipocytes and primary human adipocytes at different stages
of differentiation were exposed to different concentrations of α-MSH for different time
periods. Real-time PCR performed on mRNA extracts obtained from murine 3T3-L1
cells and human adipocytes provided no consistent expression data for melanogenesis
related genes. The enzymatic activity of a tyrosinase from protein extracts obtained from
3T3-L1 adipocytes was evaluated by L-dopa assay. A gradual decrease in the rate of L-
dopa oxidation was observed spectrophotometrically during the differentiation of
adipocytes. C14 assays indicated the presence of minimal residual activity of tyrosinase in
cultured human cells. Western blotting performed on extracts from human adipocytes
showed the presence of a specific band characterized by a smaller molecular weight than
normal tyrosinase. The glycosidase digestions confirmed that this band corresponds to an
inactive, nonglycosylated form of tyrosinase.
These collective findings indicate that the melanin synthesis pathway is functional
in intact human adipose tissue while further work on the appropriate cellular model of the
adipocytic melanogenesis is warranted.
1
Introduction
Pigmentation is one of the most variable phenotypes in humans. Skin color varies
not only between races, but also between individuals of the same ethnic group.
Differences in the human color traits in hair, skin, and eyes are primarily due to a
pigment called melanin. Other chromophores present in the human body such as
hemoglobin and carotenoids play only a minor role in skin pigmentation. The wide
variation in constitutive pigmentation among humans is caused by enormous differences
in the rate of the synthesis of the two forms of melanin, eumelanin and pheomelanin, and
the rate of the transfer of the melanosomes to keratinocytes. These pigments are
synthesized in lysosome-like organelles called melanosomes in the melanin-producing
specialized cells known as the melanocytes. Pigmentation differences mainly arise due to
variation in the number, size, composition and distribution of the melanosomes; whereas
melanocyte numbers typically remain relatively constant.
Loss or gain of pigmentation due to genetic and environmental reasons leads to
various pigmentary disorders. Darkening of the skin may result from abnormal
distribution of melanin due to an increase in the number of melanocytes, to production of
excessive amounts of melanin or to increased amounts of melanin supplied by a normal
population of melanocytes. This results in various hyperpigmentary disorders like
2
epidermal melanosis, freckles, epidermal melanocytosis, lentigines etc. Diminished skin
color most commonly results from the decrease in epidermal melanin content, e.g.
leukoderma and hypopigmentation, caused by defects in the formation of the melanin
(Nordlund et al., 2006). Vitiligo, a skin disorder characterized by white, pigment-free
skin, mostly gradually growing patches with a hyperpigmented edge, is attributed to
absence or loss of melanocytes that finally leads to a loss of the melanin synthesis. In
addition to cutaneous pigmentary disorders, loss of pigmentation also affects the other
organs of the body, such as eyes, ears and hair, thus, suggesting that these pigments have
functions in addition to providing skin color. For example, loss of pigmentation in eyes,
which might be due to aging or other reasons, results in macular degeneration, whereas in
ears it results in ototoxicity.
Skin physiology has also been shown to be altered in individuals with high Body-
Mass Index (BMI). Particularly, obesity affects the skin barrier function, development of
the sebaceous glands and sebum production, sweat glands, lymphatics, collagen structure
and function and wound healing, micro- and macrocirculation, and the distribution of the
subcutaneous fat. Speaking generally, obesity aggravates existing skin disorders, for
example, elevation of the levels of androgens and other hormones frequently seen in
obese patients activates function of the sebaceous glands (Deplewski & Rosenfield,
1999). The most common dermatological manifestation of obesity is an acanthosis
nigricans that is characterized by symmetric, velvety, hyperpigmented plaques mostly
seen in the axilla, groin and posterior neck areas. Obesity is also associated with
alteration of the collagen structure and function and impaired wound healing. A study of
3
obese mice demonstrated slower wound healing and decreased wound collagen
deposition (Goodson & Hunt, 1986), which could be related to the structural changes in
subcutaneous adipose tissue.
This is the first time the presence of melanin granules have been documented in
the adipocytes of adipose tissue obtained from morbidly obese subjects. In this study the
enzymes required for pigmentation was shown to be are present in human adipose tissue.
The presence of melanin in adipocytes implies that the changes in adipose tissue
associated with obesity may be due to peripheral action of α-MSH, the main
melanocortin peptide required for pigmentation and which also plays a critical role in
energy homeostasis. Study of the regulation of this pathway in adipose tissue may
elucidate the pathogenesis of the obesity and the secondary consequences of this
metabolic disorder.

4
Chapter I
Obesity
Obesity is a multifactorial chronic disease involving environmental, genetic,
physiologic, metabolic, behavioral, and psychological components. Obesity is defined as
a condition of excess body fat, and is associated with a large number of debilitating and
life-threatening consequences, particularly, cardiovascular, metabolic and other
noncommunicable diseases. Obesity has been increasing at an alarming rate world-wide
over the past two decades to the extent that it has become pandemic. In the United States,
obesity is considered as the second leading cause of preventable death and affects every
segment of the population, including men, women and now even children.
Obesity is defined as an increase in the amount of adipose tissue in the body. For
the past fifty years both visceral and subcutaneous adipose tissues were considered as
simple depots of triglycerides. Recently, the complex metabolic endocrine functions
performed by adipose tissue has become increasingly clear. In other words, adipose tissue
can be defined as a very active, multifunctional endocrine organ which is involved in
intense signaling crosstalk with other peripheral tissues (Kershaw & Flier, 2004). It acts
as a site for mediation of chronic inflammation through the action of known pro-
5
inflammatory adipocytokines (Degawa-Yamauchi et al., 2003; McTernan et al., 2002).
Obesity can be characterized by a state of chronic low-grade inflammation (Yudkin et al.,
1999; Das, 2001; Festa et al., 2001).
Morphology of Adipose Tissue
Adipose tissue could be described as loosely connected tissue that functions as the
major storage site for the fat in the form of triglycerides. The major bulk of adipose tissue
is a loose association of lipid-filled cells called adipocytes, which are held in a
framework of collagen fibers. In addition to adipocytes, adipose tissue contains stromal
vascular cells, fibroblastic connective tissue cells, leukocytes, macrophages, and pre-
adipocytes (not yet filled with lipid), which contribute to structural integrity. The size of
adipose tissue is a function of both adipocyte number and size (Johnson & Greenwood,
1988).
The adipose tissue can be differentiated into two types depending on the structure
and composition of adipocytes: white adipose and brown adipose tissue. Brown adipose
tissue is present in human newborns and in hibernating mammals; its primary purpose is
to generate body heat. The white adipose tissue makes the omental fat, present in the
deep abdomen, and serves many other functions besides acting as storage of triglycerides.
Brown adipose tissue is more vascularized than white adipose tissue. Furthermore, brown
adipose tissue differs from white adipose tissue in terms of composition of adipocytes:
adipocytes in brown adipose tissue have multilocular lipid droplets whereas adipocytes of
white adipose tissue have one big unilocular lipid droplet. Morphologically, nuclei and
6
the cytoplasm of adipocytes of white adipose tissue are pushed to the periphery of the
cells whereas the central vacuole is filled with a big lipid droplet.
Adipocytes originate from mesenchymal multipotent stem cells that develop into
adipocyte precursor cells (usually termed preadipocytes) by largely unknown
mechanisms. In vitro, isolated preadipocytes can be stimulated to differentiate into mature
adipocytes by treatment with specific adipogenic factors that activate PPAR /RXR
receptors (Ailhaud & Hauner, 1997; Spiegelman & Flier, 1996). After differentiation
from fibroblast-like preadipocytes, adipocytes start accumulating lipids once they reach
critical size. Increases in adipocyte turnover rate, differentiation and apoptosis can result
in the weight gain or loss. Substantial weight gain, or an increase in body mass index
(BMI) to ≥ 30, is known as obesity - a metabolic disorder, associated with multiple
secondary complications.
Adipose tissue changes in obesity
During obesity, adipose tissue undergoes drastic changes besides an increase in
size and number of adipocytes. Histologically, adipose tissue of obese individuals is
characterized by infiltration by mononuclear cells, relative rarefaction of blood vessels
and neural structures (Wellen & Hotamisligil, 2003). Structurally, adipose tissues are less
vascularized under diseased conditions as compared to normal conditions. Obesity is also
often accompanied by chronic inflammation; this results in reduction of the cross
sectional area of blood vessels per unit weight of adipose tissue which leads to the
reduction in blood flow as compared to non-obese conditions (Summers et al., 1996;
7
Summers et al., 1999). Surprisingly, in terms of energy homeostasis, obese subjects
found to be hyperglycemic and hyperinsulinaemic as compared to lean group show the
same glucose uptake by the adipose tissue (Coppack et al., 1996). So, instead of being
absorbed or transported to the adipose tissue, obesity leads to an increase of the
concentration of glucose in the blood.
In addition to all the factors discussed above, various paracrine and endocrine
factors which include several hormones, cytokines and adipokines are differentially
expressed under the obese conditions. Various epidemiological studies have established a
direct association between the increased expression and secretion of cytokines and the
development of a variety of pathological processes, particularly, insulin resistance,
glucose intolerance, dyslipidaemia, elevated blood pressure, impaired fibrinolysis and
endothelial dysfunction (Bjorntorp, 1991). Obesity is also associated with a constellation
of risk factors that are nowadays recognized as components of what is now called
Metabolic Syndrome (MS) (Reaven, 1988; Bjorntorp, 1991; Hauner, 2002). Metabolic
syndrome is commonly accompanied by changes in the secreted adipokines that are
regulated both on the mRNA and protein levels. This indirectly indicates that adipokines
could serve as major players in pathogenesis of metabolic syndrome, as they modulate
complex networks of homeostatic, immunological and inflammatory processes. Changes
in cytokine levels produced by immune cells infiltrating adipose tissue also have
deleterious consequences on such processes. For example, Esposito et al. found that
levels of some anti-inflammatory cytokines, such as IL-10, are decreased in metabolic
syndrome patients, but remain normal in healthy obese controls (Esposito et al., 2003).
8
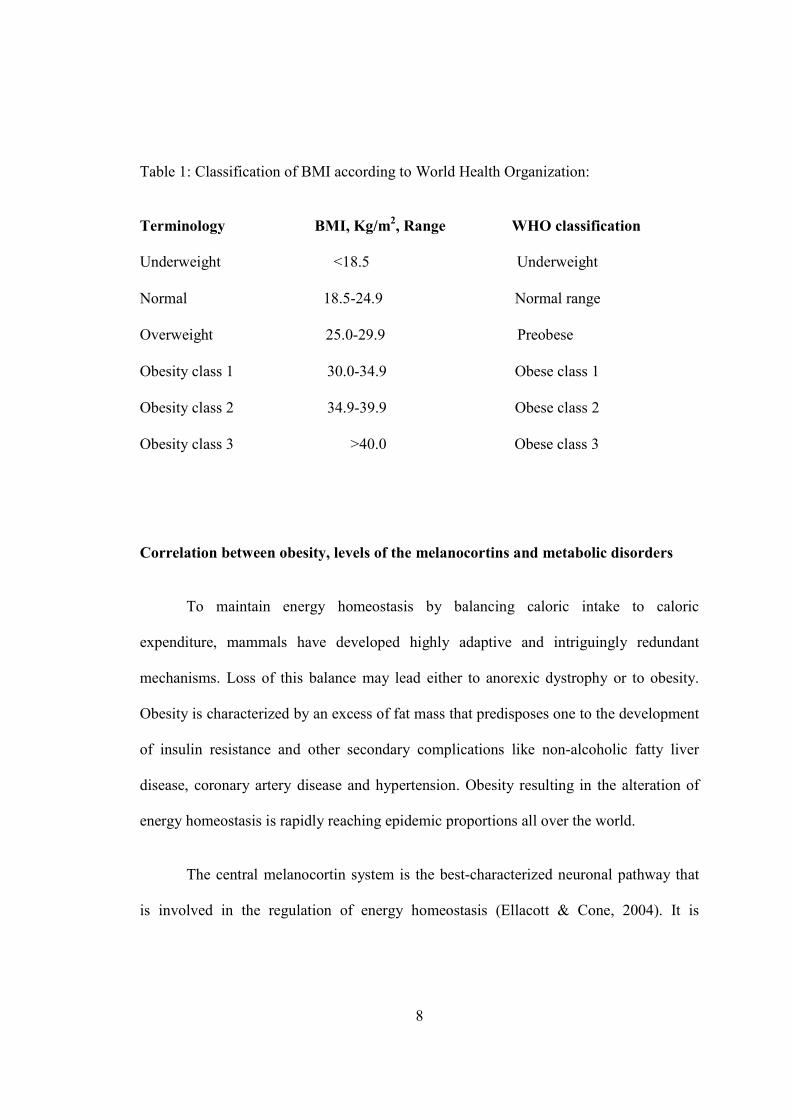
Table 1: Classification of BMI according to World Health Organization:
Terminology BMI, Kg/m2, Range WHO classification
Underweight <18.5 Underweight
Normal 18.5-24.9 Normal range
Overweight 25.0-29.9 Preobese
Obesity class 1 30.0-34.9 Obese class 1
Obesity class 2 34.9-39.9 Obese class 2
Obesity class 3 >40.0 Obese class 3
Correlation between obesity, levels of the melanocortins and metabolic disorders
To maintain energy homeostasis by balancing caloric intake to caloric
expenditure, mammals have developed highly adaptive and intriguingly redundant
mechanisms. Loss of this balance may lead either to anorexic dystrophy or to obesity.
Obesity is characterized by an excess of fat mass that predisposes one to the development
of insulin resistance and other secondary complications like non-alcoholic fatty liver
disease, coronary artery disease and hypertension. Obesity resulting in the alteration of
energy homeostasis is rapidly reaching epidemic proportions all over the world.
The central melanocortin system is the best-characterized neuronal pathway that
is involved in the regulation of energy homeostasis (Ellacott & Cone, 2004). It is
9
considered a promising target for the treatment of eating disorders and obesity (MacNeil
et al., 2002). The melanocortin system refers to a set of hormonal, neuropeptidergic, and
paracrine signaling pathways that are defined by five G protein-coupled melanocortin
receptors (MC-Rs), peptide agonists derived from the proopiomelanocortin (POMC)
preprohormone precursor and their endogenous antagonists, agouti and agouti-related
protein. The location of POMC neurons (arcuate nucleus of the hypothalamus, nucleus
tractus solitarius of the brain stem) and AgRP neurons (arcuate nucleus of the
hypothalamus) suggests their role in the regulation of satiety and energy expenditure
(Ellacott and Cone, 2004).
Obesity and inflammation:
Adipose tissue can be described as an endocrine organ that produces various
cytokines, aromatized steroid hormones and protein adipokines like leptin and
adiponectin. More than 100 soluble factors have been identified as produced by and
released from adipose tissue; these adipokines exert multiple effects at both the local and
the systemic level by modulating many different metabolic processes (Hauner, 2005).
Any change in the mass and the composition of adipose tissue associated with Metabolic
Syndrome are accompanied by changes in secreted adipokines that are regulated both on
the mRNA and protein levels. This indirectly indicates that adipokines could serve as
major players in pathogenesis of metabolic syndrome, as they modulate complex
networks of homeostatic, immunological and inflammatory processes. For example,
levels of some anti-inflammatory cytokines, such as IL-10, are decreased in metabolic
10
syndrome patients, but remain normal in healthy obese controls (Esposito et al., 2003),
while the production of the inflammatory peptides is increased in the sickest cohort of the
morbidly obese patients (Jarrar et al., 2008). In addition, there is a link between low
levels of circulatory adiponectin and high systolic blood pressure (Huang et al., 2003).
Recent studies revealed that obesity induces ER stress and that the latter in turn activates
an inflammatory response, thus contributing to insulin resistance in the liver and adipose
tissue (Ozcan et al., 2004; Nakatani et al., 2005). The general assumption is that
inflammation is consequent to obesity, but obesity has also been suggested to be infact, a
result of inflammatory disease (Das, 2001).
11
TNF-α, IL-1β
IL-6, IL-8
IL-10, TGF-β
IL-17D, IL-18
Cytokines
Chemokines
Ac
ute
ph
as
ep
rote
ins
PAI-1, Haptoglobin,
Serum amyloid A,
CRP
InflammatoryproteinsAdiponectin,MCP-1, NGFVEGF, leptin,Resistin, Visfatin
Fatty acid
sLPL
Agouti
Adipocyte
Macrophage
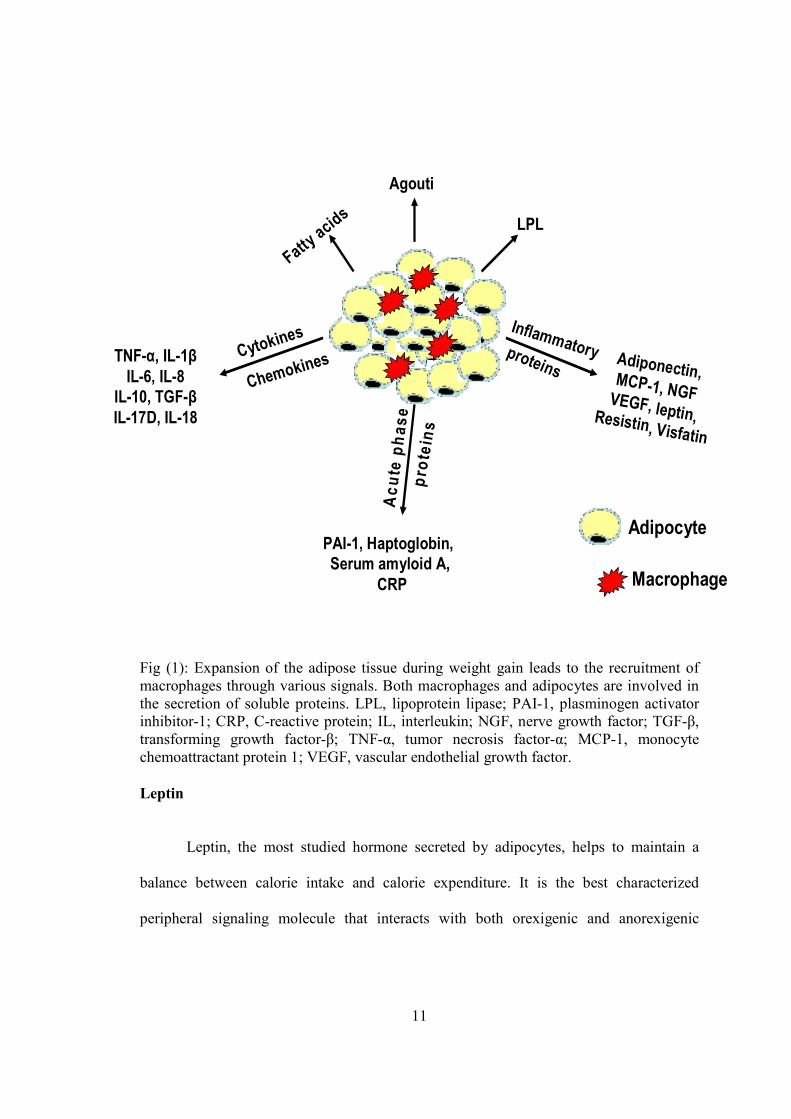
Fig (1): Expansion of the adipose tissue during weight gain leads to the recruitment of macrophages through various signals. Both macrophages and adipocytes are involved in the secretion of soluble proteins. LPL, lipoprotein lipase; PAI-1, plasminogen activator inhibitor-1; CRP, C-reactive protein; IL, interleukin; NGF, nerve growth factor; TGF-β, transforming growth factor-β; TNF-α, tumor necrosis factor-α; MCP-1, monocyte chemoattractant protein 1; VEGF, vascular endothelial growth factor.
Leptin
Leptin, the most studied hormone secreted by adipocytes, helps to maintain a
balance between calorie intake and calorie expenditure. It is the best characterized
peripheral signaling molecule that interacts with both orexigenic and anorexigenic
12
pathways (Trayhurn et al., 1999). The leptin receptor is expressed in several regions of
the central nervous system (CNS), including the hypothalamus (Tartaglia et al., 1995), as
well as in a number of peripheral tissues. The hypothalamus is considered as primary
location where leptin acts to inhibit feeding (Jacob et al., 1997; Satoh et al., 1997; Tang-
Christensen et al., 1999b). This energy regulation is mediated through hypothalamic
neuropeptide-POMC neurons in the hypothalamus where leptin induces catabolic effects
(Mizuno et al., 1998, Woods et al., 1998; Schwartz et al., 1999). Thus, leptin, along with
insulin which also has direct actions in the CNS (Schwartz et al., 1994; Woods et al.,
1996), functions as a negative feedback signal to the CNS to regulate energy balance.
Particularly, leptin inhibits the actions of neuropeptide Y, melanin concentrating hormone
(MCH), orexin A, agouti-related peptide and cannabinoid systems (Meister, 2000; Di
Marzo et al., 2001), whereas POMC and cocaine- and amphetamine-regulated transcripts
(CART) are upregulated by leptin (Schwartz et al., 1996; Kristensen et al., 1998; Meister,
2000). Mutations in the genes encoding leptin (Montague et al., 1997; Strobel et al.,
1998) or the leptin receptor (Clement et al., 1998) results in an obese phenotype both in
mice (ob/ob) and humans.
α-MSH has been shown to inhibit leptin secretion in differentiated rat adipocytes
cultured in vitro (Hoggard et al., 2004). Leptin administered to ob/ob mice increases the
release of α-MSH into the circulation, suggesting a possible feedback loop between the
sites of α-MSH release and the release of leptin from the adipose tissue (Hoggard et al.,
2004; Norman et al., 2003). The physiological significance of this putative feedback
13
probably depends upon the underlying state of energy balance, since low plasma levels of
α-MSH in fasting animals are paralleled by low plasma leptin (Hoggard et al., 2004).
Adiponectin
Adiponectin is one of the most abundant protein hormones secreted into the
bloodstream by adipocytes. It plays a role in the suppression of inflammation-associated
metabolic disorders, particularly, of type II diabates, obesity, and atherosclerosis. Serum
levels of the adiponectin shows a distinct decrease in circulating levels in obesity and an
inverse correlation with BMI. Adiponectin possesses antidiabetic properties due to its
insulin-mimetic and insulin-sensitizing characteristics, its anti-inflammatory and anti-
artherosclerotic effects have also been consistently reported (Hotta et al., 2000).
Additionally, a number of epidemiological studies have implicated adiponectin in
modulating angiogenesis, and cardiac remodeling (Spranger et al., 2003; Yamauchi et al.,
2001; Maeda et al., 2002). These effects are thought to be mediated by adiponectin
binding to its cell surface receptors (Yamauchi et al., 2003; Hug et al., 2004) and
subsequent activation of signaling pathways within the target cell (Yamauchi et al.,
2003). Anti-inflammatory properties of the adiponectin play a critical role in reducing
TNF-α production, as it antagonizes several of the inflammatory effects of TNF-α (Ouchi
et al., 2003). In contrast, the pro-inflammatory agents produced in the obese subjects
attenuate the production of adiponectin (Ouchi et al., 2003). Clinically, plasma
adiponectin levels inversely correlate with levels of C-reactive protein in humans, which
14
is another inflammatory agent secreted by adipose tissue of individuals with high BMIs
(Ouchi et al., 2003).
Adipocyte precursors have potent phagocytic capacity and can be transformed
into macrophage-like cells in response to appropriate stimuli (Charriere et al., 2003).
Adiponectin plays a critical role in this process, as it promotes the clearance of early
apoptotic debris (Takemura et al., 2007). In macrophages, adiponectin stimulates
clearance of early apoptotic bodies by their engulfment and suppresses TNF-α
production. Slower clearance of such debris might exacerbate symptoms of inflammation
and autoimmunity (Savill et al., 2002; Potter et al., 2003), as the delay in the engulfment
of apoptotic bodies leads to the production of proinflammatory cytokines (Savill et al.,
2002).
Levels of adiponectin in the serum are inversely correlated with the size of the
central (visceral) depot of the fat. Once established, these levels cannot be altered by
lowering of leptin level via fasting or external administration of leptin (Gavrila et al.,
2003). Peripheral administrations of melanocortin receptor agonist-like peptides, for
example, melanotan II has been shown to upregulate the expression of adiponectin
receptors 1 and 2, whereas no effect was seen on the level of adiponectin in the serum
(Blüher S et al., 2004). Serum level of α-MSH was found to be higher in obese
individuals as compared to lean subjects (Hoggard et al., 2004), but serum levels of
adiponectin remained low.
15
Resistin
Human studies have also highlighted substantial expression of resistin in adipose
tissue (Savage et al., 2001), particularly in abdominal depots (McTernan et al., 2002).
Furthermore, a positive correlation between serum resistin and body fat content has also
been reported (Zhang et al., 2002). Resistin expression is positively correlated with the
BMI and visceral fat area (Azuma et al., 2003; Vozarova de Courten et al., 2004), which
is mainly due to an increase in adipocyte number and differentiation (Asensio et al.,
2004). According to one hypothesis, adipose tissue in obese subjects is under continuous
infiltration pressure by macrophages that also contributes to resistin expression. The
infiltration itself further propagates the recruitment of more macrophages, which
perpetuates an increase in resistin expression. Alternatively, macrophage recruitment may
arise from trans-differentiation of pre-adipocytes into macrophages-like cells (Lehrke et
al., 2004; Kaser et al., 2003), which may also result in high resistin expression.
Resistin is postulated to contribute to insulin resistance and other inflammatory
responses; some correlations may exist between levels of resistin and other inflammatory
factors produced by obese subjects. One such study has shown that in obese patients with
obstructive sleep apnea syndrome, resistin levels are significantly correlated with levels
of IL-6 and ICAM-1 (intercellular cell-adhesion molecule-1) (Kaser et al., 2003).
Correlations between expression and secretion of resistin and other inflammatory
cytokines, including IL-6, Leptin, TNF-α and CRT have also been reported in patients
with severe inflammatory disease, obesity and type II diabetes (Lehrke et al., 2004).
16
Resistin expression in humans has been shown to be stimulated by LPS, IL-1, TNF-α and
IL-6 (Mc Ternan et al., 2003; Vendrell et al., 2004; Wellen & Hotmisligil, 2003).
Cytokines
In addition to adipokines, white adipose tissue secretes cytokines as well as other
soluble proteins directly involved in lipid metabolism, the complement system and
vascular homeostasis. The main consideration is the regulation of the cytokine production
by adipokines (Ahima & Flier, 2000). The wide variety of cytokines secreted by white
adipose tissue includes TNF-α, IL-6, IL-1β, IL-8, IL-10, IL-18, IL-17D and TGF-β.
Circulating levels of all these cytokines except IL-10 increases with obesity and
decreases with weight reduction (Esposito et al., 2003) and can be correlated to the
amount of adipose tissue, especially the visceral fat.
The earliest identified secretory protein with autocrine effects recognized as the
product of adipocytes was lipoprotein lipase responsible for the breakdown of circulating
triacylglycerols (chylomicrons and VLDL) to fatty acids. White adipose tissue is also a
major source of angiotensinogen, which regulates blood pressure and stimulates the
production of prostacyclins acting as a signal for the differentiation of preadipocytes to
adipocytes (Zorad et al., 1995; Ailhaud et al., 2000). The circulating levels of
angiotensinogen are higher in obesity is correlated with an increase in adipose tissue
mass.
17
TNF-α was the first inflammatory cytokine described as expressed in and secreted
by adipocytes of white adipose tissue (Hotamisligil et al., 1993). Besides its critical role
in host defense, it also plays a major role in lipid and glucose metabolism (Pennica et al.,
1984). Even though TNF-α mRNA is expressed by the adipocytes of white adipose
tissue, its secretion by other infiltrating cells of adipose tissues, for example,
macrophages and vascular fraction, has also been documented (Weisberg et al., 2003;
Fain et al., 2004a). The serum levels of TNF-α are significantly correlated with visceral
adiposity (Hotamisligil et al., 1993). Administration of TNF-α to experimental animals
has been shown to induce insulin resistance (Lang et al., 1992) whereas inhibition of
TNF-α by a blockade of TNF-α bioactivity in vivo (Hotamisligil et al., 1993; Ofei et al.,
1996; Cheung et al., 1998) or genetic knockout of the TNF receptor/ligand (Uysal et al.,
1997; Schreyer et al., 1998; Ventre et al., 1997) improves insulin sensitivity and glucose
metabolism. Moreover, TNF-α acts on murine adipocytes in vitro to suppress expression
of many adipose-specific genes, including the enzymes involved in lipogenesis
(Kawakami et al., 1986). Inactivation of the lipogenesis enzymes leads to hyperlipidemia
by increasing the level of triglycerides (Semb et al., 1987; Sherman et al., 1988), and can
be the main cause of hyperlipidemia and hyperinsulimenia in obese subjects.
TNF-α also plays a pivotal role in the production of several cytokines and other
adipokines (Coppack, 2001). Nowadays, TNF-α, in addition to its role in inflammation, is
recognized as a multi-functional regulatory cytokine, implicated in other cellular
processes, particularly, in cell apoptosis and survival, cytotoxicity, production of acute-
phase protein, haptoglobin and other cytokines, such as IL-1 and IL-6 (Chiellini et al.,
18
2002). TNF-α strongly stimulates the expression of IL-18, IL-8 and IL-1β by fat cells
(Wood et al., 2005).
Recent developments in the area of the role of central nervous and neuroendocrine
systems in host responses (Besedovsky & del Rey, 1992; Goetzl & Sreedharan, 1992)
have provided some new insights about the niche of the neuronal and soluble mediators
in these systems that influence inflammation. One of these mediators is the endogenous
neuropeptide α-MSH which is believed to modulate host reactions by inhibiting the
actions of cytokines (Lipton, 1990; Catania and Lipton, 1993). Both α-MSH and its
synthetic analogues exert potent anti-inflammatory activity when administered
systemically (Deeter et al., 1988; Hiltz & Lipton, 1989, 1990; Catania & Lipton, 1993;
Hiltz et al., 1992). For example, one recent study demonstrated that systemically
administered -MSH inhibits TNF- concentrations circulating in the brain. TNF-
production by human peripheral blood mononuclear cells is inhibited by -MSH, which
indicates that a direct effect of the peptide is mediated through melanocortin receptors on
monocytes. In mice, the level of TNF-α induction after intraperitoneal injection of
lipopolysaccharides (LPS) was found to be reduced by the simultaneous injection of α-
MSH or its analogues (Gonindard et al., 1996). In addition, α-MSH has the properties to
modulate the cytokine regulatory properties of TNF-α. Recently α-MSH has been shown
to inhibit TNF-α induced expression of the matrix metalloproteinase-13 in human
chondrosarcoma cells by modulating NF-κB signaling (Yoon et al., 2008).
19
IL-18 gene expression was registered in human subcutaneous and visceral adipose
tissue, both in mature adipocytes and the stromal-vascular fraction. In cultured human
adipocytes, IL-18 mRNA levels dramatically rise in response to TNF-α (Wood et al.,
2005). When IL-18 operates at a local level, its proinflammatory action invokes a cascade
of inflammatory events involving cytokines, chemokines and adhesion molecules (Gracie
et al., 2003). IL-18 has been also shown to stimulate the expression of IL-6 and IL-8 in
human lung carcinoma cell line (Kim et al., 2005). Interestingly, recent reports indicate
that under specific conditions IL-18 may act as both an angiogenic activator (Qiao et al.,
2004) and angiogenic suppressor (Cao et al., 1999).
IL-8 is another chemokine secreted by adipocytes. It has been implicated in
arthrosclerosis and coronary heart disease (Ross, 1999) as it plays a role in modulating an
inflammatory response. IL-8 possesses chemoattractant properties as it serves to recruit
the neutrophils, T lymphocytes, induces the adhesion of monocytes to endothelium and
promotes the migration of vascular smooth muscle cells (Yue et al., 1993). All these
events lead to intimal thickening resulting in arthrosclerosis. Initially IL-8 was thought to
be produced by macrophages and monocytes only (Baggiolini, 1995). Recently two in
vitro studies by Bruun et al. revealed that IL-8 is produced and secreted by human
adipocytes (Bruun et al., 2000; Bruun et al., 2001). Other studies have shown that
oxidized low-density lipoprotein particles are also able to stimulate production and
secretion of IL-8 by macrophages embedded in the adipose tissue (Liu et al., 1997).
Therefore it can be speculated that a correlation between the severity of obesity and the
20
development of secondary complications of this disorder, particularly the atherosclerosis
and cardiovascular disease, is partially due to an increase in IL-8 levels.
Underlying pathology behind inflammation
Lipid peroxidation and reactive oxygen species
Lipid peroxidation refers to the oxidative degradation of lipids. This free radical-
generating process occurs on every membrane containing structure of the cell. Actually,
the peroxidation of the lipids is a major contributor to the ROS production. Obesity can
be considered as a major cause of increased lipid peroxidation including oxidation of cell
membranes and proteins in conjunction with disturbances of cellular redox homeostasis
(Shattock et al., 1994; Girotti et al., 1998; McDuffee et al., 1997). Free radicals
produced during lipid peroxidation are known to be involved in a number of human
pathologies including atherosclerosis (Steinberg, 1997), cancer (Cerutti, 1994) and
hypertension (Russo C et al, 1998). Recent evidence has shown that obesity is also
associated with increased myocardial lipid peroxidation and susceptibility to oxidative
damage in vitro (Vincent et al., 1998). Increased production of ROS has been
documented in myocardium muscles in obese subjects, which may be due to an increase
in mechanical and metabolic load leading to increased consumption of oxygen and finally
resulting in the formation of hydrogen peroxide from mitochondrial respiration (Turrens
et al., 1997). In the heart, significant oxidative injury produced by lipid peroxidation can
ultimately lead to cardiac arrhythmias, poor contractility, infarction, cardiac failure or
sudden death (Yu, 1994; Shattock & Haddock 1991).
21
Low density lipoprotein oxidation has been reported as the prominent cause of
atherosclerosis (Witztum et al., 1991). Lipid accumulation in steatotic liver is also
associated with a phenomenon of peroxidation (MacDonald, 2001) analogous to that
observed in LDL of the atherosclerotic lesion (Glass & Witztum, 2001). In both organs
the oxidized LDL particles are taken up by macrophages which act as a chemotactic aid
for monocytes and vascular smooth muscle cells, simultaneously inducing their
proliferation, partially by stimulating expression of adhesion molecules, cytokines and
growth factors. Besides this, oxidized LDL also induces humoral and cell-mediated
immune responses (Witztum, 1994; Jialal & Devaraj, 1996).
An excess of the adipose tissue is associated with increased release of cytokines
that in a number of ways stimulate the generation of ROS. Although cells might produce
both enzymatic and non-enzymatic antioxidants to help remove ROS, in morbidly obese
subjects the pool of these antioxidants gets rapidly depleted leading to an increase in
cellular stress due to continuous production of ROS (Farshad Amirkhizi et al, 2007). The
consequence of the ROS overproduction in human obesity is constant oxidative stress
resulting in progressive tissue damage that attracts more ROS-producing cells of the
immune system, thus, forming a vicious circle.
Hypoxia
Hypoxia occurs when oxygen availability does not match the demand of the
surrounding tissue, resulting in decreased oxygen tension. Hypoxic stress plays a pivotal
role in normal human development and physiology, including embryogenesis and wound
22
repair. Hypoxia has been well studied for its importance in the pathogenesis of several
human diseases, including heart disease, stroke, diabetes, and cancer (Semenza, 2000).
Hypoxia is known to increase the mRNA expression of HIF-1 (Hypoxia inducible factor-
1) and a wide variety of other genes that stimulate erythropoiesis, angiogenesis, and
glycolysis (Semenza, 2000). Besides engaging the HIF-1-dependent pathway, hypoxia
also activates HIF-1 independent pathways that contribute to the cellular adaptation to
this type of the stress (Bi et al., 2005).
Obesity can be morphologically described as hypertrophy and hyperplasia of
adipocytes. Adipocytes under normal conditions have a limited capacity for hypertrophy;
one reason for this is the diffusion limit of oxygen, which is at most 100 µm (Helmlinger,
1997). The resistance of adipose tissue to hypertrophic and angiogenic stimuli is one of
the reasons why white adipose tissue is not richly vascularized. In obesity, adipocytes
become hypertrophic as their size increases up to 140–180 µm in diameter. Therefore,
hypertrophic adipocytes have to endure a less-than-adequate oxygen supply, which
suggests the existence of hypoxic conditions in the adipose. Hypoxia has now been
directly demonstrated in adipose tissue of several obese mouse models (ob/ob, KKAy,
diet-induced) and molecular studies indicate that the level of the HIF-1 is increased, as is
expression of the hypoxia-sensitive marker gene, GLUT1 [Ye et al., 2007; Trayhurn et
al., 2008]. Hypoxia is known to have a great impact on the expression of genes encoding
adipokines, including angiopoietin-like protein 4, IL-6, leptin, macrophage migration
inhibitory factor and vascular endothelial growth factor (Trayhurn et al., 2008; Hosogai
23
et al., 2007). One of the well documented examples in hypoxia-dependent degradation is
degradation of adiponectin mRNA in adipocytes (Hosogai et al., 2007).
Hypoxia in adipose tissue has at least two major effects on obesity-associated
chronic inflammation. First, it induces the adipocyte expression of cytokines, for
example, MIF and MCP-1 factors that promote macrophage infiltration in the adipose
tissue. Second, hypoxic environment stimulates macrophages, which are much more
active than adipocytes in the production of inflammatory cytokines (Kadowaki et al.,
2006). The hypoxia may also increase lipolysis that leads to the release of free fatty acids
(FFA) from adipocytes, which later on also join the cycle of the endocrine alteration and
inflammation. Hypoxia also directly leads to an increase of the levels of mRNAs of ER
stress marker genes, CHOP and GRP78 (glucose-regulated protein, 78 kD) (Hosogai et
al., 2007). In conclusion, hypoxia can impair adipocyte function and secretion of
adipokines. Therefore, hypoxia may contribute to the development of the secondary
complications of obesity, particularly, insulin resistance and metabolic syndrome (Wellen
& Hotamisligil, 2005).
Cutaneous manifestations of obesity
Obesity is associated with a variety of dermatoses, including acanthosis nigricans,
acrochordons, keratosis pilaris, hyperandrogenism and hirsutism, striae distensae, and
adiposis dolorosa, and as well with fat redistribution.
24
Acanthosis nigricans is the most common dermatological manifestation of
obesity. It is traditionally characterized by hyperpigmented, velvety thickening of
epidermis that primarily affects the axillae, posterior neck fold, flexor skin surfaces, and
umbilicus, and infrequently is diffuse with involvement of the mucosal surfaces of body
folds (Schwartz, 1994). This increased pigmentation may range from a brown to gray
color depending on the underlying skin tone. It is typically found in obese persons,
individuals with type II diabetes, or those with a family history of diabetes mellitus
(Gibson, 2004), however, its prevalence and significance in an unselected adult obese
population is unknown.
Acanthosis nigricans is a reliable cutaneous marker of hyperinsulinemia, a
consequence of insulin resistance that is associated with obesity (Katz et al., 2000).
Obese children with acanthosis nigricans have also been shown to have insulin resistance
(J.F. Fu, et al.2004). The blood glucose levels may or may not be elevated as the high
level of insulin is often able to maintain glucose homeostasis in the presence of insulin
resistance (Katz et al., 2000). The proposed mechanism of how hyperinsulinemia leads to
this epidermal change begins at the cellular level. Increased levels of circulating insulin
lead to a decrease in the number of functional insulin receptors (Rendon et al., 1989;
Cruz & Hud 1992). These “classic” insulin receptors regulate glucose uptake, cell
growth, DNA synthesis, and protein and fat metabolism via tyrosine kinase activity.
Keratinocytes and fibroblasts both express insulin-like growth factor (IGF) receptors that
are also capable of binding insulin and have growth-promoting effects (Hermanns-Le et
25
al., 2004). Decreased numbers of functional insulin receptors cause a shift to increased
binding to IGF receptors contributing to the development of acanthosis nigricans.
As could be seen from what is written above, the current explanation for the
connection between insulin resistance and an increase in the cutaneous pigmentation is
rather vague. There is a possibility for other, not yet unidentified factors produced by
adipose and influencing the skin. There are indications of significant crosstalk between
adipocytes and the melanocortin system, which point to the existence of novel pathways
in adipocytes. Study of these pathways may elucidate the pathogenesis of the metabolic
disorders.
Melanocortins:
POMC (proopiomelanocortin)
POMC gene encodes a polypeptide hormone precursor that undergoes extensive
and tissue-specific post-translational processing via cleavage by specific enzymes known
as prohormone convertases. This gene is actively transcribed in several tissues, including
the corticotroph cells of the anterior pituitary, neurons originating in the arcuate nucleus
of the hypothalamus, and cells in the dermis and the lymphoid system (Bertagna, 1994).
The POMC-related peptides ACTH and β-endorphin have also been documented in the
cardiac tissue of rat. There is a possibility that POMC is synthesized by cardiomyocytes,
but not by cardiac neurons (Forman & Bagasra 1992; Millington, 1993). Besides that, not
26
much is known about their cellular localization and function in heart (Saito 1983; Forman
et al., 1989; Forman et al., 1994).
The primary site of POMC expression, the pituitary gland, consists of two
POMC-expressing lineages: Corticotroph and Melanotroph. The single copy of POMC
gene is expressed in both pituitary lineages but under different developmental and
hormonal regulatory pathways. At the cellular level, this regulation is exerted by
transcription factors that regulate both POMC transcription and cell differentiation. The
corticotroph lineage constitutes the central link integrating signals from the brain and
periphery that serves as a regulator of the production of glucocorticoids. In the cells of
this lineage POMC is processed into adrenocorticotropin (ACTH). In the melanotrophs
the POMC is processed further, so α-melanocyte stimulating hormone (α-MSH) is
produced instead of ACTH.
Apart from differential expression of POMC in several tissues as mentioned
above, other mechanisms of POMC regulation exist. First, POMC could be regulated at
the transcriptional level through the formation of truncated and non-truncated forms of
POMC mRNA. The 5’ truncated POMC transcript lacks the POMC signal sequence
encoded by exon 2 of the POMC gene, so it is unlikely to undergo translation (Jeannotte
L, 1987; Lacaze-Masnoteil T, 1987; Clark AJL, 1990). In the testes, ovaries, pancreas
and other peripheral tissues expessing the POMC gene this short POMC transcript is far
more abundant that full-length POMC mRNA (DeBold CR, 1988; Hummel A, 1994;
27
Ivell R, 1994). In these tissues POMC peptide concentrations correlate with full-length,
not 5’ truncated, POMC mRNA levels (DeBold CR, 1988).
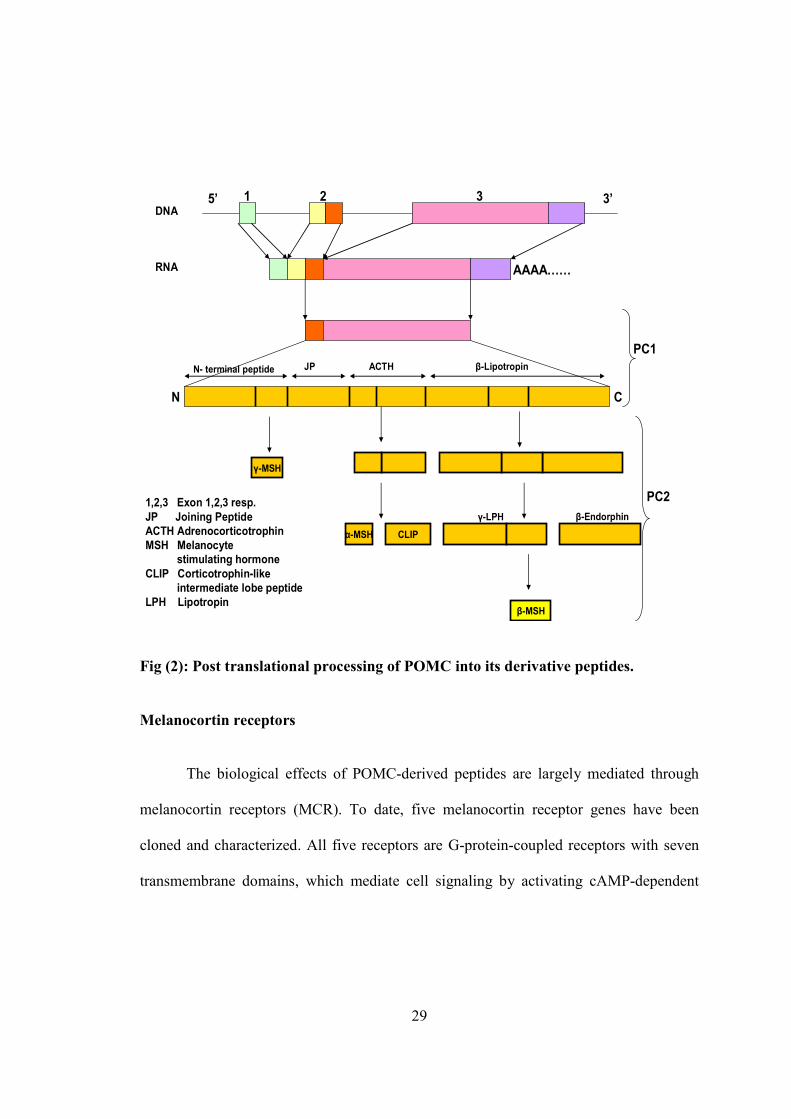
Second, POMC production is regulated at the posttranslational level. POMC
undergoes extensive and tissue specific posttranslational processing to yield a range of
biologically active peptides. The POMC gene produces a 32 kDa propeptide, which is
targeted via a specific signal into regulated secretory granules when passed through the
Golgi stacks (Cool et al. 1997). The processing of POMC depends on the range of
processing enzymes present in the tissue. For example, in pituitary, expression of
prohormone convertase 1 (PC1), but not PC2, results in the production of only N terminal
peptide, joining peptide, ACTH and β-lipotropin (White and Gibson 1998). In contrast,
expression of PC2 in hypothalamus in addition to PC1 leads to the production of CLIP, β
and γ-MSH due to its action on ACTH and gamma-LPH respectively (Bertagna et al.,
1988).
In addition to prohormone convertases and their endogenous inhibitors in
hypothalamus, other enzymes play a key role in generating mature POMC-derived
peptides. The generation of mature α-MSH from ACTH1-17 is catalysed by
caboxypeptidase E (CPE), peptidyl α-amidating mono-oxygenase (PAM) and N-
acetyltransferase. ACTH is absent in the hypothalamus due to the presence of PC2, PAM
and CPE enzymes which process the ACTH into smaller peptides. In this process,
carboxy-terminal basic amino acids are trimmed from ACTH1-17 by CPE which is
subsequently amidated by PAM to generate desacetyl α-MSH (DA-αMSH), which is
28
further converted to mature form of α-MSH by N-acetyltransferase. Besides pituitary and
hypothalamus, POMC and POMC derived peptides undergo extensive post-translational
processing in cardiac tissue (Millington, 1993).
Peptides derived from POMC serve a wide range of functions such as skin
pigmentation and energy homeostasis (Hadley & Haskell-Luevano, 1999; Cone, 2005).
In addition to this, POMC and POMC-derived peptides regulate a remarkably diverse
array of physiological functions including adrenocortical steroidogenesis, natriuresis,
erectile responses, and exocrine gland secretion and also exerts immunomodulatory
effects.
The biological effects of POMC-derived peptides are diverse. Mutations in
POMC in humans result in metabolic disorders, such as early onset of obesity due to
adrenal insufficiency (Krude et al., 1998) and hyperphagia (Krude and Gruters 2000).
Furthermore, POMC also serves as a quantitative trait locus (QTL) in human obesity
(QTL is a genetic factor that interacts with other genes and environmental factors to
predispose to complex human phenotypes) (Comuzzie et al., 1998). Mutations in POMC
have also been involved in the development of the different skin color phenotypes due to
switch from eumelanin to pheomelanin resulting in the formation of pale skin and red
hair pigmentation. Besides, mutations in enzymes required for POMC processing, for
example, PC1, also disrupt melanocortin signaling, as lack of α-MSH generation in the
hypothalamus ultimately results in obesity (Jackson et al., 1997).
29
5’ 3’
AAAA……
N- terminal peptide JP ACTH β-Lipotropin
γ-MSH
CLIPα-MSH
γ-LPH β-Endorphin
β-MSH
N C
1 2 3
1,2,3 Exon 1,2,3 resp.
JP Joining Peptide
ACTH Adrenocorticotrophin
MSH Melanocyte
stimulating hormone
CLIP Corticotrophin-like
intermediate lobe peptide
LPH Lipotropin
DNA
RNA
PC1
PC2
Fig (2): Post translational processing of POMC into its derivative peptides.
Melanocortin receptors
The biological effects of POMC-derived peptides are largely mediated through
melanocortin receptors (MCR). To date, five melanocortin receptor genes have been
cloned and characterized. All five receptors are G-protein-coupled receptors with seven
transmembrane domains, which mediate cell signaling by activating cAMP-dependent
30
pathways. These receptors differ in their tissue distribution and in their ability to
recognize various melanocortins and their physiological antagonists.
MC1R was the first MC receptor cloned (Mountjoy et al., 1992; Chhajlani &
Wikberg., 1992). The human MC1 receptor affinity is equally high for α-MSH and
ACTH and lower for β-MSH and γ-MSH (Mountjoy, 1994.). Initially, this receptor was
considered as peripheral receptor, and was thought to be expressed only by melanocytes,
keratinocytes and melanoma cells, with its main function involved in the regulation of
skin physiology and melanogenesis (Chhajlani, 1996; Eberle, 1988). However, the
expression of MC1R has been documented by macrophage/monocytic cells (Star et al.,
1995), lymphocytes with antigen-presenting and cytotoxic functions (Neumann et al.,
2001), neutrophils (Catania et al., 1996), and dendritic cells (Becher et al., 1999), which
suggests a specific role of MC1R in inflammation. It is also expressed at low levels in
adipocytes (Boston & Cone, 1996) and endothelial cells (Vergoni & Bertolini, 2000).
Recently, high expression of MC1R has been documented in the adipocytes of severely
obese subjects as compared to adipocytes of lean subjects (Hoch et al., 2007). The
authors suggested a functional role of MC1R in regulation of fat cell proliferation (Hoch
et al., 2007). Function of MC1R has not been proven yet, so there is another possibility
that MC1R expression in the adipocytes of morbidly obese subjects is involved in their
pigmentation.
MC2R is mainly expressed in the zona fasciculata and zona glomerulosa of the
adrenal cortex (Mountjoy et al., 1992). Recently expression of MC2R has been
31
documented in adipocytes of both subcutaneous and visceral adipose tissues (Schaffler et
al., 2005). MC2R shows great affinity for ACTH peptides and mediates the production
and release of steroids in the adrenal cortex (Xia & Wikberg, 1996; Buckley &
Ramachandran, 1981). Hereditary isolated glucocorticoid deficiency, a rare autosomal
disorder, is caused by mutations in the MC2R gene (Tsigos et al., 1993).
MC3R is expressed within the central nervous system, for example, within the
hypothalamus, thalamus, hippocampus, anterior amygdala, and cortex. In the periphery it
is expressed in the placenta, ovary, mammary gland, testis, gastrointestinal tract, and the
heart (Chahajlani & Wikeberg, 1992; Grantz et al., 1993; Chhajlani, 1996). Recently
expression of MC3R has been documented on adipocytes from both subcutaneous and
visceral adipose tissues (Smith et al., 2003). The receptor shows same binding affinity for
all MC peptides and plays an important role in the regulation of cardiovascular functions,
thermoregulation, and feeding behavior (Getting, 2002; Low, 2004). Besides, MC3R is
also involved in mediating some of the anti-inflammatory effects of α-MSH (Getting,
2002; Getting et al., 2003). Knockout mice lacking MC3R are obese, but not hyperphagic
(Butler and Cone, 2003).
MC4R is expressed within the neuroendocrine system in the brain: those receptors
are particularly dense in regions of hypothalamus. MC4R is reported in the rat
osteosarcoma cell line, UMR-106 and in the growth plate in the rat fetus (Dumont, 2001;
Mountjoy et al., 2003). Expression of MC4R has also been shown in adipocytes from
both subcutaneous and visceral fat (Smith et al., 2003; Schaffler et al., 2005). Both
32
MC3R and MC4R have been identified as important downstream effectors regulating
energy homeostasis in response to neuropeptides secreted by POMC- and AgRP-ergic
neurons. MC4R shows the highest affinity for α-MSH and ACTH. This receptor is
particularly involved in the control of the feeding and behavior, specifically in the
paraventricular nucleus, the dorsomedial hypothalamus and the lateral hypothalamic area,
which are (Mountjoy, 1994). Mutations in the MC4R gene in humans lead to
hyperinsulinemia and obese phenotype (Vaisse et al., 1998), which confirms its role in
appetite regulation. Even heterozygous MC4R mutations display an obese phenotype
which signifies that appetite regulation is sensitive to quantitative variation in MC4R
expression.
MC5R is localized to sebaceous glands, exocrine glands, hair follicles, and
epidermis in human skin, adipocytes and skin mast cells as well as in cultured human
sebocytes (Thiboutot et al., 2000, Slominski et al., 2000, Bohm et al, 2006). Mutations in
the MC5R gene in mice result in defective water repulsion and thermoregulation as well
as in reduced sebaceous gland secretion (Chen et al., 1997).
Therefore, adipocytes express all types of MC receptors. Additionally, all types of
melanocortin receptors were found in bone cells (both osteoblasts and osteoclasts) and
chondrocytes (Zhong et al., 2005). However, their exact function in bone tissue is not
known yet.
33
α-MSH
α-MSH is derived from post-translational cleavage of POMC. This peptide was
first discovered due to its role in pigmentation, but now is observed to be involved in
various biologic processes (Lipton, 1998). In the brain, α-MSH is mainly produced by
neurons in the arcuate nucleus of the hypothalamus. α-MSH could be produced by
immunocompetent cells (Schiöth et al., 1997; Taylor et al., 1994; Taylor et al., 1992).
Particularly, α-MSH has been discovered in lymphocytes, monocytes/macrophages
(Rajora et al., 1996; Star et al., 1995), Langerhans cells and epidermal cells (Schauer et
al., 1994), where it exerts immunomodulatory effects. The mechanisms by which its anti-
inflammatory effects are executed are not fully understood, but they clearly involve direct
action of the peptide on its receptors in peripheral inflammatory cells. Additionally, an
indirect action on peripheral inflammation is thought to be mediated by stimulation of -
MSH receptors present within the brain. Genetic defects inactivating the receptors for α-
MSH in experimental animals and in humans have been shown to result in obesity
(Farooqi et al., 1999).
Central action of α-MSH
POMC-derived α-MSH peptides regulate the central control of feeding and
energy balance (Pierroz et al., 2002) by decreasing body weight mediated by the decrease
of the fat mass and improvements of glucose uptake. Intracerebroventricular
administration of melanotan, a synthetic analogue of α-MSH, to morbidly obese rats has
been shown to elevate serum leptin level independently of morphological changes in
34
white adipose tissue (Banno et al., 2007). Furthermore, an increase in serum adiponectin
level and insulin sensitivity after central administration of Melanotan has also been
documented (Banno et al., 2007). Therefore, activation of the central melanocortin
systems with α-MSH or its analogues reduces adiposity by producing anorexigenic
signals, which might result in increased insulin sensitivity through their action within the
white adipose tissues. Besides an important role in appetite regulation, α-MSH has also
been shown to reduce fever and acute inflammation in the skin when administered
centrally. The above provids evidence suggesting that anti-inflammatory influences of
neural origin that are triggered by α-MSH could be used to treat systemic inflammation.
Peripheral action of α-MSH
α-MSH has antipyretic and anti-inflammatory roles. Recently, peripheral action
of α-MSH generated much interest, as this peptide and its synthetic analogues were
shown to provide protection against ischemia/reperfusion injury in various tissues. In
myocytes, α-MSH induces expression of cytoskeleton proteins and represses immune,
inflammatory, cell cycle, and protein turnover mediators (Colombo et al., 2005). α-MSH
modulates the production of proinflammatory cytokines like IL-1β, and IL-6 but do not
block them completely (Hiltz & Lipton 1998; Lipton and Catania 1997). Similarly α-
MSH also modulates the formation of NO and TNF-α, but can not completely stop the
production completely, by inactivating the NF-kB pathway (Manna & Aggarwal, 1998).
In senile plaques of Alzheimer’s disease patients α-MSH modulates inflammation
(Galimberti et al., 1999). Another interesting consequence of α-MSH signaling is the
35
suppression of the collagen synthesis and deposition (Bohm et al., 2004) and modulation
of the balance between MMP-1, MMP-8 and their inhibitors (TIMPs) (Wang et al.,
2006), thus pointing at α-MSH as potential antifibrotic drug target.
Besides repressing the level of various inflammatory mediators, α-MSH also
increases the production of anti-inflammatory cytokines like IL-10 by human monocytes
(Bhardwaj et al., 1996). α-MSH also has immunosuppressive effects as it suppresses the
synthesis of the endotoxin receptor CD14 present on the macrophages (Sarkar et al.,
2003), induces neutrophil elastase (Manna et al., 2006), decreases the production of
interferon gamma by human T-cells (Taylor, 2003) and modulates IgE synthesis by
human B cells (Aebischer et al., 1994). In addition, intraperitoneal administration of a
small concentration of α-MSH has been shown to modulate the circulating level of
inflammatory agents like TNF-α, IL-6 and others in the serum (Hernàndez et al., 1999).
α-MSH levels are elevated in plasma of obese men (Katsuki et al., 2000; Haggards et al.
1994) compared with non-obese subjects, suggesting possible peripheral resistance to
anorexigenic action of this peptide, while peripheral administration of α-MSH to POMC-
null mice leads to substantial weight loss, with direct effects on adipocytes (Yaswen et
al., 1999 and Zemel & Shi, 2000). Therefore, peripheral action of α-MSH is equally
important for the homeostasis of energy. Additionally, the broad anticytokine effects of
α-MSH suggest that this peptide might as well regulate adipokine release, thus producing
effects on a variety of obesity-related pathological phenotypes.
36
Chapter II
Pigmentation
Mammalian skin is pigmented due to to the cellular accumulation of amorphous,
opaque, insoluble mixtures of biopolymers called melanins. These pigments are
synthesized in the melanocytes located in the basal layer of the epidermis, the hair bulb,
and the iris. Melanins also occur naturally in the inner ear and choroid of eye (Prota,
1992). Synthesized melanin is stored in special lysosomal-like organelles called
melanosomes (Raposo & Marks, 2002) present in the melanocytes. Later the
melanosomes are actively exported to keratinocytes along the dendritic processes of
melanocytes. Each functional epidermal melanogenic unit that produces and distributes
melanin is composed of one melanocyte and approximately 36 neighboring keratinocytes
(Jimbow, 1995; Ortonne, 1992). Melanin is produced from L-tyrosine, which acts as the
major substrate, by special enzymes produced by the tyrosinase gene family. Melanin
synthesis can be induced by exposure to ultraviolet radiation, inflammatory modulators
such as leukotrienes and prostaglandins, and hormonal and growth factor stimuli such as
α-melanocyte-stimulating hormone and endothelins.
37
Cutaneous pigmentation:
Skin, the main source of melanin, is one of the largest organs with vital function.
It serves as an interface between the body and an external environment filled with
stresses such as solar radiation, thermal and chemical insults. Cutaneous pigmentation
plays a critical role in camouflage, mimicry and social communication. Furthermore, it
also provides a basis for gender recognition, as in many mammals the epidermis of
females is less melanized than that of males (Robins, 1991), which may be due to higher
need of vitamin D during pregnancy and lactation (Wilson, 1990).
The amount of pigment in the skin depends on the quantity, quality, and
distribution of the melanin. Cutaneous pigmentation results from exquisite interactions
between various cell types in the skin. The best described of these are the interactions
between the specialized melanin-synthesizing epidermal cells called melanocytes and the
keratinocytes, and between the melanocytes and the dermal fibroblasts. To be more
specific, skin pigmentation relies on melanocytes to provide, among other things,
photoprotection and thermoregulation. Melanocytes produce melanin and transfer it to
the recipient keratinocytes. This cellular interaction is subject to regulation by a wide
array of factors, some of which are endocrine, while others are paracrine and/or
autocrine. Many of these factors regulate both the constitutive pigmentation and the
ultraviolet radiation (UVR) or inflammation-induced hyperpigmentation.
38
Structure of the skin
The human skin consists of three individual layers: epidermis, dermis and
hypodermis. The epidermis is a continually renewing surface epithelial layer-the
outermost layer of skin-which can be divided into stratum corneum, granular, squamous,
and basal layer. Keratinocytes make up 90% of the epidermal cells. These cells arise in
the basal layer of epidermis. Later on they migrate toward the surface of the skin and
gradually lose their nuclei to form the stratum corneum (Slominski et al. 2004). The
granular layer of epidermis is composed of tightly apposed keratohyaline granules and 5
to 7 layers of polyhedral cells makes the squamous layer, attached to each other by
intercellular bridges that contain desmosomes. Langerhans cells are the type of dendritic
cells present in squamous layer. The basal layer of epidermis is made up of cuboidal or
columnar basal cells which lie along the dermoepidermal junction, attached to each other
and to the overlying squamous cells by intercellular bridges with melanocytes scattered
among them. Melanocytes are melanin pigment-producing specialized cells, with ample,
pale, non-filamentous cytoplasm, and are not connected to each other. These cells possess
large oval nuclei, a small nucleolus and pale dendritic possesses that extend between the
intercellular spaces of keratinocytes. Melanocytes contain small sub-cellular membrane-
bound endosomal organelles called melanosomes, where melanin is synthesized and later
on packed into granules and targeted preferentially to the ends of the dendrites for
transfer out to neighboring keratinocytes (Hearing 2005). A melanocytes itself rarely
contains melanin granules unless the cell has been activated to produce increased
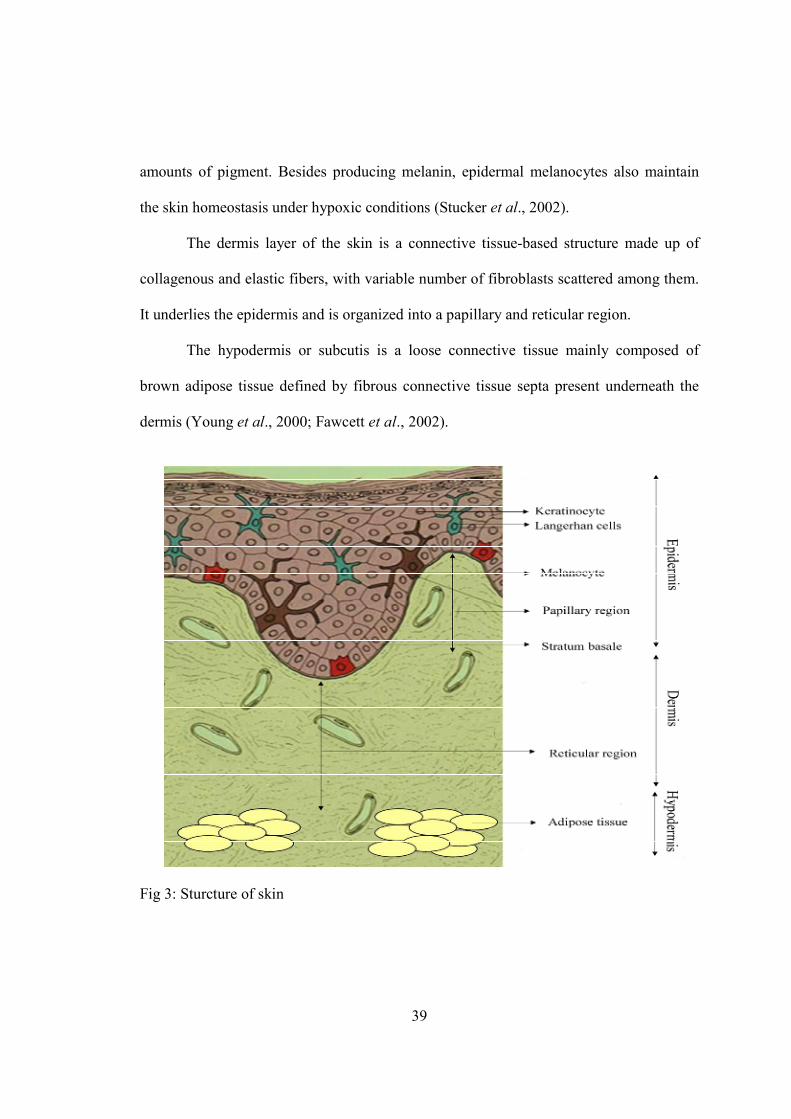
39
amounts of pigment. Besides producing melanin, epidermal melanocytes also maintain
the skin homeostasis under hypoxic conditions (Stucker et al., 2002).
The dermis layer of the skin is a connective tissue-based structure made up of
collagenous and elastic fibers, with variable number of fibroblasts scattered among them.
It underlies the epidermis and is organized into a papillary and reticular region.
The hypodermis or subcutis is a loose connective tissue mainly composed of
brown adipose tissue defined by fibrous connective tissue septa present underneath the
dermis (Young et al., 2000; Fawcett et al., 2002).
Fig 3: Sturcture of skin
40
Types of melanin in mammals
Melanocytic melanin
Melanin is a ubiquitous biological pigment (Kollias et al., 1991). Most of the
visible pigmentation in mammals results from the synthesis and distribution of two types
of melanin, whereas most feather coloration in birds is due to carotenoid pigments. The
two types of melanin pigments are eumelanin and pheomelanin. The eumelanin provides
brown/black color phenotype and preferentially contains indolic monomers, while the
pheomelanin provides contains yellow/red color phenotype and consists of benzothiazine
subunits (Prota, 1988). These two pigments differ not only in color but also in the size,
shape and packaging of their granules (Slominski 2004).
Both pigments provide body color, but their functions are very different from
biological point of view. Eumelanin is photoprotective for the skin cells, as it possesses
an intriguing and rather unique set of physicochemical properties, including strong broad
band UV and visible light absorption (Meredith & Riesz, 2004); powerful anti-oxidant
and free radical scavenging ability (Sarna et al., 1986); and, somewhat curiously,
electrical conductivity and photoconductivity in the condensed phase (Jastrzebska et al.,
1995; Rosei et al., 1996). Pheomelanin is believed to be carcinogenic, as it acts
synergistically with UV radiation (Harsanyi et al., 1980). It serves as a potent UV
photosensitizer that possibly contributes to increased sensitivity of fair-skinned
individuals with yellow or red hair to sunburn, premature aging, and/or malignant
transformation (Takeuchi et al., 2004).
41
Melanocytic extracutaneous melanin
Besides skin, extracutaneous melanin has been documented in eyes, ears, hair,
mucosal tissues and other organs. Recently, extracutaneous production of melanin has
been reported in heart (Ambani et al., 2005). These findings were supported by the
discovery of the melanocytes in the adult heart, where they are localized primarily in the
valvuloseptal apparatus (Mjaatvedt et al., 2005).
In the eye, melanin is found at a higher concentration than anywhere else in the
human body (Potts, 1964). Ocular pigmentation is believed to be formed for lifetime
during a brief period of the fetal and perinatal developmental window. In birds, the
deposition of the melanin in the retina of the eye occurs primarily dural fetal development
and continues for several days after hatching. The pigmented cells of the eye are non-
dividing and no melanin renewal is known to occur at this location. Abnormalities in
melanogenesis in eyes have been seen during the vision loss due to age-related macular
degeneration (Young, 1987; Bressler et al., 1988).
The eye contains two pigmented cell types, the choroidal/uveal melanocytes and
the retinal pigment epithelium (RPE) cells, which forms melanosomes indistinguishable
from those in the skin melanocytes. RPE forms the outermost layer of retina and is
composed of a monolayer of polygonal cells which are continuous cranially with the
pigmented eptithelial layer of the ciliary body and epithelium of iris. Both in RPE and
other pigmented cells of the eye melanin shows very little turnover (Ings, 1984; Sarna,
1992). Besides melanin, the eye contains another pigment, called lipofuscin, which is also
42
black in color like melanin but differs in chemical composition, biosynthesis and
function. Inconsistant with melanin, amount of lipofuscin increases with age.
Apart from the eye, extracutaneous melanocytes are also present in the cochlear
and vestibular tissues, mostly in the cuticle, ampullae and parts of the semicircular canals
of ear. They are also present near the vascular plexus of the modiolus (Franz et al., 1990).
The highest number of melanocytes has been documented in the stria vascularis (Savin,
1965; Conlee et al., 1989; Cable & Steel, 1991), a well vascularized, three-layered
epithelium where the pigment cells form the intermediate layer. In this layer, the pigment
cells are interplaced with the secretory cells, which are responsible for the unique ionic
composition of the endolymph and are in close contact with the capillary vessels. Little is
known about the function of inner ear melanins, and no data are available about inner ear
melanogenesis. However, an association between pigment abnormalities and hearing
defects has been clearly established (Meyer zum Gottesberge, 1988), suggesting an
important role for melanin and/or for the melanin-synthesizing cells. Melanocytes of the
inner ear are involved in the regulation of the secretion of endolymph, the trans-epithelial
ion transport, and the protection against ototoxic drugs and high-intensity noise damage
(Barrenas & Lindgren, 1990).
Pigmentation of the hair is another example of extracutaneous formation of
melanocytic melanin. The color of hair depends on the pigment content of the hair shaft,
with melanin granules mainly found in the cortex, whereas no melanin is seen in the cells
of the inner root sheath. The process of the pigmentation of hair follicles follows
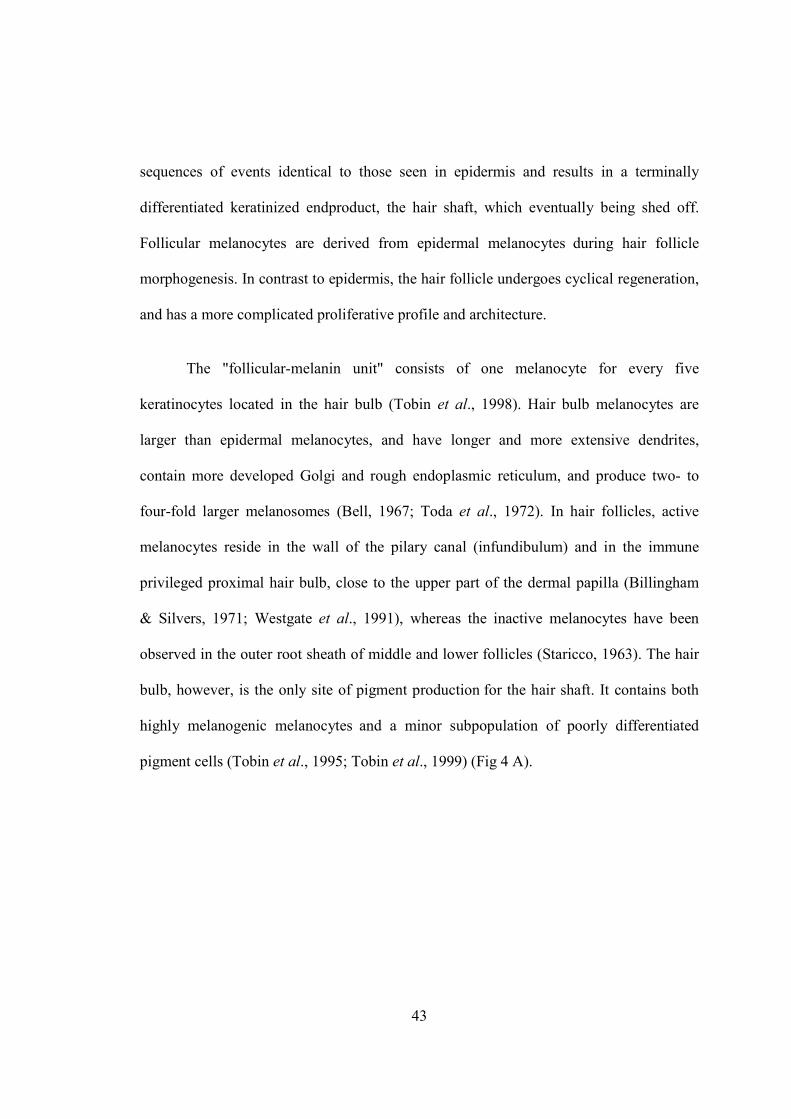
43
sequences of events identical to those seen in epidermis and results in a terminally
differentiated keratinized endproduct, the hair shaft, which eventually being shed off.
Follicular melanocytes are derived from epidermal melanocytes during hair follicle
morphogenesis. In contrast to epidermis, the hair follicle undergoes cyclical regeneration,
and has a more complicated proliferative profile and architecture.
The "follicular-melanin unit" consists of one melanocyte for every five
keratinocytes located in the hair bulb (Tobin et al., 1998). Hair bulb melanocytes are
larger than epidermal melanocytes, and have longer and more extensive dendrites,
contain more developed Golgi and rough endoplasmic reticulum, and produce two- to
four-fold larger melanosomes (Bell, 1967; Toda et al., 1972). In hair follicles, active
melanocytes reside in the wall of the pilary canal (infundibulum) and in the immune
privileged proximal hair bulb, close to the upper part of the dermal papilla (Billingham
& Silvers, 1971; Westgate et al., 1991), whereas the inactive melanocytes have been
observed in the outer root sheath of middle and lower follicles (Staricco, 1963). The hair
bulb, however, is the only site of pigment production for the hair shaft. It contains both
highly melanogenic melanocytes and a minor subpopulation of poorly differentiated
pigment cells (Tobin et al., 1995; Tobin et al., 1999) (Fig 4 A).
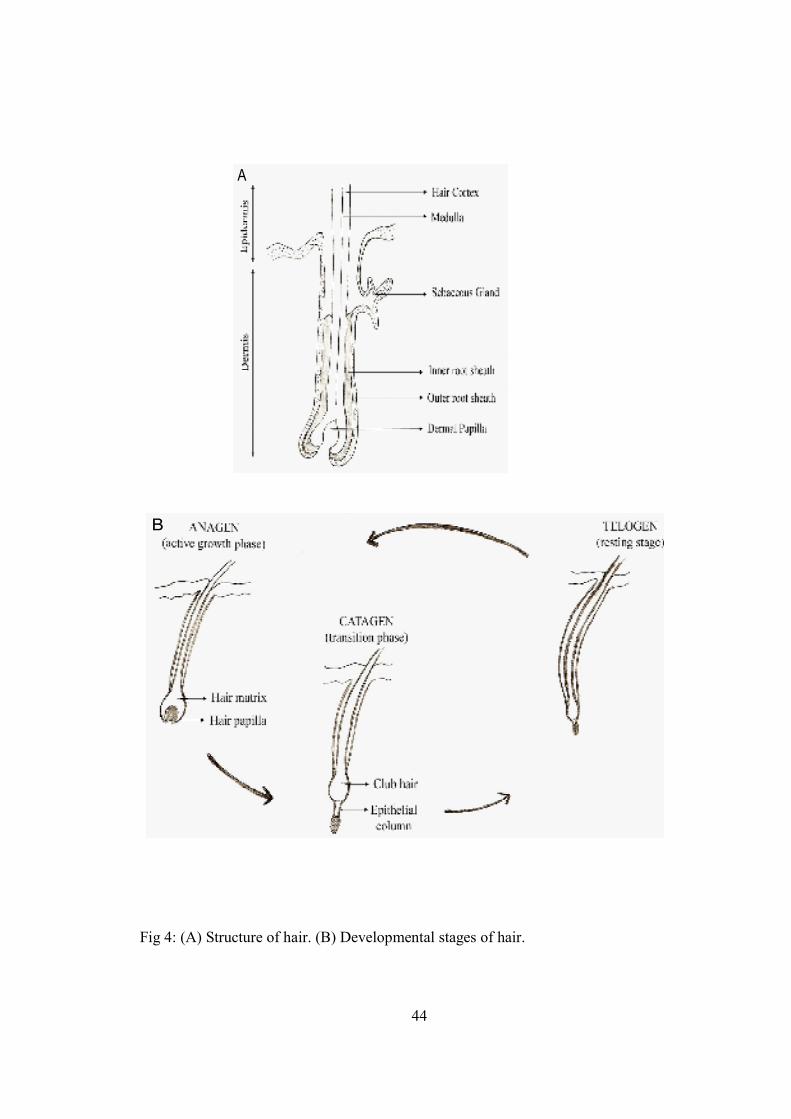
44
A
B
Fig 4: (A) Structure of hair. (B) Developmental stages of hair.
45
The hair follicle cycle consists of stages of rest (telogen), hair growth (anagen),
follicle regression (catagen), and hair shedding (exogen) (Fig 4 B). The entire lower
epithelial structure is formed during anagen, and regresses during catagen. Hair is formed
by rapidly proliferating matrix keratinocytes in the bulb located at the base of the
growing (anagen) follicle. Matrix cells eventually stop proliferating, and hair growth
ceases at catagen when the lower follicle regresses to reach a stage of rest (telogen). After
telogen, the lower hair-producing portion of the follicle regenerates, marking the new
anagen phase. Generally, in parallel to anagen onset in humans, the hair shaft is shed
during the exogen stage (Milner et al., 2002). Undifferentiated melanocytes are
transferred in the epithelial column of the catagen stage follicle which later differentiates
into active melanocytes during the telogen and anagen stage follicles of the hair germ.
The differentiated melanocytes then transfer melanosomes to the follicular epithelial
cells. The numbers of melanocytes in follicles during catagen and telogen are very low
with little cytoplasm and less developed Golgi complex and rough endoplasmic
reticulum, but their number increases during the early anagen stage. These observations
suggest that the bulb population of melanocytes has a perpetuating system, that is, a
melanocyte reservoir that contributes to normal hair pigmentation despite the shedding
and replacing of hairs throughout the life (Sugyiama S, 1976).
Extracutaneous non-melanocytic melanin
Extracutaneous pigmented granules were first found in the human central nervous
system (Scherer, 1939). Neuromelanin (NM) is a non-melanocytic extracutaneous
46
pigment found in the substantia nigra and locus coeruleus of the brain (Zecca et al.,
1996). Synthesis of neuromelanin itself is understood poorly. Most researchers consider
neuromelanin as an inert cellular by-product of dopamine synthesis produced via simple
autoxidation (Double et al., 2000; Zecca et al., 2003). In humans, these pigments keep
accumulating in the nigrostriatal dopamine neurons up to the age of 60 years and then
decrease afterwards (Mann et al., 1977). Neuromelanins are insoluble brown/black
macropolymer granular pigments composed of aminochromes and noradrenalinochromes,
with the properties of both pheomelanins and eumelanins (Odh et al., 1994). The absence
of NM in the central nervous system is possibly associated with pathogenesis of
Parkinson disease (Zecca et al., 2003).
Reactivation of the melanocyte–specific differentiation program is also a
characteristic of pulmonary lymphangioleiomyomatosis (LAM). LAM cells could be
stained with antibodies against melanocytic markers gp100 and CD63 (tetraspanin) as
well as with PNL2, an antibody against an as yet uncharacterized melanocytic antigen
(Zhe & Schuger, 2004). Occasional findings of extracutaneous melanin were also
described in non-melanoma neuroendocrine tumor of lungs (Iihara et al., 2002),
pheochromocytoma (Bellezza et al., 2004), composite paraganglioma-ganglioneuroma of
the urinary bladder (Dundr et al., 2003) and in black pigmented adrenal nodules found in
association with Cushing's syndrome (Damron et al., 1985).
The liver of Rana esculenta is also a site of extracutaneous production of melanin.
In the amphibian liver melanin is produced not by melanocytes or any other pigment cell
47
of neural origin, but by Kupffer cells of macrophage lineage (Pintucci et al., 1990, Sichel
et al., 1997, Guida et al., 1998). The fact that the liver possesses its own endogenous
melanogenic ability (Cicero et al., 1982, Sciuto et al., 1988) is supported by findings of
dopa oxidase activity in the frog liver (Cicero et al., 1989) and in the cultured Kupffer
cells, which do indeed express a tyrosinase (Guida et al., 2000).
Non-melanin pigments
Argentaffin pigments and lipofuscin are examples of extracutaneously produced
pigments which resemble melanin in color but differ in chemical composition.
Lipofuscins, also called age pigments, are fine yellow-brown granules composed of lipid-
containing residues of lysosomal digestion that cannot be degraded by lysosomal
hydrolases and also cannot be exocytosed. This intralysosomal polymeric materials are
found mainly in the liver, kidney, heart muscle, adrenals, nerve cells, and ganglion cells
and are specifically arranged around the nucleus. Lipofuscins originate from
autophagocytosed cellular components that have become oxidized outside or inside the
lysosomal compartment and continued to accumulate over time within metabolically
active postmitotic cells such as cardiac myocytes, neurons and RPE (Boulton et al., 2004,
Cuervo and Dice, 2000 and Yin, 1996).
An accumulation of lipofuscin (LF) pigments with age may be hazardous to
cellular functions (Brunk & Terman, 2002a) as these pigments have metal binding
capacity. In the case of cells of the RPE, most of the lipofuscin pigments are derived from
the ingestion of photoreceptor outer segments. These photoreceptor outer segments are
48
mainly composed of polysaturated fatty acids (PUFAs) which are susceptible to attack by
oxygen-derived free radicals. Due to the rich oxygen supply of the retina and its exposure
to light of short wavelengths, PUFAs are peroxidized by iron-catalyzed intralysosomal
oxidation and further transformed into fluorophores, which are known components of LF
(Gutteridge, 1982). Since RPE cells do not divide and thereby cannot reduce their LF
content, a substantial part of the RPE cell cytoplasm may finally be occupied by LF
(Feeney-Burns et al., 1984). Some of the retinal disorders like age-related macular
degeneration (AMD) and retinitis pigmentosa (Boulton et al., 2004) are accompanied by
an abundance of RPE-derived lipofuscin whose composition is similar to age-related
lipofuscin.
The content of lipofuscin in the liver, the heart and the neurons positively
correlates with mitochondrial damage and the production of ROS. Most likely, the
lipofuscin accumulation and the mitochondrial damage have common underlying
mechanisms, particularly, imperfect autophagy and lysosomal degradation of oxidatively
damaged mitochondria and other organelles (Terman et al., 2004). Several qualitative
analyses provide supportive evidence that aging is accompanied by increases in the
volume and/or in the number of dense bodies (secondary lysosomes, residual bodies,
lipofuscin) in rodent and human hepatocytes (Schmucker, 1990 and Schmucker & Sachs,
2002 ).
The argentaffin-producing cells of the enteroendocrine system found in gastric
glands secrete black pigment called argentaffin granules. The cells are located randomly
49
within the mucous membrane lining of the intestine and in tube-like depressions in that
lining known as the Lieberkühn glands. The argentaffin granules contain a chemical
called serotonin which stimulates smooth muscle contractions. Besides argentaffin
granules, these cells secrete a number of hormones, including gastrin, enteroglucagon,
serotonin and histamine.
Properties of melanin
In the human skin, melanin acts as a natural sunscreen and photoprotective
pigment. Melanin is capable of absorbing and scattering solar radiation, particularly, the
energetic UV and short wavelength visible photons. The pigment absorbs the harmful UV
radiation. The energy of the absorbed photons is rapidly utilized. However, the absorbing
potency decreases exponentially from the UV to the visible range (Sarna, 1992). Melanin
reacts continuously to impinging photons and either gets degraded or photoionized, or
produces free radicals on exposure to light. A very efficient non-radiative de-excitation of
melanin following the absorption of ultraviolet and visible photons has been reported in
several studies (Crippa et al., 1991; Forrest et al., 2000).
Environmental ultraviolet (UV) is known to cause a wide range of cutaneous
effects including skin cancer, immune suppression, photoaging and erythema (Phan et al.,
2006). These effects are a result of various physical and biochemical changes such as
proliferation of epithelial cells, skin hyperpigmentation, DNA damage, activation or
inactivation of a wide range of enzymes and proteins, and oxygen free radical production
(Lim et al., 2008). UVA-induced facultative pigmentation is limited to the basal cell layer
50
of epidermis whereas UVB-induced facultative pigmentation is distributed in
keratinocytes throughout the epidermis, activated melanocytes and corneocytes of the
stratum corneum (Rosen et al., 1990). Cutaneous melanin protects the skin, while ocular
melanin protects the eye, specifically the retina, from chronic exposure to solar radiation,
which reduces the incidence of age-related macular degeneration (AMD) (Young, 1988).
UV photons can mediate damage through two different mechanisms, either by
direct absorption of UV via cellular chromophores, resulting in formation of an excited
state and subsequent chemical reaction, or by phosensitization mechanisms, where the
UV light is absorbed by endogenous (or exogenous) sensitizers that are excited and their
further reactions lead to formation of ROS. These highly reactive species can interact
with cellular macromolecules such as DNA, proteins, fatty acids and saccharides causing
oxidative damage. Direct and indirect injuries result in a number of harmful effects such
as disrupted cell metabolism, morphological and ultrastructural changes, attacks on the
regulation pathways and alterations in the differentiation, proliferation and apoptosis of
the skin cells. These pathological processes may lead to erythema, sunburn,
inflammation, immunosuppression, photoaging, gene mutation, and development of
cutaneous malignancies.
In dark-skinned subjects eumelanin acts as a filter against UV radiation and as an
antioxidant that scavenges the ROS thus protecting the skin against UVB-induced DNA
lesions and UVA-induced membrane damage (Montagna & Carlisle, 1991). On the
contrary, pheomelanin, which is abundant in the light skinned individuals is not a good
51
scavenger of free radicals. This type of the melanin can produce free radicals and damage
cellular material including DNA. Subtypes of eumelanin also differ in their properties:
darker and highly polymerized DHI-eumelanin provides optimal photoabsoption but
potentially increases cytotoxic effects (Jimbow, 1995; Schmitz et al., 1995) whereas
DHICA-eumelanins have somewhat reduced photoabsorbing properties, but they are
associated with decreased toxicity towards cells (Hochstein & Cohen, 1963; Pawelek &
Lerner, 1978; Urabe et al., 1994).
Besides producing ROS and DNA damage, UV radiation also induces
inflammatory responses. Prostanoids and eicosanoids play an important part in triggering
melanin synthesis in UV-induced pigmentation (Nordlund & Askenase, 1983;Tomita et
al., 1992; Morelli and Norris, 1993), in a manner similar to that of other melanogens such
as endothelin-1 (Imokawa et al., 1995) and α-MSH (Hunt et al., 1994). Prostanoids and
eicosanoids activate a wide variety of responses in the skin, including: increased
vasodilation of blood vessels, increased vascular leakiness of fluid into the skin, the
activation of nerve endings, an increased release of histamine, and an activation of the
melanocytes. If the skin is continually exposed to solar radiation over many years, the
constant production of inflammatory hormones ultimately results in a permanent
activation of melanocytes. Another ubiquitous inflammatory factor, histamine, exerts its
stimulation through H2 receptors. Histamine has a melanogenic effect on cultured human
melanocytes (Tomita et al., 1988). In human skin, histamine is produced and released by
dermal mast cells and keratinocytes, and an increased release of histamine by UV
irradiation was reported by Gilchrest & Eller (1999). These findings strongly suggest the
52
involvement of histamine in UV-stimulated pigmentation. In conclusion, UV irradiation
increases the amount of melanin directly and indirectly through different pathways. Anti-
oxidant properties of melanin are responsible for scavenging of ROS, thus, reducing the
DNA damage.
Origin of melanocytes
Melanocytes originate from a subpopulation of neural crest cells (NCC) called
melanoblasts that emerge from the dorsal neural tube. The NCC migrates dorso-laterally
to form melanocytes of the skin, hair and inner ear mainly within cochlea, including the
stria vascularis (Schrott & Spoendlin, 1987; Peters et al., 1995; Conlee et al., 1994;
Motohashi et al., 1994). These cells can also migrate ventrally and contribute to the
formation of sensory and glia neurons and glia of cranial ganglia and mesenchymal cells
capable of differentiating into tendons, adipocytes, cartilage and bone, connective tissue,
neuroendocrine cells (Le Douarin, 1982; Le Douarin and Kalcheim, 1999).
The NCCs are derived from neural crest, a transient embryonic structure that
arises from neuroectoderm and gives rise to many cell types and tissues of the adult
vertebrate organism. NCCs originate dorsally at the tip, or ‘crest’, of the neural tube
within developing embryo, and undergo a well-defined extensive migration following
epithelial-to-mesenchymal conversion and detachment from the neural tube (Le Douarin
& Kalcheim, 1999; Bronnner-Fraser & Fraser, 1988). At the onset of migration, the NCC
are composed of a heterogeneous population of cells endowed with different proliferation
and differentiation potentials, capable of forming pigment cells, neurons and glial cells of
53
the peripheral nervous system (PNS) and endocrine cells (Sieber-Blum & Cohen, 1980).
NCC that differentiate into melanoblasts migrate by a dorso-lateral pathway between
dermatome and the overlying ectoderm; from embryonic day (E10.5) they migrate
ventrally through the developing dermis. At E14.5, they begin to invade the overlying
epidermis and then migrate into the developing hair follicles, where they continue to
proliferate and differentiate, before beginning to synthesize pigment at around postnatal
day 4 (Mayer, 1973; Jordan & Jackson, 2000b).
The pigment cells of eye, retinal pigment epithelium (RPE), develop from a
totally different source, the anterior neuroepithelium: optic cups of the brain (Bharti et
al., 2006). These optic vesicles arise as paired bulb-like outpocketings of the forebrain.
The vesicles indent to form a double-layered cup whose innermost layer develops into the
highly complex neural retina while the outer one gives rise chiefly to the single-cell-layer
pigment epithelium. Any defect in retinal pigmentation leads to visual impairment.
As shown by in vitro lineage analysis, both the cardiac and the trunk NCCs
possess the ability to form pigmented melanocytes (Sieber-Blum and Cohen, 1980;
Baroffio et al., 1991). There is also a possibility that melanocytes derived from NCCs
may arrest during migration and may have undergone malignant transformation in situ.
Non cutaneous occurrence of the malignant melanoma (MM) indicates a good example of
above mentioned assumption. Furthermore, the mRNA transcripts of tyrosinase, the most
specific marker of melanocytic differentiation, have been detected by PCR analysis in
various non cutaneous tissues of normal human organs such as lymph nodes, antrum,
54
colon, kidney, lung, testis, ovary, breast, and peripheral nerves (Battayani et al., 1995).
These finding is explained by the presence of the scattered fully-differentiated
melanocytes, melanocytic precursors, or Schwann cells bearing potentialities of
melanocytic differentiation within normal tissue. However, since the non-melanocytic
human cells can express tyrosinase but can not form the functional enzyme, these PCR
experiments cannot be viewed as the ultimate proof of the “scattered melanocytes”
theory.
On the other hand, the presence of the melanocytes has also been reported in the
adult heart where these cells are localized mostly in the valvuloseptal apparatus
(Mjaatvedt et al., 2005; Ambani et al., 2005). Heart melanocytes were revealed in the
transgenic mouse model that expresses the LacZ reporter gene under the control of the
Dopachrome tautomerase (Dct) promoter (abstract in PASPCR "The origin of
melanocytes in the murine heart"). The contribution of NCCs to heart development has
been established earlier (Kirby & Waldo, 1995). The analysis of embryos from E10.5
through E12.5 showed that the melanocytes destined to the heart initially follow the same
migratory route as those moving towards the skin and originate from the same region as
the cardiac NCCs. At E11.5 they leave the skin, travel inwards and reach the heart by
E12.5. By E14.5, their numbers have increased. The location of the melanocytes within
the embryonic heart and within the adult heart is the same.
55
Melanosomes and their biogenesis
Eumelanin and pheomelanin synthesis takes place in specialized, pigment-
containing, lysosome-related organelles called melanosomes. The melanosomes are
present within the melanocytes located in the skin and other places of the body such as
the eye, the ear, the meninges, the harderian gland, and accessory lacrimal glands on the
inner side of the orbit. In birds, melanosomes are found in the melanocytes of the feather-
follicles as well as other tissues. Melanosomes are also present in the connective tissue of
the portal canals, in the space of Disse and around the sinusoids of amphibian and
reptilian livers (Eberth, 1866; Oppel, 1990).
Melanosomes, like other cellular organelles, are membrane-bound structures
containing a variety of molecules including lipids, proteins and melanin. The structure
and contents of melanosomes depend on their origin and correlate with the type of
melanin produced. Eumelanin-producing eumelanosomes are of elliptical shape and
contain fibrillar matrix, pheomelanosomes have a more rounded contour and contain
vesiculoglobular matrix (Ozeki et al., 2007). Neuromelanin-producing
neuromelanosomes have a complex structure. Their melanic component is bound to
metals, peptides, and lipids, which at present haveunknown structure (Zecca et al., 2000;
Zecca et al., 1992; Zecca et al., 1996).
The biogenesis and the maturation of melanosomes in melanocytes and their
transfer to adjacent keratinocytes provide the basic processes underlying the mammalian
pigmentation (Marks and Seabra, 2001). Melanosomes originate from the trans-Golgi
56
apparatus and mature within the melanocyte or the developing RPE through four
morphologically distinct stages (Marks and Seabra, 2001). Stage I melanosomes, also
called premelanosomes, are formed by outpouching of a smooth membrane from the
RER; these organelles are characterized by the early matrix organization, while in stage II
the matrix is already organized but melanin is not formed yet. The structural foundation
of the fibrils in stage I and II melanosomes is PMEL 17 protein. In stage III, there is a
deposition of melanin. In stage IV, melanosomes are fully melanized. Pigment-loaded
melanosomes of stage IV are translocated bidirectionally to their recipient keratinocytes
along the dendrites of melanocytes.
Melanin biosynthetic enzymes tyrosinase (TYR), tyrosinase-related protein 1
(TYRP1) and tyrosinase-related protein 2 (TYRP2) are integral membrane proteins that
are enriched in stage III and IV melanosomes (Raposo et al., 2001; Kushimoto et al.,
2001; Theos et al., 2005). The process of the cellular sorting for these integral membrane
proteins is unique to these specialized cells. When expressed ectopically in non-
pigmented cells, most melanosomal proteins are localized to late endosomes and
lysosomes (Bouchard et al., 1989; Vijayasaradhi et al., 1995; Berson et al., 2001).
Microtubule-based transport of mature melanosomes to keratinocytes is facilitated
by dynein and kinesin motor proteins. These mature melanosomes are captured by actin-
based motor proteins which are later on dispersed into the cytoplasm of keratinocytes
(Seabra & Coudrier, 2004; Barral & Seabra, 2004). Capture on actin filaments is
mediated by a protein complex that consists of myosin Va, the small GTPase RAB27a
57
and the linker protein melanophilin (also known as SLAC2a) (Seabra & Coudrier, 2004).
Genetic, morphologic and biochemical studies of three mouse coat color mutants, dilute,
ashen and leaden, provided the understanding of the mechanisms that regulates the
binding of melanosomes to myosin Va and helps their (Barral & Seabra, 2004; Goud,
2002; Hammer & Wu, 2002). A protease activated receptor 2 (PAR2) that is present on
the keratinocytes also plays an important role in melanosome transfer (Boissy, 2003).
In contrast, RPE melanosomes are synthesized in utero and remain unchanged
thereafter. Unlike the cutaneous melanocytes, the melanosomes of the eye never transfer
to adjacent cells, but are retained inside the cells of origin. Premelanosomes are rarely
found in the normal retina, which suggests a slow turnover of melanosomes in mature
RPE. The melanosomes in the retina are thought to function in the absorption of stray
light that enters the eye, thus, minimizing light scatter, and in the detoxification of
oxidative intermediates (Schraermeyer & Heimann, 1999).
Defects in the formation, maturation and trafficking of melanosomes within
melanocytes result in several genetic disorders, particulrly, Hermansky–Pudlak
syndrome, Chediak–Higashi syndrome, Griscelli syndrome and Elejalde syndrome.
Individuals with one of these syndromes show defects in skin and/or hair pigmentation.
In cells of these patients melanosomes appear to be clustered around the perinuclear area
due to improper transportation, instead of being scattered at the periphery, as seen in
normal melanocytes.
58
Melanosomal pH has been documented to control the rate of melanogenesis,
eumelanin/phaeomelanin ratio and melanosome maturation in melanocytes (Ancans et
al., 2001). Catalytic domains of the enzymes required for melanogenesis face the
intracellular environment of melanocytes, so proper pH activates these enzymes.
Particularly, melanosomal pH regulates multiple stages of melanin production in human
pigment cells and the enzymatic activity of TYR (Ancans et al., 2001). In fact, the intact
melanosomes are reported to have a proton gradient similar to that of lysosomes (Klaus,
1971; Hori et al., 1968), which makes the melanosomes acidic.
Melanocytes from different skin types differ in the pH of their melanosomes
(Fuller 2001). Generally, more highly pigmented melanosomes are more acidic than less-
pigmented melanosomes (Bhatnagar et al, 1993; Ramaiah, 2002). Higher enzymatic
activity of TYR at low pH values has been reported (Tabachnick, J. 1970; Burka, R.C.
1965), probably because of the activating change in the conformation of TYR at low pH.
Tyrosinase enzyme activity can be also boosted by a single dose of UV irradiation
(Pathak et al., 1965). An inducible increase in the activity of TYR is explained by the
hypothesis that it mainly exists in an inactive or partially inhibited state and is activated
“on demand” by a decrease in pH of the intact melanosomes or by an increase of the ROS
(Fitzpatrick, 1965).
Genetics of pigmentation:
Melanogenesis is a very complex, enzymatically regulated process controlled by
more than 120 distinct genes (Bennett and Lamoreux, 2003). These genes work to
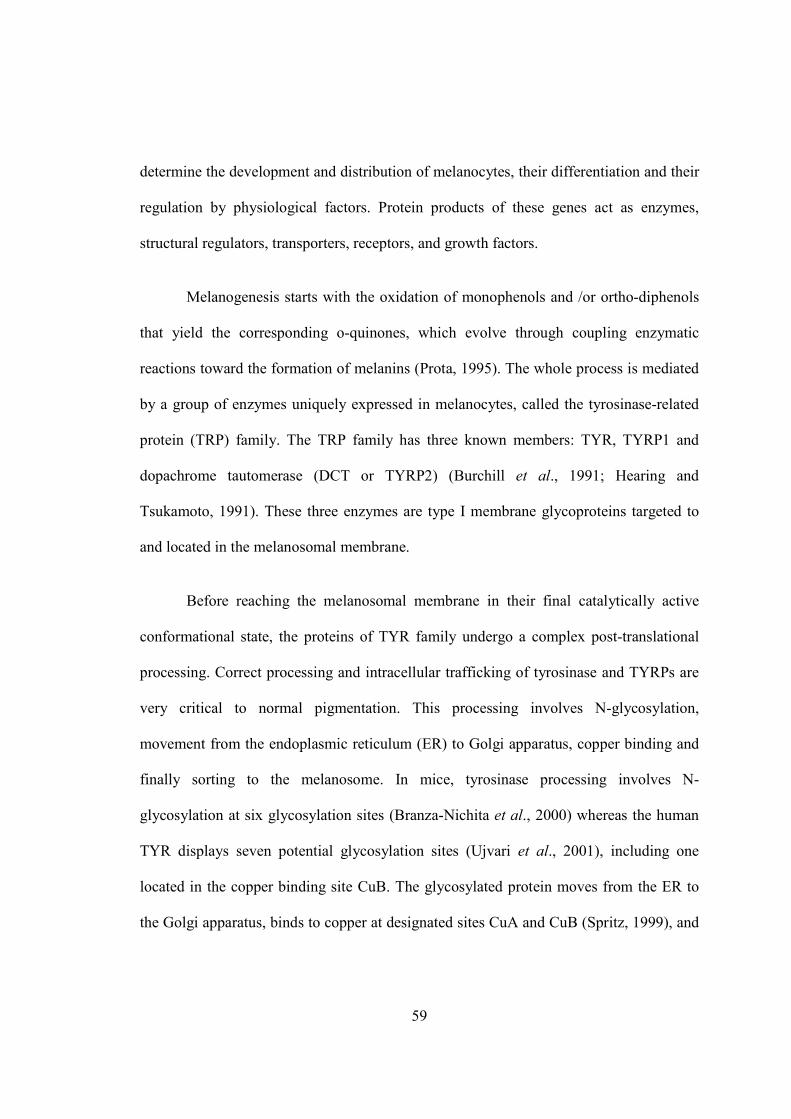
59
determine the development and distribution of melanocytes, their differentiation and their
regulation by physiological factors. Protein products of these genes act as enzymes,
structural regulators, transporters, receptors, and growth factors.
Melanogenesis starts with the oxidation of monophenols and /or ortho-diphenols
that yield the corresponding o-quinones, which evolve through coupling enzymatic
reactions toward the formation of melanins (Prota, 1995). The whole process is mediated
by a group of enzymes uniquely expressed in melanocytes, called the tyrosinase-related
protein (TRP) family. The TRP family has three known members: TYR, TYRP1 and
dopachrome tautomerase (DCT or TYRP2) (Burchill et al., 1991; Hearing and
Tsukamoto, 1991). These three enzymes are type I membrane glycoproteins targeted to
and located in the melanosomal membrane.
Before reaching the melanosomal membrane in their final catalytically active
conformational state, the proteins of TYR family undergo a complex post-translational
processing. Correct processing and intracellular trafficking of tyrosinase and TYRPs are
very critical to normal pigmentation. This processing involves N-glycosylation,
movement from the endoplasmic reticulum (ER) to Golgi apparatus, copper binding and
finally sorting to the melanosome. In mice, tyrosinase processing involves N-
glycosylation at six glycosylation sites (Branza-Nichita et al., 2000) whereas the human
TYR displays seven potential glycosylation sites (Ujvari et al., 2001), including one
located in the copper binding site CuB. The glycosylated protein moves from the ER to
the Golgi apparatus, binds to copper at designated sites CuA and CuB (Spritz, 1999), and
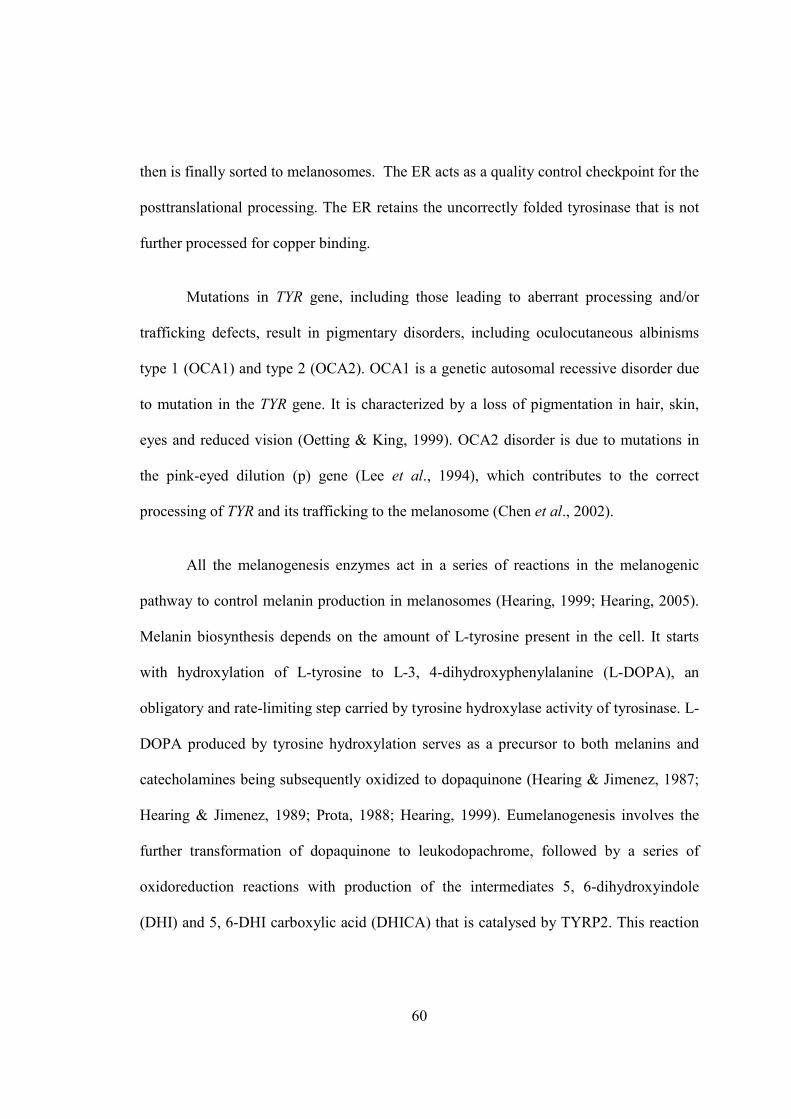
60
then is finally sorted to melanosomes. The ER acts as a quality control checkpoint for the
posttranslational processing. The ER retains the uncorrectly folded tyrosinase that is not
further processed for copper binding.
Mutations in TYR gene, including those leading to aberrant processing and/or
trafficking defects, result in pigmentary disorders, including oculocutaneous albinisms
type 1 (OCA1) and type 2 (OCA2). OCA1 is a genetic autosomal recessive disorder due
to mutation in the TYR gene. It is characterized by a loss of pigmentation in hair, skin,
eyes and reduced vision (Oetting & King, 1999). OCA2 disorder is due to mutations in
the pink-eyed dilution (p) gene (Lee et al., 1994), which contributes to the correct
processing of TYR and its trafficking to the melanosome (Chen et al., 2002).
All the melanogenesis enzymes act in a series of reactions in the melanogenic
pathway to control melanin production in melanosomes (Hearing, 1999; Hearing, 2005).
Melanin biosynthesis depends on the amount of L-tyrosine present in the cell. It starts
with hydroxylation of L-tyrosine to L-3, 4-dihydroxyphenylalanine (L-DOPA), an
obligatory and rate-limiting step carried by tyrosine hydroxylase activity of tyrosinase. L-
DOPA produced by tyrosine hydroxylation serves as a precursor to both melanins and
catecholamines being subsequently oxidized to dopaquinone (Hearing & Jimenez, 1987;
Hearing & Jimenez, 1989; Prota, 1988; Hearing, 1999). Eumelanogenesis involves the
further transformation of dopaquinone to leukodopachrome, followed by a series of
oxidoreduction reactions with production of the intermediates 5, 6-dihydroxyindole
(DHI) and 5, 6-DHI carboxylic acid (DHICA) that is catalysed by TYRP2. This reaction
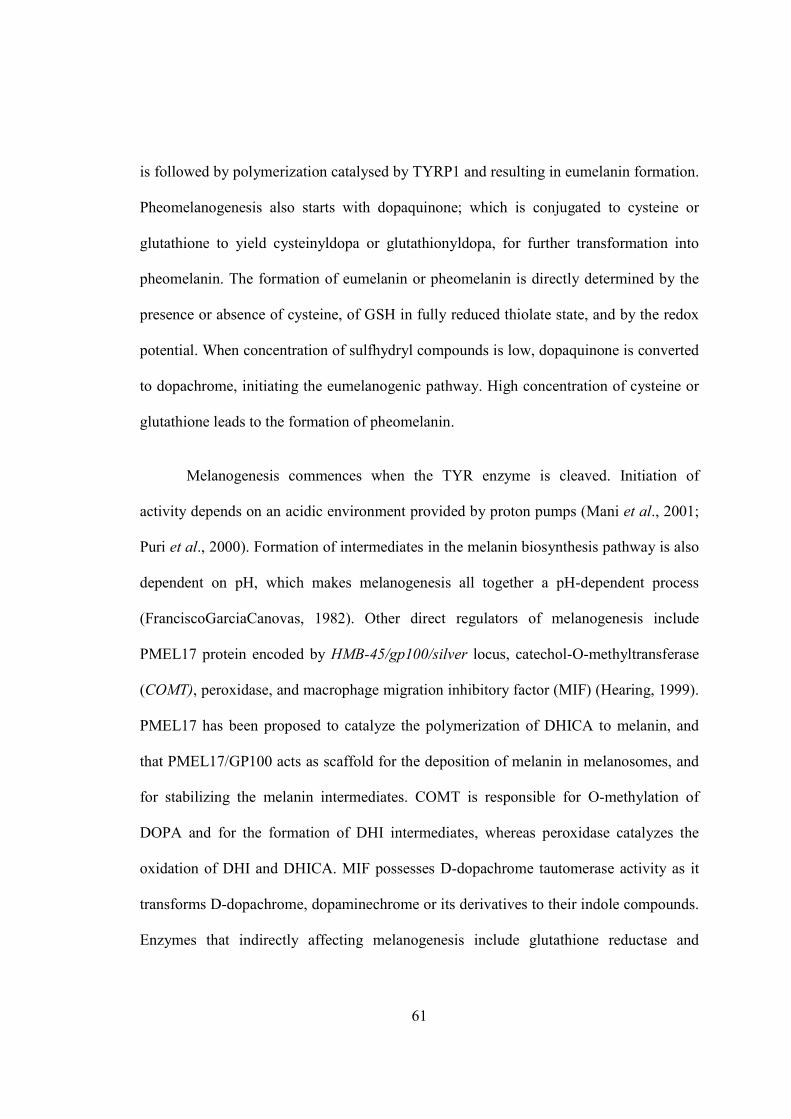
61
is followed by polymerization catalysed by TYRP1 and resulting in eumelanin formation.
Pheomelanogenesis also starts with dopaquinone; which is conjugated to cysteine or
glutathione to yield cysteinyldopa or glutathionyldopa, for further transformation into
pheomelanin. The formation of eumelanin or pheomelanin is directly determined by the
presence or absence of cysteine, of GSH in fully reduced thiolate state, and by the redox
potential. When concentration of sulfhydryl compounds is low, dopaquinone is converted
to dopachrome, initiating the eumelanogenic pathway. High concentration of cysteine or
glutathione leads to the formation of pheomelanin.
Melanogenesis commences when the TYR enzyme is cleaved. Initiation of
activity depends on an acidic environment provided by proton pumps (Mani et al., 2001;
Puri et al., 2000). Formation of intermediates in the melanin biosynthesis pathway is also
dependent on pH, which makes melanogenesis all together a pH-dependent process
(FranciscoGarciaCanovas, 1982). Other direct regulators of melanogenesis include
PMEL17 protein encoded by HMB-45/gp100/silver locus, catechol-O-methyltransferase
(COMT), peroxidase, and macrophage migration inhibitory factor (MIF) (Hearing, 1999).
PMEL17 has been proposed to catalyze the polymerization of DHICA to melanin, and
that PMEL17/GP100 acts as scaffold for the deposition of melanin in melanosomes, and
for stabilizing the melanin intermediates. COMT is responsible for O-methylation of
DOPA and for the formation of DHI intermediates, whereas peroxidase catalyzes the
oxidation of DHI and DHICA. MIF possesses D-dopachrome tautomerase activity as it
transforms D-dopachrome, dopaminechrome or its derivatives to their indole compounds.
Enzymes that indirectly affecting melanogenesis include glutathione reductase and
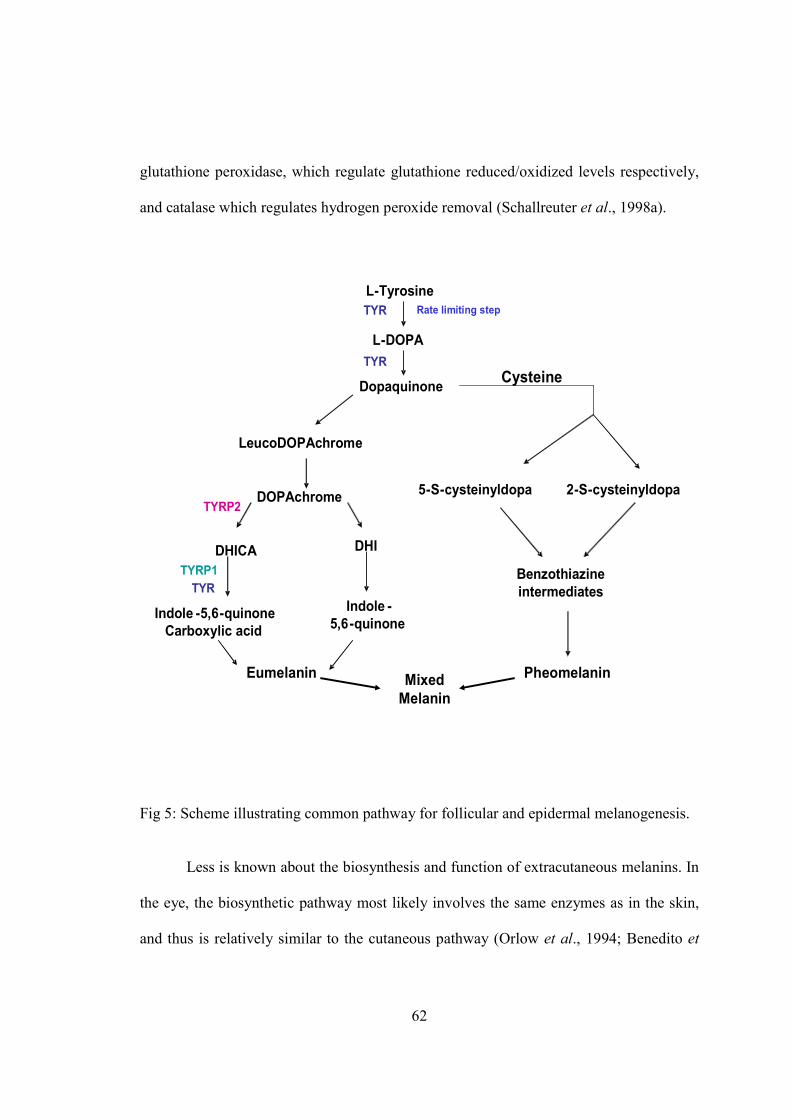
62
glutathione peroxidase, which regulate glutathione reduced/oxidized levels respectively,
and catalase which regulates hydrogen peroxide removal (Schallreuter et al., 1998a).
L-Tyrosine
L-DOPA
Dopaquinone
LeucoDOPAchrome
DOPAchrome
DHICA DHI
Indole -5,6-quinone
Carboxylic acid
Indole -
5,6-quinone
Eumelanin
TYR
TYR
TYRP2
TYRP1
TYR
Cysteine
5-S-cysteinyldopa 2-S-cysteinyldopa
Benzothiazine
intermediates
Pheomelanin
Rate limiting step
Mixed
Melanin
Fig 5: Scheme illustrating common pathway for follicular and epidermal melanogenesis.
Less is known about the biosynthesis and function of extracutaneous melanins. In
the eye, the biosynthetic pathway most likely involves the same enzymes as in the skin,
and thus is relatively similar to the cutaneous pathway (Orlow et al., 1994; Benedito et
63
al., 1995). However, the biosynthetic pathway involved in the formation of neuromelanin
in brain is still uncharacterized and, apparently, involves neither TYR (Barden, 1981),
nor a peroxidase activity (Rabey & Hefti, 1990). Neuromelanin in the substantia nigra is
assumed to be formed by catalyzing the conversion of the amino acid L-tyrosine to the
dopamine (DA) precursor of dihydroxyphenylalanine (DOPA), by tyrosine hydroxylase
(TH). DA and other catecholamines later on undergo non-enzymatic autoxidation to form
neuromelanin (Breathnach, 1988). Alternatively, TH-mediated oxidation of dopamine has
been proposed (Havvik, 1997). In addition to this, enzymatic activity of macrophage
migration inhibitory factor was also suggested for neuromelanin synthesis, because it
converts catecholamines into dihydroxyindole derivatives, the potential precursors of
neuromelanin (Matsunaga et al., 1999). Tyrosine hydroxylase has been used as a marker
of putative dopaminergic neurons and the existence of this enzyme in the human
midbrain neurons is considered to be an evidence of DA synthesis in this area. A recent
study, however, has found a low level of TYR mRNA expression in the human SN (J.
Haavik, 1977). Some authors proposed that TYR could be involved in neuromelanin
biosynthesis, because TYR mRNA (Haavik, 1977) and TYR promoter activity (Tief et al.,
1998) have been detected in the substantia nigra. However, TYR protein was not detected
in substantia nigra by immunohistochemistry (Ikemoto et al., 1998). Moreover, albinos,
who lack TYR gene, display normally pigmented substantia nigra (Foley & Baxter, 1958).
In human substantia nigra, the neuromelanin content increases until age 60 and
decreases afterwards (Fenichel & Bazelon, 1968), probably, due to loss of
catecholeaminergic neurons during the process of aging. This neurodegneration results in
64
a loss of dopaminergic neurons in the substantia-nigra, which results in the loss of TH
containing nerve endings in the striatum, and diminished levels of the striatal dopamine
production causing abnormal motor behavior, finally leading to degenerative disorder
called Parkinson’s Disease (PD) (Booij et al., 2001).
Regulatory pathways in melanogenesis
Melanogenesis is a tightly controlled process that can be regulated by
postranslational, translational, and transcriptional mechanisms (Eberle, 1988). A key role
in the control of pigmentation in mammals is played by melanocortins. Melanocortins are
a group of pituitary hormones that include ACTH and α, β and γ-MSH generated by the
posttranslational cleavage of prohormone proopiomelanocortin. These peptides act
through melanocortin receptors. In addition to their well-known roles in pigmentation and
in neuroendocrine pathways, melanocortins serve as regulators of immune function, lipid
metabolism and feeding behaviors in rodents and humans (Wintzen et al., 1996; Huszar
et al., 1997; Luger et al., 1999).
α-MSH peptide is the main product of POMC acting upon the skin (Slominski et
al., 2000). The other products, particularly, ACTH, γ-MSH and β-endorphin also serve as
important mammalian cutaneous mediators (Inoue et al., 2003; Johansson & Wang, 1993;
Kauser et al., 2003). In cultured human melanocytes, nanomolar concentrations of α-
MSH, β-MSH, and ACTH stimulate melanogenesis, cell proliferation, dendrite formation,
and cAMP production (Abdel-Malek et al., 1995; Rousseau et al., 2007; Hunt, 1995;
Suzuki et al., 1996), whereas γ-MSH stimulates cAMP production, but had no significant
effect on melanogenesis or proliferation in human melanocytes (Suzuki et al., 1996).
65
Five MC receptors (MC1R - MC5R) have been cloned and characterized from
human tissues; most of them show tissue-specific expression patterns. MC1R serves as
the key control of pigmentation as it has high affinity for α-MSH and signals through
cAMP-dependent pathway ((Lalli & Sassone-Corsi, 1994). In vitro, the melanogenic
effects of α-MSH can be mimicked by pharmacologic agents such as forskolin, a direct
activator of adenylate cyclase (Englaro et al., 1995). Any mutation in MC1R or Gαs
protein that controls cAMP level as well as a decrease of αMSH expression leads to
inhibition of melanin synthesis (Valverde 1995; Krude et al., 1998; Schwindinger et al.,
1992). cAMP increases melanogenesis mainly through the MITF-dependent stimulation
of TYR expression. Patients with altered function of the cAMP/PKA pathway present
with skin pigmentation defects, thereby demonstrating the importance of the cAMP/PKA
pathway in the regulation of melanogenesis (Schwindinger et al., 1992).
Through activation of PKA and the transcription factor CREB, cAMP promotes
an increase in the expression of microphthalmia-associated transcription factor (MITF)
(Bertolotto 1998). MITF is a melanocyte-specific transcription factor of the basic-helix-
loop-helix-leucine-zipper family (b-HLH-LZ) (Hodgkinson et al., 1993; Steingrimsson et
al., 1994). MITF binds as a dimer to the M-box (11bp motif AGTCATGTGCT), a highly
conserved DNA sequence (Goding & Fisher, 1997; Sato et al., 1997; Yasumoto et al.,
1997). Recent studies revealed that MITF is able to transactivate several other gene
promoters in addition to pigmentation genes. For example, in cultured human osteoclasts
MITF upregulates endogenous cathepsin K, which are required for the bone resorption.
Several related b-HLH-Zip transcription factors can heterodimerize with MITF and bind
66
to identical DNA sequences. These related factors, namely transcription factors EB
(TFEB), TFE3 and TFEC, together with MITF are called the MIT family (Hemesath et
al., 1998). MITF is expressed only in specific cell types, while other members of the MIT
family are ubiquitously expressed. MITF mediates both the differentiation effect of α-
MSH (Price et al., 1998; Bertolotto et al., 1998) and promotes the survival of pigment
cells by up-regulating the expression of the major antiapoptotic protein BCL2 (McGill et
al., 2002).
The MITF gene has a multi-promoter organization. At least nine distinct
promoter-exon units direct the initiation of specific MITF isoforms that differ in their first
one or two exons spliced to the common downstream exons (Hershey & Fisher, 2005).
The promoter that is most proximal to the common downstream exons is known as the M
promoter and is selectively expressed in melanocytes (Fuse et al., 1996). MITF-M
promoter expression is cell-type specific despite its regulation by the ubiquitous cAMP–
CREB pathway. Structural analysis of the MITF gene revealed that it encodes four
isoforms of MITF proteins, termed MITF-A, -C, -H and –M (Shibahara et al., 2001;
Amae et al., 1998). The longest isoform, MITF-A, is expressed in many cultured cells,
including RPE cells (Amae et al., 1998). MITF-C is also expressed in many cultured
cells, but is undetectable in melanocytes (Fuse et al., 1999), whereas MITF-H is enriched
in the rodent heart tissue (Hodgkinson et al., 1993).
Regulation of MITF gene expression in melanocytes has been studied relatively
well. In these cells, the activation of MC1R receptors by UV radiation or by binding to
α-MSH peptides leads to activation of adenylyl cyclase and the subsequent increase in the
67
production of cAMP. Increase in cAMP leads to the phosphorylation of CREB
transcription factors which activate MITF-M promoters (Price et al., 1998). In addition to
CREB, other transcription factors, namely, paired box gene 3 (PAX3), SRY (sex
determining region Y)-box 10 (SOX 10), lymphoid enhancer-binding factor 1 (LEF
1/TCF), one cut domain 2 (ONECUT-2) also bind to the MITF-M promoter (Widlund
2003, Yasumoto 2002). PAX3 is expressed in both melanocytes and melanoblasts cell
lines (Galibert et al., 1999) and recognizes the MITF promoter for both in vitro and in
vivo conditions (Watanabe et al., 1998). Mutations in PAX3 are known to impair its
ability to regulate transcription by inhibiting its capacity to regulate MITF promoter
activity. Sox10 proteins are also expressed in melanocytes and in melanoma cell lines
(Kuhlbrodt et al., 1998; Southard-Smith et al., 1998) and are required in the development
of the melanocyte lineage. Mutations in Sox 10 are responsible for Waardenburg-
Hirschsprung syndrome (WS4) in humans (Pingault et al., 1998; Southard-Smith et al.,
1998). This disease is characterized by a combination of deafness and pigmentary
disorder.
Pigment cell formation is also promoted by ectopic expression of β-catenin in
NCCs. Promoter regions of MITF (Takeda et al., 2002) contain binding sites for Tcf/Lef
trancription factors (Dorsky et al., 1998), which form a complex with β-catenin and act as
a transcriptional activator of Wnt target genes (Seidensticker & Behrens, 2000).
Mutations in the Tcf/Lef binding sites of MITF-M regulated promoters inhibit the
function of MITF- dependent genes in murine melanocytes (Takeda et al., 2002).
68
Exogenously applied WNT protein transactivates the MITF-M promoter and
upregulates MITF-M RNA (Takeda et al., 2002). WNT signaling promotes this event
possibly by up-activation of dishevelled protein, which is shown to inhibit GSK3β-
phosphorylation and subsequent ubiquitination/degradation of β-catenin (Seidensticker &
Behrens, 2000). Insulin-like growth factor has also been shown to enhance melanocyte
growth (Edmonson SR, 1999). However, insulin itself downregulates tyrosinase and
inhibits tyrosinase activity in melanoma cells (Ando et al., 1995; Fuller et al., 1987).
In addition to transcriptional regulation, MITF is also subjected to post-
translational modifications, particularly phosphorylation by mitogen-activated protein
kinase (MAPK), ribosomal S6 kinase (RSK), glycogen synthase kinase-3β (GSK3β) and
p38 (Weilbaecher et al., 2001; Wu et al., 2000; Takeda et al., 2000). Particularly,
activation of the Ras/ERK cascade inhibits melanogenesis by phosphorylating the MITF
transcription factor that leads to its degradation (Hemesath et al., 1998; Wu 2000). This
pathway is thought to be a feedback mechanism preventing an excessive production of
melanin (Englaro et al., 1998). The transcriptional activity of MITF is also affected by
sumoylation, a post-translational modification mediated by protein inhibitor of the
activated STAT3 (PIAS3). On promoters with multiple MITF binding sites, sumoylated
MITF seems to be less active than unsumoylated MITF. Therefore, post-translation
modifications regulate MITF activity in a way that alters its target-gene specificity based
on cellular contexts or signals (Miller et al., 2005; Murakami & Arnheiter, 2005).
NIH/3T3-L1 fibroblasts are known to differentiate into myoblasts or adipocytes in
response to ectopic expression of specific lineage-determining transcription factor genes
69
(Davis et al., 1987; Weintraub et al., 1991; Tontonoz et al., 1993). Ectopic expression of
MITF differentiates 3T3-L1 fibroblasts into cells with melanocyte characteristics
(Tachibana et al., 1996).
UVR is the primary cause of melanoma and a potent inducer of ROS, including
superoxide radical as well as hydrogen peroxide and hydroxyl radicals. ROS production
results in inflammation and oxidative stress (Miller & Weinstock, 1994). Skin exposure
to UVR induces a range of biologic responses such as erythema, inflammation,
hyperpigmentation, hyperplasia, skin cancer (Norris et al., 1992; Gilchrest et al., 1996),
DNA damage and mutations, induction of early and late gene responses (Sachsenmaier et
al., 1994; Herrlich et al. 1994), systemic immunosuppression (Kripke, 1994), and
activation of dormant viruses (Herrlich et al., 1994). UVR also induces pigmentation
through the process that consists of three main steps, i.e., the proliferation of melanocytes
(Rosdahl & Szabo, 1978), the synthesis and activation of tyrosinase (Imokawa &
Mishima, 1982; Mishima & Imokawa, 1983), and the transfer of melanosomes to
keratinocytes (Okazaki et al., 1976). The oxidative stress produced due to UVR,
particularly UVB, selectively triggers the p38 signaling pathway and, to a lesser extent,
ERK1/2 pathway (Peus et al., 1999; Rouse et al., 1994; Galibert et al., 2001), thus
inducing the expression of POMC, MC1R, and TYR. This finding has been confirmed in
experiments involving preincubation of skin explants with a specific inhibitor of p38
kinase (Galibert et al., 2001).
UVR also stimulates cleavage and turnover of cell membrane phospholipid
constituents by phospholipases (DeLeo et al., 1988). This process generates a number of
70
signaling mediators, such as diacylglycerols, that activates the PKC-β pathway and
upregulate tyrosinase expression (Nishizuka, 1988). Stimulation of PKC-β pathway has
been shown to be associated with both differentiation and proliferation of melanocytes
(Yada et al., 1991). UVR also stimulates epidermal cell proliferation and induces the
secretion of several cytokines, including bFGF, α-MSH, nitric oxide, SCF and
endothelin-1 (ET-1). Due to the paracrine linkage between keratinocytes and melanocytes
within the epidermis, these cytokines regulate melanocytes growth and survival playing a
critical role in cutaneous physiology and pathology (Grabbe et al., 1994).
ET-1 peptides that stimulate proliferation, chemotaxis, and pigment production in
melanocytic cells are secreted by keratinocytes (Imokawa et al., 1996). Endothelins not
only act to regulate melanocyte progenitor cell number, but also to induce pigment
production in these cells. Endothelins also stimulate differentiation of the melanocyte
progenitors into fully mature melanocytes. UVR induces a marked and sustained increase
in ET-1 secretion by keratinocytes (Imokawa et al., 1992) and over expression of ET-B
and its receptor EDNRB in human skin (Kadono et al., 2001). Studies in mice have
established that Ednrb signaling is not necessary for the specification of pigment cells but
is involved in the proliferation and migration of pigment cells (Pavan & Tilghman, 1994;
Hosoda et al., 1994). Mutations of genes for EDNRB and its ligand endothelin 3 (EDN)
lead to deficiencies in neural crest-derived melanocytes and neurons in mice (Hosoda et
al., 1994; Baynash et al., 1994) and humans (Puffenberger et al., 1994). An EDNRB
antagonist has also been shown to inhibit the growth and to induce cell death in the
human melanoma cell lines (Lahav et al., 1994).
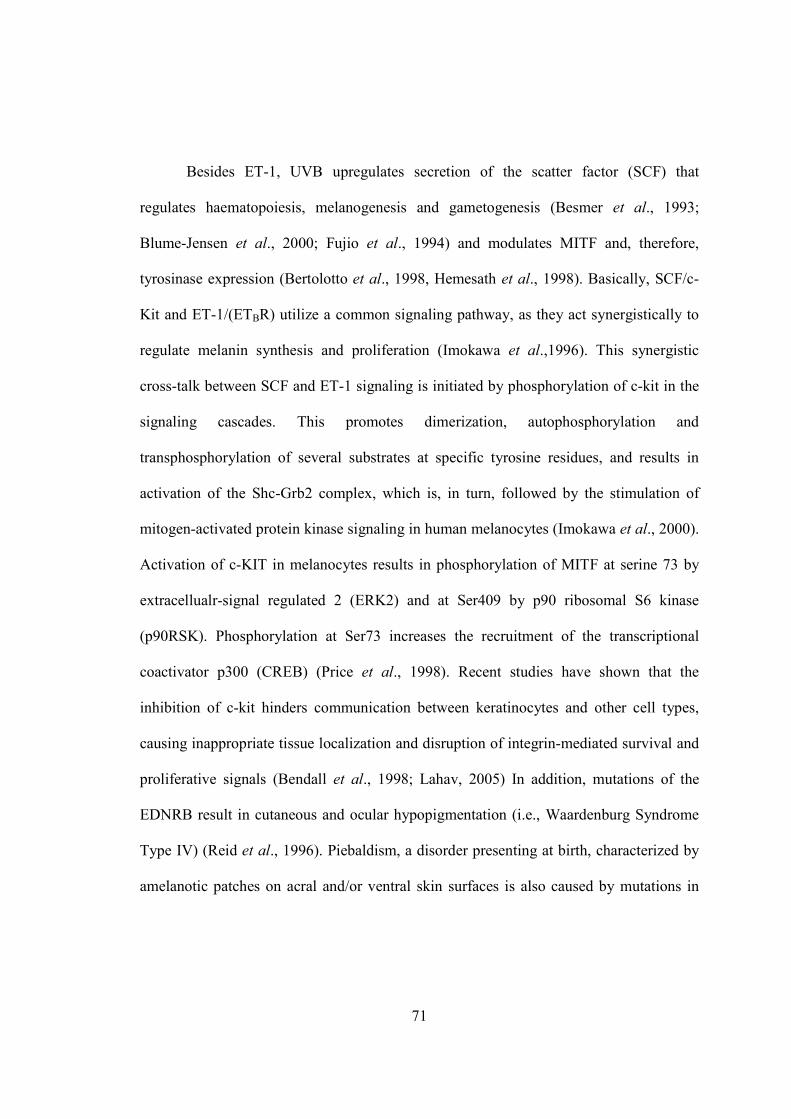
71
Besides ET-1, UVB upregulates secretion of the scatter factor (SCF) that
regulates haematopoiesis, melanogenesis and gametogenesis (Besmer et al., 1993;
Blume-Jensen et al., 2000; Fujio et al., 1994) and modulates MITF and, therefore,
tyrosinase expression (Bertolotto et al., 1998, Hemesath et al., 1998). Basically, SCF/c-
Kit and ET-1/(ETBR) utilize a common signaling pathway, as they act synergistically to
regulate melanin synthesis and proliferation (Imokawa et al.,1996). This synergistic
cross-talk between SCF and ET-1 signaling is initiated by phosphorylation of c-kit in the
signaling cascades. This promotes dimerization, autophosphorylation and
transphosphorylation of several substrates at specific tyrosine residues, and results in
activation of the Shc-Grb2 complex, which is, in turn, followed by the stimulation of
mitogen-activated protein kinase signaling in human melanocytes (Imokawa et al., 2000).
Activation of c-KIT in melanocytes results in phosphorylation of MITF at serine 73 by
extracellualr-signal regulated 2 (ERK2) and at Ser409 by p90 ribosomal S6 kinase
(p90RSK). Phosphorylation at Ser73 increases the recruitment of the transcriptional
coactivator p300 (CREB) (Price et al., 1998). Recent studies have shown that the
inhibition of c-kit hinders communication between keratinocytes and other cell types,
causing inappropriate tissue localization and disruption of integrin-mediated survival and
proliferative signals (Bendall et al., 1998; Lahav, 2005) In addition, mutations of the
EDNRB result in cutaneous and ocular hypopigmentation (i.e., Waardenburg Syndrome
Type IV) (Reid et al., 1996). Piebaldism, a disorder presenting at birth, characterized by
amelanotic patches on acral and/or ventral skin surfaces is also caused by mutations in
72
the genes encoding c-kit (Bendall et al., 1998; Lahav, 2005) and ETBR (Puffenberger et
al., 1994; Amiel et al., 1996).
ET3
EDNRB
SCF
c-Kit
Ras
Raf
MEK
ERK2
p90RSK p90RSKP
p38
Rho-GTPase
Oxidative stress
ATF-2
CREBP
P
Tyrosinase
gene family
AC
α-MSH
β γGsα
GDPGTPGsα
ATP
cAMP
RCC R
PKA PKA
CC
MC
1R
Fig 6: Melanogenesis signal transduction pathways.
73
Chapter III
Hypothesis and Research Objectives
Our specific hypothesis behind the proposed research is that the melanin
synthesis pathway is functional in the adipocytes and that its activation may
result in the formation of melanin.
The basis for our hypothesis is formed by following observations:
1) Our previous expression profiling experiments revealed statistically significant
overexpression of melanogenesis-related genes in the visceral fat of obese
individuals (Baranova et al., 2005) as compared to lean individuals.
2) α-MSH, a melanocortin peptide produced after the posttranslational cleavage
of POMC, is required both for pigmentation control and energy homeostasis.
Melanocortin peptides signal through G-coupled melanocortin receptors (MCR).
Particularly in adipocytes, α-MSH signals through MC1R, MC2R, MC3R and
MC4R receptors, whereas in the skin it exerts its action through MC1R and the
protein kinase A (PKA) pathway. The expression of MC1R is more pronounced in
the adipocytes of morbidly obese subjects as compared to normal subjects (Hoggard
et al., 2004). Therefore, there is a possibility that under morbidly obese conditions,
74
melanogenesis-related genes may become activated ectopically in response to the
signal propagated by MC1R activation.
3) Extracutaneous production of melanin has already been described in human
central nervous system (Substantia nigra) of the Parkinson disease patients (Scherer,
1939 & Zecca et al., 1996) and in abnormal smooth muscle cells seen in the lungs of
the patients with lymphangioleiomyomatosis (LAM) (Ferrans VJ et al, 2000).
Therefore, this is not the first time that extracutaneous production of melanin has
been documented.
4) Dermatological changes have been reported in patients with obesity. These
changes include the hyperpigmentation disorder acanthosis nigricans that usually
presents as periorbital darkening or darkening of the neck or knuckles (Garcia
Hidalgo L. 2002).
It was hypothesized that hyperpigmentation in these obese subjects may be
caused by increased levels of ROS characteristic of morbid obesity and
compensatory increase in the expression of tyrosinase.
5) Sumo wrestlers, the grotesquely obese behemoths who measure more than 182
Kg are formally classified under morbidly obese category, but they are found to be
devoid of any metabolic disorders as observed in other morbidly obese subjects. In
these wrestlers, except for blood glucose and total cholesterol, mean serum levels of
triglycerides, phospholipid, uric acid and total protein were significantly higher than
in controls. Even though the basal metabolic index and serum composition of sumo
wrestlers is similar to morbidly obese subjects, they don’t show any symptoms of
75
disorders like diabetes type II and arthrosclerosis. This phenomenon could be
explained by the suppression of the production of ROS by intense exercise training
sessions (Chinda D et al., 2003). Some percentage of morbidly obese subjects do not
have sign of metabolic disorders (Jarrar et al., 2008), which suggests there should be
something different about these patients, which is compensating for production of
the ROS.
It was hypothesized that the ectopic melanin may serve as an agent capable of the
buffering the ROS under morbidly obese conditions. The specific aims of this project
are designed to support that melanogenesis may indeed take place in the adipose
tissue of morbidly obese subjects.
Specific aims
1) Quantification of the melanin pigment present in the adipose tissues obtained
from morbidly obese subjects and from lean controls.
a) The melanin pigment present in the adipose tissue was analyzed by the Fontana
Masson assay, which is specific for melanin, lipofuscin and argentaffin granules.
Positive staining for melanin granules can be differentiated from lipofuscin staining
by controlling the time period for staining.
b) The eumelanin content present in the adipose tissue sections was measured by
HPLC.
2) Gene expression analysis of melanogenesis-related genes in adipose tissue
sections of morbid obese and of lean subjects.
76
Under normal circumstances, melanin is produced by specialized cells (melanocytes)
in membrane-bound organelles termed melanosomes. Melanosomes gradually
develop melanin pigment as they mature and are transported along the dendritic
projections of melanocytes before being passed into adjacent keratinocytes of the
skin and hair follicles. The list of the proteins required for melanin formation include
tyrosinase (TYR), tyrosinase-related protein-1 (TYRP1), tyrosinase related protein-2
(TYRP2), microphthalmia transcription factor (MITF) and a structural protein gp
100 (PMEL17). The main substrate for the formation of the melanin is the tyrosine
which is converted to L-3, 4-dihydroxy phenylalanine (L-dopa) which is ultimately
converted to orange-colored dopachrome that is further processed to melanin. TYR
enzyme performs one of the most critical steps required for melanin formation.
a) In this study expression analysis of the melanogenesis-related genes in the tissue
samples obtained from obese subjects undergoing gastric bypass surgery and from
lean subjects was performed. Gene expression study was performed for TYR,
TYRP1, TYRP2 and MC1R that were analyzed by Real Time-PCR technique.
b) Localization of mRNA for TYR in morphologically preserved frozen tissue
sections was established by in situ hybridization.
3) Enzyme activity assays of the adipose tissue extracts of morbidly obese and of
lean subjects:
77
An assessment of the total melanogenic pathway activity was performed by
radioactive C14 assay on adipose tissue samples from obese and from lean subjects as
well as on liver and gastric tissue samples.
4) Protein expression analysis in adipose tissue obtained from morbidly obese
and from lean subjects.
a) The melanogenesis-related enzymes TYR, TYRP1 and TYRP2 were localized by
immunohistochemistry in adipose tissue sections of morbidly obese and of lean
subjects.
b) The protein expression for TYR was assessed by western blotting in adipose tissue
of morbidly obese and of lean subjects as well as on liver and gastric tissue samples.
5) Gene expression analysis of melanogenesis-related genes in cultured human
and murine adipocytes.
Melanocortins interact with melanocytes through MC1R receptor. In these cells,
stimulation by α-MSH enhances the expression, de novo synthesis, and activation of
tyrosinase (Hunt et al., 1994). In cultured human melanocytes synthetic α-MSH has
been shown to induce a significant increase in the level of eumelanin but has lesser
and varied effects on the level of pheomelanin (Hunt, 1995). Therefore, at least in
melanocytes, the melanogenic pathway remains active when cells are cultured in
vitro.
α-MSH plays a major role in energy homeostasis in adipose tissue and it is also
required for activation in melanocytes of TYR, the rate limiting enzyme required for
78
pigmentation. Adipocytes constituting the major component of adipose tissue
express MC1R, MC2R, MC3R, and MC4R receptors. There is a possibility that α-
MSH is capable of inducing the expression of melanogenesis-related enzymes in the
fully mature adipocytes. This hypothesis was attempted to confirm in cell culture
based experiments. For this purpose, human and murine adipocytes and
preadipocytes were incubated at different levels of differentiation with different
concentrations of α-MSH for a number of time intervals. This helped to find the
specific stage and concentration of α-MSH required to induce the expression of
TYR.
4) Enzyme activity assay analysis in human and murine adipocytes:
Because mRNA expression does not necessarily reflect protein expression or
function, the following assays were performed.
a) Tyrosinase enzyme activity was measured by L-dopa assay in cell lysates of
murine adipocytes and preadipocytes incubated with α-MSH.
b) Tyrosinase enzyme activity was measured in human adipocytes at different stages
of differentiation after incubation with α-MSH by specific C14 radioactive assay.
5) Protein expression analysis in human adipocytes.
Tyrosinase (TYR) is absolutely required for melanogenesis, but other melanosomal
proteins, such as TYRP1, DCT, and gp100, also play important roles in regulating
mammalian pigmentation. However, pigmentation does not always correlate with the
expression of TYR mRNA or protein, as its function is also regulated at the post-
79
translational level. Even though TYR is ectopically expressed in a variety of tissues,
it does not necessarily exist in these tissues in a catalytically active form, as its post-
translational activation is required for melanin biosynthesis. After its synthesis, TYR
is translocated into the ER and eventually into the Golgi, where its post-translational
processing and glycosylation take place (Olivares et al., 2003; Francis et al., 2003).
The fully glycosylated form of TYR is delivered to stage II melanosomes where it
starts catalyzing the rate limiting step of melanogenesis. In order to catalyze the
reactions, the enzyme should be properly glycosylated and have proper
conformation.
a) The melanogenesis related enzymes TYR, TYRP1 and TYRP2 were localized in
human adipocytes at different stages of differentiation after incubation with different
concentrations of α-MSH by immunohistochemistry.
b) The protein expression for TYR, TYRP1, and TYRP2 was analyzed in human
adipocytes at different stages of differentiation after incubation with different
concentrations of α-MSH by western blotting.
c) The protein extracts obtained after incubation with different concentrations of α-
MSH at different time periods at different stages of differentiation were checked for
TYR enzyme activity by C14 assay.
d) After confirming the activity it was very interesting to see whether or not the TYR
enzyme is properly glycosylated. Human TYR enzyme is a rate-limiting enzyme and
has seven potential glycosylation sites and two copper binding sites. If the enzymes

80
are not properly glycosylated, they are considered to be inactive. In order to prove
that the enzyme is properly glycosylated, glycosidase digestions were performed and
obtained lysates were run the SDS gels along with the positive control to see the
unglycosylated form of TYR.
81
Chapter IV
Materials and Methods
1) Patient tissue samples:
The visceral adipose (N=7) and gastric (N=2) tissue samples had been collected with
informed consent during bariatric surgery as a part of ongoing Epidemiology of
Nonalcoholic Fatty Liver Disease (EPI-NAFLD) study according to the protocol
approved by Institutional Review Board of Inova Fairfax Hospital. Adipose samples from
the non-obese kidney donors (N=2) and liver specimens from patients undergoing liver
resections for liver mass with no underlying liver disease (N=2) were used as controls.
Samples were snap-frozen in liquid nitrogen immediately after collection and stored at -
800C until the time of assay. Skin samples were obtained by shave biopsies, 4mm in
diameter, as described previously (Tadokoro et al., 2003; Yamaguchi et al., 2004) and
used as positive control.
2) Culture and maintenance of cell lines:
Experiments were performed on cultured adipocytes in parallel with a study of the tissue
specimens. Four different cell lines were used:
a) Mouse 3T3-L1 fibroblast cell line (ATCC, Manassas, VA)
82
b) Human primary omental adipocytes (Zen-Bio, Research Triangle Park, NC)
c) MNT-1 melanoma cell line (NIH, Bethesda, MD)
d) HeLa cervical carcinoma cell line (ATCC, Manassas, VA)
a) Culture and differentiation of mouse 3T3-L1 fibroblast cell line:
The preadipocytes at passage 3 were purchased from ATCC (Manassas, VA). The
media for maintenance and differentiation of cell line was purchased from Zen-Bio
(Research Triangle Park, NC). Preadipocytes were cultured in 75cm2 flasks (Corning,
Corning, NJ) in preadipocyte medium (DMEM containing 10% bovine calf serum) and
passaged three times without being allowed to reach confluence, then frozen in aliquots
of 107 cells/vial at -800C for future use. For experimental purposes, the preadipocyte cells
were grown in a 5% CO2 atmosphere and preadipocyte medium was changed every other
day until the cells reach 100% confluency. One day after confluence, the preadipocyte
medium was replaced with 3T3-L1 adipocyte differentiation medium (DMEM containing
10% fetal bovine serum (FBS), 10ug/ml dexamethasone, and 0.5mM isobutylmethyl
xanthine (IBMX) for 3 days. After removing the differentiation medium, cells were fed
with 3T3-L1 adipocyte maintenance media (DMEM containing 10% FBS, 10ug/ml
dexamethasone and 10µg/ml insulin) every other day. All cell-based assays and
measurements were performed on preadipocytes, 2 days, 4 days and 6 days old
differentiated cells after incubation with 100nM, 1uM, 5uM or 10µM concentrations of
α-MSH peptides respectively. RNA and proteins were extracted after incubation at 0, 2hr,
6hr and 24 hr time periods for further analysis.
b) Culture and differentiation of primary adipocytes:
83
Human pre-adipocytes at passage 3 (Zen-Bio, Inc., Research Triangle Park, NC)
were obtained from 5 female patients, age range from 29-43 yrs with BMI ranges of 38-
52 after abdominal fat reduction surgeries. The preadipocytes were cultured in T25 cm2
flasks with Preadipocyte Growth Medium (Zen-Bio, Inc.) at 370C in 10% CO2
atmosphere. Once the cells reached confluence, differentiation was induced by treating
the cells with differentiation medium (DM) which contained insulin, dexamethasone,
IBMX and a PPARγ agonist (Zen-Bio, Inc.). The medium was changed after seven days
with adipocyte medium (DM without IBMX.) (Zen-Bio, Inc.), and subsequently the
medium was changed every two days. All cell based assays and measurements were
performed on preadipocytes, 7 days, and 14 days and 21 days old differentiated cells after
incubation with 100nM, 1µM, 5µM or 10µM concentration of α-MSH peptides
respectively. RNA and proteins were extracted after incubation at 0, 2hr, 6hr and 24 hr
time periods for further analysis.
c) Culture and maintenance of MNT1 cell line:
The MNT-1 cells (Valencia et al., 2005) are highly pigmented human melanoma
cells used as a positive control. Cells were grown at 37°C in an atmosphere of 95%
air/5% CO2 in 75-cm2 culture dishes in MEM (all culture reagents from Life
Technologies, Grand Island, NY). The medium is supplemented with heat-inactivated
FBS to a final concentration of 20% (Atlanta Biologicals, Norcross, GA), 10% AIM-V
medium, 20 mM Hepes, 1% antibiotic-antimycotic solution, 0.1 mM nonessential amino
acids, 1 mM sodium pyruvate, 2 mM L-glutamine, 30 ng/ml gentamycin, and 3.7 µg/ml
sodium bicarbonate.
84
d) Cultivation and maintenance of HeLa cell line:
The cells (human cervical carcinoma cells) were obtained from the American
Type Culture Collection (Manassas, VA, USA) and used as a negative control. The cells
were grown in Dulbecco’s modified Eagle’s medium supplemented with 10% bovine
serum and antibiotics (30 mg/l penicillin, 50 mg/l streptomycin sulphate) at 37 °C and
10% CO2. RNA and protein were extracted from the cell line after incubation with α-
MSH peptide in the same way as described from human adipocyte cell line and mouse
3T3-L1 fibroblast cell line.
3) Methods and procedures:
1) Real time PCR: Real time PCR is a technique that analyses the amplification of
genomic DNA in Real Time. This means it is possible to evaluate the size of amplicons
without having to run the finished product on a gel, though this is still recommended for
confirmation of the result (Bustin, 2000). Real Time PCR is considered to be the most
sensitive method for the detection of low-abundance mRNA (Bustin, 2000; Giulietti er
al., 2001). The technique starts with extraction of RNA, cDNA synthesis, Primer
designing which are explained below in detail.
A) RNA extraction
a) RNA extraction from cell lines:
85
The preparation of messenger RNA (mRNA) from eukaryotic cells and tissues is
an important step which requires cell or tissue disruptions, denaturation of RNases and
finally separation of mRNA from residual DNA contaminants. The important thing while
performing the extraction of RNA is to maintain an RNase-free environment, because the
ubiquitous RNase A is a highly stable and active ribonuclease that can contaminate
extractions and degrade RNA.
The RNA was extracted at exponential phase, when cells were proliferating
maximally. The cells were washed twice with PBS, trypsinized and centrifuged at 800g
for 5mins. The cell pellet was washed twice with PBS and RNA extraction was
performed using an RNeasy Mini Kit (Qiagen, Valencia, CA) according to
manufacturer’s protocol with some modifications. The cells were disrupted by adding
buffer RLT followed by homogenization. 1 volume of 70% ethanol was added to the
homogenized cell lysate and mixed well by pipetting. Out of the total volume, 700µL of
the sample was transferred to an RNeasy spin column and centrifuged for 30sec at
8000xg. Buffer RW1 (700µL) was added to the column and further it was centrifuged for
30sec at 8000xg, then 500µL of buffer RPE were added to the column twice and the
column was centrifuged for 1min at 8000xg. RNA was eluted by adding 50µL of RNase-
free water (Ambion, USA) and finally stored at -800C.
b) RNA extraction from tissues: RNA extraction and analysis:
RNA was extracted from tissues obtained from morbidly obese and from lean
subjects. Total RNA was extracted by following the procedure provided with the RNeasy
86
Lipid Tissue Midi Kit (75842, Qiagen, USA). For RNA extraction, 200mg of tissue was
homogenized in 1ml of QIAzol lysis reagent by sonication until the tissue mass was
converted into homogenous liquid. The contents after homogenization were transferred to
1.5ml test tube and incubated for 5min at room temperature to allow dissociation of
nucleoprotein complexes. Chloroform (200µL) was added to the test tube and the tube
was shaken vigorously for 15sec and incubated at room temperature for 5mins. The
contents were centrifuged at 12,000xg for 15min at 4C. The upper, aqueous phase was
transferred to a new tube and 600µL of 70% ethanol was added and mixed thoroughly by
vortexing. The content was transferred to RNeasy Mini spin column placed in a 2ml
collection tube and centrifuged for 15sec at 10000xg at room temperature. The flow
through was discarded. This step was repeated again. Buffer RW1 (700µL) was added to
the same column and centrifuged for 15 sec at 8000xg and the flow through was
discarded. Buffer RPE (500µL) was added and centrifuged for 2 min at 10000rpm. The
RNeasy spin column was placed in a 2ml collection tube and 50µL of water was added.
The column was centrifuged for 1 min at 10000rpm to collect the RNA sample.
B) Assessment of the concentration and purity of RNA:
The concentration and purity of RNA was evaluated by using a Nanodrop ND-
1000 Spectrophotometer (Nanodrop Technologies), RNA samples with the ratio of
absorbance at 260nm and 280nm of 2.0 were accepted. The readings at 260nm are
specific to nucleic acids while the readings at 280nm can detect proteins. If the ratio of
260:280 is between 1.8 and 2.0, there is little to no protein contamination within the
sample. RNA integrity was checked by electrophoresis in a 2% agarose gel. Two strong
87
ribosomal RNA bands were evident in each lane without smearing. This indicates a good
quality sample without RNA degradation. DNase I treatment of RNA samples is a prime
requirement in RT-PCR. The isolated RNA was treated with DNA-Free kit (Ambion Inc,
Austin, TX) according to manufacturer’s protocol to get rid of chromosomal DNA to a
degree that no background product is visible whereas in untreated samples false positives
are produced due to cDNA synthesized from chromosomal DNA. Basically 0.1volume of
10X DNase I reagent was added to the RNA sample, mixed gently and incubated at 370C
for 30mins. After 30mins 0.1volume of DNase inactivation reagent was added and the
samples were incubated at room temperature for 2 mins with occasional mixing. The
samples were centrifuged at 8000xg and the supernatant was transferred to sterile test
tubes.
C) Synthesis of the cDNA
Synthesis of the cDNA was performed using a first-strand cDNA synthesis kit
(Invitrogen, Carlsbad, CA) according to manufacturer’s instruction with some
modifications. RNA samples along with reaction components were thawed and vortexed.
First strand reverse transcription cDNA synthesis was performed on 2ug RNA from each
sample in 20µL reaction volume in a single reaction. Briefly, each RNase-free reaction
tube contained 2µg of RNA, 250ng random hexamers (Invitrogen, Carlsbad, CA) and
nuclease-free water (Ambion). The contents of the test tubes were mixed and centriguged
briefly. The tubes were heated at 700C for 10mins, and then cooled down to 40C. After
incubation, tubes were centrifuged to ensure that all reactants were located at the bottom
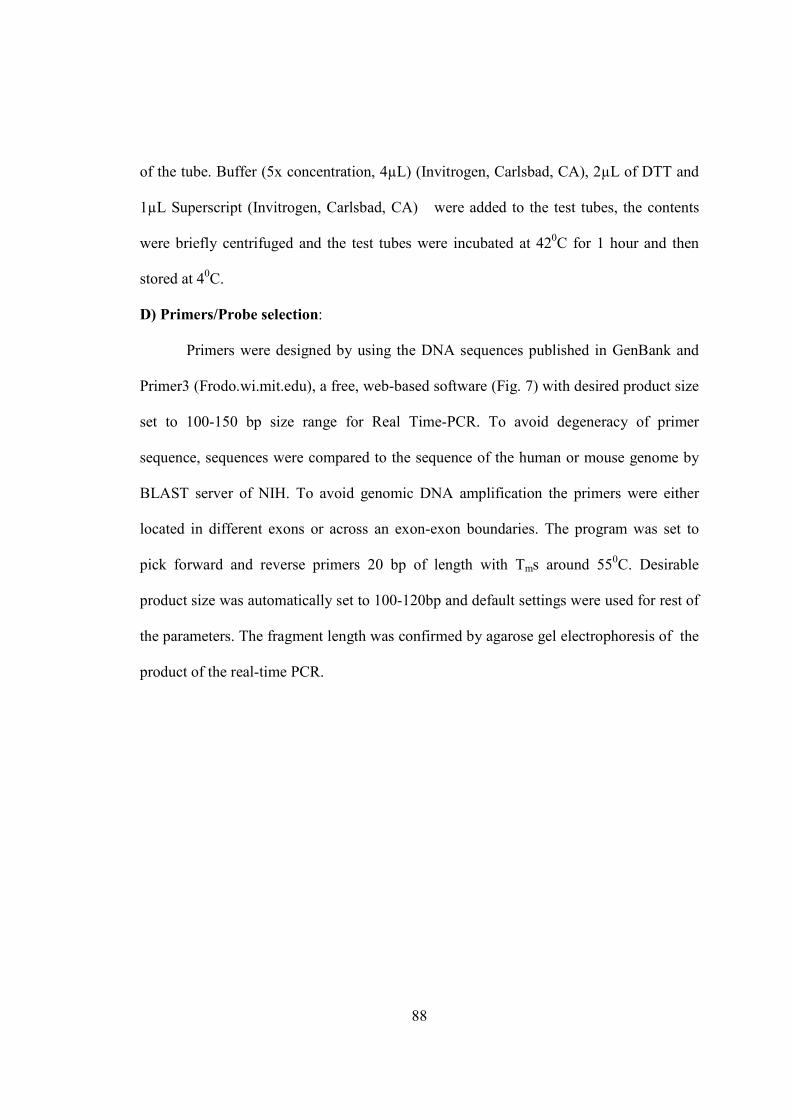
88
of the tube. Buffer (5x concentration, 4µL) (Invitrogen, Carlsbad, CA), 2µL of DTT and
1µL Superscript (Invitrogen, Carlsbad, CA) were added to the test tubes, the contents
were briefly centrifuged and the test tubes were incubated at 420C for 1 hour and then
stored at 40C.
D) Primers/Probe selection:
Primers were designed by using the DNA sequences published in GenBank and
Primer3 (Frodo.wi.mit.edu), a free, web-based software (Fig. 7) with desired product size
set to 100-150 bp size range for Real Time-PCR. To avoid degeneracy of primer
sequence, sequences were compared to the sequence of the human or mouse genome by
BLAST server of NIH. To avoid genomic DNA amplification the primers were either
located in different exons or across an exon-exon boundaries. The program was set to
pick forward and reverse primers 20 bp of length with Tms around 550C. Desirable
product size was automatically set to 100-120bp and default settings were used for rest of
the parameters. The fragment length was confirmed by agarose gel electrophoresis of the
product of the real-time PCR.
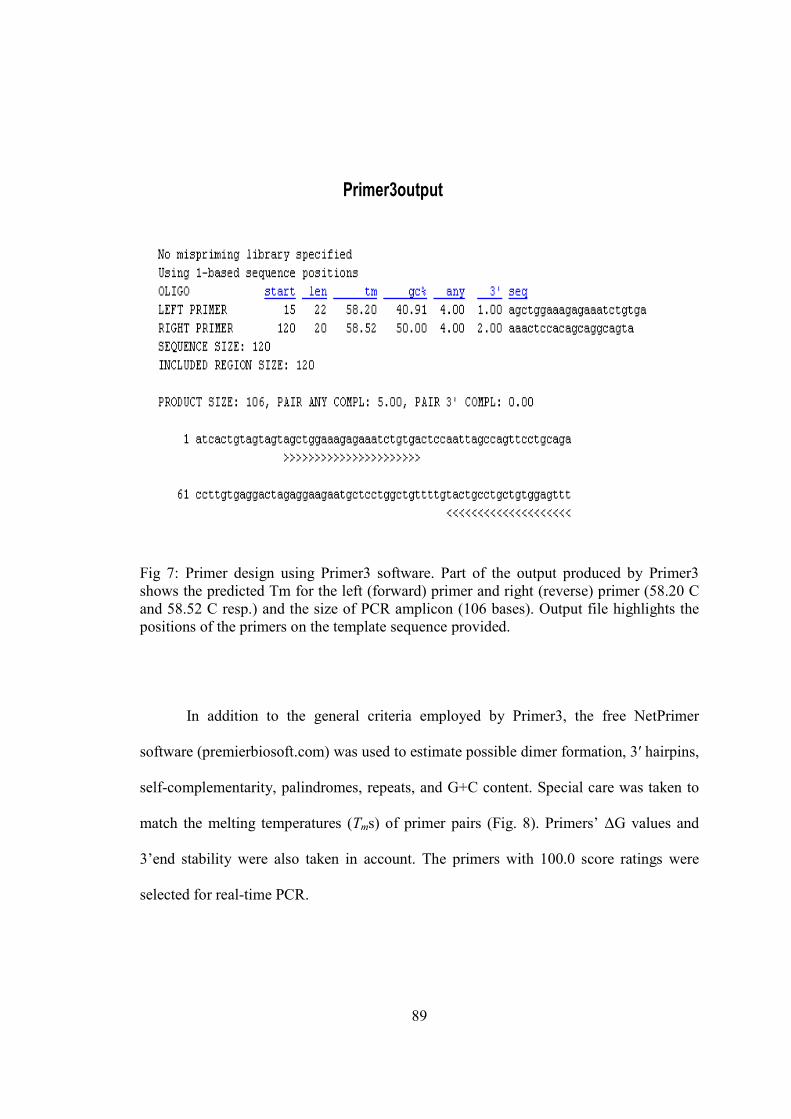
89
Primer3output
Fig 7: Primer design using Primer3 software. Part of the output produced by Primer3 shows the predicted Tm for the left (forward) primer and right (reverse) primer (58.20 C and 58.52 C resp.) and the size of PCR amplicon (106 bases). Output file highlights the positions of the primers on the template sequence provided.
In addition to the general criteria employed by Primer3, the free NetPrimer
software (premierbiosoft.com) was used to estimate possible dimer formation, 3′ hairpins,
self-complementarity, palindromes, repeats, and G+C content. Special care was taken to
match the melting temperatures (Tms) of primer pairs (Fig. 8). Primers’ ∆G values and
3’end stability were also taken in account. The primers with 100.0 score ratings were
selected for real-time PCR.
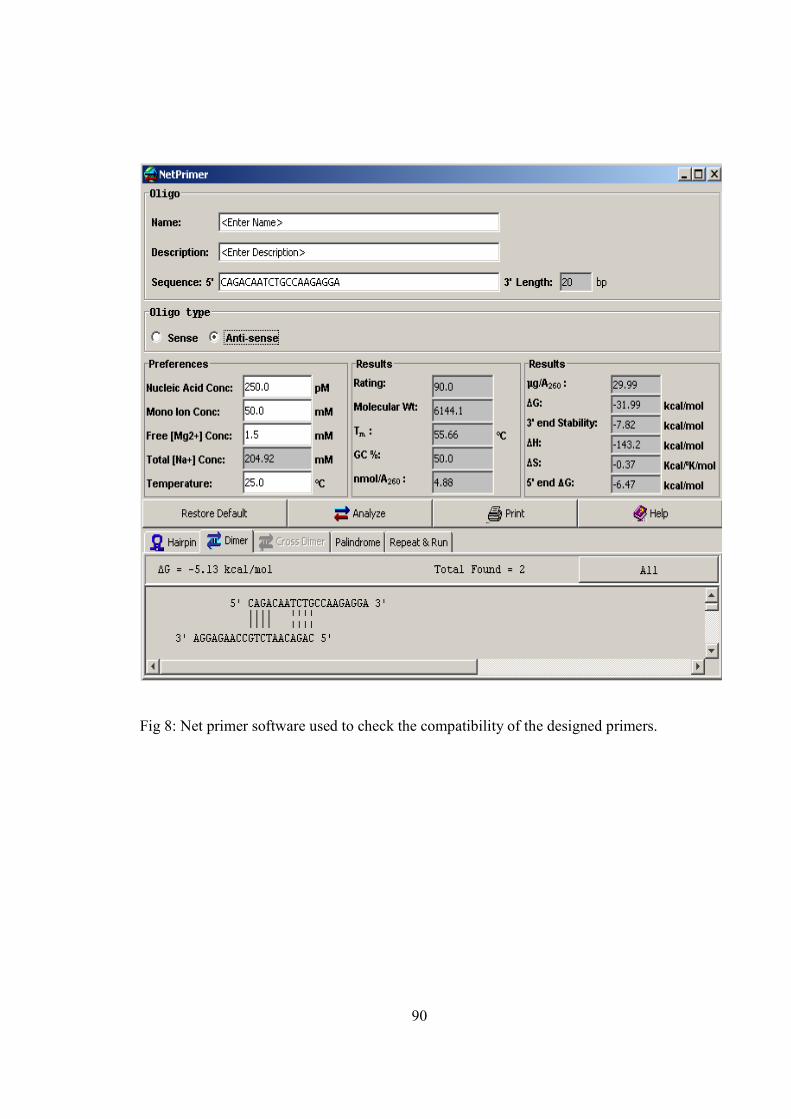
90
Fig 8: Net primer software used to check the compatibility of the designed primers.
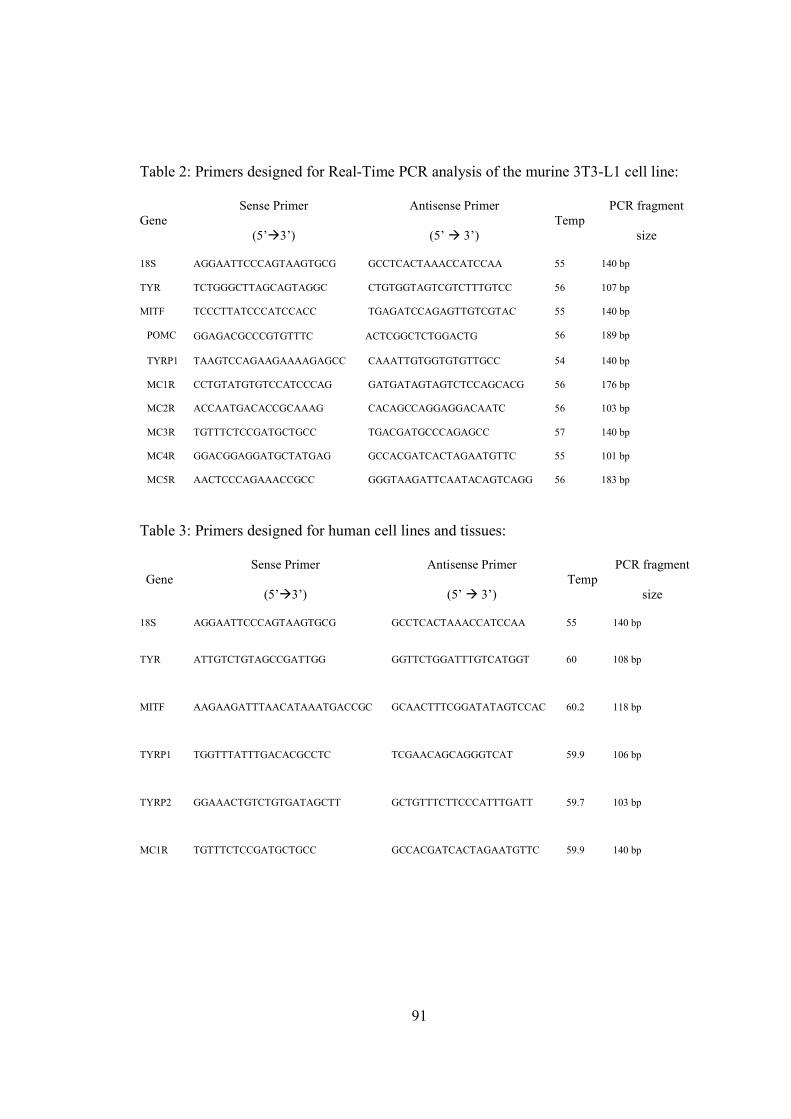
91
Table 2: Primers designed for Real-Time PCR analysis of the murine 3T3-L1 cell line:
Gene Sense Primer
(5’�3’)
Antisense Primer
(5’ � 3’) Temp
PCR fragment
size
18S AGGAATTCCCAGTAAGTGCG GCCTCACTAAACCATCCAA 55 140 bp
TYR TCTGGGCTTAGCAGTAGGC CTGTGGTAGTCGTCTTTGTCC 56 107 bp
MITF TCCCTTATCCCATCCACC TGAGATCCAGAGTTGTCGTAC 55 140 bp
POMC GGAGACGCCCGTGTTTC G ACTCGGCTCTGGACTG 56 189 bp
TYRP1 TAAGTCCAGAAGAAAAGAGCC CAAATTGTGGTGTGTTGCC 54 140 bp
MC1R CCTGTATGTGTCCATCCCAG GATGATAGTAGTCTCCAGCACG 56 176 bp
MC2R ACCAATGACACCGCAAAG CACAGCCAGGAGGACAATC 56 103 bp
MC3R TGTTTCTCCGATGCTGCC TGACGATGCCCAGAGCC 57 140 bp
MC4R GGACGGAGGATGCTATGAG GCCACGATCACTAGAATGTTC 55 101 bp
MC5R AACTCCCAGAAACCGCC GGGTAAGATTCAATACAGTCAGG 56 183 bp
Table 3: Primers designed for human cell lines and tissues:
Gene Sense Primer
(5’�3’)
Antisense Primer
(5’ � 3’) Temp
PCR fragment
size
18S AGGAATTCCCAGTAAGTGCG GCCTCACTAAACCATCCAA 55 140 bp
TYR ATTGTCTGTAGCCGATTGG GGTTCTGGATTTGTCATGGT
60 108 bp
MITF AAGAAGATTTAACATAAATGACCGC GCAACTTTCGGATATAGTCCAC
60.2 118 bp
TYRP1 TGGTTTATTTGACACGCCTC
TCGAACAGCAGGGTCAT
59.9 106 bp
TYRP2 GGAAACTGTCTGTGATAGCTT
GCTGTTTCTTCCCATTTGATT 59.7 103 bp
MC1R TGTTTCTCCGATGCTGCC GCCACGATCACTAGAATGTTC 59.9 140 bp
92
E) Real Time PCR technique:
In this study, iCycler iQ real-time PCR (Bio-rad, Hercules, CA) was used for
quantitative PCR analysis. The real-time PCR experiments were performed using the
SYBR Green fluorescent probe, which binds non-specifically to any double-stranded
DNA. The detection and quantification of fluorescence was directly proportional to the
amount of PCR product in the reaction. The method quantifies the initial amount of the
template specifically, sensitively and reproducibly, and is considered the preferred
method over standard PCR. Real-time PCR monitors the fluorescence emitted during the
reaction as an indicator of amplicon production during each PCR cycle. Primer
dimerization needs to be limited by using minimal primer concentrations during the
reaction. The optimized temperature of each PCR reaction was determined using the
temperature gradient function of the iCycler iQ. Eight reaction tubes, using the same
dilution of PCR product as template, were run at a range of annealing temperatures
between 550C and 620C.
The real-time PCR reactions were set up in 96 well plates in a total volume of
15µL. Gene-specific master mixes were prepared by adding 7.5 µL of SYBR Green
master mix (Bio-rad, Hercules, CA) to 4.5µL of nuclease-free water and 1µL of forward
and reverse primers of 4nM concentration each. cDNA was added later to the reactions
separately. In additions to reactions with cDNA, no template control (NTC) wells for
every primer set were included, which contain all reaction components with 1µL of
nuclease-free water (Ambion) instead of template cDNA. In addition to NTC, other
controls were also used, for example, no primer control, to see if anything else in the
93
reaction mix will permit amplification of the cDNA target. Thermal cycling parameters
for SYBR Green dye included first incubation at 940C for 10min, for 1 cycle, then 940C
for 20 seconds, 600C for 20seconds and 720C for 30 seconds for 40 cycles. This set of
cycles was followed by an additional extension step at 72 C for 5 min. For all RT-PCR
reactions, melting curves were performed at the end of SYBR Green qPCRs to check for
primer dimers and non-specific product formation. Only the reactions with a single melt
curve were analyzed. The amplification of a single specific product was further
confirmed by electrophoresis in 2% agarose gels. Real-time PCR results were calculated
by using Pfaffl method (Pfaffl, 2001). All the reactions were performed in triplicates.
Normalized gene expression values for each gene of interest and the housekeeping gene
18S rDNA were calculated. The expression values for each well were quantified as the
“threshold cycle method” by the iCycler computer software (Bio-Rad, Hercules,
California).
2) Western blotting:
A) Antibodies:
Rabbit polyclonal antibodies αPEP1h, αPEP7h and αPEP8h were specific to
KLH-conjugated synthetic peptides that correspond to the carboxyl termini of human
TYRP1, TYR and DCT, respectively. The peptides were as follows: PEP1h =
CLLTDQYQCYAEERI-COOH; PEP7h = CPLLMEKEDYHSLLYQSHL-COOH; and
PEP8h = CMETHLSSKRYTEEA-COOH (Virador V, 2001).
94
B) Protein extraction from cell lines:
The cell pellets were obtained in the same way as described above for RNA
extraction method. The cell pellet was solubilized in 500µL of M-PER mammalian
protein extraction reagent (Pierce Biotechnology, Rockford, IL) and Protease Inhibitor
mixture (Roche, Mannheim, Germany). Protein concentrations of extracts were
quantified using the bicinchoninic acid protein (BCA) assay kit (Pierce, Rockford, IL).
All steps were performed at 4°C to minimize the risk of proteolysis.
C) Protein extraction from adipose tissue:
Tissue (1gm) was homogenized in 1ml of RIPA buffer supplemented with
protease inhibitors (Complete; Boehringer Mannheim, Indianapolis, IN), until all the
tissue was converted into liquid. The liquid was snap frozen in liquid nitrogen and
thawed at room temperature. The samples were centrifuged at 4000xg for 30mins at 40C.
All steps were performed at 4°C to minimize the risk of proteolysis. The infranatant was
collected carefully and the protein concentration was measured by BCA protein assay
(PIERCE, Rockford, IL) according to manufacturer’s instruction. Briefly, standards were
made from BSA solution of 2000ug/ml, 1500ug/µL, 1000ug/µL, 750ug/µL, 500ug/µL,
250ug/µL and 125ug/µL with RIPA buffer, which was used for extraction of proteins.
Each standard or unknown sample replicate (25µL) was added to a well of 96-well plates.
Working reagent made by mixing 50 parts of BCA reagent A with 1 part of BCA reagent
B. The working reagent (200µL) was then added to each well with standard or sample.
95
The plate was mixed thoroughly, covered and incubated at 37C for 30mins. Readings
were taken with an ELISA reader (Bio-Tek. Instruments Inc., USA).
D) Western blotting technique:
Protein extracts from adipocyte (15ug), Hela (15ug) and MNT-1(15ug) cell lines
were separated on 4-20% gradient denaturing SDS polyacrylamide gels (Invitrogen) at
160V for 1.5 hour. For tissue samples 15ug of protein from all tissues and 5ug of protein
from MNT-1 cells were loaded into 4-20% gradient Tris-glycine gels (Invitrogen).
Briefly, lysates were mixed in Tris-glycine SDS sample buffer (2X) (Invitrogen,
Carlsbad, CA) containing 2-mercaptoethanol and were boiled for 5 mins at 950C. After
electrophoresis, proteins were transferred electrophoretically from the gel to Invitrolon
PVDF transfer membranes (Invitrogen). Blots were blocked in 5% non-fat milk in 0.05%
Tween-20 (Bio-Rad) in PBS for 1 hour at room temperature and were then incubated
with antibody to Tyrosinase (rabbit, diluted 1:5000) and GAPDH (rabbit 1:10000; Santa
Cruz Biotechnology) in 1% non-fat milk in 0.05% Tween-20 in PBS overnight at 40C.
After six washes (10 min each) with 0.05% Tween 20 (Bio-Rad) in PBS, the blots were
incubated in horseradish peroxidase-linked goat anti-rabbit whole antibody (1:10000)
(Amersham, Piscataway, NJ) in 1% non-fat milk with 0.05% Tween 20 in PBS for 1 hour
at room temperature. After three washes (10 min each) with 0.05% Tween 20 in PBS, the
immunoreactivity of the blots was detected using an ECL-plus Detection System
(Amersham), according to the manufacturer’s instructions. Each experiment was
performed at least in triplicate.
E) Glycosidase digestion performed on lysates of human adipocytes:
96
The methods used for predicting glycosylation sites analyzed both potential O-
linked and N-linked sites. Endoglycosidase H (Endo H) and peptide: N-glycosidase F
(PNGaseF) was purchased from New England Biolabs (Beverly, MA). MNT-1 cell
lysates (1 µg), adipocyte cell lysates (1µL) and Hela cell lysates (1µL) were subjected to
each glycosidase digestion according to the manufacturer's instructions. Protein extracts
were denatured in 0.5% SDS, 1% 2-mercaptoethanol at 100°C for 10 min. One-tenth
volumes of 0.5 M sodium phosphate (pH 7.5) and 10% NP-40 were added. N-
Glycosidase F (2 µl of 500 U/µl) or Endoglycosidase H (2 µl of 5 mU/µl) was used for
digestion at 37°C for overnight. Reactions were stopped by addition of an equal volume
of 2x Lammeli loading buffer. After the digestion reaction, each cell lysate was subjected
to SDS-PAGE, and immunoreactive bands were detected by western blotting using
antibodies against TYR (dilution 1:5000).
3) Protein activity assays:
A) Protein activity assays performed on human tissues
a) Melanogenic assay: Materials: the radioactive substrates (L-[U-14C] tyrosine and L-
[3,5-3H]tyrosine were obtained from both Amersham/Searle (Arlington Heights, IL) and
Schwarz/Mann. BSA, chloramphenicol, cycloheximide and penicillin G were purchased
from Sigma Chemical Co. (ST. Louis, MO, U.S.A.); Celite 545 and Norit A were
purchased from Fisher Scientific Co. (Fair Lawn, NJ, U.S.A.).
a) 14
C -tyrosinase enzyme activity: The method was a modification of the original
technique described by Hearing and Ekel (1975). The tissue samples obtained from
morbidly obese and from lean subjects were used as experimental samples whereas a
97
protein extract obtained from human melanocyte cell line was used as a positive control.
Other controls used in this procedure were blanks from which substrate and/or enzyme
were omitted. The assay (final volume 50µL) contained 30µL (50µg of protein) of
sample in 10µL 14C isotope (25µCi/ml, specific radioactivity 100µCi/mmol) and 10µl of
buffer solution containing made up of 1M potassium phosphate (pH 7.2), 1mg/ml
chloramphenicol, 1mg/ml cycloheximide, 0.1mg/ml serum albumin, 1000U/ml penicillin
B, and 0.25mM DOPA cofactor. The assay was set up on ice in triplicates in a 96-well
round bottom microtiter plate and incubated for 16hr at 370C. After incubation the plate
was put on ice to stop the reaction and 40µL of sample were removed to Whatman 3MM
filter-paper discs. The filters were dried and then washed as follows: one 15 min wash
with 0.1N HCl (1l/50 filters) containing unlabelled tyrosine (1g/l), two 15 min washes
with 0.1N HCl, two 5 min washes with 95% (v/v) ethanol (200ml/50filters) and one 5
wash with acetone (200ml/50liters). The filters were allowed to dry in air and the amount
of radioactivity was determined using 0.4% (w/v) 2, 5-diphenyloxazole in toluene (with
70% efficiency).
b) Melanogenic assay: 3H-tyrosine assay for tyrosine hydroxylase: TH activity was
determined by a modified method of Reinhard et al.(1986) . The assay was set up in the
same way as described above and same controls were used except for the label, which
was [3H] tyrosine (250µCi/ml, specific radioactivity 1µCi/mmol) and the cofactor DOPA
was replaced by (6R)-R-L-erythro 5,6,7,8 tetrahydrobiopterin dihydrochoride (6BH4) at a
concentration of 0.5mM. 6BH4 regulates tyrosinase through uncompetitive inhibition,
whereas tyrosine hydroxylase requires 6BH4 as a cofactor for the hydroxylation reaction
98
of L-tyrosine to L-DOPA. This method specifically measures the tritiated water produced
during the hydroxylation of tyrosine to DOPA. Briefly, for each assay a 1 uCi aliquot of
L-[3,5-3H]tyrosine was diluted 1:5 with a 500µM solution of cold L-tyrosine, HCL and
used immediately. Each assay contained: 5.0 mM dithiothreitol (DTT) to ensure reducing
conditions; 0.5M 6BH4; 9200units C-100catalase; 25uM L-tyrosine solution and 30µgm
of protein sample. After incubation for 16hr at 370C the activity was quenched by adding
40µL of sample from each well into plastic tubes containing 1ml of stirred charcoal
slurry, 7.5% (w/v) in 1.0M HCl. The tubes containing the mixture were agitated
vigorously every 10min for 1 hr and centrifuged at 1000g for 5 min. 100µL of
supernatant was carefully removed from each tube into a scintillation vial containing 5ml
suitable cocktail for aqueous samples. The radioactivity was measured in liquid
scintillation counter and reported as, pmol product.
B) Protein activity assays performed on cells:
a) L-dopa assay:
Tyrosinase activity will be measured using L-DOPA as a substrate. The
melanocyte cell line was used as the positive control, RPMI and HL60 cell lines were
used as the negative control. Murine adipocyte cell line 3T3-L1 was used as the
experimental samples and was incubated with the required concentrations of α-MSH as
explained above for the respective time intervals. Since tyrosinase catalyzes the
conversion of L-Dopa to dopachrome, this will permit measurement of the conversion of
colorless DOPA to the dark orange dopachrome. α-MSH induces the expression of
99
tyrosinase enzyme, so we believe that after incubation tyrosinase enzyme will be present
in the cell lysate. The standard reaction mixture contained 5mM L-DOPA, 0.1 M sodium
phosphate buffer (pH 6.8) and the enzyme solution in a total volume of 3ml. Enzymatic
activity was determined by the change of color of L-dopa to an orange color. The reaction
was monitored continuously at room temperature using a spectrophotometer at 475nm.
Phenoloxidase activity was assayed with L-DOPA as a substrate. It is based on the
conversion of L-DOPA to L-DOPA-quinone by tyrosinase and results in the formation of
dopachrome which is measured at 475nm.
L-DOPA + tyrosinase → L-DOPA-tyrosinase complex → L-DOPA quinone +
tyrosinase
One unit of tyrosinase is defined as the amount of enzyme required to oxidize 1µM of L-
DOPA per min under the above conditions.
6) Histochemical stainings
A) Staining performed on cellular model:
a) Immunocytochemistry:
Immunocytochemistry is a method of analyzing and identifying cell types based
on the binding of antibodies to specific components of the cell. After three washes in
PBS, the cells were fixed in 4% paraformaldehyde for 15 min at 4 °C. After three further
washes in PBS, the cells were permeabilized with 100% methanol for 15 min at 4 °C and
then blocked with 10% normal goat serum (Vector Laboratories, Burlingame, CA) for 1
hour at room temperature. The cells were incubated with primary antibodies against
100
TYR, TYRP1 and TYRP2 (gift from Dr Hearing, NIH) (at dilutions of 1:700, 1:700 and
1:7500, respectively) with 5% goat serum overnight at 4 °C in a humid chamber. After
three washes with 0.05% Tween20 in PBS, the slides were incubated with Alexa
Fluor®594 goat anti-rabbit IgG (H+L) (Molecular Probes, Eugene, OR) at room
temperature for 1 hour at 1:500 dilution with 5% goat serum and 0.05% Tween20, Nuclei
were counterstained with DAPI (4,6-diamidino-2-phenylindole, blue fluorescence;
Vector Laboratories). Alexa fluorescence was observed and analyzed using Leica DMR
B/D MLD fluorescence microscope (Leica, Wetzlar, Germany) and ScionImage software
(Scion, Frederick, MD).
B) Staining performed on tissues:
a) Preparation of frozen tissue sections:
The tissues were dissected and mounted in optimum cutting temperature
compound (O.C.T) (Internal medical equipment, San Marcos, CA) then frozen at -800C.
The next day the frozen block of adipose tissue was sectioned into 10µm thickness in the
cryostat chamber at a temperature of -18 to -200C. Sections were stored at -800C until
further processing.
b) Preparation of frozen tissue sections:
The tissues were dissected and immersed in 70%, 90% and 100% ethanol
sequentially for 30 min each at room temperature. Tissues were immersed in toluene for
20min at room temperature and embedded in paraffin (Paraplast, Fisher Scientific) two
times for 60 min each at 580C. The paraffin embedded tissues were cut into 10µm thick
101
tissue sections using a rotary microtome and floated in 560C water bath, followed by
mounting onto histological slides. The slides were dried overnight and stored at room
temperature. Most of the work was performed on frozen tissue sections instead of
paraffin embedded sections, because RNA in the frozen sections is more stable and it can
be analyzed by in situ hybridization.
c) Fixation of frozen tissue sections:
Fixation of the tissue is the cornerstone for all types of staining. The main purpose
of tissue fixation is to preserve tissue morphology and is essential for accurate
histopathologic evaluation of the tissue. It arrests autolysis and putrefaction, coagulates
soluble and structural proteins, fortifies tissues against the deleterious effects of
subsequent processing, and facilitates staining. Preservation of tissue antigens and their
availability for immunochemical staining and mRNA for in-situ hybridization depends on
the type and concentration of fixative, on fixation time, and on the size of the tissue
specimen to be fixed. Poor fixation or overfixation of the tissue sections can be
detrimental for the histology technique.
Frozen tissue sections were fixed in 4% paraformaldehyde for 6 hr at 40C.
Fixation was followed by washing with PBS three times. The tissues were incubated with
70%, 90% and 100% methanol for 5 min each at 40C for permeabilization and washed in
PBS three times. The slides were dried with tussues and marked with a DAKO pen.
For paraffinized tissue sections, fixation was done after deparaffinization of tissue
sections with xylene twice for 5 min each at room temperature. Deparaffinization was
followed by dehydration step with 100%, 95%, 70% and 50% methanol for 3 min each at
102
room temperature. The slides were rinsed with PBS three times at room temperature
followed by antigen retrieval step with 2% unmasking solution and heated in a
microwave for 12 min and cooled down to room temperature for 20 min. The slides were
dried with tissues and the tissue sections were marked with a DAKO pen.
d) Fontana-Masson staining:
Fontana-Masson staining (American Master Tech Scientific. INC, CA, USA) was
performed according to the manufacturer’s recommendations with modifications. After
fixation the tissue sections were rinsed with distilled water three times, followed by a
quick rinse with running tap water followed by another quick rinse with distilled water.
Fontana silver solution was prepared by adding ammonium hydroxide solution drop by
drop to 10% silver nitrate solution followed by continuous stirring until a faint
opalescence appears. The slides were placed in ammoniacal silver solution and incubated
in a 600C water bath for 35 min. After incubation the slides were rinsed with distilled
water 3 times and placed in 0.1 % gold chloride for 1 min. The slides were rinsed with
distilled water 2 times. The slides were placed in 5% sodium thiosulphate for 2 min. The
slides were rinsed in running tap water for 3 min twice. Then the slides were placed in
Nuclear Fast Red Stain for 5 min followed by rinsing in tap water twice and dehydrated
with 3 changes of fresh absolute alcohol. The slides were cleared with 3 changes of fresh
xylene. Finally the slides were covered with cover slips using the permanent mounting
media. The pigment was observed with a light microscope. Commercially available skin
samples were used a positive control.
103
e) Immunohistochemistry:
Immunohistochemistry involves the detection of specific chemical substances
(infectious agents or cellular markers) within tissue by the use of derived antibodies to
the substances. Antibodies (polyclonal or monoclonal) are applied to tissue sections and
allowed to bind to their corresponding antigen. IHC was performed on adipose tissues
slides obtained from obese and from lean subjects as explained above, skin sections were
used as positive controls. After fixation the slides were washed with PBS twice for 3 min
each. The tissue sections were marked with a DAKO pen. The slides were incubated in
20% goat serum (Vector Laboratories, Burlingame, California) for 1 hr at room
temperature, then washed with PBS 3 times for 3 min each and incubated with the
primary antibody overnight at 40C in a humid chamber. The rabbit polyclonal antibodies
against carboxyl termini of TYR ( PEP7h), TYRP1 ( PEP1h) and TYRP2 (αPEP8h)
were diluted in PBS containing 2% goat serum up to 1:500, 1:500 and 1:1500,
respectively. The next day the slides were given 3 washes with PBS containing 0.05%
Tween-20 for 5 min each and incubated with Alexa Fluor(R) 594 goat anti- rabbit IgG
(Molecular Probes, Eugene, OR) for 1 hr at room temperature at 1:200 dilutions with 2%
goat serum and 0.05% Tween-20 in PBS. The slides were washed three times with PBS
containing 0.05% Tween-20 for 5 min each in dark. After the final wash, the slides were
mounted with DAPI plus Vector shield (Vector, CA) and glass cover slips were placed on
the tissue sections and were fixed in place with nail polish. Red and blue florescence
signals were observed and analyzed with Leica DMRB/DMLD laser microscope (Leica
Microsystems, Bannockburn, IL) and Scionlmage software (Scion, Frederick, MD).
104
IHC staining was also performed by using the Envision+ system-HRP (DAB) kit
(Dakocytomation, Carpinteria, CA) for detection of the antibodies listed above. Briefly,
after incubating the fixed slides overnight with primary antibody in same way as for
immunohistochemistry, the sections were washed three times with PBS for 5 min each.
This step was followed with an application of enough hydrogen peroxide for peroxidase
blocking and incubated for 5min. The slides were gently rinsed with buffer and incubated
with the secondary antibody: Labelled Polymer, HRP anti-rabbit (DAKO Corp.,
Carpinteria, CA) for 1 hr. Sections were rinsed 3 times with PBS containing 0.1%
Tween-20 for five min each. For development the slides were incubated with 3,3’-
diaminobenzidine tetrahydrochloride (DAB) substrate and chromogen for 10 min at room
temperature. The color development was observed under the microscope to prevent
background staining. The slides were rinsed again with PBS containing 0.1% Tween-20.
After the washes, the slides were counterstainted with hematoxylin (Sigma–Aldrich; St
Louis, MO) for 3 min at room temperature, dehydrated and permanently mounted. For
negative controls, primary antibodies were omitted.
f) In situ hybridization:
The purpose of the technique is to determine when and where the mRNA of a
particular gene is localized, mainly by detection of complementary single-stranded
nucleic acid strands (RNA or DNA), commonly known as "probes", which will hybridize
to a specific mRNA. This technique is very time consuming and divided into cloning,
PCR, labeling of riboprobe and hybridization with labeled riboprobe.
105
1) Cloning:
The human TYR and MITF clones in pSPORT6 vector were purchased from
ATCC (Manassas, VA). The identity and orientation of the inserts were confirmed by
sequence analysis. Re-cloning into the SP6 and T7 promoter containing vector pSPORT1
(Invitrogen, CA, USA) was performed for the tyrosine hydroxylase (TH) PCR4-TOPO
clone (ATCC, Manassas, VA). RNA probes can be readily created utilizing SP6, T3, or
T7 promoters in both sense and antisense orientations to provide non-specific (control)
and specific probes.
a) Transformation:
The competent cells JM109 (Gene Choice) were transformed with pSPORT1
plasmid DNA and grown on agar plates overnight at 370C for 16-18hr. Transformation
was done by adding 50-100ng of plasmid DNA into 5µL of competent cells. The test tube
containing both plasmid DNA and competent cells was placed on ice for 30min. After 30
min the test tube was immersed in 420C water bath for 35sec, followed by immediate
addition of SOC media (1ml) and the mixture was spread on agar plates containing the
required amount of ampicillin. The next day single colonies were used to inoculate liquid
broth containing ampicillin. Cultures were incubated overnight at 370C at 225 rpm.
Plasmid DNA was extracted the next day by using Plasmid mini kit (Qiagen) according
to the instructions provided by manufacturer. Briefly, the bacterial cells were harvested
by centrifugation at 5000 rpm for 15 min at 40C. The bacterial pellet was resuspended
completely in 300µL of Buffer P1 by vortexing or pipeting. Buffer P2 (300µL) was
added to this mixture and mixed thoroughly by inverting the tube 4-6 times. The tube was
106
incubated at room temperature for 5 min. Chiled Buffer P3 (300µL) was added and
mixed immediately by inverting the tube 4-6 times. The tube was incubated on ice for
5mins. The mixture was centrifuged at 14000 rpm for 10 min and supernatant which
contains the plasmid was removed immediately. Qiagen-tip 20 was equilibrated with 1ml
of Buffer QBT and allowed to empty by gravity flow. The supernatant containing
plasmid was added to the equilibrated tip and allowed to empty by gravity flow. The tip
was later washed twice with 2ml of Buffer QC and the DNA was eluted with 800µL of
Buffer QF. The DNA solution obtained was precipitated by 560µL of isopropanal at
room temperature. The mixture was centrifuged at 10000rpm for 30 min and supernatant
was removed. The DNA pellet obtained was washed with 70% ethanol and air-dried. The
DNA was redissolved in 50µL of pellet. The DNA concentration was calculated by using
NanoDropTM 1000 Spectrophotometer and the quality of the plasmid was determined by
agarose gel electrophoresis.
Plasmid DNA of the PCR4-TOPO clone was extracted in the essentially the same
way.
b) Restriction digestion:
To determine if the insert is of the correct size, the plasmids from both clones
were restriction digested with EcoRI (New England Biolabs) in a total volume of 20µL.
To each test tube 2µL of compatible buffer (New England Biolabs), BSA (10X), enzyme
EcoRI each, 5ng of plasmid DNA and DEPC-treated water were added. The mixtures
were incubated at 370C for 2 hr and separated by electrophoresis on a 2% agarose gels.
107
To excise the TH cDNA insert from teh PCR4-TOPO backbone, the plasmid was
restriction digested with EcoRI as described above and the mixtures were separated on
2% agarose gels. The band on the gel corresponding to TH insert was extracted from the
gel by Gel Extraction Kit (Qiagen, USA) according to manufacturer’s instructions.
Briefly, the DNA fragment was extracted from the agarose gel with a clean and sharp
scalpel. Three volumes of Buffer QG was added to the extracted gel in a sterile tube. The
tube was incubated at 500C for 10 min and 1 volume of isopropanol was added to the
sample and mixed. The Qiaquick spin column was placed in a 2 ml collection tube and
the sample was applied to the column and centrifuged for 1 min. Buffer QG (0.5µL) was
added to Qiaquick column and centrifuged for another min. The column was washed with
750µL of Buffer PE and centrifuged for 1min. The Qiaquick column was placed in a
sterile test tube and the DNA was eluted with water. The quality and size of the insert
was checked by agarose gel electrophoresis and the concentration of the insert was
checked by NanoDropTM 1000 Spectrophotometer.
c) Ligation:
Ligation was performed between the pSPORT1 plasmid (used as vector
backbone) and the insert from PCR4-TOPO obtained after gel elution. The reactions were
performed in duplicates. Prior to ligation the vector was restriction digested with EcoRI
for 1 hr and 30 min and dephosphorylated with 1unit/µL of CIP for another 30min. After
two hours the test tubes were incubated at 650C for 2 hr to inactivate the restriction
enzyme and the CIP. For ligation the vector backbone and insert were used in the ratio
1:6 along with 2µL of ligase buffer and 1µL of ligase enzyme (New England biolabs).
108
The samples were incubated in 160C waterbath overnight. Transformation was performed
with these samples next day as explained above. The pSPORT1 vector expresses LacZ
operon which makes the blue and white screening possible with IPTG and X-gal added to
the agar medium. The transformed cells were allowed to grow on these agar plates for 16-
18hr at 370C. Next day only the big white colonies were selected, whereas the small
colonies near the large colonies (satellite colonies) were disregarded. The correct
orientation of the insert was confirmed by sequencing.
2) PCR for in situ hybridization:
The cDNA inserts for TYR, MITF and TH present in their respective vectors were
amplified by PCR. Pimers specific for amplification of human TYR, MITF and TH were
designed. Target sites were selected based on the analysis of sequence matches and
mismatches in BLAST (GenBank). The primers showed no evidence of crossreaction
with sequences of other genes including other genes of the tyrosinase family. In case of
tyrosinase, best results were obtained with the following probes: sense primer 5'-
CATACGATTTAGGTGACACTATAG-gggcaggcggaggcagagga-3'; antisense primer 5'-
GCGCGTAATACGACTCACTATAGGG-gctgctcagctcgccgatgtcc-3'. The PCR reaction
was performed in triplicates in PCR test tubes. Briefly, to each test tube 0.2 µg of plasmid
DNA was added to, 1µL of dNTP (10µM final concentration), 2.5µL of EasyA
transcription buffer (Roche) and EasyA polymerase (Roche), 1µL of reverse and forward
primer each (10µM final concentration) and DEPC-treated water to make the final
volume 25µL. The samples were incubated in the thermocycler that was programmed as
follows: one cycle at 950C for 2min, 28 cycles at 950C for 30sec, 600C for 30sec and
109
720C for 1min. This set of cycles was followed by an additional extension step at 720C
for 5 min and finally the products were cooled down to 40C. The amplified product of the
insert obtained after PCR was run on a 2% agarose gel electrophoresis, and extracted
from the gel by using the gel extraction kit as explained above. The concentration of the
DNA extracted from the gel was measured with NanoDropTM 1000 Spectrophotometer.
c) DIG labeling of the riboprobe:
The amplified probe was labeled using a digoxigenine (DIG) RNA labeling kit
(Roche) according to manufacturer’s protocol. Briefly, to each test tube 20ng of template
or amplified product was added to 2µL of dNTP mix, 2µL of 10X transcription buffer,
1µL of RNase inhibitor, 2µL of RNA polymerase (T7 or SP6) and water to make the
final volume of 21µL. The reaction mixture was incubated at 370C for 2hr. DNase I was
added after 2hr and was further incubated for 15min. The riboprobe obtained was further
purified using a RNeasy minikit (Qiagen) according to manufacturer’s instructions and
stored at -800C.
d) Hybridization:
The probes were 3' tailed with digoxigenin-11-dUTP with a DIG RNA labeling
kit (Roche, Basel, Switzerland), according to recommendations of the manufacturer.
TISH was carried out as described previously with minor modifications. Briefly, after
fixation of the tissues as described above, slides were then washed in glycine solution (2
mg/ml in PBS) for 10 min, then washed twice in PBS, and placed in 200 ml of
acetylation buffer (0.1 M triethylamine, pH 8.0, containing 0.25% acetic anhydride) for
15 min. After washing in 4xSSC for 10 min, samples were incubated in prehybridization
110
solution (2xSSC, 50% deionized formamide) for 1 hr at 470C. After overnight
hybridization at 470C, samples were placed in hybridization solution (3) containing 10 l
of purified DIG-labeled antisense riboprobe. Samples then were incubated in 10 mM
Tris-HCl, 0.5 M NaCl, and 0.25 mM EDTA (TNE) buffer, treated with RNaseA for 30
min, and returned to TNE buffer for 3 min, all at 370C. After washing in 0.1xSSC for 15
min at 470C, samples were blocked for 30 min and incubated with anti-DIG/HRP
conjugate (DAKO, Carpinteria, CA) for 40 min at room temperature. For detection, we
used the tyramide signal amplification system (GenePoint kit, DAKO) and VIP solution
(Vector Laboratories) according to the manufacturers' instructions. Samples were
observed and photographed in a Leica DMRB microscope.
7) LC-MS Analysis of Pyrrole-2,3,5-tricarboxylic acid (PTCA):
A) Extraction of melanin from hair:
The acid/base extraction of melanin from human hair was performed according to
Bolt’s procedure (Bolt AG., 1967) with some modifications. Hairs were washed with
detergent, water and acetone to remove dirt and lipid. The air dried hair was minced into
2-5 mm pieces and digested in 1N NaOH overnight. Concentrated HCl was added to the
whole mixture to precipitate brown gum sediment. NaOH (1N) was used to dissolve the
sediment, which was again precipitated by adding HCl. Base solubilization and acid
precipitation was repeated 15 times until the supernatant of the acid wash was almost
colorless. Melanoprotein concentrate obtained through the above procedure was stirred in
1M HCl for 4 hr and centrifuged. This step was repeated 10 times until the supernatant
111
was colorless. The resultant melanoprotein concentrate was washed with distilled water 6
times ethanol twice and finally washed with ether and lyophilized in a SpeedVac.
B) Extraction of melanin from adipose tissues:
One gm samples of adipose tissue were homogenized by sonication in 4 ml of
RIPA buffer until the mass of tissue was converted to liquid. The samples were then were
centrifuged at 4000 rpm. The fat was removed and the liquid phase was stored at -800C.
Pellets consisting of cell debris and black pigment were washed twice with PBS and
centrifuged again at 4000 rpm. The pellets were dissolved in 1M NaOH to dissolve the
pigment. HPLC was used to analyze the extracted pigments.
C) Permanganate oxidation of synthetic and extracted melanin:
Oxidation experiments were performed using 1mg of synthetic melanin, 1 mg of
lyophilized hair melanin and melanin extracts obtained from 1 g of sonicated tissue
samples as described above. To achieve complete solubilisation of the melanin, the
mixtures were sonicated for 24 hr in 1ml of 1M NaOH. Each sample underwent
permangate oxidation essentially as described by the original Ito and Fujita method (Ito
and Fujita, 1985). Each sample was assayed in duplicate. Aqueous suspensions were
prepared by sonicating 100µL of respective homogenates in separate test tubes with
100µL of BSA (20mg/ml) and 800µL of 1M H2SO4 at room temperature overnight. This
step is required for the breakdown of melanin to PTCA which serves as an indicator of
eumelanin presence that can be quantified by HPLC. To this, 3% KMnO4 was added in
portions of 20µL while mixing until the purple color persists. At 10 min after the first
112
addition, the residual KMnO4 and newly formed MnO2 were decomposed by the addition
of 100µL of 10% Na2SO3.
D) Sample preparation:
Samples obtained after permanganate oxidation were evaporated to dryness using
a Centrivap sample concentrator (Labconco, Kansas City, MO). Samples were
reconstituted in 1 mL of 18 M ultra-pure water and filtered into 12 x 32 mm deactivated
amber autosampler vials (National Scientific Co., Rockwood, TN) using Millex
hydrophilic PTFE syringe filters with 0.45 µm pores (Millipore Corp., Billerica, MA).
F) LC-UV-MS Analysis of Pyrrole-2,3,5-tricarboxylic acid (PTCA) protocol:
2.3.5-pyrroletricarboxylic acid (PTCA) standards were obtained as a gift from Dr.
S. Ito (Fujita Health University, Toyoake, Japan). Synthetic melanin (Sigma) and melanin
extracted from hair were used as a positive control whereas a HeLa cell extract was used
as negative control. The calibrating standards for the assay were prepared in Millipore-
filtered water. A PTCA stock solution (1 mg/mL in water) was serially diluted in
standard curve matrix to prepare a 10-point calibration curve ranging from 1 to 1000
ng/mL. A 10 µg/mL working solution of 3-nitro-tyrosine (internal standard) was prepared
in 10mM ammonium acetate with 0.05% ammonium hydroxide. The applicability of this
substitute matrix to accurately and precisely quantify PTCA in biological samples was
established by using quality control (QC) samples prepared by pooling and spiking
Caucasian skin sample extracts with known amounts of PTCA to prepare QC samples at
five concentration points across the assay calibration range.
113
Samples were analyzed using a Waters 2695 Alliance Separations Module, a
Waters Atlantis dC-18 column of 2.1 x 150 mm with 3 µm beads, a Waters 996 photo
diode array detector (PDA) and a Waters ZQ2000 single-quadrupole mass spectrometer
with an electrospray ionization (ESI) probe (Waters Corp., Milford, MA).
Chromatographic separations were achieved with a binary gradient consisting of 0.1%
v/v acetic acid in 18 M ultra-pure water as mobile phase A and 0.1% v/v acetic acid in
acetonitrile as mobile phase B. Mobile phase B was increased linearly at a flow rate of
0.2 mL/min from 5% to 100% over 20 min and held at 100% for 10 min to purge the
column. The gradient was returned to the initial conditions over 5 min and held for a 10-
min column equilibration. Samples were kept in the refrigerated autosampler at 4 oC, and
the column was heated to 35 oC.
The detectors were configured serially with the non-destructive PDA upstream to
the MS. The PDA monitored the UV spectrum from 190 to 400 nm and recorded the
absorbance at 270 nm for additional confirmation of PTCA. The MS ESI probe was
operated in negative ionization mode with a capillary voltage of 3.5 kV and an extractor
voltage of 5 V. The source temperature was 150 oC, and the desolvation temperature was
350 oC. The nitrogen desolvation gas flow was 250 L/hr and the cone flow was 50 L/hr.
The mass spectrometer was operated in selected ion recording (SIR) mode monitoring
ions 198, 154 and 110 m/z with a dwell time of 0.5 sec for each ion. The cone voltage
was alternated between 14V and 25V during each 1.5 sec MS scan. The 198 m/z parent
ion was produced at 14V. The higher cone voltage of 25V increased the kinetic energy
114
of the PTCA ion resulting in collision-induced fragmentation in the source to produce the
154 and 110 m/z secondary ions.
Quantitative analysis was accomplished using Waters Corp. MassLynx ver. 4.0
software. Five calibration standards were made in 18 M ultra-pure water at
concentrations of 100, 250, 500, 750 and 1000 ng/mL. A peak from an unknown sample
component partially co-eluted with the primary ion 198, therefore, the area response of
secondary ion 154 m/z which was free from interference was used for external standard
quantitation, and the ions 198 and 110 m/z were used for identification confirmation. A
five-point linear calibration curve with forced 0, 0 axis generated a coefficient of
determination value of 0.9997 for ion 154 m/z.
115
Chapter V
Results
Initially adipose tissue was merely considered as a fat storage organ, but later with
the discovery of leptin hormone less than a decade ago, in 1994, adipose tissue joined the
list of endocrine organs. Besides being an endocrine organ, under morbidly obese
conditions adipose tissue also acts as a source of inflammation by promoting the
secretion and production of inflammatory molecules. Recently, a plethora of papers have
been published on the adipocytic secretion of various adipokines and pro-inflammatory
agents, uncovering additional regulatory roles of adipose tissue. Even though several
novel signaling pathways have been identified in adipose tissue recently, additional
studies are required for further characterization of the genes expressed in adipose tissue
in order to evaluate the physiological role of this tissue. These studies may provide us
with new approaches for the treatment of the metabolic consequences of excessive
adipose accumulation and the lipodystrophy. In this study we describe a novel
phenomenon of the expression of melanogenesis-related genes and biosynthesis of the
melanin in the adipocytes obtained from morbidly obese subjects.
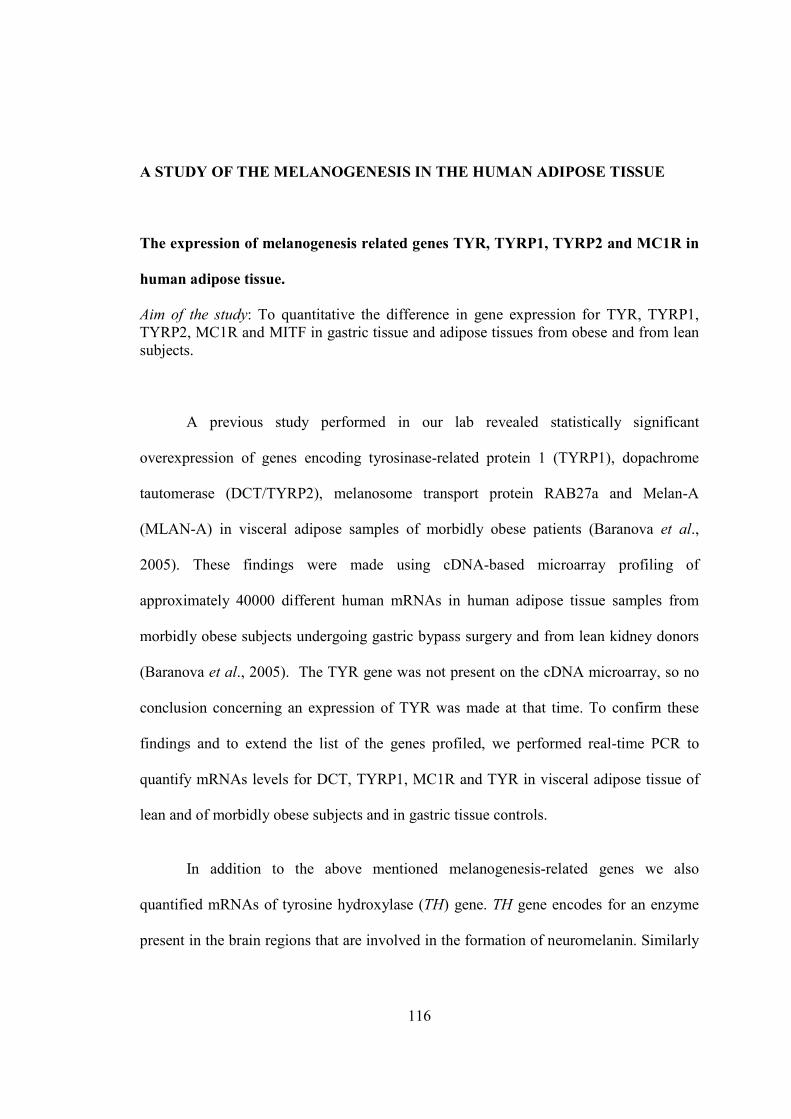
116
A STUDY OF THE MELANOGENESIS IN THE HUMAN ADIPOSE TISSUE
The expression of melanogenesis related genes TYR, TYRP1, TYRP2 and MC1R in
human adipose tissue.
Aim of the study: To quantitative the difference in gene expression for TYR, TYRP1, TYRP2, MC1R and MITF in gastric tissue and adipose tissues from obese and from lean subjects.
A previous study performed in our lab revealed statistically significant
overexpression of genes encoding tyrosinase-related protein 1 (TYRP1), dopachrome
tautomerase (DCT/TYRP2), melanosome transport protein RAB27a and Melan-A
(MLAN-A) in visceral adipose samples of morbidly obese patients (Baranova et al.,
2005). These findings were made using cDNA-based microarray profiling of
approximately 40000 different human mRNAs in human adipose tissue samples from
morbidly obese subjects undergoing gastric bypass surgery and from lean kidney donors
(Baranova et al., 2005). The TYR gene was not present on the cDNA microarray, so no
conclusion concerning an expression of TYR was made at that time. To confirm these
findings and to extend the list of the genes profiled, we performed real-time PCR to
quantify mRNAs levels for DCT, TYRP1, MC1R and TYR in visceral adipose tissue of
lean and of morbidly obese subjects and in gastric tissue controls.
In addition to the above mentioned melanogenesis-related genes we also
quantified mRNAs of tyrosine hydroxylase (TH) gene. TH gene encodes for an enzyme
present in the brain regions that are involved in the formation of neuromelanin. Similarly
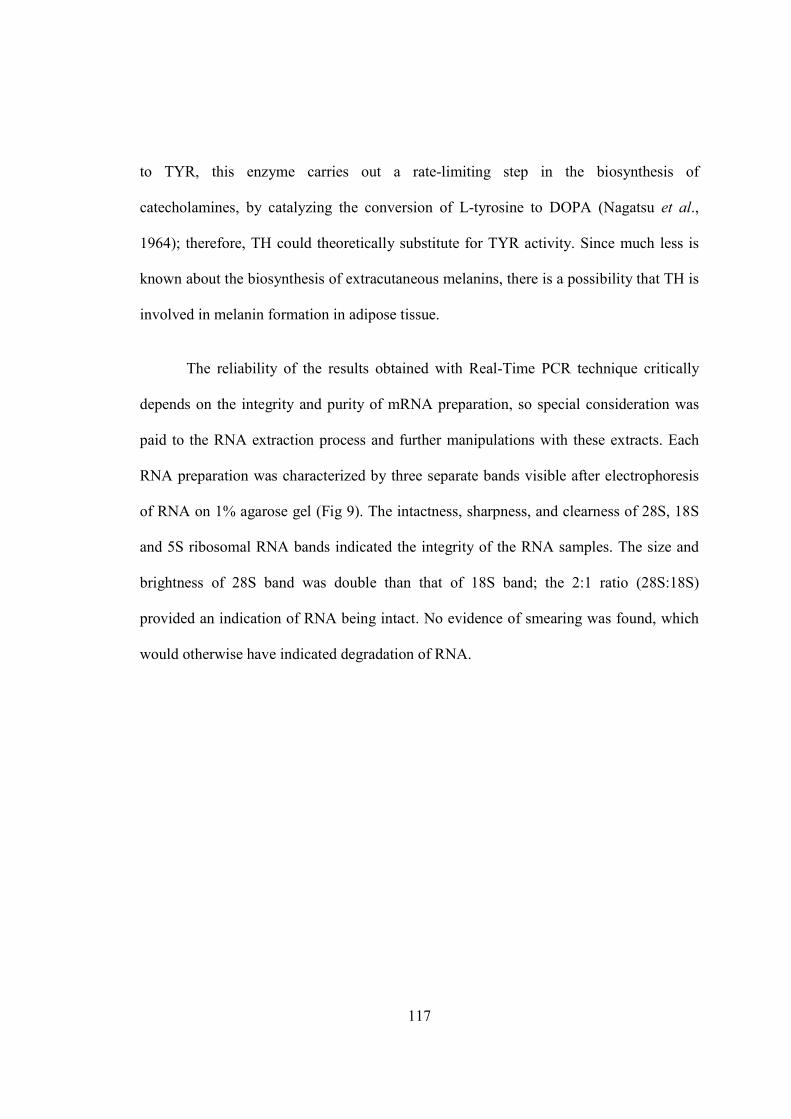
117
to TYR, this enzyme carries out a rate-limiting step in the biosynthesis of
catecholamines, by catalyzing the conversion of L-tyrosine to DOPA (Nagatsu et al.,
1964); therefore, TH could theoretically substitute for TYR activity. Since much less is
known about the biosynthesis of extracutaneous melanins, there is a possibility that TH is
involved in melanin formation in adipose tissue.
The reliability of the results obtained with Real-Time PCR technique critically
depends on the integrity and purity of mRNA preparation, so special consideration was
paid to the RNA extraction process and further manipulations with these extracts. Each
RNA preparation was characterized by three separate bands visible after electrophoresis
of RNA on 1% agarose gel (Fig 9). The intactness, sharpness, and clearness of 28S, 18S
and 5S ribosomal RNA bands indicated the integrity of the RNA samples. The size and
brightness of 28S band was double than that of 18S band; the 2:1 ratio (28S:18S)
provided an indication of RNA being intact. No evidence of smearing was found, which
would otherwise have indicated degradation of RNA.
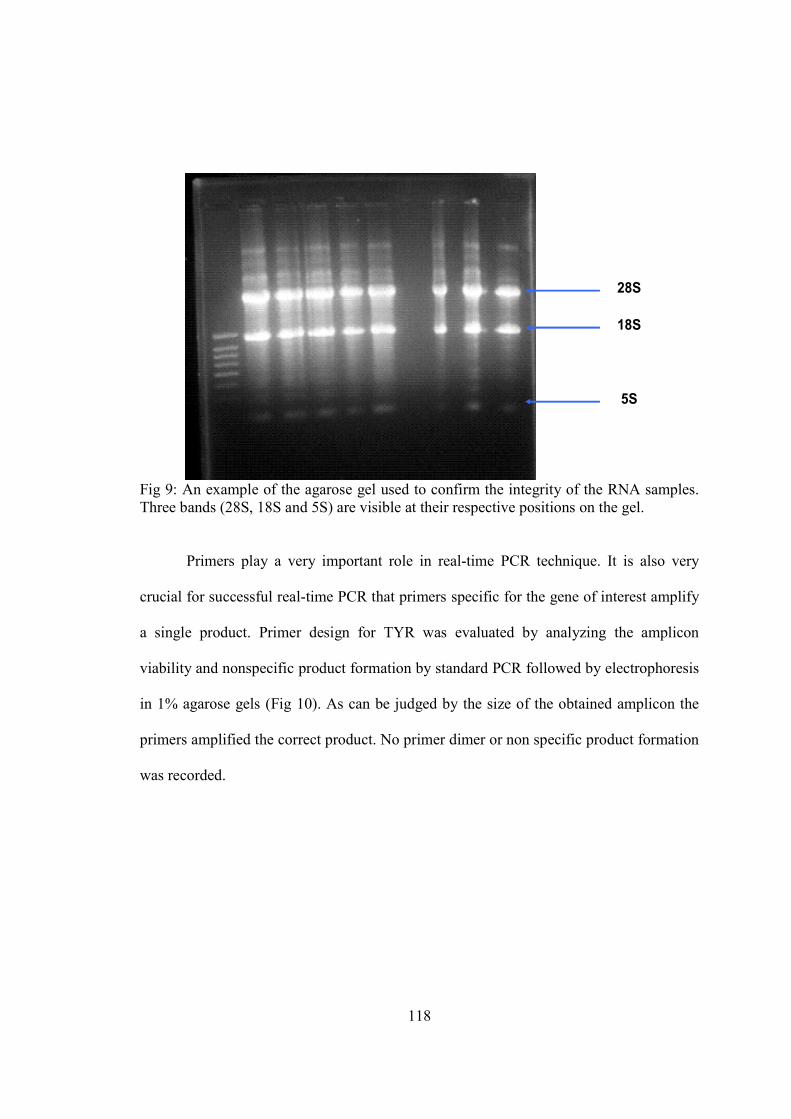
118
28S
18S
5S
Fig 9: An example of the agarose gel used to confirm the integrity of the RNA samples. Three bands (28S, 18S and 5S) are visible at their respective positions on the gel.
Primers play a very important role in real-time PCR technique. It is also very
crucial for successful real-time PCR that primers specific for the gene of interest amplify
a single product. Primer design for TYR was evaluated by analyzing the amplicon
viability and nonspecific product formation by standard PCR followed by electrophoresis
in 1% agarose gels (Fig 10). As can be judged by the size of the obtained amplicon the
primers amplified the correct product. No primer dimer or non specific product formation
was recorded.
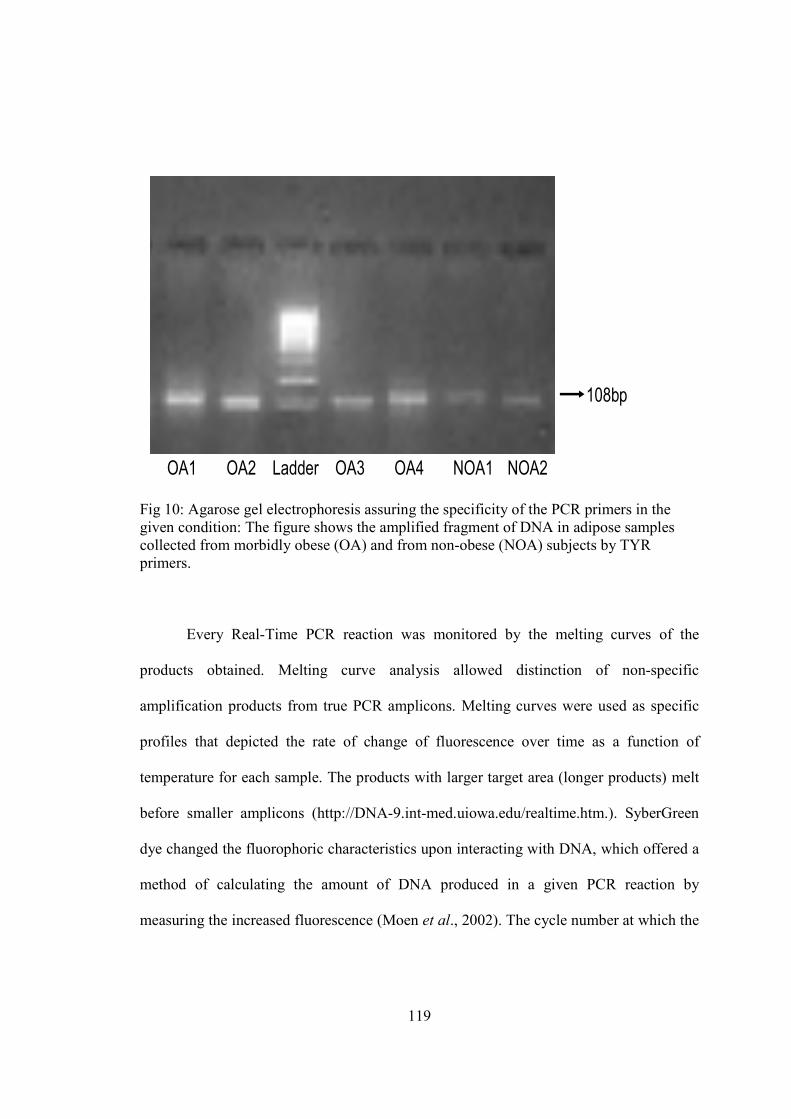
119
LadderOA2 OA3 OA4 NOA1 NOA2OA1
108bp
Fig 10: Agarose gel electrophoresis assuring the specificity of the PCR primers in the given condition: The figure shows the amplified fragment of DNA in adipose samples collected from morbidly obese (OA) and from non-obese (NOA) subjects by TYR primers.
Every Real-Time PCR reaction was monitored by the melting curves of the
products obtained. Melting curve analysis allowed distinction of non-specific
amplification products from true PCR amplicons. Melting curves were used as specific
profiles that depicted the rate of change of fluorescence over time as a function of
temperature for each sample. The products with larger target area (longer products) melt
before smaller amplicons (http://DNA-9.int-med.uiowa.edu/realtime.htm.). SyberGreen
dye changed the fluorophoric characteristics upon interacting with DNA, which offered a
method of calculating the amount of DNA produced in a given PCR reaction by
measuring the increased fluorescence (Moen et al., 2002). The cycle number at which the
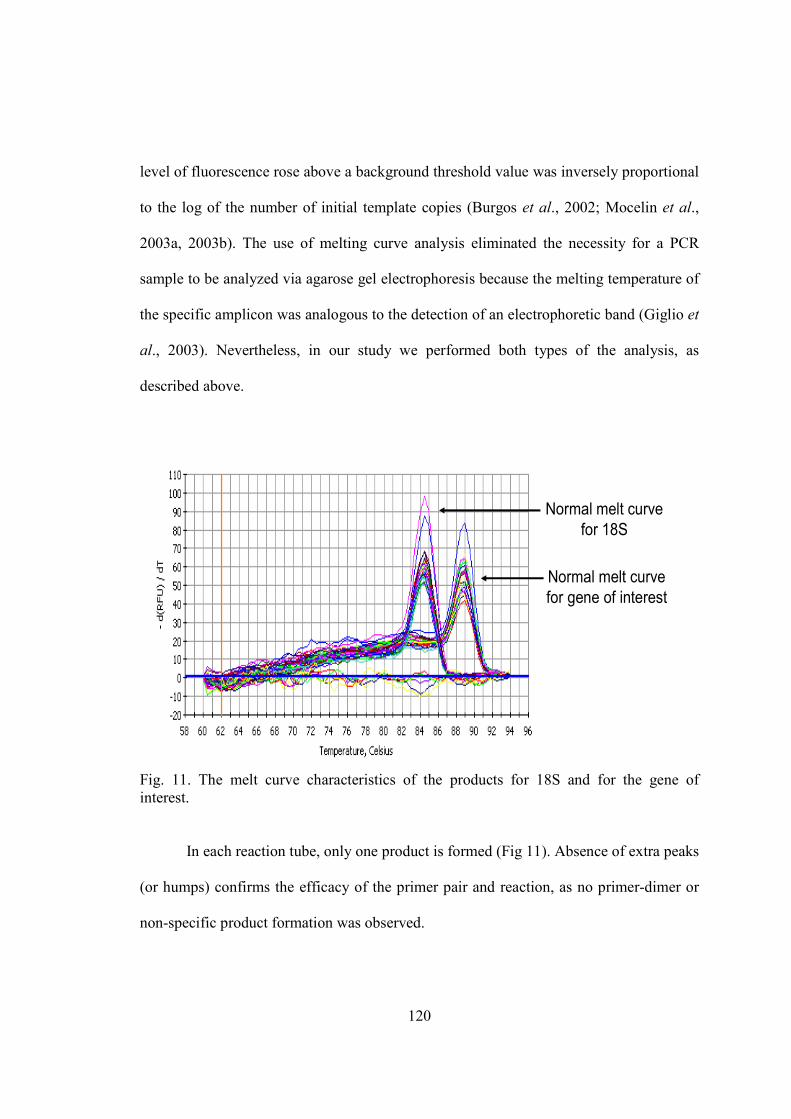
120
level of fluorescence rose above a background threshold value was inversely proportional
to the log of the number of initial template copies (Burgos et al., 2002; Mocelin et al.,
2003a, 2003b). The use of melting curve analysis eliminated the necessity for a PCR
sample to be analyzed via agarose gel electrophoresis because the melting temperature of
the specific amplicon was analogous to the detection of an electrophoretic band (Giglio et
al., 2003). Nevertheless, in our study we performed both types of the analysis, as
described above.
Normal melt curve
for 18S
Normal melt curve
for gene of interest
Fig. 11. The melt curve characteristics of the products for 18S and for the gene of interest.
In each reaction tube, only one product is formed (Fig 11). Absence of extra peaks
(or humps) confirms the efficacy of the primer pair and reaction, as no primer-dimer or
non-specific product formation was observed.
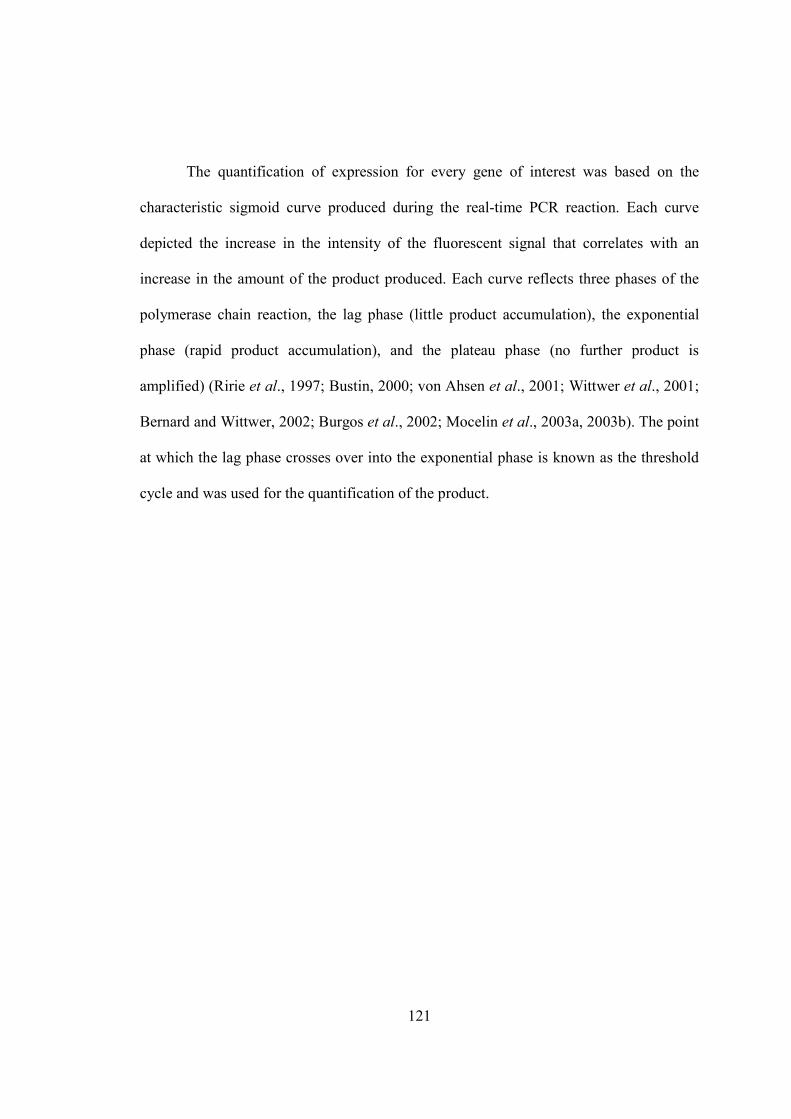
121
The quantification of expression for every gene of interest was based on the
characteristic sigmoid curve produced during the real-time PCR reaction. Each curve
depicted the increase in the intensity of the fluorescent signal that correlates with an
increase in the amount of the product produced. Each curve reflects three phases of the
polymerase chain reaction, the lag phase (little product accumulation), the exponential
phase (rapid product accumulation), and the plateau phase (no further product is
amplified) (Ririe et al., 1997; Bustin, 2000; von Ahsen et al., 2001; Wittwer et al., 2001;
Bernard and Wittwer, 2002; Burgos et al., 2002; Mocelin et al., 2003a, 2003b). The point
at which the lag phase crosses over into the exponential phase is known as the threshold
cycle and was used for the quantification of the product.
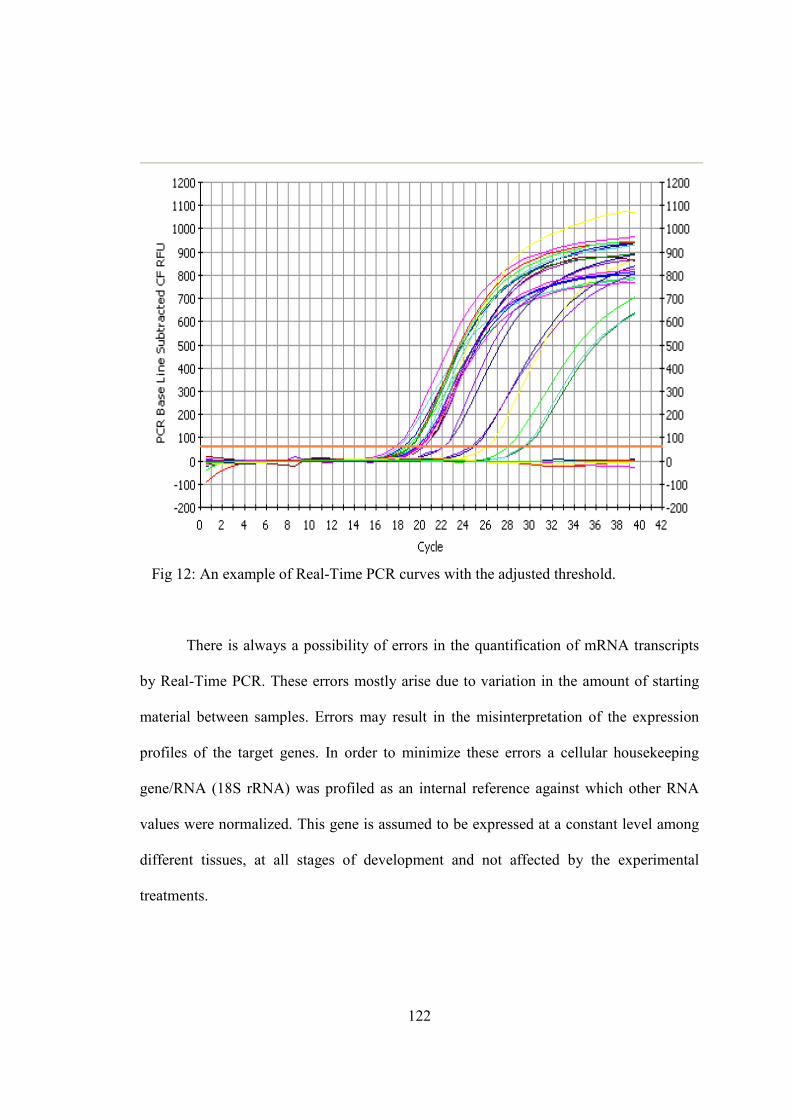
122
Fig 12: An example of Real-Time PCR curves with the adjusted threshold.
There is always a possibility of errors in the quantification of mRNA transcripts
by Real-Time PCR. These errors mostly arise due to variation in the amount of starting
material between samples. Errors may result in the misinterpretation of the expression
profiles of the target genes. In order to minimize these errors a cellular housekeeping
gene/RNA (18S rRNA) was profiled as an internal reference against which other RNA
values were normalized. This gene is assumed to be expressed at a constant level among
different tissues, at all stages of development and not affected by the experimental
treatments.
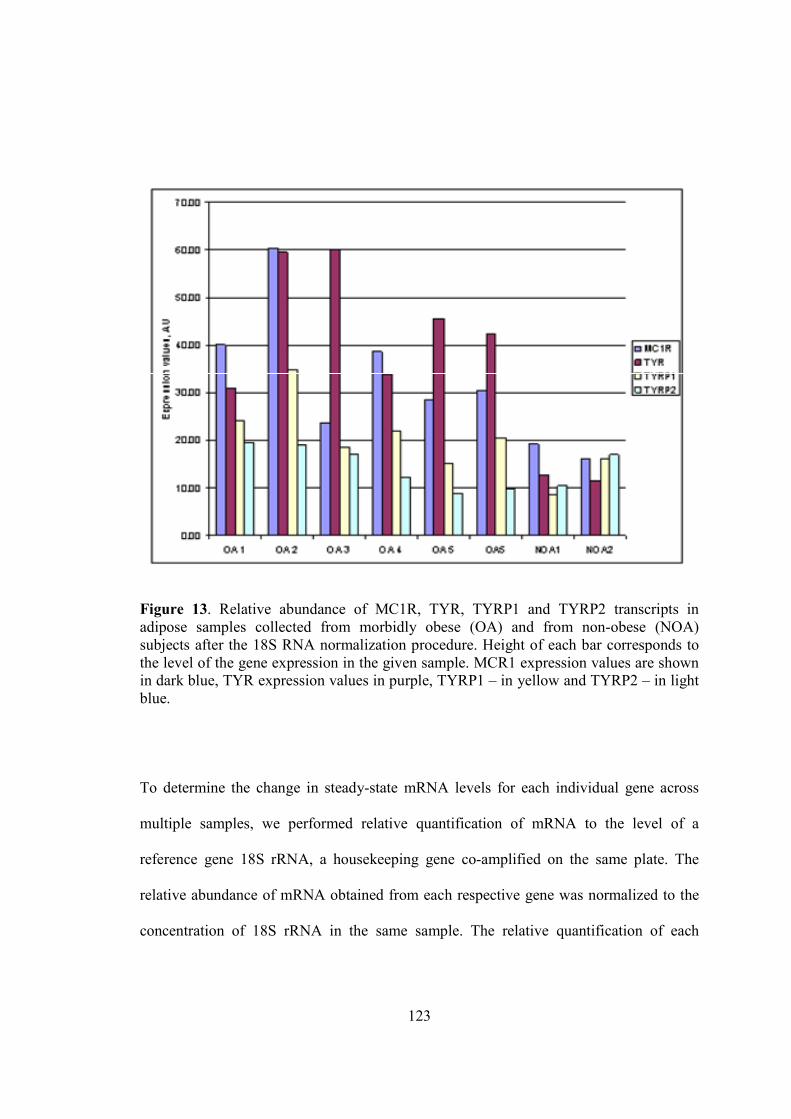
123
The figure shows the results of real-time PCR (RT-PCR) assays, which represents
Figure 13. Relative abundance of MC1R, TYR, TYRP1 and TYRP2 transcripts in adipose samples collected from morbidly obese (OA) and from non-obese (NOA) subjects after the 18S RNA normalization procedure. Height of each bar corresponds to the level of the gene expression in the given sample. MCR1 expression values are shown in dark blue, TYR expression values in purple, TYRP1 – in yellow and TYRP2 – in light blue.
To determine the change in steady-state mRNA levels for each individual gene across
multiple samples, we performed relative quantification of mRNA to the level of a
reference gene 18S rRNA, a housekeeping gene co-amplified on the same plate. The
relative abundance of mRNA obtained from each respective gene was normalized to the
concentration of 18S rRNA in the same sample. The relative quantification of each
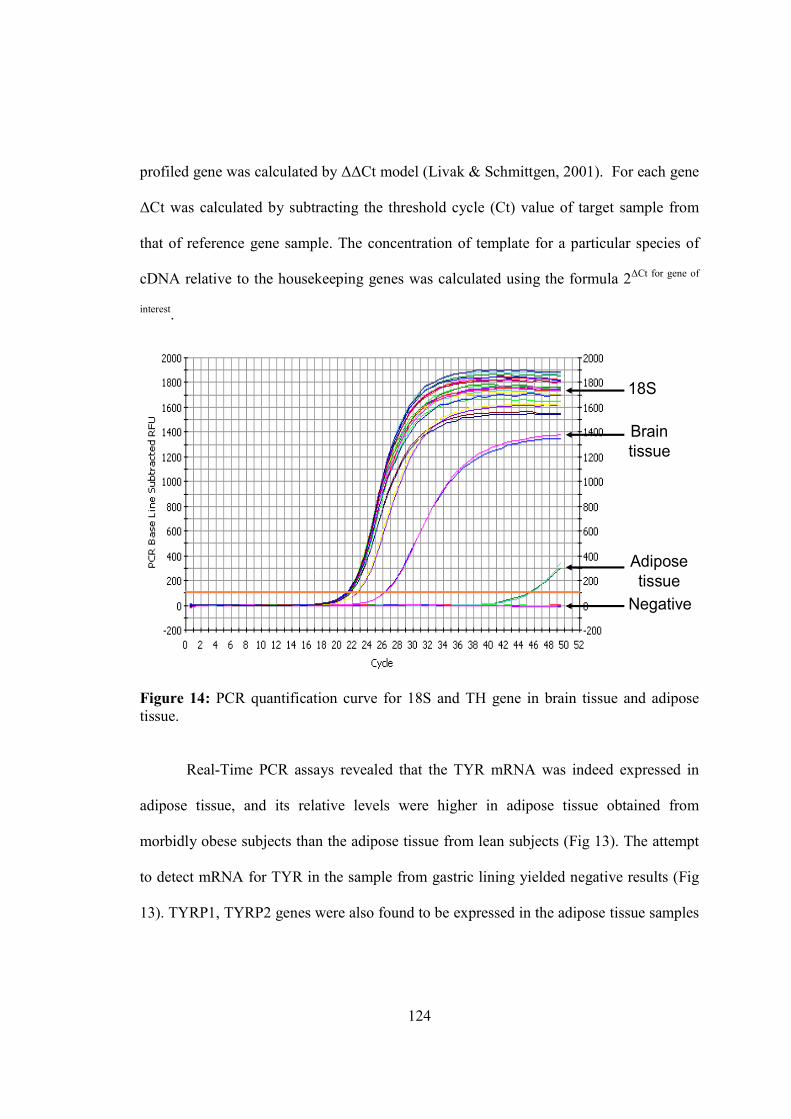
124
profiled gene was calculated by ∆∆Ct model (Livak & Schmittgen, 2001). For each gene
∆Ct was calculated by subtracting the threshold cycle (Ct) value of target sample from
that of reference gene sample. The concentration of template for a particular species of
cDNA relative to the housekeeping genes was calculated using the formula 2∆Ct for gene of
interest.
18S
Brain
tissue
Adipose
tissue
Negative
Figure 14: PCR quantification curve for 18S and TH gene in brain tissue and adipose tissue.
Real-Time PCR assays revealed that the TYR mRNA was indeed expressed in
adipose tissue, and its relative levels were higher in adipose tissue obtained from
morbidly obese subjects than the adipose tissue from lean subjects (Fig 13). The attempt
to detect mRNA for TYR in the sample from gastric lining yielded negative results (Fig
13). TYRP1, TYRP2 genes were also found to be expressed in the adipose tissue samples
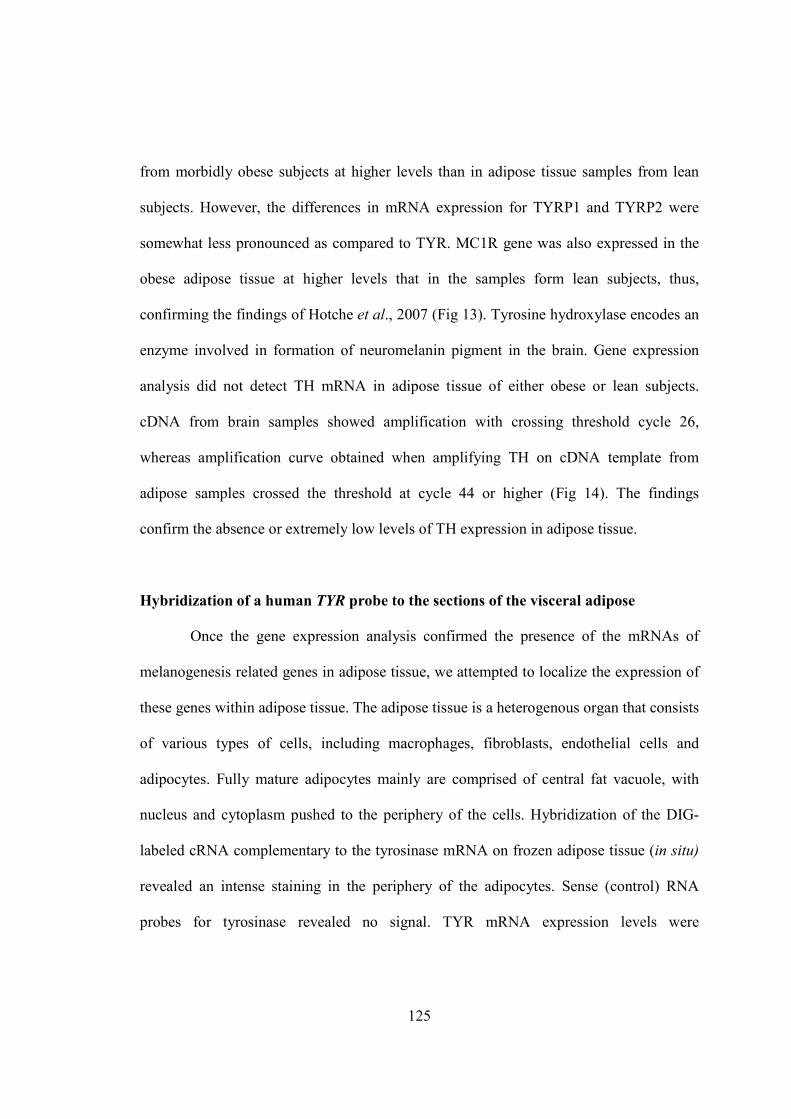
125
from morbidly obese subjects at higher levels than in adipose tissue samples from lean
subjects. However, the differences in mRNA expression for TYRP1 and TYRP2 were
somewhat less pronounced as compared to TYR. MC1R gene was also expressed in the
obese adipose tissue at higher levels that in the samples form lean subjects, thus,
confirming the findings of Hotche et al., 2007 (Fig 13). Tyrosine hydroxylase encodes an
enzyme involved in formation of neuromelanin pigment in the brain. Gene expression
analysis did not detect TH mRNA in adipose tissue of either obese or lean subjects.
cDNA from brain samples showed amplification with crossing threshold cycle 26,
whereas amplification curve obtained when amplifying TH on cDNA template from
adipose samples crossed the threshold at cycle 44 or higher (Fig 14). The findings
confirm the absence or extremely low levels of TH expression in adipose tissue.
Hybridization of a human TYR probe to the sections of the visceral adipose
Once the gene expression analysis confirmed the presence of the mRNAs of
melanogenesis related genes in adipose tissue, we attempted to localize the expression of
these genes within adipose tissue. The adipose tissue is a heterogenous organ that consists
of various types of cells, including macrophages, fibroblasts, endothelial cells and
adipocytes. Fully mature adipocytes mainly are comprised of central fat vacuole, with
nucleus and cytoplasm pushed to the periphery of the cells. Hybridization of the DIG-
labeled cRNA complementary to the tyrosinase mRNA on frozen adipose tissue (in situ)
revealed an intense staining in the periphery of the adipocytes. Sense (control) RNA
probes for tyrosinase revealed no signal. TYR mRNA expression levels were
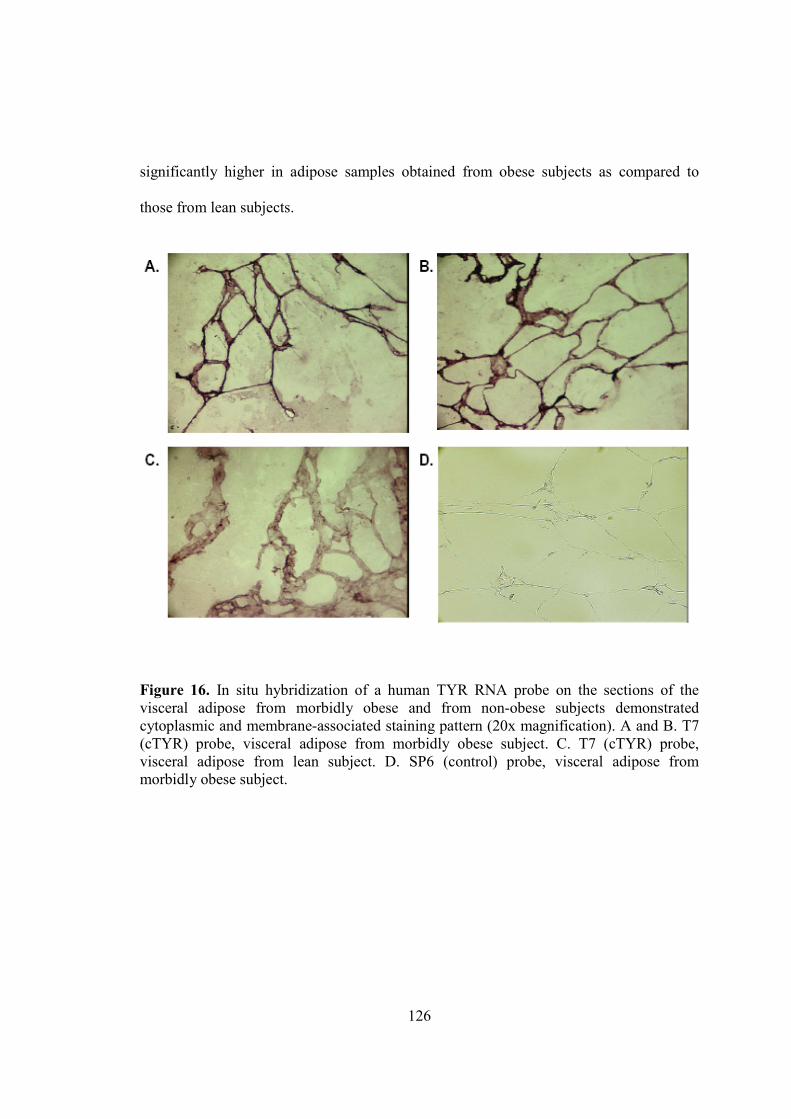
126
significantly higher in adipose samples obtained from obese subjects as compared to
those from lean subjects.
Figure 16. In situ hybridization of a human TYR RNA probe on the sections of the visceral adipose from morbidly obese and from non-obese subjects demonstrated cytoplasmic and membrane-associated staining pattern (20x magnification). A and B. T7 (cTYR) probe, visceral adipose from morbidly obese subject. C. T7 (cTYR) probe, visceral adipose from lean subject. D. SP6 (control) probe, visceral adipose from morbidly obese subject.
127
Protein expression for TYR, TYRP1 and TYRP2 in visceral adipose tissue samples
from obese and from lean individuals revealed by immunohistochemistry.
Aim of the study: To confirm that the above mentioned melanogenesis related enzymes are expressed in the adipocytes and not in other cells of adipose tissue. The second aim was to compare the difference in protein expression of enzymes between adipocytes of obese and of lean adipose tissue.
Gene expression does not always correlate with protein expression (Nie et al.,
2007). Particularly, high expression of mRNA may not lead to similarly prominent levels
of the encoded cellular protein due to the changes in its posttranslational processing that
may enhance the degradation of the protein. Therefore, after confirming the expression of
the genes encoding melanogenesis related enzymes we evaluated expression of their
corresponding proteins and localized them within adipose tissue. Particularly, the
expression of enzymes participating in the melanin biosynthesis was localized by
immunohistochemical staining of cryosliced adipose samples with αPEP7h, αPEP1h, and
αPEP8h antibodies specific for TYR, TYRP1 and TYRP2, respectively.
Standardizing the Immunohistochemistry technique:
Immunohistochemistry is now accepted as the most useful ancillary method in
diagnostic histopathology, apart from simple histochemical stains. The specificity of IHC
is affected by a variety of factors, including the quality of the primary antibodies, fixation
of the tissues, unmasking of epitopes and sensitivity of the detection system. Before
performing the experiment, we standardized the IHC technique by taking into account all
the above factors. Particularly, the processing of the adipose tissue represented the major
problem. Visceral fat is mainly composed of lipids that melt at room temperature.
Moreover, this type of tissue cannot be fixed by paraformaldehyde. In order to maintain
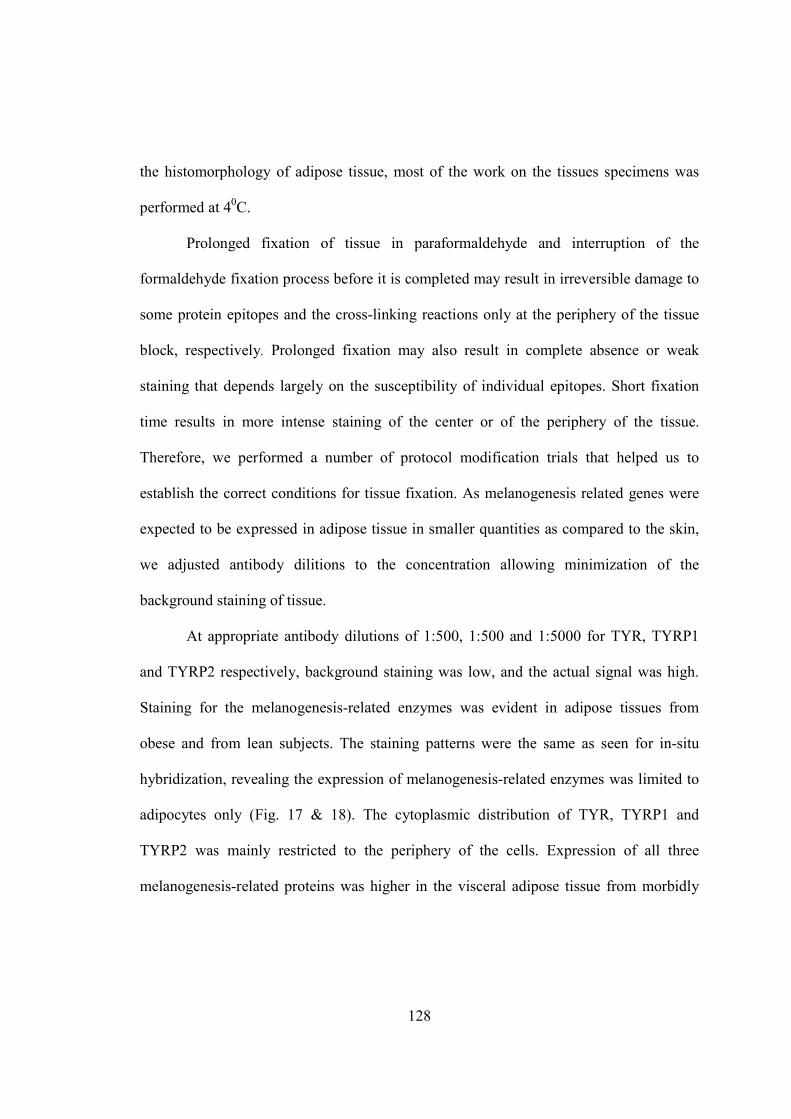
128
the histomorphology of adipose tissue, most of the work on the tissues specimens was
performed at 40C.
Prolonged fixation of tissue in paraformaldehyde and interruption of the
formaldehyde fixation process before it is completed may result in irreversible damage to
some protein epitopes and the cross-linking reactions only at the periphery of the tissue
block, respectively. Prolonged fixation may also result in complete absence or weak
staining that depends largely on the susceptibility of individual epitopes. Short fixation
time results in more intense staining of the center or of the periphery of the tissue.
Therefore, we performed a number of protocol modification trials that helped us to
establish the correct conditions for tissue fixation. As melanogenesis related genes were
expected to be expressed in adipose tissue in smaller quantities as compared to the skin,
we adjusted antibody dilitions to the concentration allowing minimization of the
background staining of tissue.
At appropriate antibody dilutions of 1:500, 1:500 and 1:5000 for TYR, TYRP1
and TYRP2 respectively, background staining was low, and the actual signal was high.
Staining for the melanogenesis-related enzymes was evident in adipose tissues from
obese and from lean subjects. The staining patterns were the same as seen for in-situ
hybridization, revealing the expression of melanogenesis-related enzymes was limited to
adipocytes only (Fig. 17 & 18). The cytoplasmic distribution of TYR, TYRP1 and
TYRP2 was mainly restricted to the periphery of the cells. Expression of all three
melanogenesis-related proteins was higher in the visceral adipose tissue from morbidly

129
obese as compared to non-obese subjects. TYR expression was higher than that of
TYRP1 and TYRP2.
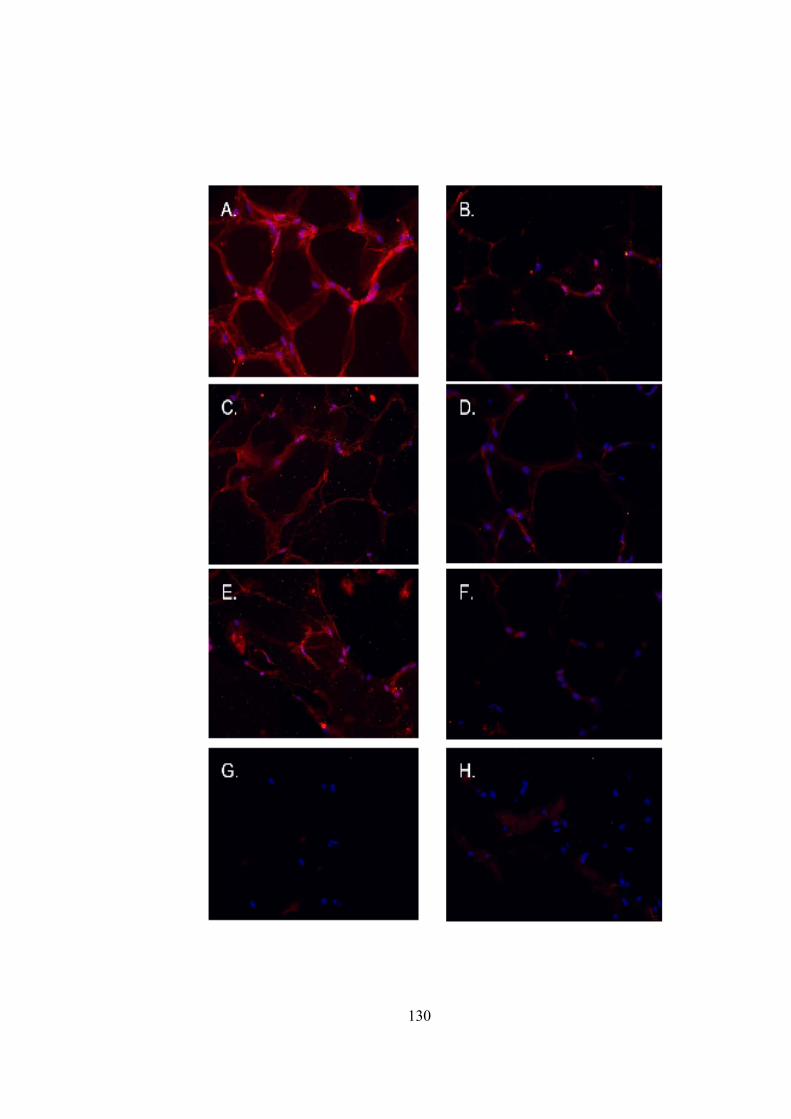
130

131
Figure 17. Immunohistochemical staining of the visceral adipose tissue sections from morbidly obese and non-obese subjects for human TYR, TYRP1 and TYRP2 proteins (20x magnification). Red: TYR, TYRP1 or TYRP2 stainings. Blue: DAPI (nuclei). A, C, E, G: Visceral adipose from morbidly obese subject. B, D, F, H: Visceral adipose from non-obese subject. A and B: Tyrosinase; C and D: Tyrosinase-related protein Tyrp1 (dopachrome tautomerase); E and F: Tyrosinase-related protein Tyrp1; G and H: Negative control (secondary antibodies) and DAPI.
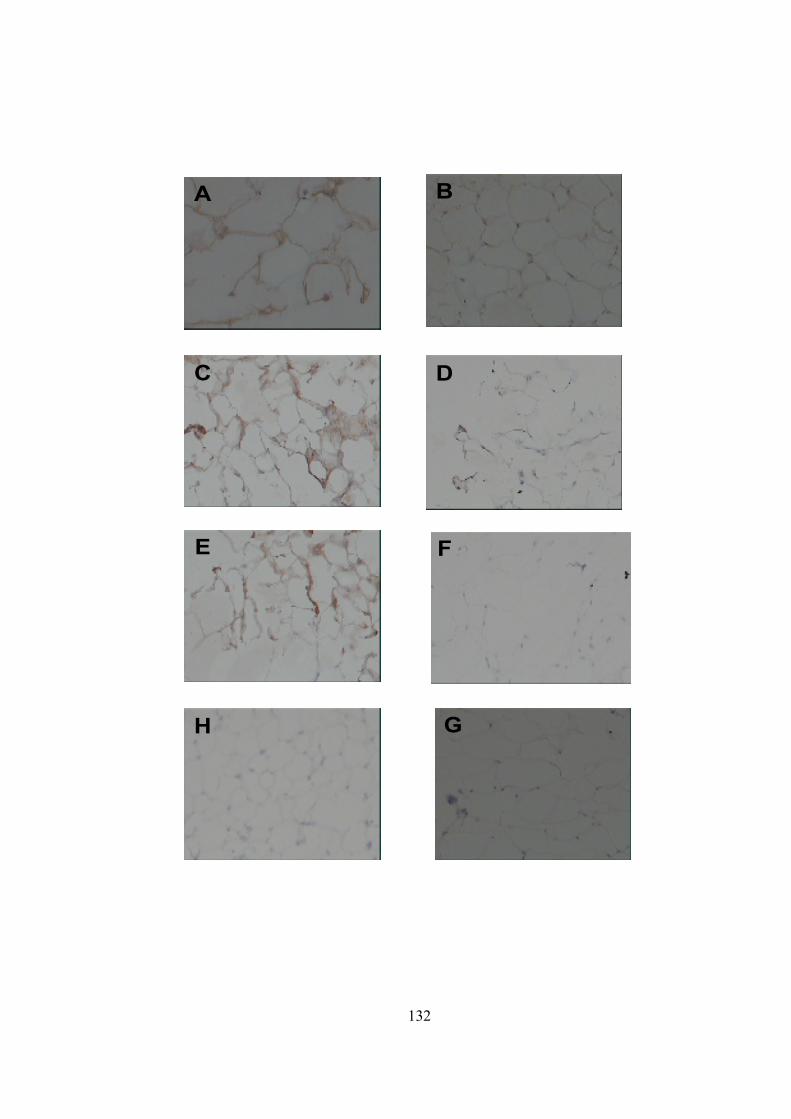
132
A B
C D
E F
H G
133
Figure 18. DAB staining of the visceral adipose tissue sections from morbidly obese and non-obese subjects for human TYR, TYRP1 and TYRP2 proteins (20x magnification). Red: TYR, TYRP1 or TYRP2 stainings. Blue: DAPI (nuclei). A, C, E, G: Visceral adipose from morbidly obese subject. B, D, F, H: Visceral adipose from non-obese subject. A and B: Tyrosinase; C and D: Tyrosinase-related protein Tyrp1 (dopachrome tautomerase); E and F: Tyrosinase-related protein Tyrp1; G and H: Negative control (secondary antibodies) and DAPI. Optimizing the western blotting technique:
Aim of the study: To validate the results of immunohistochemistry by western blotting on the gastric tissues and adipose tissues from obese and from lean subjects .
The separation of the proteins extracted from the adipose tissue in the gel and
their transfer to a membrane was a challenging task that required optimization. Adipose
tissue from morbidly obese subjects contains a substantial amount of lipids, and produces
a very prominent albumin band that is the most visible band on the gel. Albumin
molecules tend to bind to other proteins and interfere with their migration through the
gel. Attempts to perform chloroform/phenol extraction of proteins from adipose tissues
uniformly failed. For the purpose of this study, the proteins were extracted from adipose
tissue after flash freezing the specimen in the liquid nitrogen, followed by
homogenization of the tissues, another flash freezing of the homogenate and thawing it at
the room temperature. The infranatants of the tissue homogenates were collected while
carefully separating the fat. Samples were centrifuged before adding to the gel.
Expression of tyrosinase protein in visceral adipose samples from morbidly obese
subjects was confirmed by western blotting with αPEP7h antibodies (Fig. 19). The
140KDa band corresponds to the dimer of the normal fully glycosylated tyrosinase. It
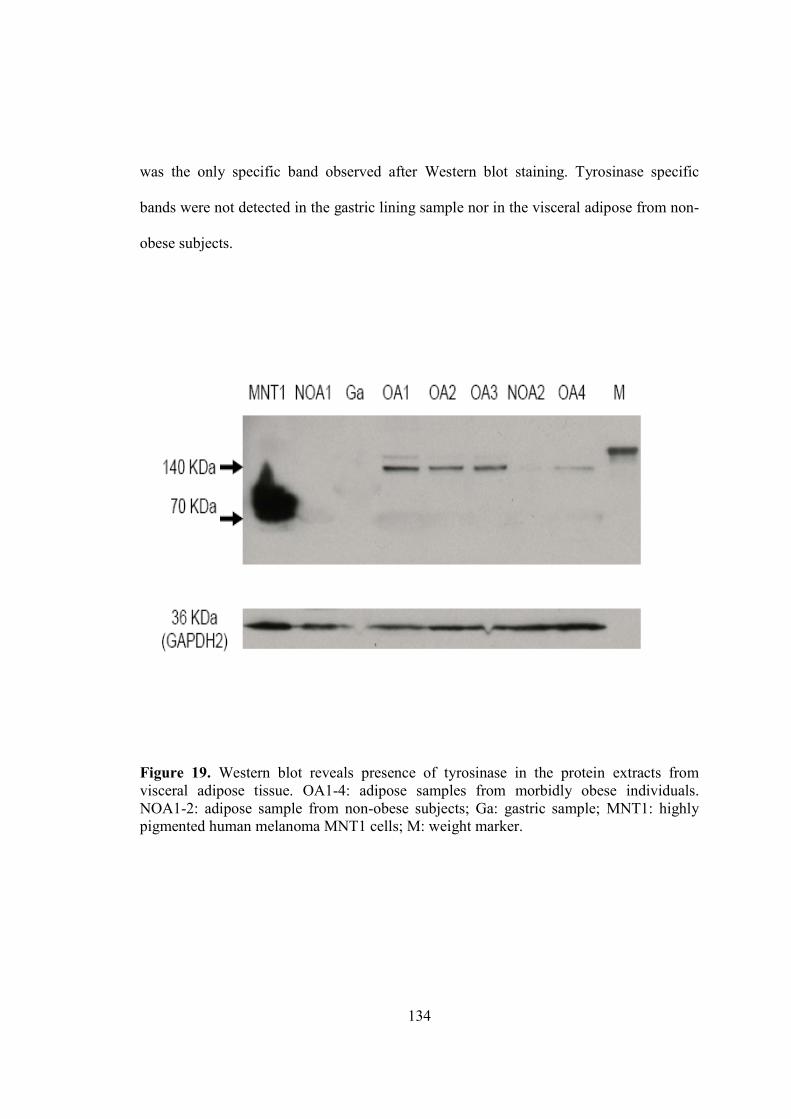
134
was the only specific band observed after Western blot staining. Tyrosinase specific
bands were not detected in the gastric lining sample nor in the visceral adipose from non-
obese subjects.
Figure 19. Western blot reveals presence of tyrosinase in the protein extracts from visceral adipose tissue. OA1-4: adipose samples from morbidly obese individuals. NOA1-2: adipose sample from non-obese subjects; Ga: gastric sample; MNT1: highly pigmented human melanoma MNT1 cells; M: weight marker.
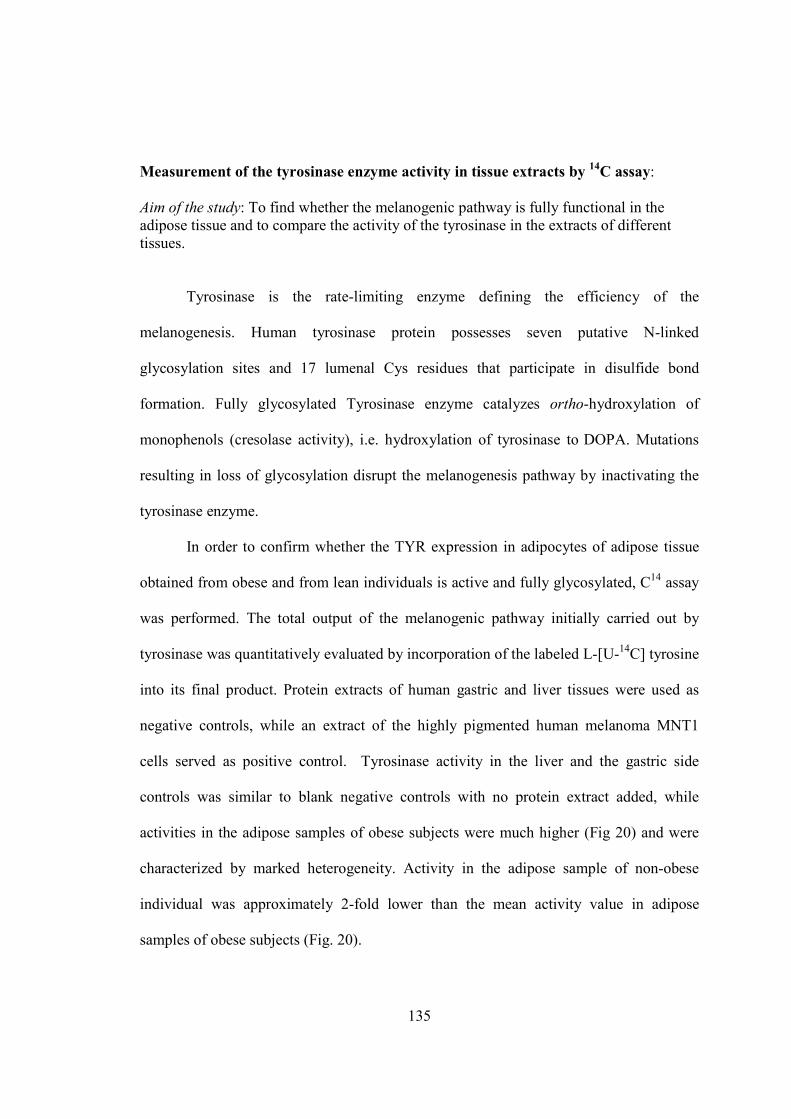
135
Measurement of the tyrosinase enzyme activity in tissue extracts by 14
C assay:
Aim of the study: To find whether the melanogenic pathway is fully functional in the adipose tissue and to compare the activity of the tyrosinase in the extracts of different tissues.
Tyrosinase is the rate-limiting enzyme defining the efficiency of the
melanogenesis. Human tyrosinase protein possesses seven putative N-linked
glycosylation sites and 17 lumenal Cys residues that participate in disulfide bond
formation. Fully glycosylated Tyrosinase enzyme catalyzes ortho-hydroxylation of
monophenols (cresolase activity), i.e. hydroxylation of tyrosinase to DOPA. Mutations
resulting in loss of glycosylation disrupt the melanogenesis pathway by inactivating the
tyrosinase enzyme.
In order to confirm whether the TYR expression in adipocytes of adipose tissue
obtained from obese and from lean individuals is active and fully glycosylated, C14 assay
was performed. The total output of the melanogenic pathway initially carried out by
tyrosinase was quantitatively evaluated by incorporation of the labeled L-[U-14C] tyrosine
into its final product. Protein extracts of human gastric and liver tissues were used as
negative controls, while an extract of the highly pigmented human melanoma MNT1
cells served as positive control. Tyrosinase activity in the liver and the gastric side
controls was similar to blank negative controls with no protein extract added, while
activities in the adipose samples of obese subjects were much higher (Fig 20) and were
characterized by marked heterogeneity. Activity in the adipose sample of non-obese
individual was approximately 2-fold lower than the mean activity value in adipose
samples of obese subjects (Fig. 20).
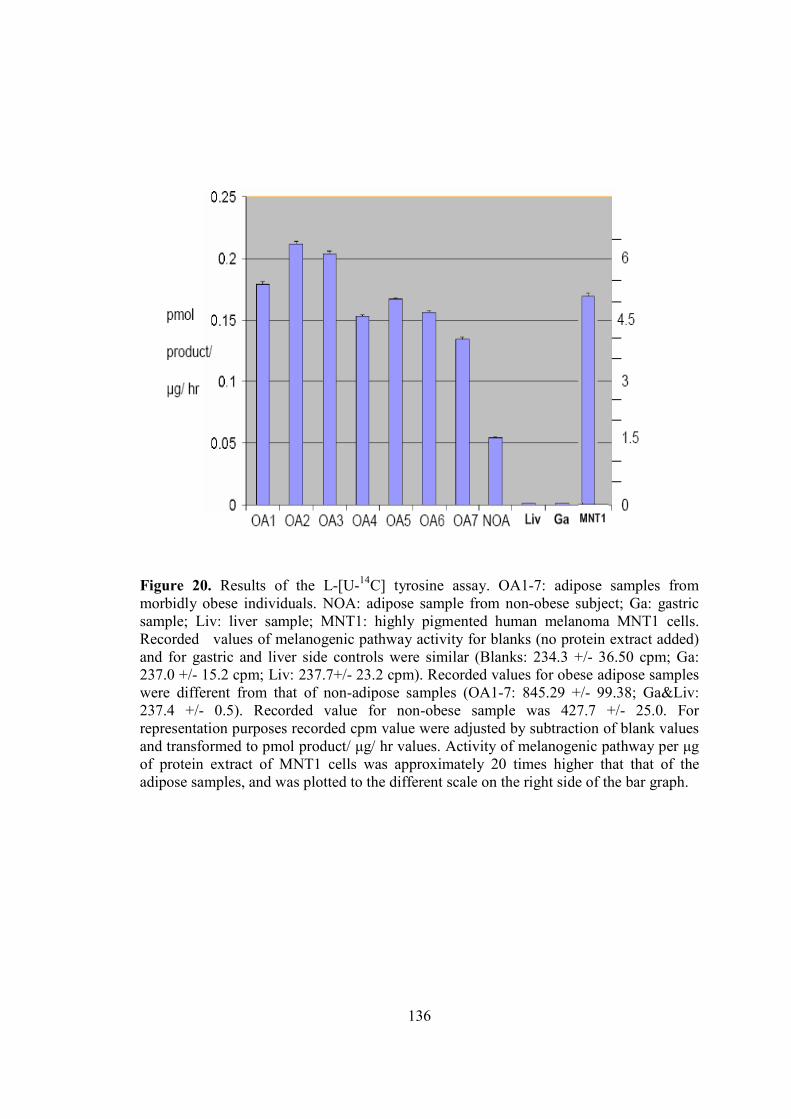
136
Figure 20. Results of the L-[U-14C] tyrosine assay. OA1-7: adipose samples from morbidly obese individuals. NOA: adipose sample from non-obese subject; Ga: gastric sample; Liv: liver sample; MNT1: highly pigmented human melanoma MNT1 cells. Recorded values of melanogenic pathway activity for blanks (no protein extract added) and for gastric and liver side controls were similar (Blanks: 234.3 +/- 36.50 cpm; Ga: 237.0 +/- 15.2 cpm; Liv: 237.7+/- 23.2 cpm). Recorded values for obese adipose samples were different from that of non-adipose samples (OA1-7: 845.29 +/- 99.38; Ga&Liv: 237.4 +/- 0.5). Recorded value for non-obese sample was 427.7 +/- 25.0. For representation purposes recorded cpm value were adjusted by subtraction of blank values and transformed to pmol product/ µg/ hr values. Activity of melanogenic pathway per µg of protein extract of MNT1 cells was approximately 20 times higher that that of the adipose samples, and was plotted to the different scale on the right side of the bar graph.
137
Melanin staining was confirmed by Fontana Masson staining:
Aim of the study: to visualize staining for melanin in the adipose tissue from obese and from lean subjects and particularly in the adipocytes.
The histological examination of adipose tissue revealed an accumulation of
melanin pigment in the periphery of adipocytes of adipose tissue from morbidly obese
patients (Fig 21 A&B). The staining pattern revealed the specificity of the staining to
adipocytes. This cytoplasmic staining was localized to the periphery of the cells with no
staining observed in the lipid-filled central vacuoles of adipocytes, and in other cells of
adipose tissue, including microvessels and fibroblasts (Fig 21E). Little or no melanin
pigment was detected in the adipocytes from adipose tissue of lean subjects (Fig 21
C&D).
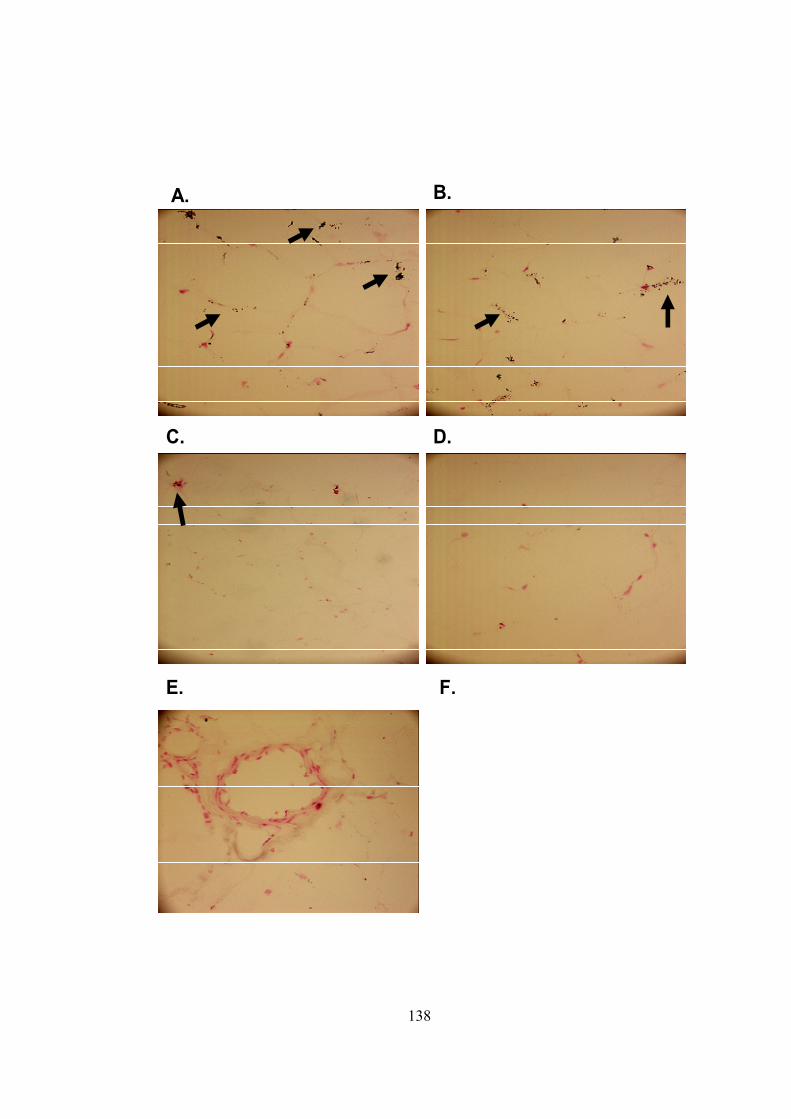
138
A. B.
F. E.
D. C.
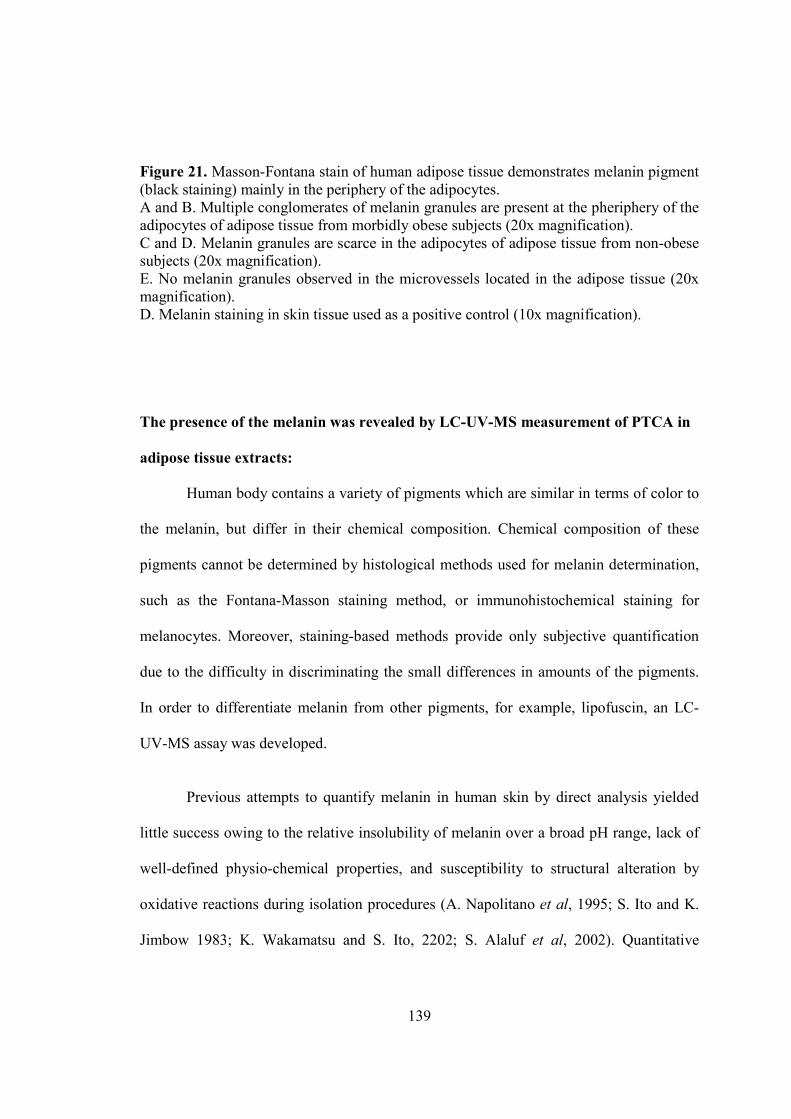
139
Figure 21. Masson-Fontana stain of human adipose tissue demonstrates melanin pigment (black staining) mainly in the periphery of the adipocytes. A and B. Multiple conglomerates of melanin granules are present at the pheriphery of the adipocytes of adipose tissue from morbidly obese subjects (20x magnification). C and D. Melanin granules are scarce in the adipocytes of adipose tissue from non-obese subjects (20x magnification). E. No melanin granules observed in the microvessels located in the adipose tissue (20x magnification). D. Melanin staining in skin tissue used as a positive control (10x magnification).
The presence of the melanin was revealed by LC-UV-MS measurement of PTCA in
adipose tissue extracts:
Human body contains a variety of pigments which are similar in terms of color to
the melanin, but differ in their chemical composition. Chemical composition of these
pigments cannot be determined by histological methods used for melanin determination,
such as the Fontana-Masson staining method, or immunohistochemical staining for
melanocytes. Moreover, staining-based methods provide only subjective quantification
due to the difficulty in discriminating the small differences in amounts of the pigments.
In order to differentiate melanin from other pigments, for example, lipofuscin, an LC-
UV-MS assay was developed.
Previous attempts to quantify melanin in human skin by direct analysis yielded
little success owing to the relative insolubility of melanin over a broad pH range, lack of
well-defined physio-chemical properties, and susceptibility to structural alteration by
oxidative reactions during isolation procedures (A. Napolitano et al, 1995; S. Ito and K.
Jimbow 1983; K. Wakamatsu and S. Ito, 2202; S. Alaluf et al, 2002). Quantitative
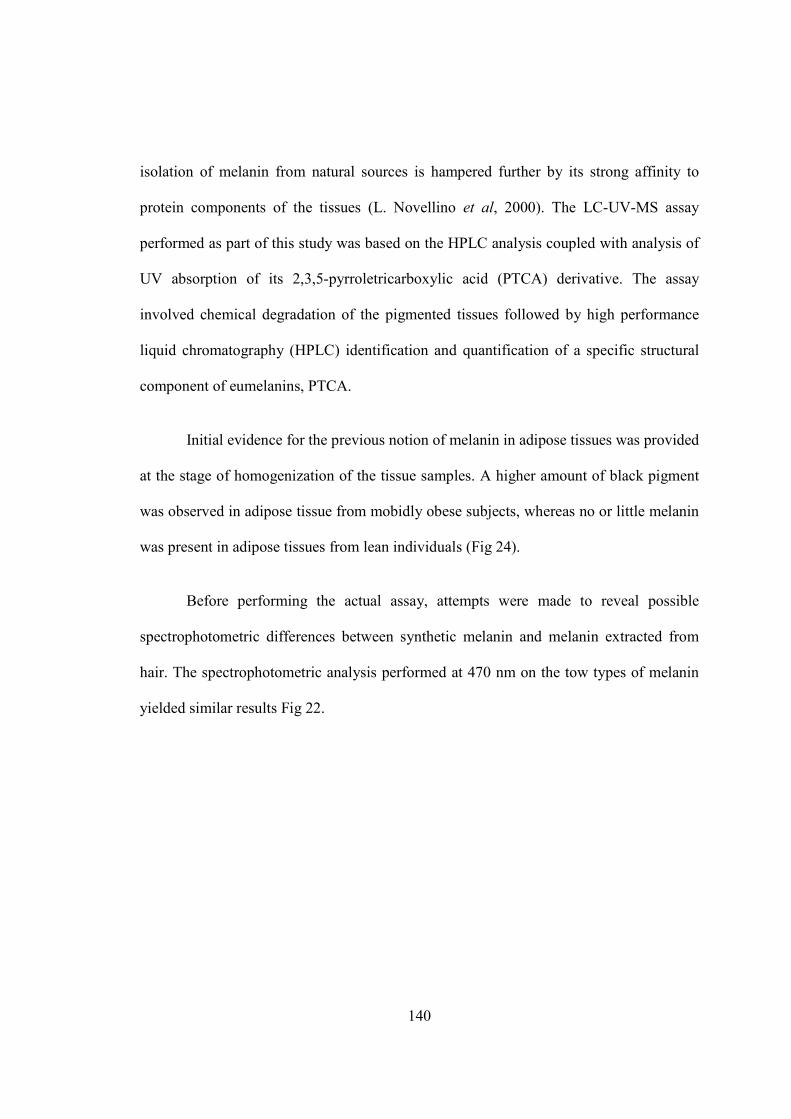
140
isolation of melanin from natural sources is hampered further by its strong affinity to
protein components of the tissues (L. Novellino et al, 2000). The LC-UV-MS assay
performed as part of this study was based on the HPLC analysis coupled with analysis of
UV absorption of its 2,3,5-pyrroletricarboxylic acid (PTCA) derivative. The assay
involved chemical degradation of the pigmented tissues followed by high performance
liquid chromatography (HPLC) identification and quantification of a specific structural
component of eumelanins, PTCA.
Initial evidence for the previous notion of melanin in adipose tissues was provided
at the stage of homogenization of the tissue samples. A higher amount of black pigment
was observed in adipose tissue from mobidly obese subjects, whereas no or little melanin
was present in adipose tissues from lean individuals (Fig 24).
Before performing the actual assay, attempts were made to reveal possible
spectrophotometric differences between synthetic melanin and melanin extracted from
hair. The spectrophotometric analysis performed at 470 nm on the tow types of melanin
yielded similar results Fig 22.
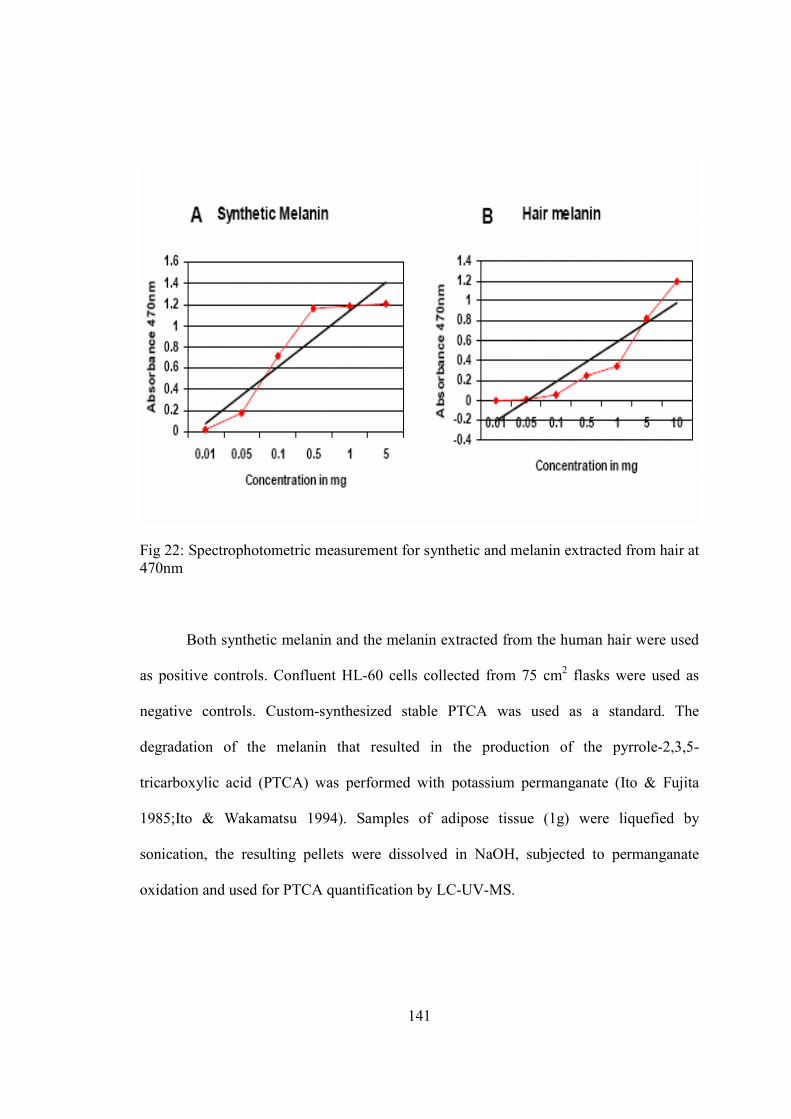
141
Fig 22: Spectrophotometric measurement for synthetic and melanin extracted from hair at 470nm
Both synthetic melanin and the melanin extracted from the human hair were used
as positive controls. Confluent HL-60 cells collected from 75 cm2 flasks were used as
negative controls. Custom-synthesized stable PTCA was used as a standard. The
degradation of the melanin that resulted in the production of the pyrrole-2,3,5-
tricarboxylic acid (PTCA) was performed with potassium permanganate (Ito & Fujita
1985;Ito & Wakamatsu 1994). Samples of adipose tissue (1g) were liquefied by
sonication, the resulting pellets were dissolved in NaOH, subjected to permanganate
oxidation and used for PTCA quantification by LC-UV-MS.
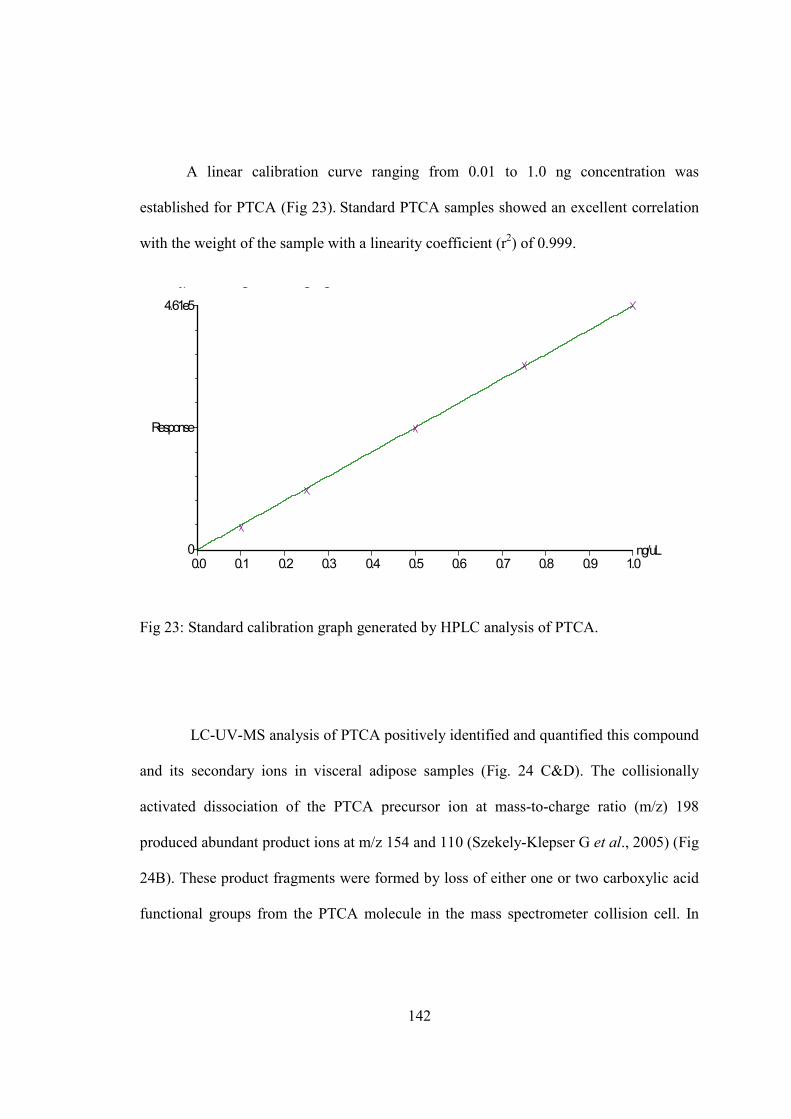
142
A linear calibration curve ranging from 0.01 to 1.0 ng concentration was
established for PTCA (Fig 23). Standard PTCA samples showed an excellent correlation
with the weight of the sample with a linearity coefficient (r2) of 0.999.
Curve type: Linear, Origin: Force, Weighting: Null, Axis trans: None
0.0 0.1 0.2 0.3 0.4 0.5 0.6 0.7 0.8 0.9 1.0ng/uL0
4.61e5
Response
Fig 23: Standard calibration graph generated by HPLC analysis of PTCA.
LC-UV-MS analysis of PTCA positively identified and quantified this compound
and its secondary ions in visceral adipose samples (Fig. 24 C&D). The collisionally
activated dissociation of the PTCA precursor ion at mass-to-charge ratio (m/z) 198
produced abundant product ions at m/z 154 and 110 (Szekely-Klepser G et al., 2005) (Fig
24B). These product fragments were formed by loss of either one or two carboxylic acid
functional groups from the PTCA molecule in the mass spectrometer collision cell. In
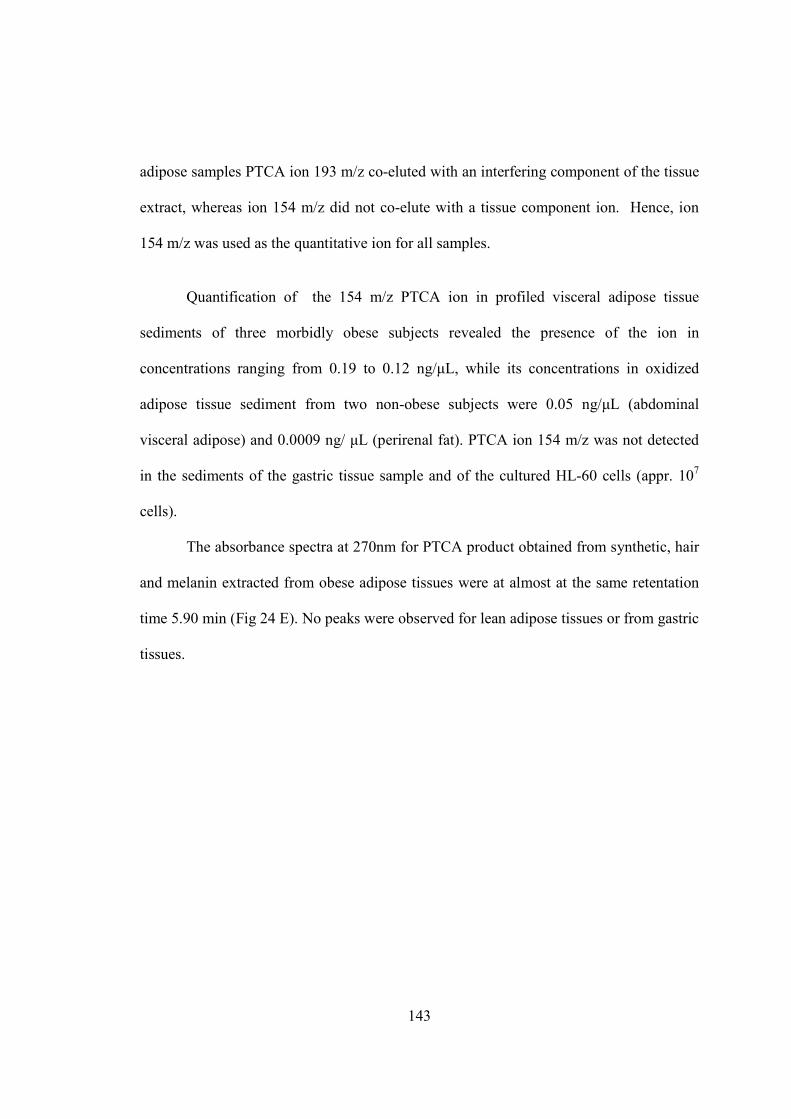
143
adipose samples PTCA ion 193 m/z co-eluted with an interfering component of the tissue
extract, whereas ion 154 m/z did not co-elute with a tissue component ion. Hence, ion
154 m/z was used as the quantitative ion for all samples.
Quantification of the 154 m/z PTCA ion in profiled visceral adipose tissue
sediments of three morbidly obese subjects revealed the presence of the ion in
concentrations ranging from 0.19 to 0.12 ng/µL, while its concentrations in oxidized
adipose tissue sediment from two non-obese subjects were 0.05 ng/µL (abdominal
visceral adipose) and 0.0009 ng/ µL (perirenal fat). PTCA ion 154 m/z was not detected
in the sediments of the gastric tissue sample and of the cultured HL-60 cells (appr. 107
cells).
The absorbance spectra at 270nm for PTCA product obtained from synthetic, hair
and melanin extracted from obese adipose tissues were at almost at the same retentation
time 5.90 min (Fig 24 E). No peaks were observed for lean adipose tissues or from gastric
tissues.
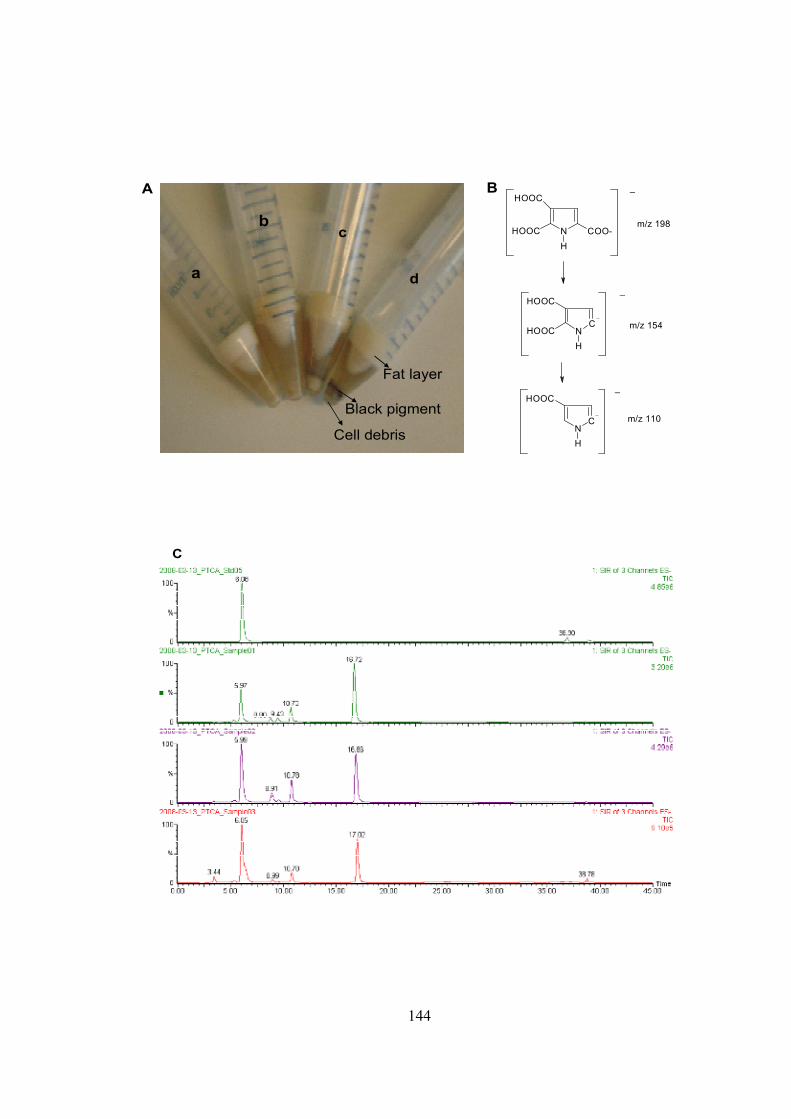
144
Cell debris
Black pigment
Fat layer
a
bc
d
A
N
H
HOOC
HOOC COO-
CN
H
HOOC
HOOC
CN
H
HOOC
_
m/z 198
_
_
m/z 154
m/z 110
B
C
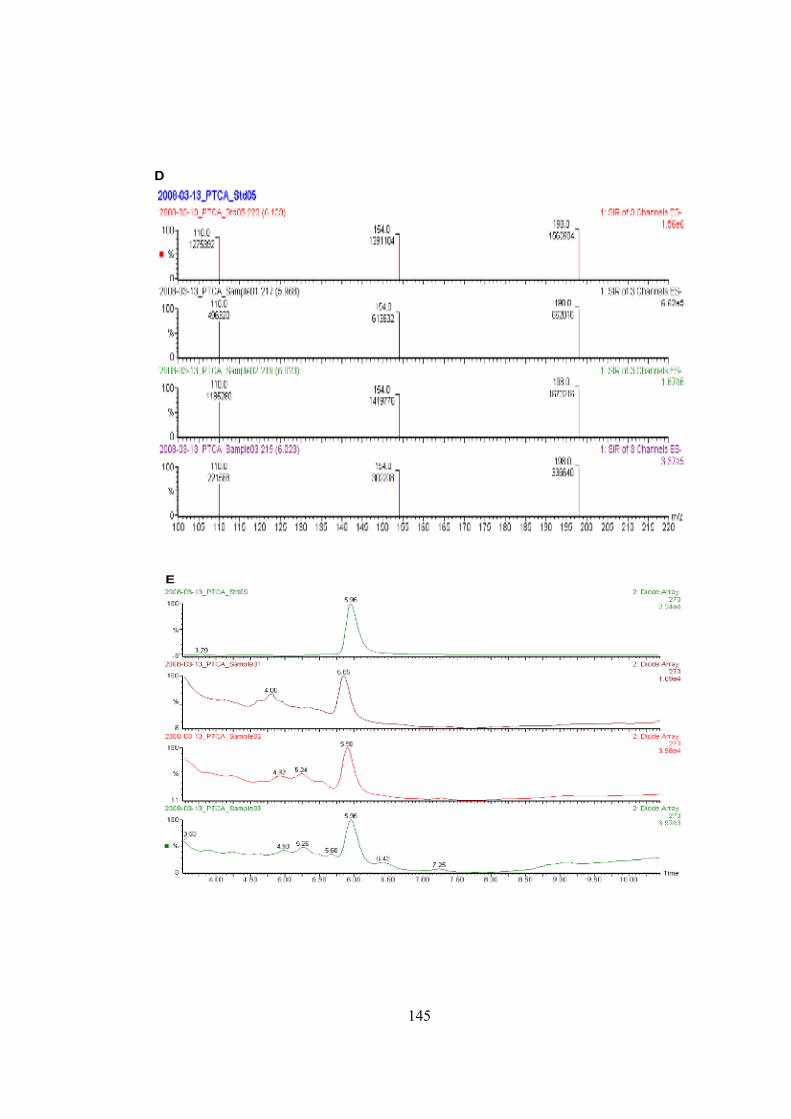
145
D
E
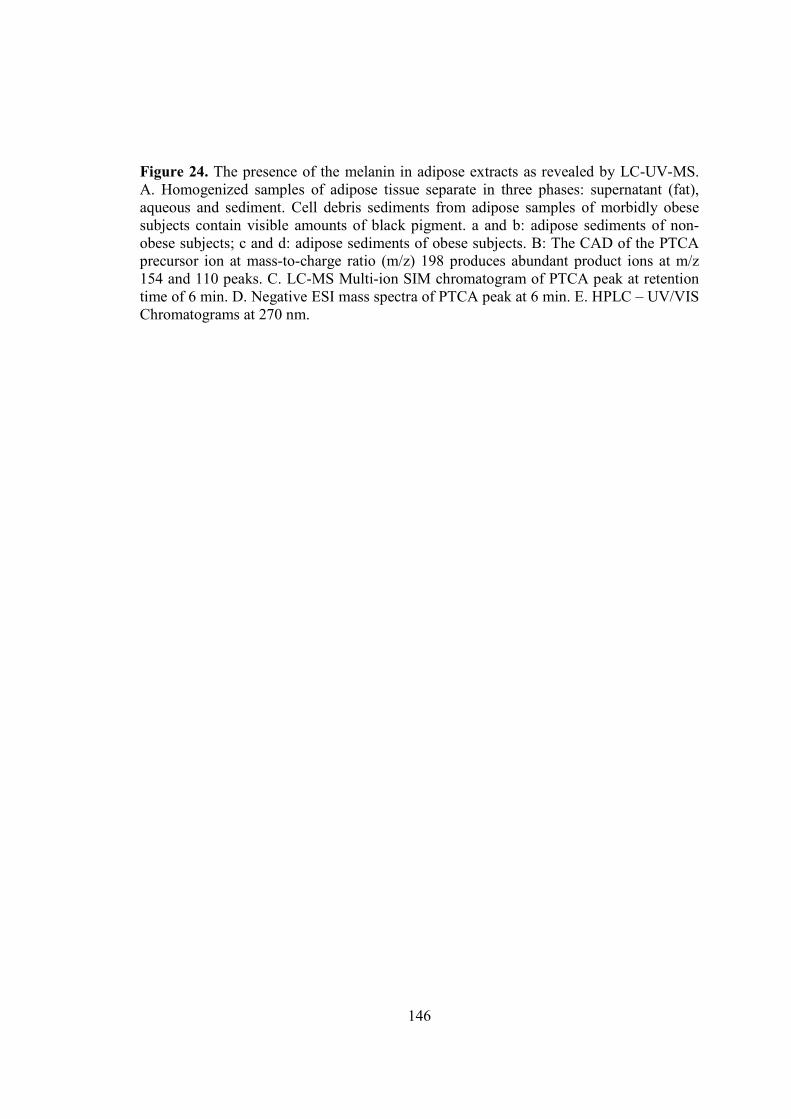
146
Figure 24. The presence of the melanin in adipose extracts as revealed by LC-UV-MS. A. Homogenized samples of adipose tissue separate in three phases: supernatant (fat), aqueous and sediment. Cell debris sediments from adipose samples of morbidly obese subjects contain visible amounts of black pigment. a and b: adipose sediments of non-obese subjects; c and d: adipose sediments of obese subjects. B: The CAD of the PTCA precursor ion at mass-to-charge ratio (m/z) 198 produces abundant product ions at m/z 154 and 110 peaks. C. LC-MS Multi-ion SIM chromatogram of PTCA peak at retention time of 6 min. D. Negative ESI mass spectra of PTCA peak at 6 min. E. HPLC – UV/VIS Chromatograms at 270 nm.
147
A summary of attempts to develop an in vitro model of adipocytic
melanogenesis.
Expression of melanogenesis-related genes was demonstrated in the experiments
with the human adipose tissue samples both at mRNA and protein levels as described
above. Furthermore, by analyzing the chemical composition of the adipose pigment by
LC/UV/MS proved that the pigment produced in these adipocytes is the melanin.
To pave the way for the study of the regulation of the ectopic melanogenesis in
adipocytes, attempts were made to reproduce the findings in the primary human samples
in adipocytic cellular model on various stages of differentiation cultivated in vitro. Two
types of cells were used: murine fibroblastic cell line (3T3-L1) differentiated into
adipocytes and primary human pre-adipocytes purchased from Zen-Bio. At the different
stages of differentiation, these adipocytes were exposed to different concentrations of α-
MSH 100nM, 1µM, 5µM and 10µM at different time periods. The physiological
concentrations of α-MSH tested in the experiment were chosen according to the existing
literature. Preadipocytic cells and differentiated cells at different stages were incubated
with 100nM, 1uM, 5uM and 10uM concentrations of α-MSH for 2hr, 6hr and 24hr time
periods. The main objective was to determine at which stage and which concentration of
α-MSH the biosynthetic pathway will be induced.
After incubation with α-MSH the expression levels of tyrosinase mRNA and
protein expression were recorded in both cell lines. Both in 3T3-L1 preadipocytes and 2
day differentiated 3T3-L1 adipocytes gene expression profiles of TYR were similar same
as its mRNA levels were increased in the first two hours of incubation with α-MSH, then
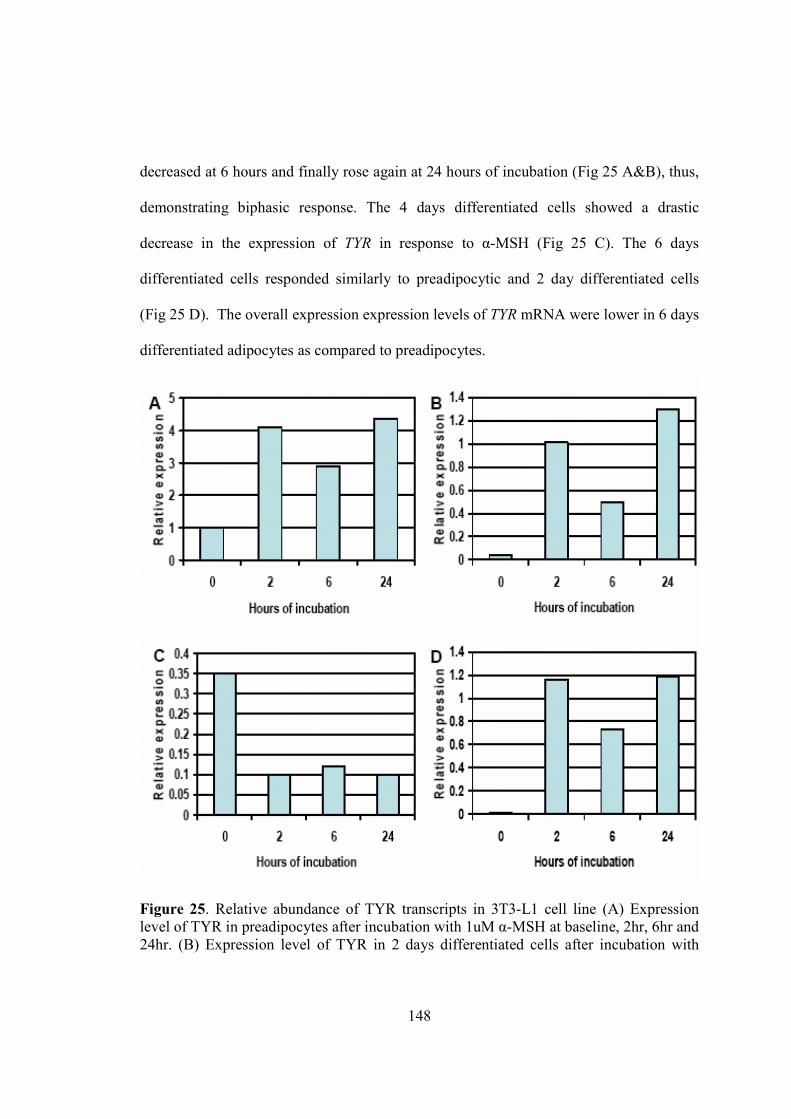
148
decreased at 6 hours and finally rose again at 24 hours of incubation (Fig 25 A&B), thus,
demonstrating biphasic response. The 4 days differentiated cells showed a drastic
decrease in the expression of TYR in response to α-MSH (Fig 25 C). The 6 days
differentiated cells responded similarly to preadipocytic and 2 day differentiated cells
(Fig 25 D). The overall expression expression levels of TYR mRNA were lower in 6 days
differentiated adipocytes as compared to preadipocytes.
Figure 25. Relative abundance of TYR transcripts in 3T3-L1 cell line (A) Expression level of TYR in preadipocytes after incubation with 1uM α-MSH at baseline, 2hr, 6hr and 24hr. (B) Expression level of TYR in 2 days differentiated cells after incubation with
149
1uM α-MSH at baseline, 2hr, 6hr and 24hr. (C) Expression level of TYR in 4 days differentiated cells after incubation with 1uM α-MSH at baseline, 2hr, 6hr and 24hr. (D) Expression level of in 6 days differentiated cells after incubation with 1uM α-MSH at baseline, 2hr, 6hr and 24hr.
In human preadipocytes, expression levels of TYR mRNAs decreased after 2, 6 or
24 hour of exposure to α-MSH as compared to the baseline (Fig. 26 A). In cells
differentiated for 7 days, expression levels of TYR mRNAs decreased after 2 hours of
exposure to α-MSH as compared to the baseline. Six and 24 hours incubation of these
cells to α-MSH resulted in less pronounced decrease of TYR mRNA levels (Fig 26 B).
Cells differentiated for 14 days reacted to 2 and 6 hours of exposure to α-MSH by a
decrease of TYR mRNA levels, while 24 hours exposure resulted in an increase in these
levels (Fig 23 C). Cells differentiated for 21 days (full differentiation) reacted to any
length of exposure to α-MSH by an increase in TYR mRNA levels. This increase was
most pronounced after 2 hours exposure as compared to 6 and 24 hours exposure (Fig 23
D).
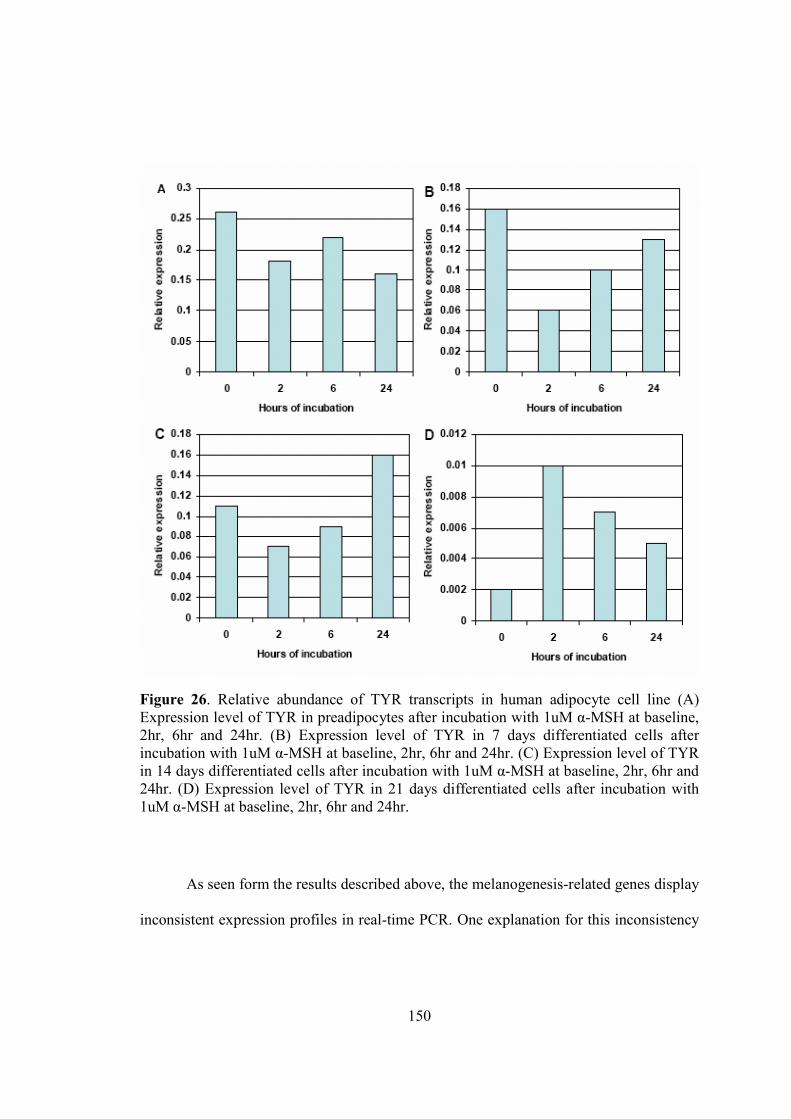
150
Figure 26. Relative abundance of TYR transcripts in human adipocyte cell line (A) Expression level of TYR in preadipocytes after incubation with 1uM α-MSH at baseline, 2hr, 6hr and 24hr. (B) Expression level of TYR in 7 days differentiated cells after incubation with 1uM α-MSH at baseline, 2hr, 6hr and 24hr. (C) Expression level of TYR in 14 days differentiated cells after incubation with 1uM α-MSH at baseline, 2hr, 6hr and 24hr. (D) Expression level of TYR in 21 days differentiated cells after incubation with 1uM α-MSH at baseline, 2hr, 6hr and 24hr.
As seen form the results described above, the melanogenesis-related genes display
inconsistent expression profiles in real-time PCR. One explanation for this inconsistency
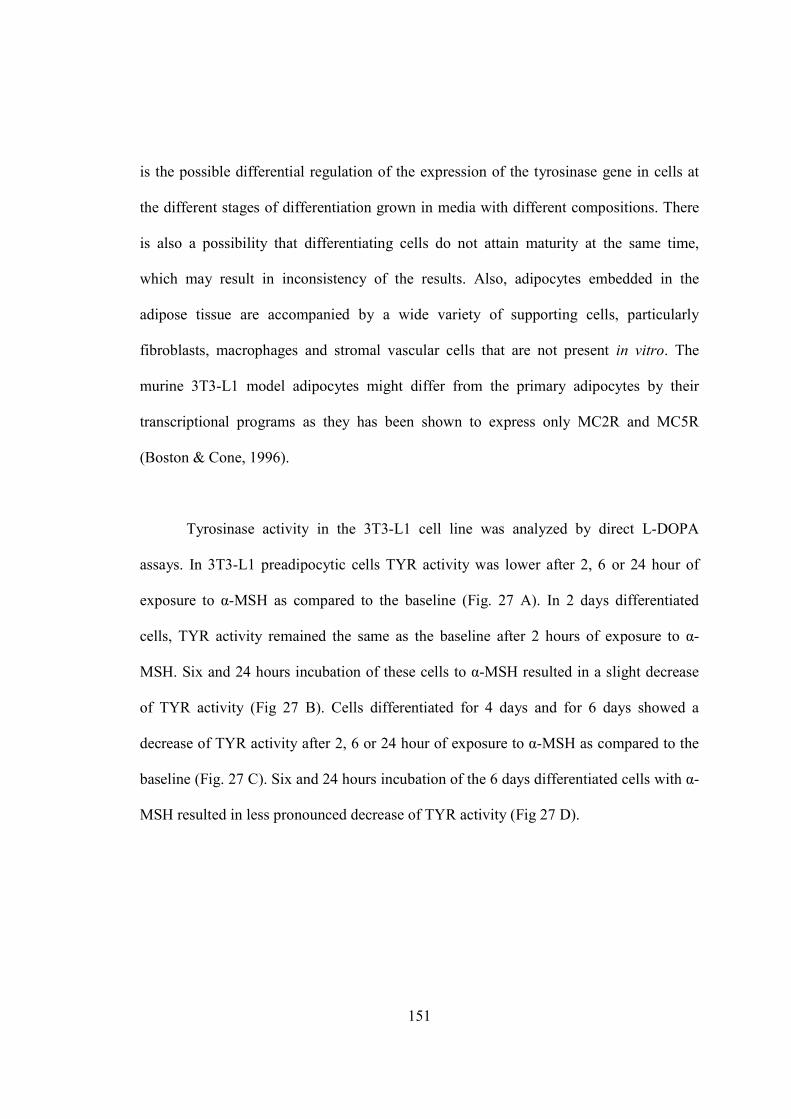
151
is the possible differential regulation of the expression of the tyrosinase gene in cells at
the different stages of differentiation grown in media with different compositions. There
is also a possibility that differentiating cells do not attain maturity at the same time,
which may result in inconsistency of the results. Also, adipocytes embedded in the
adipose tissue are accompanied by a wide variety of supporting cells, particularly
fibroblasts, macrophages and stromal vascular cells that are not present in vitro. The
murine 3T3-L1 model adipocytes might differ from the primary adipocytes by their
transcriptional programs as they has been shown to express only MC2R and MC5R
(Boston & Cone, 1996).
Tyrosinase activity in the 3T3-L1 cell line was analyzed by direct L-DOPA
assays. In 3T3-L1 preadipocytic cells TYR activity was lower after 2, 6 or 24 hour of
exposure to α-MSH as compared to the baseline (Fig. 27 A). In 2 days differentiated
cells, TYR activity remained the same as the baseline after 2 hours of exposure to α-
MSH. Six and 24 hours incubation of these cells to α-MSH resulted in a slight decrease
of TYR activity (Fig 27 B). Cells differentiated for 4 days and for 6 days showed a
decrease of TYR activity after 2, 6 or 24 hour of exposure to α-MSH as compared to the
baseline (Fig. 27 C). Six and 24 hours incubation of the 6 days differentiated cells with α-
MSH resulted in less pronounced decrease of TYR activity (Fig 27 D).
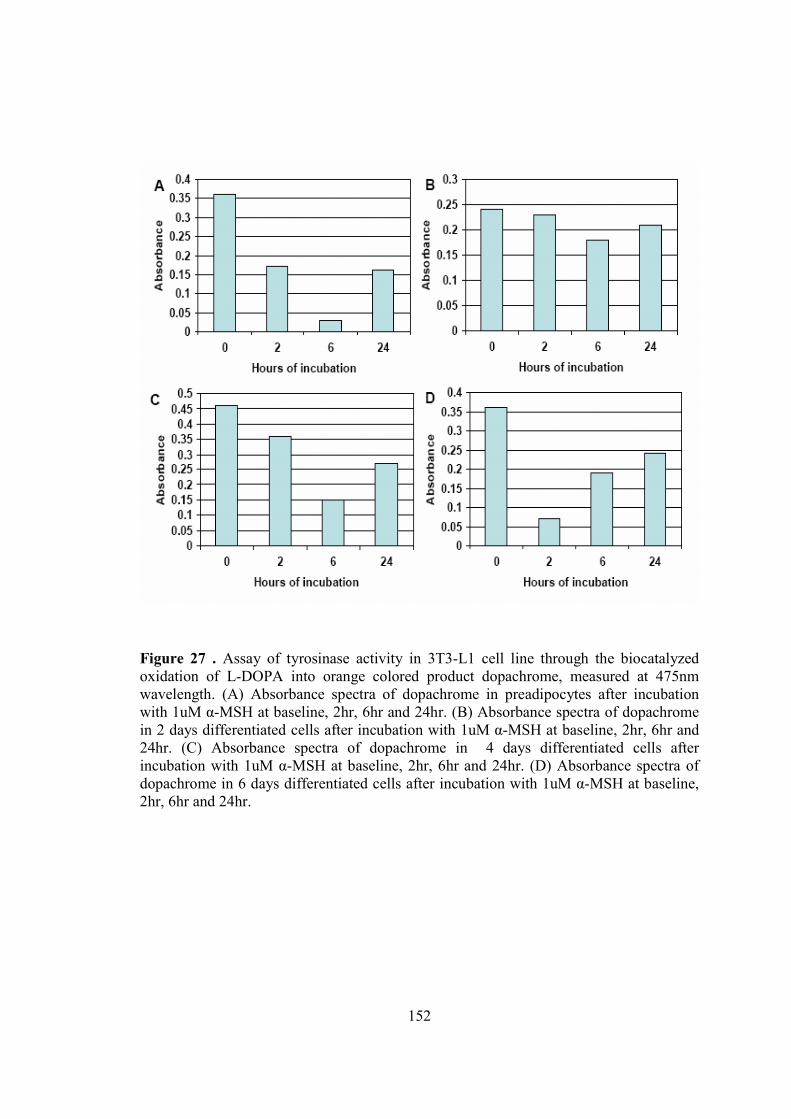
152
Figure 27 . Assay of tyrosinase activity in 3T3-L1 cell line through the biocatalyzed oxidation of L-DOPA into orange colored product dopachrome, measured at 475nm wavelength. (A) Absorbance spectra of dopachrome in preadipocytes after incubation with 1uM α-MSH at baseline, 2hr, 6hr and 24hr. (B) Absorbance spectra of dopachrome in 2 days differentiated cells after incubation with 1uM α-MSH at baseline, 2hr, 6hr and 24hr. (C) Absorbance spectra of dopachrome in 4 days differentiated cells after incubation with 1uM α-MSH at baseline, 2hr, 6hr and 24hr. (D) Absorbance spectra of dopachrome in 6 days differentiated cells after incubation with 1uM α-MSH at baseline, 2hr, 6hr and 24hr.
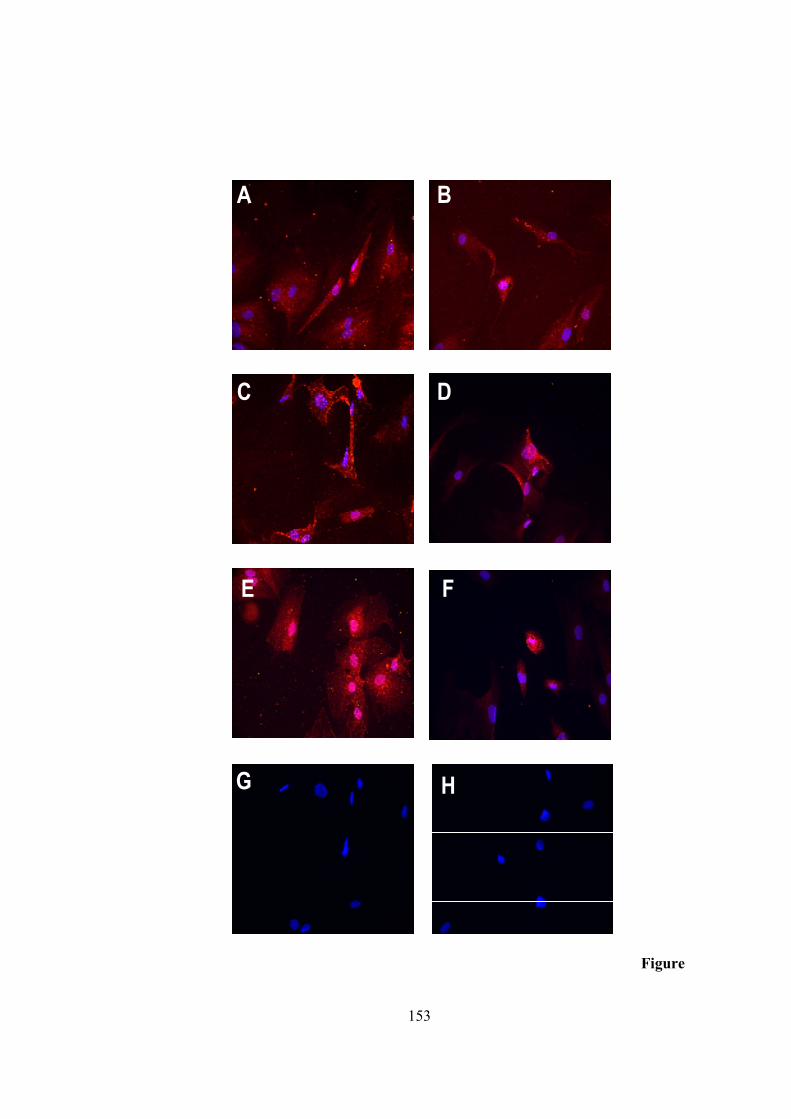
153
A
HG
F
D
E
C
B
Figure
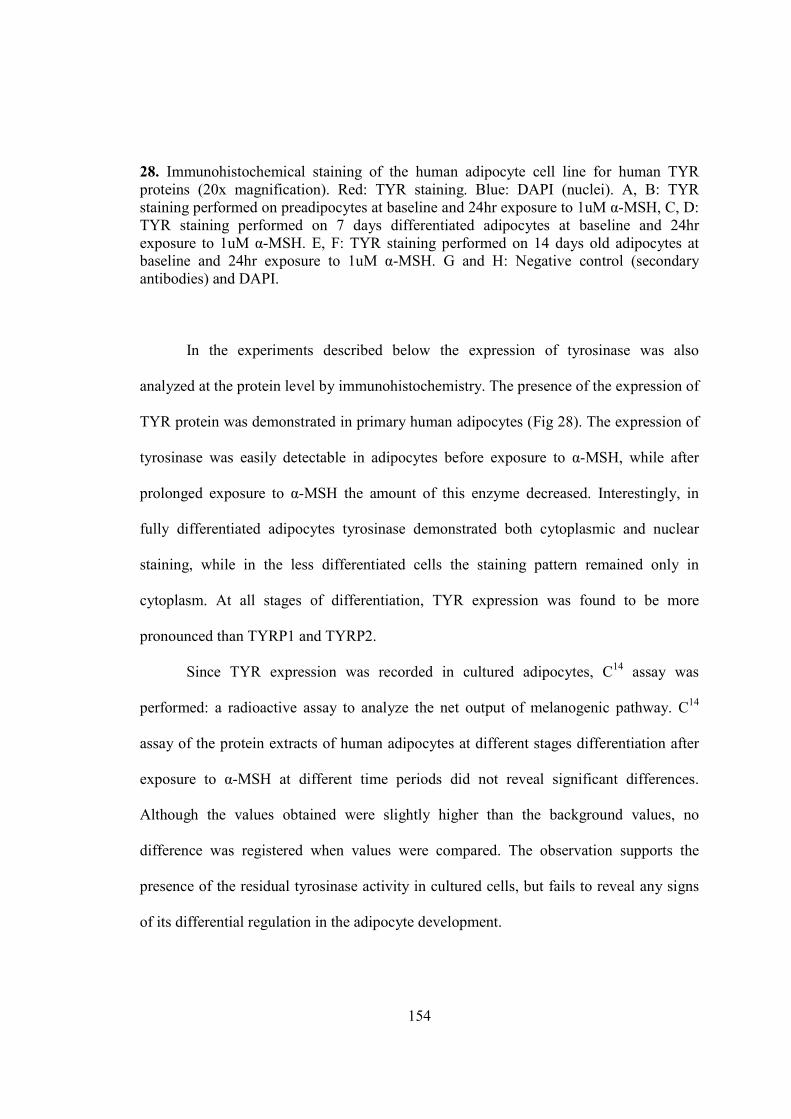
154
28. Immunohistochemical staining of the human adipocyte cell line for human TYR proteins (20x magnification). Red: TYR staining. Blue: DAPI (nuclei). A, B: TYR staining performed on preadipocytes at baseline and 24hr exposure to 1uM α-MSH, C, D: TYR staining performed on 7 days differentiated adipocytes at baseline and 24hr exposure to 1uM α-MSH. E, F: TYR staining performed on 14 days old adipocytes at baseline and 24hr exposure to 1uM α-MSH. G and H: Negative control (secondary antibodies) and DAPI.
In the experiments described below the expression of tyrosinase was also
analyzed at the protein level by immunohistochemistry. The presence of the expression of
TYR protein was demonstrated in primary human adipocytes (Fig 28). The expression of
tyrosinase was easily detectable in adipocytes before exposure to α-MSH, while after
prolonged exposure to α-MSH the amount of this enzyme decreased. Interestingly, in
fully differentiated adipocytes tyrosinase demonstrated both cytoplasmic and nuclear
staining, while in the less differentiated cells the staining pattern remained only in
cytoplasm. At all stages of differentiation, TYR expression was found to be more
pronounced than TYRP1 and TYRP2.
Since TYR expression was recorded in cultured adipocytes, C14 assay was
performed: a radioactive assay to analyze the net output of melanogenic pathway. C14
assay of the protein extracts of human adipocytes at different stages differentiation after
exposure to α-MSH at different time periods did not reveal significant differences.
Although the values obtained were slightly higher than the background values, no
difference was registered when values were compared. The observation supports the
presence of the residual tyrosinase activity in cultured cells, but fails to reveal any signs
of its differential regulation in the adipocyte development.
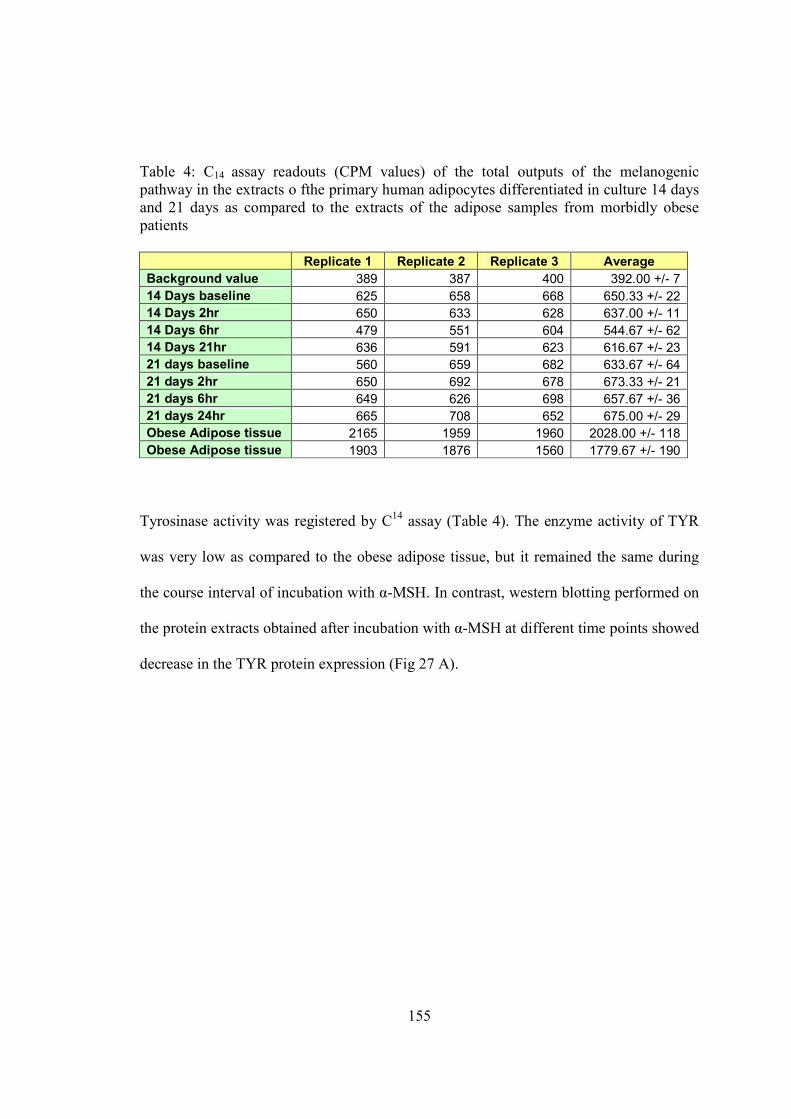
155
Table 4: C14 assay readouts (CPM values) of the total outputs of the melanogenic pathway in the extracts o fthe primary human adipocytes differentiated in culture 14 days and 21 days as compared to the extracts of the adipose samples from morbidly obese patients Replicate 1 Replicate 2 Replicate 3 Average
Background value 389 387 400 392.00 +/- 7
14 Days baseline 625 658 668 650.33 +/- 22
14 Days 2hr 650 633 628 637.00 +/- 11
14 Days 6hr 479 551 604 544.67 +/- 62
14 Days 21hr 636 591 623 616.67 +/- 23
21 days baseline 560 659 682 633.67 +/- 64
21 days 2hr 650 692 678 673.33 +/- 21
21 days 6hr 649 626 698 657.67 +/- 36
21 days 24hr 665 708 652 675.00 +/- 29
Obese Adipose tissue 2165 1959 1960 2028.00 +/- 118
Obese Adipose tissue 1903 1876 1560 1779.67 +/- 190
Tyrosinase activity was registered by C14 assay (Table 4). The enzyme activity of TYR
was very low as compared to the obese adipose tissue, but it remained the same during
the course interval of incubation with α-MSH. In contrast, western blotting performed on
the protein extracts obtained after incubation with α-MSH at different time points showed
decrease in the TYR protein expression (Fig 27 A).
156
Chapter VI
DISCUSSION
White adipose tissue is a heterogeneous organ with major part consisting of loose
association of lipid-filled cells called adipocytes, which are held in a framework of
collagen fibers. In addition to adipocytes, adipose tissue contains stromal-vascular cells
including fibroblastic connective tissue cells, leukocytes, macrophages, and pre-
adipocytes (not yet filled with lipid), which contribute to the structural integrity. During
the past 10 years, the understanding of the physiologic and pathophysiologic role of the
adipose tissue has completely changed. Traditionally, adipose tissue was considered to be
a passive type of connective tissue involved only in storing excess energy as triglycerides.
In 1987, adipose tissue was for the first time described as a source of bioactive molecules
carrying out various functions in the human body. These proteins are collectively known
as adipokines and act at both the local (autocrine/paracrine) and systemic (endocrine) level
(Siiteri, 1987).
Nowadays, adipose tissue has been established as a true endocrine organ coupling
endocrine and metabolic signaling (Kershaw and Flier), with adipocytes secreting a
majority of the hormones. This critical change in our perspectives on white adipose tissue
came about due to the discovery of the cytokine-like factor, leptin (Zhang et al., 1997).
Secretory products of both mature adipocytes and stromal adipose cells are referred to as
adipocytokines (2), which regulate energy homeostasis, appetite/satiety, reproduction,
insulin sensitivity and influence neuroendocrine, endothelial, immunological,
157
hematological, angiogenic and vascular functions in endocrine, paracrine and autocrine
manners. These adipokines consist of polypeptides but also nonprotein factors that are
known to affect immune function (complement factors and haptoglobin), endocrine
function (leptin, sex steroids, and various growth factors), metabolic function (fatty acids,
adiponectin and resistin), angiogenesis (Vascular endothelial growth factor) and
cardiovascular function (angiotensinogen and plasminogen activator inhibitor-1)
(Trayhurn & Beattie, 2001; Trayhurn & Wood, 2004). With the exception of adiponectin,
most circulating factors are elevated. Even though a large group of peptides have been
discovered to be expressed and secreted by the components of adipose tissue, there are
undoubtedly more of these molecules yet to be discovered.
In previous studies expression of melanogenesis-related genes was observed in the
primary adipose tissue samples. The results were obtained by studying transcriptome of
the visceral adipose of morbidly obese individuals (Baranova et al., 2005). Moreover,
when visceral fat of morbidly obese individuals was compared to that of lean subjects,
these genes were found to be expressed at the higher levels. In the current study, the
expression of melanogenesis-related mRNAs and proteins, namely TYR (Tyrosinase),
DCT (Tyrp1), TYRP2 and MITF (microphthalmia transcription factor) in human adipose
tissue was confirmed by real-time PCR and by immunohistochemical (IHC) staining.
Additionally, TYR mRNA signal was registered by in situ hybridization in the visceral
adipocytes, and TYR protein in the protein extracts of the visceral adipose tissue of
morbidly obese subjects. The staining of the western blot with antibodies to human TYR
158
revealed the 140 kDa band which corresponds to mature tyrosinase homodimer
representing properly folded enzyme (Francis Parag 2003).
The presence of the melanin pigment in human adipose tissue was revealed by
Masson–Fontana staining (Fig. 21) and was further characterized by permanganate
degradation of melanin coupled with Liquid Chromatography/ Mass Spectrometry
(LC/UV/MS) determination of pyrrole-2,3,5-tricarboxylic acid (PTCA) derivative of the
eumelanin.
To exclude an obvious possibility that a certain level of melanogenic activity is a
common characteristic for many human tissues, total outputs of the melanogenic pathway
in adipose tissue and other human tissues was compared by incorporation of the labeled
L-[U-14C] tyrosine into its final product, an acid insoluble melanin. Activities of the
pathway in the adipose samples of obese subjects were much higher than that in the non-
obese adipose tissue (Fig. 20), while activities in the protein extracts of human gastric
and liver tissues were similar to that of blank controls. Marked heterogeneity of the
melanogenic activities of individual adipose tissue extracts was noted. The connections
between extracutaneous accumulation of the melanin and morbid obesity were never
described before, although a hyperpigmentation of the skin known as acanthosis nigricans
has been associated with either clinical or subclinical insulin resistance, a component of
the metabolic syndrome.
What would be a plausible explanation for the fact that adipose tissue of morbidly
obese patients produces higher levels of melanin compared to lean subjects? Ectopic
synthesis of melanin may serve as a compensatory mechanism that utilizes anti-
159
inflammatory (Mohaghheghpour et al., 2001) and oxidative damage absorbing
(Rózanowska et al., 1999; Seagle et al., 2005) capacities of this compound.
The maintenance of the BMI within the healthy standards is recommended for the
prevention of conditions associated with oxidative injury and increased inflammation.
Weight gain generally results in obesity, which is mainly related to an increase in number
and size of adipocytes, infiltration of adipose deposits by mononuclear cells, and the
relative rarefaction of blood vessels and neural structures (Wellen & Hotamisligil, 2003).
Obesity is associated with a state of chronic, low-grade inflammation characterized by
abnormal cytokine production, increased acute-phase reactants, and activation of
inflammatory signaling pathways (Hotamisligil, 2003). Through the activation of ‘stress-
sensing pathways’, metabolic and endocrine alterations are produced. These pathways
probably contribute to the pathogenesis of co-morbidities associated with obesity. The
cluster of diseases associated with obesity includes development of insulin resistance and
subsequent diabetes type 2, atherosclerosis and other cardiovascular diseases,
dyslipidemia and hypertension that feature a number of common abnormalities of both
metabolic and inflammatory pathways.
TNFα was the first inflammatory cytokine recognized in white adipose tissue,
where it acts as powerful local regulator within adipose tissue and influences a wide range
of processes (Prins et al., 1997; Coppack, 2001) including production of cytokines and
adipokines. TNFα is markedly increased in morbidly obese subjects (Hotamisligil et al.,
1993). Plasminogen activator inhibitor-1 (PAI-1), another important bioactive substance
produced in adipose tissue by adipocytes, has been shown to play an important regulatory
160
role in the fibrinolytic process and in thrombus formation (Shimomura et al., 1996). The
increase in the level of expression and secretion of these and other inflammatory agents
are linked to development of the manifestations of the metabolic syndrome, particularly in
diabetes type II and atherosclerosis. In addition to inflammatory agents, adipose tissue
also secretes anti-inflammatory agents, for example, adiponectin; however, the decline in
the concentration of these agents has been documented in the state of obesity (Ouchi et al.,
2000; Arita et al., 1999). The levels of adiponectin could be downregulated by an increase
in expression and activation of TNFα and peroxisome proliferators-activated receptors α
(PPARα) (Moore et al., 2001). Overproduction of several circulating markers,
particularly, IL-18, MIF, SAA, IL-6, TNFα, C-reactive proteins and haptoglobin, has
already been reported in morbidly obese subjects (Yudkin et al., 1999; Das, 2001; Festa et
al., 2001)
Adipocytes themselves are considered as the immediate source of these
inflammatory markers, as an increase of their production parallels an increase in white
adipose mass. In addition to that, some new models propose that as a consequence of the
production of proinflammatory molecules inflammation is enhanced through infiltration of
adipose tissue by macrophages and by interactions between the adipocytes and
macrophages (Xu et al., 2003; Weisberg et al., 2003). The recent series of publications by
Fain and co-authors indicated that the net production of pro-inflammatory molecules by
adipose tissue is supported mostly by non-fat cellular components of this tissue, including
macrophages (Fain et al., 2007; Fain et al., 2006; Fain et al., 2004).
161
One possible mechanism for the increased inflammation within white adipose
tissue is the hypoxic conditions. White adipose tissue is not highly vascularized as
compared to brown adipose tissue and moreover the cross-sectional area of blood vessels
per unit weight of adipose tissue is reduced in obesity (Summers, 1996, Summers, 1999).
Due to less oxygen provided to the growing adipocytes, the clusters of adipocytes
become relatively hypoxic, which leads to an induction of leptin and VEGF expression in
adipocytes through hypoxia-inducible factor-1α (HIF-1α). Immunoreactive HIF-1α has
been reported in 3T3-L1 adipocytes (Lolmede et al., 2003). The initiation of hypoxia may
also leads to the stimulation of the release of inflammatory cytokines, chemokines and
angiogenic factors, the function of which is to increase blood flow and stimulate
vascularization (Trayhurn & Wood, 2004). Since production of ROS is regulated by
oxygen tension, ROS have been hypothesized to be a signaling mechanism in hypoxia-
induced pulmonary vasoconstriction and vascular remodeling. Increased production of
ROS selectively in adipose tissue of obese mice was found to be accompanied by
augmented expression of NADPH oxidase and decreased expression of antioxidative
enzymes. Furthermore, an increased ROS production is also implicated in arteriosclerosis,
which is also indirectly linked to an increase of inflammatory agent secretion by
adipocytes.
Another source for an increase of inflammatory processes in the adipose tissue is
through the enhancement of the lipid peroxidation. Subcutaneous and visceral adipose
tissues are thought to be composed of 60 to 85% of lipids with 90-99% being
triglycerides, while the rest is composed of small amounts of free fatty acids, diglyceride,
162
cholesterol and phospholipids. These mixes of lipids are under continuous pressure for
lipid peroxidation. Lipid peroxidation is a continuous process which proceeds by a free
radical chain reaction mechanism and results in the formation of ROS. Excessive
production of these molecules creates "oxidative stress," which can damage cellular
structures and trigger an inflammatory response (Hotamisligil, 2006). The primary
cellular defense against the toxicity of free radicals of oxygen is the antioxidant activity
of several enzymatic systems such as superoxide dismutase, catalase, and glutathione
peroxidase.
Recently, the melanin as been proposed as the non-enzymatic antioxidant
compound (Sichel et al., 1987) capable of the reduction of the oxidative stress in the skin.
Melanin could be also involved in the prevention of oxidative stress generated by lipid
peroxidation in other pigmented tissues. In one study, a comparison of liver tissue from
albino rats and melanin-pigmented frog liver demonstrated superior resistance to lipid
peroxidation related oxidative stress in amphibian tissue (Scalia et al., 1990).
As has been mentioned before, an increase in the inflammatory and oxidative
stress is the common feature of obesity. In most cases, these conditions lead to the
development of the obesity-associated metabolic syndrome. Nevertheless, some morbidly
obese patients with BMIs > 45 remains relatively disease free, having a normal degree of
resistance to insulin (Jarrar et al., 2007). These findings speculate that the existence of
some differential factors capable of counteracting the proinflammatory oxidative pressure
within adipose tissue and actively suppressing the secretion of harmful adipocytokines.
163
Speaking generally, these, yet unknown, factors, can be regarded as endogenous
protectors, allowing some morbidly obese patients to remain relatively healthy. So it can
be proposed that the endogenous adipocytic melanin as one of these hypothetical factors.
Below is the summary of the hypothesis that will serve as the basis for the future
studies aimed at the testing of this hypothesis. With the progression of obesity and an
increase of the cellular fat depot, adipocytes become more exposed to endogenous
apoptotic signals, especially ROS. To counteract pro-apoptotic ROS effects, the
adipocytes, in turn, may ectopically activate the genetic program of melanogenesis, thus,
neutralizing excessive ROS. Adipocytic melanin also suppresses secretion of pro-
inflammatory molecules (Mohaghheghpour et al., 2001), therefore, decreasing the pro-
inflammatory background in the obese body and alleviating the metabolic syndrome.
Very high levels of polymorphism in human genes regulating melanin
biosynthesis may account for the highly individual melanogenic response of adipocytes
that may account for the differences in an individual’s propensity to develop secondary
complications of obesity. Interestingly, limited clinical information available for 5 out of
9 patients sampled for visceral adipose allowed us to reveal a positive correlation
between fasting glucose levels and total outputs of the melanogenic pathway in adipose
tissue (R = 0.9685, p <= 0.007). This observation might indicate a connection of
adipocytic melanogenesis to insulin resistance.
Alternatively, an explanation for an activation of the melanogenic pathway in
adipose tissue may be related to the significantly elevated levels of an endogenous
melanogenic peptide α-MSH in the serum of obese subjects (Hoggard et al., 2004). α-
164
MSH exerts its effects through the melanocortin receptors which have been shown to
relay the signal resulting in the execution of the wide range of relevant effects both in the
nucleus and in cytoplasm of the human cells. For example, in melanocytes MC1-R
triggers α-MSH-induced melanogenesis in melanocytes, whereas in other tissues this
receptor propagates an anti-inflammatory signal. Recently, MC1-R has been shown to be
expressed by adipocytes of morbidly obese subjects (Hoch et al., 2007). Other MC
receptors, for example, MC2-R, are also found on the surface of the adipocytes, where
they participate in lipolysis, whereas adipocytic MC3R and MC4R are involved in energy
homeostasis (Cone, 2005). Etopic melanogenesis in human adipose tissue may result
from excessive exposure of human adipocytes to melanogenic signals, including α-MSH.
The described phenomenon is possibly more complex than that and being connected to
other, not yet uncovered facets of human obesity.
Interestingly, the G-coupled melanocortin receptors signal through the PKA
pathway resulting in the induction of cAMP. Recently, the cAMP-activated protein kinase
(AMPK) cascade (Heymans & Bouckaert, 1930) has come to prominence as a sensor of
metabolic stress that appears to be ubiquitous throughout eukaryotes (Hardie, 2003).
AMPK is activated by many types of the metabolic disorders, including heat shock and
metabolic poisons in hepatocytes (Corton et al., 1994), exercise in skeletal muscle and
ischemia and hypoxia in the heart (Marsin et al., 2000). An explanation of whether
increased levels of α-MSH in the serum of morbidly obese subjects are capable to activate
AMPK.
165
What are the factors inducing the program of ectopic melanogenesis in adipose
tissue? A variety of genes has been shown to be differentially expressed in adipose tissue
under morbidly obese conditions (Baranova et al., 2005; MacLaren et al., 2008; Marrades
et al., 2006; Lee et al., 2005; Nair et al., 2005). Other factors change their states on post-
translationally. For example, HIF1-α is rapidly degraded under normoxic conditions of
lean adipose tissue and is stabilized in obesity. Hypoxia is known to result in disturbances
in adipokine secretion and increased macrophage infiltration in adipose tissue, events that
are frequently observed in obesity (Goossens, 2007). On top of that, hypoxic conditions
prompt human tissue to paradoxically release ROS (Guzy & Schumarker et al., 2006). A
novel mechanism of tyrosinase activation by H2O2 was proposed recently, providing a
connection between melanogenesis and pro-inflammatory background in the ROS-
overproducing obese adipose tissue (Schallreuter et al., 2008).
Taking into account all written above, the plausible explanation for an increase in
the melanin biosynthesis seen in the adipose tissue of the morbidly obese patients is the
protective properties of the melanin. The above study perfomed on adipose tissues raised
more questions than it roduces answers. Both the causes and the consequences of the
melanin production in adipose tissue remain unknown; one obvious candidate for
regulatory molecule is α-MSH that is intimately connected to both melanogenesis and
energy homeostasis. The immediate attempts will be aimed at the development of the
appropriate cellular system allowing study of the adipocytic melanogenesis in vitro and at
exploring the connection between melanogenesis and metabolic syndrome.
166
Interestingly, attempts to register melanogenesis in human and mouse adipocytes
differentiated from primary cultured preadipocytes repeatedly failed. Despite substantial
expression levels of TYR, TYRP1, DCT and MITF mRNAs neither an enzymatic activity
of tyrosinase, nor the production of the enzyme was detected in vitro. Cultured
adipocytes are probably unable to support adequate post-translational modifications or
the folding of tyrosinase and, therefore, are deficient in this sense. This notion supports
previous evidence that the molecular networks activated during adipocyte development in
vivo and in vitro, although overlapping, are in many respects quite different (Soukas et
al., 2001). Next plan is to continue efforts aimed at the development of the suitable in
vitro system for the studies of the regulation of the production of ectopic melanin.
Particularly, next attempt will be to induce melanogenesis in the cultured human
adipocytes by the stimulation with melanogenic peptide hormone α-MSH and/or
compounds inducing differentiation of adipocytes, e.g. by the insulin and the agonists of
PPAR-γ.
In conclusion, the study performed demonstrates for the first time that the
biosynthesis of the melanin is indeed taking place in visceral adipose tissue of morbidly
obese subjects. Thus, an entirely new phenomenon never reported before is uncovered in
this study. Further research into this area is warranted.

167
List of References
168
List of References
A. Slominski, J. Wortsman, T. Luger, R. Paus and S. Solomon. Corticotropin releasing hormone and proopiomelanocortin involvement in the cutaneous response to stress. Physiol Rev. 2000; pp. 979–1020. A.A. Butler and R.D. Cone. Knockout studies defining different roles for melanocortin receptors in energy homeostasis. Ann N Y Acad Sci. 2003; pp. 240–245 A.N. Eberle. The Melanotropins; Chemistry, Physiology and Mechanisms of Action. S. Karger Publishing. 1988; pp. 73–78. Abdel-Malek Z, Swope VB, Suzuki I, Akcali C, Harriger MD, Boyce ST, Urabe K, and Hearing VJ. Mitogenic and melanogenic stimulation of normal human melanocytes by melanotropic peptides. Proc Natl Acad Sci.1995; 92: 1789–1793. Aebischer I, Stampfli MR, Zurcher A, Miescher S, Urwyler A, Frey B, Luger T, White RR, Stadler BM. Neuropeptides are potent modulators of human in vitro immunoglobulin E synthesis Eur J Immunol. 1994 Aug;24(8):1908-13 Ahima RS, Flier JS. Adipose tissue as an endocrine organ. Trends Endocrinol Metab. 2000; 11(8):327-32. Ailhaud G, Fukamizu A, Massiera F, Negrel R, Saint-Marc P, Teboul M. Angiotensinogen, angiotensin II and adipose tissue development. Int J Obes Relat Metab Disord.2000; 24 Suppl 4:S33-5. Ailhaud G, Hauner H. Development of white adipose tissue. Eds G Bray, C Bouchard, PT James. In Handbook of obesity. New York: Marcel Dekker. 2000; 359–378.
169
Alina Gavrila, Jean L. Chan, Nikos Yiannakouris, Meropi Kontogianni, Lisa C. Miller, Christine Orlova and Christos S. Mantzoros. Serum Adiponectin Levels Are Inversely Associated with Overall and Central Fat Distribution but Are Not Directly Regulated by Acute Fasting or Leptin Administration in Humans: Cross-Sectional and Interventional 169 Studies. The Journal of Clinical Endocrinology & Metabolism. 2003; Vol. 88, No. 10 4823-4831. Amae S, Fuse N, Yasumoto K, Sato S, Yajima I, Yamamoto H, Udono T, Durlu YK, Tamai M, Takahashi K, Shibahara S. Identification of a novel isoform of microphthalmia associated transcription factor that is enriched in retinal pigment epithelium. Biochem Biophys Res Commun. 1998 Jun 29;247(3):710-5. Ambani LM, Jhung JW, Edelstein LM, Van Woert MH. Quantification of melanin in hepatic and cardiac lipofuscin. Experientia. 1977 Mar; 15;33(3):296-8. Amiel J, Attie T, Jan D, Pelet A, Edery P, Bidaud C, Lacombe D, Tam P, Simeoni J, Flori E, Nihoul-Fekete C, Munnich A, Lyonnet S. Heterozygous endothelin receptor B (EDNRB) mutations in isolated Hirschsprung disease. Hum Mol Genet. 1996; 5:255 257. Ancans J, Tobin DJ, Hoogduijn MJ, Smit NP, Wakamatsu K, Thody AJ. Melanosomal pH controls rate of melanogenesis, eumelanin/phaeomelanin ratio and melanosome maturation in melanocytes and melanoma cells. Exp Cell Res. 2001 Aug 1;268(1):26-35. Ando H, Itoh A, Mishima Y, Ichihashi M. Correlation between the number of melanosomes, tyrosinase mRNA levels, and tyrosinase activity in cultured murine melanoma cells in response to various melanogenesis regulatory agents. J Cell Physiol. 1995 Jun;163(3):608-14. Arita Y, Kihara S, Ouchi N, Takahashi M, Maeda K, Miyagawa J, Hotta K, Shimomura I, Nakamura T, Miyaoka K, Kuriyama H, Nishida M, Yamashita S, Okubo K, Matsubara K, Muraguchi M, Ohmoto Y, Funahashi T, Matsuzawa Y. Paradoxical decrease of an adiposespecific protein, adiponectin, in obesity. Biochem Biophys Res Commun. 1999 Apr 2;257(1):79-83. Asensio C, Muzzin P, Rohner-Jeanrenaud F. Role of glucocorticoids in the physiopathology of excessive fat deposition and insulin resistance. Int J Obes Relat Metab Disord. 2004; 28 Suppl 4:S45-52.
170
Azuma K, Katsukawa F, Oguchi S, Murata M, Yamazaki H, Shimada A, Saruta T. Correlation between serum resistin level and adiposity in obese individuals.Obes Res. 2003;11(8):997-1001. Baggiolini M. Activation and recruitment of neutrophil leukocytes Clin Exp Immunol. 1995 Jul;101 Suppl 1:5-6. Banno R, Arima H, Hayashi M, Goto M, Watanabe M, Sato I, Ozaki N, Nagasaki H, Ozaki N, Oiso Y. Central administration of melanocortin agonist increased insulin sensitivity in diet-induced obese rats. FEBS Lett. 2007 Mar 20; 581(6):1131-6. Baranova A, Collantes R, Gowder SJ, Elariny H, Schlauch K, Younoszai A, King S, Randhawa M, Pusulury S, Alsheddi T, Ong JP, Martin LM, Chandhoke V, Younossi ZM Obesity-related differential gene expression in the visceral adipose tissue. Obes Surg. 2005 Jun-Jul;15(6):758-65. Barden H. Interference filter microfluorometry of neuromelanin and lipofuscin in human brain. J Neuropathol Exp Neurol. 1980 Sep;39(5):598-605. Baroffio A, Dupin E, Le Douarin NM. Common precursors for neural and mesectodermal derivatives in the cephalic neural crest. Development. 1991 May;112(1):301-5. Barral DC, Seabra MC . The melanosome as a model to study organelle motility in mammals. Pigment Cell Res. 2004; 7: 111– 118. Barrenas ML, Lindgren F The influence of inner ear melanin on susceptibility to TTS in humans. Scand Audiol. 1990;19(2):97-102. Battayani Z, Grob JJ, Xerri L, Noe C, Zarour H, Houvaeneghel G, Delpero JR, Birmbaum D, Hassoun J, Bonerandi JJ. Polymerase chain reaction detection of circulating melanocytes as a prognostic marker in patients with melanoma. Arch Dermatol. 1995 Apr;131(4):443-7.
171
Baynash AG, Hosoda K, Giaid A, Richardson JA, Emoto N, Hammer RE, and Yanagisawa M. Interaction of endothelin-3 with endothelin-B receptor is essential for development of epidermal melanocytes and enteric neurons. Cell. 1994; 1277–1285. BECHER, E., K. MAHNKE, T. BRZOSKA, et al. Human peripheral blood-derived dendritic cells express functional melanocortin receptor MC-1R. Ann. N. Y. Acad. Sci. 1999; 885: 188–195. Bell M. Ultrastructure of differentiating hair follicles. In: Advances in Biology of Skin, edited by Montagna W and Dobson RL. New York: Pergamon. 1967, p. 61–81 Bellezza G, Giansanti M, Cavaliere A, Sidoni A. Pigmented "black" pheochromocytoma of the adrenal gland: a case report and review of the literature. Arch Pathol Lab Med. 2004 Oct;128(10):e125-8. Bendall LJ, Makrynikola V, Hutchinson A, et al. Stem cell factor enhances the adhesion of AML cells to fibronectin and augments fibronectin-mediated anti-apoptotic and proliferative signals. Leukemia. 1998;12:1375–1382. Benedito E, Jimenez-Cervantes C, Cubillana JD, Solano F, Lozano JA, Garcia-Borron JC. Biochemical characterization of the melanogenic system in the eye of adult rodents. Biochim Biophys Acta. 1995 Oct 25;1252(2):217-24. Bennett DC, Lamoreux ML. The color loci of mice--a genetic century. Pigment Cell Res. 2003 Aug;16(4):333-44. Berson, J. F., Harper, D., Tenza, D., Raposo, G. & Marks, M. S. Pmel17 initiates premelanosome morphogenesis within multivesicular bodies. Mol. Biol. Cell. 2001; 12, 3451–3464. Bertagna X: Proopiomelanocortin-derived peptides (Review). Endocrinol Metab Clin North Am. 1994; 23:467–485.. Bertolotto C, Busca R, Abbe P, Bille K, Aberdam E, Ortonne JP, Ballotti R. Different cisacting elements are involved in the regulation of TRP1 and TRP2 promoter activities
172
by cyclic AMP: pivotal role of M boxes (GTCATGTGCT) and of microphthalmia. Mol Cell Biol. 1998;18:694–702. Besedovsky HO, del Rey A Immune-neuroendocrine circuits: integrative role of cytokines. Front Neuroendocrinol. 1992 Jan;13(1):61-94. Besmer P, Manova K, Duttlinger R, et al. The kit-ligand and its receptor c-kit/w: pleiotropic roles in gametogenesis and melanogenesis. Dev Suppl. 1993; 125–137. Bhardwaj RS, Schwarz A, Becher E, Mahnke K, Aragane Y, Schwarz T, Luger TA. Proopiomelanocortin-derived peptides induce IL-10 production in human monocytes. J Immunol. 1996 Apr 1;156(7):2517-21. Bharti K, Nguyen MT, Skuntz S, Bertuzzi S, Arnheiter H. The other pigment cell: specification and development of the pigmented epithelium of the vertebrate eye. Pigment Cell Res. 2006 Oct;19(5):380-94. Bhatnagar V, Anjaiah S, Puri N, Darshanam BN, Ramaiah A. pH of melanosomes of B 16 murine melanoma is acidic: its physiological importance in the regulation of melanin biosynthesis. Arch Biochem Biophys. 1993 Nov 15;307(1):183-92. Bi M, Naczki C, Koritzinsky M, Fels D, Blais J, Hu N, Harding H, Novoa I, Varia M, Raleigh J, Scheuner D, Kaufman RJ, Bell J, Ron D, Wouters BG, Koumenis C. ER stressregulated translation increases tolerance to extreme hypoxia and promotes tumor growth. EMBO J. 2005 Oct 5;24(19):3470-81. Billingham RE and Silvers WK. A biologist's reflections on dermatology. J Invest Dermatol. 1971; 57: 227–240. Bjorntorp P: Metabolic implications of body fat distribution. Diabetes Care 1991; 14: 1132-1143. Bluher S, Ziotopoulou M, Bullen JW Jr, Moschos SJ, Ungsunan L, Kokkotou E, Maratos-Flier E, Mantzoros CS. Responsiveness to peripherally administered melanocortins in lean and obese mice. Diabetes. 2004 Jan;53(1):82-90.
173
Blume-Jensen P, Jiang G, Hyman R, et al. Kit/stem cell factor receptor-induced activation of phosphatidylinositol 3'-kinase is essential for male fertility. Nat Genet. 2000;24:157–162. Bohm M, Luger TA. Melanocortins in fibroblast biology--current update and future perspective for dermatology. Exp Dermatol. 2004;13 Suppl 4:16-21. Boissy RE. Melanosome transfer to and translocation in the keratinocyte. Exp Dermatol. 2003;12 Suppl 2:5-12. Booij J, Bergmans P, Winogrodzka A, Speelman JD, Wolters EC. Imaging of dopamine transporters with FP-CIT SPECT does not suggest a significant effect of age on the symptomatic threshold of disease in Parkinson's disease. Synapse. 2001; 39: 101–108. Boston, B. A. and Cone, R. D. Characterization of melanocortin receptor subtype expression in murine adipose tissues and in the 3T3-L1 cell line. Endocrinology. 1996; 137, 2043 – 2050 Bouchard, B., Fuller, B. B., Vijayasaradhi, S. & Houghton, A. N. Induction of pigmentation in mouse fibroblasts by expression of human tyrosinase cDNA. J. Exp. Med. 1989;169, 2029–2042. Boulton M, Roanowska M, Wess T. Ageing of the retinal pigment epithelium: implications for transplantation Graefes Arch Clin Exp Ophthalmol. 2004 Jan;242(1):76 84. Branza-Nichita N, Petrescu AJ, Negroiu G, Dwek RA, Petrescu SM. N-glycosylation processing and glycoprotein folding-lessons from the tyrosinase-related proteins Chem Rev. 2000 Dec 13;100(12):4697-712. Breathnach AS. Extra-cutaneous melanin. Pigment Cell Res. 1988;1(4):234-7.
174
Bressler NM, Bressler SB, Fine SL. Age-related macular degeneration. Surv Ophthalmol. 1988 May-Jun;32(6):375-413. Bronner-Fraser, M. and Fraser, S. E. Cell lineage analysis reveals multipotency of some avian neural crest cells. Nature. 1988; 335,161 -164. Brunk UT, Terman A. Lipofuscin: mechanisms of age-related accumulation and influence on cell function. Free Radic Biol Med. 2002 Sep 1;33(5):611-9. Bruun JM, Pedersen SB, Richelsen B Interleukin-8 production in human adipose tissue. inhibitory effects of anti-diabetic compounds, the thiazolidinedione ciglitazone and the biguanide metformin. Horm Metab Res. 2000 Nov-Dec;32(11-12):537-41. Bruun JM, Pedersen SB, Richelsen B. Regulation of interleukin 8 production and gene expression in human adipose tissue in vitro. J Clin Endocrinol Metab. 2001 Mar;86(3):1267-73. Buckley, D.I. & J. Ramachandran.Characterization of corticotropin receptors on adrenocortical cells. Proc. Natl. Acad. Sci.1981;78: 7431–7435. Burchill SA, Bennett DC, Holmes A, Thody AJ. Tyrosinase expression and melanogenesis in melanotic and amelanotic B16 mouse melanoma cells Pathobiology. 1991;59(5):335-9. Burgos JS, Ramirez C, Tenorio R, Sastre I, Bullido MJ. Influence of reagents formulation on real-time PCR parameters. Mol Cell Probes. 2002 Aug;16(4):257-60. Ram Kumar Tripathi, Chintamani Chaya Devi, Abburi Ramaiah. pH-dependent interconversion of two forms of tyrosinase in human skin. Biochem. J. (1988) 252, 481 487. Bustin SA. Absolute quantification of mRNA using real-time reverse transcription polymerase chain reaction assays. J Mol Endocrinol. 2000 Oct;25(2):169-93.
175
Cable J, Steel KP. Identification of two types of melanocyte within the stria vascularis of the mouse inner ear. Pigment Cell Res. 1991 Mar;4(2):87-101. Cao R, Farnebo J, Kurimoto M, Cao Y. Interleukin-18 acts as an angiogenesis and tumor Suppressor. FASEB J. 1999 Dec;13(15):2195-202. Catania A, Lipton JM. alpha-Melanocyte stimulating hormone in the modulation of host Reactions. Endocr Rev. 1993 Oct;14(5):564-76. Catania, A., N. Rajora, F. Capsoni, et al. The neuropeptide α-MSH has specific receptors on neutrophils and reduces chemotaxis in vitro. Peptides. 1996;17: 675–679. Cerutti PA. Oxy-radicals and cancer. Lancet. 1994 Sep 24;344(8926):862-3. Charriere G, Cousin B, Arnaud E, Andre M, Bacou F, Penicaud I, Casteilla L. Preadipocyte conversion to macrophage. Evidence of plasticity. J Biol Chem. 2003; 278:9850-9855. Chen K, Manga P, and Orlow SJ. Pink-eyed dilution protein controls the processing of tyrosinase. Mol Biol Cell. 2002; 13: 1953–1964. Chen, W., M.A. Kelly, X. Opitz-Araya et al., et al. Exocrine gland dysfunction in MC5-R deficient mice: evidence for coordinated regulation of exocrine gland function by melanocortin peptides. Cell. 1997; 91: 789–798. Cheung AT, Ree D, Kolls JK, Fuselier J, Coy DH, Bryer-Ash M. An in vivo model for elucidation of the mechanism of tumor necrosis factor-alpha (TNF-alpha)-induced insulin resistance: evidence for differential regulation of insulin signaling by TNF-alpha Endocrinology. 1998; 139(12):4928-35. Chhajlani, V. & J.E. Wikberg. Molecular cloning and expression of the human melanocyte stimulating hormone receptor cDNA. FEBS Lett. 309: 417–420.
176
Chhajlani, V. Distribution of cDNA for melanocortin receptor subtypes in human tissues. Biochem. Mol. Biol. Int.1996; 38: 73–80. Chiellini C, Bertacca A, Novelli SE, Gorgun CZ, Ciccarone A, Giordano A, Xu H, Soukas A, Costa M, Gandini D, Dimitri R, Bottone P, Cecchetti P, Pardini E, Perego L, Navalesi R, Folli F, Benzi L, Cinti S, Friedman JM, Hotamisligil GS, Maffei M. Obesity modulates the expression of haptoglobin in the white adipose tissue via TNFalpha. J Cell Physiol. 2002 Feb;190(2):251-8. Chinda D, Umeda T, Shimoyama T, Kojima A, Tanabe M, Nakaji S, Sugawara K. The acute response of neutrophil function to a bout of judo training. Luminescence. 2003 Sep-Oct;18(5):278-82. Cicero R, Mallardi A, Maida I, Gallone A, Pintucci G. Melanogenesis in the pigment cells of Rana esculenta L. liver: evidence for tyrosinase-like activity in the melanosome protein fraction Pigment Cell Res. 1989 Mar-Apr;2(2):100-8. Cicero R, Sciuto S, Chillemi R, Sichel G. Melanosynthesis in the Kupffer cells of amphibian. Comp Biochem Physiol A. 1982;73(3):477-9. Clement K, Vaisse C, Lahlou N, Cabrol S, Pelloux V, Cassuto D, Gourmelen M, Dina C, Chambaz J, Lacorte JM, Basdevant A, Bougneres P, Lebouc Y, Froguel P and Guy-Grand B. A mutation in the human leptin receptor gene causes obesity and pituitary dysfunction. Nature. 1998; 392, 398-401. Colombo G, Gatti S, Turcatti F, Sordi A, Fassati LR, Bonino F, Lipton JM, Catania A. Gene expression profiling reveals multiple protective influences of the peptide alpha melanocyte-stimulating hormone in experimental heart transplantation. J Immunol. 2005 Sep 1;175(5):3391-401. Comuzzie AG, Allison DB The search for human obesity genes. Science. 1998 May 29;280(5368):1374-7. Cone RD: Anatomy and regulation of the central melanocortin system (Review). Nat Neurosci. 2005; 8:571–578.
177
Conlee JW, Gerity LC, Bennett ML. Ongoing proliferation of melanocytes in the stria vascularis of adult guinea pigs. Hear Res. 1994 Sep;79(1-2):115-22. Conlee JW, Parks TN, Schwartz IR, Creel DJ. Comparative anatomy of melanin pigment in the stria vascularis. Evidence for a distinction between melanocytes and intermediate cells in the cat. Acta Otolaryngol. 1989 Jan-Feb;107(1-2):48-58. Coppack SW. Pro-inflammatory cytokines and adipose tissue. Proc Nutr Soc. 2001 Aug;60(3):349-56. Coppack, S.W., Fisher, R.M., Humphreys, S.M., Clark, M.L., Pointon, J.J. and Franyn, K.N. Carbohydrate metabolism in insulin resistance: glucose uptake and lactate production by adipose and forearm tissues in vivo before and after a mixed meal. Clin. Sci. 1996; 90, 409-415. Corton JM, Gillespie JG, Hardie DG. Role of the AMP-activated protein kinase in the cellular stress response. Curr Biol. 1994 Apr 1;4(4):315-24. Crippa PR, Martini F, Viappiani C. Direct evidence of electron-phonon interaction in melanins J Photochem Photobiol B. 1991 Dec;11(3-4):371-5. Cuervo AM, Dice JF. When lysosomes get old. Exp Gerontol. 2000 Mar;35(2):119-31. D.M.A. Mann, P.O. Yates and C.M. Barton. Neuromelanin and RNA in cells of substantia nigra. J. Neuropathol. Exp. Neurol. 1977; pp. 379–384. Damron TA, Schelper RL, Sorensen L. Cytochemical demonstration of neuromelanin in black pigmented adrenal nodules. Am J Clin Pathol. 1987 Mar;87(3):334-41. Das UN. Is obesity an inflammatory condition? Nutrition. 2001; 17, 953-966. Davis RL, Weintraub H, Lassar AB. Expression of a single transfected cDNA converts fibroblasts to myoblasts. Cell. 1987 Dec 24;51(6):987-1000.
178
Deeter LB, Martin LW, Lipton JM. Antipyretic properties of centrally administered alpha-MSH fragments in the rabbit Peptides. 1988 Nov-Dec;9(6):1285-8. Degawa-Yamauchi M, Dilts JR, Bovenkerk JE, Saha C, Pratt JH, Considine RV. Lower serum adiponectin levels in African-American boys. Obes Res. 2003 Nov;11(11):1384 90. DeLeo V, Scheide S, Meshulam J, Hanson D, Cardullo A. Ultraviolet radiation alters choline phospholipid metabolism in human keratinocytes. J Invest Dermatol. 1988 Oct;91(4):303-8. Delgado Hernandez R, Demitri MT, Carlin A, Meazza C, Villa P, Ghezzi P, Lipton JM, Catania A. Inhibition of systemic inflammation by central action of the neuropeptide alpha melanocyte-stimulating hormone. Neuroimmunomodulation. 1999 May Jun;6(3):187-92. Deplewski D, Rosenfield RL. Growth hormone and insulin-like growth factors have different effects on sebaceous cell growth and differentiation. Endocrinology. 1999 Sep;140(9):4089-94. Di Marzo V, Goparaju SK, Wang L, Liu J, Batkai S, Jarai Z, Fezza F, Miura GI, Palmiter RD, Sugiura T, Kunos G. Leptin-regulated endocannabinoids are involved in maintaining food intake. Nature. 2001; 410 822 – 825. Dorsky RI, Moon RT, Raible DW. Control of neural crest cell fate by the Wnt signaling pathway Nature. 1998 Nov 26;396(6709):370-3. Double KL, Zecca L, Costi P, Mauer M, Griesinger C, Ito S, Ben-Shachar D, Bringmann G, Fariello RG, Riederer P, and Gerlach M. Structural characteristics of human substantia nigra neuromelanin and synthetic dopamine melanins. J Neurochem. 2000;75: 2583 2589.
179
Dumont LM, Wu CS, Aschkenasi CJ, Elmquist JK, Lowell BB, Mountjoy KG Mouse melanocortin-4 receptor gene 5'-flanking region imparts cell specific expression in vitro. Mol Cell Endocrinol. 2001 Nov 26;184(1-2):173-85. Dundr P, Pesl M, Povysil C, Vitkova I, Dvoracek J. Large cell neuroendocrine carcinoma of the urinary bladder with lymphoepithelioma-like features Pathol Res Pract. 2003;199(8):559-63. Englaro W, Rezzonico R, Durand-Clement M, Lallemand D, Ortonne JP, Ballotti R. Mitogen-activated protein kinase pathway and AP-1 are activated during cAMP-induced melanogenesis in B-16 melanoma cells. J Biol Chem. 1995 Oct 13;270(41):24315-20. Englaro, W., Bertolotto, C., Busca, R., Brunet, A., Pages, G., Ortonne, J. P., and Ballotti, R. Inhibition of the Mitogen-activated Protein Kinase Pathway Triggers B16 Melanoma Cell Differentiation. J. Biol. Chem. 1998; 273, 9966-9970. Esposito K, Pontillo A, Giugliano F, Giugliano G, Marfella R, Nicoletti G, Giugliano D: Association of low interleukin-10 levels with the metabolic syndrome in obese women. J. Clin. Endocr. Metab. 2003; 88: 1055-1058. Ezoe K, Holmes SA, Ho I, Bennett CP, Bolognia JL, Brueton L, Burn J, Falabella R, Gatto EM, Ishii N, Moss C, Pittelkow MR, Thompson E, Ward KA, Spritz RA. Novel mutations and deletions of the KIT (steel factor receptor) gene in human piebaldism. Am J Hum Genet. 1995;56:58–66. Fain JN, Bahouth SW, Madan AK. TNFalpha release by the nonfat cells of human adipose tissue Int J Obes Relat Metab Disord. 2004; 28(4):616-22. Fain JN, Nesbit AS, Sudlow FF, Cheema P, Peeples JM, Madan AK, Tichansky DS. Release in vitro of adipsin, vascular cell adhesion molecule 1, angiotensin 1-converting enzyme, and soluble tumor necrosis factor receptor 2 by human omental adipose tissue as well as by the nonfat cells and adipocytes. Metabolism. 2007 Nov;56(11):1583-96. Fain JN. Release of interleukins and other inflammatory cytokines by human adipose tissue is enhanced in obesity and primarily due to the nonfat cells. Vitam Horm. 2006;74:443-77.
180
Farooqi, I. S. et al. Effects of recombinant leptin therapy in a child with congenital leptin deficiency. N. Engl. J. Med. 1999; 341, 879–884. Fawcett DW, Jensh RPJ & Bloom W. Bloom & Fawcett"s concise histology. Arnold, London. 2002. Feeney-Burns L, Hilderbrand ES, Eldridge S. Aging human RPE: morphometric analysis of macular, equatorial, and peripheral cells. Invest Ophthalmol Vis Sci. 1984 Feb;25(2):195-200. Fenichel GM, Bazelon M. Studies on neuromelanin. II. Melanin in the brainstems of infants and children. Neurology. 1968 Aug;18(8):817-20. Festa A, D’Agostino R Jr, Williams K, Karter AJ, Mayer-Davis EJ, Tracy RP & Haffner SM . The relation of body fat mass and distribution to markers of chronic inflammation. Int J. Obesity. 2001; 25, 1407-1415. Fitzpatrick TB. Mammalian melanin biosynthesis. Trans St Johns Hosp Dermatol Soc. 1965;51(1):1-26. Foley JM, Baxter D. On the nature of pigment granules in the cells of the locus coeruleus and substantia nigra. J Neuropathol Exp Neurol. 1958 Oct;17(4):586-98. Forman LJ, Bagasra O. Demonstration by in situ hybridization of the proopiomelanocortin gene in the rat heart. Brain Res Bull. 1992 Mar;28(3):441-5 178. Forman LJ, Estilow S, Hock CE. Localization of beta-endorphin in the rat heart and modulation by testosterone. Proc Soc Exp Biol Med. 1989 Mar;190(3):240-5. Forman LJ, Hock CE, Harwell M, Estilow-Isabell S. The results of exposure to immobilization, hemorrhagic shock, and cardiac hypertrophy on beta-endorphin in rat cardiac tissue. Proc Soc Exp Biol Med. 1994 Jun;206(2):124-9.
181
Forrest IS, Gutmann F, Keyzer H. In vitro interaction of chlorpromazine and melanin Agressologie. 1966 Mar-Apr;7(2):147-53. Francis, E., Wang, N., Parag, H., Halaban, R., and Hebert, D. N. Tyrosinase maturation and oligomerization in the endoplasmic reticulum require a melanocyte-specific factor. J. Biol. Chem. 2003 278,25607-25617. Franz P, Aharinejad S, Firbas W. Melanocytes in the modiolus of the guinea pig cochlea. Acta Otolaryngol. 1990 Mar-Apr;109(3-4):221-7. Fujio K, Evarts RT, Hu Z, et al. Expression of stem cell factor and its receptor, c-kit during liver regeneration from putative stem cell in adult rat. Lab Invest. 1994;70:511 516. Fuller BB, Lunsford JB, and Iman DS. Alpha-melanocyte-stimulating hormone regulation of tyrosinase in Cloudman S-91 mouse melanoma cell cultures. J Biol Chem. 1987; 262:4024–4033. Fuller BB, Spaulding DT, and Smith DR. Regulation of the catalytic activity of preexisting tyrosinase in black and Caucasian human melanocyte cell cultures. Exp Cell Res. 2001;262: 197–208. Fuse N, Yasumoto K, Suzuki H, Takahashi K, Shibahara S. Identification of a melanocytetype promoter of the microphthalmia-associated transcription factor gene. Biochem Biophys Res Commun. 1996 Feb 27;219(3):702-7. Fuse N, Yasumoto K, Takeda K, Amae S, Yoshizawa M, Udono T, Takahashi K, Tamai M, Tomita Y, Tachibana M, Shibahara S. Molecular cloning of cDNA encoding a novel microphthalmia-associated transcription factor isoform with a distinct amino-terminus. J Biochem. 1999 Dec;126(6):1043-51. Galibert MD, Carreira S, Goding CR. The Usf-1 transcription factor is a novel target for the stress-responsive p38 kinase and mediates UV-induced Tyrosinase expression. EMBO J. 2001 Sep 3;20(17):5022-31.
182
Galibert MD, Yavuzer U, Dexter TJ, and Goding CR. Pax3 and regulation of the melanocyte-specific tyrosinase-related protein-1 promoter. J Biol Chem. 1999; 274: 26894–26900. Galimberti D, Baron P, Meda L, Prat E, Scarpini E, Delgado R, Catania A, Lipton JM, Scarlato G. Alpha-MSH peptides inhibit production of nitric oxide and tumor necrosis factor-alpha by microglial cells activated with beta-amyloid and interferon gamma. Biochem Biophys Res Commun. 1999 Sep 16;263(1):251-6. Gantz, I., Y. Konda, T. Tashiro, et al. Molecular cloning of a novel melanocortin receptor. J. Biol. Chem. 1993; 268: 8246–8250. Garcia Hidalgo, L Dermatological complications of obesity. Am-J-Clin-Dermatol. 2002; 3(7): 497-506. Getting SJ, Christian HC, Lam CW, Gavins FN, Flower RJ, Schioth HB, Perretti M. Redundancy of a functional melanocortin 1 receptor in the anti-inflammatory actions of melanocortin peptides: studies in the recessive yellow (e/e) mouse suggest an important role for melanocortin 3 receptor. J Immunol. 2003 Mar 15;170(6):3323-30 Getting SJ. Melanocortin peptides and their receptors: new targets for anti-inflammatory therapy Trends Pharmacol Sci. 2002 Oct;23(10):447-9. Gibson LE Acanthosis nigricans. Mayo Clin Proc. 2004 Dec;79(12):1571. Giebel LB, Spritz RA. Mutation of the KIT (mast/stem-cell growth factor receptor) protooncogene in human piebaldism. Proc Natl Acad Sci USA. 1991;88:8696–8699. Giglio S, Monis PT, Saint CP. Demonstration of preferential binding of SYBR Green I to specific DNA fragments in real-time multiplex PCR. Nucleic Acids Res. 2003 Nov 15;31(22):e136. Gilchrest BA and Eller MS. DNA photodamage stimulates melanogenesis and other photoprotective responses. J Invest Dermatol Symp Proc. 1999; 4: 35–40.
183
Gilchrest BA, Park HY, Eller MS, and Yaar M. Mechanisms of ultraviolet light-induced pigmentation. Photochem Photobiol. 1996; 63: 1–10. Girotti AW. Lipid hydroperoxide generation, turnover, and effector action in biological systems. J Lipid Res. 1998; 39: 15291542. Glass CK, Witztum JL. Atherosclerosis. the road ahead. Cell. 2001 Feb 23;104(4):503 16. Goding CR, Fisher DE. Regulation of melanocyte differentiation and growth Cell Growth Differ. 1997 Sep;8(9):935-40. Goetzl EJ, Sreedharan SP. Mediators of communication and adaptation in the neuroendocrine and immune systems. FASEB J. 1992 Jun;6(9):2646-52. Gonindard C, Goigoux C, Hollande E, D'Hinterland LD. The administration of an alpha MSH analogue reduces the serum release of IL-1 alpha and TNF alpha induced by the injection of a sublethal dose of lipopolysaccharides in the BALB/c mouse. Pigment Cell Res. 1996 Jun;9(3):148-53. Goodson WH 3rd, Hunt TK. Wound collagen accumulation in obese hyperglycemic mice. Diabetes. 1986 Apr;35(4):491-5. Goossens GH. The role of adipose tissue dysfunction in the pathogenesis of obesity related insulin resistance. Physiol Behav. 2007 Oct 22. Goud B . How Rab proteins link motors to membranes. Nat Cell Biol. 2002; 4: E77– E78. Grabbe J, Welker P, Dippel E, et al. Stem cell factor, a novel cutaneous growth factor for mast cells and melanocytes. Arch Dermatol Res. 1994;287:78–84.
184
Gracie JA, Robertson SE, McInnes IB. Interleukin-18. J Leukoc Biol. 2003 Feb;73(2):213-24. Guida G, Gallone A, Maida I, Boffoli D, Cicero R. Tyrosinase gene expression in the Kupffer cells of Rana esculenta L. Pigment Cell Res. 2000 Dec;13(6):431-5. Guida G, Maida I, Gallone A, Boffoli D, Cicero R. Ultrastructural and functional study of the liver pigment cells from Rana esculenta L. In Vitro Cell Dev Biol Anim. 1998 May;34(5):393-400. Gutteridge JM, Rowley DA, Halliwell B, Westermarck T. Increased non-protein-bound iron and decreased protection against superoxide-radical damage in cerebrospinal fluid from patients with neuronal ceroid lipofuscinoses. Lancet. 1982 Aug 28;2(8296):459-60. Guzy RD, Schumacker PT. Oxygen sensing by mitochondria at complex III: the paradox of increased reactive oxygen species during hypoxia. Exp Physiol. 2006 Sep;91(5):807 19. Haavik J. L-DOPA is a substrate for tyrosine hydroxylase. J Neurochem. 1997 Oct;69(4):1720-8. Hadley ME, Haskell-Luevano C: The proopiomelanocortin system (Review). Ann N Y Acad Sci. 1999; 885:1–21. Hammer JA 3rd, Wu XS . Rabs grab motors: defining the connections between Rab GTPases and motor proteins. Curr Opin Cell Biol. 2002; 14: 69– 75. Hardie DG. Minireview: the AMP-activated protein kinase cascade: the key sensor of cellular energy status. Endocrinology. 2003 Dec;144(12):5179-83. Epub 2003 Sep 4 Harsanyi ZP, Post PW, Brinkmann JP, Chedekel MR, Deibel RM. Mutagenicity of melanin from human red hair. Experientia. 1980 Mar 15;36(3):291-2. Hauner H. Insulin resistance and the metabolic syndrome – a challenge of the new
185
Millennium. European Journal of Clinical Nutrition. 2002; 56 Suppl. 1, S25: S29. Hauner H. Secretory factors from human adipose tissue and their functional role. Proceedings of the Nutrition Society. 2005; 64:163–169. Hearing VJ and Tsukamoto K. Enzymatic control of pigmentation in mammals. FASEB J. 1991; 5: 2902–2909. Hearing VJ, Ekel TM. Involvement of tyrosinase in melanin formation in murine melanoma. J Invest Dermatol. 1975 Feb;64(2):80-5. Hearing VJ. Biochemical control of melanogenesis and melanosomal organization. J Invest Dermatol Symp Proc. 1999; 4: 24–28. Hearing VJ. Biogenesis of pigment granules: a sensitive way to regulate melanocyte function. J Dermatol Sci. 2005 Jan;37(1):3-14. Hearing, V. J., and Jimenez, M. Int. Mammalian tyrosinase--the critical regulatory control point in melanocyte pigmentation. J. Biochem. 1987; 19, 1141-1147. Hearing, V. J., and Jimenez, M. Pigm. Cell. Res. 1989; 2, 75-85. Helmlinger G, Yuan F, Dellian M, Jain RK. Interstitial pH and pO2 gradients in solid tumors in vivo: high-resolution measurements reveal a lack of correlation. Nat Med. 1997 Feb;3(2):177-82. Hemesath TJ, Price ER, Takemoto C, Badalian T, Fisher DE. MAPK links the transcription factor microphthalmia to c-kit signaling in melanocytes. Nature. 1998;391:289–301. Hermanns-Le T, Scheen A, Pierard GE. Acanthosis nigricans associated with insulin resistance : pathophysiology and management. Am J Clin Dermatol. 2004;5(3):199-203.
186
Herrlich P, Sachsenmaier C, Radler-Pohl A, Gebel S, Blattner C, Rahmsdorf HJ. The mammalian UV response: mechanism of DNA damage induced gene expression. Adv Enzyme Regul. 1994;34:381-95. Hershey CL, Fisher DE. Genomic analysis of the Microphthalmia locus and identification of the MITF-J/Mitf-J isoform. Gene. 2005 Feb 28;347(1):73-82. Heymans C, Bouckaert JJ. Sinus caroticus and respiratory reflexes: I. Cerebral blood flow and respiration. Adrenaline apnoea. J Physiol. 1930 Apr 14;69(2):254-66. Hiltz ME, Catania A, Lipton JM. Alpha-MSH peptides inhibit acute inflammation induced in mice by rIL-1 beta, rIL-6, rTNF-alpha and endogenous pyrogen but not that caused by LTB4, PAF and rIL-8. Cytokine. 1992 Jul;4(4):320-8. Hiltz ME, Lipton JM. Alpha-MSH peptides inhibit acute inflammation and contact sensitivity Peptides. 1990 Sep-Oct;11(5):979-82. Hiltz ME, Lipton JM. Antiinflammatory activity of a COOH-terminal fragment of the neuropeptide alpha-MSH. FASEB J. 1989 Sep;3(11):2282-4. Hoch M, Eberle AN, Wagner U, Bussmann C, Peters T, Peterli R. Expression and localization of melanocortin-1 receptor in human adipose tissues of severely obese patients. Obesity (Silver Spring). 2007 Jan;15(1):40-9. Hochstein P, Cohen G. The cytotoxicity of melanin precursors. Ann N Y Acad Sci. 1963 Feb 15;100:876-86. Hodgkinson, C. A., Moore, K. J., Nakayama, A., Steingrimsson, E., Copeland, N. G., Jenkins, N. A., and Arnheiter, H. Cell. 1993; 74, 395-404. Hoggard N, Johnstone AM, Faber P, Gibney ER, Elia M, Lobley G, Rayner V, Horgan G, Hunter L, Bashir S, Stubbs RJ. Plasma concentrations of α-MSH, AgRP and leptin in lean and obese men and their relationship to differing states of energy balance perturbation. Clin Endocrinol (Oxf). 2004 Jul;61(1):31-9.
187
Hoggard N, L Hunter, J S Duncan and D V Rayner. Regulation of adipose tissue leptin secretion by alpha-melanocyte-stimulating hormone and agouti-related protein: further evidence of an interaction between leptin and the melanocortin signaling system. Journal of Molecular Endocrinologh. 2004; 32, 145-153. Hori Y, Toda K, Pathak MA, Clark WH Jr, Fitzpatrick TB. A fine-structure study of the human epidermal melanosome complex and its acid phosphatase activity. J Ultrastruct Res. 1968 Oct;25(1):109-20. Hosoda K, Hammer RE, Richardson JA, Baynash AG, Cheung JC, Giaid A, and Yanagisawa M. Targeted and natural (piebald-lethal) mutations of endothelin-B receptor gene produce megacolon associated with spotted coat color in mice. Cell. 1994; 79: 1267–1276. Hosogai N, Fukuhara A, Oshima K, Miyata Y, Tanaka S, Segawa K, Furukawa S, Tochino Y, Komuro R, Matsuda M, Shimomura I. Adipose tissue hypoxia in obesity and its impact on adipocytokine dysregulation. Diabetes. 2007 Apr;56(4):901-11. Hotamisligil GS, Shargill NS, Spiegelman BM. Adipose expression of tumor necrosis factor-alpha: direct role in obesity-linked insulin resistance. Science. 1993; 259(5091):87-91. Hotamisligil GS. Inflammation and metabolic disorders. Nature. 2006 Dec 14;444(7121):860-7. Hotamisligil, G.S. Inflammation, TNFα and insulin resistance. In Diabetes mellitus. 2003. Hotta K, Funahashi T, Arita Y, Takahashi M, Matsuda M, Okamoto Y, Iwahashi H, Kuriyama H, Ouchi N, Maeda K, Nishida M, Kihara S, Sakai N, Nakajima T, Hasegawa K, Muraguchi M, Ohmoto Y, Nakamura T, Yamashita S, Hanafusa T & Matsuzawa Y. Plasma concentrations of a novel, adipose-specific protein, adiponectin, in type 2 diabetic patients. Arteriosclerosis, Trombosis and Vascular Biology. 2000; 20 1595–1599.
188
Huang K.-C.; Chen C.-L.; Chuang L.-M, Ho S.-R, Tai T.-Y, Yang W.-S. Plasma Adiponectin levels and blood pressures in nondiabetic adolescent females. J. Clin. Endocr. Metab. 2003; 88: 4130-4134. Hug C, Wang J, Ahmad NS, Bogan JS, Tsao TS & Lodish HF. T-cadherin is a receptor for hexameric and high-molecular-weight forms of Acrp30/adiponectin. PNAS. 2004;101 10308–10313. Hunt G, Donatien PD, Lunec J, Todd C, Kyne S, and Thody AJ. Cultured human melanocytes respond to MSH peptides and ACTH. Pigment Cell Res. 1994; 7: 217–221. Hunt G. Melanocyte-stimulating hormone: a regulator of human melanocyte physiology. Pathobiology. 1995; 63: 12–21. Huszar D, Lynch CA, Fairchild-Huntress V, Dunmore JH, Fang Q, Berkemeier LR, Gu W, Kesterson RA, Boston BA, Cone RD, Smith FJ, Campfield LA, Burn P, and Lee F. Targeted disruption of the melanocortin-4 receptor results in obesity in mice. Cell. 1997; 88: 131–141. Iihara K, Yamaguchi K, Fujioka Y, Uno S. Pigmented neuroendocrine tumor of the lung, showing neuromelanin. Pathol Int. 2002 Nov;52(11):734-9. Ikemoto K, Nagatsu I, Ito S, King RA, Nishimura A, Nagatsu T. Does tyrosinase exist in neuromelanin-pigmented neurons in the human substantia nigra? Neurosci Lett. 1998 Sep 11;253(3):198-200. Imokawa G, Kobayashi T, Miyagishi M. Intracellular signaling mechanisms leading to synergistic effects of endothelin-1 and stem cell factor on proliferation of cultured human melanocytes: cross-talk via trans-activation of the tyrosine kinase C-kit receptor. J Biol Chem. 2000;275:33321–33328. Imokawa G, Mishima Y. Loss of melanogenic properties in tyrosinases induced by glucosylation inhibitors within malignant melanoma cells. Cancer Res. 1982 May;42(5):1994-2002.
189
Imokawa G, Miyagishi M, and Yada Y. Endothelin-1 as a new melanogen: coordinated expression of its gene and the tyrosinase gene in UVB-exposed human epidermis. J Invest Dermatol. 1995; 105: 32–37. Imokawa G, Yada Y, and Miyagishi M. Endothelins secreted from human keratinocytes are intrinsic mitogens for human melanocytes. J Biol Chem. 1992; 267: 24675–24680. Imokawa G, Yada Y, Kimura M. Signaling mechanisms of endothelin-induced mitogenesis in human melanocytes. Biochem J. 1996;314:305–312. Ings RM. The melanin binding of drugs and its implications. Drug Metab Rev. 1984;15(5-6):1183-212. Inoue K, Hosoi J, Ideta R, Ohta N, Ifuku O, Tsuchiya T. Stress augmented ultravioletirradiation-induced pigmentation J Invest Dermatol. 2003 Jul;121(1):165-71. Integrative analysis of transcriptomic and proteomic data: challenges, solutions Ito, S & Fujita, K: Microanalysis of eumelanin and pheomelanin in hair and melanomas by chemical degradation and liquid chromatography. Anal Biochem 1985 144, 527–536. Ito, S & Jimbow, K: Quantitative analysis of eumelanin and pheomelanin in hair and melanomas. J Invest Dermatol. 1983 80, 268–272. Ito, S & Wakamatsu, K: An improved modification of permanganate oxidation of eumelanin that gives a constant yield of pyrrole-2,3,5-tricarboxylic acid. Pigment Cell Res 1994 7, 141–144. Ito, S & Wakamatsu, K. Chemical degradation of melanins: application to identification of dopamine-melanin. Pigment Cell Res 1998 11, 120–126. J.F. Fu, L. Liang, G.P. Dong, Y.J. Jiang and C.C. Zou. Obese children with benign acanthosis nigricans and insulin resistance: analysis of 19 cases. Zhonghua Er Ke Za Zhi. 2004; pp. 917–919.
190
Jackson RS, Creemers JWM, Ohagi S, Raffin-Sanson M-L, Sanders L, Montague CT, Hutton JC, O’Rahilly S. Obesity and impaired prohormone processing associated with mutations in the human prohormone convertase 1 gene. Nat Genet. 1997; 16:303–306. Jacob RJ, Dziura J, Medwick MB, Leone P, Caprio S, During M, Shulman GI and Sherwin RS. The effect of leptin is enhanced by microinjection into the ventromedial hypothalamus. Diabetes. 1997; 46, 150-152. Jarrar MH, Baranova A, Collantes R, Ranard B, Stepanova M, Bennett C, Fang Y, Elariny H, Goodman Z, Chandhoke V, Younossi ZM. Adipokines and cytokines in non alcoholic fatty liver disease. Aliment Pharmacol Ther. 2008 Mar 1;27(5):412-21. Jialal I, Devaraj S.The role of oxidized low density lipoprotein in atherogenesis. J Nutr. 1996 Apr;126(4 Suppl):1053S-7S. Jimbow K Current update and trends in melanin pigmentation and melanin biology. Keio J Med. 1995 Mar;44(1):9-18. Johansson O and Wang L. Choline acetyltransferase-like immunofluorescence in epidermis of human skin. Neurobiology. 1993; 1: 201–206. Johnson, P.R. and M.R.C. Greenwood. The adipose tissue. In: "Cell and Tissue Biology: A Textbook of Histology." (ed. by L. Weiss), 6th edition, Urban and Schwarzenberg, Baltimore, MD. 1988; pp. 191-209. Jordan SA, Jackson IJ. A late wave of melanoblast differentiation and rostrocaudal migration revealed in patch and rump-white embryos. Mech Dev. 2000 Apr;92(2):135 43. K.L. Ellacott and R.D. Cone. The central melanocortin system and the integration of short- and long-term regulators of energy homeostasis. Recent Prog Horm Res. 2004; pp. 395–408. Kadono S, Manaka I, Kawashima M, Kobayashi T, and Imokawa G. The role of the epidermal endothelin cascade in the hyperpigmentation mechanism of lentigo senilis. J Invest Dermatol. 2001; 116: 571–577.
191
Kadowaki T, Yamauchi T, Kubota N, Hara K, Ueki K, Tobe K. Adiponectin and adiponectin receptors in insulin resistance, diabetes, and the metabolic syndrome. J Clin Invest. 2006; 116: 1784–1792. Kamaraju AK, Bertolotto C, Chebath J, and Revel M. Pax3 down-regulation and shut-off of melanogenesis in melanoma B16/F10.9 by interleukin-6 receptor signaling. J Biol Chem. 2002; 277: 15132–15141. Kaser S, Kaser A, Sandhofer A, Ebenbichler CF, Tilg H, Patsch JR. Resistin messenger-RNA expression is increased by proinflammatory cytokines in vitro. Biochem Biophys Res Commun. 2003; 19;309(2):286-90. Katsuki A, Sumida Y, Murashima S, Furuta M, Araki-Sasaki R, Tsuchihashi K, Hori Y, Yano Y, Adachi Y. Elevated plasma levels of alpha-melanocyte stimulating hormone (alpha-MSH) are correlated with insulin resistance in obese men. Int J Obes Relat Metab Disord. 2000 Oct;24(10):1260-4. Katz AS, Goff DC, Feldman SR. Acanthosis nigricans in obese patients: Presentations and implications for prevention of atherosclerotic vascular disease. Dermatol Online J. 2000 Sep;6(1):1. Kauser S, Schallreuter KU, Thody AJ, Gummer C, and Tobin DJ. Regulation of human epidermal melanocyte biology by beta-endorphin. J Invest Dermatol. 2003; 120: 1073– 1080. Kawakami M, Ishibashi S, Ogawa H, Murase T, Takaku F, Shibata S. Cachectin/TNF as well as interleukin-1 induces prostacyclin synthesis in cultured vascular endothelial cells. Biochem Biophys Res Commun. 1986 Dec 15;141(2):482-7. Kim SH, Han SY, Azam T, Yoon DY, Dinarello CA. Interleukin-32: a cytokine and inducer of TNFalpha Immunity. 2005 Jan;22(1):131-42. Kirby ML, Waldo KL. Neural crest and cardiovascular patterning. Circ Res. 1995 Aug;77(2):211-5.
192
Klaus W. Electrolyte shifts and cardiac function. Triangle. 1971;10(4):131-8. Kripke ML. Ultraviolet radiation and immunology: something new under the sun-- presidential address. Cancer Res. 1994 Dec 1;54(23):6102-5. Kristensen P Judge ME Thim L Ribel U Christjansen KN Wulff BS Clausen JT Jensen PB Madsen OD Vrang N Larsen PJ Hastrup S. Hypothalamic CART is a new anorectic peptide regulated by leptin. Nature. 1998; 393 72 – 76. Krude H, Gruters A. Implications of proopiomelanocortin (POMC) mutations in humans: the POMC deficiency syndrome. Trends Endocrinol Metab. 2000 Jan-Feb;11(1):15-22. Krude, H., Biebermann, H., Luck, W., Horn, R., Brabant, G., and Gruters, A. Severe early-onset obesity, adrenal insuffi ciency and red hair pigmentation caused by POMC mutations in humans. Nat. Genet. 1998; 19, 155-157. Kuhlbrodt K, Herbarth B, Sock E, Hermans-Borgmeyer I, Wegner M. Sox10, a novel transcriptional modulator in glial cells J Neurosci. 1998 Jan 1;18(1):237-50. Kushimoto, T. et al. A model for melanosome biogenesis based on the purification and analysis of early melanosomes. Proc. Natl Acad. Sci. 2001; 98, 10698–10703. Lahav R, Lecoin L, Ziller C, Nataf V, Carnahan JF, Martin FH, and Le Douarin NM. Effect of the Steel gene product on melanogenesis in avian neural crest cell cultures. Differentiation. 1994; 58: 133–139. Lahav R. Endothelin receptor B is required for the expansion of melanocyte precursors and malignant melanoma. Int J Dev Biol. 2005;49:173–180. Lalli, E., and Sassone-Corsi, P. Signal transduction and gene regulation: the nuclear response to cAMP. J. Biol. Chem. 1994; 269, 17359-17362.
193
Lang CH, Dobrescu C, Bagby GJ. Tumor necrosis factor impairs insulin action on peripheral glucose disposal and hepatic glucose output. Endocrinology. 1992; 130(1):43 52. Le Douarin NM. Plasticity in the development of the peripheral nervous system. Ciba Found Symp. 1981;83:19-50. Le Douarin, N. M. and Kalcheim, C. The Neural Crest. Cambridge, UK: Cambridge University Press. 1999. Lee ST, Nicholls RD, Bundey S, Laxova R, Musarella M, Spritz RA. Mutations of the P gene in oculocutaneous albinism, ocular albinism, and Prader-Willi syndrome plus albinism. N Engl J Med. 1994 Feb 24;330(8):529-34. Lee YH, Nair S, Rousseau E, Allison DB, Page GP, Tataranni PA, Bogardus C, Permana PA. Microarray profiling of isolated abdominal subcutaneous adipocytes from obese vs non-obese Pima Indians: increased expression of inflammation-related genes. Diabetologia. 2005 Sep;48(9):1776-83. Lehrke M, Reilly MP, Millington SC, Iqbal N, Rader DJ, Lazar MA. An inflammatory cascade leading to hyperresistinemia in humans. PLoS Med. 2004. Lim, S. H., Kim, S. M., Lee, Y. W., Ahn, K. J. & Choe, Y. B. Change of biophysical properties of the skin caused by ultraviolet radiation-induced photodamage in Koreans.Skin Research and Technology. 2008; 14 (1), 93-102. Lipton JM, Catania A. Mechanisms of antiinflammatory action of the neuroimmunomodulatory peptide alpha-MSH. Ann N Y Acad Sci. 1998 May 1;840:373-80. Lipton JM. Modulation of host defense by the neuropeptide alpha-MSH. Yale J Biol Med. 1990 Mar-Apr;63(2):173-82.
194
Liu Y, Hulten LM, Wiklund O. Macrophages isolated from human atherosclerotic plaques produce IL-8, and oxysterols may have a regulatory function for IL-8 production. Arterioscler Thromb Vasc Biol. 1997 Feb;17(2):317-23. Livak KJ, Schmittgen TD: Analysis of relative gene expression data using real-time quantitative PCR and the 2-ffCT method. Methods. 2001, 25:402-408. Lolmede K, Durand de Saint Front V, Galitzky J, Lafontan M, Bouloumie A. Effects of hypoxia on the expression of proangiogenic factors in differentiated 3T3-F442A adipocytes. Int J Obes Relat Metab Disord. 2003 Oct;27(10):1187-95. Low MJ. Role of proopiomelanocortin neurons and peptides in the regulation of energy homeostasis. J Endocrinol Invest. 2004;27(6 Suppl):95-100. Luger T, Paus R, Slominski A, and Lipton J. Cutaneous neuromodulation: the proopiomelanocortin system. Ann NY Acad Sci. 1999; 885: 1–479. M. A. Rosei, L. Mosca and F. Galluzzi. Photoelectronic properties of synthetic melanins. Synth. Met. 1996; 76, 331–335. M. M. Jastrzebska, H. Isotalo, J. Paloheimo and H. Stub, J. Biomater. Sci., Polym. Ed., 1995, 7(7), 577–586. M.I. Rendon, P.D. Cruz Jr., R.D. Sontheimer and P.R. Bergstresser, Acanthosis nigricans: a cutaneous marker of tissue resistance to insulin, J Am Acad Dermatol. 1989; pp. 461–469. Macdonald GA. Pathogenesis of hepatocellular carcinoma Clin Liver Dis. 2001 Feb;5(1):69-85. MacLaren R, Cui W, Simard S, Cianflone K. Influence of obesity and insulin sensitivity on insulin signaling genes in human omental and subcutaneous adipose tissue. J Lipid Res. 2008 Feb;49(2):308-23.
195
Mani I, Sharma V, Tamboli I, Raman G. Interaction of melanin with proteins—the importance of an acidic intramelanosomal pH. Pigment Cell Res. 2001 Jun;14(3):170-9. Manna SK, Aggarwal BB. Alpha-melanocyte-stimulating hormone inhibits the nuclear transcription factor NF-kappa B activation induced by various inflammatory agents. J Immunol. 1998 Sep 15;161(6):2873-80. Manna SK, Sarkar A, Sreenivasan Y. Alpha-melanocyte-stimulating hormone downregulates CXC receptors through activation of neutrophil elastase. Eur J Immunol. 2006 Mar;36(3):754-69. Marks, M. S. & Seabra, M. C. The melanosome: membrane dynamics in black and white. Nature Rev. Mol. Cell Biol. 2001, 738–748. Marrades MP, Milagro FI, Martinez JA, Moreno-Aliaga MJ. Differential expression of aquaporin 7 in adipose tissue of lean and obese high Marsin AS, Bertrand L, Rider MH, Deprez J, Beauloye C, Vincent MF, Van den Berghe G, Carling D, Hue L. Phosphorylation and activation of heart PFK-2 by AMPK has a role in the stimulation of glycolysis during ischaemia. Curr Biol. 2000 Oct 19;10(20):1247 55. Matsunaga J, Sinha D, Solano F, Santis C, Wistow G, and Hearing V. Macrophage migration inhibitory factor (MIF)—its role in catecholamine metabolism. Cell Mol Biol 45: 035–1040, 1999. Mayer TC. The migratory pathway of neural crest cells into the skin of mouse embryos. Dev Biol. 1973 Sep;34(1):39-46. McDuffee AT, Senisterra G, Huntley S, Lepock JR, Sekhar KR, Meredith MJ, Borrelli MJ, Morrow JD, Freeman ML. Proteins containing non-native disulfide bonds by oxidative stress can act as signals for the induction of the heat shock response. J Cell Phys 1997. McGill GG, Horstmann M, Widlund HR, Du J, Motyckova G, Nishimura EK, Lin YL, Ramaswamy S, Avery W, Ding HF, Jordan SA, Jackson IJ, Korsmeyer SJ, Golub TR,
196
and Fisher DE. Bcl2 regulation by the melanocyte master regulator Mitf modulates lineage survival and melanoma cell viability. Cell 109: 707–718, 2002. Meister B. Control of food intake via leptin receptors in the hypothalamus. Vitamins and Hormones. 2000;59 265 – 304. Meyer, zum Gottesberge, A. M. Physiology and patho-. physiology of inner ear melanin. Pigm. Cell Res. 1988. Miller AJ, Levy C, Davis IJ, Razin E, Fisher DE. Sumoylation of MITF and its related family members TFE3 and TFEB. J Biol Chem. 2005 Jan 7;280(1):146-55. Miller DL, Weinstock MA. Nonmelanoma skin cancer in the United States: incidence. J Am Acad Dermatol. 1994 May;30(5 Pt 1):774-8. Millington WR, Evans VR, Forman LJ, Battie CN. Characterization of beta-endorphin-and alpha-MSH-related peptides in rat heart. Peptides. 1993 Nov-Dec;14(6):1141-7. Milner Y, Sudnik J, Filippi M, Kizoulis M, Kashgarian M, Stenn K. Exogen, shedding phase of the hair growth cycle: characterization of a mouse model. 2002. Mishima Y, Imokawa G Selective aberration and pigment loss in melanosomes of malignant melanoma cells in vitro by glycosylation inhibitors: premelanosomes as glycoprotein. J Invest Dermatol. 1983 Aug;81(2):106-14 Mizuno TM, Kleopoulos SP, Bergen HT, Roberts JL, Priest CA, Mobbs CV. Hypothalamic pro-opiomelanocortin mRNA is reduced by fasting and [corrected] in ob/ob and db/db mice, but is stimulated by leptin, Diabetes. 1998 Feb;47(2):294-7. Mjaatvedt CH, Kern CB, Norris RA, Fairey S, Cave CL. Normal distribution of melanocytes in the mouse heart. Anat Rec A Discov Mol Cell Evol Biol. 2005 Aug;285(2):748-57.
197
Mocellin S, Rossi CR, Marincola FM. Quantitative real-time PCR in cancer research. Arch Immunol Ther Exp (Warsz). 2003;51(5):301-13. Moen EM, Sleboda J, Grinde B. Real-time PCR methods for independent quantitation of TTV and TLMV. J Virol Methods. 2002 Jun;104(1):59-67. Mohagheghpour N, Waleh N, Garger SJ, Dousman L, Grill LK, Tuse D. Synthetic melanin suppresses production of proinflammatory cytokines. Cell Immunol. 2000 Jan 10;199(1):25-36. Montagna, W. & Carlisle, K. The architecture of black and white facial skin. J. Am. Acad. Dermatol. 1991;24:, 929–937. Montague CT, Farooqi IS, Whitehead JP, Soos MA, Rau H, Wareham NJ, Sewter CP, Digby JE, Mohammed SN, Hurst JA, Cheetham CH, Earley AR, Barnett AH, Prins JB and O’Rahilly S. Congenital leptin deficiency is associated with severe early-onset obesity in humans. Nature. 1997;387, 903-908. Moore GB, Chapman H, Holder JC, Lister CA, Piercy V, Smith SA, Clapham JC. Differential regulation of adipocytokine mRNAs by rosiglitazone in db/db mice. Biochem Biophys Res Commun. 2001 Aug 31;286(4):735-41. Morelli JG, Norris DA. Influence of inflammatory mediators and cytokines on human melanocyte function. J Invest Dermatol. 1993 Feb;100(2 Suppl):191S-195S. Motohashi H, Hozawa K, Oshima T, Takeuchi T, Takasaka T. Dysgenesis of melanocytes and cochlear dysfunction in mutant microphthalmia (mi) mice. Hear Res. 1994 Oct;80(1):10-20. Mountjoy KG The human melanocyte stimulating hormone receptor has evolved to become "super-sensitive" to melanocortin peptides Mol Cell Endocrinol. 1994 Jun;102(1 2):R7-11. Mountjoy KG, Wu CS, Cornish J, Callon KE. alpha-MSH and desacetyl-alpha-MSH signaling through melanocortin receptors. Ann N Y Acad Sci. 2003 Jun;994:58-65.
198
Mountjoy, K.G., L.S. Robbins, M.T. Mortrud, et al. The cloning of a family of genes that encode the melanocortin receptors. Science. 1992;257: 1248–1251. Murakami H, Arnheiter H. Sumoylation modulates transcriptional activity of MITF in a promoter-specific manner. Pigment Cell Res. 2005 Aug;18(4):265-77. Nagatsu T, Levitt M, Udenfriend S. Tyrosine hydroxylase. The initial step in norepinephrine biosynthesis. J Biol Chem. 1964 Sep;239:2910-7. Nair S, Lee YH, Rousseau E, Cam M, Tataranni PA, Baier LJ, Bogardus C, Permana PA. Increased expression of inflammation-related genes in cultured preadipocytes/stromal vascular cells from obese compared with non-obese Pima Indians. Diabetologia. 2005 Sep;48(9):1784-8. Nakatani Y, Kaneto H, Kawamori D, Yoshiuchi K, Hatazaki M, Matsuoka TA, Ozawa K, Ogawa S, Hori M, Yamasaki Y, Matsuhisa M: Involvement of endoplasmic reticulum stress in insulin resistance and diabetes. J Biol Chem. 2005; 280:847–851. Napolitano, A, Pezzella, A, d'ischia, M, Prota, G. Oxidative polimerisation of 5,6- dihydroxyindole-2-carboxylic acid to melanin: a new insight. Tetrahedron. 1996a;52, 8775–8780. Napolitano, A, Pezzella, A, Vincensi, MR, Prota, G: Oxidative degradation of melanins to pyrrole acids: a pilot study. Tetrahedron. 1995; 51, 5913–5920. Neumann Andersen, G., O. Nagaeva, I. Mandrika, et al. MC(1) receptors are constitutively expressed on leucocyte subpopulations with antigen presenting and cytotoxic functions. Clin. Exp. Immunol. 2001;126: 441–446. Nishizuka Y. Studies and prospectives of protein kinase C in signal transduction Nippon Ketsueki Gakkai Zasshi. 1988 Dec;51(8):1321-6.
199
Nordlund JJ, Askenase PW. The effect of histamine, antihistamines, and a mast cell stabilizer on the growth of cloudman melanoma cells in DBA/2 mice. J Invest Dermatol. 1983 Jul;81(1):28-31. Nordlund JJ, Cestari TF, Chan H, Westerhof W. Confusions about colour: a classification of discolorations of the skin. Br J Dermatol. 2006 Dec;156 Suppl 1:3-6. Norman D, Isidori AM, Frajese V, Caprio M, Chew SL, Grossman AB, Clark AJ, Michael Besser G, Fabbri A. ACTH and α-MSH inhibit leptin expression and secretion in 3T3-L1 adipocytes: model for a central-peripheral melanocortin-leptin pathway. Mol Cell Endocrinol. 2003 Feb 28;200(1-2):99-109. Norris DA. Leukotriene C4 and TGF-alpha are stimulators of human melanocyte migration in vitro. J Invest Dermatol. 1992;98: 290–295. Odh G, Carstam R, Paulson J, Wittbjer A, Rosengren E, and Rorsman H. Neuromelanin of the human substantia nigra: a mixed-type melanin. J Neurochem. 1994;62: 2030–2036. Oetting WS and King RA. Molecular basis of albinism: mutations and polymorphisms of pigmentation genes associated with albinism. Hum Mutat. 1999;13: 99–115. Ofei F, Hurel S, Newkirk J, Sopwith M, Taylor R. Effects of an engineered human anti-TNF-alpha antibody (CDP571) on insulin sensitivity and glycemic control in patients with NIDDM. Diabetes. 1996;45(7):881-5. Okazaki K, Uzuka M, Morikawa F, Toda K, and Seiji M. Transfer mechanism of melanosomes in epidermal cell culture. J Invest Dermatol. 1976;67: 541–547.
Olivares, C., Solano, F., and Garcia-Borron, J. C. Conformation-dependent Post translational Glycosylation of Tyrosinase: requirement of a specific interaction involving the cub metal binding site. J. Biol. Chem. 2003;278, 15735-15743.
Oppel A. Lehrbuch der vergleichende mikroskopische Anatomie der Wirbeltiere. Jena: Fischer. 1900.
200
Orlow SJ, Zhou BK, Chakraborty AK, Drucker M, Pifko-Hirst S, and Pawelek JM. Highmolecular-weight forms of tyrosinase and the tyrosinase-related proteins: evidence for a melanogenic complex. J Invest Dermatol. 1994;103: 196–201. Ortonne JP. Retinoic acid and pigment cells: a review of in-vitro and in-vivo studies. Br J Dermatol. 1992;127 Suppl 41: 43–47. Ouchi N et al. Obesity, adiponectin, and vascular inflammatory disease. Current Opinion in Lipidology. 2003;14(6): 561-566. Ouchi N, Kihara S, Arita Y, Maeda K, Kuriyama H, Okamoto Y, Hotta K, Nishida M, Takahashi M, Nakamura T, Yamashita S, Funahashi T, Matsuzawa Y. Novel modulator for endothelial adhesion molecules: adipocyte-derived plasma protein adiponectin. Circulation. 1999 Dec 21-28;100(25):2473-6. Ozcan U, Cao Q, Yilmaz E, Lee AH, Iwakoshi NN, Ozdelen E, Tuncman G, Gorgun C, Glimcher LH, Hotamisligil GS: Endoplasmic reticulum stress links obesity, insulin action, and type II diabates. Science 306:457–461, 2004. Ozeki H, Oshima K, Senn P, Kurihara H, Kaga K Development and regeneration of hair cells. Acta Otolaryngol Suppl. 2007 Dec;(559):38-44. P. Meredith and J. Riesz. Radiative Relaxation Quantum Yields for Synthetic Eumelanin. Photochem. Photobiol., 2004, 79(2), 211–216. P.D. Cruz Jr. and J.A. Hud Jr., Excess insulin binding to insulin-like growth factor receptors: proposed mechanism for acanthosis nigricans, J Invest Dermatol. 1992; pp. 82S–85S. Pathak MA, Sinesi SJ, Szabo G. The effect of a single dose of ultraviolet radiation on epidermal melanocytes. J Invest Dermatol. 1965 Dec;45(6):520-8.
201
Pavan WJ, Tilghman SM. Piebald lethal (sl) acts early to disrupt the development of neural crest-derived melanocytes. Proc Natl Acad Sci U S A. 1994 Jul 19;91(15):7159 63. Pawelek JM, Lerner AB. 5,6-Dihydroxyindole is a melanin precursor showing potent cytotoxicity. Nature. 1978 Dec 7;276(5688):626-8. Pennica D, Nedwin GE, Hayflick JS, Seeburg PH, Derynck R, Palladino MA, Kohr WJ, Aggarwal BB, Goeddel DV. Human tumour necrosis factor: precursor structure, expression and homology to lymphotoxin.Nature. 1984;312(5996):724-9. Peters TA, Kuijpers W, Tonnaer EL, van Muijen GN, Jap PH. Distribution and features of melanocytes during inner ear development in pigmented and albino rats. Hear Res. 1995 May;85(1-2):169-80. Peus D, Vasa RA, Beyerle A, Meves A, Krautmacher C, Pittelkow MR. UVB activates ERK1/2 and p38 signaling pathways via reactive oxygen species in cultured keratinocytes. J Invest Dermatol. 1999 May;112(5):751-6. Pfaffl MW. A new mathematical model for relative quantification in real-time RT-PCR. Nucleic Acids Res. 2001 May 1;29(9):e45. Phan, Tai A., Halliday, Gary M., Barnetson, Ross StC. & Damian, Diona L. Melanin differentially protects from the initiation and progression of threshold UVinduced erythema depending on UV waveband.Photodermatology, Photoimmunology & Photomedicine. 2006;22 (4), 174-180. Pierroz DD, Ziotopoulou M, Ungsunan L, Moschos S, Flier JS, Mantzoros CS. Effects of acute and chronic administration of the melanocortin agonist MTII in mice with dietinduced obesity. Diabetes. 2002 May;51(5):1337-45. Pingault V, Bondurand N, Kuhlbrodt K, Goerich DE, Prehu MO, Puliti A, Herbarth B, Hermans-Borgmeyer I, Legius E, Matthijs G, Amiel J, Lyonnet S, Ceccherini I, Romeo G, Smith JC, Read AP, Wegner M, and Goossens M. SOX10 mutations in patients with Waardenburg-Hirschsprung disease. Nat Genet. 1998;18: 171–173.
202
Pintucci G, Manzionna MM, Maida I, Boffi M, Boffoli D, Gallone A, Cicero R. Morphofunctional characterization of cultured pigment cells from Rana esculenta L. liver. In Vitro Cell Dev Biol. 1990 Jul;26(7):659-64. Potter P.K., Cortes-Hernandez J., Quartier P., Botto M., Walport M.J. Lupus-prone mice have an abnormal response to thioglycolate and an impaired clearance of apoptotic cells. J. Immunol. 2003;170:3223–3232. Potts AM. Further studies concerning the accumulation of polycyclic compounds on uveal melanin. Invest Ophthalmol. 1964 AUG;3:399-404. Price ER, Horstmann MA, Wells AG, Weilbaecher KN, Takemoto CM, Landis MW, Fisher DE. alpha-Melanocyte-stimulating hormone signaling regulates expression of microphthalmia, a gene deficient in Waardenburg syndrome. J Biol Chem. 1998 Dec 4;273(49):33042-7. Prins JB, Niesler CU, Winterford CM, Bright NA, Siddle K, O'Rahilly S, Walker NI, Cameron DP. Tumor necrosis factor-alpha induces apoptosis of human adipose cells Diabetes. 1997 Dec;46(12):1939-44. Prota G. Melanins and Melanogenesis. New York: Academic, 1992. Prota G. The chemistry of melanins and melanogenesis. Fortsch Chem Organ Natur. 1995;64:93–148. Prota, G. Progress in the chemistry of melanins and related metabolites. Med. Res. Rev. 1988;8, 525-556. Puffenberger EG, Hosoda K, Washington SS, Nakao K, deWit D, Yanagisawa M, Chakravarti A. A missense mutation of the endothelin-B receptor gene in multigenic Hirschsprung’s disease. Cell. 1994;79:1257–1266. Puri N, Gardner JM, Brilliant MH. Aberrant pH of melanosomes in pink-eyed dilution (p) mutant melanocytes. J Invest Dermatol. 2000 Oct;115(4):607-13.
203
Qiao H, Sonoda KH, Sassa Y, Hisatomi T, Yoshikawa H, Ikeda Y, Murata T, Akira S, Ishibashi T. Abnormal retinal vascular development in IL-18 knockout mice Lab Invest. 2004 Aug;84(8):973-80. Rabey JM, Hefti F. Neuromelanin synthesis in rat and human substantia nigra J Neural Transm Park Dis Dement Sect. 1990;2(1):1-14. Rajora N, Ceriani G, Catania A, Star RA, Murphy MT, Lipton JM. alpha-MSH production, receptors, and influence on neopterin in a human monocyte/macrophage cell line J Leukoc Biol. 1996 Feb;59(2):248-53. Ramaiah A. Melanosomal pH and the regulation of pigmentation Pigment Cell Res. 2002 Jun;15(3):239-40. Raposo G, Marks MS. The dark side of lysosome-related organelles: specialization of the endocytic pathway for melanosome biogenesis. Traffic. 2002; 3:237–248. Raposo, G., Tenza, D., Murphy, D. M., Berson, J. F. & Marks, M. S. Distinct protein sorting and localization to premelanosomes, melanosomes, and lysosomes in pigmented melanocytic cells. J. Cell Biol. 2001;152, 809–823. Reaven, G. M.. Role of insulin resistance in human disease. Diabetes. 1988; 37: 1595 1607. Reid K, Turnley AM, Maxwell GD, et al. Multiple roles for endothelin in melanocyte development: regulation of progenitor number and stimulation of differentiation. Development 1996;122:3911–3919. Ririe KM, Rasmussen RP, Wittwer CT. Product differentiation by analysis of DNA melting curves during the polymerase chain reaction. Anal Biochem. 1997 Feb 15;245(2):154-60.
204
Robins AH. Biological Perspectives on Human Pigmentation. Cambridge, UK: CambridgeUniv. Press, 1991. Rodriguez-Lopez JN, Tudela J, Varon R, Garcia-Canovas F. Kinetic study on the effect of pH on the melanin biosynthesis pathway. Biochim Biophys Acta. 1991 Feb 15;1076(3):379-86. Rosdahl IK and Szabo G. Mitotic activity of epidermal melanocytes in UV-irradiated mouse skin. J Invest Dermatol. 1978;70: 143–148. Rosen EM, Meromsky L, Setter E, Vinter DW, Goldberg ID. Purified scatter factor stimulates epithelial and vascular endothelial cell migration. Proc Soc Exp Biol Med. 1990 Oct;195(1):34-43. Ross R. Atherosclerosis is an inflammatory disease. Am Heart J. 1999 Nov;138,S419-20. Rouse J, Cohen P, Trigon S, Morange M, Alonso-Llamazares A, Zamanillo D, Hunt T, Nebreda AR. A novel kinase cascade triggered by stress and heat shock that stimulates MAPKAP kinase-2 and phosphorylation of the small heat shock proteins. Cell. 1994 Sep 23;78(6):1027-37. Rousseau K, Kauser S, Pritchard LE, Warhurst A, Oliver RL, Slominski A, Wei ET, Thody AJ, Tobin DJ, White A. Proopiomelanocortin (POMC), the ACTH/melanocortin precursor, is secreted by human epidermal keratinocytes and melanocytes and stimulates melanogenesis. FASEB J. 2007 Jun;21(8):1844-56. Rozanowska M, Sarna T, Land EJ, Truscott TG. Free radical scavenging properties of melanin interaction of eu- and pheo-melanin models with reducing and oxidising radicals. Free Radic Biol Med. 1999 Mar;26(5-6):518-25. Russo C, Olivieri O, Girelli D, Faccini G, Zenari ML, Lombardi S, Corrocher R. Antioxidant status and lipid peroxidation in patients with essential hypertension. J Hypertens. 1998 Sep;16(9):1267-71.
205
S. R. Edmondson, V. C. Russo, A. C. McFarlane, C. J. Wraight, and G. A. Werther. Interactions between Growth Hormone, Insulin-Like Growth Factor I, and Basic Fibroblast Growth Factor in Melanocyte Growth. J. Clin. Endocrinol. Metab., May 1, 1999; 84(5): 1638 - 1644. Sachsenmaier C, Radler-Pohl A, Muller A, Herrlich P, Rahmsdorf HJ. Damage to DNA by UV light and activation of transcription factors Biochem Pharmacol. 1994 Jan 13;47(1):129-36. Sarkar A, Sreenivasan Y, Manna SK. alpha-Melanocyte-stimulating hormone inhibits lipopolysaccharide-induced biological responses by downregulating CD14 from macrophages. FEBS Lett. 2003 Oct 23;553(3):286-94. Sarna T. Properties and function of the ocular melanin—a photobiophysical view. J Photochem Photobiol. 1992;12: 215–258. Sato, S., Roberts, K., Gambino, G., Cook, A., Kouzarides, T., and Goding, C. R. CBP/p300 as a co-factor for the microphthalmia transcription factor.Oncogene. 1997;14, 3083-3092. Satoh N, Ogawa Y, Katsuura G, Hayase M, Tsuji T, Imagawa K, Yoshimasa Y, Nishi S, Hosoda K and Nakao K. The arcuate nucleus as a primary site of satiety effect of leptin in rats. Neuroscience Letters. 1997;224, 149-152. Savage, D.B. et al. Resistin/Frizz3 expression in relation to obesity and peroxisome proliferator-activated receptor gamma action in humans. Diabetes. 2001;50, 2199-2202. Savill J, Dransfield I, Gregory C, Haslett C. A blast from the past: clearance of apoptotic cells regulates immune responses. Nat. Rev. Immunol. 2002;2:965. Savin C. The blood vessels and pigmentary cells of the inner ear. Ann Otol Rhinol Laryngol. 1965 Sep;74(3):611-22;
206
Scalia M, Geremia E, Corsaro C, Santoro C, Baratta D, Sichel G. Lipid peroxidation in pigmented and unpigmented liver tissues: protective role of melanin. Pigment Cell Res. 1990 Mar-Apr;3(2):115-9. Schaffler A, Scholmerich J, Buchler C. Mechanisms of disease: adipocytokines and visceral adipose tissue--emerging role in nonalcoholic fatty liver disease. Nat Clin Pract Gastroenterol Hepatol. 2005 Jun;2(6):273-80. Schallreuter K, Slominski A, Pawelek JM, Jimbow K, and Gilchrest BA. What controls melanogenesis? Exp Dermatol. 1998;7: 143–150. Schallreuter KU, Kothari S, Chavan B, Spencer JD. Regulation of melanogenesis-- controversies and new concepts Exp Dermatol. 2008 May;17(5):395-404. Schauer E, Trautinger F, Kock A, Schwarz A, Bhardwaj R, Simon M, Ansel JC, Schwarz T, Luger TA. Proopiomelanocortin-derived peptides are synthesized and released by human keratinocytes. J Clin Invest. 1994 May;93(5):2258-62. Scherer, H.J. Melanin pigmentation of the substantia nigra in primates. J Comp Neurology. 1939;71, 91-98. Schioth HB, Muceniece R, Larsson M, Wikberg JE. The melanocortin 1, 3, 4 or 5 receptors do not have a binding epitope for ACTH beyond the sequence of alpha-MSH J Endocrinol. 1997 Oct;155(1):73-8. Schmitz S, Thomas PD, Allen TM, Poznansky MJ, Jimbow K. Dual role of melanins and melanin precursors as photoprotective and phototoxic agents: inhibition of ultraviolet radiation-induced lipid peroxidation. Photochem Photobiol. 1995 Jun;61(6):650-5. Schmucker DL, Sachs H. Quantifying dense bodies and lipofuscin during aging: a morphologist's perspective. Arch Gerontol Geriatr. 2002 May-Jun;34(3):249-61. Schmucker DL. Hepatocyte fine structure during maturation and senescence J Electron Microsc Tech. 1990 Feb;14(2):106-25.
207
Schraermeyer U, Heimann K. Current understanding on the role of retinal pigment epithelium and its pigmentation. Pigment Cell Res 1999; 12: 219– 236. Schreyer SA, Chua SC Jr, LeBoeuf RC. Obesity and diabetes in TNF-alpha receptordeficient mice J Clin Invest. 1998 Jul 15;102(2):402-11. Schrott A, Spoendlin H. Pigment anomaly-associated inner ear deafness. Acta Otolaryngol. 1987 May-Jun;103(5-6):451-7. Schwartz MW Seeley RJ Campfield LA Burn P Baskin DG. Identification of targets of leptin action in rat hypo-thalamus Journal of Clinical Investigation. 1996;98 1101 –1106. Schwartz MW, Baskin DG, Kaiyala KJ and Woods SC. Model for the regulation of energy balance and adiposity by the central nervous system. American Journal of Clinical Nutrition. 1999;69, 584–596. Schwartz MW, Figlewicz DP, Baskin DG, Woods SC and Porte D. Insulin and the central regulation of energy balance. In Monographs 2; The Endocrine Pancreas, Insulin Action, and Diabetes. Endocrine Reviews. 1994;pp. 81–113. Schwartz RA. Acanthosis nigricans. J Am Acad Dermatol 1994;31(1):1-19; quiz 20-2. Schwindinger, W. F., Francomano, C. A., and Levine, M. A. Proc. Natl. Acad. Sci. 1992;89, 5152-5156. Sciuto S, Chillemi R, Patti A, Sichel G, Scalia M. Melanosomes from liver and skin of Rana esculenta L. A comparative chemical study Comp Biochem Physiol B. 1988;90(2):397-400. Seabra, M. C. & Coudrier, E. Rab GTPases and myosin motors in organelle motility. Traffic. 2004;5, 393–399.
208
Seagle BL, Rezai KA, Gasyna EM, Kobori Y, Rezaei KA, Norris JR Jr. Time-resolved detection of melanin free radicals quenching reactive oxygen species. J Am Chem Soc. 2005 Aug 17;127(32):11220-1. Seidensticker MJ, Behrens J. Biochemical interactions in the wnt pathway. Biochim Biophys Acta. 2000 Feb 2;1495(2):168-82. Semb H, Peterson J, Tavernier J, Olivecrona T. Multiple effects of tumor necrosis factor on lipoprotein lipase in vivo. J Biol Chem. 1987 Jun 15;262(17):8390-4. Semenza GL. HIF-1: using two hands to flip the angiogenic switch. Cancer Metastasis Rev. 2000;19(1-2):59-65. Shattock MJ, Haddock PS. Oxidant stress and the heart: modulation of ion transport mechanisms during ischemia and reperfusion. In: Immunopharmacology of free radical species. Academic Press: Baltimore, MD, 1991, 5372. Shattock MJ, Matsuura H, Ward JP Sodium pump current measured in cardiac ventricular myocytes isolated from control and potassium depleted rabbits. Cardiovasc Res. 1994 Dec;28(12):1854-62. Sherman ML, Spriggs DR, Arthur KA, Imamura K, Frei E 3rd, Kufe DW Recombinant human tumor necrosis factor administered as a five-day continuous infusion in cancer patients: phase I toxicity and effects on lipid metabolism. J Clin Oncol. 1988 Feb;6(2):344-50. Shibahara S, Takeda K, Yasumoto K, Udono T, Watanabe K, Saito H, and Takahashi K. Microphthalmia-associated transcription factor (MITF): multiplicity in structure, function,and regulation. J Invest Dermatol Symp Proc. 2001;6: 99–104. Shimomura, I., T. Funahashi, M. Takahashi, K. Maeda, K. Kotani, T. Nakamura, S. Yamashita, M. Miura, Y. Fukuda, K. Takemura, K. Tokunaga & Y. Matsuzawa. Enhanced expression of PAI-1 in visceral fat: possible contributor to vascular disease in obesity. Nature Med. 1996;2: 800–802.
209
Sichel G, Corsaro C, Scalia M, Sciuto S, Geremia E. Relationship between melanin content and superoxide dismutase (SOD) activity in the liver of various species of animals. Cell Biochem Funct. 1987 Apr;5(2):123-8. Sichel G, Scalia M, Mondio F, Corsaro C. The amphibian Kupffer cells build and demolish melanosomes: an ultrastructural point of view. Pigment Cell Res. 1997 Oct;10(5):271-87. Sieber-Blum, M. and Cohen, A. M. Clonal analysis of quail neural crest cells: they are pluripotent and differentiate in vitro in the absence of noncrest cells. Dev. Biol. 1980;80, 96-106. Siiteri PK. Adipose tissue as a source of hormones. Am J Clin Nutr. 1987 Jan;45(1 Suppl):277-82. Slominski A, Tobin DJ, Shibahara S, Wortsman J. Melanin pigmentation in mammalian skin and its hormonal regulation. Physiol Rev. 2004 Oct;84(4):1155-228. Smith SR, Gawronska-Kozak B, Janderova L, Nguyen T, Murrell A, Stephens JM, Mynatt RL. Agouti expression in human adipose tissue: functional consequences and increased expression in type II diabates. Diabetes. 2003 Dec;52(12):2914-22. Soukas A, Socci ND, Saatkamp BD, Novelli S, Friedman JM. Distinct transcriptional profiles of adipogenesis in vivo and in vitro. J Biol Chem. 2001 Sep 7;276(36):34167-74. Southard-Smith EM, Kos L, Pavan WJ. Sox10 mutation disrupts neural crest development in Dom Hirschsprung mouse model. Nat Genet. 1998 Jan;18(1):60-4. Spranger J, Kroke A, Mohlig M, Bergmann MM, Ritsow M, Boeing H and Pfeiffer AFfH. Adiponectin and protection against type II diabates mellitus. Lancet 361, 226-228. Spritz RA. Multi-organellar disorders of pigmentation: intracellular traffic jams in mammals, flies and yeast. Trends Genet. 2003;15: 337–340, 1999.
210
Star R.A., N. Rajora, J. Huang, et al. Evidence of autocrine modulation of macrophage nitric oxide synthase by α-melanocyte–stimulating hormone. Proc. Natl. Acad. Sci. USA. 1995;92: 8016–8020. Staricco RG. Amelanotic melanocytes in the outer sheath of the human hair follicle and their role in the repigmentation of regenerated epidermis. Ann NY Acad Sci. 1963;100: 239–255. Steinberg D. Low density lipoprotein oxidation and its pathobiological significance. J Biol Chem. 1997 Aug 22;272(34):20963-6. Steingrimsson E, Moore KJ, Lamoreux ML, Ferre-D'Amare AR, Burley SK, Zimring DC, Skow LC, Hodgkinson CA, Arnheiter H, Copeland NG, et al. Molecular basis of mouse microphthalmia (mi) mutations helps explain their developmental and phenotypic consequences. Nat Genet. 1994 Nov;8(3):256-63. Strobel A, Issad T, Camoin L, Ozata M and Strosberg AD. A leptin missense mutation associated with hypogonadism and morbid obesity. Nature Genetics. 1998;18, 213-215. Stucker M, Struk A, Altmeyer P, Herde M, Baumgartl H, Lubbers DW. The cutaneous uptake of atmospheric oxygen contributes significantly to the oxygen supply of human dermis and epidermis. J Physiol. 2002 Feb 1;538(Pt 3):985-94. Sugiyama S. Mode of redifferentiation and melanogenesis of melanocytes in mouse hair follicles. An ultrastructural and cytochemical study. J Ultrastruct Res. 1979 Apr;67(1):40-54. Summers, L.K.M., Samra, J.S., and Frayn, K.N. Atherosclerosis. 1999;147, 11-15. Summers, L.K.M., Samra, J.S., Humphreys, S.M., Morris, R.J. and Frayn, K.N. Subcutaneous abdominal adipose tissue blood flow: variation within and between subjects and relationship to obesity.Clin. Sci. 1996;91, 679-683.
211
Suzuki I, Cone RD, Im S, Nordlund J, and Abdel-Malek ZA. Binding of melanotropic hormones to the melanocortin receptor MC1R on human melanocytes stimulates proliferation and melanogenesis. Endocrinology. 1996;137: 1627–1633. Szekely-Klepser G, Wade K, Woolson D, Brown R, Fountain S, Kindt E. A validated LC/MS/MS method for the quantification of pyrrole-2,3,5-tricarboxylic acid (PTCA), a eumelanin specific biomarker, in human skin punch biopsies. J Chromatogr B Analyt Technol Biomed Life Sci. 2005 Nov 5;826(1-2):31-40. T. Nagatsu, M. Levitt and S. Udenfriend, Tyrosine hydroxylase, the initial step in norepinephrine biosynthesis, J. Biol. Chem. 1964;239, pp. 2910–2917. T. Sarna, B. Pilas, E. J. Land and T. G. Truscott. Photochemical studies of porphyrin melanin interaction Biochim. Biophys. Acta. 1986;883, 162–167. Tachibana M, Takeda K, Nobukuni Y, Urabe K, Long JE, Meyers KA, Aaronson SA, Miki T. Ectopic expression of MITF, a gene for Waardenburg syndrome type 2, converts fibroblasts to cells with melanocyte characteristics. Nat Genet. 1996 Sep;14(1):50-4. Tadokoro T, Kobayashi N, Zmudzka BZ, Ito S, Wakamatsu K, Yamaguchi Y, Korossy KS, Miller SA, Beer JZ, Hearing VJ. UV-induced DNA damage and melanin content in human skin differing in racial/ethnic origin. FASEB J. 2003 Jun;17(9):1177-9. Epub 2003 Apr 8. Takeda K, Yasumoto K, Kawaguchi N, Udono T, Watanabe K, Saito H, Takahashi K, Noda M, and Shibahara S. Mitf-D, a newly identified isoform, expressed in the retinal pigment epithelium and monocyte-lineage cells affected by Mitf mutations. Biochim Biophys Acta. 2002;1574: 15–23. Takeda K, Yasumoto K, Takada R, Takada S, Watanabe K, Udono T, Saito H, Takahashi K, Shibahara S. Induction of melanocyte-specific microphthalmia-associated transcription factor by Wnt-3a. J Biol Chem. 2000 May 12;275(19):14013-6. Takeuchi, S., Zhang, W., Wakamatsu, K., Ito, S., Hearing, V. J., Kraemer, K. H. & Brash, D. E. Proc. Natl. Acad. Sci. USA. 2004;101, 15076-15081.
212
Tang-Christensen M, Holst JJ, Hartmann B and Vrang N. The arcuate nucleus is pivotal in mediating the anorectic effects of centrally administered leptin. NeuroReport. 1999b;10, 1183-1187. Tartaglia LA, Dembski M, Weng X, Deng N, Culpepper J, Devos R, Richards GJ, Campfield LA, Clark FT and Deeds J. Identification and expression cloning of a leptin receptor, OB-R. Cell. 1995;83, 1263-1271. Taylor AW, Streilein JW, Cousins SW. Alpha-melanocyte-stimulating hormone suppresses antigen-stimulated T cell production of gamma-interferon. Neuroimmunomodulation. 1994 May-Jun;1(3):188-94. Taylor AW, Streilein JW, Cousins SW. Identification of alpha-melanocyte stimulating hormone as a potential immunosuppressive factor in aqueous humor. Curr Eye Res. 1992 Dec;11(12):1199-206. Taylor AW. Modulation of regulatory T cell immunity by the neuropeptide alphamelanocyte stimulating hormone. Cell Mol Biol (Noisy-le-grand). 2003 Mar;49(2):143-9. Terman A, Dalen H, Eaton JW, Neuzil J, Brunk UT. Aging of cardiac myocytes in culture: oxidative stress, lipofuscin accumulation, and mitochondrial turnover. Ann N Y Acad Sci. 2004 Jun;1019:70-7. Theos, A. C. et al. Functions of AP-3 and AP-1 in tyrosinase sorting from endosomes to melanosomes. Mol. Biol. Cell. 2005;16, 5356–5372. Thiboutot D, Sivarajah A, Gilliland K, Cong Z, Clawson G. The melanocortin 5 receptor is expressed in human sebaceous glands and rat preputial cells J Invest Dermatol. 2000 Oct;115(4):614-9. Tief K, Schmidt A, and Beermann F. New evidence for presence of tyrosinase in substantianigra, forebrain and midbrain. Brain Res. 1998;53: 307–310.
213
Tobin DJ, Colen SR, and Bystryn JC. Isolation and long-term culture of human hairfollicle melanocytes. J Invest Dermatol. 1995;104: 86–89. Tobin DJ, Hagen E, Botchkarev VA, and Paus R. Do hair bulb melanocytes undergo apoptosis during hair follicle regression (catagen)? J Invest Dermatol. 1998;111: 941-947. Tobin DJ, Slominski A, Botchkarev V, and Paus R. The fate of hair follicle melanocytes during the hair growth in mice. J Invest Dermatol Symp Proc. 1999;4: 323–332. Toda K, Pathak MA, Parrish JA, Fitzpatrick TB, Quevedo WC Jr. Alteration of racial differences in melanosome distribution in human epidermis after exposure to ultraviolet light Nat New Biol. 1972 Apr 5;236(66):143-5 Tomita Y, Maeda K, and Tagami H. Leukotrienes and thromboxane B2 stimulate normal human melanocytes in vitro: possible inducers of postinflammatory pigmentation. Tohoku J Exp Med. 1988;156: 303–304. Tomita Y, Maeda K, and Tagami H. Melanocyte-stimulating properties of arachidonic acid metabolites: possible role in postinflammatory pigmentation. Pigment Cell Res. 1992;5: 357–361. Tontonoz P, Kim JB, Graves RA, Spiegelman BM. ADD1: a novel helix-loop-helix transcription factor associated with adipocyte determination and differentiation. Mol Cell Biol. 1993 Aug;13(8):4753-9. Trayhurn P Hoggard N Mercer JG Rayner DV. Leptin: fundamental aspects International. Journal of Obesity. 1999;23 22 – 28. Trayhurn P, Beattie JH. Physiological role of adipose tissue: white adipose tissue as an endocrine and secretory organ. Proc Nutr Soc. 2001 Aug;60(3):329-39. Trayhurn P, Wang B, Wood IS. Hypoxia in adipose tissue: a basis for the dysregulation of tissue function in obesity? Br J Nutr. 2008 Apr 9;:1-9.
214
Trayhurn P, Wood IS. Adipokines: inflammation and the pleiotropic role of white adipose tissue. Br J Nutr. 2004 Sep;92(3):347-55. Tsigos, C., K. Arai, W. Hung, ET AL. Hereditary isolated glucocorticoid deficiency is associated with abnormalities of the adrenocorticotropin receptor gene. J. Clin. Invest. 1993;92: 2458–2461. Turrens JF, Lariccia J, Nair MG. Resveratrol has no effect on lipoprotein profile and does not prevent peroxidation of serum lipids in normal rats. Free Radic Res. 1997 Dec;27(6):557-62. Ujvari A, Aron R, Eisenhaure T, Cheng E, Parag HA, Smicun Y, Halaban R, Hebert DN. Translation rate of human tyrosinase determines its N-linked glycosylation level. J Biol Chem. 2001 Feb 23;276(8):5924-31. Urabe K, Aroca P, Tsukamoto K, Mascagna D, Palumbo A, Prota G, Hearing VJ. The inherent cytotoxicity of melanin precursors: a revision. Biochim Biophys Acta. 1994 Apr 28;1221(3):272-8. Uysal KT, Wiesbrock SM, Marino MW, Hotamisligil GS. Protection from obesity induced insulin resistance in mice lacking TNF-alpha function. Nature. 1997 Oct 9;389(6651):610-4 V J Hearing and T M Ekel Biochem. J. Mammalian tyrosinase. A comparison of tyrosine hydroxylation and melanin formation. 1976;157. Vaisse C, Clement K, Guy-Grand B, Froguel P. A frameshift mutation in human MC4R is associated with a dominant form of obesity. Nat Genet. 1998 Oct;2 Vendrell J, Broch M,Vilarrasa N, Molina A, Gomez JM, Gutierrez C, Simon I, Soler J, Richart C.2004. Resistin, adiponectin, ghrelin, leptin, and proinflammatory cytokines: relationships in obesity. Obes Res. 12(6):962-71.
215
Valverde, P., Healy, E., Jackson, I., Rees, J. L., and Thody, A. Variants of the MSH Receptor Gene Are Associated with Red Hair in Humans. J. Nat. Genet. 1995;11, 328-330. Ventre J, Doebber T, Wu M, MacNaul K, Stevens K, Pasparakis M, Kollias G, Moller DE. Targeted disruption of the tumor necrosis factor-alpha gene: metabolic consequences in obese and nonobese mice. Diabetes. 1997 Sep;46(9):1526-31. Vergoni AV, Bertolini A Role of melanocortins in the central control of feeding Eur J Pharmacol. 2000 Sep 29;405(1-3):25-32. Vijayasaradhi, S., Xu, Y. Q., Bouchard, B. & Houghton, A. N. Intracellular sorting and targeting of melanosomal membrane proteins: identification of signals for sorting of the human brown locus protein, gp75. J. Cell Biol. 1995;130, 807–820. Vincent HK, Powers SK, Stewart DS, Demirel H, Shanely A, Naito H. Obesity and myocardial oxidative stress. Int J Obes Relat Metab Disord. 1998; 22: 18. Vozarova de Courten B, Degawa-Yamauchi M, Considine RV, Tataranni PA. High serum resistin is associated with an increase in adiposity but not a worsening of insulin resistance in Pima Indians. Diabetes. 2004;53(5):1279-84. Wang CH, Lee TH, Lu CN, Chou WY, Hung KS, Concejero AM, Jawan B. Electroporative alpha-MSH gene transfer attenuates thioacetamide-induced murine hepatic fibrosis by MMP and TIMP modulation. Gene Ther. 2006 Jul;13(13):1000-9. Watanabe A, Takeda K, Ploplis B, Tachibana M. Epistatic relationship between Waardenburg syndrome genes MITF and PAX3. Nat Genet. 1998 Mar;18(3):283-6. Weilbaecher KN, Motyckova G, Huber WE, Takemoto CM, Hemesath TJ, Xu Y, Hershey CL, Dowland NR, Wells AG, Fisher DE. Linkage of M-CSF signaling to Mitf, TFE3, and the osteoclast defect in Mitf(mi/mi) mice. Mol Cell. 2001 Oct;8(4):749-58.
216
Weintraub H, Davis R, Tapscott S, Thayer M, Krause M, Benezra R, Blackwell TK, Turner D, Rupp R, Hollenberg S, et al. The myoD gene family: nodal point during specification of the muscle cell lineage. Science. 1991 Feb 15;251(4995):761-6. Weisberg SP, McCann D, Desai M, Rosenbaum M, Leibel RL, Ferrante AW Jr.Obesity is associated with macrophage accumulation in adipose tissue. J Clin Invest. 2003;112(12):1796-80. Wellen KE, Hotamisligil GS: Inflammation, stress, and diabetes. J Clin Invest.2005; 115:1111–1119. Wellen, K.E. and Hotamisligil, G.S. Obesity-induced inflammatory changes in adipose tissue. J. Clin. Invest. 2003;112, 1785-1788. Westgate GE, Craggs RI, and Gibson WT. Immune privilege in hair growth. J Invest Dermatol. 1991;97: 417–420. Widlund HR and Fisher DE. Microphthalamia-associated transcription factor: a critical regulator of pigment cell development and survival. Oncogene. 2003;22: 3035–3041. Wilson SG, Retallack RW, Kent JC, Worth GK, and Gutteridge DH. Serum free 1,25- dihydroxyvitamin D and the free 1,25-dihydroxyvitamin D index during a longitudinal study of human pregnancy and lactation. Clin Endocrinol. 1990;32: 613–622. Wintzen M, Yaar M, Burback JPH, and Gilchrest BA. Proopiomelanocortin gene product regulation in keratinocytes. J Invest Dermatol. 1996;106: 673–678. Witztum JL. The oxidation hypothesis of atherosclerosis. Lancet. 1994 Sep 17;344(8925):793-5. Witztum JL. The role of oxidized LDL in atherosclerosis Adv Exp Med Biol. 1991;285:353-65.
217
Wood IS, Wang B, Jenkins JR, Trayhurn P. The pro-inflammatory cytokine IL-18 is expressed in human adipose tissue and strongly upregulated by TNFalpha in human adipocytes. Biochem Biophys Res Commun. 2005 Nov 18;337(2):422-9. Woods SC, Chavez M, Park CR, Riedy C, Kaiyala K, Richardson RD, Figlewicz DP, Schwartz MW, Porte D and Seeley RJ. The evaluation of insulin as a metabolic signal influencing behavior via the brain. Neuroscience and Biobehavior Reviews. 1996;20,139–144. Woods SC, Seeley RJ, Porte D Jr and Schwartz MW. Signals that regulate food intake and energy homeostasis. Science. 1998;280, 1378-1383. Wu M, Hemesath TJ, Takemoto CM, Horstmann MA, Wells AG, Price ER, Fisher DZ, Fisher DE. c-Kit triggers dual phosphorylations, which couple activation and degradation of the essential melanocyte factor Mi. Genes Dev. 2000 Feb 1;14(3):301-12. Xia, Y. & J.E. Wikberg. Localization of ACTH receptor mRNA by in situ hybridization in mouse adrenal gland. Cell. Tissue. Res. 1996;286: 63–68. Xu H, Barnes GT, Yang Q, Tan G, Yang D, Chou CJ, Sole J, Nichols A, Ross JS, Tartaglia LA, Chen H. Chronic inflammation in fat plays a crucial role in the development of obesity-related insulin resistance. J Clin Invest. 2003 Dec;112(12):1821 30. Yada Y, Higuchi K, and Imokawa G. Effects of endothelins on signal transduction and proliferation in human melanocytes. J Biol Chem. 1991;266: 18352–18357. Yamaguchi Y, Itami S, Watabe H, Yasumoto K, Abdel-Malek ZA, Kubo T, Rouzaud F, Tanemura A, Yoshikawa K, Hearing VJ. Mesenchymal-epithelial interactions in the skin: increased expression of dickkopf1 by palmoplantar fibroblasts inhibits melanocyte growth and differentiation. J Cell Biol. 2004 Apr 26;165(2):275-85. Yamauchi T, Kamon J, Ito Y, Tsuchida A, Yokomizo T, Kita S, Sugiyama T, Miyagishi M, Hara K, Tsunoda M, Murakami K, Ohteki T, Uchida S, Takekawa S, Waki H, Tsuno NH, Shibata Y, Terauchi Y, Froguel P, Tobe K, Koyasu S, Taira K, Kitamura T, Shimizu
218
T, agai R & Kadowaki T.Cloning of adiponectin receptors that mediate anti-diabetic metabolic effects. Nature. 2003;769. Yamauchi T, Kamon J, Waki H, Terauchi Y, Kubota N, Hara K, Mori Y, Ide T, Murakami K, Tsuboyama-Kasaoka N, Ezaki O, Akanuma Y, Gavrilova O, Vinson C, Reitman ML, Kagechika H, Shudo K, Yoda M, Nakano Y, Tobe K, Nagai R, Kimura S, Tomita M, Froguel P & Kadowaki T. The fat-derived hormone adiponectin reverses insulin resistance associated with both lipoatrophy and obesity. Nature Medicine. 2001;7 941–946. Yasumoto K, Takeda K, Saito H, Watanabe K, Takahashi K, and Shibahara S. Microphthalmia-associated transcription factor interacts with LEF-1, a mediator of Wnt signaling. EMBO J. 2002;21: 2703–2714. Yasumoto, K., Yokoyama, K., Takahashi, K., Tomita, Y., and Shibahara, S. Functional Analysis of Microphthalmia-associated Transcription Factor in Pigment Cell-specific Transcription of the Human Tyrosinase Family Genes. J. Biol.Chem. 1997;272, 503-509. Yaswen L, Diehl N, Brennan MB, Hochgeschwender U. Obesity in the mouse model of pro-opiomelanocortin deficiency responds to peripheral melanocortin. Nat Med. 1999 Sep;5(9):1066-70. Ye J, Gao Z, Yin J, He Q.Hypoxia is a potential risk factor for chronic inflammation and adiponectin reduction in adipose tissue of ob/ob and dietary obese mice. Am J Physiol Endocrinol Metab. 2007 ;293(4):E1118-28. Yin D. Biochemical basis of lipofuscin, ceroid, and age pigment-like fluorophores Free Radic Biol Med. 1996;21(6):871-88. Yoon SW, Chun JS, Sung MH, Kim JY, Poo H. alpha-MSH inhibits TNF-alpha-induced matrix metalloproteinase-13 expression by modulating p38 kinase and nuclear factor kappaB signaling in human chondrosarcoma HTB-94 cells. Osteoarthritis Cartilage. 2008 Jan;16(1):115-24.
219
Young B, Heath JW, Stevens A, Lowe JS, Wheater PR & Burkitt HG. Wheater"s functional histology: a text and colour atlas. Churchill Livingstone, Edinburgh ; New York. 2000. Young RW. Solar radiation and age-related macular degeneration. Surv Ophthalmol. 1988;Jan-Feb;32(4):252-69. Young RW. Pathophysiology of age-related macular degeneration. Surv Ophthalmol. 1987;Mar-Apr;31(5):291-306. Yu B. Cellular defenses against damage from reactive oxygen species. Phys Rev. 1994; 74:139162. Yudkin JS, Coppack SW, Bulmer K, Rawesh A and Mohamed-Ali V. Lack of evidence for secretion of plasminogen activator inhibitor-1by human subcutaneous adipose tissue in vivo. Thrombosis research. 1999;96, 1-9. Yue TL, Mckenna PJ, Gu JL, Feuerstein GZ. Interleukin-8 is chemotactic for vascular smooth muscle cells. Eur J Pharmacol. 1993 Aug 10;240(1):81-4. Yukihiro Takemura, Noriyuki Ouchi, Rei Shibata, Tamar Aprahamian, Michael T. Kirber, Ross S. Summer, Shinji Kihara and Kenneth Walsh. Adiponectin modulate inflammatory reactions via calreticulin receptor–dependent clearance of early apoptotic bodies. . Clin. Invest. 2007;117(2): 375-386. Yutaka Matsumoto, Koji Horiba, Jiro Usuki, Shan C. Chu, Victor J. Ferrans, and Joel Moss. Markers of Cell Proliferation and Expression of Melanosomal Antigen in Lymphangioleiomyomatosis. Am. J. Respir. Cell Mol. Biol. 1999;21,327-336. Zecca L, Costi P, Mecacci C, Ito S, Terreni M, Sonnino S. Interaction of human substantia nigra neuromelanin with lipids and peptides. J Neurochem. 2000;74: 1758– 1765. Zecca L, Mecacci C, Seraglia R, Parati E. The chemical characterization of melanin contained in substantia nigra of human brain. Biochim Biophys Acta. 1992;1138: 6–10.
220
Zecca L, Shima T, Stroppolo A, Goj C, Battiston GA, Gerbasi R, Sarna T, Swartz HM. Interaction of neuromelanin and iron in substantia nigra and other areas of human brain. Neuroscience. 1996 Jul;73(2):407-15. Zecca L, Tampellini D, Gatti A, Crippa R, Eisner M, Sulzer D, Ito S, Fariello R, Gallorini M. The neuromelanin of human substantia nigra and its interaction with metals. J Neural Transm. 2002; 109: 663– 672. Zecca L, Zucca FA, Wilms H, Sulzer D. Neuromelanin of the substantia nigra: a neuronal black hole with protective and toxic characteristics. Trends Neurosci. 2003; 26: 578– 580. Zemel MB, Shi H. Pro-opiomelanocortin (POMC) deficiency and peripheral melanocortins in obesity. Nutr Rev. 2000 Jun;58(6):177-80. Zhang J, Qin Y, Zheng X, Qiu J, Gong L, Mao H, Jia W, Guo J. The relationship between human serum resistin level and body fat content, plasma glucose as well as blood pressure. Zhonghua Yi Xue Za Zhi. 2002 ;10;82(23):1609-12. Zhang Y, Olbort M, Schwarzer K, Nuesslein-Hildesheim B, Nicolson M, Murphy E, Kowalski TJ, Schmidt I, Leibel RL. The leptin receptor mediates apparent autocrine regulation of leptin gene expression. Biochem Biophys Res Commun. 1997 Nov 17;240(2):492-5. Zhe X, Schuger L. Combined smooth muscle and melanocytic differentiation in Lymphangioleiomyomatosis. J Histochem Cytochem. 2004 Dec;52(12):1537-42. Zhong Q, Sridhar S, Ruan L, Ding KH, Xie D, Insogna K, Kang B, Xu J, Bollag RJ, Isales CM. Multiple melanocortin receptors are expressed in bone cells. Bone. 2005 May;36(5):820-31. Zorad S, Fickova M, Zelezna B, Macho L, Kral JG. The role of angiotensin II and its receptors in regulation of adipose tissue metabolism and cellularity. Gen Physiol Biophys. 1995;14(5):383-91.
221
Curriculum Vitae
Manpreet Kaur Randhawa was born and raised in the state of Punjab present in the northern part of India. She has one sibling Bikramjit Singh Dhillon, who still reside in Punjab and cares for her a lot. She graduated from Punjab Agriculture University in 1999. After getting married she moved to US and joined George Mason University for further education. Right now she is the mom of two boys. She volunteered in NIH for month before starting the PhD degree. In the year 2007 she joined NIH as a visinting scientist along with persuing her degree in George Mason University.


![Melanin Translation[1]](https://img.pdfslide.net/doc/110x75/577d22411a28ab4e1e96f1ae/melanin-translation1.jpg)