Embed Size (px)
Citation preview

An extraordinary episode of Yellowstone caldera uplift,2004–2010, from GPS and InSAR observations
Wu‐Lung Chang,1 Robert B. Smith,2 Jamie Farrell,2 and Christine M. Puskas2
Received 9 September 2010; accepted 30 September 2010; published 3 December 2010.
[1] Geodetic measurements of Yellowstone grounddeformation from 2006 to June 2010 reveal decelerationof the recent uplift of the Yellowstone caldera followingan unprecedented period of uplift that began in 2004. In2006–2008 uplift rates decreased from 7 to 5 cm/yr and4 to 2 cm/yr in the northern and southwest caldera,respectively, and in 2009 rates further reduced to 2 cm/yrand 0.5 cm/yr in the same areas. Elastic‐dislocationmodeling of the deformation data robustly indicates anexpanding sill at ∼7–10 km depth near the top of aseismically imaged, crystallizing magma reservoir, with a60% decrease in the volumetric expansion rate between2006 and 2009. Reduction of hydrothermal‐volcanicrecharge from beneath the northeast caldera and seismicmoment release of the 2008 and 2010 large earthquakeswarms are plausible mechanisms for decelerating the calderauplift and may have influenced the change in recent calderamotion from uplift to subsidence. Citation: Chang, W.‐L.,R. B. Smith, J. Farrell, and C. M. Puskas (2010), An extraordinaryepisode of Yellowstone caldera uplift, 2004–2010, from GPS andInSAR observations, Geophys. Res. Lett. , 37 , L23302,doi:10.1029/2010GL045451.
1. Introduction
[2] The late‐Quaternary Yellowstone silicic volcanicsystem is characterized by extensive earthquake activity,extraordinarily high heat flow, widespread hydrothermalactivity, and rapid variations of ground deformation [e.g.,Smith et al., 2009]. Geodetic techniques including preciseleveling, GPS (Global Positioning System), and InSAR(Interferometric Synthetic Aperture Radar) revealed mul-tiple episodes of Yellowstone caldera uplift and subsi-dence from 1923 to 2003 with average rates of 1–2 cm/yr[Wicks et al., 2006; Puskas et al., 2007; Chang et al.,2007]. In addition, a secondary zone of uplift across thenorthern caldera rim near Norris Geyser Basin was observedfrom 1987 to 2003 by GPS and InSAR measurements, withan average rate of 1.0 ± 0.5 cm/yr [Wicks et al., 2006].Spatial and temporal variations of Yellowstone groundmovement are correlated with changes in seismic andhydrothermal activity in and around the caldera [Waite andSmith, 2002, Chang et al., 2007, Smith et al., 2009].[3] To monitor the temporal variation of ground defor-
mation in the context of the evolution of Yellowstone’s
volcanic features and related hazards, the University of Utahand EarthScope PBO (Plate Boundary Observatory) de-ployed and operated 14 continuous‐recording GPS stationswithin Yellowstone National Park (Figure 1a). In mid‐2004,GPS data revealed an acceleration of ground uplift acrossthe entire caldera, while subsidence near the northern calderaboundary initiated about two months later [Chang et al.,2007]. The GPS and InSAR measurements indicatedunexpectedly high uplift rates up to 7 cm/yr through 2006,over three times faster than that of previous caldera inflationepisodes. Concurrently, the subsidence rate of −3.5 cm/yrin the northern caldera was more than two times greaterthan that recorded in 1996–2003.[4] In this paper we present new measurements of Yellow-
stone deformation through mid‐2010 and evaluate thetemporal variations of magmatic sources interpreted to beresponsible for this most recent episode of caldera unrest.These results together with an analysis of seismic activity ofthe Yellowstone caldera provide information on how decadal‐scale uplift episodes are considered in the context of volcanohazards.
2. GPS and InSAR Measurements
[5] Position time series of continuous GPS stations(for more information see the auxiliary material) in andaround the Yellowstone caldera consistently reveal areduction in uplift rates from 2006 to 2010 (Figure 2)compared to the accelerated uplift from 2004 to 2006.1
The maximum total uplift of ∼25 cm was recorded at stationWLWY, located on the Sour Creek resurgent dome inthe northeast caldera, where the average uplift rate hasdecreased from ∼7 ± 0.2 cm/yr before 2007 to 5 ± 0.3 cm/yrand 2 ± 0.3 cm/yr in the periods of 2007–2008 and2008–2009, respectively (Figure 1b). At the Mallard Lakeresurgent dome in the southwest caldera, vertical motionat station OFW2 near Old Faithful has decreased from4.2 ± 0.2 cm/yr to 2.3 ± 0.2 cm/yr in 2008 and 0.5 ± 0.2 cm/yrin 2009 (Figure 1b). The Norris area has experienced groundsubsidence with rates from −3.2 ± 0.2 cm/yr in 2004–2006 to−0.9 ± 0.2 cm/yr in 2008–2009 at station NRWY.[6] Note that Figure 2 reveals a caldera‐wide change
to subsidence along with coincident changes in horizontalmotions (e.g., from SE to NW at WLWY) during the firstsix months of 2010. Although further geodetic observationsare needed to confirm the continuation of the subsidence toavoid disturbances of non‐tectonic transient signals, the asso-ciation of this deformation with the 2010 earthquake swarm(Figure 2) is notable and will be discussed later in this paper.
1Department of Earth Sciences, National Central University, Jhongli,Taiwan.
2Department of Geology and Geophysics, University of Utah, SaltLake City, Utah, USA.
Copyright 2010 by the American Geophysical Union.0094‐8276/10/2010GL045451
1Auxiliary materials are available in the HTML. doi:10.1029/2010GL045451.
GEOPHYSICAL RESEARCH LETTERS, VOL. 37, L23302, doi:10.1029/2010GL045451, 2010
L23302 1 of 6

[7] Responding to this unprecedented deformation epi-sode, the University of Utah conducted two GPS surveys inYellowstone during the summers of 2008 and 2009, re-occupying 15 sites established in earlier surveys near thetwo resurgent domes where the highest rates of calderainflation were observed (Figure 1a). Data from these surveyssupplemented the permanent GPS stations to increase thespatial sampling of ground deformation (Figure 3). Thesedata reveal up to 2.5 cm of uplift and 0.8 cm of horizontalmotion radially outward from the Sour Creek dome in2008–2009. The caldera uplift was lower to the southwest(∼0.5–0.6 cm), and reversed to subsidence toward the
northwest caldera boundary. Note that the previous GPSsurvey in Yellowstone was conducted in 2003, prior to thestart of this deformation episode. For comparison, we esti-mated the ground motion based on the 2003 and 2008 surveydata. The results show a similar deformation pattern butmuch higher rates than that of 2008–2009 GPS observations.[8] InSAR measurements of the Yellowstone area also
show spatial and temporal variations of ground deformationin a near‐vertical, or satellite line‐of‐sight (LOS), directionfrom the autumn periods of 2004 to 2009. Figure 3 showsthat the recent 2008–2009 caldera uplift had magnitudes of∼2 cm at the Sour Creek dome and <1 cm at the Mallard Lake
Figure 1. (a) Map showing the Yellowstone volcanic system and locations of continuous (squares) and campaign(triangles) GPS stations used in this study. SC, Sour Creek dome; ML, Mallard Lake dome; NGB, Norris Geyser Basin,YL, Yellowstone Lake. White and gray circles show background seismicity and swarm earthquakes during the period of the2004–2010 caldera uplift, respectively. The two large earthquake swarms at the north of Yellowstone Lake (2008–12) and thewestern caldera boundary (2010–01) are shown in red circles. Gray lines showQuaternary faults. (b) Monthly earthquakes andthe cumulative seismic moment within the caldera, together with vertical displacements of the GPS stations WLWY andOFW2.
CHANG ET AL.: YELLOWSTONE CALDERA UPLIFT 2004–2010 L23302L23302
2 of 6

dome. An area of subsidence is also revealed across thenorthern caldera boundary near Norris, similar to thatgiven by Chang et al. [2007] although the maximum LOSvelocity decreased from −3.5 cm/yr in 2004–2006 to −1cm/yr in 2009.
3. Source Modeling
[9] We employed a nonlinear optimization technique[Cervelli et al., 2001; Chang et al., 2007] to evaluate thegeometry and volume change of rectangular dislocationsources in a homogeneous elastic half‐space that best fit theGPS and InSAR measurements for three distinct time peri-ods: 2005–2007, 2007–2008, and 2008–2009. The map andoblique views of the best‐fitting source models are shown inFigure 4, which include inflating sills with optimal dips of<6° and depths of 7–9 km beneath the caldera (Table S3).These modeled sills also have a geometry and location com-parable to the inverted source for the 2004–2006 accelerateduplift [Chang et al., 2007], with the area reduced about 30%in 2009. We therefore suggest the same expanding sourcewas responsible for the caldera uplift since 2004.[10] The average rate of volumetric expansion of the cal-
dera source decreased from 0.11 km3/yr in 2004–2006[Chang et al., 2007] to 0.06–0.07 km3/yr and 0.03 km3/yr in2005–2008 and 2008–2009, respectively. Note that previouscaldera deformation episodes were consistent with sourcevolume changes of 0.01–0.03 km3/yr [Wicks et al., 1998;Vasco et al., 2007] that are 2–10 times lower than ourmodeled rates of 2004–2008 but comparable to the valueof 2008–2009.[11] The modeled deflating sources were located at 7–13
km depth beneath the Norris area with rates of volumetriccontraction decreasing from −0.02 to −0.004 km3/yr in
2005–2009 (Figure 4). The confidence ranges of the sourcedepths (Table S3) suggest the same contracting volumeduring the time period, with its location similar to an
Figure 2. Temporal variations of Yellowstone caldera ground deformation determined by GPS. Each dot represents adaily position coordinate. From left to right the upward trend denotes north, east, and up motions, respectively, withup components scaled five times larger than the north and east. Gray lines indicate the time of the Dec. 2008 andJan. 2010 earthquake swarms.
Figure 3. 2008–2009 Yellowstone ground motion deter-mined by InSAR (LOS velocity in background) andGPS (red and white arrows denote vertical and horizontalvelocities, respectively) observations. Squares and trian-gles represent permanent and campaign GPS stations,respectively. Two ENVISAT IS2 images of 08/27/2008and 09/16/2009 were used to form the interferogram.Ellipses and bars represent 2‐s errors.
CHANG ET AL.: YELLOWSTONE CALDERA UPLIFT 2004–2010 L23302L23302
3 of 6

expanded magmatic sill modeled for InSAR measurementsof the ground uplift in 1996–2001 [Wicks et al., 2006].
4. Discussion
[12] Figure 4 shows that the modeled caldera sills of the2005–2009 geodetic data are near the top of a seismicallyimaged crystallizing magma reservoir at ∼8 km beneath thesurface [Husen et al., 2004]. This scenario is similar to thatof the 2004–2006 source model [Chang et al., 2007], sug-gesting that the pressurization of the Yellowstone crustalmagmatic system, possibly due to migration of magmatic
fluids from deeper (>10 km) to shallower parts of themagma reservoir [Fournier, 1989], can be the mechanismof the caldera uplift through 2009.[13] While magmatic intrusion was proposed as a plausi-
ble mechanism for the 2004–2009 Yellowstone uplift, cir-culation of shallow hydrothermal fluids (water and gases)could induce poroelastic transients and in turn cause rapidground inflation and deflation [e.g., Battaglia et al., 2006;Hutnak et al., 2009]. Seismic and geochemical evidencesuggested that the brittle, permeable hydrothermal systemof the Yellowstone caldera is shallower than ∼5 km[Fournier, 1989; Dzurisin et al., 1994], while our modeled
Figure 4. Source models of the Yellowstone crustal motion for three periods from 2005 to 2009. (left) Observed horizontal(white arrows) and vertical (black arrows) GPS velocities with background colors showing LOS velocity field measured byInSAR. Gray crosses are InSAR data points used for source inversion. Red and blue dashed rectangles represent surfaceprojections of modeled inflating and deflating sources, with solid lines indicating the up‐dip edges of the dislocations.(right) Oblique view (from NW) of the modeled sills superimposed on a seismically imaged partial‐molten body (see text).The distribution of opening rates of the inflating sill is shown on the top. The vertical exaggeration is a factor of two.
CHANG ET AL.: YELLOWSTONE CALDERA UPLIFT 2004–2010 L23302L23302
4 of 6
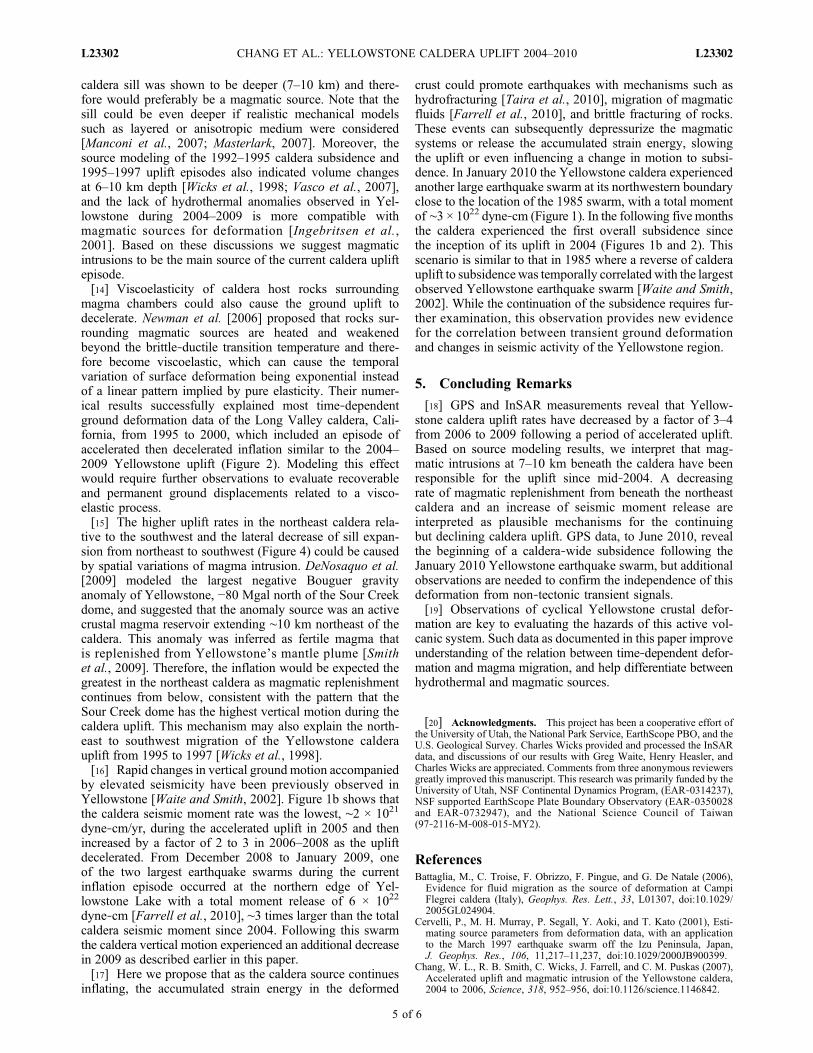
caldera sill was shown to be deeper (7–10 km) and there-fore would preferably be a magmatic source. Note that thesill could be even deeper if realistic mechanical modelssuch as layered or anisotropic medium were considered[Manconi et al., 2007; Masterlark, 2007]. Moreover, thesource modeling of the 1992–1995 caldera subsidence and1995–1997 uplift episodes also indicated volume changesat 6–10 km depth [Wicks et al., 1998; Vasco et al., 2007],and the lack of hydrothermal anomalies observed in Yel-lowstone during 2004–2009 is more compatible withmagmatic sources for deformation [Ingebritsen et al.,2001]. Based on these discussions we suggest magmaticintrusions to be the main source of the current caldera upliftepisode.[14] Viscoelasticity of caldera host rocks surrounding
magma chambers could also cause the ground uplift todecelerate. Newman et al. [2006] proposed that rocks sur-rounding magmatic sources are heated and weakenedbeyond the brittle‐ductile transition temperature and there-fore become viscoelastic, which can cause the temporalvariation of surface deformation being exponential insteadof a linear pattern implied by pure elasticity. Their numer-ical results successfully explained most time‐dependentground deformation data of the Long Valley caldera, Cali-fornia, from 1995 to 2000, which included an episode ofaccelerated then decelerated inflation similar to the 2004–2009 Yellowstone uplift (Figure 2). Modeling this effectwould require further observations to evaluate recoverableand permanent ground displacements related to a visco-elastic process.[15] The higher uplift rates in the northeast caldera rela-
tive to the southwest and the lateral decrease of sill expan-sion from northeast to southwest (Figure 4) could be causedby spatial variations of magma intrusion. DeNosaquo et al.[2009] modeled the largest negative Bouguer gravityanomaly of Yellowstone, −80 Mgal north of the Sour Creekdome, and suggested that the anomaly source was an activecrustal magma reservoir extending ∼10 km northeast of thecaldera. This anomaly was inferred as fertile magma thatis replenished from Yellowstone’s mantle plume [Smithet al., 2009]. Therefore, the inflation would be expected thegreatest in the northeast caldera as magmatic replenishmentcontinues from below, consistent with the pattern that theSour Creek dome has the highest vertical motion during thecaldera uplift. This mechanism may also explain the north-east to southwest migration of the Yellowstone calderauplift from 1995 to 1997 [Wicks et al., 1998].[16] Rapid changes in vertical ground motion accompanied
by elevated seismicity have been previously observed inYellowstone [Waite and Smith, 2002]. Figure 1b shows thatthe caldera seismic moment rate was the lowest, ∼2 × 10²¹
dyne‐cm/yr, during the accelerated uplift in 2005 and thenincreased by a factor of 2 to 3 in 2006–2008 as the upliftdecelerated. From December 2008 to January 2009, oneof the two largest earthquake swarms during the currentinflation episode occurred at the northern edge of Yel-lowstone Lake with a total moment release of 6 × 10²²
dyne‐cm [Farrell et al., 2010], ∼3 times larger than the totalcaldera seismic moment since 2004. Following this swarmthe caldera vertical motion experienced an additional decreasein 2009 as described earlier in this paper.[17] Here we propose that as the caldera source continues
inflating, the accumulated strain energy in the deformed
crust could promote earthquakes with mechanisms such ashydrofracturing [Taira et al., 2010], migration of magmaticfluids [Farrell et al., 2010], and brittle fracturing of rocks.These events can subsequently depressurize the magmaticsystems or release the accumulated strain energy, slowingthe uplift or even influencing a change in motion to subsi-dence. In January 2010 the Yellowstone caldera experiencedanother large earthquake swarm at its northwestern boundaryclose to the location of the 1985 swarm, with a total momentof ∼3 × 10²² dyne‐cm (Figure 1). In the following five monthsthe caldera experienced the first overall subsidence sincethe inception of its uplift in 2004 (Figures 1b and 2). Thisscenario is similar to that in 1985 where a reverse of calderauplift to subsidencewas temporally correlated with the largestobserved Yellowstone earthquake swarm [Waite and Smith,2002]. While the continuation of the subsidence requires fur-ther examination, this observation provides new evidencefor the correlation between transient ground deformationand changes in seismic activity of the Yellowstone region.
5. Concluding Remarks
[18] GPS and InSAR measurements reveal that Yellow-stone caldera uplift rates have decreased by a factor of 3–4from 2006 to 2009 following a period of accelerated uplift.Based on source modeling results, we interpret that mag-matic intrusions at 7–10 km beneath the caldera have beenresponsible for the uplift since mid‐2004. A decreasingrate of magmatic replenishment from beneath the northeastcaldera and an increase of seismic moment release areinterpreted as plausible mechanisms for the continuingbut declining caldera uplift. GPS data, to June 2010, revealthe beginning of a caldera‐wide subsidence following theJanuary 2010 Yellowstone earthquake swarm, but additionalobservations are needed to confirm the independence of thisdeformation from non‐tectonic transient signals.[19] Observations of cyclical Yellowstone crustal defor-
mation are key to evaluating the hazards of this active vol-canic system. Such data as documented in this paper improveunderstanding of the relation between time‐dependent defor-mation and magma migration, and help differentiate betweenhydrothermal and magmatic sources.
[20] Acknowledgments. This project has been a cooperative effort ofthe University of Utah, the National Park Service, EarthScope PBO, and theU.S. Geological Survey. Charles Wicks provided and processed the InSARdata, and discussions of our results with Greg Waite, Henry Heasler, andCharles Wicks are appreciated. Comments from three anonymous reviewersgreatly improved this manuscript. This research was primarily funded by theUniversity of Utah, NSF Continental Dynamics Program, (EAR‐0314237),NSF supported EarthScope Plate Boundary Observatory (EAR‐0350028and EAR‐0732947), and the National Science Council of Taiwan(97‐2116‐M‐008‐015‐MY2).
ReferencesBattaglia, M., C. Troise, F. Obrizzo, F. Pingue, and G. De Natale (2006),
Evidence for fluid migration as the source of deformation at CampiFlegrei caldera (Italy), Geophys. Res. Lett., 33, L01307, doi:10.1029/2005GL024904.
Cervelli, P., M. H. Murray, P. Segall, Y. Aoki, and T. Kato (2001), Esti-mating source parameters from deformation data, with an applicationto the March 1997 earthquake swarm off the Izu Peninsula, Japan,J. Geophys. Res., 106, 11,217–11,237, doi:10.1029/2000JB900399.
Chang, W. L., R. B. Smith, C. Wicks, J. Farrell, and C. M. Puskas (2007),Accelerated uplift and magmatic intrusion of the Yellowstone caldera,2004 to 2006, Science, 318, 952–956, doi:10.1126/science.1146842.
CHANG ET AL.: YELLOWSTONE CALDERA UPLIFT 2004–2010 L23302L23302
5 of 6

DeNosaquo, K., R. B. Smith, and A. R. Lowry (2009), Density and litho-spheric strength models of the Yellowstone‐Snake River Plain volcanicsystem from gravity and heat flow data, J. Volcanol. Geotherm. Res.,188, 108–127, doi:10.1016/j.jvolgeores.2009.08.006.
Dzurisin, D., K. M. Yamashita, and J. W. Kleinman (1994), Mechanisms ofcrustal uplift and subsidence at the Yellowstone caldera, Wyoming, Bull.Volcanol., 56, 261–270, doi:10.1007/BF00302079.
Farrell, J., R. B. Smith, T. Taira, W. L. Chang, and C. M. Puskas(2010), Dynamics and rapid migration of the energetic 2008–2009Yellowstone Lake earthquake swarm, Geophys. Res. Lett., 37, L19305,doi:10.1029/2010GL044605.
Fournier, R. O. (1989), Geochemistry and dynamics of the YellowstoneNational Park hydrothermal system, Annu. Rev. Earth Planet. Sci., 17,13–53, doi:10.1146/annurev.ea.17.050189.000305.
Husen, S., R. B. Smith, and G. P. Waite (2004), Evidence for gas andmagmatic sources beneath the Yellowstone volcanic field from seismictomographic imaging, J. Volcanol. Geotherm. Res., 131, 397–410,doi:10.1016/S0377-0273(03)00416-5.
Hutnak,M., S. Hurwitz, S. E. Ingebritsen, and P. A. Hsieh (2009), Numericalmodels of caldera deformation: Effects of multiphase andmulticomponenthydrothermal fluid flow, J. Geophys. Res., 114, B04411, doi:10.1029/2008JB006151.
Ingebritsen, S. E., D. L. Galloway, E. M. Colvard, M. L. Sorey, andR. H. Mariner (2001), Time‐variation of hydrothermal discharge atselected sites in the western United States: Implications for monitoring,J. Volcanol. Geotherm. Res., 111, 1–23, doi:10.1016/S0377-0273(01)00207-4.
Manconi, A., T. R. Walter, and F. Amelung (2007), Effects of mechanicallayering on volcano deformation, Geophys. J. Int., 170, 952–958,doi:10.1111/j.1365-246X.2007.03449.x.
Masterlark, T. (2007), Magma intrusion and deformation predictions:Sensitivities to the Mogi assumptions, J. Geophys. Res., 112, B06419,doi:10.1029/2006JB004860.
Newman, A. V., T. H. Dixon, and N. Gourmelen (2006), A four‐dimensionalviscoelastic deformation model for Long Valley caldera, California,
between 1995 and 2000, J. Volcanol. Geotherm. Res., 150, 244–269,doi:10.1016/j.jvolgeores.2005.07.017.
Puskas, C. M., R. B. Smith, C. M. Meertens, and W. L. Chang (2007),Crustal deformation of the Yellowstone‐Snake River Plain volcano‐tectonic system: Campaign and continuous GPS observations, 1987–2004, J. Geophys. Res., 112, B03401, doi:10.1029/2006JB004325.
Smith, R. B., M. Jordan, B. Steinberger, C. Puskas, J. Farrell, G. P. Waite,S. Husen, W. L. Chang, and R. O’Connell (2009), Geodynamics of theYellowstone hotspot and mantle plume: Seismic and GPS imaging,kinematics, and mantle flow, J. Volcanol. Geotherm. Res., 188, 26–56,doi:10.1016/j.jvolgeores.2009.08.020.
Taira, T., R. B. Smith, and W. L. Chang (2010), Seismic evidence for dila-tational deformation accompanying the 2004–2008 Yellowstone acceler-ated uplift episode, J. Geophys. Res., 115, B02301, doi:10.1029/2008JB006281.
Vasco, D. W., C. M. Puskas, R. B. Smith, and C. M. Meertens (2007),Crustal deformation and source models of the Yellowstone volcanic fieldfrom geodetic data, J. Geophys. Res., 112, B07402, doi:10.1029/2006JB004641.
Waite, G. P., and R. B. Smith (2002), Seismic evidence for fluid migrationaccompanying subsidence of the Yellowstone caldera, J. Geophys. Res.,107(B9), 2177, doi:10.1029/2001JB000586.
Wicks, C., W. Thatcher, and D. Dzurisin (1998), Migration of fluidsbeneath Yellowstone caldera inferred from satellite radar interferometry,Science, 282, 458–462, doi:10.1126/science.282.5388.458.
Wicks, C., W. Thatcher, D. Dzurisin, and J. Svarc (2006), Uplift, thermalunrest, and magma intrusion at Yellowstone caldera, observed withInSAR, Nature, 440, 72–75, doi:10.1038/nature04507.
W.‐L. Chang, Department of Earth Sciences, National Central University,300 Jhongda Rd., Jhongli 32001, Taiwan. ([email protected])J. Farrell, C. M. Puskas, and R. B. Smith, Department of Geology
and Geophysics, University of Utah, 135 S. 1460 E, Salt Lake City,UT 84112, USA.
CHANG ET AL.: YELLOWSTONE CALDERA UPLIFT 2004–2010 L23302L23302
6 of 6