Embed Size (px)
Citation preview
i
AN INTEGRATED MODEL FOR PRODUCTION
LINE BALANCING PLANNING
ALI ASGHAR JOMAH ADHAM
Thesis submitted in fulfillment of the requirements for the award of degree of Doctor of
Philosophy of Technology
Faculty of Technology
UNIVERSITI MALAYSIA PAHANG
12 April 2012
vi
ABSTRACT
Automobile manufacturing is one of the most important industries in the world. The
production line is one of the main supply chain of this industry. The production line
consists of four shops. The shops include many stations. Each station has several
variables such as car parts, materials, task's number, cycle time, number of workers, etc.
The task's numbers depend on the number of car parts and pieces depending on the type
of car. To complete tasks at the station, the workers need time to weld the pieces to the
structure of the car. The cycle times of these tasks are not equal in each station and
shop. The unbalance cycle time stations create queuing and idle time. The Production
Line Balancing Problem (PLBP) is one of the main focuses of research in automobile
manufacturing. The problem in PLBP is the queuing and the idle time during task
achievement that is an obstacle to efficient assembly line. Moreover, the unbalancing
problems also include the tasks number and the number of workers among the stations.
In addition, the unbalancing problem includes the unbalance between the quantity of the
customers demand and the production quantity, which are the Production Line Planning
(PLP) problems. This study used a new method to solve these problems. The new
method is the Multi-Objectives Model (MOM) combined with the Genetic Algorithm
(GA) system (MOM/GA). Furthermore, the Simulation Model (SM) is used to solve the
PLP problem to achieve the customer order by increasing the quantity of production.
The new approach is called Hybrid Model of the Production Line (HMPL) which is a
combination of MOM, GA, and SM. This approach is employed to solve the production
line problems and to develop the efficiency of the production line. As a result, the
Mixed Model (MM) that combines the MOM and GA is developed to solve the PLBP
and efficiency of the Production Line System (PLS) in order to reduce the queuing and
the idle time to obtain the best balance among the stations. Also the MM is applied to
PLS to re-regulate the tasks' number and re-distribute the jobs to the workers among the
stations in order to obtain the optimum solution. On the other hand, the SM is applied to
solve the planning problem to make new plans then to make several strategies to solve
the PLP problem and to achieve the customer orders. The aim of this study is to
combine MM and SM to develop the efficiency of the production line and to solve both
problems by using the output of MM as an input for SM and vice versa. This is a new
method to obtain the best or the optimum balance among the stations and also between
the quantity of customers demand and the production quantity. The method increased
the ratio of production and reduced the queuing and idle time by minimizing the
queuing and idle time and maximizing the productions, as well as balancing the tasks’
number and distributing the jobs to the workers evenly.
vii
ABSTRAK
Pengilangan keluaran automotif merupakan salah satu industri yang terpenting di
dunia. Operasi pengilangan automotif ini juga merupakan salah satu daripada rantaian
bekalan utama bagi industri ini. Operasi di kilang kebiasaannya dibahagikan kepada
empat pusat utama. Bagi setiap pusat ini pula terdapat bahagian-bahagian lain yang
dikenali sebagai stesen. Untuk setiap stesen ini terdapat beberapa parameter penting
seperti komponen kereta, bahan-bahan, nombor tugas, masa kitaran, bilangan pekerja,
dan lain-lain yang bergantung pula kepada bilangan alat-alat ganti kereta dan model
kereta. Untuk menyelesaikan tugasan di stesen ini, para pekerja memerlukan masa
tertentu untuk mengimpal kepingan alatan pada struktur kereta. Masa menyiapkan
tugasan ini tidak sama bagi setiap stesen-setesen ini. Disebabkan masa melakukan
sesuatu tugasan yang berbeza ini menyebabkan wujudnya keadaan menunggu giliran
dan masa tidak produktif. Masalah ketidakseimbang ini (PLBP) merupakan salah satu
fokus utama penyelidikan dalam industri pengilangan automotif. Masalah giliran dan
masa yang tidak produktif menyebabkan pencapaian tugasan menjadi penghalang
kecekapan pemasangan kenderaan. Selain itu, masalah ketidak seimbangan ini juga
berlaku dalam pengagihan bilangan tugasan dan pekerja di stesen-stesen berkenaan. Ia
juga menyebabkan ketidak seimbangan diantara kuantiti permintaan oleh pelanggan dan
kuantiti pengeluaran oleh kilang. Kajian penuelidikan ini dijalankan dengan
menggunakan metod baru bagi menyelesaikan masalah-masalah yang dinyatakan di
atas. Kaedah-kaedah baru ini dikenali sebagai Model Multi-Objektif (MOM) yang
digabungkan dengan Algoritma Genetik (GA) dikenali MOM/GA. Disamping itu juga,
Model Simulasi (SM) digunakan untuk menyelesaikan masalah PLP bagi memenuhi
permintaan pelanggan dengan meningkatkan kuantiti pengeluaran. Pendekatan baru ini
dikenali sebagai pemodelan Hibrid Pengeluaran (HMPL) yang merupakan gabungan
MOM, GA, dan SM. Pendekatan ini digunakan untuk menyelesaikan masalah-masalah
pengeluaran dan meningkatkan kecekapan pengeluaran kenderaan. Juga Model
gabungan ( MM) digunakan untuk mengawal selia bilangan tugasan dan mengagihkan
semula tugasan kepada pekerja-pekerja di stesen-stesen berkenaan bagi mendapatkan
penyelesaian optimum. SM juga digunakan untuk menyelesaikan masalah perancangan
bagi menilai beberapa strategi untuk menyelesaikan masalah PLP dan untuk menmenuhi
permintaan pelanggan. Tujuan kajian ini juga adalah untuk menggabungkan MM dan
SM bagi meningkatkan kecekapan pengeluaran dan untuk menyelesaikan masalah
kedua-duanya dengan menggunakan output MM sebagai input untuk SM dan
sebaliknya. Ini adalah satu kaedah baru untuk mendapatkan yang terbaik atau
keseimbangan yang optimum di kalangan stesen-stesen dan juga antara kuantiti
permintaan pelanggan-pelanggan dan kuantiti pengeluaran. Kaedah ini berjaya
meningkatkan nisbah pengeluaran dan mengurangkan masa menunggu dan masa tidak
produktif dengan meminimumkan masa menunggu dan masa tidak produktif. Ia juga
berupaya memaksimumkan pengeluaran kilang dan mengimbangi bilangan tugasan
dengan mengagihkan tugasan secara sama rata.
viii
TABLE OF CONTENTS
Page
SUPERVISOR’S DECLARATION ii
STUDENT’S DECLARATION iii
DEDICATION iv
ACKNOWLEDGEMENTS v
ABSTRACT vi
ABSTRAK vii
TABLE OF CONTENTS viii
LIST OF TABLES xiv
LIST OF FIGURES xviii
LIST OF NOMENCLATURES xxii
LIST OF ABBREVIATIONS xxiv
CHAPTER 1 INTRODUCTION
1.1 Background 1
1.2 System Description 3
1.3 Problem Background 4
1.3.1 Problem Description 4
1.3.2 Problem Statement 6
1.4 Research Objectives 7
1.5 Method of Analysis 7
1.5.1 Multi Objectives Model and Genetic Algorithm System 7
1.5.2 Simulation Model 8
1.5.3 Hybrid Model 8
1.5.4 Decision Support System 9
1.6 Scope of Study 9
1.7 Significant of Study 9
1.8 Thesis Organization 10
ix
CHAPTER 2 LITERATURE REVIEW
2.1 Introduction 12
2.2 Overview on Study of the Production Line 13
2.2.1 History of the Production Line 13
2.2.2 Design of the Production Line 15
2.2.3 Operation Research Models of Manufacturing System 17
2.3 Structure of the Production Line System 18
2.4 Background of Production Line Problems 20
2.4.1 Unbalanced Processing Time of Production Line 21
2.4.2 Production Line Plan Problem 22
2.5 Modeling Approaches to Production Line Problems 23
2.5.1 Multi-Objectives Model 23
2.5.2 Genetic Algorithm 26
2.5.3 Simulation Model 28
2.5.4 Hybrid Model 30
2.5.5 Decision Support System of the Manufacturing System 31
2.6 Different Approaches to Production Line Study 33
2.6.1 Researches that Applying Multi-Objectives Model 33
2.6.2 Researches that Applying MOM and GA system 35
2.6.3 Applying Simulation Model to Production Line Plan 37
2.6.4 Applying Hybrid Model of Production Line 39
2.6.5 Other Models Applied to the Production Line 40
2.7 Summary 43
CHAPTER 3 PRODUCTION LINE LAYOUT AND DATA COLLECTION
3.1 Introduction 44
3.2 Plant Layout of Production Line 45
3.3 Problems at Production Line 47
3.3.1 Balancing Problems in PLS 47
3.3.2 Problem Related to PLP 49
3.4 Methods of Data Collection 50
x
3.4.1 Technical Data (Reports) 50
3.4.2 Interview 51
3.4.3 System Observation 51
3.4.4 Other Resources 51
3.5 Production Line and Data Analysis 51
3.5.1 Body Shop (Welding Shop) 52
3.5.2 Assembly Shop 56
3.6 Production Line Plan 67
3.6.1 Production Line Plan for Case Under Study 68
3.7 Summary 70
CHAPTER 4 FORMULATION OF THE MIXED-MODEL OF MULTI-
OBJECTIVES MODEL AND GENETIC ALGORITHM
4.1 Introduction 71
4.2 Mixed Model of a Production Line 71
4.3 Formulating the Multi-Objectives Model 73
4.3.1 Objectives 73
4.3.2 Constraints 74
4.4 Genetic Algorithm Formulation 75
4.4.1 Objectives 76
4.4.2 Procedure of Genetic Algorithm 78
4.5 Mixed Model Optimum Solution 78
4.5.1 Algorithm of Mixed Model 80
4.5.2 Flowchart of Mixed Model 81
4.6 MATLAB`S Algorithm 84
4.7 Output of the Mixed Model 86
4.7.1 Output of Multi Objectives Model 86
4.7.2 Output of Genetic Algorithm 93
4.8 Summary
104
xi
CHAPTER 5 CONSTRUCTION OF SIMULATION MODEL OF
PRODUCTION PLAN
5.1 Introduction 105
5.2 Simulation Approach to the Production Planning Problem 105
5.3 Strategies of the Production Planning 107
5.4 Development of Production Line Plan Using Simulation 109
5.5 Formulation of Simulation Model 110
5.6 Simulation Modeling using MATLAB 112
5.6.1 Algorithm of the Software 112
5.6.2 Computer Programs 113
5.7 Simulation Model and Production Planning Analysis 115
5.8 Algorithm of the Planning Problem 117
5.9 The Flowchart of the Simulation Model 117
5.10 Output of Simulation Model 119
5.10.1 Daily plan 119
5.10.2 Weekly Plan 122
5.10.3 Monthly Plan 125
5.10.4 Six Monthly Plan 128
5.11 Summary 130
CHAPTER 6 DEVELOPMENT OF HYBRID MODEL OF THE
PRODUCTION LINE AND DSSPL
6.1 Introduction 131
6.2 Hybrid Model of the Production Line 131
6.3 Problem Background at Production Line 133
6.4 Structure of Hybrid Model 134
6.5 Hybrid Model Options 135
6.5.1 Option I 135
6.5.2 Option II 138
6.6 Development of the Hybrid Model 141
6.7 Optimum Solution of HMPL 142
xii
6.8 Significance of Hybrid Model 143
6.9 Results of the Hybrid Model 143
6.9.1 Results of Option I 143
6.9.2 Results of Option II 151
6.10 Decision Support System 155
6.11 Summary 157
CHAPTER 7 MODELS OUTPUT ANALYSIS
7.1 Introduction 158
7.2 Output Analysis of the Mixed Model 158
7.2.1 The Mixed Model with Queuing and Idle time 159
7.3 Analysis the Output of the Simulation Model 182
7.3.1 Quantity of Demand
7.3.2 Opportunity Loss
7.3.3 Capacity of the Production Line
183
184
184
7.4 Strategies of the Multi Plans 184
7.4.1 Strategy I 185
7.4.2 Strategy II 186
7.4.3 Strategy III 186
7.5 Analysis the Output of the HMPL 187
7.5.1 Analysis the Output of Option I 187
7.5.2 Analysis the Output of Option II 189
7.6 Optimum Solution 190
7.7 Summary 192
CHAPTER 8 CONCLUSION AND RECOMMENDATIONS FOR FUTURE
STUDY
8.1 Introduction 193
8.2 Overview of the Research Problem 193
8.3 Development of the Models 194
8.4 Discussion on the Approaches Methods 195
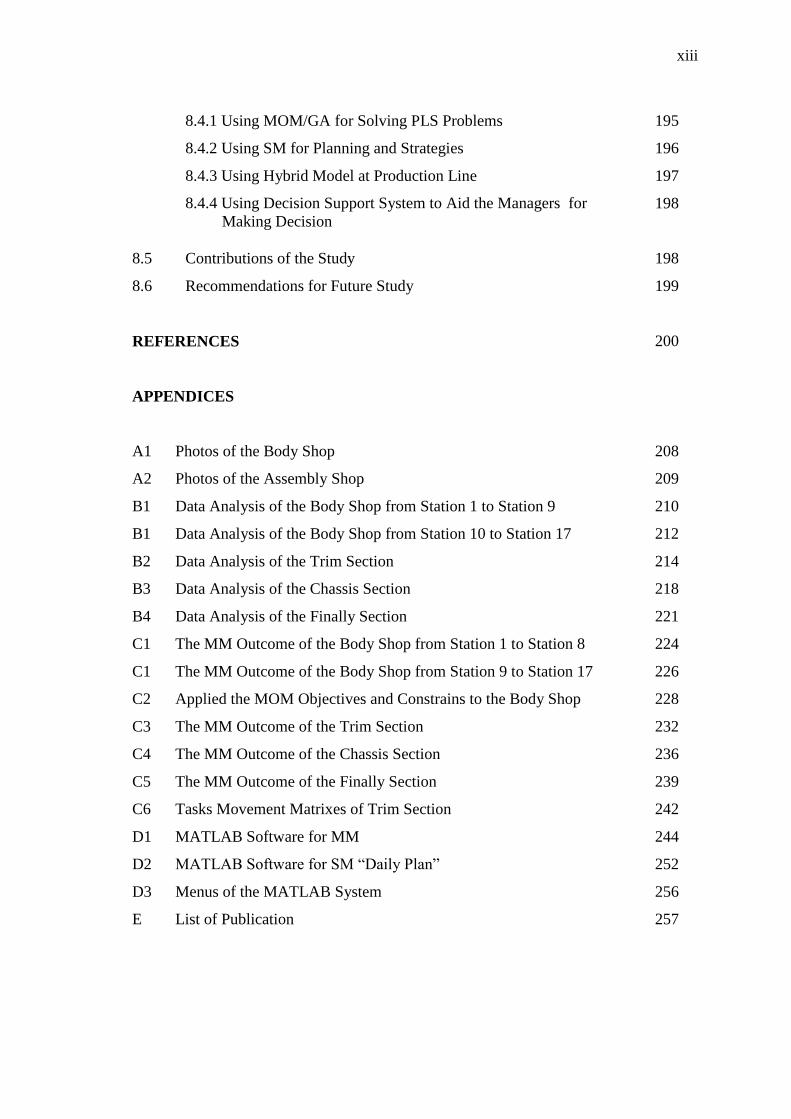
xiii
8.4.1 Using MOM/GA for Solving PLS Problems 195
8.4.2 Using SM for Planning and Strategies 196
8.4.3 Using Hybrid Model at Production Line 197
8.4.4 Using Decision Support System to Aid the Managers for
Making Decision
198
8.5 Contributions of the Study 198
8.6 Recommendations for Future Study 199
REFERENCES
200
APPENDICES
A1 Photos of the Body Shop 208
A2 Photos of the Assembly Shop 209
B1 Data Analysis of the Body Shop from Station 1 to Station 9 210
B1 Data Analysis of the Body Shop from Station 10 to Station 17 212
B2 Data Analysis of the Trim Section 214
B3 Data Analysis of the Chassis Section 218
B4 Data Analysis of the Finally Section 221
C1 The MM Outcome of the Body Shop from Station 1 to Station 8 224
C1 The MM Outcome of the Body Shop from Station 9 to Station 17 226
C2 Applied the MOM Objectives and Constrains to the Body Shop 228
C3 The MM Outcome of the Trim Section 232
C4 The MM Outcome of the Chassis Section 236
C5 The MM Outcome of the Finally Section 239
C6 Tasks Movement Matrixes of Trim Section 242
D1 MATLAB Software for MM 244
D2 MATLAB Software for SM “Daily Plan” 252
D3 Menus of the MATLAB System 256
E List of Publication
257
xiv
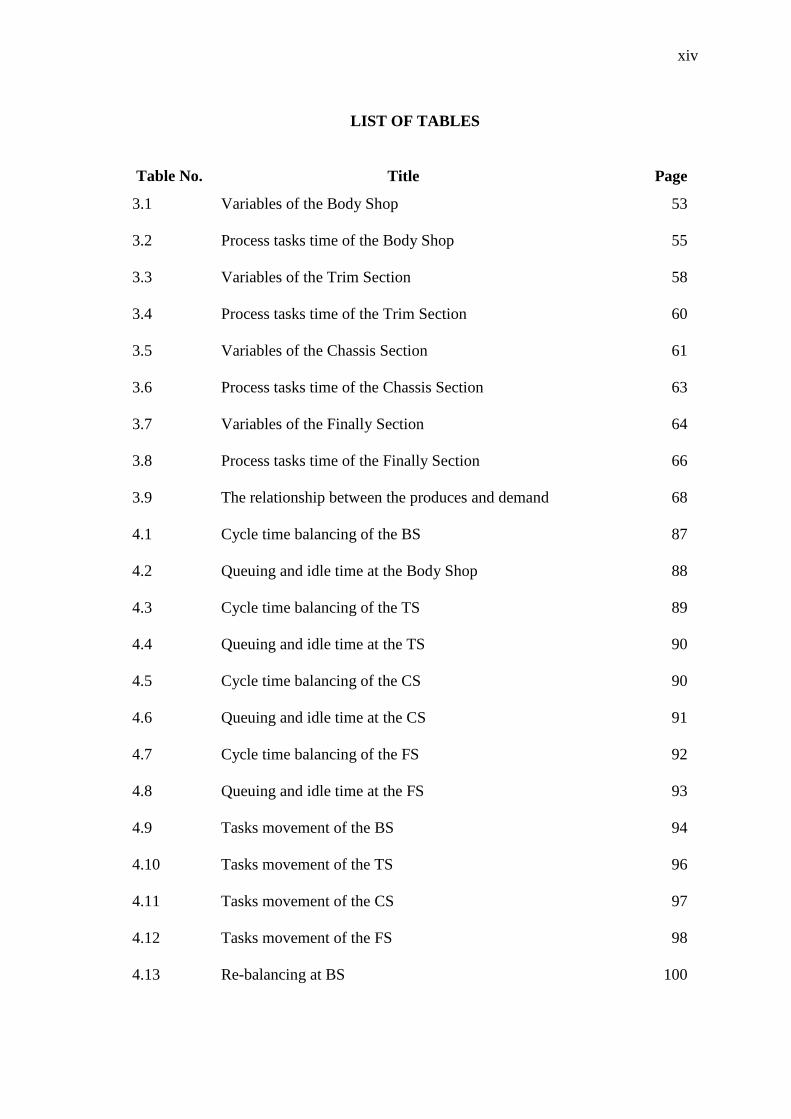
LIST OF TABLES
Table No. Title Page
3.1 Variables of the Body Shop 53
3.2 Process tasks time of the Body Shop 55
3.3 Variables of the Trim Section 58
3.4 Process tasks time of the Trim Section 60
3.5 Variables of the Chassis Section 61
3.6 Process tasks time of the Chassis Section 63
3.7 Variables of the Finally Section 64
3.8 Process tasks time of the Finally Section 66
3.9 The relationship between the produces and demand 68
4.1 Cycle time balancing of the BS 87
4.2 Queuing and idle time at the Body Shop 88
4.3 Cycle time balancing of the TS 89
4.4 Queuing and idle time at the TS 90
4.5 Cycle time balancing of the CS 90
4.6 Queuing and idle time at the CS 91
4.7 Cycle time balancing of the FS 92
4.8 Queuing and idle time at the FS 93
4.9 Tasks movement of the BS 94
4.10 Tasks movement of the TS 96
4.11 Tasks movement of the CS 97
4.12 Tasks movement of the FS 98
4.13 Re-balancing at BS 100
xv
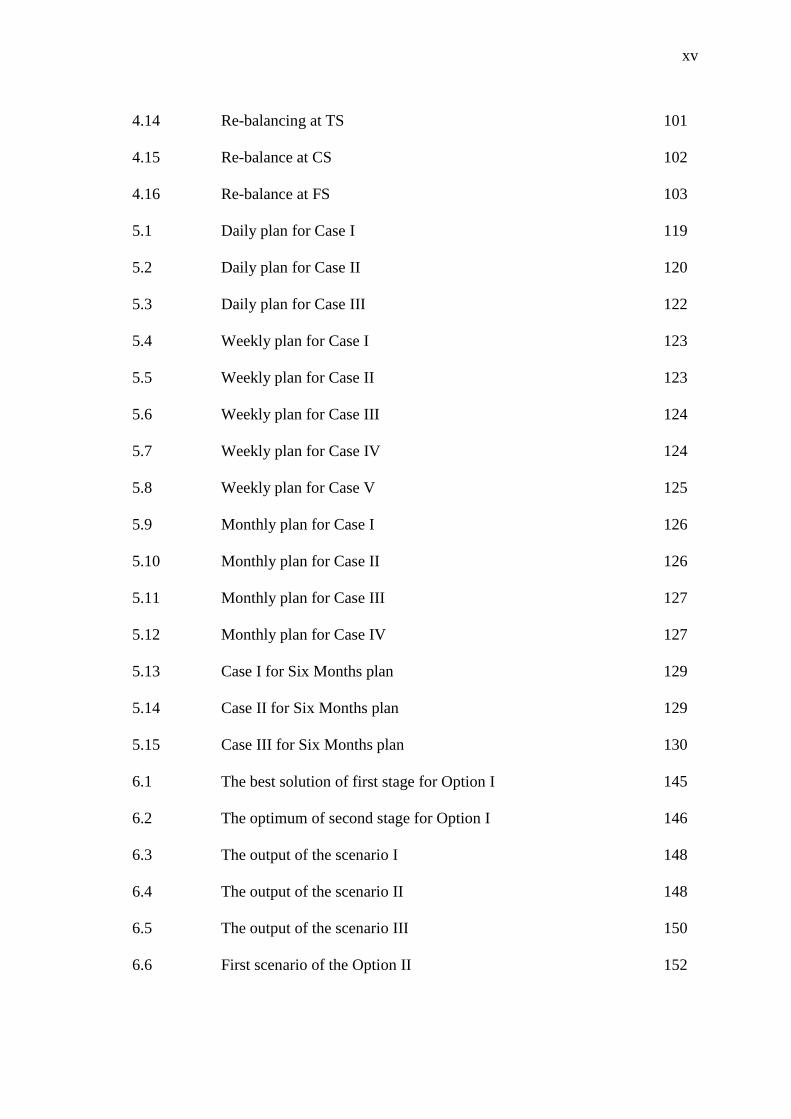
4.14 Re-balancing at TS 101
4.15 Re-balance at CS 102
4.16 Re-balance at FS 103
5.1 Daily plan for Case I 119
5.2 Daily plan for Case II 120
5.3 Daily plan for Case III 122
5.4 Weekly plan for Case I 123
5.5 Weekly plan for Case II 123
5.6 Weekly plan for Case III 124
5.7 Weekly plan for Case IV 124
5.8 Weekly plan for Case V 125
5.9 Monthly plan for Case I 126
5.10 Monthly plan for Case II 126
5.11 Monthly plan for Case III 127
5.12 Monthly plan for Case IV 127
5.13 Case I for Six Months plan 129
5.14 Case II for Six Months plan 129
5.15 Case III for Six Months plan 130
6.1 The best solution of first stage for Option I 145
6.2 The optimum of second stage for Option I 146
6.3 The output of the scenario I 148
6.4 The output of the scenario II 148
6.5 The output of the scenario III 150
6.6 First scenario of the Option II 152
xvi
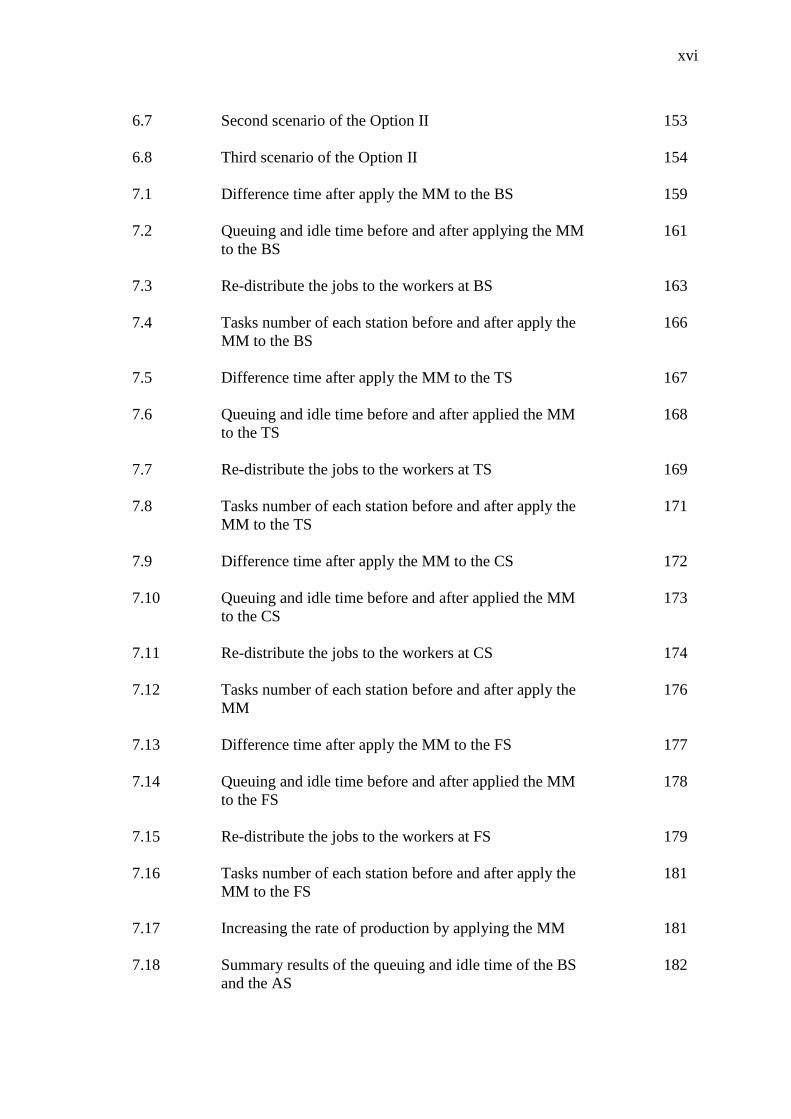
6.7 Second scenario of the Option II 153
6.8 Third scenario of the Option II 154
7.1 Difference time after apply the MM to the BS 159
7.2 Queuing and idle time before and after applying the MM
to the BS
161
7.3 Re-distribute the jobs to the workers at BS 163
7.4 Tasks number of each station before and after apply the
MM to the BS
166
7.5 Difference time after apply the MM to the TS 167
7.6 Queuing and idle time before and after applied the MM
to the TS
168
7.7 Re-distribute the jobs to the workers at TS 169
7.8 Tasks number of each station before and after apply the
MM to the TS
171
7.9 Difference time after apply the MM to the CS 172
7.10 Queuing and idle time before and after applied the MM
to the CS
173
7.11 Re-distribute the jobs to the workers at CS 174
7.12 Tasks number of each station before and after apply the
MM
176
7.13 Difference time after apply the MM to the FS 177
7.14 Queuing and idle time before and after applied the MM
to the FS
178
7.15 Re-distribute the jobs to the workers at FS 179
7.16 Tasks number of each station before and after apply the
MM to the FS
181
7.17 Increasing the rate of production by applying the MM 181
7.18 Summary results of the queuing and idle time of the BS
and the AS
182
xvii
7.19 New plan by apply the SM 185
7.20 First strategy 185
7.21 Second strategy 186
7.22 Third strategy 186
7.23 HMPL of option I 188
7.24 HMPL of option II 190
7.25 The best and optimum solution of production line 191
7.26 Total time increase by using HMPL 192
xviii
LIST OF FIGURES
Figure No. Title Page
1.1 Production line of automobile manufacturing system 3
1.2 Production line of assembly and sub-assembly line 4
1.3 Unbalance problem of the PLS 5
1.4 Relation between demand and produces 6
1.5 Structure of the HMPL 8
1.6 Thesis organization 10
2.1 The framework of Chapter 2 13
2.2 Production line development 14
2.3 Production line in 1955 15
2.4 U-shape assembly line 16
2.5 Two-sided design system 16
2.6 The PLS in automobile manufacturing 18
2.7 Production line with stations 19
2.8 PLS in automobile manufacturing 20
2.9 Unbalance problems in production line 21
2.10 Relations between the demand and the produces 22
2.11 Relation between the objectives and constraints 26
3.1 Framework of Chapter 3 44
3.2 Production line in automobile manufacturing system 45
3.3 Production line (Stations, Assembly, and Sub-assembly) 46
3.4 Variables of production line 47
3.5 Unbalancing problem in PLS 48
xix
3.6 Queuing and idle time of the production line 49
3.7 Relations between the produces and demand 50
3.8 Framework of the Body Shop 52
3.9 Relationship among variables of the BS 54
3.10 Cycle time stations at the BS 56
3.11 Framework of the Assembly Shop 57
3.12 Relationship among variables of the Trim section 59
3.13 Cycle time stations at the Trim section 61
3.14 Relationship among variables of the Chassis section 62
3.15 Cycle time stations at the Chassis section 64
3.16 Relationhip among stations at the Finally section 65
3.17 Cycle time stations at the Finally section 67
3.18 Quantity of demand and productions 69
3.19 Unbalance between the produces and demand 70
4.1 Mixed model (MOM / GA) 72
4.2 Tasks movement using GA 76
4.3 Movement type of the tasks 77
4.4 Optimazition method 79
4.5 Flowchart of MM 83
4.6 Programming using MATLAB 85
4.7 Tasks movement at Body Shop 95
4.8 Tasks movement at Trim section 96
4.9 Tasks movement at Chassis section 97
4.10 Tasks movement at Finally section 99
xx
4.11 Best balance at Body Shop 100
4.12 Best balance at Trim Section 102
4.13 Best balancing at Chassis Section 103
4.14 Best balancing at Finally Section 104
5.1 Unbalancing problem between the demand and production 107
5.2 Strategy planning between demand and products 108
5.3 Formulation of the SM 112
5.4 The algorithm of PLP using MATLAB 113
5.5 MATLAB software programming 114
5.6 Result of the MATLAB programming 115
5.7 Goals of the simulation model 116
5.8 Flowchart of the new plan 119
5.9 Daily plan for Case I 121
5.10 Daily plan for Case II 120
5.11 Daily plan for Case III 122
5.12 weekly plan for Case V 125
5.13 Monthly plan for Case IV 128
5.14 Case III for six months plan 131
6.1 Framework of hybrid models 132
6.2 Problems at the production line 133
6.3 Hybrid model in the Option I 135
6.4 Hybrid model flowchart of the Option I 137
6.5 Hybrid model in the Option II 138
6.6 Hybrid models flowchart of the Option II 140
xxi
6.7 Framework of hybrid model of production line 141
6.8 Optimum solution of the hybrid model for production line 142
6.9 Main menu for MATLAB software 155
6.10 Second menu of the MATLAB software 156
6.11 Third menu of the MATLAB software 157
7.1 Cycle time stations before and after applying the MM to the BS
160
7.2 Queuing and idle time among the stations before re-distribute the
jobs to the workers at BS
163
7.3 The queuing and idle time after re-distribution the jobs to the
workers at BS
163
7.4 Cycle time stations before and after applying the MM to the TS
167
7.5 Queuing and idle time among the stations before apply the MM
to the TS
169
7.6 The queuing and idle time after distribution of the jobs to
workers at the TS
170
7.7 Cycle time stations before and after applying the MM to the CS
172
7.8 Queuing and idle time among the stations before re-distribute the
jobs to the workers at the CS
174
7.9 The queuing and idle time after distribution the jobs to the
workers at the CS
175
7.10 Cycle time stations before and after applying the MM to the FS
177
7.11 Queuing and idle time among the stations before re-distribute the
jobs to the workers at the FS
179
7.12 Queuing and idle time after distribution the jobs to the workers
at the FS
180
7.13 Bottleneck of production line 183
7.14 The relations among the capacity, demand, and production 191
xxii
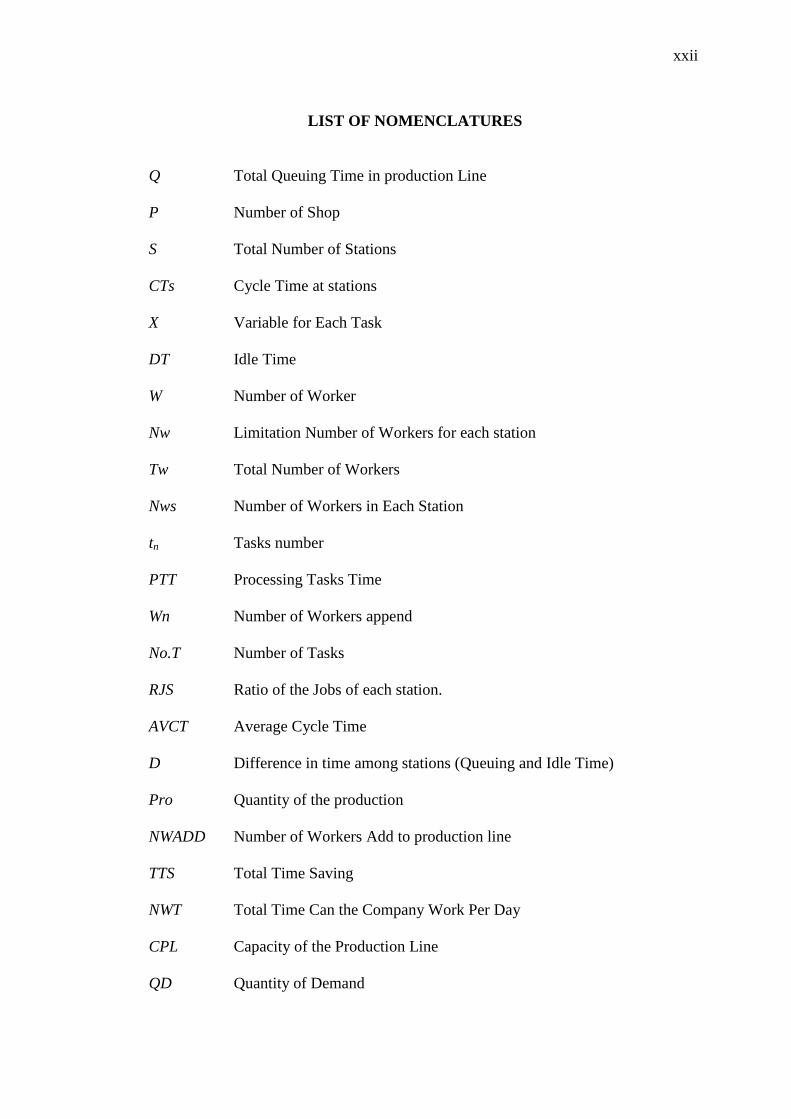
LIST OF NOMENCLATURES
Q Total Queuing Time in production Line
P Number of Shop
S Total Number of Stations
CTs Cycle Time at stations
X Variable for Each Task
DT Idle Time
W Number of Worker
Nw Limitation Number of Workers for each station
Tw Total Number of Workers
Nws Number of Workers in Each Station
tn Tasks number
PTT Processing Tasks Time
Wn Number of Workers append
No.T Number of Tasks
RJS Ratio of the Jobs of each station.
AVCT Average Cycle Time
D Difference in time among stations (Queuing and Idle Time)
Pro Quantity of the production
NWADD Number of Workers Add to production line
TTS Total Time Saving
NWT Total Time Can the Company Work Per Day
CPL Capacity of the Production Line
QD Quantity of Demand

xxiii
ATPOC The Average Time to Produce One Car
TJTEW Total Jobs Time for Each Worker in each station
NWES Number of Workers of Each Station
xxiv
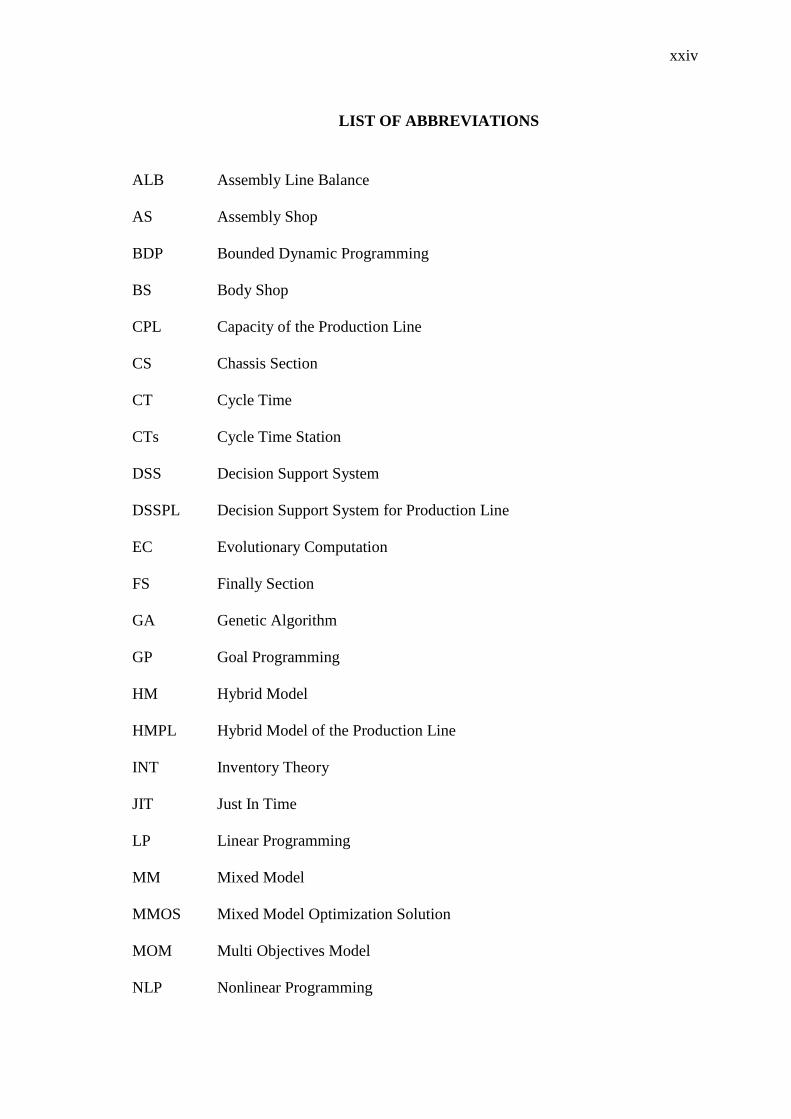
LIST OF ABBREVIATIONS
ALB Assembly Line Balance
AS Assembly Shop
BDP Bounded Dynamic Programming
BS Body Shop
CPL Capacity of the Production Line
CS Chassis Section
CT Cycle Time
CTs Cycle Time Station
DSS Decision Support System
DSSPL Decision Support System for Production Line
EC Evolutionary Computation
FS Finally Section
GA Genetic Algorithm
GP Goal Programming
HM Hybrid Model
HMPL Hybrid Model of the Production Line
INT Inventory Theory
JIT Just In Time
LP Linear Programming
MM Mixed Model
MMOS Mixed Model Optimization Solution
MOM Multi Objectives Model
NLP Nonlinear Programming
xxv
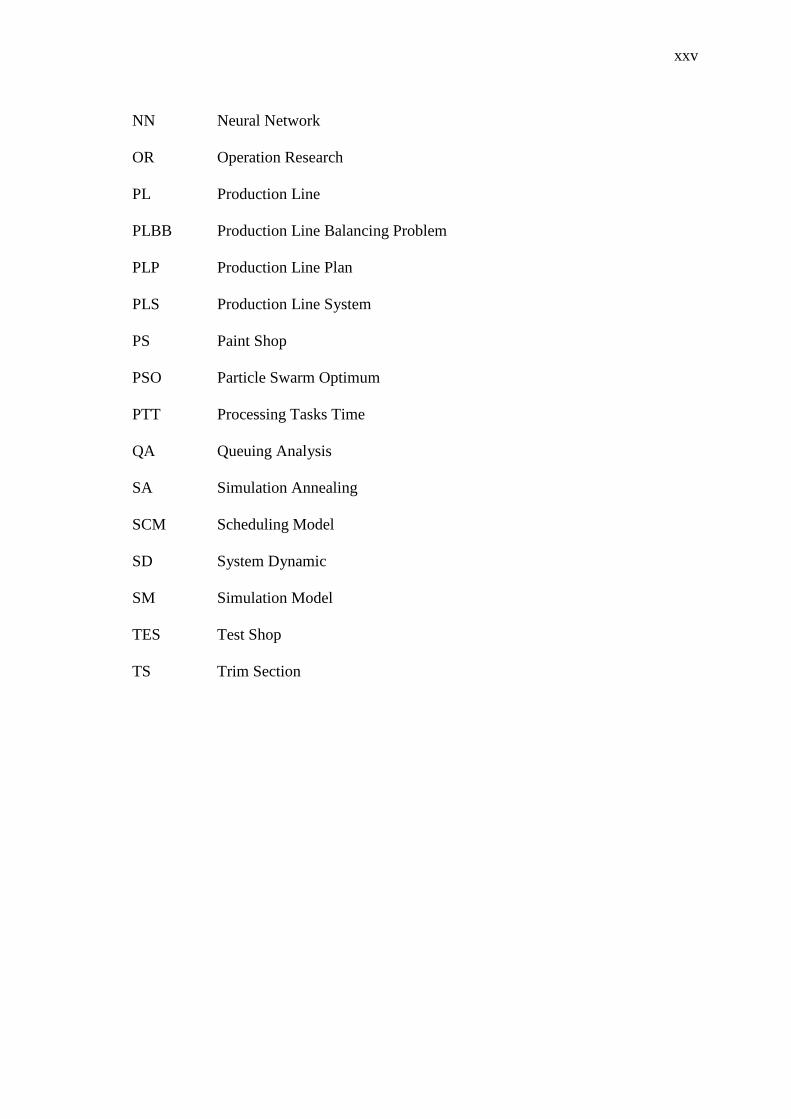
NN Neural Network
OR Operation Research
PL Production Line
PLBB Production Line Balancing Problem
PLP Production Line Plan
PLS Production Line System
PS Paint Shop
PSO Particle Swarm Optimum
PTT Processing Tasks Time
QA Queuing Analysis
SA Simulation Annealing
SCM Scheduling Model
SD System Dynamic
SM Simulation Model
TES Test Shop
TS Trim Section
26
CHAPTER ONE
INTRODUCTION
1.1 BACKGROUND
The automobile manufacturing is one of the most important industries to date
established in Germany in 1886. The industry has been relying on intensive labor since
its inception. Due to the durability of product life cycles and fierce competition, the
automobile industry has moved towards cost-effective products i.e., they produce a
variety of product types. Moreover, these automobile companies face tough challenges
in automobile production such as reducing time of the production line and developing
production plan that meets customers demand (Toshio et al., 1996; Gnoni and
Lavagilio, 2003; Mehrdad, 2004).
In the automobile manufacturing system, one of the areas under consideration is
Production Line Balancing Problem (PLBP) which distributes the total workload among
manufacturing stages (Toshio et al., 1996). There are many researchers who studied on
the problems regarding PLBP and Production Line System (PLS) in order to obtain the
best solution (Minh and Soemon, 2008). These important problems present the first
major problem of the production line.
Production Line Plan (PLP) is an important requirement of the automotive
manufacturing system to ensure the optimum balances between the quantity of
customers demand and the productions quantity, by producing a new management plan.
Sometime the managers of the production line cannot satisfy the customers due to gap
between the quantity of productions and the demand (Gnoni and Lavagilio, 2003). This
problem presents the second major problem of the production line.
27
There are several mathematical models that have been developed in the
automobile manufacturing industry such as linear programming (LP), queuing,
probability, simulation models, scheduling, neural network, system dynamic, and
statistics (Dalvi and Guay, 2009; Resano and Luis, 2009; Birkan and Cathal, 2012.).
Many of these models were developed based on decision support system that is used for
assisting the management to make decision (Poon et al., 2011). Nowadays, there is a
trend to develop a hybrid model which can be more efficient in solving complex
problems (Amir and Farhad, 2006; Burcin et al., 2011). In this study, two distinct
models are developed to solve PLBP and PLP problems. The two models are Multi
Objectives Model (MOM) and Simulation Model (SM). Further, a combination of these
two models will form a Hybrid Model of Production Line (HMPL). It is a desire that
HMPL will be a more powerful model that could solve a wider scope of problems for
producing an optimum plan for the production line. The study will also present a
Genetic Algorithm (GM) system that is embedded with MOM for obtaining an optimum
solution. This approach is still at an infancy stage among researchers.
In this study, MOM/GA is used to solve the queuing problem of the production
line which include several stations that consists many operations. The developed model
will be used to reduce the queuing among these stations, hence, resulting in minimized
cycle time, and maximized workload (Amir and Farhad, 2006). On the other hand, SM
approach was used to solve the planning problem by improving PLP and ensuring
optimum balance between the quantity of the customer’s demand and production
quantity (Ruey-Shun, C. and Kun-Yung, 2002).
The developed Decision Support System for Production Line (DSSPL) for this
study is an ultimate integration of MOM, GA, SM, and HMPL. The Decision Support
System (DSS) is an advanced method that applies these models to develop a plan and
system of the automobile manufacturing.
28
Body Shop Paint Shop
Assembly Shop Test Shop
Check
Park/ Storage
Destroy body car
Yes
No
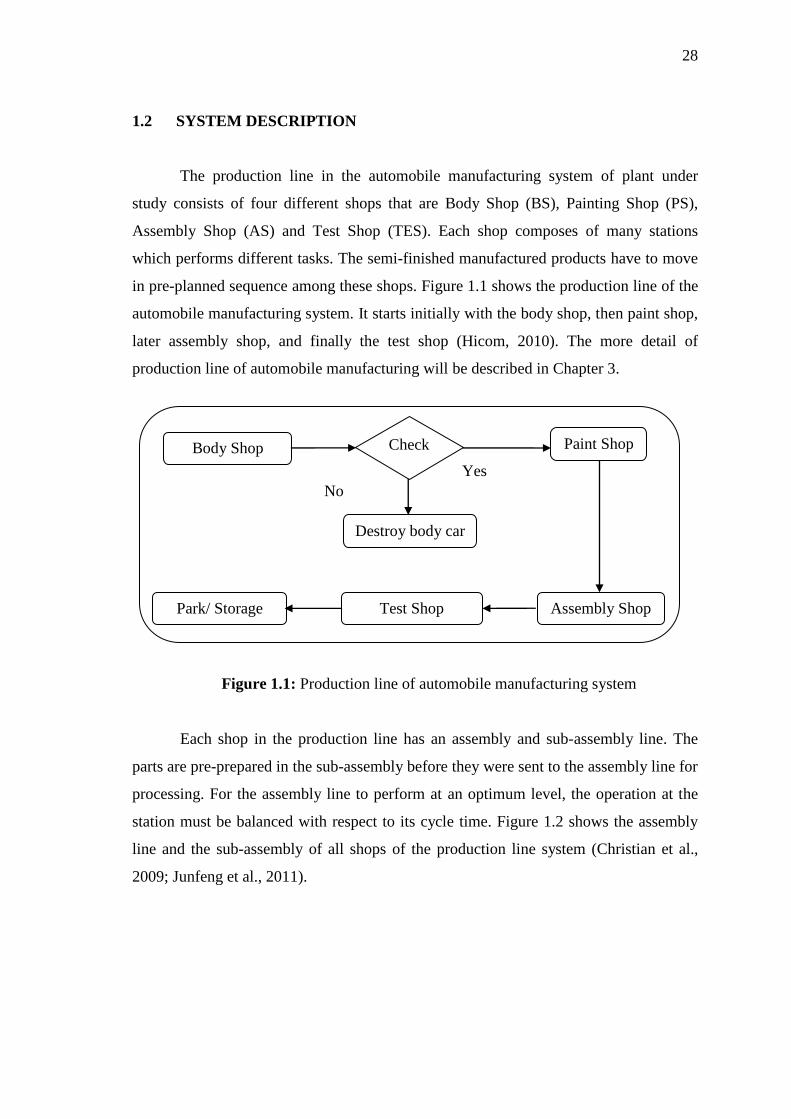
1.2 SYSTEM DESCRIPTION
The production line in the automobile manufacturing system of plant under
study consists of four different shops that are Body Shop (BS), Painting Shop (PS),
Assembly Shop (AS) and Test Shop (TES). Each shop composes of many stations
which performs different tasks. The semi-finished manufactured products have to move
in pre-planned sequence among these shops. Figure 1.1 shows the production line of the
automobile manufacturing system. It starts initially with the body shop, then paint shop,
later assembly shop, and finally the test shop (Hicom, 2010). The more detail of
production line of automobile manufacturing will be described in Chapter 3.
Figure 1.1: Production line of automobile manufacturing system
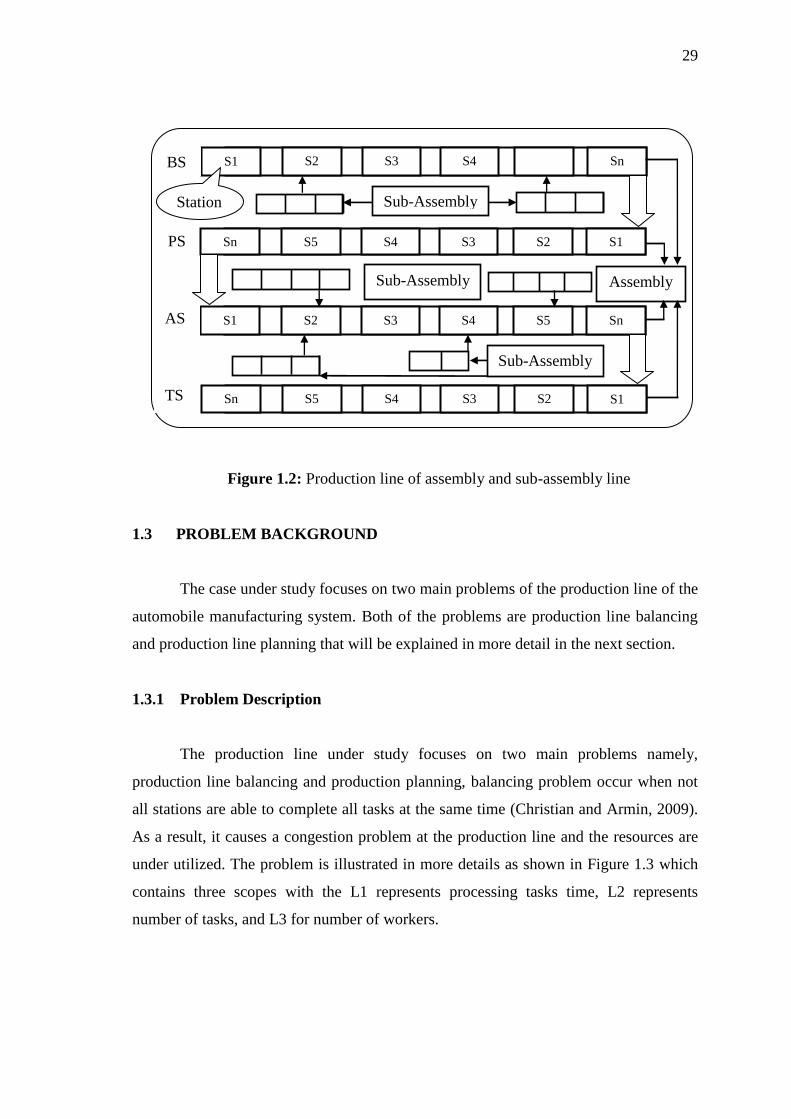
Each shop in the production line has an assembly and sub-assembly line. The
parts are pre-prepared in the sub-assembly before they were sent to the assembly line for
processing. For the assembly line to perform at an optimum level, the operation at the
station must be balanced with respect to its cycle time. Figure 1.2 shows the assembly
line and the sub-assembly of all shops of the production line system (Christian et al.,
2009; Junfeng et al., 2011).
29
Figure 1.2: Production line of assembly and sub-assembly line
1.3 PROBLEM BACKGROUND
The case under study focuses on two main problems of the production line of the
automobile manufacturing system. Both of the problems are production line balancing
and production line planning that will be explained in more detail in the next section.
1.3.1 Problem Description
The production line under study focuses on two main problems namely,
production line balancing and production planning, balancing problem occur when not
all stations are able to complete all tasks at the same time (Christian and Armin, 2009).
As a result, it causes a congestion problem at the production line and the resources are
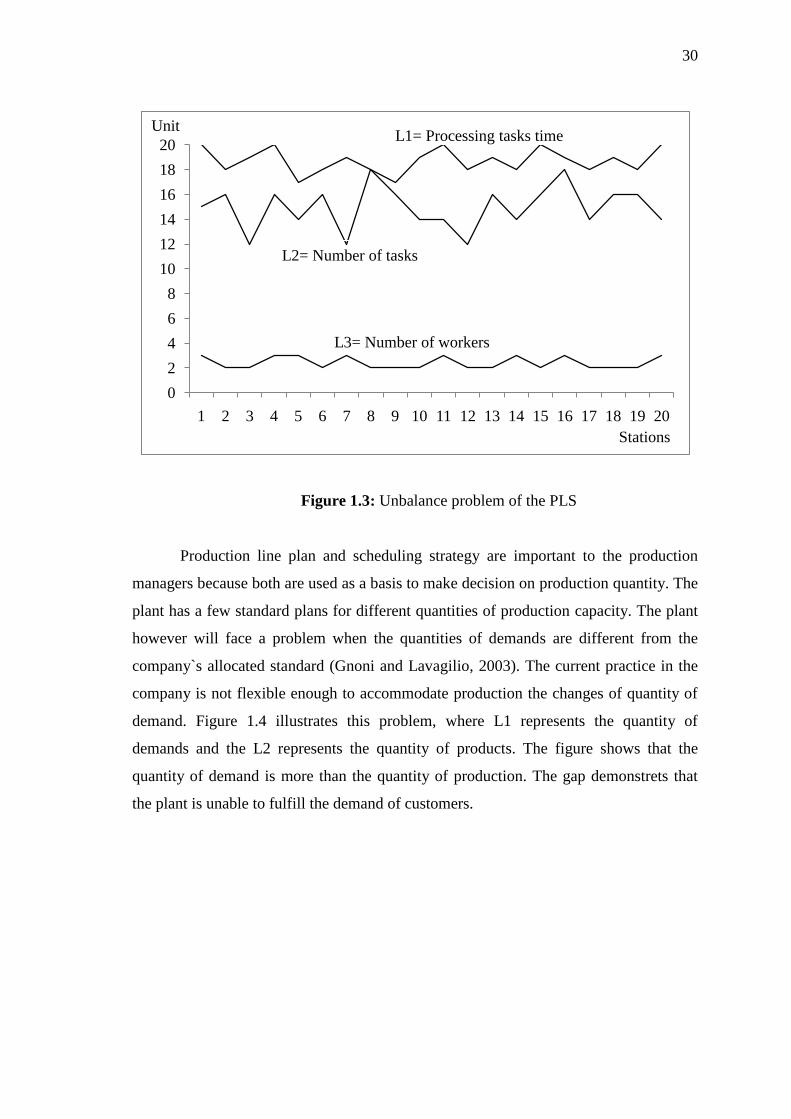
under utilized. The problem is illustrated in more details as shown in Figure 1.3 which
contains three scopes with the L1 represents processing tasks time, L2 represents
number of tasks, and L3 for number of workers.
Sn
S4
S3
S2
S1
S1 S2 S3 S4 S5 Sn
Sn S5 S4 S3 S2 S1
S1 S2
S3
S4
S5
Sn
BS
AS
PS
TS
Assembly
Sub-Assembly
Sub-Assembly
Sub-Assembly Station
30
Figure 1.3: Unbalance problem of the PLS
Production line plan and scheduling strategy are important to the production
managers because both are used as a basis to make decision on production quantity. The
plant has a few standard plans for different quantities of production capacity. The plant
however will face a problem when the quantities of demands are different from the
company`s allocated standard (Gnoni and Lavagilio, 2003). The current practice in the
company is not flexible enough to accommodate production the changes of quantity of
demand. Figure 1.4 illustrates this problem, where L1 represents the quantity of
demands and the L2 represents the quantity of products. The figure shows that the
quantity of demand is more than the quantity of production. The gap demonstrets that
the plant is unable to fulfill the demand of customers.
0
2
4
6
8
10
12
14
16
18
20
1 2 3 4 5 6 7 8 9 10 11 12 13 14 15 16 17 18 19 20
Stations
UnitL1= Processing tasks time
L2= Number of tasks
L3= Number of workers