Embed Size (px)
Citation preview
AN INTEGRATED PHYSICS-BASED RISK MODEL FOR ASSESSING THE ASTEROID THREAT
Samira Motiwala1, Donovan Mathias2, and Christopher Mattenberger3
1Universities Space Research Association, NASA Ames Research Center: Moffett Field, CA, 94035. [email protected]
2NASA Ames Research Center: Moffett Field, CA, 94035. [email protected] 3Science and Technology Corporation, NASA Ames Research Center: Moffett Field, CA, 94035.
Although most asteroids and other near-Earth objects (NEOs) do not pose a threat to Earth’s inhabitants, impacts from objects that are just tens of meters in diameter can cause significant damage if they occur over a populated area. This paper forms the foundation of an effort at NASA Ames Research Center to quantify these risks and identify the greatest risk-driving parameters and uncertainties. An integrated risk model that couples dynamic probabilistic simulations of strike occurrences with physics-based models of NEO impact damage factors has been developed to generate casualty estimates for a range of NEO impact properties. Currently, the model focuses on the risk due to blast overpressure damage from airbursts and impacts on land. The model is first used to reproduce results from established sources, and then is extended to perform sensitivity studies that yield greater insights into risk-driving parameters. Results show that meteor strength and entry angle play a role for small to mid-size NEOs, and that accounting for the specific target location significantly affects casualty estimates and dominates the risk. Future work will continue to refine and expand the models to better characterize key impact risk factors, include additional types of threats such as tsunamis and climate effects, and ultimately support assessments of potential asteroid mitigation strategies.
I. INTRODUCTION
Earth is bombarded by meteoroids and comet
fragments every day. The majority of these near-Earth objects (NEOs) are harmless—they either disintegrate high up in the atmosphere or are too small to cause significant damage upon impact. However, objects tens of meters to kilometers in size are capable of penetrating the atmosphere and either impacting the ground or airbursting low enough to cause substantial surface damage and threaten human life1. Recently released data from nuclear weapon test monitoring satellites indicate that the Earth is struck at a rate of two times per year by impact explosions
on the scale of an early atomic bomb2. Although the majority of such large impacts burst harmlessly high in the atmosphere and/or over unpopulated areas, they occur with enough likelihood and potential consequence to cause reasonable concern. Congress has mandated the National Aeronautics and Space Administration (NASA) to detect 90 percent of all NEOs at least 140 meters in diameter by 2020 (Ref. 3). As part of this effort, NASA has announced a Grand Challenge initiative focusing on detecting, characterizing, and mitigating potentially life-threatening asteroids4. The task of assessing, selecting, and designing appropriate asteroid mitigation strategies is a highly coupled problem that requires comprehensive assessment of impact risk factors and risk drivers.
Existing probabilistic risk assessment (PRA) models of asteroid threats do not incorporate the physics and dynamic interactions involved in these impacts, and are therefore unable to account for the high coupling of the relevant risk factors. Chapman and Morrison5 calculated the estimated casualties per year for pre-defined NEO size classes by adopting the average total Earth impact flux from Shoemaker6, using the Tunguska airburst’s yield energy as a reference point to estimate lethal damage area, and multiplying that area by the average world population density. Stokes et al.1 based their damage assessments on models from Hill and Goda7 and used a Monte Carlo analysis with a gridded world population density map to evaluate the impact risk for stony asteroids with a single fixed density and speed. From these analyses, they also estimated the fatalities per year from all potential impactors. Alan W. Harris, from the Space Science Institute, revised these results with updated size distribution estimates8.
Although such models have provided estimates of average NEO threat levels based on surveys of impact size and frequency, development of effective mitigation solutions requires specific details of threat levels as a function of many asteroid parameters. Higher-fidelity modeling and simulation can yield specific scenarios, accurately model mitigation strategies, and enable
researchers to understand where the greatest sensitivities to uncertainties lie.
The Engineering Risk Assessment (ERA) team at NASA Ames Research Center has developed an integrated, physics-based risk model to better characterize the NEO threat and investigate the effects of key asteroid/impact parameters on the expected level of damage. The integrated approach couples physics-based models of NEO impact damage factors with dynamic, Monte-Carlo-style probabilistic simulations of strike occurrences to estimate expected casualties for various NEO properties and determine the most sensitive risk-driving parameters. The ERA approach applied in this work focuses on developing dynamic, physics-based risk models to not only quantify the probabilities of individual failures, but also to learn about specific systems, identify risk-driving factors, and guide decision makers toward the most effective strategies for reducing risk9. When applied to asteroid threats, this approach can provide insight into the most effective mitigation strategies and help guide future research and development efforts to enhance protective capabilities in a cost-effective way.
This paper presents an overview of the modeling approach, simulation methods, and physics-based models used to assess the impact hazard. Results from an existing assessment are reproduced and compared as a benchmark to validate the model. A sensitivity analysis is then performed to demonstrate the significance of specific impactor parameters and strike location modeling approaches in estimating casualties. II. MODEL DEVELOPMENT AND SCOPE
Asteroid threats can be broken into three components: regional damage caused by airbursts or ground impacts onto land; tsunami damage from ocean impacts; and global climatic damage from large-scale impacts. Currently, the model only assesses the first component as an initial step to develop and illustrate the approach. However, future work will extend the model to include all three types of threats.
The 2003 NASA Study to Determine the Feasibility of Extending the Search for Near-Earth Objects to Smaller Limiting Diameters by Stokes et al.1—hereafter referred to as the “NEO report”—was used as a baseline for initial model development and validation, since it provides a thorough and comprehensive hazard analysis with relatively recent data. The NEO report assessment provides impact frequency data for various NEO size classes, and estimates the expected land impact/airburst damage and resulting fatalities for stony-type asteroids with a specific set of initial conditions (i.e., density, speed, and entry angle are fixed).
The current ERA asteroid threat model expands upon the NEO report results by assessing the damage from impactors with varying strength, density, speed, and entry
angle rather than just considering a single type of impactor with fixed parameters. This enables the model to produce estimated casualty numbers for a range of parameter values to demonstrate their relative significance in characterizing impact risks. The simulation model was developed as a stand-alone C++ code.
III. MODELING APPROACH
The integrated model incorporates the stochastic flux
of various types of NEOs, their physical properties (e.g., size, mass, and composition), and flight trajectory characteristics (e.g., entry speed, angle, and location) to predict the entry, breakup, and impact physics of NEO threats and estimate their corresponding damage. The impact hazard is assessed by simulating the probabilistic strike occurrences over a given time period in a Monte Carlo framework. In each realization of the Monte Carlo simulation, distributions of asteroid parameters are sampled to determine the attributes of the incoming threat. These coupled parameters are used as inputs to physics-based models of the blast overpressure hazard created from either an airburst or ground impact and the propagations of these hazardous environments are evaluated to determine the possible risk outcome.
III.A. Input Parameters
Input characteristics of the NEO are specified as a
range of values in the input file used to run the model. Specifically, the parameters used to describe the NEO include size, density, speed, strength, and impact frequency. The model randomly generates the latitude and longitude of each predicted strike in order to account for the fact that most NEO impacts will occur over or in the ocean or unpopulated terrain. World population density data was obtained from NASA’s Socioeconomic Data and Applications Center (SEDAC)10, where gridded datasets are constructed from national or subnational input units.
The SEDAC population density data used in this assessment has a 2.5-arcminute grid cell resolution (~5 km at the equator), provides estimates for the year 2000 (the most recent such data available), and is adjusted to match United Nations population totals. This gridded dataset does not include estimates for latitudes greater than 85 degrees or less than -58 degrees, since it is assumed that these regions are unpopulated. Furthermore, the population density values are based on the amount of land area within a given cell, neglecting any water area, rather than on the full area of the cell. The population from this dataset determines the range of casualties possible for a given strike.
The impact frequency input data comes from the NEO report. The NEO report provides impact frequencies for “bins” of NEO size ranges that are defined by a minimum, maximum, and midrange diameter. The NEO
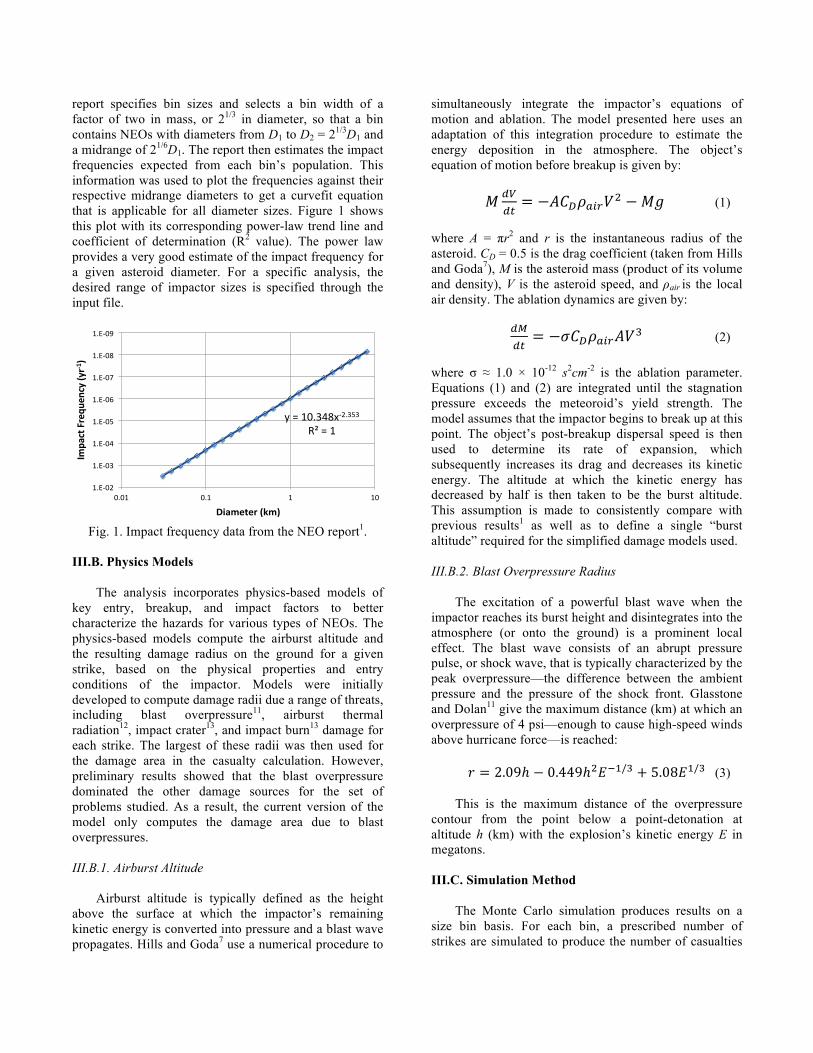
report specifies bin sizes and selects a bin width of a factor of two in mass, or 21/3 in diameter, so that a bin contains NEOs with diameters from D1 to D2 = 21/3D1 and a midrange of 21/6D1. The report then estimates the impact frequencies expected from each bin’s population. This information was used to plot the frequencies against their respective midrange diameters to get a curvefit equation that is applicable for all diameter sizes. Figure 1 shows this plot with its corresponding power-law trend line and coefficient of determination (R2 value). The power law provides a very good estimate of the impact frequency for a given asteroid diameter. For a specific analysis, the desired range of impactor sizes is specified through the input file.
Fig. 1. Impact frequency data from the NEO report1.
III.B. Physics Models
The analysis incorporates physics-based models of key entry, breakup, and impact factors to better characterize the hazards for various types of NEOs. The physics-based models compute the airburst altitude and the resulting damage radius on the ground for a given strike, based on the physical properties and entry conditions of the impactor. Models were initially developed to compute damage radii due a range of threats, including blast overpressure11, airburst thermal radiation12, impact crater13, and impact burn13 damage for each strike. The largest of these radii was then used for the damage area in the casualty calculation. However, preliminary results showed that the blast overpressure dominated the other damage sources for the set of problems studied. As a result, the current version of the model only computes the damage area due to blast overpressures. III.B.1. Airburst Altitude
Airburst altitude is typically defined as the height
above the surface at which the impactor’s remaining kinetic energy is converted into pressure and a blast wave propagates. Hills and Goda7 use a numerical procedure to
simultaneously integrate the impactor’s equations of motion and ablation. The model presented here uses an adaptation of this integration procedure to estimate the energy deposition in the atmosphere. The object’s equation of motion before breakup is given by:
𝑀 !"!"= −𝐴𝐶!𝜌!"#𝑉! −𝑀𝑔 (1)
where A = πr2 and r is the instantaneous radius of the asteroid. CD = 0.5 is the drag coefficient (taken from Hills and Goda7), M is the asteroid mass (product of its volume and density), V is the asteroid speed, and ρair is the local air density. The ablation dynamics are given by:
!"!"= −𝜎𝐶!𝜌!"#𝐴𝑉! (2)
where σ ≈ 1.0 × 10⁻¹² s2cm-2 is the ablation parameter. Equations (1) and (2) are integrated until the stagnation pressure exceeds the meteoroid’s yield strength. The model assumes that the impactor begins to break up at this point. The object’s post-breakup dispersal speed is then used to determine its rate of expansion, which subsequently increases its drag and decreases its kinetic energy. The altitude at which the kinetic energy has decreased by half is then taken to be the burst altitude. This assumption is made to consistently compare with previous results1 as well as to define a single “burst altitude” required for the simplified damage models used. III.B.2. Blast Overpressure Radius
The excitation of a powerful blast wave when the impactor reaches its burst height and disintegrates into the atmosphere (or onto the ground) is a prominent local effect. The blast wave consists of an abrupt pressure pulse, or shock wave, that is typically characterized by the peak overpressure—the difference between the ambient pressure and the pressure of the shock front. Glasstone and Dolan11 give the maximum distance (km) at which an overpressure of 4 psi—enough to cause high-speed winds above hurricane force—is reached: 𝑟 = 2.09ℎ − 0.449ℎ!𝐸!!/! + 5.08𝐸!/! (3)
This is the maximum distance of the overpressure contour from the point below a point-detonation at altitude h (km) with the explosion’s kinetic energy E in megatons. III.C. Simulation Method
The Monte Carlo simulation produces results on a size bin basis. For each bin, a prescribed number of strikes are simulated to produce the number of casualties
y"="10.348x+2.353"R²"="1"
1.E+09"
1.E+08"
1.E+07"
1.E+06"
1.E+05"
1.E+04"
1.E+03"
1.E+02"0.01" 0.1" 1" 10"
Impa
ct'Frequ
ency'(yr01)'
Diameter'(km)'
Impact'Frequency'vs.'Asteroid'Size'
per strike in each realization. Then, these outcomes are weighted by the impact frequency to produce an expected number of casualties per year. Samples are combined to generate average results for each NEO size class.
Each realization begins by sampling from the input distributions to generate a specific instance of size, density, strength, and velocity. The model calculates the entry angle internally from a sinusoidal distribution scaled such that 45 degrees is the most probable angle.13 The impact point (latitude and longitude) is then internally selected from a random distribution that ensures equal likelihood of impact across the Earth’s surface. These internally generated values can be overridden by command line arguments during model execution. An airburst damage radius is computed for each realization based on the NEO parameters in combination with the airburst model described in the previous section.
To determine the number of casualties for each strike, the blast damage radius is overlaid on the gridded SEDAC population density data, centered at the impact latitude and longitude. To include the proper population data, the model determines the number of 2.5-x-2.5-arcminute grid cells needed in each direction to completely cover the damage area. Each grid cell is then subdivided into a user-specified number of sub-cells. Each of those sub-cells is searched, and if its center point falls within the damage radius, then its area is computed and multiplied by the population density of the SEDAC grid cell to obtain its population count. The populations of all the sub-cells with center points within the damage radius are summed to get the total casualties.
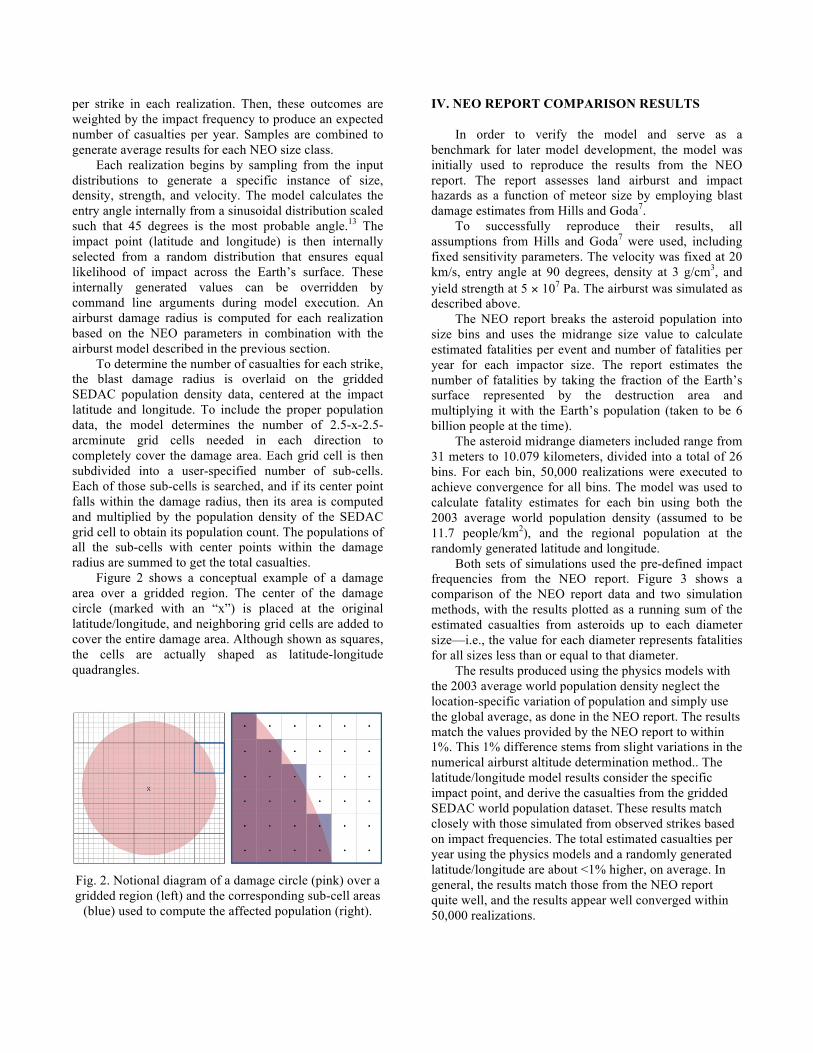
Figure 2 shows a conceptual example of a damage area over a gridded region. The center of the damage circle (marked with an “x”) is placed at the original latitude/longitude, and neighboring grid cells are added to cover the entire damage area. Although shown as squares, the cells are actually shaped as latitude-longitude quadrangles.
Fig. 2. Notional diagram of a damage circle (pink) over a gridded region (left) and the corresponding sub-cell areas
(blue) used to compute the affected population (right).
IV. NEO REPORT COMPARISON RESULTS
In order to verify the model and serve as a benchmark for later model development, the model was initially used to reproduce the results from the NEO report. The report assesses land airburst and impact hazards as a function of meteor size by employing blast damage estimates from Hills and Goda7.
To successfully reproduce their results, all assumptions from Hills and Goda7 were used, including fixed sensitivity parameters. The velocity was fixed at 20 km/s, entry angle at 90 degrees, density at 3 g/cm3, and yield strength at 5 × 10⁷ Pa. The airburst was simulated as described above.
The NEO report breaks the asteroid population into size bins and uses the midrange size value to calculate estimated fatalities per event and number of fatalities per year for each impactor size. The report estimates the number of fatalities by taking the fraction of the Earth’s surface represented by the destruction area and multiplying it with the Earth’s population (taken to be 6 billion people at the time).
The asteroid midrange diameters included range from 31 meters to 10.079 kilometers, divided into a total of 26 bins. For each bin, 50,000 realizations were executed to achieve convergence for all bins. The model was used to calculate fatality estimates for each bin using both the 2003 average world population density (assumed to be 11.7 people/km2), and the regional population at the randomly generated latitude and longitude.
Both sets of simulations used the pre-defined impact frequencies from the NEO report. Figure 3 shows a comparison of the NEO report data and two simulation methods, with the results plotted as a running sum of the estimated casualties from asteroids up to each diameter size—i.e., the value for each diameter represents fatalities for all sizes less than or equal to that diameter.
The results produced using the physics models with the 2003 average world population density neglect the location-specific variation of population and simply use the global average, as done in the NEO report. The results match the values provided by the NEO report to within 1%. This 1% difference stems from slight variations in the numerical airburst altitude determination method.. The latitude/longitude model results consider the specific impact point, and derive the casualties from the gridded SEDAC world population dataset. These results match closely with those simulated from observed strikes based on impact frequencies. The total estimated casualties per year using the physics models and a randomly generated latitude/longitude are about <1% higher, on average. In general, the results match those from the NEO report quite well, and the results appear well converged within 50,000 realizations.
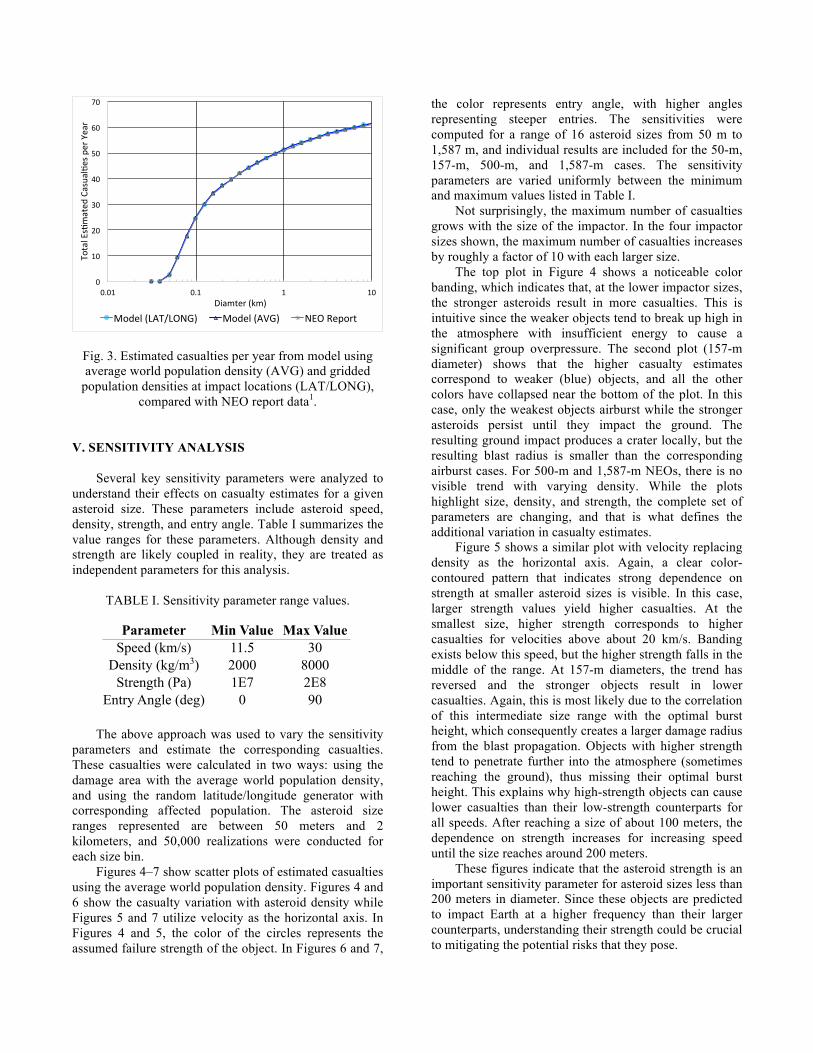
Fig. 3. Estimated casualties per year from model using average world population density (AVG) and gridded
population densities at impact locations (LAT/LONG), compared with NEO report data1.
V. SENSITIVITY ANALYSIS
Several key sensitivity parameters were analyzed to understand their effects on casualty estimates for a given asteroid size. These parameters include asteroid speed, density, strength, and entry angle. Table I summarizes the value ranges for these parameters. Although density and strength are likely coupled in reality, they are treated as independent parameters for this analysis.
TABLE I. Sensitivity parameter range values.
The above approach was used to vary the sensitivity parameters and estimate the corresponding casualties. These casualties were calculated in two ways: using the damage area with the average world population density, and using the random latitude/longitude generator with corresponding affected population. The asteroid size ranges represented are between 50 meters and 2 kilometers, and 50,000 realizations were conducted for each size bin.
Figures 4–7 show scatter plots of estimated casualties using the average world population density. Figures 4 and 6 show the casualty variation with asteroid density while Figures 5 and 7 utilize velocity as the horizontal axis. In Figures 4 and 5, the color of the circles represents the assumed failure strength of the object. In Figures 6 and 7,
the color represents entry angle, with higher angles representing steeper entries. The sensitivities were computed for a range of 16 asteroid sizes from 50 m to 1,587 m, and individual results are included for the 50-m, 157-m, 500-m, and 1,587-m cases. The sensitivity parameters are varied uniformly between the minimum and maximum values listed in Table I.
Not surprisingly, the maximum number of casualties grows with the size of the impactor. In the four impactor sizes shown, the maximum number of casualties increases by roughly a factor of 10 with each larger size.
The top plot in Figure 4 shows a noticeable color banding, which indicates that, at the lower impactor sizes, the stronger asteroids result in more casualties. This is intuitive since the weaker objects tend to break up high in the atmosphere with insufficient energy to cause a significant group overpressure. The second plot (157-m diameter) shows that the higher casualty estimates correspond to weaker (blue) objects, and all the other colors have collapsed near the bottom of the plot. In this case, only the weakest objects airburst while the stronger asteroids persist until they impact the ground. The resulting ground impact produces a crater locally, but the resulting blast radius is smaller than the corresponding airburst cases. For 500-m and 1,587-m NEOs, there is no visible trend with varying density. While the plots highlight size, density, and strength, the complete set of parameters are changing, and that is what defines the additional variation in casualty estimates.
Figure 5 shows a similar plot with velocity replacing density as the horizontal axis. Again, a clear color-contoured pattern that indicates strong dependence on strength at smaller asteroid sizes is visible. In this case, larger strength values yield higher casualties. At the smallest size, higher strength corresponds to higher casualties for velocities above about 20 km/s. Banding exists below this speed, but the higher strength falls in the middle of the range. At 157-m diameters, the trend has reversed and the stronger objects result in lower casualties. Again, this is most likely due to the correlation of this intermediate size range with the optimal burst height, which consequently creates a larger damage radius from the blast propagation. Objects with higher strength tend to penetrate further into the atmosphere (sometimes reaching the ground), thus missing their optimal burst height. This explains why high-strength objects can cause lower casualties than their low-strength counterparts for all speeds. After reaching a size of about 100 meters, the dependence on strength increases for increasing speed until the size reaches around 200 meters.
These figures indicate that the asteroid strength is an important sensitivity parameter for asteroid sizes less than 200 meters in diameter. Since these objects are predicted to impact Earth at a higher frequency than their larger counterparts, understanding their strength could be crucial to mitigating the potential risks that they pose.
0"
10"
20"
30"
40"
50"
60"
70"
0.01" 0.1" 1" 10"
Total"Es2mated
"Casual2es"per"Year"
Diamter"(km)"
Model"(LAT/LONG)" Model"(AVG)" NEO"Report"
Parameter Min Value Max Value Speed (km/s) 11.5 30
Density (kg/m3) 2000 8000 Strength (Pa) 1E7 2E8
Entry Angle (deg) 0 90
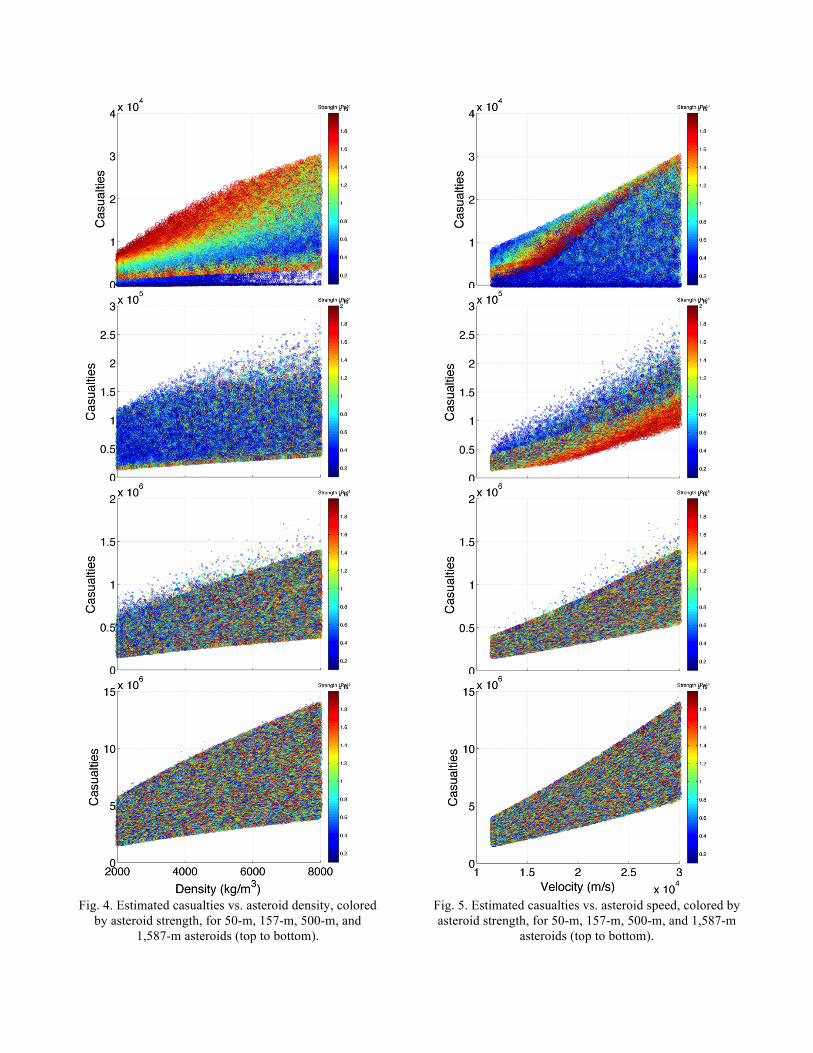
Fig. 4. Estimated casualties vs. asteroid density, colored
by asteroid strength, for 50-m, 157-m, 500-m, and 1,587-m asteroids (top to bottom).
Fig. 5. Estimated casualties vs. asteroid speed, colored by asteroid strength, for 50-m, 157-m, 500-m, and 1,587-m
asteroids (top to bottom).
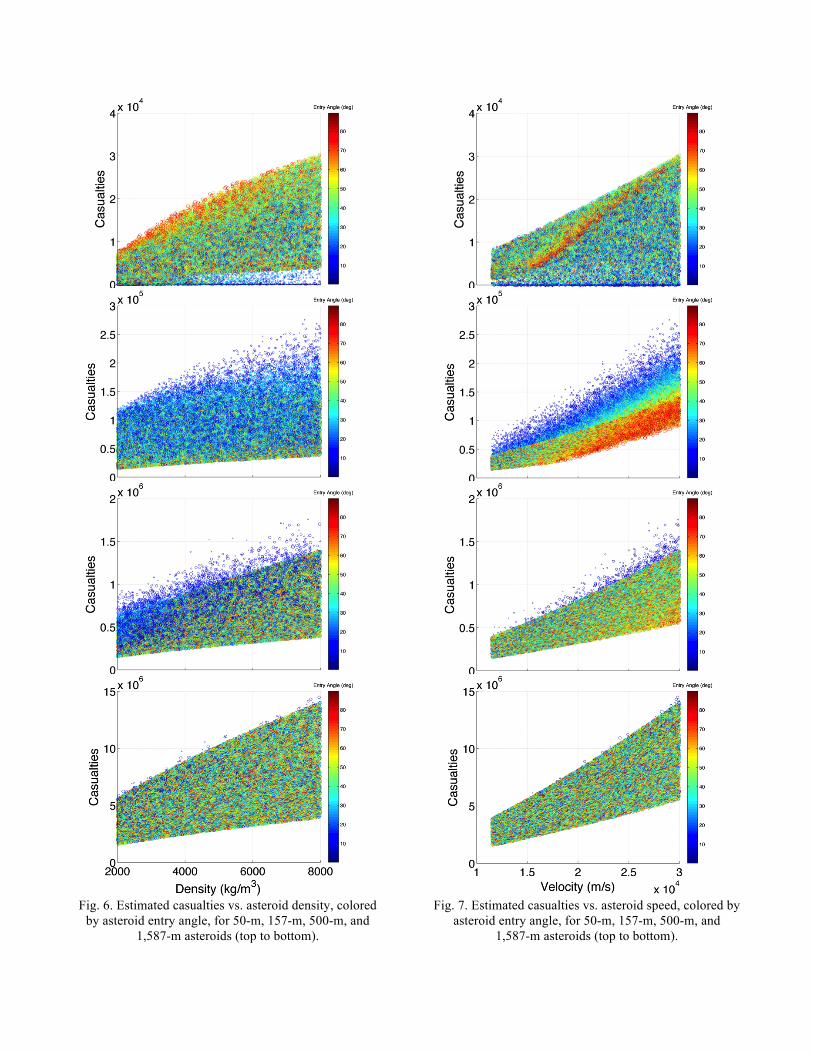
Fig. 6. Estimated casualties vs. asteroid density, colored
by asteroid entry angle, for 50-m, 157-m, 500-m, and 1,587-m asteroids (top to bottom).
Fig. 7. Estimated casualties vs. asteroid speed, colored by
asteroid entry angle, for 50-m, 157-m, 500-m, and 1,587-m asteroids (top to bottom).
Figures 6 and 7 are analogous to Figures 4 and 5, except they are colored by entry angle. Figure 7 shows a weak dependence on entry angle for varying densities. However, for diameters between 100 and 400 meters, shallower entry angles tend to cause higher casualties. This can also be explained by the object over-penetrating the atmosphere and not breaking up at its optimal burst height. In addition, objects penetrating the atmosphere with steeper entry angles tend to ablate more and therefore have overall less energy deposition during their airburst. However, these results assume a static airburst and the directional effects of the moving airburst are not taken into consideration. Figure 7 yields analogous dependencies to Figure 5, where higher entry angles yield lower casualties for all speeds in the mid-diameter range. These results suggest that entry angle is an important sensitivity parameter for asteroid sizes between 100 and 400 meters.
For all four cases, however, the strength and entry angle do not affect the estimated casualties after reaching a certain asteroid size.
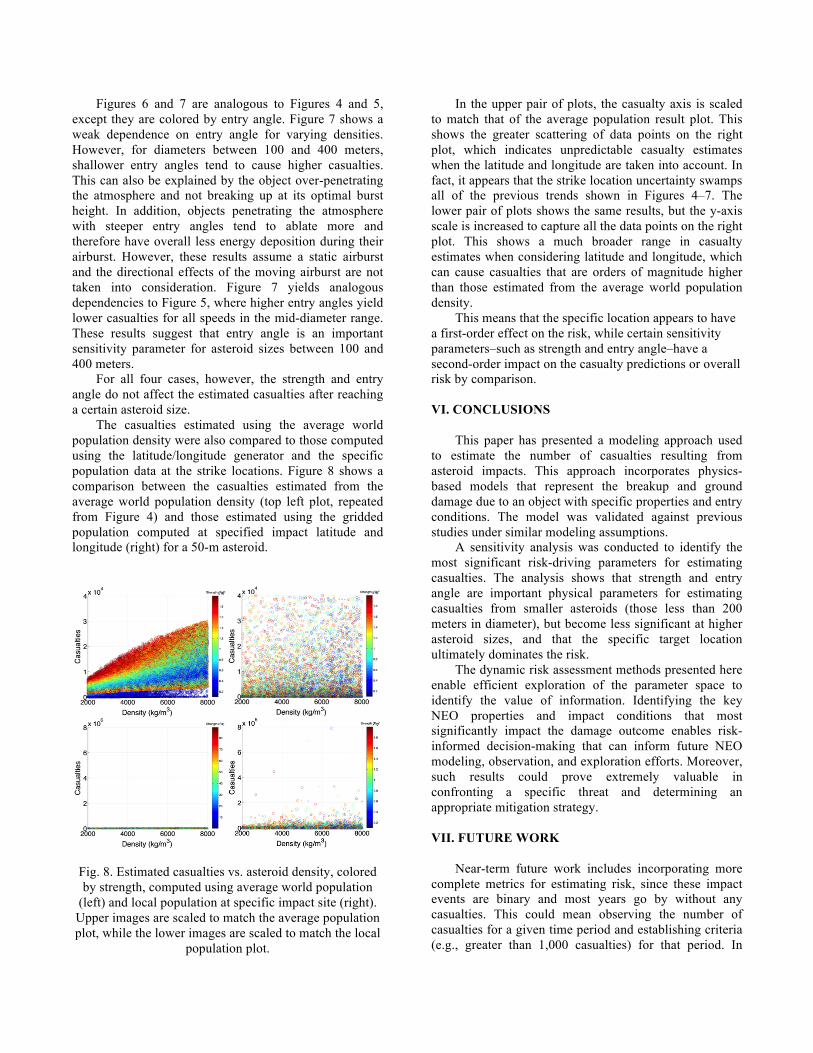
The casualties estimated using the average world population density were also compared to those computed using the latitude/longitude generator and the specific population data at the strike locations. Figure 8 shows a comparison between the casualties estimated from the average world population density (top left plot, repeated from Figure 4) and those estimated using the gridded population computed at specified impact latitude and longitude (right) for a 50-m asteroid.
Fig. 8. Estimated casualties vs. asteroid density, colored by strength, computed using average world population
(left) and local population at specific impact site (right). Upper images are scaled to match the average population plot, while the lower images are scaled to match the local
population plot.
In the upper pair of plots, the casualty axis is scaled to match that of the average population result plot. This shows the greater scattering of data points on the right plot, which indicates unpredictable casualty estimates when the latitude and longitude are taken into account. In fact, it appears that the strike location uncertainty swamps all of the previous trends shown in Figures 4–7. The lower pair of plots shows the same results, but the y-axis scale is increased to capture all the data points on the right plot. This shows a much broader range in casualty estimates when considering latitude and longitude, which can cause casualties that are orders of magnitude higher than those estimated from the average world population density.
This means that the specific location appears to have a first-order effect on the risk, while certain sensitivity parameters–such as strength and entry angle–have a second-order impact on the casualty predictions or overall risk by comparison. VI. CONCLUSIONS
This paper has presented a modeling approach used to estimate the number of casualties resulting from asteroid impacts. This approach incorporates physics-based models that represent the breakup and ground damage due to an object with specific properties and entry conditions. The model was validated against previous studies under similar modeling assumptions.
A sensitivity analysis was conducted to identify the most significant risk-driving parameters for estimating casualties. The analysis shows that strength and entry angle are important physical parameters for estimating casualties from smaller asteroids (those less than 200 meters in diameter), but become less significant at higher asteroid sizes, and that the specific target location ultimately dominates the risk.
The dynamic risk assessment methods presented here enable efficient exploration of the parameter space to identify the value of information. Identifying the key NEO properties and impact conditions that most significantly impact the damage outcome enables risk-informed decision-making that can inform future NEO modeling, observation, and exploration efforts. Moreover, such results could prove extremely valuable in confronting a specific threat and determining an appropriate mitigation strategy. VII. FUTURE WORK
Near-term future work includes incorporating more
complete metrics for estimating risk, since these impact events are binary and most years go by without any casualties. This could mean observing the number of casualties for a given time period and establishing criteria (e.g., greater than 1,000 casualties) for that period. In
addition, the static airburst assumption will be refined to account for the directional effects of the moving, distributed energy depositions. This will change the resulting damage area size and shape on the ground. Future assessments may also couple the strength and density parameters, since treating them as independent can introduce non-physical combinations that are not representative of the actual NEO population.
Long-term future work includes adding other damage models to account for tsunamis and global effects. In addition, other types of damages (death, building collapse, injury, etc.) will be identified and represented with concentric damage circles to account for all types of hazards. Finally, the asteroid impact risk will be assessed with and without mitigation strategies to determine the most effective solutions for a given size class of asteroid.
ACKNOWLEDGMENTS
The authors would like to thank Lorien Wheeler, Susie Go, and Darrel Robertson for their editorial help.
REFERENCES
1. STOKES ET AL., Study to Determine the Feasibility of Extending the Search for Near-Earth Objects to Smaller Limiting Diameters, National Aeronautics and Space Administration (2003).
2. A. WOOD, “B612 Foundation Highlights the Risk of City-destroying Asteroids,” Gizmag. (23 Apr. 2014).
3. NASA Authorization Act of 2005. Public Law No: 109-155: 2006.
4. S. RAMSEY, and R. KRAFT, “NASA Announces Asteroid Grand Challenge,” NASA HQ News: Release 13-188, National Aeronautics and Space Administration, (18 June 2013).
5. C. R. CHAPMAN and D. MORRISON, “Impacts on the Earth by Asteroids and Comets: Assessing the Hazard,” Nature, Vol. 367, pp. 33-39 (1994).
6. E. M. SHOEMAKER, “Asteroid and Comet Bombardment of the Earth,” Annual Review of Earth and Planetary Sciences, Vol. 11, pp. 461-94 (1983).
7. J. G. HILLS and M. P. GODA, “The Fragmentation of Small Asteroids in the Atmosphere,” The Astronomical Journal, Vol. 105, No. 3, pp. 1114-44 (1993).
8. National Research Council, Defending Planet Earth: Near-Earth Object Surveys and Hazard Mitigation Strategies, National Academies Press, Washington, D.C. (2010).
9. S. GO, D. L. MATHIAS, C. J. MATTENBERGER, S. LAWRENCE, K. GEE, “An Integrated Reliability and Physics-based Risk Modeling Approach for Assessing Human Spaceflight Systems,” Probabilistic Safety Assessment and Management Conference, Honolulu, HI (2014).
10. Center for International Earth Science Information Network (CIESIN), Columbia University; and Centro Internacional de Agricultura Tropical (CIAT). 2005. Gridded Population of the World Version 3 (GPWv3): Population Density Grids. Palisades, NY: Socioeconomic Data and Applications Center (SEDAC), Columbia University. Available at http://sedac.ciesin.columbia.edu/gpw.
11. S. GLASSTONE and P. J. DOLAN, “The Effects of Nuclear Weapons,” U.S. Government Printing Office, Washington, D.C., (1977).
12. G. S. COLLINS, H. J. MELOSH, and R. A. MARCUS, “Earth Impact Effects Program: A Web-based Computer Program for Calculating the Regional Environmental Consequences of a Meteoroid Impact on Earth,” Meteoritics and Planetary Science, Vol. 40, No. 6, pp. 817-40 (2005).
13. O. B. TOON, K. ZAHNLE, D. MORRISON, R. P. TURCO, and C. COVEY, “Environmental Perturbations Caused by the Impacts of Asteroids and Comets,” Reviews of Geophysics, Vol. 35, No. 1, pp. 41-78 (1997).