Embed Size (px)
Citation preview

John B. Nezlek
College of William & Mary
University of Social Sciences and
Humanities, Poznan
email: [email protected]
An Introduction to
Multilevel Analysis

Once you know that
hierarchies exist,
you see them everywhere
Kreft and deLeeuw (1998)

Basic Multilevel Data Structure
• Observations at one level of analysis are
nested within observations at another
• Persons within groups such as work groups,
classrooms, clinics, families, and so forth
• Observations within persons -- various
types of diary studies

Multilevel Analyses
• Sometimes such data sets are referred to as
"nested" or "hierarchically nested" because
observations (also referred to as units of analysis)
at one level of analysis are nested within
observations at another level.
• This nesting needs to be taken into account when
you analyze the data. If you do not, you violate
important assumptions about independence of
errors.

Independence of errors
• For example, all the children in the same
classroom have the same teacher. Although the
students are individuals, they share a teacher. This
means that they cannot be treated as independent
observations
• Students in another class are also individuals and
have the same teacher, but this teacher is different
than the teacher in class #1.

Independence of errors
• When analyzing student level measures (e.g.,
reading and studying) the fact that students in the
same class have the same teacher but have a
different teacher than students in another class
needs to be controlled.
• Multilevel modeling does this in the most accurate
way that is currently available.

Advantages of Multilevel Analyses
• Parameter estimates incorporate effects of
hierarchies
• Analyze phenomena (means, variances and
covariances) at multiple levels
simultaneously
• Very important: Relationships (covariances)
can differ across levels of analysis

Relationships Across Different
Levels of Analysis
• Relationships can vary across different
levels of analysis
• Relationships at different levels of analysis
are mathematically independent
• Knowing the relationship at one level of
analysis tells us nothing about relationships
at the another level of analysis

An Example: Relationships between
Productivity and Group Identity
• Three groups with 5 people in each group.
• For each person, we measure
– Productivity -- how much the person produces
– Identity -- how much does the person identify
with the group

Group 1 Group 2 Group 3
1 8 4 13 9 182 7 5 12 10 173 6 6 11 11 164 5 7 10 12 155 4 8 9 13 14
3 6 6 11 11 16
Negative Within-Group
Positive Between-Group

Negative Within-Group
Positive Between-Group
Group 1 Group 2 Group 3
6 11 9 9 11 67 12 10 10 12 78 13 11 11 13 89 14 12 12 14 9
10 15 13 13 15 10
8 13 11 11 13 8
Positive Within-Group
Negative Between-Group

Positive Within-Group
Negative Between-Group

Group 1 Group 2 Group 3
1 8 4 10 9 152 8 5 10 10 153 8 6 10 11 154 8 7 10 12 155 8 8 10 13 15
3 8 6 10 11 15
No Within-Group
Positive Between-Group

No Within-Group
Positive Between-Group

Group 1 Group 2 Group 3 1 10 4 10 9 13 2 9 5 10 10 14 3 8 6 10 11 15 4 7 7 10 12 16 5 6 8 10 13 17 3 8 6 10 11 15
Varying Within-Group
Positive Between-Group

Varying Within-Group
Positive Between-Group

Review of other methods
• Other ways of analyzing multilevel data
structures.
• Although useful in some ways, the methods
described next are not as accurate as
multilevel random coefficient modeling.
• Accuracy defined in terms of Monte Carlo
studies comparing different techniques.

Ordinary Least Squares
Multilevel Analyses
• Aggregated means analyses
• Dummy-coded least squares (LSDV)
• Sub-group analyses
– Regression by groups
– Group level correlations

Aggregated means
• Calculate within-group means
• Examine relationships between/among these
means
• Correlations, ANOVAS, regression, etc.
• Advantages: Simple, familiar
• Disadvantages: Ignores within-group
relationships, inaccurate parameter
estimates

LSDV Analysis
Least-Squares Dummy Variable
• Add dummy variables representing groupmembership, e.g., five groups
– y = intercept + g1 + g2 + g3 + g4 + x
• Advantages: Familiar (OLS regression),takes into account between-groupdifferences in means
• Disadvantages: Need g-1 variables, does notexamine how x-y relationship varies acrossgroups (Interaction terms can be included).Does not model error properly.

Sub-group analyses
• Analyze within-group relationships
• Regression by group analysis
– Calculate regression equations for each group
– Compare equations with F-test (g-1 df)
• Calculate within-group correlations (or
regression coefficient) and use these as
dependent measures

Sub-group analyses
• Advantages: Can analyze within-group
relationships and how they vary as a
function of other group-level measures
• Disadvantages: Does not account for
differences among groups in reliability of
estimates (group size and consistency of
responses), does not model error properly
(treats parameters as fixed, not random)

When to use Multilevel Modeling
• When the data are nested
• Ignore advice about ICC (intraclasscorrelations)
• ICCs concern distribution of means only
• Interest usually focuses on relationships
• There may be no between group variance intwo measures, but there may still bebetween group variability in relationships

Problems of Relying on ICCs to
make Decisions about
Multilevel Analyses
• In the next example, the ICCs are all 0. All
means are 3. There is no between-group
variability for either measure.
• Yet, the relationship between x and y varies
across the 6 groups
• Positive in 1, 2, 3, negative 4, 5, 6.

Group 1 Group 2 Group 3x y x y x y1 5 1 5 1 52 4 2 4 2 43 3 3 3 3 34 2 4 2 4 25 1 5 1 5 1Group 4 Group 5 Group 6x y x y x y1 1 1 1 1 12 2 2 2 2 23 3 3 3 3 34 4 4 4 4 45 5 5 5 5 5

Multiple levels
of random sampling
• Traditionally, people (observations) are the
random element -- sampled from population
• In multilevel structures, organizing units
may also be sampled from populations
• Classes randomly sampled from schools
• Work groups randomly sampled from
factory

Logic of Multilevel Modeling
• Coefficients describing level 1 phenomena
are estimated for each level 2 unit
– Intercepts--means
– Slopes--covariances (like regression coef.)
• Level 1 coefficients are then analyzed at
level 2

Typical Data Structure
• Individuals nested with groups
– Students in classrooms
– Worker in work groups

Level 1 Equations: Intercepts
Means for Each Group
• Intercept (mean productivity)
– yij = β0j + rij
• y productivity
– i individuals
– across j groups
– r individual level error

Totally unconditional model
• Level 1 model: yij = β0j + rij
• Level 2 model: β0j = γ00 + µ0j
• “Totally unconditional” because no predictors at
either level
• Provides estimates of variances at each level
(within-group, r, between group µ) which suggest
where analyses with predictors might be
productive

Level 2 Equations: Intercepts
Do Group Means Differ?
• Mean productivity for each group
– β0j = γ00 + µ0j
• Mean productivity and a group level
variable (time together)
– β0j = γ00 + γ01 (Time) + µ0j

Level 1 Slope:
Within-group relationship between
Productivity & Identification
• Relationship between productivity and
identification
– yij = β0j + β1j (Identification) + rij
• Intercept for each group β0j
• Identification slope for each group β1j
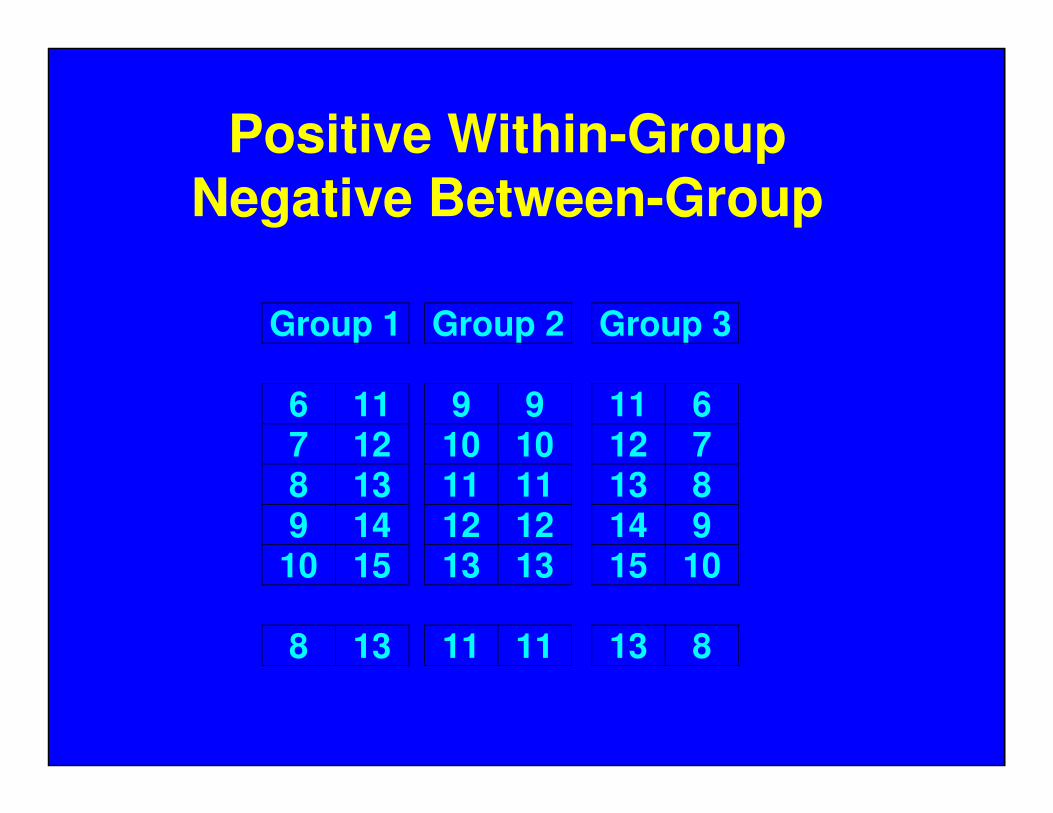
Level 2 Equations: Slopes
Does P-I Relationship Vary?
• Mean productivity-identification
relationship across all groups
– β1j = γ10 + µ1j
• Does productivity-identification
relationship vary as a function of how long
the group has been together?
– β1j = γ10 + γ11(Time) + µ1j

Analyses of slopes
• Are sometimes called “slopes as outcomes”
analyses because the slope from level 1
becomes the dependent measure at level 2
• or… “cross level interactions” because
relationships at level 1 vary as a function of
a variable at level 2
• or… moderation analyses because a
variable at level 2 moderates a relationship
at level 1
Analyses of slopes
• Provide much more accurate estimates of
differences in covariances (correlations)
than other methods.
• Can also analyze within-person correlations
-- difficult to do using OLS.

In conclusion
• Multilevel modeling (MLM) can answer
different and more sophisticated questions
than comparable OLS analyses and do so
more accurately.
• MLM is being used more frequently in
many disciplines.

Some helpful references
• Kreft, I. G. G., & de Leeuw, J. (1998). Introducing multilevel
modeling. Newbury Park, CA: Sage Publications.
• Nezlek, J. B. (2011). Multilevel modeling for social and
personality psychology. In J. B. Nezlek (Ed.) The SAGE
Library in Social and Personality Psychology Methods.
London: Sage Publications.
• Raudenbush, S. W., & Bryk, A. S. (2002). Hierarchical linear
models (2nd ed.). Newbury Park, CA: Sage Publications
• Snijders, T., & Bosker, R. (1999). Multilevel analysis.
London: Sage Publications