Embed Size (px)
Citation preview

An Overview of Current and Projected Shale and Tight Gas
Water Use in Texas: Implications for Local Water Resources
Jean-Philippe ‘JP’ Nicot
Bureau of Economic GeologyJackson School of GeosciencesThe University of Texas at Austin
Technical Workshop #4 for the Hydraulic Fracturing Study:Water Resources Management
Arlington, VA – March 29-30, 2011

2
Bureau of Economic Geology
A few numbers….
0
2,000
4,000
6,000
8,000
10,000
12,000
Mun
icip
al
Man
ufac
turin
g
Minin
g
Ste
am-e
lect
ric
Live
stoc
k
Irrig
atio
n
Wate
r U
se (
MA
F/y
r)
TWDB Projections Yr 2010
Mining = ~200 MAF
Total = ~18,300 MAF
1 MAF = 1,000 AF = 326 million Gal.

3
Bureau of Economic Geology
A few numbers….
0
2,000
4,000
6,000
8,000
10,000
12,000
Mun
icip
al
Man
ufac
turin
g
Minin
g
Ste
am-e
lect
ric
Live
stoc
k
Irrig
atio
n
Wate
r U
se (
MA
F/y
r)
TWDB Projections Yr 2010
Mining = ~200 MAF
Total = ~18,300 MAF
2010 Mining Water Use:
Oil and Gas = ~60 MAF
Coal/Lignite = ~25 MAF
Aggregates = >50 MAF
Others= ~10 MAF
1 MAF = 1,000 AF = 326 million Gal.

4
Bureau of Economic Geology
A few numbers….
0
2,000
4,000
6,000
8,000
10,000
12,000
Mun
icip
al
Man
ufac
turin
g
Minin
g
Ste
am-e
lect
ric
Live
stoc
k
Irrig
atio
n
Wate
r U
se (
MA
F/y
r)
TWDB Projections Yr 2010
Mining = 270 MAF (?)
Total = ~18,300 MAF
Mining:
Oil and Gas
Coal/Lignite
Aggregates
Others
0
10
20
30
40
50
Drillin
g
Com
plet
ion
EO
R
Wate
r U
se (
MA
F/y
r)
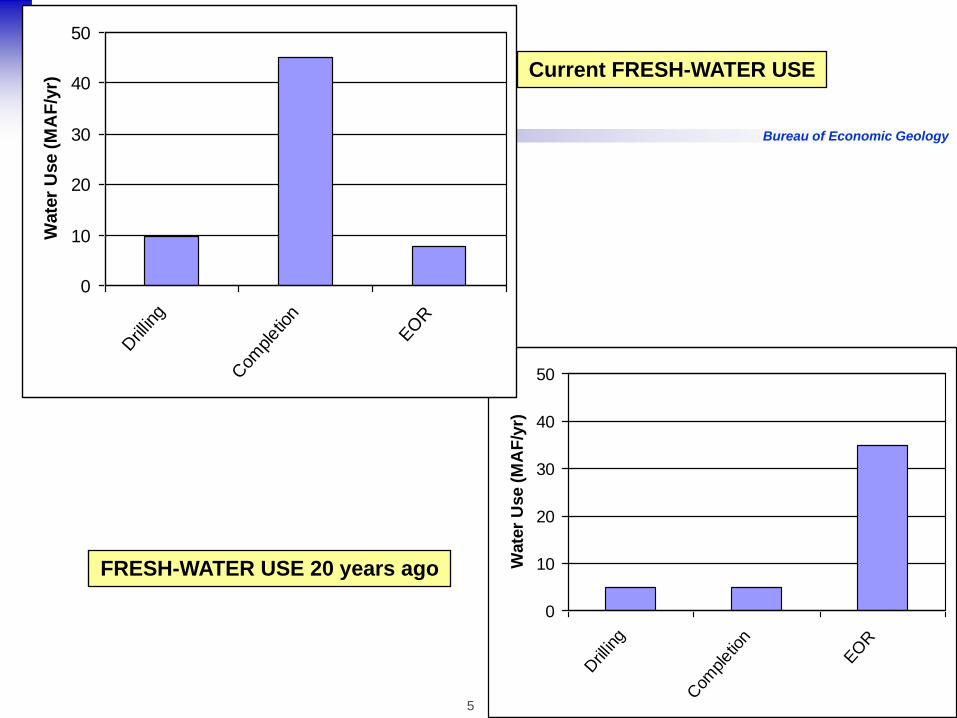
Current FRESH-WATER USE
5
Bureau of Economic Geology
A few numbers….
0
10
20
30
40
50
Drillin
g
Com
plet
ion
EO
R
Wate
r U
se (
MA
F/y
r)
Current FRESH-WATER USE
FRESH-WATER USE 20 years ago
0
10
20
30
40
50
Drillin
g
Com
plet
ion
EO
R
Wate
r U
se (
MA
F/y
r)

6
Bureau of Economic Geology
>30,000 wells fraced
in the past 5 years
Nicot et al., 2011

7
Bureau of Economic Geology
Nicot et al., 2011
>30,000 wells fraced
in the past 5 years
BARNETT SHALE
HAYNESVILLE SHALE
SHALES
BOSSIER SHALE
WOODFORD SHALE
BARNETT SHALE
EAGLE FORD SHALE
PEARSALL SHALE

8
Bureau of Economic Geology
>30,000 wells fraced
in the past 5 years
BARNETT SHALE
HAYNESVILLE SHALE
SHALES
TIGHT GAS
Granite wash, Cleveland, Marmaton
BOSSIER SHALE
Cotton Valley,
Travis Peak
Wolfberry
Canyon Sands
Vicksburg,
Wilcox
Olmos
WOODFORD SHALE
BARNETT SHALE
Nicot et al., 2011
EAGLE FORD SHALE
PEARSALL SHALE

9
Bureau of Economic Geology
2008 = ~36,000 AF
0
5
10
15
20
25
30
Barnett
Sh.
Haynesv
ille S
h.
Eagle Ford
Sh.
Woodfor
d/Barn
ettPB/P
earsa
ll Sh.
Anadarko T
G
East Texa
s TG
Permian
Basin
TG/T
O
South T
exas /
Gulf C
oast TG
Wa
ter
Us
e (
Th
ou
sa
nd
AF
)

10
Bureau of Economic Geology
2010 = ~45,000 AF
0
5
10
15
20
25
30
Barnett
Sh.
Haynesv
ille S
h.
Eagle Ford
Sh.
Woodfor
d/Barn
ettPB/P
earsa
ll Sh.
Anadarko T
G
East Texa
s TG
Permian
Basin
TG/T
O
South T
exas /
Gulf C
oast TG
Wa
ter
Us
e (
Th
ou
sa
nd
AF
)

11
Bureau of Economic Geology
In 2010
Barnett Shale:
~50% of water use
Permian Basin
~16%
Eagle Ford
~14.5%
Haynesville Shale:
~6.5% of water use
East Texas TG:
~4.5% of water use
Anadarko Bas. TG:
~6% of water use

12
Bureau of Economic Geology
From Devon Energy, 2006
BARNETT VERTICAL - STATISTICS
Raw data from IHS
13
Bureau of Economic Geology
From Devon Energy, 2006
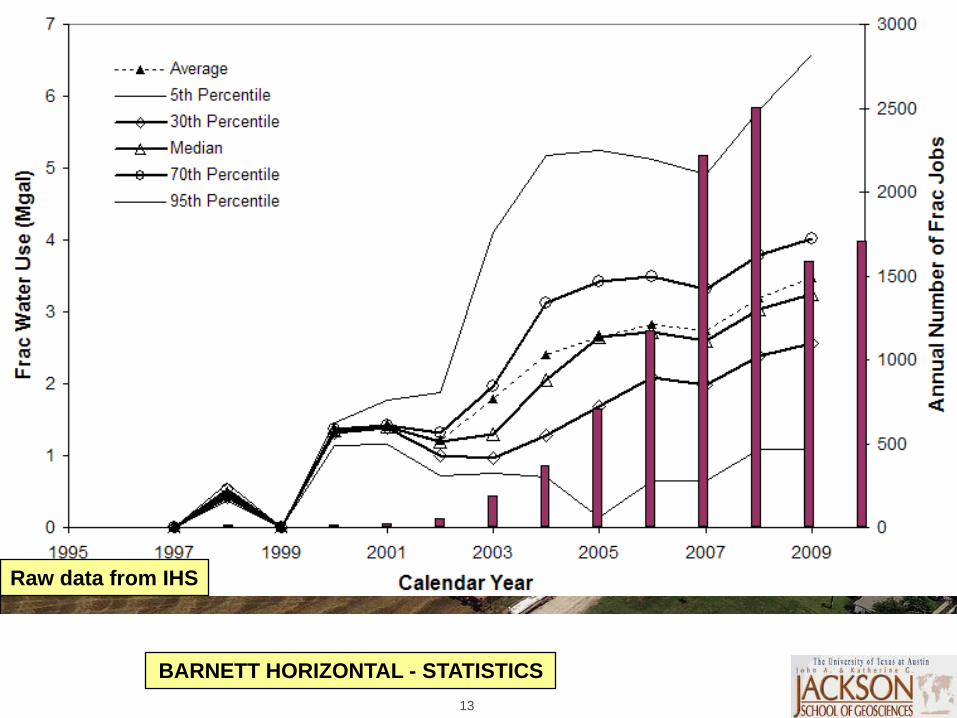
BARNETT HORIZONTAL - STATISTICS
Raw data from IHS

14
Bureau of Economic Geology
A few numbers….PRELIMINARY RESULTS
WORK IN PROGRESS
Nicot et al., 2011

15
Bureau of Economic Geology
A few numbers….PRELIMINARY RESULTS
WORK IN PROGRESS
0
50
100
150
2010 2020 2030 2040 2050 2060
Calendar Year
Wate
r U
se (
tho
usan
d A
F)
O&G Shale Gas Tight Fm. Waterflood Drilling
Nicot et al., 2011
16
Bureau of Economic Geology
Barnett Shale
Hill
Bell
Clay
Ellis
Erath
Jack Wise
Llano
Milam
Falls
Mills
Burnet
Coryell
Dallas
BrownColeman
Young
Cooke
Mason
Parker
Baylor Archer
Denton
Bosque
Tarrant
Knox
San Saba
EastlandCallahan
Williamson
McLennan
McCulloch
Collin
Grayson
Stephens
Haskell
Palo Pinto
Montague
Hamilton
Wilbarger
Comanche
Wichita
JohnsonHood
Kimble
Foard
Menard
Lampasas
LeeGillespie
Shackelford
Taylor
Concho
Throckmorton
Travis
Navarro
Burleson
Hardeman
Robertson
Blanco
Somervell
Rockwall
Brazos¹0 20 40 60 8010
Miles
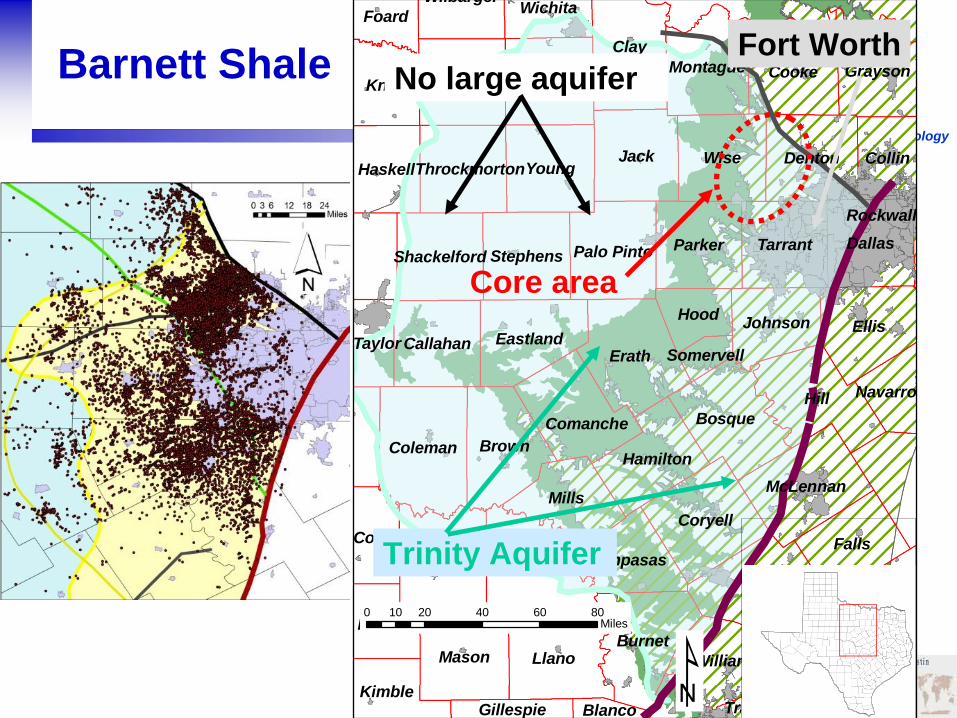
Trinity Aquifer
Fort WorthNo large aquifer
Core area

17
Bureau of Economic Geology
BackscatteredElectron Image
Pyrite
Calcite
Dolomite
Barite
Albite
QuartzMacrofracture Close-Up
BackscatteredElectron Image
Pyrite
Calcite
Dolomite
Barite
Albite
QuartzMacrofracture Close-Up
Total groundwater Total groundwater
useuse
High use estimateHigh use estimate
Barnett Shale GW use
2005-2007:
~50% GW - ~50% SW
Accurate figures are
very hard to come by
Bene et al, 2007

18
Bureau of Economic Geology
Eagle Ford wells
Carrizo-Wilcox footprint
Data from IHS
19
Bureau of Economic Geology
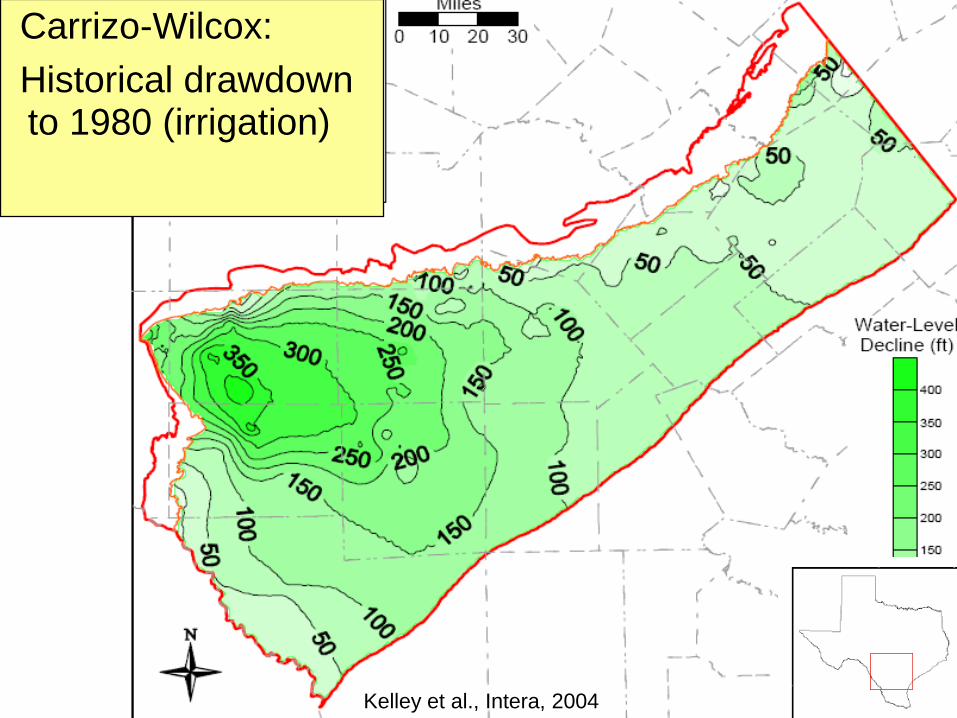
Carrizo-Wilcox:
Historical drawdown to 1980 (irrigation)
Kelley et al., Intera, 2004

20
Bureau of Economic Geology
Wade and Jigmond, TWDB, 2010
Carrizo-Wilcox, drawdown and recovery projections to 2060 - no shale gas water supply wells (exempt use) included

21
Bureau of Economic Geology
•Recompletions:– not clear if happening at a large scale
•Reuse / Recycling:– Not all plays have large flow back
– It is the trend, but economics?
•Standard sources: groundwater, lakes and rivers, municipal water
•Alternative sources:– Rain water collected in stock ponds
– WWTP reclaimed water (municipal and industrial)
•Develop additives effective at higher salinity
•Develop less water-intensive techniques
The Future

.08
An Overview of Current and Projected Shale and Tight-Gas Water Use in Texas: Implication for Local Water Resources
Jean-Philippe Nicot Bureau of Economic Geology, The University of Texas at Austin
The statements made during the workshop do not represent the views or opinions of EPA. The
claims made by participants have not been verified or endorsed by EPA.
In the middle of 2009, we undertook a study of water use in the state of Texas in the upstream segment of the oil and gas industry (that is, water used to extract the commodity until it leaves the wellhead), both current and projected for the next 50 years (Nicot et al., 2011). The objective of the study was to determine the amount of water used for different purposes (well drilling, completion, and secondary and tertiary recovery processes of conventional resources) across the state. With tens of thousands of wells having been hydraulically fractured in the past few years, the state water agency (TWDB) called for a study to assess hydraulic fracturing (HF) water use. Secondary objectives were (1) to collect information on the source of the water (groundwater, surface water, or another source) and the quality of the water (fresh or brackish) and (2) to understand the extent of recycling/reuse across the industry. We were able to gather relatively accurate data from the stimulation stage (HF), as a well is being readied for production. Operators have to report the amount of water used in the process, and tabulated data are available in a format easy to process from private vendors (IHS Energy). The data were not without typos, but they and other issues were resolved by ensuring consistency between amount of water, number of stages, and proppant loading. We assigned median values to those wells with no usable data. The split between surface water, groundwater, and other sources (waste water) was much harder to determine. It seems that neither groundwater nor surface water dominates in most plays, and both are used across the state. To the best of our knowledge, alternative water sources are still marginal in Texas. The amount of reuse/recycling was also difficult to discern. We estimated it at ~5% of the amount injected for shale-gas plays. We are more uncertain about water use for drilling wells and waterfloods, although it is clearly nonnegligible. Overall, in 2010, we estimate that the oil and gas industry used (preliminary numbers) ~45,000 acre-feet (AF) for fracturing wells (Figure 11) and ~18,000 AF for other purposes more widespread across the state. These figures do not show a large departure from water volume used in previous decades, in which a similar amount of fresh/brackish water was used mostly for waterfloods in the western half of the state. Currently hydraulic fracturing is being used in many plays across the state, primarily in shale-gas plays, including the Barnett Shale play in the Fort Worth area, which is responsible for ~50% of the HF water use (22,500 AF). Other important shale plays include the Haynesville/Bossier play in East Texas straddling the Louisiana state line (~3,000 AF in Texas) and the Eagle Ford play in South Texas (6,500 AF). The Eagle Ford play also contains a significant oil section, which is the focus of current exploration and

.08
production. The Permian Basin, a major oil-producing area, has also seen a recent revival, thanks to HF of long vertical wells (the “Wolfberry” play). In 2010, Permian Basin plays used ~7,000 AF for the hydraulic fracturing of many formations (including >3,500 AF in the “Wolfberry” play). Tight-gas plays, which, unlike shale plays, are conventional reservoirs or sections of conventional reservoirs with a very low permeability, have been receiving hydraulic fracturing treatment for decades in Texas. They too have seen a significant increase in interest, HF operations, and gas production. East Texas gas plays used ~2,000 AF for HF, whereas the Texas section of the Anadarko Basin in the Texas Panhandle used >25,000 AF. The south Gulf Coast gas province may be the only basin that has not seen an increase in the number of large HF jobs (~1,000 AF over a large area).
To put these figures in perspective, Texas has been projected to have consumed ~18.3 million AF of water in 2010, according the most recent 2007 state water plan, including >10 and ~4.8 million AF for irrigation and municipal use, respectively. HF water use composes a small fraction of the state water use (0.4%). Projections for the oil and gas industry were made with the help of various sources by estimating the amount of oil and gas (including shale gas) to be produced in the state in the
0
5
10
15
20
25
30
Barnett
Sh
Haynesv
ille S
h
Eagle Ford
Sh
oodford/B
arnettP
B/Pear
sall S
h
Anadarko T
East Texa
s T
Permian
Basin
TG/T
South T
exas /
Gulf C
oast TG. . .
W
. G G O
Wa
ter
Us
e (
Th
ou
sa
nd
AF
)
Work in progress, preliminary results
Figure 11. Estimated hydraulic fracturing water use in 2008 and 2010 in the state of Texas.

.08
next few decades and by distributing it through time (Figure 12). Given the volatility of the price of oil and gas, the figures provided clearly indicate only a possible future. We project that state overall water use in the oil and gas industry will peak in the 2020–2030 decade at ~<150,000 AF, thanks to the oil and gas unconventional resources that “will start” to decrease in terms of water use around that time.
In Texas, only one thorough study (Bene et al., 2007) in the public domain and performed in 2007 addresses the regional impact of shale-gas water use on an aquifer (the Barnett Shale and the Trinity aquifer). The conclusion of the study was that the aquifer as a whole was not in danger of being depleted and that gas operators use only a relatively small fraction of the total demand. However, some rural counties, typically relying on groundwater for domestic use, are seeing a relatively large increase in groundwater pumping. A similar situation exists in the Carrizo aquifer overlying the Eagle Ford Shale in South Texas. Local recovery following the large decrease in irrigation-water demand could be slowed because of HF. In some other areas of the aquifer, HF water demand could increase stress to the aquifer. In both these aquifers, note that historical pumping stresses were much higher than could be generated by HF and that water levels rebounded relatively quickly. However, healthy aquifers do not necessarily mean an absence of local water-resource issues. If an HF water supply well is located close to a domestic well, pumps may have to be lowered and/or the well deepened, and pumping rates may be reduced.
0
50
100
150
2010 2020 2030 2040 2050 2060
Calendar Year
Wat
er U
se (
tho
usa
nd
AF
)
O&G Shale Gas Tight Fm. Waterflood Drilling
Work in progress, preliminary results
Figure 12. Projected oil and gas water use 2010–2060.

.08
Reference
Bene, P.G., B. Harden, S.W. Griffin, and J.-P. Nicot. 2007. Northern Trinity/Woodbine Aquifer Groundwater Availability Model: Assessment of Groundwater Use in the Northern Trinity Aquifer Due to Urban Growth and Barnett Shale Development. Texas Water Development Board. TWDB Contract No. 0604830613.
Nicot, J.-P., A. K. Hebel, S. M. Ritter, S. Walden, R. Baier, P. Galusky, J. Beach, R. Kyle, L. Symank, and C. Breton. 2011. Current and Projected Water Use in the Texas Mining and Oil andGas Industry, report prepared by the Bureau of Economic Geology. The University of Texas at Austin, in review for the Texas Water Development Board, Austin, TX.