Embed Size (px)
Citation preview
March 2013
The Next Frontier in United States Shale Gas and Tight Oil Extraction: Strategic Reduction of Environmental Impacts
MEAGAN S. MAUTER
VANESSA R. PALMER
YIQIAO TANG
A. PATRICK BEHRER
ENERGY TECHNOLOGY INNOVATION POLICY RESEARCH GROUP
ENERGY TECHNOLOGY INNOVATION POLICY RESEARCH GROUP
THE NEXT FRONTIER IN UNITED STATES SHALE GAS AND TIGHT OIL EXTRACTION: STRATEGIC REDUCTION OF ENVIRONMENTAL IMPACTS
MEAGAN S. MAUTER VANESSA R. PALMER YIQIAO TANG A. PATRICK BEHRER
MARCH 2013
The Next Frontier in United States Shale Gas and Tight Oil Extraction: Strategic Reduction of Environmental Impacts
2
Discussion Paper #2013 – 04
Energy Technology Innovation Policy Discussion Paper Series
Energy Technology Innovation Policy (ETIP) Research Group
Belfer Center for Science and International Affairs
John F. Kennedy School of Government
Harvard University
79 JFK Street
Cambridge, MA 02138
Fax: (617) 495-8963
Email: [email protected]
Website: http://belfercenter.org
Copyright 2013 President and Fellows of Harvard College
The authors of this report invite liberal use of the information provided in it for educational
purposes, requiring only that the reproduced material clearly state: Reproduced Mauter, M.S.;
Palmer, V.R.; Tang, Y.; Behrer, A.P. The Next Frontier in United States Unconventional Shale
Gas and Tight Oil Extraction: Strategic Reduction of Environmental Impact. Energy
Technology Innovation Policy Discussion Paper No. 2013 – 04. Belfer Center for Science and
International Affairs, Harvard Kennedy School, March 2013.
Statements and views expressed in this report are solely those of the authors and do not imply
endorsement by Harvard University, the Harvard Kennedy School, or the Belfer Center for
Science and International Affairs.
Cover photo: © Megan Wold of Megan Wold Photography
The Next Frontier in United States Shale Gas and Tight Oil Extraction: Strategic Reduction of Environmental Impacts
3
ACKNOWLEDGEMENTS
The authors would like to thank Venkatesh Narayanamurti, Laura Diaz Anadon, Sarah
Jordaan, and Francis O’Sullivan for their invaluable feedback on the work. We would like to
acknowledge funding from the Consortium for Energy Policy Research (a gift from Shell), the
Energy Technology Innovation Policy research group (a grant from BP) both at the Harvard
Kennedy School, and a grant from the Electric Power Research Institute. We also thank the
Harvard community and the Belfer Center for Science and International Affairs for their
continued efforts to contextualize the political and environmental implications of U.S. shale gas
development. The many seminars, workshops, and symposia held in 2012 have helped to frame
the current work and provide an audience for its preliminary findings. In particular, Henry Lee,
William Hogan, Meghan O’Sullivan, Daniel Schrag, Amanda Sardonis, Louisa Lund, and Karin
Vander Schaaf deserve recognition for their sponsorship and coordination of the ongoing events.
The Next Frontier in United States Shale Gas and Tight Oil Extraction: Strategic Reduction of Environmental Impacts
4
ABSTRACT
The unconventional fossil fuel extraction industry—in the U.S., primarily shale gas and tight
oil—is expected to continue expanding dramatically in coming decades as conventionally recoverable
reserves wane. At the global scale, a long-term domestic supply of natural gas is expected to yield
environmental benefits over alternative sources of fossil energy. At the local level, however, the
environmental impacts of shale gas and tight oil development may be significant. The development of
technology, management practices, and regulatory policies that mitigate the associated environmental
impacts of shale gas development is quickly becoming the next frontier in U.S. unconventional fossil
resource extraction.
In this report, we argue that strategic planning by both companies and regulatory agencies to
minimize the environmental impacts of unconventional extraction requires a contextualized understanding
of regional issues and the available technical, management, and policy interventions to mitigate them.
Following an introduction to the topic of impact mitigation in hydraulic fracturing, we present a brief
discussion of the history of the U.S. unconventional oil and gas extraction industry and its associated
environmental challenges. Next, we characterize the environmental concerns in three key U.S.
unconventional plays, differentiating between concerns common between plays and those specific to the
Barnett, the Marcellus, or the Bakken. We follow this section by reviewing opportunities for
environmental impact mitigation and the policy incentives that might drive their adoption in tight oil and
shale gas operations.
Finally, we present cost-benefit analyses for three technologies—reduced emissions completions,
model-assisted optimized hydraulic fracturing, and reduced-impact well site foundations—contextualized
in the specific environments of the focus plays. These technologies offer a comparative perspective on the
scale of technology benefit (global, regional, local), the range of forces driving adoption (regulation, cost-
minimization, lease holder demands), and the degree of current adoption (widely adopted to very limited
adoption). We find that two of the three technologies are currently cost neutral or cost-saving without
additional regulatory intervention, while the third is expected to become cost-neutral before 2014.
The laggard adoption of environmental mitigation technologies in the unconventional shale gas
and tight oil extraction industries, however, suggests that cost effectiveness is a necessary but insufficient
condition for technology implementation. Lease-holder education and empowerment, incentives for
technology implementation, and regulatory interventions will be critical in stimulating widespread
adoption of these technologies. Finally, effective policy instruments will be based upon a systemic
understanding of the regional impacts associated with unconventional oil and gas extraction and will
adapt as drilling activity expands to new plays.
The Next Frontier in United States Shale Gas and Tight Oil Extraction: Strategic Reduction of Environmental Impacts
5
TABLE OF CONTENTS
I. The Call for Regional Environmental Impact Analysis and Associated Mitigation Efforts in Unconventional Extraction ........................................................................................................... 6
II. Overview of Unconventional Extraction in the United States ........................................ 8
Role of new technologies in enabling unconventional extraction ............................................... 8
Role in the domestic energy mix ................................................................................................. 9
Environmental impacts associated with hydraulically fractured horizontal wells .................. 12
III. Comparative Analysis: Environmental Context of Three U.S. Unconventional Plays17
Texas’ Barnett Shale .................................................................................................................. 17
Pennsylvania’s Marcellus Shale ................................................................................................ 22
North Dakota’s Bakken Oil Shale ............................................................................................. 26
IV. Opportunities for Environmental Impact Reduction in Shale Gas and Tight Oil Operations 34
Potential opportunities ............................................................................................................... 34
Scale of Implementation ............................................................................................................ 39
Scale of benefits ........................................................................................................................ 39
Degree of adoption .................................................................................................................... 40
Barriers to implementation ........................................................................................................ 40
Where are the low-hanging fruit? .............................................................................................. 41
V. Impact Mitigation Case Studies and Contextualized Benefits in Focus Plays ............ 43
Case study: Probabilistic economic consequences of reduced-emissions completions ........... 43
Case study: Hydraulic fracturing program optimization to reduce water-related impacts ........ 49
Case Study: Reduced-impact well site foundations................................................................... 57
VI. Policy Implications ........................................................................................................... 62
VII. Appendix ........................................................................................................................... 64
References ..................................................................................................................................... 70
The Next Frontier in United States Shale Gas and Tight Oil Extraction: Strategic Reduction of Environmental Impacts
6
I. THE CALL FOR REGIONAL ENVIRONMENTAL IMPACT ANALYSIS AND ASSOCIATED MITIGATION EFFORTS IN UNCONVENTIONAL EXTRACTION
Unconventional fossil fuel extraction from shale formations has already transformed the U.S.
energy portfolio. An anticipated 100-year domestic supply of relatively inexpensive natural gas is
spawning vast change in the electricity sector, with nearly half of electricity production coming from
natural gas fired power plants in 2012 (US EIA 2012c). The substantial increase observed in domestic
oil production over the past five years has the U.S. on track to become the world’s leading oil producer by
2017. And the growth of both oil and gas production is expected to make the U.S. a net gas and oil
exporter by 2030 (IEA WEO 2012a).
These projections for U.S. extraction gloss over the innovation that preceded them and the
challenges that this magnitude of extraction activity will pose for regions endowed with shale resources.
The pairing of horizontal drilling and hydraulic fracturing capabilities has enabled shale gas and tight oil
extraction from low-porosity shale beds previously considered inaccessible, but the complex and
intensive extraction process comes with a broader suite of risks and environmental impacts. These
significant advances in extraction capability have also precipitated a transition in the spatial extent of
drilling activity. The diffuse nature of unconventional extraction translates into intensive drilling
operations over frequent intervals, further elevating the regional impacts of the extraction process.
Another unique attribute of U.S. unconventional resources is the geographic distribution of shale
gas and tight oil resources. The expansion of drilling operations outside of the past decade’s largest U.S.
basins, mostly concentrated in Gulf Coast states, have re-introduced large scale oil and gas extraction
operations to regions and populations unaccustomed to intense drilling activity. The social and
environmental implications of this expansion must be considered in light of regional and global benefits,
but they cannot be justified by these factors. Instead, the pressing challenge for policy makers, oil and
gas companies, and innovators is to develop regulations, management strategies, and technologies to
reduce regional impacts.
The relative novelty of combined horizontal drilling and hydraulic fracturing technologies,
combined with the intensity of drilling operations and the distribution over populated areas, necessitates a
comprehensive evaluation of environmental impacts from shale gas and tight oil extraction. It also
motivates an honest evaluation of impacts and risks intrinsic to the process itself, and those impacts or
risks that can be mitigated through environmental technologies or better management practices.
The Next Frontier in United States Shale Gas and Tight Oil Extraction: Strategic Reduction of Environmental Impacts
7
This report aims to characterize the regional environmental impacts of unconventional extraction
by focusing on the unique environmental sensitivities of three major unconventional plays: the Barnett in
Texas, the Marcellus in Pennsylvania, and the Bakken in North Dakota. After reviewing the projections
for well development in these plays, this work evaluates regional environmental risks, and identifies
potential mitigation efforts. A range of well-level technologies, company management practices, and
regional policies are detailed, with three strategies highlighted in cost-benefit evaluations. We find that
cost effectiveness is a necessary but insufficient condition for the voluntary adoption of environmental
mitigation technologies in unconventional oil and gas extraction, and we suggest that lease-holder
empowerment, incentives for technology implementation, and regulatory interventions will be critical to
stimulating regionally appropriate technological adoption.
The Next Frontier in United States Shale Gas and Tight Oil Extraction: Strategic Reduction of Environmental Impacts
8
II. OVERVIEW OF UNCONVENTIONAL EXTRACTION IN THE UNITED STATES
ROLE OF NEW TECHNOLOGIES IN ENABLING UNCONVENTIONAL EXTRACTION
The synergistic pairing of two established techniques has been a key driver in the rapid
development of unconventional oil and gas plays over the past five years. The first, horizontal drilling,
involves creating a wellbore that runs roughly parallel to the surface after reaching a desired vertical
depth. Rather than drawing only from the point at which a vertical bore reaches the targeted stratum, a
horizontal wellbore makes contact with a long lateral section of source rock. This would boost
production in many formations, but is an especially advantageous approach under two conditions often
found in shales: (1) the presence of hydrocarbons in disjointed pockets rather than as a continuous
reservoir, and (2) a hydrocarbon-bearing formation that is extensive but thin. Horizontal drilling
increases the subsurface space that is accessible via one well, reducing the number of wells needed to
develop the area of a lease holding. These wells present a greater technical challenge in drilling than
their vertical counterparts, and first became economically practicable in the 1980s (US EIA 1993).
The second practice critical to modern unconventional extraction from shale plays, hydraulic
fracturing, occurs following drilling during the completion phase of a well. Large volumes of fluid are
pumped down the wellbore at high pressures to create a network of cracks in the source rock, which are
held open by a proppant—typically sand—carried by additional injected fluid. Fracturing fluid consists
of primarily of water and proppant (≈99% by volume), but it also contains acids, biocides, and
polymerizing gels to prevent scaling, facilitate large fractures, and deter biochemical oxidation of the
hydrocarbons (ALL 2009). Following the fracture process, the well is depressurized and hydrocarbons
begin to flow out of the cracks through the porous matrix of the proppant. The net effect of the process
is to increase the effective surface area of the reservoir, which in turn makes a greater amount of oil or gas
recoverable from a given volume of rock. Though it can add significant costs to a well, hydraulic
fracturing has been widely used in conventional vertical operations since the 1950s (Montgomery and
Smith 2010). Thus, by combining horizontal drilling with hydraulic fracturing, producers can induce
economic flow rates across a large, diffuse subsurface area, then extract from it at volume—all through a
single well.
Though hydraulically fractured horizontal wells were something of a novelty ten years ago, the
technology has since advanced considerably. Two industry-wide trends have become apparent. First,
the horizontal sections of these wells (“laterals”) have become longer over time. The length of a lateral
is governed by geology and economic considerations, as longer laterals are more costly to drill and may
The Next Frontier in United States Shale Gas and Tight Oil Extraction: Strategic Reduction of Environmental Impacts
9
not contribute to increased production in all reservoirs. For shale gas wells, lateral length now clusters
around 1,500 m (IHS CERA 2010). In tight oil1 plays2 such as the Bakken, lateral length shows a wider
range—from hundreds of meters to more than 6,000 m—but generally exceeds the average for shale gas
wells (Zargari 2010). Second, like the reach of a lateral, the number of locations at which it is fractured
along its length has also trended upward in the industry.3 Fracture geometry is determined by many
factors, but virtually all unconventional wells in the U.S. undergo several ‘frac stages,’ each of which
contains multiple clusters of fractures. Laterals now most commonly undergo between 10 and 20 frac
stages, though completions with as many as 40 stages have been reported (Montgomery and Smith 2010,
Snyder and Seale 2011, personal communications with operators). Wells with several laterals radiating
from a single central vertical borehole are not uncommon, and multiple wells are increasingly clustered
on one drilling site (Ladlee and Jacquet 2011). As fractures grow in number and complexity on further-
reaching lateral networks, producers continue to move toward higher efficiencies in exploiting
unconventional reservoirs.
ROLE IN THE DOMESTIC ENERGY MIX
The pairing of horizontal drilling and hydraulic fracturing technologies has opened formally
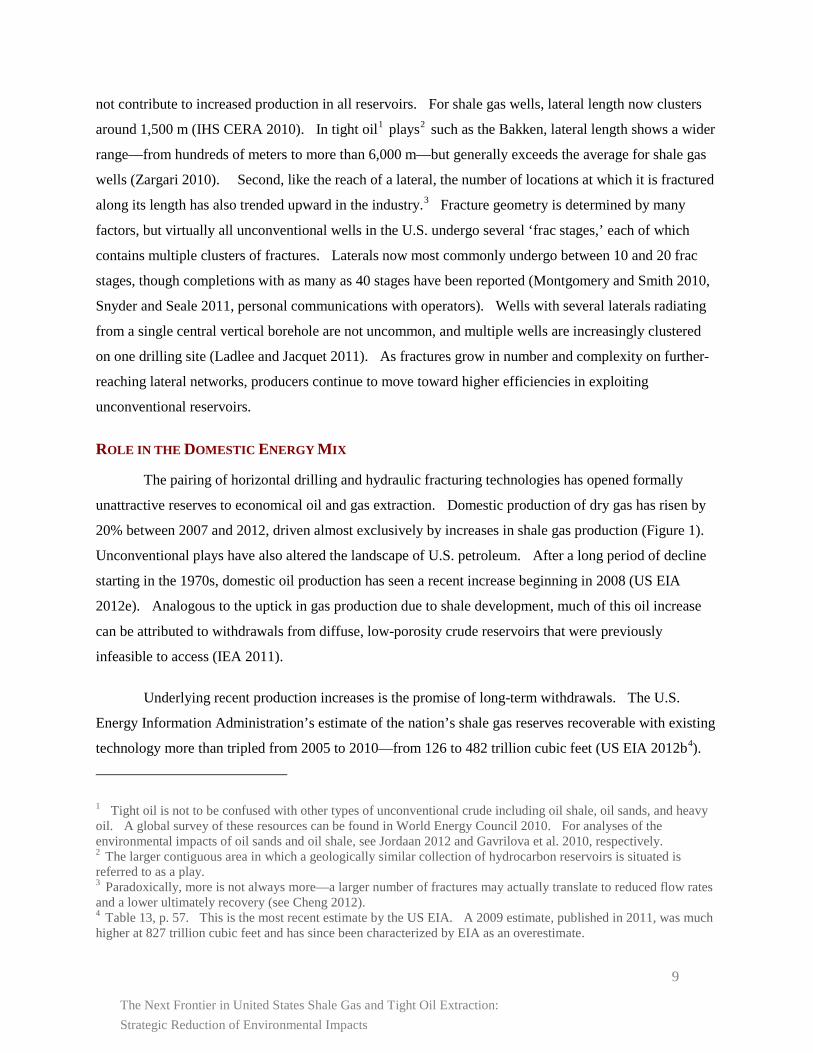
unattractive reserves to economical oil and gas extraction. Domestic production of dry gas has risen by
20% between 2007 and 2012, driven almost exclusively by increases in shale gas production (Figure 1).
Unconventional plays have also altered the landscape of U.S. petroleum. After a long period of decline
starting in the 1970s, domestic oil production has seen a recent increase beginning in 2008 (US EIA
2012e). Analogous to the uptick in gas production due to shale development, much of this oil increase
can be attributed to withdrawals from diffuse, low-porosity crude reservoirs that were previously
infeasible to access (IEA 2011).
Underlying recent production increases is the promise of long-term withdrawals. The U.S.
Energy Information Administration’s estimate of the nation’s shale gas reserves recoverable with existing
technology more than tripled from 2005 to 2010—from 126 to 482 trillion cubic feet (US EIA 2012b4).
1 Tight oil is not to be confused with other types of unconventional crude including oil shale, oil sands, and heavy oil. A global survey of these resources can be found in World Energy Council 2010. For analyses of the environmental impacts of oil sands and oil shale, see Jordaan 2012 and Gavrilova et al. 2010, respectively. 2 The larger contiguous area in which a geologically similar collection of hydrocarbon reservoirs is situated is referred to as a play. 3 Paradoxically, more is not always more—a larger number of fractures may actually translate to reduced flow rates and a lower ultimately recovery (see Cheng 2012). 4 Table 13, p. 57. This is the most recent estimate by the US EIA. A 2009 estimate, published in 2011, was much higher at 827 trillion cubic feet and has since been characterized by EIA as an overestimate.
The Next Frontier in United States Shale Gas and Tight Oil Extraction: Strategic Reduction of Environmental Impacts
10
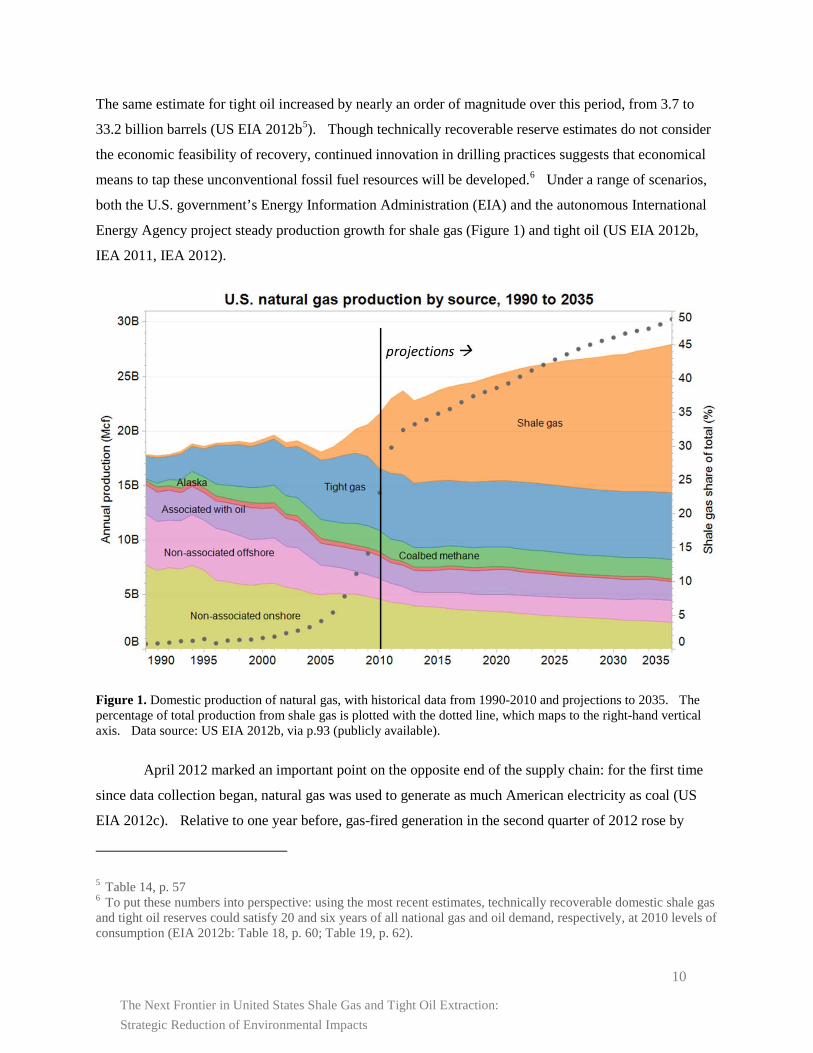
The same estimate for tight oil increased by nearly an order of magnitude over this period, from 3.7 to
33.2 billion barrels (US EIA 2012b5). Though technically recoverable reserve estimates do not consider
the economic feasibility of recovery, continued innovation in drilling practices suggests that economical
means to tap these unconventional fossil fuel resources will be developed.6 Under a range of scenarios,
both the U.S. government’s Energy Information Administration (EIA) and the autonomous International
Energy Agency project steady production growth for shale gas (Figure 1) and tight oil (US EIA 2012b,
IEA 2011, IEA 2012).
Figure 1. Domestic production of natural gas, with historical data from 1990-2010 and projections to 2035. The percentage of total production from shale gas is plotted with the dotted line, which maps to the right-hand vertical axis. Data source: US EIA 2012b, via p.93 (publicly available).
April 2012 marked an important point on the opposite end of the supply chain: for the first time
since data collection began, natural gas was used to generate as much American electricity as coal (US
EIA 2012c). Relative to one year before, gas-fired generation in the second quarter of 2012 rose by
5 Table 14, p. 57 6 To put these numbers into perspective: using the most recent estimates, technically recoverable domestic shale gas and tight oil reserves could satisfy 20 and six years of all national gas and oil demand, respectively, at 2010 levels of consumption (EIA 2012b: Table 18, p. 60; Table 19, p. 62).
The Next Frontier in United States Shale Gas and Tight Oil Extraction: Strategic Reduction of Environmental Impacts
11
nearly half—from 22% to 31% of the national net total (US EIA 2012c). By some forecasts, natural gas
could permanently overtake coal in U.S. electricity generation in the next quarter-century, with one- to
two-thirds of domestic production coming from shale (IEA 20127, US EIA 2012b8, Paltsev et al. 2011).
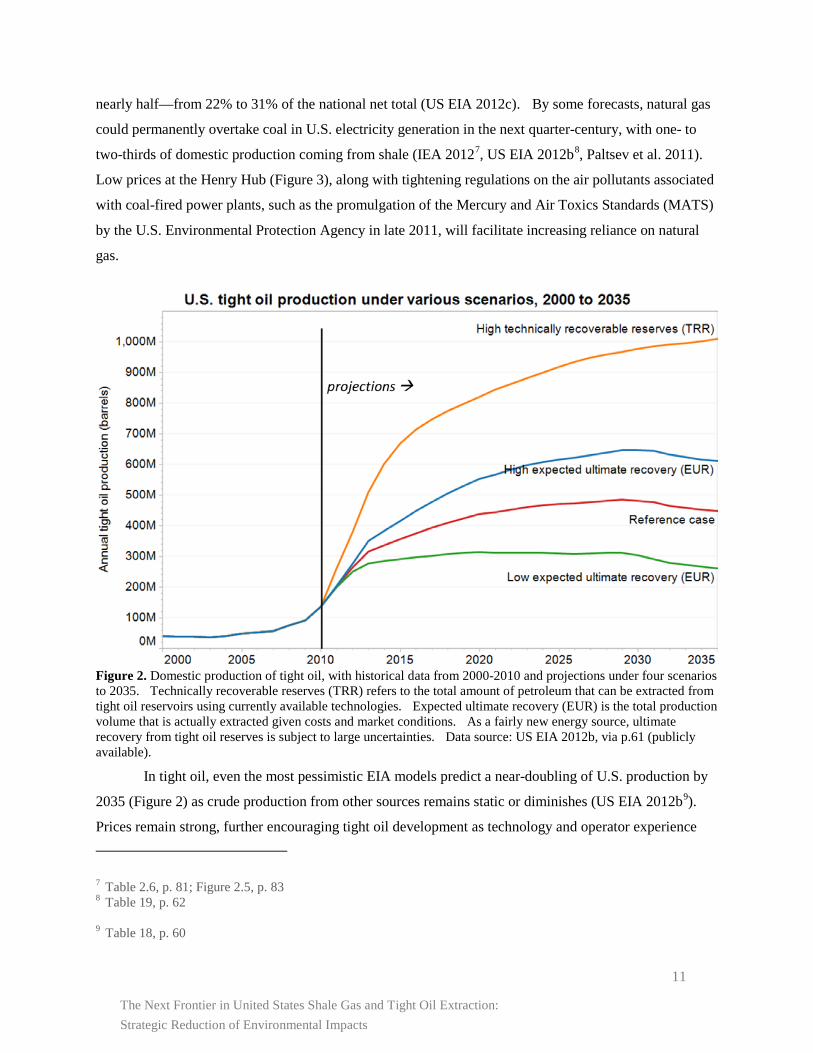
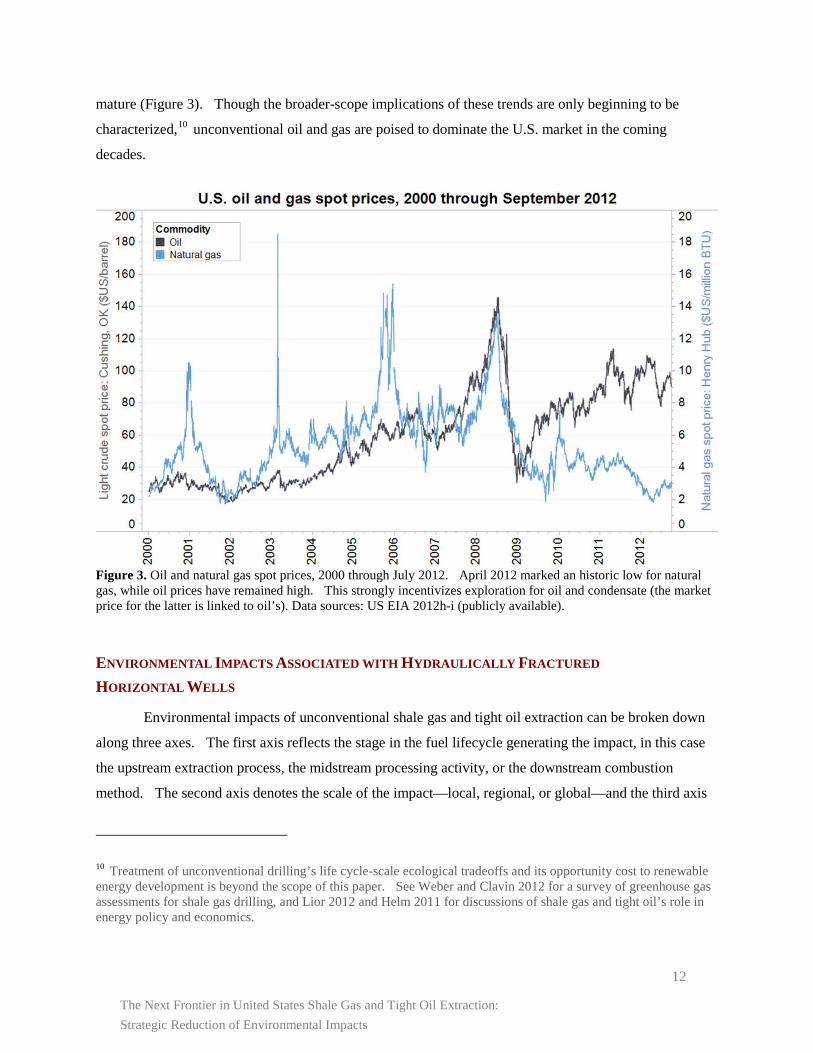
Low prices at the Henry Hub (Figure 3), along with tightening regulations on the air pollutants associated
with coal-fired power plants, such as the promulgation of the Mercury and Air Toxics Standards (MATS)
by the U.S. Environmental Protection Agency in late 2011, will facilitate increasing reliance on natural
gas.
Figure 2. Domestic production of tight oil, with historical data from 2000-2010 and projections under four scenarios to 2035. Technically recoverable reserves (TRR) refers to the total amount of petroleum that can be extracted from tight oil reservoirs using currently available technologies. Expected ultimate recovery (EUR) is the total production volume that is actually extracted given costs and market conditions. As a fairly new energy source, ultimate recovery from tight oil reserves is subject to large uncertainties. Data source: US EIA 2012b, via p.61 (publicly available).
In tight oil, even the most pessimistic EIA models predict a near-doubling of U.S. production by
2035 (Figure 2) as crude production from other sources remains static or diminishes (US EIA 2012b9).
Prices remain strong, further encouraging tight oil development as technology and operator experience
7 Table 2.6, p. 81; Figure 2.5, p. 83 8 Table 19, p. 62 9 Table 18, p. 60
The Next Frontier in United States Shale Gas and Tight Oil Extraction: Strategic Reduction of Environmental Impacts
12
mature (Figure 3). Though the broader-scope implications of these trends are only beginning to be
characterized,10 unconventional oil and gas are poised to dominate the U.S. market in the coming
decades.
Figure 3. Oil and natural gas spot prices, 2000 through July 2012. April 2012 marked an historic low for natural gas, while oil prices have remained high. This strongly incentivizes exploration for oil and condensate (the market price for the latter is linked to oil’s). Data sources: US EIA 2012h-i (publicly available).
ENVIRONMENTAL IMPACTS ASSOCIATED WITH HYDRAULICALLY FRACTURED HORIZONTAL WELLS
Environmental impacts of unconventional shale gas and tight oil extraction can be broken down
along three axes. The first axis reflects the stage in the fuel lifecycle generating the impact, in this case
the upstream extraction process, the midstream processing activity, or the downstream combustion
method. The second axis denotes the scale of the impact—local, regional, or global—and the third axis
10 Treatment of unconventional drilling’s life cycle-scale ecological tradeoffs and its opportunity cost to renewable energy development is beyond the scope of this paper. See Weber and Clavin 2012 for a survey of greenhouse gas assessments for shale gas drilling, and Lior 2012 and Helm 2011 for discussions of shale gas and tight oil’s role in energy policy and economics.
The Next Frontier in United States Shale Gas and Tight Oil Extraction: Strategic Reduction of Environmental Impacts
13
describes the impacted environmental media, including air, water, land use, and other environmental
impact categories. While this report does not seek to provide a comprehensive analysis of the existing
literature highlighting potential environmental impacts along these three axes, we provide a brief
introduction to prominent environmental impacts as a means of contextualizing subsequent discussion on
regionally specific impacts and the technologies that exist to mitigate them.
Much of the discussion around the environmental implications of the U.S.’s shale gas resources
has focused on the global carbon emission benefits of downstream natural gas combustion as a substitute
for coal. Natural gas has the lowest carbon dioxide emission factor at combustion of any fossil fuel and,
on a per-heating unit basis, releases lower amounts than coal of all air quality criteria pollutants (US EIA
2011a, 2012a11). Domestic production of shale gas and tight oil would also reduce energy losses and
environmental impacts of long-distance midstream transport associated with importing fuels (Engelder
2011). When the global environmental impacts of shale gas are assessed on the life-cycle scale—that is,
when the associated extraction and transport processes are taken into account—the prima facie reductions
in greenhouse gas emissions of unconventional fuels become less pronounced. The climate impacts of
drilling, completions, and natural gas transport to climate change has been widely discussed in the
literature (Jiang et al. 2011, Howarth et al. 2012), with particular emphasis placed on the need for
accurate estimates of methane leakage from natural gas pipelines (Weber and Clavin 2012).12 Also
highlighted in recent literature is the potential for low gas prices to undermine the cost-competitiveness of
renewable energy technologies in certain regions (Lee et al. 2012).
Regional air quality impacts from upstream extraction and midstream processing are also a
growing environmental concern (Colborn et al. 2011, McKenzie et al. 2012). Pad construction, water
and material transport, drilling and fracturing, and gas delivery activities are associated with increased
emissions of particulates, ozone precursors, air toxics, and other criteria pollutants (Kemball-Cook et al.
2010, Schmidt 2011). Trucking and transport activity stemming from the hundreds to thousands of truck
trips over a well pad’s life-cycle (NY DEC 2011) has clear regional impacts, but so too does the release of
volatile organics, such as those dissolved in flowback and produced water, and NOx from on-site
generators that can effect downwind ozone concentrations many miles from the well pad (Kemball-Cook
et al. 2010). These well-pad emissions also create local hot-spots for air toxics that, depending on
11 Table A-1, p. 173; Table A-4, p. 176 12 By the most widely-accepted calculations, methane has 25 times the climate forcing potential of carbon dioxide over a hundred-year time horizon, and 72 times that of carbon dioxide over a twenty-year period (Forster et al. 2007).
The Next Frontier in United States Shale Gas and Tight Oil Extraction: Strategic Reduction of Environmental Impacts
14
background concentration levels and other environmental conditions, may exceed the EPA’s acceptable
cancer risk range (CO Dept. of Public Health 2010). To realize potential climate and health benefits of
transitioning from coal to natural gas, the upstream and midstream activities associated with bringing
shale gas and tight oil to market must be performed in an environmentally responsible and regionally
appropriate manner.
In addition to air quality impacts at the global, regional, and local scales, there is a growing focus
on the land use implications of shale gas extraction (Cucura, 2012). Individual and collective land use
impacts of well pads, including increased erosion, habitat fragmentation, and disruption of ecosystem
processes, are evident at the local and regional scales (Johnson et al. 2010).
The most prominent environmental issues surrounding shale gas and tight oil development,
however, are the potential impacts of unconventional extraction on water resource availability, subsurface
water quality, and waste water disposal. The large volumes and chemical content of hydraulic fracturing
wastewater (ALL 2009)—along with high-profile reported instances of methane migration into water
wells (Smith et al. 2010, Osborne et al. 2011)—have stoked public fears of water contamination. Water-
related impacts of unconventional extraction fall into three general categories:
1. Sourcing: Freshwater withdrawals of several million gallons per unconventional well can
impinge on local ecosystems and compete with regional water demands. While water
consumption by hydraulic fracturing activity is generally a small fraction of a state’s total water
consumption (<1% for TX), local impacts will vary with water availability (Nicot 2012, Entrekin
et al. 2011, Rahm and Riha 2012).
2. Groundwater contamination: Near the surface where groundwater may be present, several
concentric layers of metal piping (“casing”) and cement are intended to isolate the contents of the
wellbore from the surrounding environment.13 Aging processes or poor well construction can
precipitate cracks in the casing and cement, compromising the integrity of this isolation and
opening the possibility for aquifer contamination (Gresh 2011). Although hydraulic fracturing
processes generally occur more than a thousand feet below the surface, at least one documented
instance of aquifer contamination by hydraulic fracturing fluids occurred in a poorly-planned
vertical well fractured at shallow depths (US EPA 2011a). Contamination events (such as
13 The industry group American Petroleum Institute recommends that the drilling of this near-surface portion of the wellbore itself be performed using fresh water, air, or freshwater-based fluids to minimize the risk of groundwater contamination prior to casing and cementing (API 2009a). This practice is required by law in some states.
The Next Frontier in United States Shale Gas and Tight Oil Extraction: Strategic Reduction of Environmental Impacts
15
methane migration) involving rural residential water supplies are more likely if these water wells
are poorly encased (Gold 2012).
3. Waste water disposal: A sizable fraction of the water injected—roughly 10% to 40%—flows
back up the well following the completion (Stepan et al. 2010, Galusky 2011). This water is
high in dissolved minerals, including trace amounts of naturally occurring radioactive metals
(NORM), and contains detectible levels of residual fracturing chemicals and dissolved
hydrocarbons. The hundreds of thousands to millions of gallons of wastewater produced per
well are temporarily stored on site and subsequently reused in future fracture operations,
transported off-site for treatment, or injected into Class II wells. The risk of accidental discharge
through leaks in detention units or spills during waste transfer creates logistical challenges for its
reuse or disposal. One method of wastewater disposal, deep-well underground injection, was
recently linked to a series of small earthquakes in Ohio (OH DMR 2012).14 Though opponents
point to risks across several categories in invocations of the precautionary principle, the water-
related impacts of unconventional extraction have loomed large (Finkel and Law 2011).
The true magnitude of the environmental risks posed by unconventional extraction continues to
be the subject of passionate scientific and popular debate. A number of life-cycle assessments,
greenhouse gas emissions inventories, and local environmental assessments are currently under
development by academics, industrial players, and non-government organizations to clarify the extent of
impacts at the local, regional, and global levels. A national taskforce, coordinated by the U.S.
Environmental Protection Agency, has also been formed to evaluate the potential impacts of hydraulic
fracturing on drinking water resources (US EPA, 2012c). In the meantime, a regulatory vacuum on the
federal level15 has placed states with poor oil and gas regulatory infrastructure in the challenging position
of ascertaining environmental impacts of unconventional drilling, drafting environmental regulations, and
enforcing these new requirements. This absence of federal regulatory oversight, paired with residual
14 In addition to the Ohio seismic events associated with injection wastewater disposal, a report by the Oklahoma Geological Survey found a possibility that hydraulic fracturing itself was the cause of several 2011 earthquakes in that state (Holland 2011). See Section II for discussion of related findings in Texas.
15Until April 2012, emissions associated with hydraulic fracturing were not specifically addressed in the Clean Air Act (Weinhold 2012). Per the 2005 Energy Policy Act, hydraulic fracturing injection activities are currently excluded from regulation under the Safe Drinking Water Act with the exception of those injecting diesel (US EPA 2012a). This is because a 2002 EPA study of hydraulic fracturing practices (as used in the extraction of coalbed methane, typically shallower and at smaller scales than current processes for shale gas or tight oil) found that diesel used in fracturing fluid constituted the only appreciable threat to drinking water supplies (US EPA 2002). However, the use of diesel as a fracturing fluid additive was phased out from 2003 (US EPA 2004).
The Next Frontier in United States Shale Gas and Tight Oil Extraction: Strategic Reduction of Environmental Impacts
16
uncertainty over the magnitude of human and environmental impacts, the reluctance of some
unconventional extraction firms to disclose information about their drilling practices, and perceptions of
regulatory incompetence or corruption at the state level, have precipitated public distrust of hydraulic
fracturing in a significant portion of the population. Unfortunately, the polemics of the hydraulic
fracturing debate have often limited discussion about the technical, managerial, and policy interventions
that might mitigate impacts associated with unconventional resource extraction, as well as the effects that
these interventions would have on the relative costs and benefits of unconventional oil and gas extraction
compared to conventional and renewable energy sources.
Even the most efficient, soundly managed, and optimally cited operations generate human and
environmental impacts. Contextualizing these consequences in relation to the impacts of other energy
production methods, as well as evaluating them in a holistic regional context, may inform impact
minimization and mitigation efforts. The following section will evaluate the regional environmental
challenges specific to three major U.S. unconventional plays: the Barnett, the Marcellus, and the Bakken,
while Section IV will evaluate technologies, management strategies, and policies to minimize regional
human and environmental impacts.
The Next Frontier in United States Shale Gas and Tight Oil Extraction: Strategic Reduction of Environmental Impacts
17
III. COMPARATIVE ANALYSIS: ENVIRONMENTAL CONTEXT OF THREE U.S. UNCONVENTIONAL PLAYS
From a global perspective, a hydraulically fractured horizontal well in one state may appear
environmentally equivalent to a similar well located elsewhere around the country. Similar processes
beget similar carbon emissions, land area demands, and water usage. The leap from environmental
inventories to environmental impact analysis, however, requires that these impacts be contextualized
within the regions’ existing human and environmental stressors. Detailing the specific environmental
attributes of major plays is therefore essential to relating the degree of environmental impact to cost-
effective interventions for mitigation.
In this section, we evaluate the regional characteristics of three major U.S. unconventional plays.
All of them—the Barnett Shale in Texas, the Marcellus Shale in Pennsylvania, and the Bakken Oil Shale
in North Dakota—host extensions of the booming U.S. unconventional extraction industry, but each
exists within a unique set of ecological, economic, and demographic parameters. The Barnett is the most
mature play, with ready access to an extensive physical infrastructure. Its predominant environmental
concerns are water scarcity and air pollution in a development area with a large population base. The
Marcellus has developed more recently than the Barnett, but it possesses a well-developed pipeline
network stemming from past conventional drilling activity and its proximity to gas demand centers in the
Northeast. Its primary environmental challenge is wastewater disposal and materials distribution across
a spatially diffuse development area. The Bakken is the most recently established unconventional play
discussed here and is growing at a pace that threatens to overwhelm the region’s resources. Greenhouse
gas emissions due to venting/flaring and minimizing wastewater-related risks are among its most
prominent environmental concerns.
A characterization of the environmental context is presented for each play, followed by the local
developmental arc of oil and gas from years 2000 to 2012. Each section concludes with discussion of the
environmental impacts of unconventional extraction specific to that play. Plays are introduced in
chronological order of development, and attributes are presented comparatively at the end of this section
in Tables 1-3.
TEXAS’ BARNETT SHALE
Located in the north-central portion of Texas near the Oklahoma border, the Barnett Shale is a
moderate-sized play that is characterized by ecological heterogeneity and mixed population density. The
core zone of the play is centered in a four-county area of 3,300 mi2 (8,700 km2), but Barnett wells have
The Next Frontier in United States Shale Gas and Tight Oil Extraction: Strategic Reduction of Environmental Impacts
18
been drilled in 19 additional counties, collectively affecting a surface area of approximately 18,000 mi2
(47,000 km2) (TX RRC 2012f, US CB 2012a). The counties in which Barnett drilling has taken place
account for only 7.0% of the state’s total area, but their 5.8 million residents comprise almost a quarter
(22.7%) of Texas’ population. The positioning of the play poses a unique challenge: while most of the
surface area above the formation is rural, the eastern portion is located beneath the heart of the Dallas-
Fort Worth metroplex, the fourth most populous metropolitan area in the United States. For this reason,
the population density in Barnett-affected counties ranges from 3.7 to 2,718.0 (median 40.3) persons per
square mile (1.4 to 1049.4, median 15.5 km-2).
Precipitation varies widely across the Barnett, with annual rainfall over the past decade averaging
from 20 to 35 inches (51-89 cm) in the semiarid western section to between 25 and 45 inches (64-114 cm)
in the east. The entire region is also prone to cyclical droughts, sometimes severe enough to cause acute
water shortages; precipitation in 2011 was half of normal levels in some locations. The topography of
the Barnett Shale surface area is characterized by flat or gently rolling plains, and ground cover in non-
cultivated rural areas is primarily grasses (USGS 2012). These climatological and geographic features
translate to Bailey ecosystem classifications of dry subtropical steppe in the west and humid temperate
prairie in the east (USDI 2012). In addition to its ecological characteristics, the significant human
presence in the area also comes to bear on impact considerations in energy development.
Fossil fuel extraction has long been a cornerstone of the Texas economy. In all but one of the
past thirty years, Texas has surpassed every other state in oil and gas production, generally accounting for
one-fifth to one-quarter of national totals for oil and approximately one-third of those for gas (US EIA
2012f-g). Since 2000, the state has collected between $2.0 and $4.1 billion dollars annually in severance
taxes16 (US CB 2012b). Though the Barnett was first proved in the early 1980s, production did not
begin in earnest until the early 2000s, when the coupling of hydraulic fracturing and horizontal drilling
was pioneered there. Between 2001 and 2011, natural gas production climbed from 135 billion cubic
feet to 2.0 trillion cubic feet (Figure 5)—increasing the Barnett’s contribution to Texas gas production
from 2.4% to 27% (TX RRC 2012a-b). In 2001, there were 1,400 producing wells in the Barnett,
representing half a percent of the oil and gas wells in the state; ten years later, there were nearly 16,000,
comprising 5.6% of the state total (TX RRC 2012d-e). The Barnett’s wells have chiefly been drilled to
exploit its dry natural gas: while condensate and oil production does add value to wells (2011 production:
16 Severance taxes are paid according to a set schedule—determined by individual states—on the extraction of non-renewable resources.
The Next Frontier in United States Shale Gas and Tight Oil Extraction: Strategic Reduction of Environmental Impacts
19
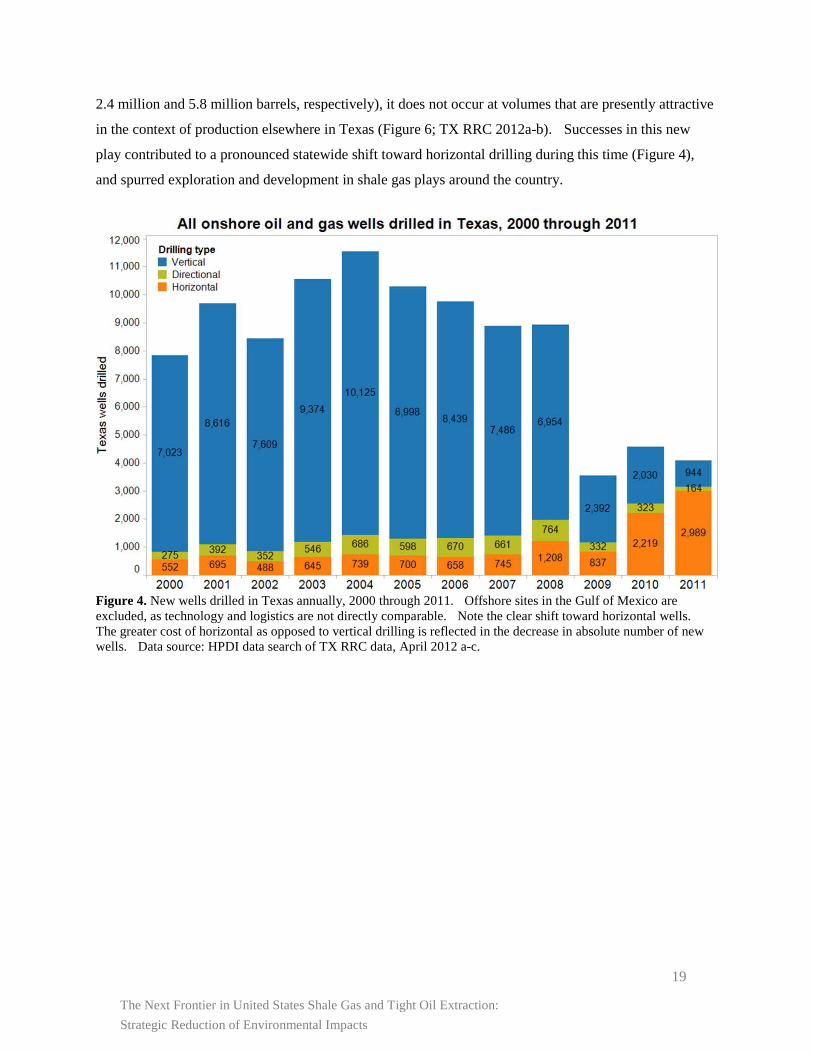
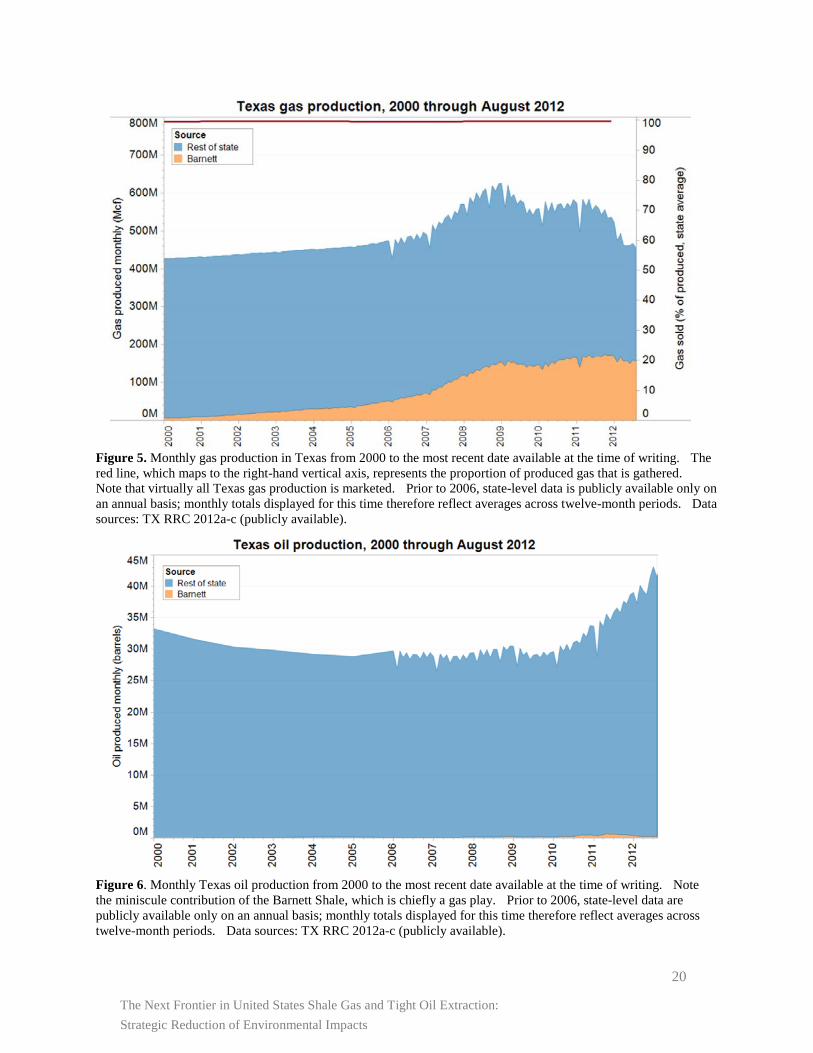
2.4 million and 5.8 million barrels, respectively), it does not occur at volumes that are presently attractive
in the context of production elsewhere in Texas (Figure 6; TX RRC 2012a-b). Successes in this new
play contributed to a pronounced statewide shift toward horizontal drilling during this time (Figure 4),
and spurred exploration and development in shale gas plays around the country.
Figure 4. New wells drilled in Texas annually, 2000 through 2011. Offshore sites in the Gulf of Mexico are excluded, as technology and logistics are not directly comparable. Note the clear shift toward horizontal wells. The greater cost of horizontal as opposed to vertical drilling is reflected in the decrease in absolute number of new wells. Data source: HPDI data search of TX RRC data, April 2012 a-c.
The Next Frontier in United States Shale Gas and Tight Oil Extraction: Strategic Reduction of Environmental Impacts
20
Figure 5. Monthly gas production in Texas from 2000 to the most recent date available at the time of writing. The red line, which maps to the right-hand vertical axis, represents the proportion of produced gas that is gathered. Note that virtually all Texas gas production is marketed. Prior to 2006, state-level data is publicly available only on an annual basis; monthly totals displayed for this time therefore reflect averages across twelve-month periods. Data sources: TX RRC 2012a-c (publicly available).
Figure 6. Monthly Texas oil production from 2000 to the most recent date available at the time of writing. Note the miniscule contribution of the Barnett Shale, which is chiefly a gas play. Prior to 2006, state-level data are publicly available only on an annual basis; monthly totals displayed for this time therefore reflect averages across twelve-month periods. Data sources: TX RRC 2012a-c (publicly available).
The Next Frontier in United States Shale Gas and Tight Oil Extraction: Strategic Reduction of Environmental Impacts
21
The most prominent environmental impacts of drilling in the Barnett, competition for water
quantity and the air emissions from drilling operations, are exacerbated by the population density in the
region. The economy of rural areas overlying the Barnett is dominated by ranging and irrigated
agriculture and their demands for fresh water are in direct competition with a rapidly growing urban
population (Sun et al. 2008). Periodic droughts magnify the water scarcity problem and attract scrutiny
to the large volumes of freshwater (median: 3.3 million gallons per well; Nicot and Scanlon 2012)
sourced from declining aquifers (Bené et al. 2007) and used for hydraulic fracturing operations.
Disposal of fracture flowback has also created tension in the region. A typical Barnett well
generates approximately 1.7 million gallons of wastewater (Galusky 2011), conservatively representing a
collective annual volume on the order of 108 gallons as development continues. The conventional
method of wastewater disposal in the Barnett is deep underground injection at a Class II disposal facility,
and there are several dozen of these facilities in the region (Prozzi et al. 2011). Seismic activity
stemming from the large volumes of injected waste, however, has elicited public concern (Frohlich 2012).
A third major environmental issue in the Barnett is air quality. The Dallas-Fort Worth metroplex
has struggled for years with high ozone levels, and has failed since 1997 to reach attainment status under
eight-hour national ambient air quality standards.17 Because drilling in the Barnett sometimes occurs in
close proximity to communities, public concern has been raised over its potential to exacerbate poor air
quality. This has prompted several rounds of well pad-level measurements by the state environmental
agency (TCEQ 2010).18 Despite the long history of the oil and gas industry in Texas—and its
importance to the greater Dallas-Fort Worth economy—the air and water impacts of Barnett shale gas
extraction have drawn harsh criticism from some among the area’s many residents.
17 Ozone is produced when mono-nitrogen oxides (NOx) react with volatile organic compounds (VOCs) in the presence of sunlight. Its acute effects range from mild respiratory dysfunction (including wheezing or shortness of breath) to acute symptoms such as asthma attacks. Ozone can also contribute to increased mortality among susceptible subpopulations. Both NOx and VOCs are generated by combustion engines, but VOCs such as benzene may also be released during well site operations—particularly if joints and valves on transfer equipment are not tightly sealed. 18 While these studies did document the presence of a variety of VOCs—including several locations at which benzene levels exceeded the state’s long-term air quality standards—no sites exceeded short-term thresholds. However, monitors were installed in four Barnett-are communities that now post real-time air quality data online for public download.
The Next Frontier in United States Shale Gas and Tight Oil Extraction: Strategic Reduction of Environmental Impacts
22
PENNSYLVANIA’S MARCELLUS SHALE
Unconventional extraction activity in the Marcellus Shale is primarily focused in Pennsylvania,
though the play extends through a large swath of the eastern United States. Though larger than the
Barnett in terms of absolute affected surface area, the Marcellus is not yet as densely developed with
wells. The approximately 4,000 Marcellus wells drilled in Pennsylvania have been spread over a 38-
county area, spanning some 29,000 mi2 (74,000 km2) (PA DEP 2012b-c; US CB 2012a). Operations are
concentrated in the north-central portion of the state and its southwestern corner, but nearly two-thirds
(66%) of the land area of Pennsylvania has been annexed into the broader Marcellus development (PA
DEP 2012b-c). Much of the region is rural, though significant urban centers are also affected. The total
population of the counties in which active Marcellus wells have been reported is 4.8 million (38% of the
state), over half of whom reside in the greater Pittsburgh metropolitan area (US CB 2012a). As in the
Barnett, population density in the Marcellus therefore shows a wide range: 12.8 to 1675.6 persons per
square mile, with a median of 72.6 (4.9 to 647.0, median 28.0 km-2; US CB 2012a).
The landscape of the Marcellus is primarily forested and the topography is hilly to mountainous
(USGS 2012). The fractured geology underlying these features precludes high-volume underground
injection of fluids as a means of disposal in some places (McCurdy 2011). The region enjoys favorable
hydrology, with 35 to 55 inches (89 to 140 cm) of precipitation per year (OSU PRISM 2012) and many
rivers and streams. Though surface water is generally plentiful, winter freezing can complicate access
and transport. With its trees, abundant rainfall, and distinct seasons, the large and diffusely-developed
area overlying the Pennsylvania Marcellus is classified as a humid temperate continental ecoregion with
mixed forests.
Unconventional gas extraction precipitated important economic changes in Pennsylvania.
Though the state was home to the first commercial oil well in the United States, by the 1990s its oil and
gas production had plateaued, dwarfed by that of other states (US EIA 2012 g-h). The success of
hydraulic fracturing in the Barnett shale spurred technology transfer to Pennsylvania, rapidly reigniting
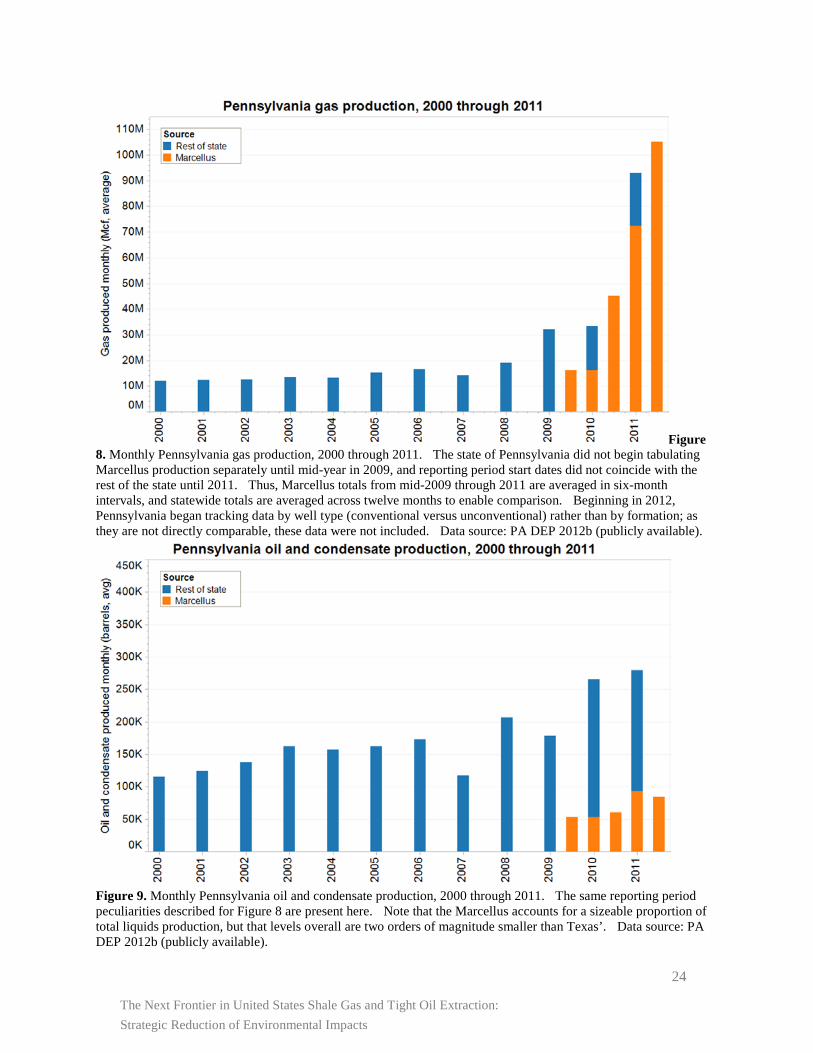
the gas industry in the region. The Marcellus functionally did not exist as a play in 2007, but in 2011
produced nearly 1.1 trillion cubic feet of natural gas—81% of the state total, and already nearly half of the
Barnett’s output despite having a quarter of the wells (Figure 8; PA DEP 2012b). Over the same time
period, the percentage of new wells in Pennsylvania that were drilled horizontally rose from less than one
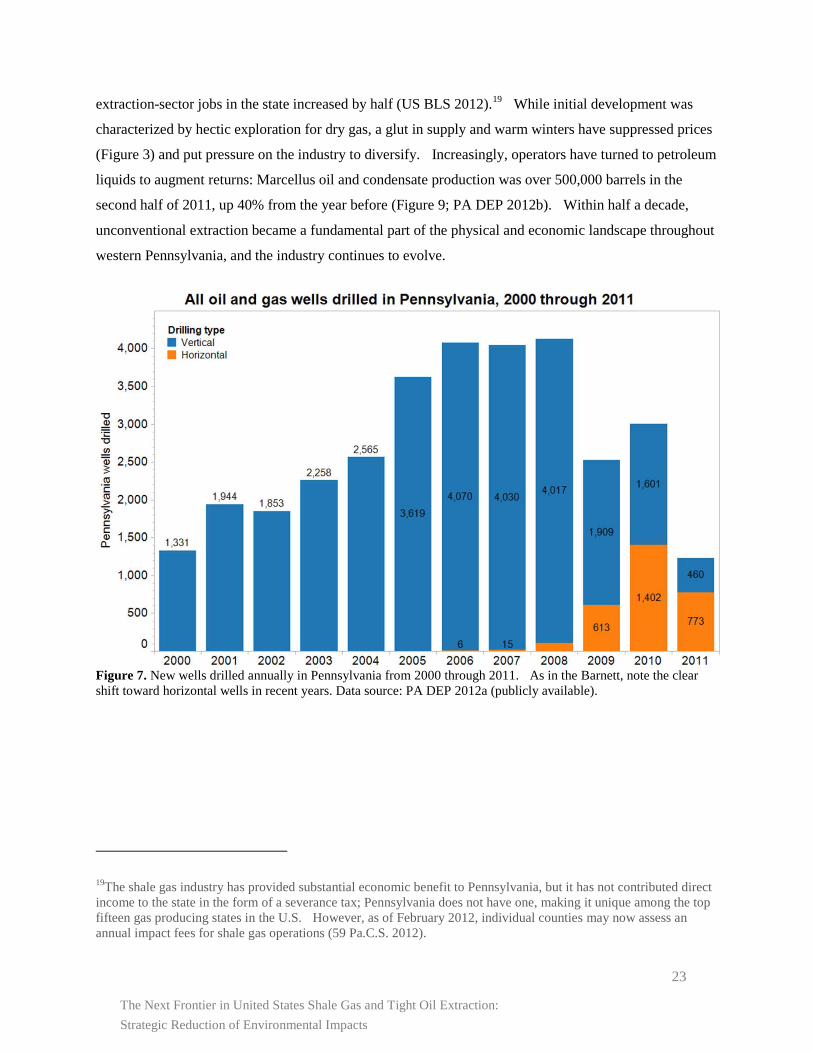
percent to 63% (Figure 7; PA DEP 2012a). In the midst of a national recession, the number of
The Next Frontier in United States Shale Gas and Tight Oil Extraction: Strategic Reduction of Environmental Impacts
23
extraction-sector jobs in the state increased by half (US BLS 2012).19 While initial development was
characterized by hectic exploration for dry gas, a glut in supply and warm winters have suppressed prices
(Figure 3) and put pressure on the industry to diversify. Increasingly, operators have turned to petroleum
liquids to augment returns: Marcellus oil and condensate production was over 500,000 barrels in the
second half of 2011, up 40% from the year before (Figure 9; PA DEP 2012b). Within half a decade,
unconventional extraction became a fundamental part of the physical and economic landscape throughout
western Pennsylvania, and the industry continues to evolve.
Figure 7. New wells drilled annually in Pennsylvania from 2000 through 2011. As in the Barnett, note the clear shift toward horizontal wells in recent years. Data source: PA DEP 2012a (publicly available).
19The shale gas industry has provided substantial economic benefit to Pennsylvania, but it has not contributed direct income to the state in the form of a severance tax; Pennsylvania does not have one, making it unique among the top fifteen gas producing states in the U.S. However, as of February 2012, individual counties may now assess an annual impact fees for shale gas operations (59 Pa.C.S. 2012).
The Next Frontier in United States Shale Gas and Tight Oil Extraction: Strategic Reduction of Environmental Impacts
24
Figure 8. Monthly Pennsylvania gas production, 2000 through 2011. The state of Pennsylvania did not begin tabulating Marcellus production separately until mid-year in 2009, and reporting period start dates did not coincide with the rest of the state until 2011. Thus, Marcellus totals from mid-2009 through 2011 are averaged in six-month intervals, and statewide totals are averaged across twelve months to enable comparison. Beginning in 2012, Pennsylvania began tracking data by well type (conventional versus unconventional) rather than by formation; as they are not directly comparable, these data were not included. Data source: PA DEP 2012b (publicly available).
Figure 9. Monthly Pennsylvania oil and condensate production, 2000 through 2011. The same reporting period peculiarities described for Figure 8 are present here. Note that the Marcellus accounts for a sizeable proportion of total liquids production, but that levels overall are two orders of magnitude smaller than Texas’. Data source: PA DEP 2012b (publicly available).
The Next Frontier in United States Shale Gas and Tight Oil Extraction: Strategic Reduction of Environmental Impacts
25
The similarities between extractive operations in the Barnett and the Marcellus belie the
substantive differences in environmental impacts. Wells in the Marcellus require the same 3.0 to 5.0
million gallons of fresh water (Cawley et al. 2012, Gaudlip and Paugh 2008), but water scarcity is not a
significant regional concern in Pennsylvania. Instead, large-volume sourcing from numerous small
surface waters may reduce in-stream flow rates and degrade local environmental quality. The greater
challenge in the Marcellus lies in the management and disposal of fracture flowback and brines. There
are fewer than 10 Class II injection wells for oil and gas wastewater in the state of Pennsylvania (US
EPAR3 2012), compared to several dozen in the Barnett.
The scarcity of conventional disposal options has forced operators and service providers to seek
alternative methods of disposal, such as brine recycling or thermal desalination, or transport the waste
further afield. Evidence of this challenge is manifest in the lengthy average waste transport distances for
Marcellus flowback: while the average waste transport distance in the Marcellus in 2011 was greater than
100 miles (Mauter 2012, in preparation), the average in the Barnett was approximately 10 miles (Prozzi et
al. 2011). These long transport distances raise concern of large carbon footprints associated with waste
transit, as well and the risk of accidental wastewater release. Until a 2011 law effectively banned the
practice, one of the most economical disposal alternatives was discharge into surface waters via municipal
water treatment facilities, which were unequipped to treat the high salinity levels and large volumes of
wastewater produced by hydraulic fracturing operations. Today, the dominant waste management
approach is to reuse the flowback water in future fracture operations, but risks associated with storage and
transport between fracture operations remains a concern. Finally, groundwater impacts from hydraulic
fracturing activity are also a concern in a state where a large percentage of rural communities source their
drinking water from wells. The PA Department of Environmental Protection has linked drilling activity
to elevated methane concentrations in residential wells,20 but, to date, there has been no documented
linkage between groundwater contamination and injected flowback waste.21
Collective land-use impacts of unconventional drilling present another distinct difficulty. The
disperse drilling patterns in the Marcellus have established oil and gas operations as a pervasive part of
the landscape, rather than a confined feature of a localized development zone, and has resulted in the
habitat fragmentation of previously undisturbed forests (Johnson 2010). Soil disruption and the associated
erosion and stream sedimentation have been a particular concern in the hilly terrain of the Marcellus, and
20 See e.g. Smith 2010, Gresh 2011 21 See e.g. White 2012 for EPA’s final findings in a collection of high-profile well contamination cases in Susquehanna County, Pennsylvania.
The Next Frontier in United States Shale Gas and Tight Oil Extraction: Strategic Reduction of Environmental Impacts
26
these issues have prompted recent changes to Pennsylvania’s oil and gas permitting regime (59 Pa.C.S.
2012). Technological interventions to further minimize soil disruption will be addressed in Section IV.
The rapid pace of unconventional extraction development in Pennsylvania—where an aging energy
industry lacked the widespread public familiarity, regulatory experience, and strategic resources found in
Texas—have made it something of a policy laboratory for environmental impact management strategies.
Its profound ecological differences relative to the Barnett have also stymied attempts for direct adoption
of regulatory and management practices from earlier shale plays.
NORTH DAKOTA’S BAKKEN OIL SHALE
The drilling technologies used in the Bakken are akin to those used in the Marcellus and the
Barnett, but the Bakken’s distinct set of environmental concerns hinge on the high density of agricultural
and rangeland in the play. Current Bakken development has been focused in western North Dakota,
though the formation spans several states and the boarder with Canada.22 Bakken wells have been drilled
in twelve North Dakota counties, affecting 27% of the state’s land area—some 18,000 mi2 (49,000 km2),
and only slightly smaller than the Barnett (ND DMR 2012c; US CB 2012a). Drilling density in the
Bakken is more similar to the Marcellus, with approximately 3,400 wells spread across this area (ND
DMR 2012b). While the Bakken development area encompasses a fifth (21%) of ND’s rural population,
the absolute number of people, 140,000, is thirty- and forty- fold less than its counterparts in
Pennsylvania and Texas, respectively (US CB 2012a). Population density is quite homogenous, ranging
from 0.7 to 30.6 persons per square mile with a median of 2.0 (0.23 to 11.8 km-2, median 0.77; US CB
2012a). Unique among the three plays, a small part of the Bakken surface area (<10%) is located on the
Fort Berthold Indian Reservation.
The rolling prairie that comprises most of the Bakken is topographically similar to the western
Barnett, though the southwestern portion of the area is characterized by the rugged badlands of Theodore
Roosevelt National Park. Annual precipitation in the last decade has averaged between 10 and 25 inches
(25-64 cm), making the Bakken the driest of the three plays (OSU PRISM 2012). The limited rainfall
and harsh winters result in few continuously-accessible surface waters, with the exception of a large man-
made reservoir roughly centrally within the play. Thus, the ecological environment overlying the
Bakken can best be described as dry temperate steppe.
22 Two additional pools, atop which the Bakken is superimposed to varying degrees, have been discovered as industry has developed in western North Dakota. Monthly extractions from the Bakken, Sanish, Three Forks, and Bakken/Three Forks pools are reported by the state as production from the Bakken, and this convention is followed within this report.
The Next Frontier in United States Shale Gas and Tight Oil Extraction: Strategic Reduction of Environmental Impacts
27
The oil and gas industry also has historical precedent in the Bakken, but the recent arrival of
unconventional extraction—focused here not on gas, but on oil—has brought dramatic changes. In 2006,
just prior to the appearance of horizontal drilling and hydraulic fracturing in the Marcellus, 2.3 million
barrels of oil were extracted from the Bakken’s 313 wells, representing 5.8% of North Dakota production.
In 2011, over 3,000 additional Bakken wells collectively produced 129 million barrels, or 84% of the
state total (Figure 12; ND DMR 2012a-b) and 6.2% of national crude oil production (US EIA 2012f).
The rapid expansion of oil extraction has also precipitated statewide economic changes, with collections
of severance tax increasing from $347 million in 2006 to $1.8 billion in 2011. This shift represents an
increase from 21% of all state tax revenue to 49% (US CB 2012b), and raises internal debate about
allocation of rents from state resources. As the national unemployment rate peaked at 10.0% in 2009,
North Dakota’s reached a maximum of 4.2% (US BLS 2012). With the advent of technologies making
tight oil profitable, this sparsely populated state is experiencing an extraordinary influx of equipment,
capital, and personnel as production skyrockets.
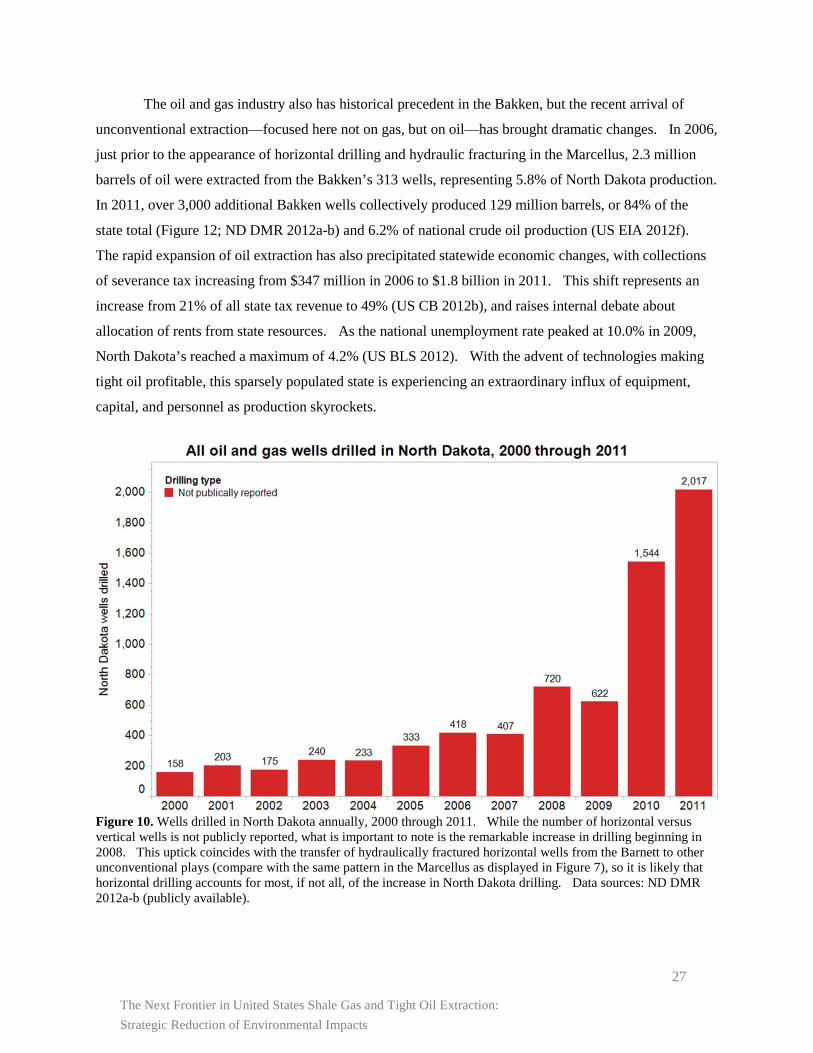
Figure 10. Wells drilled in North Dakota annually, 2000 through 2011. While the number of horizontal versus vertical wells is not publicly reported, what is important to note is the remarkable increase in drilling beginning in 2008. This uptick coincides with the transfer of hydraulically fractured horizontal wells from the Barnett to other unconventional plays (compare with the same pattern in the Marcellus as displayed in Figure 7), so it is likely that horizontal drilling accounts for most, if not all, of the increase in North Dakota drilling. Data sources: ND DMR 2012a-b (publicly available).
The Next Frontier in United States Shale Gas and Tight Oil Extraction: Strategic Reduction of Environmental Impacts
28
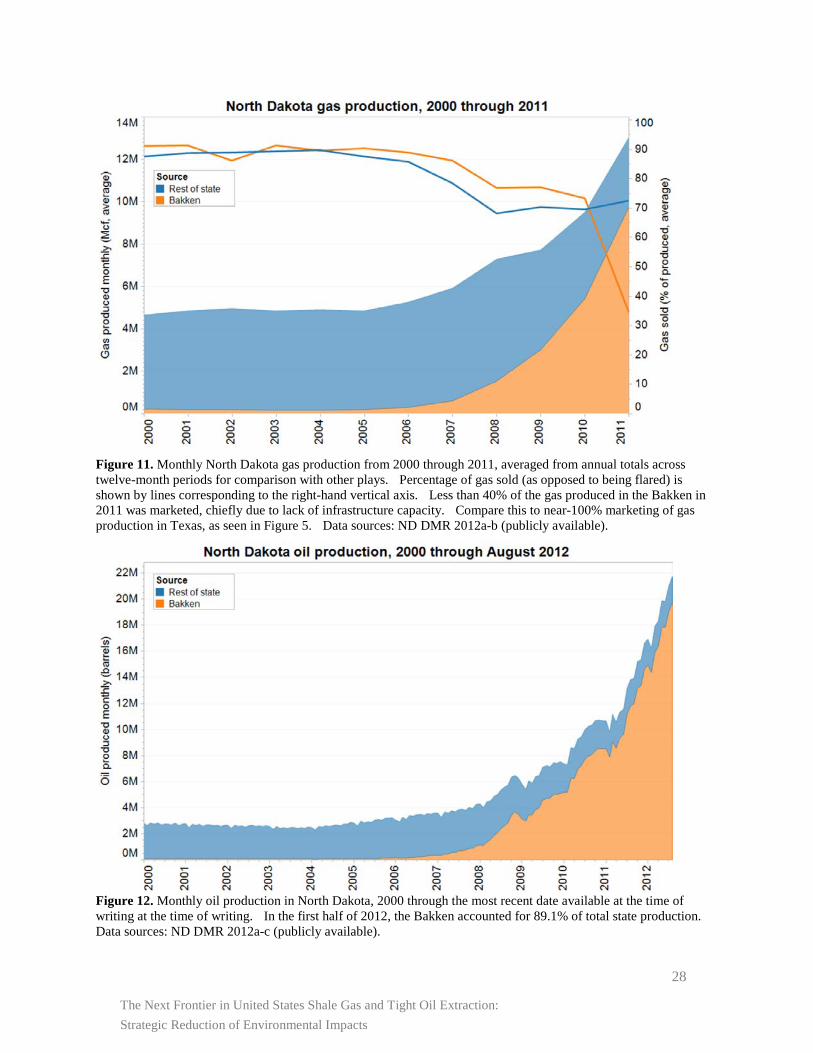
Figure 11. Monthly North Dakota gas production from 2000 through 2011, averaged from annual totals across twelve-month periods for comparison with other plays. Percentage of gas sold (as opposed to being flared) is shown by lines corresponding to the right-hand vertical axis. Less than 40% of the gas produced in the Bakken in 2011 was marketed, chiefly due to lack of infrastructure capacity. Compare this to near-100% marketing of gas production in Texas, as seen in Figure 5. Data sources: ND DMR 2012a-b (publicly available).
Figure 12. Monthly oil production in North Dakota, 2000 through the most recent date available at the time of writing at the time of writing. In the first half of 2012, the Bakken accounted for 89.1% of total state production. Data sources: ND DMR 2012a-c (publicly available).
The Next Frontier in United States Shale Gas and Tight Oil Extraction: Strategic Reduction of Environmental Impacts
29
As in the Marcellus and the Barnett, unconventional extraction in the Bakken is associated with
context-specific environmental impacts. The extraction industry faces land use conflicts with the area’s
farms and ranches,23 and hunters have been critical of ecological disruption on rangelands. Analogous to
the other plays, water sourcing is another concern. Although the absolute quantity of water required for
hydraulic fracturing activity represents a fraction of the 18 billion gallons per year utilized for irrigation in
Bakken-area counties (USGS 2005), surface water is often locally limited and new water demands have
the potential to generate conflict with agricultural users in the state. The frackwater is generally sourced
from groundwater stores or are trucked long distances from the area’s few large reservoirs (Stepan 2010).
Groundwater often requires treatment to remove dissolved minerals, representing additional costs and
energy input, while the carbon cost of trucking surface water grows as development expands farther afield
from a small number of readily-accessible sources.
Third, waste disposal in the Bakken presents unique difficulties associated with the high
development rate of the play. Class II injection facilities for oil and gas wastewater are distributed
throughout the region, though trucking large volumes of wastewater to these sites carries the same risk of
accidental release as in other plays. The enforcement of waste handling regulations essential to reducing
this risk has proved challenging in a thinly-populated state with few field inspection staff.24
The final major environmental challenge in the Bakken is a consequence of its geographic
isolation and absence of ready markets for natural gas. Unlike oil, gas must be piped to refining facilities
via gathering lines. Historical natural gas extraction in Pennsylvania and Texas has left ready networks
of lines crisscrossing the Marcellus and the Barnett, but no such legacy exists in North Dakota. In the
Bakken, gas production is predominantly an indirect consequence of oil development, and the
infrastructure presently in place in western North Dakota simply lacks the capacity to accommodate the
fourteen-fold increase in produced volumes between 2006 and 2011 (ND DMR 2012a-b). Of the 116
billion cubic feet produced in the Bakken in 2011, less than 60% was marketed (ND DMR 2012b).
The challenges of transporting natural gas to market have made methane byproducts from oil
extraction a waste product rather than a commodity. State law prevents direct venting of natural gas into
23 In North Dakota (as in Texas and Pennsylvania), mineral rights and surface rights are severable, with the former dominant. That is, the rights to a given parcel of land and the oil and gas beneath it may belong to different entities, with the party owning the subsurface rights retaining the right of access via the overlying land—with or without the consent of the surface rights holder. 24 As of July 2012, there are thirteen field inspectors employed by the state (ND DMR 2012d). See Dalrymple 2012 for an example of recent compliance challenges.
The Next Frontier in United States Shale Gas and Tight Oil Extraction: Strategic Reduction of Environmental Impacts
30
the ambient environment, so gas not piped for sale must be burned nonproductively (“flared”) at the well
site. These flares represent a significant source of carbon dioxide emissions: in 2011, 47 billion cubic
feet of natural gas—equivalent to 4.5% of production in the Marcellus—was flared from the Bakken (ND
DMR 2012b), illuminating the region in photographs taken by satellites in space. Though a smaller
human population is affected than in the Marcellus or the Barnett, managing the global carbon impacts of
unconventional extraction in the Bakken nonetheless represents a new challenge for North Dakota.
The Next Frontier in United States Shale Gas and Tight Oil Extraction: Strategic Reduction of Environmental Impacts
31
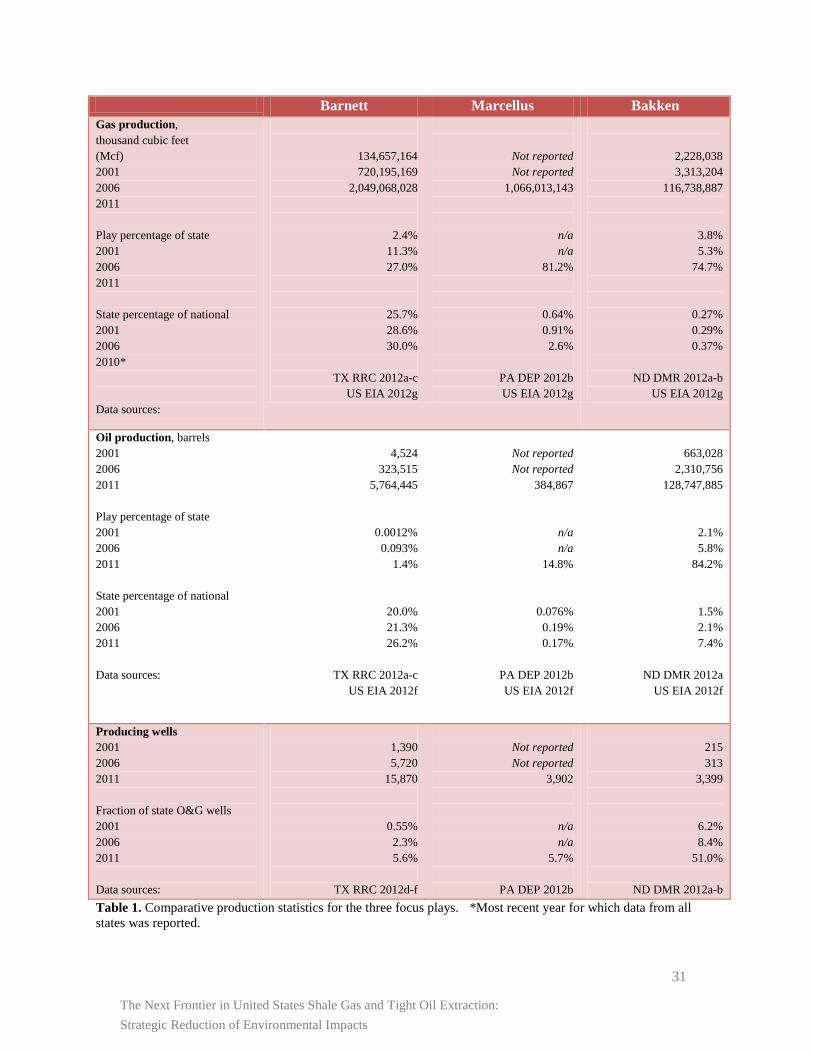
Barnett Marcellus Bakken Gas production, thousand cubic feet (Mcf) 2001 2006 2011 Play percentage of state 2001 2006 2011 State percentage of national 2001 2006 2010* Data sources:
134,657,164 720,195,169 2,049,068,028
2.4% 11.3%
27.0%
25.7% 28.6% 30.0%
TX RRC 2012a-c
US EIA 2012g
Not reported Not reported
1,066,013,143
n/a n/a
81.2%
0.64% 0.91%
2.6%
PA DEP 2012b US EIA 2012g
2,228,038 3,313,204
116,738,887
3.8% 5.3%
74.7%
0.27% 0.29% 0.37%
ND DMR 2012a-b
US EIA 2012g
Oil production, barrels 2001 2006 2011 Play percentage of state 2001 2006 2011 State percentage of national 2001 2006 2011 Data sources:
4,524
323,515 5,764,445
0.0012% 0.093%
1.4%
20.0% 21.3% 26.2%
TX RRC 2012a-c
US EIA 2012f
Not reported Not reported
384,867
n/a n/a
14.8%
0.076% 0.19% 0.17%
PA DEP 2012b US EIA 2012f
663,028
2,310,756 128,747,885
2.1% 5.8%
84.2%
1.5% 2.1% 7.4%
ND DMR 2012a
US EIA 2012f
Producing wells 2001 2006 2011 Fraction of state O&G wells 2001 2006 2011 Data sources:
1,390 5,720
15,870
0.55% 2.3% 5.6%
TX RRC 2012d-f
Not reported Not reported
3,902
n/a n/a
5.7%
PA DEP 2012b
215 313
3,399
6.2% 8.4%
51.0%
ND DMR 2012a-b Table 1. Comparative production statistics for the three focus plays. *Most recent year for which data from all states was reported.
The Next Frontier in United States Shale Gas and Tight Oil Extraction: Strategic Reduction of Environmental Impacts
32
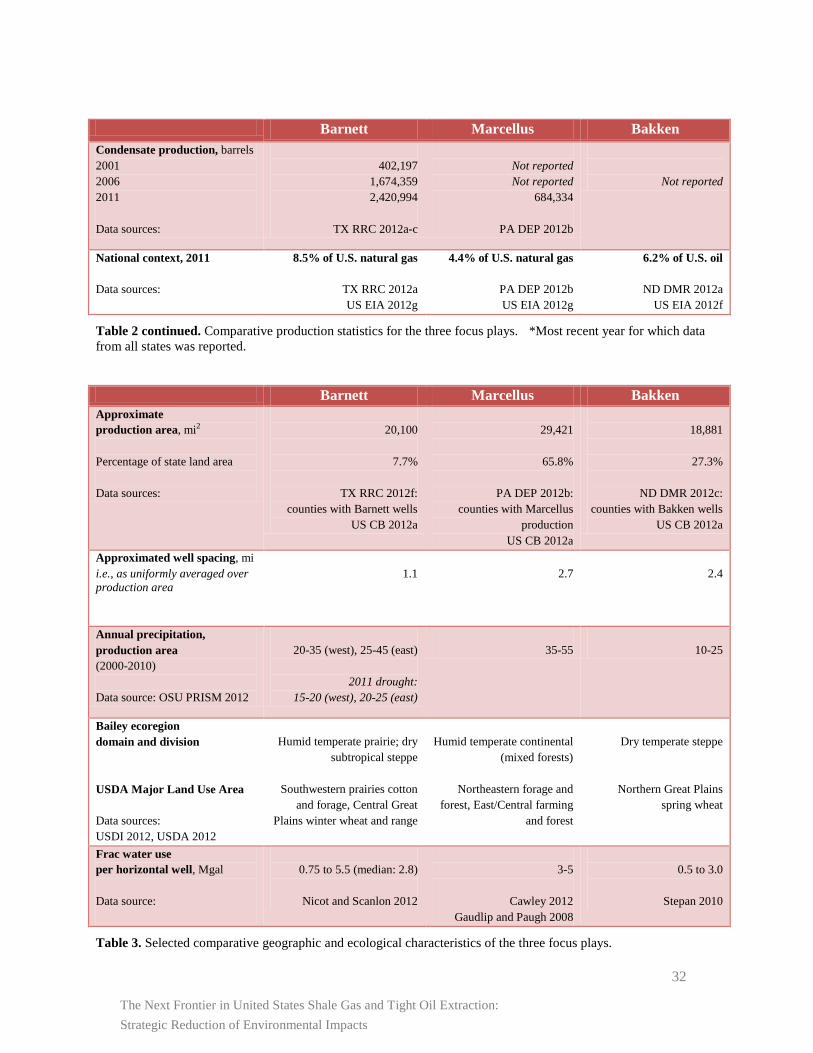
Barnett Marcellus Bakken Condensate production, barrels 2001 2006 2011 Data sources:
402,197
1,674,359 2,420,994
TX RRC 2012a-c
Not reported Not reported
684,334
PA DEP 2012b
Not reported
National context, 2011 Data sources:
8.5% of U.S. natural gas
TX RRC 2012a US EIA 2012g
4.4% of U.S. natural gas
PA DEP 2012b US EIA 2012g
6.2% of U.S. oil
ND DMR 2012a US EIA 2012f
Table 2 continued. Comparative production statistics for the three focus plays. *Most recent year for which data from all states was reported.
Barnett Marcellus Bakken Approximate production area, mi2 Percentage of state land area Data sources:
20,100
7.7%
TX RRC 2012f:
counties with Barnett wells US CB 2012a
29,421
65.8%
PA DEP 2012b:
counties with Marcellus production
US CB 2012a
18,881
27.3%
ND DMR 2012c:
counties with Bakken wells US CB 2012a
Approximated well spacing, mi i.e., as uniformly averaged over production area
1.1
2.7
2.4
Annual precipitation, production area (2000-2010) Data source: OSU PRISM 2012
20-35 (west), 25-45 (east)
2011 drought:
15-20 (west), 20-25 (east)
35-55
10-25
Bailey ecoregion domain and division USDA Major Land Use Area Data sources: USDI 2012, USDA 2012
Humid temperate prairie; dry
subtropical steppe
Southwestern prairies cotton and forage, Central Great
Plains winter wheat and range
Humid temperate continental
(mixed forests)
Northeastern forage and forest, East/Central farming
and forest
Dry temperate steppe
Northern Great Plains spring wheat
Frac water use per horizontal well, Mgal Data source:
0.75 to 5.5 (median: 2.8)
Nicot and Scanlon 2012
3-5
Cawley 2012
Gaudlip and Paugh 2008
0.5 to 3.0
Stepan 2010
Table 3. Selected comparative geographic and ecological characteristics of the three focus plays.
The Next Frontier in United States Shale Gas and Tight Oil Extraction: Strategic Reduction of Environmental Impacts
33
Barnett Marcellus Bakken Severance taxes collected by state 2001 2006 2011 As percentage of state tax revenue 2001 2006 2011 Data source: US CB 2012b
$2,044,795,000 $3,216,387,000 $2,677,604,000
6.9% 8.8% 6.2%
$0 $0 $0
n/a n/a n/a
$164,624,000 $346,672,000
$1,883,816,000
14.1% 21.4% 49.3%
Population, production area* Percentage of state Data source: US CB 2012a
5,824,733
22.7%
4,820,003
37.8%
142,418
20.8%
Population density, production area, persons/mi2* Data source: US CB 2012a
3.7 to 2718.0
median: 40.2
12.8 to 1675.6
median: 72.6
0.7 to 30.6
median: 2.0
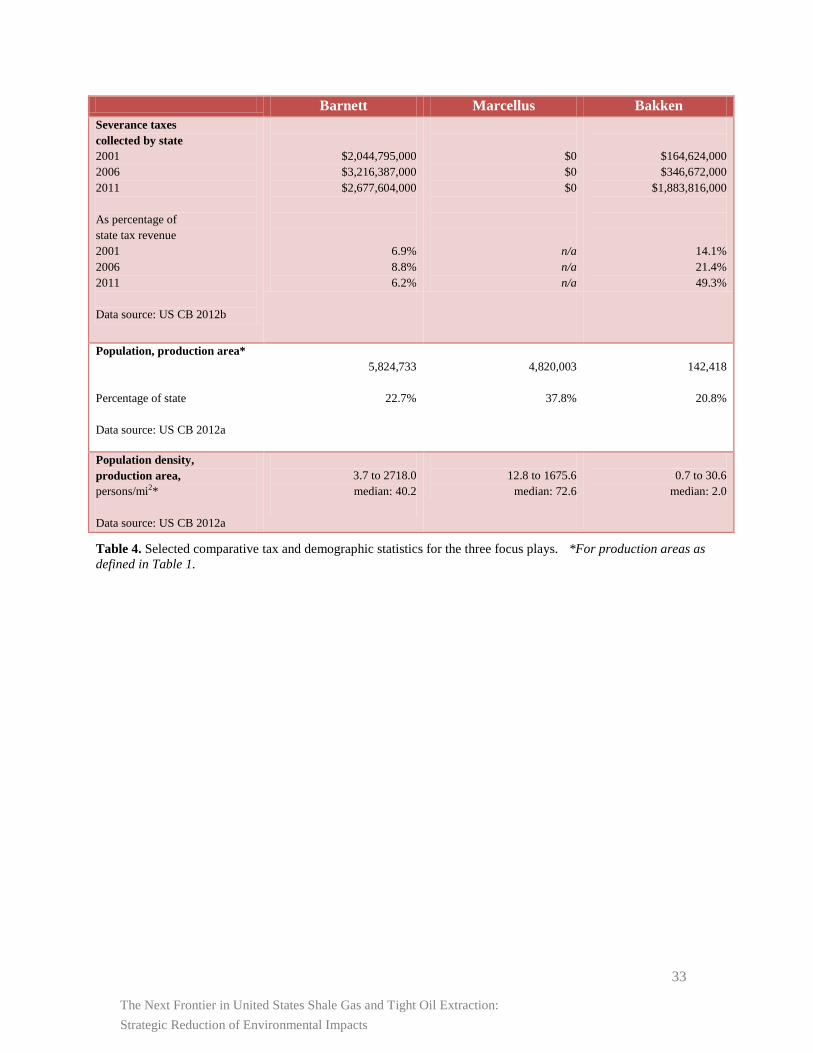
Table 4. Selected comparative tax and demographic statistics for the three focus plays. *For production areas as defined in Table 1.
The Next Frontier in United States Shale Gas and Tight Oil Extraction: Strategic Reduction of Environmental Impacts
34
IV. OPPORTUNITIES FOR ENVIRONMENTAL IMPACT REDUCTION IN SHALE GAS AND TIGHT OIL OPERATIONS
POTENTIAL OPPORTUNITIES
The regional environmental impacts stemming from unconventional extraction in the Barnett,
Marcellus, and Bakken plays are both intrinsic to the technology and exacerbated by the failure to
implement available control technologies, to adopt responsible environmental management practices, and
improve regulatory oversight. Fortunately, these failures at the well and regional levels are beginning to
garner attention across the extraction, oil and gas services, and policy sectors as opportunities for risk
reduction and profit maximization. Technological, management, and policy interventions to mitigate or
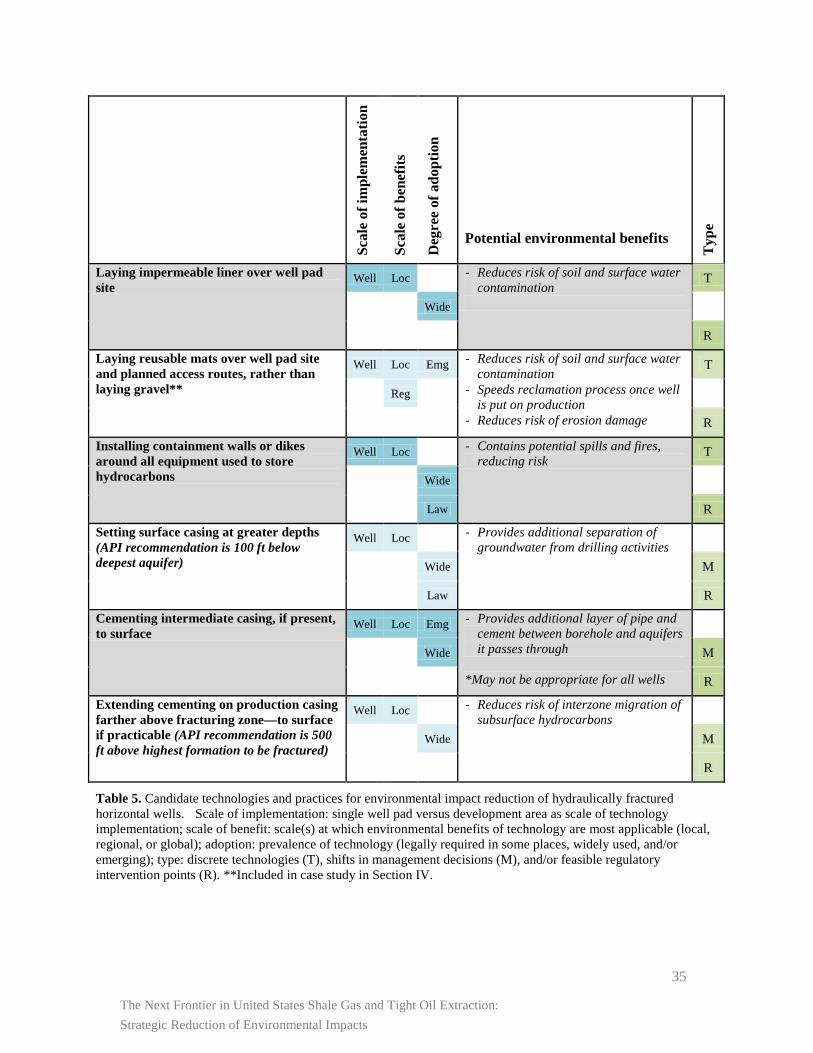
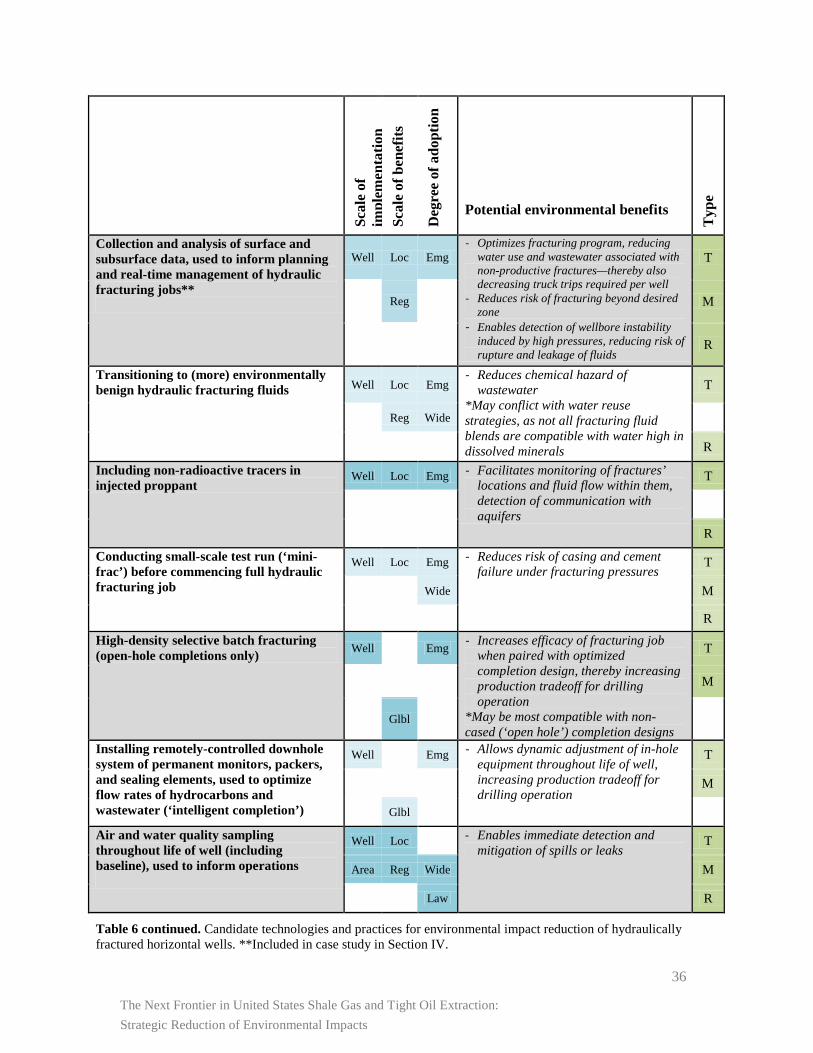
reduce the environmental impacts of shale extraction are catalogued in Table 4. This table highlights
mitigation opportunities in four dimensions: (1) the scale of technology implementation, from the single-
well level to the development scale (i.e., all the sites owned in an area by a particular operator); (2) the
scale of technology benefits, from the local level to the regional level to the global level; (3) the present
degree of adoption, from an emerging technology embraced by early adopters, to widespread
implementation, to regulations mandating adoption; and (4) the type of mitigation measure (discrete
technology, shift in management practices, or feasible regulatory intervention).
While the list represents promising technologies, management strategies, and policies for
reducing or mitigating environmental impacts, it is not an exhaustive compilation. We exclude
technologies in the development and testing stage, instead choosing to focus on technologies that are
available for deployment in 2013. The list is also not intended to endorse any individual product or
vendor, but to identify viable and commercially available technical interventions to reduce impacts
intrinsic to the extraction process. Also omitted are practices designed to reduce impacts not directly
related to environmental quality, an example of which would be noise control measures.25 It should be
noted that many operators already make use of one or more of these strategies, and that some
interventions are legally required in certain jurisdictions. The costs and benefits of three of these impact
reduction measures, representing a range of implementation scales, benefit categories, and degrees of
adoption, are presented as case studies in Section IV.
25 Other serious non-environmental impacts of unconventional extraction operations include social changes and strain on local infrastructure in affected communities. The potential feedback impacts of these phenomena on the industry’s “social license to operate” were featured prominently in a recent report from the International Energy Agency—see IEA 2012.
The Next Frontier in United States Shale Gas and Tight Oil Extraction: Strategic Reduction of Environmental Impacts
35
Scal
e of
impl
emen
tatio
n
Scal
e of
ben
efits
Deg
ree
of a
dopt
ion
Potential environmental benefits T
ype
Laying impermeable liner over well pad site
Well Loc - Reduces risk of soil and surface water contamination
T
Wide
R
Laying reusable mats over well pad site and planned access routes, rather than laying gravel**
Well Loc Emg - Reduces risk of soil and surface water contamination
- Speeds reclamation process once well is put on production
- Reduces risk of erosion damage
T
Reg
R
Installing containment walls or dikes around all equipment used to store hydrocarbons
Well Loc - Contains potential spills and fires, reducing risk
T
Wide
Law R
Setting surface casing at greater depths (API recommendation is 100 ft below deepest aquifer)
Well Loc - Provides additional separation of groundwater from drilling activities
Wide M
Law R
Cementing intermediate casing, if present, to surface
Well Loc Emg - Provides additional layer of pipe and cement between borehole and aquifers it passes through
*May not be appropriate for all wells
Wide M
R
Extending cementing on production casing farther above fracturing zone—to surface if practicable (API recommendation is 500 ft above highest formation to be fractured)
Well Loc - Reduces risk of interzone migration of subsurface hydrocarbons
Wide M
R
Table 5. Candidate technologies and practices for environmental impact reduction of hydraulically fractured horizontal wells. Scale of implementation: single well pad versus development area as scale of technology implementation; scale of benefit: scale(s) at which environmental benefits of technology are most applicable (local, regional, or global); adoption: prevalence of technology (legally required in some places, widely used, and/or emerging); type: discrete technologies (T), shifts in management decisions (M), and/or feasible regulatory intervention points (R). **Included in case study in Section IV.
The Next Frontier in United States Shale Gas and Tight Oil Extraction: Strategic Reduction of Environmental Impacts
36
Scal
e of
im
plem
enta
tion
Scal
e of
ben
efits
Deg
ree
of a
dopt
ion
Potential environmental benefits T
ype
Collection and analysis of surface and subsurface data, used to inform planning and real-time management of hydraulic fracturing jobs**
Well Loc Emg - Optimizes fracturing program, reducing
water use and wastewater associated with non-productive fractures—thereby also decreasing truck trips required per well
- Reduces risk of fracturing beyond desired zone
- Enables detection of wellbore instability induced by high pressures, reducing risk of rupture and leakage of fluids
T
Reg M
R
Transitioning to (more) environmentally benign hydraulic fracturing fluids Well Loc Emg
- Reduces chemical hazard of wastewater
*May conflict with water reuse strategies, as not all fracturing fluid blends are compatible with water high in dissolved minerals
T
Reg Wide
R
Including non-radioactive tracers in injected proppant
Well Loc Emg - Facilitates monitoring of fractures’ locations and fluid flow within them, detection of communication with aquifers
T
R
Conducting small-scale test run (‘mini-frac’) before commencing full hydraulic fracturing job
Well Loc Emg - Reduces risk of casing and cement failure under fracturing pressures
T
Wide M
R
High-density selective batch fracturing (open-hole completions only) Well Emg - Increases efficacy of fracturing job
when paired with optimized completion design, thereby increasing production tradeoff for drilling operation
*May be most compatible with non-cased (‘open hole’) completion designs
T
M
Glbl
Installing remotely-controlled downhole system of permanent monitors, packers, and sealing elements, used to optimize flow rates of hydrocarbons and wastewater (‘intelligent completion’)
Well Emg - Allows dynamic adjustment of in-hole equipment throughout life of well, increasing production tradeoff for drilling operation
T
M
Glbl
Air and water quality sampling throughout life of well (including baseline), used to inform operations
Well Loc - Enables immediate detection and mitigation of spills or leaks
T
Area Reg Wide M
Law R
Table 6 continued. Candidate technologies and practices for environmental impact reduction of hydraulically fractured horizontal wells. **Included in case study in Section IV.
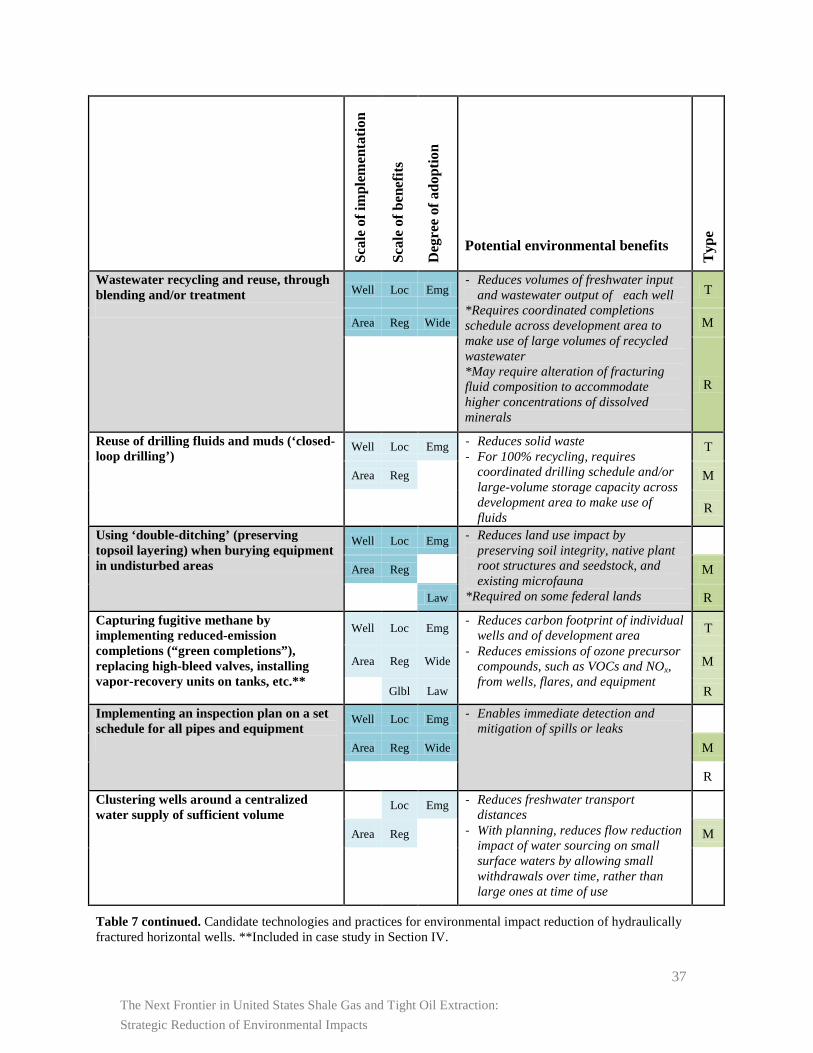
The Next Frontier in United States Shale Gas and Tight Oil Extraction: Strategic Reduction of Environmental Impacts
37
Scal
e of
impl
emen
tatio
n
Scal
e of
ben
efits
Deg
ree
of a
dopt
ion
Potential environmental benefits T
ype
Wastewater recycling and reuse, through blending and/or treatment
Well Loc Emg - Reduces volumes of freshwater input
and wastewater output of each well *Requires coordinated completions schedule across development area to make use of large volumes of recycled wastewater *May require alteration of fracturing fluid composition to accommodate higher concentrations of dissolved minerals
T
Area Reg Wide M
R
Reuse of drilling fluids and muds (‘closed-loop drilling’)
Well Loc Emg - Reduces solid waste - For 100% recycling, requires
coordinated drilling schedule and/or large-volume storage capacity across development area to make use of fluids
T
Area Reg M
R
Using ‘double-ditching’ (preserving topsoil layering) when burying equipment in undisturbed areas
Well Loc Emg - Reduces land use impact by preserving soil integrity, native plant root structures and seedstock, and existing microfauna
*Required on some federal lands
Area Reg M
Law R
Capturing fugitive methane by implementing reduced-emission completions (“green completions”), replacing high-bleed valves, installing vapor-recovery units on tanks, etc.**
Well Loc Emg - Reduces carbon footprint of individual wells and of development area
- Reduces emissions of ozone precursor compounds, such as VOCs and NOx, from wells, flares, and equipment
T
Area Reg Wide M
Glbl Law R
Implementing an inspection plan on a set schedule for all pipes and equipment
Well Loc Emg - Enables immediate detection and mitigation of spills or leaks
Area Reg Wide M
R
Clustering wells around a centralized water supply of sufficient volume
Loc Emg - Reduces freshwater transport distances
- With planning, reduces flow reduction impact of water sourcing on small surface waters by allowing small withdrawals over time, rather than large ones at time of use
Area Reg M
Table 7 continued. Candidate technologies and practices for environmental impact reduction of hydraulically fractured horizontal wells. **Included in case study in Section IV.
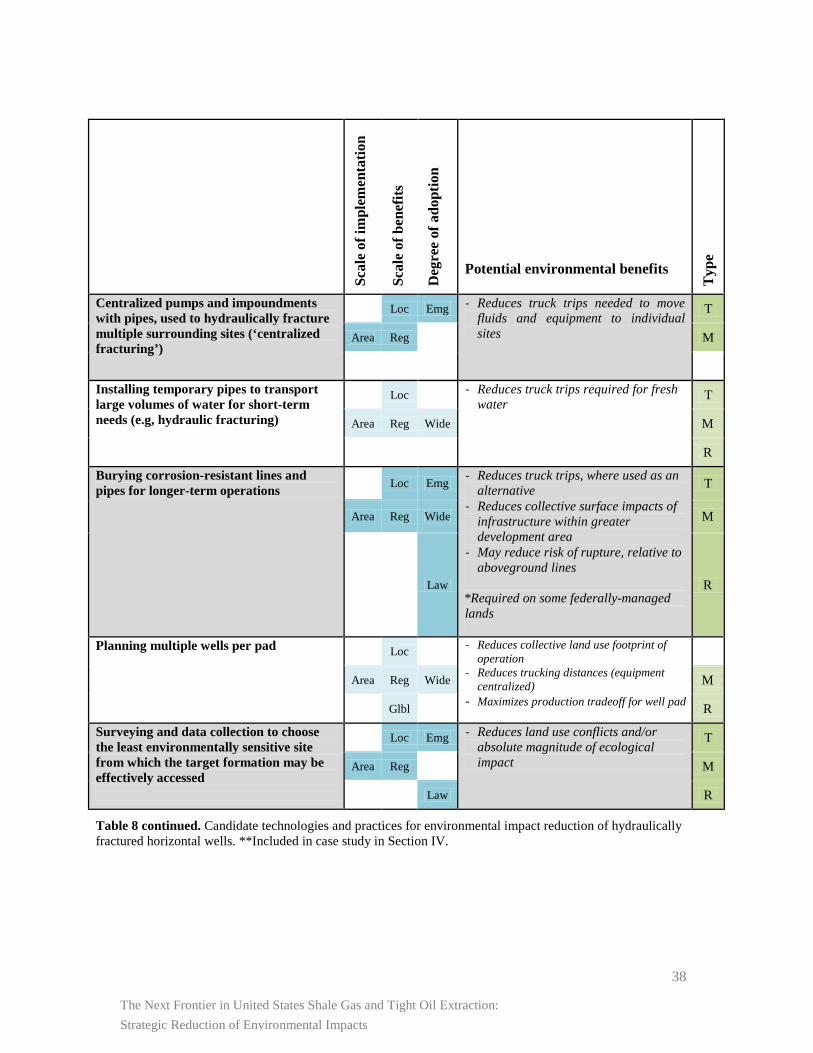
The Next Frontier in United States Shale Gas and Tight Oil Extraction: Strategic Reduction of Environmental Impacts
38
Scal
e of
impl
emen
tatio
n
Scal
e of
ben
efits
Deg
ree
of a
dopt
ion
Potential environmental benefits T
ype
Centralized pumps and impoundments with pipes, used to hydraulically fracture multiple surrounding sites (‘centralized fracturing’)
Loc Emg - Reduces truck trips needed to move fluids and equipment to individual sites
T
Area Reg M
Installing temporary pipes to transport large volumes of water for short-term needs (e.g, hydraulic fracturing)
Loc - Reduces truck trips required for fresh water
T
Area Reg Wide M
R
Burying corrosion-resistant lines and pipes for longer-term operations Loc Emg - Reduces truck trips, where used as an
alternative - Reduces collective surface impacts of
infrastructure within greater development area
- May reduce risk of rupture, relative to aboveground lines
*Required on some federally-managed lands
T
Area Reg Wide M
Law R
Planning multiple wells per pad Loc - Reduces collective land use footprint of operation
- Reduces trucking distances (equipment centralized)
- Maximizes production tradeoff for well pad
Area Reg Wide M
Glbl R
Surveying and data collection to choose the least environmentally sensitive site from which the target formation may be effectively accessed
Loc Emg - Reduces land use conflicts and/or absolute magnitude of ecological impact
T
Area Reg M
Law R
Table 8 continued. Candidate technologies and practices for environmental impact reduction of hydraulically fractured horizontal wells. **Included in case study in Section IV.
The Next Frontier in United States Shale Gas and Tight Oil Extraction: Strategic Reduction of Environmental Impacts
39
SCALE OF IMPLEMENTATION
Technologies, policies, and management interventions to mitigate the environmental impacts of
hydraulic fracturing may occur at the well level or at the development (area) scale. Historically,
interventions have emphasized well-level mitigation strategies that are primarily technological in nature.
Examples listed above include improved site protection (e.g. impermeable liners to contain spills),
reductions in hazardous materials (e.g. transitioning to environmentally benign hydraulic fracturing
fluids), or pollution control technologies (e.g. vapor separation systems to capture fugitive methane
emissions during the completion process).
These technology-focused well-level interventions present simple, often cost-effective
opportunities for companies or regulators to reduce the environmental impacts of hydraulic fracturing.
Exclusive emphasis on well-side technologies, however, obscures the more meaningful development
scale interventions. These development scale interventions address systemic inefficiencies that arise
from treating each well as an individual entity, rather than part of a larger extraction network.
Opportunities highlighted in Table 4 include technologies that leverage efficiency of scale (e.g.
centralized pumps and impoundments that serve multiple well sites), well drilling strategies to maximize
recovery while minimizing environmental impact (e.g. planning multiple wells per pad), and coordination
of operations to improve opportunities for synergistic activity (e.g. spatial temporal clustering of drilling
operations to maximize wastewater reuse). These development scale technology and management
interventions are often low or no cost modifications that result in significant reductions in environmental
impact.
SCALE OF BENEFITS
Incentivizing adoption of pollution control technologies or risk mitigation practices will largely
fall to land owners and regulators on the local, state, or national levels. Table 4 categorizes the scale of
benefit accrual from impact mitigation practices to offer perspective on the appropriate scale of policy
intervention.
Interventions with highly localized benefits include landscape preservation techniques,
technologies to minimize of hazardous releases, and management practices to reduce the probability of
accidents. While locally proposed legislation at the city or county level may face legal challenges, land-
owners have significant leverage during the lease signing process to mandate the use of specific
mitigation technologies. Regional scale benefits are more closely associated with management
interventions that minimize oil and gas trucking activity, control technologies that reduce criteria
The Next Frontier in United States Shale Gas and Tight Oil Extraction: Strategic Reduction of Environmental Impacts
40
pollutants, and water conservation and treatment strategies to maintain adequate health of regional
watersheds. Global benefits are primarily liked to greenhouse gas mitigation technologies, but these
same mitigation technologies often have trickle down effects at the regional and local scales. Indeed, the
vertical translation of benefits across scales is apparent in many technologies listed.
DEGREE OF ADOPTION
Each technology, management strategy, or regulatory intervention presented in Table 4 has
shown demonstrable impact reduction in field applications. The degree of technology adoption
(emerging, widespread, or legally mandated) is therefore a function of factors other than technology
readiness. Cost, magnitude of benefits, regional availability of a product, or demand from the
community may be influencing the extent of technology adoption.
Evaluating the adoption of impact mitigation technologies at the company level may reveal
additional insights obscured by aggregate data presented in Table 4. Technology diffusion in a play can
occur within a firm or across a region, though few studies have evaluated the primary mode of technology
transfer in the hydraulic fracturing industry. Another question of potential interest is the competitive
advantage associated with early adoption. Devon Energy in Texas, for instance, leveraged their early
adoption of water reuse and green completions technology to launch a public relations campaign.
Similarly, Range Resources employed spokesmen to communicate their water recycling efforts in the
Marcellus far before other firms began addressing these public concerns on a regional level. Anecdotal
evidence suggests that firms are not allocating resources to promote environmental impact mitigation
efforts in North Dakota, though it is not clear whether this is attributable to poor environmental
performance in the state or lower public concern surrounding the environmental impacts of tight oil
extraction. Other advantages of early adoption from a productivity or risk mitigation perspective are
more difficult to ascertain with available data, but represent an interesting opportunity for future research.
BARRIERS TO IMPLEMENTATION
Despite the low to moderate cost of many interventions, time, capital, and environmental trade-
offs have been cited as barriers to adoption. The extended timeframes associated with many of the
surveying and testing technologies may limit the agility and competitiveness of firms. For instance,
careful well siting requires lengthy pre-drilling testing and analysis, though collectivization of this
analysis for a set of spatially clustered wells combined with improvements in the technology itself, may
soon reduce this barrier. Once a site is selected, optimizing its design can both reduce the number of
additional pads needed and increase recovery efficiency; however, it too takes time and technical
The Next Frontier in United States Shale Gas and Tight Oil Extraction: Strategic Reduction of Environmental Impacts
41
expertise. Practices that promote centralization and multi-site coordination may require sequential,
rather than simultaneous, drilling, with a net effect of longer times to production. The cumulative effects
of this lag time will weigh on companies with expiring leases, limited numbers of rigs, or seasonal
constraints. Efforts by firms to develop longer leasing contracts may reduce barriers to spatial temporal
clustering of drilling operations and promote environmentally sensitive development scale planning and
drilling coordination.
In addition to time constraints, the large capital costs associated with centralized drilling
operations pose a significant barrier to entry. For instance, large operators with long payback periods on
their investments have been the early adopters of permanent physical infrastructure for water transport,
while small operators or operators seeking to aggregate and sell leases have little incentive to pursue these
costly strategies beyond statutory mandates. Business and regulatory schemes to promote shared water
infrastructure systems may offer a compromise that preserves the competitiveness of small firms without
accepting the systemic inefficiencies that small scale operators impose.
Finally, the resistance to pricing environmental externalities including pollution, habitat
fragmentation, or low-probability, high impact events limits the incentives that companies have to
implement environmental safety and impact mitigation technologies. While this problem is not unique to
hydraulic fracturing, regulatory action to internalize energy externalities would offer a technology- and
management strategy- agnostic means of driving down many of the environmental impacts of
unconventional extraction. On a risk front, the incentive to adopt risk reduction measures will depend
largely on the legal and financial consequences of an event. While the fines levied for violations vary by
state, a recent analysis found that fines on federal lands were inconsistently applied, incongruous with the
extent of damages, and insufficient to deter future violations (Markey and Holf, 2012).
WHERE ARE THE LOW-HANGING FRUIT?
Comparing the scale of implementation, the distribution of benefits, and the degree of adoption
across available technologies highlights characteristics of successful environmental mitigation strategies
in an industry with an historically slow rate of technology adoption. Technologies and practices with
low barriers to entry tend to be economically favorable, applicable on the individual well scale, and
require very little additional lead time. Capital intensive technologies, such as intelligent completions
technologies that add $100K to $1M per well, have been slow to catch on in unconventional plays despite
their frequent deployment in deep-sea offshore wells (Gao 2007). Similarly, technologies requiring
extensive development scale coordination have seen low adoption rates among unconventional drillers.
This may be influenced by the large number of companies operating less than 10 wells, the constraints
The Next Frontier in United States Shale Gas and Tight Oil Extraction: Strategic Reduction of Environmental Impacts
42
that expiring leases place on development scale coordination, or the capital costs of some of the
infrastructure systems. Finally, lead times appear to be a critical barrier to technology adoption. The
rush to develop lease holdings in areas with time requirements may disincentivize measures like planning
multiple wells per pad because operators must drill on each site to maintain lease.
Variation in the landscape of technology adoption across large and small companies is not yet
established in the literature. Aside from anecdotal evidence that larger operators concerned about
maintaining a social license to operate may be more inclined to adopt environmental technologies that are
inherently unprofitable, or that smaller operators are reluctant to adopt environmental technologies unless
regulation obligates them to do so, there is surprisingly little empirical evidence to support claims around
environmental innovation in the unconventional extraction industry. There is some evidence that large
firms with greater access to capital may be lobbying for tighter environmental regulation of the
unconventional extraction industry. This raises the concern of regulatory capture through a process of
establishing regulation that prices-out or discriminates against the economic interests of smaller
competitors with less access to the capital necessary for the adoption of some mitigation approaches.
There is similarly scant data available on the diffusion of technologies between operators. One
might posit that the diffusion of environmental impact reduction practices will be accelerated in plays
dominated by large operators with uniformity between wells, though this too remains unexplored in this
specific body of literature. Further characterization of formal and informal data exchange would benefit
research in this area. Finally, research to probe the relationship between the experience of operators in a
play and their commitment to environmental mitigation would shed light on the long term prospects for
impact reduction in unconventional extraction operations.
The Next Frontier in United States Shale Gas and Tight Oil Extraction: Strategic Reduction of Environmental Impacts
43
V. IMPACT MITIGATION CASE STUDIES AND CONTEXTUALIZED BENEFITS IN FOCUS PLAYS
Despite a range of technological, management, and regulatory strategies for impact reduction,
unconventional extraction generates significant climate, health, and environmental impacts. Companies
or regulatory agencies seeking to mitigate these impacts would benefit from a cost-based ranking of
abatement measures. To assist on that front, as well as to highlight common synergies between field-
based efficiency measures and impact reduction practices, we present cost-benefit analyses for three
mitigation interventions. The case studies presented below were chosen from among those discussed in
Section IV. because (1) all are well pad-level practices, and (2) data on their costs and benefits were either
available or directly estimable. The region-specific impacts of each on the environmental issues of
concern in the Barnett, the Marcellus, and the Bakken are discussed. The first case study, reduced-
emissions completions, is also relevant to interpreting the Final Air Rules for the Oil and Natural Gas
Industry issued by the U.S. EPA in 2012 (US EPA 2012b).
CASE STUDY: PROBABILISTIC ECONOMIC CONSEQUENCES OF REDUCED-EMISSIONS
COMPLETIONS (RECS)
In this section, we consider technologies to reduce pollutant emissions and capture natural gas
during the initial period of production, when mixtures of gases and/or petroleum liquids flow out of the
well along with large volumes of water from the hydraulic fracturing process. So-called “green
completions”—also known as reduced - emissions completions (RECs)— implement a closed-loop
system that pairs temporary processing equipment with permanent infrastructure to separate and capture
hydrocarbons for processing and future sale. In the absence of REC technology, volatiles are directly
released to the atmosphere or flared on-site until hydrocarbon flow has stabilized and the well can be
permanently connected to separation and gathering infrastructure.
By reducing flaring and venting, RECs provide two important benefits. First, RECs abate the
release of volatilized organic compounds (VOCs) and nitrous oxides (NOx), thereby moderating ozone
levels in the surrounding area. Second, RECs reduce greenhouse gas emissions by preventing both the
methane release of direct venting and the carbon dioxide release associated with flaring. The U.S.
Energy Information Administration has estimated that 2-3% of natural gas production is leaked on-site
(US EIA2012j). Of this, approximately 30% is attributable to the completion stage and can, in principle,
be recovered during RECs to generate revenue (NRDC 2012). The combined benefits of reduced air
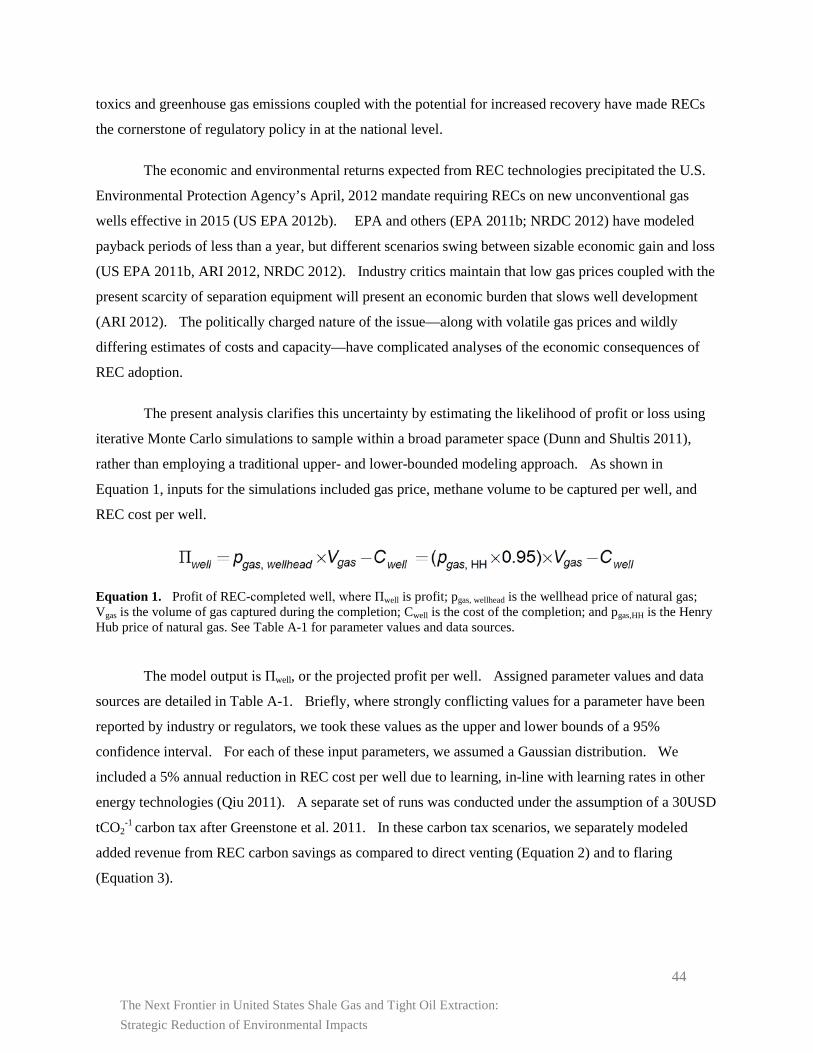
The Next Frontier in United States Shale Gas and Tight Oil Extraction: Strategic Reduction of Environmental Impacts
44
toxics and greenhouse gas emissions coupled with the potential for increased recovery have made RECs
the cornerstone of regulatory policy in at the national level.
The economic and environmental returns expected from REC technologies precipitated the U.S.
Environmental Protection Agency’s April, 2012 mandate requiring RECs on new unconventional gas
wells effective in 2015 (US EPA 2012b). EPA and others (EPA 2011b; NRDC 2012) have modeled
payback periods of less than a year, but different scenarios swing between sizable economic gain and loss
(US EPA 2011b, ARI 2012, NRDC 2012). Industry critics maintain that low gas prices coupled with the
present scarcity of separation equipment will present an economic burden that slows well development
(ARI 2012). The politically charged nature of the issue—along with volatile gas prices and wildly
differing estimates of costs and capacity—have complicated analyses of the economic consequences of
REC adoption.
The present analysis clarifies this uncertainty by estimating the likelihood of profit or loss using
iterative Monte Carlo simulations to sample within a broad parameter space (Dunn and Shultis 2011),
rather than employing a traditional upper- and lower-bounded modeling approach. As shown in
Equation 1, inputs for the simulations included gas price, methane volume to be captured per well, and
REC cost per well.
Equation 1. Profit of REC-completed well, where Πwell is profit; pgas, wellhead is the wellhead price of natural gas; Vgas is the volume of gas captured during the completion; Cwell is the cost of the completion; and pgas,HH is the Henry Hub price of natural gas. See Table A-1 for parameter values and data sources.
The model output is Πwell, or the projected profit per well. Assigned parameter values and data
sources are detailed in Table A-1. Briefly, where strongly conflicting values for a parameter have been
reported by industry or regulators, we took these values as the upper and lower bounds of a 95%
confidence interval. For each of these input parameters, we assumed a Gaussian distribution. We
included a 5% annual reduction in REC cost per well due to learning, in-line with learning rates in other
energy technologies (Qiu 2011). A separate set of runs was conducted under the assumption of a 30USD
tCO2-1
carbon tax after Greenstone et al. 2011. In these carbon tax scenarios, we separately modeled
added revenue from REC carbon savings as compared to direct venting (Equation 2) and to flaring
(Equation 3).
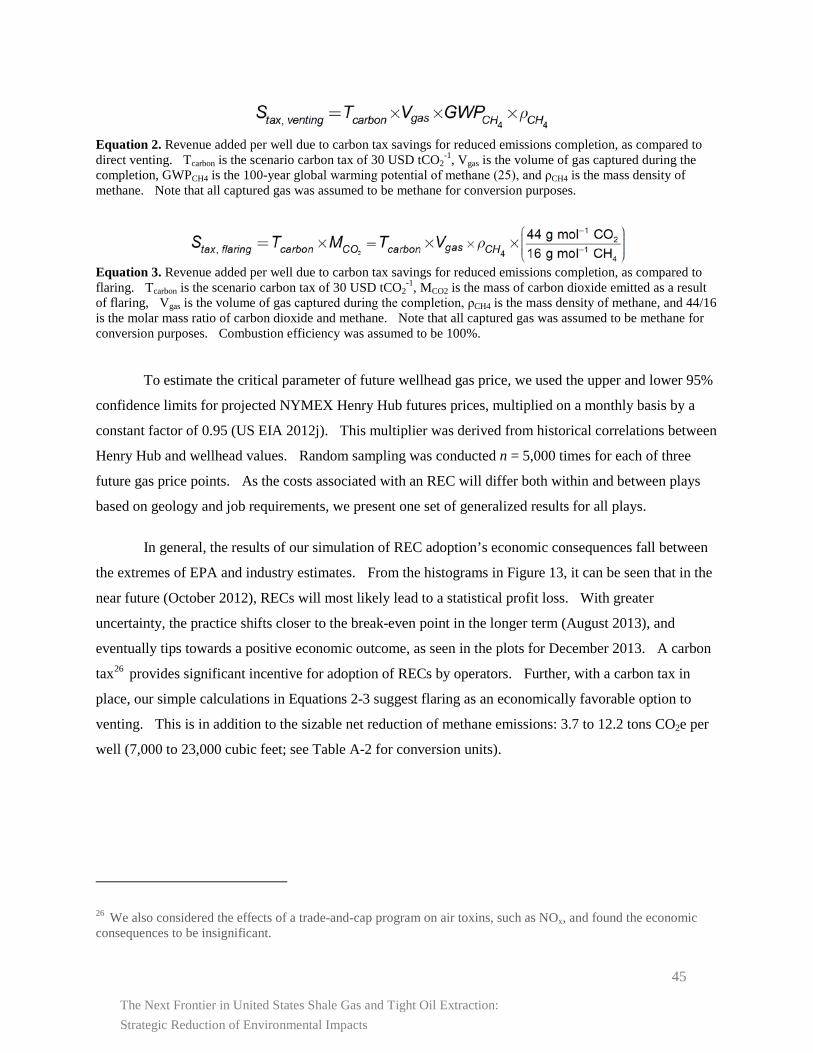
The Next Frontier in United States Shale Gas and Tight Oil Extraction: Strategic Reduction of Environmental Impacts
45
Equation 2. Revenue added per well due to carbon tax savings for reduced emissions completion, as compared to direct venting. Tcarbon is the scenario carbon tax of 30 USD tCO2
-1, Vgas is the volume of gas captured during the completion, GWPCH4 is the 100-year global warming potential of methane (25), and ρCH4 is the mass density of methane. Note that all captured gas was assumed to be methane for conversion purposes.
Equation 3. Revenue added per well due to carbon tax savings for reduced emissions completion, as compared to flaring. Tcarbon is the scenario carbon tax of 30 USD tCO2
-1, MCO2 is the mass of carbon dioxide emitted as a result of flaring, Vgas is the volume of gas captured during the completion, ρCH4 is the mass density of methane, and 44/16 is the molar mass ratio of carbon dioxide and methane. Note that all captured gas was assumed to be methane for conversion purposes. Combustion efficiency was assumed to be 100%.
To estimate the critical parameter of future wellhead gas price, we used the upper and lower 95%
confidence limits for projected NYMEX Henry Hub futures prices, multiplied on a monthly basis by a
constant factor of 0.95 (US EIA 2012j). This multiplier was derived from historical correlations between
Henry Hub and wellhead values. Random sampling was conducted n = 5,000 times for each of three
future gas price points. As the costs associated with an REC will differ both within and between plays
based on geology and job requirements, we present one set of generalized results for all plays.
In general, the results of our simulation of REC adoption’s economic consequences fall between
the extremes of EPA and industry estimates. From the histograms in Figure 13, it can be seen that in the
near future (October 2012), RECs will most likely lead to a statistical profit loss. With greater
uncertainty, the practice shifts closer to the break-even point in the longer term (August 2013), and
eventually tips towards a positive economic outcome, as seen in the plots for December 2013. A carbon
tax26 provides significant incentive for adoption of RECs by operators. Further, with a carbon tax in
place, our simple calculations in Equations 2-3 suggest flaring as an economically favorable option to
venting. This is in addition to the sizable net reduction of methane emissions: 3.7 to 12.2 tons CO2e per
well (7,000 to 23,000 cubic feet; see Table A-2 for conversion units).
26 We also considered the effects of a trade-and-cap program on air toxins, such as NOx, and found the economic consequences to be insignificant.
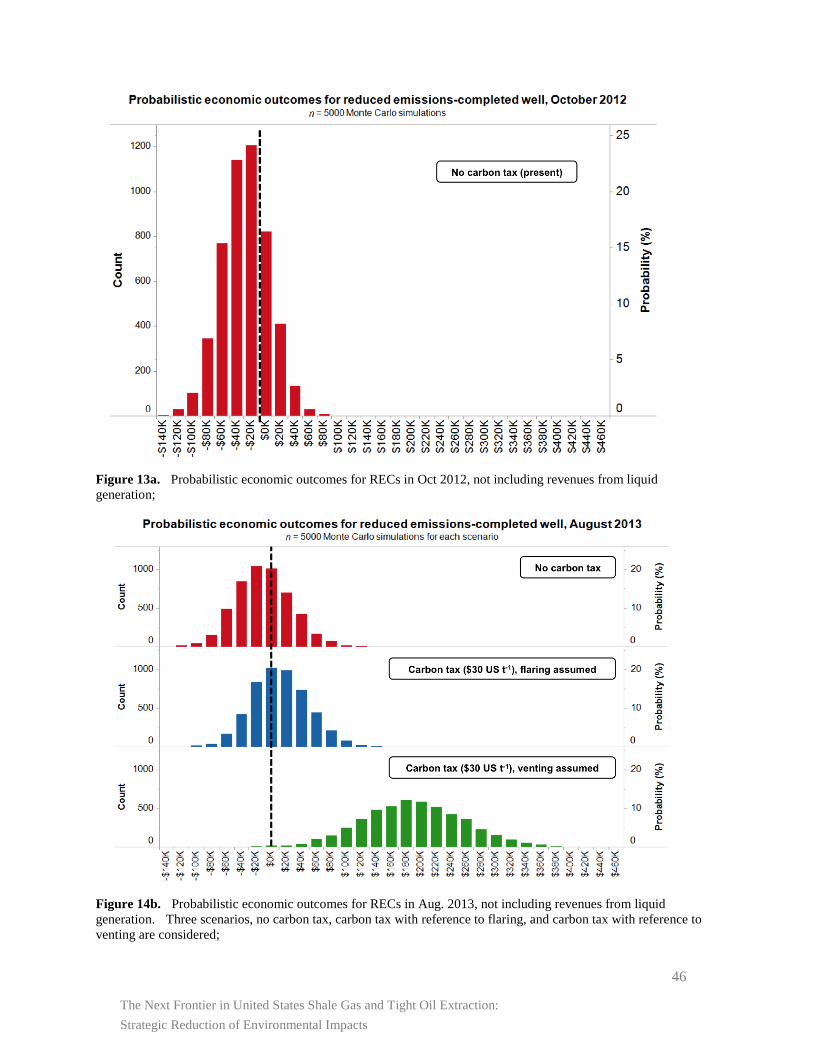
The Next Frontier in United States Shale Gas and Tight Oil Extraction: Strategic Reduction of Environmental Impacts
46
Figure 13a. Probabilistic economic outcomes for RECs in Oct 2012, not including revenues from liquid generation;
Figure 14b. Probabilistic economic outcomes for RECs in Aug. 2013, not including revenues from liquid generation. Three scenarios, no carbon tax, carbon tax with reference to flaring, and carbon tax with reference to venting are considered;
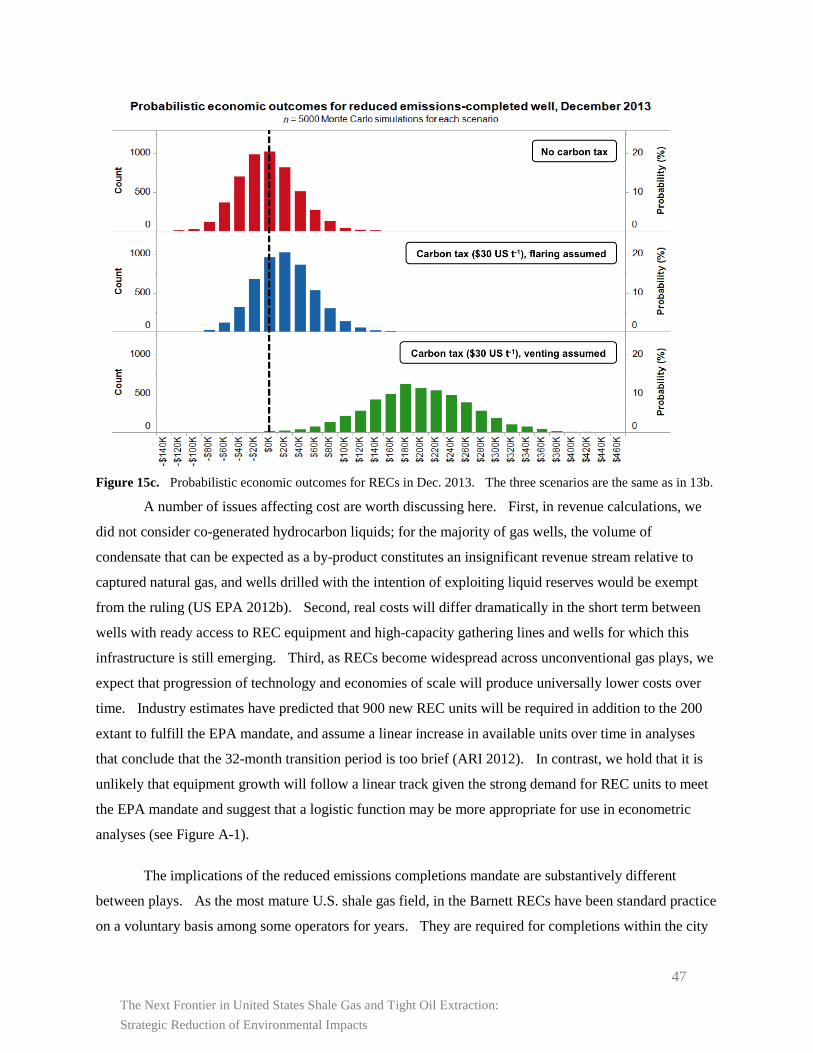
The Next Frontier in United States Shale Gas and Tight Oil Extraction: Strategic Reduction of Environmental Impacts
47
Figure 15c. Probabilistic economic outcomes for RECs in Dec. 2013. The three scenarios are the same as in 13b.
A number of issues affecting cost are worth discussing here. First, in revenue calculations, we
did not consider co-generated hydrocarbon liquids; for the majority of gas wells, the volume of
condensate that can be expected as a by-product constitutes an insignificant revenue stream relative to
captured natural gas, and wells drilled with the intention of exploiting liquid reserves would be exempt
from the ruling (US EPA 2012b). Second, real costs will differ dramatically in the short term between
wells with ready access to REC equipment and high-capacity gathering lines and wells for which this
infrastructure is still emerging. Third, as RECs become widespread across unconventional gas plays, we
expect that progression of technology and economies of scale will produce universally lower costs over
time. Industry estimates have predicted that 900 new REC units will be required in addition to the 200
extant to fulfill the EPA mandate, and assume a linear increase in available units over time in analyses
that conclude that the 32-month transition period is too brief (ARI 2012). In contrast, we hold that it is
unlikely that equipment growth will follow a linear track given the strong demand for REC units to meet
the EPA mandate and suggest that a logistic function may be more appropriate for use in econometric
analyses (see Figure A-1).
The implications of the reduced emissions completions mandate are substantively different
between plays. As the most mature U.S. shale gas field, in the Barnett RECs have been standard practice
on a voluntary basis among some operators for years. They are required for completions within the city
The Next Frontier in United States Shale Gas and Tight Oil Extraction: Strategic Reduction of Environmental Impacts
48
of Fort Worth under certain conditions (US EPA 2012b). Nonetheless, universal adoption of green
completions across the Barnett’s many wells will further reduce gas well-associated VOC and NOx
emissions in this densely populated area, hopefully providing some degree of improvement in its long-
standing air quality issues. Turning to RECs’ impact on the greenhouse gas footprint of shale gas, both
the Marcellus and the Barnett are highly productive plays for which the absolute magnitude of methane
emissions reduction is likely to be large. This reduction will strengthen the arguments of proponents of
natural gas as a more environmentally responsible fossil fuel.
Finally, the introduction of reduced emissions completions presents a unique challenge in the
Bakken. As noted in Section II, the primary reason behind the flaring of such significant volumes of gas
(47 billion cubic feet in 2011 alone) is lack of infrastructure to transport it to market. Importantly,
unconventional gas wells demonstrated to lie outside of areas with established gas gathering lines of
sufficient capacity—termed “wildcat” or “delineation” wells—are exempt from the REC mandate, as are
wells drilled primarily for oil.27 Thus, due both to the Bakken’s primary purpose as a tight oil play and
the dearth of gas lines, the promulgation will functionally not apply there. Absent EPA compulsion,
economic incentives for rapid construction of pipelines in the Bakken are relatively weak given (1) its
remote location (2) recent low gas and high oil prices, (3) a national gas surplus, and (4) the play’s
plentiful oil reserves. While VOC and NOx emissions are unlikely to have a large absolute human
impact locally due to the sparse population, flaring in the Bakken is a considerable source of greenhouse
gas emissions without the forthcoming regulatory and market-based solutions applicable in other plays.
Reduced emissions completions (RECs) are effective in mitigating some of shale gas extraction’s
air-related impacts, as they substantially cut the release of both air pollutants and greenhouse gases—
including methane, which is also the desired end product of normal well operations and therefore provides
some economic incentive for RECs. Given volatility in gas price, controversial estimation on RECs’
costs, and recoverable methane volume, we applied Monte Carlo methods to examine the economic
consequence of REC implementation. We conclude that RECs performed today may lead to profit loss
in the near term. As expected gas price rise over time, however, RECs economics tip toward profitability
within one to two years, before the mandated implementation in 2015. For states or regions seeking to
evaluate their own potential policies, we suggest performing region-specific econometric study in
27 However, wildcat and delineation gas wells will be required to flare methane emissions as opposed to venting them (EPA 2012b). Some states—including North Dakota—already prohibit venting, but the practice will now be required nation-wide.
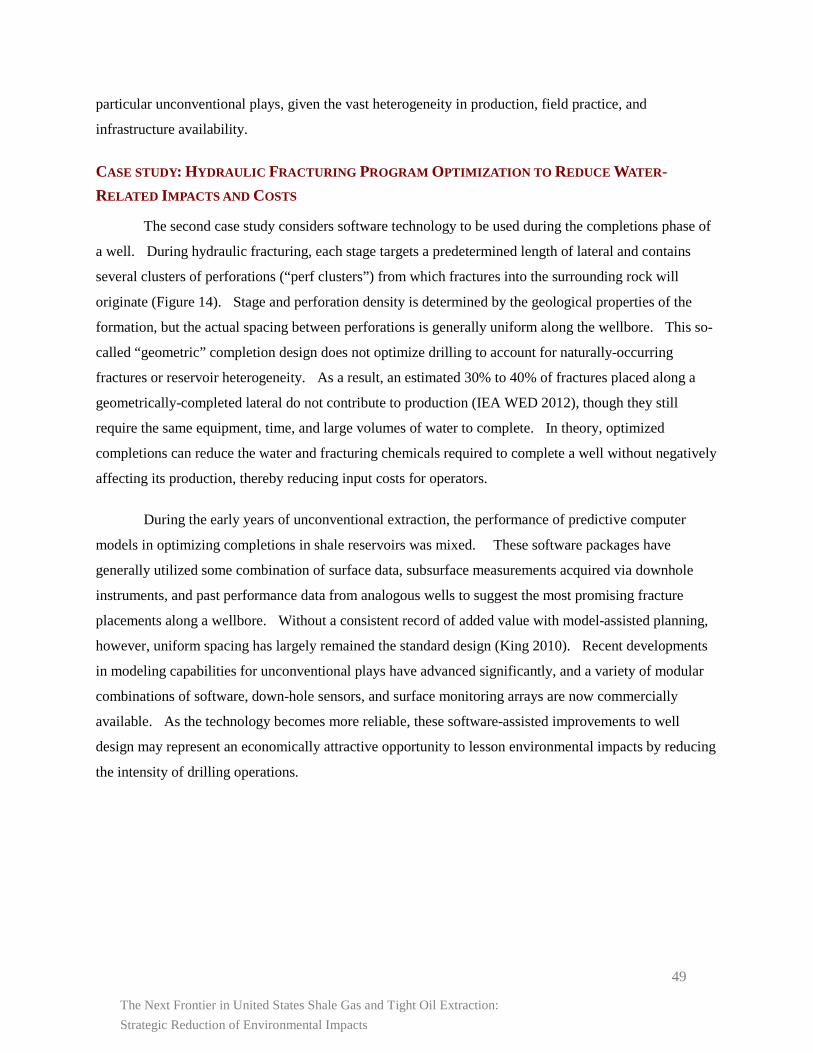
The Next Frontier in United States Shale Gas and Tight Oil Extraction: Strategic Reduction of Environmental Impacts
49
particular unconventional plays, given the vast heterogeneity in production, field practice, and
infrastructure availability.
CASE STUDY: HYDRAULIC FRACTURING PROGRAM OPTIMIZATION TO REDUCE WATER-RELATED IMPACTS AND COSTS
The second case study considers software technology to be used during the completions phase of
a well. During hydraulic fracturing, each stage targets a predetermined length of lateral and contains
several clusters of perforations (“perf clusters”) from which fractures into the surrounding rock will
originate (Figure 14). Stage and perforation density is determined by the geological properties of the
formation, but the actual spacing between perforations is generally uniform along the wellbore. This so-
called “geometric” completion design does not optimize drilling to account for naturally-occurring
fractures or reservoir heterogeneity. As a result, an estimated 30% to 40% of fractures placed along a
geometrically-completed lateral do not contribute to production (IEA WED 2012), though they still
require the same equipment, time, and large volumes of water to complete. In theory, optimized
completions can reduce the water and fracturing chemicals required to complete a well without negatively
affecting its production, thereby reducing input costs for operators.
During the early years of unconventional extraction, the performance of predictive computer
models in optimizing completions in shale reservoirs was mixed. These software packages have
generally utilized some combination of surface data, subsurface measurements acquired via downhole
instruments, and past performance data from analogous wells to suggest the most promising fracture
placements along a wellbore. Without a consistent record of added value with model-assisted planning,
however, uniform spacing has largely remained the standard design (King 2010). Recent developments
in modeling capabilities for unconventional plays have advanced significantly, and a variety of modular
combinations of software, down-hole sensors, and surface monitoring arrays are now commercially
available. As the technology becomes more reliable, these software-assisted improvements to well
design may represent an economically attractive opportunity to lesson environmental impacts by reducing
the intensity of drilling operations.
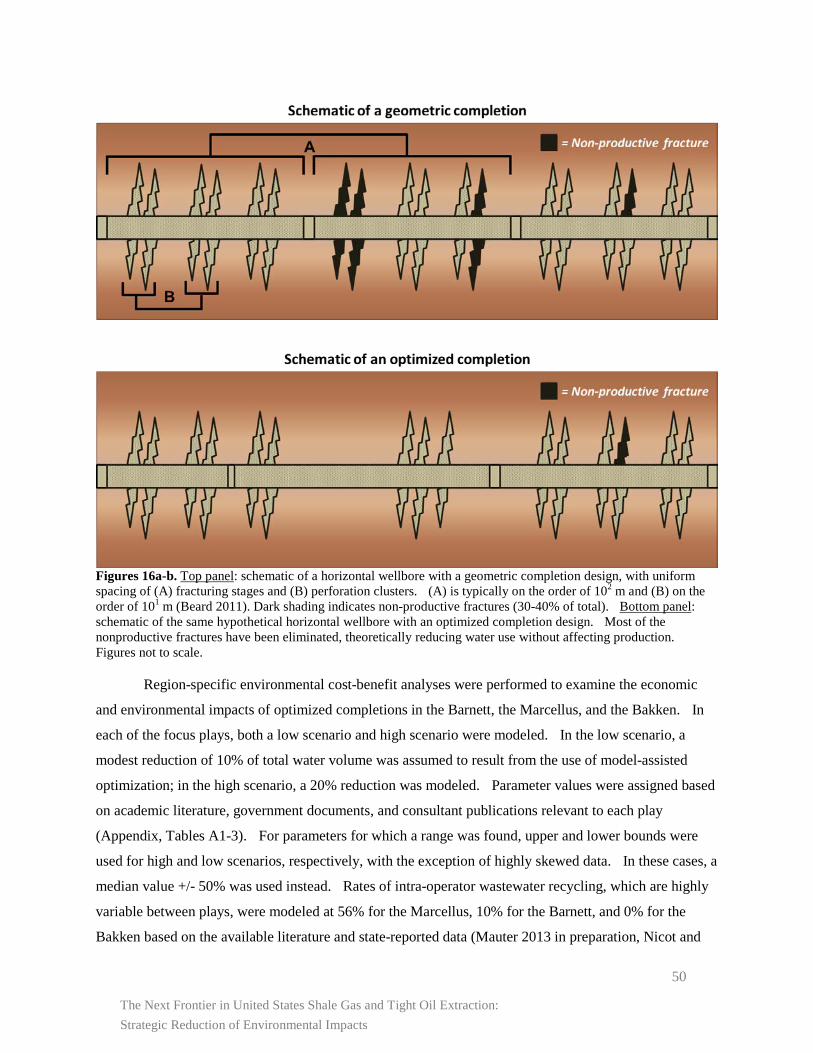
The Next Frontier in United States Shale Gas and Tight Oil Extraction: Strategic Reduction of Environmental Impacts
50
Figures 16a-b. Top panel: schematic of a horizontal wellbore with a geometric completion design, with uniform spacing of (A) fracturing stages and (B) perforation clusters. (A) is typically on the order of 102 m and (B) on the order of 101 m (Beard 2011). Dark shading indicates non-productive fractures (30-40% of total). Bottom panel: schematic of the same hypothetical horizontal wellbore with an optimized completion design. Most of the nonproductive fractures have been eliminated, theoretically reducing water use without affecting production. Figures not to scale.
Region-specific environmental cost-benefit analyses were performed to examine the economic
and environmental impacts of optimized completions in the Barnett, the Marcellus, and the Bakken. In
each of the focus plays, both a low scenario and high scenario were modeled. In the low scenario, a
modest reduction of 10% of total water volume was assumed to result from the use of model-assisted
optimization; in the high scenario, a 20% reduction was modeled. Parameter values were assigned based
on academic literature, government documents, and consultant publications relevant to each play
(Appendix, Tables A1-3). For parameters for which a range was found, upper and lower bounds were
used for high and low scenarios, respectively, with the exception of highly skewed data. In these cases, a
median value +/- 50% was used instead. Rates of intra-operator wastewater recycling, which are highly
variable between plays, were modeled at 56% for the Marcellus, 10% for the Barnett, and 0% for the
Bakken based on the available literature and state-reported data (Mauter 2013 in preparation, Nicot and
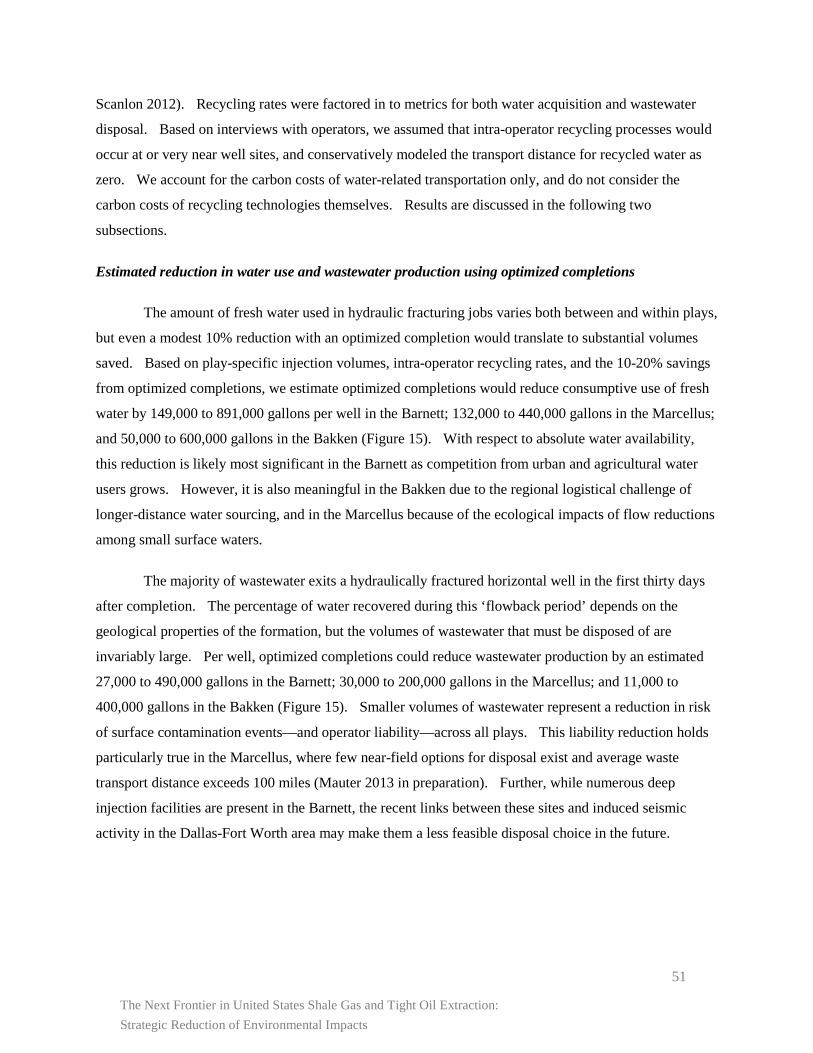
The Next Frontier in United States Shale Gas and Tight Oil Extraction: Strategic Reduction of Environmental Impacts
51
Scanlon 2012). Recycling rates were factored in to metrics for both water acquisition and wastewater
disposal. Based on interviews with operators, we assumed that intra-operator recycling processes would
occur at or very near well sites, and conservatively modeled the transport distance for recycled water as
zero. We account for the carbon costs of water-related transportation only, and do not consider the
carbon costs of recycling technologies themselves. Results are discussed in the following two
subsections.
Estimated reduction in water use and wastewater production using optimized completions
The amount of fresh water used in hydraulic fracturing jobs varies both between and within plays,
but even a modest 10% reduction with an optimized completion would translate to substantial volumes
saved. Based on play-specific injection volumes, intra-operator recycling rates, and the 10-20% savings
from optimized completions, we estimate optimized completions would reduce consumptive use of fresh
water by 149,000 to 891,000 gallons per well in the Barnett; 132,000 to 440,000 gallons in the Marcellus;
and 50,000 to 600,000 gallons in the Bakken (Figure 15). With respect to absolute water availability,
this reduction is likely most significant in the Barnett as competition from urban and agricultural water
users grows. However, it is also meaningful in the Bakken due to the regional logistical challenge of
longer-distance water sourcing, and in the Marcellus because of the ecological impacts of flow reductions
among small surface waters.
The majority of wastewater exits a hydraulically fractured horizontal well in the first thirty days
after completion. The percentage of water recovered during this ‘flowback period’ depends on the
geological properties of the formation, but the volumes of wastewater that must be disposed of are
invariably large. Per well, optimized completions could reduce wastewater production by an estimated
27,000 to 490,000 gallons in the Barnett; 30,000 to 200,000 gallons in the Marcellus; and 11,000 to
400,000 gallons in the Bakken (Figure 15). Smaller volumes of wastewater represent a reduction in risk
of surface contamination events—and operator liability—across all plays. This liability reduction holds
particularly true in the Marcellus, where few near-field options for disposal exist and average waste
transport distance exceeds 100 miles (Mauter 2013 in preparation). Further, while numerous deep
injection facilities are present in the Barnett, the recent links between these sites and induced seismic
activity in the Dallas-Fort Worth area may make them a less feasible disposal choice in the future.
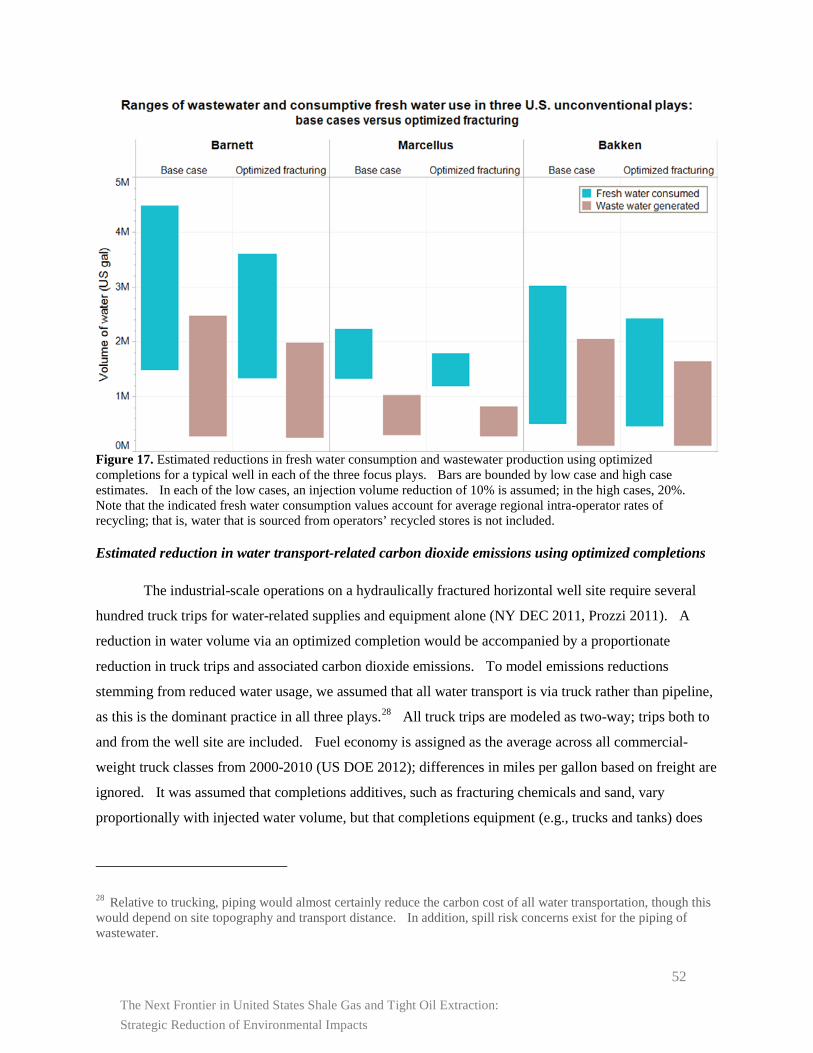
The Next Frontier in United States Shale Gas and Tight Oil Extraction: Strategic Reduction of Environmental Impacts
52
Figure 17. Estimated reductions in fresh water consumption and wastewater production using optimized completions for a typical well in each of the three focus plays. Bars are bounded by low case and high case estimates. In each of the low cases, an injection volume reduction of 10% is assumed; in the high cases, 20%. Note that the indicated fresh water consumption values account for average regional intra-operator rates of recycling; that is, water that is sourced from operators’ recycled stores is not included.
Estimated reduction in water transport-related carbon dioxide emissions using optimized completions
The industrial-scale operations on a hydraulically fractured horizontal well site require several
hundred truck trips for water-related supplies and equipment alone (NY DEC 2011, Prozzi 2011). A
reduction in water volume via an optimized completion would be accompanied by a proportionate
reduction in truck trips and associated carbon dioxide emissions. To model emissions reductions
stemming from reduced water usage, we assumed that all water transport is via truck rather than pipeline,
as this is the dominant practice in all three plays.28 All truck trips are modeled as two-way; trips both to
and from the well site are included. Fuel economy is assigned as the average across all commercial-
weight truck classes from 2000-2010 (US DOE 2012); differences in miles per gallon based on freight are
ignored. It was assumed that completions additives, such as fracturing chemicals and sand, vary
proportionally with injected water volume, but that completions equipment (e.g., trucks and tanks) does
28 Relative to trucking, piping would almost certainly reduce the carbon cost of all water transportation, though this would depend on site topography and transport distance. In addition, spill risk concerns exist for the piping of wastewater.
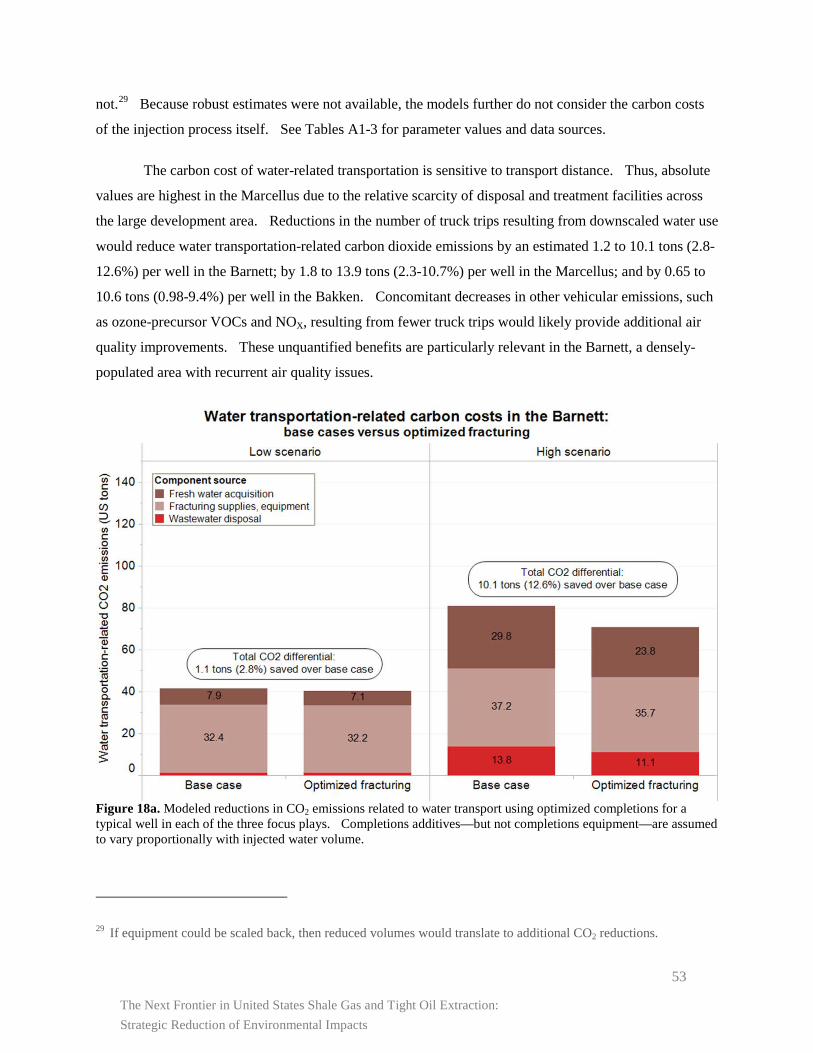
The Next Frontier in United States Shale Gas and Tight Oil Extraction: Strategic Reduction of Environmental Impacts
53
not.29 Because robust estimates were not available, the models further do not consider the carbon costs
of the injection process itself. See Tables A1-3 for parameter values and data sources.
The carbon cost of water-related transportation is sensitive to transport distance. Thus, absolute
values are highest in the Marcellus due to the relative scarcity of disposal and treatment facilities across
the large development area. Reductions in the number of truck trips resulting from downscaled water use
would reduce water transportation-related carbon dioxide emissions by an estimated 1.2 to 10.1 tons (2.8-
12.6%) per well in the Barnett; by 1.8 to 13.9 tons (2.3-10.7%) per well in the Marcellus; and by 0.65 to
10.6 tons (0.98-9.4%) per well in the Bakken. Concomitant decreases in other vehicular emissions, such
as ozone-precursor VOCs and NOX, resulting from fewer truck trips would likely provide additional air
quality improvements. These unquantified benefits are particularly relevant in the Barnett, a densely-
populated area with recurrent air quality issues.
Figure 18a. Modeled reductions in CO2 emissions related to water transport using optimized completions for a typical well in each of the three focus plays. Completions additives—but not completions equipment—are assumed to vary proportionally with injected water volume.
29 If equipment could be scaled back, then reduced volumes would translate to additional CO2 reductions.
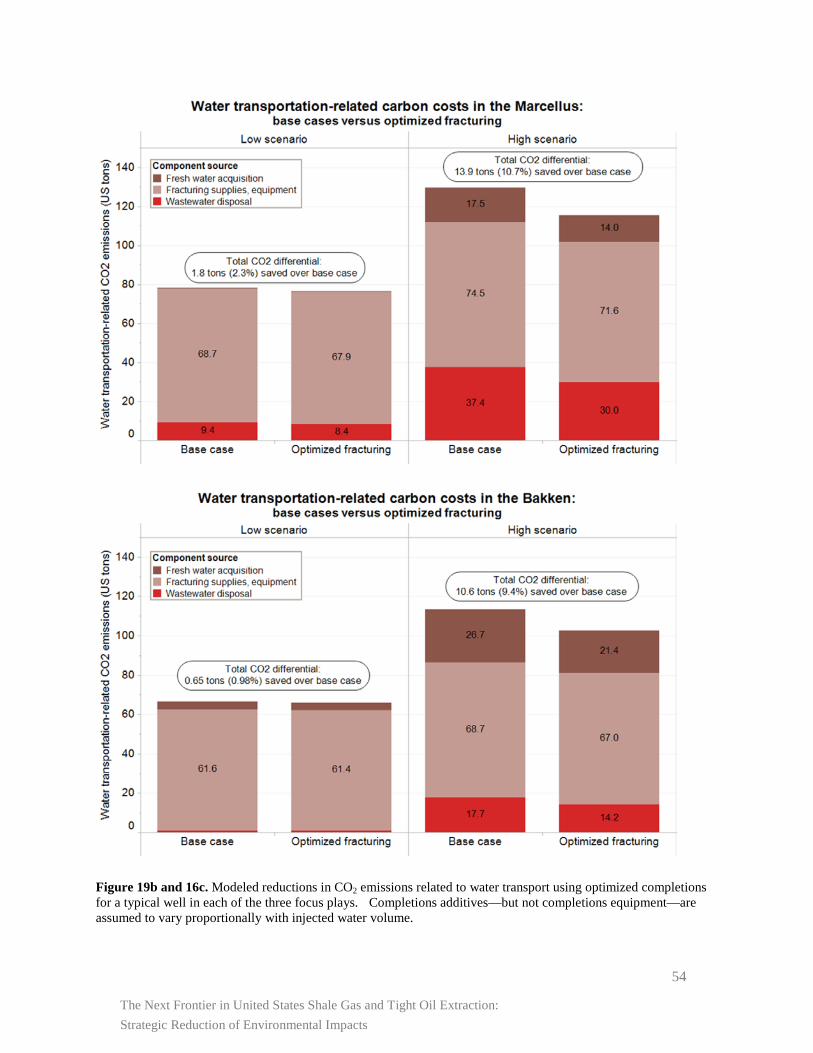
The Next Frontier in United States Shale Gas and Tight Oil Extraction: Strategic Reduction of Environmental Impacts
54
Figure 19b and 16c. Modeled reductions in CO2 emissions related to water transport using optimized completions for a typical well in each of the three focus plays. Completions additives—but not completions equipment—are assumed to vary proportionally with injected water volume.
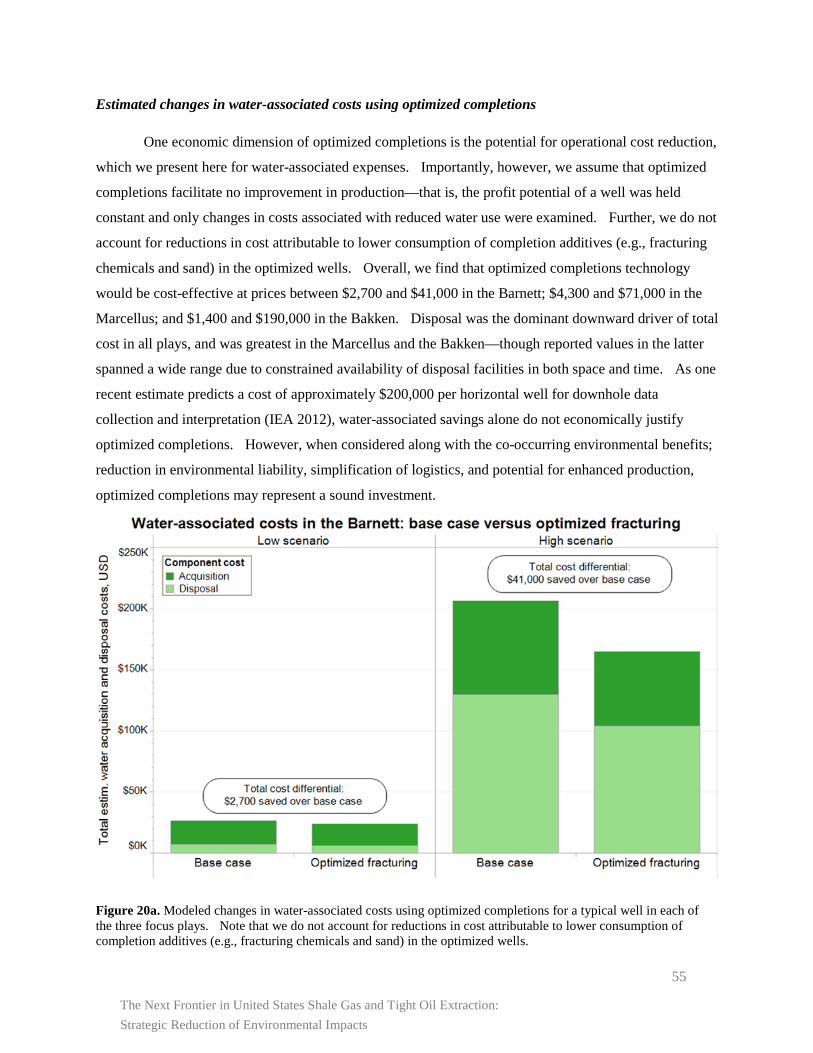
The Next Frontier in United States Shale Gas and Tight Oil Extraction: Strategic Reduction of Environmental Impacts
55
Estimated changes in water-associated costs using optimized completions
One economic dimension of optimized completions is the potential for operational cost reduction,
which we present here for water-associated expenses. Importantly, however, we assume that optimized
completions facilitate no improvement in production—that is, the profit potential of a well was held
constant and only changes in costs associated with reduced water use were examined. Further, we do not
account for reductions in cost attributable to lower consumption of completion additives (e.g., fracturing
chemicals and sand) in the optimized wells. Overall, we find that optimized completions technology
would be cost-effective at prices between $2,700 and $41,000 in the Barnett; $4,300 and $71,000 in the
Marcellus; and $1,400 and $190,000 in the Bakken. Disposal was the dominant downward driver of total
cost in all plays, and was greatest in the Marcellus and the Bakken—though reported values in the latter
spanned a wide range due to constrained availability of disposal facilities in both space and time. As one
recent estimate predicts a cost of approximately $200,000 per horizontal well for downhole data
collection and interpretation (IEA 2012), water-associated savings alone do not economically justify
optimized completions. However, when considered along with the co-occurring environmental benefits;
reduction in environmental liability, simplification of logistics, and potential for enhanced production,
optimized completions may represent a sound investment.
Figure 20a. Modeled changes in water-associated costs using optimized completions for a typical well in each of the three focus plays. Note that we do not account for reductions in cost attributable to lower consumption of completion additives (e.g., fracturing chemicals and sand) in the optimized wells.
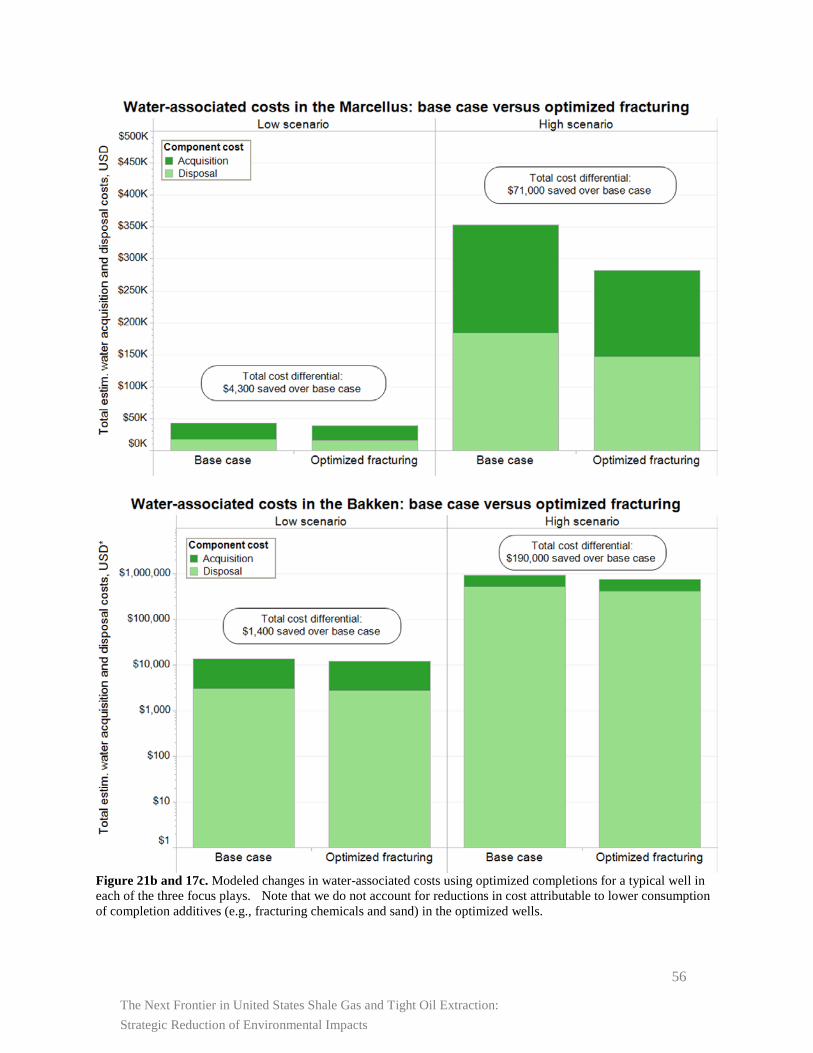
The Next Frontier in United States Shale Gas and Tight Oil Extraction: Strategic Reduction of Environmental Impacts
56
Figure 21b and 17c. Modeled changes in water-associated costs using optimized completions for a typical well in each of the three focus plays. Note that we do not account for reductions in cost attributable to lower consumption of completion additives (e.g., fracturing chemicals and sand) in the optimized wells.
The Next Frontier in United States Shale Gas and Tight Oil Extraction: Strategic Reduction of Environmental Impacts
57
CASE STUDY: REDUCED-IMPACT WELL SITE FOUNDATIONS
As discussed in Section I, the land use impacts of unconventional extraction include erosive
damage, sedimentation of nearby streams, and incompatibility with previous and surrounding patterns of
use. Sites have become smaller over time but are still sizable, with a typical Marcellus well at the peak
of its development occupying some two to six acres of land (Hefley et al. 2011). While some degree of
well site reclamation is required by state law in each of the focus plays, time to return to baseline
conditions can be protracted given the disturbance to soil and plant root structures. Land use impacts are
most effectively mitigated by thoughtful siting and become more defensible with maximized production
tradeoff for a site (e.g., by drilling multiple wells per pad). Even with optimal siting and efficiency,
however, the construction of well pads and access roads unavoidably affects the local environment.
One opportunity to minimize the risks and environmental impacts of siting is to replace the use of
gravel ground cover with reusable, prefabricated access pads. From an ecological perspective, pads offer
improvements in biodiversity preservation, erosion control, and spill control. From a carbon perspective,
prefabricated pads offer potential improvements over gravel by reducing the number of truck trips
required to prepare the site, reducing the amount of time that heavy machinery operates in site-
preparation, reducing the soil disturbance, and increasing the reusability of site materials. And from a
risk perspective, the presence of an impermeable barrier will significantly reduce the risk that small spills
pose to human and environmental health—and therefore the risk that violation or litigation costs pose to a
company’s bottom line. The absence of strong regulatory or economic incentives for ecological
preservation or carbon abatement makes it difficult to compute the full scale of economic benefits derived
from of this intervention. Nevertheless, we find that the operational cost savings obtained by substituting
mats for gravel justifies the adoption of this technology even without internalizing these other benefits.
A well pad and access road is typically constructed by clearing and leveling the site, constructing
or installing erosion controls, and spreading several layers of gravel approximately a foot thick across the
site (Hefley et al. 2011). Once the well is producing at a stable rate, the site is reclaimed up to the active
production area; this includes gravel removal, re-grading, and re-spreading of topsoil. In both cases
modeled here, the well pad is assumed to have been leveled and constructed to meet erosion control
standards. However, in the mat case, prefabricated mats linked together with steel pins replace the gravel
layers. Construction of the access road is simplified in the mat case because eliminating the gravel
removes the need to grade to sub-soil depths, allowing the topsoil and root structures to remain relatively
undisturbed. We assume one layer of mats is required to line the well site, and that the initial distance
that the gravel and mats are transported is equal at 45 miles round-trip. Reused materials are assumed to
The Next Frontier in United States Shale Gas and Tight Oil Extraction: Strategic Reduction of Environmental Impacts
58
be transported a shorter round-trip distance of 20 miles. Further, we assume that topsoil is stored on site
and respread during reclamation, rather than being trucked in at the reclamation stage. The amount of
time required to clear land and prepare the foundation (gravel or mats) is assumed to be proportional to
the area treated, and equal in both cases. In order to account for the effects of reuse over the pads’
expected lifetime, a ten-year timeframe was chosen for the model. We include the carbon costs of the
foundation materials themselves, and assume a 70% recycling rate for gravel. “High” and “low”
scenarios vary only in the land area associated with the well site. See Table A-6 for a full list of
parameter values and data sources derived from the Marcellus play. We assume comparable well site
construction practices across plays and present one generalized, ten-year cost model. It should be noted
that robustness checks indicate that the general results discussed below are robust to positive and negative
changes in all of our critical assumptions.
The results from our model run with the standard assumptions reveal that reusable mats are
associated with a net reduction of 88.3 tons (22.0%) and 967.6 tons (56.5%) of CO2 in the low and high
scenarios, respectively, over the use of gravel. The present values of costs associated with the pad cases
is 22.3% (66.9%) lower than the costs associated with gravel. Notably, the improved performance vis-a-
vis costs occurs beginning in year 1; there is no upfront increase in costs with pads that is offset by lower
operating costs over the lifetime of the pads. Rather, the pads are less expensive in every year utilized.
This result is driven primarily by the higher cost of transporting gravel from well to well. A more
detailed examination of the results indicates that for each of the three categories of site preparation
identified—land clearing, materials, and site reclamation—the mats offer low scenario (high scenario)
reductions in carbon emissions of 11.2% (61.37%), 44.8% (44.2%), and 43.3% (46.2%).
While our results are robust to the assumptions made, they are not independent of them. It is
clear that a significant part of the improvement in emissions stems from the reusable nature of the mats as
opposed to the need to purchase at least some new gravel for each well. This allows the carbon cost
associated with the manufacture of the mats, which on a CO2 per kilogram of product basis is much
higher than that of gravel, to be amortized over the full ten-year life of the mat. So while gravel has a
much lower carbon factor than the mats, there are additional emissions for every well site over the ten-
year period. The amount of additional emissions per mat associated with the production of new gravel
depends on the amount of gravel that is assumed to be recycled from well to well.
The second major driver of the lower emissions associated with the mat is due to the variations in
transport requirements. While we assume that the mats and the gravel travel the same distance to reach
the well and, in the case of recycled gravel, the same distance between well sites, gravel requires
The Next Frontier in United States Shale Gas and Tight Oil Extraction: Strategic Reduction of Environmental Impacts
59
substantially more truck trips in both cases than the mats. In the low scenario, the mileage associated
with the initial delivery of gravel is more than double the mileage associated with the delivery of the
mats. Additionally, gravel incurs a second emissions penalty in the transport category due to its low
reusability as compared to mats. Except in the case where 100% of the gravel is assumed to be reused, at
least some gravel at each well site is new gravel. Because we assume that the initial distance traveled for
each material is greater than the distance between well locations, using some new gravel at each well-site,
as opposed to re-using the mats, results in significantly higher total mileages required for gravel over the
ten-year period than for the mats. In the low scenario, both the initial (the emissions associated with the
delivery of new material to a well-site) and subsequent (defined as the emissions associated with moving
materials from one well-site to the next) are more than double those emissions in the same categories for
the mats. The importance of this aspect of gravel is reinforced by the results in the extreme case where it
is assumed that 100% of the gravel can be reused. In that situation, gravel’s carbon performance is
nearly the same as that of mats in the low scenario (small well pad size) with standard assumptions.
The final driver of the difference in carbon performance between gravel and the mats is
differences in the vegetative emissions associated with each. Because we assume that in the mat scenario
the vegetation underneath the access road remains substantially undisturbed, this area does not count
towards emissions from vegetation change. In the low scenario this is a very minor difference (less than
5% of the area) but for the high case it means that the devegetated area in the mat cases is 34% smaller
than in the gravel scenario. The difference here explains why in the high case the mats significantly
outperform gravel. As a robustness check the model was run assuming the same area was devegetated in
both cases and we find no difference in the overall conclusions of the model.
Aside from the overall results demonstrating the improvement of the reusable mats over gravel in
terms of emissions and costs, the most important result from our model is the indication that the percent
of recycled material utilized in the manufacture of the mat is crucially important for the emissions profile
of that option. While the cost results do not change - an artifact of the small percentage of overall costs
associated with a price on carbon, regardless of that price - the emissions benefits are very sensitive to the
percentage of recycled material. Interviews with representatives of one mat manufacturer indicated that
current mats are made almost exclusively from recycled material. The standard model, therefore,
assumes a 100% recycling in the production of the mats (McDowell 2012). Based on the EPA’s WARM
model (EPA 2012) using the 100% figure results in a reduction in the emissions factor associated with the
manufacture of the mats by 80.6%. Clearly, assuming a lower percentage of recycled material in the
production of the mats will have a substantial impact on its emissions performance relative to gravel.
The Next Frontier in United States Shale Gas and Tight Oil Extraction: Strategic Reduction of Environmental Impacts
60
Figure 19 indicates just how sensitive the emissions performance of the mat technology is to the
amount of recycled material used. As is obvious from the graph, for our standard set of assumptions, in
the low scenario there exists a critical threshold at 15% recycled material, below which the mats actually
have a lower performance from an emissions standpoint than gravel. Robustness checks reveal that
while the precise location of this threshold is sensitive to our assumptions, its existence in every case but
one is not. In other words, regardless of the other assumptions in the model, this threshold exists. In our
robustness checks the threshold value ranged between 15% and 95%.
Overall, shifting from gravel to reusable access mats improves the carbon emissions performance
of hydraulically fractured horizontal wells at a lower cost than utilizing gravel. From a carbon emissions
perspective the mats offer clear improvements over gravel as long as a crucial assumption is met: the
percentage of recycled material used in the production of the mats must exceed the threshold value.
While that threshold value will depend on a number of firm and site specific criteria, the maximum
carbon benefits are realized when the percentage of recycled material is as close to 100% as possible.
Our ten year cost model shows that these carbon improvements more than pay for themselves in lower
operating costs, regardless of whether there is a price on carbon.
Ultimately, the improvement in both environmental and cost performance is measurable and
significant even when including only one dimension of environmental performance. Consideration of
environmental categories in addition to carbon emissions—erosion control, biodiversity preservation,
spill control, etc.—will likely add to the performance benefits of reusable mats relative to gravel.
Finding ways to quantify both the improvements offered by mat technology in these areas and the
economic benefit of the improvements is an important area of future research.
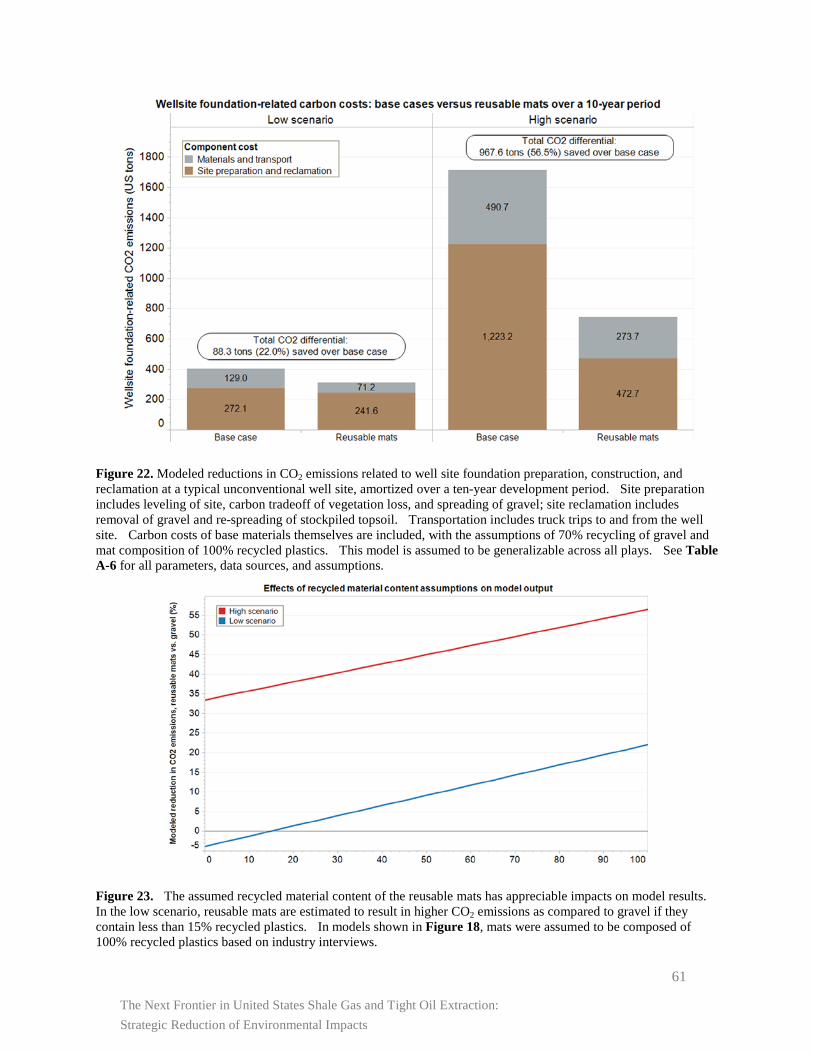
The Next Frontier in United States Shale Gas and Tight Oil Extraction: Strategic Reduction of Environmental Impacts
61
Figure 22. Modeled reductions in CO2 emissions related to well site foundation preparation, construction, and reclamation at a typical unconventional well site, amortized over a ten-year development period. Site preparation includes leveling of site, carbon tradeoff of vegetation loss, and spreading of gravel; site reclamation includes removal of gravel and re-spreading of stockpiled topsoil. Transportation includes truck trips to and from the well site. Carbon costs of base materials themselves are included, with the assumptions of 70% recycling of gravel and mat composition of 100% recycled plastics. This model is assumed to be generalizable across all plays. See Table A-6 for all parameters, data sources, and assumptions.
Figure 23. The assumed recycled material content of the reusable mats has appreciable impacts on model results. In the low scenario, reusable mats are estimated to result in higher CO2 emissions as compared to gravel if they contain less than 15% recycled plastics. In models shown in Figure 18, mats were assumed to be composed of 100% recycled plastics based on industry interviews.
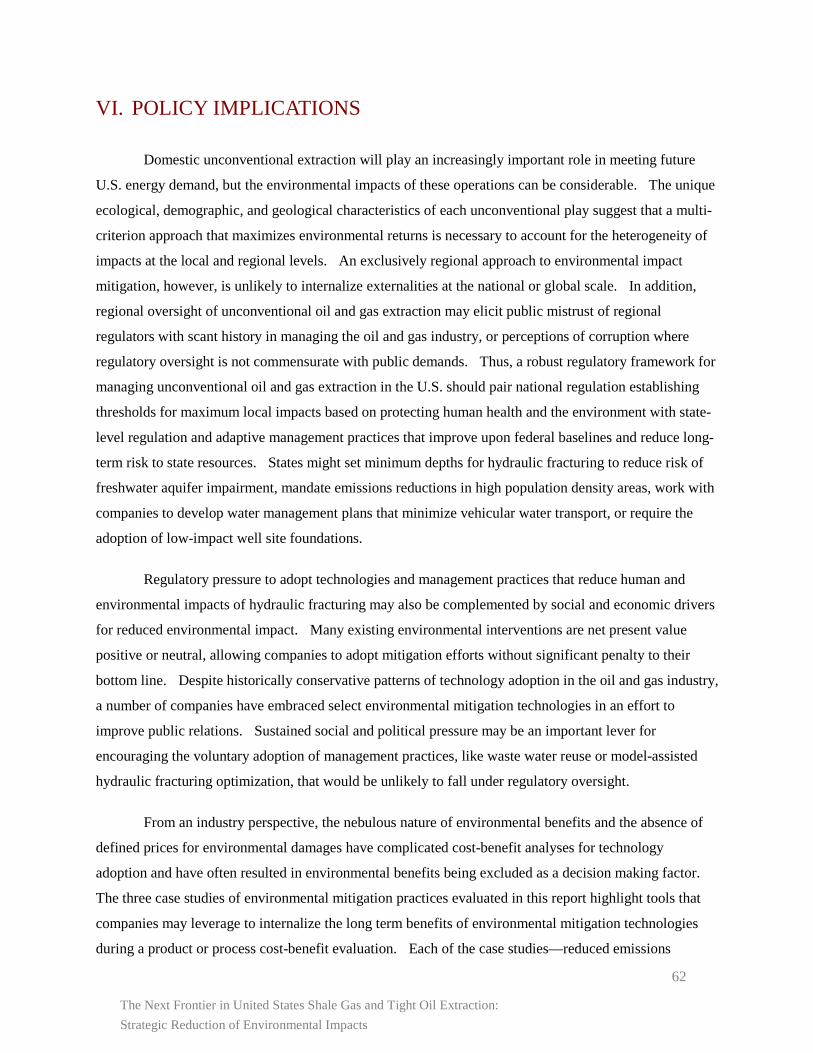
The Next Frontier in United States Shale Gas and Tight Oil Extraction: Strategic Reduction of Environmental Impacts
62
VI. POLICY IMPLICATIONS
Domestic unconventional extraction will play an increasingly important role in meeting future
U.S. energy demand, but the environmental impacts of these operations can be considerable. The unique
ecological, demographic, and geological characteristics of each unconventional play suggest that a multi-
criterion approach that maximizes environmental returns is necessary to account for the heterogeneity of
impacts at the local and regional levels. An exclusively regional approach to environmental impact
mitigation, however, is unlikely to internalize externalities at the national or global scale. In addition,
regional oversight of unconventional oil and gas extraction may elicit public mistrust of regional
regulators with scant history in managing the oil and gas industry, or perceptions of corruption where
regulatory oversight is not commensurate with public demands. Thus, a robust regulatory framework for
managing unconventional oil and gas extraction in the U.S. should pair national regulation establishing
thresholds for maximum local impacts based on protecting human health and the environment with state-
level regulation and adaptive management practices that improve upon federal baselines and reduce long-
term risk to state resources. States might set minimum depths for hydraulic fracturing to reduce risk of
freshwater aquifer impairment, mandate emissions reductions in high population density areas, work with
companies to develop water management plans that minimize vehicular water transport, or require the
adoption of low-impact well site foundations.
Regulatory pressure to adopt technologies and management practices that reduce human and
environmental impacts of hydraulic fracturing may also be complemented by social and economic drivers
for reduced environmental impact. Many existing environmental interventions are net present value
positive or neutral, allowing companies to adopt mitigation efforts without significant penalty to their
bottom line. Despite historically conservative patterns of technology adoption in the oil and gas industry,
a number of companies have embraced select environmental mitigation technologies in an effort to
improve public relations. Sustained social and political pressure may be an important lever for
encouraging the voluntary adoption of management practices, like waste water reuse or model-assisted
hydraulic fracturing optimization, that would be unlikely to fall under regulatory oversight.
From an industry perspective, the nebulous nature of environmental benefits and the absence of
defined prices for environmental damages have complicated cost-benefit analyses for technology
adoption and have often resulted in environmental benefits being excluded as a decision making factor.
The three case studies of environmental mitigation practices evaluated in this report highlight tools that
companies may leverage to internalize the long term benefits of environmental mitigation technologies
during a product or process cost-benefit evaluation. Each of the case studies—reduced emissions
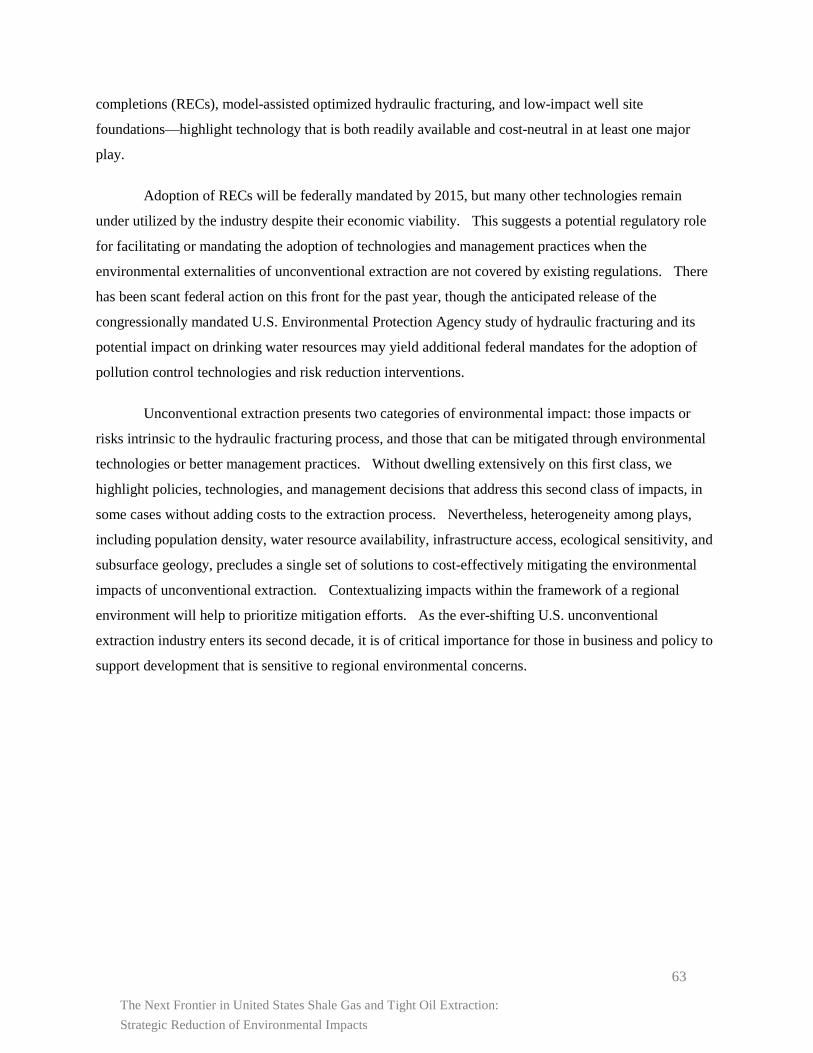
The Next Frontier in United States Shale Gas and Tight Oil Extraction: Strategic Reduction of Environmental Impacts
63
completions (RECs), model-assisted optimized hydraulic fracturing, and low-impact well site
foundations—highlight technology that is both readily available and cost-neutral in at least one major
play.
Adoption of RECs will be federally mandated by 2015, but many other technologies remain
under utilized by the industry despite their economic viability. This suggests a potential regulatory role
for facilitating or mandating the adoption of technologies and management practices when the
environmental externalities of unconventional extraction are not covered by existing regulations. There
has been scant federal action on this front for the past year, though the anticipated release of the
congressionally mandated U.S. Environmental Protection Agency study of hydraulic fracturing and its
potential impact on drinking water resources may yield additional federal mandates for the adoption of
pollution control technologies and risk reduction interventions.
Unconventional extraction presents two categories of environmental impact: those impacts or
risks intrinsic to the hydraulic fracturing process, and those that can be mitigated through environmental
technologies or better management practices. Without dwelling extensively on this first class, we
highlight policies, technologies, and management decisions that address this second class of impacts, in
some cases without adding costs to the extraction process. Nevertheless, heterogeneity among plays,
including population density, water resource availability, infrastructure access, ecological sensitivity, and
subsurface geology, precludes a single set of solutions to cost-effectively mitigating the environmental
impacts of unconventional extraction. Contextualizing impacts within the framework of a regional
environment will help to prioritize mitigation efforts. As the ever-shifting U.S. unconventional
extraction industry enters its second decade, it is of critical importance for those in business and policy to
support development that is sensitive to regional environmental concerns.
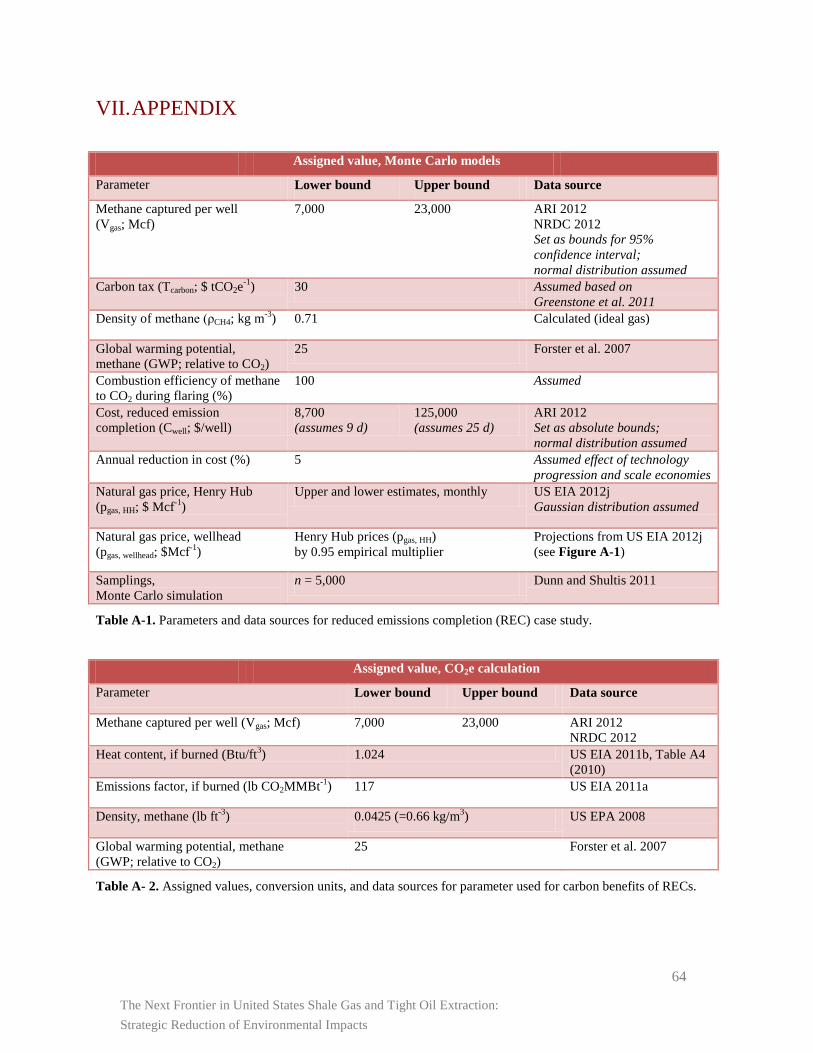
The Next Frontier in United States Shale Gas and Tight Oil Extraction: Strategic Reduction of Environmental Impacts
64
VII. APPENDIX
Assigned value, Monte Carlo models
Parameter Lower bound Upper bound Data source
Methane captured per well (Vgas; Mcf)
7,000 23,000 ARI 2012 NRDC 2012 Set as bounds for 95% confidence interval; normal distribution assumed
Carbon tax (Tcarbon; $ tCO2e-1) 30 Assumed based on Greenstone et al. 2011
Density of methane (ρCH4; kg m-3) 0.71 Calculated (ideal gas)
Global warming potential, methane (GWP; relative to CO2)
25 Forster et al. 2007
Combustion efficiency of methane to CO2 during flaring (%)
100 Assumed
Cost, reduced emission completion (Cwell; $/well)
8,700 (assumes 9 d)
125,000 (assumes 25 d)
ARI 2012 Set as absolute bounds; normal distribution assumed
Annual reduction in cost (%) 5 Assumed effect of technology progression and scale economies
Natural gas price, Henry Hub (pgas, HH; $ Mcf-1)
Upper and lower estimates, monthly US EIA 2012j Gaussian distribution assumed
Natural gas price, wellhead (pgas, wellhead; $Mcf-1)
Henry Hub prices (pgas, HH) by 0.95 empirical multiplier
Projections from US EIA 2012j (see Figure A-1)
Samplings, Monte Carlo simulation
n = 5,000 Dunn and Shultis 2011
Table A-1. Parameters and data sources for reduced emissions completion (REC) case study.
Assigned value, CO2e calculation
Parameter Lower bound Upper bound Data source
Methane captured per well (Vgas; Mcf) 7,000 23,000 ARI 2012 NRDC 2012
Heat content, if burned (Btu/ft3) 1.024 US EIA 2011b, Table A4 (2010)
Emissions factor, if burned (lb CO2MMBt-1) 117 US EIA 2011a
Density, methane (lb ft-3) 0.0425 (=0.66 kg/m3) US EPA 2008
Global warming potential, methane (GWP; relative to CO2)
25 Forster et al. 2007
Table A- 2. Assigned values, conversion units, and data sources for parameter used for carbon benefits of RECs.
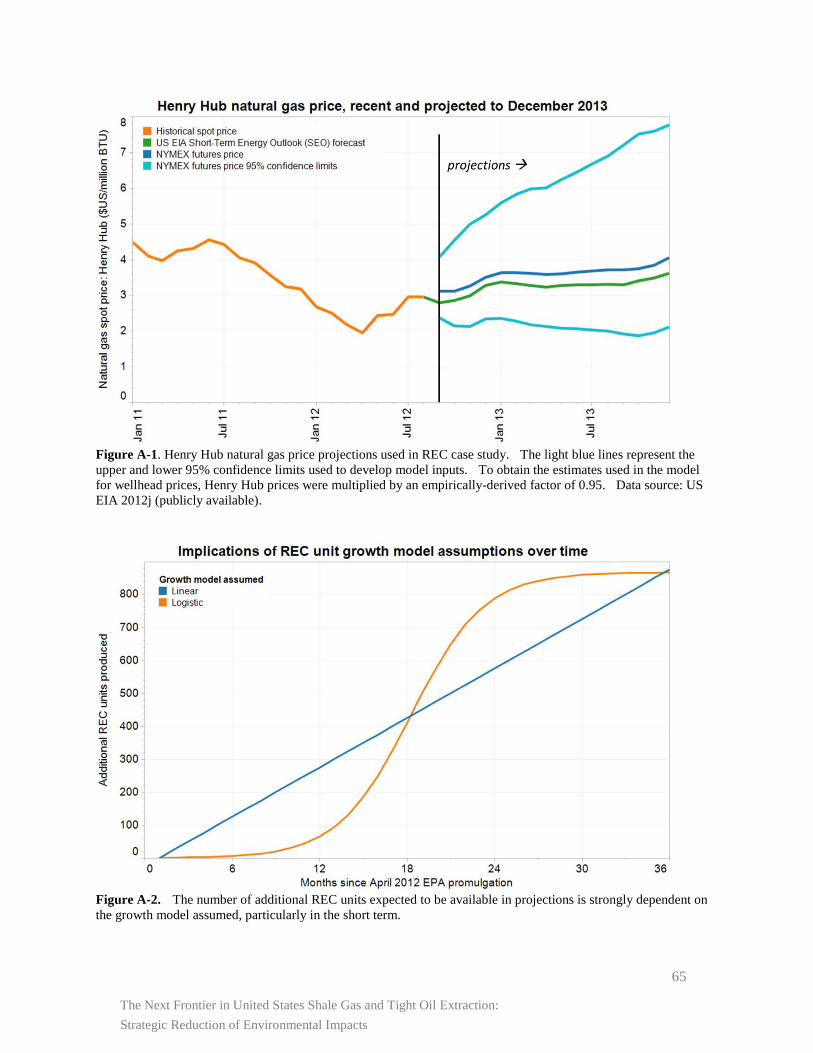
The Next Frontier in United States Shale Gas and Tight Oil Extraction: Strategic Reduction of Environmental Impacts
65
Figure A-1. Henry Hub natural gas price projections used in REC case study. The light blue lines represent the upper and lower 95% confidence limits used to develop model inputs. To obtain the estimates used in the model for wellhead prices, Henry Hub prices were multiplied by an empirically-derived factor of 0.95. Data source: US EIA 2012j (publicly available).
Figure A-2. The number of additional REC units expected to be available in projections is strongly dependent on the growth model assumed, particularly in the short term.
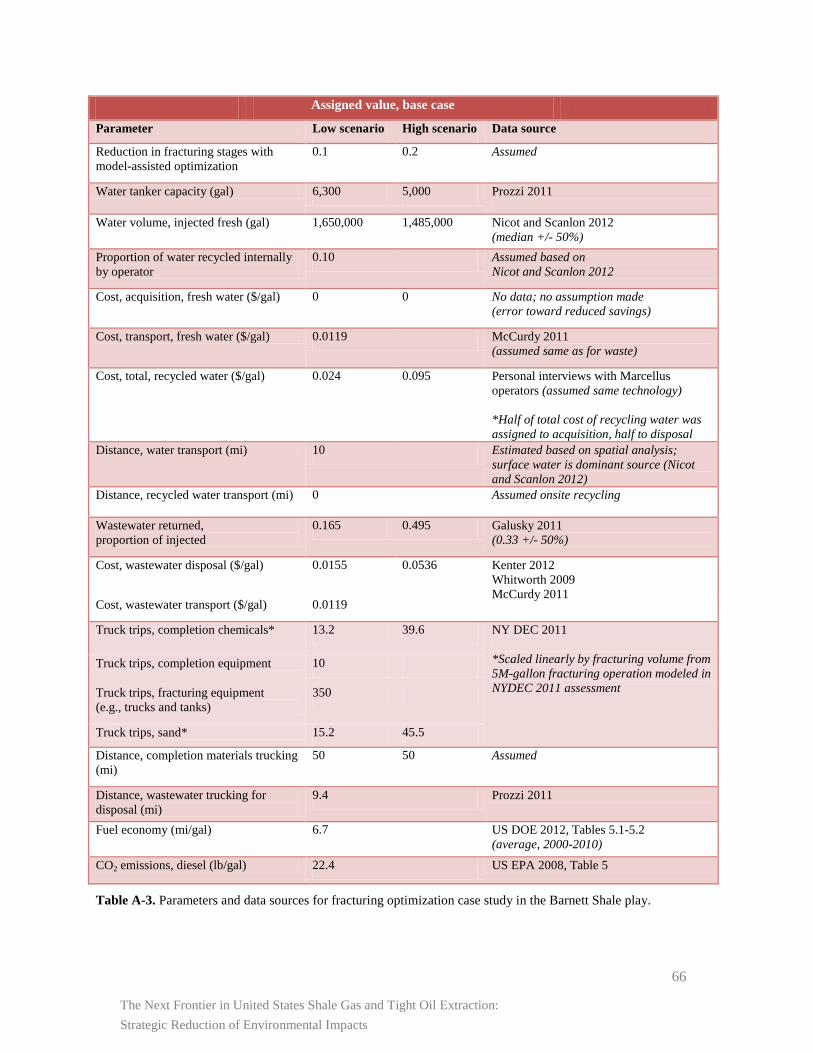
The Next Frontier in United States Shale Gas and Tight Oil Extraction: Strategic Reduction of Environmental Impacts
66
Assigned value, base case
Parameter Low scenario High scenario Data source
Reduction in fracturing stages with model-assisted optimization
0.1 0.2 Assumed
Water tanker capacity (gal) 6,300 5,000 Prozzi 2011
Water volume, injected fresh (gal) 1,650,000 1,485,000 Nicot and Scanlon 2012 (median +/- 50%)
Proportion of water recycled internally by operator
0.10 Assumed based on Nicot and Scanlon 2012
Cost, acquisition, fresh water ($/gal) 0 0 No data; no assumption made (error toward reduced savings)
Cost, transport, fresh water ($/gal) 0.0119 McCurdy 2011 (assumed same as for waste)
Cost, total, recycled water ($/gal) 0.024 0.095 Personal interviews with Marcellus operators (assumed same technology) *Half of total cost of recycling water was assigned to acquisition, half to disposal
Distance, water transport (mi) 10 Estimated based on spatial analysis; surface water is dominant source (Nicot and Scanlon 2012)
Distance, recycled water transport (mi) 0 Assumed onsite recycling
Wastewater returned, proportion of injected
0.165 0.495 Galusky 2011 (0.33 +/- 50%)
Cost, wastewater disposal ($/gal) 0.0155 0.0536 Kenter 2012 Whitworth 2009 McCurdy 2011
Cost, wastewater transport ($/gal) 0.0119
Truck trips, completion chemicals* 13.2 39.6 NY DEC 2011 *Scaled linearly by fracturing volume from 5M-gallon fracturing operation modeled in NYDEC 2011 assessment
Truck trips, completion equipment 10
Truck trips, fracturing equipment (e.g., trucks and tanks)
350
Truck trips, sand* 15.2 45.5
Distance, completion materials trucking (mi)
50 50 Assumed
Distance, wastewater trucking for disposal (mi)
9.4 Prozzi 2011
Fuel economy (mi/gal) 6.7 US DOE 2012, Tables 5.1-5.2 (average, 2000-2010)
CO2 emissions, diesel (lb/gal) 22.4 US EPA 2008, Table 5
Table A-3. Parameters and data sources for fracturing optimization case study in the Barnett Shale play.
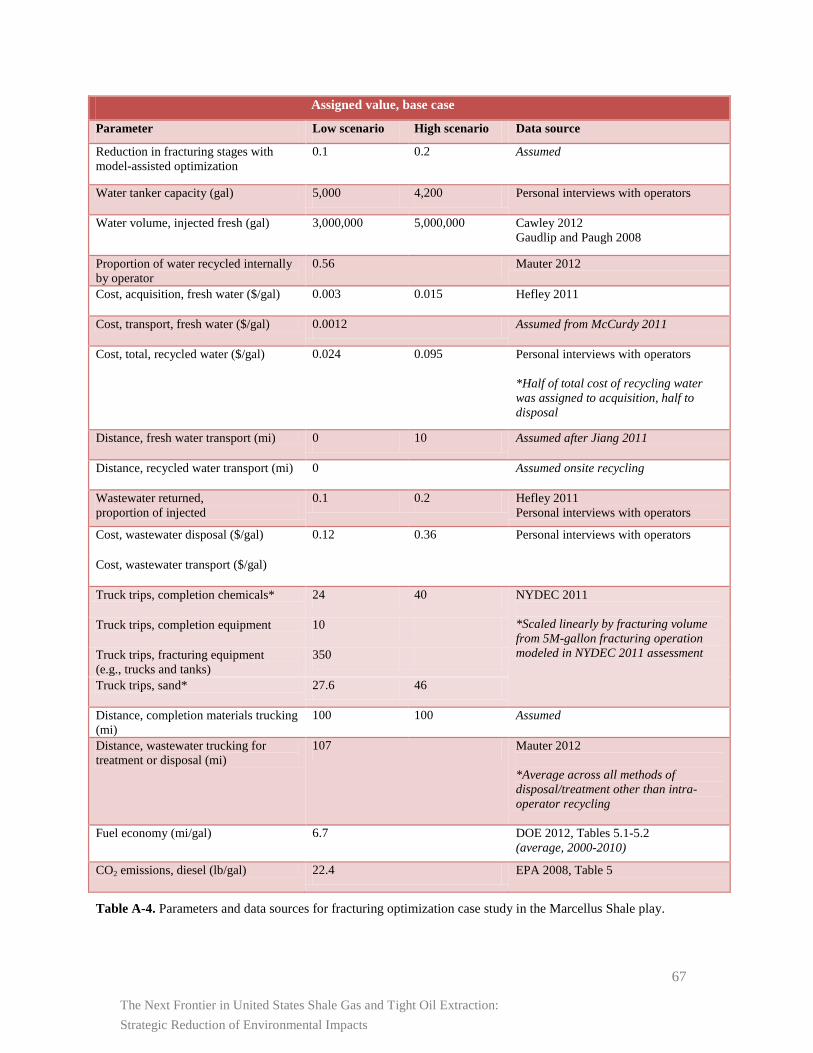
The Next Frontier in United States Shale Gas and Tight Oil Extraction: Strategic Reduction of Environmental Impacts
67
Assigned value, base case
Parameter Low scenario High scenario Data source
Reduction in fracturing stages with model-assisted optimization
0.1 0.2 Assumed
Water tanker capacity (gal) 5,000 4,200 Personal interviews with operators
Water volume, injected fresh (gal) 3,000,000 5,000,000 Cawley 2012 Gaudlip and Paugh 2008
Proportion of water recycled internally by operator
0.56 Mauter 2012
Cost, acquisition, fresh water ($/gal) 0.003 0.015 Hefley 2011
Cost, transport, fresh water ($/gal) 0.0012 Assumed from McCurdy 2011
Cost, total, recycled water ($/gal) 0.024 0.095 Personal interviews with operators *Half of total cost of recycling water was assigned to acquisition, half to disposal
Distance, fresh water transport (mi) 0 10 Assumed after Jiang 2011
Distance, recycled water transport (mi) 0 Assumed onsite recycling
Wastewater returned, proportion of injected
0.1 0.2 Hefley 2011 Personal interviews with operators
Cost, wastewater disposal ($/gal) 0.12 0.36 Personal interviews with operators
Cost, wastewater transport ($/gal)
Truck trips, completion chemicals* 24 40 NYDEC 2011 *Scaled linearly by fracturing volume from 5M-gallon fracturing operation modeled in NYDEC 2011 assessment
Truck trips, completion equipment 10
Truck trips, fracturing equipment (e.g., trucks and tanks)
350
Truck trips, sand* 27.6 46
Distance, completion materials trucking (mi)
100 100 Assumed
Distance, wastewater trucking for treatment or disposal (mi)
107 Mauter 2012 *Average across all methods of disposal/treatment other than intra-operator recycling
Fuel economy (mi/gal) 6.7 DOE 2012, Tables 5.1-5.2 (average, 2000-2010)
CO2 emissions, diesel (lb/gal) 22.4 EPA 2008, Table 5
Table A-4. Parameters and data sources for fracturing optimization case study in the Marcellus Shale play.
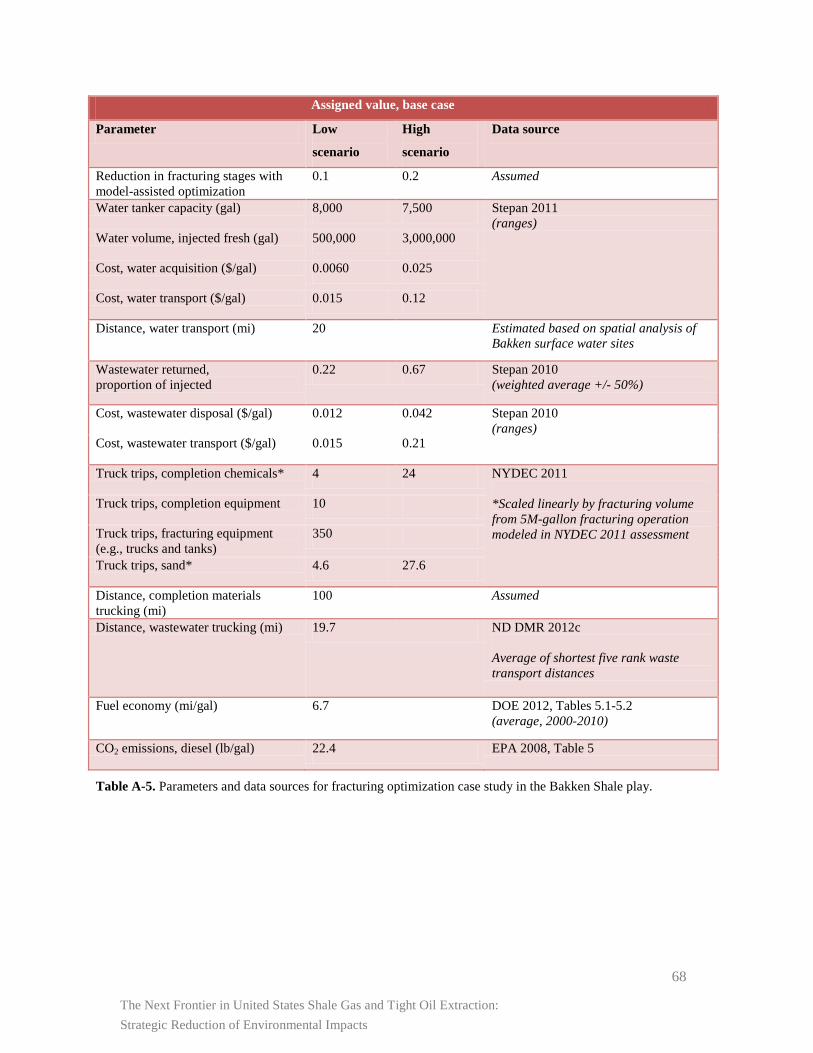
The Next Frontier in United States Shale Gas and Tight Oil Extraction: Strategic Reduction of Environmental Impacts
68
Assigned value, base case
Parameter Low
scenario
High
scenario
Data source
Reduction in fracturing stages with model-assisted optimization
0.1 0.2 Assumed
Water tanker capacity (gal) 8,000 7,500 Stepan 2011 (ranges)
Water volume, injected fresh (gal) 500,000 3,000,000
Cost, water acquisition ($/gal) 0.0060 0.025
Cost, water transport ($/gal) 0.015 0.12
Distance, water transport (mi) 20 Estimated based on spatial analysis of Bakken surface water sites
Wastewater returned, proportion of injected
0.22 0.67 Stepan 2010 (weighted average +/- 50%)
Cost, wastewater disposal ($/gal) 0.012 0.042 Stepan 2010 (ranges)
Cost, wastewater transport ($/gal) 0.015 0.21
Truck trips, completion chemicals* 4 24 NYDEC 2011 *Scaled linearly by fracturing volume from 5M-gallon fracturing operation modeled in NYDEC 2011 assessment
Truck trips, completion equipment 10
Truck trips, fracturing equipment (e.g., trucks and tanks)
350
Truck trips, sand* 4.6 27.6
Distance, completion materials trucking (mi)
100 Assumed
Distance, wastewater trucking (mi) 19.7 ND DMR 2012c Average of shortest five rank waste transport distances
Fuel economy (mi/gal) 6.7 DOE 2012, Tables 5.1-5.2 (average, 2000-2010)
CO2 emissions, diesel (lb/gal) 22.4 EPA 2008, Table 5
Table A-5. Parameters and data sources for fracturing optimization case study in the Bakken Shale play.
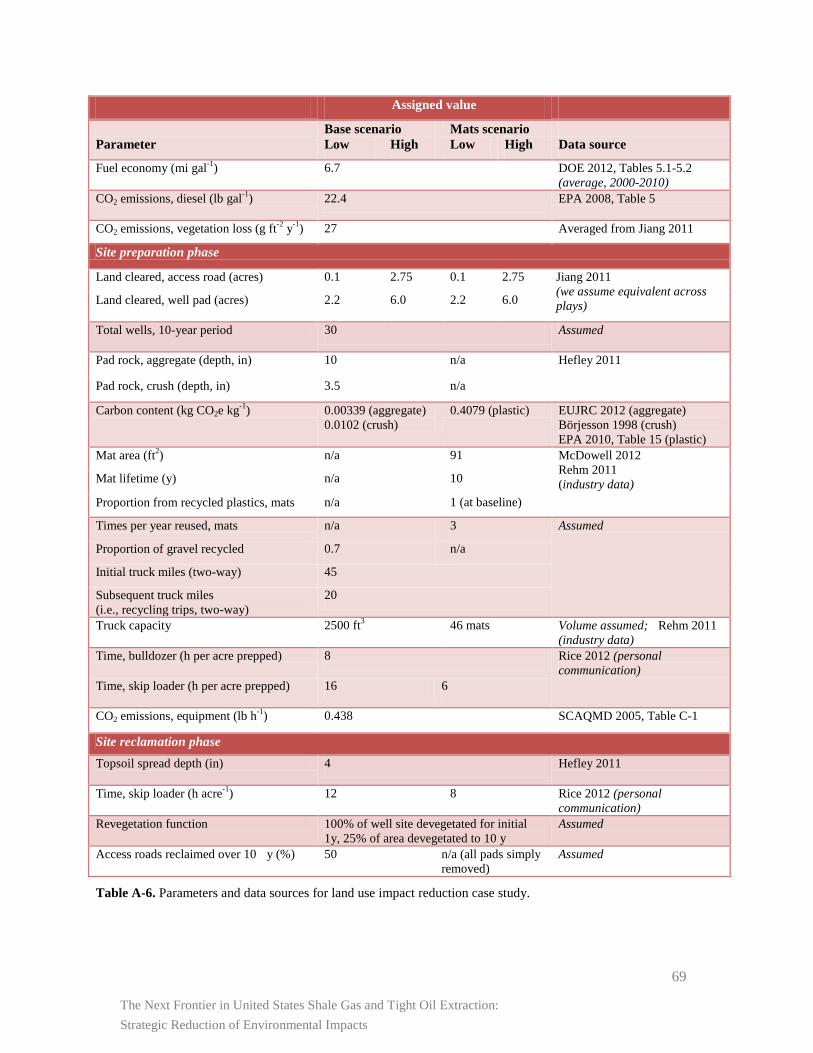
The Next Frontier in United States Shale Gas and Tight Oil Extraction: Strategic Reduction of Environmental Impacts
69
Assigned value
Base scenario Mats scenario Parameter Low High Low High Data source
Fuel economy (mi gal-1) 6.7 DOE 2012, Tables 5.1-5.2 (average, 2000-2010)
CO2 emissions, diesel (lb gal-1) 22.4 EPA 2008, Table 5
CO2 emissions, vegetation loss (g ft-2 y-1) 27 Averaged from Jiang 2011
Site preparation phase
Land cleared, access road (acres) 0.1 2.75 0.1 2.75 Jiang 2011 (we assume equivalent across plays) Land cleared, well pad (acres) 2.2 6.0 2.2 6.0
Total wells, 10-year period 30 Assumed
Pad rock, aggregate (depth, in) 10 n/a Hefley 2011
Pad rock, crush (depth, in) 3.5 n/a
Carbon content (kg CO2e kg-1) 0.00339 (aggregate) 0.0102 (crush)
0.4079 (plastic) EUJRC 2012 (aggregate) Börjesson 1998 (crush) EPA 2010, Table 15 (plastic)
Mat area (ft2) n/a 91 McDowell 2012 Rehm 2011 (industry data) Mat lifetime (y) n/a 10
Proportion from recycled plastics, mats n/a 1 (at baseline)
Times per year reused, mats n/a 3 Assumed
Proportion of gravel recycled 0.7 n/a
Initial truck miles (two-way) 45
Subsequent truck miles (i.e., recycling trips, two-way)
20
Truck capacity 2500 ft3 46 mats Volume assumed; Rehm 2011 (industry data)
Time, bulldozer (h per acre prepped) 8 Rice 2012 (personal communication)
Time, skip loader (h per acre prepped) 16 6
CO2 emissions, equipment (lb h-1) 0.438 SCAQMD 2005, Table C-1
Site reclamation phase Topsoil spread depth (in) 4 Hefley 2011
Time, skip loader (h acre-1) 12 8 Rice 2012 (personal communication)
Revegetation function 100% of well site devegetated for initial 1y, 25% of area devegetated to 10 y
Assumed
Access roads reclaimed over 10 y (%) 50 n/a (all pads simply removed)
Assumed
Table A-6. Parameters and data sources for land use impact reduction case study.
The Next Frontier in United States Shale Gas and Tight Oil Extraction: Strategic Reduction of Environmental Impacts
70
REFERENCES
1. Advanced Resources International for American Petroleum Institute 2012. “Estimate of Impacts of EPA Proposals to Reduce Air Emissions from Hydraulic Fracturing Operations: Final Report.” February. Online at http://www.api.org/~/media/Files/Policy/Hydraulic_Fracturing/NSPS-OG-ARI-Impacts-of-EPA-Air-Rules-Final-Report.ashx; last accessed 4 September 2012.
2. American Petroleum Institute 2009a. “Hydraulic Fracturing Operations: Well Construction and Integrity Guidelines.” API Guidance Document HF1, First Edition; October. Online at http://www.api.org/~/media/Files/Policy/Exploration/API_HF1.ashx; last accessed 29 August 2012.
3. American Petroleum Institute 2009b. “Environmental Protection for Onshore Oil and Gas Production Operations and Leases.” API Recommended Practice 51R, First Edition; July. Online at www.api.org/~/media/files/policy/exploration/api_rp_51r.ashx; last accessed 3 September 2012.
4. ALL Consulting for United States Department of Energy, Office of Fossil Energy 2009. “Modern Shale Gas Development in the United States: A Primer.” Online at http://www.netl.doe.gov/technologies/oil-gas/publications/EPreports/Shale_Gas_Primer_2009.pdf; last accessed 10 August 2012.
5. Beard, T. 2011. “Fracture Design in Horizontal Shale Wells: Data Gathering to Implementation.” In: Proceedings of the Technical Workshops for the Hydraulic Fracturing Study: Well Construction and Operation. EPA EPA 600-R-11-046, May 2011. Online at http://water.epa.gov/type/groundwater/uic/class2/hydraulicfracturing/upload/hydraulicfracturingstudywellconstructionandoperation.pdf; last accessed 15 September 2012.
6. Bené, J.; Harden, B.; Griffin, S.W.; Nicot, J.P. for Texas Water Development Board 2007. “Northern Trinity/Woodbine GAM Assessment of Groundwater Use in the Northern Trinity Aquifer Due To Urban Growth and Barnett Shale Development.” Online at www.twdb.state.tx.us/RWPG/rpgm_rpts/0604830613_BarnetShale.pdf; downloaded 23 August 2012.
7. Börjesson, P.; Gustavsson, L. 1998. “Greenhouse Gas Emission from Building Construction in a Life-Cycle Perspective – Wood or Concrete Buildings?” Proceedings from the 1998 ACEEE Summer Study on Energy Efficiency in Buildings. Online at http://eec.ucdavis.edu/ACEEE/1998/pdffiles/papers/0901.pdf; last accessed 30 September 2012.
8. Cathles, L.M. 2012. Assessing the greenhouse impact of natural gas. Geochemistry Geophysics Geosystems 13(6), Q06013 (18 pp).
9. Cawley, J. et al. 2012. “Governor’s Marcellus Shale Advisory Commission Report.” July. Online: http://files.dep.state.pa.us/PublicParticipation/MarcellusShaleAdvisoryCommission/MarcellusShaleAdvisoryPortalFiles/MSAC_Final_Report.pdf; last accessed 15 August 2012.
10. Cheng, Y. 2012. Impacts of the number of perforation clusters and cluster spacing on production performance on horizontal shale-gas wells. Society of Petroleum Engineers (SPE) Evaluation and Engineering 15(1), 31-40.
11. Colborn, T.; Kwiatkowski, C.; Schultz, K.; Bachran, M. 2011. Natural gas operations from a public health perspective. Human and Ecological Risk Assessment 17(5), 1039-1056.
The Next Frontier in United States Shale Gas and Tight Oil Extraction: Strategic Reduction of Environmental Impacts
71
12. Colorado Department of Public Health and Environment. 2010. Garfield County Air Toxics Inhalation: Screening Level Human Health Risk Assessment.
13. Cucura, J.; Burnap, B.; Spatari, S.; Gallagher, P.; Jordaan, S. 2012 “Geospatial LCA of
Pennsylvanian Marcellus Shale Gas.” Online at http://lcacenter.org/lcaxi/final/460.pdf; last accessed 21 December 2012.
14. Dalrymple, A. 2012. “North Dakota pursues largest civil and first ever criminal case against oil and
gas operator.” Fargo Forum Oil Patch Dispatch, 19 July. Online at http://oilpatchdispatch.areavoices.com/2012/07/19/north-dakota-pursues-largest-civil-and-first-ever-criminal-case-against-oil-and-gas-operator/; last accessed 30 August 2012.
15. Dunn, W.L.; Shultis, J.K. 2011. Exploring Monte Carlo Methods. Burlington, MA: Elsevier Science.
16. The Economist 2012. “Gas works: Shale gas is giving a big boost to America’s economy.” In Special Report: Natural gas, an unconventional bonanza. 14 July 2012. Online at http://www.economist.com/node/21558459; last accessed 9 August 2012.
17. Engelder, T. 2011. Comment: Should fracking stop: No, it’s too valuable. Nature 477, 271-275.
18. Entrekin, S.; Evans-White, M.; Johnson, B.; Hagenbuch, E. 2011. Rapid expansion of natural gas development poses a threat to surface waters. Frontiers in Ecology and the Environment 9, 503−511.
19. European Commission Joint Research Center (EUJRC) 2012. “Process data set: Gravel 2/32; wet and dry quarry; production mix, at plant; undried (en).” Online at http://lca.jrc.ec.europa.eu/lcainfohub/datasets/html/processes/898618b2-3306-11dd-bd11-0800200 c9a66_02.01.000.html; last accessed 30 September 2012.
20. Finkel, M.L.; Law, A. 2011. The rush to drill for natural gas: a public health cautionary tale. American Journal of Public Health 101(5), 784-785.
21. Forster, P.; Ramaswamy, V.; Artaxo, P.; Berntsen, T.; Betts, R. ; Fahey, D.W.; Haywood, J.; Lean, J.; Lowe, D.C.; Myhre, G.; Nganga, J.; Prinn, R.; Raga, G.; Schulz, M.; Van Dorland, R. 2007. “Changes in Atmospheric Constituents and in Radiative Forcing.” In: Climate Change 2007: The Physical Science Basis. Contribution of Working Group I to the Fourth Assessment Report of the Intergovernmental Panel on Climate Change [Solomon, S., D. Qin, M. Manning, Z. Chen, M. Marquis, K.B. Averyt, M.Tignor and H.L. Miller (eds.)]. Cambridge University Press, Cambridge, United Kingdom and New York, NY, USA.
22. Frohlich, C. 2012. Two-year survey comparing earthquake activity and injection-well locations in the Barnett Shale, Texas. Proceedings of the National Academy of Sciences. In press.
23. Galusky, L.P. for Gas Technology Institute 2011. “Feasibility Assessment of Early Flowback Water Recovery for Reuse in Subsequent Well Completions.” Report 08122-05.07. Online at http://www.netl.doe.gov/technologies/oil-gas/publications/EPact/08122-05-early-flowback-water.pdf; last accessed 10 August 2012.
24. Gao, C.; Rajeswaran, R.; Nakagawa, E. A Literature Review on Smart Well Technology. Production and Operations Symposium Conference Proceedings, DOI: 10.2118/106011-MS
The Next Frontier in United States Shale Gas and Tight Oil Extraction: Strategic Reduction of Environmental Impacts
72
25. Gaudlip, A.W.; Paugh, L.O. 2008. Marcellus Shale water management challenges in Pennsylvania. SPE white paper 119898, presented at the 2008 SPE Shale Gas Production Conference, Fort Worth, Texas, 16-18 November.
26. Gavrilova, O.; Vilu, R.; Vallner, L. 2010. A life cycle environmental impact assessment of oil shale produced and consumed in Estonia. Resources, Conservation, and Recycling 55, 232-245.
27. Gold, R. 2012. Faulty wells, not fracking, blamed for water pollution. The Wall Street Journal, online, 25 March 2012.
28. Greenstone, M.; Kopits, E.; Wolverton, A. 2011. “Estimating the Social Cost of Carbon for Use in U.S. Federal Rulemakings: A Summary and Interpretation.” National Bureau of Economic Research Work Paper 16913, March. Online at http://www.nber.org/papers/w16913; last accessed 21 September 2012.
29. Gresh, K. 2011. “DEP Fines Chesapeake Energy More Than $1 Million.” Commonwealth of Pennsylvania Department of Environmental Protection press release, 17 May. Online at http://www.portal.state.pa.us/portal/server.pt/community/newsroom/14287?id=17405&typeid=1; last accessed 16 November 2012.
30. Hefley et al. 2011. “The Economic Impact of the Value Chain of a Marcellus Shale Well.” University of Pittsburgh Katz School Graduate School of Business Working Paper Series, August. Online at http://www.business.pitt.edu/faculty/papers/PittMarcellusShaleEconomics2011.pdf; last accessed 15 August 2012.
31. Helm, D. 2011. Peak oil and energy policy—a critique. Oxford Review of Economic Policy 27(1), 68-91.
32. Holland, A. for Oklahoma Geological Survey 2011. “Examination of Possibly Induced Seismicity from Hydraulic Fracturing in the Eola Field, Garvin County, Oklahoma.” Open File Report OF1-2011, August. Online at http://www.ogs.ou.edu/pubsscanned/openfile/OF1_2011.pdf; last accessed 13 August 2012.
33. Howarth, R.W.; Santoro, R.; Ingraffea, A. 2012. Venting and leaking of methane from shale gas development: response to Cathles et al. Climatic Change 113, 537-549.
34. International Energy Agency (IEA) 2012. “Golden Rules for a Golden Age of Gas: Special Report on Unconventional Gas.” Online at http://www.worldenergyoutlook.org/media/weowebsite/2012/goldenrules/WEO2012_GoldenRulesReport.pdf; last accessed 8 August 2012.
35. International Energy Agency (IEA) 2011. “Medium-Term Oil and Gas Markets 2011.” Online at
http://www.iea.org/publications/freepublications/publication/MTOGM2011_Unsecured.pdf; last accessed 7 August 2012.
36. International Energy Agency World Energy Outlook (IEA WEO) 2012. “World Energy Outlook 2012.” Online at http://www.worldenergyoutlook.org/publications/weo-2012/; last accessed 18 November 2012.
37. IHS CERA 2010. “Cream of the Crop: Performance analytics for North America gas resource plays.”
The Next Frontier in United States Shale Gas and Tight Oil Extraction: Strategic Reduction of Environmental Impacts
73
38. Jiang, M.; Griffin, W.M.; Hendrickson, C.; Jaramillo, P.; VanBriesen, J.; Venkatesh, A. 2011. Life cycle greenhouse gas emissions of Marcellus shale gas. Environmental Research Letters 6(3), 034014 (9 pp).
39. Johnson, N.; Gagnolet, T.; Ralls, R.; Zimmerman, E.; Eichelberger, B.; Tracey, C.; Kreitler, G.; Orndorff, S.; Tomlinson, J.; Bearer, S.; Sargent, S.; for the Nature Conservancy 2010. “Pennsylvania Energy Impacts Assessment Report 1: Marcellus Shale Natural Gas and Wind.” Online at http://www.nature.org/media/pa/pa_energy_assessment_report.pdf; last accessed 14 August 2012.
40. Jordaan, S. M. 2012. Land and water impacts of oil sands production in Alberta. Environmental Science and Technology 46, 3611-3617.
41. Kemball-Cook, S.; Bar-Ilan, A. Grant, J.; Parker, L.; Jung, J.; Santamaria, W.; Mathews, J.; Yarwood, G. 2010. Ozone impacts of natural gas development in the Haynesville shale. Environmental Science and Technology 44, 9357-9363.
42. Kenter, P. 2012. “Waste Not.” Gas, Oil, and Mining Contractor February: 14-20. Published online at
http://www.gomcmag.com/ezine/2012/02/14; last accessed 30 August 2012.
43. King, G.E. 2010. Thirty years of gas shale fracturing: What have we learned? SPE white paper 133456, presented at the Society of Petroleum Engineers Annual Technical Conference and Exhibition, Florence, Italy, 19-22 September.
44. Ladlee, J.; Jacquet, J. 2011. The implications of multi-well pads in the Marcellus Shale. Community and Regional Development Institute at Cornell (CaRDI) Research and Policy Brief Series 43, September. Available online from http://devsoc.cals.cornell.edu/cals/devsoc/outreach/cardi/publications/research-and-policy-brief-series.cfm; last accessed 10 August 2012.
45. Lee, A.; Zinaman, O.; Logan, J.; Bazilian, M.; Arent, D.; Newmark, R. Interactions, Complementarities and Tensions at the Nexus of Natural Gas and Renewable Energy. The Electricity Journal 25, 38-48.
46. Lior, N. 2012. Sustainable energy development: The present (2011) situation and possible paths to the
future. Energy 43, 174-191.
47. Markey, E.J. and Holt, R.D. “Drilling Dysfunction: How the Failure to Oversee Drilling on Public Lands Endangers Health and the Environment.” Report prepared for the House Natural Resources Committee on February 8, 2012.
48. Mauter, M.S. 2013. In preparation, based on publicly available Pennsylvania Department of Environmental Protection Oil and Gas Bureau waste and production data.
49. McCurdy, R. 2011. “Underground Injection Wells For Produced Water Disposal.” In: Proceedings of the Technical Workshops for the Hydraulic Fracturing Study: Water Resources Management. EPA 600-R-11-048, May 2011. Online at http://www.epa.gov/hfstudy/HF_Workshop_4_Proceedings_FINAL_508.pdf; last accessed 30 August 2012.
The Next Frontier in United States Shale Gas and Tight Oil Extraction: Strategic Reduction of Environmental Impacts
74
50. McDonald R.I.; Fargione, J.; Kiesecker, J.; Miller, W.M.; Powell, J. 2009. Energy sprawl or energy efficiency: climate policy impacts on natural habitat for the United States of America. PLoS ONE 4(8), e6802 (11 pp).
51. McDowell, J. (Newpark Resources) 2012. Personal communication.
52. McKenzie, L.M.; Witter, R.Z.; Newman, L.S.; Adgate, J.L. 2012. Human health risk assessment of air emissions from development of unconventional natural gas. Science of the Total Environment 424, 79-87.
53. Mielke, E.; Diaz Anadon, L.; Narayanamurti, V. 2010. “Water Consumption of Energy Resource Extraction, Processing, and Conversion.” Belfer Center, Harvard Kennedy School: Energy Technology Innovation Policy Discussion Paper Series, Discussion Paper 2010-15, October. Online at http://belfercenter.ksg.harvard.edu/files/ETIP-DP-2010-15-final-4.pdf; last accessed 14 August 2012.
54. Mohaghegh, S. D.; Gruic, O.; Zargari, S.; Kalantari-Dahaghi, A; Bromhal, GS 2012. Top-down, intelligent reservoir modelling of oil and gas producing shale reservoirs: case studies. International Journal of Oil, Gas, and Coal Technology 5(1), 3-28.
55. Montgomery, C. T.; Smith, M. B. 2010. Hydraulic fracturing: history of an enduring technology. Journal of Petroleum Technology 62(12), 26-41.
56. Myers, T. 2012. Potential contaminant pathways from hydraulically fractured shale to aquifers. Ground Water, in press.
57. Natural Resources Defense Council 2012. “Leaking Profits: The U.S. Oil and Gas Industry Can Reduce Pollution, Conserve Resources, and Make Money by Preventing Methane Waste.” May. Online at www.nrdc.org/energy/files/Leaking-Profits-Report.pdf; last accessed 4 September 2012.
58. New York Department of Environmental Conservation (NY DEC) 2011. “Revised draft, supplemental general environmental impact statement on the oil, gas, and solution mining regulatory program: Well permit issuance for horizontal drilling ad high-volume hydraulic fracturing to develop the Marcellus shale and other low-permeability gas reservoirs.” Online at http://www.dec.ny.gov/energy/75370.html; last accessed 7 August 2012.
59. Nicot, J., Scanlon, B.R. 2012. Water use for shale-gas production in Texas, U.S. Environmental Science and Technology 46, 3580-3586.
60. North Dakota Industrial Commission, Department of Mineral Resources (ND DMR), Oil and Gas Division 2012a. Data set: Historical monthly Bakken oil production statistics. Online at https://www.dmr.nd.gov/oilgas/stats/historicalbakkenoilstats.pdf; last accessed 7 August 2012
61. North Dakota Industrial Commission, Department of Mineral Resources (ND DMR), Oil and Gas Division 2012b. Data sets: Oil and gas production totals by formation for the year, 1998-2011. Available online via https://www.dmr.nd.gov/oilgas/stats/statisticsvw.asp; last accessed 15 August 2012.
62. North Dakota Industrial Commission, Department of Mineral Resources (ND DMR), Oil and Gas Division 2012c. Data sets: Oil and gas shapefiles. Available online via the Department’s GIS server at https://www.dmr.nd.gov/oilgas/; downloaded 23 August 2012.
The Next Frontier in United States Shale Gas and Tight Oil Extraction: Strategic Reduction of Environmental Impacts
75
63. North Dakota Industrial Commission, Department of Mineral Resources (ND DMR), Oil and Gas
Division 2012d. Employee directory. Available online via at https:// www.dmr.nd.gov/oilgas/employees.asp/; last accessed 29 August 2012.
64. Ohio Department of Natural Resources (OHDNR) 2012. “Preliminary report on the Northstar I Class II Injection Well and the Seismic Events in the Youngstown, Ohio Area.” March. Online at http://ohiodnr.com/downloads/northstar/UICreport.pdf; last accessed 13 August 2012.
65. Oregon State University PRISM Climate Group 2012. Data sets: Annual precipitation, 2000-2011. Online at http://prismmap.nacse.org/nn/index.phtml; queried 23 August 2012.
66. Osborne, S.G.; Vengosh, A.; Warner, N.R.; Jackson, R.B. Methane contamination of drinking water accompanying gas-well drilling and hydraulic fracturing. Proceedings of the National Academy of Sciences 108(20), 8172–8176.
67. Paltsev, S.; Jacoby, H.D.; Reilly, J.M.; Ejaz, Q.J.; Morris, J.; O’Sullivan, F.; Rausch, S.; Wincheser, N.; Kragha, O. 2011. The future of U.S. natural gas production, use, and trade. Energy Policy 39, 5309-5321.
68. Pennsylvania Department of Environmental Protection (PA DEP) Office of Oil and Gas Management 2012a. Data set: SPUD Data Report, 01/01/2001 to 12/31/2011. Available via http://www.depreportingservices.state.pa.us/ReportServer/Pages/ReportViewer.aspx?/Oil_Gas/Spud_External_Data; downloaded 14 August 2012.
69. Pennsylvania Department of Environmental Protection (PA DEP) Office of Oil and Gas Management 2012b. Data sets: Statewide Production Reports, 2000-2011. Available via https://www.paoilandgasreporting.state.pa.us/publicreports/Modules/DataExports/DataExports.aspx; downloaded 15 August 2012.
70. Pennsylvania Department of Environmental Protection (PA DEP) Office of Oil and Gas Management 2012c. Data sets: Permits issued and wells drilled maps, 2000-2012. Available via http://www.portal.state.pa.us/portal/server.pt/community/marcellus_shale/20296; downloaded 17 August 2012.
71. Pennsylvania Consolidated Statutes Title 58, as revised by General Assembly of Pennsylvania House Bill 1950 (Act 13 of 2012, enacted 14 February 2012). Full text Online at http://www.ctbpls.com/www/PA/11R/PDF/PA11RHB01950CC1.pdf; last accessed 27 August 2012.
72. Prozzi, J.; Grebenschikov, S.; Bannerjee, A.; Prozzi, J. for Texas Department of Transportation 2011. “Impacts of Energy Developments on the Texas Transportation System Infrastructure.” Online at http://www.utexas.edu/research/ctr/pdf_reports/0_6513_1a.pdf; downloaded 23 August 2012.
73. Qiu, Y.; Anadon, L.D. 2011. The price of wind power in China during its expansion: Technology
adoption, learning-by-doing, economies of scale, and manufacturing localization. Energy Economics 34, 772-785.
74. Rahm, B.G.; Riha, S.J. 2012. Toward strategic management of shale gas development: Regional, collective impacts on water resources. Environmental Science and Policy 17, 12-23.
The Next Frontier in United States Shale Gas and Tight Oil Extraction: Strategic Reduction of Environmental Impacts
76
75. Rehm, N. 2011. “Site Access and Logistics: Newpark Resources.” Presentation at the Petroleum Technology Transfer Council and Environmentally Friendly Drilling Workshop “Lowering the Environmental Footprint of Marcellus Shale Development,” 26 July, Morgantown, WV. Online via http://www.pttc.org/workshops.htm; last accessed 4 October 2012.
76. Rice, D. (Rice Excavating and Plumbing Inc.) 2012. Personal communication.
77. Rozell, D.J.; Reaven, S.J. 2012. Water pollution risk associated with natural gas extraction from the Marcellus Shale. Risk Analysis 32(8), 1382-1393.
78. Schmidt, C.W. 2010. Blind Rush? Shale Gas Boom Proceeds Amid Human Health Questions.
Environmental Health Perspectives 119, a348–a353.
79. Smith, M. 2010. “Dimock Residents to Share $4.1 Million, Receive Gas Mitigation Systems Under DEP-Negotiated Settlement with Cabot Oil and Gas.” Commonwealth of Pennsylvania Department of Environmental Protection press release, 16 December. Online at http://www.portal.state.pa.us/portal/server.pt/community/newsroom/14287?id=15595&typeid=1; last accessed 16 November 2012.
80. Snyder, D.J.; Seale, R. 2011. Optimization of completions in unconventional reservoirs for ultimate recovery: Case studies. SPE white paper 143066, presented at the Society of Petroleum Engineers EUROPEC/EAGE Annual Conference and Exhibition, Vienna, Austria, 23-26 May 2011.
81. South Coast Air Quality Management District (SCAQMD) 2005. “Final Environmental Assessment for Proposed Amended Role 403, Appendix C: Calculations and Assumptions used for Determining Construction Emissions Associated with the Transportation and Spreading of Gravel on Unpaved Roads at One Confined Animal Facility.” Online at http://www.aqmd.gov/ceqa/documents/2005/aqmd/finalEA/403/appC.doc; last accessed 14 September 2012.
82. Stepan, D.J. and University of North Dakota Energy and Environmental Research Center for North Dakota Industrial Commission Oil and Gas Research Council 2010. “Bakken Water Opportunities Assessment: Phase 1.” April. Online at www.nd.gov/ndic/ogrp/info/g-018-036-fi.pdf; last accessed 10 August 2012.
83. Sun, G.; McNulty, S.G.; Moore Myers, J.A.; Cohen, E.C. 2008. Impacts of climate change, population growth, land use change, and groundwater availability on water supply and demand across the Conterminous U.S. American Water Resources Association Watershed Update 6(2), 30 pp. Online at http://www.awra.org/committees/techcom/watershed/pdfs/AWRA%20HandWM_2008_2_climatechange.pdf; last accessed 24 August 2012.
84. Texas Commission on Environmental Quality (TCEQ) 2010. “City of Fort Worth Follow-Up Survey Project: Fort Worth, Texas Area – April 19 - 23, 2010.” Online at http://www.tceq.state.tx.us/assets/public/implementation/barnett_shale/samplingFtWorth/FortWorthSurvey1004Summary.pdf; downloaded 23 August 2012.
85. Texas Railroad Commission 2012a. Data query results: East Newark (Barnett Shale) Production, Jan 1993 to May 2012. Online at http://webapps.rrc.state.tx.us/PDQ/generalReportAction.do; submitted 15 August 2012.
The Next Frontier in United States Shale Gas and Tight Oil Extraction: Strategic Reduction of Environmental Impacts
77
86. Texas Railroad Commission 2012b. Data sets: Natural gas and oil production and well counts (1935-2011). Available at http://www.rrc.state.tx.us/data/production/gaswellcounts.php and http://www.rrc.state.tx.us/data/production/oilwellcounts.php; updated 3 July 2012, retrieved 16 August 2012.
87. Texas Railroad Commission 2012c. Data set: Texas Monthly Oil and Gas Production (2003-2012). Online at http://www.rrc.state.tx.us/data/production/ogismcon.pdf; updated 25 July 2012, last accessed 4 September 2012.
88. Texas Railroad Commission 2012d. Chart: Newark, East (Barnett Shale) Well Count 1993 through July 19, 2012. Online at http://www.rrc.state.tx.us/barnettshale/barnettshalewellcount_1993-2012.pdf; last accessed 23 August 2012.
89. Texas Railroad Commission 2012e. Data sets: Well Distribution Tables - Well Counts by Type and Status. (Averaged across all reported months of selected years.) Online at http://www.rrc.state.tx.us/data/wells/welldistribution/index.php; downloaded 23 August 2012.
90. Texas Railroad Commission 2012f. Data set: Newark, East (Barnett Shale) Statistics. Online at http://www.rrc.state.tx.us/data/fielddata/barnettshale.pdf; downloaded 23 August 2012.
91. United States Bureau of Labor Statistics (USBLS) 2012. Data sets: Labor force data archives, North Dakota, Pennsylvania, and United States: 2000-2012. Available via http://www.bls.gov/eag/eag.pa.htm, http://www.bls.gov/eag/eag.nd.htm, and http://www.bls.gov/eag/eag.us.htm; downloaded 27 August 2012.
92. United States Census Bureau (US CB) 2012a. Database download: State and county QuickFacts. Files available at http://quickfacts.census.gov/qfd/download_data.html; accessed 15 August 2012.
93. United States Census Bureau (US CB) 2012b. Data sets: Annual surveys of state government tax collections, 2001-2011. Available online via http://www.census.gov/govs/statetax/; accessed 24 August 2012.
94. United States Department of the Interior (USDI) National Atlas of the United States 2012. Data query: Bailey ecoregions of North Dakota, Pennsylvania, and Texas. Online at http://nationalatlas.gov/mld/ecoregp.html; submitted 15 August 2012.
95. United States Department of Agriculture (USDA) 2012. Data set: 2006 Major Land Resource Area Geographic Database, version 4.2 (shapefiles). Online at ftp://ftp-fc.sc.egov.usda.gov/NSSC/MLRA/MLRA_42.zip; downloaded 23 August 2012.
96. United States Department of Energy (USDOE) 2012. “Transportation Energy Data Book: Edition 31.” ORNL-6987. Online at http://cta.ornl.gov/data/tedb31/Edition31_Full_Doc.pdf; last accessed 31 August 2012.
97. United States Energy Information Administration (US EIA) 1993. Drilling sideways: A review of horizontal well technology and its domestic application. DOE/EIA-TR-0565. Online at ftp://ftp.eia.doe.gov/petroleum/tr0565.pdf; last accessed 6 August 2012.
98. United States Energy Information Administration (US EIA) 2011a. Data table: Carbon dioxide uncontrolled emission factors. Online at http://www.eia.gov/electricity/annual/pdf/tablea3.pdf; last accessed 10 August 2012.
The Next Frontier in United States Shale Gas and Tight Oil Extraction: Strategic Reduction of Environmental Impacts
78
99. United States Energy Information Administration (US EIA) 2011b. “Annual Energy Review.”
October. Online at http://www.eia.gov/totalenergy/data/annual/pdf/aer.pdf; last accessed 4 September 2012.
100. United States Energy Information Administration (US EIA) 2012a. “Monthly Energy Review: July.” Online at http://www.eia.gov/totalenergy/data/monthly/pdf/sec13_1.pdf; last accessed 10 August 2012.
101. United States Energy Information Administration (US EIA) 2012b. “Annual Energy Outlook 2012 with Projections to 2035.” DOE/EIA-0383. Online at http://www.eia.gov/forecasts/aeo/pdf/0383(2012).pdf; last accessed 5 August 2012.
102. United States Energy Information Administration (US EIA) 2012c. “Electric Power Monthly: July 2012.” Online at http://www.eia.gov/electricity/monthly/; last accessed 6 August 2012.
103. United States Energy Information Administration (US EIA) 2012d. Data set: U.S. Natural Gas Production, 1990-2035. Online at http://www.eia.gov/energy_in_brief/data/natgas_production_AEO2012.xlsx; downloaded 20 August 2012.
104. United States Energy Information Administration (US EIA) 2012e. Data set: U.S. Crude Oil Production, 1990-2035. Online at http://www.eia.gov/todayinenergy/chartdata/AEO2012Crude.csv; downloaded 20 August 2012.
105. United States Energy Information Administration (US EIA) 2012f. Data set: U.S. Crude Oil Production, 1859-2011. Online at http://www.eia.gov/dnav/pet/xls/pet_crd_crpdn_adc_mbbl_a.xls; downloaded 23 August 2012.
106. United States Energy Information Administration (US EIA) 2012g. Data set: U.S. Natural Gas Production, 1900-2011. Online at http://www.eia.gov/dnav/ng/xls/NG_prod_sum_a_epg0_vgm_mmcf_a.xls; downloaded 24 August 2012.
107. United States Energy Information Administration (US EIA) 2012h. Data set: Spot Prices, Petroleum
and Other Liquids, 1986-2012. Online at http://www.eia.gov/dnav/pet/xls/pet_pri_spt_s1_d.xls; last downloaded 28 October 2012.
108. United States Energy Information Administration (US EIA) 2012i. Data set: Natural Gas Spot and
Futures Prices, 1997-2012. Online at http://www.eia.gov/dnav/ng/xls/NG_pri_fut_s1_d.xls; last downloaded 28 October 2012.
109. United States Energy Information Administration 2012j. Data set: Figures, Short-Term Energy
Outlook, August 2012. Online at http://www.eia.gov/forecasts/steo/xls/chart-gallery.xls; last accessed 10 September 2012.
110. United States Environmental Protection Agency (US EPA) 2002. “Completed Study of Potential
Impacts of Hydraulic Fracturing of Coalbed Methane Wells.” Available at http://www.epa.gov/safewater/uic/cbmstudy/zips/completestudy.zip; last accessed 13 August 2012.
The Next Frontier in United States Shale Gas and Tight Oil Extraction: Strategic Reduction of Environmental Impacts
79
111. United States Environmental Protection Agency (US EPA) 2004. “Evaluation of Impacts to Underground Sources of Drinking Water by Hydraulic Fracturing of Coalbed Methane Reservoirs Study.” Available at http://water.epa.gov/type/groundwater/uic/upload/completestudy.zip; last accessed 13 August 2012.
112. United States Environmental Protection Agency (US EPA) 2008. “Climate Leaders Greenhouse Gas
Inventory Protocol Core Module Guidance: Direct Emissions from Mobile Combustion Sources.” EPA430-K-08-004; May. Online at http://www.epa.gov/stateply/documents/resources/mobilesource_guidance.pdf; last accessed 31 August 2012.
113. United States Environmental Protection Agency (US EPA) 2010. “Documentation for Greenhouse Gas Emission and Energy Factors Used in the Waste Reduction Model (WARM): Plastics.” Online at http://www.epa.gov/climatechange/waste/SWMGHG report.html; last accessed 30 September 2012.
114. United States Environmental Protection Agency (US EPA) 2011a. “Draft Report: Investigation of Ground Water Contamination near Pavilion, Wyoming.” EPA 600/R-00/000, December. Online at http://www.epa.gov/region8/superfund/wy/pavillion/EPA_ReportOnPavillion_Dec-8-2011.pdf; last accessed 27 August 2012.
115. United States Environmental Protection Agency (US EPA) 2011b. “Lessons Learned from Natural Gas STAR Partners: Reduced Emissions Completions for Hydraulically Fractured Natural Gas Wells.” Online at www.epa.gov/gasstar/documents/reduced_emissions_completions.pdf; last accessed 4 September 2012.
116. United State Environmental Protection Agency (US EPA) 2012a. “Regulation of Hydraulic Fracturing Under the Safe Drinking Water Act.” EPA 816-D-02-006. Available via http://water.epa.gov/type/groundwater/uic/class2/hydraulicfracturing/wells_hydroreg.cfm; last accessed 13 August 2012.
117. United State Environmental Protection Agency (US EPA) 2012b. “Oil and Natural Gas Sector: New
Source Performance Standards and National Emission Standards for Hazardous Air Pollutants Reviews.” EPA-HQ-OAR-2010-0505; 17 April. Online at http://www.epa.gov/airquality/oilandgas/pdfs/20120417finalrule.pdf; last accessed 4 September 2012.
118. United State Environmental Protection Agency (US EPA) 2012c. “EPA's Study of Hydraulic Fracturing and Its Potential Impact on Drinking Water Resources.” Available via http://www.epa.gov/hfstudy/; last accessed 18 November 2012.
119. United State Environmental Protection Agency Region III (US EPAR3) 2012. Personal
communication.
120. United States Geological Survey (USGS) Gap Analysis Program 2012. Data sets: Land cover; Texas, Pennsylvania, North Dakota. Available via http://dingo.gapanalysisprogram.com/landcoverv2/Map.aspx; last accessed 27 August 2012.
121. United States Geological Survey (USGS) North Dakota Water Science Center 2005. Data set: Water Use in North Dakota by County. Online at http://water.usgs.gov/watuse/data/2005/ndco2005.xls; last accessed 29 August 2012.
The Next Frontier in United States Shale Gas and Tight Oil Extraction: Strategic Reduction of Environmental Impacts
80
122. Warner, N.R.; Jackson, R.B.; Darrah, T.H.; Osborne, S.G.; Down, A.; Zhao, K.; White, A.; Vengosh, A. 2012. Geochemical evidence for possible natural migration of Marcellus Formation brine to shallow aquifers in Pennsylvania. Proceedings of the National Academy of Science 109(30), 11961-11966.
123. Weber, C.L.; Clavin, C. 2012. Life cycle carbon footprint of shale gas: Review of evidence and
implications. Environmental Science and Technology 46, 5688-5695. 124. Weinhold, B. 2012. The future of fracking: New rules target air emissions for cleaner natural gas
production. Environmental Health Perspectives 120: a272-a279. 125. White, T. 2012 “EPA Completes Drinking Water Sampling in Dimock, Pa.” Environmental
Protection Agency press release, 25 July. Available at http://yosemite.epa.gov/opa/admpress.nsf/0/1A6E49D193E1007585257A46005B61AD; last accessed 27 August 2012.
126. Whitworth, P. et al 2009. “The Application of EOG Resources, Inc. to Dispose of Oil and Gas Waste
by Injection into a Reservoir Not Productive of Oil or Gas, Erath County SWD Lease Well No. 1, Newark, East (Barnett Shale) Field, Erath County, Texas.” Railroad Commission of Texas Oil and Gas Docket No 9-025964. Online at www.rrc.state.tx.us/meetings/ogpfd/09-59654-r9p.pdf; last accessed 30 August 2012.
127. World Energy Council 2010. “2010 Survey of Energy Resources.” Online at
http://www.worldenergy.org/documents/ser_2010_report_1.pdf; last accessed 7 August 2012. 128. Zargari, S.; Mohaghedgh, S. D. 2010. Field development strategies for Bakken Shale Formation.
SPE white paper 139032, presented at the Society of Petroleum Engineers Eastern Regional Meeting, Morgantown, WV, 12-14 October 2010.