Embed Size (px)
Citation preview
Analysis of Brazilian industry’s dependency on imported inputs between 2000 and 2014
Valéria Silva Mortari and Maria Aparecida Silva Oliveira
Abstract
The aim of this paper is to analyse the extent to which different sectors of Brazilian industry were dependent on imported inputs between 2000 and 2014. The methodology of input-output analysis was used for this purpose, and the sectors were classified according to their direct and indirect demand for imported inputs. Sectors with relatively little demand for imported inputs are those related to the food, timber, wood and cork product industries and the repair and installation of machinery and equipment. The other industrial sectors relied on imported inputs to carry out their productive activities. The increasing use of imported inputs in Brazilian production processes means that the benefits of sector growth are partly appropriated by other economies.
Keywords
Industry, imports, input-output analysis, industrial production, industrial statistics, Brazil
JEL classification
L60, L160, O14
Authors
Valéria Silva Mortari is a master’s degree student at the Institute of Economics and International Relations of the Federal University of Uberlândia (UFU), Brazil. Email: [email protected].
Maria Aparecida Silva Oliveira is a professor in the Economics Department of the Federal University of São Carlos (UFSCar). Email: [email protected].

132 CEPAL Review N° 127 • April 2019
Analysis of Brazilian industry’s dependency on imported inputs between 2000 and 2014
I. Introduction
Industry is hugely important for a country’s economic performance, given its capacity to produce indirect intersectoral effects in terms of employment, income and technology, by establishing integrated national production chains. As a result, a stimulus to production in a given sector of industry is not confined to that sector alone, but spreads to other economic activities that are directly or indirectly linked to it (Hirschman, 1958; Kaldor, 1957). A country’s industrial production structure is crucial for generating dynamic growth and economic development in both the short and the long run (Prebisch, 1950; Furtado, 1964).1
The Brazilian economy underwent profound structural changes in the 1990s, not only because of the economic policy measures that were adopted to stabilize prices, but also because of the way those policies were implemented, which was prejudicial to Brazilian industry. Key measures in the rapid process of opening up the economy entailed liberalizing imports without at the same time implementing an industrial policy to protect the various sectors of industry from increasing competition (Kon and Coan, 2009, p. 13). This opening-up process involved successive cuts in import quotas, followed by an appreciation of the real; and it marked the transition of Brazilian industry towards a new trade regime, coming after at least four decades of vigorous import protection (Moreira, 1999, p. 295).2
These measures fuelled a continuous and generalized growth of imports into Brazil. The data reveal the gathering pace of inflows, mainly of intermediate goods, which have been gaining an increasing share of Brazilian imports and presage a rising trend for the years to come, as shown in figure 1. The import share in gross domestic product (GDP) grew significantly in the late 1990s and remained at a high level throughout the 2000 decade.
Figure 1 Brazil: imports, current values and share of gross domestic product (GDP), 1996–2013
(Thousands of reais and percentages)
0
2
4
6
8
10
12
14
16
0
50 000
100 000
150 000
200 000
250 000
1996
1998
2000
2002
2004
2006
2008
2010
2012
Intermediate goodsNon-durable consumer goods Durable consumer goods
Capital goodsImport/GDP ratio Imports
Source: Prepared by the authors, on the basis of data from Ipeadata and the System of National Accounts.
1 See also Nakabashi, Scatolin and da Cruz (2010).2 According to Cardoso (2001), the Real Plan —which was designed to combat chronic inflation— went through three stages:
measures to balance the government accounts, establishment of monetary reform, and use of the exchange rate as a nominal anchor. The combination of these economic policies triggered a sharp rise in the real interest rate, which attracted a large influx of capital into Brazil and caused the exchange rate to appreciate. This, in conjunction with trade liberalization policies, damaged the industrial sector and fuelled higher unemployment (Cardoso, 2001, p. 12).

133CEPAL Review N° 127 • April 2019
Valéria Silva Mortari and Maria Aparecida Silva Oliveira
In view of the lengthy process of trade liberalization that accompanied the exchange-rate appreciation, industrial activity in Brazil has gradually become more externally dependent, with more and more imported components and products being used in production processes.3
According to Morceiro, Gomes and Magacho (2014), imported inputs grew across the board between 2003 and 2008, to account for at least 60% of tradable inputs used in production. This detracts from industry’s contribution to GDP growth and job creation; and it also weakens production linkages (Marconi and Barbi, 2010; Fonseca, 2010; Morceiro, 2012; Magacho, 2010 and 2013; Morceiro, Gomes and Magacho, 2014), resulting in a lower degree of sectoral interdependence in the economy. The aforementioned authors also show that the largest share of imported inputs is used in the production of high-technology goods, so the value added by these industries leaks out to the external sector.
In view of the external dependency that has developed in Brazilian industry in recent decades, in which the import content of domestically produced goods is steadily increasing, and given the adverse effects of this process on income and employment, this article sets out to quantify the extent to which Brazilian industry is reliant on imported inputs. The aim is then to identify which products are most needed (those most widely used in domestic industry) and where they are used —in other words, the sectors that generate the heaviest demand for imports.
The study uses input-output analysis to quantitatively identify the sectors that increase the economy’s external dependency when their output grows, considering their direct and indirect needs for imported inputs and the substitution of domestic suppliers by foreign ones.
II. Industrial production linkages and imports of intermediate goods
According to Hirschman (1958), it is important to study industry linkages because of their capacity to boost economic growth through the intersectoral relations that are forged between different production chains. The effects of a demand stimulus in one sector are not confined to that sector alone, but are also felt in others, through forward and backward linkages involving relations of buying and selling between productive activities. Hirschman explains this in terms of the complementary capacities of industry —when one industry increases its output, it stimulates joint expansion in other sectors.
In this connection, it is interesting to note the different points of view that exist on the use of imported inputs in the industrial production process, in other words how an industry’s deficiencies can be overcome by importing intermediate goods.
Ishikawa (1992) argues that the use of imported inputs in the production process should benefit industry, because it represents a major source of technology transfer, especially in developing countries (Aurea and Galvão, 1998; Lastres and Cassiolato, 2000). The import process thus represents the transfer of knowledge and technology between nations (Veeramani, 2009), which can generate significant productivity increases in industrial activity, as reported in the work of Bonelli and Fonseca (1998), Rossi Júnior and Ferreira (1999) and Carvalho and Feijó (2000).
In a context of global value chains, which has been a recent focus of the literature, it is clear that the act of exportation requires a counterpart act of importation.4 This can be inferred from the fact
3 See Fonseca, Carvalho and Pourchet (1998); Levy and Serra (2002); Feijó, Carvalho and Almeida (2005); and Fonseca (2010).4 The global value chains phenomenon entails the fragmentation of production processes worldwide. The movement gained force
in the 1970s, but achieved greater prominence in the 2000 decade (UNCTAD, 2013). In the global value chains framework, firms no longer operate in all stages of the production of a final good, but spread them across different countries, while themselves concentrating on higher value added activities. This strategy enabled large firms to reduce their costs, based on the greater incorporation of imported parts, parts and components, without losing control of the main areas of the business (Gereffi, Humphrey and Sturgeon, 2005).

134 CEPAL Review N° 127 • April 2019
Analysis of Brazilian industry’s dependency on imported inputs between 2000 and 2014
that the consumption of intermediate goods in production accounts for 51% of all international trade (Thorstensen, Ferraz and Gutierre, 2014). Accordingly, policies that restrict the importation of inputs would have direct and indirect effects on a country’s capacity to increase the technological complexity of its industrial production destined for the domestic or external market. It would, therefore, also hinder its differentiated integration into global value chains (Thorstensen, Ferraz and Gutierre, 2014). In the current context, the importation of intermediate goods is an inherent part of the production process and represents competitiveness gains based on a strategic and differentiated form of international engagement by the country in question.5
The counterargument is based on the importance of a country’s production structure for its economic development, and how the domestic sourcing intermediate goods supports the diversification of production and growth of per capita income, as noted by Marconi and Rocha (2012) drawing on Chenery, Robinson and Syrquin (1986). The reason for this is that intermediate goods are also produced from other intermediate goods, thereby structuring a good’s production chain or value chain (Marconi and Rocha, 2012, p. 859). In view of this and following Marconi and Rocha (2012), it is argued that the continuous substitution of domestic inputs in the production process by imported ones hinders indirect inter-industry effects and frustrates the industrialization process.
Authors such as Coutinho (1997), Morceiro (2012), Magacho (2010 and 2013) and Morceiro, Gomes and Magacho (2014) also stress that importing inputs can break pre-existing industrial linkages and impede the formation of new ones. This view sees the substitution of domestic suppliers by foreign ones as leading to a reduction in the capacity of industry to generate indirect productive effects in terms of income, employment and technology.
As noted in the studies by Marconi and Barbi (2010) and Marconi and Rocha (2012), the process of substituting domestic inputs with imported ones is also considered to be one of the causes of the de-industrialization process. Lastly, a number of studies highlight the harmful effects of this process on the capacity of industry to create jobs (Soares, Servo and Arbache, 2001; Maia, 2001, Moreira and Najberg, 1998), and how the use of imported inputs in production can undermine the capacity of industry to endogenously generate the factors needed for economic growth (Magacho, 2013).6
III. Methodology
1. Input-output table
Input-output analysis is used to achieve the proposed aim of analysing the degree to which the Brazilian economy depends on imported inputs. This model was developed in the 1930s by Leontief, who managed to portray the economy in a given period, by capturing contemporary relationships between sectors as if they were parts of a single organism (Guilhoto, 2004). The economic relations thus synthesized constitute the input-output table.
The input-output table describes the economy in terms of circulation, as an integrated system of flows and transfers of inputs and outputs between sectors. It is formed by calculating global production and is divided into three parts. The first reflects intermediate demand, in other words purchase and sale transactions between the different sectors of production. The second consists of value added —which includes factor remunerations, and production taxes and subsidies— and imports. The third, which corresponds to final demand, comprises household and government consumption, gross capital formation and exports.
5 See Sá Porto, Canuto and Mota (2017).6 The papers cited here are studies of the Brazilian case.

135CEPAL Review N° 127 • April 2019
Valéria Silva Mortari and Maria Aparecida Silva Oliveira
To ease understanding of the methodology, table 1 presents an illustrative input-product matrix, in which X1 and X2 are sectors of production, Y is final demand, VA is value added, M represents the share of intermediate consumption that is sourced abroad, T is total taxes net of subsidies paid, and X represents the gross value of production (GVP). The xij variables represent the intermediate consumption of input i in the production of good j. The columns of the matrix represent the costs of input purchases; and the rows show the income obtained by the sector from the sale of the good for intermediate consumption by other sectors and for final demand.
Table 1 Representative input-output table
Input/Output Sectors Y GVP
(Costs/ Income) X1 X2
X1 x11 x21 y1 X1
X2 x12 x22 y2 X2
M1 m11 m21
M2 m12 m22
VA va1 va2
T t1 t2
VBP X1 X2
Source: Prepared by the authors, on the basis of R. E. Miller and P. D. Blair, Input-Output Analysis: Foundations and Extensions, New York, Cambridge University Press, 2009.
The technical coefficients matrix can be obtained from the intermediate consumption matrix, which is given by:
in which or (1)
For each row of the input-output table:
x y X X yijj
ni i ijj
nj i1 1
a+ = = += =/ / (2)
in which n is the number of sectors in the economy.
In matrix terms, AX +Y =X, which can be rearranged to give:
or A YX I X LY1= − =−R W or (3)
where I is an identity matrix and is the Leontief inverse matrix, in which, according to Guilhoto (2004), each lij element represents the direct and indirect input requirements of sector i per unit of final demand in the production of sector j. Equation (3) describes the basic Leontief model.
The intermediate consumption of the n sectors of the economy can also be satisfied through imports; and here it is important to observe the relationship between the domestic and external sectors. This is represented by the matrix M, in which each element mij indicates the value of intermediate goods imported from (external) sector i that are used in the production process of (domestic) sector j. The matrix M is at the heart of the analysis of this article; and its components are used to achieve the proposed aim of the study, as shown in the next section.

136 CEPAL Review N° 127 • April 2019
Analysis of Brazilian industry’s dependency on imported inputs between 2000 and 2014
2. Degree of dependence on imported inputs
Dependency on imported inputs is analysed using the method proposed by Schuschny (2005), which consists initially of calculating the sector’s direct requirements for imported inputs. Let Am be the matrix of imported technical coefficients given by:
(4)
is the value of input i imported by sector j and aij m is the coefficient that measures the value of imported inputs i used by sector j for each monetary unit produced by this sector. Thus, the total imports matrix is obtained by post-multiplying the matrix of import coefficients by the Leontief inverse, as follows:
(5)
Each qij element indicates the direct and indirect imports of input i needed to generate one monetary unit of production in sector j. The sum of the elements of column j of the matrix reports the total import content needed to produce one monetary unit of sector j domestically. According to Schuschny (2005), this calculation provides very useful structural information, since it can be used to identify activities that rely heavily on imports from the rest of the world —in other words they depend on external resources to increase their level of production. Similarly, the sum of the elements of row i of the matrix indicates the value of imports of input i needed for all sectors to increase production by one monetary unit. This indicator identifies the foreign sectors on which the domestic economy as a whole relies most, in other words those that do most to fuel the flow of imports when domestic production expands.
Comparing the indicators described above makes it possible to classify sectors in groups according to their behaviour as demanding or demanded of imported intermediate inputs, as shown in table 2.
Table 2 Sectoral classification according to the demand for imported intermediate inputs
Demanding Relatively undemanding
Demanded
Type II Type I
Relatively undemanded
Type III Type IV
Source: Prepared by the authors, on the basis of A. R. Schuschny, “Tópicos sobre el modelo de insumo-producto: teoría y aplicaciones”, Statistical and Prospective Studies series, No. 37 (LC/L.2444-P), Santiago, Economic Commission for Latin America and the Caribbean (ECLAC), 2005.
The sectoral characteristic of the typology presented in table 2 can be described as follows:
• Type I: when the production of the economy expands, direct and indirect demand for imported inputs from these sectors increases by more than average; but, when the production of these sectors themselves increases, their own demand for imported inputs is relatively small.
137CEPAL Review N° 127 • April 2019
Valéria Silva Mortari and Maria Aparecida Silva Oliveira
• Type II: to increase their production by one monetary unit these sectors depend directly and indirectly on imported inputs, to a greater extent than the economy-wide average; and, when the other sectors of the economy increase their production, the direct and indirect importation of inputs from these sectors also increases by more than average. Consequently, these are sectors that need imported inputs for their own production and which supply the domestic demand for inputs by less than the average for the economy as a whole. For that reason, these sectors are unlikely to create many linkages in the domestic production system.
• Type III: although these sectors have direct and indirect demand for imported inputs above the average of the economy at large, when the other sectors increase their production, the direct and indirect demand for imported inputs from these sectors is below average.
• Type IV: these sectors depend little on imported inputs to increase their production, so any incentives to industry sectors in this category are appropriated by the domestic sector. They are also sectors that are relatively undemanded, so when the economy as a whole grows, the direct and indirect demand for imported inputs from these sectors is less than the average across all sectors.
The sectors classified as type II or type III tend to increase the country’s external dependency, because their production directly and indirectly fuels imports through their intermediate demand. As these sectors rely on imported inputs to increase their production, they generate less value added domestically, which has negative repercussions on the national production chain.
3. Database
This study makes use of the input-output tables for 2000–2014 that are available in the World Input-Output Database (WIOD). The input-output tables and tables of imports of intermediate inputs are broken down into 56 sectors, 20 of which are industrial. This enables a detailed analysis to be made of the external dependency of national industrial production. The data contained in the tables are measured in millions of dollars at current prices.
IV. Discussion of the results
This section discusses the results obtained by applying the methodology explained above. To improve understanding, the classification of Pavitt (1984) and the Organization for Economic Cooperation and Development (OECD) (2005) is used, which groups sectors by type of industry or technology. As the groups contain sectors with similar industrial characteristics, the discussion is subdivided as follows: natural-resource-intensive industry, scale-intensive industry, science-based industry, labour-intensive industry and industry with differentiated technology.
1. Natural-resource-intensive industry
A recent discussion in the scientific literature noted a structural change in Brazilian industry, which has intensified since the economic liberalization measures of the 1990s. Some authors, such as Nassif (2008) and Oreiro and Feijó (2010), have shown that industrial production in Brazil has shifted towards natural-resource-intensive industry, which has come to play a key role in the performance of the national economy. Thus, the analysis of reliance on imported inputs is relevant for identifying the sectors that directly and indirectly stimulate imports when their production increases and, thus, establish whether the stimuli generated in this industry are appropriated abroad.

138 CEPAL Review N° 127 • April 2019
Analysis of Brazilian industry’s dependency on imported inputs between 2000 and 2014
The sectors that comprise natural-resource-intensive industry are listed in table 3, classified by their degree of external dependency. Firstly, although this industry has played a crucial role in the economy through its export performance, when natural-resource-intensive sectors increase their production they generally demand imported inputs, directly and indirectly, to a greater extent than the average of the economy as a whole.
Table 3 Brazil: classification of the degree of dependency on imported inputs,
natural-resource-intensive industry
Sectors / Year 2000 2001 2002 2003 2004 2005 2006 2007 2008 2009 2010 2011 2012 2013 2014
Extractive industry II II II II II II I II I II II II I I I
Food products, beverages and tobacco III III III III III III III III III III III III III III III
Coke and refined petroleum products II II II II II II II II II II II II II II II
Other non-metallic mineral products III III III III III III III III III III II III III III III
Metal products (except machinery and equipment) II III II II II III III III III III III III III II II
Source: Prepared by the authors, on the basis of data from the World Input-Output Database (WIOD).
Table 3 shows that, between 2000 and 2011, extractive industry was generally classified as type II, since its production generates more than average demand for imported inputs; and the economy at large is also more than averagely reliant on imported inputs from this sector to increase its production. Since 2012, however, this industry has been classified as type I, so its external dependency was relatively small during this period. Figure 2 shows that the extractive industry’s direct and indirect demand for imported inputs has dropped slightly below the economy-wide average in the last three years.
Figure 2 Brazil: direct and indirect demand for imported inputs per dollar of output generated
by the sectors, natural resource-intensive industry, 2000–2014 (Dollars)
0
0.05
0.10
0.15
0.20
0.25
0.30
0.35
2000 2001 2002 2003 2004 2005 2006 2007 2008 2009 2010 2011 2012 2013 2014
AverageExtractive industry
Manufacture of food, beverageand tobacco products
Manufacture of coke and refinedpetroleum products
Manufacture of other non-metallicmineral products
Manufacture of metallic products(except machinery and equipment)
Source: Prepared by the authors, on the basis of data from the World Input-Output Database (WIOD).

139CEPAL Review N° 127 • April 2019
Valéria Silva Mortari and Maria Aparecida Silva Oliveira
Nonetheless, figure 3 shows that the economy at large relies heavily on imported inputs from extractive industry and that this dependency has remained high over the years. Whereas a one-monetary-unit increase in production in other sectors of the economy generated a direct and indirect import requirement from this sector of US$ 0.24 in 2000, the amount had increased to US$ 0.58 by 2014. In that year, the sectors most dependent on imports of this type of input were the following: manufacture of coke and refined petroleum products (responsible for 27% of the result reported in that year), manufacture of basic metals, manufacture of other non-metallic mineral products, and manufacture of chemicals and chemical products (manufacture of chemical substances and products).
Figure 3 Brazil: direct and indirect demand for imported inputs per dollar of production generated
in the economy, natural resource-intensive industry, 2000–2014(Dollars)
0
0.10
0.20
0.30
0.40
0.50
0.60
0.70
0.80
2000 2001 2002 2003 2004 2005 2006 2007 2008 2009 2010 2011 2012 2013 2014
AverageExtractive industry
Manufacture of food, beverageand tobacco products
Manufacture of coke and refined petroleum products
Manufacture of other non-metallic mineral products
Manufacture of metallic products(except machinery and equipment)
Source: Prepared by the authors, on the basis of data from the World Input-Output Database (WIOD).
Relative to the other sectors, the coke manufacturing and oil refining sector stood out for its high degree of external dependency. As shown in table 3, this sector was classified as type II, since its need for imported intermediate goods is above the average for the economy as a whole, and also represents inputs which economy as a whole must import to increase production.
When the coke and oil refining sector is analysed separately in the matrix Q, it can be seen that its main imported input throughout 2000–2014 comes from extractive industry itself, which on average accounts for 40% of its imports. Thus, the oil refining sector is dependent on an input that is closely related to its final product, since oil and gas production is a sector of extractive industry.
Figure 2 shows that, among the sectors analysed here, the coke and oil refining sector has the highest import requirements. In the period studied, that sector directly and indirectly imported an average of about US$ 0.27 for each dollar produced; and in 2014 the amount was US$ 0.32. Figure 3 also shows that, when the production of the other sectors of the economy increases by a dollar, the direct and indirect import demand linked to this sector averaged US$ 0.31 in the period analysed.

140 CEPAL Review N° 127 • April 2019
Analysis of Brazilian industry’s dependency on imported inputs between 2000 and 2014
The sectors that relied most heavily on imported inputs from the coke and oil refining sector during 2000–2014 were, respectively: coke and oil refining, air transport, chemicals and chemical products, land transport and manufacture of rubber and plastic products.
The food, beverages and tobacco sector has maintained its type III classification. As shown in figure 2, the sector depends on inputs from abroad, importing US$ 0.10 per dollar produced in the period under review. Nonetheless, the direct and indirect demand for imported inputs from this sector by the economy as a whole was, in general, below average.
The other non-metallic mineral products sector was generally classified as type III, in other words as one in which production directly and indirectly requires imported inputs, to an extent that exceeds the average for the economy at large, as shown in figure 2. Nonetheless, when the other sectors of the economy increase their production, their external dependency on this sector is low, as can be seen in figure 3.
Lastly, the metal products manufacturing sector was classified as type II and type III during the period analysed, since its production depends on imports, and the economy as a whole relies on inputs from this sector for its productive activities. Thus, a stimulus to the manufacture of metallic products is associated, as a counterpart, with an increase in imports entering the country.
2. Scale-intensive industry
The sectors classified as scale-intensive industry are listed in table 4, which shows that production in this industry is highly dependent on imports of intermediate inputs. This is evident because in general this industry was classified as type II (demanding and demanded) and type III (demanding and relatively undemanded).
Table 4 Brazil: classification of the degree of dependency on imported inputs, scale-intensive industry
Sectors / Year 2000 2001 2002 2003 2004 2005 2006 2007 2008 2009 2010 2011 2012 2013 2014
Paper and paper products
II II II II II II II III III III III III III III III
Printing and reproduction of media
III III III III III III III III III III III III III III III
Chemicals and chemical products
II II II II II II II II II II II II II II II
Rubber and plastic products
II II II II II II II II II II II II II II II
Basic metals II II II II II II II II II II II II II II II
Vehicles and trailers II II II II II II II II II II II II II II II
Other transport equipment
III II III III III II II II II II II II II II II
Source: Prepared by the authors, on the basis of data from the World Input-Output Database (WIOD).
The classification of the paper and paper products manufacturing sector changed from type II to type III in 2007, as shown in table 4. This means that, in carrying on their production activities, the other sectors become less dependent on the paper and paper products manufacturing sector through time.
According to Montebello and Bacha (2011), firms in the Brazilian pulp and paper sector are vertically integrated and operate in various stages of the production process. Their main comparative advantage is in pulp production, exploiting the high level of production of wood from planted forests. These authors also note that production in the pulp sector has expanded significantly in recent years

141CEPAL Review N° 127 • April 2019
Valéria Silva Mortari and Maria Aparecida Silva Oliveira
to serve the external market. Interestingly, according to the authors, although the pulp sector is capital-intensive, for each direct job generated another five are created indirectly, based on activities that are interrelated with this sector. It is therefore worth noting that the change in this industry’s classification is linked to its internal development in creating new firms related to this sector, which in turn enabled it to integrate into later stages of the national production chain and reduced the national economy’s external dependency in relation to the pulp and paper sector.
In general, the printing and reproduction of recorded media sector was classified as type III; in other words, to increase its production, its demand for imported inputs exceeds the average for the economy as a whole. Although the sector reported average imported inputs of US$ 0.11 per dollar of production, figure 4 shows that its direct and indirect requirement for imported inputs stayed broadly constant in the period studied. In general, it did not replace domestic suppliers with foreign ones over time. Analysis shows that the Brazilian economy’s external dependency in relation to this sector is close to zero (see figure 5).
Among the sectors studied in this article, the chemicals and chemical products sector displays the Brazilian economy’s highest degree of external dependency. When the production of the economy increases by one dollar, the direct and indirect need for imported inputs from the chemicals and chemical products sector averages US$ 0.81. The sectors displaying the highest level of external dependency in relation to imports of chemical and chemical product inputs were: manufacture of chemical substances and products, manufacture of rubber and plastic products, animal and plant production and related services activities, manufacture of paper and paper products and pharmaceutical products. This sector’s production demands an average of US$ 0.20 of imported inputs per dollar produced; and nearly half of this amount is related to the chemicals and chemical products sector itself, so the indirect effects generated by this sector are mostly not appropriated by the national economy.
Figure 4 Brazil: direct and indirect demand for imported inputs per dollar of production generated
by the sectors, scale-intensive industry, 2000–2014(Dollars)
0
0.05
0.10
0.15
0.20
0.25
0.30
2000 2001 2002 2003 2004 2005 2006 2007 2008 2009 2010 2011 2012 2013 2014
AverageManufacture of paper and paper products
Printing and reproduction of recorded media
Manufacture of chemicals and chemical productsManufacture of basic metalsManufacture of vehicles and trailers
Other transport equipment
Manufacture of rubber and plastic products
Source: Prepared by the authors, on the basis of data from the World Input-Output Database (WIOD).

142 CEPAL Review N° 127 • April 2019
Analysis of Brazilian industry’s dependency on imported inputs between 2000 and 2014
Figure 5 Brazil: direct and indirect demand for imported inputs per dollar of production generated
in the economy, scale-intensive industry, 2000–2014(Dollars)
0
0.20
0.40
0.60
0.80
1.00
1.20
2000 2001 2002 2003 2004 2005 2006 2007 2008 2009 2010 2011 2012 2013 2014
Average
Manufacture of paper and paper products
Printing and reproduction of recorded media
Manufacture of chemicals and chemical products Manufacture of basic metalsManufacture of vehicles and trailers
Other transport equipmentManufacture of rubber and plastic products
Source: Prepared by the authors, on the basis of data from the World Input-Output Database (WIOD).
Table 4 shows that the rubber and plastic products sector and the basic metals sector were classified as type II throughout the years studied, reporting average imported inputs of US$ 0.18 and US$ 0.17 per dollar of production, respectively. Thus, when these sectors increase their production, they draw imports into the country. The rubber and plastic products sector is mainly dependent on imports of chemical substances and products, which represents over 52% of their direct and indirect imports, while the basic metals sector mainly requires imports from extractive industry (35%).
In general, the manufacture of vehicles and trailers sector and that of other transport equipment were classified as type II in terms of their external dependency. This means that they themselves depend on imported inputs to produce, and that the economy as a whole also demands imported inputs from these sectors, as shown in figures 4 and 5. These figures reveal that both sectors have direct and indirect input requirements that exceed the average for the economy at large; and also, that when the economy as a whole grows, its demand for imported inputs from these sectors is above average. As shown in figure 4, the vehicle and trailer sector gradually increased its direct and indirect demand for imported inputs during the period analysed, to an average of US$ 0.16 per dollar produced. This amount rises to US$ 0.22 in the case of the other transport equipment sector. It is interesting to note that the main inputs demanded by these sectors come from external suppliers linked to the production of vehicles and trailers and other transport equipment, respectively.
An analysis of scale-intensive Brazilian industry shows that the indirect intersectoral effects generated by it are largely appropriated by the external sector. This is clear in the figures presented, which show that all sectors of this industry directly and indirectly demand imported inputs to an extent that exceeds the economy-wide average. In other words, an increase in the production of these sectors is inexorably linked to increased flows of imports entering the country.

143CEPAL Review N° 127 • April 2019
Valéria Silva Mortari and Maria Aparecida Silva Oliveira
3. Science-based industry
Science-based industry, characterized by its high technological content, consists only of the pharmaceutical industry and the manufacture of pharmaceutical products. Table 5 shows that this sector was generally classified as type III, in other words a sector that demands imported inputs. Consequently, an increase in the production of science-based industry stimulates imports both directly and indirectly.
Table 5 Brazil: classification of degree of dependency on imported inputs, science-based industry
Sector / Year 2000 2001 2002 2003 2004 2005 2006 2007 2008 2009 2010 2011 2012 2013 2014Pharmaceutical industry and manufacture of pharmaceutical products
IV III III III III IV IV III III III III III III III III
Source: Prepared by the authors, on the basis of data from the World Input-Output Database (WIOD).
Figure 6 shows that science-based industry’s direct and indirect demand for imported inputs generally exceeds the economy-wide average, and its external dependency increased gradually during the period under review. This suggests that domestic suppliers in this sector have probably been replaced over time. Between 2000 and 2014, the sector demanded an average of US$ 0.08 of imported inputs per dollar produced.
Figure 6 Brazil: direct and indirect demand for imported inputs per dollar of production generated
by the sectors, science-based industry, 2000–2014(Dollars)
0
0.02
0.04
0.06
0.08
0.10
0.12
2000 2001 2002 2003 2004 2005 2006 2007 2008 2009 2010 2011 2012 2013 2014
AveragePharmaceutical industry and manufacture of pharmaceutical products
Source: Prepared by the authors, on the basis of data from the World Input-Output Database (WIOD).
As science-based industry was generally considered to be type III (a sector that is relatively undemanded by the economy at large), the value of direct and indirect demand for imported inputs is below average, as shown in figure 7. Thus, the economy has a low level of dependency on imported inputs from this sector; so an increase in its production does not generate a great demand for imports from the pharmaceutical industry and the manufacture of pharmaceutical products.
Brógio (2002) argues that Brazilian-owned pharmaceutical firms display fragilities, since foreign capital predominates in serving the domestic consumer market. The author notes that the firms that operate in Brazil display low levels of integration, probably because large firms keep the input-producing segment centralized in their countries of origin, which results in a heavy reliance on imports from those countries (Brógio, 2002, p. 115). Canchumani (2009) explains that the domestic and foreign-owned firms operating

144 CEPAL Review N° 127 • April 2019
Analysis of Brazilian industry’s dependency on imported inputs between 2000 and 2014
in Brazil are engaged in the final stages of the production process —the formulation and marketing of medicines— and have a high degree of dependency in relation to the earlier stages that develop in the matrix. As a result, the pharmaceutical industry’s production process is associated with import growth.
Figure 7 Brazil: direct and indirect demand for imported inputs per dollar of production generated
in the economy, science-based industry, 2000–2014 (Dollars)
0
0.01
0.02
0.03
0.04
0.05
0.06
0.07
0.08
0.09
0.10
2000 2001 2002 2003 2004 2005 2006 2007 2008 2009 2010 2011 2012 2013 2014
Average Pharmaceutical industry and manufacture of pharmaceutical products
Source: Prepared by the authors, on the basis of data from the World Input-Output Database (WIOD).
4. Labour-intensive industryThe sectors that comprise labour-intensive industry in Brazil are listed in table 6. It can be seen that this industry in Brazil is not dependent on intermediate goods imports, because, when production in the economy grows, imports of inputs from these sectors do not increase significantly, as shown in figure 8. This is reflected in the classification of these sectors as type IV or III, as shown in table 6.
Figure 8 Brazil: direct and indirect demand for imported inputs per dollar of production generated
by the sectors, labour-intensive industry 2000–2014(Dollars)
0
0.02
0.04
0.06
0.08
0.10
0.12
0.14
0.16
2000 2001 2002 2003 2004 2005 2006 2007 2008 2009 2010 2011 2012 2013 2014
Average
Manufacture of textile, wearing appareland leather productsManufacture of wood, products of wood and cork,
except furniture
Manufacture of furniture and other manufacturing
Source: Prepared by the authors, on the basis of data from the World Input-Output Database (WIOD).
145CEPAL Review N° 127 • April 2019
Valéria Silva Mortari and Maria Aparecida Silva Oliveira
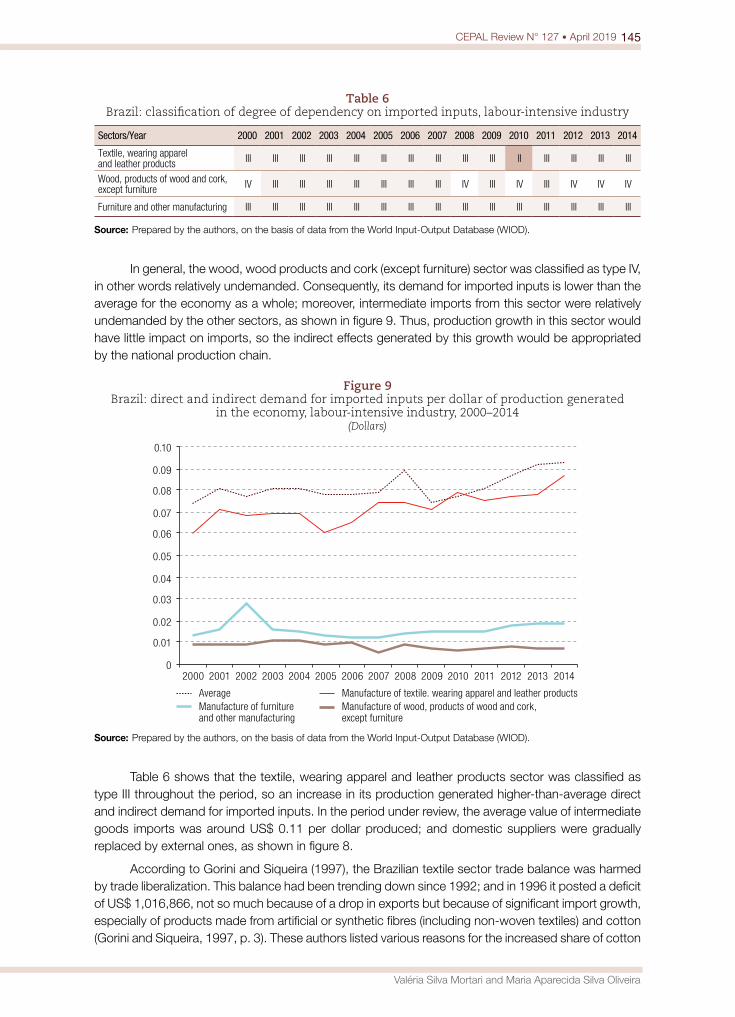
Table 6 Brazil: classification of degree of dependency on imported inputs, labour-intensive industry
Sectors/Year 2000 2001 2002 2003 2004 2005 2006 2007 2008 2009 2010 2011 2012 2013 2014
Textile, wearing apparel and leather products III III III III III III III III III III II III III III III
Wood, products of wood and cork, except furniture IV III III III III III III III IV III IV III IV IV IV
Furniture and other manufacturing III III III III III III III III III III III III III III III
Source: Prepared by the authors, on the basis of data from the World Input-Output Database (WIOD).
In general, the wood, wood products and cork (except furniture) sector was classified as type IV, in other words relatively undemanded. Consequently, its demand for imported inputs is lower than the average for the economy as a whole; moreover, intermediate imports from this sector were relatively undemanded by the other sectors, as shown in figure 9. Thus, production growth in this sector would have little impact on imports, so the indirect effects generated by this growth would be appropriated by the national production chain.
Figure 9 Brazil: direct and indirect demand for imported inputs per dollar of production generated
in the economy, labour-intensive industry, 2000–2014(Dollars)
0
0.01
0.02
0.03
0.04
0.05
0.06
0.07
0.08
0.09
0.10
2000 2001 2002 2003 2004 2005 2006 2007 2008 2009 2010 2011 2012 2013 2014
Average Manufacture of textile. wearing apparel and leather productsManufacture of wood, products of wood and cork,except furniture
Manufacture of furniture and other manufacturing
Source: Prepared by the authors, on the basis of data from the World Input-Output Database (WIOD).
Table 6 shows that the textile, wearing apparel and leather products sector was classified as type III throughout the period, so an increase in its production generated higher-than-average direct and indirect demand for imported inputs. In the period under review, the average value of intermediate goods imports was around US$ 0.11 per dollar produced; and domestic suppliers were gradually replaced by external ones, as shown in figure 8.
According to Gorini and Siqueira (1997), the Brazilian textile sector trade balance was harmed by trade liberalization. This balance had been trending down since 1992; and in 1996 it posted a deficit of US$ 1,016,866, not so much because of a drop in exports but because of significant import growth, especially of products made from artificial or synthetic fibres (including non-woven textiles) and cotton (Gorini and Siqueira, 1997, p. 3). These authors listed various reasons for the increased share of cotton

146 CEPAL Review N° 127 • April 2019
Analysis of Brazilian industry’s dependency on imported inputs between 2000 and 2014
in the textile industry’s import structure, such as the reduction in import quotas, different payment terms between foreign and domestic suppliers, an increase in global supply and consequent fall in prices; and, lastly, the fact that in some countries, such as the United States, the product received subsidies.
According to Kon and Coan (2009), trade liberalization enabled and intensified the inflow of imports. This increased competition and, in turn, pushed many firms in the sector into bankruptcy. Nonetheless, following the impact of the policies implemented in the textile industry during the 1990s, steps were taken to restructure production to enable the sector to gain competitiveness and recover, with a view to serving both the domestic and the external markets. Innovation in the production process was very intensive in the textile industry, because it required modernization of the industry’s technology stock involving the computerization of production (Kon and Coan, 2009, p. 21). According to these authors, in the 2000 decade, the Textile Sector Restructuring Program of the National Bank of Economic and Social Development (BNDES), made it possible to increase the sector’s productivity and expand its productive capacity, through huge investments not only in the formation of physical capital but also in technology and innovation. Nonetheless, another challenge faced by this sector in the 2000 decade stemmed from the high level of China’s international competitiveness, as described in Rangel, Silva and Costa (2010).
Lastly, during the period under study, the furniture and related manufacturing sector was considered as a demanding sector and, consequently, classified as type III. Figure 8 shows that, between 2000 and 2014, this sector substituted domestic suppliers with external ones, to the extent that the direct and indirect demand for imported inputs was US$ 0.11 per dollar produced at the start of the series, but had grown to US$ 0.15 by the last year of the series.
5. Industry with differentiated technology
The results of the classification of sectors belonging to industry with differentiated technology are shown in table 7. Except for the repair and installation of machinery and equipment sector, this industry is classified as type II: so, to increase their level of production, the sectors’ direct and indirect requirements for imported inputs are above the economy-wide average; and, analogously, the production of the economy at large also depends on imported inputs from these sectors.
Table 7 Brazil: classification of degree of dependency on imported inputs, industry
with differentiated technology
Sectors / Year 2000 2001 2002 2003 2004 2005 2006 2007 2008 2009 2010 2011 2012 2013 2014Computer, electronic and optical products II II II II II II II II II II II II II II II
Electric equipment II II II II II II II II II II II II II II II
Machinery and equipment not elsewhere classified II II II II II II II II II II II II II II II
Repair and installation of machinery and equipment IV IV IV IV IV IV IV IV IV IV IV IV I I I
Source: Prepared by the authors, on the basis of data from the World Input-Output Database (WIOD).
Over the entire period studied, the manufacture of computer, electronic and optical products sector was classified as type II, that is, as both a demanding and a demanded sector. Figure 10 shows it has the highest demand for imported inputs among the sectors included in industry with differentiated technology, with direct and indirect imports averaging US$ 0.30 per dollar produced between 2000 and 2014. Although its direct and indirect demand for imported inputs fell sharply in 2007, the literature has not found an explanation for this; but as the values subsequently resumed their upward trend the inference is that the reduction reflects a conjunctural event.

147CEPAL Review N° 127 • April 2019
Valéria Silva Mortari and Maria Aparecida Silva Oliveira
Figure 10 Brazil: direct and indirect demand for imported inputs per dollar of production generated
by the sectors, industry with differentiated technology, 2000–2014(Dollars)
0
0.05
0.10
0.15
0.20
0.25
0.30
0.35
0.40
2000 2001 2002 2003 2004 2005 2006 2007 2008 2009 2010 2011 2012 2013 2014
AverageManufacture of computer. electronic and optical products Manufacture of electric equipmentMachinery and equipment not elsewhere classifiedRepair and installation of machinery and equipment
Source: Prepared by the authors, on the basis of data from the World Input-Output Database (WIOD).
The sector’s main external dependency is linked to the importation of inputs from the manufacture of computer, electronic and optical products sector, which accounts for over half of its direct and indirect imported intermediate goods requirement. Nonetheless, figure 10 shows that the sector gradually replaced external suppliers with domestic ones during the period under review: while the direct and indirect importation of inputs amounted to US$ 0.36 per dollar produced in 2003, the figure had fallen to US$ 0.31 by 2014. The same occurs when analysing the overall economy’s dependency on imported inputs from this sector, as can be seen in figure 11.
Figure 11 Brazil: direct and indirect demand for imported inputs per dollar of production generated
in the economy, industry with differentiated technology, 2000–2014(Dollars)
0
0.10
0.20
0.30
0.40
0.50
0.60
2000 2001 2002 2003 2004 2005 2006 2007 2008 2009 2010 2011 2012 2013 2014
Average
Manufacture of computer. electronic and optical productsManufacture of electric equipment
Machinery and equipment not elsewhere classifiedRepair and installationof machinery and equipment
Source: Prepared by the authors, on the basis of data from the World Input-Output Database (WIOD).

148 CEPAL Review N° 127 • April 2019
Analysis of Brazilian industry’s dependency on imported inputs between 2000 and 2014
Like the other sectors in this industry, the manufacture of electrical equipment sector was generally classified as type II. This means that the sector’s production demands imported inputs in proportions that exceed the average of the economy at large, and that the economy as a whole depends on imported inputs from this sector to undertake its activities. The average demand for imported inputs from this sector during the period analysed was US$ 0.17 per dollar produced. Between 2000 and 2014, the demand for imported inputs from this sector and the machinery and equipment sector remained within a certain range, as can be seen in figure 10. The same is true of the overall economy’s dependency on imported inputs from this sector, as shown in figure 11.
The sector that encompasses machinery and equipment not elsewhere classified was considered type II. In the period under review, this sector’s imports averaged US$ 0.16 per dollar produced, with more than 39% of that amount corresponding to imported machinery and equipment; in other words, the sector draws in imports from the same sector. Analogously, the production of the economy as a whole demands inputs related to this sector in above-average proportions, as can be seen in figure 11; and the main demander is the machinery and equipment sector itself. Thus, when this sector’s production increases, import demand is stimulated by more than average, thereby increasing the economy’s external dependency. This is true for all of the sectors considered in this section.
Lastly, the repair and installation of machinery and equipment sector was classified as type IV during the period studied —that is, as a sector that is not very demanding and relatively undemanded. Nonetheless, figure 11 shows that between 2000 and 2014 the economy relied increasingly on imported inputs related to this sector to undertake its own productive activities, so the sector was reclassified as type I from 2012 onward.
V. Overview of Brazilian industry’s dependency on imported inputs
To synthesize the findings of this research, table 8 presents the 20 industrial sectors studied, classified according to their direct and indirect demand for imported inputs.
Table 8 Brazil: classification of industrial sectors by dependency on imported inputs
Classification Demanding Relatively undemandingDemanded Extractive industry
Coke and petroleum refiningManufacture of metal products (except machines and equipment)Chemicals and chemical productsRubber and plastic productsBasic metalsVehicles and trailersOther transport equipmentComputer, electronic and optical productsElectric equipmentMachines and equipment not classified elsewhere
Relatively undemanded Other non-metallic mineral products Repair and installation of machinery and equipmentTextile, wearing apparel and leather products Wood, products of wood and cork, except furnitureFurniture and other manufacturingPaper and paper productsPrinting and media reproduction
Food, beverage and tobacco products Pharmaceuticals and pharmaceutical products
Source: Prepared by the authors.

149CEPAL Review N° 127 • April 2019
Valéria Silva Mortari and Maria Aparecida Silva Oliveira
The table shows that most of Brazil’s industrial sectors are both demanding and demanded; that is, sectors whose production directly and indirectly demands imported inputs in proportions above the economy-wide average. By stimulating industrial production, imports are also directly and indirectly stimulated. Similarly, when the production of the economy as a whole increases, imports from the sectors listed in the first quadrant of table 8 are stimulated by more than the economy-wide average. This reflects the fact that the structure of industrial production is heavily dependent on the external sector.
By contrast, the economy has low levels of dependency on imported inputs from the food industry. Sato (1997) argues that, after the Real Plan (which boosted workers’ real incomes), the food sector made significant gains; and the period was also characterized by mergers and acquisitions that fuelled growth in the sector. Gouveia (2006) notes the importance of the food industry for the Brazilian economy, since it employs about 1 million workers, generated 15% of industrial sector sales in 2006 and plays a major part in generating trade surpluses. Thus, it can be stated that the indirect intersectoral effects generated by these sectors are mainly retained by the domestic sector.
An issue of concern, however, is that many of the most dynamic and technologically advanced industrial sectors —belonging to differentiated and scale-intensive industries, as well as the oil refining sector— display high levels of external dependency (they are shown in the first part of table 8). As a result, part of the growth generated by these sectors is no longer appropriated by the national economy. This is partly because of their large direct and indirect requirements for imported inputs, but also because other sectors of the economy themselves depend on imported imports from these industries to increase their production.
VI. Final remarks
The industrial sector is crucially important for a country’s economic performance, given its capacity to produce indirect intersectoral effects in terms of employment, income and technology. Nonetheless, in recent decades, Brazilian industry has gradually increased its reliance on the external sector, by incorporating a large number of imported inputs into its production processes. This weakens pre-existing industrial linkages and hinders the formation of new ones, limiting their capacity to form production chains and intensifying the country’s external dependency.
The aim of this study has been to analyse the extent to which different sectors of Brazilian industry were dependent on imported inputs between 2000 and 2014. The results made it possible to identify the activities that depend significantly on imports from the rest of the world; in other words, they draw on resources from external economies to increase their level of production. They also make it possible to identify the external sectors on which the economy relies most —that is, those with the largest share in the increased flow of imports when domestic production grows.
In general, it was found that Brazil’s industrial sectors depend on imports of intermediate goods to expand their level of production. Moreover, as noted in the graphical analyses, the external dependency of Brazilian industry has intensified in the last two decades, owing to the effects of economic liberalization combined with a policy of currency appreciation. This increased incentives to replace domestic suppliers with foreign ones, since domestic industry was unable to compete with the imported content. The change and the intensive reduction of tariff and non-tariff barriers made it cheaper to buy foreign goods; and, as they represented lower costs for domestic companies, they succeeded in permeating the industrial fabric on an ongoing basis, as was seen in the analysis of the results. The process of replacing domestic suppliers with foreign ones was not reversed in the 2000 decade. On the contrary, it was maintained, possibly owing to the productive restructuring of the previous decade and the continuation of the strong currency policy.

150 CEPAL Review N° 127 • April 2019
Analysis of Brazilian industry’s dependency on imported inputs between 2000 and 2014
Thus, a large part of the indirect effects generated by Brazilian industrial production is appropriated by the external sector, insofar as the gaps in the industrial matrix are partly filled by imported intermediate goods. Moreover, the main sectors that demand imported inputs are those with production that incorporates major technological content, such as differentiated and scale-intensive industries and the oil refining sector.
Nonetheless, the method used here has shortcomings, as noted in Schuschny’s work (2005, p. 26). These relate to how the input-output table is constructed, which aggregates a large number of products in sectors assuming perfect substitutability between factors of production. Moreover, the assumption of fixed technical coefficients eliminates the possibilities for sectors to obtain gains from (dis)economies of scale. Lastly, filling the gaps in the matrices by monetary values assumes a price system that is perfectly homogeneous between sectors; but this does not exist in practice.
BibliographyAurea, A. P. and A. C. F. Galvão (1998), “Importação de tecnologia, acesso às inovações e desenvolvimento
regional: o quadro recente no Brasil”, Texto para Discussão, No. 616, Brasilia, Institute of Applied Economic Research (IPEA).
Bonelli, R. and R. Fonseca (1998), “Ganhos de produtividade e de eficiência: novos resultados para a economia brasileira”, Pesquisa e Planejamento Econômico, vol. 28, Rio de Janeiro, Institute of Applied Economic Research (IPEA).
Brógio, A. (2002), “O comércio intrafirma na indústria farmacêutica brasileira”, Pensamento & Realidade, vol. 11, São Paulo.
Canchumani, R. M. L. (2009), “A produção de fármacos e medicamentos no Brasil e na Índia: uma análise comparativa (1995–2001)” [online] http://bibliofarma.com/download/13087/.
Cardoso, E. (2001), “A crise monetária no Brasil: migrando da âncora cambial para o regime flexível”, Brazilian Journal of Political Economy, vol. 21, No. 3, São Paulo, Center of Political Economy.
Carvalho, P. G. and C. A. Feijó (2000), “Produtividade industrial no Brasil: o debate recente”, Indicadores Econômicos FEE, vol. 28, No. 3.
Chenery, H. B., S. Robinson and M. Syrquin (1986), Industrialization and Growth: A Comparative Study, Washington, D.C., World Bank.
Coutinho, L. (1997), “A especialização regressiva: um balanço do desempenho industrial pós-estabilização”, Brasil: desafios de um país em transformação, J. P. R. Velloso (org.), Rio de Janeiro, José Olympio.
Feijó, C. A., P. G. Carvalho and J. S. G. Almeida (2005), “Ocorreu uma desindustrialização no Brasil?”, Industrial Development Study Institute [online] https://iedi.org.br/admin_ori/pdf/20051129_desindustrializacao.pdf.
Fonseca, R. (2010), “Valorização cambial no Brasil e as armas para defender a indústria na guerra cambial”, Revista Brasileira de Comércio Exterior, No. 105, Rio de Janeiro, Centre for Foreign Trade Studies Foundation (FUNCEX).
Fonseca, R., M. C. Carvalho Jr. and H. Pourchet (1998), “A orientação externa da indústria de transformação brasileira após a liberalização comercial”, Texto para Discussão, No. 135, Rio de Janeiro, Centre for Foreign Trade Studies Foundation (FUNCEX).
Furtado, C. (1964), Development and Underdevelopment, Berkeley, University of California Press. Gereffi, G., J. Humphrey and T. Sturgeon (2005), “The governance of global value chains”, Review of
International Political Economy, vol. 12, No. 1, Abingdon, Taylor & Francis.Gorini, A. P. F. and S. H. Siqueira (1997), “Complexo têxtil brasileiro” [online] https://www.bndes.gov.br/
SiteBNDES/export/sites/default/bndes_pt/Galerias/Arquivos/conhecimento/bnset/bsesptex.pdf.Gouveia, F. (2006), “Indústria de alimentos: no caminho da inovação e de novos produtos”, Inovação Uniemp,
vol. 2, No. 5, Campinas, Uniemp Institute.Guilhoto, J. J. M. (2004), “Análise de insumo e produto: teoria e fundamentos”, São Paulo, University of
São Paulo.Hirschman, A. O. (1958), The Strategy of Economic Development, New Haven, Yale University Press.Ishikawa, J. (1992), “Trade patterns and gains from trade with an intermediate good produced under increasing
returns to scale”, Journal of International Economics, vol. 32, No. 1, Amsterdam, Elsevier.

151CEPAL Review N° 127 • April 2019
Valéria Silva Mortari and Maria Aparecida Silva Oliveira
Kaldor, N. (1957), “A model of economic growth”, The Economic Journal, vol. 67, No. 268, Wiley.Kon, A. and D. C. Coan (2009), “Transformações da indústria têxtil brasileira: a transição para a modernização”,
Revista de Economia Mackenzie, vol. 3, No. 3.Lastres, H. M. M. and J. E. Cassiolato (2000), “Sistemas de inovação: políticas e perspectivas”, Parceiras
Estratégicas, vol. 5, No. 8.Levy, P. M. and M. I. F. Serra (2002), “Coeficientes de importação e exportação na indústria”, Boletim de
Conjuntura, No. 58, Rio de Janeiro, Institute of Applied Economic Research (IPEA).Magacho, G. R. (2013), “Incorporating import coefficients into a structural decomposition analysis: an
empirical investigation on Brazilian growth sources” [online] https://www3.eco.unicamp.br/neit/images/Downloads/seminarioagosto13.pdf.(2010), “Desarticulação das cadeias produtivas no Brasil: impacto sobre a geração de emprego e a renda (1995-2008)”, Boletim NEIT, No. 15, Campinas, Institute of Economics, State University at Campinas.
Maia, K. (2001), “Progresso tecnológico, qualificação da mão-de-obra e desemprego”, thesis, Brasilia, Department of Economics, University of Brasilia.
Marconi, N. and F. C. Barbi (2010), “Taxa de câmbio e composição setorial da produção: sintomas de desindustrialização da economia brasileira”, Texto para Discussão, No. 255, São Paulo, São Paulo School of Economics of Getulio Vargas Foundation.
Marconi, N. and M. Rocha (2012), “Taxa de câmbio, comércio exterior e desindustrialização precoce – o caso brasileiro”, Economia e Sociedade, vol. 21, special issue, Campinas, State University at Campinas.
Miller, R. E. and P. D. Blair (2009), Input-Output Analysis: Foundations and Extensions, New York, Cambridge University Press.
Montebello, A. E. S. and C. J. C. Bacha (2011), “O setor de celulose e papel na economia brasileira”, O Papel, vol. 72, No. 4, São Paulo.
Morceiro, P. (2012), “Desindustrialização na economia brasileira no período 2000-2011: abordagens e indicadores”, São Paulo, Cultura Acadêmica.
Morceiro, P., R. Gomes and G. R. Magacho (2014), “Conteúdo importado na produção industrial e na demanda final do Brasil recente: uma proposta de indicadores de importação e de conteúdo nacional/estrangeiro”, Anais do XL Encontro Nacional de Economia, Association of Centers for Post-Graduation in Economics (ANPEC).
Moreira, M. (1999), “A indústria brasileira nos anos 90: o que já se pode dizer”, A economia brasileira nos anos 90, F. Giambiagi and M. M. Moreira (orgs.), Rio de Janeiro, National Bank for Economic and Social Development (BNDES).
Moreira, M. and S. Najberg (1998), “Abertura comercial: criando ou exportando empregos?”, Pesquisa e Planejamento Econômico, vol. 28, No. 2, Rio de Janeiro, Institute of Applied Economic Research (IPEA).
Nakabashi, L., F. D. Scatolin and M. J. V. da Cruz (2010), “Impactos da mudança estrutural da economia brasileira sobre o seu crescimento”, Revista de Economia Contemporânea, vol. 14, No. 2, Rio de Janeiro, Institute of Economics, Federal University of Rio de Janeiro.
Nassif, A. (2008), “Há evidências de desindustrialização no Brasil?”, Brazilian Journal of Political Economy, vol. 28, No. 1, São Paulo, Center of Political Economy.
OECD (Organization for Economic Cooperation and Development) (2005), Science, Technology and Industry Scoreboard 2005, Paris.
Oreiro, J. L. and C. A. Feijó (2010), “Desindustrialização: conceituação, causas, efeitos e o caso brasileiro”, Revista de Economia Política, vol. 30, No. 2, São Paulo, Center of Political Economy.
Pavitt, K. (1984), “Sectoral patterns of technical change: towards a taxonomy and a theory”, Research Policy, vol. 13, No. 6, Amsterdam, Elsevier.
Prebisch, R. (1950), The Economic Development of Latin America and its Principal Problems (E/CN.12/89/Rev.1), New York, United Nations.
Rangel, A. S., M. M. Silva and B. K. Costa (2010), “Competitividade da indústria têxtil brasileira”, Revista de Administração e Inovação, vol. 7, No. 1, São Paulo, University of São Paulo.
Rossi Júnior, J. L. and P. C. Ferreira (1999), “Evolução da produtividade industrial brasileira e abertura comercial”, Texto para Discussão, No. 651, Rio de Janeiro, Institute of Applied Economic Research (IPEA).
Sá Porto, P. C., O. Canuto and A. A. L. Mota (2017), “As possibilidades de inserção do Brasil nas cadeias globais de valor”, Informe GEPEC, vol. 21, No. 1, Toledo, Paraná, State University of Western Paraná.
Sato, G. S. (1997), “Perfil da indústria de alimentos no Brasil: 1990–97”, Revista de Administração de Empresas, vol. 37, No. 3, São Paulo.

152 CEPAL Review N° 127 • April 2019
Analysis of Brazilian industry’s dependency on imported inputs between 2000 and 2014
Schuschny, A. R (2005), “Tópicos sobre el modelo de insumo-producto: teoría y aplicaciones”, Statistical and Prospective Studies series, No. 37 (LC/L.2444-P), Santiago, Economic Commission for Latin America and the Caribbean (ECLAC).
Soares, S., L. M. S. Servo and J. S. Arbache (2001), “O que (não) sabemos sobre a relação entre abertura comercial e mercado de trabalho no Brasil”, Texto para Discussão, No. 843, Rio de Janeiro, Institute of Applied Economic Research (IPEA).
Thorstensen, V., L. Ferraz and L. Gutierre (2014), “O Brasil nas cadeias globais de valor”, Dossiê, special issue, vol. 2, year 13, Brazilian Center for International Relations (CEBRI).
UNCTAD (United Nations Conference on Trade and Development) (2013), World Investment Report. Global Value Chains: Investment and Trade for Development (UNCTAD/WIR/2013), New York, United Nations.
Veeramani, C. (2009), “Impact of imported intermediate and capital goods on economic growth: a cross country analysis” [online] https://papers.ssrn.com/sol3/Delivery.cfm/SSRN_ID1325181_code729291.pdf?abstractid=1325181&mirid=1.


![Introduction to Dependency Grammar [0.2cm] and Dependency ...ufal.mff.cuni.cz/~bejcek/parseme/prague/Nivre1.pdf · Introduction to Dependency Grammar and Dependency Parsing Joakim](https://img.pdfslide.net/doc/110x75/5b14bded7f8b9a201a8b9282/introduction-to-dependency-grammar-02cm-and-dependency-ufalmffcuniczbejcekparsemeprague.jpg)