Embed Size (px)
Citation preview

Journal of the Science of Food and Agriculture J Sci Food Agric 87:2152–2163 (2007)
Analysis of furanocoumarinsin vegetables (Apiaceae) and citrus fruits(Rutaceae)Radek Peroutka, Vera Schulzova,∗ Petr Botek and Jana HajslovaInstitute of Chemical Technology, Department of Food Chemistry and Analysis, Technicka 3, 166 28 Prague 6, Czech Republic
Abstract: Several alternative approaches applicable for the analysis of furanocoumarins, toxic componentsoccurring in some fruits and vegetables representing both Apiaceae and Rutaceae families, were tested in ourstudy. Limits of detection (LODs) for angelicin, psoralen, bergapten, xanthotoxin, trioxsalen, isopimpinellin,sphondin, pimpinellin and isobergapten obtained by GC/MS (SIM) were in the range 0.01–0.08 µg g−1. Slightlyhigher LODs (0.02–0.20 µg g−1) were achieved by LC/MS–MS. The latter is the only alternative for analysis ofbergamottin (LOD = 0.01 µg g−1) in citrus fruits because this furanocoumarin is unstable under GC conditions.Regardless of the determination step used, the repeatability of the measurements (expressed as RSD) did notexceed 10%. As shown in our study the levels of furanocoumarins in celery, celeriac, parsnip, carrot, lemon andother foods obtained at a retail market varied over a wide range; the highest contents were determined in parsnip,while the levels of these toxins in carrots and citrus pulps were relatively low. 2007 Society of Chemical Industry
Keywords: furanocoumarins; GC/MS; LC/MS–MS; fruits; vegetables
INTRODUCTIONFuranocoumarins are toxic secondary metabolites thatoccur in various plant species including food crops.As shown in studies concerned with their biologicaleffects, these compounds may demonstrate antifungalactivities1 and are phototoxic.2,3 In the presence oflong-wave UV light, furanocoumarins yield productsthat are able to interact with DNA, forming mono-and di-adducts. These mutagenic and carcinogeniceffects were also demonstrated in animal studies.2 Itshould be noted that the current toxicological databaseis far from complete. Therefore, in the meantime,dietary furanocoumarins should be considered aspotentially harmful to consumer health. Additionally,more studies are needed to clarify the health concernsrelated to these phytochemicals in diet.
The highest levels of furanocoumarins in food crops4
are typically present in plants representing the Apiaceaefamily; maximum contents (expressed as a sum ofthe most abundant representatives) reported in theliterature were celery 45 µg g−1,5 parsnip 145 µg g−1,6
and parsley 112 µg g−1.7 The results were quantified ona fresh-weight basis. The content of furanocoumarinsin citrus fruits (Rutaceae family) is rather lower, e.g.the concentration of bergamottin in grapefruit juiceswas only about 6 µg g−1.8 The presence of variousfuranocoumarins was also proved in many otherplants, such as Fabaceae, Pittosporaceae, Solanaceae,Amaranthaceae, Rosaceae, Cyperaceae and Moraceae,9
and fruit of some of these, e.g. figs, representing thelast family, is also used for human consumption.
The distribution of furanocoumarins within a plantis uneven. While higher contents are typically foundin leaves and other green parts, the concentrationsin fruits and roots are often markedly lower. Itshould be noted that the levels of these plant toxinsmay significantly increase under stress conditions,such as attack by fungi10 and unfavourable storageconditions resulting in damage of crop tissues.11
Another factor to be considered when estimating thedietary intake of potential consumers is the stability offuronacoumarins while being processed under eitherdomestic or industrial conditions. As shown in oneof older studies,12 no breakdown of furanocoumarinsoccurred during cooking. There is no other detailedinformation on this issue available in the literature.
At present, more than 50 furanocoumarins areknown. Considering their chemical structure, twomain subgroups can be recognised. The first involveslinear furanocoumarins (e.g. psoralen, bergapten,xanthotoxin, trioxsalen, isopimpinellin, bergamottin);the second is represented by angular furanocoumarins(e.g. angelicin, pimpinellin, sphondin, isobergapten).1
In most published studies, isolation of furanocou-marins from plant matrices was carried out eitherby polar (e.g. water,5 methanol13,14) or semi-polar(ethyl acetate8,15) solvents. Several extraction tech-niques were reported, utilising, for example, Soxhlet
∗ Correspondence to: Vera Schulzova, Institute of Chemical Technology, Department of Food Chemistry and Analysis, Technicka 3, 166 28 Prague 6, CzechRepublicE-mail: [email protected]/grant sponsor: Ministry of Education, Youth and Sports of the Czech Republic; contract/grant number: Project MSM No. 6046137305Project COST 924(Received 24 July 2006; revised version received 4 January 2007; accepted 12 March 2007)Published online 27 June 2007; DOI: 10.1002/jsfa.2979
2007 Society of Chemical Industry. J Sci Food Agric 0022–5142/2007/$30.00

Analysis of furanocoumarins in vegetables and citrus fruits
apparatus4,16 and homogenisation with solvent usingvarious types of grinders.5,7,8 Supercritical fluid extrac-tion (SFE) using supercritical carbon dioxide was alsodescribed as an isolation alternative in one paper.4 Insome studies, crude aqueous homogenate was puri-fied by liquid–liquid extraction (toluene5 and/or ethylacetate7,17 were used for partitioning) or, alternatively,by solid-phase extraction (SPE). Cartridges such asSep-Pak silica,4,13 extract clean SPE5 and/or Sep-Pak C18,13,14,17 have been used for this purpose.High-performance liquid chromatography (HPLC)with UV detection was the most frequently employedmethod4,6–8,14,15,17,18 for the final analysis of the com-monly analysed furanocoumarins. Limits of detection(LODs) of such procedures were typically higher than20 µg kg−1 (fr.wt) for the particular analytes. Liq-uid chromatography coupled to mass spectrometry(LC/MS) has usually been the technique of choicein recent studies,19,20 and its application also enablesidentification of some minor furanocoumarins. Forinstance, the presence of 5-methoxy-3-(3-methyl-2,3-dihydroxybutyl)-psoralen and 5,8-dimethoxy-3-(3-methyl-2,3-dihydroxybutyl)-psoralen in herbalextracts21 was confirmed using LC/MS. Nowadays,gas chromatography coupled to mass selective detec-tor (GC/MSD) is the most common approach forseparation and quantification of thermally stablefuranocoumarins7,13,19,22 in plant extracts.
The aim of the present study was to critically assessperformance characteristics of existing modern chro-matographic techniques conceivable for analysis offuranocoumarins in various products. Optimised pro-cedures were used for the examination of samples ofselected vegetables and some other food commoditiesobtained from a retail market. In the second part ofthe study, the influence of storage conditions on fura-nocoumarin levels (related to studies11,17,22) in severalcelery cultivars was investigated.
EXPERIMENTALChemicalsAngelicin, psoralen, bergapten, xanthotoxin, berg-amottin and trioxsalen were purchased from Sigma–
Aldrich, Steinheim, Germany; isopimpinellin wasobtained from INDOFINE Chemical Company(Hillsborough, NJ, USA). The purity of all standardswas 98% or greater. Ethyl acetate, purchased fromScharlau (Barcelona, Spain), was used for extraction offuranocoumarins from vegetables. Methanol, obtainedfrom Merck (Darmstadt, Germany), was used forextraction of furanocoumarins from citrus fruits.
MaterialsSamples collected within the monitoring studyVegetables represented by parsnip (Pastinaca sativa),celery (Apium graveolens var. Dulce), celeriac (celeryroot, Apium graveolens var. Rapaceum), parsley (Pet-roselinum sativum), carrot (Daucus carota), citrus fruits,e.g. grapefruit (Citrus paradisi), lime (Citrus arantifo-lia), orange (Citrus aurantium), lemon (Citrus limon)and products made from them were purchased from aCzech retail market within the years 2003–2004.
Samples used for the experimentsCelery and celeriac cultivars used for the followingexperiments were obtained from the collaboratingfarms and the summary of the samples is shown inTable 1.
Analysis of samplesExtractionVegetables. All sample homogenates were preparedfrom washed vegetables using a Foss Tecator 2094homogeniser (Hoganas, Sweden). Forty millilitres ofethyl acetate were added to 10 g of homogenateand the suspension was shaken (HS250 basic IKALabortechnik, Staufen, Germany) for 30 min at thelaboratory temperature, the solvent was then decanted.After filtration, extracts obtained by two repeatedextractions were combined into a 100 mL volumetricflask and the volume was made up with ethylacetate.
Dried vegetable (seasoning, soup). Six millilitres of waterwas added to 2 g of sample to reconstitute the originaltexture. After 1 h of conditioning, 40 mL of ethyl
Table 1. Summary of the samples investigated and the storage conditions applied in this study (the representative sample for analysis was
prepared by homogenisation of five washed roots and/or 20 haulms representing the median size of the particular cultivar batch)
Year offarming Vegetable Cultivar
Part ofvegetable
Storageconditions
Storageperiod
Experimentnumber
2002 Celeriac Maxim, Radiant,Diamond, Neon
Root Household cellar(5–13 ◦C)
26 weeks 1
Maxim Root infected by fungi(Penicillium sp.)
Household cellar(5–13 ◦C)
Identified withinweek 16–26
2
Radiant Root cut into 8 parts Household cellar(5–13 ◦C)
6 weeks 3
2003 Celeriac Albin, Kompakt,Maxim
Root, haulm 4 ◦C 12 weeks (4 weeksfor haulm)
4
Haulm 40 ◦C 4 daysCelery Malachit, Avalon, Haulm 4 ◦C 4 weeks 5
Jemny 40 ◦C 4 days
J Sci Food Agric 87:2152–2163 (2007) 2153DOI: 10.1002/jsfa

R Peroutka et al.
acetate were added to the mixture and extractedin the same way as described above for vegetables.Ten millilitres of extract was evaporated to drynessand the residue was redissolved in 1 mL of ethylacetate.
Citrus fruits. Pulp: Sixty millilitres of methanol wasadded to 10 g of pulp homogenate (homogenisatorETA 0010, Hlinkso, Czech Republic) and suspensionwas mixed using a Turrax (IKA Werke, Staufen,Germany) for 10 min. This mixture was shaken for30 min (laboratory shaker HS250 basic ICA). Theextracts were filtered into a 100 mL volumetric flaskand the volume was made up with methanol.
Peel: Forty millilitres of methanol was added to10 g of homogenate (Homogenizer Foss Tecator2094) and the suspension was shaken for 30 min(laboratory shaker HS250 basic ICA), the supernatantwas decanted. After filtration, extracts obtained by tworepeated extractions were combined into a 100 mLvolumetric flask and the volume was made up withmethanol.
Fruit tea (dried mixture): Forty millilitres of methanolwas added to 2 g of fruit tea sample and shakenfor 30 min at the laboratory temperature (laboratoryshaker HS250 basic ICA). The solvent was decanted,the extraction was repeated, the combined extractswere filtered into a 100 mL volumetric flask andthe volume was made up with methanol. Tenmillilitres of extract were evaporated to drynessand the residue was re-dissolved in 1 mL ofmethanol.
Citrus juice: Forty millilitres of ethyl acetate wasadded to 10 g of juice and the suspension was shakenfor 30 min (laboratory shaker HS250 basic ICA). Thesupernatant was decanted. The extracts obtained bytwo repeated extractions were filtered into a 100 mLvolumetric flask and the volume was made up withethyl acetate. Ten millilitres of extract were evaporatedto dryness and the residue was re-dissolved in 1 mL ofmethanol.
Chromatographic separationBoth GC and HPLC techniques were used forseparation of the sample components. In additionto a mass selective detector, UV detection wasalso employed for identification/quantification of thesample components.
High-performance liquid chromatography. HPLC sepa-ration was carried out using HP 1100 liquid chro-matograph (Agilent Technologies, Palo Alto, CA,USA). A LiChroCART column 250 × 4 mm, LiChro-spher 100 RP-18, 5 mmm particles, (Merck) equippedwith pre-column LiChroCART column 4 × 4 mm,LiChrospher 100 RP-18, 5 µm particles, (Merck). Thecolumn temperature was kept at 40 ◦C and the mobilephase flow rate was set at 1 mL min−1. The followinggradient was used: 0–8 min methanol/water (52:48,v/v); 8–18 min linear increase up to 100% methanol;18–25 min 100% methanol. Prior to the injectionof 20 µL of the extract, crude extracts were filteredthrough a 0.45 µm syringe filter (Millipore, Yonezawa,Japan).
UV detection: Furanocoumarins were detected byan HP 1100 DAD detector (Agilent Technologies,Palo Alto, CA, USA) at 248 nm. Quantification wasobtained by comparing the peak areas of the targetanalytes with the abundances of these compounds incorresponding standards used for the calibration curvepreparation.
MS detection: MS/MS measurements were carriedout using LCQ Deca instrument equipped withan ion trap (ITD) analyser (Finnigan, San Jose,CA, USA). Positive atmospheric pressure chemicalionisation (+APCI) was applied in all performedexperiments. The following experimental conditionswere used during infusion of 50 µg mL−1 of eachstandard into the source (at the flow rate of3 µL min−1): capillary temperature 170 ◦C, vaporisertemperature 300 ◦C, flow rates of sheath gas andauxiliary gas 1.5 and 3 L min−1, respectively, sourcevoltage and current 6 kV and 7 mA, respectively.Specific conditions applied for the detection of
Table 2. MS detector setting in LC/MS–MS and GC/MS analyses
Specification and conditions set for individual analytes
Method ofidentification orquantification Parameter
Bergapten,xanthotoxin
(isobergapten,sphondin)
Angelicin,psoralen
Isopimpinellin(pimpinellin) Trioxsalen Bergamottin
LC/MS–MS Capillary voltage (V) 22 31 19 8 46Activation amplitude (%) 37 25 35 38 35Activation Q 0.34 0.25 0.35 0.35 0.35Activation time (ms) 33 30 35 35 30Molecular ion (M+), m/z 217.3 187.3 247.2 229.3 338.9Product ions (M+), m/z 202.3 187.3a 232.2 142.3, 201.1, 173.2, 157.8 203.2
GC/MS (SIM) EI ionisation (eV) 70 70 70 70 –Quantification ion, m/z 216 186 246 228 –Qualification ions, m/z 173, 201, 145 158, 130, 102 231, 188 199, 128, 185 –
a Due to low intensity of fragment ions, molecular ion was used for quantification.
2154 J Sci Food Agric 87:2152–2163 (2007)DOI: 10.1002/jsfa

Analysis of furanocoumarins in vegetables and citrus fruits
furanocoumarins are shown in Table 2. The massanalyser was programmed to perform a full scanin the m/z range of 50–500 in a positive modefor each analyte. Quantification was obtained bycomparing the peak areas of the furanocoumarins withthe corresponding calibration curve prepared for thestandards.
GC/MS. An HP 6890 (Agilent Technologies) capil-lary gas chromatograph in conjunction with a 5973mass selective detector (MSD) of the same producerwas used. Furanocoumarins were separated on cap-illary column DB-5MS (60 m × 0.25 mm × 0.25 µm)(J&W Scientific, Folsom, CA, USA). The oven tem-perature was held at 75 ◦C for 2 min, then increased atthe rate of 20 ◦C min−1 to 250 ◦C; held for 3 minand again increased at the rate of 30 ◦C min−1
to 280 ◦C and held for 5 min. One microlitres ofsample was introduced onto the GC column insplitless mode. The injectior temperature was keptconstant at 250 ◦C, and a splitless period of 2 minwas used. MSD using an electron impact (EI) typeof ionisation was operated in selected ion monitoring(SIM) mode. Quantification was achieved by compar-ing the peak areas of the target analytes with theabundances of these compounds in correspondingstandards used for the calibration curve preparation.Table 2 lists ions used for the quantification and con-firmation purposes when running GC/MS in the SIMmode.
RESULTS AND DISCUSSIONAs summarised in the Introduction, a wide range ofanalytical procedures was utilised in studies concernedwith the occurrence of furanocoumarins in variouscrops. Rather surprisingly, quality assurance/qualitycontrol (QA/QC) issues were not discussed in any ofthem. In the following paragraphs, two of the mostcommonly used procedures (HPLC and GC) andboth their advantages and limitations are discussed onthe basis of the data generated within the validationprocess.
Determination of furanocoumarins in vegetables(Apiaceae)Regarding the extraction of furanocoumarins, sev-eral solvents largely differing in their polarity andother physico-chemical properties were used in thepublished studies. Since certified reference material(CRM) is currently not commercially available, thereliability of results cannot be easily assessed. To opti-mise the extraction step for the highest recovery offuranocoumarins, three solvents varying in polarities(water, ethyl acetate and dichlormethane) and onesolvent mixture (acetonitril/water, 1:1), were testedin our experiments. As shown in Fig. 1, extractionwith ethyl acetate was found to be the most efficientand, therefore, this solvent was used in all subsequentexperiments.
Optimisation of identification and quantificationIn the first step, HPLC separation of the availablefuranocoumarin standards was optimised. Using thereversed phase (RP) C18 silica separation column withthe gradient of water and methanol as a mobile phase,angelicin, psoralen, bergapten, xanthotoxin, trioxsalenand isopimpinellin were easily separated. LODsranged from 0.05 to 0.2 µg g−1 when employing a UVdetector. However, when analysing extracts preparedfrom vegetables representing the Apiaceae family,interference from co-isolated matrix components withthe peaks of major furanocoumarins was encountered.To improve the performance characteristics of theanalytical method (the selectivity of analyte detectionas well as the accuracy of the generated data) and toavoid the need to employ a purification step, a massspectrometry detector (ion trap analyser) was usedinstead. The optimal ionisation of target analytes,hence the highest signal-to-noise (S/N) ratio wasobtained by using positive APCI. Negative APCIand electrospray ionisation (ESI) were also testedwithin this study, but these ionisation techniqueswere much less sensitive. The analysis of the real-lifeparsnip sample is illustrated in Fig. 2 as an example.Considering the literature data13 and comparingthe spectral information and the relative retention
0
10
20
30
40
50
60
70
A B D BC A C
µg g
−1
AngelicinPsoralenXanthotoxinBergapten
Parsnip Celery
Figure 1. Efficiency of furanocoumarins extraction achieved using various solvents/solvent mixtures, quantification carried out by GC/MS (averagevalues, n = 3); A = H2O; B = ethyl acetate; C = CH2Cl2; D = acetonitrile/H2O (1:1, v/v).
J Sci Food Agric 87:2152–2163 (2007) 2155DOI: 10.1002/jsfa

R Peroutka et al.
Figure 2. LC/MS (+APCI) analysis of furanocoumarins in extract from parsnip (aliquot contained in injected sample corresponded to 2 mg of theoriginal matrix), content of individual analytes was 2.2 µg g−1 for psoralen, 1.8 µg g−1 for angelicin, 1.5 µg g−1 for isopimpinellin, 0.2 µg g−1 forpimpinellin, 7.1 µg g−1 for xanthotoxin, 0.7 µg g−1 for sphondin, 4.5 µg g−1 for bergapten and 2.0 µg g−1 for isobergapten; pimpinellin sphondin andisobergapten were identified only tentatively.
Figure 3. GC/MS analysis of furanocoumarins in extract from parsnip (aliquot contained in injected sample corresponded to 0.1 mg of the originalmatrix), content of individual analytes was 0.9 µg g−1 for psoralen, 6.2 µg g−1 for angelicin, 2.0 µg g−1 for isopimpinellin, 0.3 µg g−1 for pimpinellin,7.1 µg g−1 for xanthotoxin, 0.7 µg g−1 for sphondin, 2.5 µg g−1 for bergapten and 4.5 µg g−1 for isobergapten; pimpinellin sphondin andisobergapten were identified only tentatively.
times, pimpinellin, sphondin and isobergapten weretentatively identified in our study. LODs for allanalytes using MS detection were in the range0.02–0.2 µg g−1.
As a conceivable alternative, GC/MS procedure wasoptimised for the determination of angelicin, psoralen,bergapten, xanthotoxin, sphondin, isobergapten, tri-oxsalen, pimpinellin and isopimpinellin (see Fig. 3).In addition to identification by comparison of the mea-sured data with the commercially available analyticalstandards, such as pimpinellin, sphondin and isober-gapten, the target compounds were also identified froman NIST library search, while MSD was operated inthe full scan mode. LODs for all analytes (MSD oper-ated in SIM mode) were in the range 0.01–0.08 µg g−1
Limits of quantification (LOQs) were calculated asthree times the levels of LODs.
Regarding the quantification of the analytes, thelevels of furanocoumarins determined by either theGC/MS or LC/MS–MS method were comparable
for the same parsnip and celeriac samples. Theconcentrations determined by the HPLC/UV methodwere rather higher for some of the target analytes(psoralen and angelicin). This was probably due toco-elution of some UV-absorbing matrix co-extracts.Since lower LODs were obtained, GC/MS methodwas preferred for identification and quantification offuranocoumarins in vegetables. The overview of theperformance characteristic is summarised in Table 3.
Determination of furanocoumarins in citrus fruitsand products containing bergamottinTo identify the optimal solvent for isolation of berg-amottin (the major furanocoumarin in citrus fruits),the extraction efficiency of acetonitrile, methanoland/or ethyl acetate extraction was compared. Asdocumented in Fig. 4, methanol was the most suit-able solvent in this case; moreover, this solvent iscompatible with the LC separation system. Con-trary to vegetables representing the Apiaceae family
2156 J Sci Food Agric 87:2152–2163 (2007)DOI: 10.1002/jsfa

Analysis of furanocoumarins in vegetables and citrus fruits
Table 3. Performance characteristics of the LC/UV, LC/MS–MS and GC/MS methods employed for the determination of furanocoumarins
Characteristic of method Furanocoumarin
Method ParameterMatrix
(spiking level) Angelicin Psoralen Xanthotoxin Bergapten Isopimpinellin Trioxsalen Bergamottin
LC/UV LOD (µg g−1) Vegetables(Apiaceae)
0.07 0.06 0.06 0.20 0.05 0.05 ND
LC/MS LOD (µg g−1) Vegetables, citrusfruit
0.23 0.04 0.04 0.07 0.02 0.02 0.01
Recovery (%)(n = 3)
Citrus pulp(1 µg g−1)
110 101 101 94 92 92 97
Citrus peel(1 µg g−1)
111 111 101 104 102 100 a
RSD (%) ofmethod
Citrus pulp(1 µg g−1)
7 2 3 4 4 3 8
(n = 8) Citrus peel(1 µg g−1)
7 4 6 4 2 2 a
GC/MS LOD (µg g−1) Vegetables(Apiaceae)
0.02 0.08 0.03 0.04 0.02 0.01 ND
Recovery (%) Celeriac (3 µg g−1) 93 102 102 97 96 95 ND(n = 3) Parsnip (10 µg g−1) 93 93 97 92 94 95 ND
RSD (%) ofmethod
Celeriac(0.1–16 µg g−1)b
ND 5 5 5 8 ND ND
(n = 8) Parsnip(1–10 µg g−1)b
4 7 7 4 4 ND ND
a Recovery not tested, the original content of bergamottin was 72 µg g−1.b Natural level.ND, not detected.
0
10
20
30
40
Peel
µg g
−1
Ethylacetate AcetonitrileMethanol
0
0.5
1
1.5
2
Pulp
µg g
−1
Ethylacetate AcetonitrileMethanol
Figure 4. Comparison of extraction efficiencies for furanocoumarinsin peel and pulp using various solvents (average values, n = 3).
where GC/MS method was the preferred alternative,LC/MS is the only applicable procedure for analy-sis of furanocoumarins in citrus fruit (see Fig. 5). Asshown in our preliminary experiments,23 degradation
of bergamottin occurs under GC conditions evenwhen a programmable temperature vaporisation injec-tor (PTV, sample introduced into cold injector withtemperature gradient 500 ◦C min−1 starting at 40 ◦C)is used instead of hot splitless injector. The perfor-mance characteristics of the procedure optimised forcitrus fruit and several other matrices are summarisedin Table 3.
Levels of furanocoumarins in vegetables andfruitsLevels of furanocoumarins in vegetablesTo generate the data needed for estimation offuranocoumarins dietary intake, average levels ofthese natural toxins were determined in samplescollected at retail market. As shown in Table 4, thefuranocoumarin levels determined were within therange reported for various crops and products in theliterature.2 It should be noted that the average levelsof the relatively more toxic linear furanocoumarins(represented by xanthotoxin, bergapten and psoralen)in celeriac root and parsnip were comparable.In addition, angular furanocoumarins (angelicin,sphondin and isobergapten) were contained in parsnipin relatively high amounts as well. According to resultsobtained in animal experiments,2 these compoundsdemonstrate relatively lower toxicity. One shouldbe aware that considering the values of ‘total’furanocoumarins for the dietary risk assessmentmight be rather misleading, the content of individualcompounds should always be specified.
J Sci Food Agric 87:2152–2163 (2007) 2157DOI: 10.1002/jsfa

R Peroutka et al.
Figure 5. LC/MS analysis of furanocoumarins in extract from lime pulp (aliquot contained in injected sample corresponded to 2 mg of the originalmatrix); content of individual analytes was 0.8 µg g−1 for isopimpinellin, 0.3 µg g−1 for bergapten and 5.8 µg g−1 for bergamottin.
Table 4. Average levels of furanocoumarins in food products obtained at a Czech market (µg g−1), compared with the results from another study
Vegetable
Parsnip(Pastinaca sativa)
Celeriac root(Apium graveolens)
Parsley(Petroselinum sativum)
FuranocoumarinOur study(n = 50)
Publisheddata1
Our study(n = 50)
Publisheddata1
Our study(n = 50)
Publisheddata1
LinearPsoralen <LOD–6.6 0.1–10.5 <LOD–5.8 0.1–10.5 <LOD–0.1 0.1–0.5Xanthotoxin 1.1–28.0 0.8–48.0 1.2–9.7 0.4–22.0 0.1–0.3 0.3–1.4Bergapten 0.9–9.0 0.9–7.0 1.5–5.9 0.7–31.5 0.2–1.7 1.0–9.0Isopimpinellin 0.7–8.3 1.4–12.6 1.1–10.7 1.4–12.6 0.1–0.3 2.3Trioxsalen <LOD NR <LOD NR <LOD NR
AngularAngelicin 0.4–27.8 1.8–20.8 <LOD NR <LOD NRSphondina 0.2–4.9 NR <LOD NR <LOD NRIsobergaptena 1.0–16.3 NR <LOD NR <LOD NRPimpinellina <LOD–0.7 NR <LOD NR <LOD NR
Furanocoumarin contentTotal 5–89 1–140 4–38 1.1–50 0.3–2.4 1.3Average 26.2 NR 17.3 NR 1.4 NRMedian 17.6 NR 16.4 NR 1.4 NRRSD (%) 77 NR 56 NR 111 NRPercentile 0.1 8.5 NR 7.4 NR 0.5 NRPercentile 0.9 56.8 NR 30.8 NR 2.2 NR
n = number of examined samples.NR = not reported in the published study.a tentative identification1 Søborg et al., 1996.Values in bold type are sum of all analysed furanocoumarins.
To identify potential differences in furanocoumarinlevels, various celeriac root cultivars were analysed inthe next part of our study. As shown in Fig. 6, theirprofiles were very similar, while bergapten was thedominating furanocoumarin occurring in celeriac root.Rather surprisingly, psoralen was not detected in bothcultivars Maxim and Neon, although this compoundwas unambiguously found in the other two cultivars.
Levels of furanocoumarins in vegetable products from aCzech marketIn addition to fresh vegetables, several other productsavailable at the market containing Apiaceae vegetableswere examined for the presence of furanocoumarins.
Table 5 shows the content of furanocoumarins (aver-age value obtained by analyses of the representativesample prepared from five individual packages) inseasoning, soup, salad and frozen vegetable mixture.Relatively low levels of furanocoumarins were detectedin frozen vegetable mixtures (containing celeriac root,carrot, parsnip or parsley), these relatively high con-centrations (50 µg g−1 and greater) were found in freshmixtures made of cut vegetables.
Levels of furanocoumarins in fruits containingbergamottinCitrus fruits represent another dietary source offuranocoumarins. As shown in Table 6, the highest
2158 J Sci Food Agric 87:2152–2163 (2007)DOI: 10.1002/jsfa

Analysis of furanocoumarins in vegetables and citrus fruits
0
2
4
6
8
10
Radiant Maxim Neon Diamant
µg g
−1
Psoralen Xanthotoxin BergaptenIsopimpinellin Sum
Figure 6. Comparison of furanocoumarin levels in harvested celeriacroots (different cultivars compared).
content of these natural toxins is contained in lemonsand limes. As regards distribution of furanocoumarinswithin the fruit, peels contain largest levels offuranocoumarin (up to 50% of the total content).Although, typically, peels of citrus fruits are removedbefore consumption or industrial production offruit juices, this waste material is commonly usedfor the isolation of essential oils. This product iswidely applied in flavouring of various foodstuffsand, consequently, co-isolated furanocoumarins aretransferred into the respective product. For example,high contents of bergamottin were found in someflavoured teas (Table 6). The additional experimentsconcerned with leaching of furanocoumarins intothe infusion during the tee preparation showed thatapproximately 65% of their original content wastransferred from 2 g of tea leaves into 100 mL ofboiling water within 5 min. The total amount offuranocoumarins in the suspension (leached tea leaves+ infusion) did not change in this experiment, whichdocuments their thermal stability.
The dynamics of furanocoumarin levels in storedand processed celery and celeriacIn general, various physiological processes take placein food crops after harvesting,11 both biodegradationand/or biosynthesis of secondary metabolites mayoccur. Since the Apiaceae crops are often consumedafter several weeks or months after harvesting, theinfluence of storage conditions on furanocoumarinlevels in selected samples was investigated.
Celeriac rootIn this part of study, the levels of furanocoumarinswere monitored during 26-week storage period infour varieties of celeriac root. As shown in Fig. 7,all celeriac root cultivars stored in a home cellar(experiment 1 in Table 1) showed a gradual increaseof toxins, occurring within 10 weeks of storage. Thepeak concentration for all varieties was achieved inweek 10. At that time, the levels of furanocoumarins
0
20
40
60
80
100
120
140
0 2 4 6 10 16 26Week of storage
µg g
−1
RadiantMaximNeonDiamant
Figure 7. Changes of furanocoumarin levels during storage ofceleriac root in household cellar (sum of furanocoumarins; µg g−1;results expressed on a fresh weight basis, levels in dry matter did notdiffer significantly).
in the Maxim cultivar were 16 times higher (thedominating representative being xanthotoxin) ascompared to those determined right after harvesting.In the following period, a successive decrease offuranocoumarin levels took place and after 26 weeks ofstorage, their concentrations approached the originallevels. It should be noted that, regardless the cultivar,while only small variations in furanocoumarin contentwere found for celeriac directly after the harvest(RSD = 7%, based on analysis of 10 individual roots),the differences of the concentrations were much higherat the end of the storage period (RSD = 53%).
Only slightly higher levels of furanocoumarinswere found in celeriac root cultivars after storage inrefrigerator (4 ◦C) for the period of 12 weeks (Fig. 8;and for experimental conditions see experiment 4 inTable 1).
As documented in several other studies,2,11,17 theincrease/decrease of toxic secondary metabolites infood crops occurs as a consequence of the damage ofplant tissues. As can be seen from Fig. 9, rapid increaseof furanocoumarins was observed in cut crops whencompared to the intact celeriac roots (for experimentalconditions see experiment 3 in Table 1). In contrastto celeriac, the changes in sliced parsnip11 were lesspronounced under the same conditions.
Celeriac haulm and celeryAlthough the differences in furanocoumarin levelsafter 4 week of celeriac roots storage at 4 ◦C were low(see Fig. 8), enormous increase of their concentrationwas found in celery and celeriac haulm after 4 weeksof storage in refrigerator (Fig. 10; for experimentalconditions see experiments 4 and 5 in Table 1). Angreat increase in psoralen, as high as two ordersof magnitude (originally 4 µg g−1 d.w. as comparedto 470 µg g−1 d.w. after being stored), occurred incultivar Maxim after 2 weeks of storing at theseconditions. The increasing trend in concentrationsof other furanocoumarins was also observed, althoughthis trend was less intense (the levels of isopimpinellinand bergapten were only five times higher after1 week of storage). Similar trends were reported by
J Sci Food Agric 87:2152–2163 (2007) 2159DOI: 10.1002/jsfa

R Peroutka et al.
Tab
le5.
Fura
noco
umar
ins
inve
geta
ble
pro
duc
tsob
tain
edat
aC
zech
mar
ket,
aver
age
cont
ent
(µg
g−1
ofor
igin
alm
ater
ial)
obta
ined
by
anal
ysis
offiv
ed
iffer
ent
bat
ches
Type
ofpr
oduc
tC
omm
erci
alna
me
Des
crip
tion
(com
posi
tion)
Pso
rale
nXa
ntho
toxi
nB
erga
pten
Isop
impi
nellin
Trio
xsal
enA
ngel
icin
Sph
ondi
naIs
ober
gapt
ena
Pim
pine
llina
Sum
Mix
ture
ofcu
tFr
esh
sala
dFr
esh
(car
rot5
0%,p
arsl
ey25
%)
0.12
1.68
0.59
0.41
0.01
1.18
0.47
1.28
<LO
D5.
75ve
geta
bles
Sou
pm
ixtu
reFr
esh,
(car
rot3
0%,c
eler
iac
20%
,par
snip
30%
)17
.39
15.9
017
.07
4.27
0.01
<LO
D<
LOD
<LO
D<
LOD
54.6
5
Veg
etab
leso
upFr
ozen
,(ca
rrot
10%
,cel
eria
c20
%,p
arsn
ip30
%)
0.03
0.17
0.10
0.02
<LO
D<
LOD
<LO
D<
LOD
<LO
D0.
31
Veg
etab
lem
ixtu
reFr
ozen
,(ca
rrot
10%
,cel
eria
c10
%,p
arsl
ey20
%)
0.08
0.37
0.30
0.13
<LO
D0.
100.
020.
13<
LOD
1.14
Dry
vege
tabl
eV
eget
able
mix
ture
Sea
soni
ng1.
2526
.58
5.20
4.46
<LO
D27
.60
<LO
D<
LOD
<LO
D65
.08
Par
sley
haul
mS
easo
ning
0.77
1.04
34.4
72.
86<
LOD
<LO
D<
LOD
<LO
D<
LOD
39.1
4P
arsl
eyha
ulm
Sea
soni
ng<
LOD
<LO
D23
.27
<LO
D<
LOD
<LO
D<
LOD
<LO
D<
LOD
23.2
7
Sea
soni
ngP
odra
vka
Sea
soni
ngfo
rso
up0.
210.
520.
910.
40<
LOD
0.29
0.04
0.14
<LO
D2.
51A
scom
mer
ceS
easo
ning
for
soup
0.67
0.58
0.68
0.27
<LO
D0.
120.
210.
10<
LOD
2.63
Tant
Sea
soni
ngfo
rso
up0.
060.
100.
550.
20<
LOD
0.05
<LO
D0.
02<
LOD
0.97
Juic
eV
eget
able
juic
e(C
arro
t25%
,cel
eria
c25
%,
pars
nip
25%
,par
sley
25%
)0.
040.
030.
030.
03<
LOD
<LO
D<
LOD
<LO
D<
LOD
0.13
Pro
cess
edS
teril
ised
cele
riac
Sol
idpo
rtio
n(3
3%w
/w)
0.05
0.28
0.43
0.23
<LO
D<
LOD
<LO
D<
LOD
<LO
D0.
99ce
lery
Liqu
idpa
rt(6
7%,w
/w)
<LO
D0.
080.
080.
06<
LOD
<LO
D<
LOD
<LO
D<
LOD
0.22
ate
ntat
ive
iden
tifica
tion.
2160 J Sci Food Agric 87:2152–2163 (2007)DOI: 10.1002/jsfa

Analysis of furanocoumarins in vegetables and citrus fruits
Table 6. Furanocoumarins in fruits and fruit products (average, n = 5) obtained at a Czech market, average content (µg g−1)
Product Descriptiona Psoralen Xanthotoxin Bergapten Isopimpinellin Bergamottin Sum
Fresh fruit and juicesLemon Pulp (80%) <LOD <LOD <LOD <LOD 0.25 0.3
Peel (20%) <LOD <LOD 2.57 0.14 72.27 75.0Grapefruit Pulp (76%) <LOD <LOD <LOD <LOD 2.96 3.0
Peel (24%) <LOD <LOD 1.92 <LOD 10.18 12.1Lime Pulp (83%) <LOD <LOD 0.35 0.98 6.02 7.4
Peel (17%) 0.12 0.38 12.91 4.49 33.40 51.3Mandarin Pulp (82%) <LOD <LOD <LOD <LOD 0.05 0.1
Peel (18%) <LOD <LOD <LOD <LOD 0.52 0.5Orange Pulp (75%) <LOD <LOD <LOD <LOD 0.05 0.1
Peel (25%) <LOD <LOD <LOD <LOD 0.52 0.5Grapefruit juice 100% natural <LOD <LOD 0.001 0.002 0.098 0.1Orange juice 100% natural <LOD <LOD <LOD <LOD <LOD <LODRio Bio Activ juice 100% natural <LOD <LOD <LOD 0.330 0.290 0.6
TeasPickwick lemon tea Lemon peel <LOD <LOD <LOD <LOD 5.4 5.4Pickwick Earl Grey tea Flavour <LOD <LOD <LOD <LOD 0.1 0.1Fruit tea Orange peel <LOD <LOD <LOD <LOD <LOD <LODFruit tea Lemon peel <LOD <LOD <LOD 0.1 3.4 3.5Fruit tea Grapefruit peel <LOD <LOD 0.1 <LOD 3.1 3.2Tea Earl Grey (Pink teahouse) 0.1 <LOD 0.6 0.1 16.9 17.6Tea Earl Grey (Teekanne) 0.1 0.2 0.4 <LOD 44.7 45.4Green Tea Grapefruit peel <LOD <LOD <LOD <LOD 0.2 0.2Green tea Lemon peel 0.1 0.1 0.1 0.3 2.6 3.3
a Average proportion from the total weight (%).
0
20
40
60
80
0 2 4 8 12Week of storage
µg g
−1
AlbinKompaktMaxim
Figure 8. Changes of furanocoumarin levels in celeriac roots duringstorage at 4 ◦C (sum of furanocoumarins; µg g−1).
Chaudhary:17 levels of furanocoumarins increasedfour times after 44 days of storage at 4 ◦C.
In addition to the storage experiments discussedabove, homogenised samples of whole haulm werealso analysed. Furanocoumarin levels in homogenatesvaried only slightly during storage at 4 ◦C as comparedto the content of furanocoumarins determined in thehaulm.
Dry celery and celeriac haulm are often used in sea-soning mixtures. In our study, a slight decrease (e.g.118 µg g−1 d.w., originally 152 µg g−1 d.w. in Maximcultivar, or 63 µg g−1 d.w., originally 144 µg g−1 d.w. inMalachit cultivar) of furanocoumarin concentrationswas found (for experimental conditions see experi-ments 4 and 5 in Table 1). Similar experiments werenot described in any of the published studies.
0
100
200
300
400
500
600
0 1 2 3 4 6Week of storage
µg g
−1
whole celeriac rootcut celeriac root
Figure 9. Changes of furanocoumarin levels in whole and cut celeriacroot (cultivar Radiant) during storage at 4–8 ◦C in a cellar (totalcontent, µg g−1).
0100200300400500600700800900
1000
Maxim Malachit Avalon Albin Kompakt
µg g
−1
Week 0Week 1Week 2Week 4
Figure 10. Changes of furanocoumarins in celery and celeriachaulms during storage at 4 ◦C (total content, µg g−1 dry weight).
J Sci Food Agric 87:2152–2163 (2007) 2161DOI: 10.1002/jsfa
R Peroutka et al.
0
20
40
60
80
100
Psoralen Xanthotoxin Bergapten Isopimpinellin Psoralen Xanthotoxin Bergapten Isopimpinellin
Psoralen Xanthotoxin Bergapten IsopimpinellinPsoralen Xanthotoxin Bergapten Isopimpinellin
µg g
−1
A
0
20
40
60
80
100
µg g
−1
B
0
20
40
60
80
100
µg g
−1
D
0
20
40
60
80
100
µg g
−1
C
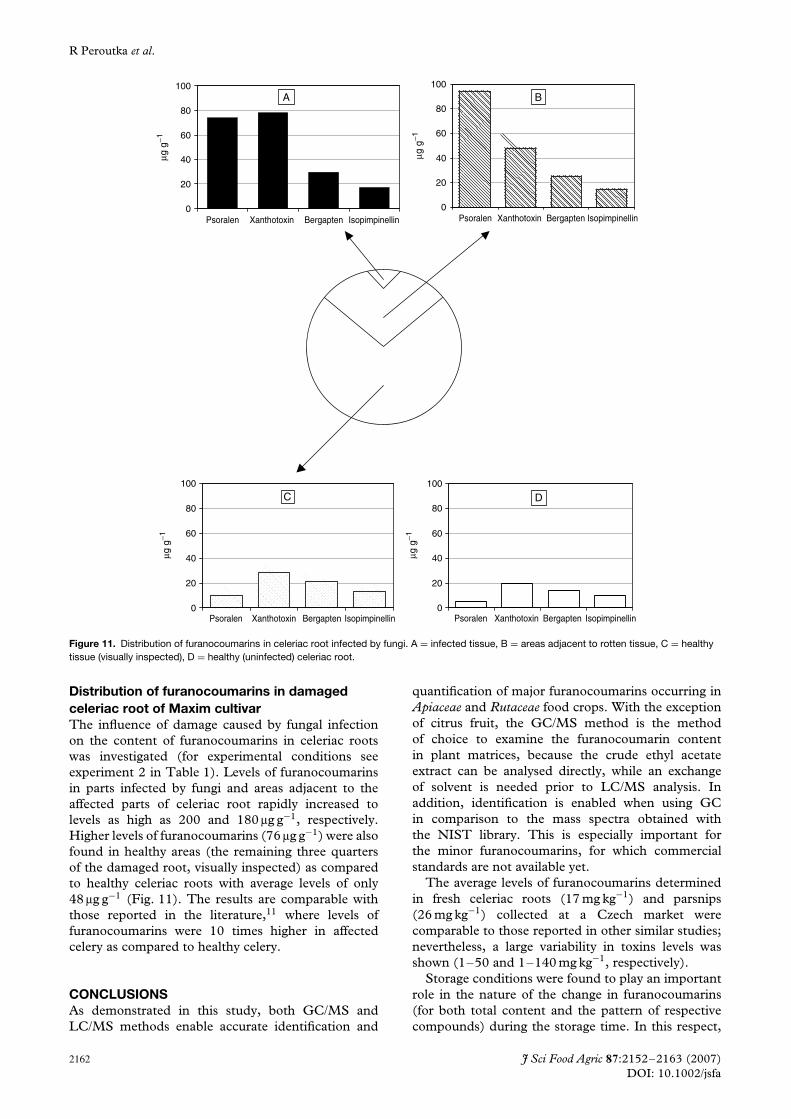
Figure 11. Distribution of furanocoumarins in celeriac root infected by fungi. A = infected tissue, B = areas adjacent to rotten tissue, C = healthytissue (visually inspected), D = healthy (uninfected) celeriac root.
Distribution of furanocoumarins in damagedceleriac root of Maxim cultivarThe influence of damage caused by fungal infectionon the content of furanocoumarins in celeriac rootswas investigated (for experimental conditions seeexperiment 2 in Table 1). Levels of furanocoumarinsin parts infected by fungi and areas adjacent to theaffected parts of celeriac root rapidly increased tolevels as high as 200 and 180 µg g−1, respectively.Higher levels of furanocoumarins (76 µg g−1) were alsofound in healthy areas (the remaining three quartersof the damaged root, visually inspected) as comparedto healthy celeriac roots with average levels of only48 µg g−1 (Fig. 11). The results are comparable withthose reported in the literature,11 where levels offuranocoumarins were 10 times higher in affectedcelery as compared to healthy celery.
CONCLUSIONSAs demonstrated in this study, both GC/MS andLC/MS methods enable accurate identification and
quantification of major furanocoumarins occurring inApiaceae and Rutaceae food crops. With the exceptionof citrus fruit, the GC/MS method is the methodof choice to examine the furanocoumarin contentin plant matrices, because the crude ethyl acetateextract can be analysed directly, while an exchangeof solvent is needed prior to LC/MS analysis. Inaddition, identification is enabled when using GCin comparison to the mass spectra obtained withthe NIST library. This is especially important forthe minor furanocoumarins, for which commercialstandards are not available yet.
The average levels of furanocoumarins determinedin fresh celeriac roots (17 mg kg−1) and parsnips(26 mg kg−1) collected at a Czech market werecomparable to those reported in other similar studies;nevertheless, a large variability in toxins levels wasshown (1–50 and 1–140 mg kg−1, respectively).
Storage conditions were found to play an importantrole in the nature of the change in furanocoumarins(for both total content and the pattern of respectivecompounds) during the storage time. In this respect,
2162 J Sci Food Agric 87:2152–2163 (2007)DOI: 10.1002/jsfa

Analysis of furanocoumarins in vegetables and citrus fruits
temperature is the key factor. In general, storing theroot vegetable below 4 ◦C prevents and increase infuranocoumarin levels, which may occur when thecrop is kept at higher temperatures. In contrast to theroot parts, a rapid increase of furanocoumarins wasobserved in haulms (even when refrigerated).
In order to reduce/minimise the dietary intakeof furanocoumarins and avoid any health riskassociated with the intake of these natural toxins,the consumption of injured vegetables should betotally avoided. Care should be also taken to storevegetables properly, i.e. at rather low temperatures.Significant reduction of the furanocoumarin contentcan be achieved by peeling the vegetable carefully.
ACKNOWLEDGEMENTThis study was carried out within the project MSMNo. 6046137305 supported by the Ministry ofEducation, Youth and Sports of the Czech Republic.Implementation of analytical procedure was funded byproject COST 924. The authors wish to express theirthanks to Dr Christer Andersson from National FoodAdministration, Uppsala, Sweden for scientific adviceon the project.
REFERENCES1 Sardari S, Mori Y, Horita K, Micetich RG, Nishibe S
and Daneshtalab M, Synthesis and antifungal activity ofcoumarins and angular furanocoumarins. Bioorg Med Chem7:1933–1940 (1999).
2 Søborg I, Andersson C and Gry J, TemaNord: Furanocoumarinsin Plant Food. Copenhagen, Denmark (1996).
3 Llano J, Raber J and Eriksson LA, Theoretical study ofphototoxic reactions of psoralens. J Photochem Photobiol A154:235–243 (2003).
4 Jarvenpaa EP, Jestoi MN and Huopalahti R, Quantitativedetermination of phototoxic furanocoumarins in celeriac(Apium graveolens L. Var. Rapeceum) using supercriticalfluid extraction and high performance liquid chromatography.Phytochem Anal 8:250–256 (1997).
5 Diawara MM, Trumble JT, Quiros CF and Hensen RJ, Impli-cations of distributions of linear furanocoumarins withincelery. J Agric Food Chem 43:723–727 (1995).
6 Lombeart GA, Sieements KH, Pellars P, Mankotia M andNg W, Furanocoumarins in celery and parsnip. JAOACInternational 84:1135–1143 (2001).
7 Bier RC, Ivie BW and Oertli EH, Linear furanocoumarins andgraveolone from the common herb parsley. Phytochemistry36:869–872 (1994).
8 Fukuda A, Guo L, Ohaski N, Yoshikawa M and Yamazoe Y,Amount and variation in grapefruit juice of the main
components causing grapefruit–drug interaction. J ChromatogB 741:195–203 (2000).
9 Murray RDH, Mendez J and Brown SA, The Natural Coumarins,Wiley, Chichester, UK (1982).
10 Health-Pagliuso S, Matlin SA, Fang N, Thompson RH andRappaport L, Simulation of furanocoumarin accumulationin celery and celeriac tissue by Fusarium oxysporum F. SP.Apii. Phytochemistry 31:2683–2688 (1992).
11 Ostertag E, Becker T, Ammon J, Buer-Aymanns H and SchrenkD, Effect of storage conditions on furanocoumarin levels inintact, chopped, or homogenized parsnips. J Agric Food Chem50:2565–2570 (2002).
12 Ivie GW, Holt DL and Ivey MC, Natural toxicants in humanfoods: Psoralens in raw and cooked parsnip root. Science213:909–9101 (1981).
13 Cardoso CAL, Vilegas W and Honda NK, Rapid determinationof furanocoumarins in creams and pomades using SPE andGC. J Pharm Biomed Anal 22:203–214 (2000).
14 Zgorka G and Glowniak K, Simultaneous determinationof phenolic acids and linear furanocoumarins in fruitsof Libanotis dolichostyla by solid-phase extraction andhigh performance liquid chromatography. Phytochem Anal10:268–271 (1999).
15 Berenbaum MR, Zangerl AR and Nitao JK, Furanocoumarinsin seeds of wild and cultivated parsnip. Phytochemistry23:1809–1810 (1984).
16 Spencer GF, Tjarks LW and Powell RG, Analysis of linear andangular furanocoumarins by dual-column high performanceliquid chromatography. J Agric Food Chem 35:803–805(1987).
17 Chaudhary SK, Ceska O, Warrington PJ and Ashwood-Smith MJ, Increased furocoumarin content of cel-ery during storage. J Agric Food Chem 33:1153–1157(1985).
18 Ceska O, Chaudhary SK, Warrington PJ and Ashwood-SmithMJ, Furanocoumarins in the cultivated carrot, daucus carota.Phytochemistry 25:81–83 (1986).
19 Zschocke S, Liu JH, Stuppner H and Bauer R, Comparativestudy of roots of Angelica sinensis and related umbelliferousdrugs by thin layer chromatography, high-performance liquidchromatography, and liquid chromatography-mass spectrom-etry. Phytochem Anal 9:283–290 (1998).
20 Dugo P, Mondello L, Dugo L, Stancanelli R and Dugo G,LC–MS for the identification of oxygen heterocycliccompounds in citrus essential oils. J Pharm Biomed Anal24:147–154 (2000).
21 Franke K, Porzel A, Masaoud M and Adam G, Fura-nocoumarins from Dorstenie gigas J. Schmidt. Phytochemistry56:611–621 (2001).
22 Schulzova V, Peroutka R and Hajslova J, Levels of fura-nocoumarins in vegetables from organic and conventionalfarming, Pol J Food Nutr Sci 11/52:25–27 (2002).
23 Su CFH and Horvath R, Isolation and characterization of fourmajor components from insecticidally active lemon peelextract. J Agric Food Chem 35:509–511 (1987).
J Sci Food Agric 87:2152–2163 (2007) 2163DOI: 10.1002/jsfa