Embed Size (px)
Citation preview
03/12/2013
1
ANALYST AND INVESTOR PRESENTATION Q4-2013 CONFERENCE CALL
Wednesday, December 4, 2013 - 1:30 pm
CAUTION REGARDING FORWARD-LOOKING STATEMENTS
From time to time, National Bank of Canada (the Bank) makes written and oral forward-looking statements, such as those contained in the Major EconomicTrends and the Outlook for National Bank sections of the 2013 Annual Report, in other filings with Canadian securities regulators, and in othercommunications, for the purpose of describing the economic environment in which the Bank will operate during fiscal 2014 and the objectives it has set foritself for that period. These forward-looking statements are made in accordance with current securities legislation. They include, among others, statementswith respect to the economy—particularly the Canadian and U.S. economies—market changes, observations regarding the Bank’s objectives and itsstrategies for achieving them, Bank projected financial returns and certain risks faced by the Bank. These forward-looking statements are typically identifiedby future or conditional verbs or words such as "outlook," "believe," "anticipate," "estimate," "project," "expect," "intend," "plan," and similar terms andexpressions.
By their very nature, such forward-looking statements require assumptions to be made and involve inherent risks and uncertainties, both general andspecific. Assumptions about the performance of the Canadian and U.S. economies in 2014 and how they will affect the Bank’s business are among the mainfactors considered in setting the Bank’s strategic priorities and objectives and in determining its financial targets, including provisions for credit losses. Indetermining its expectations for economic growth, both broadly and in the financial services sector in particular, the Bank primarily considers historicaleconomic data provided by the Canadian and U.S. governments and their agencies.
There is a strong possibility that expressed or implied projections contained in these forward-looking statements will not materialize or will not be accurate.The Bank recommends that readers not place undue reliance on these statements, as a number of factors, many of which are beyond the Bank’scontrol, could cause actual future results, conditions, actions or events to differ significantly from the targets, expectations, estimates or intentionsexpressed in the forward-looking statements. These factors include credit risk, market risk, liquidity risk, operational risk, regulatory risk, reputation risk, andenvironmental risk (all of which are described in greater detail in the Risk Management section that begins on page 60 of this Annual Report); the generaleconomic environment and financial market conditions in Canada, the United States and certain other countries in which the Bank conductsbusiness, including the effects of uncertainty surrounding U.S. government debt negotiations; changes to regulations affecting the Bank’s business, capitaland liquidity; the situation with respect to the restructured notes of the master asset vehicle (MAV) conduits, in particular the realizable value of underlyingassets; changes in the accounting policies the Bank uses to report its financial condition, including uncertainties associated with assumptions and criticalaccounting estimates; tax laws in the countries in which the Bank operates, primarily Canada and the United States; and changes to capital and liquidityguidelines and to the manner in which they are to be presented and interpreted.
03/12/2013
2
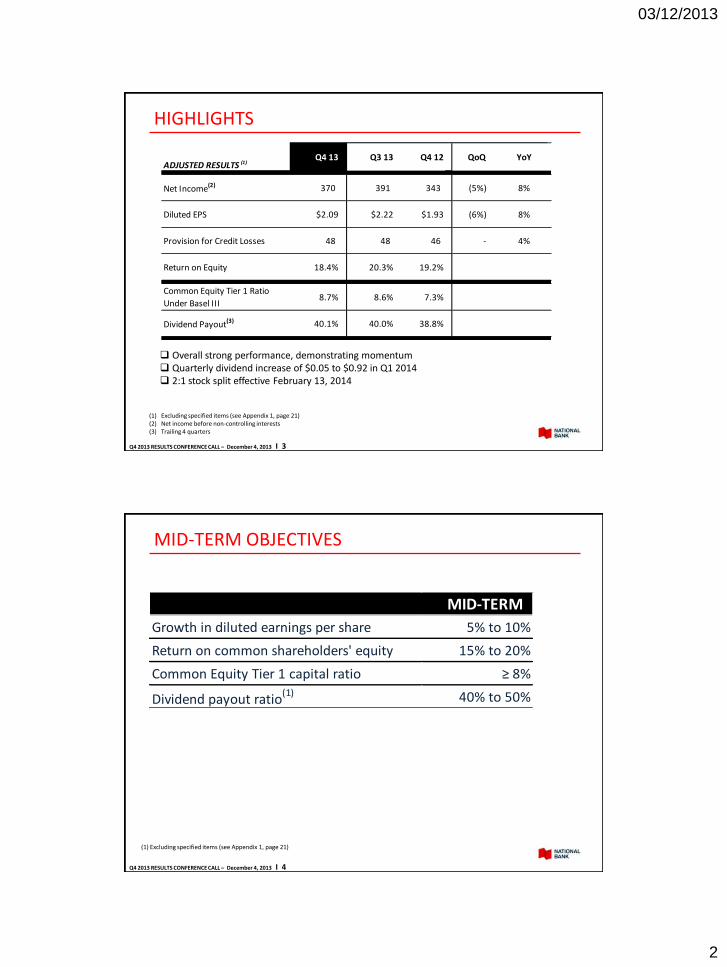
HIGHLIGHTS
Q4 2013 RESULTS CONFERENCE CALL – December 4, 2013 I 3
(1) Excluding specified items (see Appendix 1, page 21)(2) Net income before non-controlling interests(3) Trailing 4 quarters
Overall strong performance, demonstrating momentum Quarterly dividend increase of $0.05 to $0.92 in Q1 2014 2:1 stock split effective February 13, 2014
ADJUSTED RESULTS (1)Q4 13 Q3 13 Q4 12 QoQ YoY
Net Income(2) 370 391 343 (5%) 8%
Diluted EPS $2.09 $2.22 $1.93 (6%) 8%
Provision for Credit Losses 48 48 46 - 4%
Return on Equity 18.4% 20.3% 19.2%
Common Equity Tier 1 Ratio
Under Basel III8.7% 8.6% 7.3%
Dividend Payout(3) 40.1% 40.0% 38.8%
MID-TERM OBJECTIVES
Growth in diluted earnings per share 5% to 10%
Return on common shareholders' equity 15% to 20%
Common Equity Tier 1 capital ratio ≥ 8%
Dividend payout ratio(1) 40% to 50%
MID-TERM
Q4 2013 RESULTS CONFERENCE CALL – December 4, 2013 I 4
(1) Excluding specified items (see Appendix 1, page 21)

03/12/2013
3
Ghislain ParentChief Financial Officer and Executive Vice-President, Finance and Treasury
FINANCIAL REVIEW
PERFORMANCE SNAPSHOT – Q4 2013
Q4 2013 RESULTS CONFERENCE CALL – December 4, 2013 I 6
(1) Excluding specified items (see Appendix 1, page 21)(2) Net income before non-controlling interests
(millions of dollars)
ADJUSTED (1) Q4 13 Q3 13 Q4 12 QoQ YoY
Revenues 1,263 1,294 1,240 (2%) 2%
Expenses 772 783 770 (1%) -
Net Income(2) 370 391 343 (5%) 8%
Diluted EPS $2.09 $2.22 $1.93 (6%) 8%
ROE 18.4% 20.3% 19.2%
REPORTED Q4 13 Q3 13 Q4 12 QoQ YoY
Specified Items (33) 28 8 - -
Net Income(2) 337 419 351 (20%) (4%)
Diluted EPS $1.89 $2.39 $1.97 (21%) (4%)
ROE 16.6% 21.9% 19.8%
03/12/2013
4
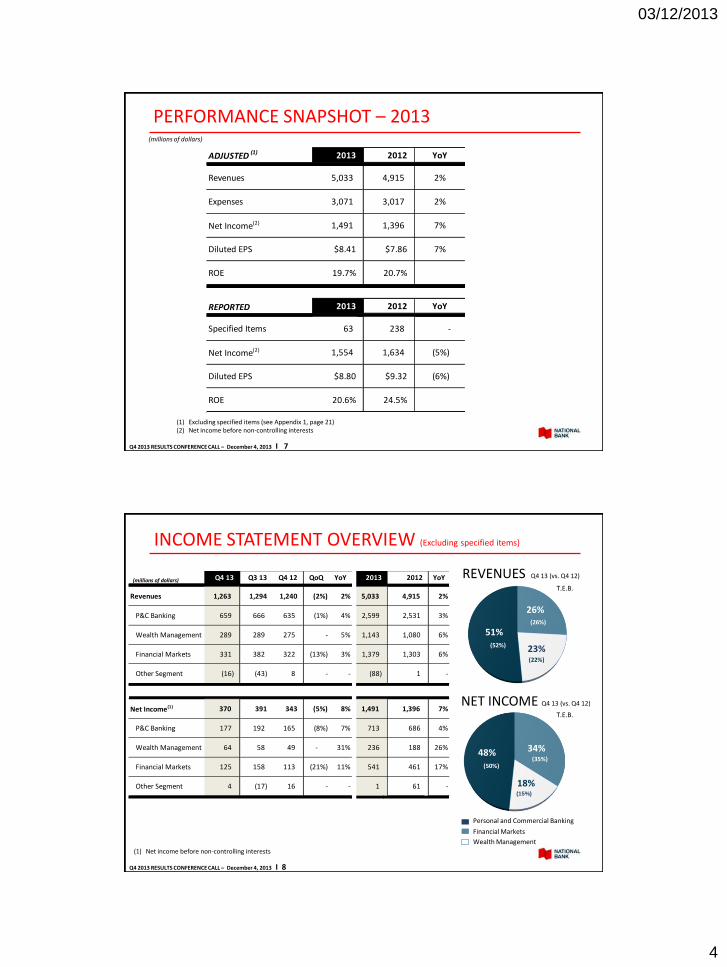
PERFORMANCE SNAPSHOT – 2013
Q4 2013 RESULTS CONFERENCE CALL – December 4, 2013 I 7
(1) Excluding specified items (see Appendix 1, page 21)(2) Net income before non-controlling interests
(millions of dollars)
ADJUSTED (1) 2013 2012 YoY
Revenues 5,033 4,915 2%
Expenses 3,071 3,017 2%
Net Income(2) 1,491 1,396 7%
Diluted EPS $8.41 $7.86 7%
ROE 19.7% 20.7%
REPORTED 2013 2012 YoY
Specified Items 63 238 -
Net Income(2) 1,554 1,634 (5%)
Diluted EPS $8.80 $9.32 (6%)
ROE 20.6% 24.5%
INCOME STATEMENT OVERVIEW (Excluding specified items)
Q4 2013 RESULTS CONFERENCE CALL – December 4, 2013 I 8
(millions of dollars) Q4 13 Q3 13 Q4 12 QoQ YoY 2013 2012 YoY
Revenues 1,263 1,294 1,240 (2%) 2% 5,033 4,915 2%
P&C Banking 659 666 635 (1%) 4% 2,599 2,531 3%
Wealth Management 289 289 275 - 5% 1,143 1,080 6%
Financial Markets 331 382 322 (13%) 3% 1,379 1,303 6%
Other Segment (16) (43) 8 - - (88) 1 -
Net Income(1) 370 391 343 (5%) 8% 1,491 1,396 7%
P&C Banking 177 192 165 (8%) 7% 713 686 4%
Wealth Management 64 58 49 - 31% 236 188 26%
Financial Markets 125 158 113 (21%) 11% 541 461 17%
Other Segment 4 (17) 16 - - 1 61 -
REVENUES Q4 13 (vs. Q4 12)
26%
23%
51%(52%)
(26%)
(22%)
NET INCOME Q4 13 (vs. Q4 12)
Personal and Commercial Banking
Financial Markets
Wealth Management
34%
18%
48%(35%)
(15%)
(50%)
T.E.B.
T.E.B.
(1) Net income before non-controlling interests
03/12/2013
5
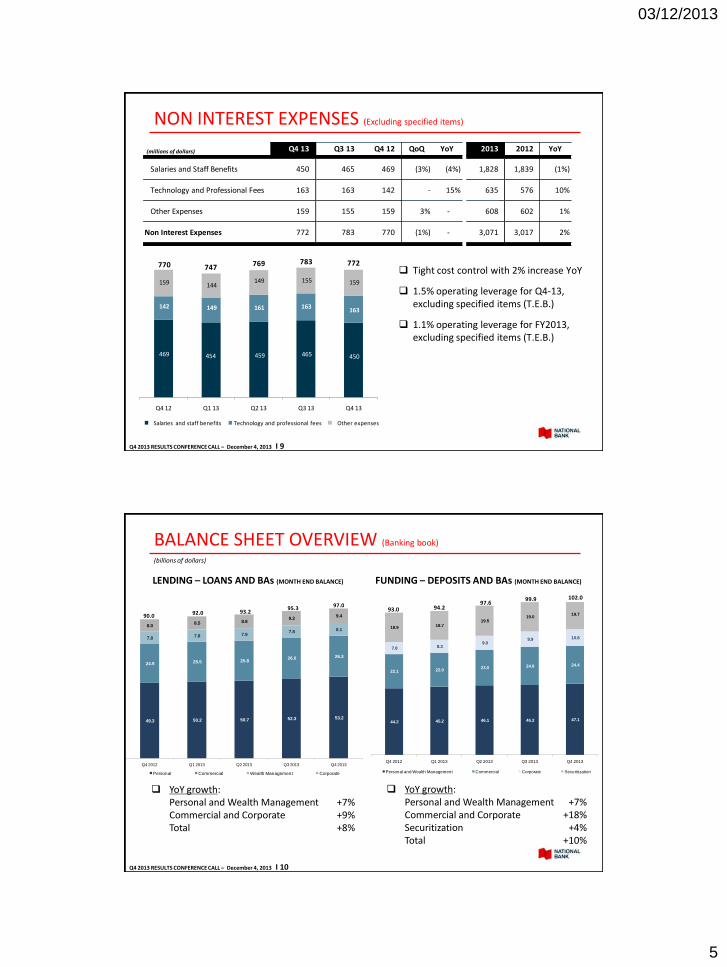
NON INTEREST EXPENSES (Excluding specified items)
Tight cost control with 2% increase YoY
1.5% operating leverage for Q4-13, excluding specified items (T.E.B.)
1.1% operating leverage for FY2013, excluding specified items (T.E.B.)
Q4 2013 RESULTS CONFERENCE CALL – December 4, 2013 I 9
469 454 459 465 450
142 149 161 163 163
159 144 149 155 159
Q4 12 Q1 13 Q2 13 Q3 13 Q4 13
Salaries and staff benefits Technology and professional fees Other expenses
770 747 769 783 772
(millions of dollars) Q4 13 Q3 13 Q4 12 QoQ YoY 2013 2012 YoY
Salaries and Staff Benefits 450 465 469 (3%) (4%) 1,828 1,839 (1%)
Technology and Professional Fees 163 163 142 - 15% 635 576 10%
Other Expenses 159 155 159 3% - 608 602 1%
Non Interest Expenses 772 783 770 (1%) - 3,071 3,017 2%
BALANCE SHEET OVERVIEW (Banking book)
Q4 2013 RESULTS CONFERENCE CALL – December 4, 2013 I 10
LENDING – LOANS AND BAs (MONTH END BALANCE) FUNDING – DEPOSITS AND BAs (MONTH END BALANCE)
(billions of dollars)
YoY growth:Personal and Wealth Management +7%Commercial and Corporate +9%Total +8%
YoY growth:Personal and Wealth Management +7%Commercial and Corporate +18%Securitization +4%Total +10%
49.3 50.2 50.7 52.3 53.2
24.9 25.5 25.8 26.0 26.3
7.8 7.8 7.9
7.8 8.1 8.0
8.5 8.8 9.2
9.4
Q4 2012 Q1 2013 Q2 2013 Q3 2013 Q4 2013
Personal Commercial Wealth Management Corporate
97.0 95.3 93.2 92.0 90.0
44.2 45.2 46.1 46.2 47.1
22.1 22.0 23.0 24.8 24.4
7.8 8.3 9.0
9.9 10.8
18.9 18.7 19.5
19.0 19.7
Q4 2012 Q1 2013 Q2 2013 Q3 2013 Q4 2013
Personal and Wealth Management Commercial Corporate Securitization
99.9
94.293.097.6
102.0
03/12/2013
6
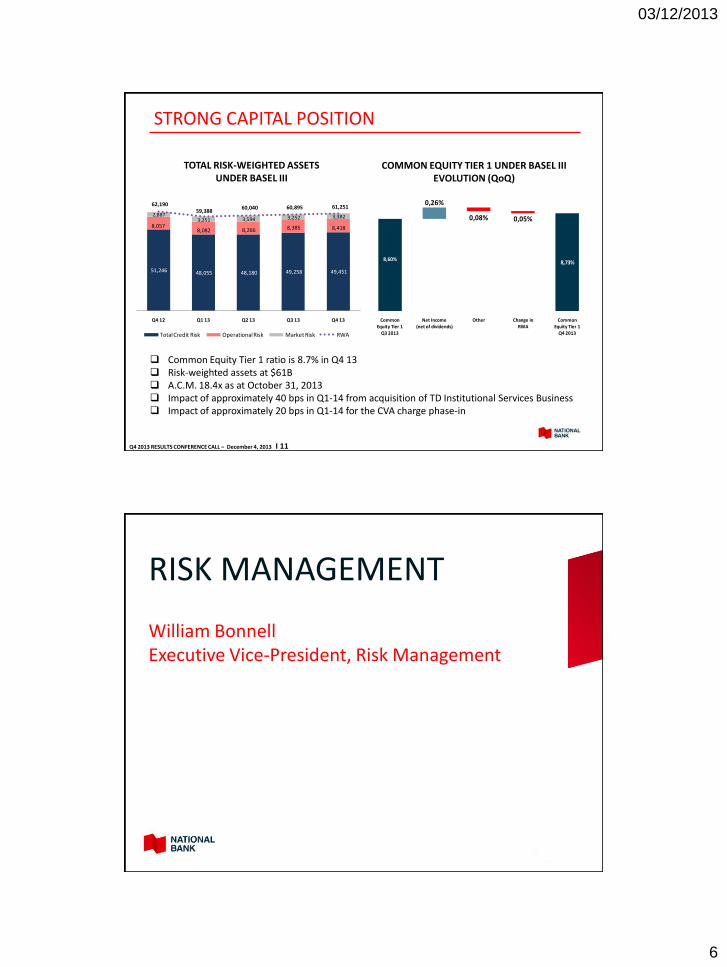
STRONG CAPITAL POSITION
COMMON EQUITY TIER 1 UNDER BASEL III EVOLUTION (QoQ)
Common Equity Tier 1 ratio is 8.7% in Q4 13 Risk-weighted assets at $61B A.C.M. 18.4x as at October 31, 2013 Impact of approximately 40 bps in Q1-14 from acquisition of TD Institutional Services Business Impact of approximately 20 bps in Q1-14 for the CVA charge phase-in
TOTAL RISK-WEIGHTED ASSETS UNDER BASEL III
Q4 2013 RESULTS CONFERENCE CALL – December 4, 2013 I 11
51,246 48,055 48,180 49,258 49,451
8,057 8,082 8,266 8,385 8,418
2,887 3,251 3,594 3,252 3,382
62,190 59,388
60,040 60,895 61,251
Q4 12 Q1 13 Q2 13 Q3 13 Q4 13
Total Credit Risk Operational Risk Market Risk RWA
8,60%8,60%
8,78% 8,73% 8,73%
0,26%
0,08% 0,05%
Common Equity Tier 1
Q3 2013
Net Income (net of dividends)
Other Change inRWA
Common Equity Tier 1
Q4 2013
RISK MANAGEMENT
William BonnellExecutive Vice-President, Risk Management
03/12/2013
7
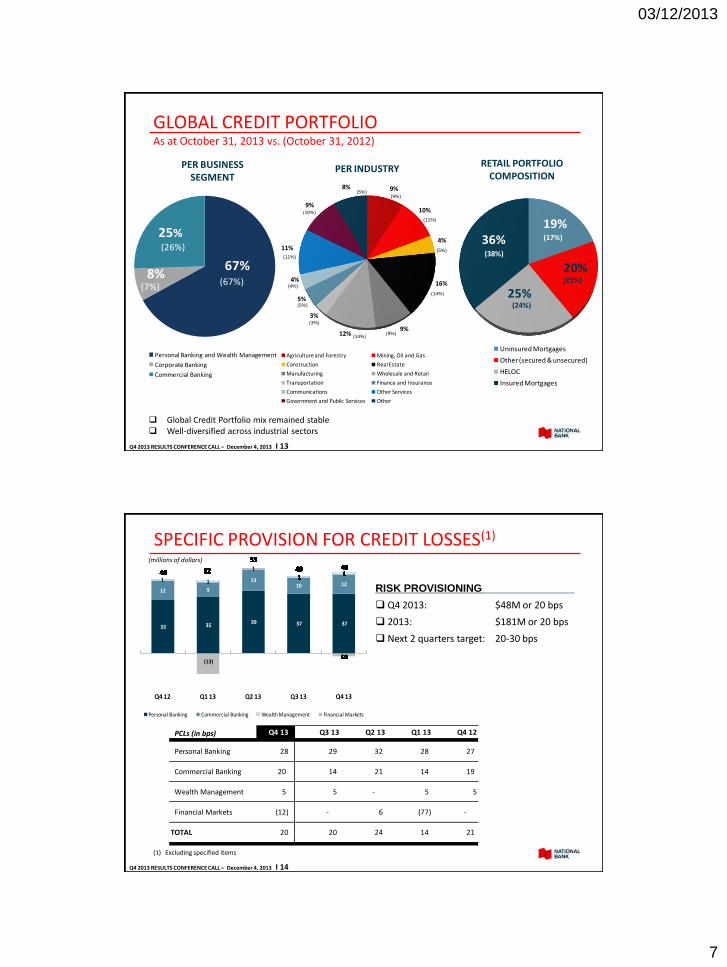
GLOBAL CREDIT PORTFOLIO As at October 31, 2013 vs. (October 31, 2012)
PER BUSINESS SEGMENT
PER INDUSTRYRETAIL PORTFOLIO
COMPOSITION
Global Credit Portfolio mix remained stable Well-diversified across industrial sectors
Q4 2013 RESULTS CONFERENCE CALL – December 4, 2013 I 13
19%
20%
25%
36%
Uninsured Mortgages
Other (secured & unsecured)
HELOC
Insured Mortgages
(21%)
(38%)
(24%)
(17%)
9%
10%
4%
16%
9%12%
3%
5%
4%
11%
9%
8%
Agriculture and Forestry Mining, Oil and Gas
Construction Real Estate
Manufacturing Wholesale and Retail
Transportation Finance and Insurance
Communications Other Services
Government and Public Services Other
(11%)
(5%)
(3%)
(14%)(9%)
(14%)
(5%)
(11%)
(9%)
(4%)
(10%)
(5%)
(67%)(7%)
(26%)
Personal Banking and Wealth Management
Corporate Banking
Commercial Banking
67%8%
25%
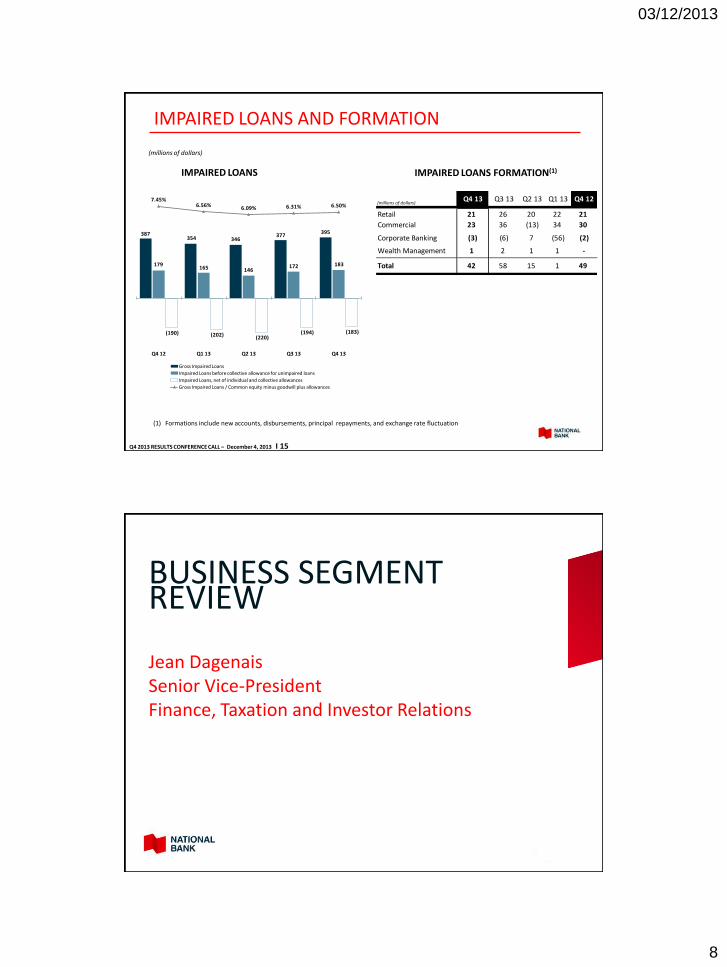
SPECIFIC PROVISION FOR CREDIT LOSSES(1)
(1) Excluding specified items
(millions of dollars)
RISK PROVISIONING
Q4 2013: $48M or 20 bps
2013: $181M or 20 bps
Next 2 quarters target: 20-30 bps
Q4 2013 RESULTS CONFERENCE CALL – December 4, 2013 I 14
33 35 39 37 37
12 9
1310 121
(13)
1
Q4 12 Q1 13 Q2 13 Q3 13 Q4 13
Personal Banking Commercial Banking Wealth Management Financial Markets
(2)
4846 32481
4846
53
3248
1
4846 32484846 3248
(2)
4846 32481
4846
53
3248
1
4846 32484846 3248
(2)
4846 32481
4846
53
3248
1
4846 32484846 3248
(2)
4846 32481
4846
53
3248
1
4846 32484846 3248
(2)
4846 32481
4846
53
3248
1
4846 32484846 3248
(2)
4846 32481
4846
53
3248
1
4846 32484846 3248
(2)
4846 32481
4846
53
3248
1
4846 32484846 3248
(2)
4846 32481
4846
53
3248
1
4846 32484846 3248
(2)
4846 32481
4846
53
3248
1
4846 32484846 3248
(2)
4846 32481
4846
53
3248
1
4846 32484846 3248
(2)
4846 32481
4846
53
3248
1
4846 32484846 3248
(2)
4846 32481
4846
53
3248
1
4846 32484846 3248
(2)
4846 32481
4846
53
3248
1
4846 32484846 3248
(2)
4846 32481
4846
53
3248
1
4846 32484846 3248
(2)
4846 32481
4846
53
3248
1
4846 32484846 3248
(2)
4846 32481
4846
53
3248
1
4846 32484846 3248
(2)
4846 32481
4846
53
3248
1
4846 32484846 3248
(2)
4846 32481
4846
53
3248
1
4846 32484846 3248
(2)
4846 32481
4846
53
3248
1
4846 32484846 3248
(2)
4846 32481
4846
53
3248
1
4846 32484846 3248
(2)
4846 32481
4846
53
3248
1
4846 32484846 3248
(2)
4846 32481
4846
53
3248
1
4846 32484846 3248
(2)
4846 32481
4846
53
3248
1
4846 32484846 3248
(2)
4846 32481
4846
53
3248
1
4846 32484846 3248
(2)
4846 32481
4846
53
3248
1
4846 32484846 3248
(2)
4846 32481
4846
53
3248
1
4846 32484846 3248
(2)
4846 32481
4846
53
3248
1
4846 32484846 3248
(2)
4846 32481
4846
53
3248
1
4846 32484846 3248
(2)
4846 32481
4846
53
3248
1
4846 32484846 3248
(2)
4846 32481
4846
53
3248
1
4846 32484846 3248
(2)
4846 32481
4846
53
3248
1
4846 32484846 3248
(2)
4846 32481
4846
53
3248
1
4846 32484846 3248
(2)
4846 32481
4846
53
3248
1
4846 32484846 3248
(2)
4846 32481
4846
53
3248
1
4846 32484846 3248
(2)
4846 32481
4846
53
3248
1
4846 32484846 3248
(2)
4846 32481
4846
53
3248
1
4846 32484846 3248
(2)
4846 32481
4846
53
3248
1
4846 32484846 3248
(2)
4846 32481
4846
53
3248
1
4846 32484846 3248
(2)
4846 32481
4846
53
3248
1
4846 32484846 3248
(2)
4846 32481
4846
53
3248
1
4846 32484846 3248
(2)
4846 32481
4846
53
3248
1
4846 32484846 3248
(2)
4846 32481
4846
53
3248
1
4846 32484846 3248
(2)
4846 32481
4846
53
3248
1
4846 32484846 3248
(2)
4846 32481
4846
53
3248
1
4846 32484846 3248
(2)
4846 32481
4846
53
3248
1
4846 32484846 3248
(2)
4846 32481
4846
53
3248
1
4846 32484846 3248
(2)
4846 32481
4846
53
3248
1
4846 32484846 3248
(2)
4846 32481
4846
53
3248
1
4846 324848
146 32
48
PCLs (in bps) Q4 13 Q3 13 Q2 13 Q1 13 Q4 12
Personal Banking 28 29 32 28 27
Commercial Banking 20 14 21 14 19
Wealth Management 5 5 - 5 5
Financial Markets (12) - 6 (77) -
TOTAL 20 20 24 14 21
03/12/2013
8
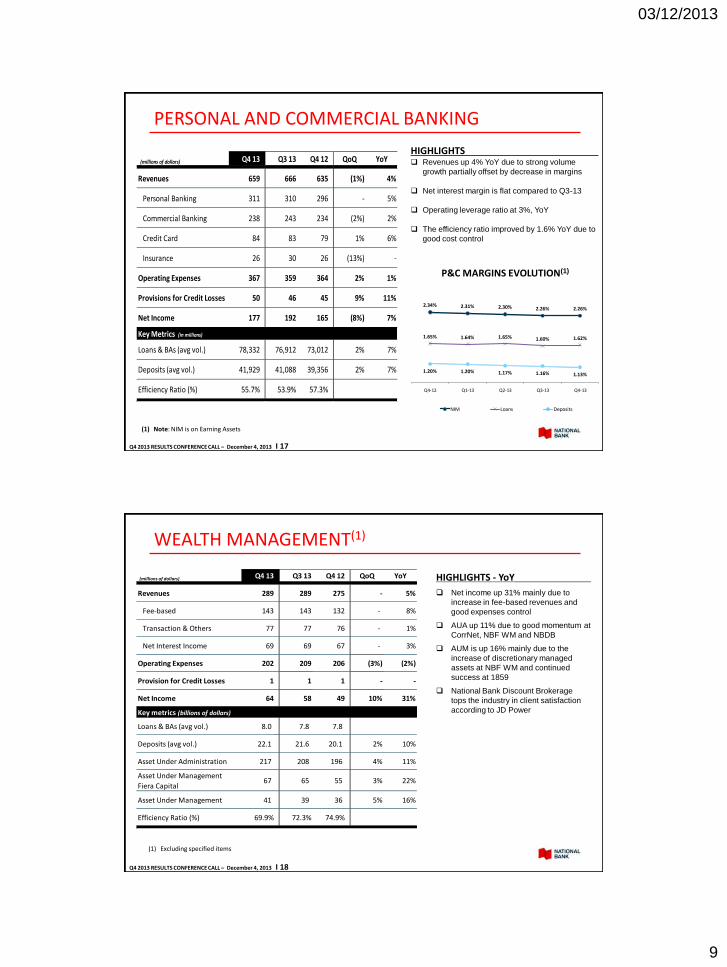
IMPAIRED LOANS AND FORMATION
(millions of dollars)
IMPAIRED LOANS IMPAIRED LOANS FORMATION(1)
(1) Formations include new accounts, disbursements, principal repayments, and exchange rate fluctuation
Q4 2013 RESULTS CONFERENCE CALL – December 4, 2013 I 15
(millions of dollars)Q4 13 Q3 13 Q2 13 Q1 13 Q4 12
Retail 21 26 20 22 21
Commercial 23 36 (13) 34 30
Corporate Banking (3) (6) 7 (56) (2)
Wealth Management 1 2 1 1 -
Total 42 58 15 1 49
387 354 346
377 395
179 165 146
172 183
(190) (202) (220)(194) (183)
7.45%6.56% 6.09% 6.31% 6.50%
Q4 12 Q1 13 Q2 13 Q3 13 Q4 13
Gross Impaired Loans
Impaired Loans before collective allowance for unimpaired loans
Impaired Loans, net of individual and collective allowances
Gross Impaired Loans / Common equity minus goodwill plus allowances
Jean DagenaisSenior Vice-PresidentFinance, Taxation and Investor Relations
BUSINESS SEGMENT REVIEW
03/12/2013
9
PERSONAL AND COMMERCIAL BANKING
P&C MARGINS EVOLUTION(1)
HIGHLIGHTS Revenues up 4% YoY due to strong volume
growth partially offset by decrease in margins
Net interest margin is flat compared to Q3-13
Operating leverage ratio at 3%, YoY
The efficiency ratio improved by 1.6% YoY due to
good cost control
Q4 2013 RESULTS CONFERENCE CALL – December 4, 2013 I 17
(1) Note: NIM is on Earning Assets
(millions of dollars) Q4 13 Q3 13 Q4 12 QoQ YoY
Revenues 659 666 635 (1%) 4%
Personal Banking 311 310 296 - 5%
Commercial Banking 238 243 234 (2%) 2%
Credit Card 84 83 79 1% 6%
Insurance 26 30 26 (13%) -
Operating Expenses 367 359 364 2% 1%
Provisions for Credit Losses 50 46 45 9% 11%
Net Income 177 192 165 (8%) 7%
Key Metrics (in millions)
Loans & BAs (avg vol.) 78,332 76,912 73,012 2% 7%
Deposits (avg vol.) 41,929 41,088 39,356 2% 7%
Efficiency Ratio (%) 55.7% 53.9% 57.3%
2.34% 2.31% 2.30% 2.26% 2.26%
1.65% 1.64% 1.65% 1.60% 1.62%
1.20% 1.20% 1.17% 1.16% 1.13%
Q4-12 Q1-13 Q2-13 Q3-13 Q4-13
NIM Loans Deposits
WEALTH MANAGEMENT(1)
(1) Excluding specified items
HIGHLIGHTS - YoY
Net income up 31% mainly due to
increase in fee-based revenues and
good expenses control
AUA up 11% due to good momentum at
CorrNet, NBF WM and NBDB
AUM is up 16% mainly due to the
increase of discretionary managed
assets at NBF WM and continued
success at 1859
National Bank Discount Brokerage
tops the industry in client satisfaction
according to JD Power
Q4 2013 RESULTS CONFERENCE CALL – December 4, 2013 I 18
(millions of dollars) Q4 13 Q3 13 Q4 12 QoQ YoY
Revenues 289 289 275 - 5%
Fee-based 143 143 132 - 8%
Transaction & Others 77 77 76 - 1%
Net Interest Income 69 69 67 - 3%
Operating Expenses 202 209 206 (3%) (2%)
Provision for Credit Losses 1 1 1 - -
Net Income 64 58 49 10% 31%
Key metrics (billions of dollars)
Loans & BAs (avg vol.) 8.0 7.8 7.8
Deposits (avg vol.) 22.1 21.6 20.1 2% 10%
Asset Under Administration 217 208 196 4% 11%
Asset Under Management
Fiera Capital 67 65 55 3% 22%
Asset Under Management 41 39 36 5% 16%
Efficiency Ratio (%) 69.9% 72.3% 74.9%
03/12/2013
10
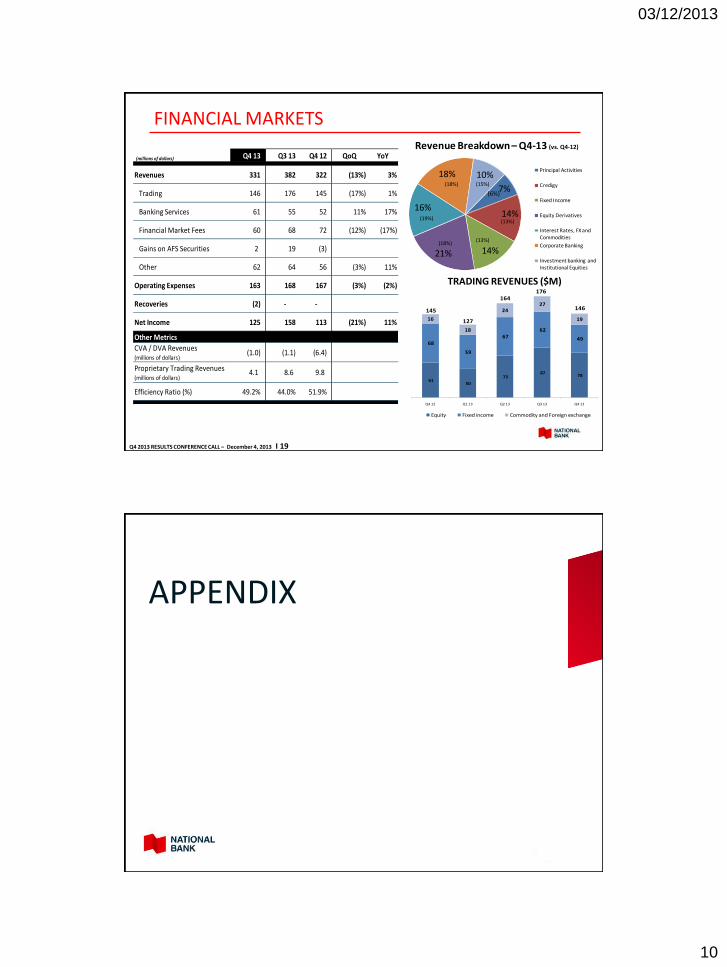
61 50
73 87
78
68
59
67 62
49
16
18
2427
19
Q4 12 Q1 13 Q2 13 Q3 13 Q4 13
Equity Fixed income Commodity and Foreign exchange
127
145
164
146
176
FINANCIAL MARKETS
TRADING REVENUES ($M)
Q4 2013 RESULTS CONFERENCE CALL – December 4, 2013 I 19
(millions of dollars) Q4 13 Q3 13 Q4 12 QoQ YoY
Revenues 331 382 322 (13%) 3%
Trading 146 176 145 (17%) 1%
Banking Services 61 55 52 11% 17%
Financial Market Fees 60 68 72 (12%) (17%)
Gains on AFS Securities 2 19 (3)
Other 62 64 56 (3%) 11%
Operating Expenses 163 168 167 (3%) (2%)
Recoveries (2) - -
Net Income 125 158 113 (21%) 11%
Other Metrics
CVA / DVA Revenues(millions of dollars)
(1.0) (1.1) (6.4)
Proprietary Trading Revenues(millions of dollars)
4.1 8.6 9.8
Efficiency Ratio (%) 49.2% 44.0% 51.9%
7%
14%
14%21%
16%
18% 10%
Revenue Breakdown – Q4-13 (vs. Q4-12)
Principal Activities
Credigy
Fixed Income
Equity Derivatives
Interest Rates, FX and Commodities
Corporate Banking
Investment banking and Institutional Equities
(13%)
(13%)(18%)
(19%)
(18%) (15%)
(6%)
APPENDIX
03/12/2013
11
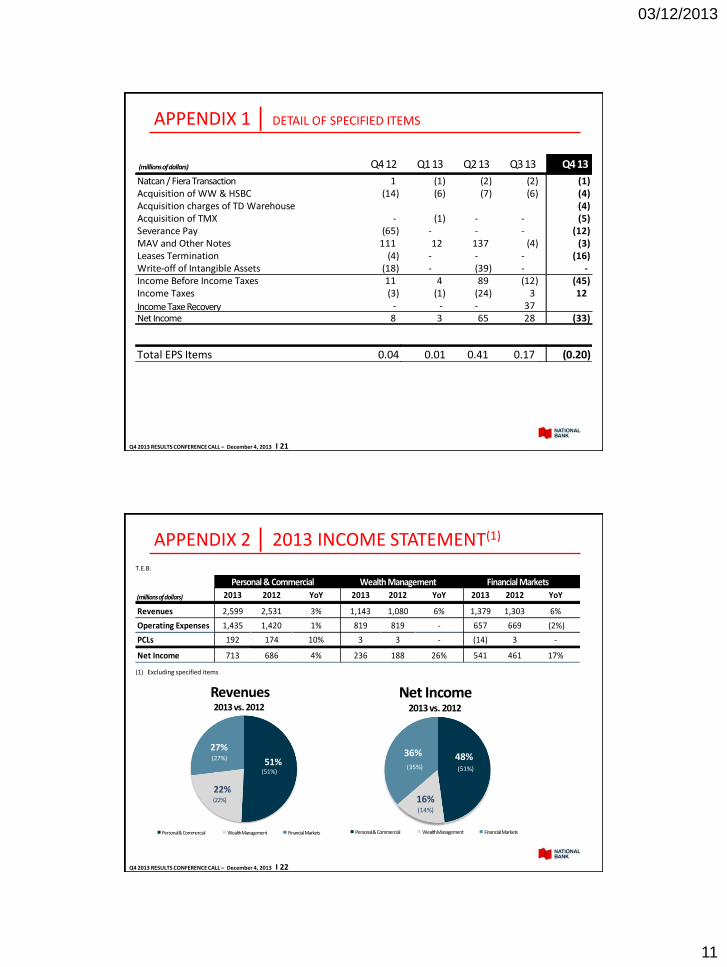
APPENDIX 1 │ DETAIL OF SPECIFIED ITEMS
Triggers could also be breached if realized losses in the CDX credit indices above exceeded 12% (currently at 1.11%)
Q4 2013 RESULTS CONFERENCE CALL – December 4, 2013 I 21
(millions of dollars) Q4 12 Q1 13 Q2 13 Q3 13 Q4 13
Natcan / Fiera Transaction 1 (1) (2) (2) (1) Acquisition of WW & HSBC (14) (6) (7) (6) (4) Acquisition charges of TD Warehouse (4) Acquisition of TMX - (1) - - (5) Severance Pay (65) - - - (12) MAV and Other Notes 111 12 137 (4) (3) Leases Termination (4) - - - (16) Write-off of Intangible Assets (18) - (39) - - Income Before Income Taxes 11 4 89 (12) (45) Income Taxes (3) (1) (24) 3 12
Income Taxe Recovery - - - 37 Net Income 8 3 65 28 (33)
Total EPS Items 0.04 0.01 0.41 0.17 (0.20)
51%
22%
27%
Revenues2013 vs. 2012
Personal & Commercial Wealth Management Financial Markets
(22%)
(27%)
(51%)
APPENDIX 2 │ 2013 INCOME STATEMENT(1)
(1) Excluding specified items
T.E.B.
Q4 2013 RESULTS CONFERENCE CALL – December 4, 2013 I 22
2013 2012 YoY 2013 2012 YoY 2013 2012 YoY
Revenues 2,599 2,531 3% 1,143 1,080 6% 1,379 1,303 6%
Operating Expenses 1,435 1,420 1% 819 819 - 657 669 (2%)
PCLs 192 174 10% 3 3 - (14) 3 -
Net Income 713 686 4% 236 188 26% 541 461 17%
Wealth Management Financial MarketsPersonal & Commercial
(millions of dollars)
(35%)
48%
16%
36%
Net Income2013 vs. 2012
Personal & Commercial Wealth Management Financial Markets
(35%) (51%)
(14%)
03/12/2013
12
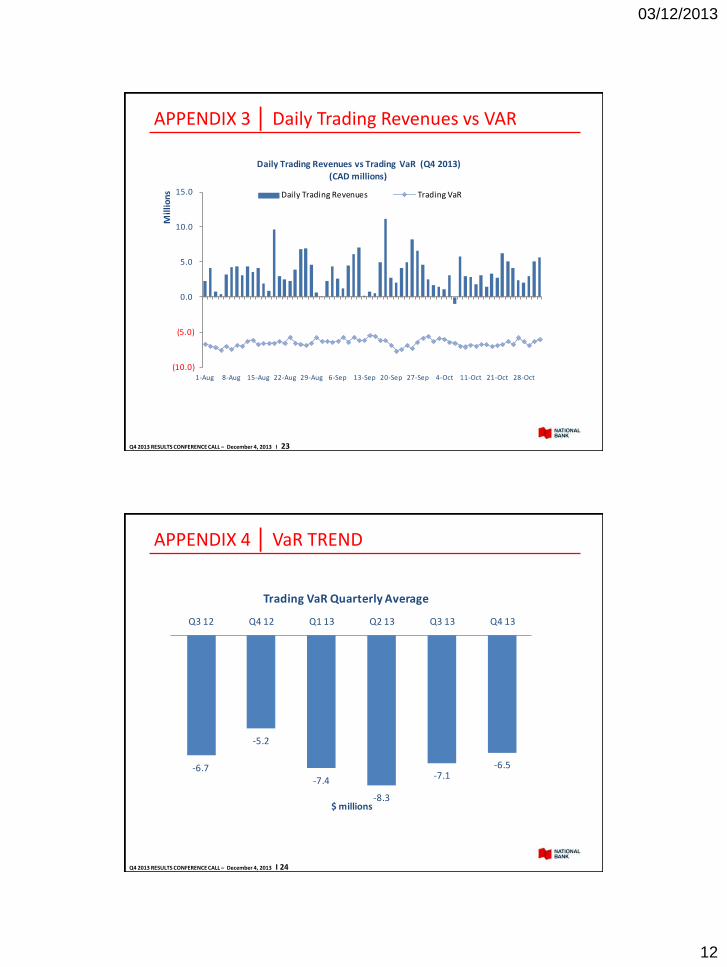
APPENDIX 3 │ Daily Trading Revenues vs VAR
Q4 2013 RESULTS CONFERENCE CALL – December 4, 2013 I 23
(10.0)
(5.0)
0.0
5.0
10.0
15.0
1-Aug 8-Aug 15-Aug 22-Aug 29-Aug 6-Sep 13-Sep 20-Sep 27-Sep 4-Oct 11-Oct 21-Oct 28-Oct
Mil
lio
ns
Daily Trading Revenues vs Trading VaR (Q4 2013)(CAD millions)
Daily Trading Revenues Trading VaR
APPENDIX 4 │ VaR TREND
Q4 2013 RESULTS CONFERENCE CALL – December 4, 2013 I 24
-6.7
-5.2
-7.4
-8.3
-7.1-6.5
Q3 12 Q4 12 Q1 13 Q2 13 Q3 13 Q4 13
$ millions
Trading VaR Quarterly Average
03/12/2013
13
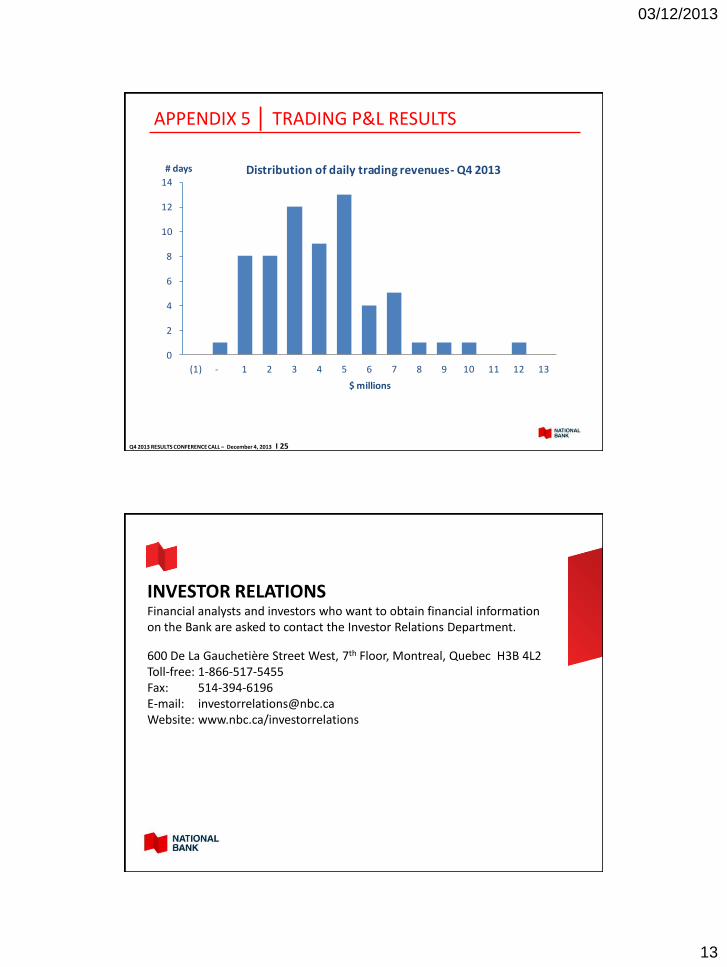
APPENDIX 5 │ TRADING P&L RESULTS
Q4 2013 RESULTS CONFERENCE CALL – December 4, 2013 I 25
0
2
4
6
8
10
12
14
(1) - 1 2 3 4 5 6 7 8 9 10 11 12 13
# days
$ millions
Distribution of daily trading revenues - Q4 2013
INVESTOR RELATIONSFinancial analysts and investors who want to obtain financial information on the Bank are asked to contact the Investor Relations Department.
600 De La Gauchetière Street West, 7th Floor, Montreal, Quebec H3B 4L2Toll-free: 1-866-517-5455Fax: 514-394-6196E-mail: [email protected]: www.nbc.ca/investorrelations