Embed Size (px)
Citation preview
Analytic Strategy: Child-LevelFocus on the set of processes and outcomes most central to 4Rs theory of change3-Level Hierarchical Linear Model using HLM 6.02
Level 1: Time (4 repeated measurements)Intercept, Slope, Quadratic (only int. & slope for T-report)
Level 2: ChildBaseline: Gender, Race/Ethnicity, SES Risk, Community Risk, Behavioral Risk, average Y1-Y2 Classroom size, teacher burnout and experience
Level 3: School LevelTX/Control dummy8 school match dummies
Estimate Tx impact on intercept, slope, and quadratic parameters (employ alpha of p <.1, effect sizes)
Results: Child-Level TX Main Effects
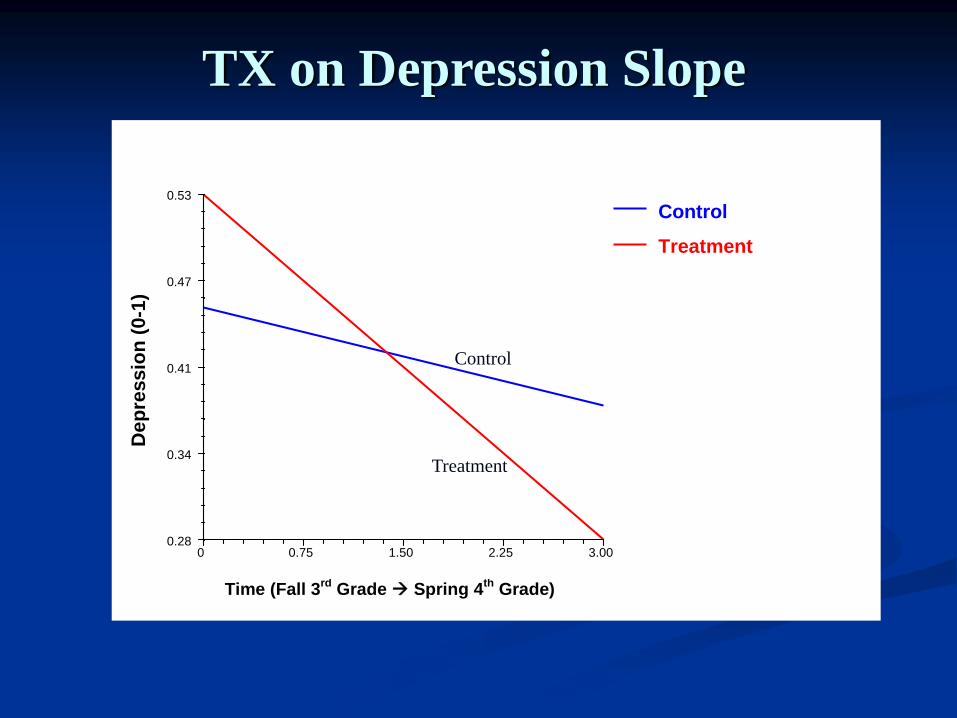
Significant impacts for 3 of 5 child-reported outcomesHostile Attributional Biases (slope)Child Self-Report Depression (slope)Child Self-Report Aggressive INS (quadratic)Aggressive & Prosocial Fantasies (n.s.)
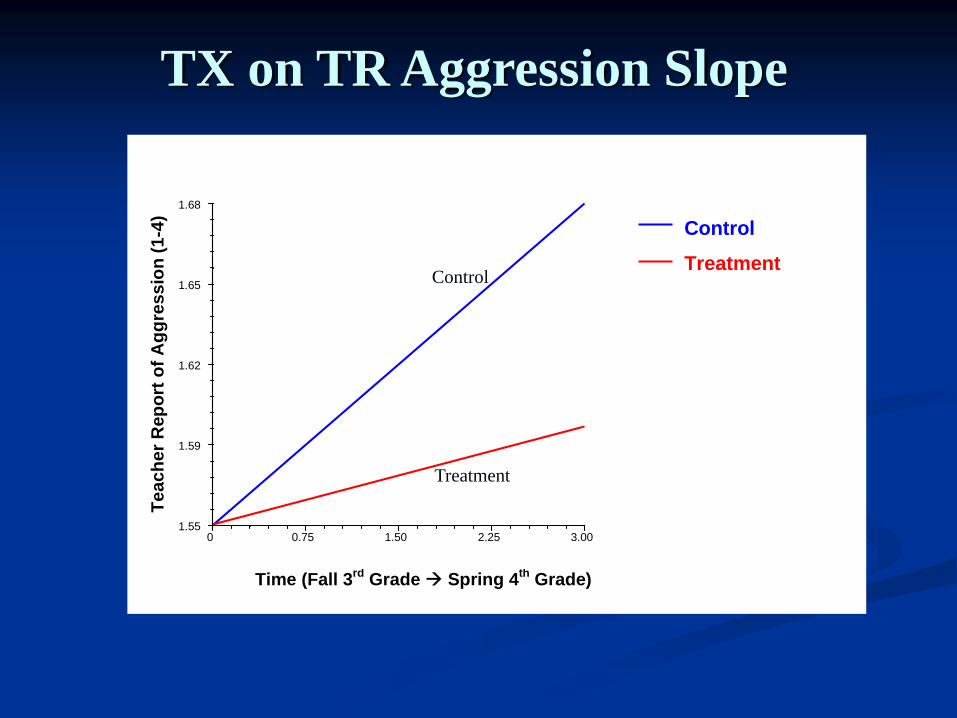
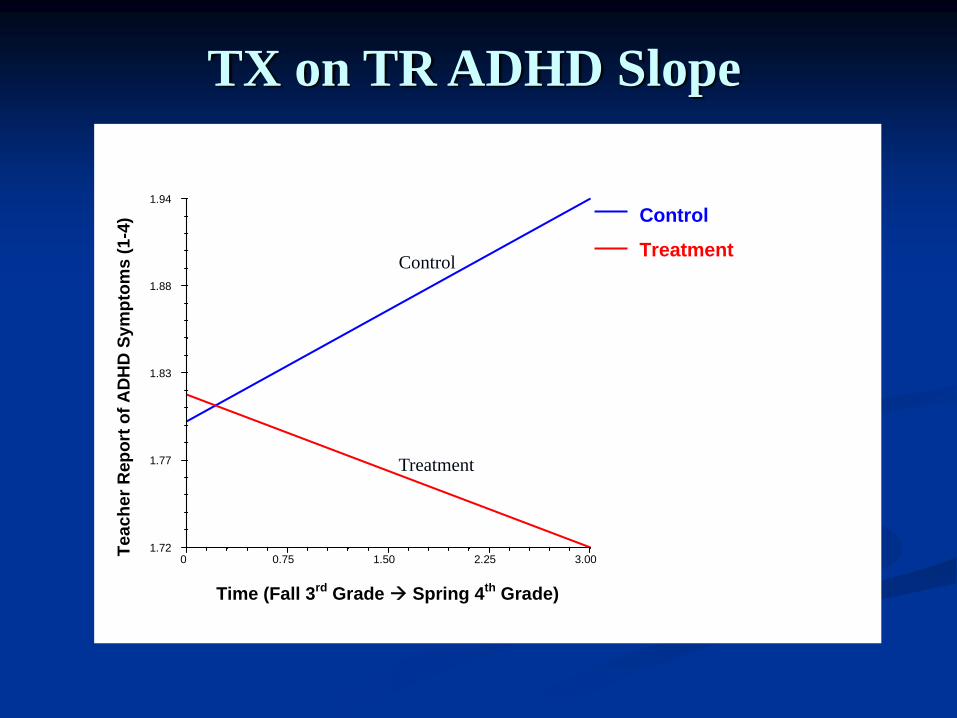
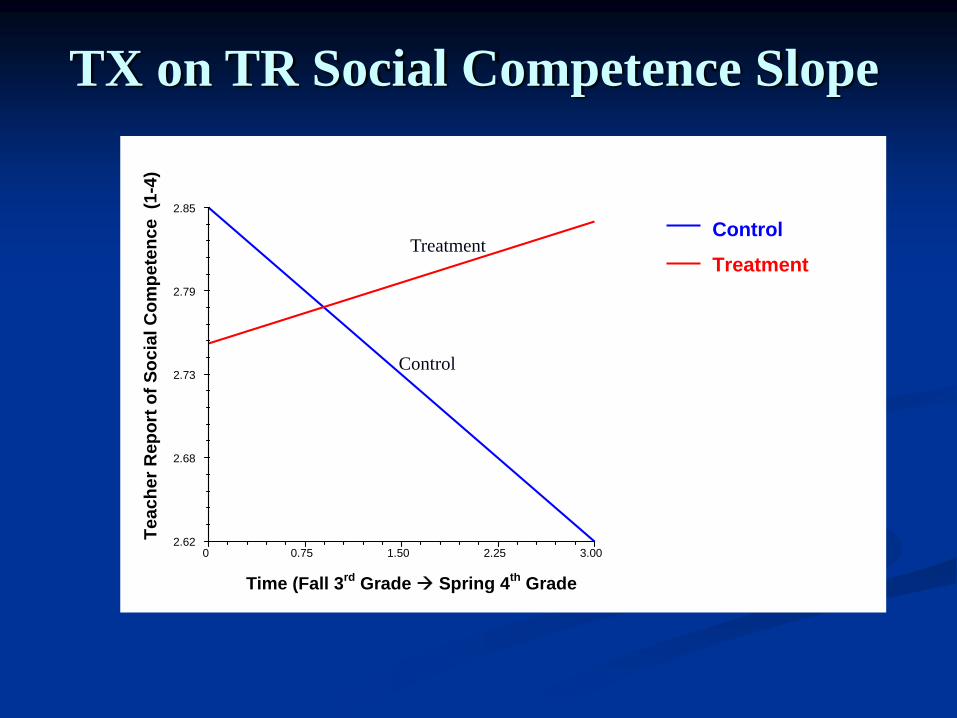
Significant impacts for 3 of 4 teacher-reported outcomesAggressive Behavior (slope)ADHD Symptoms (slope)Social Competence (slope)Academic Skills (n.s.)
School Records (n.s.)
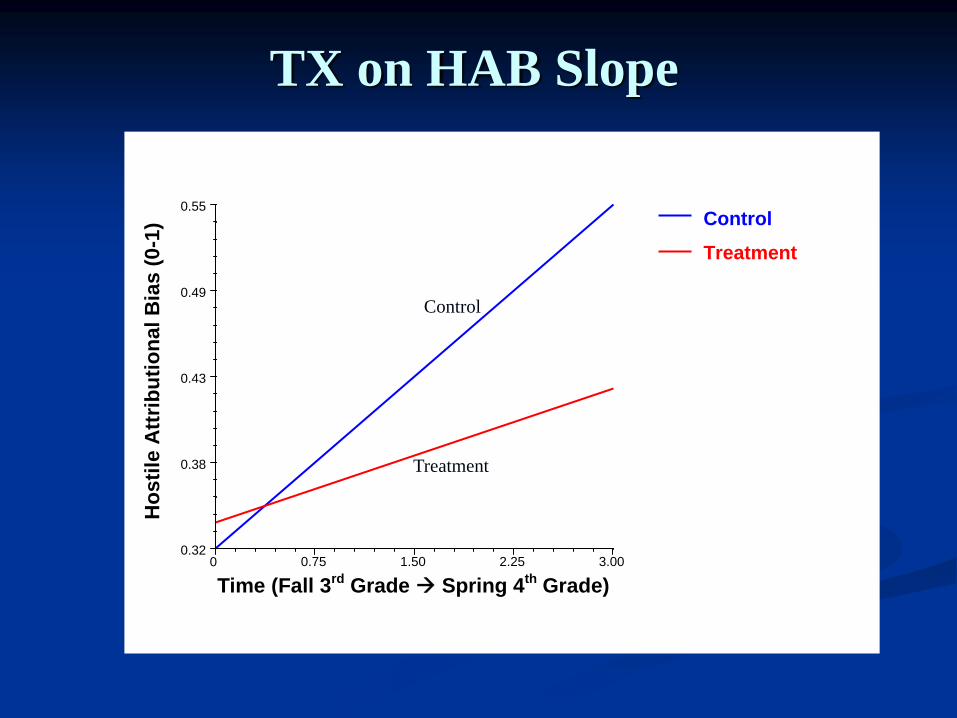
0 0.75 1.50 2.25 3.000.32
0.38
0.43
0.49
0.55
Time (Fall 3rd Grade Spring 4th Grade)
Control
Treatment
Hos
tile
Attr
ibut
iona
l Bia
s (0
-1)
TX on HAB Slope
Treatment
Control
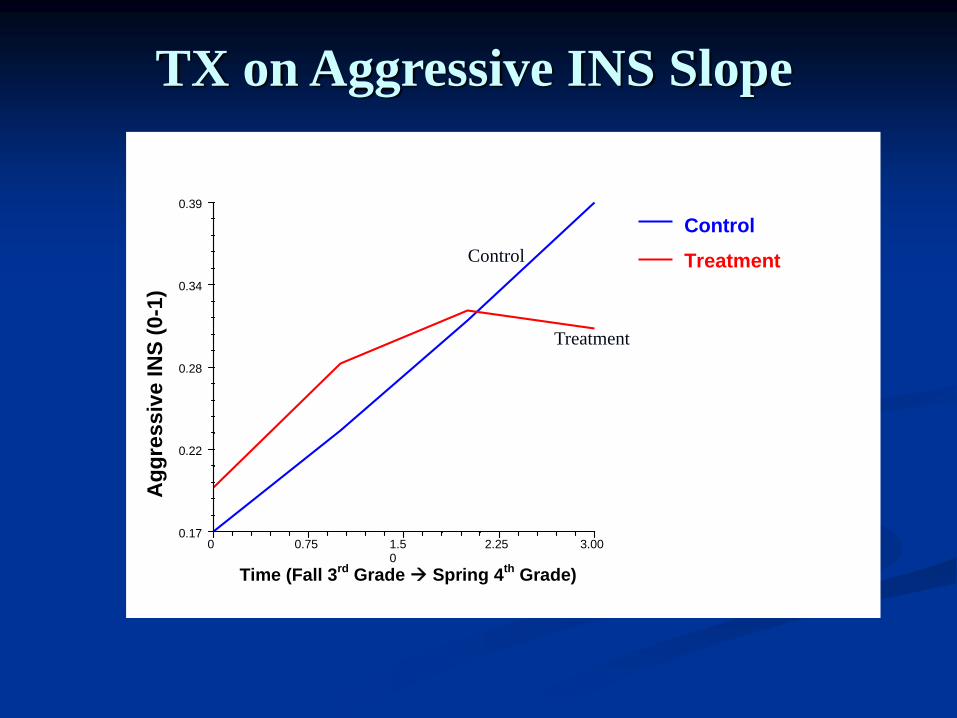
TX on Aggressive INS Slope
0 0.75 1.50
2.25 3.00 0.17
0.22
0.28
0.34
0.39
Time (Fall 3rd Grade Spring 4th Grade)
Agg
ress
ive
INS
(0-1
)
Control
TreatmentControl
Treatment
TX on TR Aggression Slope
0 0.75 1.50 2.25 3.00 1.55
1.59
1.62
1.65
1.68
Teac
her R
epor
t of A
ggre
ssio
n (1
-4) Control
Treatment
Time (Fall 3rd Grade Spring 4th Grade)
Treatment
Control
TX on Depression Slope
0 0.75 1.50 2.25 3.000.28
0.34
0.41
0.47
0.53
Time (Fall 3rd Grade Spring 4th Grade)
Dep
ress
ion
(0-1
)
Control
Treatment
Treatment
Control
TX on TR ADHD Slope
0 0.75 1.50 2.25 3.00 1.72
1.77
1.83
1.88
1.94
Time (Fall 3rd Grade Spring 4th Grade)
Teac
her R
epor
t of A
DH
D S
ympt
oms
(1-4
) Control
TreatmentControl
Treatment
TX on TR Social Competence Slope
0 0.75 1.50 2.25 3.00 2.62
2.68
2.73
2.79
2.85
Time (Fall 3rd Grade Spring 4th Grade
Teac
her R
epor
t of S
ocia
l Com
pete
nce
(1-4
)
Control
Treatment
Control
Treatment
Results: Tx by Baseline Covariates
No significant Tx by baseline covariate interactions with 3 exceptions….. Tx by baseline behavioral risk interactions significant for:
Teacher-reported Academic SkillsMath AchievementReading Achievement
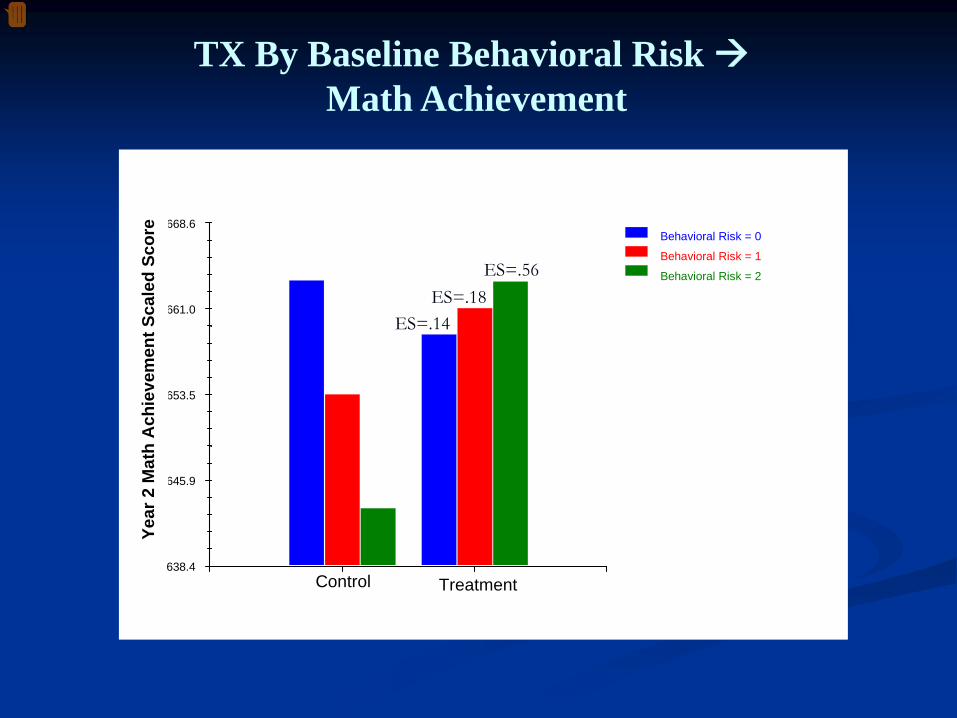
TX By Baseline Behavioral Risk Math Achievement
Control Treatment 638.4
645.9
653.5
661.0
668.6 Behavioral Risk = 0
Behavioral Risk = 1
Behavioral Risk = 2
Year
2 M
ath
Ach
ieve
men
t Sca
led
Scor
e
ES=.56ES=.18
ES=.14
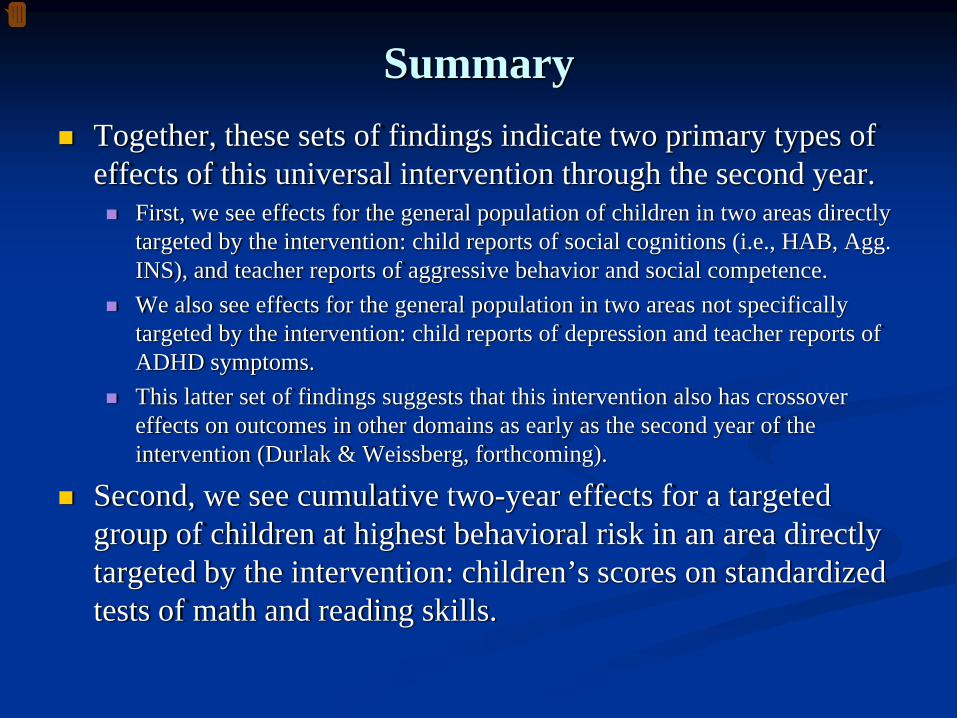
SummaryTogether, these sets of findings indicate two primary types of effects of this universal intervention through the second year.
First, we see effects for the general population of children in two areas directly targeted by the intervention: child reports of social cognitions (i.e., HAB, Agg. INS), and teacher reports of aggressive behavior and social competence. We also see effects for the general population in two areas not specifically targeted by the intervention: child reports of depression and teacher reports of ADHD symptoms. This latter set of findings suggests that this intervention also has crossover effects on outcomes in other domains as early as the second year of the intervention (Durlak & Weissberg, forthcoming).
Second, we see cumulative two-year effects for a targeted group of children at highest behavioral risk in an area directly targeted by the intervention: children’s scores on standardized tests of math and reading skills.
Next Steps and Future Directions
Next Steps/Future DirectionsMiddle School Follow-Up: “Health Risk Behavior in Late Childhood: Impact of a Longitudinal Randomized Trial”Model impacts of dosage/fidelity (low dosage in TX, high take-up in control schools)
Propensity score matching
Identify clusters of classrooms based on teacher and climate characteristicsFinalize 2nd year and 3rd year child- and classroom-level impactsWhole-school administrative records studyPeer- and Teacher social network study G x E study of “differential susceptibility to intervention”.
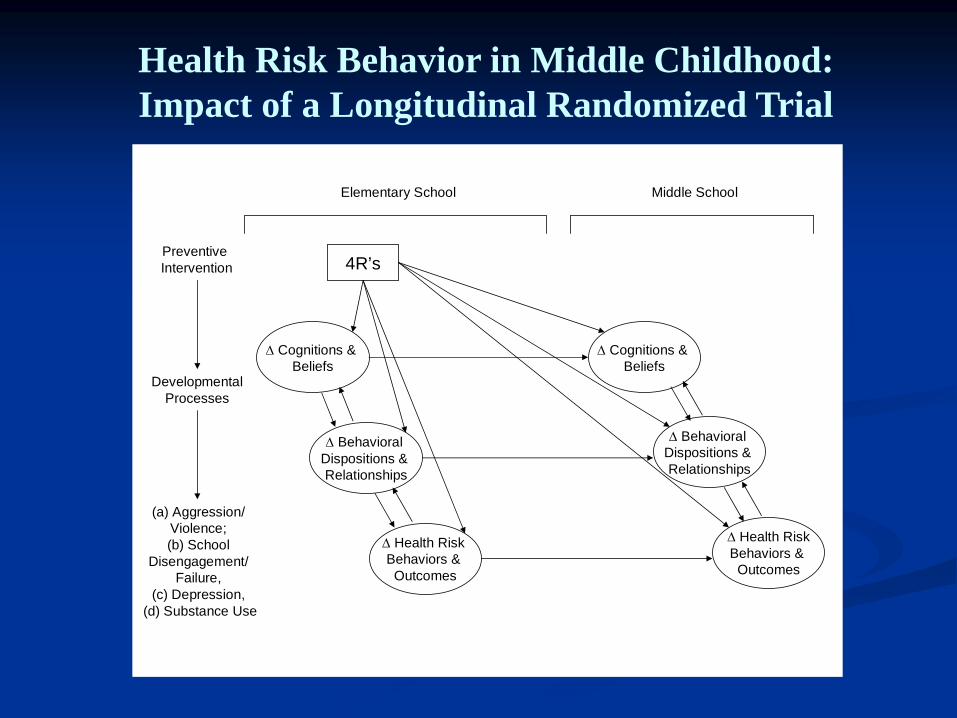
Δ Cognitions & Beliefs
Δ Behavioral Dispositions & Relationships
Δ Health Risk Behaviors & Outcomes
Δ Cognitions & Beliefs
Δ Health RiskBehaviors & Outcomes
Δ Behavioral Dispositions & Relationships
4R’sPreventive Intervention
DevelopmentalProcesses
(a) Aggression/Violence; (b) School
Disengagement/Failure,
(c) Depression,(d) Substance Use
Figure 1: Conceptual Model Guiding the Specific Aims of the Proposed StudyElementary School Middle School
Health Risk Behavior in Middle Childhood: Impact of a Longitudinal Randomized Trial
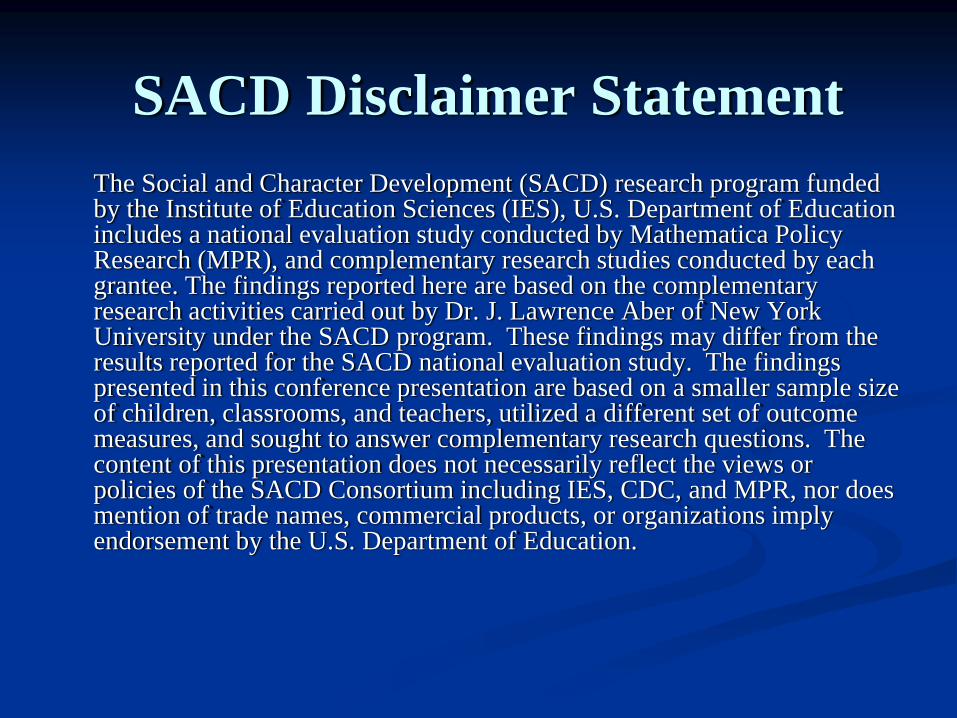
SACD Disclaimer StatementThe Social and Character Development (SACD) research program funded by the Institute of Education Sciences (IES), U.S. Department of Education includes a national evaluation study conducted by Mathematica Policy Research (MPR), and complementary research studies conducted by each grantee. The findings reported here are based on the complementary research activities carried out by Dr. J. Lawrence Aber of New York University under the SACD program. These findings may differ from the results reported for the SACD national evaluation study. The findings presented in this conference presentation are based on a smaller sample size of children, classrooms, and teachers, utilized a different set of outcome measures, and sought to answer complementary research questions. The content of this presentation does not necessarily reflect the views or policies of the SACD Consortium including IES, CDC, and MPR, nor does mention of trade names, commercial products, or organizations imply endorsement by the U.S. Department of Education.
End
Program ImplementationYears 1 and 2
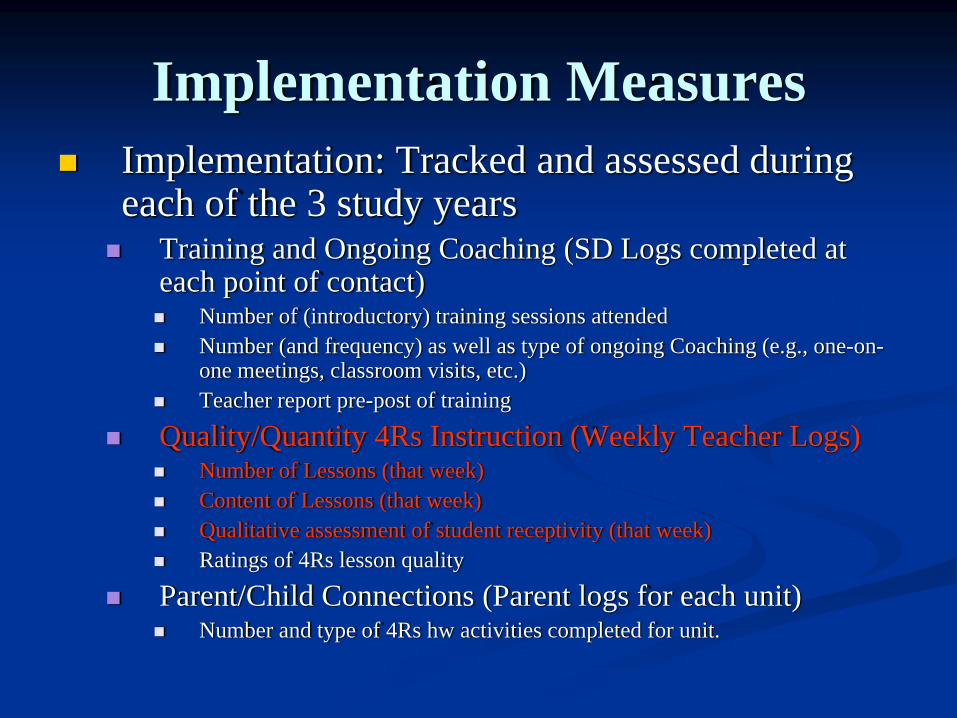
Implementation MeasuresImplementation: Tracked and assessed during each of the 3 study years
Training and Ongoing Coaching (SD Logs completed at each point of contact)
Number of (introductory) training sessions attendedNumber (and frequency) as well as type of ongoing Coaching (e.g., one-on-one meetings, classroom visits, etc.)Teacher report pre-post of training
Quality/Quantity 4Rs Instruction (Weekly Teacher Logs)Number of Lessons (that week)Content of Lessons (that week)Qualitative assessment of student receptivity (that week)Ratings of 4Rs lesson quality
Parent/Child Connections (Parent logs for each unit)Number and type of 4Rs hw activities completed for unit.
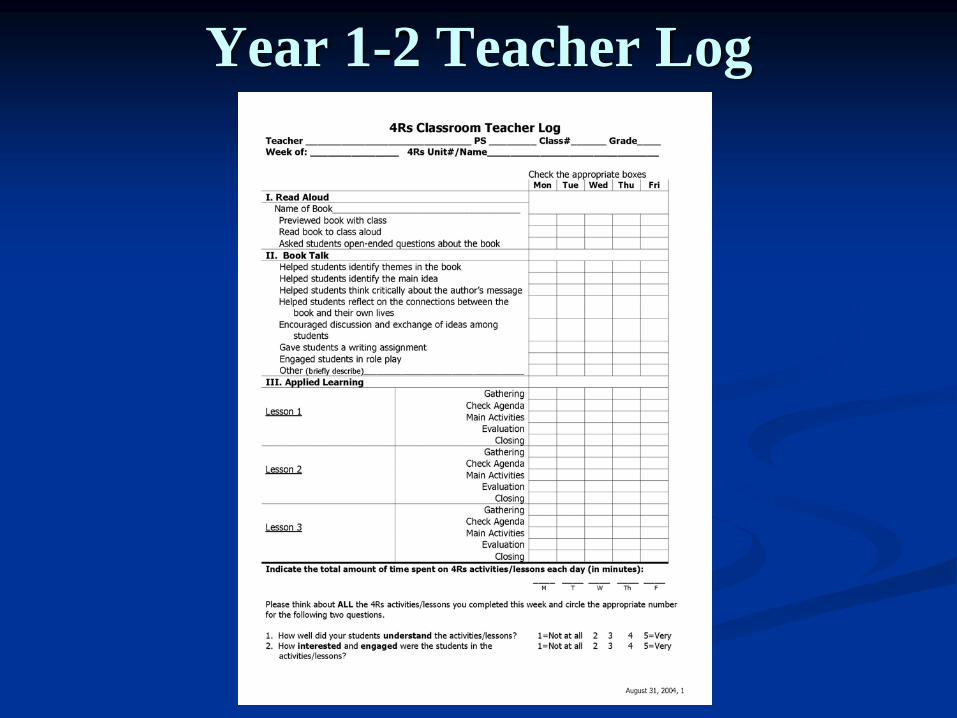
Year 1-2 Teacher Log
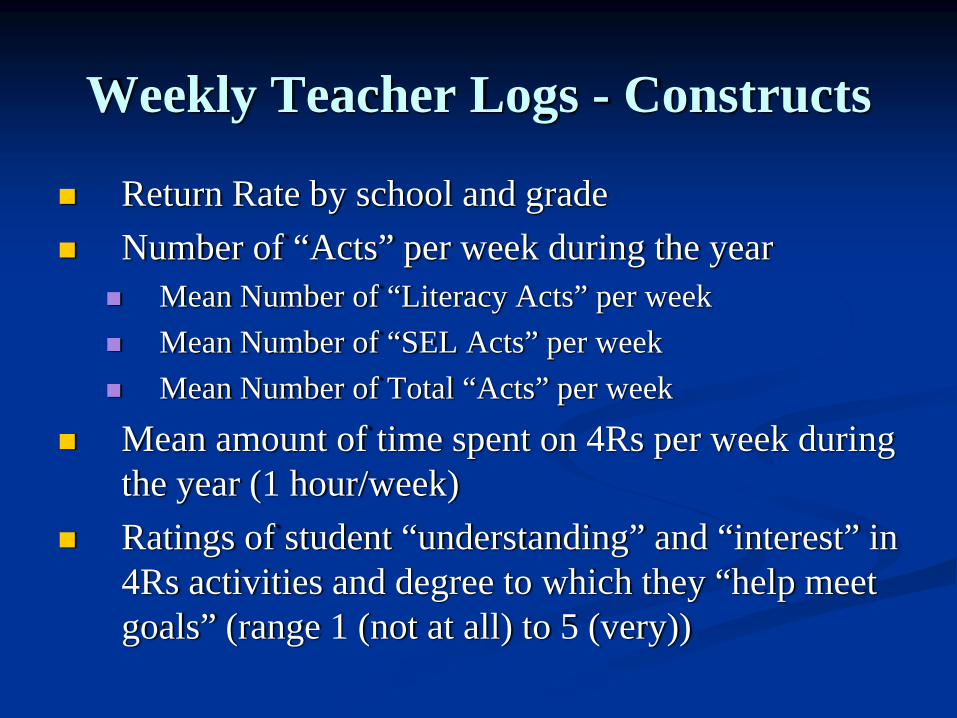
Weekly Teacher Logs - Constructs
Return Rate by school and gradeNumber of “Acts” per week during the year
Mean Number of “Literacy Acts” per weekMean Number of “SEL Acts” per weekMean Number of Total “Acts” per week
Mean amount of time spent on 4Rs per week during the year (1 hour/week)Ratings of student “understanding” and “interest” in 4Rs activities and degree to which they “help meet goals” (range 1 (not at all) to 5 (very))
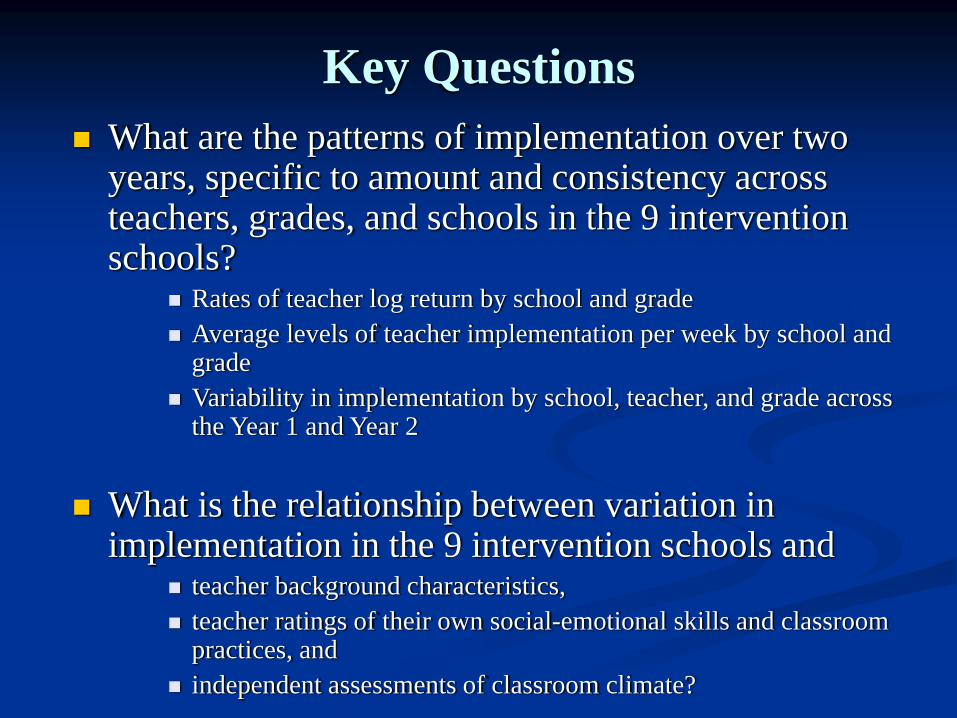
Key QuestionsWhat are the patterns of implementation over two years, specific to amount and consistency across teachers, grades, and schools in the 9 intervention schools?
Rates of teacher log return by school and gradeAverage levels of teacher implementation per week by school and gradeVariability in implementation by school, teacher, and grade across the Year 1 and Year 2
What is the relationship between variation in implementation in the 9 intervention schools and
teacher background characteristics, teacher ratings of their own social-emotional skills and classroom practices, andindependent assessments of classroom climate?
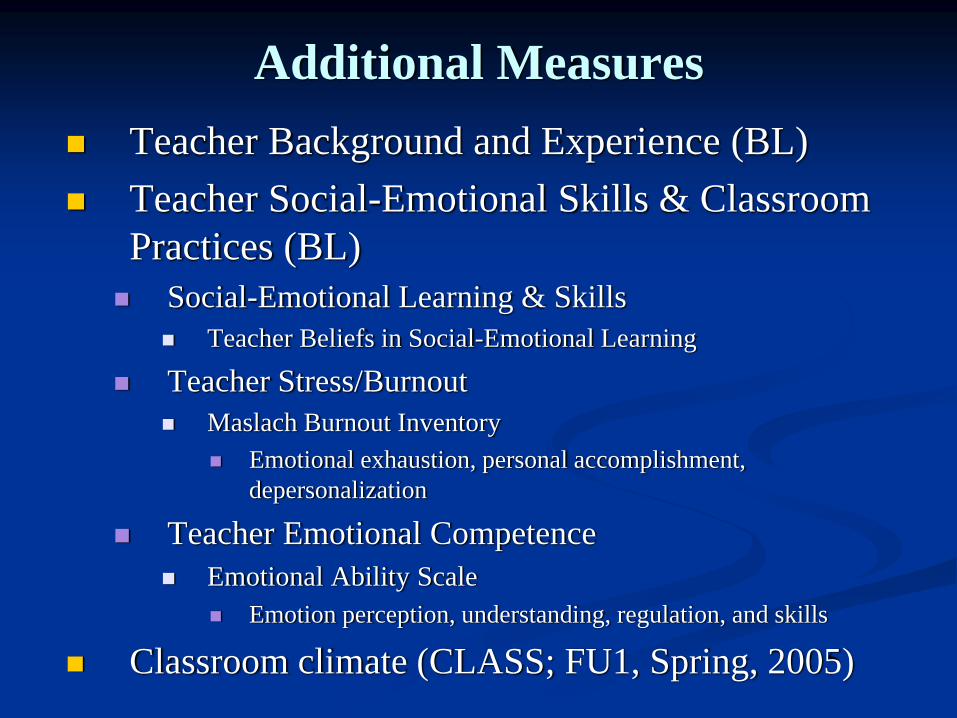
Additional Measures Teacher Background and Experience (BL)Teacher Social-Emotional Skills & Classroom Practices (BL)
Social-Emotional Learning & SkillsTeacher Beliefs in Social-Emotional Learning
Teacher Stress/BurnoutMaslach Burnout Inventory
Emotional exhaustion, personal accomplishment, depersonalization
Teacher Emotional CompetenceEmotional Ability Scale
Emotion perception, understanding, regulation, and skills
Classroom climate (CLASS; FU1, Spring, 2005)
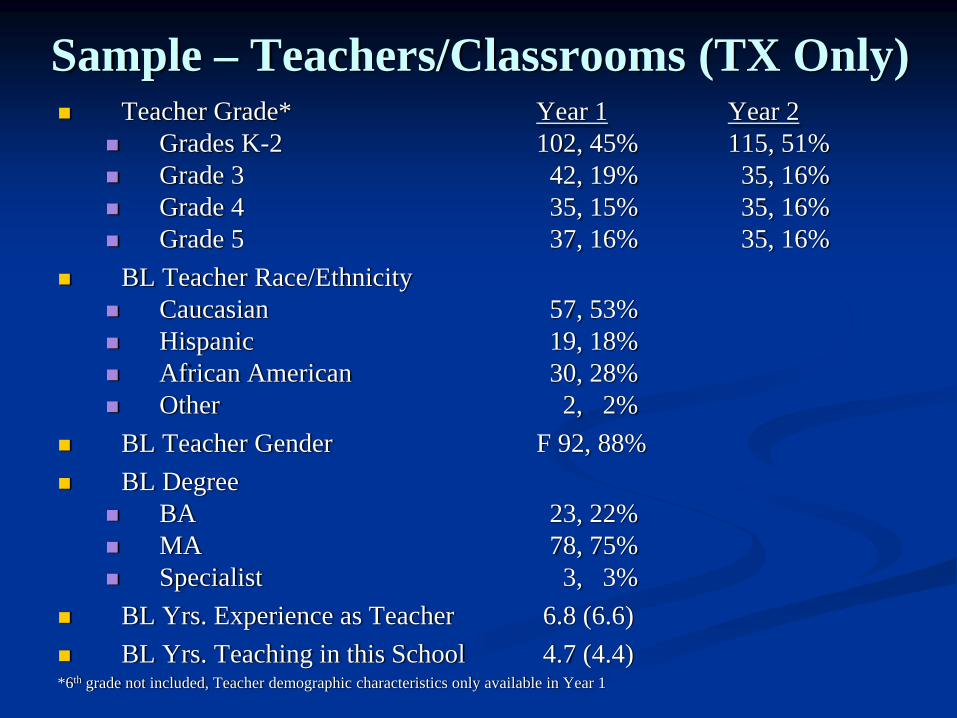
Sample – Teachers/Classrooms (TX Only)Teacher Grade* Year 1 Year 2
Grades K-2 102, 45% 115, 51%Grade 3 42, 19% 35, 16%Grade 4 35, 15% 35, 16%Grade 5 37, 16% 35, 16%
BL Teacher Race/EthnicityCaucasian 57, 53%Hispanic 19, 18%African American 30, 28%Other 2, 2%
BL Teacher Gender F 92, 88%BL Degree
BA 23, 22%MA 78, 75%Specialist 3, 3%
BL Yrs. Experience as Teacher 6.8 (6.6)BL Yrs. Teaching in this School 4.7 (4.4)
*6th grade not included, Teacher demographic characteristics only available in Year 1
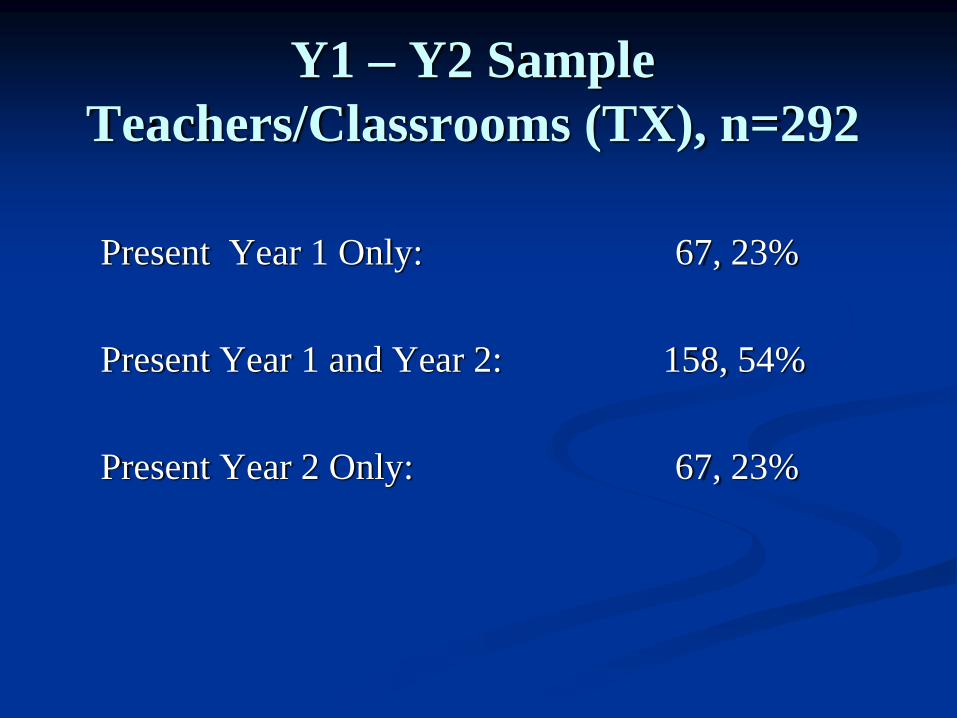
Y1 – Y2 Sample Teachers/Classrooms (TX), n=292
Present Year 1 Only: 67, 23%
Present Year 1 and Year 2: 158, 54%
Present Year 2 Only: 67, 23%
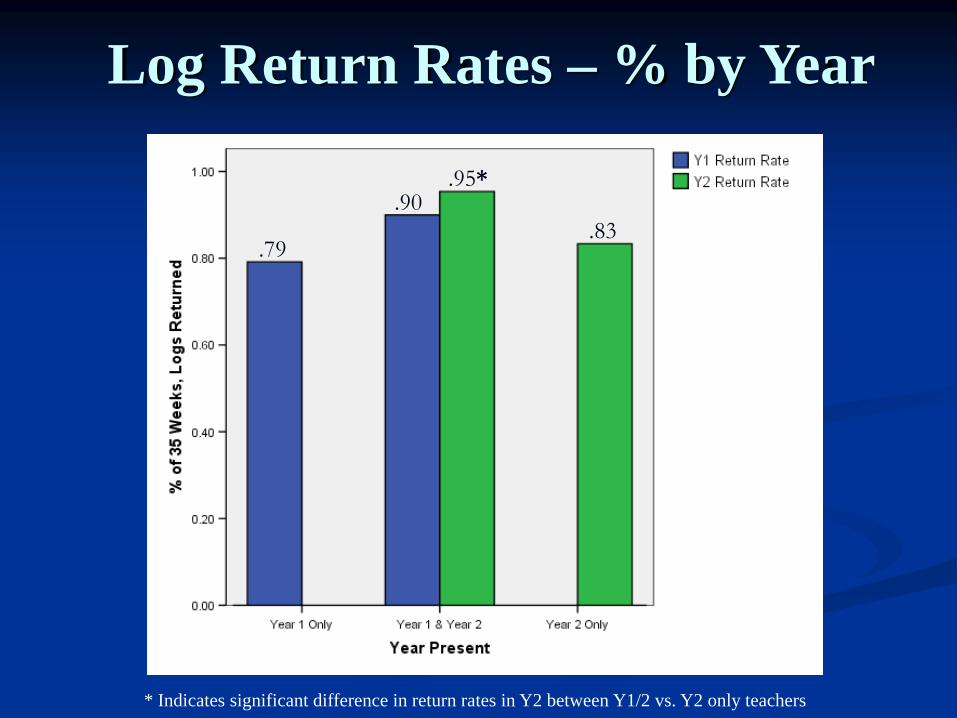
Log Return Rates – % by Year
.79
.90.95*
.83
* Indicates significant difference in return rates in Y2 between Y1/2 vs. Y2 only teachers
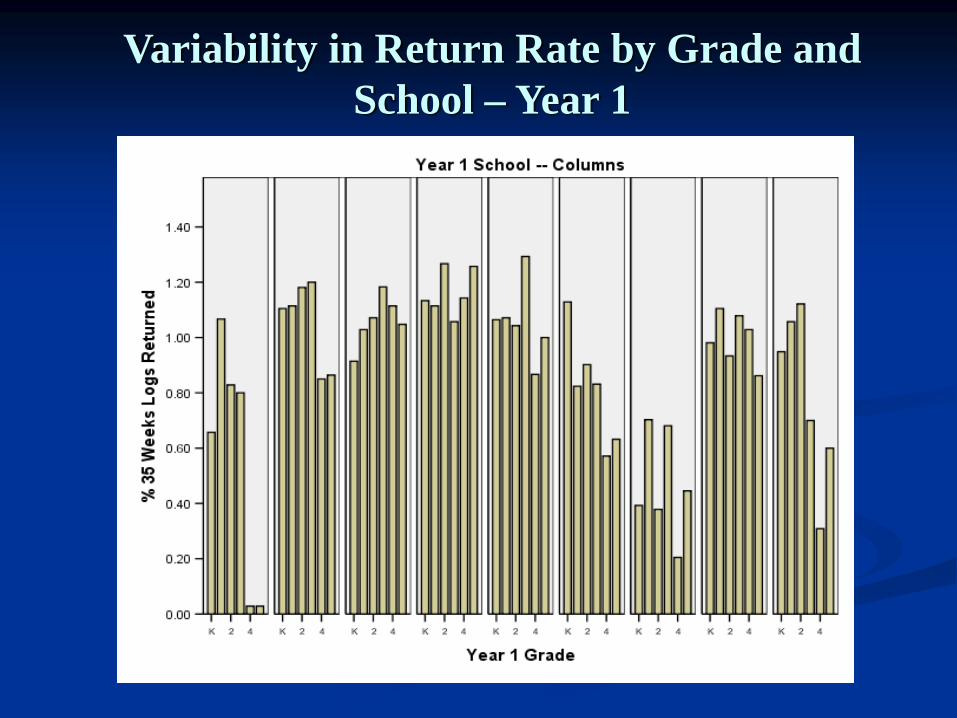
Variability in Return Rate by Grade and School – Year 1
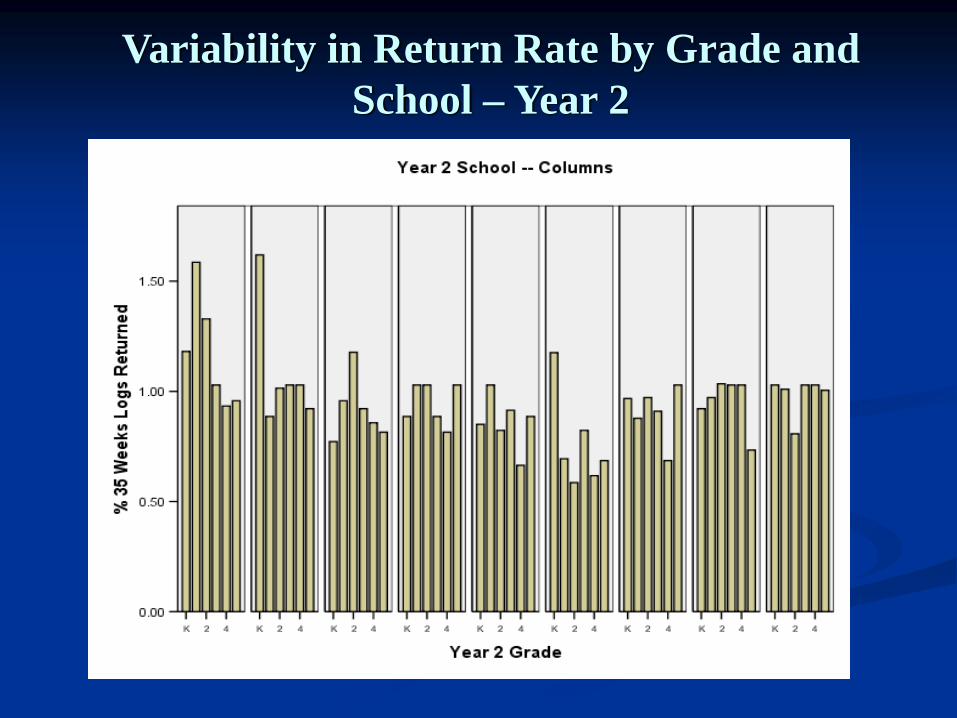
Variability in Return Rate by Grade and School – Year 2
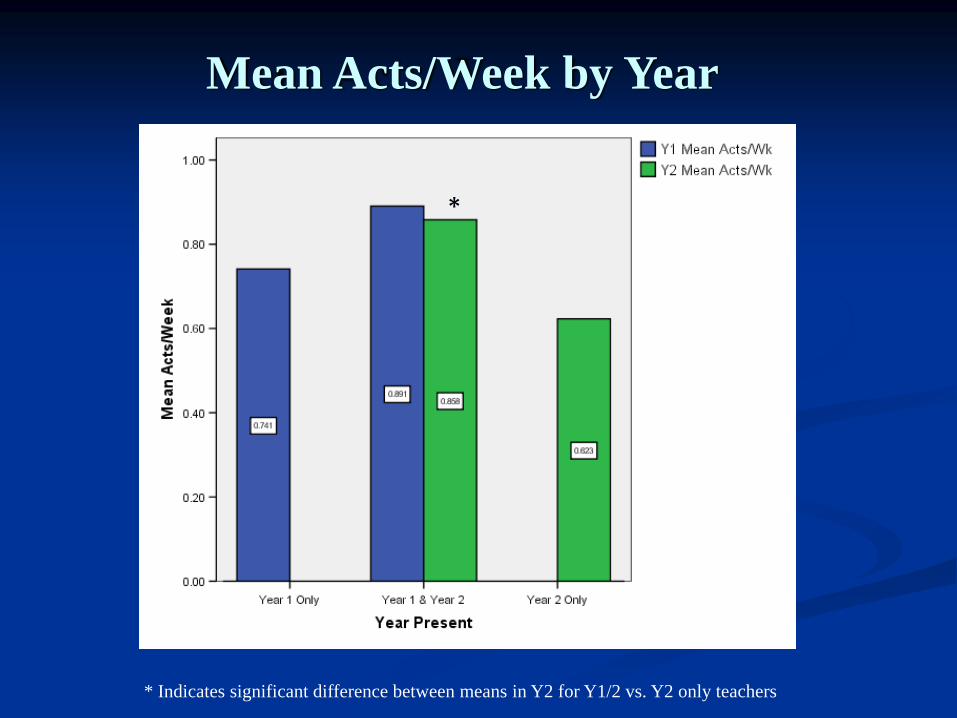
Mean Acts/Week by Year
* Indicates significant difference between means in Y2 for Y1/2 vs. Y2 only teachers
*
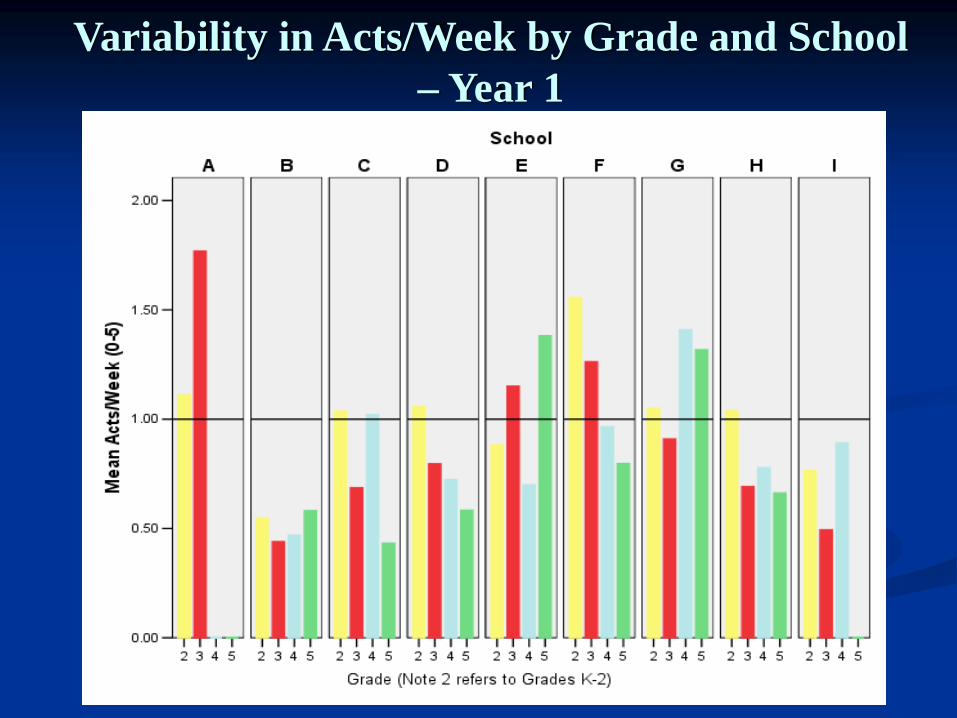
Variability in Acts/Week by Grade and School – Year 1
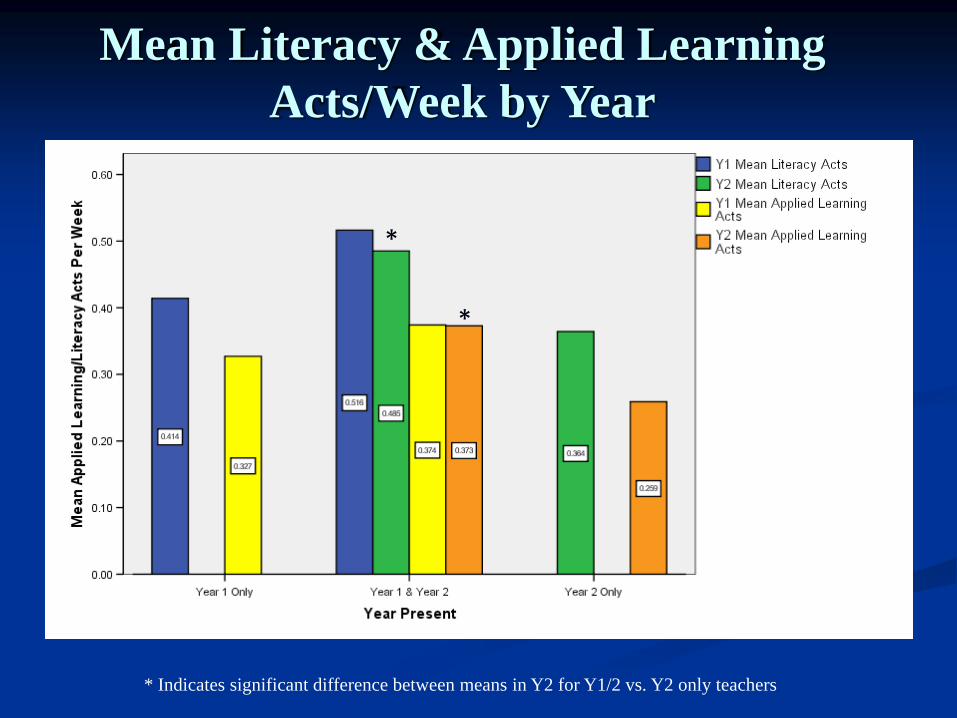
Mean Literacy & Applied Learning Acts/Week by Year
*
*
* Indicates significant difference between means in Y2 for Y1/2 vs. Y2 only teachers
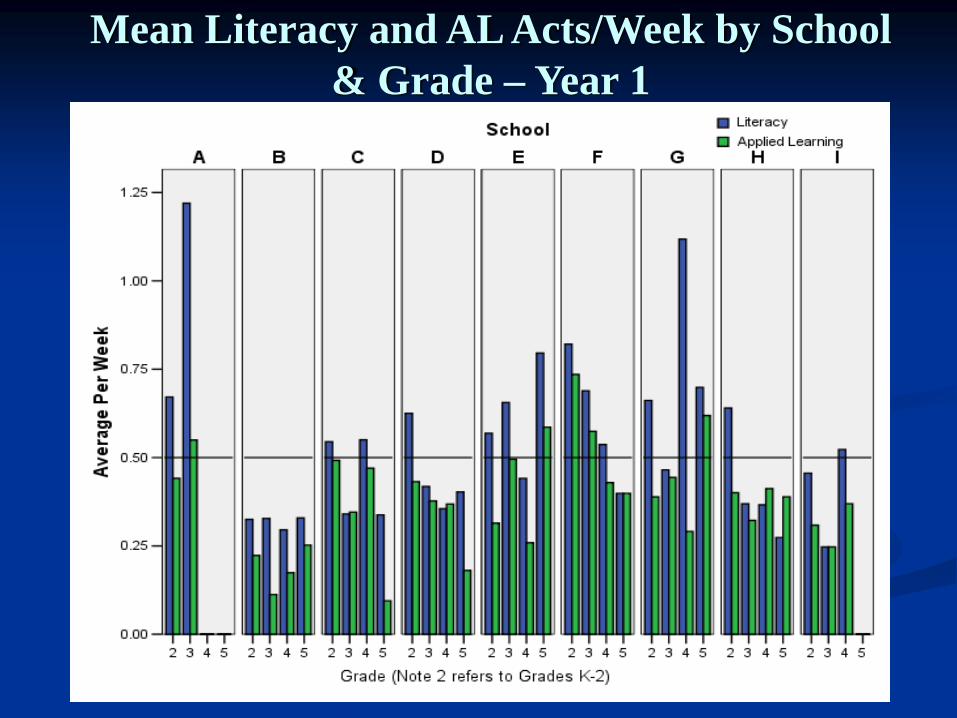
Mean Literacy and AL Acts/Week by School & Grade – Year 1
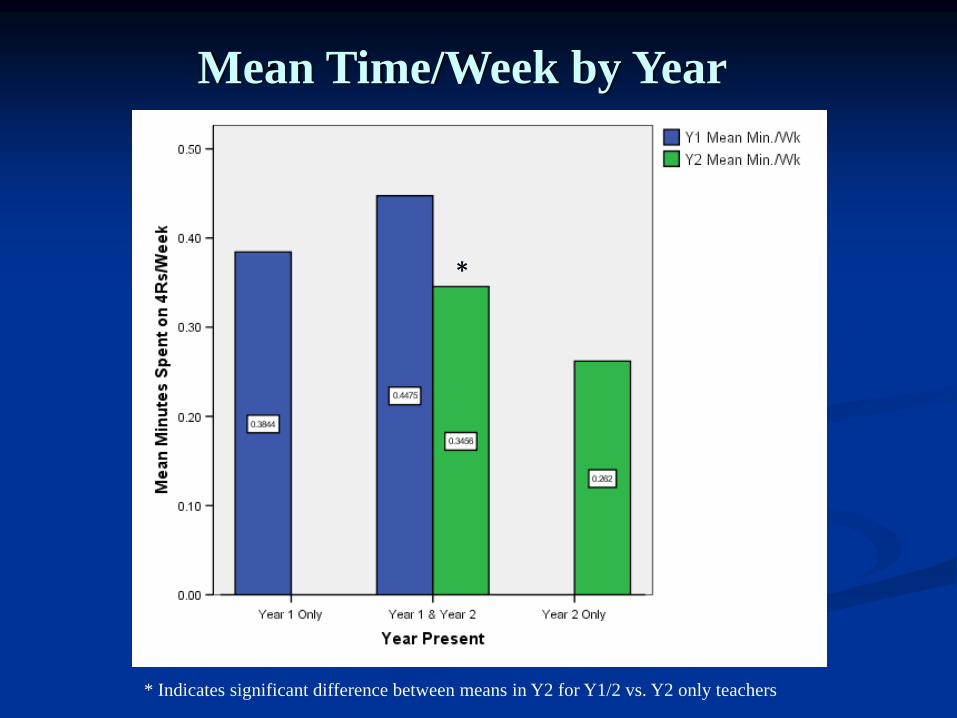
Mean Time/Week by Year
*
* Indicates significant difference between means in Y2 for Y1/2 vs. Y2 only teachers
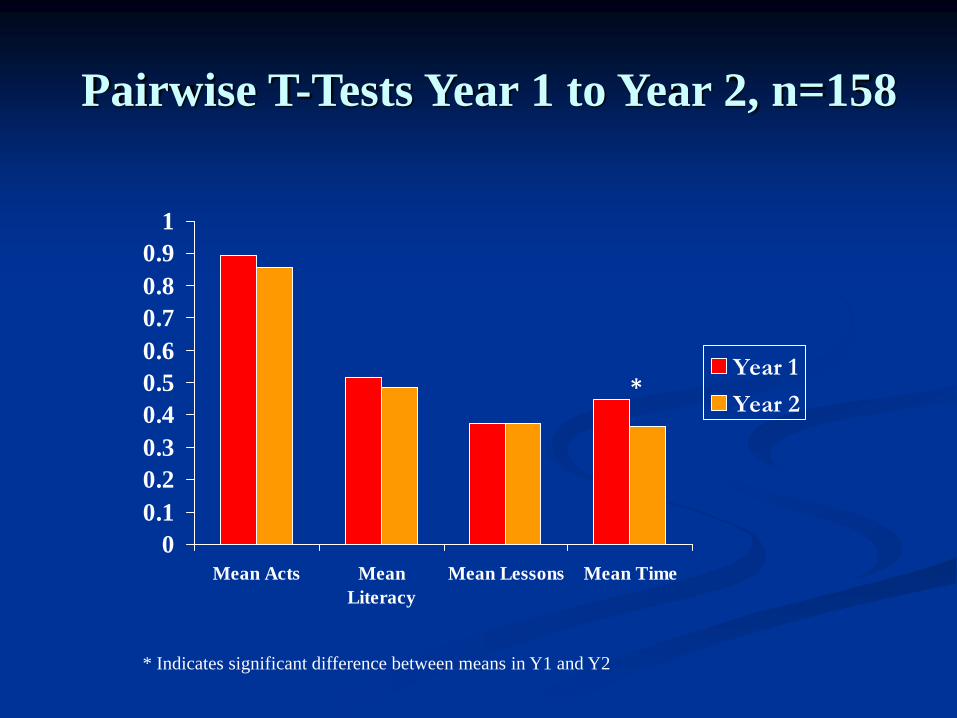
00.10.20.30.40.50.60.70.80.9
1
Mean Acts MeanLiteracy
Mean Lessons Mean Time
Year 1
Year 2
Pairwise T-Tests Year 1 to Year 2, n=158
*
* Indicates significant difference between means in Y1 and Y2
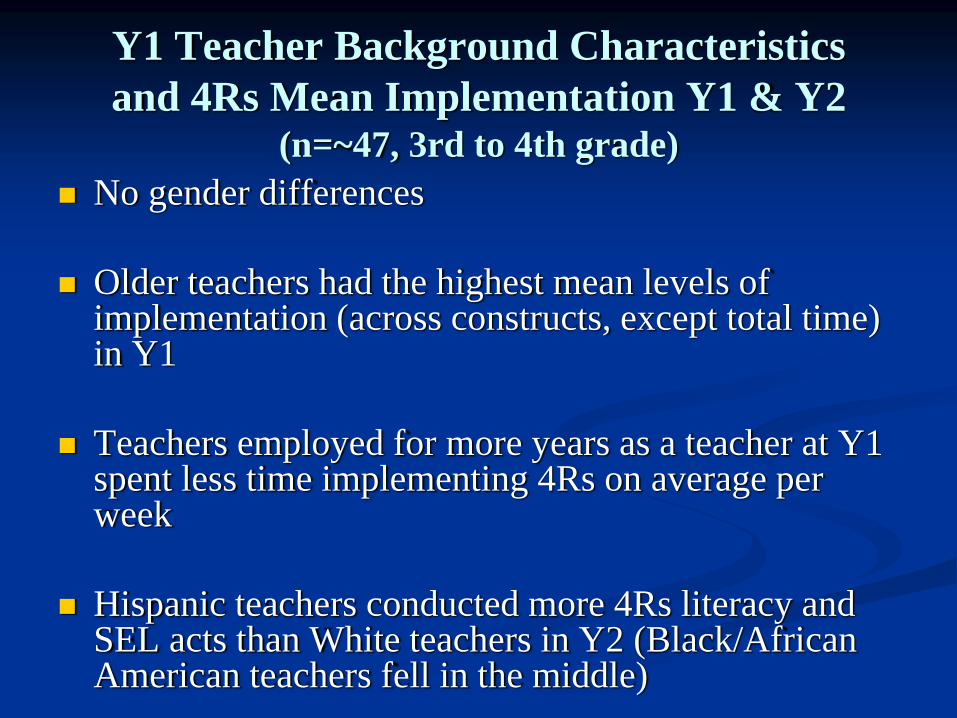
Y1 Teacher Background Characteristics and 4Rs Mean Implementation Y1 & Y2
(n=~47, 3rd to 4th grade)No gender differences
Older teachers had the highest mean levels of implementation (across constructs, except total time) in Y1
Teachers employed for more years as a teacher at Y1 spent less time implementing 4Rs on average per week
Hispanic teachers conducted more 4Rs literacy and SEL acts than White teachers in Y2 (Black/African American teachers fell in the middle)
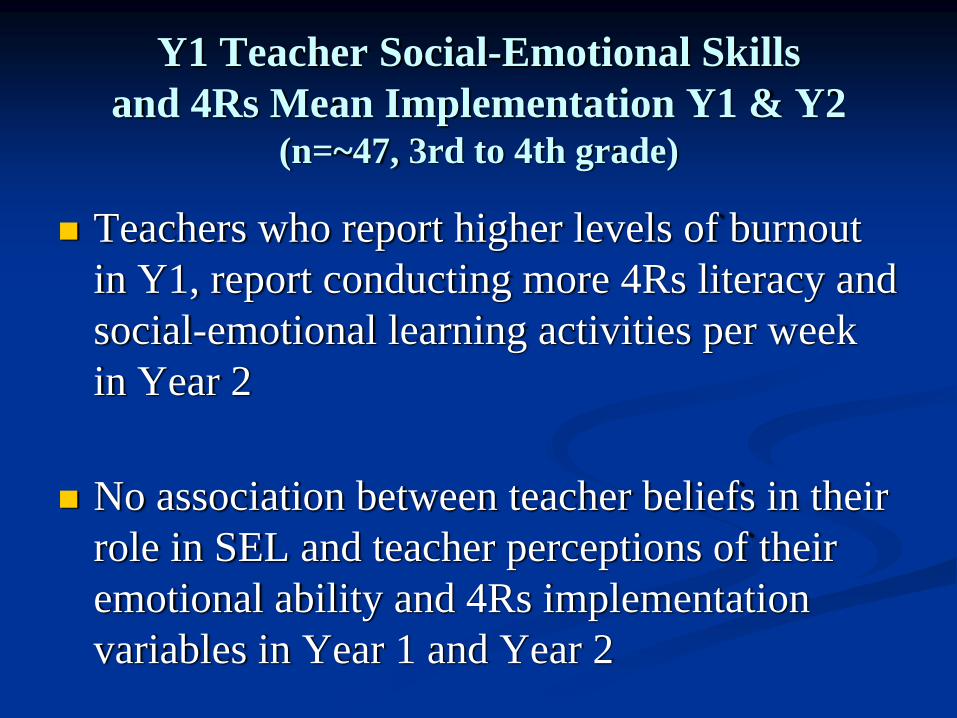
Y1 Teacher Social-Emotional Skills and 4Rs Mean Implementation Y1 & Y2
(n=~47, 3rd to 4th grade)
Teachers who report higher levels of burnout in Y1, report conducting more 4Rs literacy and social-emotional learning activities per week in Year 2
No association between teacher beliefs in their role in SEL and teacher perceptions of their emotional ability and 4Rs implementation variables in Year 1 and Year 2
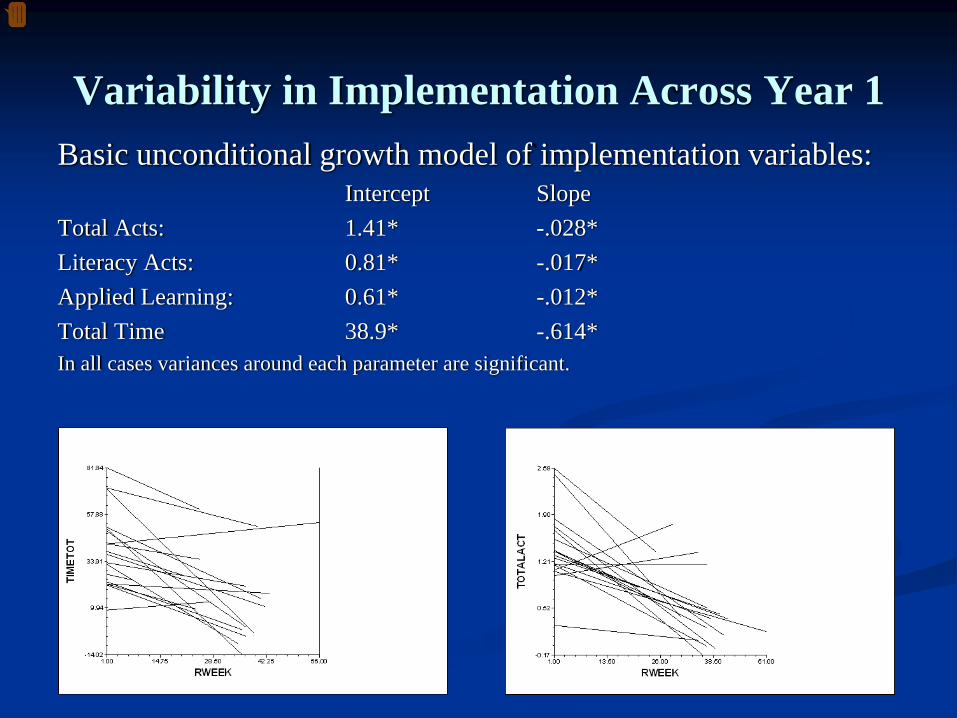
Variability in Implementation Across Year 1Basic unconditional growth model of implementation variables:
Intercept SlopeTotal Acts: 1.41* -.028*Literacy Acts: 0.81* -.017*Applied Learning: 0.61* -.012*Total Time 38.9* -.614*In all cases variances around each parameter are significant.
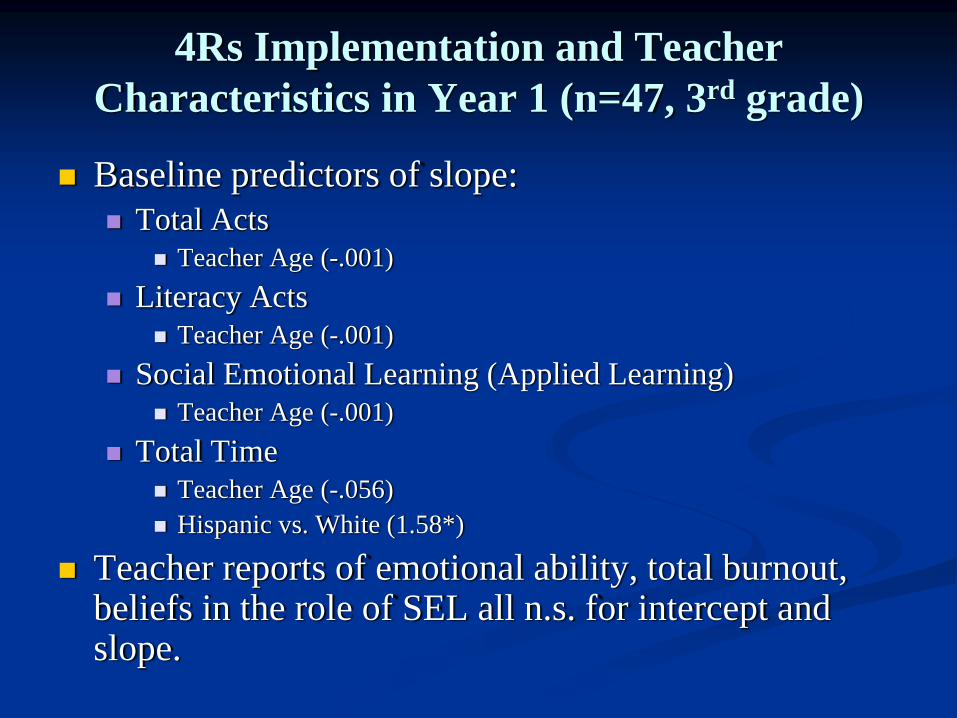
4Rs Implementation and Teacher Characteristics in Year 1 (n=47, 3rd grade)
Baseline predictors of slope:Total Acts
Teacher Age (-.001)Literacy Acts
Teacher Age (-.001)Social Emotional Learning (Applied Learning)
Teacher Age (-.001)Total Time
Teacher Age (-.056)Hispanic vs. White (1.58*)
Teacher reports of emotional ability, total burnout, beliefs in the role of SEL all n.s. for intercept and slope.
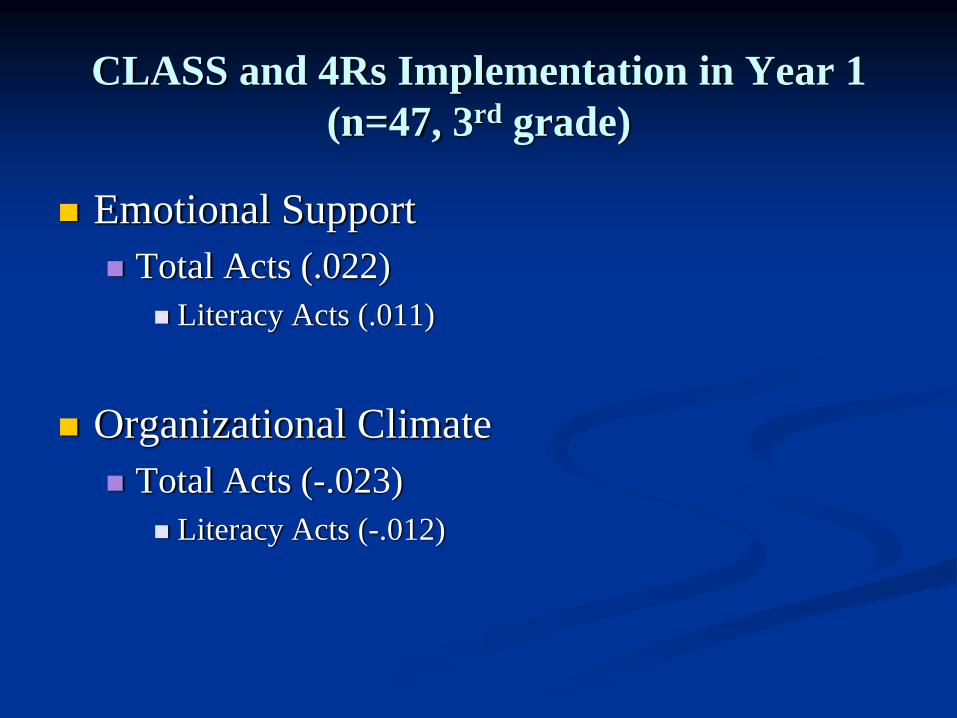
CLASS and 4Rs Implementation in Year 1 (n=47, 3rd grade)
Emotional SupportTotal Acts (.022)
Literacy Acts (.011)
Organizational ClimateTotal Acts (-.023)
Literacy Acts (-.012)
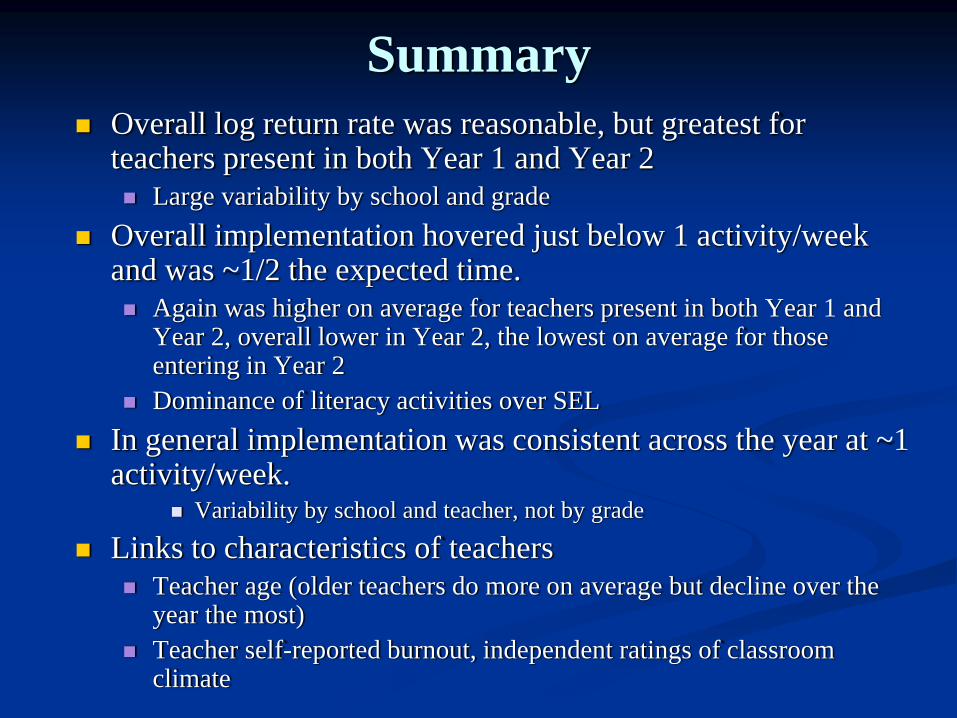
SummaryOverall log return rate was reasonable, but greatest for teachers present in both Year 1 and Year 2
Large variability by school and gradeOverall implementation hovered just below 1 activity/week and was ~1/2 the expected time.
Again was higher on average for teachers present in both Year 1 and Year 2, overall lower in Year 2, the lowest on average for those entering in Year 2Dominance of literacy activities over SEL
In general implementation was consistent across the year at ~1 activity/week.
Variability by school and teacher, not by grade
Links to characteristics of teachersTeacher age (older teachers do more on average but decline over the year the most)Teacher self-reported burnout, independent ratings of classroom climate
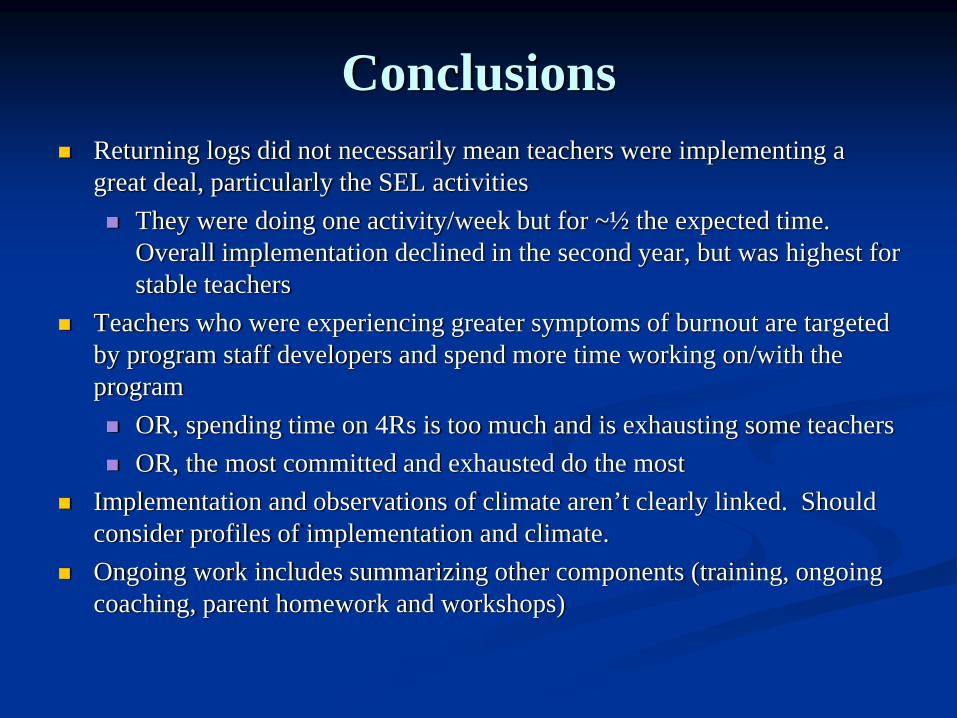
ConclusionsReturning logs did not necessarily mean teachers were implementing a great deal, particularly the SEL activities
They were doing one activity/week but for ~½ the expected time. Overall implementation declined in the second year, but was highest for stable teachers
Teachers who were experiencing greater symptoms of burnout are targeted by program staff developers and spend more time working on/with the program
OR, spending time on 4Rs is too much and is exhausting some teachersOR, the most committed and exhausted do the most
Implementation and observations of climate aren’t clearly linked. Should consider profiles of implementation and climate.Ongoing work includes summarizing other components (training, ongoing coaching, parent homework and workshops)


![PEP Web - The Analytic Third: Working with Intersubjective ... … · analytic third'. This third subjectivity, the intersubjective analytic third Green's [1975] 'analytic object'),](https://img.pdfslide.net/doc/110x75/6099619e2d4b51336024f694/pep-web-the-analytic-third-working-with-intersubjective-analytic-third.jpg)