Embed Size (px)
Citation preview
RESEARCH PAPER
Analytical and numerical simulations of uplift processesat the Tibet-Sichuan boundary
Diandian Peng . Wei Leng
Received: 15 January 2017 / Accepted: 23 May 2017 / Published online: 27 June 2017
� The Author(s) 2017. This article is an open access publication
Abstract Previous studies have shown that the uplift of
Tibetan plateau started in response to the collision of Indian
plate and Eurasian plate. During this process, the crust of
Tibetan plateau has been greatly thickened which leads to
significant elevations. The elevationgradient is extremely large
at the east boundary of Tibetan plateau where Longmenshan
fault exists, dropping from 4500 to 500 m within a distance of
100 km, while it is more gentle at the south and north sides of
Sichuan basin. Such a difference of elevation gradient has been
explained with a crustal channel flow model. However, pre-
vious crustal flow models consider the thickness of the lower
crust as a constant which is highly simplified. Therefore, it is
essential to build a more realistic crustal flow model, in which
the thickness of the lower crust is variable and dependent on the
inflow velocity of crustal materials. Here we build up both
analytical and numerical models to study the mechanism and
process of the uplift of Tibetan plateau at the eastern boundary.
The results of the analytical model show that if the thickness of
the lower crust can vary during the uplift process, the lower
crustal viscosity of the Sichuan basin needs to be 1022 Pas to fit
the observed elevation gradient. Such a viscosity is one-order
magnitude larger than the previous results. Numerical model
results further show that the state of stresses at the plateau
boundary changes during uplift processes. Such a stress state
change may cause the formation of different fault types in the
Longmenshan fault area during its uplift history.
Keywords Tibetan plateau � Sichuan basin � Channelflow � Geodynamic modeling
1 Introduction
Tibetan plateau is the largest plateau in the world with an
average elevation of *4500 m. The plateau has a flat
interior and magnificent mountain belts around it (Tappon-
nier et al. 2001; Jimenez-Munt and Platt 2006) (Fig. 1). The
mechanism for uplift of the Tibetan plateau has always been
a focus in geological researches. The common consensus is
that the uplift began when the Indian plate collided with the
Eurasian plate after the oceanic lithosphere of the Tethys
Sea subducted beneath the Eurasian plate (van der Voo et al.
1999; Royden et al. 2008). But the time of the collision is
still under debate, probably starting from 50 Ma or earlier
(Tapponnier et al. 2001; Yin and Harrison 2000; Royden
et al. 2008; Wang et al. 2012). The suture zones distributed
in Tibetan plateau imply that the plateau has undergone
several episodes of different terranes being pieced together
(Yin and Harrison 2000; Tapponnier et al. 2001). When
being squeezed by the Indian plate, the crust of Tibetan
plateau got shortened in south-north direction and thick-
ened, with extensions at east-west direction and an outflow
of materials toward east (Yin and Harrison 2000; Tappon-
nier et al. 2001; Zhang et al. 2004; Royden et al. 2008).
At the eastern margin of the plateau, the flow of mate-
rials breaks into two branches due to the obstruction of
Sichuan basin: one toward Ordos basin and the other
toward Indo-China block with a clockwise rotation (Roy-
den et al. 2008; Zhao et al. 2013). The elevation gradient
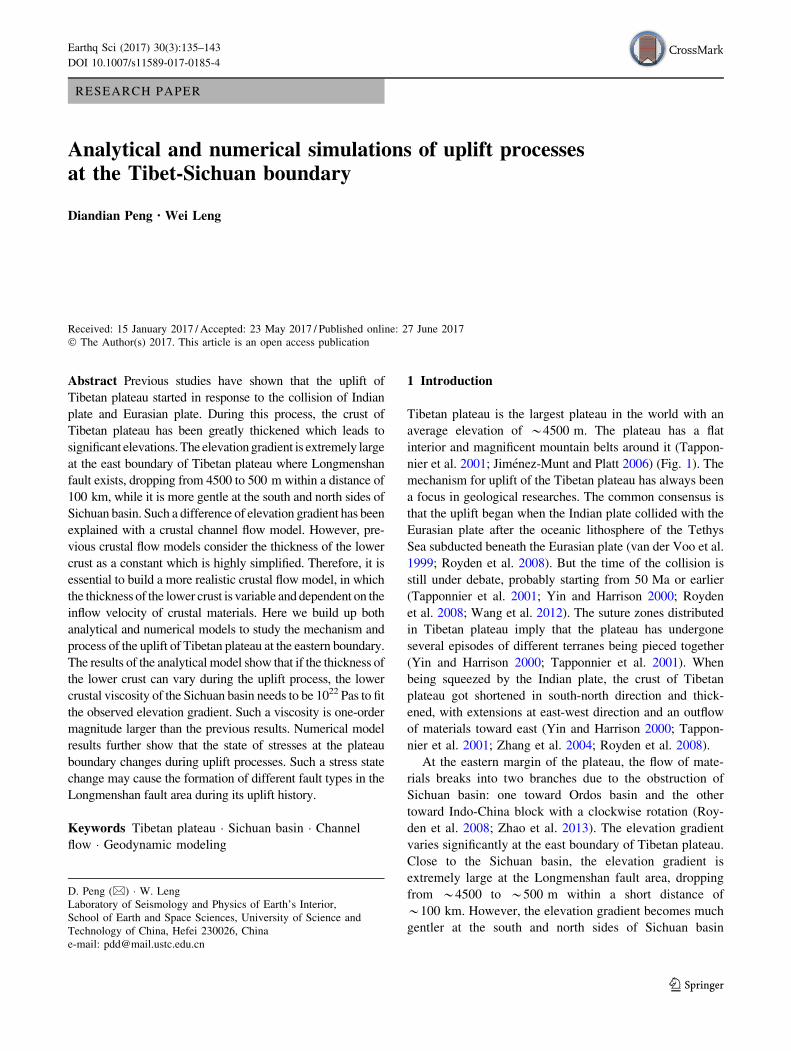
varies significantly at the east boundary of Tibetan plateau.
Close to the Sichuan basin, the elevation gradient is
extremely large at the Longmenshan fault area, dropping
from *4500 to *500 m within a short distance of
*100 km. However, the elevation gradient becomes much
gentler at the south and north sides of Sichuan basin
D. Peng (&) � W. Leng
Laboratory of Seismology and Physics of Earth’s Interior,
School of Earth and Space Sciences, University of Science and
Technology of China, Hefei 230026, China
e-mail: [email protected]
123
Earthq Sci (2017) 30(3):135–143
DOI 10.1007/s11589-017-0185-4
(Fig. 1). Understanding the uplift history and the elevation
gradient variations at the eastern boundary of the Tibetan
plateau is one of the key aspects for building up the
dynamic evolution processes of the Tibetan plateau.
According to the results of seismic source mechanism,
magnetotelluric imaging and anisotropic tomography
results, the lower crust of the Tibetan plateau is probably a
layer with high temperature and low viscosities (Nelson
et al. 1996; Wei et al. 2001; Unsworth et al. 2005; Jimenez-
Munt and Platt 2006; Priestley et al. 2008; Yang et al.
2012; Liu et al. 2014). First, the crustal thickness of the
plateau is almost twice as much as the worldwide averaged
value (Jimenez-Munt and Platt 2006). Therefore, it should
contain more radioactive elements, leading to high tem-
perature in the lower crust. Magnetotelluric results reveal
that the electrical resistivity of the lower crust in the
Tibetan plateau is lower than ambient regions such as
Sichuan basin and Tarim basin, suggesting the possible
existence of partial melting (Nelson et al. 1996; Wei et al.
2001; Unsworth et al. 2005). Second, according to the
distribution of earthquake locations, the seismic activity is
very weak in the lower crust (Priestley et al. 2008), which
100˚
100˚
102˚
102˚
104˚
104˚
106˚
106˚
28˚ 28˚
30˚ 30˚
32˚ 32˚
34˚ 34˚
100˚
100˚
102˚
102˚
104˚
104˚
106˚
106˚
28˚ 28˚
30˚ 30˚
32˚ 32˚
34˚ 34˚
100˚
100˚
102˚
102˚
104˚
104˚
106˚
106˚
28˚ 28˚
30˚ 30˚
32˚ 32˚
34˚ 34˚
100˚
100˚
102˚
102˚
104˚
104˚
106˚
106˚
28˚ 28˚
30˚ 30˚
32˚ 32˚
34˚ 34˚
100˚
100˚
102˚
102˚
104˚
104˚
106˚
106˚
28˚ 28˚
30˚ 30˚
32˚ 32˚
34˚ 34˚
100˚
100˚
102˚
102˚
104˚
104˚
106˚
106˚
28˚ 28˚
30˚ 30˚
32˚ 32˚
34˚ 34˚
100˚
100˚
102˚
102˚
104˚
104˚
106˚
106˚
28˚ 28˚
30˚ 30˚
32˚ 32˚
34˚ 34˚
1 cm/a
100˚
100˚ E
102˚
102˚
104˚
104˚
106˚
106˚
28˚ 28˚
30˚ 30˚
32˚ 32˚
34˚ N 34˚
A’
A
Sichuan basinLo
ngmen
shan
fault
Tibetan plateau
Xianshuihe fault
0 1000 2000 3000 4000 5000 6000 7000
Topography (m)
Fig. 1 Topography map at the Tibet-Sichuan boundary. The red lines are faults in this region. Two major faults, Longmenshan fault and
Xianshuihe fault, are labeled in the figure. Arrows with ellipses at the heads are the surface movement from GPS observation (Zhang et al. 2004),
and the ellipses mean 95% error range. AA0 notates the profile discussed later. The elevation of AA0 is shown in Fig. 3. The inset map shows
Tibetan plateau and ambient areas. The black lines are major plate boundaries. The blue box shows the location of our study area
136 Earthq Sci (2017) 30(3):135–143
123
can be explained by the low mechanical strength of the
lower crust. Tomography results also show low-velocity
zones in the lower crust (Meissner and Mooney 1998;
Galve et al. 2006; Wang et al. 2007; Yao et al. 2008; Yang
et al. 2012; Liu et al. 2014). Furthermore, small elastic
thickness and high Q value of Tibetan plateau both support
a weak lower crust for the Tibetan plateau (Jordan and
Watts 2005; Wang et al. 2007; Bao et al. 2011; Zhao et al.
2013). Third, the lower crust of the plateau has strong
seismic anisotropy, where the velocity of SH wave is much
higher than SV wave (Shapiro et al. 2004; Huang et al.
2010; Yao et al. 2010). This radial anisotropy may be
explained by the horizontal arrangement of anisotropic
minerals such as mica (Shapiro et al. 2004; Huang et al.
2010; Shen et al. 2015). Such rearrangement of minerals
may reflect flow motions in the lower crust layer and
behaves as a direct evidence that the lower crust flow exists
(Shapiro et al. 2004). Lower crustal channel flow may also
be the reason for the extensional tectonics and, at the same
time, the collapse of Songpan-Garze orogenic belt at early
Mesozoic (Yan et al. 2008).
Based on these observed factors of the lower crust, a
crustal channel flow model has been proposed to explain
the difference of elevation gradient at the east boundary of
the Tibetan plateau (Royden et al. 1997; Clark and Royden
2000; Beaumont et al. 2001; Clark et al. 2005; Cook and
Royden 2008; Royden et al. 2008). It proposed that the
lower crust of the Tibetan plateau is mechanically weak
with a lower viscosity than the upper crust and the upper
mantle; therefore, the lower crust materials within the weak
channel should be able to flow from the Tibet area to the
ambient regions. In this model, the viscosity of the lower
crust controls the elevations gradient at the plateau
boundaries. A higher viscosity in the lower crust corre-
sponds to a larger elevation gradient (Royden et al. 1997;
Clark and Royden 2000). With this model and the observed
elevation gradients, the viscosity of the lower crust beneath
the Sichuan basin has been constrained as 1021 Pas.
However, when deriving this channel flow model, the
thickness of the lower crust is kept constant. This is against
the reality that the thickness of the lower crust should
increase when new materials flow in. The thickness of the
lower crust plays an important role in surface topography
and elevation gradient. It is essential to build a more
realistic crustal flow model to incorporate this effect.
Here we study the uplift process at the Tibet-Sichuan
boundary, so we choose a profile across the Longmenshan
fault (profile AA0 in Fig. 1). In this study, we first analyt-
ically derive an improved channel flow model in which the
thickness of the lower crust is controlled by the inflow
velocity of the crustal materials. Then with the observed
elevation gradients, this new model is used to constrain the
viscosity of the lower crust beneath the Sichuan basin.
Starting from this analytic model, we further build
numerical models to explore the time evolutions of the
uplift history in the Longmenshan fault area. We also
discuss the temporal and spatial distributions of stresses in
this area during the uplift processes.
2 An improved analytical channel flow model
During the strong uplift processes of the Tibetan plateau,
no significant crustal shortening was observed (Yin and
Harrison 2000; Clark and Royden 2000). Therefore, Clark
and Royden (2000) proposed an analytical channel flow
model to explain the uplift mechanism, in which weak
lower crust materials can horizontally flow within a chan-
nel of constant thickness (Fig. 2a). When the flowing
materials are blocked by strong basins such as the Sichuan
basin, lower crustal materials accumulate and cause
increased crustal thickness which leads to high elevations.
The elevation gradient is dominantly controlled by the
lower crust viscosity of the strong basins. With the
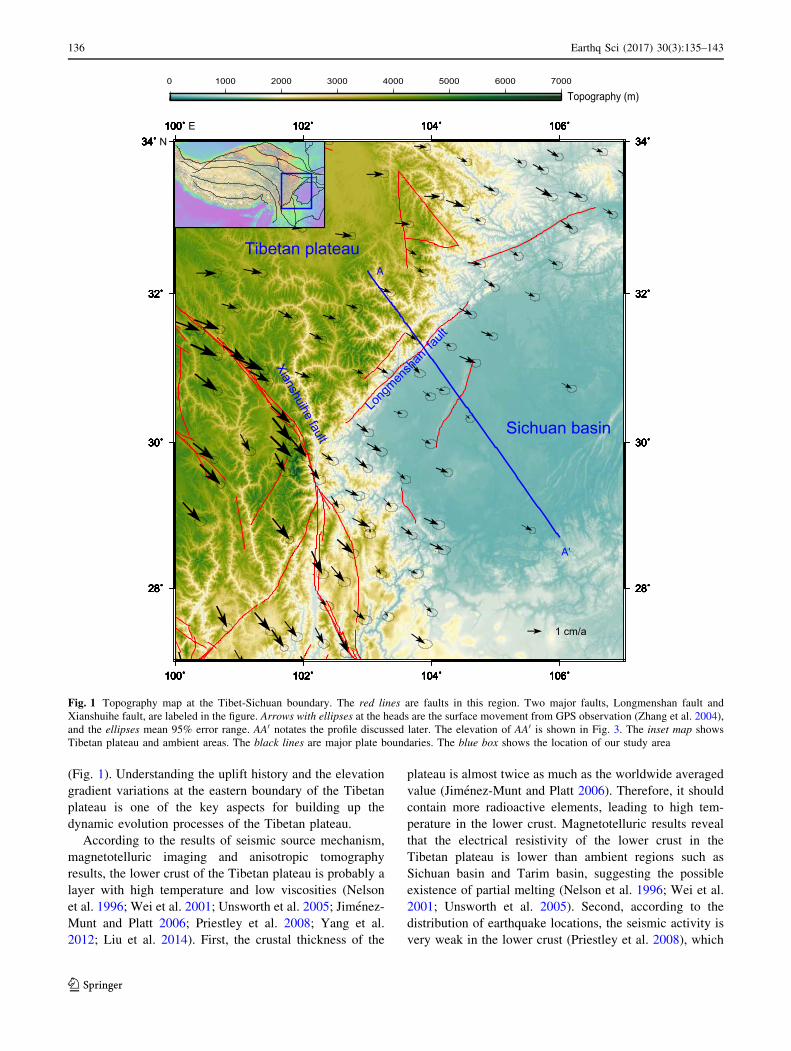
Fig. 2 a A schematic figure for traditional channel flow model (Clark and Royden 2000). The lightly shaded zone shows the thickened lower
crust parts which do not take part in the channel flow. b Our improved model in which the flow channel includes all the thickened lower crust
parts
Earthq Sci (2017) 30(3):135–143 137
123
observed elevation gradient at the Tibet-Sichuan boundary,
close to the Longmenshan area, Clark and Royden (2000)
constrain the viscosity of the lower crust beneath the
Sichuan basin to be 1021 Pas.
There are two points in the previous channel flow model
which need to be reconsidered. First, the thickness of the
channel is fixed as a constant (Fig. 2a), which is obviously
not in accordance with the tectonic facts that the thickness
of the flow channel should gradually increase with the
influx materials (Fig. 2b). Second, Clark and Royden
(2000) chose 20 Ma as the duration time for the uplift
process at the Longmenshan area. But Kirby et al. (2002)
used thermochronology to suggest that the uplift of
Longmenshan started at 11–5 Ma. Wang et al. (2012) also
proposed that there may be two rapid uplift processes at the
Longmenshan area, and the later one probably started from
15 to 10 Ma.
Here we set up an improved channel flow model to
incorporate the variations of the channel thickness and the
updated duration time for the uplift process at the Long-
menshan area. In our model, the uplift of Longmenshan
area began at 11 Ma. The channel thickness is a variable
which depends on the amount of materials flowing in
from the left boundary (Fig. 2b). The velocities above and
below the channel are zero. The left and right boundaries
are free slip. The thickness of the lower crust is set as 27
and 15 km at these two boundaries, which, respectively,
represent the lower crust thickness beneath the Tibetan
plateau and the Sichuan basin from the P-wave velocity
studies (Wang et al. 2007) (Fig. 2b). The initial thickness
of the channel is 15 km. The crust and mantle density is
2600 and 3300 kg/m3, respectively. The viscosity of the
lower crust materials in the channel is taken as a constant.
In this model, although the upper and lower boundaries
of the flow are not parallel, we can still consider flow in the
channel as a Poiseuille flow in each infinitely small box in
the horizontal direction. According to the Poiseuille law,
the horizontal velocity u depends on the horizontal pressure
gradient (Turcotte and Schubert 2002):
uðx; zÞ ¼ 1
2ldp
dxðz2 � hzÞ; ð1Þ
where x and z are the horizontal and vertical coordinates; lis viscosity. p ¼ qcgE is pressure, where qc, g and E are the
crustal density, gravitational acceleration and surface
topography. h is the thickness of the lower crust channel.
The total material flux in the channel, U, is:
UðxÞ ¼Z h
0
uðzÞdz ¼ � 1
12lh3
dp
dxð2Þ
The temporal variation of lower crust thickness c is the
same as the total material flux:
dc
dt¼ � dU
dt¼ 1
12ld
dxh3
dp
dx
� �: ð3Þ
The surface elevation is controlled by crustal isostasy as
dE
dt¼ qm � qc
qm
dc
dt¼ 1
12lqcðqm � qcÞg
qm
d
dxh3
dE
dx
� �: ð4Þ
If we consider the thickness of the channel h is the same as
the thickness of the lower crust c, we finally obtain the
controlling equations for channel thickness and the surface
topography:
dh
dt¼ a2
d
dxh3
dh
dx
� �; ð5Þ
dE
dt¼ a2
d
dxh3
dE
dx
� �; ð6Þ
where a ¼ffiffiffiffiffiffiffiffiffiffiffiffiffiffiffiffiffiffiffiffiffiffiffiffiffi1
12lqcðqm�qcÞ
qmg
q; qm is the mantle density.
Equations (5) and (6) are solved with Wolfram Mathe-
matica to obtain h and E at any instant time when initial
and boundary conditions are given. According to the
crustal structure from Wang et al. (2007) and topography
data, E(x = 0) = 4150 m, E(x[ 0) = 400 m, h(x = 0)
= 27 km, and h(x[ 0) = 15 km. We plot the temporal
variations of lower crustal thickness and surface elevation
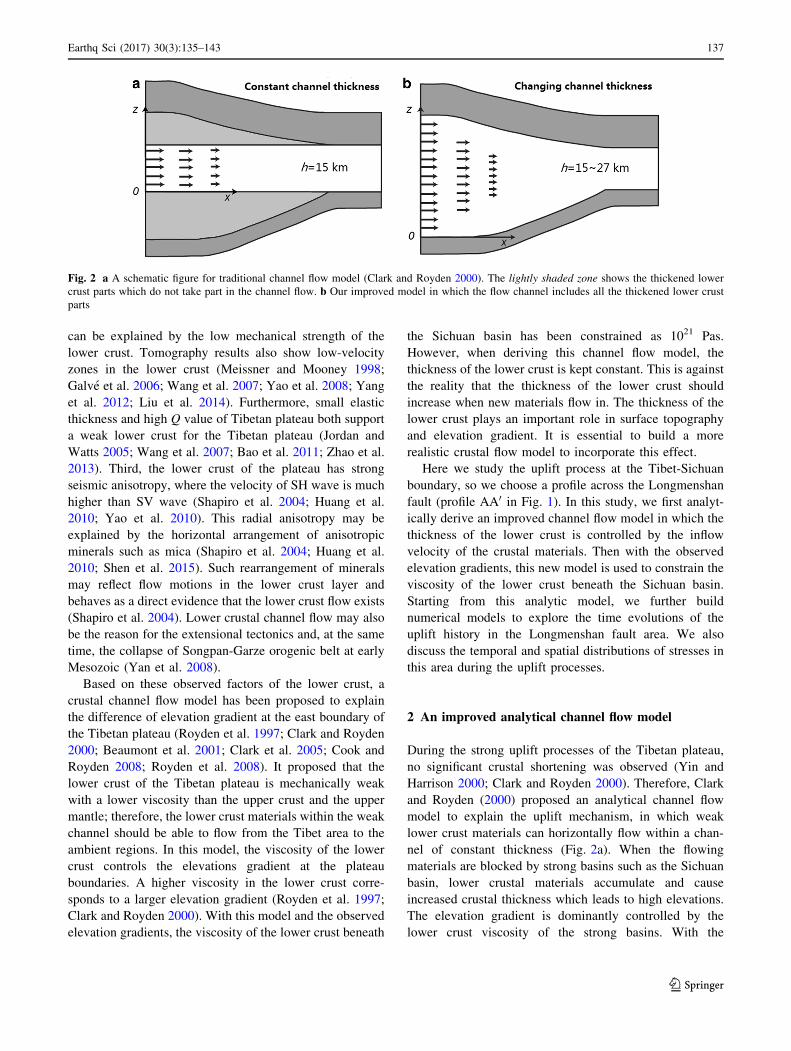
at x = 10, 50 and 100 km (Fig. 3a). It can be observed that
near the left boundary (red lines in Fig. 3a), both the
thickness of the lower crust and the elevation increase
quickly in the first few million years. Then they gradually
Thickness
0 2 4 6 8 1010
15
20
25
30
Thic
knes
s(k
m)
Elevation
0
1000
2000
3000
4000
5000
Ele
vatio
n(m
)
Time (Ma)
10 km
10 km
50 km
50 km
100 km
100 km
0 100 200 300 4000
1000
2000
3000
4000
5000
6000
X (km)
Ele
vatio
n( m
)
1021 Pas
1022 Pas
1023 Pas
b
A’A
a
Fig. 3 a Temporal evolution of the lower crustal thickness (solidlines) and the surface elevation (dashed lines) at x = 10 km (redlines), x = 50 km (blue lines) and x = 100 km (green lines) for our
channel flow model with a lower crustal viscosity of 1022 Pas. b The
observed elevation (black line) along the AA0 profile and the modeled
results from cases with different lower crust viscosities (red line:
l ¼ 1021 Pas; blue line: l ¼ 1022 Pas; red line: l ¼ 1023 Pas)
138 Earthq Sci (2017) 30(3):135–143
123
approach to steady-state values. At further positions (blue
and green lines in Fig. 3a), the thickness and elevation
grow much slower. As pointed out by Clark and Royden
(2000), the elevation gradient at the Tibet-Sichuan
boundary is controlled by the viscosity of the lower crust
beneath the Sichuan basin. The larger the lower crust vis-
cosity, the steeper the elevation gradient. In order to
reproduce the observed elevation gradient, the lower crust
viscosity is constrained to be 1022 Pas (Fig. 3b). This value
is one-order magnitude larger than previous modeling
results, suggesting that a variable channel thickness plays
an important role in the channel flow model. When the
lower crust channel is thickened, more materials can flow
into Sichuan basin through the channel. Therefore, to form
the same elevation gradient, we need a larger viscosity of
lower crust in our model.
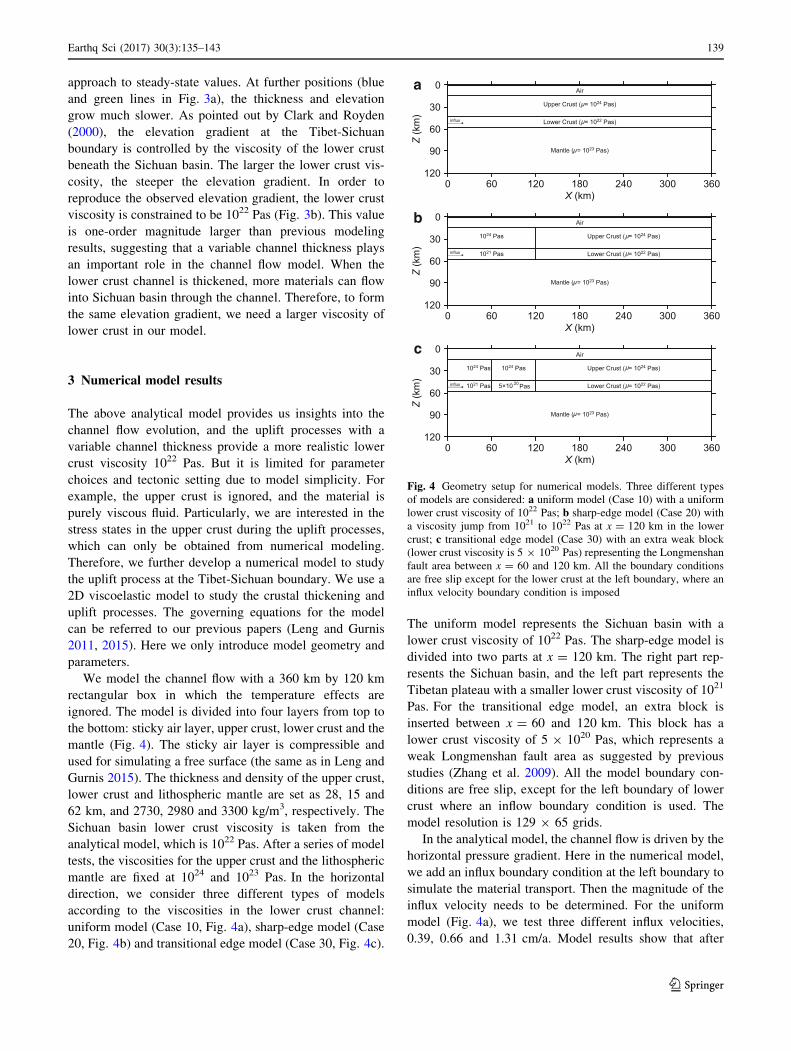
3 Numerical model results
The above analytical model provides us insights into the
channel flow evolution, and the uplift processes with a
variable channel thickness provide a more realistic lower
crust viscosity 1022 Pas. But it is limited for parameter
choices and tectonic setting due to model simplicity. For
example, the upper crust is ignored, and the material is
purely viscous fluid. Particularly, we are interested in the
stress states in the upper crust during the uplift processes,
which can only be obtained from numerical modeling.
Therefore, we further develop a numerical model to study
the uplift process at the Tibet-Sichuan boundary. We use a
2D viscoelastic model to study the crustal thickening and
uplift processes. The governing equations for the model
can be referred to our previous papers (Leng and Gurnis
2011, 2015). Here we only introduce model geometry and
parameters.
We model the channel flow with a 360 km by 120 km
rectangular box in which the temperature effects are
ignored. The model is divided into four layers from top to
the bottom: sticky air layer, upper crust, lower crust and the
mantle (Fig. 4). The sticky air layer is compressible and
used for simulating a free surface (the same as in Leng and
Gurnis 2015). The thickness and density of the upper crust,
lower crust and lithospheric mantle are set as 28, 15 and
62 km, and 2730, 2980 and 3300 kg/m3, respectively. The
Sichuan basin lower crust viscosity is taken from the
analytical model, which is 1022 Pas. After a series of model
tests, the viscosities for the upper crust and the lithospheric
mantle are fixed at 1024 and 1023 Pas. In the horizontal
direction, we consider three different types of models
according to the viscosities in the lower crust channel:
uniform model (Case 10, Fig. 4a), sharp-edge model (Case
20, Fig. 4b) and transitional edge model (Case 30, Fig. 4c).
The uniform model represents the Sichuan basin with a
lower crust viscosity of 1022 Pas. The sharp-edge model is
divided into two parts at x = 120 km. The right part rep-
resents the Sichuan basin, and the left part represents the
Tibetan plateau with a smaller lower crust viscosity of 1021
Pas. For the transitional edge model, an extra block is
inserted between x = 60 and 120 km. This block has a
lower crust viscosity of 5 9 1020 Pas, which represents a
weak Longmenshan fault area as suggested by previous
studies (Zhang et al. 2009). All the model boundary con-
ditions are free slip, except for the left boundary of lower
crust where an inflow boundary condition is used. The
model resolution is 129 9 65 grids.
In the analytical model, the channel flow is driven by the
horizontal pressure gradient. Here in the numerical model,
we add an influx boundary condition at the left boundary to
simulate the material transport. Then the magnitude of the
influx velocity needs to be determined. For the uniform
model (Fig. 4a), we test three different influx velocities,
0.39, 0.66 and 1.31 cm/a. Model results show that after
0
30
60
90
120
Z (k
m)
0 60 120 180 240 300 360X (km)
Air
Mantle ( = 1023 Pas)
Upper Crust (μ= 1024 Pas)
Lower Crust ( = 1022 Pas)influx
a
μ
μ
0
30
60
90
120
Z (k
m)
0 60 120 180 240 300 360X (km)
Air
Mantle ( = 1023 Pas)
Upper Crust ( = 1024 Pas)
Lower Crust ( = 1022 Pas)
1024 Pas
1021 Pasinflux
b
0
30
60
90
120
Z (k
m)
0 60 120 180 240 300 360X (km)
Air
Mantle ( = 1023 Pas)
Upper Crust ( = 1024 Pas)
Lower Crust ( = 1022 Pas)
1024 Pas
1021 Pas
1024 Pas
5×10 20 Pasinflux
c
μ
μ
μ
μ
μ
μ
Fig. 4 Geometry setup for numerical models. Three different types
of models are considered: a uniform model (Case 10) with a uniform
lower crust viscosity of 1022 Pas; b sharp-edge model (Case 20) with
a viscosity jump from 1021 to 1022 Pas at x = 120 km in the lower
crust; c transitional edge model (Case 30) with an extra weak block
(lower crust viscosity is 5 9 1020 Pas) representing the Longmenshan
fault area between x = 60 and 120 km. All the boundary conditions
are free slip except for the lower crust at the left boundary, where an
influx velocity boundary condition is imposed
Earthq Sci (2017) 30(3):135–143 139
123
*11 million years of uplift process, the surface elevations
at the left boundary are 3000, 4000 and 7000 m, respec-
tively. We, therefore, choose 0.66 cm/a, which causes a
surface elevation consistent with the Tibetan plateau, as the
reference influx velocity for all our models. Such a velocity
also agrees to the velocity difference between the Tibetan
plateau and the Sichuan basin from GPS data (Zhang et al.
2004).
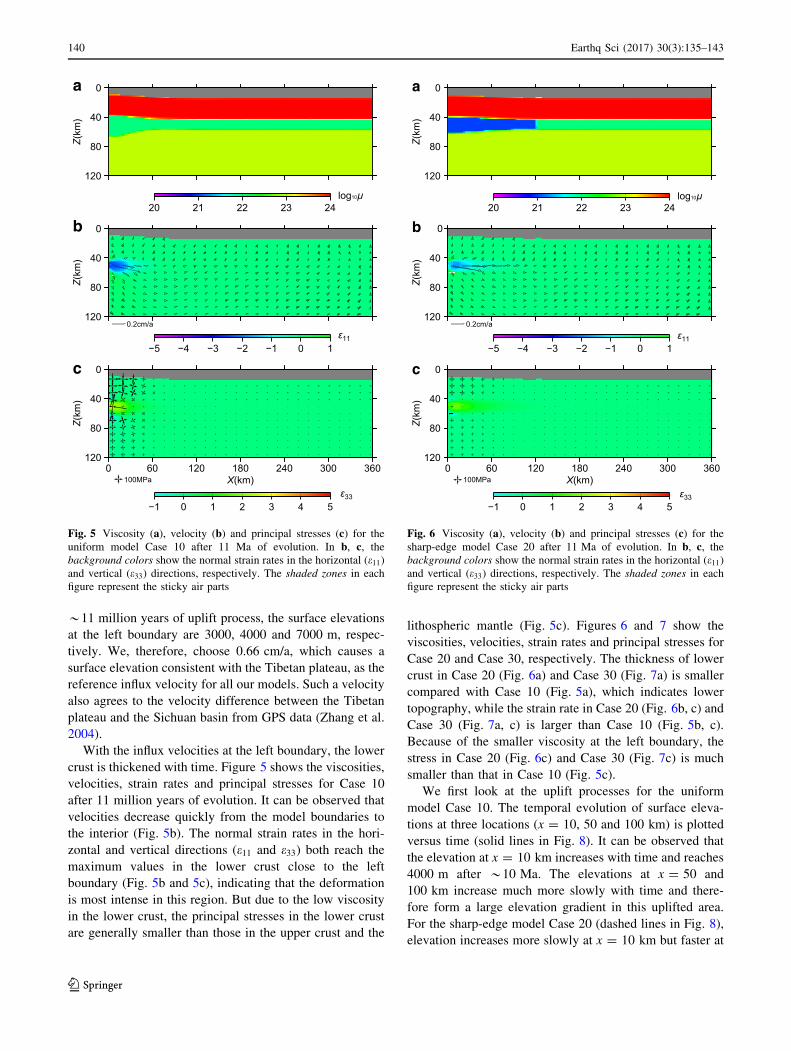
With the influx velocities at the left boundary, the lower
crust is thickened with time. Figure 5 shows the viscosities,
velocities, strain rates and principal stresses for Case 10
after 11 million years of evolution. It can be observed that
velocities decrease quickly from the model boundaries to
the interior (Fig. 5b). The normal strain rates in the hori-
zontal and vertical directions (e11 and e33) both reach the
maximum values in the lower crust close to the left
boundary (Fig. 5b and 5c), indicating that the deformation
is most intense in this region. But due to the low viscosity
in the lower crust, the principal stresses in the lower crust
are generally smaller than those in the upper crust and the
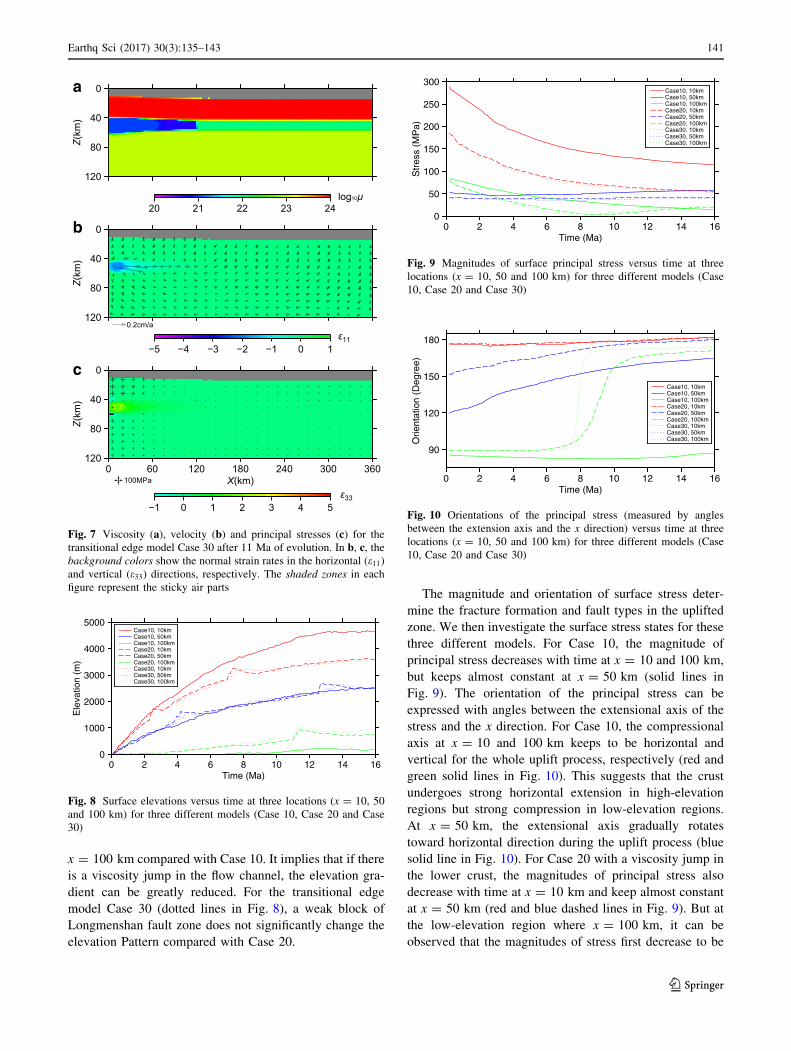
lithospheric mantle (Fig. 5c). Figures 6 and 7 show the
viscosities, velocities, strain rates and principal stresses for
Case 20 and Case 30, respectively. The thickness of lower
crust in Case 20 (Fig. 6a) and Case 30 (Fig. 7a) is smaller
compared with Case 10 (Fig. 5a), which indicates lower
topography, while the strain rate in Case 20 (Fig. 6b, c) and
Case 30 (Fig. 7a, c) is larger than Case 10 (Fig. 5b, c).
Because of the smaller viscosity at the left boundary, the
stress in Case 20 (Fig. 6c) and Case 30 (Fig. 7c) is much
smaller than that in Case 10 (Fig. 5c).
We first look at the uplift processes for the uniform
model Case 10. The temporal evolution of surface eleva-
tions at three locations (x = 10, 50 and 100 km) is plotted
versus time (solid lines in Fig. 8). It can be observed that
the elevation at x = 10 km increases with time and reaches
4000 m after *10 Ma. The elevations at x = 50 and
100 km increase much more slowly with time and there-
fore form a large elevation gradient in this uplifted area.
For the sharp-edge model Case 20 (dashed lines in Fig. 8),
elevation increases more slowly at x = 10 km but faster at
0
40
80
120
Z(km
)
20 21 22 23 24
0
40
80
120
Z(km
)
−5 −4 −3 −2 −1 0 1
0.2cm/a
0
40
80
120
Z(km
)
0 60 120 180 240 300 360X(km)
−1 0 1 2 3 4 5
100MPa
log10μ
ε11
ε33
a
b
c
Fig. 5 Viscosity (a), velocity (b) and principal stresses (c) for the
uniform model Case 10 after 11 Ma of evolution. In b, c, the
background colors show the normal strain rates in the horizontal (e11)and vertical (e33) directions, respectively. The shaded zones in each
figure represent the sticky air parts
0
40
80
120
Z(km
)
20 21 22 23 24
0
40
80
120
Z(km
)
−5 −4 −3 −2 −1 0 1
0.2cm/a
0
40
80
120
Z(km
)
0 60 120 180 240 300 360X(km)
−1 0 1 2 3 4 5
100MPa
log10μ
ε11
ε33
a
b
c
Fig. 6 Viscosity (a), velocity (b) and principal stresses (c) for the
sharp-edge model Case 20 after 11 Ma of evolution. In b, c, thebackground colors show the normal strain rates in the horizontal (e11)and vertical (e33) directions, respectively. The shaded zones in each
figure represent the sticky air parts
140 Earthq Sci (2017) 30(3):135–143
123
x = 100 km compared with Case 10. It implies that if there
is a viscosity jump in the flow channel, the elevation gra-
dient can be greatly reduced. For the transitional edge
model Case 30 (dotted lines in Fig. 8), a weak block of
Longmenshan fault zone does not significantly change the
elevation Pattern compared with Case 20.
The magnitude and orientation of surface stress deter-
mine the fracture formation and fault types in the uplifted
zone. We then investigate the surface stress states for these
three different models. For Case 10, the magnitude of
principal stress decreases with time at x = 10 and 100 km,
but keeps almost constant at x = 50 km (solid lines in
Fig. 9). The orientation of the principal stress can be
expressed with angles between the extensional axis of the
stress and the x direction. For Case 10, the compressional
axis at x = 10 and 100 km keeps to be horizontal and
vertical for the whole uplift process, respectively (red and
green solid lines in Fig. 10). This suggests that the crust
undergoes strong horizontal extension in high-elevation
regions but strong compression in low-elevation regions.
At x = 50 km, the extensional axis gradually rotates
toward horizontal direction during the uplift process (blue
solid line in Fig. 10). For Case 20 with a viscosity jump in
the lower crust, the magnitudes of principal stress also
decrease with time at x = 10 km and keep almost constant
at x = 50 km (red and blue dashed lines in Fig. 9). But at
the low-elevation region where x = 100 km, it can be
observed that the magnitudes of stress first decrease to be
0
40
80
120
Z(km
)
20 21 22 23 24
0
40
80
120
Z(km
)
−5 −4 −3 −2 −1 0 1
0.2cm/a
0
40
80
120
Z(km
)
0 60 120 180 240 300 360X(km)
−1 0 1 2 3 4 5
100MPa
log10μ
ε11
ε33
a
b
c
Fig. 7 Viscosity (a), velocity (b) and principal stresses (c) for the
transitional edge model Case 30 after 11 Ma of evolution. In b, c, thebackground colors show the normal strain rates in the horizontal (e11)and vertical (e33) directions, respectively. The shaded zones in each
figure represent the sticky air parts
0
1000
2000
3000
4000
5000
Ele
vatio
n (m
)
0 2 4 6 8 10 12 14 16Time (Ma)
Case10, 10kmCase10, 50kmCase10, 100kmCase20, 10kmCase20, 50kmCase20, 100kmCase30, 10kmCase30, 50kmCase30, 100km
Fig. 8 Surface elevations versus time at three locations (x = 10, 50
and 100 km) for three different models (Case 10, Case 20 and Case
30)
0
50
100
150
200
250
300
Str
ess
(MP
a)
0 2 4 6 8 10 12 14 16Time (Ma)
Case10, 10kmCase10, 50kmCase10, 100kmCase20, 10kmCase20, 50kmCase20, 100kmCase30, 10kmCase30, 50kmCase30, 100km
Fig. 9 Magnitudes of surface principal stress versus time at three
locations (x = 10, 50 and 100 km) for three different models (Case
10, Case 20 and Case 30)
90
120
150
180
Orie
ntat
ion
(Deg
ree)
0 2 4 6 8 10 12 14 16Time (Ma)
Case10, 10kmCase10, 50kmCase10, 100kmCase20, 10kmCase20, 50kmCase20, 100kmCase30, 10kmCase30, 50kmCase30, 100km
Fig. 10 Orientations of the principal stress (measured by angles
between the extension axis and the x direction) versus time at three
locations (x = 10, 50 and 100 km) for three different models (Case
10, Case 20 and Case 30)
Earthq Sci (2017) 30(3):135–143 141
123
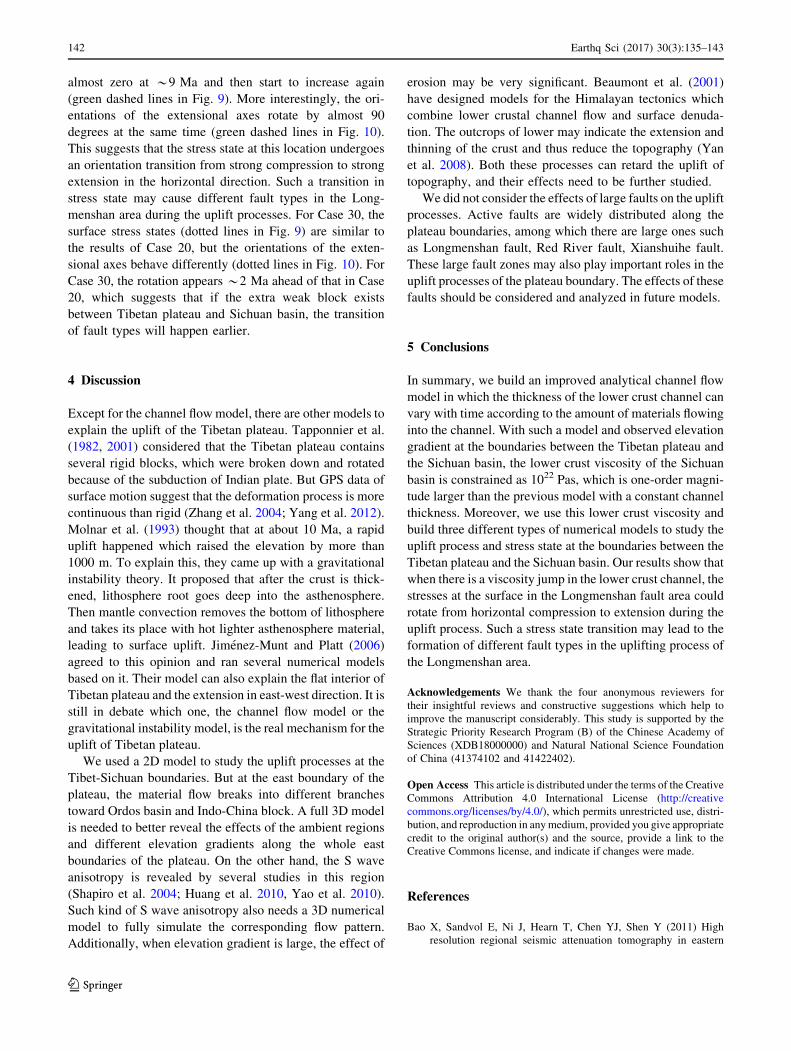
almost zero at *9 Ma and then start to increase again
(green dashed lines in Fig. 9). More interestingly, the ori-
entations of the extensional axes rotate by almost 90
degrees at the same time (green dashed lines in Fig. 10).
This suggests that the stress state at this location undergoes
an orientation transition from strong compression to strong
extension in the horizontal direction. Such a transition in
stress state may cause different fault types in the Long-
menshan area during the uplift processes. For Case 30, the
surface stress states (dotted lines in Fig. 9) are similar to
the results of Case 20, but the orientations of the exten-
sional axes behave differently (dotted lines in Fig. 10). For
Case 30, the rotation appears *2 Ma ahead of that in Case
20, which suggests that if the extra weak block exists
between Tibetan plateau and Sichuan basin, the transition
of fault types will happen earlier.
4 Discussion
Except for the channel flowmodel, there are other models to
explain the uplift of the Tibetan plateau. Tapponnier et al.
(1982, 2001) considered that the Tibetan plateau contains
several rigid blocks, which were broken down and rotated
because of the subduction of Indian plate. But GPS data of
surface motion suggest that the deformation process is more
continuous than rigid (Zhang et al. 2004; Yang et al. 2012).
Molnar et al. (1993) thought that at about 10 Ma, a rapid
uplift happened which raised the elevation by more than
1000 m. To explain this, they came up with a gravitational
instability theory. It proposed that after the crust is thick-
ened, lithosphere root goes deep into the asthenosphere.
Then mantle convection removes the bottom of lithosphere
and takes its place with hot lighter asthenosphere material,
leading to surface uplift. Jimenez-Munt and Platt (2006)
agreed to this opinion and ran several numerical models
based on it. Their model can also explain the flat interior of
Tibetan plateau and the extension in east-west direction. It is
still in debate which one, the channel flow model or the
gravitational instability model, is the real mechanism for the
uplift of Tibetan plateau.
We used a 2D model to study the uplift processes at the
Tibet-Sichuan boundaries. But at the east boundary of the
plateau, the material flow breaks into different branches
toward Ordos basin and Indo-China block. A full 3D model
is needed to better reveal the effects of the ambient regions
and different elevation gradients along the whole east
boundaries of the plateau. On the other hand, the S wave
anisotropy is revealed by several studies in this region
(Shapiro et al. 2004; Huang et al. 2010, Yao et al. 2010).
Such kind of S wave anisotropy also needs a 3D numerical
model to fully simulate the corresponding flow pattern.
Additionally, when elevation gradient is large, the effect of
erosion may be very significant. Beaumont et al. (2001)
have designed models for the Himalayan tectonics which
combine lower crustal channel flow and surface denuda-
tion. The outcrops of lower may indicate the extension and
thinning of the crust and thus reduce the topography (Yan
et al. 2008). Both these processes can retard the uplift of
topography, and their effects need to be further studied.
We did not consider the effects of large faults on the uplift
processes. Active faults are widely distributed along the
plateau boundaries, among which there are large ones such
as Longmenshan fault, Red River fault, Xianshuihe fault.
These large fault zones may also play important roles in the
uplift processes of the plateau boundary. The effects of these
faults should be considered and analyzed in future models.
5 Conclusions
In summary, we build an improved analytical channel flow
model in which the thickness of the lower crust channel can
vary with time according to the amount of materials flowing
into the channel. With such a model and observed elevation
gradient at the boundaries between the Tibetan plateau and
the Sichuan basin, the lower crust viscosity of the Sichuan
basin is constrained as 1022 Pas, which is one-order magni-
tude larger than the previous model with a constant channel
thickness. Moreover, we use this lower crust viscosity and
build three different types of numerical models to study the
uplift process and stress state at the boundaries between the
Tibetan plateau and the Sichuan basin. Our results show that
when there is a viscosity jump in the lower crust channel, the
stresses at the surface in the Longmenshan fault area could
rotate from horizontal compression to extension during the
uplift process. Such a stress state transition may lead to the
formation of different fault types in the uplifting process of
the Longmenshan area.
Acknowledgements We thank the four anonymous reviewers for
their insightful reviews and constructive suggestions which help to
improve the manuscript considerably. This study is supported by the
Strategic Priority Research Program (B) of the Chinese Academy of
Sciences (XDB18000000) and Natural National Science Foundation
of China (41374102 and 41422402).
Open Access This article is distributed under the terms of the Creative
Commons Attribution 4.0 International License (http://creative
commons.org/licenses/by/4.0/), which permits unrestricted use, distri-
bution, and reproduction in anymedium, provided you give appropriate
credit to the original author(s) and the source, provide a link to the
Creative Commons license, and indicate if changes were made.
References
Bao X, Sandvol E, Ni J, Hearn T, Chen YJ, Shen Y (2011) High
resolution regional seismic attenuation tomography in eastern
142 Earthq Sci (2017) 30(3):135–143
123
Tibetan Plateau and adjacent regions. Geophys Res Lett 38(16).
doi:10.1029/2011GL048012
Beaumont C, Jamieson RA, Nguyen MH, Lee B (2001) Himalayan
tectonics explained by extrusion of a low-viscosity crustal
channel coupled to focused surface denudation. Nature
414(6865):738–742
Clark MK, Bush JWM, Royden LH (2005) Dynamic topography
produced by lower crustal flow against rheological strength
heterogeneities bordering the Tibetan Plateau. Geophys J Int
162(2):575–590
Clark MK, Royden LH (2000) Topographic ooze: building the eastern
margin of Tibet by lower crustal flow. Geology 28(8):703–706
Cook KL, Royden LH (2008) The role of crustal strength variations in
shaping orogenic plateaus, with application to Tibet. J Geophys
Res Solid Earth 113(B8). doi:10.1029/2007JB005457
Galve A, Jiang M, Hirn A, Sapin M, Laigle M, de Voogd B, Gallart J,
Qian H (2006) Explosion seismic P and S velocity and
attenuation constraints on the lower crust of the North-Central
Tibetan Plateau, and comparison with the Tethyan Himalayas:
implications on composition, mineralogy, temperature, and
tectonic evolution. Tectonophysics 412(3–4):141–157
Huang H, Yao H, van der Hilst RD (2010) Radial anisotropy in the
crust of SE Tibet and SW China from ambient noise interfer-
ometry. Geophys Res Lett 37(21). doi:10.1029/2010GL044981
Jimenez-Munt I, Platt J (2006) Influence of mantle dynamics on the
topographic evolution of the Tibetan Plateau: results from
numerical modeling. Tectonics 25(6). doi:10.1029/
2006TC001963
Jordan TA, Watts AB (2005) Gravity anomalies, flexure and the
elastic thickness structure of the India-Eurasia collisional
system. Earth Planet Sci Lett 236(3):732–750
Kirby E, Reiners PW, Krol MA, Whipple KX, Hodges KV, Farley
KA, Tang W, Chen Z (2002) Late Cenozoic evolution of the
eastern margin of the Tibetan Plateau: inferences from 40Ar/39Ar
and (U-Th)/He thermochronology. Tectonics 21(1). doi:10.1029/
2000TC001246
Leng W, Gurnis M (2011) Dynamics of subduction initiation with
different evolutionary Pathways. Geochem Geophys Geosyst
12(12). doi:10.1029/2011GC003877
Leng W, Gurnis M (2015) Subduction initiation at relic arcs. Geophys
Res Lett 42(17):7014–7021
Liu QY, van der Hilst RD, Li Y, Yao HJ, Chen JH, Guo B, Qi SH,
Wang J, Huang H, Li SC (2014) Eastward expansion of the
Tibetan Plateau by crustal flow and strain Partitioning across
faults. Nat Geosci 7(5):361–365
Meissner R, Mooney W (1998) Weakness of the lower continental
crust: a condition for delamination, uplift, and escape. Tectono-
physics 296(1–2):47–60
Molnar P, England P, Martinod J (1993) Mantle dynamics, uplift of
the Tibetan Plateau, and the Indian monsoon. Rev Geophys
31(4):357–396
Nelson KD, Zhao W, Brown LD, Kuo J, Che J, Liu X, Klemperer SL,
Makovsky Y, Meissner R, Mechie J, Kind R (1996) Partially
molten middle crust beneath southern Tibet: synthesis of project
INDEPTH results. Science 274(5293):1684–1688
Priestley K, Jackson J, McKenzie D (2008) Lithospheric structure and
deep earthquakes beneath India, the Himalaya and southern
Tibet. Geophys J Int 172(1):345–362
Royden LH, Burchfiel BC, King RW, Wang E, Chen Z, Shen F, Liu Y
(1997) Surface deformation and lower crustal flow in eastern
Tibet. Science 276(5313):788–790
Royden LH, Burchfiel BC, van der Hilst RD (2008) The geological
evolution of the Tibetan Plateau. Science 321(5892):1054–1058
Shapiro NM, Ritzwoller MH, Molnar P, Levin V (2004) Thinning and
flow of Tibetan crust constrained by seismic anisotropy. Science
305(5681):233–236
Shen X, Yuan X, Ren J (2015) Anisotropic low-velocity lower crust
beneath the northeastern margin of Tibetan Plateau: evidence for
crustal channel flow. Geochem Geophys Geosyst
16(12):4223–4236
Tapponnier P, Peltzer G, Le Dain AY, Armijo R, Cobbold P (1982)
Propagating extrusion tectonics in Asia: new insights from
simple experiments with plasticine. Geology 10(12):611–616
Tapponnier P, Zhiqin X, Roger F, Meyer B, Arnaud N, Wittlinger G,
Jingsui Y (2001) Oblique stepwise rise and growth of the Tibet
Plateau. Science 294(5547):1671–1677
Turcotte DL, Schubert G (2002) Plate tectonics. Geodynamics, 2nd
edn. Cambridge University Press, Cambridge, pp 1–21
Unsworth MJ, Jones AG, Wei W, Marquis G, Gokarn SG, Spratt JE,
Bedrosian P, Booker J, Leshou C, Clarke G, Shenghui L (2005)
Crustal rheology of the Himalaya and Southern Tibet inferred
from magnetotelluric data. Nature 438(7064):78–81
van der Voo R, Spakman W, Bijwaard H (1999) Tethyan subducted
slabs under India. Earth Planet Sci Lett 171(1):7–20
Wang CY, Han WB, Wu JP, Lou H, Chan WW (2007) Crustal
structure beneath the eastern margin of the Tibetan Plateau and
its tectonic implications. J Geophys Res Solid Earth 112(B7).
doi:10.1029/2005JB003873
Wang E, Kirby E, Furlong KP, Van Soest M, Xu G, Shi X, Kamp PJ,
Hodges KV (2012) Two-phase growth of high topography in
eastern Tibet during the Cenozoic. Nat Geosci 5(9):640–645
Wei W, Unsworth M, Jones A, Booker J, Tan H, Nelson D, Chen L,
Li S, Solon K, Bedrosian P, Jin S (2001) Detection of
widespread fluids in the Tibetan crust by magnetotelluric studies.
Science 292(5517):716–719
Yin A, Harrison TM (2000) Geologic evolution of the Himalayan-
Tibetan orogen. Annu Rev Earth Planet Sci 28(1):211–280
Yan D, Zhou M, Wei G, Liu H, Dong T, Zhang W, Jin Z (2008)
Collapse of Songpan-Garze orogenic belt resulted from Meso-
zoic Middle-crustal ductile channel flow: evidences from
deformation and metamorphism within Sinian-Paleozoic strata
in hinterland of Longmenshan foreland thrust belt. Earth Sci
Front 15(3):186–198
Yang Y, Ritzwoller MH, Zheng Y, Shen W, Levshin AL, Xie Z
(2012) A synoptic view of the distribution and connectivity of
the mid-crustal low velocity zone beneath Tibet. J Geophys Res
Solid Earth 117(B4). doi:10.1029/2011JB008810
Yao H, Beghein C, Van Der Hilst RD (2008) Surface wave array
tomography in SE Tibet from ambient seismic noise and two-
station analysis-II. Crustal and upper-mantle structure. Geophys
J Int 173(1):205–219
Yao H, Van Der Hilst RD, Montagner JP (2010) Heterogeneity and
anisotropy of the lithosphere of SE Tibet from surface wave
array tomography. J Geophys Res Solid Earth 115(B12). doi:10.
1029/2009JB007142
Zhang PZ, Shen Z, Wang M, Gan W, Burgmann R, Molnar P, Wang
Q, Niu Z, Sun J, Wu J, Hanrong S (2004) Continuous
deformation of the Tibetan Plateau from global positioning
system data. Geology 32(9):809–812
Zhang Z, Wang Y, Chen Y, Houseman GA, Tian X, Wang E, Teng J
(2009) Crustal structure across Longmenshan fault belt from
Passive source seismic profiling. Geophys Res Lett 36(17).
doi:10.1029/2009GL039580
Zhao LF, Xie XB, He JK, Tian X, Yao ZX (2013) Crustal flow Pattern
beneath the Tibetan Plateau constrained by regional Lg-wave Q
tomography. Earth Planet Sci Lett 383:113–122
Earthq Sci (2017) 30(3):135–143 143
123