Embed Size (px)
Citation preview

ANALYZE THIS
*According to a survey of 1,000 students via SurveyU.com. | **According to a survey of 238 accounting students at 2- and 4-year schools.
WHAT IF......all students wanted to read their textbook?70% The percentage of students who report that they read their textbooks and
earn a 3.5 grade point average or higher in school.*
...coming to class was something every student desired?34% The percentage of students who go to every class during a semester.*
...we could encourage a better teaching and learning experience in accounting classrooms?88% The percentage of students who are interested in learning from a
streamlined textbook.*
...we gave students a book with online homework for less than $100 retail?84% The percentage of students surveyed who prefer ACCT over a
traditional book.**
...we gave students engaging resources to help them study?98% The percentage of students surveyed who want to use the ACCT
reference cards.**
53915_00_FM.indd i53915_00_FM.indd i 11/11/09 5:25:38 PM11/11/09 5:25:38 PM

Preview Guide: Financial ACCT, 2010 Edition
Godwin, Alderman
Vice President of Editorial, Business: Jack W. Calhoun
Editor-in-Chief: Rob Dewey
Publisher/Director, 4LTR Press: Neil Marquardt
Senior Acquisitions Editor: Matthew Filimonov
Supervising Developmental Editor: Aaron Arnsparger
Senior Project Manager, 4LTR Press: Michelle Lockard
Senior Marketing Manager: Kristen Hurd
Senior Marketing Communications Manager: Libby Shipp
Marketing Coordinator: Heather McAuliff e
Senior Content Project Manager: Cliff Kallemeyn
Media Editor: Chris Valentine
Senior Frontlist Buyer, Manufacturing: Doug Wilke
Production Service: LEAP Publishing Services, Inc.
Compositor: MPS Content Services
Senior Art Director: Stacy Jenkins Shirley
Internal and Cover Designer: KeDesign, Mason, OH
Cover Image: ®iStock Images
Senior Image Rights Acquisition Account Manager: Deanna Ettinger
Photo Researcher: Terri Miller
Brief Contents Images: © Kristian Sekulic/Shutterstock.com, © iStockphoto.com/alvarez, © iStockphoto.com/quavondo, and © Yuri Arcurs/Shutterstock.com
© 2010 South-Western, Cengage Learning
ALL RIGHTS RESERVED. No part of this work covered by the copyright hereon may be reproduced or used in any form or by any means—graphic, electronic, or mechanical, including photocopying, recording, taping, Web distribution, information storage and retrieval systems, or in any other manner—except as may be permitted by the license terms herein.
For product information and technology assistance, contact us at Cengage Learning Customer & Sales Support, 1-800-354-9706
For permission to use material from this text or product, submit all requests online at www.cengage.com/permissions
Further permissions questions can be emailed to [email protected]
ISBN-13: 978-0-538-45392-9ISBN-10: 0-538-45392-3
South-Western Cengage Learning5191 Natorp BoulevardMason, OH 45040USA
Cengage Learning products are represented in Canada by Nelson Education, Ltd.
For your course and learning solutions, visit www.cengage.comPurchase any of our products at your local college store or at our preferred online store www.ichapters.com
Printed in the United States of America1 2 3 4 5 6 7 13 12 11 10 09
53915_00_FM.indd ii53915_00_FM.indd ii 11/11/09 5:25:45 PM11/11/09 5:25:45 PM

1 Financial Accounting
2 Corporate Financial Statements
3 Recording Accounting Transactions
4 Accrual Accounting and Adjusting Entries
5 Internal Controls and Cash
6 Receivables
7 Inventory
8 Fixed Assets and Intangible Assets
9 Liabilities
10 Equity
11 The Statement of Cash Flows
12 Financial Statement Analysis
Appendix: Home Depot 2008 Annual Report
Appendix: Investments
Appendix: Time Value of Money
Subject Index
ACCT ContentsBrief Contents
B r i e f C o n t e n t s iii
53915_00_FM.indd iii53915_00_FM.indd iii 11/11/09 5:25:45 PM11/11/09 5:25:45 PM
ACCT1 Financial Accounting
1.1 BEGINNING ASSUMPTIONS
Economic Entity Assumption Time Period Assumption Monetary Unit Assumption Going Concern Assumption
1.2 REPORTING PROFITABILITY: THE INCOME STATEMENT
Revenue Expenses The Income Statement
1.3 REPORTING FINANCIAL POSITION: THE BALANCE SHEET
Assets Liabilities Equity The Balance Sheet
1.4 REPORTING EQUITY: THE STATEMENT OF RETAINED EARNINGS
Linking the Income Statement and the Balance Sheet
1.5 REPORTING CASH FLOWS: THE STATEMENT OF CASH FLOWS
Financing Activities Investing Activities Operating Activities The Statement of Cash Flows
1.6 QUALITATIVE CHARACTERISTICS OF ACCOUNTING INFORMATION
Understandability
Relevance Reliability Comparability Consistency Materiality Conservatism
1.7 THE CONCEPTUAL FRAMEWORK
Contents
© IS
TOC
KP
HO
TO.C
OM
/SE
AN
LO
CK
E
C o n t e n t siv
53915_00_FM.indd iv53915_00_FM.indd iv 11/11/09 5:26:09 PM11/11/09 5:26:09 PM
2 Corporate Financial Statements
2.1 BUSINESS FORMS
2.2 GENERALLY ACCEPTED ACCOUNTING PRINCIPLES
2.3 THE CLASSIFIED BALANCE SHEET
Assets Liabilities Equity
2.4 THE MULTI-STEP INCOME STATEMENT
Gross Profi t Operating Profi t Income Before Taxes Net Income
2.5 HORIZONTAL AND VERTICAL ANALYSES
Horizontal Analysis Vertical Analysis
2.6 THE STATEMENT OF STOCKHOLDERS’ EQUITY
2.7 INFORMATION BEYOND THE FINANCIAL STATEMENTS
Notes to the Financial Statements Auditor’s Report Management’s Discussion and Analysis
3 Recording Accounting Transactions
3.1 THE ACCOUNTING INFORMATION SYSTEM
3.2 ACCOUNTING TRANSACTIONS AND THE ACCOUNTING EQUATION
Transaction Analysis Summary of Transactions
3.3 THE DOUBLE-ENTRY ACCOUNTING SYSTEM
The T-Account Summary of Debit and Credit Rules
3.4 RECORDING TRANSACTIONS INTO THE ACCOUNTING SYSTEM
The Journal The Ledger The Trial Balance
3.5 COMPREHENSIVE EXAMPLE: JOURNAL ENTRIES TO FINANCIAL STATEMENTS
Recording Transactions in the Journal and Posting to the Ledger
Preparing a Trial Balance Preparation of Financial Statements
4 Accrual Accounting and Adjusting Entries
4.1 ACCRUAL AND CASH BASES OF ACCOUNTING
Reporting Accrual- and Cash-Based Income
4.2 ADJUSTING JOURNAL ENTRIES
Scenario 1: Deferred Revenue Scenario 2: Accrued Revenue The Journal Scenario 3: Deferred Expense Scenario 4: Accrued Expense Summary of Adjusting Journal Entries
4.3 COMPREHENSIVE EXAMPLE: ADJUSTING JOURNAL ENTRIES
Journalizing and Posting Adjusting Entries
© M
ON
KE
Y B
US
INE
SS
IMA
GE
S/S
HU
TTE
RS
TOC
K.C
OM
C o n t e n t s v
53915_00_FM.indd v53915_00_FM.indd v 11/11/09 5:26:12 PM11/11/09 5:26:12 PM

Preparing an Adjusted Trial Balance Prepare Financial Statements
4.4 CLOSING PROCESS
5 Internal Controls and Cash
5.1 INTERNAL CONTROL
5.2 COMPONENTS OF INTERNAL CONTROL
Control Environment Risk Assessment
Control Activities Information and Communication Monitoring Limitations of Internal Control
5.3 CASH CONTROLS
Bank Reconciliations Bank Reconciliation Example Petty Cash Funds
5.4 REPORTING CASH AND CASH EQUIVALENTS
5.5 ANALYZING CASH
Free Cash Flow Horizontal and Vertical Analyses
6 Receivables
6.1 RECORDING AND REPORTING ACCOUNTS RECEIVABLE
Recording Accounts Receivable Reporting Accounts Receivable
6.2 UNCOLLECTIBLE RECEIVABLES
Direct Write-off Method Allowance Method
6.3 ESTIMATING BAD DEBT EXPENSE
Percentage of Sales Approach Percentage of Receivables Approach
6.4 ANALYZING ACCOUNTS RECEIVABLE
Horizontal and Vertical Analyses Receivable Turnover Ratio Allowance Ratio
6.5 NOTES RECEIVABLE
Recording the Note Recording Interest Collecting the Note
© IS
TOC
KP
HO
TO.C
OM
/AN
DR
EW
RIC
H
C o n t e n t svi
53915_00_FM.indd vi53915_00_FM.indd vi 11/11/09 5:26:20 PM11/11/09 5:26:20 PM

7 Inventory
7.1 RECORDING, EXPENSING AND REPORTING INVENTORY
Recording Inventory Expensing Inventory Reporting Inventory and Cost of Goods Sold
7.2 INVENTORY COSTING METHODS
Specifi c Identifi cation Method First-In First-Out (FIFO) Method Last-In First-Out (LIFO) Moving Average Method
7.3 COMPARING INVENTORY COSTING METHODS
Eff ects on Income Taxes
7.4 INVENTORY ERRORS
7.5 ESTIMATING ENDING INVENTORY
7.6 LOWER OF COST OR MARKET
7.7 EVALUATING A COMPANY’S MANAGEMENT OF INVENTORY
Horizontal and Vertical Analyses
Inventory Turnover and Days in Inventory Ratios
7.8 APPENDIX
Recording Inventory Inventory Costing Methods Specifi c Identifi cation Method First-In First-Out (FIFO) Method Last-In First-Out (LIFO) Method Weighted Average Method
8 Fixed Assets and Intangible Assets
8.1 RECORDING, EXPENSING, AND REPORTING FIXED ASSETS
Recording Fixed Assets Expensing Fixed Assets Reporting Fixed Assets
8.2 CALCULATING DEPRECIATION EXPENSE
Straight-Line Method Double-Declining-Balance Method Units-of-Activity Method Comparing Depreciation Methods
8.3 ADJUSTMENTS MADE DURING A FIXED ASSET’S USEFUL LIFE
Changes in Depreciation Estimates Expenditures After Acquisition Asset Impairment
8.4 DISPOSING OF FIXED ASSETS
8.5 EVALUATING A COMPANY’S MANAGEMENT OF FIXED ASSETS
Horizontal and Vertical Analyses Fixed Asset Turnover Ratio Average Life and Age of Fixed Assets
8.6 FIXED ASSETS AND CASH FLOWS
8.7 INTANGIBLE ASSETS
Amortizing Intangible Assets
© Y
UR
I AR
CU
RS
/SH
UTT
ER
STO
CK
.CO
M
C o n t e n t s vii
53915_00_FM.indd vii53915_00_FM.indd vii 11/11/09 5:26:25 PM11/11/09 5:26:25 PM

9 Liabilities
9.1 CURRENT LIABILITIES
Taxes Payable Notes Payable Current Portion Due of Long-Term Debt Reporting Current Liabilities
9.2 LONG-TERM LIABILITIES
9.3 BONDS
Bonds Issued at Face Value Bonds Issued at a Discount Bonds Issued at a Premium
9.4 REDEEMING A BOND BEFORE MATURITY
9.5 ADDITIONAL LONG-TERM LIABILITIES
Leases Contingent Liabilities
9.6 EVALUATING A COMPANY’S MANAGEMENT OF LIABILITIES
Horizontal and Vertical Analyses Current Ratio Debt to Assets Ratio
9.7 APPENDIX 9A: DETERMINING A BOND’S ISSUANCE PRICE
9.8 EFFECTIVE INTEREST METHOD OF AMORTIZATION
Discount Example Premium Example
10 Equity
10.1 THE CORPORATE FORM OF BUSINESS
Separate Legal Entity Ability to Raise Capital Limited Liability of Owners Transferability of Ownership Double Taxation Regulation
10.2 COMMON STOCK
Authorized, Issued, and Outstanding Shares
Stockholder Rights Par Value Recording Common Stock Reporting Common Stock
10.3 DIVIDENDS
Cash Dividends Stock Dividends Stock Splits
10.4 PREFERRED STOCK
Recording Preferred Stock Reporting Preferred Stock Cash Dividends on Preferred
Stock
10.5 TREASURY STOCK
Recording Treasury Stock Reporting Treasury Stock
© Y
UR
I AR
CU
RS
/SH
UTT
ER
STO
CK
.CO
M
C o n t e n t sviii
53915_00_FM.indd viii53915_00_FM.indd viii 11/11/09 5:26:43 PM11/11/09 5:26:43 PM

10.6 EVALUATING A COMPANY’S MANAGEMENT OF EQUITY
Horizontal and Vertical Analyses Earnings Per Share Return on Equity Dividend Payout Ratio Dividend Yield Stockholders’ Equity and Cash Flows
11 The Statement of Cash Flows
11.1 THE STATEMENT OF CASH FLOWS
Cash Flows from Operating Activities Cash Flows from Investing Activities Cash Flows from Financing Activities Net Increase (Decrease) in Cash Supplemental Disclosures
11.2 PREPARING THE STATEMENT OF CASH FLOWS
11.3 COMPUTING CASH FLOWS FROM OPERATING ACTIVITIES—DIRECT METHOD
Converting Sales to Cash Receipts Converting Cost of Goods Sold to Cash Paid to
Suppliers Converting Operating Expenses to Cash Payments Converting Other Expenses to Cash Payments Summary of Operating Cash Flows
11.4 COMPUTING CASH FLOWS FROM OPERATING ACTIVITIES—INDIRECT METHOD
Adjustments for Noncash Items Adjustments for Changes in Current Assets and
Current Liabilities Summary of Operating Cash Flows
11.5 COMPUTING CASH FLOWS FROM INVESTING ACTIVITIES
Analysis of Noncurrent Assets Summary of Investing Cash Flows
11.6 COMPUTING CASH FLOWS FROM FINANCING ACTIVITIES
Analysis of Long-Term Liabilities Analysis of Equity Summary of Financing Cash Flows
© D
MIT
RIV
SH
IRO
NO
SO
V/S
HU
TTE
RS
TOC
K.C
OM
11.7 ANALYZING THE STATEMENT OF CASH FLOWS
Comparing Operating Cash Flows and Net Income
Free Cash Flow
12 Financial Statement Analysis
12.1 FINANCIAL STATEMENT ANALYSIS
12.2 HORIZONTAL AND VERTICAL ANALYSES
Horizontal Analysis Vertical Analysis
12.3 PROFITABILITY ANALYSIS
Profi t Margin Return on Equity Return on Assets Earnings per Share Price to Earnings Dividend Payout Ratio
12.4 LIQUIDITY ANALYSIS
Current Ratio Quick Ratio
C o n t e n t s ix
53915_00_FM.indd ix53915_00_FM.indd ix 11/11/09 5:26:55 PM11/11/09 5:26:55 PM

x
Receivable Turnover Ratio Days in Receivables Inventory Turnover Ratio Days in Inventory
12.5 SOLVENCY ANALYSIS
Debt to Assets Debt to Equity Times Interest Earned Debt Service Ratio
12.6 DUPONT ANALYSIS
Appendix: Home Depot
Appendix: Investments
Appendix: Time Value of Money
Subject Index
C o n t e n t s
53915_00_FM.indd x53915_00_FM.indd x 11/11/09 5:27:00 PM11/11/09 5:27:00 PM

AC
CT
CengageNOWTM is an easy-to-use online resource that helps you
study in less time to get the grade you want – NOW.
CengageNOWTM comes FREE with each new copy of ACCT and features:• End-of-chapter homework from the
textbook written by the authors • eBook • Videos, quizzes, games, e-lectures,
and more!
How to Register Your Access Code:1. Launch a Web browser. Go to
www.cengage.com/login and click on “Create My Account.” Already have an account? Enter your email/password under “Sign In.”
2. Entexactly how it appears on your card.
3. New users: Enter your account information and click “Continue.”
4. Record your email address and password below and store it in a secure location for future visits. [Email Address: ____________________ ] [Password: ________________________ ]
IT’S ALL ABOUT THE HOMEWORK!
Want Extra Problems?CengageNOW comes automatically with this book and offers additional exercises and problems to give you a variety of assignment options. You can create static assignments or algorithmic assignments and you can also assign cases and longer problems.
Through the 4LTR+ Custom Program, you can package these additional exercises with your students’ textbooks for just $5. Students will see the additional exercises in CengageNOW if you assign them, but some may also prefer to use them in a printed format. www.4ltrpress.cengage.com/4ltrplusbc.html
53915_00_FM.indd xi53915_00_FM.indd xi 11/11/09 5:27:01 PM11/11/09 5:27:01 PM

53915_00_FM.indd xii53915_00_FM.indd xii 11/11/09 5:27:01 PM11/11/09 5:27:01 PM

AC
CT
ACCT puts a multitude of study aids
chapters, check out these resources for further help:
• Review Cards, found in the back of your book, include all learning objectives, key concepts and
for each chapter.
• Online Printable Flash Cards give you additional ways to check your comprehension of key accounting concepts.
• Other great tools to help you review include interactive games, E-Lectures, online tutorials, and quizzes.
Go to 4ltrpress.cengage.com/acct to find plenty of resources to help you Review!
REVIEW!
53915_00_FM.indd Sec1:153915_00_FM.indd Sec1:1 11/11/09 5:27:01 PM11/11/09 5:27:01 PM

Acct
2 C h a p t e r 8 : F i x e d A s s e t s a n d I n t a n g i b l e A s s e t s
Introduction
This chapter examines the accounting for property and equipment, or as it is sometimes called, “fi xed assets.” For most companies,
the objectives associated with fi xed assets are fairly simple. They want to acquire fi xed assets, use them productively for some period of time, and then dispose of them. Thus, the chapter examines these three activities—the acquisition of fi xed assets, the depreciation of fi xed assets over their useful lives, and the disposal of fi xed assets. It also examines a few issues that arise during the life of a fi xed asset, such as additional expenditures and revisions of original estimates. The chap-ter then focuses on how to analyze a company’s fi xed asset position. It concludes with the accounting for intangible assets.
LO1 Recording, Expensing, and Reporting Fixed Assets
A fi xed asset is any tangible resource that is expected to be used in the normal course of operations for more than one year and is
not intended for resale. Examples include land, buildings, equipment, furniture, fi xtures, etc. Fixed assets are reported on the balance sheet and are classifi ed as noncurrent assets because they are used for more than one year.
As you consider the defi nition of a fi xed asset, note that the phrase “not intended for resale” differentiates a fi xed asset from inventory. A computer that Dell Corporation makes for sale is inventory, while an identical computer used by an employee in business operations is a fi xed asset. Also, note that the phrase “used in the normal course of operations” differen-
tiates a fi xed asset from an investment. Land on which a company builds a manufacturing plant is a fi xed asset, while land bought to be sold to a developer is an investment. The company’s intended use of the asset dictates how the asset is classifi ed.
Fixed Assetsand Intangible Assets
Learning Objectives
After studying the material in this chapter, you should be able to:
LO1 Describe fi xed assets and how they are recorded, expensed, and reported.
LO2 Calculate and compare depreciation expense using straight-line, double-declining-balance, and units-of-activity methods.
LO3 Understand the effects of adjustments that may be made during a fi xed asset’s useful life.
LO4 Record the disposal of fi xed assets.
LO5 Evaluate fi xed assets through the calculation and interpretation of horizontal, vertical, and ratio analyses.
LO6 Describe the cash fl ow effect of acquiring fi xed assets.
LO7 Describe intangible assets and how they are recorded, expensed, and reported.
Fixed asset A tangible
resource that is expected to be used in
operations for more than one year and is not
intended for resale.
53915_01_CH08_002-026.indd 253915_01_CH08_002-026.indd 2 11/12/09 8:31:30 PM11/12/09 8:31:30 PM

AC
CT
C H A P T E R 8
3C h a p t e r 8 : F i x e d A s s e t s a n d I n t a n g i b l e A s s e t s
Accounting for fi xed assets like this truck involves recording the purchase, depreciating the asset over its
life, and then disposing of it.
© ISTOCKPHOTO.COM/ELENA ELISSEEVA
Recording Fixed Assets
Following the cost principle, fi xed assets should be recorded at the cost of acquiring them. This includes all costs incurred to get the asset delivered, installed, and ready to use. Examples of expenditures to include in the cost of a fi xed asset would therefore include, but not be limited to, the following:
• purchase price
• taxes paid on the purchase
• fees such as closing costs paid to attorneys
• delivery costs
• insurance costs during transit
• installation costs
53915_01_CH08_002-026.indd 353915_01_CH08_002-026.indd 3 11/12/09 8:32:03 PM11/12/09 8:32:03 PM

4 C h a p t e r 8 : F i x e d A s s e t s a n d I n t a n g i b l e A s s e t s
To illustrate, suppose that Dozier Building Supply buys a delivery truck with a purchase price of $60,000, additional state sales taxes of $3,600, and a county fee of $400. Prior to receiving the truck, Dozier has the dealer paint the company’s logo on the doors and install a specialized GPS. The dealer charges an addi-tional $1,000 for this. Finally, Dozier pays an insurance company an additional $1,400 in premiums to add the truck to its coverage for the coming year. Given the pre-ceding items, the cost of Dozier’s truck is determined as follows:
Purchase price $60,000
Sales taxes 3,600
County fee 400
Installation of logo and GPS 1,000
Total cost $65,000
All of the costs except for the insurance are neces-sary to get the asset into its condition and location for intended use and are therefore included in the cost of the truck. The insurance covers the truck during its op-erations and is therefore an operating expense during the year. Assuming that Dozier paid cash to the dealer, the entry to record the purchase of the truck would be as follows:
Delivery Truck 65,000
Cash 65,000
(To record the purchase of truck)
Assets 5 Liabilities 1 Equity 165,000 265,000
Consider another example. Suppose a company purchases a tract of land for a new building site. The
purchase price is $500,000 plus $25,400 in taxes and fees paid to the realtor, the bank, and the attorneys. Included on the land are four small buildings that must be removed at a total cost of $12,000. Also, the land requires $100,000 in logging, grading, and fi lling be-fore it can be used. The timber harvested from the log-ging will be sold for $20,000. The total cost of the land is as follows:
Purchase price $500,000
Taxes and fees 25,400
Removal of buildings 12,000
Logging, grading, and fi lling 100,000
Less: Sales of timber (20,000)
Total cost $617,400
In this case, each cost is included in the asset be-cause the land is not in the condition for use until each of the activities is completed. Notice also that the pro-ceeds from the sale of the timber reduce the cost of the land.
Expensing Fixed Assets
A fi xed asset converts to an expense as it is used or consumed. The expensing of fi xed assets is accom-plished through depreciation. Depreciation is the process of allocating the cost of a fi xed asset over its useful life. Depreciation is an application of the matching principle—because a fi xed asset is used to generate rev-enues period after period, some of its cost should be expensed in, or matched to, those same periods. The amount of expense recognized each period is known as depreciation expense. The cumulative amount of depre-ciation expense recognized to date is known as accumu-lated depreciation.
Some students experience some confusion with de-preciation because of its everyday use in our language. For example, it is often said that a new car “depreci-ates” in value once it is driven off the dealer’s lot. When utilized in this way, the term depreciation implies a decline or loss in value because the car is used. For our purposes, depreciation is a process of allocating an asset’s cost, not a method of determining an asset’s market value.
While depreciation applies to fi xed assets, not all fi xed assets are depreciated. Depreciation applies only to those assets with limited useful lives. An asset has a
Depreciation The process of systematically and
rationally allocating the cost of a fi xed asset over its
useful life.
Depreciation expense The portion of a fi xed asset’s cost
that is recognized as an expense in the current period.
Accumulated depreciation The cumulative amount of
depreciation expense recognized to date on a fi xed asset.
53915_01_CH08_002-026.indd 453915_01_CH08_002-026.indd 4 11/12/09 8:32:09 PM11/12/09 8:32:09 PM
5C h a p t e r 8 : F i x e d A s s e t s a n d I n t a n g i b l e A s s e t s
limited useful life when its revenue generating potential is limited by wear and tear and/or obsolescence. Most fi xed assets such as equipment and buildings have lim-ited useful lives and are therefore subject to deprecia-tion. The major exception to this is land, which has an unlimited useful life. As a result, land is not subject to depreciation.
Depreciation expense is normally calculated at the end of an accounting period and recorded with an ad-justing journal entry. Regardless of the fi xed asset being depreciated or the facts of the calculation, the general form of the entry is the same: Depreciation Expense and Accumulated Depreciation are increased. To illustrate, suppose that Dozier calculates its truck’s depreciation as $10,000 for the fi rst year. At year-end, Dozier would make the following entry:
Year-end Depreciation Expense 10,000
Accumulated Depreciation 10,000
Assets 5 Liabilities 1 Equity 210,000 210,000
In this entry, Dozier increases Depreciation Expense for the $10,000 of cost allocated to the cur-rent period and increases Accumulated Depreciation for the same amount. The Accumulated Depreciation account accumulates all depreciation recorded to date on a fi xed asset. It is a contra-asset account, meaning that its balance is subtracted from the fi xed asset ac-count to yield the net book value of the fi xed asset. We will see an example of this in the next section. The result of this entry is a decrease to both equity and assets.
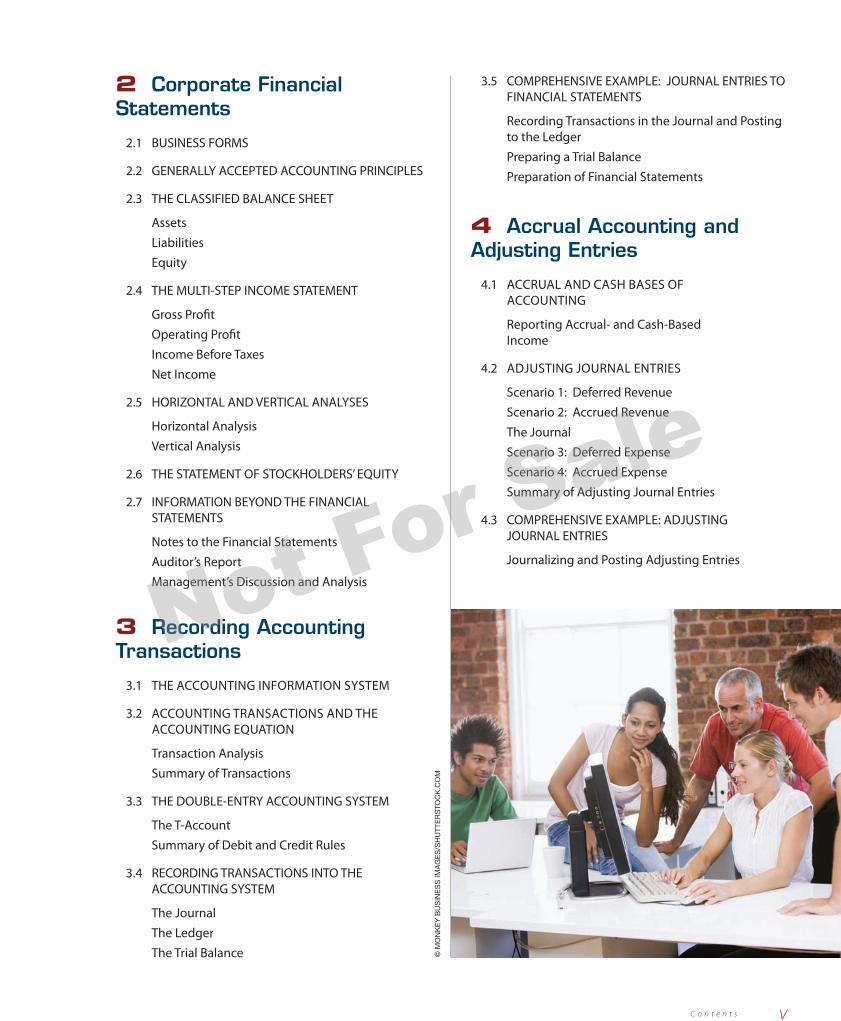
Like other expenses, depreciation expense is re-ported on the income statement. Some companies, such as the Wendy’s/Arby’s Group, report it as a separate line item. A condensed version of Wendy’s/Arby’s Group’s 2008 operating expenses follows:
Wendy’s/Arby’s Group 2008 Condensed Operating Expenses
in thousands Costs and expenses
Cost of sales 1,415,534
General and administrative 248,718
Depreciation and amortization 88,315
Goodwill impairment 460,075
Other 23,769
Total 2,236,411
Other companies, such as McDonald’s Corporation and Burger King Holdings, do not separately disclose depreciation expense. Rather, they include it in a larger expense category, usually in Administrative Expenses. The operating expense portion of McDonald’s 2008 income statement is shown as follows:
McDonald’s 2008 Condensed Operating Expenses
in millionsOPERATING COSTS AND EXPENSES
Company-operated restaurant expenses
Food & paper 5,586.1 Payroll & employee benefi ts 4,300.1 Occupancy & other operating expenses 3,766.7Franchised restaurants–occupancy expenses 1,230.3Selling, general & administrative expenses 2,355.5Impairment and other charges, net 6.0Other operating (income) expense, net (165.2)Total operating costs and expenses 17,079.5
No reference is made to depreciation expense on the statement, but this does not mean that McDonald’s had no depreciation expense. To fi nd it, we must consult the notes to the fi nancial statements. The following is an excerpt from McDonald’s Property and Equipment note:
Excerpt from McDonald’s 2008 Property and Equipment Note
Depreciation and amortization expense related to continuing operations was (in millions): 2008—$1,161.6; 2007—$1,145.0; 2006—$1,146.3.
For accounting purposes,
depreciation is a process of
allocating an asset’s cost, not a
method of determining an asset’s
market value.
53915_01_CH08_002-026.indd 553915_01_CH08_002-026.indd 5 11/12/09 8:32:11 PM11/12/09 8:32:11 PM

6 C h a p t e r 8 : F i x e d A s s e t s a n d I n t a n g i b l e A s s e t s
This note shows that over $1 billion in deprecia-tion expense is included in one of the six operating expense subtotals in McDonald’s 2008 income state-ment. Even though you don’t see it on the income statement, it is there as a component of the reported expenses.
Reporting Fixed Assets
Fixed assets are reported on the balance sheet, usu-ally as a separate line item just below current assets. A condensed version of Wendy’s/Arby’s 2008 balance sheet follows:
Wendy’s/Arby’s Group 2008 Condensed Balance Sheet
in thousands 2008
Total Current Assets 380,838
Property and Equipment, net 1,770,372
Other Assets 2,494,410
Total Assets 4,645,620
Notice fi rst that Wendy’s/Arby’s uses “Property and Equipment” instead of “Fixed Assets.” Because
the bulk of fi xed assets for most companies is prop-erty, buildings, and equipment, most companies use some variation of the term “property, plant and equipment” to describe their fi xed assets. Notice also that Wendy’s/Arby’s description includes the word “net.” The term “net” is an abbreviation for the phrase net book value. Net book value represents the cost of a fi xed asset that has not yet been depreci-ated. It is calculated by subtracting the accumulated depreciation to date from the cost of the fi xed asset. For example, an asset costing $5,000 with $1,000 of accumulated depreciation would have a net book value of $4,000.
Because Wendy’s/Arby’s only reports the net num-ber on the balance sheet, those interested in how the net book value was calculated would need to consult the notes to the fi nancial statements. In Wendy’s/Arby’s notes, we fi nd the following condensed data, in thou-sands of dollars:
Wendy’s/Arby’s 2008 Fixed Asset Note
in thousands 2008
Property and equipment, at cost 1,977,253 Accumulated depreciation and amortization (206,881) Net property and equipment 1,770,372
At the end of 2008, Wendy’s/Arby’s held fi xed assets with a total cost of almost $1.98 billion and accumulated depreciation of approximately $207 million. Netting those together yields the $1.77 billion net book value reported on the balance sheet.
Net book value The unexpired cost of a fi xed
asset, calculated by subtracting accumulated depreciation
from the cost of the fi xed asset.
Look at Home Depot’s Balance Sheet in Appendix C. What general name does the company use for its fi xed assets and what specifi c fi xed asset accounts
does it list? What is the historical cost of its fi xed assets, how much depreciation expense has been accumulated to date, and what is the net book value of those fi xed assets? What does the company report for depreciation expense for the current year?
Home Depot uses the name Property and Equipment for fi xed assets. It lists the following six specifi c accounts: Land; Buildings; Furniture, Fixtures and Equipment; Leasehold Improvements; Construction in Progress; and Capital Leases. It reports a cost of $36,477 for its Prop-erty and Equipment. It also reports Accumulated De-preciation and Amortization to date of $10,243 million. Together, these result in a net book value of $26,234 mil-lion. Depreciation and Amortization for the current year is reported as $1,785 million on the income statement.
HOME DEPOT ANALYSIS
53915_01_CH08_002-026.indd 653915_01_CH08_002-026.indd 6 11/12/09 8:32:12 PM11/12/09 8:32:12 PM

7C h a p t e r 8 : F i x e d A s s e t s a n d I n t a n g i b l e A s s e t s
Cost The historical cost of a fi xed asset being
depreciated.
Salvage value An estimate of the amount to be
received for a fi xed asset at the end of its useful life.
Depreciable cost The diff erence between an asset’s cost
and its salvage value.
Useful life The length of time a fi xed asset is expected to be
used in operations.
Depreciation method The method used to calculate
depreciation expense, such as the straight-line method, the double-
declining-balance method, and the units-of-activity method.
Straight-line method A depreciation method that results in
the same amount of depreciation expense each year of the asset’s
useful life.
methods for calculating depreciation expense. This chapter focuses on the following three methods:
• Straight-line
• Double-declining- balance
• Units-of-activity
To illustrate how depreciation expense is calcu-lated under each method, we will continue the Dozier Building Supply example. The following information about Dozier’s delivery truck is available:
• Purchase Date: January 1, 2010
• Cost: $65,000
• Estimated Salvage Value: $15,000
• Estimated Useful Life: 5 years or 100,000 miles
Straight-Line Method
The straight-line method of depreciation spreads depre-ciation expense evenly over each year of the asset’s use-ful life. It is a very simple calculation. The depreciable cost of the asset is divided by the useful life of the asset (in years) to yield the amount of depreciation expense per period. This calculation is shown below:
Depreciation Expense 5 Cost 2 Salvage Value
_________________ Useful Life
For Dozier’s delivery truck, annual depreciation ex-pense under the straight-line method would therefore be:
Depreciation Expense 5 $65,000 2 $15,000
5 $10,000
5
While Wendy’s/Arby’s reports the cost and accumu-lated depreciation amounts in its notes, other compa-nies, such as McDonald’s, report both amounts directly on their balance sheets.
McDonald’s 2008 Fixed Assets Section of Balance Sheet
in millions 2008
Property and equipment, at cost 31,152.4 Accumulated depreciation and amortization (10,897.9) Net property and equipment 20,254.5
McDonald’s lists over $31 billion in cost of fi xed assets and almost $11 billion in accumulated depreciation of those assets. Thus, the net book value of its fi xed assets is over $20 billion.
LO2 Calculating Depreciation Expense
When a company owns depreciable assets, it must calculate depreciation expense each period.
Doing so requires the following information about the asset:
• Cost
• Salvage Value
• Useful Life
• Depreciation Method
Cost refers to the historical cost of the asset be-ing depreciated. This is the amount that was recorded when the asset was purchased. Salvage value refers to the market value of the asset at the end of its useful life. It is the amount the company expects to receive when the asset is sold, traded-in, or scrapped. The difference between an asset’s cost and its salvage value is the asset’s net cost to the company, or its depreciable cost. The depreciable cost is the total amount that should be depreciated over time. Useful life refers to the length of time the asset will be used in operations.
Depreciation method refers to the method used to calculate depreciation expense. Generally accepted ac-counting principles allow the use of several different
53915_01_CH08_002-026.indd 753915_01_CH08_002-026.indd 7 11/12/09 8:32:13 PM11/12/09 8:32:13 PM

8 C h a p t e r 8 : F i x e d A s s e t s a n d I n t a n g i b l e A s s e t s
Dozier would record the depreciation expense with the following adjusting journal entry at the end of the fi rst year:
12/31/2010 Depreciation Expense 10,000
Accumulated Depreciation 10,000
Assets 5 Liabilities 1 Equity 210,000 210,000
The same entry would be made at the end of each year through 2014. Exhibit 8-1 illustrates depreciation for the entire useful life of the asset.
Double-Declining-Balance Method
The double-declining-balance method of depreciation is an accelerated method that results in more deprecia-tion expense in the early years of an asset’s life and less depreciation expense in the later years of an asset’s life. As a result, the double- declining-balance method often matches expenses to revenues better than the straight-line method. More depreciation expense is recorded when the asset is more useful.
To calculate depreciation expense under the double-declining-balance method, we fi rst calculate the rate of depreciation by taking the straight-line rate of
Double-declining-balance method A
depreciation method that accelerates depreciation expense
into the early years of an asset’s life.
From the depreciation schedule, we can highlight several items. First, depreciation expense is the same each period. This will always be true under the straight-line method.
Second, the accumulated depreciation account grows each year by $10,000 until the balance equals the depreciable cost of the asset. This is no coincidence. The fi nal balance in accumulated depreciation is the total of all depreciation expense recorded during the asset’s life. Therefore, the balance should equal the asset’s deprecia-ble cost. This will be true regardless of the depreciation method used.
Finally, the net book value decreases each year by $10,000 until it equals the salvage value estimated for the asset. This is no coincidence either. Net book value represents the remaining unexpired cost of the asset. Therefore, an asset’s fi nal net book value should always equal the estimated salvage value at the end of the asset’s useful life. This will be true regardless of the depreciation method used.
depreciation and doubling it (hence, the word double in the name). For example, if an asset has a four-year life, it has a straight-line rate of 25% (calculated by dividing 100% by four years). The straight-line rate is then doubled to 50%. An asset with a fi ve-year life would have a 20% straight-line rate, which would be doubled to 40%. The doubled rate is then multiplied by the net book value of the asset to yield the amount of depreciation expense for the period. This calculation is shown as follows:
Depreciation Expense 5 Depreciation Rate 3 Net Book Value
5 (Straight-Line Rate 3 2)
3 (Cost – Accumulated Depreciation)
Before we calculate depreciation expense for Dozier with this method, we should emphasize that the de-preciation rate is applied to the net book value of the asset, not its net cost. Because an asset’s net book value declines as the asset is depreciated, the amount of depre-ciation expense will differ each period. In fact, depre-ciation expense will become smaller and smaller each period as the depreciation rate is applied to a smaller net
Exhibit 8-1 Depreciation Schedule—Straight-Line Method
Year Calculation Depreciation Expense Accumulated Depreciation Net Book Value $ 0 $65,0002010 ($65,000 2 $15,000) / 5 $10,000 10,000 55,0002011 ($65,000 2$15,000) / 5 10,000 20,000 45,0002012 ($65,000 2 $15,000) / 5 10,000 30,000 35,0002013 ($65,000 2 $15,000) / 5 10,000 40,000 25,0002014 ($65,000 2 $15,000) / 5 10,000 50,000 15,000
53915_01_CH08_002-026.indd 853915_01_CH08_002-026.indd 8 11/12/09 8:32:14 PM11/12/09 8:32:14 PM

9C h a p t e r 8 : F i x e d A s s e t s a n d I n t a n g i b l e A s s e t s
book value. This stands in contrast to the straight-line method and is why the name of the method contains the words declining balance.
Under the double-declining-balance method, Dozier’s depreciation expense for the fi rst year of the asset’s life is calculated as follows:
Depreciation Expense for 2010
5 (20% 3 2) 3 ($65,000 2 $0) 5 $26,000
You can now see how the double-declining-balance method accelerates the depreciation. Instead of $10,000 of expense as under the straight-line method, deprecia-tion expense in the fi rst year is $26,000. In other words, $16,000 of depreciation expense is accelerated to the fi rst year by using the double-declining-balance method instead of the straight-line method.
In the second year of the asset’s life, the same formula is used. However, the resulting depreciation expense is lower because the depreciation rate is ap-plied to a lower net book value. With $26,000 in depreciation to date, the accumulated depreciation bal-ance is $26,000, yielding a net book value of $39,000 ($65,000 – $26,000). Therefore, depreciation expense in the second year would be:
Depreciation Expense for 2011 5 (20% 3 2) 3 ($65,000 2 $26,000)
5 $15,600
tion of $41,600). Therefore, the calculation of deprecia-tion expense for the third year is as follows:
Depreciation Expense for 2012
5 (20% 3 2) 3 ($65,000 2 $41,600)5 $9,360
Now, at this point we need to be careful. Over an asset’s life, an entity cannot record more total deprecia-tion than the asset’s depreciable cost. Regardless of how much depreciation expense is calculated to be, an asset’s accumulated depreciation balance should never exceed the asset’s net cost. In our example, Dozier’s depreciable cost is $50,000. Accumulated depreciation after 2011 is $41,600. Therefore, depreciation expense in 2012 is limited to $8,400. This calculation is as follows:
Depreciable cost of asset ($65,000 2 $15,000) $50,000
Less: Accumulated depreciation at the end of 2011 41,600
Remaining depreciation to be taken $ 8,400
Even though the calculation yields $9,360, depreciation expense for 2012 is limited to $8,400. And, because Dozier’s truck is fully depreciated after 2012, there is no depreciation expense for the remaining two years of the truck’s life.
A schedule of depreciation for all fi ve years is shown in Exhibit 8-2. The calculated amounts in 2012 are struck through and are replaced with the necessary amounts.
Year Calculation Depreciation Expense Accumulated Depreciation Net Book Value $ 0 $65,0002010 (20% 3 2) 3 ($65,000 2 $0) $26,000 26,000 39,0002011 (20% 3 2) 3 ($65,000 2 $26,000) 15,600 41,600 23,4002012 (20% 3 2) 3 ($65,000 2 $41,600) 9,360 50,960 14,040
8,400 50,000 15,0002013 0 50,000 15,0002014 0 50,000 15,000
Exhibit 8-2 Depreciation Schedule—Double-Declining-Balance Method
As you can see, depreciation expense for the second year is lower than the fi rst year, but it is still more than would be calculated under the straight-line method. In other words, depreciation expense is still being acceler-ated to the early years of the asset’s life.
In the third year of the asset’s life, the same for-mula is used again, but this time the net book value is $23,400 (cost of $65,000 less accumulated deprecia-
Note that, as expected, depreciation expense is accelerated to the early years of the asset’s life. Note also that, like the straight-line method, the double- declining-balance method results in a total of $50,000 of depreciation expense and a resulting net book value that is equal to the estimated salvage value of $15,000. The only difference between the methods is when de-preciation expense is recognized.
53915_01_CH08_002-026.indd 953915_01_CH08_002-026.indd 9 11/12/09 8:32:15 PM11/12/09 8:32:15 PM

10 C h a p t e r 8 : F i x e d A s s e t s a n d I n t a n g i b l e A s s e t s
Units-of-Activity Method
Both the straight-line and double-declining-balance methods are a function of the passage of time rather than the actual use of the asset. Each method assumes that the calculated depreciation is a reasonable repre-sentation of the actual usage of the asset. In contrast, the units-of-activity method of depreciation calculates depreciation based on actual asset activity. Because it relies on an estimate of an asset’s lifetime activity, the method is limited to those assets whose units of activity can be determined with some degree of accuracy.
To calculate depreciation expense under the units-of-activity method, we fi rst calculate depreciation per unit of expected activity. Depreciation per unit of expected activity is the depreciable cost of the asset divided by the estimated units of activity over the life of the asset.
Depreciation Expense per Unit 5 Cost 2 Salvage Value
_________________ Useful Life in Units
For Dozier’s truck, depreciation expense per unit will be a function of miles driven. Since Dozier estimates that the truck will be driven 100,000 miles, its estimated depreciation per mile would be $0.50 per mile.
Depreciation Expense per Unit 5 $65,000 2 $15,000
100,000 miles5 $0.50 per mile
With a $0.50 per mile rate, we simply need the actual miles driven in a given year to calculate depreciation ex-pense. Assume that Dozier drives the truck 24,000 miles in 2010. Its depreciation expense for 2010 would there-fore be $12,000.
Depreciation Expense 5 $0.50 3 24,000 5 $12,000
Similar calculations would be made for the next four years of the asset’s life. A depreciation schedule, complete with the actual miles driven in each of the fi ve years, is shown in Exhibit 8-3.
Units-of-activity method A depreciation
method in which depreciation expense is a function of the
actual usage of the asset.
As you review the schedule, note that depreciation expense fl uctuates as the asset’s activity fl uctuates. As a result, depreciation expense is a function of usage. Second, note that the total number of miles driven over the fi ve years equals 100,000 miles. This assumption is made for simplicity. However, had Dozier driven the truck more than 100,000 miles, total depreciation ex-pense over the life of the asset would still be limited to $50,000, the asset’s net cost.
Comparing Depreciation Methods
The calculations in the previous sections demonstrate that a company’s depreciation expense in a given year will depend on the depreciation method chosen. For com-parative purposes, Exhibit 8-4 summarizes the annual depreciation for Dozier’s truck as well as the resulting net book values under the three methods.
Year Calculation Depreciation Expense Accumulated Depreciation Net Book Value $ 0 $65,0002010 $0.50 3 24,000 miles $12,000 12,000 53,0002011 $0.50 3 22,000 miles 11,000 23,000 42,0002012 $0.50 3 27,000 miles 13,500 36,500 28,5002013 $0.50 3 17,000 miles 8,500 45,000 20,0002014 $0.50 × 10,000 miles 5,000 50,000 15,000
Exhibit 8-3 Depreciation Schedule—Units-of-Activity Method
Note that this calculation is very similar to the straight-line calculation. Depreciable cost is divided by estimated life. But, instead of calculating depreciation expense per year, we are calculating depreciation ex-pense per unit. Once we know depreciation expense per unit, we calculate depreciation expense by multiplying the per unit rate by the actual units of activity during the period. The calculation is as follows:
Depreciation Expense 5 Depreciation Expense per Unit 3 Actual Units of Activity
53915_01_CH08_002-026.indd 1053915_01_CH08_002-026.indd 10 11/12/09 8:32:17 PM11/12/09 8:32:17 PM

11C h a p t e r 8 : F i x e d A s s e t s a n d I n t a n g i b l e A s s e t s
Exhibit 8-4 Comparison of Three Depreciation Methods
Straight-Line Double-Declining-Balance Units-of-Activity
Year Depr. Exp. NBV2010 $10,000 $55,0002011 10,000 45,0002012 10,000 35,0002013 10,000 25,0002014 10,000 15,000 $50,000
Year Depr. Exp. NBV2010 $26,000 $39,0002011 15,600 23,4002012 8,400 15,0002013 0 15,0002014 0 15,000 $50,000
Year Depr. Exp. NBV2010 $12,000 $53,0002011 11,000 42,0002012 13,500 28,5002013 8,500 20,0002014 5,000 15,000 $50,000
One of the most common
reasons that companies
choose one depreciation
method over another is
the eff ect on taxes.
The summary demonstrates that total depreciation ex-pense over the life of the asset is $50,000 regardless of the method chosen. However, each method arrives at $50,000 differently. The straight-line method depreciates the same amount each year. The double-declining-balance method accelerates depreciation into the early years of the asset’s life. The units-of-activity method depreciates different amounts each year depending on the asset’s usage. No de-preciation method is right. They are just different, and com-panies choose to use one over another for different reasons. One of the most common reasons is the effect on taxes.
Like all expenses, depreciation expense reduces net income, which in turn reduces income taxes. Assuming a 40% tax rate in the example above, the $50,000 of depreciation on the truck will lower taxes by $20,000. The advantage of the double-declining-balance method is that all of the tax savings are realized in three years rather than fi ve. This is benefi cial to a company because the company can temporarily use the cash that would otherwise be paid to the government.
Many companies take advantage of this tax effect by using one method of depreciation for tax purposes and another for fi nancial reporting purposes. The Internal Revenue Service (IRS) allows companies to use a de-preciation method known as the Modifi ed Accelerated
Cost Recovery System (MACRS). As its name implies, MACRS is an accelerated method much like the double-declining-balance method. However, the IRS does not require that a company use the same method on its tax return that it does for its fi nancial statements. As a re-sult, many companies that use MACRS for taxes use the straight-line method for fi nancial reports.
Regardless of the method chosen, companies must disclose their choices in the notes to their fi nancial statements so that comparisons can be made among different companies. This is an application of the quali-tative characteristic of comparability. The disclosure is sometimes found in a note dedicated solely to fi xed as-sets. However, most companies like McDonald’s put it in the fi rst note summarizing the signifi cant accounting policies used to prepare fi nancial statements.
McDonald’s 2008 Property and Equipment Note
Property and equipment are stated at cost, with depreciation and amortization provided using the straight-line method over the following estimated useful lives: buildings—up to 40 years; leasehold improvements–the lesser of useful lives of assets or lease terms, which generally include option periods; and equipment—three to 12 years.
© D
MIT
RIV
SH
IRO
NO
SO
V /S
HU
TT
ER
ST
OC
K.C
OM
53915_01_CH08_002-026.indd 1153915_01_CH08_002-026.indd 11 11/12/09 8:32:18 PM11/12/09 8:32:18 PM

12 C h a p t e r 8 : F i x e d A s s e t s a n d I n t a n g i b l e A s s e t s
When actual experience shows that a past estimate was incorrect, accountants change the estimate going forward instead of correcting the past.
Now suppose that during the fi fth year of use, Thomas decides that the machine will last only eight years rather than the ten years originally estimated and will have a salvage value of only $6,000 rather than $10,000. When these revisions are made, Thomas does not correct the four previous entries of $8,000 because they were based on reasonable estimates at the time. Instead, Thomas calculates the remaining depreciable cost of the asset and spreads it out over the remaining useful life.
To do this, Thomas must fi rst calculate the net book value of the asset. This represents the unexpired cost of the asset.
To calculate net book value at the time of estimate revision:
Cost of the asset, January 1, 2010 $90,000
Less: Accumulated depreciation for four years 32,000
Net book value on January 1, 2014 $58,000
Next, Thomas subtracts from the net book value the asset’s salvage value, which will result in the as-set’s remaining depreciable cost. Keep in mind that Thomas uses the revised salvage value. This is shown as follows:
To calculate depreciable cost for future depreciation:
Net book value on January 1, 2014 $58,000
Less: Estimated salvage value 6,000
Remaining depreciable cost $52,000
Finally, under the straight-line method Thomas cal-culates depreciation expense by dividing the depreciable cost by the remaining useful life. In this case, the total useful life is now estimated to be eight years instead of ten, which means that there are only four years remain-ing instead of six.
LO3 Adjustments Made During a Fixed Asset’s Useful Life
Since fi xed assets are used for multiple years, com-panies sometimes must make adjustments as new
information is available or as new activity occurs. These adjustments can arise from the following:
• Changes in estimates
• Additional expenditures to improve the fi xed asset
• Signifi cant declines in the asset’s market value
Changes in Depreciation Estimates
Calculating depreciation expense requires that a com-pany estimate the asset’s useful life and its salvage value. These estimates are normally based on previous compa-ny experience with similar assets as well as factors such as the manufacturer’s recommendations. As a result, they are usually fair and reasonable. However, estimates can differ from actual experience. When such errors are small and will not affect decision making, they are usually ig-nored. When the estimates are materially wrong, though, revisions can be made. We call this a change in estimate.
When an estimate is changed, the change is made prospectively, meaning that the change affects only the calculation of current and future depreciation expense. Depreciation expense for prior years is not retroactive-ly corrected. Once an estimate is revised, current and future depreciation expense is calculated with the new estimate. This is done by (1) determining the remaining depreciable cost of the asset at the time of the revision and (2) depreciating that cost over the remaining useful life using the same depreciation method.
To illustrate, suppose that Thomas Supply purchas-es a machine for $90,000 on January 1, 2010. Thomas estimates that the machine will have a 10-year useful life and a $10,000 salvage value. Thomas uses the straight-line method of depreciation and records $8,000 of de-preciation expense [($90,000 2 $10,000) 4 10] each year as follows:
Dec. 31 Depreciation Expense 8,000
Accumulated Depreciation 8,000
(To record depreciation expense)
Assets 5 Liabilities 1 Equity 28,000 28,000
53915_01_CH08_002-026.indd 1253915_01_CH08_002-026.indd 12 11/12/09 8:32:34 PM11/12/09 8:32:34 PM

13C h a p t e r 8 : F i x e d A s s e t s a n d I n t a n g i b l e A s s e t s
personal automobile to see this. The purchasing price is only the fi rst cost. Expenditures for oil changes, tune ups, minor repairs, and even major repairs come later. So, how are these additional expenditures treated from an accounting standpoint?
The accounting treatment for expenditures made during the useful life of a fi xed asset depends on wheth-er they are classifi ed as capital or revenue expenditures. A capital expenditure increases the expected useful life or productivity of the asset. An example would be a new engine for an automobile. Capital expenditures are added to the cost of the asset and depreciated over the asset’s remaining useful life. A revenue expendituremaintains the expected useful life or productivity of the asset. An example would be an oil change. Revenue expenditures are expensed in the period in which they are incurred. They are not added to the cost of the asset.
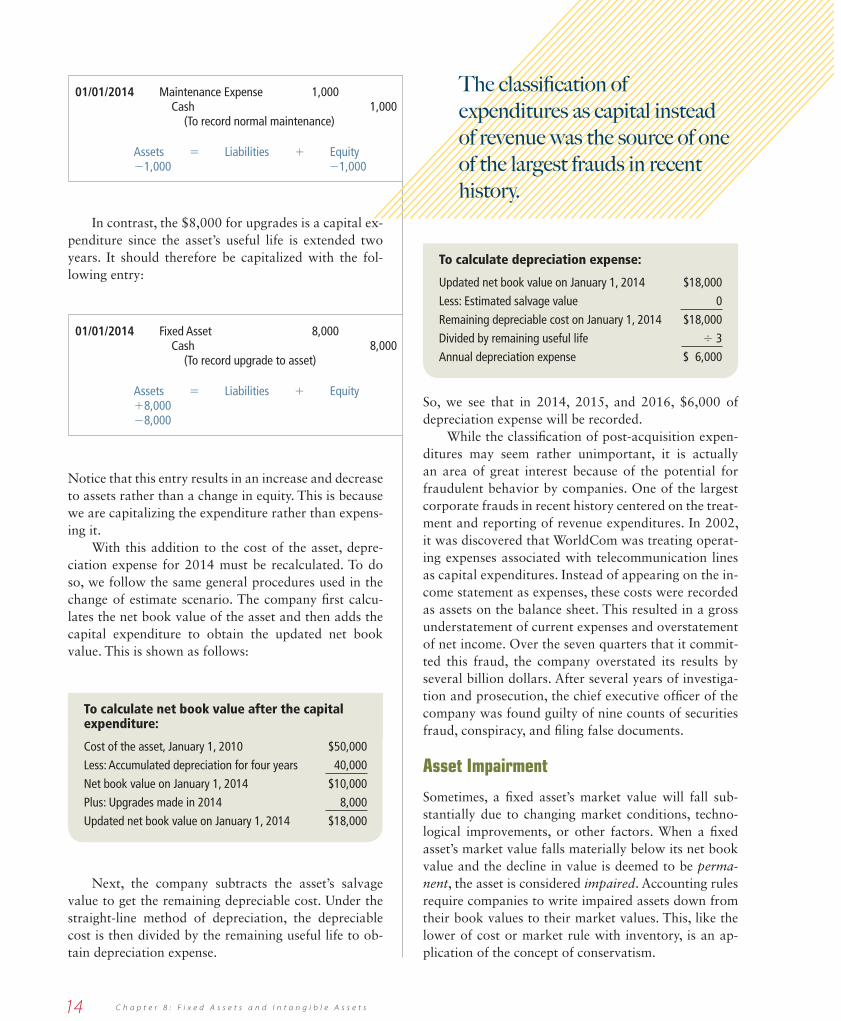
To illustrate, suppose that a company purchases a fi xed asset for $50,000 on January 1, 2010. The company estimates the asset’s useful life and salvage value at fi ve years and $0, respectively. Using the straight-line depreciation method, the company rec-ords $10,000 of depreciation expense each year. Now suppose that on January 1, 2014, during the fi fth year of the asset’s life, the company incurs $1,000 in ordi-nary maintenance and $8,000 for upgrades. The up-grades allow the machine to be used productively in 2015 and 2016.
Given this information, the $1,000 is a revenue ex-penditure and should be expensed as follows:
To calculate depreciation expense under revised estimates:
Remaining depreciable cost $52,000
Divided by remaining useful life 4 4
Annual depreciation expense $13,000
With this new depreciation expense calculated, Thomas would make the following journal entry at the end of Years 5 through 8.
Dec. 31 Depreciation Expense 13,000
Accumulated Depreciation 13,000
(To record depreciation expense)
Assets 5 Liabilities 1 Equity 213,000 213,000
So, Thomas depreciates $8,000 per year in Years 1 through 4 and $13,000 per year in Years 5 through 8. This results in $84,000 of total depreciation over the life of the asset, which is equal to the original cost of the asset less its revised salvage value ($90,000 2 $6,000 5$84,000).
When a company has a material change in a fi xed asset estimate, it will disclose information on the change in the notes to fi nancial statements. Exhibit 8-5 is an example from IBM, which in 1999 reduced income $404 million due to a change in useful life estimates on computers.
Exhibit 8-5 Change in Estimate—IBM
Change in EstimateAs a result of a change in the estimated useful life of personal computers from fi ve years to three years, the company recognized a charge in the second quarter of 1999 of $404 million ($241 million after tax, $0.13 per diluted common share). In the second quarter of 1999, the company wrote off the net book value of personal computers that were three years old or older and, therefore, had no remaining useful life. The remaining book value of the assets will be depreciated over the remaining new useful life.
Expenditures After Acquisition
Most fi xed assets require expenditures throughout their useful lives. You have to think no further than your
Because classifying expenditures as capital or revenue is subjective, two accountants may classify the same expenditure differently.
Capital expenditure An expenditure that
increases the expected useful life or productivity of a
fi xed asset.
Revenue expenditure An expenditure that maintains the
expected useful life or the productivity of a fi xed asset.
53915_01_CH08_002-026.indd 1353915_01_CH08_002-026.indd 13 11/12/09 8:32:37 PM11/12/09 8:32:37 PM
14 C h a p t e r 8 : F i x e d A s s e t s a n d I n t a n g i b l e A s s e t s
01/01/2014 Maintenance Expense 1,000 Cash 1,000 (To record normal maintenance)
Assets 5 Liabilities 1 Equity 21,000 21,000
In contrast, the $8,000 for upgrades is a capital ex-penditure since the asset’s useful life is extended two years. It should therefore be capitalized with the fol-lowing entry:
01/01/2014 Fixed Asset 8,000 Cash 8,000 (To record upgrade to asset)
Assets 5 Liabilities 1 Equity 18,000 28,000
Notice that this entry results in an increase and decrease to assets rather than a change in equity. This is because we are capitalizing the expenditure rather than expens-ing it.
With this addition to the cost of the asset, depre-ciation expense for 2014 must be recalculated. To do so, we follow the same general procedures used in the change of estimate scenario. The company fi rst calcu-lates the net book value of the asset and then adds the capital expenditure to obtain the updated net book value. This is shown as follows:
To calculate net book value after the capital expenditure:
Cost of the asset, January 1, 2010 $50,000
Less: Accumulated depreciation for four years 40,000
Net book value on January 1, 2014 $10,000
Plus: Upgrades made in 2014 8,000
Updated net book value on January 1, 2014 $18,000
Next, the company subtracts the asset’s salvage value to get the remaining depreciable cost. Under the straight-line method of depreciation, the depreciable cost is then divided by the remaining useful life to ob-tain depreciation expense.
To calculate depreciation expense:
Updated net book value on January 1, 2014 $18,000
Less: Estimated salvage value 0
Remaining depreciable cost on January 1, 2014 $18,000
Divided by remaining useful life 4 3
Annual depreciation expense $ 6,000
So, we see that in 2014, 2015, and 2016, $6,000 of depreciation expense will be recorded.
While the classifi cation of post-acquisition expen-ditures may seem rather unimportant, it is actually an area of great interest because of the potential for fraudulent behavior by companies. One of the largest corporate frauds in recent history centered on the treat-ment and reporting of revenue expenditures. In 2002, it was discovered that WorldCom was treating operat-ing expenses associated with telecommunication lines as capital expenditures. Instead of appearing on the in-come statement as expenses, these costs were recorded as assets on the balance sheet. This resulted in a gross understatement of current expenses and overstatement of net income. Over the seven quarters that it commit-ted this fraud, the company overstated its results by several billion dollars. After several years of investiga-tion and prosecution, the chief executive offi cer of the company was found guilty of nine counts of securities fraud, conspiracy, and fi ling false documents.
Asset Impairment
Sometimes, a fi xed asset’s market value will fall sub-stantially due to changing market conditions, techno-logical improvements, or other factors. When a fi xed asset’s market value falls materially below its net book value and the decline in value is deemed to be perma-nent, the asset is considered impaired. Accounting rules require companies to write impaired assets down from their book values to their market values. This, like the lower of cost or market rule with inventory, is an ap-plication of the concept of conservatism.
The classifi cation of
expenditures as capital instead
of revenue was the source of one
of the largest frauds in recent
history.
53915_01_CH08_002-026.indd 1453915_01_CH08_002-026.indd 14 11/12/09 8:32:39 PM11/12/09 8:32:39 PM

15C h a p t e r 8 : F i x e d A s s e t s a n d I n t a n g i b l e A s s e t s
To illustrate, suppose a company has equipment that makes a unique toy that becomes extremely popu-lar. The equipment has a net book value of $140,000 and a higher market value. Suppose further that the toy suddenly loses its popularity, and the company is unable to alter the machine to produce anything else. As a result, the market value of the machine plummets to $40,000. The company deems this decline in mar-ket value to be permanent and declares that the asset is impaired. The asset impairment would be recorded as follows:
Loss on Impairment 100,000 Fixed Asset 100,000 (To record permanent impairment asset)
Assets 5 Liabilities 1 Equity 2100,000 2100,000
In the above entry, a Loss on Impairment is in-creased to refl ect the decline in value of the asset. This reduces equity. Because this loss is not a result of normal operations, the loss would be included among Other Revenues and Expenses on the income statement. In
Look at Home Depot’s fi rst note to its fi nancial state-ments in Appendix C. There is one paragraph de-scribing expenditures for a certain type of activity
where the treatment of the expenditures is very similar to the capital and revenue expenditures described in this text. What is this activity?
The activity is software costs. Home Depot describes in the Capitalized Software Costs paragraph that certain expendi-tures associated with the development of software are cap-italized into Furniture, Fixtures, and Equipment and then amortized over the software’s useful life, which is three to six years. All expenditures not meeting the requirements for capitalization are expensed in the period incurred.
HOME DEPOT ANALYSIS
Exhibit 8-6 Asset Impairment—Eli Lilly
Note 4: Asset Impairment and Other Site ChargesIn December 2005, management approved, as part of our ongoing eff orts to increase productivity and reduce our cost structure, decisions that resulted in non-cash charges of $154.6 million for the write-down of certain impaired assets, and other charges of $17.3 million, primarily related to contract termination payments. The impaired assets, which have no future use, include manufacturing buildings and equipment no longer needed to supply projected capacity requirements, as well as obsolete research and development equipment. The impairment charges are necessary to adjust the carrying value of the assets to fair value.
addition, the Fixed Asset account is decreased to refl ect the reduced value. This reduces assets. After the impair-ment entry, depreciation expense would be calculated based on the revised depreciable cost and remaining useful life.
Asset impairments are not uncommon. In fact, cur-rent accounting rules require companies to periodically assess whether any of their fi xed assets are impaired. Consider the note to Eli Lilly’s fi nancial statements as shown in Exhibit 8-6.
While the note speaks of issues that are beyond the scope of this book, we can at least tell that asset impair-ments can be material to a company’s fi nancial results. Eli Lilly recorded over $154 million in impairments in one year.
LO4 Disposing of Fixed Assets
When a company decides that it no longer needs a fi xed asset, it usually disposes of the asset in
one of three ways. When the asset has no value, it will simply be discarded. When the asset still has value, it will either be sold or traded in for another asset, often a
53915_01_CH08_002-026.indd 1553915_01_CH08_002-026.indd 15 11/12/09 8:32:39 PM11/12/09 8:32:39 PM

16 C h a p t e r 8 : F i x e d A s s e t s a n d I n t a n g i b l e A s s e t s
newer model. Since the accounting for trading an asset is beyond the scope of this book, we will focus on the fi rst two cases—discarding or selling the asset.
The accounting for the disposal of a fi xed asset consists of the following three steps:
1. Update depreciation on the asset.
2. Calculate gain or loss on the disposal.
3. Record the disposal.
The fi rst step is to record any necessary deprecia-tion expense to update the accumulated depreciation account. Usually, this means that depreciation expense must be recorded for a partial period. For example, a company that records annual depreciation expense on December 31 and sells equipment on the following February 15 must record depreciation expense for one and one-half months at the time of disposal.
The second step is to calculate any gain or loss on the disposal by comparing the asset’s net book value to the proceeds from the asset’s sale, if any. When the proceeds exceed the net book value, a gain on disposal
is re cog nized. When the net book value exceeds the pro-ceeds, a loss on disposal is recognized. This is summa-rized below:
Gain on Disposal if: Proceeds from Sale . Net Book Value
Loss on Disposal if: Proceeds from Sale , Net Book Value
The third and fi nal step is to prepare a journal entry that decreases the asset account and its related accumu-lated depreciation account. If the asset is sold and cash is received, the entry must also record the increase in cash. Finally, any gain or loss on the disposal must be recorded.
To illustrate, suppose that a company purchases a machine on January 1, 2010, for $30,000. The compa-ny estimates the useful life and salvage value to be four years and $2,000, respectively. The company uses the straight-line method of depreciation and records depre-ciation expense annually on December 31. Given these facts, annual depreciation expense for the machine is $7,000 [($30,000 2 $2,000) / 4].
MAKING IT REAL
The value of a company’s equipment can be im-paired or reduced for many reasons. One of those is a decrease in demand for the
product that the equipment makes. Take Crocs, Inc., as an example.
Crocs, Inc., is well known for its lightweight and colorful ventilated clogs. The company burst onto the scene in 2002 with the launch of its Beach™ model, and demand grew quickly. The company responded by rapidly diversifying into diff erent styles and increasing production capacity and warehouse space. By 2007, the company was generating record profi ts of $168 million.
But things quickly changed. Demand for Crocs’ products fell in 2008, resulting in a $185 million overall loss. Approxi-
mately 11% of that loss, or $21 million, was attributable to impairment charges on its manufacturing equipment. Spe-
cifi cally, projections of prod-uct demand indicated that the company had signifi cant excess capacity. It simply had too much equipment and too many shoe molds given de-mand. As a result, the compa-ny abandoned the equipment and molds and took a $21 mil-lion charge to income.
And unfortunately for the company, the impairments
continued into 2009. For the fi rst six months of 2009, Crocs has recognized $17 million in asset impairment charges re-lated to shoe molds and distribution facilities.
© A
P IM
AG
ES
/AP
PH
OT
O/F
RA
NK
AU
GS
TE
IN
53915_01_CH08_002-026.indd 1653915_01_CH08_002-026.indd 16 11/12/09 8:32:41 PM11/12/09 8:32:41 PM

17C h a p t e r 8 : F i x e d A s s e t s a n d I n t a n g i b l e A s s e t s
Loss Example Suppose further that the company sells the machine on June 30, 2012, for $12,000. To account for this sale, the company must fi rst update the accumulated depreciation account. The asset has been used for six months since the last time depre-ciation was recorded (December 31), so the company must record six months of depreciation expense. Since annual depreciation expense is $7,000, six months of depreciation would be half of that, or $3,500. Therefore, the following entry would be made on June 30, 2012:
6/30/2012 Depreciation Expense 3,500
Accumulated Depreciation 3,500
Assets 5 Liabilities 1 Equity 23,500 23,500
As a result of this entry, the accumulated deprecia-tion account is updated to a balance of $17,500 ($7,000 in 2010, $7,000 in 2011, and $3,500 in 2012). With this balance, the gain/loss on disposal can be calculated as follows:
Proceeds from sale $12,000
Cost of machine $30,000
Less: Accumulated Depreciation 17,500
Net Book Value at 6/30/2012 12,500
Loss on sale $ (500)
Because the asset’s net book value of $12,500 exceeds the sale proceeds of $12,000, the company generates a $500 loss. With this information, the company can pre-pare the following journal entry to record the disposal:
6/30/2012 Cash 12,000
Accumulated Depreciation 17,500
Loss on Disposal 500
Machine 30,000
Assets 5 Liabilities 1 Equity 112,000 2500 117,500 230,000
The entry fi rst decreases the Machine account by $30,000 to eliminate the account. A common mistake is to think that the Machine account should be decreased
by its net book value of $12,500. But remember that fi xed assets are recorded and maintained at their costs, so the balance in the Machine account is $30,000 prior to disposal. Second, the entry decreases Accumulated Depreciation by $17,500. When a company no longer has an asset, it should no longer maintain accumulated depreciation for the asset. Third, the entry increases the Cash account to refl ect the asset received from selling the machine. Finally, the entry increases a Loss on Disposal account to refl ect the loss on sale. This account is re-ported on the income statement among Other Revenues and Expenses. As a result of the entry, assets and equity are decreasing by $500, the amount of the loss.
Gain Example To illustrate a gain example, sup-pose that the company sells the machine on March 31, 2013, for $8,000. After updating depreciation, the ac-cumulated depreciation account would have a balance of $22,750:
Three full years (2010, 2011, 2012) $21,000
One-fourth of 2013 ($7,000 3 ¼) 1,750
Accumulated depreciation at 3/31/2013 $22,750
Therefore, the machine’s net book value and the gain/loss on disposal at 3/31/2013 can be calculated as follows:
Proceeds from sale $8,000
Cost of machine $30,000
Less: Accumulated depreciation 22,750
Net book value at 3/31/2013 7,250
Gain on sale $ 750
Because the sale proceeds of $8,000 exceed the as-set’s net book value of $7,250, the company generates a $750 gain. With this information, the following journal entry can be prepared to record the disposal:
3/31/2013 Cash 8,000
Accumulated Depreciation 22,750
Gain on Disposal 750
Machine 30,000
Assets 5 Liabilities 1 Equity 1 8,000 1750 122,750 230,000
53915_01_CH08_002-026.indd 1753915_01_CH08_002-026.indd 17 11/12/09 8:32:45 PM11/12/09 8:32:45 PM

18 C h a p t e r 8 : F i x e d A s s e t s a n d I n t a n g i b l e A s s e t s
A loss on the sale of a fi xed asset is reported in other expenses so that operating expenses include only those expenses related to normal operations.
Like the loss example, the entry decreases the Machine account by $30,000. It also decreases the ma-chine’s Accumulated Depreciation account by $22,750 to eliminate the account and increases the Cash account by $8,000 to refl ect the asset received from selling the machine. Finally, the entry increases a Gain on Disposal account to refl ect the gain on sale. Like the loss ex-ample, the net effect on the accounting equation is an equal change in assets and equity, with this example resulting in a $750 increase to both.
LO5 Evaluating a Company’s Management of Fixed Assets
Because fi xed assets comprise the largest category of assets for most companies, it is usually a good
idea to evaluate a company’s management of its fi xed assets. A company manages fi xed assets by acquiring them, using them productively, and then replacing them. Therefore, three issues of importance for any company with fi xed assets would be as follows:
1. How productive are the company’s fi xed assets in generating revenues?
2. What is the condition of the company’s fi xed assets?
3. How are cash fl ows affected by the purchase of fi xed assets?
The following sections examine these issues for the fi xed assets of McDonald’s. The examination will re-quire information from the company’s balance sheet, income statement, and notes to the fi nancial statements. The required information is found in Exhibit 8-7, excerpted from McDonald’s 2008 Annual Report.
Exhibit 8-7 Account Balances from McDonald’s 2008 Annual Report
Source Accounts 2008 2007
Income Statement Total revenues $ 23,522.4 $ 22,786.6
Balance Sheet
Property and equipment, at cost
Less: Accumulated depreciationNet property and equipment
Total assets
$ 31,152.4 $ 32,203.7
(10,897.9) (11,219.0) $ 20,254.5 $ 20,984.7
$ 28,461.5 $ 29,391.7
Notes to Financial Statements Depreciation expense $ 1,161.6 $ 1,145.0
Horizontal and Vertical Analyses
A good place to start an analysis of fi xed assets is with horizontal and vertical analyses. Recall from Chapter 2 that horizontal analysis calculates the dollar change in an account balance, defi ned as the current year balance less the prior year balance, and divides that change by the prior year balance to yield the percentage change. Vertical analysis divides each account balance by a base account, yielding a percentage. The base account is total assets for balance sheet accounts and net sales or total revenues for income statement accounts. These calcula-tions are summarized as follows:
Horizontal AnalysisDollar change in
5account balance Current year balance – Prior year balance
Percentage change 5
in account balanceCurrent year balance – Prior year balance
Prior year balance
Vertical AnalysisBalance Sheet Income Statement
Percentage 5Account Balance or
Total Assets
Account Balance
Net Sales or Revenue
53915_01_CH08_002-026.indd 1853915_01_CH08_002-026.indd 18 11/12/09 8:32:45 PM11/12/09 8:32:45 PM

19C h a p t e r 8 : F i x e d A s s e t s a n d I n t a n g i b l e A s s e t s
Given McDonald’s fi nancial information in Exhibit 8-8, horizontal and vertical analyses of fi xed assets and depreciation expense result in the following. Note that the net book value of property and equip-ment is used in the calculations. Note also that vertical analysis is conducted on both years of data.
Horizontal AnalysisDollar Change Percentage Change
Property and equipment
20,254.5
220,984.7
(730.2)
(730.2)
20,984.75 (3.5%)
Depreciation Expense
1,161.6
21,145.0
16.6
16.6
1,145.05 1.5%
Vertical Analysis2008 2007
Property and equipment
20,254.5
28,461.5 5 71.2%
20,984.7
29,391.7 5 71.4%
Depreciation Expense
1,161.6
23,522.45 4.9% 1,145.0
22,786.6 5 5.0%
The calculations show a fairly stable fi xed asset posi-tion. Horizontal analysis shows a slight decrease of 3.5% in fi xed assets and a slight increase of 1.5% in deprecia-tion expense from 2007 to 2008. Vertical analysis shows that fi xed assets make up a large part of McDonald’s asset base. In each year, slightly over 71% of the assets are fi xed assets. Furthermore, depreciation expense is shown to be about 5% in each year. This tells us that for every dollar in sales in revenue, the company incurs about a nickel in depreciation expense. Overall, both of these analyses indi-cate fairly stable fi xed assets over the two-year period.
For comparison purposes, the 2008 horizontal and vertical analyses of Burger King Holdings are listed below. While McDonald’s has a larger percentage of its total assets in fi xed assets, Burger King is increasing its fi xed assets and depreciation at a greater rate.
company is using those fi xed assets productively to gen-erate revenues. One means to fi nd out is to calculate the fi xed asset turnover ratio. The fi xed asset turnover ratiocompares total revenues during a period to the average net book value of fi xed assets during that period. It is calculated as follows:
Fixed Asset Turnover Ratio 5
Total RevenuesAverage Net Book Value of Fixed Assets
Where average net book value is calculated as:
Average Net Book Value 5
Beginning Net Book Value 1 Ending Net Book Value2
Because this ratio compares total revenues to fi xed assets, it indicates the productivity of every dollar invest-ed in fi xed assets. In general, companies want this ratio to be higher rather than lower. All other things equal, a higher ratio indicates that the company is using its fi xed assets more effectively to produce more revenue.
McDonald’s 2008 fi xed asset turnover ratio is cal-culated as follows.
23,522.4 5
(20,254.5 1 20,984.7)/21.14
The 1.14 ratio tells us that McDonald’s total revenues for 2008 were 1.14 times the average net book value of its fi xed assets. In other words, for every dollar of fi xed assets, on average, McDonald’s was able to gener-ate $1.14 in revenue during the period. Whether this is good or bad requires some comparison. Wendy’s/Arby’s 2008 fi xed asset turnover ratio was 1.60, while Burger King’s was 2.67. McDonald’s trails its two rivals in gen-erating revenues from its fi xed assets.
Average Life and Age of Fixed Assets
In addition to understanding the productivity of fi xed assets, it is a good idea to understand the con-dition of a company’s fi xed assets.
Fixed asset turnover A comparison of total
revenues to the average net book value of fi xed assets that
measures the productivity of fi xed assets.
Fixed Asset Turnover Ratio
The preceeding analyses indicate that McDonald’s fi xed assets were stable. But they do not indicate whether the
Horizontal Analysis Vertical Analysis
Fixed AssetsMcDonald’sBurger King
(3.5%)
9.3%
71.2%
35.8%
Depreciation ExpenseMcDonald’sBurger King
1.5%
5.4%
4.9%
4.8%
53915_01_CH08_002-026.indd 1953915_01_CH08_002-026.indd 19 11/12/09 8:32:47 PM11/12/09 8:32:47 PM

20 C h a p t e r 8 : F i x e d A s s e t s a n d I n t a n g i b l e A s s e t s
Average Useful Life 5 Cost of Fixed Assets Depreciation Expense
The ratio divides the total cost of fi xed assets by the amount of annual depreciation expense to approxi-mate the number of years that it will take to fully depre-ciate the assets. A higher number represents a longer useful life. You may notice that this ratio is basically a rearrangement of the calculation of straight-line depre-ciation. Therefore, the ratio works best when the com-pany uses the straight-line method.
The average age of fi xed assets represents the number of years, on average, that the company has used its fi xed assets. It is calculated as follows:
Average Age 5 Accumulated Depreciation Depreciation Expense
Fixed assets in poor condition are usually less productive and normally require signifi cant expenditures either to repair or replace. While a user of McDonald’s fi nancial statements cannot physically examine the company’s fi xed assets, one way to get a rough idea of the general condition of a company’s fi xed assets is to look at the age of the assets in comparison to their useful lives. This can be accomplished by calculating the average useful life and average age of the assets.
The average useful life of fi xed assets represents the number of years, on average, that a company expects to use its fi xed assets. It is calculated as follows:
HOME DEPOT ANALYSIS
Using Home Depot’s information in Appendix C, calculate and interpret 1) horizontal and verti-cal analyses of fi xed assets and depreciation ex-
pense, 2) fi xed asset turnover ratio, and 3) average life and average age of fi xed assets.
Horizontal Analysis
Fixed assets: ($26,234 2 $27,476) / 27,476 5 (4.5%)Depreciation Expense: ($1,785 2 $1,702) / 1,702 5 4.9%
Vertical Analysis
Fixed assets: $26,234 / $41,164 5 63.7%Depreciation Expense: $1,785 / $71,288 5 2.5%
The horizontal analysis shows that while deprecia-tion expense was up slightly, overall fi xed assets actually decreased during the year. The 63.7% vertical analysis of fi xed assets shows how important fi xed assets are to the company. Almost two-thirds of its assets are in fi xed as-sets. The 2.5% vertical analysis of depreciation expense indicates that although the company has large fi xed
assets, depreciation expense consumes less than three cents per dollar of sales in the most recent year.
Fixed Asset Turnover Ratio: $71,288 / ($26,234 1 $27,476)/2 5 2.66
The 2.66 fi xed asset turnover ratio indicates that Home Depot generates $2.66 in sales for every $1 of fi xed assets that it owns. This could provide Home Depot with a benchmark expectation for stores. For example, a store with $10 million of fi xed assets could be expected to gen-erate about $27 million in sales.
Average Life Ratio: $26,234 / $1,785 5 14.7 yearsAverage Age Ratio: $10,243 / $1,785 5 5.7 years
The 14.7 average life ratio shows that Home Depot’s average fi xed asset has about a 15 year life. The 5.7 av-erage age ratio indicates that the company’s fi xed as-sets are relatively young, having been used for only 5 or so years. Taken together, these two ratios indicate that Home Depot will not need signifi cant fi xed asset replace-ment in the near term.
Average useful life of fi xed assets A
comparison of the cost of fi xed assets to depreciation
expense that estimates the number of years, on average, that a
company expects to use its fi xed assets.
Average age of fi xed assets A comparison of
accumulated depreciation to depreciation expense that estimates
the number of years, on average, that the company has used its
fi xed assets.
53915_01_CH08_002-026.indd 2053915_01_CH08_002-026.indd 20 11/12/09 8:32:48 PM11/12/09 8:32:48 PM

21C h a p t e r 8 : F i x e d A s s e t s a n d I n t a n g i b l e A s s e t s
A negative number for capital expenditures indicates that a company is investing in operating assets
The ratio divides the accumulated depreciation bal-ance by the amount of annual depreciation expense to approximate the number of years that the assets have already been depreciated. A higher number means that the assets are older. Like the average useful life ratio, the average age ratio works best when the company uses the straight-line method.
Calculating McDonald’s 2008 ratios requires the cost of the fi xed assets and their accumulated deprecia-tion balances at the end of 2008. These are found on the balance sheet. It also requires depreciation expense for 2008. This is found in the company’s Property and Equipment note to its fi nancial statements. Each account balance is shown in Exhibit 8-7.
Average Life 531,152.4
1,161.65 26.8
Average Age 510,897.9
1,161.65 9.4
The ratios show that McDonald’s fi xed assets, on average, have about a 27-year expected life and are currently about 9 years old. Now, we have to be care-ful here not to read too much into these numbers. In its fi rst note to its fi nancial statements, McDonald’s re-ports that it assumes lives of up to 40 years for build-ings, up to 15 years for restaurant equipment, and up to 10 years for other equipment. Like many companies, McDonald’s has various fi xed assets with various useful lives. While this makes the average life and age ratios very general estimates, the calculations do allow us to draw the general conclusion that the company’s fi xed assets are relatively new. On average, the company has used its fi xed assets for about one-third of their useful
HOME DEPOT ANALYSIS
Look at Home Depot’s statement of cash fl ows in Ap-pendix C. How much cash has the company spent to acquire fi xed assets over the past three years in
total? Compare Home Depot’s capital expenditures in the most recent year to its cash from operations.
According to the investing activities section of its statement of cash fl ows, Home Depot spent a total of
$8,947 capital expenditures over the past three years ($1,847 1 $3,558 1 $3,542 5 $8,947).
Home Depot’s capital expenditures in the most recent year were $1,847 million while its cash generated from operations was $5,528. Thus, it appears that Home Depot generated enough cash to pay for its growth in fi xed assets without having to borrow the cash or dip into its reserves.
lives. Thus, we would not expect McDonald’s to have abnormally high expenditures for repairing or replac-ing fi xed assets in the near future.
LO6 Fixed Assets and Cash Flows
Another important aspect of fi xed assets is their effect on a company’s cash fl ows. Fixed assets
affect cash fl ows the most when they are purchased. Because companies often purchase signifi cant amounts of fi xed assets each year, the cash paid for them is re-ported as a separate line item in the investing activi-ties section of the statement of cash fl ows. The line item is often labeled as Capital Expenditures or some-thing similar. McDonald’s is a little more specifi c, re-porting the following on the fi rst line of its investing activities:
McDonald’s 2008 Capital Expenditures from the Statement of Cash Flows
in millions 2008 2007 2006
Property and equipment expenditures ($2,135.7) ($1,946.6) ($1,741.9)
53915_01_CH08_002-026.indd 2153915_01_CH08_002-026.indd 21 11/12/09 8:32:49 PM11/12/09 8:32:49 PM
22 C h a p t e r 8 : F i x e d A s s e t s a n d I n t a n g i b l e A s s e t s
The negative number signifi es a cash outfl ow. In 2008, McDonald’s spent over $2.1 billion in cash to purchase fi xed assets. In the two previous years, the company spent about $1.9 billion and $1.7 billion. For the three years combined, this totals over $5.8 billion in cash paid for fi xed assets.
A natural question arising from this data is where the company got the $5.8 billion it needed for these investments in fi xed assets. Did it borrow the money or did it have it on hand? We can get an idea of where the money came from by looking one line above the capital expenditures. There we fi nd the cash provid-ed by operating activities, which is summarized as follows:
McDonald’s 2008 Operating Cash Flows from the Statement of Cash Flows
in millions 2008 2007 2006
Cash provided by operations $5,917.2 $4,876.3 $4,341.5
In each year, McDonald’s generated more cash from operating activities than it spent for fi xed assets. For example, in 2008 the company generated $5.9 billion in cash from operations while it paid out $2.1 billion for fi xed assets. This means that the company was able to fi nance its growth with money generated from profi table operations. When a company’s capital expenditures exceed its cash from operating activi-ties, the company must get the needed cash from some other place. Either it must use its cash reserves or bor-row the money from a creditor. Being able to generate enough cash to pay for new fi xed assets is a good sign for McDonald’s.
LO7 Intangible Assets
In addition to fi xed assets, companies often possess other long-term assets known as intangible assets.
An intangible asset is a resource that is used in op-erations for more than one year but has no physical substance. A patent is a good example. A patent is the right, granted by the United States Patent Offi ce, for the holder of the patent to manufacture, sell, or use a par-ticular product or process exclusively for a limited pe-riod of time. Although the right of exclusive use has no physical properties, it can be a very valuable resource to the holder. Consider the pharmaceutical industry. When a company develops a new drug that is approved by the Food and Drug Administration, which will be more valuable—the equipment that manufactures the drug or the patent that provides for exclusive manufacturing and selling of the drug? Pharmaceutical companies will likely tell you that the patent is most valuable to them.
You are probably familiar with other intangible assets. For example, a trademark or trade name is the right, granted by the United States Patent Offi ce, for a company to use exclusively a name, symbol, or phrase to identify the company. Often, you can tell if something is registered as a trademark if it has a small ™ or ® be-side the name or symbol. Wendy’s/Arby’s Frosty™ is an example. No other company, without permission from Wendy’s/Arby’s, can lawfully use the name Frosty™ in association with an ice cream drink. The Nike swoosh™ is another example, as is the script Coca-Cola™.
Another recognizable intangible is a copyright. A copyright is the right, granted by the United States Copyright Offi ce, to reproduce or sell an artistic or published work. The publisher of this book owns the copyright to the material in the book and can repro-duce and sell it as it pleases. The material cannot be reproduced by someone else lawfully without the per-mission of the publisher.
A third intangible with which you may be familiar is a franchise. A franchise is the right, granted by the
The Nike swoosh is a well known example of
a trademark.
© A
P IM
AG
ES
/PR
NE
WS
FO
TO
/NIK
EIntangible asset A resource that is used in
operations for more than one year but that has no physical
substance.
Patent The right to manufacture, sell, or use a particular product
or process exclusively for a limited period of time.
Trademark (trade name) The right to use exclusively a
name, symbol, or phrase to identify a company.
Copyright The right to reproduce or sell an artistic or published
work.
Franchise The right to operate a business under the trade name
of the franchisor.
53915_01_CH08_002-026.indd 2253915_01_CH08_002-026.indd 22 11/12/09 8:32:51 PM11/12/09 8:32:51 PM

23C h a p t e r 8 : F i x e d A s s e t s a n d I n t a n g i b l e A s s e t s
Goodwill An intangible asset equal to the excess
that one company pays to acquire the net assets of another
company.
franchisor, to operate a business under the trade name of the franchisor. Examples of franchises are all around you. For example, whenever you visit a McDonald’s, you may be entering into a restaurant that is owned by an individual (the franchisee) who has purchased from McDonald’s Corporation (the franchisor) the right to operate the restaurant.
Recording Intangible Assets
Like all other assets, intangible assets are recorded at their acquisition costs. However, what is included as an acqui-sition cost can vary given the type of intangible asset and how it is acquired. The easiest case is when an intangible asset is acquired through an external transaction. For example, suppose that a company purchases a product patent from another company for $100,000. Because the patent is purchased in an arm’s length transaction with another company, the cost of the patent is the purchase price. In general, if an intangible asset is acquired through an external transaction, its cost is the purchase price.
A common example of an intangible that is created through an external transaction is goodwill. Goodwill is created when one company buys another company and pays more than the value of the net assets of the purchased company. Goodwill is equal to the excess of the purchase price over the value of the purchased net assets. For example, suppose that Buyer Company pur-chases Seller Company for $8 million when the value of Seller Company’s net assets is $6 million. In this trans-action, Buyer Company pays $8 million and records $6 million of new assets and $2 million of goodwill. A condensed form of the entry Buyer Company would make to record this transaction would be as follows:
Net Assets of Seller Company 6,000,000
Goodwill 2,000,000
Cash 8,000,000
(To record the purchase of Seller)
Assets 5 Liabilities 1 Equity 16,000,000 12,000,000 28,000,000
The above entry records the decrease in cash re-sulting from the purchase and the increase in net as-sets acquired through the purchase. The difference of $2 million is debited to Goodwill, which increases that asset account. The result of the entry is an increase and decrease to assets.
To understand what goodwill represents, think about why a company would pay a premium for an-other company. The purchasing company might want to acquire the other company’s customers, its reputa-tion, its employees, its market share, or its research. Whatever the reason, the purchasing company is pay-ing for something intangible that the other company possesses. This intangible value is what goodwill rep-resents. Note here that goodwill can be recorded by a company only when it purchases another company. Goodwill created internally by a company cannot be recorded as an asset because its cost cannot be reliably determined. Only through an independent purchase can the value of goodwill be objectively measured.
Goodwill can be a large asset on the balance sheets of companies that have acquired other compa-nies. Wendy’s/Arby’s is a good example. On its 2008 balance sheet, the company reports over $853 million in goodwill. Most of this goodwill was created when Wendy’s International was purchased by Triarc, the parent company of Arby’s. With total assets of approxi-mately $4.6 billion, goodwill represents about 18% of assets. McDonald’s also has a large balance in goodwill. It reports over $2.2 billion in goodwill on total assets of over $28 billion. Goodwill makes up about 8% of McDonald’s assets.
In these two examples, intangible assets were pur-chased externally and therefore recorded at their pur-chase prices. When an intangible asset is developed inter-nally, the accounting is slightly different. The initial cost of an internally generated intangible asset is limited to the legal and administrative fees to establish the asset.
To illustrate, suppose that a company’s researchers spend $150,000 creating a patentable product. To regis-ter the patent, the company spends $10,000. In this case, the cost of the patent is only $10,000. The $150,000 of research and development must be expensed in the period they are incurred, not added to the cost of the asset. While many disagree with this accounting treat-ment, it is another application of conservatism. It is very diffi cult to know whether particular research and development costs will result in productive assets and how long those assets might last. Given this uncertainty, excluding research and development costs from the cost of an internally developed intangible asset reduces the likelihood that the intangible asset is overstated.
53915_01_CH08_002-026.indd 2353915_01_CH08_002-026.indd 23 11/12/09 8:32:53 PM11/12/09 8:32:53 PM

24 C h a p t e r 8 : F i x e d A s s e t s a n d I n t a n g i b l e A s s e t s
Once an intangible asset is acquired and recorded, it is often challenged by other companies. For example, pat-ent holders often must defend their rights against compa-nies manufacturing similar products. When a company incurs costs to successfully defend the legality of its assets, such costs should be added to the cost of the asset. You can see this treatment in company disclosures. For exam-ple, eSpeed, Inc., a provider of business-to-business elec-tronic solutions, discloses in its notes that “[i]ntangible assets consist of purchased patents, costs incurred in con-nection with the fi ling and registration of patents and the costs to defend and enforce our rights under patents.”
Amortizing Intangible Assets
Like fi xed assets that are depreciated, intangible assets with limited useful lives are amortized. Amortization is the process of spreading out the cost of an intangible as-set over its useful life. Two examples of intangible assets with limited lives are patents and copyrights. Patents are granted for up to 20 years, and copyrights are granted for the life of the creator plus 70 years. Companies usu-ally use the straight-line method for amortization.
To illustrate, suppose that a company possesses a $60,000 patent that has the maximum legal life of 20 years. The company believes that the patent will be useful for only 12 years and will then be worthless. Amortization expense at the end of each year would be $5,000 ($60,000 4 12) and would be recorded as follows:
End of year Amortization Expense 5,000
Patent 5,000
Assets 5 Liabilities 1 Equity 25,000 25,000
The result of this entry is an increase to expenses and a decrease to assets. Notice that the entry records amorti-zation expense based on the 12-year useful life, not the 20-year legal life. Amortization should be based on the shorter of the legal life or useful life. Notice also that the entry directly reduces the patent account. Unlike fi xed assets, the amortization of intangible assets does not require the use of an accumulated amortization contra-account.
Amortization applies only to intangible assets with limited lives. Assets with indefi nite lives such as trade-marks and goodwill are instead examined periodically to check for impairment. This is similar to the impair-ment of fi xed assets. In general, if the market value of the intangible asset permanently falls below its cost, then the asset is impaired. In such a case, the company records a loss on impairment and reduces the asset to its market value. As you can imagine, determining whether an intangible asset is impaired is a very sub-jective process and requires a great deal of judgment. In such cases, it is important for accountants to follow guiding principles such as conservatism, relevance, and reliability.
STUDY TOOLSCHAPTER 8
CHAPTER REVIEW CARD
❑ Learning Objective and Key Concept Reviews
❑ Key Defi nitions and Formulas
ONLINE (Located at 4ltrpress.cengage.com/acct)
❑ Flash Cards and Crossword Puzzles
❑ Conceptual and Computational Interactive Quizzes
❑ E-Lectures
❑ Static, Algorithmic, and Additional Homework Activities (as directed by your instructor)
Amortization The process of spreading out the
cost of an intangible asset over its useful life.
53915_01_CH08_002-026.indd 2453915_01_CH08_002-026.indd 24 11/12/09 8:32:54 PM11/12/09 8:32:54 PM
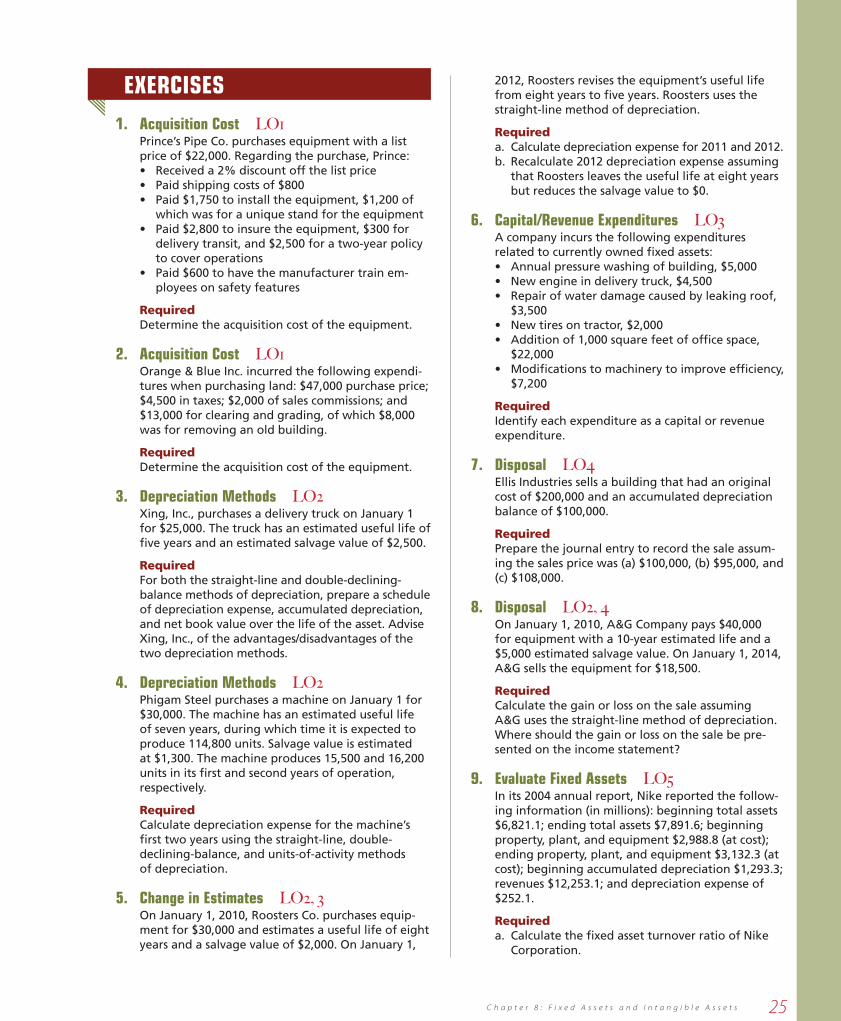
25C h a p t e r 8 : F i x e d A s s e t s a n d I n t a n g i b l e A s s e t s
EXERCISES
1. Acquisition Cost LO1 Prince’s Pipe Co. purchases equipment with a list
price of $22,000. Regarding the purchase, Prince:• Received a 2% discount off the list price• Paid shipping costs of $800• Paid $1,750 to install the equipment, $1,200 of
which was for a unique stand for the equipment • Paid $2,800 to insure the equipment, $300 for
delivery transit, and $2,500 for a two-year policy to cover operations
• Paid $600 to have the manufacturer train em-ployees on safety features
Required Determine the acquisition cost of the equipment.
2. Acquisition Cost LO1 Orange & Blue Inc. incurred the following expendi-
tures when purchasing land: $47,000 purchase price; $4,500 in taxes; $2,000 of sales commissions; and $13,000 for clearing and grading, of which $8,000 was for removing an old building.
Required Determine the acquisition cost of the equipment.
3. Depreciation Methods LO2 Xing, Inc., purchases a delivery truck on January 1
for $25,000. The truck has an estimated useful life of fi ve years and an estimated salvage value of $2,500.
Required For both the straight-line and double-declining-
balance methods of depreciation, prepare a schedule of depreciation expense, accumulated depreciation, and net book value over the life of the asset. Advise Xing, Inc., of the advantages/disadvantages of the two depreciation methods.
4. Depreciation Methods LO2 Phigam Steel purchases a machine on January 1 for
$30,000. The machine has an estimated useful life of seven years, during which time it is expected to produce 114,800 units. Salvage value is estimated at $1,300. The machine produces 15,500 and 16,200 units in its fi rst and second years of operation, respectively.
Required Calculate depreciation expense for the machine’s
fi rst two years using the straight-line, double- declining-balance, and units-of-activity methods of depreciation.
5. Change in Estimates LO2, 3 On January 1, 2010, Roosters Co. purchases equip-
ment for $30,000 and estimates a useful life of eight years and a salvage value of $2,000. On January 1,
2012, Roosters revises the equipment’s useful life from eight years to fi ve years. Roosters uses the straight-line method of depreciation.
Requireda. Calculate depreciation expense for 2011 and 2012.b. Recalculate 2012 depreciation expense assuming
that Roosters leaves the useful life at eight years but reduces the salvage value to $0.
6. Capital/Revenue Expenditures LO3 A company incurs the following expenditures
related to currently owned fi xed assets:• Annual pressure washing of building, $5,000• New engine in delivery truck, $4,500• Repair of water damage caused by leaking roof,
$3,500• New tires on tractor, $2,000• Addition of 1,000 square feet of offi ce space,
$22,000• Modifi cations to machinery to improve effi ciency,
$7,200
Required Identify each expenditure as a capital or revenue
expenditure.
7. Disposal LO4 Ellis Industries sells a building that had an original
cost of $200,000 and an accumulated depreciation balance of $100,000.
Required Prepare the journal entry to record the sale assum-
ing the sales price was (a) $100,000, (b) $95,000, and (c) $108,000.
8. Disposal LO2, 4 On January 1, 2010, A&G Company pays $40,000
for equipment with a 10-year estimated life and a $5,000 estimated salvage value. On January 1, 2014, A&G sells the equipment for $18,500.
Required Calculate the gain or loss on the sale assuming
A&G uses the straight-line method of depreciation. Where should the gain or loss on the sale be pre-sented on the income statement?
9. Evaluate Fixed Assets LO5 In its 2004 annual report, Nike reported the follow-
ing information (in millions): beginning total assets $6,821.1; ending total assets $7,891.6; beginning property, plant, and equipment $2,988.8 (at cost); ending property, plant, and equipment $3,132.3 (at cost); beginning accumulated depreciation $1,293.3; revenues $12,253.1; and depreciation expense of $252.1.
Requireda. Calculate the fi xed asset turnover ratio of Nike
Corporation.
53915_01_CH08_002-026.indd 2553915_01_CH08_002-026.indd 25 11/12/09 8:32:55 PM11/12/09 8:32:55 PM

26 C h a p t e r 8 : F i x e d A s s e t s a n d I n t a n g i b l e A s s e t s
b. Calculate the average useful life of Nike’s fi xed assets at the end of 2004.
c. Calculate the average age of Nike’s fi xed assets at the end of 2004.
10. Evaluate Fixed Assets LO5 The following data was taken from the annual
fi nancial statements of Grizzle Company: Revenues Fixed Asset NBV2004 4,889 1502005 5,897 2012006 6,583 2452007 8,563 3952008 10,589 5242009 13,584 6872010 14,555 793
Required Calculate the fi xed asset turnover ratio for the years
presented. What does the trend in the ratio tell you about the company’s performance?
11. Intangible Assets LO7 Phoebe Inc. incurred the following expenditures:
• Research and development costs of $60,000 were incurred to develop a new patentable product.
• Phoebe paid $1,000 in application fees for the patent.
• Phoebe paid $12,000 in legal fees to register the awarded patent.
• Phoebe incurred $5,000 in legal fees to success-fully defend the patent against a competitor.
Required Determine the total cost of the patent.
PROBLEMS
12. Depreciation Methods LO2, 4 Development Industries purchased a depreciable
asset for $50,000 on January 1, 2010. The asset has a fi ve-year useful life and a $10,000 estimated sal-vage value. The company will use the straight-line method of depreciation for book purposes. However, Development will use the double-declining-balance method for tax purposes. Assume a tax rate of 30%.
Requireda. Prepare depreciation schedules using the straight-
line and double-declining-balance methods of depreciation for the useful life of the asset.
b. Calculate the 2010 tax savings from the use of the accelerated depreciation method for tax purposes.
c. Under the straight-line method of depreciation, what is the gain or loss if the equipment is sold (1) at the end of 2012 for $30,000 or (2) at the end of 2013 for $16,000?
d. How is the gain or loss on the disposal of the equipment presented in the fi nancial statements?
13. Various Transactions LO1, 2, 3, 4 On January 1, 2010, Ravioli, Inc., purchased a build-
ing for a cash price of $192,000 and accrued prop-erty taxes of $14,950. The building is estimated to have a useful life of 10 years and no salvage value. On the same day, Ravioli paid $25,450 in cash plus sales tax of $2,290 for a new delivery truck that is estimated to have a useful life of fi ve years and a salvage value of $2,200. Another $1,100 was paid to paint the truck company colors with the company logo. Over the next several years, the following events related to these fi xed assets occurred.
1/1/11 Uncovered new information which caused the estimated life of the truck to be reduced to three total years instead of fi ve years.
6/30/11 Repaired air conditioning system which broke down for one week, $500.
1/1/12 Renovated bottom fl oor of the build-ing for $15,000, adding three years useful life to the building.
1/1/13 Sold building for $163,000. 9/1/13 Sold truck for $5,350.
Required Prepare all entries for 2010 through 2013. Ravioli
records annual depreciation expense on 12/31.
14. Evaluate Fixed Assets LO5 The following information was available from the
2008 fi nancial statements of Papa John’s Pizza: 2008 2007Net property and equipment $ 189,992 $ 198,957Total Assets 386,468 401,817Depreciation Expense 31,800 30,600Cost of Property and Equipment 388,080 408,074Accumulated Depreciation 198,088 209,117Total Revenues 1,132,087 1,063,595
Required Calculate and interpret (1) horizontal and vertical
analyses of fi xed assets and depreciation expense, (2) fi xed asset turnover ratio, and (3) average life and average age of fi xed assets.
REMEMBER
• All exercises and problems from the text are available online in static and algorithmic versions.
• Additional multiple choice, exercises, problems, and cases are available online in CengageNOW or as an enrichment module that can be customized into this text.
53915_01_CH08_002-026.indd 2653915_01_CH08_002-026.indd 26 11/12/09 8:32:56 PM11/12/09 8:32:56 PM

AC
CT
ACCT will prepare you for the real world by showing you how accounting information is used to make business decisions.
Throughout the text, take a look at the Making It Real features that highlight everyday businesses.
Home Depot Analysis boxes found within each chapter give students experience with analyzing fi nancial data found in Home Depot’s 2008 Annual Report. The excerpted annual report is located in the back of the text.
Each chapter contains a wealth of recent fi nancial statements from today’s leading companies such as Wendy’s, Bed, Bath and Beyond, American Eagle Outfi tters, Domino’s Pizza, and many, many more.
Each chapter’s fi nal learning objective usually includes a discussion of analysis that includes both vertical and horizontal presentation as well as coverage of important ratios that relate to the chapter topics.
MAKINGIT REAL!
53915_00_BM.indd 2753915_00_BM.indd 27 11/12/09 4:06:01 PM11/12/09 4:06:01 PM
AC
CT
ACCT has it all! Between the text and online resources, ACCT offers everything you need to study at one low price:
• Tear-out Chapter Review Cards• Two Sets of Interactive Quizzes• Printable Flash Cards• CengageNOWTM Online
Homework Solution
• E-Lectures• Animations• Interactive Games• And More!
Go to 4ltrpress.cengage.com/acct to see all that ACCT has to offer.
MORE BANGFOR YOUR BUCK!
53915_00_BM.indd 2853915_00_BM.indd 28 11/12/09 4:06:34 PM11/12/09 4:06:34 PM
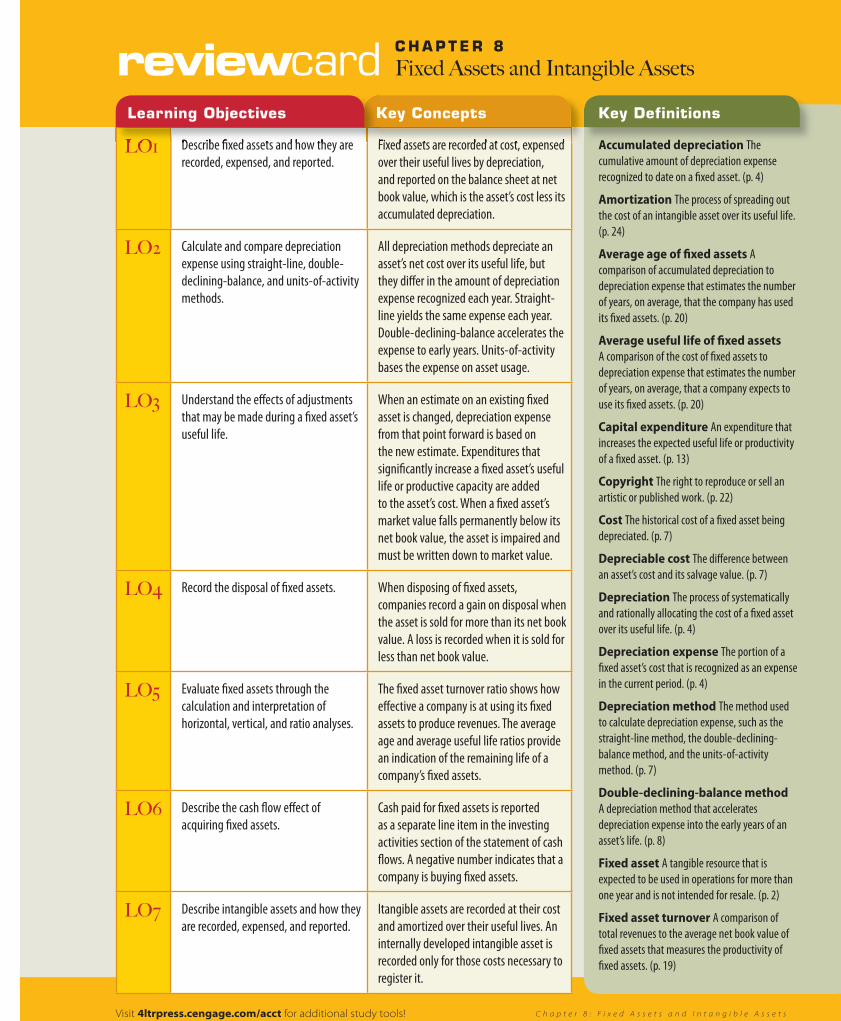
C h a p t e r 8 : F i x e d A s s e t s a n d I n t a n g i b l e A s s e t s
reviewcard C H A P T E R 8
Fixed Assets and Intangible Assets
Accumulated depreciation The
cumulative amount of depreciation expense
recognized to date on a fi xed asset. (p. 4)
Amortization The process of spreading out
the cost of an intangible asset over its useful life.
(p. 24)
Average age of fi xed assets A
comparison of accumulated depreciation to
depreciation expense that estimates the number
of years, on average, that the company has used
its fi xed assets. (p. 20)
Average useful life of fi xed assets
A comparison of the cost of fi xed assets to
depreciation expense that estimates the number
of years, on average, that a company expects to
use its fi xed assets. (p. 20)
Capital expenditure An expenditure that
increases the expected useful life or productivity
of a fi xed asset. (p. 13)
Copyright The right to reproduce or sell an
artistic or published work. (p. 22)
Cost The historical cost of a fi xed asset being
depreciated. (p. 7)
Depreciable cost The diff erence between
an asset’s cost and its salvage value. (p. 7)
Depreciation The process of systematically
and rationally allocating the cost of a fi xed asset
over its useful life. (p. 4)
Depreciation expense The portion of a
fi xed asset’s cost that is recognized as an expense
in the current period. (p. 4)
Depreciation method The method used
to calculate depreciation expense, such as the
straight-line method, the double-declining-
balance method, and the units-of-activity
method. (p. 7)
Double-declining-balance method A depreciation method that accelerates
depreciation expense into the early years of an
asset’s life. (p. 8)
Fixed asset A tangible resource that is
expected to be used in operations for more than
one year and is not intended for resale. (p. 2)
Fixed asset turnover A comparison of
total revenues to the average net book value of
fi xed assets that measures the productivity of
fi xed assets. (p. 19)
C h a p t e r 8 : F i x e d A s s e t s a n d I n t a n g i b l e A s s e t s
Key Definitions
LO1 Describe fi xed assets and how they are
recorded, expensed, and reported.
Fixed assets are recorded at cost, expensed
over their useful lives by depreciation,
and reported on the balance sheet at net
book value, which is the asset’s cost less its
accumulated depreciation.
LO2 Calculate and compare depreciation
expense using straight-line, double-
declining-balance, and units-of-activity
methods.
All depreciation methods depreciate an
asset’s net cost over its useful life, but
they diff er in the amount of depreciation
expense recognized each year. Straight-
line yields the same expense each year.
Double-declining-balance accelerates the
expense to early years. Units-of-activity
bases the expense on asset usage.
LO3 Understand the eff ects of adjustments
that may be made during a fi xed asset’s
useful life.
When an estimate on an existing fi xed
asset is changed, depreciation expense
from that point forward is based on
the new estimate. Expenditures that
signifi cantly increase a fi xed asset’s useful
life or productive capacity are added
to the asset’s cost. When a fi xed asset’s
market value falls permanently below its
net book value, the asset is impaired and
must be written down to market value.
LO4 Record the disposal of fi xed assets. When disposing of fi xed assets,
companies record a gain on disposal when
the asset is sold for more than its net book
value. A loss is recorded when it is sold for
less than net book value.
LO5 Evaluate fi xed assets through the
calculation and interpretation of
horizontal, vertical, and ratio analyses.
The fi xed asset turnover ratio shows how
eff ective a company is at using its fi xed
assets to produce revenues. The average
age and average useful life ratios provide
an indication of the remaining life of a
company’s fi xed assets.
LO6 Describe the cash fl ow eff ect of
acquiring fi xed assets.
Cash paid for fi xed assets is reported
as a separate line item in the investing
activities section of the statement of cash
fl ows. A negative number indicates that a
company is buying fi xed assets.
LO7 Describe intangible assets and how they
are recorded, expensed, and reported.
Itangible assets are recorded at their cost
and amortized over their useful lives. An
internally developed intangible asset is
recorded only for those costs necessary to
register it.
Key ConceptsLearning Objectives
Visit 4ltrpress.cengage.com/acct for additional study tools!
53915_01_CH08_PG.indd 153915_01_CH08_PG.indd 1 11/12/09 6:46:07 PM11/12/09 6:46:07 PM
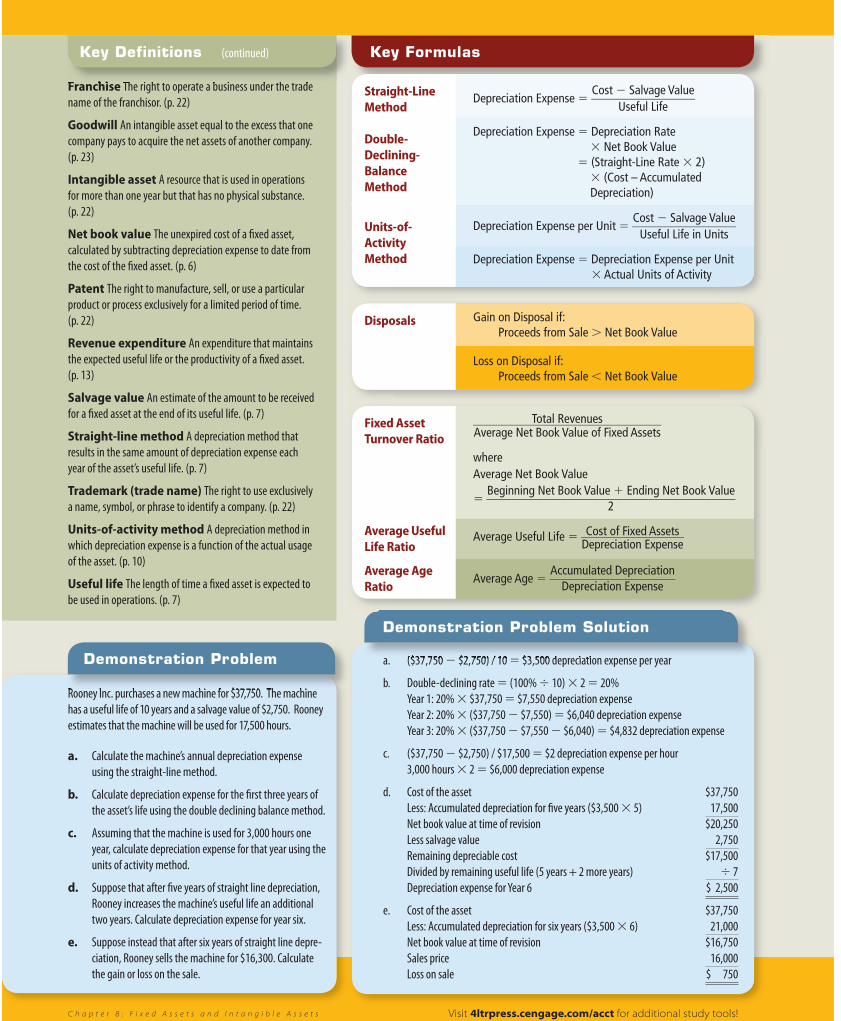
P a r t 0 0 : P a r t t i t l e
C h a p t e r 8 : F i x e d A s s e t s a n d I n t a n g i b l e A s s e t s
Franchise The right to operate a business under the trade
name of the franchisor. (p. 22)
Goodwill An intangible asset equal to the excess that one
company pays to acquire the net assets of another company.
(p. 23)
Intangible asset A resource that is used in operations
for more than one year but that has no physical substance.
(p. 22)
Net book value The unexpired cost of a fi xed asset,
calculated by subtracting depreciation expense to date from
the cost of the fi xed asset. (p. 6)
Patent The right to manufacture, sell, or use a particular
product or process exclusively for a limited period of time.
(p. 22)
Revenue expenditure An expenditure that maintains
the expected useful life or the productivity of a fi xed asset.
(p. 13)
Salvage value An estimate of the amount to be received
for a fi xed asset at the end of its useful life. (p. 7)
Straight-line method A depreciation method that
results in the same amount of depreciation expense each
year of the asset’s useful life. (p. 7)
Trademark (trade name) The right to use exclusively
a name, symbol, or phrase to identify a company. (p. 22)
Units-of-activity method A depreciation method in
which depreciation expense is a function of the actual usage
of the asset. (p. 10)
Useful life The length of time a fi xed asset is expected to
be used in operations. (p. 7)
Rooney Inc. purchases a new machine for $37,750. The machine
has a useful life of 10 years and a salvage value of $2,750. Rooney
estimates that the machine will be used for 17,500 hours.
a. Calculate the machine’s annual depreciation expense
using the straight-line method.
b. Calculate depreciation expense for the fi rst three years of
the asset’s life using the double declining balance method.
c. Assuming that the machine is used for 3,000 hours one
year, calculate depreciation expense for that year using the
units of activity method.
d. Suppose that after fi ve years of straight line depreciation,
Rooney increases the machine’s useful life an additional
two years. Calculate depreciation expense for year six.
e. Suppose instead that after six years of straight line depre-
ciation, Rooney sells the machine for $16,300. Calculate
the gain or loss on the sale.
Demonstration Problem
Key FormulasKey Definitions (continued)
a. ($37,750 − $2,750) / 10 = $3,500 depreciation expense per year
b. Double-declining rate = (100% ÷ 10) × 2 = 20%
Year 1: 20% × $37,750 = $7,550 depreciation expense
Year 2: 20% × ($37,750 − $7,550) = $6,040 depreciation expense
Year 3: 20% × ($37,750 − $7,550 − $6,040) = $4,832 depreciation expense
c. ($37,750 − $2,750) / $17,500 = $2 depreciation expense per hour
3,000 hours × 2 = $6,000 depreciation expense
d. Cost of the asset $37,750
Less: Accumulated depreciation for fi ve years ($3,500 × 5) 17,500
Net book value at time of revision $20,250
Less salvage value 2,750
Remaining depreciable cost $17,500
Divided by remaining useful life (5 years + 2 more years) ÷ 7
Depreciation expense for Year 6 $ 2,500
e. Cost of the asset $37,750
Less: Accumulated depreciation for six years ($3,500 × 6) 21,000
Net book value at time of revision $16,750
Sales price 16,000
Loss on sale $ 750
Demonstration Problem Solution
Visit 4ltrpress.cengage.com/acct for additional study tools!
Disposals Gain on Disposal if: Proceeds from Sale > Net Book Value
Loss on Disposal if: Proceeds from Sale < Net Book Value
Depreciation Expense = Cost − Salvage Value
_________________ Useful Life
Depreciation Expense = Depreciation Rate × Net Book Value= (Straight-Line Rate × 2) × (Cost – Accumulated
Depreciation)
Depreciation Expense per Unit = Cost − Salvage Value
_________________ Useful Life in Units
Depreciation Expense = Depreciation Expense per Unit× Actual Units of Activity
Straight-Line Method
Double-Declining-Balance Method
Units-of-Activity Method
Fixed Asset Turnover Ratio
Average Useful Life Ratio
Average Age Ratio
Total Revenues _______________________________ Average Net Book Value of Fixed Assets
where Average Net Book Value
= Beginning Net Book Value + Ending Net Book Value
________________________________________ 2
Average Useful Life = Cost of Fixed Assets _________________ Depreciation Expense
Average Age = Accumulated Depreciation
_____________________ Depreciation Expense
53915_01_CH08_PG.indd 253915_01_CH08_PG.indd 2 11/12/09 6:46:10 PM11/12/09 6:46:10 PM

prepcard C H A P T E R 8
Fixed Assets and Intangible Assets
C h a p t e r 8 : F i x e d A s s e t s a n d I n t a n g i b l e A s s e t s
LO1 Describe fi xed assets and how they are
recorded, expensed, and reported.
LO2 Calculate and compare depreciation
expense using straight-line, double-
declining-balance, and units-of-
activity methods.
LO3 Understand the eff ects of adjustments
that may be made during a fi xed asset’s
useful life.
LO4 Record the disposal of fi xed assets.
LO5 Evaluate fi xed assets through the
calculation and interpretation of
horizontal, vertical, and ratio analyses.
LO6 Describe the cash fl ow eff ect of
acquiring fi xed assets.
LO7 Describe intangible assets and how
they are recorded, expensed, and
reported.
Learning Objectives Lecture Example
Recording Fixed Assets: Cost Principle
1. What is the cost of the truck, based on the following data?
Truck purchase price $55,000Sales tax 3,300Delivery & insurance cost during transit 500Insurance (1-yr. policy after purchase) 1,500
2. Assuming the company paid cash, how do you record the entry to show the purchase
of the truck?
Delivery Truck 58,800 Cash 58,800 (To record the purchase of truck)
Assets = Liabilities + Equity+58,800−58,800
Assume the truck will have a 4-year useful life (90,000 miles) and $15,000 residual
value. It was purchased January 2, 2009. Compute the yearly depreciation expense
for year one using straight-line depreciation (SLM), the double-declining-balance
method (DDB), and the units-of-activity method (25,000 miles for year one).
What’s Inside
Key topics in this chapter: Defi ne, classify and account for fi xed assets; compute depreciation expense using the
following three methods: straight-line, double-declining-balance, and units-of-activity methods; journalize entries
for disposal of fi xed assets; defi ne intangible assets and describe the accounting for intangible assets, such as patents,
copyrights, and goodwill.
Lecture Example Solution
1. $58,800. Following the cost principle, fixed assets should be recorded at the cost of
acquiring them. This includes all costs incurred to get the asset delivered, installed, and ready
to use. All the above costs (except for the one-year insurance policy) are necessary to get the
asset into its condition and location for intended use and are therefore included in the cost of
the truck.
2.SLM = (Cost − Salvage Value)/Salvage Life = (58,800 − 15,000)/4 = $10,950
DDB = Depreciation Rate × Net Book ValueDDB = (SLM × 2) × (Cost − Accumulated Depreciation)DDB = (25% × 2) × (58,800 − 0) = $29,400
Units-of-Activity Method:Depreciation Exp per unit: (Cost − Salvage Value)/Useful life units
= (58,800 − 15,000)/90,000 = 0.486 per mile
Depreciation Exp = Depreciation Exp. per unit × Actual units of activity= 0.486 × 25,000 miles = $12,150
Visit 4ltrpress.cengage.com/acct for additional materials to enhance your lectures!
53915_01_CH08_PG.indd 353915_01_CH08_PG.indd 3 11/12/09 6:46:13 PM11/12/09 6:46:13 PM

Your Students Will Ask About…
What is depreciation?Explain how the matching concept (accrual basis)
plays a major role in how we record transactions
and report the financial statements. Provide an
example.
Machinery Depreciation ExpenseRecorded as Transferred to anan ASSET when EXPENSE account aspurchased used
This is what we called depreciation expense, which
is the process of recording an estimated amount of
the portion of the asset that was “used up” during
each year. Since depreciation is only an estimate of
the usefulness of a long-term asset that has expired,
the asset account is not reduced directly. Rather, a
contra-account called Accumulated Depreciation is
used to reduce the asset. For example, the adjusting
entry to record depreciation on a piece of machinery
would be:
Depreciation Expense−Machinery … XXX
Accumulated Depreciation−Machinery … XXX
Which depreciation method is the best to use?Explain the advantages and disadvantages of the
three methods illustrated within the chapter. For
instance, straight-line method (ease of use, simple,
IRS benefit), units-of-activity method (better
matching), and double-declining-balance method
(accelerated method advantage).
Does it really matter if you classify an item as capital or revenue expenditure? After reading the textbook, discuss how WorldCom
treated operating expenses as capital expenditures.
What were the consequences on WorldCom’s
income statement and balance sheet?
C h a p t e r 8 : F i x e d A s s e t s a n d I n t a n g i b l e A s s e t s
Visit 4ltrpress.cengage.com/acct for additional materials to enhance your lectures!
8.1 Recording, Expensing, and Reporting Fixed Assets (p. 2)
Recording Fixed Assets (p. 3)
Expensing Fixed Assets (p. 4)
Reporting Fixed Assets (p. 6)
8.2 Calculating Depreciation Expense (p. 7)
Straight-Line Method (p. 7)
Double-Declining-Balance Method (p. 8)
Units-of-Activity Method (p. 10)
Comparing Depreciation Methods (p. 10)
8.3 Adjustments Made During a Fixed Asset’s Useful Life (p. 12)
Changes in Depreciation Estimates (p. 12)
Expenditures After Acquisition (p. 13)
Asset Impairment (p. 14)
8.4 Disposing of Fixed Assets (p. 15)
8.5 Evaluating a Company’s Management of Fixed Assets (p. 18)
Horizontal and Vertical Analyses (p. 18)
Fixed Asset Turnover Ratio (p. 19)
Average Life and Age of Fixed Assets (p. 19)
8.6 Fixed Assets and Cash Flows (p. 21)
8.7 Intangible Assets (p. 22)
Recording Intangible Assets (p. 23)
Amortizing Intangible Assets (p. 24)
Chapter Outline
Comparative Analysis
Find the Lowe’s 2008 annual report on the web and answer the following questions:
1. Look at Lowe’s Balance Sheet. What name does the company use for its fi xed assets, and what
specifi c fi xed asset accounts does it list? What is the historical cost of its fi xed assets, how much
depreciation expense has been accumulated to date, and what is the net book value of those
fi xed assets? What depreciation expense does Lowe’s report for the current year?
2. Calculate the horizontal and vertical analyses of fi xed assets and depreciation expense.
3. Look at Lowe’s statement of cash fl ows. How much total cash has the company spent to acquire
fi xed assets over the past three years? Compare Lowe’s capital expenditures in the most recent
year to its cash from operations.
Answers to the comparative analysis questions for Lowe’s can be found in the solutions manual that accompanies this text.
53915_01_CH08_PG.indd 453915_01_CH08_PG.indd 4 11/12/09 6:46:15 PM11/12/09 6:46:15 PM