Embed Size (px)
Citation preview

Analyzing an Income & Cash Flow Statement
Oğuz Benice Bilkent University
School of Tourism &Hotel Management

Definition
ANALYZING AN INCOME & CASH FLOW STATEMENT
To control cost, managers need to be able to calculate the net profit, or loss. The Income & cash flow statement is the financial document showing a company's income, expenses and cash balance over a given period .
F&B Sales
Food 80.0% $39'200
Beverage 20.0% $9'800
Total F&B Sales 100.0% $49'000
Cost of Sales
Food: 30% of Food Sales 24.0% $11'760
Beverage: 25% of Beverage Sales 5.0% $2'450
Total Cost of Sales 29.0% $14'210
Gross Profit $34'790
Other Income $3'000
Total Income $37'790
Labor Cost
Employee wages 13.0% $6'370Management salaries 5.0% $2'450Employee Benefit 2.0% $980
Total Labor Cost 20.0% $9'800
Operating ExpensesDirect Operating Expenses 6.1% $3'000Music & Entertainment 0.2% $100Marketing 3.1% $1'500Utilities 3.1% $1'500Repair & Maintenance 1.6% $800Administration 2.0% $1'000Rent 6.1% $3'000Interest 2.0% $1'000
Total Operating expenses 24.3% $11'900
Restaurant Profit before taxes & refund $16'090KDV taxes 18% of Total Sales $9'360Refund $3'000
Cash Balance 7.6% $3'730
March 2002

Food Sales
Include revenue from food, coffee, tea, milk, juices and other non-alcoholic items typically part of a meal. If there is no alcoholic beverage service, soft drinks would also be included in this category.
F&B Sales
Food 80.0% $39'200
Beverage 20.0% $9'800
Total F&B Sales 100.0% $49'000
Cost of Sales
Food: 30% of Food Sales 24.0% $11'760
Beverage: 25% of Beverage Sales 5.0% $2'450
Total Cost of Sales 29.0% $14'210
Gross Profit $34'790
Other Income $3'000
Total Income $37'790
Labor Cost
Employee wages 13.0% $6'370Management salaries 5.0% $2'450Employee Benefit 2.0% $980
Total Labor Cost 20.0% $9'800
Operating ExpensesDirect Operating Expenses 6.1% $3'000Music & Entertainment 0.2% $100Marketing 3.1% $1'500Utilities 3.1% $1'500Repair & Maintenance 1.6% $800Administration 2.0% $1'000Rent 6.1% $3'000Interest 2.0% $1'000
Total Operating expenses 24.3% $11'900
Restaurant Profit before taxes & refund $16'090KDV taxes 18% of Total Sales $9'360Refund $3'000
Cash Balance 7.6% $3'730
March 2002

Beverage Sales
Beverage Sales includes wine, liquor, beer and soft drinks.
F&B Sales
Food 80.0% $39'200
Beverage 20.0% $9'800
Total F&B Sales 100.0% $49'000
Cost of Sales
Food: 30% of Food Sales 24.0% $11'760
Beverage: 25% of Beverage Sales 5.0% $2'450
Total Cost of Sales 29.0% $14'210
Gross Profit $34'790
Other Income $3'000
Total Income $37'790
Labor Cost
Employee wages 13.0% $6'370Management salaries 5.0% $2'450Employee Benefit 2.0% $980
Total Labor Cost 20.0% $9'800
Operating ExpensesDirect Operating Expenses 6.1% $3'000Music & Entertainment 0.2% $100Marketing 3.1% $1'500Utilities 3.1% $1'500Repair & Maintenance 1.6% $800Administration 2.0% $1'000Rent 6.1% $3'000Interest 2.0% $1'000
Total Operating expenses 24.3% $11'900
Restaurant Profit before taxes & refund $16'090KDV taxes 18% of Total Sales $9'360Refund $3'000
Cash Balance 7.6% $3'730
March 2002

Food Cost
Food Cost includes food, coffee, tea, milk and soft drink expenses associated with the service of meals. (generally between 25% & 35% of food sales).
F&B Sales
Food 80.0% $39'200
Beverage 20.0% $9'800
Total F&B Sales 100.0% $49'000
Cost of Sales
Food: 30% of Food Sales 24.0% $11'760
Beverage: 25% of Beverage Sales 5.0% $2'450
Total Cost of Sales 29.0% $14'210
Gross Profit $34'790
Other Income $3'000
Total Income $37'790
Labor Cost
Employee wages 13.0% $6'370Management salaries 5.0% $2'450Employee Benefit 2.0% $980
Total Labor Cost 20.0% $9'800
Operating ExpensesDirect Operating Expenses 6.1% $3'000Music & Entertainment 0.2% $100Marketing 3.1% $1'500Utilities 3.1% $1'500Repair & Maintenance 1.6% $800Administration 2.0% $1'000Rent 6.1% $3'000Interest 2.0% $1'000
Total Operating expenses 24.3% $11'900
Restaurant Profit before taxes & refund $16'090KDV taxes 18% of Total Sales $9'360Refund $3'000
Cash Balance 7.6% $3'730
March 2002

Beverage Cost
Beverage Cost includes beverage expenditures associated with the sale of all wines, liquors and beers. (generally between 15% & 25% of beverage sales).
F&B Sales
Food 80.0% $39'200
Beverage 20.0% $9'800
Total F&B Sales 100.0% $49'000
Cost of Sales
Food: 30% of Food Sales 24.0% $11'760
Beverage: 25% of Beverage Sales 5.0% $2'450
Total Cost of Sales 29.0% $14'210
Gross Profit $34'790
Other Income $3'000
Total Income $37'790
Labor Cost
Employee wages 13.0% $6'370Management salaries 5.0% $2'450Employee Benefit 2.0% $980
Total Labor Cost 20.0% $9'800
Operating ExpensesDirect Operating Expenses 6.1% $3'000Music & Entertainment 0.2% $100Marketing 3.1% $1'500Utilities 3.1% $1'500Repair & Maintenance 1.6% $800Administration 2.0% $1'000Rent 6.1% $3'000Interest 2.0% $1'000
Total Operating expenses 24.3% $11'900
Restaurant Profit before taxes & refund $16'090KDV taxes 18% of Total Sales $9'360Refund $3'000
Cash Balance 7.6% $3'730
March 2002

Other Income
Other Income includes cover charges, banquet room rental, sundry sales, vending sales, telephone commissions, salvage sales and other miscellaneous revenue items.
F&B Sales
Food 80.0% $39'200
Beverage 20.0% $9'800
Total F&B Sales 100.0% $49'000
Cost of Sales
Food: 30% of Food Sales 24.0% $11'760
Beverage: 25% of Beverage Sales 5.0% $2'450
Total Cost of Sales 29.0% $14'210
Gross Profit $34'790
Other Income $3'000
Total Income $37'790
Labor Cost
Employee wages 13.0% $6'370Management salaries 5.0% $2'450Employee Benefit 2.0% $980
Total Labor Cost 20.0% $9'800
Operating ExpensesDirect Operating Expenses 6.1% $3'000Music & Entertainment 0.2% $100Marketing 3.1% $1'500Utilities 3.1% $1'500Repair & Maintenance 1.6% $800Administration 2.0% $1'000Rent 6.1% $3'000Interest 2.0% $1'000
Total Operating expenses 24.3% $11'900
Restaurant Profit before taxes & refund $16'090KDV taxes 18% of Total Sales $9'360Refund $3'000
Cash Balance 7.6% $3'730
March 2002

Employee Wages
Employee wages includes all positions including categories such as, host, server bus person, cook, dishwasher, storeroom clerk and bartender’s wages except restaurant managers.
F&B Sales
Food 80.0% $39'200
Beverage 20.0% $9'800
Total F&B Sales 100.0% $49'000
Cost of Sales
Food: 30% of Food Sales 24.0% $11'760
Beverage: 25% of Beverage Sales 5.0% $2'450
Total Cost of Sales 29.0% $14'210
Gross Profit $34'790
Other Income $3'000
Total Income $37'790
Labor Cost
Employee wages 13.0% $6'370Management salaries 5.0% $2'450Employee Benefit 2.0% $980
Total Labor Cost 20.0% $9'800
Operating ExpensesDirect Operating Expenses 6.1% $3'000Music & Entertainment 0.2% $100Marketing 3.1% $1'500Utilities 3.1% $1'500Repair & Maintenance 1.6% $800Administration 2.0% $1'000Rent 6.1% $3'000Interest 2.0% $1'000
Total Operating expenses 24.3% $11'900
Restaurant Profit before taxes & refund $16'090KDV taxes 18% of Total Sales $9'360Refund $3'000
Cash Balance 7.6% $3'730
March 2002

Management Salaries
Management salaries includes restaurant manager’ salary.
F&B Sales
Food 80.0% $39'200
Beverage 20.0% $9'800
Total F&B Sales 100.0% $49'000
Cost of Sales
Food: 30% of Food Sales 24.0% $11'760
Beverage: 25% of Beverage Sales 5.0% $2'450
Total Cost of Sales 29.0% $14'210
Gross Profit $34'790
Other Income $3'000
Total Income $37'790
Labor Cost
Employee wages 13.0% $6'370Management salaries 5.0% $2'450Employee Benefit 2.0% $980
Total Labor Cost 20.0% $9'800
Operating ExpensesDirect Operating Expenses 6.1% $3'000Music & Entertainment 0.2% $100Marketing 3.1% $1'500Utilities 3.1% $1'500Repair & Maintenance 1.6% $800Administration 2.0% $1'000Rent 6.1% $3'000Interest 2.0% $1'000
Total Operating expenses 24.3% $11'900
Restaurant Profit before taxes & refund $16'090KDV taxes 18% of Total Sales $9'360Refund $3'000
Cash Balance 7.6% $3'730
March 2002

Employee Benefits
Employee Benefits include social security taxes, unemployment taxes and state health insurance tax. It also includes insurance (such as worker's compensation and health coverage), employee meals and other benefits.
F&B Sales
Food 80.0% $39'200
Beverage 20.0% $9'800
Total F&B Sales 100.0% $49'000
Cost of Sales
Food: 30% of Food Sales 24.0% $11'760
Beverage: 25% of Beverage Sales 5.0% $2'450
Total Cost of Sales 29.0% $14'210
Gross Profit $34'790
Other Income $3'000
Total Income $37'790
Labor Cost
Employee wages 13.0% $6'370Management salaries 5.0% $2'450Employee Benefit 2.0% $980
Total Labor Cost 20.0% $9'800
Operating ExpensesDirect Operating Expenses 6.1% $3'000Music & Entertainment 0.2% $100Marketing 3.1% $1'500Utilities 3.1% $1'500Repair & Maintenance 1.6% $800Administration 2.0% $1'000Rent 6.1% $3'000Interest 2.0% $1'000
Total Operating expenses 24.3% $11'900
Restaurant Profit before taxes & refund $16'090KDV taxes 18% of Total Sales $9'360Refund $3'000
Cash Balance 7.6% $3'730
March 2002

Direct Operating Exp.
Direct Operating Expense includes uniforms, laundry, tableware and linen, utensils, kitchen fuel, supplies, menus, contract cleaning, flowers and decorations, auto expense, licenses and permits and other expenses.
F&B Sales
Food 80.0% $39'200
Beverage 20.0% $9'800
Total F&B Sales 100.0% $49'000
Cost of Sales
Food: 30% of Food Sales 24.0% $11'760
Beverage: 25% of Beverage Sales 5.0% $2'450
Total Cost of Sales 29.0% $14'210
Gross Profit $34'790
Other Income $3'000
Total Income $37'790
Labor Cost
Employee wages 13.0% $6'370Management salaries 5.0% $2'450Employee Benefit 2.0% $980
Total Labor Cost 20.0% $9'800
Operating ExpensesDirect Operating Expenses 6.1% $3'000Music & Entertainment 0.2% $100Marketing 3.1% $1'500Utilities 3.1% $1'500Repair & Maintenance 1.6% $800Administration 2.0% $1'000Rent 6.1% $3'000Interest 2.0% $1'000
Total Operating expenses 24.3% $11'900
Restaurant Profit before taxes & refund $16'090KDV taxes 18% of Total Sales $9'360Refund $3'000
Cash Balance 7.6% $3'730
March 2002

Music & Entertainment
Music and Entertainment Expense includes musicians,
entertainers, royalties and other costs.
In a dining situation, the entertainment should complement the overall atmosphere. In some type of facilities, the entertainment may be a major reason why people come in.
The cost of entertainment must produce a revenue increase greater than the cost. (see graph)
F&B Sales
Food 80.0% $39'200
Beverage 20.0% $9'800
Total F&B Sales 100.0% $49'000
Cost of Sales
Food: 30% of Food Sales 24.0% $11'760
Beverage: 25% of Beverage Sales 5.0% $2'450
Total Cost of Sales 29.0% $14'210
Gross Profit $34'790
Other Income $3'000
Total Income $37'790
Labor Cost
Employee wages 13.0% $6'370Management salaries 5.0% $2'450Employee Benefit 2.0% $980
Total Labor Cost 20.0% $9'800
Operating ExpensesDirect Operating Expenses 6.1% $3'000Music & Entertainment 0.2% $100Marketing 3.1% $1'500Utilities 3.1% $1'500Repair & Maintenance 1.6% $800Administration 2.0% $1'000Rent 6.1% $3'000Interest 2.0% $1'000
Total Operating expenses 24.3% $11'900
Restaurant Profit before taxes & refund $16'090KDV taxes 18% of Total Sales $9'360Refund $3'000
Cash Balance 7.6% $3'730
March 2002

Marketing
Marketing Expense includes selling and promotion costs, advertising, public relations, franchise fees and other expenses incurred to make the public aware of the restaurant. (should be around 3% from total F&B sales, and 6% for the first year).
F&B Sales
Food 80.0% $39'200
Beverage 20.0% $9'800
Total F&B Sales 100.0% $49'000
Cost of Sales
Food: 30% of Food Sales 24.0% $11'760
Beverage: 25% of Beverage Sales 5.0% $2'450
Total Cost of Sales 29.0% $14'210
Gross Profit $34'790
Other Income $3'000
Total Income $37'790
Labor Cost
Employee wages 13.0% $6'370Management salaries 5.0% $2'450Employee Benefit 2.0% $980
Total Labor Cost 20.0% $9'800
Operating ExpensesDirect Operating Expenses 6.1% $3'000Music & Entertainment 0.2% $100Marketing 3.1% $1'500Utilities 3.1% $1'500Repair & Maintenance 1.6% $800Administration 2.0% $1'000Rent 6.1% $3'000Interest 2.0% $1'000
Total Operating expenses 24.3% $11'900
Restaurant Profit before taxes & refund $16'090KDV taxes 18% of Total Sales $9'360Refund $3'000
Cash Balance 7.6% $3'730
March 2002

Utilities
Utilities Expense includes electricity, gas, water and sewer services. It excludes fuel used to operate the kitchen.
F&B Sales
Food 80.0% $39'200
Beverage 20.0% $9'800
Total F&B Sales 100.0% $49'000
Cost of Sales
Food: 30% of Food Sales 24.0% $11'760
Beverage: 25% of Beverage Sales 5.0% $2'450
Total Cost of Sales 29.0% $14'210
Gross Profit $34'790
Other Income $3'000
Total Income $37'790
Labor Cost
Employee wages 13.0% $6'370Management salaries 5.0% $2'450Employee Benefit 2.0% $980
Total Labor Cost 20.0% $9'800
Operating ExpensesDirect Operating Expenses 6.1% $3'000Music & Entertainment 0.2% $100Marketing 3.1% $1'500Utilities 3.1% $1'500Repair & Maintenance 1.6% $800Administration 2.0% $1'000Rent 6.1% $3'000Interest 2.0% $1'000
Total Operating expenses 24.3% $11'900
Restaurant Profit before taxes & refund $16'090KDV taxes 18% of Total Sales $9'360Refund $3'000
Cash Balance 7.6% $3'730
March 2002
Repairs & Maintenance
Repairs and Maintenance Expense includes supplies, materials and contracted work associated with maintaining the building and grounds.
F&B Sales
Food 80.0% $39'200
Beverage 20.0% $9'800
Total F&B Sales 100.0% $49'000
Cost of Sales
Food: 30% of Food Sales 24.0% $11'760
Beverage: 25% of Beverage Sales 5.0% $2'450
Total Cost of Sales 29.0% $14'210
Gross Profit $34'790
Other Income $3'000
Total Income $37'790
Labor Cost
Employee wages 13.0% $6'370Management salaries 5.0% $2'450Employee Benefit 2.0% $980
Total Labor Cost 20.0% $9'800
Operating ExpensesDirect Operating Expenses 6.1% $3'000Music & Entertainment 0.2% $100Marketing 3.1% $1'500Utilities 3.1% $1'500Repair & Maintenance 1.6% $800Administration 2.0% $1'000Rent 6.1% $3'000Interest 2.0% $1'000
Total Operating expenses 24.3% $11'900
Restaurant Profit before taxes & refund $16'090KDV taxes 18% of Total Sales $9'360Refund $3'000
Cash Balance 7.6% $3'730
March 2002

Administrative
Administrative Expense includes overhead items required to run the business, but not directly related to the service of the customer. Items included are office supplies, postage, computers and software, telephone, travel, general insurance, credit card commissions, collection fees, cash shortages, and other administrative costs.
F&B Sales
Food 80.0% $39'200
Beverage 20.0% $9'800
Total F&B Sales 100.0% $49'000
Cost of Sales
Food: 30% of Food Sales 24.0% $11'760
Beverage: 25% of Beverage Sales 5.0% $2'450
Total Cost of Sales 29.0% $14'210
Gross Profit $34'790
Other Income $3'000
Total Income $37'790
Labor Cost
Employee wages 13.0% $6'370Management salaries 5.0% $2'450Employee Benefit 2.0% $980
Total Labor Cost 20.0% $9'800
Operating ExpensesDirect Operating Expenses 6.1% $3'000Music & Entertainment 0.2% $100Marketing 3.1% $1'500Utilities 3.1% $1'500Repair & Maintenance 1.6% $800Administration 2.0% $1'000Rent 6.1% $3'000Interest 2.0% $1'000
Total Operating expenses 24.3% $11'900
Restaurant Profit before taxes & refund $16'090KDV taxes 18% of Total Sales $9'360Refund $3'000
Cash Balance 7.6% $3'730
March 2002

Rent
Rent is the amount paid for the use of a premises. (should not exceed 5% to 8% of total F&B sales).
F&B Sales
Food 80.0% $39'200
Beverage 20.0% $9'800
Total F&B Sales 100.0% $49'000
Cost of Sales
Food: 30% of Food Sales 24.0% $11'760
Beverage: 25% of Beverage Sales 5.0% $2'450
Total Cost of Sales 29.0% $14'210
Gross Profit $34'790
Other Income $3'000
Total Income $37'790
Labor Cost
Employee wages 13.0% $6'370Management salaries 5.0% $2'450Employee Benefit 2.0% $980
Total Labor Cost 20.0% $9'800
Operating ExpensesDirect Operating Expenses 6.1% $3'000Music & Entertainment 0.2% $100Marketing 3.1% $1'500Utilities 3.1% $1'500Repair & Maintenance 1.6% $800Administration 2.0% $1'000Rent 6.1% $3'000Interest 2.0% $1'000
Total Operating expenses 24.3% $11'900
Restaurant Profit before taxes & refund $16'090KDV taxes 18% of Total Sales $9'360Refund $3'000
Cash Balance 7.6% $3'730
March 2002

Interest
Interest Expense is the periodic charge for the use of funds loaned by a bank or other lender.
F&B Sales
Food 80.0% $39'200
Beverage 20.0% $9'800
Total F&B Sales 100.0% $49'000
Cost of Sales
Food: 30% of Food Sales 24.0% $11'760
Beverage: 25% of Beverage Sales 5.0% $2'450
Total Cost of Sales 29.0% $14'210
Gross Profit $34'790
Other Income $3'000
Total Income $37'790
Labor Cost
Employee wages 13.0% $6'370Management salaries 5.0% $2'450Employee Benefit 2.0% $980
Total Labor Cost 20.0% $9'800
Operating ExpensesDirect Operating Expenses 6.1% $3'000Music & Entertainment 0.2% $100Marketing 3.1% $1'500Utilities 3.1% $1'500Repair & Maintenance 1.6% $800Administration 2.0% $1'000Rent 6.1% $3'000Interest 2.0% $1'000
Total Operating expenses 24.3% $11'900
Restaurant Profit before taxes & refund $16'090KDV taxes 18% of Total Sales $9'360Refund $3'000
Cash Balance 7.6% $3'730
March 2002

KDV
KDV is the Turkish Tax based on total food & beverage sales plus other income.
F&B Sales
Food 80.0% $39'200
Beverage 20.0% $9'800
Total F&B Sales 100.0% $49'000
Cost of Sales
Food: 30% of Food Sales 24.0% $11'760
Beverage: 25% of Beverage Sales 5.0% $2'450
Total Cost of Sales 29.0% $14'210
Gross Profit $34'790
Other Income $3'000
Total Income $37'790
Labor Cost
Employee wages 13.0% $6'370Management salaries 5.0% $2'450Employee Benefit 2.0% $980
Total Labor Cost 20.0% $9'800
Operating ExpensesDirect Operating Expenses 6.1% $3'000Music & Entertainment 0.2% $100Marketing 3.1% $1'500Utilities 3.1% $1'500Repair & Maintenance 1.6% $800Administration 2.0% $1'000Rent 6.1% $3'000Interest 2.0% $1'000
Total Operating expenses 24.3% $11'900
Restaurant Profit before taxes & refund $16'090KDV taxes 18% of Total Sales $9'360Refund $3'000
Cash Balance 7.6% $3'730
March 2002

Refund
Refund is the periodic back payment of funds loaned by a bank or other lender.
F&B Sales
Food 80.0% $39'200
Beverage 20.0% $9'800
Total F&B Sales 100.0% $49'000
Cost of Sales
Food: 30% of Food Sales 24.0% $11'760
Beverage: 25% of Beverage Sales 5.0% $2'450
Total Cost of Sales 29.0% $14'210
Gross Profit $34'790
Other Income $3'000
Total Income $37'790
Labor Cost
Employee wages 13.0% $6'370Management salaries 5.0% $2'450Employee Benefit 2.0% $980
Total Labor Cost 20.0% $9'800
Operating ExpensesDirect Operating Expenses 6.1% $3'000Music & Entertainment 0.2% $100Marketing 3.1% $1'500Utilities 3.1% $1'500Repair & Maintenance 1.6% $800Administration 2.0% $1'000Rent 6.1% $3'000Interest 2.0% $1'000
Total Operating expenses 24.3% $11'900
Restaurant Profit before taxes & refund $16'090KDV taxes 18% of Total Sales $9'360Refund $3'000
Cash Balance 7.6% $3'730
March 2002

Exercise A1
Customer per month 7000 Music & Entertainment $100Check Average $7,0 Marketing $1.500% of Food Sales 80,0% Utilities $1.500Other Income $0 Repair & Maintenance $800Food Cost 30% Administration $1.000Beverage Cost 25% Rent $3.000Employee wages 13,0% Interest $1.000Management salaries 5,0% KDV taxes 18%Employee Benefit 2,0% Refund $3.000Direct Operating Expenses$3.000
1) Calculate the Cash Balance $1.270

Exercise A1 (& result)
F&B Sales
Food 80,0% $39.200
Beverage 20,0% $9.800
Total F&B Sales 100,0% $49.000
Cost of Sales
Food: 30% of Food Sales 24,0% $11.760
Beverage: 25% of Beverage Sales 5,0% $2.450
Total Cost of Sales 29,0% $14.210
Gross Profit $34.790
Other Income $0
Total Income $34.790
Labor CostEmployee wages 13,0% $6.370Management salaries 5,0% $2.450Employee Benefit 2,0% $980
Total Labor Cost 20,0% $9.800

Exercise A1 (& result)
Management salaries 5,0% $2.450Employee Benefit 2,0% $980
Total Labor Cost 20,0% $9.800
Operating ExpensesDirect Operating Expenses 6,1% $3.000Music & Entertainment 0,2% $100Marketing 3,1% $1.500Utilities 3,1% $1.500Repair & Maintenance 1,6% $800Administration 2,0% $1.000Rent 6,1% $3.000Interest 2,0% $1.000
Total Operating expenses 24,3% $11.900
Restaurant Profit before taxes & refund $13.090KDV taxes 18% of Total Sales $8.820Refund $3.000
Cash Balance 2,6% $1.270

Exercise A2
Customer per month 8000 Music & Entertainment $100
Check Average $6,5 Marketing $1.250
% of Food Sales 85,0% Utilities $1.250
Other Income $0 Repair & Maintenance $500
Food Cost 25% Administration $500
Beverage Cost 20% Rent $2.800
Employee wages 15,0% Interest $1.000
Management salaries 5,0% KDV taxes 18%
Employee Benefit 2,0% Refund $4.500
Direct Operating Expenses $2.000
1) Calculate the Cash Balance $4.6902) Calculate the guest needed monthly (break even) 5.982
3) Calculate the guest needed daily to reach a profit of 10,0% 277
4) Calculate the guest needed daily to reach a profit of $6.500 293

Exercise A2 (& result)
F&B Sales
Food 85,0% $44.200
Beverage 15,0% $7.800
Total F&B Sales 100,0% $52.000
Cost of Sales
Food: 25% of Food Sales 21,3% $11.050
Beverage: 20% of Beverage Sales 3,0% $1.560
Total Cost of Sales 24,3% $12.610
Gross Profit $39.390
Other Income $0
Total Income $39.390
Labor Cost
Employee wages 15,0% $7.800
Management salaries 5,0% $2.600
Employee Benefit 2,0% $1.040
Total Labor Cost 22,0% $11.440

Exercise A2 (& result)
Total Labor Cost 22,0% $11.440
Operating Expenses
Direct Operating Expenses 3,8% $2.000
Music & Entertainment 0,2% $100Marketing 2,4% $1.250
Utilities 2,4% $1.250Repair & Maintenance 1,0% $500Administration 1,0% $500Rent 5,4% $2.800Interest 1,9% $1.000
Total Operating expenses 18,1% $9.400
Restaurant Profit before taxes & refund $18.550KDV taxes 18% of Total Sales $9.360Refund $4.500
Cash Balance 9,0% $4.690

Break-even Point
ANALYZING AN INCOME & CASH FLOW STATEMENT
To control cost, managers need to be able to calculate the breakeven point. The simple definition of a breakeven point is the volume of sales or guest needed daily for a business to generate zero profit. Formula:

Exercise A1 (& result)
Total Operating Expenses $11.900Principle on note (refund) $3.000Total Fixed Cost $14.900Other Income (without KDV) $0Total $14.9001-(%Total Variable Cost / 100) 0,3300
% of Total Cost of Sales0,2900% of Total Labor Cost 0,2000% KDV 0,1800% of Total Variable Cost0,6700
Check Average $7Customer needed monthly to break even: 6.450Number of days in one month 30Customers needed daily to break even: 215

Break-even Point
ANALYZING AN INCOME & CASH FLOW STATEMENT
Calculate the breakeven for the exercice A2

Exercise A2 (& result)
Total Operating Expenses $9.400 + Principle on note (refund) $4.500
Total Fixed Cost $13.900 - Other Income (without KDV) $0
Total $13.900./. 1-(%Total Variable Cost / 100) 0,3575
% of Total Cost of Sales 0,2425% of Total Labor Cost 0,2200% KDV 0,1800% of Total Variable Cost 0,6425
./. Check Average $7Customer needed monthly to break even: 5.982
./. Number of days in one month 30Customers needed daily to break even: 199

Exercise A3
Customer per month 7000 Music & Entertainment $100
Check Average $6,5 Marketing $500
% of Food Sales 85,0% Utilities $1.250
Other Income $0 Repair & Maintenance $500
Food Cost 30% Administration $500
Beverage Cost 20% Rent $10.500
Employee wages 15,0% Interest $1.000
Management salaries 7,5% KDV taxes 18%
Employee Benefit 3,0% Refund $4.500
Direct Operating Expenses $2.000
1) Calculate the Cash Balance -$8.1102) Calculate the guest needed daily to break even 11.456
3) Calculate the guest needed daily to reach a profit of 10,0% 594
4) Calculate the guest needed daily to reach a profit of $6.500 501

Exercise A4
Customer per month 8000 Music & Entertainment $100
Check Average $6,5 Marketing $1.250
% of Food Sales 85,0% Utilities $1.250
Other Income $0 Repair & Maintenance $500
Food Cost 25% Administration $500
Beverage Cost 20% Rent $2.800
Employee wages 15,0% Interest $1.000
Management salaries 5,0% KDV taxes 18%
Employee Benefit 2,0% Refund $4.500
Direct Operating Expenses $2.000
1) Calculate the Cash Balance $4.6902) Calculate the guest needed monthly (break even) 5.982
3) Calculate the guest needed daily to reach a profit of 10,0% 277
4) Calculate the guest needed daily to reach a profit of $6.500 293

Forecasting Yearly Sales
ANALYZING AN INCOME & CASH FLOW STATEMENT
Check Average Seasts Days per Year$4.00 75 360
Week
Turnover Guests Turnover Guests Turnover GuestsMonday 1 75 2 150 3 225Tuesday 1 75 2 150 3 225Wednesday 2 150 3 225 4 300Thursday 2 150 3 225 4 300Friday 3 225 4 300 5 375Saturday 3 225 4 300 5 375Sunday 0 0 0 0 0 0Guests per week:Weeks per year:Guest per Year: 11700Sales:
Total Sales Average Turnover (Total Guests per Year / Total Seats available per Year)$268'200 2.48 (11700+33750+21600)/(75*360)
Low Season Mid Season High Season
180012
$86'400$135'000
90013
$46'80033750 21600
135025

Forecasting Monthly Sales
ANALYZING AN INCOME & CASH FLOW STATEMENT
Check Average Seasts Days per Month$4.00 75 30
Week
Turnover Guests Turnover Guests Turnover GuestsMonday 1 75 2 150 3 225Tuesday 1 75 2 150 3 225Wednesday 2 150 3 225 4 300Thursday 2 150 3 225 4 300Friday 3 225 4 300 5 375Saturday 3 225 4 300 5 375Sunday 0 0 0 0 0 0Guests per week:Weeks / Month:Guest per Month: 900Sales:
Total Sales Average Turnover (Total Guests per Month / Total Seats available per Month)$19'800 2.20 (900+4050+0)/(75*30)
$3'600 $16'200 $0
1 3 04050 0
High Season
900 1350 1800
Low Season Mid Season
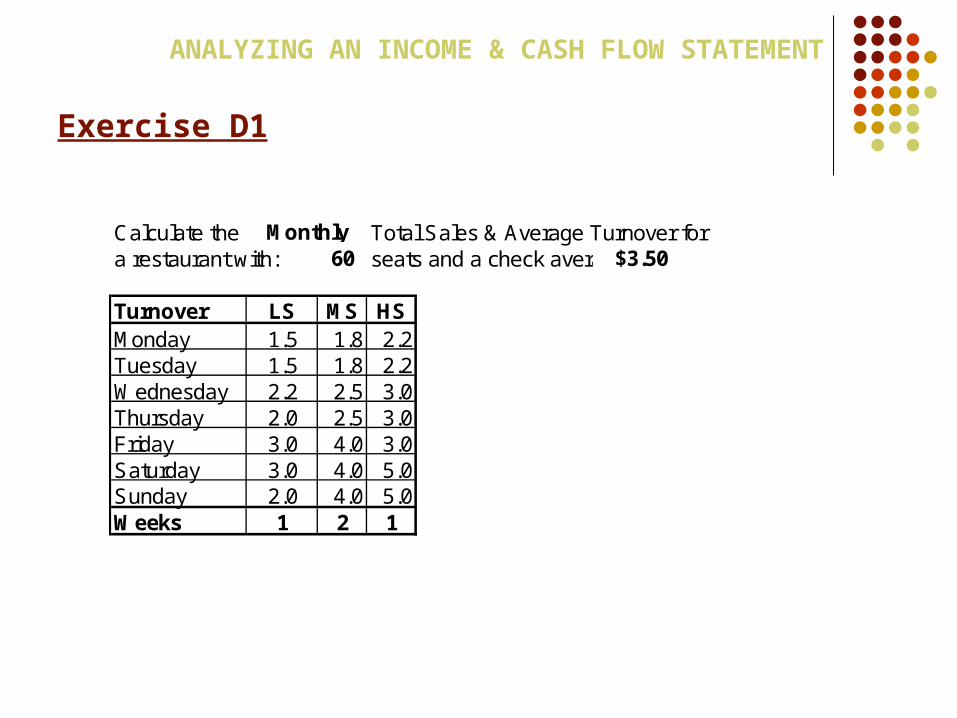
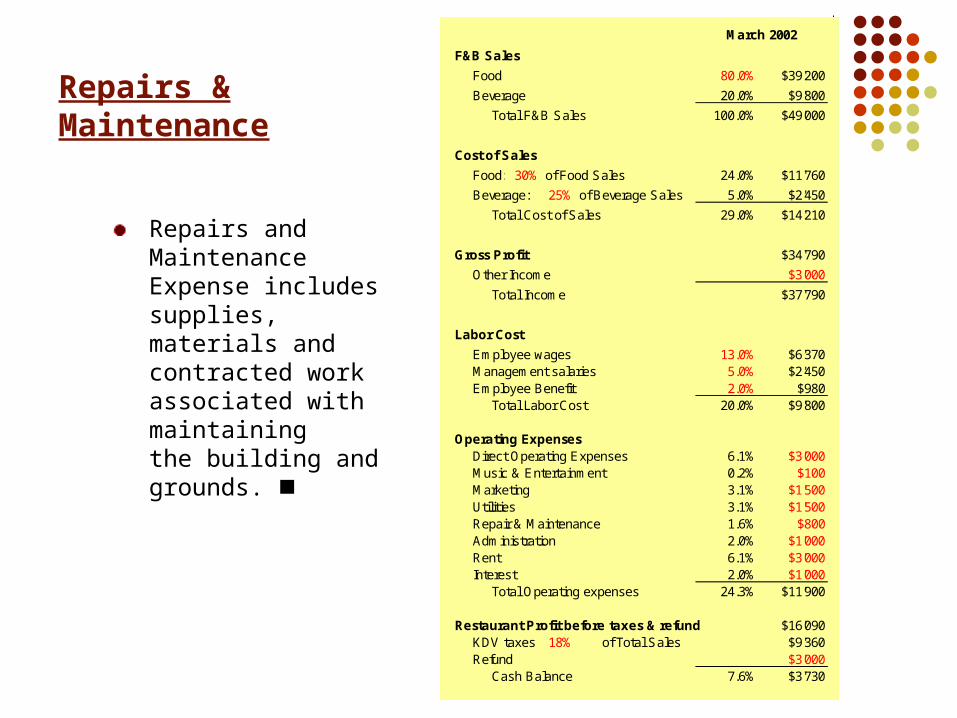
Exercise D1
ANALYZING AN INCOME & CASH FLOW STATEMENT
Calculate the Total Sales & Average Turnover fora restaurant with: 60 seats and a check average of:$3.50
Turnover LS MS HSMonday 1.5 1.8 2.2Tuesday 1.5 1.8 2.2Wednesday 2.2 2.5 3.0Thursday 2.0 2.5 3.0Friday 3.0 4.0 3.0Saturday 3.0 4.0 5.0Sunday 2.0 4.0 5.0Weeks 1 2 1
Total Sales Average Turnover$19'152 2.66
Monthly

Exercise D1 (result)
ANALYZING AN INCOME & CASH FLOW STATEMENT
Check Average Seasts Number of Days$3.50 60 30
Week
Turnover Guests Turnover Guests Turnover GuestsMonday 1.5 90 1.8 108 2.2 132Tuesday 1.5 90 1.8 108 2.2 132Wednesday 2.2 132 2.5 150 3.0 180Thursday 2.0 120 2.5 150 3.0 180Friday 3.0 180 4.0 240 3.0 180Saturday 3.0 180 4.0 240 5.0 300Sunday 2.0 120 4.0 240 5.0 300Guests per week:Weeks / Month:Guest per Month: 912
Sales:
Total Sales Average Turnover$16'758 2.66
Low Season Mid Season High Season
912 1236 14041 2 1
2472 1404
$3'192 $8'652 $4'914

Exercise E1
ANALYZING AN INCOME & CASH FLOW STATEMENT
Calculate the Total Sales & Average Turnover fora restaurant with: 50 seats and a check average of:$4.00
Turnover LS MS HSMonday 1.2 1.6 2.0Tuesday 1.2 1.6 2.0Wednesday 2.0 2.2 2.5Thursday 2.0 2.2 2.5Friday 2.0 3.0 2.0Saturday 3.0 4.0 5.0Sunday 1.0 3.0 3.0Weeks 1 1 2
Total Sales Average Turnover$13'600 2.27
Monthly

Exercise E1 (result)
ANALYZING AN INCOME & CASH FLOW STATEMENT
Check Average Seasts Number of Days$4.00 50 30
Week
Turnover Guests Turnover Guests Turnover GuestsMonday 1.2 60 1.6 80 2.0 100Tuesday 1.2 60 1.6 80 2.0 100Wednesday 2.0 100 2.2 110 2.5 125Thursday 2.0 100 2.2 110 2.5 125Friday 2.0 100 3.0 150 2.0 100Saturday 3.0 150 4.0 200 5.0 250Sunday 1.0 50 3.0 150 3.0 150Guests per week:Weeks / Month:Guest per Month: 620
Sales:
Total Sales Average Turnover$13'600 2.27
Low Season Mid Season High Season
620 880 9501 1 2
880 1900
$2'480 $3'520 $7'600

Exercise D2
ANALYZING AN INCOME & CASH FLOW STATEMENT
Calculate the Total Sales & Average Turnover fora restaurant with: 35 seats and a check average of:$4.50
Turnover LS MS HSMonday 1.0 1.5 2.0Tuesday 1.0 1.5 2.0Wednesday 1.5 1.8 2.0Thursday 1.5 2.0 2.5Friday 2.0 2.5 3.0Saturday 2.0 3.0 4.0Sunday 1.7 2.5 3.0Weeks 15 20 13
Total Sales Average Turnover$97'580 1.94
Yearly

Exercise D2 (result)
ANALYZING AN INCOME & CASH FLOW STATEMENT
Check Average Seasts Number of Days$4.50 35 360
Week
Turnover Guests Turnover Guests Turnover GuestsMonday 1.0 35.0 1.5 52.5 2.0 70.0Tuesday 1.0 35.0 1.5 52.5 2.0 70.0Wednesday 1.5 52.5 1.8 63.0 2.0 70.0Thursday 1.5 52.5 2.0 70.0 2.5 87.5Friday 2.0 70.0 2.5 87.5 3.0 105.0Saturday 2.0 70.0 3.0 105.0 4.0 140.0Sunday 1.7 59.5 2.5 87.5 3.0 105.0Guests per week:Weeks / Month:Guest per Month: 5617.5
Sales:
Total Sales Average Turnover$109'778 1.94
25278.8 46620.0 37878.8
20.0 13.010360.0 8417.5
Low Season Mid Season High Season
374.5 518.0 647.515.0

Exercise E2
ANALYZING AN INCOME & CASH FLOW STATEMENT
Calculate the Total Sales & Average Turnover fora restaurant with: 45 seats and a check average of:$5.50
Turnover LS MS HSMonday 1.2 1.6 2.0Tuesday 1.2 1.6 2.0Wednesday 1.2 1.8 2.3Thursday 2.0 2.2 3.0Friday 2.0 2.5 3.0Saturday 3.0 4.0 4.5Sunday 1.5 3.0 4.0Weeks 14 19 14
Total Sales Average Turnover$140'022 2.16
Yearly

Exercise E2 (result)
ANALYZING AN INCOME & CASH FLOW STATEMENT
Check Average Seasts Number of Days$5.50 45 360
Week
Turnover Guests Turnover Guests Turnover GuestsMonday 1.2 54.0 1.6 72.0 2.0 90.0Tuesday 1.2 54.0 1.6 72.0 2.0 90.0Wednesday 1.2 54.0 1.8 81.0 2.3 103.5Thursday 2.0 90.0 2.2 99.0 3.0 135.0Friday 2.0 90.0 2.5 112.5 3.0 135.0Saturday 3.0 135.0 4.0 180.0 4.5 202.5Sunday 1.5 67.5 3.0 135.0 4.0 180.0Guests per week:Weeks / Month:Guest per Month: 7623.0
Sales:
Total Sales Average Turnover$192'530 2.16
Low Season Mid Season High Season
544.5 751.5 936.014.0 19.0 14.0
14278.5 13104.0
41926.5 78531.8 72072.0

Exercise F2
ANALYZING AN INCOME & CASH FLOW STATEMENT
Calculate the Total Sales & Average Turnover fora restaurant with: 55 seats and a check average of:$4.00
Turnover LS MS HSMonday 1.3 1.7 2.2Tuesday 1.3 1.7 2.2Wednesday 1.4 2.2 2.4Thursday 1.7 2.4 3.2Friday 1.8 3.0 3.2Saturday 2.0 3.5 4.4Sunday 2.0 3.5 4.0Weeks 10 35 5
Total Sales Average Turnover$187'660 2.37
Yearly

Exercise F2 (result)
ANALYZING AN INCOME & CASH FLOW STATEMENT
Check Average Seasts Number of Days$4,00 55 360
Week
Turnover Guests Turnover Guests Turnover GuestsMonday 1,3 71,5 1,7 93,5 2,2 121,0Tuesday 1,3 71,5 1,7 93,5 2,2 121,0Wednesday 1,4 77,0 2,2 121,0 2,4 132,0Thursday 1,7 93,5 2,4 132,0 3,2 176,0Friday 1,8 99,0 3,0 165,0 3,2 176,0Saturday 2,0 110,0 3,5 192,5 4,4 242,0Sunday 2,0 110,0 3,5 192,5 4,0 220,0Guests per week:Weeks / Month:Guest per Month: 6325,0
Sales:
Total Sales Average Turnover$187 660 2,37
Low Season Mid Season High Season
632,5 990,0 1188,010,0 35,0 5,0
34650,0 5940,0
25300,0 138600,0 23760,0

Exercise F2 (result)
ANALYZING AN INCOME & CASH FLOW STATEMENT
Check Average Seasts Number of Days$4.00 55 360
Week
Turnover Guests Turnover Guests Turnover GuestsMonday 1.3 71.5 1.7 93.5 2.2 121.0Tuesday 1.3 71.5 1.7 93.5 2.2 121.0Wednesday 1.4 77.0 2.2 121.0 2.4 132.0Thursday 1.7 93.5 2.4 132.0 3.2 176.0Friday 1.8 99.0 3.0 165.0 3.2 176.0Saturday 2.0 110.0 3.5 192.5 4.4 242.0Sunday 2.0 110.0 3.5 192.5 4.0 220.0Guests per week:Weeks / Month:Guest per Month: 6325.0
Sales:
Total Sales Average Turnover$187'660 2.37
Low Season Mid Season High Season
632.5 990.0 1188.010.0 35.0 5.0
34650.0 5940.0
25300.0 138600.0 23760.0

Exercise E1
ANALYZING AN INCOME & CASH FLOW STATEMENT
The cost of entertainment must produce a revenue increase greater than the cost. Consider the following sample:
Before Entertainment: 150 customers buy, on average, 3 drinks at $1.75 each. Revenue produced each night = $ 787.50 X 6 nights 4725.00 Subtract cost of goods sold 1181.25 (assume 25%) 3543.75 Subtract operating expenses 350.00
Gross operating profit $ 3193.75
After Entertainment: 182 customers buy, on average, 3 drinks at $1.75 each. Revenue produced each night = $ 955.50 X 6 nights 5733.00 Subtract cost of goods sold 1433.25 (assume 25%) 4299.75 Subtract operating expenses 350.00 Subtract cost of entertainment 750.00
Gross operating profit $ 3199.75

Mid Term 2005 Spring - A
ANALYZING AN INCOME & CASH FLOW STATEMENT
Calculate the Total Sales & Average Turnover fora restaurant with: 110 seats and a check average of YTL:
Turnover LS MS HSMonday 1,2 1,7 2,1Tuesday 1,2 1,7 2,1Wednesday 1,3 2,2 2,3Thursday 1,6 2,4 3,1Friday 1,7 2,9 3,1Saturday 1,9 3,4 4,3Sunday 1,9 3,4 3,8Weeks 2 1 1
Total Sales Average Turnover$93.876 2,00
Monthly

Mid Term 2005 Spring - B
ANALYZING AN INCOME & CASH FLOW STATEMENT
$15,20 115 30
Week
Turnover Guests Turnover Guests Turnover GuestsMonday 1,2 138 2,1 242 1,7 196Tuesday 1,2 138 2,1 242 1,7 196Wednesday 1,3 150 2,3 265 2,2 253Thursday 1,6 184 3,1 357 2,4 276Friday 1,7 196 3,1 357 2,9 334Saturday 1,9 219 4,3 495 3,4 391Sunday 1,9 219 3,8 437 3,4 391Guests per week:Weeks / Month:Guest per Month: 1242Sales:
Total Sales Average Turnover (Total Guests per Month / Total Seats available per Month)
High Season
1242 2392 2036
Low Season Mid Season
1 2 14784 2036
$18.878 $72.717 $30.940

Mid Term 2005 Spring - C
ANALYZING AN INCOME & CASH FLOW STATEMENT
$16,20 120 30
Week
Turnover Guests Turnover Guests Turnover GuestsMonday 1,7 204 1,2 144 2,1 252Tuesday 1,7 204 1,2 144 2,1 252Wednesday 2,2 264 1,3 156 2,3 276Thursday 2,4 288 1,6 192 3,1 372Friday 2,9 348 1,7 204 3,1 372Saturday 3,4 408 1,9 228 4,3 516Sunday 3,4 408 1,9 228 3,8 456Guests per week:Weeks / Month:Guest per Month: 2124Sales:
Total Sales Average Turnover (Total Guests per Month / Total Seats available per Month)
High Season
2124 1296 2496
Low Season Mid Season
1 1 21296 4992
$34.409 $20.995 $80.870

Mid Term 2005 Spring - D
ANALYZING AN INCOME & CASH FLOW STATEMENT
Saturday 4,3 538 1,9 238 3,4 425Sunday 3,8 475 1,9 238 3,4 425Guests per week:Weeks / Month:Guest per Month: 5200Sales:
Total Sales Average Turnover (Total Guests per Month / Total Seats available per Month)$150.715 2,34 (900+4050+0)/(75*30)
Total Sales Average Turnover#REF! #REF!
2600 1350 22132 1 1
1350 2213$89.440 $23.220 $38.055

Mid Term 2005 Spring – A
F&B Sales
Repair & Maintenance $750 Employee Benefit 4,0% Food
Music & Entertainment $750 Marketing $1.690 Beverage
Direct Operating Expenses $3.650 Utilities $1.700 Total F&B Sales
Other Income $2.300 Refund $1.220
KDV taxes 18% Administration $480 Cost of Sales
Beverage Cost 24% Rent $4.200 Food: 28% of Food Sales
Employee wages 9,0% Interest $1.400 Beverage: 24%
Management salaries 5,5% Food Cost 28% Total Cost of Sales
% of Food Sales 80,0% % of Food Sales 80,0%
Total Sales 93876 Gross Profit
Other Income
Total Income1) Calculate the Cash Balance $20.1232) Calculate the guest needed monthly (break even) 2.707 90 Labor Cost
3) Calculate the guest needed monthly to reach a profit of 15,0% 154 Employee wages
4) Calculate the guest needed monthly to reach a profit of $20.000 220 Management salaries
Employee Benefit
Total Labor Cost

Mid Term 2005 Spring – B
Exercice A1F&B Sales
Repair & Maintenance $750 Employee Benefit 4,0% Food
Music & Entertainment $750 Marketing $1.690 Beverage
Direct Operating Expenses $3.650 Utilities $1.700 Total F&B Sales
Other Income $2.300 Refund $1.220
KDV taxes 18% Administration $780 Cost of Sales
Beverage Cost 25% Rent $4.200 Food: 28% of Food Sales
Employee wages 7,0% Interest $1.400 Beverage: 25% of Beverage Sales
Management salaries 5,5% Food Cost 28% Total Cost of Sales
% of Food Sales 82,0%
Total Sales 122535 Gross Profit
Other Income
Total Income1) Calculate the Cash Balance $32.3582) Calculate the guest needed monthly (break even) 2.465 82 Labor Cost
3) Calculate the guest needed monthly to reach a profit of 15,0% 136 Employee wages
4) Calculate the guest needed monthly to reach a profit of $20.000 197 Management salaries

Mid Term 2005 Spring – C
Labor Cost
Employee wages 11,0% $14.990
Management salaries 5,5% $7.495
Employee Benefit 4,0% $5.451
Total Labor Cost 20,5% $27.936
Operating Expenses
Direct Operating Expenses 2,7% $3.650
Music & Entertainment 0,6% $750Marketing 1,2% $1.690
Utilities 1,2% $1.700Repair & Maintenance 0,6% $750Administration 0,7% $980Rent 3,1% $4.200Interest 1,0% $1.400

Mid Term 2005 Spring – D
F&B Sales
Repair & Maintenance $750 Employee Benefit 4,0% Food
Music & Entertainment $750 Marketing $1.690 Beverage
Direct Operating Expenses $3.650 Utilities $1.700 Total F&B Sales
Other Income $2.300 Refund $1.220
KDV taxes 18% Administration $680 Cost of Sales
Beverage Cost 27% Rent $4.200 Food: 28% of Food Sales
Employee wages 9,0% Interest $1.400 Beverage: 27% of Beverage Sales
Management salaries 5,5% Food Cost 28% Total Cost of Sales
% of Food Sales 86,0%
Total Sales 150715 Gross Profit
Other Income
Total Income1) Calculate the Cash Balance $39.5612) Calculate the guest needed monthly (break even) 2.309 77 Labor Cost
3) Calculate the guest needed monthly to reach a profit of 15,0% 133 Employee wages
4) Calculate the guest needed monthly to reach a profit of $20.000 186 Management salaries
Employee Benefit
Total Labor Cost