Embed Size (px)
Citation preview
1274 | ICES WGCSE REPORT 2012
Annex 2: Stock Annexes
3.2 Stock Annex VIa Cod
Stock specific documentation of standard assessment procedures used by ICES.
Stock West of Scotland Cod (Division VIa)
Working Group Celtic Seas Ecoregion (WGCSE)
Date February 2012
Revised by WKROUND/Steven Holmes
A. General
A.1. Stock definition
Cod west of Scotland are believed to comprise of at least two subpopulations of cod that remain geographically separate throughout the year. The latitudinal boundary of these groups is between 57 and 58°30’ N. The southern component is characterized by coastal groups with a tendency towards year-round residency, although there is some exchange with the Irish Sea. The northern component appears to inter-mix with cod in IVa at all stages of the life history (ICES 2012, WD 4).
A.2. Fishery
The minimum landing size of cod in this area is 35 cm.
The demersal fisheries in Division VIa are predominantly conducted by otter trawlers fishing for cod, haddock, anglerfish and whiting, with bycatches of saithe, megrim, lem-on sole, ling and skate sp.. Fishing in the area is conducted mainly by vessels from Scot-land, France, Ireland, Norway and Spain with Scottish vessels taking the majority of cod catch. Since 1976, effort by larger Scottish trawlers and seiners has decreased. Records of effort trends since 2000 can be obtained from the (STECF) [https://stecf.jrc.ec.europa.eu/home]. Cod is believed to be no longer targeted in any of the fisheries now operating in ICES Division VIa. Cod are a bycatch in Nephrops and an-glerfish fisheries in Division VIa. Nephrops fisheries use a smaller mesh size than the 120 mm mandatory for cod targeted fisheries, but landings of cod are restricted through bycatch regulations and from 2012 all fisheries are restricted to landings of cod through bycatch only (see below).
For 2009 Council regulation (EC) No 1342\2008 introduced a cod long-term management plan. The objective of the plan is to ensure the sustainable exploitation of the cod stock on the basis of maximum sustainable yield while maintaining a fishing mortality of 0.4.
For stocks above Bpa, but where mortality is above 0.4 the harvest control rule (HCR) re-quires:
1 ) setting a TAC that achieves a 10% decrease in the fishing mortality in the year of application of the TAC compared with the previous year, or a TAC that achieves a fishing mortality of 0.4, whichever is the higher.
2 ) limiting annual changes in TAC to ± 20%.
ICES WGCSE REPORT 2012 | 1275
For stocks above Blim, the HCR requires:
3 ) setting a TAC that achieves a 15% decrease in the fishing mortality in the year of application of the TAC compared with the previous year, or a TAC that achieves a fishing mortality of 0.4, whichever is the higher.
4 ) limiting annual changes in TAC to ± 20%.
For stocks below Blim the Regulation requires:
5 ) setting a TAC that achieves a 25% decrease in the fishing mortality in the year of application of the TAC compared with the previous year.
6 ) limiting annual changes in TAC to ± 20%.
In addition the plan states:
• That if lack of sufficiently accurate and representative information does not al-low a TAC affecting fishing mortality to be set with confidence then,
• If advice is for catches of cod to be reduced to the lowest possible level, the TAC shall be reduced by 25%,
• In all other cases the TAC shall be reduced by 15% (unless STACF advises this is not appropriate).
• TACs are to be set net of discards and fish corresponding to other sources of cod mortality caused by fishing.
• Initial baseline values for effort shall be set for effort groups defined by the Council then annual effort and cod catch calculated for those effort groups. For effort groups where the percentage cumulative catch is ≥20% of that for all fleets, maximum allowable effort shall be adjusted by the same amount as the TAC.
• If STECF advises cod stocks are failing to recover properly the EU Council will set a TAC and maximum allowable effort lower than those derived from the HCR.
For 2012 council regulation (EU) No 43/2012 set a zero TAC for cod in VIa and EU and international waters of Vb east of 12°00′ W with the proviso that:
Bycatch of cod in the area covered by this TAC may be landed provided that it does not comprise more than 1,5% of the live weight of the total catch retained on board per fish-ing trip.
A.3. Ecosystem aspects
Geographical location and timing of spawning
Spawning has occurred throughout much of the region in depths <200 m. However, a number of spawning concentrations can be identified from egg surveys in the 1950s, 1992 and from recent surveys of spawning adult distribution. The most commercially im-portant of these, range from the Butt of Lewis to Papa Bank. There are also important spawning areas in the Clyde and off Mull. The relative contribution of these areas is not known. Based on recent evidence there are no longer any significant spawning areas in
1276 | ICES WGCSE REPORT 2012
the Minch. Peak spawning appears to be in March, based on egg surveys (Raitt, 1967). Recent sampling suggests that this is still the case.
The main concentrations of juveniles are now found in coastal waters.
Fecundity
Fecundity data are available from West, 1970 and Yoneda and Wright, 2004. Potential fecundity for a given length is higher than in the northern North Sea but lower than off the Scottish east coast (see Yoneda and Wright, 2004). There was no significant difference in the potential fecundity–length relationship for cod between 1970 (West, 1970) and 2002–2003 (Yoneda and Wright, 2004).
B. Data
B.1. Commercial catch
Raised landings and discards data, ages 1 to 7+. Discard data are available from1978 but sampling was very limited before 1981. Discards in years 1981–2003 raised according to Millar and Fryer (2005).
The following table gives the source of landings data for West of Scotland cod:
Kind of data
Country Caton (catch-in-weight)
Canum (catch-at-age in numbers)
Weca (weight-at-age in the catch)
Matprop (proportion mature-by-age)
Length composition in catch
UK(NI) UK(E&W) UK(Scotland) Ireland France Norway
X X X X X X
X X
X X
X
X X
B.2. Biological
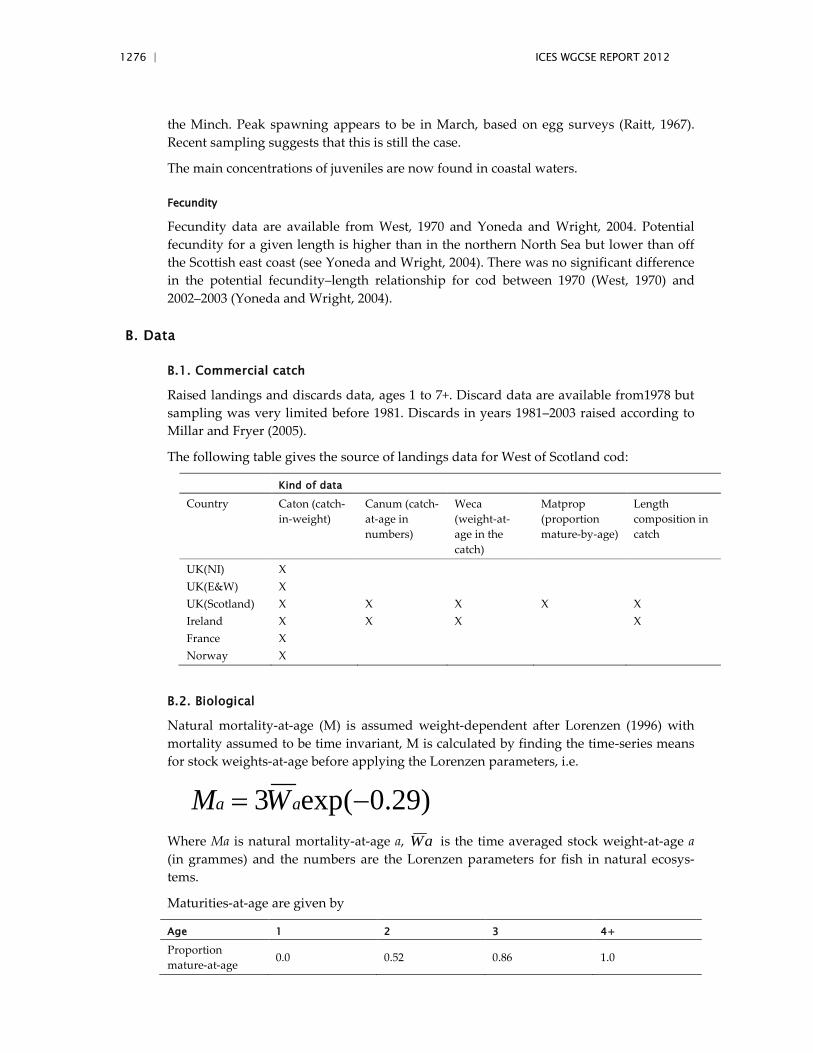
Natural mortality-at-age (M) is assumed weight-dependent after Lorenzen (1996) with mortality assumed to be time invariant, M is calculated by finding the time-series means for stock weights-at-age before applying the Lorenzen parameters, i.e.
)29.0(exp3 −= aa WM
Where Ma is natural mortality-at-age a, aW is the time averaged stock weight-at-age a (in grammes) and the numbers are the Lorenzen parameters for fish in natural ecosys-tems.
Maturities-at-age are given by
Age 1 2 3 4+
Proportion mature-at-age
0.0 0.52 0.86 1.0
ICES WGCSE REPORT 2012 | 1277
Weights-at-age are supplied separately for landings and discards. Catch weights are de-rived using the sum of products from the landings and discards weights-at-age. Stock weights-at-age are assumed equal to the catch weights-at-age.
B.3. Surveys
ScoGFS – WIBTS – Q1: 1985–2010. Ages 1 to 6 where oldest age is a true age. Fixed station design.
ScoGFS – WIBTS – Q4: 1996–2009. Ages 1 to 6 where oldest age is a true age. Fixed station design. Modest to poor self consistency (a weak ability to track cohorts) and very limited influence on exploratory assessment runs means not included in assessment.
IGFS – WIBTS – Q4: 2003– . Ages 0 to 4 where oldest age is a true age. Sufficient non-zero entries only present for ages 1 and 2. Survey only extends to 56°30’N. Concerns survey not representative of full assessment area means not included in assessment.
UKSGFS – WIBTS – Q1: 2011– . Ages 1 to 6 where oldest age is a true age. Random strati-fied design. Replaced ScoGFS – WIBTS – Q1. ICES will consider inclusion as a tuning in-dex through an inter-benchmark procedure when 4+ years of data have been gathered.
UKSGFS – WIBTS – Q4: 2011– . Ages 1 to 6 where oldest age is a true age. Random strati-fied design. Replaced ScoGFS – WIBTS – Q4. ICES will consider inclusion as a tuning in-dex through an inter-benchmark procedure when 4+ years of data have been gathered.
B.4. Commercial cpue
Not used.
B.5. Other relevant data
Grey seal consumption of cod data from Hammond and Harris (2006). Supplementary model run only (used to test sensitivity of outcomes to assumptions about natural mor-tality).
C. Assessment: data and method
Model used: TSA
Software used: NAG library (FORTRAN DLL) and functions in R.
Model Options chosen:
Weight-dependent M after Lorenzen (1996); ‘natural system’ values.
• Mwght.b <- -0.29 • Mwght.Mu <- 3.0
Response: landings-at-age, discards-at-age and survey indices-at-age
Commercial data
• 1981–1990: treated as unbiased • 1991–2005: age structure only used (with unaccounted mortality estimated) • 2006–2010: adjusted to account for misreporting then treated as unbiased
1278 | ICES WGCSE REPORT 2012
Points given greater variance at WKROUND 2012
• landings cvmult-at-age = c(1, 1, 1, 1, 1, 2, 2): extra variability for ages 6 and 7+ • landings cvmult = 3 for age 2 in 1987 and 7+ in 1989 • discards cvmult = 2 for age 1 in 1988, age 2 in 1988, age 1 in 1992 • discards cvmult = 3 for age 2 in 1992 • discards cvmult = 5 for age 2 in 1998, age 2 in 2002
Discard model
• step model: random walk for each age, with a step function allowed • 1981–2005: ages 1and 2 modelled • 2006–2010: ages 1 to 4 modelled, with a step function for ages 1 and 2
Stock–recruit model
• Ricker • Numbers-at-age 1 assumed to be independent and normally distributed
with mean η1 S exp(−η2 S), where S is the spawning–stock biomass at the start of the previous year. To allow recruitment variability to increase with mean recruitment, a constant coefficient of variation is assumed.
• Large year class: 1986 • Mean in Ricker model replaced by 5η1 S exp(−η2 S). The factor of 5 was
chosen by comparing maximum recruitment to median recruitment from 1966–1996 for VIa cod, haddock, and whiting in turn using previous XSA runs. The coefficient of variation is again assumed to be constant.
Fishing selection model
• amat = 4: fishing selection flat (apart from noise) from age 4 • gudmundssonH1 = c(2, 1, 1, 1, 1, 1, 1): extra variability for age 1
Survey model (IBTS Q1)
• full model: separate catchability for each age • ages 1 to 6 modelled • transitory and persistent changes in catchability allowed
Points given greater variance at WKROUND 2012
• cvmult = 3 for age 4 in 2001, 2 in 2007, 4 in 2008, 2 in 2010 • cvmult = 5 for age 5 in 2001, 3 in 2008
The main diagnostics of the quality of the model fit come from consideration of the objec-tive value (-2*log likelihood), prediction error results and a consideration of how well the model has replicated discard ratios in the input data. As new years of data become avail-able these diagnostics will indicate the need to downweigh individual datapoints or that the data – be it landings, discards or survey - for a given age is more or less variable than previously thought. It is therefore important that changes to the variance structures used in the TSA models will be allowed if they improve model diagnostics.
Seal feeding model (supplementary model run only)
ICES WGCSE REPORT 2012 | 1279
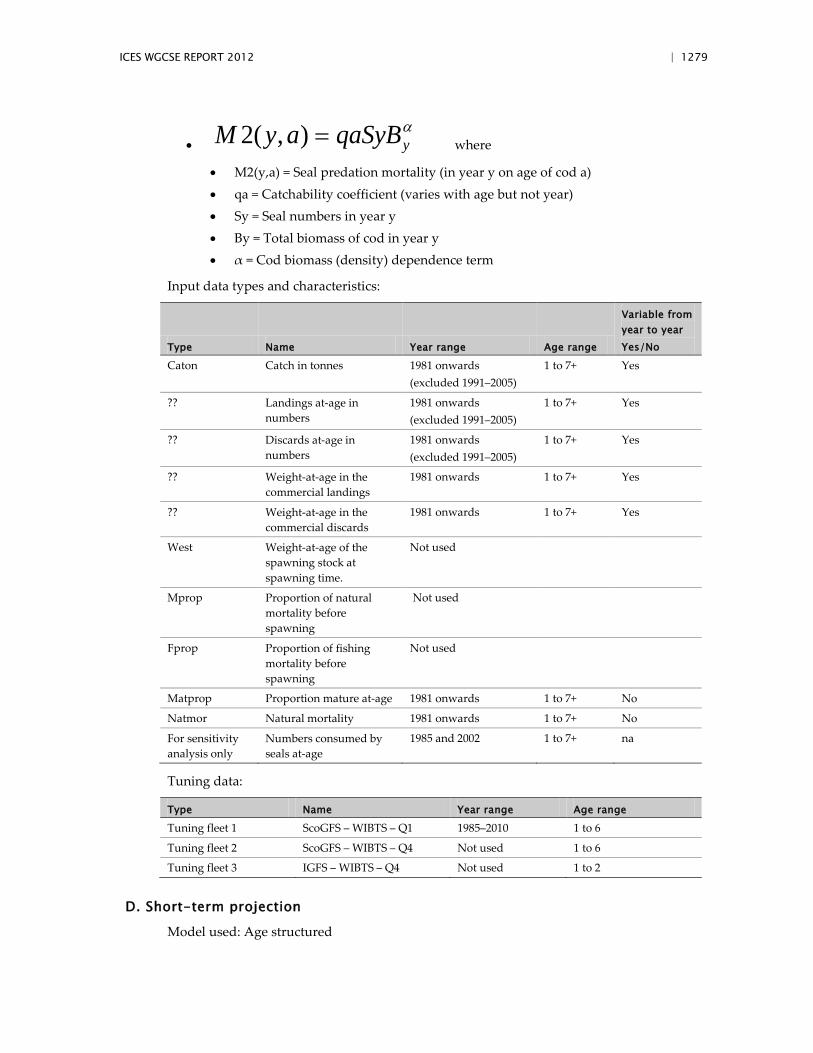
• αyqaSyBayM =),(2 where
• M2(y,a) = Seal predation mortality (in year y on age of cod a) • qa = Catchability coefficient (varies with age but not year) • Sy = Seal numbers in year y • By = Total biomass of cod in year y • α = Cod biomass (density) dependence term
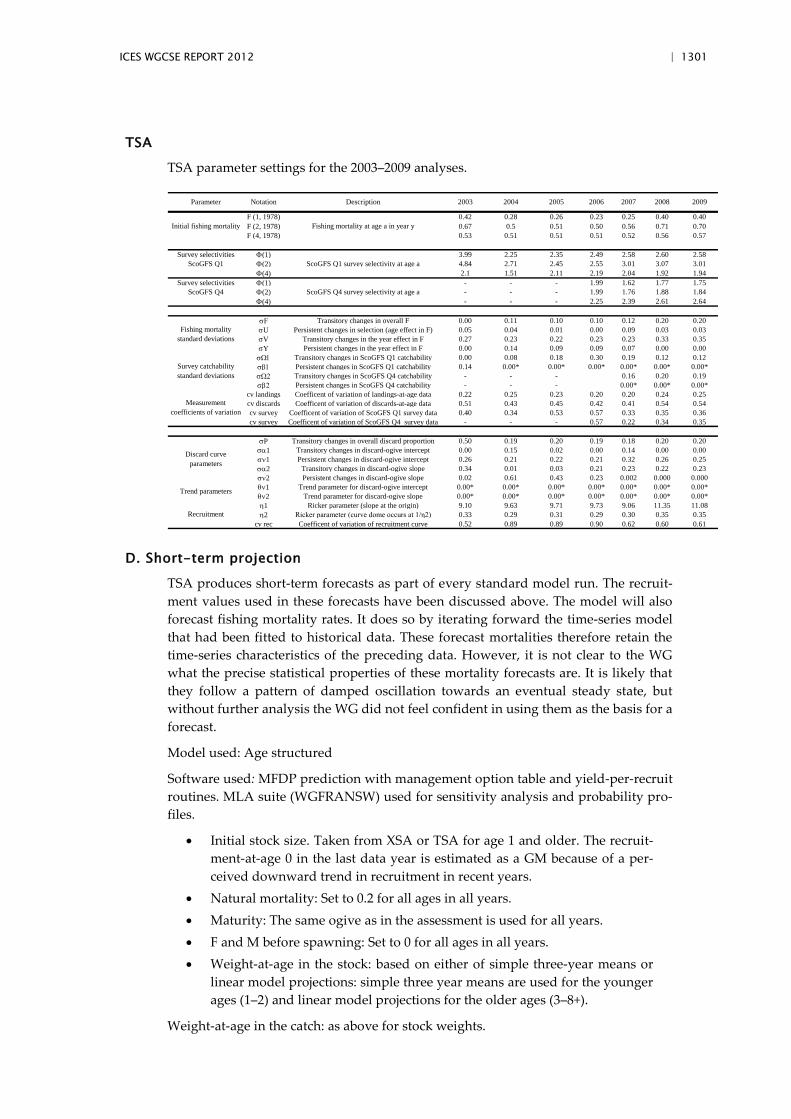
Input data types and characteristics:
Type Name Year range Age range
Variable from year to year Yes/No
Caton Catch in tonnes 1981 onwards (excluded 1991–2005)
1 to 7+ Yes
?? Landings at-age in numbers
1981 onwards (excluded 1991–2005)
1 to 7+ Yes
?? Discards at-age in numbers
1981 onwards (excluded 1991–2005)
1 to 7+ Yes
?? Weight-at-age in the commercial landings
1981 onwards 1 to 7+ Yes
?? Weight-at-age in the commercial discards
1981 onwards 1 to 7+ Yes
West Weight-at-age of the spawning stock at spawning time.
Not used
Mprop Proportion of natural mortality before spawning
Not used
Fprop Proportion of fishing mortality before spawning
Not used
Matprop Proportion mature at-age 1981 onwards 1 to 7+ No
Natmor Natural mortality 1981 onwards 1 to 7+ No
For sensitivity analysis only
Numbers consumed by seals at-age
1985 and 2002 1 to 7+ na
Tuning data:
Type Name Year range Age range
Tuning fleet 1 ScoGFS – WIBTS – Q1 1985–2010 1 to 6
Tuning fleet 2 ScoGFS – WIBTS – Q4 Not used 1 to 6
Tuning fleet 3 IGFS – WIBTS – Q4 Not used 1 to 2
D. Short-term projection
Model used: Age structured
1280 | ICES WGCSE REPORT 2012
Software used: MFDP prediction with management option table and yield-per-recruit routines. MLA suite (WGFRANSW) used for sensitivity analysis and probability profiles.
The following configuration was agreed at WGNSDS 2008
Initial stock size: Taken from TSA for age 1 and older.
Weight-at-age in the catch: Average weight of the three last years.
Weight-at-age in the stock: Average stock weights for last three years. Assumed equal to the catch weight-at-age, (adopted because mean weights-at-age have been relatively sta-ble over the recent past). CVs are calculated from the standard errors on weights-at-age.
Maturity: The same ogive as in the assessment is used for all years.
F and M before spawning: Set to 0 for all ages in all years.
Exploitation pattern: Average of the three last years.
Not partitioned to give landings, misreporting and discard F. If further work can solve this problem, this partition should be applied.
Intermediate year assumptions: Still open.
Stock–recruitment model used: None, recruitment in the intermediate year (terminal year year class at age 1) is taken from the TSA assessment, (the value is based largely on the ScoGFSQ1 survey datum from the terminal year). For the TAC year and following year the short-term (10 years to year before terminal year) geometric mean recruitment-at-age 1 is used.
Procedures used for splitting projected catches: Still open.
E. Medium-term projections
Not considered at the WKROUND benchmark.
F. Long-term projections
Not considered at the WKROUND benchmark.
ICES WGCSE REPORT 2012 | 1281
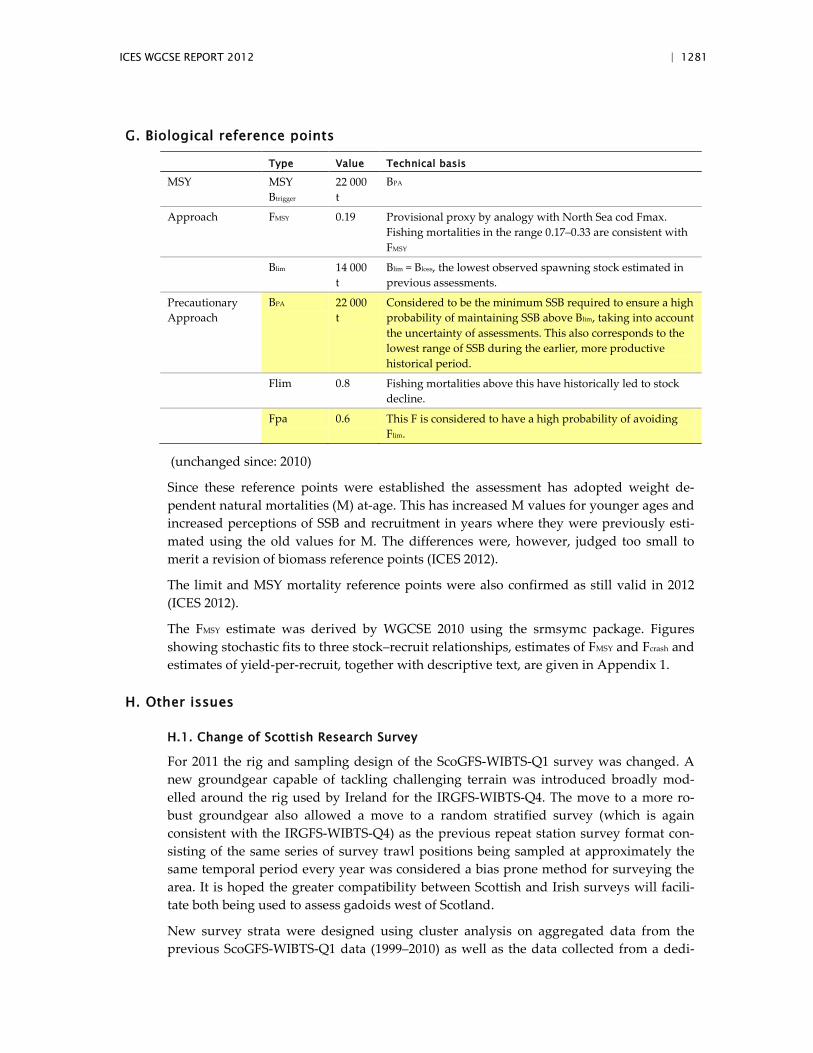
G. Biological reference points
Type Value Technical basis
MSY MSY Btrigger
22 000 t
BPA
Approach FMSY 0.19 Provisional proxy by analogy with North Sea cod Fmax. Fishing mortalities in the range 0.17–0.33 are consistent with FMSY
Blim 14 000 t
Blim = Bloss, the lowest observed spawning stock estimated in previous assessments.
Precautionary Approach
BPA 22 000 t
Considered to be the minimum SSB required to ensure a high probability of maintaining SSB above Blim, taking into account the uncertainty of assessments. This also corresponds to the lowest range of SSB during the earlier, more productive historical period.
Flim 0.8 Fishing mortalities above this have historically led to stock decline.
Fpa 0.6 This F is considered to have a high probability of avoiding Flim.
(unchanged since: 2010)
Since these reference points were established the assessment has adopted weight de-pendent natural mortalities (M) at-age. This has increased M values for younger ages and increased perceptions of SSB and recruitment in years where they were previously esti-mated using the old values for M. The differences were, however, judged too small to merit a revision of biomass reference points (ICES 2012).
The limit and MSY mortality reference points were also confirmed as still valid in 2012 (ICES 2012).
The FMSY estimate was derived by WGCSE 2010 using the srmsymc package. Figures showing stochastic fits to three stock–recruit relationships, estimates of FMSY and Fcrash and estimates of yield-per-recruit, together with descriptive text, are given in Appendix 1.
H. Other issues
H.1. Change of Scottish Research Survey
For 2011 the rig and sampling design of the ScoGFS-WIBTS-Q1 survey was changed. A new groundgear capable of tackling challenging terrain was introduced broadly mod-elled around the rig used by Ireland for the IRGFS-WIBTS-Q4. The move to a more ro-bust groundgear also allowed a move to a random stratified survey (which is again consistent with the IRGFS-WIBTS-Q4) as the previous repeat station survey format con-sisting of the same series of survey trawl positions being sampled at approximately the same temporal period every year was considered a bias prone method for surveying the area. It is hoped the greater compatibility between Scottish and Irish surveys will facili-tate both being used to assess gadoids west of Scotland.
New survey strata were designed using cluster analysis on aggregated data from the previous ScoGFS-WIBTS-Q1 data (1999–2010) as well as the data collected from a dedi-
1282 | ICES WGCSE REPORT 2012
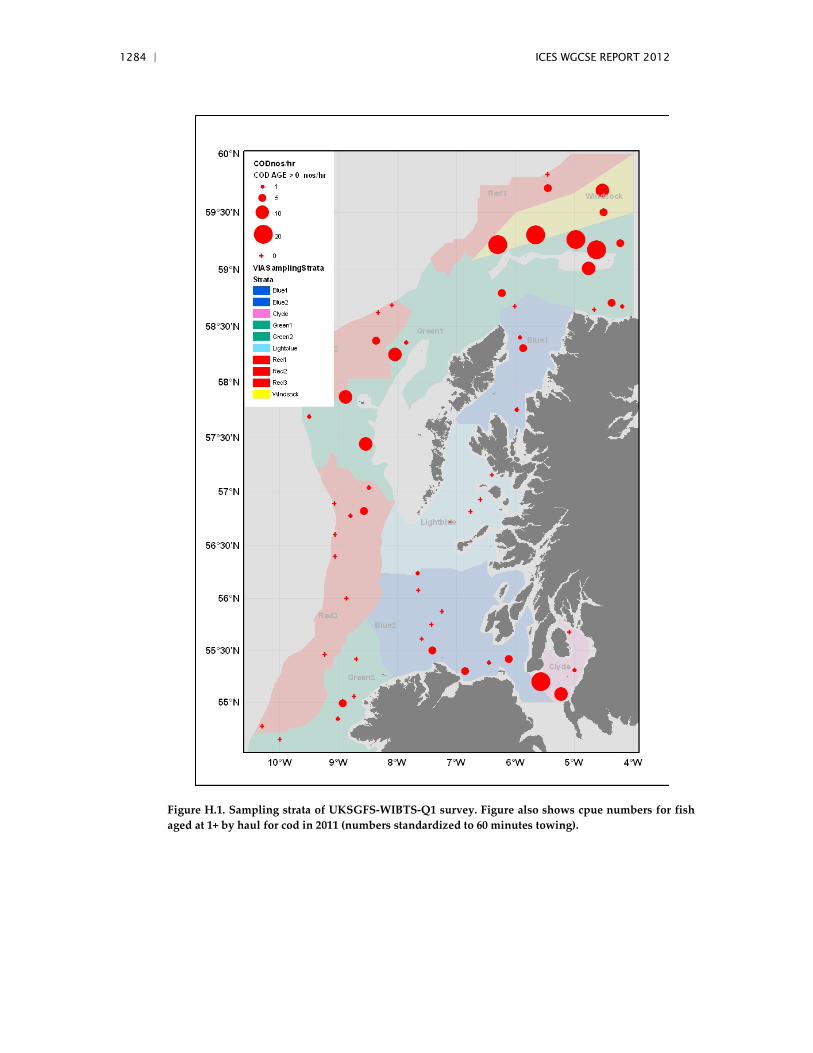
cated gadoid survey which took place during quarter 1 of 2010. Species considered were cod, haddock, whiting, saithe and hake. Cluster analysis yielded four specific clusters. Two additional strata were added; the Clyde area and the ‘windsock’ which is an area that has been designated as a recovery zone since 2002 and has therefore experienced no mobile gear exploitation during this time. The new strata are shown in Figure H.1. Each individual polygon was treated as a separate stratum and the number of survey stations for each was allocated according to polygon size and the variability of indices within each stratum. Strata were weighted by surface area to build the final indices.
H.2. Historical overview of previous assessment methods
2004 to 2011.
Model used: TSA
Software used: Compaq visual FORTRAN using NAG library.
Model Options chosen:
Natural mortality (M) 0.2 at all ages.
Commercial data
• 1978–1994: treated as unbiased • 1995–AY-1: omitted • landings cvmult-at-age = c(1, 1, 1, 1, 1, 2, 2): extra variability for ages 6 and 7+
Discard model
• 1978–1994: ages 1and 2 modelled • 1995–AY-1: omitted
Stock–recruit model
• ricker • large year class: 1986
Fishing selection model
• amat = 4: fishing selection flat (apart from noise) from age 4 • gudmundssonH1 = c(4, 1, 1, 1, 1, 1, 1): extra variability for age 1
Survey model (IBTS Q1)
• amat = 4: catchability flat (apart from noise) from age 4 • survey catchabilities up to amat assumed to follow a log-linear model • survey cvmult-at-age = c(2, 1, 1, 1, 2, 2): extra variability for ages 1, 5 and 6 • ages 1 to 6 modelled • only transitory changes in catchability allowed; modelled using the additive
scale.
Summary of data ranges used in recent assessments (no accepted assessment in 2011):
ICES WGCSE REPORT 2012 | 1283
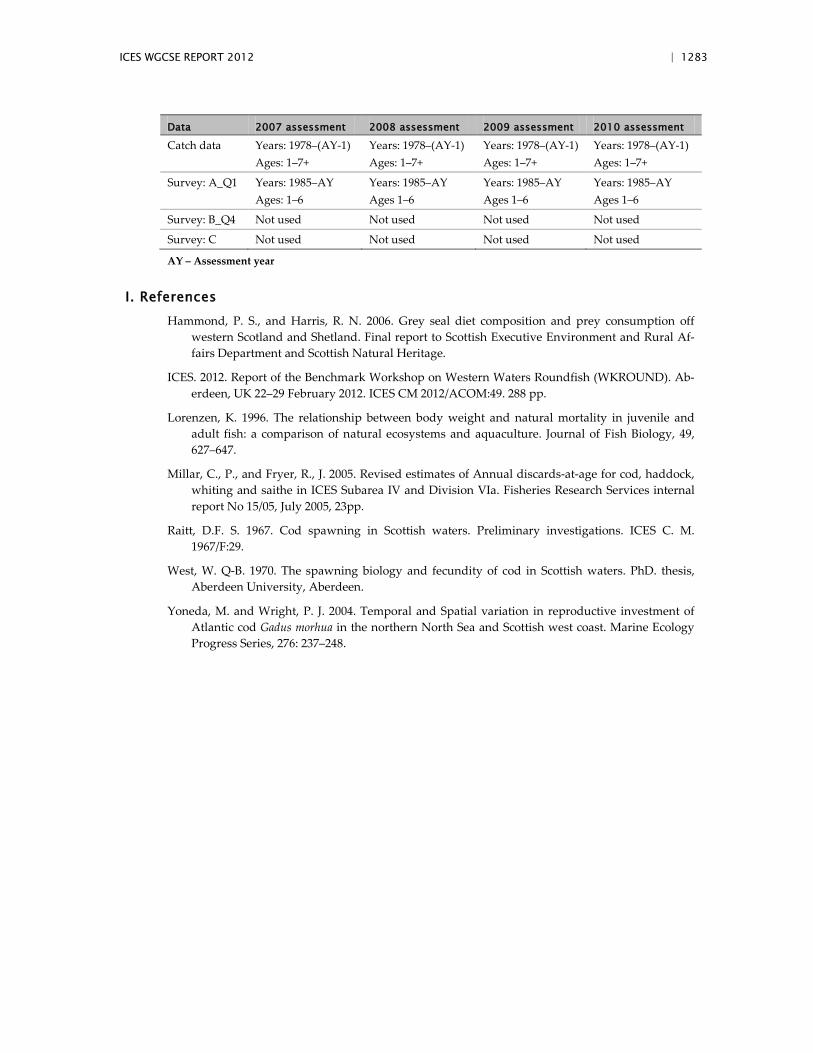
Data 2007 assessment 2008 assessment 2009 assessment 2010 assessment
Catch data Years: 1978–(AY-1) Ages: 1–7+
Years: 1978–(AY-1) Ages: 1–7+
Years: 1978–(AY-1) Ages: 1–7+
Years: 1978–(AY-1) Ages: 1–7+
Survey: A_Q1 Years: 1985–AY Ages: 1–6
Years: 1985–AY Ages 1–6
Years: 1985–AY Ages 1–6
Years: 1985–AY Ages 1–6
Survey: B_Q4 Not used Not used Not used Not used
Survey: C Not used Not used Not used Not used
AY – Assessment year
I. References Hammond, P. S., and Harris, R. N. 2006. Grey seal diet composition and prey consumption off
western Scotland and Shetland. Final report to Scottish Executive Environment and Rural Af-fairs Department and Scottish Natural Heritage.
ICES. 2012. Report of the Benchmark Workshop on Western Waters Roundfish (WKROUND). Ab-erdeen, UK 22–29 February 2012. ICES CM 2012/ACOM:49. 288 pp.
Lorenzen, K. 1996. The relationship between body weight and natural mortality in juvenile and adult fish: a comparison of natural ecosystems and aquaculture. Journal of Fish Biology, 49, 627–647.
Millar, C., P., and Fryer, R., J. 2005. Revised estimates of Annual discards-at-age for cod, haddock, whiting and saithe in ICES Subarea IV and Division VIa. Fisheries Research Services internal report No 15/05, July 2005, 23pp.
Raitt, D.F. S. 1967. Cod spawning in Scottish waters. Preliminary investigations. ICES C. M. 1967/F:29.
West, W. Q-B. 1970. The spawning biology and fecundity of cod in Scottish waters. PhD. thesis, Aberdeen University, Aberdeen.
Yoneda, M. and Wright, P. J. 2004. Temporal and Spatial variation in reproductive investment of Atlantic cod Gadus morhua in the northern North Sea and Scottish west coast. Marine Ecology Progress Series, 276: 237–248.
1284 | ICES WGCSE REPORT 2012
Figure H.1. Sampling strata of UKSGFS-WIBTS-Q1 survey. Figure also shows cpue numbers for fish aged at 1+ by haul for cod in 2011 (numbers standardized to 60 minutes towing).
ICES WGCSE REPORT 2012 | 1285
Appendix 1: Investigations of FMSY using the srmsymc package
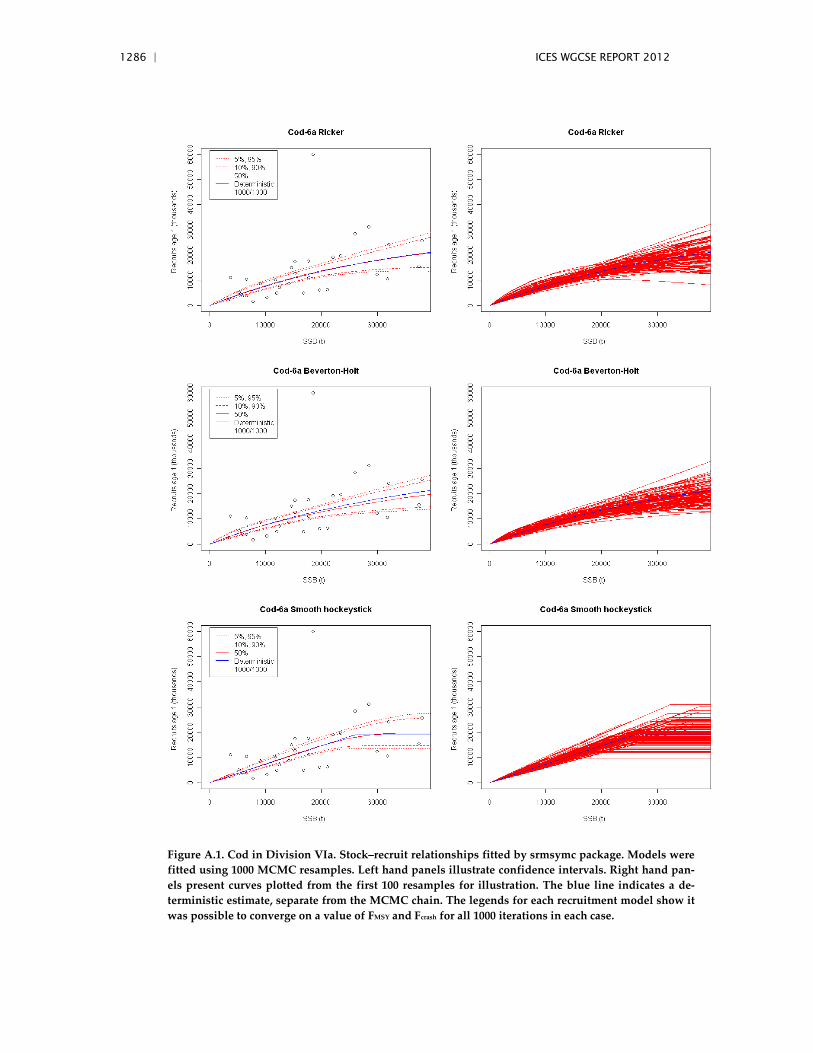
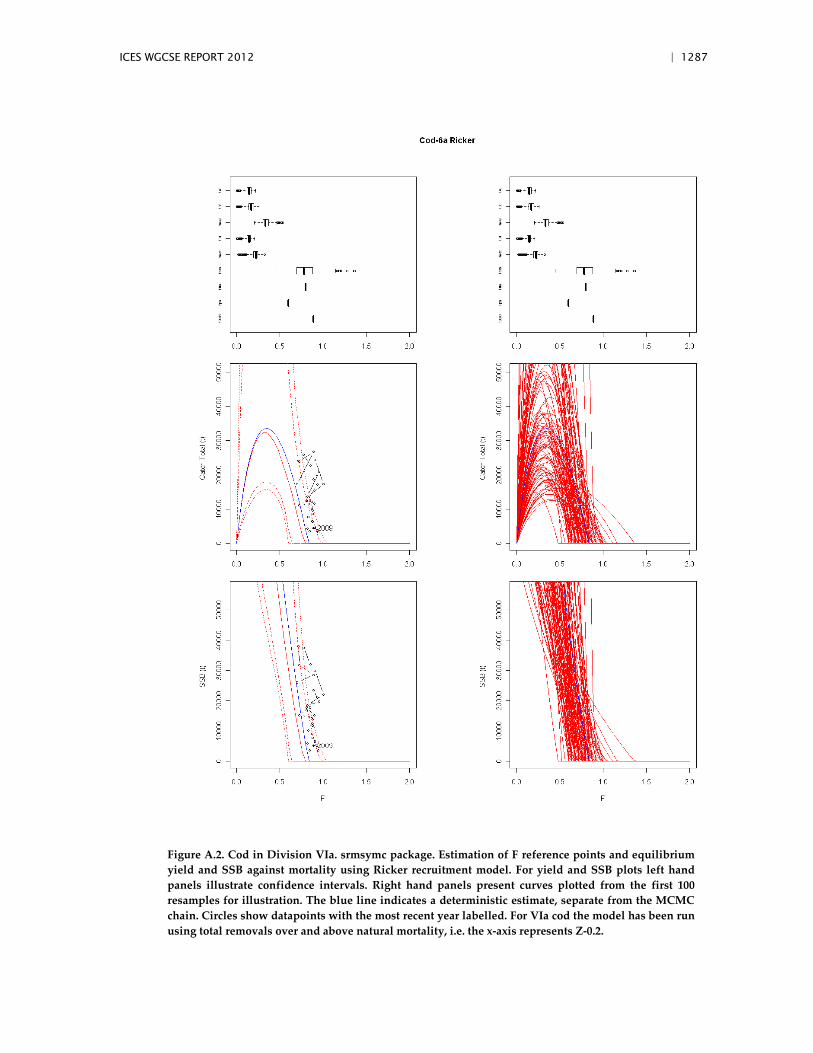
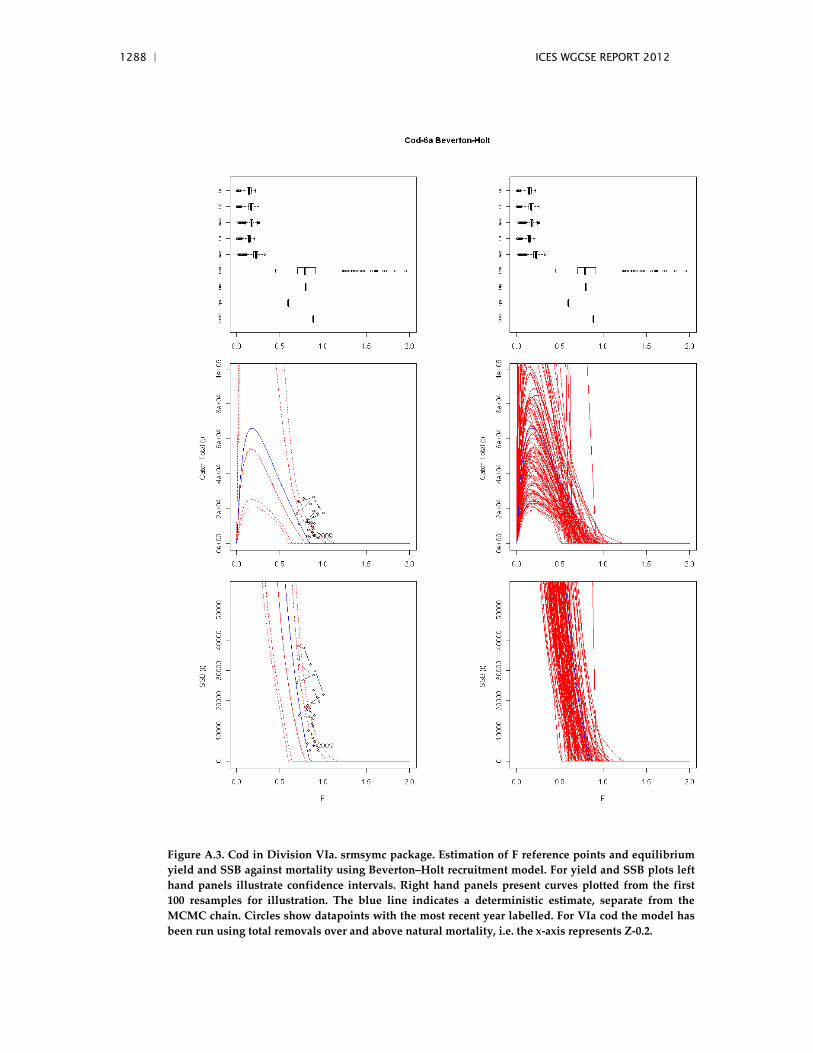
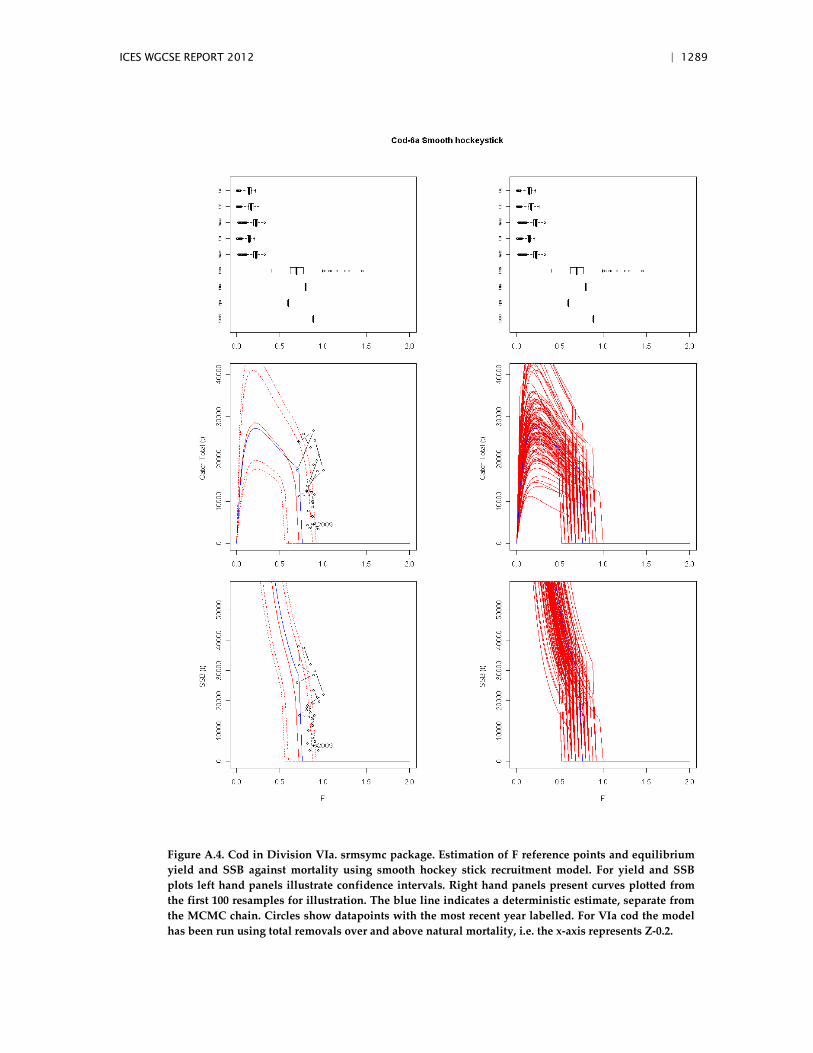
The same input data files as used for the short-term forecast were used. An alternative run using ten year means for stock weights-at-age and mortality-at-age showed there to be little sensitivity to the averaging period used. Figure A.1 shows the three stock–recruit relationships fitted by the package; Ricker, Beverton–Holt and smooth hockey stick. Models were fitted using 1000 MCMC resamples. For all three stock–recruit relationships all resamples allowed FMSY and Fcrash values to be determined. As such, there was no basis to reject any of the recruitment models as unsuitable for this stock. For each of the stock–recruit relationships (SRR) Figures A.2 to A.4 show box plots of FMSY and Fcrash together with the values of FPA and Flim. For the Ricker and Beverton–Holt SRR the estimated value of Fcrash is very close to Flim. For the smooth hockey stick SRR Fcrash is estimated between Flim and FPA. For all three SRR the current level of Z-02 is higher than the median Fcrash value. Also the value of FMSY is well defined and considerably lower than FPA for all three SRR. The level of removals possible at the estimated FMSY is poorly defined however. Cir-cles showing the datapoints show values of Z-0.2 repeatedly in excess of the upper per-centile for Fcrash. As expected removals and SSB have declined such that values for both are now inside confidence limits for these metrics at the estimated Z-0.2 mortality rates.
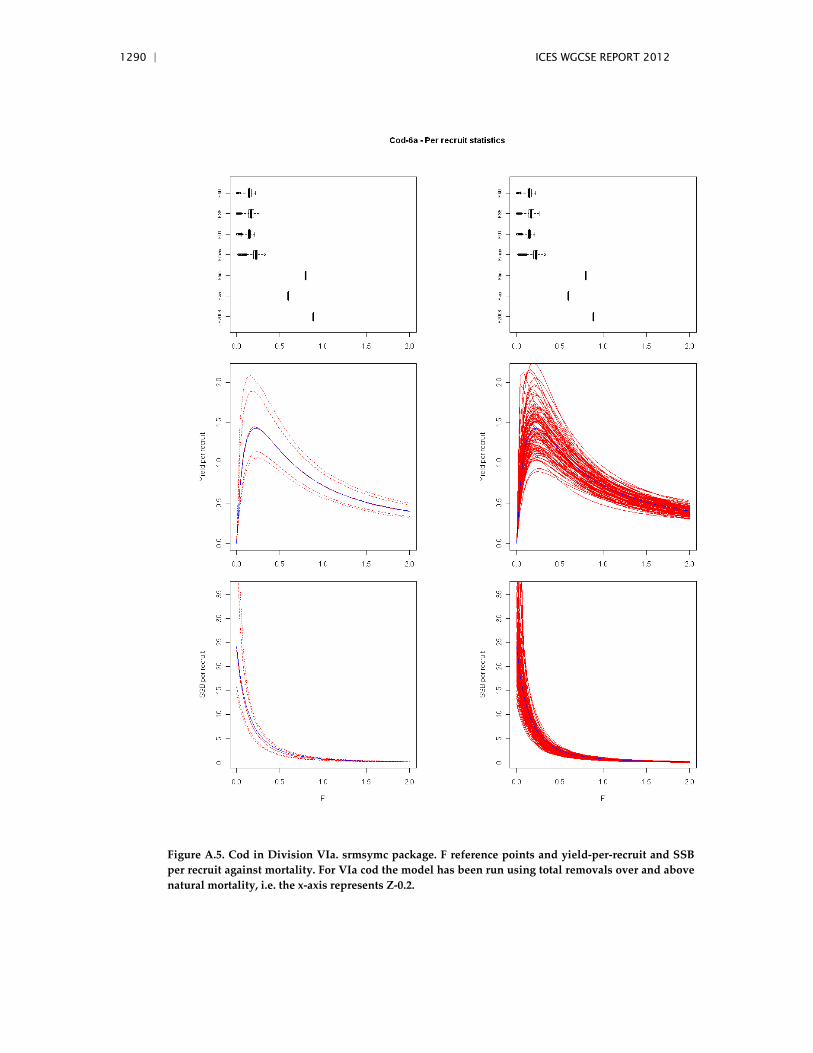
Figure A.5 shows estimation of yield-per-recruit. FMAX is well defined for this stock. Comparison of FMAX to FMSY estimated using the three SRRs (Figures A.2–4) shows FMSY estimated as lower than FMAX for the Beverton–Holt model, equal for the smooth hockey stick and higher than FMAX in the Ricker model reflecting the downward slope of the stock–recruit relationship at higher SSBs.
In conclusion mortalities from removals in the range 0.17 to 0.33 were considered con-sistent with FMSY.
1286 | ICES WGCSE REPORT 2012
Figure A.1. Cod in Division VIa. Stock–recruit relationships fitted by srmsymc package. Models were fitted using 1000 MCMC resamples. Left hand panels illustrate confidence intervals. Right hand pan-els present curves plotted from the first 100 resamples for illustration. The blue line indicates a de-terministic estimate, separate from the MCMC chain. The legends for each recruitment model show it was possible to converge on a value of FMSY and Fcrash for all 1000 iterations in each case.
ICES WGCSE REPORT 2012 | 1287
Figure A.2. Cod in Division VIa. srmsymc package. Estimation of F reference points and equilibrium yield and SSB against mortality using Ricker recruitment model. For yield and SSB plots left hand panels illustrate confidence intervals. Right hand panels present curves plotted from the first 100 resamples for illustration. The blue line indicates a deterministic estimate, separate from the MCMC chain. Circles show datapoints with the most recent year labelled. For VIa cod the model has been run using total removals over and above natural mortality, i.e. the x-axis represents Z-0.2.
1288 | ICES WGCSE REPORT 2012
Figure A.3. Cod in Division VIa. srmsymc package. Estimation of F reference points and equilibrium yield and SSB against mortality using Beverton–Holt recruitment model. For yield and SSB plots left hand panels illustrate confidence intervals. Right hand panels present curves plotted from the first 100 resamples for illustration. The blue line indicates a deterministic estimate, separate from the MCMC chain. Circles show datapoints with the most recent year labelled. For VIa cod the model has been run using total removals over and above natural mortality, i.e. the x-axis represents Z-0.2.
ICES WGCSE REPORT 2012 | 1289
Figure A.4. Cod in Division VIa. srmsymc package. Estimation of F reference points and equilibrium yield and SSB against mortality using smooth hockey stick recruitment model. For yield and SSB plots left hand panels illustrate confidence intervals. Right hand panels present curves plotted from the first 100 resamples for illustration. The blue line indicates a deterministic estimate, separate from the MCMC chain. Circles show datapoints with the most recent year labelled. For VIa cod the model has been run using total removals over and above natural mortality, i.e. the x-axis represents Z-0.2.
1290 | ICES WGCSE REPORT 2012
Figure A.5. Cod in Division VIa. srmsymc package. F reference points and yield-per-recruit and SSB per recruit against mortality. For VIa cod the model has been run using total removals over and above natural mortality, i.e. the x-axis represents Z-0.2.
ICES WGCSE REPORT 2012 | 1291
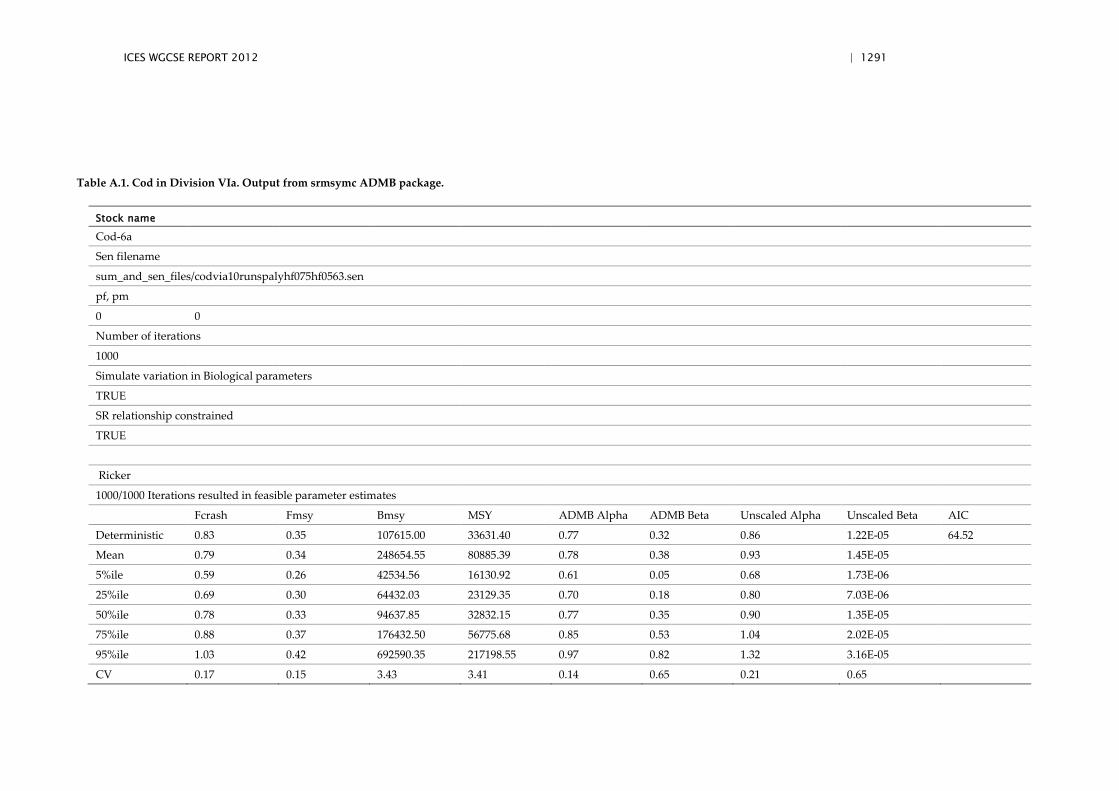
Table A.1. Cod in Division VIa. Output from srmsymc ADMB package.
Stock name
Cod-6a
Sen filename
sum_and_sen_files/codvia10runspalyhf075hf0563.sen
pf, pm
0 0
Number of iterations
1000
Simulate variation in Biological parameters
TRUE
SR relationship constrained
TRUE
Ricker
1000/1000 Iterations resulted in feasible parameter estimates
Fcrash Fmsy Bmsy MSY ADMB Alpha ADMB Beta Unscaled Alpha Unscaled Beta AIC
Deterministic 0.83 0.35 107615.00 33631.40 0.77 0.32 0.86 1.22E-05 64.52
Mean 0.79 0.34 248654.55 80885.39 0.78 0.38 0.93 1.45E-05
5%ile 0.59 0.26 42534.56 16130.92 0.61 0.05 0.68 1.73E-06
25%ile 0.69 0.30 64432.03 23129.35 0.70 0.18 0.80 7.03E-06
50%ile 0.78 0.33 94637.85 32832.15 0.77 0.35 0.90 1.35E-05
75%ile 0.88 0.37 176432.50 56775.68 0.85 0.53 1.04 2.02E-05
95%ile 1.03 0.42 692590.35 217198.55 0.97 0.82 1.32 3.16E-05
CV 0.17 0.15 3.43 3.41 0.14 0.65 0.21 0.65
1292 | ICES WGCSE REPORT 2012
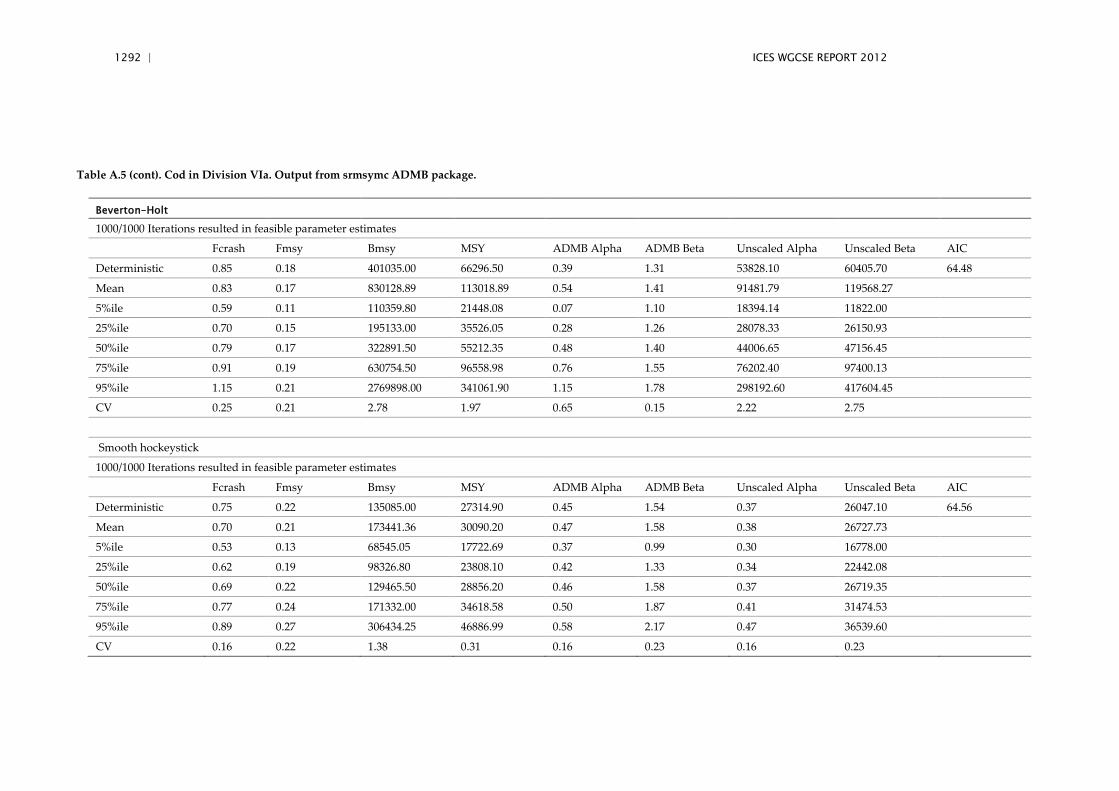
Table A.5 (cont). Cod in Division VIa. Output from srmsymc ADMB package.
Beverton–Holt
1000/1000 Iterations resulted in feasible parameter estimates
Fcrash Fmsy Bmsy MSY ADMB Alpha ADMB Beta Unscaled Alpha Unscaled Beta AIC
Deterministic 0.85 0.18 401035.00 66296.50 0.39 1.31 53828.10 60405.70 64.48
Mean 0.83 0.17 830128.89 113018.89 0.54 1.41 91481.79 119568.27
5%ile 0.59 0.11 110359.80 21448.08 0.07 1.10 18394.14 11822.00
25%ile 0.70 0.15 195133.00 35526.05 0.28 1.26 28078.33 26150.93
50%ile 0.79 0.17 322891.50 55212.35 0.48 1.40 44006.65 47156.45
75%ile 0.91 0.19 630754.50 96558.98 0.76 1.55 76202.40 97400.13
95%ile 1.15 0.21 2769898.00 341061.90 1.15 1.78 298192.60 417604.45
CV 0.25 0.21 2.78 1.97 0.65 0.15 2.22 2.75
Smooth hockeystick
1000/1000 Iterations resulted in feasible parameter estimates
Fcrash Fmsy Bmsy MSY ADMB Alpha ADMB Beta Unscaled Alpha Unscaled Beta AIC
Deterministic 0.75 0.22 135085.00 27314.90 0.45 1.54 0.37 26047.10 64.56
Mean 0.70 0.21 173441.36 30090.20 0.47 1.58 0.38 26727.73
5%ile 0.53 0.13 68545.05 17722.69 0.37 0.99 0.30 16778.00
25%ile 0.62 0.19 98326.80 23808.10 0.42 1.33 0.34 22442.08
50%ile 0.69 0.22 129465.50 28856.20 0.46 1.58 0.37 26719.35
75%ile 0.77 0.24 171332.00 34618.58 0.50 1.87 0.41 31474.53
95%ile 0.89 0.27 306434.25 46886.99 0.58 2.17 0.47 36539.60
CV 0.16 0.22 1.38 0.31 0.16 0.23 0.16 0.23
ICES WGCSE REPORT 2012 | 1293
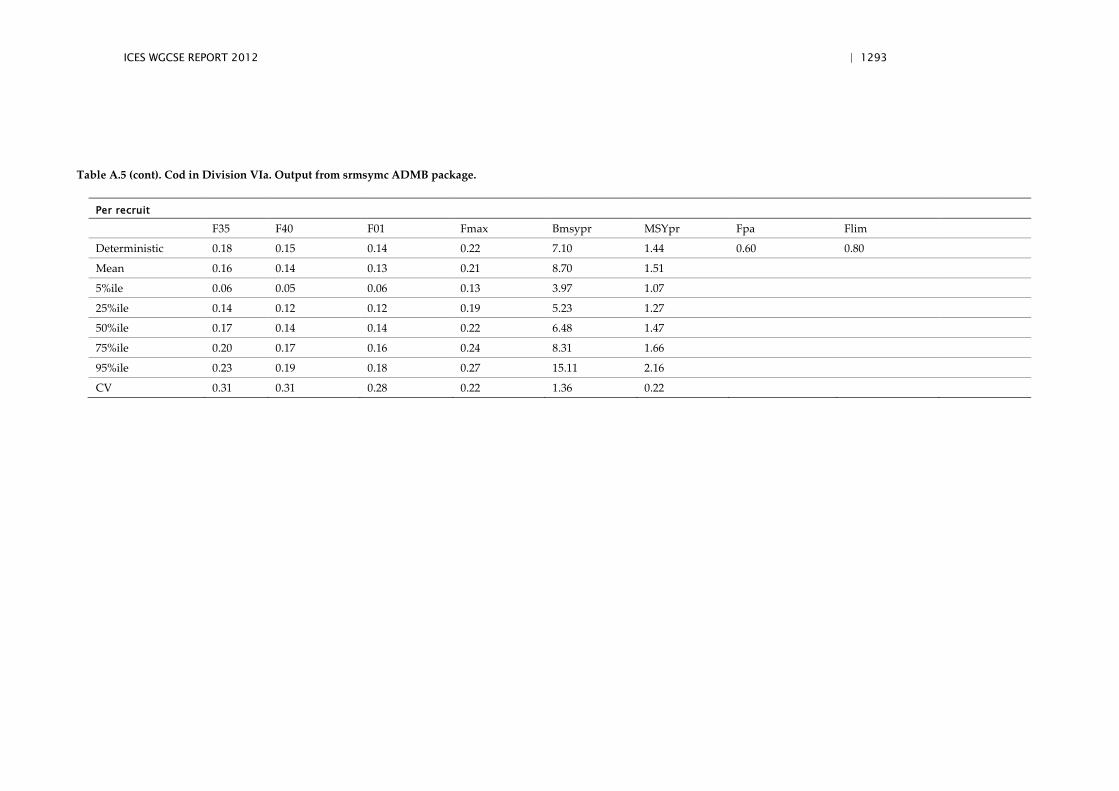
Table A.5 (cont). Cod in Division VIa. Output from srmsymc ADMB package.
Per recruit
F35 F40 F01 Fmax Bmsypr MSYpr Fpa Flim
Deterministic 0.18 0.15 0.14 0.22 7.10 1.44 0.60 0.80
Mean 0.16 0.14 0.13 0.21 8.70 1.51
5%ile 0.06 0.05 0.06 0.13 3.97 1.07
25%ile 0.14 0.12 0.12 0.19 5.23 1.27
50%ile 0.17 0.14 0.14 0.22 6.48 1.47
75%ile 0.20 0.17 0.16 0.24 8.31 1.66
95%ile 0.23 0.19 0.18 0.27 15.11 2.16
CV 0.31 0.31 0.28 0.22 1.36 0.22
1294 | ICES WGCSE REPORT 2012
3.3 Stock Annex Haddock VIa
Stock specific documentation of standard assessment procedures used by ICES.
Stock West of Scotland Haddock (Division VIa)
Working Group Assessment of Northern Shelf Demersal Stock
Last updated May 2009
A. General
A.1. Stock definition
The haddock is widely distributed around the west coast of Scotland and can be caught in most areas within the 200 m depth contour. The stocks occurring off the northwest coast of Scotland are usually identified according to the regions which support a fishery, but genetic and biological marker studies suggest the possibility of different populations of haddock. A continuous population of haddock is thought to extend from the west coast around to the north of Scotland. Results from tagging ex-periments and larval transport studies suggest that there may be links between west coast haddock and those in the North Sea.
A.2. The fishery
The minimum landing size of haddock in the human consumption fishery in this area is 30 cm.
The demersal fisheries in Division VIa are predominantly conducted by demersal trawlers fishing for cod, haddock, anglerfish and whiting, with bycatches of saithe, megrim, lemon sole, ling and several species of skate. Since 1976, effort by Scottish heavy trawlers and seiners has decreased. Light trawler effort has declined rapidly since 1997 after a long-term increasing trend.
2000 onwards
Emergency measures were introduced in 2001 to allow the maximum number of cod to spawn (see emergency measures below). Council Regulation (EC) No. 423\2004 introduced a cod recovery plan affecting Division VIa. This has been revised and up-dated (Council Regulation (EC) No. 1342/2008). The measures only take effect east of a line defined in Council Regulation No 51\2006. The days-at-sea limitations associ-ated with the cod recovery plan and this seasonal closure has lead some of the Irish Demersal fleet to switch effort away from VIa.
Under Council Regulation (EC) No. 51/2006 the use of gillnets has been banned out-side 200 m depth. WGFTFB 2006 report that this has greatly reduced effort at depths greater than 200 m in VIa. The measure was aimed to protect monkfish and deep-water shark and it is unclear what effect it will have on haddock.
Technical measures
The minimum mesh size for vessels fishing for haddock in the mixed demersal fish-ery in EC Zones 1 and 2 (West of Scotland and North Sea excluding Skagerrak) changed from 100 mm to 120 mm from the start of 2002. This came under EU regula-tions regarding the cod recovery plan (Commission Regulation EC 2056/2001), with a one-year derogation of 110 mm for vessels targeting species other than cod. This der-ogation was not extended beyond the end of 2002.
ICES WGCSE REPORT 2012 | 1295
Since mid-2000, UK vessels in this fishery have been required to include a 90 mm square mesh panel (SSI 227/2000), predominantly to reduce discarding of the large 1999 year class of haddock. Further unilateral legislation in 2001 (SSI 250/2001) banned the use of lifting bags in the Scottish fleet.
Under Council Regulation No. 51/2006 the use of gillnets has been banned outside 200 m depth.
Emergency measures and effort limitation
Emergency measures were enacted in 2001, consisting of area closures from 6 March–30 April, in an attempt to maximize cod egg production. These measures were re-tained into 2003 and 2004.
In 2005 the following area closures were in effect:
1 ) The Greencastle codling fishery from mid-November to mid-February. This closure has been operating since 2003.
2 ) A closure in the Clyde for spawning cod from 14th February to 30th April. This closure has been operating since 2001 and was last revised by The Sea Fish (prohibited methods of fishing; Firth of Clyde) Order 2002.
3 ) A closure introduced in 2004 by Council Regulation No. EC 2287\2003, known as the ‘windsock’.
Effort reductions for much of the international fleet to 16 days-at-sea per month have been imposed since February 2003 (EU 2003\0090). The maximum number-of-days in any calendar month for which a fishing vessel may be absent from port to the West of Scotland varies for particular gears and the allocations since 2003 are given below:
Gear Maximum Days Allowed
2003: 2004: 2005: 2006:
Demersal trawls, seines or similar towed gears of mesh size ≥100 mm except beam trawls
9 10 8 91/12
Demersal trawls, seines or similar towed gears of mesh size between 70 mm and 99 mm except beam trawls1;
25 22 21 127/12
Demersal trawls, seines or similar towed gears of mesh size between 16 mm and 31 mm except beam trawls.
23 20 19 128/12
1: With mesh size between 80 mm and 99 mm in 2004.
The documents listing these days-at-sea limitations are,
2004: (EC) No 2287/2003
2005: (EC) No 27/2005-Annex IVa
2006: (EC) No 51/2006-Annex IIa
A Commission Decision (C (2003) 762) in March 2003 allocated additional days absent from port to particular vessels and Member States. UK vessels were granted four ad-ditional days-per-month (based on evidence of decommissioning programmes). An additional two days was granted to demersal trawls, seines or similar towed gears (mesh ≥100 mm, except beam trawls) to compensate for steaming time between home ports and fishing grounds and for the adjustment to the newly installed effort man-agement scheme.
For 2006 one extra day was allocated to trawls >=100 mm if the mesh was >120 mm and the net contained a square mesh panel of 140 mm mesh size. Altogether 148 days
1296 | ICES WGCSE REPORT 2012
in the year was allowed for vessels with mesh between 100 and 120 mm if the catch contained <5% cod in 2002. This allowance rises to 160 days in the year if the same 140 mm square mesh panel is used together with a mesh size >120 mm.
The new effort regulations provided an incentive for some vessels previously using >100 mesh in otter trawls to switch to smaller mesh gears to take advantage of the larger numbers of days-at-sea available. This would also require these vessels to be targeting Nephrops or anglerfish, megrim and whiting with various catch and bycatch composition limits after EC Regulation No 850/98.
Decommissioning schemes. Vessel decommissioning has been underway since 2002. Infor-mation on the number of vessels operating in the cod recovery zone to have been de-commissioned in Division VIa between 2001 and 2004 was as follows:
Total VIa 2001 Decomm. To 2004 Percentage
Number of vessels > 10 m 298 96 30.2%
A.3. Ecosystem aspects
Geographical location and timing of spawning
Spawning of haddock usually occurs in February and March and in almost any area where the fish are distributed. There is major spawning between the Butt of Lewis and Shetland. Some larvae from the west coast spawning grounds can be transported to the North Sea, which they enter through the Fair Isle/Shetland Gap or to the north-east of Shetland. Young haddock then spend the first few months of life in the upper water layers before adopting the demersal way of life. The survival rate of young haddock is very variable from year to year.
Fecundity
The majority of haddock mature-at-age two with usually all mature by age three. However, mature age two haddock spawn fewer eggs for a given size than an age three haddock. A three-year-old female of good size is able to produce around 300 000 eggs in a season and releases her eggs in a number of batches over many weeks.
Diet
The diet of haddock varies seasonally and according to location and body size. In winter, haddock of all sizes feed mainly on benthic invertebrates, for example, poly-chaetes, small crustaceans and echinoderms. In spring and summer, fish prey, espe-cially sandeels, are important particularly for larger haddock. Norway pout is also important prey for haddock. During herring spawning seasons, haddock will feed heavily on herring eggs.
B. Data
B.1. Commercial catch
B1.1. Landings
The following table gives the source of landings data for West of Scotland haddock:
ICES WGCSE REPORT 2012 | 1297
Kind of data
Country Caton (catch-in-weight)
Canum (catch-at-age in numbers)
Weca (weight-at-age in the catch)
Matprop (proportion mature-by-age)
Length composition-in-catch
UK(NI) UK(E&W) UK(Scotland) Ireland France Norway
X X X X X X
X X
X X
X
X X
Quarterly landings and length/age composition data are supplied from databases maintained by national Government Departments and research agencies. These fig-ures may be adjusted by national scientists to correct for known or estimated misre-porting by area or species. Data are supplied in the requested format to a stock coordinator, who compiles the international landings and catch-at-age data and maintains a time-series of such data with any amendments. To avoid double counting of landings data, each UK region supplies data for UK landings into its regional ports, and landings by its fleet into non-UK ports.
Quarterly landings are provided by the UK (Scotland), UK (E/W), UK (NI), France and Ireland .The quarterly estimates of landings-at-age by UK (Scotland) and Ireland are raised to include landings by France, UK (NI) and Norway (distributed propor-tionately over quarters), then summed over quarters to produce the annual landings-at-age.
B1.2. Discards
EU countries are now required under the EU Data Collection regulation to collect data on discards of haddock and other species. Up to 2003, estimates of discards were available only from UK (Scotland) and Ireland. Observer data are collected using standard at-sea sampling schemes. Results are reported to ICES.
The quantity, length and age of haddock discarded by Scottish Nephrops trawlers are collected during observer trips on board commercial vessels. Haddock discarded by boats using other gears (heavy trawl, seine, light trawl and pair trawl) are also col-lected by Scotland. Haddock discarded by otter board trawl and otter board/twin rig gears are collected by Ireland.
Discards from Scottish and Irish boats using several different gear types are estimat-ed by observers.
B.2. Biological
Natural mortality is assumed to be constant (M=0.2, applied annually) for the whole range of ages and years. There are no direct estimates of M.
Proportion mature-at-age is currently assumed constant over the full time-series as follows:
Age 1 2 3+
Proportion mature 0.00 0.57 1.0
These maturity values were derived from a French survey carried out in Division VIa in 1983. They were first discussed in the 1984 meeting of the North Sea Roundfish Working Group (ICES-NSRWG 1984), and were first used at the 1985 meeting (ICES-
1298 | ICES WGCSE REPORT 2012
NSRWG 1985). Proportions of F and M before spawning were both set to 0.0, in order to generate abundance (and hence SSB) estimates dated to January 1st.
B.3. Surveys
Four research vessel survey series for haddock in VIa were available to the Working Group in 2009. In all surveys listed the highest age represents a true age not a plus group.
• Scottish first-quarter west coast groundfish survey (ScoGFSQ1): ages 1–7, years 1985–2009.
The survey gear is a GOV trawl, and the design is a minimum of one station per rec-tangle, but with more depending on logistics. Ages are reported from 0 to the maxi-mum obtained. Sex/Maturity-Sex and Maturity (ICES 4-stage scale) are reported. The Scottish groundfish survey has been conducted with a new vessel and gear since 1999. The catch rates for the series as presented are corrected for the change on the basis of comparative trawl haul data (Zuur et al., 2001).
• Irish fourth-quarter west coast groundfish survey (IreGFS): ages 0–3, years 1993–2002.
The Irish quarter four survey was a comparatively short series. It was discontinued in 2003 and has been replaced by the IRGFS (see below).
• Scottish fourth quarter west coast groundfish survey (ScoGFSQ4): ages 0–8, years 1996–2008.
As is the case for the European IBTS surveys (such as ScoGFS Q1 above) the survey gear is a GOV trawl, and the design is a minimum of one station per rectangle, but with more depending on logistics. Ages are reported from 0 to the maximum ob-tained. Sex/Maturity-Sex and Maturity (ICES 4-stage scale) are reported. The Scottish groundfish survey has been conducted with a new vessel and gear since 1999. The catch rates for the series as presented are corrected for the change on the basis of comparative trawl haul data (Zuur et al., 2001).
• Irish fourth-quarter west coast groundfish survey (IRGFS); ages 0–3, years 2003–2008.
This survey used the RV Celtic Explorer and is part of the IBTS coordinated western waters surveys. The vessel uses a GOV trawl, and the design is a depth stratified sur-vey with randomized stations. Effort is recorded as minutes towed. There were 41 stations sampled in 2003, 44 in 2004 and 34 in 2005, corresponding to 1229, 1321 and 1010 minutes towed.
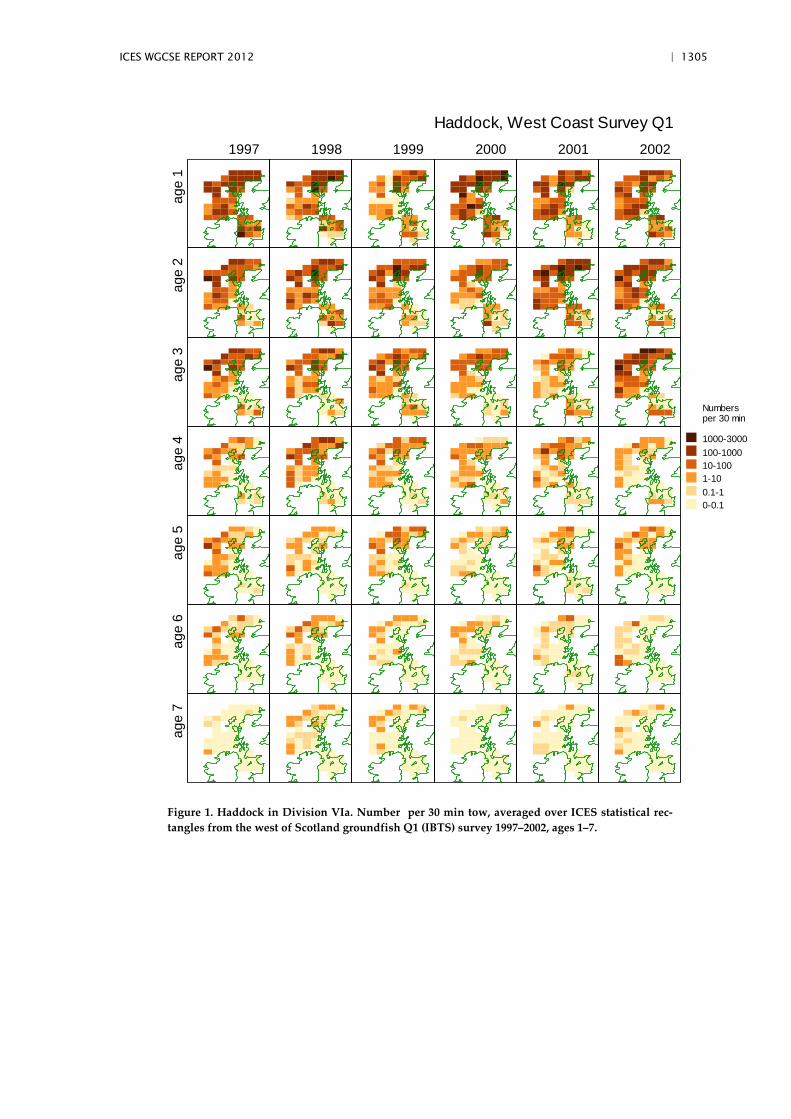
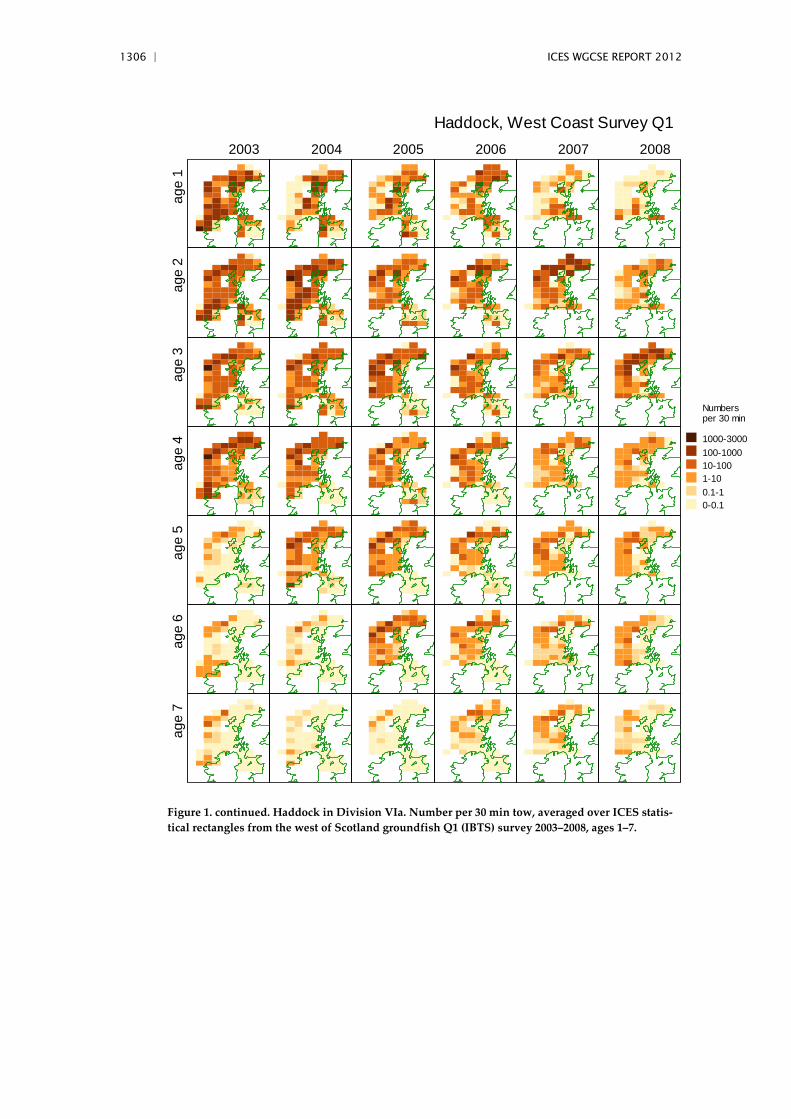
Plots of the spatial distribution of the ScoGFS Q1 survey mean catch rates per ICES statistical rectangle by age class are given in Figure 1. The numbers caught in the most recent Scottish Groundfish Surveys are indicated in Figure 2.
B.4. Commercial cpue
Three commercial Scottish cpue series have been made available in recent years. Irish otter trawl cpue data (IreOTR) were presented for the first time at the 2001 WG meet-ing. Updated series have been presented to subsequent meetings. Given the current concerns about misreporting of catch and effort, this series has not been considered further as a tuning fleet.
The commercial cpue data available consists of the following:
ICES WGCSE REPORT 2012 | 1299
• Scottish seiners (ScoSEI): ages 1–6, years 1978–2005. • Scottish light trawlers (ScoLTR): ages 1–6, years 1978–2005. • Irish otter trawlers (IreOTR): ages 1–7, years 1995–2005.
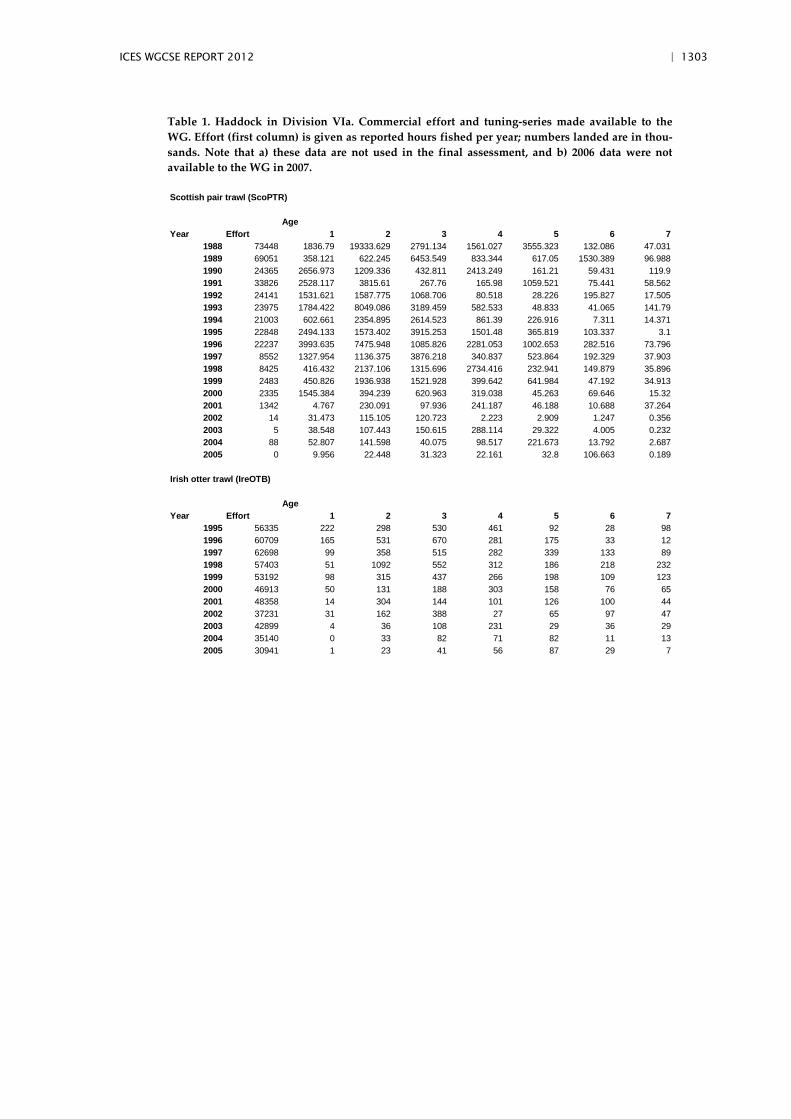
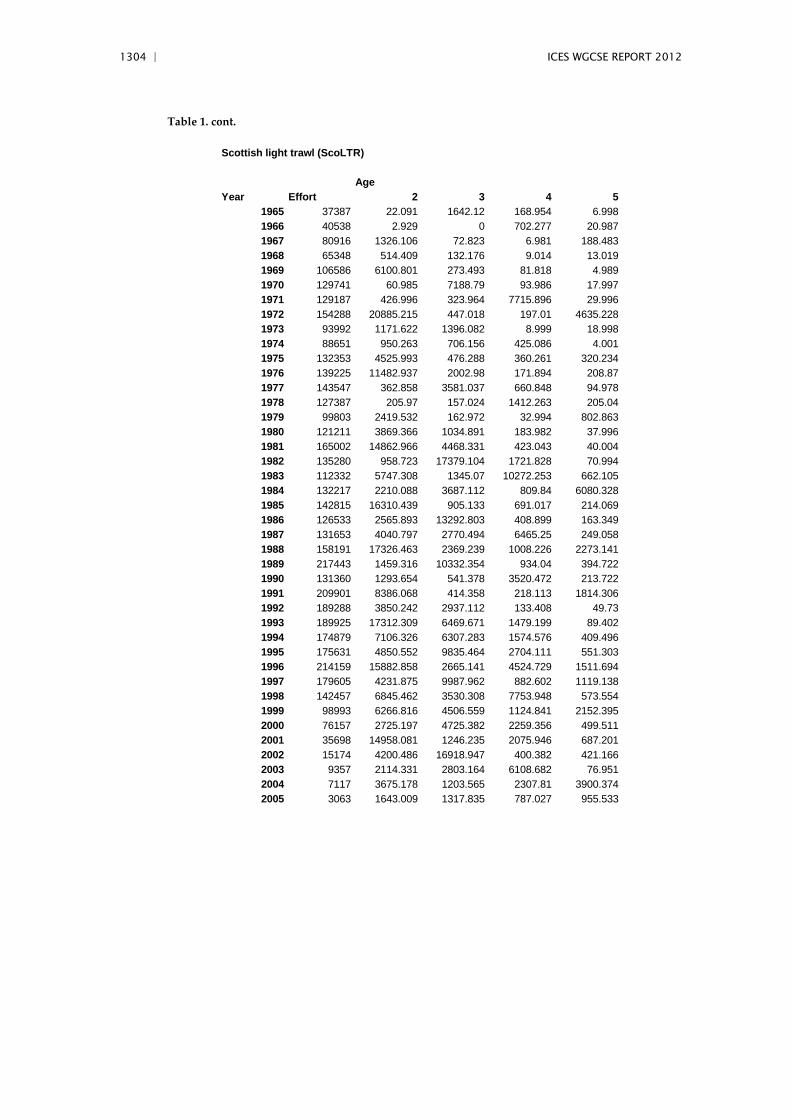
Reported effort has declined in recent years to very low levels in both Scottish fleets for which effort data are available to the WG (pairtrawlers and light trawlers; see Ta-ble 1). The historical mean levels of lpue (landings-per-unit-effort) for these fleets were more constant, although variable. However, problems with effort recording mean that these estimates are unlikely to be valid: further details are available in the report of the 2000 meeting of ICES WG on the Assessment of Demersal Stocks in the North Sea and Skagerrak (ICES-WGNSSK 2000). For this reason, commercial Scottish lpue data has not been used in the current assessment. Data are also available (alt-hough not updated to 2007) from the Irish trawler fleet (IreOTB; Table 4.1.8), but are not used in the assessment as a consequence of concerns about targeting leading to hyperstability.
B.5. Other relevant data
None.
C. Historical stock development
In 2007 ICES changed its advisory structure: the previous committees (ACE, ACFM and ACME) were merged into a single committee now known as ACOM. Among many of the modifications to accompanying working practices, it was intended that all stock assessments conducted by the Expert Groups from 2008 should be update analyses based on the work conducted by the last benchmark meeting. For west of Scotland haddock, a benchmark assessment per se has not taken place for some time. However, at the 2004 WGNSDS, “a full and detailed examination” of the assessment was carried out following concerns of ACFM about the assumptions and parameter settings implemented in the TSA methods used to assess this stock (ICES, 2004). The investigation used Time Series Analysis (TSA) Extended Survivors Analysis (XSA) and Survey Based Assessment (SURBA) models. Although the results from this inves-tigation were in some ways contradictory, and the WG remained uncertain about the most appropriate model for the stock, subsequent Review Groups concluded that a TSA assessment, using the Scottish Quarter 1 Groundfish Survey and excluding the catch and discard data from 1995 onwards, should be presented as the final assess-ment in 2005. In 2006 this assessment was modified slightly to incorporate an addi-tional survey, the Scottish Quarter 4 Groundfish Survey (western division bottom-trawl survey). In 2007, concerns were raised about the potential impact on manage-ment advice of using a plus-group at-age 8 when the dominant large 1999 year class has reached that age in 2007, and also about the removal in the previous assessment of older ages in the Scottish Q4 Groundfish Survey (ScoGFS Q4). Several exploratory analyses were carried out, from which it was concluded that the same procedure should be used in 2007 as was used 2006, but with two additional ages in the ScoGFS Q4 dataset. In 2008, subject to the ACOM request, an update assessment was carried out using the same procedures as in 2007. In 2009 an update assessment was carried out using the same procedure as in 2008. This used the TSA assessment model and tuning data from the two Scottish Groundfish surveys.
Software used: Lowestoft VPA suite; Marine Scotland Science (Marine Lab Aberdeen) TSA and SURBA software.
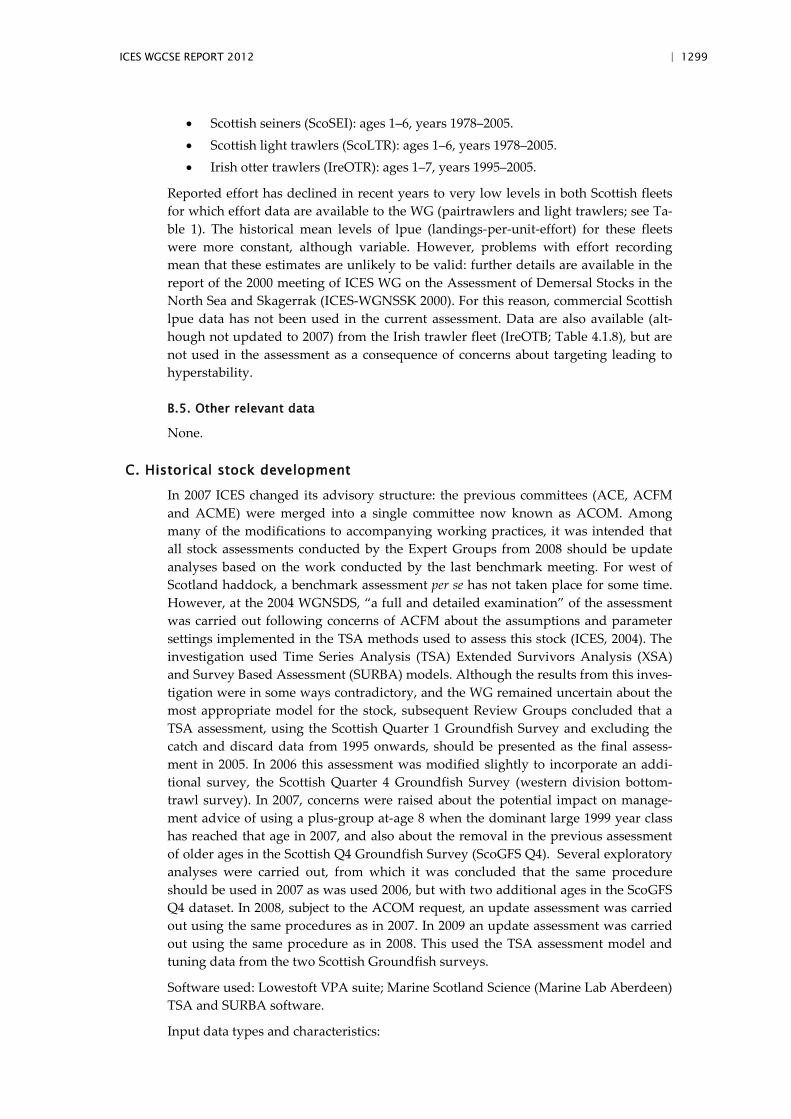
Input data types and characteristics:
1300 | ICES WGCSE REPORT 2012
Type Name Year range Age range
Variable from year to year Yes/No
Caton Catch in tonnes 1966–last data year
1–8+ Yes
Canum Catch-at-age in numbers
1966–last data year
1–8+ Yes
Weca Weight-at-age in the commercial catch
1966–last data year
1–8+ Yes
West Weight-at-age of the stock at spawning time.
1968–last data year
1–8+ Yes
Mprop Proportion of natural mortality before spawning
1978–last data year
1–8+ No–set to 0 for all ages in all years
Fprop Proportion of fishing mortality before spawning
1978–last data year
1–8+ No–set to 0 for all ages in all years
Matprop Proportion mature-at-age
1978–last data year
1–8+ No–the same ogive for all years
Natmor Natural mortality 1978–last data year
1–8+ No–set to 0.2 for all ages in all years
Tuning data:
Type Name Year range Age range
Research Vessel Survey
Tuning fleet 1 ScoGFS-Q1 1985–last data year 1–7
Tuning fleet 3 ScoGFS-Q4 1996–last data year 1–7
Summary of data ranges used in recent assessments:
Data 2006 assessment
2007 assessment
2008 assessment
2009 assessment
Catch data Years: 1978–1994 Ages: 1–8+
Years: 1978–1994 Ages: 1–8+
Years: 1978–1994 Ages: 1–8+
Years: 1978–1994 Ages: 1–8+
Survey: ScoGFS Q1 Years: 1985–2006 Ages: 1–7
Years: 1985–2007 Ages 1–7
Years: 1985–2008 Ages 1–7
Years: 1985–2009 Ages 1–7
Survey: ScoGFS Q4 Years: 1996–2005 Ages: 1–5
Years: 1996–2006 Ages 1–7
Years: 1996–2007 Ages 1–7
Years: 1996–2008 Ages 1–7
Survey: IreGFS Not used Not used Not used Not used
ICES WGCSE REPORT 2012 | 1301
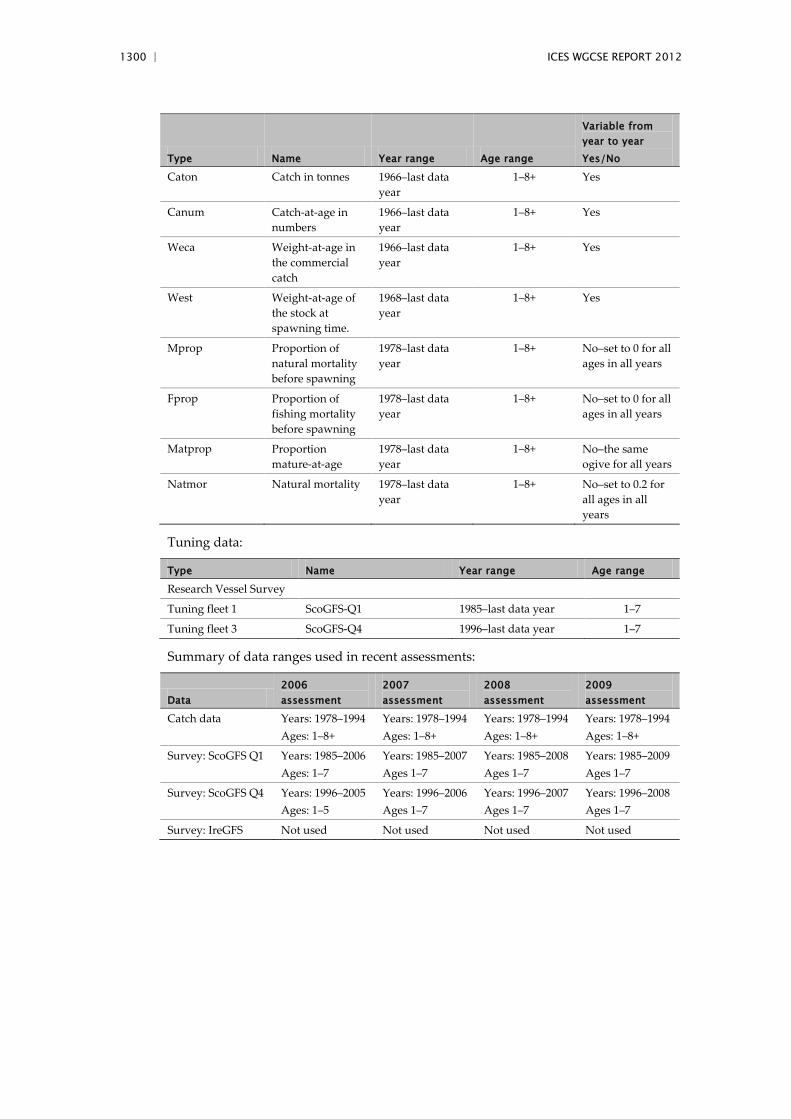
TSA
TSA parameter settings for the 2003–2009 analyses.
F (1, 1978) 0.42 0.28 0.26 0.23 0.25 0.40 0.40F (2, 1978) 0.67 0.5 0.51 0.50 0.56 0.71 0.70F (4, 1978) 0.53 0.51 0.51 0.51 0.52 0.56 0.57
Survey selectivities Φ(1) 3.99 2.25 2.35 2.49 2.58 2.60 2.58ScoGFS Q1 Φ(2) ScoGFS Q1 survey selectivity at age a 4.84 2.71 2.45 2.55 3.01 3.07 3.01
Φ(4) 2.1 1.51 2.11 2.19 2.04 1.92 1.94Survey selectivities Φ(1) - - - 1.99 1.62 1.77 1.75
ScoGFS Q4 Φ(2) ScoGFS Q4 survey selectivity at age a - - - 1.99 1.76 1.88 1.84Φ(4) - - - 2.25 2.39 2.61 2.64
σF Transitory changes in overall F 0.00 0.11 0.10 0.10 0.12 0.20 0.20σU Persistent changes in selection (age effect in F) 0.05 0.04 0.01 0.00 0.09 0.03 0.03σV Transitory changes in the year effect in F 0.27 0.23 0.22 0.23 0.23 0.33 0.35σY Persistent changes in the year effect in F 0.00 0.14 0.09 0.09 0.07 0.00 0.00σΩ1 Transitory changes in ScoGFS Q1 catchability 0.00 0.08 0.18 0.30 0.19 0.12 0.12σβ1 Persistent changes in ScoGFS Q1 catchability 0.14 0.00* 0.00* 0.00* 0.00* 0.00* 0.00*σΩ2 Transitory changes in ScoGFS Q4 catchability - - - 0.16 0.20 0.19σβ2 Persistent changes in ScoGFS Q4 catchability - - - 0.00* 0.00* 0.00*
cv landings Coefficent of variation of landings-at-age data 0.22 0.25 0.23 0.20 0.20 0.24 0.25cv discards Coefficent of variation of discards-at-age data 0.51 0.43 0.45 0.42 0.41 0.54 0.54cv survey Coefficent of variation of ScoGFS Q1 survey data 0.40 0.34 0.53 0.57 0.33 0.35 0.36cv survey Coefficent of variation of ScoGFS Q4 survey data - - - 0.57 0.22 0.34 0.35
σP Transitory changes in overall discard proportion 0.50 0.19 0.20 0.19 0.18 0.20 0.20σα1 Transitory changes in discard-ogive intercept 0.00 0.15 0.02 0.00 0.14 0.00 0.00σν1 Persistent changes in discard-ogive intercept 0.26 0.21 0.22 0.21 0.32 0.26 0.25σα2 Transitory changes in discard-ogive slope 0.34 0.01 0.03 0.21 0.23 0.22 0.23σν2 Persistent changes in discard-ogive slope 0.02 0.61 0.43 0.23 0.002 0.000 0.000θν1 Trend parameter for discard-ogive intercept 0.00* 0.00* 0.00* 0.00* 0.00* 0.00* 0.00*θν2 Trend parameter for discard-ogive slope 0.00* 0.00* 0.00* 0.00* 0.00* 0.00* 0.00*η1 Ricker parameter (slope at the origin) 9.10 9.63 9.71 9.73 9.06 11.35 11.08η2 Ricker parameter (curve dome occurs at 1/η2) 0.33 0.29 0.31 0.29 0.30 0.35 0.35
cv rec Coefficent of variation of recruitment curve 0.52 0.89 0.89 0.90 0.62 0.60 0.61
2009
Trend parameters
Recruitment
2006
Survey catchability standard deviations
Fishing mortality standard deviations
Discard curve parameters
2004
Measurement coefficients of variation
2008200720052003
Initial fishing mortality Fishing mortality at age a in year y
Parameter Notation Description
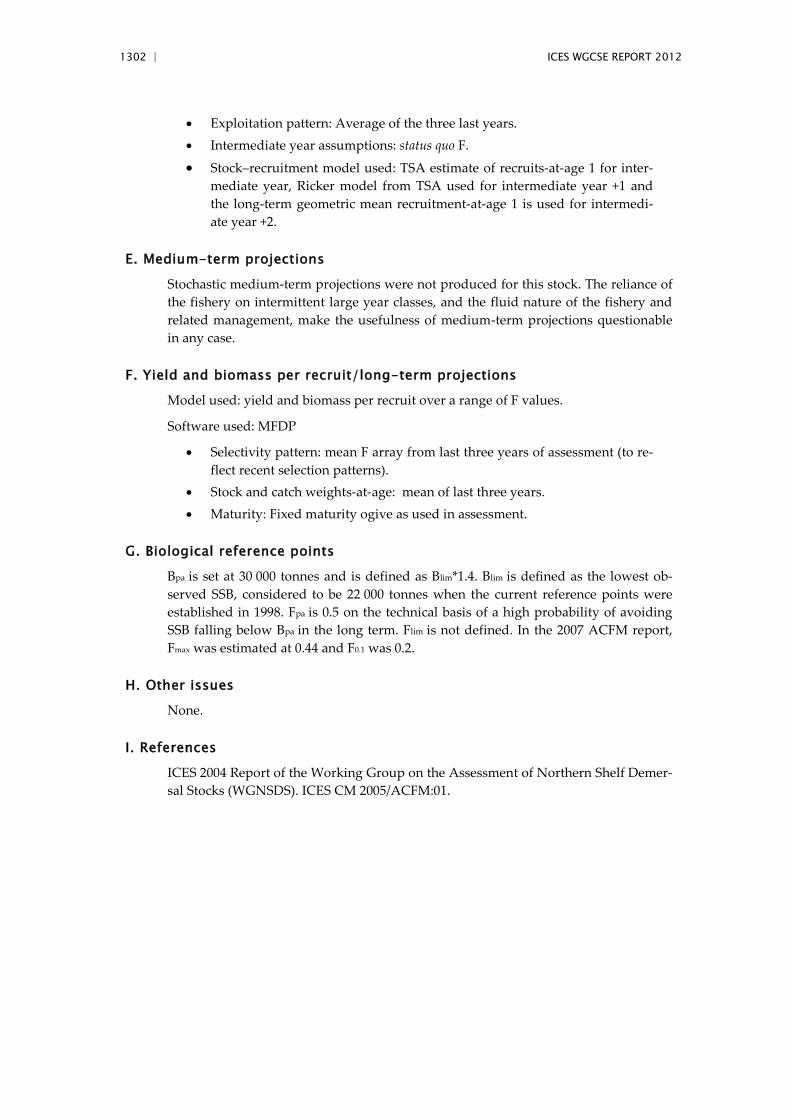
D. Short-term projection
TSA produces short-term forecasts as part of every standard model run. The recruit-ment values used in these forecasts have been discussed above. The model will also forecast fishing mortality rates. It does so by iterating forward the time-series model that had been fitted to historical data. These forecast mortalities therefore retain the time-series characteristics of the preceding data. However, it is not clear to the WG what the precise statistical properties of these mortality forecasts are. It is likely that they follow a pattern of damped oscillation towards an eventual steady state, but without further analysis the WG did not feel confident in using them as the basis for a forecast.
Model used: Age structured
Software used: MFDP prediction with management option table and yield-per-recruit routines. MLA suite (WGFRANSW) used for sensitivity analysis and probability pro-files.
• Initial stock size. Taken from XSA or TSA for age 1 and older. The recruit-ment-at-age 0 in the last data year is estimated as a GM because of a per-ceived downward trend in recruitment in recent years.
• Natural mortality: Set to 0.2 for all ages in all years. • Maturity: The same ogive as in the assessment is used for all years. • F and M before spawning: Set to 0 for all ages in all years. • Weight-at-age in the stock: based on either of simple three-year means or
linear model projections: simple three year means are used for the younger ages (1–2) and linear model projections for the older ages (3–8+).
Weight-at-age in the catch: as above for stock weights.
1302 | ICES WGCSE REPORT 2012
• Exploitation pattern: Average of the three last years. • Intermediate year assumptions: status quo F.
• Stock–recruitment model used: TSA estimate of recruits-at-age 1 for inter-mediate year, Ricker model from TSA used for intermediate year +1 and the long-term geometric mean recruitment-at-age 1 is used for intermedi-ate year +2.
E. Medium-term projections
Stochastic medium-term projections were not produced for this stock. The reliance of the fishery on intermittent large year classes, and the fluid nature of the fishery and related management, make the usefulness of medium-term projections questionable in any case.
F. Yield and biomass per recruit/long-term projections Model used: yield and biomass per recruit over a range of F values.
Software used: MFDP
• Selectivity pattern: mean F array from last three years of assessment (to re-flect recent selection patterns).
• Stock and catch weights-at-age: mean of last three years. • Maturity: Fixed maturity ogive as used in assessment.
G. Biological reference points
Bpa is set at 30 000 tonnes and is defined as Blim*1.4. Blim is defined as the lowest ob-served SSB, considered to be 22 000 tonnes when the current reference points were established in 1998. Fpa is 0.5 on the technical basis of a high probability of avoiding SSB falling below Bpa in the long term. Flim is not defined. In the 2007 ACFM report, Fmax was estimated at 0.44 and F0.1 was 0.2.
H. Other issues
None.
I. References
ICES 2004 Report of the Working Group on the Assessment of Northern Shelf Demer-sal Stocks (WGNSDS). ICES CM 2005/ACFM:01.
ICES WGCSE REPORT 2012 | 1303
Table 1. Haddock in Division VIa. Commercial effort and tuning-series made available to the WG. Effort (first column) is given as reported hours fished per year; numbers landed are in thou-sands. Note that a) these data are not used in the final assessment, and b) 2006 data were not available to the WG in 2007.
Scottish pair trawl (ScoPTR)
AgeYear Effort 1 2 3 4 5 6 7
1988 73448 1836.79 19333.629 2791.134 1561.027 3555.323 132.086 47.0311989 69051 358.121 622.245 6453.549 833.344 617.05 1530.389 96.9881990 24365 2656.973 1209.336 432.811 2413.249 161.21 59.431 119.91991 33826 2528.117 3815.61 267.76 165.98 1059.521 75.441 58.5621992 24141 1531.621 1587.775 1068.706 80.518 28.226 195.827 17.5051993 23975 1784.422 8049.086 3189.459 582.533 48.833 41.065 141.791994 21003 602.661 2354.895 2614.523 861.39 226.916 7.311 14.3711995 22848 2494.133 1573.402 3915.253 1501.48 365.819 103.337 3.11996 22237 3993.635 7475.948 1085.826 2281.053 1002.653 282.516 73.7961997 8552 1327.954 1136.375 3876.218 340.837 523.864 192.329 37.9031998 8425 416.432 2137.106 1315.696 2734.416 232.941 149.879 35.8961999 2483 450.826 1936.938 1521.928 399.642 641.984 47.192 34.9132000 2335 1545.384 394.239 620.963 319.038 45.263 69.646 15.322001 1342 4.767 230.091 97.936 241.187 46.188 10.688 37.2642002 14 31.473 115.105 120.723 2.223 2.909 1.247 0.3562003 5 38.548 107.443 150.615 288.114 29.322 4.005 0.2322004 88 52.807 141.598 40.075 98.517 221.673 13.792 2.6872005 0 9.956 22.448 31.323 22.161 32.8 106.663 0.189
Irish otter trawl (IreOTB)
AgeYear Effort 1 2 3 4 5 6 7
1995 56335 222 298 530 461 92 28 981996 60709 165 531 670 281 175 33 121997 62698 99 358 515 282 339 133 891998 57403 51 1092 552 312 186 218 2321999 53192 98 315 437 266 198 109 1232000 46913 50 131 188 303 158 76 652001 48358 14 304 144 101 126 100 442002 37231 31 162 388 27 65 97 472003 42899 4 36 108 231 29 36 292004 35140 0 33 82 71 82 11 132005 30941 1 23 41 56 87 29 7
1304 | ICES WGCSE REPORT 2012
Table 1. cont.
Scottish light trawl (ScoLTR)
AgeYear Effort 2 3 4 5
1965 37387 22.091 1642.12 168.954 6.9981966 40538 2.929 0 702.277 20.9871967 80916 1326.106 72.823 6.981 188.4831968 65348 514.409 132.176 9.014 13.0191969 106586 6100.801 273.493 81.818 4.9891970 129741 60.985 7188.79 93.986 17.9971971 129187 426.996 323.964 7715.896 29.9961972 154288 20885.215 447.018 197.01 4635.2281973 93992 1171.622 1396.082 8.999 18.9981974 88651 950.263 706.156 425.086 4.0011975 132353 4525.993 476.288 360.261 320.2341976 139225 11482.937 2002.98 171.894 208.871977 143547 362.858 3581.037 660.848 94.9781978 127387 205.97 157.024 1412.263 205.041979 99803 2419.532 162.972 32.994 802.8631980 121211 3869.366 1034.891 183.982 37.9961981 165002 14862.966 4468.331 423.043 40.0041982 135280 958.723 17379.104 1721.828 70.9941983 112332 5747.308 1345.07 10272.253 662.1051984 132217 2210.088 3687.112 809.84 6080.3281985 142815 16310.439 905.133 691.017 214.0691986 126533 2565.893 13292.803 408.899 163.3491987 131653 4040.797 2770.494 6465.25 249.0581988 158191 17326.463 2369.239 1008.226 2273.1411989 217443 1459.316 10332.354 934.04 394.7221990 131360 1293.654 541.378 3520.472 213.7221991 209901 8386.068 414.358 218.113 1814.3061992 189288 3850.242 2937.112 133.408 49.731993 189925 17312.309 6469.671 1479.199 89.4021994 174879 7106.326 6307.283 1574.576 409.4961995 175631 4850.552 9835.464 2704.111 551.3031996 214159 15882.858 2665.141 4524.729 1511.6941997 179605 4231.875 9987.962 882.602 1119.1381998 142457 6845.462 3530.308 7753.948 573.5541999 98993 6266.816 4506.559 1124.841 2152.3952000 76157 2725.197 4725.382 2259.356 499.5112001 35698 14958.081 1246.235 2075.946 687.2012002 15174 4200.486 16918.947 400.382 421.1662003 9357 2114.331 2803.164 6108.682 76.9512004 7117 3675.178 1203.565 2307.81 3900.3742005 3063 1643.009 1317.835 787.027 955.533
ICES WGCSE REPORT 2012 | 1305
Numbersper 30 min
1000-3000100-100010-1001-100.1-10-0.1
age
7ag
e 6
age
5ag
e 4
age
3ag
e 2
age
1
1997 1998 1999 2000 2001 2002
Haddock, West Coast Survey Q1
Figure 1. Haddock in Division VIa. Number per 30 min tow, averaged over ICES statistical rec-tangles from the west of Scotland groundfish Q1 (IBTS) survey 1997–2002, ages 1–7.
1306 | ICES WGCSE REPORT 2012
Numbersper 30 min
1000-3000100-100010-1001-100.1-10-0.1
age
7ag
e 6
age
5ag
e 4
age
3ag
e 2
age
1
2003 2004 2005 2006 2007 2008
Haddock, West Coast Survey Q1
Figure 1. continued. Haddock in Division VIa. Number per 30 min tow, averaged over ICES statis-tical rectangles from the west of Scotland groundfish Q1 (IBTS) survey 2003–2008, ages 1–7.
ICES WGCSE REPORT 2012 | 1307
12 11 10 9 8 7 6 5 4
55
56
57
58
59
60
100
200500
1000
2000
100
100
1000
VIa
-
-
--
-
-
-
--
--
ScoGFSQ4 2008Haddock > 21 cm
1000 100 10 1
- 0
Closed areas
West_Scot_Mgnt_Line
12 11 10 9 8 7 6 5 4
55
56
57
58
59
60
100
200500
1000
2000
100
100
1000
VIa
--
--
-
-
- -
-
-
-
-
ScoGFSQ1 2009Haddock > 13 cm
1000 100 10 1
- 0
Closed areas
West_Scot_Mgnt_Line
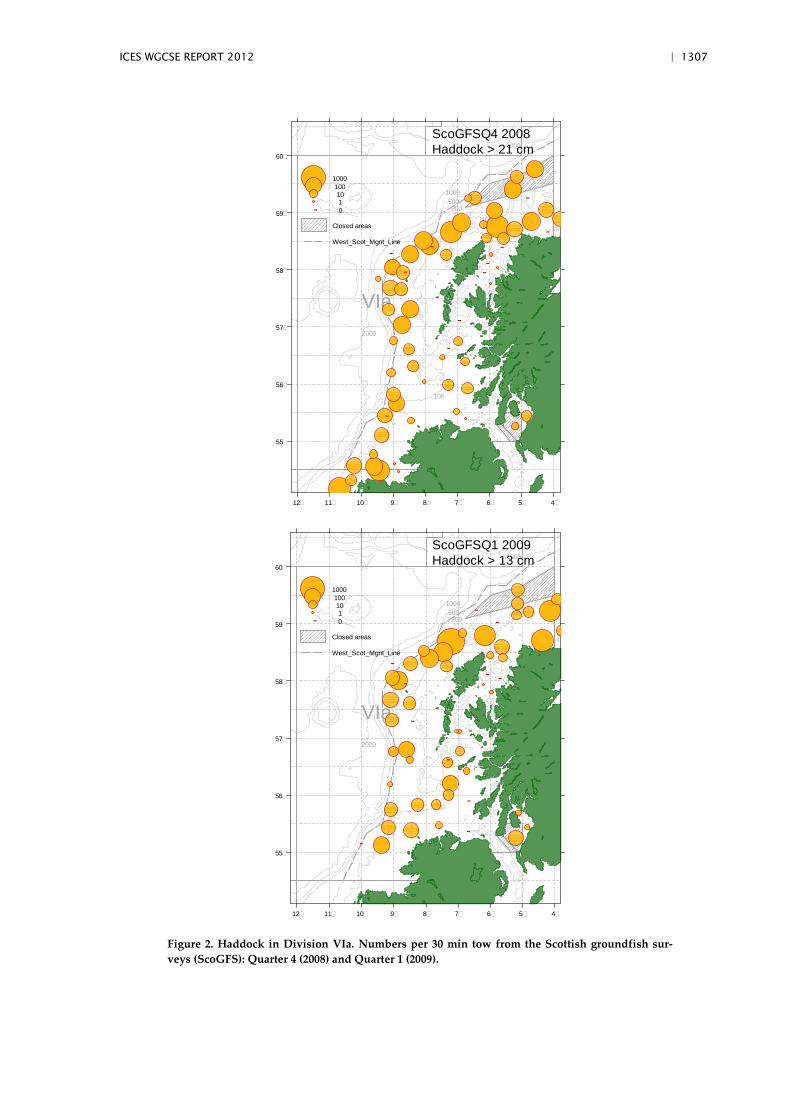
Figure 2. Haddock in Division VIa. Numbers per 30 min tow from the Scottish groundfish sur-veys (ScoGFS): Quarter 4 (2008) and Quarter 1 (2009).
1308 | ICES WGCSE REPORT 2012
3.4 Stock Annex Whiting in Subarea VI
Stock specific documentation of standard assessment procedures used by ICES.
Stock West of Scotland Whiting (Subarea VI)
Working Group Working Group for the Celtic Seas Ecoregion (WGCSE)
Date February 2012
Author Andrzej Jaworski
Revised by WKROUND/Andrzej Jaworski
A. General
A.1. Stock definition
Whiting occur throughout Northeast Atlantic waters in a wide range of depths from shallow inshore waters down to 200 m. Adult whiting are widespread throughout Division VIa, while large numbers of juvenile fish occur in inshore areas. Whiting are less common in Division VIb, and it is likely these fish are migrants from VIa, rather than a separate stock.
Stock identity in Division VIa has recently been explored in greater detail. Tagging experiments on recruiting fish have shown that the whiting found to the south of 56°N and to the west of Ireland are distinct from those in the Minches, the Clyde and the Irish Sea. Five juvenile nursery areas have been discriminated off the west of Scot-land and northern North Sea, three of them being found in VIa. The nursery areas on the Scottish west coast contribute individuals to the spawning aggregations in the Scottish coastal North Sea and Shetland, and there is no evidence of the converse (To-bin et al., 2010). Within VIa, there is little indication of interaction between population components in the south and that off the northwest coast.
A.2. Fishery
The demersal fisheries in Division VIa are predominantly conducted by otter trawlers fishing for cod, haddock, anglerfish and Nephrops, with bycatch of whiting, saithe, megrim, lemon sole, ling and a number of skate species. Whiting are taken by trawl-ers using gear with mesh size between 80 mm and 120 mm. Since 1976, effort by Scot-tish heavy trawlers and seiners has decreased. Light trawler effort has declined rapidly since 1997 after a long-term increasing trend. More recently, days-at-sea limi-tations associated with the cod recovery plan and the seasonal closure of some areas has lead to some switching of effort away from VIa.
The demersal whitefish fishery in Subarea VI occurs largely in Division VIa with the UK, Ireland and France being the most important exploiters. Landings from Rockall (Division VIb) are generally less than 10 t. The whiting fishery in VIa is dominated by the UK (Scotland) and Irish fleets. French whiting landings have declined considera-bly since the late 1980s.
Landings of whiting in Division VIa are affected by emergency measures introduced in 2001 as part of the cod recovery programme. Council Regulation 423/2004 intro-duced a cod recovery plan affecting Division VIa. The measures only take effect, however east of a line defined in Council Regulation No 51/2006. Measures brought in 2002, such as a switch from 100 to 120 mm mesh codends at the start of 2002 (Commission Regulation EC2056/2001), are likely to have had some impact on whit-
ICES WGCSE REPORT 2012 | 1309
ing. The UK implemented a regulation requiring the fitting of a square mesh panel in certain towed gears.
Most catch of whiting comes in non-whiting directed fisheries, particularly the Nephrops trawl fishery. The Nephrops trawl fishery in VIa discards significant amounts of small whiting, making whiting landings figures a poor indicator of removals due to fishing. The proportion of whiting discarded has been very high and appears to have increased in recent years. Whiting also has a low market demand, which con-tributes to increased discarding and highgrading. In terms of the total weight of de-mersal fish landed by the Scottish fleet from the west coast, whiting is ranked fourth, with an annual value of £368 000 (in 2009).
The minimum landing size of whiting in the human consumption fishery in this area is 27 cm.
There have been some problems regarding area misreporting of Scottish landings during the early 1990s, which are linked to area misreporting of other species such as haddock and anglerfish into Division VIb. More recently there has been area misre-porting of anglerfish from VIa to IVa, which may have affected the reliability of whit-ing landings distribution.
A.3. Ecosystem aspects
Unlike some species, whiting do not form distinct spawning shoals, and both ripe and immature fish are often found together. As the latitude increases, spawning of whiting occurs progressively later. This is closely associated with temperature chang-es, but spawning activity generally peaks in spring, just as sea temperatures begin to rise. On the west coast of Scotland whiting spawn between January and June. Within this period, the spawning season of an individual female lasts around fourteen weeks, during which time she releases many batches of eggs. At two years old most whiting are mature and able to spawn. By the time it reaches four years old, a single female fish of reasonable size can produce more than 400 000 eggs. Like many other fish, whiting spend their first few months of life in the upper water layers before moving to the seabed. Male and female whiting grow very quickly reaching around 19 cm in their first year. After this the growth rate becomes much slower. There are large differences between the growth rates of individual fish and a 30 cm fish can be as young as one year or as old as six.
Whiting are active predators. Juvenile fish eat mainly crustaceans (shrimps and crabs) but as whiting grow, the amount of fish in their diet increases. The exact composition of the diet depends on the size of the fish, the area and the time of the year. Whiting is one of the main predators of other commercially important species of fish. Norway pout, sandeels, haddock, cod and even whiting themselves are frequently eaten. It has been estimated that each year the whiting population consumes several hundred thousand tonnes of these species.
B. Data
B.1. Commercial catch
Monthly length frequency distribution data were available from Scotland for Division VIa. A total international catch-at-age distribution for Division VIa was obtained by raising this distribution to the WG estimates of total international catch from this ar-ea. Landings officially reported to ICES were used for countries not supplying esti-mates directly to the WG. The Scottish market sampling length–weight relationships
1310 | ICES WGCSE REPORT 2012
(given below) have been used to raise the sampled catch-at-length distribution data Working Group estimates of total landings for Division VIa.
Month b a1 2.9456 0.012 2.9456 0.00943 2.9456 0.0094 2.9456 0.00885 2.9456 0.00886 2.9456 0.00897 2.9456 0.0098 2.9456 0.00929 2.9456 0.009510 2.9456 0.009611 2.9456 0.009712 2.9456 0.0097
Discard data are available from 1978 but sampling was very limited before 1981. To reduced bias and increase precision, discards in years 1981–2003 were raised accord-ing to the procedure described in Millar and Fryer (2005). Discard age-compositions are generally available from both Scotland and Ireland, but in some recent years (2006 and 2007) lack of access to fishing vessels by Irish observers has meant that no Irish data have been collected.
B.2. Biological
Natural mortality (M) is assumed to vary and be dependent on fish weight (Lo-renzen, 1996). M values are time-invariant and are calculated as:
29.00.3 −= aa WM
where aM is natural mortality-at-age a, aW is the time averaged stock weight-at-age a (in grammes) and the numbers are the Lorenzen parameters for fish in natural eco-systems.
A combined sex maturity is assumed, knife-edged at age 2. The use of a knife-edged maturity ogive has been a source of criticism in previous assessments. However, re-cent research on gadoid maturity conducted by the UK gives no evidence of substan-tial change in whiting maturity since the 1950s, although there has been an increase in the incidence of precocious maturity-at-age 1, particularly in males, since 1998, in the Irish Sea.
B.3. Surveys
Six research vessel survey-series for whiting in VIa were available to the WKROUND 2012. In all surveys listed, the highest age represents a true age not a plus group.
• Scottish first-quarter west coast groundfish survey (ScoGFS-WIBTS-Q1): ages 1–7, years 1985–2010).
• Scottish fourth quarter west coast groundfish survey (ScoGFS-WIBTS-Q4): ages 0–8, years 1996–2009).
The Q1 Scottish Groundfish survey was running in the period 1985–2010, and this was performed using a repeat station format with the GOV survey trawl together with the west coast groundgear rig, ‘C’. Similarly the Q4 Scottish Groundfish survey
ICES WGCSE REPORT 2012 | 1311
was running in 1996–2010, once again using the GOV survey trawl with groundgear ‘C’ and the fixed station format.
In 2011, the Q1 and Q4 Scottish Groundfish surveys were re-designed. The previous repeat station survey format consisting of the same series of survey trawl positions being sampled at approximately the same temporal period every year is considered a rather imprecise method for surveying both these subareas and as such a move to-wards some sort of random stratified survey design was judged necessary. The larg-est obstacle preventing an earlier move to a more randomized survey design was the lack of confidence in the ‘C’ rig to tackle the potentially hard substrata that a new randomized survey was likely to encounter. The first step in the process of modifying the survey design was therefore to design a new groundgear that would be capable of tackling such challenging terrain. The introduction of the new design initiated two new time-series:
• Scottish first-quarter west coast groundfish survey (no acronym assigned yet): ages 1–7, years 2011–2012).
• Scottish fourth quarter west coast groundfish survey (no acronym assigned yet): ages 0–8, years 2011–).
ICES will consider inclusion of the above time-series to produce tuning indices through an inter-benchmark procedure when 4+ years of data have been gathered.
The Irish groundfish surveys:
• Irish fourth-quarter west coast groundfish survey (IreGFS): ages 0–5, years 1993–2002.
The Irish quarter four survey was a comparatively short series, was discontinued in 2003 and has been replaced by the IGFS.
• Irish fourth quarter west coast groundfish survey (IGFS-WIBTS-Q4): ages 0–6, years 2003–2010.
This survey used the RV Celtic Explorer and is part of the IBTS coordinated western waters surveys. The vessel uses a GOV trawl, and the design is a depth stratified sur-vey with randomized stations. Effort is recorded in terms of minutes towed. Further descriptions of these surveys and distribution plots of whiting catch rates obtained on these surveys can be found in the IBTS WG Report of 2011.
B.4. Commercial cpue
Due to a number of concerns regarding the non-mandatory recording of effort in terms of hours fished, the present assessment of the stocks does not make use of commercial catch per unit of effort data. The data are included here for completeness and include:
• Scottish light trawlers (ScoLTR): ages 1–7 years 1965–2005 • Scottish seiners (ScoSEI): ages 1–6 years 1965–2005 • Scottish Neprhops trawlers (ScoNTR): ages 1–6 years 1965–2005 • Irish Otter Trawlers (IreOTB): ages 1–7 years 1995–2005
Data to update these time-series were not available for the recent years.
1312 | ICES WGCSE REPORT 2012
B.5. Other relevant data
Fecundity data for a number of areas are available from Hislop and Hall (1974), and was estimated at 4.933 L3.25 for whiting in Subarea VI.
C. Assessment: data and method
Model used: TSA
Software used: NAG library (FORTRAN DLL) and functions in R.
Model Options chosen:
Weight-dependent M after Lorenzen (1996)
• Mwght.b <- –0.29 • Mwght.Mu <- 3.0
Response: landings-at-age, discards-at-age and survey indices-at-age
Commercial data
• 1981–1994: treated as unbiased • 1995–2005: age structure only used (with unaccounted mortality estimated) • 2006–2010: treated as unbiased • landings cvmult-at-age = c(2, 1, 1, 1, 1, 1, 2): extra variability for ages 1 and
7+ • discards cvmult-at-age = c(1, 1, 1, 1, 2): extra variability for age 5 • discards cvmult = 3 for age 1 in 1981, age 1 in 1987, age 3 in 1991, age 1 in
2000
Discard model
• full model • 1981–2010: ages 1–5 modelled
Stock–recruit model
• hockey stick
Fishing selection model
• amat = 4: fishing selection flat (apart from noise) from age 4 • gudmundssonH1 = c(2, 1, 1, 1, 1, 1, 1): extra variability for age 1
Survey model (ScoGFS-WIBTS-Q1)
• full model: separate catchability for each age • ages 1 to 6 modelled • transitory and persistent changes in catchability allowed • cvmult = 3 for age 5 in 1992, age 2 in 1993, age 1 in 2000, age 2 in 2000 • cvmult = 5 for age 4 in 1992
Survey model (ScoGFS-WIBTS-Q4)
• full model: separate catchability for each age • ages 1 to 6 modelled • transitory and persistent changes in catchability allowed
ICES WGCSE REPORT 2012 | 1313
• cvmult-at-age = c(1, 1, 1, 1, 1, 2): extra variability for age 6 • cvmult = 3 for age 4 in 2007, age 5 in 2007
Survey model (IGFS Q4 IGFS-WIBTS-Q4)
• full model: separate catchability for each age • ages 1 to 4 modelled • years 2003–2006 and 2008–2010 (year 2007 excluded due to a high predic-
tion error) • transitory and persistent changes in catchability allowed
Input data types and characteristics:
Type Name Year range Age range
Variable from year to year Yes/No
Caton Catch in tonnes 1981–2010 1 to 7+ Yes
Canum Catch-at-age in numbers
1981–2010 1 to 7+ Not used
?? Landings-at-age in numbers
1981–2010 1 to 7+ Yes
?? Discards-at-age in numbers
1981–2010 1 to 7+ Yes
Weca Weight-at-age in the commercial catch
1981–2010 1 to 7+ Not used
?? Weight-at-age in the commercial landings
1981–2010 1 to 7+ Yes
?? Weight-at-age in the commercial discards
1981–2010 1 to 7+ Yes
Weca Weight-at-age in the commercial catch
1981–2010 1 to 7+ Not used
West Weight-at-age of the spawning–stock at spawning time
1981–2010 1 to 7+ Not used
Mprop Proportion of natural mortality before spawning
1981–2010 1 to 7+ No
Fprop Proportion of fishing mortality before spawning
1981–2010 1 to 7+ No
Matprop Proportion mature at-age
1981–2010 1 to 7+ No
Natmor Natural mortality 1981–2010 1 to 7+ No
Tuning data:
Type Name Year range Age range
Tuning fleet 1 ScoGFS-WIBTS-Q1 1985–2010 1–6
Tuning fleet 2 ScoGFS-WIBTS-Q4 1996–2009 1–6
Tuning fleet 3 IGFS-WIBTS-Q4 2003–2010 1–4
1314 | ICES WGCSE REPORT 2012
D. Short-term projection
Not done.
E. Medium-term projections
No medium-term projections are carried out for this stock.
F. Long-term projections
No long-term projections are carried out for this stock.
G. Biological reference points
Type Value Technical basis
MSY MSY Btrigger No estimate
Approach FMSY No estimate
Blim 16000 t ICES proposition
Precautionary BPA 22000 t ICES proposition
Approach Flim 1.0 ICES proposition
FPA 0.6 ICES proposition
H. Other issues
H.1. Historical overview of previous assessment methods
Data 2008 assessment 2009 assessment 2010 assessment 2011 assessment
Catch data No assessment No assessment Years: 1965–2009 Ages: 1–7+
Years: 1965–1994 and 2006–2010 Ages: 1–7+
Survey: ScoGFS Q1
No assessment No assessment Years: 1985–2010 Ages 1–6
Years: 1985–2011 Ages 1–6
Survey: ScoGFS Q4
No assessment No assessment Not used Not used
Survey: IRGFS Q4
No assessment No assessment Not used Not used

ICES WGCSE REPORT 2012 | 1315
I. References Hislop, J. R. G., Hall, W. B. 1974. The fecundity of whiting, Merlangius merlangus (L.) in the
North Sea, the Minch and at Iceland. Journal du Conseil International pour L'exploration de la Mer, 36: 42–49.
Millar, C. P., Fryer, R., J. 2005. Revised estimates of Annual discards-at-age for cod, haddock, whiting and saithe in ICES Subarea IV and Division VIa. Fisheries Research Services inter-nal report No 15/05, July 2005, 23 pp.
Lorenzen, K. 1996. The relationship between body weight and natural mortality in juvenile and adult fish: a comparison of natural ecosystems and aquaculture. Journal of Fish Biology, 49: 627–647.
Tobin, D., Wright, P. J., Gibb, F. M., Gibb, I. M. 2010. The importance of life stage to population connectivity in whiting (Merlangius merlangus) from the northern European shelf. Marine Biology, 157: 1063–1073.
1316 | ICES WGCSE REPORT 2012
3.5 Stock Annex Nephrops FU11, North Minch
Stock specific documentation of standard assessment procedures used by ICES.
Stock North Minch Nephrops (FU 11)
Date 09 March 2009 (WKNEPH2009)
Revised by Sarah Clarke/Carlos Mesquita
A. General
A.1. Stock definition
Throughout its distribution, Nephrops is limited to muddy habitat, and requires sedi-ment with a silt & clay content of between 10–100% to excavate its burrows. This means that the distribution of suitable sediment defines the species distribution. Adult Nephrops only undertake very small-scale movements (a few 100 m) but larval transfer may occur between separate mud patches in some areas. The North Minch Functional Unit (FU 11) is located off the northwest coast of Scotland. The northern boundary of the FU is the 59°N line, although there are no areas of suitable sediment north of 58°30’N. The boundary with the South Minch FU is at 57°30’N. The North Minch includes areas of sediment in the Inner Sound, between Skye and the main-land, with other small, isolated areas of sediment.
A.2. Fishery
The North Minch Nephrops fishery is predominantly exploited by Nephrops trawlers using single rig gear with a 70 mm mesh, although about 15% of landings are current-ly made by creel vessels. About 15% of the trawl landings are made with a 100 mm mesh, and only 1% of landings appear to be made by twin-rig vessels.
All the creel vessels are local, and roughly three quarters of the trawl landings are made by vessels based between Mallaig and Kinlochbervie on the mainland, and Stornoway on the Isle of Lewis. The major landing ports are Ullapool, Gairloch and Stornoway. In all, about 135 trawlers contribute to the landings, 75% of which are local. Mean engine power is 206 kW, and mean vessel length 15.5 m. Most vessels were built between the 1960s and 1980s.
The minimum landing size for Nephrops in the North Minch is 20 mm CL, and less than 0.5 % of the animals are landed under size. Discarding takes place at sea, and landings are made by category for whole animals (small, medium and large) and as tails. The main bycatch species is haddock, although whiting and Norway pout also feature significantly in discards.
The fishery is exploited throughout the year, with the highest landings usually made in spring and summer. Vessels usually have a trip duration of one day in winter, but up to six days in summer.
The current legislation governing Nephrops trawl fisheries on the West coast of Scot-land was laid down by the North Sea and West of Scotland cod recovery plan (EC 2056/2001), which established measures additional to EC 850/98. This regulation was amended in 2003 by Annex XVII of EC 2341/2002, which establishes fishing effort and additional conditions for monitoring, inspection and surveillance for the recovery of certain cod stocks. This regulation effectively limits vessels targeting Nephrops with
ICES WGCSE REPORT 2012 | 1317
70–99 mm mesh size to 25 days at sea per month. The use of square mesh and head-line panels are compulsory in this fishery.
Additional Scottish legislation (SSI No 2000/226) applies to twin trawlers operating North of 56°N, A mesh size of 100 mm or above must be used without a lifting bag and with not more than 100 meshes round the circumference but with up to 5 mm double twine. By comparison, vessels using a single trawl may use 70–89 mm mesh with a lifting bag and 120 meshes round the codend but with 4 mm single twine.
A.3. Ecosystem aspects
No information on the ecosystem aspects of this stock has been collated by the Work-ing Group.
B. Data
B.1. Commercial catch
Length and sex compositions of Nephrops landed from the North Minch are estimated from port sampling in Scotland. Length data from Scottish sampling are applied to all catches and raised to total international landings. Rates of discarding by length class are estimated for Scottish fleets by on-board sampling, and extrapolated to all other fleets. The proportion of discarded to landed Nephrops changes with year, often de-termined by strong year classes. Discard sampling started in 1990, and for years prior to this estimates have been made based on later data. Landings and discards at length are combined (assuming a discard survival rate of 25%) to removals. Removals are raised separately for each sex.
Scottish Nephrops trawler lpue remains at a high level in 2007, showing a marked in-crease for females; although lpue on males shows a reduction in 2007 (Table B1.1 and Figure B1.1). However, it is difficult to conclude whether these data are representa-tive of actual lpue as improved reporting of landings in recent years (due to ‘buyers and sellers’) will have contributed to this increase and the trends also likely to be af-fected by non-mandatory effort recording (hours fished). These comments also apply to the paragraphs below.
In general, males make the largest contribution to the landings (Figure B1.2). Effort has traditionally been higher in the 2nd and 3rd quarters of the year in this fishery, but has declined in the 3rd quarter in the most recent years and it is now the 2nd quarter that exhibits the highest fishing effort. Male lpue declined between 1996 and 1998, but has increased since then, and has been particularly high in the 1st and 4th quarters of recent years. The lpue for females is highest in summer between the hatching and spawning periods.
Cpue data for each sex, for Nephrops above and below 35 mm CL, are shown in Figure B1.3. This size was chosen for all the Scottish stocks examined as the general size limit above which the effects of discarding practices and the addition of recruits were like-ly to be small. The data show a peak in cpue for smaller individuals in 1994 (and for females in 1995), with values declining to the longer term average until 2001. Since then, values have been increasing and reached a peak in 2006. The drop in 2007 may be associated with reduced recruitment and corresponds to the reduced UWTV den-sities (see report). The cpue for larger males show a similar pattern, although the cpue has increased further in 2007. Cpue for the larger females appears to be very stable, with small increases in the past two years.
1318 | ICES WGCSE REPORT 2012
Trawl and creel fisheries are sampled separately.
B.2. Biological
Mean weights-at-age for this stock are estimated from fixed Scottish weight–length relationships (Howard et al., 1988, citation required). Relevant biological parameters are as follows: natural mortality was assumed to be 0.3 for males of all ages and in all years. Natural mortality was assumed to be 0.3 for immature females, and 0.2 for ma-ture females.
Summary
Growth parameters:
Males; L∞ = 70 mm, k = 0.16
Immature Females; L∞ = 70 mm, k = 0.16
Mature Females; L∞ = 60 mm, k = 0.06,
Size at maturity = 27 mm
Weight–length parameters:
Males a = 0.00028, b = 3.24
Females a= 0.00074, b = 2.91
Discards
Discard survival rate: 25%
Discard rate: 19.9%
Proportion of F and M prior to spawning was specified as zero to give estimates of spawning–stock biomass at January 1.
B.3. Surveys
Abundance indices are available from the following research-vessel surveys:
Underwater TV survey: years 1995–present. The survey usually occurs in June. The burrowing nature of Nephrops, and variable emergence rates mean that trawl catch rates may bear little resemblance to population abundance. An underwater TV sur-vey has been developed, estimating Nephrops population abundance from burrow density raised to stock area. The survey provides a total abundance estimate, and is not age or length structured.
Because of this uncertainty in sediment distribution and suitability, the North Minch is divided into four arbitrary rectangles, roughly corresponding to discrete patches of mud in (or on the border of) the functional unit, for survey purposes (Figure B3.1). Samples are distributed randomly over the area of suitable sediment within each rec-tangle. In the assessment, burrow densities in the four rectangles are raised to the ar-ea of suitable sediment in each region.
A number of factors are suspected to contribute bias to the surveys. In order to use the survey abundance estimate as an absolute it is necessary to correct for these po-tential biases. The history of bias estimates are given in the following table and are based on simulation models, preliminary experimentation and expert opinion, the biases associated with the estimates of Nephrops abundance in the North Minch are:
ICES WGCSE REPORT 2012 | 1319
Time period Edge effect
detection rate
species identification occupancy
Cumulative bias
FU 11: North Minch <=2009 1.38 0.85 1.1 1 1.33
B.4. Commercial cpue
Catch per unit of effort time-series are available from the following fleets:
Scottish Nephrops trawl gears: Landings at-age and effort data for Scottish Nephrops trawl gears are used to generate a cpue index. Cpue is estimated using officially rec-orded effort (hours fished) although the recording of effort is not mandatory. Com-bined effort for Nephrops single trawl and multiple Nephrops trawl is raised to landings reported by the four gears listed above. Discard sampling commenced in 1990 for this fishery, and for years prior to this, an average of the 1990 and 1991 val-ues is applied. There is no account taken of any technological creep in the fleet.
For more information see Section B.1.
B.5. Other relevant data
C. Historical stock development
1 ) Survey indices are worked up annually resulting in the TV index. 2 ) Adjust index for bias (see Section B3). The combined effect of these biases
is to be applied to the new survey index. 3 ) Generate mean weight in landings. Check the time-series of mean landing
weights for evidence of a trend in the most recent period. If there is no firm evidence of a recent trend in mean weight use the average of the three most recent years. If, however, there is strong evidence of a recent trend then apply most recent value (don’t attempt to extrapolate the trend fur-ther in future).
D. Short-term projection
1 ) The catch option table will include the harvest ratios associated with fish-ing at F0.1 and FMAX. These values have been estimated by the Benchmark Workshop (see Section 9.2) and are to be revisited by subsequent bench-mark groups. The values are FU specific and have been put in the Stock Annexes.
2 ) Create catch option table on the basis of a range of harvest ratios ranging from 0 to the maximum observed ratio or the ratio equating to FMAX, whichever is the larger. Insert the harvest ratios from step 4 and also the current harvest ratio.
3 ) Multiply the survey index by the harvest ratios to give the number of total removals.
4 ) Create a landings number by applying a discard factor. This conversion factor has been estimated by the Benchmark Workshop and is to be revisit-ed at subsequent benchmark groups. The value is FU specific and has been put in the Stock Annex.
5 ) Produce landings biomass by applying mean weight.
The suggested catch option table format is as follows.
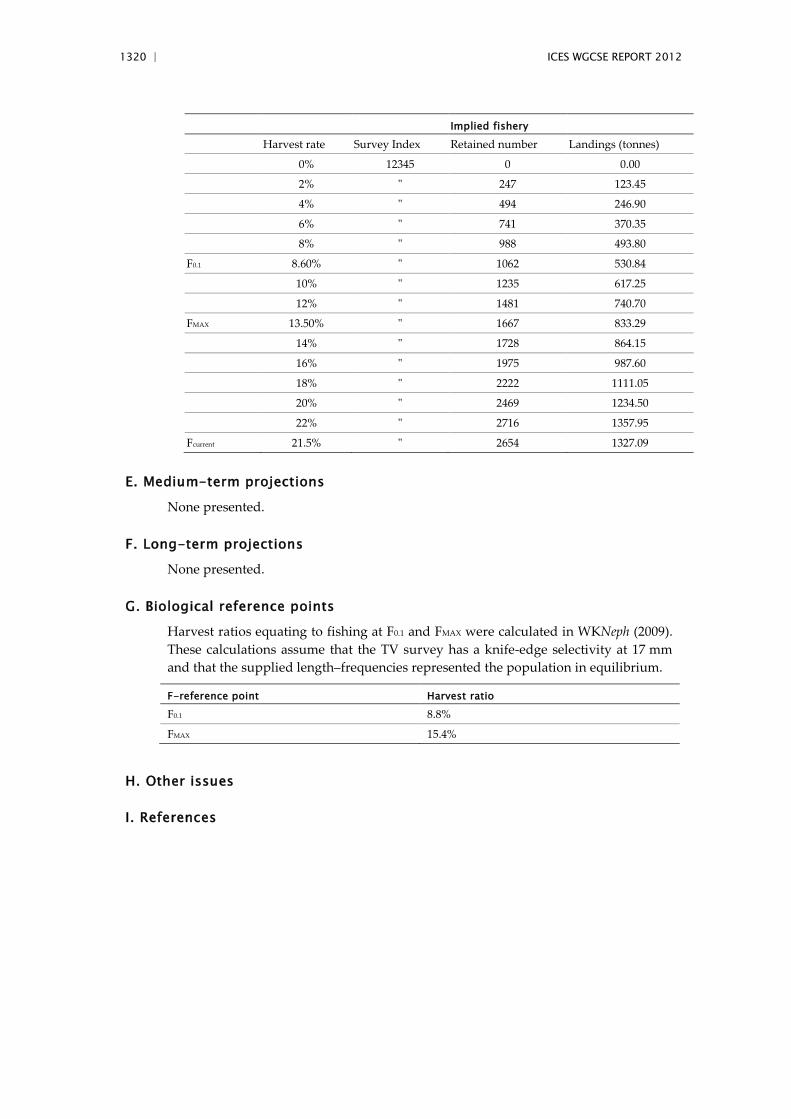
1320 | ICES WGCSE REPORT 2012
Implied fishery
Harvest rate Survey Index Retained number Landings (tonnes)
0% 12345 0 0.00
2% " 247 123.45
4% " 494 246.90
6% " 741 370.35
8% " 988 493.80
F0.1 8.60% " 1062 530.84
10% " 1235 617.25
12% " 1481 740.70
FMAX 13.50% " 1667 833.29
14% " 1728 864.15
16% " 1975 987.60
18% " 2222 1111.05
20% " 2469 1234.50
22% " 2716 1357.95
Fcurrent 21.5% " 2654 1327.09
E. Medium-term projections
None presented.
F. Long-term projections
None presented.
G. Biological reference points
Harvest ratios equating to fishing at F0.1 and FMAX were calculated in WKNeph (2009). These calculations assume that the TV survey has a knife-edge selectivity at 17 mm and that the supplied length–frequencies represented the population in equilibrium.
F-reference point Harvest ratio
F0.1 8.8%
FMAX 15.4%
H. Other issues
I. References
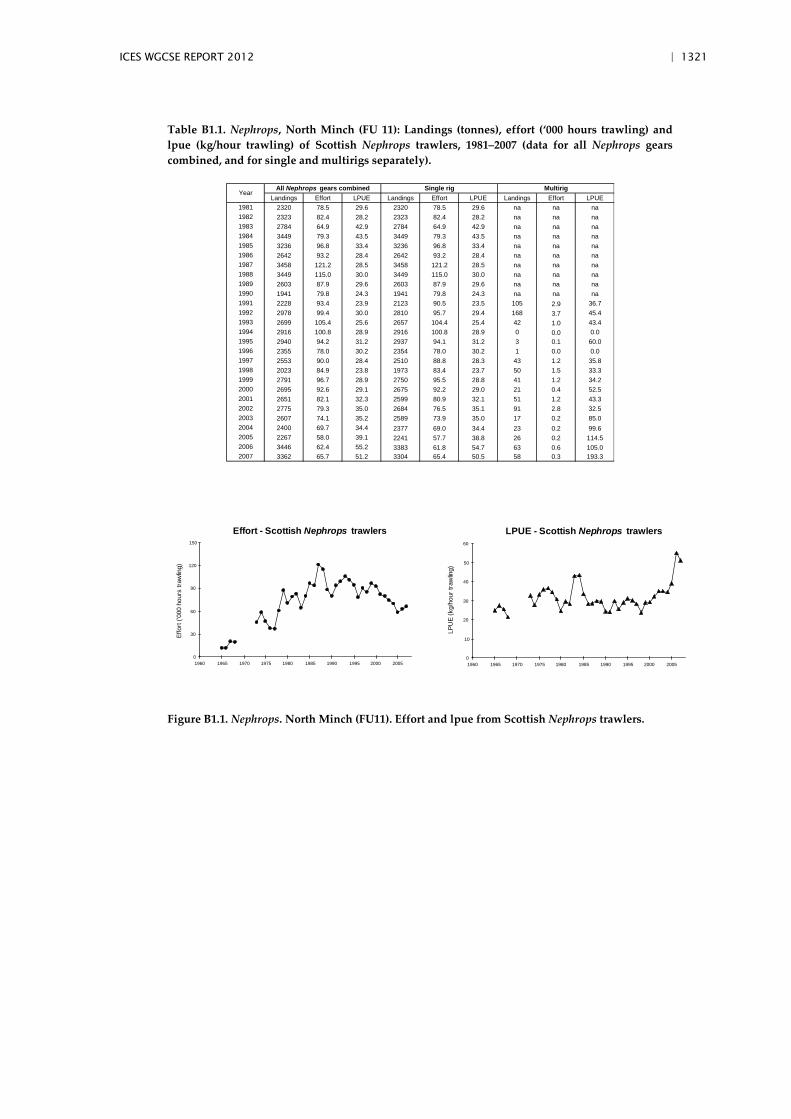
ICES WGCSE REPORT 2012 | 1321
Table B1.1. Nephrops, North Minch (FU 11): Landings (tonnes), effort (‘000 hours trawling) and lpue (kg/hour trawling) of Scottish Nephrops trawlers, 1981–2007 (data for all Nephrops gears combined, and for single and multirigs separately).
Landings Effort LPUE Landings Effort LPUE Landings Effort LPUE
2320 78.5 29.6 2320 78.5 29.6 na na na2323 82.4 28.2 2323 82.4 28.2 na na na2784 64.9 42.9 2784 64.9 42.9 na na na3449 79.3 43.5 3449 79.3 43.5 na na na3236 96.8 33.4 3236 96.8 33.4 na na na2642 93.2 28.4 2642 93.2 28.4 na na na3458 121.2 28.5 3458 121.2 28.5 na na na3449 115.0 30.0 3449 115.0 30.0 na na na2603 87.9 29.6 2603 87.9 29.6 na na na1941 79.8 24.3 1941 79.8 24.3 na na na2228 93.4 23.9 2123 90.5 23.5 105 2.9 36.72978 99.4 30.0 2810 95.7 29.4 168 3.7 45.42699 105.4 25.6 2657 104.4 25.4 42 1.0 43.42916 100.8 28.9 2916 100.8 28.9 0 0.0 0.02940 94.2 31.2 2937 94.1 31.2 3 0.1 60.02355 78.0 30.2 2354 78.0 30.2 1 0.0 0.02553 90.0 28.4 2510 88.8 28.3 43 1.2 35.82023 84.9 23.8 1973 83.4 23.7 50 1.5 33.32791 96.7 28.9 2750 95.5 28.8 41 1.2 34.22695 92.6 29.1 2675 92.2 29.0 21 0.4 52.52651 82.1 32.3 2599 80.9 32.1 51 1.2 43.32775 79.3 35.0 2684 76.5 35.1 91 2.8 32.52607 74.1 35.2 2589 73.9 35.0 17 0.2 85.02400 69.7 34.4 2377 69.0 34.4 23 0.2 99.62267 58.0 39.1 2241 57.7 38.8 26 0.2 114.53446 62.4 55.2 3383 61.8 54.7 63 0.6 105.03362 65.7 51.2 3304 65.4 50.5 58 0.3 193.3
1995
Year
1984198519861987
1999200020012002
2007
2003
2005
All Nephrops gears combined
2006
198119821983
1988
19931994
Multirig
1996
1989199019911992
Single rig
19971998
2004
Effort - Scottish Nephrops trawlers
0
30
60
90
120
150
1960 1965 1970 1975 1980 1985 1990 1995 2000 2005
Effo
rt ('0
00 h
ours
traw
ling)
LPUE - Scottish Nephrops trawlers
0
10
20
30
40
50
60
1960 1965 1970 1975 1980 1985 1990 1995 2000 2005
LPU
E (k
g/ho
ur tr
awlin
g)
Figure B1.1. Nephrops. North Minch (FU11). Effort and lpue from Scottish Nephrops trawlers.
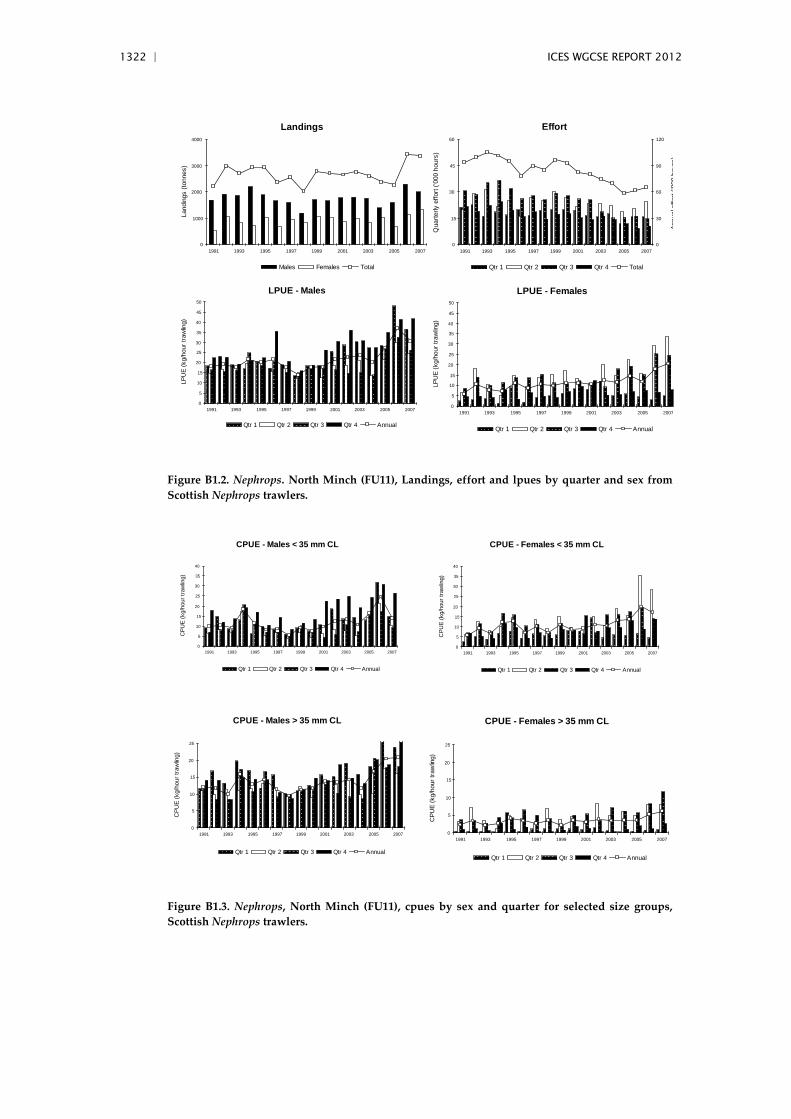
1322 | ICES WGCSE REPORT 2012
Landings
0
1000
2000
3000
4000
1991 1993 1995 1997 1999 2001 2003 2005 2007
Land
ings
(ton
nes)
Males Females Total
Effort
0
15
30
45
60
1991 1993 1995 1997 1999 2001 2003 2005 2007
Qua
rterly
effo
rt ('0
00 h
ours
)
0
30
60
90
120
Annu
al e
ffort
('000
hou
rs)
Qtr 1 Qtr 2 Qtr 3 Qtr 4 Total LPUE - Males
0
5
10
15
20
25
30
35
40
45
50
1991 1993 1995 1997 1999 2001 2003 2005 2007
LPU
E (k
g/ho
ur tr
awlin
g)
Qtr 1 Qtr 2 Qtr 3 Qtr 4 Annual
LPUE - Females
0
5
10
15
20
25
30
35
40
45
50
1991 1993 1995 1997 1999 2001 2003 2005 2007
LPU
E (k
g/ho
ur tr
awlin
g)Qtr 1 Qtr 2 Qtr 3 Qtr 4 Annual
Figure B1.2. Nephrops. North Minch (FU11), Landings, effort and lpues by quarter and sex from Scottish Nephrops trawlers.
CPUE - Males < 35 mm CL
0
5
10
15
20
25
30
35
40
1991 1993 1995 1997 1999 2001 2003 2005 2007
CPU
E (k
g/ho
ur tr
awlin
g)
Qtr 1 Qtr 2 Qtr 3 Qtr 4 Annual
CPUE - Females < 35 mm CL
0
5
10
15
20
25
30
35
40
1991 1993 1995 1997 1999 2001 2003 2005 2007
CPU
E (k
g/ho
ur tr
awlin
g)
Qtr 1 Qtr 2 Qtr 3 Qtr 4 Annual
CPUE - Males > 35 mm CL
0
5
10
15
20
25
1991 1993 1995 1997 1999 2001 2003 2005 2007
CPU
E (k
g/ho
ur tr
awlin
g)
Qtr 1 Qtr 2 Qtr 3 Qtr 4 Annual
CPUE - Females > 35 mm CL
0
5
10
15
20
25
1991 1993 1995 1997 1999 2001 2003 2005 2007
CPU
E (k
g/ho
ur tr
awlin
g)
Qtr 1 Qtr 2 Qtr 3 Qtr 4 Annual
Figure B1.3. Nephrops, North Minch (FU11), cpues by sex and quarter for selected size groups, Scottish Nephrops trawlers.
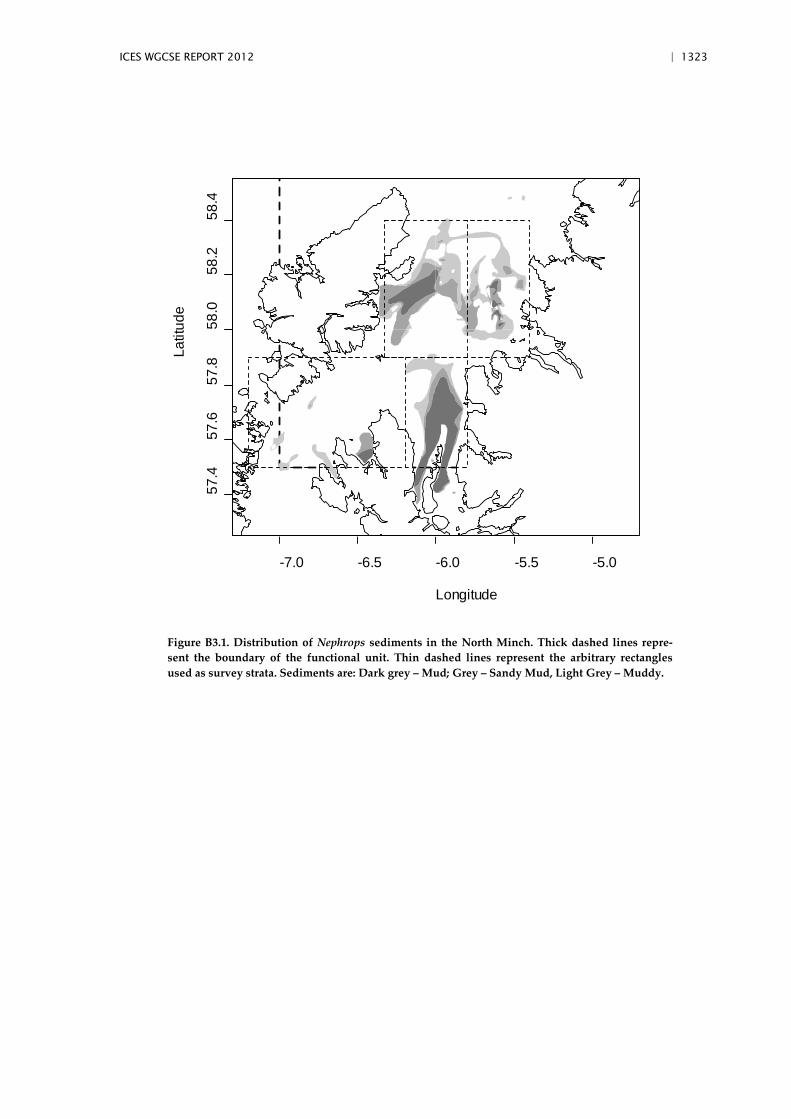
ICES WGCSE REPORT 2012 | 1323
-7.0 -6.5 -6.0 -5.5 -5.0
57.4
57.6
57.8
58.0
58.2
58.4
Longitude
Latit
ude
Figure B3.1. Distribution of Nephrops sediments in the North Minch. Thick dashed lines repre-sent the boundary of the functional unit. Thin dashed lines represent the arbitrary rectangles used as survey strata. Sediments are: Dark grey – Mud; Grey – Sandy Mud, Light Grey – Muddy.
1324 | ICES WGCSE REPORT 2012
3.6 Stock Annex Nephrops FU12, South Minch
Stock specific documentation of standard assessment procedures used by ICES.
Stock South Minch Nephrops (FU 12)
Date 09 March 2009 (WKNEPH2009)
Revised by Sarah Clarke/Carlos Mesquita
A. General
A.1. Stock definition
Throughout its distribution, Nephrops is limited to muddy habitat, and requires sedi-ment with a silt & clay content of between 10–100% to excavate its burrows, and this means that the distribution of suitable sediment defines the species distribution. Adult Nephrops only undertake very small-scale movements (a few 100 m) but larval transfer may occur between separate mud patches in some areas. In the South Minch area the Nephrops stock inhabits a generally continuous area of muddy sediment ex-tending from the south of Skye to the Stanton Bank, to the south of the Outer Hebri-des. The South Minch functional unit (FU12) is located off the west coast of Scotland, and is bounded to the north and south by the 56°00’ and 57°30’ circles of latitude, and to the west by the 8°W meridian. Out with the functional unit, a mixed fishery for gadoids and Nephrops takes place on Stanton Bank, to the southwest of the Outer Hebrides.
A.2. Fishery
The South Minch Nephrops fishery is predominantly exploited by Nephrops trawlers, although about 15% of landings are made by creel vessels, which has increased in recent years. About 90% of trawler landings are made by vessels targeting Nephrops, and only 1% of landings are made by twin-rig vessels. Of the Nephrops trawlers, about 80% of landings are made with a 70 mm mesh.
All the creel vessels are local, and roughly half of the trawl landings are made by ves-sels based between Mallaig and Campbeltown. Visiting vessels originate in the North Minch (8% of landings) and the Scottish east coast. The east coast vessels tend to be larger than the local ones, and carry out longer trips. Mean engine power of the local vessels is 200 kW, and their mean length 15.0 m. Most vessels were built between the 1960s and the 1980s. The major landing ports are Oban and Mallaig. The smaller ves-sels usually have a trip duration of 1–3 days, while larger boats may stay out for 5–6 days.
The minimum landing size for Nephrops in the South Minch is 20 mm CL and less than 0.5% of animals are landed under size. Discarding takes place at sea and land-ings are made by category for whole animals (small and large) and as tails. The main bycatch species are whiting and haddock, with whiting in particular featuring heavily in discards. Of the non-commercial species caught, poor cod, Norway pout and long rough dab contribute significantly to the discards.
The fishery is exploited throughout the year, with the highest landings usually being made in spring and summer. A seasonal sprat fishery often develops in November and December, which is targeted by vessels of all sizes (including those that usually target Nephrops). Some vessels also turn to scallop dredging when Nephrops catches or
ICES WGCSE REPORT 2012 | 1325
prices drop, although the scope for this has been limited in recent years with ASP and PSP closures of the scallop fishery in some areas.
The current legislation governing Nephrops trawl fisheries on the West coast of Scot-land was laid down by the North Sea and West of Scotland cod recovery plan (EC 2056/2001), which established measures additional to EC 850/98. This regulation was amended in 2003 by Annex XVII of EC 2341/2002, which establishes fishing effort and additional conditions for monitoring, inspection and surveillance for the recovery of certain cod stocks. This regulation effectively limits vessels targeting Nephrops with 70–99 mm mesh size to 25 days at sea per month. The use of square mesh and head-line panels are compulsory in this fishery.
Additional Scottish legislation (SSI No 2000/226) applies to twin trawlers operating North of 56°N, A mesh size of 100 mm or above must be used without a lifting bag and with not more than 100 meshes round the circumference but with up to 5 mm double twine. By comparison, vessels using a single trawl may use 70–89 mm mesh with a lifting bag and 120 meshes round the codend but with 4 mm single twine.
A.3. Ecosystem aspects
No information on the ecosystem aspects of this stock has been collated by the Work-ing Group.
B. Data
B.1. Commercial catch
Length and sex compositions of Nephrops landed from the South Minch are estimated from port sampling in Scotland. Length data from Scottish sampling are applied to all catches and raised to total international landings. Rates of discarding by length class are estimated for Scottish fleets by on-board sampling, and extrapolated to all other fleets. The proportion of discarded to landed Nephrops changes with year, often de-termined by strong year classes. Discard sampling started in 1990, and for years prior to this estimates have been made based on later data. Landings and discards at length are combined (assuming a discard survival rate of 25%) to removals. The differences in catchability between sexes have lead to the two sexes being assessed separately. And hence removals are raised separately for each sex.
Reported Nephrops trawl effort in 2007 was similar to the four previous years, while total landings show a marked increase since 2006 (Figure B1.1), possibly as a result of more accurate reporting since the introduction of the “buyers and sellers” regulations in the UK in this year.
Reported effort by Scottish Nephrops trawlers showed a steady decline since 1990 to 2002 but has since stabilized (Figure B1.2 and Table B1.1). The reliability of these data (and the resulting lpue trends) is questionable since the logsheet recording of ‘hours fished’ is known to have been erratic in the past as it is a non-mandatory field on the logsheet. Scottish Nephrops trawler lpue remained stable between 1998 and 2001, but has shown an increase more recently; particularly over the last two years (2006 and 2007).
Males contribute more to the landings than females (Figure B1.2)., as in all other func-tional units. Effort is normally highest in the 2nd quarter in this fishery, and generally lowest in the 4th quarter. Male lpue has remained relatively stable over the time-
1326 | ICES WGCSE REPORT 2012
series prior to 2006, but shows a marked increase in 2006 and 2007, possibly as a re-sult of the aforementioned introduction of the “buyers and sellers” regulations.
Discarding of undersize and unwanted Nephrops occurs in this fishery, and quarterly discard sampling has been conducted on the Scottish Nephrops trawler fleet since 1990. Discarding rates averaged over the period 2005 to 2007 for this stock were 21% by number or 12% by weight. This represents a decrease on the 2003 to 2005 period.
Cpue data for each sex, for Nephrops above and below 35 mm CL, are shown in Figure B1.3. This size was chosen for all the Scottish stocks examined as the general size limit above which the effects of discarding practices and the addition of recruits were like-ly to be small. The data show a peak in cpue for smaller individuals in 1995, with values declining to the longer term average after this, and a second rise in 2001 which has continued upwards to 2007. The higher values are particularly evident for males in the 1st and 4th quarters. The cpue for females over 35 mm has fluctuated without trend over the time period, and show consistently higher values in the 2nd and 3rd quarters of the year.
Trawl and creel fisheries are sampled separately.
B.2. Biological
Mean weights-at-age for this stock are estimated from fixed Scottish weight–length relationships (Howard et al., 1988, citation required). Relevant biological parameters are as follows: natural mortality was assumed to be 0.3 for males of all ages and in all years. Natural mortality was assumed to be 0.3 for immature females, and 0.2 for ma-ture females.
Summary
Growth parameters:
Males; L∞ = 66 mm, k = 0.16
Immature Females; L∞ = 66 mm, k = 0.16
Mature Females; L∞ = 59 mm, k = 0.06,
Size at maturity = 25 mm
Weight–length parameters:
Males a = 0.00028, b = 3.24
Females a= 0.00074, b = 2.91
Discards
Discard survival rate: 25%
Discard rate: 16.7%
Proportion of F and M prior to spawning was specified as zero to give estimates of spawning–stock biomass at January 1.
B.3. Surveys
Abundance indices are available from the following research vessel surveys:
Underwater TV survey: years 1995–present. The survey usually occurs in June. The burrowing nature of Nephrops, and variable emergence rates mean that trawl catch rates may bear little resemblance to population abundance. An underwater TV sur-
ICES WGCSE REPORT 2012 | 1327
vey has been developed, estimating Nephrops population abundance form burrow density raised to stock area. A random stratified sampling design is used, on the basis of British Geological Survey sediment strata. The survey provides a total abundance estimate, and is not age or length structured (Figure B3.1).
A number of factors are suspected to contribute bias to the surveys. In order to use the survey abundance estimate as an absolute it is necessary to correct for these po-tential biases. The history of bias estimates are given in the following table and are based on simulation models, preliminary experimentation and expert opinion, the biases associated with the estimates of Nephrops abundance in the South Minch are:
Time period Edge effect
detection rate
species identification occupancy
Cumulative bias
FU 12: South Minch <=2009 1.37 0.85 1.1 1 1.32
B.4. Commercial cpue
Landings per unit of effort time-series are available from: Nephrops single trawl, mul-tiple Nephrops trawl, light trawl and multiple demersal trawl.
Scottish Nephrops trawl gears: Landings-at-age and effort data for Scottish Nephrops trawl gears are used to generate a cpue index. Cpue is estimated using officially rec-orded effort (hours fished) although the recording of effort is not mandatory. Com-bined effort for Nephrops single trawl and multiple Nephrops trawl is raised to landings reported by the four gears listed above. Discard sampling commenced in 1990 for this fishery, and for years prior to this, an average of the 1990 and 1991 val-ues is applied. There is no account taken of any technological creep in the fleet.
For more information see Section B.1.
B.5. Other relevant data
C. Historical stock development
1 ) Survey indices are worked up annually resulting in the TV index. 2 ) Adjust index for bias (see Section B3). The combined effect of these biases
is to be applied to the new survey index. 3 ) Generate mean weight in landings. Check the time-series of mean landing
weights for evidence of a trend in the most recent period. If there is no firm evidence of a recent trend in mean weight use the average of the three most recent years. If, however, there is strong evidence of a recent trend then apply most recent value (don’t attempt to extrapolate the trend fur-ther in future).
D. Short-term projection
1 ) The catch option table will include the harvest ratios associated with fish-ing at F0.1 and FMAX. These values have been estimated by the Benchmark Workshop (see Section 9.2) and are to be revisited by subsequent bench-mark groups. The values are FU specific and have been put in the Stock Annexes.
2 ) Create catch option table on the basis of a range of harvest ratios ranging from 0 to the maximum observed ratio or the ratio equating to Fmax, which-
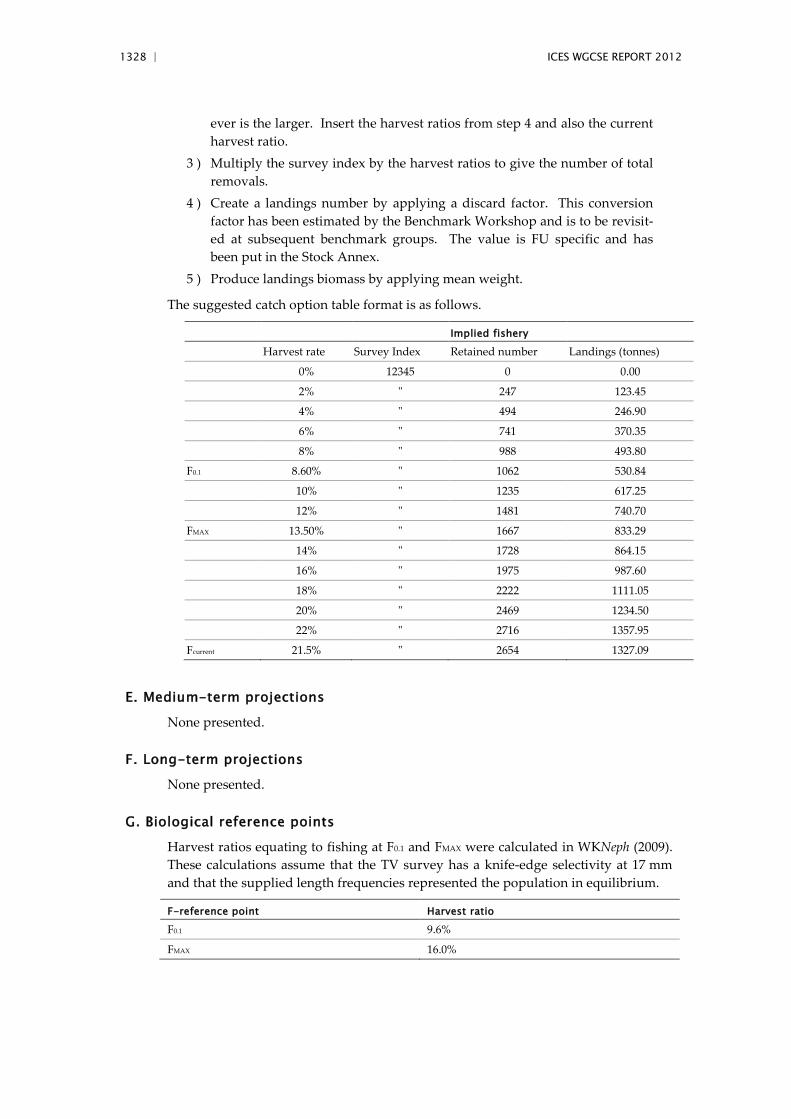
1328 | ICES WGCSE REPORT 2012
ever is the larger. Insert the harvest ratios from step 4 and also the current harvest ratio.
3 ) Multiply the survey index by the harvest ratios to give the number of total removals.
4 ) Create a landings number by applying a discard factor. This conversion factor has been estimated by the Benchmark Workshop and is to be revisit-ed at subsequent benchmark groups. The value is FU specific and has been put in the Stock Annex.
5 ) Produce landings biomass by applying mean weight.
The suggested catch option table format is as follows.
Implied fishery
Harvest rate Survey Index Retained number Landings (tonnes)
0% 12345 0 0.00
2% " 247 123.45
4% " 494 246.90
6% " 741 370.35
8% " 988 493.80
F0.1 8.60% " 1062 530.84
10% " 1235 617.25
12% " 1481 740.70
FMAX 13.50% " 1667 833.29
14% " 1728 864.15
16% " 1975 987.60
18% " 2222 1111.05
20% " 2469 1234.50
22% " 2716 1357.95
Fcurrent 21.5% " 2654 1327.09
E. Medium-term projections
None presented.
F. Long-term projections
None presented.
G. Biological reference points
Harvest ratios equating to fishing at F0.1 and FMAX were calculated in WKNeph (2009). These calculations assume that the TV survey has a knife-edge selectivity at 17 mm and that the supplied length frequencies represented the population in equilibrium.
F-reference point Harvest ratio
F0.1 9.6%
FMAX 16.0%
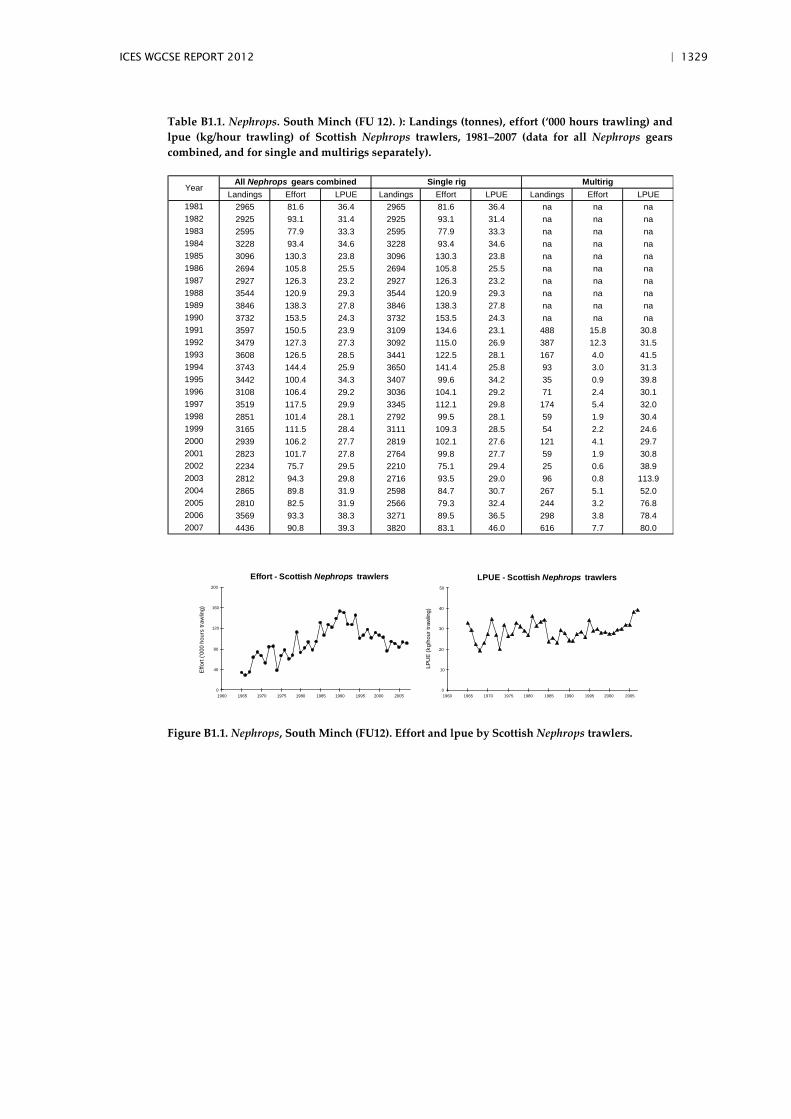
ICES WGCSE REPORT 2012 | 1329
Table B1.1. Nephrops. South Minch (FU 12). ): Landings (tonnes), effort (‘000 hours trawling) and lpue (kg/hour trawling) of Scottish Nephrops trawlers, 1981–2007 (data for all Nephrops gears combined, and for single and multirigs separately).
Landings Effort LPUE Landings Effort LPUE Landings Effort LPUE
2965 81.6 36.4 2965 81.6 36.4 na na na2925 93.1 31.4 2925 93.1 31.4 na na na2595 77.9 33.3 2595 77.9 33.3 na na na3228 93.4 34.6 3228 93.4 34.6 na na na3096 130.3 23.8 3096 130.3 23.8 na na na2694 105.8 25.5 2694 105.8 25.5 na na na2927 126.3 23.2 2927 126.3 23.2 na na na3544 120.9 29.3 3544 120.9 29.3 na na na3846 138.3 27.8 3846 138.3 27.8 na na na3732 153.5 24.3 3732 153.5 24.3 na na na3597 150.5 23.9 3109 134.6 23.1 488 15.8 30.83479 127.3 27.3 3092 115.0 26.9 387 12.3 31.53608 126.5 28.5 3441 122.5 28.1 167 4.0 41.53743 144.4 25.9 3650 141.4 25.8 93 3.0 31.33442 100.4 34.3 3407 99.6 34.2 35 0.9 39.83108 106.4 29.2 3036 104.1 29.2 71 2.4 30.13519 117.5 29.9 3345 112.1 29.8 174 5.4 32.02851 101.4 28.1 2792 99.5 28.1 59 1.9 30.43165 111.5 28.4 3111 109.3 28.5 54 2.2 24.62939 106.2 27.7 2819 102.1 27.6 121 4.1 29.72823 101.7 27.8 2764 99.8 27.7 59 1.9 30.82234 75.7 29.5 2210 75.1 29.4 25 0.6 38.92812 94.3 29.8 2716 93.5 29.0 96 0.8 113.92865 89.8 31.9 2598 84.7 30.7 267 5.1 52.02810 82.5 31.9 2566 79.3 32.4 244 3.2 76.83569 93.3 38.3 3271 89.5 36.5 298 3.8 78.44436 90.8 39.3 3820 83.1 46.0 616 7.7 80.02007
2004
Multirig
1981
2006
198219831984
Single rig
200120022003
2005
All Nephrops gears combinedYear
19951996
199919981997
2000
19851986
19931994
1988198919901991
1987
1992
Effort - Scottish Nephrops trawlers
0
40
80
120
160
200
1960 1965 1970 1975 1980 1985 1990 1995 2000 2005
Effo
rt ('0
00 h
ours
traw
ling)
LPUE - Scottish Nephrops trawlers
0
10
20
30
40
50
1960 1965 1970 1975 1980 1985 1990 1995 2000 2005
LPU
E (k
g/ho
ur tr
awlin
g)
Figure B1.1. Nephrops, South Minch (FU12). Effort and lpue by Scottish Nephrops trawlers.
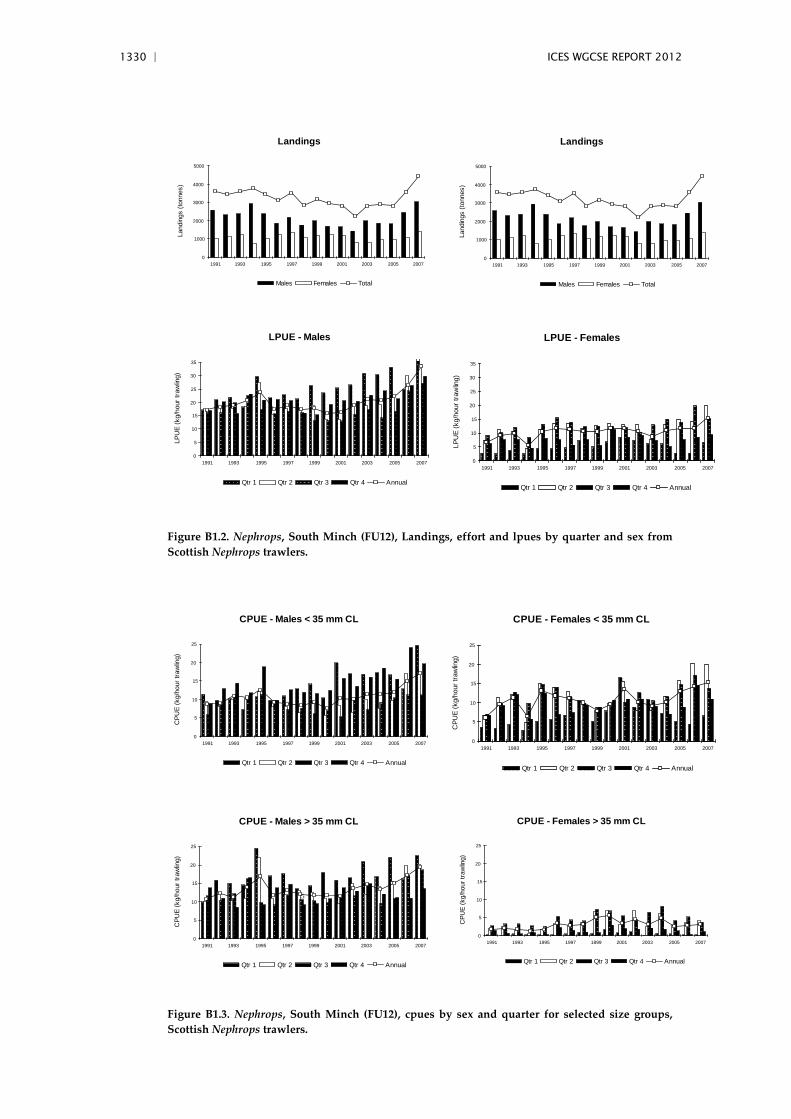
1330 | ICES WGCSE REPORT 2012
Landings
0
1000
2000
3000
4000
5000
1991 1993 1995 1997 1999 2001 2003 2005 2007
Land
ings
(ton
nes)
Males Females Total
Landings
0
1000
2000
3000
4000
5000
1991 1993 1995 1997 1999 2001 2003 2005 2007
Land
ings
(ton
nes)
Males Females Total
LPUE - Males
0
5
10
15
20
25
30
35
1991 1993 1995 1997 1999 2001 2003 2005 2007
LPU
E (k
g/ho
ur tr
awlin
g)
Qtr 1 Qtr 2 Qtr 3 Qtr 4 Annual
LPUE - Females
0
5
10
15
20
25
30
35
1991 1993 1995 1997 1999 2001 2003 2005 2007
LPU
E (k
g/ho
ur tr
awlin
g)
Qtr 1 Qtr 2 Qtr 3 Qtr 4 Annual
Figure B1.2. Nephrops, South Minch (FU12), Landings, effort and lpues by quarter and sex from Scottish Nephrops trawlers.
CPUE - Males < 35 mm CL
0
5
10
15
20
25
1991 1993 1995 1997 1999 2001 2003 2005 2007
CPU
E (k
g/ho
ur tr
awlin
g)
Qtr 1 Qtr 2 Qtr 3 Qtr 4 Annual
CPUE - Females < 35 mm CL
0
5
10
15
20
25
1991 1993 1995 1997 1999 2001 2003 2005 2007
CPU
E (k
g/ho
ur tr
awlin
g)
Qtr 1 Qtr 2 Qtr 3 Qtr 4 Annual
CPUE - Males > 35 mm CL
0
5
10
15
20
25
1991 1993 1995 1997 1999 2001 2003 2005 2007
CPU
E (k
g/ho
ur tr
awlin
g)
Qtr 1 Qtr 2 Qtr 3 Qtr 4 Annual
5
CPUE - Females > 35 mm CL
0
5
10
15
20
25
1991 1993 1995 1997 1999 2001 2003 2005 2007
CPU
E (k
g/ho
ur tr
awlin
g)
Qtr 1 Qtr 2 Qtr 3 Qtr 4 Annual
Figure B1.3. Nephrops, South Minch (FU12), cpues by sex and quarter for selected size groups, Scottish Nephrops trawlers.
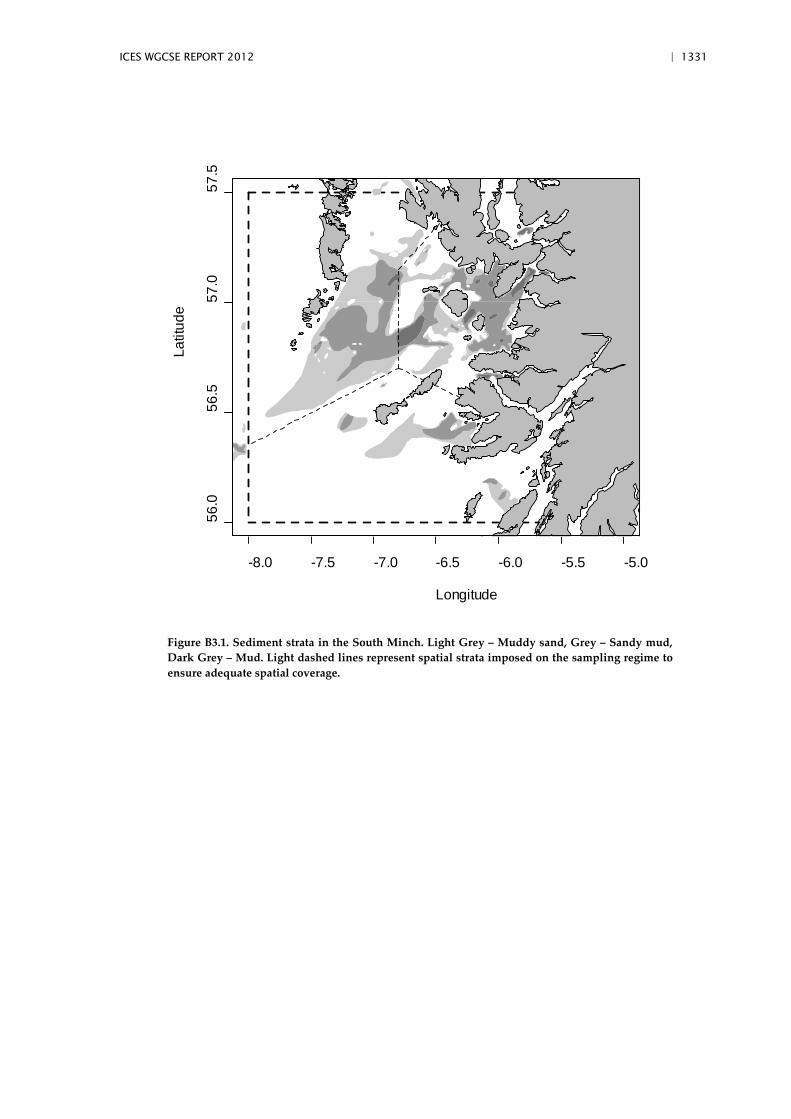
ICES WGCSE REPORT 2012 | 1331
-8.0 -7.5 -7.0 -6.5 -6.0 -5.5 -5.0
56.0
56.5
57.0
57.5
Longitude
Latit
ude
Figure B3.1. Sediment strata in the South Minch. Light Grey – Muddy sand, Grey – Sandy mud, Dark Grey – Mud. Light dashed lines represent spatial strata imposed on the sampling regime to ensure adequate spatial coverage.
1332 | ICES WGCSE REPORT 2012
3.7 Stock Annex Nephrops FU13, Clyde
Stock specific documentation of standard assessment procedures used by ICES.
Stock Clyde Nephrops (FU 13)
Date 09 March 2009
Revised by Sarah Clarke/Carlos Mesquita
A. General
A.1. Stock definition
Throughout its distribution, Nephrops is limited to muddy habitat, and requires sedi-ment with a silt & clay content of between 10–100% to excavate its burrows, and this means that the distribution of suitable sediment defines the species distribution. Adult Nephrops only undertake very small-scale movements (a few 100 m) but larval transfer may occur between separate mud patches in some areas. In the Clyde area the Nephrops stock inhabits an area of muddy sediment extending throughout the Firth of Clyde, and another smaller area in the Sound of Jura, as shown in Figure B3.1. The two areas are separated by a large area of sandy gravely sediment around the Mull of Kintyre, and are treated as separate populations since they have differing population characteristics.
A.2. Fishery
Firth of Clyde
The Firth of Clyde Nephrops fishery is predominantly exploited by a dedicated Nephrops trawler fleet of approximately 120 vessels, with less than 2–3% of the land-ings made by creel vessels. The 90 resident Clyde trawlers make about 90% of the Nephrops landings. Under the Scottish 'Inshore Fishing Order' of 1989 (Prohibition of Fishing and Fishing Methods), fishing with mobile gear is prohibited within the Firth of Clyde over weekends, and with vessels >70 feet (about 21 m) in length.
The trawler fleet that fishes the Firth of Clyde mostly consists of vessels between 10 and 20 m in length (mean overall length 14 m), with a mean engine power of 185 kW. Almost half the fleet was built during the 1960s, with less than 20% built after 1979. Most vessels use single otter trawls with a 70 mm mesh codend, but just under a third of Nephrops landings are taken by vessels using twin-rig trawls with an 80 mm mesh codend. Vessels employing twin-rig gear are generally slightly more powerful than the single rig vessels (mean power 214 kW compared with 176 kW).
The regular fleet is comprised of Scottish vessels, but some catches are taken by Northern Ireland and Republic of Ireland vessels. The major landing ports are Troon, Campbeltown, Girvan and Tarbert, but smaller landings are also made at Carradale, Largs and Rothsay.
The minimum landing size for Nephrops in the Clyde is 20 mm CL. Compliance with the minimum landing size is good, with samples suggesting only a very small under-sized component in the landings (< 0.5%).
Nephrops growth varies within the area, with low density animals growing to large sizes in the North, and with higher density animals reaching smaller sizes in the South. Far more Nephrops material (undersized individuals and 'heads' from tailed animals) is discarded in the South. Discarding usually takes place at sea and landings

ICES WGCSE REPORT 2012 | 1333
are made by category for whole animals (small, medium and large) and as tails. In poor weather or for the last haul of the day, discarding may take place within the harbour, thus increasing discard mortality.
Only a small fish bycatch is made in the Firth of Clyde, with whiting and cod being the most important species. The composition of the bycatch and discards varies with-in the Firth of Clyde, with more flatfish (common and long rough dab), echinoderms and crustaceans (other than Nephrops) caught in the North, while more roundfish (particularly whiting) are caught in the South. These differences reflect the different habitats and fish communities in the area.
The fishery is exploited throughout the year, with highest landings usually made be-tween July and September. Vessels usually have a trip duration of one day, sailing to shoot before dawn, and carrying out 3–4 hauls of four hours per day.
Sound of Jura
The fishery for Nephrops in the Sound of Jura constitutes part of the Clyde FU, but is examined separately from the fishery within the Firth of Clyde, because of differences in the biological parameters of the Nephrops populations.
The fleet exploiting the Sound of Jura is also different from the Firth of Clyde, with vessels tending to be slightly smaller but more powerful. Most landings are taken by Scottish vessels (which are virtually all local to the area) with a very small proportion taken by boats from the rest of the UK. The local trawler fleet consists of vessels be-tween 9 and 16 m in length, and with a mean engine power of 185 kW.
Just over half the landings are made by twin-rig Nephrops trawlers using 80 mm meshes, with most of the remainder landed by single rig vessels using 70 mm mesh-es. Vessels employing twin-rig gear are generally larger and more powerful than those using single rig trawls (15 m and 220 kW compared with 13 m and 160 kW). The main landing ports are Port Askaig, West Loch Tarbert and Crinan.
The minimum landing size for Nephrops in the Sound of Jura is 20 mm CL. Nephrops are found in high densities in this stock, but only grow to relatively small sizes. Dis-carding takes place at sea (this can be a large proportion of the catch by number, be-cause of the small mean size of the animals caught), and landings are made by category for whole animals (small, medium and large) and as tails.
Catches of fish in the Sound of Jura area are generally poor, and Nephrops are clearly the target species, with only small bycatches of whitefish and flatfish.
The fishery is exploited throughout the year, with highest landings usually made be-tween April and June. Vessels usually have a trip duration of one day, with 3–4 hauls per day.
For both areas the current legislation governing Nephrops trawl fisheries on the west coast of Scotland was laid down by the North Sea and West of Scotland cod recovery plan (EC 2056/2001), which established measures additional to EC 850/98. This regu-lation was amended in 2003 by Annex XVII of EC 2341/2002, which establishes fish-ing effort and additional conditions for monitoring, inspection and surveillance for the recovery of certain cod stocks. This regulation effectively limits vessels targeting Nephrops with 70–99 mm mesh size to 25 days at sea per month. The use of square mesh and headline panels are compulsory in this fishery. Additional UK legislation has also been applied in the southern areas of the Firth of Clyde in recent years,
1334 | ICES WGCSE REPORT 2012
aimed at protecting the aggregating cod in the south of the Clyde during February, March and April.
A.3. Ecosystem aspects
No information on the ecosystem aspects of this stock has been collated by the Work-ing Group.
B. Data
B.1. Commercial catch
Length and sex compositions of Nephrops landed from the Firth of Clyde are estimat-ed from port sampling in Scotland. Length data from Scottish sampling are applied to all catches and raised to total international landings. Rates of discarding by length class are estimated for Scottish fleets by on-board sampling, and extrapolated to all other fleets. The proportion of discarded to landed Nephrops changes with year, often determined by strong year classes. Discard sampling started in 1990, and for years prior to this estimates have been made based on later data. Landings and discards at length are combined (assuming a discard survival rate of 25%) to removals. Due to differences in catchability between sexes removals are raised separately for each sex.
Reported effort has declined from high levels in the mid 1990s until 2004, but has shown an increase since then (Figure B1.1). Landings also declined, to a lesser extent, over this time period and show a sharp increase over the past two years. Scottish Nephrops trawler lpue has increased markedly since 2001 (Figure B1.1 and Table B1.1). However this may be more of an artefact due to improved reporting of landings data due to the introduction of the buyers and sellers regulations in the UK in 2006. In ad-dition, logsheet recording of ‘hours fished’ is known to be erratic as it is a non-mandatory field on the logsheet It is therefore not clear whether the observed inter-annual trends described below are actually indicative of real trends in lpue.
Males contribute more to the landings than females. Effort has previously been high-est in the 3rd quarter in this fishery, but has become far more even through the year as the overall level of effort has declined (Figure B1.2). Male lpue showed an increase in 1995, to a relatively stable level, then a further increase between 2001 and 2005. It has increased again in 2006 and remains high in 2007 particularly in the first and fourth quarters. Female lpue is lower than that for males, but shows similar increases after 1995 and 2001; the highest rates are obtained in the second and third quarters.
Cpue data for each sex, for Nephrops above and below 35 mm CL, are shown in Figure B1.3. This size was chosen for all the Scottish stocks examined as the general size limit above which the effects of discarding practices and the addition of recruits were like-ly to be small. For both sexes the data show a series of increases in cpue for smaller individuals in 1995, 2003 and 2007 The cpue for larger males remained relatively sta-ble prior to 2003, fell to a slightly lower level in 2005, then increased markedly in 2006; remaining high but falling in 2007. Cpue for the larger females has fluctuated around a stable level for the entire time-series, showing significantly higher values in the second quarter. These trends, are however, effected by the recent improvements in the reliability of catch data and erratic effort recording and are therefore difficult to interpret reliably.
ICES WGCSE REPORT 2012 | 1335
B.2. Biological
Mean weights-at-age for this stock are estimated from fixed Scottish weight–length relationships (Howard et al., 1988, citation required). Relevant biological parameters are as follows: natural mortality was assumed to be 0.3 for males of all ages and in all years. Natural mortality was assumed to be 0.3 for immature females, and 0.2 for ma-ture females.
Summary
Growth parameters:
Males; L∞ = 73 mm, k = 0.16
Immature Females; L∞ = 73 mm, k = 0.16
Mature Females; L∞ = 60 mm, k = 0.06,
Size at maturity = 25 mm
Weight–length parameters:
Males a = 0.00028, b = 3.24
Females a= 0.00074, b = 2.91
Discards
Discard survival rate: 25%
Discard rate: 18.6%
Proportion of F and M prior to spawning was specified as zero to give estimates of spawning–stock biomass at January 1.
B.3. Surveys
The burrowing nature of Nephrops, and variable emergence rates mean that trawl catch rates may bear little resemblance to population abundance. An underwater TV survey has been developed, estimating Nephrops population abundance from burrow density raised to stock area. A random stratified sampling design is used on the basis of British Geological Survey sediment strata and latitude (Tuck et al., 1999/ see Figure B3.1). The survey provides a total abundance estimate, and is not age or length struc-tured. A series of annual underwater TV surveys are available since 1995 for the Firth of Clyde and Sound of Jura. Whereas the survey in the Clyde has been continuous, the TV survey for the Sound of Jura was not conducted from 1997 to 2000, and again in 2004. Such large gaps in the series make interpretation of any trends from the data difficult. The number of valid stations in the survey has remained relatively stable throughout the time period. An average of 36 stations have been sampled in each year, then raised to a stock area of 2062.2 km2 for the Firth of Clyde, and an average of ten stations have been considered valid each year for the Sound of Jura. Confidence intervals around the abundance estimates have remained relatively stable through the time period.
A number of factors are suspected to contribute bias to the surveys. In order to use the survey abundance estimate as an absolute it is necessary to correct for these po-tential biases. The history of bias estimates are given in the following table and are based on simulation models, preliminary experimentation and expert opinion, the biases associated with the estimates of Nephrops abundance in the Fladen are:
1336 | ICES WGCSE REPORT 2012
Time period Edge effect detection rate
species identification occupancy
Cumulative bias
FU 13: Clyde <=2009 1.19 0.75 1.25 1 1.19
B.4. Commercial cpue
Landings per unit of effort time-series are available from the following fleets: Nephrops single trawl, multiple Nephrops trawl, light trawl and multiple demersal trawl.
Scottish Nephrops trawl gears: Landings-at-age and effort data for Scottish Nephrops trawl gears are used to generate a cpue index. Cpue is estimated using officially rec-orded effort (hours fished) although the recording of effort is not mandatory. Com-bined effort for Nephrops single trawl and multiple Nephrops trawl is raised to landings reported by the four gears listed above. Discard sampling commenced in 1990 for this fishery, and for years prior to this, an average of the 1990 and 1991 val-ues is applied. There is no account taken of any technological creep in the fleet.
More information is contained in Section B.1.
B.5. Other relevant data
C. Historical stock development
1 ) Survey indices are worked up annually resulting in the TV index. 2 ) Adjust index for bias (see Section B3). The combined effect of these biases
is to be applied to the new survey index. 3 ) Generate mean weight in landings. Check the time-series of mean landing
weights for evidence of a trend in the most recent period. If there is no firm evidence of a recent trend in mean weight use the average of the three most recent years. If, however, there is strong evidence of a recent trend then apply most recent value (don’t attempt to extrapolate the trend fur-ther in future).
D. Short-term projection
1 ) The catch option table will include the harvest ratios associated with fish-ing at F0.1 and FMAX. These values have been estimated by the Benchmark Workshop (see Section 9.2) and are to be revisited by subsequent bench-mark groups. The values are FU specific and have been put in the Stock Annexes.
2 ) Create catch option table on the basis of a range of harvest ratios ranging from 0 to the maximum observed ratio or the ratio equating to FMAX, whichever is the larger. Insert the harvest ratios from step 4 and also the current harvest ratio.
3 ) Multiply the survey index by the harvest ratios to give the number of total removals.
4 ) Create a landings number by applying a discard factor. This conversion factor has been estimated by the Benchmark Workshop and is to be revisit-ed at subsequent benchmark groups. The value is FU specific and has been put in the Stock Annex.
5 ) Produce landings biomass by applying mean weight.
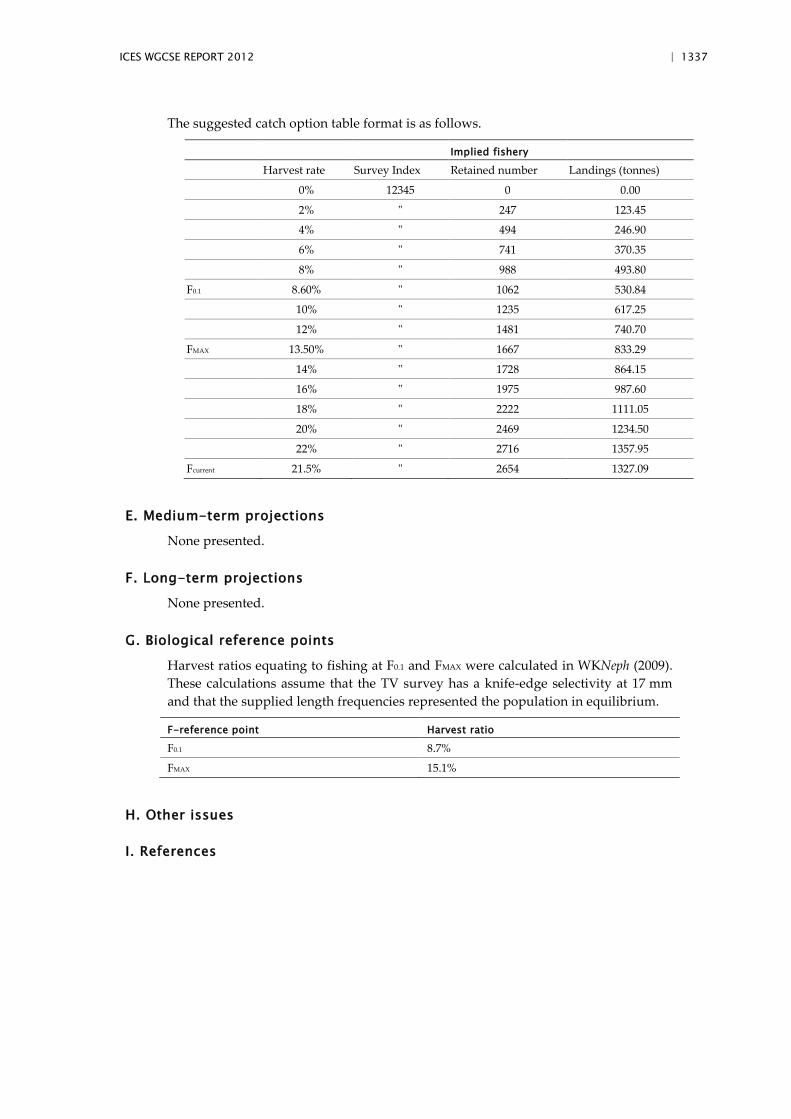
ICES WGCSE REPORT 2012 | 1337
The suggested catch option table format is as follows.
Implied fishery
Harvest rate Survey Index Retained number Landings (tonnes)
0% 12345 0 0.00
2% " 247 123.45
4% " 494 246.90
6% " 741 370.35
8% " 988 493.80
F0.1 8.60% " 1062 530.84
10% " 1235 617.25
12% " 1481 740.70
FMAX 13.50% " 1667 833.29
14% " 1728 864.15
16% " 1975 987.60
18% " 2222 1111.05
20% " 2469 1234.50
22% " 2716 1357.95
Fcurrent 21.5% " 2654 1327.09
E. Medium-term projections
None presented.
F. Long-term projections
None presented.
G. Biological reference points
Harvest ratios equating to fishing at F0.1 and FMAX were calculated in WKNeph (2009). These calculations assume that the TV survey has a knife-edge selectivity at 17 mm and that the supplied length frequencies represented the population in equilibrium.
F-reference point Harvest ratio
F0.1 8.7%
FMAX 15.1%
H. Other issues
I. References
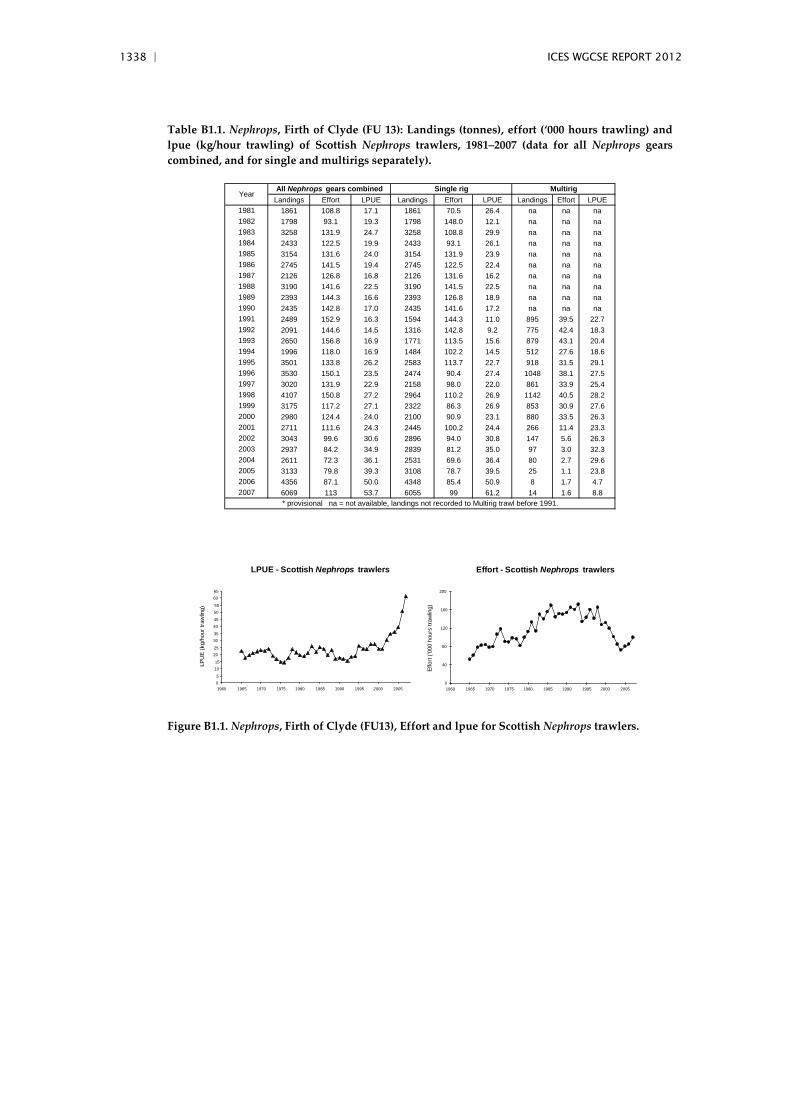
1338 | ICES WGCSE REPORT 2012
Table B1.1. Nephrops, Firth of Clyde (FU 13): Landings (tonnes), effort (‘000 hours trawling) and lpue (kg/hour trawling) of Scottish Nephrops trawlers, 1981–2007 (data for all Nephrops gears combined, and for single and multirigs separately).
Landings Effort LPUE Landings Effort LPUE Landings Effort LPUE1861 108.8 17.1 1861 70.5 26.4 na na na1798 93.1 19.3 1798 148.0 12.1 na na na3258 131.9 24.7 3258 108.8 29.9 na na na2433 122.5 19.9 2433 93.1 26.1 na na na3154 131.6 24.0 3154 131.9 23.9 na na na2745 141.5 19.4 2745 122.5 22.4 na na na2126 126.8 16.8 2126 131.6 16.2 na na na3190 141.6 22.5 3190 141.5 22.5 na na na2393 144.3 16.6 2393 126.8 18.9 na na na2435 142.8 17.0 2435 141.6 17.2 na na na2489 152.9 16.3 1594 144.3 11.0 895 39.5 22.72091 144.6 14.5 1316 142.8 9.2 775 42.4 18.32650 156.8 16.9 1771 113.5 15.6 879 43.1 20.41996 118.0 16.9 1484 102.2 14.5 512 27.6 18.63501 133.8 26.2 2583 113.7 22.7 918 31.5 29.13530 150.1 23.5 2474 90.4 27.4 1048 38.1 27.53020 131.9 22.9 2158 98.0 22.0 861 33.9 25.44107 150.8 27.2 2964 110.2 26.9 1142 40.5 28.23175 117.2 27.1 2322 86.3 26.9 853 30.9 27.62980 124.4 24.0 2100 90.9 23.1 880 33.5 26.32711 111.6 24.3 2445 100.2 24.4 266 11.4 23.33043 99.6 30.6 2896 94.0 30.8 147 5.6 26.32937 84.2 34.9 2839 81.2 35.0 97 3.0 32.32611 72.3 36.1 2531 69.6 36.4 80 2.7 29.63133 79.8 39.3 3108 78.7 39.5 25 1.1 23.84356 87.1 50.0 4348 85.4 50.9 8 1.7 4.76069 113 53.7 6055 99 61.2 14 1.6 8.8
20062007
19871988
2003
Single rig Multirig
* provisional na = not available, landings not recorded to Multirig trawl before 1991.
199119921993
19841985
1997
2005
19811982
1989
2004
Year
2000
19951996
1983
19981999
1994
1990
1986
2002
All Nephrops gears combined
2001
LPUE - Scottish Nephrops trawlers
05
1015
2025
3035
4045
5055
6065
1960 1965 1970 1975 1980 1985 1990 1995 2000 2005
LPU
E (k
g/ho
ur tr
awlin
g)
Effort - Scottish Nephrops trawlers
0
40
80
120
160
200
1960 1965 1970 1975 1980 1985 1990 1995 2000 2005
Effo
rt ('0
00 h
ours
traw
ling)
Figure B1.1. Nephrops, Firth of Clyde (FU13), Effort and lpue for Scottish Nephrops trawlers.
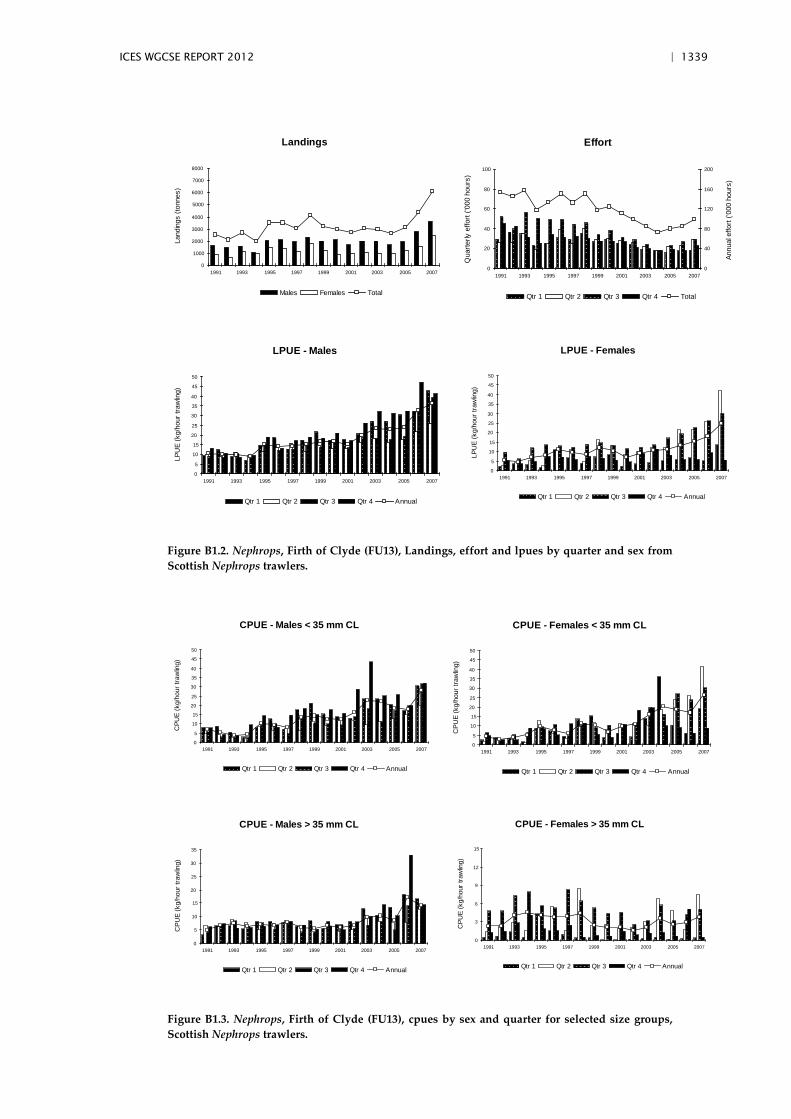
ICES WGCSE REPORT 2012 | 1339
Landings
0
1000
2000
3000
4000
5000
6000
7000
8000
1991 1993 1995 1997 1999 2001 2003 2005 2007
Land
ings
(ton
nes)
Males Females Total
Effort
0
20
40
60
80
100
1991 1993 1995 1997 1999 2001 2003 2005 2007
Qua
rterly
effo
rt ('0
00 h
ours
)
0
40
80
120
160
200
Annu
al e
ffort
('000
hou
rs)
Qtr 1 Qtr 2 Qtr 3 Qtr 4 Total
LPUE - Males
0
5
10
15
20
25
30
35
40
45
50
1991 1993 1995 1997 1999 2001 2003 2005 2007
LPU
E (k
g/ho
ur tr
awlin
g)
Qtr 1 Qtr 2 Qtr 3 Qtr 4 Annual
LPUE - Females
0
5
10
15
20
25
30
35
40
45
50
1991 1993 1995 1997 1999 2001 2003 2005 2007LP
UE
(kg/
hour
traw
ling)
Qtr 1 Qtr 2 Qtr 3 Qtr 4 Annual
Figure B1.2. Nephrops, Firth of Clyde (FU13), Landings, effort and lpues by quarter and sex from Scottish Nephrops trawlers.
CPUE - Males < 35 mm CL
0
5
10
15
20
25
30
35
40
45
50
1991 1993 1995 1997 1999 2001 2003 2005 2007
CPU
E (k
g/ho
ur tr
awlin
g)
Qtr 1 Qtr 2 Qtr 3 Qtr 4 Annual
CPUE - Females < 35 mm CL
0
5
10
15
20
25
30
35
40
45
50
1991 1993 1995 1997 1999 2001 2003 2005 2007
CPU
E (k
g/ho
ur tr
awlin
g)
Qtr 1 Qtr 2 Qtr 3 Qtr 4 Annual
CPUE - Males > 35 mm CL
0
5
10
15
20
25
30
35
1991 1993 1995 1997 1999 2001 2003 2005 2007
CPU
E (k
g/ho
ur tr
awlin
g)
Qtr 1 Qtr 2 Qtr 3 Qtr 4 Annual
CPUE - Females > 35 mm CL
0
3
6
9
12
15
1991 1993 1995 1997 1999 2001 2003 2005 2007
CPU
E (k
g/ho
ur tr
awlin
g)
Qtr 1 Qtr 2 Qtr 3 Qtr 4 Annual
Figure B1.3. Nephrops, Firth of Clyde (FU13), cpues by sex and quarter for selected size groups, Scottish Nephrops trawlers.
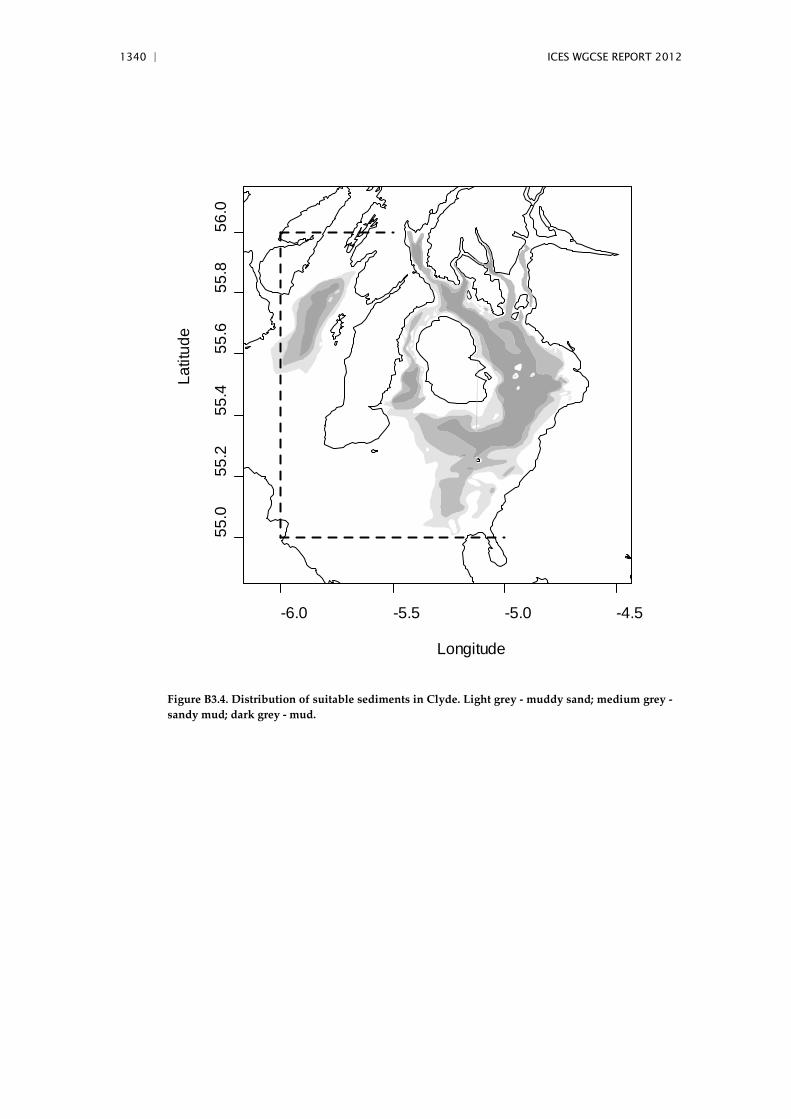
1340 | ICES WGCSE REPORT 2012
-6.0 -5.5 -5.0 -4.5
55.0
55.2
55.4
55.6
55.8
56.0
Longitude
Latit
ude
Figure B3.4. Distribution of suitable sediments in Clyde. Light grey - muddy sand; medium grey - sandy mud; dark grey - mud.
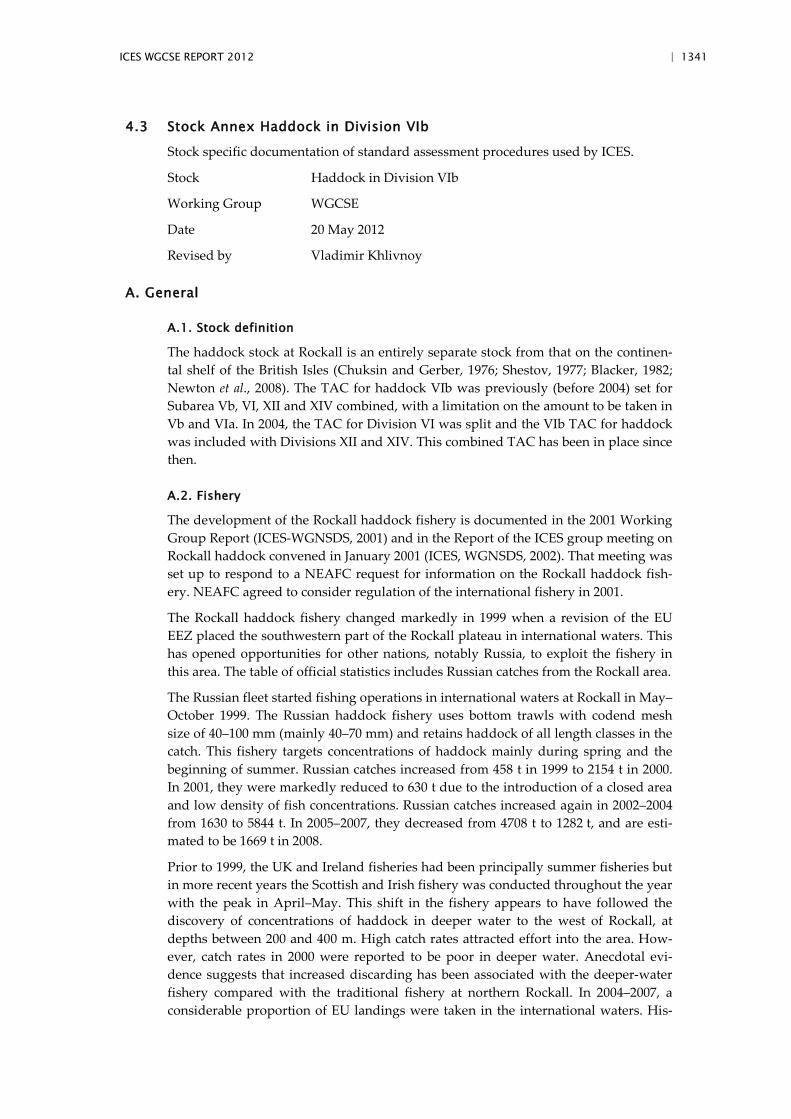
ICES WGCSE REPORT 2012 | 1341
4.3 Stock Annex Haddock in Division VIb
Stock specific documentation of standard assessment procedures used by ICES.
Stock Haddock in Division VIb
Working Group WGCSE
Date 20 May 2012
Revised by Vladimir Khlivnoy
A. General
A.1. Stock definition
The haddock stock at Rockall is an entirely separate stock from that on the continen-tal shelf of the British Isles (Chuksin and Gerber, 1976; Shestov, 1977; Blacker, 1982; Newton et al., 2008). The TAC for haddock VIb was previously (before 2004) set for Subarea Vb, VI, XII and XIV combined, with a limitation on the amount to be taken in Vb and VIa. In 2004, the TAC for Division VI was split and the VIb TAC for haddock was included with Divisions XII and XIV. This combined TAC has been in place since then.
A.2. Fishery
The development of the Rockall haddock fishery is documented in the 2001 Working Group Report (ICES-WGNSDS, 2001) and in the Report of the ICES group meeting on Rockall haddock convened in January 2001 (ICES, WGNSDS, 2002). That meeting was set up to respond to a NEAFC request for information on the Rockall haddock fish-ery. NEAFC agreed to consider regulation of the international fishery in 2001.
The Rockall haddock fishery changed markedly in 1999 when a revision of the EU EEZ placed the southwestern part of the Rockall plateau in international waters. This has opened opportunities for other nations, notably Russia, to exploit the fishery in this area. The table of official statistics includes Russian catches from the Rockall area.
The Russian fleet started fishing operations in international waters at Rockall in May–October 1999. The Russian haddock fishery uses bottom trawls with codend mesh size of 40–100 mm (mainly 40–70 mm) and retains haddock of all length classes in the catch. This fishery targets concentrations of haddock mainly during spring and the beginning of summer. Russian catches increased from 458 t in 1999 to 2154 t in 2000. In 2001, they were markedly reduced to 630 t due to the introduction of a closed area and low density of fish concentrations. Russian catches increased again in 2002–2004 from 1630 to 5844 t. In 2005–2007, they decreased from 4708 t to 1282 t, and are esti-mated to be 1669 t in 2008.
Prior to 1999, the UK and Ireland fisheries had been principally summer fisheries but in more recent years the Scottish and Irish fishery was conducted throughout the year with the peak in April–May. This shift in the fishery appears to have followed the discovery of concentrations of haddock in deeper water to the west of Rockall, at depths between 200 and 400 m. High catch rates attracted effort into the area. How-ever, catch rates in 2000 were reported to be poor in deeper water. Anecdotal evi-dence suggests that increased discarding has been associated with the deeper-water fishery compared with the traditional fishery at northern Rockall. In 2004–2007, a considerable proportion of EU landings were taken in the international waters. His-
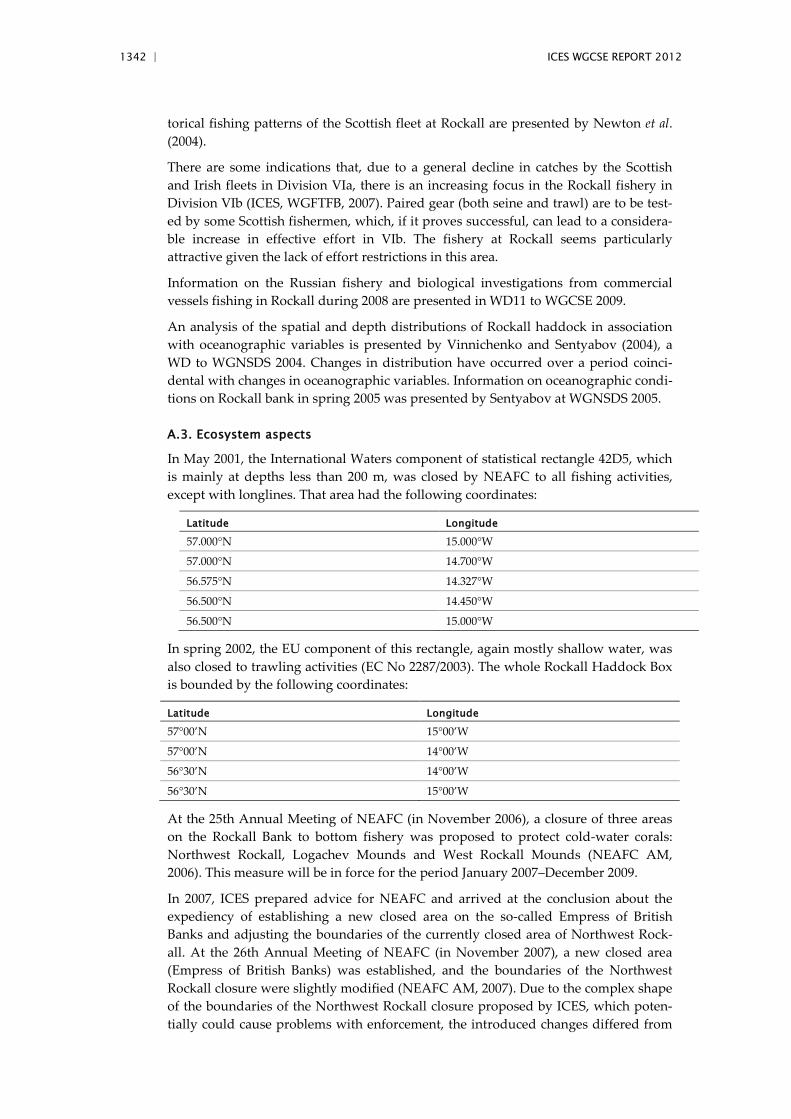
1342 | ICES WGCSE REPORT 2012
torical fishing patterns of the Scottish fleet at Rockall are presented by Newton et al. (2004).
There are some indications that, due to a general decline in catches by the Scottish and Irish fleets in Division VIa, there is an increasing focus in the Rockall fishery in Division VIb (ICES, WGFTFB, 2007). Paired gear (both seine and trawl) are to be test-ed by some Scottish fishermen, which, if it proves successful, can lead to a considera-ble increase in effective effort in VIb. The fishery at Rockall seems particularly attractive given the lack of effort restrictions in this area.
Information on the Russian fishery and biological investigations from commercial vessels fishing in Rockall during 2008 are presented in WD11 to WGCSE 2009.
An analysis of the spatial and depth distributions of Rockall haddock in association with oceanographic variables is presented by Vinnichenko and Sentyabov (2004), a WD to WGNSDS 2004. Changes in distribution have occurred over a period coinci-dental with changes in oceanographic variables. Information on oceanographic condi-tions on Rockall bank in spring 2005 was presented by Sentyabov at WGNSDS 2005.
A.3. Ecosystem aspects
In May 2001, the International Waters component of statistical rectangle 42D5, which is mainly at depths less than 200 m, was closed by NEAFC to all fishing activities, except with longlines. That area had the following coordinates:
Latitude Longitude
57.000°N 15.000°W
57.000°N 14.700°W
56.575°N 14.327°W
56.500°N 14.450°W
56.500°N 15.000°W
In spring 2002, the EU component of this rectangle, again mostly shallow water, was also closed to trawling activities (EC No 2287/2003). The whole Rockall Haddock Box is bounded by the following coordinates:
Latitude Longitude
57°00’N 15°00’W
57°00’N 14°00’W
56°30’N 14°00’W
56°30’N 15°00’W
At the 25th Annual Meeting of NEAFC (in November 2006), a closure of three areas on the Rockall Bank to bottom fishery was proposed to protect cold-water corals: Northwest Rockall, Logachev Mounds and West Rockall Mounds (NEAFC AM, 2006). This measure will be in force for the period January 2007–December 2009.
In 2007, ICES prepared advice for NEAFC and arrived at the conclusion about the expediency of establishing a new closed area on the so-called Empress of British Banks and adjusting the boundaries of the currently closed area of Northwest Rock-all. At the 26th Annual Meeting of NEAFC (in November 2007), a new closed area (Empress of British Banks) was established, and the boundaries of the Northwest Rockall closure were slightly modified (NEAFC AM, 2007). Due to the complex shape of the boundaries of the Northwest Rockall closure proposed by ICES, which poten-tially could cause problems with enforcement, the introduced changes differed from
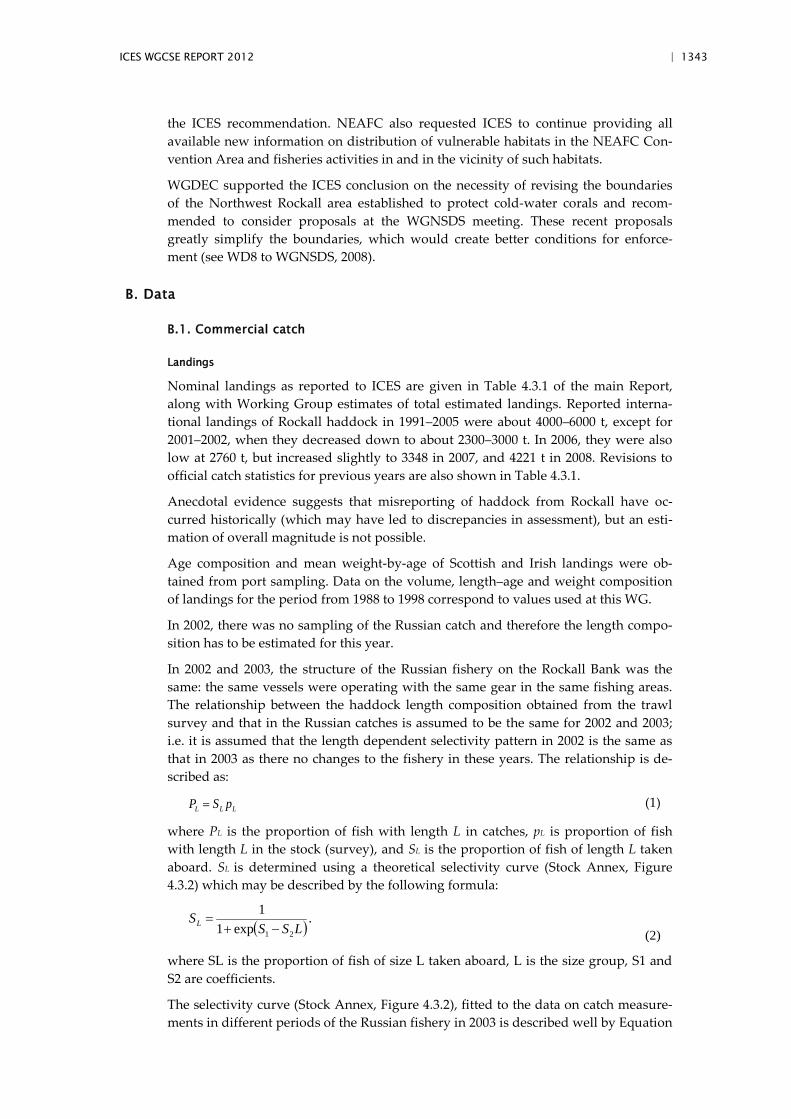
ICES WGCSE REPORT 2012 | 1343
the ICES recommendation. NEAFC also requested ICES to continue providing all available new information on distribution of vulnerable habitats in the NEAFC Con-vention Area and fisheries activities in and in the vicinity of such habitats.
WGDEC supported the ICES conclusion on the necessity of revising the boundaries of the Northwest Rockall area established to protect cold-water corals and recom-mended to consider proposals at the WGNSDS meeting. These recent proposals greatly simplify the boundaries, which would create better conditions for enforce-ment (see WD8 to WGNSDS, 2008).
B. Data
B.1. Commercial catch
Landings
Nominal landings as reported to ICES are given in Table 4.3.1 of the main Report, along with Working Group estimates of total estimated landings. Reported interna-tional landings of Rockall haddock in 1991–2005 were about 4000–6000 t, except for 2001–2002, when they decreased down to about 2300–3000 t. In 2006, they were also low at 2760 t, but increased slightly to 3348 in 2007, and 4221 t in 2008. Revisions to official catch statistics for previous years are also shown in Table 4.3.1.
Anecdotal evidence suggests that misreporting of haddock from Rockall have oc-curred historically (which may have led to discrepancies in assessment), but an esti-mation of overall magnitude is not possible.
Age composition and mean weight-by-age of Scottish and Irish landings were ob-tained from port sampling. Data on the volume, length–age and weight composition of landings for the period from 1988 to 1998 correspond to values used at this WG.
In 2002, there was no sampling of the Russian catch and therefore the length compo-sition has to be estimated for this year.
In 2002 and 2003, the structure of the Russian fishery on the Rockall Bank was the same: the same vessels were operating with the same gear in the same fishing areas. The relationship between the haddock length composition obtained from the trawl survey and that in the Russian catches is assumed to be the same for 2002 and 2003; i.e. it is assumed that the length dependent selectivity pattern in 2002 is the same as that in 2003 as there no changes to the fishery in these years. The relationship is de-scribed as:
LLL pSP = (1)
where PL is the proportion of fish with length L in catches, pL is proportion of fish with length L in the stock (survey), and SL is the proportion of fish of length L taken aboard. SL is determined using a theoretical selectivity curve (Stock Annex, Figure 4.3.2) which may be described by the following formula:
( ) .exp11
21 LSSSL −+
= (2)
where SL is the proportion of fish of size L taken aboard, L is the size group, S1 and S2 are coefficients.
The selectivity curve (Stock Annex, Figure 4.3.2), fitted to the data on catch measure-ments in different periods of the Russian fishery in 2003 is described well by Equation
1344 | ICES WGCSE REPORT 2012
2 with coefficients S1 = 12.539 and S2 = 0.4951. The estimated length–frequency distri-butions for 2003 are compared with the measured length–frequency distributions for this year in Stock Annex, Figure 4.3.2. The size distribution in the Russian catch in 2002 is then estimated by applying the theoretical selectivity curve to the survey length frequency in 2002.
To determine the age composition in Russian catches in 2002, the combined age–length key for all years of Russian catches was used.
Discards
The haddock catch estimated by landings is underestimated as a result of unaccount-ed discarding of small individuals in the Scottish and Irish fisheries in most years. On Russian vessels, the whole catch of haddock is retained on board and therefore, total catch is equivalent to landings.
Haddock discards on board Scottish vessels in 1999 and 2001 and Irish vessels in 1995, 1997, 1998, 2000 and 2001 were determined directly. In other years, indirect es-timates of discarding were calculated.
The direct estimates from the Scottish trawlers in 1985, 1999 and 2001 showed a larger proportion of discards of small haddock: from 12 to 75% by weight (Table 4.3.1) and up to 80–90% of catch numbers. Discard trips in 1995, 1997, 1998, 2000 and 2001 showed that discarding by Irish fishing vessels also reaches considerable values (Ta-ble 4.3.2). Discard trips in 1995, 1997, 1998, 2000 and 2001 showed that discarding by Irish fishing vessels is variable with a mean rate of 30% (Table 4.3.2).
Discard data were also obtained by Irish scientists from discard trips in 2007–2009 and 2011. They showed that 52, 87 and 63% of the catch in numbers, respectively, was discarded. The range of discarded sizes was 19–43 cm (mean 30 cm). In 2011 the dis-cards are significantly reduced as a result of the small number of young haddock in the population. (Table 4.3.2 of main report). It should be noted that these estimates are based on very few trips (one, two and three for 2007, 2008 and 2009 respectively) and should therefore be treated with caution.
Total numbers and weight landed and discarded by age on the Scottish observer trips in 1999 and 2001 are presented in Stock Annex, Tables 4.3.3 and 4.34.
The analysis of the discard data collected by Scottish scientists in 1999 and 2001 indi-cated that only a relatively small proportion of fish taken aboard is landed (Stock an-nex Figure 4.2.3). The probability of being retained increases with increasing fish length (Stratoudakis et al., 1999; Palsson et al., 2002; Palsson, 2003; Sokolov, 2003). The relationship between the number of individuals caught and number discarded may be described by the following relationship:
LLL NPPDND ×= (3)
where NDL is the number of discarded fish with length L, NPL is the number of fish caught at length L, PDL is the portion of discarded fish at length L.
The length composition of fish taken on board by Scottish and Irish trawlers was cal-culated by applying the logistic selectivity curve (Stock Annex, Figure 4.3.4) to the haddock stock length composition obtained from the survey. The selectivity parame-ters were calculated from Scottish and Irish catches taken by trawls with mesh size that are typical for the fleets of those countries operating at Rockall. The parameters were calculated as S1 = 12.608 and S2 = 0.4360 for the Scottish fleet. S1 = 26.248 and S2 = 0.8524 were used for Irish catches.
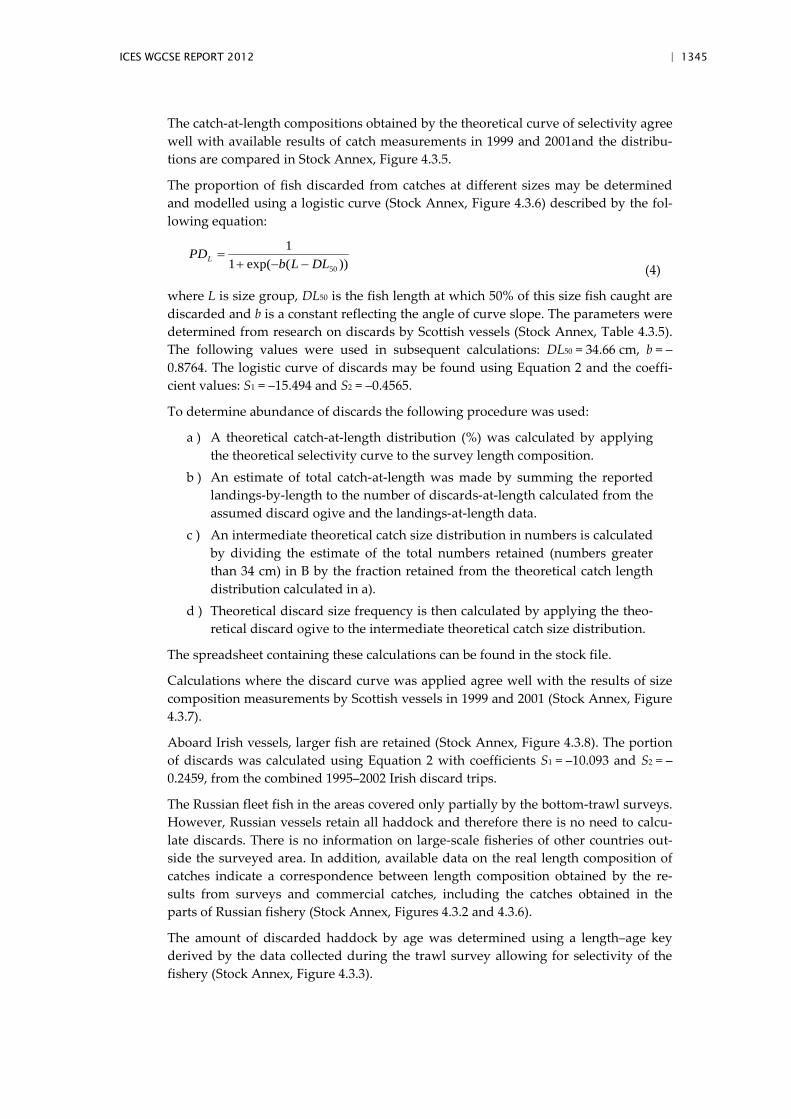
ICES WGCSE REPORT 2012 | 1345
The catch-at-length compositions obtained by the theoretical curve of selectivity agree well with available results of catch measurements in 1999 and 2001and the distribu-tions are compared in Stock Annex, Figure 4.3.5.
The proportion of fish discarded from catches at different sizes may be determined and modelled using a logistic curve (Stock Annex, Figure 4.3.6) described by the fol-lowing equation:
))(exp(11
50DLLbPDL −−+
= (4)
where L is size group, DL50 is the fish length at which 50% of this size fish caught are discarded and b is a constant reflecting the angle of curve slope. The parameters were determined from research on discards by Scottish vessels (Stock Annex, Table 4.3.5). The following values were used in subsequent calculations: DL50 = 34.66 cm, b = –0.8764. The logistic curve of discards may be found using Equation 2 and the coeffi-cient values: S1 = –15.494 and S2 = –0.4565.
To determine abundance of discards the following procedure was used:
a ) A theoretical catch-at-length distribution (%) was calculated by applying the theoretical selectivity curve to the survey length composition.
b ) An estimate of total catch-at-length was made by summing the reported landings-by-length to the number of discards-at-length calculated from the assumed discard ogive and the landings-at-length data.
c ) An intermediate theoretical catch size distribution in numbers is calculated by dividing the estimate of the total numbers retained (numbers greater than 34 cm) in B by the fraction retained from the theoretical catch length distribution calculated in a).
d ) Theoretical discard size frequency is then calculated by applying the theo-retical discard ogive to the intermediate theoretical catch size distribution.
The spreadsheet containing these calculations can be found in the stock file.
Calculations where the discard curve was applied agree well with the results of size composition measurements by Scottish vessels in 1999 and 2001 (Stock Annex, Figure 4.3.7).
Aboard Irish vessels, larger fish are retained (Stock Annex, Figure 4.3.8). The portion of discards was calculated using Equation 2 with coefficients S1 = –10.093 and S2 = –0.2459, from the combined 1995–2002 Irish discard trips.
The Russian fleet fish in the areas covered only partially by the bottom-trawl surveys. However, Russian vessels retain all haddock and therefore there is no need to calcu-late discards. There is no information on large-scale fisheries of other countries out-side the surveyed area. In addition, available data on the real length composition of catches indicate a correspondence between length composition obtained by the re-sults from surveys and commercial catches, including the catches obtained in the parts of Russian fishery (Stock Annex, Figures 4.3.2 and 4.3.6).
The amount of discarded haddock by age was determined using a length–age key derived by the data collected during the trawl survey allowing for selectivity of the fishery (Stock Annex, Figure 4.3.3).
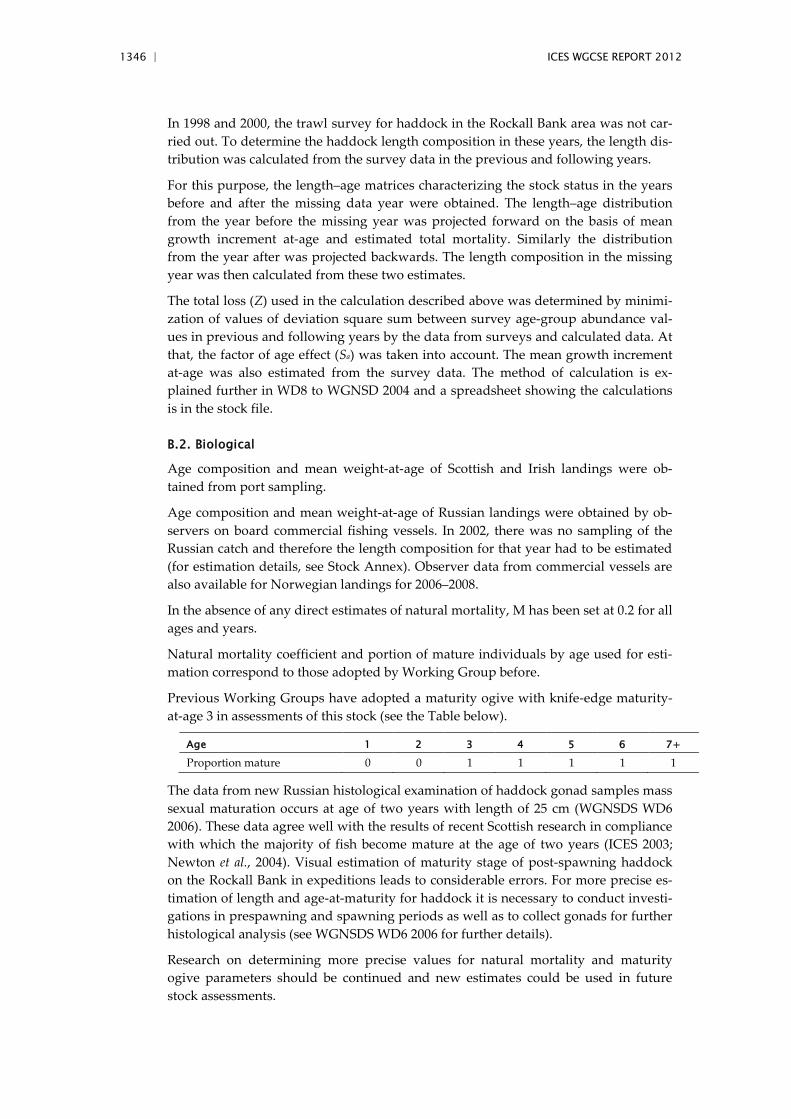
1346 | ICES WGCSE REPORT 2012
In 1998 and 2000, the trawl survey for haddock in the Rockall Bank area was not car-ried out. To determine the haddock length composition in these years, the length dis-tribution was calculated from the survey data in the previous and following years.
For this purpose, the length–age matrices characterizing the stock status in the years before and after the missing data year were obtained. The length–age distribution from the year before the missing year was projected forward on the basis of mean growth increment at-age and estimated total mortality. Similarly the distribution from the year after was projected backwards. The length composition in the missing year was then calculated from these two estimates.
The total loss (Z) used in the calculation described above was determined by minimi-zation of values of deviation square sum between survey age-group abundance val-ues in previous and following years by the data from surveys and calculated data. At that, the factor of age effect (Sa) was taken into account. The mean growth increment at-age was also estimated from the survey data. The method of calculation is ex-plained further in WD8 to WGNSD 2004 and a spreadsheet showing the calculations is in the stock file.
B.2. Biological
Age composition and mean weight-at-age of Scottish and Irish landings were ob-tained from port sampling.
Age composition and mean weight-at-age of Russian landings were obtained by ob-servers on board commercial fishing vessels. In 2002, there was no sampling of the Russian catch and therefore the length composition for that year had to be estimated (for estimation details, see Stock Annex). Observer data from commercial vessels are also available for Norwegian landings for 2006–2008.
In the absence of any direct estimates of natural mortality, M has been set at 0.2 for all ages and years.
Natural mortality coefficient and portion of mature individuals by age used for esti-mation correspond to those adopted by Working Group before.
Previous Working Groups have adopted a maturity ogive with knife-edge maturity-at-age 3 in assessments of this stock (see the Table below).
Age 1 2 3 4 5 6 7+
Proportion mature 0 0 1 1 1 1 1
The data from new Russian histological examination of haddock gonad samples mass sexual maturation occurs at age of two years with length of 25 cm (WGNSDS WD6 2006). These data agree well with the results of recent Scottish research in compliance with which the majority of fish become mature at the age of two years (ICES 2003; Newton et al., 2004). Visual estimation of maturity stage of post-spawning haddock on the Rockall Bank in expeditions leads to considerable errors. For more precise es-timation of length and age-at-maturity for haddock it is necessary to conduct investi-gations in prespawning and spawning periods as well as to collect gonads for further histological analysis (see WGNSDS WD6 2006 for further details).
Research on determining more precise values for natural mortality and maturity ogive parameters should be continued and new estimates could be used in future stock assessments.
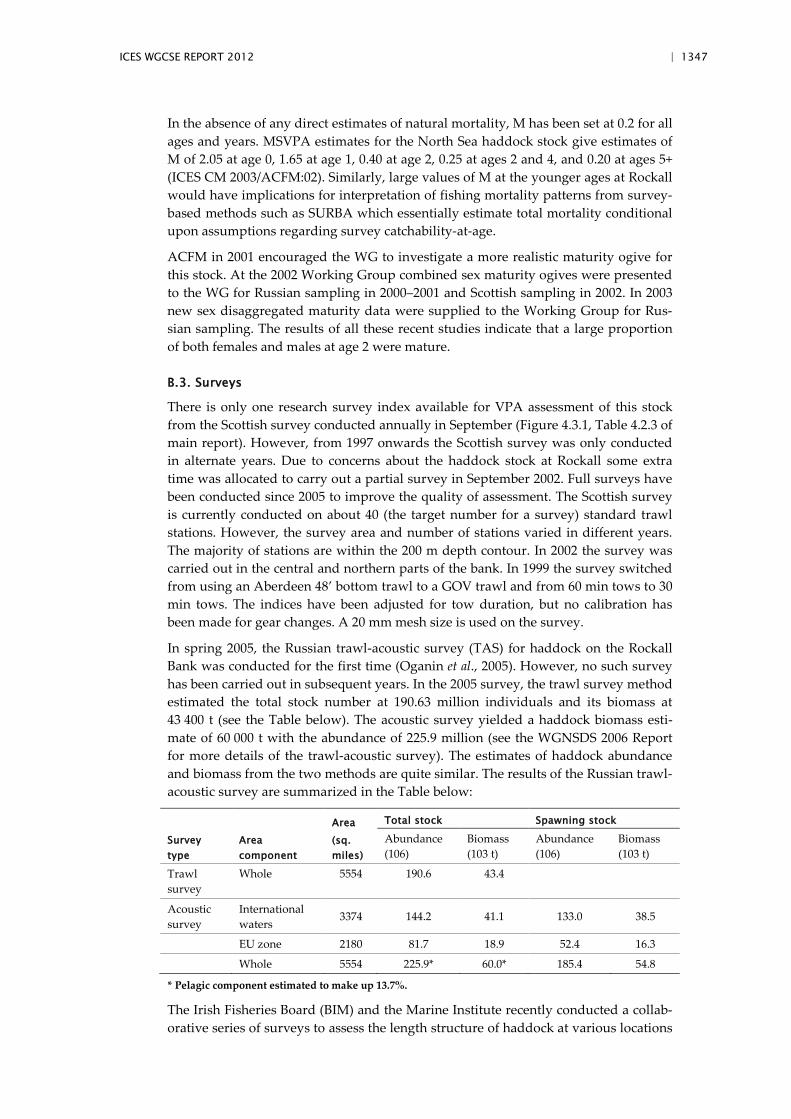
ICES WGCSE REPORT 2012 | 1347
In the absence of any direct estimates of natural mortality, M has been set at 0.2 for all ages and years. MSVPA estimates for the North Sea haddock stock give estimates of M of 2.05 at age 0, 1.65 at age 1, 0.40 at age 2, 0.25 at ages 2 and 4, and 0.20 at ages 5+ (ICES CM 2003/ACFM:02). Similarly, large values of M at the younger ages at Rockall would have implications for interpretation of fishing mortality patterns from survey-based methods such as SURBA which essentially estimate total mortality conditional upon assumptions regarding survey catchability-at-age.
ACFM in 2001 encouraged the WG to investigate a more realistic maturity ogive for this stock. At the 2002 Working Group combined sex maturity ogives were presented to the WG for Russian sampling in 2000–2001 and Scottish sampling in 2002. In 2003 new sex disaggregated maturity data were supplied to the Working Group for Rus-sian sampling. The results of all these recent studies indicate that a large proportion of both females and males at age 2 were mature.
B.3. Surveys
There is only one research survey index available for VPA assessment of this stock from the Scottish survey conducted annually in September (Figure 4.3.1, Table 4.2.3 of main report). However, from 1997 onwards the Scottish survey was only conducted in alternate years. Due to concerns about the haddock stock at Rockall some extra time was allocated to carry out a partial survey in September 2002. Full surveys have been conducted since 2005 to improve the quality of assessment. The Scottish survey is currently conducted on about 40 (the target number for a survey) standard trawl stations. However, the survey area and number of stations varied in different years. The majority of stations are within the 200 m depth contour. In 2002 the survey was carried out in the central and northern parts of the bank. In 1999 the survey switched from using an Aberdeen 48’ bottom trawl to a GOV trawl and from 60 min tows to 30 min tows. The indices have been adjusted for tow duration, but no calibration has been made for gear changes. A 20 mm mesh size is used on the survey.
In spring 2005, the Russian trawl-acoustic survey (TAS) for haddock on the Rockall Bank was conducted for the first time (Oganin et al., 2005). However, no such survey has been carried out in subsequent years. In the 2005 survey, the trawl survey method estimated the total stock number at 190.63 million individuals and its biomass at 43 400 t (see the Table below). The acoustic survey yielded a haddock biomass esti-mate of 60 000 t with the abundance of 225.9 million (see the WGNSDS 2006 Report for more details of the trawl-acoustic survey). The estimates of haddock abundance and biomass from the two methods are quite similar. The results of the Russian trawl-acoustic survey are summarized in the Table below:
Survey type
Area component
Area (sq. miles)
Total stock Spawning stock
Abundance (106)
Biomass (103 t)
Abundance (106)
Biomass (103 t)
Trawl survey
Whole 5554 190.6 43.4
Acoustic survey
International waters
3374 144.2 41.1 133.0 38.5
EU zone 2180 81.7 18.9 52.4 16.3
Whole 5554 225.9* 60.0* 185.4 54.8
* Pelagic component estimated to make up 13.7%.
The Irish Fisheries Board (BIM) and the Marine Institute recently conducted a collab-orative series of surveys to assess the length structure of haddock at various locations
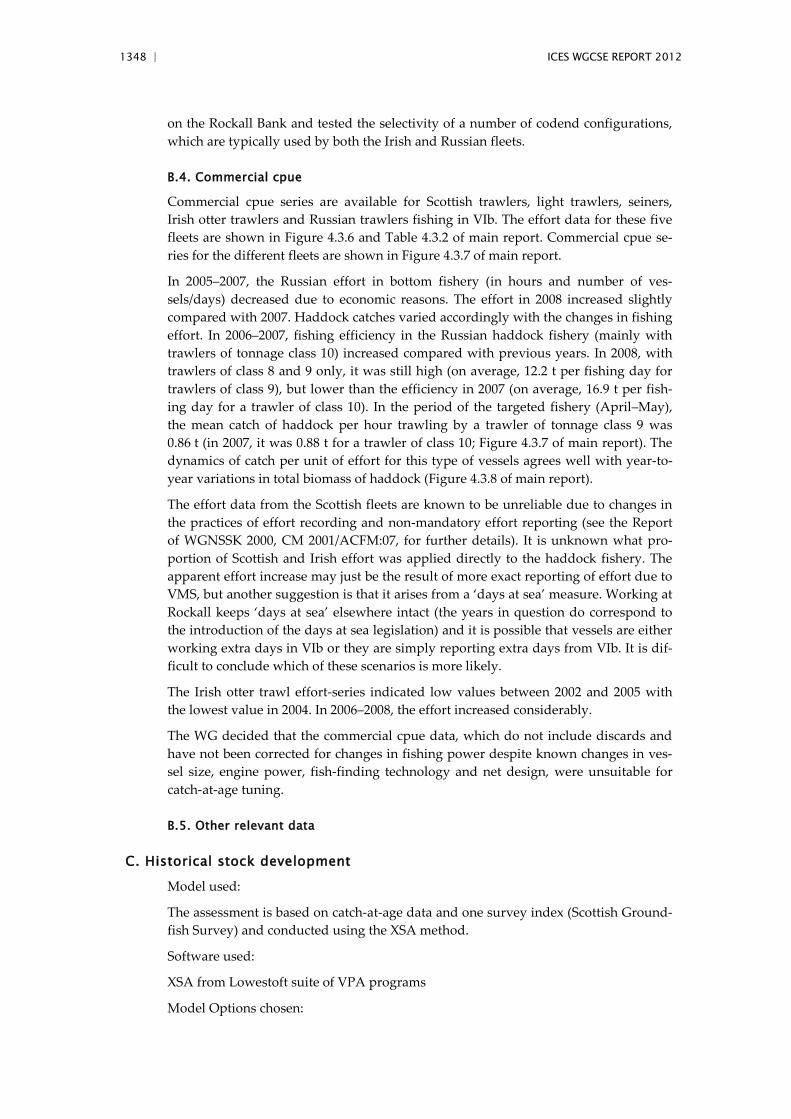
1348 | ICES WGCSE REPORT 2012
on the Rockall Bank and tested the selectivity of a number of codend configurations, which are typically used by both the Irish and Russian fleets.
B.4. Commercial cpue
Commercial cpue series are available for Scottish trawlers, light trawlers, seiners, Irish otter trawlers and Russian trawlers fishing in VIb. The effort data for these five fleets are shown in Figure 4.3.6 and Table 4.3.2 of main report. Commercial cpue se-ries for the different fleets are shown in Figure 4.3.7 of main report.
In 2005–2007, the Russian effort in bottom fishery (in hours and number of ves-sels/days) decreased due to economic reasons. The effort in 2008 increased slightly compared with 2007. Haddock catches varied accordingly with the changes in fishing effort. In 2006–2007, fishing efficiency in the Russian haddock fishery (mainly with trawlers of tonnage class 10) increased compared with previous years. In 2008, with trawlers of class 8 and 9 only, it was still high (on average, 12.2 t per fishing day for trawlers of class 9), but lower than the efficiency in 2007 (on average, 16.9 t per fish-ing day for a trawler of class 10). In the period of the targeted fishery (April–May), the mean catch of haddock per hour trawling by a trawler of tonnage class 9 was 0.86 t (in 2007, it was 0.88 t for a trawler of class 10; Figure 4.3.7 of main report). The dynamics of catch per unit of effort for this type of vessels agrees well with year-to-year variations in total biomass of haddock (Figure 4.3.8 of main report).
The effort data from the Scottish fleets are known to be unreliable due to changes in the practices of effort recording and non-mandatory effort reporting (see the Report of WGNSSK 2000, CM 2001/ACFM:07, for further details). It is unknown what pro-portion of Scottish and Irish effort was applied directly to the haddock fishery. The apparent effort increase may just be the result of more exact reporting of effort due to VMS, but another suggestion is that it arises from a ‘days at sea’ measure. Working at Rockall keeps ‘days at sea’ elsewhere intact (the years in question do correspond to the introduction of the days at sea legislation) and it is possible that vessels are either working extra days in VIb or they are simply reporting extra days from VIb. It is dif-ficult to conclude which of these scenarios is more likely.
The Irish otter trawl effort-series indicated low values between 2002 and 2005 with the lowest value in 2004. In 2006–2008, the effort increased considerably.
The WG decided that the commercial cpue data, which do not include discards and have not been corrected for changes in fishing power despite known changes in ves-sel size, engine power, fish-finding technology and net design, were unsuitable for catch-at-age tuning.
B.5. Other relevant data
C. Historical stock development
Model used:
The assessment is based on catch-at-age data and one survey index (Scottish Ground-fish Survey) and conducted using the XSA method.
Software used:
XSA from Lowestoft suite of VPA programs
Model Options chosen:
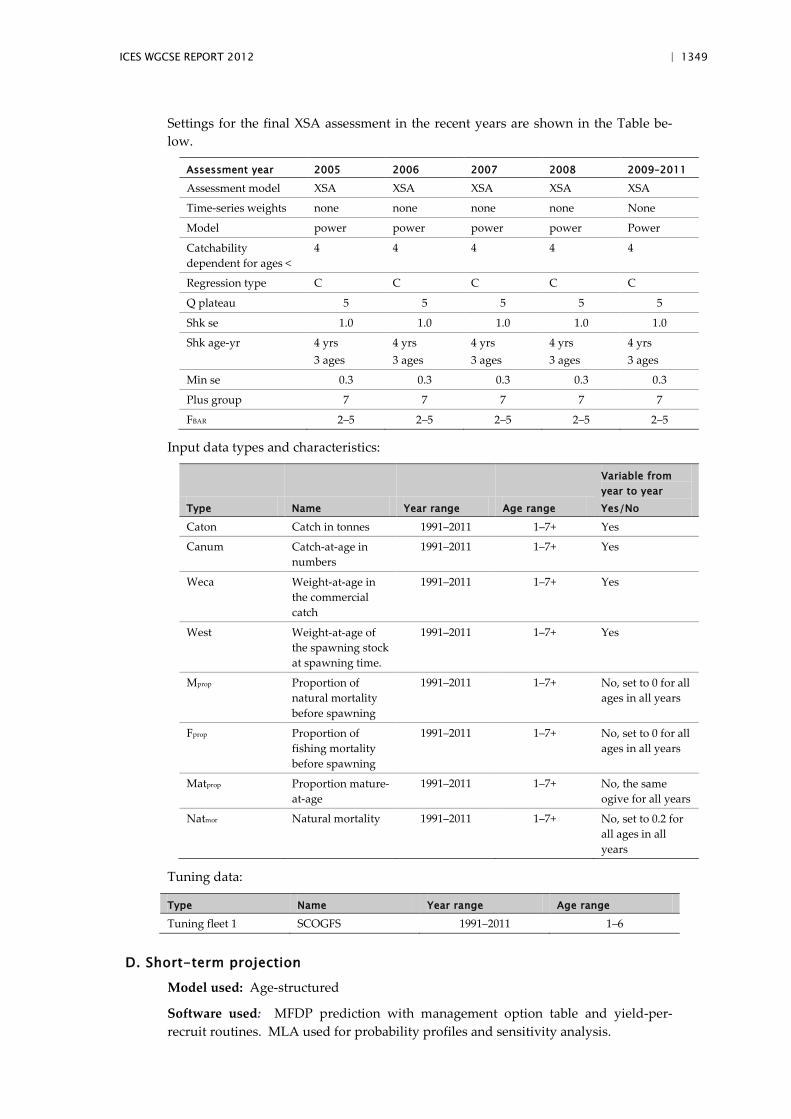
ICES WGCSE REPORT 2012 | 1349
Settings for the final XSA assessment in the recent years are shown in the Table be-low.
Assessment year 2005 2006 2007 2008 2009–2011
Assessment model XSA XSA XSA XSA XSA
Time-series weights none none none none None
Model power power power power Power
Catchability dependent for ages <
4 4 4 4 4
Regression type C C C C C
Q plateau 5 5 5 5 5
Shk se 1.0 1.0 1.0 1.0 1.0
Shk age-yr 4 yrs 3 ages
4 yrs 3 ages
4 yrs 3 ages
4 yrs 3 ages
4 yrs 3 ages
Min se 0.3 0.3 0.3 0.3 0.3
Plus group 7 7 7 7 7
FBAR 2–5 2–5 2–5 2–5 2–5
Input data types and characteristics:
Type Name Year range Age range
Variable from year to year Yes/No
Caton Catch in tonnes 1991–2011 1–7+ Yes
Canum Catch-at-age in numbers
1991–2011 1–7+ Yes
Weca Weight-at-age in the commercial catch
1991–2011 1–7+ Yes
West Weight-at-age of the spawning stock at spawning time.
1991–2011 1–7+ Yes
Mprop Proportion of natural mortality before spawning
1991–2011 1–7+ No, set to 0 for all ages in all years
Fprop Proportion of fishing mortality before spawning
1991–2011 1–7+ No, set to 0 for all ages in all years
Matprop Proportion mature-at-age
1991–2011 1–7+ No, the same ogive for all years
Natmor Natural mortality 1991–2011 1–7+ No, set to 0.2 for all ages in all years
Tuning data:
Type Name Year range Age range
Tuning fleet 1 SCOGFS 1991–2011 1–6
D. Short-term projection
Model used: Age-structured
Software used: MFDP prediction with management option table and yield-per-recruit routines. MLA used for probability profiles and sensitivity analysis.

1350 | ICES WGCSE REPORT 2012
Initial stock size: Taken from XSA for age 1 and older. The recruitment-at-age 1 in 2009 is estimated using RCT3. For forecasting recruitment in 2010 and thereafter, a geometric mean was used for 1991–2006.
Natural mortality: Set to 0.2 for all ages in all years.
Maturity: The same ogive as in the assessment is used for all years.
F and M before spawning: Set to 0 for all ages in all years.
Weight-at-age in the stock: Three year means (mean weights in the stock are as-sumed to be the same as catch weights, see below).
Weight-at-age in the catch: Three year means.
Exploitation pattern: Average of the three last years. Landings F are varied in the management option table.
Intermediate year assumptions: Status quo F.
Stock–recruitment model used: XSA estimate of recruits at age 1 for intermediate year. RCT3 model used for intermediate year +1 in 2009 and the long-term geometric mean recruitment-at-age 1 is used for forecasting recruitment in 2010 and thereafter.
Procedures used for splitting projected catches: F vectors in each of the last three years of the assessment are multiplied by the proportion landed at-age to give partial F for landings. The vectors of partial F are then averaged over the last three years to give the forecast values.
E. Medium-term projections
Model used: Age structured
Software used: MLA used for Medium-term projections.
Initial stock size: Taken from the XSA for age 1 and older. The recruitment-at-age 1 in 2009 is estimated using RCT3. For forecasting recruitment in 2010 and thereafter, a geometric mean was used for 1991–2006.
Natural mortality: Set to 0.2 for all ages in all years.
Maturity: The same ogive as in the assessment is used for all years.
F and M before spawning: Set to 0 for all ages in all years.
Weight-at-age in the stock: Three year means (mean weights in the stock are as-sumed to be the same as catch weights, see below).
Weight-at-age in the catch: Three year means.
Exploitation pattern: Average of the three last years.
Intermediate year assumptions:
Stock–recruitment model used: RCT3 model used for intermediate year +1 in 2009.
Uncertainty models used:
1 ) Initial stock size; 2 ) Natural mortality; 3 ) Maturity; 4 ) F and M before spawning; 5 ) Weight-at-age in the stock;
ICES WGCSE REPORT 2012 | 1351
6 ) Weight-at-age in the catch; 7 ) Exploitation pattern; 8 ) Intermediate year assumptions; 9 ) Stock–recruitment model used.
F. Yield and biomass-per-recruit/long-term projections
Model used: Yield and biomass-per-recruit over a range of F values.
Software used: MLA and “st graf”.
Maturity: Fixed maturity ogive as used in the assessment.
F and M before spawning: Set to 0 for all ages in all years.
Weight-at-age in the stock: Three year means (mean weights in the stock are as-sumed to be the same as catch weights, see below).
Weight-at-age in the catch: Three year means.
G. Biological reference points
Biological reference points for this stock are given below:
Blim: 6000 t (lowest observed SSB)
Bpa: 9000 t (Bloss × 1.4)
Fpa: 0.4 (by analogy with other haddock stocks).
H. Other issues
None.
I. References Blacker R.W. 1982. Rockall and its fishery. Laboratory Leaflet, Lowestoft. No 55. 23 pp.
Chuksin, Yu.V. and E.M.Gerber. 1976. Soviet fishery in the Rockall and Porcupine areas. Zaprybpromrazvedka. Kaliningrad, 8 pp.
ICES-WGFTFB. 2007. Report of ICES-FAO Working Group on Fish Technology and Fish Be-haviour (WGFTFB). ICES CM 2007/FTC:06.
ICES-WGNSDS. 2001. Report of the Working Group on the Assessment of Northern Shelf De-mersal Stock. ICES CM 2001/ACFM:01.
ICES-WGNSDS. 2002. Report of the Working Group on the Assessment of Northern Shelf De-mersal Stock. ICES CM 2002/ACFM:02.
NEAFC AM. 2006. Report of the 25th Annual Meeting of the North-East Atlantic Fisheries Commission.
NEAFC AM. 2006. Report of the 26th Annual Meeting of the North-East Atlantic Fisheries Commission.
Newton, A. W., Peach, K. J., Coull, K. A., Gault, M. and Needle, C. L. 2008. Rockall and the Scottish haddock fishery. Fisheries research, 94: 133–140.
Pálsson, Ó. K. 2003. A length-based analysis of haddock discards in Icelandic fisheries. Fisher-ies Research, 59: 437–446.

1352 | ICES WGCSE REPORT 2012
Pálsson, Ó. K., Karlsson, G., Arason, A., Gíslason, G. S., Jóhannesson, G. and Aðalsteinsson, S. 2002. Analysis of cod and haddock discards 2001. Reports of the Marine Research Institute No. 90, pp. 18. [Hafrannsóknastofnun Fjölrit Nr. 90, in Icelandic].
Shestov, V.P. 1977. Rockall haddock. Fishery biological resources of the North Atlantic and adjacent seas of the Arctic Ocean. Moscow, p. 344–346.
Sokolov, K. M. 2003. Estimation of cod discards in the Barents Sea and adjacent waters in 1993–2002. Comparison of results obtained using different methods. Working Document 9 to the Arctic Fisheries Working Group, Pasaia, 23 April–02 May 2003.
Stratoudakis, Y., Fryer, R. J., Cook, R. M., Pierce, G. J. 1999. Fish discarded from Scottish de-mersal vessels: estimators of total discards and annual estimates for targeted gadoids. IC-ES Journal of Marine Science, 56: 592–605.
ICES WGCSE REPORT 2012 | 1353
5.2 Stock Annex Northern Shelf Anglerfish
Stock specific documentation of standard assessment procedures used by ICES.
Stock Anglerfish (Northern Shelf, Division IIIa, Subarea IV and Subarea VI, and Norwegian Sea, Division IIa)
Working Group Assessment of Northern Shelf Demersal Stocks
Date 17 May 2005
Last updated 19 May 2008
A. General
A.1. Stock definition
Anglerfish occur in a wide range of depths, from quite shallow inshore waters down to at least 1000 m. Small anglerfish occur over most of the northern North Sea and Division VIa, but large fish, the potential spawners, are more rarely caught. Little is known about when and where anglerfish spawn in northern European waters and consequently stock structure is unclear. This lack of knowledge is due to the unusual spawning habits of anglerfish. The eggs and larvae are pelagic, but whereas most ma-rine fish produce individual free-floating eggs, anglerfish eggs are spawned in a large, buoyant, gelatinous ribbon which may contain more than a million eggs. Due to this strange behaviour, anglerfish eggs and larvae are rarely caught in convention-al surveys.
An EU-funded research project entitled ‘Distribution and biology of anglerfish and megrim in the waters to the West of Scotland’ (Anon, 2001) did however, improve our understanding. A particle tracking model was use to predict the origins of young fish and indicates that post-larval anglerfish may be transported over considerable distances before settling to the seabed (Hislop et al., 2001). Anglerfish in deeper wa-ters to the west of Scotland and at Rockall could therefore be supplying recruits to the western shelf and the North Sea. Furthermore, results of microsatellite DNA analysis carried out as part of this project show no structuring of the anglerfish stock into mul-tiple genetic populations within or among samples from Divisions IVa, Division VIa and Rockall. In fact this project also suggested that anglerfish from further south (Subarea VII) may also be part of the same stock. Fish tagged and released around the Shetland Islands (Division IVa) by Laurenson et al., 2005 have occasionally been re-captured in Subarea V and also Division IIa.
The WGNSDS considered the stock structure on a wider European scale in 2004, and found insufficient evidence to indicate an extension of the stock area northwards to include Division IIa. Anglerfish in IIa is at present treated separately by the Working Group.
A.2. Fishery
A.2.1. Northern Shelf anglerfish fisheries
UK vessels account for more than 50% of the total reported anglerfish landings from the Northern Shelf area. The Danish and Norwegian fleets are the next most im-portant exploiters of this stock in the North Sea while Irish and French vessels take a significant proportion of the landings to the West of Scotland. The fishery for an-glerfish in Subarea VI occurs largely in Division VIa with the UK and France being

1354 | ICES WGCSE REPORT 2012
the most important exploiters, followed by Ireland. Landings from Rockall (Division VIb) are generally less than 1000 t with the UK taking on average around 50% of the total. In the North Sea, the majority of landings are reported in Division IVa which reflects the northerly distribution of the species within the North Sea (Knijn et al., 1993).
A general description of the anglerfish fisheries of the most important nations taking part in this fishery is given below:
Scottish (UK) fishery
The Scottish fishery for anglerfish in Division VIa comprises two main fleets targeting mixed roundfish. The Scottish Light Trawl Fleet (SCOLTR) takes around 60% of land-ings and the Scottish Heavy Trawl Fleet (SCOTRL) over 20%. Around 10% of land-ings are bycatch from the Nephrops trawlers. The development of a directed fishery for anglerfish has led to considerable changes in the way the Scottish fleet operates. Part of this is a change in the distribution of fishing effort; the development of a di-rected fishery having led to effort shifting away from traditional roundfish fisheries in inshore areas to more offshore areas and deeper waters. The expansion in area and depth range fished has been accompanied by the development of specific trawls and vessels to exploit the stock. There has been an almost linear increase in landings from Division VIa since the start of the directed fishery until 1996 which has been followed more recently by a very severe decline, indicating the previous increase was almost certainly due only to the expansion and increase in efficiency of the fishery. More re-cent declines in landings (2002–2004) may have been due to restrictive TACs and the decline is not necessarily representative of the actual landings.
The Scottish fleet operating in VIb consists mainly of large otter trawlers (SCOTRL) targeting haddock and anglerfish at Rockall. Their activity depends on weather and the availability of haddock quota in VIb.
The Scottish fishery for anglerfish in the North Sea is located in two main areas: on the Shelf Edge to the north and west of Shetland and at the Fladen Ground. It ex-panded in a similar manner since the 1980s to that operating in Division VIa. The fishery to the north and west of Shetland operates as an extension to that in Division VIa and consists mainly of light trawlers targeting mixed round-fish. The highest re-ported landings in recent years (to 2007) come from the statistical rectangles around Shetland. The light-trawler fleet accounted for approximately 55% of Scottish report-ed landings in this area in 2007. The landings from the fishery at Fladen are lower but still significant (around 15% of the total) with anglerfish caught as a bycatch in the Nephrops fishery which consists of approximately 200 vessels in 2007. A small com-ponent of the landings (~10% in recent years) comes from the gillnet fishery which operates on the shelf edge in the far northwest of Division IVa. A large proportion of the landings in the gillnet fishery are taken by Spanish owned, UK registered vessels.
Ahead of the anglerfish STECF Review Group meeting in 2006 (SGRST-06-03), at-tempts were made to develop descriptions of the main Scottish anglerfish fisheries which were spatially more relevant to the stock distribution and activity of fishing vessels, rather than by ICES area. The descriptions used data on catch rates from var-ious sources, including research vessel surveys, observer trips on board commercial boats, consultation with skippers and analysis of individual trip records. An ‘an-glerfish fishery’ area was defined as the combined area of high abundance (catch-rates) from FRS/industry survey and observer data analysis. A ‘Nephrops fishery’ area was assumed to cover the Nephrops grounds which are well defined by soft substra-
ICES WGCSE REPORT 2012 | 1355
tum and are described in the appropriate ICES WGs. The areas are mostly separate but where overlaps occur, these are taken to be part of the anglerfish area. A third area is defined to include all other statistical rectangles.
In the Scottish ‘anglerfish’ area, large meshed otter trawlers have the largest contribu-tion to the total landings associated with anglerfish. This métier has a mixed species catch composition with haddock being the most important species and anglerfish and cod the next most important. In the Nephrops area the largest overall landings associ-ated with anglerfish come from the <100 mm gear category with the dominant species being Nephrops, followed by haddock and anglerfish.
Previous studied have found it difficult to identify a specific anglerfish fishery as catch composition can vary a great deal over a small spatial scale (i.e. less than a sta-tistical rectangle). Further analysis of the main, large mesh trawl operating in the ‘an-glerfish area’ is required to provide a more comprehensive picture of catch composition. This has so far been beyond the scope of the WG.
Irish fishery
The Irish fleet which takes around 15–20% of the total Division VIa landings is a light trawl fleet targeting anglerfish, hake, megrim and other gadoids on the Stanton Bank and on the slope northwest of Ireland. This fleet uses a mesh size of 80 mm or greater. Irish Division VIa landings come mainly from the Stanton bank with some landings from Donegal Bay and the slope northwest of Ireland. Since 1996 there has been an increase in the number of vessels using twin rigs in this fleet. There have also been changes to the fleet composition since 2000, with around ten vessels decommissioned and four new vessels joining the fleet. The activity of this fleet is not thought to have been significantly affected by the recent hake and cod recovery plans.
The Irish fleet otter trawl in Division VIb take anglerfish as a bycatch in the haddock fishery on the Rockall Bank. The fleet targeting haddock uses 100 mm mesh and twin rig trawls. Occasionally Irish-Spanish flag vessels target anglerfish, witch and megrim with 80 mm mesh on the slope in VIb. Discarding practices of these vessels are not known although discarding of anglerfish from the fleet targeting haddock in Division VIb is not thought to be significant (Anon, 2001). The fleet composition changed in 2001. Four vessels have recently been decommissioned and two new vessels have joined the fleet that targets haddock. In 2006 and 2007, the effort of the Irish fleet op-erating at Rockall has increased with the increase in Rockall haddock TAC.
Danish fishery
According to logbook records, the majority of Danish anglerfish landings are taken in the northeastern North Sea, in the part constituting the Norwegian Deeps, situated in the Norwegian EEZ of the North Sea. Other important fishing areas for anglerfish are the Fladen Ground (also in IVa) and in the Skagerrak (IIIa). More than 80% of the Danish landings come from ICES Divisions IVa and IIIa. The remaining part is from the most northern part of Division IVb.
The majority of the Danish vessels are taking anglerfish with demersal trawls with over 90% of these vessels in the size range 20–40 m.
Fishery definitions by gear type and mesh size as currently used by Danish Fisheries Directorate for the North Sea are given in the following text table:
1356 | ICES WGCSE REPORT 2012
Fishery/gear Mesh size, mm
Dem. Trawl >= 100 mm
Nephrops trawl 70–99 mm
Shrimp trawl 33–69 mm
Industrial trawl < = 32 mm
Beam trawl >= 80 mm
Note that in the North Sea demersal trawls account for more than 90% of total Danish landings. However, it is necessary to further specify that at present the majority of the Danish catches of anglerfish are taken by fisheries in the Norwegian zone of IVa ap-plying demersal trawls with mesh size >= 120 mm. In 2006, the fishery with demersal trawl in the Norwegian Deeps (in the Norwegian zone) accounted for around 75% of total Danish landings by all gears from the entire North Sea. In the Skagerrak (IIIa) the two main fisheries taking anglerfish are the (mixed) Nephrops fishery and the de-mersal trawl fishery. In both areas minor landings are taken in gillnets and as bycatch in fisheries for shrimp (Pandalus).
Information on the species composition of the landings from Danish fisheries taking anglerfish is available from the Danish logbook records and also from the Danish at-sea samples from observers on discard trips. Further details can be found in Section 6.2.1 of ICES WGNSDS 2007. Typically anglerfish constitutes less than 15% by weight of the landings from demersal trawlers fishing in the Norwegian Deeps.
Norwegian fisheries
A Norwegian directed gillnet fishery (360 mm mesh size), targeting large anglerfish, carried out by small vessels in coastal waters in the eastern part of the Northern North Sea started in the early 1990s. These vessels are responsible for around 60–70% of the total Norwegian landings from this area and they comprise around 6% of the total landings from Division IVa since 1999. The remaining Norwegian landings in IVa are mostly bycatch in various trawl fisheries. A similar pattern of fishing is found in the Skagerrak (IIIa). The third quarter has in recent years been the most important season for the directed fishery, while the second quarter is apparently most important for other gears.
Other fisheries
French demersal trawlers also take a considerable proportion of the total landings from this area. The vessels catching anglerfish may be targeting saithe and other de-mersal species or fishing in deep water for roundnose grenadier, blue ling or orange roughy.
Since the mid-1990s, a deep-water gillnet fishery targeting anglerfish has been con-ducting a fishery on the continental slopes to the West of the British Isles, North of Shetland, at Rockall and the Hatton Bank. These vessels, though mostly based in Spain are registered in the UK, Germany and other countries outside the EU such as Panama. Gear loss and discarding of damaged catch are thought to be substantial in this fishery. Until now these fisheries have not been well documented or understood and they seem to be largely unregulated, with little or no information on catch com-position, discards and a high degree of suspected misreporting. There are currently (2005) around 16 vessels participating in the fishery, 12 UK registered and four Ger-man registered.
ICES WGCSE REPORT 2012 | 1357
In response to the concerns with these gillnet fisheries for deep-water sharks and an-glerfish in Subarea VI, the EC banned the setting of gillnets in waters greater than 200 m in 2006 (Council Regulation 51/2006). However, this regulation was reviewed in July 2006 and a new regulation put in place which is a permanent ban, but allows a derogation for entangling nets in waters less than 600 m, not exceeding 100 km in total length with a maximum soak time of 72 hours. (EC Regulation No 40/2008 An-nex III, article 8). NEAFC have also introduced an indefinite ban. There is also legisla-tion proposed which will extend the ban to other areas including Division IVa.
In addition, the EU has recently funded a ghost net retrieval programme, DEEPCLEAN, (coordinated by the Marine Institute, Ireland) which is due to com-mence in autumn 2007. The intention of this programme is to a) maximize the recov-ery of lost or abandoned gillnets and b) to quantify the scale and biological consequences.
A.2.2. Division IIa anglerfish fisheries
In Division IIa most of the anglerfish is caught by small vessels in a directed gillnet fishery close to the coast. The legal mesh size has, since 1995, been 360 mm and max-imum two days soaking time. Offshore gillnetting, trawls and Danish seines are re-sponsible for the other catches. For the directed gillnet fishery, the area between N 62° and N 64° has been the most important with maximum catches almost reaching 3000 tonnes in 1993. During recent years the catches have varied between 1000–2000 tonnes. A fishery north of N 64° has developed rapidly, with catches reaching 2400 tonnes in 2007, exceeding the level of catches in the southern part of IIa for the first time. For the other gears, catches have increased from around 100 tonnes in the early 1990s to approximately 300–500 tonnes during the last four years. Very low catch fig-ures are reported from other nations north of N 62°.
A.3. Ecosystem aspects
No information.
B. Data
B.1. Commercial catch
B.1.1. Data compilation
Quarterly length–frequency distribution data were available from Scotland and Ire-land for Division VIa and Spain for Subarea VI in the past. A total international catch-at-length distribution for Division VIa was obtained by summing national raised catch-at-length distributions then raising this distribution to the WG estimates of total international catch from this area. Landings officially reported to ICES were used for countries not supplying estimates directly to the WG. Since 2001, the Scottish market sampling length–weight relationships (given below) have been used to raise the sam-pled catch-at-length distribution data Working Group estimates of total landings for Division VIa. Length–frequency data availability for VIb has been limited to Scottish and Irish samples.
Year Range Formula (L – length in cm, W – weight in g) Source
1992–2000 W=0.01626L2.988 Coull et. al., 1989
2001 onwards W=0.0232L2.828 Scottish Market Sampling
1358 | ICES WGCSE REPORT 2012
For anglerfish in the North Sea, catch-at-age composition data are available from Scotland for the years 1992 to 2007. In the past the Scottish quarterly age–length keys were applied to the available length–frequency data and non-sampled catches were attributed to age assuming their length–frequency distributions to be equivalent to the combined sampled distribution.
As a first step in assembling assessment data for the North Sea component of the stock, length compositions from Scottish market sampling have been raised to Work-ing Group estimates of total landings in the past. The Working Group estimate of to-tal landings was assumed equal to the landings obtained by national scientists plus official landings as reported to ICES for those countries not providing landings data to the Working Group. The Scottish market sampling data are only available from 1993 onwards, and even for these years the level of sampling has been relatively low. More recently, additional length samples are available from the Danish and Norwe-gian fisheries since 2002 including samples from Division IIIa.
Total international catch-at-length distribution data for the whole Northern shelf (Di-vision IIIa, Subarea IV and Subarea VI) have previously been obtained by summing the length distributions from the individual areas and assuming that this distribution is representative of the whole Northern Shelf. This was then raised to Working Group estimates of total landings for the Northern Shelf.
In addition, catch-at-length distribution data are available from the Norwegian di-rected coastal gillnetting in Division IIa from 1993 to 2007, although there are no data from 1997–2001. There are also catch-at-length distribution data from anglerfish caught as bycatch in the offshore gillnetting and longlining fleets for 2004–2007. No attempts have been made to present raised catch-at-length distribution for anglerfish from Division IIa.
B.1.2. Commercial catch data quality
For a number of years, anglerfish in Subarea VI, XII, XIV and Division Vb (EU zone) were subjected to a precautionary TAC (8600 t), based on average landings in earlier years. In 2002 the TAC was set at 4770 t and was further reduced to 3180 t in 2003 and 2004. The TAC was increased in 2005 to 4686 t and to 5155 t for 2007. At the WG in 2003, it was highlighted that the reduction off the TAC in 2003 to just two-thirds of that in 2002 would likely imply an increased incentive to misreport landings and in-crease discarding unless fishing effort was reduced accordingly (Section 6.4.6, ICES WGNSDS 2003). Anecdotal information from the fishery in 2003 to 2005 appeared to suggest that the TAC was particularly restrictive in these years. The official statistics for these years are, therefore, likely to be particularly unrepresentative of actual land-ings.
The absence of a TAC for Subarea IV prior to 1999 means that before then, landings in excess of the TAC in other areas, were likely to be misreported into the North Sea. In 1999, a precautionary TAC was introduced for North Sea anglerfish, but unfortunate-ly for current and future reporting purposes, the TAC was set in accord with recent catch levels from the North Sea which includes a substantial amount misreported from Subarea VI. The area misreporting practices have thus become institutionalised and the statistical rectangles immediately east of the 4°W boundary (E6 squares) have accounted for a disproportionate part of the combined VIa/North Sea catches of an-glerfish.
The Working Group historically (prior to 2005) provided estimates of the actual Divi-sion VIa landings by adjusting the reported data for Division VIa to include a propor-
ICES WGCSE REPORT 2012 | 1359
tion of the landings declared from Division IVa in the E6 ICES statistical rectangles. The correction has been applied by first estimating a value for the true catch in each E6 square then allocating the remainder of the catch into VIa squares in proportion to the reported catches in those squares. The ‘true’ catches in the E6 squares are estimat-ed by replacing the reported values by the mean of the catches in the adjacent squares to the east and west. This mean is calculated iteratively to account for increases in catches in the VIa squares resulting from reallocation from the E6 squares. Such a re-allocation of catches may still inadvertently include some landings taken legally in Division IVa on the shelf edge to the west of Shetland, but these are likely to comprise fish within the distribution of the Division VIa stock component. Due to technical problems associated with changes to the Scottish Executive database and lack of land-ings data provided to the Working Group by some of the major nations exploiting the fishery, WG estimates of the actual Division VIa landings have not been calculated for recent years (2005–2007).
At the 2010 WGCSE, for data in 2009, this procedure was adjusted to reallocate data to the whole of Area VI: i.e. not just VIa but including Rockall (VIb). This was based on information received from Marine Scotland Compliance indicating that some ves-sels fishing for anglerfish at Rockall are reporting large catches in the E6 squares from the same voyage. The distribution of landings this new scheme produced was more in keeping with the distribution of the stock as indicated from the anglerfish surveys.
B.2. Biological
Previous assessments of this stock used the natural mortality rate applied to an-glerfish in Division VI adopted by an earlier Hake Assessment Working Group of 0.15 yr1. This value is once more adopted for all ages and lengths in the absence of any direct estimates for this stock.
Historically, the catch-at-age analysis of anglerfish in Division VIa used the same ma-turity ogive as that applied to anglerfish in Subareas VII and VIII by the Working Group on the Assessment of Southern Shelf Demersal Stocks. However, a number of more recent maturity studies based on the VIa stock indicate that maturity does not occur until much later than previously estimated. Afonso-Dias and Hislop, 1996 give a length–maturity ogive for this stock, 50% maturity at approximately 74 cm in fe-males, and 50 cm in males. However, this study was based on few samples. New in-formation has become available from the EU-funded project (Anon, 2001) which indicates female 50% maturity at approximately 94 cm and males at 57 cm. The corre-sponding age based ogives indicate 50% maturity at approximately age 9 in females and age 5 in males. This has also been supported by more recent studies by Lauren-son et al., 2005.
B.3. Surveys
In previous length-based assessments of this stock, a recruitment index was used which had been obtained from the Scottish March West Coast survey. The index con-sists of numbers of anglerfish less than 30 cm caught per hour. However, at more re-cent meetings of this WG it has been concluded that the traditional groundfish surveys are ineffective at catching anglerfish and do not provide a reliable indication of stock size. As a result of this conclusion, and the urgent requirement for fishery-independent data, Marine Scotland Science began a new joint science/industry survey in 2005. This is a targeted anglerfish survey with a scientific design using commercial gear. In 2006, 2007 and 2009 Ireland extended the anglerfish survey to cover the re-maining part of VIa (from 54°30’ to 56°39’). Further details of the survey including
1360 | ICES WGCSE REPORT 2012
information on design, sampling protocol and gear and vessel are given in Fernandes et al., 2007 and in annual working documents which describe the survey results.
B.4. Commercial cpue
B.4.1. Official logbook data
Previous length based assessments attempted to use effort data to constrain the tem-poral trend in fishing mortality. Scottish Light Trawl data, disaggregated into an in-shore and offshore component, the latter of which is associated with the anglerfish fishery, for both West of Scotland and Shetland (N Sea) were provided to the Work-ing Group. However, these data are no longer considered to be reliable due to non-mandatory recording of hours fished in the logbook data. Further details of the Scot-tish fleet effort recording problem can be found in the report of the 2000 WGNSSK (ICES, 2001). Since these data are considered unreliable, they are not presented here.
Irish lpue data in terms of hours fished has been presented to the WG for Division VIa and Division VIb for all fleets up to 2006 (shown in Table B.4.1). The measure of kWdays is believed to be a more reliable proxy for effort than hours fished due to reporting issues and these data are presented in the WG report.
Danish landings and effort data (hours fished) from logbook data are also available to the WG for Division IIIa and Division IVa. Although these data are considered to be reliable (in terms of accuracy of reporting), it is not know to what extent they are use-ful in providing an indicator of stock size due to management regulations in the Norwegian zone (TAC constraints) and technological creep.
No effort data have been made available to the WG for fisheries operating in Division IIa.
B.4.2. Tallybook data
Analysis of skippers’ personal diary information collected in 2004 and 2005 in an at-tempt to improve knowledge of the state of the stock and of the Scottish anglerfish fishery provided valuable information to ICES (Bailey et al., 2004) on temporal and spatial trends in catch rate. Following the success of these data collation exercise, IC-ES advised the process to continue and a more formal scheme was proposed by FRS.
Extensive discussions with the fishing industry during 2005 resulted in FRS imple-menting the monkfish tallybook project at the start off 2006. The project is part of a long-term approach to providing better information on the monkfish fishery and the state of the stock, and is being operated in conjunction with fishers’ organizations (Scottish Fishermen’s Federation, Fishermen’s Association Limited and Pecheurs de Manche et Atlantique) and the North Atlantic Fisheries College (NAFC) Marine Cen-tre, Shetland. These organizations have been responsible for distributing the tally-books, coordinating the returns and allocating a vessel code before the anonymised tallybook sheets are forwarded to FRS. The tallybooks are filled in on a haul-by-haul basis to give weight caught by size category and information on haul location, dura-tion and depth in a standardized format as well as gear and mesh being used. Addi-tionally information on mature females has been requested. Data are stored in a database at FRS.
So far, the time-series is relatively short, with the first returns from fishing trips at the end of December 2005 and the most recent from March 2008. Initial participation in the scheme was high with returns received from up to 37 vessels with a wide spatial
ICES WGCSE REPORT 2012 | 1361
coverage (across Subarea VI, Division IVa, IIa and Vb) and different target species. Of the 37 vessels which have so far supplied information, two are French and these are operating towards the southern end of the shelf edge in Division VIa northwest of Ireland. The haul depth information collated so far indicates that most of the hauls are taken in depths between 100 and 400 m although there are a significant number of hauls from depths between 600 and 800 m. The records from the deeper water are largely from the French vessels although it does appear that a number of the Scottish vessels make occasional trips into deeper water. Average catch rates are similar to those previously seen in the diary data and observer data (presented in previous WG reports) and range from around 10 kg/h for boats targeting Nephrops to over 100 kg/h for some whitefish boats.
Analysis of the catch rate data is presented in the WG report and in Dobby et al., 2007.
B.5. Other relevant data
None.
C. Historical stock development
Since 2003 the WG has been unable to provide an assessment of anglerfish. This is due to a combination of unreliable commercial data: landings misreporting in some of the main fleets involved in the fishery and uncertain effort data, and poor catcha-bility of anglerfish in traditional research vessel surveys.
Although, the stock status has been classified as uncertain in recent years, TAC in-creases of 10% occurred in both the West of Scotland and North Sea areas on the basis of advice from the STECF Review Group meeting (SGRST-06-03) which examined trends in commercial catch rate data and fishery information.
In previous years the stock assessment has been conducted using a length based model for which the settings are outlined below.
Model used: Catch-at-length analysis (modified CASA-Sullivan et. al., 1990; Dobby, 2002).
Software used: Fortran coded executable-LBAV4_1.
Model Options chosen:
Sex differentiated von Bertalanffy growth, variability distributed according to a beta function. Parameters taken from Scottish anglerfish survey in 2000: L4(F)=140.5, K(F)=0.117, L4(M)=110.5, K(M)=0.154.
Fishing mortality in 1993=1.0
Historical equilibrium fishing mortality fitted using mean of historical WG estimates of landings which is approximately 18 000 t over 1987–1991.
Logistic exploitation pattern with fitted parameters.
Trend in temporal fishing mortality equal to trend in recent SCOLTR effort data
Total recruitment normally distributed over length classes
Input data types and characteristics:
1362 | ICES WGCSE REPORT 2012
Name Year range Variable from year to year Yes/No
Catch in tonnes 1993–last data year Yes
Catch-at-length in numbers 1993–last data year Yes
Weight-at-length in the commercial catch
1993–last data year Yes/No–2 weight-length relationships: covering 1993–2000, and 2001 onwards
Weight-at-length of the spawning stock at spawning time.
1993–last data year Yes/No-assumed to be the same as weight-at-length in the catch
Proportion mature-at-length 1993–last data year No–the same ogive for all years
Natural mortality 1993–last data year No–set to 0.15 for all lengths in all years
Auxiliary data:
Type Name Year range Size range
Recruitment index Scottish March West Coast survey
1993–last data year < 30 cm
D. Short-term projection
In previous years the short-term forecast has used a length structured method with settings outlined below.
Model used: Length-structured
Software used: Fortran coded executable LBForecast.exe
Initial stock size: taken from catch-at-length analysis. The long-term geometric mean recruitment is used in all projection years. Natural mortality: Set to 0.15 for all lengths in all years
Maturity: The same ogive as in the assessment is used for all years
Weight–length relationship: as used in the assessment (Scottish Market sampling)
Exploitation pattern: Fixed exploitation-at-length pattern is estimated in the catch-at-length analysis. This is assumed to apply in all further years.
E. Medium-term projections
No medium-term projections are carried out for this stock.
F. Yield and biomass-per-recruit/long-term projections
Previous yield and biomass-per-recruit calculations were carried out on the basis of the results of length-based assessments which are no longer carried out.
G. Biological reference points
Precautionary approach reference points: “ICES considers that there is currently no biological basis for defining Blim or Flim. ICES proposes that F35%SPR =0.30 be chosen as Fpa. It is considered to be an approximation of FMSY.”
The statement included above first appeared in 1998, but the WG has been unable to find the basis of the derivation of this reference point and considers it no longer ap-propriate to include it.
ICES WGCSE REPORT 2012 | 1363
H. Other issues
In previous (‘catch-at-length’) assessments of this stock, the SSB was always estimat-ed to be at a very low level. The length data have been based on the UK landings only (in Subdivisions. IVa and VIa), where very few individuals over 80 cm appear in the catch and therefore the model predicts very few in the population. Since females do not mature until they are over 90 cm in length the SSB is estimated to be very low. The length data from the eastern part of the North Sea (Danish and Norwegian fisher-ies) for the recent years indicate a higher amount of larger individuals in the catches. Although the Danish and Norwegian landings are small in comparison with the UK landings, the inclusion of the Danish and Norwegian length frequencies in the data used for any future assessment may change the concept of the magnitude of the SSB.
The fact that mature female anglerfish are rarely observed either on scientific surveys or by observers on board commercial vessels supports a very low estimate of spawn-ing–stock biomass, yet there is little evidence of reduction in spatial distribution as fish are still recruiting to relatively inshore areas. It has been hypothesized that fe-males may become pelagic when spawning as they produce a buoyant, gelatinous ribbon of eggs, and would therefore not appear in the catch of trawlers. (Anglerfish have been caught near the surface, Hislop et al., 2000). This would imply different exploitation patterns for males and females: a dome-shaped pattern (decreased ex-ploitation at larger sizes) for females and a logistic pattern for males. It is also not known whether anglerfish are an iteroparous or semelparous species. The latter would also account for the almost complete absence of spawning females in commer-cial catches or research vessel surveys.
The key features of the species’ life history in relation to its exploitation are the loca-tion of the main spawning areas, and whether or not there is any systematic migra-tion of younger fish back into the deeper waters to spawn. At present, despite the large increase in catches during the mid 1990s, there is no apparent contraction in distribution; fish are still recruiting to relatively inshore areas such as the Moray Firth in the northern North Sea. The fact that spawning may occur largely in deep water off the edge of the continental shelf may offer the stock some degree of refuge. However, this assumes that the spawning component of the stock is resident in the deep water, and is thus not subject to exploitation. It is not known to what extent this is true, but if such a reservoir exists then the currently used assessment methods which make dynamic pool assumptions about the population are likely to be inappropriate. Nev-ertheless, it is clear that further expansion of the fishery into deeper water is likely to have a negative effect on the SSB and given the spatial development of the fishery, it cannot be ruled out that the serial depletion of fishing grounds has been occurring. In addition, some life-history characteristics of anglerfish suggest that it may be particu-larly vulnerable to high exploitation. A detailed discussion of the fishery develop-ment and biology can be found in Sections 7.5.4 and 7.5.5 of the 2000 Report of this Working Group (ICES, 2001).
I. References Afonso-Dias, I. P. and J. R. G. Hislop. 1996. The population of anglerfish (Lophius piscatorius)
from the northwest coast of Scotland. J. Fish. Biol. 49 (Suppl A): 18–39.
Anon. 2001. The distribution and biology of anglerfish and megrim in waters to the west of Scotland. EC Study Contract 98/096 Final Report August 2001.
1364 | ICES WGCSE REPORT 2012
Coull, K.A., A.S. Jermyn, A.W. Newton, G.I. Henderson and W.B. Hall 1989. Length/Weight relationships for 88 species of fish encountered in the North East Atlantic. Scottish Fisher-ies Research Report No. 43.
Dobby, H. 2002. A length-based assessment of anglerfish in Division VIa: developments in growth modelling. Working Document for the Working Group on the Assessment of Northern Shelf Demersal Stocks, 2002.
Dobby, H., L. Allan, M. Harding, C. Laurenson and H. A. McLay. 2007. Improving the quality of information on Scottish anglerfish fisheries–making use of fishers’ data. ICES CM 2007/K:16.
Fernandes, P. G., Armstrong, F., Burns, F., Copland, P., Davis, C., Graham, N., Harlay, X., O’Cuaig, M., Penny, I., Pout, A. C. and Clarke, E. D. 2007. Progress in estimating the abso-lute abundance of anglerfish on the European northern shelf from a trawl survey. ICES CM 2007/K:12.
Hislop, J. R. G., A. Gallego, M. R. Heath, F. M. Kennedy, S. A. Reeves and P. J. Wright. 2001. A synthesis of the early life history of anglerfish, Lophius Piscatorius (Linnaeus, 1756) in north-ern British waters. ICES Journal of Marine Science, 58, 70–86.
ICES. 2001. Report of the Working Group on the Assessment of Demersal Stocks in the North Sea and Skagerrak, 2000. ICES CM 2001/ACFM:07.
Knijn, R. J., T. W. Boon, H. J. L. Heessen and J. R. G. Hislop. 1993. Atlas of North Sea Fishes–ICES Cooperative Research Report No. 194.
Laurenson, C. H., A. Johnson and I. G. Priede. 2005. Movements and growth of monkfish Lo-phius piscatorius tagged at the Shetland Islands, northeastern Atlantic. Fisheries Research 71:185–195.
Sullivan, P. J., H-L Lai and V. F. Gallucci. 1990. A catch-at-length analysis that incorporates a stochastic model of growth. Can. J. Fish. Aquat. Sci. 47, 184–198.
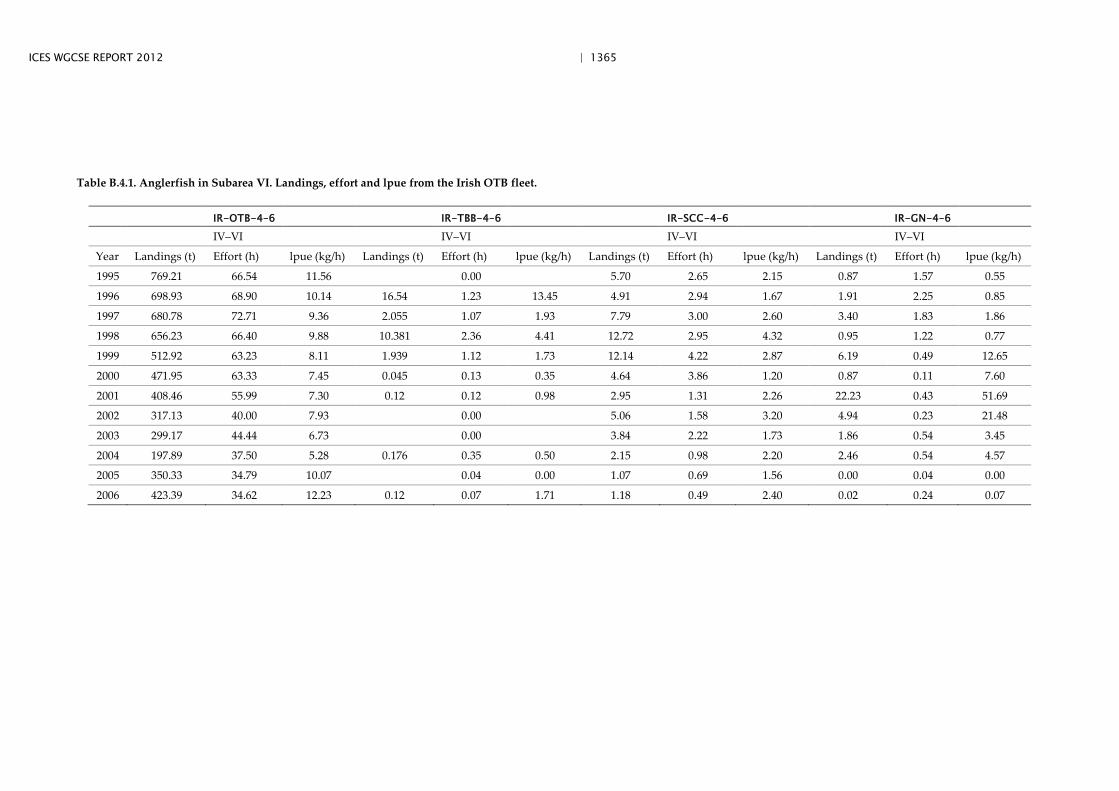
ICES WGCSE REPORT 2012 | 1365
Table B.4.1. Anglerfish in Subarea VI. Landings, effort and lpue from the Irish OTB fleet.
IR-OTB-4–6 IR-TBB-4–6 IR-SCC-4–6 IR-GN-4–6
IV–VI IV–VI IV–VI IV–VI
Year Landings (t) Effort (h) lpue (kg/h) Landings (t) Effort (h) lpue (kg/h) Landings (t) Effort (h) lpue (kg/h) Landings (t) Effort (h) lpue (kg/h)
1995 769.21 66.54 11.56 0.00 5.70 2.65 2.15 0.87 1.57 0.55
1996 698.93 68.90 10.14 16.54 1.23 13.45 4.91 2.94 1.67 1.91 2.25 0.85
1997 680.78 72.71 9.36 2.055 1.07 1.93 7.79 3.00 2.60 3.40 1.83 1.86
1998 656.23 66.40 9.88 10.381 2.36 4.41 12.72 2.95 4.32 0.95 1.22 0.77
1999 512.92 63.23 8.11 1.939 1.12 1.73 12.14 4.22 2.87 6.19 0.49 12.65
2000 471.95 63.33 7.45 0.045 0.13 0.35 4.64 3.86 1.20 0.87 0.11 7.60
2001 408.46 55.99 7.30 0.12 0.12 0.98 2.95 1.31 2.26 22.23 0.43 51.69
2002 317.13 40.00 7.93 0.00 5.06 1.58 3.20 4.94 0.23 21.48
2003 299.17 44.44 6.73 0.00 3.84 2.22 1.73 1.86 0.54 3.45
2004 197.89 37.50 5.28 0.176 0.35 0.50 2.15 0.98 2.20 2.46 0.54 4.57
2005 350.33 34.79 10.07 0.04 0.00 1.07 0.69 1.56 0.00 0.04 0.00
2006 423.39 34.62 12.23 0.12 0.07 1.71 1.18 0.49 2.40 0.02 0.24 0.07
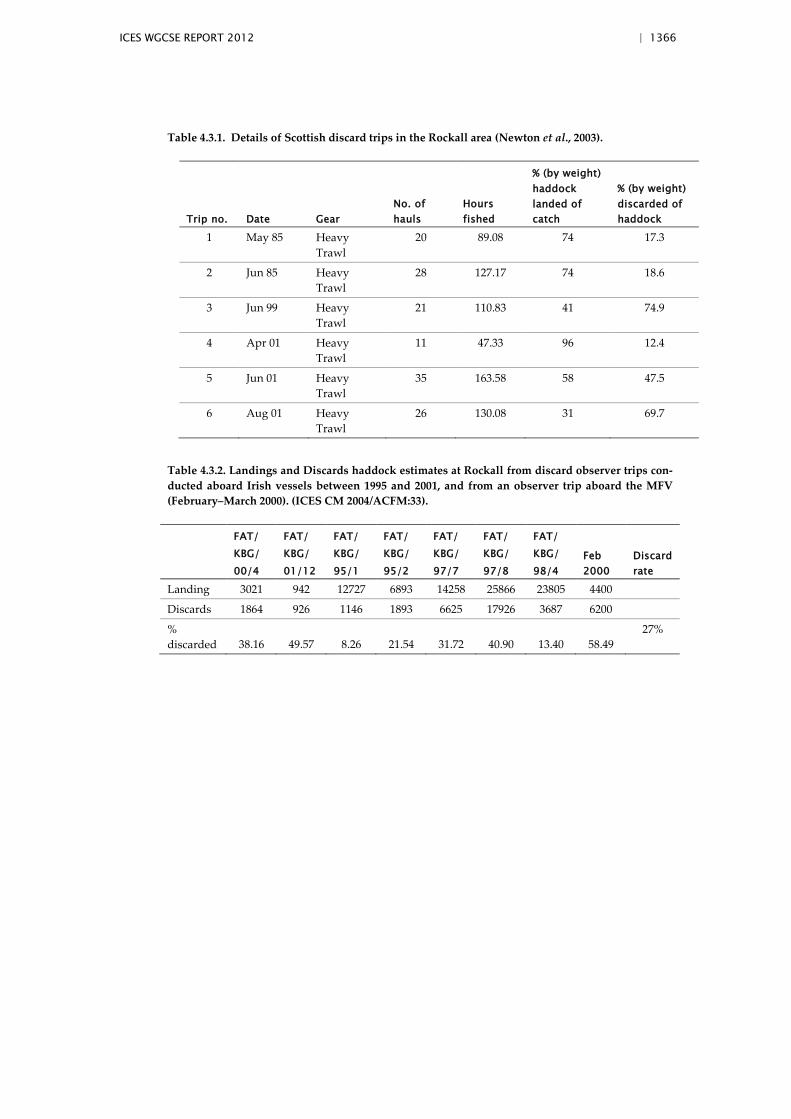
ICES WGCSE REPORT 2012 | 1366
Table 4.3.1. Details of Scottish discard trips in the Rockall area (Newton et al., 2003).
Trip no. Date Gear No. of hauls
Hours fished
% (by weight) haddock landed of catch
% (by weight) discarded of haddock
1 May 85 Heavy Trawl
20 89.08 74 17.3
2 Jun 85 Heavy Trawl
28 127.17 74 18.6
3 Jun 99 Heavy Trawl
21 110.83 41 74.9
4 Apr 01 Heavy Trawl
11 47.33 96 12.4
5 Jun 01 Heavy Trawl
35 163.58 58 47.5
6 Aug 01 Heavy Trawl
26 130.08 31 69.7
Table 4.3.2. Landings and Discards haddock estimates at Rockall from discard observer trips con-ducted aboard Irish vessels between 1995 and 2001, and from an observer trip aboard the MFV (February–March 2000). (ICES CM 2004/ACFM:33).
FAT/ KBG/ 00/4
FAT/ KBG/ 01/12
FAT/ KBG/ 95/1
FAT/ KBG/ 95/2
FAT/ KBG/ 97/7
FAT/ KBG/ 97/8
FAT/ KBG/ 98/4
Feb 2000
Discard rate
Landing 3021 942 12727 6893 14258 25866 23805 4400
Discards 1864 926 1146 1893 6625 17926 3687 6200
% discarded 38.16 49.57 8.26 21.54 31.72 40.90 13.40 58.49
27%
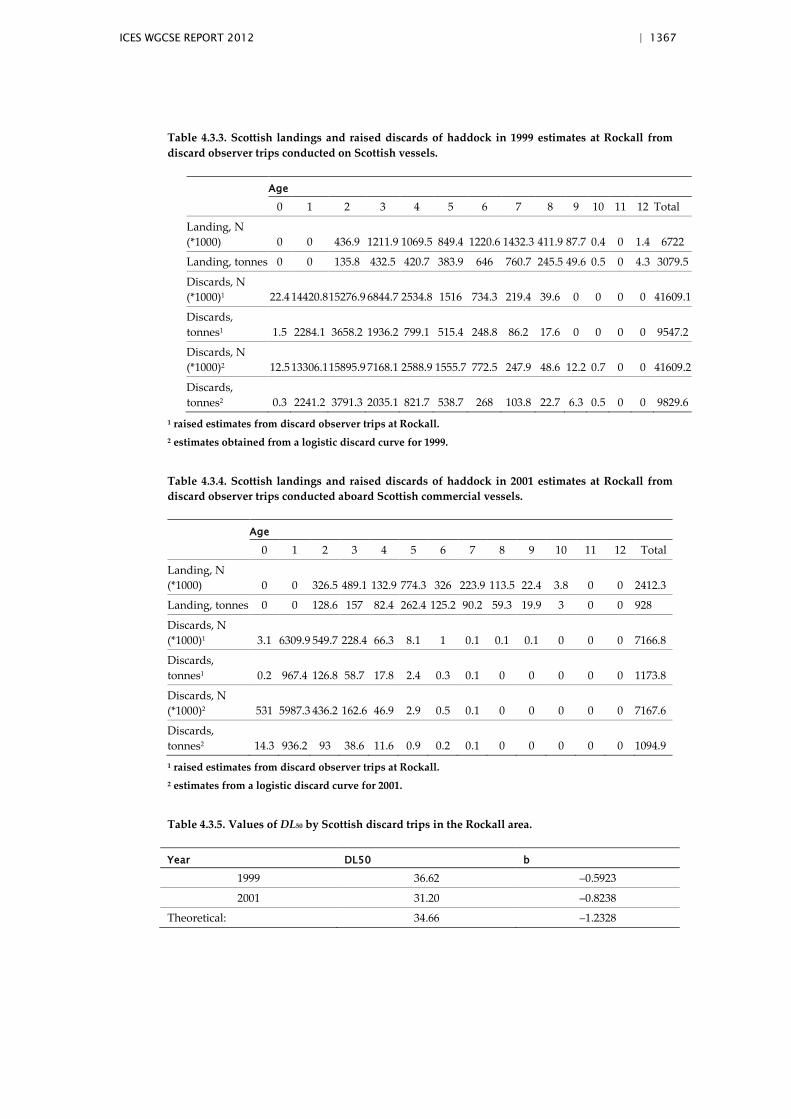
ICES WGCSE REPORT 2012 | 1367
Table 4.3.3. Scottish landings and raised discards of haddock in 1999 estimates at Rockall from discard observer trips conducted on Scottish vessels.
Age
0 1 2 3 4 5 6 7 8 9 10 11 12 Total
Landing, N (*1000) 0 0 436.9 1211.9 1069.5 849.4 1220.6 1432.3 411.9 87.7 0.4 0 1.4 6722
Landing, tonnes 0 0 135.8 432.5 420.7 383.9 646 760.7 245.5 49.6 0.5 0 4.3 3079.5
Discards, N (*1000)1 22.4 14420.8 15276.9 6844.7 2534.8 1516 734.3 219.4 39.6 0 0 0 0 41609.1
Discards, tonnes1 1.5 2284.1 3658.2 1936.2 799.1 515.4 248.8 86.2 17.6 0 0 0 0 9547.2
Discards, N (*1000)2 12.5 13306.1 15895.9 7168.1 2588.9 1555.7 772.5 247.9 48.6 12.2 0.7 0 0 41609.2
Discards, tonnes2 0.3 2241.2 3791.3 2035.1 821.7 538.7 268 103.8 22.7 6.3 0.5 0 0 9829.6
1 raised estimates from discard observer trips at Rockall. 2 estimates obtained from a logistic discard curve for 1999.
Table 4.3.4. Scottish landings and raised discards of haddock in 2001 estimates at Rockall from discard observer trips conducted aboard Scottish commercial vessels.
Age
0 1 2 3 4 5 6 7 8 9 10 11 12 Total
Landing, N (*1000) 0 0 326.5 489.1 132.9 774.3 326 223.9 113.5 22.4 3.8 0 0 2412.3
Landing, tonnes 0 0 128.6 157 82.4 262.4 125.2 90.2 59.3 19.9 3 0 0 928
Discards, N (*1000)1 3.1 6309.9 549.7 228.4 66.3 8.1 1 0.1 0.1 0.1 0 0 0 7166.8
Discards, tonnes1 0.2 967.4 126.8 58.7 17.8 2.4 0.3 0.1 0 0 0 0 0 1173.8
Discards, N (*1000)2 531 5987.3 436.2 162.6 46.9 2.9 0.5 0.1 0 0 0 0 0 7167.6
Discards, tonnes2 14.3 936.2 93 38.6 11.6 0.9 0.2 0.1 0 0 0 0 0 1094.9 1 raised estimates from discard observer trips at Rockall. 2 estimates from a logistic discard curve for 2001.
Table 4.3.5. Values of DL50 by Scottish discard trips in the Rockall area.
Year DL50 b
1999 36.62 –0.5923
2001 31.20 –0.8238
Theoretical: 34.66 –1.2328
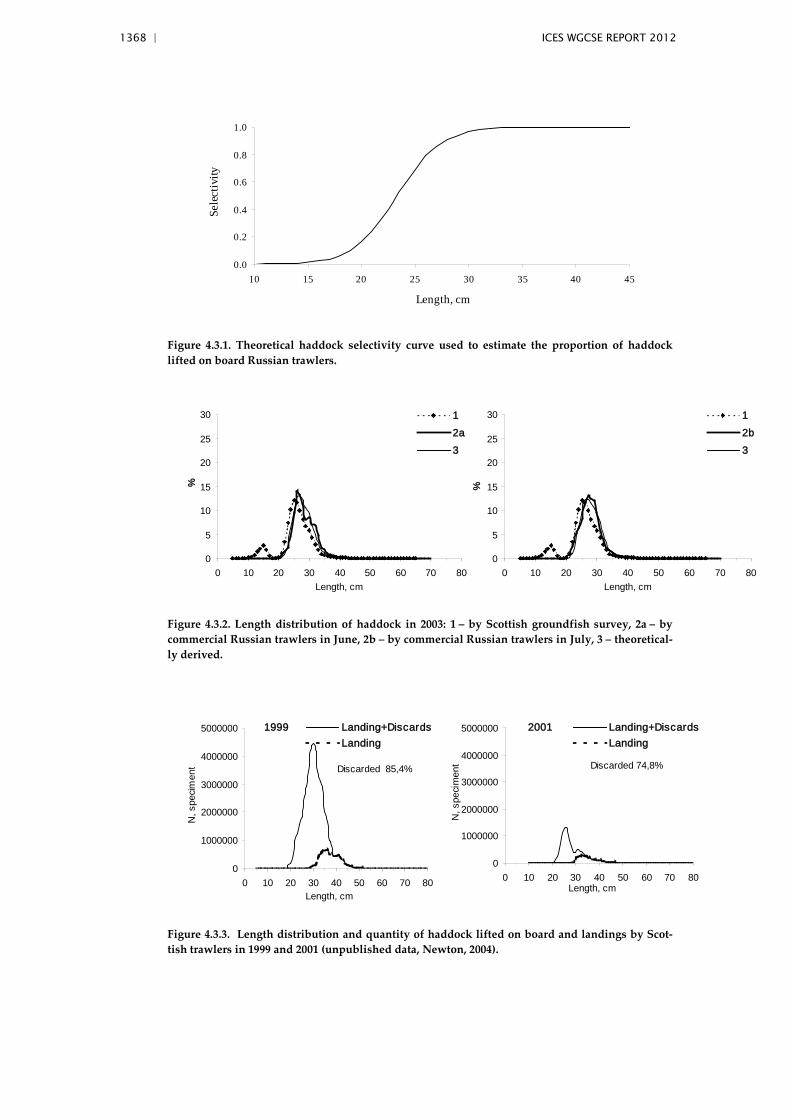
1368 | ICES WGCSE REPORT 2012
0.0
0.2
0.4
0.6
0.8
1.0
10 15 20 25 30 35 40 45
Length, cm
Sele
ctiv
ity
Figure 4.3.1. Theoretical haddock selectivity curve used to estimate the proportion of haddock lifted on board Russian trawlers.
0
5
10
15
20
25
30
0 10 20 30 40 50 60 70 80Length, cm
%
1
2a
3
0
5
10
15
20
25
30
0 10 20 30 40 50 60 70 80Length, cm
%
1
2b
3
Figure 4.3.2. Length distribution of haddock in 2003: 1 – by Scottish groundfish survey, 2a – by commercial Russian trawlers in June, 2b – by commercial Russian trawlers in July, 3 – theoretical-ly derived.
0
1000000
2000000
3000000
4000000
5000000
0 10 20 30 40 50 60 70 80Length, cm
N, s
pecim
ent
Landing+DiscardsLanding
1999
Discarded 85,4% ( )
0
1000000
2000000
3000000
4000000
5000000
0 10 20 30 40 50 60 70 80Length, cm
N, s
peci
men
t
Landing+DiscardsLanding
2001
Discarded 74,8%
Figure 4.3.3. Length distribution and quantity of haddock lifted on board and landings by Scot-tish trawlers in 1999 and 2001 (unpublished data, Newton, 2004).
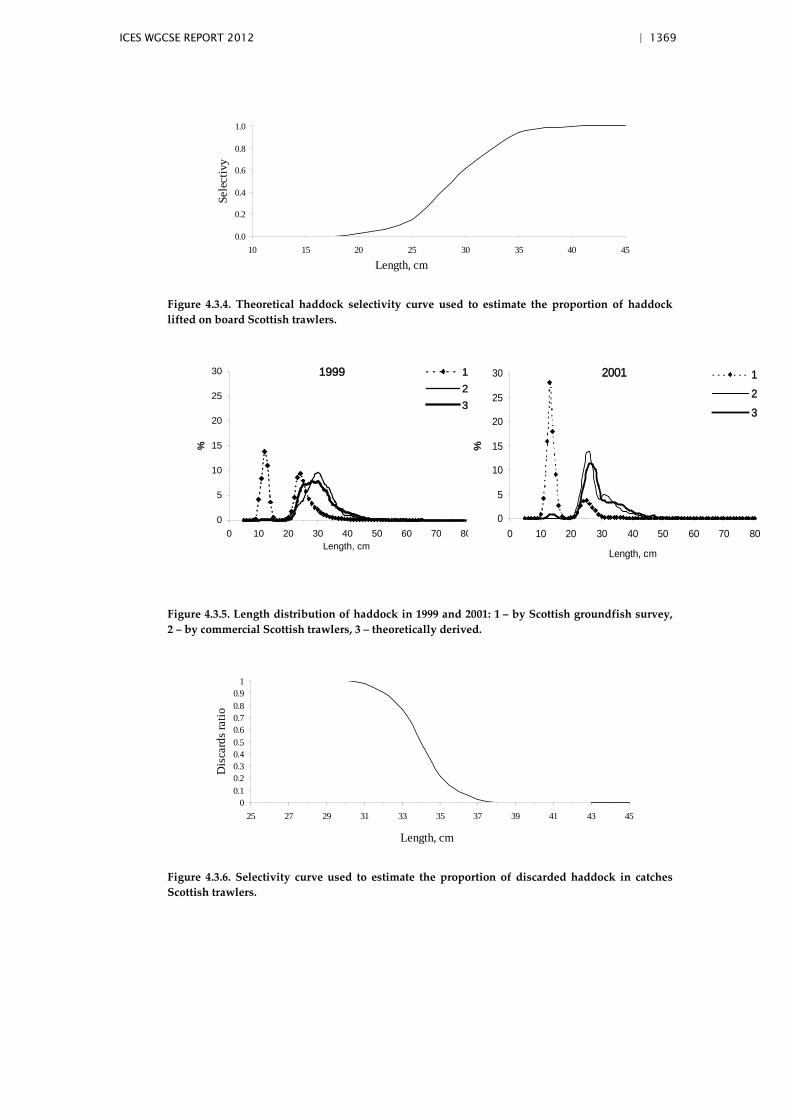
ICES WGCSE REPORT 2012 | 1369
0.0
0.2
0.4
0.6
0.8
1.0
10 15 20 25 30 35 40 45
Length, cm
Sele
ctiv
y
Figure 4.3.4. Theoretical haddock selectivity curve used to estimate the proportion of haddock lifted on board Scottish trawlers.
0
5
10
15
20
25
30
0 10 20 30 40 50 60 70 80Length, cm
%
123
1999
0
5
10
15
20
25
30
0 10 20 30 40 50 60 70 80
Length, cm
%
1
2
3
2001
Figure 4.3.5. Length distribution of haddock in 1999 and 2001: 1 – by Scottish groundfish survey, 2 – by commercial Scottish trawlers, 3 – theoretically derived.
00.10.20.30.40.50.60.70.80.9
1
25 27 29 31 33 35 37 39 41 43 45
Length, cm
Dis
card
s rat
io
Figure 4.3.6. Selectivity curve used to estimate the proportion of discarded haddock in catches Scottish trawlers.
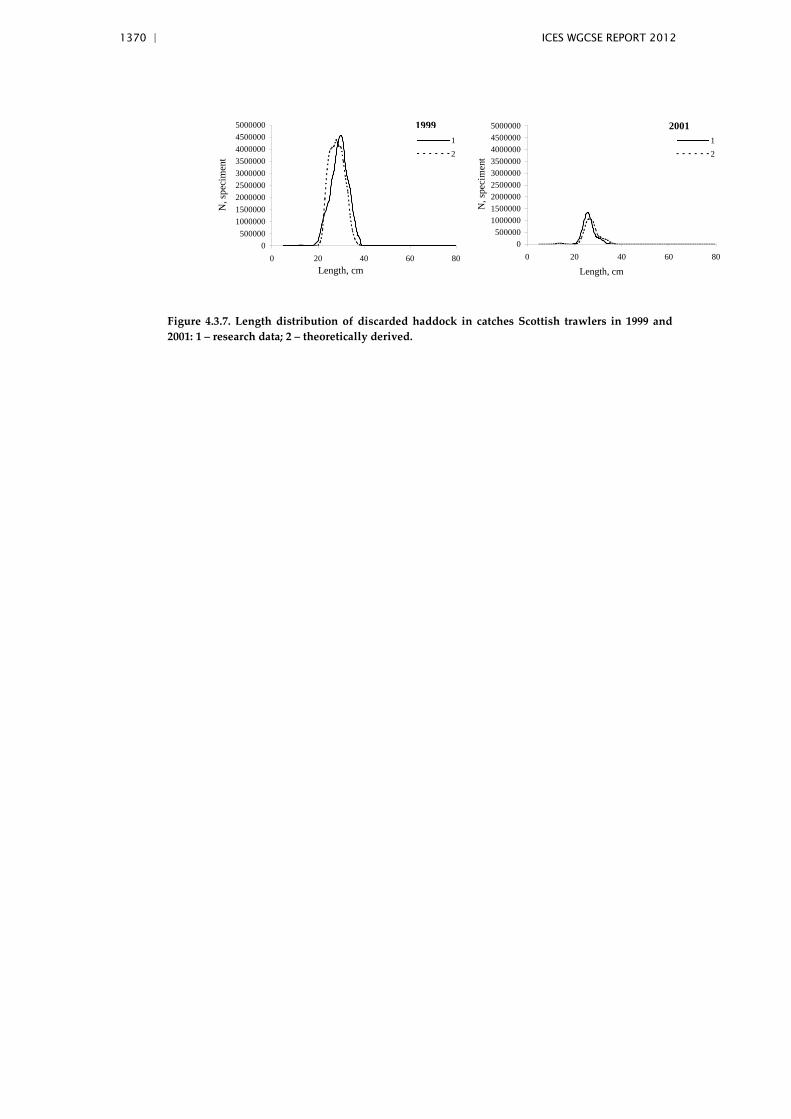
1370 | ICES WGCSE REPORT 2012
0500000
100000015000002000000250000030000003500000400000045000005000000
0 20 40 60 80
Length, cm
N, s
peci
men
t
12
2001
0500000
100000015000002000000250000030000003500000400000045000005000000
0 20 40 60 80Length, cm
N, s
peci
men
t
12
1999
Figure 4.3.7. Length distribution of discarded haddock in catches Scottish trawlers in 1999 and 2001: 1 – research data; 2 – theoretically derived.
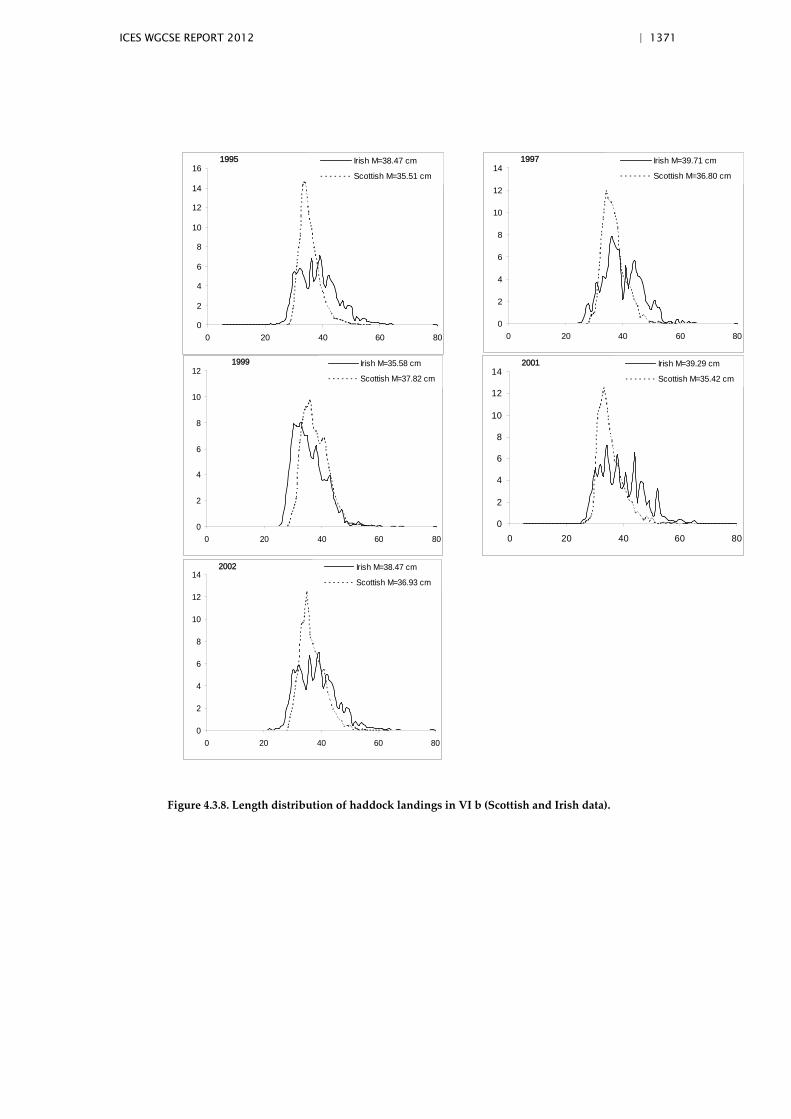
ICES WGCSE REPORT 2012 | 1371
0
2
4
6
8
10
12
14
16
0 20 40 60 80
Irish M=38.47 cm
Scottish M=35.51 cm
1995
0
2
4
6
8
10
12
14
0 20 40 60 80
Irish M=39.71 cm
Scottish M=36.80 cm
1997
0
2
4
6
8
10
12
0 20 40 60 80
Irish M=35.58 cm
Scottish M=37.82 cm
1999
0
2
4
6
8
10
12
14
0 20 40 60 80
Irish M=39.29 cm
Scottish M=35.42 cm
2001
0
2
4
6
8
10
12
14
0 20 40 60 80
Irish M=38.47 cm
Scottish M=36.93 cm
2002
Figure 4.3.8. Length distribution of haddock landings in VI b (Scottish and Irish data).
1372 | ICES WGCSE REPORT 2012
6.3 Stock Annex Haddock VIIa
Stock specific documentation of standard assessment procedures used by ICES.
Stock Irish Sea Haddock (Division VIIa)
Working Group Celtic Seas Ecoregion
Last updated 19 May 2009
Revised by Pieter-Jan Schön
A. General
A.1. Stock definition
A.2. Fishery
Directed fishing for haddock in the Irish Sea is mainly carried out by UK (Northern Ireland) midwater trawlers using 100 mm mesh codends, particularly targeting ag-gregations that can be detected acoustically. These conditions prevail mainly during winter and spring when the hours of darkness are longest, and the fish are aggregat-ing on the spawning grounds in the western Irish Sea. Other demersal whitefish ves-sels from Northern Ireland, Ireland and to a lesser extent Scotland, using single or twin trawls with 100 mm mesh, also target haddock when abundant. (Prior to the introduction of Council technical conservation Regulation 850/98 in 2001, most white-fish vessels in the Irish Sea used 80 mm codends.) Bycatches of haddock are made in the UK (NI) and Irish Nephrops fisheries using single nets with 70 mm codends or twin trawls with 80 mm codends. The haddock stock is mainly distributed in the western Irish Sea and south of the Isle of Man, preferring the coarser seabed sedi-ments around the periphery of the muddy Nephrops grounds. Juveniles are taken ex-tensively in the otter trawl fisheries in these areas, leading to substantial discarding (see Section B1.2).
The nature of the fishery has been modified by the cod closure since 2000 (Council Regulation (EC) No 304/2000). Targeted fishing with whitefish trawls was prohibited inside the closure from mid February to the end of April. Derogations for Nephrops fishing were allowed. Irish Nephrops trawlers were involved in an experiment to test inclined separator panels in 2000 and 2001, the object being to minimize the bycatch of cod. Fishing inside a small area of the western Irish Sea closed to all fishing in spring 2000 and 2001 was permitted if separator panels were used. These panels would also have allowed escapement of part of the haddock catch. Closure of the main whitefish fishing grounds in spring 2000 resulted in a shift in fishing activities of midwater trawlers and other UK(NI) whitefish vessels into the North Channel (Ar-ea VIIa) and Firth of Clyde (VIa south). A subsequent closure of the Firth of Clyde in spring 2001 under the VIa cod recovery programme (Council Regulation (EC) No 456/2001) resulted in a reduction in reported fishing activity in this region. Several rounds of decommissioning in 1995–1997, 2001 and 2003 have reduced the size of the commercial fleets. UK vessels decommissioned at the beginning of 2002 accounted for 17% of the haddock landings from the Irish Sea in 1999–2001. A further round of de-commissioning in 2003 removed 19 out of 237 UK vessels that operated in the Irish Sea at the beginning of 2004, representing a loss of 8% of the fleet by number and 9.3% by tonnage.
Gear specific effort regulations (days-at-sea) have been introduced in the Irish Sea in 2004. Annex V to Council Regulation (EC) No 2341/2002 regulated the maximum
ICES WGCSE REPORT 2012 | 1373
number of days in any calendar month of 2004 for which a fishing vessel may be ab-sent from port in the Irish Sea. Monthly effort limitation under this Regulation is as follows: ten days for demersal trawls, seines and similar towed gears with mesh size >=100 mm, 14 days for beam trawls of mesh size >= 80 mm and static demersal nets, 17 days for demersal longlines, and 22 days for demersal trawls, seines and similar towed gears with mesh size 70–99 mm. Additional days are available for vessels meeting certain conditions such as track record of low cod catches. In particular, an additional two days are available for whitefish trawlers (mesh >=100 mm) and beam trawlers (mesh >=80 mm) which spend more than half of their allocated days in a giv-en management period fishing in the Irish Sea, in recognition of the area closure in the Irish Sea and the assumed reduction in fishing mortality on cod.
A.3. Ecosystem aspects
B. Data
B.1. Commercial catch
B.1.1. Landings
The following table gives the source of landings data for Irish Sea haddock:
Kind of data
Country Caton (catch-in-weight)
Canum (catch-at-age/in-numbers)
Weca (weight-at-age in the catch)
Matprop (proportion mature-by-age)
Length composition in catch
UK(NI) UK(E&W) UK(Scotland) UK (IOM) Ireland France Belgium
X X X X X X X
X
X
X
X
X X
X
Quarterly landings and length/age composition data are supplied from databases maintained by national Government Departments and research agencies. These fig-ures may be adjusted by national scientists to correct for known or estimated misre-porting by area or species. Data are supplied in Excel files to a stock coordinator nominated by ICES Northern Shelf Demersal Working Group, who compiles the in-ternational landings and catch-at-age data and maintains a time-series of such data with any amendments. To avoid double counting of landings data, each UK region supplies data for UK landings into its regional ports, and landings by its fleet into non-UK ports.
Quarterly landings are provided by the UK (E&W), UK (Scotland), Belgium and France and annual landings are provided by UK (IOM). The quarterly estimates of landings-at-age into UK (NI) and Ireland are raised to include landings by France, Belgium, UK (E&W), UK (Scotland), UK (IOM) (distributed proportionately over quarters), then summed over quarters to produce the annual landings-at-age.
The Excel spreadsheet files used for age distribution, adjustments and aggregations can be found with the stock co-ordinator and for the current and previous year in the ICES computer system under w:\acfm\wgnsds\year\personal\name (of stock co-ordinator).
1374 | ICES WGCSE REPORT 2012
The result files (FAD data) can be found at ICES and with the stock co-ordinator, as ASCII files on the Lowestoft format, under w:\acfm\wgnsds\year\data\whg_7a.
B.1.2. Discards
The potential magnitude of discarding was evaluated using limited data from the following fleets:
• Northern Ireland self sampling scheme for Nephrops. The fisher self-sampling scheme that provides discards data for VIIa whiting was altered in 1996 to record quantities of other species in the samples. The quantity of haddock discarded from the UK (NI) Nephrops fishery is estimated on a quarterly basis from samples of discards and total catch provided by skip-pers. The discards samples contain the heads of Nephrops tailed at sea. Us-ing a length–weight relationship, the live weight of Nephrops that would have been landed as tails only is calculated from the carapace lengths of the discarded heads. The number of haddock in the discard samples is summed over all samples in a quarter and expressed as a ratio of the summed live weight of Nephrops in the discard samples (i.e. those repre-sented as heads only in the samples). The reported live weight of Nephrops landed as tails only is then used to estimate the quantity of haddock dis-carded using the haddock:Nephrops ratio in the discard samples. Length–frequencies of haddock in the samples are then raised to the fleet estimate. No otoliths were collected, but the length–frequencies could be partitioned to age class based on appearance of modes and comparison with length-at-age distributions in March and October surveys. The age data from 2001and 2002 were derived using survey and commercial fleet ALKs. The UK (NI) estimates are available since 1996 but the reliability of these esti-mates has not been determined. Roughly 40 discard samples are collected annually. There are several limitations to these data: only a small subset of single-rig trawlers is sampled; the method of raising to the fleet discards will be affected by any inaccuracies in the reported landings of Nephrops; and there are no estimates of landings of whiting from these vessels with which to calculate proportions discarded-at-age. The WG has not used the-se data in past assessments.
• Northern Ireland observer sampling (all fleets): Length–frequencies from NI (AFBI) observer trips in specified fleet métiers are raised to the trip lev-el, summed across trips during each year or by quarter (if requested) then raised to the annual number of trips per year in the NI fleet in VIIa to give raised annual LFDs for discards. An age–length key from discards trips is then applied to give annual discards by age class and métier.
• Irish otter trawl fleet (IR-OTB). Discards are estimated by observers on Irish trawlers operating in VIIa. Estimates for this fleet are given in the Re-port of ICES Study Group on Discards and Bycatch Information (ICES CM 2002 ACFM:09). The anomalous high estimate of discards for this fleet in 2001 was a result of an inappropriate raising procedure, and data for this year are not presented. No discard data were available for 2002 as a conse-quence of a very limited number of sampling trips (n=1). This sampling level has increased in 2003, but is still low (n=6). A re-analysis of the Irish discard data raised to the number of trips, instead of landings, was per-formed based on methods described by Borges et al., 2005 and provided to the WG in 2005.
ICES WGCSE REPORT 2012 | 1375
B.2. Biological
Natural mortality was assumed to be constant (M=0.2, applied annually) for the whole range of ages and years, in the absence of a direct estimate of natural mortality of Irish Sea haddock.
A combined sex maturity is assumed, knife-edged at age 2 for all years. Recent re-search on the changes in maturity of the Irish Sea haddock stock conducted by the UK (NI) demonstrated, using a GLM analysis on the effects of year, region, age, and length on the probability of being mature, that maturity is determined differently for male and female haddock. Maturity was found to be predominantly a function of length in male haddock, whereas age was the main factor in females. Interannual var-iation in the proportion mature was mostly confined to the age 2 group, whereas oth-er age groups were either fully immature or fully mature. Over 99% of 3 year-olds were mature.
The proportion of F and M before spawning are set to zero to reflect a SSB calculation date of 1 January.
Working Groups prior to 2001 used constant weights-at-age over years based on analysis of some early survey data. However, evidence of a decline in mean length of adult haddock over time needed to be reflected in the stock weights-at-age. Since 2001 the WG calculated stock weights are calculated by fitting a von Bertalanffy growth curve to all available survey estimates of mean length-at-age in March, with an additional vector for parameters estimated to allow for year-class effects in asymp-totic length. To increase the number of observations for older age classes, the mean lengths-at-age in UK (NI) first-quarter landings were included for age classes three and over. (Comparisons of survey and landings data demonstrated that values from landings were larger than from the survey at ages 1 and 2 because of selectivity pat-terns in the fishery, but very similar for ages 3 and over.) Stock weights-at-age were calculated from the model-fitted mean lengths-at-age, using length–weight parame-ters calculated from all March survey samples (2001 WG) or annual length–weight parameters (since 2002 WG). The time-series of length–weight parameters are listed below:
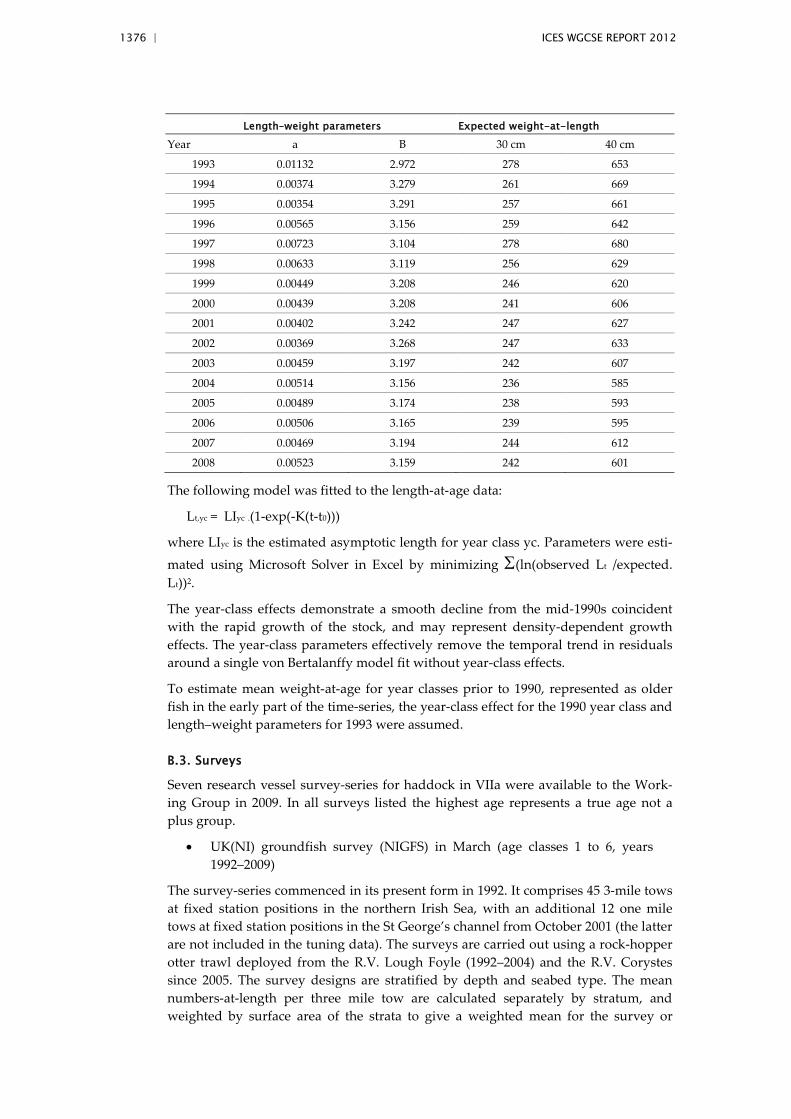
1376 | ICES WGCSE REPORT 2012
Length–weight parameters Expected weight-at-length
Year a B 30 cm 40 cm
1993 0.01132 2.972 278 653
1994 0.00374 3.279 261 669
1995 0.00354 3.291 257 661
1996 0.00565 3.156 259 642
1997 0.00723 3.104 278 680
1998 0.00633 3.119 256 629
1999 0.00449 3.208 246 620
2000 0.00439 3.208 241 606
2001 0.00402 3.242 247 627
2002 0.00369 3.268 247 633
2003 0.00459 3.197 242 607
2004 0.00514 3.156 236 585
2005 0.00489 3.174 238 593
2006 0.00506 3.165 239 595
2007 0.00469 3.194 244 612
2008 0.00523 3.159 242 601
The following model was fitted to the length-at-age data:
Lt,yc = LIyc .(1-exp(-K(t-t0)))
where LIyc is the estimated asymptotic length for year class yc. Parameters were esti-
mated using Microsoft Solver in Excel by minimizing Σ(ln(observed Lt /expected. Lt))2.
The year-class effects demonstrate a smooth decline from the mid-1990s coincident with the rapid growth of the stock, and may represent density-dependent growth effects. The year-class parameters effectively remove the temporal trend in residuals around a single von Bertalanffy model fit without year-class effects.
To estimate mean weight-at-age for year classes prior to 1990, represented as older fish in the early part of the time-series, the year-class effect for the 1990 year class and length–weight parameters for 1993 were assumed.
B.3. Surveys
Seven research vessel survey-series for haddock in VIIa were available to the Work-ing Group in 2009. In all surveys listed the highest age represents a true age not a plus group.
• UK(NI) groundfish survey (NIGFS) in March (age classes 1 to 6, years 1992–2009)
The survey-series commenced in its present form in 1992. It comprises 45 3-mile tows at fixed station positions in the northern Irish Sea, with an additional 12 one mile tows at fixed station positions in the St George’s channel from October 2001 (the latter are not included in the tuning data). The surveys are carried out using a rock-hopper otter trawl deployed from the R.V. Lough Foyle (1992–2004) and the R.V. Corystes since 2005. The survey designs are stratified by depth and seabed type. The mean numbers-at-length per three mile tow are calculated separately by stratum, and weighted by surface area of the strata to give a weighted mean for the survey or
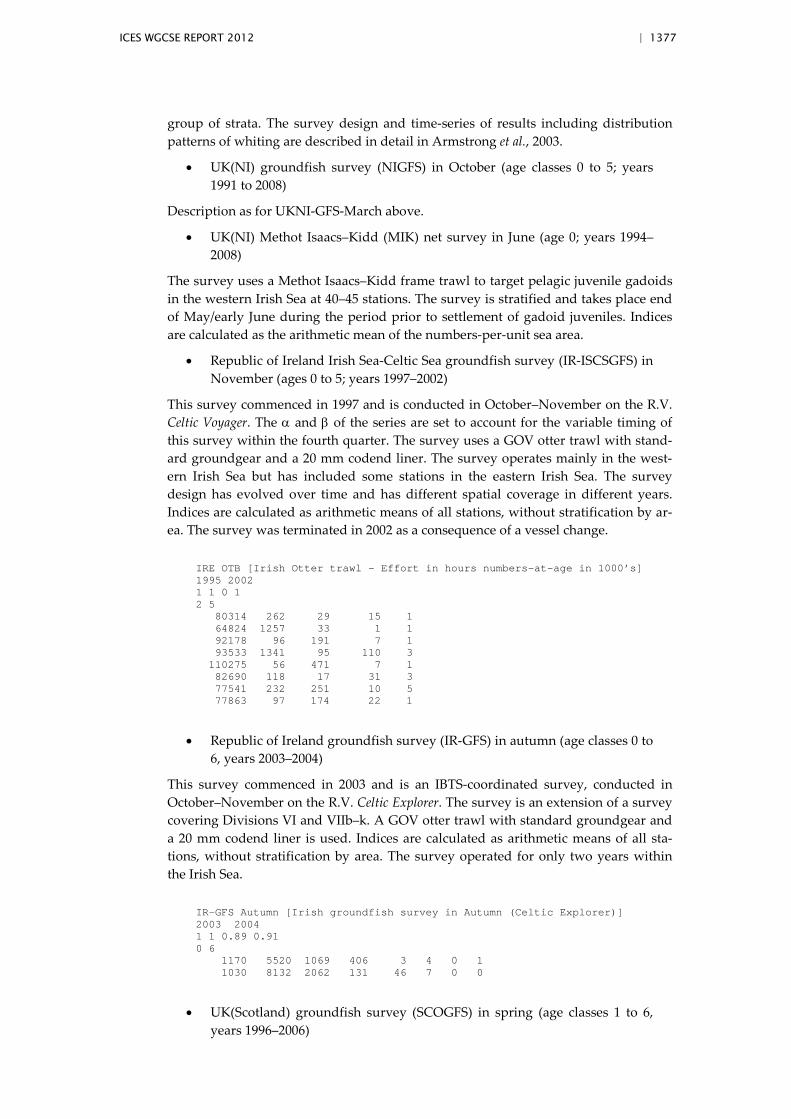
ICES WGCSE REPORT 2012 | 1377
group of strata. The survey design and time-series of results including distribution patterns of whiting are described in detail in Armstrong et al., 2003.
• UK(NI) groundfish survey (NIGFS) in October (age classes 0 to 5; years 1991 to 2008)
Description as for UKNI-GFS-March above.
• UK(NI) Methot Isaacs–Kidd (MIK) net survey in June (age 0; years 1994–2008)
The survey uses a Methot Isaacs–Kidd frame trawl to target pelagic juvenile gadoids in the western Irish Sea at 40–45 stations. The survey is stratified and takes place end of May/early June during the period prior to settlement of gadoid juveniles. Indices are calculated as the arithmetic mean of the numbers-per-unit sea area.
• Republic of Ireland Irish Sea-Celtic Sea groundfish survey (IR-ISCSGFS) in November (ages 0 to 5; years 1997–2002)
This survey commenced in 1997 and is conducted in October–November on the R.V. Celtic Voyager. The α and β of the series are set to account for the variable timing of this survey within the fourth quarter. The survey uses a GOV otter trawl with stand-ard groundgear and a 20 mm codend liner. The survey operates mainly in the west-ern Irish Sea but has included some stations in the eastern Irish Sea. The survey design has evolved over time and has different spatial coverage in different years. Indices are calculated as arithmetic means of all stations, without stratification by ar-ea. The survey was terminated in 2002 as a consequence of a vessel change.
IRE OTB [Irish Otter trawl - Effort in hours numbers-at-age in 1000’s] 1995 2002 1 1 0 1 2 5 80314 262 29 15 1 64824 1257 33 1 1 92178 96 191 7 1 93533 1341 95 110 3 110275 56 471 7 1 82690 118 17 31 3 77541 232 251 10 5 77863 97 174 22 1
• Republic of Ireland groundfish survey (IR-GFS) in autumn (age classes 0 to 6, years 2003–2004)
This survey commenced in 2003 and is an IBTS-coordinated survey, conducted in October–November on the R.V. Celtic Explorer. The survey is an extension of a survey covering Divisions VI and VIIb–k. A GOV otter trawl with standard groundgear and a 20 mm codend liner is used. Indices are calculated as arithmetic means of all sta-tions, without stratification by area. The survey operated for only two years within the Irish Sea.
IR-GFS Autumn [Irish groundfish survey in Autumn (Celtic Explorer)] 2003 2004 1 1 0.89 0.91 0 6 1170 5520 1069 406 3 4 0 1 1030 8132 2062 131 46 7 0 0
• UK(Scotland) groundfish survey (SCOGFS) in spring (age classes 1 to 6, years 1996–2006)
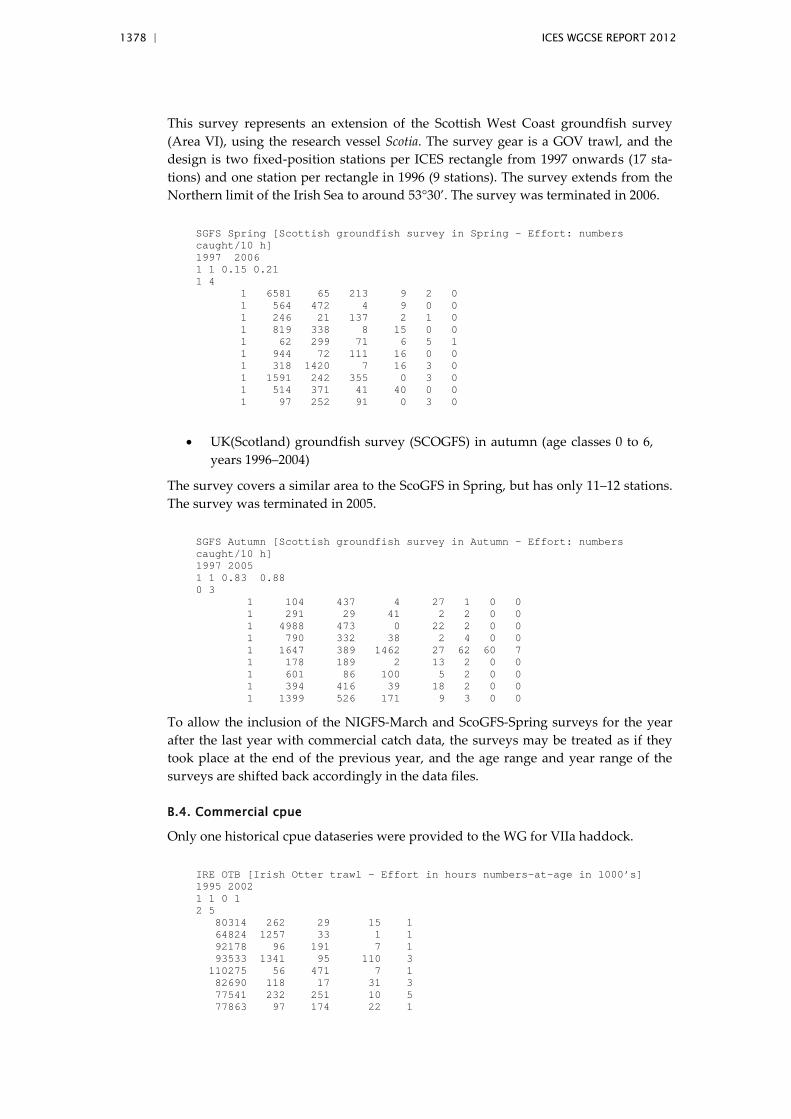
1378 | ICES WGCSE REPORT 2012
This survey represents an extension of the Scottish West Coast groundfish survey (Area VI), using the research vessel Scotia. The survey gear is a GOV trawl, and the design is two fixed-position stations per ICES rectangle from 1997 onwards (17 sta-tions) and one station per rectangle in 1996 (9 stations). The survey extends from the Northern limit of the Irish Sea to around 53°30’. The survey was terminated in 2006.
SGFS Spring [Scottish groundfish survey in Spring – Effort: numbers caught/10 h] 1997 2006 1 1 0.15 0.21 1 4 1 6581 65 213 9 2 0 1 564 472 4 9 0 0 1 246 21 137 2 1 0 1 819 338 8 15 0 0 1 62 299 71 6 5 1 1 944 72 111 16 0 0 1 318 1420 7 16 3 0 1 1591 242 355 0 3 0 1 514 371 41 40 0 0 1 97 252 91 0 3 0
• UK(Scotland) groundfish survey (SCOGFS) in autumn (age classes 0 to 6, years 1996–2004)
The survey covers a similar area to the ScoGFS in Spring, but has only 11–12 stations. The survey was terminated in 2005.
SGFS Autumn [Scottish groundfish survey in Autumn – Effort: numbers caught/10 h] 1997 2005 1 1 0.83 0.88 0 3 1 104 437 4 27 1 0 0 1 291 29 41 2 2 0 0 1 4988 473 0 22 2 0 0 1 790 332 38 2 4 0 0 1 1647 389 1462 27 62 60 7 1 178 189 2 13 2 0 0 1 601 86 100 5 2 0 0 1 394 416 39 18 2 0 0 1 1399 526 171 9 3 0 0
To allow the inclusion of the NIGFS-March and ScoGFS-Spring surveys for the year after the last year with commercial catch data, the surveys may be treated as if they took place at the end of the previous year, and the age range and year range of the surveys are shifted back accordingly in the data files.
B.4. Commercial cpue
Only one historical cpue dataseries were provided to the WG for VIIa haddock.
IRE OTB [Irish Otter trawl - Effort in hours numbers-at-age in 1000’s] 1995 2002 1 1 0 1 2 5 80314 262 29 15 1 64824 1257 33 1 1 92178 96 191 7 1 93533 1341 95 110 3 110275 56 471 7 1 82690 118 17 31 3 77541 232 251 10 5 77863 97 174 22 1
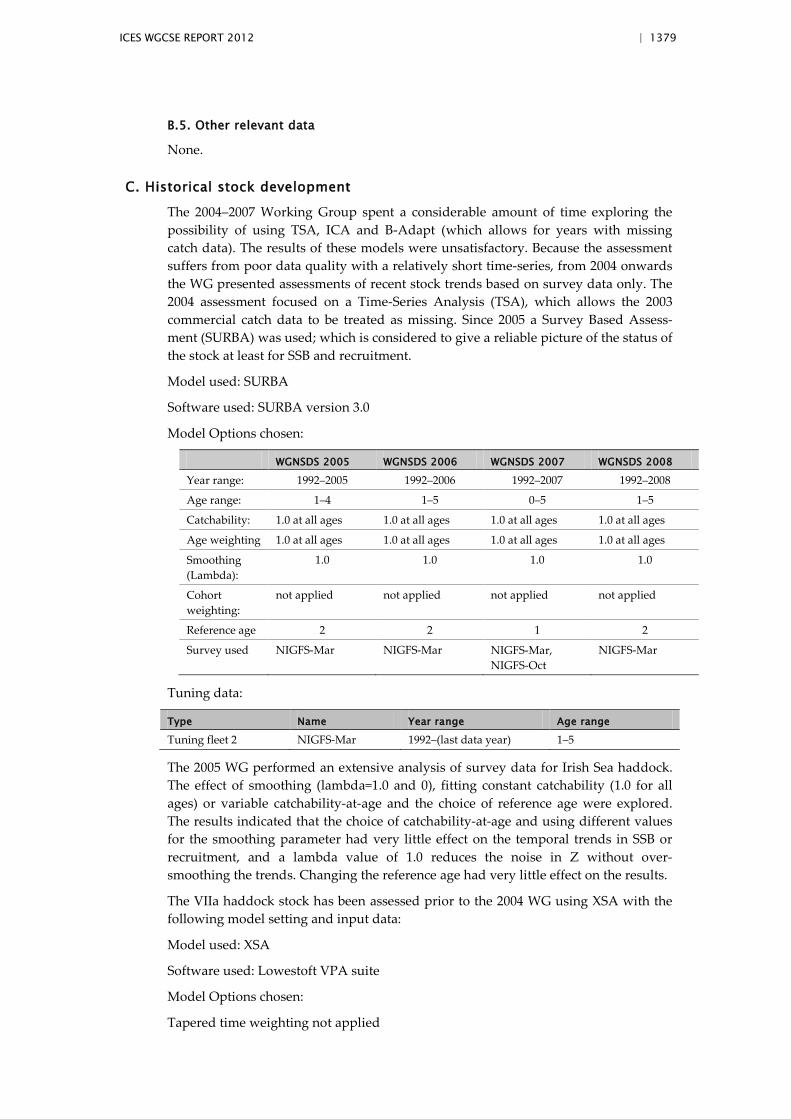
ICES WGCSE REPORT 2012 | 1379
B.5. Other relevant data
None.
C. Historical stock development
The 2004–2007 Working Group spent a considerable amount of time exploring the possibility of using TSA, ICA and B-Adapt (which allows for years with missing catch data). The results of these models were unsatisfactory. Because the assessment suffers from poor data quality with a relatively short time-series, from 2004 onwards the WG presented assessments of recent stock trends based on survey data only. The 2004 assessment focused on a Time-Series Analysis (TSA), which allows the 2003 commercial catch data to be treated as missing. Since 2005 a Survey Based Assess-ment (SURBA) was used; which is considered to give a reliable picture of the status of the stock at least for SSB and recruitment.
Model used: SURBA
Software used: SURBA version 3.0
Model Options chosen:
WGNSDS 2005 WGNSDS 2006 WGNSDS 2007 WGNSDS 2008
Year range: 1992–2005 1992–2006 1992–2007 1992–2008
Age range: 1–4 1–5 0–5 1–5
Catchability: 1.0 at all ages 1.0 at all ages 1.0 at all ages 1.0 at all ages
Age weighting 1.0 at all ages 1.0 at all ages 1.0 at all ages 1.0 at all ages
Smoothing (Lambda):
1.0 1.0 1.0 1.0
Cohort weighting:
not applied not applied not applied not applied
Reference age 2 2 1 2
Survey used NIGFS-Mar NIGFS-Mar NIGFS-Mar, NIGFS-Oct
NIGFS-Mar
Tuning data:
Type Name Year range Age range
Tuning fleet 2 NIGFS-Mar 1992–(last data year) 1–5
The 2005 WG performed an extensive analysis of survey data for Irish Sea haddock. The effect of smoothing (lambda=1.0 and 0), fitting constant catchability (1.0 for all ages) or variable catchability-at-age and the choice of reference age were explored. The results indicated that the choice of catchability-at-age and using different values for the smoothing parameter had very little effect on the temporal trends in SSB or recruitment, and a lambda value of 1.0 reduces the noise in Z without over-smoothing the trends. Changing the reference age had very little effect on the results.
The VIIa haddock stock has been assessed prior to the 2004 WG using XSA with the following model setting and input data:
Model used: XSA
Software used: Lowestoft VPA suite
Model Options chosen:
Tapered time weighting not applied
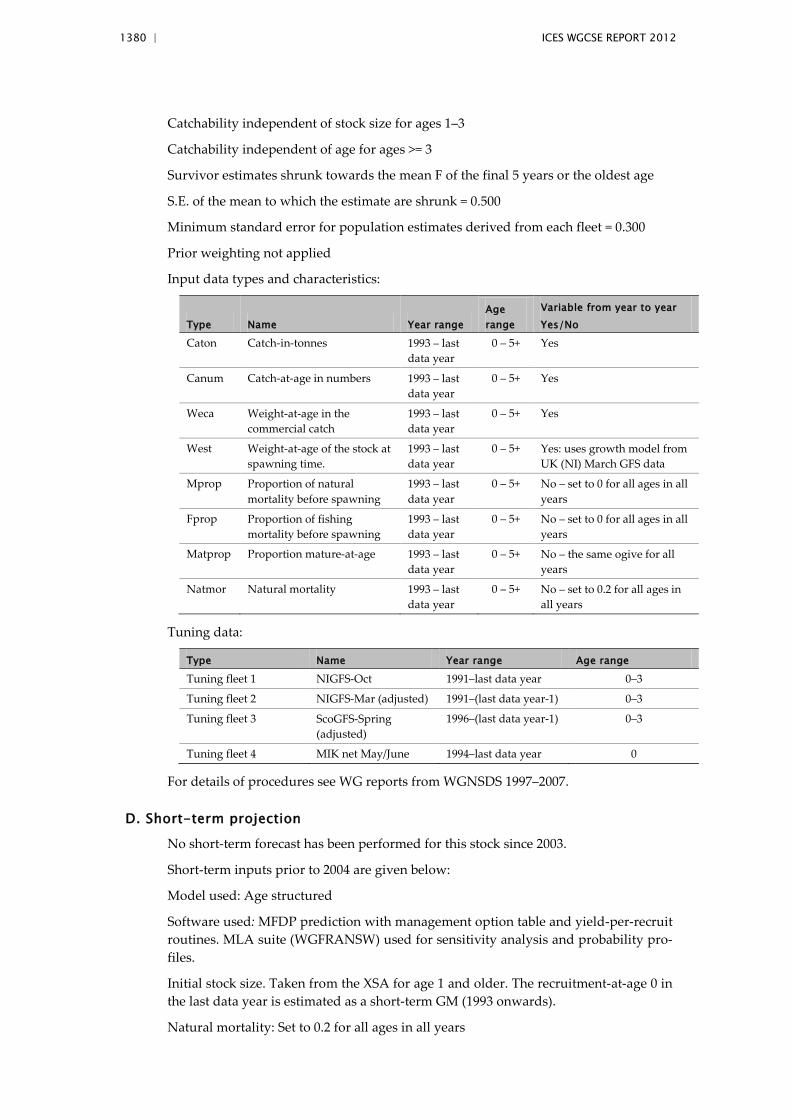
1380 | ICES WGCSE REPORT 2012
Catchability independent of stock size for ages 1–3
Catchability independent of age for ages >= 3
Survivor estimates shrunk towards the mean F of the final 5 years or the oldest age
S.E. of the mean to which the estimate are shrunk = 0.500
Minimum standard error for population estimates derived from each fleet = 0.300
Prior weighting not applied
Input data types and characteristics:
Type Name Year range Age range
Variable from year to year Yes/No
Caton Catch-in-tonnes 1993 – last data year
0 – 5+ Yes
Canum Catch-at-age in numbers 1993 – last data year
0 – 5+ Yes
Weca Weight-at-age in the commercial catch
1993 – last data year
0 – 5+ Yes
West Weight-at-age of the stock at spawning time.
1993 – last data year
0 – 5+ Yes: uses growth model from UK (NI) March GFS data
Mprop Proportion of natural mortality before spawning
1993 – last data year
0 – 5+ No – set to 0 for all ages in all years
Fprop Proportion of fishing mortality before spawning
1993 – last data year
0 – 5+ No – set to 0 for all ages in all years
Matprop Proportion mature-at-age 1993 – last data year
0 – 5+ No – the same ogive for all years
Natmor Natural mortality 1993 – last data year
0 – 5+ No – set to 0.2 for all ages in all years
Tuning data:
Type Name Year range Age range
Tuning fleet 1 NIGFS-Oct 1991–last data year 0–3
Tuning fleet 2 NIGFS-Mar (adjusted) 1991–(last data year-1) 0–3
Tuning fleet 3 ScoGFS-Spring (adjusted)
1996–(last data year-1) 0–3
Tuning fleet 4 MIK net May/June 1994–last data year 0
For details of procedures see WG reports from WGNSDS 1997–2007.
D. Short-term projection
No short-term forecast has been performed for this stock since 2003.
Short-term inputs prior to 2004 are given below:
Model used: Age structured
Software used: MFDP prediction with management option table and yield-per-recruit routines. MLA suite (WGFRANSW) used for sensitivity analysis and probability pro-files.
Initial stock size. Taken from the XSA for age 1 and older. The recruitment-at-age 0 in the last data year is estimated as a short-term GM (1993 onwards).
Natural mortality: Set to 0.2 for all ages in all years
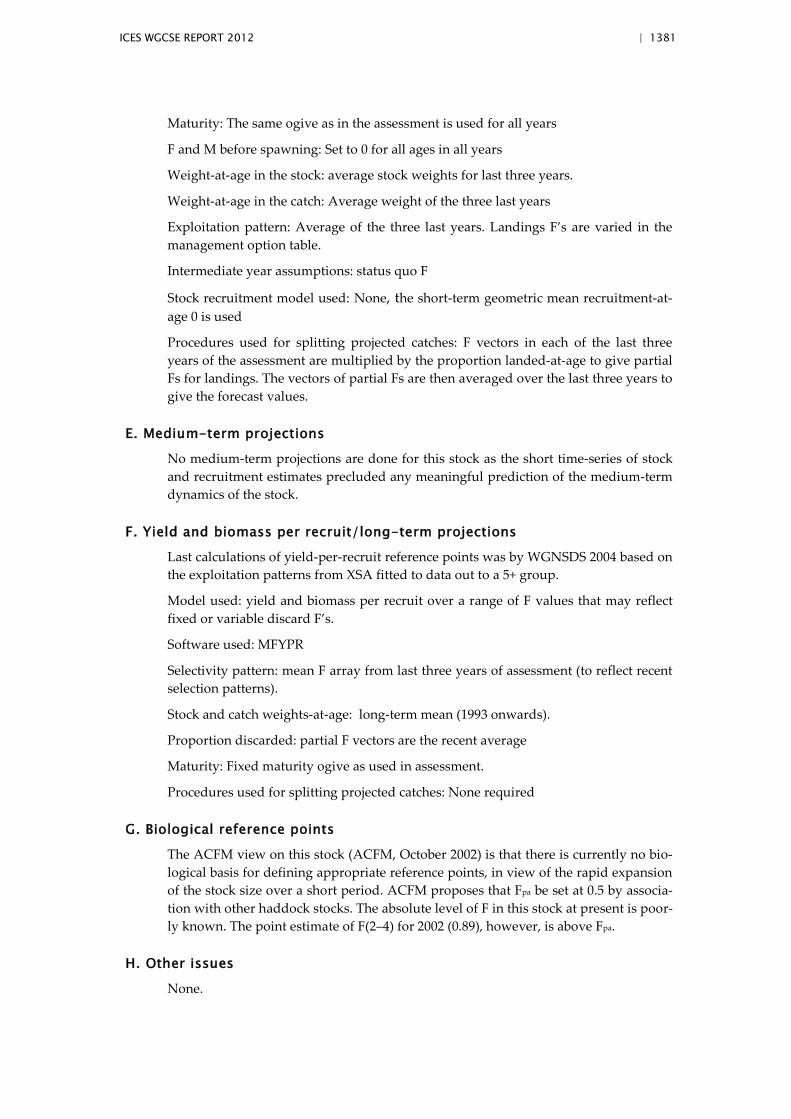
ICES WGCSE REPORT 2012 | 1381
Maturity: The same ogive as in the assessment is used for all years
F and M before spawning: Set to 0 for all ages in all years
Weight-at-age in the stock: average stock weights for last three years.
Weight-at-age in the catch: Average weight of the three last years
Exploitation pattern: Average of the three last years. Landings F’s are varied in the management option table.
Intermediate year assumptions: status quo F
Stock recruitment model used: None, the short-term geometric mean recruitment-at-age 0 is used
Procedures used for splitting projected catches: F vectors in each of the last three years of the assessment are multiplied by the proportion landed-at-age to give partial Fs for landings. The vectors of partial Fs are then averaged over the last three years to give the forecast values.
E. Medium-term projections
No medium-term projections are done for this stock as the short time-series of stock and recruitment estimates precluded any meaningful prediction of the medium-term dynamics of the stock.
F. Yield and biomass per recruit/long-term projections Last calculations of yield-per-recruit reference points was by WGNSDS 2004 based on the exploitation patterns from XSA fitted to data out to a 5+ group.
Model used: yield and biomass per recruit over a range of F values that may reflect fixed or variable discard F’s.
Software used: MFYPR
Selectivity pattern: mean F array from last three years of assessment (to reflect recent selection patterns).
Stock and catch weights-at-age: long-term mean (1993 onwards).
Proportion discarded: partial F vectors are the recent average
Maturity: Fixed maturity ogive as used in assessment.
Procedures used for splitting projected catches: None required
G. Biological reference points
The ACFM view on this stock (ACFM, October 2002) is that there is currently no bio-logical basis for defining appropriate reference points, in view of the rapid expansion of the stock size over a short period. ACFM proposes that Fpa be set at 0.5 by associa-tion with other haddock stocks. The absolute level of F in this stock at present is poor-ly known. The point estimate of F(2–4) for 2002 (0.89), however, is above Fpa.
H. Other issues
None.

1382 | ICES WGCSE REPORT 2012
I. References Armstrong, M.J., Peel, J., McAliskey, M., McCurdy, W., McCorriston, P. and Briggs, R. 2003.
Survey indices of abundance for cod, haddock and whiting in the Irish Sea (Area VIIaN): 1992–2003. Working Document No. 3 submitted to 2003 meeting of ICES Working Group on Assessment of Northern Shelf Demersal Stocks. 33pp.
Borges, L., Zuur, A.F., Rogan, E. and Officer, R. 2005. Choosing the best sampling unit and aux-iliary variable for discards estimations. Working Document No. 3 submitted to 2005 meet-ing of ICES Working Group on Assessment of Northern Shelf Demersal Stocks. 25pp.
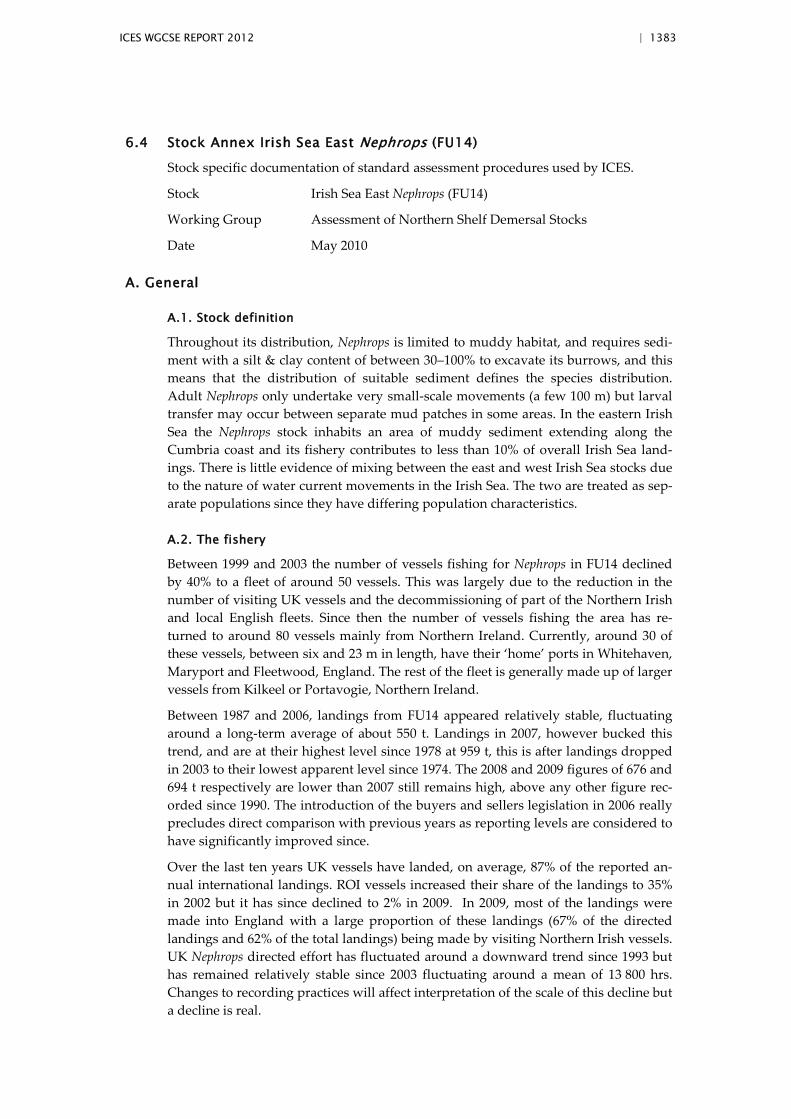
ICES WGCSE REPORT 2012 | 1383
6.4 Stock Annex Irish Sea East Nephrops (FU14)
Stock specific documentation of standard assessment procedures used by ICES.
Stock Irish Sea East Nephrops (FU14)
Working Group Assessment of Northern Shelf Demersal Stocks
Date May 2010
A. General
A.1. Stock definition
Throughout its distribution, Nephrops is limited to muddy habitat, and requires sedi-ment with a silt & clay content of between 30–100% to excavate its burrows, and this means that the distribution of suitable sediment defines the species distribution. Adult Nephrops only undertake very small-scale movements (a few 100 m) but larval transfer may occur between separate mud patches in some areas. In the eastern Irish Sea the Nephrops stock inhabits an area of muddy sediment extending along the Cumbria coast and its fishery contributes to less than 10% of overall Irish Sea land-ings. There is little evidence of mixing between the east and west Irish Sea stocks due to the nature of water current movements in the Irish Sea. The two are treated as sep-arate populations since they have differing population characteristics.
A.2. The fishery
Between 1999 and 2003 the number of vessels fishing for Nephrops in FU14 declined by 40% to a fleet of around 50 vessels. This was largely due to the reduction in the number of visiting UK vessels and the decommissioning of part of the Northern Irish and local English fleets. Since then the number of vessels fishing the area has re-turned to around 80 vessels mainly from Northern Ireland. Currently, around 30 of these vessels, between six and 23 m in length, have their ‘home’ ports in Whitehaven, Maryport and Fleetwood, England. The rest of the fleet is generally made up of larger vessels from Kilkeel or Portavogie, Northern Ireland.
Between 1987 and 2006, landings from FU14 appeared relatively stable, fluctuating around a long-term average of about 550 t. Landings in 2007, however bucked this trend, and are at their highest level since 1978 at 959 t, this is after landings dropped in 2003 to their lowest apparent level since 1974. The 2008 and 2009 figures of 676 and 694 t respectively are lower than 2007 still remains high, above any other figure rec-orded since 1990. The introduction of the buyers and sellers legislation in 2006 really precludes direct comparison with previous years as reporting levels are considered to have significantly improved since.
Over the last ten years UK vessels have landed, on average, 87% of the reported an-nual international landings. ROI vessels increased their share of the landings to 35% in 2002 but it has since declined to 2% in 2009. In 2009, most of the landings were made into England with a large proportion of these landings (67% of the directed landings and 62% of the total landings) being made by visiting Northern Irish vessels. UK Nephrops directed effort has fluctuated around a downward trend since 1993 but has remained relatively stable since 2003 fluctuating around a mean of 13 800 hrs. Changes to recording practices will affect interpretation of the scale of this decline but a decline is real.
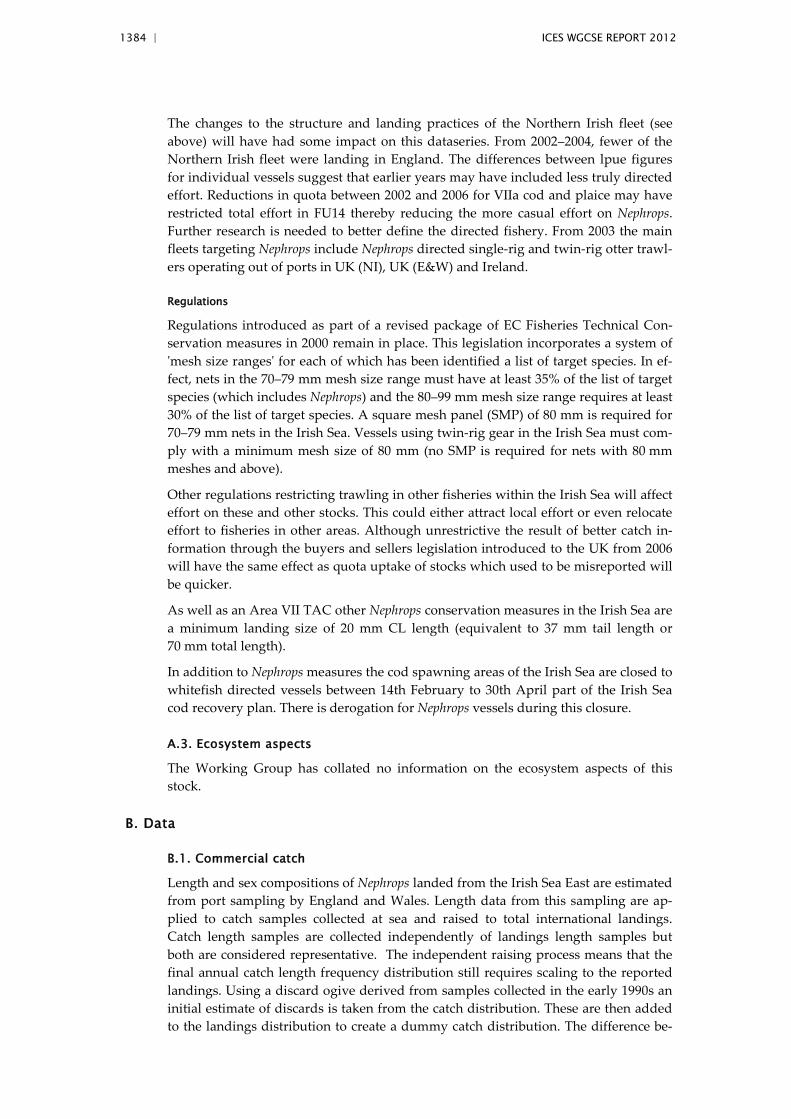
1384 | ICES WGCSE REPORT 2012
The changes to the structure and landing practices of the Northern Irish fleet (see above) will have had some impact on this dataseries. From 2002–2004, fewer of the Northern Irish fleet were landing in England. The differences between lpue figures for individual vessels suggest that earlier years may have included less truly directed effort. Reductions in quota between 2002 and 2006 for VIIa cod and plaice may have restricted total effort in FU14 thereby reducing the more casual effort on Nephrops. Further research is needed to better define the directed fishery. From 2003 the main fleets targeting Nephrops include Nephrops directed single-rig and twin-rig otter trawl-ers operating out of ports in UK (NI), UK (E&W) and Ireland.
Regulations
Regulations introduced as part of a revised package of EC Fisheries Technical Con-servation measures in 2000 remain in place. This legislation incorporates a system of 'mesh size ranges' for each of which has been identified a list of target species. In ef-fect, nets in the 70–79 mm mesh size range must have at least 35% of the list of target species (which includes Nephrops) and the 80–99 mm mesh size range requires at least 30% of the list of target species. A square mesh panel (SMP) of 80 mm is required for 70–79 mm nets in the Irish Sea. Vessels using twin-rig gear in the Irish Sea must com-ply with a minimum mesh size of 80 mm (no SMP is required for nets with 80 mm meshes and above).
Other regulations restricting trawling in other fisheries within the Irish Sea will affect effort on these and other stocks. This could either attract local effort or even relocate effort to fisheries in other areas. Although unrestrictive the result of better catch in-formation through the buyers and sellers legislation introduced to the UK from 2006 will have the same effect as quota uptake of stocks which used to be misreported will be quicker.
As well as an Area VII TAC other Nephrops conservation measures in the Irish Sea are a minimum landing size of 20 mm CL length (equivalent to 37 mm tail length or 70 mm total length).
In addition to Nephrops measures the cod spawning areas of the Irish Sea are closed to whitefish directed vessels between 14th February to 30th April part of the Irish Sea cod recovery plan. There is derogation for Nephrops vessels during this closure.
A.3. Ecosystem aspects
The Working Group has collated no information on the ecosystem aspects of this stock.
B. Data
B.1. Commercial catch
Length and sex compositions of Nephrops landed from the Irish Sea East are estimated from port sampling by England and Wales. Length data from this sampling are ap-plied to catch samples collected at sea and raised to total international landings. Catch length samples are collected independently of landings length samples but both are considered representative. The independent raising process means that the final annual catch length frequency distribution still requires scaling to the reported landings. Using a discard ogive derived from samples collected in the early 1990s an initial estimate of discards is taken from the catch distribution. These are then added to the landings distribution to create a dummy catch distribution. The difference be-
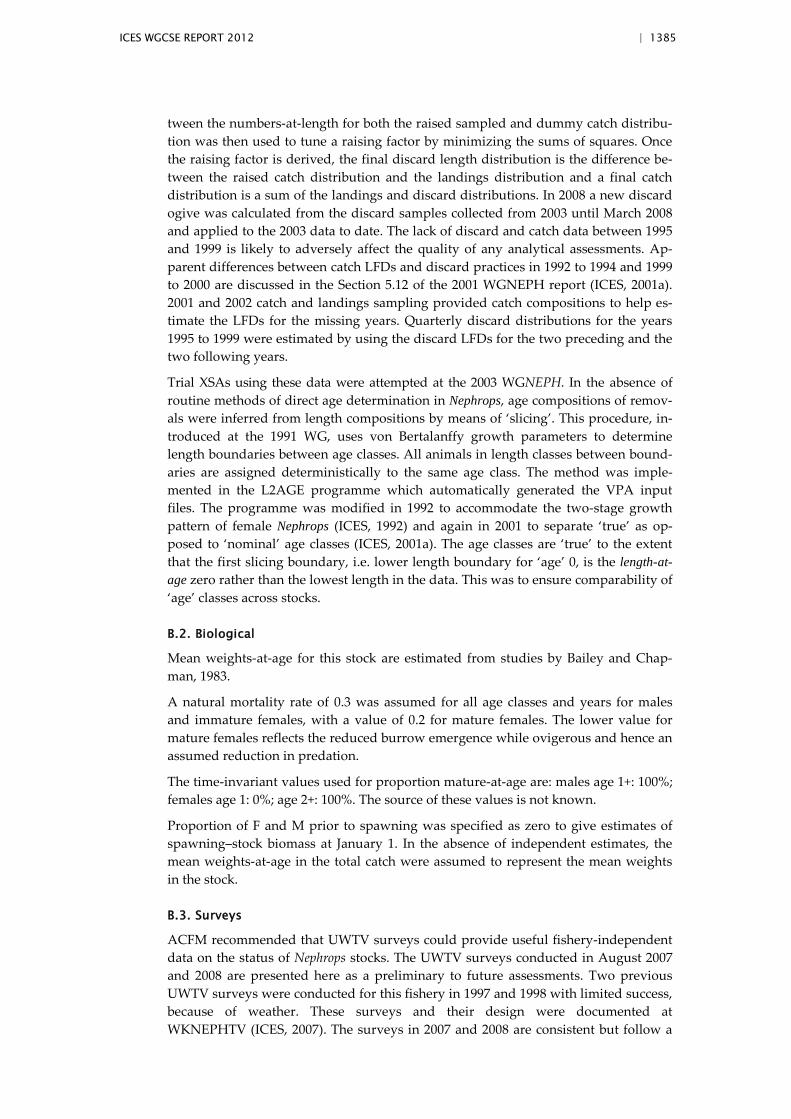
ICES WGCSE REPORT 2012 | 1385
tween the numbers-at-length for both the raised sampled and dummy catch distribu-tion was then used to tune a raising factor by minimizing the sums of squares. Once the raising factor is derived, the final discard length distribution is the difference be-tween the raised catch distribution and the landings distribution and a final catch distribution is a sum of the landings and discard distributions. In 2008 a new discard ogive was calculated from the discard samples collected from 2003 until March 2008 and applied to the 2003 data to date. The lack of discard and catch data between 1995 and 1999 is likely to adversely affect the quality of any analytical assessments. Ap-parent differences between catch LFDs and discard practices in 1992 to 1994 and 1999 to 2000 are discussed in the Section 5.12 of the 2001 WGNEPH report (ICES, 2001a). 2001 and 2002 catch and landings sampling provided catch compositions to help es-timate the LFDs for the missing years. Quarterly discard distributions for the years 1995 to 1999 were estimated by using the discard LFDs for the two preceding and the two following years.
Trial XSAs using these data were attempted at the 2003 WGNEPH. In the absence of routine methods of direct age determination in Nephrops, age compositions of remov-als were inferred from length compositions by means of ‘slicing’. This procedure, in-troduced at the 1991 WG, uses von Bertalanffy growth parameters to determine length boundaries between age classes. All animals in length classes between bound-aries are assigned deterministically to the same age class. The method was imple-mented in the L2AGE programme which automatically generated the VPA input files. The programme was modified in 1992 to accommodate the two-stage growth pattern of female Nephrops (ICES, 1992) and again in 2001 to separate ‘true’ as op-posed to ‘nominal’ age classes (ICES, 2001a). The age classes are ‘true’ to the extent that the first slicing boundary, i.e. lower length boundary for ‘age’ 0, is the length-at-age zero rather than the lowest length in the data. This was to ensure comparability of ‘age’ classes across stocks.
B.2. Biological
Mean weights-at-age for this stock are estimated from studies by Bailey and Chap-man, 1983.
A natural mortality rate of 0.3 was assumed for all age classes and years for males and immature females, with a value of 0.2 for mature females. The lower value for mature females reflects the reduced burrow emergence while ovigerous and hence an assumed reduction in predation.
The time-invariant values used for proportion mature-at-age are: males age 1+: 100%; females age 1: 0%; age 2+: 100%. The source of these values is not known.
Proportion of F and M prior to spawning was specified as zero to give estimates of spawning–stock biomass at January 1. In the absence of independent estimates, the mean weights-at-age in the total catch were assumed to represent the mean weights in the stock.
B.3. Surveys
ACFM recommended that UWTV surveys could provide useful fishery-independent data on the status of Nephrops stocks. The UWTV surveys conducted in August 2007 and 2008 are presented here as a preliminary to future assessments. Two previous UWTV surveys were conducted for this fishery in 1997 and 1998 with limited success, because of weather. These surveys and their design were documented at WKNEPHTV (ICES, 2007). The surveys in 2007 and 2008 are consistent but follow a
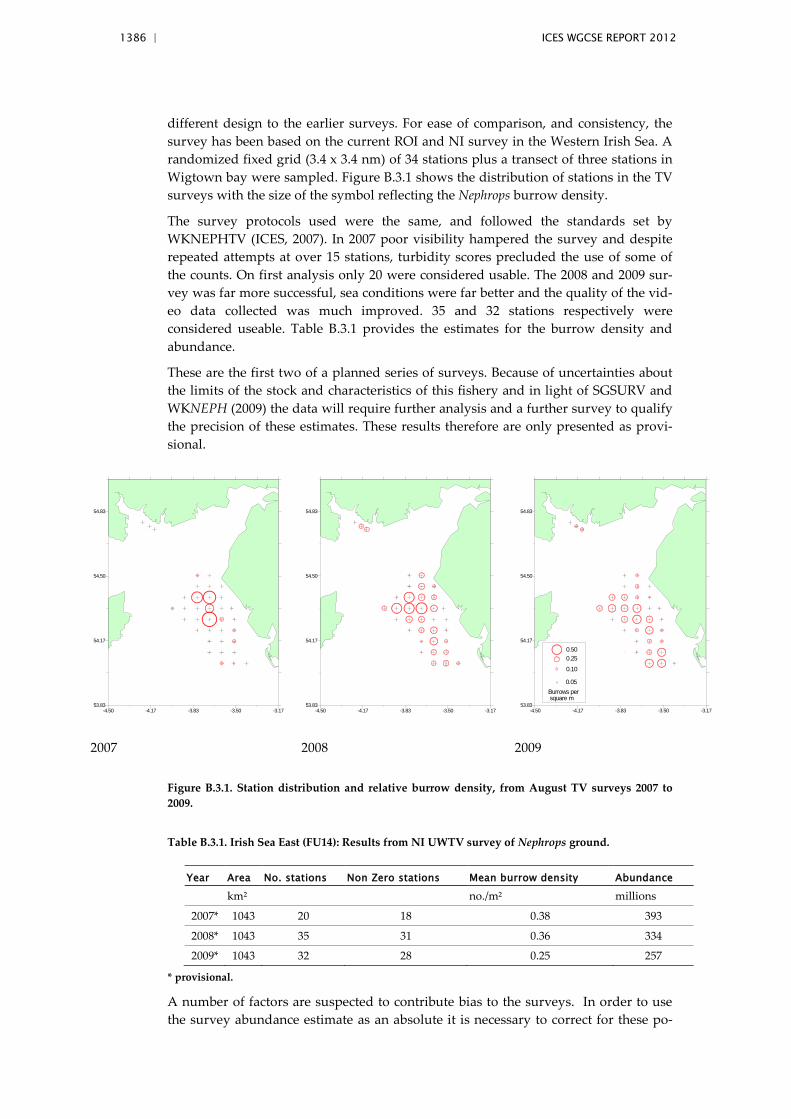
1386 | ICES WGCSE REPORT 2012
different design to the earlier surveys. For ease of comparison, and consistency, the survey has been based on the current ROI and NI survey in the Western Irish Sea. A randomized fixed grid (3.4 x 3.4 nm) of 34 stations plus a transect of three stations in Wigtown bay were sampled. Figure B.3.1 shows the distribution of stations in the TV surveys with the size of the symbol reflecting the Nephrops burrow density.
The survey protocols used were the same, and followed the standards set by WKNEPHTV (ICES, 2007). In 2007 poor visibility hampered the survey and despite repeated attempts at over 15 stations, turbidity scores precluded the use of some of the counts. On first analysis only 20 were considered usable. The 2008 and 2009 sur-vey was far more successful, sea conditions were far better and the quality of the vid-eo data collected was much improved. 35 and 32 stations respectively were considered useable. Table B.3.1 provides the estimates for the burrow density and abundance.
These are the first two of a planned series of surveys. Because of uncertainties about the limits of the stock and characteristics of this fishery and in light of SGSURV and WKNEPH (2009) the data will require further analysis and a further survey to qualify the precision of these estimates. These results therefore are only presented as provi-sional.
-4.50 -4.17 -3.83 -3.50 -3.1753.83
54.17
54.50
54.83
-4.50 -4.17 -3.83 -3.50 -3.1753.83
54.17
54.50
54.83
-4.50 -4.17 -3.83 -3.50 -3.1753.83
54.17
54.50
54.83
0.05
0.10
0.250.50
Burrows per square m
2007 2008 2009
Figure B.3.1. Station distribution and relative burrow density, from August TV surveys 2007 to 2009.
Table B.3.1. Irish Sea East (FU14): Results from NI UWTV survey of Nephrops ground.
Year Area No. stations Non Zero stations Mean burrow density Abundance
km² no./m² millions
2007* 1043 20 18 0.38 393
2008* 1043 35 31 0.36 334
2009* 1043 32 28 0.25 257
* provisional.
A number of factors are suspected to contribute bias to the surveys. In order to use the survey abundance estimate as an absolute it is necessary to correct for these po-
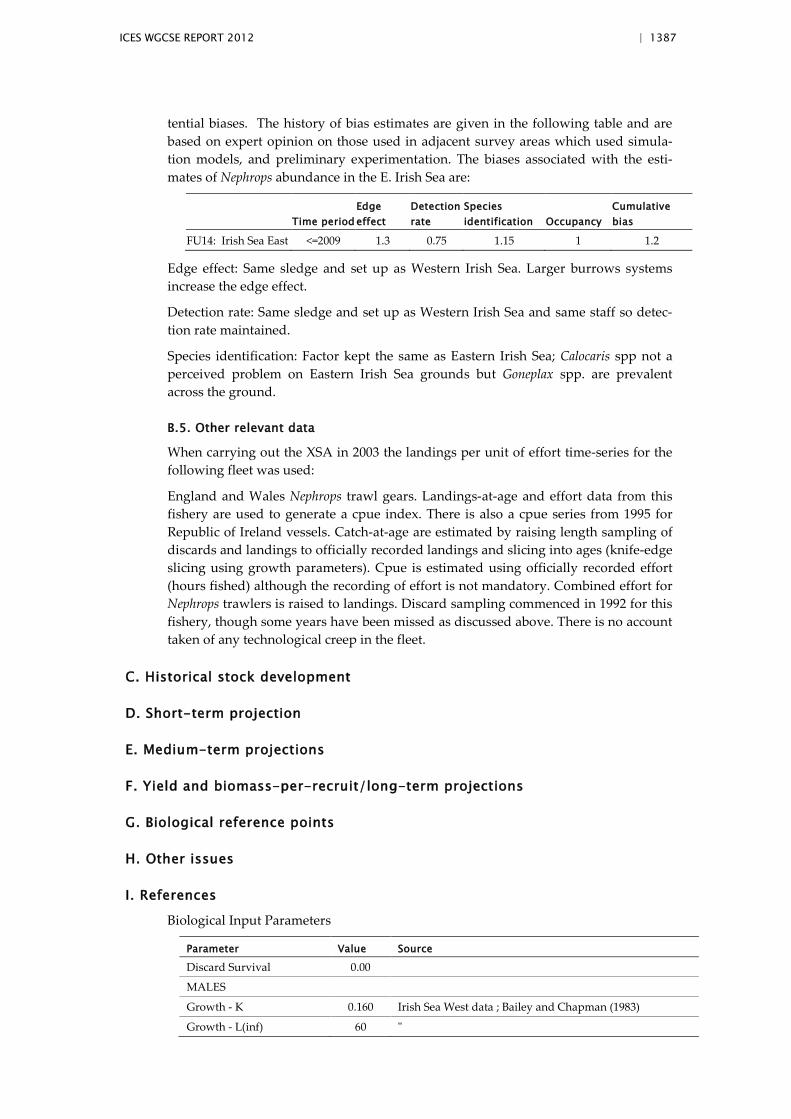
ICES WGCSE REPORT 2012 | 1387
tential biases. The history of bias estimates are given in the following table and are based on expert opinion on those used in adjacent survey areas which used simula-tion models, and preliminary experimentation. The biases associated with the esti-mates of Nephrops abundance in the E. Irish Sea are:
Time period Edge effect
Detection rate
Species identification Occupancy
Cumulative bias
FU14: Irish Sea East <=2009 1.3 0.75 1.15 1 1.2
Edge effect: Same sledge and set up as Western Irish Sea. Larger burrows systems increase the edge effect.
Detection rate: Same sledge and set up as Western Irish Sea and same staff so detec-tion rate maintained.
Species identification: Factor kept the same as Eastern Irish Sea; Calocaris spp not a perceived problem on Eastern Irish Sea grounds but Goneplax spp. are prevalent across the ground.
B.5. Other relevant data
When carrying out the XSA in 2003 the landings per unit of effort time-series for the following fleet was used:
England and Wales Nephrops trawl gears. Landings-at-age and effort data from this fishery are used to generate a cpue index. There is also a cpue series from 1995 for Republic of Ireland vessels. Catch-at-age are estimated by raising length sampling of discards and landings to officially recorded landings and slicing into ages (knife-edge slicing using growth parameters). Cpue is estimated using officially recorded effort (hours fished) although the recording of effort is not mandatory. Combined effort for Nephrops trawlers is raised to landings. Discard sampling commenced in 1992 for this fishery, though some years have been missed as discussed above. There is no account taken of any technological creep in the fleet.
C. Historical stock development
D. Short-term projection
E. Medium-term projections
F. Yield and biomass-per-recruit/long-term projections
G. Biological reference points
H. Other issues
I. References
Biological Input Parameters
Parameter Value Source
Discard Survival 0.00
MALES
Growth - K 0.160 Irish Sea West data ; Bailey and Chapman (1983)
Growth - L(inf) 60 "
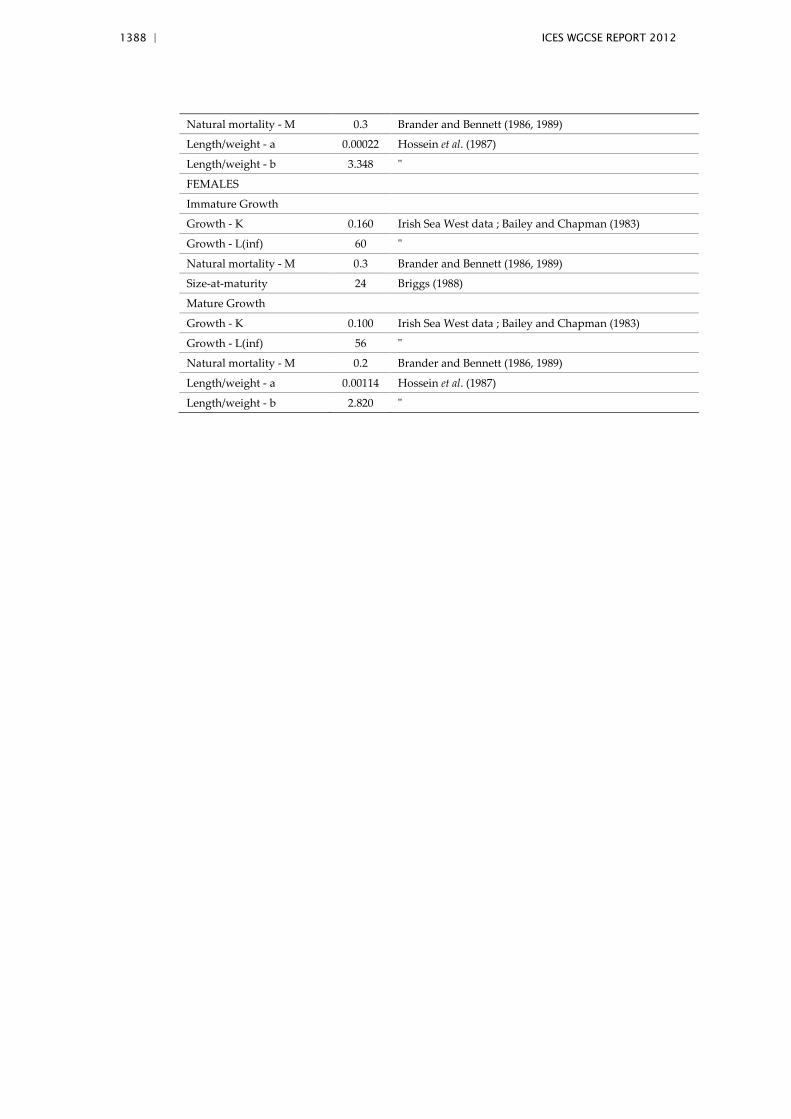
1388 | ICES WGCSE REPORT 2012
Natural mortality - M 0.3 Brander and Bennett (1986, 1989)
Length/weight - a 0.00022 Hossein et al. (1987)
Length/weight - b 3.348 "
FEMALES
Immature Growth
Growth - K 0.160 Irish Sea West data ; Bailey and Chapman (1983)
Growth - L(inf) 60 "
Natural mortality - M 0.3 Brander and Bennett (1986, 1989)
Size-at-maturity 24 Briggs (1988)
Mature Growth
Growth - K 0.100 Irish Sea West data ; Bailey and Chapman (1983)
Growth - L(inf) 56 "
Natural mortality - M 0.2 Brander and Bennett (1986, 1989)
Length/weight - a 0.00114 Hossein et al. (1987)
Length/weight - b 2.820 "
ICES WGCSE REPORT 2012 | 1389
6.5 Stock Annex Irish Sea West Nephrops (FU15)
Stock specific documentation of standard assessment procedures used by ICES.
Stock Irish Sea West Nephrops (FU15)
Working Group WKNEPH 2009 (WKNEPH2009)
Date 6 March 2009
A. General
A.1. Stock definition
Throughout its distribution, Nephrops is limited to muddy habitat, and requires sedi-ment with a silt & clay content of between 10–100% to excavate its burrows, and this means that the distribution of suitable sediment defines the species distribution. Adult Nephrops only undertake very small-scale movements (a few 100 m) but larval transfer may occur between separate mud patches in some areas. In the western Irish Sea the Nephrops stock inhabits an extensive area of muddy sediment between the Isle of Man and Northern Ireland and its fishery contributes to more than 90% of overall Irish Sea landings. There is little evidence of mixing between the east and west Irish Sea stocks due to the nature of water current movements, which is characterized in the west by a gyre, which has a retention effect on both sediment and larvae. The eastern and western Nephrops stocks are treated as separate populations as they have different population characteristics.
A.3. Ecosystem aspects
A number of studies have examined Nephrops larvae distribution in order to examine how recruitment may impinge upon the distribution of a “catchable” (adult) Nephrops population and the maintenance of the population. Hillis (1968) found that although generally the larvae occupied the same areas as the adults, there was some evidence of advective losses to the southeastern part of their range, most probably due to tidal currents (White et al., 1988). More recent studies in the western Irish Sea have uncov-ered the existence of a seasonal cyclonic gyre which appears to facilitate retention of larvae over the mud patch (Dickey-Collas et al., 1996; Hill et al., 1996; Horsburgh et al., 2000).
B. Data
B.1. Commercial catch
Length and sex compositions of Nephrops landed from the Irish Sea West are estimat-ed from port sampling by Ireland and Northern Ireland and Ireland. A lack of coop-eration by the Northern Ireland industry prevented sampling commercial catches over the period 2003–2007. The Irish LFDs are therefore raised to the international catch for these years. Northern Ireland sampling resumed in 2008 and these data are combined with those from Ireland for that year. Sample data are used to compute international removals (Landings + dead discards).
Landings per unit of effort time-series are available from the following fleets:
Northern Ireland Nephrops trawl gears. Landings-at-age and effort data from this fishery since 1986 are used to generate a cpue index. There is also a cpue series since
1390 | ICES WGCSE REPORT 2012
1995 for a subset of Republic of Ireland Nephrops vessels. Catch-at-age are estimated by raising length sampling of discards and landings to officially recorded landings and slicing into ages (knife-edge slicing using growth parameters). Cpue is estimated using officially recorded effort (hours fished). Discard sampling commenced in the mid-1980s by Northern Ireland and the Republic of Ireland. There is no account taken of any technological creep in the fleet.
B.2. Biological
Mean weights-at-length for this stock are estimated from studies by Pope and Thom-as (1955).
A natural mortality rate of 0.3 was assumed for males and immature females, with a value of 0.2 for mature females. The lower value for mature females reflects the re-duced burrow emergence while ovigerous and hence an assumed reduction in preda-tion.
Maturity for females is taken as 22.1 mm carapace length (McQuaid et al., 2006).
Proportion of F and M prior to spawning was specified as zero to give estimates of spawning–stock biomass at January 1. In the absence of independent estimates, the mean weights-at-age in the total catch were assumed to represent the mean weights in the stock.
B.3. Surveys
Ireland and Northern Ireland jointly carry out underwater television (UWTV) sur-veys on the main Nephrops grounds in the western Irish Sea (Figure 1) since 2003. These surveys are based on a randomized fixed grid design. The methods used dur-ing the survey are similar to those employed for UWTV surveys of Nephrops stocks elsewhere and are detailed in WKNEPHTV, 2007 and WKNEPHBID, 2008.
Northern Ireland have carried out a spring (April) and summer (August) Nephrops trawl surveys since 1994. These surveys provide data on catch rates and length fre-quency distributions from of stations throughout in the western Irish Sea. These sur-veys generate data on Nephrops size composition, mean size, maturity and sex ratio.
A number of factors are suspected to contribute bias to the UWTV surveys. In order to use the survey abundance estimate as an absolute it is necessary to correct for these potential biases. The history of bias estimates are given in the following table and are based on simulation models, preliminary experimentation and expert opinion, the biases associated with the estimates of Nephrops abundance in the Irish Sea West are:
Time period Edge effect
detection rate
species identification occupancy
Cumulative bias
FU15: Irish Sea West <=2009 1.24 0.75 1.15 1 1.14
B.4. Commercial cpue
B.5. Other relevant data
Table 1 is a summary of available data along with an assessment of its reliability.
Table 2 is a summary of assessment parameters.
ICES WGCSE REPORT 2012 | 1391
C. Historical stock development
1 ) Survey indices are worked up annually resulting in the TV index. 2 ) Adjust index for bias (see Section B.3). The combined effect of these biases
is to be applied to the new survey index. 3 ) Generate mean weight in landings. Check the time-series of mean landing
weights for evidence of a trend in the most recent period. If there is no firm evidence of a recent trend in mean weight use the average of the three most recent years. If, however, there is strong evidence of a recent trend then apply most recent value (don’t attempt to extrapolate the trend fur-ther in future).
D. Short-term projection
1 ) The catch option table will include the harvest ratios associated with fish-ing at F0.1 and Fmax. These values have been estimated by the Benchmark Workshop (see Section 9.2) and are to be revisited by subsequent bench-mark groups. The values are FU specific and have been put in the Stock Annexes.
2 ) Create catch option table on the basis of a range of harvest ratios ranging from 0 to the maximum observed ratio or the ratio equating to FMAX, whichever is the larger. Insert the harvest ratios from step 4 and also the current harvest ratio.
3 ) Multiply the survey index by the harvest ratios to give the number of total removals.
4 ) Create a landings number by applying a discard factor. This conversion factor has been estimated by the Benchmark Workshop and is to be revisit-ed at subsequent benchmark groups. The value is FU specific and has been put in the Stock Annex.
5 ) Produce landings biomass by applying mean weight.
The suggested catch option table format is as follows.
Implied fishery
Harvest rate Survey Index Retained number Landings (tonnes) 0% 12 345 0 0.00 2% " 247 123.45 4% " 494 246.90 6% " 741 370.35 8% " 988 493.80 F0.1 8.60% " 1062 530.84 10% " 1235 617.25 12% " 1481 740.70 FMAX 13.50% " 1667 833.29 14% " 1728 864.15 16% " 1975 987.60 18% " 2222 1111.05 20% " 2469 1234.50 22% " 2716 1357.95 Fcurrent 21.5% " 2654 1327.09
1392 | ICES WGCSE REPORT 2012
E. Medium-term projections
None presented.
F. Long-term projections
None presented.
G. Biological reference points
Harvest ratios equating to fishing at F0.1 and FMAX were calculated in WKNeph (2009). These calculations assume that the TV survey has a knife-edge selectivity at 17 mm and that the supplied length frequencies represented the population in equilibrium.
F0.1 = 10.9%
FMAX= 20.2%
I. References Dickey-Collas, M., Gowen, R.J. and Fox, C.J. 1996. Distribution of larval and juvenile fish in the
western Irish Sea: Relationship to phytoplankton, zooplankton biomass and recurrent physical features. Marine and Freshwater Research 47: 169–181.
Horsburgh, K.J., Hill, A.E., Brown, J., Fernand, L., Garvine, R.W., Angelico, M.M.P. 2000. Sea-sonal evolution of the cold pool gyre in the western Irish Sea. Progress in Oceanography 46: 1–58.
Hill, A.E., Brown, J. and Fernand, L. 1996. The western Irish Sea gyre: a retention mechanism for the Norway Lobster (Nephrops norvegicus) Oceanologica Acta 19: 357–369.
Hillis, J.P. 1968. Larval distribution of Nephrops norvegicus (L.) in the Irish Sea and North Chan-nel. ICRES C.M. 1968. Doc. No. K6. (Mimeo).
McQuaid, N., Briggs, R.P.and Roberts, D. 2006. Estimation of the size of onset of sexual maturi-ty in Nephrops norvegicus (L.). Fisheries Research.
White, R.G., Hill, A.E. and Jones, D.A. 1988. Distribution of Nephrops norvegicus (L.) larvae in the western Irish Sea: an example of advective control on recruitment. Journal of Plankton Research 10(4): 735–747.
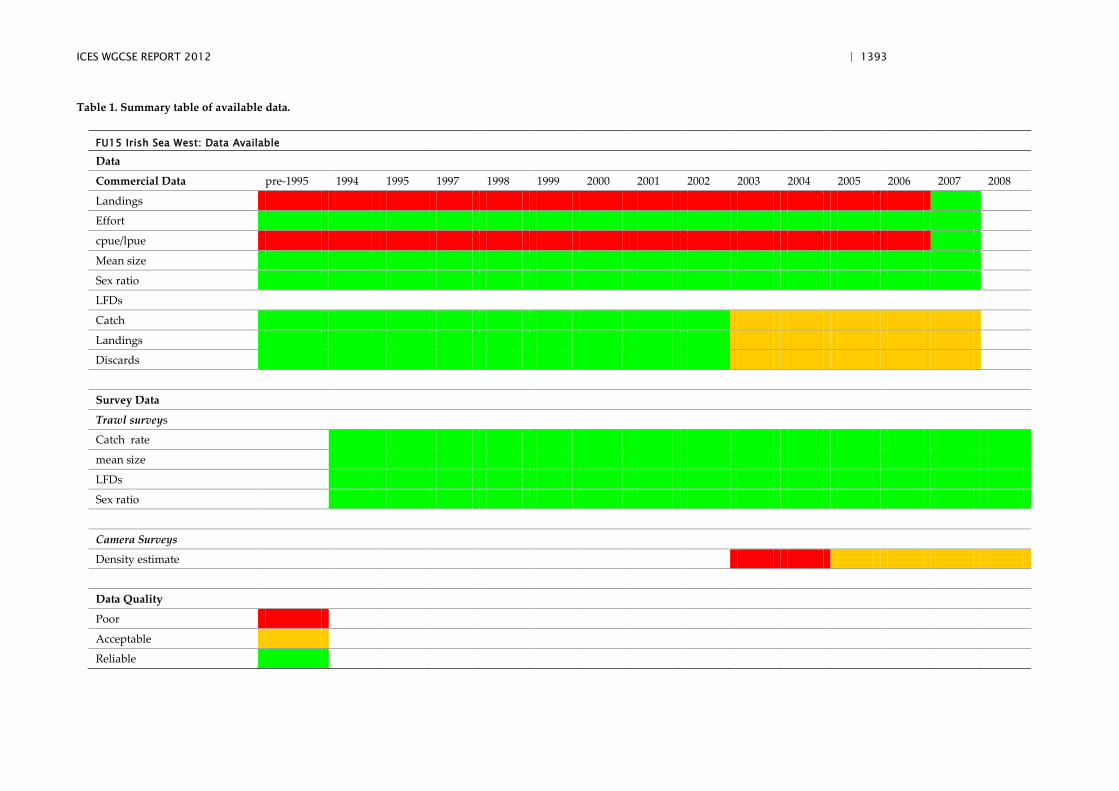
ICES WGCSE REPORT 2012 | 1393
Table 1. Summary table of available data.
FU15 Irish Sea West: Data Available
Data
Commercial Data pre-1995 1994 1995 1997 1998 1999 2000 2001 2002 2003 2004 2005 2006 2007 2008
Landings
Effort
cpue/lpue
Mean size
Sex ratio
LFDs
Catch
Landings
Discards
Survey Data
Trawl surveys
Catch rate
mean size
LFDs
Sex ratio
Camera Surveys
Density estimate
Data Quality
Poor
Acceptable
Reliable
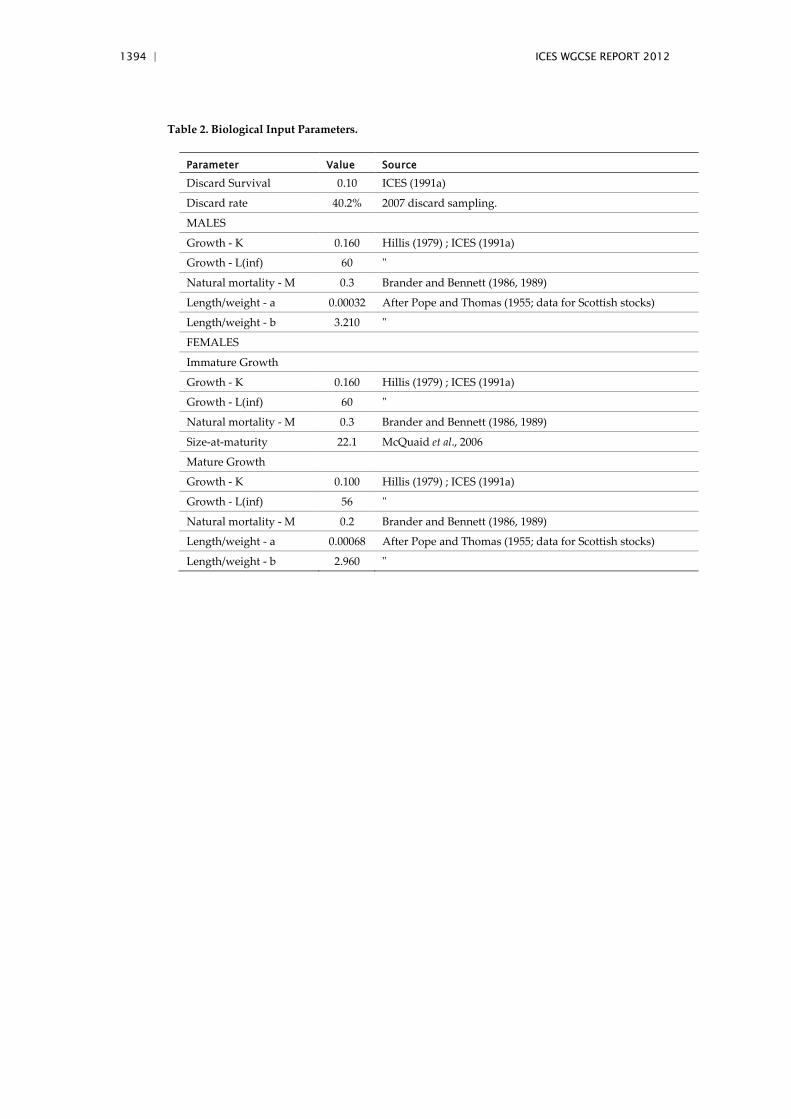
1394 | ICES WGCSE REPORT 2012
Table 2. Biological Input Parameters.
Parameter Value Source
Discard Survival 0.10 ICES (1991a)
Discard rate 40.2% 2007 discard sampling.
MALES
Growth - K 0.160 Hillis (1979) ; ICES (1991a)
Growth - L(inf) 60 "
Natural mortality - M 0.3 Brander and Bennett (1986, 1989)
Length/weight - a 0.00032 After Pope and Thomas (1955; data for Scottish stocks)
Length/weight - b 3.210 "
FEMALES
Immature Growth
Growth - K 0.160 Hillis (1979) ; ICES (1991a)
Growth - L(inf) 60 "
Natural mortality - M 0.3 Brander and Bennett (1986, 1989)
Size-at-maturity 22.1 McQuaid et al., 2006
Mature Growth
Growth - K 0.100 Hillis (1979) ; ICES (1991a)
Growth - L(inf) 56 "
Natural mortality - M 0.2 Brander and Bennett (1986, 1989)
Length/weight - a 0.00068 After Pope and Thomas (1955; data for Scottish stocks)
Length/weight - b 2.960 "
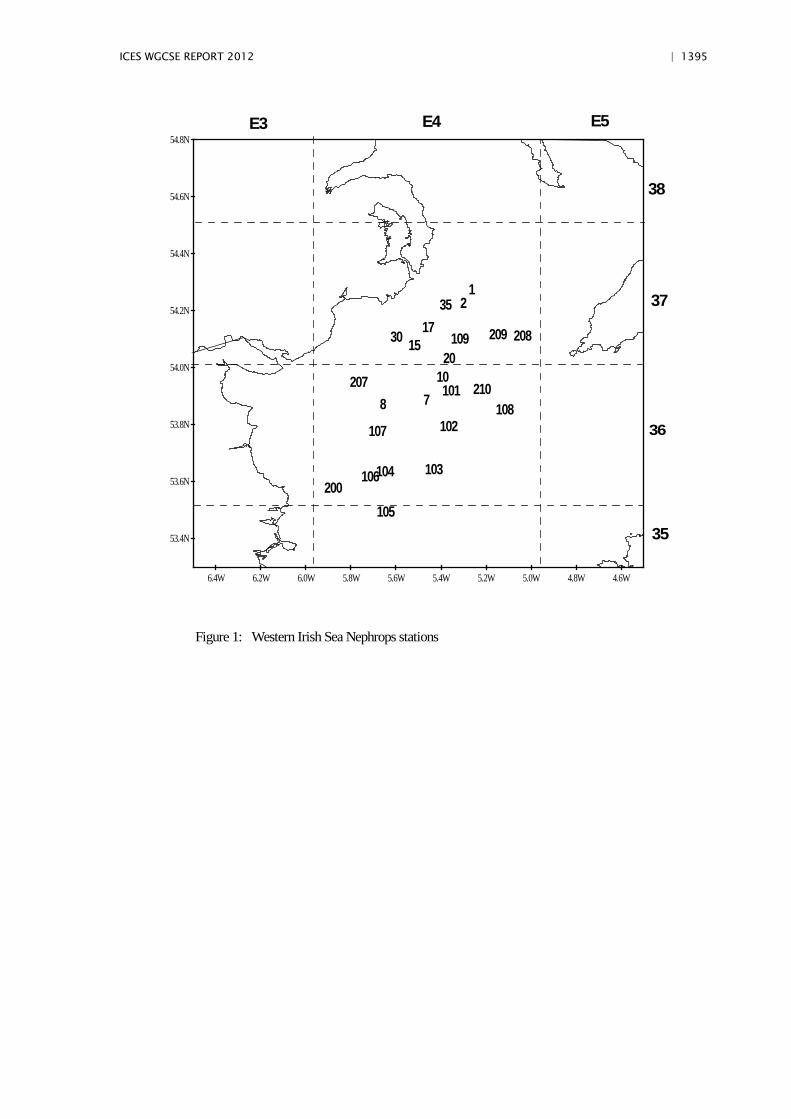
ICES WGCSE REPORT 2012 | 1395
12
78
10
1517
2030
35
101
102
103104
105
106
107108
109
200
207
208209
210
6.4W 6.2W 6.0W 5.8W 5.6W 5.4W 5.2W 5.0W 4.8W 4.6W
53.4N
53.6N
53.8N
54.0N
54.2N
54.4N
54.6N
54.8N
36
E4 E5E3
37
38
35
Figure 1: Western Irish Sea Nephrops stations
1396 | ICES WGCSE REPORT 2012
6.6 Stock Annex Whiting VIIa
Stock specific documentation of standard assessment procedures used by ICES.
Stock Irish Sea Whiting (Division VIIa)
Working Group Assessment of Northern Shelf Demersal Stocks
Last updated WGCSE 2011
Updates Inclusion of Fishery Data from Ireland
A. General
A.1. Stock definition
Whiting in Division VIIa are considered a single stock for management purposes. In 2004 an informal meeting was established to review current knowledge of the distri-bution, movements and stock structure of whiting in the Irish Sea, and linkages be-tween whiting in the Irish Sea and surrounding management areas. Information on egg and larval, tagging, survey studies was presented as a working document (WD10) in WGNSDS, 2005. The results of this are synopsized below:
UK egg and larva surveys have shown that whiting spawn in spring throughout the eastern Irish Sea and in the coastal waters of the western Irish Sea. This is supported by the distribution of actively spawning fish caught during trawl surveys in March.
Transport of whiting eggs, larvae or pelagic prerecruits from Celtic Sea spawning grounds into the Irish Sea is likely to be impeded by the Celtic Sea thermal front that becomes increasingly established from spring onwards.
Whiting recruitment grounds are in the same general area as the spawning grounds, and young whiting are widespread in the coastal bights of the Irish Sea. The gyre sys-tem that becomes established from late spring onwards in the western Irish Sea ap-pears important in retaining larvae and pelagic prerecruits of whiting, as shown by the results of frame-trawl surveys of pelagic prerecruits in the western Irish Sea.
As the whiting become demersal from late summer onwards, they are found throughout the western Irish Sea although densities appear highest around the pe-riphery of the mud patch in coastal waters and along the southern boundary between Ireland and the Isle of Man. This pattern is also noted by fishermen operating in this area. Densities of young whiting in the eastern Irish Sea appear highest off Cumbria and the Solway Firth in autumn, but are more widespread in spring.
Tagging studies in the late 1950s show some seasonal dispersal of whiting from the Irish Coast to as far as the Clyde, Liverpool Bay and the Celtic Sea, with evidence of return migrations. Whiting tagged in these studies ranged from about 20–40 cm, av-eraging around 30 cm. Whiting recaptured well away from the tagging sites off County Down in the western Irish Sea tended to be several cm larger, on average, than the tagged whiting.
Both the western Irish Sea and the Clyde have historically been characterized b catch-es of immature and first-maturing whiting, whereas the eastern Irish Sea has a broad-er age-range of whiting. This pattern persists to the present day.
The evidence of interchange of whiting between the western Irish Sea and other areas within the Irish Sea precludes treating different areas within the Irish Sea as contain-
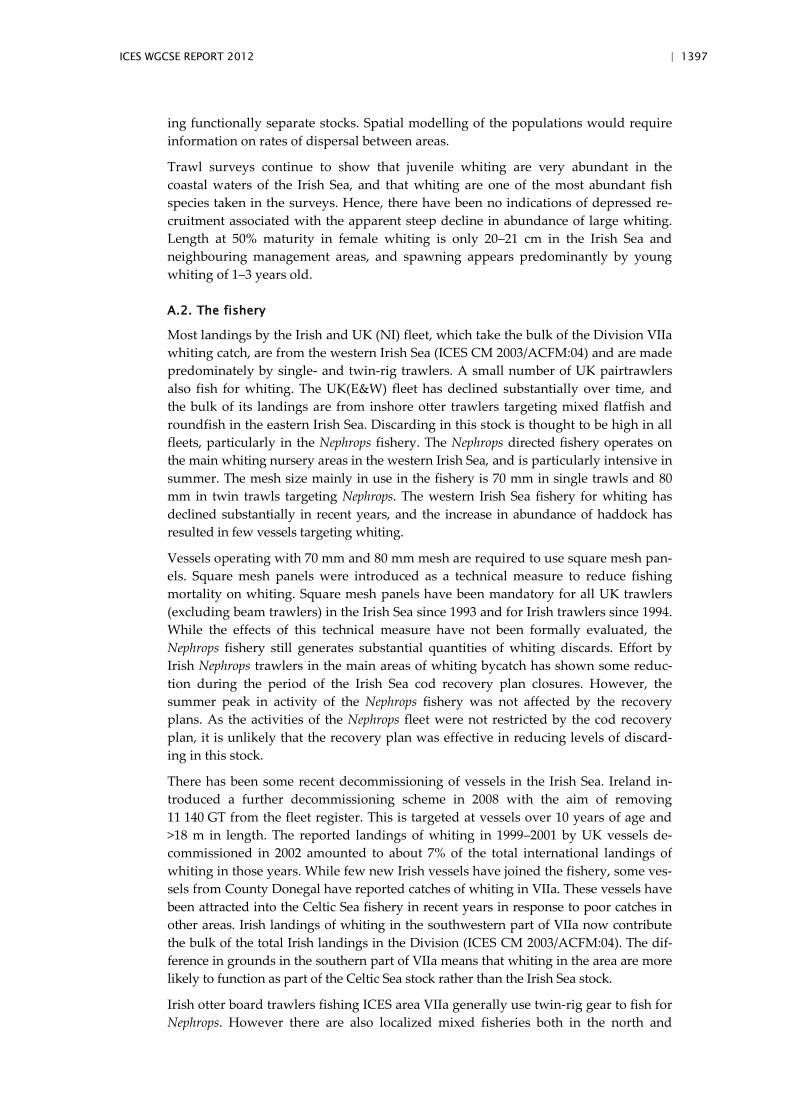
ICES WGCSE REPORT 2012 | 1397
ing functionally separate stocks. Spatial modelling of the populations would require information on rates of dispersal between areas.
Trawl surveys continue to show that juvenile whiting are very abundant in the coastal waters of the Irish Sea, and that whiting are one of the most abundant fish species taken in the surveys. Hence, there have been no indications of depressed re-cruitment associated with the apparent steep decline in abundance of large whiting. Length at 50% maturity in female whiting is only 20–21 cm in the Irish Sea and neighbouring management areas, and spawning appears predominantly by young whiting of 1–3 years old.
A.2. The fishery
Most landings by the Irish and UK (NI) fleet, which take the bulk of the Division VIIa whiting catch, are from the western Irish Sea (ICES CM 2003/ACFM:04) and are made predominately by single- and twin-rig trawlers. A small number of UK pairtrawlers also fish for whiting. The UK(E&W) fleet has declined substantially over time, and the bulk of its landings are from inshore otter trawlers targeting mixed flatfish and roundfish in the eastern Irish Sea. Discarding in this stock is thought to be high in all fleets, particularly in the Nephrops fishery. The Nephrops directed fishery operates on the main whiting nursery areas in the western Irish Sea, and is particularly intensive in summer. The mesh size mainly in use in the fishery is 70 mm in single trawls and 80 mm in twin trawls targeting Nephrops. The western Irish Sea fishery for whiting has declined substantially in recent years, and the increase in abundance of haddock has resulted in few vessels targeting whiting.
Vessels operating with 70 mm and 80 mm mesh are required to use square mesh pan-els. Square mesh panels were introduced as a technical measure to reduce fishing mortality on whiting. Square mesh panels have been mandatory for all UK trawlers (excluding beam trawlers) in the Irish Sea since 1993 and for Irish trawlers since 1994. While the effects of this technical measure have not been formally evaluated, the Nephrops fishery still generates substantial quantities of whiting discards. Effort by Irish Nephrops trawlers in the main areas of whiting bycatch has shown some reduc-tion during the period of the Irish Sea cod recovery plan closures. However, the summer peak in activity of the Nephrops fishery was not affected by the recovery plans. As the activities of the Nephrops fleet were not restricted by the cod recovery plan, it is unlikely that the recovery plan was effective in reducing levels of discard-ing in this stock.
There has been some recent decommissioning of vessels in the Irish Sea. Ireland in-troduced a further decommissioning scheme in 2008 with the aim of removing 11 140 GT from the fleet register. This is targeted at vessels over 10 years of age and >18 m in length. The reported landings of whiting in 1999–2001 by UK vessels de-commissioned in 2002 amounted to about 7% of the total international landings of whiting in those years. While few new Irish vessels have joined the fishery, some ves-sels from County Donegal have reported catches of whiting in VIIa. These vessels have been attracted into the Celtic Sea fishery in recent years in response to poor catches in other areas. Irish landings of whiting in the southwestern part of VIIa now contribute the bulk of the total Irish landings in the Division (ICES CM 2003/ACFM:04). The dif-ference in grounds in the southern part of VIIa means that whiting in the area are more likely to function as part of the Celtic Sea stock rather than the Irish Sea stock.
Irish otter board trawlers fishing ICES area VIIa generally use twin-rig gear to fish for Nephrops. However there are also localized mixed fisheries both in the north and
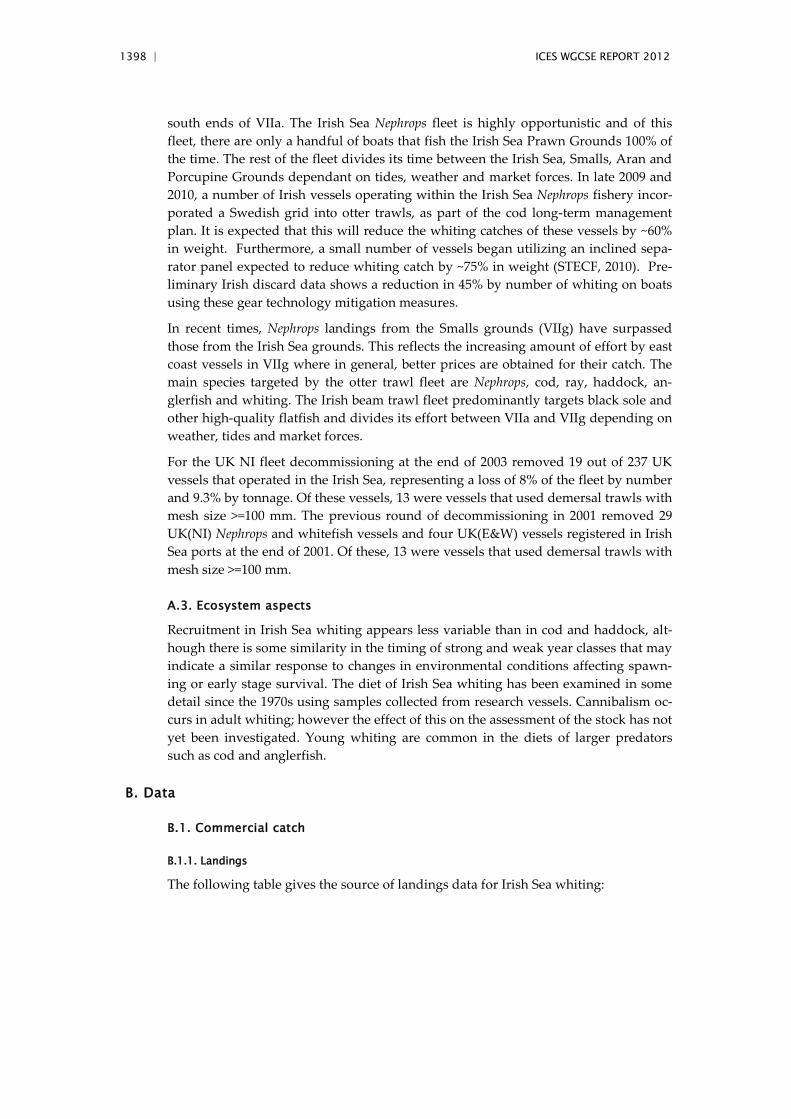
1398 | ICES WGCSE REPORT 2012
south ends of VIIa. The Irish Sea Nephrops fleet is highly opportunistic and of this fleet, there are only a handful of boats that fish the Irish Sea Prawn Grounds 100% of the time. The rest of the fleet divides its time between the Irish Sea, Smalls, Aran and Porcupine Grounds dependant on tides, weather and market forces. In late 2009 and 2010, a number of Irish vessels operating within the Irish Sea Nephrops fishery incor-porated a Swedish grid into otter trawls, as part of the cod long-term management plan. It is expected that this will reduce the whiting catches of these vessels by ~60% in weight. Furthermore, a small number of vessels began utilizing an inclined sepa-rator panel expected to reduce whiting catch by ~75% in weight (STECF, 2010). Pre-liminary Irish discard data shows a reduction in 45% by number of whiting on boats using these gear technology mitigation measures.
In recent times, Nephrops landings from the Smalls grounds (VIIg) have surpassed those from the Irish Sea grounds. This reflects the increasing amount of effort by east coast vessels in VIIg where in general, better prices are obtained for their catch. The main species targeted by the otter trawl fleet are Nephrops, cod, ray, haddock, an-glerfish and whiting. The Irish beam trawl fleet predominantly targets black sole and other high-quality flatfish and divides its effort between VIIa and VIIg depending on weather, tides and market forces.
For the UK NI fleet decommissioning at the end of 2003 removed 19 out of 237 UK vessels that operated in the Irish Sea, representing a loss of 8% of the fleet by number and 9.3% by tonnage. Of these vessels, 13 were vessels that used demersal trawls with mesh size >=100 mm. The previous round of decommissioning in 2001 removed 29 UK(NI) Nephrops and whitefish vessels and four UK(E&W) vessels registered in Irish Sea ports at the end of 2001. Of these, 13 were vessels that used demersal trawls with mesh size >=100 mm.
A.3. Ecosystem aspects
Recruitment in Irish Sea whiting appears less variable than in cod and haddock, alt-hough there is some similarity in the timing of strong and weak year classes that may indicate a similar response to changes in environmental conditions affecting spawn-ing or early stage survival. The diet of Irish Sea whiting has been examined in some detail since the 1970s using samples collected from research vessels. Cannibalism oc-curs in adult whiting; however the effect of this on the assessment of the stock has not yet been investigated. Young whiting are common in the diets of larger predators such as cod and anglerfish.
B. Data
B.1. Commercial catch
B.1.1. Landings
The following table gives the source of landings data for Irish Sea whiting:
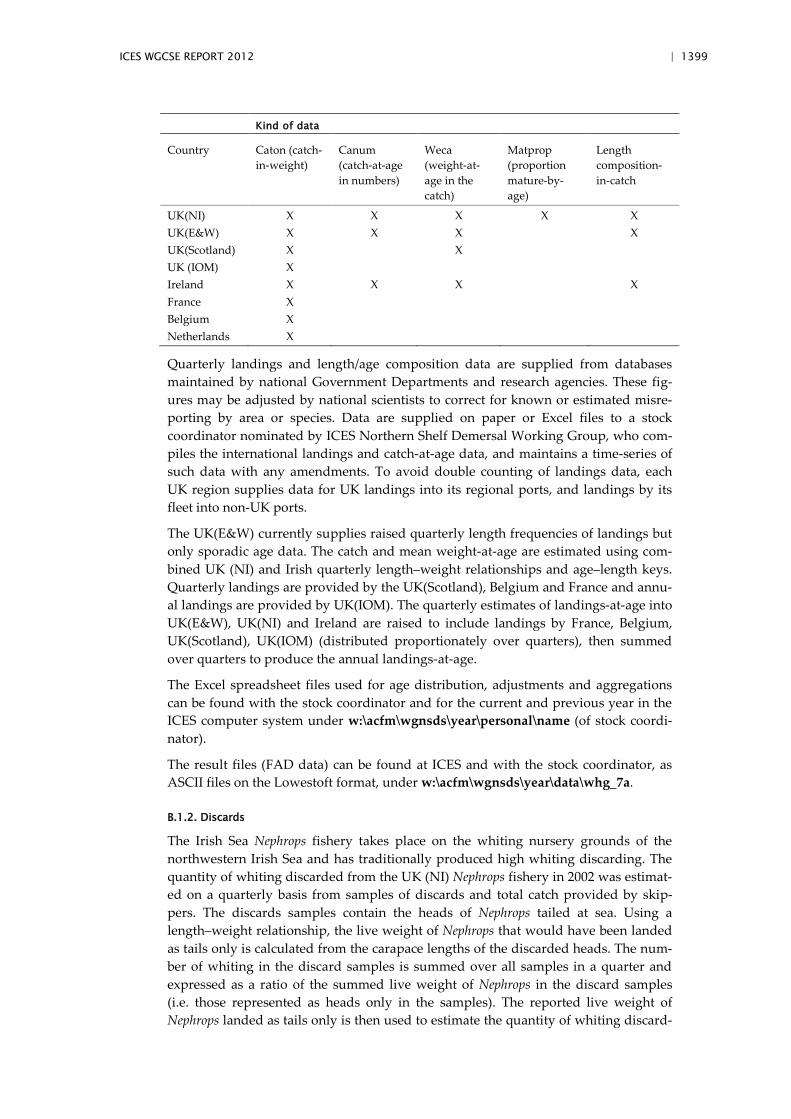
ICES WGCSE REPORT 2012 | 1399
Kind of data
Country Caton (catch-in-weight)
Canum (catch-at-age in numbers)
Weca (weight-at-age in the catch)
Matprop (proportion mature-by-age)
Length composition-in-catch
UK(NI) UK(E&W) UK(Scotland) UK (IOM) Ireland France Belgium Netherlands
X X X X X X X X
X X
X
X X X
X
X X X
X
Quarterly landings and length/age composition data are supplied from databases maintained by national Government Departments and research agencies. These fig-ures may be adjusted by national scientists to correct for known or estimated misre-porting by area or species. Data are supplied on paper or Excel files to a stock coordinator nominated by ICES Northern Shelf Demersal Working Group, who com-piles the international landings and catch-at-age data, and maintains a time-series of such data with any amendments. To avoid double counting of landings data, each UK region supplies data for UK landings into its regional ports, and landings by its fleet into non-UK ports.
The UK(E&W) currently supplies raised quarterly length frequencies of landings but only sporadic age data. The catch and mean weight-at-age are estimated using com-bined UK (NI) and Irish quarterly length–weight relationships and age–length keys. Quarterly landings are provided by the UK(Scotland), Belgium and France and annu-al landings are provided by UK(IOM). The quarterly estimates of landings-at-age into UK(E&W), UK(NI) and Ireland are raised to include landings by France, Belgium, UK(Scotland), UK(IOM) (distributed proportionately over quarters), then summed over quarters to produce the annual landings-at-age.
The Excel spreadsheet files used for age distribution, adjustments and aggregations can be found with the stock coordinator and for the current and previous year in the ICES computer system under w:\acfm\wgnsds\year\personal\name (of stock coordi-nator).
The result files (FAD data) can be found at ICES and with the stock coordinator, as ASCII files on the Lowestoft format, under w:\acfm\wgnsds\year\data\whg_7a.
B.1.2. Discards
The Irish Sea Nephrops fishery takes place on the whiting nursery grounds of the northwestern Irish Sea and has traditionally produced high whiting discarding. The quantity of whiting discarded from the UK (NI) Nephrops fishery in 2002 was estimat-ed on a quarterly basis from samples of discards and total catch provided by skip-pers. The discards samples contain the heads of Nephrops tailed at sea. Using a length–weight relationship, the live weight of Nephrops that would have been landed as tails only is calculated from the carapace lengths of the discarded heads. The num-ber of whiting in the discard samples is summed over all samples in a quarter and expressed as a ratio of the summed live weight of Nephrops in the discard samples (i.e. those represented as heads only in the samples). The reported live weight of Nephrops landed as tails only is then used to estimate the quantity of whiting discard-
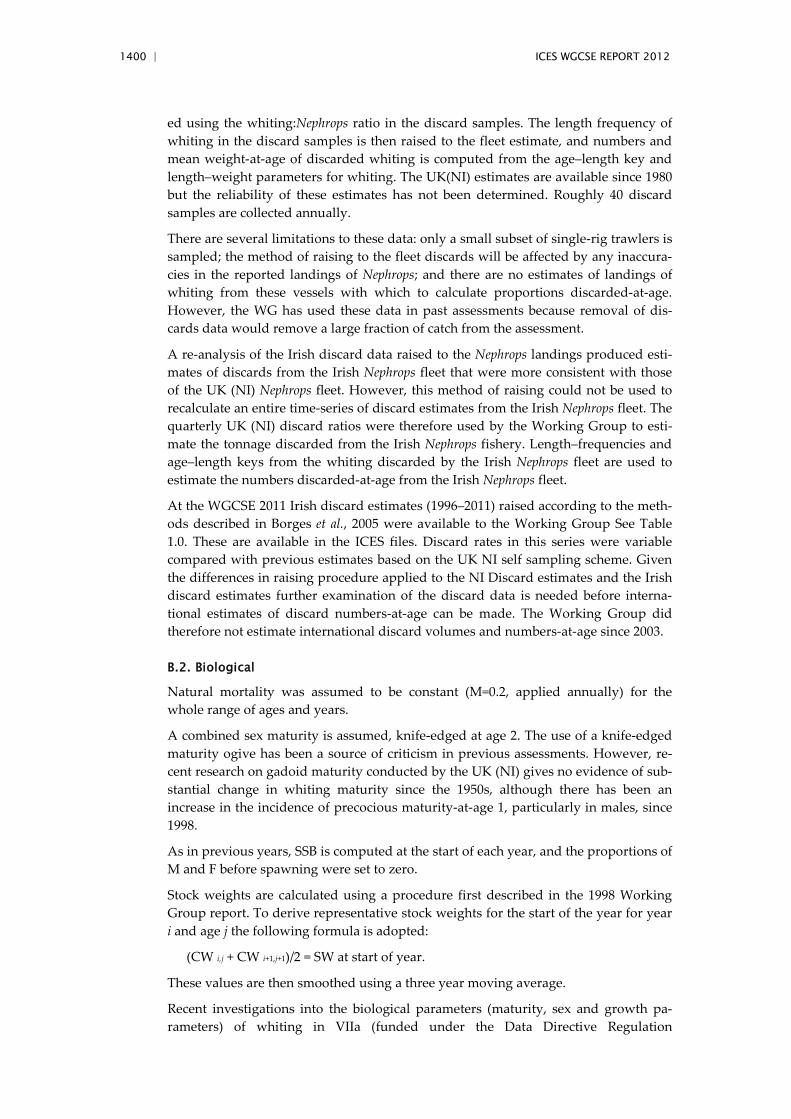
1400 | ICES WGCSE REPORT 2012
ed using the whiting:Nephrops ratio in the discard samples. The length frequency of whiting in the discard samples is then raised to the fleet estimate, and numbers and mean weight-at-age of discarded whiting is computed from the age–length key and length–weight parameters for whiting. The UK(NI) estimates are available since 1980 but the reliability of these estimates has not been determined. Roughly 40 discard samples are collected annually.
There are several limitations to these data: only a small subset of single-rig trawlers is sampled; the method of raising to the fleet discards will be affected by any inaccura-cies in the reported landings of Nephrops; and there are no estimates of landings of whiting from these vessels with which to calculate proportions discarded-at-age. However, the WG has used these data in past assessments because removal of dis-cards data would remove a large fraction of catch from the assessment.
A re-analysis of the Irish discard data raised to the Nephrops landings produced esti-mates of discards from the Irish Nephrops fleet that were more consistent with those of the UK (NI) Nephrops fleet. However, this method of raising could not be used to recalculate an entire time-series of discard estimates from the Irish Nephrops fleet. The quarterly UK (NI) discard ratios were therefore used by the Working Group to esti-mate the tonnage discarded from the Irish Nephrops fishery. Length–frequencies and age–length keys from the whiting discarded by the Irish Nephrops fleet are used to estimate the numbers discarded-at-age from the Irish Nephrops fleet.
At the WGCSE 2011 Irish discard estimates (1996–2011) raised according to the meth-ods described in Borges et al., 2005 were available to the Working Group See Table 1.0. These are available in the ICES files. Discard rates in this series were variable compared with previous estimates based on the UK NI self sampling scheme. Given the differences in raising procedure applied to the NI Discard estimates and the Irish discard estimates further examination of the discard data is needed before interna-tional estimates of discard numbers-at-age can be made. The Working Group did therefore not estimate international discard volumes and numbers-at-age since 2003.
B.2. Biological
Natural mortality was assumed to be constant (M=0.2, applied annually) for the whole range of ages and years.
A combined sex maturity is assumed, knife-edged at age 2. The use of a knife-edged maturity ogive has been a source of criticism in previous assessments. However, re-cent research on gadoid maturity conducted by the UK (NI) gives no evidence of sub-stantial change in whiting maturity since the 1950s, although there has been an increase in the incidence of precocious maturity-at-age 1, particularly in males, since 1998.
As in previous years, SSB is computed at the start of each year, and the proportions of M and F before spawning were set to zero.
Stock weights are calculated using a procedure first described in the 1998 Working Group report. To derive representative stock weights for the start of the year for year i and age j the following formula is adopted:
(CW i,j + CW i+1,j+1)/2 = SW at start of year.
These values are then smoothed using a three year moving average.
Recent investigations into the biological parameters (maturity, sex and growth pa-rameters) of whiting in VIIa (funded under the Data Directive Regulation
ICES WGCSE REPORT 2012 | 1401
(1639/2001)) took place during a Biological Sampling survey (BBS) in March 2004. Parameter estimates of maturity-at-length indicate the L50 for whiting in VIIa for males and females is 13.65 cm and 19.76 cm, respectively. Maturity-at-age for both sexes are similar for most stock area (VIIa, b, j and g) with the notable exception of age 1 males in the Celtic Sea where the estimates are outside the 95% CI bounds for VIIa and considerably lower than VIa. In most areas whiting were mature by age three and most were mature at age 2. The sex ratio for whiting tended to increase with length for nearly all the age classes in all areas indicating that females tend to have larger length at-age than males (Gerritsen, 2005).
Gerritsen et al., 2002 describes the relationships between maturity, length and age of whiting sampled on a length-stratified basis from NI groundfish surveys of the Irish Sea during spawning in spring 1992–2001. Findings show that most one year old fe-males were immature while most two year old females were mature; almost all 3 year olds of both sexes were mature. Length at 50 maturity average around 19 cm in males and 22 cm in females.
B.3. Surveys
Seven research vessel survey series for whiting in VIIa were available to the Working Group in 2011. In all surveys listed the highest age represents a true age not a plus group.
• UK(England and Wales) Beam Trawl Survey (UK (E&W)-BTS-Q3): ages 0 and 1, years 1988–2011: The survey covers the entire Irish Sea and is con-ducted in September on the R.V. Corystes. The survey uses a 4 m beam trawl targeted at flatfish. The survey is stratified by area and depth band, although the survey indices are calculated from the total survey catch without accounting for stratification. Numbers of whiting at-age per km towed are provided for prime stations only (i.e. those fished in most sur-veys).
• UK(Northern Ireland) October Groundfish Survey (NIGFS-WIBTS-Q4-EAST & WEST): ages 0–5, years 1992–2011: The survey-series commenced in its present form in 1992. It comprises 45 three mile tows at fixed station positions in the northern Irish Sea, with an additional 12 one mile tows at fixed station positions in the St George’s channel from October 2001 (the latter are not included in the tuning data). The surveys are carried out us-ing a rock-hopper otter trawl deployed from the R.V. Lough Foyle. The sur-vey designs are stratified by depth and seabed type. The mean numbers-at-length per 3 mile tow are calculated separately by stratum, and weighted by surface area of the strata to give a weighted mean for the survey or group of strata. The strata are grouped into western Irish Sea and eastern Irish Sea, and a separate age–length key is derived for each area to calcu-late abundance indices by age class. The survey design and time-series of results including distribution patterns of whiting are described in detail in Armstrong et al., 2003.
• UK(Northern Ireland) March Groundfish Survey (NIGFS-WIBTS-Q1-EAST & WEST): ages 1–5, years 1992–2012: Description as for NIGFS-WIBTS-Q4-EAST & WEST above.
• UK(Northern Ireland) Methot Isaacs–Kidd Survey (NIMIK): age 0, years 1994–2011: The survey uses a Methot Isaacs–Kidd frame trawl to target pe-lagic juvenile gadoids in the western Irish Sea at 40–45 stations. The survey
1402 | ICES WGCSE REPORT 2012
is stratified and takes place in June during the period prior to settlement of gadoid juveniles. Indices are calculated as the arithmetic mean of the num-bers-per-unit sea area.
• Ireland’s Irish Sea Celtic Sea Groundfish Survey (IR-ISCSGFS): ages 0–5, years 1997–2002: This survey commenced in 1997 and is conducted in Oc-tober-November on the R.V. Celtic Voyager. The α and β of the series are set to account for the variable timing of this survey within the fourth quarter. The survey uses a GOV otter trawl with standard groundgear and a 20 mm codend liner. The survey operates mainly in the western Irish Sea but has included some stations in the eastern Irish Sea. The survey design has evolved over time and has different spatial coverage in different years. In-dices are calculated as arithmetic means of all stations, without stratifica-tion by area.
• UK(Scotland) groundfish survey in Spring (ScoGFS-spring): ages 1–8, years 1996–2006: This survey represents an extension of the Scottish West Coast groundfish survey (Area VI), using the research vessel Scotia. The sur-vey gear is a GOV trawl, and the design is two fixed-position stations per ICES rectangle from 1997 onwards (17 stations) and one station per rectan-gle in 1996 (nine stations). The survey extends from the Northern limit of the Irish Sea to around 53°30’.
• UK(Scotland) groundfish survey in autumn (ScoGFS-autumn): ages 0–5, years 1997–2005: The survey covers a similar area to the ScoGFS in spring, but has only 11–12 stations.
• IRGFS (Ireland) (IR-Q4 IBTS): This survey commenced in 2003 aboard the R.V. Celtic Explorer. It is a depth stratified survey using a GOV trawl with a 20 mm mesh liner on the codend. The survey currently covers VIIb, j, g and VIa. Protocols for the survey are governed by the International Bot-tom-trawl Survey Working Group (IBTS).
To allow the inclusion of the IR-Q4 IBTS and ScoGFS-Spring surveys for the year after the last year with commercial catch data in an XSA, the surveys may be treated as if they took place at the end of the previous year, and the age range and year range of the surveys may be shifted back accordingly in the data files.
The following research surveys were available to the 2011 Working group:
• UK(NI) groundfish survey: March 1992–2012. • UK(NI) groundfish survey: October 1992–2011. • UK(Scotland) groundfish survey: March 1996–2006. • UK(Scotland) groundfish survey: autumn 1997–2005. • Irish groundfish survey: autumn 2003 and 2004. • UK(NI) MIK net surveys of pelagic-stage 0-group cod, western Irish Sea
1994–2011. • UK(E&W) beam trawl survey: 0-1 gp cod, 1988–2011.
FSP surveys of Irish Sea round fish: 2004–2010.
Further details of the tuning data are given in Appendix 1 and 2 of the 1999 WG Re-port.
ICES WGCSE REPORT 2012 | 1403
B.4. Commercial cpue
No cpue data have been provided for the French (Lorient) trawl fleet since 1992. Four commercial catch effort dataseries were available to the WG:
• Irish otter trawl (IR-OTB): ages 1–6, years 1995–2002: Effort and cpue data provided for the Irish fleet comprise total annual effort (hours fished, not corrected for fishing power) and total numbers-at-age in landings from ot-ter trawlers. The data were revised to take account of updated logbook in-formation. This fleet operates mainly in the western Irish Sea, targeting Nephrops and/or whitefish. The distribution of fishing is concentrated in the western part of the range of the whiting stock in the Irish Sea. Hence the catch rates will represent changes in abundance of whiting in the western part of VIIa. The use of this fleet as a tuning index therefore relies on the assumption that trends in abundance in the west of VIIa reflect those of the entire stock. The catch-at-age data comprise a large proportion of the total international catch. Hence, some correlation of errors can be expected be-tween the tuning dataset and the catch-at-age data. The effect of such cor-relations has not been evaluated. The otter trawl catch-at-age data contained data for landings only. Hence the reliability of the tuning fleet will be limited for age groups which are heavily discarded.
• UK(Northern Ireland) pelagic trawl: ages 2–6, years 1993–2002: The pelagic trawl catch-at-age data contained data for landings only. Hence the relia-bility of the tuning fleet will be limited for age groups which are heavily discarded. This fleet currently targets haddock and cod in the deeper wa-ters of the western Irish Sea and the North Channel. Bycatches of whiting are currently very small and are heavily discarded due to their low value. The fleet is considered unsuitable for indexing whiting abundance.
• UK(Northern Ireland) single-rig otter trawl: ages 0–6, years 1993–2002: This fleet operates mainly in the western Irish Sea. The distribution of fish-ing does not encompass the entire range of the whiting stock (which sur-veys suggest is distributed across the Irish Sea). Whiting discards from single-rig trawlers (estimated from fisher self-sampling scheme) are included.
• UK(England and Wales) otter trawl: ages 2–6, years 1981–2000: Estimates up to and including 2000 of commercial lpue from UK(E&W) otter trawlers contain data for landings only. Hence the reliability of the tuning fleet will be limited for age groups which are heavily discarded. This fleet operates mainly in the eastern Irish Sea. The distribution of fishing does not encom-pass the entire range of the whiting stock (which surveys suggest is dis-tributed across the Irish Sea) or the main whiting nursery grounds (in the western Irish Sea). Age compositions in most years have been estimated from length frequencies using ALKs that were obtained from sampling of fleets operating mainly in the western Irish Sea. This has introduced addi-tional uncertainties into the data.
B.5. Other relevant data
None.
C. Historical stock development
No assessment was carried out for this stock in 2011. The last assessment for this stock was a survey based assessment in 2007.
1404 | ICES WGCSE REPORT 2012
Model used:
XSA (up to 2002)
SURBA 2.0-2003
SURBA 3.0-2004
SURBA 2.2-2005–2011
Software used:
Lowestoft VPA suite
SURBA 2.2
XSA Model Options chosen:
Tapered time weighting not applied
Catchability independent of stock size for all ages
Catchability independent of age for ages >=4
Survivor estimates shrunk towards the mean F of the final five years or the two oldest ages
S.E. of the mean to which the estimate are shrunk =0.500
Minimum standard error for population estimates derived from each fleet =0.300
Prior weighting not applied
Input data types and characteristics for XSA:
Type Name Year range Age range
Variable from year to year Yes/No
Caton Catch in tonnes 1980–last data year
0–6+ Yes
Canum Catch-at-age in numbers
1980–last data year
0–6+ Yes
Weca Weight-at-age in the commercial catch
1980–last data year
0–6+ Yes
West Weight-at-age of the stock at spawning time.
1980–last data year
0–6+ Yes: uses smoothed catch weights adjusted to start of year
Mprop Proportion of natural mortality before spawning
1980–last data year
0–6+ No – set to 0 for all ages in all years
Fprop Proportion of fishing mortality before spawning
1980–last data year
0–6+ No – set to 0 for all ages in all years
Matprop Proportion mature-at-age
1980–last data year
0–6+ No – the same ogive for all years
Natmor Natural mortality 1980–last data year
0–6+ No – set to 0.2 for all ages in all years
Tuning data:
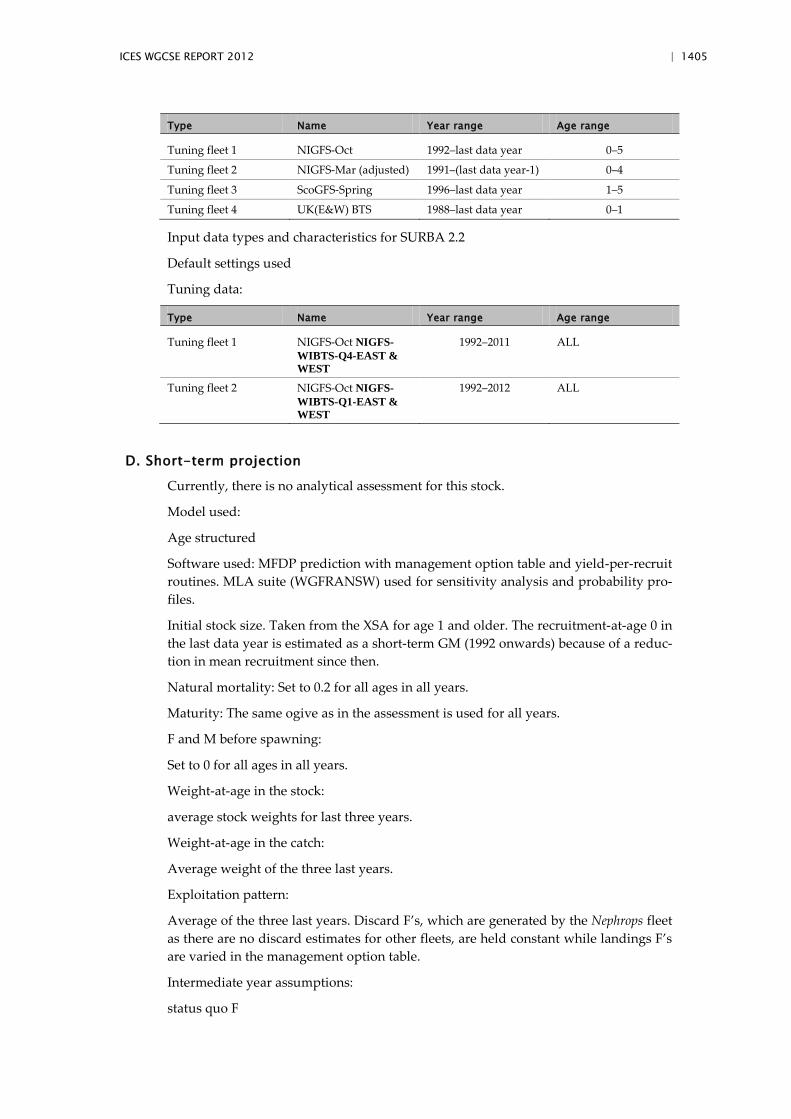
ICES WGCSE REPORT 2012 | 1405
Type Name Year range Age range
Tuning fleet 1 NIGFS-Oct 1992–last data year 0–5
Tuning fleet 2 NIGFS-Mar (adjusted) 1991–(last data year-1) 0–4
Tuning fleet 3 ScoGFS-Spring 1996–last data year 1–5
Tuning fleet 4 UK(E&W) BTS 1988–last data year 0–1
Input data types and characteristics for SURBA 2.2
Default settings used
Tuning data:
Type Name Year range Age range
Tuning fleet 1 NIGFS-Oct NIGFS-WIBTS-Q4-EAST & WEST
1992–2011 ALL
Tuning fleet 2 NIGFS-Oct NIGFS-WIBTS-Q1-EAST & WEST
1992–2012 ALL
D. Short-term projection
Currently, there is no analytical assessment for this stock.
Model used:
Age structured
Software used: MFDP prediction with management option table and yield-per-recruit routines. MLA suite (WGFRANSW) used for sensitivity analysis and probability pro-files.
Initial stock size. Taken from the XSA for age 1 and older. The recruitment-at-age 0 in the last data year is estimated as a short-term GM (1992 onwards) because of a reduc-tion in mean recruitment since then.
Natural mortality: Set to 0.2 for all ages in all years.
Maturity: The same ogive as in the assessment is used for all years.
F and M before spawning:
Set to 0 for all ages in all years.
Weight-at-age in the stock:
average stock weights for last three years.
Weight-at-age in the catch:
Average weight of the three last years.
Exploitation pattern:
Average of the three last years. Discard F’s, which are generated by the Nephrops fleet as there are no discard estimates for other fleets, are held constant while landings F’s are varied in the management option table.
Intermediate year assumptions:
status quo F
1406 | ICES WGCSE REPORT 2012
Stock–recruitment model used:
None, the short-term geometric mean recruitment-at-age 0 is used.
Procedures used for splitting projected catches:
F vectors in each of the last three years of the assessment are multiplied by the pro-portion landed or discarded-at-age to give partial Fs for landings and discards. The vectors of partial Fs are then averaged over the last three years to give the forecast values.
E. Medium-term projections
No medium-term projections are done for this stock due to problems with estimating current F.
F. Yield and biomass per recruit/long-term projections Model used: yield and biomass per recruit over a range of F values that may reflect fixed or variable discard F’s.
Software used: MFY or MLA
Selectivity pattern:
mean F array from last three years of assessment (to reflect recent selection patterns).
Stock and catch weights-at-age:
mean of last three years (weights-at-age have declined as the stock has declined since the 1980s; it is not known if this is an environmental effect on growth that is inde-pendent of stock size).
Proportion discarded:
partial F vectors are the recent average.
Maturity: Fixed maturity ogive as used in assessment.
G. Biological reference points
Precautionary approach reference points have remained unchanged since 1999. BPA is set at 7000 t and is defined as Blim*1.4. Blim is defined as the lowest observed SSB (ACFM, 1999), considered to be 5000 t. There is not considered to be clear evidence of reduced recruitment at the lowest observed SSBs. FPA is set at 0.65 on the technical basis of high probabilities of avoiding Flim and of SSB remaining above BPA in the long term. Flim is defined as 0.95, the fishing mortality estimated to lead to a potential stock collapse.
H. Other issues
None.
I. References Armstrong, M.J., Peel, J., McAliskey, M., McCurdy, W., McCorriston, P. and Briggs, R. 2003.
Survey indices of abundance for cod, haddock and whiting in the Irish Sea (Area VIIaN): 1992–2003. Working Document No. 3 submitted to 2003 meeting of ICES Working Group on Assessment of Northern Shelf Demersal Stocks. 33pp.

ICES WGCSE REPORT 2012 | 1407
Borges, L.; Rogan, E. and Officer, R. 2005. “Discarding by the demersal fishery in the waters around Ireland”, Fish. Res. (in press).
Gerritsen, H. 2005. Biological parameters for Irish Demersal Stocks in 2004. WD5 (WGNSDS, 2005).
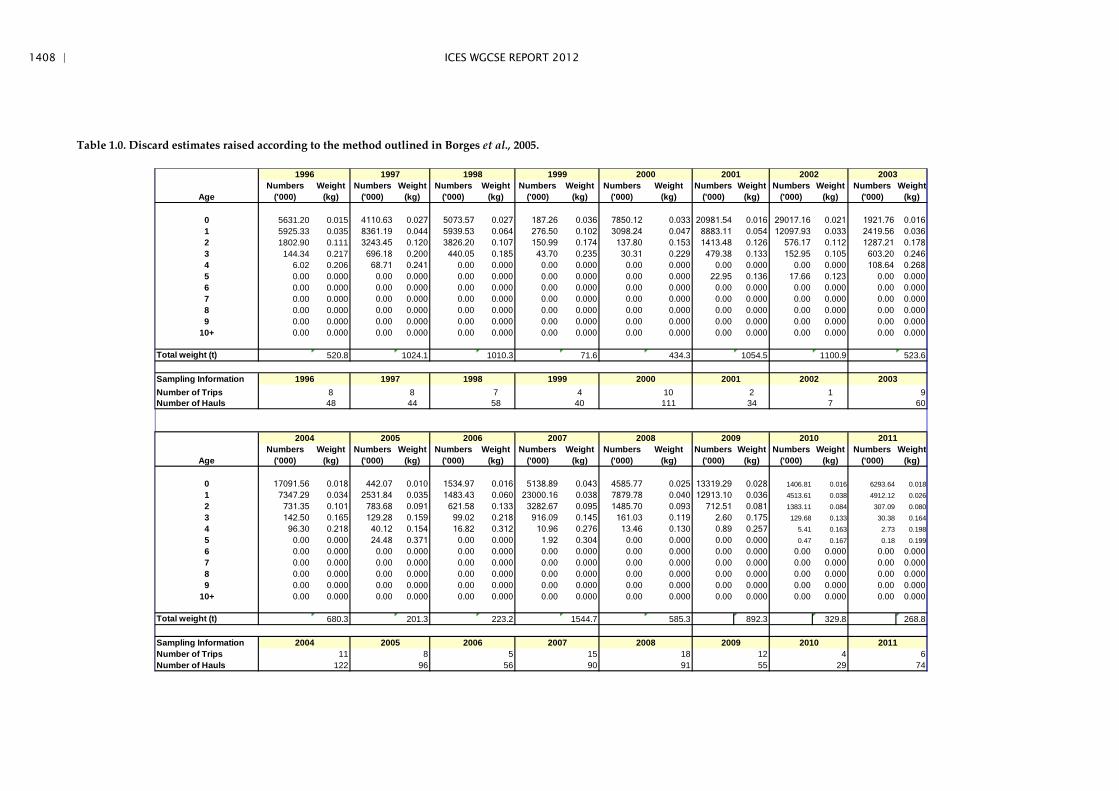
1408 | ICES WGCSE REPORT 2012
Table 1.0. Discard estimates raised according to the method outlined in Borges et al., 2005.
Numbers Weight Numbers Weight Numbers Weight Numbers Weight Numbers Weight Numbers Weight Numbers Weight Numbers WeightAge ('000) (kg) ('000) (kg) ('000) (kg) ('000) (kg) ('000) (kg) ('000) (kg) ('000) (kg) ('000) (kg)
0 5631.20 0.015 4110.63 0.027 5073.57 0.027 187.26 0.036 7850.12 0.033 20981.54 0.016 29017.16 0.021 1921.76 0.0161 5925.33 0.035 8361.19 0.044 5939.53 0.064 276.50 0.102 3098.24 0.047 8883.11 0.054 12097.93 0.033 2419.56 0.0362 1802.90 0.111 3243.45 0.120 3826.20 0.107 150.99 0.174 137.80 0.153 1413.48 0.126 576.17 0.112 1287.21 0.1783 144.34 0.217 696.18 0.200 440.05 0.185 43.70 0.235 30.31 0.229 479.38 0.133 152.95 0.105 603.20 0.2464 6.02 0.206 68.71 0.241 0.00 0.000 0.00 0.000 0.00 0.000 0.00 0.000 0.00 0.000 108.64 0.2685 0.00 0.000 0.00 0.000 0.00 0.000 0.00 0.000 0.00 0.000 22.95 0.136 17.66 0.123 0.00 0.0006 0.00 0.000 0.00 0.000 0.00 0.000 0.00 0.000 0.00 0.000 0.00 0.000 0.00 0.000 0.00 0.0007 0.00 0.000 0.00 0.000 0.00 0.000 0.00 0.000 0.00 0.000 0.00 0.000 0.00 0.000 0.00 0.0008 0.00 0.000 0.00 0.000 0.00 0.000 0.00 0.000 0.00 0.000 0.00 0.000 0.00 0.000 0.00 0.0009 0.00 0.000 0.00 0.000 0.00 0.000 0.00 0.000 0.00 0.000 0.00 0.000 0.00 0.000 0.00 0.000
10+ 0.00 0.000 0.00 0.000 0.00 0.000 0.00 0.000 0.00 0.000 0.00 0.000 0.00 0.000 0.00 0.000
Total weight (t) 520.8 1024.1 1010.3 71.6 434.3 1054.5 1100.9 523.6
Sampling Information Number of Trips 8 8 7 4 10 2 1 9Number of Hauls 48 44 58 40 111 34 7 60
Numbers Weight Numbers Weight Numbers Weight Numbers Weight Numbers Weight Numbers Weight Numbers Weight Numbers WeightAge ('000) (kg) ('000) (kg) ('000) (kg) ('000) (kg) ('000) (kg) ('000) (kg) ('000) (kg) ('000) (kg)
0 17091.56 0.018 442.07 0.010 1534.97 0.016 5138.89 0.043 4585.77 0.025 13319.29 0.028 1406.81 0.016 6293.64 0.0181 7347.29 0.034 2531.84 0.035 1483.43 0.060 23000.16 0.038 7879.78 0.040 12913.10 0.036 4513.61 0.038 4912.12 0.0262 731.35 0.101 783.68 0.091 621.58 0.133 3282.67 0.095 1485.70 0.093 712.51 0.081 1383.11 0.084 307.09 0.0803 142.50 0.165 129.28 0.159 99.02 0.218 916.09 0.145 161.03 0.119 2.60 0.175 129.68 0.133 30.38 0.1644 96.30 0.218 40.12 0.154 16.82 0.312 10.96 0.276 13.46 0.130 0.89 0.257 5.41 0.163 2.73 0.1985 0.00 0.000 24.48 0.371 0.00 0.000 1.92 0.304 0.00 0.000 0.00 0.000 0.47 0.167 0.18 0.1996 0.00 0.000 0.00 0.000 0.00 0.000 0.00 0.000 0.00 0.000 0.00 0.000 0.00 0.000 0.00 0.0007 0.00 0.000 0.00 0.000 0.00 0.000 0.00 0.000 0.00 0.000 0.00 0.000 0.00 0.000 0.00 0.0008 0.00 0.000 0.00 0.000 0.00 0.000 0.00 0.000 0.00 0.000 0.00 0.000 0.00 0.000 0.00 0.0009 0.00 0.000 0.00 0.000 0.00 0.000 0.00 0.000 0.00 0.000 0.00 0.000 0.00 0.000 0.00 0.000
10+ 0.00 0.000 0.00 0.000 0.00 0.000 0.00 0.000 0.00 0.000 0.00 0.000 0.00 0.000 0.00 0.000
Total weight (t) 680.3 201.3 223.2 1544.7 585.3 892.3 329.8 268.8
Sampling Information Number of Trips 11 8 5 15 18 12 4 6Number of Hauls 122 96 56 90 91 55 29 74
2010
2010
2002
2002
2011
2011
2003
2005
2008
2008
2009
2009
20072006
2007
20011996 1997 1998 1999
2006
2004
2004
2000
2005
2001 20031996 1997 1998 1999 2000
ICES WGCSE REPORT 2012 | 1409
6.7 Stock Annex Irish Sea Plaice
Stock specific documentation of standard assessment procedures used by ICES.
Stock Plaice (Division VIIa)
Working Group Celtic Seas Ecoregion
Date 17th May 2012
By Christopher Lynam
A. General
A.1. Stock definition
There are considered to be three principle spawning areas of plaice in the Irish Sea: one off the Irish coast, another northeast of the Isle of Man towards the Cumbrian coast, and the third off the north Wales coast (Nichols et al., 1993; Fox et al., 1997; Fig-ure A.1). Cardigan Bay has also been identified as a spawning ground for plaice in the Irish Sea (Simpson, 1959).
The level of mixing between the east and west components of the Irish Sea stock ap-pears small. (Dunn and Pawson, 2002). Length-at-age measurements from research surveys as well as anecdotal information from the fishing industry suggests that plaice in the western Irish Sea grow at a much slower rate than those in the eastern Irish Sea. Earlier studies have suggested that the east and west components of the stock are distinct (Brander 1975; Sideek 1989). Morphometric differences have been observed between the east and west components of the stock; the 2004 WG indicated that the UK(E&W) beam trawl survey in September (from 1989) catches plaice off the Irish coast that are smaller-at-age than those caught in the eastern Irish Sea.
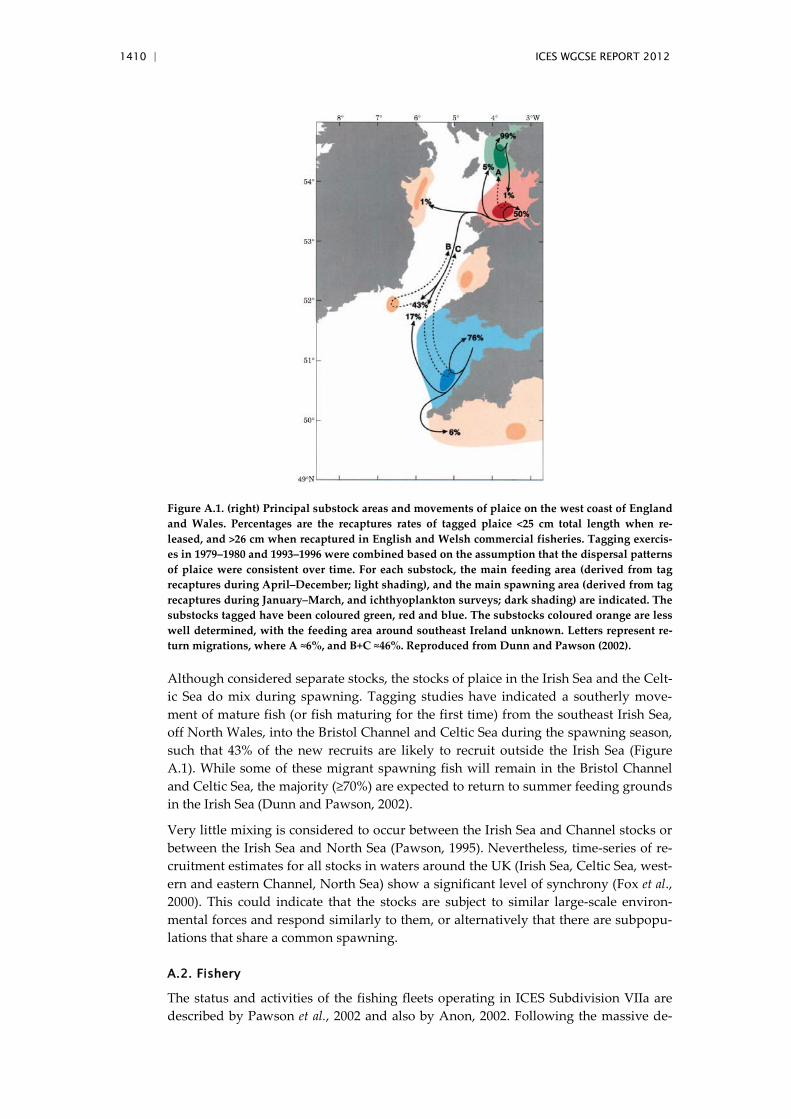
1410 | ICES WGCSE REPORT 2012
Figure A.1. (right) Principal substock areas and movements of plaice on the west coast of England and Wales. Percentages are the recaptures rates of tagged plaice <25 cm total length when re-leased, and >26 cm when recaptured in English and Welsh commercial fisheries. Tagging exercis-es in 1979–1980 and 1993–1996 were combined based on the assumption that the dispersal patterns of plaice were consistent over time. For each substock, the main feeding area (derived from tag recaptures during April–December; light shading), and the main spawning area (derived from tag recaptures during January–March, and ichthyoplankton surveys; dark shading) are indicated. The substocks tagged have been coloured green, red and blue. The substocks coloured orange are less well determined, with the feeding area around southeast Ireland unknown. Letters represent re-turn migrations, where A ≈6%, and B+C ≈46%. Reproduced from Dunn and Pawson (2002).
Although considered separate stocks, the stocks of plaice in the Irish Sea and the Celt-ic Sea do mix during spawning. Tagging studies have indicated a southerly move-ment of mature fish (or fish maturing for the first time) from the southeast Irish Sea, off North Wales, into the Bristol Channel and Celtic Sea during the spawning season, such that 43% of the new recruits are likely to recruit outside the Irish Sea (Figure A.1). While some of these migrant spawning fish will remain in the Bristol Channel and Celtic Sea, the majority (≥70%) are expected to return to summer feeding grounds in the Irish Sea (Dunn and Pawson, 2002).
Very little mixing is considered to occur between the Irish Sea and Channel stocks or between the Irish Sea and North Sea (Pawson, 1995). Nevertheless, time-series of re-cruitment estimates for all stocks in waters around the UK (Irish Sea, Celtic Sea, west-ern and eastern Channel, North Sea) show a significant level of synchrony (Fox et al., 2000). This could indicate that the stocks are subject to similar large-scale environ-mental forces and respond similarly to them, or alternatively that there are subpopu-lations that share a common spawning.
A.2. Fishery
The status and activities of the fishing fleets operating in ICES Subdivision VIIa are described by Pawson et al., 2002 and also by Anon, 2002. Following the massive de-
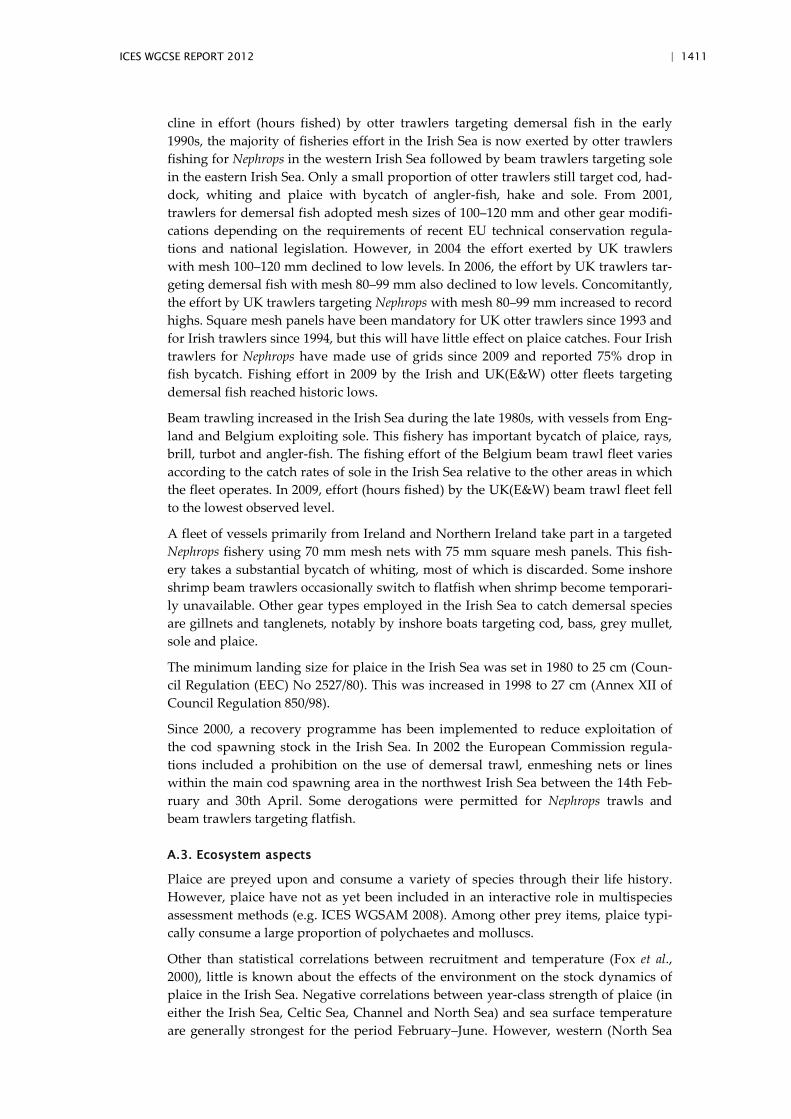
ICES WGCSE REPORT 2012 | 1411
cline in effort (hours fished) by otter trawlers targeting demersal fish in the early 1990s, the majority of fisheries effort in the Irish Sea is now exerted by otter trawlers fishing for Nephrops in the western Irish Sea followed by beam trawlers targeting sole in the eastern Irish Sea. Only a small proportion of otter trawlers still target cod, had-dock, whiting and plaice with bycatch of angler-fish, hake and sole. From 2001, trawlers for demersal fish adopted mesh sizes of 100–120 mm and other gear modifi-cations depending on the requirements of recent EU technical conservation regula-tions and national legislation. However, in 2004 the effort exerted by UK trawlers with mesh 100–120 mm declined to low levels. In 2006, the effort by UK trawlers tar-geting demersal fish with mesh 80–99 mm also declined to low levels. Concomitantly, the effort by UK trawlers targeting Nephrops with mesh 80–99 mm increased to record highs. Square mesh panels have been mandatory for UK otter trawlers since 1993 and for Irish trawlers since 1994, but this will have little effect on plaice catches. Four Irish trawlers for Nephrops have made use of grids since 2009 and reported 75% drop in fish bycatch. Fishing effort in 2009 by the Irish and UK(E&W) otter fleets targeting demersal fish reached historic lows.
Beam trawling increased in the Irish Sea during the late 1980s, with vessels from Eng-land and Belgium exploiting sole. This fishery has important bycatch of plaice, rays, brill, turbot and angler-fish. The fishing effort of the Belgium beam trawl fleet varies according to the catch rates of sole in the Irish Sea relative to the other areas in which the fleet operates. In 2009, effort (hours fished) by the UK(E&W) beam trawl fleet fell to the lowest observed level.
A fleet of vessels primarily from Ireland and Northern Ireland take part in a targeted Nephrops fishery using 70 mm mesh nets with 75 mm square mesh panels. This fish-ery takes a substantial bycatch of whiting, most of which is discarded. Some inshore shrimp beam trawlers occasionally switch to flatfish when shrimp become temporari-ly unavailable. Other gear types employed in the Irish Sea to catch demersal species are gillnets and tanglenets, notably by inshore boats targeting cod, bass, grey mullet, sole and plaice.
The minimum landing size for plaice in the Irish Sea was set in 1980 to 25 cm (Coun-cil Regulation (EEC) No 2527/80). This was increased in 1998 to 27 cm (Annex XII of Council Regulation 850/98).
Since 2000, a recovery programme has been implemented to reduce exploitation of the cod spawning stock in the Irish Sea. In 2002 the European Commission regula-tions included a prohibition on the use of demersal trawl, enmeshing nets or lines within the main cod spawning area in the northwest Irish Sea between the 14th Feb-ruary and 30th April. Some derogations were permitted for Nephrops trawls and beam trawlers targeting flatfish.
A.3. Ecosystem aspects
Plaice are preyed upon and consume a variety of species through their life history. However, plaice have not as yet been included in an interactive role in multispecies assessment methods (e.g. ICES WGSAM 2008). Among other prey items, plaice typi-cally consume a large proportion of polychaetes and molluscs.
Other than statistical correlations between recruitment and temperature (Fox et al., 2000), little is known about the effects of the environment on the stock dynamics of plaice in the Irish Sea. Negative correlations between year-class strength of plaice (in either the Irish Sea, Celtic Sea, Channel and North Sea) and sea surface temperature are generally strongest for the period February–June. However, western (North Sea
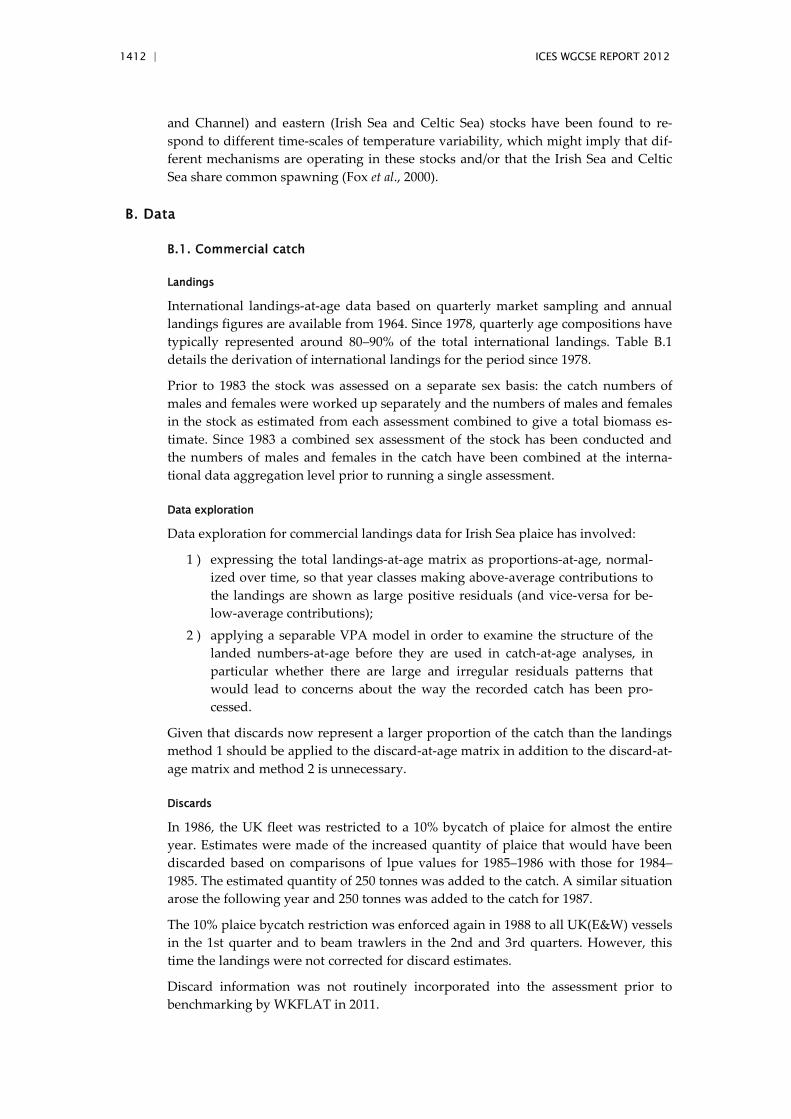
1412 | ICES WGCSE REPORT 2012
and Channel) and eastern (Irish Sea and Celtic Sea) stocks have been found to re-spond to different time-scales of temperature variability, which might imply that dif-ferent mechanisms are operating in these stocks and/or that the Irish Sea and Celtic Sea share common spawning (Fox et al., 2000).
B. Data
B.1. Commercial catch
Landings
International landings-at-age data based on quarterly market sampling and annual landings figures are available from 1964. Since 1978, quarterly age compositions have typically represented around 80–90% of the total international landings. Table B.1 details the derivation of international landings for the period since 1978.
Prior to 1983 the stock was assessed on a separate sex basis: the catch numbers of males and females were worked up separately and the numbers of males and females in the stock as estimated from each assessment combined to give a total biomass es-timate. Since 1983 a combined sex assessment of the stock has been conducted and the numbers of males and females in the catch have been combined at the interna-tional data aggregation level prior to running a single assessment.
Data exploration
Data exploration for commercial landings data for Irish Sea plaice has involved:
1 ) expressing the total landings-at-age matrix as proportions-at-age, normal-ized over time, so that year classes making above-average contributions to the landings are shown as large positive residuals (and vice-versa for be-low-average contributions);
2 ) applying a separable VPA model in order to examine the structure of the landed numbers-at-age before they are used in catch-at-age analyses, in particular whether there are large and irregular residuals patterns that would lead to concerns about the way the recorded catch has been pro-cessed.
Given that discards now represent a larger proportion of the catch than the landings method 1 should be applied to the discard-at-age matrix in addition to the discard-at-age matrix and method 2 is unnecessary.
Discards
In 1986, the UK fleet was restricted to a 10% bycatch of plaice for almost the entire year. Estimates were made of the increased quantity of plaice that would have been discarded based on comparisons of lpue values for 1985–1986 with those for 1984–1985. The estimated quantity of 250 tonnes was added to the catch. A similar situation arose the following year and 250 tonnes was added to the catch for 1987.
The 10% plaice bycatch restriction was enforced again in 1988 to all UK(E&W) vessels in the 1st quarter and to beam trawlers in the 2nd and 3rd quarters. However, this time the landings were not corrected for discard estimates.
Discard information was not routinely incorporated into the assessment prior to benchmarking by WKFLAT in 2011.
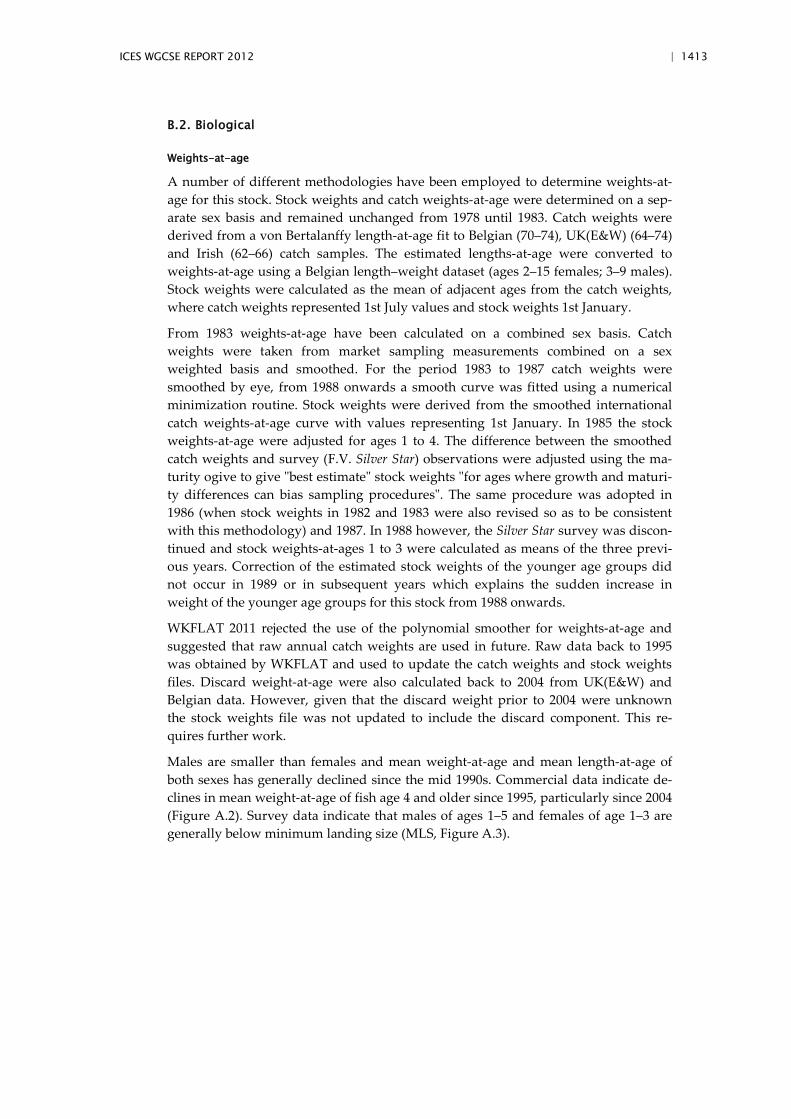
ICES WGCSE REPORT 2012 | 1413
B.2. Biological
Weights-at-age
A number of different methodologies have been employed to determine weights-at-age for this stock. Stock weights and catch weights-at-age were determined on a sep-arate sex basis and remained unchanged from 1978 until 1983. Catch weights were derived from a von Bertalanffy length-at-age fit to Belgian (70–74), UK(E&W) (64–74) and Irish (62–66) catch samples. The estimated lengths-at-age were converted to weights-at-age using a Belgian length–weight dataset (ages 2–15 females; 3–9 males). Stock weights were calculated as the mean of adjacent ages from the catch weights, where catch weights represented 1st July values and stock weights 1st January.
From 1983 weights-at-age have been calculated on a combined sex basis. Catch weights were taken from market sampling measurements combined on a sex weighted basis and smoothed. For the period 1983 to 1987 catch weights were smoothed by eye, from 1988 onwards a smooth curve was fitted using a numerical minimization routine. Stock weights were derived from the smoothed international catch weights-at-age curve with values representing 1st January. In 1985 the stock weights-at-age were adjusted for ages 1 to 4. The difference between the smoothed catch weights and survey (F.V. Silver Star) observations were adjusted using the ma-turity ogive to give "best estimate" stock weights "for ages where growth and maturi-ty differences can bias sampling procedures". The same procedure was adopted in 1986 (when stock weights in 1982 and 1983 were also revised so as to be consistent with this methodology) and 1987. In 1988 however, the Silver Star survey was discon-tinued and stock weights-at-ages 1 to 3 were calculated as means of the three previ-ous years. Correction of the estimated stock weights of the younger age groups did not occur in 1989 or in subsequent years which explains the sudden increase in weight of the younger age groups for this stock from 1988 onwards.
WKFLAT 2011 rejected the use of the polynomial smoother for weights-at-age and suggested that raw annual catch weights are used in future. Raw data back to 1995 was obtained by WKFLAT and used to update the catch weights and stock weights files. Discard weight-at-age were also calculated back to 2004 from UK(E&W) and Belgian data. However, given that the discard weight prior to 2004 were unknown the stock weights file was not updated to include the discard component. This re-quires further work.
Males are smaller than females and mean weight-at-age and mean length-at-age of both sexes has generally declined since the mid 1990s. Commercial data indicate de-clines in mean weight-at-age of fish age 4 and older since 1995, particularly since 2004 (Figure A.2). Survey data indicate that males of ages 1–5 and females of age 1–3 are generally below minimum landing size (MLS, Figure A.3).
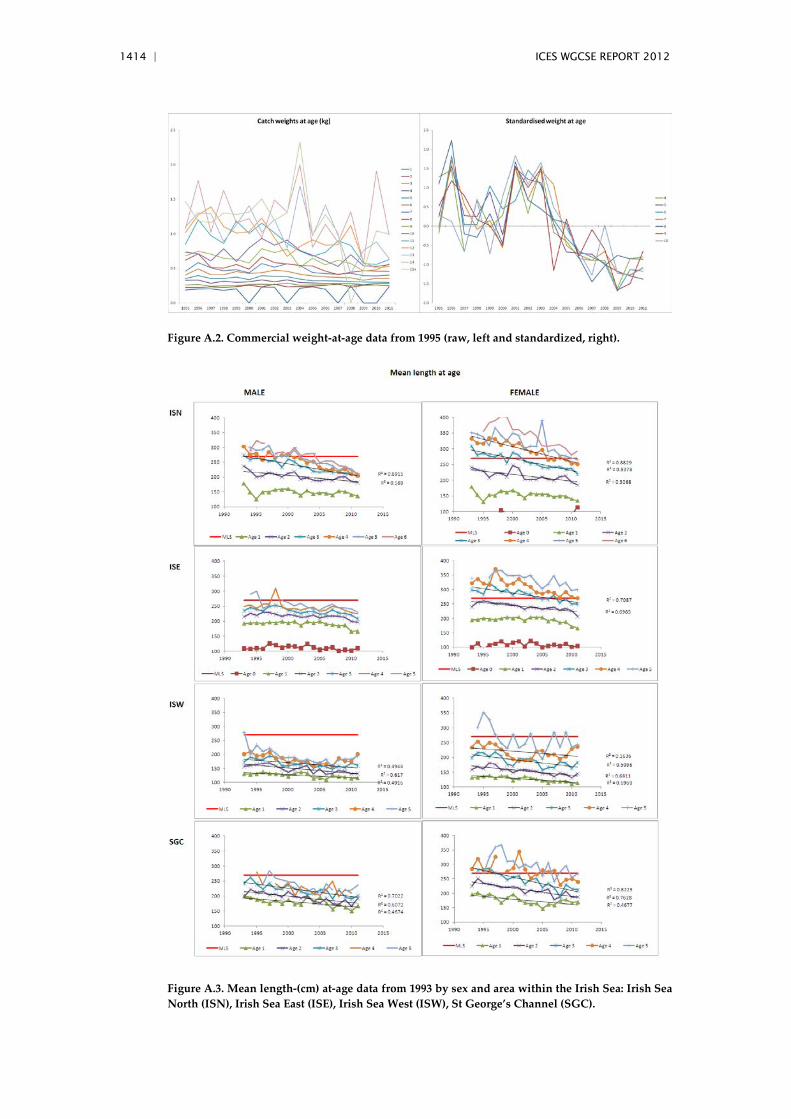
1414 | ICES WGCSE REPORT 2012
Figure A.2. Commercial weight-at-age data from 1995 (raw, left and standardized, right).
Figure A.3. Mean length-(cm) at-age data from 1993 by sex and area within the Irish Sea: Irish Sea North (ISN), Irish Sea East (ISE), Irish Sea West (ISW), St George’s Channel (SGC).
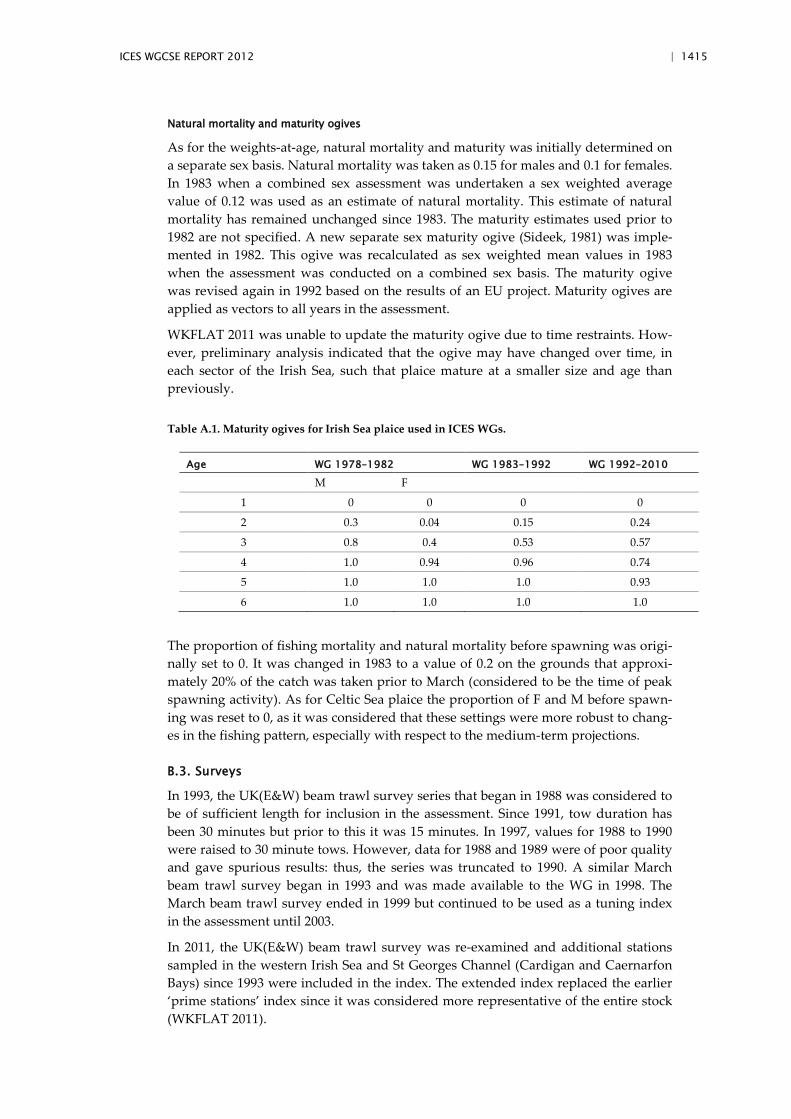
ICES WGCSE REPORT 2012 | 1415
Natural mortality and maturity ogives
As for the weights-at-age, natural mortality and maturity was initially determined on a separate sex basis. Natural mortality was taken as 0.15 for males and 0.1 for females. In 1983 when a combined sex assessment was undertaken a sex weighted average value of 0.12 was used as an estimate of natural mortality. This estimate of natural mortality has remained unchanged since 1983. The maturity estimates used prior to 1982 are not specified. A new separate sex maturity ogive (Sideek, 1981) was imple-mented in 1982. This ogive was recalculated as sex weighted mean values in 1983 when the assessment was conducted on a combined sex basis. The maturity ogive was revised again in 1992 based on the results of an EU project. Maturity ogives are applied as vectors to all years in the assessment.
WKFLAT 2011 was unable to update the maturity ogive due to time restraints. How-ever, preliminary analysis indicated that the ogive may have changed over time, in each sector of the Irish Sea, such that plaice mature at a smaller size and age than previously.
Table A.1. Maturity ogives for Irish Sea plaice used in ICES WGs.
Age WG 1978–1982 WG 1983–1992 WG 1992–2010
M F
1 0 0 0 0
2 0.3 0.04 0.15 0.24
3 0.8 0.4 0.53 0.57
4 1.0 0.94 0.96 0.74
5 1.0 1.0 1.0 0.93
6 1.0 1.0 1.0 1.0
The proportion of fishing mortality and natural mortality before spawning was origi-nally set to 0. It was changed in 1983 to a value of 0.2 on the grounds that approxi-mately 20% of the catch was taken prior to March (considered to be the time of peak spawning activity). As for Celtic Sea plaice the proportion of F and M before spawn-ing was reset to 0, as it was considered that these settings were more robust to chang-es in the fishing pattern, especially with respect to the medium-term projections.
B.3. Surveys
In 1993, the UK(E&W) beam trawl survey series that began in 1988 was considered to be of sufficient length for inclusion in the assessment. Since 1991, tow duration has been 30 minutes but prior to this it was 15 minutes. In 1997, values for 1988 to 1990 were raised to 30 minute tows. However, data for 1988 and 1989 were of poor quality and gave spurious results: thus, the series was truncated to 1990. A similar March beam trawl survey began in 1993 and was made available to the WG in 1998. The March beam trawl survey ended in 1999 but continued to be used as a tuning index in the assessment until 2003.
In 2011, the UK(E&W) beam trawl survey was re-examined and additional stations sampled in the western Irish Sea and St Georges Channel (Cardigan and Caernarfon Bays) since 1993 were included in the index. The extended index replaced the earlier ‘prime stations’ index since it was considered more representative of the entire stock (WKFLAT 2011).
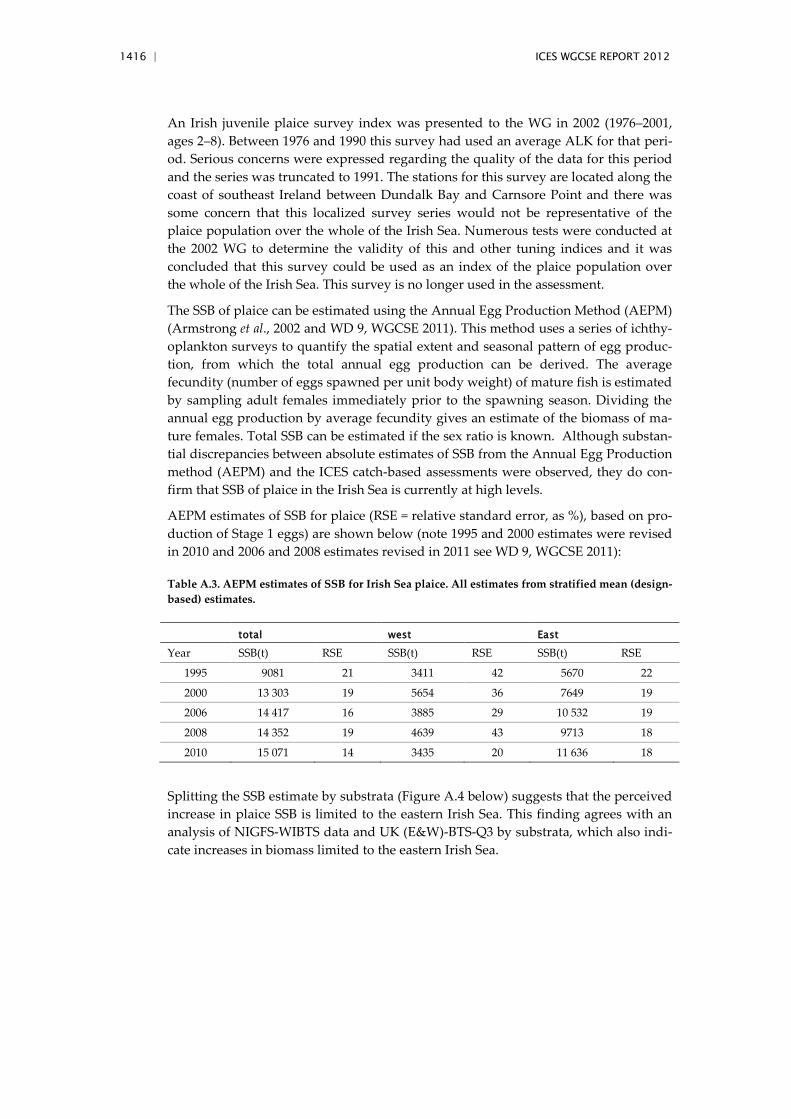
1416 | ICES WGCSE REPORT 2012
An Irish juvenile plaice survey index was presented to the WG in 2002 (1976–2001, ages 2–8). Between 1976 and 1990 this survey had used an average ALK for that peri-od. Serious concerns were expressed regarding the quality of the data for this period and the series was truncated to 1991. The stations for this survey are located along the coast of southeast Ireland between Dundalk Bay and Carnsore Point and there was some concern that this localized survey series would not be representative of the plaice population over the whole of the Irish Sea. Numerous tests were conducted at the 2002 WG to determine the validity of this and other tuning indices and it was concluded that this survey could be used as an index of the plaice population over the whole of the Irish Sea. This survey is no longer used in the assessment.
The SSB of plaice can be estimated using the Annual Egg Production Method (AEPM) (Armstrong et al., 2002 and WD 9, WGCSE 2011). This method uses a series of ichthy-oplankton surveys to quantify the spatial extent and seasonal pattern of egg produc-tion, from which the total annual egg production can be derived. The average fecundity (number of eggs spawned per unit body weight) of mature fish is estimated by sampling adult females immediately prior to the spawning season. Dividing the annual egg production by average fecundity gives an estimate of the biomass of ma-ture females. Total SSB can be estimated if the sex ratio is known. Although substan-tial discrepancies between absolute estimates of SSB from the Annual Egg Production method (AEPM) and the ICES catch-based assessments were observed, they do con-firm that SSB of plaice in the Irish Sea is currently at high levels.
AEPM estimates of SSB for plaice (RSE = relative standard error, as %), based on pro-duction of Stage 1 eggs) are shown below (note 1995 and 2000 estimates were revised in 2010 and 2006 and 2008 estimates revised in 2011 see WD 9, WGCSE 2011):
Table A.3. AEPM estimates of SSB for Irish Sea plaice. All estimates from stratified mean (design-based) estimates.
total west East
Year SSB(t) RSE SSB(t) RSE SSB(t) RSE
1995 9081 21 3411 42 5670 22
2000 13 303 19 5654 36 7649 19
2006 14 417 16 3885 29 10 532 19
2008 14 352 19 4639 43 9713 18
2010 15 071 14 3435 20 11 636 18
Splitting the SSB estimate by substrata (Figure A.4 below) suggests that the perceived increase in plaice SSB is limited to the eastern Irish Sea. This finding agrees with an analysis of NIGFS-WIBTS data and UK (E&W)-BTS-Q3 by substrata, which also indi-cate increases in biomass limited to the eastern Irish Sea.
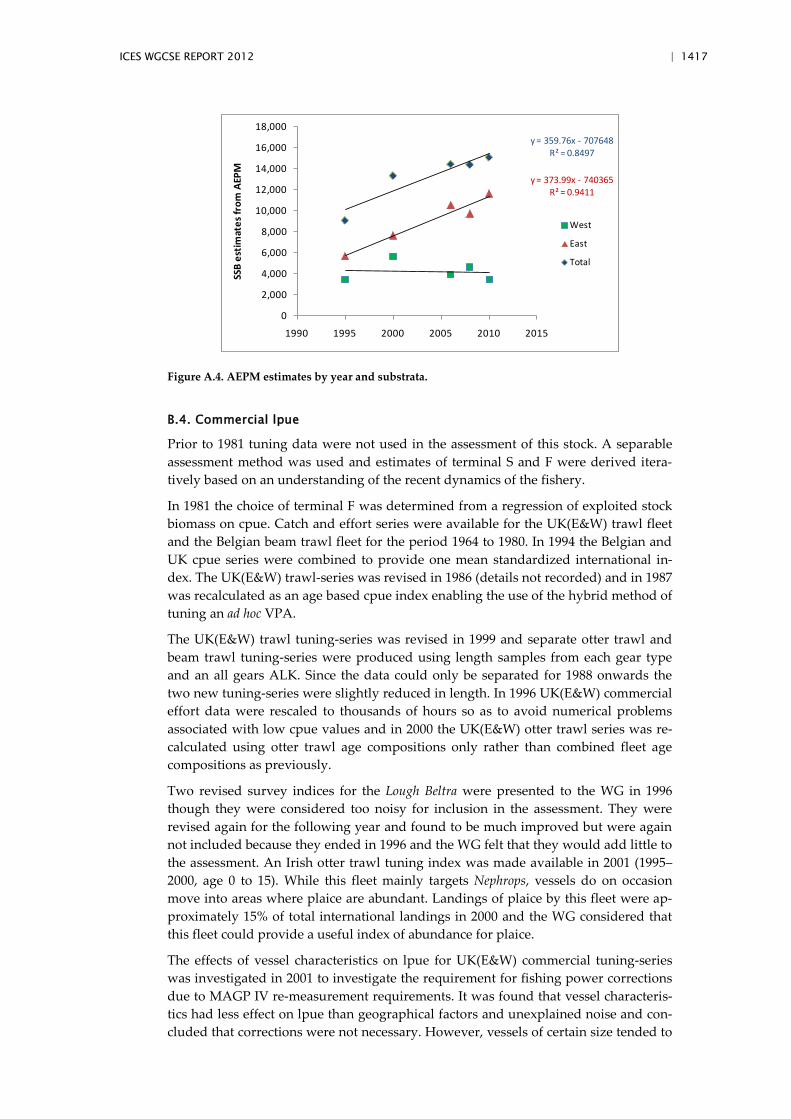
ICES WGCSE REPORT 2012 | 1417
y = 373.99x - 740365R² = 0.9411
y = 359.76x - 707648R² = 0.8497
0
2,000
4,000
6,000
8,000
10,000
12,000
14,000
16,000
18,000
1990 1995 2000 2005 2010 2015
SSB
estim
ates
from
AEP
MWest
East
Total
Figure A.4. AEPM estimates by year and substrata.
B.4. Commercial lpue
Prior to 1981 tuning data were not used in the assessment of this stock. A separable assessment method was used and estimates of terminal S and F were derived itera-tively based on an understanding of the recent dynamics of the fishery.
In 1981 the choice of terminal F was determined from a regression of exploited stock biomass on cpue. Catch and effort series were available for the UK(E&W) trawl fleet and the Belgian beam trawl fleet for the period 1964 to 1980. In 1994 the Belgian and UK cpue series were combined to provide one mean standardized international in-dex. The UK(E&W) trawl-series was revised in 1986 (details not recorded) and in 1987 was recalculated as an age based cpue index enabling the use of the hybrid method of tuning an ad hoc VPA.
The UK(E&W) trawl tuning-series was revised in 1999 and separate otter trawl and beam trawl tuning-series were produced using length samples from each gear type and an all gears ALK. Since the data could only be separated for 1988 onwards the two new tuning-series were slightly reduced in length. In 1996 UK(E&W) commercial effort data were rescaled to thousands of hours so as to avoid numerical problems associated with low cpue values and in 2000 the UK(E&W) otter trawl series was re-calculated using otter trawl age compositions only rather than combined fleet age compositions as previously.
Two revised survey indices for the Lough Beltra were presented to the WG in 1996 though they were considered too noisy for inclusion in the assessment. They were revised again for the following year and found to be much improved but were again not included because they ended in 1996 and the WG felt that they would add little to the assessment. An Irish otter trawl tuning index was made available in 2001 (1995–2000, age 0 to 15). While this fleet mainly targets Nephrops, vessels do on occasion move into areas where plaice are abundant. Landings of plaice by this fleet were ap-proximately 15% of total international landings in 2000 and the WG considered that this fleet could provide a useful index of abundance for plaice.
The effects of vessel characteristics on lpue for UK(E&W) commercial tuning-series was investigated in 2001 to investigate the requirement for fishing power corrections due to MAGP IV re-measurement requirements. It was found that vessel characteris-tics had less effect on lpue than geographical factors and unexplained noise and con-cluded that corrections were not necessary. However, vessels of certain size tended to
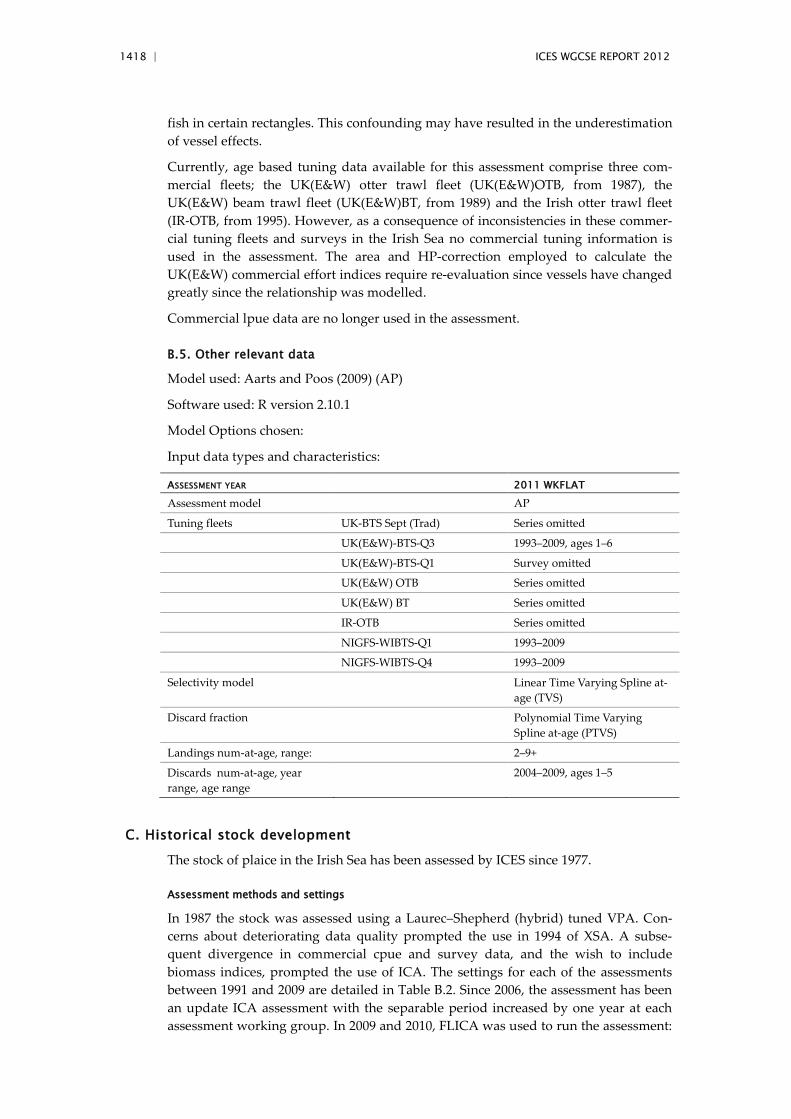
1418 | ICES WGCSE REPORT 2012
fish in certain rectangles. This confounding may have resulted in the underestimation of vessel effects.
Currently, age based tuning data available for this assessment comprise three com-mercial fleets; the UK(E&W) otter trawl fleet (UK(E&W)OTB, from 1987), the UK(E&W) beam trawl fleet (UK(E&W)BT, from 1989) and the Irish otter trawl fleet (IR‐OTB, from 1995). However, as a consequence of inconsistencies in these commer-cial tuning fleets and surveys in the Irish Sea no commercial tuning information is used in the assessment. The area and HP-correction employed to calculate the UK(E&W) commercial effort indices require re-evaluation since vessels have changed greatly since the relationship was modelled.
Commercial lpue data are no longer used in the assessment.
B.5. Other relevant data
Model used: Aarts and Poos (2009) (AP)
Software used: R version 2.10.1
Model Options chosen:
Input data types and characteristics:
ASSESSMENT YEAR 2011 WKFLAT
Assessment model AP
Tuning fleets UK-BTS Sept (Trad) Series omitted
UK(E&W)-BTS-Q3 1993–2009, ages 1–6
UK(E&W)-BTS-Q1 Survey omitted
UK(E&W) OTB Series omitted
UK(E&W) BT Series omitted
IR-OTB Series omitted
NIGFS-WIBTS-Q1 1993–2009
NIGFS-WIBTS-Q4 1993–2009
Selectivity model Linear Time Varying Spline at-age (TVS)
Discard fraction Polynomial Time Varying Spline at-age (PTVS)
Landings num-at-age, range: 2–9+
Discards num-at-age, year range, age range
2004–2009, ages 1–5
C. Historical stock development
The stock of plaice in the Irish Sea has been assessed by ICES since 1977.
Assessment methods and settings
In 1987 the stock was assessed using a Laurec–Shepherd (hybrid) tuned VPA. Con-cerns about deteriorating data quality prompted the use in 1994 of XSA. A subse-quent divergence in commercial cpue and survey data, and the wish to include biomass indices, prompted the use of ICA. The settings for each of the assessments between 1991 and 2009 are detailed in Table B.2. Since 2006, the assessment has been an update ICA assessment with the separable period increased by one year at each assessment working group. In 2009 and 2010, FLICA was used to run the assessment:
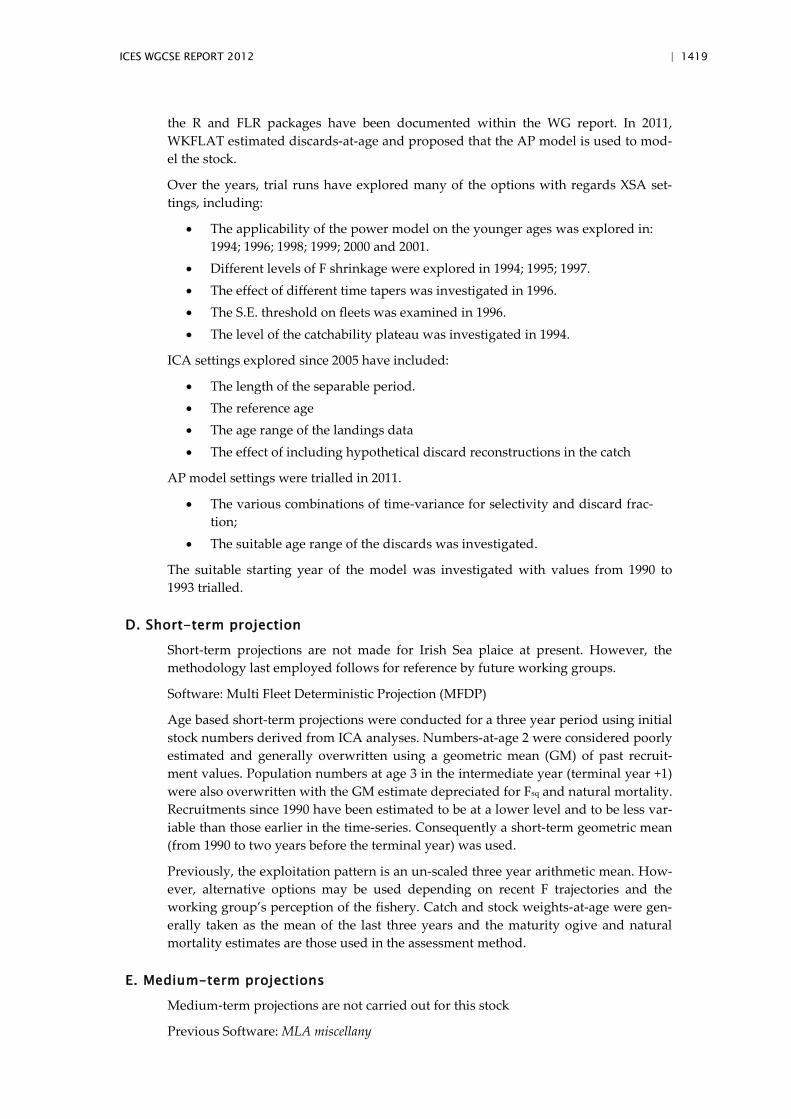
ICES WGCSE REPORT 2012 | 1419
the R and FLR packages have been documented within the WG report. In 2011, WKFLAT estimated discards-at-age and proposed that the AP model is used to mod-el the stock.
Over the years, trial runs have explored many of the options with regards XSA set-tings, including:
• The applicability of the power model on the younger ages was explored in: 1994; 1996; 1998; 1999; 2000 and 2001.
• Different levels of F shrinkage were explored in 1994; 1995; 1997. • The effect of different time tapers was investigated in 1996. • The S.E. threshold on fleets was examined in 1996. • The level of the catchability plateau was investigated in 1994.
ICA settings explored since 2005 have included:
• The length of the separable period. • The reference age • The age range of the landings data • The effect of including hypothetical discard reconstructions in the catch
AP model settings were trialled in 2011.
• The various combinations of time-variance for selectivity and discard frac-tion;
• The suitable age range of the discards was investigated.
The suitable starting year of the model was investigated with values from 1990 to 1993 trialled.
D. Short-term projection
Short-term projections are not made for Irish Sea plaice at present. However, the methodology last employed follows for reference by future working groups.
Software: Multi Fleet Deterministic Projection (MFDP)
Age based short-term projections were conducted for a three year period using initial stock numbers derived from ICA analyses. Numbers-at-age 2 were considered poorly estimated and generally overwritten using a geometric mean (GM) of past recruit-ment values. Population numbers at age 3 in the intermediate year (terminal year +1) were also overwritten with the GM estimate depreciated for Fsq and natural mortality. Recruitments since 1990 have been estimated to be at a lower level and to be less var-iable than those earlier in the time-series. Consequently a short-term geometric mean (from 1990 to two years before the terminal year) was used.
Previously, the exploitation pattern is an un-scaled three year arithmetic mean. How-ever, alternative options may be used depending on recent F trajectories and the working group’s perception of the fishery. Catch and stock weights-at-age were gen-erally taken as the mean of the last three years and the maturity ogive and natural mortality estimates are those used in the assessment method.
E. Medium-term projections
Medium‐term projections are not carried out for this stock
Previous Software: MLA miscellany
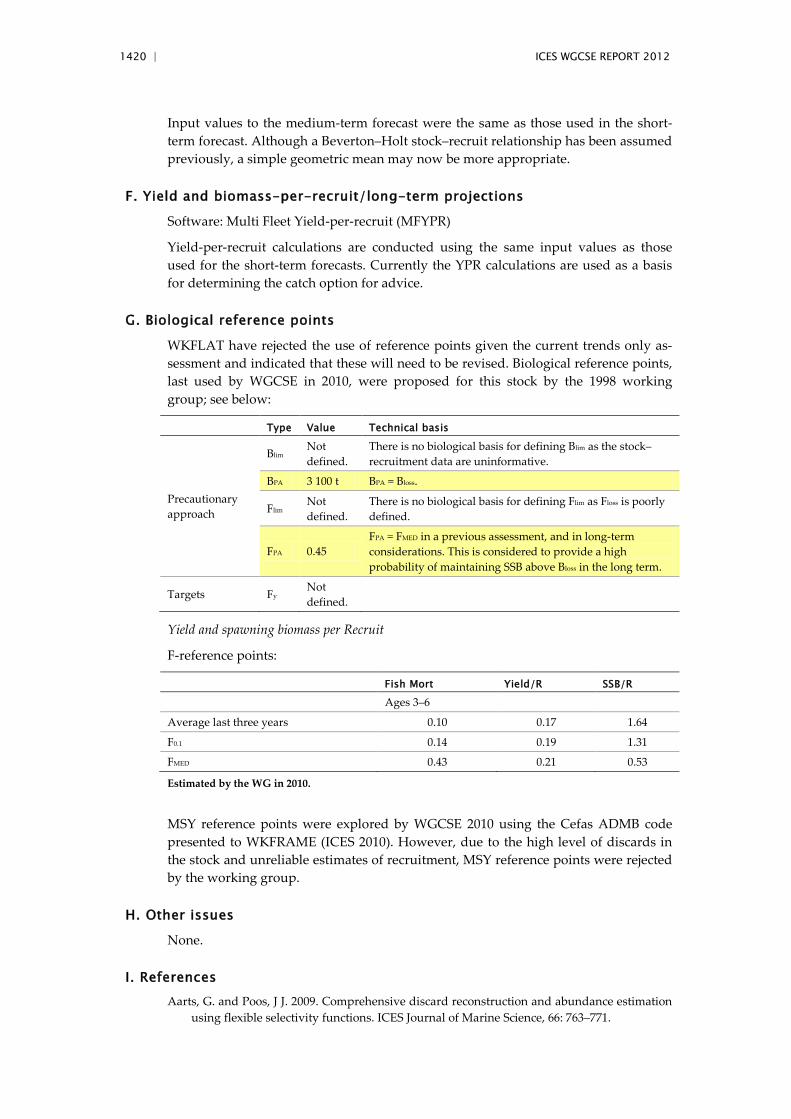
1420 | ICES WGCSE REPORT 2012
Input values to the medium-term forecast were the same as those used in the short-term forecast. Although a Beverton–Holt stock–recruit relationship has been assumed previously, a simple geometric mean may now be more appropriate.
F. Yield and biomass-per-recruit/long-term projections
Software: Multi Fleet Yield-per-recruit (MFYPR)
Yield-per-recruit calculations are conducted using the same input values as those used for the short-term forecasts. Currently the YPR calculations are used as a basis for determining the catch option for advice.
G. Biological reference points
WKFLAT have rejected the use of reference points given the current trends only as-sessment and indicated that these will need to be revised. Biological reference points, last used by WGCSE in 2010, were proposed for this stock by the 1998 working group; see below:
Type Value Technical basis
Precautionary approach
Blim Not defined.
There is no biological basis for defining Blim as the stock–recruitment data are uninformative.
BPA 3 100 t BPA = Bloss.
Flim Not defined.
There is no biological basis for defining Flim as Floss is poorly defined.
FPA 0.45 FPA = FMED in a previous assessment, and in long-term considerations. This is considered to provide a high probability of maintaining SSB above Bloss in the long term.
Targets Fy Not defined.
Yield and spawning biomass per Recruit
F-reference points:
Fish Mort Yield/R SSB/R
Ages 3–6
Average last three years 0.10 0.17 1.64
F0.1 0.14 0.19 1.31
FMED 0.43 0.21 0.53
Estimated by the WG in 2010.
MSY reference points were explored by WGCSE 2010 using the Cefas ADMB code presented to WKFRAME (ICES 2010). However, due to the high level of discards in the stock and unreliable estimates of recruitment, MSY reference points were rejected by the working group.
H. Other issues
None.
I. References
Aarts, G. and Poos, J J. 2009. Comprehensive discard reconstruction and abundance estimation using flexible selectivity functions. ICES Journal of Marine Science, 66: 763–771.
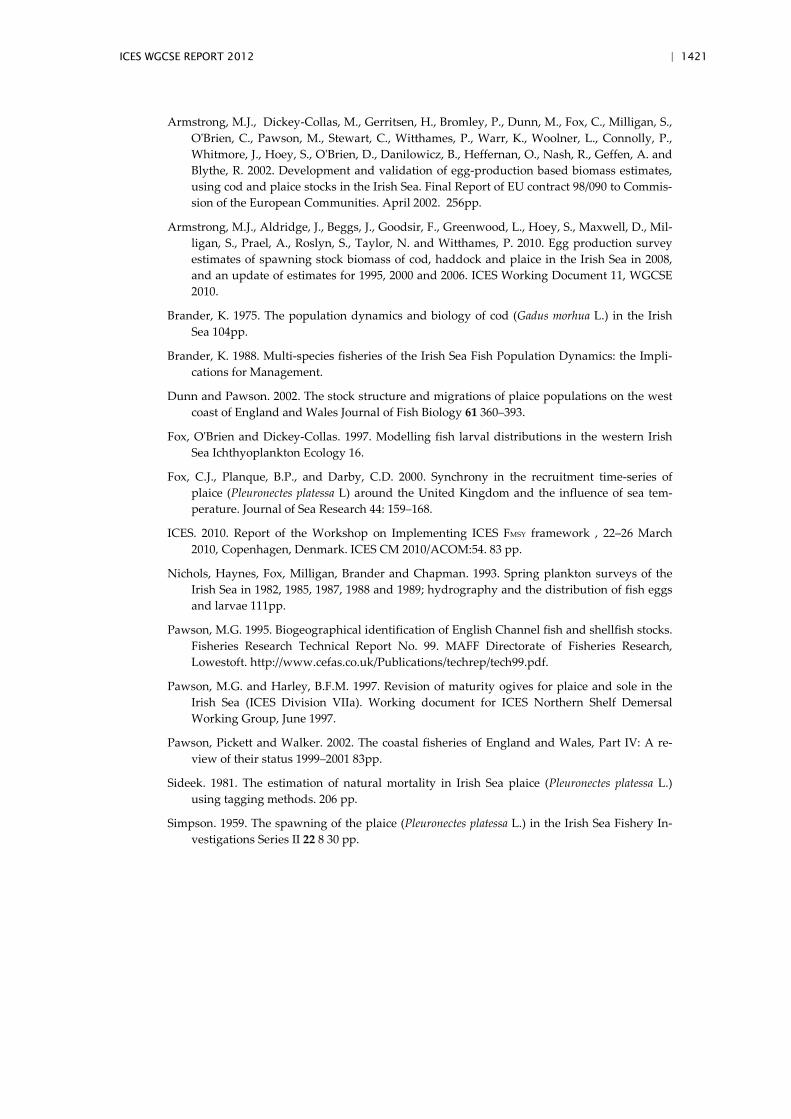
ICES WGCSE REPORT 2012 | 1421
Armstrong, M.J., Dickey-Collas, M., Gerritsen, H., Bromley, P., Dunn, M., Fox, C., Milligan, S., O'Brien, C., Pawson, M., Stewart, C., Witthames, P., Warr, K., Woolner, L., Connolly, P., Whitmore, J., Hoey, S., O'Brien, D., Danilowicz, B., Heffernan, O., Nash, R., Geffen, A. and Blythe, R. 2002. Development and validation of egg-production based biomass estimates, using cod and plaice stocks in the Irish Sea. Final Report of EU contract 98/090 to Commis-sion of the European Communities. April 2002. 256pp.
Armstrong, M.J., Aldridge, J., Beggs, J., Goodsir, F., Greenwood, L., Hoey, S., Maxwell, D., Mil-ligan, S., Prael, A., Roslyn, S., Taylor, N. and Witthames, P. 2010. Egg production survey estimates of spawning stock biomass of cod, haddock and plaice in the Irish Sea in 2008, and an update of estimates for 1995, 2000 and 2006. ICES Working Document 11, WGCSE 2010.
Brander, K. 1975. The population dynamics and biology of cod (Gadus morhua L.) in the Irish Sea 104pp.
Brander, K. 1988. Multi-species fisheries of the Irish Sea Fish Population Dynamics: the Impli-cations for Management.
Dunn and Pawson. 2002. The stock structure and migrations of plaice populations on the west coast of England and Wales Journal of Fish Biology 61 360–393.
Fox, O'Brien and Dickey-Collas. 1997. Modelling fish larval distributions in the western Irish Sea Ichthyoplankton Ecology 16.
Fox, C.J., Planque, B.P., and Darby, C.D. 2000. Synchrony in the recruitment time-series of plaice (Pleuronectes platessa L) around the United Kingdom and the influence of sea tem-perature. Journal of Sea Research 44: 159–168.
ICES. 2010. Report of the Workshop on Implementing ICES FMSY framework , 22–26 March 2010, Copenhagen, Denmark. ICES CM 2010/ACOM:54. 83 pp.
Nichols, Haynes, Fox, Milligan, Brander and Chapman. 1993. Spring plankton surveys of the Irish Sea in 1982, 1985, 1987, 1988 and 1989; hydrography and the distribution of fish eggs and larvae 111pp.
Pawson, M.G. 1995. Biogeographical identification of English Channel fish and shellfish stocks. Fisheries Research Technical Report No. 99. MAFF Directorate of Fisheries Research, Lowestoft. http://www.cefas.co.uk/Publications/techrep/tech99.pdf.
Pawson, M.G. and Harley, B.F.M. 1997. Revision of maturity ogives for plaice and sole in the Irish Sea (ICES Division VIIa). Working document for ICES Northern Shelf Demersal Working Group, June 1997.
Pawson, Pickett and Walker. 2002. The coastal fisheries of England and Wales, Part IV: A re-view of their status 1999–2001 83pp.
Sideek. 1981. The estimation of natural mortality in Irish Sea plaice (Pleuronectes platessa L.) using tagging methods. 206 pp.
Simpson. 1959. The spawning of the plaice (Pleuronectes platessa L.) in the Irish Sea Fishery In-vestigations Series II 22 8 30 pp.
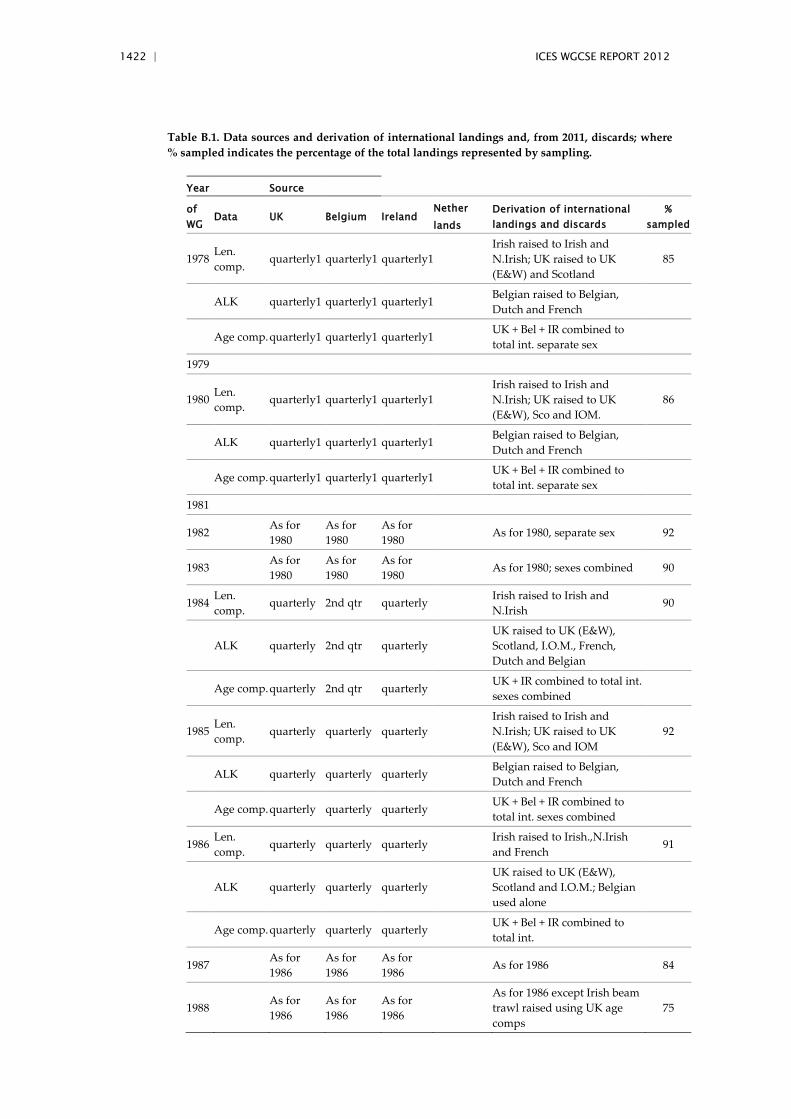
1422 | ICES WGCSE REPORT 2012
Table B.1. Data sources and derivation of international landings and, from 2011, discards; where % sampled indicates the percentage of the total landings represented by sampling.
Year Source
of WG
Data UK Belgium Ireland Nether lands
Derivation of international landings and discards
% sampled
1978 Len. comp.
quarterly1 quarterly1 quarterly1 Irish raised to Irish and N.Irish; UK raised to UK (E&W) and Scotland
85
ALK quarterly1 quarterly1 quarterly1 Belgian raised to Belgian, Dutch and French
Age comp. quarterly1 quarterly1 quarterly1 UK + Bel + IR combined to total int. separate sex
1979
1980 Len. comp.
quarterly1 quarterly1 quarterly1 Irish raised to Irish and N.Irish; UK raised to UK (E&W), Sco and IOM.
86
ALK quarterly1 quarterly1 quarterly1 Belgian raised to Belgian, Dutch and French
Age comp. quarterly1 quarterly1 quarterly1 UK + Bel + IR combined to total int. separate sex
1981
1982 As for 1980
As for 1980
As for 1980
As for 1980, separate sex 92
1983 As for 1980
As for 1980
As for 1980
As for 1980; sexes combined 90
1984 Len. comp.
quarterly 2nd qtr quarterly Irish raised to Irish and N.Irish
90
ALK quarterly 2nd qtr quarterly UK raised to UK (E&W), Scotland, I.O.M., French, Dutch and Belgian
Age comp. quarterly 2nd qtr quarterly UK + IR combined to total int. sexes combined
1985 Len. comp.
quarterly quarterly quarterly Irish raised to Irish and N.Irish; UK raised to UK (E&W), Sco and IOM
92
ALK quarterly quarterly quarterly Belgian raised to Belgian, Dutch and French
Age comp. quarterly quarterly quarterly UK + Bel + IR combined to total int. sexes combined
1986 Len. comp.
quarterly quarterly quarterly Irish raised to Irish.,N.Irish and French
91
ALK quarterly quarterly quarterly UK raised to UK (E&W), Scotland and I.O.M.; Belgian used alone
Age comp. quarterly quarterly quarterly UK + Bel + IR combined to total int.
1987 As for 1986
As for 1986
As for 1986
As for 1986 84
1988 As for 1986
As for 1986
As for 1986
As for 1986 except Irish beam trawl raised using UK age comps
75
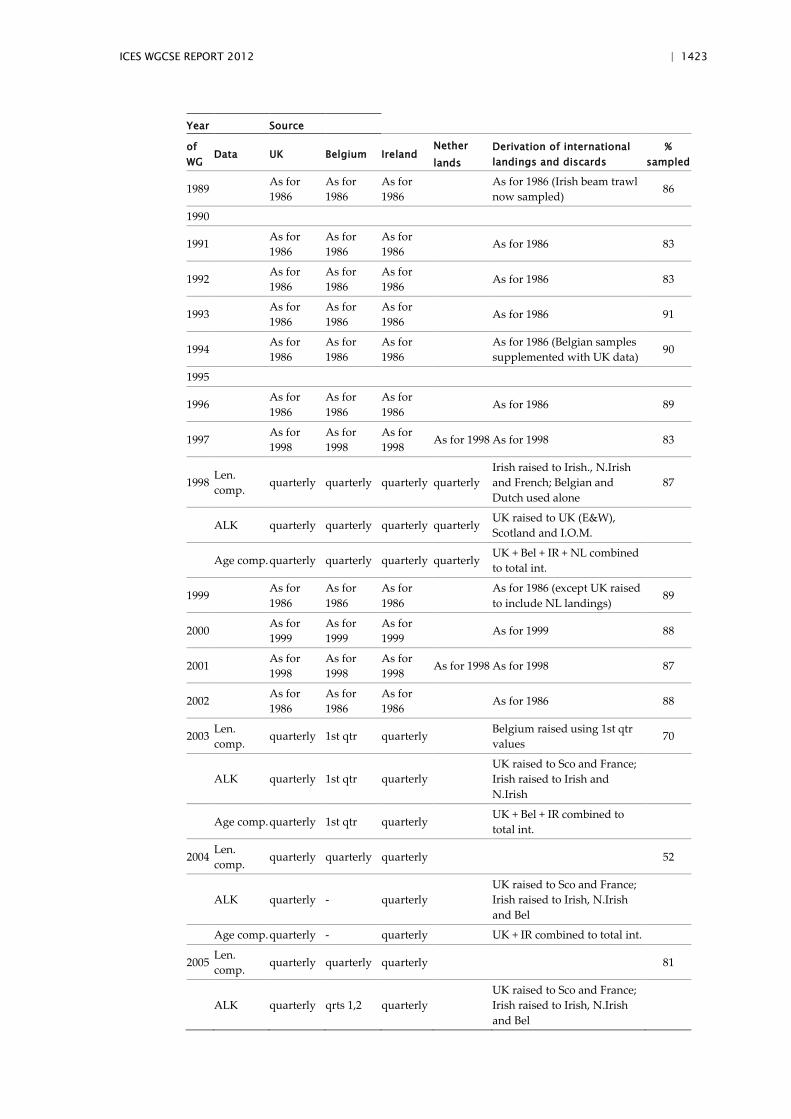
ICES WGCSE REPORT 2012 | 1423
Year Source
of WG
Data UK Belgium Ireland Nether lands
Derivation of international landings and discards
% sampled
1989 As for 1986
As for 1986
As for 1986
As for 1986 (Irish beam trawl now sampled)
86
1990
1991 As for 1986
As for 1986
As for 1986
As for 1986 83
1992 As for 1986
As for 1986
As for 1986
As for 1986 83
1993 As for 1986
As for 1986
As for 1986
As for 1986 91
1994 As for 1986
As for 1986
As for 1986
As for 1986 (Belgian samples supplemented with UK data)
90
1995
1996 As for 1986
As for 1986
As for 1986
As for 1986 89
1997 As for 1998
As for 1998
As for 1998
As for 1998 As for 1998 83
1998 Len. comp.
quarterly quarterly quarterly quarterly Irish raised to Irish., N.Irish and French; Belgian and Dutch used alone
87
ALK quarterly quarterly quarterly quarterly UK raised to UK (E&W), Scotland and I.O.M.
Age comp. quarterly quarterly quarterly quarterly UK + Bel + IR + NL combined to total int.
1999 As for 1986
As for 1986
As for 1986
As for 1986 (except UK raised to include NL landings)
89
2000 As for 1999
As for 1999
As for 1999
As for 1999 88
2001 As for 1998
As for 1998
As for 1998
As for 1998 As for 1998 87
2002 As for 1986
As for 1986
As for 1986
As for 1986 88
2003 Len. comp.
quarterly 1st qtr quarterly Belgium raised using 1st qtr values
70
ALK quarterly 1st qtr quarterly UK raised to Sco and France; Irish raised to Irish and N.Irish
Age comp. quarterly 1st qtr quarterly UK + Bel + IR combined to total int.
2004 Len. comp.
quarterly quarterly quarterly 52
ALK quarterly - quarterly UK raised to Sco and France; Irish raised to Irish, N.Irish and Bel
Age comp. quarterly - quarterly UK + IR combined to total int.
2005 Len. comp.
quarterly quarterly quarterly 81
ALK quarterly qrts 1,2 quarterly UK raised to Sco and France; Irish raised to Irish, N.Irish and Bel
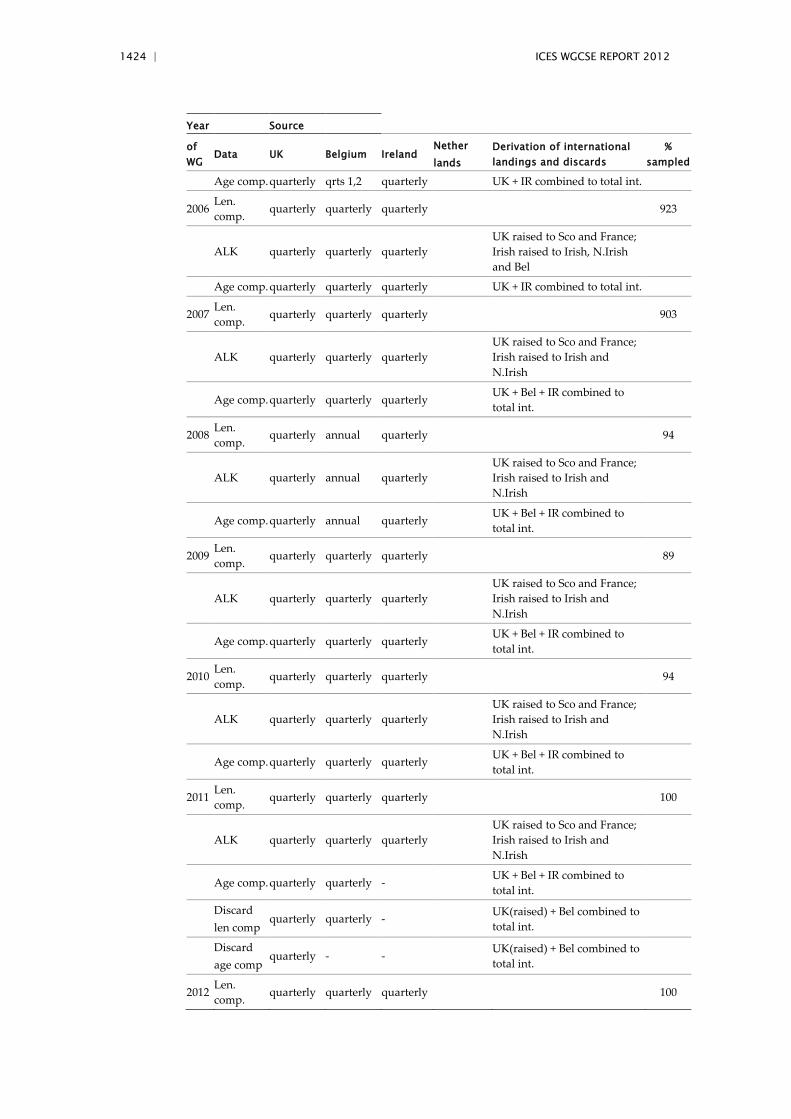
1424 | ICES WGCSE REPORT 2012
Year Source
of WG
Data UK Belgium Ireland Nether lands
Derivation of international landings and discards
% sampled
Age comp. quarterly qrts 1,2 quarterly UK + IR combined to total int.
2006 Len. comp.
quarterly quarterly quarterly 923
ALK quarterly quarterly quarterly UK raised to Sco and France; Irish raised to Irish, N.Irish and Bel
Age comp. quarterly quarterly quarterly UK + IR combined to total int.
2007 Len. comp.
quarterly quarterly quarterly 903
ALK quarterly quarterly quarterly UK raised to Sco and France; Irish raised to Irish and N.Irish
Age comp. quarterly quarterly quarterly UK + Bel + IR combined to total int.
2008 Len. comp.
quarterly annual quarterly 94
ALK quarterly annual quarterly UK raised to Sco and France; Irish raised to Irish and N.Irish
Age comp. quarterly annual quarterly UK + Bel + IR combined to total int.
2009 Len. comp.
quarterly quarterly quarterly 89
ALK quarterly quarterly quarterly UK raised to Sco and France; Irish raised to Irish and N.Irish
Age comp. quarterly quarterly quarterly UK + Bel + IR combined to total int.
2010 Len. comp.
quarterly quarterly quarterly 94
ALK quarterly quarterly quarterly UK raised to Sco and France; Irish raised to Irish and N.Irish
Age comp. quarterly quarterly quarterly UK + Bel + IR combined to total int.
2011 Len. comp.
quarterly quarterly quarterly 100
ALK quarterly quarterly quarterly UK raised to Sco and France; Irish raised to Irish and N.Irish
Age comp. quarterly quarterly - UK + Bel + IR combined to total int.
Discard len comp
quarterly quarterly - UK(raised) + Bel combined to total int.
Discard age comp
quarterly - - UK(raised) + Bel combined to total int.
2012 Len. comp.
quarterly quarterly quarterly 100
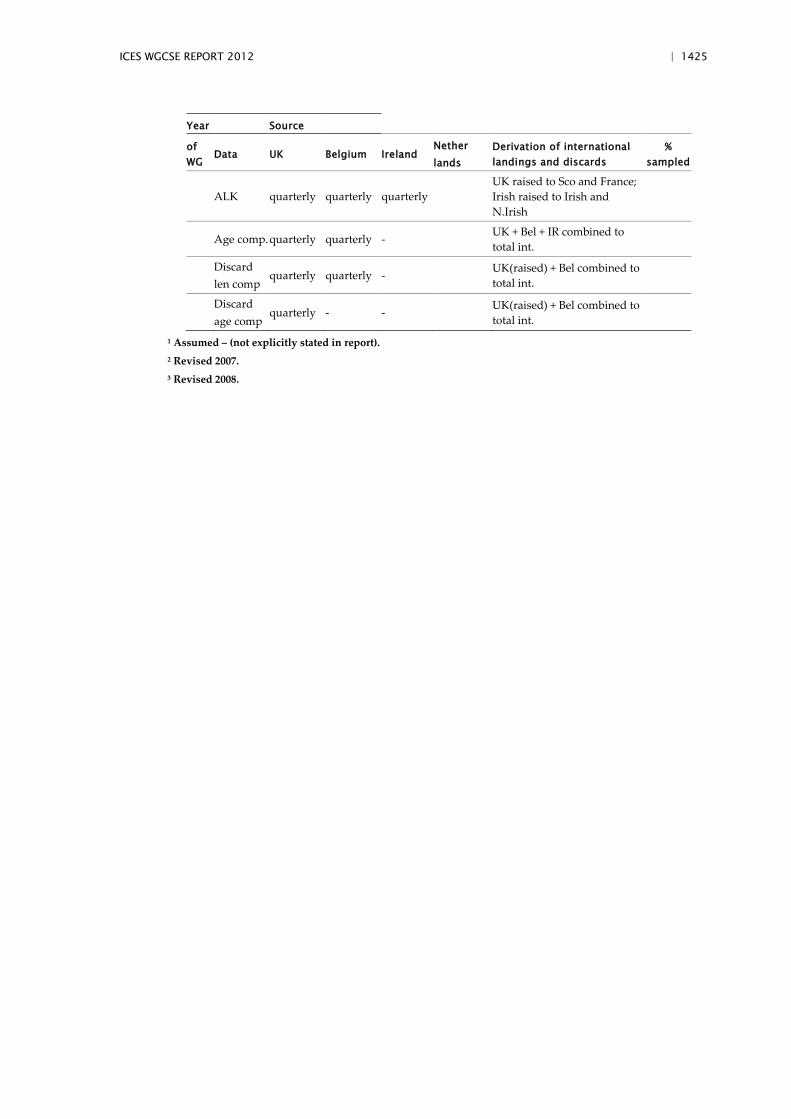
ICES WGCSE REPORT 2012 | 1425
Year Source
of WG
Data UK Belgium Ireland Nether lands
Derivation of international landings and discards
% sampled
ALK quarterly quarterly quarterly UK raised to Sco and France; Irish raised to Irish and N.Irish
Age comp. quarterly quarterly - UK + Bel + IR combined to total int.
Discard len comp
quarterly quarterly - UK(raised) + Bel combined to total int.
Discard age comp
quarterly - - UK(raised) + Bel combined to total int.
1 Assumed – (not explicitly stated in report). 2 Revised 2007. 3 Revised 2008.
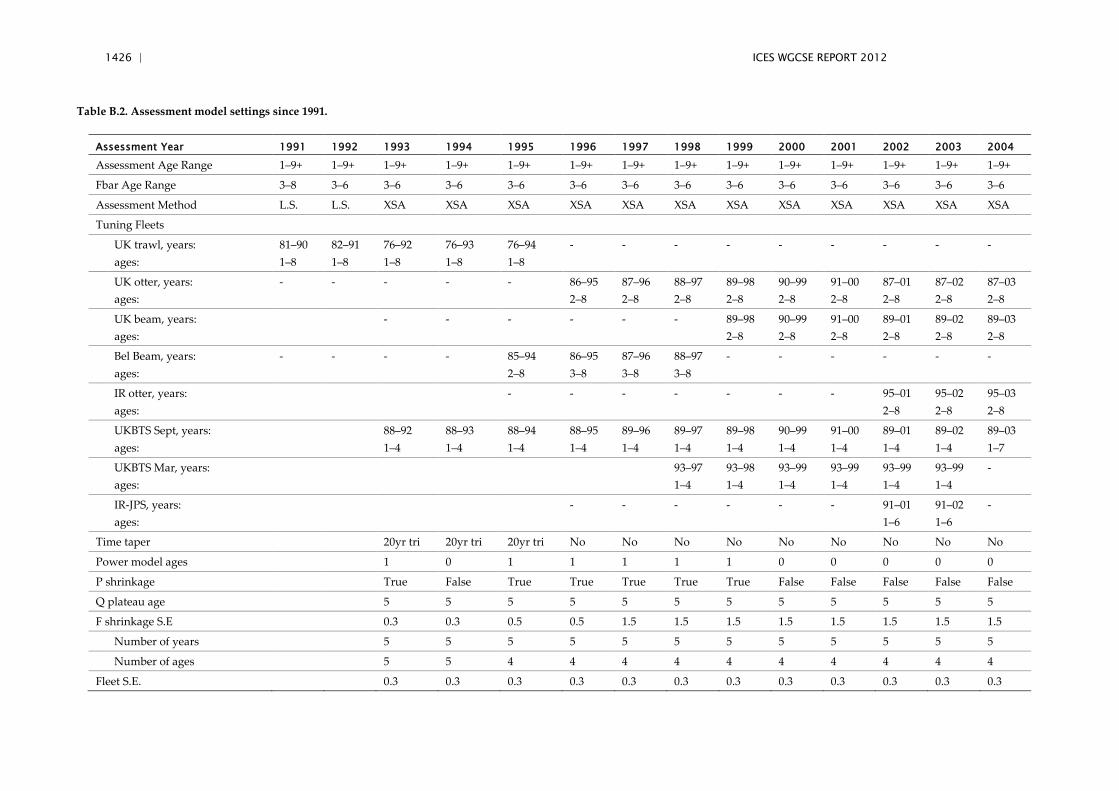
1426 | ICES WGCSE REPORT 2012
Table B.2. Assessment model settings since 1991.
Assessment Year 1991 1992 1993 1994 1995 1996 1997 1998 1999 2000 2001 2002 2003 2004
Assessment Age Range 1–9+ 1–9+ 1–9+ 1–9+ 1–9+ 1–9+ 1–9+ 1–9+ 1–9+ 1–9+ 1–9+ 1–9+ 1–9+ 1–9+
Fbar Age Range 3–8 3–6 3–6 3–6 3–6 3–6 3–6 3–6 3–6 3–6 3–6 3–6 3–6 3–6
Assessment Method L.S. L.S. XSA XSA XSA XSA XSA XSA XSA XSA XSA XSA XSA XSA
Tuning Fleets
UK trawl, years: ages:
81–90 1–8
82–91 1–8
76–92 1–8
76–93 1–8
76–94 1–8
- - - - - - - - -
UK otter, years: ages:
- - - - - 86–95 2–8
87–96 2–8
88–97 2–8
89–98 2–8
90–99 2–8
91–00 2–8
87–01 2–8
87–02 2–8
87–03 2–8
UK beam, years: ages:
- - - - - - 89–98 2–8
90–99 2–8
91–00 2–8
89–01 2–8
89–02 2–8
89–03 2–8
Bel Beam, years: ages:
- - - - 85–94 2–8
86–95 3–8
87–96 3–8
88–97 3–8
- - - - - -
IR otter, years: ages:
- - - - - - - 95–01 2–8
95–02 2–8
95–03 2–8
UKBTS Sept, years: ages:
88–92 1–4
88–93 1–4
88–94 1–4
88–95 1–4
89–96 1–4
89–97 1–4
89–98 1–4
90–99 1–4
91–00 1–4
89–01 1–4
89–02 1–4
89–03 1–7
UKBTS Mar, years: ages:
93–97 1–4
93–98 1–4
93–99 1–4
93–99 1–4
93–99 1–4
93–99 1–4
-
IR-JPS, years: ages:
- - - - - - 91–01 1–6
91–02 1–6
-
Time taper 20yr tri 20yr tri 20yr tri No No No No No No No No No
Power model ages 1 0 1 1 1 1 1 0 0 0 0 0
P shrinkage True False True True True True True False False False False False
Q plateau age 5 5 5 5 5 5 5 5 5 5 5 5
F shrinkage S.E 0.3 0.3 0.5 0.5 1.5 1.5 1.5 1.5 1.5 1.5 1.5 1.5
Number of years 5 5 5 5 5 5 5 5 5 5 5 5
Number of ages 5 5 4 4 4 4 4 4 4 4 4 4
Fleet S.E. 0.3 0.3 0.3 0.3 0.3 0.3 0.3 0.3 0.3 0.3 0.3 0.3
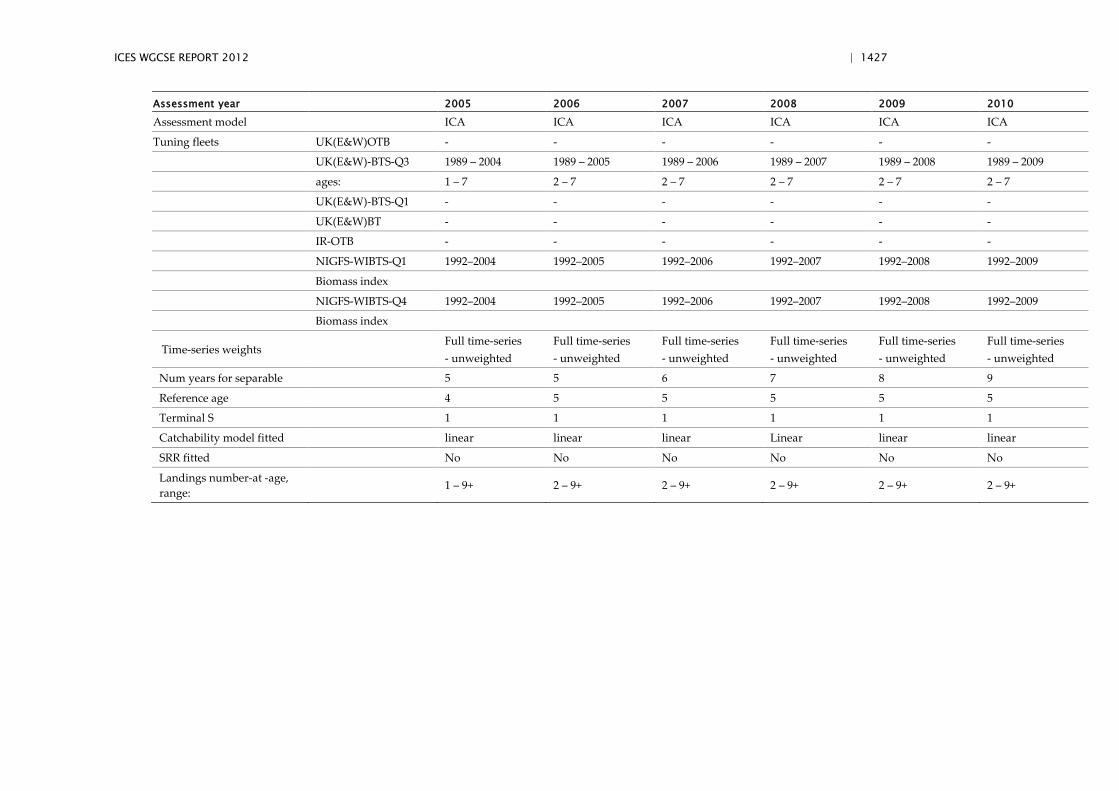
ICES WGCSE REPORT 2012 | 1427
Assessment year 2005 2006 2007 2008 2009 2010
Assessment model ICA ICA ICA ICA ICA ICA
Tuning fleets UK(E&W)OTB - - - - - -
UK(E&W)-BTS-Q3 1989 – 2004 1989 – 2005 1989 – 2006 1989 – 2007 1989 – 2008 1989 – 2009
ages: 1 – 7 2 – 7 2 – 7 2 – 7 2 – 7 2 – 7
UK(E&W)-BTS-Q1 - - - - - -
UK(E&W)BT - - - - - -
IR-OTB - - - - - -
NIGFS-WIBTS-Q1 1992–2004 1992–2005 1992–2006 1992–2007 1992–2008 1992–2009
Biomass index
NIGFS-WIBTS-Q4 1992–2004 1992–2005 1992–2006 1992–2007 1992–2008 1992–2009
Biomass index
Time-series weights Full time-series - unweighted
Full time-series - unweighted
Full time-series - unweighted
Full time-series - unweighted
Full time-series - unweighted
Full time-series - unweighted
Num years for separable 5 5 6 7 8 9
Reference age 4 5 5 5 5 5
Terminal S 1 1 1 1 1 1
Catchability model fitted linear linear linear Linear linear linear
SRR fitted No No No No No No
Landings number-at -age, range:
1 – 9+ 2 – 9+ 2 – 9+ 2 – 9+ 2 – 9+ 2 – 9+
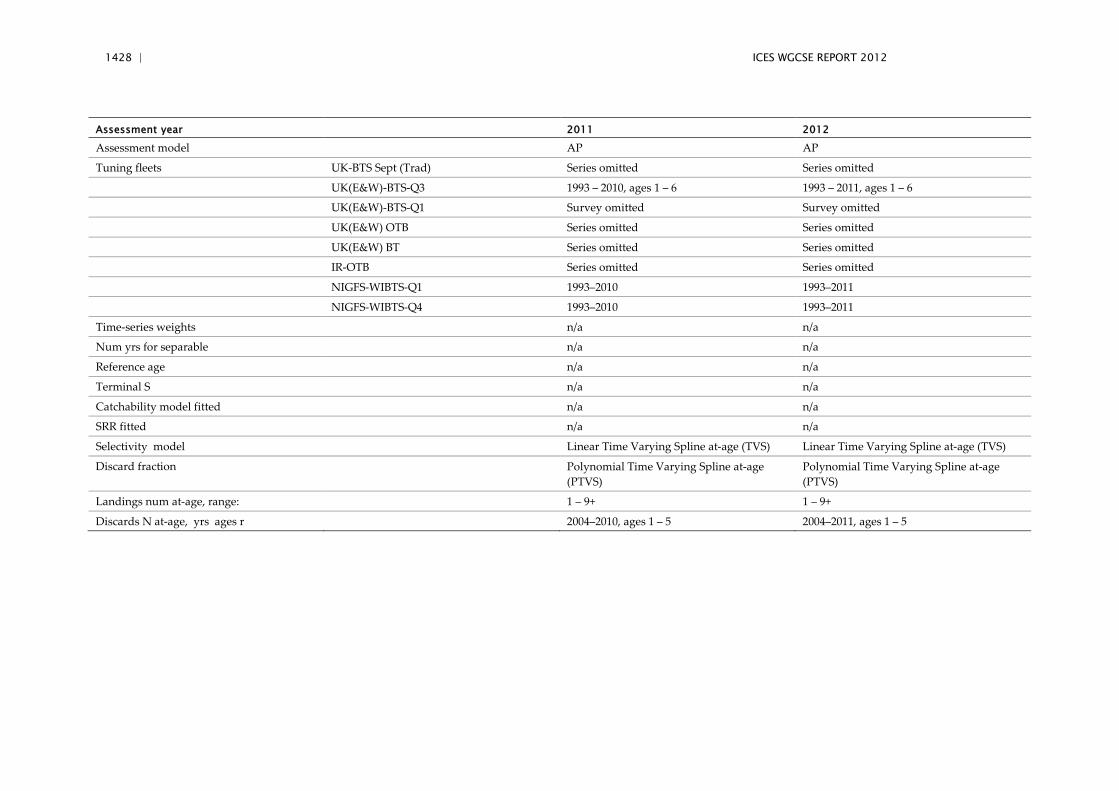
1428 | ICES WGCSE REPORT 2012
Assessment year 2011 2012
Assessment model AP AP
Tuning fleets UK-BTS Sept (Trad) Series omitted Series omitted
UK(E&W)-BTS-Q3 1993 – 2010, ages 1 – 6 1993 – 2011, ages 1 – 6
UK(E&W)-BTS-Q1 Survey omitted Survey omitted
UK(E&W) OTB Series omitted Series omitted
UK(E&W) BT Series omitted Series omitted
IR-OTB Series omitted Series omitted
NIGFS-WIBTS-Q1 1993–2010 1993–2011
NIGFS-WIBTS-Q4 1993–2010 1993–2011
Time-series weights n/a n/a
Num yrs for separable n/a n/a
Reference age n/a n/a
Terminal S n/a n/a
Catchability model fitted n/a n/a
SRR fitted n/a n/a
Selectivity model Linear Time Varying Spline at-age (TVS) Linear Time Varying Spline at-age (TVS)
Discard fraction Polynomial Time Varying Spline at-age (PTVS)
Polynomial Time Varying Spline at-age (PTVS)
Landings num at-age, range: 1 – 9+ 1 – 9+
Discards N at-age, yrs ages r 2004–2010, ages 1 – 5 2004–2011, ages 1 – 5
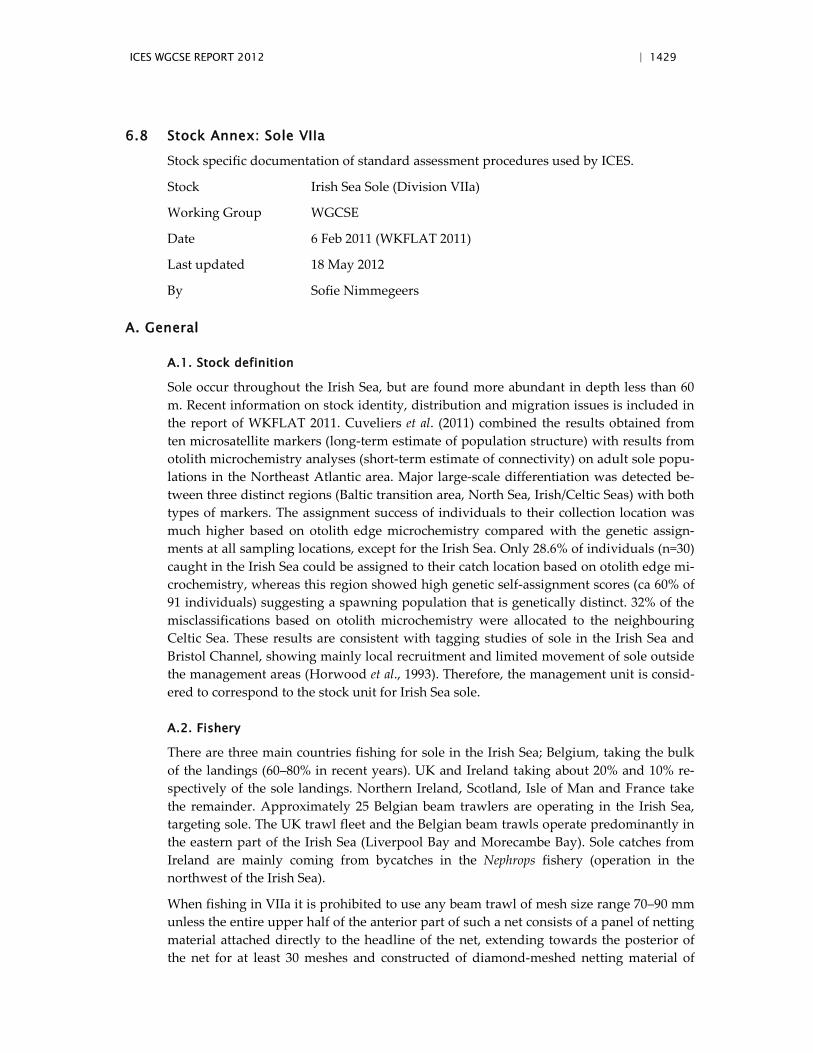
ICES WGCSE REPORT 2012 | 1429
6.8 Stock Annex: Sole VIIa
Stock specific documentation of standard assessment procedures used by ICES.
Stock Irish Sea Sole (Division VIIa)
Working Group WGCSE
Date 6 Feb 2011 (WKFLAT 2011)
Last updated 18 May 2012
By Sofie Nimmegeers
A. General
A.1. Stock definition
Sole occur throughout the Irish Sea, but are found more abundant in depth less than 60 m. Recent information on stock identity, distribution and migration issues is included in the report of WKFLAT 2011. Cuveliers et al. (2011) combined the results obtained from ten microsatellite markers (long-term estimate of population structure) with results from otolith microchemistry analyses (short-term estimate of connectivity) on adult sole popu-lations in the Northeast Atlantic area. Major large-scale differentiation was detected be-tween three distinct regions (Baltic transition area, North Sea, Irish/Celtic Seas) with both types of markers. The assignment success of individuals to their collection location was much higher based on otolith edge microchemistry compared with the genetic assign-ments at all sampling locations, except for the Irish Sea. Only 28.6% of individuals (n=30) caught in the Irish Sea could be assigned to their catch location based on otolith edge mi-crochemistry, whereas this region showed high genetic self-assignment scores (ca 60% of 91 individuals) suggesting a spawning population that is genetically distinct. 32% of the misclassifications based on otolith microchemistry were allocated to the neighbouring Celtic Sea. These results are consistent with tagging studies of sole in the Irish Sea and Bristol Channel, showing mainly local recruitment and limited movement of sole outside the management areas (Horwood et al., 1993). Therefore, the management unit is consid-ered to correspond to the stock unit for Irish Sea sole.
A.2. Fishery
There are three main countries fishing for sole in the Irish Sea; Belgium, taking the bulk of the landings (60–80% in recent years). UK and Ireland taking about 20% and 10% re-spectively of the sole landings. Northern Ireland, Scotland, Isle of Man and France take the remainder. Approximately 25 Belgian beam trawlers are operating in the Irish Sea, targeting sole. The UK trawl fleet and the Belgian beam trawls operate predominantly in the eastern part of the Irish Sea (Liverpool Bay and Morecambe Bay). Sole catches from Ireland are mainly coming from bycatches in the Nephrops fishery (operation in the northwest of the Irish Sea).
When fishing in VIIa it is prohibited to use any beam trawl of mesh size range 70–90 mm unless the entire upper half of the anterior part of such a net consists of a panel of netting material attached directly to the headline of the net, extending towards the posterior of the net for at least 30 meshes and constructed of diamond-meshed netting material of
1430 | ICES WGCSE REPORT 2012
which no individual mesh is of mesh size less than 180 mm. The Irish otter trawl fleet employs either a 70 mm mesh with square mesh panels or more commonly an 80 mm mesh. Similarly the Belgian and UK(E&W) beam trawls use 80 mm mesh gear. Otter trawlers targeting roundfish have, since 2000, used 100 mm mesh gear.
It was concluded at the 2000 working group and confirmed in 2001 that the cod recovery measures first enacted (EU Regulations 304/2000 and 2549/2000 + revisions in 2001–2003) in 2000 would have had little impact on the sole fishery. The closed area in 2001 covered a reduced area confined to the west of the Irish Sea and therefore is also expected to have had little effect on the level of fishing effort for sole The spawning closure for cod in 2002 is also unlikely to have had an impact on the sole fishery. The effort regulations and max-imum daily uptake, implemented in 2003 will delay the uptake of the quota but is also unlikely to be restrictive for the total uptake. It is unlikely that any measures concerning the cod management plan in the Irish Sea had restrictions on the sole fishery after 2003.
Discard are estimated to be minor. Preliminary data indicate ranges from 0 to 8% by weight discarded.
Although no data are available on the extent of misreporting of landings from this stock, it is not considered to be a problem for this stock, given the partial uptake of the agreed TAC in recent years.
ICES WGCSE REPORT 2012 | 1431
A.3. Ecosystem aspects
1432 | ICES WGCSE REPORT 2012
(Connolly, P.L. et al., 2009).
ICES WGCSE REPORT 2012 | 1433
B. Data
B.1. Commercial catch
Quarterly age compositions are available from UK(E&W), Belgium and Ireland, as well as quarterly landings from France, Northern Ireland, Isle of man and Scotland. The total international age composition is obtained using a combined ALK from UK(E&W), Bel-gium and Ireland raw data, responsible for 99% of the total international sole landings. The combined ALK is applied to the length distributions of the separate countries to ob-tain an aggregated age composition.
Catch weights were obtained from the combined AWK (UK(E&W), Belgium and Ireland raw data).
Stock weights were obtained using the Rivard weight calculator (http://nft.nefsc.noaa.gov./) that conducts a cohort interpolation of the catch weights.
B.2. Biological
Currently there are no direct (from tagging) or independent (from survey information) estimates of natural mortality. Therefore, annual natural mortality (M) is assumed to be constant over ages and years, at 0.1 yr-1.
The maturity ogive used in this and previous assessments is based on survey information for this stock.:
AGE 1 2 3 4 5 6 AND OLDER
Mat. 0.00 0.38 0.71 0.97 0.98 1.00
Proportions of M and F before spawning were set to zero, as in previous years.
Males and females of this stock are strongly dimorphic, with males showing much re-duced rates of growth after reaching maturity, while females continue to grow. Given the minimum landing size of 24 cm the majority of landings represent mature females.
B.3. Surveys
One survey is used in the assessment of VIIa sole: the UK beam trawl survey (UK (BTS-3Q)).
Area covered
Irish Sea; 52°N to 55°N; 3°W to 6°30’ W.
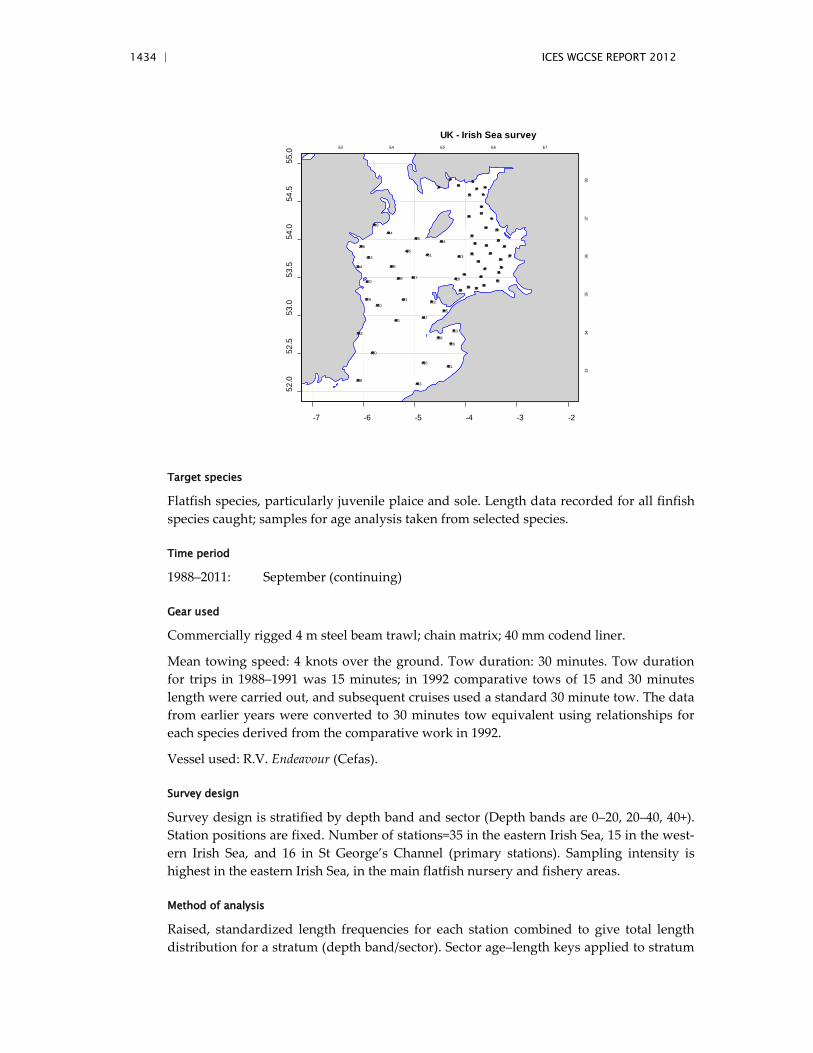
1434 | ICES WGCSE REPORT 2012
-7 -6 -5 -4 -3 -2
52.0
52.5
53.0
53.5
54.0
54.5
55.0
E3 E4 E5 E6 E7
3334
3536
3738
UK - Irish Sea survey
2
3 456
7
9
10
12
14
15
16
1718
19
22
23
2728
3031
3236
373840
4142
43
47
49
53
54
55
203
206
213
214
220
229
233
302
305
309
313
316
321
401405
408
409
416
419
421
423
424425
430
438
440
441442
443
444
447
Target species
Flatfish species, particularly juvenile plaice and sole. Length data recorded for all finfish species caught; samples for age analysis taken from selected species.
Time period
1988–2011: September (continuing)
Gear used
Commercially rigged 4 m steel beam trawl; chain matrix; 40 mm codend liner.
Mean towing speed: 4 knots over the ground. Tow duration: 30 minutes. Tow duration for trips in 1988–1991 was 15 minutes; in 1992 comparative tows of 15 and 30 minutes length were carried out, and subsequent cruises used a standard 30 minute tow. The data from earlier years were converted to 30 minutes tow equivalent using relationships for each species derived from the comparative work in 1992.
Vessel used: R.V. Endeavour (Cefas).
Survey design
Survey design is stratified by depth band and sector (Depth bands are 0–20, 20–40, 40+). Station positions are fixed. Number of stations=35 in the eastern Irish Sea, 15 in the west-ern Irish Sea, and 16 in St George’s Channel (primary stations). Sampling intensity is highest in the eastern Irish Sea, in the main flatfish nursery and fishery areas.
Method of analysis
Raised, standardized length frequencies for each station combined to give total length distribution for a stratum (depth band/sector). Sector age–length keys applied to stratum
ICES WGCSE REPORT 2012 | 1435
length distributions 1988–1994; stratum age–length keys applied 1995 onwards. Mean stratum cpue (kg per 100 km and numbers-at-age per 100 km) are calculated. Overall mean cpue values are simple totals divided by distance in metres (or hours fished). Popu-lation number estimates derived using stratum areas as weighting factors.
The September beam trawl survey has proven to estimate year-class strength well, and providing 50% to over 90% of the weighting to the total estimates of the incoming year classes.
B.4. Commercial lpue
Lpue and effort series were available from the Belgium beam trawlers, UK(E&W) beam and otter trawlers, the Irish otter trawlers and from two UK beam trawl surveys (Sep-tember and March).
Lpue for both UK and Belgian beam trawlers has declined since the beginning of the time-series, but has remained relatively constant over the last decade, with a renewed increase over the last few years (2008–2009 for Belgium and 2007–2009 for UK).
Effort from both commercial beam trawl fleets increased from the early seventies until the late eighties. Since then Belgian beam trawl effort has declined over the nineties, in-creased again in the period 2000–2005 and subsequently dropped to much lower values in 2008–2011 (the lowest values since 1984). In the nineties, the UK beam trawl effort fluc-tuated around a lower level than the late eighties, and dropped during the 21st century to a lower value of the time-series.
Indices of abundance derived from the UK September survey (UK (BTS-3Q)) (data from 1988 onwards) are shown in WGNSDS 2002 (Table 12.2.2). High abundance indices for the UK September survey (UK (BTS-3Q)) can be seen for year classes 1989, 1995 and 1996. The dataseries from the UK March beam trawl survey (UK (BTS-1Q)) is rather short (from 1993 to 1999), and therefore difficult to interpret.
B.5. Other relevant data
No information.
C. Assessment: data and method
Model used: XSA
Software used: IFAP/Lowestoft VPA suite
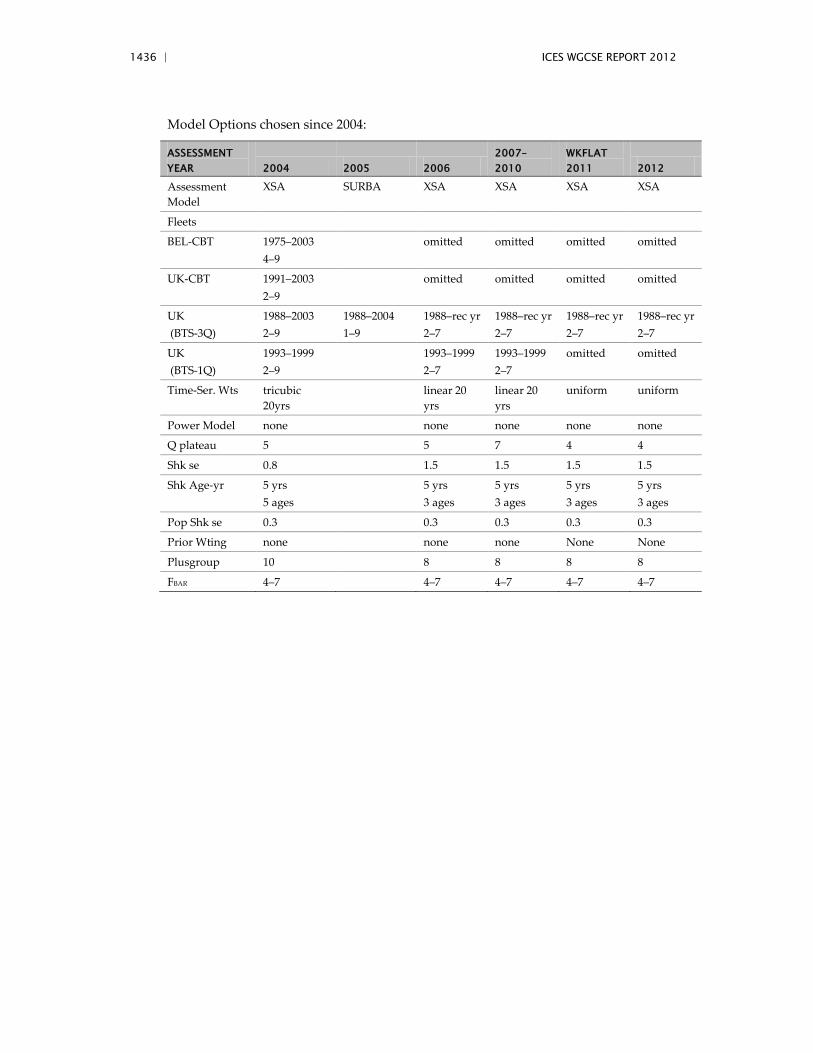
1436 | ICES WGCSE REPORT 2012
Model Options chosen since 2004:
ASSESSMENT YEAR 2004 2005 2006
2007–2010
WKFLAT 2011 2012
Assessment Model
XSA SURBA XSA XSA XSA XSA
Fleets
BEL-CBT 1975–2003 4–9
omitted omitted omitted omitted
UK-CBT 1991–2003 2–9
omitted omitted omitted omitted
UK (BTS-3Q)
1988–2003 2–9
1988–2004 1–9
1988–rec yr 2–7
1988–rec yr 2–7
1988–rec yr 2–7
1988–rec yr 2–7
UK (BTS-1Q)
1993–1999 2–9
1993–1999 2–7
1993–1999 2–7
omitted omitted
Time-Ser. Wts tricubic 20yrs
linear 20 yrs
linear 20 yrs
uniform uniform
Power Model none none none none none
Q plateau 5 5 7 4 4
Shk se 0.8 1.5 1.5 1.5 1.5
Shk Age-yr 5 yrs 5 ages
5 yrs 3 ages
5 yrs 3 ages
5 yrs 3 ages
5 yrs 3 ages
Pop Shk se 0.3 0.3 0.3 0.3 0.3
Prior Wting none none none None None
Plusgroup 10 8 8 8 8
FBAR 4–7 4–7 4–7 4–7 4–7
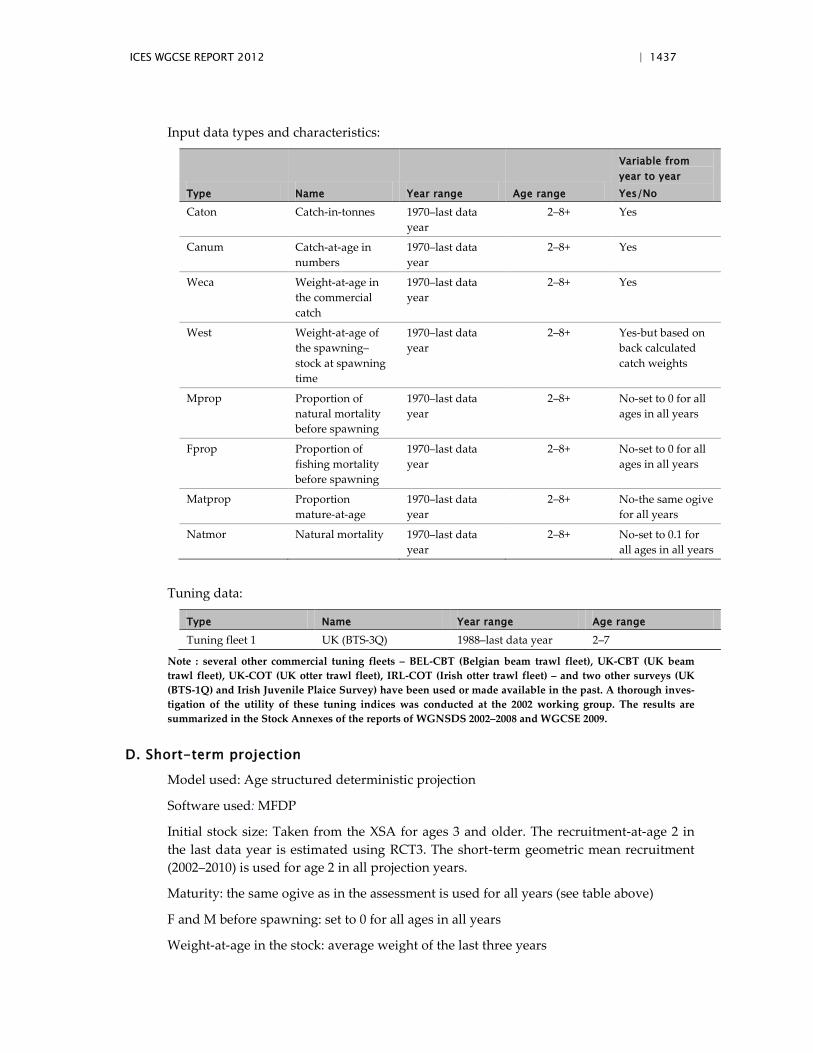
ICES WGCSE REPORT 2012 | 1437
Input data types and characteristics:
Type Name Year range Age range
Variable from year to year Yes/No
Caton Catch-in-tonnes 1970–last data year
2–8+ Yes
Canum Catch-at-age in numbers
1970–last data year
2–8+ Yes
Weca Weight-at-age in the commercial catch
1970–last data year
2–8+ Yes
West Weight-at-age of the spawning–stock at spawning time
1970–last data year
2–8+ Yes-but based on back calculated catch weights
Mprop Proportion of natural mortality before spawning
1970–last data year
2–8+ No-set to 0 for all ages in all years
Fprop Proportion of fishing mortality before spawning
1970–last data year
2–8+ No-set to 0 for all ages in all years
Matprop Proportion mature-at-age
1970–last data year
2–8+ No-the same ogive for all years
Natmor Natural mortality 1970–last data year
2–8+ No-set to 0.1 for all ages in all years
Tuning data:
Type Name Year range Age range
Tuning fleet 1 UK (BTS-3Q) 1988–last data year 2–7
Note : several other commercial tuning fleets – BEL-CBT (Belgian beam trawl fleet), UK-CBT (UK beam trawl fleet), UK-COT (UK otter trawl fleet), IRL-COT (Irish otter trawl fleet) – and two other surveys (UK (BTS-1Q) and Irish Juvenile Plaice Survey) have been used or made available in the past. A thorough inves-tigation of the utility of these tuning indices was conducted at the 2002 working group. The results are summarized in the Stock Annexes of the reports of WGNSDS 2002–2008 and WGCSE 2009.
D. Short-term projection
Model used: Age structured deterministic projection
Software used: MFDP
Initial stock size: Taken from the XSA for ages 3 and older. The recruitment-at-age 2 in the last data year is estimated using RCT3. The short-term geometric mean recruitment (2002–2010) is used for age 2 in all projection years.
Maturity: the same ogive as in the assessment is used for all years (see table above)
F and M before spawning: set to 0 for all ages in all years
Weight-at-age in the stock: average weight of the last three years
1438 | ICES WGCSE REPORT 2012
Weight-at-age in the catch: average weight of the three last years
Exploitation pattern: average of the three last years, not scaled to the last year’s FBAR (4–7) if no trend in F was detected (scaled to the last year’s FBAR (4–7) if a trend in F was detect-ed).
Intermediate year assumptions: status quo F
Stock–recruitment model used: none
Procedures used for splitting projected catches: not relevant
E. Medium-term projections
Medium-term projections were not conducted at WKFLAT 2011. The last medium-term projections were carried out in 2008. The settings used are described below.
Model used: Age structured
Software used: IFAP single option prediction
Initial stock size: Same as in the short-term projections.
Natural mortality: Set to 0.2 for all ages in all years
Maturity: The same ogive as in the assessment is used for all years
F and M before spawning: Set to 0 for all ages in all years
Weight-at-age in the stock: Assumed to be the same as weight-at-age in the catch
Weight-at-age in the catch: Average weight of the three last years
Exploitation pattern: Average of the three last years, scaled by the FBAR (3–6) to the level of the last year
Intermediate year assumptions: F-factor from the management option table correspond-ing to the TAC
Stock–recruitment model used: None, the long-term geometric mean recruitment-at-age 2 is used.
Uncertainty models used: @RISK for excel, Latin Hypercubed, 500 iterations, fixed ran-dom number generator
• Initial stock size: Lognormal distribution, LOGNORM(mean, standard devia-tion), with mean as in the short-term projections and standard deviation calcu-lated by multiplying the mean by the external standard error from the XSA diagnostics (except for age 2, see recruitment below)
• Natural mortality: Set to 0.2 for all ages in all years • Maturity: The same ogive as in the assessment is used for all years • F and M before spawning: Set to 0.2 for all ages in all years • Weight-at-age in the stock: Assumed to be the same as weight-at-age in the
catch • Weight-at-age in the catch: Average weight of the three last years
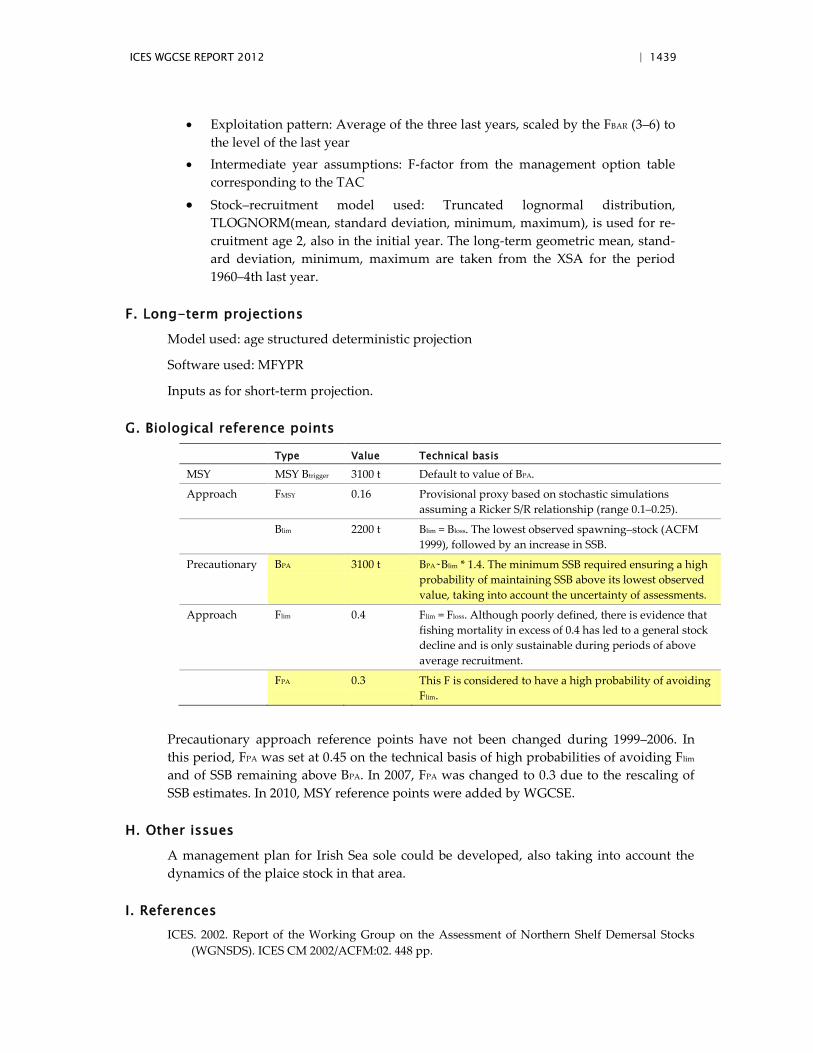
ICES WGCSE REPORT 2012 | 1439
• Exploitation pattern: Average of the three last years, scaled by the FBAR (3–6) to the level of the last year
• Intermediate year assumptions: F-factor from the management option table corresponding to the TAC
• Stock–recruitment model used: Truncated lognormal distribution, TLOGNORM(mean, standard deviation, minimum, maximum), is used for re-cruitment age 2, also in the initial year. The long-term geometric mean, stand-ard deviation, minimum, maximum are taken from the XSA for the period 1960–4th last year.
F. Long-term projections
Model used: age structured deterministic projection
Software used: MFYPR
Inputs as for short-term projection.
G. Biological reference points
Type Value Technical basis
MSY MSY Btrigger 3100 t Default to value of BPA.
Approach FMSY 0.16 Provisional proxy based on stochastic simulations assuming a Ricker S/R relationship (range 0.1–0.25).
Blim 2200 t Blim = Bloss. The lowest observed spawning–stock (ACFM 1999), followed by an increase in SSB.
Precautionary BPA 3100 t BPA Blim * 1.4. The minimum SSB required ensuring a high probability of maintaining SSB above its lowest observed value, taking into account the uncertainty of assessments.
Approach Flim 0.4 Flim = Floss. Although poorly defined, there is evidence that fishing mortality in excess of 0.4 has led to a general stock decline and is only sustainable during periods of above average recruitment.
FPA 0.3 This F is considered to have a high probability of avoiding Flim.
Precautionary approach reference points have not been changed during 1999–2006. In this period, FPA was set at 0.45 on the technical basis of high probabilities of avoiding Flim and of SSB remaining above BPA. In 2007, FPA was changed to 0.3 due to the rescaling of SSB estimates. In 2010, MSY reference points were added by WGCSE.
H. Other issues
A management plan for Irish Sea sole could be developed, also taking into account the dynamics of the plaice stock in that area.
I. References ICES. 2002. Report of the Working Group on the Assessment of Northern Shelf Demersal Stocks
(WGNSDS). ICES CM 2002/ACFM:02. 448 pp.
1440 | ICES WGCSE REPORT 2012
ICES. 2019. Report of the Working Group on the Celtic Seas Ecoregion (WGCSE), 13–19 May 2009, Copenhagen, Denmark. ICES CM 2009/ACOM:09. 1430 pp.
ICES. 2010. Report of the Working Group on Celtic Seas Ecosystems, 12–20 May 2010, Copenhagen, Denmark. ICES CM 2010/ACOM:12. 1435pp.
ICES. 2011. Report of the Working Group on Celtic Seas Ecosystems, 11–19 May 2011, Copenhagen, Denmark. ICES CM 2011/ACOM:12. 1572pp.
Connolly, P.L., Kelly, E., Dransfeld, L., Slattery, N., Paramor, O.A.L., and Frid, C.L.J. 2009: MEFEPO North Western Waters Atlas. Marine Institute.
ICES WGCSE REPORT 2012 | 1441
7.2 Stock Annex Cod VIIe–k
Stock specific documentation of standard assessment procedures used by ICES.
Stock Cod in VIIe–k (Celtic Sea cod)
Expert Group Celtic Sea Working Group
Date March 2012
Revised by Colm Lordan, Lionel Pawlowski
A. General
A.1. Stock definition
Since 1997, this assessment has related to the cod in Divisions VIIe–k, covering the West-ern Channel and the Celtic Sea. Tagging information presented at WKROUND 2012 (WDs 9 and 11) confirms minimal movement of cod from VIIe–k to other areas. In fact even within VIIe–k there seems to be limited mixing between fish tagged in VIIg or VIIa South and those tagged in VIIf and VIIe.
Up to 2008, the management area was set in Divisions VIIb–k, VIII, IX, X, and CECAF 34.1.1 which does not correspond to the area assessed. The management area was re-vised in 2009 to exclude VIId. The new TAC covers ICES Areas VIIb–c, VIIe–k, VIII, IX, X, and CECAF 34.1.1(1). This is more representative of the stock area in recent years and landings from VIIbc, VIII, IX and X have been minimal.
The area assessed has gradually increased from VIIfg before 1994 to VIIfgh, to VIIefgh in 1996 and finally to VIIe–k. In 1994, at the request of ACFM, ICES Working Group on Southern Shelf Demersal Stocks (WGSSDS) studied the possible extension of the area as-sessed from VIIfg to VIIfgh. Examination of data from surveys and logbooks indicated a continuity of the distribution of VIIg cod into VIIh. Depending on the year, catches in Division VIIh represented 9–15% of the catches in VIIfg, with a coincidence of years of peak or low catches in both areas. Therefore, catches from VIIh were included in the as-sessment. In 1996, at the request of ACFM, WGSSDS studied the possible extension of the area assessed from VIIfgh to VIIefgh. The population dynamics parameters for VIIfgh and VIIe cod were examined and compared for the period 1988–1994, when independent tuning fleets, international catch-at-age, mean weights-at-age in the landings and in the stocks were available for both areas. Patterns of F were consistent between VIIe and VII fgh in earlier years (1988–1990), and SSBs trends were similar in the period 1988–1992. The patterns of recruitments (age 1) were found to be fairly consistent through this peri-od 1988–1994, though it cannot be assumed that this consistency was also valid in earlier years when catch-at-age were only available in Divisions VIIf, g, h. It was therefore de-cided to combine Western Channel Cod with the Celtic Sea Cod assessment for the years 1988–1995, but an independent assessment of Celtic sea Cod in VIIfgh was maintained for the longer period available 1971–1995. This was to allow scaling of the historic (1971–1987) SSBs and recruitments values from VIIfgh to VIIe–h.
At WGSSDS 1997, due to the lack of a long independent series of catch-at-age in Divi-sions VIIj,k, the estimate of landings from Divisions VIIjk was discussed and it was de-
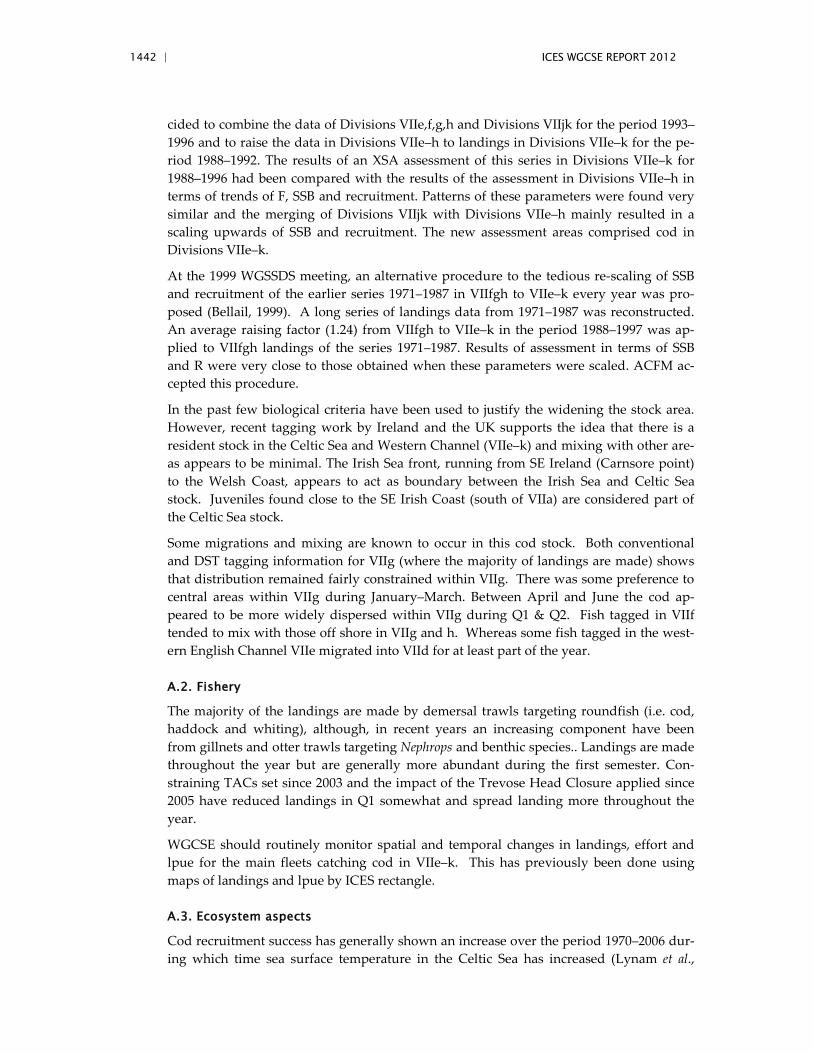
1442 | ICES WGCSE REPORT 2012
cided to combine the data of Divisions VIIe,f,g,h and Divisions VIIjk for the period 1993–1996 and to raise the data in Divisions VIIe–h to landings in Divisions VIIe–k for the pe-riod 1988–1992. The results of an XSA assessment of this series in Divisions VIIe–k for 1988–1996 had been compared with the results of the assessment in Divisions VIIe–h in terms of trends of F, SSB and recruitment. Patterns of these parameters were found very similar and the merging of Divisions VIIjk with Divisions VIIe–h mainly resulted in a scaling upwards of SSB and recruitment. The new assessment areas comprised cod in Divisions VIIe–k.
At the 1999 WGSSDS meeting, an alternative procedure to the tedious re-scaling of SSB and recruitment of the earlier series 1971–1987 in VIIfgh to VIIe–k every year was pro-posed (Bellail, 1999). A long series of landings data from 1971–1987 was reconstructed. An average raising factor (1.24) from VIIfgh to VIIe–k in the period 1988–1997 was ap-plied to VIIfgh landings of the series 1971–1987. Results of assessment in terms of SSB and R were very close to those obtained when these parameters were scaled. ACFM ac-cepted this procedure.
In the past few biological criteria have been used to justify the widening the stock area. However, recent tagging work by Ireland and the UK supports the idea that there is a resident stock in the Celtic Sea and Western Channel (VIIe–k) and mixing with other are-as appears to be minimal. The Irish Sea front, running from SE Ireland (Carnsore point) to the Welsh Coast, appears to act as boundary between the Irish Sea and Celtic Sea stock. Juveniles found close to the SE Irish Coast (south of VIIa) are considered part of the Celtic Sea stock.
Some migrations and mixing are known to occur in this cod stock. Both conventional and DST tagging information for VIIg (where the majority of landings are made) shows that distribution remained fairly constrained within VIIg. There was some preference to central areas within VIIg during January–March. Between April and June the cod ap-peared to be more widely dispersed within VIIg during Q1 & Q2. Fish tagged in VIIf tended to mix with those off shore in VIIg and h. Whereas some fish tagged in the west-ern English Channel VIIe migrated into VIId for at least part of the year.
A.2. Fishery
The majority of the landings are made by demersal trawls targeting roundfish (i.e. cod, haddock and whiting), although, in recent years an increasing component have been from gillnets and otter trawls targeting Nephrops and benthic species.. Landings are made throughout the year but are generally more abundant during the first semester. Con-straining TACs set since 2003 and the impact of the Trevose Head Closure applied since 2005 have reduced landings in Q1 somewhat and spread landing more throughout the year.
WGCSE should routinely monitor spatial and temporal changes in landings, effort and lpue for the main fleets catching cod in VIIe–k. This has previously been done using maps of landings and lpue by ICES rectangle.
A.3. Ecosystem aspects
Cod recruitment success has generally shown an increase over the period 1970–2006 dur-ing which time sea surface temperature in the Celtic Sea has increased (Lynam et al.,
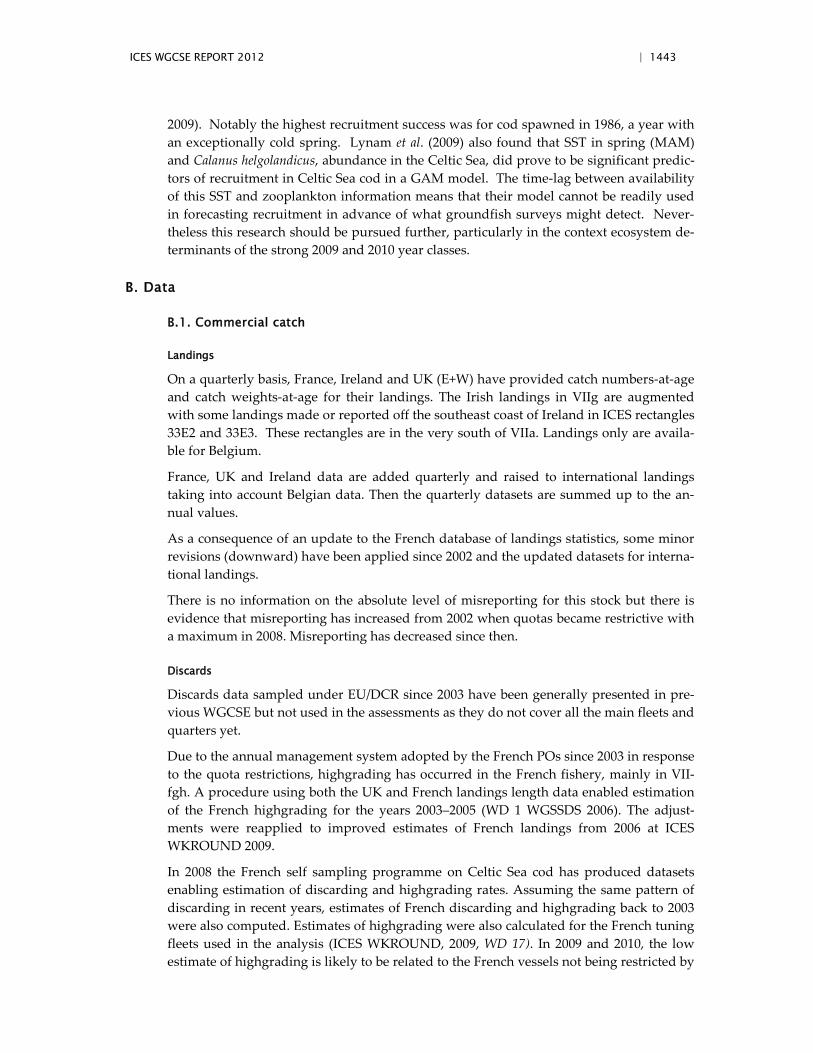
ICES WGCSE REPORT 2012 | 1443
2009). Notably the highest recruitment success was for cod spawned in 1986, a year with an exceptionally cold spring. Lynam et al. (2009) also found that SST in spring (MAM) and Calanus helgolandicus, abundance in the Celtic Sea, did prove to be significant predic-tors of recruitment in Celtic Sea cod in a GAM model. The time-lag between availability of this SST and zooplankton information means that their model cannot be readily used in forecasting recruitment in advance of what groundfish surveys might detect. Never-theless this research should be pursued further, particularly in the context ecosystem de-terminants of the strong 2009 and 2010 year classes.
B. Data
B.1. Commercial catch
Landings
On a quarterly basis, France, Ireland and UK (E+W) have provided catch numbers-at-age and catch weights-at-age for their landings. The Irish landings in VIIg are augmented with some landings made or reported off the southeast coast of Ireland in ICES rectangles 33E2 and 33E3. These rectangles are in the very south of VIIa. Landings only are availa-ble for Belgium.
France, UK and Ireland data are added quarterly and raised to international landings taking into account Belgian data. Then the quarterly datasets are summed up to the an-nual values.
As a consequence of an update to the French database of landings statistics, some minor revisions (downward) have been applied since 2002 and the updated datasets for interna-tional landings.
There is no information on the absolute level of misreporting for this stock but there is evidence that misreporting has increased from 2002 when quotas became restrictive with a maximum in 2008. Misreporting has decreased since then.
Discards
Discards data sampled under EU/DCR since 2003 have been generally presented in pre-vious WGCSE but not used in the assessments as they do not cover all the main fleets and quarters yet.
Due to the annual management system adopted by the French POs since 2003 in response to the quota restrictions, highgrading has occurred in the French fishery, mainly in VII-fgh. A procedure using both the UK and French landings length data enabled estimation of the French highgrading for the years 2003–2005 (WD 1 WGSSDS 2006). The adjust-ments were reapplied to improved estimates of French landings from 2006 at ICES WKROUND 2009.
In 2008 the French self sampling programme on Celtic Sea cod has produced datasets enabling estimation of discarding and highgrading rates. Assuming the same pattern of discarding in recent years, estimates of French discarding and highgrading back to 2003 were also computed. Estimates of highgrading were also calculated for the French tuning fleets used in the analysis (ICES WKROUND, 2009, WD 17). In 2009 and 2010, the low estimate of highgrading is likely to be related to the French vessels not being restricted by
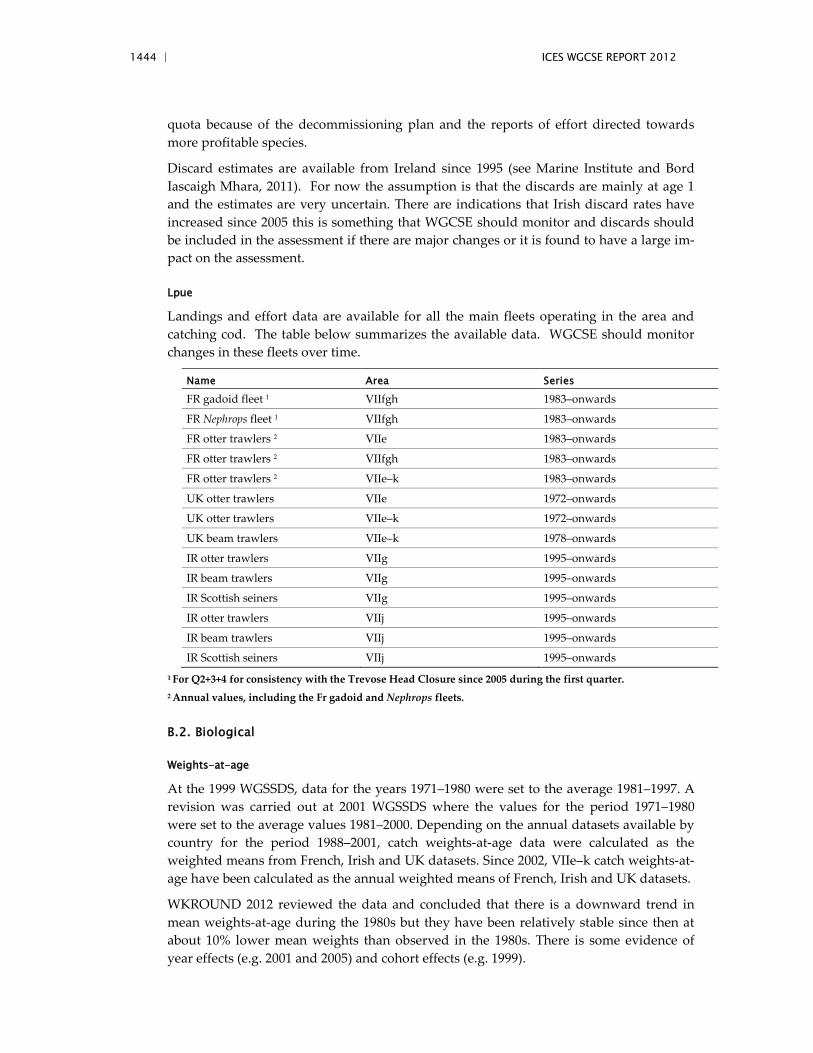
1444 | ICES WGCSE REPORT 2012
quota because of the decommissioning plan and the reports of effort directed towards more profitable species.
Discard estimates are available from Ireland since 1995 (see Marine Institute and Bord Iascaigh Mhara, 2011). For now the assumption is that the discards are mainly at age 1 and the estimates are very uncertain. There are indications that Irish discard rates have increased since 2005 this is something that WGCSE should monitor and discards should be included in the assessment if there are major changes or it is found to have a large im-pact on the assessment.
Lpue
Landings and effort data are available for all the main fleets operating in the area and catching cod. The table below summarizes the available data. WGCSE should monitor changes in these fleets over time.
Name Area Series
FR gadoid fleet 1 VIIfgh 1983–onwards
FR Nephrops fleet 1 VIIfgh 1983–onwards
FR otter trawlers 2 VIIe 1983–onwards
FR otter trawlers 2 VIIfgh 1983–onwards
FR otter trawlers 2 VIIe–k 1983–onwards
UK otter trawlers VIIe 1972–onwards
UK otter trawlers VIIe–k 1972–onwards
UK beam trawlers VIIe–k 1978–onwards
IR otter trawlers VIIg 1995–onwards
IR beam trawlers VIIg 1995–onwards
IR Scottish seiners VIIg 1995–onwards
IR otter trawlers VIIj 1995–onwards
IR beam trawlers VIIj 1995–onwards
IR Scottish seiners VIIj 1995–onwards 1 For Q2+3+4 for consistency with the Trevose Head Closure since 2005 during the first quarter. 2 Annual values, including the Fr gadoid and Nephrops fleets.
B.2. Biological
Weights-at-age
At the 1999 WGSSDS, data for the years 1971–1980 were set to the average 1981–1997. A revision was carried out at 2001 WGSSDS where the values for the period 1971–1980 were set to the average values 1981–2000. Depending on the annual datasets available by country for the period 1988–2001, catch weights-at-age data were calculated as the weighted means from French, Irish and UK datasets. Since 2002, VIIe–k catch weights-at-age have been calculated as the annual weighted means of French, Irish and UK datasets.
WKROUND 2012 reviewed the data and concluded that there is a downward trend in mean weights-at-age during the 1980s but they have been relatively stable since then at about 10% lower mean weights than observed in the 1980s. There is some evidence of year effects (e.g. 2001 and 2005) and cohort effects (e.g. 1999).
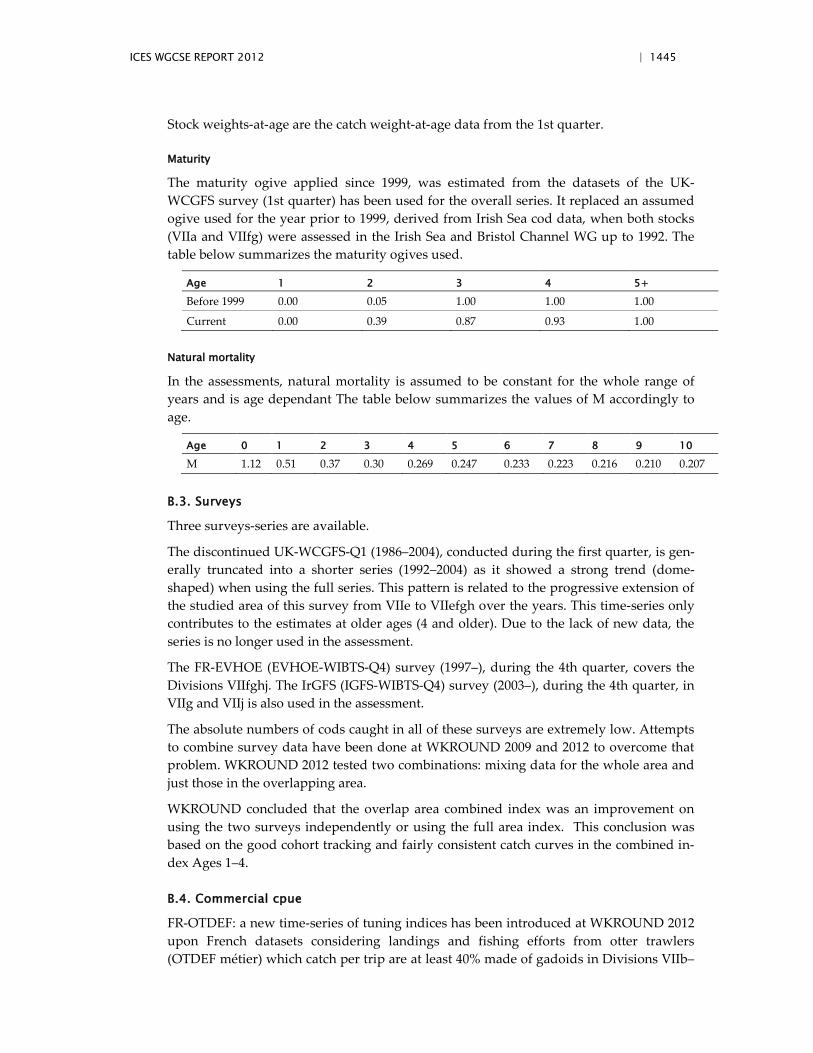
ICES WGCSE REPORT 2012 | 1445
Stock weights-at-age are the catch weight-at-age data from the 1st quarter.
Maturity
The maturity ogive applied since 1999, was estimated from the datasets of the UK-WCGFS survey (1st quarter) has been used for the overall series. It replaced an assumed ogive used for the year prior to 1999, derived from Irish Sea cod data, when both stocks (VIIa and VIIfg) were assessed in the Irish Sea and Bristol Channel WG up to 1992. The table below summarizes the maturity ogives used.
Age 1 2 3 4 5+
Before 1999 0.00 0.05 1.00 1.00 1.00
Current 0.00 0.39 0.87 0.93 1.00
Natural mortality
In the assessments, natural mortality is assumed to be constant for the whole range of years and is age dependant The table below summarizes the values of M accordingly to age.
Age 0 1 2 3 4 5 6 7 8 9 10
M 1.12 0.51 0.37 0.30 0.269 0.247 0.233 0.223 0.216 0.210 0.207
B.3. Surveys
Three surveys-series are available.
The discontinued UK-WCGFS-Q1 (1986–2004), conducted during the first quarter, is gen-erally truncated into a shorter series (1992–2004) as it showed a strong trend (dome-shaped) when using the full series. This pattern is related to the progressive extension of the studied area of this survey from VIIe to VIIefgh over the years. This time-series only contributes to the estimates at older ages (4 and older). Due to the lack of new data, the series is no longer used in the assessment.
The FR-EVHOE (EVHOE-WIBTS-Q4) survey (1997–), during the 4th quarter, covers the Divisions VIIfghj. The IrGFS (IGFS-WIBTS-Q4) survey (2003–), during the 4th quarter, in VIIg and VIIj is also used in the assessment.
The absolute numbers of cods caught in all of these surveys are extremely low. Attempts to combine survey data have been done at WKROUND 2009 and 2012 to overcome that problem. WKROUND 2012 tested two combinations: mixing data for the whole area and just those in the overlapping area.
WKROUND concluded that the overlap area combined index was an improvement on using the two surveys independently or using the full area index. This conclusion was based on the good cohort tracking and fairly consistent catch curves in the combined in-dex Ages 1–4.
B.4. Commercial cpue
FR-OTDEF: a new time-series of tuning indices has been introduced at WKROUND 2012 upon French datasets considering landings and fishing efforts from otter trawlers (OTDEF métier) which catch per trip are at least 40% made of gadoids in Divisions VIIb–
1446 | ICES WGCSE REPORT 2012
k during quarters 2 to 4. FR-OTDEF is a substitute for the discontinued FR-Gadoid and FR-Nephrops fleet.
B.5. Other relevant data
Input from industry
No new datasets. There are several industry–science partnerships regarding cod:
• French industry self-sampling programme. • Ireland-UK tagging programme in the Irish and Celtic Seas. • Irish industry–science partnership quarter 1 cod survey 2010.
At the moment only the data from the French self-sampling programme are integrated into the observation-at-sea dataset used at the assessment working group. Information on tagging are however reviewed each year at the WG and by WKROUND. An Irish indus-try–science partnership survey was carried out in Q1 2010. This survey has not been re-peated due to resource constraints. Any new information provided by the industry is also reviewed each year.
C. Historical stock development
Model to be used: XSA
Software: R 2.8.1 with FLR packages FLCore 2.2, FLAssess 2.0.1, FLXSA 2.0, FLEDA 2.0.
Model Options agreed at WKROUND 2012:
• Taper : no • Age s catch dep. Stock size : none • q plateau : 3 • F shrinkage se : 1 • F shrinkage year range : 5 • F shrinkage age range : 3 • F shrinkage age range of mean F : 2–5 • Fleet SE threshold : 0.3 • Prior weights : No
Input data types and characteristics:
Type Name Year range Age range
Variable from year to year Yes/No
Caton Catch in tonnes 1971– 1–7+ Yes
Canum Landings-at-age in numbers
1971– 1–7+ Yes
Weca Weight-at-age in the commercial catch
1971– 1–7+ Yes
West Weight-at-age of the spawning stock at spawning time
1971– 1–7+ Yes
ICES WGCSE REPORT 2012 | 1447
Mprop Proportion of natural mortality before spawning
1971– 1–7+ No
Fprop Proportion of fishing mortality before spawning
1971– 1–7+ No
Matprop Proportion mature at-age
1971– 1–7+ No
Natmor Natural mortality 1971– 1–7+ No
Tuning data:
Type Name Year range Age range
French Otter Trawler in VIIek Q2-Q4
FR-OTDEF 2000– 1–7+
Combined EVHOE-WIBTS, IGFS-WIBTS
FR-IR-WIBTS 2003– 0–4+
D. Short-term projection
Model used: Age structured
Software used: MFDP
Initial stock size:
1 ) the survivors at age 2 and greater from the XSA assessment; 2 ) N at age 1 = long-term geometric mean omitting the last two years.
Maturity: same ogive as in the assessment
F and M before spawning: 0 (for all ages and years)
Weight-at-age in the stock: average stock and catch weights over the preceding three years.
Exploitation pattern: The F vector used is the average F-at-age in the last three years, scaled by Fbar (2–5) to the level of last year unless there is strong indication of a significant trend in F. In the latter case the average selectivity pattern will be rescaled to the final F in the series.
E. Medium-term projections
Medium-term forecasts are not provided for this stock.
F. Yield and Biomass per Recruit
Software used: YPR 3.0 (NOAA fisheries toolbox)
• Stock/catch-at-age/spawning–stock weights-at-age: Average last five years • Selectivity on Fishing mortality: Rescaled F Average last five years • Selectivity on Natural mortality: Rescaled M-at-age (Lorenzen), M-at-age 1=1 • Fraction mature: same as maturity ogive • Proportion of fishing/natural mortality before spawning: 0.0
1448 | ICES WGCSE REPORT 2012
G. Biological reference points
Type Value Technical basis
MSY MSY Btrigger 8800 t Provisionally set at BPA.
Approach FMSY 0.40 Provisional proxy based on FMAX (ICES, 2010).
Blim 6300 t Blim=Bloss (B76), the lowest observed spawning–stock biomass
Precautionary BPA 8800 t BPA=Blim*1.4. Biomass above this value affords a high probability of maintaining SSB above Blim, taking into account the variability in the stock dynamics and the uncertainty in assessments
Approach Flim 0.90 The fishing mortality estimated to lead to potential collapse
FPA 0.68 FPA=5th percentile of Floss. This F is considered to have a high probability of avoiding Flim and maintaining SSB above BPA in the medium term (assuming normal recruitment), taking into accounts the uncertainty assessments
H. Other issues
None.
I. References Armstrong, M. 2006. Results of the UK Fisheries Science Partnership surveys of Celtic Sea cod,
haddock and whiting and Western Channel sole and plaice: 2003–2006. WD10 contributing to the 2006 WGSSDS 4p.
Bellail, R. 1999. Derivation of Cod landings in Divisions VIIe-k and application for an assessment using a long series 1971–1997. WD3 contributing to the 1999 WGSSDS. 4p.
Bellail, R. 2001. Revision of weight-at-age and catch numbers at age in series 1971–1980 of cod in Areas VIIe–k. WD4 contributing to the 2001 WGSSDS. 4p.( datasets of CW@A replaced by mean values of the series 1981–2000).
Bellail, R. 2006. An attempt to estimate and integrate French highgrading of cod in Celtic Sea into annual length and age compositions of landings from 2003. WD1 contributing to the 2006 WGSSDS. 7p.
Bellail, R.; Peronnet, I.; Rochet, MJ; Lamothe J.2008 Self sampling of cod in the Celtic Sea by French trawlers. WD1 contributing to the 2008 WKSC. 13pp.
Biseau, A. 2005. Effect of the cod closure in the Celtic Sea on the fishing behaviour. WD2 contrib-uting to the 2005 SSDSWG. 2p.
Biseau, A. 2007. trends in French fishing effort in ICES Division VIIg / Impact of the Trevose clo-sure?. WD2 contributing to the 2007 SSDSWG. 10p.
Biseau, A.; Bellail, R. 2004. Celtic Sea Cod : Catch limitation and LPUE series from French trawlers. WD1 contributing to the 2004 SSDSWG.
Biseau, A.; Bellail, R. 2006.Trends in French Gadoids effort in the Celtic sea- Impact of the closure of zones on the fishing strategy of the French vessels?. WD2 contributing to the 2006 SSDSWG. 11p.
ICES WGCSE REPORT 2012 | 1449
Brander, K. M. 1994. The location and timing of cod spawning around the British Isles. ICES Jour-nal of Marine Science, 51: 71–89.
Darby, C. 2004. B-Adapt. WD 15 contributing to ICES 2004 WGNSDSK.
Demaré, W. 2006. On the CPUE and effort of the Belgian beam trawl fleet operating in the Celtic Sea. WD 14 contributing to the 2006 WGSSDS.
Gerritsen, H. 2008. Maturity at age estimates for Irish Demersal Stocks in VIIb–k. 2004–2007. WD 1 contributing to the 2008 WGSSDS.
ICES. ISBCWG. 1991. Report of the Irish Sea and Bristol Channel Working Group. ICES C.M.1992/Assess:1. (Assessed area= VIIfg).
ICES. PGCCDBS. 2007. Report of the Planning Group on Commercial Catch, Discards and Biologi-cal Sampling. ICES CM 2007/ACFM:09. 115pp.
ICES. PGCCDBS. 2008. Report of the Planning Group on Commercial Catch, Discards and Biologi-cal Sampling. ICES CM 2008/ACOM:29. 91pp.
ICES. WGCSE. 2011. Report of the Working Group on the Celtic Seas Ecoregion (WGCSE), 11–19 May 2011, Copenhagen, Denmark. ICES CM 2011/ACOM:12.
ICES. WGQAF. 2008. Report of the Working Group on Quantifying all Fishing Mortality. ICES CM 20008/FTC:03. 24pp.
ICES. WGSSDS. 1994. Report of the Working group on the assessment of Southern Shelf Demersal Stocks. ICES C.M. 1995/Assess:6.( Assessed area= VIIfgh).
ICES. WGSSDS. 1996. Report of the Working group on the assessment of Southern Shelf Demersal Stocks. ICES C.M. 1997/Assess:5.(Assessed area= VIIefgh).
ICES. WGSSDS. 1997. Report of the Working group on the assessment of Southern Shelf Demersal Stocks. ICES C.M. 1998/Assess:4. (Assessed area= VIIe–k).
ICES. WGSSDS. 1999. Report of the Working group on the assessment of Southern Shelf Demersal Stocks. ICES C.M. 2000/ACFM:4. (Estimating landings VIIe–k for years-1971–1987=VIIfgh land-ings raised by 1.24, new maturity ogive).
ICES. WGSSDS. 2001. Report of the Working group on the assessment of Southern Shelf Demersal Stocks. ICES C.M. 2002/ACFM:5. (revision of datasets1971–1980).
ICES. WGSSDS. 2004. Report of the Working group on the assessment of Southern Shelf Demersal Stocks. ICES C.M. 2005/ACFM:03.
ICES. WGSSDS. 2005. Report of the Working group on the assessment of Southern Shelf Demersal Stocks. ICES C.M. 2005/ACFM:04.
ICES. WGSSDS. 2006. Report of the Working group on the assessment of Southern Shelf Demersal Stocks. ICES C.M. 2006/ACFM:33.
ICES. WGSSDS. 2007. Report of the Working group on the assessment of Southern Shelf Demersal Stocks. ICES C.M. 2007/ACFM:28.
ICES. WGSSDS. 2008. Report of the Working group on the assessment of Southern Shelf Demersal Stocks. ICES C.M. 2008/ACOM:12.
ICES. WGFTFB. 2006. Report of the Working Group on Fish Technology and Fish Behaviour. ICES CM 2006/FTC:06.
ICES. WGFTFB. 2007. ICES - FAO Working Group on Fishing Technology & Fish Behaviour [April 2007 report not yet available].
1450 | ICES WGCSE REPORT 2012
ICES. WGFTFB. 2008. ICES - FAO Working Group on Fishing Technology & Fish Behaviour [April 2007 report not yet available].
ICES. WKSC. 2008. Report of the Workshop on Fishers Sampling of Catches 55p.
Lordan, C.; Gerritsen, H. 2008. The GM assumption in the Short Term Forecast of Cod in VIIe–k. WD 7 contributing to the 2008 WGSSDS.
Nielsen, A. 2008. State–space fish stock assessment model:SAM model. WD contributing to ICES 2008 WGNSSK.
Righton, D., Quayle, V.A., Hetherington, S. and Burt, G. 2007. Movements and distribution of cod (Gadus morhua) in the southern North Sea and English Channel: results from conventional and electronic tagging experiments. J. Mar. Biol. Ass. UK 87: 599–613.
Scott, R.; Houghton, C.; Woods, T. 2006. Impacts of the 2005 and 2006 Celtic Sea closed area on the catches of cod, plaice and sole. WD11 contributing to the 2006 WGSSDS. 29p.
Warnes, S.; Pawson, M.; Bellail, R. 1999. Revision of Maturity ogive for Cod in Celtic Sea (ICES Di-visions VIIe–k. WD 11 contributing to 1999 SSDSWG. 4p.
ICES WGCSE REPORT 2012 | 1451
7.4 Stock Annex Haddock VIIb–k
Stock specific documentation of standard assessment procedures used by ICES.
Stock Haddock VIIb-k
Working Group WGCSE
Date last revision 29/02/12
Revised by Hans Gerritsen
A. General
A.1. Stock definition
For assessment purposes, the stock is defined as VIIb–k excluding VIId. The TAC for haddock is set for VIIb–k, VIII, IX and X. However, official international landings from VIII, IX and X have been less than 2% of all landings in the TAC area in most years since 1973.
Adult haddock appear to be continuously distributed from the north of Biscay along the Irish coasts and the west of Scotland into the North Sea. It is not clear from their distribu-tion if the VIIb–k stock is distinct from the surrounding areas. Irish Otter trawl lpue in the northernmost rectangles of VIIb is relatively high and similar lpue continues into VIa, suggesting that the haddock in the north of VIIb might belong to the same stock as those in VIa (Gerritsen, 2009). The pattern of lpue in the Irish Sea appears to be relatively dis-tinct from VIIb–k with relatively high otter and beam trawl lpue in VIIg, low lpue in VIIa-South and high lpue in VIIa north (Gerritsen, 2009). Results from the French EVHOE-WIBTS-Q4 survey suggest that relatively low densities of haddock continue from VIIh into VIIIa. Irish Groundfish Survey (IGFS-WIBTS-Q4) data indicates two dis-tinct nursery areas with high catches of 0-group haddock: one area off the southwest coast of Ireland (VIIb south and VIIj north) and one area off the southeast coast (VIIg north). Catches of older haddock in VIIb are generally low and it is not clear whether the young fish from VIIb move north to VIa or south to VIIj stock (Gerritsen and Stokes, 2006).
A.2. Fishery
Haddock in Divisions VIIb–k are taken as a component of catches in mixed trawl fisher-ies. France usually takes about 50–80% of the landings. French landings are made mainly by gadoid trawlers, which prior to 1980 were mainly fishing for hake in the Celtic Sea. Ireland has historically taken about 25–40% of the landings. Fleets from Belgium, Nor-way, the Netherlands, Spain, and the UK take the remainder of the landings. Landings reported between 1984 and 1995 varied between 2600 t and 4900 t, then increased sharply to 10 300 t in 1997. Since then the landings have varied between 5000 t and 10 000 t.
The vast majority of the landings are taken by otter trawls, most of the remainder of the landings are taken by seines and beam trawls.
1452 | ICES WGCSE REPORT 2012
A.3. Ecosystem aspects
Haddock are widely distributed throughout the stock area across a range of habitats. They have a varied diet but do not appear to be cannibalistic (Needle et al., 2003)
The mixed trawl fisheries impacts on benthic communities through bottom contact. Other ecosystem impacts result from discarding of non-target, undersize, over-quota or low-value fish.
Recruitment of haddock is highly variable. For North Sea haddock, no link could be found between temperature and recruitment (Cook and Heath, 2005). But parental condi-tion has been linked to recruitment success in Northwest Atlantic haddock (e.g. Fried-land et al., 2003; Marshall and Frank, 1999).
B. Data
B.1. Commercial catch
Sampling and data raising
Data on landings-at-age and mean weight-at-age-are available for fleets landing into Ire-land since 1993, and from France and the UK since 2002. Irish age compositions from VIIgj were used to estimate the age compositions of the international landings. Note that Irish landings contributed around 30% of the international landings so there is consider-able uncertainty about the age composition of the landings before 2002.
The UK landings numbers-at-age are supplied for the combined VIIe–k area and the landings data from each Division are used to scale the catch numbers to each Division. French VIIfgh landings numbers are combined with Irish VIIg data to estimate VIIfgh landings numbers. Since 2009, the French landings numbers-at-age are supplied for the whole stock area (VIIb–k). The table below shows the data available and the procedures used to derive quarterly length compositions, age compositions and mean weights-at-age.
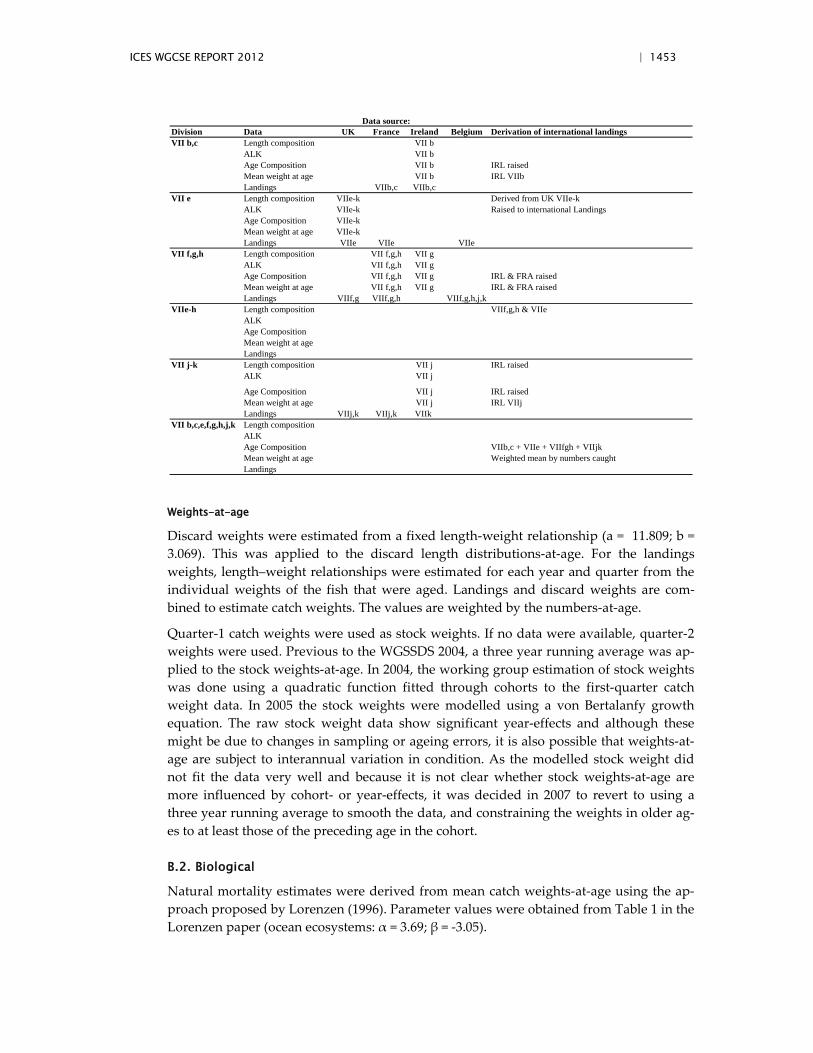
ICES WGCSE REPORT 2012 | 1453
Division Data UK France Ireland Belgium Derivation of international landingsVII b,c Length composition VII b
ALK VII bAge Composition VII b IRL raisedMean weight at age VII b IRL VIIbLandings VIIb,c VIIb,c
VII e Length composition VIIe-k Derived from UK VIIe-k ALK VIIe-k Raised to international Landings Age Composition VIIe-kMean weight at age VIIe-kLandings VIIe VIIe VIIe
VII f,g,h Length composition VII f,g,h VII gALK VII f,g,h VII gAge Composition VII f,g,h VII g IRL & FRA raisedMean weight at age VII f,g,h VII g IRL & FRA raisedLandings VIIf,g VIIf,g,h VIIf,g,h,j,k
VIIe-h Length composition VIIf,g,h & VIIeALKAge CompositionMean weight at ageLandings
VII j-k Length composition VII j IRL raisedALK VII j
Age Composition VII j IRL raisedMean weight at age VII j IRL VIIj Landings VIIj,k VIIj,k VIIk
VII b,c,e,f,g,h,j,k Length compositionALKAge Composition VIIb,c + VIIe + VIIfgh + VIIjkMean weight at age Weighted mean by numbers caughtLandings
Data source:
Weights-at-age
Discard weights were estimated from a fixed length-weight relationship (a = 11.809; b = 3.069). This was applied to the discard length distributions-at-age. For the landings weights, length–weight relationships were estimated for each year and quarter from the individual weights of the fish that were aged. Landings and discard weights are com-bined to estimate catch weights. The values are weighted by the numbers-at-age.
Quarter-1 catch weights were used as stock weights. If no data were available, quarter-2 weights were used. Previous to the WGSSDS 2004, a three year running average was ap-plied to the stock weights-at-age. In 2004, the working group estimation of stock weights was done using a quadratic function fitted through cohorts to the first-quarter catch weight data. In 2005 the stock weights were modelled using a von Bertalanfy growth equation. The raw stock weight data show significant year-effects and although these might be due to changes in sampling or ageing errors, it is also possible that weights-at-age are subject to interannual variation in condition. As the modelled stock weight did not fit the data very well and because it is not clear whether stock weights-at-age are more influenced by cohort- or year-effects, it was decided in 2007 to revert to using a three year running average to smooth the data, and constraining the weights in older ag-es to at least those of the preceding age in the cohort.
B.2. Biological
Natural mortality estimates were derived from mean catch weights-at-age using the ap-proach proposed by Lorenzen (1996). Parameter values were obtained from Table 1 in the Lorenzen paper (ocean ecosystems: α = 3.69; β = -3.05).
1454 | ICES WGCSE REPORT 2012
Age 0 Age 1 Age 2 Age 3 Age 4 Age 5 Age 6 Age 7 Age 8+
0.99 0.72 0.60 0.50 0.43 0.40 0.37 0.36 0.34
Maturity was assumed to be knife-edged at age 2. Recent Irish Survey data are generally in agreement with this maturity ogive, although males occasionally mature at age one.
F and M before spawning were set to 0 for all ages in all years.
B.3. Surveys and commercial tuning fleets
Description
The surveys described below are coordinated by the IBTSWG (International Bottom-trawl Survey Working Group).
The French 7fghj EVHOE-WIBTS-Q4 annual groundfish has been carried out since 1997 on the RV Thalassa. Age data are available from 2001 onwards. ALK data from Irish sur-veys were applied to the EVHOE data for the years 1997–2000 to estimate numbers-at-age for these years. The sampling design is a stratified random allocation. The number of hauls per stratum is optimized by a Neyman allocation taking into account the most im-portant commercial species in the area (hake, monkfish and megrim). The fishing gear used is a GOV with an average vertical opening of 4 m and a horizontal opening of 20 m.
The Irish Groundfish Survey (IGFS-WIBTS-Q4) has been carried out since 2003 and co-vers VIa, VIIbgj. This survey is carried out on RV Celtic Explorer. The IGFS has a random stratified design and uses a GOV (with rock-hopper in VIa) with a 20 mm codend liner.
The two surveys were combined to provide a single index that covers nearly the full stock area. Gerritsen (2012a) describes the justification and for combining the surveys. The two indices are directly combined, weighted by the surface area covered by each survey (37 000 nm2 for the IGFS and 30 000 nm2 for the EVHOE). The combined survey starts in 2003. The EVHOE data before 2003 are not used.
A French commercial OTB DEF tuning fleet is available but this fleet takes the majority of the landings and is therefore not included as tuning fleet.
An Irish commercial OTB fleet is available from 1995 onwards. This fleet is based on the landings and effort from ICES Rectangles 32D9, 31D9, 31E0, 31E1, 31E2, 32E1 and 32E2. These rectangles were selected in order to avoid changes in lpue due to shifts in targeting behaviour. The selected rectangles do not include any major Nephrops or hake, monkfish or megrim fishing grounds or areas with seasonal closures.
Consistency
The survey shows good internal consistency for ages 0 to 4. The Irish tuning shows good consistency from the age of 2 to 7. However discards are not included in this index and it is not known if discarding patterns have been consistent over time, therefore ages 2 and 3 were not included.
B.4. Commercial cpue
Effort and lpue data are available from the Irish otter trawl fleets operating in Divisions VIIb, VIIj and VIIg since 1995, French demeral trawlers in VIIfgh since 2004 and effort
ICES WGCSE REPORT 2012 | 1455
data are available for the UK beam trawl fleet in VIIe–k and all other trawl gears in VIIe–k since 1983. The effort in the French gadoid fleet has decreased in recent years and is now at a similar level to the Irish and UK fleets. Effort in the Irish OTB VIIg fleet has in-creased in recent years, while the Irish OTB effort in VIIb and VIIj appears to have lev-elled off in recent years. The lpue of the French gadoid fleet is still much higher than that of the other fleets. The Irish and UK fleets have seen a minor increasing trend in lpue in recent years.
B.5. Other relevant data
Discard data
Discard data are available from the Irish fleet since 1995. Data were raised using effort (hours fished) as auxiliary variable and stratified by ICES division. The number of trips in some years is quite low, leading to concerns about the precision of the data.
French discard data are available since 2004. These data were also raised using effort (hours fished) as auxiliary variable. Data before 2008 are considered unreliable. Therefore French discards were estimated from the mean discard rate-at-age for the period 1993–2007. It was assumed that 90% of one-year-olds, 50% of two-year-olds and 10% of three-year-olds were discarded. These proportions were applied to the French catch numbers-at-age to estimate historic discards. For the period 1993–2001, no French age composition data were available, therefore Irish age composition data were raised to French landings and the discard numbers were estimated from these.
French and Irish discard data were combined and a further raising factor was applied to account for discards from other countries. This raising factor was estimated from the total landings of all countries as a proportion of the combined French and Irish landings. This raising factor did not exceed 1.15 in any year.
No French age data are available for the discards. Irish age data are available but there are some concerns about the reliability of these data. For this reason, a quarterly length split is applied to the smallest length classes (where the cohorts are quite distinct). For larger fish, quarterly ALKs from the French and Irish landings are used.
Length-splits applied to the discard data. For lengths where landings ALKs were availa-ble, these were used.
Country Area Quarter Age 0 Age 1 Age 2 Age 3
Ireland VIIb 1 ≤10 11–18 19–27 ≥28
2 ≤11 12–21 22–29 ≥30
3 ≤14 15–23 24–33 ≥34
4 ≤17 18–25 26–34 ≥35
Ireland VIIgj 1 ≤15 16–23 24–34 ≥35
2 ≤17 18–26 ≥27
3 ≤20 21–29 ≥30
4 ≤21 22–30 ≥31
France VIIbk 1 ≤18 19–23 24–32 ≥33
2 ≤17 18–26 27–34 ≥35
3 ≤20 21–29 ≥30
1456 | ICES WGCSE REPORT 2012
4 ≤21 22–29 ≥30
C. Historical stock development
Model used:
ASAP; (XSA is also used for quality control purposes; if the two models disagree the dif-ferences will need to be explained.)
Software used:
ASAP V2.0 NOAA Fisheries toolbox (http://nft.nefsc.noaa.gov)
VPA95 (http://www.ices.dk/datacentre/software.asp)
FLR with R version 2.8.1 with packages FLCore 2.2, FLAssess 2.0.1, FLXSA 2.0 and FLE-DA 2.0 (http://cran.r-project.org; http://flr-project.org)
ASAP is proposed as the main assessment model. However, due to the short time-series and noisy catch data, it is uncertain whether the separable assumption holds. Therefore it is proposed to also use XSA to monitor if the two models continue to provide similar trends and absolute estimates of SSB and F.
C.1. Input data types and characteristics
A plusgroup of 8+ was used. Age group 0 was included in the assessment data to allow inclusion of 0-group indices. However, catch numbers and selectivity-at-age 0 were set to zero in all years because catches at this age were very low or zero.
Discard estimates are included in the catch numbers and weights, therefore catch is ex-plicitly defined here as landings + discards.
Data Year range Age range
Variable from year to year
Catch (tonnes) 1993–current
0–8+ Yes
Catch-at-age in numbers (thousands) 1993–current
0–8+ Yes
Weight-at-age in the commercial catch (kg) 1993–current
0–8+ Yes
Weight-at-age of the stock at spawning time (kg). 1993–current
0–8+ Yes
Weight-at-age of the stock at January 1 (same as stock weights) 1993–current
0–8+ Yes
Proportion of natural mortality before spawning (Lorenzen M) 1993–current
0–8+ No
Proportion of fishing mortality before spawning (XSA only) 1993–current
0–8+ No
Proportion mature-at-age 1993–current
0–8+ No
Natural mortality 1993–current
0–8+ No

ICES WGCSE REPORT 2012 | 1457
C.2. Model Options
ASAP
Note that ASAP does not accommodate inclusion of data for age 0. Therefore the ages in ASAP are offset by 1 year. All age settings above refer to the real age, not the age group used by ASAP.
1458 | ICES WGCSE REPORT 2012
Option Setting
Include discards separately No
Use likelihood constant Yes
Mean F (Fbar) age range 3–5
Number of selectivity blocks 1
Fleet selectivity Fixed at 0 for age 0; freely estimated for age 1 and 2, fixed at 1 for ages 3–8+
Discards Included in catch (not specified separately from landings)
Index units 2 (numbers)
Index month FR_IR_IBTS: 11; IR_GAD: 7 (7 = July 1st, the middle of the year)
Index selectivity linked to fleet -1 (not linked; the commercial index does not include discards)
Index age range FR_IR_IBTS: 0-5; IR_GAD: 3–7
Index Selectivity – FR_IR_IBTS Fixed at 1 for all ages
Index Selectivity - IR_GAD Freely estimated at age 3, fixed at 1 for all other ages
Index CV & ESS – FR_IR_IBTS CV 0.3 all years, estimated sample size 40 for all years
Index CV & ESS – IR_GAD CV 0.2 all years, estimated sample size 40 for all years
Phase for F-Mult in 1st year 1
Phase for F-Mult deviations 2
Phase for recruitment deviations 3
Phase for N in 1st Year 1
Phase for catchability in 1st Year 3
Phase for catchability deviations -5 (Assume constant catchability in indices)
Phase for unexploited stock size 1
Phase for steepness -5 (Do not fit stock–recruitment curve)
Catch total CV 0.3 for 1993–2007; 0.2 for 2008-present (reliable discard data available)
Input effective sample size 25 for 1993–2001; 50 for 2002-present (only Irish age comp before 2002)
Lambda for recruit deviations 0 (freely estimated)
Lambda for total catch 1
Lambda for total discards NA (discards included in catch)
Lambda for F-Mult in 1st year 0 (freely estimated)
Lambda for F-Mult deviations 0 (freely estimated)
Lambda for index 1 for both indices in the model
Lambda for index catchability 0 for all indices (freely estimated)
Lambda for catchability devs NA (phase is negative)
Lambda N in 1st year deviations 0 (freely estimated)
Lambda devs initial steepness NA (phase is negative)
Lambda devs unexpl stock size 0 (freely estimated)
Discards were not included separately because this resulted in undesirable residual pat-terns. Only one selectivity block was used due to the short time-series, as the time-series gets longer it may be appropriate to allow a separate block for the time period where ob-served discard data are available. Fleet selectivity was forced to be flat topped to reduce
ICES WGCSE REPORT 2012 | 1459
the number of parameters to be estimated. The F-pattern from XSA indicated flat-topped selectivity.
XSA
Option Setting
Ages catch dep stock size None
Q plateau 4
Taper No
F shrinkage SE 1.5
F shrinkage year range 5
F shrinkage age range 3
Fleet SE threshold 0.3
Prior weights No
There is no evidence to suggest that catchability depends on stock size; the linear regres-sion fits the data well. The effect of releasing the q-plateau was investigated and catcha-bility appeared to level off at age 4. There is no evidence to suggest that the tuning fleets have changed over time, therefore no tapered time weighting was applied. In recent years there has not been a clear retrospective pattern, therefore a relatively high F shrink-age SE was used with a short year and age range. The fleets are relatively well behaved so an SE threshold of 0.3 was applied.
Tuning data:
Type Name Year range Age range
Survey FR_IR_IBTS 2003–present 0–5
Commercial IR_GAD 1995–present 3–7
D. Short-term projection
Model used: Multifleet Deterministic Projection. Landings and discards are modelled as separate fleets.
Software used: MFDP1a (http://www.ices.dk/datacentre/software.asp)
1460 | ICES WGCSE REPORT 2012
Option Setting
Initial stock size Long-term GM (omitting last two years) Stock numbers-at-age 1 and older from model
Natural mortality Lorenzen M, as in model
Maturity Knife-edged at age 2
F and M before spawning 0 for all ages in all years
Stock / catch weights-at-age Average last three years
Exploitation pattern Average last three years
Intermediate year assumptions F in the last year – check retrospective pattern for evidence of bias
Stock–recruit model None, long-term GM recruitment (omitting last two years)
Fbar range 5–5*
Rescale to last year No
* The Fbar age range used in the assessment model outputs is 3–5 this F refers to the catch (including dis-cards). Ages 3–-5 are fully selected in the catch (but not landings). MFYPR output supplies YPR based on landings F. In order to compare (landings) F reference points with the (catch) Fbar it was decided to calculate Fbar only for age 5 because at this age the catch and landings are both fully selected and because a flat-topped selection pattern was applied in ASAP the result will be correct. So, in this context Fmax refers to the catch F where the landings per recruit are maximized.
E. Medium-term projections
None.
F. Yield and biomass per recruit
No stock–recruit relationship exists for this stock; recruitment is characterized by sporad-ic extreme recruitment events.
Software used: NOAA fisheries toolbox YPR V3.0.
Option Setting
Stock / catch weights-at-age Average last three years
Selectivity Average last three years
Natural mortality Lorenzen M, as in model
Maturity Knife-edged at age 2
G. Biological reference points
No reference points have been defined for this stock. The following results from the anal-yses by WKROUND could be informative:
Fmax (landings) = 0.28
F0.1 (landings) = 0.19
Fmsy = Fmax = 0.28
Bloss = 7500 tonnes
H. Other issues
None.
ICES WGCSE REPORT 2012 | 1461
I. References Cook, R.M. and Heath, M.R. 2005. The implications of warming climate for the management of
North Sea demersal fisheries. ICES JMS 62: 1322–1326. doi:10.1016/j.icesjms.2005.04.023.
Friedland K D, Hare JA. Wood GB. Col LA, Buckley LJ, Mountain DG, Kane J, Brodziak J, Lough RG, Pilskaln CH. 2003. Does the fall phytoplankton bloom control recruitment of Georges Bank haddock, Melanogrammus aeglefinus, through parental condition? Canadian Journal of Fisheries and Aquatic Sciences, Volume 65, Number 6, pp. 1076–1086.
Gerritsen, H. 2009. Spatial distribution of Irish Landings, Effort and LPUE of Demersal Stocks in Divisions VI and VII in 1995–2008. Working Document 1 to ICES WGCSE, Copenhagen 12–19 May 2009.
Gerritsen H. 2012a. Haddock 7b–k Combined IGFS-WIBTS-Q4 and EVHOE_WIBTS-Q4 surveys. Working document 12 ICES WKROUND, Aberdeen 23–29 February 2012.
Gerritsen H. 2012b. Irish haddock discards in VIIb–k. Evaluation of raising methods. Working document 13 ICES WKROUND, Aberdeen 23–29 February 2012.
Gerritsen H and Stokes D. 2006. Stock structure of Haddock in VIIb–k: Information from the Irish Groundfish Surveys Working document 7. ICES WGSSDS, Copenhagen , 27 June–6 July 2006.
Lorenzen K. 1996. The relationship between body weight and natural mortality in juvenile and adult fish: a comparison of natural ecosystems and aquaculture. Journal of Fish Biology 49, 627–647.
Marshall CT, Frank, KT. 1999. The effect of interannual variation in growth and condition on had-dock recruitment. Canadian Journal of Fisheries and Aquatic Sciences, 56:347–355.
Needle CL, O’Brien CM, Darby CD, and Smith MT. 2003. Incorporating time-series structure in medium-term recruitment projections. Sci Mar 67 (suppl 1): 201–209.
1462 | ICES WGCSE REPORT 2012
7.5 Stock Annex Nephrops FU17, Aran Grounds
Stock specific documentation of standard assessment procedures used by ICES.
Stock Aran Grounds Nephrops (FU17)
Date 06 March 2009 (WKNEPH 2009)
Revised by Colm Lordan (WGCSE, 2011 to address RGCSE 2010 comments)
A. General
A.1. Stock definition
Nephrops is limited to muddy habitat, and requires sediment with a silt and clay content of between 10–100% to excavate its burrows, and this means that the distribution of suit-able sediment defines the species distribution. Adult Nephrops probably only undertake very small-scale movements (a few 100 m) but larval transfer may occur between sepa-rate mud patches in some areas. In FU17, the main Nephrops stock inhabits an extensive area of muddy sediment known as the Aran Grounds which lie to the west and south-west of the Aran Islands, there are also smaller discrete mud patches in Galway Bay and Slyne Head.
A.2. Fishery
In recent years the Nephrops stock in FU17 are almost exclusively exploited by Irish ves-sels. Figure A.2.1 shows the spatial distribution of landings and lpue for Irish otter trawl vessels in 2005 using logbook and VMS data linked together to give finer spatial resolu-tion. The Aran groundfishery is clearly highlighted.
The Nephrops fishery ‘at the back of the Aran Islands’ can be considered the mainstay of the Ros a Mhíl fleet. Without this Nephrops fishery the majority of vessels in the fleet would cease being economically viable (Meredith, 1999). The Irish fishery consists of en-tirely of otter trawl vessels. The majority of vessels use twin-rigs and 80 mm. Smaller vessels do use 70 mm with a SMP. Some vessels have using 90 mm. Vessels from Ros a Mhíl, Dingle, Union Hall, Dunmore East, Clogherhead and Kinsale mainly exploit the fishery.
The number of Irish vessels reporting Nephrops landings from FU17 has fluctuated around 50/yr (Figure A.2.2). Around 18 vessels report landings in excess of 10 t. These are the main vessels in the fishery accounting for around 85% of the total landings. The majority of these vessels are between 20–22 m overall length (Figure A.2.3). There has been a slight shift to lager vessels over time. The majority of vessels are in the power range of 200–400 KW (Figure A.2.4). There has also been a shift to more powerful vessels over time with the introduction of twin-rigs to the fishery in the early 2000s. Most of the larger boats move freely between the Nephrops fisheries in FUs 15, 16, 20-22 and other areas depending on the tides and weather.
The fishery shows a distinctive seasonal pattern with highest landings, catches, lpue and cpue in April–June and October–November. The monthly landings time-series with the average pattern is shown in Figure A.2.5. The first period of elevated landings is associ-
ICES WGCSE REPORT 2012 | 1463
ated with the emergence of females from their burrows post-hatching of their eggs. The sex ratio during this period is biased towards females (Figure A.2.6). Females mature quickly during the early summer and spawning occurs in July and August. This is coin-cident with a decline in landings and cpue in the fishery. The Ros a Mhíl fleet traditional-ly tie up in August each year for maintenance and refurbishment.
The following TCMs are in place for Nephrops in VII (excluding VIIa) after EC 850/98: Minimum Landing Sizes (MLS); total length >85 mm, carapace length >25 mm, tail length >46 mm. Mesh Size Restrictions; Vessels targeting Nephrops using towed gears having at least 35% by weight of this species on board will require 70 mm diamond mesh plus an 80 mm square mesh panel as a minimum or having at least 30% by weight of Nephrops on board will require 80–99 mm diamond mesh.
A.3. Ecosystem aspects
Physical oceanography
The Aran Ground is coincident with a pool of oceanic water, which is rich in nutrients and low in dissolved oxygen. The currents throughout the water column over the ground are generally weak although there is a well-documented bottom density front on the eastern flank of the ground (Nolan and Lyons, 2006). This is a seasonal feature, which establishes in May and persists until autumn. The front causes a persistent jet like flow from south to north close to the seabed through the Nephrops ground. The mean po-sition of jet varies from year to year by up to 30 km. Timing and position of the jet may influence recruitment and settlement success of post-larval Nephrops since it could advect larval from the area. Salinity differences, due to over winter freshwater input, are thought to heavily influence the density structure and location of this front. Until a time-series of recruitment and jet dynamics is established it is not possible to draw any firm conclusions about the impact of this ecosystem feature on the stock and fishery. Potential sinks for advected larvae include Slyne head and possibly Galway Bay.
Temperature and salinity time-series
An emerging time-series of temperature and salinity data are available for a transect through the Aran Grounds (Nolan and Lyons, 2006). In all years since 1999 (except 2001) the 53°N section has exhibited positive anomalies in temperature of between 0.2°C and 2°C (Figure A.3.1). In 2001, the temperature anomaly from the long-term climatology was zero. Years with lower temperature anomalies seem to coincide with years of strong-ly negative salinity anomalies (e.g. 2001 and 2005, 2006) perhaps reflecting the limited influence of ENAW on the section in those years as the section is dominated by coastal discharges from the Loire and Shannon. Salinity anomalies along 53°N range from -0.3 to +0.1 psu over the period. The freshest years were 2001, 2005 and 2006. In 2000, 2003 and 2004 ENAW has a stronger influence on the salinity structure and positive anomalies in salinity from the long-term climatology are the result. The higher UWTV abundance in 2003 and 2004 is coincident with the warmest anomaly but the time-series remains too short to draw definitive conclusions.
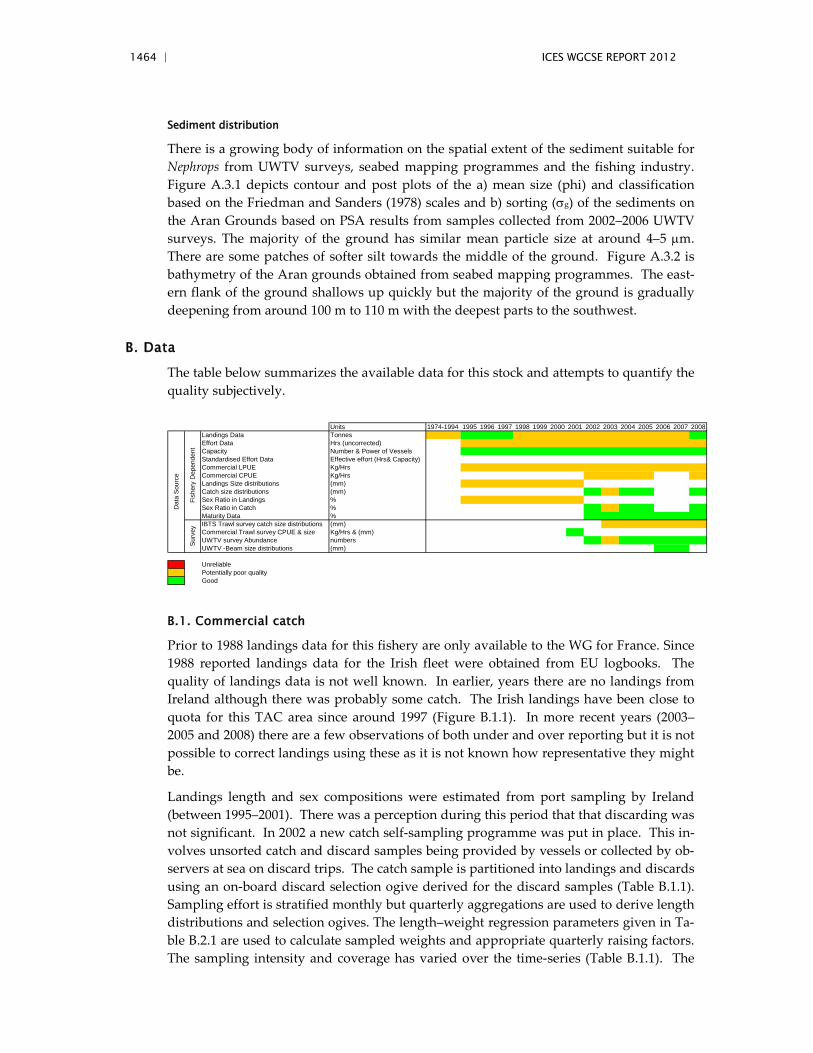
1464 | ICES WGCSE REPORT 2012
Sediment distribution
There is a growing body of information on the spatial extent of the sediment suitable for Nephrops from UWTV surveys, seabed mapping programmes and the fishing industry. Figure A.3.1 depicts contour and post plots of the a) mean size (phi) and classification based on the Friedman and Sanders (1978) scales and b) sorting (σg) of the sediments on the Aran Grounds based on PSA results from samples collected from 2002–2006 UWTV surveys. The majority of the ground has similar mean particle size at around 4–5 µm. There are some patches of softer silt towards the middle of the ground. Figure A.3.2 is bathymetry of the Aran grounds obtained from seabed mapping programmes. The east-ern flank of the ground shallows up quickly but the majority of the ground is gradually deepening from around 100 m to 110 m with the deepest parts to the southwest.
B. Data
The table below summarizes the available data for this stock and attempts to quantify the quality subjectively.
Units 1974-1994 1995 1996 1997 1998 1999 2000 2001 2002 2003 2004 2005 2006 2007 2008Landings Data TonnesEffort Data Hrs (uncorrected)Capacity Number & Power of VesselsStandardised Effort Data Effective effort (Hrs& Capacity)Commercial LPUE Kg/HrsCommercial CPUE Kg/HrsLandings Size distributions (mm)Catch size distributions (mm)Sex Ratio in Landings %Sex Ratio in Catch %Maturity Data %IBTS Trawl survey catch size distributions (mm)Commercial Trawl survey CPUE & size Kg/Hrs & (mm)UWTV survey Abundance numbersUWTV -Beam size distributions (mm)
UnreliablePotentially poor qualityGood
Fish
ery
Dep
ende
nt
Dat
a So
urce
Surv
ey
B.1. Commercial catch
Prior to 1988 landings data for this fishery are only available to the WG for France. Since 1988 reported landings data for the Irish fleet were obtained from EU logbooks. The quality of landings data is not well known. In earlier, years there are no landings from Ireland although there was probably some catch. The Irish landings have been close to quota for this TAC area since around 1997 (Figure B.1.1). In more recent years (2003–2005 and 2008) there are a few observations of both under and over reporting but it is not possible to correct landings using these as it is not known how representative they might be.
Landings length and sex compositions were estimated from port sampling by Ireland (between 1995–2001). There was a perception during this period that that discarding was not significant. In 2002 a new catch self-sampling programme was put in place. This in-volves unsorted catch and discard samples being provided by vessels or collected by ob-servers at sea on discard trips. The catch sample is partitioned into landings and discards using an on-board discard selection ogive derived for the discard samples (Table B.1.1). Sampling effort is stratified monthly but quarterly aggregations are used to derive length distributions and selection ogives. The length–weight regression parameters given in Ta-ble B.2.1 are used to calculate sampled weights and appropriate quarterly raising factors. The sampling intensity and coverage has varied over the time-series (Table B.1.1). The
ICES WGCSE REPORT 2012 | 1465
quality of the sampling has not yet been qualitatively assessed in terms of precision and accuracy.
Nephrops landings and discards from the Aran Grounds have not been sampled for the majority of 2006 and all 2007 due to a lack of cooperation by the industry. However, sampling resumed in 2008 and the intensity and coverage is considered the best to date.
Fish and other bycatches in the fishery have been collected by on-board observers since 1994. The number of trips is variable over time with a gap in the series in 2006 and 2007.
B.2. Biological
Biological parameters for this stock are outlined in Table B.2.1.
Length–weight
Mean weights-at-age for this stock are estimated from studies on Scottish stocks by Pope and Thomas (1955). This relationship was examined in 2003 and it seemed appropriate. Given the variability in length–weight parameters found in Allan et al., 2009 it would be worth monitoring these more closely in future.
Natural mortality
A natural mortality rate of 0.3 was assumed for all age classes and years for males and immature females, with a value of 0.2 for mature females. The lower value for mature females reflects the reduced burrow emergence while ovigerous and hence an assumed reduction in predation. The accuracy of these assumptions is unknown. Cod are not common on the Aran Grounds but other potential predators include dogfish, monkfish megrim and gurnards. Stomach contents data on the Irish GFS could be used to examine this in future.
Maturity
The L50 of females using a macroscopic visual maturity scale is known to vary depending sampling month (Lordan and Gerritsen, 2006). The L50 in July was chosen as the most appropriate estimate given the maturity schedules observed (Figure B.2.1). It is worth mentioning that commercial vessel surveys in November 2001 and in June 2002 demon-strated considerable differences between the maturity schedules of female Nephrops sam-pled in shallower waters of Galway Bay compared with the Aran Grounds.
Proportion of F and M prior to spawning was specified as zero to give estimates of spawning–stock biomass at January 1. In the absence of independent estimates, the mean weights-at-age in the total catch were assumed to represent the mean weights in the stock.
Discard survival
Given the trip durations (~5 days average) and behaviour of the fleet the majority of dis-cards on the Aran Grounds are returned to the sea over suitable sediment. The propor-tion scavenged by birds is probably quite low. Tow durations, volume of catches, prolonged sorting on deck and relatively high density of Nephrops on the seabed proba-bly results in relatively low discard survival. This is estimated to be around 10%.
1466 | ICES WGCSE REPORT 2012
B.3. Surveys
Since 2002 Ireland has conducted underwater television survey (UWTV) annually on the main Nephrops grounds - Aran grounds. Indicator camera stations are also carried out on the adjacent grounds of Galway Bay and Slyne Head weather and time permitting. The surveys were based on a randomized fixed grid design. The methods used during the survey were similar to those employed for UWTV surveys of Nephrops stocks around Scotland and elsewhere and are documented by WKNEPHTV (ICES, 2007).
A number of factors are suspected to contribute bias to the surveys. In order to use the survey abundance estimate as an absolute it is necessary to correct for these potential biases. The history of bias estimates are given in the following table and are based on simulation models, preliminary experimentation and expert opinion, the biases associat-ed with the estimates of Nephrops abundance in the Aran Grounds are:
Time period Edge effect detection rate species identification occupancy Cumulative bias
FU17: Aran <=2009 1.35 0.9 1.05 1 1.3
B.4. Commercial cpue
Prior to 1988 landings data for this fishery are only available to the WG for France. Since 1988 reported landings data for the Irish fleet were obtained from EU logbooks (Table B.4.1).
Effort data for FU17 is available from 1995 for the Irish otter trawl Nephrops directed fleet (Table B.4.2). A threshold of 30% of Nephrops in reported landings by trip is used to iden-tify the catches and effort of this fleet. This threshold was based on an analysis of the trip-by-trip catch compositions. In 2007 this fleet accounted for ~90% of the landings and compared with an average of 70% over the time period. These data have not been stand-ardized to take into account vessel or efficiency changes during the time period. Land-ings per unit of effort (lpues) have been fluctuating around an average of 39 kg/h with an increasing trend since 2004, to the highest observed (59 kg/h) in the time-series in 2007 (Figure B.4.1).
B.5. Other relevant data
C. Historical stock development
Age structured XSA assessment for this stock was carried Nephrops WG in 2003 (ICES, 2003). The results were considered unreliable for several reasons most importantly; in-adequate historical sampling of catch, growth and natural mortality assumptions and concern about accuracy of tuning data. Since then the focus has been on developing a time-series of UWTV survey data as the basis of assessment and advice for this stock.
The 2009 Benchmark decided on the following procedure:
1 ) Survey indices are worked up annually resulting in the TV index. 2 ) Adjust index for bias (see Section B.3). The combined effect of these biases is to
be applied to the new survey index.
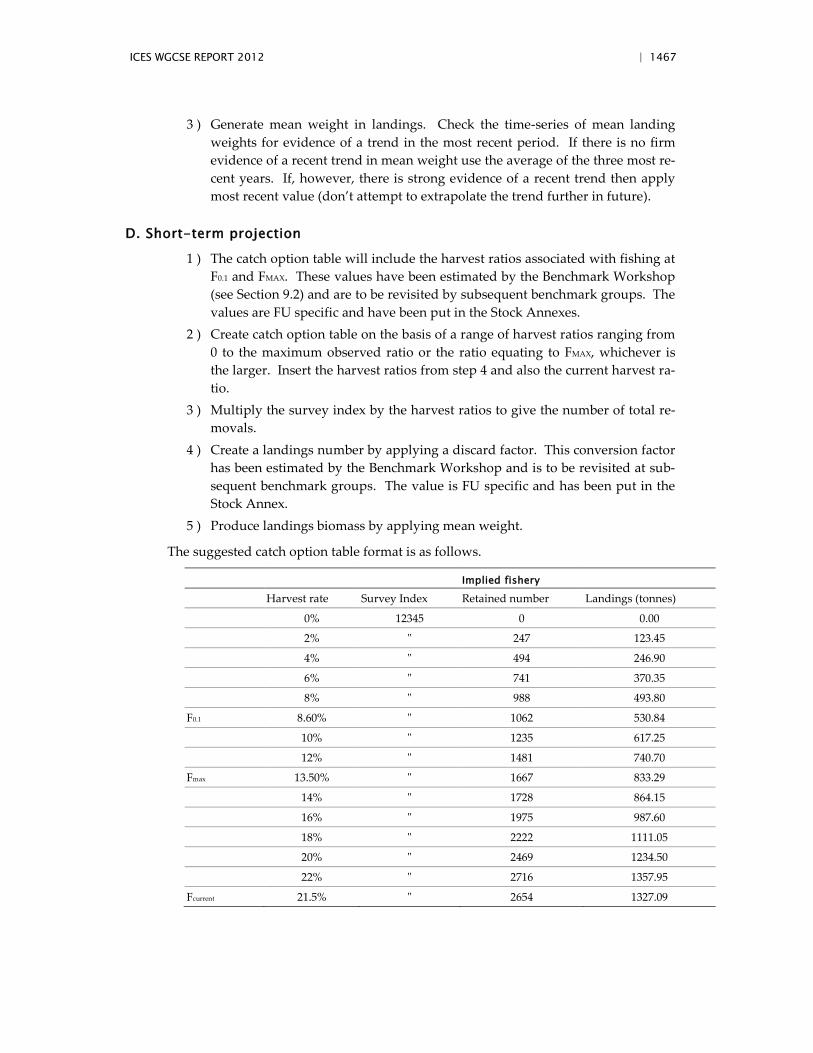
ICES WGCSE REPORT 2012 | 1467
3 ) Generate mean weight in landings. Check the time-series of mean landing weights for evidence of a trend in the most recent period. If there is no firm evidence of a recent trend in mean weight use the average of the three most re-cent years. If, however, there is strong evidence of a recent trend then apply most recent value (don’t attempt to extrapolate the trend further in future).
D. Short-term projection
1 ) The catch option table will include the harvest ratios associated with fishing at F0.1 and FMAX. These values have been estimated by the Benchmark Workshop (see Section 9.2) and are to be revisited by subsequent benchmark groups. The values are FU specific and have been put in the Stock Annexes.
2 ) Create catch option table on the basis of a range of harvest ratios ranging from 0 to the maximum observed ratio or the ratio equating to FMAX, whichever is the larger. Insert the harvest ratios from step 4 and also the current harvest ra-tio.
3 ) Multiply the survey index by the harvest ratios to give the number of total re-movals.
4 ) Create a landings number by applying a discard factor. This conversion factor has been estimated by the Benchmark Workshop and is to be revisited at sub-sequent benchmark groups. The value is FU specific and has been put in the Stock Annex.
5 ) Produce landings biomass by applying mean weight.
The suggested catch option table format is as follows.
Implied fishery
Harvest rate Survey Index Retained number Landings (tonnes)
0% 12345 0 0.00
2% " 247 123.45
4% " 494 246.90
6% " 741 370.35
8% " 988 493.80
F0.1 8.60% " 1062 530.84
10% " 1235 617.25
12% " 1481 740.70
Fmax 13.50% " 1667 833.29
14% " 1728 864.15
16% " 1975 987.60
18% " 2222 1111.05
20% " 2469 1234.50
22% " 2716 1357.95
Fcurrent 21.5% " 2654 1327.09
1468 | ICES WGCSE REPORT 2012
E. Medium-term projections
None presented.
F. Long-term projections
None presented.
G. Biological reference points
The time-series of available length frequencies were insufficient to generate reliable esti-mates of F0.1 and Fmax.
H. Other issues
I. References Fernand, L., Nolan, G.D., Raine, R., Chambers, C.E., Dye, S.R., White, M. and Brown, J. 2006. The
Irish coastal current: A seasonal jet-like circulation. Continental Shelf Research, Vol. 26, Issue 15, 1775–1793.
ICES. 2006. Report of the Workshop on Nephrops Stocks. Annex 6: Working Document by Lordan and Gerritsen. ICES CM 2006/ACFM:12.
ICES. 2007. Report of the Workshop on the use of UWTV surveys for determining abundance in Nephrops stocks throughout European waters (WKNEPHTV). ICES CM: 2007/ACFM: 14 Ref: LRC, PGCCDBS.
ICES. 2008. Report of the Workshop and training course on Nephrops Burrow Identification (WKNEPHBID). ICES CM: 2008/LRC: 03 Ref: ACOM.
ICES. 2008. Report of the Working Group on the Assessment of Southern Shelf Stocks of Hake, Monk and Megrim (WGHMM). ICES CM: 2008/ ACOM:07.
ICES. 2005. Using UWTV surveys to develop a conceptual ecosystem model of Aran Grounds Nephrops population distribution. ICES CM 2005/L:30 Annual Science Conference.
Colm Lordan and Hans Gerritsen. 2006. The accuracy and precision of maturity parameters from sampling of female Nephrops from stocks around Ireland. WD6 in the Report of the Workshop on Nephrops stocks. ICES CM 2006/ACFM:12.
Nolan,G.D. and Lyons. 2006. Ocean climate variability on the western Irish Shelf, an emerging time series., K., Proceedings of ICES Annual Science Conference, Theme Session C, C:28.
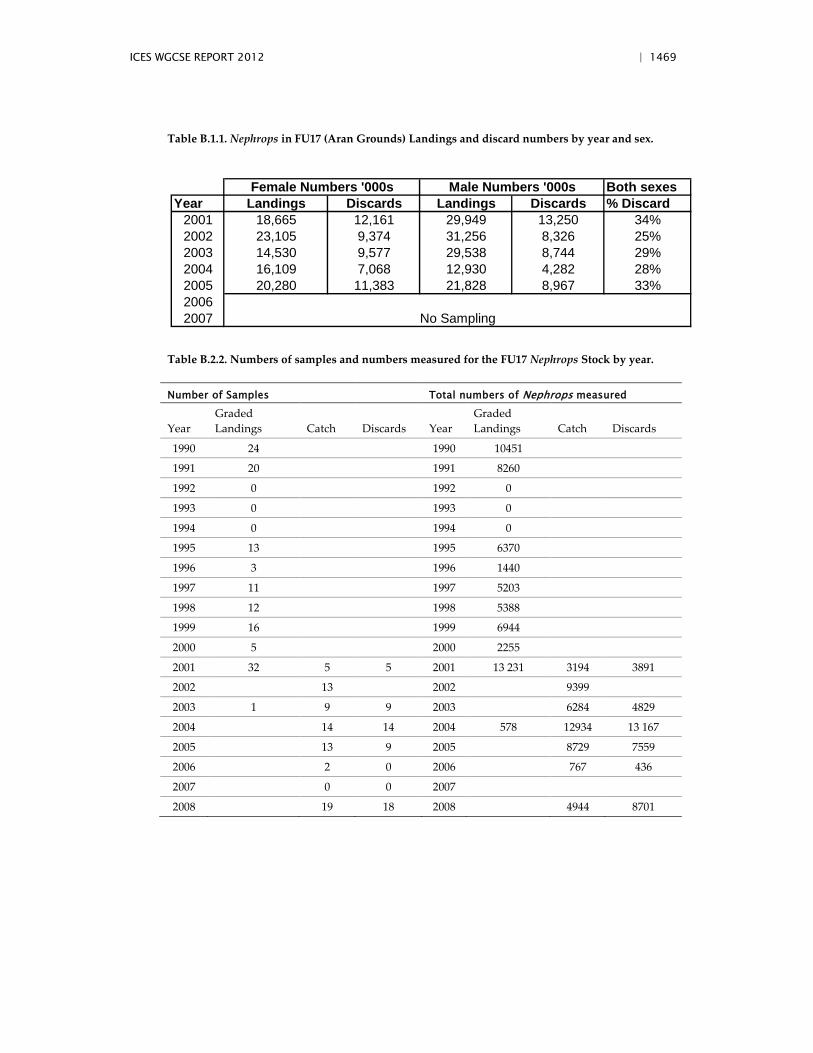
ICES WGCSE REPORT 2012 | 1469
Table B.1.1. Nephrops in FU17 (Aran Grounds) Landings and discard numbers by year and sex.
Both sexesYear Landings Discards Landings Discards % Discard
2001 18,665 12,161 29,949 13,250 34%2002 23,105 9,374 31,256 8,326 25%2003 14,530 9,577 29,538 8,744 29%2004 16,109 7,068 12,930 4,282 28%2005 20,280 11,383 21,828 8,967 33%20062007 No Sampling
Female Numbers '000s Male Numbers '000s
Table B.2.2. Numbers of samples and numbers measured for the FU17 Nephrops Stock by year.
Number of Samples Total numbers of Nephrops measured
Year Graded Landings Catch Discards Year
Graded Landings Catch Discards
1990 24 1990 10451
1991 20 1991 8260
1992 0 1992 0
1993 0 1993 0
1994 0 1994 0
1995 13 1995 6370
1996 3 1996 1440
1997 11 1997 5203
1998 12 1998 5388
1999 16 1999 6944
2000 5 2000 2255
2001 32 5 5 2001 13 231 3194 3891
2002 13 2002 9399
2003 1 9 9 2003 6284 4829
2004 14 14 2004 578 12934 13 167
2005 13 9 2005 8729 7559
2006 2 0 2006 767 436
2007 0 0 2007
2008 19 18 2008 4944 8701
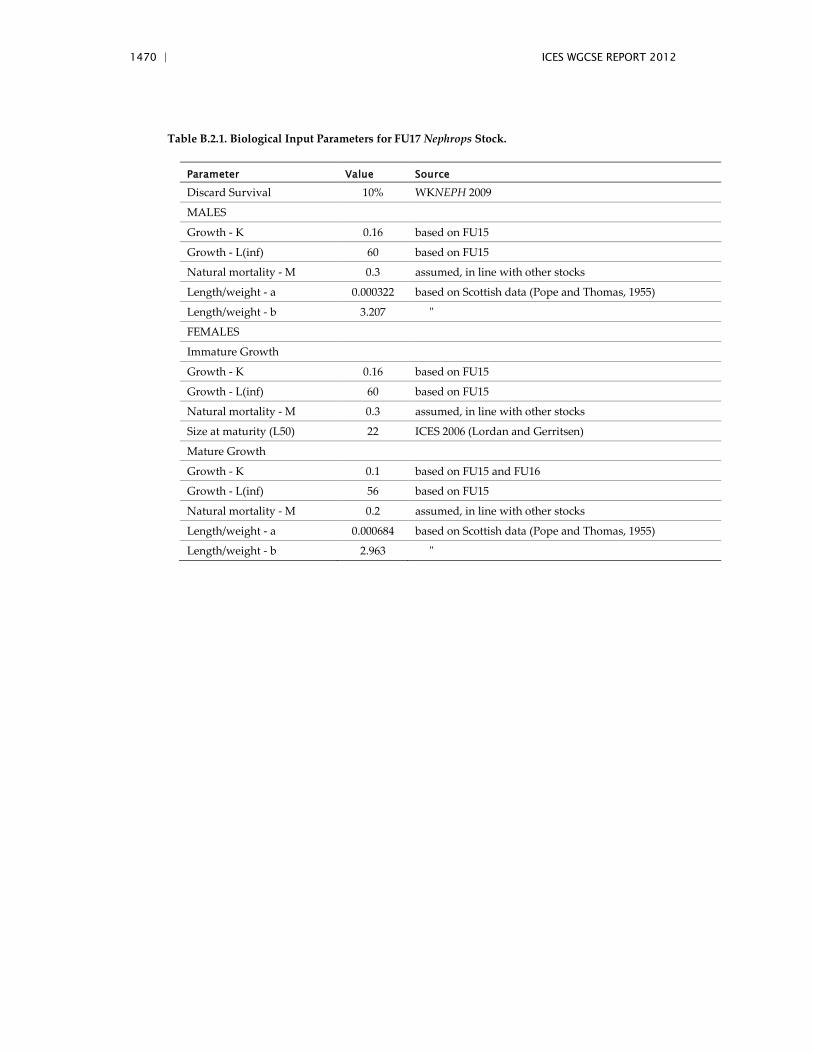
1470 | ICES WGCSE REPORT 2012
Table B.2.1. Biological Input Parameters for FU17 Nephrops Stock.
Parameter Value Source
Discard Survival 10% WKNEPH 2009
MALES
Growth - K 0.16 based on FU15
Growth - L(inf) 60 based on FU15
Natural mortality - M 0.3 assumed, in line with other stocks
Length/weight - a 0.000322 based on Scottish data (Pope and Thomas, 1955)
Length/weight - b 3.207 "
FEMALES
Immature Growth
Growth - K 0.16 based on FU15
Growth - L(inf) 60 based on FU15
Natural mortality - M 0.3 assumed, in line with other stocks
Size at maturity (L50) 22 ICES 2006 (Lordan and Gerritsen)
Mature Growth
Growth - K 0.1 based on FU15 and FU16
Growth - L(inf) 56 based on FU15
Natural mortality - M 0.2 assumed, in line with other stocks
Length/weight - a 0.000684 based on Scottish data (Pope and Thomas, 1955)
Length/weight - b 2.963 "
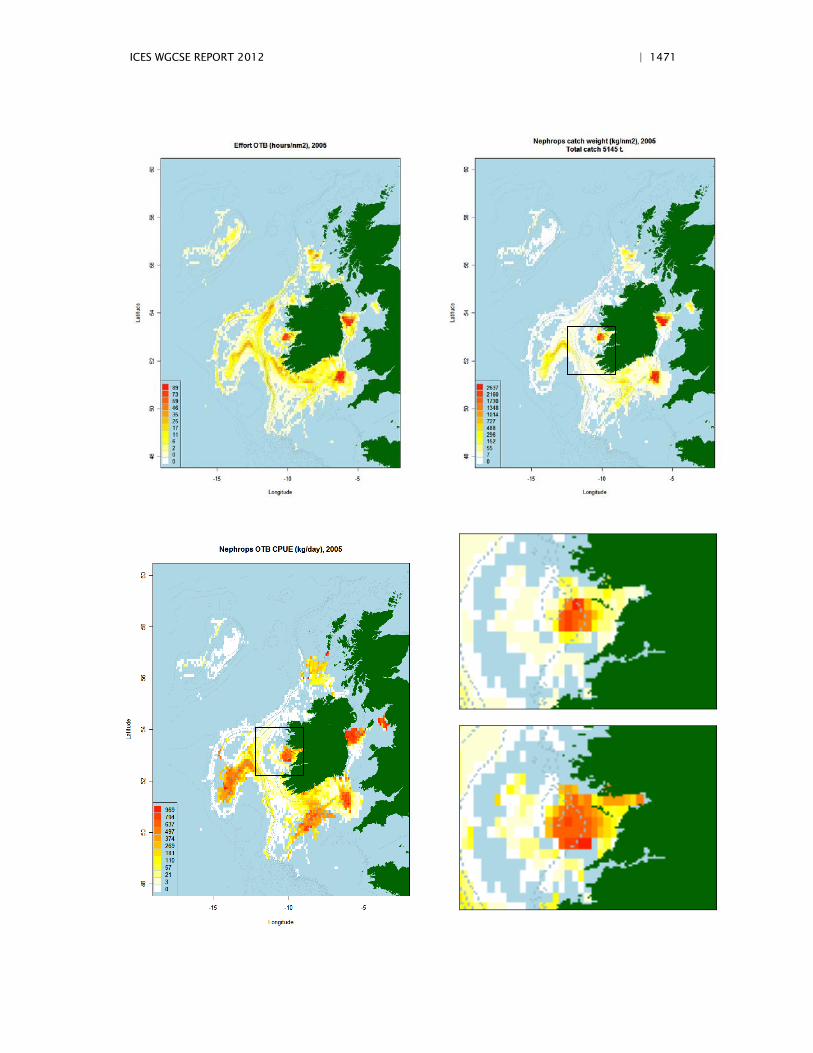
ICES WGCSE REPORT 2012 | 1471
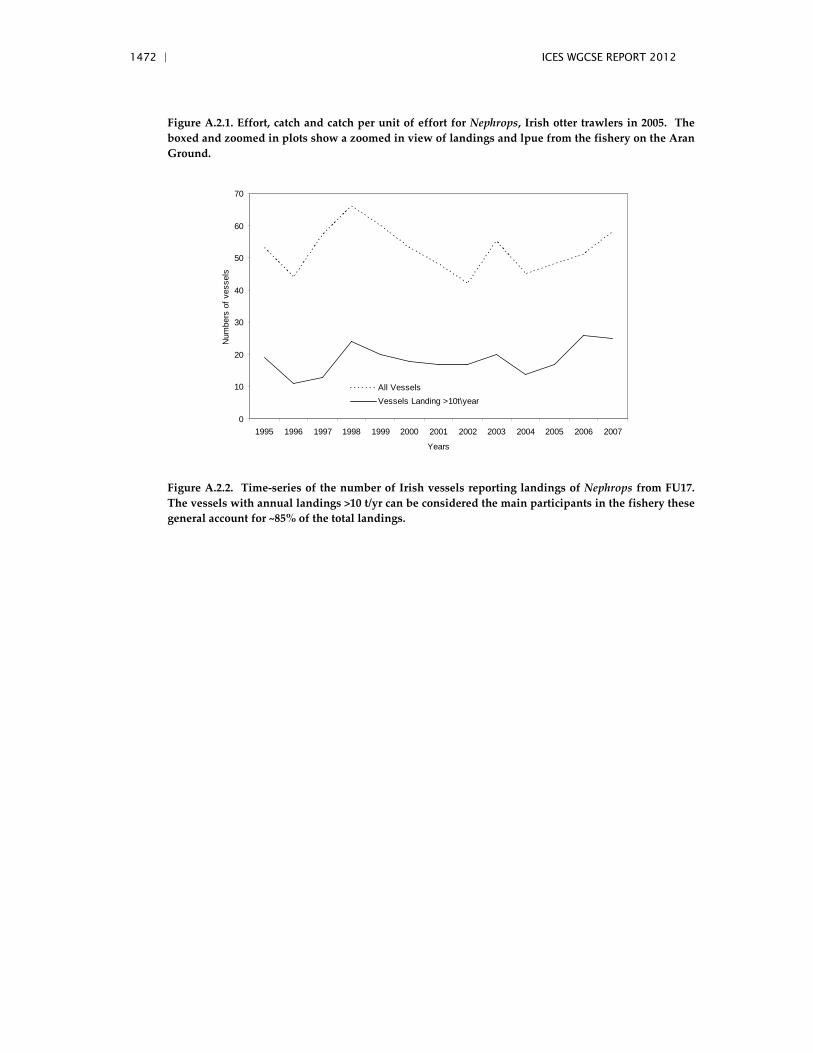
1472 | ICES WGCSE REPORT 2012
Figure A.2.1. Effort, catch and catch per unit of effort for Nephrops, Irish otter trawlers in 2005. The boxed and zoomed in plots show a zoomed in view of landings and lpue from the fishery on the Aran Ground.
0
10
20
30
40
50
60
70
1995 1996 1997 1998 1999 2000 2001 2002 2003 2004 2005 2006 2007
Years
Num
bers
of v
esse
ls
All VesselsVessels Landing >10t\year
Figure A.2.2. Time-series of the number of Irish vessels reporting landings of Nephrops from FU17. The vessels with annual landings >10 t/yr can be considered the main participants in the fishery these general account for ~85% of the total landings.
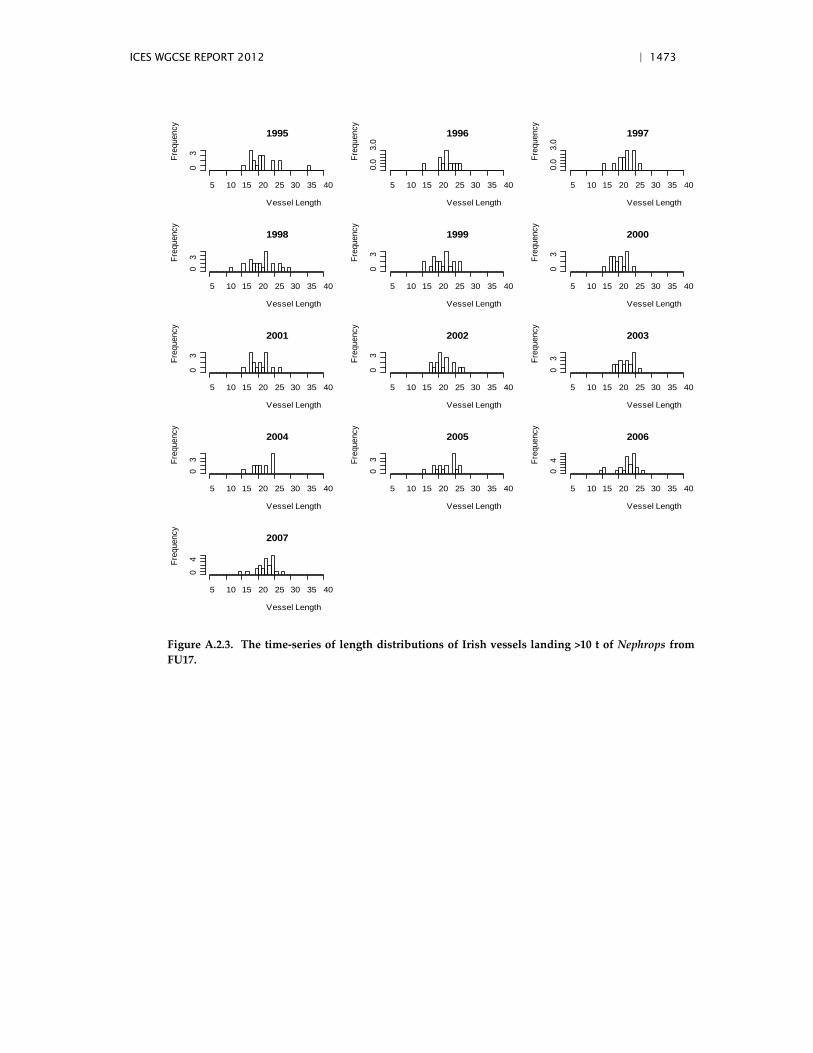
ICES WGCSE REPORT 2012 | 1473
1995
Vessel Length
Freq
uenc
y5 10 15 20 25 30 35 40
03
1996
Vessel Length
Freq
uenc
y
5 10 15 20 25 30 35 40
0.0
3.0
1997
Vessel Length
Freq
uenc
y
5 10 15 20 25 30 35 40
0.0
3.0
1998
Vessel Length
Freq
uenc
y
5 10 15 20 25 30 35 40
03
1999
Vessel Length
Freq
uenc
y
5 10 15 20 25 30 35 40
03
2000
Vessel Length
Freq
uenc
y
5 10 15 20 25 30 35 40
03
2001
Vessel Length
Freq
uenc
y
5 10 15 20 25 30 35 40
03
2002
Vessel Length
Freq
uenc
y
5 10 15 20 25 30 35 40
03
2003
Vessel Length
Freq
uenc
y
5 10 15 20 25 30 35 40
03
2004
Vessel Length
Freq
uenc
y
5 10 15 20 25 30 35 40
03
2005
Vessel Length
Freq
uenc
y
5 10 15 20 25 30 35 40
03
2006
Vessel Length
Freq
uenc
y
5 10 15 20 25 30 35 40
04
2007
Vessel Length
Freq
uenc
y
5 10 15 20 25 30 35 40
04
Figure A.2.3. The time-series of length distributions of Irish vessels landing >10 t of Nephrops from FU17.
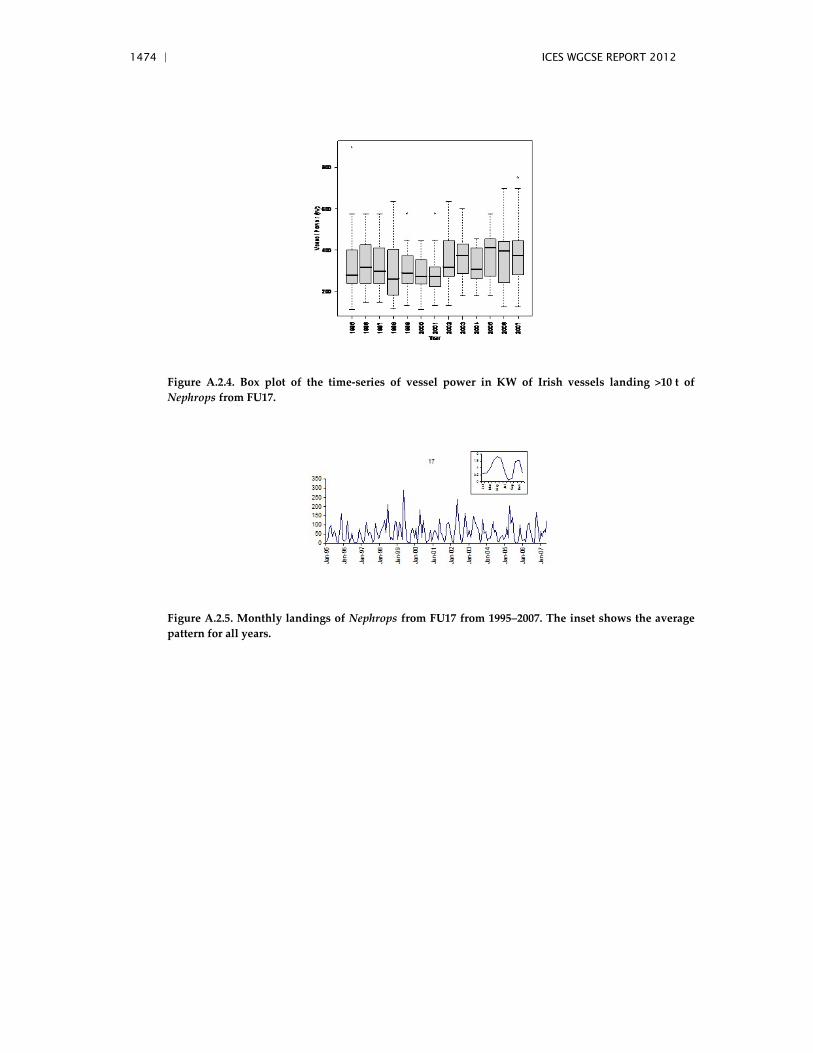
1474 | ICES WGCSE REPORT 2012
Figure A.2.4. Box plot of the time-series of vessel power in KW of Irish vessels landing >10 t of Nephrops from FU17.
Figure A.2.5. Monthly landings of Nephrops from FU17 from 1995–2007. The inset shows the average pattern for all years.
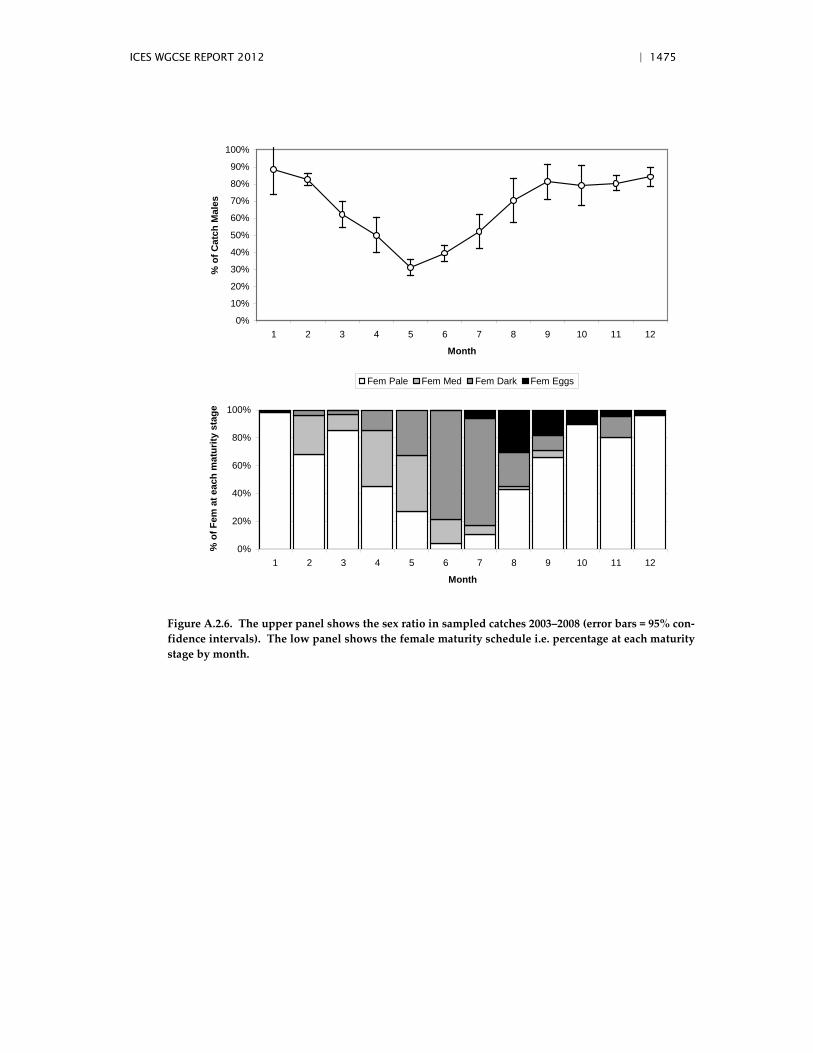
ICES WGCSE REPORT 2012 | 1475
0%
10%
20%
30%
40%
50%
60%
70%
80%
90%
100%
1 2 3 4 5 6 7 8 9 10 11 12
Month
% o
f Cat
ch M
ales
0%
20%
40%
60%
80%
100%
1 2 3 4 5 6 7 8 9 10 11 12
Month
% o
f Fem
at e
ach
mat
urity
sta
ge
Fem Pale Fem Med Fem Dark Fem Eggs
Figure A.2.6. The upper panel shows the sex ratio in sampled catches 2003–2008 (error bars = 95% con-fidence intervals). The low panel shows the female maturity schedule i.e. percentage at each maturity stage by month.
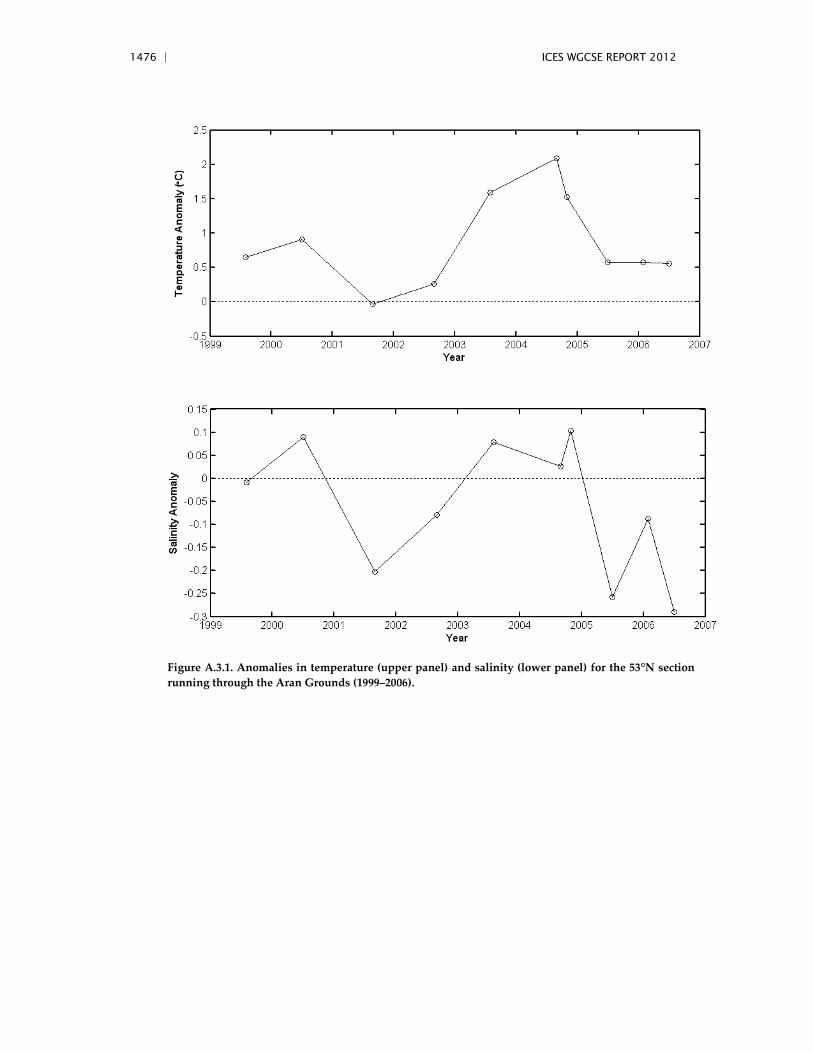
1476 | ICES WGCSE REPORT 2012
Figure A.3.1. Anomalies in temperature (upper panel) and salinity (lower panel) for the 53°N section running through the Aran Grounds (1999–2006).
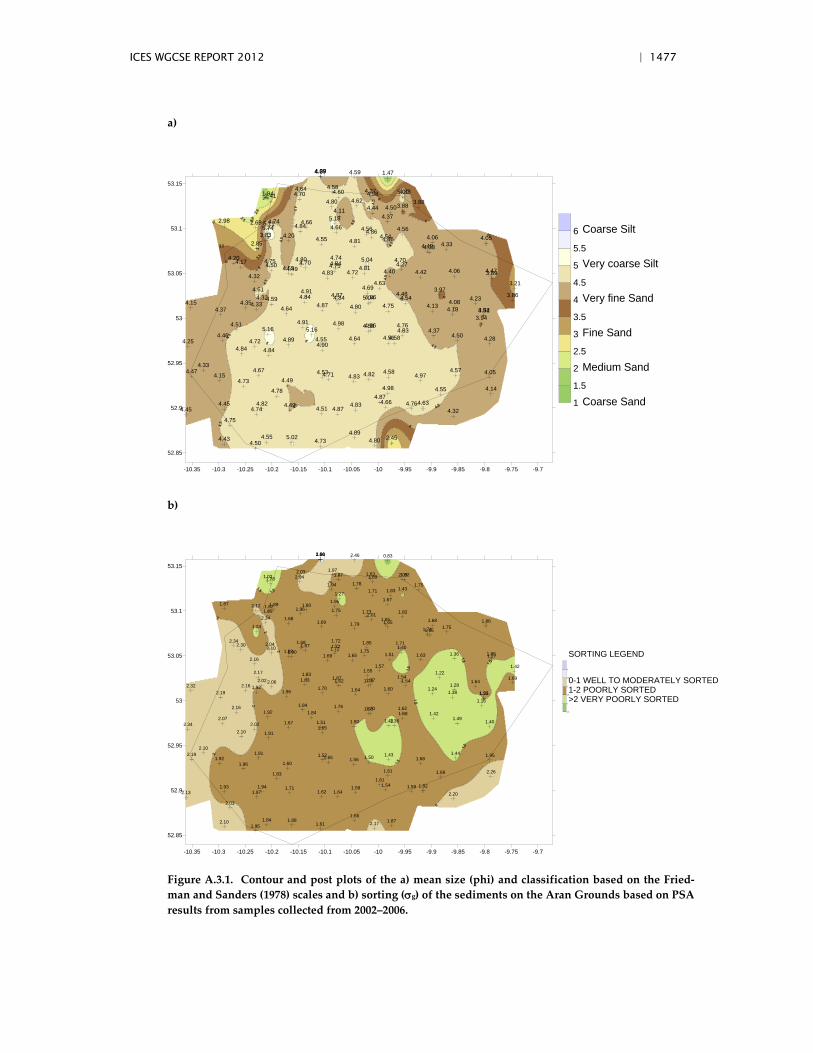
ICES WGCSE REPORT 2012 | 1477
a)
-10.35 -10.3 -10.25 -10.2 -10.15 -10.1 -10.05 -10 -9.95 -9.9 -9.85 -9.8 -9.75 -9.7
52.85
52.9
52.95
53
53.05
53.1
53.15
4.50 4.73 4.804.43 2.455.024.554.89
4.754.324.45 4.74 4.874.514.49 4.834.45 4.82 4.764.634.66
4.874.78 4.55 4.144.98
4.73 4.49 4.83 4.974.15 4.71 4.82 4.054.53 4.584.47 4.574.674.33
4.844.84 4.904.25 4.72 4.89 4.55 4.284.64 4.564.58 4.504.464.374.835.165.16 4.584.86 4.764.51 4.984.91
3.944.523.944.37 4.184.64 4.80 4.75 4.134.874.334.15 4.35 4.084.59 4.234.544.84 5.044.32 4.864.84 3.864.87 4.484.91 3.974.61 4.69
3.214.634.32 3.894.83 4.72 4.424.40 4.06 4.474.494.55 4.814.754.50 4.274.844.704.17 4.75 4.705.044.804.20 4.74
4.334.49 4.332.85 4.81 4.464.55 4.054.064.544.203.83 4.86 4.564.565.74 4.664.845.112.69 4.664.742.98 5.18 4.374.11 4.44 4.503.88 3.884.80 4.62
2.41 4.70 4.581.94 4.60 5.004.334.274.64 4.58
1.474.594.094.874.29
1
1.5
2
2.5
3
3.5
4
4.5
5
5.5
6 Coarse Silt
Very coarse Silt
Very fine Sand
Fine Sand
Medium Sand
Coarse Sand
b)
-10.35 -10.3 -10.25 -10.2 -10.15 -10.1 -10.05 -10 -9.95 -9.9 -9.85 -9.8 -9.75 -9.7
52.85
52.9
52.95
53
53.05
53.1
53.15
1.95 1.61 2.172.10 1.871.881.841.66
2.03
2.202.13 1.97 1.641.621.71 1.591.93 1.94 1.58 1.821.54
1.611.83 1.68 2.261.61
1.96 1.601.56 1.681.92 1.65 1.50 1.951.52 1.432.19 1.441.91
2.10
1.912.101.65
2.34 2.02 1.67 1.51 1.401.50 1.431.38 1.492.071.421.681.841.92
1.501.70 1.622.16 1.761.841.161.551.212.19 1.381.96 1.64 1.60 1.241.701.922.32 2.16 1.282.06 1.641.541.62 1.782.02 1.771.83 1.691.87 1.541.83 1.222.17 1.55
1.421.572.16
1.271.69 1.65 1.631.51 1.36 1.851.901.88 1.751.722.10 1.401.721.872.30 2.04 1.711.851.682.34 1.72
1.651.74 1.751.24 1.79 1.651.69 1.861.681.651.682.342.01 1.821.731.89 1.751.961.822.12 1.801.891.87 1.95 1.67
1.27 1.71 1.83 1.431.751.94 1.78
1.28 2.04 1.891.02 1.87 2.051.921.632.03 1.97
0.832.462.562.041.60
0.5
1
1.5
2
2.5
3
SORTING LEGEND
0-1 WELL TO MODERATELY SORTED1-2 POORLY SORTED>2 VERY POORLY SORTED
Figure A.3.1. Contour and post plots of the a) mean size (phi) and classification based on the Fried-man and Sanders (1978) scales and b) sorting (σg) of the sediments on the Aran Grounds based on PSA results from samples collected from 2002–2006.
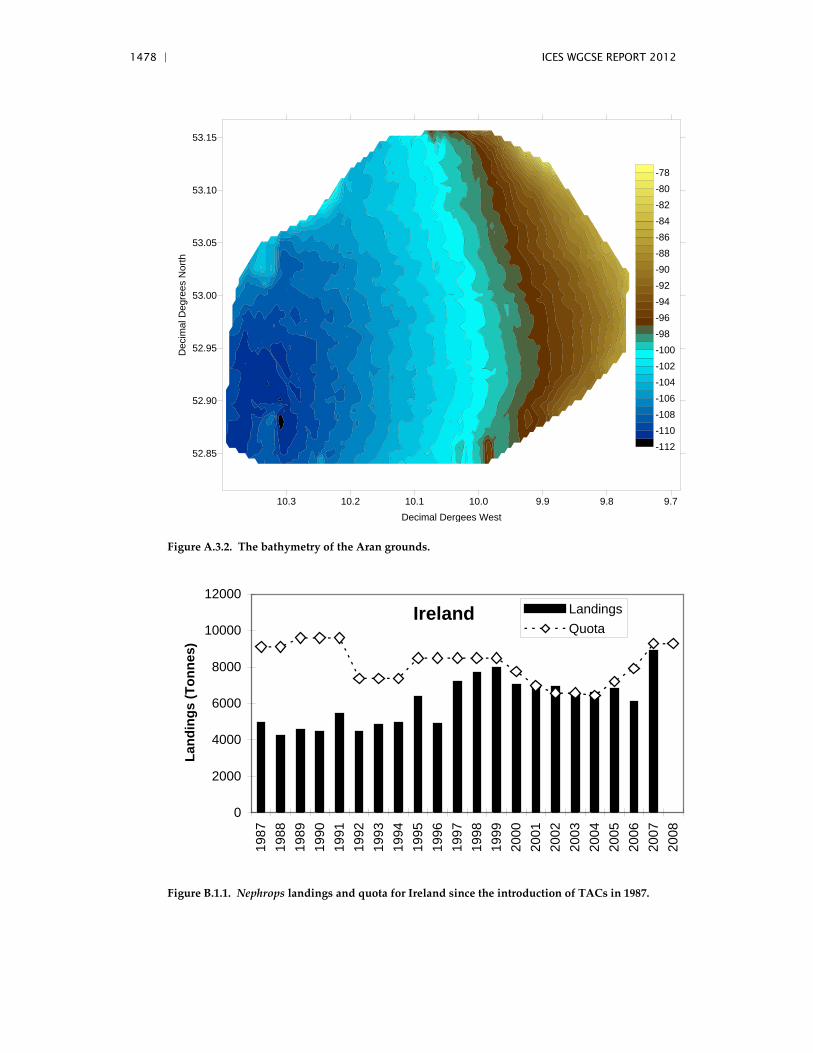
1478 | ICES WGCSE REPORT 2012
10.3 10.2 10.1 10.0 9.9 9.8 9.7Decimal Dergees West
52.85
52.90
52.95
53.00
53.05
53.10
53.15
Dec
imal
Deg
rees
Nor
th
-112-110-108-106-104-102-100-98-96-94-92-90-88-86-84-82-80-78
Figure A.3.2. The bathymetry of the Aran grounds.
Ireland
0
2000
4000
6000
8000
10000
12000
1987
1988
1989
1990
1991
1992
1993
1994
1995
1996
1997
1998
1999
2000
2001
2002
2003
2004
2005
2006
2007
2008
Land
ings
(Ton
nes)
LandingsQuota
Figure B.1.1. Nephrops landings and quota for Ireland since the introduction of TACs in 1987.
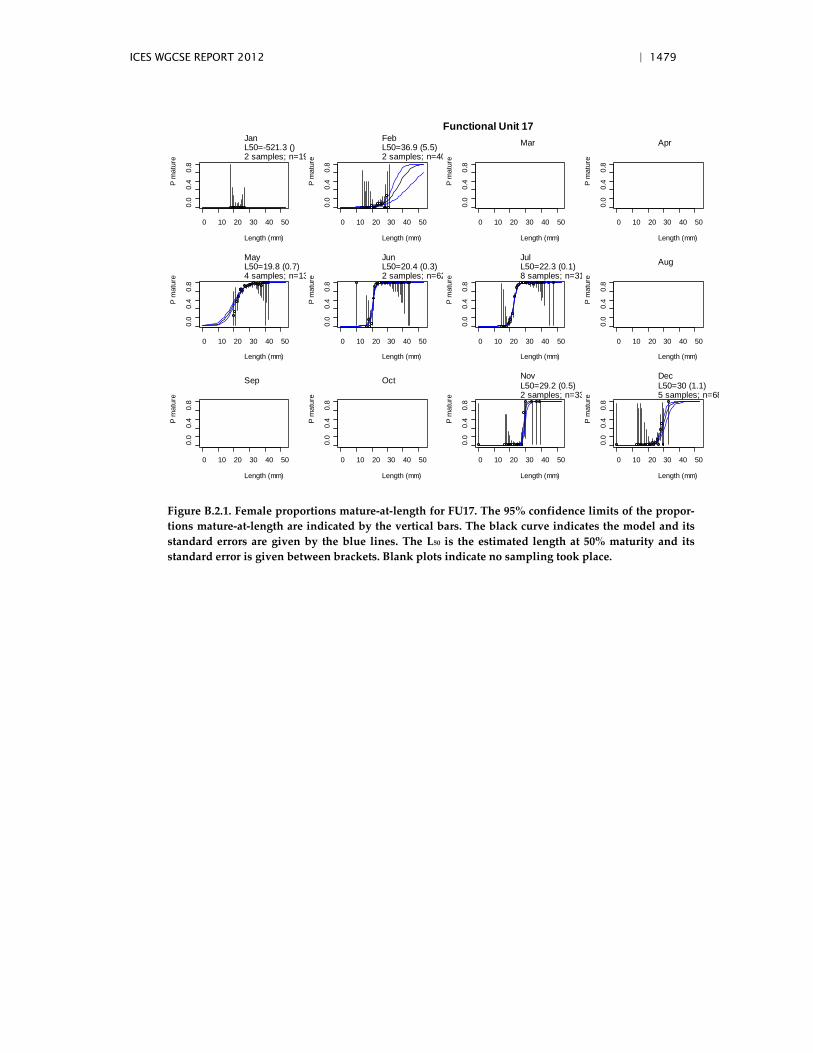
ICES WGCSE REPORT 2012 | 1479
0 10 20 30 40 50
0.0
0.4
0.8
JanL50=-521.3 ()2 samples; n=19
Length (mm)
P m
atur
e
0 10 20 30 40 50
0.0
0.4
0.8
FebL50=36.9 (5.5)2 samples; n=40
Length (mm)
P m
atur
e
0 10 20 30 40 50
0.0
0.4
0.8
Mar
Length (mm)
P m
atur
e
0 10 20 30 40 50
0.0
0.4
0.8
Apr
Length (mm)
P m
atur
e
0 10 20 30 40 50
0.0
0.4
0.8
MayL50=19.8 (0.7)4 samples; n=13
Length (mm)
P m
atur
e
0 10 20 30 40 50
0.0
0.4
0.8
JunL50=20.4 (0.3)2 samples; n=62
Length (mm)
P m
atur
e
0 10 20 30 40 50
0.0
0.4
0.8
JulL50=22.3 (0.1)8 samples; n=31
Length (mm)
P m
atur
e
0 10 20 30 40 50
0.0
0.4
0.8
Aug
Length (mm)
P m
atur
e
0 10 20 30 40 50
0.0
0.4
0.8
Sep
Length (mm)
P m
atur
e
0 10 20 30 40 50
0.0
0.4
0.8
Oct
Length (mm)
P m
atur
e
0 10 20 30 40 500.
00.
40.
8
NovL50=29.2 (0.5)2 samples; n=33
Length (mm)
P m
atur
e0 10 20 30 40 50
0.0
0.4
0.8
DecL50=30 (1.1)5 samples; n=68
Length (mm)
P m
atur
e
Functional Unit 17
Figure B.2.1. Female proportions mature-at-length for FU17. The 95% confidence limits of the propor-tions mature-at-length are indicated by the vertical bars. The black curve indicates the model and its standard errors are given by the blue lines. The L50 is the estimated length at 50% maturity and its standard error is given between brackets. Blank plots indicate no sampling took place.
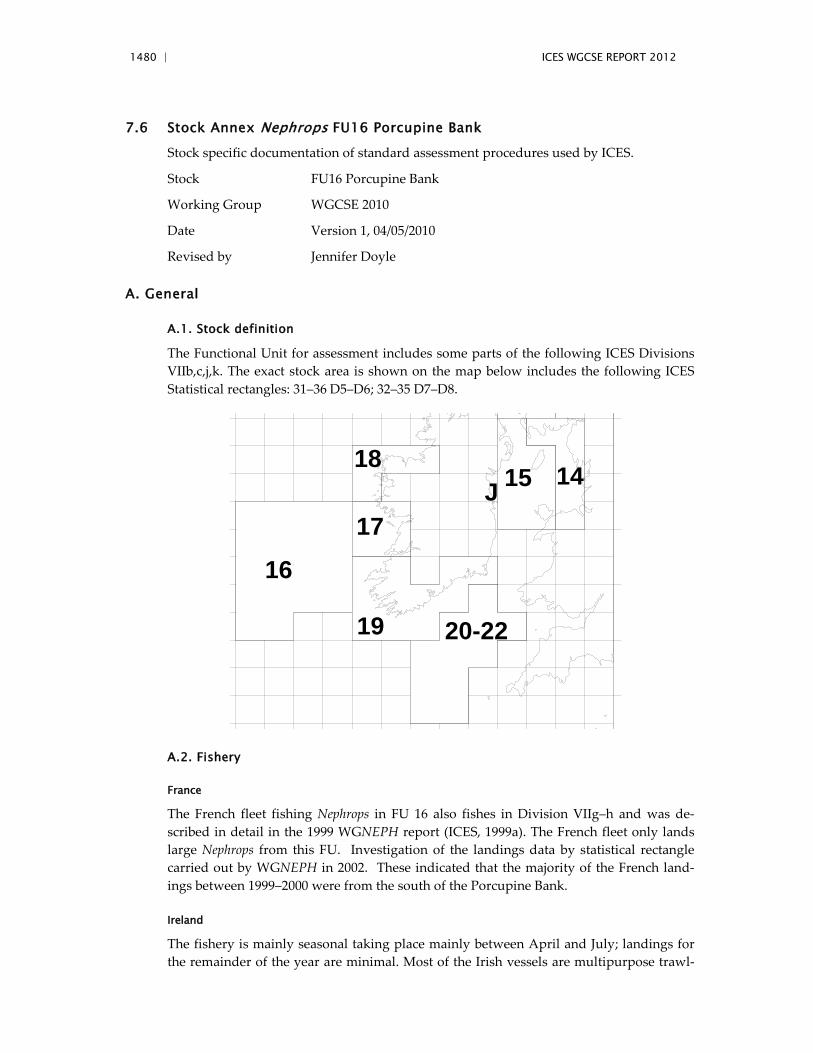
1480 | ICES WGCSE REPORT 2012
7.6 Stock Annex Nephrops FU16 Porcupine Bank
Stock specific documentation of standard assessment procedures used by ICES.
Stock FU16 Porcupine Bank
Working Group WGCSE 2010
Date Version 1, 04/05/2010
Revised by Jennifer Doyle
A. General
A.1. Stock definition
The Functional Unit for assessment includes some parts of the following ICES Divisions VIIb,c,j,k. The exact stock area is shown on the map below includes the following ICES Statistical rectangles: 31–36 D5–D6; 32–35 D7–D8.
3
15 14
20-2219
17
18
16
J
A.2. Fishery
France
The French fleet fishing Nephrops in FU 16 also fishes in Division VIIg–h and was de-scribed in detail in the 1999 WGNEPH report (ICES, 1999a). The French fleet only lands large Nephrops from this FU. Investigation of the landings data by statistical rectangle carried out by WGNEPH in 2002. These indicated that the majority of the French land-ings between 1999–2000 were from the south of the Porcupine Bank.
Ireland
The fishery is mainly seasonal taking place mainly between April and July; landings for the remainder of the year are minimal. Most of the Irish vessels are multipurpose trawl-
ICES WGCSE REPORT 2012 | 1481
ers and are relatively large (between 20 and 35 m in total length). Irish vessels land both whole prawns and tails depending on markets from this FU and the sizes of the Irish landings are significantly smaller than those for the French and Spanish fleets. The Irish vessels are mainly using twin-rig trawls. Fishing is often weather dependent (particularly for the smaller vessels), with trip duration varying between seven and ten days. Investi-gation of the landings data by statistical rectangle provided to the WGNEPH in 2002 in-dicates that the majority of the Irish landings between 1995 and 2001 were from the south central area of the Porcupine Bank.
The recent spatial distribution of the fishery is shown in Figure 1.
Spain
The Spanish fishery in the Porcupine area is a typical multispecies fishery, targeting dif-ferent demersal species, among them Nephrops. The fleet, which consists of about 35 ves-sels, is composed of side trawlers and is part of the so-called ‘300 fleet’ in the Adhesion Treaty of Spain to the EEC in 1986. Within the Porcupine fleet, two components can be distinguished: one consisting of vessels fishing with finfish trawls (average engine power 980 hp), and the other fishing with Nephrops trawls (average engine power 680 hp). The average duration of their trips is 15 days, of which 10–12 are actual fishing days. The ma-jor landing port is La Coruña.
The target species for the finfish directed fleet are hake, megrim and anglerfish, with Nephrops as a valued bycatch. Vessels fishing with Nephrops trawls are much more di-rected towards Nephrops (especially in spring and summer), and fish is a bycatch. These two fleets not are currently disaggregated in the time-series.
A.3. Ecosystem aspects
Productivity of deep-water Nephrops stocks is generally lower that those on the shelf although individual Nephrops grow to relatively large sizes.
A persistent Taylor column circulation around Porcupine Bank provides an important mechanism for the retention of pelagic eggs and larvae of the various marine species spawning in the area. (Mohn et al., 2002). The Nephrops stock on the Porcupine Bank are distributed on mud patches in relatively deep waters 200–600 m. It is not know how lar-vae are retained over these grounds but the Taylor column may help with larval reten-tion.
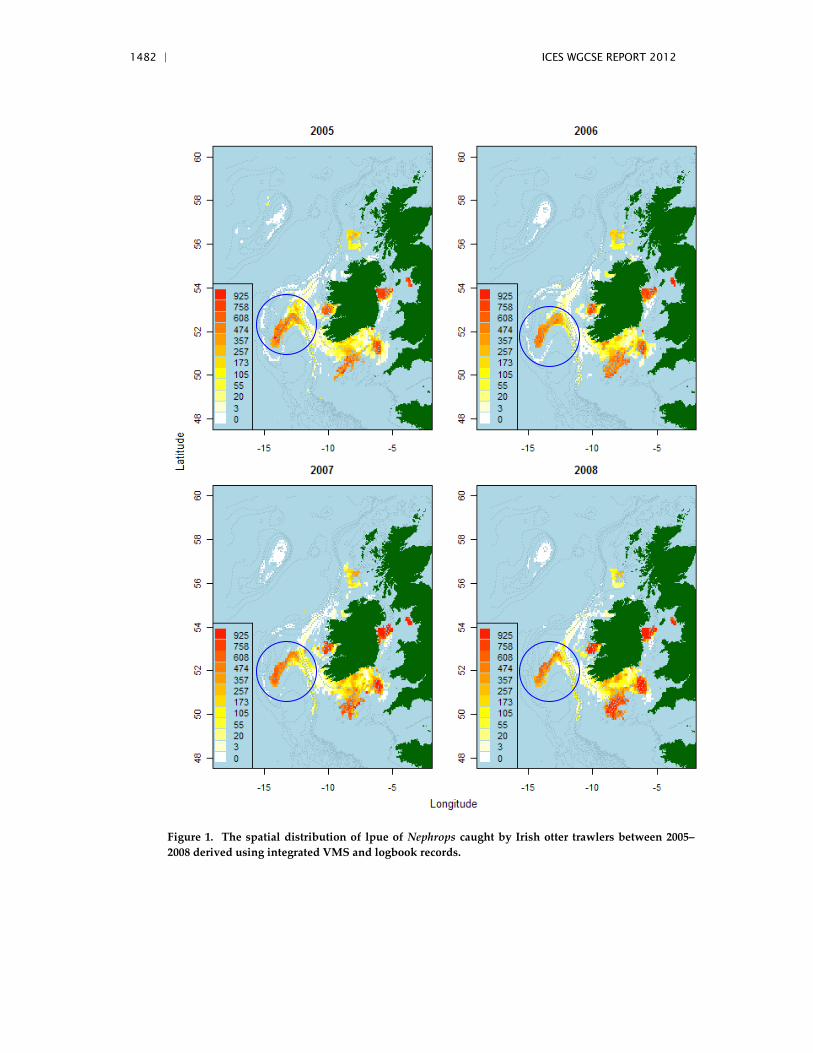
1482 | ICES WGCSE REPORT 2012
Figure 1. The spatial distribution of lpue of Nephrops caught by Irish otter trawlers between 2005–2008 derived using integrated VMS and logbook records.
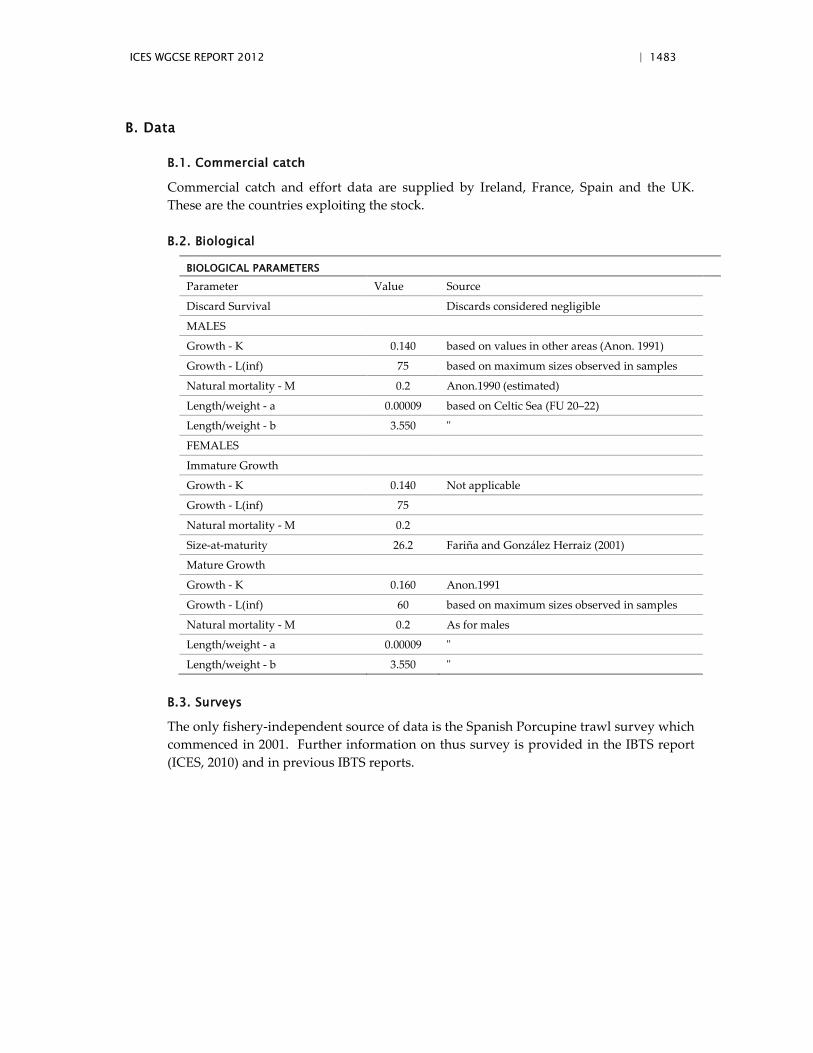
ICES WGCSE REPORT 2012 | 1483
B. Data
B.1. Commercial catch
Commercial catch and effort data are supplied by Ireland, France, Spain and the UK. These are the countries exploiting the stock.
B.2. Biological
BIOLOGICAL PARAMETERS
Parameter Value Source
Discard Survival Discards considered negligible
MALES
Growth - K 0.140 based on values in other areas (Anon. 1991)
Growth - L(inf) 75 based on maximum sizes observed in samples
Natural mortality - M 0.2 Anon.1990 (estimated)
Length/weight - a 0.00009 based on Celtic Sea (FU 20–22)
Length/weight - b 3.550 "
FEMALES
Immature Growth
Growth - K 0.140 Not applicable
Growth - L(inf) 75
Natural mortality - M 0.2
Size-at-maturity 26.2 Fariña and González Herraiz (2001)
Mature Growth
Growth - K 0.160 Anon.1991
Growth - L(inf) 60 based on maximum sizes observed in samples
Natural mortality - M 0.2 As for males
Length/weight - a 0.00009 "
Length/weight - b 3.550 "
B.3. Surveys
The only fishery-independent source of data is the Spanish Porcupine trawl survey which commenced in 2001. Further information on thus survey is provided in the IBTS report (ICES, 2010) and in previous IBTS reports.
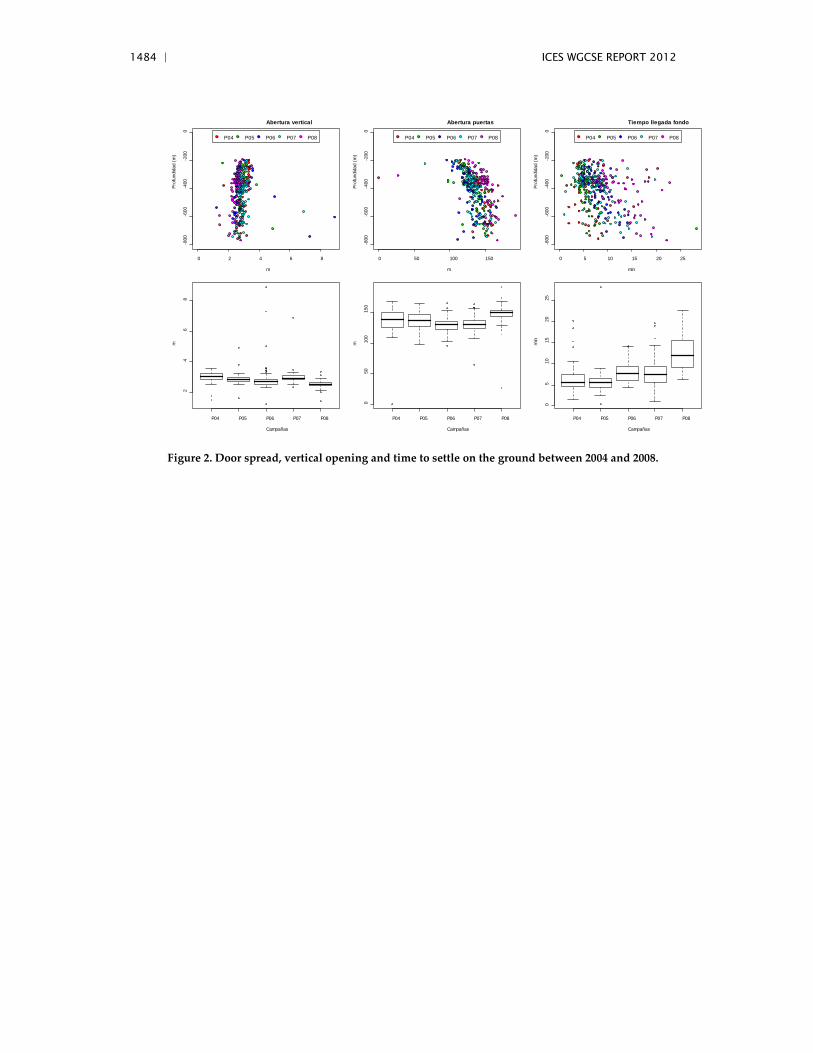
1484 | ICES WGCSE REPORT 2012
0 2 4 6 8
-800
-600
-400
-200
0
Abertura vertical
m
Prof
undi
dad
(m)
P04 P05 P06 P07 P08
0 50 100 150
-800
-600
-400
-200
0
Abertura puertas
m
Prof
undi
dad
(m)
P04 P05 P06 P07 P08
0 5 10 15 20 25
-800
-600
-400
-200
0
Tiempo llegada fondo
min
Prof
undi
dad
(m)
P04 P05 P06 P07 P08
P04 P05 P06 P07 P08
24
68
Campañas
m
P04 P05 P06 P07 P08
050
100
150
Campañas
m
P04 P05 P06 P07 P08
05
1015
2025
Campañas
min
Figure 2. Door spread, vertical opening and time to settle on the ground between 2004 and 2008.
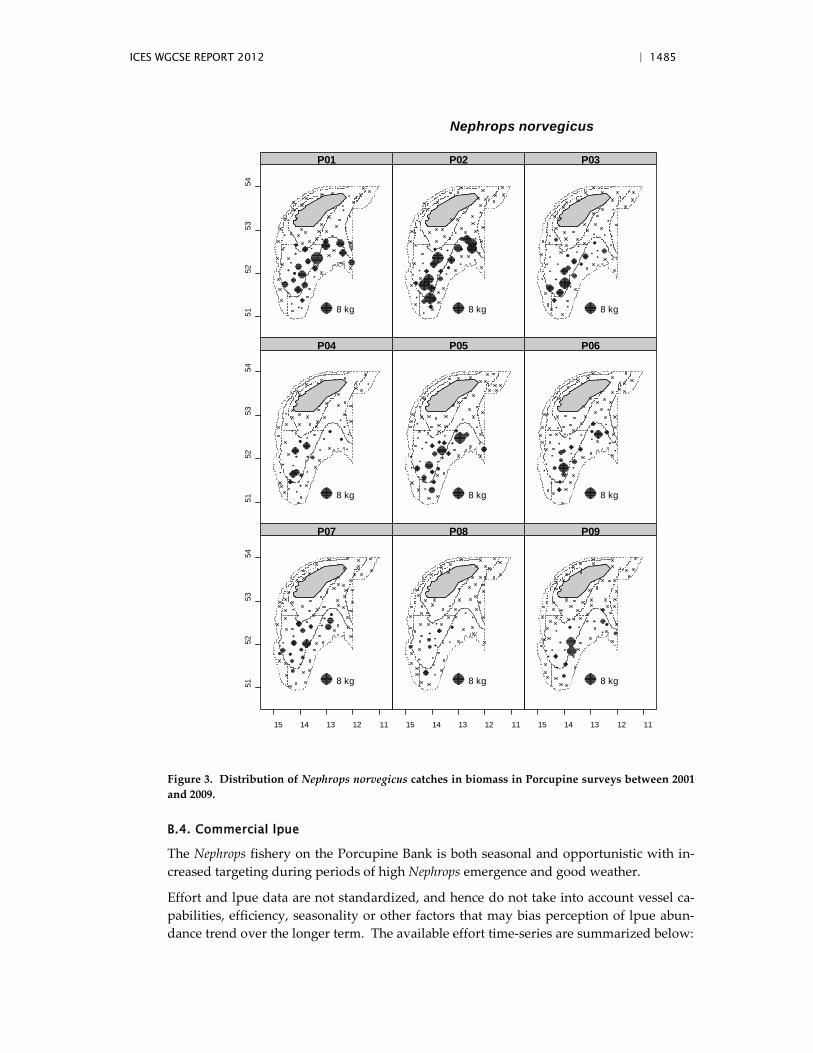
ICES WGCSE REPORT 2012 | 1485
Nephrops norvegicus
5152
5354
8 kg
P01
8 kg
P02
8 kg
P03
5152
5354
8 kg
P04
8 kg
P05
8 kg
P06
5152
5354
15 14 13 12 11
8 kg
P07
15 14 13 12 11
8 kg
P08
15 14 13 12 11
8 kg
P09
Figure 3. Distribution of Nephrops norvegicus catches in biomass in Porcupine surveys between 2001 and 2009.
B.4. Commercial lpue
The Nephrops fishery on the Porcupine Bank is both seasonal and opportunistic with in-creased targeting during periods of high Nephrops emergence and good weather.
Effort and lpue data are not standardized, and hence do not take into account vessel ca-pabilities, efficiency, seasonality or other factors that may bias perception of lpue abun-dance trend over the longer term. The available effort time-series are summarized below:
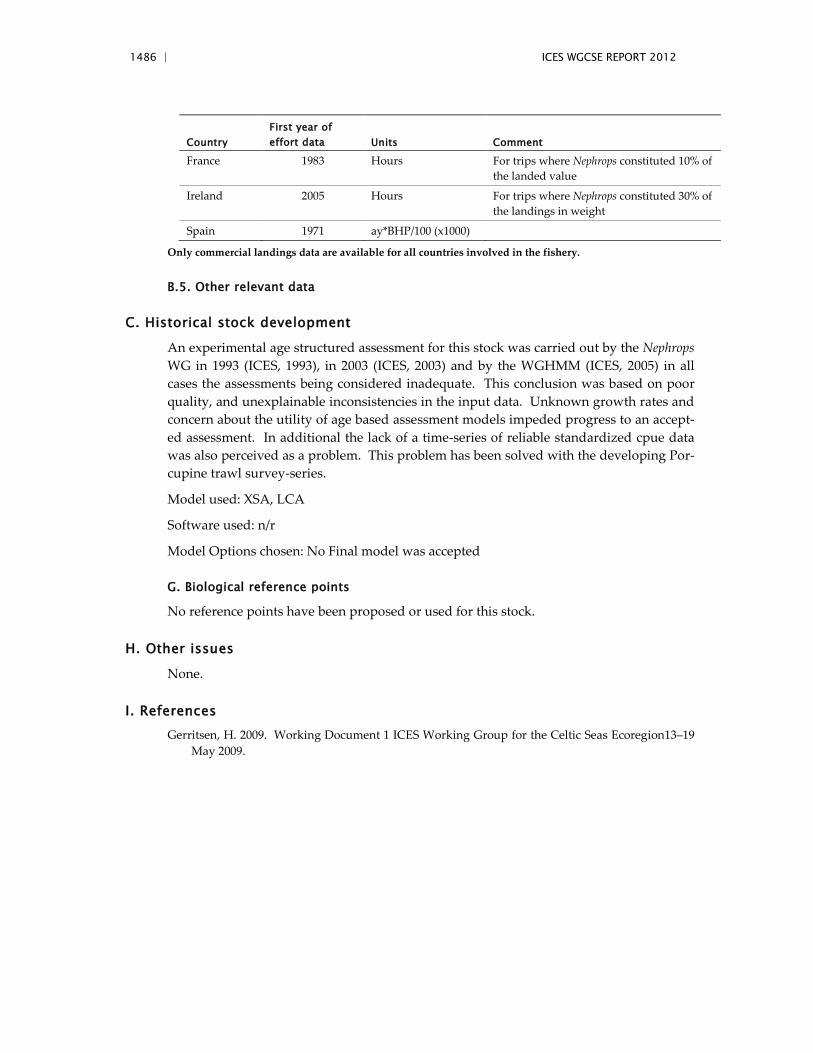
1486 | ICES WGCSE REPORT 2012
Country First year of effort data Units Comment
France 1983 Hours For trips where Nephrops constituted 10% of the landed value
Ireland 2005 Hours For trips where Nephrops constituted 30% of the landings in weight
Spain 1971 ay*BHP/100 (x1000)
Only commercial landings data are available for all countries involved in the fishery.
B.5. Other relevant data
C. Historical stock development
An experimental age structured assessment for this stock was carried out by the Nephrops WG in 1993 (ICES, 1993), in 2003 (ICES, 2003) and by the WGHMM (ICES, 2005) in all cases the assessments being considered inadequate. This conclusion was based on poor quality, and unexplainable inconsistencies in the input data. Unknown growth rates and concern about the utility of age based assessment models impeded progress to an accept-ed assessment. In additional the lack of a time-series of reliable standardized cpue data was also perceived as a problem. This problem has been solved with the developing Por-cupine trawl survey-series.
Model used: XSA, LCA
Software used: n/r
Model Options chosen: No Final model was accepted
G. Biological reference points
No reference points have been proposed or used for this stock.
H. Other issues
None.
I. References Gerritsen, H. 2009. Working Document 1 ICES Working Group for the Celtic Seas Ecoregion13–19
May 2009.
ICES WGCSE REPORT 2012 | 1487
7.7 Stock Annex Nephrops FU 20–22 (Celtic Sea; VIIfgh)
Stock specific documentation of standard assessment procedures used by ICES.
Stock Nephrops (Nephrops norvegicus) Division VIIfgh
Working Group WGCSE (Working Group for Celtic Seas Ecoregion)
Date created June 2007
Last updated May 2009
A. General
A.1. Stock definition
The management area for this stock is delimited in area VIIfgh (FU 20–22; Figure 1). The management unit is pertinent because of the sedentary feature of Nephrops. However, the sources of recruits are much more poorly defined. There is no evidence that the whole exploited area belongs to the same stock or that there are several patches linked in meta-population sense.
A.2. Fishery
Nephrops present particular ground features and in the FU 20–22 are known to occur in several areas of muddy sediment and the stock structure is uncertain. The Nephrops fish-eries target different areas and have very different size structures in Nephrops catches and landings. These fisheries also have differences in non-Nephrops bycatch composition.
As for all crustaceans, Nephrops grow by successive moults which are to a large extent tied to reproduction. For this species moult occurs twice a year, in spring and autumn until sexual maturity. Once males are sexually mature, they continue to moult twice a year while females moult only once a year in the latter spring/summer right after the hatching of their eggs. In previous references (1970–1980s), it is pointed out that matura-tion of females happens at a median size of 31 mm CL (10 cm of total length) which cor-responds to 3.5 years old individuals. There is no specific reference for the sexual maturation of males in the FU 20–22, but biological references on close areas with similar hydrological conditions (FU 15; Western Irish Sea) indicate a first size of functional ma-turity of 29–31 mm CL.
As reported by the WGNEPH 2004 and the WGSSDS 2005 and 2006, Nephrops in FU 20–22 is mainly exploited by trawlers from France, Republic of Ireland and UK although the contribution of other countries is lower. The spatial distribution of landings by statistical rectangles are provided below (Figure 2–5). It indicates heterogeneous spatial behaviour of the main fleets.
France
No major changes have taken place in the fishery for more than fifteen years apart from the implementation of a new mesh regulation in 2000 which increased the minimum codend mesh size from 80 to 100 mm (in fact, the regulation involves to 90 mm mesh size, but 100 mm meshes are adopted aiming to avoid problems with bycatch composition).
1488 | ICES WGCSE REPORT 2012
The 100 mm mesh size also allows them to switch to finfish (cod, whiting, haddock) when Nephrops catch rates are low (e.g. because of diurnal and seasonal variations of catchability for this species or during periods of bad weather). The MLS applied by the French Producers' Organisations is fixed at 11.5 cm total length (i.e. 35 mm CL). The total number of vessels from the harbours of the South Brittany remains stable (more than 90 declared Nephrops catches from the Celtic Sea in recent years, but around 70 are actually targeting this species). A part of these units (15–20) switch to other Nephrops stocks (FU16; Porcupine Bank; Figure 1) mainly in 2nd and 3rd quarters when the meteorologi-cal conditions are favourable. At the opposite, many trawlers (20–30) move towards the FU19 Nephrops (SE and SW Irish coast) mainly in autumn and winter according to diffi-culties due to weather.
Analytical investigations were carried out on the data collected in 2006 and 2007 involv-ing in the French trawlers. Global indices for fishing effort and lpue provided by this fleet (97 trawlers composed by 73 exclusive in Celtic Sea, 15 switching to Porcupine Bank i.e. FU16 and eight also targeting Nephrops in the Bay of Biscay i.e. FU 23–24) seem to be per-tinent: 99% of vessels*months registered for sales at auction can also be found in log-books (94% of French landings in 2007). In 2006, almost 50% of French landings occurred in two ICES rectangles (29E2, 30E2; the rectangle 30E2 during the 2nd quarter concentrat-ed 21% of yearly landings). In 2007, the contribution of the two rectangles 29E1 and 30E2 was 41% of yearly landings. In 2008, the rectangles 28E1 and 30E2 were represented by 44% of yearly landings. The peak of production is observed during the 2nd quarter of the year (Figure 4): in 2006, the maximum landings are obtained in June whereas a shift oc-curred in 2007 (maximum value in May which may be caused by bad meteorological conditions in June). In 2008, the shape of French landings vs. month was bi-modal (May and July were the mostly represented months).
The historical review of French landings shows that the contribution of the rectangle 31E3 (concentrating the major part of Irish landings) declined over the last ten years: from 41% of total French landings registered in 1999 this contribution is currently less than 10% (Figure 3). During the last ten years, the most productive rectangle for French trawlers was 30E2 mainly during the late 2000s: the average annual contribution of this rectangle was around 15% in the early 2000s, but this proportion reached more than 30% during the recent years. It seems that the French fleet moved gradually from 31E3 to 30E2 under the steeply increasing concentration of Irish trawlers on the "traditional" Nephrops grounds (Smalls, Labadie).
Republic of Ireland
More than 60 Irish vessels target Nephrops in the Celtic Sea. In 2007, 95 Irish trawlers were registered as landing Nephrops, but 63 of them exceeded threshold of 10 t (Figure 6). In 2008, 99 Irish vessels reported landings from this area whereas 67 of them landed more than 10 t. The fishery presents a more typical seasonal profile than the French vessels and most of the landings are made between March and July. These vessels are mid-size mul-tipurpose trawlers, with a length of 18–23 m and engine power between 250 and 350 kW. Many of the vessels switch between FU15 and FU 20–22, depending on the tides in the Irish Sea. Other vessels switch from targeting finfish in winter to Nephrops in spring and early summer. The mesh size used by Irish vessels is 80 mm, and increasingly these ves-
ICES WGCSE REPORT 2012 | 1489
sels are using twin trawls. The MLS applied by Irish trawlers is the European one fixed at 8.5 cm total length (i.e. 25 mm CL).
The Irish landings seem to be more concentrated spatially than the French. During the period 2003–2006, 63–67% of the Irish nominal landings were provided by one ICES rec-tangle (31E3). The Irish fishing effort is located more northerly than the French one.
UK
The UK fishery in the Celtic Sea has generally remained unchanged. Since the early 2000s, the number of UK Nephrops directed vessels has increased from around ten to 15, but their contributions in total landings remains minor (usually less than 50 t of land-ings). The maximum historical value of UK landings is reported in 2008 (242 t).
A.3. Ecosystem aspects
Nephrops occur in discrete patches where the sediment is suitable for them to construct their burrows. There is a larval phase of long duration where there may be some mixing with Nephrops from other areas depending on the oceanographic conditions, but the mechanisms for this in the Celtic Sea are not currently known.
Cod has been identified as a predator of Nephrops in some areas, and the generally low level of the cod stock is likely to have resulted in reduced predation on Nephrops.
B. Data
B.1. Commercial catch
Landings are reported mainly by France and the Republic of Ireland. French landings fluctuated between 2000 and 3800 t. Irish landings rose from around 500 to more than 2000 t in the last 15 years. The highest value of Irish landings is observed in 2007 (more than 3200 t). A part of this trend is due to greater accuracy of reporting mainly after the end of the late 1990s. The contribution of French landings has gradually decreased from 80–90% at the end of 1980s to 50–60% at the beginning of 2000s. Between 2004 and 2005, French landings remained stable while Irish landings steeply increased and the total har-vested quantity was the highest during the last decade. For the first time, in 2007, the Irish ladings exceeded the French ones (3230 t against 2080 t). This may be caused by constraints linked to the international context affecting fuel prices for fishing vessels. The overall fishing profile remains typically seasonal with a dominance of the 2nd and 3rd quarters (60–70%; the other quarters are less productive because of meteorological condi-tions and of less accessibility of females due to burrowing).
During the recent years, the evolution of the French fishing effort and lpue was some-times considerably different from the evolution of the same indicators for the Irish fleet (e.g. between 2004 and 2005: -5% of fishing effort and +2% of lpue for French trawlers against +50% of fishing effort and +25% of lpue for Irish trawlers). In 2007, an increase occurred for lpue values of both main fleets: a slight upwards trend of French trawlers (+13% associated to a strong reduction of the fishing effort: -25% whereas the total num-ber of vessels remained almost stable) and a steep one for the Irish fleet (+36% coinciding with +31% of the fishing effort which was displayed by an increasing number of trawlers operating in the Celtic Sea: +19% between 2006 and 2007). This underlines the divergence
1490 | ICES WGCSE REPORT 2012
of features of the targeting vessels for each country and indicates the great heterogeneity of the area. A direct comparison between both countries cannot be undertaken because the fishing effort is not available in the same unit (France: otter trawlers getting at least 10% of their total landings by targeting this species; Ireland: otter trawl vessels where >30% of monthly landings in live weight were Nephrops). Furthermore, the actual fishing areas are different and the Irish fleet is more restricted spatially as already reported by WGSSDS 2005–2008.
B.2. Biological
Natural mortality and maturity-at-age
A natural mortality of 0.3 is applied to all Nephrops males whereas the mortality of fe-males changes at the size of first maturity (occurring at 31 mm CL as explained previous-ly): a value of 0.2 is usually applied on mature individuals.
The L2AGE slicing programme usually applied on Nephrops stocks allocates length clas-ses into age groups by assuming von Bertalanffy model of individual growth. This slicing is applied to length distributions by sex. All parameters, L∞ and K by sex, calculated mean sizes by age for each sex, natural mortality and maturity by sex (assumed to be knife-edged for males and s-shaped for females) and combined are given below.
Table 1. Nephrops FU20–22 (Celtic Sea). Individual growth, natural mortality, maturity parameters by sex.
Males and immature females: L∞=68, K=0.17; mature females: L∞=49, K=0.10
age 1 2 3 4 5 6 7 8+
Size (CL mm) mm
males 11 20 27 34 39 44 47 51
females 11 20 27 32 33 35 36 37
M
males 0.3 0.3 0.3 0.3 0.3 0.3 0.3 0.3
females 0.3 0.3 0.3 0.2 0.2 0.2 0.2 0.2
combined 0.3 0.3 0.3 0.25 0.25 0.25 0.25 0.25
Maturity
males 0 0 1 1 1 1 1 1
females 0 0 0 0.5 1 1 1 1
combined 0 0 0.5 0.75 1 1 1 1
Biological sampling
Landings: The total French landings have been available since 1983 (on quarterly basis since 1987) whereas the Irish series began in 1987 (on quarterly basis since 1995).
Lpue and fishing effort: Lpue series are provided since 1987 in France while Irish data are available over 1996. It has to be noted that the French and Irish method of calculation of the fishing effort are not carried out by the same way (threshold of 10% in weight for Nephrops on total landings applied for French trawlers whereas 30% is the threshold used for Irish fleet), thus a direct comparison of those indices is not appropriate.
DLF of landings: French sampling plan at auction started in 1983, but only after 1986 the data can be used on quarterly basis. The Irish plan as written previously began in 2002 (in
ICES WGCSE REPORT 2012 | 1491
fact, solely 2003 has been entirely sampled in the FU 20–22 area; 2002s data involving the whole Management Area M: see processing by WGSSDS 2006; two quarters were not sampled in 2004 and 2005: see processing by WGSSDS 2006). For French landings, the increasing proportion of tailed individuals (see below) and the inappropriate method of sampling before the end of 2007 provided.
DLF of discards: French estimation of discards occurred only in three separate years (1985, 1991 and 1997), but only the data collected in 1997 can be included in analytical investiga-tions. The available dataset is given for only one year of discard sampling (1997) because of unavailable quarterly data for landings for the first year of discard sampling (1985) whereas data collected in 1991 were considered as unreliable (samples sorted by fisher-men). Irish sampling has been undertaken since 2002 (lack of information for two quar-ters in 2004; see processing by WGSSDS 2006).
Length compositions of the landings by sex are provided for the two main fleets, but the time-series are different. Sampling of French landings since 1984 has provided length frequencies by sex on a monthly basis. Due to uncertainty of the older datasets, the data for 1984–1986 were omitted from further analysis. The Irish sampling programme was launched in 2002 under the EU DCR and gave length frequencies for the period 2002–2006 (after simulation undertaken for some missing information in 2004 as explained during WGSSDS 2006).
French estimation of discards occurred only in several separate years (1985, 1991 and 1997; in 2005, samples for two quarters, 3rd and 4th, were also provided), but only the data collected in 1997 can be included in analytical investigations because of unavailable quarterly data on landings for the first year of discard sampling (1985) whereas data col-lected in 1991 were considered as unreliable (samples sorted by fishermen not repre-sentative of the discarding behaviour of the whole fleet). The 1997 French plan on board showed high spatial and temporal variability of discard size-composition vs. that of land-ings (CV>30%). The Irish sampling launched under DCR gave results as presented by Table 2.
The heterogeneity of the dataset in addition to that of the harvested area by each country affects the discard rate by fleet: it was higher for French vessels: 65% in 1997 against 37% for Irish in 2003 (the only one year with sampling , but only 11% during the quarters 2 and 3 in 2004) and by sex (stronger in the case of females growing less quickly).
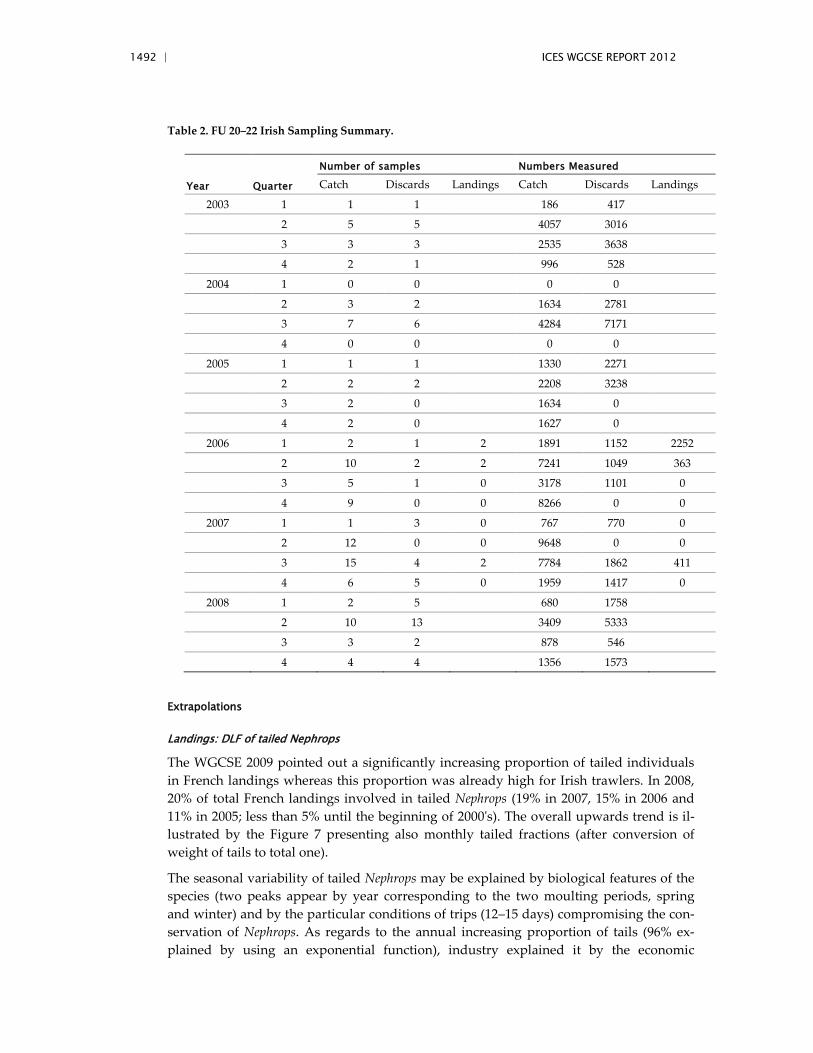
1492 | ICES WGCSE REPORT 2012
Table 2. FU 20–22 Irish Sampling Summary.
Year Quarter
Number of samples Numbers Measured
Catch Discards Landings Catch Discards Landings
2003 1 1 1 186 417
2 5 5 4057 3016
3 3 3 2535 3638
4 2 1 996 528
2004 1 0 0 0 0
2 3 2 1634 2781
3 7 6 4284 7171
4 0 0 0 0
2005 1 1 1 1330 2271
2 2 2 2208 3238
3 2 0 1634 0
4 2 0 1627 0
2006 1 2 1 2 1891 1152 2252
2 10 2 2 7241 1049 363
3 5 1 0 3178 1101 0
4 9 0 0 8266 0 0
2007 1 1 3 0 767 770 0
2 12 0 0 9648 0 0
3 15 4 2 7784 1862 411
4 6 5 0 1959 1417 0
2008 1 2 5 680 1758
2 10 13 3409 5333
3 3 2 878 546
4 4 4 1356 1573
Extrapolations
Landings: DLF of tailed Nephrops
The WGCSE 2009 pointed out a significantly increasing proportion of tailed individuals in French landings whereas this proportion was already high for Irish trawlers. In 2008, 20% of total French landings involved in tailed Nephrops (19% in 2007, 15% in 2006 and 11% in 2005; less than 5% until the beginning of 2000's). The overall upwards trend is il-lustrated by the Figure 7 presenting also monthly tailed fractions (after conversion of weight of tails to total one).
The seasonal variability of tailed Nephrops may be explained by biological features of the species (two peaks appear by year corresponding to the two moulting periods, spring and winter) and by the particular conditions of trips (12–15 days) compromising the con-servation of Nephrops. As regards to the annual increasing proportion of tails (96% ex-plained by using an exponential function), industry explained it by the economic
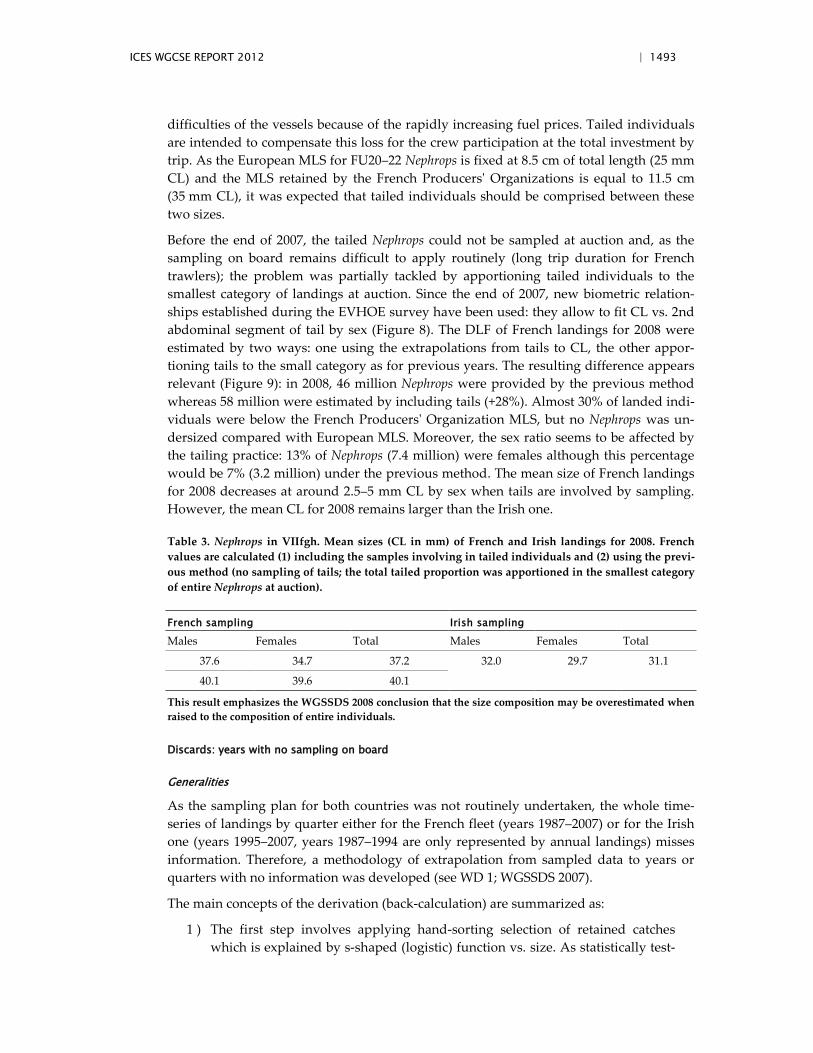
ICES WGCSE REPORT 2012 | 1493
difficulties of the vessels because of the rapidly increasing fuel prices. Tailed individuals are intended to compensate this loss for the crew participation at the total investment by trip. As the European MLS for FU20–22 Nephrops is fixed at 8.5 cm of total length (25 mm CL) and the MLS retained by the French Producers' Organizations is equal to 11.5 cm (35 mm CL), it was expected that tailed individuals should be comprised between these two sizes.
Before the end of 2007, the tailed Nephrops could not be sampled at auction and, as the sampling on board remains difficult to apply routinely (long trip duration for French trawlers); the problem was partially tackled by apportioning tailed individuals to the smallest category of landings at auction. Since the end of 2007, new biometric relation-ships established during the EVHOE survey have been used: they allow to fit CL vs. 2nd abdominal segment of tail by sex (Figure 8). The DLF of French landings for 2008 were estimated by two ways: one using the extrapolations from tails to CL, the other appor-tioning tails to the small category as for previous years. The resulting difference appears relevant (Figure 9): in 2008, 46 million Nephrops were provided by the previous method whereas 58 million were estimated by including tails (+28%). Almost 30% of landed indi-viduals were below the French Producers' Organization MLS, but no Nephrops was un-dersized compared with European MLS. Moreover, the sex ratio seems to be affected by the tailing practice: 13% of Nephrops (7.4 million) were females although this percentage would be 7% (3.2 million) under the previous method. The mean size of French landings for 2008 decreases at around 2.5–5 mm CL by sex when tails are involved by sampling. However, the mean CL for 2008 remains larger than the Irish one.
Table 3. Nephrops in VIIfgh. Mean sizes (CL in mm) of French and Irish landings for 2008. French values are calculated (1) including the samples involving in tailed individuals and (2) using the previ-ous method (no sampling of tails; the total tailed proportion was apportioned in the smallest category of entire Nephrops at auction).
French sampling Irish sampling
Males Females Total Males Females Total
37.6 34.7 37.2 32.0 29.7 31.1
40.1 39.6 40.1
This result emphasizes the WGSSDS 2008 conclusion that the size composition may be overestimated when raised to the composition of entire individuals.
Discards: years with no sampling on board
Generalities
As the sampling plan for both countries was not routinely undertaken, the whole time-series of landings by quarter either for the French fleet (years 1987–2007) or for the Irish one (years 1995–2007, years 1987–1994 are only represented by annual landings) misses information. Therefore, a methodology of extrapolation from sampled data to years or quarters with no information was developed (see WD 1; WGSSDS 2007).
The main concepts of the derivation (back-calculation) are summarized as:
1 ) The first step involves applying hand-sorting selection of retained catches which is explained by s-shaped (logistic) function vs. size. As statistically test-
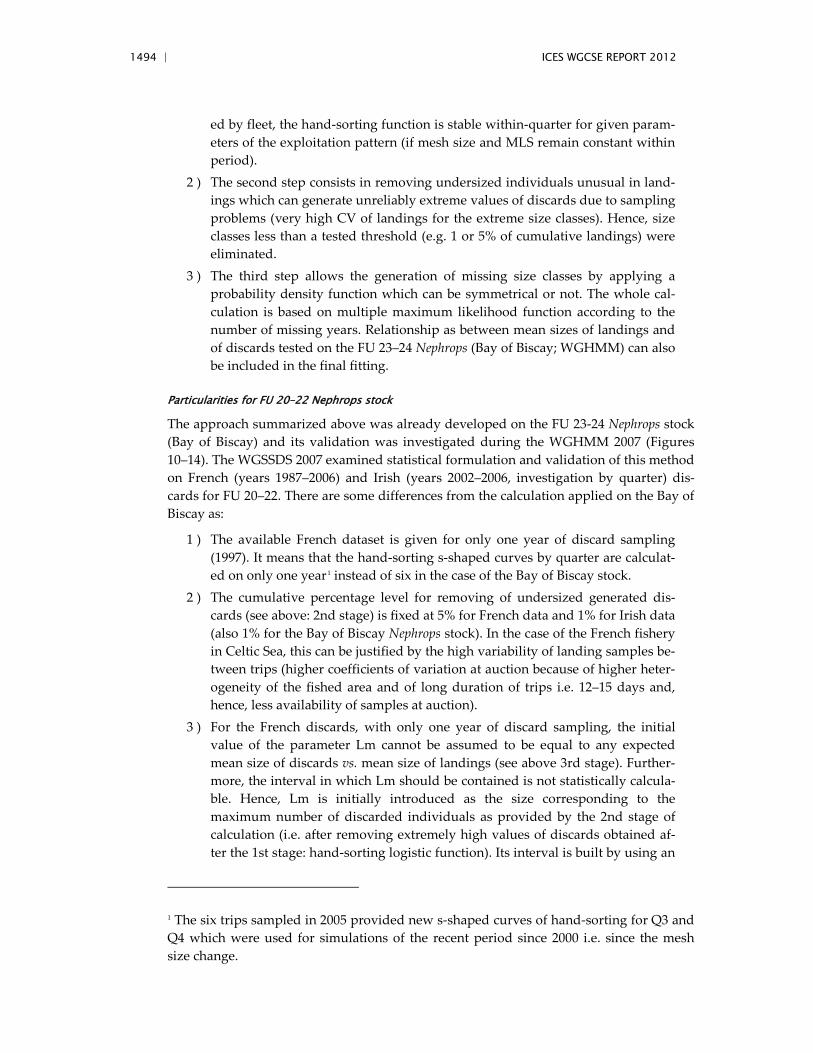
1494 | ICES WGCSE REPORT 2012
ed by fleet, the hand-sorting function is stable within-quarter for given param-eters of the exploitation pattern (if mesh size and MLS remain constant within period).
2 ) The second step consists in removing undersized individuals unusual in land-ings which can generate unreliably extreme values of discards due to sampling problems (very high CV of landings for the extreme size classes). Hence, size classes less than a tested threshold (e.g. 1 or 5% of cumulative landings) were eliminated.
3 ) The third step allows the generation of missing size classes by applying a probability density function which can be symmetrical or not. The whole cal-culation is based on multiple maximum likelihood function according to the number of missing years. Relationship as between mean sizes of landings and of discards tested on the FU 23–24 Nephrops (Bay of Biscay; WGHMM) can also be included in the final fitting.
Particularities for FU 20–22 Nephrops stock
The approach summarized above was already developed on the FU 23-24 Nephrops stock (Bay of Biscay) and its validation was investigated during the WGHMM 2007 (Figures 10–14). The WGSSDS 2007 examined statistical formulation and validation of this method on French (years 1987–2006) and Irish (years 2002–2006, investigation by quarter) dis-cards for FU 20–22. There are some differences from the calculation applied on the Bay of Biscay as:
1 ) The available French dataset is given for only one year of discard sampling (1997). It means that the hand-sorting s-shaped curves by quarter are calculat-ed on only one year1 instead of six in the case of the Bay of Biscay stock.
2 ) The cumulative percentage level for removing of undersized generated dis-cards (see above: 2nd stage) is fixed at 5% for French data and 1% for Irish data (also 1% for the Bay of Biscay Nephrops stock). In the case of the French fishery in Celtic Sea, this can be justified by the high variability of landing samples be-tween trips (higher coefficients of variation at auction because of higher heter-ogeneity of the fished area and of long duration of trips i.e. 12–15 days and, hence, less availability of samples at auction).
3 ) For the French discards, with only one year of discard sampling, the initial value of the parameter Lm cannot be assumed to be equal to any expected mean size of discards vs. mean size of landings (see above 3rd stage). Further-more, the interval in which Lm should be contained is not statistically calcula-ble. Hence, Lm is initially introduced as the size corresponding to the maximum number of discarded individuals as provided by the 2nd stage of calculation (i.e. after removing extremely high values of discards obtained af-ter the 1st stage: hand-sorting logistic function). Its interval is built by using an
1 The six trips sampled in 2005 provided new s-shaped curves of hand-sorting for Q3 and Q4 which were used for simulations of the recent period since 2000 i.e. since the mesh size change.
ICES WGCSE REPORT 2012 | 1495
a priori coefficient of variation around the initial Lm (CV of 0.10 and 0.20 were tested). For the Irish data, no constraint on relationship between mean sizes of discards and landings was set because of lack of any information on that due to the short time-series.
4 ) The large mesh size of the French vessels in the FU 20–22 area indicates that the distribution of length frequencies of discards is probably no symmetrical because of selectivity effects which should be more significant than for the FU23–24 stock or for the Irish trawlers in the FU 20–22.
5 ) For French discards, the absence of reference about any relationship between mean sizes of landings and discards at the opposite of the Bay of Biscay, im-plies that the final fitting aims to provide the more linear as possible relation-ship (after log–log transformation) with only one reference point (year 1997). Hence, the optimization is more based on geometric concept than on statistical one.
1st stage: the s-shaped hand-sorting curve
Let j be a year with no dataset on discards. By quarter k, the number of discarded indi-viduals by sex (m or f) and by size L, NDjklm (or NDjklf), is not calculated on data provided from other years, but from the number of landed individuals NLiklm (or NLiklf) during the same year, quarter k, sex (m or f) and size L:
))50.(exp(. kkjklmjklm LLNLND −−= α or ))50.(exp(. kkjklfjklf LLNLND −−= α
[1]
αk and L50k are the parameters of the s-shaped curve (logistic model) fitted by quarter k describing the commercial Nephrops hand-sorting on board. For this fitting, both sexes are combined and the dependent variable is expressed by the number of landed individuals for size L and the independent one is the total number of catches by size L for the years with discard sampling on board.
The estimates αk and L50k were calculated by assuming the stability of hand-sorting pro-cess on board if mesh size and MLS remain unchanged. The short Irish time-series 2002–2006 was considered as a common dataset, but, for the French trawlers, the overall time-series was divided into three periods:
1 ) Years 1987–1990: The results of sampling carried out in 1985 are not available on computing support. Thus, there is no formal information if the hand-sorting on board could be approximated by the more recent parameters of 1990s. α and L50 were not got fixed, but their values were estimated by the multiple likelihood function as for the parameters of the probability density by year (see below).
2 ) Years 1991–1999: The hand-sorting was fitted on data from 1997 (1991s data were not representative of the whole fleet). The missing data of years 1991–1996 and 1998–1999 were therefore estimated.
3 ) Years 2000–2006: Because of the mesh size change, the hand-sorting should be different from 1997s sampling data. However, there is no new information for the 1st and 2nd quarters (the 2005s sampling plan provided relevant results only for the 3rd and 4th quarters). Hence, α and L50 for the first two quarters
1496 | ICES WGCSE REPORT 2012
were fixed equal to 1997s parameters, but the simulation for the other two quarters is based on 2005s data.
2nd stage: removing of unreliable size classes of discards
This derivation approach reduces interdependence between yearly datasets which may induce lack of contrast in recruitment time-series. Despite that, some inconveniencies of the new approach have to be taken into account: (1) the hand-sorting on-board s-shaped curve implies that, for a given size class, no calculation of discards is possible while there is no landed individuals and (2) the exponential expression gives extremely unreliable high values of discards when undersized individuals are sampled in landings (mainly because of hand-sorting deviation due to sampling rate not representative for extreme size classes).
1 ) Undersized individuals unusual in landings. As written previously, undersized Nephrops sampled in landings should produce unreliable high discarded amounts by size because of the exponential calculation. All size classes repre-senting less than a minimum cumulative percentage level in landings by year were removed (5% for French landings, 1% for Irish landings).
2 ) Discarded individuals by size exceeding observed mean ratios discards/landings. Gen-erated discarded numbers were removed when the calculated ratio dis-cards/landings by size (decreasing function vs. size) exceeded observed mean ratios by size2. Almost all size classes involved by (2) were already removed by (1). This operation was added at the aim of elimination of not normally high ratios discards/landings for large sizes (which has a little impact on total dis-carded number due to the s-shaped function of hand-sorting).
This calculation process retains only a part of the initial hand-sorting generated distribu-tions of discards mainly the decreasing part of discarded individuals.
3rd stage: simulation of densities of probability of discarded individuals (yearly distribution for French and quarterly for Irish discards)
Finally, the assumed distribution of discards for the whole range of sizes was calculated from the descending part. This process needs to input the probability density of discards given by:
).(exp(1)( LmLL −+= βαϕ [2]
where α, β, Lm are coefficients of the distribution (φ(L)=α/2 when L=Lm).
Because of the assumed skewness for the French discard distribution, as explained above, the whole function of the probability density is approximated by:
).(exp(1)( LmLL −−+= γβαϕ for L≤Lm
2 This procedure is performed only on Irish dataset whereas it is not pertinent for French data (only one year dataset).
ICES WGCSE REPORT 2012 | 1497
).(exp(1)( LmLL −+= βαϕ for L>Lm
[3]
with a complementary coefficient γ: if γ=1 the whole probability density is symmetrical, if γ<1 the skewness of the distribution is positive if γ>1 the skewness is negative (γ=1 for Irish discards, γ≠1 for French discards).
The fitting of φ(L) is processed on two stages:
• Lm and α are fixed: α is initially fixed at 2*φmax which is the maximum fre-quency retained after the 2nd stage of calculation (see above), Lm is fixed at the size corresponding to the maximum number of discarded individuals as provided by the 2nd stage of calculation (see previously) and, hence, β is given by:
LmLnL
LL Ln−−+
=
−= ∑
11min
min1)(
max.2ln1ϕϕβ [4]
(Lmin= first size represented by not null individuals and n= number of total size classes with discards different from zero).
All parameters are estimated: α, β, Lm got obtained by the 1st stage are input for the final calculation using Newton cancellation of gradient and assuming stochastic approach for Lm. Lm is assumed to be included in the interval defined accordingly to an a priori CV of Lm (see above)3.
Otherwise, the final run includes constraints as:
• The sum of frequencies for descending part of distribution is equal to that cal-culated by the model i.e. the retained values of the 2nd stage of calculation de-scribed previously are assumed to be reliable.
• Lm ≥ Lmin [Lmin=(1-Z1-α/2.CV)*Lm] (usually: α=0.05=>Z1-α/2=1.96) • Lm ≤ Lmax [Lmax=(1+ Z1-α/2.CV)*Lm] • For French discards, the coefficient of determination of the relationship be-
tween the mean sizes of landings and the mean sizes of discards for missing years has to be as close as possible to 1 (with no possibility of statistical test be-cause of only one year dataset).
• Statistical formulation and validation
Calculation of variances
Matrix of variances-covariances of model parameters
The Generalized Reduced Gradient and the Complex method do not give an estimate of the matrix of variances–covariances of the four (three for Irish) parameters. In this case, it is usually recommended to apply non-parametric techniques such as the Bootstrap meth-
3 For French discards, are also included in the optimisation algorithm, the parameters α and L50 of the first period (1987–1990) which remained unknown.
1498 | ICES WGCSE REPORT 2012
od. The calculation can also be carried out according to parametric procedure (Lin, 1987; Fifas and Berthou, 1999; Fifas et al., 2004) using Jacobian matrix (i.e. matrix of partial de-rivatives of the objective).
The matrix of variances–covariances is obtained by the following relationship:
[M] = s².[I]-1 [5]
with:
[M]= matrix of variances-covariances; [I]-1= inverse of matrix of information; s²= sum of mean residual squares of the fitted function (s²=SCE/DDL4):
2
1
2
1 ).(exp(1)().(exp(1)(
−+−+
−−+−= ∑∑>=
+=
<
= LmLLLmLLSCEi
i
LmLj
jiii
LmLj
i βαϕγβ
αϕ
[6]
The matrix of information is obtained by:
[I] = [J]’.[J] [7]
[J] is the Jacobian matrix (nc rows and 4 columns for French data, 3 for Irish):
[ ]
∂
∂
∂∂
=
LmLLLL
LmLLLL
LmLLLL
J
ncncncnc
∂∂ϕ
∂γ∂ϕ
∂β∂ϕ
α∂ϕ
∂∂ϕ
∂γ∂ϕ
∂β∂ϕ
α∂ϕ
∂ϕ∂γ
∂ϕ∂β
∂ϕα
∂ϕ
)()()()(...............
)()()()(
)()()()(
2222
1111
[8]
[J]’ is the transpose of [J], the partial derivatives of the equation [8], also defined as abso-lute coefficients of sensitivity of order 1 written as a(α), a(β), a(γ), a(Lm) are given below:
αϕ
α∂ϕ )()( LL =∂ [9]
))(1).(()..()(αϕϕγβ
∂ϕ LLLmLL −−=∂ if L ≤ Lm [10a]
))(1).(().()(αϕϕβ
∂ϕ LLLmLL −−−=∂ if L > Lm [10b]
))(1).(()..()(αϕϕβγ
∂ϕ LLLmLL −−=∂ if L ≤ Lm [11a]
0)( =∂γ∂ϕ L if L > Lm [11b]
4 DDL is equal to nc-4 for French discards, but equal to nc-3 for Irish data (parameter γ is omitted).
ICES WGCSE REPORT 2012 | 1499
))(1).((..)(αϕϕγβ∂ϕ LLLm
L −−=∂ if L ≤ Lm [12a]
))(1).((.)(αϕϕβγ
∂ϕ LLL −=∂ if L > Lm [12b]
Uncertainty of simulated discards
The matrix of variances–covariances of the four (three for Irish) parameters of the model and the use of partial derivatives of order 1 provide an approximate calculation of the variance of the variable Ψ(L) corresponding to simulated discards vs. size L. This proce-dure is based on limited developments of order 1 in Taylor’s series (known as Delta methods: Laurec, 1986; Laurec and Mesnil, 1987; Chevaillier, 1990; Chevaillier and Lau-rec, 1990; Fifas and Berthou, 1999; Fifas et al., 2004).
By using Taylor’s polynomial on a function Φ against parameters θ1, θ2, …, θk it is possi-ble to present the variance of Φ by:
[ ] [ ] [ ]∑ ∑∑−
= +== ∂Φ∂
∂Φ∂
+
∂Φ∂
≈Φ1
1 11
2
,..2.k
i
k
ijji
k
ii Cov
jiV
iV θθ
θθθ
θ [13]
Then, the variance of simulated discards vs. size, V[Ψ(L)], is written as:
+++++≈Ψ ],[).().(.2][)².(][)².(][)².(][)².()]([ βαβαγγββαα CovaaLmVLmaVaVaVaLV
++++ ],[).().(.2],[).().(.2],[).().(.2],[).().(.2 LmCovLmaaCovaaLmCovLmaaCovaa ββγβγβααγαγα
],[).().(.2 LmCovLmaa γγ [14]
where the absolute coefficients of sensitivity of order 1 (partial derivatives) are defined above (equations [9] to [12]).
Validation
The generated by simulation values are tested against discards estimated by sampling. This procedure is undertaken on French data of 1997 and also on available Irish set (all quarters of 2003, 2004-Q2, 2004-Q3, 2005-Q1, 2005-Q2, 2006 apart from Q4 i.e. 11 quar-ters). As performed for the Bay of Biscay Nephrops stock, this validation involves in three main stages (Figures 10–14): (1) Examination of the total amount of discards calculated by simulation that should not be significantly different from that obtained by sampling. (2) Test by linear regression performed on simulated numbers vs. size as dependent variable against sampled numbers as independent one. The slope of this relationship should not be significantly different from 1 (bisecting line) and the intercept should not be signifi-cantly different from 0. (3) Test of cumulative frequencies of the sets, sampled and simu-lated, using non parametric approaches such as Kolmogorov–Smirnov.
Results
Hand-sorting s-shaped curves
The French and Irish hand-sorting logistic curves estimated by sampling are provided by Figure 15. In the Table 4, are also presented the French parameters involving in years
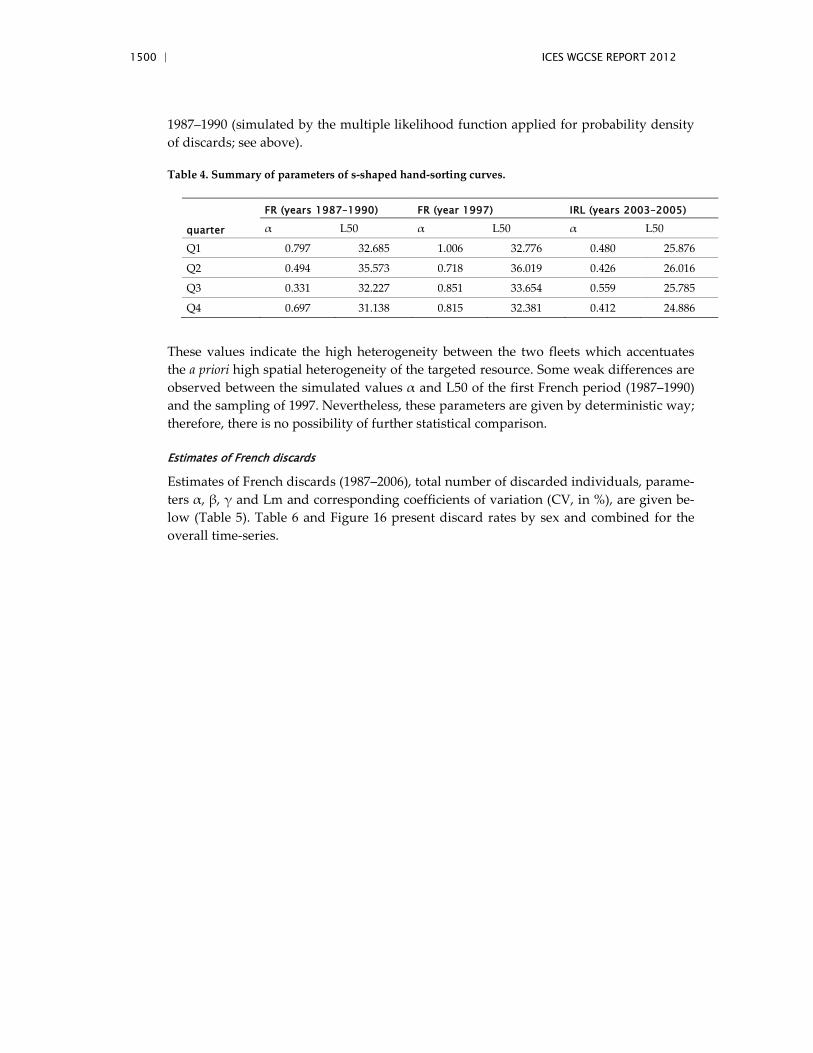
1500 | ICES WGCSE REPORT 2012
1987–1990 (simulated by the multiple likelihood function applied for probability density of discards; see above).
Table 4. Summary of parameters of s-shaped hand-sorting curves.
quarter
FR (years 1987–1990) FR (year 1997) IRL (years 2003–2005)
α L50 α L50 α L50
Q1 0.797 32.685 1.006 32.776 0.480 25.876
Q2 0.494 35.573 0.718 36.019 0.426 26.016
Q3 0.331 32.227 0.851 33.654 0.559 25.785
Q4 0.697 31.138 0.815 32.381 0.412 24.886
These values indicate the high heterogeneity between the two fleets which accentuates the a priori high spatial heterogeneity of the targeted resource. Some weak differences are observed between the simulated values α and L50 of the first French period (1987–1990) and the sampling of 1997. Nevertheless, these parameters are given by deterministic way; therefore, there is no possibility of further statistical comparison.
Estimates of French discards
Estimates of French discards (1987–2006), total number of discarded individuals, parame-ters α, β, γ and Lm and corresponding coefficients of variation (CV, in %), are given be-low (Table 5). Table 6 and Figure 16 present discard rates by sex and combined for the overall time-series.
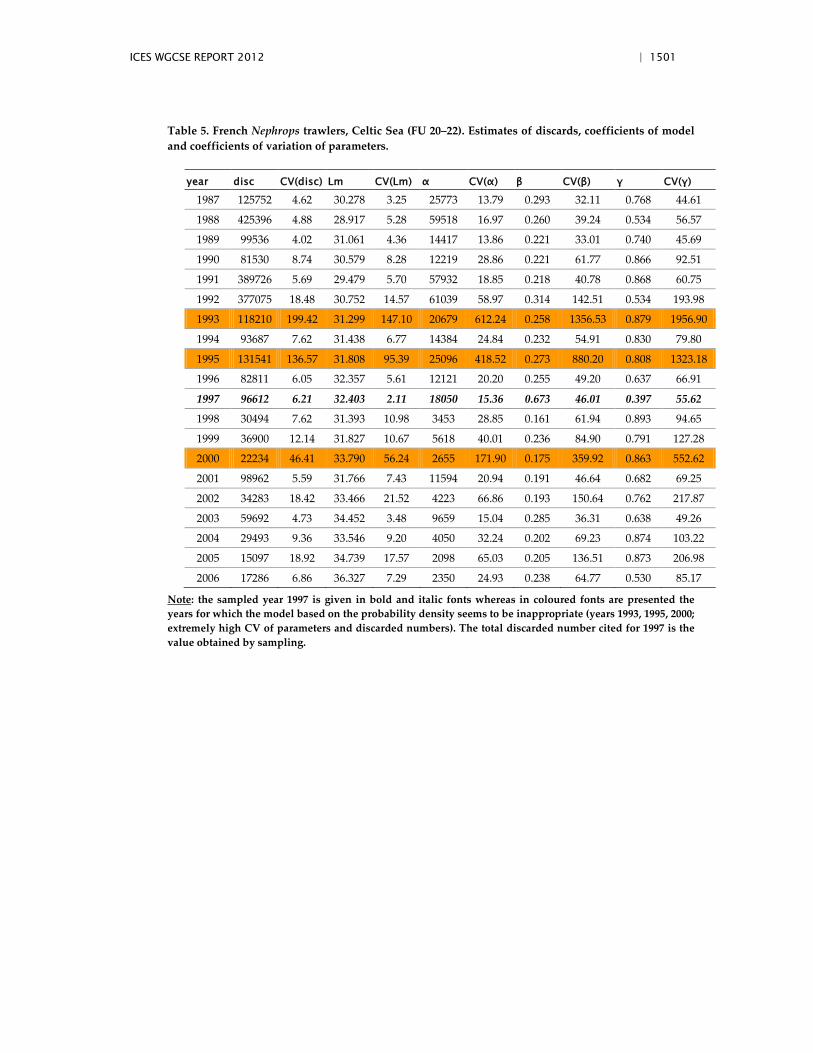
ICES WGCSE REPORT 2012 | 1501
Table 5. French Nephrops trawlers, Celtic Sea (FU 20–22). Estimates of discards, coefficients of model and coefficients of variation of parameters.
year disc CV(disc) Lm CV(Lm) α CV(α) β CV(β) γ CV(γ)
1987 125752 4.62 30.278 3.25 25773 13.79 0.293 32.11 0.768 44.61
1988 425396 4.88 28.917 5.28 59518 16.97 0.260 39.24 0.534 56.57
1989 99536 4.02 31.061 4.36 14417 13.86 0.221 33.01 0.740 45.69
1990 81530 8.74 30.579 8.28 12219 28.86 0.221 61.77 0.866 92.51
1991 389726 5.69 29.479 5.70 57932 18.85 0.218 40.78 0.868 60.75
1992 377075 18.48 30.752 14.57 61039 58.97 0.314 142.51 0.534 193.98
1993 118210 199.42 31.299 147.10 20679 612.24 0.258 1356.53 0.879 1956.90
1994 93687 7.62 31.438 6.77 14384 24.84 0.232 54.91 0.830 79.80
1995 131541 136.57 31.808 95.39 25096 418.52 0.273 880.20 0.808 1323.18
1996 82811 6.05 32.357 5.61 12121 20.20 0.255 49.20 0.637 66.91
1997 96612 6.21 32.403 2.11 18050 15.36 0.673 46.01 0.397 55.62
1998 30494 7.62 31.393 10.98 3453 28.85 0.161 61.94 0.893 94.65
1999 36900 12.14 31.827 10.67 5618 40.01 0.236 84.90 0.791 127.28
2000 22234 46.41 33.790 56.24 2655 171.90 0.175 359.92 0.863 552.62
2001 98962 5.59 31.766 7.43 11594 20.94 0.191 46.64 0.682 69.25
2002 34283 18.42 33.466 21.52 4223 66.86 0.193 150.64 0.762 217.87
2003 59692 4.73 34.452 3.48 9659 15.04 0.285 36.31 0.638 49.26
2004 29493 9.36 33.546 9.20 4050 32.24 0.202 69.23 0.874 103.22
2005 15097 18.92 34.739 17.57 2098 65.03 0.205 136.51 0.873 206.98
2006 17286 6.86 36.327 7.29 2350 24.93 0.238 64.77 0.530 85.17
Note: the sampled year 1997 is given in bold and italic fonts whereas in coloured fonts are presented the years for which the model based on the probability density seems to be inappropriate (years 1993, 1995, 2000; extremely high CV of parameters and discarded numbers). The total discarded number cited for 1997 is the value obtained by sampling.
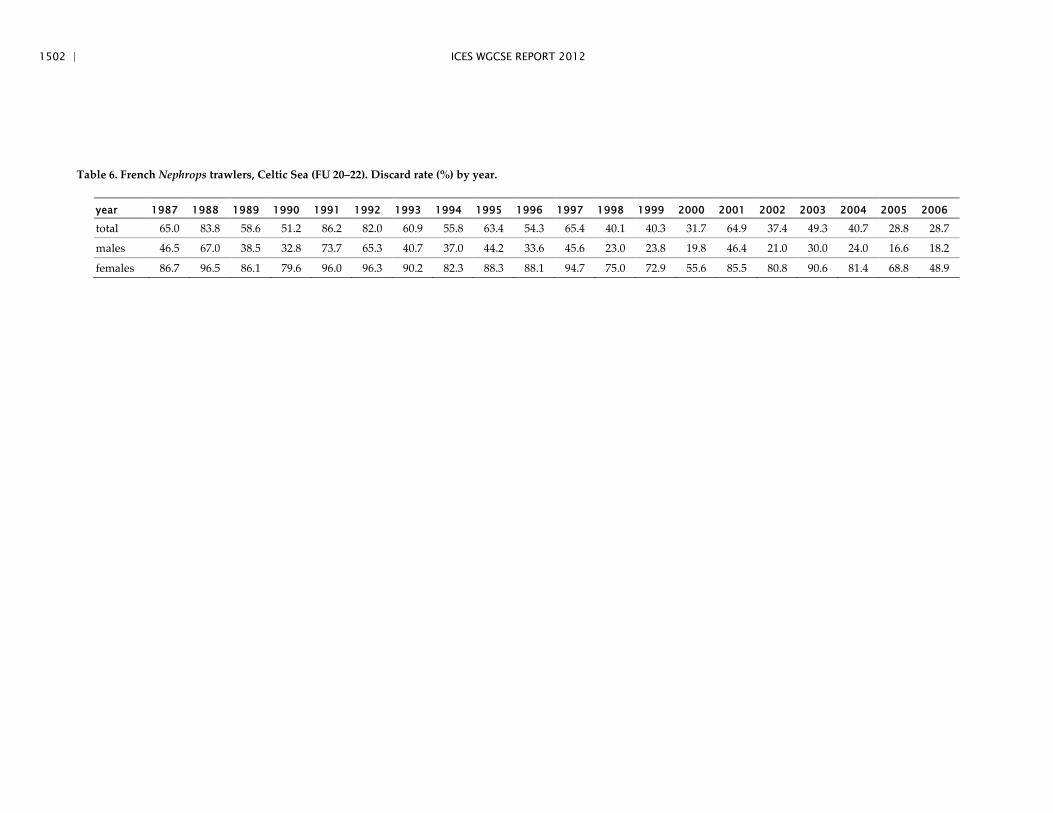
1502 | ICES WGCSE REPORT 2012
Table 6. French Nephrops trawlers, Celtic Sea (FU 20–22). Discard rate (%) by year.
year 1987 1988 1989 1990 1991 1992 1993 1994 1995 1996 1997 1998 1999 2000 2001 2002 2003 2004 2005 2006
total 65.0 83.8 58.6 51.2 86.2 82.0 60.9 55.8 63.4 54.3 65.4 40.1 40.3 31.7 64.9 37.4 49.3 40.7 28.8 28.7
males 46.5 67.0 38.5 32.8 73.7 65.3 40.7 37.0 44.2 33.6 45.6 23.0 23.8 19.8 46.4 21.0 30.0 24.0 16.6 18.2
females 86.7 96.5 86.1 79.6 96.0 96.3 90.2 82.3 88.3 88.1 94.7 75.0 72.9 55.6 85.5 80.8 90.6 81.4 68.8 48.9
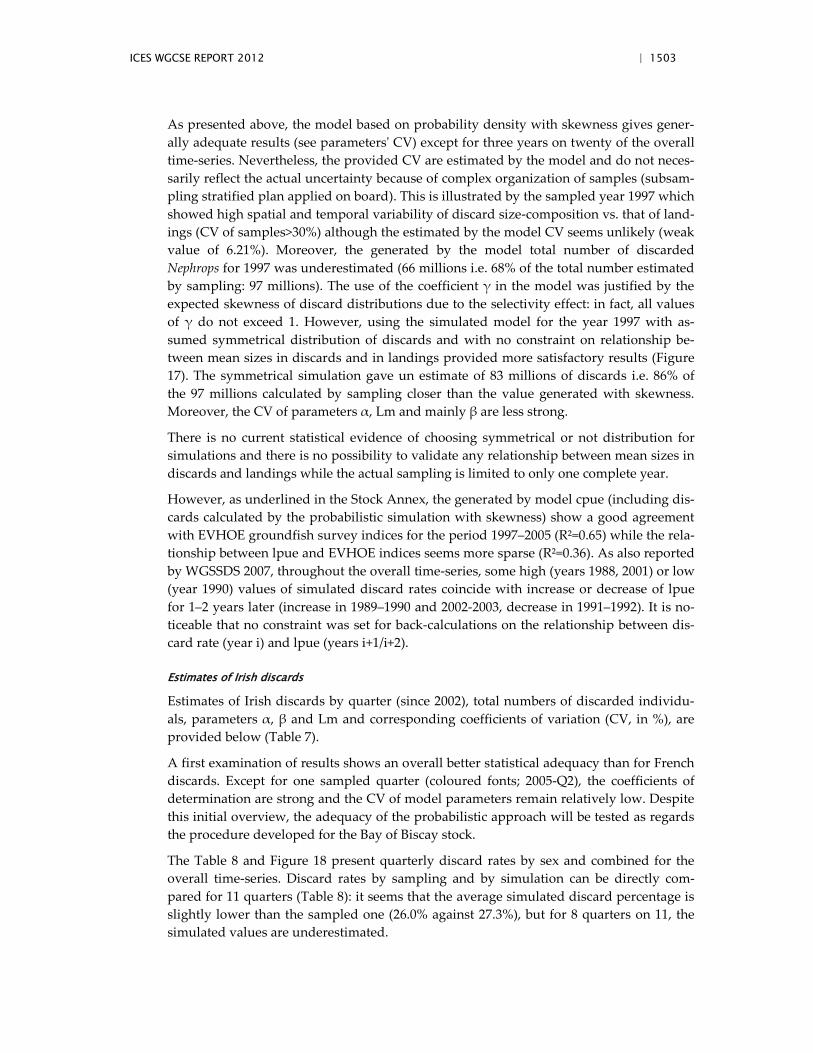
ICES WGCSE REPORT 2012 | 1503
As presented above, the model based on probability density with skewness gives gener-ally adequate results (see parameters' CV) except for three years on twenty of the overall time-series. Nevertheless, the provided CV are estimated by the model and do not neces-sarily reflect the actual uncertainty because of complex organization of samples (subsam-pling stratified plan applied on board). This is illustrated by the sampled year 1997 which showed high spatial and temporal variability of discard size-composition vs. that of land-ings (CV of samples>30%) although the estimated by the model CV seems unlikely (weak value of 6.21%). Moreover, the generated by the model total number of discarded Nephrops for 1997 was underestimated (66 millions i.e. 68% of the total number estimated by sampling: 97 millions). The use of the coefficient γ in the model was justified by the expected skewness of discard distributions due to the selectivity effect: in fact, all values of γ do not exceed 1. However, using the simulated model for the year 1997 with as-sumed symmetrical distribution of discards and with no constraint on relationship be-tween mean sizes in discards and in landings provided more satisfactory results (Figure 17). The symmetrical simulation gave un estimate of 83 millions of discards i.e. 86% of the 97 millions calculated by sampling closer than the value generated with skewness. Moreover, the CV of parameters α, Lm and mainly β are less strong.
There is no current statistical evidence of choosing symmetrical or not distribution for simulations and there is no possibility to validate any relationship between mean sizes in discards and landings while the actual sampling is limited to only one complete year.
However, as underlined in the Stock Annex, the generated by model cpue (including dis-cards calculated by the probabilistic simulation with skewness) show a good agreement with EVHOE groundfish survey indices for the period 1997–2005 (R²=0.65) while the rela-tionship between lpue and EVHOE indices seems more sparse (R²=0.36). As also reported by WGSSDS 2007, throughout the overall time-series, some high (years 1988, 2001) or low (year 1990) values of simulated discard rates coincide with increase or decrease of lpue for 1–2 years later (increase in 1989–1990 and 2002-2003, decrease in 1991–1992). It is no-ticeable that no constraint was set for back-calculations on the relationship between dis-card rate (year i) and lpue (years i+1/i+2).
Estimates of Irish discards
Estimates of Irish discards by quarter (since 2002), total numbers of discarded individu-als, parameters α, β and Lm and corresponding coefficients of variation (CV, in %), are provided below (Table 7).
A first examination of results shows an overall better statistical adequacy than for French discards. Except for one sampled quarter (coloured fonts; 2005-Q2), the coefficients of determination are strong and the CV of model parameters remain relatively low. Despite this initial overview, the adequacy of the probabilistic approach will be tested as regards the procedure developed for the Bay of Biscay stock.
The Table 8 and Figure 18 present quarterly discard rates by sex and combined for the overall time-series. Discard rates by sampling and by simulation can be directly com-pared for 11 quarters (Table 8): it seems that the average simulated discard percentage is slightly lower than the sampled one (26.0% against 27.3%), but for 8 quarters on 11, the simulated values are underestimated.
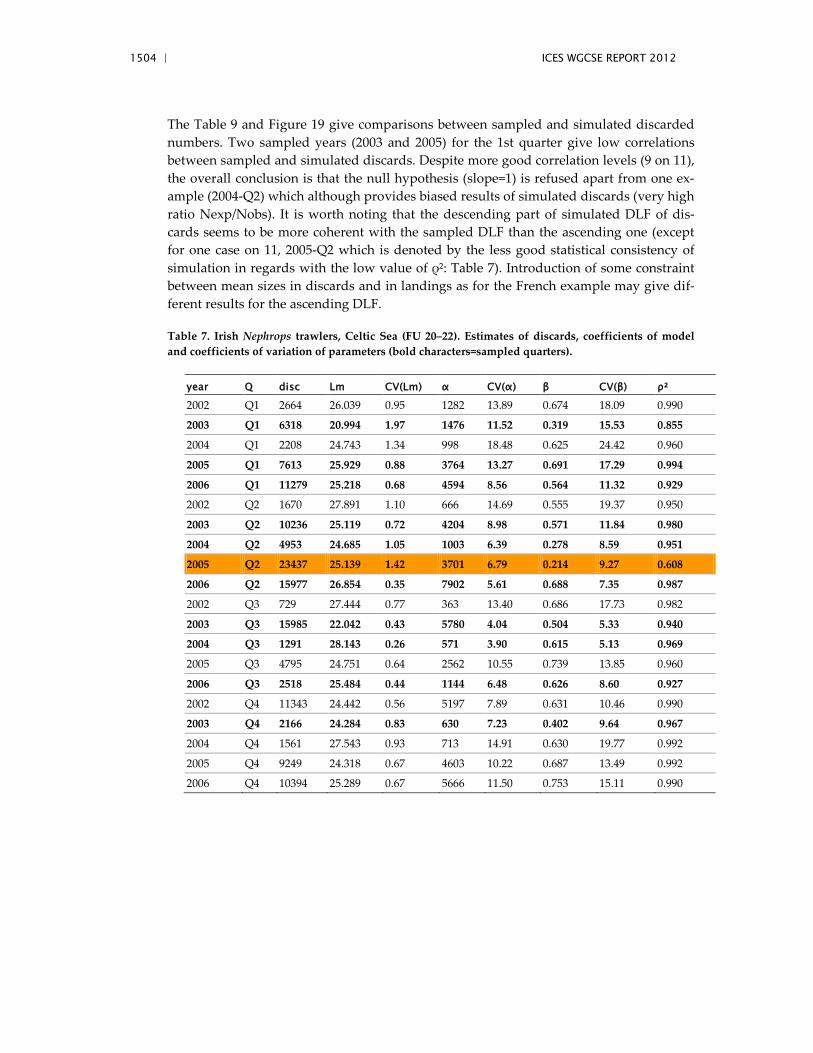
1504 | ICES WGCSE REPORT 2012
The Table 9 and Figure 19 give comparisons between sampled and simulated discarded numbers. Two sampled years (2003 and 2005) for the 1st quarter give low correlations between sampled and simulated discards. Despite more good correlation levels (9 on 11), the overall conclusion is that the null hypothesis (slope=1) is refused apart from one ex-ample (2004-Q2) which although provides biased results of simulated discards (very high ratio Nexp/Nobs). It is worth noting that the descending part of simulated DLF of dis-cards seems to be more coherent with the sampled DLF than the ascending one (except for one case on 11, 2005-Q2 which is denoted by the less good statistical consistency of simulation in regards with the low value of ρ²: Table 7). Introduction of some constraint between mean sizes in discards and in landings as for the French example may give dif-ferent results for the ascending DLF.
Table 7. Irish Nephrops trawlers, Celtic Sea (FU 20–22). Estimates of discards, coefficients of model and coefficients of variation of parameters (bold characters=sampled quarters).
year Q disc Lm CV(Lm) α CV(α) β CV(β) ρ²
2002 Q1 2664 26.039 0.95 1282 13.89 0.674 18.09 0.990
2003 Q1 6318 20.994 1.97 1476 11.52 0.319 15.53 0.855
2004 Q1 2208 24.743 1.34 998 18.48 0.625 24.42 0.960
2005 Q1 7613 25.929 0.88 3764 13.27 0.691 17.29 0.994
2006 Q1 11279 25.218 0.68 4594 8.56 0.564 11.32 0.929
2002 Q2 1670 27.891 1.10 666 14.69 0.555 19.37 0.950
2003 Q2 10236 25.119 0.72 4204 8.98 0.571 11.84 0.980
2004 Q2 4953 24.685 1.05 1003 6.39 0.278 8.59 0.951
2005 Q2 23437 25.139 1.42 3701 6.79 0.214 9.27 0.608
2006 Q2 15977 26.854 0.35 7902 5.61 0.688 7.35 0.987
2002 Q3 729 27.444 0.77 363 13.40 0.686 17.73 0.982
2003 Q3 15985 22.042 0.43 5780 4.04 0.504 5.33 0.940
2004 Q3 1291 28.143 0.26 571 3.90 0.615 5.13 0.969
2005 Q3 4795 24.751 0.64 2562 10.55 0.739 13.85 0.960
2006 Q3 2518 25.484 0.44 1144 6.48 0.626 8.60 0.927
2002 Q4 11343 24.442 0.56 5197 7.89 0.631 10.46 0.990
2003 Q4 2166 24.284 0.83 630 7.23 0.402 9.64 0.967
2004 Q4 1561 27.543 0.93 713 14.91 0.630 19.77 0.992
2005 Q4 9249 24.318 0.67 4603 10.22 0.687 13.49 0.992
2006 Q4 10394 25.289 0.67 5666 11.50 0.753 15.11 0.990
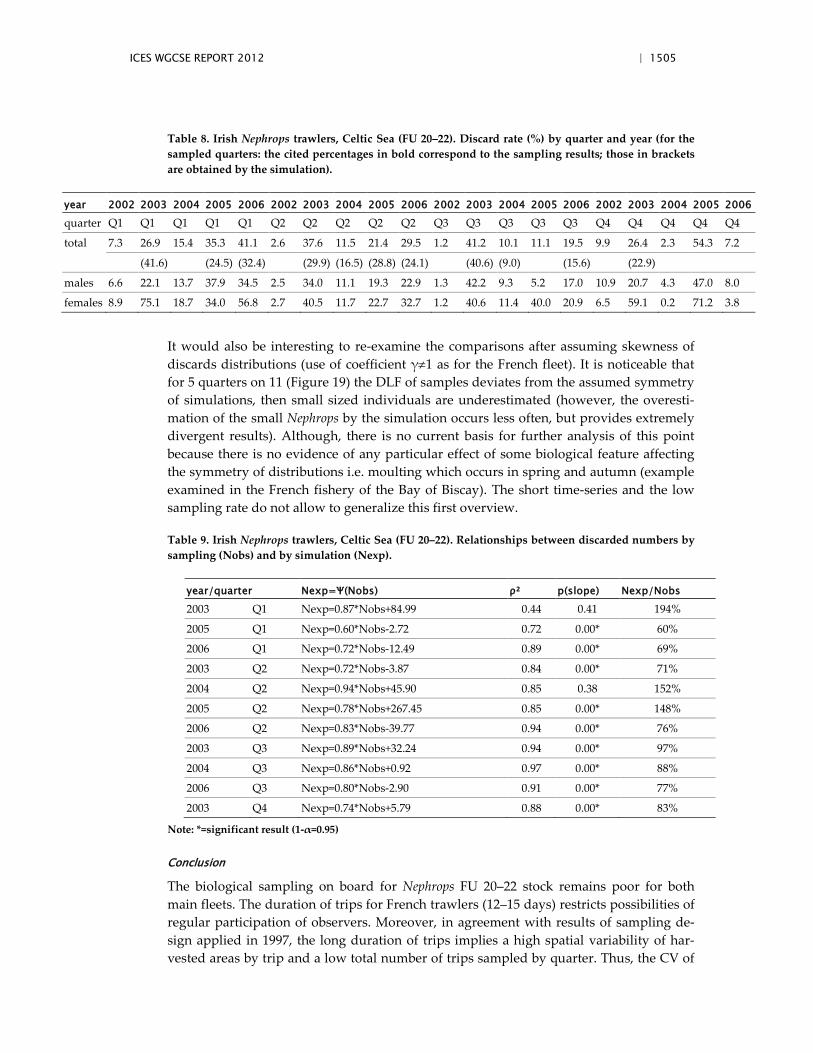
ICES WGCSE REPORT 2012 | 1505
Table 8. Irish Nephrops trawlers, Celtic Sea (FU 20–22). Discard rate (%) by quarter and year (for the sampled quarters: the cited percentages in bold correspond to the sampling results; those in brackets are obtained by the simulation).
year 2002 2003 2004 2005 2006 2002 2003 2004 2005 2006 2002 2003 2004 2005 2006 2002 2003 2004 2005 2006
quarter Q1 Q1 Q1 Q1 Q1 Q2 Q2 Q2 Q2 Q2 Q3 Q3 Q3 Q3 Q3 Q4 Q4 Q4 Q4 Q4
total 7.3 26.9 15.4 35.3 41.1 2.6 37.6 11.5 21.4 29.5 1.2 41.2 10.1 11.1 19.5 9.9 26.4 2.3 54.3 7.2
(41.6) (24.5) (32.4) (29.9) (16.5) (28.8) (24.1) (40.6) (9.0) (15.6) (22.9)
males 6.6 22.1 13.7 37.9 34.5 2.5 34.0 11.1 19.3 22.9 1.3 42.2 9.3 5.2 17.0 10.9 20.7 4.3 47.0 8.0
females 8.9 75.1 18.7 34.0 56.8 2.7 40.5 11.7 22.7 32.7 1.2 40.6 11.4 40.0 20.9 6.5 59.1 0.2 71.2 3.8
It would also be interesting to re-examine the comparisons after assuming skewness of discards distributions (use of coefficient γ≠1 as for the French fleet). It is noticeable that for 5 quarters on 11 (Figure 19) the DLF of samples deviates from the assumed symmetry of simulations, then small sized individuals are underestimated (however, the overesti-mation of the small Nephrops by the simulation occurs less often, but provides extremely divergent results). Although, there is no current basis for further analysis of this point because there is no evidence of any particular effect of some biological feature affecting the symmetry of distributions i.e. moulting which occurs in spring and autumn (example examined in the French fishery of the Bay of Biscay). The short time-series and the low sampling rate do not allow to generalize this first overview.
Table 9. Irish Nephrops trawlers, Celtic Sea (FU 20–22). Relationships between discarded numbers by sampling (Nobs) and by simulation (Nexp).
year/quarter Nexp=Ψ(Nobs) ρ² p(slope) Nexp/Nobs
2003 Q1 Nexp=0.87*Nobs+84.99 0.44 0.41 194%
2005 Q1 Nexp=0.60*Nobs-2.72 0.72 0.00* 60%
2006 Q1 Nexp=0.72*Nobs-12.49 0.89 0.00* 69%
2003 Q2 Nexp=0.72*Nobs-3.87 0.84 0.00* 71%
2004 Q2 Nexp=0.94*Nobs+45.90 0.85 0.38 152%
2005 Q2 Nexp=0.78*Nobs+267.45 0.85 0.00* 148%
2006 Q2 Nexp=0.83*Nobs-39.77 0.94 0.00* 76%
2003 Q3 Nexp=0.89*Nobs+32.24 0.94 0.00* 97%
2004 Q3 Nexp=0.86*Nobs+0.92 0.97 0.00* 88%
2006 Q3 Nexp=0.80*Nobs-2.90 0.91 0.00* 77%
2003 Q4 Nexp=0.74*Nobs+5.79 0.88 0.00* 83%
Note: *=significant result (1-α=0.95)
Conclusion
The biological sampling on board for Nephrops FU 20–22 stock remains poor for both main fleets. The duration of trips for French trawlers (12–15 days) restricts possibilities of regular participation of observers. Moreover, in agreement with results of sampling de-sign applied in 1997, the long duration of trips implies a high spatial variability of har-vested areas by trip and a low total number of trips sampled by quarter. Thus, the CV of
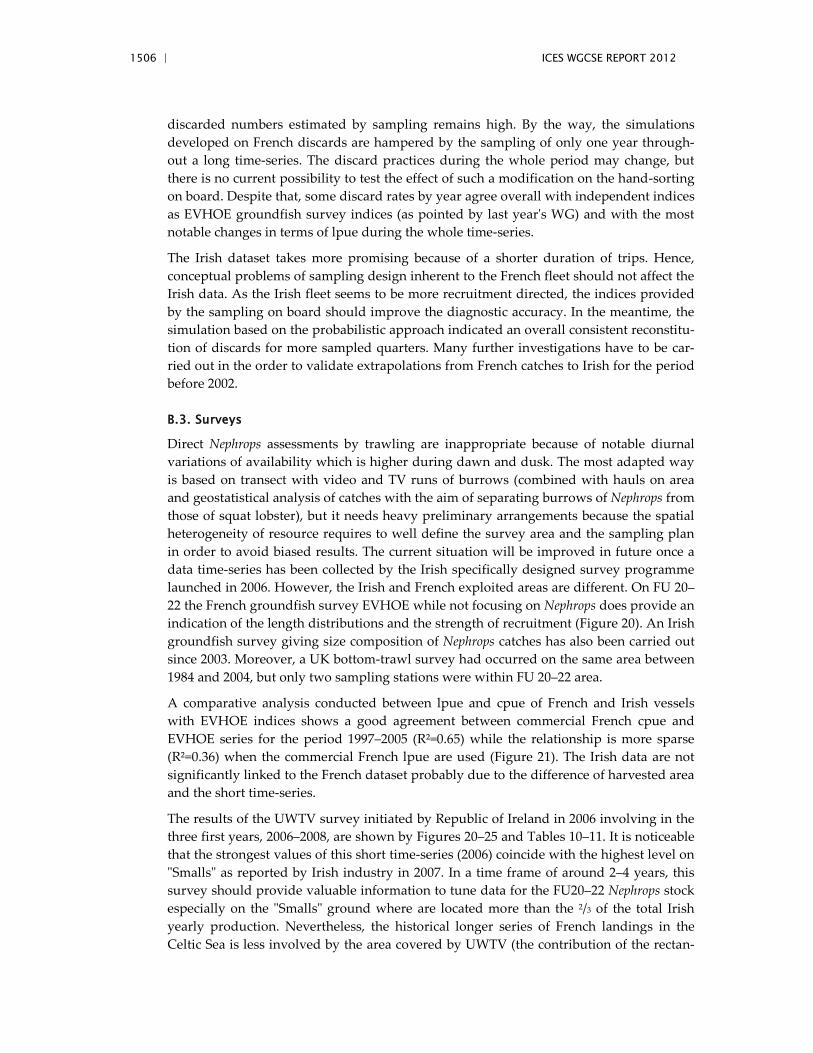
1506 | ICES WGCSE REPORT 2012
discarded numbers estimated by sampling remains high. By the way, the simulations developed on French discards are hampered by the sampling of only one year through-out a long time-series. The discard practices during the whole period may change, but there is no current possibility to test the effect of such a modification on the hand-sorting on board. Despite that, some discard rates by year agree overall with independent indices as EVHOE groundfish survey indices (as pointed by last year's WG) and with the most notable changes in terms of lpue during the whole time-series.
The Irish dataset takes more promising because of a shorter duration of trips. Hence, conceptual problems of sampling design inherent to the French fleet should not affect the Irish data. As the Irish fleet seems to be more recruitment directed, the indices provided by the sampling on board should improve the diagnostic accuracy. In the meantime, the simulation based on the probabilistic approach indicated an overall consistent reconstitu-tion of discards for more sampled quarters. Many further investigations have to be car-ried out in the order to validate extrapolations from French catches to Irish for the period before 2002.
B.3. Surveys
Direct Nephrops assessments by trawling are inappropriate because of notable diurnal variations of availability which is higher during dawn and dusk. The most adapted way is based on transect with video and TV runs of burrows (combined with hauls on area and geostatistical analysis of catches with the aim of separating burrows of Nephrops from those of squat lobster), but it needs heavy preliminary arrangements because the spatial heterogeneity of resource requires to well define the survey area and the sampling plan in order to avoid biased results. The current situation will be improved in future once a data time-series has been collected by the Irish specifically designed survey programme launched in 2006. However, the Irish and French exploited areas are different. On FU 20–22 the French groundfish survey EVHOE while not focusing on Nephrops does provide an indication of the length distributions and the strength of recruitment (Figure 20). An Irish groundfish survey giving size composition of Nephrops catches has also been carried out since 2003. Moreover, a UK bottom-trawl survey had occurred on the same area between 1984 and 2004, but only two sampling stations were within FU 20–22 area.
A comparative analysis conducted between lpue and cpue of French and Irish vessels with EVHOE indices shows a good agreement between commercial French cpue and EVHOE series for the period 1997–2005 (R²=0.65) while the relationship is more sparse (R²=0.36) when the commercial French lpue are used (Figure 21). The Irish data are not significantly linked to the French dataset probably due to the difference of harvested area and the short time-series.
The results of the UWTV survey initiated by Republic of Ireland in 2006 involving in the three first years, 2006–2008, are shown by Figures 20–25 and Tables 10–11. It is noticeable that the strongest values of this short time-series (2006) coincide with the highest level on "Smalls" as reported by Irish industry in 2007. In a time frame of around 2–4 years, this survey should provide valuable information to tune data for the FU20–22 Nephrops stock especially on the "Smalls" ground where are located more than the 2/3 of the total Irish yearly production. Nevertheless, the historical longer series of French landings in the Celtic Sea is less involved by the area covered by UWTV (the contribution of the rectan-
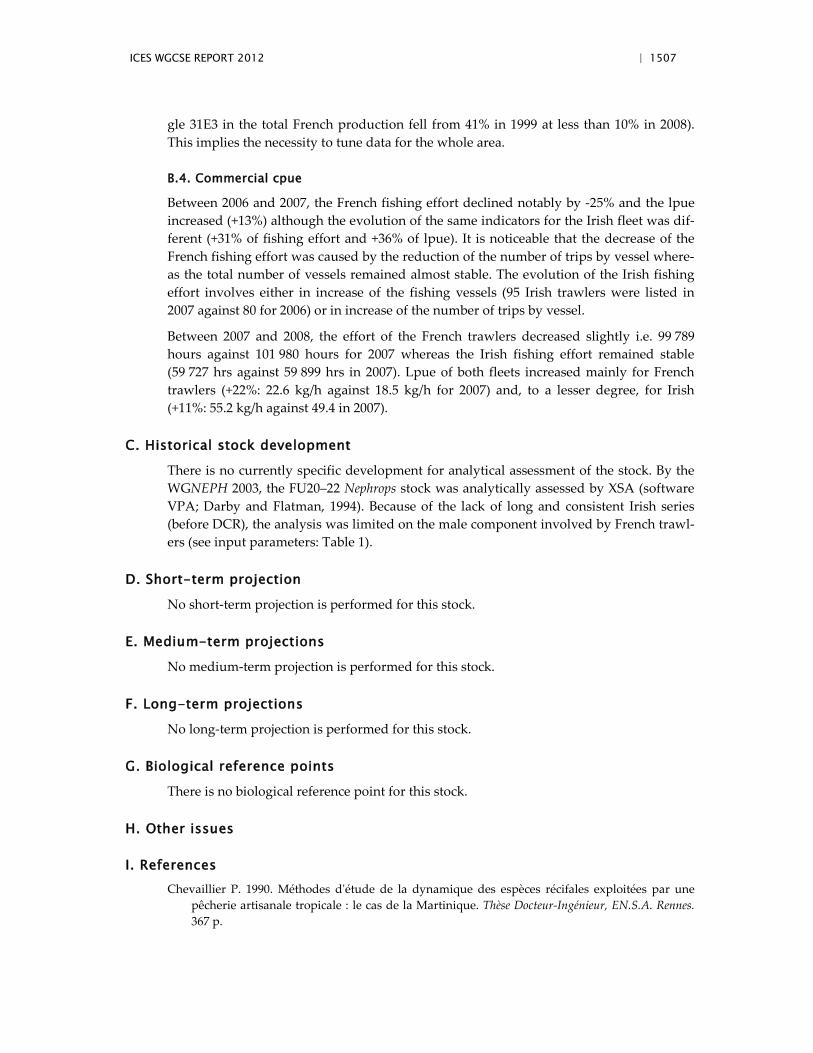
ICES WGCSE REPORT 2012 | 1507
gle 31E3 in the total French production fell from 41% in 1999 at less than 10% in 2008). This implies the necessity to tune data for the whole area.
B.4. Commercial cpue
Between 2006 and 2007, the French fishing effort declined notably by -25% and the lpue increased (+13%) although the evolution of the same indicators for the Irish fleet was dif-ferent (+31% of fishing effort and +36% of lpue). It is noticeable that the decrease of the French fishing effort was caused by the reduction of the number of trips by vessel where-as the total number of vessels remained almost stable. The evolution of the Irish fishing effort involves either in increase of the fishing vessels (95 Irish trawlers were listed in 2007 against 80 for 2006) or in increase of the number of trips by vessel.
Between 2007 and 2008, the effort of the French trawlers decreased slightly i.e. 99 789 hours against 101 980 hours for 2007 whereas the Irish fishing effort remained stable (59 727 hrs against 59 899 hrs in 2007). Lpue of both fleets increased mainly for French trawlers (+22%: 22.6 kg/h against 18.5 kg/h for 2007) and, to a lesser degree, for Irish (+11%: 55.2 kg/h against 49.4 in 2007).
C. Historical stock development
There is no currently specific development for analytical assessment of the stock. By the WGNEPH 2003, the FU20–22 Nephrops stock was analytically assessed by XSA (software VPA; Darby and Flatman, 1994). Because of the lack of long and consistent Irish series (before DCR), the analysis was limited on the male component involved by French trawl-ers (see input parameters: Table 1).
D. Short-term projection
No short-term projection is performed for this stock.
E. Medium-term projections
No medium-term projection is performed for this stock.
F. Long-term projections
No long-term projection is performed for this stock.
G. Biological reference points
There is no biological reference point for this stock.
H. Other issues
I. References Chevaillier P. 1990. Méthodes d'étude de la dynamique des espèces récifales exploitées par une
pêcherie artisanale tropicale : le cas de la Martinique. Thèse Docteur-Ingénieur, EN.S.A. Rennes. 367 p.
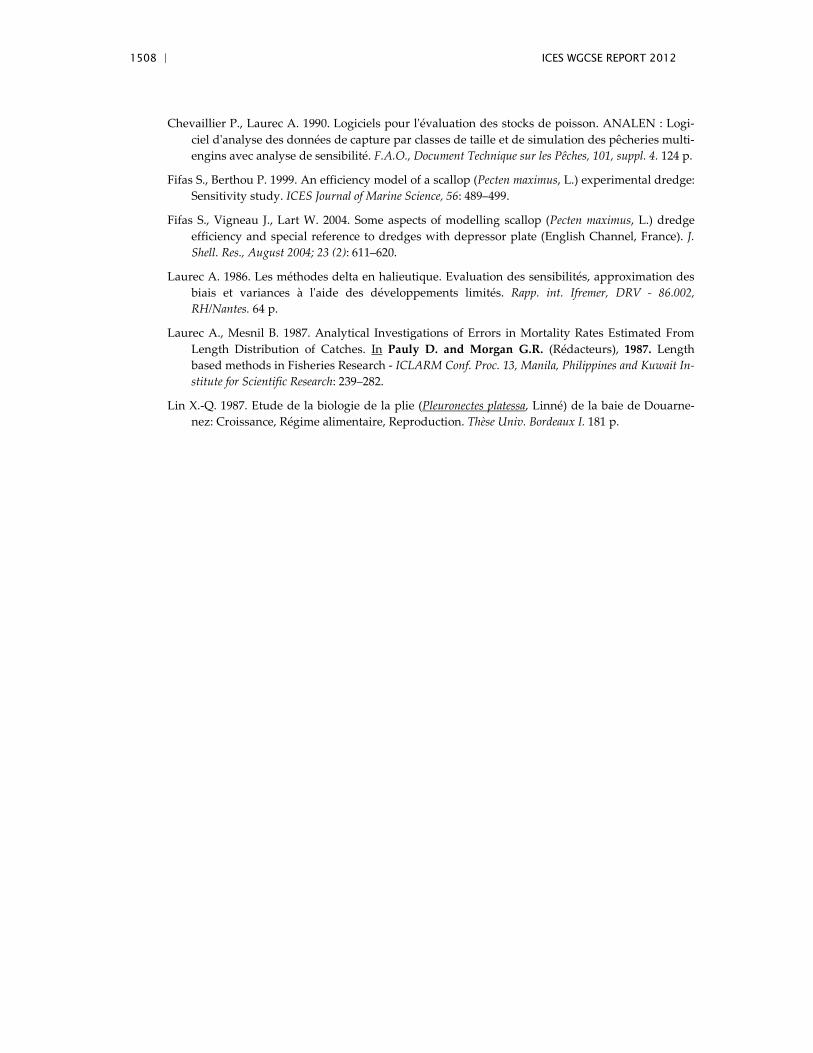
1508 | ICES WGCSE REPORT 2012
Chevaillier P., Laurec A. 1990. Logiciels pour l'évaluation des stocks de poisson. ANALEN : Logi-ciel d'analyse des données de capture par classes de taille et de simulation des pêcheries multi-engins avec analyse de sensibilité. F.A.O., Document Technique sur les Pêches, 101, suppl. 4. 124 p.
Fifas S., Berthou P. 1999. An efficiency model of a scallop (Pecten maximus, L.) experimental dredge: Sensitivity study. ICES Journal of Marine Science, 56: 489–499.
Fifas S., Vigneau J., Lart W. 2004. Some aspects of modelling scallop (Pecten maximus, L.) dredge efficiency and special reference to dredges with depressor plate (English Channel, France). J. Shell. Res., August 2004; 23 (2): 611–620.
Laurec A. 1986. Les méthodes delta en halieutique. Evaluation des sensibilités, approximation des biais et variances à l'aide des développements limités. Rapp. int. Ifremer, DRV - 86.002, RH/Nantes. 64 p.
Laurec A., Mesnil B. 1987. Analytical Investigations of Errors in Mortality Rates Estimated From Length Distribution of Catches. In Pauly D. and Morgan G.R. (Rédacteurs), 1987. Length based methods in Fisheries Research - ICLARM Conf. Proc. 13, Manila, Philippines and Kuwait In-stitute for Scientific Research: 239–282.
Lin X.-Q. 1987. Etude de la biologie de la plie (Pleuronectes platessa, Linné) de la baie de Douarne-nez: Croissance, Régime alimentaire, Reproduction. Thèse Univ. Bordeaux I. 181 p.
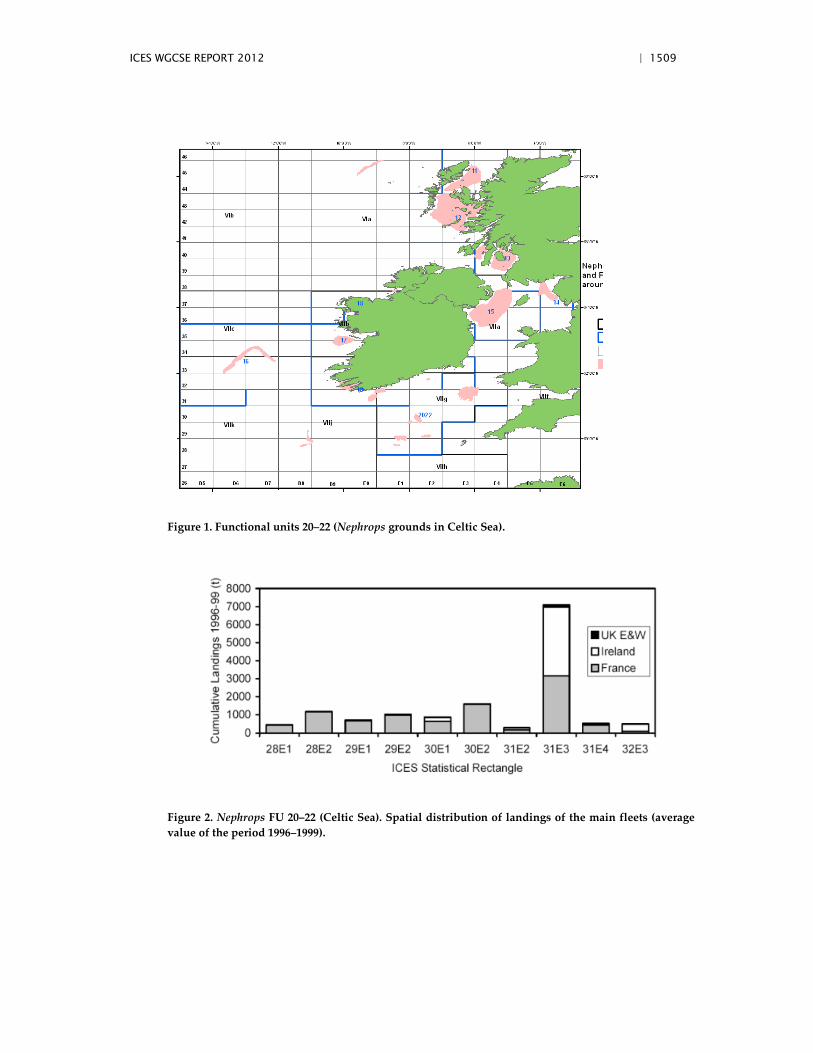
ICES WGCSE REPORT 2012 | 1509
Figure 1. Functional units 20–22 (Nephrops grounds in Celtic Sea).
Figure 2. Nephrops FU 20–22 (Celtic Sea). Spatial distribution of landings of the main fleets (average value of the period 1996–1999).
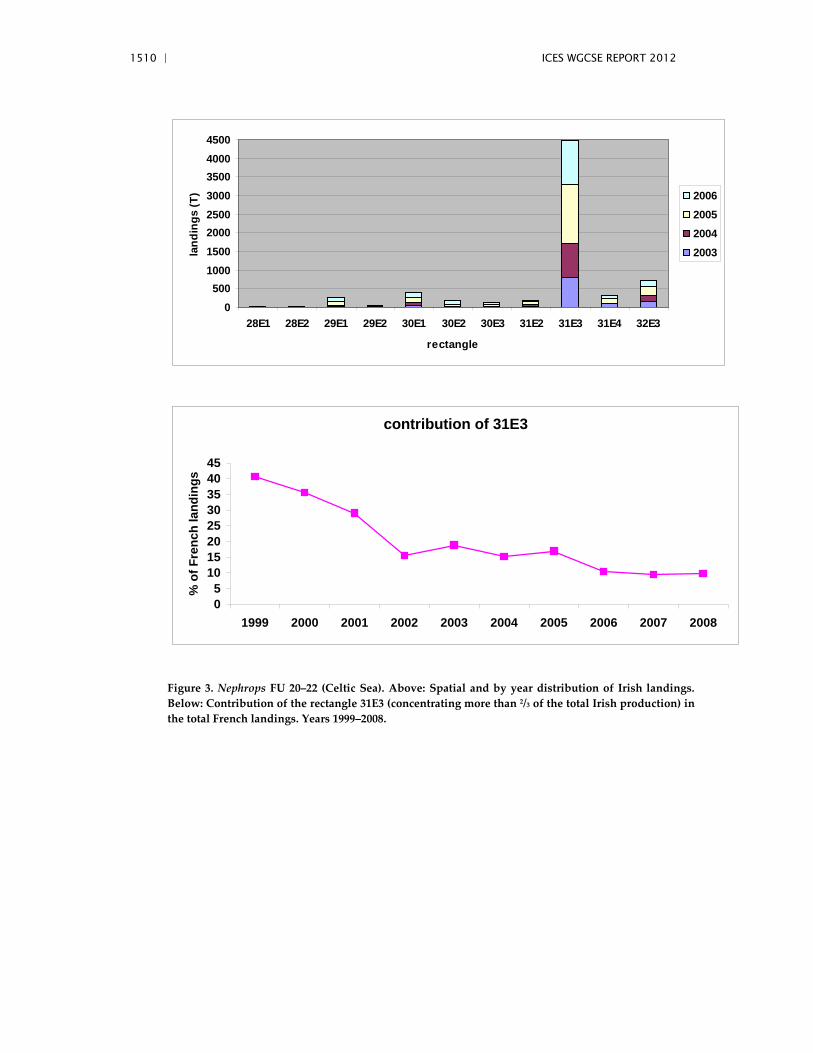
1510 | ICES WGCSE REPORT 2012
0500
10001500200025003000350040004500
28E1 28E2 29E1 29E2 30E1 30E2 30E3 31E2 31E3 31E4 32E3
rectangle
land
ings
(T) 2006
200520042003
contribution of 31E3
05
1015202530354045
1999 2000 2001 2002 2003 2004 2005 2006 2007 2008
% o
f Fre
nch
land
ings
Figure 3. Nephrops FU 20–22 (Celtic Sea). Above: Spatial and by year distribution of Irish landings. Below: Contribution of the rectangle 31E3 (concentrating more than 2/3 of the total Irish production) in the total French landings. Years 1999–2008.
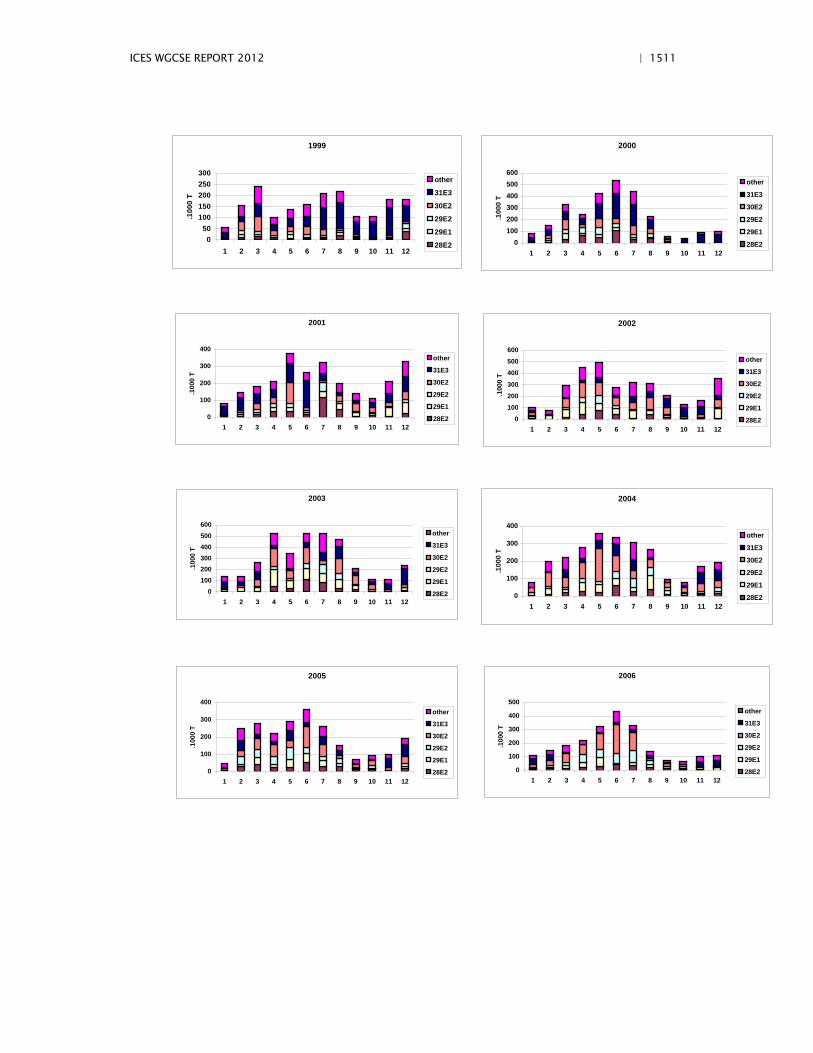
ICES WGCSE REPORT 2012 | 1511
1999
050
100150200250300
1 2 3 4 5 6 7 8 9 10 11 12
.100
0 T
other
31E3
30E2
29E2
29E1
28E2
2000
0100200300400500600
1 2 3 4 5 6 7 8 9 10 11 12
.100
0 T
other
31E3
30E2
29E2
29E1
28E2
2001
0
100
200
300
400
1 2 3 4 5 6 7 8 9 10 11 12
.100
0 T
other
31E3
30E2
29E2
29E1
28E2
2002
0100200300400500600
1 2 3 4 5 6 7 8 9 10 11 12
.100
0 T
other
31E3
30E2
29E2
29E1
28E2
2003
0100200300400500600
1 2 3 4 5 6 7 8 9 10 11 12
.100
0 T
other
31E3
30E2
29E2
29E1
28E2
2004
0
100
200
300
400
1 2 3 4 5 6 7 8 9 10 11 12
.100
0 T
other
31E3
30E2
29E2
29E1
28E2
2005
0
100
200
300
400
1 2 3 4 5 6 7 8 9 10 11 12
.100
0 T
other
31E3
30E2
29E2
29E1
28E2
2006
0
100
200
300
400
500
1 2 3 4 5 6 7 8 9 10 11 12
.100
0 T
other
31E3
30E2
29E2
29E1
28E2
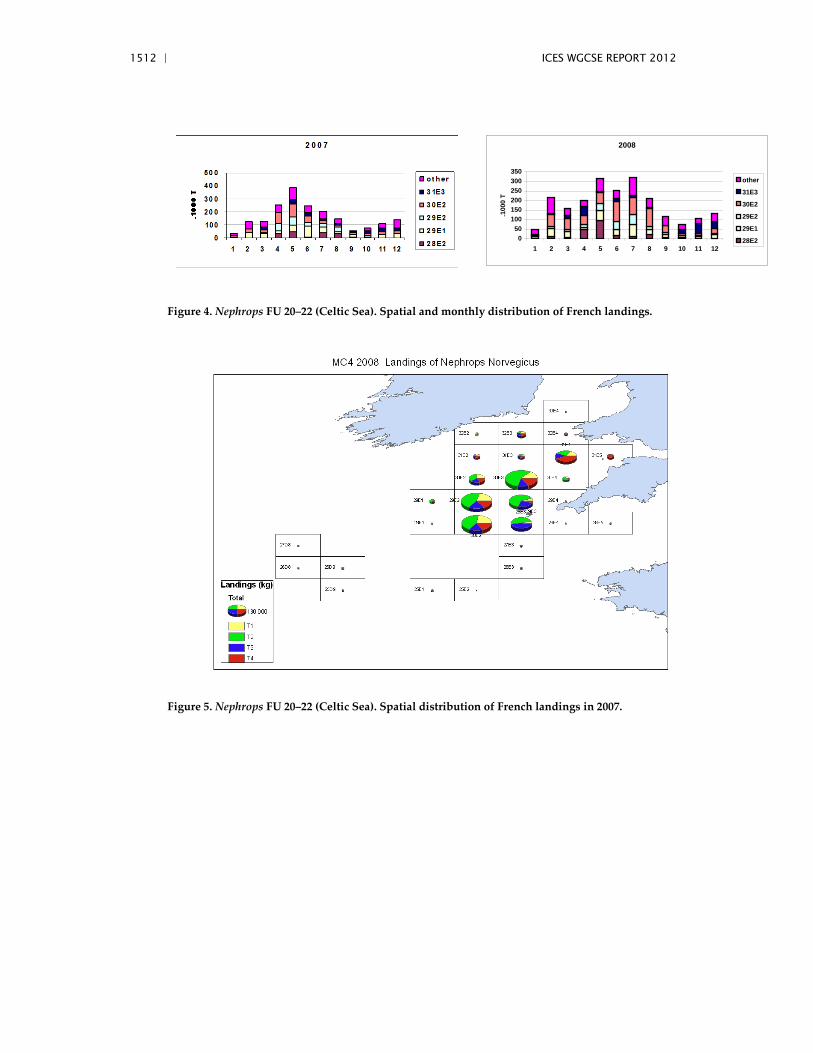
1512 | ICES WGCSE REPORT 2012
2008
050
100150200250300350
1 2 3 4 5 6 7 8 9 10 11 12
.100
0 T
other
31E3
30E2
29E2
29E1
28E2
Figure 4. Nephrops FU 20–22 (Celtic Sea). Spatial and monthly distribution of French landings.
Figure 5. Nephrops FU 20–22 (Celtic Sea). Spatial distribution of French landings in 2007.
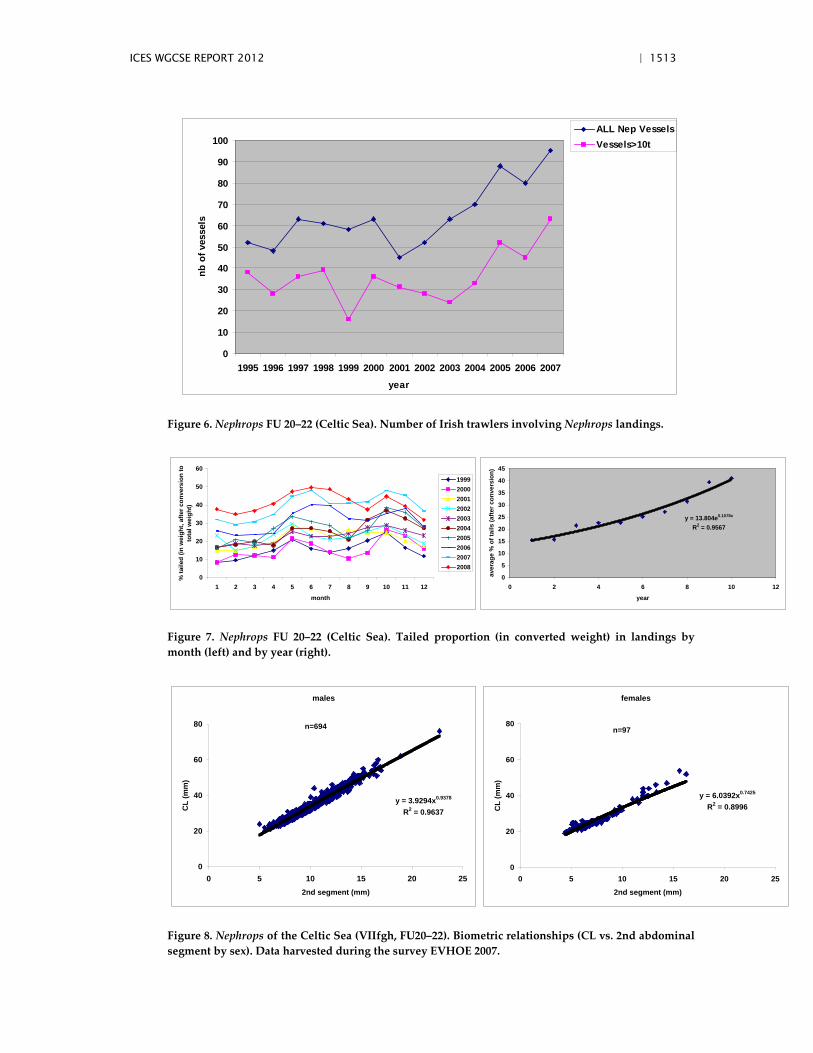
ICES WGCSE REPORT 2012 | 1513
0
10
20
30
40
50
60
70
80
90
100
1995 1996 1997 1998 1999 2000 2001 2002 2003 2004 2005 2006 2007
year
nb o
f ves
sels
ALL Nep VesselsVessels>10t
Figure 6. Nephrops FU 20–22 (Celtic Sea). Number of Irish trawlers involving Nephrops landings.
0
10
20
30
40
50
60
1 2 3 4 5 6 7 8 9 10 11 12
month
% ta
iled
(in w
eigh
t, af
ter c
onve
rsio
n to
to
tal w
eigh
t)
1999200020012002200320042005200620072008
y = 13.804e0.1078x
R2 = 0.9567
0
5
10
15
20
25
30
35
40
45
0 2 4 6 8 10 12
year
aver
age
% o
f tai
ls (a
fter c
onve
rsio
n)
Figure 7. Nephrops FU 20–22 (Celtic Sea). Tailed proportion (in converted weight) in landings by month (left) and by year (right).
males
y = 3.9294x0.9378
R2 = 0.9637
0
20
40
60
80
0 5 10 15 20 252nd segment (mm)
CL
(mm
)
n=694
females
y = 6.0392x0.7425
R2 = 0.8996
0
20
40
60
80
0 5 10 15 20 25
2nd segment (mm)
CL
(mm
)
n=97
Figure 8. Nephrops of the Celtic Sea (VIIfgh, FU20–22). Biometric relationships (CL vs. 2nd abdominal segment by sex). Data harvested during the survey EVHOE 2007.
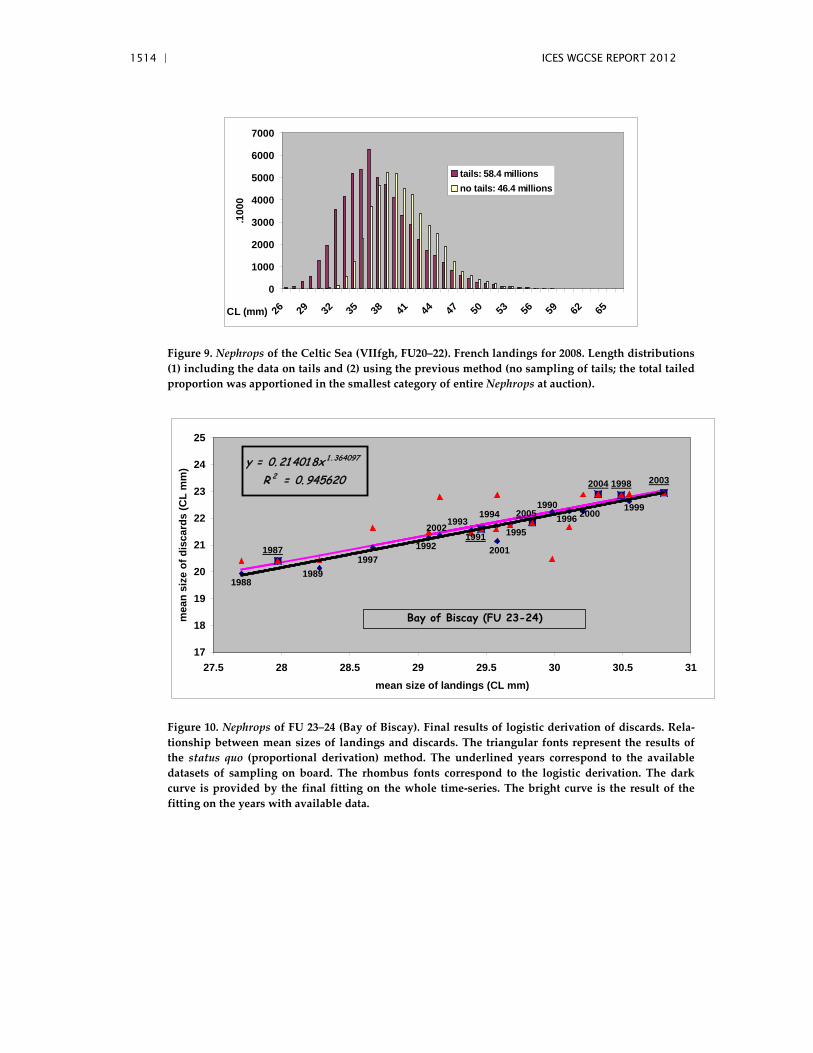
1514 | ICES WGCSE REPORT 2012
0
1000
2000
3000
4000
5000
6000
7000
26 29 32 35 38 41 44 47 50 53 56 59 62 65CL (mm)
.100
0
tails: 58.4 millionsno tails: 46.4 millions
Figure 9. Nephrops of the Celtic Sea (VIIfgh, FU20–22). French landings for 2008. Length distributions (1) including the data on tails and (2) using the previous method (no sampling of tails; the total tailed proportion was apportioned in the smallest category of entire Nephrops at auction).
y = 0. 21 401 8x 1 . 364097
R 2 = 0. 945620
17
18
19
20
21
22
23
24
25
27.5 28 28.5 29 29.5 30 30.5 31mean size of landings (CL mm)
mea
n si
ze o
f dis
card
s (C
L m
m)
1988
1987
1989
1992
200219931991
2001
1994
1995
20051990
1996 2000
2004
1999
2003
1997
1998
Bay of Biscay (FU 23-24)
Figure 10. Nephrops of FU 23–24 (Bay of Biscay). Final results of logistic derivation of discards. Rela-tionship between mean sizes of landings and discards. The triangular fonts represent the results of the status quo (proportional derivation) method. The underlined years correspond to the available datasets of sampling on board. The rhombus fonts correspond to the logistic derivation. The dark curve is provided by the final fitting on the whole time-series. The bright curve is the result of the fitting on the years with available data.
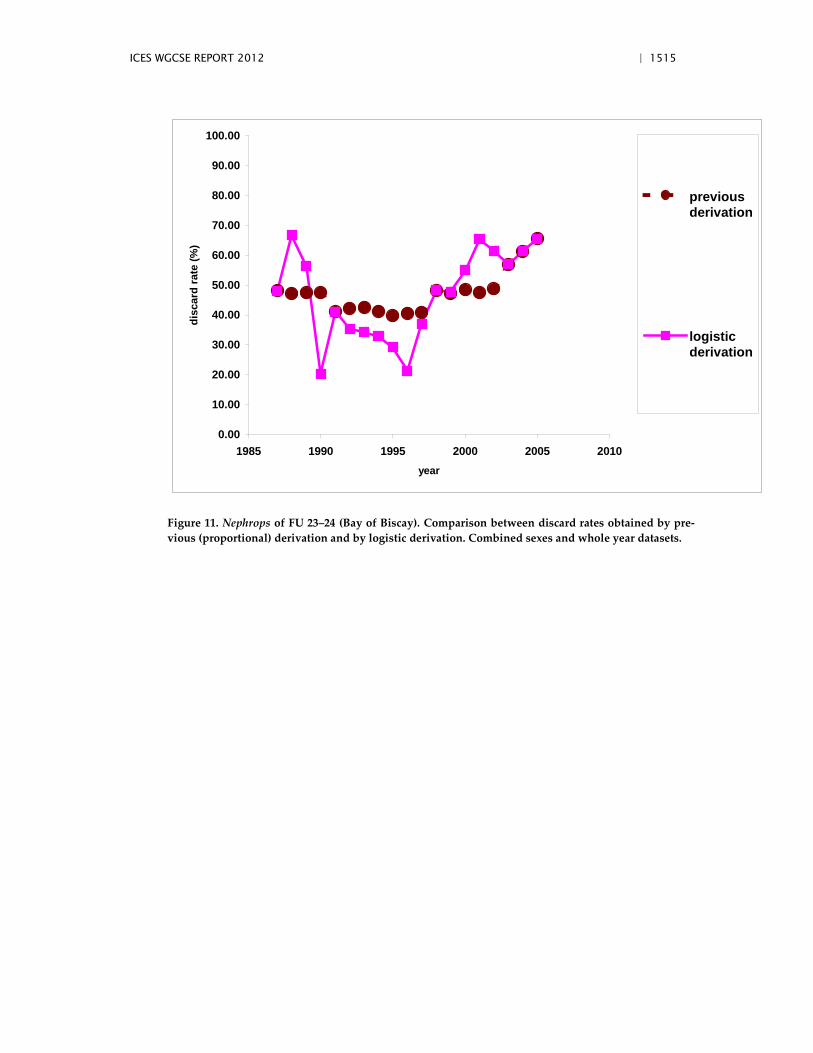
ICES WGCSE REPORT 2012 | 1515
0.00
10.00
20.00
30.00
40.00
50.00
60.00
70.00
80.00
90.00
100.00
1985 1990 1995 2000 2005 2010year
disc
ard
rate
(%)
previousderivation
logisticderivation
Figure 11. Nephrops of FU 23–24 (Bay of Biscay). Comparison between discard rates obtained by pre-vious (proportional) derivation and by logistic derivation. Combined sexes and whole year datasets.
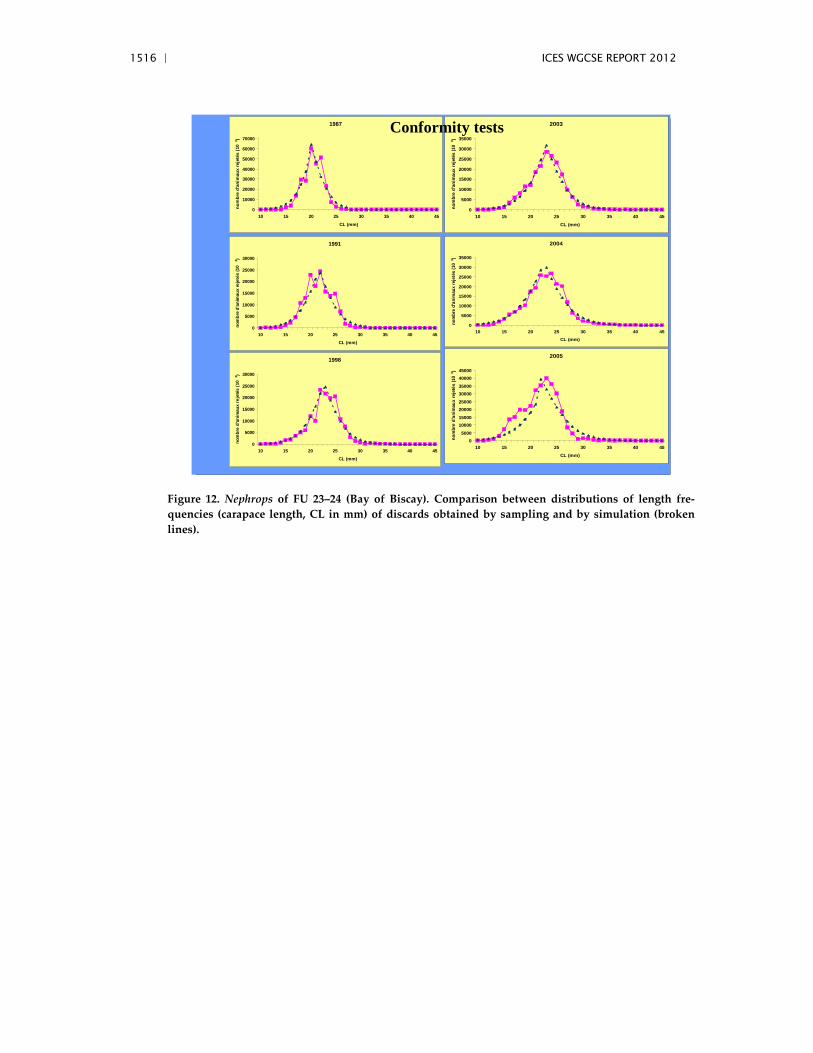
1516 | ICES WGCSE REPORT 2012
2005
05000
1000015000
2000025000
3000035000
4000045000
10 15 20 25 30 35 40 45
CL (mm)no
mbr
e d'
anim
aux
reje
tés
(10
3 )
2004
0
5000
10000
15000
20000
25000
30000
35000
10 15 20 25 30 35 40 45
CL (mm)
nom
bre
d'an
imau
x re
jeté
s (1
03 )
2003
0
5000
10000
15000
20000
25000
30000
35000
10 15 20 25 30 35 40 45
CL (mm)
nom
bre
d'an
imau
x re
jeté
s (1
03 )
1998
0
5000
10000
15000
20000
25000
30000
10 15 20 25 30 35 40 45
CL (mm)
nom
bre
d'an
imau
x re
jeté
s (1
03 )
1991
0
5000
10000
15000
20000
25000
30000
10 15 20 25 30 35 40 45
CL (mm)
nom
bre
d'an
imau
x re
jeté
s (1
03 )
1987
0
10000
20000
30000
40000
50000
60000
70000
10 15 20 25 30 35 40 45
CL (mm)
nom
bre
d'an
imau
x re
jeté
s (1
03 )
Conformity tests
Figure 12. Nephrops of FU 23–24 (Bay of Biscay). Comparison between distributions of length fre-quencies (carapace length, CL in mm) of discards obtained by sampling and by simulation (broken lines).
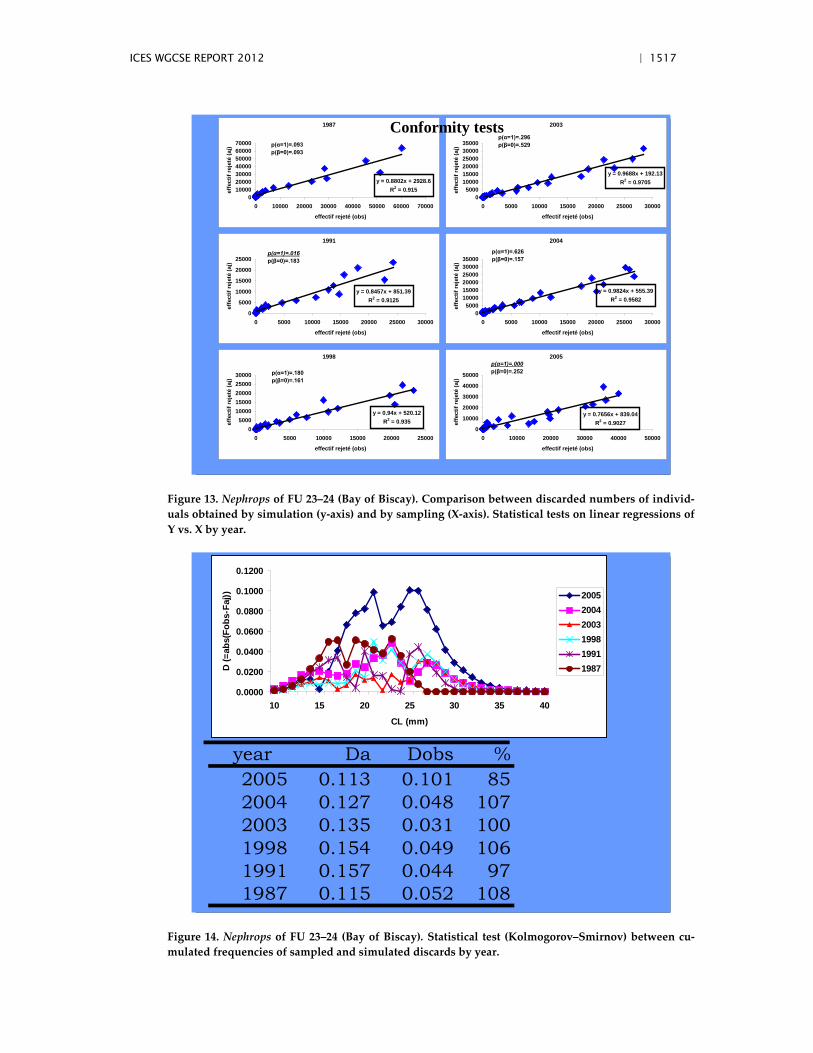
ICES WGCSE REPORT 2012 | 1517
1987
y = 0.8802x + 2928.6R2 = 0.915
010000200003000040000500006000070000
0 10000 20000 30000 40000 50000 60000 70000
effectif rejeté (obs)
effe
ctif
reje
té (a
j) p(α=1)=.093p(β=0)=.093
1991
y = 0.8457x + 851.39R2 = 0.9125
0
5000
10000
15000
20000
25000
0 5000 10000 15000 20000 25000 30000
effectif rejeté (obs)
effe
ctif
reje
té (a
j)
p(α=1)=.016p(β=0)=.183
1998
y = 0.94x + 520.12R2 = 0.935
05000
1000015000200002500030000
0 5000 10000 15000 20000 25000
effectif rejeté (obs)
effe
ctif
reje
té (a
j)
p(α=1)=.180p(β=0)=.161
2003
y = 0.9688x + 192.13R2 = 0.9705
05000
100001500020000250003000035000
0 5000 10000 15000 20000 25000 30000
effectif rejeté (obs)
effe
ctif
reje
té (a
j)
p(α=1)=.296p(β=0)=.529
2004
y = 0.9824x + 555.39R2 = 0.9582
05000
100001500020000250003000035000
0 5000 10000 15000 20000 25000 30000
effectif rejeté (obs)
effe
ctif
reje
té (a
j)
p(α=1)=.626p(β=0)=.157
2005
y = 0.7656x + 839.04R2 = 0.9027
0
10000
20000
30000
40000
50000
0 10000 20000 30000 40000 50000
effectif rejeté (obs)ef
fect
if re
jeté
(aj)
p(α=1)=.000p(β=0)=.252
Conformity tests
Figure 13. Nephrops of FU 23–24 (Bay of Biscay). Comparison between discarded numbers of individ-uals obtained by simulation (y-axis) and by sampling (X-axis). Statistical tests on linear regressions of Y vs. X by year.
0.0000
0.0200
0.0400
0.0600
0.0800
0.1000
0.1200
10 15 20 25 30 35 40
CL (mm)
D (=
abs(
Fobs
-Faj
)) 200520042003199819911987
year Da Dobs %2005 0.113 0.101 852004 0.127 0.048 1072003 0.135 0.031 1001998 0.154 0.049 1061991 0.157 0.044 971987 0.115 0.052 108
Figure 14. Nephrops of FU 23–24 (Bay of Biscay). Statistical test (Kolmogorov–Smirnov) between cu-mulated frequencies of sampled and simulated discards by year.
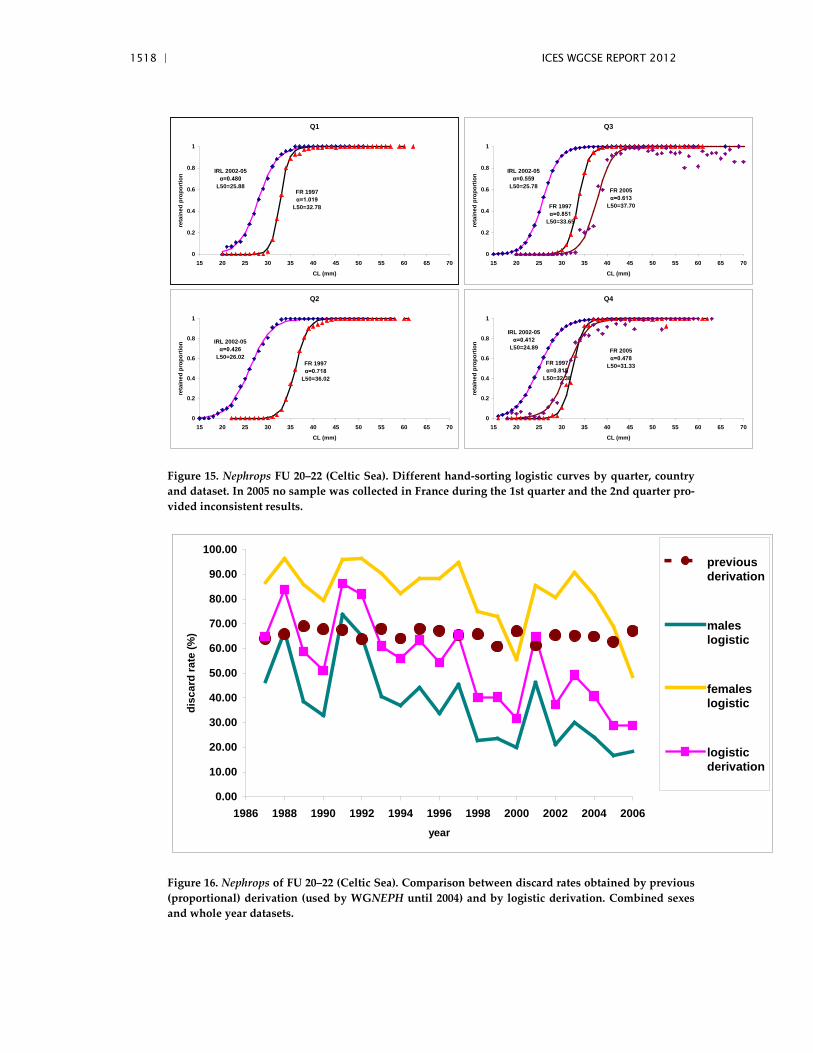
1518 | ICES WGCSE REPORT 2012
Q1
0
0.2
0.4
0.6
0.8
1
15 20 25 30 35 40 45 50 55 60 65 70
CL (mm)
reta
ined
pro
port
ion
IRL 2002-05α=0.480
L50=25.88FR 1997α=1.019
L50=32.78
Q2
0
0.2
0.4
0.6
0.8
1
15 20 25 30 35 40 45 50 55 60 65 70
CL (mm)
reta
ined
pro
port
ion IRL 2002-05
α=0.426L50=26.02
FR 1997α=0.718
L50=36.02
Q3
0
0.2
0.4
0.6
0.8
1
15 20 25 30 35 40 45 50 55 60 65 70
CL (mm)
reta
ined
pro
port
ion
IRL 2002-05α=0.559
L50=25.78
FR 1997α=0.851
L50=33.65
FR 2005α=0.613
L50=37.70
Q4
0
0.2
0.4
0.6
0.8
1
15 20 25 30 35 40 45 50 55 60 65 70
CL (mm)
reta
ined
pro
port
ion
IRL 2002-05α=0.412
L50=24.89
FR 1997α=0.815
L50=32.38
FR 2005α=0.478
L50=31.33
Figure 15. Nephrops FU 20–22 (Celtic Sea). Different hand-sorting logistic curves by quarter, country and dataset. In 2005 no sample was collected in France during the 1st quarter and the 2nd quarter pro-vided inconsistent results.
0.00
10.00
20.00
30.00
40.00
50.00
60.00
70.00
80.00
90.00
100.00
1986 1988 1990 1992 1994 1996 1998 2000 2002 2004 2006year
disc
ard
rate
(%)
previousderivation
maleslogistic
femaleslogistic
logisticderivation
Figure 16. Nephrops of FU 20–22 (Celtic Sea). Comparison between discard rates obtained by previous (proportional) derivation (used by WGNEPH until 2004) and by logistic derivation. Combined sexes and whole year datasets.
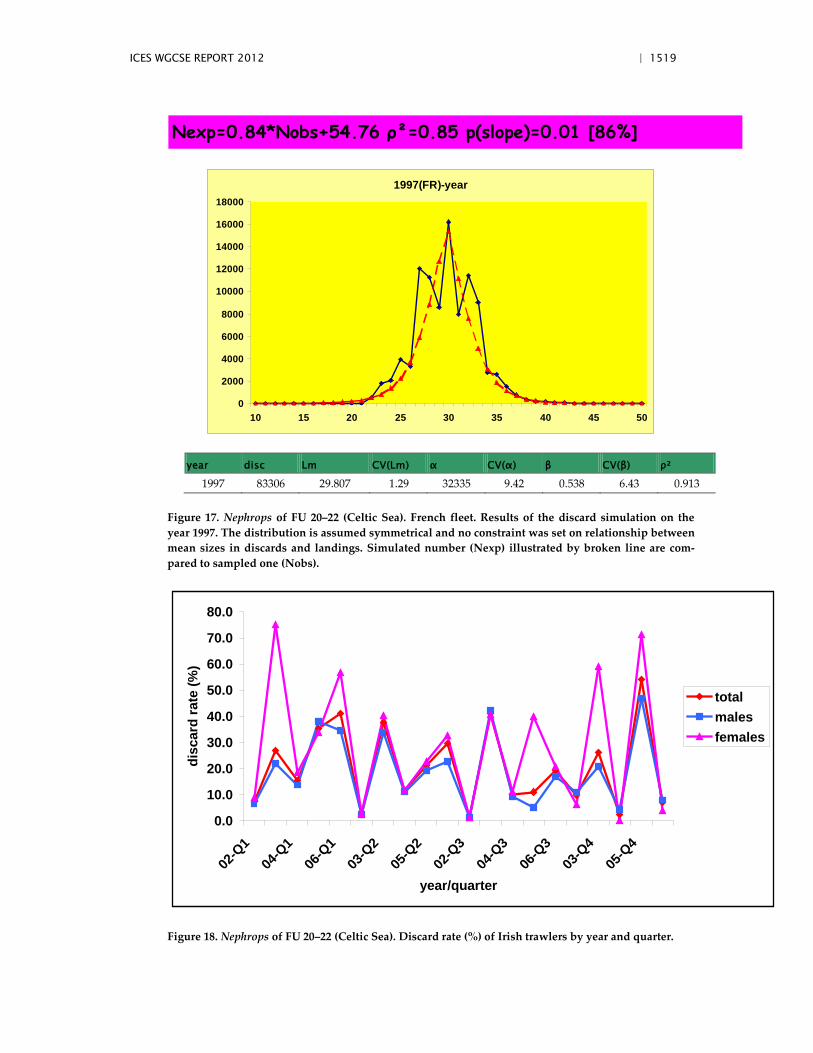
ICES WGCSE REPORT 2012 | 1519
Nexp=0.84*Nobs+54.76 ρ²=0.85 p(slope)=0.01 [86%]
1997(FR)-year
0
2000
4000
6000
8000
10000
12000
14000
16000
18000
10 15 20 25 30 35 40 45 50
year disc Lm CV(Lm) α CV(α) β CV(β) ρ²
1997 83306 29.807 1.29 32335 9.42 0.538 6.43 0.913
Figure 17. Nephrops of FU 20–22 (Celtic Sea). French fleet. Results of the discard simulation on the year 1997. The distribution is assumed symmetrical and no constraint was set on relationship between mean sizes in discards and landings. Simulated number (Nexp) illustrated by broken line are com-pared to sampled one (Nobs).
0.0
10.0
20.0
30.0
40.0
50.0
60.0
70.0
80.0
02-Q
104
-Q1
06-Q
103
-Q2
05-Q
202
-Q3
04-Q
306
-Q3
03-Q
405
-Q4
year/quarter
disc
ard
rate
(%)
totalmalesfemales
Figure 18. Nephrops of FU 20–22 (Celtic Sea). Discard rate (%) of Irish trawlers by year and quarter.
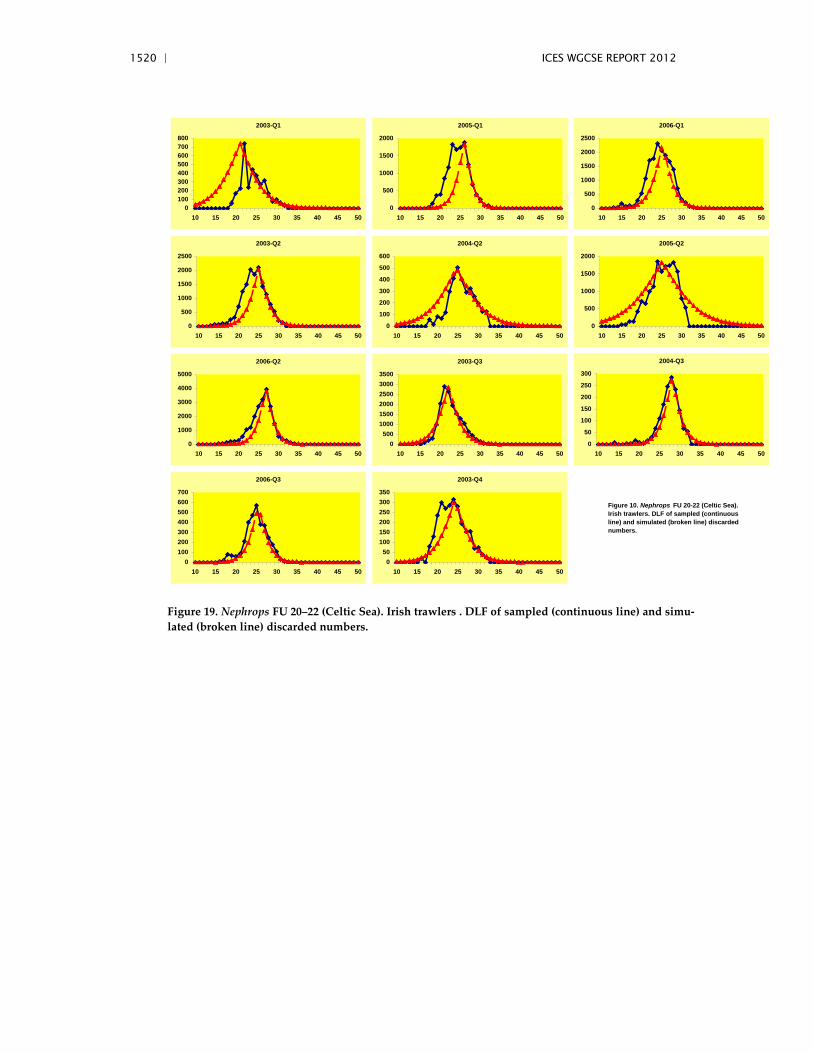
1520 | ICES WGCSE REPORT 2012
2003-Q1
0100200300400500600700800
10 15 20 25 30 35 40 45 50
2005-Q1
0
500
1000
1500
2000
10 15 20 25 30 35 40 45 50
2006-Q1
0
500
1000
1500
2000
2500
10 15 20 25 30 35 40 45 50
2003-Q2
0
500
1000
1500
2000
2500
10 15 20 25 30 35 40 45 50
2004-Q2
0
100
200
300
400
500
600
10 15 20 25 30 35 40 45 50
2005-Q2
0
500
1000
1500
2000
10 15 20 25 30 35 40 45 50
2006-Q2
0
1000
2000
3000
4000
5000
10 15 20 25 30 35 40 45 50
2003-Q3
0500
100015002000250030003500
10 15 20 25 30 35 40 45 50
2004-Q3
0
50
100
150
200
250
300
10 15 20 25 30 35 40 45 50
2006-Q3
0100200300400500600700
10 15 20 25 30 35 40 45 50
2003-Q4
050
100150200250300350
10 15 20 25 30 35 40 45 50
Figure 10. Nephrops FU 20-22 (Celtic Sea). Irish trawlers. DLF of sampled (continuous line) and simulated (broken line) discarded numbers.
Figure 19. Nephrops FU 20–22 (Celtic Sea). Irish trawlers . DLF of sampled (continuous line) and simu-lated (broken line) discarded numbers.
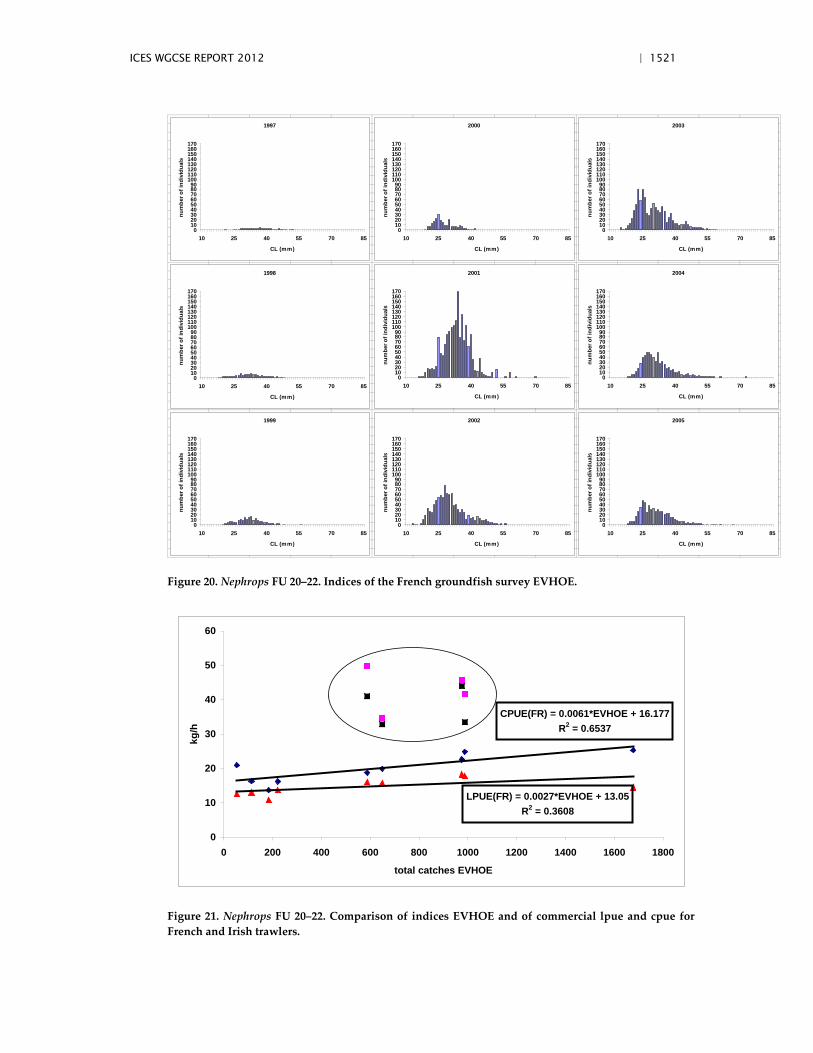
ICES WGCSE REPORT 2012 | 1521
1997
0102030405060708090
100110120130140150160170
10 25 40 55 70 85
CL (mm)
num
ber o
f ind
ivid
uals
1998
0102030405060708090
100110120130140150160170
10 25 40 55 70 85
CL (mm)
num
ber o
f ind
ivid
uals
1999
0102030405060708090
100110120130140150160170
10 25 40 55 70 85
CL (mm)
num
ber o
f ind
ivid
uals
2000
0102030405060708090
100110120130140150160170
10 25 40 55 70 85
CL (mm)
num
ber o
f ind
ivid
uals
2001
0102030405060708090
100110120130140150160170
10 25 40 55 70 85
CL (mm)
num
ber o
f ind
ivid
uals
2002
0102030405060708090
100110120130140150160170
10 25 40 55 70 85
CL (mm)
num
ber o
f ind
ivid
uals
2003
0102030405060708090
100110120130140150160170
10 25 40 55 70 85
CL (mm)
num
ber o
f ind
ivid
uals
2004
0102030405060708090
100110120130140150160170
10 25 40 55 70 85
CL (mm)
num
ber o
f ind
ivid
uals
2005
0102030405060708090
100110120130140150160170
10 25 40 55 70 85
CL (mm)
num
ber o
f ind
ivid
uals
Figure 20. Nephrops FU 20–22. Indices of the French groundfish survey EVHOE.
CPUE(FR) = 0.0061*EVHOE + 16.177R2 = 0.6537
LPUE(FR) = 0.0027*EVHOE + 13.05R2 = 0.3608
0
10
20
30
40
50
60
0 200 400 600 800 1000 1200 1400 1600 1800
total catches EVHOE
kg/h
Figure 21. Nephrops FU 20–22. Comparison of indices EVHOE and of commercial lpue and cpue for French and Irish trawlers.
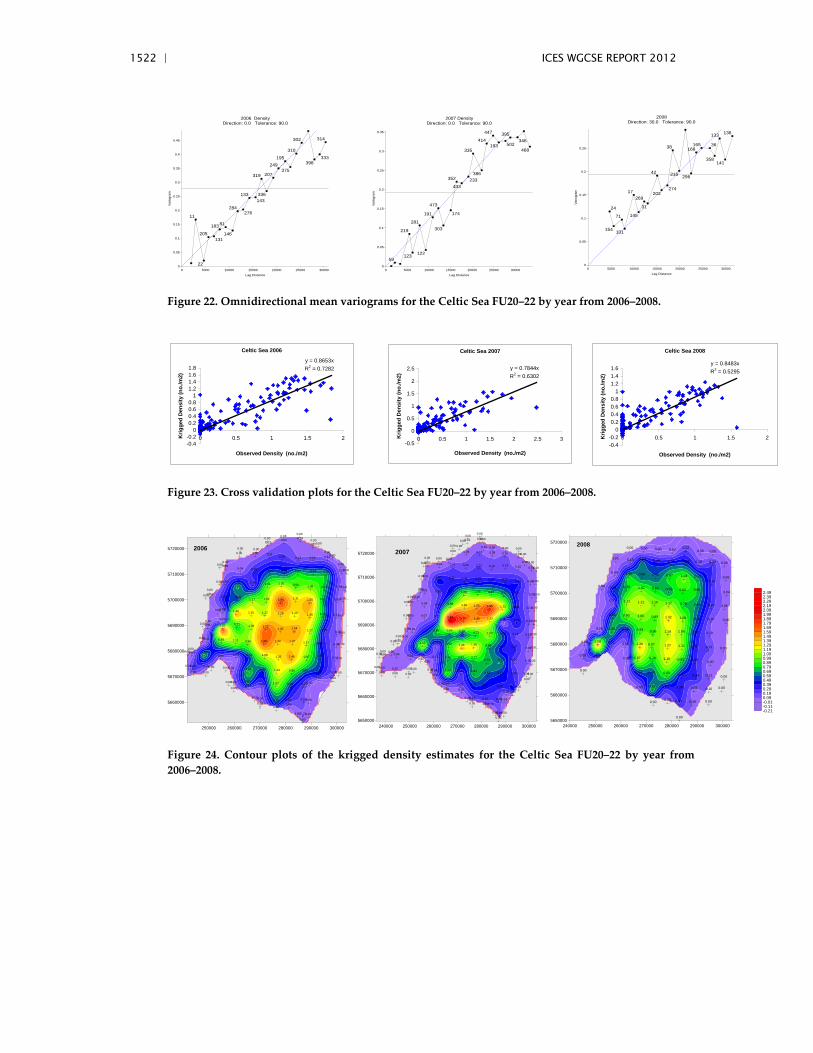
1522 | ICES WGCSE REPORT 2012
0 5000 10000 15000 20000 25000 30000Lag Distance
0
0.05
0.1
0.15
0.2
0.25
0.3
0.35
0.4
0.45
Vario
gram
Direction: 0.0 Tolerance: 90.02006 Density
11
22
205131
18381
146
284276
133143
319
336
207
249195
375
310
302
398333
314
0 5000 10000 15000 20000 25000 30000Lag Distance
0
0.05
0.1
0.15
0.2
0.25
0.3
0.35
Vario
gram
Direction: 0.0 Tolerance: 90.02007 Density
59
219
123
281
122
191
473
303
174
352
433233
335
386
414
447
193 502
395346
468
0 5000 10000 15000 20000 25000 30000Lag Distance
0
0.05
0.1
0.15
0.2
0.25
Vario
gram
Direction: 30.0 Tolerance: 90.02008
24
154
71
101
17
145
269
31
42
202274
38
215 296
168165 36
358
133
141
136
Figure 22. Omnidirectional mean variograms for the Celtic Sea FU20–22 by year from 2006–2008.
Celtic Sea 2006
y = 0.8653xR2 = 0.7282
-0.4-0.2
00.20.40.60.8
11.21.41.61.8
0 0.5 1 1.5 2
Observed Density (no./m2)
Krig
ged
Den
sity
(no.
/m2)
Celtic Sea 2007
y = 0.7844xR2 = 0.6302
-0.5
0
0.5
1
1.5
2
2.5
0 0.5 1 1.5 2 2.5 3
Observed Density (no./m2)
Krig
ged
Den
sity
(no.
/m2)
Celtic Sea 2008
y = 0.8483xR2 = 0.5295
-0.4-0.2
00.20.40.60.8
11.21.41.6
0 0.5 1 1.5 2
Observed Density (no./m2)
Krig
ged
Den
sity
(no.
/m2)
Figure 23. Cross validation plots for the Celtic Sea FU20–22 by year from 2006–2008.
0.030.14 0.04
0.02
0.00 0.05 0.210.28 0.13 0.16 0.14
0.050.04 0.35 0.64 0.54 0.88 0.74 0.79 0.02
0.20 0.77 0.18 1.01 1.20 0.94 1.08 0.74 0.10
0.040.40 0.56
1.17 1.02 1.83 1.31 1.55 0.67 0.09
0.03 1.49 1.25 1.17 1.28 1.20 1.36 0.71 0.11
0.01 1.82 0.71 1.09 1.721.46 1.54 1.17 0.29 0.10
0.03 0.89 1.11 0.98 1.68 1.34 1.37 1.17 0.49 0.08
0.00 0.80 0.130.00 0.51 1.09 1.25 1.46 0.97 0.53 0.11
0.28 0.00 0.02 0.84 0.40 1.24 0.85 0.53 0.46 0.15
0.01 0.630.09 1.07 0.49 0.20
0.00 0.59 0.21 0.18
0.13
0.000.00
0.00
0.000.00
0.000.00
0.00
0.00
0.00
0.00
0.000.00
0.00
0.000.00
0.00
0.00 0.00
0.00
0.00
0.00
0.00
0.000.00
0.00
0.000.00
0.00
0.00
0.00
0.00
0.00
0.00
0.00 0.00
0.00
0.00
0.00
0.00
0.00
0.00
0.00
0.00
0.00
0.000.00
0.000.00
0.00
250000 260000 270000 280000 290000 300000
5660000
5670000
5680000
5690000
5700000
5710000
5720000 2006
2.47
1.95
1.76
1.55
1.46
1.45
1.36
1.36
1.32
1.22
1.17
1.08
1.07
0.98
0.98
0.95
0.90
0.87
0.81
0.81
0.77
0.77
0.76
0.73
0.73 0.72
0.69
0.640.59
0.53
0.53
0.50
0.49
0.47
0.47
0.47
0.46
0.44
0.43
0.42
0.39
0.370.37
0.37 0.360.35
0.35
0.32
0.32
0.31
0.29
0.29
0.29
0.27
0.25
0.230.21
0.20
0.20
0.18
0.18
0.17
0.16
0.16
0.15
0.15
0.13
0.13
0.13
0.120.11
0.10 0.10
0.10
0.10
0.09
0.09
0.08
0.07
0.07
0.06
0.06
0.05
0.05
0.05
0.04
0.04
0.04
0.04
0.04
0.04
0.030.01
0.01
0.01
0.01
0.01
0.01
0.01
0.00
0.00
0.00
0.00
0.00
0.00
0.00
0.00
0.000.000.00
0.00
0.000.00
0.000.00
0.000.00 0.00
0.00
0.00
0.00
0.00
0.00
0.00
0.00
0.00
0.00
0.00
0.00
0.00
0.00
0.00
0.00
0.00
0.00
0.00
0.00
0.00
0.000.000.00
0.00
0.000.00
0.00
0.00
0.00
0.00
0.00
0.000.000.00
0.00
0.000.00
0.00
0.00
0.00
0.00
0.00
0.00
0.00
0.00
0.00 0.00
0.00
0.00
0.00
0.00
0.00
240000 250000 260000 270000 280000 290000 3000005650000
5660000
5670000
5680000
5690000
5700000
5710000
5720000 2007
240000 250000 260000 270000 280000 290000 3000005650000
5660000
5670000
5680000
5690000
5700000
5710000
5720000
0.090.30
0.100.230.82 0.020.39
0.340.30 0.110.49 0.850.43
0.091.07 0.82 0.320.78 1.18
0.211.27 0.380.21 1.38 1.110.97
1.58
0.96 1.14 0.100.240.80
0.410.93 1.06
0.660.54 0.101.080.890.90 1.00 1.32
0.64 0.060.241.21 0.781.17
0.07 1.11 1.10
0.540.04
0.830.650.831.020.760.80
0.26
0.84 0.600.750.60 1.040.87
0.15 0.46 0.540.680.030.180.53 0.30
0.220.000.000.000.00
0.00
0.00
0.00
0.00
0.00
0.00
0.00
0.00
0.00
0.00
0.00 0.00
0.00
0.00
0.00
0.00
0.00
0.00
0.00
0.00
0.000.00
-0.21-0.11-0.010.090.190.290.390.490.590.690.790.890.991.091.191.291.391.491.591.691.791.891.992.092.192.292.392.49
2008
Figure 24. Contour plots of the krigged density estimates for the Celtic Sea FU20–22 by year from 2006–2008.
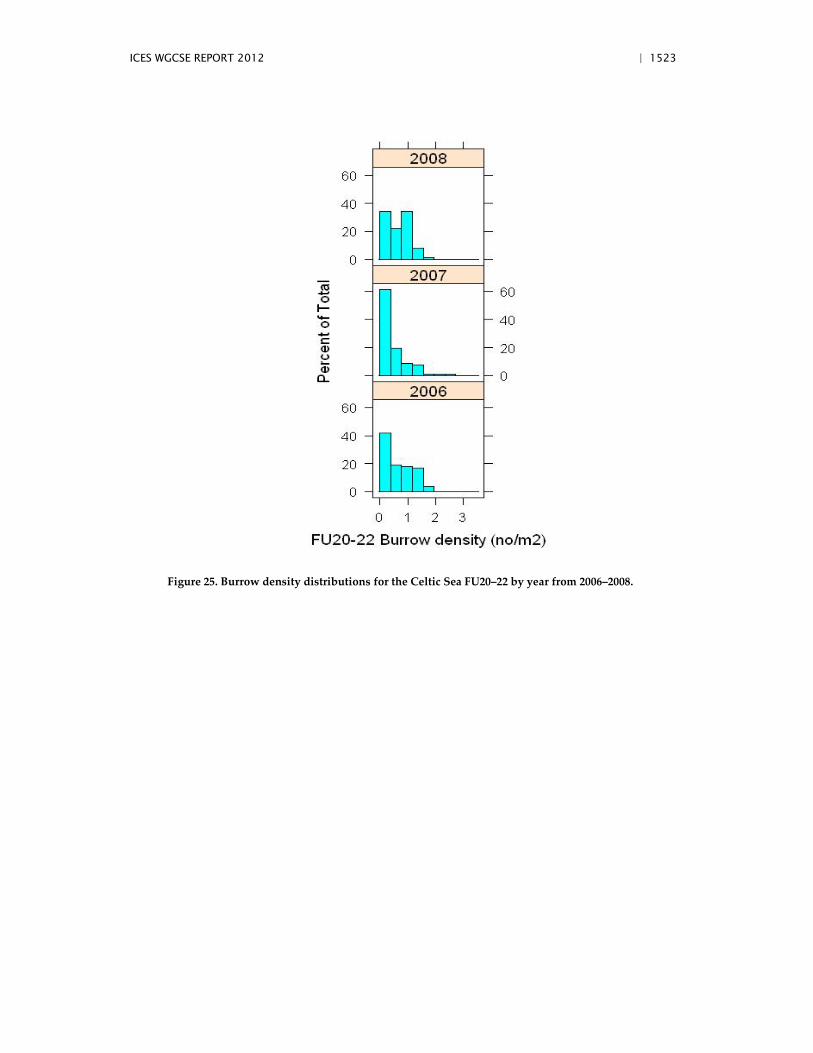
ICES WGCSE REPORT 2012 | 1523
Figure 25. Burrow density distributions for the Celtic Sea FU20–22 by year from 2006–2008.
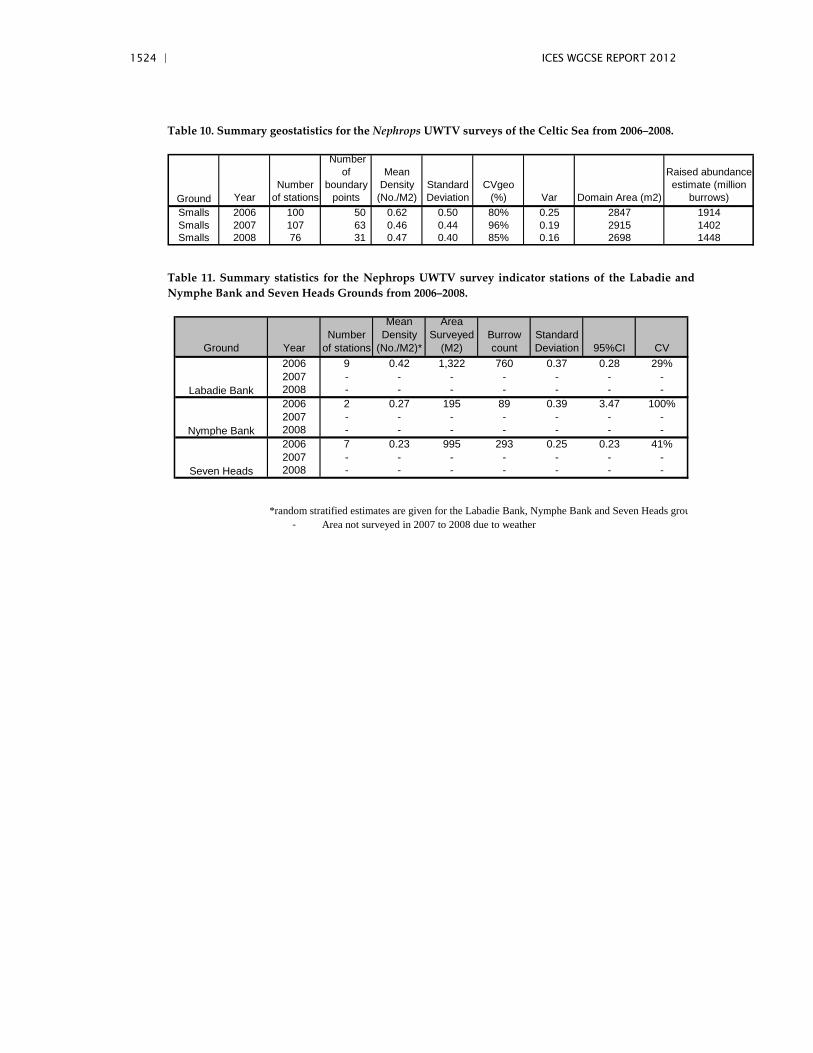
1524 | ICES WGCSE REPORT 2012
Table 10. Summary geostatistics for the Nephrops UWTV surveys of the Celtic Sea from 2006–2008.
Ground YearNumber
of stations
Number of
boundary points
Mean Density
(No./M2)Standard Deviation
CVgeo (%) Var Domain Area (m2)
Raised abundance estimate (million
burrows)Smalls 2006 100 50 0.62 0.50 80% 0.25 2847 1914Smalls 2007 107 63 0.46 0.44 96% 0.19 2915 1402Smalls 2008 76 31 0.47 0.40 85% 0.16 2698 1448
Table 11. Summary statistics for the Nephrops UWTV survey indicator stations of the Labadie and Nymphe Bank and Seven Heads Grounds from 2006–2008.
Ground YearNumber
of stations
Mean Density
(No./M2)*
Area Surveyed
(M2)Burrow count
Standard Deviation 95%CI CV
2006 9 0.42 1,322 760 0.37 0.28 29%2007 - - - - - - -2008 - - - - - - -2006 2 0.27 195 89 0.39 3.47 100%2007 - - - - - - -2008 - - - - - - -2006 7 0.23 995 293 0.25 0.23 41%2007 - - - - - - -2008 - - - - - - -
*random stratified estimates are given for the Labadie Bank, Nymphe Bank and Seven Heads grou- Area not surveyed in 2007 to 2008 due to weather
Labadie Bank
Nymphe Bank
Seven Heads
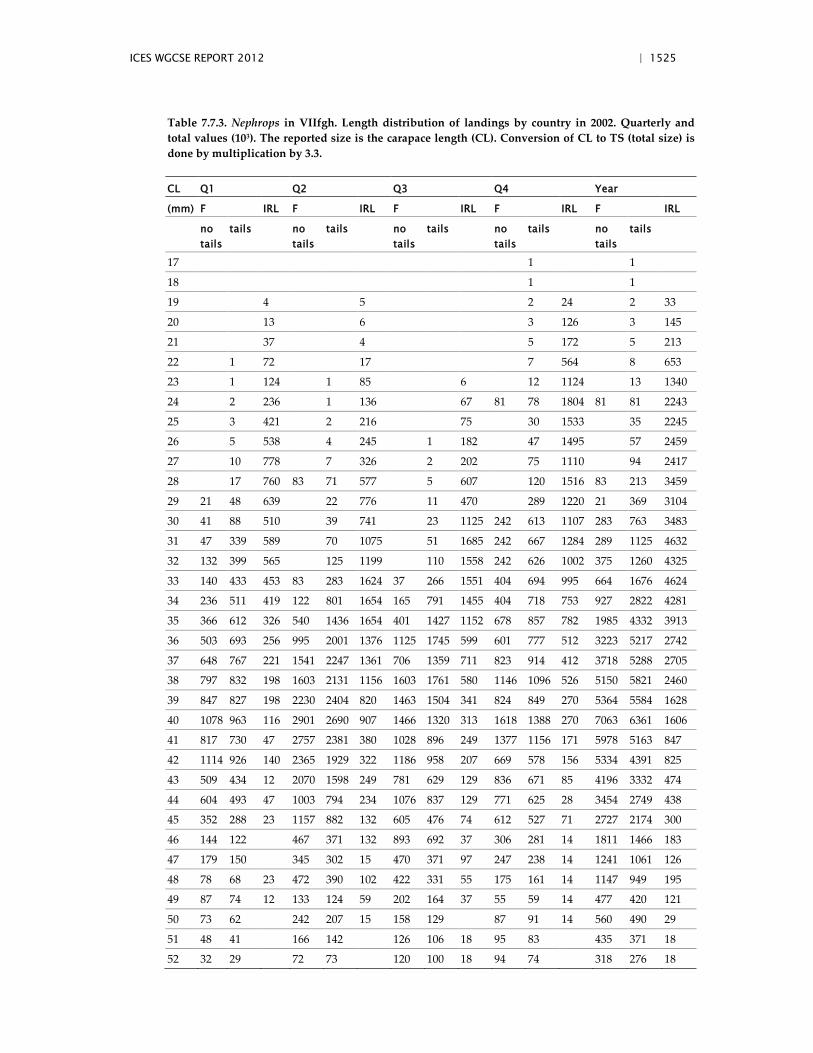
ICES WGCSE REPORT 2012 | 1525
Table 7.7.3. Nephrops in VIIfgh. Length distribution of landings by country in 2002. Quarterly and total values (103). The reported size is the carapace length (CL). Conversion of CL to TS (total size) is done by multiplication by 3.3.
CL Q1 Q2 Q3 Q4 Year
(mm) F IRL F IRL F IRL F IRL F IRL
no tails
tails no tails
tails no tails
tails no tails
tails no tails
tails
17 1 1
18 1 1
19 4 5 2 24 2 33
20 13 6 3 126 3 145
21 37 4 5 172 5 213
22 1 72 17 7 564 8 653
23 1 124 1 85 6 12 1124 13 1340
24 2 236 1 136 67 81 78 1804 81 81 2243
25 3 421 2 216 75 30 1533 35 2245
26 5 538 4 245 1 182 47 1495 57 2459
27 10 778 7 326 2 202 75 1110 94 2417
28 17 760 83 71 577 5 607 120 1516 83 213 3459
29 21 48 639 22 776 11 470 289 1220 21 369 3104
30 41 88 510 39 741 23 1125 242 613 1107 283 763 3483
31 47 339 589 70 1075 51 1685 242 667 1284 289 1125 4632
32 132 399 565 125 1199 110 1558 242 626 1002 375 1260 4325
33 140 433 453 83 283 1624 37 266 1551 404 694 995 664 1676 4624
34 236 511 419 122 801 1654 165 791 1455 404 718 753 927 2822 4281
35 366 612 326 540 1436 1654 401 1427 1152 678 857 782 1985 4332 3913
36 503 693 256 995 2001 1376 1125 1745 599 601 777 512 3223 5217 2742
37 648 767 221 1541 2247 1361 706 1359 711 823 914 412 3718 5288 2705
38 797 832 198 1603 2131 1156 1603 1761 580 1146 1096 526 5150 5821 2460
39 847 827 198 2230 2404 820 1463 1504 341 824 849 270 5364 5584 1628
40 1078 963 116 2901 2690 907 1466 1320 313 1618 1388 270 7063 6361 1606
41 817 730 47 2757 2381 380 1028 896 249 1377 1156 171 5978 5163 847
42 1114 926 140 2365 1929 322 1186 958 207 669 578 156 5334 4391 825
43 509 434 12 2070 1598 249 781 629 129 836 671 85 4196 3332 474
44 604 493 47 1003 794 234 1076 837 129 771 625 28 3454 2749 438
45 352 288 23 1157 882 132 605 476 74 612 527 71 2727 2174 300
46 144 122 467 371 132 893 692 37 306 281 14 1811 1466 183
47 179 150 345 302 15 470 371 97 247 238 14 1241 1061 126
48 78 68 23 472 390 102 422 331 55 175 161 14 1147 949 195
49 87 74 12 133 124 59 202 164 37 55 59 14 477 420 121
50 73 62 242 207 15 158 129 87 91 14 560 490 29
51 48 41 166 142 126 106 18 95 83 435 371 18
52 32 29 72 73 120 100 18 94 74 318 276 18
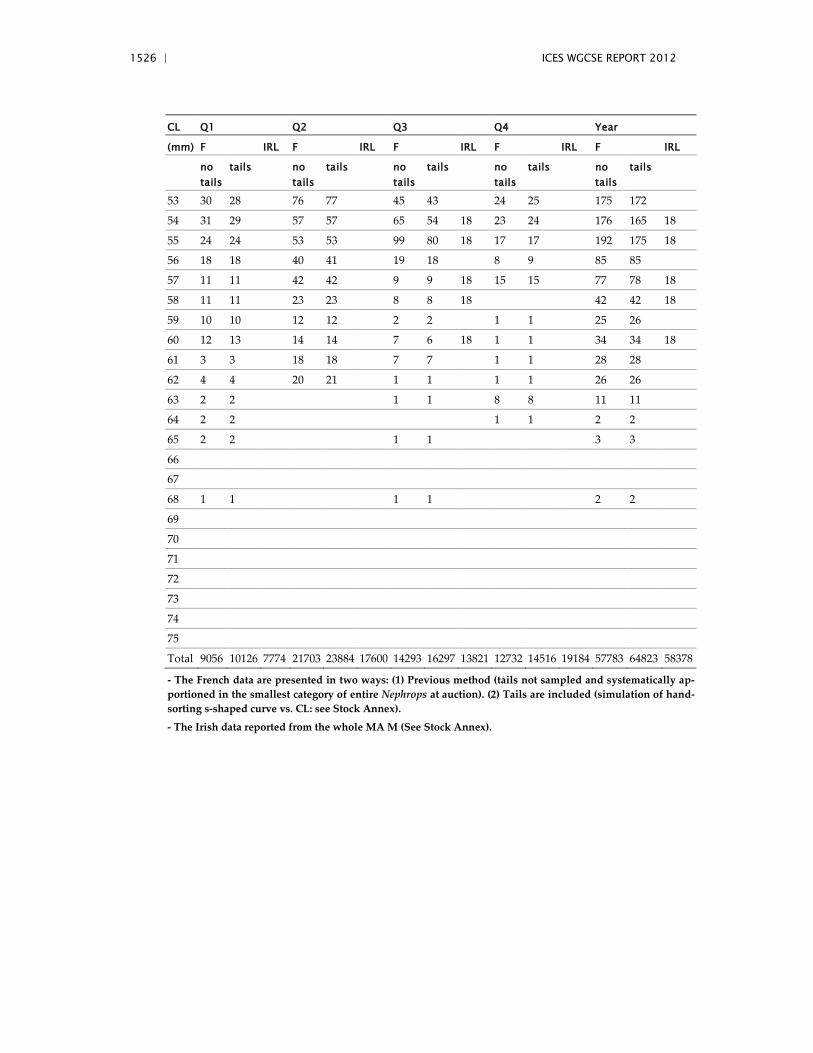
1526 | ICES WGCSE REPORT 2012
CL Q1 Q2 Q3 Q4 Year
(mm) F IRL F IRL F IRL F IRL F IRL
no tails
tails no tails
tails no tails
tails no tails
tails no tails
tails
53 30 28 76 77 45 43 24 25 175 172
54 31 29 57 57 65 54 18 23 24 176 165 18
55 24 24 53 53 99 80 18 17 17 192 175 18
56 18 18 40 41 19 18 8 9 85 85
57 11 11 42 42 9 9 18 15 15 77 78 18
58 11 11 23 23 8 8 18 42 42 18
59 10 10 12 12 2 2 1 1 25 26
60 12 13 14 14 7 6 18 1 1 34 34 18
61 3 3 18 18 7 7 1 1 28 28
62 4 4 20 21 1 1 1 1 26 26
63 2 2 1 1 8 8 11 11
64 2 2 1 1 2 2
65 2 2 1 1 3 3
66
67
68 1 1 1 1 2 2
69
70
71
72
73
74
75
Total 9056 10126 7774 21703 23884 17600 14293 16297 13821 12732 14516 19184 57783 64823 58378
- The French data are presented in two ways: (1) Previous method (tails not sampled and systematically ap-portioned in the smallest category of entire Nephrops at auction). (2) Tails are included (simulation of hand-sorting s-shaped curve vs. CL: see Stock Annex).
- The Irish data reported from the whole MA M (See Stock Annex).
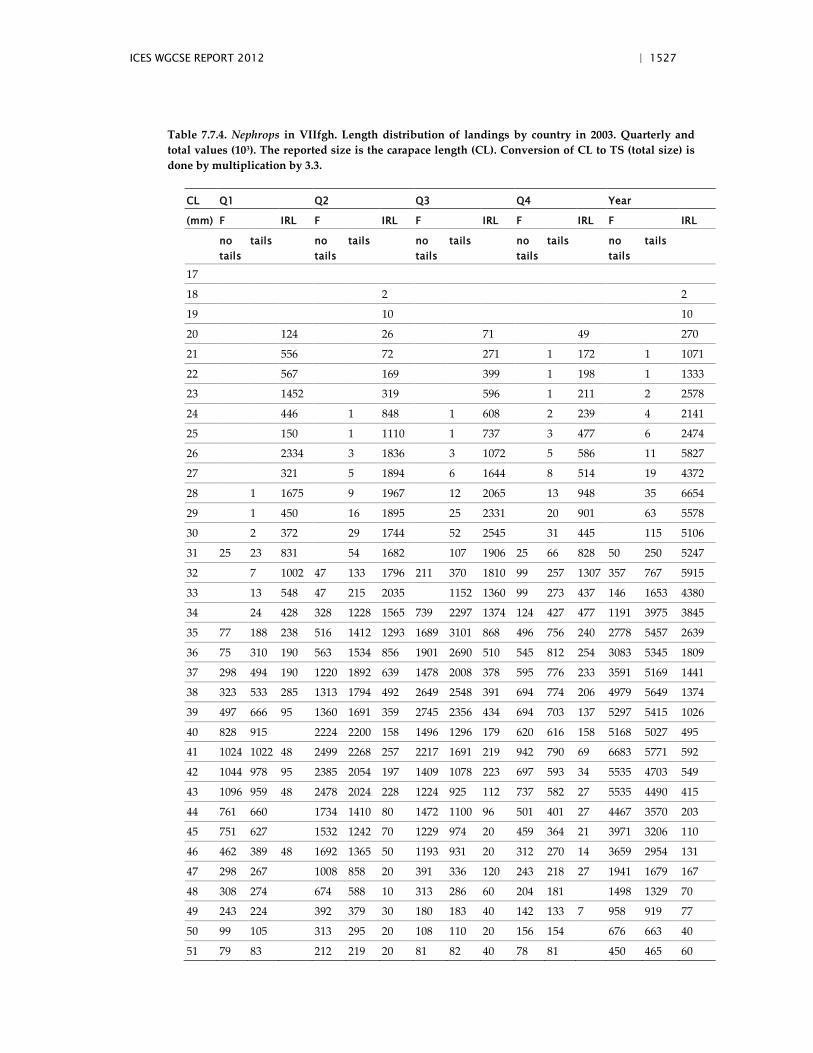
ICES WGCSE REPORT 2012 | 1527
Table 7.7.4. Nephrops in VIIfgh. Length distribution of landings by country in 2003. Quarterly and total values (103). The reported size is the carapace length (CL). Conversion of CL to TS (total size) is done by multiplication by 3.3.
CL Q1 Q2 Q3 Q4 Year
(mm) F IRL F IRL F IRL F IRL F IRL
no tails
tails no tails
tails no tails
tails no tails
tails no tails
tails
17
18 2 2
19 10 10
20 124 26 71 49 270
21 556 72 271 1 172 1 1071
22 567 169 399 1 198 1 1333
23 1452 319 596 1 211 2 2578
24 446 1 848 1 608 2 239 4 2141
25 150 1 1110 1 737 3 477 6 2474
26 2334 3 1836 3 1072 5 586 11 5827
27 321 5 1894 6 1644 8 514 19 4372
28 1 1675 9 1967 12 2065 13 948 35 6654
29 1 450 16 1895 25 2331 20 901 63 5578
30 2 372 29 1744 52 2545 31 445 115 5106
31 25 23 831 54 1682 107 1906 25 66 828 50 250 5247
32 7 1002 47 133 1796 211 370 1810 99 257 1307 357 767 5915
33 13 548 47 215 2035 1152 1360 99 273 437 146 1653 4380
34 24 428 328 1228 1565 739 2297 1374 124 427 477 1191 3975 3845
35 77 188 238 516 1412 1293 1689 3101 868 496 756 240 2778 5457 2639
36 75 310 190 563 1534 856 1901 2690 510 545 812 254 3083 5345 1809
37 298 494 190 1220 1892 639 1478 2008 378 595 776 233 3591 5169 1441
38 323 533 285 1313 1794 492 2649 2548 391 694 774 206 4979 5649 1374
39 497 666 95 1360 1691 359 2745 2356 434 694 703 137 5297 5415 1026
40 828 915 2224 2200 158 1496 1296 179 620 616 158 5168 5027 495
41 1024 1022 48 2499 2268 257 2217 1691 219 942 790 69 6683 5771 592
42 1044 978 95 2385 2054 197 1409 1078 223 697 593 34 5535 4703 549
43 1096 959 48 2478 2024 228 1224 925 112 737 582 27 5535 4490 415
44 761 660 1734 1410 80 1472 1100 96 501 401 27 4467 3570 203
45 751 627 1532 1242 70 1229 974 20 459 364 21 3971 3206 110
46 462 389 48 1692 1365 50 1193 931 20 312 270 14 3659 2954 131
47 298 267 1008 858 20 391 336 120 243 218 27 1941 1679 167
48 308 274 674 588 10 313 286 60 204 181 1498 1329 70
49 243 224 392 379 30 180 183 40 142 133 7 958 919 77
50 99 105 313 295 20 108 110 20 156 154 676 663 40
51 79 83 212 219 20 81 82 40 78 81 450 465 60
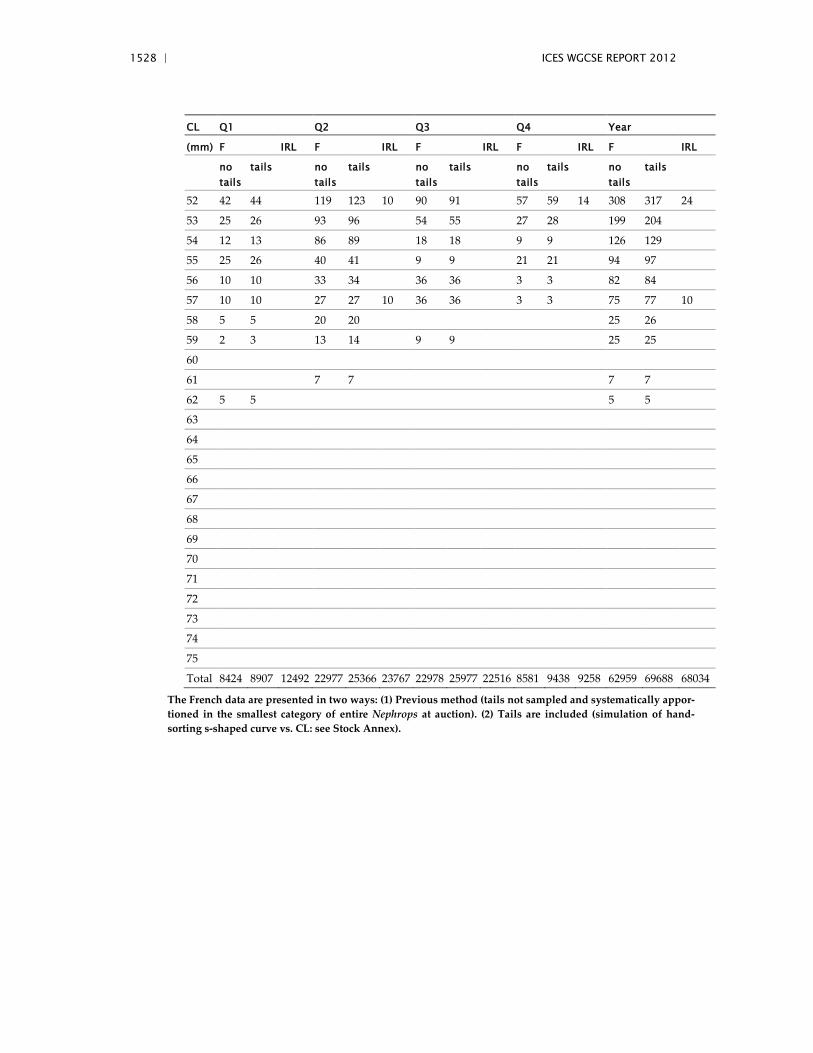
1528 | ICES WGCSE REPORT 2012
CL Q1 Q2 Q3 Q4 Year
(mm) F IRL F IRL F IRL F IRL F IRL
no tails
tails no tails
tails no tails
tails no tails
tails no tails
tails
52 42 44 119 123 10 90 91 57 59 14 308 317 24
53 25 26 93 96 54 55 27 28 199 204
54 12 13 86 89 18 18 9 9 126 129
55 25 26 40 41 9 9 21 21 94 97
56 10 10 33 34 36 36 3 3 82 84
57 10 10 27 27 10 36 36 3 3 75 77 10
58 5 5 20 20 25 26
59 2 3 13 14 9 9 25 25
60
61 7 7 7 7
62 5 5 5 5
63
64
65
66
67
68
69
70
71
72
73
74
75
Total 8424 8907 12492 22977 25366 23767 22978 25977 22516 8581 9438 9258 62959 69688 68034
The French data are presented in two ways: (1) Previous method (tails not sampled and systematically appor-tioned in the smallest category of entire Nephrops at auction). (2) Tails are included (simulation of hand-sorting s-shaped curve vs. CL: see Stock Annex).
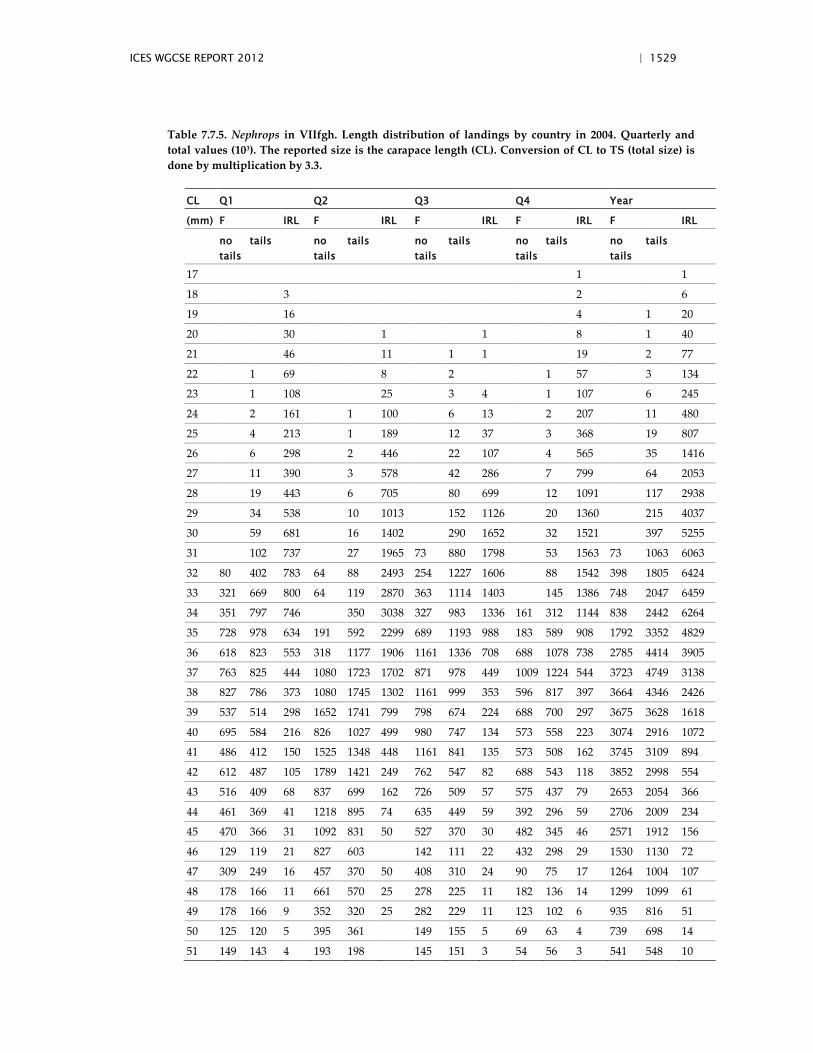
ICES WGCSE REPORT 2012 | 1529
Table 7.7.5. Nephrops in VIIfgh. Length distribution of landings by country in 2004. Quarterly and total values (103). The reported size is the carapace length (CL). Conversion of CL to TS (total size) is done by multiplication by 3.3.
CL Q1 Q2 Q3 Q4 Year
(mm) F IRL F IRL F IRL F IRL F IRL
no tails
tails no tails
tails no tails
tails no tails
tails no tails
tails
17 1 1
18 3 2 6
19 16 4 1 20
20 30 1 1 8 1 40
21 46 11 1 1 19 2 77
22 1 69 8 2 1 57 3 134
23 1 108 25 3 4 1 107 6 245
24 2 161 1 100 6 13 2 207 11 480
25 4 213 1 189 12 37 3 368 19 807
26 6 298 2 446 22 107 4 565 35 1416
27 11 390 3 578 42 286 7 799 64 2053
28 19 443 6 705 80 699 12 1091 117 2938
29 34 538 10 1013 152 1126 20 1360 215 4037
30 59 681 16 1402 290 1652 32 1521 397 5255
31 102 737 27 1965 73 880 1798 53 1563 73 1063 6063
32 80 402 783 64 88 2493 254 1227 1606 88 1542 398 1805 6424
33 321 669 800 64 119 2870 363 1114 1403 145 1386 748 2047 6459
34 351 797 746 350 3038 327 983 1336 161 312 1144 838 2442 6264
35 728 978 634 191 592 2299 689 1193 988 183 589 908 1792 3352 4829
36 618 823 553 318 1177 1906 1161 1336 708 688 1078 738 2785 4414 3905
37 763 825 444 1080 1723 1702 871 978 449 1009 1224 544 3723 4749 3138
38 827 786 373 1080 1745 1302 1161 999 353 596 817 397 3664 4346 2426
39 537 514 298 1652 1741 799 798 674 224 688 700 297 3675 3628 1618
40 695 584 216 826 1027 499 980 747 134 573 558 223 3074 2916 1072
41 486 412 150 1525 1348 448 1161 841 135 573 508 162 3745 3109 894
42 612 487 105 1789 1421 249 762 547 82 688 543 118 3852 2998 554
43 516 409 68 837 699 162 726 509 57 575 437 79 2653 2054 366
44 461 369 41 1218 895 74 635 449 59 392 296 59 2706 2009 234
45 470 366 31 1092 831 50 527 370 30 482 345 46 2571 1912 156
46 129 119 21 827 603 142 111 22 432 298 29 1530 1130 72
47 309 249 16 457 370 50 408 310 24 90 75 17 1264 1004 107
48 178 166 11 661 570 25 278 225 11 182 136 14 1299 1099 61
49 178 166 9 352 320 25 282 229 11 123 102 6 935 816 51
50 125 120 5 395 361 149 155 5 69 63 4 739 698 14
51 149 143 4 193 198 145 151 3 54 56 3 541 548 10
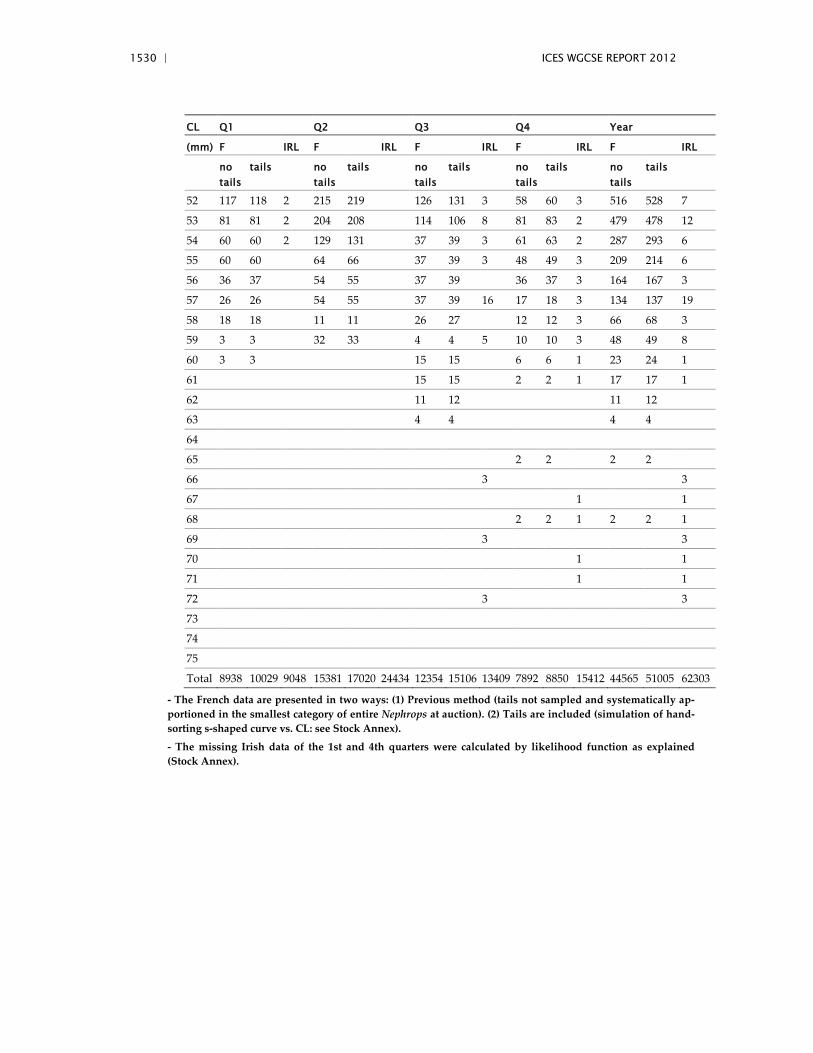
1530 | ICES WGCSE REPORT 2012
CL Q1 Q2 Q3 Q4 Year
(mm) F IRL F IRL F IRL F IRL F IRL
no tails
tails no tails
tails no tails
tails no tails
tails no tails
tails
52 117 118 2 215 219 126 131 3 58 60 3 516 528 7
53 81 81 2 204 208 114 106 8 81 83 2 479 478 12
54 60 60 2 129 131 37 39 3 61 63 2 287 293 6
55 60 60 64 66 37 39 3 48 49 3 209 214 6
56 36 37 54 55 37 39 36 37 3 164 167 3
57 26 26 54 55 37 39 16 17 18 3 134 137 19
58 18 18 11 11 26 27 12 12 3 66 68 3
59 3 3 32 33 4 4 5 10 10 3 48 49 8
60 3 3 15 15 6 6 1 23 24 1
61 15 15 2 2 1 17 17 1
62 11 12 11 12
63 4 4 4 4
64
65 2 2 2 2
66 3 3
67 1 1
68 2 2 1 2 2 1
69 3 3
70 1 1
71 1 1
72 3 3
73
74
75
Total 8938 10029 9048 15381 17020 24434 12354 15106 13409 7892 8850 15412 44565 51005 62303
- The French data are presented in two ways: (1) Previous method (tails not sampled and systematically ap-portioned in the smallest category of entire Nephrops at auction). (2) Tails are included (simulation of hand-sorting s-shaped curve vs. CL: see Stock Annex).
- The missing Irish data of the 1st and 4th quarters were calculated by likelihood function as explained (Stock Annex).
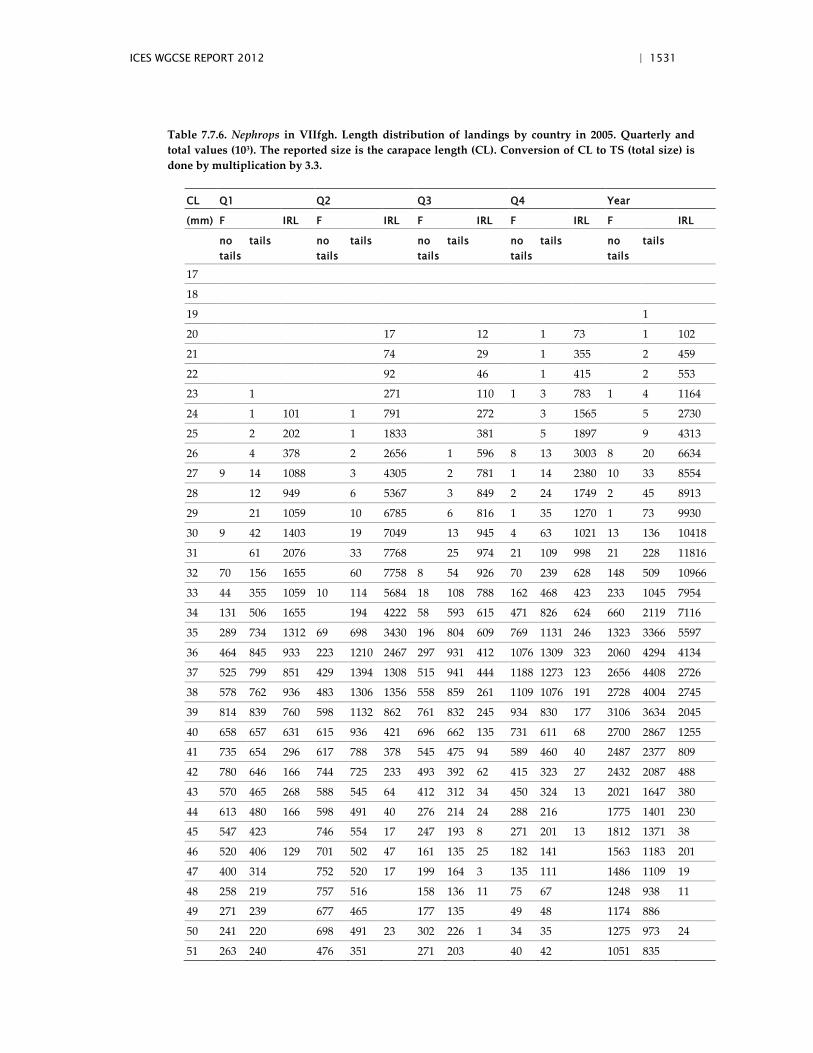
ICES WGCSE REPORT 2012 | 1531
Table 7.7.6. Nephrops in VIIfgh. Length distribution of landings by country in 2005. Quarterly and total values (103). The reported size is the carapace length (CL). Conversion of CL to TS (total size) is done by multiplication by 3.3.
CL Q1 Q2 Q3 Q4 Year
(mm) F IRL F IRL F IRL F IRL F IRL
no tails
tails no tails
tails no tails
tails no tails
tails no tails
tails
17
18
19 1
20 17 12 1 73 1 102
21 74 29 1 355 2 459
22 92 46 1 415 2 553
23 1 271 110 1 3 783 1 4 1164
24 1 101 1 791 272 3 1565 5 2730
25 2 202 1 1833 381 5 1897 9 4313
26 4 378 2 2656 1 596 8 13 3003 8 20 6634
27 9 14 1088 3 4305 2 781 1 14 2380 10 33 8554
28 12 949 6 5367 3 849 2 24 1749 2 45 8913
29 21 1059 10 6785 6 816 1 35 1270 1 73 9930
30 9 42 1403 19 7049 13 945 4 63 1021 13 136 10418
31 61 2076 33 7768 25 974 21 109 998 21 228 11816
32 70 156 1655 60 7758 8 54 926 70 239 628 148 509 10966
33 44 355 1059 10 114 5684 18 108 788 162 468 423 233 1045 7954
34 131 506 1655 194 4222 58 593 615 471 826 624 660 2119 7116
35 289 734 1312 69 698 3430 196 804 609 769 1131 246 1323 3366 5597
36 464 845 933 223 1210 2467 297 931 412 1076 1309 323 2060 4294 4134
37 525 799 851 429 1394 1308 515 941 444 1188 1273 123 2656 4408 2726
38 578 762 936 483 1306 1356 558 859 261 1109 1076 191 2728 4004 2745
39 814 839 760 598 1132 862 761 832 245 934 830 177 3106 3634 2045
40 658 657 631 615 936 421 696 662 135 731 611 68 2700 2867 1255
41 735 654 296 617 788 378 545 475 94 589 460 40 2487 2377 809
42 780 646 166 744 725 233 493 392 62 415 323 27 2432 2087 488
43 570 465 268 588 545 64 412 312 34 450 324 13 2021 1647 380
44 613 480 166 598 491 40 276 214 24 288 216 1775 1401 230
45 547 423 746 554 17 247 193 8 271 201 13 1812 1371 38
46 520 406 129 701 502 47 161 135 25 182 141 1563 1183 201
47 400 314 752 520 17 199 164 3 135 111 1486 1109 19
48 258 219 757 516 158 136 11 75 67 1248 938 11
49 271 239 677 465 177 135 49 48 1174 886
50 241 220 698 491 23 302 226 1 34 35 1275 973 24
51 263 240 476 351 271 203 40 42 1051 835
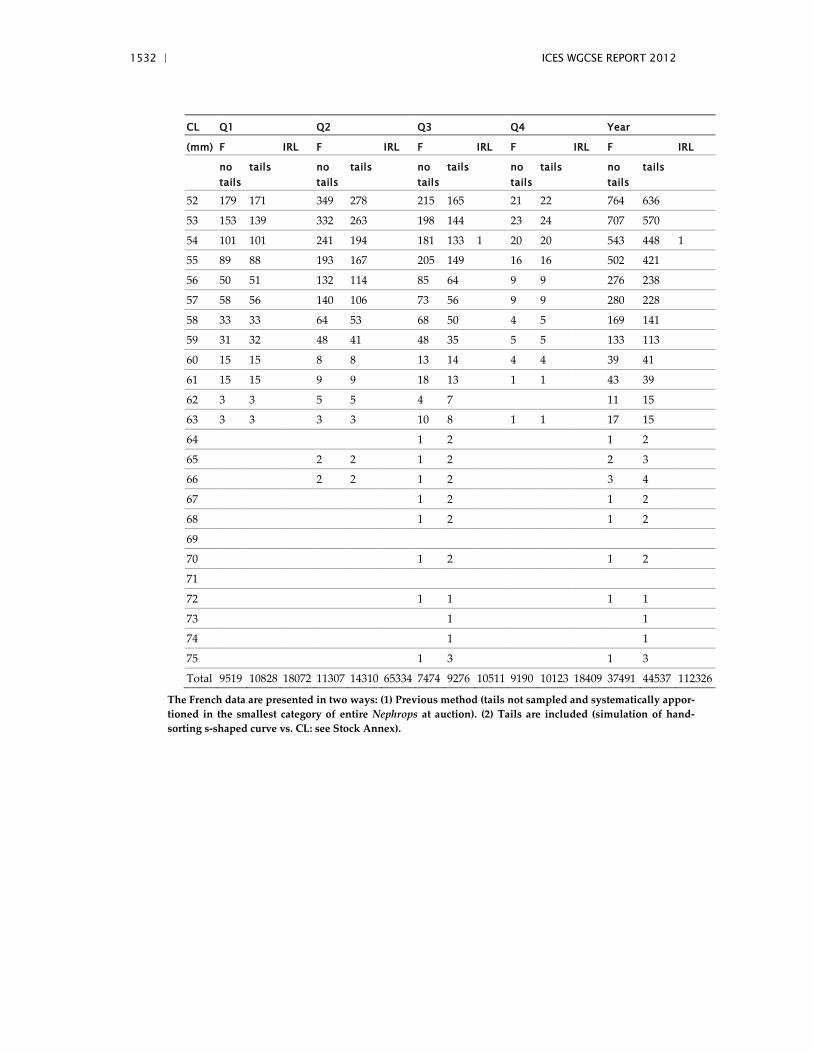
1532 | ICES WGCSE REPORT 2012
CL Q1 Q2 Q3 Q4 Year
(mm) F IRL F IRL F IRL F IRL F IRL
no tails
tails no tails
tails no tails
tails no tails
tails no tails
tails
52 179 171 349 278 215 165 21 22 764 636
53 153 139 332 263 198 144 23 24 707 570
54 101 101 241 194 181 133 1 20 20 543 448 1
55 89 88 193 167 205 149 16 16 502 421
56 50 51 132 114 85 64 9 9 276 238
57 58 56 140 106 73 56 9 9 280 228
58 33 33 64 53 68 50 4 5 169 141
59 31 32 48 41 48 35 5 5 133 113
60 15 15 8 8 13 14 4 4 39 41
61 15 15 9 9 18 13 1 1 43 39
62 3 3 5 5 4 7 11 15
63 3 3 3 3 10 8 1 1 17 15
64 1 2 1 2
65 2 2 1 2 2 3
66 2 2 1 2 3 4
67 1 2 1 2
68 1 2 1 2
69
70 1 2 1 2
71
72 1 1 1 1
73 1 1
74 1 1
75 1 3 1 3
Total 9519 10828 18072 11307 14310 65334 7474 9276 10511 9190 10123 18409 37491 44537 112326
The French data are presented in two ways: (1) Previous method (tails not sampled and systematically appor-tioned in the smallest category of entire Nephrops at auction). (2) Tails are included (simulation of hand-sorting s-shaped curve vs. CL: see Stock Annex).
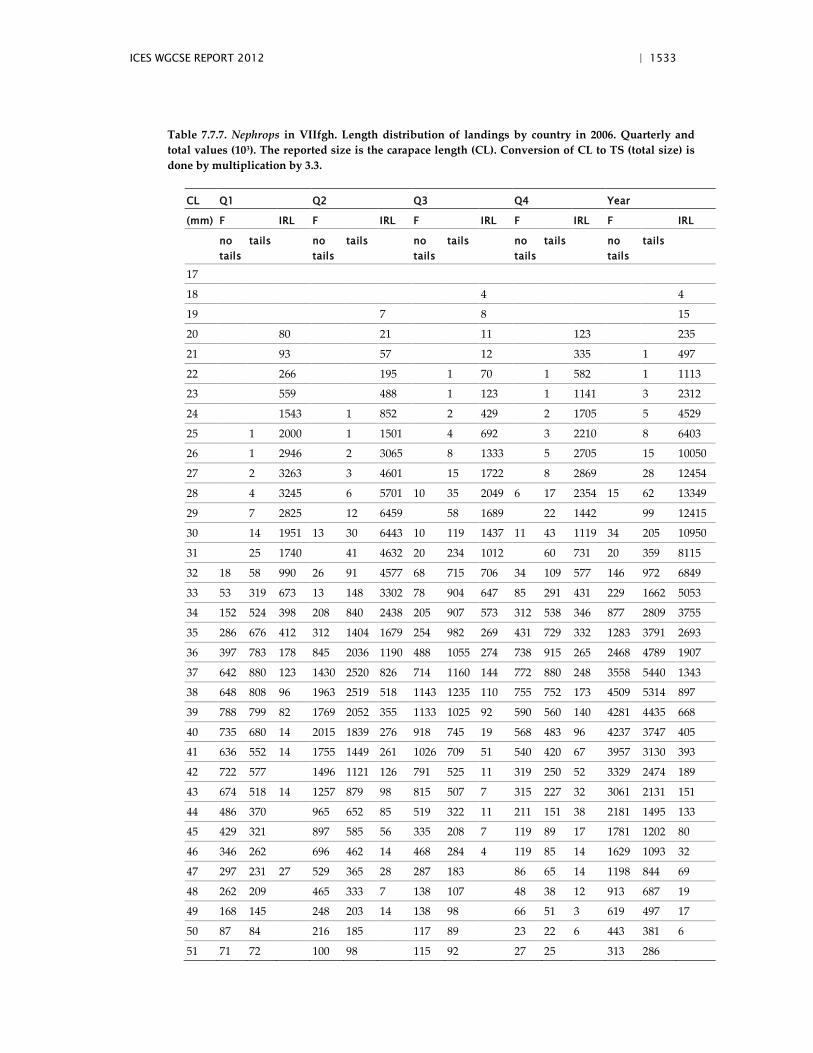
ICES WGCSE REPORT 2012 | 1533
Table 7.7.7. Nephrops in VIIfgh. Length distribution of landings by country in 2006. Quarterly and total values (103). The reported size is the carapace length (CL). Conversion of CL to TS (total size) is done by multiplication by 3.3.
CL Q1 Q2 Q3 Q4 Year
(mm) F IRL F IRL F IRL F IRL F IRL
no tails
tails no tails
tails no tails
tails no tails
tails no tails
tails
17
18 4 4
19 7 8 15
20 80 21 11 123 235
21 93 57 12 335 1 497
22 266 195 1 70 1 582 1 1113
23 559 488 1 123 1 1141 3 2312
24 1543 1 852 2 429 2 1705 5 4529
25 1 2000 1 1501 4 692 3 2210 8 6403
26 1 2946 2 3065 8 1333 5 2705 15 10050
27 2 3263 3 4601 15 1722 8 2869 28 12454
28 4 3245 6 5701 10 35 2049 6 17 2354 15 62 13349
29 7 2825 12 6459 58 1689 22 1442 99 12415
30 14 1951 13 30 6443 10 119 1437 11 43 1119 34 205 10950
31 25 1740 41 4632 20 234 1012 60 731 20 359 8115
32 18 58 990 26 91 4577 68 715 706 34 109 577 146 972 6849
33 53 319 673 13 148 3302 78 904 647 85 291 431 229 1662 5053
34 152 524 398 208 840 2438 205 907 573 312 538 346 877 2809 3755
35 286 676 412 312 1404 1679 254 982 269 431 729 332 1283 3791 2693
36 397 783 178 845 2036 1190 488 1055 274 738 915 265 2468 4789 1907
37 642 880 123 1430 2520 826 714 1160 144 772 880 248 3558 5440 1343
38 648 808 96 1963 2519 518 1143 1235 110 755 752 173 4509 5314 897
39 788 799 82 1769 2052 355 1133 1025 92 590 560 140 4281 4435 668
40 735 680 14 2015 1839 276 918 745 19 568 483 96 4237 3747 405
41 636 552 14 1755 1449 261 1026 709 51 540 420 67 3957 3130 393
42 722 577 1496 1121 126 791 525 11 319 250 52 3329 2474 189
43 674 518 14 1257 879 98 815 507 7 315 227 32 3061 2131 151
44 486 370 965 652 85 519 322 11 211 151 38 2181 1495 133
45 429 321 897 585 56 335 208 7 119 89 17 1781 1202 80
46 346 262 696 462 14 468 284 4 119 85 14 1629 1093 32
47 297 231 27 529 365 28 287 183 86 65 14 1198 844 69
48 262 209 465 333 7 138 107 48 38 12 913 687 19
49 168 145 248 203 14 138 98 66 51 3 619 497 17
50 87 84 216 185 117 89 23 22 6 443 381 6
51 71 72 100 98 115 92 27 25 313 286
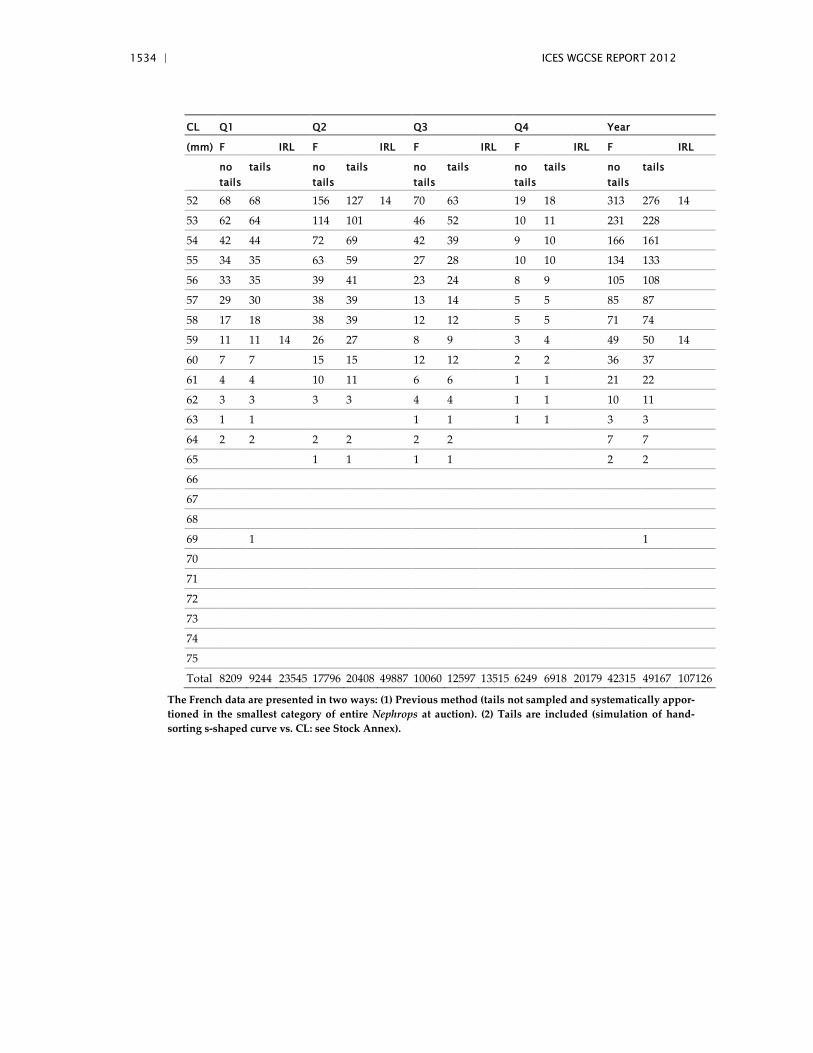
1534 | ICES WGCSE REPORT 2012
CL Q1 Q2 Q3 Q4 Year
(mm) F IRL F IRL F IRL F IRL F IRL
no tails
tails no tails
tails no tails
tails no tails
tails no tails
tails
52 68 68 156 127 14 70 63 19 18 313 276 14
53 62 64 114 101 46 52 10 11 231 228
54 42 44 72 69 42 39 9 10 166 161
55 34 35 63 59 27 28 10 10 134 133
56 33 35 39 41 23 24 8 9 105 108
57 29 30 38 39 13 14 5 5 85 87
58 17 18 38 39 12 12 5 5 71 74
59 11 11 14 26 27 8 9 3 4 49 50 14
60 7 7 15 15 12 12 2 2 36 37
61 4 4 10 11 6 6 1 1 21 22
62 3 3 3 3 4 4 1 1 10 11
63 1 1 1 1 1 1 3 3
64 2 2 2 2 2 2 7 7
65 1 1 1 1 2 2
66
67
68
69 1 1
70
71
72
73
74
75
Total 8209 9244 23545 17796 20408 49887 10060 12597 13515 6249 6918 20179 42315 49167 107126
The French data are presented in two ways: (1) Previous method (tails not sampled and systematically appor-tioned in the smallest category of entire Nephrops at auction). (2) Tails are included (simulation of hand-sorting s-shaped curve vs. CL: see Stock Annex).
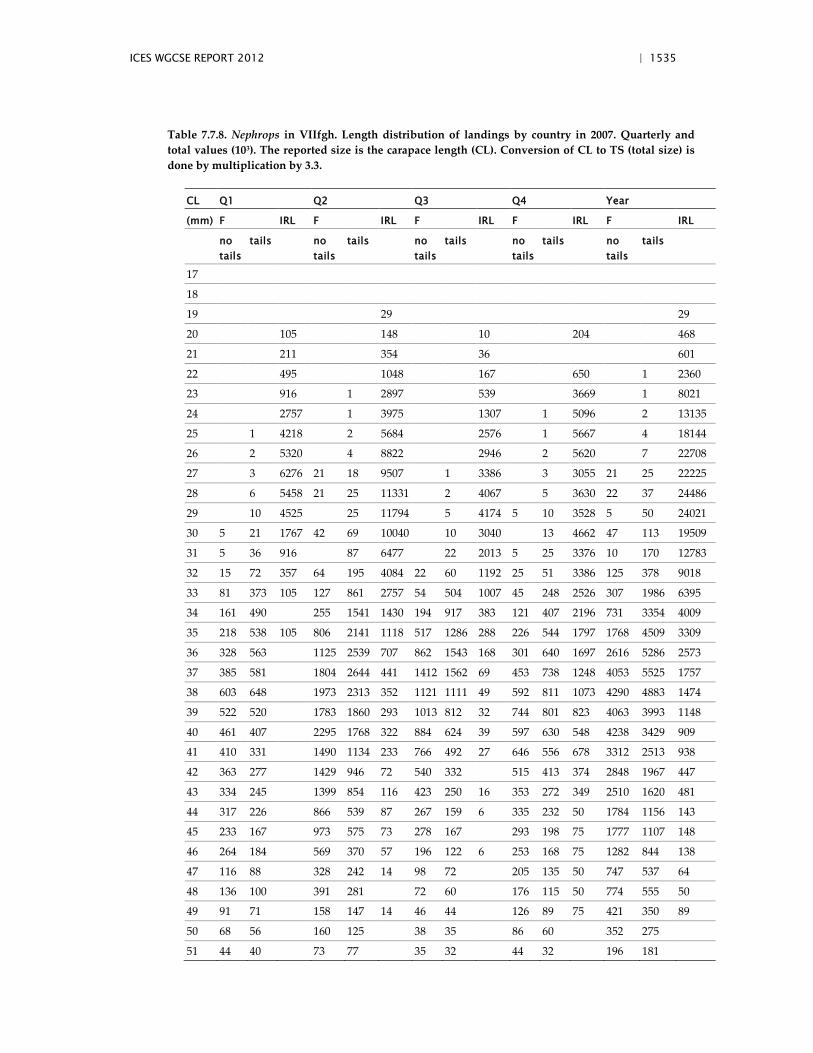
ICES WGCSE REPORT 2012 | 1535
Table 7.7.8. Nephrops in VIIfgh. Length distribution of landings by country in 2007. Quarterly and total values (103). The reported size is the carapace length (CL). Conversion of CL to TS (total size) is done by multiplication by 3.3.
CL Q1 Q2 Q3 Q4 Year
(mm) F IRL F IRL F IRL F IRL F IRL
no tails
tails no tails
tails no tails
tails no tails
tails no tails
tails
17
18
19 29 29
20 105 148 10 204 468
21 211 354 36 601
22 495 1048 167 650 1 2360
23 916 1 2897 539 3669 1 8021
24 2757 1 3975 1307 1 5096 2 13135
25 1 4218 2 5684 2576 1 5667 4 18144
26 2 5320 4 8822 2946 2 5620 7 22708
27 3 6276 21 18 9507 1 3386 3 3055 21 25 22225
28 6 5458 21 25 11331 2 4067 5 3630 22 37 24486
29 10 4525 25 11794 5 4174 5 10 3528 5 50 24021
30 5 21 1767 42 69 10040 10 3040 13 4662 47 113 19509
31 5 36 916 87 6477 22 2013 5 25 3376 10 170 12783
32 15 72 357 64 195 4084 22 60 1192 25 51 3386 125 378 9018
33 81 373 105 127 861 2757 54 504 1007 45 248 2526 307 1986 6395
34 161 490 255 1541 1430 194 917 383 121 407 2196 731 3354 4009
35 218 538 105 806 2141 1118 517 1286 288 226 544 1797 1768 4509 3309
36 328 563 1125 2539 707 862 1543 168 301 640 1697 2616 5286 2573
37 385 581 1804 2644 441 1412 1562 69 453 738 1248 4053 5525 1757
38 603 648 1973 2313 352 1121 1111 49 592 811 1073 4290 4883 1474
39 522 520 1783 1860 293 1013 812 32 744 801 823 4063 3993 1148
40 461 407 2295 1768 322 884 624 39 597 630 548 4238 3429 909
41 410 331 1490 1134 233 766 492 27 646 556 678 3312 2513 938
42 363 277 1429 946 72 540 332 515 413 374 2848 1967 447
43 334 245 1399 854 116 423 250 16 353 272 349 2510 1620 481
44 317 226 866 539 87 267 159 6 335 232 50 1784 1156 143
45 233 167 973 575 73 278 167 293 198 75 1777 1107 148
46 264 184 569 370 57 196 122 6 253 168 75 1282 844 138
47 116 88 328 242 14 98 72 205 135 50 747 537 64
48 136 100 391 281 72 60 176 115 50 774 555 50
49 91 71 158 147 14 46 44 126 89 75 421 350 89
50 68 56 160 125 38 35 86 60 352 275
51 44 40 73 77 35 32 44 32 196 181
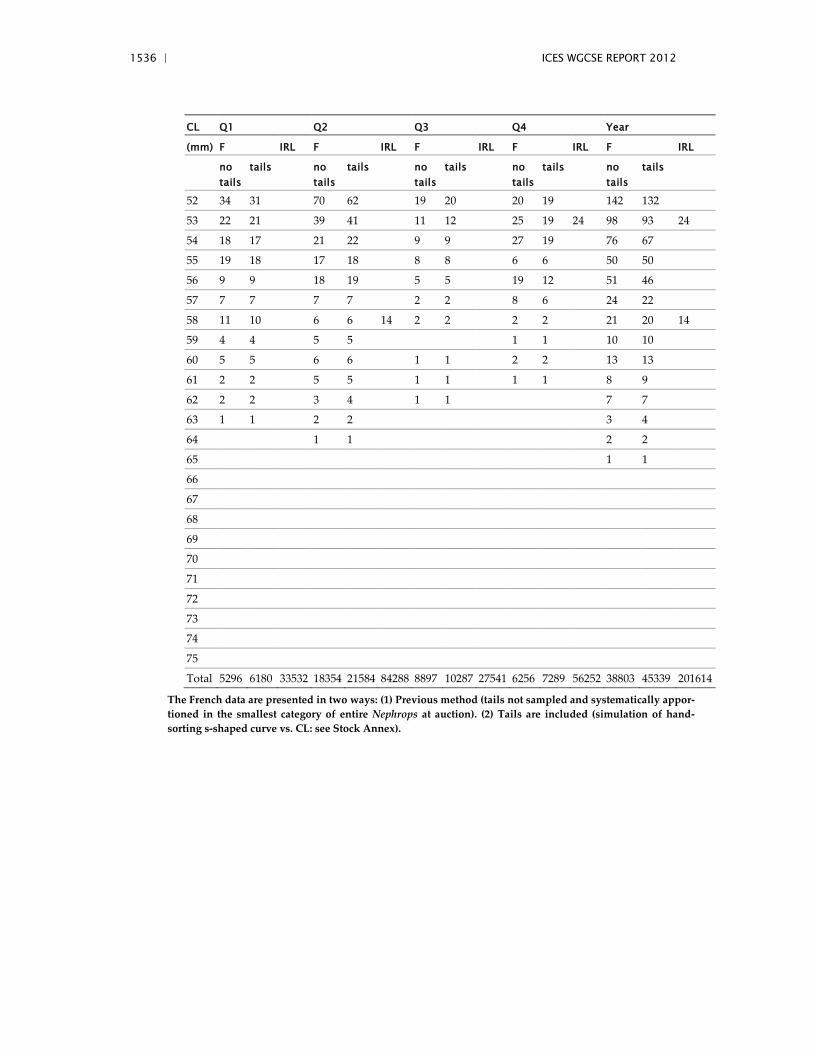
1536 | ICES WGCSE REPORT 2012
CL Q1 Q2 Q3 Q4 Year
(mm) F IRL F IRL F IRL F IRL F IRL
no tails
tails no tails
tails no tails
tails no tails
tails no tails
tails
52 34 31 70 62 19 20 20 19 142 132
53 22 21 39 41 11 12 25 19 24 98 93 24
54 18 17 21 22 9 9 27 19 76 67
55 19 18 17 18 8 8 6 6 50 50
56 9 9 18 19 5 5 19 12 51 46
57 7 7 7 7 2 2 8 6 24 22
58 11 10 6 6 14 2 2 2 2 21 20 14
59 4 4 5 5 1 1 10 10
60 5 5 6 6 1 1 2 2 13 13
61 2 2 5 5 1 1 1 1 8 9
62 2 2 3 4 1 1 7 7
63 1 1 2 2 3 4
64 1 1 2 2
65 1 1
66
67
68
69
70
71
72
73
74
75
Total 5296 6180 33532 18354 21584 84288 8897 10287 27541 6256 7289 56252 38803 45339 201614
The French data are presented in two ways: (1) Previous method (tails not sampled and systematically appor-tioned in the smallest category of entire Nephrops at auction). (2) Tails are included (simulation of hand-sorting s-shaped curve vs. CL: see Stock Annex).
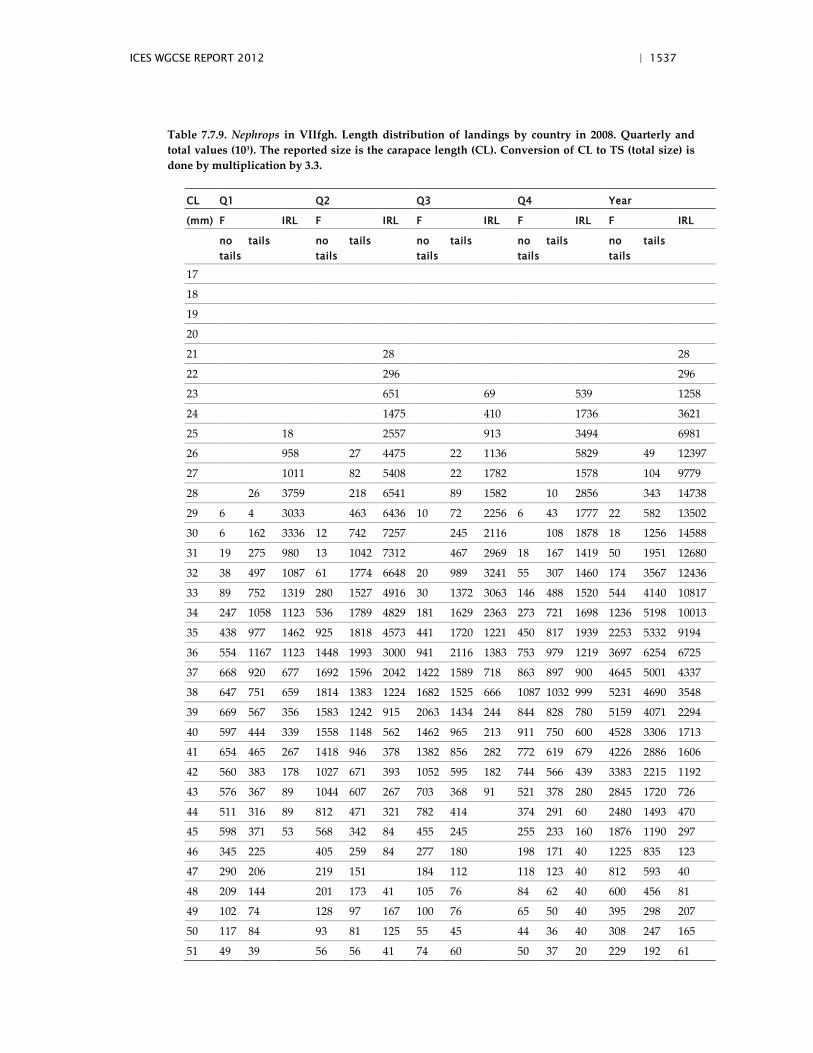
ICES WGCSE REPORT 2012 | 1537
Table 7.7.9. Nephrops in VIIfgh. Length distribution of landings by country in 2008. Quarterly and total values (103). The reported size is the carapace length (CL). Conversion of CL to TS (total size) is done by multiplication by 3.3.
CL Q1 Q2 Q3 Q4 Year
(mm) F IRL F IRL F IRL F IRL F IRL
no tails
tails no tails
tails no tails
tails no tails
tails no tails
tails
17
18
19
20
21 28 28
22 296 296
23 651 69 539 1258
24 1475 410 1736 3621
25 18 2557 913 3494 6981
26 958 27 4475 22 1136 5829 49 12397
27 1011 82 5408 22 1782 1578 104 9779
28 26 3759 218 6541 89 1582 10 2856 343 14738
29 6 4 3033 463 6436 10 72 2256 6 43 1777 22 582 13502
30 6 162 3336 12 742 7257 245 2116 108 1878 18 1256 14588
31 19 275 980 13 1042 7312 467 2969 18 167 1419 50 1951 12680
32 38 497 1087 61 1774 6648 20 989 3241 55 307 1460 174 3567 12436
33 89 752 1319 280 1527 4916 30 1372 3063 146 488 1520 544 4140 10817
34 247 1058 1123 536 1789 4829 181 1629 2363 273 721 1698 1236 5198 10013
35 438 977 1462 925 1818 4573 441 1720 1221 450 817 1939 2253 5332 9194
36 554 1167 1123 1448 1993 3000 941 2116 1383 753 979 1219 3697 6254 6725
37 668 920 677 1692 1596 2042 1422 1589 718 863 897 900 4645 5001 4337
38 647 751 659 1814 1383 1224 1682 1525 666 1087 1032 999 5231 4690 3548
39 669 567 356 1583 1242 915 2063 1434 244 844 828 780 5159 4071 2294
40 597 444 339 1558 1148 562 1462 965 213 911 750 600 4528 3306 1713
41 654 465 267 1418 946 378 1382 856 282 772 619 679 4226 2886 1606
42 560 383 178 1027 671 393 1052 595 182 744 566 439 3383 2215 1192
43 576 367 89 1044 607 267 703 368 91 521 378 280 2845 1720 726
44 511 316 89 812 471 321 782 414 374 291 60 2480 1493 470
45 598 371 53 568 342 84 455 245 255 233 160 1876 1190 297
46 345 225 405 259 84 277 180 198 171 40 1225 835 123
47 290 206 219 151 184 112 118 123 40 812 593 40
48 209 144 201 173 41 105 76 84 62 40 600 456 81
49 102 74 128 97 167 100 76 65 50 40 395 298 207
50 117 84 93 81 125 55 45 44 36 40 308 247 165
51 49 39 56 56 41 74 60 50 37 20 229 192 61
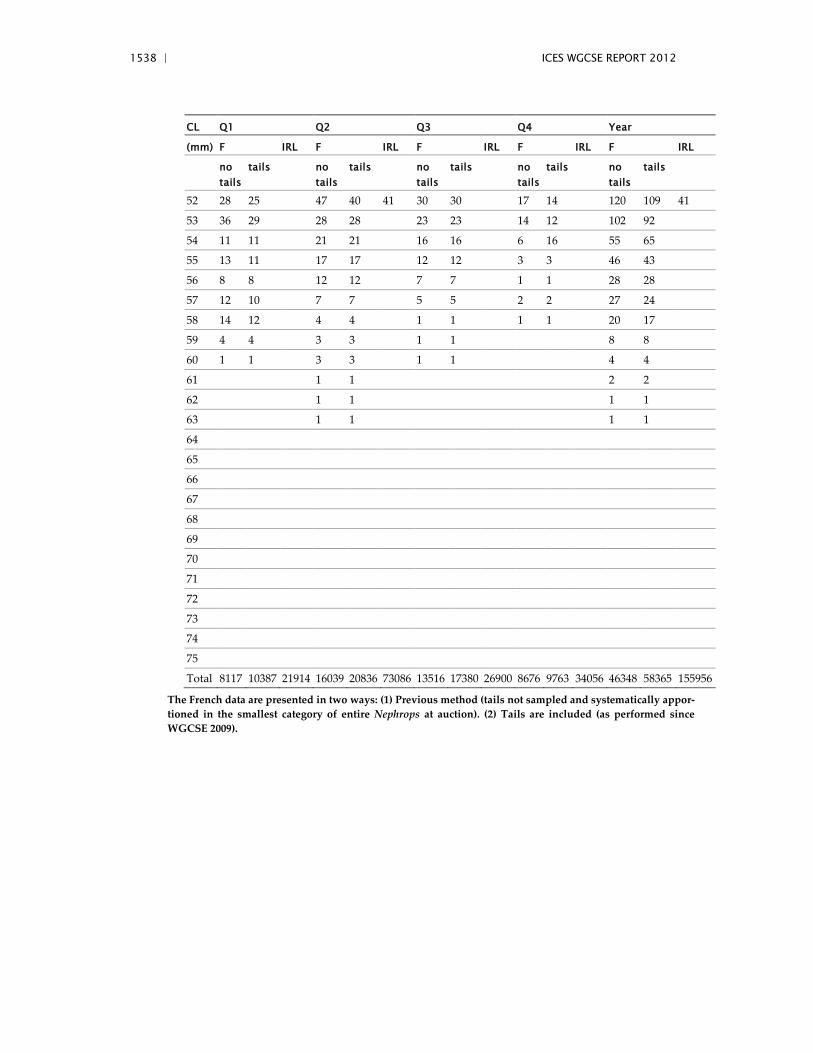
1538 | ICES WGCSE REPORT 2012
CL Q1 Q2 Q3 Q4 Year
(mm) F IRL F IRL F IRL F IRL F IRL
no tails
tails no tails
tails no tails
tails no tails
tails no tails
tails
52 28 25 47 40 41 30 30 17 14 120 109 41
53 36 29 28 28 23 23 14 12 102 92
54 11 11 21 21 16 16 6 16 55 65
55 13 11 17 17 12 12 3 3 46 43
56 8 8 12 12 7 7 1 1 28 28
57 12 10 7 7 5 5 2 2 27 24
58 14 12 4 4 1 1 1 1 20 17
59 4 4 3 3 1 1 8 8
60 1 1 3 3 1 1 4 4
61 1 1 2 2
62 1 1 1 1
63 1 1 1 1
64
65
66
67
68
69
70
71
72
73
74
75
Total 8117 10387 21914 16039 20836 73086 13516 17380 26900 8676 9763 34056 46348 58365 155956
The French data are presented in two ways: (1) Previous method (tails not sampled and systematically appor-tioned in the smallest category of entire Nephrops at auction). (2) Tails are included (as performed since WGCSE 2009).
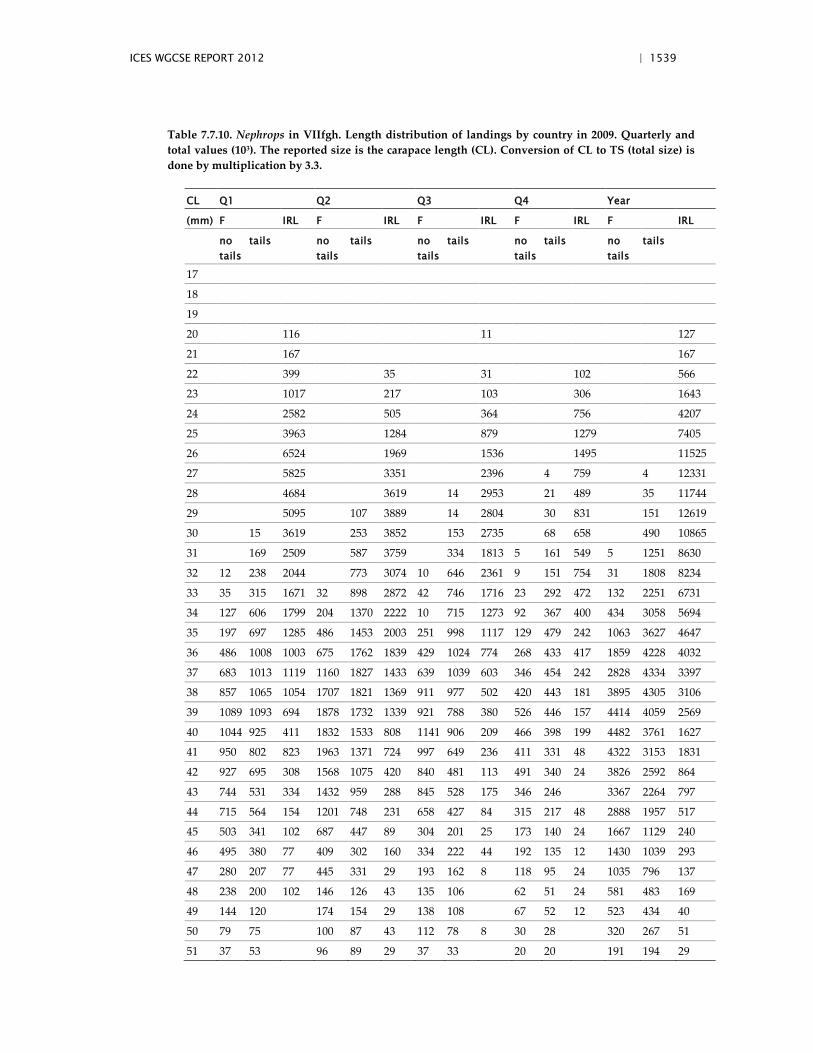
ICES WGCSE REPORT 2012 | 1539
Table 7.7.10. Nephrops in VIIfgh. Length distribution of landings by country in 2009. Quarterly and total values (103). The reported size is the carapace length (CL). Conversion of CL to TS (total size) is done by multiplication by 3.3.
CL Q1 Q2 Q3 Q4 Year
(mm) F IRL F IRL F IRL F IRL F IRL
no tails
tails no tails
tails no tails
tails no tails
tails no tails
tails
17
18
19
20 116 11 127
21 167 167
22 399 35 31 102 566
23 1017 217 103 306 1643
24 2582 505 364 756 4207
25 3963 1284 879 1279 7405
26 6524 1969 1536 1495 11525
27 5825 3351 2396 4 759 4 12331
28 4684 3619 14 2953 21 489 35 11744
29 5095 107 3889 14 2804 30 831 151 12619
30 15 3619 253 3852 153 2735 68 658 490 10865
31 169 2509 587 3759 334 1813 5 161 549 5 1251 8630
32 12 238 2044 773 3074 10 646 2361 9 151 754 31 1808 8234
33 35 315 1671 32 898 2872 42 746 1716 23 292 472 132 2251 6731
34 127 606 1799 204 1370 2222 10 715 1273 92 367 400 434 3058 5694
35 197 697 1285 486 1453 2003 251 998 1117 129 479 242 1063 3627 4647
36 486 1008 1003 675 1762 1839 429 1024 774 268 433 417 1859 4228 4032
37 683 1013 1119 1160 1827 1433 639 1039 603 346 454 242 2828 4334 3397
38 857 1065 1054 1707 1821 1369 911 977 502 420 443 181 3895 4305 3106
39 1089 1093 694 1878 1732 1339 921 788 380 526 446 157 4414 4059 2569
40 1044 925 411 1832 1533 808 1141 906 209 466 398 199 4482 3761 1627
41 950 802 823 1963 1371 724 997 649 236 411 331 48 4322 3153 1831
42 927 695 308 1568 1075 420 840 481 113 491 340 24 3826 2592 864
43 744 531 334 1432 959 288 845 528 175 346 246 3367 2264 797
44 715 564 154 1201 748 231 658 427 84 315 217 48 2888 1957 517
45 503 341 102 687 447 89 304 201 25 173 140 24 1667 1129 240
46 495 380 77 409 302 160 334 222 44 192 135 12 1430 1039 293
47 280 207 77 445 331 29 193 162 8 118 95 24 1035 796 137
48 238 200 102 146 126 43 135 106 62 51 24 581 483 169
49 144 120 174 154 29 138 108 67 52 12 523 434 40
50 79 75 100 87 43 112 78 8 30 28 320 267 51
51 37 53 96 89 29 37 33 20 20 191 194 29
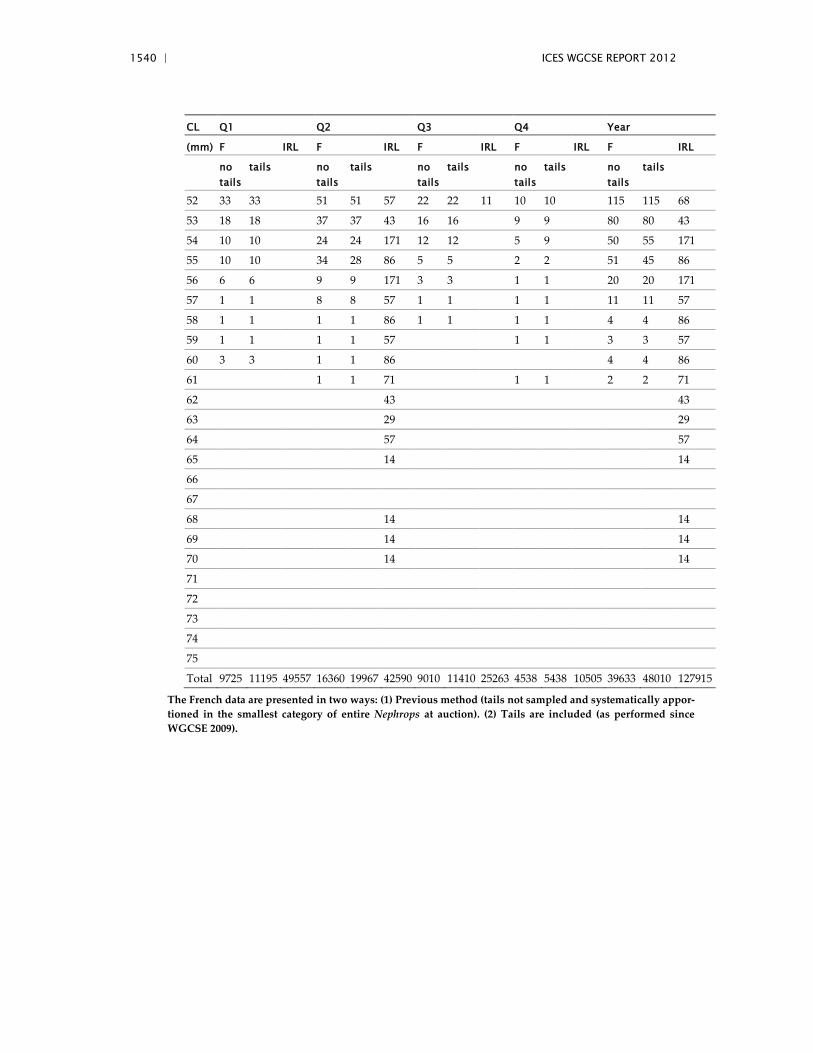
1540 | ICES WGCSE REPORT 2012
CL Q1 Q2 Q3 Q4 Year
(mm) F IRL F IRL F IRL F IRL F IRL
no tails
tails no tails
tails no tails
tails no tails
tails no tails
tails
52 33 33 51 51 57 22 22 11 10 10 115 115 68
53 18 18 37 37 43 16 16 9 9 80 80 43
54 10 10 24 24 171 12 12 5 9 50 55 171
55 10 10 34 28 86 5 5 2 2 51 45 86
56 6 6 9 9 171 3 3 1 1 20 20 171
57 1 1 8 8 57 1 1 1 1 11 11 57
58 1 1 1 1 86 1 1 1 1 4 4 86
59 1 1 1 1 57 1 1 3 3 57
60 3 3 1 1 86 4 4 86
61 1 1 71 1 1 2 2 71
62 43 43
63 29 29
64 57 57
65 14 14
66
67
68 14 14
69 14 14
70 14 14
71
72
73
74
75
Total 9725 11195 49557 16360 19967 42590 9010 11410 25263 4538 5438 10505 39633 48010 127915
The French data are presented in two ways: (1) Previous method (tails not sampled and systematically appor-tioned in the smallest category of entire Nephrops at auction). (2) Tails are included (as performed since WGCSE 2009).
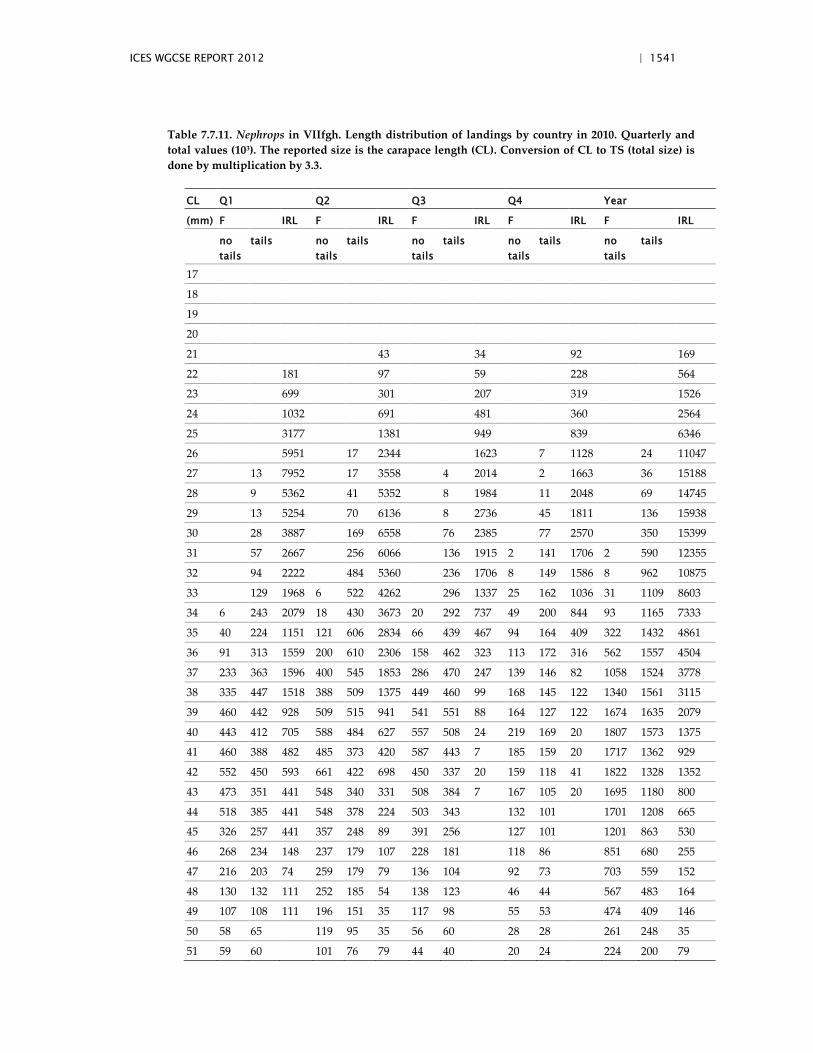
ICES WGCSE REPORT 2012 | 1541
Table 7.7.11. Nephrops in VIIfgh. Length distribution of landings by country in 2010. Quarterly and total values (103). The reported size is the carapace length (CL). Conversion of CL to TS (total size) is done by multiplication by 3.3.
CL Q1 Q2 Q3 Q4 Year
(mm) F IRL F IRL F IRL F IRL F IRL
no tails
tails no tails
tails no tails
tails no tails
tails no tails
tails
17
18
19
20
21 43 34 92 169
22 181 97 59 228 564
23 699 301 207 319 1526
24 1032 691 481 360 2564
25 3177 1381 949 839 6346
26 5951 17 2344 1623 7 1128 24 11047
27 13 7952 17 3558 4 2014 2 1663 36 15188
28 9 5362 41 5352 8 1984 11 2048 69 14745
29 13 5254 70 6136 8 2736 45 1811 136 15938
30 28 3887 169 6558 76 2385 77 2570 350 15399
31 57 2667 256 6066 136 1915 2 141 1706 2 590 12355
32 94 2222 484 5360 236 1706 8 149 1586 8 962 10875
33 129 1968 6 522 4262 296 1337 25 162 1036 31 1109 8603
34 6 243 2079 18 430 3673 20 292 737 49 200 844 93 1165 7333
35 40 224 1151 121 606 2834 66 439 467 94 164 409 322 1432 4861
36 91 313 1559 200 610 2306 158 462 323 113 172 316 562 1557 4504
37 233 363 1596 400 545 1853 286 470 247 139 146 82 1058 1524 3778
38 335 447 1518 388 509 1375 449 460 99 168 145 122 1340 1561 3115
39 460 442 928 509 515 941 541 551 88 164 127 122 1674 1635 2079
40 443 412 705 588 484 627 557 508 24 219 169 20 1807 1573 1375
41 460 388 482 485 373 420 587 443 7 185 159 20 1717 1362 929
42 552 450 593 661 422 698 450 337 20 159 118 41 1822 1328 1352
43 473 351 441 548 340 331 508 384 7 167 105 20 1695 1180 800
44 518 385 441 548 378 224 503 343 132 101 1701 1208 665
45 326 257 441 357 248 89 391 256 127 101 1201 863 530
46 268 234 148 237 179 107 228 181 118 86 851 680 255
47 216 203 74 259 179 79 136 104 92 73 703 559 152
48 130 132 111 252 185 54 138 123 46 44 567 483 164
49 107 108 111 196 151 35 117 98 55 53 474 409 146
50 58 65 119 95 35 56 60 28 28 261 248 35
51 59 60 101 76 79 44 40 20 24 224 200 79
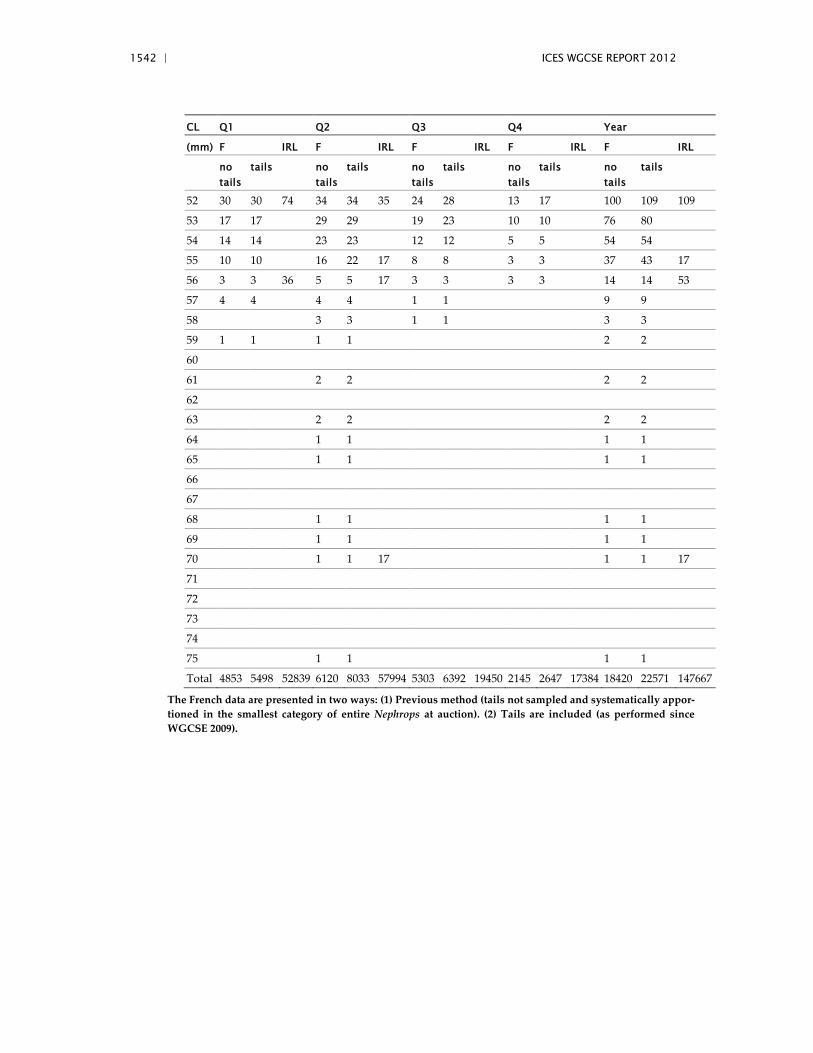
1542 | ICES WGCSE REPORT 2012
CL Q1 Q2 Q3 Q4 Year
(mm) F IRL F IRL F IRL F IRL F IRL
no tails
tails no tails
tails no tails
tails no tails
tails no tails
tails
52 30 30 74 34 34 35 24 28 13 17 100 109 109
53 17 17 29 29 19 23 10 10 76 80
54 14 14 23 23 12 12 5 5 54 54
55 10 10 16 22 17 8 8 3 3 37 43 17
56 3 3 36 5 5 17 3 3 3 3 14 14 53
57 4 4 4 4 1 1 9 9
58 3 3 1 1 3 3
59 1 1 1 1 2 2
60
61 2 2 2 2
62
63 2 2 2 2
64 1 1 1 1
65 1 1 1 1
66
67
68 1 1 1 1
69 1 1 1 1
70 1 1 17 1 1 17
71
72
73
74
75 1 1 1 1
Total 4853 5498 52839 6120 8033 57994 5303 6392 19450 2145 2647 17384 18420 22571 147667
The French data are presented in two ways: (1) Previous method (tails not sampled and systematically appor-tioned in the smallest category of entire Nephrops at auction). (2) Tails are included (as performed since WGCSE 2009).
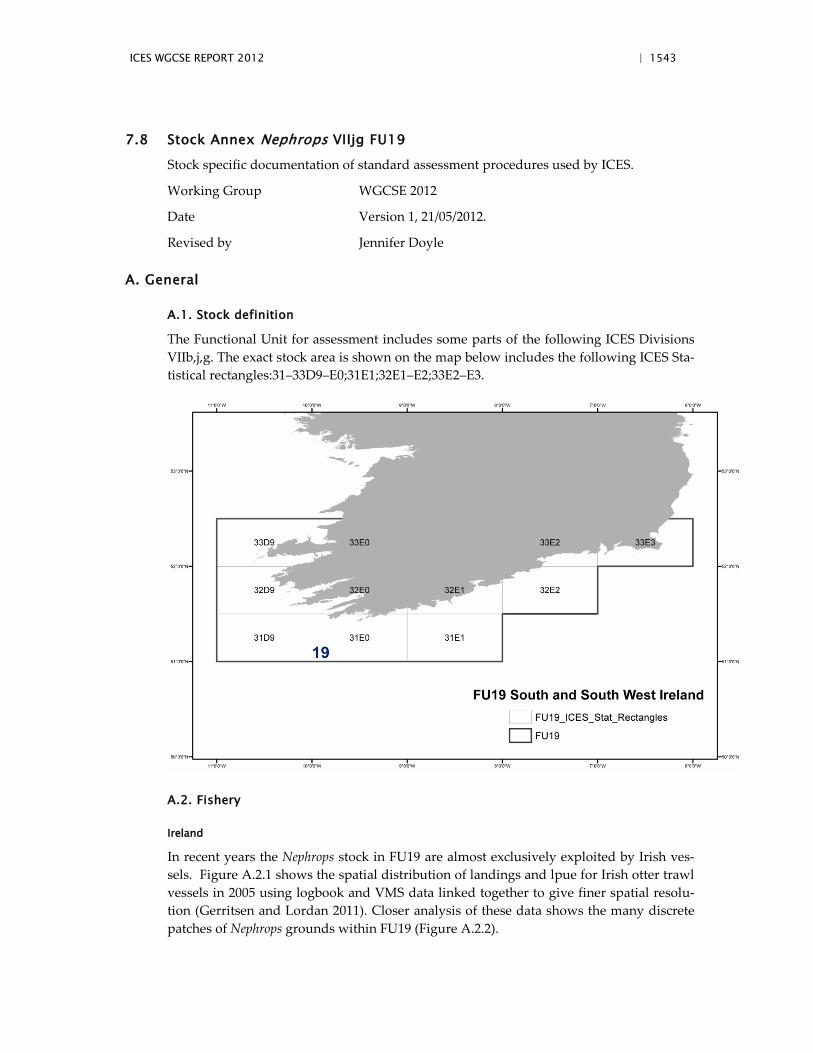
ICES WGCSE REPORT 2012 | 1543
7.8 Stock Annex Nephrops VIIjg FU19
Stock specific documentation of standard assessment procedures used by ICES.
Working Group WGCSE 2012
Date Version 1, 21/05/2012.
Revised by Jennifer Doyle
A. General
A.1. Stock definition
The Functional Unit for assessment includes some parts of the following ICES Divisions VIIb,j,g. The exact stock area is shown on the map below includes the following ICES Sta-tistical rect angles:31–33D9–E0;31E1;32E1–E2;33E2–E3.
A.2. Fishery
Ireland
In recent years the Nephrops stock in FU19 are almost exclusively exploited by Irish ves-sels. Figure A.2.1 shows the spatial distribution of landings and lpue for Irish otter trawl vessels in 2005 using logbook and VMS data linked together to give finer spatial resolu-tion (Gerritsen and Lordan 2011). Closer analysis of these data shows the many discrete patches of Nephrops grounds within FU19 (Figure A.2.2).
1544 | ICES WGCSE REPORT 2012
The number of Irish vessels reporting Nephrops landings from FU 19 has fluctuated around 50/yr (Figure A.2.3). Around eleven vessels report landings in excess of 10 t in 2011. These are the main vessels in the fishery accounting for around 40% of the total landings in 2011. The majority of these vessels are less than 18 m. There has been a slight shift to larger vessels over time. There has also been a shift to more powerful vessels over time with the introduction of twin-rigs to the fishery in the early 2000s. Most of the larger boats move freely between the Nephrops fisheries in FUs 15, 16, 20-22 and other areas depending on the tides and weather.
The fishery shows no distinctive seasonal pattern with the exception of May. The month-ly landings time-series with the average pattern is shown in Figure A.2.4.
The following TCMs are in place for Nephrops in VII (excluding VIIa) after EC 850/98: Minimum Landing Sizes (MLS); total length >85 mm, carapace length >25 mm, tail length >46 mm. Mesh Size Restrictions; Vessels targeting Nephrops using towed gears having at least 35% by weight of this species on board will require 70 mm diamond mesh plus an 80 mm square mesh panel as a minimum or having at least 30% by weight of Nephrops on board will require 80–99 mm diamond mesh.
France
The numbers of French vessels reporting Nephrops landings from 19 has shown a decreas-ing trend. (Table A.2.1). 20 in 2009, 24 in 2008, 31 in 2007, 30 in 2006 and 35 in 2005.
Nephrops fisheries in this area are fairly mixed also catching megrim, anglerfish and other demersal species. There are also some catches of hake, and in the offshore parts of the area. The Nephrops grounds in FU19 coincide with an important nursery area for juvenile hake and anglerfish among other species (Marine Institute, 2012).
A.3. Ecosystem aspects
Physical oceanography
Nephrops occur in discrete patches where the sediment is suitable for them to construct their burrows. There is a larval phase of long duration where there may be some mixing with Nephrops from other areas depending on the oceanographic conditions, but the mechanisms for this in FU19 are not currently known.
Sediment distribution
There is a growing body of information on the spatial extent of the sediment suitable for Nephrops from UWTV surveys, seabed mapping programmes and the fishing industry. However, this information is patchy and has yet to be summarized for this area. In terms of bathymetry UWTV station depths ranged from 18 metres in Bantry Bay to 104 metres in the Galley Grounds.
B. Data
The table below summarizes the available data for this stock and attempts to quantify the quality subjectively.
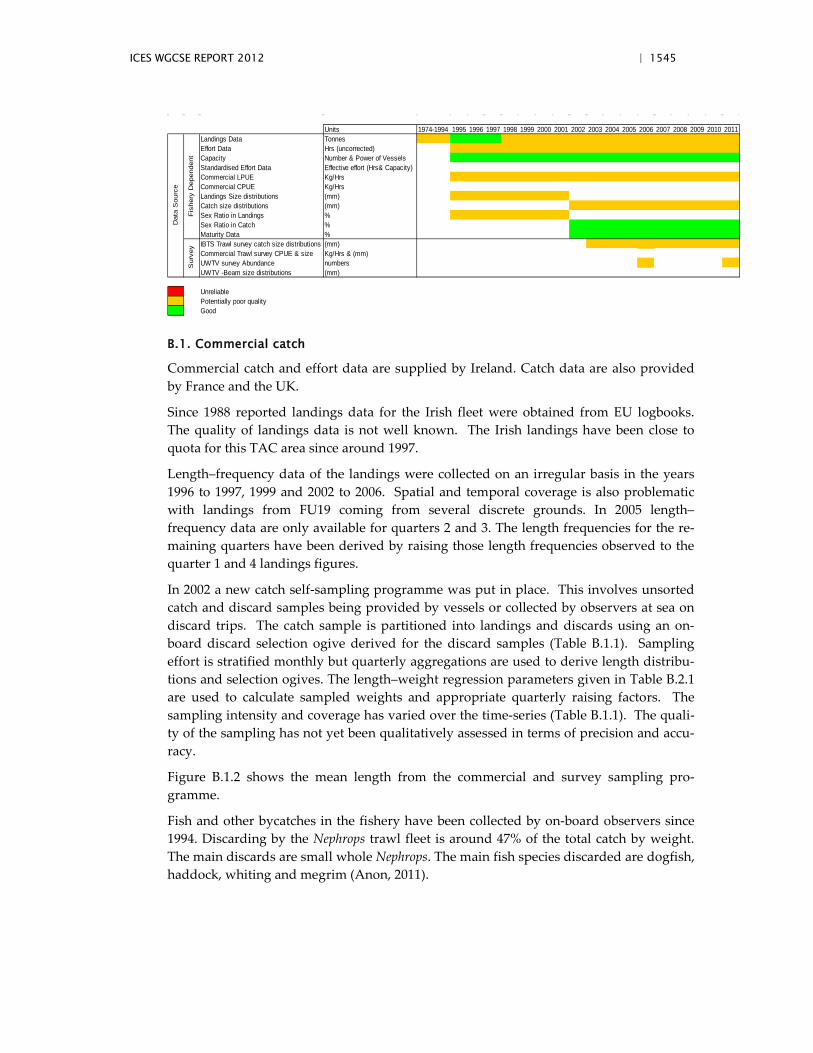
ICES WGCSE REPORT 2012 | 1545
Units 1974-1994 1995 1996 1997 1998 1999 2000 2001 2002 2003 2004 2005 2006 2007 2008 2009 2010 2011Landings Data TonnesEffort Data Hrs (uncorrected)Capacity Number & Power of VesselsStandardised Effort Data Effective effort (Hrs& Capacity)Commercial LPUE Kg/HrsCommercial CPUE Kg/HrsLandings Size distributions (mm)Catch size distributions (mm)Sex Ratio in Landings %Sex Ratio in Catch %Maturity Data %IBTS Trawl survey catch size distributions (mm)Commercial Trawl survey CPUE & size Kg/Hrs & (mm)UWTV survey Abundance numbersUWTV -Beam size distributions (mm)
UnreliablePotentially poor qualityGood
Fis
hery
Dep
ende
nt
Dat
a S
ourc
e
Sur
vey
B.1. Commercial catch
Commercial catch and effort data are supplied by Ireland. Catch data are also provided by France and the UK.
Since 1988 reported landings data for the Irish fleet were obtained from EU logbooks. The quality of landings data is not well known. The Irish landings have been close to quota for this TAC area since around 1997.
Length–frequency data of the landings were collected on an irregular basis in the years 1996 to 1997, 1999 and 2002 to 2006. Spatial and temporal coverage is also problematic with landings from FU19 coming from several discrete grounds. In 2005 length–frequency data are only available for quarters 2 and 3. The length frequencies for the re-maining quarters have been derived by raising those length frequencies observed to the quarter 1 and 4 landings figures.
In 2002 a new catch self-sampling programme was put in place. This involves unsorted catch and discard samples being provided by vessels or collected by observers at sea on discard trips. The catch sample is partitioned into landings and discards using an on-board discard selection ogive derived for the discard samples (Table B.1.1). Sampling effort is stratified monthly but quarterly aggregations are used to derive length distribu-tions and selection ogives. The length–weight regression parameters given in Table B.2.1 are used to calculate sampled weights and appropriate quarterly raising factors. The sampling intensity and coverage has varied over the time-series (Table B.1.1). The quali-ty of the sampling has not yet been qualitatively assessed in terms of precision and accu-racy.
Figure B.1.2 shows the mean length from the commercial and survey sampling pro-gramme.
Fish and other bycatches in the fishery have been collected by on-board observers since 1994. Discarding by the Nephrops trawl fleet is around 47% of the total catch by weight. The main discards are small whole Nephrops. The main fish species discarded are dogfish, haddock, whiting and megrim (Anon, 2011).
1546 | ICES WGCSE REPORT 2012
B.2. Biological
Biological parameters for this stock are outlined in Table B.2.1.These have not been esti-mated in recent years and are based on those for FU22 “Smalls” component of the Celtic Sea.
Length–weight
Mean weights-at-age for this stock are estimated from studies on Scottish stocks by Pope and Thomas (1955). Given the spatial distribution of the discrete Nephrops patches it would be worth monitoring length–weight parameters more closely in future.
Natural mortality
A natural mortality rate of 0.3 was assumed for all age classes and years for males and immature females, with a value of 0.2 for mature females. The lower value for mature females reflects the reduced burrow emergence while ovigerous and hence an assumed reduction in predation. The accuracy of these assumptions is unknown. Stomach con-tents data on the Irish GFS could be used to examine this in future to determine potential predators.
Maturity
Maturity is assumed in line with other Nephrops stocks and is based on FU17 Aran grounds. This needs to be investigated for the discrete patches within FU19.
Discard survival
As for other Nephrops stocks given the trip durations (~5 days average) and behaviour of the fleet the majority of discards are returned to the sea over suitable sediment. The pro-portion scavenged by birds is probably quite low. Tow durations, volume of catches, prolonged sorting on deck and relatively high density of Nephrops on the seabed proba-bly results in relatively low discard survival. This is estimated to be around 10% in line with other Nephrops stocks.
B.3. Surveys
UWTV surveys
In 2006 as part of the UWTV survey on the Celtic Sea which primary objective is to sur-vey FU22 the “Smalls” grounds-6 indicator stations in FU19 (Galley Ground 4) were completed (Figure B.3.1). In 2011, 35 stations on the discrete patches within FU19 were completed (ICES 2011, WD09). The 2011 UWTV stations in FU19 were randomly picked from within polygons defined using integrated VMS data to determine the extent of the Nephrops patches. The discrete grounds have been named as: Bantry Bay, Galley Ground 1–4, Cork Channels and Helvick 1–3 and are shown in Figure B.3.2.
The methods used during the survey were similar to those employed for UWTV surveys of Nephrops stocks around Scotland and elsewhere and are documented by WKNEPHTV (ICES, 2007).The estimation of the areas within FU19 were calculated based on polygons using ArcGIS10 (Table B.3.1). The percentage contribution of the area of each of the dis-
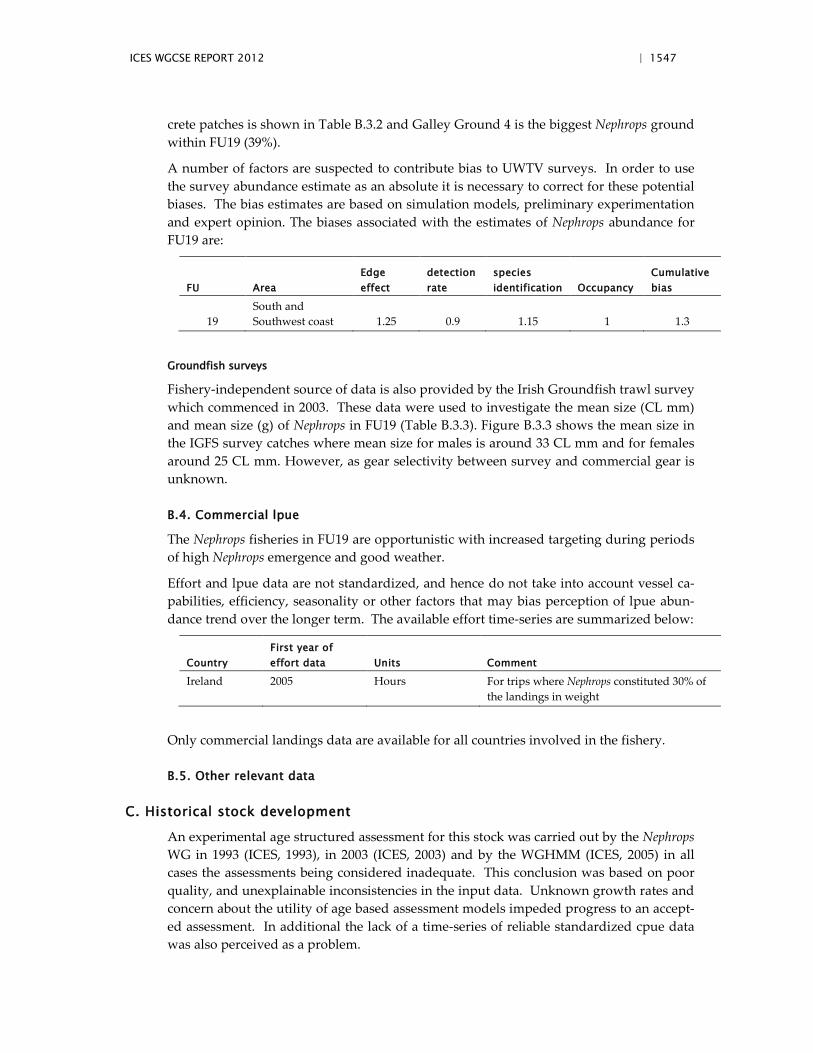
ICES WGCSE REPORT 2012 | 1547
crete patches is shown in Table B.3.2 and Galley Ground 4 is the biggest Nephrops ground within FU19 (39%).
A number of factors are suspected to contribute bias to UWTV surveys. In order to use the survey abundance estimate as an absolute it is necessary to correct for these potential biases. The bias estimates are based on simulation models, preliminary experimentation and expert opinion. The biases associated with the estimates of Nephrops abundance for FU19 are:
FU Area Edge effect
detection rate
species identification Occupancy
Cumulative bias
19 South and Southwest coast 1.25 0.9 1.15 1 1.3
Groundfish surveys
Fishery-independent source of data is also provided by the Irish Groundfish trawl survey which commenced in 2003. These data were used to investigate the mean size (CL mm) and mean size (g) of Nephrops in FU19 (Table B.3.3). Figure B.3.3 shows the mean size in the IGFS survey catches where mean size for males is around 33 CL mm and for females around 25 CL mm. However, as gear selectivity between survey and commercial gear is unknown.
B.4. Commercial lpue
The Nephrops fisheries in FU19 are opportunistic with increased targeting during periods of high Nephrops emergence and good weather.
Effort and lpue data are not standardized, and hence do not take into account vessel ca-pabilities, efficiency, seasonality or other factors that may bias perception of lpue abun-dance trend over the longer term. The available effort time-series are summarized below:
Country First year of effort data Units Comment
Ireland 2005 Hours For trips where Nephrops constituted 30% of the landings in weight
Only commercial landings data are available for all countries involved in the fishery.
B.5. Other relevant data
C. Historical stock development
An experimental age structured assessment for this stock was carried out by the Nephrops WG in 1993 (ICES, 1993), in 2003 (ICES, 2003) and by the WGHMM (ICES, 2005) in all cases the assessments being considered inadequate. This conclusion was based on poor quality, and unexplainable inconsistencies in the input data. Unknown growth rates and concern about the utility of age based assessment models impeded progress to an accept-ed assessment. In additional the lack of a time-series of reliable standardized cpue data was also perceived as a problem.
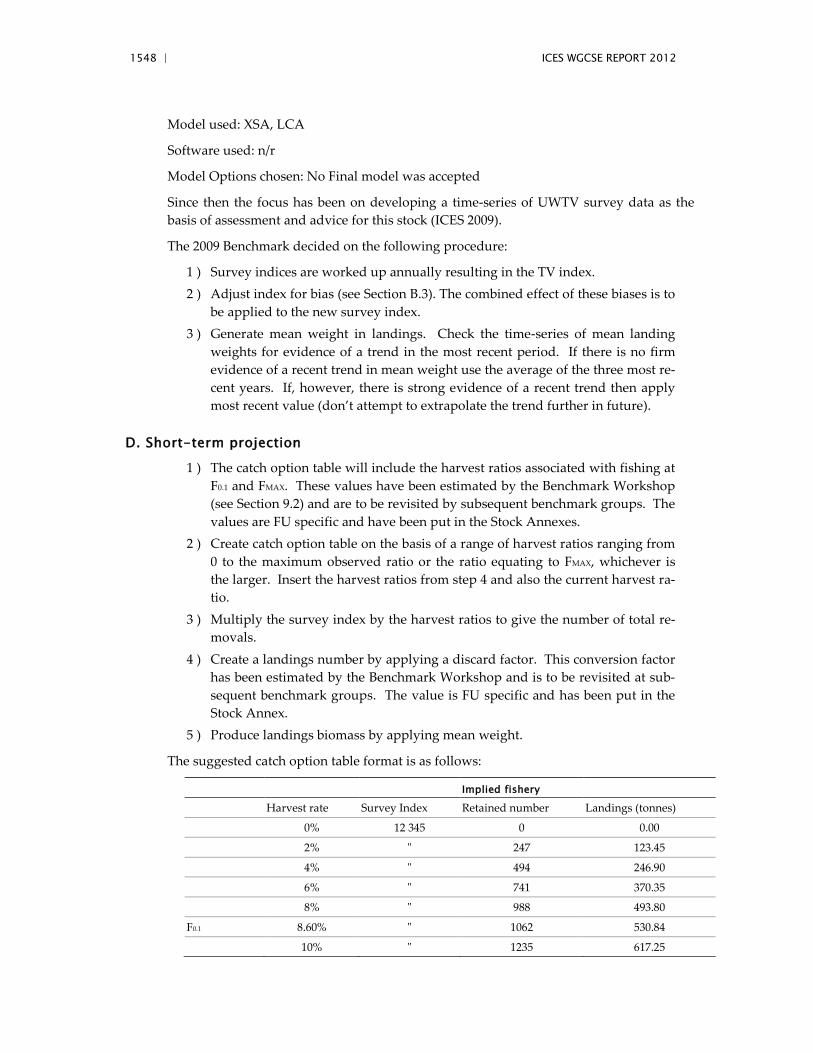
1548 | ICES WGCSE REPORT 2012
Model used: XSA, LCA
Software used: n/r
Model Options chosen: No Final model was accepted
Since then the focus has been on developing a time-series of UWTV survey data as the basis of assessment and advice for this stock (ICES 2009).
The 2009 Benchmark decided on the following procedure:
1 ) Survey indices are worked up annually resulting in the TV index. 2 ) Adjust index for bias (see Section B.3). The combined effect of these biases is to
be applied to the new survey index. 3 ) Generate mean weight in landings. Check the time-series of mean landing
weights for evidence of a trend in the most recent period. If there is no firm evidence of a recent trend in mean weight use the average of the three most re-cent years. If, however, there is strong evidence of a recent trend then apply most recent value (don’t attempt to extrapolate the trend further in future).
D. Short-term projection
1 ) The catch option table will include the harvest ratios associated with fishing at F0.1 and FMAX. These values have been estimated by the Benchmark Workshop (see Section 9.2) and are to be revisited by subsequent benchmark groups. The values are FU specific and have been put in the Stock Annexes.
2 ) Create catch option table on the basis of a range of harvest ratios ranging from 0 to the maximum observed ratio or the ratio equating to FMAX, whichever is the larger. Insert the harvest ratios from step 4 and also the current harvest ra-tio.
3 ) Multiply the survey index by the harvest ratios to give the number of total re-movals.
4 ) Create a landings number by applying a discard factor. This conversion factor has been estimated by the Benchmark Workshop and is to be revisited at sub-sequent benchmark groups. The value is FU specific and has been put in the Stock Annex.
5 ) Produce landings biomass by applying mean weight.
The suggested catch option table format is as follows:
Implied fishery
Harvest rate Survey Index Retained number Landings (tonnes)
0% 12 345 0 0.00
2% " 247 123.45
4% " 494 246.90
6% " 741 370.35
8% " 988 493.80
F0.1 8.60% " 1062 530.84
10% " 1235 617.25
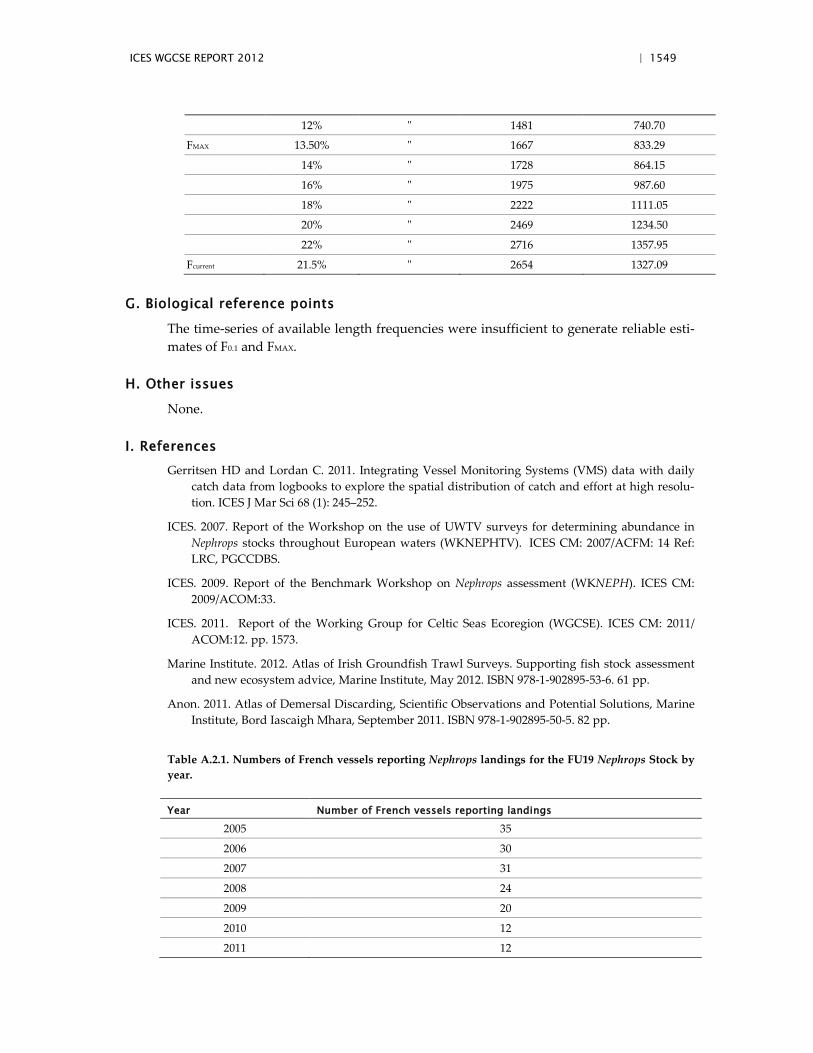
ICES WGCSE REPORT 2012 | 1549
12% " 1481 740.70
FMAX 13.50% " 1667 833.29
14% " 1728 864.15
16% " 1975 987.60
18% " 2222 1111.05
20% " 2469 1234.50
22% " 2716 1357.95
Fcurrent 21.5% " 2654 1327.09
G. Biological reference points
The time-series of available length frequencies were insufficient to generate reliable esti-mates of F0.1 and FMAX.
H. Other issues
None.
I. References Gerritsen HD and Lordan C. 2011. Integrating Vessel Monitoring Systems (VMS) data with daily
catch data from logbooks to explore the spatial distribution of catch and effort at high resolu-tion. ICES J Mar Sci 68 (1): 245–252.
ICES. 2007. Report of the Workshop on the use of UWTV surveys for determining abundance in Nephrops stocks throughout European waters (WKNEPHTV). ICES CM: 2007/ACFM: 14 Ref: LRC, PGCCDBS.
ICES. 2009. Report of the Benchmark Workshop on Nephrops assessment (WKNEPH). ICES CM: 2009/ACOM:33.
ICES. 2011. Report of the Working Group for Celtic Seas Ecoregion (WGCSE). ICES CM: 2011/ ACOM:12. pp. 1573.
Marine Institute. 2012. Atlas of Irish Groundfish Trawl Surveys. Supporting fish stock assessment and new ecosystem advice, Marine Institute, May 2012. ISBN 978-1-902895-53-6. 61 pp.
Anon. 2011. Atlas of Demersal Discarding, Scientific Observations and Potential Solutions, Marine Institute, Bord Iascaigh Mhara, September 2011. ISBN 978-1-902895-50-5. 82 pp.
Table A.2.1. Numbers of French vessels reporting Nephrops landings for the FU19 Nephrops Stock by year.
Year Number of French vessels reporting landings
2005 35
2006 30
2007 31
2008 24
2009 20
2010 12
2011 12
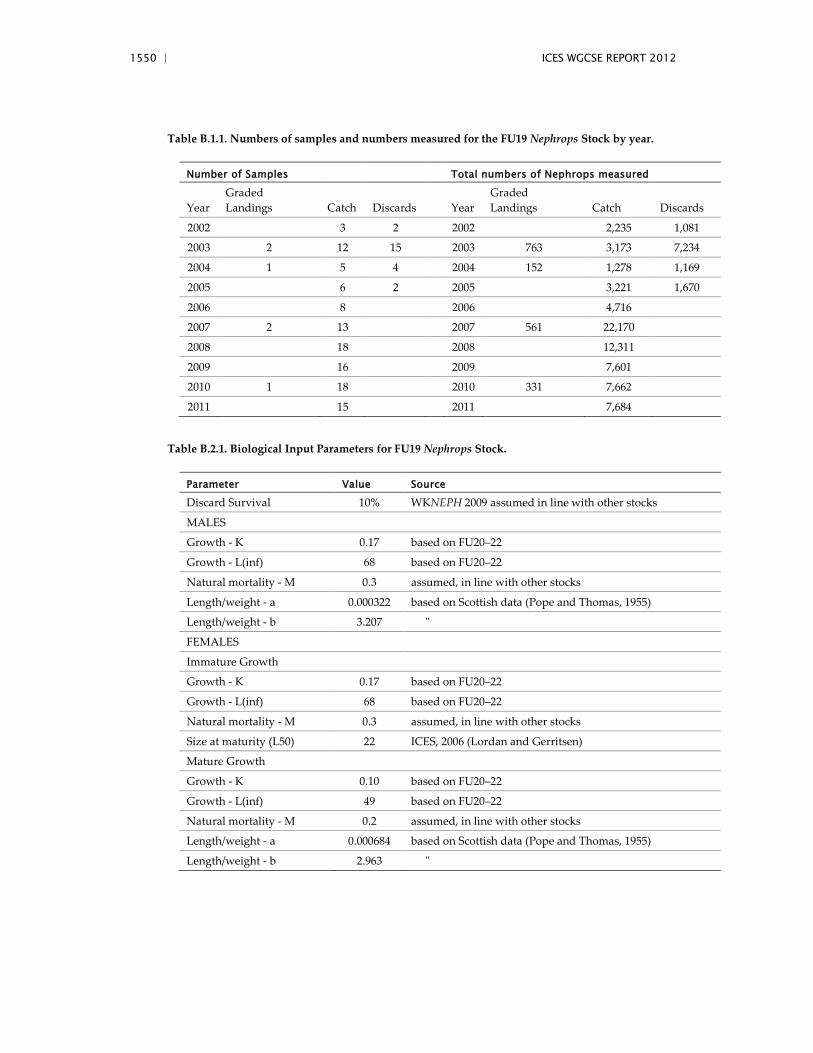
1550 | ICES WGCSE REPORT 2012
Table B.1.1. Numbers of samples and numbers measured for the FU19 Nephrops Stock by year.
Number of Samples Total numbers of Nephrops measured
Year Graded Landings Catch Discards Year
Graded Landings Catch Discards
2002
3 2
2002
2,235 1,081
2003 2 12 15
2003 763 3,173 7,234
2004 1 5 4
2004 152 1,278 1,169
2005
6 2
2005
3,221 1,670
2006
8
2006
4,716
2007 2 13
2007 561 22,170
2008
18
2008
12,311
2009
16
2009
7,601
2010 1 18
2010 331 7,662
2011
15
2011
7,684
Table B.2.1. Biological Input Parameters for FU19 Nephrops Stock.
Parameter Value Source
Discard Survival 10% WKNEPH 2009 assumed in line with other stocks
MALES
Growth - K 0.17 based on FU20–22
Growth - L(inf) 68 based on FU20–22
Natural mortality - M 0.3 assumed, in line with other stocks
Length/weight - a 0.000322 based on Scottish data (Pope and Thomas, 1955)
Length/weight - b 3.207 "
FEMALES
Immature Growth
Growth - K 0.17 based on FU20–22
Growth - L(inf) 68 based on FU20–22
Natural mortality - M 0.3 assumed, in line with other stocks
Size at maturity (L50) 22 ICES, 2006 (Lordan and Gerritsen)
Mature Growth
Growth - K 0.10 based on FU20–22
Growth - L(inf) 49 based on FU20–22
Natural mortality - M 0.2 assumed, in line with other stocks
Length/weight - a 0.000684 based on Scottish data (Pope and Thomas, 1955)
Length/weight - b 2.963 "
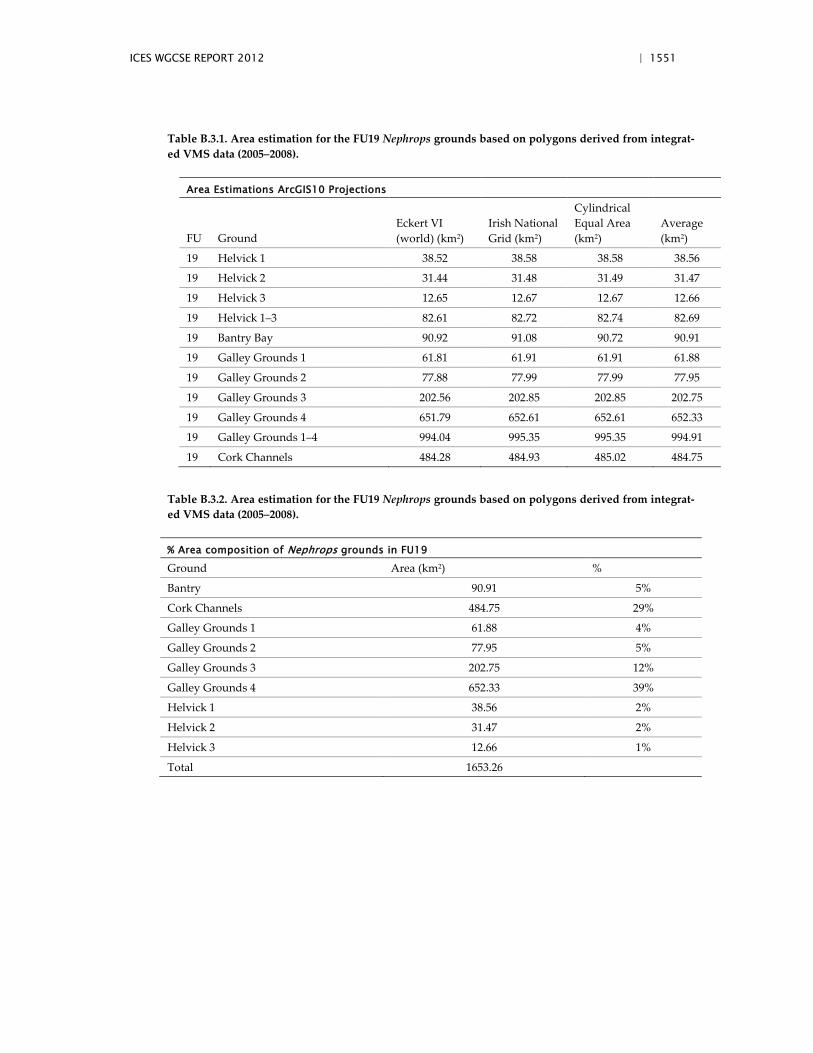
ICES WGCSE REPORT 2012 | 1551
Table B.3.1. Area estimation for the FU19 Nephrops grounds based on polygons derived from integrat-ed VMS data (2005–2008).
Area Estimations ArcGIS10 Projections
FU Ground Eckert VI (world) (km2)
Irish National Grid (km2)
Cylindrical Equal Area (km2)
Average (km2)
19 Helvick 1 38.52 38.58 38.58 38.56
19 Helvick 2 31.44 31.48 31.49 31.47
19 Helvick 3 12.65 12.67 12.67 12.66
19 Helvick 1–3 82.61 82.72 82.74 82.69
19 Bantry Bay 90.92 91.08 90.72 90.91
19 Galley Grounds 1 61.81 61.91 61.91 61.88
19 Galley Grounds 2 77.88 77.99 77.99 77.95
19 Galley Grounds 3 202.56 202.85 202.85 202.75
19 Galley Grounds 4 651.79 652.61 652.61 652.33
19 Galley Grounds 1–4 994.04 995.35 995.35 994.91
19 Cork Channels 484.28 484.93 485.02 484.75
Table B.3.2. Area estimation for the FU19 Nephrops grounds based on polygons derived from integrat-ed VMS data (2005–2008).
% Area composition of Nephrops grounds in FU19
Ground Area (km2) %
Bantry 90.91 5%
Cork Channels 484.75 29%
Galley Grounds 1 61.88 4%
Galley Grounds 2 77.95 5%
Galley Grounds 3 202.75 12%
Galley Grounds 4 652.33 39%
Helvick 1 38.56 2%
Helvick 2 31.47 2%
Helvick 3 12.66 1%
Total 1653.26
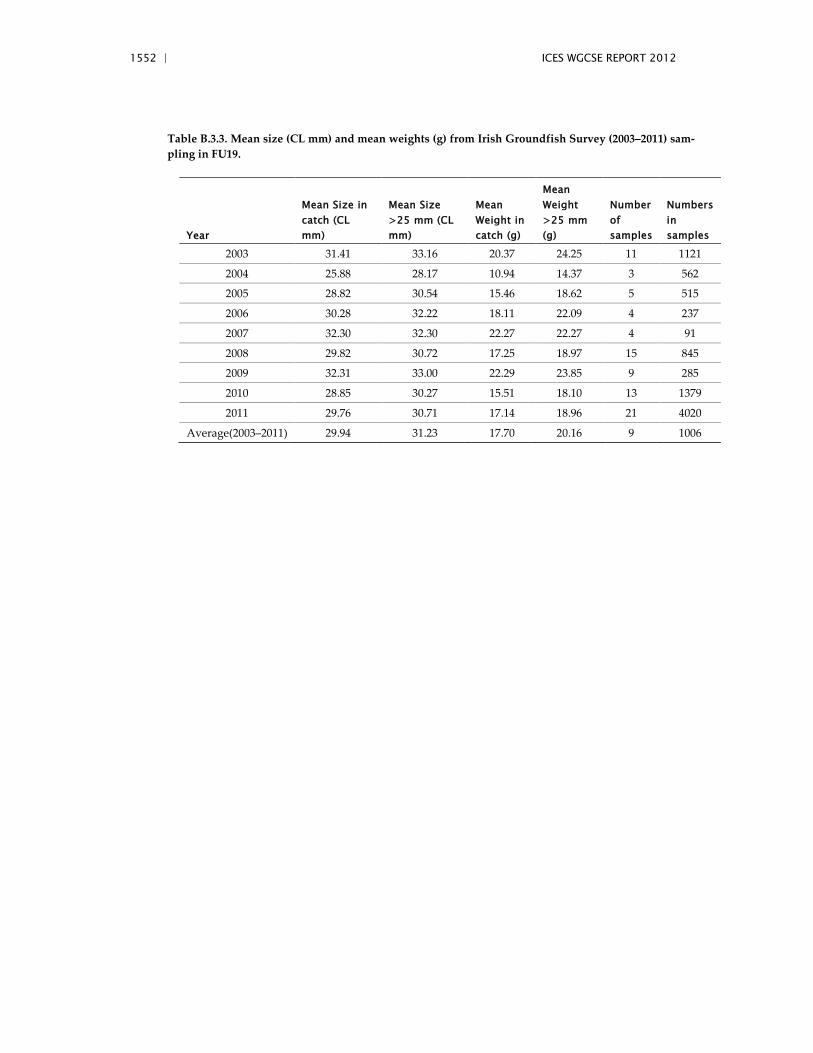
1552 | ICES WGCSE REPORT 2012
Table B.3.3. Mean size (CL mm) and mean weights (g) from Irish Groundfish Survey (2003–2011) sam-pling in FU19.
Year
Mean Size in catch (CL mm)
Mean Size >25 mm (CL mm)
Mean Weight in catch (g)
Mean Weight >25 mm (g)
Number of samples
Numbers in samples
2003 31.41 33.16 20.37 24.25 11 1121
2004 25.88 28.17 10.94 14.37 3 562
2005 28.82 30.54 15.46 18.62 5 515
2006 30.28 32.22 18.11 22.09 4 237
2007 32.30 32.30 22.27 22.27 4 91
2008 29.82 30.72 17.25 18.97 15 845
2009 32.31 33.00 22.29 23.85 9 285
2010 28.85 30.27 15.51 18.10 13 1379
2011 29.76 30.71 17.14 18.96 21 4020
Average(2003–2011) 29.94 31.23 17.70 20.16 9 1006
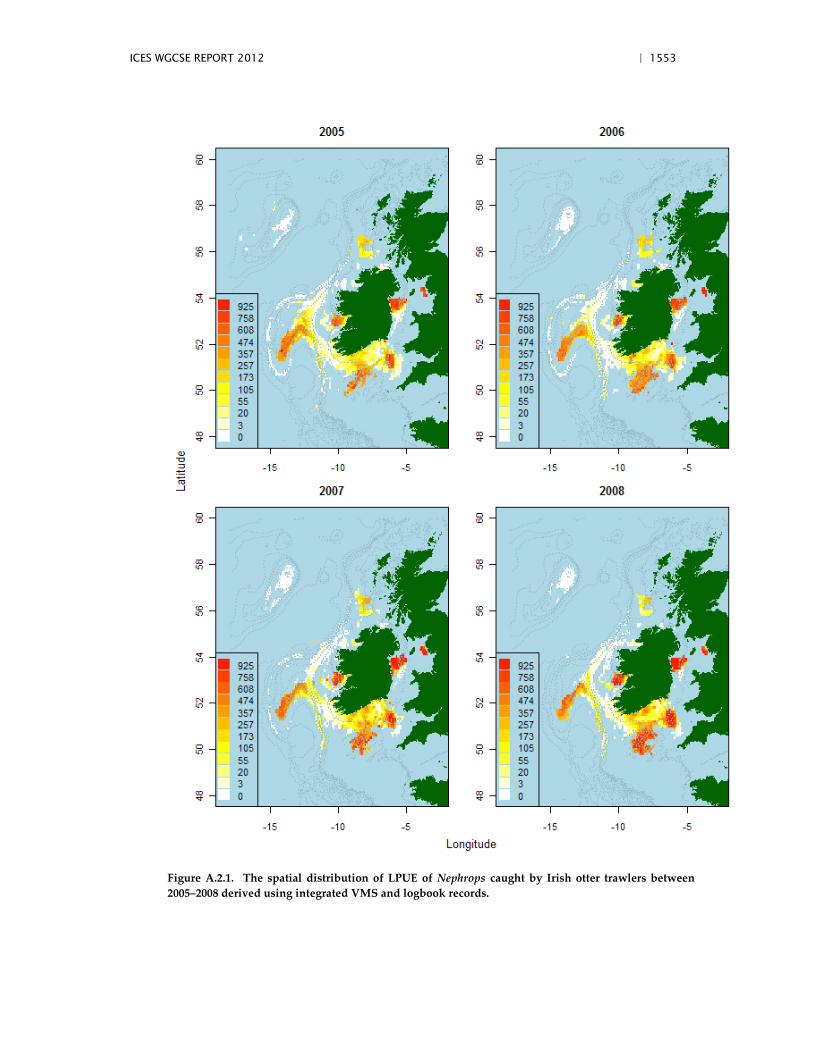
ICES WGCSE REPORT 2012 | 1553
Figure A.2.1. The spatial distribution of LPUE of Nephrops caught by Irish otter trawlers between 2005–2008 derived using integrated VMS and logbook records.
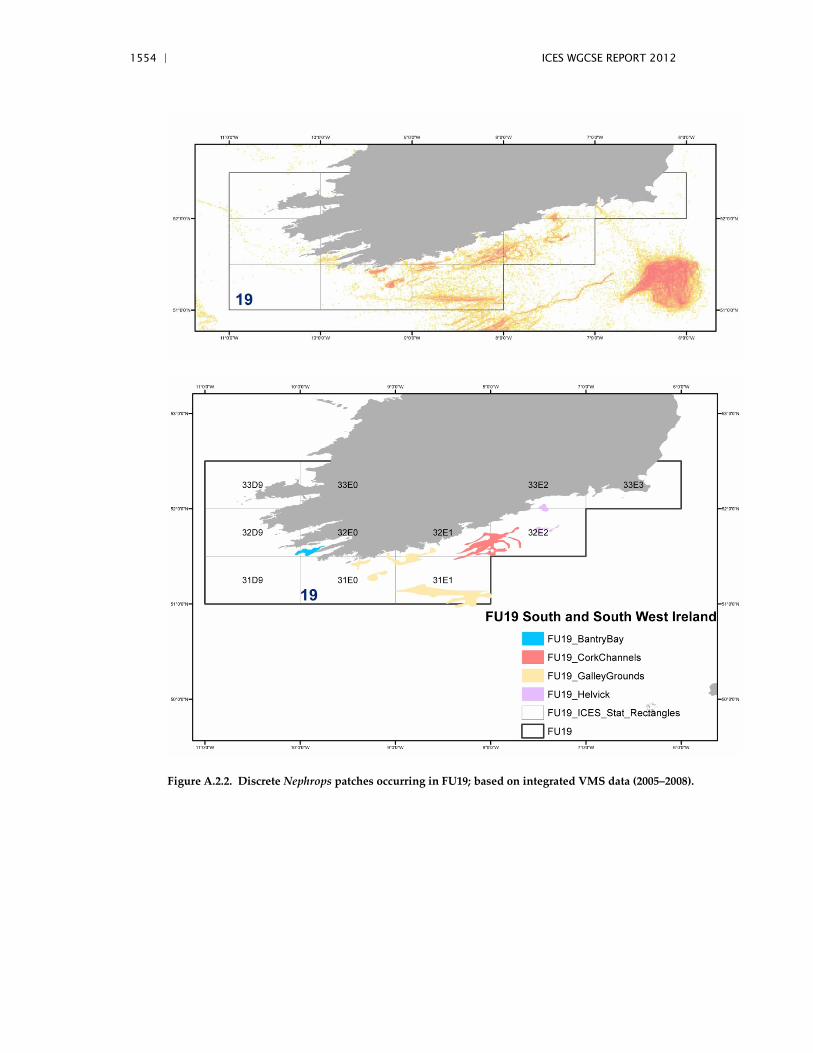
1554 | ICES WGCSE REPORT 2012
Figure A.2.2. Discrete Nephrops patches occurring in FU19; based on integrated VMS data (2005–2008).
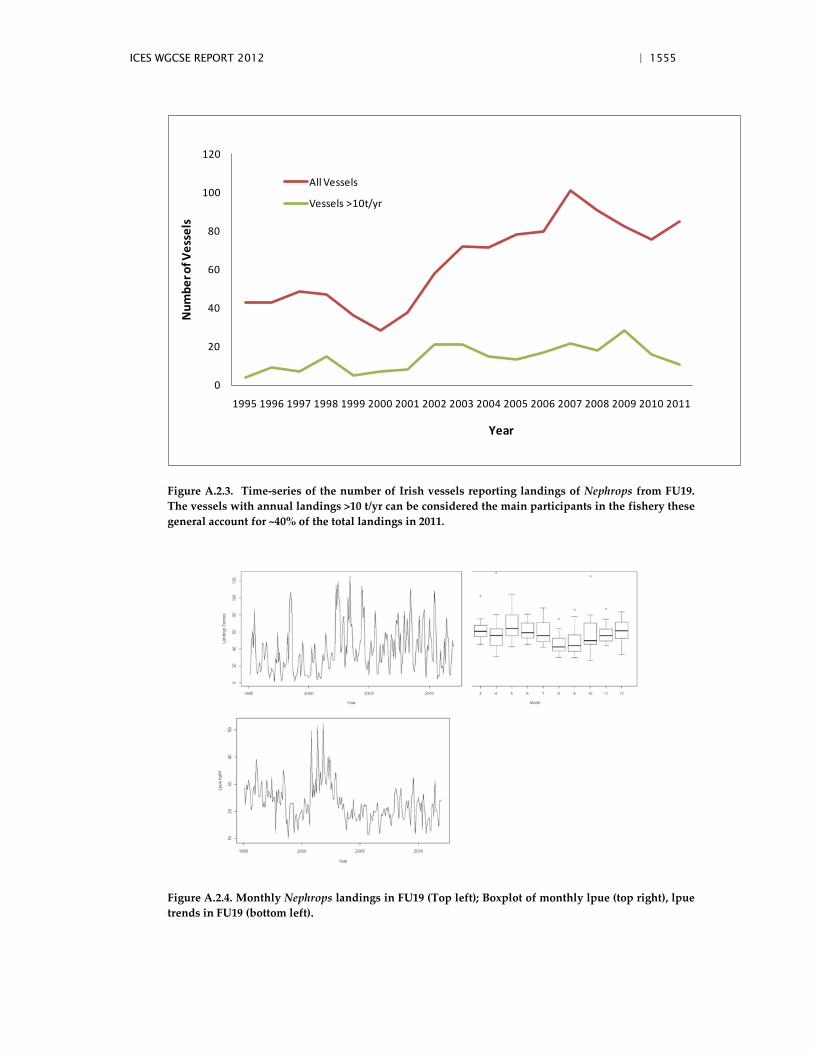
ICES WGCSE REPORT 2012 | 1555
0
20
40
60
80
100
120
1995 1996 1997 1998 1999 2000 2001 2002 2003 2004 2005 2006 2007 2008 2009 2010 2011
Num
ber o
f Ves
sels
All Vessels
Vessels >10t/yr
Year
Figure A.2.3. Time-series of the number of Irish vessels reporting landings of Nephrops from FU19. The vessels with annual landings >10 t/yr can be considered the main participants in the fishery these general account for ~40% of the total landings in 2011.
Figure A.2.4. Monthly Nephrops landings in FU19 (Top left); Boxplot of monthly lpue (top right), lpue trends in FU19 (bottom left).
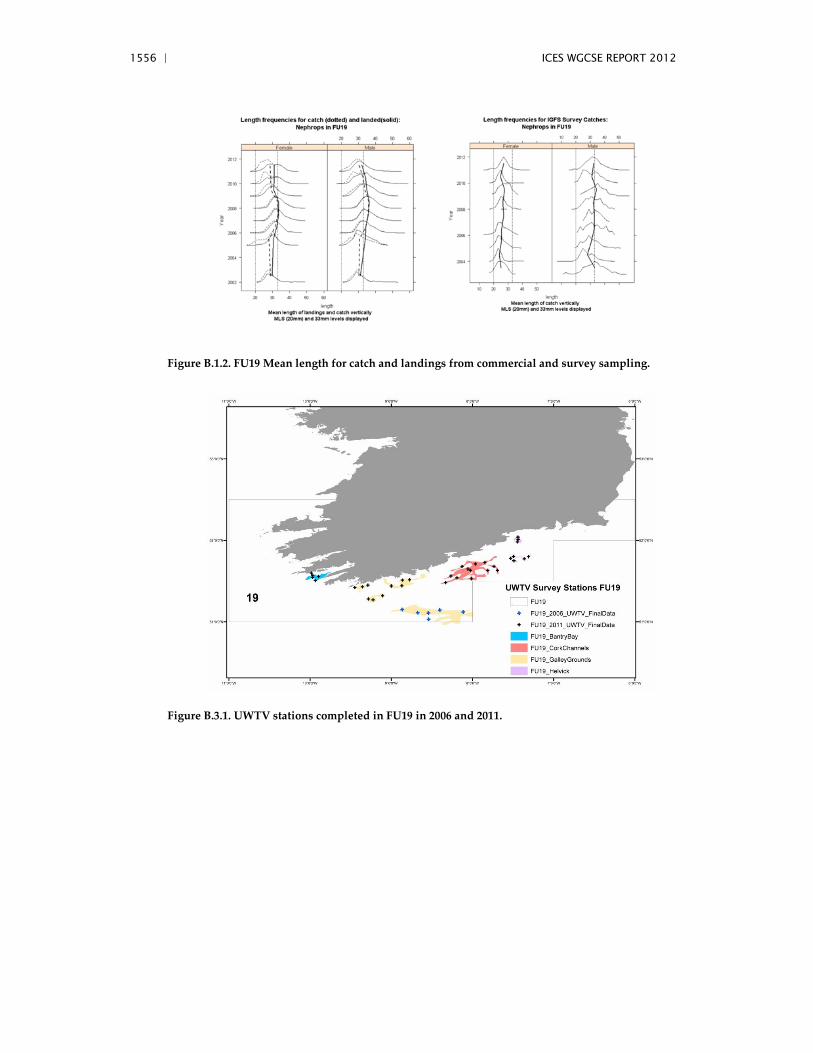
1556 | ICES WGCSE REPORT 2012
Figure B.1.2. FU19 Mean length for catch and landings from commercial and survey sampling.
Figure B.3.1. UWTV stations completed in FU19 in 2006 and 2011.
ICES WGCSE REPORT 2012 | 1557
7.10 Stock Annex Celtic Sea Plaice VIIf&g
Stock specific documentation of standard assessment procedures used by ICES.
Stock Plaice (Division VIIf&g)
Working Group Celtic Seas Ecoregion
Date March 2011
By Chris Darby
A. General
A.1. Stock definition
The degree of separation between the stocks of plaice in the Celtic Sea and the Irish Sea is unclear. Historic tagging studies indicate a southerly movement of mature fish (or fish maturing for the first time) from the southeast Irish Sea, off North Wales, into the Bristol Channel and Celtic Sea during the spawning season (Figure A1). While some of these migrant spawning fish will remain in the Bristol Channel and Celtic Sea, the majority are expected to return to summer feeding grounds in the Irish Sea (Dunn and Pawson, 2002).
Very little mixing is considered to occur between the stocks (Pawson, 1995). Neverthe-less, time-series of recruitment estimates for all stocks in waters around the UK (Irish Sea, Celtic Sea, western and eastern Channel, North Sea) show a significant level of synchrony (Fox et al., 2000). This could indicate that the stocks are subject to similar large-scale envi-ronmental forces and respond similarly to them.
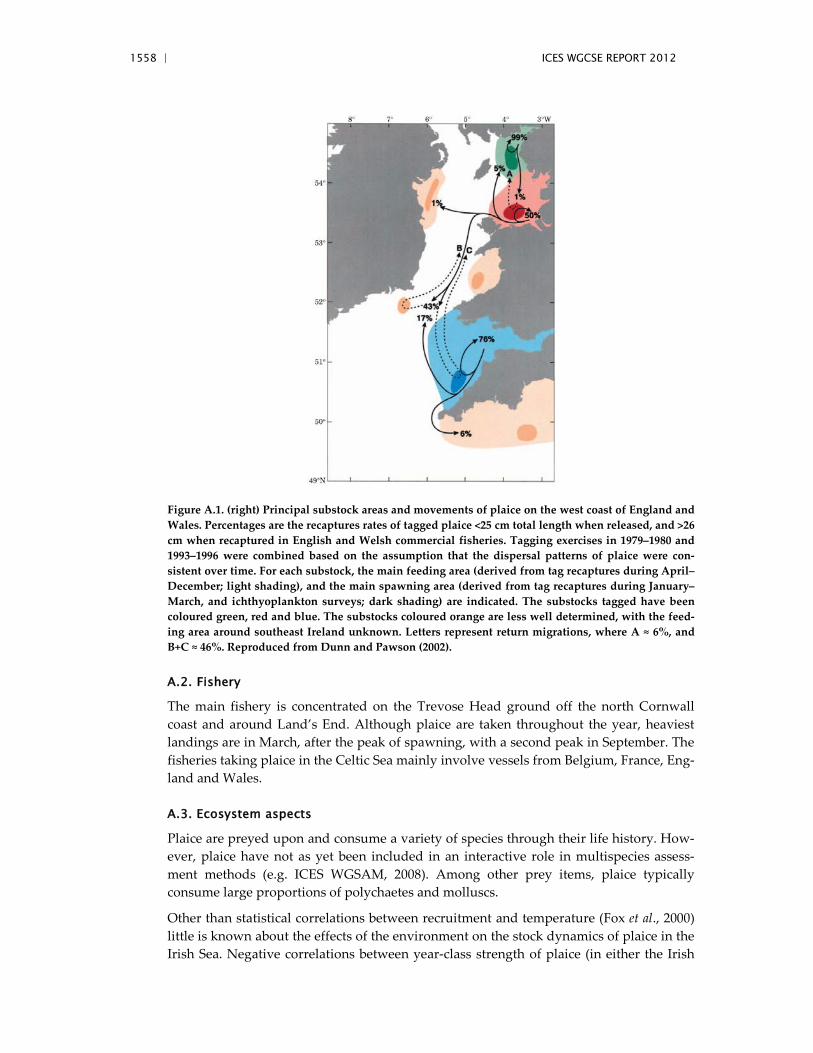
1558 | ICES WGCSE REPORT 2012
Figure A.1. (right) Principal substock areas and movements of plaice on the west coast of England and Wales. Percentages are the recaptures rates of tagged plaice <25 cm total length when released, and >26 cm when recaptured in English and Welsh commercial fisheries. Tagging exercises in 1979–1980 and 1993–1996 were combined based on the assumption that the dispersal patterns of plaice were con-sistent over time. For each substock, the main feeding area (derived from tag recaptures during April–December; light shading), and the main spawning area (derived from tag recaptures during January–March, and ichthyoplankton surveys; dark shading) are indicated. The substocks tagged have been coloured green, red and blue. The substocks coloured orange are less well determined, with the feed-ing area around southeast Ireland unknown. Letters represent return migrations, where A ≈ 6%, and B+C ≈ 46%. Reproduced from Dunn and Pawson (2002).
A.2. Fishery
The main fishery is concentrated on the Trevose Head ground off the north Cornwall coast and around Land’s End. Although plaice are taken throughout the year, heaviest landings are in March, after the peak of spawning, with a second peak in September. The fisheries taking plaice in the Celtic Sea mainly involve vessels from Belgium, France, Eng-land and Wales.
A.3. Ecosystem aspects
Plaice are preyed upon and consume a variety of species through their life history. How-ever, plaice have not as yet been included in an interactive role in multispecies assess-ment methods (e.g. ICES WGSAM, 2008). Among other prey items, plaice typically consume large proportions of polychaetes and molluscs.
Other than statistical correlations between recruitment and temperature (Fox et al., 2000) little is known about the effects of the environment on the stock dynamics of plaice in the Irish Sea. Negative correlations between year-class strength of plaice (in either the Irish
ICES WGCSE REPORT 2012 | 1559
Sea, Celtic Sea, Channel and North Sea) and sea surface temperature are generally strongest for the period February–June. However, western (North Sea and Channel) and eastern (Irish Sea and Celtic Sea) stocks have been found to respond to different time-scales of temperature variability, which might imply that different mechanisms are oper-ating in these stocks and/or that the Irish Sea and Celtic Sea share common spawning (Fox et al., 2000).
B. Data
B.1. Commercial catch
Landings
International landings-at-age data based on quarterly market sampling and annual land-ings figures are available from 1977. Landings rose to a maximum in the late 1980s, de-clined during the early 1990s, then fluctuated around 1000 t. The decline reach a low at 390 t in 2005 following which there has been a gradual increase. Estimates of the level of discarding have been collected since 2004 and have shown a consistent increase, apart from 2007 when a substantial increase occurred by all fleets, followed by a return to the previously lower levels.
For the period 1991 to 2005 quarterly age compositions have typically represented around 70% of the total international landings, though in 2002 this fell to around 25% when age compositions were not available for the Belgian fleet. Belgian age sampling in 1993 was at a reduced level and was augmented with UK data. There was no UK sam-pling in the 4th quarter of 1994 and landings of 1 year olds by the UK otter trawl fleet may be underestimated in this year. Sampling levels during the earlier years in the time-series are considered to be low for all fleets and the quality of the catch data, particularly for older ages, up until around 1992 is believed to be poor. In 1995 UK age compositions for the period 1984–1988 were revised using new ALKs which used data from adjacent time periods where necessary. In the 2005 benchmark assessment, it was noted that numbers-at-age 1 in the landings data were very sparse and variable, reflecting the selec-tion on this age (and especially considering the probable substantial discarding), so the values were replaced by zero to avoid fitting to noise. Keeping age 1 in the assessment allows the survey data at age 1 to contribute.
Discards
Discard information was not routinely incorporated into the assessment prior to 2011. WG estimates of the combined, raised, level of discards are available from 2004, they have shown a consistent increase apart from 2007 when a substantial increase occurred in the discarding by all fleets followed by a return to the previously lower levels. Recent discard rates, although variable, are substantial in some fleets/periods. Total raised dis-card information is available for some fleets, and data raised to sampled vessels for oth-ers.
1560 | ICES WGCSE REPORT 2012
B.2. Biological
Weights-at-age
Landings
Historically, landings weights-at-age were constructed by fitting a quadratic smoother through the aggregated catch weights for each year. In 2011 WKFLAT decided not to continue with this approach, following concerns raised by WGCSE that the quadratic smoothing was resulting in the youngest ages having heavier weights than older ages. WKFLAT 2011 rejected the use of the polynomial smoother for weights-at-age and sug-gested that raw catch weights are used in future. Raw data back to 1995 was obtained by WKFLAT and used to update the catch weights and stock weights files.
Discards
Discard weight-at-age data were available for Belgium and UK(E+W). The UK weight-at-age data were derived from data collected by Cefas for each year (2002–2009). The Bel-gian weight-at-age data were derived using estimates of total catch biomass and total numbers-at-age for years 2004–2009. These values were used to derive a weight-at-age matrix in grammes for an individual fish. The two national weight-at-age matrices were ‘combined’ to a total international matrix by weighting the individual weights-at-age for each year, by the total discard tonnages from the two countries for that year. Where only one estimate of weight was available for an age/year, then that estimate was used.
The above processes also produced estimates of discard numbers-at-age for the two countries. The UK estimates were raised to incorporate equivalent levels of discards for the ‘unsampled’ countries of France, Ireland and N Ireland (on the basis of similar gear types). A raising factor based on tonnages ‘landed’ for these countries was calculated and applied to the UK(E+W) estimates of discard numbers. Finally, these estimates were add-ed to those calculated for Belgium to give total international discard numbers-at-age es-timates.
Stock weights
For the years 2004–2009 where discard estimates were available, a revised set of stock weights-at-age were calculated. The stock weights-at-age based on landings – with SOP correction but no ‘fitting’ were combined with the international discard weights-at-age data. These were weighted by the relative landed or discarded international annual ton-nages. The international annual discard tonnage was not readily available, as the ‘un-sampled’ countries did not have estimates. These were derived using the ratio of UK(E+W) tonnages of landings and discards and this ratio was applied to these unsam-pled nations landings to produce an estimate of total discard biomass for each of these countries. For the years prior to 2004, a revised set of stock weights-at-age data based on the international landings only was produced. These new values were based on the ‘ob-served’ weight data, but were SOP corrected. For this series of data, the ‘smoothing’ of the data by fitting a curve through the observed data was removed.
ICES WGCSE REPORT 2012 | 1561
Natural mortality and maturity ogives
Initial estimates of natural mortality (0.12 yr all years and all ages, from tagging studies) and maturity were based on values estimated for Irish Sea plaice. A new maturity ogive based on UK(E&W) VIIfg survey data for March 1993 and March 1994 (Pawson and Har-ley, 1997) was produced in 1997 and is applied to all years in the assessment.
Age 1 2 3 4 5+
Historic maturity 0 0.15 0.53 0.96 1.00
Revised maturity 0 0.26 0.52 0.86 1.00
The proportion of mortality before spawning was originally set at 0.2 since approximate-ly 20% of the total catch was taken prior to late February–early March, considered to be the time of peak spawning activity. The proportion of F and M before spawning was changed to zero at the request of ACFM in 1996 as it was considered that these settings were more robust to seasonal changes in fishing patterns, especially with respect to the medium-term projections. No updated information was provided to WKFLAT and the estimates were retained.
B.3. Surveys
Indices of abundance are available from the UK (BTS-Q3) beam trawl survey in VIIf and the Irish Celtic Explorer IBTS survey (IBTS-EA-4Q).
The UK(E&W) beam trawl survey series that began in 1988; since 1991, tow duration has been 30 minutes but prior to this it was 15 minutes. In 1997, values for 1988 to 1990 were raised to 30 minute tows. However, data for 1988 and 1989 were of poor quality and gave spurious results: thus, the series was truncated to 1990. A similar March beam trawl sur-vey began in 1993 and was made available to the WG in 1998. The March beam trawl survey ended in 1999 but continued to be used as a tuning index in the assessment until 2003.
Recent data have shown less correlation between ages than the historic time-series which should be monitored in case it is a developing problem. The log catch curves show good consistency over time and the reduction through time of the negative slope indicates that mortality rates have been declining.
The IGFS is a demersal trawl survey which started in 2003. It is coordinated through IC-ES International Bottom-trawl (IBTS) working group, providing annual indices of abun-dance for commercially exploited groundfish stocks on the Irish continental shelf (ICES VIa, VIIb,g&j) for Q3-4. Plaice are caught by the survey off the SE coast up to, and just over, the border of VIIg with VIIa (ICES rectangles (32E2, 32E3).
Year effects in the survey catch rates dominate the abundance indices. The year class and catch curve plots illustrates that the consistency of plaice year-class abundance estimates at each age is relatively poor. The survey was not fitted within the assessment model, but will be monitored as the time-series progresses.
B.4. Commercial lpue
Commercial tuning indices of abundance from the UK(E&W) beam trawl and otter trawl data are used in the assessment to provide information on the oldest ages in the popula-
1562 | ICES WGCSE REPORT 2012
tion. Historically, only ages 4–8 have been used to calibrate the assessment because of concerns about the level of discarding at the youngest ages. The data show good histori-cal consistency of year-class estimates throughout the time-series, especially for the beam trawls, with more noise resulting from two major year effects in the otter trawl data.
C. Stock assessment
Historically the stock was assessed using XSA, under the assumption that discarding had a minimal effect on the estimates. Recent increases in the level of discarding led to this assumption being untenable and so at the 2011 WKFLAT discard estimates were intro-duced to the assessment fitted using the AP model. The settings and data for the model fits are set out in the table below:
ICES WGCSE REPORT 2012 | 1563
Assessment year 2011 WKFLAT
Assessment model AP
Catch data Including discards 1990–2009
Tuning fleets UK(E&W)-BTSurvey 1990–2009 ages 1–5
UK commercial beam trawl 1990–2009 ages 4–8
UK commercial otter trawl 1990–2009 ages 4–8
Ire GFS Q3/4 Series omitted
Selectivity model Linear Time Varying Spline at-age (TVS)
Discard fraction Polynomial Time Varying Spline at-age (PTVS)
Landings num-at-age, range: 1–9+
Discards num-at-age, year range, age range
2004–2009, ages 1–8+
Three AP models which could not be distinguished in terms of the AIC, similar residual patterns and fits to the dataseries; the TI_PTVS, TI_TVS and TV_PTVS models. WKFLAT 2011 concluded that the TV_PTVS model, which allows for variation in time in the selec-tion patterns of both landings and discards, was the most plausible model; given the known changes in gear types and discarding. However, it was not statistically distin-guishable from the models which maintain the landings selection pattern as constant throughout the time-series.
Comparison of the management and stock metrics from the three model fits showed very similar time-series trends in the estimates of fishing mortality, SSB and total estimated discards. WKFLAT therefore concluded that:
1 ) Due to the change in estimated fishing mortality when discards are included within the model fit, that discards should be retained within the assessment model structure.
2 ) Given that the time-series of discard data to which the models are fitted is short and that, consequently, there are likely to be changes in the management estimates as discard data are added in subsequent years, no definitive model structure can be recommended at this stage in the development process.
3 ) The most flexible of the models TVS_PTVS should be used as the basis for ad-vice; in terms of relative changes in estimated total fishing mortality and bio-mass.
4 ) The other two models which provide similar structures should continue to be fitted at the WG to provide sensitivity comparisons.
5 ) As the dataseries are extended a final model selection can be then determined.
D. Short-term projection
For short-term forecasts based on the revised assessment it is recommended that the cur-rent methods be applied to the populations and fishing mortalities (separated into dis-card and landings mortalities) derived from the PV_TVS model (assuming that the
1564 | ICES WGCSE REPORT 2012
previously discussed sensitivity analyses do not indicate a change of model); in order to provide indications of the expected trends in discards, landings and spawning biomass.
E. Medium-term projections
Medium‐term projections are not carried out for this stock.
F. Yield and biomass-per-recruit/long-term projections
Yield-per-recruit calculations are conducted using the same input values as those used for the short-term forecasts. Currently the YPR calculations are used as a basis for deter-mining the catch option for advice.
G. Biological reference points
The addition of discards increases the estimates of spawning biomass in the most recent years following the increased estimates of discards in time. Similarly fishing mortality averaged across ages 3–6, which include ages that are discarded also increases. Previous BRPs may therefore not be consistent with new assessment methodology and should not be used until the assessment methodology is considered sufficiently stable (a longer time-series of discard data) to evaluate new reference levels.
H. References
Fox, C.J., Planque, B.P., and Darby, C.D. 2000. Synchrony in the recruitment time-series of plaice (Pleuronectes platessa L) around the United Kingdom and the influence of sea temperature. Journal of Sea Research 44: 159–168.
Pawson, M.G. 1995. Biogeographical identification of English Channel fish and shellfish stocks. Fisheries Research Technical Report No. 99. MAFF Directorate of Fisheries Research, Lowes-toft. http://www.cefas.co.uk/Publications/techrep/tech99.pdf.
Sideek. 1981. The estimation of natural mortality in Irish Sea plaice (Pleuronectes platessa L.) using tagging methods 206pp.
ICES WGCSE REPORT 2012 | 1565
7.13 Stock Annex Celtic Sea Sole VIIfg
Stock specific documentation of standard assessment procedures used by ICES.
Stock Sole (Division VIIf,g)
Working Group Assessment of Southern Shelf Demersal Stocks
Date 29th July 2004
Last updated 16th May 2012, Willy Vanhee
A. General
A.1. Stock definition
A description of the stock definition of sole in the Celtic Sea was given in the leaflet “Fisheries information – cod, sole, plaice and whiting in the southwest of the British Isles” published by Cefas under a EU funded project (SAMFISH: EU Study Contract 99-009, Improving sampling of western and southern European Atlantic Fisheries) and is taken over here.
In the coastal waters of western England and Wales, sole are found in greatest abundance in the northeastern Irish Sea and the eastern Celtic Sea. The main spawning areas for sole in the Celtic Sea are in deep waters (40–75 m) off Trevose Head, where spawning usually takes place between March and May. Sole nursery grounds are generally located in shal-low waters such as estuaries, tidal inlets and sandy bays. Juvenile sole (0 and 1 year old fish) are found chiefly in depths up to 40 m, and adult sole (fish aged 3 plus) are general-ly found in deeper water. Spawning and nursery grounds are well defined.
Over 6000 sole were tagged on the nursery grounds of the Bristol Channel and the Irish Sea between 1977 and 1988. The majority of fish tagged in Swansea Bay and Carmarthen Bay were between 15 and 24 cm in length. Most of the recaptures of these tagged fish oc-curred two or more years after release, which meant that many fish tagged as juveniles were recaptured as adults. The majority of returned fish were reported off the north coasts of Devon and Cornwall, and over a wide area in the eastern Celtic Sea and St George's Channel. These results suggest that once an adult sole has recruited to an area, it tends to remain there, and that there is only limited movement of sole between the Celtic Sea and adjoining areas.
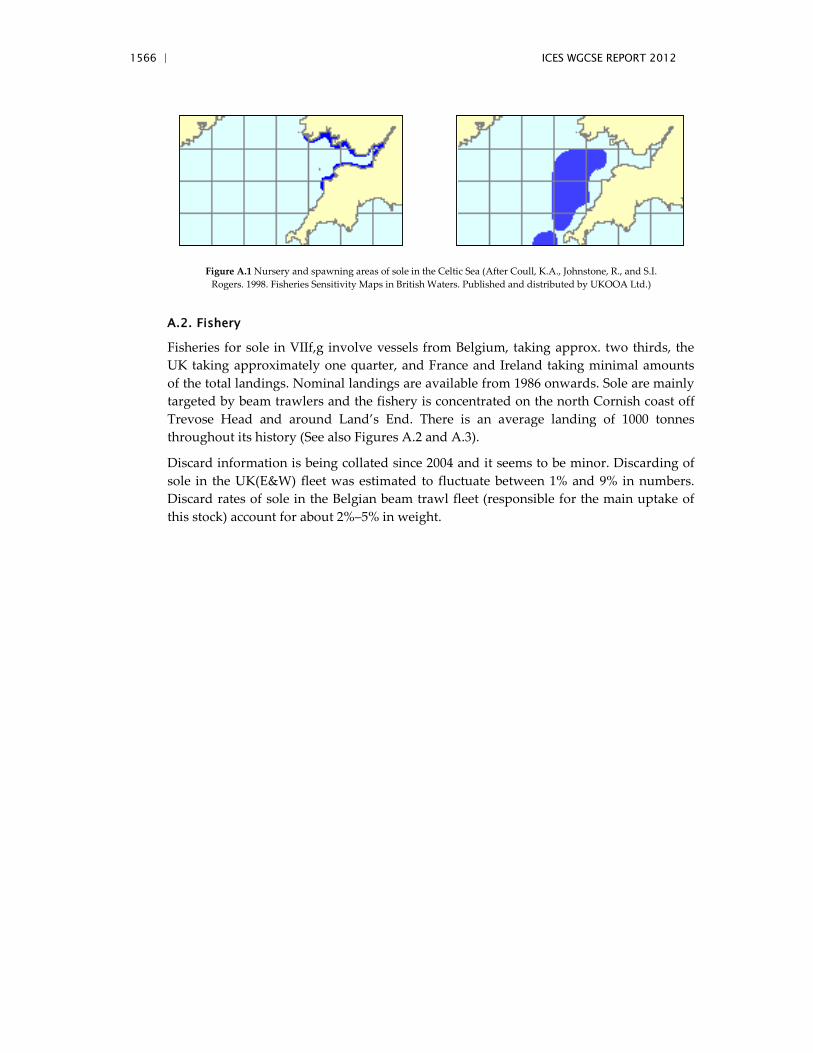
1566 | ICES WGCSE REPORT 2012
Figure A.1 Nursery and spawning areas of sole in the Celtic Sea (After Coull, K.A., Johnstone, R., and S.I. Rogers. 1998. Fisheries Sensitivity Maps in British Waters. Published and distributed by UKOOA Ltd.)
A.2. Fishery
Fisheries for sole in VIIf,g involve vessels from Belgium, taking approx. two thirds, the UK taking approximately one quarter, and France and Ireland taking minimal amounts of the total landings. Nominal landings are available from 1986 onwards. Sole are mainly targeted by beam trawlers and the fishery is concentrated on the north Cornish coast off Trevose Head and around Land’s End. There is an average landing of 1000 tonnes throughout its history (See also Figures A.2 and A.3).
Discard information is being collated since 2004 and it seems to be minor. Discarding of sole in the UK(E&W) fleet was estimated to fluctuate between 1% and 9% in numbers. Discard rates of sole in the Belgian beam trawl fleet (responsible for the main uptake of this stock) account for about 2%–5% in weight.
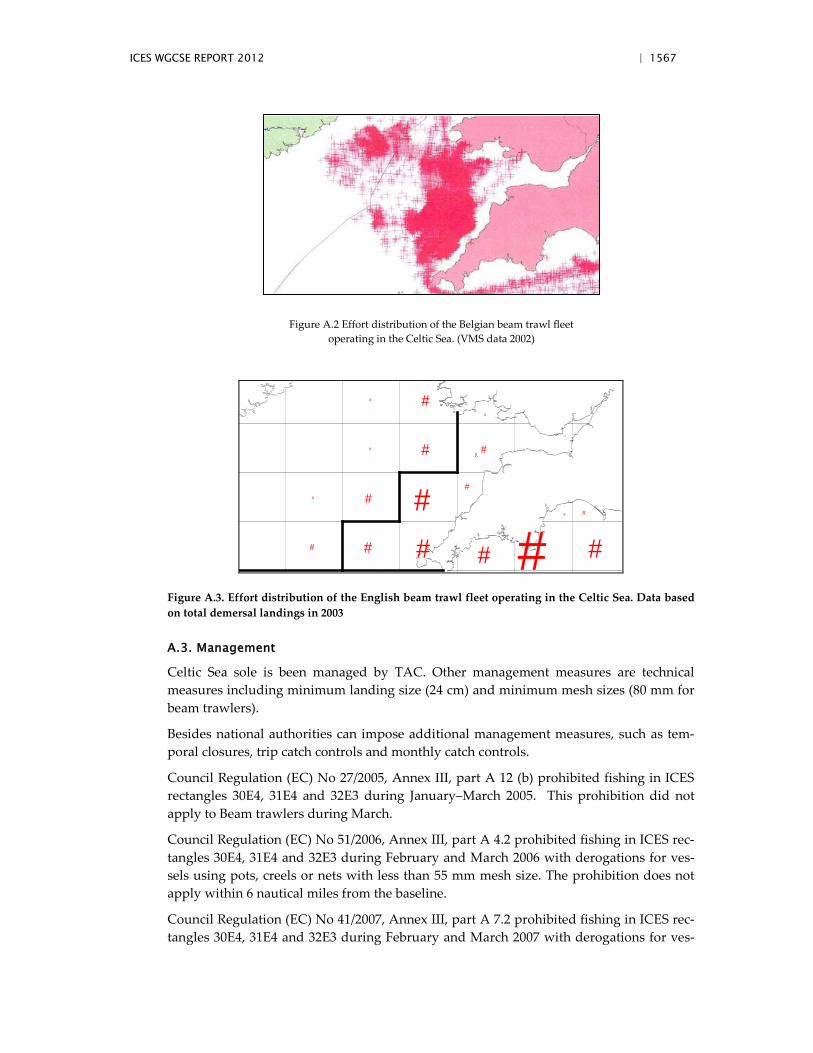
ICES WGCSE REPORT 2012 | 1567
Figure A.2 Effort distribution of the Belgian beam trawl fleet operating in the Celtic Sea. (VMS data 2002)
##
## ##
#
#
#
#
#
#
#
#
#
#
#
#
#
Figure A.3. Effort distribution of the English beam trawl fleet operating in the Celtic Sea. Data based on total demersal landings in 2003
A.3. Management
Celtic Sea sole is been managed by TAC. Other management measures are technical measures including minimum landing size (24 cm) and minimum mesh sizes (80 mm for beam trawlers).
Besides national authorities can impose additional management measures, such as tem-poral closures, trip catch controls and monthly catch controls.
Council Regulation (EC) No 27/2005, Annex III, part A 12 (b) prohibited fishing in ICES rectangles 30E4, 31E4 and 32E3 during January–March 2005. This prohibition did not apply to Beam trawlers during March.
Council Regulation (EC) No 51/2006, Annex III, part A 4.2 prohibited fishing in ICES rec-tangles 30E4, 31E4 and 32E3 during February and March 2006 with derogations for ves-sels using pots, creels or nets with less than 55 mm mesh size. The prohibition does not apply within 6 nautical miles from the baseline.
Council Regulation (EC) No 41/2007, Annex III, part A 7.2 prohibited fishing in ICES rec-tangles 30E4, 31E4 and 32E3 during February and March 2007 with derogations for ves-
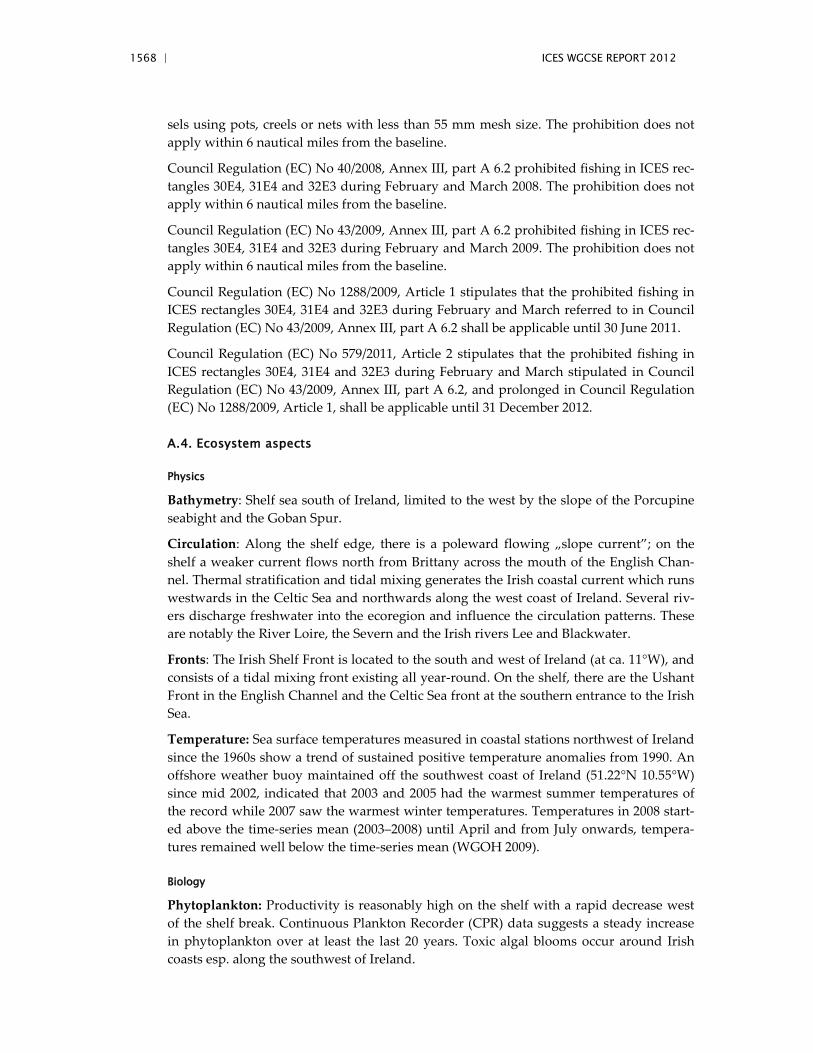
1568 | ICES WGCSE REPORT 2012
sels using pots, creels or nets with less than 55 mm mesh size. The prohibition does not apply within 6 nautical miles from the baseline.
Council Regulation (EC) No 40/2008, Annex III, part A 6.2 prohibited fishing in ICES rec-tangles 30E4, 31E4 and 32E3 during February and March 2008. The prohibition does not apply within 6 nautical miles from the baseline.
Council Regulation (EC) No 43/2009, Annex III, part A 6.2 prohibited fishing in ICES rec-tangles 30E4, 31E4 and 32E3 during February and March 2009. The prohibition does not apply within 6 nautical miles from the baseline.
Council Regulation (EC) No 1288/2009, Article 1 stipulates that the prohibited fishing in ICES rectangles 30E4, 31E4 and 32E3 during February and March referred to in Council Regulation (EC) No 43/2009, Annex III, part A 6.2 shall be applicable until 30 June 2011.
Council Regulation (EC) No 579/2011, Article 2 stipulates that the prohibited fishing in ICES rectangles 30E4, 31E4 and 32E3 during February and March stipulated in Council Regulation (EC) No 43/2009, Annex III, part A 6.2, and prolonged in Council Regulation (EC) No 1288/2009, Article 1, shall be applicable until 31 December 2012.
A.4. Ecosystem aspects
Physics
Bathymetry: Shelf sea south of Ireland, limited to the west by the slope of the Porcupine seabight and the Goban Spur.
Circulation: Along the shelf edge, there is a poleward flowing „slope current”; on the shelf a weaker current flows north from Brittany across the mouth of the English Chan-nel. Thermal stratification and tidal mixing generates the Irish coastal current which runs westwards in the Celtic Sea and northwards along the west coast of Ireland. Several riv-ers discharge freshwater into the ecoregion and influence the circulation patterns. These are notably the River Loire, the Severn and the Irish rivers Lee and Blackwater.
Fronts: The Irish Shelf Front is located to the south and west of Ireland (at ca. 11°W), and consists of a tidal mixing front existing all year-round. On the shelf, there are the Ushant Front in the English Channel and the Celtic Sea front at the southern entrance to the Irish Sea.
Temperature: Sea surface temperatures measured in coastal stations northwest of Ireland since the 1960s show a trend of sustained positive temperature anomalies from 1990. An offshore weather buoy maintained off the southwest coast of Ireland (51.22°N 10.55°W) since mid 2002, indicated that 2003 and 2005 had the warmest summer temperatures of the record while 2007 saw the warmest winter temperatures. Temperatures in 2008 start-ed above the time-series mean (2003–2008) until April and from July onwards, tempera-tures remained well below the time-series mean (WGOH 2009).
Biology
Phytoplankton: Productivity is reasonably high on the shelf with a rapid decrease west of the shelf break. Continuous Plankton Recorder (CPR) data suggests a steady increase in phytoplankton over at least the last 20 years. Toxic algal blooms occur around Irish coasts esp. along the southwest of Ireland.
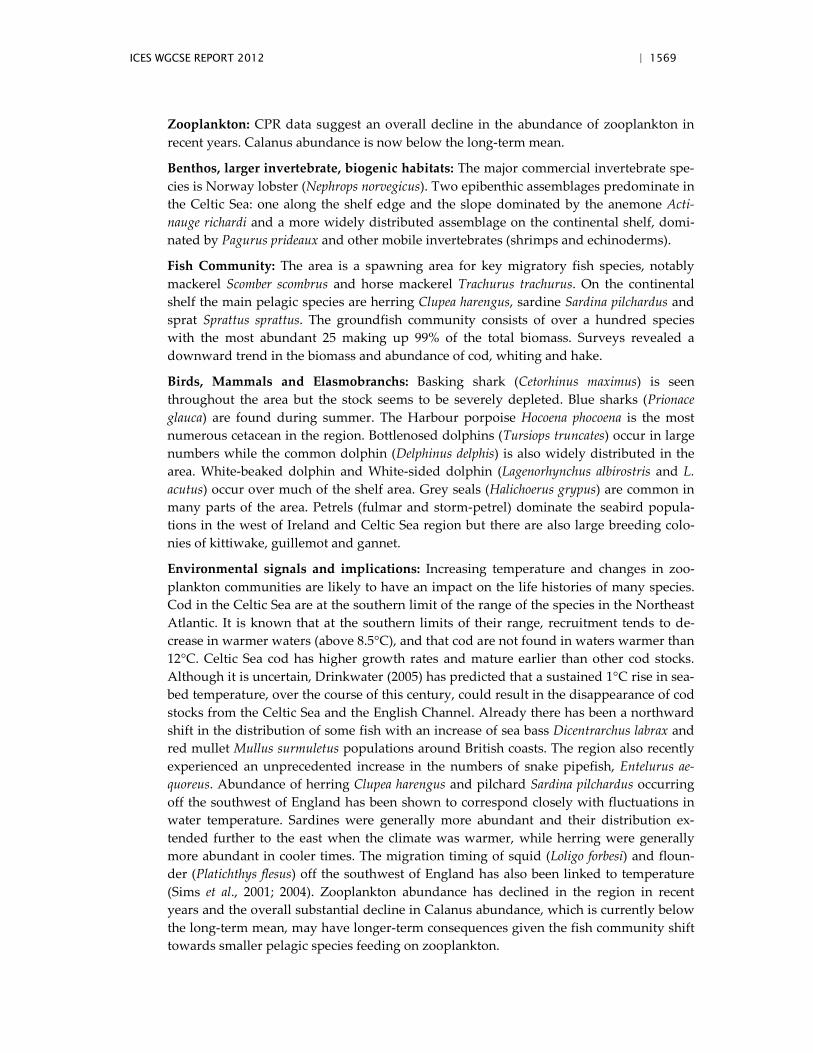
ICES WGCSE REPORT 2012 | 1569
Zooplankton: CPR data suggest an overall decline in the abundance of zooplankton in recent years. Calanus abundance is now below the long-term mean.
Benthos, larger invertebrate, biogenic habitats: The major commercial invertebrate spe-cies is Norway lobster (Nephrops norvegicus). Two epibenthic assemblages predominate in the Celtic Sea: one along the shelf edge and the slope dominated by the anemone Acti-nauge richardi and a more widely distributed assemblage on the continental shelf, domi-nated by Pagurus prideaux and other mobile invertebrates (shrimps and echinoderms).
Fish Community: The area is a spawning area for key migratory fish species, notably mackerel Scomber scombrus and horse mackerel Trachurus trachurus. On the continental shelf the main pelagic species are herring Clupea harengus, sardine Sardina pilchardus and sprat Sprattus sprattus. The groundfish community consists of over a hundred species with the most abundant 25 making up 99% of the total biomass. Surveys revealed a downward trend in the biomass and abundance of cod, whiting and hake.
Birds, Mammals and Elasmobranchs: Basking shark (Cetorhinus maximus) is seen throughout the area but the stock seems to be severely depleted. Blue sharks (Prionace glauca) are found during summer. The Harbour porpoise Hocoena phocoena is the most numerous cetacean in the region. Bottlenosed dolphins (Tursiops truncates) occur in large numbers while the common dolphin (Delphinus delphis) is also widely distributed in the area. White-beaked dolphin and White-sided dolphin (Lagenorhynchus albirostris and L. acutus) occur over much of the shelf area. Grey seals (Halichoerus grypus) are common in many parts of the area. Petrels (fulmar and storm-petrel) dominate the seabird popula-tions in the west of Ireland and Celtic Sea region but there are also large breeding colo-nies of kittiwake, guillemot and gannet.
Environmental signals and implications: Increasing temperature and changes in zoo-plankton communities are likely to have an impact on the life histories of many species. Cod in the Celtic Sea are at the southern limit of the range of the species in the Northeast Atlantic. It is known that at the southern limits of their range, recruitment tends to de-crease in warmer waters (above 8.5°C), and that cod are not found in waters warmer than 12°C. Celtic Sea cod has higher growth rates and mature earlier than other cod stocks. Although it is uncertain, Drinkwater (2005) has predicted that a sustained 1°C rise in sea-bed temperature, over the course of this century, could result in the disappearance of cod stocks from the Celtic Sea and the English Channel. Already there has been a northward shift in the distribution of some fish with an increase of sea bass Dicentrarchus labrax and red mullet Mullus surmuletus populations around British coasts. The region also recently experienced an unprecedented increase in the numbers of snake pipefish, Entelurus ae-quoreus. Abundance of herring Clupea harengus and pilchard Sardina pilchardus occurring off the southwest of England has been shown to correspond closely with fluctuations in water temperature. Sardines were generally more abundant and their distribution ex-tended further to the east when the climate was warmer, while herring were generally more abundant in cooler times. The migration timing of squid (Loligo forbesi) and floun-der (Platichthys flesus) off the southwest of England has also been linked to temperature (Sims et al., 2001; 2004). Zooplankton abundance has declined in the region in recent years and the overall substantial decline in Calanus abundance, which is currently below the long-term mean, may have longer-term consequences given the fish community shift towards smaller pelagic species feeding on zooplankton.
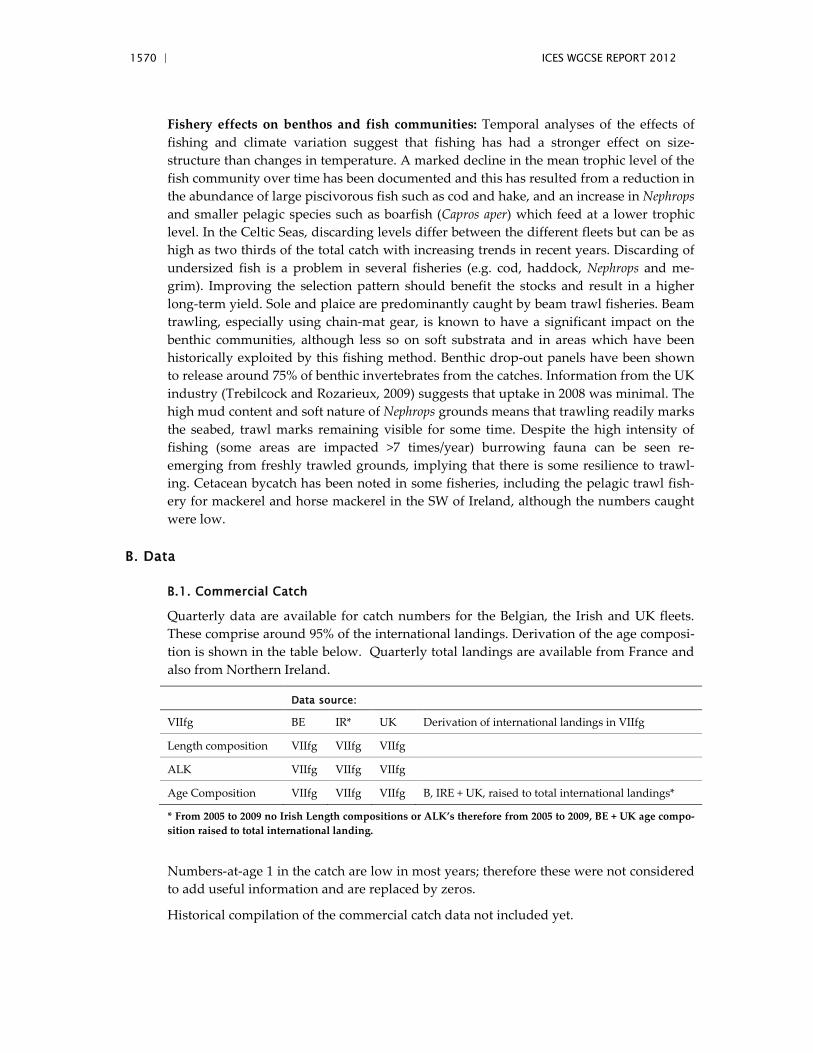
1570 | ICES WGCSE REPORT 2012
Fishery effects on benthos and fish communities: Temporal analyses of the effects of fishing and climate variation suggest that fishing has had a stronger effect on size-structure than changes in temperature. A marked decline in the mean trophic level of the fish community over time has been documented and this has resulted from a reduction in the abundance of large piscivorous fish such as cod and hake, and an increase in Nephrops and smaller pelagic species such as boarfish (Capros aper) which feed at a lower trophic level. In the Celtic Seas, discarding levels differ between the different fleets but can be as high as two thirds of the total catch with increasing trends in recent years. Discarding of undersized fish is a problem in several fisheries (e.g. cod, haddock, Nephrops and me-grim). Improving the selection pattern should benefit the stocks and result in a higher long-term yield. Sole and plaice are predominantly caught by beam trawl fisheries. Beam trawling, especially using chain-mat gear, is known to have a significant impact on the benthic communities, although less so on soft substrata and in areas which have been historically exploited by this fishing method. Benthic drop-out panels have been shown to release around 75% of benthic invertebrates from the catches. Information from the UK industry (Trebilcock and Rozarieux, 2009) suggests that uptake in 2008 was minimal. The high mud content and soft nature of Nephrops grounds means that trawling readily marks the seabed, trawl marks remaining visible for some time. Despite the high intensity of fishing (some areas are impacted >7 times/year) burrowing fauna can be seen re-emerging from freshly trawled grounds, implying that there is some resilience to trawl-ing. Cetacean bycatch has been noted in some fisheries, including the pelagic trawl fish-ery for mackerel and horse mackerel in the SW of Ireland, although the numbers caught were low.
B. Data
B.1. Commercial Catch
Quarterly data are available for catch numbers for the Belgian, the Irish and UK fleets. These comprise around 95% of the international landings. Derivation of the age composi-tion is shown in the table below. Quarterly total landings are available from France and also from Northern Ireland.
Data source:
VIIfg BE IR* UK Derivation of international landings in VIIfg
Length composition VIIfg VIIfg VIIfg
ALK VIIfg VIIfg VIIfg
Age Composition VIIfg VIIfg VIIfg B, IRE + UK, raised to total international landings*
* From 2005 to 2009 no Irish Length compositions or ALK’s therefore from 2005 to 2009, BE + UK age compo-sition raised to total international landing.
Numbers-at-age 1 in the catch are low in most years; therefore these were not considered to add useful information and are replaced by zeros.
Historical compilation of the commercial catch data not included yet.
ICES WGCSE REPORT 2012 | 1571
B.2. Biological
Weights-at-age
The total international catch weights-at-age are calculated as the weighted mean of the annual weight-at-age data supplied by Belgium, UK(E&W) and Ireland, which account for 95% of the total international landings (weighted by landed numbers), and smoothed using a quadratic fit where catch weights-at-age are mid-year values (age = 1.5, 2.5, etc.). These quadratic fits through these points differ from year to year. Therefore they are provided for each year separately. The method is always the same; just the fit differs from year to year as the catch weights differ from year to year.
Catch weights-at-age have been scaled to give a SOP of 100%.
This technique has been used for many years (at least since stock has been assessed by the Southern Shelf Demersal WG. The same technique has been used in other stocks in the WGCSE (e.g. plaice VIIe).
The text table below shows the quadratic fit of the data, the R² of the fit, the periodicity of the data being collected and the countries that delivered the data to calculate the fit.
Year Quadratic fit W(t) = R²
Periodicity data
Contributing countries
2002 -0.0659 + 0.0825*(AGE+0.5) - 0.0017*(AGE+0.5)² 0.93 Quarterly B, IRE, UK
2003 0.0503 + 0.0484*(AGE+0.5) - 0.0001*(AGE+0.5)² 0.91 Quarterly B, IRE, UK
2004 -0.0333 + 0.0671*(AGE+0.5) - 0.0006*(AGE+0.5)² 0.96 Quarterly B, IRE, UK
2005 -0.0542 + 0.0846*(AGE+0.5) - 0.0019*(AGE+0.5)² 0.96 Quarterly B, UK
2006 0.0023 + 0.0553*(AGE+0.5) - 0.0003*(AGE+0.5)² 0.95 Quarterly B, UK
2007 0.0023 + 0.0553*(AGE+0.5) - 0.0003*(AGE+0.5)² 0.95 Quarterly B, UK
2008 -0.0267 + 0.07*(AGE+0.5) - 0.0015*(AGE+0.5)² 0.88 Quarterly B, UK
2009 +0.0093 + 0.0612*(AGE+0.5) - 0.0012*(AGE+0.5)² 0.90 Quarterly B, UK
2010 Not available for the moment due to a hard disk crash Quarterly B, IRE, UK
2011 +0.0084 + 0.0566*(AGE+0.5) - 0.007*(AGE+0.5)² 0.97 Quarterly B, IRE, UK
2012 -0.0388 + 0.069*(AGE+0.5) - 0.0012*(AGE+0.5)² 0.92 Quarterly B, IRE, UK
For the period 2002–2002 the stock weights-at-age are the catch weights of the Belgian beam trawl fleet (BEL-BEAM) in the first quarter, smoothed by fitting a Gompertz func-tion. The text table gives a historical overview of the parameters that have been used in the Gompertz function [ )))exp(1(exp()( tcbatW ×−××= ].
Year Parameter a Parameter b Parameter c R²
2002 13.89 4.220 -0.3376
2003 86.14 3.049 -0.1115 0.4
2004 3.77 3.47 -0.196 0.4
For the period 2005–2009, the stock weights were calculated as the weighted mean of the 1st quarter weights-at-age data supplied by Belgium and UK(E&W) (weighted by landed

1572 | ICES WGCSE REPORT 2012
numbers) and soothed using a quadratic fit through these points. Since 2010 Ireland also provides this information and these data were included in the calculations.
The text table below shows the quadratic fit of the data, the R² of the fit, the periodicity of the data being collected and the countries that delivered the data to calculate the fit.
Stock weights-at-age have been scaled to give a SOP of 100%.
ICES WGCSE REPORT 2012 | 1573
Year Quadratic fit W(t) = R²
Periodicity data
Contributing countries
2005 -0.0113 + 0.065*(AGE) - 0.0003*(AGE)² 0.96 1st quarter B, UK
2006 0.0381 + 0.0397*(AGE) + 0.0009*(AGE)² 0.97 1st quarter B, UK
2007 0.0381 + 0.0397*(AGE) + 0.0009*(AGE)² 0.97 1st quarter B, UK
2008 -0.0389 + 0.0638*(AGE) - 0.0006*(AGE)² 0.94 1st quarter B, UK
2009 +0.0112 + 0.0517*(AGE) - 0.0002*(AGE)² 0.98 1st quarter B, UK
2010 Not available for the moment due to a hard disk crash Quarterly B, IRE, UK
2011 -0.0472 + 0.0812*(AGE+0.5) - 0.022*(AGE+0.5)² 0.92 Quarterly B, IRE, UK
2012 +0.0786 + 0.0369*(AGE+0.5) - 0.006*(AGE+0.5)² 0.98 Quarterly B, IRE, UK
Stock and catch weights have no explicit trends. The values for 2001 showed a strange convergence and were replaced by the mean of the 2000 and the 2002 weights.
At some ages, the weights in the stock are higher than the weights in the catch. This is because sole caught from spawning concentrations in the 1st quarter are heavier (10% to 15 %) than after spawning.
Historical compilation of the weight-at-age data not fully included yet.
Natural mortality and maturity ogives
Natural mortality was assumed to be 0.1 for all ages and years. This is consistent with the natural mortality estimates used for sole by other ICES working groups (WGNSSK: IV, VIId, WGNSDS: VIIa, WGSSDS: VIIfg, VIIIa,b) and consistent with estimates of M re-ported in Horwood (1993).
The maturity ogive applied to all years is, a combined sex maturity ogive taken from Ar-ea VIIfg attributed to Pawson and Harley, WD presented to WGSSDS in 1997.
Age 1 2 3 4 5 6 and older
0.00 0.14 0.45 0.88 0.98 1.00
The proportion of M and F before spawning was set to zero.
B.3. Surveys
Abundance indices for Celtic Sea sole are available for one survey, the UK beam trawl survey (UK(E&W)-BTS-Q3). The survey has been conducted in September for approxi-mately 24 days annually since 1988. There are 101 core fishing and hydrographic stations distributed around the Irish Sea, Bristol Channel and Celtic Sea between 50 to 55 degrees N and between the English, Welsh and Irish coasts. The survey is coordinated by ICES BTS WG.
Abundance indices for all ages used in the assessment (standardized to the mean of the respective ages) are given in the figure below. The figure shows that the survey is able to track the strength of the year classes reasonably well.
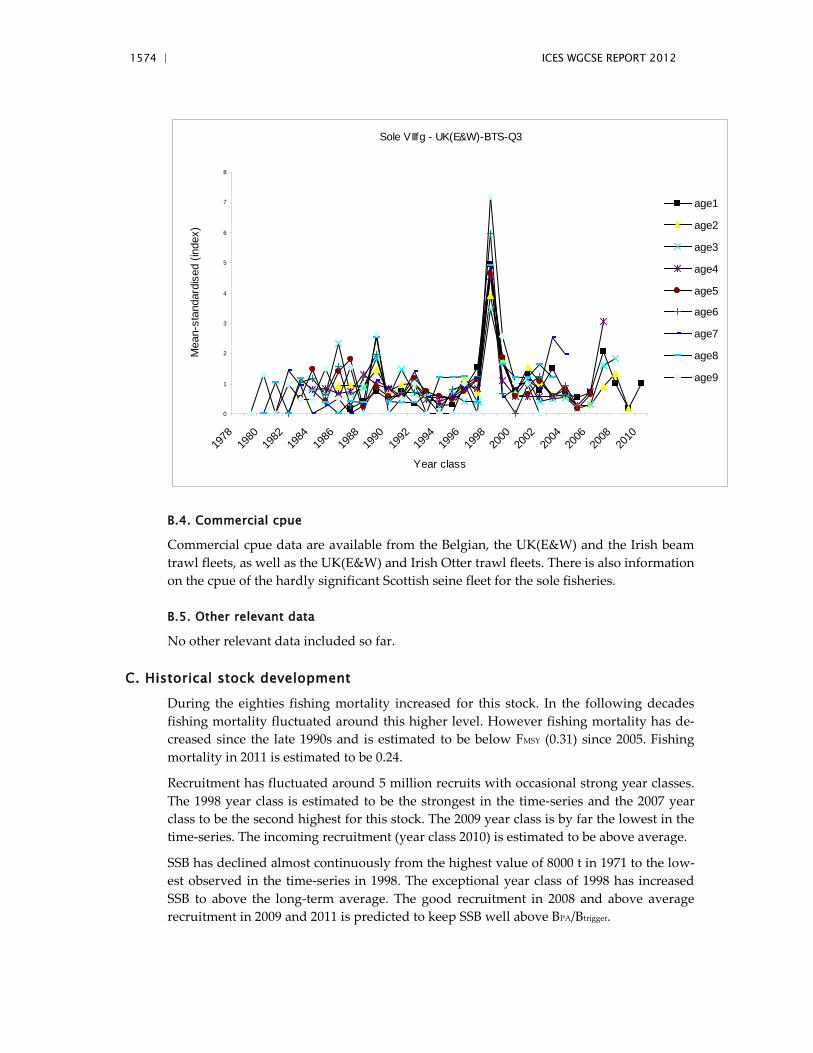
1574 | ICES WGCSE REPORT 2012
Sole VIIfg - UK(E&W)-BTS-Q3
0
1
2
3
4
5
6
7
8
1978
1980
1982
1984
1986
1988
1990
1992
1994
1996
1998
2000
2002
2004
2006
2008
2010
Year class
Mea
n-st
anda
rdis
ed (i
ndex
)age1
age2
age3
age4
age5
age6
age7
age8
age9
B.4. Commercial cpue
Commercial cpue data are available from the Belgian, the UK(E&W) and the Irish beam trawl fleets, as well as the UK(E&W) and Irish Otter trawl fleets. There is also information on the cpue of the hardly significant Scottish seine fleet for the sole fisheries.
B.5. Other relevant data
No other relevant data included so far.
C. Historical stock development
During the eighties fishing mortality increased for this stock. In the following decades fishing mortality fluctuated around this higher level. However fishing mortality has de-creased since the late 1990s and is estimated to be below FMSY (0.31) since 2005. Fishing mortality in 2011 is estimated to be 0.24.
Recruitment has fluctuated around 5 million recruits with occasional strong year classes. The 1998 year class is estimated to be the strongest in the time-series and the 2007 year class to be the second highest for this stock. The 2009 year class is by far the lowest in the time-series. The incoming recruitment (year class 2010) is estimated to be above average.
SSB has declined almost continuously from the highest value of 8000 t in 1971 to the low-est observed in the time-series in 1998. The exceptional year class of 1998 has increased SSB to above the long-term average. The good recruitment in 2008 and above average recruitment in 2009 and 2011 is predicted to keep SSB well above BPA/Btrigger.
ICES WGCSE REPORT 2012 | 1575
Tuning data
XSA tuning data that have been used in recent assessments are those from Belgium beam trawlers (BEL-CBT), 1971 onwards; from the UK beam trawl fleet (UK-CBT), Division VIIf, 1991 onwards; and from the UK Corystes September beam trawl survey (UK(E&W)-BTS-Q3 survey), 1988 onwards. The Belgian beam trawl fleet is temporally discontinued in 2003. This is due to a change in the calculation of the effort statistics from the official logbooks and sale slip notes in the most recent years. Before the next benchmark assess-ment, a new derivation of these data should become available.
There do exist other tuning data for this stock (e.g. UK otter trawl fleet), but these have not been included in the assessment as they were not considered to be representative for this stock.
The Irish Groundfish survey, held in the 4th quarter is available since 2003 but is not yet used in the XSA as the time-series is too short.
Assessment methods and settings
Celtic Sea sole has been assessed with XSA. An overview of the changes in parameter settings of the XSA are given below:
Fleets Years Ages α-β Years Ages α-β Years Ages α-βBEL-CBT commercial 71-asses-year-1 2-9 0-1 86-asses-year-1 2-9 0-1 86-asses-year-1 2-9 0-1UK-CBT commercial 91-asses-year-1 2-9 0-1 87-asses-year-1 3-9 0-1 91-asses-year-1 2-9 0-1UK(E&W)-BTS-Q3 survey 88-asses-year-1 1-4 0.75-0.85 88-asses-year-1 1-4 0.75-0.85 88-asses-year-1 1-4 0.75-0.85
-First data year 1989 1986 1986-Last data year assessment year-1 assessment year-1 assessment year-1
-First age 1 1 1-Last age 10+ 10+ 10+Time series weights None None None
-Model-Q plateau set at age 7 7 7
-Survivors estimates shrunk towards mean F-s.e. of the means 0.5 1.5 1.5-Min s.e. for pop. Estimates 0.3 0.3 0.3-Prior weighting None None None Fbar (4-8)
Fleets Years Ages α-β Years Ages α-β Years Ages α-βBEL-CBT commercial 87-asses-year-1 2-9 0-1 71-asses-year-1 2-9 0-1 71-asses-year-1 2-9 0-1UK-CBT commercial 91-asses-year-1 2-9 0-1 91-asses-year-1 2-9 0-1 91-asses-year-1 2-9 0-1UK(E&W)-BTS-Q3 survey 88-asses-year-1 1-4 0.75-0.85 88-asses-year-1 1-4 0.75-0.85 88-asses-year-1 1-9 0.75-0.85
-First data year 1987 1971 1971-Last data year assessment year-1 2011 2011
-First age 1 1 1-Last age 10+ 10+ 10+Time series weights None None None
-Model-Q plateau set at age 7 7 7
-Survivors estimates shrunk towards mean F 5 years / 5 ages 5 years / 5 ages-s.e. of the means 1.5 1.5 1.5-Min s.e. for pop. Estimates 0.3 0.3 0.3-Prior weighting None None None Fbar (4-8)
5 years / 5 ages
assessment 2006-Currentassessment 2004-2005
Power model (ages 1 & 2) Mean q model all ages
2003 assessment
Power model (ages 1 & 2)
5 years / 5 ages
assessment 2001-2002
Power model (ages 1 & 2)
5 years / 5 ages
2000 assessment
Power model (ages 1 & 2)
5 years / 5 ages
assessment 1998-1999
Mean q model all ages
Short-term projection
Population numbers for ages 2 and older are taken from the XSA output (estimates of the year = the assessment year minus 1). The long-term geometric mean (starting year up to assessment year minus 3) is assumed for age 1 in the forecast.
Fishing mortality is set at the mean over the last three years, not rescaled. If a trend oc-curs in fishing mortality (three consecutive higher or lower estimates), the Working
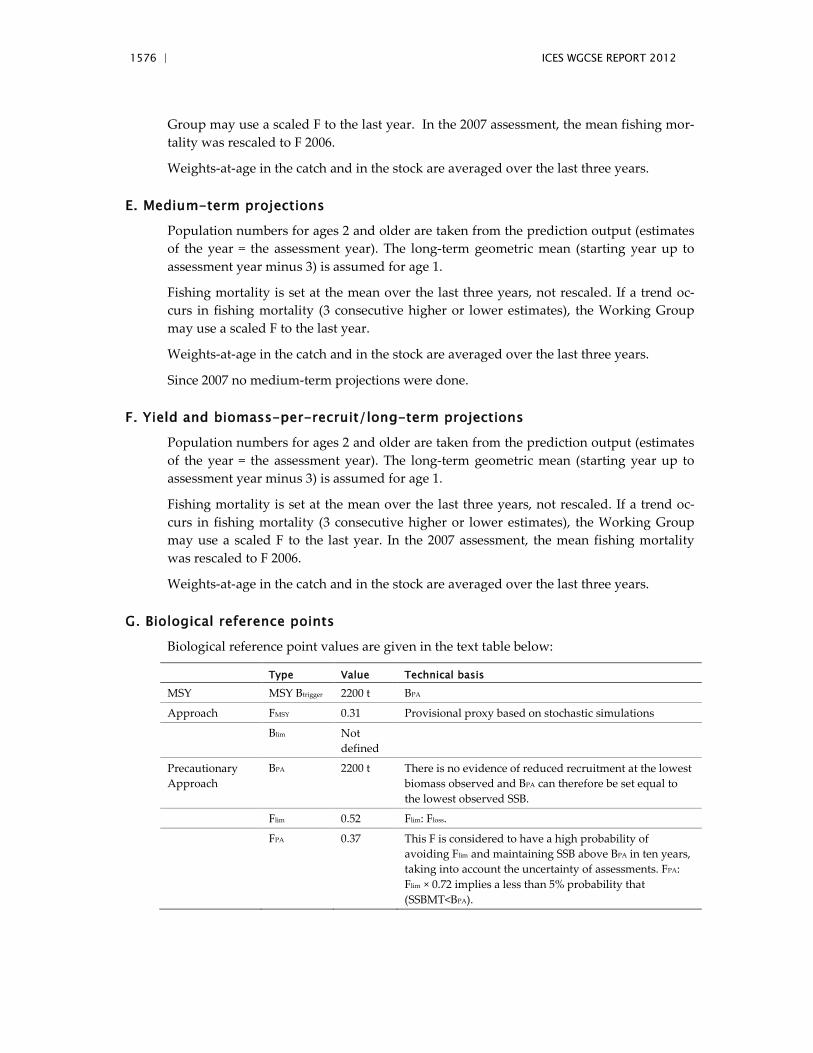
1576 | ICES WGCSE REPORT 2012
Group may use a scaled F to the last year. In the 2007 assessment, the mean fishing mor-tality was rescaled to F 2006.
Weights-at-age in the catch and in the stock are averaged over the last three years.
E. Medium-term projections
Population numbers for ages 2 and older are taken from the prediction output (estimates of the year = the assessment year). The long-term geometric mean (starting year up to assessment year minus 3) is assumed for age 1.
Fishing mortality is set at the mean over the last three years, not rescaled. If a trend oc-curs in fishing mortality (3 consecutive higher or lower estimates), the Working Group may use a scaled F to the last year.
Weights-at-age in the catch and in the stock are averaged over the last three years.
Since 2007 no medium-term projections were done.
F. Yield and biomass-per-recruit/long-term projections
Population numbers for ages 2 and older are taken from the prediction output (estimates of the year = the assessment year). The long-term geometric mean (starting year up to assessment year minus 3) is assumed for age 1.
Fishing mortality is set at the mean over the last three years, not rescaled. If a trend oc-curs in fishing mortality (3 consecutive higher or lower estimates), the Working Group may use a scaled F to the last year. In the 2007 assessment, the mean fishing mortality was rescaled to F 2006.
Weights-at-age in the catch and in the stock are averaged over the last three years.
G. Biological reference points
Biological reference point values are given in the text table below:
Type Value Technical basis
MSY MSY Btrigger 2200 t BPA
Approach FMSY 0.31 Provisional proxy based on stochastic simulations
Blim Not defined
Precautionary Approach
BPA 2200 t There is no evidence of reduced recruitment at the lowest biomass observed and BPA can therefore be set equal to the lowest observed SSB.
Flim 0.52 Flim: Floss.
FPA 0.37 This F is considered to have a high probability of avoiding Flim and maintaining SSB above BPA in ten years, taking into account the uncertainty of assessments. FPA: Flim × 0.72 implies a less than 5% probability that (SSBMT<BPA).

ICES WGCSE REPORT 2012 | 1577
H. Other Issues
No other issues so far.
I. References Connolly, P.L., Kelly, E., Dransfeld, L., Slattery, N., Paramor, O.A.L., and Frid, C.L.J. 2009.
MEFEPO North Western Waters Atlas. Marine Institute. ISBN 978 1 902895 45 1.
1578 | ICES WGCSE REPORT 2012
7.15 Stock Annex Whiting VIIe–k
Stock specific documentation of standard assessment procedures used by ICES.
Stock Whiting VIIe–k
Working Group Celtic Sea Ecoregion
Date 17 May 2010
Revised by Sarah Davie
A. General
A.1. Stock definition
The degree of separation of whiting stocks between the Irish Sea, and ICES Divisions VIIb–c from the Celtic Sea, is currently unclear. SAMFISH (EU Study Contract 99-009, Improving sampling of western and southern European Atlantic Fisheries) described the stock unit as follows:
The main spawning areas of whiting in the Western Channel and Celtic Sea are off Start Point, off Trevose Head and southeast of Ireland. The spawning season is from February to May, and the larvae are found in midwater before moving to live near the seabed by September. For the next two years, juvenile whiting are found in shallow coastal and es-tuarine areas, being particularly abundant around Start Point. Nearly 4000 adult whiting were tagged and released off Start Point during August 1958 and 1960. Most returns were within three months of release and demonstrated little indication of movement. Subse-quent recaptures indicated more movement of whiting into the Celtic Sea than between the western and eastern Channel. Whiting released in summer between 1957 and 1961 near Carmarthen Bay moved south and west towards the two spawning grounds off Tre-vose and southeast of Ireland. There was no evidence of emigration out of the Celtic Sea area. Returns of whiting tagged and released in the County Down spawning area in the Irish Sea demonstrate more movement south into the Celtic Sea than north to the west of Scotland.
A.2. Fishery
Whiting in Divisions VIIe–k are taken as a component of catches in mixed trawl fisheries. Whiting landings through the mid 1980s totalled between 10 000 t and 15 000 t, through the mid to late 1990s landings were elevated to around 20 000 t. Since the turn of the cen-tury, landings have been in decline and are now below 10 000 t. Through the 1980s and early 1990s France accounted for around 60–85% of landings. While Ireland accounted for between 10% and 20% of landings, the UK 10%, and Belgium had minimal contribution (1–2%). Landings from both the UK and Belgium have remained at similar levels over time. Since the early 1990s Ireland has accounted for a greater proportion of landings. Proportions since 2004 have been similar to France whose landings have been falling since the turn of the century.
French landings are made mainly by gadoid trawlers, which prior to 1980 were mainly fishing for hake in the Celtic Sea. Irish demersal trawlers from Dunmore East and Cas-
ICES WGCSE REPORT 2012 | 1579
tletownbere and other ports in southwest Ireland have traditionally targeted Celtic Sea whiting in a mixed trawl fishery. In response to poor catches in other areas vessels have been attracted into this fishery in recent years from County Donegal.
A detailed description of the Irish fishery is given in the annual WD to WGSSDS: ‘A summary of the Irish Fishery and Sampling of Whiting in VIIe–k’.
A.3. Ecosystem aspects
No relevant information has been made available to the Working Group.
B. Data
B.1. Commercial catch
Data on international landings-at-age and mean weight-at-age are available for Irish, French and UK fleets from 1999 to present. The following procedures have been applied to aggregate the data for the areas VIIe, VIIfgh and VIIj,k and build the database for VIIe–k. UK VIIe–k data were used to scale catch numbers according to the landings for each area. French VIIf,g,h data were used with Irish VIIg data to scale VIIf,g,h catch numbers. Irish VIIj data were used to scale VIIj,k catch numbers. The Table below demonstrates the data available and the procedures used to derive quarterly length compositions, age compositions and mean weights-at-age.
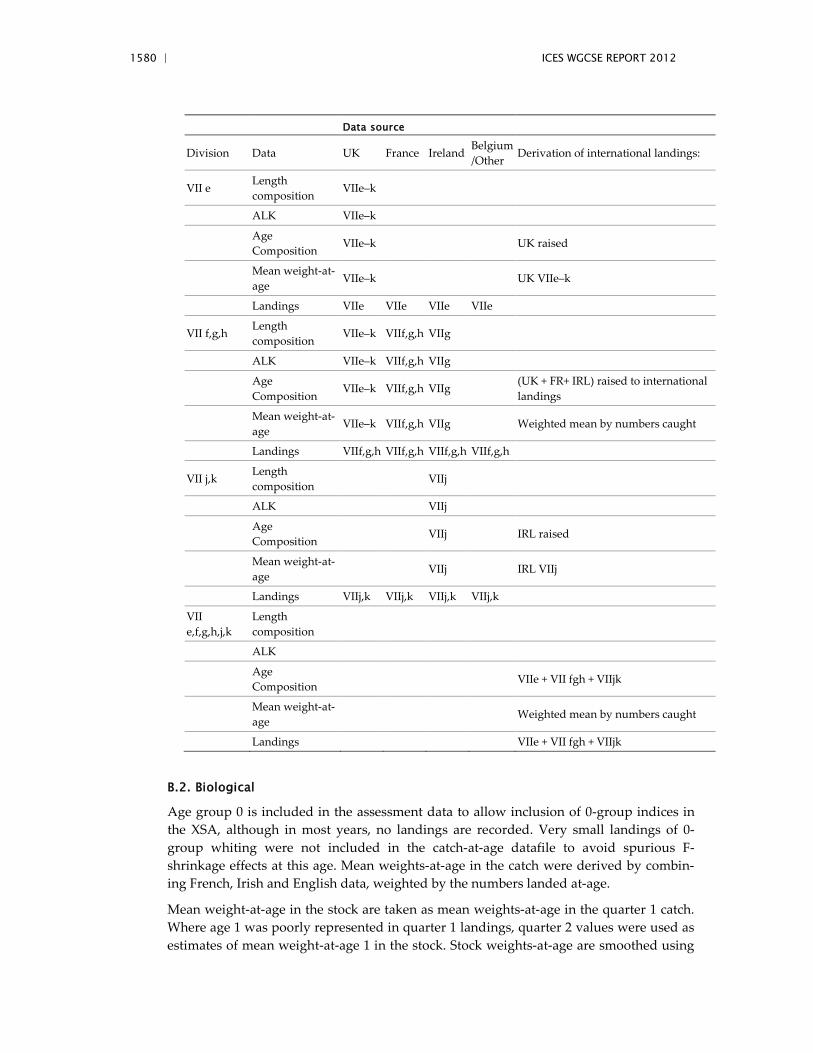
1580 | ICES WGCSE REPORT 2012
Data source
Division Data UK France Ireland Belgium /Other
Derivation of international landings:
VII e Length composition
VIIe–k
ALK VIIe–k
Age Composition
VIIe–k UK raised
Mean weight-at-age
VIIe–k UK VIIe–k
Landings VIIe VIIe VIIe VIIe
VII f,g,h Length composition
VIIe–k VIIf,g,h VIIg
ALK VIIe–k VIIf,g,h VIIg
Age Composition
VIIe–k VIIf,g,h VIIg (UK + FR+ IRL) raised to international landings
Mean weight-at-age
VIIe–k VIIf,g,h VIIg Weighted mean by numbers caught
Landings VIIf,g,h VIIf,g,h VIIf,g,h VIIf,g,h
VII j,k Length composition
VIIj
ALK VIIj
Age Composition
VIIj IRL raised
Mean weight-at-age
VIIj IRL VIIj
Landings VIIj,k VIIj,k VIIj,k VIIj,k
VII e,f,g,h,j,k
Length composition
ALK
Age Composition
VIIe + VII fgh + VIIjk
Mean weight-at-age
Weighted mean by numbers caught
Landings VIIe + VII fgh + VIIjk
B.2. Biological
Age group 0 is included in the assessment data to allow inclusion of 0-group indices in the XSA, although in most years, no landings are recorded. Very small landings of 0-group whiting were not included in the catch-at-age datafile to avoid spurious F-shrinkage effects at this age. Mean weights-at-age in the catch were derived by combin-ing French, Irish and English data, weighted by the numbers landed at-age.
Mean weight-at-age in the stock are taken as mean weights-at-age in the quarter 1 catch. Where age 1 was poorly represented in quarter 1 landings, quarter 2 values were used as estimates of mean weight-at-age 1 in the stock. Stock weights-at-age are smoothed using
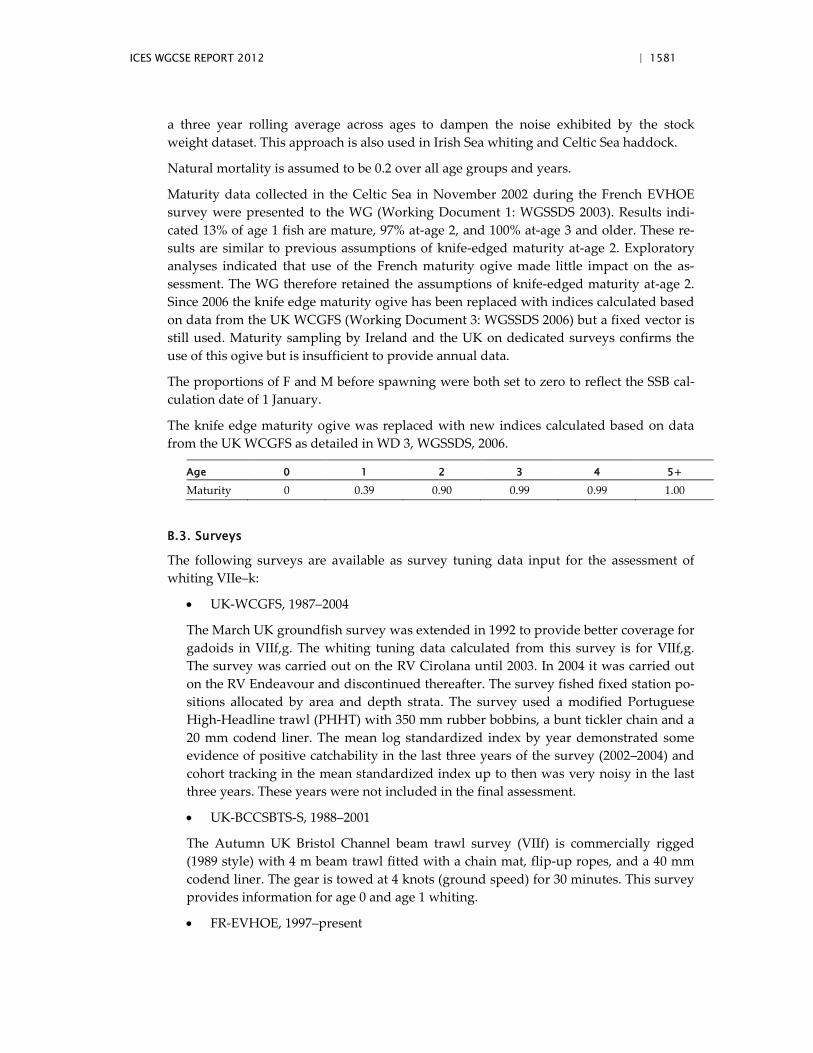
ICES WGCSE REPORT 2012 | 1581
a three year rolling average across ages to dampen the noise exhibited by the stock weight dataset. This approach is also used in Irish Sea whiting and Celtic Sea haddock.
Natural mortality is assumed to be 0.2 over all age groups and years.
Maturity data collected in the Celtic Sea in November 2002 during the French EVHOE survey were presented to the WG (Working Document 1: WGSSDS 2003). Results indi-cated 13% of age 1 fish are mature, 97% at-age 2, and 100% at-age 3 and older. These re-sults are similar to previous assumptions of knife-edged maturity at-age 2. Exploratory analyses indicated that use of the French maturity ogive made little impact on the as-sessment. The WG therefore retained the assumptions of knife-edged maturity at-age 2. Since 2006 the knife edge maturity ogive has been replaced with indices calculated based on data from the UK WCGFS (Working Document 3: WGSSDS 2006) but a fixed vector is still used. Maturity sampling by Ireland and the UK on dedicated surveys confirms the use of this ogive but is insufficient to provide annual data.
The proportions of F and M before spawning were both set to zero to reflect the SSB cal-culation date of 1 January.
The knife edge maturity ogive was replaced with new indices calculated based on data from the UK WCGFS as detailed in WD 3, WGSSDS, 2006.
Age 0 1 2 3 4 5+
Maturity 0 0.39 0.90 0.99 0.99 1.00
B.3. Surveys
The following surveys are available as survey tuning data input for the assessment of whiting VIIe–k:
• UK-WCGFS, 1987–2004
The March UK groundfish survey was extended in 1992 to provide better coverage for gadoids in VIIf,g. The whiting tuning data calculated from this survey is for VIIf,g. The survey was carried out on the RV Cirolana until 2003. In 2004 it was carried out on the RV Endeavour and discontinued thereafter. The survey fished fixed station po-sitions allocated by area and depth strata. The survey used a modified Portuguese High-Headline trawl (PHHT) with 350 mm rubber bobbins, a bunt tickler chain and a 20 mm codend liner. The mean log standardized index by year demonstrated some evidence of positive catchability in the last three years of the survey (2002–2004) and cohort tracking in the mean standardized index up to then was very noisy in the last three years. These years were not included in the final assessment.
• UK-BCCSBTS-S, 1988–2001
The Autumn UK Bristol Channel beam trawl survey (VIIf) is commercially rigged (1989 style) with 4 m beam trawl fitted with a chain mat, flip-up ropes, and a 40 mm codend liner. The gear is towed at 4 knots (ground speed) for 30 minutes. This survey provides information for age 0 and age 1 whiting.
• FR-EVHOE, 1997–present
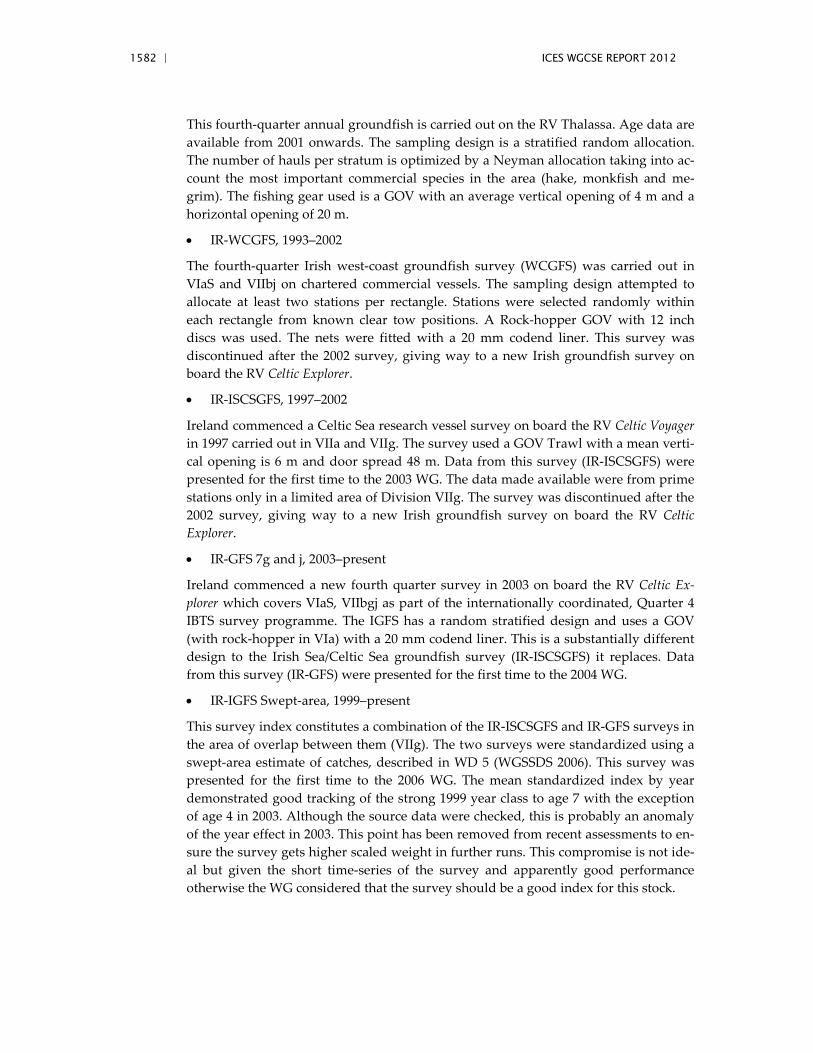
1582 | ICES WGCSE REPORT 2012
This fourth-quarter annual groundfish is carried out on the RV Thalassa. Age data are available from 2001 onwards. The sampling design is a stratified random allocation. The number of hauls per stratum is optimized by a Neyman allocation taking into ac-count the most important commercial species in the area (hake, monkfish and me-grim). The fishing gear used is a GOV with an average vertical opening of 4 m and a horizontal opening of 20 m.
• IR-WCGFS, 1993–2002
The fourth-quarter Irish west-coast groundfish survey (WCGFS) was carried out in VIaS and VIIbj on chartered commercial vessels. The sampling design attempted to allocate at least two stations per rectangle. Stations were selected randomly within each rectangle from known clear tow positions. A Rock-hopper GOV with 12 inch discs was used. The nets were fitted with a 20 mm codend liner. This survey was discontinued after the 2002 survey, giving way to a new Irish groundfish survey on board the RV Celtic Explorer.
• IR-ISCSGFS, 1997–2002
Ireland commenced a Celtic Sea research vessel survey on board the RV Celtic Voyager in 1997 carried out in VIIa and VIIg. The survey used a GOV Trawl with a mean verti-cal opening is 6 m and door spread 48 m. Data from this survey (IR-ISCSGFS) were presented for the first time to the 2003 WG. The data made available were from prime stations only in a limited area of Division VIIg. The survey was discontinued after the 2002 survey, giving way to a new Irish groundfish survey on board the RV Celtic Explorer.
• IR-GFS 7g and j, 2003–present
Ireland commenced a new fourth quarter survey in 2003 on board the RV Celtic Ex-plorer which covers VIaS, VIIbgj as part of the internationally coordinated, Quarter 4 IBTS survey programme. The IGFS has a random stratified design and uses a GOV (with rock-hopper in VIa) with a 20 mm codend liner. This is a substantially different design to the Irish Sea/Celtic Sea groundfish survey (IR-ISCSGFS) it replaces. Data from this survey (IR-GFS) were presented for the first time to the 2004 WG.
• IR-IGFS Swept-area, 1999–present
This survey index constitutes a combination of the IR-ISCSGFS and IR-GFS surveys in the area of overlap between them (VIIg). The two surveys were standardized using a swept-area estimate of catches, described in WD 5 (WGSSDS 2006). This survey was presented for the first time to the 2006 WG. The mean standardized index by year demonstrated good tracking of the strong 1999 year class to age 7 with the exception of age 4 in 2003. Although the source data were checked, this is probably an anomaly of the year effect in 2003. This point has been removed from recent assessments to en-sure the survey gets higher scaled weight in further runs. This compromise is not ide-al but given the short time-series of the survey and apparently good performance otherwise the WG considered that the survey should be a good index for this stock.
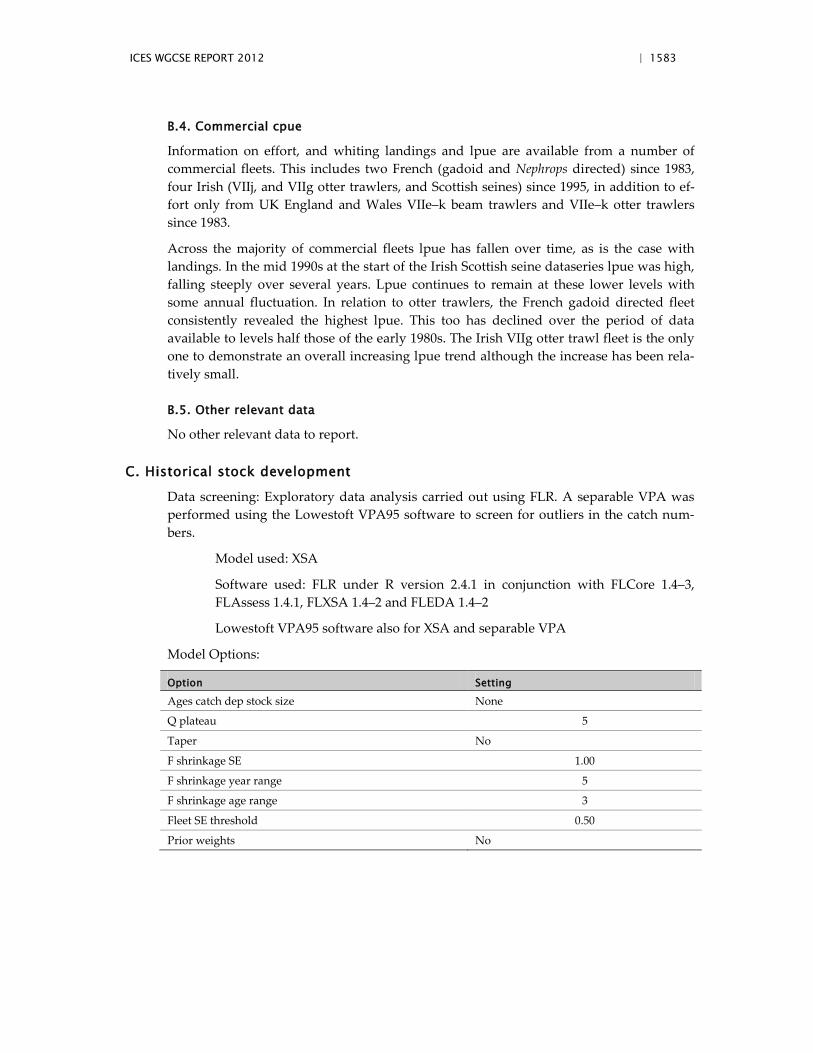
ICES WGCSE REPORT 2012 | 1583
B.4. Commercial cpue
Information on effort, and whiting landings and lpue are available from a number of commercial fleets. This includes two French (gadoid and Nephrops directed) since 1983, four Irish (VIIj, and VIIg otter trawlers, and Scottish seines) since 1995, in addition to ef-fort only from UK England and Wales VIIe–k beam trawlers and VIIe–k otter trawlers since 1983.
Across the majority of commercial fleets lpue has fallen over time, as is the case with landings. In the mid 1990s at the start of the Irish Scottish seine dataseries lpue was high, falling steeply over several years. Lpue continues to remain at these lower levels with some annual fluctuation. In relation to otter trawlers, the French gadoid directed fleet consistently revealed the highest lpue. This too has declined over the period of data available to levels half those of the early 1980s. The Irish VIIg otter trawl fleet is the only one to demonstrate an overall increasing lpue trend although the increase has been rela-tively small.
B.5. Other relevant data
No other relevant data to report.
C. Historical stock development
Data screening: Exploratory data analysis carried out using FLR. A separable VPA was performed using the Lowestoft VPA95 software to screen for outliers in the catch num-bers.
Model used: XSA
Software used: FLR under R version 2.4.1 in conjunction with FLCore 1.4–3, FLAssess 1.4.1, FLXSA 1.4–2 and FLEDA 1.4–2
Lowestoft VPA95 software also for XSA and separable VPA
Model Options:
Option Setting
Ages catch dep stock size None
Q plateau 5
Taper No
F shrinkage SE 1.00
F shrinkage year range 5
F shrinkage age range 3
Fleet SE threshold 0.50
Prior weights No
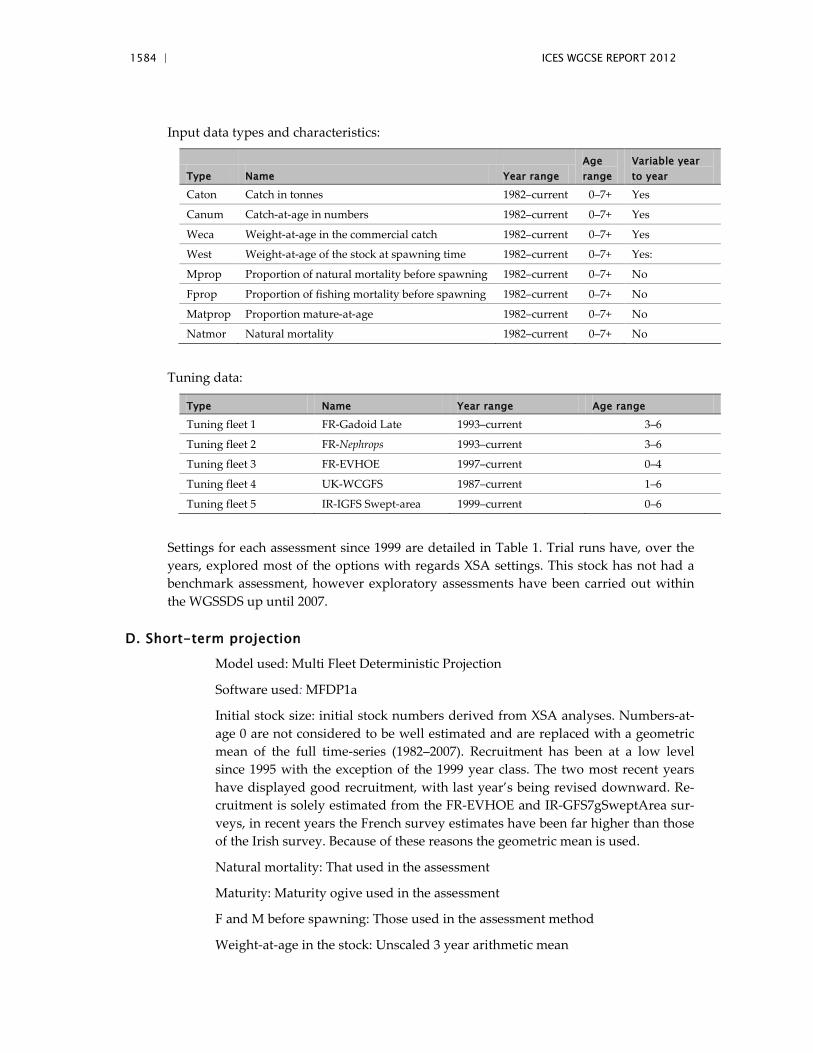
1584 | ICES WGCSE REPORT 2012
Input data types and characteristics:
Type Name Year range Age range
Variable year to year
Caton Catch in tonnes 1982–current 0–7+ Yes
Canum Catch-at-age in numbers 1982–current 0–7+ Yes
Weca Weight-at-age in the commercial catch 1982–current 0–7+ Yes
West Weight-at-age of the stock at spawning time 1982–current 0–7+ Yes:
Mprop Proportion of natural mortality before spawning 1982–current 0–7+ No
Fprop Proportion of fishing mortality before spawning 1982–current 0–7+ No
Matprop Proportion mature-at-age 1982–current 0–7+ No
Natmor Natural mortality 1982–current 0–7+ No
Tuning data:
Type Name Year range Age range
Tuning fleet 1 FR-Gadoid Late 1993–current 3–6
Tuning fleet 2 FR-Nephrops 1993–current 3–6
Tuning fleet 3 FR-EVHOE 1997–current 0–4
Tuning fleet 4 UK-WCGFS 1987–current 1–6
Tuning fleet 5 IR-IGFS Swept-area 1999–current 0–6
Settings for each assessment since 1999 are detailed in Table 1. Trial runs have, over the years, explored most of the options with regards XSA settings. This stock has not had a benchmark assessment, however exploratory assessments have been carried out within the WGSSDS up until 2007.
D. Short-term projection
Model used: Multi Fleet Deterministic Projection
Software used: MFDP1a
Initial stock size: initial stock numbers derived from XSA analyses. Numbers-at-age 0 are not considered to be well estimated and are replaced with a geometric mean of the full time-series (1982–2007). Recruitment has been at a low level since 1995 with the exception of the 1999 year class. The two most recent years have displayed good recruitment, with last year’s being revised downward. Re-cruitment is solely estimated from the FR-EVHOE and IR-GFS7gSweptArea sur-veys, in recent years the French survey estimates have been far higher than those of the Irish survey. Because of these reasons the geometric mean is used.
Natural mortality: That used in the assessment
Maturity: Maturity ogive used in the assessment
F and M before spawning: Those used in the assessment method
Weight-at-age in the stock: Unscaled 3 year arithmetic mean
ICES WGCSE REPORT 2012 | 1585
Weight-at-age in the catch: Unscaled 3 year arithmetic mean
Exploitation pattern: Unscaled 3 year arithmetic mean (though alternative op-tions may be used depending on recent F trajectories and the Working Group’s perception of the fishery).
Intermediate year assumptions: Status quo F
Stock–recruitment model used: Geometric mean of full time-series (1982 to pre-sent-1) for age 0 recruitment
Fbar: That used in the assessment
E. Medium-term projections
None.
F. Long-term projections
Model used: Multi Fleet Yield-per-recruit
Software used: MFYPR2a
Yield-per-recruit calculations are conducted using the same input values as those used for the short-term forecasts.
G. Biological reference points
A summary of reference point proposals to date, their technical basis and currently adopted reference points is given in the text Table below:
WG 1998 ACFM 1998 WG 2000 ACFM 2000Flim No Proposal No Proposal 1.18 (Flim=Floss) No ProposalFpa No Proposal No Proposal 0.72 (Fpa=Flim x e-1.645 x 0.3) No ProposalBlim 15,000 t 15,000 t 15 000 t (Blim=Bloss) 15,000 t (Blim=Bloss)
Bpa 18,000 t 21,000 t 21 000 t (Bpa=Bloss x 1.4) 21,000 t (Bpa=Bloss x 1.4)
The technical basis of ACFM’s 1998 Bpa proposal is given below (1999 WG text):
Bpa = Blim x 1.4 = 21 000 t. In the past the WG have selected MBAL as 18 000 t based on ev-idence of reduced recruitment at SSBs <18 000 t. However this MBAL is driven by a peri-od of low recruitments at low SSB in the earlier years of the time-series (1982–1985) when the data are probably not reliable. Examination of the stock–recruit plot provides no compelling evidence of reduced recruitment below SSB of 18 000 t.
The technical basis of the WG’s 2000 Flim and FPA proposals are given below:
On the basis of results obtained from a LOWESS fitted non-parametric stock and re-cruitment relationship and the derived equilibrium SSB and yield curves with the origi-nal data trajectories the 2000 Working Group considered that FPA and Flim could be defined because Floss appeared reasonably estimated. However, taking into account the uncertainties in the data the 2000 Working Group decided to use 0.3 as the SE in calcula-tion of FPA from Floss. The technical basis for the proposed reference points are defined below:

1586 | ICES WGCSE REPORT 2012
Flim = Floss (1.18 in this year’s assessment) FPA = Flim x e-1.645*0.3 = 0.72
The currently adopted reference points are as follows:
Current Reference PointsFlim No ProposalFpa No ProposalBlim 15,000 t (BLIM = BLOSS 1983, ACFM1998)Bpa 21,000 t (BPA = BLOSS 1983 x 1.4)
H. Other issues
No other issues.
I. References
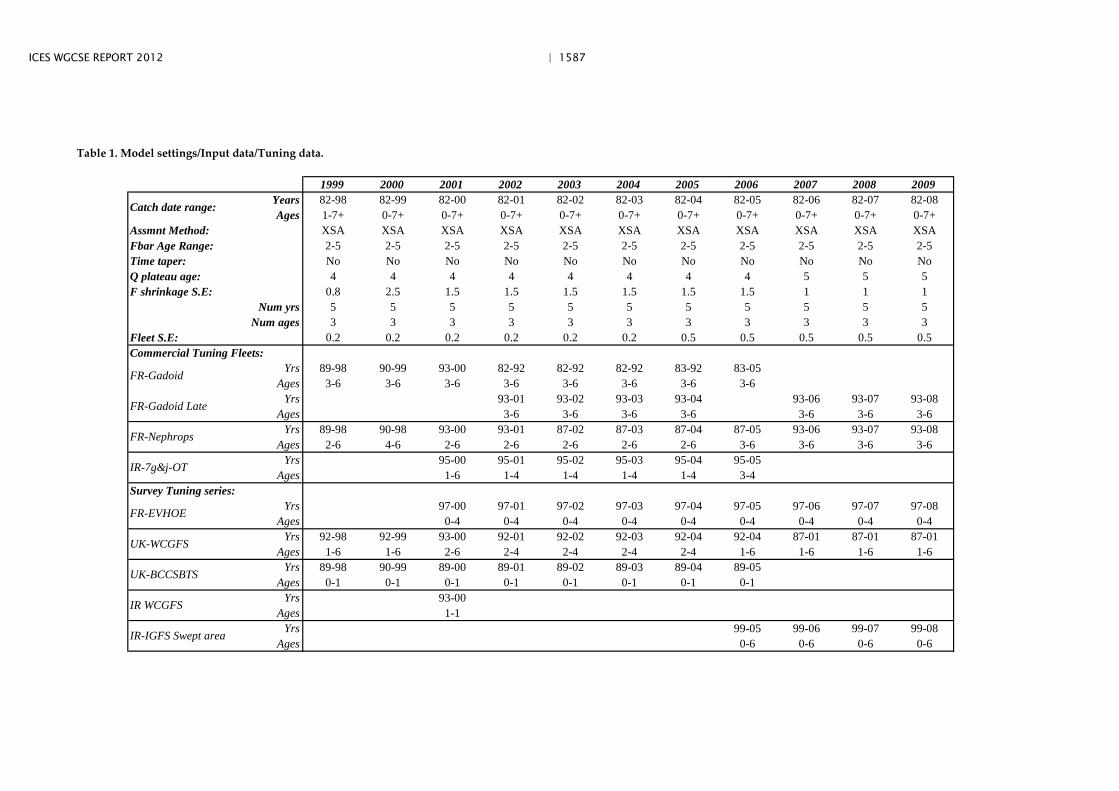
ICES WGCSE REPORT 2012 | 1587
Table 1. Model settings/Input data/Tuning data.
1999 2000 2001 2002 2003 2004 2005 2006 2007 2008 2009Years 82-98 82-99 82-00 82-01 82-02 82-03 82-04 82-05 82-06 82-07 82-08Ages 1-7+ 0-7+ 0-7+ 0-7+ 0-7+ 0-7+ 0-7+ 0-7+ 0-7+ 0-7+ 0-7+
XSA XSA XSA XSA XSA XSA XSA XSA XSA XSA XSA2-5 2-5 2-5 2-5 2-5 2-5 2-5 2-5 2-5 2-5 2-5No No No No No No No No No No No4 4 4 4 4 4 4 4 5 5 5
0.8 2.5 1.5 1.5 1.5 1.5 1.5 1.5 1 1 1Num yrs 5 5 5 5 5 5 5 5 5 5 5
Num ages 3 3 3 3 3 3 3 3 3 3 30.2 0.2 0.2 0.2 0.2 0.2 0.5 0.5 0.5 0.5 0.5
Yrs 89-98 90-99 93-00 82-92 82-92 82-92 83-92 83-05Ages 3-6 3-6 3-6 3-6 3-6 3-6 3-6 3-6
Yrs 93-01 93-02 93-03 93-04 93-06 93-07 93-08Ages 3-6 3-6 3-6 3-6 3-6 3-6 3-6
Yrs 89-98 90-98 93-00 93-01 87-02 87-03 87-04 87-05 93-06 93-07 93-08Ages 2-6 4-6 2-6 2-6 2-6 2-6 2-6 3-6 3-6 3-6 3-6
Yrs 95-00 95-01 95-02 95-03 95-04 95-05Ages 1-6 1-4 1-4 1-4 1-4 3-4
Yrs 97-00 97-01 97-02 97-03 97-04 97-05 97-06 97-07 97-08Ages 0-4 0-4 0-4 0-4 0-4 0-4 0-4 0-4 0-4
Yrs 92-98 92-99 93-00 92-01 92-02 92-03 92-04 92-04 87-01 87-01 87-01Ages 1-6 1-6 2-6 2-4 2-4 2-4 2-4 1-6 1-6 1-6 1-6
Yrs 89-98 90-99 89-00 89-01 89-02 89-03 89-04 89-05Ages 0-1 0-1 0-1 0-1 0-1 0-1 0-1 0-1
Yrs 93-00Ages 1-1
Yrs 99-05 99-06 99-07 99-08Ages 0-6 0-6 0-6 0-6
Catch date range:
FR-Gadoid Late
Q plateau age:F shrinkage S.E:
FR-Gadoid
FR-Nephrops
IR-7g&j-OT
Commercial Tuning Fleets:
Fbar Age Range:Assmnt Method:
Fleet S.E:
Survey Tuning series:
Time taper:
UK-BCCSBTS
UK-WCGFS
FR-EVHOE
IR-IGFS Swept area
IR WCGFS
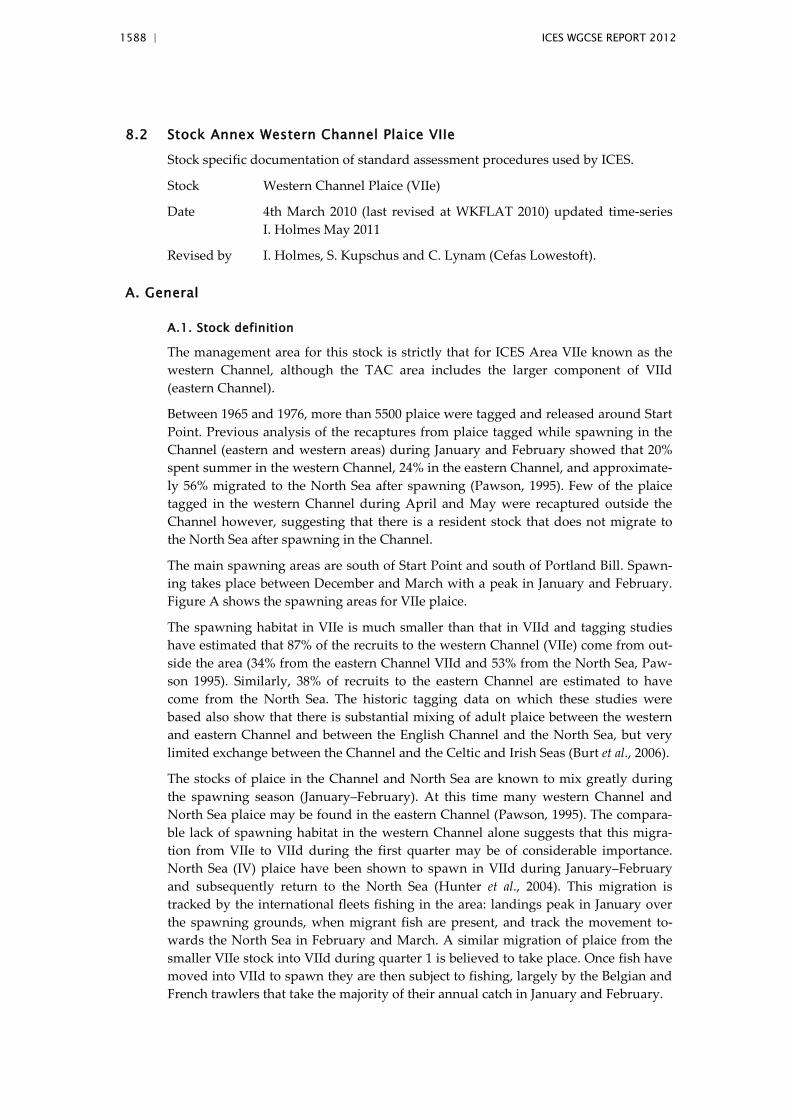
1588 | ICES WGCSE REPORT 2012
8.2 Stock Annex Western Channel Plaice VIIe
Stock specific documentation of standard assessment procedures used by ICES.
Stock Western Channel Plaice (VIIe)
Date 4th March 2010 (last revised at WKFLAT 2010) updated time-series I. Holmes May 2011
Revised by I. Holmes, S. Kupschus and C. Lynam (Cefas Lowestoft).
A. General
A.1. Stock definition
The management area for this stock is strictly that for ICES Area VIIe known as the western Channel, although the TAC area includes the larger component of VIId (eastern Channel).
Between 1965 and 1976, more than 5500 plaice were tagged and released around Start Point. Previous analysis of the recaptures from plaice tagged while spawning in the Channel (eastern and western areas) during January and February showed that 20% spent summer in the western Channel, 24% in the eastern Channel, and approximate-ly 56% migrated to the North Sea after spawning (Pawson, 1995). Few of the plaice tagged in the western Channel during April and May were recaptured outside the Channel however, suggesting that there is a resident stock that does not migrate to the North Sea after spawning in the Channel.
The main spawning areas are south of Start Point and south of Portland Bill. Spawn-ing takes place between December and March with a peak in January and February. Figure A shows the spawning areas for VIIe plaice.
The spawning habitat in VIIe is much smaller than that in VIId and tagging studies have estimated that 87% of the recruits to the western Channel (VIIe) come from out-side the area (34% from the eastern Channel VIId and 53% from the North Sea, Paw-son 1995). Similarly, 38% of recruits to the eastern Channel are estimated to have come from the North Sea. The historic tagging data on which these studies were based also show that there is substantial mixing of adult plaice between the western and eastern Channel and between the English Channel and the North Sea, but very limited exchange between the Channel and the Celtic and Irish Seas (Burt et al., 2006).
The stocks of plaice in the Channel and North Sea are known to mix greatly during the spawning season (January–February). At this time many western Channel and North Sea plaice may be found in the eastern Channel (Pawson, 1995). The compara-ble lack of spawning habitat in the western Channel alone suggests that this migra-tion from VIIe to VIId during the first quarter may be of considerable importance. North Sea (IV) plaice have been shown to spawn in VIId during January–February and subsequently return to the North Sea (Hunter et al., 2004). This migration is tracked by the international fleets fishing in the area: landings peak in January over the spawning grounds, when migrant fish are present, and track the movement to-wards the North Sea in February and March. A similar migration of plaice from the smaller VIIe stock into VIId during quarter 1 is believed to take place. Once fish have moved into VIId to spawn they are then subject to fishing, largely by the Belgian and French trawlers that take the majority of their annual catch in January and February.
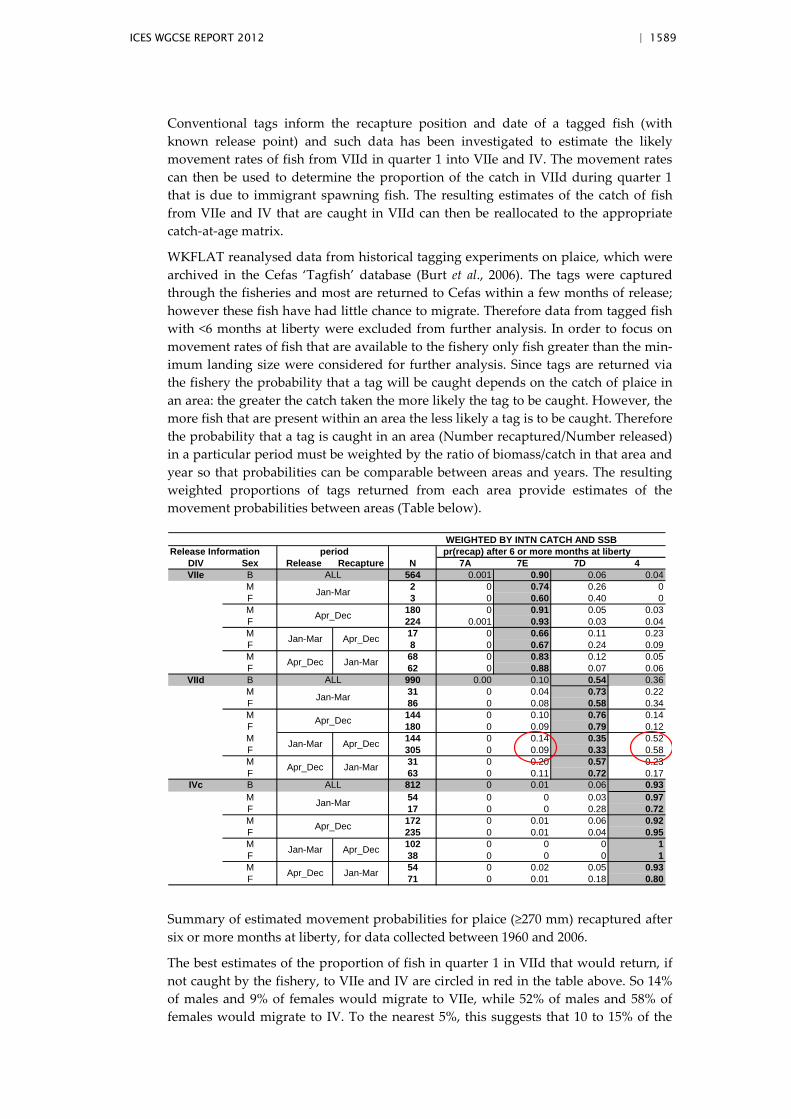
ICES WGCSE REPORT 2012 | 1589
Conventional tags inform the recapture position and date of a tagged fish (with known release point) and such data has been investigated to estimate the likely movement rates of fish from VIId in quarter 1 into VIIe and IV. The movement rates can then be used to determine the proportion of the catch in VIId during quarter 1 that is due to immigrant spawning fish. The resulting estimates of the catch of fish from VIIe and IV that are caught in VIId can then be reallocated to the appropriate catch-at-age matrix.
WKFLAT reanalysed data from historical tagging experiments on plaice, which were archived in the Cefas ‘Tagfish’ database (Burt et al., 2006). The tags were captured through the fisheries and most are returned to Cefas within a few months of release; however these fish have had little chance to migrate. Therefore data from tagged fish with <6 months at liberty were excluded from further analysis. In order to focus on movement rates of fish that are available to the fishery only fish greater than the min-imum landing size were considered for further analysis. Since tags are returned via the fishery the probability that a tag will be caught depends on the catch of plaice in an area: the greater the catch taken the more likely the tag to be caught. However, the more fish that are present within an area the less likely a tag is to be caught. Therefore the probability that a tag is caught in an area (Number recaptured/Number released) in a particular period must be weighted by the ratio of biomass/catch in that area and year so that probabilities can be comparable between areas and years. The resulting weighted proportions of tags returned from each area provide estimates of the movement probabilities between areas (Table below).
WEIGHTED BY INTN CATCH AND SSB pr(recap) after 6 or more months at liberty
DIV Sex Release Recapture N 7A 7E 7D 4VIIe B 564 0.001 0.90 0.06 0.04
M 2 0 0.74 0.26 0F 3 0 0.60 0.40 0M 180 0 0.91 0.05 0.03F 224 0.001 0.93 0.03 0.04M 17 0 0.66 0.11 0.23F 8 0 0.67 0.24 0.09M 68 0 0.83 0.12 0.05F 62 0 0.88 0.07 0.06
VIId B 990 0.00 0.10 0.54 0.36M 31 0 0.04 0.73 0.22F 86 0 0.08 0.58 0.34M 144 0 0.10 0.76 0.14F 180 0 0.09 0.79 0.12M 144 0 0.14 0.35 0.52F 305 0 0.09 0.33 0.58M 31 0 0.20 0.57 0.23F 63 0 0.11 0.72 0.17
IVc B 812 0 0.01 0.06 0.93M 54 0 0 0.03 0.97F 17 0 0 0.28 0.72M 172 0 0.01 0.06 0.92F 235 0 0.01 0.04 0.95M 102 0 0 0 1F 38 0 0 0 1M 54 0 0.02 0.05 0.93F 71 0 0.01 0.18 0.80
Release Information period
ALL
Jan-Mar
Apr_Dec
Jan-Mar Apr_Dec
Apr_Dec Jan-Mar
ALL
Jan-Mar
Apr_Dec
Jan-Mar Apr_Dec
Apr_Dec Jan-Mar
ALL
Jan-Mar
Apr_Dec
Jan-Mar Apr_Dec
Apr_Dec Jan-Mar
Summary of estimated movement probabilities for plaice (≥270 mm) recaptured after six or more months at liberty, for data collected between 1960 and 2006.
The best estimates of the proportion of fish in quarter 1 in VIId that would return, if not caught by the fishery, to VIIe and IV are circled in red in the table above. So 14% of males and 9% of females would migrate to VIIe, while 52% of males and 58% of females would migrate to IV. To the nearest 5%, this suggests that 10 to 15% of the
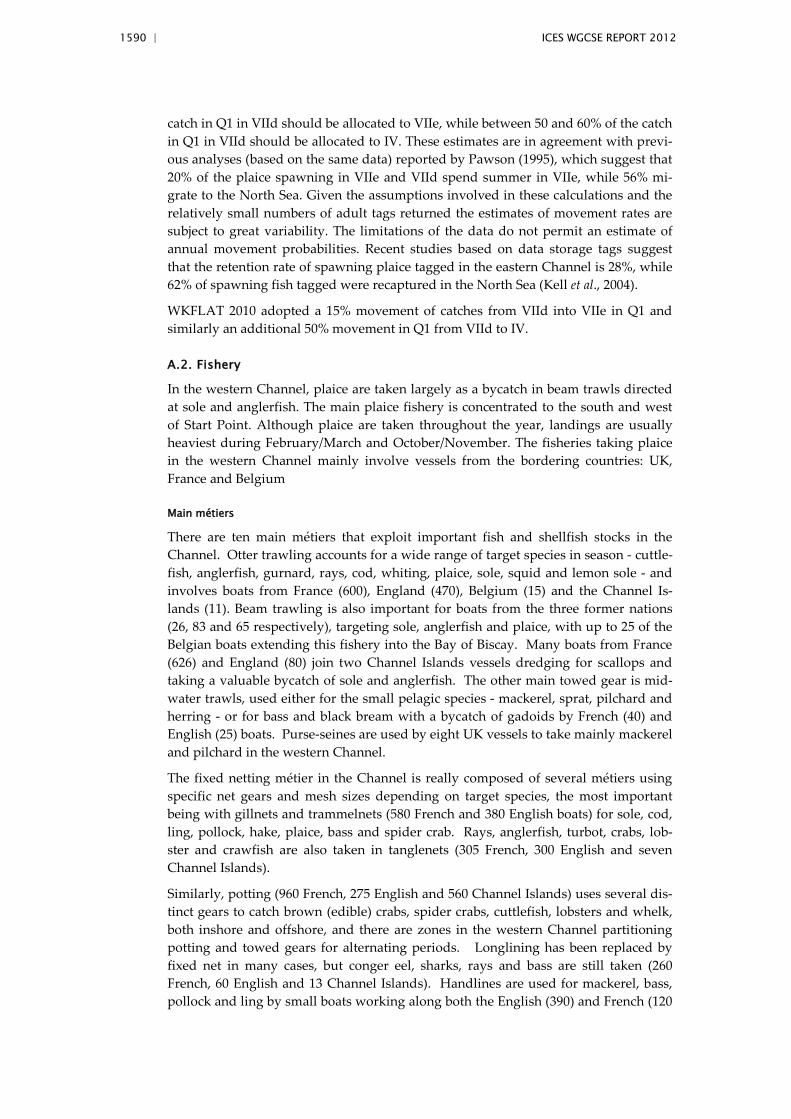
1590 | ICES WGCSE REPORT 2012
catch in Q1 in VIId should be allocated to VIIe, while between 50 and 60% of the catch in Q1 in VIId should be allocated to IV. These estimates are in agreement with previ-ous analyses (based on the same data) reported by Pawson (1995), which suggest that 20% of the plaice spawning in VIIe and VIId spend summer in VIIe, while 56% mi-grate to the North Sea. Given the assumptions involved in these calculations and the relatively small numbers of adult tags returned the estimates of movement rates are subject to great variability. The limitations of the data do not permit an estimate of annual movement probabilities. Recent studies based on data storage tags suggest that the retention rate of spawning plaice tagged in the eastern Channel is 28%, while 62% of spawning fish tagged were recaptured in the North Sea (Kell et al., 2004).
WKFLAT 2010 adopted a 15% movement of catches from VIId into VIIe in Q1 and similarly an additional 50% movement in Q1 from VIId to IV.
A.2. Fishery
In the western Channel, plaice are taken largely as a bycatch in beam trawls directed at sole and anglerfish. The main plaice fishery is concentrated to the south and west of Start Point. Although plaice are taken throughout the year, landings are usually heaviest during February/March and October/November. The fisheries taking plaice in the western Channel mainly involve vessels from the bordering countries: UK, France and Belgium
Main métiers
There are ten main métiers that exploit important fish and shellfish stocks in the Channel. Otter trawling accounts for a wide range of target species in season - cuttle-fish, anglerfish, gurnard, rays, cod, whiting, plaice, sole, squid and lemon sole - and involves boats from France (600), England (470), Belgium (15) and the Channel Is-lands (11). Beam trawling is also important for boats from the three former nations (26, 83 and 65 respectively), targeting sole, anglerfish and plaice, with up to 25 of the Belgian boats extending this fishery into the Bay of Biscay. Many boats from France (626) and England (80) join two Channel Islands vessels dredging for scallops and taking a valuable bycatch of sole and anglerfish. The other main towed gear is mid-water trawls, used either for the small pelagic species - mackerel, sprat, pilchard and herring - or for bass and black bream with a bycatch of gadoids by French (40) and English (25) boats. Purse-seines are used by eight UK vessels to take mainly mackerel and pilchard in the western Channel.
The fixed netting métier in the Channel is really composed of several métiers using specific net gears and mesh sizes depending on target species, the most important being with gillnets and trammelnets (580 French and 380 English boats) for sole, cod, ling, pollock, hake, plaice, bass and spider crab. Rays, anglerfish, turbot, crabs, lob-ster and crawfish are also taken in tanglenets (305 French, 300 English and seven Channel Islands).
Similarly, potting (960 French, 275 English and 560 Channel Islands) uses several dis-tinct gears to catch brown (edible) crabs, spider crabs, cuttlefish, lobsters and whelk, both inshore and offshore, and there are zones in the western Channel partitioning potting and towed gears for alternating periods. Longlining has been replaced by fixed net in many cases, but conger eel, sharks, rays and bass are still taken (260 French, 60 English and 13 Channel Islands). Handlines are used for mackerel, bass, pollock and ling by small boats working along both the English (390) and French (120
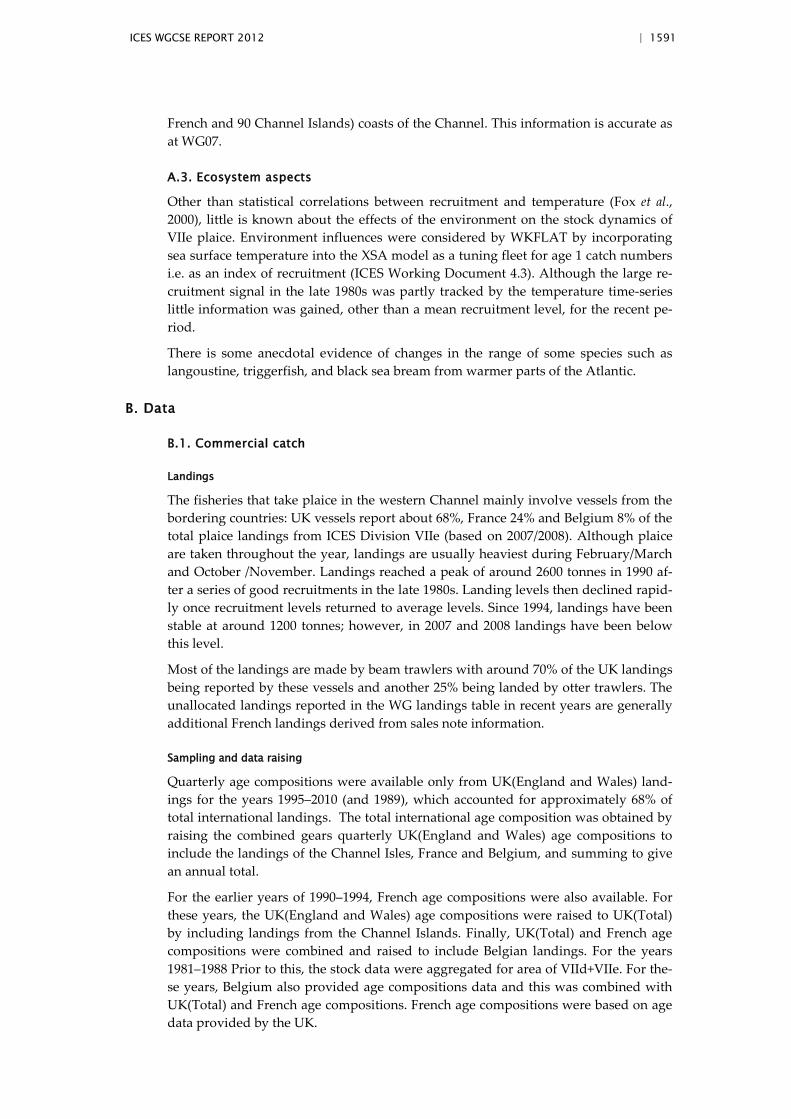
ICES WGCSE REPORT 2012 | 1591
French and 90 Channel Islands) coasts of the Channel. This information is accurate as at WG07.
A.3. Ecosystem aspects
Other than statistical correlations between recruitment and temperature (Fox et al., 2000), little is known about the effects of the environment on the stock dynamics of VIIe plaice. Environment influences were considered by WKFLAT by incorporating sea surface temperature into the XSA model as a tuning fleet for age 1 catch numbers i.e. as an index of recruitment (ICES Working Document 4.3). Although the large re-cruitment signal in the late 1980s was partly tracked by the temperature time-series little information was gained, other than a mean recruitment level, for the recent pe-riod.
There is some anecdotal evidence of changes in the range of some species such as langoustine, triggerfish, and black sea bream from warmer parts of the Atlantic.
B. Data
B.1. Commercial catch
Landings
The fisheries that take plaice in the western Channel mainly involve vessels from the bordering countries: UK vessels report about 68%, France 24% and Belgium 8% of the total plaice landings from ICES Division VIIe (based on 2007/2008). Although plaice are taken throughout the year, landings are usually heaviest during February/March and October /November. Landings reached a peak of around 2600 tonnes in 1990 af-ter a series of good recruitments in the late 1980s. Landing levels then declined rapid-ly once recruitment levels returned to average levels. Since 1994, landings have been stable at around 1200 tonnes; however, in 2007 and 2008 landings have been below this level.
Most of the landings are made by beam trawlers with around 70% of the UK landings being reported by these vessels and another 25% being landed by otter trawlers. The unallocated landings reported in the WG landings table in recent years are generally additional French landings derived from sales note information.
Sampling and data raising
Quarterly age compositions were available only from UK(England and Wales) land-ings for the years 1995–2010 (and 1989), which accounted for approximately 68% of total international landings. The total international age composition was obtained by raising the combined gears quarterly UK(England and Wales) age compositions to include the landings of the Channel Isles, France and Belgium, and summing to give an annual total.
For the earlier years of 1990–1994, French age compositions were also available. For these years, the UK(England and Wales) age compositions were raised to UK(Total) by including landings from the Channel Islands. Finally, UK(Total) and French age compositions were combined and raised to include Belgian landings. For the years 1981–1988 Prior to this, the stock data were aggregated for area of VIId+VIIe. For the-se years, Belgium also provided age compositions data and this was combined with UK(Total) and French age compositions. French age compositions were based on age data provided by the UK.
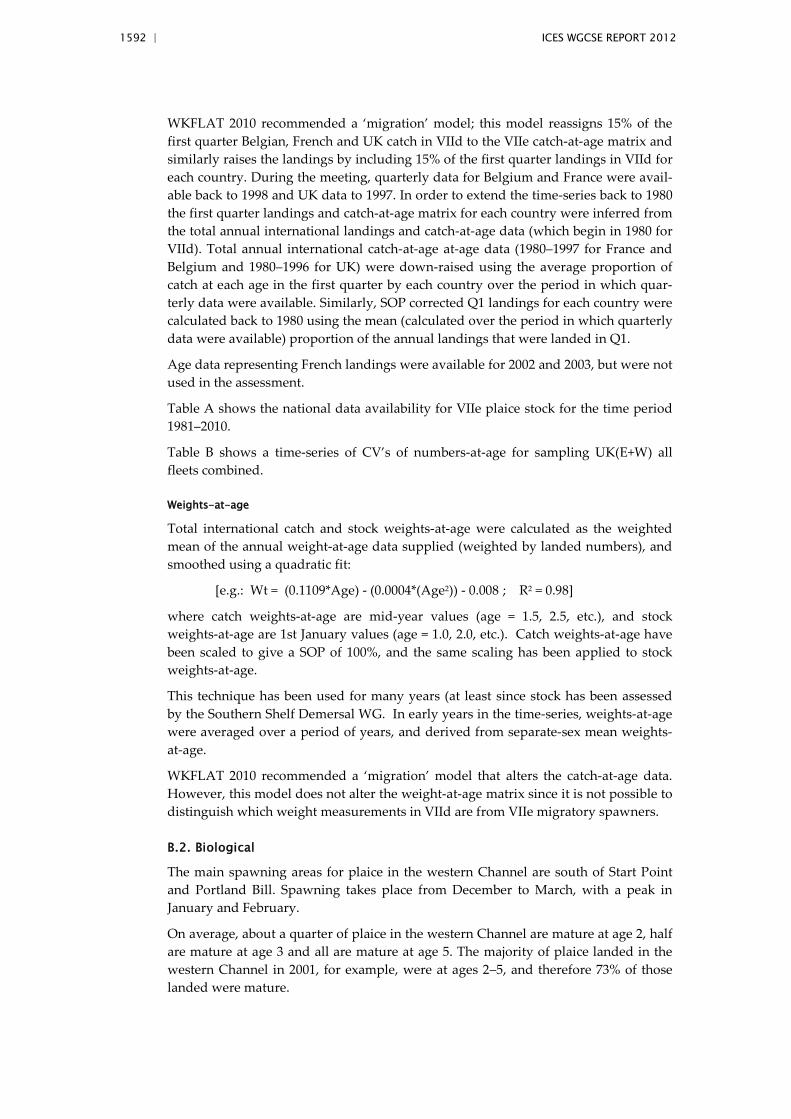
1592 | ICES WGCSE REPORT 2012
WKFLAT 2010 recommended a ‘migration’ model; this model reassigns 15% of the first quarter Belgian, French and UK catch in VIId to the VIIe catch-at-age matrix and similarly raises the landings by including 15% of the first quarter landings in VIId for each country. During the meeting, quarterly data for Belgium and France were avail-able back to 1998 and UK data to 1997. In order to extend the time-series back to 1980 the first quarter landings and catch-at-age matrix for each country were inferred from the total annual international landings and catch-at-age data (which begin in 1980 for VIId). Total annual international catch-at-age at-age data (1980–1997 for France and Belgium and 1980–1996 for UK) were down-raised using the average proportion of catch at each age in the first quarter by each country over the period in which quar-terly data were available. Similarly, SOP corrected Q1 landings for each country were calculated back to 1980 using the mean (calculated over the period in which quarterly data were available) proportion of the annual landings that were landed in Q1.
Age data representing French landings were available for 2002 and 2003, but were not used in the assessment.
Table A shows the national data availability for VIIe plaice stock for the time period 1981–2010.
Table B shows a time-series of CV’s of numbers-at-age for sampling UK(E+W) all fleets combined.
Weights-at-age
Total international catch and stock weights-at-age were calculated as the weighted mean of the annual weight-at-age data supplied (weighted by landed numbers), and smoothed using a quadratic fit:
[e.g.: Wt = (0.1109*Age) - (0.0004*(Age2)) - 0.008 ; R2 = 0.98]
where catch weights-at-age are mid-year values (age = 1.5, 2.5, etc.), and stock weights-at-age are 1st January values (age = 1.0, 2.0, etc.). Catch weights-at-age have been scaled to give a SOP of 100%, and the same scaling has been applied to stock weights-at-age.
This technique has been used for many years (at least since stock has been assessed by the Southern Shelf Demersal WG. In early years in the time-series, weights-at-age were averaged over a period of years, and derived from separate-sex mean weights-at-age.
WKFLAT 2010 recommended a ‘migration’ model that alters the catch-at-age data. However, this model does not alter the weight-at-age matrix since it is not possible to distinguish which weight measurements in VIId are from VIIe migratory spawners.
B.2. Biological
The main spawning areas for plaice in the western Channel are south of Start Point and Portland Bill. Spawning takes place from December to March, with a peak in January and February.
On average, about a quarter of plaice in the western Channel are mature at age 2, half are mature at age 3 and all are mature at age 5. The majority of plaice landed in the western Channel in 2001, for example, were at ages 2–5, and therefore 73% of those landed were mature.
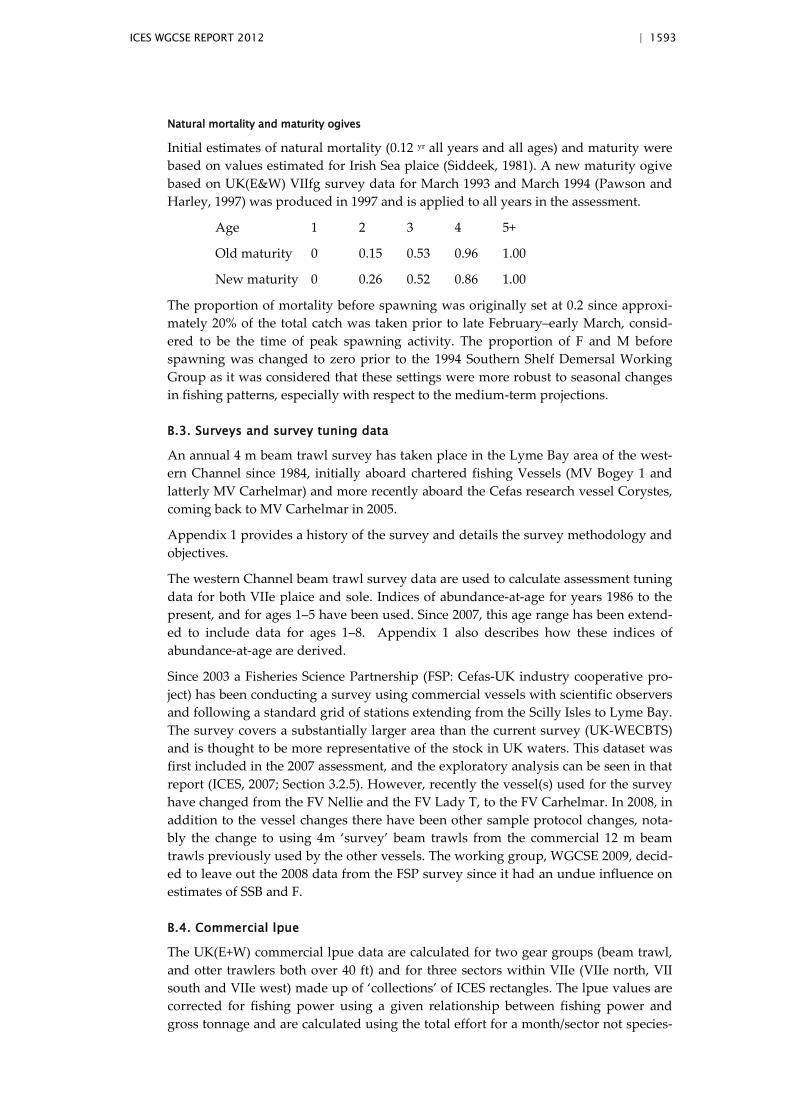
ICES WGCSE REPORT 2012 | 1593
Natural mortality and maturity ogives
Initial estimates of natural mortality (0.12 yr all years and all ages) and maturity were based on values estimated for Irish Sea plaice (Siddeek, 1981). A new maturity ogive based on UK(E&W) VIIfg survey data for March 1993 and March 1994 (Pawson and Harley, 1997) was produced in 1997 and is applied to all years in the assessment.
Age 1 2 3 4 5+
Old maturity 0 0.15 0.53 0.96 1.00
New maturity 0 0.26 0.52 0.86 1.00
The proportion of mortality before spawning was originally set at 0.2 since approxi-mately 20% of the total catch was taken prior to late February–early March, consid-ered to be the time of peak spawning activity. The proportion of F and M before spawning was changed to zero prior to the 1994 Southern Shelf Demersal Working Group as it was considered that these settings were more robust to seasonal changes in fishing patterns, especially with respect to the medium-term projections.
B.3. Surveys and survey tuning data
An annual 4 m beam trawl survey has taken place in the Lyme Bay area of the west-ern Channel since 1984, initially aboard chartered fishing Vessels (MV Bogey 1 and latterly MV Carhelmar) and more recently aboard the Cefas research vessel Corystes, coming back to MV Carhelmar in 2005.
Appendix 1 provides a history of the survey and details the survey methodology and objectives.
The western Channel beam trawl survey data are used to calculate assessment tuning data for both VIIe plaice and sole. Indices of abundance-at-age for years 1986 to the present, and for ages 1–5 have been used. Since 2007, this age range has been extend-ed to include data for ages 1–8. Appendix 1 also describes how these indices of abundance-at-age are derived.
Since 2003 a Fisheries Science Partnership (FSP: Cefas-UK industry cooperative pro-ject) has been conducting a survey using commercial vessels with scientific observers and following a standard grid of stations extending from the Scilly Isles to Lyme Bay. The survey covers a substantially larger area than the current survey (UK-WECBTS) and is thought to be more representative of the stock in UK waters. This dataset was first included in the 2007 assessment, and the exploratory analysis can be seen in that report (ICES, 2007; Section 3.2.5). However, recently the vessel(s) used for the survey have changed from the FV Nellie and the FV Lady T, to the FV Carhelmar. In 2008, in addition to the vessel changes there have been other sample protocol changes, nota-bly the change to using 4m ‘survey’ beam trawls from the commercial 12 m beam trawls previously used by the other vessels. The working group, WGCSE 2009, decid-ed to leave out the 2008 data from the FSP survey since it had an undue influence on estimates of SSB and F.
B.4. Commercial lpue
The UK(E+W) commercial lpue data are calculated for two gear groups (beam trawl, and otter trawlers both over 40 ft) and for three sectors within VIIe (VIIe north, VII south and VIIe west) made up of ‘collections’ of ICES rectangles. The lpue values are corrected for fishing power using a given relationship between fishing power and gross tonnage and are calculated using the total effort for a month/sector not species-
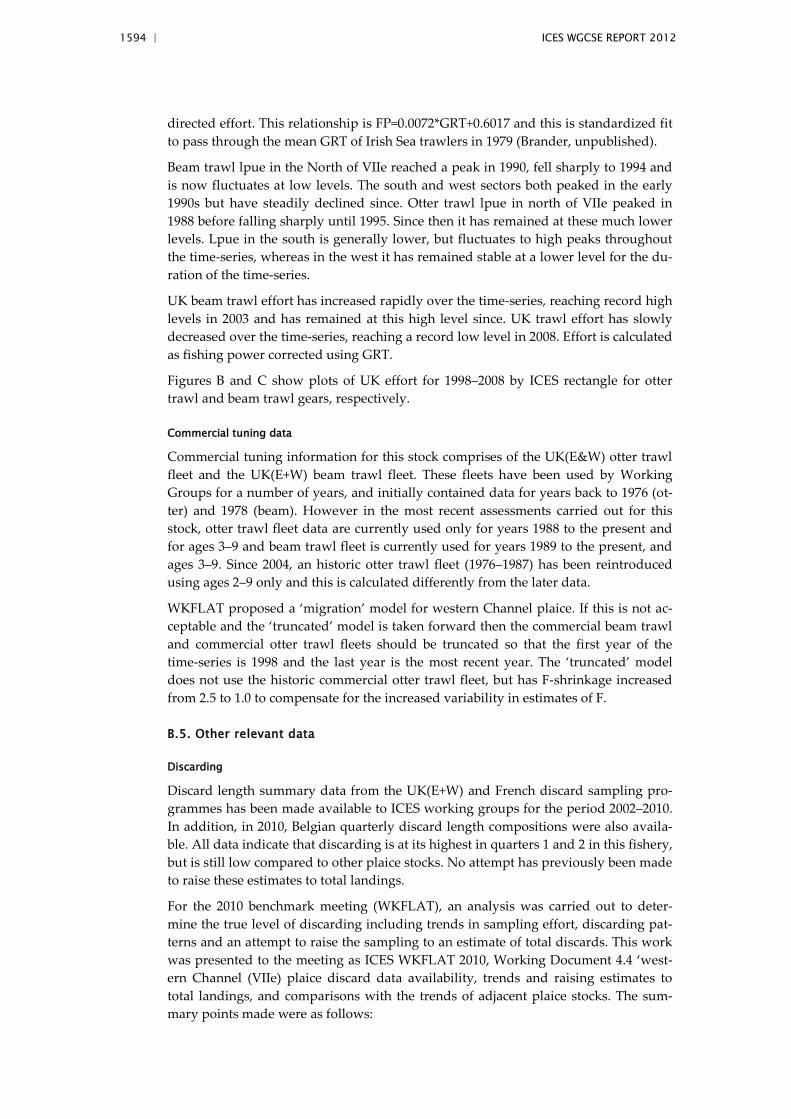
1594 | ICES WGCSE REPORT 2012
directed effort. This relationship is FP=0.0072*GRT+0.6017 and this is standardized fit to pass through the mean GRT of Irish Sea trawlers in 1979 (Brander, unpublished).
Beam trawl lpue in the North of VIIe reached a peak in 1990, fell sharply to 1994 and is now fluctuates at low levels. The south and west sectors both peaked in the early 1990s but have steadily declined since. Otter trawl lpue in north of VIIe peaked in 1988 before falling sharply until 1995. Since then it has remained at these much lower levels. Lpue in the south is generally lower, but fluctuates to high peaks throughout the time-series, whereas in the west it has remained stable at a lower level for the du-ration of the time-series.
UK beam trawl effort has increased rapidly over the time-series, reaching record high levels in 2003 and has remained at this high level since. UK trawl effort has slowly decreased over the time-series, reaching a record low level in 2008. Effort is calculated as fishing power corrected using GRT.
Figures B and C show plots of UK effort for 1998–2008 by ICES rectangle for otter trawl and beam trawl gears, respectively.
Commercial tuning data
Commercial tuning information for this stock comprises of the UK(E&W) otter trawl fleet and the UK(E+W) beam trawl fleet. These fleets have been used by Working Groups for a number of years, and initially contained data for years back to 1976 (ot-ter) and 1978 (beam). However in the most recent assessments carried out for this stock, otter trawl fleet data are currently used only for years 1988 to the present and for ages 3–9 and beam trawl fleet is currently used for years 1989 to the present, and ages 3–9. Since 2004, an historic otter trawl fleet (1976–1987) has been reintroduced using ages 2–9 only and this is calculated differently from the later data.
WKFLAT proposed a ‘migration’ model for western Channel plaice. If this is not ac-ceptable and the ‘truncated’ model is taken forward then the commercial beam trawl and commercial otter trawl fleets should be truncated so that the first year of the time-series is 1998 and the last year is the most recent year. The ‘truncated’ model does not use the historic commercial otter trawl fleet, but has F-shrinkage increased from 2.5 to 1.0 to compensate for the increased variability in estimates of F.
B.5. Other relevant data
Discarding
Discard length summary data from the UK(E+W) and French discard sampling pro-grammes has been made available to ICES working groups for the period 2002–2010. In addition, in 2010, Belgian quarterly discard length compositions were also availa-ble. All data indicate that discarding is at its highest in quarters 1 and 2 in this fishery, but is still low compared to other plaice stocks. No attempt has previously been made to raise these estimates to total landings.
For the 2010 benchmark meeting (WKFLAT), an analysis was carried out to deter-mine the true level of discarding including trends in sampling effort, discarding pat-terns and an attempt to raise the sampling to an estimate of total discards. This work was presented to the meeting as ICES WKFLAT 2010, Working Document 4.4 ‘west-ern Channel (VIIe) plaice discard data availability, trends and raising estimates to total landings, and comparisons with the trends of adjacent plaice stocks. The sum-mary points made were as follows:
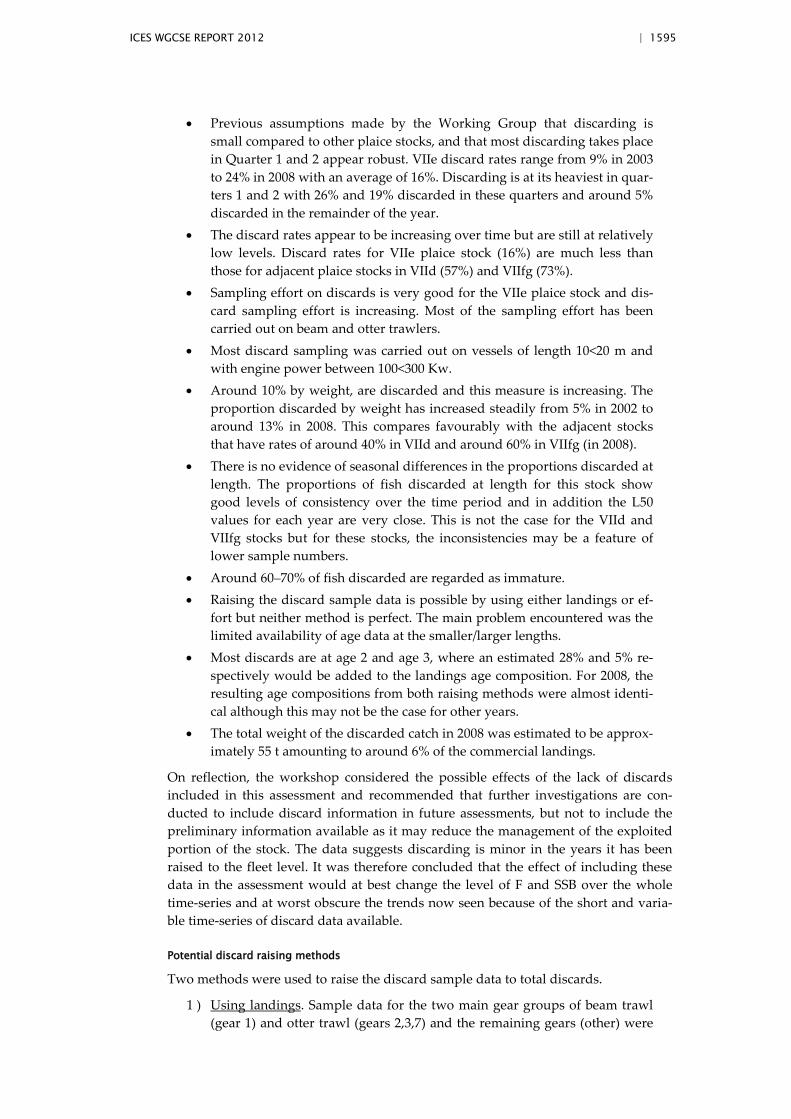
ICES WGCSE REPORT 2012 | 1595
• Previous assumptions made by the Working Group that discarding is small compared to other plaice stocks, and that most discarding takes place in Quarter 1 and 2 appear robust. VIIe discard rates range from 9% in 2003 to 24% in 2008 with an average of 16%. Discarding is at its heaviest in quar-ters 1 and 2 with 26% and 19% discarded in these quarters and around 5% discarded in the remainder of the year.
• The discard rates appear to be increasing over time but are still at relatively low levels. Discard rates for VIIe plaice stock (16%) are much less than those for adjacent plaice stocks in VIId (57%) and VIIfg (73%).
• Sampling effort on discards is very good for the VIIe plaice stock and dis-card sampling effort is increasing. Most of the sampling effort has been carried out on beam and otter trawlers.
• Most discard sampling was carried out on vessels of length 10<20 m and with engine power between 100<300 Kw.
• Around 10% by weight, are discarded and this measure is increasing. The proportion discarded by weight has increased steadily from 5% in 2002 to around 13% in 2008. This compares favourably with the adjacent stocks that have rates of around 40% in VIId and around 60% in VIIfg (in 2008).
• There is no evidence of seasonal differences in the proportions discarded at length. The proportions of fish discarded at length for this stock show good levels of consistency over the time period and in addition the L50 values for each year are very close. This is not the case for the VIId and VIIfg stocks but for these stocks, the inconsistencies may be a feature of lower sample numbers.
• Around 60–70% of fish discarded are regarded as immature. • Raising the discard sample data is possible by using either landings or ef-
fort but neither method is perfect. The main problem encountered was the limited availability of age data at the smaller/larger lengths.
• Most discards are at age 2 and age 3, where an estimated 28% and 5% re-spectively would be added to the landings age composition. For 2008, the resulting age compositions from both raising methods were almost identi-cal although this may not be the case for other years.
• The total weight of the discarded catch in 2008 was estimated to be approx-imately 55 t amounting to around 6% of the commercial landings.
On reflection, the workshop considered the possible effects of the lack of discards included in this assessment and recommended that further investigations are con-ducted to include discard information in future assessments, but not to include the preliminary information available as it may reduce the management of the exploited portion of the stock. The data suggests discarding is minor in the years it has been raised to the fleet level. It was therefore concluded that the effect of including these data in the assessment would at best change the level of F and SSB over the whole time-series and at worst obscure the trends now seen because of the short and varia-ble time-series of discard data available.
Potential discard raising methods
Two methods were used to raise the discard sample data to total discards.
1 ) Using landings. Sample data for the two main gear groups of beam trawl (gear 1) and otter trawl (gears 2,3,7) and the remaining gears (other) were
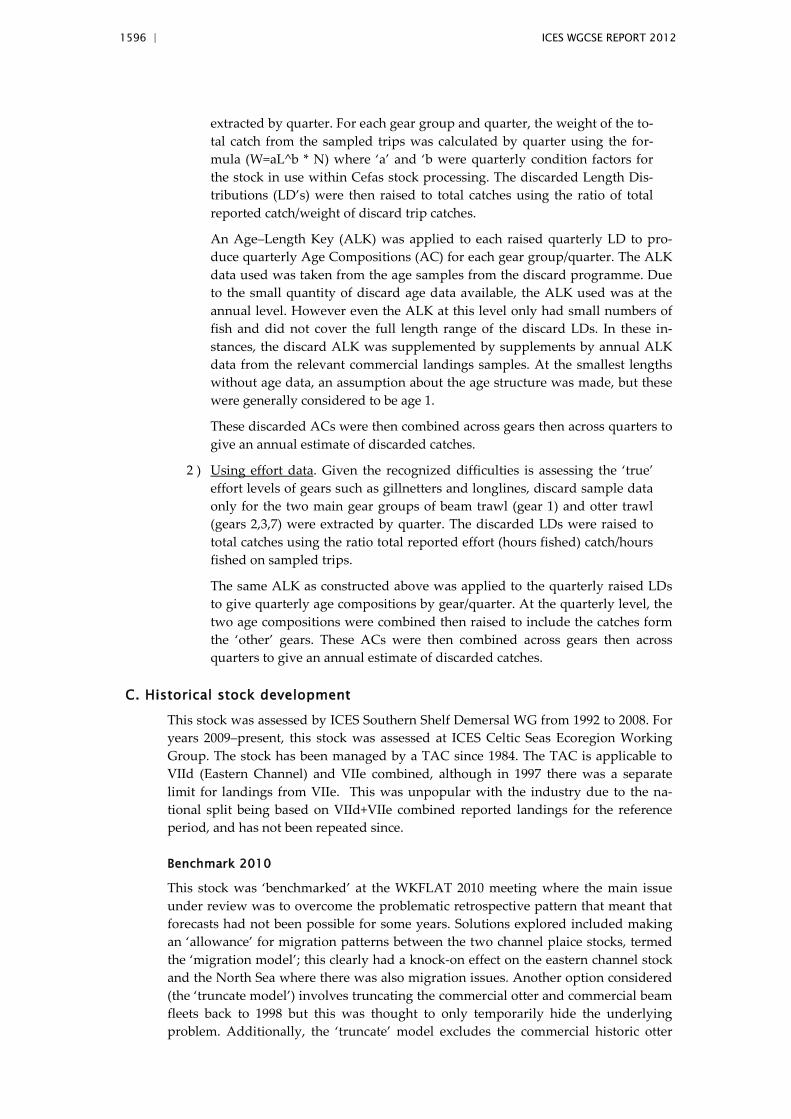
1596 | ICES WGCSE REPORT 2012
extracted by quarter. For each gear group and quarter, the weight of the to-tal catch from the sampled trips was calculated by quarter using the for-mula (W=aL^b * N) where ‘a’ and ‘b were quarterly condition factors for the stock in use within Cefas stock processing. The discarded Length Dis-tributions (LD’s) were then raised to total catches using the ratio of total reported catch/weight of discard trip catches.
An Age–Length Key (ALK) was applied to each raised quarterly LD to pro-duce quarterly Age Compositions (AC) for each gear group/quarter. The ALK data used was taken from the age samples from the discard programme. Due to the small quantity of discard age data available, the ALK used was at the annual level. However even the ALK at this level only had small numbers of fish and did not cover the full length range of the discard LDs. In these in-stances, the discard ALK was supplemented by supplements by annual ALK data from the relevant commercial landings samples. At the smallest lengths without age data, an assumption about the age structure was made, but these were generally considered to be age 1.
These discarded ACs were then combined across gears then across quarters to give an annual estimate of discarded catches.
2 ) Using effort data. Given the recognized difficulties is assessing the ‘true’ effort levels of gears such as gillnetters and longlines, discard sample data only for the two main gear groups of beam trawl (gear 1) and otter trawl (gears 2,3,7) were extracted by quarter. The discarded LDs were raised to total catches using the ratio total reported effort (hours fished) catch/hours fished on sampled trips.
The same ALK as constructed above was applied to the quarterly raised LDs to give quarterly age compositions by gear/quarter. At the quarterly level, the two age compositions were combined then raised to include the catches form the ‘other’ gears. These ACs were then combined across gears then across quarters to give an annual estimate of discarded catches.
C. Historical stock development
This stock was assessed by ICES Southern Shelf Demersal WG from 1992 to 2008. For years 2009–present, this stock was assessed at ICES Celtic Seas Ecoregion Working Group. The stock has been managed by a TAC since 1984. The TAC is applicable to VIId (Eastern Channel) and VIIe combined, although in 1997 there was a separate limit for landings from VIIe. This was unpopular with the industry due to the na-tional split being based on VIId+VIIe combined reported landings for the reference period, and has not been repeated since.
Benchmark 2010
This stock was ‘benchmarked’ at the WKFLAT 2010 meeting where the main issue under review was to overcome the problematic retrospective pattern that meant that forecasts had not been possible for some years. Solutions explored included making an ‘allowance’ for migration patterns between the two channel plaice stocks, termed the ‘migration model’; this clearly had a knock-on effect on the eastern channel stock and the North Sea where there was also migration issues. Another option considered (the ‘truncate model’) involves truncating the commercial otter and commercial beam fleets back to 1998 but this was thought to only temporarily hide the underlying problem. Additionally, the ‘truncate’ model excludes the commercial historic otter
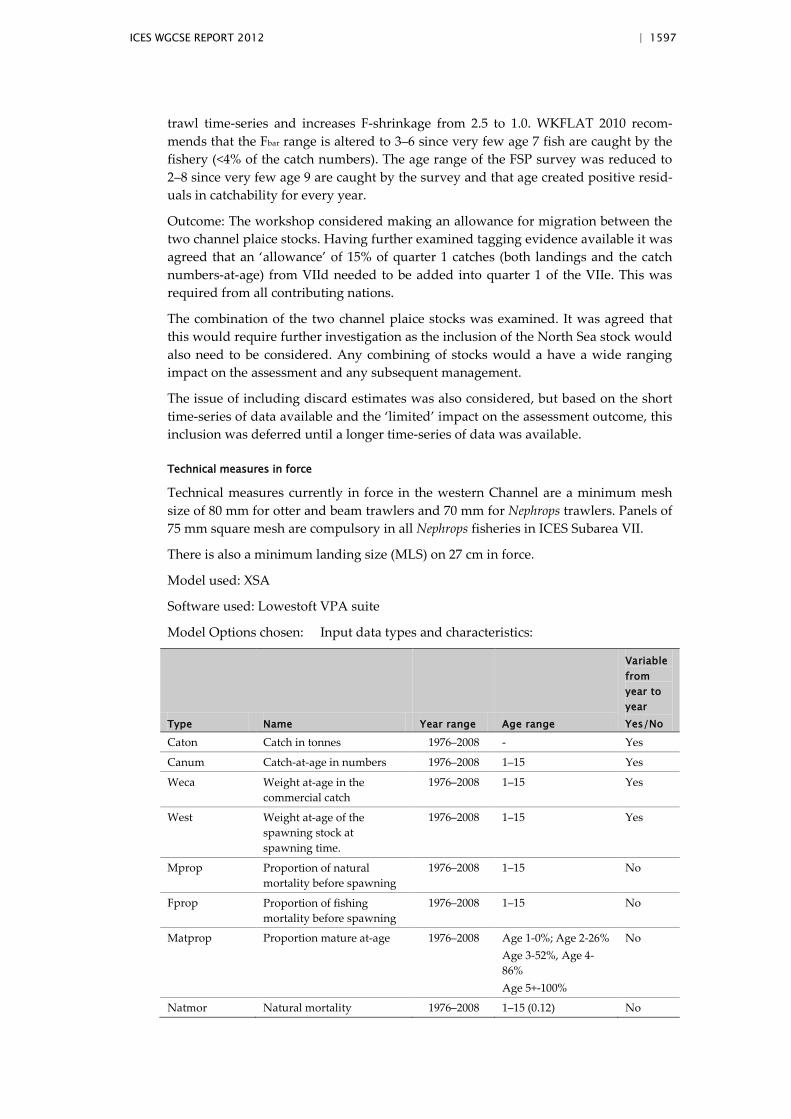
ICES WGCSE REPORT 2012 | 1597
trawl time-series and increases F-shrinkage from 2.5 to 1.0. WKFLAT 2010 recom-mends that the Fbar range is altered to 3–6 since very few age 7 fish are caught by the fishery (<4% of the catch numbers). The age range of the FSP survey was reduced to 2–8 since very few age 9 are caught by the survey and that age created positive resid-uals in catchability for every year.
Outcome: The workshop considered making an allowance for migration between the two channel plaice stocks. Having further examined tagging evidence available it was agreed that an ‘allowance’ of 15% of quarter 1 catches (both landings and the catch numbers-at-age) from VIId needed to be added into quarter 1 of the VIIe. This was required from all contributing nations.
The combination of the two channel plaice stocks was examined. It was agreed that this would require further investigation as the inclusion of the North Sea stock would also need to be considered. Any combining of stocks would a have a wide ranging impact on the assessment and any subsequent management.
The issue of including discard estimates was also considered, but based on the short time-series of data available and the ‘limited’ impact on the assessment outcome, this inclusion was deferred until a longer time-series of data was available.
Technical measures in force
Technical measures currently in force in the western Channel are a minimum mesh size of 80 mm for otter and beam trawlers and 70 mm for Nephrops trawlers. Panels of 75 mm square mesh are compulsory in all Nephrops fisheries in ICES Subarea VII.
There is also a minimum landing size (MLS) on 27 cm in force.
Model used: XSA
Software used: Lowestoft VPA suite
Model Options chosen: Input data types and characteristics:
Type Name Year range Age range
Variable from year to year Yes/No
Caton Catch in tonnes 1976–2008 - Yes
Canum Catch-at-age in numbers 1976–2008 1–15 Yes
Weca Weight at-age in the commercial catch
1976–2008 1–15 Yes
West Weight at-age of the spawning stock at spawning time.
1976–2008 1–15 Yes
Mprop Proportion of natural mortality before spawning
1976–2008 1–15 No
Fprop Proportion of fishing mortality before spawning
1976–2008 1–15 No
Matprop Proportion mature at-age 1976–2008 Age 1-0%; Age 2-26% Age 3-52%, Age 4-86% Age 5+-100%
No
Natmor Natural mortality 1976–2008 1–15 (0.12) No
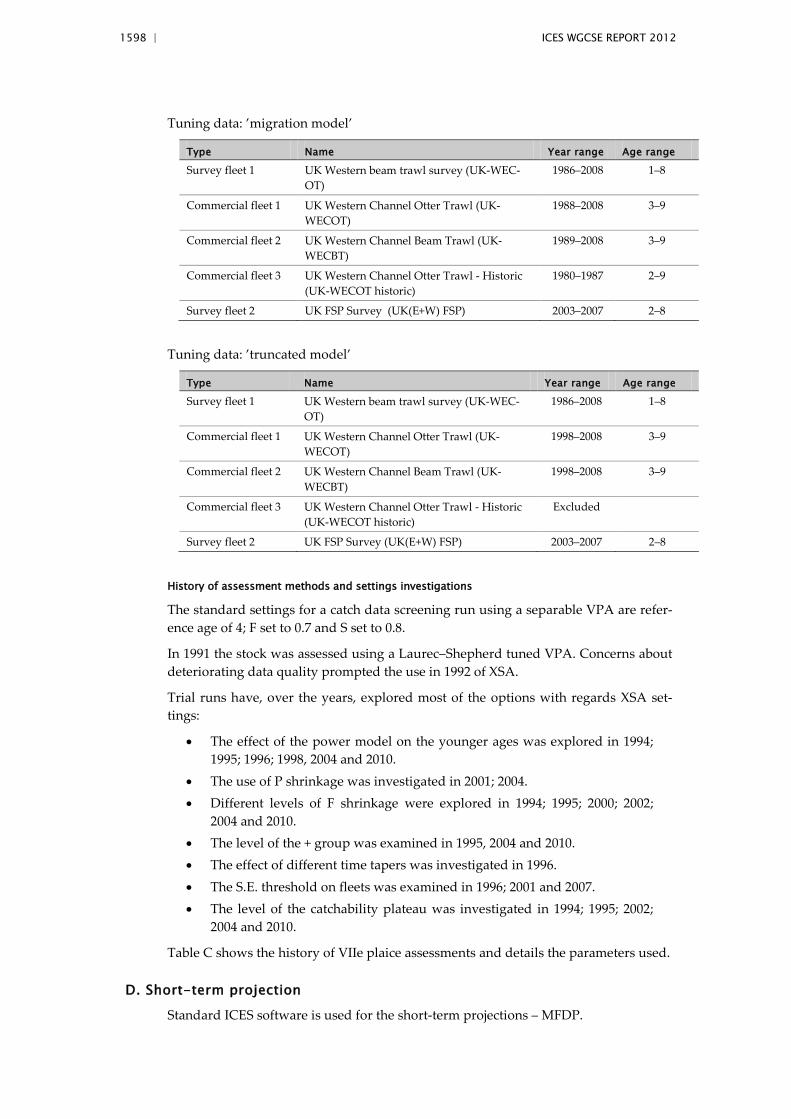
1598 | ICES WGCSE REPORT 2012
Tuning data: ’migration model’
Type Name Year range Age range
Survey fleet 1 UK Western beam trawl survey (UK-WEC-OT)
1986–2008 1–8
Commercial fleet 1 UK Western Channel Otter Trawl (UK-WECOT)
1988–2008 3–9
Commercial fleet 2 UK Western Channel Beam Trawl (UK-WECBT)
1989–2008 3–9
Commercial fleet 3 UK Western Channel Otter Trawl - Historic (UK-WECOT historic)
1980–1987 2–9
Survey fleet 2 UK FSP Survey (UK(E+W) FSP) 2003–2007 2–8
Tuning data: ’truncated model’
Type Name Year range Age range
Survey fleet 1 UK Western beam trawl survey (UK-WEC-OT)
1986–2008 1–8
Commercial fleet 1 UK Western Channel Otter Trawl (UK-WECOT)
1998–2008 3–9
Commercial fleet 2 UK Western Channel Beam Trawl (UK-WECBT)
1998–2008 3–9
Commercial fleet 3 UK Western Channel Otter Trawl - Historic (UK-WECOT historic)
Excluded
Survey fleet 2 UK FSP Survey (UK(E+W) FSP) 2003–2007 2–8
History of assessment methods and settings investigations
The standard settings for a catch data screening run using a separable VPA are refer-ence age of 4; F set to 0.7 and S set to 0.8.
In 1991 the stock was assessed using a Laurec–Shepherd tuned VPA. Concerns about deteriorating data quality prompted the use in 1992 of XSA.
Trial runs have, over the years, explored most of the options with regards XSA set-tings:
• The effect of the power model on the younger ages was explored in 1994; 1995; 1996; 1998, 2004 and 2010.
• The use of P shrinkage was investigated in 2001; 2004. • Different levels of F shrinkage were explored in 1994; 1995; 2000; 2002;
2004 and 2010. • The level of the + group was examined in 1995, 2004 and 2010. • The effect of different time tapers was investigated in 1996. • The S.E. threshold on fleets was examined in 1996; 2001 and 2007. • The level of the catchability plateau was investigated in 1994; 1995; 2002;
2004 and 2010.
Table C shows the history of VIIe plaice assessments and details the parameters used.
D. Short-term projection
Standard ICES software is used for the short-term projections – MFDP.
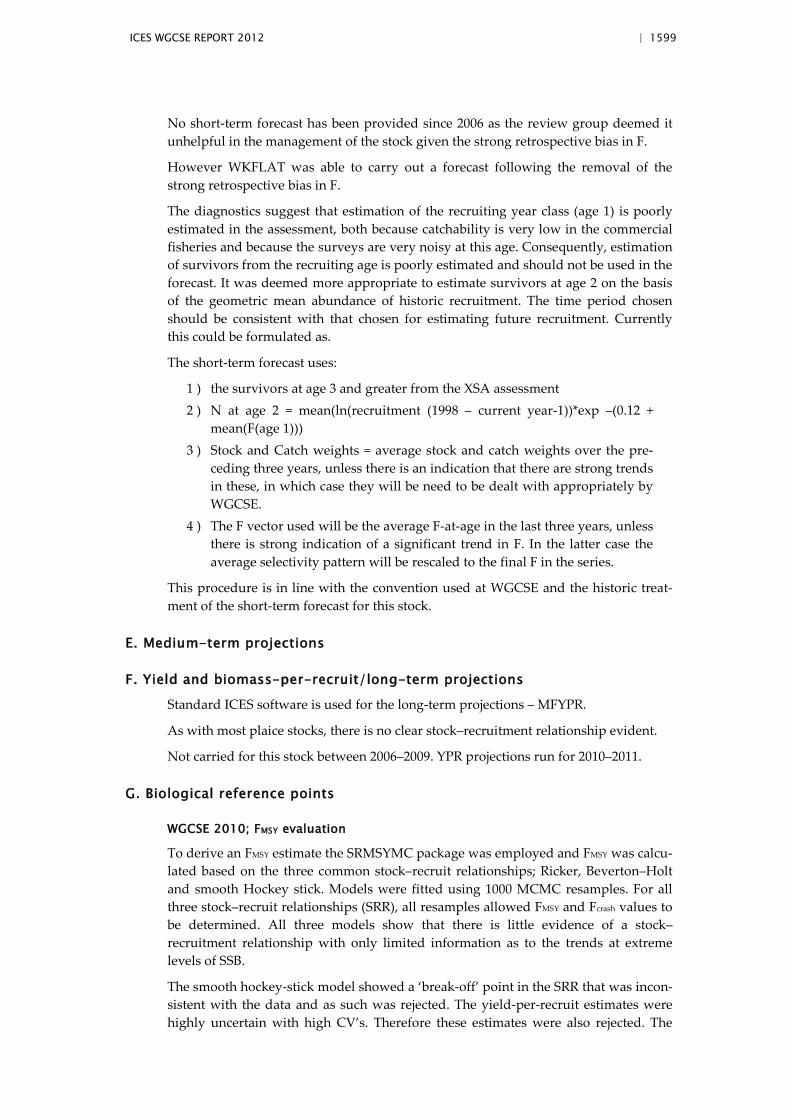
ICES WGCSE REPORT 2012 | 1599
No short-term forecast has been provided since 2006 as the review group deemed it unhelpful in the management of the stock given the strong retrospective bias in F.
However WKFLAT was able to carry out a forecast following the removal of the strong retrospective bias in F.
The diagnostics suggest that estimation of the recruiting year class (age 1) is poorly estimated in the assessment, both because catchability is very low in the commercial fisheries and because the surveys are very noisy at this age. Consequently, estimation of survivors from the recruiting age is poorly estimated and should not be used in the forecast. It was deemed more appropriate to estimate survivors at age 2 on the basis of the geometric mean abundance of historic recruitment. The time period chosen should be consistent with that chosen for estimating future recruitment. Currently this could be formulated as.
The short-term forecast uses:
1 ) the survivors at age 3 and greater from the XSA assessment 2 ) N at age 2 = mean(ln(recruitment (1998 – current year-1))*exp –(0.12 +
mean(F(age 1))) 3 ) Stock and Catch weights = average stock and catch weights over the pre-
ceding three years, unless there is an indication that there are strong trends in these, in which case they will be need to be dealt with appropriately by WGCSE.
4 ) The F vector used will be the average F-at-age in the last three years, unless there is strong indication of a significant trend in F. In the latter case the average selectivity pattern will be rescaled to the final F in the series.
This procedure is in line with the convention used at WGCSE and the historic treat-ment of the short-term forecast for this stock.
E. Medium-term projections
F. Yield and biomass-per-recruit/long-term projections
Standard ICES software is used for the long-term projections – MFYPR.
As with most plaice stocks, there is no clear stock–recruitment relationship evident.
Not carried for this stock between 2006–2009. YPR projections run for 2010–2011.
G. Biological reference points
WGCSE 2010; FMSY evaluation
To derive an FMSY estimate the SRMSYMC package was employed and FMSY was calcu-lated based on the three common stock–recruit relationships; Ricker, Beverton–Holt and smooth Hockey stick. Models were fitted using 1000 MCMC resamples. For all three stock–recruit relationships (SRR), all resamples allowed FMSY and Fcrash values to be determined. All three models show that there is little evidence of a stock–recruitment relationship with only limited information as to the trends at extreme levels of SSB.
The smooth hockey-stick model showed a ‘break-off’ point in the SRR that was incon-sistent with the data and as such was rejected. The yield-per-recruit estimates were highly uncertain with high CV’s. Therefore these estimates were also rejected. The
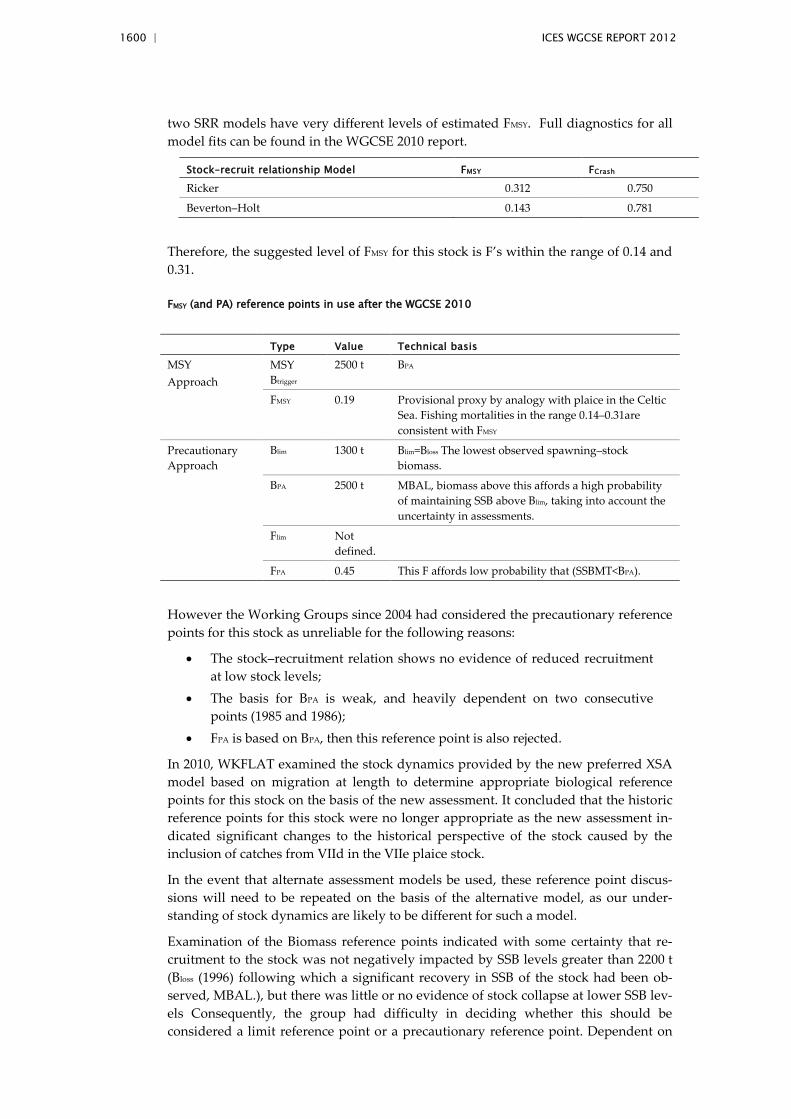
1600 | ICES WGCSE REPORT 2012
two SRR models have very different levels of estimated FMSY. Full diagnostics for all model fits can be found in the WGCSE 2010 report.
Stock–recruit relationship Model FMSY FCrash
Ricker 0.312 0.750
Beverton–Holt 0.143 0.781
Therefore, the suggested level of FMSY for this stock is F’s within the range of 0.14 and 0.31.
FMSY (and PA) reference points in use after the WGCSE 2010
Type Value Technical basis
MSY Approach
MSY Btrigger
2500 t BPA
FMSY 0.19 Provisional proxy by analogy with plaice in the Celtic Sea. Fishing mortalities in the range 0.14–0.31are consistent with FMSY
Precautionary Approach
Blim 1300 t Blim=Bloss The lowest observed spawning–stock biomass.
BPA 2500 t MBAL, biomass above this affords a high probability of maintaining SSB above Blim, taking into account the uncertainty in assessments.
Flim Not defined.
FPA 0.45 This F affords low probability that (SSBMT<BPA).
However the Working Groups since 2004 had considered the precautionary reference points for this stock as unreliable for the following reasons:
• The stock–recruitment relation shows no evidence of reduced recruitment at low stock levels;
• The basis for BPA is weak, and heavily dependent on two consecutive points (1985 and 1986);
• FPA is based on BPA, then this reference point is also rejected.
In 2010, WKFLAT examined the stock dynamics provided by the new preferred XSA model based on migration at length to determine appropriate biological reference points for this stock on the basis of the new assessment. It concluded that the historic reference points for this stock were no longer appropriate as the new assessment in-dicated significant changes to the historical perspective of the stock caused by the inclusion of catches from VIId in the VIIe plaice stock.
In the event that alternate assessment models be used, these reference point discus-sions will need to be repeated on the basis of the alternative model, as our under-standing of stock dynamics are likely to be different for such a model.
Examination of the Biomass reference points indicated with some certainty that re-cruitment to the stock was not negatively impacted by SSB levels greater than 2200 t (Bloss (1996) following which a significant recovery in SSB of the stock had been ob-served, MBAL.), but there was little or no evidence of stock collapse at lower SSB lev-els Consequently, the group had difficulty in deciding whether this should be considered a limit reference point or a precautionary reference point. Dependent on
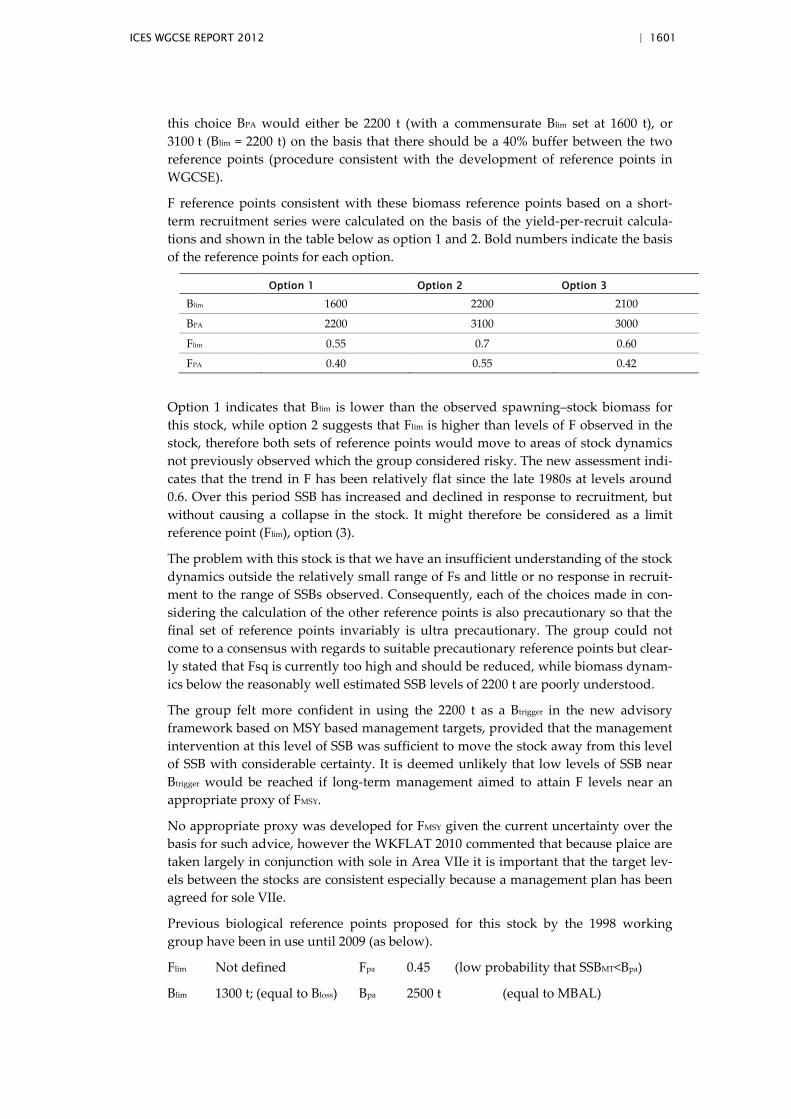
ICES WGCSE REPORT 2012 | 1601
this choice BPA would either be 2200 t (with a commensurate Blim set at 1600 t), or 3100 t (Blim = 2200 t) on the basis that there should be a 40% buffer between the two reference points (procedure consistent with the development of reference points in WGCSE).
F reference points consistent with these biomass reference points based on a short-term recruitment series were calculated on the basis of the yield-per-recruit calcula-tions and shown in the table below as option 1 and 2. Bold numbers indicate the basis of the reference points for each option.
Option 1 Option 2 Option 3
Blim 1600 2200 2100
BPA 2200 3100 3000
Flim 0.55 0.7 0.60
FPA 0.40 0.55 0.42
Option 1 indicates that Blim is lower than the observed spawning–stock biomass for this stock, while option 2 suggests that Flim is higher than levels of F observed in the stock, therefore both sets of reference points would move to areas of stock dynamics not previously observed which the group considered risky. The new assessment indi-cates that the trend in F has been relatively flat since the late 1980s at levels around 0.6. Over this period SSB has increased and declined in response to recruitment, but without causing a collapse in the stock. It might therefore be considered as a limit reference point (Flim), option (3).
The problem with this stock is that we have an insufficient understanding of the stock dynamics outside the relatively small range of Fs and little or no response in recruit-ment to the range of SSBs observed. Consequently, each of the choices made in con-sidering the calculation of the other reference points is also precautionary so that the final set of reference points invariably is ultra precautionary. The group could not come to a consensus with regards to suitable precautionary reference points but clear-ly stated that Fsq is currently too high and should be reduced, while biomass dynam-ics below the reasonably well estimated SSB levels of 2200 t are poorly understood.
The group felt more confident in using the 2200 t as a Btrigger in the new advisory framework based on MSY based management targets, provided that the management intervention at this level of SSB was sufficient to move the stock away from this level of SSB with considerable certainty. It is deemed unlikely that low levels of SSB near Btrigger would be reached if long-term management aimed to attain F levels near an appropriate proxy of FMSY.
No appropriate proxy was developed for FMSY given the current uncertainty over the basis for such advice, however the WKFLAT 2010 commented that because plaice are taken largely in conjunction with sole in Area VIIe it is important that the target lev-els between the stocks are consistent especially because a management plan has been agreed for sole VIIe.
Previous biological reference points proposed for this stock by the 1998 working group have been in use until 2009 (as below).
Flim Not defined Fpa 0.45 (low probability that SSBMT<Bpa)
Blim 1300 t; (equal to Bloss) Bpa 2500 t (equal to MBAL)
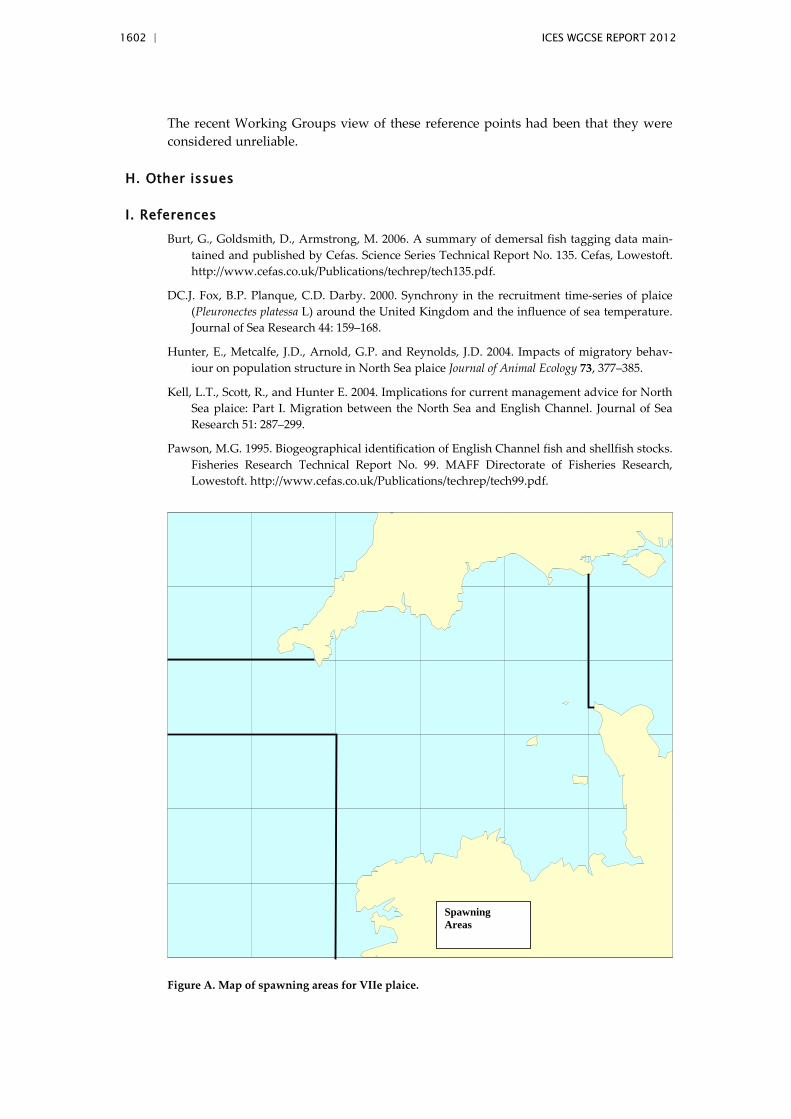
1602 | ICES WGCSE REPORT 2012
The recent Working Groups view of these reference points had been that they were considered unreliable.
H. Other issues
I. References Burt, G., Goldsmith, D., Armstrong, M. 2006. A summary of demersal fish tagging data main-
tained and published by Cefas. Science Series Technical Report No. 135. Cefas, Lowestoft. http://www.cefas.co.uk/Publications/techrep/tech135.pdf.
DC.J. Fox, B.P. Planque, C.D. Darby. 2000. Synchrony in the recruitment time-series of plaice (Pleuronectes platessa L) around the United Kingdom and the influence of sea temperature. Journal of Sea Research 44: 159–168.
Hunter, E., Metcalfe, J.D., Arnold, G.P. and Reynolds, J.D. 2004. Impacts of migratory behav-iour on population structure in North Sea plaice Journal of Animal Ecology 73, 377–385.
Kell, L.T., Scott, R., and Hunter E. 2004. Implications for current management advice for North Sea plaice: Part I. Migration between the North Sea and English Channel. Journal of Sea Research 51: 287–299.
Pawson, M.G. 1995. Biogeographical identification of English Channel fish and shellfish stocks. Fisheries Research Technical Report No. 99. MAFF Directorate of Fisheries Research, Lowestoft. http://www.cefas.co.uk/Publications/techrep/tech99.pdf.
Spawning Areas
Figure A. Map of spawning areas for VIIe plaice.
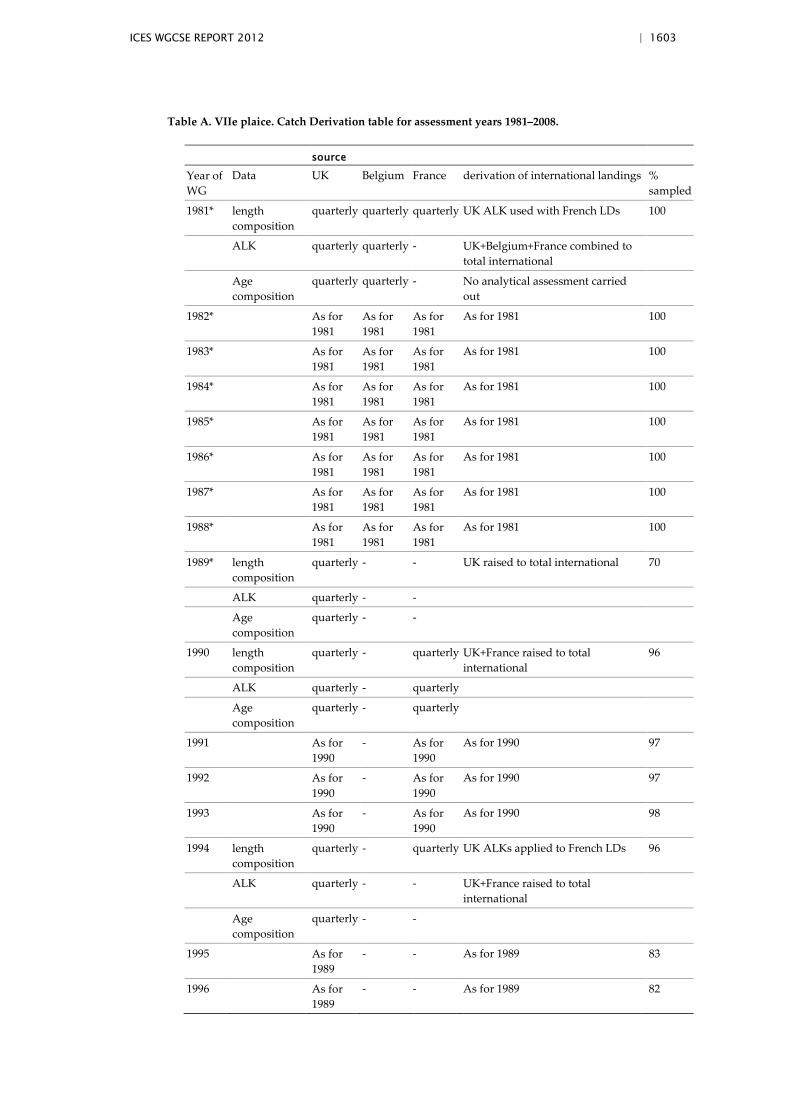
ICES WGCSE REPORT 2012 | 1603
Table A. VIIe plaice. Catch Derivation table for assessment years 1981–2008.
source
Year of WG
Data UK Belgium France derivation of international landings % sampled
1981* length composition
quarterly quarterly quarterly UK ALK used with French LDs 100
ALK quarterly quarterly - UK+Belgium+France combined to total international
Age composition
quarterly quarterly - No analytical assessment carried out
1982* As for 1981
As for 1981
As for 1981
As for 1981 100
1983* As for 1981
As for 1981
As for 1981
As for 1981 100
1984* As for 1981
As for 1981
As for 1981
As for 1981 100
1985* As for 1981
As for 1981
As for 1981
As for 1981 100
1986* As for 1981
As for 1981
As for 1981
As for 1981 100
1987* As for 1981
As for 1981
As for 1981
As for 1981 100
1988* As for 1981
As for 1981
As for 1981
As for 1981 100
1989* length composition
quarterly - - UK raised to total international 70
ALK quarterly - -
Age composition
quarterly - -
1990 length composition
quarterly - quarterly UK+France raised to total international
96
ALK quarterly - quarterly
Age composition
quarterly - quarterly
1991 As for 1990
- As for 1990
As for 1990 97
1992 As for 1990
- As for 1990
As for 1990 97
1993 As for 1990
- As for 1990
As for 1990 98
1994 length composition
quarterly - quarterly UK ALKs applied to French LDs 96
ALK quarterly - - UK+France raised to total international
Age composition
quarterly - -
1995 As for 1989
- - As for 1989 83
1996 As for 1989
- - As for 1989 82
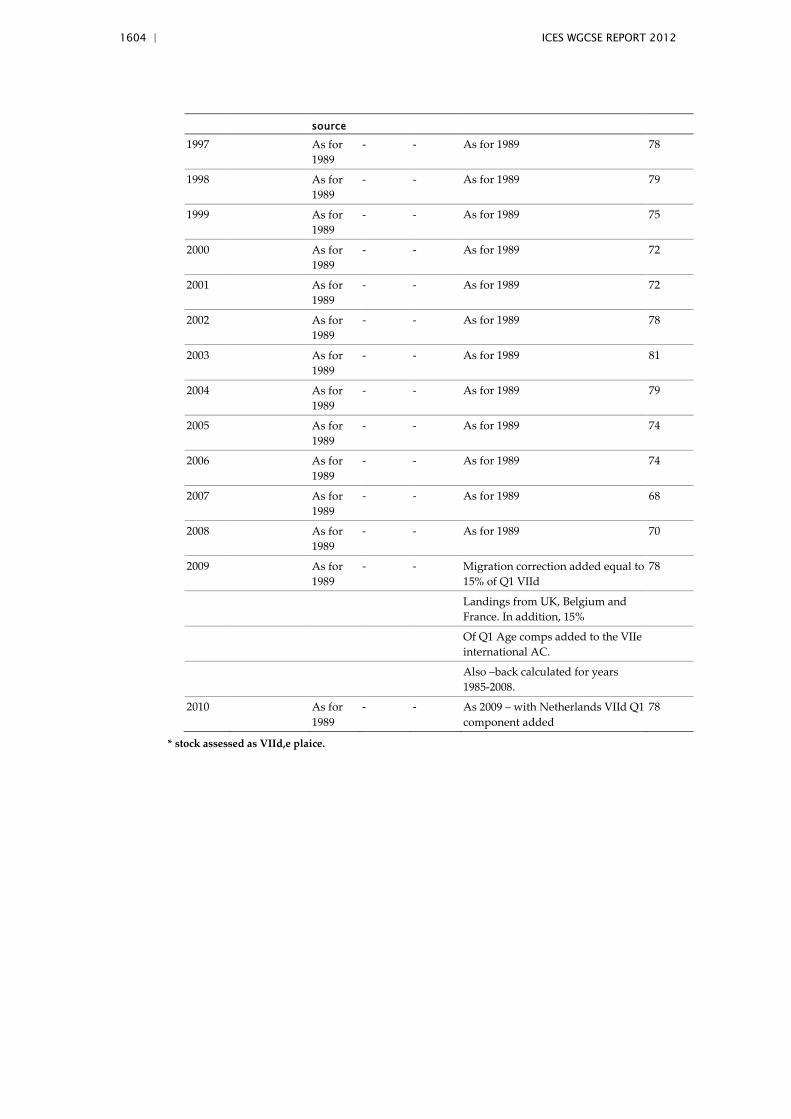
1604 | ICES WGCSE REPORT 2012
source
1997 As for 1989
- - As for 1989 78
1998 As for 1989
- - As for 1989 79
1999 As for 1989
- - As for 1989 75
2000 As for 1989
- - As for 1989 72
2001 As for 1989
- - As for 1989 72
2002 As for 1989
- - As for 1989 78
2003 As for 1989
- - As for 1989 81
2004 As for 1989
- - As for 1989 79
2005 As for 1989
- - As for 1989 74
2006 As for 1989
- - As for 1989 74
2007 As for 1989
- - As for 1989 68
2008 As for 1989
- - As for 1989 70
2009 As for 1989
- - Migration correction added equal to 15% of Q1 VIId
78
Landings from UK, Belgium and France. In addition, 15%
Of Q1 Age comps added to the VIIe international AC.
Also –back calculated for years 1985-2008.
2010 As for 1989
- - As 2009 – with Netherlands VIId Q1 component added
78
* stock assessed as VIId,e plaice.
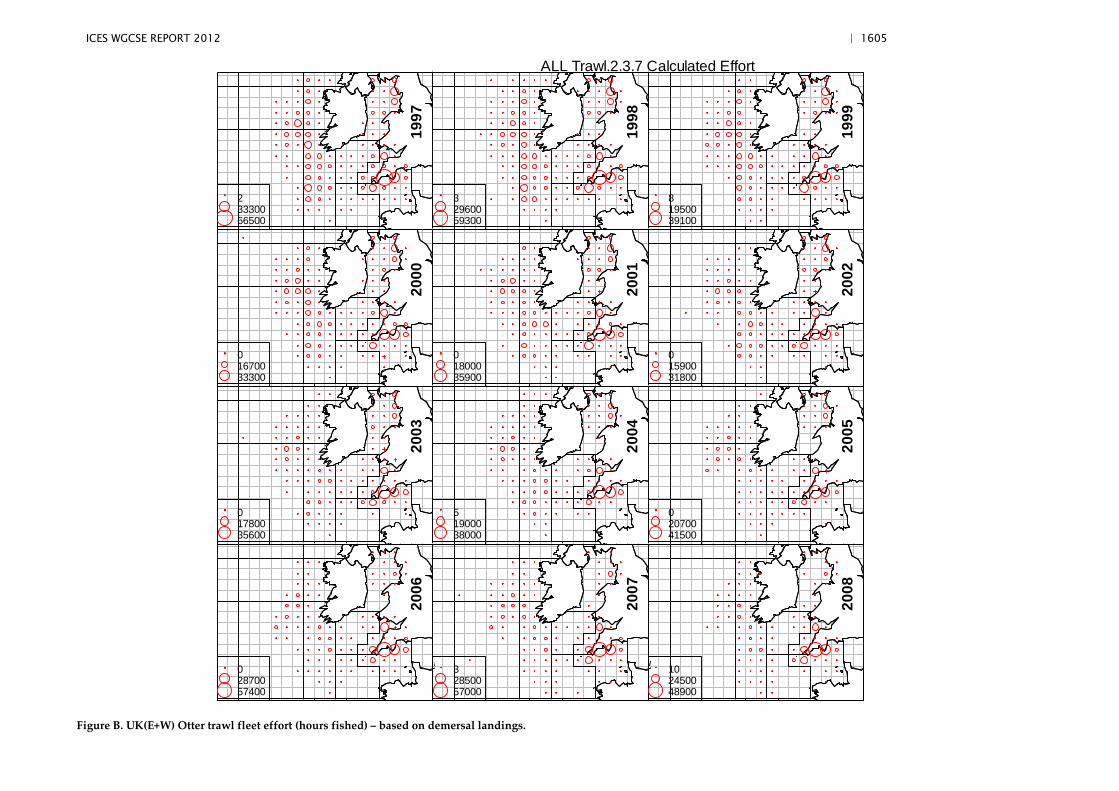
ICES WGCSE REPORT 2012 | 1605
23330066500
1997
32960059300
1998
81950039100
1999
01670033300
2000
01800035900
2001
01590031800
2002
01780035600
2003
51900038000
2004
02070041500
2005
02870057400
2006
32850057000
2007
102450048900
2008
ALL Trawl.2.3.7 Calculated Effort
Figure B. UK(E+W) Otter trawl fleet effort (hours fished) – based on demersal landings.
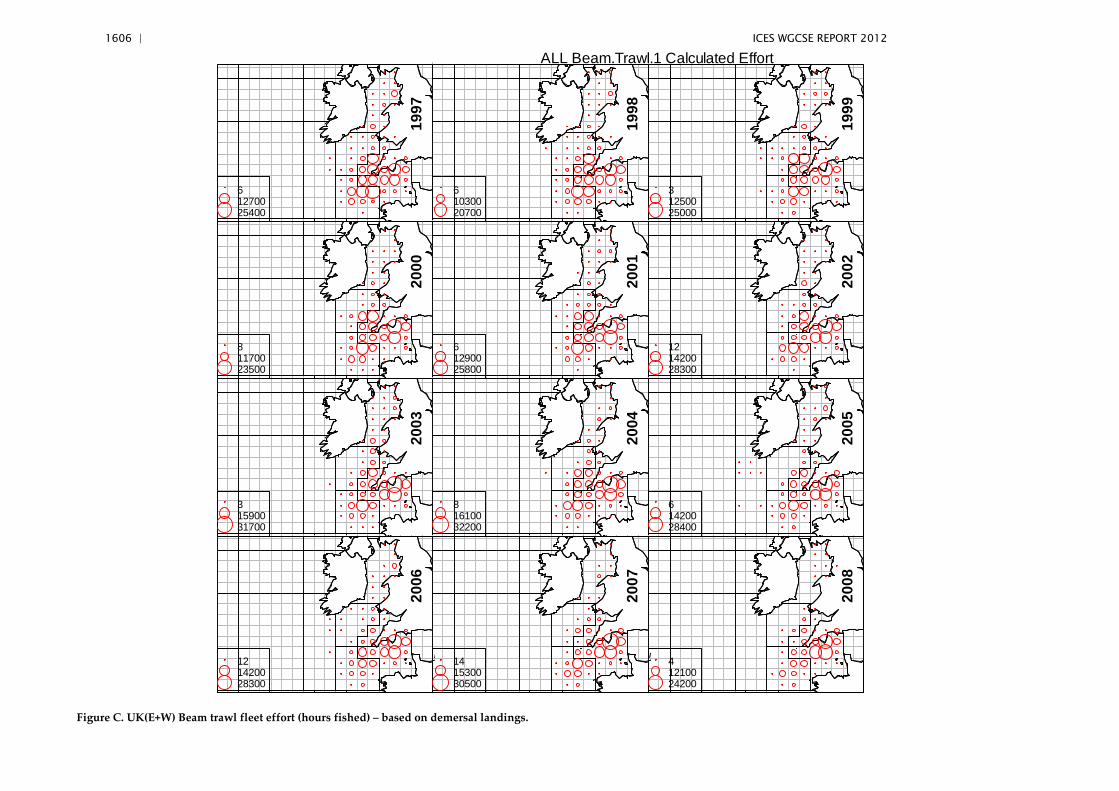
1606 | ICES WGCSE REPORT 2012
61270025400
1997
61030020700
1998
31250025000
1999
81170023500
2000
61290025800
2001
121420028300
2002
31590031700
2003
81610032200
2004
61420028400
2005
121420028300
2006
141530030500
2007
41210024200
2008
ALL Beam.Trawl.1 Calculated Effort
Figure C. UK(E+W) Beam trawl fleet effort (hours fished) – based on demersal landings.
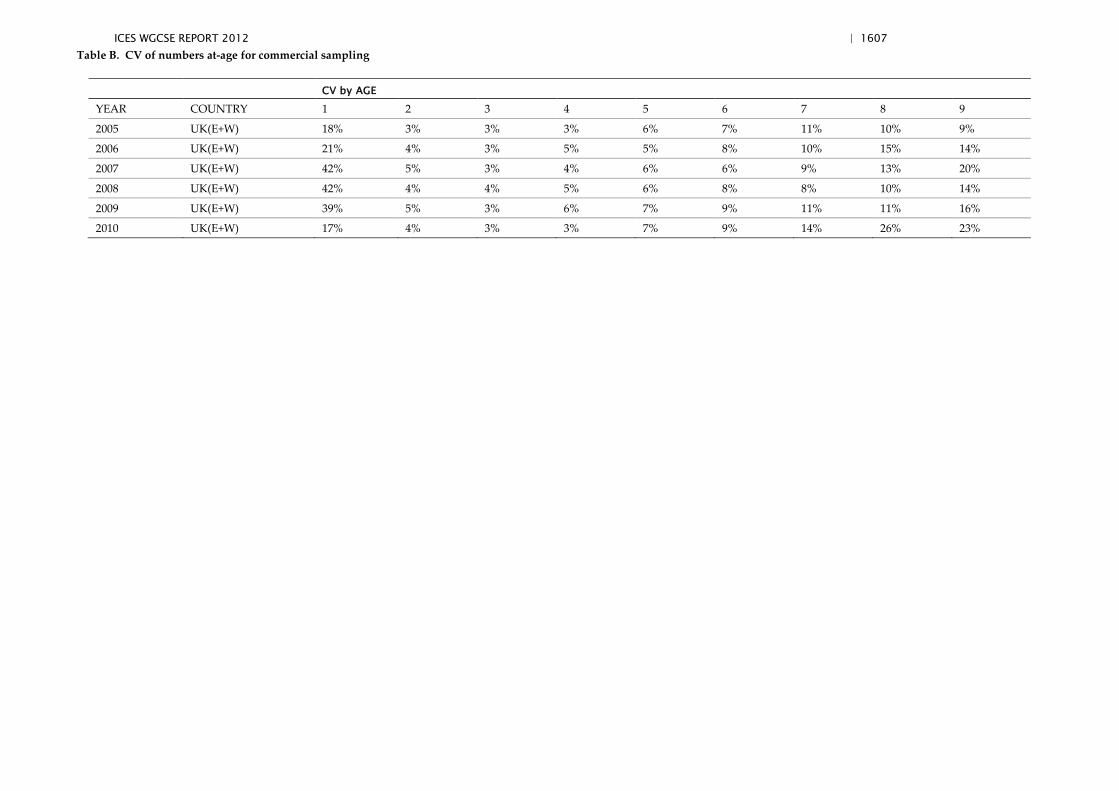
ICES WGCSE REPORT 2012 | 1607
Table B. CV of numbers at-age for commercial sampling
CV by AGE
YEAR COUNTRY 1 2 3 4 5 6 7 8 9
2005 UK(E+W) 18% 3% 3% 3% 6% 7% 11% 10% 9%
2006 UK(E+W) 21% 4% 3% 5% 5% 8% 10% 15% 14%
2007 UK(E+W) 42% 5% 3% 4% 6% 6% 9% 13% 20%
2008 UK(E+W) 42% 4% 4% 5% 6% 8% 8% 10% 14%
2009 UK(E+W) 39% 5% 3% 6% 7% 9% 11% 11% 16%
2010 UK(E+W) 17% 4% 3% 3% 7% 9% 14% 26% 23%
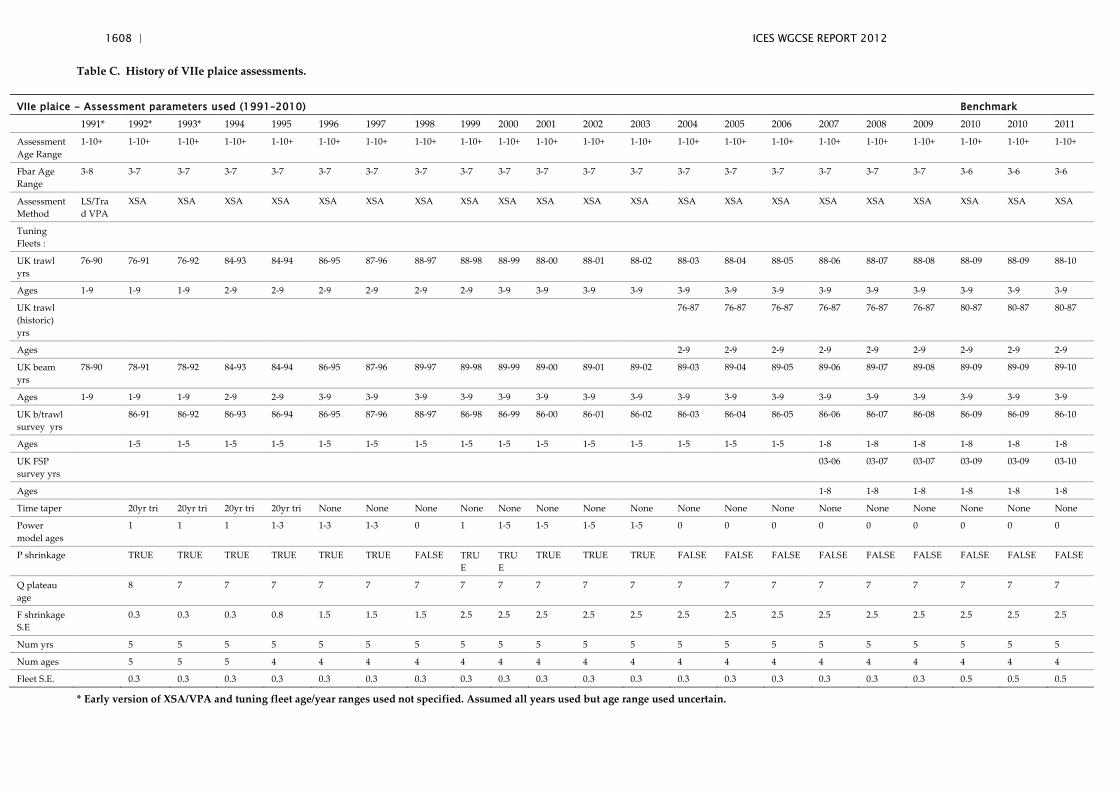
1608 | ICES WGCSE REPORT 2012
Table C. History of VIIe plaice assessments.
VIIe plaice - Assessment parameters used (1991–2010) Benchmark 1991* 1992* 1993* 1994 1995 1996 1997 1998 1999 2000 2001 2002 2003 2004 2005 2006 2007 2008 2009 2010 2010 2011
Assessment Age Range
1-10+ 1-10+ 1-10+ 1-10+ 1-10+ 1-10+ 1-10+ 1-10+ 1-10+ 1-10+ 1-10+ 1-10+ 1-10+ 1-10+ 1-10+ 1-10+ 1-10+ 1-10+ 1-10+ 1-10+ 1-10+ 1-10+
Fbar Age Range
3-8 3-7 3-7 3-7 3-7 3-7 3-7 3-7 3-7 3-7 3-7 3-7 3-7 3-7 3-7 3-7 3-7 3-7 3-7 3-6 3-6 3-6
Assessment Method
LS/Trad VPA
XSA XSA XSA XSA XSA XSA XSA XSA XSA XSA XSA XSA XSA XSA XSA XSA XSA XSA XSA XSA XSA
Tuning Fleets :
UK trawl yrs
76-90 76-91 76-92 84-93 84-94 86-95 87-96 88-97 88-98 88-99 88-00 88-01 88-02 88-03 88-04 88-05 88-06 88-07 88-08 88-09 88-09 88-10
Ages 1-9 1-9 1-9 2-9 2-9 2-9 2-9 2-9 2-9 3-9 3-9 3-9 3-9 3-9 3-9 3-9 3-9 3-9 3-9 3-9 3-9 3-9
UK trawl (historic) yrs
76-87 76-87 76-87 76-87 76-87 76-87 80-87 80-87 80-87
Ages 2-9 2-9 2-9 2-9 2-9 2-9 2-9 2-9 2-9
UK beam yrs
78-90 78-91 78-92 84-93 84-94 86-95 87-96 89-97 89-98 89-99 89-00 89-01 89-02 89-03 89-04 89-05 89-06 89-07 89-08 89-09 89-09 89-10
Ages 1-9 1-9 1-9 2-9 2-9 3-9 3-9 3-9 3-9 3-9 3-9 3-9 3-9 3-9 3-9 3-9 3-9 3-9 3-9 3-9 3-9 3-9
UK b/trawl survey yrs
86-91 86-92 86-93 86-94 86-95 87-96 88-97 86-98 86-99 86-00 86-01 86-02 86-03 86-04 86-05 86-06 86-07 86-08 86-09 86-09 86-10
Ages 1-5 1-5 1-5 1-5 1-5 1-5 1-5 1-5 1-5 1-5 1-5 1-5 1-5 1-5 1-5 1-8 1-8 1-8 1-8 1-8 1-8
UK FSP survey yrs
03-06 03-07 03-07 03-09 03-09 03-10
Ages 1-8 1-8 1-8 1-8 1-8 1-8
Time taper 20yr tri 20yr tri 20yr tri 20yr tri None None None None None None None None None None None None None None None None None
Power model ages
1 1 1 1-3 1-3 1-3 0 1 1-5 1-5 1-5 1-5 0 0 0 0 0 0 0 0 0
P shrinkage TRUE TRUE TRUE TRUE TRUE TRUE FALSE TRUE
TRUE
TRUE TRUE TRUE FALSE FALSE FALSE FALSE FALSE FALSE FALSE FALSE FALSE
Q plateau age
8 7 7 7 7 7 7 7 7 7 7 7 7 7 7 7 7 7 7 7 7
F shrinkage S.E
0.3 0.3 0.3 0.8 1.5 1.5 1.5 2.5 2.5 2.5 2.5 2.5 2.5 2.5 2.5 2.5 2.5 2.5 2.5 2.5 2.5
Num yrs 5 5 5 5 5 5 5 5 5 5 5 5 5 5 5 5 5 5 5 5 5
Num ages 5 5 5 4 4 4 4 4 4 4 4 4 4 4 4 4 4 4 4 4 4
Fleet S.E. 0.3 0.3 0.3 0.3 0.3 0.3 0.3 0.3 0.3 0.3 0.3 0.3 0.3 0.3 0.3 0.3 0.3 0.3 0.5 0.5 0.5
* Early version of XSA/VPA and tuning fleet age/year ranges used not specified. Assumed all years used but age range used uncertain.
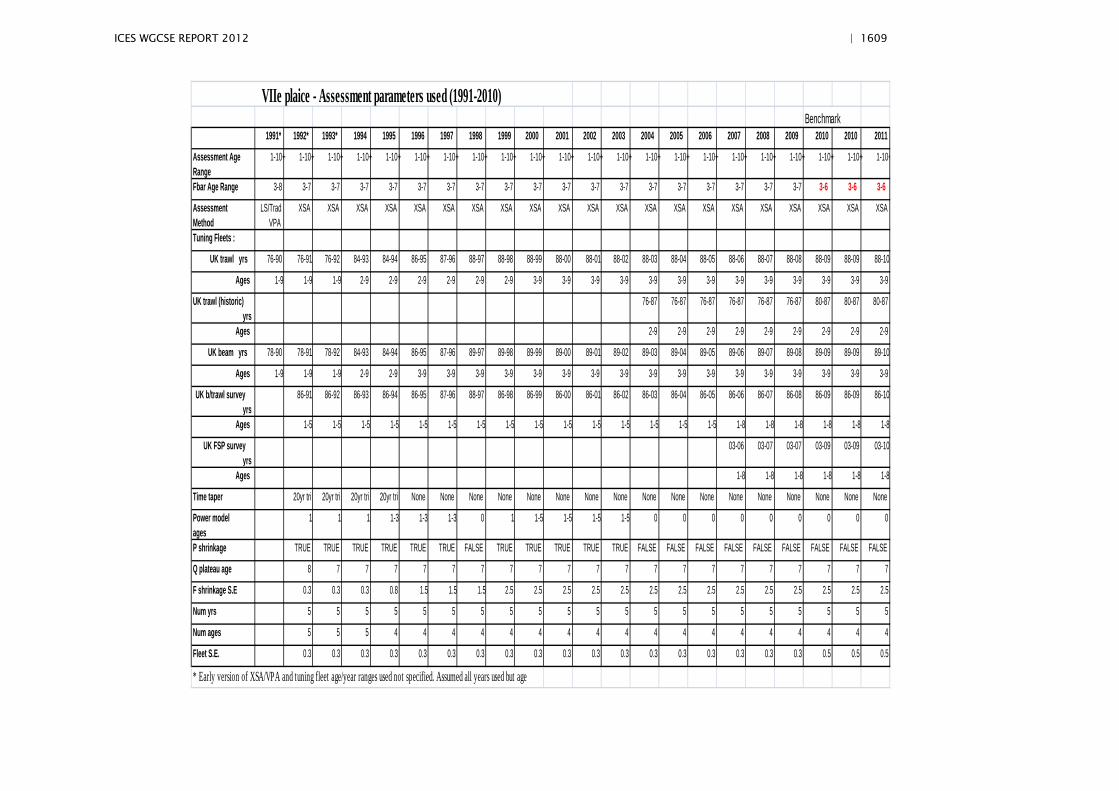
ICES WGCSE REPORT 2012 | 1609
Benchmark1991* 1992* 1993* 1994 1995 1996 1997 1998 1999 2000 2001 2002 2003 2004 2005 2006 2007 2008 2009 2010 2010 2011
Assessment Age Range
1-10+ 1-10+ 1-10+ 1-10+ 1-10+ 1-10+ 1-10+ 1-10+ 1-10+ 1-10+ 1-10+ 1-10+ 1-10+ 1-10+ 1-10+ 1-10+ 1-10+ 1-10+ 1-10+ 1-10+ 1-10+ 1-10+
Fbar Age Range 3-8 3-7 3-7 3-7 3-7 3-7 3-7 3-7 3-7 3-7 3-7 3-7 3-7 3-7 3-7 3-7 3-7 3-7 3-7 3-6 3-6 3-6
Assessment Method
LS/Trad VPA
XSA XSA XSA XSA XSA XSA XSA XSA XSA XSA XSA XSA XSA XSA XSA XSA XSA XSA XSA XSA XSA
Tuning Fleets :
UK trawl yrs 76-90 76-91 76-92 84-93 84-94 86-95 87-96 88-97 88-98 88-99 88-00 88-01 88-02 88-03 88-04 88-05 88-06 88-07 88-08 88-09 88-09 88-10
Ages 1-9 1-9 1-9 2-9 2-9 2-9 2-9 2-9 2-9 3-9 3-9 3-9 3-9 3-9 3-9 3-9 3-9 3-9 3-9 3-9 3-9 3-9
UK trawl (historic) yrs
76-87 76-87 76-87 76-87 76-87 76-87 80-87 80-87 80-87
Ages 2-9 2-9 2-9 2-9 2-9 2-9 2-9 2-9 2-9
UK beam yrs 78-90 78-91 78-92 84-93 84-94 86-95 87-96 89-97 89-98 89-99 89-00 89-01 89-02 89-03 89-04 89-05 89-06 89-07 89-08 89-09 89-09 89-10
Ages 1-9 1-9 1-9 2-9 2-9 3-9 3-9 3-9 3-9 3-9 3-9 3-9 3-9 3-9 3-9 3-9 3-9 3-9 3-9 3-9 3-9 3-9
UK b/trawl survey yrs
86-91 86-92 86-93 86-94 86-95 87-96 88-97 86-98 86-99 86-00 86-01 86-02 86-03 86-04 86-05 86-06 86-07 86-08 86-09 86-09 86-10
Ages 1-5 1-5 1-5 1-5 1-5 1-5 1-5 1-5 1-5 1-5 1-5 1-5 1-5 1-5 1-5 1-8 1-8 1-8 1-8 1-8 1-8
UK FSP survey yrs
03-06 03-07 03-07 03-09 03-09 03-10
Ages 1-8 1-8 1-8 1-8 1-8 1-8
Time taper 20yr tri 20yr tri 20yr tri 20yr tri None None None None None None None None None None None None None None None None None
Power model ages
1 1 1 1-3 1-3 1-3 0 1 1-5 1-5 1-5 1-5 0 0 0 0 0 0 0 0 0
P shrinkage TRUE TRUE TRUE TRUE TRUE TRUE FALSE TRUE TRUE TRUE TRUE TRUE FALSE FALSE FALSE FALSE FALSE FALSE FALSE FALSE FALSE
Q plateau age 8 7 7 7 7 7 7 7 7 7 7 7 7 7 7 7 7 7 7 7 7
F shrinkage S.E 0.3 0.3 0.3 0.8 1.5 1.5 1.5 2.5 2.5 2.5 2.5 2.5 2.5 2.5 2.5 2.5 2.5 2.5 2.5 2.5 2.5
Num yrs 5 5 5 5 5 5 5 5 5 5 5 5 5 5 5 5 5 5 5 5 5
Num ages 5 5 5 4 4 4 4 4 4 4 4 4 4 4 4 4 4 4 4 4 4
Fleet S.E. 0.3 0.3 0.3 0.3 0.3 0.3 0.3 0.3 0.3 0.3 0.3 0.3 0.3 0.3 0.3 0.3 0.3 0.3 0.5 0.5 0.5
* Early version of XSA/VPA and tuning fleet age/year ranges used not specified. Assumed all years used but age
VIIe plaice - Assessment parameters used (1991-2010)
| 1610 ICES WGCSE REPORT 2012
Appendix A – Beam trawl surveys in the western Channel (VIIe)
1. History of the survey
Complaints from the fishing industry in the southwest about the lack of scientific in-vestigation and knowledge of the local sole stock provided the catalyst for the survey in VIIe. Following enquiries of the local fishery officers and normal tendering proce-dures, a skipper-owned 300-hp beam trawler, the Bogey 1, was selected. The first year (1984) the survey consisted of a collection of tows on the main sole grounds. In 1989 the Bogey 1 was replaced with the Carhelmar and the survey continued unchanged until 2002 when R.V. Corystes took over the survey as an extension to its ‘near-west groundfish survey’.
Due to the changes occurring through the time-series, the surveys completed on R.V. Corystes (2002 onwards) will be described separately to the ‘previous’ surveys (pre 2002).
2.a. Survey objectives (1984 to 2001, and 2005 onwards)
To provide independent (of commercial) indices of abundance of all age groups of sole and plaice on the west channel grounds, and an index of recruitment of young (1–3 year old) sole prior to full recruitment to the fishery.
2.b. Survey objectives (2002 to 2004)
The primary objectives of the Irish Sea beam trawl survey are to (a) carry out a 4 m beam trawl survey of groundfish to i) obtain fisheries-independent data on the distri-bution and abundance of commercial flatfish species, and ii) derive age compositions of sole and plaice for use in the assessment of stock size; and (b) to collect biological data, including maturity and weight-at-age, for sole, plaice, lemon sole and other commercially important species. The epibenthic bycatch from these catches has been quantified, and these surveys are also used to collect biological samples in support of other Cefas projects and training courses.
3.a. Survey methods (1984 to 2001, and 2005 onwards)
For the years 1984–1988 the vessel was unchanged and was equipped with two 6 m chain mat beam trawls with 75 mm codends. For the survey hauls one of the codends was fitted with a 60 mm liner. In 1989 the Bogey 1 was replaced by the latest design 24 m 300 hp(220 kw) beam trawler Carhelmar. In 1988 two commercial chain mat 4 m beam trawls (measured inside the shoe plates) were purchased by MAFF as dedicat-ed survey gear. Both beams were fitted with the standard flip-up ropes and 75 mm codend. For years 1989 and 1990 only one codend was fished with a 40 mm liner but from 1991 with the introduction of 80 mm codends both were fitted with 40 mm lin-ers. The vessel and gear has remained unchanged since 1991.
Between 1989 and 2001 the survey remained relatively unchanged apart from small adjustments to the position of individual hauls to provide an improved spacing. In 1995 two inshore tows in shallow water (8–15 m) were introduced. The survey now consists of 58 tows of 30 minutes duration, with a towing speed of 4 knots in an area within 35 miles radius of Start Point. The survey design is stratified by ‘distance from the coast’ bands, in contrast to the VIIa, f+g survey that is stratified by depth bands. The reason for this is that the coastal shelf with a depth of water less than 40 m is
ICES WGCSE REPORT 2012 | 1611
relatively narrow and in addition is often fished with fixed gear. The survey bands (in miles) are 0–3, 3–6, 6–12, 12+ inshore, and 12+offshore.
3.b. Survey methods (2002 to 2004)
The standard gear used is a single 4 m beam trawl with chain mat, flip-up rope, and a 40 mm codend liner to retain small fish. The gear is towed at 4 knots (over the ground) for 30 minutes, averaging 2 nautical miles per tow. Fishing is only carried out in daylight, shooting after sunrise and hauling no later than sunset, as the distri-bution of some species is known to vary diurnally.
Once on board the catch is sorted to species level, with the exception of small gobies and sandeels, which are identified to genus. Plaice, sole, dab, and elasmobranchs are sorted by sex, all fish categories weighed, and total lengths are measured to the full centimetre below, or half centimetre if the species is pelagic. Area stratified samples of selected species are sampled for weight, length, sex, maturity, and otoliths or scales removed for ageing.
The standard grid of 58 stations was fished in 2002 and 2003 (see map), and although other stations have been fished in this period, they were for exploratory purposes and were not included in the assessment.
4. Abundance index calculation
Plaice and sole abundance indices are calculated by allocating the appropriate ages to the fish that are caught. This gives the age composition (AC) of the catch, and this is used in the appropriate working group analysis.
The AC’s are calculated by proportioning a length distribution (LD) to an appropriate age–length key (ALK). To account for possible population differences within ICES Division VIIe, biological samples are taken from sectors stratified by distance from shore (see map). The survey bands (in miles) are 0–3, 3–12, 12+ inshore, and 12+ off-shore. Where appropriate the ALK’s are separated by sex, and this allows a particular ‘sector, depth-band and sex’ ALK to be raised to the corresponding LD to give an ac-curate AC for that particular habitat. The AC’s can then be combined as required to give results in the form of ‘numbers at-age, per distance or time’.
Between 1984 and 1990 a total survey age–length key was applied to the ‘grid’ length distribution, but from 1990 onwards stratum stratified age–length keys were used.
The table below show the stratifications currently used to calculate the ‘near-west groundfish survey’ abundance indices.
5. Map of survey grid
Additional stations have been fished throughout the time period, but as these stations are not consistently fished, they are excluded from this map.
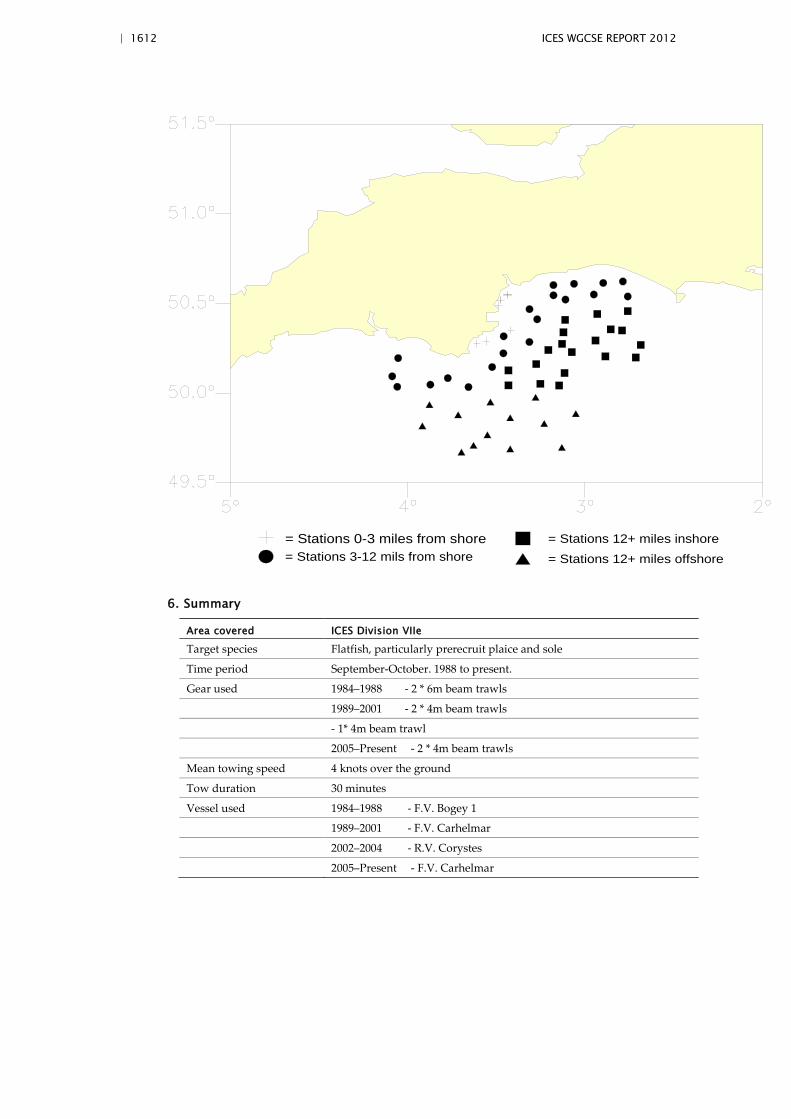
| 1612 ICES WGCSE REPORT 2012
= Stations 0-3 miles from shore= Stations 3-12 mils from shore
= Stations 12+ miles inshore= Stations 12+ miles offshore
6. Summary
Area covered ICES Division VIIe
Target species Flatfish, particularly prerecruit plaice and sole
Time period September-October. 1988 to present.
Gear used 1984–1988 - 2 * 6m beam trawls
1989–2001 - 2 * 4m beam trawls
- 1* 4m beam trawl
2005–Present - 2 * 4m beam trawls
Mean towing speed 4 knots over the ground
Tow duration 30 minutes
Vessel used 1984–1988 - F.V. Bogey 1
1989–2001 - F.V. Carhelmar
2002–2004 - R.V. Corystes
2005–Present - F.V. Carhelmar
ICES WGCSE REPORT 2012 | 1613
8.3 Sole in Division VIIe
Stock Sole in Division VIIe (Western Channel)
Date 13/03/2009
Revised by Sven Kupschus (revised at WKFLAT 2012. ICES, 2012)
A. General
A.1. Stock definition
The management area for this stock is strictly that for Division VIIe. Biologically speaking however the picture is much less clear. Sole in general are relatively seden-tary, once settled they perform a seasonal inshore offshore movements during their spawning migration with a random longshore component. Therefore the manage-ment unit of the stock is well defined for mature fish. There is good evidence to sug-gest that the stock is split into two biological stocks on either side of the Hurd Deep. If this prevents complete mixing of the stock it an assessment methodology capable of taking account of this should be applied. This could explain differences in the trends representative of stock dynamics in the different fisheries. The two main fisheries on the UK coast around Lyme Bay and the Start as well as the fishery on the coast in the eastern part of the management area are clearly separated by the deeper waters of the channel, so that the fishery covers only about half of the management area so that incomplete mixing may be a problem in this stock.
With respect to the stock as observed by the fishery there seem to relatively few is-sues regarding stock identity and once recruited the stock appears to represent a closed population. Spawning migrations by sole tend to be in a seasonal onshore off-shore pattern with a small random movement alongshore described for the species in other areas. Given the layout of the stock and the apparent breaks in the distribution of sole at the edges of the management unit there appears to be little concern for sig-nificant leakage across stocks. However the biological stock unit for Division VIIe is much less certain at the larval and prerecruit stage. The proportion of the area that represents nursery grounds is much smaller than those for other sole stocks of equal size, with only two small regions (the inner part of Lyme Bay and the Bay de Mount St Michelle) known to regularly produce 1-groups sole.
Tagging information of juvenile sole, mostly 1–3 year olds show that there is signifi-cant ingress of recruits from the adjacent stock in ICES Division VIId from both the French and the UK coast that appear in the region of out Lyme Bay. Unfortunately, very little tagging data are available to examine if there is an equal or greater recipro-cal movement in the opposite direction, but given the limited nursery habitat and the abundance of sole recruits in Division VIIe it seems reasonable to assume that there is a net inwards migration of prerecruits that remain in the area following maturation.
Spawning is known to occur in the division from survey evidence in a relatively small concentration on the ‘Bank de Langustine’ and intermittently in very low con-centrations in the western part of the UK coastal region and around the edges of the Hurd Deep. Little is known about the fate of the spawning products, but given the relatively long egg and larval stage as well as the significant net eastward movement of waters in the channel it is plausible that the stock utilizes nursery habitat in the eastern half of the channel. The degree of stock isolation in terms of these recruits has
| 1614 ICES WGCSE REPORT 2012
not been investigated, as it is possible that the recruits contribute to a common pool of recruits with the eastern stock.
Isolation from the Celtic Sea (both the Bristol Channel and the Bay of Biscay) appears to be more rigorous according to tagging information, with few individual traversing the strong environmental and habitat gradients found in the rocky areas around lands end. However, the 1998 year class is indicated to be above average from all tun-ing information with the exception of the UK-BTS survey. The fact that this cohort is not well represented in what is thought to be the best indicator of recruitment, yet is readily observed in information from the more westerly and offshore parts of the stock area may indicate that there are other, as yet poorly understood recruit sources within the region.
From a stock assessment point of view and in the absence of a modelled stock–recruitment relationship there appears then relatively little concern over a lack of a closed population given the low movement rates post maturation. The low move-ment and its seasonality in conjunction with the high concentration of fishing effort around Start Point may produce effects of local depletion that may imply higher rates of fishing mortality for the UK-CBT fleet when compared to mortality rates from oth-er indices covering a wider area. Such conjecture is potentially supported by the fact that when the new Q1SWBeam survey is viewed as an absolute index of abundance it produces higher estimates of stock size than the assessment. While stock size remains relatively stable and the behaviour of the fishery remains stable this is likely to have little impact on the assessment as the difference is absorbed in the estimates of catch-ability. If the fishery expands spatially with a commensurate reduction in the per-unit-area effort, or as migration rates change in response to stock size such affects may become more apparent in the assessment so that it is important to consid-er/examine such changes in future.
The assessment method agreed by WKFLAT 2012 (ICES, 2012), and described in this “Stock Annex”, does not specifically deal with the uncertainty regarding stock boundaries, nor the issue of incomplete mixing and spatial dynamics in the stock and fishers. However, for advisory purposes the assessment methodology agreed at WKFLAT 2012 is able to provide robust advice despite these slight omissions. Part of the problem is that such process error is apparent in this stock only because of the high degree of precision and certainty in the data. Spatial issues are known to occur in other stocks, but the results of this process error are not apparent from the assess-ments because overall variability is much greater.
A.2. Fishery
The principal gears used for sole in the Western Channel are beam and otter trawls, for the UK fleet and entangling nets and otter trawls for the French fleet. In recent years, UK vessels have accounted for around three quarters of the total international landings, with France taking approximately a quarter and Belgian vessels the re-mainder. UK landings were low and stable between 1950 and the mid-1970s, but in-creased rapidly after 1978 as a consequence of the replacement of otter trawlers by beam trawlers. Because the UK fleet is the major component of the international land-ings, they follow a similar trend. Sole is the target species of an offshore beam trawl fleet, which is concentrated off the south Devon and Cornish coasts, and also catches plaice and anglerfish. In recent years a winter fishery targeting cuttlefish has devel-oped for the English beam trawl fleet in the Western Channel, lasting from November till the end of March. This has taken some of the reliance of the fleet away from sole,
ICES WGCSE REPORT 2012 | 1615
but sole still represents a substantial portion of the catch during this time so it is not clear to what degree the switch to cuttle-fishing has reduced fishing mortality on sole.
Discarding of sole in this fishery is thought to be minor, supported by the time-series (2002–2008) of discard information for the UK fleet shown in Figure A.2.1. Landings of sole reached a high level above 1400 t in the 1980s, boosted initially by high re-cruitment in the late 1970s, followed by an increase in exploitation. Landings declined between 1988 and 1991, following the recruitment of three below-average year classes (1986–1988); since 1991 they have fluctuated between 800 t and 1100 t. Substantial quantities of sole caught in VIIe have been reported to two rectangles in VIId in order to avoid quota restrictions. Corrections for this misreporting were first made during the 2002 WG, but misreporting to other areas has been more difficult to identify. In addition, black landings are likely to have occurred to various degrees since quotas became restrictive in the late 1980s. No estimates of the scale of the problem exist so that this uncertainty has not been incorporated into the assessment process.
Since the development of the beam trawl fleet in the Western Channel in the early 1980s there has been a consolidation to larger more powerful vessels, particularly in the late 1990s and early 2000s. However, the severe quota restrictions at that time have lead to a reversal of this trend and a lesser emphasis on sole as the major income for the fleet. Undoubtedly sole still form the back bone of this fishery due to the steady availability over the ground. However in recent years the fishery has adapted with smaller more flexible vessels and an overall reduction in kWH as well as a fur-ther small decrease in the number of boats due to a decommissioning scheme, to make the most of other resources such as scallops, cuttlefish, gurnards, etc. foregoing possible higher catch rates of sole. This is reflected in the offshore movement of the fishery around Start Point.
At the lower catch rates described above the fleet is at an appropriate capacity to take the available quota and appears to have sufficient financial stability and certainty to allow for continued investment in the fishery. Were the industry to return to previous patterns of exploitation targeting the younger and more abundant sole in Lyme Bay it would almost certainly be able to increase the fishing mortality to levels greater than that assumed to be sustainable. The current enforcement regulations with a change in the attitude of the industry have meant that the TAC is an appropriate management tool in at least the UK fishery. Limiting days at sea further will have a perverse ten-dency to reverse this trend and focus effort grounds in Lyme Bay because of their proximity and the higher catch rates.
A.3. Ecosystem aspects
Little is known with regards of the effect of the environment on the stock dynamics of VIIe sole. Certainly the division is on the convergence between the Celtic Sea proper and the Channel/North Sea ecosystem. If predicted increases in temperature were to materialize changes to the stock dynamics of this and other species in the Division would be expected. To date there is good evidence of a sizeable increase in the abun-dance of bass in the area, a species with a similar pan European distribution as sole. In addition there is some anecdotal evidence of changes in the range of some species such as langoustine, triggerfish, and black sea bream from warmer parts of the Atlan-tic. In the North Sea it has also been suggested that cold periods immediately prior to spawning have a tendency to increase year-class strength and there is some indica-tion of this for this stock, but no statistical analysis has been carried out to date.
| 1616 ICES WGCSE REPORT 2012
Beam trawling is known to have a significant impact on the seabed. It is understood though that those areas affected continue to be productive in terms of the target spe-cies. After the initial degradation of the habitat usually associated with the loss of sessile macro fauna, continued use of beam trawls seems to have few further impacts.
B. Data
B.1. Commercial catch
UK (>60%) and France (>30%) together provide almost all the catches for this stock. UK Landings data are based on EU logbook data for VIIe catches. In 2002 the UK in-dustry indicated that there had been substantial misreporting of landings to two rec-tangles in Division VIId. It was possible to identify the misreported landings spatially and by reported lpue. Having identified misreported landings, data were corrected back to 1985 by the 2002 WG. This method of correction is ongoing. French official landings statistics have been poor since 1997, but since 1997 landings data have been calculated much more accurately using buyer and sellers notes. France has provided corrected landings information to the Working Group since 2002.
Numbers-at-age prior to 1994 are calculated by raising the UK age composition to UK and Channel Island Catches, adding the French age composition data, and finally raising the resulting age composition to the total international landings. From 1995 WG to 2005 WG the international landings for the stock were based entirely on English quarterly sampling effort then raised to quarterly international landings. Since 2006 WG French age data from 2003 onwards have been included.
Numbers-at-age 1 in the catch are low or zero in most years and most likely reflect variation in the sampling, rather than variation in the stock itself. Therefore, these were not considered to add useful information and are replaced by zeros.
Table A demonstrates the history of the derivation of catch numbers-at-age.
B.2. Biological
Weights-at-age
Total international catch and stock weights-at-age for each year’s catch data are calcu-lated as the weighted mean of the annual weight-at-age data (weighted by catch numbers), and smoothed in-year using a quadratic fit so that:
Wt = a + b*Age +c* Age2
where catch weights-at-age are mid-year values, and stock weights-at-age are 1 Janu-ary values. Following the estimation of the weights-at-age catch-numbers are adjust-ed to so that the sum of products of the weights and catches sum to the estimated Landings (SOP correction). Catch numbers-at-age 1 are replaced by zeros, but the catch weights-at-age 1 were retained because they are part of the smoothing proce-dure and do not affect the assessment. They are also essential if a medium-term fore-cast is performed.
A smoother is applied to sampled catch weights-at-age to adjust for variation in the weight-at-age that may result from low levels of sampling rather than differences in growth rate between cohorts. It also allows estimation of the stock weights-at-age by extrapolation of the curve rather than by using quarter 1 samples, which may be sparse. However this smoother is applied through the plus group and the age range
ICES WGCSE REPORT 2012 | 1617
in the plus group is such that this will tend to overestimate the weights at the young-er ages. This needs to be corrected as soon as possible.
Natural mortality and maturity-at-age
Natural mortality is assumed constant over ages and years at 0.1. This is consistent with the natural mortality estimates used for sole by other ICES working groups (WGNSSK: IV, VIId, WGCSE: VIIa, VIIfg, VIIIa,b) and consistent with estimates of M reported in Horwood, 1993 for VIIfg sole as well as other stocks and papers cited therein.
Assessments prior to 1997 had use knife edge maturity-at-age 3. This was changed in 1997 to a maturity ogive from area VIIf and g according to Pawson and Harley (WD presented to WGSSDS in 1997), which is applied in all years, 1969 to present, since the 1997 WG.
Age 1 2 3 4 5 6,7, …12+
Prop. Mature 0.00 0.14 0.45 0.88 0.98 1.00
Proportions of F and M before spawning are both set to zero to reflect the SSB calcula-tion date of 1 January.
B.3. Surveys
UK-BTS
The longest survey time-series available for this stock is the Western Channel Beam Trawl Survey conducted by the UK in late September, early October (UK-BTS). The survey covers a relatively small area of VIIe from Start Point through to the middle of Lyme Bay and out to the edges of the Hurd Deep covering the immediate area of fish-ing for the Brixham and Plymouth fleets. Sampling started originally in 1984 on the chartered commercial fishing vessel ‘Bogey One’, replaced in 1988 by the ‘Carhelmar’ and moved to the research vessel ‘Corystes’ in 2002 to 2004. Concerns were raised regarding differences in catchability between the Carhelmar and Corystes, and in 2003 the survey was carried out on both vessels. The results of the comparison con-vinced Cefas to return the survey to the long-serving Carhelmar and to replace the 2003 data with the data from the comparison trials in order to improve consistency. Consequently, the time-series has been largely recovered, with only 2002 and 2004 data coming from the RV Corystes.
The survey cpue demonstrates a decline from 1986 to 1995 in line with the commer-cial data, after which SSB seems to have largely stabilized at lower levels. The abun-dance indices at-ages 1 and 2 demonstrate little overall trend, but ages 3 to 6 indicate a decline over the middle part of the series, despite intermittent peaks and troughs. More recently survey cpue has increased to the highest level over the consistent time-series (starting in 1988 as used in the assessment) with the majority of the increase coming from the younger ages and only a marginal increase at the older ages. The age information is internally consistent to the survey, with 1989 year class is indicated to be strong at all ages and this year class can also be traced through the catch-at-age matrix. More recently the 1998 year class can be tracked reasonably consistently.
UK-FSP
A shorter, but more spatially extensive survey-series has been developed and man-aged by Cefas since 2003 in the UK in conjunction with the industry. Age sampling
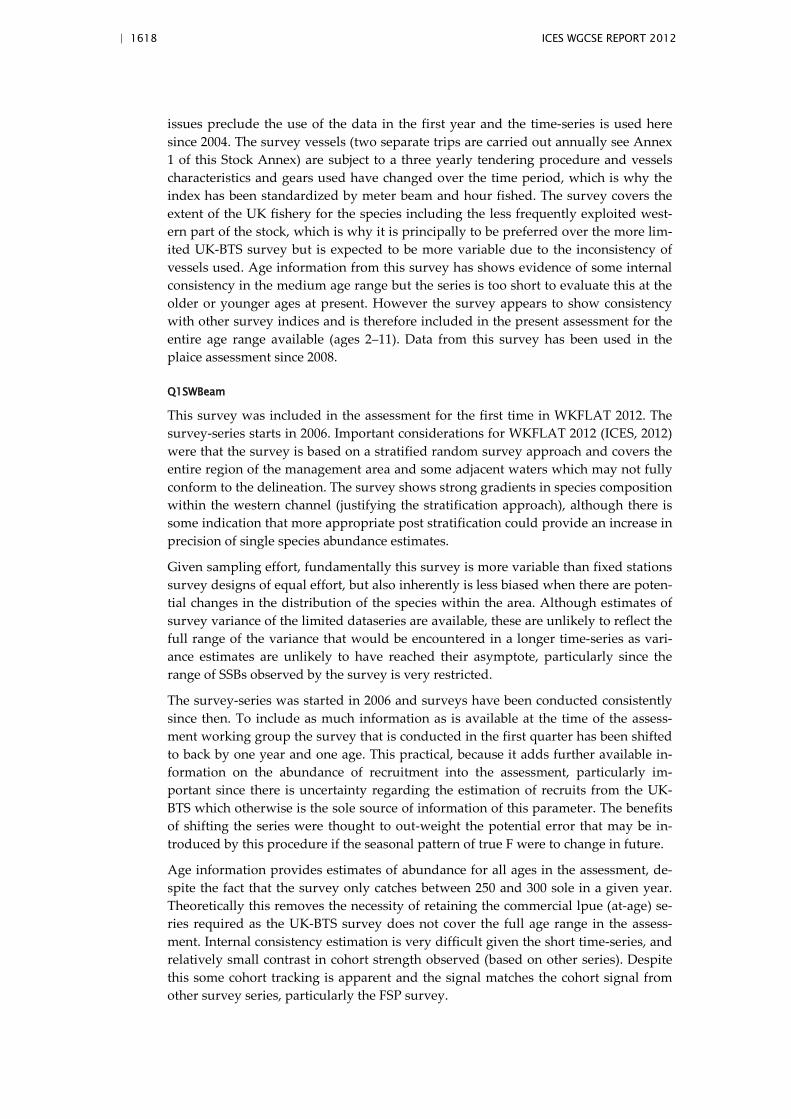
| 1618 ICES WGCSE REPORT 2012
issues preclude the use of the data in the first year and the time-series is used here since 2004. The survey vessels (two separate trips are carried out annually see Annex 1 of this Stock Annex) are subject to a three yearly tendering procedure and vessels characteristics and gears used have changed over the time period, which is why the index has been standardized by meter beam and hour fished. The survey covers the extent of the UK fishery for the species including the less frequently exploited west-ern part of the stock, which is why it is principally to be preferred over the more lim-ited UK-BTS survey but is expected to be more variable due to the inconsistency of vessels used. Age information from this survey has shows evidence of some internal consistency in the medium age range but the series is too short to evaluate this at the older or younger ages at present. However the survey appears to show consistency with other survey indices and is therefore included in the present assessment for the entire age range available (ages 2–11). Data from this survey has been used in the plaice assessment since 2008.
Q1SWBeam
This survey was included in the assessment for the first time in WKFLAT 2012. The survey-series starts in 2006. Important considerations for WKFLAT 2012 (ICES, 2012) were that the survey is based on a stratified random survey approach and covers the entire region of the management area and some adjacent waters which may not fully conform to the delineation. The survey shows strong gradients in species composition within the western channel (justifying the stratification approach), although there is some indication that more appropriate post stratification could provide an increase in precision of single species abundance estimates.
Given sampling effort, fundamentally this survey is more variable than fixed stations survey designs of equal effort, but also inherently is less biased when there are poten-tial changes in the distribution of the species within the area. Although estimates of survey variance of the limited dataseries are available, these are unlikely to reflect the full range of the variance that would be encountered in a longer time-series as vari-ance estimates are unlikely to have reached their asymptote, particularly since the range of SSBs observed by the survey is very restricted.
The survey-series was started in 2006 and surveys have been conducted consistently since then. To include as much information as is available at the time of the assess-ment working group the survey that is conducted in the first quarter has been shifted to back by one year and one age. This practical, because it adds further available in-formation on the abundance of recruitment into the assessment, particularly im-portant since there is uncertainty regarding the estimation of recruits from the UK-BTS which otherwise is the sole source of information of this parameter. The benefits of shifting the series were thought to out-weight the potential error that may be in-troduced by this procedure if the seasonal pattern of true F were to change in future.
Age information provides estimates of abundance for all ages in the assessment, de-spite the fact that the survey only catches between 250 and 300 sole in a given year. Theoretically this removes the necessity of retaining the commercial lpue (at-age) se-ries required as the UK-BTS survey does not cover the full age range in the assess-ment. Internal consistency estimation is very difficult given the short time-series, and relatively small contrast in cohort strength observed (based on other series). Despite this some cohort tracking is apparent and the signal matches the cohort signal from other survey series, particularly the FSP survey.
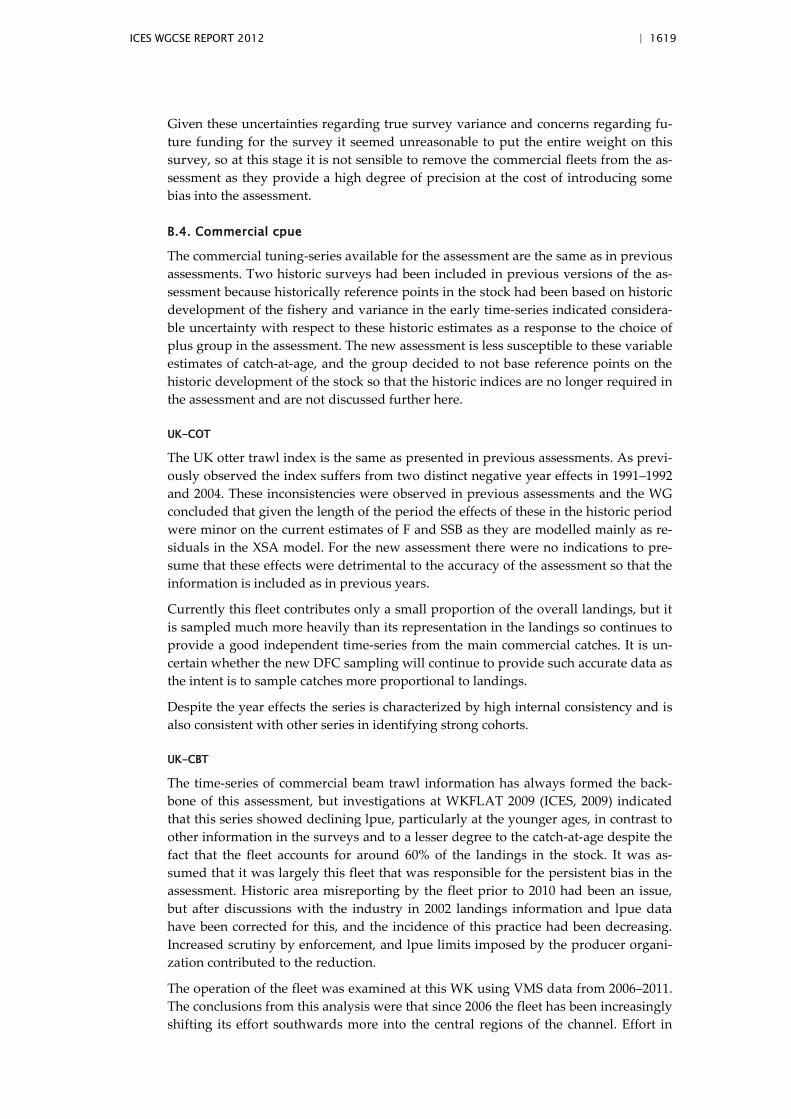
ICES WGCSE REPORT 2012 | 1619
Given these uncertainties regarding true survey variance and concerns regarding fu-ture funding for the survey it seemed unreasonable to put the entire weight on this survey, so at this stage it is not sensible to remove the commercial fleets from the as-sessment as they provide a high degree of precision at the cost of introducing some bias into the assessment.
B.4. Commercial cpue
The commercial tuning-series available for the assessment are the same as in previous assessments. Two historic surveys had been included in previous versions of the as-sessment because historically reference points in the stock had been based on historic development of the fishery and variance in the early time-series indicated considera-ble uncertainty with respect to these historic estimates as a response to the choice of plus group in the assessment. The new assessment is less susceptible to these variable estimates of catch-at-age, and the group decided to not base reference points on the historic development of the stock so that the historic indices are no longer required in the assessment and are not discussed further here.
UK-COT
The UK otter trawl index is the same as presented in previous assessments. As previ-ously observed the index suffers from two distinct negative year effects in 1991–1992 and 2004. These inconsistencies were observed in previous assessments and the WG concluded that given the length of the period the effects of these in the historic period were minor on the current estimates of F and SSB as they are modelled mainly as re-siduals in the XSA model. For the new assessment there were no indications to pre-sume that these effects were detrimental to the accuracy of the assessment so that the information is included as in previous years.
Currently this fleet contributes only a small proportion of the overall landings, but it is sampled much more heavily than its representation in the landings so continues to provide a good independent time-series from the main commercial catches. It is un-certain whether the new DFC sampling will continue to provide such accurate data as the intent is to sample catches more proportional to landings.
Despite the year effects the series is characterized by high internal consistency and is also consistent with other series in identifying strong cohorts.
UK-CBT
The time-series of commercial beam trawl information has always formed the back-bone of this assessment, but investigations at WKFLAT 2009 (ICES, 2009) indicated that this series showed declining lpue, particularly at the younger ages, in contrast to other information in the surveys and to a lesser degree to the catch-at-age despite the fact that the fleet accounts for around 60% of the landings in the stock. It was as-sumed that it was largely this fleet that was responsible for the persistent bias in the assessment. Historic area misreporting by the fleet prior to 2010 had been an issue, but after discussions with the industry in 2002 landings information and lpue data have been corrected for this, and the incidence of this practice had been decreasing. Increased scrutiny by enforcement, and lpue limits imposed by the producer organi-zation contributed to the reduction.
The operation of the fleet was examined at this WK using VMS data from 2006–2011. The conclusions from this analysis were that since 2006 the fleet has been increasingly shifting its effort southwards more into the central regions of the channel. Effort in
| 1620 ICES WGCSE REPORT 2012
Lyme Bay, the region where catch data and survey information indicate the majority of younger fish are found are now much lower than previously and have ceased al-most entirely in 2010 and 2011. This shift in the selectivity towards older ages is very apparent also from the catch-at-age information for the fleet from market sampling records suggesting that it would be appropriate to split the fleet on the basis of incon-sistent operation.
It was not possible from independent information to discern when the majority of the contrast in this information occurred, and hence to decide on appropriate time to split the series, because VMS data are not available prior to 2006. Information from the industry also confirmed that there had been changes in the operation of the fleet, but again suggested that these changes had been gradual, rather than abrupt making the choice of the year for a split of this fleet difficult. The WK determined that 2002, the period when the area misreporting was officially acknowledged, would be an appro-priate point for splitting and would also be suitable for the assessment, as this would retain a sufficiently long time-series over which to estimate the new catchabilities for the fleet. This new methodology was adapted and the UK-CBT fleet is used in the assessment as two fleets UK-CBT-early (1989–2002) and UK-BTS-late (2003–2010).
B.5. Other relevant data
None.
C. Assessment: data and method
Model used: extended survivor analysis.
Software used: FLXSA (version 1.4-2)
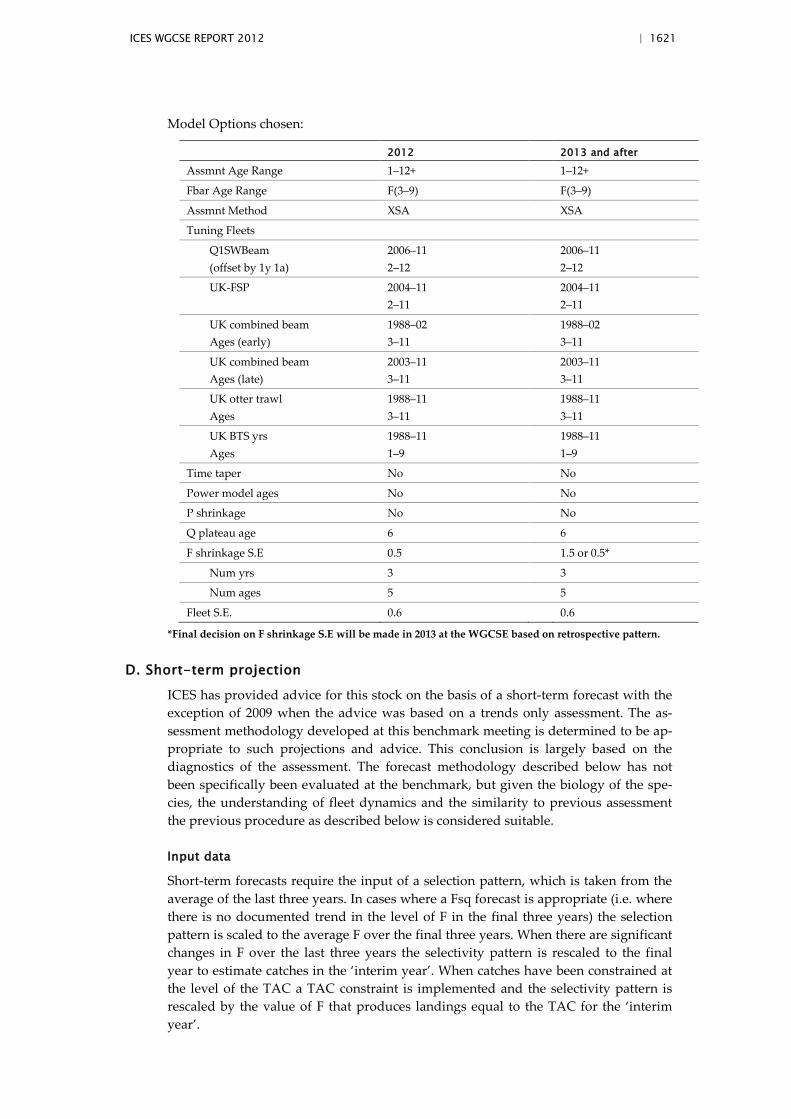
ICES WGCSE REPORT 2012 | 1621
Model Options chosen:
2012 2013 and after
Assmnt Age Range 1–12+ 1–12+
Fbar Age Range F(3–9) F(3–9)
Assmnt Method XSA XSA
Tuning Fleets
Q1SWBeam (offset by 1y 1a)
2006–11 2–12
2006–11 2–12
UK-FSP 2004–11 2–11
2004–11 2–11
UK combined beam Ages (early)
1988–02 3–11
1988–02 3–11
UK combined beam Ages (late)
2003–11 3–11
2003–11 3–11
UK otter trawl Ages
1988–11 3–11
1988–11 3–11
UK BTS yrs Ages
1988–11 1–9
1988–11 1–9
Time taper No No
Power model ages No No
P shrinkage No No
Q plateau age 6 6
F shrinkage S.E 0.5 1.5 or 0.5*
Num yrs 3 3
Num ages 5 5
Fleet S.E. 0.6 0.6
*Final decision on F shrinkage S.E will be made in 2013 at the WGCSE based on retrospective pattern.
D. Short-term projection
ICES has provided advice for this stock on the basis of a short-term forecast with the exception of 2009 when the advice was based on a trends only assessment. The as-sessment methodology developed at this benchmark meeting is determined to be ap-propriate to such projections and advice. This conclusion is largely based on the diagnostics of the assessment. The forecast methodology described below has not been specifically been evaluated at the benchmark, but given the biology of the spe-cies, the understanding of fleet dynamics and the similarity to previous assessment the previous procedure as described below is considered suitable.
Input data
Short-term forecasts require the input of a selection pattern, which is taken from the average of the last three years. In cases where a Fsq forecast is appropriate (i.e. where there is no documented trend in the level of F in the final three years) the selection pattern is scaled to the average F over the final three years. When there are significant changes in F over the last three years the selectivity pattern is rescaled to the final year to estimate catches in the ‘interim year’. When catches have been constrained at the level of the TAC a TAC constraint is implemented and the selectivity pattern is rescaled by the value of F that produces landings equal to the TAC for the ‘interim year’.

| 1622 ICES WGCSE REPORT 2012
Survivor estimates for fish greater than age three in the interim year are used in the projections. Recruits, including the last cohort in the assessment (age one, given as survivors at age 2) are not thought to be particularly reliably estimated as they are poorly selected even in the inshore survey so their values is replaced by geometric mean recruitment determined as in the paragraph below depreciated for natural mor-tality.
Recruitment in subsequent years is determined as geometric mean recruitment over the appropriate time-series. For this stock in recent year this is currently the entire time-series excluding the last two years (i.e. 1969–2008 for the 2011 assessment). His-torically there have been periods where recruitment was thought to be lower or high-er, in which case GM is calculated over a shorter recruitment-series, minus one year).
E. Medium-term projections
No longer applicable.
F. Long-term projections
Long-term projections are no longer carried out as part of the stock assessment pro-cedure at working groups. However, STECF (SGMOS 9-02, SGMOS 10-06a) carried out long-term simulations as part of the management plan evaluations. The method-ology examined the effects of different types of biases and uncertainty on the man-agement of the stock running stochastic simulations under similar assumptions to the short-term forecast. This method was also employed to derive the level of MSY Btrigger by WKFLAT 2012 (ICES, 2012).
G. Biological reference points
Biological reference points in this stock were originally set in 1998 as described in the Table below along with the reasoning and amended in 2001 to take account of a change to the assessment methodology.
WG(1998)/ACFM(1998) since WG(2001)/ACFM (2001)
Age range extended from 1–10+ to 1–12+
Flim 0.36 (Floss WG98) 0.28 (Floss WG01)
Fpa 0.26 (Flim*0.72) 0.20 (Flim*0.72)
Blim 1800 t (Bloss= B73 WG98) 2000 t (Bloss= B00 WG01)
Bpa 2500 t (Blim*1.4) 2800 t (Historical development)
The assessment methodology that formed the basis for these precautionary reference points was rejected by WKFLAT 2009 (ICES, 2009) and resulted in rejection of the reference points. ICES has adopted a provisional MSY Btrigger based on the former Bpa as the technical basis. Having developed a new assessment methodology during WKFLAT 2012 (ICES, 2012) appropriate values for the assessment, given a sound technical basis, were determined as shown below.
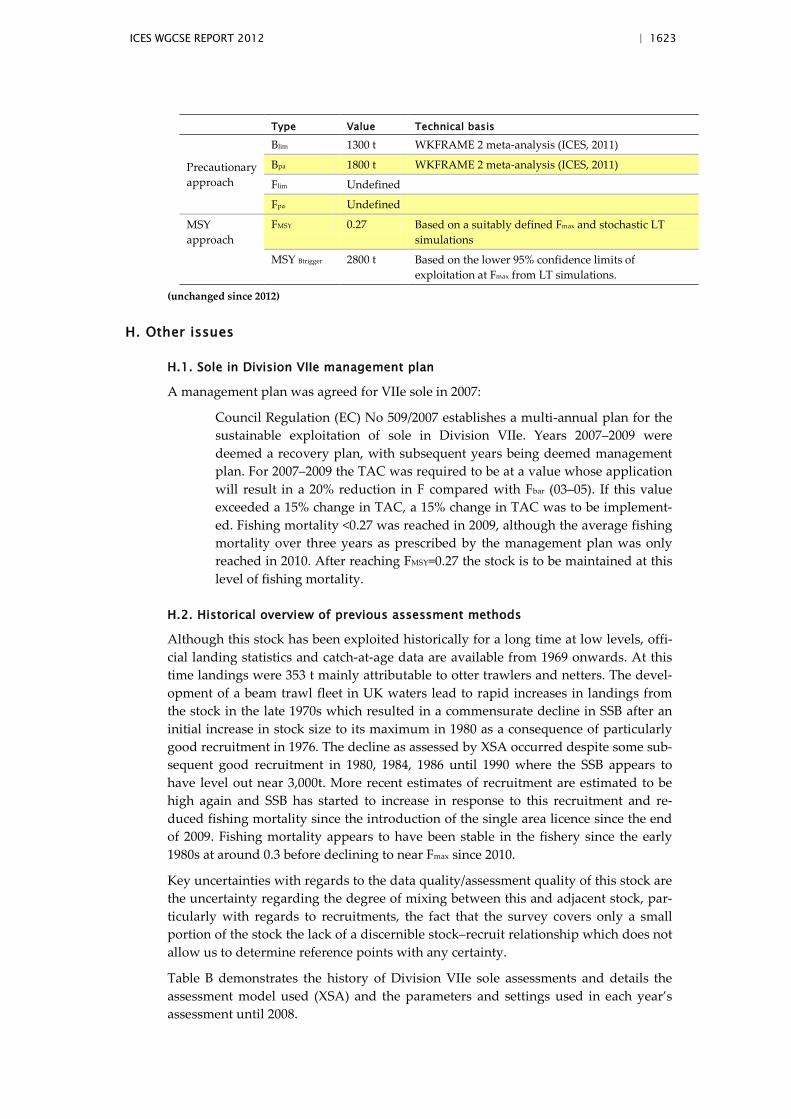
ICES WGCSE REPORT 2012 | 1623
Type Value Technical basis
Precautionary approach
Blim 1300 t WKFRAME 2 meta-analysis (ICES, 2011)
Bpa 1800 t WKFRAME 2 meta-analysis (ICES, 2011)
Flim Undefined
Fpa Undefined
MSY approach
FMSY 0.27 Based on a suitably defined Fmax and stochastic LT simulations
MSY Btrigger 2800 t Based on the lower 95% confidence limits of exploitation at Fmax from LT simulations.
(unchanged since 2012)
H. Other issues
H.1. Sole in Division VIIe management plan
A management plan was agreed for VIIe sole in 2007:
Council Regulation (EC) No 509/2007 establishes a multi-annual plan for the sustainable exploitation of sole in Division VIIe. Years 2007–2009 were deemed a recovery plan, with subsequent years being deemed management plan. For 2007–2009 the TAC was required to be at a value whose application will result in a 20% reduction in F compared with Fbar (03–05). If this value exceeded a 15% change in TAC, a 15% change in TAC was to be implement-ed. Fishing mortality <0.27 was reached in 2009, although the average fishing mortality over three years as prescribed by the management plan was only reached in 2010. After reaching FMSY=0.27 the stock is to be maintained at this level of fishing mortality.
H.2. Historical overview of previous assessment methods
Although this stock has been exploited historically for a long time at low levels, offi-cial landing statistics and catch-at-age data are available from 1969 onwards. At this time landings were 353 t mainly attributable to otter trawlers and netters. The devel-opment of a beam trawl fleet in UK waters lead to rapid increases in landings from the stock in the late 1970s which resulted in a commensurate decline in SSB after an initial increase in stock size to its maximum in 1980 as a consequence of particularly good recruitment in 1976. The decline as assessed by XSA occurred despite some sub-sequent good recruitment in 1980, 1984, 1986 until 1990 where the SSB appears to have level out near 3,000t. More recent estimates of recruitment are estimated to be high again and SSB has started to increase in response to this recruitment and re-duced fishing mortality since the introduction of the single area licence since the end of 2009. Fishing mortality appears to have been stable in the fishery since the early 1980s at around 0.3 before declining to near Fmax since 2010.
Key uncertainties with regards to the data quality/assessment quality of this stock are the uncertainty regarding the degree of mixing between this and adjacent stock, par-ticularly with regards to recruitments, the fact that the survey covers only a small portion of the stock the lack of a discernible stock–recruit relationship which does not allow us to determine reference points with any certainty.
Table B demonstrates the history of Division VIIe sole assessments and details the assessment model used (XSA) and the parameters and settings used in each year’s assessment until 2008.
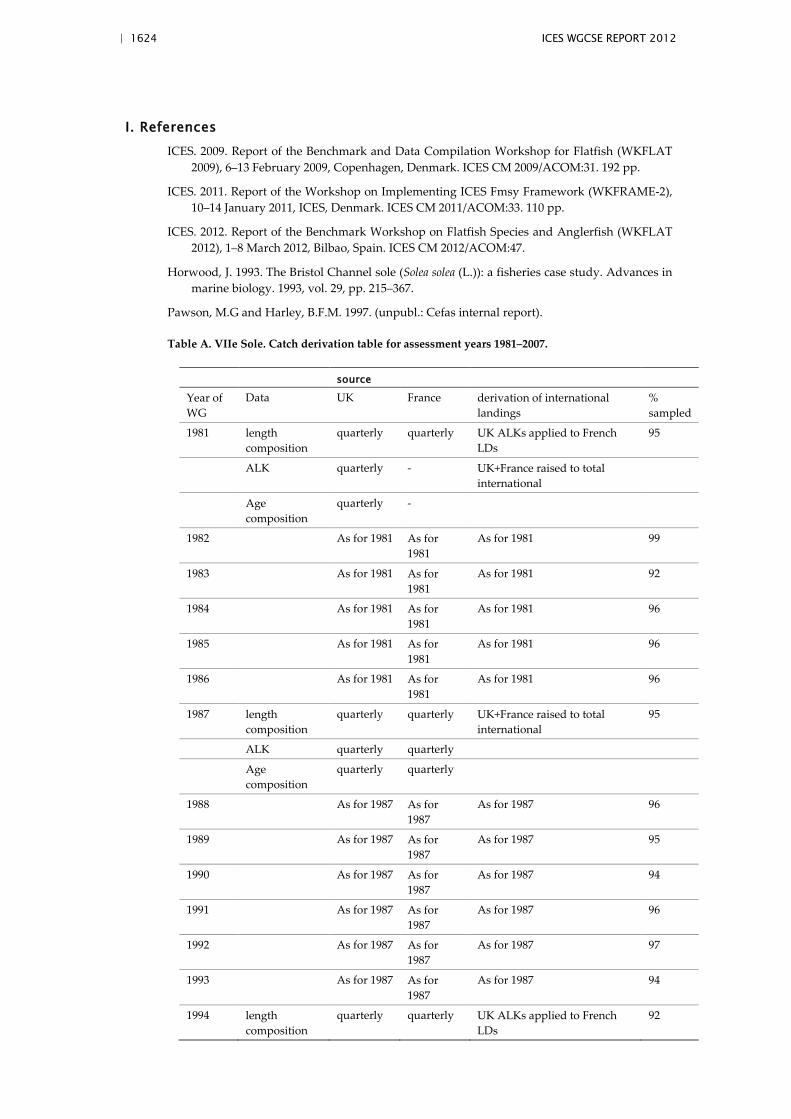
| 1624 ICES WGCSE REPORT 2012
I. References ICES. 2009. Report of the Benchmark and Data Compilation Workshop for Flatfish (WKFLAT
2009), 6–13 February 2009, Copenhagen, Denmark. ICES CM 2009/ACOM:31. 192 pp.
ICES. 2011. Report of the Workshop on Implementing ICES Fmsy Framework (WKFRAME-2), 10–14 January 2011, ICES, Denmark. ICES CM 2011/ACOM:33. 110 pp.
ICES. 2012. Report of the Benchmark Workshop on Flatfish Species and Anglerfish (WKFLAT 2012), 1–8 March 2012, Bilbao, Spain. ICES CM 2012/ACOM:47.
Horwood, J. 1993. The Bristol Channel sole (Solea solea (L.)): a fisheries case study. Advances in marine biology. 1993, vol. 29, pp. 215–367.
Pawson, M.G and Harley, B.F.M. 1997. (unpubl.: Cefas internal report).
Table A. VIIe Sole. Catch derivation table for assessment years 1981–2007.
source
Year of WG
Data UK France derivation of international landings
% sampled
1981 length composition
quarterly quarterly UK ALKs applied to French LDs
95
ALK quarterly - UK+France raised to total international
Age composition
quarterly -
1982 As for 1981 As for 1981
As for 1981 99
1983 As for 1981 As for 1981
As for 1981 92
1984 As for 1981 As for 1981
As for 1981 96
1985 As for 1981 As for 1981
As for 1981 96
1986 As for 1981 As for 1981
As for 1981 96
1987 length composition
quarterly quarterly UK+France raised to total international
95
ALK quarterly quarterly
Age composition
quarterly quarterly
1988 As for 1987 As for 1987
As for 1987 96
1989 As for 1987 As for 1987
As for 1987 95
1990 As for 1987 As for 1987
As for 1987 94
1991 As for 1987 As for 1987
As for 1987 96
1992 As for 1987 As for 1987
As for 1987 97
1993 As for 1987 As for 1987
As for 1987 94
1994 length composition
quarterly quarterly UK ALKs applied to French LDs
92
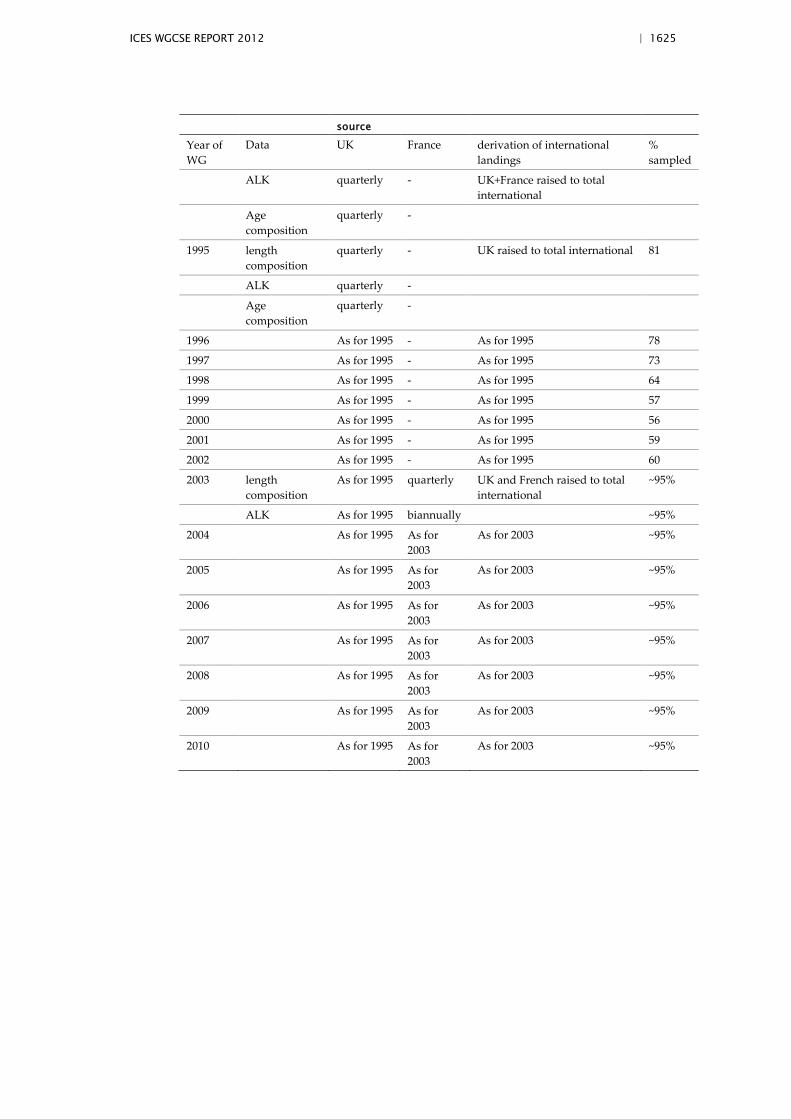
ICES WGCSE REPORT 2012 | 1625
source
Year of WG
Data UK France derivation of international landings
% sampled
ALK quarterly - UK+France raised to total international
Age composition
quarterly -
1995 length composition
quarterly - UK raised to total international 81
ALK quarterly -
Age composition
quarterly -
1996 As for 1995 - As for 1995 78
1997 As for 1995 - As for 1995 73
1998 As for 1995 - As for 1995 64
1999 As for 1995 - As for 1995 57
2000 As for 1995 - As for 1995 56
2001 As for 1995 - As for 1995 59
2002 As for 1995 - As for 1995 60
2003 length composition
As for 1995 quarterly UK and French raised to total international
~95%
ALK As for 1995 biannually ~95%
2004 As for 1995 As for 2003
As for 2003 ~95%
2005 As for 1995 As for 2003
As for 2003 ~95%
2006 As for 1995 As for 2003
As for 2003 ~95%
2007 As for 1995 As for 2003
As for 2003 ~95%
2008 As for 1995 As for 2003
As for 2003 ~95%
2009 As for 1995 As for 2003
As for 2003 ~95%
2010 As for 1995 As for 2003
As for 2003 ~95%
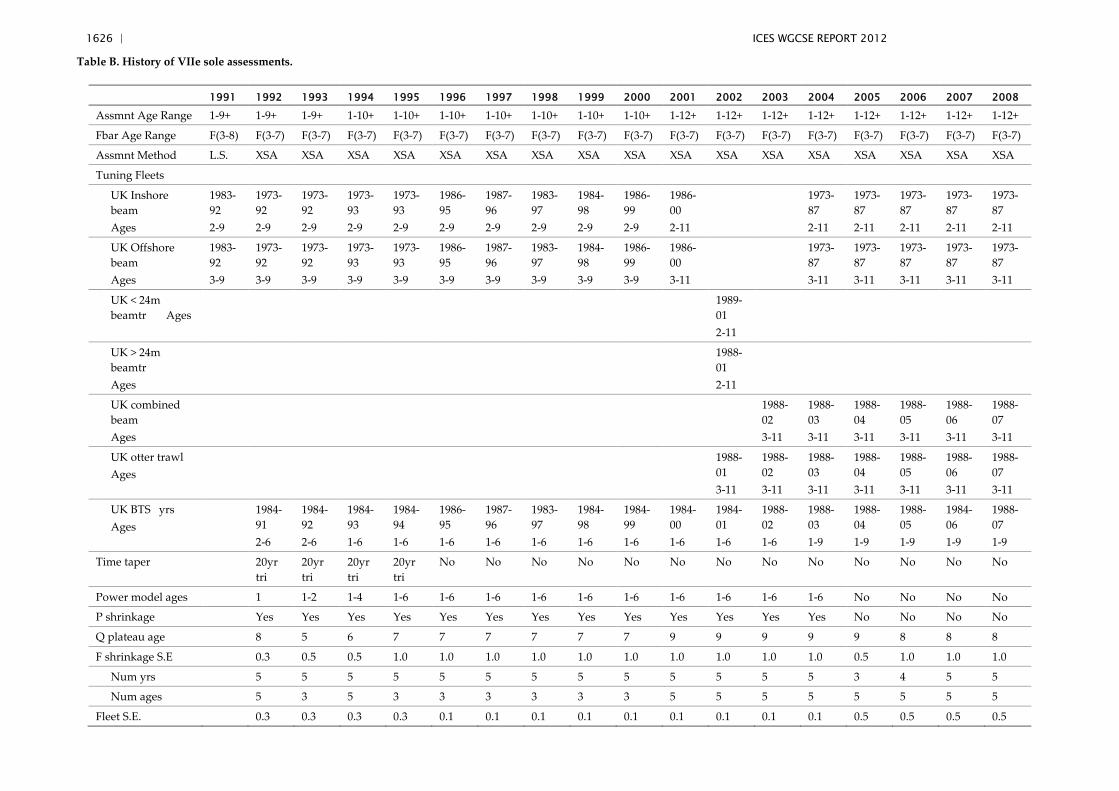
1626 | ICES WGCSE REPORT 2012
Table B. History of VIIe sole assessments.
1991 1992 1993 1994 1995 1996 1997 1998 1999 2000 2001 2002 2003 2004 2005 2006 2007 2008
Assmnt Age Range 1-9+ 1-9+ 1-9+ 1-10+ 1-10+ 1-10+ 1-10+ 1-10+ 1-10+ 1-10+ 1-12+ 1-12+ 1-12+ 1-12+ 1-12+ 1-12+ 1-12+ 1-12+
Fbar Age Range F(3-8) F(3-7) F(3-7) F(3-7) F(3-7) F(3-7) F(3-7) F(3-7) F(3-7) F(3-7) F(3-7) F(3-7) F(3-7) F(3-7) F(3-7) F(3-7) F(3-7) F(3-7)
Assmnt Method L.S. XSA XSA XSA XSA XSA XSA XSA XSA XSA XSA XSA XSA XSA XSA XSA XSA XSA
Tuning Fleets
UK Inshore beam Ages
1983-92 2-9
1973-92 2-9
1973-92 2-9
1973-93 2-9
1973-93 2-9
1986-95 2-9
1987-96 2-9
1983-97 2-9
1984-98 2-9
1986-99 2-9
1986-00 2-11
1973-87 2-11
1973-87 2-11
1973-87 2-11
1973-87 2-11
1973-87 2-11
UK Offshore beam Ages
1983-92 3-9
1973-92 3-9
1973-92 3-9
1973-93 3-9
1973-93 3-9
1986-95 3-9
1987-96 3-9
1983-97 3-9
1984-98 3-9
1986-99 3-9
1986-00 3-11
1973-87 3-11
1973-87 3-11
1973-87 3-11
1973-87 3-11
1973-87 3-11
UK < 24m beamtr Ages
1989-01 2-11
UK > 24m beamtr Ages
1988-01 2-11
UK combined beam Ages
1988-02 3-11
1988-03 3-11
1988-04 3-11
1988-05 3-11
1988-06 3-11
1988-07 3-11
UK otter trawl Ages
1988-01 3-11
1988-02 3-11
1988-03 3-11
1988-04 3-11
1988-05 3-11
1988-06 3-11
1988-07 3-11
UK BTS yrs Ages
1984-91 2-6
1984-92 2-6
1984-93 1-6
1984-94 1-6
1986-95 1-6
1987-96 1-6
1983-97 1-6
1984-98 1-6
1984-99 1-6
1984-00 1-6
1984-01 1-6
1988-02 1-6
1988-03 1-9
1988-04 1-9
1988-05 1-9
1984-06 1-9
1988-07 1-9
Time taper 20yr tri
20yr tri
20yr tri
20yr tri
No No No No No No No No No No No No No
Power model ages 1 1-2 1-4 1-6 1-6 1-6 1-6 1-6 1-6 1-6 1-6 1-6 1-6 No No No No
P shrinkage Yes Yes Yes Yes Yes Yes Yes Yes Yes Yes Yes Yes Yes No No No No
Q plateau age 8 5 6 7 7 7 7 7 7 9 9 9 9 9 8 8 8
F shrinkage S.E 0.3 0.5 0.5 1.0 1.0 1.0 1.0 1.0 1.0 1.0 1.0 1.0 1.0 0.5 1.0 1.0 1.0
Num yrs 5 5 5 5 5 5 5 5 5 5 5 5 5 3 4 5 5
Num ages 5 3 5 3 3 3 3 3 3 5 5 5 5 5 5 5 5
Fleet S.E. 0.3 0.3 0.3 0.3 0.1 0.1 0.1 0.1 0.1 0.1 0.1 0.1 0.1 0.5 0.5 0.5 0.5
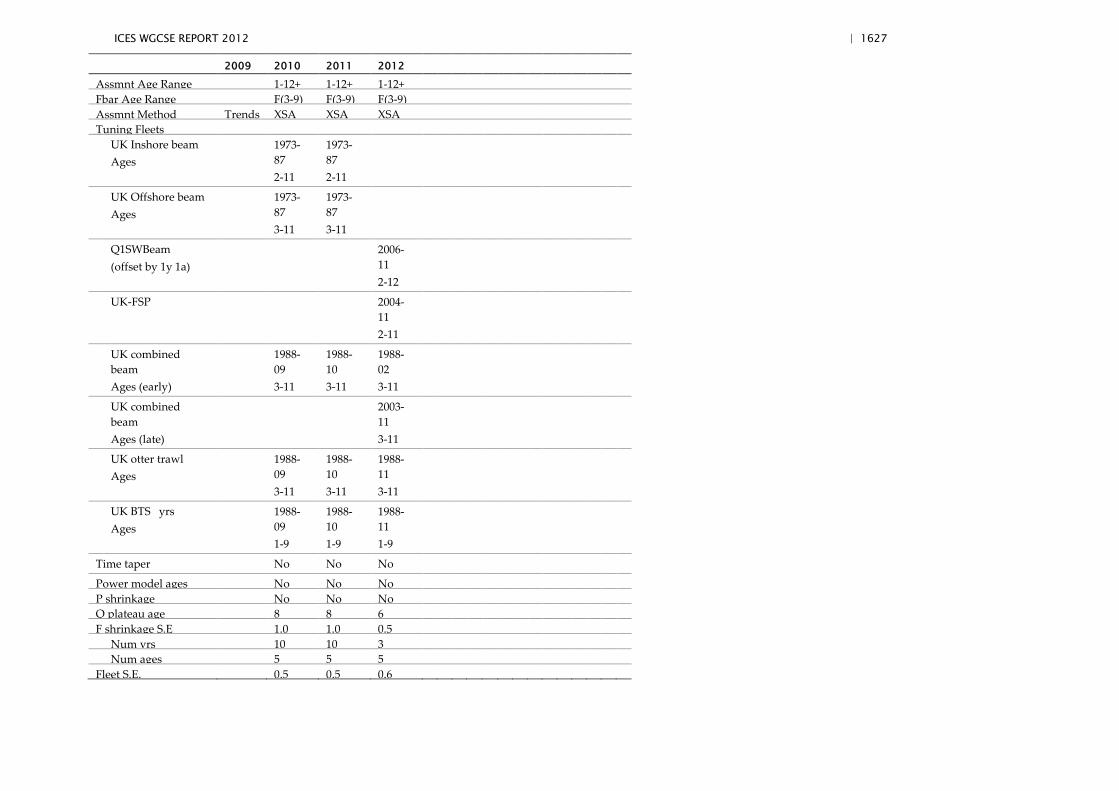
ICES WGCSE REPORT 2012 | 1627
2009 2010 2011 2012
Assmnt Age Range 1-12+ 1-12+ 1-12+ Fbar Age Range F(3-9) F(3-9) F(3-9) Assmnt Method Trends XSA XSA XSA Tuning Fleets UK Inshore beam
Ages
1973-87 2-11
1973-87 2-11
UK Offshore beam Ages
1973-87 3-11
1973-87 3-11
Q1SWBeam (offset by 1y 1a)
2006-11 2-12
UK-FSP 2004-11 2-11
UK combined beam Ages (early)
1988-09 3-11
1988-10 3-11
1988-02 3-11
UK combined beam Ages (late)
2003-11 3-11
UK otter trawl Ages
1988-09 3-11
1988-10 3-11
1988-11 3-11
UK BTS yrs Ages
1988-09 1-9
1988-10 1-9
1988-11 1-9
Time taper No No No
Power model ages No No No P shrinkage No No No Q plateau age 8 8 6 F shrinkage S.E 1.0 1.0 0.5 Num yrs 10 10 3 Num ages 5 5 5 Fleet S.E. 0.5 0.5 0.6
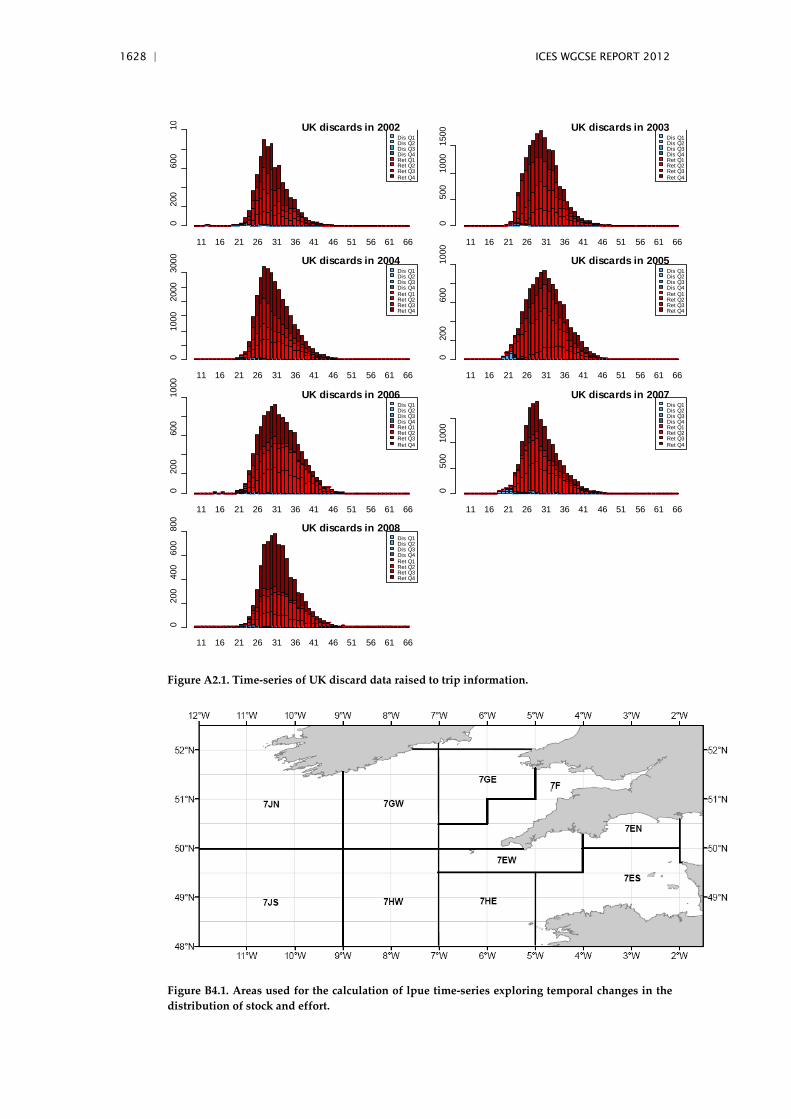
1628 | ICES WGCSE REPORT 2012
11 16 21 26 31 36 41 46 51 56 61 66
020
060
010 UK discards in 2002
Dis Q1Dis Q2Dis Q3Dis Q4Ret Q1Ret Q2Ret Q3Ret Q4
11 16 21 26 31 36 41 46 51 56 61 66
050
010
0015
00 UK discards in 2003Dis Q1Dis Q2Dis Q3Dis Q4Ret Q1Ret Q2Ret Q3Ret Q4
11 16 21 26 31 36 41 46 51 56 61 66
010
0020
0030
00 UK discards in 2004Dis Q1Dis Q2Dis Q3Dis Q4Ret Q1Ret Q2Ret Q3Ret Q4
11 16 21 26 31 36 41 46 51 56 61 66
020
060
010
00
UK discards in 2005Dis Q1Dis Q2Dis Q3Dis Q4Ret Q1Ret Q2Ret Q3Ret Q4
11 16 21 26 31 36 41 46 51 56 61 66
020
060
010
00
UK discards in 2006Dis Q1Dis Q2Dis Q3Dis Q4Ret Q1Ret Q2Ret Q3Ret Q4
11 16 21 26 31 36 41 46 51 56 61 66
050
010
00
UK discards in 2007Dis Q1Dis Q2Dis Q3Dis Q4Ret Q1Ret Q2Ret Q3Ret Q4
11 16 21 26 31 36 41 46 51 56 61 66
020
040
060
080
0
UK discards in 2008Dis Q1Dis Q2Dis Q3Dis Q4Ret Q1Ret Q2Ret Q3Ret Q4
Figure A2.1. Time-series of UK discard data raised to trip information.
Figure B4.1. Areas used for the calculation of lpue time-series exploring temporal changes in the distribution of stock and effort.