Embed Size (px)
Citation preview

annualecoNoMic outlook
con fe ren ce
January 12, 2006

Office of the President Welcome to the University of New Mexico and the 2006 New Mexico Economic Outlook Conference. We recognize the challenges New Mexico faces in securing a place of importance in the changing economy, and we are committed to taking a leadership position in identifying and meeting those challenges. We know our community leaders want the best possible information as they make critical economic decisions. The business community in particular recognizes the importance of having a grasp of emerging trends before the future unfolds. This is what we offer you today. The UNM Bureau of Business and Economic Research, working with our partners, Wells Fargo, the Public Service Company of New Mexico, the Greater Albuquerque Chamber of Commerce and the New Mexico Business Weekly, have found the best information available about our local, regional and national economy as we go into 2006. This partnership with the business community has proven to be invaluable and will continue to do so as we move into the future. Join us in looking forward to a prosperous new year. Sincerely, Louis Caldera President

1
Institute for Applied Research Services Bureau of Business and Economic Research 1920 Lomas Blvd. NE Albuquerque, NM 87131-6021 (505) 277-2216 January 12, 2006 Dear Economic Outlook Conference Attendees; Welcome to the Annual New Mexico Economic Outlook Conference, 2006. With this conference BBER revives an old tradition of holding an annual economic outlook conference. Our goal is not simply to present BBER’s forecast for 2006 and beyond, although we will do that, but more broadly to provide understanding and offer insights regarding the changing structure of the New Mexico economy and the opportunities as well as the challenges we face. Whether we like it or not, what happens in the New Mexico economy today is influenced by developments in the surrounding region, by national economic policies and developments elsewhere in the US (Hurricanes Katrina and Rita come to mind), and, increasingly, by developments in that ever expanding global economy to which we are today inextricably tied (in this “flattening world”, as Friedman describes it). So we have sought to complement our in-house expertise on New Mexico with the regional perspective offered by Dr. Kelly Matthews of Wells Fargo and the national and international perspectives offered by one of the foremost economists and prognosticators, Dr. Narriman Behravesh, Chief Economist at Global Insight (formerly Wharton Econometrics and Data Resource Inc.). Through this conference we hope to give our New Mexico businesses useful information about the environment in which they operate. We also hope to assist in advancing sound economic development decisions by policy-makers throughout the state. BBER staff began talking seriously about holding an annual economic outlook conference a little less than a year ago. Many months of hard work by a number of people have turned that dream into a reality. On our staff, I want to appreciate Drs. Larry Waldman and Bob Grassberger who took the idea and continued to run with it, attending all the planning meetings and seeing to the myriad of details that can make or break an event. I also want to give special thanks to John Garcia who loved the idea and was able to pull together a team to make it happen in early 2006. This event would not have been possible were it not for our sponsoring partners – Wells Fargo, the Greater Albuquerque Chamber of Commerce, Public Service Company of New Mexico, and the New Mexico Business Weekly. They have helped us plan every step of this conference and provided the resources to make it happen. I also need to recognize the contribution of UNM staff and expertise from the Offices of the Vice Presidents for Research and Economic Development, Institutional Advancement, and from Health Sciences.

2
The BBER is greatly indebted to these organizations and the following persons who were involved as committee members:
Wells Fargo Deanne McElroy
GACC Michael Selliger PNM Carol Radosovich
Debra Inman
NM Business Weekly Sherri Wells Kimberly Holmes
UNM
Research & Economic Development John Garcia Dolores Gonzales Juliette Lagasse-Martinez
Communications and Marketing Karen Wentworth
Cinnamon Blair Steve Carr
UNM’s BBER will celebrate its 61st birthday this year. The Annual New Mexico Economic Outlook Conference is but one way we seek to serve New Mexico businesses and government. The BBER also performs economic and demographic research on a contract basis, provides access and expertise about economic and business data through our Data Bank, and makes forecasts of the state’s economic future. To learn more about the BBER please see our web site at http://www.unm.edu/~bber. As indicated in the conference title and above, our intent is to make this an annual event. As such, your input is important to us. If you have ideas as to how we can add value to the conference, please let us know. Please make sure that you give us input by filling out the evaluation form that you were provided when you received this booklet of the conference proceedings. Again, welcome.
Dr. Lee A. Reynis, Director Institute for Applied Research Services Bureau of Business and Economic Research

AGENDA 1:30 Registration 1:55 Call to seats 2:00 Opening remarks, Louis Caldera, President, University of New Mexico Lee Reynis, Director, Bureau of Business and Economic Research 2:15 Nariman Behravesh, Ph.D., Chief Economist and Executive Vice President. Global Insight "Economic Outlook and Risks for the U.S. and Global Economies" 3:25 Kelly Matthews, Ph.D., Senior Economist and Executive Vice President, Wells Fargo “Can the Southwest Economy Continue to Prosper?” 4:00 Lawrence Waldman, Ph.D., Senior Economist, Bureau of Business and Economic Research,
University of New Mexico “The New Mexico Economy: Recent Developments and Outlook” 4:30 Break 4:50 Q & A panel of three economists, moderator---Dan Shingler, Editor, New Mexico Business
Weekly 5:15 Summary of presentations—Dan Shingler 5:25 Closing Comments---Cindi McGill, Chairman, Greater Albuquerque Chamber of Commerce
Vice President, Customer and Market Services, PNM Greg Winegardner, Regional President, New Mexico Region, Wells Fargo 5:35 Reception

Dr. Nariman Behravesh is Chief Economist and Executive Vice President for Global Insight (formerly DRI-WEFA). Directing Global Insight's entire forecasting process, he is responsible for developing the economic outlook and risk analysis for the United States, Europe, Japan, and emerging markets. He oversees the work of over 200 professionals, located in North America and Europe, who cover economic, financial, and political developments in over 180 countries.
Behravesh and his team were designated #1 in USA Today's 2004 ranking of top economic forecasters, and in Reuters' 2004 survey of major currency exchange rate forecasters. In The Wall Street Journal's annual ranking of US forecasters, Behravesh was the only forecaster to place in the top six for both 2003 and 2004.
As Global Insight's chief spokesperson, Behravesh is quoted extensively in the media on such topics as the outlook for the US and global economies, oil prices, exchange rates, the budget deficit, the trade deficit, globalization, country risk, and emerging markets crises. He is cited frequently in leading business publications such as The Wall Street Journal, The New York Times, The Financial Times, USA Today, Investor's Business Daily, Business Week, Newsweek, Fortune, Forbes and U.S. News and World Report. He also regularly appears on national radio and television programs including BBC World Business Report, NBC Nightly News, CNN Headline News, The NewsHour with Jim Lehrer (PBS), Your World with Neil Cavuto (Fox News), CNBC's Closing Bell, Bloomberg TV's World Financial Report, and All Things Considered on National Public Radio.
Behravesh was the host of the PBS television series "Inside the Global Economy." He has authored numerous articles in such publications as European Affairs and Credit Week, co-authored two books– Economics U$A and Microcomputers, Corporate Planning and Decision Support Systems–and was a contributing author to a recent book on scenario analysis, entitled Learning From the Future.
Before joining Global Insight, Behravesh was chief international economist for Standard & Poor's. Prior to that, he was president and CEO of Oxford Economics U.S.A., Inc. He also spent ten years at the WEFA Group, where he held a number of positions, including group senior vice president. Early in his career Behravesh worked at the Congressional Budget Office and the Federal Reserve.
Behravesh holds Ph.D. and M.A. degrees in economics from the

Behravesh holds Ph.D. and M.A. degrees in economics from the University of Pennsylvania, and a B.Sc. from the Massachusetts Institute of Technology. He has lived in Europe and the Middle East, and is fluent in several languages. He travels extensively to Europe, Asia, Africa, and Latin America.
Outlook and Risks for
The U.S. and Global Economies
Nariman Behravesh
Chief Economist Global Insight
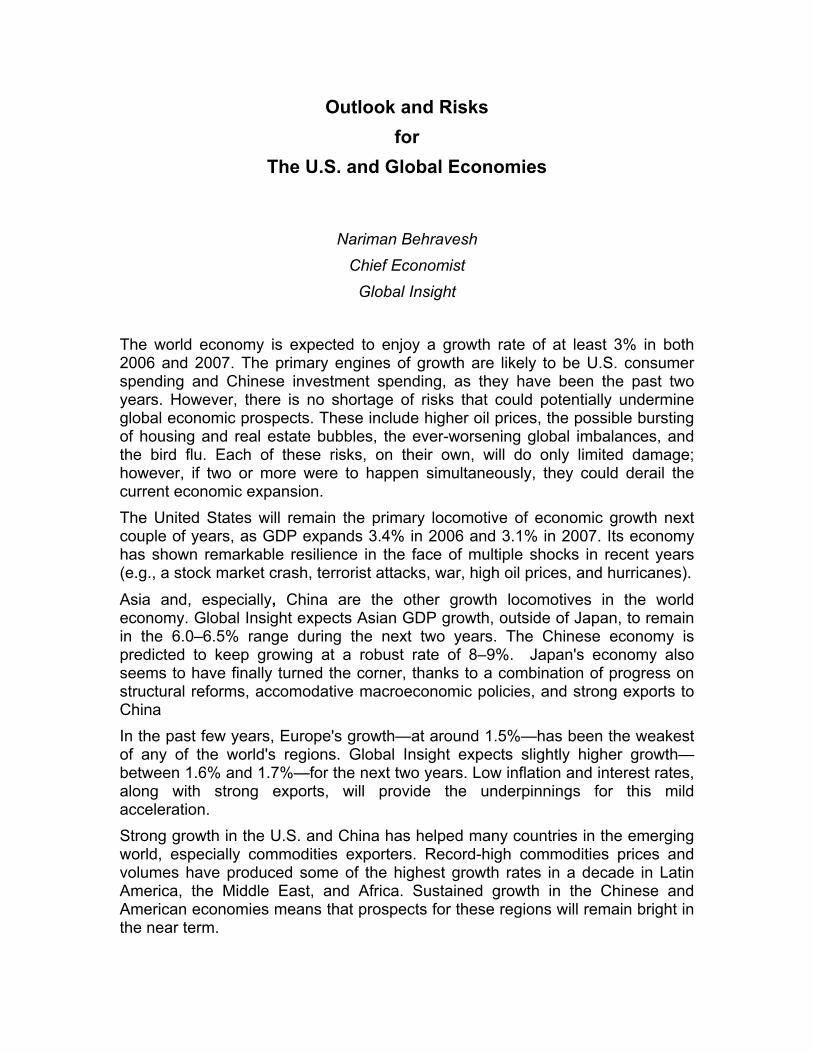
The world economy is expected to enjoy a growth rate of at least 3% in both 2006 and 2007. The primary engines of growth are likely to be U.S. consumer spending and Chinese investment spending, as they have been the past two years. However, there is no shortage of risks that could potentially undermine global economic prospects. These include higher oil prices, the possible bursting of housing and real estate bubbles, the ever-worsening global imbalances, and the bird flu. Each of these risks, on their own, will do only limited damage; however, if two or more were to happen simultaneously, they could derail the current economic expansion. The United States will remain the primary locomotive of economic growth next couple of years, as GDP expands 3.4% in 2006 and 3.1% in 2007. Its economy has shown remarkable resilience in the face of multiple shocks in recent years (e.g., a stock market crash, terrorist attacks, war, high oil prices, and hurricanes).
Asia and, especially, China are the other growth locomotives in the world economy. Global Insight expects Asian GDP growth, outside of Japan, to remain in the 6.0–6.5% range during the next two years. The Chinese economy is predicted to keep growing at a robust rate of 8–9%. Japan's economy also seems to have finally turned the corner, thanks to a combination of progress on structural reforms, accomodative macroeconomic policies, and strong exports to China In the past few years, Europe's growth—at around 1.5%—has been the weakest of any of the world's regions. Global Insight expects slightly higher growth—between 1.6% and 1.7%—for the next two years. Low inflation and interest rates, along with strong exports, will provide the underpinnings for this mild acceleration. Strong growth in the U.S. and China has helped many countries in the emerging world, especially commodities exporters. Record-high commodities prices and volumes have produced some of the highest growth rates in a decade in Latin America, the Middle East, and Africa. Sustained growth in the Chinese and American economies means that prospects for these regions will remain bright in the near term.

11
Copyright © 2005 Global Insight, Inc.
Economic Outlook and Risksfor
The U.S. and Global Economies
Nariman BehraveshChief Economist
University of New MexicoJanuary 12, 2006
Copyright © 2005 Global Insight, Inc. 210/2005
Outline of the Presentation
Storm CloudsHigh Oil PricesHousing BubblesGrowth and Policy ImbalancesSavings “Glut”/ Investment “Dearth”Avian Flu
Global OutlookRelatively Clear Sailing for Another Year or Two, Despite Serious Structural Problems
What Would It Take to Trigger a Recession?
Copyright © 2005 Global Insight, Inc. 310/2005
Why Oil Prices Will Stay High...But Not A Problem
High oil prices becauseRobust energy demand growth Relatively modest investment in exploration and drilling High vulnerability to (and fears of) supply disruptionsNo shortage of potential risks (strikes in Venezuela, rebel activity in Nigeria, sabotage in Iraq, coup in the Middle East or Africa)So, the risks are overwhelmingly on the upside for oil prices
Why Near-Record High Energy Prices Are Not a Problem—YetHigh prices are demand driven, and growth momentum is strongPetro dollars quickly recycled through investments and financial flowsZero inflationary pressures thanks to increased global competitionPrudent monetary policies induce stable inflation expectationsHigher energy efficiency in most industrial economiesEnergy subsidies in emerging markets cushions higher costsInflation-adjusted prices are still below their early 1980s peaks

22
Copyright © 2005 Global Insight, Inc. 410/2005
15
30
45
60
75
2002 2003 2004 2005 2006 2007
Oil Prices
(U.S. dollar per barrel, WTI)
Oil Prices Have Tripled Since 2002 …
Copyright © 2005 Global Insight, Inc. 510/2005
… As Growth Accelerated
0
1
2
3
4
5
2002 2003 2004 2005 2006 2007 2008 2009
World GDP Growth
(Percent change in real GDP)
Copyright © 2005 Global Insight, Inc. 610/2005
How Big of a Threat is Housing?
House prices have risen in many industrial and emerging markets, not just the U.S. and U.K.
While there is no national U.S. bubble, a few regional markets (the Boston to Washington corridor, Florida, and California) have valuations that are much higher than market fundamentals
The global rise in home prices has been driven by the fall in long-term interest rates
There is also a loose correlation between economic growth and house price inflation

33
Copyright © 2005 Global Insight, Inc. 710/2005
House Price Inflation
-75 0 75 150 225 300
Hong KongJapan
GermanySwitzerland
SwedenCanadaFrance
DenmarkBelgium
N. ZealandItalyU.S.
NetherlandsAustralia
BritainSpain Ireland
S. Africa(Percent increase 1997-2005)
Source: The Economist
Copyright © 2005 Global Insight, Inc. 810/2005
House Price Inflation – U.S.
0 25 50 75 100 125 150 175 200
DallasHouston
DetroitChicagoDenver
MinneapolisWashington, D.C.
New YorkMiami
BostonSan Francisco
Los AngelesSan Diego
(Percent increase 1997-2005, average existing homes)
Copyright © 2005 Global Insight, Inc. 910/2005
100125150
175200225250
275300
1990 1992 1994 1996 1998 2000 2002 2004 2006
(Average price of existing homes, thousands of U.S. dollars)
The U.S. Boom Is Likely to Fizzle Out Rather Than Bust

44
Copyright © 2005 Global Insight, Inc. 1010/2005
0.6
0.9
1.2
1.5
1.8
2.1
2.4
2.7
1971 1974 1977 1980 1983 1986 1989 1992 1995 1998 2001 2004 2007
Housing Starts
(Millions)
U.S. Housing Starts Are Expected To Slip, But Not Plunge
Copyright © 2005 Global Insight, Inc. 1110/2005
What If Housing Bubbles Burst?
The recent experiences in the U.K. and Australia suggest that it may not take a big rise in long-term interest rates to trigger a fall in house prices
Even if house prices stop rising, the impact on consumer spending could be substantial
If national house prices fall by 10%, real GDP growth could be cut by 1% to 2%
While such a scenario may not happen at the national level, it could easily happen in regional housing markets
Copyright © 2005 Global Insight, Inc. 1210/2005
The Other Storm Clouds
Growth and Policy ImbalancesOutput gaps--divergent trends across the world Policies—U.S. too loose, Eurozone and Japan too tight Near-term growth--domestic-led in the U.S., export-led in the rest of the worldLonger-term growth—lopsided, only 1.5% in Europe and Japan
“Glut” of Savings or “Dearth” of Investment?The savings glut—major factor for falling global long-term bond yields over the past 15 years Too little investment relative to saving in emerging marketsToo little saving relative to investment in the U.S.While this “imbalance” is unlikely to persist in the long term, it will probably go on for some time, because it is mutually beneficial

55
Copyright © 2005 Global Insight, Inc.
Assessing the Impact of
Avian Flu on
World GDP
Copyright © 2005 Global Insight, Inc. 1410/2005
How Bad a Pandemic?
The WHO estimates that a “medium-level” pandemic would kill 2 million to 7 million people world-wide
In the U.S., this would mean 60,000 to 200,000 deaths (compared with 500,000 in 1918-19; 70,000 in 1957-58; and 34,000 in 1968-69)
In China, the death rate would be 500,000 to 2 million
In each case, the number of people hospitalized would be 3 to 5 times higher, and the number of people with the flu would be 10% to 30% of the population
Given that the pandemic would likely start in Asia, and given higher population densities in the region, the death rates in Asia would be proportionally higher than other parts of the world
Copyright © 2005 Global Insight, Inc. 1510/2005
Fatalities By Region of a Medium-Level Pandemic
(Millions)(Percent)
7.402.00100Total
1.200.3216Middle East & Africa
0.600.168Latin America
1.400.4017India
2.000.5020China
4.401.2055Asia-Pacific
0.600.168CIS & CEB
0.360.108European Union
0.200.065United States
High CaseLow CasePopulation Shares
Based on WHO estimates, the U.S. and EU are assumed to have proportionally fewer deaths and Asia is assumed to have proportionally higher deaths

66
Copyright © 2005 Global Insight, Inc. 1610/2005
Supply-Side Impacts
Supply-side impactsDeathsWorker absenteeismOverwhelmed healthcare systemsClosed schools and public transit systemsRestrictions on in-bound travel, tourism, and trade (and a severe crackdown on illegal immigration)
Unlike AIDS (which has the highest incidence among workers in the 20-50 year range), 70% to 80% of flu-related deaths would be among the very young and very old
For a mild pandemic, the supply-side effects would be relatively small – no more than 0.5% of GDP, and last no more than a year
In a more serious pandemic, the supply-side impacts could be much larger – 1% to 2% of GDP – and last much longer (at least two years)
Copyright © 2005 Global Insight, Inc. 1710/2005
Demand-Side Impacts
The demand-side impacts would likely be 2 to 5 times greater than the supply-side impactsSARS only caused about 800 deaths, but reduced Asian GDP growth by 2% in 2003Q2, and by 0.5% in all of 2003The demand-side impacts include most categories of discretionary spending
Travel/mass transitTourismRetail/wholesale (except on-line)Hotels/restaurantsOther entertainment (movies, theaters, concerts and sporting events)
Over-reaction by financial markets could exacerbate the demand-side effectsThe response of national and local governments would be crucial in limiting the negative impact on consumer and business confidenceExport-oriented economies are especially vulnerable to demand-side shocks
Copyright © 2005 Global Insight, Inc. 1810/2005
Impacts on Global GDP Growth
Supply-Side
World depressionWorld recession –relatively quick rebound
Asia: -7% to -15%Asia: -5% to -7%
World: -6% to -10%World: -4% to -5%
Strong Reaction
World recession –protracted stagnationSARS writ large
Asia: -4% to -5%Asia: -2% to -3%
World: -3% to -4%World: -1% to -2%
Mild Reaction
Severe PandemicMedium Pandemic
Dem
and-
Side

77
Copyright © 2005 Global Insight, Inc.
Global Outlook:Relatively Clear Sailing
for Another Year or Two, Despite Serious Structural Problems
Copyright © 2005 Global Insight, Inc. 2010/2005
0
1
2
3
4
5
1990 1992 1994 1996 1998 2000 2002 2004 2006 2008 2010
(Real GDP, percent change)
Growth in the World Economy
Copyright © 2005 Global Insight, Inc. 2110/2005
0.0
1.5
3.0
4.5
6.0
7.5
NAFTA OtherAmericas
WesternEurope
EmergingEurope
Japan OtherAsia
MiddleEast
Africa
2003 2004 2005 2006 2007
Growth Remains Very Uneven Across the World
(Real GDP, percent change)

88
Copyright © 2005 Global Insight, Inc. 2210/2005
World Growth Contributions 2000-2005
(Percent)
16Western Europe
30United States
5Japan
5India
14China
34Asia-Pacific
Copyright © 2005 Global Insight, Inc. 2310/2005
United States: A Strong Dynamic Locomotive, or…
The resilience of the U.S. economy in the face of repeated shocks has been remarkable
Above average productivity growth (still) and competitive markets mean that robust growth (by industrial country standards) and low inflation can be sustained
Strong growth in exports (thanks to a weaker dollar) and capitalspending (thanks to a surge in profits) will offset weaker consumer and government spending
With the right kind of political leadership, the U.S. budget deficit is a manageable problem—though U.S. deficit reduction, alone, will not do much to reduce the global imbalances
Global savings flows into the U.S. are financing global growth, and not American profligacy (which is not extreme by OECD standards)
Copyright © 2005 Global Insight, Inc. 2410/2005
United States: …An Accident Waiting to Happen?
High (and rising?) oil prices will push up inflation and the current account deficit—the question is: how much?Among the OECD countries, the U.S. is the most vulnerable to higher inflationary pressures……Which, along with a weaker dollar, could push interest rates up a lot……And hurt the housing marketNot enough of the global savings that flows into the U.S. has gone into productive investments (esp. in the tradable goods sectors) and too much has gone into housing, consumer, and government spendingThe U.S. is becoming increasingly vulnerable to shifts in portfolio re-allocations by central banks (for political reasons) and private investors (if they lose confidence in the U.S.)

99
Copyright © 2005 Global Insight, Inc. 2510/2005
United States
Bottom Line:
While the ever-growing U.S. imbalances are not sustainable in the medium- to long-term, a painful unwinding is far from inevitable, given the American economy’s strong growth potential and resilience
Copyright © 2005 Global Insight, Inc. 2610/2005
-1,000-800-600-400-200
0
2000 2002 2004 2006 2008
United States
80
90
100
110
120
2000 2002 2004 2006 2008
0
1
2
3
4
2000 2002 2004 2006 2008012345
2000 2002 2004 2006 2008
Real GDP Growth Inflation
Real Exchange Rate* Current Account Balance**
*FRB broad index, March 1973=100**Billions of U.S. dollars
Copyright © 2005 Global Insight, Inc. 2710/2005
3.5
4.0
4.5
5.0
5.5
6.0
6.5
2000 2001 2002 2003 2004 2005 2006 2007 2008
(Consumer energy spending, percent of disposable income)
Energy Costs Are Biting Into U.S. Disposable Income

1010
Copyright © 2005 Global Insight, Inc. 2810/2005
U.S. Corporate Cash Flow Is at Record Levels
7
8
9
10
11
12
1970 1974 1978 1982 1986 1990 1994 1998 2002 2006 2010
(Net corporate cash flow, percent of GDP)
Copyright © 2005 Global Insight, Inc. 2910/2005
-30
-20
-10
0
10
20
1999 2000 2001 2002 2003 2004 2005 2006 2007
Equipment and Software Buildings
(Percent change from a year earlier, real spending)
The Business Capital Spending Cycle in the U.S.
Copyright © 2005 Global Insight, Inc. 3010/2005
1.0
1.5
2.0
2.5
3.0
3.5
4.0
1999 2000 2001 2002 2003 2004 2005 2006 2007
All-Urban CPI Core CPI
(Percent change from a year earlier)
U.S. Core Inflation Has Risen – Probably Will Rise A Little More

1111
Copyright © 2005 Global Insight, Inc. 3110/2005
0
1
2
3
4
5
6
7
1999 2000 2001 2002 2003 2004 2005 2006 2007
Federal Funds 2-Year Treasury Yield 10-Year Treasury Yield
(Percent)
The Fed Has More Work to Do
Copyright © 2005 Global Insight, Inc. 3210/2005
Europe: A Source of Stability, or…
Not one Europe, but many
EU expansion (and competition from Asia) will likely accelerate reforms—a little
Europe is a savings surplus region, which should help it in a crisis (e.g. an oil shock)
Inflationary pressures may be more muted than in the U.S. (because of growing output gaps and a stronger currency)
European companies have done better than European economies
A stronger euro (and surplus savings) will increase Europe’s financial clout—Switzerland writ large?
Copyright © 2005 Global Insight, Inc. 3310/2005
Europe: …Dangerous Stagnation?
Weak growth momentum means a greater vulnerability to shocks
Macro policies are (still) too restrictive
Recent political turmoil has more to do with weak growth than fears of globalization and enlargement
Declining productivity growth and growing output gaps are serious political and economic threats
Rising youth unemployment and low labor force participation will increase political tensions and worsen the pensions burden
Budget challenges are more daunting than the U.S. given lower trend growth, more rapidly aging populations, and higher tax rates
Progress on reforms has been too slow

1212
Copyright © 2005 Global Insight, Inc. 3410/2005
Europe
Bottom Line:
While the doom and gloom about Europe has undoubtedly been overdone, it faces much bigger challenges than the U.S.
Copyright © 2005 Global Insight, Inc. 3510/2005
-40-20
0204060
2000 2002 2004 2006 2008
Eurozone
0.5
0.7
0.9
1.1
1.3
2000 2002 2004 2006 2008
1.5
1.8
2.1
2.4
2.7
2000 2002 2004 2006 20080
1
2
3
4
2000 2002 2004 2006 2008
Real GDP Growth Inflation
Exchange Rate per US$* Current Account Balance**
*Year-end**Billions of U.S. dollars
Copyright © 2005 Global Insight, Inc. 3610/2005
Japan: Is it Different This Time, or…
Japan has come a long way in cleaning up its banking system and restructuring its corporate balance sheets
Macro policies have been better than in Europe (at least recently)
Proximity to China has helped
Domestic demand is growing—albeit slowly
Top 100 firms continue to do well
Tokyo property prices are—finally—rising
The political mandate for reform has strengthened
The “lost decade and a half” has probably ended

1313
Copyright © 2005 Global Insight, Inc. 3710/2005
Japan: …Is This Just Another False Dawn?
Highest debt levels (public and private) among the industrialized economies
One of the most rapidly aging populations
Saving and investment ratios have been falling
Japan remains a classical dual economy
Deflation has not yet been eliminated
There is a risk that monetary and fiscal policies will be tightened prematurely—again
Copyright © 2005 Global Insight, Inc. 3810/2005
Japan
Bottom Line:
While Japan will probably not suffer another relapse soon, and short-term prospects are better than in Europe, long-term prospects are problematic
Copyright © 2005 Global Insight, Inc. 3910/2005
050
100150200250
2000 2002 2004 2006 2008
Japan
75
90
105
120
135
2000 2002 2004 2006 2008
-2-10123
2000 2002 2004 2006 2008-1
0
1
2
3
2000 2002 2004 2006 2008
Real GDP Growth Inflation
Exchange Rate per US$* Current Account Balance**
*Year-end**Billions of U.S. dollars

1414
Copyright © 2005 Global Insight, Inc. 4010/2005
Asia: Independent Engine of Growth, or…
Domestic demand in much of Asia has contributed to growth (investment-driven in China, consumption driven in South Korea)
Monetary and fiscal policies have been largely supportive of growth
Inflation remains low (except in India)
High oil prices have done limited damage in a few economies (e.g. South Korea and Taiwan)
Current account balances are deteriorating in many economies (except China)
Copyright © 2005 Global Insight, Inc. 4110/2005
Asia: …Still Too Dependent on the U.S.?
Either directly or indirectly (through China), exports still play a big role in growth
Rates of investment are too low (except for China) for economies that are growing rapidly
By preventing their exchange rates from appreciating, the Asian economies have become part of the “global imbalance problem”
Copyright © 2005 Global Insight, Inc. 4210/2005
Asia
Bottom Line:
Asian Economies will continue to be the star performers of the world economy, but will have to wean themselves off their “addiction” to U.S. consumer spending

1515
Copyright © 2005 Global Insight, Inc. 4310/2005
Real GDP Growth in Asian Economies
0
2
4
6
8
10
China South Korea India Taiwan Hong Kong
2004 2005 2006 2007
(Percent change)
Copyright © 2005 Global Insight, Inc. 4410/2005
0
2
4
6
8
10
Australia Indonesia Singapore Malaysia Philippines
2004 2005 2006 2007
(Percent change)
Real GDP Growth in Asian Economies
Copyright © 2005 Global Insight, Inc. 4510/2005
020406080
100
2000 2002 2004 2006 2008
China
6.5
7.0
7.5
8.0
8.5
2000 2002 2004 2006 2008
-2
0
2
4
6
2000 2002 2004 2006 200802468
10
2000 2002 2004 2006 2008
Real GDP Growth Inflation
Exchange Rate per US$* Current Account Balance**
*Year-end**Billions of U.S. dollars

1616
Copyright © 2005 Global Insight, Inc.
What Would it Taketo
Trigger a Recession?
Copyright © 2005 Global Insight, Inc. 4710/2005
No Recession in the Next Couple of Years, Without the Convergence of Two or More Big Shocks
The resilience of the U.S. and world economies allowed them to withstand a number of sizeable shocks in 2005
One of the worst tsunamis on recordOne of the worst hurricanes on recordRecord-high oil prices
What would it take to trigger a recession?Oil prices over $100A wage price spiralA 300 basis point rise in long-term interest ratesA 10% drop in house prices
Fortunately, the risk of a recession in the next two years is less than 20%
Copyright © 2005 Global Insight, Inc. 4810/2005
Oil Prices
25
50
75
100
125
2005 2006 2007 2008 2009 2010 2011 2012
World Recession Scenario Baseline
(U.S. dollar per barrel)

1717
Copyright © 2005 Global Insight, Inc. 4910/2005
House Prices
-10.00-5.00Canada
-10.00-5.00United States
-10.00-5.00Italy
-10.00-5.00France
-10.00-5.00Australia
-10.00-5.00Spain
-10.00-5.00Great Britain
2007-252006
(Percent deviation)
Copyright © 2005 Global Insight, Inc. 5010/2005
Real GDP Growth
0.00.51.01.52.02.5
2005 2007 2009 2011
1
2
3
4
5
2005 2007 2009 20111
2
3
4
5
2005 2007 2009 2011
(Percent change)World
4.5
6.0
7.5
9.0
10.5
2005 2007 2009 2011
United States
Japan China
World Recession Scenario BaselineSource: Global Insight Global Scenario Model
Copyright © 2005 Global Insight, Inc. 5110/2005
Real GDP Growth
0.51.01.52.02.53.0
2005 2007 2009 2011
0.5
1.0
1.5
2.0
2.5
2005 2007 2009 20110
1
2
3
4
2005 2007 2009 2011
(Percent change)United Kingdom
-1
0
1
2
3
2005 2007 2009 2011
Germany
France Italy
Source: Global Insight Global Scenario ModelWorld Recession Scenario Baseline

1818
Copyright © 2005 Global Insight, Inc. 5210/2005
Conclusions
Higher oil prices are not a serious threat—yetSome housing bubbles are deflating—recessions will probably not followThe short- and long-term growth imbalances are a major source of concernThe savings “glut” is less of a threat than the “dearth” of investmentThe U.S. and China will remain the primary engines of growth for the next year or twoNo recession likely in 2006, or even 2007What could trigger a recession?
Even higher energy pricesRising inflation expectationsSharply higher interest ratesBig drops in house pricesA mild to serious case of avian fluTiming: No earlier than 2007Probability: No more than 20%

Dr. Kelly Matthews is Executive Vice President and Economist at Wells Fargo Bank, N.A., in Salt Lake City. He is currently responsible for national, regional, local and agricultural economics for the Intermountain Region (Utah, Idaho and Wyoming), and was also responsible for the same in New Mexico, Nevada, Oregon and California while Chief Economist for First Security Corporation. In addition to economics, Dr. Matthews is also a member of the Wells Fargo Utah PAC, which includes interacting with local, state and national government politicians, and is as the local corporate lobbyist. He is also active in customer and community relations. Raised in Montpelier, Idaho, Dr. Matthews received his education at Brigham Young University (Provo, Utah) and was awarded his doctorate at the University of Colorado (Boulder). After a brief stint at Eastman Kodak, he joined First Security Corporation in 1973 and was Chief Economist until its acquisition by Wells Fargo. Dr. Matthews currently continues his tenure as adjunct professor of finance at the University of Utah in Salt Lake City (27 years) and as president of the Utah Council on Economic Education. He was chairman of the Salt Lake Convention & Visitors Bureau in 2004 and still serves as a member of its Executive Committee and Board of Trustees. In the political arena, he currently serves as a member of the Financial Services Roundtable’s Governmental Affairs Committee and the Utah Bankers Association’s Governmental Relations Committee. In his role as an economist, Dr. Matthews serves on the Utah Governor’s Council of Economic Advisors and several of the governor’s task forces. In addition, he is a member of the Board of Trustees of the Coalition for Utah’s Future, and the recently organized Downtown Development Committee of the Salt Lake Chamber of Commerce/Downtown Alliance, as well as the Chamber’s Government Affairs Action Committee. He also is a member of Intermountain Health Care’s Home Care Board of Directors. His most recent appointment has been to the Board of Trustees and Executive Committee of the Economic Development Corporation of Utah. As a panel member, Dr. Matthews contributes to the monthly Western Blue Chip Economic Forecast, based at Arizona State University. As part of his role in community/customer relations, he continues to speak to numerous Wells Fargo customer groups and at business and community events, as well as being a sought-after analyst for newspapers, radio and television.

Prior to joining First Security Corporation in 1973, Dr.
Matthews was a staff economist for Eastman Kodak in New York. During his years at First Security, his responsibilities included economic forecasting and analysis, serving on FSC’s corporate ALCO and Investment Advisory committees, as well as lobbying national and state financial legislation. For ten years, he played an integral role in FSC’s mergers and acquisitions.

Interest Rates, Housing, and the 2006 Western Region Outlook
Kelly K. Matthews Executive Vice President & Economist
Wells Fargo Bank, N.A.
Economic fortune smiled broadly on most areas of the West in 2005. For example, Nevada, Arizona, Idaho and Utah led the nation in job growth. Despite the upheaval associated with soaring energy prices—along with consistent Federal Reserve monetary tightening—long-term interest rates remained generally flat. Accordingly, the housing and commercial construction sector boomed. Home appreciation rose rapidly in many Western states as population growth, aided by favorable mortgage financing opportunities, spurred housing demand. As we look forward to 2006, we should consider the following questions:
1. Is there any evidence of an inflation problem? 2. Is the Fed nearly finished with pushing short-term rates higher? 3. Will long-term interest rates rise? 4. Will housing demand and home prices weaken?


Dr. Lawrence A. Waldman is a Senior Research Scientist at the University of New Mexico’s Bureau of Business and Economic Research (BBER). He also teaches economics In the Economics Department and the Anderson Graduate School of Management at the University. At the BBER, he manages the FOR-UNM Economic Forecasting Service, and has for more than fifteen years. As manager of the forecasting service, Dr. Waldman is responsible for creating quarterly forecasts of the New Mexico economy and the State’s major metropolitan areas. Then, along with a team of other BBER personnel, he writes the story of the recent history of and outlook for the New Mexico economy in book form, and distributes the book to the clients of the forecasting service. In addition, Dr. Waldman publishes a quarterly forecasting newsletter, The FOR-UNM Bulletin, which is available to the general public on a subscription basis. Dr. Waldman also performs research into the New Mexico economy. Recent topics include poverty, welfare reform, economic history, water use, biotechnology, and MicroElectroMechanical Systems. He is a panelist for the monthly Western Blue Chip Economic Forecast and a member of the New Mexico Tourism Department Industry Research Advisory Committee. Dr. Waldman holds a Ph. D. in economics and a B. S. in mathematics from the University of New Mexico.

The New Mexico Economy: Recent Developments And Outlook
Larry Waldman Senior Research Scientist University of New Mexico
Bureau of Business and Economic Research
In the post-2000 period, the New Mexico economy has been one of the strongest in the nation. Indeed, New Mexico was one of only three states not to suffer a budget deficit, and one of only five states to not fall into recession (six or more consecutive months of negative employment growth). The former can be attributed to fiscally conservative former governor Gary Johnson, who kept state spending growth under control, and kept the State’s contingency fund at eight percent, when five percent was considered adequate. For the latter, New Mexico had some special circumstances not shared by most other states, including rapid growth in the healthcare sector, a generally strong (but intermittent) construction sector, rapid expansion in Native American gaming, an influx of call centers, and a booming mining (mostly oil and gas) sector, among others. The New Mexico economy has enjoyed nonfarm employment growth right at 2.0 percent for the last six quarters (2004:2 to 2005:3). Major sources of new jobs during 2005:3 include construction, government, health & social assistance, and mining. Weakness was exhibited in information, transportation/warehousing/utilities, and manufacturing. The outlook is for moderate employment growth in the 2.0 – 2.5 percent range in 2006 and 2007, slowing to near 1.5 percent through 2010. Strength will come from manufacturing (2006-2009), mining (2006), construction (2006), healthcare and social assistance (2006-2008), and government.

THE NEW MEXICO ECONOMY: RECENT DEVELOPMENTS AND OUTLOOK
Dr. Lawrence WaldmanSenior Research ScientistUniversity of New Mexico
Bureau of Business and Economic Research
NEW MEXICO ECONOMIC OUTLOOK CONFERENCEJanuary 12, 2006

Recent History
• During the post-2001 period, the New Mexico economy fared well.
• New Mexico was one of only three states to not incur a budget deficit.
• New Mexico was one of only five states to not suffer a recession– Strengths during this period
• Health care and social assistance• Construction• Native American Gaming/Resorts/Entertainment• Call Centers• Mining• LANL expansion• Tourism held up somewhat, particularly the drive market• Large and stable government sector, mostly state and local
– Weakness• Manufacturing

Current Condition• Nonfarm employment growth at approximately 2.0% for last six
quarters (2004:2 through 2005:3)
• Third quarter 2005 employment growth was 2.0%, 16,333 net new jobs– Major strengths
• Construction• Government• Healthcare and social assistance• Mining (oil & gas)
– Minor strengths• Accommodation and Food Services• Retail trade• Business services• Professional. Scientific, and technical services
– Weaknesses• Information• Transportation/warehousing/utilities• Manufacturing

Short-to-medium Term Outlook• Decent, but not spectacular
– Employment growth (%): 2005 2006 2007 2008 2009 20102.1 2.5 2.0 1.7 1.7 1.5
– Personal income growth (%): 2005 2006 2007 2008 2009 20107.1 5.9 5.4 5.2 5.1 5.0
– Unemployment rate (%): 2005 2006 2007 2008 2009 20105.8 5.4 5.4 5.3 5.3 5.3
• Major strengths– Manufacturing (2006 – 2009)
– Mining (2006)
– Construction (2006)
– Healthcare and social assistance (2006 – 2008)
– Government (2.0% throughout)

Short-to-medium Term Outlook (Cont’d)
• Lesser Strengths– Information
– Professional, scientific, and technical services
– Business services

Longer Term Issues
• Wages
• Poverty
• Per capita income
• Economic development
• Water
• Spaceport

Mr. Dan Shingler is editor of the New Mexico Business Weekly, a position he took on during the summer of 2005, after working at the Albuquerque Tribune as an assistant sports editor, columnist and business writer. Dan moved to Albuquerque in the fall of 2002 from his native Ohio. In Ohio, Dan was vice president of the Robert Falls & Co. Public Relations firm in Cleveland. He was also vice president and head of media relations for National City Corp., one of the nation's 10 largest holding companies with more than $100 billion in assets. Dan was a banking and financial writer for approximately 10 years at several of Ohio's leading business publications, including Crain's Cleveland Business and two sister papers of the New Mexico Business Weekly, The Cincinnati Business Courier and Business First of Columbus. Dan resides in Albuquerque with his wife Kelly.

Notes

Notes

A Quarterly Economic Forecastof the New Mexico Economy
Volume 16, Number 4
FOR-UNM Economic Forecasting ServiceBureau of Business and Economic ResearchUniversity of New Mexico
WINTER 2005
UNITED STATESREVIEW AND OUTLOOK
NEW MEXICOREVIEW AND OUTLOOK
(Continued on page 4) (Continued on page 4)
The FOR-UNM Bulletin
hhhhhhhhhhhhhhhhhhhhhhhhhhhhhhhhhhhhhhhhhhhhhhhhhhhhhhhhhhhhhhhhhhhhhhhh
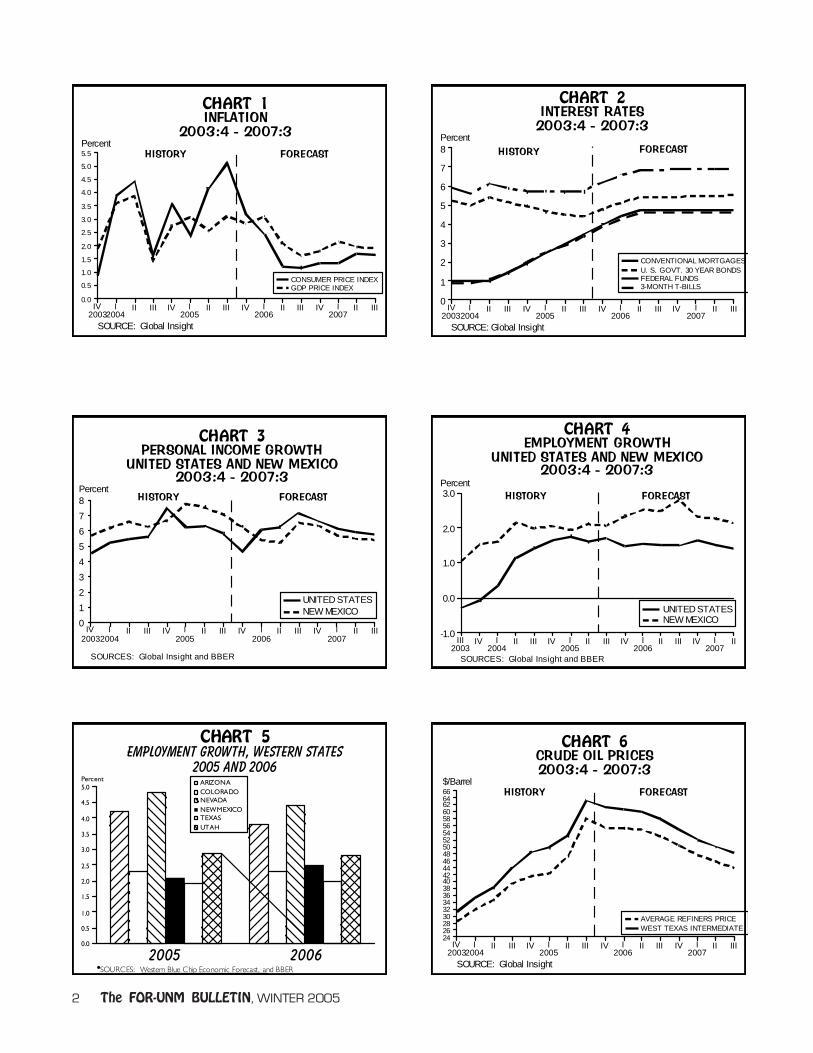
Hurricanes Katrina, Rita and Wilma left a path ofdestruction from the Florida Keys to Texas. The stormsemptied the City of New Orleans, closed it’s major portfacilities, and shut down oil and gas production, refiningand distribution facilities. In the aftermath, the USeconomy has skipped a beat, suffering job losses, slowergrowth in output, higher rates of inflation and fallingconsumer confidence, but it has also displayed asurprising resilience. Nonfarm employment slid by 8,000 in September andpicked up only 56,000 in October, but then added 215,000in November. Since the beginning of the year, monthlyemployment gains on a seasonally adjusted basis hadaveraged just under 200,000. Unemployment, which was4.9% in August, crept up to 5.1% in September, beforesettling back to 5.0% in October and November. The shutdown of oil production, refining and distributioncapacity sent the price for regular gasoline soaring toover $3.00 per gallon nationwide in early September. TheSeptember Consumer Price Index rose 1.2% comparedto September, as energy prices jumped 12%, but slowedto only 0.2% in November. Compared to a year ago, theCPI rose 4.7% in October and 4.3% in November. Energycosts, which had risen sharply in each of the threepreceding months, declined in October. The closure of the port of New Orleans created majorconcerns for Midwest farmers who rely on the river systemto ship their crops to market. From all accounts, the portre-opened within a month, and transportation links wererestored with some price impacts but with minimaldisruption overall. 2005 has been another banner yearfor the farm sector. The temporary closure and reducedvolume handled by major port facilities has exacerbatedproblems for the construction and manufacturing industriesdependent on material inputs. Both industries have beencomplaining for many months about escalating prices formaterial inputs and an inability to line up sufficientquantities of needed materials. World demand – and thevoracious appetite of China’s rapidly growing economy –has simply outpaced available supply, particularly incement and structural steel. In the immediate aftermath of Katrina, many thoughtthat the Fed might pause before further increasing thetarget federal funds rate, but in September the Fed raised
The New Mexico economy continued to expand at amoderate pace during the third quarter of 2005. Nonfarmemployment increased 2.1%, the same as in the secondquarter of 2005, and the sixth consecutive quarter ofgrowth close to 2.0%. New Mexico personal incomegrowth posted a robust 7.5% gain in the second quarterof 2005. The third quarter unemployment rate, seasonallyadjusted, was 6.2%, up from 5.7% a year earlier. Thehigh and rising unemployment rate is likely a result ofenhanced growth in the civilian labor force, which rose3.6% during the third quarter. The New Mexico added 18,333 (net) nonfarm jobsbetween the third quarter of 2004 and the third quarter of2005. Just one sector (transportation, warehousing, andutilities) exhibited a net job loss, and that was only 200jobs, so the rest of the economy added 18,533 jobs.Almost half of the net new jobs came in two sectors,construction and government. Construction employmentadded 3,733 jobs, a 7.2% gain. Housing remained strong,with the total number of housing unit authorizations up21.4%. The government sector gained 3,367 jobs, a 1.7%increase. Local government employment growth slowedto 1.7% in the third quarter, following two years of growthin the 2.5 – 3.0. State government employment rose2.3%, while federal government employment was up 0.7%,likely reflecting the addition of several hundred U. S. ForestService jobs in Albuquerque. The health care and social assistance sector has beenone the economy’s fastest growing sectors so far in thisdecade. Employment growth averaged more than 6.0%from the second quarter of 2001 through the second quarterof 2004, at which time it slowed by half, to near 3.0%,where it has remained. Employment growth in the thirdquarter of 2005 slipped to 2.0%, resulting in a net additionof 1,833 jobs, year over year. Employment in the natural resources and mining sectorcontinued to exhibit substantial growth during the thirdquarter of 2005, posting an 9.2% gain, (1,400 jobs). Oiland gas employment added 1,334 jobs (11.8%), whileother mining employment was up 0.9%. Oil productionwas down 5.6% to 15.4 million barrels in the secondquarter of 2005, while natural gas production slipped 1.4%,to 373.6 billion cubic feet.
2 The FOR-UNM BULLETIN, WINTER 2005
IIIIIIIVIIIIIIIVIIIIIIIVIIIIIIIV20072006200520042003
5.5
5.0
4.5
4.0
3.5
3.0
2.5
2.0
1.5
1.0
0.5
0.0
Percent
SOURCE: Global Insight
CHART 1INFLATION
2003:4 - 2007:3HISTORY FORECAST
CONSUMER PRICE INDEXGDP PRICE INDEX
IIIIIIIVIIIIIIIVIIIIIIIVIIIIIIIV20072006200520042003
8
7
6
5
4
3
2
1
0
Percent
SOURCE: Global Insight
CHART 2INTEREST RATES
2003:4 - 2007:3
HISTORY FORECAST
CONVENTIONAL MORTGAGESU. S. GOVT. 30 YEAR BONDSFEDERAL FUNDS3-MONTH T-BILLS
IIIIIIIVIIIIIIIVIIIIIIIVIIIIIIIV20072006200520042003
876543210
Percent
SOURCES: Global Insight and BBER
CHART 3PERSONAL INCOME GROWTH
UNITED STATES AND NEW MEXICO2003:4 - 2007:3
HISTORY FORECAST
UNITED STATESNEW MEXICO
IIIIVIIIIIIIVIIIIIIIVIIIIIIIVIII20072006200520042003
3.0
2.0
1.0
0.0
-1.0
Percent
SOURCES: Global Insight and BBER
CHART 4EMPLOYMENT GROWTH
UNITED STATES AND NEW MEXICO2003:4 - 2007:3
HISTORY FORECAST
UNITED STATESNEW MEXICO
5.0
4.5
4.0
3.5
3.0
2.5
2.0
1.5
1.0
0.5
0.0
Percent
.
CHART 5EMPLOYMENT GROWTH, WESTERN STATES
2005 AND 2006
2005 2006SOURCES: Western Blue Chip Economic Forecast, and BBER
ARIZONACOLORADONEVADANEW MEXICOTEXASUTAH
IIIIIIIVIIIIIIIVIIIIIIIVIIIIIIIV20072006200520042003
66646260585654525048464442403836343230282624
$/Barrel
SOURCE: Global Insight
CHART 6CRUDE OIL PRICES2003:4 - 2007:3
HISTORY FORECAST
AVERAGE REFINERS PRICEWEST TEXAS INTERMEDIATE

���������������� ����������������������� �������������������������������������
������������������������ �
���� ����� ���������������������� ��
���� ������������ ����������������!���� ������"#� ���$%��������&������'���#���(���������!���)���$%�!��������'���*��������##���������)�+�*������������������,�����##���� ���'����)���$%�!����������������!��� �����'��'��(���������)����)�������#�!������
�,-"&.� "$$/�00� �������������������������������������������������������������������
����������� ������������������ � ����� ������
��������������� ��� � �
�������������� ���� ������� � ��������
��������������������������������������������� ����������� ��
�������������� ������������ ���������������� ������������ � ���� �������������������������������� ������� ������������������������� ���� �� �������������������������������� ������������� �� � �������������������� � ����� ������������������������ ������!���"�����������#����������� ��������������� ���������� ���� �� ������������� ������ ����� � � ����� � ������ $����%�������� ���������������$������ ��������� �������� ���� �� ��������� ��������������������� ������������������������������������ �������������������������� ���� ������&������������������������ �� � ��������� ��'������������ ��� ������������ �������()�������*����+����,-.�..���� ������� ���������� ��������������� �������� ����� ����������������� ������������/���������� �����0���� ��0������������1 � ���2�������� �0�����!�+�������������������� ��
����&��$������ ���������� 0����� ��0������������1 � ���2�����
345.�! �����1����������������67383'9.53
(-.-*�577'5539�

The FOR-UNM Bulletin, WINTER 2005 3
UNIVERSITY OF NEW MEXICOBUREAU OF BUSINESS AND ECONOMIC RESEARCH
FALL 2005 ECONOMIC FORECAST
MOSTRECENT
QUARTERTERLY FORECAST ANNUAL
2005:3 2005:4 2006:1 2006:2 2006:3 2004 2005 2006 2007
NEW MEXICO PERSONAL INCOME, $BIL 53.306 54.341 55.208 55.964 56.775 49.778 53.311 56.430 59.501
% CHANGE, YEAR AGO 7.0 6.2 5.4 5.2 6.5 6.4 7.1 5.9 5.4
NM REAL DISPOSABLE INCOME, $BIL 2000 43.821 44.172 44.533 44.926 45.339 42.072 43.981 45.182 46.877
% CHANGE, YEAR AGO 4.5 3.7 1.6 1.9 3.5 4.0 4.5 2.7 3.8
ALBQ MSA PERSONAL INCOME, $BIL 23.325 23.779 24.485 24.993 25.006 22.172 23.444 24.919 26.141
% CHANGE, YEAR AGO 5.3 5.8 5.9 6.1 7.2 5.5 5.7 6.3 4.9
LAS CRUCES MSA PERSONAL INCOME, $BIL 4.225 4.402 4.502 4.505 4.482 4.015 4.252 4.529 4.807
% CHANGE, YEAR AGO 7.0 6.9 8.0 6.9 6.1 3.3 5.9 6.5 6.1
SANTA FE MSA PERSONAL INCOME, $BIL 5.096 4.980 5.179 5.369 5.520 4.652 4.954 5.373 5.759
% CHANGE, YEAR AGO 8.2 5.6 8.3 8.2 8.3 5.1 6.5 8.5 7.2
NM NONAG EMPLOYMENT, THOU. 808.533 820.046 812.088 828.756 831.167 790.725 807.378 827.754 844.078
% CHANGE, YEAR AGO 2.1 2.3 2.5 2.5 2.8 2.0 2.1 2.5 2.0
ALBQ MSA NONAG EMP., THOU. 377.933 379.551 384.672 379.627 389.006 370.750 378.112 389.190 396.732
% CHANGE, YEAR AGO 1.7 2.1 2.4 2.2 2.8 2.1 2.0 2.9 1.9
LAS CRUCES MSA NONAG EMP., THOU. 63.767 65.427 65.489 65.563 65.083 62.350 63.957 65.864 67.581
% CHANGE, YEAR AGO 3.3 2.5 4.1 2.9 2.1 1.1 2.6 3.0 2.6
SANTA FE MSA NONAG EMP., THOU. 62.867 62.088 61.508 63.377 64.704 60.575 61.855 63.261 64.480
% CHANGE, YEAR AGO 2.6 1.7 1.8 2.1 2.9 1.6 2.1 2.3 1.9
NM UNEMP RATE, NSA 5.9 5.2 5.6 5.6 5.4 5.7 5.7 5.4 5.4
ALBUQUERQUE MSA UNEMP RATE, NSA 5.7 4.8 4.9 5.1 5.2 5.2 5.3 5.0 5.0
LAS CRUCES MSA UNEMP RATE, NSA 6.9 5.7 7.0 7.1 6.2 6.4 6.6 6.5 6.5
SANTA FE MSA UNEMP RATE, NSA 4.8 4.4 4.8 4.7 4.7 4.3 4.6 4.6 4.6

SUBSCRIPTION RATE: $50.00 per year
UNITED STATESREVIEW AND OUTLOOK
(Continued from page 1)
NEW MEXICOREVIEW AND OUTLOOK
(Continued from page 1)
4 The FOR-UNM Bulletin, WINTER 2005
The FOR-UNM Bulletin is published four times a year by: The University of New MexicoBureau of Business and Economic Research1920 Lomas NEAlbuquerque, NM 87131-6021PHONE: (505) 277-2216FAX: (505) 277-7066WEB: http://www.unm.edu/~bber
the federal funds rate to 3.75%, and to 4.0% in November.The following statement, released on November 1, sumsup the Fed position:
Elevated energy prices and hurricane-related disruptions in economic activityhave temporarily depressed output andemployment. However, monetary policyaccommodation, coupled with robustunderlying growth in productivity, isproviding ongoing support to economicactivity that will likely be augmented byplanned rebuilding in the hurricane-affected areas. The cumulative rise inenergy and other costs has the potentialto add to inflation pressures; however, coreinflation has been relatively low in recentmonths and longer-term inflationexpectations remain contained.
Real GDP grew at a surprising large rate (SAAR) of4.3% in the third quarter, up from 3.3% in the second.Fourth quarter growth is widely expected to be significantlyslower, reflecting the impacts of the hurricanes. On theother hand, the reconstruction of areas like New Orleansthat were hard hit by the storms should help boost overallgrowth in 2006. The outlook for the U. S. economy, based on the GlobalInsight November, 2005 baseline forecast calls for realGDP growth of 3.6% in 2006 and 3.1% in 2007.Employment growth, which averaged 1.1% in 2004 shouldincrease to 1.6% in 2005 and 2006, before slowing to1.4% in 2007. Global Insight is forecasting personalincome growth of 5.7% this year with further growth of6.5% in 2006 and 5.9% in 2007. Consumer inflation willbe 3.4% in 2005, 2.6% in 2006 and slow to 1.5% in 2007,as oil prices recede. Oil prices are expected to stayabove $60 per barrel until the second half of 2006, fallingto $50 by the second quarter of 2007 and into the $40/barrel range thereafter. The US dollar, which fell by 20%against our major trading partners in 2003 and 2004, isforecast to fall by 2.0% this year, 2.5% in 2006, 6.0% in2007 and 3.5% in 2008 before stabilizing. In terms of policy, Global Insight is now expecting theFOMC to raise the federal funds rate 25 basis points atevery meeting between now and March 2006, when therate will have reached 4.75% The Fed will keep it at thatlevel until the second half of 2008, when a further boost isexpected. Federal government spending will slowsomewhat, from the 7.5%, 6.6% and 4.7% ratesrespectively in 2002, 2003, and 2004, to average 2.9% inboth 2005 and 2006, and near 1% in 2007 On the taxside, the forecast continues to assume that Congresswill fiddle with taxes enough to raise personal incometaxes back toward the historical average of 8.2% of GDP.
The trade sectors fared well in the third quarter, as retailposted a 1.1% employment gain (1,033 jobs), andwholesale employment was up 1.3% (300 jobs). Theretail gains were in motor vehicles & parts (467 jobs) andgeneral merchandise stores other than department stores,like Wal-mart, Target, and K-Mart (800 jobs). Business services employment rose 1.9% (933 jobs),while professional, scientific, and technical servicesgained 2.0% (833 jobs). the manufacturing added 167jobs, a 0.5% gain. Small as that may be, it is the firstpositive employment growth in 18 quarters. This forecast of the New Mexico economy is based uponthe BASELINE1105 national economic forecast of GlobalInsight. The outlook for the New Mexico economy remainsgood. Following 1.2% gains in both 2002 and 2003, and2.0% in 2004, nonfarm employment growth is expectedto increase to 2.1% in 2005 and 2.5% in 2006, beforeeasing to 2.0% in 2007. Personal income growth willreach 7.1% in 2005, and is expected to remain in the 5.0– 6.0% range thereafter. Strength during the forecast period will come from theusual sources, government and health care/socialassistance. Construction will be strong in the early years,but will fade thereafter, while manufacturing will achievesignificant growth beginning in 2006 and continuing through2009. The government sector will provide the greatest numberof jobs between now and 2007. Local governmentemployment will increase close to 2.5% each year. Stategovernment employment is slated to increase about 1.5%annually, while the federal government will display verylittle in the way of employment gains, except for 2006, aresult of about 800 new U. S. Forest Service jobs inAlbuquerque. The construction sector will exhibit employment growthof 7.3% this year and 4.8% next year, but growth willslow to the 1.5 – 2.0% range for the remainder of theforecast period. The slowing of construction industrygrowth will be caused in part by a shortage of cementand other construction materials. The natural resources and mining sector will continueto add a large number of jobs (almost 2,000) in 2005(8.0%) and 2006 (4.5%), but growth will slow to 1.6% in2007. In 2005, the manufacturing sector will end a four-yearslide, posting a small (0.1%) gain, followed by gains of3.0 % or more from 2006 through 2009. Another factor in the outlook for the New Mexico economyare the tax cuts passed by the New Mexico Legislatureduring the 2005 Legislature, as well as the gasoline price-related rebates passed by the Legislature in SpecialSession in October of 2005. The tax cuts and rebateswill increase the spending ability of New Mexico residents.

BUREAU OF BUSINESS AND ECONOMIC RESEARCH RECENT OUTSIDE SPONSORED RESEARCH
State Economic Forecasting Contract, New Mexico Departments of Finance and Administration, Taxation and Revenue, and State Transportation and the New Mexico Legislative Finance Committee, Annual Renewal FOR-UNM Economic Forecasting Service, Contracts with Subscribers, Various State agencies, local governments, local utilities, private businesses, Annual Renewal Federal Highway Administration Highway Statistics Reports, New Mexico State Transportation Department, Continuing Impacts of the Santa Fe $8.50 Living Wage, City of Santa Fe, 2005-06 Economic Studies of 5 Communities for the Main Street Program, Economic Development Department, 2005-06 Economic Impacts of the Arts and Cultural Industries in Albuquerque - Bernalillo County, City of Albuquerque, Bernalillo County, UNM College of Fine Arts with foundation grant, 2005-2006 Property Tax Disclosure and Availability of Alternative Sources of Data on Housing Prices, Santa Fe Association of Realtors, 2006 School District Population Modeling, Phase 2, New Mexico Public School Facilities Authority, 2005 Survey of Valencia County Employers Regarding Worker Skill Requirements, UNM Valencia Branch, 2005 Economic Impacts of Proposed Coal Fire Generating Plant in Northwest New Mexico, Mustang Energy, 2005 Socio-Economic Assessments for 5 New Mexico National Forests and Grasslands, National Forest Service Development of Models for Evaluating Fiscal Impacts of Industrial Revenue Bond Projects and Projects Submitted under the Local Economic Development Act (LEDA), City of Albuquerque Office of Economic Development, 2004-05 Economic Analysis for the Farmington Main Street Project, NM Economic Development Department, 2005 Preparation of Report for New Mexico First Town Hall on Managing the Federal Presence in New Mexico, UNM Office of the Vice President for Research and Economic Development, 2005 Population Estimates for 2004, New Mexico Health Policy Commission, 2005
Statistical Analysis of the Impacts of Indian Casinos on New Mexico Eating and Drinking Establishments, New Mexico Restaurant Association, 2004-05 Estimated School-Age Population by School District, New Mexico Public School Facilities Authority, 2004 Aircraft Manufacturer Impacts, New Mexico Economic Development Partnership with Anderson School of Management, 2004-05 Labor Force Projections, New Mexico Department of Labor, 2004 Economic Impact of the Proposed Solar Concentrator, New Mexico Energy, Minerals and Natural Resources Department, 2004 Survey For Working Disabled Individuals Program, NM Dept. of Education, Division of Vocational Rehabilitation Project Succeed and NM Human Services Dept., Medical Assistance Division, 2004 Biennial Economic Impact Assessment for Air Force Research Laboratories and the Space and Missile System Center at Kirtland on New Mexico, The Phillips Research Site, Kirtland Air Force Base, 2004-05 Project LINCS Program Evaluation, NM Division of Vocational Rehabilitation, 2004 Benefits and Costs of City-County Unification, City of Albuquerque Bernalillo County Unification Charter Commission, 2004 Economic Impacts of Intel Rio Rancho on Bernalillo and Sandoval Counties and New Mexico, Intel Corporation, 2004 Re-Analysis of Data from the 2003 Community College Survey of Student Engagement, Albuquerque Technical Vocational Institute, 2004 Census Tract 1990 and 2000, County and American Indian Reservation Population Estimates Using Vital Statistics and Housing Data, New Mexico Department of Health, 2004 Arts and Culture Based Economic Development in Santa Fe, NM, McCune Charitable Foundation, 2003-04 City of Raton Community Audit, City of Raton, 2003-04 Economic Impact of the University of New Mexico, UNM Office of Institutional Advancement, 2003-04 Economic Impact of UNM Health Sciences Center and HSC Students, UNM Health Sciences Center, 2003-04 State Data Center Support and Generation of Economic Data, New Mexico Economic Development Department, 2003-04

A Quarterly Economic Forecastof the New Mexico Economy
Volume 16, Number 3
FOR-UNM Economic Forecasting ServiceBureau of Business and Economic ResearchUniversity of New Mexico
FALL 2005
UNITED STATESREVIEW AND OUTLOOK
NEW MEXICOREVIEW AND OUTLOOK
(Continued on page 4) (Continued on page 4)
The FOR-UNM Bulletin
hhhhhhhhhhhhhhhhhhhhhhhhhhhhhhhhhhhhhhhhhhhhhhhhhhhhhhhhhhhhhhhhhhhhhhhh
The national economy continues to expand at a fairlyrobust pace. Preliminary figures show that real GrossDomestic Product (GDP) grew at a seasonally adjustedannual rate of 3.3% in the second quarter of 2005, downslightly from the 3.8% growth of the first quarter. Indications are that the economy has picked upmomentum over the summer. Industrial production wasup for the third month in a row in July. The Augustmanufacturing report from the Institute for SupplyManagement (ISM) showed the sector expanding for the27th consecutive month, with new orders and productionregistering strong gains. The July ISM report for the non-manufacturing sector, the latest report available, showedexpansion for the 28th consecutive month. The latestFederal Reserve Beige Book, released on September 3,showed continued improvement in the economy with 11out of 12 districts – all except Dallas — reportingexpansion over the summer months. The employment situation has continued to showimprovement. In August, the unemployment rate fellbelow 5% for the first time since 2000. Nonfarmemployment increased by 169,000 on a seasonallyadjusted basis, less than last month’s gain of 242,000,but above the above the 150,000 needed to employ thoseentering the labor force. However, there are a number of concerns as regardscontinued expansion. In the wake of Hurricane Katrina,oil prices jumped to over $70/barrel, and the temporaryloss of production capacity, pipelines and refining capacityin the Gulf Coast area sent gasoline pump prices over$3.00 a gallon, although they have subsided a little mostrecently. The oil supply shock coming from the Gulf ofMexico adds further uncertainty in a world that has beenrattled by recent terrorist attacks and by the growingdeath toll and continued political stalemate in Iraq. Otherconcerns include:
A slowdown in productivity. Higher productivitygrowth enables stronger economic growth without inflation,so a slowdown in productivity growth as recentlyexperienced can be troubling.
Inflation. High energy prices have put upwardpressure on prices overall. The Consumer Price Indexincreased 0.5% in July after being unchanged in June. Ina survey of manufacturing firms, expressed great concernabout the new highs in energy prices and raised questions
The New Mexico economy continued to expand at amoderate pace during the second quarter of 2005.Nonfarm employment posted a 2.1% gain, year-over-year,the fifth consecutive quarter of growth very close 2.0%.New Mexico personal income increased a robust 6.9% inthe first quarter of 2005. These figures suggest aneconomy on a solid footing. The unemployment rate(seasonally adjusted), however, crept up to 5.9% from5.6% in the preceding quarter. The New Mexico economy added a (net) 16,633 jobsfrom the second quarter of 2004 to the second quarter of2005. The major contributors of jobs were againgovernment, construction, and health care/socialassistance. The government sector added 3,933 jobs, a2.0% gain. Most of the employment increase came atthe local level, which rose 2.3%, or 2,367 jobs, of which1,367 were in education. The construction sector continued to expand at anexhilarating pace, as employment increased 7.5%.Housing was especially strong, increasing 34.4% to 5,074units. Of those, almost sixty percent were in the Citiesof Albuquerque (1,995 units) and Rio Rancho (969 units). Health care and social assistance employmentincreased 3.0%, with most of the gain in health care(3.0%, 2,167 jobs). Social assistance employment wasup 2.0%. Employment in the natural resources and miningsector surged, posting a 9.2% gain. Oil and gasextraction/exploration/drilling added 1,267 jobs (11.5%),while other mining employment was up 3.6%. A number of other sectors also made significantcontributions to employment growth in the second quarter.Business services (management/admin/support) added1,167 jobs, a 2.4% increase, and professional/scientific/technical services added 967 jobs, a 2.4% increase. Morethan a third of those jobs (400) were in scientific researchand development. Employment growth in retail tradepicked up slightly to 0.8% during the second quarter, anaddition of 733 jobs, many of which were in big boxoperations. Wholesale trade did not do as well, though,posting an employment decline of 0.1%. Smaller contributions to the overall job total were madeby several other sectors. Both finance (3.1%) andaccommodation/food services (0.8%) added 733 jobs. Thelatter included 188 jobs at a new Embassy Suites Hotelin Albuquerque.

2 The FOR-UNM BULLETIN, FALL 2005
IIIIVIIIIIIIVIIIIIIIVIIIIIIIVIII20072006200520042003
5
4
3
2
1
0
Percent
SOURCE: Global Insight
CHART 1INFLATION
2003:3 - 2007:2HISTORY FORECAST
CONSUMER PRICE INDEXGDP PRICE INDEX
IIIIVIIIIIIIVIIIIIIIVIIIIIIIVIII20072006200520042003
8
7
6
5
4
3
2
1
0
Percent
SOURCE: Global Insight
CHART 2INTEREST RATES
2003:3 - 2007:2
HISTORY FORECAST
CONVENTIONAL MORTGAGESU. S. GOVT. 30 YEAR BONDSFEDERAL FUNDS3-MONTH T-BILLS
IIIIVIIIIIIIVIIIIIIIVIIIIIIIVIII20072006200520042003
876543210
Percent
SOURCES: Global Insight and BBER
CHART 3PERSONAL INCOME GROWTH
UNITED STATES AND NEW MEXICO2003:3 - 2007:2
HISTORY FORECAST
UNITED STATESNEW MEXICO
IIIIVIIIIIIIVIIIIIIIVIIIIIIIVIII20072006200520042003
3.0
2.0
1.0
0.0
-1.0
Percent
SOURCES: Global Insight and BBER
CHART 4EMPLOYMENT GROWTH
UNITED STATES AND NEW MEXICO2003:3 - 2007:2
HISTORY FORECAST
UNITED STATESNEW MEXICO
4.5
4.0
3.5
3.0
2.5
2.0
1.5
1.0
0.5
0.0
Percent
.
CHART 5EMPLOYMENT GROWTH, WESTERN STATES
2005 AND 2006
2005 2006SOURCES: Western Blue Chip Economic Forecast, and BBER
ARIZONACOLORADONEVADANEW MEXICOTEXASUTAH
IIIIVIIIIIIIVIIIIIIIVIIIIIIIVIII20072006200520042003
6260585654525048464442403836343230282624
$/Barrel
SOURCE: Global Insight
CHART 6CRUDE OIL PRICES2003:3 - 2007:2
HISTORY FORECAST
AVERAGE REFINERS PRICEWEST TEXAS INTERMEDIATE

The FOR-UNM Bulletin, FALL 2005 3
UNIVERSITY OF NEW MEXICOBUREAU OF BUSINESS AND ECONOMIC RESEARCH
FALL 2005 ECONOMIC FORECAST
MOSTRECENT
QUARTER QUARTERLY FORECAST ANNUAL
2005:2 2005:3 2005:4 2006:1 2006:2 2003 2004 2005 2006
NEW MEXICO PERSONAL INCOME, $BIL 52.745 53.270 54.743 55.357 56.020 46.956 50.124 53.296 56.436
% CHANGE, YEAR AGO 6.0 6.8 5.7 5.6 6.2 4.5 6.7 6.3 5.9
NM REAL DISPOSABLE INCOME, $BIL 2000 43.233 43.297 44.252 44.449 44.726 40.467 42.072 43.592 44.952
% CHANGE, YEAR AGO 3.0 3.3 3.9 2.0 3.5 3.3 4.0 3.6 3.1
ALBQ MSA PERSONAL INCOME, $BIL 23.528 23.521 23.933 24.436 25.021 21.006 22.209 23.519 24.873
% CHANGE, YEAR AGO 5.5 6.3 6.1 5.8 6.3 1.5 5.7 5.9 5.8
LAS CRUCES MSA PERSONAL INCOME, $BIL 4.344 4.288 4.497 4.670 4.684 3.887 4.073 4.356 4.684
% CHANGE, YEAR AGO 6.7 7.2 7.6 8.7 7.8 5.8 4.8 7.0 7.5
SANTA FE MSA PERSONAL INCOME, $BIL 5.076 5.164 5.121 5.243 5.461 4.426 4.761 5.067 5.446
% CHANGE, YEAR AGO 5.9 7.5 6.0 6.9 7.6 3.4 7.6 6.4 7.5
NM NONAG EMPLOYMENT, THOU. 808.733 808.308 820.233 811.479 827.911 775.592 790.725 807.369 825.930
% CHANGE, YEAR AGO 2.1 2.0 2.4 2.4 2.4 1.2 2.0 2.1 2.3
ALBQ MSA NONAG EMP., THOU. 378.233 379.551 384.672 379.627 389.006 363.125 370.750 378.481 387.480
% CHANGE, YEAR AGO 1.8 2.1 2.4 2.2 2.8 0.4 2.1 2.1 2.4
LAS CRUCES MSA NONAG EMP., THOU. 63.700 62.709 65.748 65.794 65.873 61.683 62.350 63.773 65.909
% CHANGE, YEAR AGO 2.5 1.6 3.0 4.5 3.4 3.1 1.1 2.3 3.4
SANTA FE MSA NONAG EMP., THOU. 62.067 62.382 62.344 61.142 63.517 59.608 60.575 61.798 62.952
% CHANGE, YEAR AGO 2.1 1.8 2.1 1.2 2.3 1.9 1.6 2.0 1.9
NM UNEMP RATE, NSA 6.0 5.6 5.1 5.6 5.5 5.9 5.7 5.6 5.4
ALBUQUERQUE MSA UNEMP RATE, NSA 5.5 5.3 4.7 4.8 5.0 5.4 5.2 5.2 4.9
LAS CRUCES MSA UNEMP RATE, NSA 7.0 6.2 5.5 6.9 7.0 6.5 6.4 6.3 6.4
SANTA FE MSA UNEMP RATE, NSA 4.7 4.3 4.1 4.4 4.4 4.2 4.3 4.4 4.3

SUBSCRIPTION RATE: $50.00 per year
UNITED STATESREVIEW AND OUTLOOK
(Continued from page 1)
NEW MEXICOREVIEW AND OUTLOOK
(Continued from page 1)
4 The FOR-UNM Bulletin, FALL 2005
The FOR-UNM Bulletin is published four times a year by: The University of New MexicoBureau of Business and Economic Research1920 Lomas NEAlbuquerque, NM 87131-6021PHONE: (505) 277-2216FAX: (505) 277-7066WEB: http://www.unm.edu/~bber
about the sustainability of the manufacturing sectorexpansion.
Housing. Developments in the housing industrysuggest that the boom is over. Sales of new single-familyhouses rose 6.5% on a seasonally adjusted annual ratefrom June and were up 28% from July 2004. However,the number of unsold new houses at the end of July was4 times the number sold and the median sales price wasdown. Also in July, housing units permitted increased ,but housing starts and housing completions were bothdown
Federal Deficit. The Congressional Budget Office’smost recent (August 2005) projections show the federalbudget deficit above $300 billion until the expiration ofsome of the tax cut provisions in 2011, although that willcertainly be higher once the effects of Hurricane Katrinaare factored in.
The Dollar and the Deficit on Current Account.The rest of the world has helped to finance a higherstandard of living in the US by their willingness to intervenein foreign exchange markets in support of the dollar andtheir willingness to convert surplus dollar holdings intoholdings of US assets. The concern continues to be thatthis situation will unravel. Some foreign central banksand other players have indicated their intent to diversifyaway from US assets. While a falling dollar may benecessary to bring about a correction in the currentaccount deficit, a run against the dollar would cause majordisruptions. The outlook for the national economy continues to showmoderate expansion. Compared to previous forecasts,real GDP growth will be a little slower in the near termbecause of Hurricane Katrina, but a little faster later onas the rebuilding of the Gulf Coast area proceeds. RealGDP growth is expected to reach close to 3.5% in both2005 and 2006. Nonfarm employment is expected toincrease 1.6% in 2005 and 1.5% in 2006, following a 1.1%gain in 2004 and declines in both 2002 and 2003. Crude oil prices will dip to under $60/barrel, and thepump price of gasoline will fall back to the $2.50/gallonneighborhood as US refining capacity comes back online,strategic reserves make their way into the market, andoil imports increase. On the other hand, the price ofnatural gas may not decline much. Katrina has reducedsupplies of natural gas which cannot be made up byincreasing imports, and there is also no strategic reserveof natural gas to tap. The Federal Reserve has recently followed a strategy ofslowly increasing the Federal Funds rate as the economyrecovered, and was expected to continue to do so. In thewake of Hurricane Katrina, though, the Fed is nowexpected to hold off on further increases for at least theirnext two meetings (about 3 months).
A few sectors posted job declines, which were for themost part fairly small. Comprising this block werewholesale trade, transportation/warehousing/utilities,manufacturing, and information. The information sector,which experienced a 3.8% drop, is still smarting from theclosing of two Albuquerque call centers last year, MCI(880 jobs) and Qwest (230 jobs). The outlook for the New Mexico economy remains good,but not exceptional. Following 1.2% gains in both 2002and 2003, and 2.0% in 2004, nonfarm employment growthis expected to increase to 2.1% in 2005 and 2.3% in2006. Personal income growth will reach 6.3% in 2005and 5.9% in 2006. Strength during the forecast period will come from anumber of different sectors. The mining sector will remainvery robust in 2005 and 2006, with employment gains of8.4% and 6.8%, respectively, as oil and gas prices remainhigh. The construction sector will exhibit employmentgrowth of 6.0% this year, but growth will slow to 2.3%next year. Housing will enjoy a banner year in 2005,posting a 20.7% gain in total housing units, followed by a9.6% decline in 2006. The government sector will provide the greatest numberof jobs in the next two years. Local governmentemployment will increase 2.2% or 2.3% each year,including jobs in the public schools, in city, town, andvillage administration, and in Native American enterprise.New Native American casinos and expansion of existingcasinos and resort facilities are in or just emerging fromthe pipeline. For example, the refurbished Inn of theMountain Gods hotel/casino/resort facility in Ruidosoopened in late March, and employs at least 500. Also, aluxury hotel at Sandia Pueblo in Albuquerque is in thefinal stages of construction and will open later this year.Other entrants into the casino game, including the NavajoNation and Nambe Pueblo, wait in the wings. The health care and social assistance sector hasenjoyed vigorous employment growth during the last fewyears, and growth will remain fairly robust in 2005 and2006, but not up to the standard of the early years of thedecade, increasing close to 3.5% each year. One causalfactor in the slowdown will be a reduction in federalMedicaid matches. In 2005, the manufacturing sector will end a four-yearslide, posting a small (0.2%) gain, followed by significantgains of 4.8% and 4.6% in 2006 and 2007, respectively.In Albuquerque, both Eclipse Aviation and Tempur-Pedic,plan to add at least 300 jobs within a year, and Eclipsewill add hundreds more in 2007. Millennium TransitServices LLC, formerly NovaBus, the Roswell busmanufacturer, has signed a contract to deliver 289 busesto New Jersey Transit and will begin production later thisyear, adding 250 jobs.

T H A N K Y O U T O O U R S P O N S O R S