Embed Size (px)
Citation preview

University of New Mexico Bureau of Business and Economic Research
June 14, 2014 Dr. Lee A. Reynis Gillian Joyce UNM BBER 303 Girard Blvd. NE MSC06 3510 Albuquerque, New Mexico 87131 Tel. 505-277-2216
Research funded by
New Mexico MainStreet NM Economic Development Department
Zuni MainStreet Community Economic Assessment

Arial View of Zuni MainStreet District

Zuni Mainstreet Community Economic Assessment
Introduction Part 1 1. Population and Demographics 2. Housing 3. Income 4. Education 5. Employment 6. Trade Area
Part 2 Zuni Household Survey
Part 3 Challenges, Opportunities, and Strategies

Demographics
Main Street Zuni Pueblo CDP
Black Rock CDP
Zuni Res & Off Res Trust
Lands
McKinley County New Mexico
DEMOGRAPHICS Total Population (2013) * NA NA NA 10,532 73,308 2,085,287 Population (2010) 2,080 6,302 1,323 7,891 71,492 2,059,179 1990 - 2000 Annual Growth Rate NA 0.84% 3.85% 0.46% 2.11% 1.85% 2000 - 2010 Annual Growth Rate NA -0.10% 0.55% 0.18% -0.45% 1.23% Households (2010) 272 1,505 359 1,972 21,968 791,395 Average Household Size 4.18 4.07 3.69 3.98 3.22 2.55 RACE (2010) American Indian and Alaska Native 97.9% 97.1% 88.3% 95.7% 75.5% 9.4% White 0.9% 1.1% 8.4% 2.4% 15.2% 68.4% Some Other Race 0.7% 0.8% 1.9% 0.9% 6.2% 18.6% Two or More Races 0.6% 1.0% 1.5% 1.0% 3.1% 3.7% ETHNICITY (2010) Hispanic Origin 2.0% 3.0% 0.7% 2.9% 13.6% 46.3% White Alone and Not Hispanic NA 0.0.% 22.3% 2.5% 10.1% 40.5% AGE DISTRIBUTION (2010) Under 19 y/o 30.9% 32.4% 42.6% 34.1% 35.0% 28.0% 20-44 y/o 20.3% 34.6% 35.6% 35.1% 32.0% 32.1% 45-64 y/o 38.0% 24.7% 19.4% 23.5% 23.4% 26.4% 65 y/o and Over 10.9% 8.3% 2.5% 7.3% 9.6% 13.4% Median Age (2010) NA 32.0 21.4 31.7 30.3 36.6
Source: U.S. Census Bureau, Decennial Censuses 2010, 2000, 1990; Population Estimates 2013 * Zuni Census Office count is much higher: 9,378 enrolled and living on the reservation in 2014; 10,532 total on the reservation.

Housing Zuni Pueblo CDP Black Rock CDP
Zuni Res & Off Res. Trust Land
2012 McKinley County New Mexico
HOUSING OCCUPANCY Total housing units 1,737 368 2,234 25,842 900,504 Occupied housing units 1,505 287 1,862 17,518 763,844 Owner-occupied 95.4% 19.5% 83.6% 71.9% 68.9% Renter-occupied 4.6% 80.5% 16.4% 28.1% 31.1% Average household size of owner-occupied unit 6.9 1.8 6.5 4.2 2.7 Average household size of renter-occupied unit 2.7 4.2 3.8 3.7 2.5 MORTGAGE STATUS Percent with a Mortgage 15.7% 42.8% 17.1% 29.2% 60.0% UNITS IN STRUCTURE Total housing units 1,737 368 2,234 25,842 900,504 1-unit, detached 53% 62% 57% 66% 64.7% Attached 21% 16% 19% 11% 18.5% Mobile home 26% 23% 25% 23% 16.8% ROOMS Total housing units 1,737 368 2,234 25,842 900,504 1 room 1.7% 5.4% 5.1% 18.3% 2.6% 9 rooms or more 10.0% 10.6% 9.5% 4.7% 6.2% Median rooms 5.6 5.3 5.4 4.9 5.3 HOUSE HEATING FUEL Occupied housing units 1,505 287 1,862 17,518 763,844 Utility gas 4.00% 18.8% 6.1% 40.3% 67.5% Bottled, tank, or LP gas 16.2% 19.2% 16.1% 12.4% 9.6% Wood 72.6% 50.5% 70.2% 36.3% 6.6% SELECTED CHARACTERISTICS Occupied housing units 1,505 287 1,862 17,518 763,844 Lacking complete plumbing facilities 2.6% 0.0% 4.3% 11.5% 1.3% Lacking complete kitchen facilities 2.9% 0.0% 4.6% 8.4% 1.3% No telephone service available 4.5% 12.5% 5.8% 25.0% 4.7%
Source: US Census Bureau, American Community Survey 5-Year Estimates, 2008-2012

Housing
10.8%
22.3%
35.0%
25.8%
6.0%
since 2000 1990-99 1970-89 1940-70 Before 1940
Year Structure Built
Source: American Community Survey 2008-12

Income
Zuni Pueblo CDP
Black Rock CDP
Zuni Res & Off-Res Trust
Lands
McKinley County New Mexico
INCOME SOURCES (2008-2012) Total households 1,505 287 1,862 17,518 763,844 With earnings 81.9% 81.2% 79.1% 71.4% 76.7% With Social Security 30.3% 2.4% 24.9% 29.2% 29.7% With retirement income 16.7% 12.5% 15.5% 16.3% 19.1% With Supplemental Security Income 14.2% 10.5% 15.4% 10.4% 5.2% With cash public assistance income 2.7% 0.0% 2.1% 4.5% 2.7% With SNAP benefits in the past 12 months 26.4% 25.8% 27.6% 17.0% 12.7% INCOME (2008-2012) Household Income Percent of Households with Income Less than $15,000 21.3% 40.4% 25.9% 26.0% 15.6% $15,000 - $34,999 30.6% 21.3% 29.3% 28.3% 24.3% $35,000-$49,999 32.2% 26.5% 30.1% 27.5% 32.0% $50,000-$99,999 13.2% 8.0% 11.9% 14.8% 21.7% $100,000 or more 2.7% 3.8% 2.7% 3.4% 6.3% Median Household Income $32,904 $21,629 $30,250 $30,780 $44,886 Average Household Income (2008-12) $54,925 $61,477 $42,573 $44,884 $61,477 People per Household (2010) 4.07 3.69 3.98 3.22 2.55
Per Capita Income $10,163 $11,399 $10,199 $13,445 $23,749 Poverty Rate -- all people 36.8% 54.6% 39.3% 33.6% 19.5% Poverty Rate -- under 18 49.5% 62.4% 48.1% 41.30% 27.70% Source: U.S. Census Bureau, 2008-2012 American Community Survey

New Mexico Pueblo Median
Household Income (dollars)
Per Capita Income (dollars)
Pueblo of Pojoaque and Off-Reservation Trust Land, NM 54,087 28,165 San Ildefonso Pueblo and Off-Reservation Trust Land, NM 50,435 25,675 Nambe Pueblo and Off-Reservation Trust Land, NM 47,717 25,577 Jemez Pueblo, NM 46,989 23,388 Santa Ana Pueblo, NM 46,375 22,345 San Felipe Pueblo, NM 45,859 22,046 Pueblo de Cochiti, NM 45,565 21,332 Santa Clara Pueblo, NM 41,382 18,064 Ohkay Owingeh, NM 40,503 17,945 Santo Domingo Pueblo, NM 39,286 17,078 Taos Pueblo and Off-Reservation Trust Land, NM 39,167 15,825 Isleta Pueblo, NM 39,160 15,739 Sandia Pueblo, NM 38,710 15,292 Tesuque Pueblo and Off-Reservation Trust Land, NM 37,381 14,573 Laguna Pueblo and Off-Reservation Trust Land, NM 34,063 12,640 Zia Pueblo and Off-Reservation Trust Land, NM 31,563 12,509 Picuris Pueblo, NM 31,154 10,204 Zuni Reservation and Off-Reservation Trust Land, NM--AZ 30,250 10,199 Acoma Pueblo and Off-Reservation Trust Land, NM 27,938 10,188
Median Household and Per Capita Income for NM Pueblos
Source: US Census Bureau, American Community Survey 5-Year Estimates, 2008-2012
ZUNI MCKINLEY COUNTY NEW MEXICO Proficient and Above Proficient and Above Proficient and Above
Grade Reading Math Science Reading Math Science Reading Math Science
4 31.5% 17.6% 31.5% 26.1% 31.5% 28.9% 45.7% 45.4% 53.0%
8 29.3% 7.9% na 47.4% 35.4% na 60.2% 42.2% na
H3 34.0% 17.0% 9.8% 44.6% 42.8% 20.4% 55.5% 42.0% 39.9% Districtwide Countywide Statewide
Source: New Mexico Public Education Department & National Center for Education Statistics, 2012-2013
Reading, Math, and Science Proficiency for 4th, 8th, and 11th Graders
Education

New Mexico Pueblo High School Graduate or Higher (%)
College Graduate or Higher (%)
Acoma 86.6 4.4 Cochiti 81.9 27.2 Isleta 87.5 11.1 Jemez 86.4 9.7 Laguna 88.4 11.2 Nambe 85.6 25.9 Ohkay Owingeh 74 10 Picuris 77.6 15 Pojoaque San Felipe 78.8 9.6 San Ildefonso 86.9 22.4 Sandia 74.7 9.9 Santa Ana 90 11.7 Santa Clara 80 18.6 Santo Domingo 70 6 Taos 85.8 28.1 Tesuque 75 24.1 Zia 77 4.1 Zuni 76.9 7.9
Educational Attainment
Educational Attainment for Pueblos in NM
Educational attainment in Zuni and in McKinley County is lower than in New Mexico overall. Nearly a quarter (23.7%) of all those living on the Zuni Reservation over the age 25 have not finished high school, and 28.9% of those in the County have not completed high school, in comparison to 16.6% across the State.

Employment
American Community Survey, 2008-2012.
Zuni Pueblo CDP Black Rock CDPZuni Res & Off Res Trust Land
McKinley County New Mexico
EMPLOYMENT STATUSPopulation 16 years and over (2008-2012) 7,795 627 8,578 52,126 1,597,923 Civilian labor force 53.4% 59.5% 53.1% 50.7% 60.7% Employed 49.6% 47.2% 48.8% 44.7% 55.2% Unemployed 3.8% 12.3% 4.3% 6.0% 5.5% Armed Forces 0.0% 0.0% 0.0% 0.1% 0.6% Not in labor force 46.6% 40.5% 46.9% 49.3% 38.7% Percent Unemployed 7.0% 20.6% 8.1% 11.8% 9.1%Females 16 years and over (2008-2012) 4,150 260 4,451 27,211 815,505 In labor force 57.2% 52.7% 56.5% 48.5% 56.6% Employed 52.7% 37.3% 51.3% 43.7% 51.7%All parents in labor force: children under 6 40.6% 55.6% 43.0% 50.7% 61.4%All parents in labor force: children 6-17 58.0% 76.0% 60.3% 60.8% 69.4%COMMUTING TO WORKWorkers 16 years and over (2008-2012) 3,784 296 4,050 22,913 873,552Car, truck, or van -- drove alone 63.4% 61.5% 63.0% 72.9% 78.4%Other means 9.8% 16.6% 10.2% 17.0% 16.7%Worked at home 26.9% 21.9% 26.8% 10.1% 4.9%Mean travel time to work (minutes) 17.1 12.6 16.8 22 21.7OCCUPATIONCivilian employed population 16 plus 3,784 296 4,050 22,913 873,552Mgt, bus, science, & arts occupations 17.6% 33.1% 18.6% 28.1% 35.1%Service occupations 29.7% 24.7% 29.6% 25.9% 20.0%Sales and office occupations 16.7% 3.4% 15.7% 21.2% 23.8%Natl resources, const, & maint 10.3% 10.1% 10.3% 9.8% 11.9%Production, transpn, & material movg 25.7% 28.7% 25.8% 15.0% 9.2%

Zuni
Acoma Cochiti
Isleta
Jemez
Laguna
Nambe Ohkay
Owingeh
Picuris
Pojoaque Sandia
San Felipe San Ildefonso
Santa Ana Santa Clara
Santo Domingo
Taos
Tesuque
Zia ,
0%
5%
10%
15%
20%
25%
30%
New Mexico Pueblos
Percent Working at Home
Employment
Source of Data: US Census Bureau, American Community Survey, 2008-2012

Employment
Zuni
Acoma
Cochiti
Isleta
Jemez
Laguna
Nambe
Ohkay Owingeh Picuris
Pojoaque
Sandia San Felipe
San Ildefonso Santa Ana
Santa Clara
Santo Domingo
Taos Tesuque
Zia
0%
5%
10%
15%
20%
25%
30%
New Mexico Pueblos
Percent Who Are Production Workers

Employment
Note: American Community Survey, 2008-2012.
Zuni Pueblo CDP
Black Rock CDP
Zuni Res & Off Res Trust Land
McKinley County New Mexico
INDUSTRY Civilian employed population 16 plus 3,784 296 4,050 22,913 873,552
Agriculture/Mining 3.3% 3.4% 3.3% 1.8% 4.5% Construction 6.5% 0.0% 6.0% 6.8% 7.6% Manufacturing 18.9% 11.8% 18.4% 8.5% 5.1% Wholesale trade 0.0% 11.1% 0.8% 1.8% 2.1% Retail trade 19.4% 4.4% 18.2% 14.9% 11.3% Transportation/Utilities 1.7% 1.7% 1.7% 3.0% 4.4% Information 0.0% 0.0% 0.0% 1.0% 1.7% Finance/Insurance/Real Estate 2.9% 5.7% 3.1% 3.1% 4.7% Professional Business Services 0.5% 1.7% 0.7% 3.4% 10.8% Education and Health Care Services 35.3% 23.3% 34.6% 33.6% 24.8%
Leisure and Hospitality 4.8% 0.0% 4.4% 10.1% 10.6% Other services, except pub adm 0.9% 0.0% 0.9% 3.1% 4.7% Public administration 5.7% 36.8% 7.9% 8.7% 7.7% CLASS OF WORKER Civilian employed population 16 plus 2,366 409 2,848 23,241 883,420
Private wage and salary workers 48.3% 22.6% 46.7% 57.7% 70.1% Government workers 37.0% 63.5% 38.7% 34.8% 22.6% Self-employed in own not incorp 14.8% 12.5% 14.5% 7.1% 7.1% Unpaid family workers 0.0% 1.4% 0.1% 0.5% 0.2%

Employment
Zuni
Acoma
Cochiti
Isleta
Jemez
Laguna
Nambe Ohkay Owingeh
Picuris Pojoaque
Sandia
San Felipe
San Ildefonso
Santa Ana
Santa Clara
Santo Domingo
Taos Tesuque
Zia
0%
2%
4%
6%
8%
10%
12%
14%
16%
18%
20%
New Mexico Pueblos
Percent Doing Manufacturing

Zuni
Acoma
Cochiti
Isleta
Jemez
Laguna
Nambe Ohkay Owingeh
Picuris
Pojoaque Sandia
San Felipe
San Ildefonso
Santa Ana
Santa Clara
Santo Domingo
Taos Tesuque
Zia 0%
5%
10%
15%
20%
25%
30%
35%
40%
45%
New Mexico Pueblos
Percent Who Are in Arts, Entertainment, Recreation, Accommodations and Food Service Industry
Employment

Trade Area Zuni MainStreet District and Nearby Communities
Source: Department of Commerce, Census Bureau, TIGER/Line Shapefiles, Department of Transportation, Federal Highway Administration, National Highway System (2009)

Survey of Zuni
Special Thanks to Survey Techs: DeAngela Goggans, Ethan Leekya, Tesa Frejo, Alexis Bobelu, Kyla Cheama, Kaylia Vacit, Carlan Quetawki,
and Karen Wyaco.

Survey: Employment Findings
• 90% of respondents are employed in some capacity.
• Among respondents who are employed:
• 37% report having more than one job • 46% are primarily self-employed • 70% work at least in part for
themselves.

• 41% of respondents report primary employment in art or craft production
Of the 37% of respondents who report secondary employment, 94% of such employment is in arts and crafts, bringing the total percentage of the Zuni population engaged in arts and crafts production for profit to 68%.
• Government, health and social services and education employs 34% of the population
• Food and Retail Services employs 16% of the population • Various skilled and manual labor related industries make up
7% of primary employment
Survey: Industry Breakdown

Survey: Income Among Artists and Non-Artists • Average income among all respondents: $14,729 • Average income among all respondents NOT
primarily employed in arts or crafts production: $16,139
• Average income among all respondents primarily
employed in arts or crafts production: $12,500

Survey: Cash, Non-wage, Subsistence and Trade Economy
• 58% of respondents have cash income: 14% report being paid in cash alone
• Among those primarily employed in the arts, 84% have cash
income and 16% being paid in cash alone. • 37% of respondents report engagement in subsistence or
non-wage activities in order to subsidize income.
• Agricultural endeavors account for the largest percentage of this activity with 21% of respondents reporting engagement in farming or the keeping of livestock in order to supplement income.
• Trade of goods and services makes up the second largest
subsistence activity with 15% of respondents reporting engagement in the activity.

Survey: The Nitty Gritty of Arts Commerce in Zuni
• 55% of Zuni artists surveyed sell at least some work through a store
or gallery in Zuni • 59% of Zuni artists surveyed sell at least some work through a store
or gallery somewhere else in NM • 45% of Zuni artists sell at least some of their work to traders who
come into the village • 56% of Zuni artists surveyed sell at least some work on foot • 49% of Zuni artists report selling work out of their homes • Only 8% of Zuni artists surveyed report selling work through the
internet

Survey: Geography of the Zuni Arts Market
• 55% of artists surveyed sell work at stores in Zuni • 39% sell in stores in Gallup • 7% sell in stores in Santa Fe • 10% sell in stores in Albuquerque • 16% sell in stores outside New Mexico – nearly all in AZ

Challenges for Arts & Crafts Survey Participants • Finding buyers for their work
• Including both stores and individuals
• Maintaining consistent income from sales • Business tends to improve in the summer and decline in the winter
• Accessing the market beyond Zuni • Time, transportation and travel funds
• Competition and downward pressure on the local arts market • Saturation of the local market causing local stores to turn away new work
due to overstock
• Downward pressure on the market • Independent sellers making direct sales at discounted prices out of need
to recoup investment in materials or meet day-to-day needs • Local and regional stores underpaying for work • Broader issue in Native arts of misrepresentation and counterfeit native
arts

Challenges, Opportunities & Strategies
• Access to credit and funding is critical with many challenges due to land ownship. The Tribe should explore programs for providing financing for small-scale, local economic development efforts, including those of the US Dept of Agriculture. There are also a number of examples of what tribes elsewhere are doing that could serve as models.
• Educational attainment on the Zuni Reservation lags that on other Pueblos in NM, with Zuni near the bottom in terms of % of population over 25 with a high school degree and also with a college degree. The proximity of the UNM branch campuses in Zuni and Gallup provides opportunities, but the Tribe will need to work with these schools to provide degree and certificate programs that better meet Zuni needs.
• The disparity in the population count in the 2010 Census and the 2014 count of the Zuni Census office is huge – 2,600 people. Zuni Census Office needs to be brought into the process for the 2020 count. The Tribe should work with the State of NM, which has an interest in a full count review, as well as with the NM delegation in Washington. Much could be at stake.
• The concentration of people involved in artistic pursuits in Zuni is astounding, but those primarily engaged in arts and crafts production tend to have lower incomes and are more likely to be engaged in the informal cash economy, less likely to have a savings account or a bank loan, and more heavily reliant on public assistance.

• The local Zuni arts market is saturated, yet an astoundingly large number of Zuni work in the arts perhaps because that is the only way they know how to make some money. Local artisans peddle their wares on the street to tourists at bargain basement prices. A similar desperateness apparently also drives Zuni to sell their own blood. There is a need for jobs.
• At the same time, many Zuni do most of their shopping in Gallup or drive many miles to commercial centers like Albuquerque. The 10,000 or so people living on the Reservation collectively have income and financial resources that far and away exceed what they spend locally. Leakages, though difficult to measure given the data issues, are huge.
• A market survey was not part of this study, although a good survey would be revealing of the types of goods and services that are in demand and for which people currently go elsewhere. Such a study could then be used by local Zuni interested in starting a business to develop their business plan, although it would still be advisable to work with the local Small Business Development Centers at UNM Gallup.
• New businesses start-ups in Zuni face a number of obstacles which would be easier to overcome if the Tribe would make available part of the 13 acres within the MainStreet District for a small business incubator, to be built with capital outlay. There are any number of very successful incubators that could serve as models, e.g., the one run by the the South Valley Economic Development Center as well as the Santa Fe Business Incubator.
Challenges, Opportunities & Strategies

Challenges, Opportunities & Strategies
• Zuni artists and artisans face particular challenges. They often lack the infrastructure to get their work to market, with only 11% of the Zuni artists interiewed directly selling outside McKinley County. They also face challenges in terms of obtaining needed supplies at a reasonable cost.
• Zuni artists and artisans face competition from cheap copies of their designs that are often imported from elsewhere. Zuni would benefit from Tribal action to protect Zuni artists and the authenticity of their work.
• While many artists find significant benefit in working out of their homes, many could benefit from having cooperative public arts production facilities and gallery space along MainStreet. A tribally run website could help guarantee authenticity for consumers and provide an important vehicle for local artists and artisans to sell their wares.
• The owner of Turquoise Village died recently and there is concern about the future of that establishment as the son lives and works full time in NYC. While Zuni may not have the money at this point to purchase the facility, the Tribe should give priority to talking with the son, who wants to do the right thing for the Zuni people. The future of this business is important to meet the needs of artists both for market outlets and also for supplies at reasonable prices and to provide more options for tourists.
• Zuni has an opportunity in the redevelopment of the DeAnza Hotel in Albuquerque to expose more people to Zuni art & culture with a marketing outlet for Zuni artists.

• More tourism on Zuni’s own terms could give an important boost to local arts and craft production. Zuni would seem to have much to offer tourists: scenic beauty of the surroundings, archeological sites, history as the first point of contact, richness of the culture and cultural traditions, survival as a people in the face of long droughts such as are threatened for the southwest in the future, unique attractions such as the old Spanish Mission and murals.
• Zuni would be well served to develop opportunities for the new market of cultural tourists – who tend to want to leave with experiences and memories, as much as mementos. Development of cultural experiences specific to Zuni allows for excellent opportunities for Zuni to develop tourism while also developing skills and dialog around traditional cultural activities within the community. Workshops and tours around Zuni’s agricultural and irrigation practices, ethno-botany, traditional pottery skills, and other activities would all be valuable avenues to pursue. Archeological sites are attractions not affected by the religious calendar.
• However, Zuni’s location is remote, the amenities in terms of food and lodging are excellent but very limited, and access to attractions is often cut off in observance of key religious events, like the Summer Solstice. Zuni needs to expand tourism amenities particularly within the MainStreet District and to concentrate tourism in a way that takes pressure off the Middle Village.
Challenges, Opportunities & Strategies
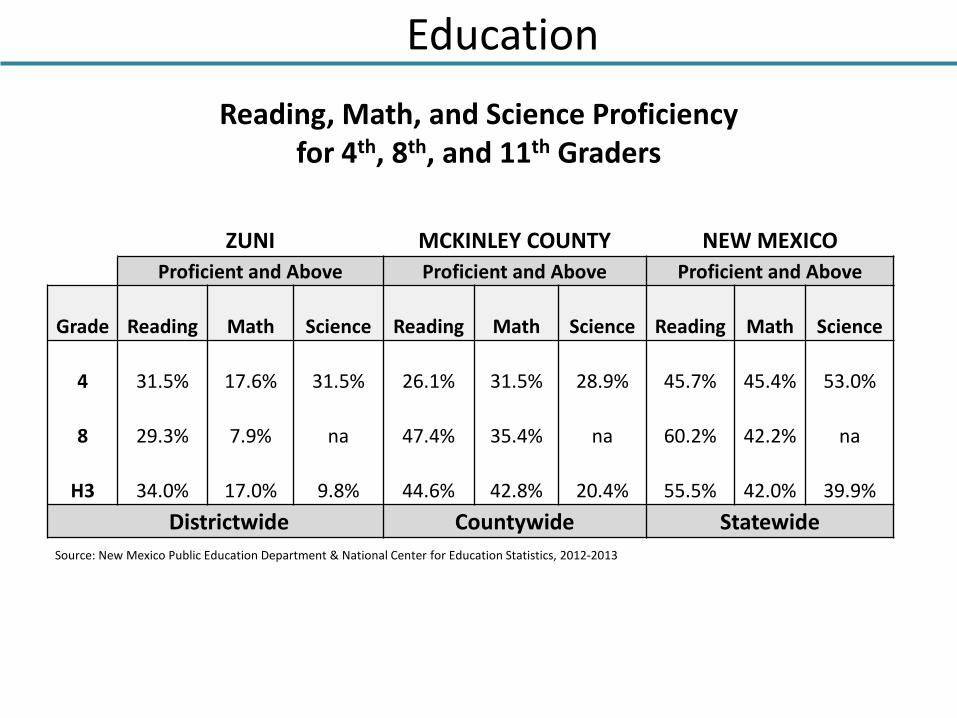
• Lodging and food services can both grow slowly and in response to demand through relatively low-investment efforts thru programs like airbnb, bed and breakfast style lodging in homes, and like Cookening, where tourists are hosted by local families for meals. Another low-investment option would be the development of food truck food services.
• In addition to pursuing hospitality industry options along MainStreet, Zuni Pueblo should consider future development of part of 112 acre property that is about 5 miles from Zuni. The area would be attractive for development of a small resort or boutique hotel that could showcase Zuni arts and crafts and introduce visitors to the options locally for cultural tourism. Zuni should avoid models that emphasize golf courses and attracting national chains. Zuni has a long history of survival in the face of drought and much to offer others trying to adapt to future aridness.
• There are a number of issues related to housing. The housing stock has not kept up with population growth and the types of housing built are “cookie-cutter” HUD designs that fail to serve well Zuni families, much less their cultural and religious traditions. The houses are too small and they are particularly deficient in the space allocated for kitchen and living room, where one can entertain relatives and friends, for example on feast days. The houses could be oriented toward the sun and of passive solar design, which would reduce dramatically heating a cooling costs.
Challenges, Opportunities & Strategies
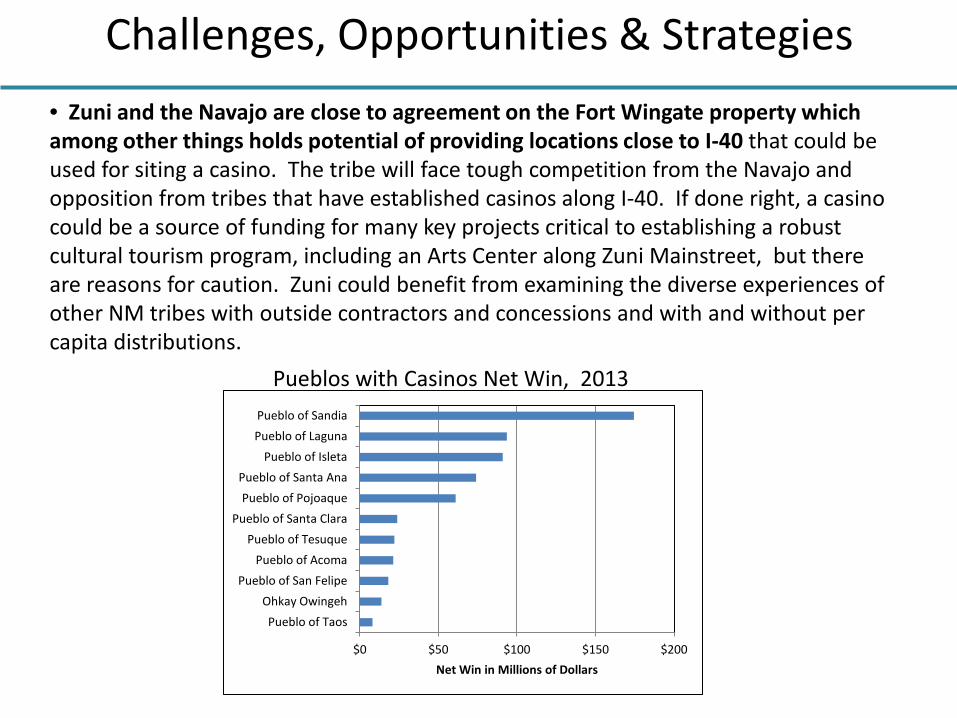
Challenges, Opportunities & Strategies • Zuni and the Navajo are close to agreement on the Fort Wingate property which among other things holds potential of providing locations close to I-40 that could be used for siting a casino. The tribe will face tough competition from the Navajo and opposition from tribes that have established casinos along I-40. If done right, a casino could be a source of funding for many key projects critical to establishing a robust cultural tourism program, including an Arts Center along Zuni Mainstreet, but there are reasons for caution. Zuni could benefit from examining the diverse experiences of other NM tribes with outside contractors and concessions and with and without per capita distributions.
$0 $50 $100 $150 $200
Pueblo of Taos Ohkay Owingeh
Pueblo of San Felipe Pueblo of Acoma
Pueblo of Tesuque Pueblo of Santa Clara
Pueblo of Pojoaque Pueblo of Santa Ana
Pueblo of Isleta Pueblo of Laguna Pueblo of Sandia
Net Win in Millions of Dollars
Pueblos with Casinos Net Win, 2013

Thank you