Embed Size (px)
Citation preview
1
Zuni MainStreet: Community Economic Assessment Dr. Lee Reynis
And
Gillian Joyce
With
Ashley Hooper
Mary Louise Gucik
Daren Ruiz
June 2014
Funding Provided by: New Mexico Economic Development Department New Mexico MainStreet

2
3
Acknowledgements We would like to thank Rich Williams, Director of New Mexico MainStreet, for allowing us the opportunity to work on this project as well as the Zuni Tribal Council members for their support during the process. Furthermore, we would like to acknowledge both Loren Thomas and Tom Kennedy of Zuni MainStreet for their help and insights.
Additionally, we owe a debt of gratitude to all involved with our survey. We would like to thank Charlie Deans of Community By Design for administering the survey and Friends of New Mexico MainStreet for funding the survey. We are also grateful for the work of the survey technicians: DeAngela Goggans, Ethan Leekya, Tesa Frejo, Alexis Bobelu, Kyla Cheama, Kaylia Vacit, Carlan Quetawki, and Karen Wyaco. Finally, we would like to acknowledge the Zuni survey participants who took time out of their days to offer their insights and experiences in working in the Zuni Pueblo.
We take full responsibility for any errors or oversights that may be contained within this report.
Sincerely,
Dr. Lee Reynis
Gillian Joyce
4
Table of Contents Acknowledgements ....................................................................................................................................... 3
Introduction .................................................................................................................................................. 6
Demographics ............................................................................................................................................... 7
Population ............................................................................................................................................. 7
Race/Ethnicity ....................................................................................................................................... 8
Age ........................................................................................................................................................ 8
Education .............................................................................................................................................. 8
Income ................................................................................................................................................ 11
Poverty ................................................................................................................................................ 13
Public Assistance ................................................................................................................................. 14
Housing ............................................................................................................................................... 15
Language ............................................................................................................................................. 16
Economy...................................................................................................................................................... 17
Employment ........................................................................................................................................ 17
Unemployment ................................................................................................................................... 20
Zuni Workers ....................................................................................................................................... 21
Tourism ............................................................................................................................................... 26
New Construction Activity .................................................................................................................. 27
Trade Area ........................................................................................................................................... 28
Injections ............................................................................................................................................. 30
Leakages .............................................................................................................................................. 30
Zuni Household Survey ............................................................................................................................... 31
Employment among Respondents: ......................................................................................................... 32
Industry Break-Down of Working Respondents: ................................................................................ 32
Income among Respondents: ............................................................................................................. 32
Cash, Non-Wage, Subsistence and Trade Economy............................................................................ 32
Banking:............................................................................................................................................... 33
Arts Production: ...................................................................................................................................... 33
Arts Commerce: ...................................................................................................................................... 34
Challenges: .......................................................................................................................................... 34
Respondent Suggestions: .................................................................................................................... 35
5
Challenges, Opportunities & Strategies: ..................................................................................................... 36
Credit and Funding .................................................................................................................................. 36
Education ................................................................................................................................................ 37
Arts and Crafts ........................................................................................................................................ 37
Subsistence Activities and Trade ............................................................................................................ 39
Tourism Development ............................................................................................................................ 39
Promoting Local Economic Development that Serves the Local Market................................................ 41
Appendix ..................................................................................................................................................... 42
6
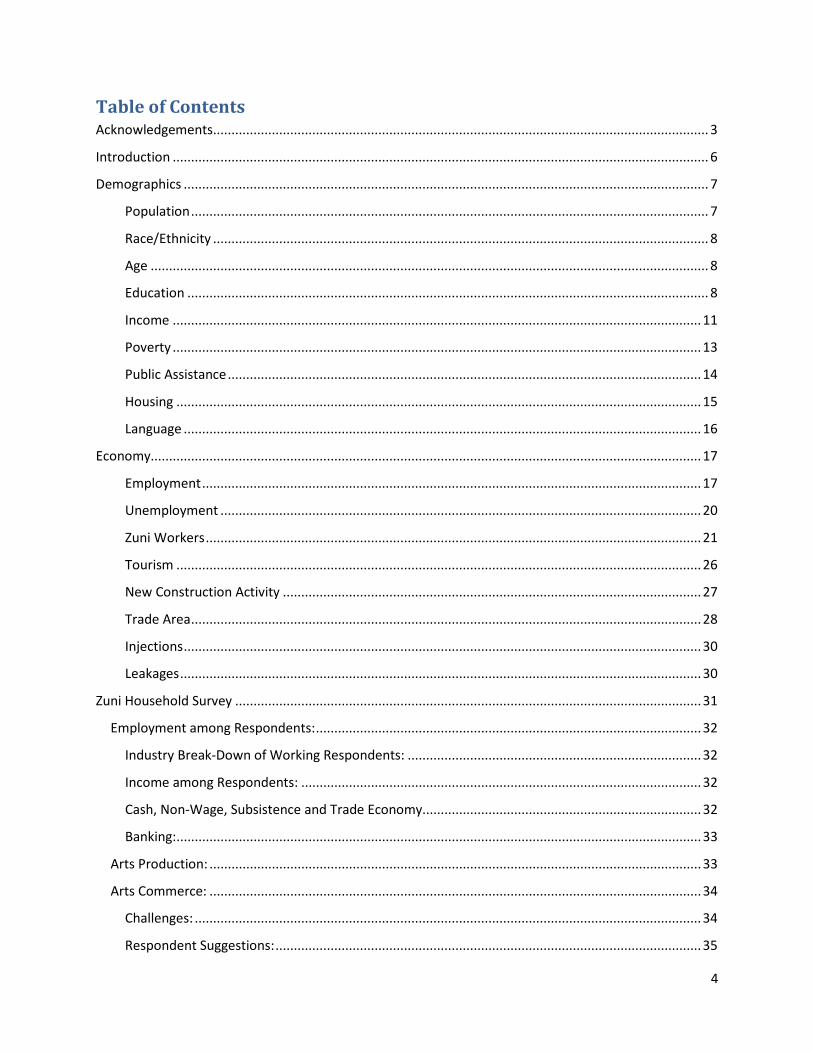
Introduction Located in the Northwestern region of New Mexico, the Zuni Pueblo is located approximately 150 miles west of Albuquerque and roughly 35 miles south of Gallup. The Reservation covers over 418,000 acres and lies on the western border of New Mexico and on the eastern border of Arizona. The predominately Native American community is comprised primarily of people who identify as belonging to the Zuni (A:shiwi) tribe. The Zuni people have inhabited the Southwest for thousands of years and have traditions deeply rooted in agriculture, art, and jewelry making. Due to its relative geographic isolation, the Zuni tribe has maintained a very unique language that is still spoken today.
Established as the first Native American MainStreet District in 2012, the Zuni MainStreet is located in the heart of the Zuni Pueblo. (See Map 1 and Map 2 below). Within the district are several trading stores and galleries that sell Zuni arts and crafts; there is also an inn and a few restaurants and grocery stores located in the Zuni MainStreet District.
Map 1. Zuni MainStreet District and the Intersecting Census Tract
University of New Mexico, Resource Geographic Information System, Digital Ortho-photography (2011), Department of Commerce, Census Bureau, TIGER/Line Shapefiles, New Mexico Economic Development Department, New Mexico MainStreet Program.
7
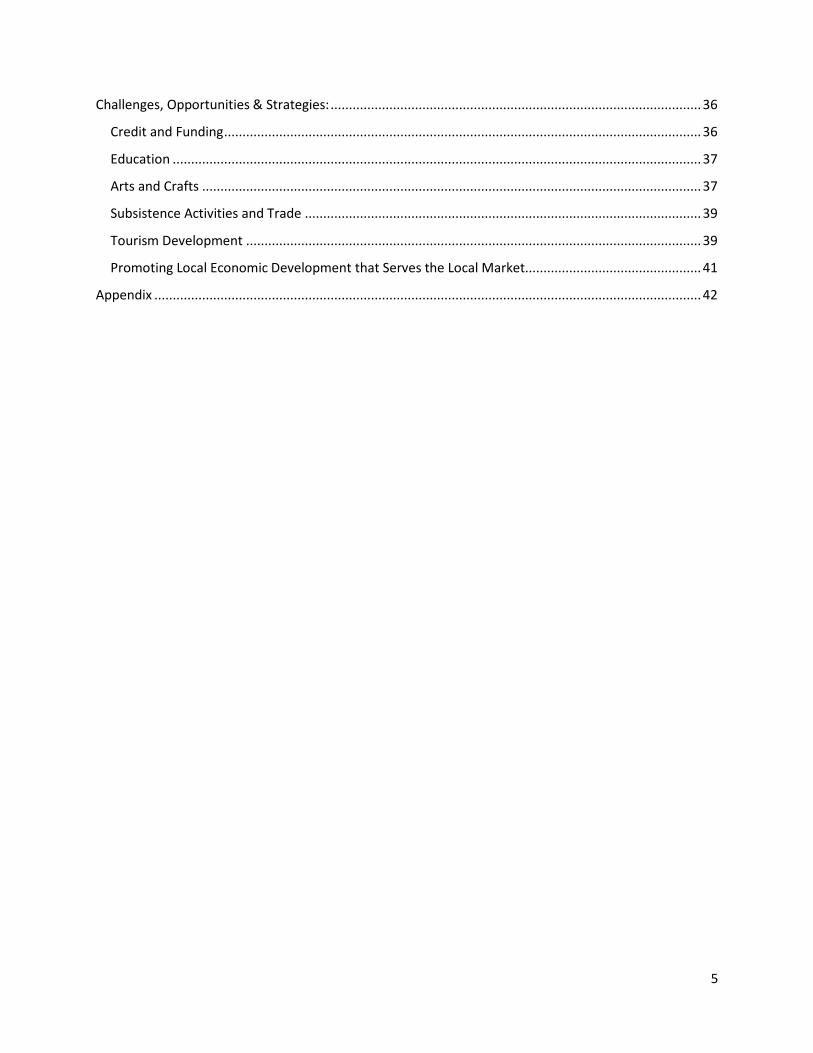
Map 2. Ariel View of the Zuni MainStreet District
Google earth (2013) and New Mexico Economic Development Department, New Mexico MainStreet Program.
Demographics1
Population2
As seen in Table A1 in the Appendix, as of the last Census, Zuni essentially saw no population growth between 2000 and 2010 (.18%). This is in relationship to slow growth in the State overall over the same period (1.23%) and slightly negative population growth in McKinley County (-.45%). Within the Reservation, the Village of Zuni saw slightly negative growth (-.10%), while Black Rock saw a slight gain (.55%). The stagnation in population growth on the Reservation is likely due to mechanical and not natural influences – i.e., the ratio of births to deaths is not accounting for Zuni’s stagnant population so much as a loss of population to other locations outside Zuni and McKinley County and potentially
1 Please note that the following demographic analyses use both the US Census 2010 data as well as the US Census American Community Survey (ACS) 2008-2012 Five-Year Estimates. The population estimates appear to be undercounting the number of people living in the Zuni Pueblo CDP and the Zuni Reservation and Off-Reservation Trust Land. After determining the current (2014) population numbers from the Zuni Census Office, BBER has determined that the ACS 2008-2012 Five-Year Estimates could be more representative of the Zuni CDP and Reservation populations and has decided to use and explicitly state the ACS population denominators rather than use the Census 2010 estimates in much of the report. These population data comparisons are reflected in Table A1 of the Appendix. 2 See Table A1 in the Appendix.

8
outside of New Mexico. The average family size on the Zuni Reservation is 7.35; this is decidedly larger than in the County (5.21), State (3.27), or among other Pueblos in New Mexico.
Race/Ethnicity3 According to the Census 2010, 95.7% of those living on the Zuni Reservation are of American Indian identity. 97.5% of those living within the MainStreet District are of Native identity, and so are 97.1% of those living in the Zuni CDP. Only 88.3% of those living in Black Rock identify as Native American – 8.4% of the population in Black Rock identifies as White, and nearly all of this population identifies as White alone and non-Hispanic. 2.4% of the population of the Reservation overall identify as White. 0.9% identify as some other race. 75.5% of the population of McKinley County identifies as Native American. Within the County of McKinley, those who identify as Navajo make up 56.9% of the population overall and 75.9% of the Native American population within the County. Pueblo Indians make up 14.5% of the County and 20.2% of the Native American population within the County. More than 35 other tribal groups are represented in McKinley County according to the Census Bureau, and 6% of Native respondents did not respond to questions about tribal affiliation. In New Mexico overall, Native Americans make up only 9.4% of the population and more than 50 tribal groups are represented. 10.1% of the County identifies as White Alone, Not Hispanic (compared to 40.5% State-wide) and 13.6% of the County identifies as Hispanic, of any race (compared to 46.3% in the State overall).
Age Zuni’s population is decidedly younger than New Mexico’s overall. The median age on the Reservation is 31, compared to 36.7 for New Mexico overall. Zuni tracks similarly to McKinley County where the median age is 30.7. The Zuni CDP tracks similarly as well with a median age of 32.8. Black Rock, however, has a drastically lower median age of 24.5. This is likely due to the number of young families and medical professionals located in Black Rock.
Education4 Educational attainment in Zuni and in McKinley County is lower than in New Mexico overall. Nearly a quarter (23.7%) of all those living on the Zuni Reservation over the age 25 have not finished high school, and 28.9% of those in the County have not completed high school, in comparison to 16.6% across the State. Numbers are similar for the Zuni CDP, where 24.4% of the population does not have a high school diploma or equivalent; however, numbers in Black Rock are quite different, where only 8.9% of the population lacks a high school diploma or equivalent. This is, once again, likely primarily explained by the location of the hospital and a large portion of its workforce in Black Rock. The same trend is seen at the upper end of educational attainment. Only 8% of those living on the Zuni Reservation have attained a bachelor’s degree or a higher degree, compared to 12.2% in McKinley County and 25.6% of the population of New Mexico. Once again, the trend in Black Rock is quite different where 26.6% of the population has attained a bachelor’s degree or higher.
3 See Table A1 4 See Table A3 in the Appendix.
9
The percentage of the population living on the Reservation enrolled in college is lower than the State-wide numbers, despite the proximity of the Zuni and Gallup branches of the University of New Mexico. On the Reservation, only 4% of the population is estimated to be enrolled in higher education. 5.6 of McKinley County is enrolled in college or graduate school. These are in comparison to the State-wide numbers where we see an estimated 8% of the population enrolled in college or graduate school. Further, when one looks only at the Zuni CDP, enrollment numbers are even lower – 3.7% of the population is enrolled in higher education, compared to 6% in Black Rock.
For those 18 to 24 years of age, 33.4 % of Zuni Pueblo residents and 36% of those living on the Zuni Reservation completed a high school degree or equivalent. This is higher than the State at 28.8% and on par with McKinley County at 33.1%; however, educational attainment for people 18 to 24 years of age is significantly lower than older age groups in these areas. For example, for those 25 to 34 years old, 72.7% of people living in the Zuni Pueblo and 74.5% of those living in the Zuni Reservation have a high school degree or equivalent. 72.1% of Pueblo residents and 76.4% of Reservation residents between the ages of 35 to 44 have high school graduate degrees or equivalent. Among 45 to 64 year olds, 83.3% of Pueblo residents and 82.8% of Reservation residents have high school diplomas or equivalents. There is a decline in the high school graduation rates among adults 65 and older; however, at 58.7% for the Pueblo and 55.1% for the Reservation, these are still higher than rates for those aged 18 to 24 years. This trend also can be seen at the State level, and it is unclear as to whether more educated adults are moving to New Mexico later in life, educational attainment is falling from generation to generation, or if older adults are returning to school.
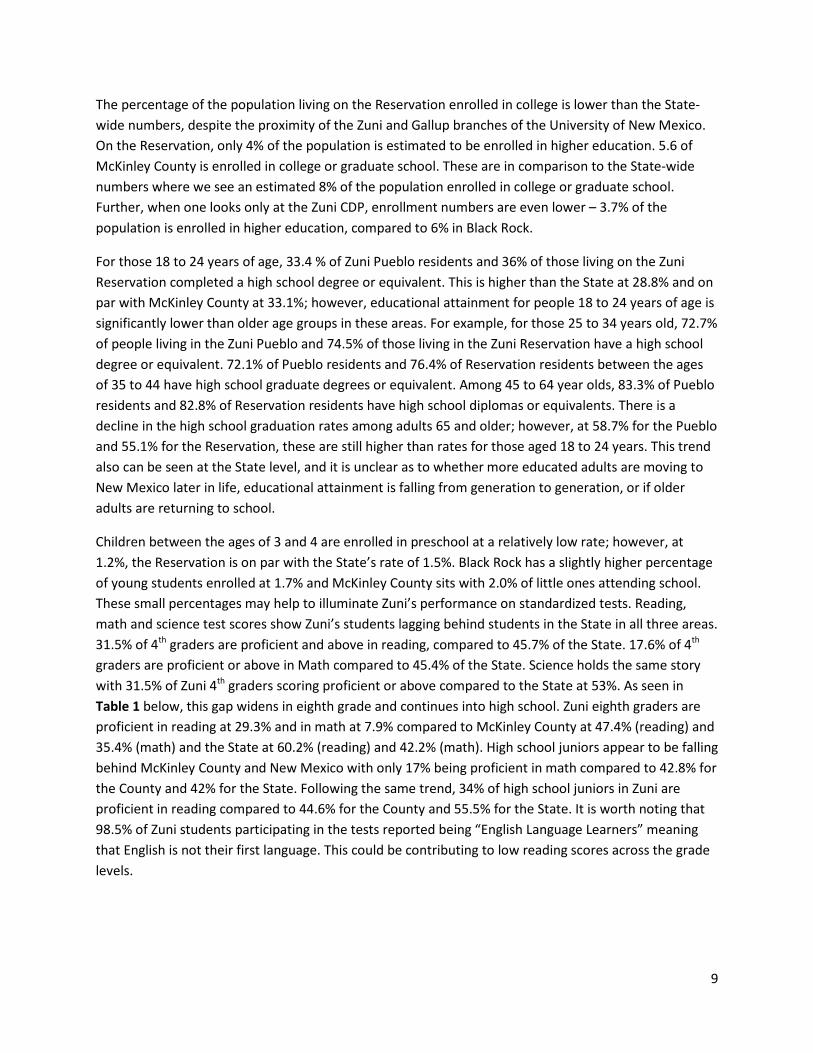
Children between the ages of 3 and 4 are enrolled in preschool at a relatively low rate; however, at 1.2%, the Reservation is on par with the State’s rate of 1.5%. Black Rock has a slightly higher percentage of young students enrolled at 1.7% and McKinley County sits with 2.0% of little ones attending school. These small percentages may help to illuminate Zuni’s performance on standardized tests. Reading, math and science test scores show Zuni’s students lagging behind students in the State in all three areas. 31.5% of 4th graders are proficient and above in reading, compared to 45.7% of the State. 17.6% of 4th graders are proficient or above in Math compared to 45.4% of the State. Science holds the same story with 31.5% of Zuni 4th graders scoring proficient or above compared to the State at 53%. As seen in Table 1 below, this gap widens in eighth grade and continues into high school. Zuni eighth graders are proficient in reading at 29.3% and in math at 7.9% compared to McKinley County at 47.4% (reading) and 35.4% (math) and the State at 60.2% (reading) and 42.2% (math). High school juniors appear to be falling behind McKinley County and New Mexico with only 17% being proficient in math compared to 42.8% for the County and 42% for the State. Following the same trend, 34% of high school juniors in Zuni are proficient in reading compared to 44.6% for the County and 55.5% for the State. It is worth noting that 98.5% of Zuni students participating in the tests reported being “English Language Learners” meaning that English is not their first language. This could be contributing to low reading scores across the grade levels.
10
Table 1. Reading, Math, and Science Proficiency for 4th, 8th, and 11th Graders
ZUNI MCKINLEY COUNTY NEW MEXICO Proficient and Above Proficient and Above Proficient and Above Grade Reading Math Science Reading Math Science Reading Math Science
4 31.5% 17.6% 31.5% 26.1% 31.5% 28.9% 45.7% 45.4% 53.0% 8 29.3% 7.9% na 47.4% 35.4% na 60.2% 42.2% na
H3 34.0% 17.0% 9.8% 44.6% 42.8% 20.4% 55.5% 42.0% 39.9% Districtwide Countywide Statewide
Source: New Mexico Public Education Department & National Center for Education Statistics, 2012-2013
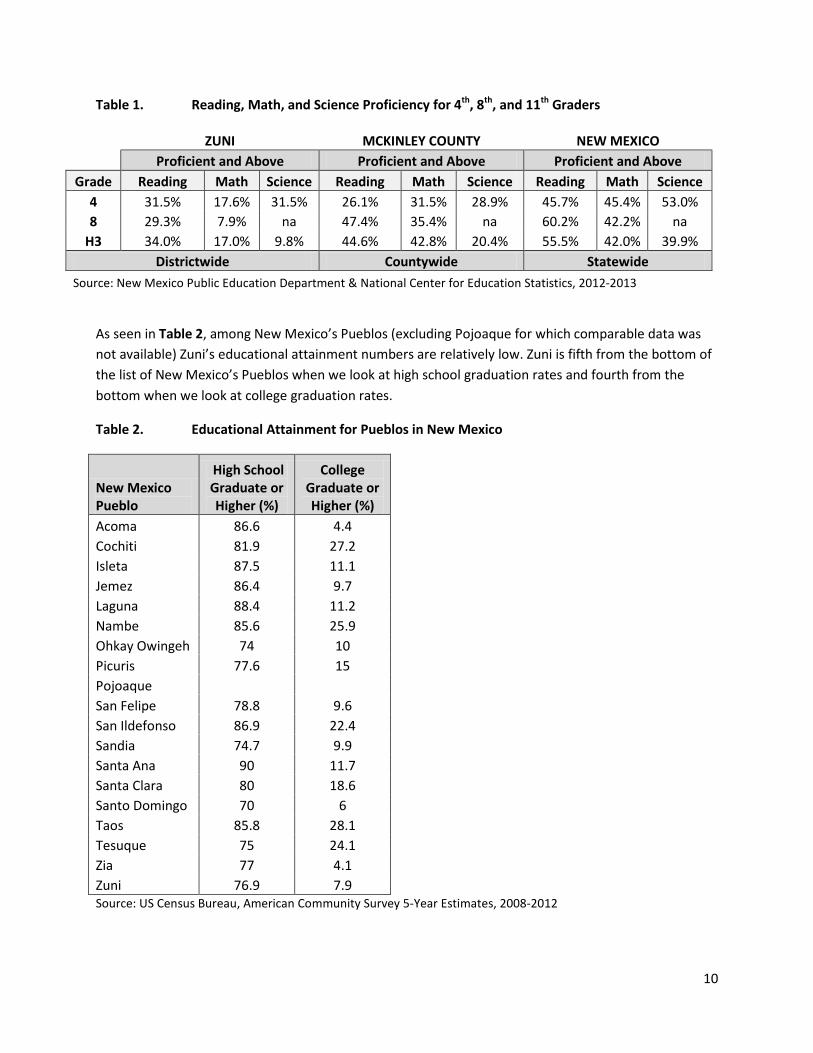
As seen in Table 2, among New Mexico’s Pueblos (excluding Pojoaque for which comparable data was not available) Zuni’s educational attainment numbers are relatively low. Zuni is fifth from the bottom of the list of New Mexico’s Pueblos when we look at high school graduation rates and fourth from the bottom when we look at college graduation rates.
Table 2. Educational Attainment for Pueblos in New Mexico
New Mexico Pueblo
High School Graduate or Higher (%)
College Graduate or Higher (%)
Acoma 86.6 4.4 Cochiti 81.9 27.2 Isleta 87.5 11.1 Jemez 86.4 9.7 Laguna 88.4 11.2 Nambe 85.6 25.9 Ohkay Owingeh 74 10 Picuris 77.6 15 Pojoaque San Felipe 78.8 9.6 San Ildefonso 86.9 22.4 Sandia 74.7 9.9 Santa Ana 90 11.7 Santa Clara 80 18.6 Santo Domingo 70 6 Taos 85.8 28.1 Tesuque 75 24.1 Zia 77 4.1 Zuni 76.9 7.9 Source: US Census Bureau, American Community Survey 5-Year Estimates, 2008-2012
11
Income The median household income for the Zuni Reservation, according to the Census Bureau, is $30,250. In McKinley County, this number is roughly the same at $30,780. Both of these numbers are notably lower than the $44,886 median household income at the State level. If one looks at per capita numbers, the difference is more drastic – the median per capita income in Zuni is $10,199. In McKinley its $13,445 and in the State it’s $23,749 –this suggests Zuni households are more likely to rely on more family members to bring income into the household.
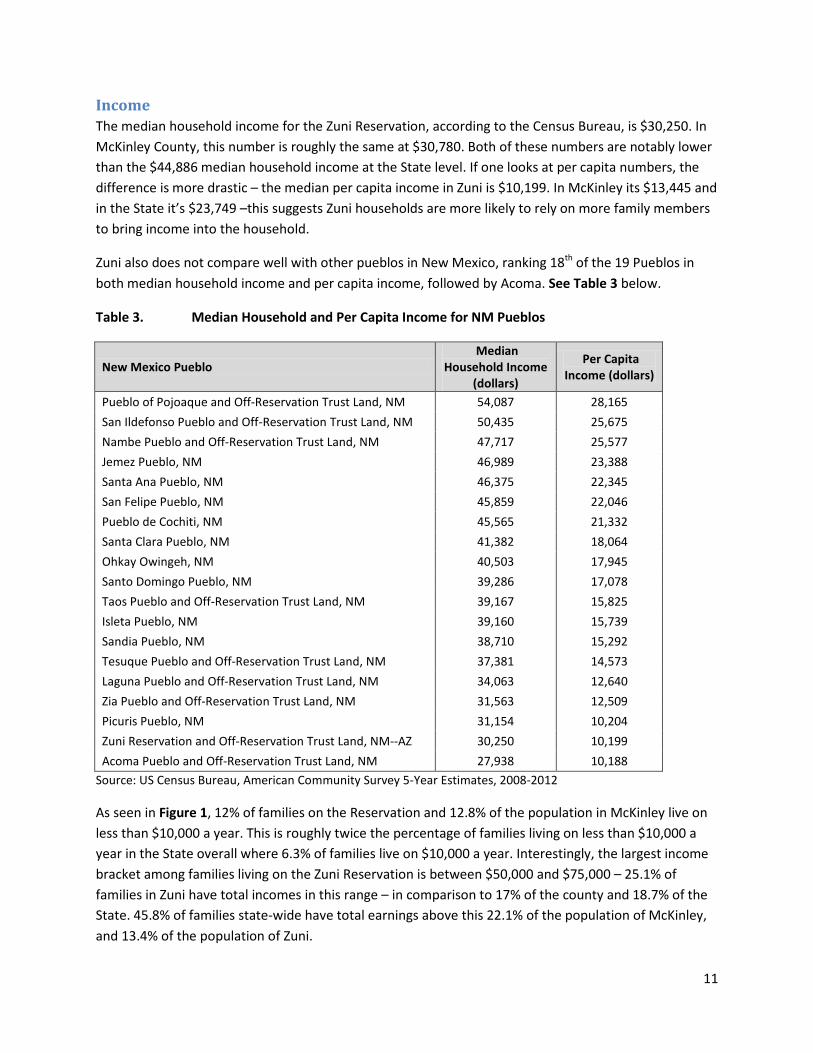
Zuni also does not compare well with other pueblos in New Mexico, ranking 18th of the 19 Pueblos in both median household income and per capita income, followed by Acoma. See Table 3 below.
Table 3. Median Household and Per Capita Income for NM Pueblos
New Mexico Pueblo Median
Household Income (dollars)
Per Capita Income (dollars)
Pueblo of Pojoaque and Off-Reservation Trust Land, NM 54,087 28,165 San Ildefonso Pueblo and Off-Reservation Trust Land, NM 50,435 25,675 Nambe Pueblo and Off-Reservation Trust Land, NM 47,717 25,577 Jemez Pueblo, NM 46,989 23,388 Santa Ana Pueblo, NM 46,375 22,345 San Felipe Pueblo, NM 45,859 22,046 Pueblo de Cochiti, NM 45,565 21,332 Santa Clara Pueblo, NM 41,382 18,064 Ohkay Owingeh, NM 40,503 17,945 Santo Domingo Pueblo, NM 39,286 17,078 Taos Pueblo and Off-Reservation Trust Land, NM 39,167 15,825 Isleta Pueblo, NM 39,160 15,739 Sandia Pueblo, NM 38,710 15,292 Tesuque Pueblo and Off-Reservation Trust Land, NM 37,381 14,573 Laguna Pueblo and Off-Reservation Trust Land, NM 34,063 12,640 Zia Pueblo and Off-Reservation Trust Land, NM 31,563 12,509 Picuris Pueblo, NM 31,154 10,204 Zuni Reservation and Off-Reservation Trust Land, NM--AZ 30,250 10,199 Acoma Pueblo and Off-Reservation Trust Land, NM 27,938 10,188
Source: US Census Bureau, American Community Survey 5-Year Estimates, 2008-2012
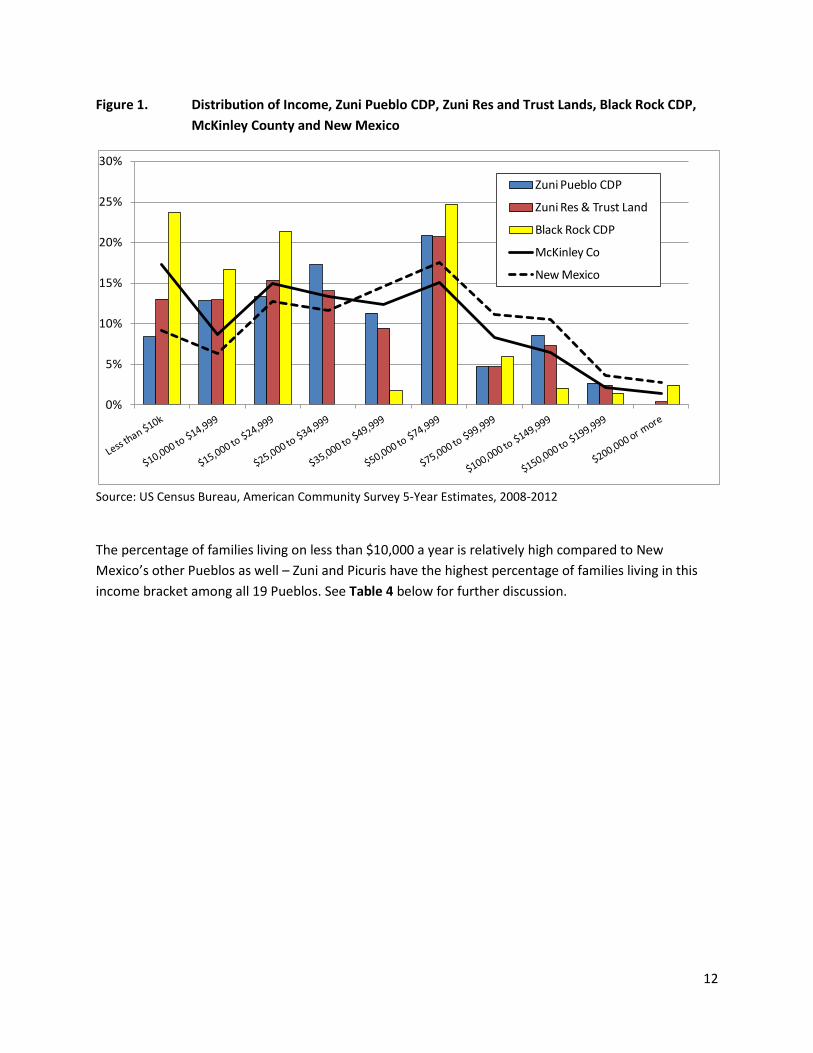
As seen in Figure 1, 12% of families on the Reservation and 12.8% of the population in McKinley live on less than $10,000 a year. This is roughly twice the percentage of families living on less than $10,000 a year in the State overall where 6.3% of families live on $10,000 a year. Interestingly, the largest income bracket among families living on the Zuni Reservation is between $50,000 and $75,000 – 25.1% of families in Zuni have total incomes in this range – in comparison to 17% of the county and 18.7% of the State. 45.8% of families state-wide have total earnings above this 22.1% of the population of McKinley, and 13.4% of the population of Zuni.
12
Figure 1. Distribution of Income, Zuni Pueblo CDP, Zuni Res and Trust Lands, Black Rock CDP, McKinley County and New Mexico
Source: US Census Bureau, American Community Survey 5-Year Estimates, 2008-2012
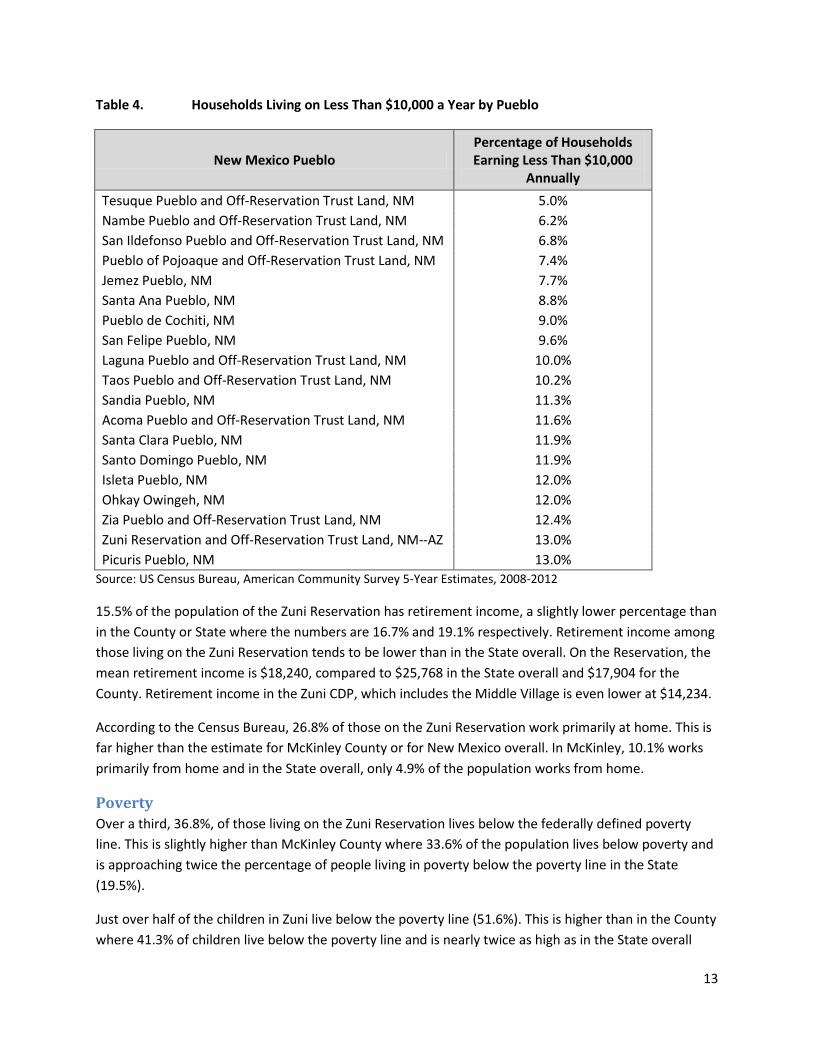
The percentage of families living on less than $10,000 a year is relatively high compared to New Mexico’s other Pueblos as well – Zuni and Picuris have the highest percentage of families living in this income bracket among all 19 Pueblos. See Table 4 below for further discussion.
0%
5%
10%
15%
20%
25%
30%
Zuni Pueblo CDP
Zuni Res & Trust Land
Black Rock CDP
McKinley Co
New Mexico
13
Table 4. Households Living on Less Than $10,000 a Year by Pueblo
New Mexico Pueblo Percentage of Households Earning Less Than $10,000
Annually Tesuque Pueblo and Off-Reservation Trust Land, NM 5.0% Nambe Pueblo and Off-Reservation Trust Land, NM 6.2% San Ildefonso Pueblo and Off-Reservation Trust Land, NM 6.8% Pueblo of Pojoaque and Off-Reservation Trust Land, NM 7.4% Jemez Pueblo, NM 7.7% Santa Ana Pueblo, NM 8.8% Pueblo de Cochiti, NM 9.0% San Felipe Pueblo, NM 9.6% Laguna Pueblo and Off-Reservation Trust Land, NM 10.0% Taos Pueblo and Off-Reservation Trust Land, NM 10.2% Sandia Pueblo, NM 11.3% Acoma Pueblo and Off-Reservation Trust Land, NM 11.6% Santa Clara Pueblo, NM 11.9% Santo Domingo Pueblo, NM 11.9% Isleta Pueblo, NM 12.0% Ohkay Owingeh, NM 12.0% Zia Pueblo and Off-Reservation Trust Land, NM 12.4% Zuni Reservation and Off-Reservation Trust Land, NM--AZ 13.0% Picuris Pueblo, NM 13.0%
Source: US Census Bureau, American Community Survey 5-Year Estimates, 2008-2012
15.5% of the population of the Zuni Reservation has retirement income, a slightly lower percentage than in the County or State where the numbers are 16.7% and 19.1% respectively. Retirement income among those living on the Zuni Reservation tends to be lower than in the State overall. On the Reservation, the mean retirement income is $18,240, compared to $25,768 in the State overall and $17,904 for the County. Retirement income in the Zuni CDP, which includes the Middle Village is even lower at $14,234.
According to the Census Bureau, 26.8% of those on the Zuni Reservation work primarily at home. This is far higher than the estimate for McKinley County or for New Mexico overall. In McKinley, 10.1% works primarily from home and in the State overall, only 4.9% of the population works from home.
Poverty Over a third, 36.8%, of those living on the Zuni Reservation lives below the federally defined poverty line. This is slightly higher than McKinley County where 33.6% of the population lives below poverty and is approaching twice the percentage of people living in poverty below the poverty line in the State (19.5%).
Just over half of the children in Zuni live below the poverty line (51.6%). This is higher than in the County where 41.3% of children live below the poverty line and is nearly twice as high as in the State overall
14
where 27.7% of children live under the poverty line. 40.3% of those over the age of 65 on the Zuni Reservation live below poverty. Again, this is higher than in McKinley County where 32.5% of the population lives in poverty and is more than three times as high as in New Mexico overall where 12.2% of those over 65 live below the poverty line. In a slight reverse of State and national trends, women living on the Zuni Reservation are slightly less likely to live below the poverty line than men – 38% compared to 40.6%.
Educational attainment, as elsewhere, is a strong indicator of poverty on the Zuni Reservation, with education having a strongly ameliorative effect on poverty. As seen in Table 5, among those living on the Zuni Reservation who have not completed high school, the poverty rate is 58.6%. Among those with a high school diploma or equivalent, the poverty rate drops by nearly 20 points to 39.1%. Among those who have attended ‘some college’ but who have not received a bachelor’s degree, the poverty rate drops another ten points to 19.1%. And finally, with a bachelor’s degree or higher, the poverty rate drops another ten points to 11.8%. Despite the poverty rate being generally higher, the effects of educational attainment in Zuni track relatively similarly to those in the State overall with a slight exception – ‘some college’ has a stronger effect on poverty in Zuni than it does in the State – statewide, ‘some college’ only decreases the percentage of people living in poverty by ten points whereas in Zuni, among those with ‘some college’ the poverty rate decreases by twenty points. Further, an actual college degree is not as helpful in Zuni as it is in the State overall –the percentage of those living below the poverty rate decreases by 7.2 points between those with ‘some college’ and those with college degrees – whereas statewide, the difference in the poverty rate between these two groups is 13.1 points.
Table 5. Poverty Rate by Educational Attainment for the Zuni Reservation and New Mexico
New Mexico Zuni Reservation
Educational Attainment Poverty Rate Poverty Rate Did Not Complete High School 47.3% 58.6% Received High School Diploma or Equivalent 29.5% 39.1% Attended 'Some College', No Bachelor Degree 18.9% 19.1% Received Bachelor Degree or Higher 5.8% 11.8%
Source: US Census Bureau, American Community Survey 5-Year Estimates, 2008-2012
Public Assistance Those living on the Zuni Reservation are three times as likely to be receiving Supplemental Security Income (SSI) as those living state-wide and twice as likely as those living in McKinley County to receive SSI. Zunis are twice as likely to receive SNAP benefits (formerly known as food stamps) than the rest of the State. Over a quarter of those living on the Reservation receives SNAP benefits in comparison to 17% of McKinley and 12.7% of the State overall. However, those living in Zuni are no more likely to receive Cash Public Assistance Income than those in the rest of the State – 2.1% of those living on the Reservation receive assistance in comparison to 2.7% State-wide and 4.5% of McKinley County.
15
Housing5 The average household size in the Zuni Pueblo is 4.07 (see Table A1).
77.5% of the housing in Zuni is located in the Zuni CDP and 16.5% is in Black Rock. Only 6% of the housing on the Reservation is estimated to exist outside these areas.
16.7% of the housing on the Zuni Reservation is estimated to be vacant. The percentage of vacant housing units is similar to that found in the state overall where 15.2% of housing units are vacant, but the Reservation has roughly half the vacancy rate of McKinley County where 32.2% of housing is vacant. Vacancy rates are higher in Black Rock (22%) than in the rest of the Reservation.
56.5% of the housing on the Reservation is made up of single housing units. 24.8% is estimated to be in mobile homes. The county is more likely to have single attached units (66%), but nearly equally likely to have mobile homes (23.2%). This is in comparison to 64% of the homes state-wide being single detached units and 16.6% of homes being mobile homes.
As of 2012, the Census Bureau estimates no housing had been built in Zuni since 2010. Construction trends on the Reservation overall have tracked similarly to the State. In both cases, roughly one third of housing was built before 1970 (30.4% for the State and 31.8% for the Zuni Reservation). The slight majority of housing was built between 1970 and 1999. Since 2000, construction has tapered off more in Zuni than Statewide. Across New Mexico, 15.5% of the housing was built since 2000 in comparison to 10.8% on the Zuni Reservation. Black Rock has a rather different development history. Roughly 30% of the housing was built before 1970 with construction beginning in the 50’s – there is no housing recorded by the Census Bureau in Black Rock built before this time. Roughly 50% of the housing stock in Black Rock was built between 1970 and 1999 – however very few of the houses in Black Rock were built in the 70’s (5.4%) and 31% were built in the 80’s.
People living on the Zuni Reservation are likely to have a longer tenure in their homes than people State-wide. 10.6% of the population moved into their homes before 1969, compared to 4.4% State-wide and 6.5% in McKinley County. 37.3% of people living on the Zuni Reservation moved into their homes before 1990, compared to 20% State-wide. 33.6% of McKinley County residents have lived in their homes since before 1990. Black Rock is the exception, where only 3.5% of the population moved into their homes before 1989. Black Rock development also strongly colors more current numbers. On the Reservation overall, 39.4% of the population moved into their homes since 2000 (compared to 62.3% in the State and 42.8% in McKinley County). However, in the CDP, 29.5% of the population has moved into their homes in this time in comparison to 80.5% of Black Rock.
Homes on the Zuni Reservation are more likely to be built to serve larger families. Nonetheless, Zuni homes are likely to have more occupants per room than in the rest of the State. 44.5% of homes in Zuni have four or more bedrooms in comparison to 15% of homes in the State and 15.8% of the homes in McKinley County. Newer homes on the Reservation, it seems, may be less likely to be built as extended homes and for larger families. In the Zuni CDP, nearly half, or 49.6%, of homes have four or more
5 See Tables A4 & A5 in Appendix.
16
bedrooms – however in Black Rock, 34.5% of homes are equipped with four bedrooms and none of the homes have five or more bedrooms. As new housing stock is added, research should be done in order to determine if these smaller homes are serving the needs of Zuni’s population. The numbers for occupants per room in Zuni are high with 17.5% of housing units having more than one occupant per room – in comparison to 3.4% of homes in the State and 12.4% of homes in the County. Indeed, this highly dense living is somewhat more likely to be seen in Black Rock where the newer and smaller housing is to be found – 21.6% of houses have more than one occupant per room in Black Rock in comparison to 17.6% of houses in the Zuni CDP.
70.2% of houses on the Zuni Reservation are heated primarily with wood, compared to 36.3% in McKinley County and 6.6% of New Mexico overall. The numbers are slightly higher in the Zuni CDP where 72.6% of homes are estimated to be heated with wood and decidedly lower in Black Rock where 50.5% of houses are estimated to be heated with wood.
5.8% of homes on the Reservation do not have telephone service in comparison to 4.7% in the State. Telephone service is far more likely to be lacking in Black Rock than in the Pueblo area – 13.9% of homes in Black Rock do not have telephone service in comparison to 3.4% in the Pueblo. The Zuni Reservation is doing far better than the County where 25% of the homes don’t have phone service.
12% of houses do not have a vehicle available – slightly lower than in McKinley County where 13.5% of houses don’t have a vehicle available and 5.7% of houses in the state don’t have access to a vehicle available. Lack of access to a vehicle can be a major impediment for rural and remote populations, where lack access to services, employment and training can cripple a household economy.
Language Zuni is a strongly bilingual community. The Zuni Pueblo retains its traditional language with 85.6% of the population on the Zuni Reservation speaks a language other than English at home. By this estimate, Zuni has the third highest percentage of Native language speakers of New Mexico’s Pueblos (among those for which comparable data was available), following only Santo Domingo and Jemez Pueblos (91% and 90.1%, respectively). This is in comparison to 56.6% of the population in McKinley County and 36% in New Mexico overall. Of those who speak a language other than English at home, 7.7% speak English less than “very well”, slightly better than the County overall where 11.8% of the population speaks English less than “very well”. This is, however much higher than in the State overall, where, of those who speak a language other than English at home, only 0.9% speak English less than “very well”.
17
Economy
Employment
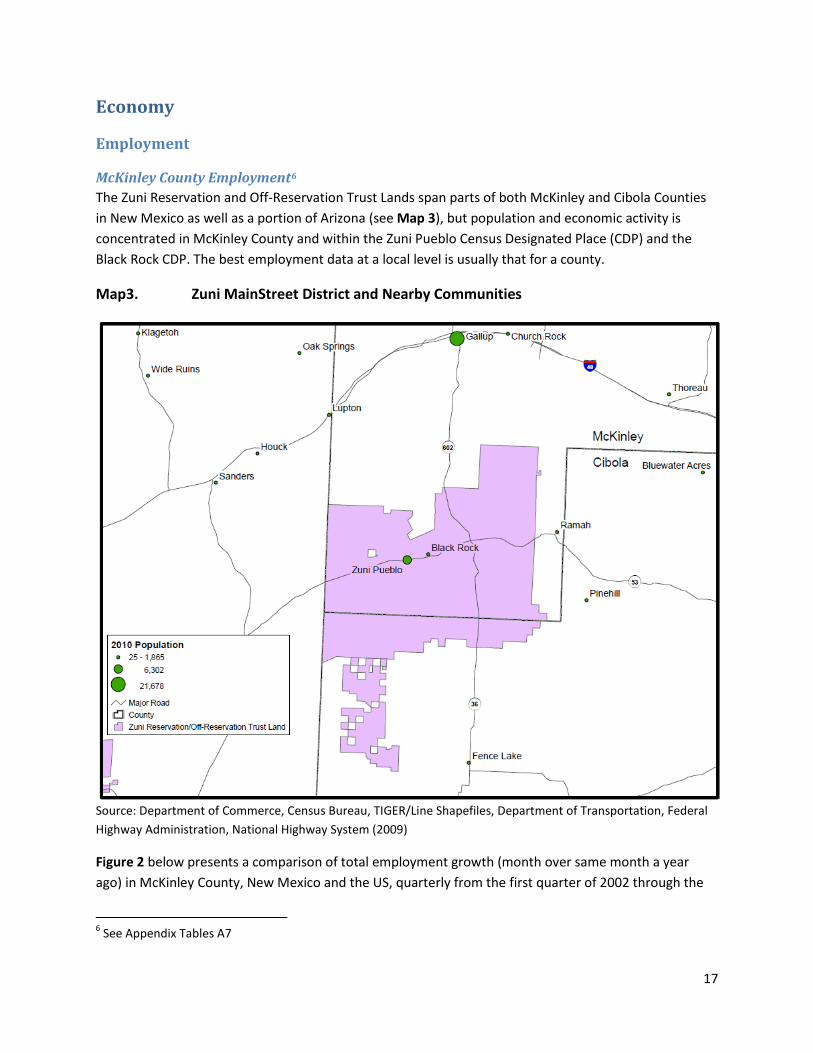
McKinley County Employment6 The Zuni Reservation and Off-Reservation Trust Lands span parts of both McKinley and Cibola Counties in New Mexico as well as a portion of Arizona (see Map 3), but population and economic activity is concentrated in McKinley County and within the Zuni Pueblo Census Designated Place (CDP) and the Black Rock CDP. The best employment data at a local level is usually that for a county.
Map3. Zuni MainStreet District and Nearby Communities
Source: Department of Commerce, Census Bureau, TIGER/Line Shapefiles, Department of Transportation, Federal Highway Administration, National Highway System (2009)
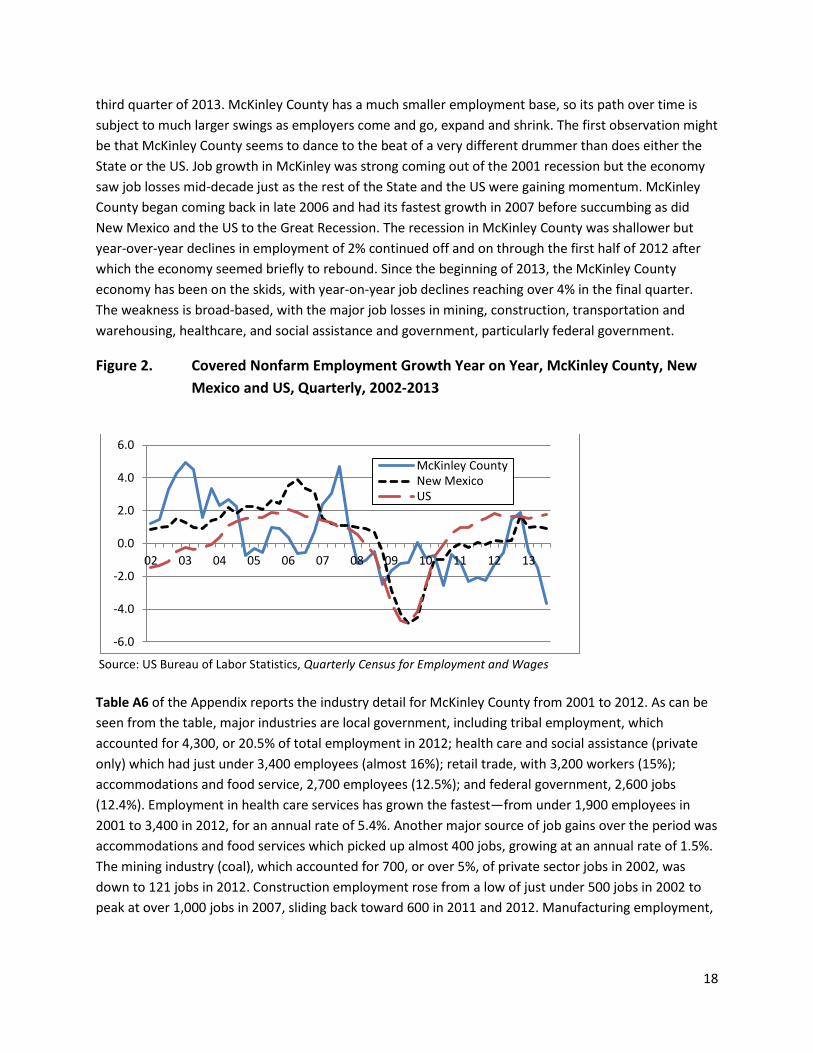
Figure 2 below presents a comparison of total employment growth (month over same month a year ago) in McKinley County, New Mexico and the US, quarterly from the first quarter of 2002 through the
6 See Appendix Tables A7
18
third quarter of 2013. McKinley County has a much smaller employment base, so its path over time is subject to much larger swings as employers come and go, expand and shrink. The first observation might be that McKinley County seems to dance to the beat of a very different drummer than does either the State or the US. Job growth in McKinley was strong coming out of the 2001 recession but the economy saw job losses mid-decade just as the rest of the State and the US were gaining momentum. McKinley County began coming back in late 2006 and had its fastest growth in 2007 before succumbing as did New Mexico and the US to the Great Recession. The recession in McKinley County was shallower but year-over-year declines in employment of 2% continued off and on through the first half of 2012 after which the economy seemed briefly to rebound. Since the beginning of 2013, the McKinley County economy has been on the skids, with year-on-year job declines reaching over 4% in the final quarter. The weakness is broad-based, with the major job losses in mining, construction, transportation and warehousing, healthcare, and social assistance and government, particularly federal government.
Figure 2. Covered Nonfarm Employment Growth Year on Year, McKinley County, New Mexico and US, Quarterly, 2002-2013
Source: US Bureau of Labor Statistics, Quarterly Census for Employment and Wages Table A6 of the Appendix reports the industry detail for McKinley County from 2001 to 2012. As can be seen from the table, major industries are local government, including tribal employment, which accounted for 4,300, or 20.5% of total employment in 2012; health care and social assistance (private only) which had just under 3,400 employees (almost 16%); retail trade, with 3,200 workers (15%); accommodations and food service, 2,700 employees (12.5%); and federal government, 2,600 jobs (12.4%). Employment in health care services has grown the fastest—from under 1,900 employees in 2001 to 3,400 in 2012, for an annual rate of 5.4%. Another major source of job gains over the period was accommodations and food services which picked up almost 400 jobs, growing at an annual rate of 1.5%. The mining industry (coal), which accounted for 700, or over 5%, of private sector jobs in 2002, was down to 121 jobs in 2012. Construction employment rose from a low of just under 500 jobs in 2002 to peak at over 1,000 jobs in 2007, sliding back toward 600 in 2011 and 2012. Manufacturing employment,
-6.0
-4.0
-2.0
0.0
2.0
4.0
6.0
02 03 04 05 06 07 08 09 10 11 12 13
McKinley County New Mexico US
19
which averaged 534 in 2001 peaked at slightly more than 700 jobs in 2004 and 2005, but was down to 531 in 2011 and 2012.
Employment on the Zuni Reservation and Off-Reservation Trust Lands and in the Zuni MainStreet District7 Table A7 of the Appendix presents figures from the American Community Survey 2008-2012 on employment in the Zuni CDP, the Black Rock CDP, and the Zuni Reservation and off-Reservation Trust Lands and makes comparisons with comparable data for McKinley County and New Mexico.
Table A8 compares the number of wage and salary employees by industry. In all cases the major underlying source of the data is the Quarterly Census of Employment and Wages. Detail on Zuni MainStreet, the Zuni CDP, Black Rock CDP and the Zuni Reservation is available through a special mapping tool that is a joint project of the Census Bureau and the Bureau of Labor Statistics: The Longitudinal Employer-Household Dynamics (LEHD) application. Unfortunately, the data for the smaller geographies in all cases appear to understate significantly actual employment, requiring that the data be supplemented from other sources. With the exception of public administration, the figures for government employments are distributed across the relevant NAICS8 codes, so some sectors, like educational services, include public school teachers and other employees. BBER did a small survey of private employers in the MainStreet District and combined with data from Dun and Bradstreet and the LEHD was able to identify some 309 employees, including federal, primarily BIA and post office, and tribal government. Estimates for tribal government and for public schools are difficult for small geographies because the data sources frequently report for many locations at a single address. For the Zuni Reservation as a whole, the estimates from various sources suggest total employment in 2011 of between 1,400 and 1,500.
Government is the largest employer on the Zuni Reservation. Tribal government employment is estimated at 387, and this figure may not include all the tribal enterprises. Health care and social assistance probably comes next and includes the Zuni Pueblo IHS hospital in Black Rock as well as Zuni Community Health Services and Zuni Home Health. Educational services is next, reflecting primarily the public schools, although figures are included the Mission school. The Federal government’s presence includes the IHS facility but also the Post Office and the Bureau of Indian Affairs. The Zuni Housing Authority is a contractor to the federal government. Trade and accommodation and food services are small but important sectors.
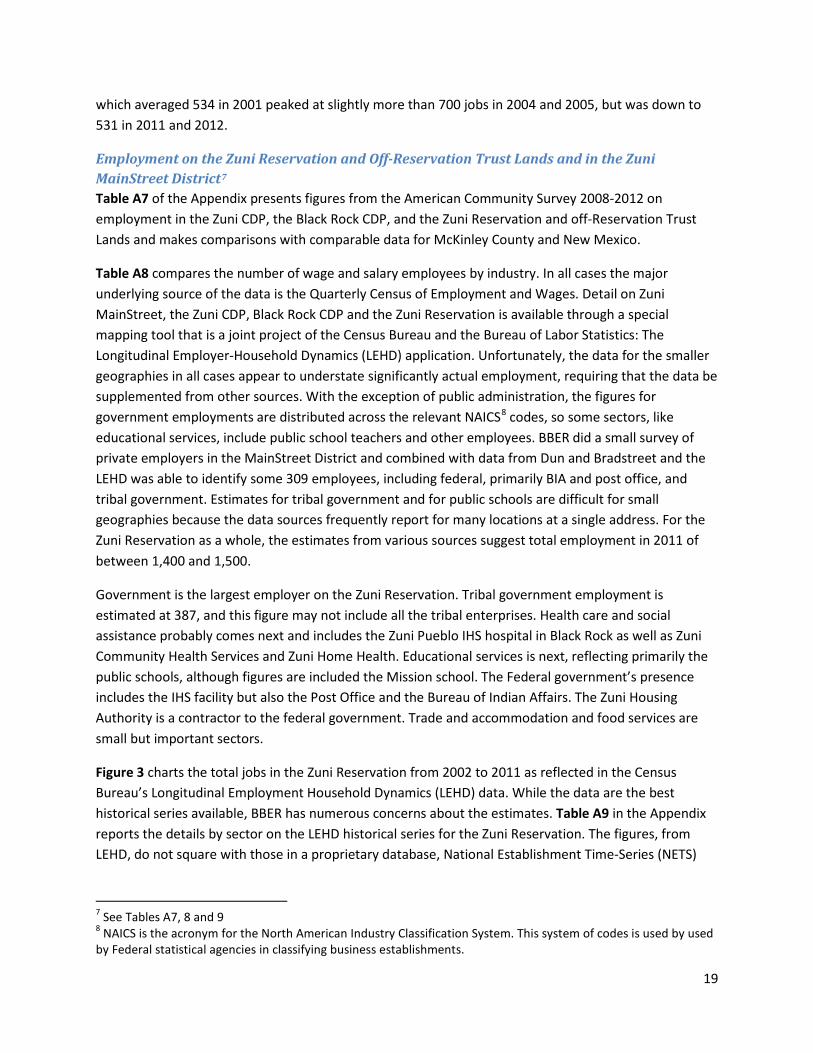
Figure 3 charts the total jobs in the Zuni Reservation from 2002 to 2011 as reflected in the Census Bureau’s Longitudinal Employment Household Dynamics (LEHD) data. While the data are the best historical series available, BBER has numerous concerns about the estimates. Table A9 in the Appendix reports the details by sector on the LEHD historical series for the Zuni Reservation. The figures, from LEHD, do not square with those in a proprietary database, National Establishment Time-Series (NETS)
7 See Tables A7, 8 and 9 8 NAICS is the acronym for the North American Industry Classification System. This system of codes is used by used by Federal statistical agencies in classifying business establishments.
20
Database©, which is compiled from Dun and Bradstreet data9, although the NETS data for many businesses appear to not have been updated. The decline in Zuni Reservation employment in 2011 in the LEHD series reflects the inclusion of only 250 education and only 153 health care jobs. Both figures are down considerably from previous years and from what BBER was able to obtain from local sources. BBER is also concerned that the Census data understate employment in the retail sector in particular. Based on our survey and local information, BBER has made a number of adjustments in the estimated 2011 Zuni Reservation employment presented in Table A7.
Figure 3. Jobs on the Zuni Reservation, 2002-11
Source: US Census Bureau, Longitudinal Employment- Household Dynamics (LEHD)
The figures included in the chart and in the tables referenced above only include wage and salary jobs. Not included are the self-employed, who, according to the American Community Survey, account for 14.5% of those residents of the Zuni Reservation who are working.10
Unemployment The McKinley County official unemployment rate, which is estimated monthly and counts only those without a job who are willing and able to work and have actively sought employment within the past 4 weeks, in March 2014 (preliminary), was 9.9%. Figure 4 below shows the seasonally unadjusted monthly rates of unemployment from January 1990 through the first quarter of 2014. According to this series,
9 Donald W.Walls compiles the database which is widely used for regional studies. Unfortunately, one has to add Walmart to the retail sector since the location for this business in the database is outside the city limits. Adding Walmart produces a total of 670 for 2011, but this total includes a number of very small retail businesses operated by individual proprietors that may not be included in the QCEW since they have no employees other than the owner. 10 U.S. Census Bureau, 2008-12 American Community Survey
800
850
900
950
1,000
1,050
1,100
1,150
1,200
2003 2004 2005 2006 2007 2008 2009 2010 2011
21
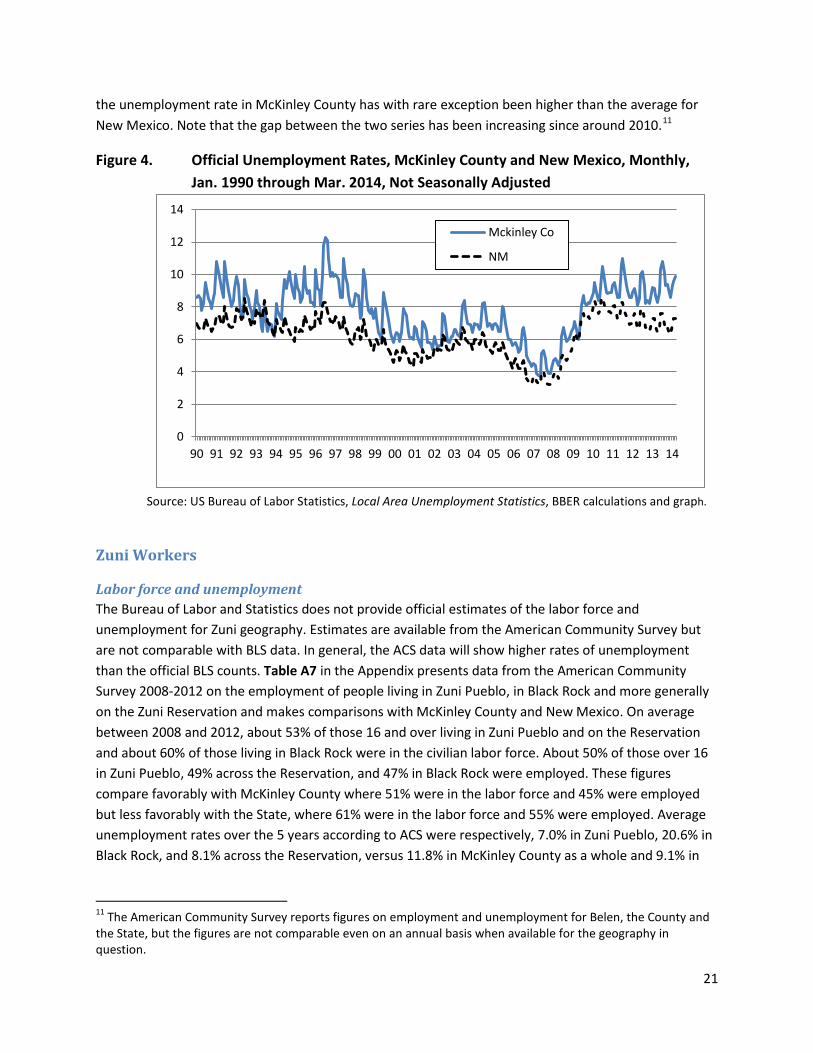
the unemployment rate in McKinley County has with rare exception been higher than the average for New Mexico. Note that the gap between the two series has been increasing since around 2010.11
Figure 4. Official Unemployment Rates, McKinley County and New Mexico, Monthly, Jan. 1990 through Mar. 2014, Not Seasonally Adjusted
Source: US Bureau of Labor Statistics, Local Area Unemployment Statistics, BBER calculations and graph.
Zuni Workers
Labor force and unemployment The Bureau of Labor and Statistics does not provide official estimates of the labor force and unemployment for Zuni geography. Estimates are available from the American Community Survey but are not comparable with BLS data. In general, the ACS data will show higher rates of unemployment than the official BLS counts. Table A7 in the Appendix presents data from the American Community Survey 2008-2012 on the employment of people living in Zuni Pueblo, in Black Rock and more generally on the Zuni Reservation and makes comparisons with McKinley County and New Mexico. On average between 2008 and 2012, about 53% of those 16 and over living in Zuni Pueblo and on the Reservation and about 60% of those living in Black Rock were in the civilian labor force. About 50% of those over 16 in Zuni Pueblo, 49% across the Reservation, and 47% in Black Rock were employed. These figures compare favorably with McKinley County where 51% were in the labor force and 45% were employed but less favorably with the State, where 61% were in the labor force and 55% were employed. Average unemployment rates over the 5 years according to ACS were respectively, 7.0% in Zuni Pueblo, 20.6% in Black Rock, and 8.1% across the Reservation, versus 11.8% in McKinley County as a whole and 9.1% in
11 The American Community Survey reports figures on employment and unemployment for Belen, the County and the State, but the figures are not comparable even on an annual basis when available for the geography in question.
0
2
4
6
8
10
12
14
90 91 92 93 94 95 96 97 98 99 00 01 02 03 04 05 06 07 08 09 10 11 12 13 14
Mckinley Co
NM
22
New Mexico.12 It is interesting that women 16 and older had higher rates both of labor force participation and of employment in Zuni Pueblo and on the Reservation than did men. Despite this higher involvement of women in the labor force, a smaller percentage of children under 6 in both geographies had all parents in the labor force.
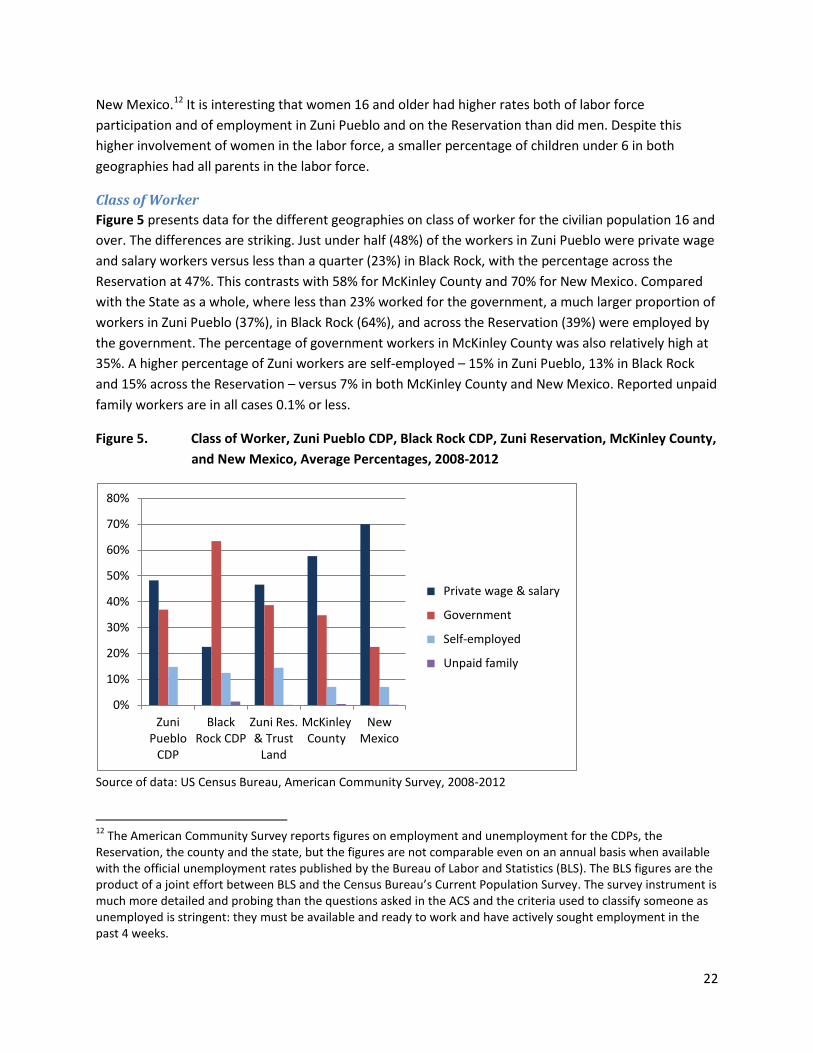
Class of Worker Figure 5 presents data for the different geographies on class of worker for the civilian population 16 and over. The differences are striking. Just under half (48%) of the workers in Zuni Pueblo were private wage and salary workers versus less than a quarter (23%) in Black Rock, with the percentage across the Reservation at 47%. This contrasts with 58% for McKinley County and 70% for New Mexico. Compared with the State as a whole, where less than 23% worked for the government, a much larger proportion of workers in Zuni Pueblo (37%), in Black Rock (64%), and across the Reservation (39%) were employed by the government. The percentage of government workers in McKinley County was also relatively high at 35%. A higher percentage of Zuni workers are self-employed – 15% in Zuni Pueblo, 13% in Black Rock and 15% across the Reservation – versus 7% in both McKinley County and New Mexico. Reported unpaid family workers are in all cases 0.1% or less.
Figure 5. Class of Worker, Zuni Pueblo CDP, Black Rock CDP, Zuni Reservation, McKinley County, and New Mexico, Average Percentages, 2008-2012
Source of data: US Census Bureau, American Community Survey, 2008-2012
12 The American Community Survey reports figures on employment and unemployment for the CDPs, the Reservation, the county and the state, but the figures are not comparable even on an annual basis when available with the official unemployment rates published by the Bureau of Labor and Statistics (BLS). The BLS figures are the product of a joint effort between BLS and the Census Bureau’s Current Population Survey. The survey instrument is much more detailed and probing than the questions asked in the ACS and the criteria used to classify someone as unemployed is stringent: they must be available and ready to work and have actively sought employment in the past 4 weeks.
0%
10%
20%
30%
40%
50%
60%
70%
80%
Zuni Pueblo
CDP
Black Rock CDP
Zuni Res. & Trust
Land
McKinley County
New Mexico
Private wage & salary
Government
Self-employed
Unpaid family
23
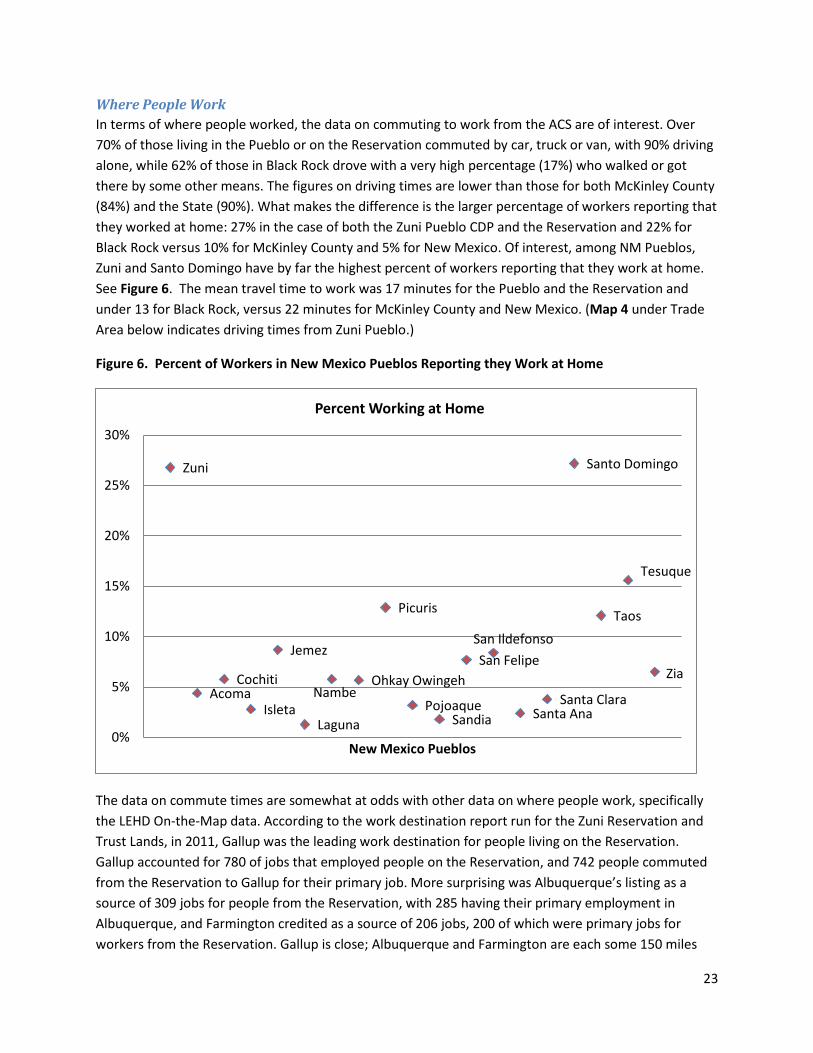
Where People Work In terms of where people worked, the data on commuting to work from the ACS are of interest. Over 70% of those living in the Pueblo or on the Reservation commuted by car, truck or van, with 90% driving alone, while 62% of those in Black Rock drove with a very high percentage (17%) who walked or got there by some other means. The figures on driving times are lower than those for both McKinley County (84%) and the State (90%). What makes the difference is the larger percentage of workers reporting that they worked at home: 27% in the case of both the Zuni Pueblo CDP and the Reservation and 22% for Black Rock versus 10% for McKinley County and 5% for New Mexico. Of interest, among NM Pueblos, Zuni and Santo Domingo have by far the highest percent of workers reporting that they work at home. See Figure 6. The mean travel time to work was 17 minutes for the Pueblo and the Reservation and under 13 for Black Rock, versus 22 minutes for McKinley County and New Mexico. (Map 4 under Trade Area below indicates driving times from Zuni Pueblo.)
Figure 6. Percent of Workers in New Mexico Pueblos Reporting they Work at Home
The data on commute times are somewhat at odds with other data on where people work, specifically the LEHD On-the-Map data. According to the work destination report run for the Zuni Reservation and Trust Lands, in 2011, Gallup was the leading work destination for people living on the Reservation. Gallup accounted for 780 of jobs that employed people on the Reservation, and 742 people commuted from the Reservation to Gallup for their primary job. More surprising was Albuquerque’s listing as a source of 309 jobs for people from the Reservation, with 285 having their primary employment in Albuquerque, and Farmington credited as a source of 206 jobs, 200 of which were primary jobs for workers from the Reservation. Gallup is close; Albuquerque and Farmington are each some 150 miles
Zuni
Acoma Cochiti
Isleta
Jemez
Laguna
Nambe Ohkay Owingeh
Picuris
Pojoaque Sandia
San Felipe San Ildefonso
Santa Ana Santa Clara
Santo Domingo
Taos
Tesuque
Zia
0%
5%
10%
15%
20%
25%
30%
New Mexico Pueblos
Percent Working at Home
24
away – hardly a 17 minute commute. BBER suspects many or most of these workers may indeed work in Albuquerque and Farmington but they probably also live there only during the week, viewing the Reservation as their home. Other communities showing a relatively large number of jobs for workers from the Reservation: St. Michaels CDP in Arizona (93); Grants, NM (44), Fort Defiance, AZ (46), Santa Fe (32), Zuni Pueblo (27), and Ramah CDP (20).
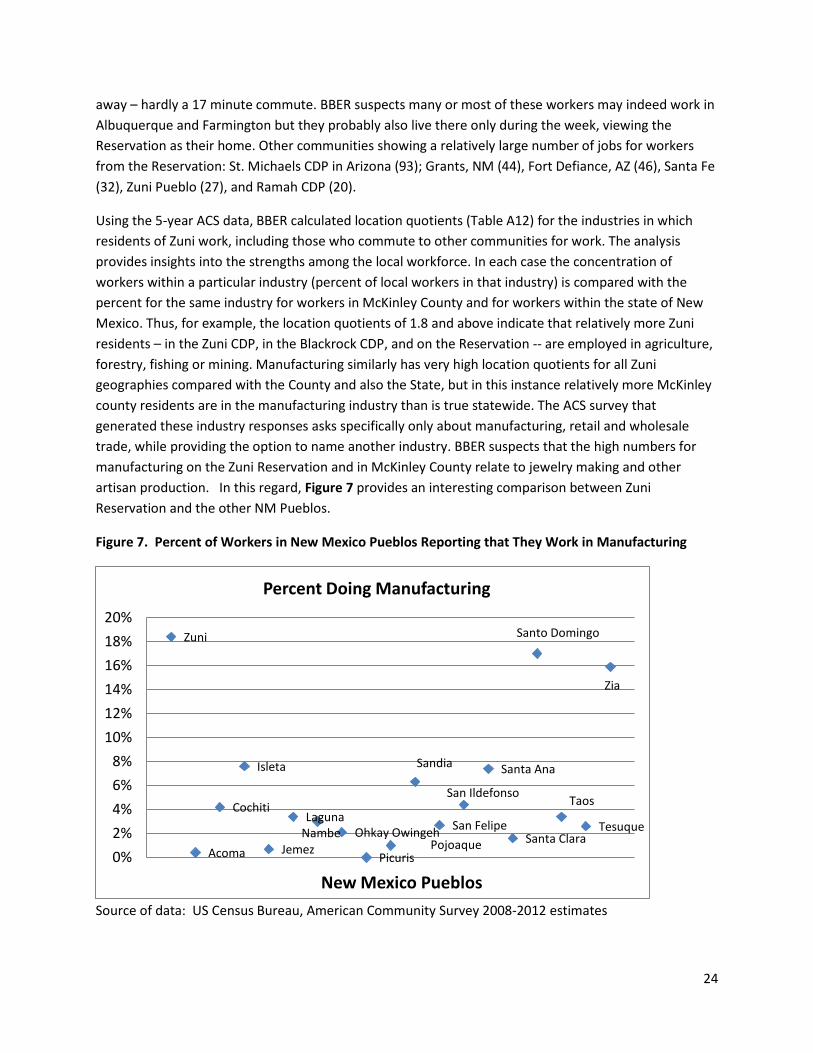
Using the 5-year ACS data, BBER calculated location quotients (Table A12) for the industries in which residents of Zuni work, including those who commute to other communities for work. The analysis provides insights into the strengths among the local workforce. In each case the concentration of workers within a particular industry (percent of local workers in that industry) is compared with the percent for the same industry for workers in McKinley County and for workers within the state of New Mexico. Thus, for example, the location quotients of 1.8 and above indicate that relatively more Zuni residents – in the Zuni CDP, in the Blackrock CDP, and on the Reservation -- are employed in agriculture, forestry, fishing or mining. Manufacturing similarly has very high location quotients for all Zuni geographies compared with the County and also the State, but in this instance relatively more McKinley county residents are in the manufacturing industry than is true statewide. The ACS survey that generated these industry responses asks specifically only about manufacturing, retail and wholesale trade, while providing the option to name another industry. BBER suspects that the high numbers for manufacturing on the Zuni Reservation and in McKinley County relate to jewelry making and other artisan production. In this regard, Figure 7 provides an interesting comparison between Zuni Reservation and the other NM Pueblos.
Figure 7. Percent of Workers in New Mexico Pueblos Reporting that They Work in Manufacturing
Source of data: US Census Bureau, American Community Survey 2008-2012 estimates
Zuni
Acoma
Cochiti
Isleta
Jemez
Laguna Nambe Ohkay Owingeh
Picuris Pojoaque
Sandia
San Felipe
San Ildefonso
Santa Ana
Santa Clara
Santo Domingo
Taos
Tesuque
Zia
0% 2% 4% 6% 8%
10% 12% 14% 16% 18% 20%
New Mexico Pueblos
Percent Doing Manufacturing
25
Relatively more Zuni CDP residents are also employed in retail trade than is true in either the county or the state. This may be capturing some Zuni residents who sell their own work. A very small percentage of Blackrock residents are employed in retail. By contrast, Blackrock has a relatively high percent employed in finance and real estate. The location quotients for education and health care services are greater than one for Zuni Pueblo and the Reservation as compared with both McKinley County and the State. Despite the location of the IHS hospital in Black Rock, relatively fewer residents there indicated that they are employed in education and health care services. Black Rock, however, has a huge concentration in Public Administration, which could be federal, state, or local and could well include the Bureau of Indian Affairs. Given the way the question was asked, BBER believes a number of those employed at the IHS hospital may have reported their industry as “public administration” and not health care.
Occupations BBER calculated location quotients for occupations (OLQs) held by working people (Table A13 from the different geographies to better understand the skill sets of the local workforce. In general the occupational locational quotients were low for management, business, science and arts with the exception of business and financial operations which showed up high for the Reservation (1.12) compared to McKinley County but not compared with New Mexico (0.49). Architecture and engineering occupations were strengths for Zuni Pueblo (1.24) and the Reservation (1.15) compared with McKinley County but not New Mexico. McKinley County has a high concentration of health care practitioners and technical workers. Compared with the County then, the location quotients for this class of occupations is low for both the Pueblo and the Reservation, but above 1.0 when compared with the State. However, the strength in both geographies is for health technologists and technicians (e.g., laboratory technicians, dental hygienists, and EMTs) and not for health diagnosing and treating practitioners, like doctors and dentists and nurse practitioners.
Service occupations are a strength for both the Zuni Pueblo and the Reservation. The greatest strength for the Pueblo and the Reservation appears to be in healthcare support occupations (1.27 and 1.17 compared with the County and 1.48 and 1.37 compared with the State), protective support (1.12 and 1.51 County, 1.06 and 1.37, State), firefighting and prevention (1.45 and 2.09, County, and 1.61 and 2.31, State), and food preparation and serving occupations (1.33 and 1.23, County, and 1.78 and 1.65, State). The County, the Reservation and the Pueblo all rank high in personal care and service.
Natural resource occupations are a strength for both Zuni geographies (1.76 and 1.61) compared with the County. Construction and extraction occupations are strong both compared with the County and the State. Finally, both areas have exceptionally high occupational quotients for production occupations both as compared to the County (2.17 and 2.22) and to the State (4.98 and 5.08). There are, however, many different types of production workers, from assemblers and fabricators, to food processing, to metal workers, to textile workers and woodworkers, and the data available are not specific. Production occupations on the Reservation may well include artisan production. Indeed, given the high response for manufacturing discussed above, BBER believes that many who indicated a production occupation were in fact involved in artisan production. There is also strength locally for material moving occupations.
26
Earnings Table A11 in the Appendix provides a comparison between the average wages paid per sector in 2011 by McKinley County employers with those paid in New Mexico. Overall, the wages paid by McKinley County employers averaged $32,072 versus $40,032 in New Mexico and were about 20% lower. According to data from the American Community Survey 2008-2012, median earnings of male full time workers living in Zuni Pueblo were $24,032 versus $38,063 in Black Rock and $25,331 across the Reservation. The comparable figure for McKinley County was $33,357, while that for New Mexico was $42,737. Median earnings for female residents who were working full-time was $22,093 for the Pueblo, $32,404 in Black Rock, $23,214 on the Reservation, versus $27,914 in McKinley County and $33,170 in New Mexico.
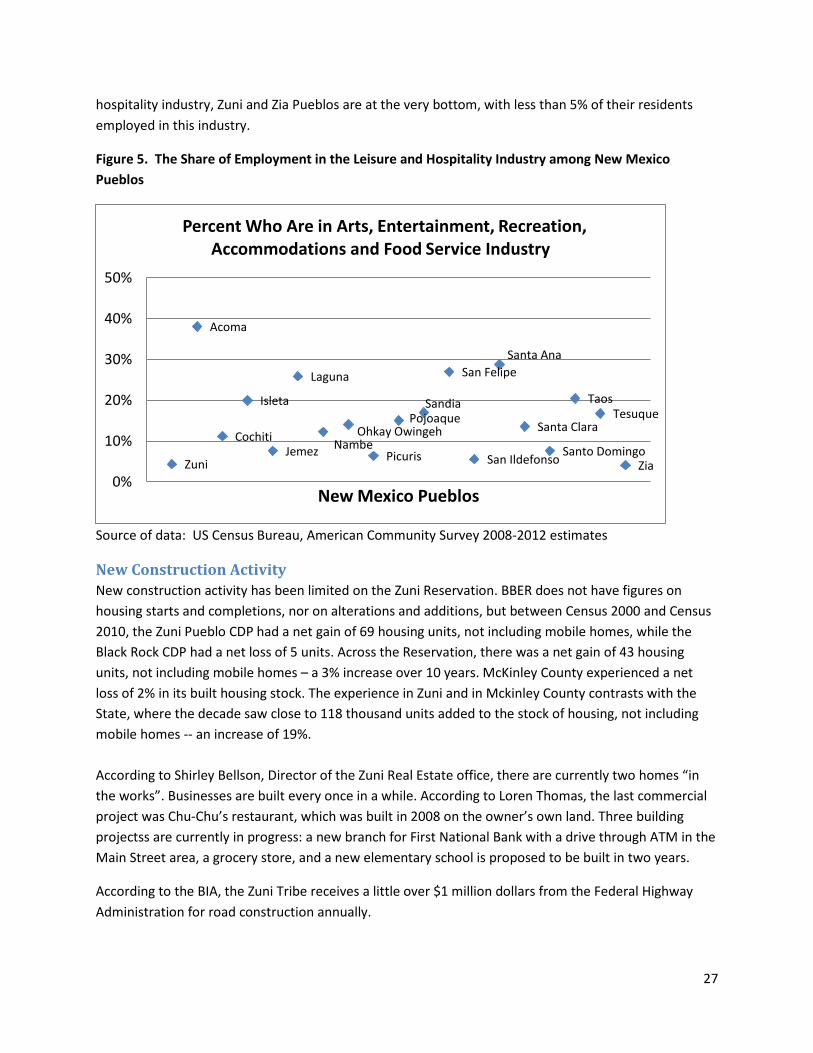
Tourism Zuni offers spectacular scenery and a number of major cultural attractions, including the A:shiwi A:wan Museum and Heritage Center and the archaeological sites of Hawikku (place of first European contact) and the Village of Great Kivas (a Chacoan outlier). Many of the attractions, including the historic 1632 Nuestra Señora de Guadalupe Mission and Seowatewa murals, are located in the historic Middle Village, where many Zuni have made their home for generations. Amidst the homes and attractions, are places that are most sacred and important in Zuni religious cerimonies, including the six kivas and various dance plazas and the mud head houses. The Middle Village is closed to visitors many times during the year, for example, during the observation of the Summer Solstice as well as for other religious observations. Even in other times, the close proximity of Zuni households, whose privacy needs to be respected, and sites sacred to the Zuni people makes it desirable to restrict access and not simply allow visitors to wander through Halona as they might through other cities. For this reason, the Toursism office organizes walking tours. But the Middle Village is right off Highway 53 and relatively easy to access. The situation at Zuni contrasts sharply with Acoma, where the major tourist destination, Sky City, sits on top of a mesa with access relatively easy to control. Few Acoma live is Sky City, and the homes there are used primarily for feast days and other cerimonial occasions.
BBER asked Tom Kennedy, Director for the Zuni Tourism Program for data on the numbers of tourists. According to Kennedy, the numbers of folks who signed in at the Vistor Center totaled 6,479 in 2009, 5,607 in 2010, 3985 in 2012 and 3,845 in 2013. Kennedy “would at least double these numbers for a more accurate count since many don’t stop again after their first visit to the Center and others just don’t stop.” He notes that the annual numbers are in contrast to their visitor count at the May 11th Main Street Festival, where in one day 4,372 visitors were counted, and this he suggests is a conservative number.
Zuni has incredible tourist potential and the tourist traffic provides an important market for Zuni artists and artisans. As the tourism numbers suggest, however, Zuni is far from realizing its potential. It is off the beaten track, on a two lane road many miles from major urban centers with flights from major airlines. The visitor who makes her way to Zuni may find the Middle Village and Museum closed and if open very limited amenities – a bed and breakfast in the Middle Village that can accommodate 7 parties, one excellent restaurant, a limited number establishments that sell the work of Zuni artists and artisans, and a couple gasoline stations. Figure 5 tells the story. In terms of employment in the leisure and
27
hospitality industry, Zuni and Zia Pueblos are at the very bottom, with less than 5% of their residents employed in this industry.
Figure 5. The Share of Employment in the Leisure and Hospitality Industry among New Mexico Pueblos
Source of data: US Census Bureau, American Community Survey 2008-2012 estimates
New Construction Activity New construction activity has been limited on the Zuni Reservation. BBER does not have figures on housing starts and completions, nor on alterations and additions, but between Census 2000 and Census 2010, the Zuni Pueblo CDP had a net gain of 69 housing units, not including mobile homes, while the Black Rock CDP had a net loss of 5 units. Across the Reservation, there was a net gain of 43 housing units, not including mobile homes – a 3% increase over 10 years. McKinley County experienced a net loss of 2% in its built housing stock. The experience in Zuni and in Mckinley County contrasts with the State, where the decade saw close to 118 thousand units added to the stock of housing, not including mobile homes -- an increase of 19%. According to Shirley Bellson, Director of the Zuni Real Estate office, there are currently two homes “in the works”. Businesses are built every once in a while. According to Loren Thomas, the last commercial project was Chu-Chu’s restaurant, which was built in 2008 on the owner’s own land. Three building projectss are currently in progress: a new branch for First National Bank with a drive through ATM in the Main Street area, a grocery store, and a new elementary school is proposed to be built in two years.
According to the BIA, the Zuni Tribe receives a little over $1 million dollars from the Federal Highway Administration for road construction annually.
Zuni
Acoma
Cochiti
Isleta
Jemez
Laguna
Nambe Ohkay Owingeh
Picuris
Pojoaque Sandia
San Felipe
San Ildefonso
Santa Ana
Santa Clara
Santo Domingo
Taos Tesuque
Zia 0%
10%
20%
30%
40%
50%
New Mexico Pueblos
Percent Who Are in Arts, Entertainment, Recreation, Accommodations and Food Service Industry
28
Construction activities on the Zuni Reservation are constrained by several factors including land ownership. Historically Zuni Reservation lands have been held in Trust by the federal government which results in the BIA having the right/responsibility to oversee everything that occurs. However, the Zuni tribe has taken advantage of the Public Law 93-638 (enacted by Congress in 1975 known as the Indian Self-determination and Education Assistance Act) process to run its own governmental affairs. As examples, the Tribal Realty and Roads departments receive funding rather than having the services directly performed by the BIA.
Most of the land within the village and along MainStreet has been assigned to individual Zuni families. Assignment confers a variety of rights, including use of the property, ability to pass the property on to heirs (which can, of course, trigger disputes that can go decades without resolution) and the ability to sell to other Tribal members or to lease to Tribal members or to outsiders, although leases to non-members must be approved by the BIA/Tribal Council. The Tribe was able to purchase 13 acres of land within the MainStreet District, thereby settling a long-standing dispute among tribal members as well as acquiring land that can now be used for public purposes, including economic development.
There are several hurdles that must be overcome before a construction project can begin even if one has land as an “assignee”. According to Bellson, every application for new construction, renovations, or additions needs to be approved by the Tribal Council and the Bureau of Indian Affairs (BIA). There are a number of environmental reports (including impact statements and land assessments), archeological reports and utility reports that must be performed and reviewed by the tribe’s historic Reservation team and others and then by the BIA. These reports are required by the National Environmental Protection Act (NEPA) on any project that involves federal funding, work by the federal government, or permits issued by a federal agency. These reports cost money and take over a year to complete, holding many projects up and dissuading others. Thomas notes that an additional problem is that much land is within the floodplain, which makes building subject to additional restrictions.
The Zuni Housing Authority was established in 1964 to finance the construction of homes, but the Authority separated from the Pueblo and now operates as a separate entity. Bellson is concerned that housing development has not kept up with the demand, and the figures reported under Housing would seem to back her up. Certainly other Pueblos, like Laguna, have been much more aggressive in trying to meet the housing needs of their members.
Trade Area The Trade Area for the Zuni Pueblo and Black Rock communities, which constitute both the economic and the population centers for the Zuni Reservation, is well captured in two maps. Map 3, included in the first section under Economy, shows the surrounding area and indicates the relative size of the population centers. Obviously, Gallup is the major center with population in excess of 21,000, with Zuni Pueblo CDC (6,300) second, Thoreau, NM (over 1,800) third, and Black Rock, fourth with 1,300. The closest communities, Ramah CDP (370) and Pinehill CDP (88) are tiny. Map 4 from ESRI provides a picture of where one can get from the center of the Zuni Pueblo CDP within 10 minutes, 25 minutes and 40 minutes. Note that Gallup is just about 45 minutes away, up route 602 from Black Rock, while Ramah is within 25 minutes and Pinehill, just over 40. While it shows up as large on the ESRI map, there are no
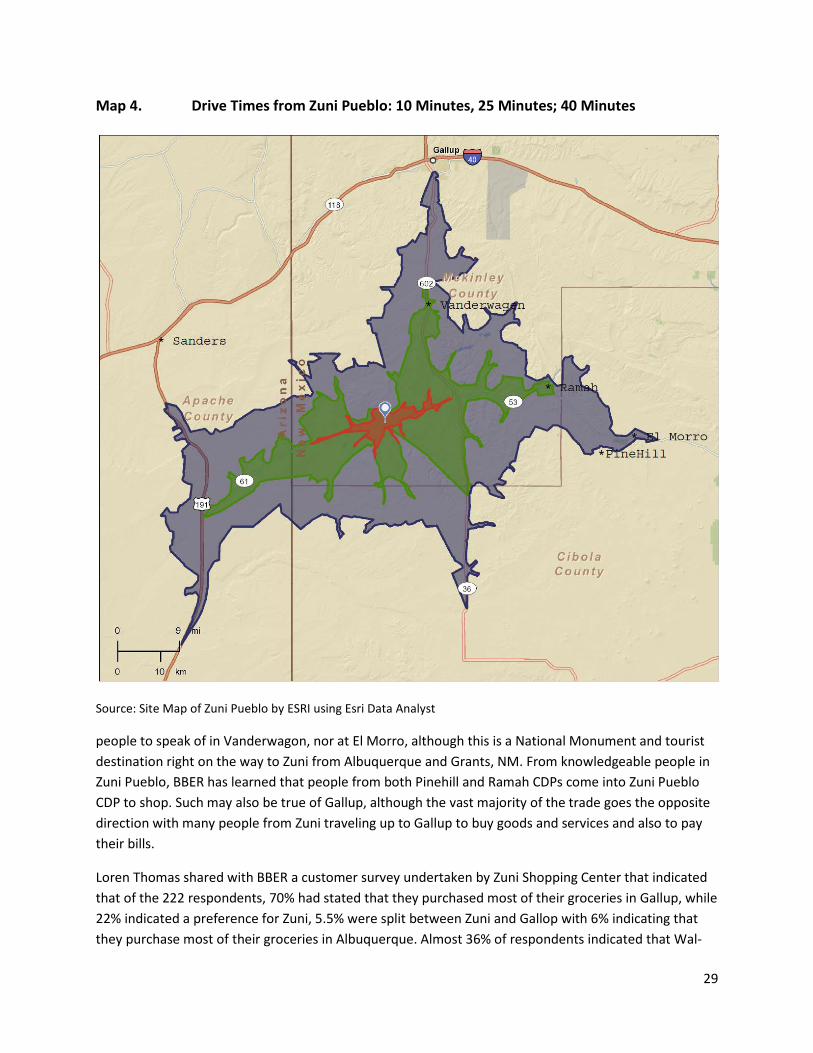
29
Map 4. Drive Times from Zuni Pueblo: 10 Minutes, 25 Minutes; 40 Minutes
Source: Site Map of Zuni Pueblo by ESRI using Esri Data Analyst
people to speak of in Vanderwagon, nor at El Morro, although this is a National Monument and tourist destination right on the way to Zuni from Albuquerque and Grants, NM. From knowledgeable people in Zuni Pueblo, BBER has learned that people from both Pinehill and Ramah CDPs come into Zuni Pueblo CDP to shop. Such may also be true of Gallup, although the vast majority of the trade goes the opposite direction with many people from Zuni traveling up to Gallup to buy goods and services and also to pay their bills.
Loren Thomas shared with BBER a customer survey undertaken by Zuni Shopping Center that indicated that of the 222 respondents, 70% had stated that they purchased most of their groceries in Gallup, while 22% indicated a preference for Zuni, 5.5% were split between Zuni and Gallop with 6% indicating that they purchase most of their groceries in Albuquerque. Almost 36% of respondents indicated that Wal-
30
Mart was where they shopped most often in Gallup. People from Zuni go to Gallup for a variety of reasons. Among the extremely important reasons for going to Gallup, over 90 of the 220 respondents indicated they go to buy groceries, with close to 100 indicating they go to pay bills. Almost 50 cited Wal-Mart as the extremely important reason for trip to Gallup, while laundry was cited as very important by 40. Grouping responses of “extremely or very important”, groceries were cited by over 200, with paying bills by 200, Wal-Mart by close to 200, Dollar Store by just under 150, restaurant by close to 150, with the next highest response that of getting out of town. Some 200 of the respondents indicated going to a bar was not an important reason for going to Gallup, with over 100 each indicating they would not go there for fast food, to see a movie, nor to go to a mall. Over 50 in each case had no interest in a laundromat, a restaurant, recreation, the dollar store, nor would they go to Gallup just to get out of town.
Injections
Arts and Crafts Zuni Pueblo sales tax data shared with us by Loren Thomas indictes that arts and craft sales approach at least $600,000. Local artists purchase some of their supplies locally and these may contribute to the sales. Nonetheless, it is reasonable to assume that most of these taxed sales are to tourists and others from outside the community. From the household survey recently conducted by Community by Design and described below, almost 70 percent (68%) reported involvement in arts and crafts industry, with more than half of the artists reporting that they sell at stores in Zuni. Other artists sell to stores outside of Zuni but in NM, with some selling to stores out of state or to traders or at festivals. A number sell out of their own homes.
Net Wages and Salaries Earned Elsewhere Just looking at primary jobs and using the LEHD data, the net gain in wages and salaries could easily be over $36 million. This does not include benefits.
Federal Income Support Taken together, estimated Social Security, Supplemental Social Security, and cash public assistance payments to Zuni households total $6.4 million. This does not include food stamps (SNAP) nor does it include payments by Medicaid (where a state match may be required) or by the Indian Health Service for Zuni Reservation residents, nor HUD housing subsidies.
The above, all conservative estimates, together account for $43 million of the $79 million in Reservation household income accounted for by wage and salary income, retirement income and public assistance – basically the money Zuni residents would have discretion over.
Leakages The above calculation is already net of wages and salaries paid to workers who live elsewhere. From the tax data, some $2.8 million in gasoline is sold locally, some to residents and some to tourists. Estimated sales from other taxable goods and services total $9.2 million. Estimated retail sales, including gasoline and arts and crafts is $12.6 million. ESRI had estimated total retail sales within a 10 minute drive of the
31
center of the Zuni CDP at $13.5 million, which is in the ballpark. Including revenues from food and drinking establishments brings their figure to $15.4 million.
From the above, total local spending including some sales to non-locals amounts to just over $15 million, which is a very small part of the $79 million in Reservation household income identified by the American Community Survey. As noted above, the Zuni Shopping Center survey indicated that some 70% of respondents did most of their shopping for groceries in Gallup. We suspect many Zuni occasionally drive even further for needed goods and services – to Grants or to major commercial centers like Albuquerque. ESRI estimates the Retail and Food & Drink gap between demand and what is supplied locally (Drive time: 10 minutes) to be $8.3 million, but if gasoline stations are excluded the figure jumps to $14.1 million.13 The data in the reports to which we have access are not good enough to pin down a solid estimate of total leakages, but given the collective financial resources of the some 10,000 people resident on the Zuni Reservation, the number has to be very large. Local economic development efforts often focus on developing local businesses to meet local needs currently satisfied by shopping outside the community. One tool in this effort would be a household market survey that explicitly focuses on the competition, both that within the community and elsewhere, and tries to identify where there are unmet needs for goods and services that could be met locally. There are clues both in the Zuni Shopping Center Survey and in the surveys that are being conducted by Zuni high school student for their economics class. The student surveys of residents (20 each) have indicated demands for chlidcare service, a laundrymat, autoparts and auto service/repair place.
Zuni Household Survey Data on Zuni, as with many tribal and rural communities, tends to be somewhat lacking in both availability and reliability. We knew both the under-the-table economy and the arts economy of Zuni to be particularly important to the overall Zuni economy, and yet, there is no reliable data on either. For that reason, we endeavored to work with Community by Design, an independent contractor with New Mexico MainStreet to create and administer a survey in the Zuni community that would allow us a window into the economy that established secondary data sources would not afford us.
The following information is based on a survey conducted in Zuni between April 14th through April 28th of 2014. 14 volunteers from the Zuni Community administered surveys throughout the Zuni and Black Rock CDPs. We worked with Census block population data in order to create relatively equally sized districts within which each volunteer would administer surveys. Those administering the survey were encouraged to use random sampling techniques in order to select participants within the districts and were encouraged to attempt contact three times, ideally at different times of day at each chosen residence in order to allow all residents of Zuni an equal likelihood of being selected for participation in
13 From our research, BBER questions ESRI’s figure on total retail sales by gasoline stations of $10 million. The stations clearly sell more goods and services beside gasoline but the sales figures in the NETS database are much too low to yield $10 million, when, per the tax data, gasoline sales are perhaps $3 million, depending upon price.
32
the survey. All survey participants had to be over the age of 18. 170 blank surveys were sent out with volunteers and 136 came back with sufficiently complete information for analysis.
Employment among Respondents: 90% of those surveyed are employed in some capacity. Of the 122 survey respondents who were employed, 37% reported having more than one job. 70% work for themselves, whether primarily or secondarily, and 46% are primarily self-employed.
Industry Break-Down of Working Respondents: BBER deduced six industry categories from survey responses – these include Arts and Crafts; Retail and Food Services; Government, Education, Social and Health Services; Manual Labor; and Skilled Labor. Among these, Arts and Crafts is notably the largest sector with 68% of survey respondents reporting primary or secondary income from participation in arts and crafts production. 41% of working survey respondents reported arts and crafts production as being their primary source of income, of which 94% report arts and crafts as their sole occupation. Further, among the 34% of working survey respondents who reported having more than one job, 97% of those jobs are in arts and crafts production. The second largest sector is Government, Education, Social and Health Services with 34% of working respondents reporting primary employment in this area. Retail and Food Services accounted 16% of the primary employment, Manual Labor 4%, Skilled Labor 3% and Students accounted for 2%.
Income among Respondents: We looked at personal income for three different groups – income for all respondents, income among those respondents whose primary occupation is in arts and crafts, and income among those whose primary occupation is not in arts or crafts. The median personal income for all survey respondents across all three categories is $12,500. The mean, however, gives us slightly more information. For all respondents, the average income is $14,729. (When looking at the average income of those who identify as ‘breadwinners’, the mean is higher at $17,971.) Among those primarily employed in non-arts and crafts occupations, it’s higher at $16,139. Among those primarily employed in arts and crafts; however, the average income is much lower at $12,500.
39% of respondents receive some sort of public assistance as a form of income; however, 46% of those whose primary income is in arts and crafts receive cash public assistance in comparison to 35% of those not employed in arts and crafts.
Cash, Non-Wage, Subsistence and Trade Economy Through this survey, we hoped to gain clues about the secondary, ‘under-the-table’ economy of Zuni. Simultaneously, we did not want to ask questions that might disconcert or threaten the privacy of participants. For that reason, we asked a number of questions that could, but do not necessarily, point to engagement in the informal economy. These questions explored prevalence of income in the form of cash, prevalence of bank accounts among respondents, and participation in activities that augment official incomes such as farming and trading among respondents.

33
58% of respondents report having cash income and 14% of respondents reported being paid only in cash. Among those involved in arts and crafts (as primary or secondary occupation) 84% have cash income and 16% report being paid solely in cash, while only 32% of those not engaged in arts or crafts report having cash income and 13% report having only cash income.
37% of those surveyed supplemented their income through non-wage endeavors including subsistence farming or keeping of livestock, hunting or fishing, or trading labor or goods with neighbors. A number of respondents volunteered that they also considered harvesting wood to subsidize heating costs as belonging in this category. Unfortunately, we did not specifically ask about wood harvesting, and so cannot make a definitive statement about Zuni’s participation in the practice. Considering the percentage of homes in Zuni heated with wood by Census Bureau estimates, this number might well be notably larger if wood harvesting was included. Of the three categories offered to survey participants (farming and/or keeping livestock, hunting and/or fishing, trading labor and/or goods with neighbors), respondents were most likely to be engaged in farming and/or keeping of livestock with a fifth (21%) of respondents reporting involvement in farming and/or keeping of livestock. 15% of respondents supplemented income by engaging in trade with community members, family members and neighbors, and 12% supplemented income through hunting and fishing. Only 7% of respondents participated in more than one of these activities.
Banking: 68% of all participants report having a bank account. Artists are notably less likely to have a bank account than non-artists, with 60% of artists having bank accounts in comparison to 77% of non-artists. 52% of all participants have a savings account. Artists are less likely to having a savings account, with 43% of all those whose primary employment is in arts and crafts production reporting having a savings account in comparison to 68% of all those whose primary employment is not in arts and crafts. Just 13% of those surveyed report having a bank loan. Artists are slightly less likely to have a bank loan than non-artists, with 10% of those whose primary occupation is in arts reporting having a bank loan in comparison to 14% of those not primarily employed in arts production.
Arts Production: In the following section, we explore survey participants’ responses to open ended questions about where they do their work and how well this location works for them. Because of the fairly broad range of responses, a discussion of the numbers would likely be a poor representation – therefore, we will not offer numbers, but will paint a picture of art and craft production simply with narrative.
Nearly every one of those surveyed who are involved in arts and crafts production work out of a home; most work out of their own home and some work at the home of relatives, often in collaborative processes. Being able to work at home is generally considered very important to survey respondents – for the sake of fostering creativity, independence and, for many, the ability to care for children or grandchildren while working.
However, many lack, or have trouble maintaining dedicated space within their homes for arts production. Some work out of detached sheds, though these often lack sufficient amenities to serve
34
them well during colder months. A few have been lucky enough to be able to convert a room in their home into a full workshop or to add a workshop on. For some, working out of a personal work space makes access to larger and more expensive necessary tools difficult.
Zuni participants lamented the difficulty in accessing supplies; multiple participants stated that art and craft supplies in Zuni tend to be either more expensive and/or more ‘picked over’ than elsewhere in the state or are simply lacking in availability. Traveling for supplies contributes to costs and to time spent and can be difficult for those with little or no access to personal transportation, according to respondents.
Arts Commerce: We asked respondents to tell us about where and how they sell their work – if they sell through stores, the internet, portal programs, festivals and fairs, or on foot or out of their homes. We asked if they engage with traders who come through Zuni to sell their work, if they sell to stores locally, around the New Mexico, and out-of-state. Most respondents access the market through a variety of routes – on average artisans use at least three routes to access the market, with some artisans using as many as seven routes to access the market. Those engaged in arts and crafts production are nearly equally likely to sell in stores in Zuni as in stores elsewhere in New Mexico or on foot (55% to 59% to 56%, respectively). 49% report selling out of their homes. 25% sell at fairs and festivals, 16% at stores outside the State, and only 5% report selling on the internet. 45% report selling to traders.
Nearly half, or 48% of those who are engaged in arts and crafts production sell at least some of their work on their own – either out of their home or on foot or at festivals, Pow Wows, Feast Days, or art fairs. A very small percentage sells their work solely this way.
Of those who sell in New Mexico stores, 55% of all those involved in selling their art or craft work sell at stores in Zuni. 39% sell in stores in Gallup. 7% sell in Santa Fe stores, and 10% sell in stores in Albuquerque. A few show in Ramah, Grants, and Alamogordo. Only 16% are selling their work out-of-state and out of this 16%, 86% are selling in Arizona. Only one respondent was selling work in a state not contiguous with New Mexico.
Of the 25% who sell at festivals, Pow Wows, Feast Days and jewelry or Indian arts fairs, 9% show at Santa Fe Indian Market or other Santa Fe based markets, 2% show at the Heard Museum Indian Market, and 2% report having gone further abroad in the United States for such opportunities.
Challenges: We asked participants open-ended questions in order to better understand their experience of marketing their work. The following paragraphs explore participants’ responses. Much as in the arts production section, responses were too varied to render anything related to valid statistics and so we offer a narrative of trends in the data as opposed to percentages.
Participants regularly mentioned the difficulty in finding buyers for their work (this includes stores and individuals). Furthermore, maintaining consistent income from sales was said to be a challenge; with business tending to improve in the summer and decline in the winter when tourism is slow. Accessing
35
the market beyond Zuni was named as a challenge. Time, transportation and travel funds all being mentioned as factors in the difficulty of marketing beyond Zuni.
Participants also mentioned the challenges associated with competition and downward pressure on the local arts market. The saturation of the local market, manifesting in local stores turning away new work due to overstock was mentioned multiple times. Downward pressure on the market, according to respondents comes from three sources – firstly, independent sellers making direct sales at discounted prices out of need to recoup investment in materials or meet day-to-day needs, local and regional stores underpaying for work, and the broader issue in Native arts of misrepresentation and counterfeit Native arts.
Those involved in arts and crafts production were overall desirous of more tourism traffic in Zuni in order to bolster the local arts market, and more avenues for accessing the tourism market within Zuni.
Respondent Suggestions: The final question in our survey asked participants to consider their own experiences working in Zuni and offer suggestions for bringing additional economic opportunities to Zuni.
Many participants stated the need for more options for arts and crafts supplies in order to provide more competition and variety. Participants in the survey also suggest that Zuni bring in more businesses in addition to an arts and crafts store, i.e. a laundromat, a dollar store, and another bank. Additional grocery stores, hardware stores, feed stores, lumber stores, and auto parts stores were also recommended.
Zuni survey respondents commonly suggested that Zuni foster more tourism in the community. Several respondents recommended that Zuni hold more markets and festivals in the summer to encourage tourism. Survey participants also recommend that the Pueblo create a weekend vendor market (including food stands) and offer free vending to locals, help to raise prices on handmade jewelry, advertise to bring more buyers and tourists into town, and be more selective about buyers allowed on the Reservation.
Several participants mentioned that an increase in the number of community events and projects, particularly for elderly, youth, disabled, and families, would be beneficial. There was an emphasis on exercise and health. Additionally, more family friendly areas, such as a convention center, were also mentioned. Survey respondents would also like more options for affordable childcare. Participants recommended making the village more beautiful by cleaning up trash and litter. A few survey participants would also like to limit panhandling.
Several suggested that education in Zuni be prioritized and improved. In conjunction, participants recommended that jobs for youth, college-educated, and skilled/technical laborers be developed in order to increase the number of higher paying jobs in Zuni.
A large majority of the survey participants are self-employed; as such it is no surprise that many suggest help or benefits with self-employment. For example, entrepreneurial classes for the community that
36
help Zuni artists to develop business skills were recommended. These courses would include customer service classes and website development. Survey participants also want the arts and crafts community to learn more about appropriate pricing for their work. Participants also want the Zuni community to feel empowered and encouraged to become entrepreneurs in their community and want the Zuni tribal council to help community members to generate the funds to open businesses and franchises. Some felt that the government was restricting economic growth by not allowing larger corporations or chains to open in the community.
Challenges, Opportunities & Strategies: For the vitality of the Zuni Economy and the retention of local talent and the viability of MainStreet development, Zuni will need to pursue creatively economic development opportunities to develop a broad range of smaller-scale, service providing enterprises. In order to foster sustainable development, it is important that a large percentage of this development come from locally-based ventures.
Credit and Funding Access to credit is a common challenge in tribal communities. Both lack of collateral due to issues related to land ownship and lower incomes contribute to the challenges faced in Native communities around accessing credit. Our survey data shows a relatively small percentage of Zuni’s have bank loans and the local credit union does not service business loans. In order to support small-scale, locally-based economic development, it is crucial that Zuni identify creative ways to finance local business ventures. Efforts to help tribal members to develop credit, access federal lending programs such as USDA Rural Development and Business and Cooperative Programs, and development of financial services is very important for economic development in Zuni. And many Zuni residents might benefit from classes in financial literacy.
There are a number of protype organizations that provide needed financial services in Indian Country. As one prominent example, the Lakota Fund for the Pine Ridge Reservation operates as a non-profit economic development center that provides many financial services not otherwise available to its community. Today, the fund provides loans of $1,000 or less without collateral for micro enterprises and small business loans ranging from $1,000 - $20,000 with collateral, technical assistance, individual development accounts, low income housing, and business incubators.
First Nations, a Native-run nonprofit, seeks to strengthen Native American communities and economies by offering financial and investor education, combating predatory lending, supporting Native American business development, strengthening Native American Nonprofits, and providing food and health programs. They are an independent subsidiary of the First Nations Oweesta Corporation that partners with Native American tribes and communities throughout the United States to assist in designing and administering financial and investor education programs.
As another example, the Choctaw Nation Credit and Loan Department provides loans to Native Americans who cannot borrow from other lenders. They provide three types of loans: small business loans, agriculture loans, and home purchase and improvement loans. In addition, they provide micro-
37
loans of up to $1,000 for emergency home improvements and small businesses; these must be repaid within 12 months.
Education In comparison to the State overall or to other Pueblo communities in New Mexico, the percentage of the population with college degrees is low. Further, the rates of college enrollment are relatively low. The proximity to the University of New Mexico (UNM) branch campuses, both in Zuni and in Gallup, is a spectacular resource for Zunis, offering community members the opportunity to pursue education and training without leaving the community. It would be worth developing an understanding of how UNM Zuni and Gallup might better engage and serve the local Zuni community. Currently, UNM Gallup at Zuni offers courses to help students prepare for the GED as well as to meet basic general education course requirement for degrees at UNM Gallup. It has a range of course offerings, but currently provides no certificate programs and only one two year program in construction technologies, which may have limited relevance to the local economy. Researching the potential for and viability of offering courses and certificate programs in such areas as arts marketing, bookkeeping, and digital media relevant to independent arts entrepreneurs would be worthwhile. Further, engaging UNM-Gallup to develop relevant Associate’s degrees in areas of arts management, business management and similar relevant areas could also serve the development of the local workforce and economy.
Arts and Crafts The concentration of people involved in artistic pursuits in Zuni is astounding. Our survey suggests arts not only provide primary employment for roughly 40% the population, the arts also serve as an important secondary income source for the Zuni community with roughly 70% of survey respondents reporting engaging in arts or crafts production for economic gain, whether it be a primary or secondary income source. This is an incredible asset to the Zuni community both in terms of community identity and economic opportunity. However, those involved in arts production are not well woven into the economy:
• Those primarily employed in arts and crafts production tend to have lower incomes than those primarily employed in non-arts occupation.
• Artists and artisans seem to be more likely to be engaged in the informal, cash economy than those in non-arts occupations.
• Artists and artisans are more likely to receive public assistance than those engaged in non-arts occupation
• Those primarily engaged in arts and crafts occupations are less likely to have a savings account or a bank loan.
Furthermore, they often lack the infrastructure to efficiently get their art work to market which may be exacerbating the issues outlined above. Only 11% of Zuni artist interviewed directly sell their work outside of McKinley County, which is a relatively isolated and saturated market.
38
Many Zuni artisans sell their work, at least in part, without any arts marketing infrastructure at all, selling work either on foot or out of their homes or at fairs, markets and festivals. Many sell to traders who come through the Pueblo, or directly to consumers. While there are a host of potential benefits to be derived from low-infrastructure direct sales, these benefits are most often enjoyed by artists with a strong business background and market savvy, without which, this system often results in downward pressure on the Native Arts market overall and therefore depressed incomes.
Further, the continued issue of mis-represented and imported Native arts puts further downward pressure on the Native Arts market.
For these reasons, investing in appropriate arts marketing advising and infrastructure is very important to the economic stability of the community. Zuni artisans would be well served by educational opportunities in business development and management, with support services available in areas of:
• Career advising and development and retirement planning
• Business plan development
• Fundraising and investment solicitation
• Accounting and financial management and tax consulting
• Marketing
• Native Arts law and protections
Services and training could involve:
• Provision of direct, low-cost technical services and consultation to individuals and small enterprises
• Scheduled workshops, seminars and trainings
• Facilitation of mentorship and internships
Further, this program should not only provide a cooperative gallery space in Zuni through which artists can market their work, it should also provide professional internet marketing and other marketing services to help Zuni artisans get their work to a broader market. Possibilities might include a secondary co-operative gallery space in Albuquerque or Santa Fe, professional staff to take Zuni work to major art and jewelry shows, co-promotion efforts with other Pueblos or tribal communities.
Nearly all Zuni artisans work out of their homes – and nearly all of them find great benefit in doing so. However, space and access to more costly tools are issues for many. For this reason, feasibility of providing some cooperative, public arts production facilities that could provide more investment-heavy equipment and space should be explored. However, because of the desire of many artisans to work out
39
of their homes, it may be equally important to connect artists with financing opportunities that will allow them to meet as many of their workshop needs as possible out of their homes.
Almost none of the Zuni artisans surveyed market their work through the internet – despite the relatively minimal infrastructural investment and the efficiency of online marketing considering the isolation of the Zuni Pueblo. For this reason, Zuni should look into developing a high-end arts commerce website on which artists can market their work to the broader market. A tribally-run website could guarantee authenticity for consumers and provide an important avenue for arts commerce for local artists.
Lastly, the issue of counterfeit and mis-represented Native arts continues to be a huge issue for the viability of Native arts as a career path, and therefore represents a threat to the continuation of these traditions into the future at a meaningful level. The Tribal government should look into potential efforts that could be made at the Tribal level to protect Zuni artists and the authenticity of Zuni arts. Measures could include: lobbying the State government to better enforce New Mexico’s Indian Arts and Crafts Act, collaboration with law enforcement and District Attorney’s office in Gallup to strengthen efforts around the IACA, development of a Zuni brand or stamp of authenticity for Zuni-made work, provision of educational materials to tourists in Zuni about the issue, and educational outreach to artists the IACA and avenues for protecting their work and reporting mis-represented work.
Subsistence Activities and Barter Subsistence activities and barter are essential to the functioning and to the cultural identity of lower-income and rural communities, and are possibly even more so to tribal communities such as Zuni, where the market economy remains a relatively recent imposition by the outside world. According to our survey data, subsistence activities and trading continue to have a decent footing in the Zuni economy with nearly 40% of survey respondents reporting involvement in at least one subsistence or trade activity. Among subsistence activities, the largest percentage of respondents are involved in farming or the keeping of livestock with 21% of survey respondents reporting engagement in these activities. 15% report engaging in trade with neighbors and 12% report engaging in hunting or fishing. These represent a strength of the Zuni community and economy that should be fostered. Extension outreach and 4-H programs with a focus on culturally relevant methods is valuable, as would be other educational and organizational efforts around agriculture and other traditional subsistence activities. Further, it would be worth exploring avenues through which these activities could become income generating activities – through agro and eco-tourism, and through sales of agricultural and value-added products that could be marketed both locally and regionally.
Tourism Development Survey respondents were quick to mention the importance of tourism when it comes to supporting Zuni’s arts market and many made suggestions that Zuni work to expand tourism. However, relative distance from population centers and lack of local amenities make tourism development a challenge for Zuni. The seasonality of the current tourism market in Zuni is a challenge for those who rely on tourism dollars. Further, Zuni is challenged to provide an enriching experience for guests while also protecting the community’s need for privacy.
40
• Co-promotion and coordination with Acoma, Laguna and Hopi Pueblos, Ramah and Native arts and culture events in Gallup is important in Zuni’s effort to draw visitors out to Zuni.
• Expansion of tourism amenities – particularly within the MainStreet District. The MainStreet District is an excellent opportunity for Zuni to concentrate tourism in such a way as to take pressure off the Middle Village area.
o Lodging and food services are the first issue faced in attracting and retaining tourism. These can both grow slowly and in response to demand through relatively low-investment efforts through programs like airbnb, bed and breakfast style lodging in homes, programs where tourists are hosted by local families for meals such as Cookening, and the development of food truck food services.
• Development of tourism activities is also important – Zuni currently lacks sufficient amenities to attract more than drive-through or possible one night stays. In order to most efficiently capture tourism dollars, Zuni would be well served to develop opportunities for the new market of cultural tourists – who tend to want to leave with experiences and memories as much as mementos. Development of cultural experiences specific to Zuni allows for excellent opportunities for Zuni to develop tourism while also developing skills and dialog around traditional cultural activities within the community. Workshops and tours around Zuni’s agricultural and irrigation practices, ethno-botany, traditional pottery skills, and other culturally relevant activities would all be valuable avenues to pursue.
• In addition to pursuing hospitality industry options along MainStreet, Zuni Pueblo should consider development of part of 112 acre property that is approximately 5 miles from Zuni. The area would be attractive for development of a boutique hotel that could showcase Zuni arts and crafts and introduce visitors to the options locally for cultural tourism. Zuni should avoid models that emphasize golf courses and attracting national chains. Zuni has a long history of survival in the face of drought and much that others could learn from in trying to adapt to future aridness.
• Zuni and the Navajo are close to agreement on the Fort Wingate property which among other things holds potential of providing locations close to I-40 that could be used for siting a casino. The tribe will face opposition from the Navajo and from tribes that have established casinos along I-40 but should be able to prevail if this is an option the Tribe wishes to pursue. There are good reasons for hesitancy and for proceeding carefully and with caution. If done right, a casino could be a source of funding for some key projects critical to establishing a robust cultural tourism program, including an Arts Center along Zuni Mainstreet. Zuni can benefit from the experiences of other tribes, such as Sandia, Acoma and Laguna.
• Zuni has an opportunity in the redevelopment of the DeAnza Hotel in Albuquerque both to expose more people to their art and culture and to establish a marketing outlet for Zuni artists.
41
• In order to obtain better prices for Zuni artists and artisans on their work and also on the supplies which they purchase, the tribe should seriously (and soon) consider purchase of the Turquoise Village. At minimum, the tribe should initiate conversations with the son of the former owner to explore what might be possible.
Promoting Local Economic Development that Serves the Local and Other Markets Many Zuni do most of their shopping in Gallup while some drive many miles to commercial centers like Albuquerque. While Zuni incomes are often low, the 10,000 or so people living on the Reservation collectively have income and financial resources that far and away exceed what they spend locally. Leakages, though difficult to measure given the data issues, are undoubtedly large.
A market survey was not part of this study, although a good survey would be revealing of the types of goods and services that are in demand. There is some preliminary data, both in the Zuni Shopping Center Survey and in the surveys of residents undertaken by Zuni High School students for their Economics class. Such data will be important to Zuni interested in starting a business or in expanding their existing operations as it can provide the basis for beginning to develop a business plan. Assistance in putting together a plan should be available from the local Small Business Development Center at UNM Gallup.
New businesses start-ups in Zuni face a number of obstacles which would be easier to overcome if they had some coaching and could share space, equiptment, and office staff with others at a relatively modest price on community land. Land can be a significant obstacle to Zuni development – because of the collateral issue in trying to get a loan but also because many do not have land that could be used for siting a business. Much as is proposed for artists, the Tribe could make available part of the 13 acres within the MainStreet District that was to be used for economic development for a small business incubator, to be built with capital outlay. There are a number of very successful incubators that could serve as models, e.g., the one run by the South Valley Economic Development Center as well as the Santa Fe Business Incubator.
In terms of exports, it may be reasonable to re-consider the furniture-making business once started as an Enterprise operation. The building is un-occupied. The former manager is reputed to be willing and has connections in other markets.
42
Appendix Table A1: Demographics: Population, Households, Race, Ethnicity, and Age Distribution
Main StreetZuni Pueblo
CDPBlack Rock
CDP
Zuni Res and Off Res. Trust
Land
McKinley County
New Mexico
DEMOGRAPHICSCensus Population Estimates 2013 (County & State); Zuni Census Office estimate 2014 (Zuni Reservation)
NA NA NA 10,532 73,308 2,085,287
Population (2010) 1,560 6,302 1,323 7,891 71,492 2,059,1791990 - 2000 Annual Growth Rate NA 0.84% 3.85% 0.46% 2.11% 1.85%2000 - 2010 Annual Growth Rate NA -0.10% 0.55% 0.18% -0.45% 1.23%Households (2010) 356 1,547 359 1,972 21,968 791,395Average Household Size (2010) 4.38 4.07 3.69 3.98 3.22 2.55
Population American Community Survey 2008-2012 1,560 10,160 1,069 11,401 71,888 2,055,287Households (2008-2012) 1,505 368 1,862 17,518 763,844
Race (2010)White 1.0% 1.1% 8.4% 2.4% 15.2% 68.4%American Indian and Alaska Native 97.5% 97.1% 88.3% 95.7% 75.5% 9.4%Some Other Race 0.6% 0.8% 1.9% 0.9% 6.2% 18.6%Two or More Races 0.6% 1.0% 1.5% 1.0% 3.1% 3.7%
Ethnicity (2010)Hispanic Origin 2.0% 3.0% 0.7% 2.9% 13.6% 46.3%White Alone and Not Hispanic NA 0.0.% 22.3% 2.5% 10.1% 40.5%
Age Distribution (2010)Under 19 y/o 30.9% 32.4% 42.6% 34.1% 35.0% 28.2%20-44 y/o 20.3% 34.6% 35.6% 35.1% 32.0% 32.0%45-64 y/o 38.0% 24.7% 19.4% 23.5% 23.4% 26.5%65 y/o and Over 10.9% 8.3% 2.5% 7.3% 9.6% 13.3%
Median Age (2010) NA 32.8 24.5 31.0 30.7 36.7
Source: U.S. Census Bureau 2010 Census, 2008-2012 American Community Survey, Population Estimates for State and County; Zuni Census Office, Reservation Population for 2014
43
Table A2: Income Data
Estimates from American Community Survey 2008-2012
Zuni Pueblo CDP
Black Rock CDP
Zuni Res & Off Res. Trust Land 2012
McKinley County New Mexico
INCOME DISTRIBUTION AND SOURCES Total households 1,505 287 1,862 17,518 763,844 Less than $10,000 8.4% 23.70% 13.0% 17.3% 9.2% $10,000 to $14,999 12.8% 16.70% 12.9% 8.7% 6.4% $15,000 to $24,999 13.3% 21.30% 15.3% 14.9% 12.7% $25,000 to $34,999 17.3% 0.00% 14.0% 13.4% 11.7% $35,000 to $49,999 11.3% 1.70% 9.4% 12.4% 14.6% $50,000 to $74,999 20.9% 24.7% 20.7% 15.1% 17.5% $75,000 to $99,999 4.7% 5.90% 4.7% 8.3% 11.1% $100,000 to $149,999 8.6% 2.10% 7.3% 6.5% 10.5% $150,000 to $199,999 2.7% 1.40% 2.4% 2.1% 3.6% $200,000 or more 0.0% 2.40% 0.4% 1.3% 2.8% Median household income (dollars) $32,904 $21,629 $30,250 $30,780 $44,886 Mean household income (dollars) $44,841 $38,659 $42,573 $44,884 $61,477 Households with earnings 81.9% 81.2% 79.1% 71.4% 76.7% Median earnings for workers (dollars) $14,646 $14,779 $14,425 $20,598 $26,259 With Social Security 30.3% 2.4% 24.9% 29.2% 29.7% Mean Social Security income (dollars) $8,280 $20,829 $8,470 $11,873 $15,521 With retirement income 16.7% 12.5% 15.5% 16.3% 19.1% Mean retirement income (dollars) $14,234 $46,278 $18,240 $17,904 $25,768 With Supplemental Security Income 14.2% 10.5% 15.4% 10.4% 5.2% Mean Supplemental Security Income (dollars)
$7,713 $8,473 $8,002 $7,073 $8,436
With cash public assistance income 2.7% 0.0% 2.1% 4.5% 2.7% Mean cash pub assist income (dollars) $5,263 na $5,263 $5,176 $3,304 With Food Stamp benefits past 12 months 26.4% 25.8% 27.6% 17.0% 12.7% POVERTY Population poverty status determined 10,091 1,064 11,299 71,020 2,013,777 Total in poverty 36.80% 54.6% 39.30% 33.60% 19.50% Under 18 years 49.50% 62.4% 51.60% 41.30% 27.70% 18 - 64 years 32.30% 50.3% 34.40% 29.60% 17.70% 65 years and over 36.30% 0.0% 40.30% 32.50% 12.20% Median earnings for male full-time, year-round workers (dollars) 24,032 38,063 25,331 33,357 42,737
Median earnings for female full-time, year-round workers (dollars) 22,093 32,404 23,214 27,914 33,170
US Census Bureau, American Community Survey 2008-2012

44
Table A3: Education
Main Street Zuni Pueblo
CDP Black Rock
CDP
Zuni Res and Off Res. Trust Land
McKinley County
New Mexico
EDUCATIONAL ATTAINMENT (2008-12) Population 25 yrs. and older 155 6,136 483 6,757 40,925 1,333,926 No HS Diploma 14.8% 24.4% 8.9% 23.7% 28.9% 16.6% High School Degree, GED or alternative credential 26.5% 36.2% 38.1% 36.3% 31.5% 26.4% Some College or Associate Degree 18.1% 33.0% 26.5% 32.1% 27.4% 31.4% Bachelor’s Degree or Higher 18.1% 6.3% 26.5% 8.0% 12.2% 25.6% Educational Attainment not available (29 yrs. & younger) 22.6% NA NA NA NA NA
SCHOOL ENROLLMENT Population 3 years and over enrolled in school NA 9,511 889 10,569 68,617 1,969,346 Nursery School, Pre-School NA 1.2% 1.7% 1.2% 2.0% 1.5% College or Graduate School NA 3.7% 6.0% 4.0% 5.6% 8.0% Employment Status (2008-2012) Population 16 yrs. & older NA 5,837 627 8,578 52,126 1,597,923 Civilian Employed NA 49.6% 47.2% 48.8% 44.7% 55.2% Civilian Unemployed NA 3.8% 12.3% 4.3% 6.0% 5.5% In Armed Forces NA 0.0% 0.0% 0.0% 0.1% 0.6% Not in Labor Force NA 46.6% 40.5% 46.9% 49.3% 38.7%
Source: 2008-2012 ACS Five-Year Estimates
45
Table A4: Housing
Sources: US Census Bureau, Census 2010; 2008-2012 American Community Survey
Zuni Pueblo CDP Black Rock CDP Zuni Res & Off Res. Trust Land
McKinley County New Mexico
HOUSING OCCUPANCYTotal housing units 1,737 368 2,234 25,842 900,504Occupied housing units 86.6% 78.0% 83.3% 67.8% 84.8%Vacant housing units 13.4% 22.0% 16.7% 32.2% 15.2%
HOUSING TENURE Total housing units 1,737 368 2,234 25,842 900,504Occupied housing units 1,505 287 1,862 17,518 763,844 Owner-occupied 95.4% 19.5% 83.6% 71.9% 68.9% Renter-occupied 4.6% 80.5% 16.4% 28.1% 31.1%
Average household size of owner-occupied unit 6.93 1.8 6.54 4.19 2.69Average household size of renter-occupied unit 2.71 4.17 3.79 3.7 2.51
MORTGAGE STATUSOwner-occupied units 1,436 56 1,557 12,587 526,495Housing units with a mortgage 225 24 266 3,681 316,246
UNITS IN STRUCTURETotal housing units 1,737 368 2,234 25,842 900,5041-unit, detached 53% 62% 57% 66% 64.7%Attached 21% 16% 19% 11% 18.5%Mobile home 26% 23% 25% 23% 16.8%
YEAR STRUCTURE BUILTTotal housing units 1,737 368 2,234 25,842 900,504Built 2000 or later 9.70% 15.5% 10.8% 7.2% 15.5%Built 1990 to 1999 24.10% 16.0% 22.3% 18.3% 17.8%Built 1970 to 1989 36.80% 36.4% 35.0% 50.1% 36.1%Built 1940 to 1970 21.80% 32.0% 25.8% 21.7% 25.0%Built 1939 or earlier 7.80% 0.0% 6.0% 2.7% 5.5%
ROOMSTotal housing units 1,737 368 2,234 25,842 900,5041 room 1.7% 5.4% 5.1% 18.3% 2.6%9 rooms or more 10.0% 10.6% 9.5% 4.7% 6.2%Median rooms 5.6 5.3 5.4 4.9 5.3
YEAR HOUSEHOLDER MOVED INTO UNITOccupied housing units 1,505 287 1,862 17,518 763,844Moved in 2010 or later 2.7% 33.1% 7.6% 5.5% 10.5%Moved in 2000 to 2009 26.8% 47.4% 31.8% 37.3% 51.7%Move in before 2000 50.8% 19.5% 42.4% 26.0% 17.6%
VEHICLES AVAILABLEOccupied housing units 1,505 287 1,862 17,518 763,844No vehicles available 10.7% 6.3% 12.1% 13.5% 5.7%
HOUSE HEATING FUELOccupied housing units 1,505 287 1,862 17,518 763,844Utility gas 4.00% 18.8% 6.1% 40.3% 67.5%Bottled, tank, or LP gas 16.2% 19.2% 16.1% 12.4% 9.6%Wood 72.6% 50.5% 70.2% 36.3% 6.6%
SELECTED CHARACTERISTICSOccupied housing units 1,505 287 1,862 17,518 763,844Lacking complete plumbing facilities 2.6% 0.0% 4.3% 11.5% 1.3%Lacking complete kitchen facilities 2.9% 0.0% 4.6% 8.4% 1.3%No telephone service available 4.50% 12.5% 5.8% 25.0% 4.7%
2008-2012 American Community Survey
2008-2012 American Community Survey
2008-2012 American Community Survey
2008-2012 American Community Survey
2008-2012 American Community Survey
2008-2012 American Community Survey
2008-2012 American Community Survey
2008-2012 American Community Survey
2008-2012 American Community Survey
2008-2012 American Community Survey
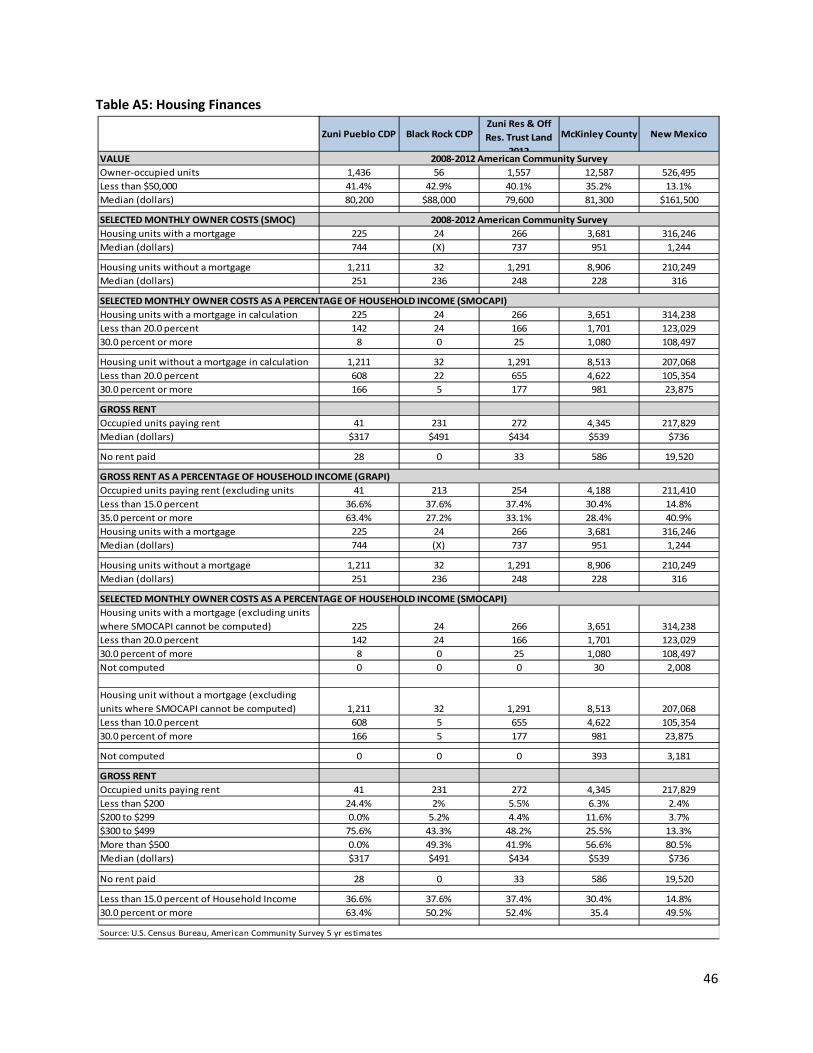
46
Table A5: Housing Finances
Zuni Pueblo CDP Black Rock CDPZuni Res & Off Res. Trust Land
2012
McKinley County New Mexico
VALUEOwner-occupied units 1,436 56 1,557 12,587 526,495Less than $50,000 41.4% 42.9% 40.1% 35.2% 13.1%Median (dollars) 80,200 $88,000 79,600 81,300 $161,500
SELECTED MONTHLY OWNER COSTS (SMOC)Housing units with a mortgage 225 24 266 3,681 316,246Median (dollars) 744 (X) 737 951 1,244
Housing units without a mortgage 1,211 32 1,291 8,906 210,249Median (dollars) 251 236 248 228 316
Housing units with a mortgage in calculation 225 24 266 3,651 314,238Less than 20.0 percent 142 24 166 1,701 123,02930.0 percent or more 8 0 25 1,080 108,497
Housing unit without a mortgage in calculation 1,211 32 1,291 8,513 207,068Less than 20.0 percent 608 22 655 4,622 105,35430.0 percent or more 166 5 177 981 23,875
GROSS RENTOccupied units paying rent 41 231 272 4,345 217,829Median (dollars) $317 $491 $434 $539 $736
No rent paid 28 0 33 586 19,520
Occupied units paying rent (excluding units 41 213 254 4,188 211,410Less than 15.0 percent 36.6% 37.6% 37.4% 30.4% 14.8%35.0 percent or more 63.4% 27.2% 33.1% 28.4% 40.9%Housing units with a mortgage 225 24 266 3,681 316,246Median (dollars) 744 (X) 737 951 1,244
Housing units without a mortgage 1,211 32 1,291 8,906 210,249Median (dollars) 251 236 248 228 316
Housing units with a mortgage (excluding units where SMOCAPI cannot be computed) 225 24 266 3,651 314,238Less than 20.0 percent 142 24 166 1,701 123,02930.0 percent of more 8 0 25 1,080 108,497Not computed 0 0 0 30 2,008
Housing unit without a mortgage (excluding units where SMOCAPI cannot be computed) 1,211 32 1,291 8,513 207,068Less than 10.0 percent 608 5 655 4,622 105,35430.0 percent of more 166 5 177 981 23,875
Not computed 0 0 0 393 3,181
GROSS RENTOccupied units paying rent 41 231 272 4,345 217,829Less than $200 24.4% 2% 5.5% 6.3% 2.4%$200 to $299 0.0% 5.2% 4.4% 11.6% 3.7%$300 to $499 75.6% 43.3% 48.2% 25.5% 13.3%More than $500 0.0% 49.3% 41.9% 56.6% 80.5%Median (dollars) $317 $491 $434 $539 $736
No rent paid 28 0 33 586 19,520
Less than 15.0 percent of Household Income 36.6% 37.6% 37.4% 30.4% 14.8%30.0 percent or more 63.4% 50.2% 52.4% 35.4 49.5%
Source: U.S. Census Bureau, American Community Survey 5 yr estimates
SELECTED MONTHLY OWNER COSTS AS A PERCENTAGE OF HOUSEHOLD INCOME (SMOCAPI)
GROSS RENT AS A PERCENTAGE OF HOUSEHOLD INCOME (GRAPI)
2008-2012 American Community Survey
2008-2012 American Community Survey
SELECTED MONTHLY OWNER COSTS AS A PERCENTAGE OF HOUSEHOLD INCOME (SMOCAPI)
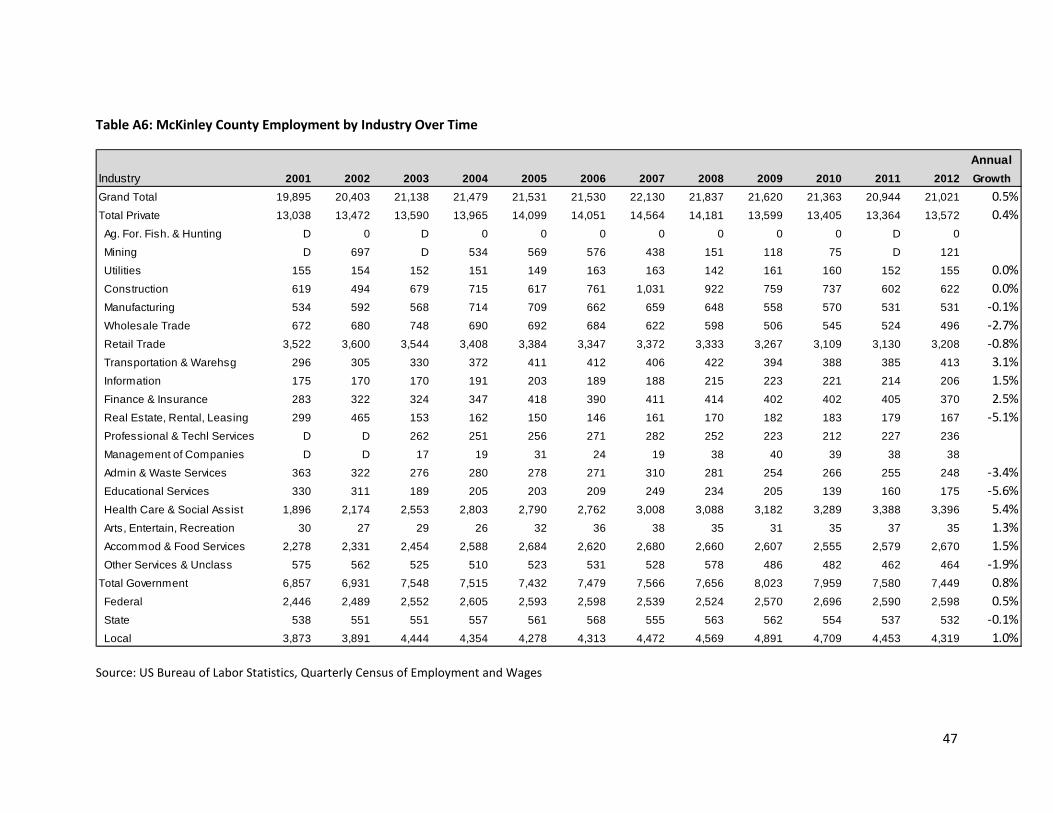
47
Table A6: McKinley County Employment by Industry Over Time
Source: US Bureau of Labor Statistics, Quarterly Census of Employment and Wages
AnnualIndustry 2001 2002 2003 2004 2005 2006 2007 2008 2009 2010 2011 2012 GrowthGrand Total 19,895 20,403 21,138 21,479 21,531 21,530 22,130 21,837 21,620 21,363 20,944 21,021 0.5%Total Private 13,038 13,472 13,590 13,965 14,099 14,051 14,564 14,181 13,599 13,405 13,364 13,572 0.4% Ag. For. Fish. & Hunting D 0 D 0 0 0 0 0 0 0 D 0
Mining D 697 D 534 569 576 438 151 118 75 D 121
Utilities 155 154 152 151 149 163 163 142 161 160 152 155 0.0% Construction 619 494 679 715 617 761 1,031 922 759 737 602 622 0.0% Manufacturing 534 592 568 714 709 662 659 648 558 570 531 531 -0.1% Wholesale Trade 672 680 748 690 692 684 622 598 506 545 524 496 -2.7% Retail Trade 3,522 3,600 3,544 3,408 3,384 3,347 3,372 3,333 3,267 3,109 3,130 3,208 -0.8% Transportation & Warehsg 296 305 330 372 411 412 406 422 394 388 385 413 3.1% Information 175 170 170 191 203 189 188 215 223 221 214 206 1.5% Finance & Insurance 283 322 324 347 418 390 411 414 402 402 405 370 2.5% Real Estate, Rental, Leasing 299 465 153 162 150 146 161 170 182 183 179 167 -5.1% Professional & Techl Services D D 262 251 256 271 282 252 223 212 227 236
Management of Companies D D 17 19 31 24 19 38 40 39 38 38
Admin & Waste Services 363 322 276 280 278 271 310 281 254 266 255 248 -3.4% Educational Services 330 311 189 205 203 209 249 234 205 139 160 175 -5.6% Health Care & Social Assist 1,896 2,174 2,553 2,803 2,790 2,762 3,008 3,088 3,182 3,289 3,388 3,396 5.4% Arts, Entertain, Recreation 30 27 29 26 32 36 38 35 31 35 37 35 1.3% Accommod & Food Services 2,278 2,331 2,454 2,588 2,684 2,620 2,680 2,660 2,607 2,555 2,579 2,670 1.5% Other Services & Unclass 575 562 525 510 523 531 528 578 486 482 462 464 -1.9%Total Government 6,857 6,931 7,548 7,515 7,432 7,479 7,566 7,656 8,023 7,959 7,580 7,449 0.8% Federal 2,446 2,489 2,552 2,605 2,593 2,598 2,539 2,524 2,570 2,696 2,590 2,598 0.5% State 538 551 551 557 561 568 555 563 562 554 537 532 -0.1% Local 3,873 3,891 4,444 4,354 4,278 4,313 4,472 4,569 4,891 4,709 4,453 4,319 1.0%
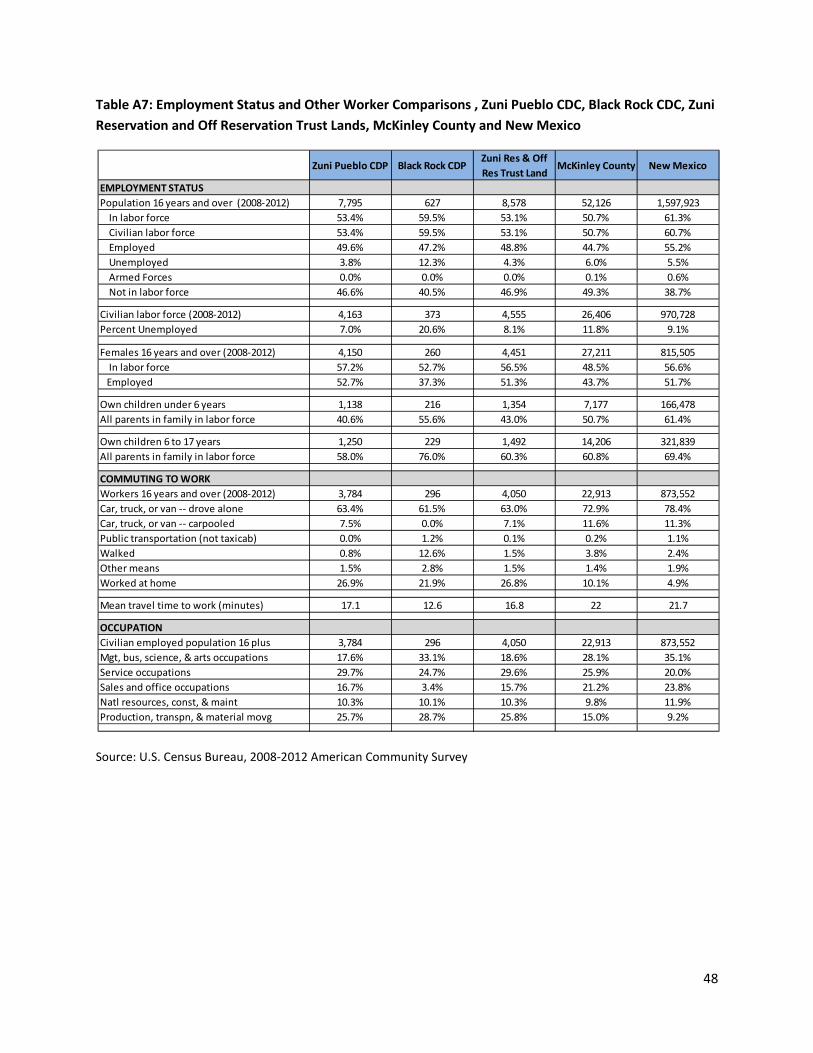
48
Table A7: Employment Status and Other Worker Comparisons , Zuni Pueblo CDC, Black Rock CDC, Zuni Reservation and Off Reservation Trust Lands, McKinley County and New Mexico
Source: U.S. Census Bureau, 2008-2012 American Community Survey
Zuni Pueblo CDP Black Rock CDPZuni Res & Off Res Trust Land
McKinley County New Mexico
EMPLOYMENT STATUSPopulation 16 years and over (2008-2012) 7,795 627 8,578 52,126 1,597,923 In labor force 53.4% 59.5% 53.1% 50.7% 61.3% Civilian labor force 53.4% 59.5% 53.1% 50.7% 60.7% Employed 49.6% 47.2% 48.8% 44.7% 55.2% Unemployed 3.8% 12.3% 4.3% 6.0% 5.5% Armed Forces 0.0% 0.0% 0.0% 0.1% 0.6% Not in labor force 46.6% 40.5% 46.9% 49.3% 38.7%
Civilian labor force (2008-2012) 4,163 373 4,555 26,406 970,728Percent Unemployed 7.0% 20.6% 8.1% 11.8% 9.1%
Females 16 years and over (2008-2012) 4,150 260 4,451 27,211 815,505 In labor force 57.2% 52.7% 56.5% 48.5% 56.6% Employed 52.7% 37.3% 51.3% 43.7% 51.7%
Own children under 6 years 1,138 216 1,354 7,177 166,478All parents in family in labor force 40.6% 55.6% 43.0% 50.7% 61.4%
Own children 6 to 17 years 1,250 229 1,492 14,206 321,839All parents in family in labor force 58.0% 76.0% 60.3% 60.8% 69.4%
COMMUTING TO WORKWorkers 16 years and over (2008-2012) 3,784 296 4,050 22,913 873,552Car, truck, or van -- drove alone 63.4% 61.5% 63.0% 72.9% 78.4%Car, truck, or van -- carpooled 7.5% 0.0% 7.1% 11.6% 11.3%Public transportation (not taxicab) 0.0% 1.2% 0.1% 0.2% 1.1%Walked 0.8% 12.6% 1.5% 3.8% 2.4%Other means 1.5% 2.8% 1.5% 1.4% 1.9%Worked at home 26.9% 21.9% 26.8% 10.1% 4.9%
Mean travel time to work (minutes) 17.1 12.6 16.8 22 21.7
OCCUPATIONCivilian employed population 16 plus 3,784 296 4,050 22,913 873,552Mgt, bus, science, & arts occupations 17.6% 33.1% 18.6% 28.1% 35.1%Service occupations 29.7% 24.7% 29.6% 25.9% 20.0%Sales and office occupations 16.7% 3.4% 15.7% 21.2% 23.8%Natl resources, const, & maint 10.3% 10.1% 10.3% 9.8% 11.9%Production, transpn, & material movg 25.7% 28.7% 25.8% 15.0% 9.2%
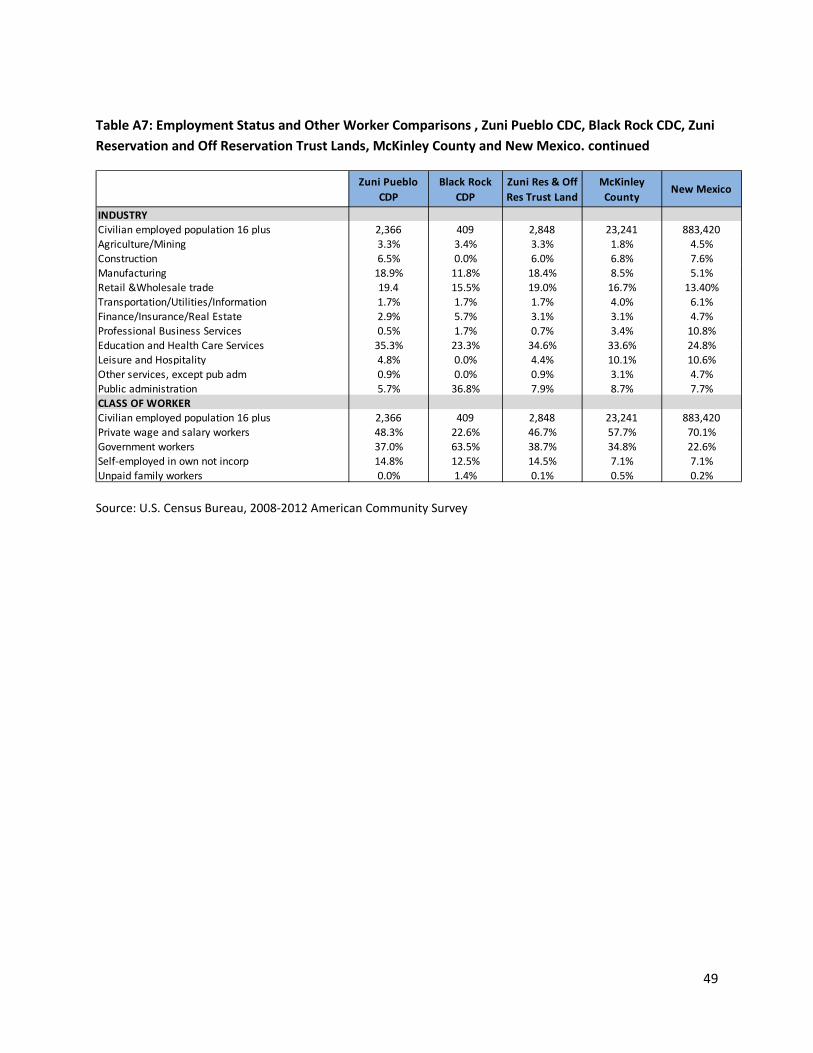
49
Table A7: Employment Status and Other Worker Comparisons , Zuni Pueblo CDC, Black Rock CDC, Zuni Reservation and Off Reservation Trust Lands, McKinley County and New Mexico. continued
Source: U.S. Census Bureau, 2008-2012 American Community Survey
Zuni Pueblo CDP
Black Rock CDP
Zuni Res & Off Res Trust Land
McKinley County
New Mexico
INDUSTRYCivilian employed population 16 plus 2,366 409 2,848 23,241 883,420Agriculture/Mining 3.3% 3.4% 3.3% 1.8% 4.5%Construction 6.5% 0.0% 6.0% 6.8% 7.6%Manufacturing 18.9% 11.8% 18.4% 8.5% 5.1%Retail &Wholesale trade 19.4 15.5% 19.0% 16.7% 13.40%Transportation/Utilities/Information 1.7% 1.7% 1.7% 4.0% 6.1%Finance/Insurance/Real Estate 2.9% 5.7% 3.1% 3.1% 4.7%Professional Business Services 0.5% 1.7% 0.7% 3.4% 10.8%Education and Health Care Services 35.3% 23.3% 34.6% 33.6% 24.8%Leisure and Hospitality 4.8% 0.0% 4.4% 10.1% 10.6%Other services, except pub adm 0.9% 0.0% 0.9% 3.1% 4.7%Public administration 5.7% 36.8% 7.9% 8.7% 7.7%CLASS OF WORKERCivilian employed population 16 plus 2,366 409 2,848 23,241 883,420Private wage and salary workers 48.3% 22.6% 46.7% 57.7% 70.1%Government workers 37.0% 63.5% 38.7% 34.8% 22.6%Self-employed in own not incorp 14.8% 12.5% 14.5% 7.1% 7.1%Unpaid family workers 0.0% 1.4% 0.1% 0.5% 0.2%
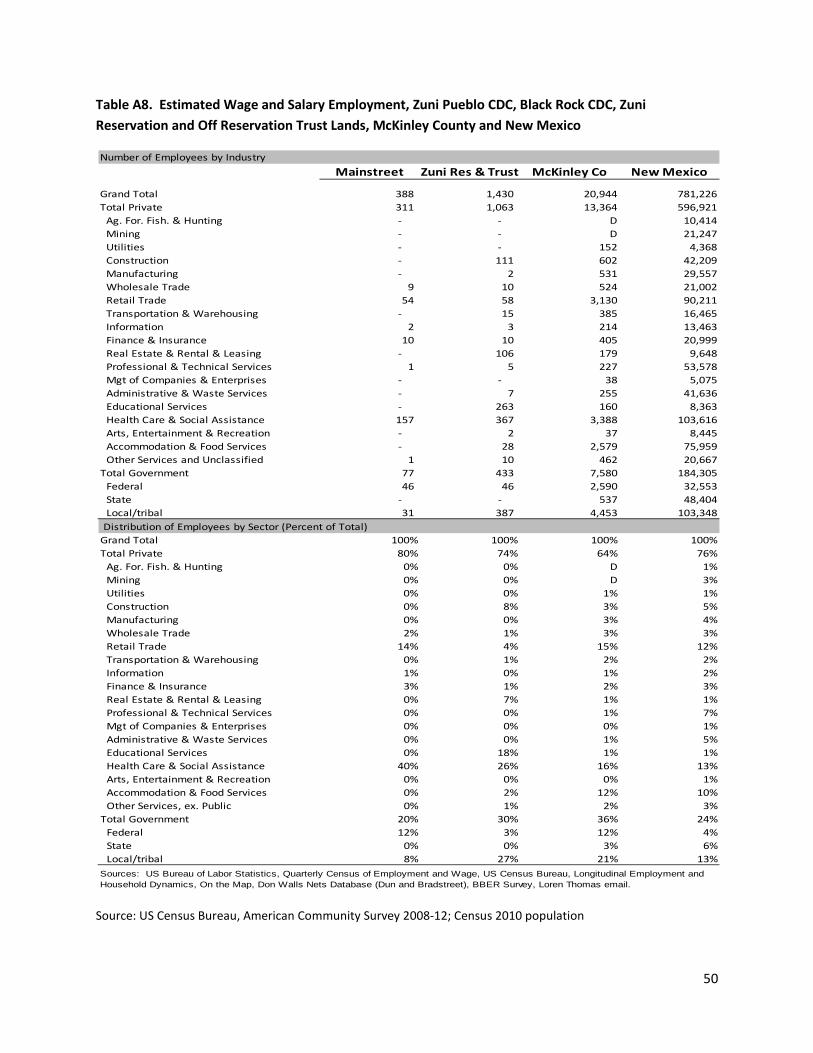
50
Table A8. Estimated Wage and Salary Employment, Zuni Pueblo CDC, Black Rock CDC, Zuni Reservation and Off Reservation Trust Lands, McKinley County and New Mexico
Source: US Census Bureau, American Community Survey 2008-12; Census 2010 population
Number of Employees by IndustryMainstreet Zuni Res & Trust McKinley Co New Mexico
Grand Total 388 1,430 20,944 781,226Total Private 311 1,063 13,364 596,921 Ag. For. Fish. & Hunting - - D 10,414 Mining - - D 21,247 Utilities - - 152 4,368 Construction - 111 602 42,209 Manufacturing - 2 531 29,557 Wholesale Trade 9 10 524 21,002 Retail Trade 54 58 3,130 90,211 Transportation & Warehousing - 15 385 16,465 Information 2 3 214 13,463 Finance & Insurance 10 10 405 20,999 Real Estate & Rental & Leasing - 106 179 9,648 Professional & Technical Services 1 5 227 53,578 Mgt of Companies & Enterprises - - 38 5,075 Administrative & Waste Services - 7 255 41,636 Educational Services - 263 160 8,363 Health Care & Social Assistance 157 367 3,388 103,616 Arts, Entertainment & Recreation - 2 37 8,445 Accommodation & Food Services - 28 2,579 75,959 Other Services and Unclassified 1 10 462 20,667Total Government 77 433 7,580 184,305 Federal 46 46 2,590 32,553 State - - 537 48,404 Local/tribal 31 387 4,453 103,348 Distribution of Employees by Sector (Percent of Total)Grand Total 100% 100% 100% 100%Total Private 80% 74% 64% 76% Ag. For. Fish. & Hunting 0% 0% D 1% Mining 0% 0% D 3% Utilities 0% 0% 1% 1% Construction 0% 8% 3% 5% Manufacturing 0% 0% 3% 4% Wholesale Trade 2% 1% 3% 3% Retail Trade 14% 4% 15% 12% Transportation & Warehousing 0% 1% 2% 2% Information 1% 0% 1% 2% Finance & Insurance 3% 1% 2% 3% Real Estate & Rental & Leasing 0% 7% 1% 1% Professional & Technical Services 0% 0% 1% 7% Mgt of Companies & Enterprises 0% 0% 0% 1% Administrative & Waste Services 0% 0% 1% 5% Educational Services 0% 18% 1% 1% Health Care & Social Assistance 40% 26% 16% 13% Arts, Entertainment & Recreation 0% 0% 0% 1% Accommodation & Food Services 0% 2% 12% 10% Other Services, ex. Public 0% 1% 2% 3%Total Government 20% 30% 36% 24% Federal 12% 3% 12% 4% State 0% 0% 3% 6% Local/tribal 8% 27% 21% 13%Sources: US Bureau of Labor Statistics, Quarterly Census of Employment and Wage, US Census Bureau, Longitudinal Employment and Household Dynamics, On the Map, Don Walls Nets Database (Dun and Bradstreet), BBER Survey, Loren Thomas email.
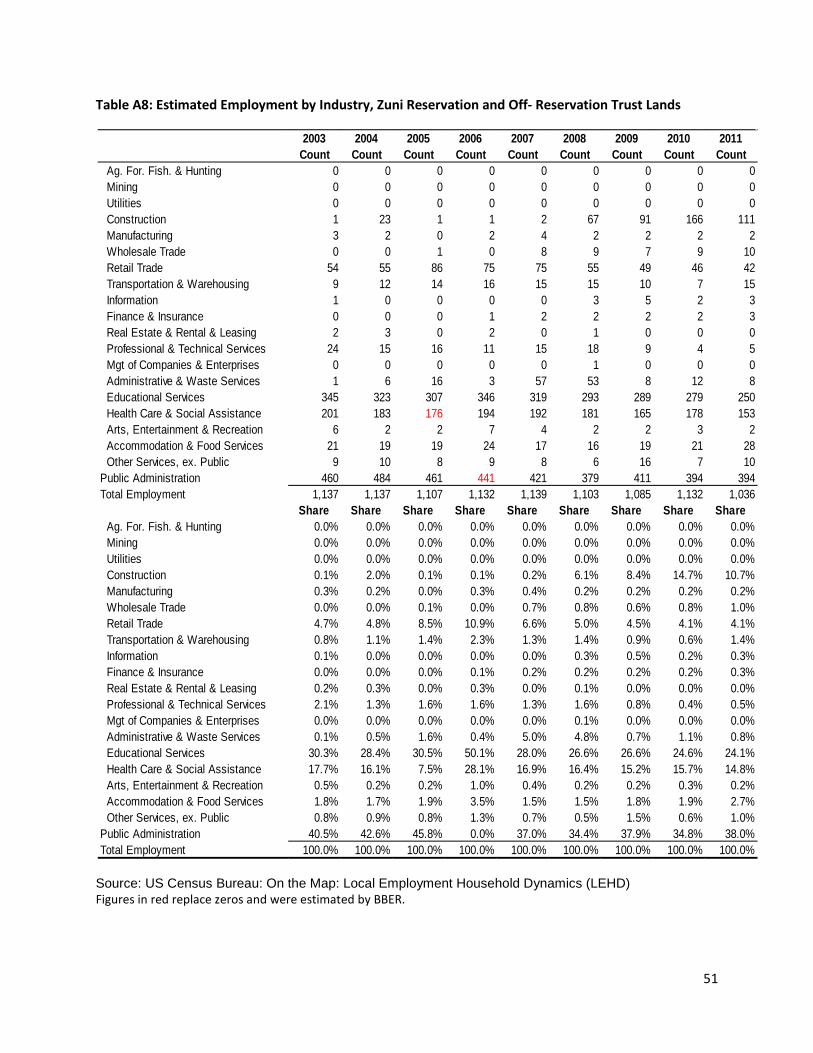
51
Table A8: Estimated Employment by Industry, Zuni Reservation and Off- Reservation Trust Lands
Source: US Census Bureau: On the Map: Local Employment Household Dynamics (LEHD) Figures in red replace zeros and were estimated by BBER.
2003 2004 2005 2006 2007 2008 2009 2010 2011Count Count Count Count Count Count Count Count Count
Ag. For. Fish. & Hunting 0 0 0 0 0 0 0 0 0 Mining 0 0 0 0 0 0 0 0 0 Utilities 0 0 0 0 0 0 0 0 0 Construction 1 23 1 1 2 67 91 166 111 Manufacturing 3 2 0 2 4 2 2 2 2 Wholesale Trade 0 0 1 0 8 9 7 9 10 Retail Trade 54 55 86 75 75 55 49 46 42 Transportation & Warehousing 9 12 14 16 15 15 10 7 15 Information 1 0 0 0 0 3 5 2 3 Finance & Insurance 0 0 0 1 2 2 2 2 3 Real Estate & Rental & Leasing 2 3 0 2 0 1 0 0 0 Professional & Technical Services 24 15 16 11 15 18 9 4 5 Mgt of Companies & Enterprises 0 0 0 0 0 1 0 0 0 Administrative & Waste Services 1 6 16 3 57 53 8 12 8 Educational Services 345 323 307 346 319 293 289 279 250 Health Care & Social Assistance 201 183 176 194 192 181 165 178 153 Arts, Entertainment & Recreation 6 2 2 7 4 2 2 3 2 Accommodation & Food Services 21 19 19 24 17 16 19 21 28 Other Services, ex. Public 9 10 8 9 8 6 16 7 10Public Administration 460 484 461 441 421 379 411 394 394Total Employment 1,137 1,137 1,107 1,132 1,139 1,103 1,085 1,132 1,036
Share Share Share Share Share Share Share Share Share Ag. For. Fish. & Hunting 0.0% 0.0% 0.0% 0.0% 0.0% 0.0% 0.0% 0.0% 0.0% Mining 0.0% 0.0% 0.0% 0.0% 0.0% 0.0% 0.0% 0.0% 0.0% Utilities 0.0% 0.0% 0.0% 0.0% 0.0% 0.0% 0.0% 0.0% 0.0% Construction 0.1% 2.0% 0.1% 0.1% 0.2% 6.1% 8.4% 14.7% 10.7% Manufacturing 0.3% 0.2% 0.0% 0.3% 0.4% 0.2% 0.2% 0.2% 0.2% Wholesale Trade 0.0% 0.0% 0.1% 0.0% 0.7% 0.8% 0.6% 0.8% 1.0% Retail Trade 4.7% 4.8% 8.5% 10.9% 6.6% 5.0% 4.5% 4.1% 4.1% Transportation & Warehousing 0.8% 1.1% 1.4% 2.3% 1.3% 1.4% 0.9% 0.6% 1.4% Information 0.1% 0.0% 0.0% 0.0% 0.0% 0.3% 0.5% 0.2% 0.3% Finance & Insurance 0.0% 0.0% 0.0% 0.1% 0.2% 0.2% 0.2% 0.2% 0.3% Real Estate & Rental & Leasing 0.2% 0.3% 0.0% 0.3% 0.0% 0.1% 0.0% 0.0% 0.0% Professional & Technical Services 2.1% 1.3% 1.6% 1.6% 1.3% 1.6% 0.8% 0.4% 0.5% Mgt of Companies & Enterprises 0.0% 0.0% 0.0% 0.0% 0.0% 0.1% 0.0% 0.0% 0.0% Administrative & Waste Services 0.1% 0.5% 1.6% 0.4% 5.0% 4.8% 0.7% 1.1% 0.8% Educational Services 30.3% 28.4% 30.5% 50.1% 28.0% 26.6% 26.6% 24.6% 24.1% Health Care & Social Assistance 17.7% 16.1% 7.5% 28.1% 16.9% 16.4% 15.2% 15.7% 14.8% Arts, Entertainment & Recreation 0.5% 0.2% 0.2% 1.0% 0.4% 0.2% 0.2% 0.3% 0.2% Accommodation & Food Services 1.8% 1.7% 1.9% 3.5% 1.5% 1.5% 1.8% 1.9% 2.7% Other Services, ex. Public 0.8% 0.9% 0.8% 1.3% 0.7% 0.5% 1.5% 0.6% 1.0%Public Administration 40.5% 42.6% 45.8% 0.0% 37.0% 34.4% 37.9% 34.8% 38.0%Total Employment 100.0% 100.0% 100.0% 100.0% 100.0% 100.0% 100.0% 100.0% 100.0%
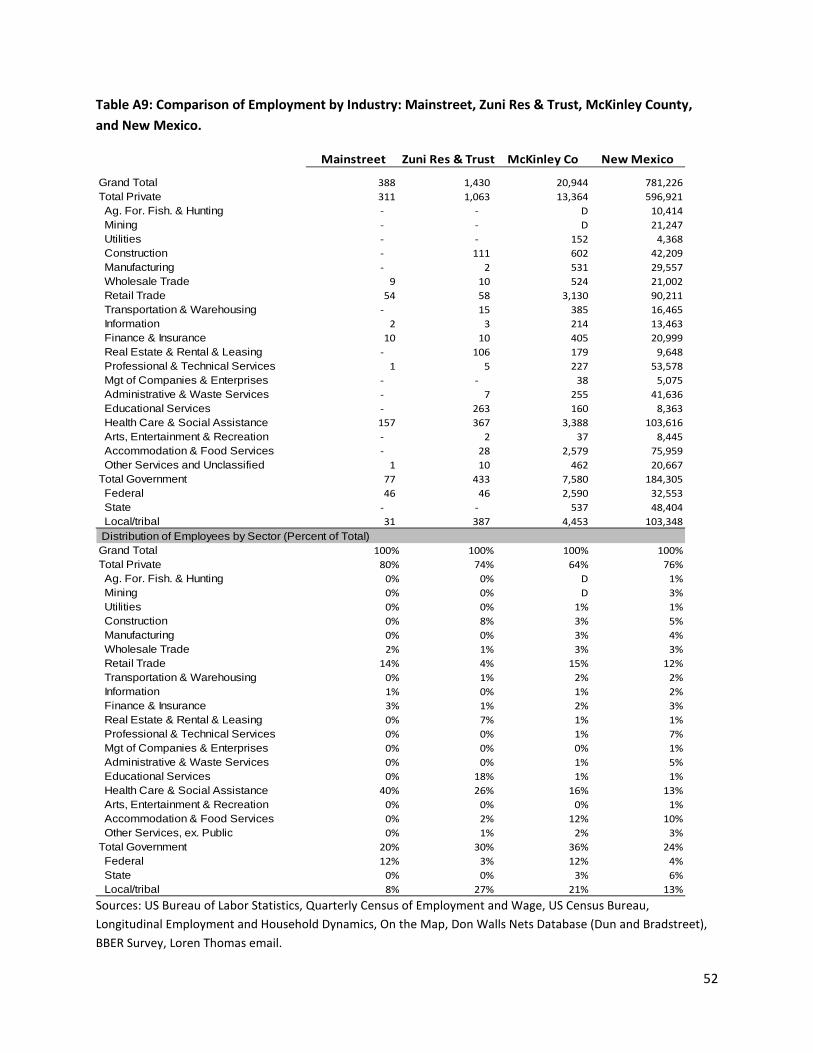
52
Table A9: Comparison of Employment by Industry: Mainstreet, Zuni Res & Trust, McKinley County, and New Mexico.
Sources: US Bureau of Labor Statistics, Quarterly Census of Employment and Wage, US Census Bureau, Longitudinal Employment and Household Dynamics, On the Map, Don Walls Nets Database (Dun and Bradstreet), BBER Survey, Loren Thomas email.
Mainstreet Zuni Res & Trust McKinley Co New Mexico
Grand Total 388 1,430 20,944 781,226Total Private 311 1,063 13,364 596,921 Ag. For. Fish. & Hunting - - D 10,414 Mining - - D 21,247 Utilities - - 152 4,368 Construction - 111 602 42,209 Manufacturing - 2 531 29,557 Wholesale Trade 9 10 524 21,002 Retail Trade 54 58 3,130 90,211 Transportation & Warehousing - 15 385 16,465 Information 2 3 214 13,463 Finance & Insurance 10 10 405 20,999 Real Estate & Rental & Leasing - 106 179 9,648 Professional & Technical Services 1 5 227 53,578 Mgt of Companies & Enterprises - - 38 5,075 Administrative & Waste Services - 7 255 41,636 Educational Services - 263 160 8,363 Health Care & Social Assistance 157 367 3,388 103,616 Arts, Entertainment & Recreation - 2 37 8,445 Accommodation & Food Services - 28 2,579 75,959 Other Services and Unclassified 1 10 462 20,667Total Government 77 433 7,580 184,305 Federal 46 46 2,590 32,553 State - - 537 48,404 Local/tribal 31 387 4,453 103,348 Distribution of Employees by Sector (Percent of Total)Grand Total 100% 100% 100% 100%Total Private 80% 74% 64% 76% Ag. For. Fish. & Hunting 0% 0% D 1% Mining 0% 0% D 3% Utilities 0% 0% 1% 1% Construction 0% 8% 3% 5% Manufacturing 0% 0% 3% 4% Wholesale Trade 2% 1% 3% 3% Retail Trade 14% 4% 15% 12% Transportation & Warehousing 0% 1% 2% 2% Information 1% 0% 1% 2% Finance & Insurance 3% 1% 2% 3% Real Estate & Rental & Leasing 0% 7% 1% 1% Professional & Technical Services 0% 0% 1% 7% Mgt of Companies & Enterprises 0% 0% 0% 1% Administrative & Waste Services 0% 0% 1% 5% Educational Services 0% 18% 1% 1% Health Care & Social Assistance 40% 26% 16% 13% Arts, Entertainment & Recreation 0% 0% 0% 1% Accommodation & Food Services 0% 2% 12% 10% Other Services, ex. Public 0% 1% 2% 3%Total Government 20% 30% 36% 24% Federal 12% 3% 12% 4% State 0% 0% 3% 6% Local/tribal 8% 27% 21% 13%
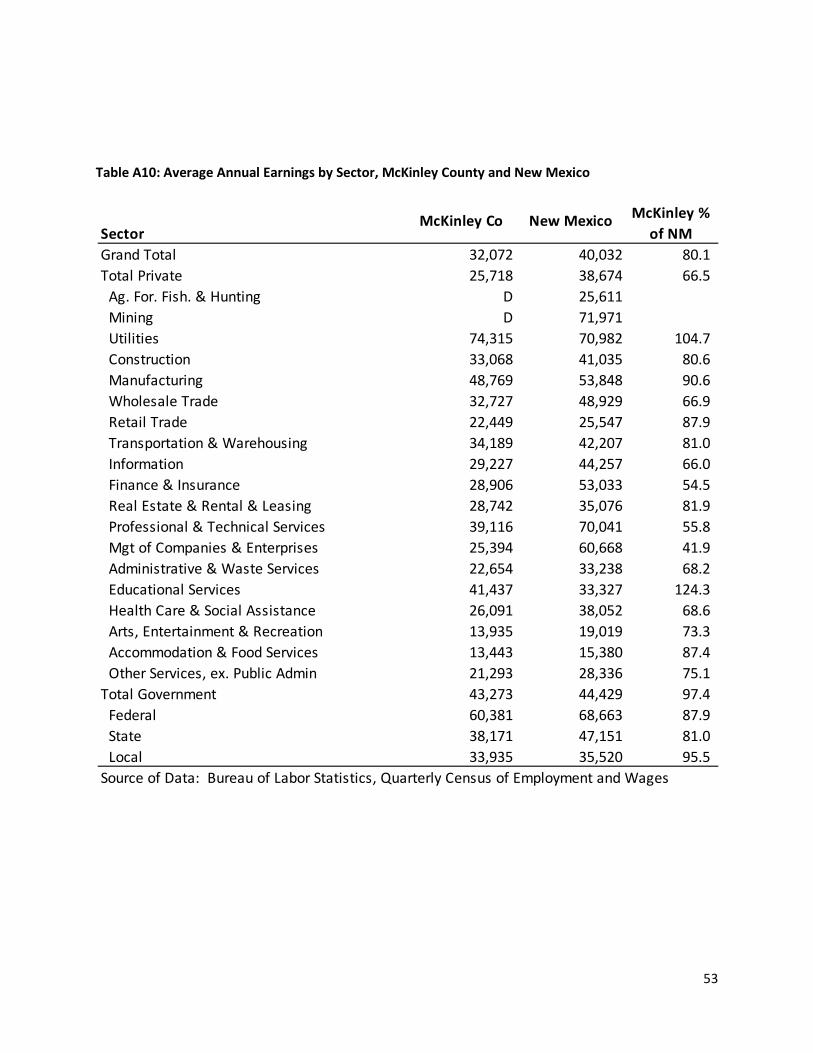
53
Table A10: Average Annual Earnings by Sector, McKinley County and New Mexico
SectorGrand Total 32,072 40,032 80.1 Total Private 25,718 38,674 66.5 Ag. For. Fish. & Hunting D 25,611 Mining D 71,971 Utilities 74,315 70,982 104.7 Construction 33,068 41,035 80.6 Manufacturing 48,769 53,848 90.6 Wholesale Trade 32,727 48,929 66.9 Retail Trade 22,449 25,547 87.9 Transportation & Warehousing 34,189 42,207 81.0 Information 29,227 44,257 66.0 Finance & Insurance 28,906 53,033 54.5 Real Estate & Rental & Leasing 28,742 35,076 81.9 Professional & Technical Services 39,116 70,041 55.8 Mgt of Companies & Enterprises 25,394 60,668 41.9 Administrative & Waste Services 22,654 33,238 68.2 Educational Services 41,437 33,327 124.3 Health Care & Social Assistance 26,091 38,052 68.6 Arts, Entertainment & Recreation 13,935 19,019 73.3 Accommodation & Food Services 13,443 15,380 87.4 Other Services, ex. Public Admin 21,293 28,336 75.1 Total Government 43,273 44,429 97.4 Federal 60,381 68,663 87.9 State 38,171 47,151 81.0 Local 33,935 35,520 95.5 Source of Data: Bureau of Labor Statistics, Quarterly Census of Employment and Wages
McKinley % of NM
McKinley Co New Mexico
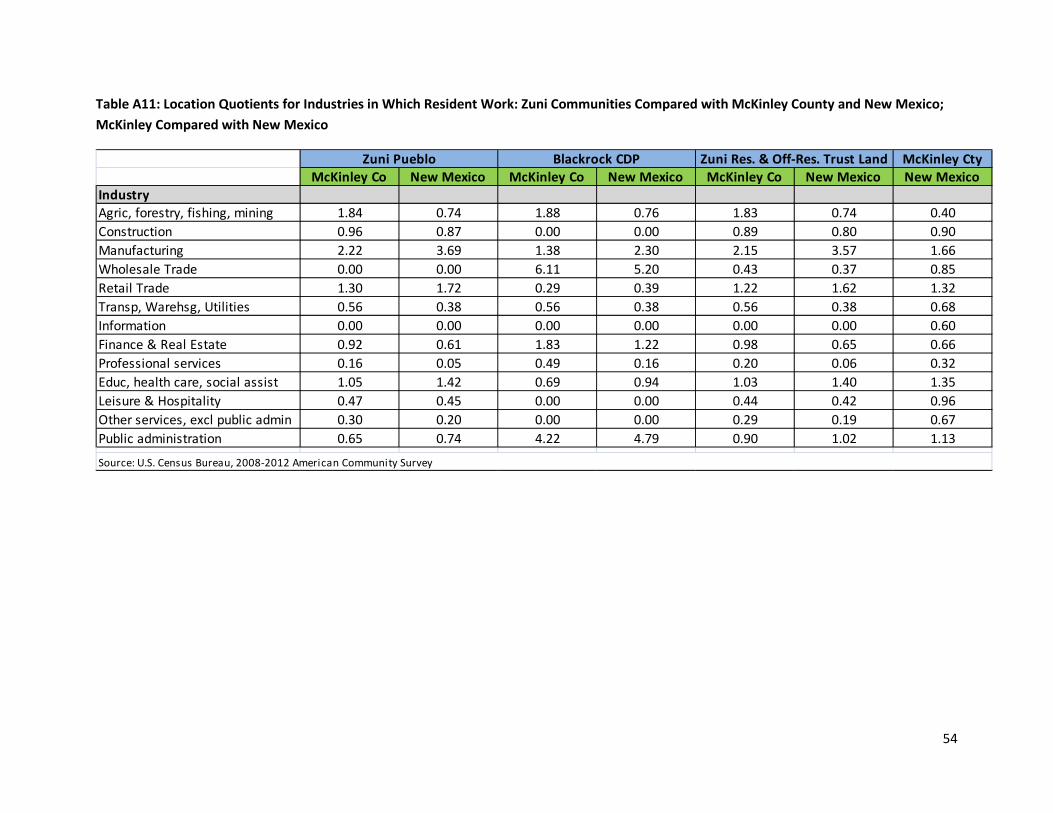
54
Table A11: Location Quotients for Industries in Which Resident Work: Zuni Communities Compared with McKinley County and New Mexico; McKinley Compared with New Mexico
McKinley CtyMcKinley Co New Mexico McKinley Co New Mexico McKinley Co New Mexico New Mexico
IndustryAgric, forestry, fishing, mining 1.84 0.74 1.88 0.76 1.83 0.74 0.40Construction 0.96 0.87 0.00 0.00 0.89 0.80 0.90Manufacturing 2.22 3.69 1.38 2.30 2.15 3.57 1.66Wholesale Trade 0.00 0.00 6.11 5.20 0.43 0.37 0.85Retail Trade 1.30 1.72 0.29 0.39 1.22 1.62 1.32Transp, Warehsg, Utilities 0.56 0.38 0.56 0.38 0.56 0.38 0.68Information 0.00 0.00 0.00 0.00 0.00 0.00 0.60Finance & Real Estate 0.92 0.61 1.83 1.22 0.98 0.65 0.66Professional services 0.16 0.05 0.49 0.16 0.20 0.06 0.32Educ, health care, social assist 1.05 1.42 0.69 0.94 1.03 1.40 1.35Leisure & Hospitality 0.47 0.45 0.00 0.00 0.44 0.42 0.96Other services, excl public admin 0.30 0.20 0.00 0.00 0.29 0.19 0.67Public administration 0.65 0.74 4.22 4.79 0.90 1.02 1.13
Zuni Pueblo Blackrock CDP Zuni Res. & Off-Res. Trust Land
Source: U.S. Census Bureau, 2008-2012 American Community Survey

55
Table A12: Occupational Location Quotients
Source of Data: U.S. Census Bureau, 2008-2012 American Community Survey; BBER calculations
Civilian employed population 16 plusMcKinley Co
McKinley Co
New Mexico
McKinley Co
New Mexico
McKinley Co
New Mexico New Mexico
OccupationsMgt, business, science, arts : 0.63 0.50 1.16 0.92 0.66 0.53 0.80 Management, business, financial: 0.35 0.17 1.39 0.66 0.42 0.20 0.48 Management occupations 0.19 0.09 0.00 0.00 0.18 0.09 0.50 Business and financial operations 0.81 0.35 5.28 2.30 1.12 0.49 0.44Computer, engineering, and sciences: 0.58 0.20 0.00 0.00 0.53 0.19 0.35 Computer & mathematical 0.00 0.00 0.00 0.00 0.00 0.00 0.33 Architecture and engineering 1.24 0.49 0.00 0.00 1.15 0.45 0.39 Life, physical, social science 0.00 0.00 0.00 0.00 0.00 0.00 0.30Educ, legal, comm serv, arts & media: 0.63 0.70 1.41 1.56 0.68 0.76 1.11 Community and social services 0.71 0.85 2.73 3.26 0.85 1.02 1.19 Legal occupations 0.00 0.00 0.00 0.00 0.00 0.00 0.39 Education, training, and library 0.68 0.89 1.37 1.79 0.72 0.95 1.31 Arts, design, entertain sports, and media 0.38 0.28 0.00 0.00 0.35 0.26 0.72Healthcare practitioner and technical: 0.87 1.20 0.93 1.28 0.87 1.20 1.39 Health diagnosing & treating & technical 0.13 0.17 1.10 1.47 0.20 0.26 1.33 Health technologists and technicians 2.37 3.58 0.56 0.85 2.23 3.37 1.51Service occupations: 1.15 1.48 0.95 1.23 1.14 1.48 1.30 Healthcare support occupations 1.27 1.48 0.00 0.00 1.17 1.37 1.17 Protective service occupations: 1.12 1.06 6.71 6.36 1.51 1.43 0.95 Fire fightg, prevent, oth protect serv, super 1.45 1.61 10.50 11.64 2.09 2.31 1.11 Law enforcement workers incl superv 0.52 0.39 0.00 0.00 0.48 0.36 0.75 Food preparation and serving related 1.33 1.78 0.00 0.00 1.23 1.65 1.34 Building & grounds cleaning & maint 0.65 0.94 0.53 0.77 0.65 0.93 1.44Personal care and service occupations 1.38 1.91 0.63 0.88 1.38 1.90 1.38Sales and office occupations: 0.79 0.70 0.16 0.14 0.74 0.66 0.89 Sales and related occupations 0.78 0.72 0.00 0.00 0.72 0.67 0.92 Office and administrative support 0.79 0.69 0.29 0.25 0.76 0.65 0.86Natl resources, construction, & maint 1.05 0.86 1.04 0.85 1.05 0.86 0.82 Farming, fishing, and forestry 1.74 0.70 0.00 0.00 1.61 0.64 0.40 Construction and extraction 1.25 1.26 0.47 0.47 1.19 1.20 1.01 Installation, maintenance, and repair 0.25 0.15 3.16 1.84 0.46 0.27 0.58Production, transp, material moving: 1.71 2.79 1.91 3.13 1.72 2.81 1.64 Production occupations 2.17 4.98 2.94 6.73 2.22 5.08 2.29 Transportation occupations 0.85 0.98 0.34 0.40 0.81 0.94 1.16 Material moving occupations 1.18 1.22 0.00 0.00 1.11 1.15 1.04
Zuni Pueblo Blackrock CDPZuni Res. & Off-Res.
Trust Land