Embed Size (px)
Citation preview

Annual financial statements 2015

Annual financial statements 2015 1
CONTENTS
Consolidated financial statements for the year ended 30 September 2015
Company financial statements for the year ended 30 September 2015
2 Directors’ responsibility 83 Company statement of financial position
3 Notice in terms of section 29 of the Companies Act, 84 Company statement of comprehensive income
Act 71 of 2008 84 Company statement of changes in equity
3 Company secretary 85 Company statement of cash flows
4 Audit and risk committee report 86 Notes to the company financial statements
6 Independent auditor’s report
7 Directors’ report
9 Accounting policies
24 Statement of financial position
25 Statement of comprehensive income
26 Statement of changes in equity
28 Statement of cash flows
29 Notes to the consolidated financial statements

Annual financial statements 2015 32 QUANTUM FOODS
These annual financial statements have been audited in compliance with the Companies Act. These annual financial statements have been prepared under the supervision of Mr AH Muller, CA(SA), chief financial officer.
COMPANY SECRETARY
In accordance with section 88 of the Companies Act, for the year ended 30 September 2015, it is hereby certified that the Company and its subsidiaries have lodged with the Companies and Intellectual Property Commission all such returns that are required of a public company in terms of the Companies Act and that such returns are true, correct and up to date.
INT NdlovuCompany Secretary
NOTICE IN TERMS OF SECTION 29 OF THE COMPANIES ACT, ACT 71 OF 2008 (“THE COMPANIES ACT”)
In accordance with the requirements of the Companies Act, the Board is responsible for the preparation of the annual financial statements and the consolidated annual financial statements of Quantum Foods Holdings Ltd (“Quantum Foods” or the “Company”). These conform to International Financial Reporting Standards (“IFRS”) and fairly present the state of Quantum Foods Holdings Ltd and its subsidiaries (“the Group”) at the reporting date.
It is the responsibility of the independent external auditors to report on the fair presentation of the financial statements.
The Board is ultimately responsible for the internal control processes of Quantum Foods. Standards and systems of internal control are designed and implemented by management to provide reasonable assurance as to the integrity and reliability of financial records and of the financial statements and to adequately safeguard, verify and maintain accountability for the Group’s assets. Appropriate accounting policies, supported by reasonable and prudent judgements and estimates are applied on a consistent and going concern basis. Systems and controls include the proper delegation of responsibilities, effective accounting procedures and adequate segregation of duties.
DIRECTORS’ RESPONSIBILITY
Based on the information and reasons given by management and the internal auditors, the Board is of the opinion that the accounting controls are sufficient and that the financial records may be relied upon for preparing the financial statements and maintaining accountability for the Group’s assets and liabilities.
Nothing has come to the attention of the directors to indicate that any breakdown in the functioning of these controls, resulting in material loss, has occurred during the financial year and up to the date of this report. The Board has a reasonable expectation that the Group and its subsidiaries have adequate resources to continue in operational existence for the foreseeable future and continue adopting the going concern basis in preparing the financial statements.
The annual financial statements which appear on pages 7 to 87 were approved by the Board on 23 November 2015 and are signed on its behalf by:
WA Hanekom HA LourensChairman ChiefExecutiveOfficer

Annual financial statements 2015 54 QUANTUM FOODS
• Recommended the reappointment of Price-waterhouse Coopers Inc. as the external auditor and Mr DG Malan as the designated auditor, after satisfying itself through enquiry that Pricewater-houseCoopers Inc. is independent as defined in terms of the Companies Act. This will be Mr DG Malan’s third year as designated auditor of the Company.
• Confirmed that PricewaterhouseCoopers Inc. and the designated auditor are accredited by the JSE.
• Confirmed and approved the internal audit charter and annual internal audit year plan.
• Reviewed the internal audit risk reports and tip-offs anonymous reports.
• Reviewed and approved risk management policy and plan.
• Reviewed business continuity capability, disaster management plans and insurance cover.
CHIEF FINANCIAL OFFICERThe committee has considered and satisfied itself of the appropriateness of the expertise and experience of Mr AH Muller as chief financial officer.
In addition, the committee also considered and has satisfied itself of the appropriateness of the expertise and adequacy of resources of the financial function and experience of the senior members of manage-ment responsible for the financial function.
GOING CONCERNThe committee has considered and reviewed a documented assessment, including key assumptions, as prepared by management of the going concern status of the Group and has made recommendations to the Board in accordance. The Board’s statement regarding the going concern status of the Group, as supported by the committee, is included in the directors’ responsibility report on page 2.
PE BurtonChairman: Audit and risk committeeWellington23 November 2015
The audit and risk committee (“the committee”) is constituted in terms of a charter which outlines the statutory duties in terms of the relevant provisions of the Companies Act and responsibilities highlighted in King III.
AUDIT AND RISK COMMITTEE CHARTERThe committee is guided by formal terms of reference. An annual work plan which serves as a guideline for the committee in the execution of its mandate was adopted during the period.
Both the charter and work plan are reviewed annually and amended as necessary.
The committee’s role and responsibilities outlined in the charter include both the statutory duties and responsibilities as required by the relevant provi-sions of the Companies Act as well as those highlighted in King III.
MEMBERS OF THE AUDIT AND RISK COMMITTEEAs at 30 September 2015, the committee comprised of three independent non-executive directors namely, ASM Karaan, GG Fortuin and is chaired by PE Burton. These members will retire and avail themselves for re-election at the second AGM in terms of section 94(2) of the Companies Act. All members are required to act objectively and independently, as described in the Companies Act and in King III.
The Group chief executive officer and the chief financial officer are permanent invitees of the committee. In addition, relevant senior managers will be invited to attend meetings from time to time. The company secretary is the statutory secretary of the committee.
The Board has approved the recommended external auditor who will be formally recommended for appointment to the shareholders at the AGM. The auditor will attend all meetings of the committee in his capacity as assurance provider.
AUDIT AND RISK COMMITTEE REPORT
MEETINGSThe committee held two meetings during the year. Attendance of the meetings is shown on page 35 of the integrated report.
FUNCTIONS AND RESPONSIBILITIES OF THE COMMITTEEDuring the period under review, the committee was able to discharge the following functions outlined in its charter and ascribed to it in terms of the Companies Act and King III:
• Reviewed the interim, preliminary and summary results as well as the year-end financial state - ments, culminating in a recommendation to the Board for approval. In the course of its review, the committee: – took the necessary steps to ensure that the
financial statements are prepared in accordance with IFRS and the requirements of the Companies Act;
– considered and, when appropriate, made recommendations on internal financial controls;
– ensured that a process is in place to be informed of any reportable irregularities (as per the Auditing Professions Act, Act 26 of 2005) identified and reported by the external auditor; and relating to the accounting practices and internal audit of the Group, the content of the financial statements, the internal financial controls of the Group or any related matter during the financial year. No such material concerns and/or complaints were raised during the financial year.
• Reviewed the external audit reports on the Group’s annual financial statements.
• Oversaw the integrated reporting process. The committee considered the Group’s information pertaining to its non-financial performance as disclosed in the integrated report and has assessed its consistency with operational and other information known to committee members, and for consistency with the annual financial statements.
Annual financial statements 2015 76 QUANTUM FOODS
1. PRINCIPAL ACTIVITIES AND BUSINESS REVIEW Quantum Foods Holdings Ltd and its subsid-iaries are a diversified feeds and poultry business providing quality animal protein to selected South African and African markets.
2. FINANCIAL RESULT The annual financial statements on pages 9 to 87 set out fully the financial position, financial performance and the cash flows for the year ended 30 September 2015.
3. SHARE CAPITAL The authorised share capital consists of 400 000 000 (2014: 400 000 000) ordinary no par value shares. At year-end 233 248 590 (2014: 233 284 332) ordinary shares were in issue.
During the reporting period, 35 742 shares held by Pioneer Food Group Ltd (“Pioneer Foods”), were cancelled before the listing of the Company on 6 October 2014. These shares were cancelled to ensure an equal 1:1 unbundling of shares at the listing.
4. DIVIDENDS A final gross dividend of 10 cents (2014: Rnil) per ordinary share was declared.
5. SUBSIDIARIES The detail on interest in and loans to subsidiaries are presented in note 5 to the consolidated financial statements.
6. DIRECTORS The directors of the Company are responsible for the activities and reports related to the Group. The Board comprises:
• Wouter André Hanekom – appointed as chairman on 28 April 2015
• Norman Celliers – stepped down as chairman on 28 April 2015
• Lambert Phillips Retief – resigned on 19 February 2015
DIRECTORS’ REPORTFOR THE YEAR ENDED 30 SEPTEMBER 2015
• Hendrik Albertus Lourens• André Hugo Muller• Prof. Abdus Salam Mohammad Karaan• Patrick Ernest Burton• Geoffrey George Fortuin – appointed on
28 April 2015
7. SPECIAL RESOLUTIONS PASSEDAnnual general meeting of shareholders (“AGM”) At the AGM held at Kleinevalleij Estate, Wellington on Friday, 20 February 2015 at 09:00 the following special resolutions were passed by the Company:
Special resolution one, for approval of the remuneration payable by the Company to its non-executive directors for their services as directors for the period 1 April 2015 until the date of the next AGM, was passed.
Special resolution two, for approval of the general authority to the Board to repurchase any of the shares issued by the Company, on the basis reflected in the special resolution, by the Company and its subsidiaries, was passed.
Special resolution three, for approval of a general authority to the Board of the Company to grant direct and indirect financial assistance to any company forming part of the Company’s group, including in the form of loans or the guaranteeing of their debts, was passed.
Special resolution four, for the approval of a general authority to the Board of the Company, to provide financial assistance to any person, by way of a loan, guarantee, the provision of security or otherwise, for the purpose of, or in connection with, the subscription of any option, or any securities, issued or to be issued by the Company or a related or inter-related company, or for the purchase of any securities of the Company or a related or inter-related company, was passed.
We have audited the consolidated and separate financial statements of Quantum Foods Holdings Ltd set out on pages 9 to 87, which comprise the statements of financial position as at 30 September 2015, and the statements of com-prehensive income, statements of changes in equity and statements of cash flows for the year then ended, and the notes, comprising a summary of significant accounting policies and other explanatory information.
DIRECTORS’ RESPONSIBILITY FOR THE FINANCIAL STATEMENTSThe Company’s directors are responsible for the preparation and fair presentation of these consolidated and separate financial statements in accordance with International Financial Reporting Standards and the requirements of the Companies Act of South Africa, and for such internal control as the directors determine is necessary to enable the preparation of consolidated and separate financial statements that are free from material misstatement, whether due to fraud or error.
AUDITOR’S RESPONSIBILITYOur responsibility is to express an opinion on these consolidated and separate financial statements based on our audit. We conducted our audit in accordance with International Standards on Auditing. Those standards require that we comply with ethical requirements and plan and perform the audit to obtain reasonable assurance about whether the consolidated and separate financial statements are free from material misstatement.
An audit involves performing procedures to obtain audit evidence about the amounts and disclosures in the financial statements. The procedures selected depend on the auditor’s judgement, including the assessment of the risks of material misstatement of the financial statements, whether due to fraud or error. In making those risk assessments, the auditor considers internal control relevant to the entity’s preparation and fair presentation of the financial statements in order to design audit procedures that are appropriate in the circumstances, but not for the purpose of expressing an opinion on the effectiveness of the entity’s internal control. An audit
INDEPENDENT AUDITOR’S REPORT TO THE SHAREHOLDERS OF QUANTUM FOODS HOLDINGS LTD
also includes evaluating the appropriateness of accounting policies used and the reasonableness of accounting estimates made by management, as well as evaluating the overall presentation of the financial statements.
We believe that the audit evidence we have obtained is sufficient and appropriate to provide a basis for our audit opinion.
OPINIONIn our opinion, the consolidated and separate financial statements present fairly, in all material respects, the consolidated and separate financial position of Quantum Foods Holdings Ltd as at 30 September 2015, and its consolidated and separate financial performance and its consolidated and separate cash flows for the year then ended in accordance with International Financial Reporting Standards and the requirements of the Companies Act of South Africa.
OTHER REPORTS REQUIRED BY THE COMPANIES ACTAs part of our audit of the consolidated and separate financial statements for the year ended 30 September 2015, we have read the Directors’ Report, the Audit Committee’s Report and the Company Secretary’s Certificate for the purpose of identifying whether there are material inconsistencies between these reports and the audited consolidated and separate financial statements. These reports are the responsibility of the respective preparers. Based on reading these reports we have not identified material inconsistencies between these reports and the audited consolidated and separate financial statements. However, we have not audited these reports and accordingly do not express an opinion on these reports.
PricewaterhouseCoopers Inc. Director: DG MalanRegistered Auditor
Paarl 23 November 2015

Annual financial statements 2015 98 QUANTUM FOODS
1. BASIS OF PREPARATIONThe principle accounting policies applied in the preparation of these consolidated annual financial statements are set out below. These policies have been consistently applied to all the years presented, unless otherwise stated.
The consolidated annual financial statements of the Group have been prepared in accordance with, and comply with, International Financial Reporting Standards (“IFRS”) and International Reporting Interpretations Committee (“IFRIC”) interpretations issued and effective at the time of preparing these financial statements, the Listings Requirements of the JSE Ltd and the Companies Act. These financial statements comply with the requirements of the SAICA Financial Reporting Guides as issued by the Accounting Practices Committee and the Financial Reporting Pronouncements as issued by the Financial Reporting Standards Council. The consolidated annual financial statements are prepared on the historic cost convention, as modified by the revaluation of biological assets and financial assets and liabilities (including derivative instruments) at fair value through profit or loss.
The reorganisation of the Pioneer Foods businesses into the Group during the previous reporting period was a common control transaction as Pioneer Foods was the ultimate controlling entity before and after the reorganisation. These financial statements were based on predecessor accounting arising from such common control transaction. This method required that the assets and liabilities of the Group were presented using the carrying amounts from the highest level of common
ACCOUNTING POLICIESFOR THE YEAR ENDED 30 SEPTEMBER 2015
control (i.e. Pioneer Foods) for which consolidated financial statements were prepared. As an operating segment of Pioneer Foods, the Group did not prepare separate financial statements in accordance with IFRS in the normal course of business for the periods up to and including 30 September 2013.
Net invested equityThe divisions of the Group generated assessed losses which were utilised by other divisions of Pioneer Foods, as such, the utilisation of these tax losses has been recognised as a distribution in net invested equity in the previous reporting period.
Furthermore all investments in subsidiaries and associates transferred to the Group were recognised in net invested equity.
The acquisitions of the subsidiaries were common control transactions. An accounting policy has been established for these business combinations as IFRS is currently silent on the treatment of these transactions. Also refer to note 2 “Basis of consolidation” of the accounting policies.
The preparation of financial statements in conformity with IFRS requires the use of certain critical accounting estimates. It also requires management to exercise its judgement in the process of applying the Group’s accounting policies. The areas involving a higher degree of judgement or complexity, or areas where assumptions and estimates are significant to the consolidated financial statements are disclosed in note 2 to the consolidated annual financial statements.
8. LITIGATION STATEMENT Refer to note 29 (contingent liabilities) of the annual financial statements for detail on the status of the dispute with contract growers and broiler and breeder farms and a claim for early termination of a distribution agreement. No other litigation matters with potential material consequences exist at the reporting date.
DIRECTORS’ REPORTFOR THE YEAR ENDED 30 SEPTEMBER 2015 (CONTINUED)
9. EVENTS AFTER THE REPORTING PERIOD Other than the matters raised in note 38 to the consolidated financial statements, no other events occurred after the reporting date that may have a material effect on the Group.
10. AUDITORS PricewaterhouseCoopers Inc. will continue in office in accordance with section 90(6) of the Companies Act, Act 71 of 2008.

Annual financial statements 2015 1110 QUANTUM FOODS
The new standard is based on the principle that revenue is recognised when control of a good or service transfers to a customer – so the notion of control replaces the existing notion of risks and rewards.
Improvements to IFRS 2014 (effective 1 January 2016)This is a collection of amendments to IFRS. These amendments are the result of conclusions the IASB reached on proposals made in its annual improvements project for 2014. The annual improvements project provides a vehicle for making non-urgent, but necessary amendments to IFRS. Certain amendments resulted in consequential amendments to IFRS.
Impact of the above amendments on the Group’s financial statementsThe Group is in the process of assessing the impact of the above standards and interpretations on the Group’s financial statements.
2. BASIS OF CONSOLIDATIONSubsidiaries Subsidiaries are all entities (including structured entities) over which the Group has control. The Group controls an entity when the Group is exposed to, or has rights to, variable returns from its involvements with the entity and has the ability to affect those returns through its power over the entity.
Subsidiaries are fully consolidated from the date on which control is transferred to the Group and are deconsolidated from the date that control ceases.
The acquisition method of accounting is used to account for business combinations by the Group. The consideration transferred for the acquisition of a subsidiary is the fair values of the assets transferred, the liabilities incurred to the former owners of the acquiree and the equity interests issued by the Group.
Identifiable assets acquired and liabilities and contingent liabilities assumed in a business
combination are measured initially at their fair values at the acquisition date.
On an acquisition-by-acquisition basis, the Group recognises any non-controlling interest in the acquiree either at fair value or at the non-controlling interest’s proportionate share of the recognised amounts of the acquiree’s identifiable net assets.
If the business combination is achieved in stages, the acquisition date fair value of the acquirer’s previously held equity interest in the acquiree is remeasured to fair value at the acquisition date through profit or loss.
Any contingent consideration to be transferred by the Group is recognised at fair value at the acquisition date. Subsequent changes to the fair value of the contingent consideration that is deemed to be an asset or liability is recognised in accordance with IAS 39 – Financial Instruments: Recognition and Measurement either in profit or loss or as a charge to other comprehensive income. Contingent consider ation that is classified as equity is not remeasured, and its subsequent settlement is accounted for within equity.
The excess of the consideration transferred, the amount of any non-controlling interest in the acquiree and the acquisition-date fair value of any previous equity interest in the acquiree over the fair value of the identifiable net assets acquired is recorded as goodwill. If the total of consideration transferred, non-controlling interest recognised and previously held interest measured is less than the fair value of the net assets of the subsidiary acquired in the case of a bargain purchase, the difference is recognised directly in profit or loss.
Intercompany transactions, balances, income and expenses on transactions between Group companies are eliminated. Profits and losses resulting from intergroup transactions that are recognised in assets are also eliminated. Accounting policies of subsidiaries have been changed where necessary to ensure consistency with the policies adopted by the Group.
for making non-urgent, but necessary amendments to IFRS. Certain amendments resulted in consequential amendments to IFRS.
1.2 New and amended accounting standards and interpretations that are not yet effective and have not been early adopted by the GroupThe following standards, amendments and interpretations are not yet effective and have not been early adopted by the Group (the effective dates stated below refer to financial reporting periods beginning on or after the stated dates):
IFRS 9 – Financial Instruments (effective 1 January 2018)This standard addresses the classification, measurement and recognition of financial assets and financial liabilities. It replaces the parts of IAS 39 that related to the classification and measurement of financials instruments. IFRS 9 requires financial assets to be classified into two measurement categories: those measured as at fair value and those measured at amortised cost. The determination is made at initial recognition. The classification depends on the entity’s business model for managing its financial instruments and the contractual cash flow characteristics of the instrument. For financial liabilities, the standard retains most of the IAS 39 requirements.
The main change is that, in cases where the fair value option is taken for financial liabilities, the part of a fair value change due to an entity’s own credit risk is recorded in other comprehensive income rather than the income statement, unless this creates an accounting mismatch.
IFRS 15 – Revenue from contracts with customers (effective 1 January 2018)IFRS 15 establishes principles for reporting useful information to users of the financial statements about the nature, amount, timing and uncertainty of revenue and cash flows arising from an entity’s contracts with customers.
1. BASIS OF PREPARATION (CONTINUED)1.1 New and amended accounting standards
and interpretations effective in 2015The following standards, amendments and interpretations, have been adopted by the Group and became effective for the current reporting period beginning on 1 October 2014, which did not have a material impact on reported results:
Amendments to IAS 32 – Financial instruments: Presentation (effective 1 January 2014)The amendments require entities to disclose gross amounts subject to rights of set-off, amounts set off in accordance with the accounting standards followed, and the related net credit exposure. This information will help investors understand the extent to which an entity has applied set-off in its statement of financial position and the effects of rights of set-off on the entity’s rights and obligations.
Amendment to IAS 36 – Recoverable amount disclosures for non-financial assets (effective 1 January 2014)The IASB has made small changes to the disclosures required by IAS 36, Impairment of assets when the recoverable amount is determined based on the fair value less costs of disposal.
IFRS 13 – Fair Value Measurement, made consequential amendments to the disclosure requirements of IAS 36. One of the amendments was drafted more widely than intended. This limited scope amendment corrects this and introduces additional disclosures about fair value measurements when there has been impairment or a reversal of impairment.
Improvements to IFRS 2013 (effective 1 July 2014)This is a collection of amendments to IFRS. These amendments are the result of conclusions the IASB reached on proposals made in its annual improvements project for 2012. The annual improvements project provides a vehicle
ACCOUNTING POLICIESFOR THE YEAR ENDED 30 SEPTEMBER 2015 (CONTINUED)

Annual financial statements 2015 1312 QUANTUM FOODS
combination. No goodwill beyond that recorded by the controlling party in relation to the acquiree can therefore arise. Differences on consolidation are included in the common control reserve in equity.
3. PROPERTY, PLANT AND EQUIPMENTLand and buildings mainly comprises factories, farms, poultry houses, offices and silos. All property, plant and equipment is stated at historical cost less depreciation and impair-ments. Historical cost includes expenditure that is directly attributable to the acquisition of the items. Cost may also include transfers from equity of any gains or losses on qualifying cash flow hedges of foreign currency purchases of property, plant and equipment.
Subsequent costs are included in the asset’s carrying amount or recognised as a separate asset, as appropriate, only when it is probable that future economic benefits associated with the item will flow to the Group and the cost of the item can be measured reliably.
The carrying amount of any component accounted for as a separate asset is derecog-nised when replaced. All other repairs and maintenance are charged to profit or loss during the financial period in which it is incurred.
Land is not depreciated. Depreciation on buildings, poultry houses, machinery, vehicles, furniture and equipment is calculated on a straight-line basis at rates deemed appropriate to write off the cost of the assets to their residual values over their expected useful lives.
The expected useful lives are as follows:
• Buildings 10 – 25 years• Poultry houses 25 years• Plant, machinery
and equipment 3 – 30 years• Vehicles 3 – 20 years
The assets’ residual values and useful lives are reviewed, and adjusted if appropriate, at each reporting date.
An asset’s carrying amount is written down immediately to its recoverable amount if the asset’s carrying amount is greater than its estimated recoverable amount.
Gains and losses on disposals of property, plant and equipment are determined by comparing proceeds with the carrying amounts. These are included within “other gains/(losses) – net” in profit or loss.
4. INTANGIBLE ASSETSGoodwill Goodwill represents the excess of the cost of an acquisition over the fair value of the Group’s share of the net identifiable assets of the acquired entity at the date of the acquisition. Goodwill arising from business combinations is included in “intangible assets”.
Goodwill is tested annually for impairment and carried at cost less accumulated impairment losses. Impairment losses on goodwill are not reversed. Gains and losses on the disposal of an entity include the carrying amount of goodwill relating to the entity sold.
Goodwill is allocated to cash-generating units (“CGUs”) for the purpose of impairment testing. The allocation is made to those CGUs or groups of CGUs that are expected to benefit from the business combination in which the goodwill arose. The units or groups of units are identified at the lowest level at which goodwill is monitored for internal management purposes, being the operating segments.
Trademarks and intellectual property Trademarks and intellectual property are shown at historical cost. Subsequently these intangible assets are carried at cost less any accumulated amortisation and accumulated impairment losses. Intellectual property has finite useful lives, whereas trademarks either have finite or indefinite useful lives.
ACCOUNTING POLICIESFOR THE YEAR ENDED 30 SEPTEMBER 2015 (CONTINUED)
2. BASIS OF CONSOLIDATION (CONTINUED)Subsidiaries (continued)In the stand-alone financial statements of the holding Company, the investments in subsidiaries are accounted for at cost less impairment. Cost is adjusted to reflect changes in consideration arising from contingent consideration amendments. Cost also includes direct attributable costs of investments.
Interest-free loans to subsidiaries, with no specific terms of repayment and with a definite intent not to demand repayment, are considered to be capital distributions to the subsidiary and are included in the carrying amount of the investment.
AssociatesAssociates are all entities over which the Group has significant influence, but not control or joint control, generally accompanying a shareholding of between 20% and 50% of the voting rights. Investments in associates are accounted for using the equity method of accounting. Under the equity method, the investment is initially recognised at cost and the carrying amount is increased or decreased to recognise the investor’s share of the profit or loss of the investee after the date of acquisition. The Group’s investment in associates includes goodwill (net of any accumulated impairment loss) identified on acquisition.
If the ownership interest in an associate is reduced, but significant influence is retained, only a proportionate share of the amounts previously recognised in other comprehensive income is reclassified to profit or loss where appropriate.
The Group’s share of post-acquisition profit or loss is recognised in profit or loss, and its share of post-acquisition movements in other comprehensive income is recognised in other comprehensive income with a corresponding adjustment to the carrying amount of the investment. When the Group’s share of losses in an associate equals or exceeds its interest in the associate, including any other unsecured
receivables, the Group does not recognise further losses, unless it has incurred legal or constructive obligations or made payments on behalf of the associate.
The Group determines at each reporting date whether there is any objective evidence that the investment in the associate is impaired. If this is the case, the Group calculates the amount of impairment as the difference between the recoverable amount of the associate and its carrying value and recognises the amount as part of the “share of profit of investments accounted for using the equity method” in profit or loss.
Unrealised gains on transactions between the Group and its associates are eliminated to the extent of the Group’s interest in associates. Unrealised losses are eliminated unless the transaction provides evidence of an impairment of the asset transferred. Dilution gains and losses arising in investments in associates are recognised in profit or loss. Accounting policies of associates have been changed, where necessary, to ensure consistency with the policies adopted by the Group.
Common control reserveIFRS 3 excludes from its scope business combinations between entities under common control. The Group has made the policy choice to apply predecessor accounting.
The principles of predecessor accounting are that no assets or liabilities are restated to their fair values. The Group incorporates predecessor carrying values, which are the carrying amounts of assets and liabilities of the acquired entity from the consolidated financial statements of the highest entity that has common control for which consolidated financial statements are prepared. These amounts include any goodwill recorded at the consolidated level in respect of the acquired entity.
No new goodwill arises. The transaction is not seen as an equal exchange of values and a change of control from the date of the business
Annual financial statements 2015 1514 QUANTUM FOODS
as current assets if expected to be settled within 12 months; otherwise, they are classified as non-current.
Loans and receivablesLoans and receivables are non-derivative financial assets with fixed or determinable payments that are not quoted in an active market. They are included in current assets, except for maturities greater than 12 months after the reporting date. These are classified as non-current assets. The Group’s loans and receivables comprise ‘trade and other receivables’ and ‘cash and cash equivalents’ in the statement of financial position.
6.2 Recognition and measurementRegular purchases and sales of financial assets are recognised on the trade date, the date on which the Group commits to purchase or sell the asset. Financial assets are initially recognised at fair value plus transaction costs for all financial assets not carried at fair value through profit or loss. Financial assets carried at fair value through profit or loss are initially recognised at fair value and transaction costs are expensed in profit or loss.
Financial assets are derecognised when the rights to receive cash flows from the investments have expired or have been transferred and the Group has transferred substantially all risks and rewards of ownership. Loans and receivables are carried at amortised cost using the effective interest rate method.
Gains or losses arising from changes in the fair value of financial assets at fair value through profit or loss are included within “other gains/(losses) – net” in profit or loss in the period in which they arise.
The fair values of quoted investments are based on current bid prices. The Group establishes fair value by using valuation techniques if the market for a financial asset is not active and for unlisted securities. These include the use of recent arm’s length transactions, reference to
other instruments that are substantially the same, discounted cash flow analysis and option pricing models, making maximum use of market inputs and relying as little as possible on entity-specific inputs.
6.3 ImpairmentThe Group assesses at the end of each reporting period whether there is objective evidence that a financial asset or a group of financial assets is impaired. A financial asset or a group of financial assets is impaired and impairment losses are incurred only if there is objective evidence of impairment as a result of one or more events that occurred after the initial recognition of the asset (a “loss event”) and that loss event (or events) has an impact on the estimated future cash flows of the financial asset or group of financial assets that can be reliably estimated.
Loans and receivablesFor the loans and receivables category, the amount of the loss is measured as the difference between the asset’s carrying amount and the present value of estimated future cash flows (excluding future credit losses that have not been incurred) discounted at the financial asset’s original effective interest rate. The carrying amount of the asset is reduced and the amount of the loss is recognised in profit or loss. If a loan has a variable interest rate, the discount rate for measuring any impairment loss is the current effective interest rate determined under the contract. As a practical expedient, the Group may measure impairment on the basis of an instrument’s fair value using an observable market price.
If, in a subsequent period, the amount of the impairment loss decreases and the decrease can be related objectively to an event occurring after the impairment was recognised (such as an improvement in the debtor’s credit rating), the reversal of the previously recognised impairment loss is recognised in profit or loss.
Impairment testing on trade receivables is described in note 11 of the accounting policy.
ACCOUNTING POLICIESFOR THE YEAR ENDED 30 SEPTEMBER 2015 (CONTINUED)
4. INTANGIBLE ASSETS (CONTINUED)Trademarks and intellectual property (continued)Intellectual property and trademarks with finite useful lives are amortised over their useful lives of between 5 and 25 years and assessed for impairment when there is an indication that the assets may be impaired.
Computer software Acquired computer software licences are capitalised on the basis of the costs incurred to acquire and bring to use the specific software. These costs are amortised over their estimated useful lives of between two and five years.
Costs associated with maintaining computer software programmes are recognised as an expense as incurred.
Development costs that are directly attributable to the production of identifiable and unique software products controlled by the Group, and that will probably generate economic benefits exceeding costs beyond one year, are recog-nised as intangible assets when the following criteria are met:
• It is technically feasible to complete the software product so that it will be available for use.
• Management intends to complete the soft- ware product and use or sell it.
• There is an ability to use or sell the software product.
• It can be demonstrated how the software product will generate probable future economic benefits.
• Adequate technical, financial and other resources to complete the development and to use or sell the software product are available.
• The expenditure attributable to the software product during its development can be reliably measured.
Directly attributable costs that are capitalised as part of the software product include the
software development employee costs and an appropriate portion of relevant overheads. Other development expenditure that does not meet the criteria is recognised as an expense as incurred. Development costs previously recognised as an expense are not recognised as an asset in a subsequent period.
5. IMPAIRMENT OF NON-FINANCIAL ASSETSAn impairment loss is recognised for the amount by which the asset’s carrying amount exceeds its recoverable amount.
The recoverable amount is the higher of an asset’s fair value less costs to sell and value-in-use. For the purposes of assessing impairment, assets are grouped at the lowest levels for which there are separately identifiable cash flows (CGUs). Non-financial assets, other than goodwill, that have suffered impairment, are reviewed for possible reversal of the impairment at each reporting date.
6. FINANCIAL ASSETS6.1 Classification
The Group classifies its financial assets in the following categories:
• at fair value through profit or loss• loans and receivables
The classification depends on the purpose for which the financial assets were acquired. Management determines the classification of its financial assets at initial recognition.
Financial assets at fair value through profit or lossFinancial assets at fair value through profit or loss are financial assets held for trading. A financial asset is classified in this category if acquired principally for the purpose of selling in the short term. Derivatives are also categorised as held-for-trading unless they are designated as hedges. The Group’s financial instruments at fair value through profit or loss comprise ‘derivative financial instruments’ not earmarked for hedging. Assets in this category are classified
Annual financial statements 2015 1716 QUANTUM FOODS
or financial reorganisation, and default or delinquency in payments are considered indicators that the trade receivable is impaired.
The amount of the provision for impairment of trade receivables is the difference between the asset’s carrying amount and the present value of estimated future cash flows, discounted at the effective interest rate. The amount of the provision is recognised in profit or loss within “other operating expenses”. The carrying amount of the asset is reduced through the use of an allowance account. When trade receivables are uncollectible, they are written off as “other operating expenses” in profit or loss. Subsequent recoveries of amounts previously written off, are credited against “other operating expenses” in profit or loss.
12. CASH AND CASH EQUIVALENTSCash and cash equivalents include cash in hand, deposits held at call with banks and other short-term highly liquid investments.
Deposits held at call with banks and other short-term highly liquid investments are held for the purpose of meeting short-term cash commitments rather than for investment or other purposes. These deposits are readily convertible to known amounts of cash and subject to an insignificant risk of changes in value.
13. SHARE CAPITALOrdinary shares are classified as equity. Incremental costs directly attributable to the issue of new ordinary shares or options are shown in equity as a deduction, net of income tax, from the proceeds.
When any Group company purchases the Group’s equity share capital (treasury shares), the consideration paid, including any directly attributable incremental costs (net of income taxes), is deducted from equity attributable to the Group’s equity holders until the shares are cancelled, reissued or disposed of. Where such shares are subsequently sold or reissued, any consideration received, net of any directly
attributable incremental transaction costs and the related income tax effects, is included in equity attributable to owners of the parent.
Interest-bearing borrowings and net invested equity from Pioneer Foods were converted to share capital as part of the Pioneer Foods reorganisation on 1 October 2013.
14. BORROWINGSBorrowings are recognised initially at fair value, net of transaction costs incurred. Borrowings are subsequently carried at amortised cost. Any difference between the proceeds (net of transaction costs) and the redemption value is recognised in profit or loss over the period of the borrowings using the effective interest rate method. Borrowings are classified as current liabilities unless the Group has an unconditional right to defer settlement of the liability for at least 12 months after the year-end reporting date.
15. PROVISIONSProvisions are recognised when the Group has a present legal or constructive obligation as a result of past events, it is more likely than not that an outflow of resources will be required to settle the obligation and the amount has been reliably estimated. Restructuring provisions comprise employee termination payments. Provisions are not recognised for future operating losses.
Where there are a number of similar obligations, the likelihood that an outflow will be required in settlement is determined by considering the class of obligations as a whole. A provision is recognised even if the likelihood of an outflow with respect to any one item included in the same class of obligations may be small.
Provisions are measured at the present value of the expenditure expected to be required to settle the obligation using a pre-tax rate that reflects current market assessments of the time value of money and the risks specific to the obligation. The increase in the provision due to passage of time is recognised as “finance costs” in profit or loss.
ACCOUNTING POLICIESFOR THE YEAR ENDED 30 SEPTEMBER 2015 (CONTINUED)
7. OFFSETTING FINANCIAL INSTRUMENTSFinancial assets and liabilities are offset and the net amount reported in the statement of financial position when there is a legally enforceable right to offset the recognised amounts and there is an intention to settle on a net basis or realise the asset and settle the liability simultaneously.
8. NON-CURRENT ASSETS (OR DISPOSAL GROUPS) HELD FOR SALENon-current assets (or disposal groups) are classified as assets held for sale when their carrying amount is to be recovered principally through a sales transaction or distribution and a sale or distribution is considered highly probable. They are stated at the lower of carrying amount and fair value less costs to sell.
9. BIOLOGICAL ASSETSBiological assets consist of livestock. The presentation of biological assets as current or non-current assets depend on the nature of the biological assets. Livestock is a consumable asset and is presented as current assets. Biological assets of the Group includes biological assets held at contract growers as the Group retains ownership of these assets. Biological assets are measured on initial recognition and at the end of each reporting period at fair value less cost to sell. Changes in the measurement of fair value less cost to sell are included within “other gains/(losses) – net” in profit or loss for the period in which they arise.
All costs incurred in maintaining the assets are included within “cost of sales” in profit or loss for the period in which they arise. Fair values of livestock held for breeding, laying hens, broilers and hatching eggs are determined with reference to market prices of livestock of similar age, breed and genetic material.
Agricultural produce is the harvested product of the entity’s biological assets and is measured at its fair value less cost to sell at the point of harvest. Such measurement is the cost at that date when transferring the harvested produce
to inventory. Agricultural produce of the Group includes eggs from laying hens, hatching eggs from breeder hens and meat from broiler chickens.
10. INVENTORIESInventories are valued at the lower of cost or net realisable value. Cost in each category is determined as follows:
• Raw material at actual cost on a weighted average cost basis.
• Own manufactured products at direct raw material and labour cost plus an appropriate portion of production overheads, on a weighted average cost basis.
• Consumable and trading stock at actual cost on a weighted average cost basis.
• Eggs purchased and broilers are valued at actual cost on a weighted average cost basis.
The cost of finished goods and work in progress comprises raw materials, direct labour, other direct costs and related production overheads (based on normal operating capacity). It excludes borrowing costs. Net realisable value is the estimated selling price in the ordinary course of business, less applicable variable selling expenses. Costs of inventories include the transfer from equity of any gains or losses on qualifying cash flow hedges relating to purchases of raw materials.
11. TRADE RECEIVABLESTrade receivables are amounts due from customers for goods sold or services performed in the ordinary course of business.
Trade receivables are recognised initially at fair value and subsequently measured at amortised cost using the effective interest rate method, less provision for impairment. A provision for impairment of trade receivables is established when there is objective evidence that the Group will not be able to collect all amounts due according to the original terms of receivables. Significant financial difficulties of the debtor, probability that the debtor will enter bankruptcy

Annual financial statements 2015 1918 QUANTUM FOODS
considered to be reliably measurable until all contingencies relating to the sale have been resolved. The Group bases its estimates on historical results, taking into consideration the type of customer, the type of transaction and the specifics of each arrangement.
Income is recognised as follows:
Sale of goodsSale of goods is recognised when a Group entity has delivered products to the customer, the customer has accepted the products and the collectability of the related receivables is reasonably assured. No element of financing is deemed present as sales are made within credit terms which are consistent with market practice. The sale of goods is the only income included in “revenue” in profit or loss.
Sale of servicesSale of services is recognised in the accounting period in which the services are rendered, by reference to the completion of services provided as a proportion of the total services to be provided. The sale of services is included in “other income” in profit or loss. Sale of services includes rental income received.
Interest incomeInterest income is recognised on a time-proportion basis using the effective interest rate method. When loans or receivables are impaired, the Group reduces the carrying amount to its recoverable amount, being the estimated future cash flows discounted at the original effective interest rate of the instrument, and continues unwinding the discount as interest income. Interest income on impaired loans and receivables is recognised using the original effective interest rate. Interest income is included in “investment income” in profit or loss.
20. FOREIGN CURRENCY TRANSLATION Functional and presentation currency
Items included in the financial statements of each of the Group’s entities are measured using the currency of the primary economic environment in which that entity operates (“the functional
currency”). The consolidated financial statements are presented in South African rand, which is the Group’s functional and presentation currency.
Transactions and balancesTransactions in foreign currency are translated into the functional currency using the exchange rates prevailing at the transaction dates. Foreign exchange gains and losses resulting from the settlement of such transactions and from the translation of monetary assets and liabilities denominated in foreign currencies at year end exchange rates are recognised in profit or loss, except when deferred in other comprehensive income as qualifying cash flow hedges and qualifying net investment hedges.
All other foreign exchange gains and losses are presented in profit or loss within “other gains and losses – net”.
Non-monetary items that are measured at fair value in a foreign currency are translated using the exchange rates at the date when the fair value is determined.
Translation differences resulting from changes in amortised cost are recognised in profit or loss, and other changes in the carrying amount are recognised in other comprehensive income.
Translation differences on non-monetary finan-cial assets and liabilities, such as equities held at fair value through profit or loss, are recognised in profit or loss as part of the “fair value gain or loss”.
Group entitiesThe results and financial position of all the Group entities (none of which has the currency of a hyperinflationary economy) that have a functional currency different from the presentation currency of South African rand are translated into South African rand as follows:
• Assets and liabilities for each statement of financial position presented (including comparatives) are translated at the closing rate at the reporting date.
ACCOUNTING POLICIESFOR THE YEAR ENDED 30 SEPTEMBER 2015 (CONTINUED)
16. TRADE PAYABLESTrade payables are obligations to pay for goods or services that have been acquired in the ordinary course of business from suppliers. Trade payables are recognised initially at fair value and subsequently measured at amortised cost using the effective interest rate method.
17. CURRENT AND DEFERRED INCOME TAXThe income tax expense or credit for the period comprises current and deferred income tax. Income tax is recognised in profit or loss, except to the extent that it relates to items recognised in other comprehensive income or directly in equity.
The current income tax expense is calculated on the basis of the tax laws enacted or substantively enacted at the reporting date in the countries where the Group’s subsidiaries and associates operate and generate taxable income. Management periodically evaluates positions taken in tax returns with respect to situations in which applicable tax regulations are subject to interpretation and establishes provisions, where appropriate, on the basis of amounts expected to be paid to the tax authorities.
Deferred income tax is provided in full, using the liability method, for all temporary differences arising between the tax bases of assets and liabilities and their carrying values. However, deferred income tax is not accounted for if it arises from initial recognition of an asset or liability in a transaction other than a business combination that, at the time of the transaction, affects neither accounting profit or loss nor taxable profit or loss. Deferred income tax is determined using tax rates (and laws) that have been enacted or substantively enacted by the reporting date and are expected to apply when the related deferred income tax asset is realised or the deferred income tax liability is settled.
Deferred income tax assets are recognised to the extent that it is probable that future taxable profits will be available against which the unused losses can be utilised.
Deferred income tax is provided on temporary differences arising on investments in subsi-diaries and associates, except where the Group controls the timing of the reversal of the temporary difference and it is probable that the temporary difference will not reverse in the foreseeable future.
Deferred income tax assets and liabilities are offset when there is a legally enforceable right to offset current tax assets against current tax liabilities and when the deferred income tax assets and liabilities relate to income taxes levied by the same taxation authority. Current tax assets and liabilities are offset where the entity has a legally enforceable right to offset and intends either to settle on a net basis, or to realise the asset and settle the liability simultaneously.
18. DIVIDEND WITHHOLDING TAXDividend withholding tax (“DWT”) became effective from 1 April 2012. Dividends are taxed at 15% in the hands of certain recipients of the dividends, rather than in the hands of the declarer of the dividend. As such, for dividends declared and paid by the Group after 1 April 2012, the Group does not recognise tax on dividends declared.
Where the Group has incurred DWT on dividends received, the tax is included in the “income tax expense” line in profit or loss.
19. REVENUE RECOGNITIONRevenue comprises the fair value of the consideration received or receivable for the sale of goods and services in the ordinary course of the Group’s activities. Revenue is shown, net of value-added tax, estimated returns, rebates and discounts and after elimination of sales within the Group.
The Group recognises revenue when the amount of revenue can be reliably measured, it is probable that future economic benefits will flow to the entity and when specific criteria have been met for each of the Group’s activities as described below. The amount of revenue is not

Annual financial statements 2015 2120 QUANTUM FOODS
grant of share appreciation rights is recognised as an expense. The total amount to be expensed over the vesting period is determined by reference to the fair value of the share appreciation rights granted, excluding the impact of any non-market vesting conditions (for example, profitability and sales growth targets). Non-market vesting conditions are included in assumptions about the number of share appreciation rights that are expected to become exercisable. At each reporting date, the Group revises its estimates of the number of share appreciation rights that are expected to become exercisable. It recognises the impact of the revision of original estimates, if any, in profit or loss, with a corresponding adjustment to other comprehensive income. Benefits falling due more than 12 months after the year-end reporting date are discounted to present value using the effective interest rate method.
The proceeds received, net of any directly attributable transaction costs, are credited to share capital when the share appreciation rights are exercised.
25. DERIVATIVE FINANCIAL INSTRUMENTS AND HEDGING ACTIVITIESDerivatives are initially recognised at fair value on the date a derivative contract is entered into and are subsequently remeasured at their fair value. The method of recognising the resulting gain or loss depends on whether the derivative is designated as a hedging instrument, and if so, the nature of the item being hedged. The Group designates certain derivatives as either cash flow or fair value hedges.
The Group documents at the inception of the transaction the relationship between hedging instruments and hedged items, as well as its risk management objectives and strategy for undertaking various hedge transactions. The Group also documents its assessment, both at hedge inception and on an ongoing basis, of whether the derivatives that are used in hedging transactions are highly effective in offsetting changes in fair values or cash flows of hedged items.
Termination benefitsTermination benefits are payable when employment is terminated before the normal retirement date, or whenever an employee accepts voluntary redundancy in exchange for these benefits.
The Group recognises termination benefits at the earlier of the following dates: (a) when the Group can no longer withdraw the offer of those benefits; and (b) when the entity recognises costs for a restructuring that is within the scope of IAS 37 and involves the payment of termination benefits. In case of an offer made to encourage voluntary redundancy, the termination benefits are measured based on the number of employees expected to accept the offer.
Benefits falling due more than 12 months after the year-end reporting date are discounted to present value using the effective interest rate method.
Bonus plansThe Group recognises a liability and an expense for bonuses based on a formula that takes into consideration the profit attributable to the Group’s shareholders after certain adjustments. The Group recognises a provision when contractually obliged or when there is a past practice that has created a constructive obligation.
Leave payAnnual leave entitlement is provided for over the period that the leave accrues. In terms of the Group’s policy, employees are entitled to accumulate vested leave benefits not taken to a cap of 36 days. Any leave days vesting in excess of the cap are forfeited in the vesting month.
Leave may not be converted to cash except at termination of employment.
24. SHARE-BASED PAYMENTSThe Group operates an equity-settled, share-based compensation plan. The fair value of the employee services received in exchange for the
22. ACCOUNTING FOR LEASES: GROUP COMPANY IS THE LESSOROperating leasesOperating lease assets are included in property, plant and equipment in the statement of financial position. These assets are depreciated over their expected useful lives on a basis consistent with similar property, plant and equipment. Rental income is recognised on a straight-line basis over the period of the lease and included in “other income” in profit or loss.
23. EMPLOYEE BENEFITS Retirement scheme arrangements
The policy of the Group is to provide retirement benefits for all its employees in the form of a defined contribution plan. A defined contribution plan is a retirement scheme under which the Group pays fixed contributions to a separate entity. The Group has no legal or constructive obligation to pay further contributions if the fund does not hold sufficient assets to pay all employees the retirement benefits relating to employee service in the current and prior periods.
For defined contribution plans, the Group pays contributions to publicly or privately admin-istered retirement schemes on a mandatory, contractual or voluntary basis. The contributions are recognised as an employee benefit expense when they are due. Prepaid contributions are recognised as an asset to the extent that a cash refund or a reduction in the future payments is available.
Other long-term employee benefitsThe Group provides for long-service awards that accrue to employees. Independent actuaries calculate the liability recognised in the statement of financial position in respect of long-service awards. Actuarial gains and losses arising from experience adjustments and changes in actuarial assumptions are recognised within “other operating expenses” in profit or loss.
20. FOREIGN CURRENCY TRANSLATION (CONTINUED)Group entities (continued)• Income and expenditure included in profit or
loss for each statement of comprehensive income are translated at average exchange rates (unless this average is not a reasonable approximation of the cumulative effect of the rates prevailing on the transaction dates, in which case income and expenditure are translated at the exchange rates prevailing at the dates of the transactions).
• All resulting exchange differences are recognised as a separate component of other comprehensive income.
Exchange differences arising from the translation of the net investment in foreign entities, and other currency instruments designated as hedges of such investments, are taken to other comprehensive income. When a foreign operation is partially disposed of or sold, such exchange differences are recognised in profit or loss as part of the gain or loss on disposal.
Goodwill and fair value adjustments arising on the acquisition of a foreign entity are treated as assets and liabilities of the foreign entity and translated at the closing rate.
21. ACCOUNTING FOR LEASES: GROUP COMPANY IS THE LESSEE
Operating leasesLeases of assets in which a significant portion of the risks and rewards of ownership are effectively retained by the lessor, are classified as operating leases. Payments made under operating leases (net of any incentive received from the lessor) are charged to profit or loss on a straight-line basis over the period of the lease.
When an operating lease is terminated before the lease period has expired, any payment required to be made to the lessor by way of penalty, is recognised as an expense in the period in which termination takes place.
ACCOUNTING POLICIESFOR THE YEAR ENDED 30 SEPTEMBER 2015 (CONTINUED)
Annual financial statements 2015 2322 QUANTUM FOODS
25. DERIVATIVE FINANCIAL INSTRUMENTS AND HEDGING ACTIVITIES (CONTINUED)The fair values of various derivative instruments used for hedging purposes and detail on movements in the hedging reserve are disclosed in note 10 to the consolidated annual financial statements. The fair value of a hedging derivative is classified as a non-current asset or liability if the remaining maturity of the hedged item is more than 12 months after the reporting date and as a current asset or liability if the remaining maturity of the hedged item is less than 12 months from this date. Trading derivatives are classified as current assets or liabilities.
Fair value hedgesFair value hedges cover the exposure to changes in the fair value of a recognised asset or liability, or an unrecognised firm commitment (except for foreign currency risk). Foreign currency risk of an unrecognised firm commitment is accounted for as a cash flow hedge.
The Group only applies fair value hedge accounting to hedge commodity price risk, i.e. changes in the fair value of fixed-price com-modity purchase commitments, due to changes in the forward price in the market of the related commodity. Financial instruments designated as fair value hedges include commodity futures and foreign exchange contracts.
Changes in the fair value of derivatives that are designated and qualify as fair value hedges are recorded in profit or loss, together with any changes in the fair value of the hedged asset or liability that are attributable to the hedged risk.
If the hedge no longer meets the criteria for hedge accounting, the adjustment to the carrying amount of a hedged item, for which the effective interest rate method is used, is amortised in profit or loss over the period of maturity.
equity and is recognised in profit or loss when the forecast transaction is ultimately recognised in profit or loss. When a forecast transaction is no longer expected to occur, the cumulative gain or loss that was reported in equity is transferred immediately to “other gains or losses – net” in profit or loss.
Derivatives that do not qualify for hedge accountingCertain derivative instruments do not qualify for hedge accounting. Changes in the fair value of any derivative instruments that do not qualify for hedge accounting are recognised immediately in profit or loss within “other gains or losses – net”.
26. DIVIDEND DISTRIBUTIONDividend distributions to the Group’s shareholders are recognised as a liability in the Group’s financial statements in the period in which the dividends are approved by the board of directors.
27. SEGMENT REPORTINGAn operating segment is a component of the Group that engages in business activities which may earn revenues and incur expenses and whose operating results are regularly reviewed by the Group’s chief operating decision-maker
Cash flow hedgesCash flow hedges cover the exposure to variability in cash flows that are attributable to a particular risk associated with:
• a recognised asset or liability; or• a highly probable forecast transaction; or• the foreign currency risk in an unrecognised
firm commitment.
Cash flow hedging instruments are mainly used to manage operational exposure to foreign exchange and commodity price risks. Financial instruments designated as cash flow hedges include commodity futures and foreign exchange contracts.
The effective portion of changes in the fair value of derivatives that are designated and qualify as cash flow hedges is recognised in other comprehensive income. The gain or loss relating to the ineffective portion is recognised imme-diately within “other gains or losses – net” in profit or loss.
Amounts accumulated in other comprehensive income are recycled to profit or loss in the periods when the hedged item will affect profit or loss. However, when the forecast transaction that is hedged, results in the recognition of a non-financial asset or liability, the gains and losses previously deferred in equity are transferred from equity and included in the initial measurement of the cost of the asset or liability. The deferred amounts are ultimately recognised in “cost of goods sold” in profit or loss (in the case of inventory) or in “depreciation” in profit or loss (in the case of property, plant and equipment).
When a hedging instrument expires or is sold or terminated, or when a hedge no longer meets the criteria for hedge accounting, any cumulative gain or loss in equity at that time remains in
(“CODM”), this being the chief executive officer and financial director of the Group, in order to allocate resources and assess performance and for which distinct financial information is available.
Operating segments are reported in a manner consistent with the internal reporting provided to the chief operating decision-maker. The operating segments were identified and grouped together based mainly on the nature of their activities and the products offered by them.
28. AMORTISED COSTSFinance costs and investment income are recognised on a time-proportion basis using the effective interest rate method. When determining the amortised cost amount of financial assets and liabilities, the Group reduces the carrying amount to the amount recoverable or payable, being the estimated future cash flows discounted at the original effective interest rate of the instrument, and continues unwinding the discount as accretions of discount. These accretions or unwinding of discount on financial assets and liabilities carried at amortised cost are included in “finance costs” or “investment income” in profit or loss.
ACCOUNTING POLICIESFOR THE YEAR ENDED 30 SEPTEMBER 2015 (CONTINUED)

Annual financial statements 2015 2524 QUANTUM FOODS
STATEMENT OF COMPREHENSIVE INCOMEFOR THE YEAR ENDED 30 SEPTEMBER 2015
Notes2015
R’000 2014
R’000
Revenue 3 468 312 3 560 943 Cost of sales (2 864 073) (2 982 629)Gross profit 604 239 578 314 Other income 18 11 639 14 450 Other gains/(losses) – net 19 238 482 74 767 Sales and distribution costs (193 631) (261 203)Marketing costs (11 287) (9 080)Administrative expenses (96 168) (95 284)Other operating expenses (389 212) (322 823)Operating profit/(loss) 20 164 062 (20 859)
Investment income 21 9 886 5 899 Finance costs 22 (1 887) (4 974)Share of profit of associate company 6 619 595 Profit/(loss) before income tax 172 680 (19 339)Income tax (expense)/credit 23 (45 764) 10 852 Profit/(loss) for the year 126 916 (8 487)
Other comprehensive income/(loss) for the yearItemsthatmaysubsequentlybereclassifiedtoprofitorloss:Fair value adjustments to cash flow hedging reserve 796 238
For the year 16 851 331 Deferred income tax effect – (93)Current income tax effect (4 718) –
Realised to profit or loss (15 747) –Deferred income tax effect 93 –Current income tax effect 4 317 –
Movement on foreign currency translation reserve Currency translation differences (75 513) (19 927)
Total comprehensive income/(loss) for the year 52 199 (28 176)
Profit/(loss) for the year attributable to owners of the parent 126 916 (8 487)
Total comprehensive income/(loss) for the year attributable to owners of the parent 52 199 (28 176)
Earnings/(loss) per ordinary share (cents) 24 54 (4)
Diluted earnings/(loss) per ordinary share (cents) 24 54 (4)
STATEMENT OF FINANCIAL POSITIONAS AT 30 SEPTEMBER 2015
Notes2015
R’000 2014
R’000
ASSETSNon-current assets 945 625 1 061 357 Property, plant and equipment 3 923 322 1 045 078 Intangible assets 4 12 784 7 116 Investment in associate 6 6 731 6 112 Deferred income tax 15 2 788 3 051
Current assets 1 053 062 985 291 Inventories 7 234 566 232 544 Biological assets 8 288 775 292 372 Trade and other receivables 9 334 794 353 863 Derivative financial instruments 10 7 424 991 Cash and cash equivalents 11 187 503 105 521
Assets held for sale 37 83 399 –
Total assets 2 082 086 2 046 648
EQUITY AND LIABILITIESCapital and reserves attributable to owners of the parent 1 514 567 1 461 224 Share capital 12 1 585 386 1 585 386 Other reserves 14 (228 968) (155 395)Retained earnings 158 149 31 233
Total equity 1 514 567 1 461 224
Non-current liabilities 220 747 195 922 Deferred income tax 15 214 258 189 577 Provisions for other liabilities and charges 16 6 489 6 345
Current liabilities 346 772 389 502 Trade and other payables 17 343 890 388 037 Current income tax 27 2 882 1 465
Total liabilities 567 519 585 424
Total equity and liabilities 2 082 086 2 046 648
Annual financial statements 2015 2726 QUANTUM FOODS
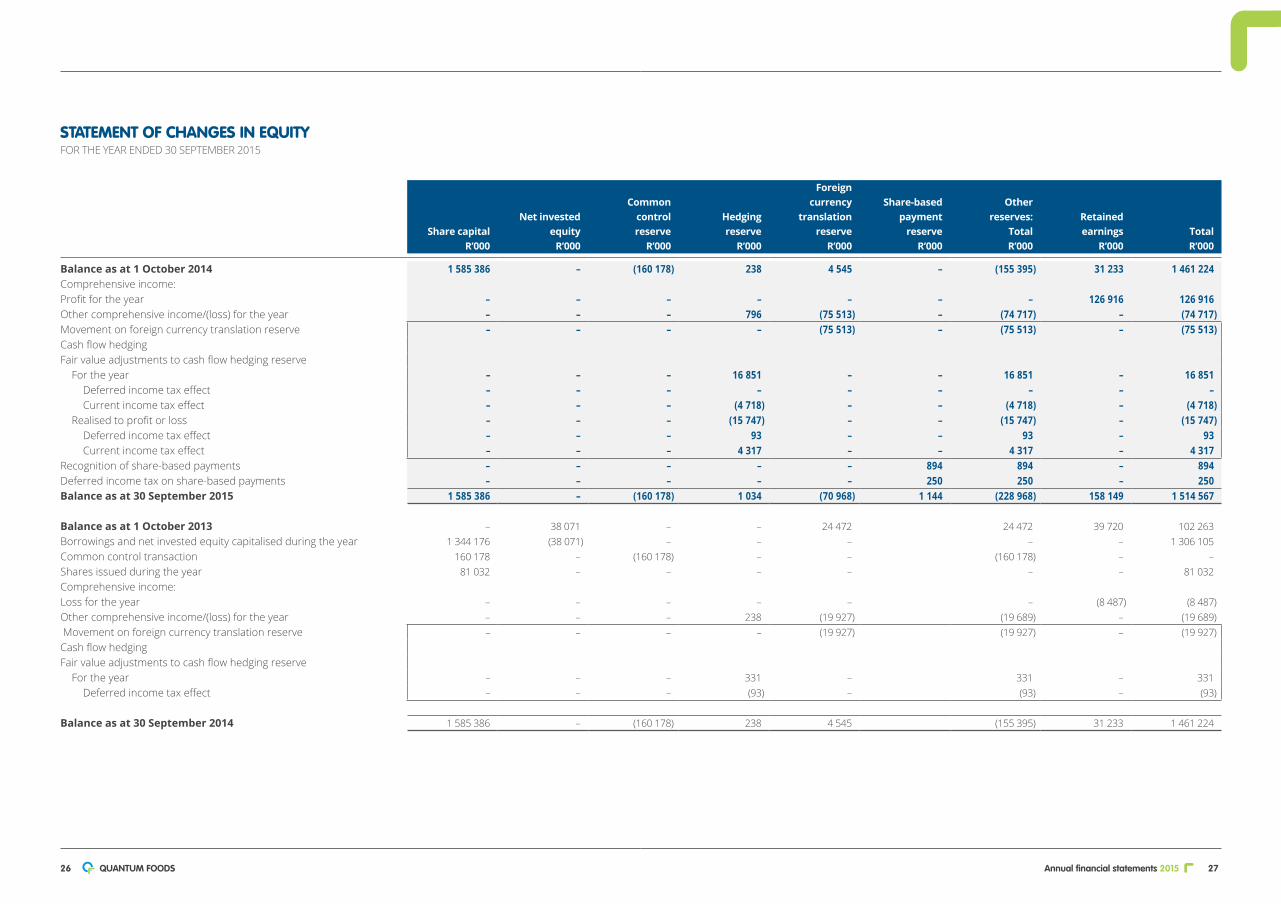
STATEMENT OF CHANGES IN EQUITYFOR THE YEAR ENDED 30 SEPTEMBER 2015
Share capitalR’000
Net investedequity R’000
Common control
reserve R’000
Hedgingreserve
R’000
Foreign currency
translationreserve
R’000
Share-basedpayment
reserve R’000
Other reserves:
TotalR’000
Retained earnings
R’000TotalR’000
Balance as at 1 October 2014 1 585 386 – (160 178) 238 4 545 – (155 395) 31 233 1 461 224 Comprehensive income:Profit for the year – – – – – – – 126 916 126 916 Other comprehensive income/(loss) for the year – – – 796 (75 513) – (74 717) – (74 717)Movement on foreign currency translation reserve – – – – (75 513) – (75 513) – (75 513)Cash flow hedgingFair value adjustments to cash flow hedging reserve
For the year – – – 16 851 – – 16 851 – 16 851 Deferred income tax effect – – – – – – – – –Current income tax effect – – – (4 718) – – (4 718) – (4 718)
Realised to profit or loss – – – (15 747) – – (15 747) – (15 747)Deferred income tax effect – – – 93 – – 93 – 93 Current income tax effect – – – 4 317 – – 4 317 – 4 317
Recognition of share-based payments – – – – – 894 894 – 894 Deferred income tax on share-based payments – – – – – 250 250 – 250 Balance as at 30 September 2015 1 585 386 – (160 178) 1 034 (70 968) 1 144 (228 968) 158 149 1 514 567
Balance as at 1 October 2013 – 38 071 – – 24 472 24 472 39 720 102 263 Borrowings and net invested equity capitalised during the year 1 344 176 (38 071) – – – – – 1 306 105 Common control transaction 160 178 – (160 178) – – (160 178) – –Shares issued during the year 81 032 – – – – – – 81 032 Comprehensive income:Loss for the year – – – – – – (8 487) (8 487)Other comprehensive income/(loss) for the year – – – 238 (19 927) (19 689) – (19 689) Movement on foreign currency translation reserve – – – – (19 927) (19 927) – (19 927)Cash flow hedgingFair value adjustments to cash flow hedging reserve
For the year – – – 331 – 331 – 331 Deferred income tax effect – – – (93) – (93) – (93)
Balance as at 30 September 2014 1 585 386 – (160 178) 238 4 545 (155 395) 31 233 1 461 224

Annual financial statements 2015 2928 QUANTUM FOODS
1. ACCOUNTING POLICIESThe principal accounting policies incorporated in the preparation of these historical financial information are set out on pages 9 to 23.
2. CRITICAL ACCOUNTING ESTIMATES AND JUDGEMENTSEstimates and judgements are continually evaluated and are based on historical experience and other factors, including expectations of future events that are believed to be reasonable under the circumstances. The Group makes estimates and judgements concerning the future. The resulting accounting estimates will, by definition, seldom equal the related actual results. The estimates and judgements that have a significant risk of causing a material adjustment to the carrying amounts of assets and liabilities within the next financial year are discussed below.
Property, plant and equipmentThese items are depreciated over their useful lives, taking into account the residual value at the end of the item’s useful life. Residual values and useful lives are based on industry knowledge and past experience with similar assets.
The Group continuously considers the existence of impairment indicators. An impairment loss is only recognised if the asset’s or cash generating unit (“CGU”) carrying amount exceeds its respective recoverable amount. The recoverable amount of an asset or CGU is the higher of its value-in-use or fair value less costs to sell. These calculations require the use of estimates.
Fair value measurement of biological assetsIn measuring fair value of biological assets, management estimates and judgements are required for determination of fair value. Refer to note 33 for key assumptions used.
Assessment of control over contract growersThe Group utilises contract growers for the growing of broilers in exchange for a fee. Goods delivered to contract growers are not recognised as revenue as the Group retains ownership of the goods. These goods are recognised as biological assets and inventories held at third parties.
The Group assesses whether it exercises control over contract growers based on an analysis of the activities of these entities, the Group’s decision-making powers, its ability to obtain benefits from these entities and the residual risks regarding these entities that are retained by the Group. Based on this analysis the Group concluded that it does not control the activities of any contract grower.
NOTES TO THE CONSOLIDATED FINANCIAL STATEMENTS FOR THE YEAR ENDED 30 SEPTEMBER 2015
Notes2015
R’000 2014
R’000
NET CASH FLOW FROM OPERATING ACTIVITIES 163 819 41 946 Net cash profit from operating activities 25 232 127 70 945 Working capital changes 26 (53 630) (27 649)Cash effect of hedging activities 1 104 –Net cash generated from operations 179 601 43 296 Income tax paid 27 (15 782) (1 350)
NET CASH FLOW FROM INVESTING ACTIVITIES (62 031) (35 359)Additions to property, plant and equipment 3 (58 323) (37 364)Additions to intangible assets 4 (5 389) (7 188)Proceeds on disposal of property, plant and equipment 28 9 295 3 294 Business combination 36 (17 500) –Interest received 21 9 886 5 899
Net cash surplus 101 788 6 587
NET CASH FLOW FROM FINANCING ACTIVITIES (1 370) 76 752 Proceeds from issue of ordinary shares – 81 032 Interest paid (1 370) (4 280)
Net increase in cash and cash equivalents 100 418 83 339 Effects of exchange rate changes (18 436) (2 038)Net cash and cash equivalents at beginning of year 105 521 24 220
Net cash and cash equivalents at end of year 11 187 503 105 521
STATEMENT OF CASH FLOWS FOR THE YEAR ENDED 30 SEPTEMBER 2015
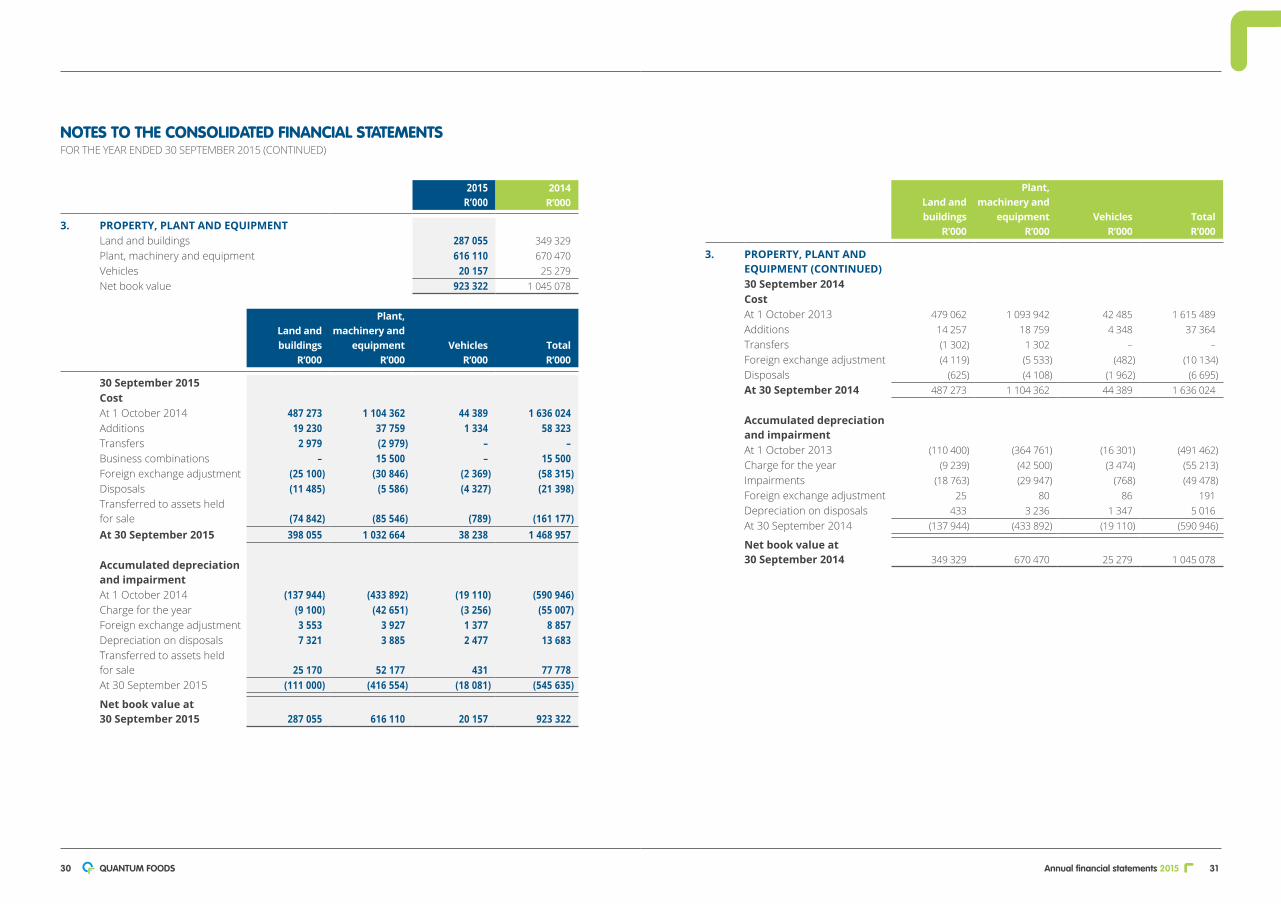
Annual financial statements 2015 3130 QUANTUM FOODS
Land and buildings
R’000
Plant, machinery and
equipment R’000
Vehicles R’000
Total R’000
3. PROPERTY, PLANT AND EQUIPMENT (CONTINUED)30 September 2014CostAt 1 October 2013 479 062 1 093 942 42 485 1 615 489 Additions 14 257 18 759 4 348 37 364 Transfers (1 302) 1 302 – –Foreign exchange adjustment (4 119) (5 533) (482) (10 134)Disposals (625) (4 108) (1 962) (6 695)At 30 September 2014 487 273 1 104 362 44 389 1 636 024
Accumulated depreciation and impairmentAt 1 October 2013 (110 400) (364 761) (16 301) (491 462)Charge for the year (9 239) (42 500) (3 474) (55 213)Impairments (18 763) (29 947) (768) (49 478)Foreign exchange adjustment 25 80 86 191 Depreciation on disposals 433 3 236 1 347 5 016 At 30 September 2014 (137 944) (433 892) (19 110) (590 946)
Net book value at 30 September 2014 349 329 670 470 25 279 1 045 078
2015 R’000
2014 R’000
3. PROPERTY, PLANT AND EQUIPMENTLand and buildings 287 055 349 329 Plant, machinery and equipment 616 110 670 470 Vehicles 20 157 25 279 Net book value 923 322 1 045 078
Land and buildings
R’000
Plant, machinery and
equipment R’000
Vehicles R’000
Total R’000
30 September 2015CostAt 1 October 2014 487 273 1 104 362 44 389 1 636 024 Additions 19 230 37 759 1 334 58 323 Transfers 2 979 (2 979) – –Business combinations – 15 500 – 15 500 Foreign exchange adjustment (25 100) (30 846) (2 369) (58 315)Disposals (11 485) (5 586) (4 327) (21 398)Transferred to assets held for sale (74 842) (85 546) (789) (161 177)At 30 September 2015 398 055 1 032 664 38 238 1 468 957
Accumulated depreciation and impairmentAt 1 October 2014 (137 944) (433 892) (19 110) (590 946)Charge for the year (9 100) (42 651) (3 256) (55 007)Foreign exchange adjustment 3 553 3 927 1 377 8 857 Depreciation on disposals 7 321 3 885 2 477 13 683 Transferred to assets held for sale 25 170 52 177 431 77 778 At 30 September 2015 (111 000) (416 554) (18 081) (545 635)
Net book value at 30 September 2015 287 055 616 110 20 157 923 322
NOTES TO THE CONSOLIDATED FINANCIAL STATEMENTS FOR THE YEAR ENDED 30 SEPTEMBER 2015 (CONTINUED)

Annual financial statements 2015 3332 QUANTUM FOODS
2015 R’000
2014 R’000
4. INTANGIBLE ASSETSComputer software 11 369 7 116 Goodwill – –Trademarks 1 415 –Net book value 12 784 7 116
ComputerSoftware
R’000 Goodwill
R’000 Trademarks
R’000 Total
R’000
30 September 2015CostAt 1 October 2014 8 441 76 944 23 000 108 385 Additions 5 389 – – 5 389 Business combinations – – 1 544 1 544 At 30 September 2015 13 830 76 944 24 544 115 318
Accumulated depreciation and impairmentAt 1 October 2014 (1 325) (76 944) (23 000) (101 269)Charge for the year (1 136) – (129) (1 265)At 30 September 2015 (2 461) (76 944) (23 129) (102 534)
Net book value at 30 September 2015 11 369 – 1 415 12 784
Computersoftware
R’000 Goodwill
R’000 Trademarks
R’000 Total
R’000
30 September 2014CostAt 1 October 2013 1 253 76 944 23 000 101 197 Additions 7 188 – – 7 188 At 30 September 2014 8 441 76 944 23 000 108 385
Accumulated depreciation and impairmentAt 1 October 2013 (1 194) (76 944) (23 000) (101 138)Charge for the year (131) – – (131)At 30 September 2014 (1 325) (76 944) (23 000) (101 269)
Net book value at 30 September 2014 7 116 – – 7 116
2015 R’000
2014 R’000
3. PROPERTY, PLANT AND EQUIPMENT (CONTINUED)The property, plant and equipment balance includes assets in the course of construction amounting to: 26 490 3 564
Land and buildings with a cost price of R215 million (2014: R392 million) are in the process of being transferred and are not yet registered in the name of the Group. This relates mainly to the property still in process of being transferred to Quantum Foods (Pty) Ltd, as part of the restructuring and unbundling from Pioneer Foods on 6 October 2014.
A register with full details of assets is available at the Group’s registered office.
Impairment losses on property, plant and equipment where impairment indicators existThese losses are impairment losses other than those resulting from the impairment of goodwill assigned to a CGU and tested annually for impairment.
The Group continuously considers the existence of impairment indicators relating to items of property, plant and equipment and CGUs. For assets or CGUs where such impairment indicators exist the Group performs impairment tests by comparing the asset’s or CGU’s carrying amount to its respective recoverable amount. An impairment loss is only recognised if the asset’s or CGU’s carrying amount exceeds its respective recoverable amount.
Impairmentindicatorsidentifiedresultedinthefollowingimpairmentlosses being recognised in the previous reporting periodThe carrying values of property, plant and equipment were impaired as follows based on the calculation performed:Broiler businessProperty, plant and equipment – 49 478 Total impairment – 49 478
No impairment was recognised during the current reporting period.
NOTES TO THE CONSOLIDATED FINANCIAL STATEMENTS FOR THE YEAR ENDED 30 SEPTEMBER 2015 (CONTINUED)
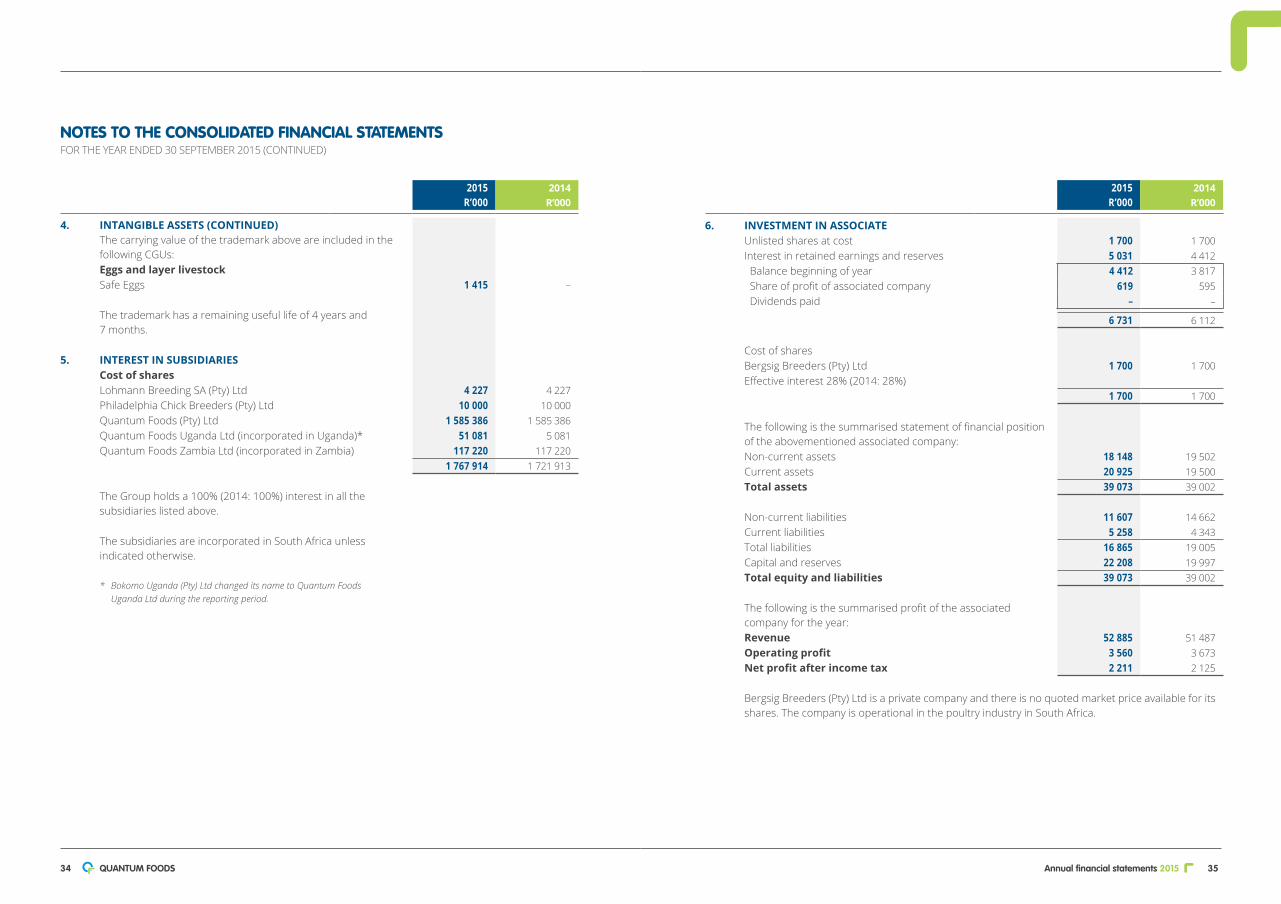
Annual financial statements 2015 3534 QUANTUM FOODS
2015 R’000
2014 R’000
6. INVESTMENT IN ASSOCIATEUnlisted shares at cost 1 700 1 700 Interest in retained earnings and reserves 5 031 4 412 Balance beginning of year 4 412 3 817 Share of profit of associated company 619 595 Dividends paid – –
6 731 6 112
Cost of sharesBergsig Breeders (Pty) Ltd 1 700 1 700 Effective interest 28% (2014: 28%)
1 700 1 700
The following is the summarised statement of financial position of the abovementioned associated company:Non-current assets 18 148 19 502 Current assets 20 925 19 500 Total assets 39 073 39 002
Non-current liabilities 11 607 14 662 Current liabilities 5 258 4 343 Total liabilities 16 865 19 005 Capital and reserves 22 208 19 997 Total equity and liabilities 39 073 39 002
The following is the summarised profit of the associated company for the year:Revenue 52 885 51 487 Operating profit 3 560 3 673 Net profit after income tax 2 211 2 125
Bergsig Breeders (Pty) Ltd is a private company and there is no quoted market price available for its shares. The company is operational in the poultry industry in South Africa.
2015 R’000
2014 R’000
4. INTANGIBLE ASSETS (CONTINUED)The carrying value of the trademark above are included in the following CGUs:Eggs and layer livestockSafe Eggs 1 415 –
The trademark has a remaining useful life of 4 years and 7 months.
5. INTEREST IN SUBSIDIARIESCost of sharesLohmann Breeding SA (Pty) Ltd 4 227 4 227 Philadelphia Chick Breeders (Pty) Ltd 10 000 10 000 Quantum Foods (Pty) Ltd 1 585 386 1 585 386 Quantum Foods Uganda Ltd (incorporated in Uganda)* 51 081 5 081 Quantum Foods Zambia Ltd (incorporated in Zambia) 117 220 117 220
1 767 914 1 721 913
The Group holds a 100% (2014: 100%) interest in all the subsidiaries listed above.
The subsidiaries are incorporated in South Africa unless indicated otherwise.
* Bokomo Uganda (Pty) Ltd changed its name to Quantum Foods Uganda Ltd during the reporting period.
NOTES TO THE CONSOLIDATED FINANCIAL STATEMENTS FOR THE YEAR ENDED 30 SEPTEMBER 2015 (CONTINUED)
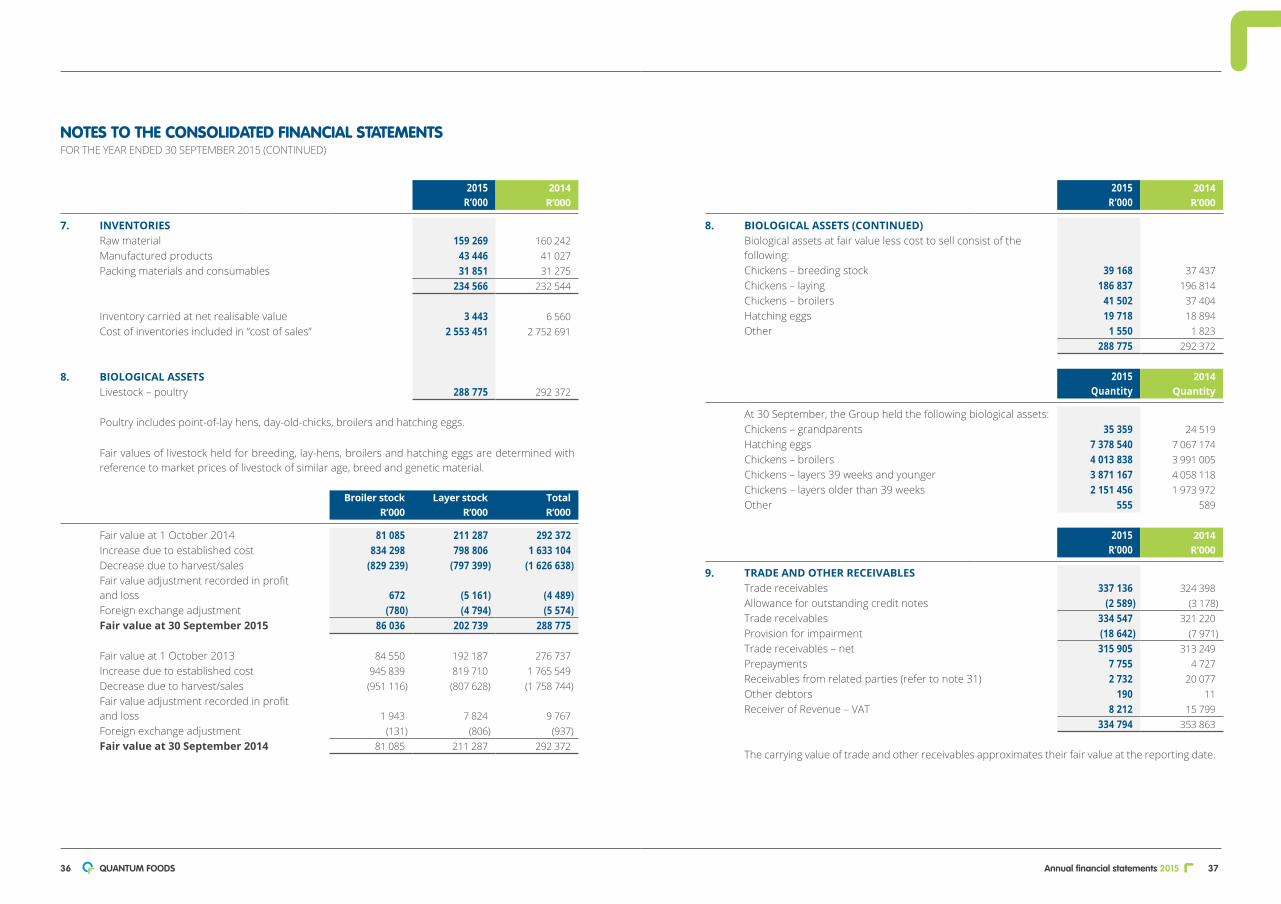
Annual financial statements 2015 3736 QUANTUM FOODS
2015 R’000
2014 R’000
8. BIOLOGICAL ASSETS (CONTINUED)Biological assets at fair value less cost to sell consist of the following:Chickens – breeding stock 39 168 37 437 Chickens – laying 186 837 196 814 Chickens – broilers 41 502 37 404 Hatching eggs 19 718 18 894 Other 1 550 1 823
288 775 292 372
2015 Quantity
2014Quantity
At 30 September, the Group held the following biological assets:Chickens – grandparents 35 359 24 519 Hatching eggs 7 378 540 7 067 174 Chickens – broilers 4 013 838 3 991 005 Chickens – layers 39 weeks and younger 3 871 167 4 058 118 Chickens – layers older than 39 weeks 2 151 456 1 973 972 Other 555 589
2015 R’000
2014 R’000
9. TRADE AND OTHER RECEIVABLESTrade receivables 337 136 324 398 Allowance for outstanding credit notes (2 589) (3 178)Trade receivables 334 547 321 220 Provision for impairment (18 642) (7 971)Trade receivables – net 315 905 313 249 Prepayments 7 755 4 727 Receivables from related parties (refer to note 31) 2 732 20 077 Other debtors 190 11 Receiver of Revenue – VAT 8 212 15 799
334 794 353 863
The carrying value of trade and other receivables approximates their fair value at the reporting date.
2015 R’000
2014 R’000
7. INVENTORIESRaw material 159 269 160 242 Manufactured products 43 446 41 027 Packing materials and consumables 31 851 31 275
234 566 232 544
Inventory carried at net realisable value 3 443 6 560 Cost of inventories included in “cost of sales” 2 553 451 2 752 691
8. BIOLOGICAL ASSETSLivestock – poultry 288 775 292 372
Poultry includes point-of-lay hens, day-old-chicks, broilers and hatching eggs.
Fair values of livestock held for breeding, lay-hens, broilers and hatching eggs are determined with reference to market prices of livestock of similar age, breed and genetic material.
Broiler stock R’000
Layer stock R’000
Total R’000
Fair value at 1 October 2014 81 085 211 287 292 372 Increase due to established cost 834 298 798 806 1 633 104 Decrease due to harvest/sales (829 239) (797 399) (1 626 638)Fair value adjustment recorded in profit and loss 672 (5 161) (4 489)Foreign exchange adjustment (780) (4 794) (5 574)Fair value at 30 September 2015 86 036 202 739 288 775
Fair value at 1 October 2013 84 550 192 187 276 737 Increase due to established cost 945 839 819 710 1 765 549 Decrease due to harvest/sales (951 116) (807 628) (1 758 744)Fair value adjustment recorded in profit and loss 1 943 7 824 9 767 Foreign exchange adjustment (131) (806) (937)Fair value at 30 September 2014 81 085 211 287 292 372
NOTES TO THE CONSOLIDATED FINANCIAL STATEMENTS FOR THE YEAR ENDED 30 SEPTEMBER 2015 (CONTINUED)
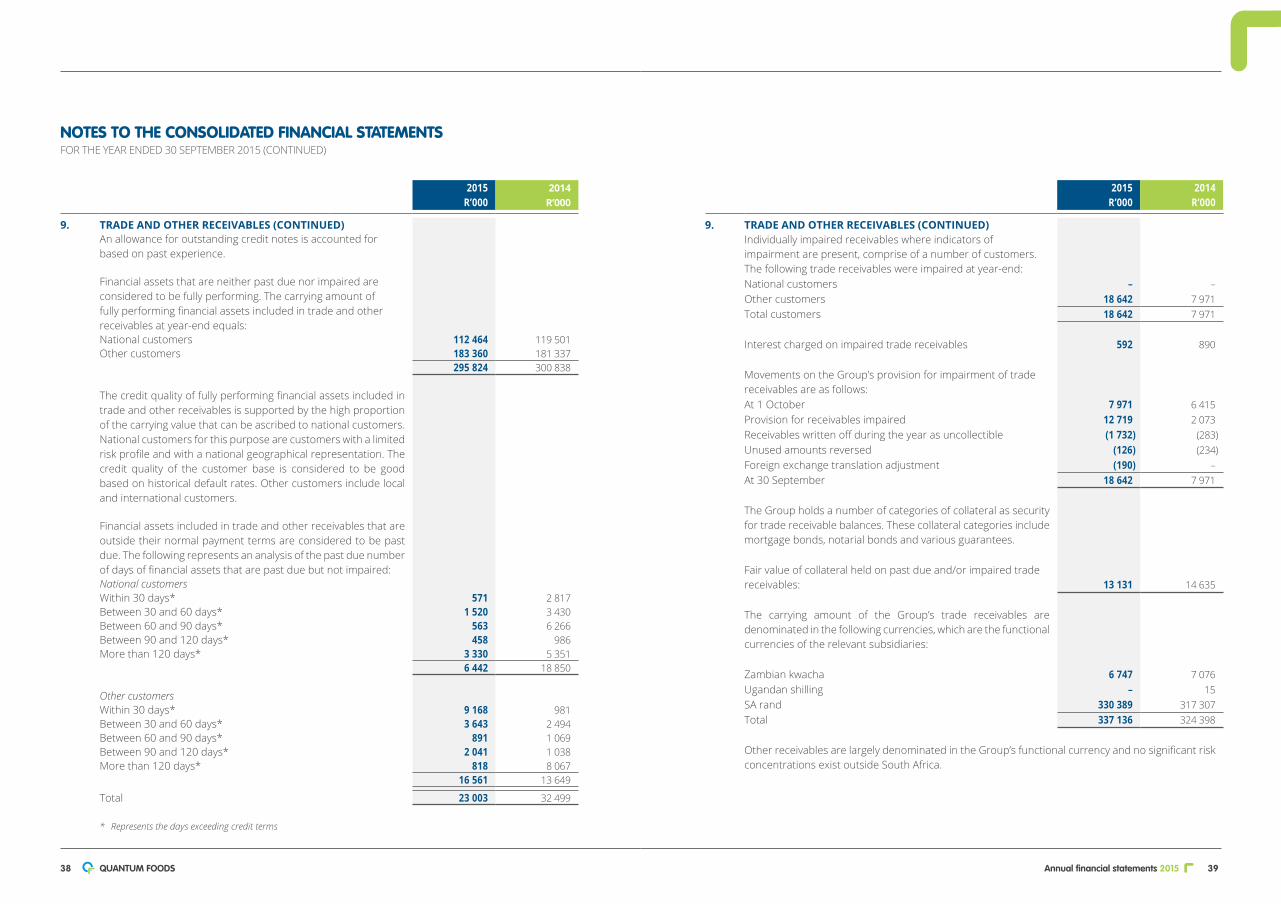
Annual financial statements 2015 3938 QUANTUM FOODS
2015 R’000
2014 R’000
9. TRADE AND OTHER RECEIVABLES (CONTINUED)Individually impaired receivables where indicators of impairment are present, comprise of a number of customers. The following trade receivables were impaired at year-end:National customers – –Other customers 18 642 7 971 Total customers 18 642 7 971
Interest charged on impaired trade receivables 592 890
Movements on the Group’s provision for impairment of trade receivables are as follows:At 1 October 7 971 6 415 Provision for receivables impaired 12 719 2 073 Receivables written off during the year as uncollectible (1 732) (283)Unused amounts reversed (126) (234)Foreign exchange translation adjustment (190) –At 30 September 18 642 7 971
The Group holds a number of categories of collateral as security for trade receivable balances. These collateral categories include mortgage bonds, notarial bonds and various guarantees.
Fair value of collateral held on past due and/or impaired trade receivables: 13 131 14 635
The carrying amount of the Group’s trade receivables are denominated in the following currencies, which are the functional currencies of the relevant subsidiaries:
Zambian kwacha 6 747 7 076 Ugandan shilling – 15 SA rand 330 389 317 307 Total 337 136 324 398
Other receivables are largely denominated in the Group’s functional currency and no significant risk concentrations exist outside South Africa.
2015 R’000
2014 R’000
9. TRADE AND OTHER RECEIVABLES (CONTINUED)An allowance for outstanding credit notes is accounted for based on past experience.
Financial assets that are neither past due nor impaired are considered to be fully performing. The carrying amount of fully performing financial assets included in trade and other receivables at year-end equals:National customers 112 464 119 501 Other customers 183 360 181 337
295 824 300 838
The credit quality of fully performing financial assets included in trade and other receivables is supported by the high proportion of the carrying value that can be ascribed to national customers. National customers for this purpose are customers with a limited risk profile and with a national geographical representation. The credit quality of the customer base is considered to be good based on historical default rates. Other customers include local and international customers.
Financial assets included in trade and other receivables that are outside their normal payment terms are considered to be past due. The following represents an analysis of the past due number of days of financial assets that are past due but not impaired:National customersWithin 30 days* 571 2 817 Between 30 and 60 days* 1 520 3 430 Between 60 and 90 days* 563 6 266 Between 90 and 120 days* 458 986 More than 120 days* 3 330 5 351
6 442 18 850
Other customersWithin 30 days* 9 168 981 Between 30 and 60 days* 3 643 2 494 Between 60 and 90 days* 891 1 069 Between 90 and 120 days* 2 041 1 038 More than 120 days* 818 8 067
16 561 13 649
Total 23 003 32 499
* Represents the days exceeding credit terms
NOTES TO THE CONSOLIDATED FINANCIAL STATEMENTS FOR THE YEAR ENDED 30 SEPTEMBER 2015 (CONTINUED)

Annual financial statements 2015 4140 QUANTUM FOODS
2015 R’000
2014 R’000
11. CASH AND CASH EQUIVALENTSCash at bank and on hand 187 503 105 521
For the purposes of the statement of cash flows, the year-end cash and cash equivalents consist of only cash at bank and on hand.
The carrying amounts of the Group’s cash and cash equivalents are denominated in the following currencies:SA rand 142 509 48 744 US dollar 18 18 187 Zambian kwacha (functional currency of a subsidiary) 40 893 31 536 Ugandan shilling (functional currency of a subsidiary) 4 083 7 054 Total 187 503 105 521
The carrying amounts of cash and cash equivalents approximate their fair values at the reporting date.
Restricted balancesCash and cash equivalents include restricted balances of R2.1 million (2014: R1.8 million). Restricted cash balances consist of initial margin balances with the JSE which serve as collateral for derivative positions held at year-end. This cash will only be accessible by the Group when the related derivative positions are closed.
12. SHARE CAPITALAuthorised – ordinary shares400 000 000 (2014: 400 000 000) ordinary no par value shares 400 000 000 400 000 000
Issued and fully paid – ordinary shares233 248 590 (2014: 233 284 332) ordinary no par value shares 1 585 386 1 585 386
Reconciliation of shares issued during the reporting periodOpening balance 1 585 386 –Shares issued to acquire entities under common control – 1 504 354 Additional share capital raised – 81 032
1 585 386 1 585 386
2015 R’000
2014 R’000
10. DERIVATIVE FINANCIAL INSTRUMENTSForeign exchange contracts 4 991 Futures – fair value hedges 7 420 –
7 424 991
Trading derivatives are classified as a current asset or liability. The carrying values of derivative financial instruments are measured at their fair values at the reporting date.
The purchase of foreign exchange contracts are for the import of raw materials used for production.
10.1 Derivative instruments earmarked for hedging (fair value hedges)Commodity instrumentsFutures 7 420 –
Foreign amount
‘000
Rand amount
R’000
Fair value R’000
10.2 Other derivative instruments30 September 2015Currency forward contractsPurchases of foreign exchange contracts 4 US dollar 459 6 361 25 Euro 170 2 649 (21)
30 September 2014Purchases of foreign exchange contracts 991 US dollar 1 750 19 809 949 Euro 39 563 8 British pound 69 1 273 34
NOTES TO THE CONSOLIDATED FINANCIAL STATEMENTS FOR THE YEAR ENDED 30 SEPTEMBER 2015 (CONTINUED)

Annual financial statements 2015 4342 QUANTUM FOODS
2015 2014
13. SHARE-BASED PAYMENTS (CONTINUED)These fair values were calculated using the Actuarial Binomial Option Pricing Model. The principal assumptions were as follows:Weighted average share price at grant date (cents per share) 375 Expected volatility 20.9% to 23.8% Expected dividend yield 3.0%Risk-free rate 6.5% to 6.8% Expected life (years) 3 to 5
Expected volatility was determined by calculating the volatility of the share price of a similar JSE-listed entity in the agricultural industry.
The shareholders initially approved a maximum number of 14 500 000 ordinary shares that may be issued in terms of the management share appreciation rights scheme. At 30 September 2015, 14 500 000 ordinary shares were still available for issue.
2015 R’000
2014 R’000
14. OTHER RESERVESCommon control reserve (160 178) (160 178)Share-based payment reserve 1 144 –Foreign currency translation reserve (70 968) 4 545 Hedging reserve 1 034 238
(228 968) (155 395)
The fair value of share appreciation rights issued to qualifying management are accounted for in the share-based payment reserve over the respective vesting periods. The reserve is adjusted at each reporting date when the entity revises its estimates of the number of share appreciation rights that are expected to become exercisable. It recognises the impact of the revision of original estimates, if any, in profit or loss, with a corresponding adjustment to this reserve in equity for the equity-settled plan. Refer to note 13 for further detail.
12. SHARE CAPITAL (CONTINUED)During the reporting period, 35 742 shares held by Pioneer Foods, were cancelled before the listing of the Company on 6 October 2014. These shares were cancelled at no value to ensure a equal 1:1 unbundling of shares at the listing.
The interest-bearing borrowings from Pioneer Foods and net invested equity were converted to share capital on 1 October 2013. The difference between this share capital converted on 1 October 2013 and the total amount of capital raised from shares issued to acquire the businesses under common control is recognised as a common control reserve in the statement of changes in equity.
13. SHARE-BASED PAYMENTSManagement share appreciation rights scheme (equity-settled)The Group adopted a share appreciation rights scheme for qualifying management during the current reporting period.
The exercise of vested share appreciation rights entitles the employee to ordinary shares in the Company. This number of ordinary shares is calculated by dividing the amount by which the share price, relating to the exercised share appreciation rights, appreciated from grant date to exercise date, by the share price at the exercise date.
2015Number
’000
2014Number
’000
Number of share appreciation rights made availableNumber at beginning of year – –New allocation at R3.15 per share 6 210 –Expired/forfeited – –Number at end of year 6 210 –
Number of share appreciation rightsAt R3.15 per share, exercisable up to 27 August 2020 6 210 –
6 210 –
Share appreciation rights were granted on 27 February 2015 at a strike price of R3.15. Vesting takes place over a five-year period with the first 33.3% vesting after three years on 27 February 2018 subject to certain time and performance-based criteria.
The net estimated weighted average fair value at grant date per share appreciation right for share appreciation rights outstanding at 30 September 2015 is R0.93. The fair value per share appreciation right was used to calculate the total cost of the scheme in terms of IFRS 2 – Share-based payment. The cost accounted for in the current year amounts to R893 800.
NOTES TO THE CONSOLIDATED FINANCIAL STATEMENTS FOR THE YEAR ENDED 30 SEPTEMBER 2015 (CONTINUED)
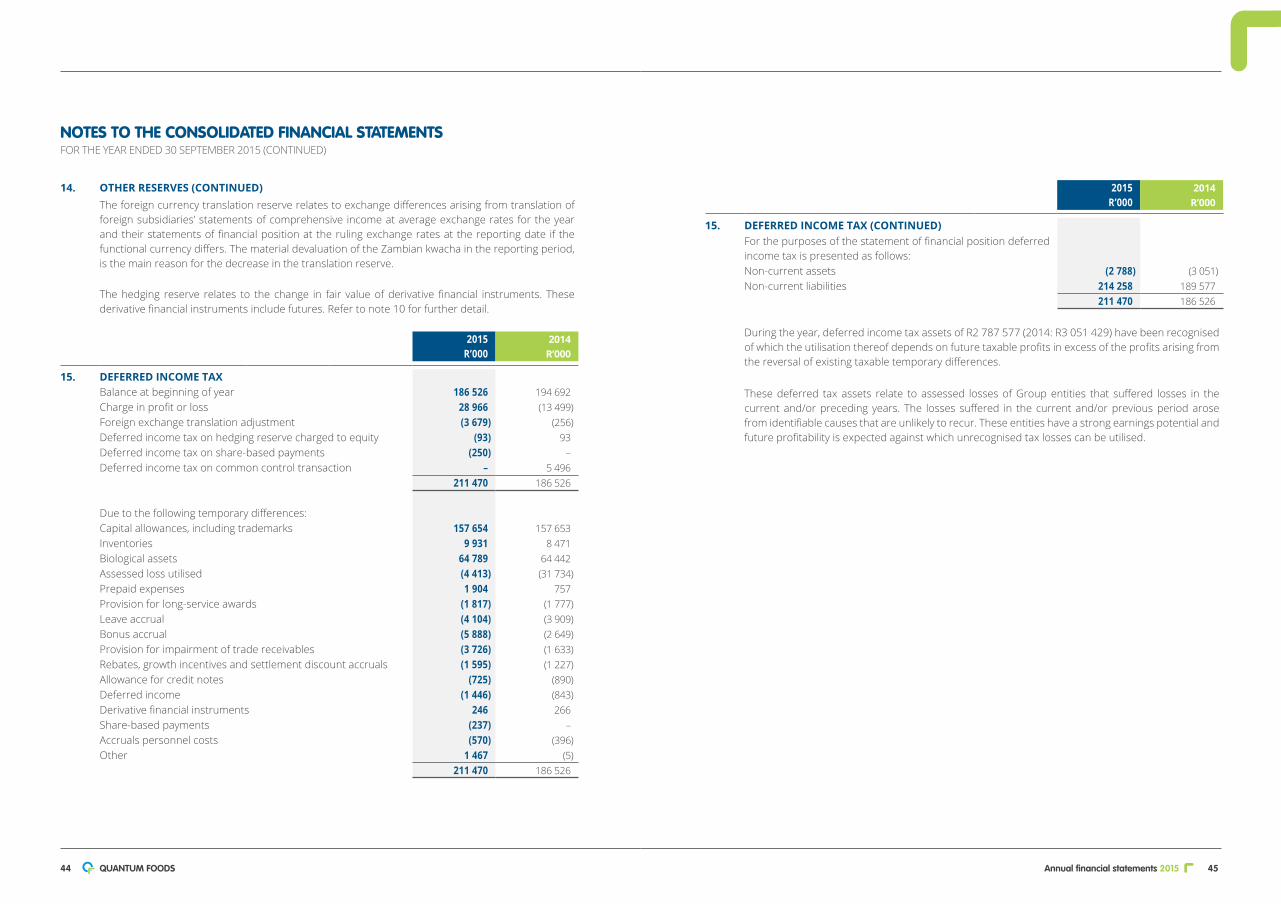
Annual financial statements 2015 4544 QUANTUM FOODS
2015 R’000
2014 R’000
15. DEFERRED INCOME TAX (CONTINUED)For the purposes of the statement of financial position deferred income tax is presented as follows:Non-current assets (2 788) (3 051)Non-current liabilities 214 258 189 577
211 470 186 526
During the year, deferred income tax assets of R2 787 577 (2014: R3 051 429) have been recognised of which the utilisation thereof depends on future taxable profits in excess of the profits arising from the reversal of existing taxable temporary differences.
These deferred tax assets relate to assessed losses of Group entities that suffered losses in the current and/or preceding years. The losses suffered in the current and/or previous period arose from identifiable causes that are unlikely to recur. These entities have a strong earnings potential and future profitability is expected against which unrecognised tax losses can be utilised.
14. OTHER RESERVES (CONTINUED)The foreign currency translation reserve relates to exchange differences arising from translation of foreign subsidiaries’ statements of comprehensive income at average exchange rates for the year and their statements of financial position at the ruling exchange rates at the reporting date if the functional currency differs. The material devaluation of the Zambian kwacha in the reporting period, is the main reason for the decrease in the translation reserve.
The hedging reserve relates to the change in fair value of derivative financial instruments. These derivative financial instruments include futures. Refer to note 10 for further detail.
2015 R’000
2014 R’000
15. DEFERRED INCOME TAXBalance at beginning of year 186 526 194 692 Charge in profit or loss 28 966 (13 499)Foreign exchange translation adjustment (3 679) (256)Deferred income tax on hedging reserve charged to equity (93) 93 Deferred income tax on share-based payments (250) –Deferred income tax on common control transaction – 5 496
211 470 186 526
Due to the following temporary differences:Capital allowances, including trademarks 157 654 157 653 Inventories 9 931 8 471 Biological assets 64 789 64 442 Assessed loss utilised (4 413) (31 734)Prepaid expenses 1 904 757 Provision for long-service awards (1 817) (1 777)Leave accrual (4 104) (3 909)Bonus accrual (5 888) (2 649)Provision for impairment of trade receivables (3 726) (1 633)Rebates, growth incentives and settlement discount accruals (1 595) (1 227)Allowance for credit notes (725) (890)Deferred income (1 446) (843)Derivative financial instruments 246 266 Share-based payments (237) –Accruals personnel costs (570) (396)Other 1 467 (5)
211 470 186 526
NOTES TO THE CONSOLIDATED FINANCIAL STATEMENTS FOR THE YEAR ENDED 30 SEPTEMBER 2015 (CONTINUED)

Annual financial statements 2015 4746 QUANTUM FOODS
2015 R’000
2014 R’000
17. TRADE AND OTHER PAYABLES (CONTINUED)The carrying amount of the Group’s trade payables are denominated in the following currencies:Covered by means of foreign exchange contracts: 2 681 1 832 Euro 2 681 563 UK pound – 1 269
Uncovered: 269 033 260 611 Euro 1 199 563 US dollar 15 710 14 933 Zambian kwacha (functional currency of a subsidiary) 5 369 7 086 Ugandan shilling (functional currency of a subsidiary) 316 2 200 SA rand 246 439 235 829
Total 271 714 262 443
Other payables are mostly denominated in the Group’s functional currency and no significant risk concentrations exist outside South Africa.
18. OTHER INCOMERental income 2 728 2 225 Sundry income and commissions 8 911 12 225
11 639 14 450
19. OTHER GAINS/(LOSSES) – NETBiological assets fair value adjustment 111 882 51 950 Unrealised – reflected in carrying amount of biological assets (4 489) 9 767 Realised – reflected in cost of goods sold 116 371 42 183 Agricultural produce fair value adjustment 121 128 70 722 Foreign exchange differences 4 000 (272)Foreign exchange contract fair value adjustments (108) 230 Profit on disposal of property, plant and equipment 1 580 1 615 Impairment of property, plant and equipment – (49 478)
238 482 74 767
Biological assets fair value adjustmentThe adjustment of biological assets from cost to fair value includes a realised and unrealised component. The unrealised portion is reflected in the carrying amount of biological assets in the statement of financial position and the realised portion is reflected in cost of goods sold.
2015 R’000
2014 R’000
16. PROVISIONS FOR OTHER LIABILITIES AND CHARGESLong-service awards 6 489 6 345
16.1 Long-service awardsBalance at beginning of year 6 345 9 294 Interest 517 694 Actuarial loss 31 (3 926)Current service costs 797 1 238 Payments (1 201) (955)
6 489 6 345
The amount recognised in the statement of financial position was determined as follows:Present value of unfunded obligations 6 489 6 345 Unrecognised actuarial loss – –
6 489 6 345
Existing provisions are based on the following important assumptions:Discount rate 8.5% p.a. 8.2% p.a. Salary increases 7% p.a. 7% p.a. Normal retirement age 60 years 60 years
The date of the most recent actuarial valuation is: 30 September
2015 30 September
2014
17. TRADE AND OTHER PAYABLESTrade payables 271 714 262 443 Accrued expenses 20 524 21 267 Related parties (refer to note 31) 5 292 72 996 Provision for leave 14 703 14 863 Provision for 13th cheque 7 715 9 990 Provision for short-term incentive bonus 13 494 –Value-added tax 785 25 Other payables 9 663 6 453
343 890 388 037
NOTES TO THE CONSOLIDATED FINANCIAL STATEMENTS FOR THE YEAR ENDED 30 SEPTEMBER 2015 (CONTINUED)

Annual financial statements 2015 4948 QUANTUM FOODS
2015 R’000
2014 R’000
21. INVESTMENT INCOMEInterest income on financial assets: loans and receivables– Call accounts and other 9 886 5 899
9 886 5 899
22. FINANCE COSTSInterest expense on financial liabilities measured at amortised cost– Call loans 1 370 30 – Provision for unwinding of discount 517 694 – Related parties (refer to note 31) – 4 250
1 887 4 974
23. INCOME TAX EXPENSE/(CREDIT)Current income tax 16 798 2 647 Current year 16 798 2 647
Deferred taxation 28 966 (13 499)Current year 28 966 (13 499)
45 764 (10 852)
The tax on the Group’s profit before tax differs from the theoretical amount that would arise using the statutory rate as follows: 28% 28%
% %Standard rate for companies* 28.0 28.0 Increase/(decrease) in rate:Exempt income (0.1) –Non-deductible expenditure 2.6 (7.9)Effect of capital gains tax (0.4) 0.7 Effect of different tax rates (2.9) 26.4 Other differences (0.7) 8.9 Effective rate 26.5 56.1
* Thestandardtaxrateforforeignsubsidiariesdifferfromtheincometaxrateof28%.QuantumFoodsZambiaLtd’sagriculturalprofitsaretaxedat10%andotherincomearetaxedat35%.QuantumFoodsUgandaLtd’sprofitsaretaxedat30%.
2015 R’000
2014 R’000
20. EXPENSE BY NATURECost of raw materials 2 366 378 2 518 424 Fair value adjustment on biological assets and agricultural produce 238 023 112 473 Inventory written off 29 031 26 791 Research and development costs 12 236 9 318 Staff costs 312 577 363 634
Wages and salaries 277 286 313 997 Termination benefits – 8 255
Other staff costs 16 782 20 141 Pension costs 17 615 21 241 Share-based payments expense (refer to note 13) 894 –
Directors’ remuneration 9 120 –Technical services from non-employees 8 198 5 708 Auditors’ remuneration 3 207 2 198
Audit – current year 2 934 2 075 Audit (over)/under provision pervious year 4 –Tax-related services 154 62 Other consultation services 115 61
Internal audit fees 950 –Rental of premises, machinery and vehicles 30 887 28 139 Travel and entertainment 6 558 4 802 Energy costs 92 763 110 649 Maintenance 74 226 64 829 Depreciation and amortisation 56 272 55 344 Insurance 8 315 14 067 Cleaning 20 962 25 969 Office expenses 47 667 48 601 Marketing costs 9 342 8 421 Security 17 734 18 262 Change in provision for trade receivables 10 704 1 556 Change in allowance for credit notes (589) (95)Bad debts 1 911 1 395 Transport and distribution costs 197 899 250 337 Other expenses – 197 Total cost of sales, sales and distribution costs, marketing, administrative and other operating expenses 3 554 371 3 671 019
NOTES TO THE CONSOLIDATED FINANCIAL STATEMENTS FOR THE YEAR ENDED 30 SEPTEMBER 2015 (CONTINUED)

Annual financial statements 2015 5150 QUANTUM FOODS
2015 R’000
2014 R’000
24. EARNINGS PER ORDINARY SHARE (CONTINUED)Reconciliationbetweenprofitattributabletoownersoftheparentand headline earningsProfit/(loss) for the year 126 916 (8 487)
Remeasurement of items of a capital natureProfit on disposal of property, plant and equipment (1 000) (1 312)
Gross (1 580) (1 615)Tax effect 580 303
Impairment of property, plant and equipment – 35 840 Gross – 49 478 Tax effect – (13 638)
Headline earnings for the year 125 916 26 041
Weighted average number of ordinary shares in issue (‘000)* 233 249 233 249
Earnings/(loss) per share (cents)Basic and diluted 54 (4)
Headline earnings per share (cents)Basic and diluted 54 11
* The loss per share and headline earnings per share for the previous corresponding period set out above were based on theGroup’sactualnumberofsharesinissueonthedateoflistingontheJSEon6October2014.
2015 R’000
2014 R’000
23. INCOME TAX EXPENSE/(CREDIT) (CONTINUED)Gross calculated tax losses of certain subsidiaries at the end of the reporting period available for utilisation against future taxable income of those companies 15 762 114 865 Less: Utilised in reduction of deferred tax (5 806) (103 969)
9 956 10 896
A current and deferred income tax charge of R308 336 (2014: R93 000) is debited directly through other comprehensive income/(loss).
24. EARNINGS PER ORDINARY SHAREBasic and dilutedThe calculation of basic and diluted earnings per share is based on earnings attributable to owners of the parent divided by the weighted average number of ordinary shares in issue during the year:Profit/(loss) for the year 126 916 (8 487)
Headline earnings is calculated based on Circular 2/2013 issued by the South African Institute of Chartered Accountants.
The Group has no dilutive potential ordinary shares.
NOTES TO THE CONSOLIDATED FINANCIAL STATEMENTS FOR THE YEAR ENDED 30 SEPTEMBER 2015 (CONTINUED)

Annual financial statements 2015 5352 QUANTUM FOODS
2015 R’000
2014 R’000
27. INCOME TAX PAID (CONTINUED)For the purposes of the statement of financial position, current income tax (receivable)/payable are presented as follows:Current assets – –Current liabilities 2 882 1 465
2 882 1 465
28. PROCEEDS ON DISPOSAL OF PROPERTY, PLANT AND EQUIPMENTBook value of property, plant and equipment 7 715 1 679 Profit on disposal of property, plant and equipment 1 580 1 615
9 295 3 294
29. CONTINGENT LIABILITIESGuarantees in terms of loans by third parties to contracted service providers 42 300 45 900
LitigationDispute with egg contract producersAs previously reported, six contract egg producers proceeded with claims in the Western Cape High Court: Cape Town. The claim from one of the six contract producers is still unresolved.
Pioneer Foods is defending contractual claims from its privatised egg contract producers and the matters were set down for arbitration during 2012. Since the hearings commenced in 2012, settlements were negotiated with four egg contract producers. A further contract producer withdrew its claim. These settlements had no adverse financial impact on Pioneer Foods.
Pioneer Foods filed a plea to the remaining claim as well as a counterclaim to recover damages suffered by Pioneer Foods as a result of breach of contract by the contract producer. Pioneer Foods is awaiting the setting of a trial date in this matter.
Although the claims were brought against Pioneer Foods, the Group indemnified Pioneer Foods against any damages which may be suffered as a result of same in terms of the internal restructuring agreements when it acquired the egg business.
Management is of the view, based on legal advice regarding the merits of the claim against the Group, that the Group will not incur any material liability in this respect.
Termination of contractThe Group received a summons in respect of early termination of a distribution contract. The matter will be defended in the High Court.
Management is of the view, based on legal advice regarding the merits of the claim against the Group, that the Group will not incur any material liability in this respect.
2015 R’000
2014 R’000
25. CASH PROFIT FROM OPERATING ACTIVITIESReconciliation of profit before tax and cash profit from operating activities:Profit/(loss) before income tax 172 680 (19 339)Adjustment for:Depreciation and amortisation 56 272 55 344 Impairment of property, plant and equipment – 49 478 Biological assets fair value adjustment 4 489 (9 767)Agricultural produce fair value adjustment – unrealised 524 (432)Net profit on sale of property, plant and equipment (1 580) (1 615)Adjustment on fixed rate leases 200 111 Unrealised (profits)/losses on FEC contracts and foreign exchange 1 832 (1 483)Fair value of commodity futures (7 420) –Change in provision for impairment of trade receivables 10 704 1 556 Change in provision for credit notes based on history (589) (95)Bad debts 1 911 1 395 Share-based payments 894 –Changes in provisions for long-service awards 828 (2 688)Interest received (9 886) (5 899)Interest paid 1 887 4 974 Share of profit of associate company (619) (595)
232 127 70 945
26. WORKING CAPITAL CHANGESIncrease in inventory (1 512) (354)Decrease/(increase) in trade and other receivables 7 043 (77 222)(Decrease)/increase in trade and other payables (55 699) 54 925 Increase in current biological assets (1 416) (5 436)Changes to derivative financial instruments (845) 1 393 Decrease in provisions (1 201) (955)
(53 630) (27 649)
27. INCOME TAX PAIDAmounts unpaid at beginning of year (1 465) (168)Current tax charge in profit and loss (16 798) (2 647)Hedging reserve – income tax current year (401) –Amounts unpaid at end of year 2 882 1 465
(15 782) (1 350)
NOTES TO THE CONSOLIDATED FINANCIAL STATEMENTS FOR THE YEAR ENDED 30 SEPTEMBER 2015 (CONTINUED)
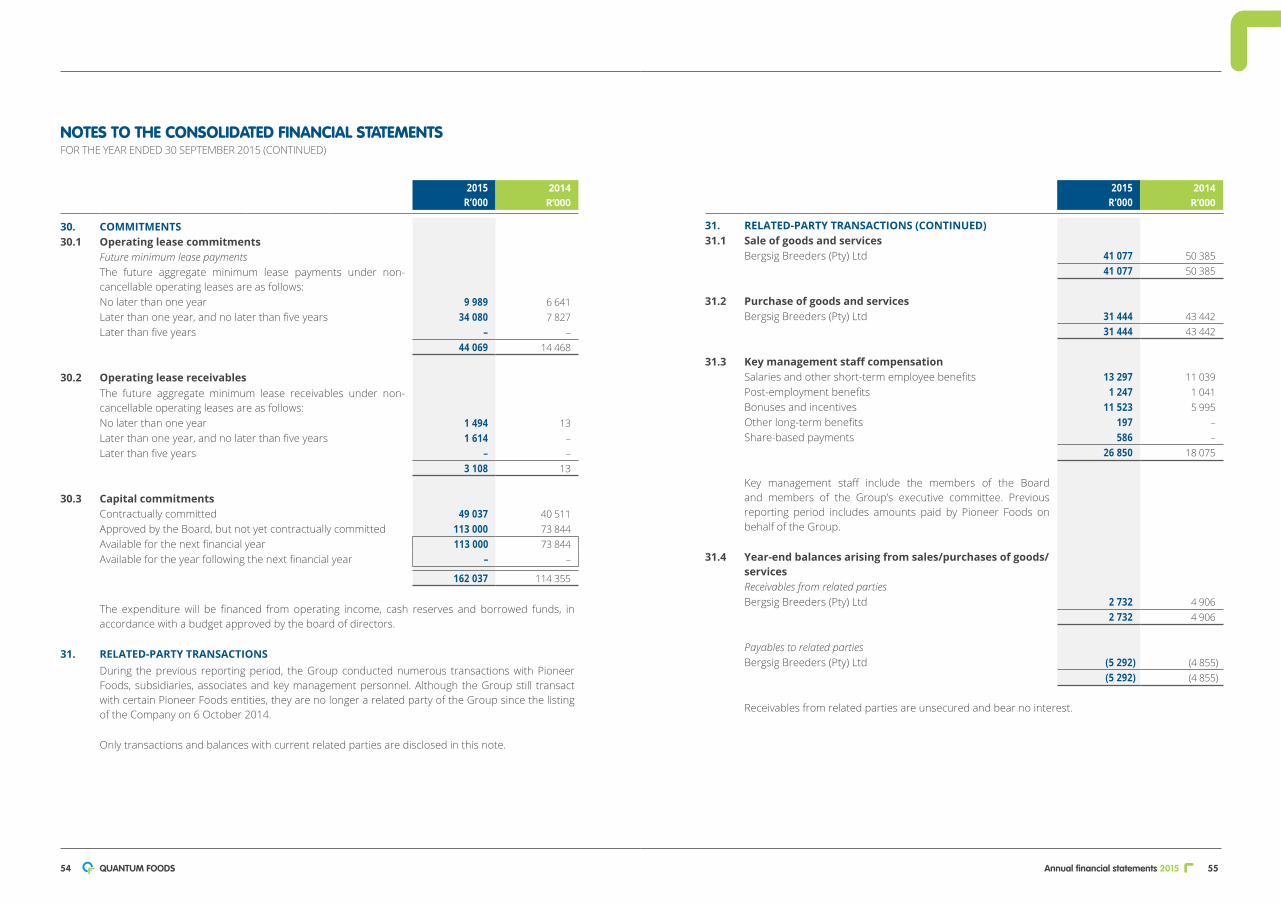
Annual financial statements 2015 5554 QUANTUM FOODS
2015 R’000
2014 R’000
31. RELATED-PARTY TRANSACTIONS (CONTINUED)31.1 Sale of goods and services
Bergsig Breeders (Pty) Ltd 41 077 50 385 41 077 50 385
31.2 Purchase of goods and servicesBergsig Breeders (Pty) Ltd 31 444 43 442
31 444 43 442
31.3 Key management staff compensationSalaries and other short-term employee benefits 13 297 11 039 Post-employment benefits 1 247 1 041 Bonuses and incentives 11 523 5 995 Other long-term benefits 197 –Share-based payments 586 –
26 850 18 075
Key management staff include the members of the Board and members of the Group’s executive committee. Previous reporting period includes amounts paid by Pioneer Foods on behalf of the Group.
31.4 Year-end balances arising from sales/purchases of goods/servicesReceivables from related partiesBergsig Breeders (Pty) Ltd 2 732 4 906
2 732 4 906
Payables to related partiesBergsig Breeders (Pty) Ltd (5 292) (4 855)
(5 292) (4 855)
Receivables from related parties are unsecured and bear no interest.
2015 R’000
2014 R’000
30. COMMITMENTS30.1 Operating lease commitments
Future minimum lease paymentsThe future aggregate minimum lease payments under non-cancellable operating leases are as follows:No later than one year 9 989 6 641 Later than one year, and no later than five years 34 080 7 827 Later than five years – –
44 069 14 468
30.2 Operating lease receivablesThe future aggregate minimum lease receivables under non-cancellable operating leases are as follows:No later than one year 1 494 13 Later than one year, and no later than five years 1 614 –Later than five years – –
3 108 13
30.3 Capital commitmentsContractually committed 49 037 40 511 Approved by the Board, but not yet contractually committed 113 000 73 844 Available for the next financial year 113 000 73 844 Available for the year following the next financial year – –
162 037 114 355
The expenditure will be financed from operating income, cash reserves and borrowed funds, in accordance with a budget approved by the board of directors.
31. RELATED-PARTY TRANSACTIONSDuring the previous reporting period, the Group conducted numerous transactions with Pioneer Foods, subsidiaries, associates and key management personnel. Although the Group still transact with certain Pioneer Foods entities, they are no longer a related party of the Group since the listing of the Company on 6 October 2014.
Only transactions and balances with current related parties are disclosed in this note.
NOTES TO THE CONSOLIDATED FINANCIAL STATEMENTS FOR THE YEAR ENDED 30 SEPTEMBER 2015 (CONTINUED)

Annual financial statements 2015 5756 QUANTUM FOODS
33. FINANCIAL RISK MANAGEMENT33.1 Financial risk factors
The Group’s activities expose it to a variety of financial risks: market risk (including cash flow interest rate risk, foreign exchange risk and price risk), credit risk and liquidity risk. The Group’s overall risk management program focuses on the unpredictability of financial markets and seeks to minimise potential adverse effects on the Group’s financial performance. The Group uses derivative financial instruments to hedge certain risk exposures.
The Board approved a broad decision making framework in terms of which financial risks are evaluated, managed and hedged by executive management.
(a) Market risk(i)CashflowinterestrateriskThe Group’s interest rate risk arises from both financial assets and financial liabilities.
Financial liabilities exposed to interest rate risk include interest-bearing short- and long-term borrowings. The Group only borrows at variable interest rates. Borrowings issued at variable rates expose the Group to cash flow interest rate risk. The interest rate characteristics of new borrowings and the refinancing of existing borrowings are positioned according to expected movements in interest rates. At year-end the Group had no borrowings.
Financial assets exposed to cash flow interest rate risk include cash and short-term bank deposits. The Group’s cash and cash equivalents are placed with creditable financial institutions. At year-end the Group only had cash at bank and on hand.
(ii) Foreign exchange riskThe Group operates internationally and is exposed to foreign exchange risk arising from various currency exposures, primarily with respect to the euro, British pound, US dollar, Zambia kwacha and Uganda shilling. Foreign exchange risk arises from future commercial transactions denominated in foreign currencies, recognised assets and liabilities denominated in foreign currencies and derivative financial instruments. Apart from the Group’s exposure to trade receivables and payables and cash denominated in foreign currencies, no other financial assets or liabilities expose the Group to significant foreign exchange risk.
The Group manages short-term foreign exchange exposure relating to trade imports, in terms of formal foreign exchange policies with prescribed limits. Foreign exchange risk arising from capital imports is hedged in total by means of forward exchange contracts or other appropriate hedging instruments.
Refer to note 10 for material forward foreign exchange contracts.
Loans andreceivables
R’000
Assets at fair value throughprofit and loss
R’000 Total
R’000
32. FINANCIAL INSTRUMENTS BY CATEGORY30 September 2015Assets as per statement of financial position
Derivative financial instruments – 7 424 7 424 Trade and other receivables* 318 827 – 318 827 Cash and cash equivalents 187 503 – 187 503
Total 506 330 7 424 513 754
Liabilities at fair value throughprofit and loss
R’000
Other financialliabilities
R’000 Total
R’000
30 September 2015Liabilities as per statement of financial position
Trade and other payables^ – 307 193 307 193 Total – 307 193 307 193
Loans andreceivables
R’000
Assets at fair value throughprofit and loss
R’000 Total
R’000
30 September 2014Assets as per statement of financial position
Derivative financial instruments – 991 991 Trade and other receivables* 333 337 – 333 337 Cash and cash equivalents 105 521 – 105 521
Total 438 858 991 439 849
Liabilities at fair value throughprofit and loss
R’000
Other financialliabilities
R’000 Total
R’000
30 September 2014Liabilities as per statement of financial position
Trade and other payables^ – 363 159 363 159 Total – 363 159 363 159
* Financial assets do not include prepaid expenses and VAT amounts receivable.^ Financialliabilitiesdonotincludeprovisionsfor13thcheque,leaveandVATamountspayable.
NOTES TO THE CONSOLIDATED FINANCIAL STATEMENTS FOR THE YEAR ENDED 30 SEPTEMBER 2015 (CONTINUED)

Annual financial statements 2015 5958 QUANTUM FOODS
33. FINANCIAL RISK MANAGEMENT (CONTINUED)33.1 Financial risk factors (continued)
(a) Market risk (continued)Interest rates decreaseIf the prime interest rate decreases, the impact will be an increase in the profit after tax of the same amount on financial instruments.
Change in commodity pricesDerivative financial instruments affected by changes in the commodity prices relate to futures. The summary below reflects the results of an expected change in the maize price of 2%, with all other variables held constant.
2015 R’000
2014 R’000
Commodity price increase– Increase in equity after income taxDerivative financial instruments earmarked for hedging (398) 541
(398) 541
If these prices would decrease it will result in a decrease in reserves of the same amount.
(b) Credit riskFinancial assets that potentially subject the Group to a concentration of credit risk consist principally of cash and cash equivalents and derivative financial instruments, as well as credit exposure to trade receivables, including outstanding receivables and committed transactions.
The Group’s credit risk exposure relating to cash and cash equivalents and derivative financial instruments is managed on a group level and are placed with a limited group of creditable financial institutions, all of which have a Moody’s P-2 short-term credit ratings. A short-term rating of P-2 indicates that the issuer has a strong ability to re-pay short-term debt obligations.
The Group’s credit risk exposure relating to trade receivables is managed on a centralised basis. Trade receivables are subject to credit limits, credit control and credit approval procedures. The credit quality of customers is assessed, taking into account its financial position, past experience with the customer and other factors when approving new customers and determining or revising individual credit limits. The utilisation of credit limits is regularly monitored.
33. FINANCIAL RISK MANAGEMENT (CONTINUED)33.1 Financial risk factors (continued)
(a) Market risk (continued)(iii) Price riskThe Group is exposed to commodity price risk. The risk arises from the Group’s need to buy specific quantities and qualities of raw materials to meet its feed requirements. These raw materials include maize and soya meal.
The Group uses exchange-for-physical contracts to hedge itself against the price risk of the maize commodity. These contracts hedge the future purchase price of raw materials. Settlement of the physical contracts and local futures are effected by physical delivery.
(iv) Sensitivity analysisThe table below summarises the impact on post-tax profit and equity of changes in market risks relating to the Group’s financial instruments exposed to foreign exchange risk.
Change in foreign currencyDerivative financial instruments affected by changes in exchange rates include foreign exchange contracts. The summary below reflects the results of an expected change in US dollar of 3% (2014: 2%), British pound of 3% (2014: 1%), Euro of 3% (2014: 5%), Zambian kwacha of 3% (2014: 1%) and Uganda shilling of 3% (2014: 1%), with all other variables held constant.
2015 R’000
2014 R’000
Rand depreciates against foreign currencies–Increase/(decrease)inprofitafterincometaxTrade receivables 149 51 Cash and cash equivalents 970 46 Trade payables (450) (265)Derivative financial instruments 22 315
691 147
Change in interest rateThe summary below reflects the results of an expected change in the prime interest rate of 0.5% (2014: 0.5%), with all other variables held constant.
Interest rate increases–Increase/(decrease)inprofitafterincometaxCall accounts and other 511 97
511 97
NOTES TO THE CONSOLIDATED FINANCIAL STATEMENTS FOR THE YEAR ENDED 30 SEPTEMBER 2015 (CONTINUED)

Annual financial statements 2015 6160 QUANTUM FOODS
2015 R’000
2014 R’000
33. FINANCIAL RISK MANAGEMENT (CONTINUED)33.1 Financial risk factors (continued)
(c) Liquidity risk (continued)Surplus cash held by Group treasury over and above the balance required for working capital management is invested in interest-bearing money market deposits with sufficient liquidity to provide sufficient head-room as determined by the above-mentioned forecasts. At the reporting date, the Group held no short-term bank deposits.
At year-end, the Group has a borrowing facility in the form of a debtors finance facility at one of the major South African banks. Sufficient collateral in the form of trade receivables are provided as security for the debt.
The Group’s unutilised borrowing facilities are as follows:Total borrowing facilities 146 329 –Net interest-bearing liabilities – –
146 329 –
33. FINANCIAL RISK MANAGEMENT (CONTINUED)33.1 Financial risk factors (continued)
(b) Credit risk (continued)Credit risk with respect to trade receivables is limited due to the large number of customers comprising the Group’s customer base and their dispersion across different industries and geographical areas. The customer base of the Group includes large national customers in the formal retail sector. These customers amounted to approximately 44% of Trade receivables – net in the previous reporting period. This has however decreased in the current reporting period, and as such the following additional credit risk evaluation is disclosed.
2015 R’000
The credit quality of trade receivables with an external rating is as follows:Low risk 70 816 Below average risk 133 112 Above average risk 17 247 High risk –
221 175
The ratings are based on the risk of default on payments from the individual debtor, which takes into account the results of a full background and credit assessment of the debtor, payment profile and an analysis of the financial statements of the debtor, where available. The balance of trade receivables consist of smaller customers for which credit evaluations was done but no external rating received in the last 12 months.
Other receivables consist mainly of prepayments, Value-added tax receivable and other debtors. The risk of default is assessed as low.
The maximum exposure to credit risk is represented by the carrying amount of each financial asset.
(c) Liquidity riskPrudent liquidity risk management implies maintaining sufficient cash, the availability of funding through an adequate amount of committed credit facilities and the ability to close out market positions.
The Group manages its liquidity risk by using reasonable and restrospectively assessed assumptions to forecast the future cash-generating capabilities and working capital requirements of the businesses it operates and by maintaining sufficient reserves, committed borrowing facilities and other credit lines as appropriate. The Group’s policy has been to maintain substantial unutilised banking facilities and reserve borrowing capacity.
NOTES TO THE CONSOLIDATED FINANCIAL STATEMENTS FOR THE YEAR ENDED 30 SEPTEMBER 2015 (CONTINUED)

Annual financial statements 2015 6362 QUANTUM FOODS
33. FINANCIAL RISK MANAGEMENT (CONTINUED)33.2 Capital risk management
For capital management purposes the current level of capital in the Group is defined as the difference between the total assets and total liabilities of the Group. The capital employed is managed on a basis that enables the Group to continue as a going concern in order to provide returns for shareholders and benefits for other stakeholders and to maintain an optimal capital structure to reduce the cost of capital.
The Group monitors capital on the basis of the debt to equity ratio. This ratio is calculated as net debt divided by total capital. Net debt is calculated as total borrowings (including current and non-current borrowings and bank overdrafts as shown in the statement of financial position) less cash and cash equivalents. Total capital is calculated as capital and reserves attributable to owners of the parent as shown in the statement of financial position.
The main focus of the Group’s capital management is to ensure liquidity, in the form of short-term borrowing facilities, in order to have sufficient available funding for the group’s working capital requirements.
33.3 Fair value measurementAll financial instruments measured at fair value are classified using a three-tiered fair value hierarchy that reflects the significance of the inputs used in determining the measurement. The hierarchy is as follows:
Level 1:Fair value measurements derived from quoted prices (unadjusted) in active markets for identical assets or liabilities at the end of the reporting period. No financial assets have been classified as level 1.
Level 2:Fair value measurements derived from inputs other than quoted prices included within level 1 that are observable for the asset or liability, either directly (i.e. as prices) or indirectly (i.e. derived from prices).
Level 3:Fair value measurements derived from valuation techniques that include inputs for the asset or liability that are not based on observable market data (unobservable inputs).
33. FINANCIAL RISK MANAGEMENT (CONTINUED)33.1 Financial risk factors (continued)
(c) Liquidity risk (continued)The table below analyses the Group’s non-derivative financial liabilities into relevant maturity groupings based on the remaining period at the reporting date to the contractual maturity date. Derivative financial liabilities are included in the analysis if their contractual maturities are essential for an understanding of the timing of the cash flows. The amounts disclosed are the contractual undiscounted cash flows.
Capital R’000
Interest R’000
Total R’000
Maturity analysis of financial liabilities30 September 2015Not later than 1 yearTrade and other payables (304 002) – (304 002)
(304 002) – (304 002)
TotalTrade and other payables (304 002) – (304 002)
(304 002) – (304 002)
30 September 2014Not later than 1 yearTrade and other payables (359 127) – (359 127)
(359 127) – (359 127)
TotalTrade and other payables (359 127) – (359 127)
(359 127) – (359 127)
Note:Financial liabilities do not include provisions, accrual for 13th cheque, deferred revenue, accrual for leave and VAT amounts payable.
NOTES TO THE CONSOLIDATED FINANCIAL STATEMENTS FOR THE YEAR ENDED 30 SEPTEMBER 2015 (CONTINUED)

Annual financial statements 2015 6564 QUANTUM FOODS
33. FINANCIAL RISK MANAGEMENT (CONTINUED)33.3 Fair value measurement (continued)
Financialinstrumentsinlevel2:The fair value of financial instruments that are not traded in an active market (for example, over-the-counter securities) is determined by using valuation techniques. These valuation techniques maximise the use of observable market data where it is available and rely as little as possible on entity specific estimates. If all significant inputs required to fair value an instrument are observable, the instrument is included in level 2.
The Group uses a variety of methods that makes assumptions that are based on market conditions existing at the reporting date. Quoted market prices or dealer quotes for similar instruments are used for derivative financial instruments. The fair value of foreign exchange contracts is determined using quoted forward exchange rates at the reporting date.
Financialinstrumentsinlevel3:BiologicalassetsThe layer and broiler livestock and agricultural produce are measured at fair value which is determined by using unobservable inputs and is categorised as level 3. Fair values of livestock held for breeding, lay-hens, broilers and hatching eggs are determined with reference to market prices of livestock of similar age, breed and genetic material.
The fair value of the layer birds, which include rearing and layer livestock, are determined by the market prices of day-old chicks, point of lay hens and culls. The fair value of the layer birds at the different stages in the lifecycle are based on their age and by using a standard production profile.
The fair value of broiler livestock is determined by the market prices of day-old chicks and live birds at slaughter age. The fair value of the broiler livestock at the different stages in the lifecycle are determined by using a standard production profile.
Changes in the fair value are included in profit or loss, with a loss of R4 489 312 (2014: profit of R9 766 851) being recognised as the unrealised fair value adjustment in profit or loss in the current period to adjust the biological asset livestock to fair value.
33. FINANCIAL RISK MANAGEMENT (CONTINUED)33.3 Fair value measurement (continued)
The following table presents the Group’s financial assets and liabilities that are measured at fair value at:
Level 1
R’000 Level 2
R’000 Level 3
R’000
30 September 2015Assets measured at fair value Derivative financial instruments – Foreign exchange contracts – 4 –– Fair value hedges – 7 420 –Biological assets – Livestock – – 288 775
– 7 424 288 775 Total assets measured at fair value 296 199
Level 1 R’000
Level 2 R’000
Level 3 R’000
30 September 2014Assets measured at fair value Derivative financial instruments – Foreign exchange contracts – 991 – Biological assets – Livestock – – 292 372
– 991 292 372 Total assets measured at fair value 293 363
There were no transfers between any levels during the year, nor were there any significant changes to the valuation techniques and inputs used to determine fair values.
NOTES TO THE CONSOLIDATED FINANCIAL STATEMENTS FOR THE YEAR ENDED 30 SEPTEMBER 2015 (CONTINUED)

Annual financial statements 2015 6766 QUANTUM FOODS
34. SEGMENT INFORMATIONManagement has determined the operating segments based on the reports reviewed on a regular basis by the CODM in order to make strategic decisions.
Operating segments are divided into the following:
• Eggs and layer livestock• Broilers• Animal feeds• Other African countries• Unallocated
Quantum Foods comprises eggs and layer livestock, broilers and animal feeds in South Africa and the businesses of Quantum Foods Zambia Ltd and Quantum Foods Uganda Ltd.
The nature of the Quantum Foods Zambia and Quantum Foods Uganda businesses operations are predominantly the production of animal feeds and the production and sale of commercial eggs and day-old chicks. These two entities are aggregated for segmental reporting as these entities are similar in nature.
The segment results disclosed per segment below is the CODM’s measure of each segment’s operational performance. The measure represents operating profit as per the statement of comprehensive income.
External revenue and all other items of income, expenses, profits and losses reported in the segment report is measured in a manner consistent with that in the statement of comprehensive income.
Segment assets consist of property, plant and equipment, intangible assets, inventories, biological assets, trade and other receivables and derivative financial instrument assets and exclude cash and cash equivalents, investment in associates and deferred and current income tax assets.
Segment liabilities consist of trade and other payables, provisions for other liabilities and charges and derivative financial instrument liabilities, and exclude current and deferred income tax liabilities.
Segment capital expenditure consists of additions and replacements of property, plant, equipment and intangible assets.
33. FINANCIAL RISK MANAGEMENT (CONTINUED)33.3 Fair value measurement (continued)
Financialinstrumentsinlevel3:Biologicalassets(continued)In measuring the fair value of biological assets, the following significant unobservable inputs were used:
Unobservable input Range of unobservable inputs
2015 2014
Layer livestockMarket price of day-old chicks R7.55 to R7.79 R7.35 to R7.42Market price of point-of-lay hens R49.93 to R52.36 R50.69 to R53.01Market price of culls R19.56 to R32.41 R21.78 to R23.92
Broiler livestockMarket price of day-old chicks R3.90 to R4.15 R3.90 to R4.20Market price of live birds R19.49 to R21.94 R19.70 to R20.31
Sensitivity analysisA sensitivity analysis of a 2% change in the market price, is shown for the significant unobservable inputs below:
Input SensitivityDay-old chick market prices A change in market price would result in a R0.7 million (2014: R0.7 million)
change in the fair value of poultry livestock.Point-of-lay hens market prices
A change in the market prices would result in a R2.3 million (2014: R2.9 million) change in the fair value of laying hens.
Cull market prices A change in the market prices would result in a R0.8 million (2014: R0.5 million) change in the fair value of laying hens.
Live-bird market prices A change in the market prices would result in a R0.8 million (2014: R0.7 million) change in the fair value of broiler livestock.
The effect of an increase in market prices will result in an increase in the fair value of the livestock.
The carrying amounts of cash and cash equivalents, trade and other receivables less provision for impairment, trade and other payables and short-term borrowings are assumed to approximate their fair values due to the short term until maturity of these assets and liabilities.
NOTES TO THE CONSOLIDATED FINANCIAL STATEMENTS FOR THE YEAR ENDED 30 SEPTEMBER 2015 (CONTINUED)

Annual financial statements 2015 6968 QUANTUM FOODS
2015 R’000
2014 R’000
34. SEGMENT INFORMATION (CONTINUED)Total segment liabilities 350 379 394 382
Eggs and layer livestock 84 456 62 202 Broilers 53 258 71 217 Animal feeds 150 890 200 448 Other African countries 18 686 13 123 Other 43 089 47 392
A reconciliation of the segments’ liabilities to the Group’s liabilities is provided below: Segment liabilities per segment report 350 379 394 382 Adjusted for:
Current and deferred income tax liabilities 217 140 191 042 Total liabilities per statement of financial position 567 519 585 424
Total segment capital expenditure (excluding business combinations) 63 712 44 552
Eggs and layer livestock 15 575 6 388 Broilers 2 335 18 450 Animal feeds 6 617 4 001 Other African countries 33 811 8 670 Other 5 374 7 043
Total segment capital expenditure (business combinations) 17 500 –
Eggs and layer livestock 17 500 –
Total assets held for sale 83 399 –Broilers 83 399 –
Total segment depreciation and amortisation 56 272 55 344 Eggs and layer livestock 24 676 21 936 Broilers 16 512 17 165 Animal feeds 7 682 8 736 Other African countries 7 402 7 507
2015 R’000
2014 R’000
34. SEGMENT INFORMATION (CONTINUED)Segment revenue 3 468 312 3 560 943
Eggs and layer livestock 1 154 315 1 086 619Broilers 1 034 834 1 241 320Animal feeds 1 099 905 1 080 880Other African countries 179 258 152 124
Segment results 164 062 (20 859)Eggs and layer livestock 40 571 (16 435)Broilers 39 706 (101 267)Animal feeds 65 493 60 889 Other African countries 25 286 35 114 Unallocated (6 994) 840
A reconciliation of the segment results to operating profit/(loss) before income tax is provided below:Segment results 164 062 (20 859)Adjusted for:
Investment income 9 886 5 899 Finance costs (1 887) (4 974)Share of profit of associate company 619 595
Profit/(loss) before income tax per statement of comprehensive income 172 680 (19 339)
Segment assets 1 885 064 1 931 964 Eggs and layer livestock 736 872 753 485 Broilers 568 344 596 920 Animal feeds 390 376 358 054 Other African countries 168 645 199 445 Other 20 827 24 060
A reconciliation of the segments’ assets to the Group’s assets is provided below: Segment assets per segment report 1 885 064 1 931 964 Adjusted for:
Investment in associate 6 731 6 112 Deferred income tax assets 2 788 3 051 Cash and cash equivalents 187 503 105 521
Total assets per statement of financial position 2 082 086 2 046 648
NOTES TO THE CONSOLIDATED FINANCIAL STATEMENTS FOR THE YEAR ENDED 30 SEPTEMBER 2015 (CONTINUED)
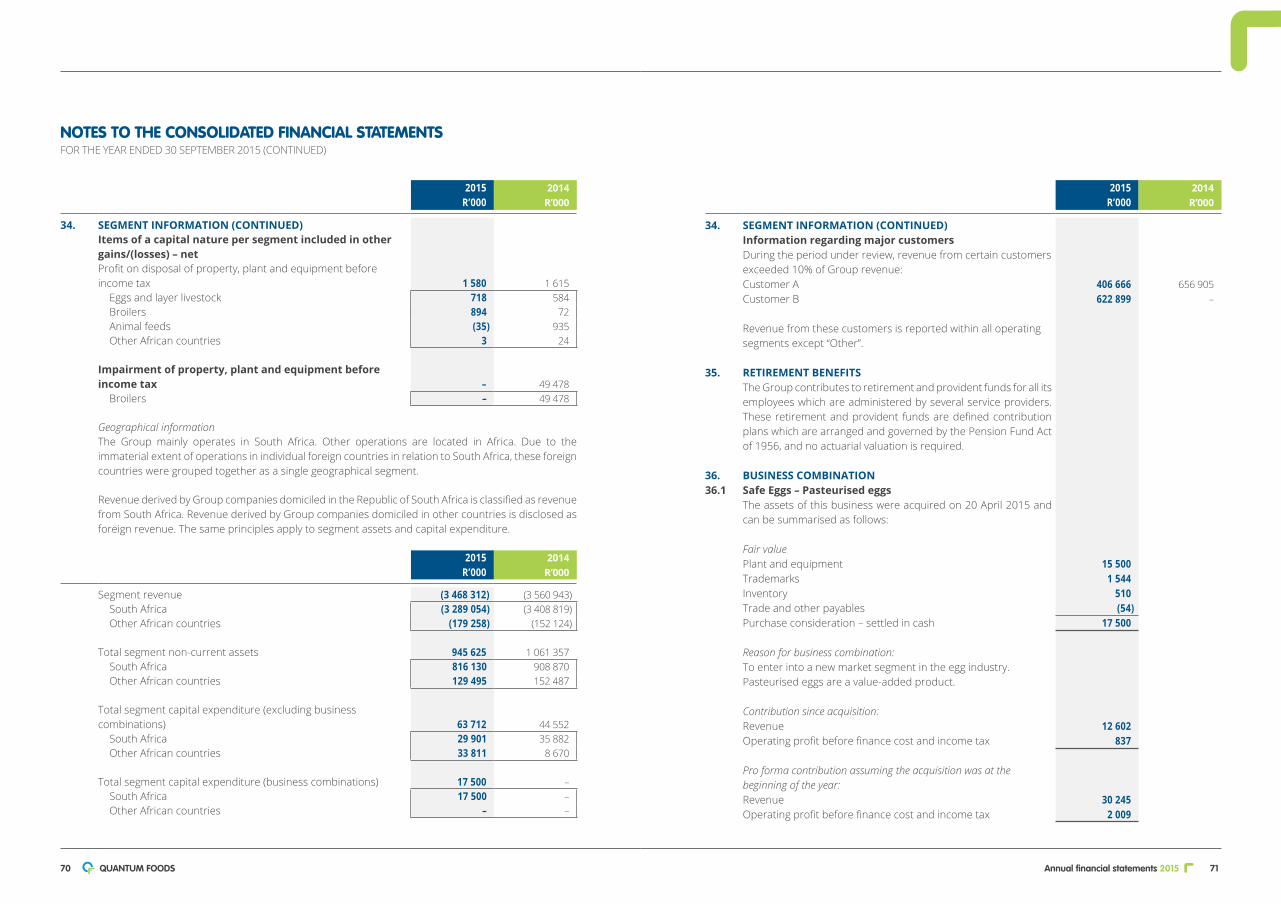
Annual financial statements 2015 7170 QUANTUM FOODS
2015 R’000
2014 R’000
34. SEGMENT INFORMATION (CONTINUED)Information regarding major customersDuring the period under review, revenue from certain customers exceeded 10% of Group revenue:Customer A 406 666 656 905 Customer B 622 899 –
Revenue from these customers is reported within all operating segments except “Other”.
35. RETIREMENT BENEFITSThe Group contributes to retirement and provident funds for all its employees which are administered by several service providers. These retirement and provident funds are defined contribution plans which are arranged and governed by the Pension Fund Act of 1956, and no actuarial valuation is required.
36. BUSINESS COMBINATION36.1 Safe Eggs – Pasteurised eggs
The assets of this business were acquired on 20 April 2015 and can be summarised as follows:
Fair value Plant and equipment 15 500 Trademarks 1 544 Inventory 510 Trade and other payables (54)Purchase consideration – settled in cash 17 500
Reason for business combination:To enter into a new market segment in the egg industry. Pasteurised eggs are a value-added product.
Contribution since acquisition:Revenue 12 602 Operating profit before finance cost and income tax 837
Pro forma contribution assuming the acquisition was at the beginning of the year:Revenue 30 245 Operating profit before finance cost and income tax 2 009
2015 R’000
2014 R’000
34. SEGMENT INFORMATION (CONTINUED)Items of a capital nature per segment included in other gains/(losses) – netProfit on disposal of property, plant and equipment before income tax 1 580 1 615
Eggs and layer livestock 718 584 Broilers 894 72 Animal feeds (35) 935 Other African countries 3 24
Impairment of property, plant and equipment before income tax – 49 478
Broilers – 49 478
Geographical informationThe Group mainly operates in South Africa. Other operations are located in Africa. Due to the immaterial extent of operations in individual foreign countries in relation to South Africa, these foreign countries were grouped together as a single geographical segment.
Revenue derived by Group companies domiciled in the Republic of South Africa is classified as revenue from South Africa. Revenue derived by Group companies domiciled in other countries is disclosed as foreign revenue. The same principles apply to segment assets and capital expenditure.
2015 R’000
2014 R’000
Segment revenue (3 468 312) (3 560 943)South Africa (3 289 054) (3 408 819)Other African countries (179 258) (152 124)
Total segment non-current assets 945 625 1 061 357 South Africa 816 130 908 870 Other African countries 129 495 152 487
Total segment capital expenditure (excluding business combinations) 63 712 44 552
South Africa 29 901 35 882 Other African countries 33 811 8 670
Total segment capital expenditure (business combinations) 17 500 –South Africa 17 500 –Other African countries – –
NOTES TO THE CONSOLIDATED FINANCIAL STATEMENTS FOR THE YEAR ENDED 30 SEPTEMBER 2015 (CONTINUED)

Annual financial statements 2015 7372 QUANTUM FOODS
38. EVENTS AFTER THE REPORTING PERIODDividendA final dividend of 10 cents per ordinary share has been declared for the year, on 23 November 2015. This will only be reflected in the statement of changes in equity in the next reporting period.
Additional information disclosed:These dividends are declared from income reserves and qualify as a dividend as defined in the Income Tax Act, Act 58 of 1962.
Dividends will be paid net of dividends tax of 15%, to be withheld and paid to the South African Revenue Service by the Company. Such tax must be withheld unless beneficial owners of the dividend have provided the necessary documentary proof to the relevant regulated intermediary that they are exempt therefrom, or entitled to a reduced rate as result of the double taxation agreement between South Africa and the country of domicile of such owner.
The net dividend amounts to 8.5 cents per ordinary share for shareholders liable to pay dividends tax. The dividend amounts to 10.0 cents per ordinary share for shareholders exempt from paying dividends tax.
The number of issued ordinary shares is 233 248 590 as at the date of this declaration.
There have been no other events that may have a material effect on the Group that occurred after the end of the reporting period and up to the date of approval of the consolidated annual financial statements by the Board.
39. GOING CONCERN STATEMENTThe Board has a reasonable expectation that the Group and its subsidiaries have adequate resources to continue in operational existence for the foreseeable future and continue adopting the going concern basis in preparing the financial statements.
37. ASSETS HELD FOR SALEThe Group’s shareholders were advised on SENS, on 11 May 2015, of an agreement entered into with Sovereign Food Investments Ltd, in terms of which the Group will dispose of the Tydstroom Abattoir business in Hartbeespoort, as a going concern. The Tydstroom Abattoir business in Hartbeespoort, relates to the slaughtering and processing of broilers for human consumption.
Accordingly, the Tydstroom Abattoir business in Hartbeespoort has been treated as an “asset held for sale” in terms of IFRS 5 – Non-current Assets Held for Sale and Discontinued Operations for the year ended 30 September 2015.
The disposal will result in the Group exiting the broiler meat market served from the Hartbeespoort abattoir in Gauteng. It will furthermore result in an aligned broiler business model for the Group in both the Western Cape and Gauteng, with the Group being a contract producer of live broilers and not participating directly in the broiler meat market.
The Group’s shareholders were advised on SENS, on 7 October 2015, that all of the conditions precedent to the sale have been fulfilled and accordingly the sale is unconditional, with an effective date of 19 October 2015.
2015 R’000
Assets of the disposal group classified as held for sale:Property, plant and equipment 83 399
83 399
NOTES TO THE CONSOLIDATED FINANCIAL STATEMENTS FOR THE YEAR ENDED 30 SEPTEMBER 2015 (CONTINUED)

Annual financial statements 2015 7574 QUANTUM FOODS
BasicsalaryR’000
Travel allowances
R’000
Bonuses andincentives
R’000
Retirementfund
contributionsR’000
Directors’fees
R’000 TotalR’000
40. REMUNERATION OF DIRECTORS AND PRESCRIBED OFFICERS30 September 2015Executive directorsHA Lourens 2 358 62 2 195 257 – 4 872 AH Muller 1 409 88 1 337 154 – 2 988 Total executive directors 3 767 150 3 532 411 – 7 860
Non-executive directorsWA Hanekom (1 October 2014)* – – – – 275 275 N Celliers – – – – 255 255 Prof. ASM Karaan – – – – 240 240 PE Burton – – – – 260 260 GG Fortuin (28 April 2015)* – – – – 110 110 LP Retief (19 February 2015)** – – – – 120 120 Total non-executive directors – – – – 1 260 1 260
Total directors 3 767 150 3 532 411 1 260 9 120
PrescribedofficersHE Pether 880 78 965 143 – 2 066 JJ Murray 1 395 250 1 471 112 – 3 228
2 275 328 2 436 255 – 5 294
Notes: * Appointed during the year. ** Resigned as director during the year.
NOTES TO THE CONSOLIDATED FINANCIAL STATEMENTS FOR THE YEAR ENDED 30 SEPTEMBER 2015 (CONTINUED)
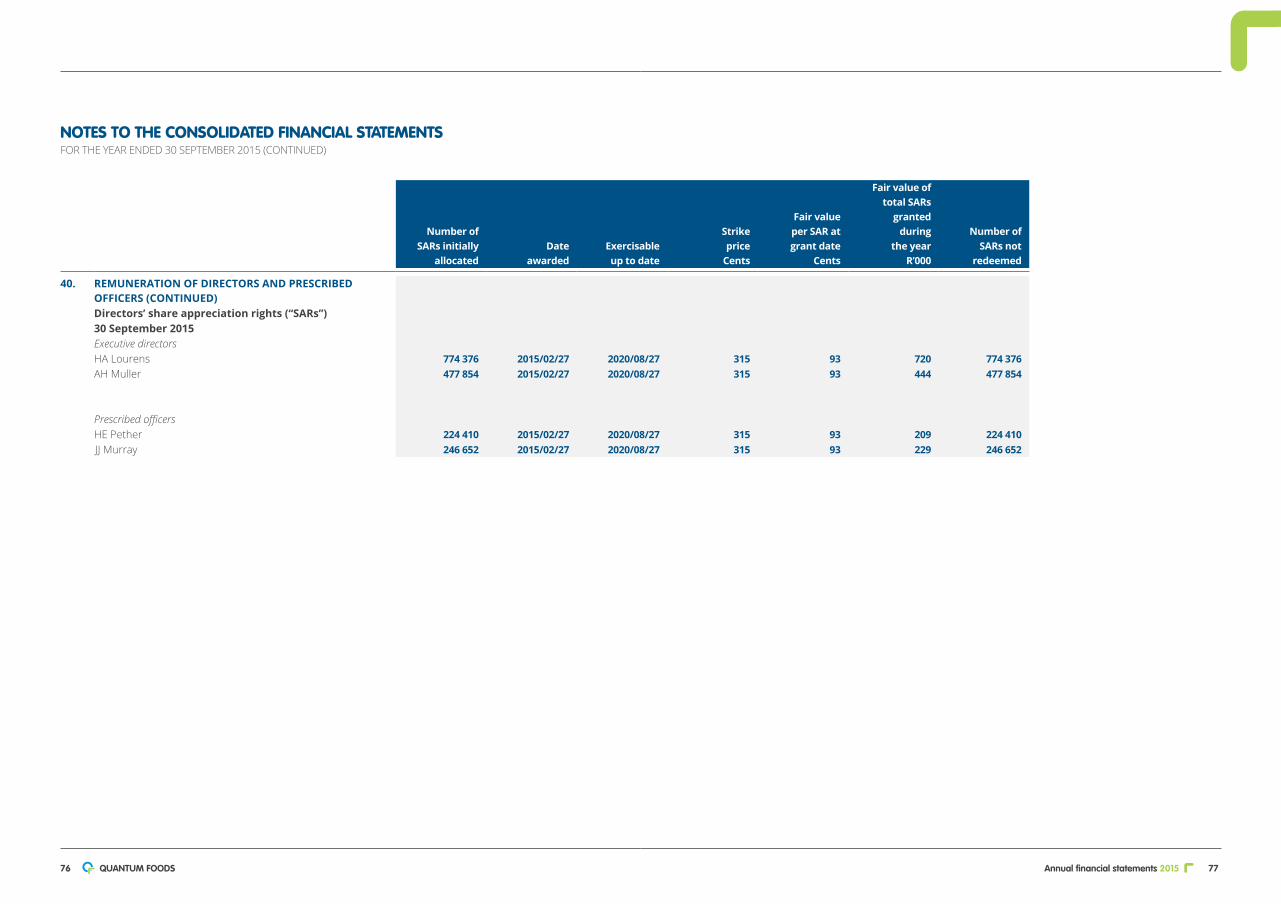
Annual financial statements 2015 7776 QUANTUM FOODS
NOTES TO THE CONSOLIDATED FINANCIAL STATEMENTS FOR THE YEAR ENDED 30 SEPTEMBER 2015 (CONTINUED)
Number of SARs initially
allocatedDate
awardedExercisableup to date
Strike price
Cents
Fair valueper SAR atgrant date
Cents
Fair value oftotal SARs
granted during
the yearR’000
Number ofSARs not
redeemed
40. REMUNERATION OF DIRECTORS AND PRESCRIBED OFFICERS (CONTINUED)Directors’ share appreciation rights (“SARs”)30 September 2015Executive directorsHA Lourens 774 376 2015/02/27 2020/08/27 315 93 720 774 376 AH Muller 477 854 2015/02/27 2020/08/27 315 93 444 477 854
PrescribedofficersHE Pether 224 410 2015/02/27 2020/08/27 315 93 209 224 410 JJ Murray 246 652 2015/02/27 2020/08/27 315 93 229 246 652
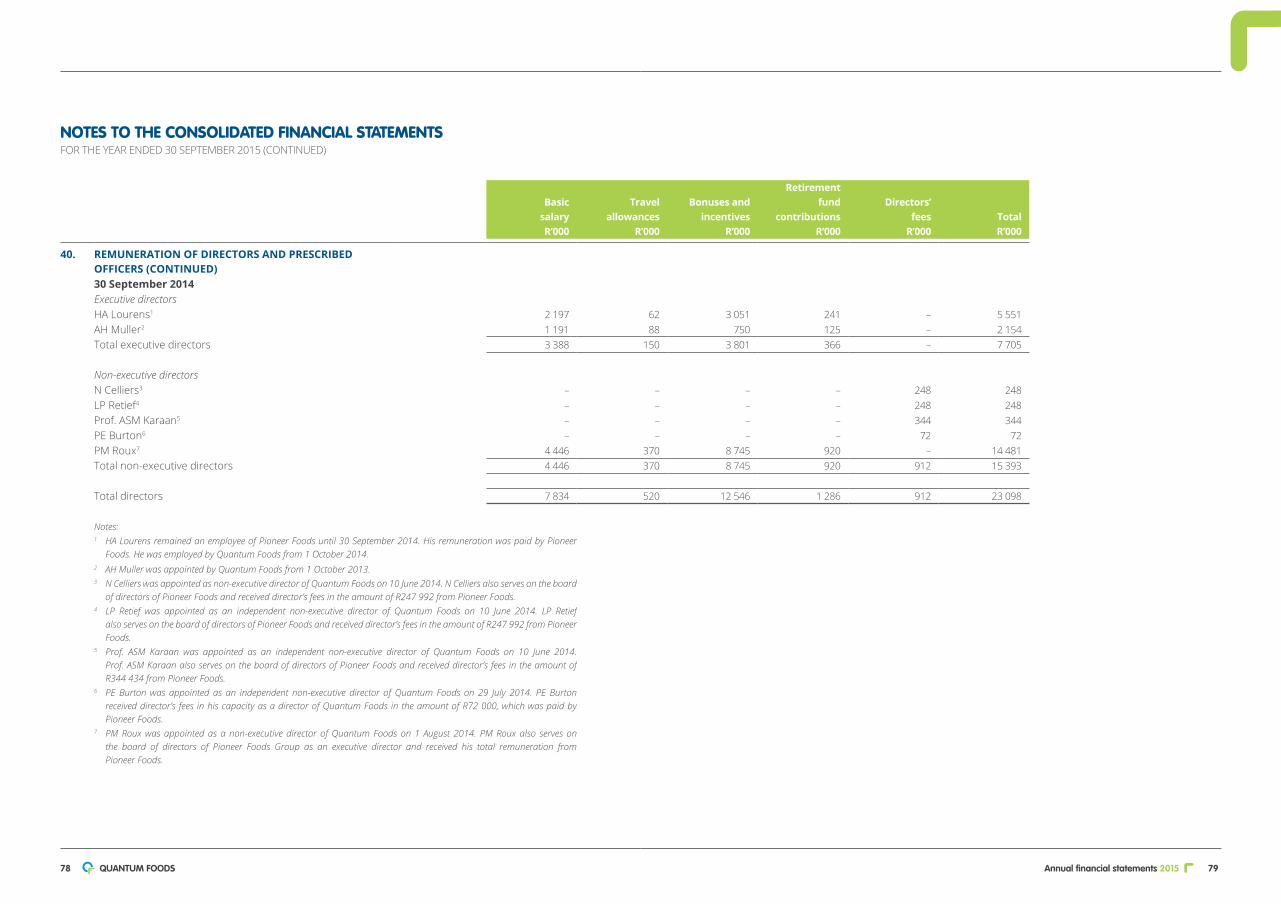
Annual financial statements 2015 7978 QUANTUM FOODS
BasicsalaryR’000
Travel allowances
R’000
Bonuses andincentives
R’000
Retirement fund
contributionsR’000
Directors’fees
R’000 TotalR’000
40. REMUNERATION OF DIRECTORS AND PRESCRIBED OFFICERS (CONTINUED)30 September 2014Executive directorsHA Lourens1 2 197 62 3 051 241 – 5 551 AH Muller2 1 191 88 750 125 – 2 154 Total executive directors 3 388 150 3 801 366 – 7 705
Non-executive directorsN Celliers3 – – – – 248 248 LP Retief4 – – – – 248 248 Prof. ASM Karaan5 – – – – 344 344 PE Burton6 – – – – 72 72 PM Roux7 4 446 370 8 745 920 – 14 481 Total non-executive directors 4 446 370 8 745 920 912 15 393
Total directors 7 834 520 12 546 1 286 912 23 098
Notes: 1 HALourensremainedanemployeeofPioneerFoodsuntil30September2014.HisremunerationwaspaidbyPioneer
Foods.HewasemployedbyQuantumFoodsfrom1October2014.2 AHMullerwasappointedbyQuantumFoodsfrom1October2013.3 NCellierswasappointedasnon-executivedirectorofQuantumFoodson10June2014.NCelliersalsoservesontheboard
ofdirectorsofPioneerFoodsandreceiveddirector’sfeesintheamountofR247992fromPioneerFoods.4 LP Retief was appointed as an independent non-executive director of Quantum Foods on 10 June 2014. LP Retief
alsoservesontheboardofdirectorsofPioneerFoodsandreceiveddirector’sfeesintheamountofR247992fromPioneerFoods.
5 Prof. ASM Karaan was appointed as an independent non-executive director of Quantum Foods on 10 June 2014. Prof.ASMKaraanalsoservesontheboardofdirectorsofPioneerFoodsandreceiveddirector’sfeesintheamountofR344434fromPioneerFoods.
6 PEBurtonwas appointed as an independent non-executive director ofQuantumFoods on29 July 2014. PEBurtonreceiveddirector’sfees inhiscapacityasadirectorofQuantumFoodsintheamountofR72000,whichwaspaidbyPioneer Foods.
7 PMRouxwasappointedasanon-executivedirectorofQuantumFoodson1August 2014.PMRouxalso serveson the board of directors of Pioneer Foods Group as an executive director and received his total remuneration from Pioneer Foods.
NOTES TO THE CONSOLIDATED FINANCIAL STATEMENTS FOR THE YEAR ENDED 30 SEPTEMBER 2015 (CONTINUED)

Annual financial statements 2015 8180 QUANTUM FOODS
Category
Numberof ordinary
shareholders% of
shareholders
Number of ordinary
shares
% of total ordinary
shares
42. SHAREHOLDER INFORMATIONShareholder spreadOrdinary sharesIndividuals 4 173 80 32 766 871 14Nominees and trusts 543 10 15 071 173 6Investment companies and corporate bodies 547 10 185 410 546 80
5 263 100 233 248 590 100
Non-public/public shareholdersPursuant to the JSE Listings Requirements and to the best knowledge of the directors, after reasonable enquiry, the spread of shareholders at 30 September 2015, is as follows:
Analysis of shareholding – ordinary shares
Public shareholdingMajor shareholdingAllan Gray (on behalf of clients) 1 – 34 653 506 14.9Coronation (on behalf of clients) 1 – 29 015 921 12.4Other shareholders 5 255 100 101 526 228 43.5
Non-public shareholdingMajor shareholdingZeder Investments Ltd 1 – 61 620 084 26.4Other shareholdersDirectors 5 – 6 432 851 2.8
5 263 100 233 248 590 100
41. DIRECTORS’ INTEREST IN SHARESThe direct and indirect interest of the directors in the issued share capital of the Company are reflected in the table below:
Number of shares#
Direct Indirect Total
% of issuedordinary share
capital
30 September 2015HA Lourens 402 005 – 402 005 0.172 AH Muller 131 079 – 131 079 0.056 WA Hanekom (1 October 2014)* – 5 810 620 5 810 620 2.491 N Celliers – – – –Prof. ASM Karaan – 86 147 86 147 0.037 PE Burton – 3 000 3 000 0.001 GG Fortuin (28 April 2015)* – – – –LP Retief (19 February 2015)** – – – –
533 084 5 899 767 6 432 851 2.758
As at 30 September 2014, no director had any beneficial interest, either directly or indirectly, in the issued share capital of the Company. At the date of the unbundling of the Group, and the separately listing of the Company on the JSE, the direct and indirect interest of the directors in the issued share capital of the Company are reflected in the table below:
10 October 2014HA Lourens 142 005 – 142 005 0.061 AH Muller 11 079 – 11 079 0.005 N Celliers – – – –LP Retief – – – –Prof. ASM Karaan – 86 147 86 147 0.037 PE Burton – 3 000 3 000 0.001 PM Roux (7 October 2014)** 9 631 – 9 631 0.004 WA Hanekom (1 October 2014)* 324 426 441 890 766 316 0.328
487 141 531 037 1 018 178 0.436
Notes: # Therehasbeennochange in thedirectors’ interest in shares fromtheendof thefinancial year to thedateof the
approvaloftheannualfinancialstatements.* Appointed during the year.** Resigned as director during the year.
NOTES TO THE CONSOLIDATED FINANCIAL STATEMENTS FOR THE YEAR ENDED 30 SEPTEMBER 2015 (CONTINUED)
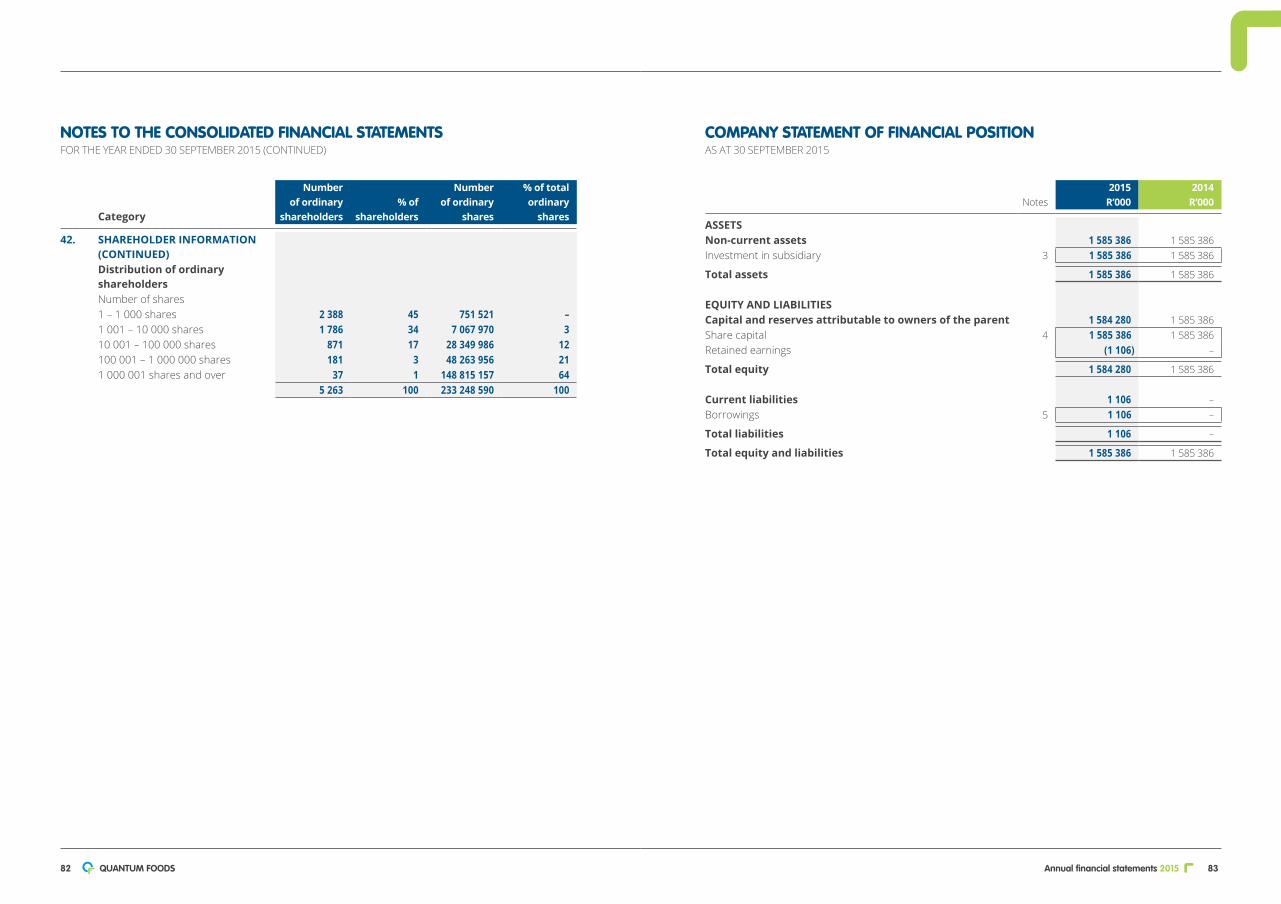
Annual financial statements 2015 8382 QUANTUM FOODS
Category
Numberof ordinary
shareholders% of
shareholders
Number of ordinary
shares
% of total ordinary
shares
42. SHAREHOLDER INFORMATION (CONTINUED)Distribution of ordinary shareholdersNumber of shares1 – 1 000 shares 2 388 45 751 521 –1 001 – 10 000 shares 1 786 34 7 067 970 310 001 – 100 000 shares 871 17 28 349 986 12100 001 – 1 000 000 shares 181 3 48 263 956 211 000 001 shares and over 37 1 148 815 157 64
5 263 100 233 248 590 100
NOTES TO THE CONSOLIDATED FINANCIAL STATEMENTS FOR THE YEAR ENDED 30 SEPTEMBER 2015 (CONTINUED)
Notes2015
R’000 2014
R’000
ASSETSNon-current assets 1 585 386 1 585 386 Investment in subsidiary 3 1 585 386 1 585 386
Total assets 1 585 386 1 585 386
EQUITY AND LIABILITIESCapital and reserves attributable to owners of the parent 1 584 280 1 585 386 Share capital 4 1 585 386 1 585 386 Retained earnings (1 106) –
Total equity 1 584 280 1 585 386
Current liabilities 1 106 –Borrowings 5 1 106 –
Total liabilities 1 106 –
Total equity and liabilities 1 585 386 1 585 386
COMPANY STATEMENT OF FINANCIAL POSITIONAS AT 30 SEPTEMBER 2015

Annual financial statements 2015 8584 QUANTUM FOODS
Notes2015
R’000 2014
R’000
Other income 6 1 008 –Administrative expenses (848) –Other operating expenses (1 266) –Operating loss 7 (1 106) –
Loss before income tax (1 106) –Income tax expense – –Loss for the year (1 106) –Other comprehensive income for the year – –Total comprehensive loss for the year (1 106) –
Loss for the year attributable to owners of the parent (1 106) –
Total comprehensive loss for the year attributable to owners of the parent (1 106) –
COMPANY STATEMENT OF CHANGES IN EQUITYFOR THE YEAR ENDED 30 SEPTEMBER 2015
Share capitalR’000
Retained earnings
R’000TotalR’000
Balance as at 1 October 2014 – – –Shares issued in acquisition of entities under common control 1 504 354 – 1 504 354 Shares issued during the reporting period 81 032 – 81 032 Balance as at 30 September 2014 1 585 386 – 1 585 386
Balance as at 1 October 2014 1 585 386 – 1 585 386 Comprehensive income: Loss for the year – (1 106) (1 106)Balance as at 30 September 2015 1 585 386 (1 106) 1 584 280
Note 4
COMPANY STATEMENT OF COMPREHENSIVE INCOMEFOR THE YEAR ENDED 30 SEPTEMBER 2015
Notes2015
R’000 2014
R’000
NET CASH FLOW FROM OPERATING ACTIVITIES (1 106) –Net cash loss from operating activities 9 (1 106) –
NET CASH FLOW FROM INVESTING ACTIVITIES – (1 585 386)Net acquisition of subsidiaries 3 – (1 585 386)
Net cash deficit (1 106) (1 585 386)
NET CASH FLOW FROM FINANCING ACTIVITIES 1 106 1 585 386 Loan received from related party 5 1 106 –Proceeds from issue of ordinary shares – 1 585 386
Net increase in cash and cash equivalents – –Net cash and cash equivalents at beginning of year – –
Net cash and cash equivalents at end of year – –
COMPANY STATEMENT OF CASH FLOWSFOR THE YEAR ENDED 30 SEPTEMBER 2015

Annual financial statements 2015 8786 QUANTUM FOODS
2015 R’000
2014 R’000
1. ACCOUNTING POLICIESThe Company applies the same principal accounting policies as the Group in the preparation of these financial statements. Refer to note 1 of the Group financial statements.
2. CRITICAL ACCOUNTING ESTIMATES AND JUDGEMENTSThe Company applies the same accounting estimates and judgements as the Group. Refer to note 2 of the Group financial statements.
3. INVESTMENT IN SUBSIDIARIESCost of sharesQuantum Foods (Pty) Ltd 1 585 386 1 585 386
1 585 386 1 585 386
The Company holds a 100% interest in the subsidiary listed above.
The subsidiary is incorporated in South Africa.
4. SHARE CAPITALAuthorised – ordinary shares400 000 000 (2014: 400 000 000) ordinary no par vale shares 400 000 000 400 000 000
Issued and fully paid – ordinary shares233 248 590 (2014: 233 284 332) ordinary no par value shares 1 585 386 1 585 386
During the reporting period, 35 742 shares held by Pioneer Foods were cancelled before the listing of the Company on 6 October 2014. These shares were cancelled to ensure a equal 1:1 unbundling of shares at the listing.
5. BORROWINGSLoan from Quantum Foods (Pty) LtdBeginning of year – –Loans advanced during the year 2 114 –Loans repaid during the year (1 008) –End of year 1 106 –
Unsecured interest-free loan with no fixed terms of repayment.
NOTES TO THE COMPANY FINANCIAL STATEMENTSFOR THE YEAR ENDED 30 SEPTEMBER 2015
2015 R’000
2014 R’000
6. OTHER INCOMEAdministration fees received 1 008 –
7. OPERATING LOSSThe operating loss is calculated after taking into account other income (refer to note 6), as well as the following:Auditors’ remuneration 10 –Listing fees and shareholder communication 838 –Directors’ remuneration 1 266 –
8. INCOME TAX EXPENSECurrent income tax
Current year – –
% %
Standard rate for companies 28.0
Non-deductible expenditure (28.0)–
R’000 R’000
9. CASH PROFIT FROM OPERATING ACTIVITIESReconciliation of loss before tax and cash loss from operating activities:Loss before income tax (1 106)