Embed Size (px)
Citation preview

Annual Report 2012
For
per
sona
l use
onl
y

Core purpose 01
Our investment approach 03
Highlights 04
Letter from the Chairman 05
Financial summary 06
Manager’s report 07
Outlook 09
Our property portfolio 10
Sustainability 15
Directors and senior management 18
Corporate governance 20
Financial statements 25
Investor information 65
Directory 65
Contents
Cover image: Bunnings Warehouse, Harrisdale, WAwww.bwptrust.com.au
BWP Trust ARSN 088 581 097
Responsible Entity BWP Management Limited ABN 26 082 856 424
Australian Financial Services Licence No. 247830
For
per
sona
l use
onl
y

1BWP TRuST AnnuAl RepoRt 2012
Cover image: Bunnings Warehouse, Harrisdale, WA Bunnings Warehouse & Bulky Goods Showrooms, Browns Plains, QLD
Core purpose
BWP Trust aims to provide a premium commercial real estate investment product, delivering unitholders a secure and growing income stream and long-term capital growth
For
per
sona
l use
onl
y

2BWP TRuST AnnuAl RepoRt 2012
For
per
sona
l use
onl
y

3BWP TRuST AnnuAl RepoRt 2012
Our investment approach
Strategies> Drive better returns from existing
assets through focused and pro-active
asset management
> Generate growth by acquiring quality
commercial properties that meet
the Trust’s investment criteria
> Deliver efficiency, sustainability and
value through effective management
of the Trust and its capital
Investment criteria> Ample land area (average 3 hectares)
> Visible and accessible from a major
road, highway or freeway
> Ready vehicle access and ample
on-site parking
> Significant catchment area
> Offers geographic diversity
> Long-term lease (or re-leasing potential)
> Financially substantial tenant in an
economically, socially and
environmentally sustainable business
> Includes sustainability measures or
prospects
The Trust’s investments comprise commercial real estate - predominantly warehouse retailing properties and, in particular, Bunnings Warehouse properties. Investments are made on behalf of the Trust by the responsible entity, according to the following strategies and investment criteria:
Bunnings Warehouse, Frankston, VIC
For
per
sona
l use
onl
y

4BWP TRuST AnnuAl RepoRt 2012
> Three Bunnings Warehouse properties acquired, two Bunnings Warehouses developed on existing Trust-owned land and an upgrade of one of the existing Bunnings Warehouses completed
> Net Tangible Assets of $1.85 per unit at 30 June 2012 (2011: $1.90 per unit)
> Weighted Average Lease Expiry of 7.7 years at 30 June 2012 (2011: 8.6 years)
> Gearing (debt/total assets) 21.6 per cent at 30 June 2012 (2011: 17.0 per cent)
> Income of $102.1 million for the year – up 19.7 per cent on the previous year
> Full-year distribution per unit of 14.67 cents (including 1.17 cents capital profit from the sale of an investment property) – up 22.5 per cent on the previous year. (13.50 cents per unit excluding capital profit – up 13.5 per cent on the previous year)
> Market rent reviews on six properties completed during the year - average 6.7 per cent increase in annual rent
Highlights
BWP total returns compared to market Periods ended 30 June
BWp trust (BWp)
ASX All ordinaries Accumulation Index
S&p/ASX 200 property Accumulation Index
S&p/ASX 300 property Accumulation Index
uBS Retail 200
total returns include distributions and movement in price (assumes distributions are reinvested). Source: uBS 1annual compound returns
10
15
-10
-15
5
-5
0 %
One Year Three Years1 Five Years1 Ten Years1
BWP
BWP BWP
BWP
Distributable profit of $76.7 million for the year, including a $6.2 million distribution of capital profits from the sale of an investment property, up 35.7 per cent on the previous year
For
per
sona
l use
onl
y

5BWP TRuST AnnuAl RepoRt 2012
Letter from the Chairman
Dear unitholderon behalf of the board of directors of BWp Management limited, the responsible entity for BWp trust, it is my pleasure to present the trust’s 2012 annual report.
In a year that most will describe as being “challenging”, we are pleased to demonstrate in this report BWp’s ability to continue to provide unitholders with a secure and growing income stream and long-term capital growth. the trust’s resilient unit price (shown in the chart on the following page) and growth in distributions per unit are underpinned by the quality of BWp’s properties, the remarkable performance and strength of the trust’s main tenant, Bunnings, and careful management of the trust’s capital.
We continued to build on the trust’s quality portfolio of Bunnings Warehouses during the year - adding five Bunnings Warehouse stores through acquisitions and developments (two of which have adjoining bulky goods showrooms) and completing the upgrade of one of the trust’s existing Bunnings Warehouses.
During the year we also sold a Bunnings Warehouse that was developed as one of the trust’s early properties. In our view this property had achieved optimal value and its sale represented an opportunity to realise the capital growth for distribution to unitholders and to reinvest the balance of the proceeds back into the portfolio. As the portfolio matures and increases in size, a more active approach to asset management is appropriate and we will continue to look at suitable properties worth acquiring as well as properties worth selling.
total returns for the year (distributions and movement in unit price) of 10.3 per cent were slightly below the benchmark S&p/ASX 200 A-ReIt accumulation index return of 11.0 per cent. over the longer term, however, the trust continues to outperform the market, as the chart on the previous page shows. In our view, it is this longer-term outperformance that measures our achievement of the trust’s core purpose of providing unitholders with a secure and growing income stream and long-term capital growth.
It is a longer-term view that also motivates our efforts in improving our approach to sustainability. While we consider that the sustainability impacts and risks associated with the trust are relatively modest we recognise the increasing imperative of understanding, acting on and reporting on sustainability issues. During the year we received recognition for our climate change disclosure by being included in the 2011 Carbon Disclosure leadership Index for Australia and new Zealand, as part of the global Carbon Disclosure project initiative. the separate sustainability section in this annual report provides more detail about this and our other endeavours.
looking forward, we expect difficult economic and political conditions globally will continue to create volatility and uncertainty that will constrain growth both overseas and to a lesser extent in Australia. BWp remains well placed to benefit from a lower interest rate environment, which provides a lower cost base and improves the affordability of improving existing properties and selective acquisitions.
Finally, I would like to express my appreciation to my fellow directors and management for their efforts during the year and thank our unitholders for their continued support of the trust.
J A Austin Chairman BWp Management limited
In our view, it is longer-term outperformance that measures our achievement of the Trust’s core purpose of providing unitholders with a secure and growing income stream and long-term capital growth
For
per
sona
l use
onl
y

6BWP TRuST AnnuAl RepoRt 2012
Year ended 30 June 2012 2011 2010 2009 2008
total income $m 102.1 85.3 78.5 73.2 65.9
net profit/(loss) $m 69.9 81.5 92.2 (11.7) 0.7
unrealised loss/(gain) in fair value of investment properties $m 0.6 (25.3) (41.8) 52.1 39.3
net realised profit on sale of investment property1 $m 6.2 0.4 - - -
Distributable profit $m 76.7 56.6 50.4 40.52 40.0
Distribution per ordinary unit interim cents 6.63 6.18 6.10 6.70 6.55
final cents 8.04 5.80 5.98 4.87 6.72
total cents 14.67 11.98 12.08 11.57 13.27
tax advantaged component % 19.36 22.60 23.93 28.07 23.55
total assets $m 1,335.2 1,242.1 1,026.4 999.9 979.9
Borrowings $m 288.9 210.8 193.5 225.9 308.5
unitholders’ equity $m 974.0 986.3 792.8 733.0 638.8
Gearing (debt to total assets) % 21.6 17.0 18.8 22.6 31.5
number of units on issue m 525 520 421 410 301
number of unitholders 14,924 13,958 12,507 12,583 12,471
net tangible asset backing per unit $ 1.85 1.90 1.88 1.79 2.12
unit price at 30 June $ 1.87 1.83 1.863 1.613 1.633
Management expense ratio4 (annualised) % 0.58 0.67 0.66 0.67 0.651 net sale proceeds less original purchase price and capital expenditure since acquisition2 adjusted for rounding3 prior years adjusted to reflect effect of $150 million capital raising in March 2011 (Source: Reuters)4 expenses other than property outgoings and borrowing costs as a percentage of average total assets
Financial performance
Source: Reuters
Financial summary
Distribution per unit (cents per unit)
BWP unit price vs market indices
Unitholders’ equity ($ million)
638.8
733.0
792.8
986.3
974.0
-20
-15
-10
-5
0
5
10
S&P/ASX 200 A-REIT
BWP
ALL ORDINARIES
4.07
-11.25
2.53
%
Jun 2011
13.27
11.57
12.08
11.98
14.67
FY08
FY10
FY09
FY11
FY12
FY08
FY10
FY09
FY11
FY12
Sep 2011 Dec 2011 Mar 2012 Jun 2012
For
per
sona
l use
onl
y

7BWP TRuST AnnuAl RepoRt 2012
Manager’s Report
Financial resultstotal income for the full-year to 30 June 2012 was $102.1 million, up by 19.7 per cent from last year. the increase in income was mainly due to growth of the property portfolio during or since last year - from acquisitions and improvements to investment properties (adding approximately $14.2 million) and rent reviews and other property income (adding approximately $3.4 million during the year). on a like-for-like basis, excluding rental income from properties acquired or upgraded during or since last year, rental income increased by approximately 3.7 per cent from last year.
Finance costs of $20.5 million were 7.5 per cent higher than last year, with average borrowings 29.1 per cent higher at $250.6 million compared with $194.2 million for 2011. Interest payments on borrowings totalled $13.5 million, including payments made under interest rate swap arrangements. this is 12.9 per cent higher than last year due to the higher average level of borrowings, which was partially offset by lower interest rates and lower average fixed rates of interest on interest rate swaps. Bank fees and margins were approximately 1.7 per cent lower as a result of restructuring existing bank debt facilities (refer to the Capital management section on page 8). the average rate of net borrowings (finance costs less finance income/average borrowings) was 7.99 per cent, compared with 9.23 per cent for the previous year.
Distributable profit for the year was $76.7 million, an increase of 35.7 per cent on the distributable profit last year. Distributable profit for the year ended 30 June 2012 excludes the unrealised net loss of $0.6 million on the revaluations of the fair value of the portfolio at 30 June 2012, but includes a capital distribution of $6.2 million on the sale of one of the trust’s properties (see revaluations section in our property portfolio).
the management expense ratio for the year ended 30 June 2012 (expenses other than property outgoings and borrowing costs as a percentage of average total assets) was 0.58 per cent (2011: 0.67 per cent). the reduction in the ratio was due to the waiver of management fees on a portfolio of
properties acquired from Bunnings Group limited (“Bunnings”), most of which settled during the year or late the previous year. the management expense ratio is expected to increase in the year ending 30 June 2013 as the waiver of management fees on the portfolio acquired from Bunnings is reduced from 100 to 50 per cent.
At 30 June 2012 the trust’s total assets were $1,335.2 million (2011: $1,242.1 million) with unitholders’ equity of $974.0 million and total liabilities of $361.2 million. Investment properties made up the majority of total assets, comprising $1,306.6 million (2011: $1,225.9 million). Details of investment properties are contained in the our property portfolio section at pages 10 to 14.
the underlying net tangible asset backing of the trust’s units (“ntA”) at 30 June 2012 was $1.85 per unit, a decrease of 1.1 per cent from $1.87 per unit at 31 December 2011 (30 June 2011: $1.90 per unit). the decrease in ntA over the six months to 30 June 2012 is due to the reduction in net assets following the distribution of $6.2 million of capital profit on the sale of an investment property and the increase in interest rate swap liabilities during the period.
the trust’s gearing ratio (debt to total assets) at 30 June 2012 was 21.6 per cent (2011: 17.0 per cent), which is at the lower end of the board’s preferred range of 20 to 30 per cent. Covenant gearing (debt and non-current liabilities to total assets) was 22.8 per cent (2011: 17.1 per cent). the interest cover ratio (earnings before interest and tax/interest expense) was 4.5 times (2011: 4.1 times).
Distribution to unitholdersthe trust pays out 100 per cent of distributable profit each period, in accordance with the requirements of the trust’s constitution. A final distribution of 8.04 cents per ordinary unit (including a distribution of capital profits of 1.17 cents per unit on the sale of an investment property) has been declared and will be made on 29 August 2012 to unitholders on the trust’s register at 5:00 pm on 29 June 2012.
the final distribution takes the total distribution for the year to 14.67 cents per unit (2011: 11.98 cents per unit). the tax
Acquisitions, improvements to an existing investment property and rent reviews have contributed to a 19.7 per cent growth in revenue. The growth in revenue, combined with a 13.4 per cent reduction in the average rate of net borrowings and the distribution of 1.17 cents per unit of the capital profit from the sale of an investment property increased the distributions per unit to 14.67 cents, 22.5 per cent higher than last year
For
per
sona
l use
onl
y

8BWP TRuST AnnuAl RepoRt 2012
advantaged component of the distribution is 19.36 per cent, which is lower than in the past due to the capital gain on the sale of an investment property during the year.
units issued under the trust’s Distribution Reinvestment plan (“DRp”) in respect of the final distribution will be issued at $1.8868 per unit, representing the volume weighted average price of the trust’s units for the 10 trading days following the record date, with no discount applied.
Capital managementDuring the year, the trust extended the duration of $230 million of the trust’s existing $330 million bilateral bank facilities to five-year terms, expiring late 2016 and early 2017 and secured an additional $100 million, also for a five-year term. the refinancing has provided the trust with greater certainty and access to funding for existing and future requirements. As at 30 June 2012, the weighted average duration of the trust’s debt facilities was 3.8 years (2011: 2.4 years) to expiry. Average utilisation of debt facilities (average borrowings/average facility limits) for the year was 66.7 per cent (2011: 58.8 per cent).
Details of the trust’s current debt facilities are provided below.
Bank facilities as at 30 June 2012
Limit
$m
Amount drawn1
$m Expiry date
Australia and new Zealand Banking Group limited 150.0 88.0 23 January 2017
Commonwealth Bank of Australia 100.0 73.3 14 January 2014
Westpac Banking Corporation 180.0 128.5 22 December 2016
430.0 289.8
1 amount drawn includes accrued interest and borrowing costs of $0.9 million as at 30 June 2012
the DRp was in place for both the interim distribution and final distribution for the year ended 30 June 2012. the trust has continued to maintain an active DRp as a component of longer-term capital management and to allow unitholders flexibility in receiving their distribution entitlements. the DRp provides a measured and efficient means of accessing additional equity capital from existing eligible unitholders.
In order to reduce the volatility of borrowing costs due to changes in market interest rates, the trust takes out interest rate swaps (hedging) to fix the interest costs of the majority of borrowings over the medium to long-term. At 30 June 2012, the trust’s interest rate hedging cover was 65.6 per cent of borrowings, with $190.0 million interest rate swaps against interest bearing debt of $289.8 million. the weighted average term to maturity of hedging was 4.05 years, including delayed start swaps.
Due to the accounting requirement to mark the value of interest rate hedges to market, the trust’s hedging liabilities increased
to approximately $16.0 million as at 30 June 2012 (2011: $1.3 million). the increase in hedging liability during the year was due to falls in interest rates over the past year. the hedging liability assesses the potential liability if all hedges were to be terminated at 30 June 2012, although this amount is not likely to be realised and the fair value of each interest rate swap (as a liability or asset) is expected to return to zero as it runs its full term.
During the year, management reviewed the trust’s hedging arrangements, including the opportunity to either: terminate the trust’s current swap arrangements and enter into new interest rate swaps at a lower fixed interest rate; or extend existing swaps by “blending” them with new swaps. neither of these options is considered to offer a material benefit to unitholders over time. However, management took advantage of lower forward interest rates by taking out four delayed-start swaps totalling $50 million to extend the duration of the existing hedging arrangements.
OperationsFurther information regarding the operations of the trust is included in the outlook, our property portfolio, and Sustainability sections on pages 9 to 17.
Grant Gernhoefer General Manager BWP Management Limited
Manager's report (continued)F
or p
erso
nal u
se o
nly

9BWP TRuST AnnuAl RepoRt 2012
Outlook
Recent refinancing of existing bank debt facilities has secured longer-dated and increased limits of debt funding, providing a secure funding platform from which to finance existing operations and growth opportunities. the renewed bank facilities also provide flexibility in the timing and ability to access alternative sources of debt capital to diversify and increase the duration of the trust’s funding base.
the average rate of net borrowings has reduced as a result of increased utilisation of debt facilities and lower interest rates. the responsible entity will continue to manage debt limits to balance the need for financial flexibility by maintaining sufficient liquidity and cost efficiency by not holding excess funding capacity. Interest rate hedging levels are now within the trust’s target range of 50 to 75 per cent of borrowings and management will aim to maintain hedging within this range, while taking advantage of lower longer-term swap rates to provide additional duration and improve the overall fixed rate of borrowings over time.
property income is expected to increase for 2012/13 as a result of a full year of rental income received from recent additions to the property portfolio. Recent additions include the Bunnings Warehouses with adjoining bulky goods/retail showrooms at Browns plains and Dubbo, new Bunnings Warehouses developed at Greenacre and Harrisdale, and completion of the upgrade to the Bunnings Warehouse at Scoresby. Additional rental growth is expected from 13 market rent reviews likely to be finalised during the year and annual CpI or fixed reviews on the balance of the portfolio.
the continued expansion by Bunnings of its store network and ongoing investment in its existing stores may generate further upgrades of some of the trust’s existing properties and possibly opportunities for the trust to acquire additional quality Bunnings Warehouses. Also as the portfolio matures, the responsible entity will continue to assess potential divestments, such as the Hoppers Crossing Bunnings Warehouse sold during the year. While no divestments are imminent, consideration will be given to divesting properties that have reached optimum value and selling provides an opportunity to recycle capital to be reinvested in the portfolio and potentially realise capital profit for distribution to unitholders.
Two main themes for the Trust’s operations will continue in the short-term: capital management to improve the efficiency, security and flexibility of funding; and asset management to continue to drive growth and value from existing properties and add quality new properties to the portfolio selectively
Bunnings Warehouse, Midland, WA
For
per
sona
l use
onl
y

10BWP TRuST AnnuAl RepoRt 2012
Our property portfolio
Property acquisitions/divestments
Acquisition of two properties from Bunnings In March 2011, unitholders approved a proposal to acquire from Bunnings a portfolio of ten operational Bunnings Warehouses, for lease back to Bunnings, and three properties on which Bunnings will develop Bunnings Warehouses. As at 30 June 2011, the trust had settled 10 of the 13 properties.
the settlement of two further properties was completed during the year ended 30 June 2012. A property at Dubbo, new South Wales, comprising a Bunnings Warehouse and two other retail tenancies, settled on 5 August 2011, with total costs of $16.8 million including acquisition costs. on 7 May 2012, a Bunnings Warehouse at Craigieburn in Melbourne’s north settled, with total costs of $19.5 million including acquisition costs. the commencing annual rentals received by the trust from the properties are $1.3 million for Dubbo and $1.4 million for Craigieburn. Rents for the Bunnings Warehouses at both properties will escalate by three per cent per annum for the initial ten-year term and will then be subject to a market rent review.
the settlement of the last of the 13 properties in the portfolio, a development site at Wallsend, new South Wales, on which a Bunnings Warehouse is to be developed, has been delayed due to negotiations between Bunnings and the vendor and development approvals taking longer than anticipated. originally expected to be finalised by June 2012, settlement of the development site is now anticipated to occur prior to 31 December 2012, following the issue of a new certificate of title.
Bunnings Warehouse and bulky goods showrooms, Browns Plains, QueenslandIn April 2012, the trust purchased an established Bunnings Warehouse and three bulky goods showrooms in the Brisbane suburb of Browns plains, Queensland. the property was acquired from an institutional owner for $25.4 million (including acquisition costs). the 4.7 hectare property is situated on the corner of Browns plains Road and Commerce Drive in Browns plains, approximately 25 kilometres south of the Brisbane central business district.
the property comprises a total lettable area of 18,704 square metres with approximately 533 car parking spaces. the annual rental of the property at the date of acquisition was $2.6 million.
Bunnings Warehouse, Hoppers Crossing, VictoriaIn June 2012, the trust sold the Bunnings Warehouse at Hoppers Crossing, Victoria. the sale price of $14.6 million realised a capital profit of $6.2 million, resulting in a distribution to unitholders of 1.17 cents per unit, to be paid as part of the final distribution for the year ended 30 June 2012. the annual rental of the property at the date of transfer to the new owner was $1.2 million.
Portfolio at a glance 2012 2011 2010 2009 2008
Bunnings Warehouses 62 60 52 52 50
Bunnings Warehouse with other showrooms 4 2 1 1 1
Bunnings Warehouse development sites 1 3 1 1 2
Bunnings Distribution Centre 1 1 1 1 2
Bulky goods showrooms 1 1 1 1 1
Industrial properties 3 3 4 4 4
total BWp portfolio 72 70 60 60 60
Annual capital expenditure $95.7m $207.9m $2.7m $45.4m $51.4m
The Trust comprises predominantly warehouse retailing properties, particularly Bunnings Warehouse properties tenanted by Bunnings, a wholly owned subsidiary of Wesfarmers Limited (“Wesfarmers”). As at 30 June 2012 the Trust owned 72 investment properties, all within Australia, with a total value of $1,306.6 million and a weighted average lease expiry of 7.7 years (compared with 8.6 years at 30 June 2011)
For
per
sona
l use
onl
y

11BWP TRuST AnnuAl RepoRt 2012
Developments and upgrades
Completion of development of Bunnings Warehouse, Greenacre, New South WalesIn April 2012, construction of the trust’s Bunnings Warehouse at Greenacre, new South Wales, was completed at a cost to the trust of $16.8 million. the trust purchased the Greenacre development site for $14.1 million (including acquisition costs) as part of the portfolio acquired from Bunnings in February 2011. the commencing annual rental received by the trust is approximately $2.2 million, which will escalate annually by three per cent for the initial ten-year term and will then be subject to a market rent review.
Completion of development of Bunnings Warehouse, Harrisdale, Western AustraliaIn october 2011, construction of the trust’s Bunnings Warehouse at Harrisdale, Western Australia, was completed at a cost to the trust of $8.6 million. the trust purchased the Harrisdale development site for $10.6 million (including acquisition costs) as part of the portfolio acquired from Bunnings in February 2011. the commencing annual rental received by the trust is approximately $1.4 million, which will escalate annually by three per cent for the initial ten-year term and will then be subject to a market review.
Completion of upgrade of Bunnings Warehouse, Scoresby, VictoriaIn June 2012, a $5.8 million upgrade of the trust’s Scoresby Bunnings Warehouse was completed by Bunnings for the trust. the upgrade extended the fully-enclosed covered area by 3,477 square metres. the annual rental increased by approximately $492,000 to $1,763,000 per annum.
Following completion of the upgrade, the parties entered into a new ten-year lease of the Bunnings Warehouse with two five-year options, exercisable by the tenant. the rent will be reviewed to market every five years and by the Consumer price Index (“CpI”) every other year. the rent at each market rent review is to be no less than the rent in the preceding year. All other terms and conditions of the existing lease will remain the same.
Commitment to upgrade Bunnings Warehouse, Fyshwick, Australian Capital TerritoryIn the year ending 30 June 2011, the trust committed to upgrade its Bunnings Warehouse at Fyshwick, Australian Capital territory, at an estimated cost of $15.0 million. the
upgrade, utilising the 1.0 hectare site adjoining the Bunnings Warehouse acquired by the trust in December 2005, increased the fully-enclosed covered area by 4,642 square metres and was expected to be completed in the latter half of the 2012 calendar year.
the upgrade was conditional on receiving an acceptable development approval, which has not been satisfied. Discussions relating to the upgrade are ongoing and Bunnings has exercised its five-year option to continue on at the existing Bunnings Warehouse.
Other improvementsDuring the year, the trust incurred a cost of $2.4 million for roof access and safety improvements to a number of properties. the works generally comprised improving internal access to the rooves with better stairways, roof hatches and landings and installing or improving walkways to areas on the roof requiring regular or periodic access. these works are to improve safety and working conditions, and reduce damage to the roof. the trust will receive no additional income from these improvements.
Approximately $0.4 million was spent on various other non-income producing improvements to the portfolio during the year.
Rent reviewsthe rent payable for each leased property is increased annually, either by a fixed percentage or by the CpI, except when a property is due for a market review. Market reviews occur for most of the trust’s Bunnings Warehouses every five years from the date of the commencement of the lease. the market rental is determined according to generally accepted rent review criteria, based on rents paid at comparable properties in the market.
During the year, 67 leases in the portfolio had annual fixed or CpI increases, resulting in an average increase of 3.4 per cent in the annual rent for these properties.
Market rent reviews were completed on six properties during the year. Market rent reviews for two of the trust’s Bunnings Warehouses due during the year (Geraldton, Western Australia and oakleigh South, Victoria) have been referred to determination by independent valuers and were not completed by 30 June 2012.
the results of the completed market rent reviews are shown in the table below.
Property location Tenant Passing rent Market review1 Uplift Effective date
($ pa) ($ pa) (%)
Midland, WA Bunnings 1,377,469 1,510,000 +9.6 5 Sep 11
Mindarie, WA Bunnings 1,332,855 1,510,000 +13.3 5 Sep 11
Croydon, VIC Bunnings 1,561,504 1,725,000 +10.5 31 oct 11
Coffs Harbour, nSW Bunnings 819,789 827,500 +0.9 26 nov 11
Frankston, VIC Bunnings 1,888,419 1,888,419 - 20 Dec 11
Blackburn, VIC2 Sleepmaster 800,000 842,500 +5.3 1 Apr 12
Weighted Average +6.71 Midland, Mindarie and Croydon were determined by independent valuers; Coffs Harbour, Frankston and Blackburn were negotiated between the trust and the tenant
2 multi-tenanted industrial property
Market rent reviews results summary
For
per
sona
l use
onl
y

12BWP TRuST AnnuAl RepoRt 2012
Our property portfolio (continued)F
or p
erso
nal u
se o
nly

13BWP TRuST AnnuAl RepoRt 2012
Revaluationsthe entire trust portfolio was revalued at 31 December 2011 and again at 30 June 2012, including 25 property revaluations performed by independent valuers (15 at 31 December 2011 and 10 at 30 June 2012). properties not independently revalued at each balance date are subject to internal valuations, with an independent valuer reviewing the methodology adopted.
the value of the portfolio increased by $80.7 million to $1,306.6 million during the year following: capital expenditure of $95.7 million; the sale of the Bunnings Warehouse at Hoppers Crossing, Victoria for net sale proceeds of $14.4 million; and a net revaluation loss of $0.6 million during the year.
the net revaluation loss was predominantly due to an increase in capitalisation rates on the majority of properties and the write-off of acquisition costs from all property acquisitions during the year, which in combination offset the effects of rental growth from annual and market rent reviews. the trust’s weighted average capitalisation rate for the portfolio at 30 June 2012 was 7.91 per cent (December 2011: 7.81 per cent and June 2011: 7.65 per cent). Details of the revaluations are disclosed in note 10 of the notes to the financial statements.
Bunnings Warehouse, Scoresby, VIC
$m
Acquisitions1
Browns Plains 25.4
Craigieburn 19.5
Dubbo 16.8
61.7
Developments
Greenacre Bunnings Warehouse 16.8
Harrisdale Bunnings Warehouse 8.6
Scoresby Bunnings Warehouse upgrade 5.8
31.2
Other expenditure
Roof access and safety 2.4
Other non-income producing 0.4
2.8
Subtotal 95.7
Divestments2
Hoppers Crossing Bunnings Warehouse (14.4)
Total 81.3
1 total outlay comprising purchase price and acquisition costs 2 net proceeds after selling costs, adjusted for rounding
Capital expenditure during 2011/12
For
per
sona
l use
onl
y

14BWP TRuST AnnuAl RepoRt 2012
As at 30 June 2012 Land area
Gross lettable area1
Annual rental2
ha sq m $000
Australian Capital Territory
Fyshwick6 2.8 6,648 1,147
tuggeranong 2.8 11,857 1,498
Total 5.6 18,505 2,645
South Australia
Mile end 3.3 14,786 2,188
noarlunga 2.6 15,054 1,389
Regency park (Blackwoods) 1.1 4,682 427
Total 7.0 34,522 4,004
New South Wales
Artarmon 0.7 5,746 1,579
Belmont north 4.0 12,640 892
Belrose 2.5 8,888 1,995
Blacktown (Blackwoods) 1.3 8,346 808
Coffs Harbour 2.5 8,657 828
Dubbo 4.5 16,344 1,324
Greenacre 2.2 13,528 2,215
lismore 2.1 10,076 908
Maitland 3.7 12,797 1,239
Minchinbury7 3.6 12,048 1,643
port Macquarie 2.0 8,801 867
thornleigh 1.2 5,301 1,271
Villawood 2.6 10,886 1,500
Wagga Wagga 3.6 13,774 1,236
Wollongong 2.7 10,811 1,360
Total 39.2 158,643 19,664
Queensland
Browns plains 4.7 18,704 2,629
Burleigh Heads 3.3 12,428 1,519
Cairns 2.4 12,917 1,265
Cannon Hill 3.6 16,470 2,055
Fairfield Waters 2.9 13,645 1,432
Hemmant (Distribution Centre) 3.5 21,523 2,205
Hervey Bay 3.0 11,824 1,131
Morayfield 3.2 12,507 1,645
Mount Gravatt 2.7 11,824 1,064
Rocklea 3.1 12,671 1,530
Smithfield 3.1 13,094 1,339
Southport 3.5 12,431 1,495
underwood 2.9 12,245 1,405
Total 41.9 182,283 20,714
Grand Total 214.9 908,153 104,135
note: totals and Grand total adjusted for rounding1 for Bunnings Warehouses this comprises the total retail area of the Bunnings Warehouse
2 annual rental figures do not include access fees detailed below3 includes additional land (1.0 hectare) for which Bunnings pays the trust an access fee of $221,636 per annum
4 development site for which Bunnings pays the trust an access fee of $602,482 per annum
5 includes adjoining properties (0.1 hectares) for which Bunnings pays the trust an access fee of $126,935 per annum
6 includes adjoining property (1.0 hectare) for which Bunnings pays the trust an access fee of $301,020 per annum
7 includes adjoining property (0.5 hectares) for which Bunnings pays the trust an access fee of $340,551 per annum
As at 30 June 2012 Land area
Gross lettable area1
Annual rental2
ha sq m $000
Western Australia
Albany 2.0 13,660 795
Balcatta 4.3 25,439 1,820
Belmont 2.2 10,381 1,288
Bibra lake 3.2 13,977 1,590
Cockburn 2.6 12,839 1,442
Geraldton 3.3 17,809 924
Geraldton Showrooms 1.2 1,511 224
Harrisdale 3.7 14,777 1,380
Joondalup 2.5 13,358 1,300
Mandurah 2.5 12,097 1,344
Midland 2.4 13,694 1,510
Mindarie 3.1 14,479 1,510
Morley 1.8 9,852 1,199
port Kennedy 2.8 11,675 1,354
Rockingham 3.3 17,179 1,524
Total 40.9 202,727 19,204
Victoria
Altona3 3.4 9,254 1,077
Bayswater 4.9 17,677 2,046
Blackburn (Industrial) 4.1 20,361 1,706
Broadmeadows 1.8 12,765 1,684
Caroline Springs 3.0 14,212 1,494
Craigieburn 4.6 16,764 1,400
Croydon 3.8 13,292 1,725
Dandenong 3.1 12,313 1,347
epping 3.1 12,027 1,156
Fountain Gate 3.2 12,624 1,410
Frankston 3.7 13,843 1,888
Hawthorn 0.8 7,462 2,966
Maribyrnong4 3.4 - -
Mentone 2.5 11,814 1,484
Mornington 4.0 13,324 1,543
northland 3.3 12,027 1,682
nunawading5 3.4 14,766 2,197
oakleigh South 4.4 16,949 1,807
pakenham 3.5 14,867 1,673
port Melbourne 3.0 13,846 1,753
Sandown 3.1 12,180 1,094
Scoresby 3.4 12,515 1,763
Sunshine 2.0 9,958 980
Vermont South 4.8 16,634 2,028
Total 80.3 311,474 37,904
Portfolio rental summary
Number of propertiesWestern Australia 15
Victoria 24
Australian Capital Territory 2
South Australia 3
New South Wales 15
Queensland 13
Total 72
Our property portfolio (continued)F
or p
erso
nal u
se o
nly

15BWP TRuST AnnuAl RepoRt 2012
Sustainability
Our commitmentthe board has adopted a set of Sustainability principles, shown in the accompanying table, for incorporating environmental, social and governance (“eSG”) issues into the trust’s policies, practices and processes. these principles are based on the united nations principles for Responsible Investment and reflect the trust’s commitment to sustainability and represent the benchmark against which the trust will report on its activities and achievements.
During the year our focus on sustainability continued to be primarily directed towards addressing climate change. As well as continuing to improve our data collection, measurement and reporting, we have also undertaken a number of practical measures to improve our sustainability
Our Sustainability Principles
We are committed to acting responsibly and ethically and operating our business in a manner that is sustainable.
We have developed the following principles for incorporating environmental, social and governance (“ESG”) issues into our policies, practices and processes.
1 We will consider ESG issues in our investment analysis and decision-making processes.
2 We will address ESG issues in policies and practices regarding our ownership of our assets and our use of resources.
3 We will engage with suppliers and tenants on ESG issues.
4 We will report on the progress of our ESG activities and initiatives.
5 We will continue to build on our knowledge and understanding of ESG and ways of addressing ESG issues in order that we can assess opportunities for improved ESG performance.
Key impacts the size and nature of the trust’s operations mean that the actual or potential impacts on the environment and society are considered relatively modest. Social and governance impacts are considered to be limited due to the passive nature and localised scope of the trust’s operations and the regulated environment in which it operates. environmentally, the trust’s ownership and management of established commercial property is considered to be low intensity in terms of emissions, waste, and use of energy and materials, and low impact on biodiversity.
the main sources of environmental impact over which we have operational control relate to indirect greenhouse gas emissions from: the purchase of electricity for lighting to common areas of some investment properties; business travel; and upstream manufacture of capital goods that are procured directly for the trust. the estimated emissions from these sources (based on a measure of carbon dioxide equivalent (“Co2-e”) are summarised in the table on the following page.
Further details of the emissions by source are provided in the Sustainability section of the trust's web site at www.bwptrust.com.au under the About us tab.
Key risks and opportunitiesAs part of our annual strategic planning process and risk review we consider a broad range of factors that may impact our operations and the long-term sustainability of our business. In addition to this more general assessment we have also undertaken detailed reviews of climate change related risks and opportunities. no material risks or opportunities arising from eSG issues have been identified, having regard to the current scale, scope and nature of our operations.
From a broad perspective, eSG risks are mitigated by the following factors: the solely domestic scope of the trust’s activities; the relatively passive nature of the trust’s business (essentially, leasing out established commercial property for retail use); its relatively uncomplicated and transparent structure; and the highly regulated framework under which the trust and responsible entity operate.
For
per
sona
l use
onl
y

16BWP TRuST AnnuAl RepoRt 2012
Estimated emissions by source
Source of emissionsAnnual CO2-e emissions
(Tonnes)Change from previous year
Scope 1 - Direct emissions 0 0%
Scope 2 - Indirect emissions from purchased electricity 171.74 -2.2%1
Scope 3 - Indirect emissions from:
> business travel 70.17 -2.7%
> capital goods acquired (roof safety and access improvements to 22 properties) 159.452 not applicable
Total tonnes/like-for-like weighted average change 401.36 -15.8%3
1 change is on a like-for-like basis, excluding properties acquired or upgraded during or since the previous year. Refer to property specific details provided for Scope 2 emissions in the Sustainability section of the trust's website
2 estimated Co2-e emissions represent the total cradle-to-gate emissions of the capital goods acquired, in accordance with the Greenhouse Gas protocol, Corporate Value Chain (Scope 3) Accounting and Reporting Standard
3 change is on a like-for-like basis, excluding properties acquired during or since the previous year and scope 3 emissions for capital goods acquired, for which no comparable previous year data is applicable
Implementing our approach to ESG to promote an ongoing focus and priority on eSG issues, sustainability has been expressly incorporated into the trust’s strategies, objectives and investment criteria. As part of the strategic planning process during the year eSG initiatives were included in action items in the annual business plan and responsibility for achieving these is included in annual performance objectives for individuals within the management team. progress of the action items in the business plan is reviewed at each board meeting. progress on individual performance objectives is monitored periodically during the year and achievement of performance objectives contributes towards 50 per cent of the individual’s short-term cash incentives. the main initiatives are summarised in the Summary of performance and future priorities table on the opposite page.
In assessing proposed acquisitions and upgrades of existing investment properties we consider what features are to be or may be incorporated to enhance the sustainability and lessen the environmental impact of the improvements and the property overall.
Targets eSG targets, at this stage, are mainly based on achieving outcomes to improve our understanding, measurement and reporting of eSG issues. these targets are included in the annual business plan and individual performance objectives of the management team, which are included in assessing short-term incentives (refer to the immediately preceding section, Implementing our approach to eSG). examples of the targets are shown in the Future priorities in the opposite table. In addition, specific performance measures have been implemented in respect to social issues, such as health and safety and diversity – the responsible entity has an annual target of no lost time or medical treatment work related injuries and a target to have at least one female director on the responsible entity’s board by 31 December 2012. We will not set specific quantitative targets relating to emissions, and energy and water usage until we have better baseline data, and are more advanced in our monitoring and understanding of data.
Disclosure the trust’s reputation could suffer if it failed to adequately address sustainability issues. Conversely, improving the level of understanding, disclosure and action regarding sustainability as it relates to trust’s operations provides an opportunity to enhance the trust’s standing with stakeholders and this is a key driver of our objective to improve eSG disclosure.
this year we have adopted the Global Reporting Initiative as a framework for reporting, to provide stakeholders with more comprehensive and comparable information. In an effort to recognise different stakeholder preferences as to the level of detail and areas of interest on sustainability, and to provide a more flexibility in reporting on eSG, we have chosen to provide a more general review of sustainability in this report and provide further detail on the trust’s website and through our participation in the Carbon Disclosure project. Further detail is available in the Sustainability section, under the About us tab, of the trust’s website at www.bwptrust.com.au.
The Trust was included in the 2011 Carbon Disclosure Leadership Index for Australia and New Zealand for its inaugural participation in the Carbon Disclosure Project last year
Sustainability (continued)F
or p
erso
nal u
se o
nly

17BWP TRuST AnnuAl RepoRt 2012
Summary of performance and future priorities
Sustainability principle Performance during the year Future priorities
1 ESG in investment analysis and decisions
All five investment proposals put to the board during the year expressly considered eSG issues
Roof access and safety improvements completed for 22 properties, improving the safety and amenity of people having to access the roof areas and helping to maintain the longer-term condition of the properties. the choice of component material and packaging and handling requirements were based on reducing embodied carbon, energy use and waste. using fibre glass for walkways is estimated to have produced less than a ¼ of the embodied carbon required for aluminium, saving an estimated 518 tonnes Co2-e to the point of installation
Continue to refine and expand eSG assessment criteria for investment analysis and decision making
2 ESG in asset ownership and resource use
Commenced a site metering project for the multi-tenanted pakenham property to allow water and electricity consumption for common areas and individual tenancies to be more accurately measured and monitored
A further ten air conditioning units replaced to phase out ozone depleting models
new standard lease for multi-tenanted premises improves the commercial viability of installing renewable energy systems
Roll out site metering systems to remaining multi-tenanted properties to allow more accurate measurement and monitoring of electricity and water usage for common areas and tenancies
Continue programme for phasing out ozone depleting air conditioning
Review and update health and safety policy to take account of the nationalisation of oHS legislation and the trust’s increased number of multi-tenanted properties
3 Tenant and supplier engagement
Continued dialogue with Bunnings regarding its sustainability initiatives and the trust has provided consent for installation of rain water harvesting systems, taking the total to 60 of the trust’s 66 Bunnings Warehouses
Continue to engage with tenants for a co-operative approach to sustainability initiatives
4 ESG reporting BWp included in the 2011 Carbon Disclosure leadership Index for Australia and new Zealand for last year’s inaugural participation in Carbon Disclosure project
Responded to the 2012 Carbon Disclosure project
Adopted the Global Reporting Initiative framework as the basis for more comprehensive and comparable disclosure
Broaden scope of eSG disclosure to other relevant and material topics
5 Build knowledge and understanding
Identified appropriate basis for measuring carbon intensity to enable comparison of performance having regard to changes in the size of our business
Continued with training of management team in property related sustainability topics
team member attendance at green building conference and other sustainability courses
Improve understanding of stakeholder requirements for sustainability disclosure
Investigation of alternative, lower emission electricity sources for piloting at a multi-tenanted property
For
per
sona
l use
onl
y

18BWP TRuST AnnuAl RepoRt 2012
Directors and senior managementJohn A AustinAssoc Dip Val, FAPI (Val&Econ), Age: 66Chairman, Non-executive external director
Member of the Audit and Risk Committee
Chairman of the Remuneration and Nomination Committee
Joined the board in 2004 and was appointed Chairman in December 2007. John has been actively involved in professional property investment markets for over 41 years, during which he has been a proprietor of Jones lang Wootton and an advisor in institutional property markets.
He was the Managing Director of GRW property ltd, the sponsor and manager of the national Industrial property trust that listed in 1993 and was on a number of industry boards and committees. Currently he is executive Chairman of Ringmer pacific pty ltd, a private property investment company. He was a non-executive director of the MReeF series of unlisted private property funds, managed by Macquarie Bank until his resignation in February 2012, and Chairman of leighton properties pty ltd until his resignation in July 2012.
Rick D HigginsFAPI, Age: 66Non-executive external director
Member of the Audit and Risk Committee
Member of the Remuneration and Nomination Committee
Joined the board in December 2007. Rick is a property professional with over 41 years experience, having provided valuations and consultancy advice to a range of large institutional clients relating to a broad range of properties, including homemaker and bulky goods centres. Before joining the board, Rick was the national Director,
Business Development for Colliers International Consultancy & Valuation and prior to this, he was employed by Jones lang Wootton for 30 years as a national Director (formally proprietor) responsible for the national valuation and consultancy division. Rick provides ongoing consulting services to Colliers’ Retail Client Development team. He is also a non-executive director of Charter Hall Direct property Management limited, a subsidiary of Charter Hall Group, and the responsible entity for a number of unlisted retail funds that invest in office, industrial and retail properties.
Bryce J H DenisonFCA, FCPA, Age: 64Non-executive external director
Chairman of the Audit and Risk Committee
Member of the Remuneration and Nomination Committee
Joined the board in october 2009. Bryce is a qualified accountant who previously held the position of General Manager, Group Accounting with Wesfarmers from 1986 to 2004. He has previously been the national president of the Group of 100 and has been a member of the Australian Accounting Standards Board. prior to joining
Wesfarmers, Mr Denison held various positions with accounting firm ernst & Young over a 19 year period. He is a Fellow Member of the Institute of Chartered Accountants in Australia and CpA Australia.
For
per
sona
l use
onl
y

19BWP TRuST AnnuAl RepoRt 2012
Grant W GernhoeferBComm, LLB, Age: 49General Manager
Manager since January 2006. For the 12 years prior to becoming General Manager, Grant worked for Wesfarmers, initially as an in-house legal counsel and then in managing the group’s risk management and insurance program. prior to joining Wesfarmers, Grant worked in the building industry in Australia and overseas.
Peter J JohnstonFCIS, FCPA, Age: 69Non-executive external director
Member of the Audit and Risk Committee
Member of the Remuneration and Nomination Committee
Joined the board September 2005. peter previously held the position of Company Secretary of Wesfarmers between 1994 and 2001 and during that time was also an inaugural director of BWp Management limited from 1998 until his retirement in 2001. past directorships include Kresta Holdings limited and a number of Kresta group subsidiaries.
Peter J MansellBComm, LLB, HDip Tax, Age: 65Non-executive external director
Member of the Audit and Risk Committee
Member of the Remuneration and Nomination Committee
Joined the board in 1998. peter practised as a commercial lawyer for some 35 years until he retired as a partner in Freehills in February 2004. over the years as a solicitor, he has advised extensively on a number of wide-ranging corporate transactions. He was president of the Council of the Australian Institute of Company Directors, Western Australian Division, having sat on the national board of the Australian Institute of Company Directors ltd in 2002 and 2003. During the past three years he has served as a director of the following companies:
> Current listed company directorships include:
Ampella Mining ltd Bullabulling Gold limited nystar nV (Belgium)
> past Australian listed company directorships (held in last 3 years):
oZ Minerals limited (June 2008 to April 2010)
thinkSmart ltd (April 2007 to May 2010)
Great Southern limited (november 2005 to September 2009)
For
per
sona
l use
onl
y

20BWP TRuST AnnuAl RepoRt 2012
Corporate governance
the governance framework is embedded in the trust’s compliance plan (referred to under the heading Risk control and compliance on page 22) to ensure ethical behaviour and transparency and to protect unitholders’ interests.
this statement outlines the main corporate governance practices of the responsible entity, which were in place throughout the year and at the date of this report. In accordance with the ASX principles, the responsible entity has posted copies of its corporate governance practices on its website: www.bwptrust.com.au.
the ASX principles have been drafted primarily for listed companies, and not all of the recommendations are readily applicable for a registered managed investment scheme and its responsible entity. However, the responsible entity seeks to comply with the majority of the ASX principles. Where it does not, it is largely in respect of obligations to disclose material or matters where the nature of regulation of listed trusts or of the trust’s business is such that the board of the responsible entity considers that there has been no detriment to the unitholders of the trust from non-compliance. Areas of non-compliance and the reasons for non-compliance are noted in this statement.
Relationship between the responsible entity and Wesfarmersthe responsible entity is a wholly owned subsidiary of Wesfarmers. A majority of the property income of the trust is received from wholly owned subsidiaries of Wesfarmers. the trust has purchased property from Wesfarmers subsidiaries, and utilised a Wesfarmers subsidiary, Bunnings, as project manager on property developments. Wesfarmers is a substantial unitholder in the trust, and details of Wesfarmers’ unitholding can be found on page 63 of this report. Further information regarding the relationship and transactions with Wesfarmers is detailed in note 19(d) in the notes to the financial statements. Details of transactions with Wesfarmers are also provided in announcements released to ASX and published on the trust’s website.
ASX Waiverthe trust holds a waiver from ASX (“waiver”), which allows the responsible entity to enter into certain leasing transactions on behalf of the trust with Bunnings, a related party, without the need to obtain unitholder approval under listing Rule 10.1.
the waiver is subject to certain conditions including disclosure of new leases, that lease agreements are substantially on the same terms and conditions established by the parties for leases of Bunnings Warehouse properties, and appropriate rent review provisions are in place.
the waiver was last renewed on 16 September 2010 and applies for six years.
Roles of the board and managementthe respective roles and responsibilities of the board and management are set out in the compliance plan.
the role of the board of the responsible entity is to ensure that the trust is managed in a manner that protects and enhances the interests of its unitholders and takes into account the interests of officers of the responsible entity, customers, suppliers, lenders and the wider community.
the board has overall responsibility for corporate governance, including setting the strategic direction for the trust, establishing goals for management and monitoring the achievement of these goals. the board’s responsibilities and duties include:
> adopting annual operating budgets for the trust and monitoring progress against budgets;
> monitoring and overseeing the trust’s financial position;
> determining that satisfactory arrangements are in place for auditing the trust’s financial affairs;
> ensuring that all transactions with Wesfarmers and other related parties are carried out at arm’s length, including obtaining independent valuation support for property related transactions;
> reviewing the level and adequacy of services provided by external service providers including services provided by Wesfarmers;
> ensuring that appropriate policies and compliance systems are in place, and that the responsible entity and its officers act legally, ethically and responsibly on all matters; and
> complying with the statutory duties and obligations as imposed by law.
the board has delegated responsibility for the day-to-day management of the trust to the General Manager.
the separation of responsibilities between the board and management is clearly understood and respected.
The responsible entity is committed to fostering a strong governance culture and framework based on the ASX Corporate Governance Council’s Corporate Governance Principles and Recommendations (“ASX Principles”)
For
per
sona
l use
onl
y

21BWP TRuST AnnuAl RepoRt 2012
Board meetingsAs provided for in the trust’s compliance plan, the board holds at least six scheduled meetings each year, although additional meetings may be called as and when required.
During the year the board held 11 meetings.
Board structurethe board is currently comprised of five non-executive directors including the Chairman. During the year the board completed a board succession plan and a competencies review. It was decided that at least one new non-executive director appointment be made during calendar year 2012. the board is satisfied that the composition of the board accords with the requirements in the trust’s compliance plan to maintain an appropriate range of backgrounds, skills and experience, but considers that it would benefit from increased diversity, for example with respect to gender or age of directors (refer Diversity policy section).
Details of directors in office at the date of this report, including their status as executive, non-executive or external directors are set out on pages 18 to 19 of this report.
the Chairman is an external director. the roles of the Chairman and the General Manager are not held by the same individual.
Director independenceDirectors of the responsible entity are expected to bring an independent view to the board’s deliberations.
It is the responsible entity’s policy that the board composition will comprise a majority of non executive directors who are considered to be independent. under the regulations applicable to managed investment schemes, “independence” is determined according to the definition of “external directors” in section 601JA of the Corporations Act (“the Act”).
under section 601JA of the Act, a director of the responsible entity is an external director if they:
a) are not, and have not been in the previous two years, an employee of the responsible entity or a related body corporate;
b) are not, and have not been in the previous two years, a senior manager of a related body corporate;
c) are not, and have not been in the previous two years, substantially involved in business dealings, or in a professional capacity, with the responsible entity or a related body corporate;
d) are not a member of a partnership that is, or has been in the previous two years, substantially involved in business dealings, or in a professional capacity, with the responsible entity or a related body corporate;
e) do not have a material interest in the responsible entity or a related body corporate; and
f) are not a relative of a person who has a material interest in the responsible entity or a related body corporate.
All five directors of the responsible entity are external directors as defined by section 601JA of the Corporations Act.
Given the different circumstances and regime under which managed investment schemes operate, the definition against which director’s independent status is assessed differs from that applied by the ASX principles to directors of listed companies.
the board’s assessment of the independence of each of the directors is included as part of the directors’ details on pages 18 to 19 of this report.
the board is satisfied that all directors bring an independent judgement to bear on board decisions in relation to the affairs of the trust and its unitholders.
Selection and appointment of directorsthe responsible entity has recognised the importance of having a balanced board comprised of directors with an appropriate range of backgrounds, skills, experience and diversity. In considering potential candidates for appointment to the board, the board considers the following factors:
> the skills, knowledge and experience of the person which are relevant to the role of director of the responsible entity;
> the extent to which the skills, knowledge and experience of the person (and additional qualities that add to the diversity of the board) complement the qualifications, expertise and experience of incumbent directors;
> the professional and personal reputation of the person; and
> any person nominated as an executive director must be of sufficient stature and security of employment to express independent views on any matter.
All non-executive directors are expected to voluntarily review their membership of the board from time to time taking into account length of service, age, qualifications and expertise relevant to the responsible entity’s then current policy and programme, together with the other criteria considered desirable for composition of a balanced board and the overall interests of the responsible entity and the trust.
In addition, each quarter, all non-executive directors are required to review the number of directorships that they hold and confirm that they are able to devote sufficient time and attention to properly fulfil their duties and responsibilities to the board of the responsible entity.
Independent professional adviceSubject to prior approval of the Chairman, directors may obtain independent professional advice at the expense of the responsible entity on matters arising in the course of their board duties.
For
per
sona
l use
onl
y

22BWP TRuST AnnuAl RepoRt 2012
Trading in unitstrading in the trust’s securities by directors, employees and contractors of the responsible entity is restricted under the responsible entity’s Securities Dealing policy and applicable statutory regulations.
the policy is published on the trust’s website at www.bwptrust.com.au.
Financial reporting
General Manager’s declarationIn accordance with section 295A of the Corporations Act 2001, the trust’s financial report preparation and approval process for the financial year ended 30 June 2012, involved the General Manager of the responsible entity providing a written statement to the board that, to the best of his knowledge and belief:
> the trust’s financial report presents a true and fair view of the trust’s financial condition and operating results and is in accordance with applicable accounting standards; and
> the trust’s financial records for the financial year have been properly maintained in accordance with section 286 of the Corporations Act 2001.
Remuneration and Nomination committeethe board has a formally constituted Remuneration and nomination Committee. A copy of the Remuneration and nomination Committee Charter is available on the trust’s website.
the committee consists of the entire board and is chaired by the Chairman of the board. During the year the committee held four meetings attended by all directors.
Audit and Risk Committeethe compliance plan entrenches processes for reporting and audit purposes.
the board has a formally constituted Audit and Risk Committee. A copy of the Audit and Risk Committee Charter is available on the trust’s website.
the committee consists of the entire board and is chaired by an external director, who is not the chairman of the board. During the year the committee held two meetings attended by all directors.
Risk control and compliance As a registered managed investment scheme, the responsible entity has a compliance plan that has been lodged with the Australian Securities and Investments Commission (ASIC) and a copy of the compliance plan can be obtained from ASIC.
the compliance plan is reviewed comprehensively every year to ensure that the way in which the responsible entity operates protects the rights and interests of unitholders and that business risks are identified and properly managed.
In particular, the compliance plan establishes processes for:
> identifying and reporting breaches of, or non-compliance with, the Corporations Act, the compliance plan, the constitution of the trust and the responsible entity’s Australian Financial Services licence;
> complying with the ASX listing Rules;
> protecting trust property;
> ensuring proper acquisition and disposal practices are followed in regard to trust property;
> ensuring the timely collection of trust income;
> completing regular valuations of trust property;
> the maintenance of financial and other records to facilitate preparation of audited/reviewed financial reports;
> ensuring proper and timely distributions to unitholders;
> complying with the trust’s investment objectives;
> managing investment risk;
> managing potential conflicts of interest with the various related parties of the trust;
> holding and maintaining adequate insurance cover;
> ensuring that borrowing occurs only within permitted limits and ensuring that borrowing terms are complied with; and
> handling complaints relating to the trust.
KpMG, the external auditor of the compliance plan, has completed its annual audit for the year ended 30 June 2012. no material breaches of the plan were identified as a result of this audit.
the Audit and Risk Committee is also responsible for assisting the board in overseeing the trust’s risk management systems. the committee is responsible for reviewing the effectiveness of those systems and recommending improvements to them.
In addition to the compliance plan, the responsible entity has in place a number of risk management controls which include the following:
> guidelines and limits for the approval of capital and operating expenditure;
> policies and procedures for the management of financial risk, including exposure to financial instruments and movement in interests rates; and
> an insurance and risk management programme.
As all members of the board are external directors (as defined in section 601JA of the Corporations Act), the board does not consider it is currently necessary to form a separate compliance committee in addition to the board of the responsible entity.
Corporate governance (continued)F
or p
erso
nal u
se o
nly

23BWP TRuST AnnuAl RepoRt 2012
General Manager’s statementIn accordance with ASX principle 7, the General Manager has provided the board with a written statement that:
> the statement given with respect to the integrity of the financial statements (referred to in the Financial reporting section) was founded on a sound system of risk management and internal compliance and control which implements the policies adopted by the board of the responsible entity; and
> the trust’s risk management and internal compliance and control system was operating effectively in all material respects in relation to financial reporting risks.
Review of board and committee performancethe board and its committees participate in performance evaluations on average every two years.
A board performance evaluation was completed in november 2011. All directors participated in a questionnaire that was designed to identify opportunities for continual improvement.
Remuneration policiesthe right of the responsible entity to be remunerated and indemnified by the trust is set out in the constitution of the trust and disclosed in note 4 to the financial statements in this report. the constitution is available from ASIC and is available to unitholders on request.
Remuneration of directors and executivesRemuneration expenses of the responsible entity are not borne by the trust. Directors are remunerated by the responsible entity, and management services are provided to the responsible entity by Wesfarmers. Wesfarmers employees seconded to the responsible entity to provide management services to the trust are engaged in dedicated roles to act exclusively for the responsible entity on behalf of the trust and are paid directly by Wesfarmers. Short-term incentives paid by Wesfarmers to employees engaged by the responsible entity are based entirely on the performance of the trust and furthering the objectives of the trust.
For the financial year ended 30 June 2012, each director was entitled to a director’s fee. Directors do not receive options or bonus payments, nor do they receive retirement benefits in connection with their directorships other than statutory superannuation. there are no equity incentive schemes in relation to the trust.
Details of the remuneration policy for directors are disclosed in note 19(b) to the financial statements.
Diversity policy
Commitment to diversity principlesthe responsible entity is a wholly owned subsidiary of Wesfarmers. the Wesfarmers diversity policy applies to all Wesfarmers’ business units and subsidiary companies and is published on the Wesfarmers website.
the responsible entity’s board and management understand that diversity relates to inclusiveness of all people, regardless of their gender, age, race, disability, sexual orientation, cultural background, religion, family responsibilities or any other area of difference. A commitment to diversity involves fostering a work environment that is free of discrimination and harassment and which ensures equal pay for equal work. Fostering diversity at all levels improves creativity and innovation, and supports the development of an enhanced talent pipeline for key and future roles by enabling access to a broader pool of talent. While opportunities to set meaningful diversity targets are presently limited for the responsible entity and the trust (as explained below), the responsible entity’s commitment to the principles of diversity is demonstrated daily by its support for flexible working arrangements as required to permit its staff and contractors to meet important family responsibilities, and its treatment of all staff and service providers equally and with respect, irrespective of differences.
Responsible entity’s workforceA key differentiating factor for our business is that neither the listed entity, the trust, nor the unlisted responsible entity has any direct employees. the responsible entity is presently staffed by only 6.6 full time equivalents (“Ftes”) who have been seconded from Wesfarmers to act exclusively for the responsible entity and the trust. In addition one external contractor (0.5 Fte) has been engaged to provide company secretarial and compliance management services. In total, of the seven Fte personnel servicing the responsible entity on a daily basis, two Ftes (consisting of one full time and one part time employee and one part time contractor) are female. the most senior responsible entity executive is the General Manager, who is the chief executive officer. this executive position has been occupied by both genders, indicating that to date, there have been no gender barriers for the most senior executive position at the responsible entity.
the responsible entity’s staffing requirements are not expected to increase in the foreseeable future. Due to the small and stable nature of the responsible entity’s workforce, it is not considered appropriate or useful to set gender specific, or other diversity specific, performance targets that relate specifically to the responsible entity and the trust operations. Rather it is expected that the responsible entity will be a natural beneficiary of the success of the overall Wesfarmers Group diversity policy by way of greater access to a broader talent pool from which to obtain future staff and support services. to the extent that it can, the responsible entity is committed to working within the guiding principles and objectives set out in the Wesfarmers diversity policy.
For
per
sona
l use
onl
y

24BWP TRuST AnnuAl RepoRt 2012
Responsible entity boardthe responsible entity board is comprised of five external non-executive directors. these board members are appointed by the responsible entity’s sole shareholder, a subsidiary of Wesfarmers limited. At the time of this report, there were no women on the responsible entity board. However the board has recently adopted a board succession plan that will see the renewal of the responsible entity board over the next four to five years, with the first new appointment expected to be made during the 2012 calendar year. A professional intermediary has been appointed to assist the board to identify suitable candidates with an instruction that the shortlist should consider diversity principles and contain representatives from each gender. Subject to the support of the responsible entity’s shareholder Wesfarmers limited, the board has set itself the objective of having at least one female member by the end of calendar year 2012.
BWPM female participation rates as at 30 June 2012
% No.
BWpM non-executive directors 0 0 of 5
executive, professional and management roles 14 0.5 of 3.5 (Fte)
total workforce 28 2.0 of 7.1 (Fte)
Conflicts management policythe trust’s compliance plan sets out the conflicts management policy, including the procedure for managing conflicts of interest. the policy applies to all directors and officers of the responsible entity.
the policy identifies circumstances where conflicts of interest may arise and outlines the requirement to evaluate conflicts, control or avoid conflicts and disclose relevant conflicts of interest. the policy also sets out who is responsible for managing conflicts and addresses the requirement to monitor, review and have appropriate approval of the conflicts management policy.
the board has also adopted a Directors’ Conflict of Interests policy that governs the disclosure of directors’ interests and procedures for managing conflicts.
Continuous disclosure and communications with unitholdersthe responsible entity has systems in place to ensure timely disclosure of price sensitive information to the market. officers of the trust receive training on their continuous disclosure obligations and all announcements made to the market, including information provided to analysts, are posted to the trust’s website.
the Continuous Disclosure and Market Communications policy is available on the website.
to enhance communication with unitholders, important information including details of the trust’s properties, financial
performance, ASX announcements, governance practices, distribution history and the trust’s complaints handling procedure can be found on the trust’s website.
the responsible entity provides advance notification of teleconferenced investor briefings following results announcements and makes these accessible for all investors.
Ethics and conductthe responsible entity has adopted a code of conduct that sets out minimum acceptable standards of behaviour to ensure that dealings are conducted with integrity and honesty, and that the highest standards of corporate behaviour and accountability are maintained.
In addition, the board has adopted the Code of Conduct for directors recommended by the Australian Institute of Company Directors.
Sustainabilitythe responsible entity is committed to acting responsibly and ethically and operating its business in a manner that is sustainable. Further information on the trust’s sustainability principles and practices are provided on pages 15 to 17.
Corporate governance (continued)F
or p
erso
nal u
se o
nly

25BWP TRuST AnnuAl RepoRt 2012
Financial Statements
Statement of comprehensive income 26
Statement of financial position 27
Statement of cash flows 28
Statement of changes in equity 29
Notes to the financial statements 30
Directors’ report 54
Directors’ declaration 58
Auditor’s independence declaration 59
Independent auditor’s report 60
Unitholder information 62
For
per
sona
l use
onl
y

26BWP TRuST AnnuAl RepoRt 2012
note
June 2012
$000
June 2011
$000
Rental income 98,048 81,875
Other property income 3,609 2,236
Finance income 3 434 1,162
Total revenue 102,091 85,273
Finance costs 3 (20,518) (19,094)
Responsible entity’s fees 4 (6,367) (6,048)
Other operating expenses 5 (4,640) (3,962)
Net profit before unrealised (losses)/gains in fair value of investment properties 70,566 56,169
Unrealised (losses)/gains in fair value of investment properties 10 (635) 25,328
Net profit attributable to unitholders of BWP Trust 69,931 81,497
Other comprehensive (loss)/ income
Effective portion of changes in fair value of cash flow hedges:
- Realised losses transferred to net profit 3 2,091 2,577
- Unrealised (losses)/gains on cash flow hedges 3 (16,796) 61
Total comprehensive income for the period attributable to the unitholders of BWP Trust 55,226 84,135
Basic and diluted earnings (cents per unit) resulting from net profit 7 13.40 17.97
the statement of comprehensive income should be read in conjunction with the accompanying notes
Statement of comprehensive incomeFor the year ended 30 June 2012
For
per
sona
l use
onl
y

27BWP TRuST AnnuAl RepoRt 2012
Statement of financial positionAs at 30 June 2012
note
June 2012
$000
June 2011
$000
ASSETS
Current assets
Cash 8 24,732 8,942
Receivables and prepayments 9 3,871 5,623
Total current assets 28,603 14,565
Non-current assets
other receivables 9 - 850
Investment properties 10 1,306,563 1,225,881
Derivative financial instruments - 833
Total non-current assets 1,306,563 1,227,564
Total assets 1,335,166 1,242,129
LIABILITIES
Current liabilities
payables and deferred income 11 14,071 12,664
Derivative financial instruments 248 378
Distribution payable 6 42,231 30,161
Total current liabilities 56,550 43,203
Non-current liabilities
Interest-bearing loans and borrowings 12 288,890 210,844
Derivative financial instruments 15,765 1,763
Total non-current liabilities 304,655 212,607
Total liabilities 361,205 255,810
Net assets 973,961 986,319
Unitholders’ equity
Issued capital 13 682,435 673,311
Reserves 14 (16,013) (1,308)
undistributed income 307,539 314,316
Total unitholders’ equity 973,961 986,319
the statement of financial position should be read in conjunction with the accompanying notesFor
per
sona
l use
onl
y

28BWP TRuST AnnuAl RepoRt 2012
Statement of cash flowsFor the year ended 30 June 2012
note
June 2012
$000
June 2011
$000
Cash flows from operating activities
Rent received 113,673 96,964
Payments to suppliers (16,028) (14,011)
Payments to the responsible entity (6,304) (5,887)
Finance income 434 1,162
Finance costs (20,650) (19,118)
Net cash flows from operating activities 15 71,125 59,110
Cash flows from investing activities
Proceeds from the sale of an investment property 14,341 7,408
Payments for purchase of, and additions to, investment properties (93,058) (211,005)
Loans to related parties 19 (d)(ii)f) 850 -
Net cash flows used in investing activities (77,867) (203,597)
Cash flows from financing activities
Proceeds of borrowings 78,046 17,370
Proceeds from issue of units via pro-rata entitlement offer - 150,005
Expenses incurred in pro-rata entitlement offer - (3,647)
Distributions paid (55,514) (31,986)
Net cash flows from financing activities 22,532 131,742
Net increase/(decrease) in cash 15,790 (12,745)
Cash at the beginning of the financial year 8,942 21,687
Cash at the end of the financial year 8 24,732 8,942
the statement of cash flows should be read in conjunction with the accompanying notes
For
per
sona
l use
onl
y

29BWP TRuST AnnuAl RepoRt 2012
Statement of changes in equityFor the year ended 30 June 2012
Issued capital
$000
Undistributed income
$000
Hedge reserve
$000
Total
$000
Balance at 1 July 2010 507,372 289,371 (3,946) 792,797
Total comprehensive income for the year attributable to the unitholders of BWP Trust
Net profit attributable to unitholders of BWP Trust - 81,497 - 81,497
Other comprehensive income: effective portion of changes in fair value of cashflow hedges - - 2,638 2,638
Transactions with unitholders recorded directly in equity
Distributions to unitholders - (56,552) - (56,552)
Equity issued during the year:
Pro-rata entitlement offer 150,005 - - 150,005
Distribution Reinvestment Plan 19,581 - - 19,581
Expenses incurred in pro-rata entitlement offer (3,647) - - (3,647)
Balance at 30 June 2011 673,311 314,316 (1,308) 986,319
Balance at 1 July 2011 673,311 314,316 (1,308) 986,319
Total comprehensive income for the year attributable to the unitholders of BWP Trust
Net profit attributable to unitholders of BWP Trust - 69,931 - 69,931
Other comprehensive loss: effective portion of changes in fair value of cashflow hedges - - (14,705) (14,705)
Transactions with unitholders recorded directly in equity
Distributions to unitholders - (76,708) - (76,708)
Equity issued during the year:
Distribution Reinvestment Plan 9,124 - - 9,124
Balance at 30 June 2012 682,435 307,539 (16,013) 973,961
the statement of changes in equity should be read in conjunction with the accompanying notesFor
per
sona
l use
onl
y

30BWP TRuST AnnuAl RepoRt 2012
1. SUMMAry Of SIGNIfICANT ACCOUNTING POLICIES
(a) Basis of preparationthe financial statements have been prepared in accordance with the requirements of the constitution of BWp trust (“the trust”) and Australian Accounting Standards. the financial statements have been prepared on an historical cost basis, except for investment properties and derivative financial instruments, which have been measured at their fair value.
the financial statements are presented in Australian dollars, which is the trust’s functional currency and all values are rounded to the nearest thousand dollars ($000) under the option available to the trust under ASIC Class order 98/100, unless otherwise stated.
(b) Statement of compliancethe financial statements are general purpose financial statements which have been prepared in accordance with Australian Accounting Standards (“AASBs”) (including Australian Interpretations) adopted by the Australian Accounting Standards Board and the Corporations Act 2001. the financial statements of the trust comply with International Financial Reporting Standards (“IFRSs”) and interpretations adopted by the International Accounting Standards Board (“IASB”).
the trust has adopted all of the new and revised standards and interpretations issued by the Australian Accounting Standards Board that are relevant to its operations and effective for financial reporting periods beginning on or before 1 July 2011. the adoption of these standards has given rise to additional disclosure but did not have a material effect on the financial statements of the trust.
A number of new standards, amendments to standards and interpretations are available for early adoption but have not been applied in preparing these financial statements. the potential impact of the new standards, amendments to standards and interpretations has been considered and they are not expected to have a significant effect on the financial statements.
(c) Significant judgements and estimatesIn applying the trust’s accounting policies management continually evaluates judgements, estimates and assumptions based on experience and other factors, including expectations about future events that may have an impact on the trust. All judgements, estimates and assumptions made are believed to be reasonable based on the most current set of circumstances available to management. Actual results may differ from the judgements, estimates and assumptions. Significant judgements, estimates and assumptions made by management in the preparation of these financial statements are outlined below.
Investment properties – operating leasesthe trust has entered into commercial property leases on its investment portfolio.
the trust has determined that it retains all the significant risks and rewards of ownership of these properties and has thus classified the leases as operating leases (see notes 1(e), 1(n), and 10(c)).
Investment properties – valuationsInvestment properties are revalued each balance date to reflect their fair value according to the trust’s policy on valuing assets and applying generally accepted valuation criteria, methodology and assumptions (see notes 1(e) and 10(a)).
financial instruments - valuationsthe fair value of interest rate swap contracts is determined by reference to market values for similar instruments (see note 1(m)).
Notes to the financial statementsFor the year ended 30 June 2012
For
per
sona
l use
onl
y

31BWP TRuST AnnuAl RepoRt 2012
Notes to the financial statementsFor the year ended 30 June 2012
(d) finance costsFinance costs are recognised as an expense when incurred, with the exception of interest charges on funds invested in properties with substantial development and construction phases, which are capitalised to the property until such times as the construction work is complete.
the capitalisation rate used to determine the amount of finance costs to be capitalised is the weighted average interest rate applicable to the trust’s outstanding borrowings during the year.
(e) Investment propertiesInitially, investment properties are measured at cost including transaction costs. expenditure capitalised to properties includes the cost of acquisition, capital and refurbishment additions, and during development includes rates, taxes, financing charges and related professional fees incurred, net of sundry income. Subsequent to initial recognition investment properties are measured at fair value. Gains or losses arising from changes in the fair values of investment properties are included in the statement of comprehensive income in the year in which they arise.
Where assets have been revalued, the potential effect of the capital gains tax (“CGt”) on disposal has not been taken into account in the determination of the revalued carrying amount. the trust does not expect to be ultimately liable for CGt in respect of the sale of assets as all realised gains would be distributed to unitholders.
(f) CashCash in the statement of financial position, and for the purposes of the statement of cash flows, comprises cash at bank and short-term deposits.
(g) Interest-bearing loans and borrowingsAll interest-bearing loans and borrowings are initially recognised at the fair value of the consideration received less directly attributable transaction costs.
After initial recognition, interest-bearing loans and borrowings are subsequently measured at amortised cost using the effective interest method. Fees paid on the establishment of loan facilities that are interest-bearing are included as part of the carrying amount of loans and borrowings.
Borrowings are classified as non-current liabilities if the trust has an unconditional right to defer settlement of the liability for at least 12 months after the balance date.
(h) ImpairmentA financial asset is assessed at each reporting date to determine whether there is any objective evidence that it is impaired. A financial asset is considered to be impaired if objective evidence indicates that one or more events have had a negative effect on the estimated future cash flows of that asset.
An impairment loss in respect of a financial asset measured at amortised cost is calculated as the difference between its carrying amount and the present value of the estimated future cash flows discounted at the original effective interest rate.
Individually significant financial assets are tested for impairment on an individual basis. the remaining financial assets are assessed collectively in groups that share similar credit risk characteristics.
In circumstances where impairment losses are deemed, these are included in the statement of comprehensive income.
(i) Payablesliabilities are recognised for amounts to be paid in the future for goods and services received, whether or not these have been billed to the trust. these liabilities are normally settled on 30 day terms except for the responsible entity’s fees payable, which are settled quarterly in arrears, and retention monies withheld on construction projects which are settled according to the terms of the construction contracts.
For
per
sona
l use
onl
y

32BWP TRuST AnnuAl RepoRt 2012
1. SUMMAry Of SIGNIfICANT ACCOUNTING POLICIES (continued)
(j) Distribution payableeach reporting period the directors of the responsible entity are required to determine the distribution entitlement of the unitholders in respect of the period. Any amounts so determined but not paid by the end of the period, are recorded as a liability.
(k) revenueRevenue is recognised to the extent that it is probable that the economic benefits will flow to the entity and the revenue can be reliably measured.
the following specific measurement criteria must also be met before revenue is recognised:
rental and other property incomeRental and other property income is recognised at the amount and when due under the terms of the lease. All fixed, Consumer price Indices-linked and market rent review increases are recognised in income from the date that these are due in accordance with the respective lease terms. this is done to ensure that rental income is matched with the associated cash flows over the term of the lease.
Interest incomeRevenue is recognised as the interest accrues, using the effective interest method.
(l) Taxation
Income Taxunder current Australian income tax legislation, the trust is not liable for income tax, provided that its taxable income (including any realised capital gains) is fully distributed to unitholders each year.
Goods and Services TaxRevenues, expenses and assets are recognised net of the amount of Goods and Services tax (“GSt”) except where the GSt incurred on a purchase of goods and services is not recoverable from the taxation authority. In these circumstances the GSt is recognised as part of the cost of the acquisition of the asset or as part of the expense.
Receivables and payables are stated with the amount of GSt included. the net amount of GSt recoverable from or payable to the taxation authority is included as part of receivables or payables in the statement of financial position.
Cash flows are included in the statement of cash flows on a gross basis and the GSt component of cash flows arising from investing and financing activities, which is recoverable from, or payable to, the taxation authority, are classified as operating cash flows.
Commitments and contingencies are disclosed net of the amount of GSt recoverable from, or payable to, the taxation authority.
(m) Derivative financial instrumentsthe trust enters into derivative financial instruments in the form of interest rate swap agreements, which are used to convert the variable interest rate of its borrowings to fixed interest rates. For the purpose of hedge accounting, these hedges are classified as cash flow hedges. the swaps are entered into with the objective of reducing the risk associated with interest rate fluctuations.
Derivative financial instruments are stated at fair value. the fair value of interest rate swap contracts is determined by reference to market values for similar instruments.
Notes to the financial statementsFor the year ended 30 June 2012
For
per
sona
l use
onl
y
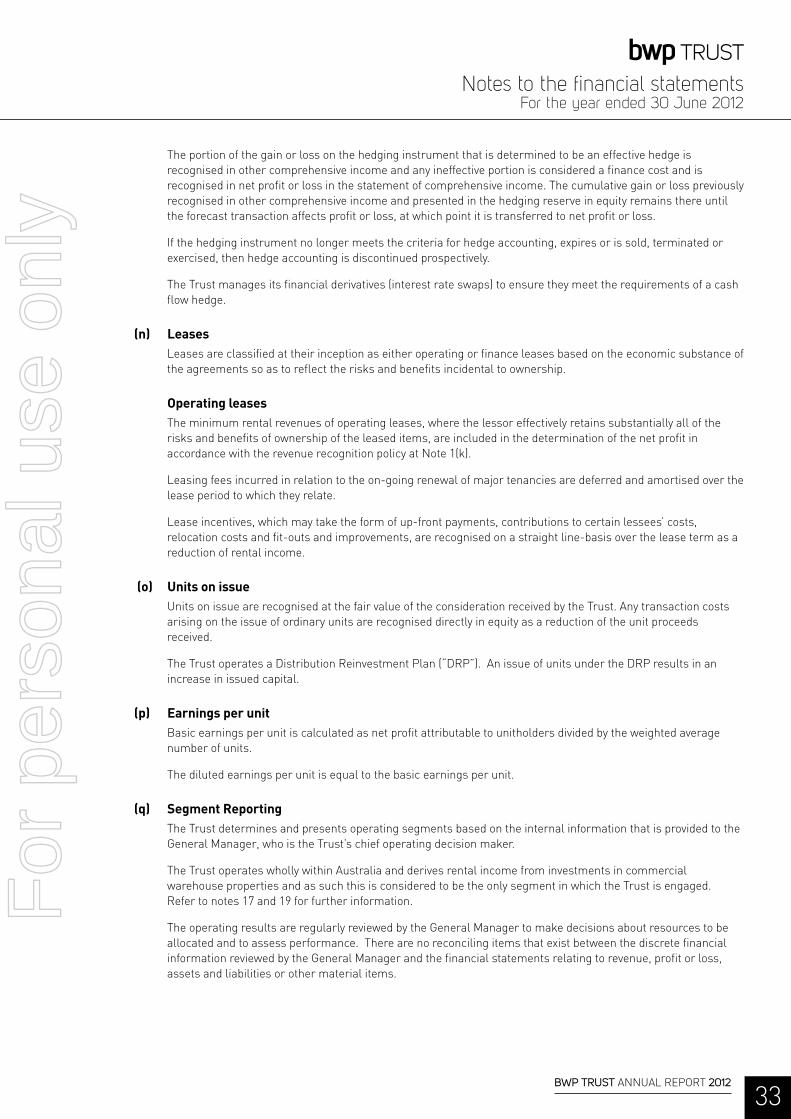
33BWP TRuST AnnuAl RepoRt 2012
Notes to the financial statementsFor the year ended 30 June 2012
the portion of the gain or loss on the hedging instrument that is determined to be an effective hedge is recognised in other comprehensive income and any ineffective portion is considered a finance cost and is recognised in net profit or loss in the statement of comprehensive income. the cumulative gain or loss previously recognised in other comprehensive income and presented in the hedging reserve in equity remains there until the forecast transaction affects profit or loss, at which point it is transferred to net profit or loss.
If the hedging instrument no longer meets the criteria for hedge accounting, expires or is sold, terminated or exercised, then hedge accounting is discontinued prospectively.
the trust manages its financial derivatives (interest rate swaps) to ensure they meet the requirements of a cash flow hedge.
(n) Leasesleases are classified at their inception as either operating or finance leases based on the economic substance of the agreements so as to reflect the risks and benefits incidental to ownership.
Operating leasesthe minimum rental revenues of operating leases, where the lessor effectively retains substantially all of the risks and benefits of ownership of the leased items, are included in the determination of the net profit in accordance with the revenue recognition policy at note 1(k).
leasing fees incurred in relation to the on-going renewal of major tenancies are deferred and amortised over the lease period to which they relate.
lease incentives, which may take the form of up-front payments, contributions to certain lessees’ costs, relocation costs and fit-outs and improvements, are recognised on a straight line-basis over the lease term as a reduction of rental income.
(o) Units on issueunits on issue are recognised at the fair value of the consideration received by the trust. Any transaction costs arising on the issue of ordinary units are recognised directly in equity as a reduction of the unit proceeds received.
the trust operates a Distribution Reinvestment plan (“DRp”). An issue of units under the DRp results in an increase in issued capital.
(p) Earnings per unitBasic earnings per unit is calculated as net profit attributable to unitholders divided by the weighted average number of units.
the diluted earnings per unit is equal to the basic earnings per unit.
(q) Segment reportingthe trust determines and presents operating segments based on the internal information that is provided to the General Manager, who is the trust’s chief operating decision maker.
the trust operates wholly within Australia and derives rental income from investments in commercial warehouse properties and as such this is considered to be the only segment in which the trust is engaged. Refer to notes 17 and 19 for further information.
the operating results are regularly reviewed by the General Manager to make decisions about resources to be allocated and to assess performance. there are no reconciling items that exist between the discrete financial information reviewed by the General Manager and the financial statements relating to revenue, profit or loss, assets and liabilities or other material items.
For
per
sona
l use
onl
y

34BWP TRuST AnnuAl RepoRt 2012
June 2012
$
June 2011
$
2. AUDITOr’S rEMUNErATION
Auditing and review of the financial statements
KpMG Australia 70,925 69,107
Other services
KpMG Australia – taxation services 20,430 22,800
91,355 91,907
June 2012
$000
June 2011
$000
3. fINANCE INCOME AND EXPENSE
recognised directly in profit and loss
Finance income - interest income on bank deposits 434 1,162
Finance expense:
- Interest expense on financial liabilities measured at amortised cost (18,427) (16,517)
- Interest expense on interest rate swaps (2,091) (2,577)
Total finance expenses (20,518) (19,094)
Net finance income and expense (20,084) (17,932)
recognised in other comprehensive (loss)/income
Net (losses)/gains on cash flow hedges for the year:
- Realised losses transferred to net profit 2,091 2,577
- Unrealised (losses)/gains on cash flow hedges (16,796) 61
Finance expense recognised in other comprehensive income (14,705) 2,638
4. rESPONSIBLE ENTITy’S fEES
the responsible entity, BWp Management limited, is entitled to a management fee payable quarterly in arrears of 0.55 per cent per annum of the gross asset value of the trust.
the responsible entity is also entitled to a fee calculated at the rate of 0.05 per cent per annum of the gross asset value of the trust up to $200 million and 0.035 per cent per annum of the amount by which the gross asset value of the trust exceeds $200 million.
the responsible entity may waive the whole or any part of the remuneration to which it would otherwise be entitled (see note 19(d)(ii)e)).
Notes to the financial statementsFor the year ended 30 June 2012
For
per
sona
l use
onl
y

35BWP TRuST AnnuAl RepoRt 2012
Notes to the financial statementsFor the year ended 30 June 2012
5. OTHEr OPErATING EXPENSES
Recoverable property costs 893 362
non-recoverable property costs1 3,331 2,819
other operating expenses 416 781
4,640 3,962
1 Included in non-recoverable property costs are amounts payable of $1,507,090 (2011: $1,448,374) for Queensland land tax which under the respective state legislation cannot be on-charged to tenants
6. DISTrIBUTIONS PAID Or PAyABLE
In accordance with the trust’s constitution, the unrealised gains or losses on the revaluation of the fair value of investment properties are not included in the profit available for distribution to unitholders. A reconciliation is provided below:
June 2012
$000
June 2011
$000
6.63 cents (2011: 6.18 cents) per unit, interim distribution paid on 24 February 2012 34,477 26,391
8.04 cents (2011: 5.80 cents) per unit, final distribution provided 42,231 30,161
76,708 56,552
net profit attributable to unitholders of BWp trust 69,931 81,497
net realised profit on sale of investment property1 6,150 376
net unrealised losses/(gains) in fair value of investment properties 635 (25,328)
Distributable profit for the year 76,716 56,545
opening undistributed profit 9 16
Closing undistributed profit (17) (9)
Distributable amount 76,708 56,552
Distribution (cents per unit) 14.67 11.98
1 net sale proceeds less original purchase price and capital expenditure since acquisition
June 2012
$000
June 2011
$000
For
per
sona
l use
onl
y

36BWP TRuST AnnuAl RepoRt 2012
June 2012 June 2011
7. EArNINGS PEr UNIT
net earnings used in calculating basic and diluted earnings per unit $69,931,000 $81,497,000
Basic and diluted earnings per unit 13.40 cents 17.97 cents
Basic and diluted earnings per unit excluding unrealised losses/gains in fair value of investment properties 13.52 cents 12.38 cents
Weighted average number of units on issue used in the calculation of basic and diluted earnings per unit 521,831,842 453,588,624
June 2012
$000
June 2011
$000
8. CASH
Cash at bank 24,732 8,942
Weighted average effective interest rates 4.00% 4.59%
the trust’s exposure to interest rate risk and a sensitivity analysis for financial assets and liabilities are set out in note 17.
June 2012
$000
June 2011
$000
9. rECEIVABLES AND PrEPAyMENTS
CurrentReceivables from Wesfarmers limited subsidiaries 393 130
other receivables 296 117
prepayments 3,182 5,376
3,871 5,623
Non-currentloan to Bunnings Group limited - 850
Wesfarmers limited is a related party (see note 19(d)(i)).
Bunnings Group limited is a controlled entity of Wesfarmers limited. the terms and conditions of the loan are disclosed in note 19(d)(ii)f).
Notes to the financial statementsFor the year ended 30 June 2012
For
per
sona
l use
onl
y

37BWP TRuST AnnuAl RepoRt 2012
10. INVESTMENT PrOPErTIES (NON-CUrrENT)
(a) Cost and fair value of investments
PropertyAcquisition
date
Purchase price $000
Acquisition costs $000
Capital improvements
since acquisition
$000
fair value adjustment
since acquisition
$000
fair value 30 June
2012 $000
fair value 30 June
2011 $000
Last independent
valuation
Albany, WA 01.11.99 4,100 206 14 5,280 9,600 9,900 31.12.10
Altona, VIC 24.09.98 6,800 566 2,781 6,110 16,257 16,157 31.12.09
Artarmon, nSW 10.02.03 14,033 864 212 6,691 21,800 21,800 31.12.11
Balcatta, WA 24.09.98 11,200 555 81 13,264 25,100 24,200 30.06.12
Bayswater, VIC 11.02.03 7,335 796 13,541 3,328 25,000 24,600 30.06.12
Belmont, WA 01.04.11 16,670 921 - (991) 16,600 16,700 15.01.11
Belmont north, nSW 04.12.06 10,850 634 298 (1,282) 10,500 10,800 31.12.09
Belrose, nSW 10.02.03 17,150 1,054 256 8,140 26,600 25,700 31.12.11
Bibra lake, WA 29.12.98 1,899 95 6,431 12,075 20,500 19,800 31.12.10
Blackburn, VIC 15.01.08 19,000 1,123 1,080 (3,403) 17,800 17,500 31.12.10
Blacktown, nSW 24.01.07 8,235 540 259 (2,534) 6,500 6,400 31.12.09
Broadmeadows, VIC 24.09.98 7,200 431 6,475 7,594 21,700 21,000 30.06.10
Browns plains, QlD 05.04.12 24,000 1,401 - (1,401) 24,000 - 01.04.12
Burleigh Heads, QlD 22.10.98 9,700 195 342 5,863 16,100 15,600 30.06.12
Cairns, QlD 10.02.03 10,000 453 1,927 1,920 14,300 14,200 31.12.11
Cannon Hill, QlD 24.12.98 5,600 313 7,942 10,645 24,500 23,400 30.06.10
Caroline Springs, VIC 23.05.11 19,080 1,098 - (878) 19,300 19,100 15.01.11
Cockburn, WA 01.04.11 18,670 1,026 - (496) 19,200 18,700 15.01.11
Coffs Harbour, nSW 05.09.01 1,900 112 4,567 221 6,800 10,200 31.12.11
Croydon, VIC 24.09.98 7,800 518 5,736 8,946 23,000 21,500 31.12.09
Craigieburn, VIC 07.05.12 18,420 1,064 - (1,384) 18,100 - 15.01.11
Dandenong, VIC 19.04.02 4,000 255 6,746 5,799 16,800 16,800 31.12.10
Dubbo, nSW 05.08.11 15,790 1,004 - (1,094) 15,700 - 15.01.11
epping, VIC 12.03.99 7,800 463 88 5,649 14,000 14,500 30.06.10
Fairfield Waters, QlD 01.04.11 16,950 977 - (127) 17,800 17,300 15.01.11
Fountain Gate, VIC 24.09.98 8,300 505 1,643 8,352 18,800 18,200 31.12.11
Frankston, VIC 26.06.01 7,300 301 9,528 8,071 25,200 26,000 30.06.10
Fyshwick, ACt 23.12.02 10,000 942 3,538 2,720 17,200 16,771 31.12.11
Geraldton, WA 10.12.01 1,250 351 5,301 6,298 13,200 11,900 30.06.10
Geraldton Showrooms, WA 11.09.07 2,897 190 836 (1,323) 2,600 2,500 30.06.10
Greenacre, nSW 01.04.11 13,250 850 16,750 (1,350) 29,500 14,078 15.01.11
Harrisdale, WA 01.04.11 10,000 573 8,656 (629) 18,600 10,571 15.01.11
Hawthorn, VIC 18.04.07 19,337 1,217 24,520 (5,574) 39,500 40,900 31.12.11
Hemmant, QlD 07.05.03 3,000 143 10,557 8,000 21,700 22,300 30.06.12
Hervey Bay, QlD 12.07.02 2,053 122 6,497 3,828 12,500 12,500 30.06.11
Hoppers Crossing, VIC - - - - - - 15,400 30.06.11
Joondalup, WA 24.09.98 8,100 593 67 7,540 16,300 16,200 30.06.12
lismore, nSW 21.04.04 7,750 447 928 1,075 10,200 10,600 30.06.12
Maitland, nSW 20.08.03 898 489 9,936 4,177 15,500 14,900 31.12.09
Mandurah, WA 24.09.98 3,050 160 5,572 8,618 17,400 17,300 30.06.12
Maribyrnong, (land) VIC 28.06.01 7,100 462 - - 7,562 7,562 n/A
Mentone, VIC 24.09.98 9,400 542 104 9,954 20,000 20,400 30.06.12
Midland, WA 06.03.01 4,600 255 5,021 10,224 20,100 18,400 31.12.09
Notes to the financial statementsFor the year ended 30 June 2012
For
per
sona
l use
onl
y

38BWP TRuST AnnuAl RepoRt 2012
PropertyAcquisition
date
Purchase price $000
Acquisition costs $000
Capital improvements
since acquisition
$000
fair value adjustment
since acquisition
$000
fair value 30 June
2012 $000
fair value 30 June
2011 $000
Last independent
valuation
Mile end, SA 22.03.00 11,250 624 3,083 12,543 27,500 27,600 30.06.11
Minchinbury, nSW 31.12.98 9,200 503 4,332 11,422 25,457 25,455 30.06.11
Mindarie, WA 03.03.00 4,184 209 5,686 9,421 19,500 17,800 31.12.11
Morayfield, QlD 22.03.00 8,000 334 3,719 7,347 19,400 18,600 30.06.11
Morley, WA 04.07.05 11,100 642 474 2,584 14,800 15,000 30.06.11
Mornington, VIC 29.12.98 3,400 204 6,573 9,723 19,900 19,800 31.12.10
Mt Gravatt, QlD 18.12.08 11,215 659 64 (438) 11,500 11,800 31.12.11
noarlunga, SA 13.04.99 2,305 124 7,442 7,529 17,400 17,300 30.06.11
northland, VIC 24.09.98 8,600 489 2,977 10,334 22,400 21,700 31.12.11
nunawading, VIC 24.09.98 13,700 786 3,198 14,203 31,887 31,887 31.12.11
oakleigh South, VIC 05.04.01 6,650 374 9,146 5,730 21,900 22,600 30.06.10
pakenham, VIC 01.04.11 20,250 1,187 - (1,137) 20,300 20,300 15.01.11
port Kennedy, WA 19.05.11 16,440 916 4 (460) 16,900 16,400 15.01.11
port Macquarie, nSW 15.11.02 2,100 141 5,460 2,499 10,200 10,500 30.06.11
port Melbourne, VIC 10.12.10 24,000 1,391 49 (440) 25,000 24,300 31.12.10
Regency park, SA 24.01.07 4,656 350 218 (524) 4,700 4,600 31.12.09
Rockingham, WA 30.06.00 3,320 166 5,917 10,297 19,700 19,700 31.12.11
Rocklea, QlD 29.10.02 6,225 296 7,477 3,302 17,300 18,300 31.12.11
Sandown, VIC 24.09.98 7,800 446 51 1,703 10,000 13,200 31.12.11
Scoresby, VIC 24.09.98 8,300 473 5,803 8,124 22,700 16,400 31.12.09
Smithfield, QlD 19.05.11 15,250 890 - (40) 16,100 15,500 15.01.11
Southport, QlD 09.11.98 2,800 188 6,927 6,585 16,500 15,800 30.06.12
Sunshine, VIC 24.09.98 7,000 407 118 4,375 11,900 11,800 30.06.10
thornleigh, nSW 07.09.04 13,333 782 360 1,925 16,400 15,800 30.06.10
tuggeranong, ACt 01.12.98 7,900 431 859 10,810 20,000 19,300 31.12.09
underwood, QlD 22.10.98 3,000 178 6,141 6,381 15,700 15,300 30.06.12
Vermont South, VIC 14.05.03 9,150 635 14,362 2,053 26,200 26,100 31.12.10
Villawood, nSW 14.05.08 18,400 861 48 91 19,400 18,800 30.06.11
Wagga Wagga, nSW 01.04.11 15,000 932 - (432) 15,500 15,000 15.01.11
Wollongong, nSW 10.02.03 12,000 628 276 4,096 17,000 16,900 31.12.11688,995 41,052 268,994 307,522 1,306,563 1,225,881
(i) Valuation policyInvestment properties are carried at fair value.
Fair value is determined by a full independent valuation completed at least every three years by an independent valuer who holds a relevant professional qualification and has recent experience in the location and category of the investment property.
properties that have not been independently valued as at balance date are carried at fair value by way of directors’ valuation.
Initially, each investment property is measured at cost including transaction costs (see note 1(e)). Subsequent revaluations to fair value according to the trust’s revaluations policy may result in transaction costs appearing as a negative adjustment (loss) in fair value.
Notes to the financial statementsFor the year ended 30 June 2012
10. INVESTMENT PrOPErTIES (NON-CUrrENT) (continued)
(a) Cost and fair value of investments (continued)
For
per
sona
l use
onl
y
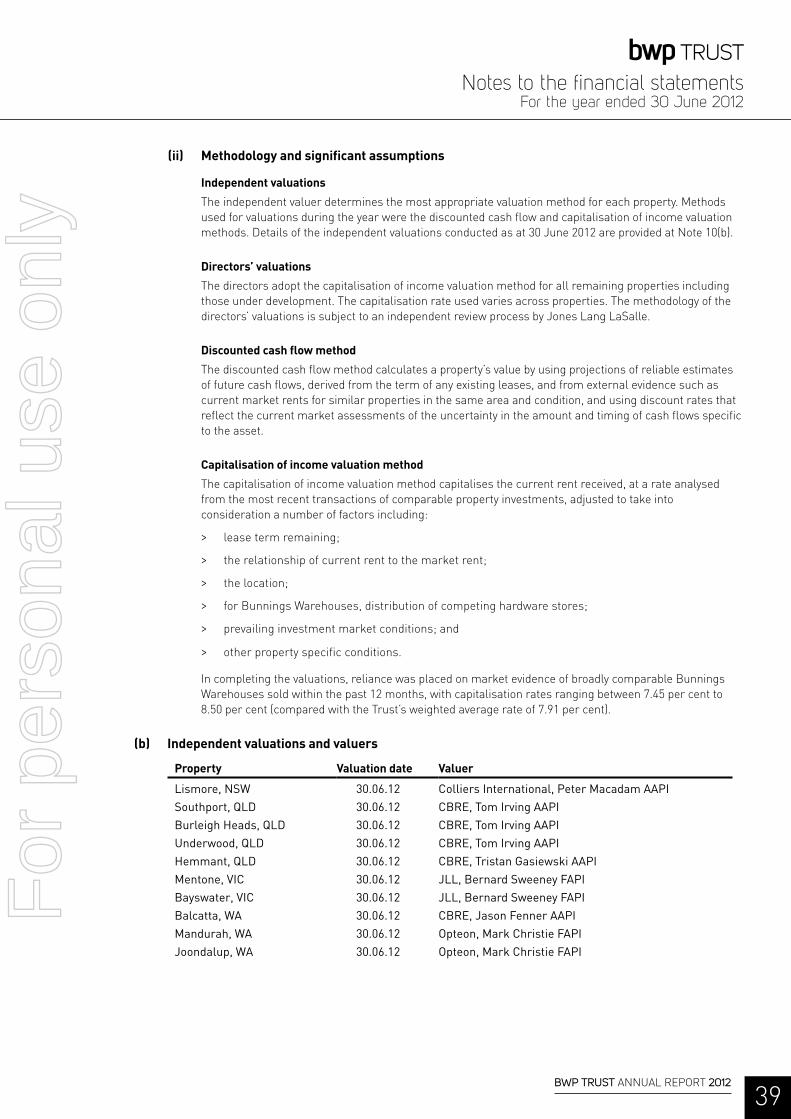
39BWP TRuST AnnuAl RepoRt 2012
(ii) Methodology and significant assumptions
Independent valuations
the independent valuer determines the most appropriate valuation method for each property. Methods used for valuations during the year were the discounted cash flow and capitalisation of income valuation methods. Details of the independent valuations conducted as at 30 June 2012 are provided at note 10(b).
Directors’ valuations
the directors adopt the capitalisation of income valuation method for all remaining properties including those under development. the capitalisation rate used varies across properties. the methodology of the directors’ valuations is subject to an independent review process by Jones lang laSalle.
Discounted cash flow method
the discounted cash flow method calculates a property’s value by using projections of reliable estimates of future cash flows, derived from the term of any existing leases, and from external evidence such as current market rents for similar properties in the same area and condition, and using discount rates that reflect the current market assessments of the uncertainty in the amount and timing of cash flows specific to the asset.
Capitalisation of income valuation method
the capitalisation of income valuation method capitalises the current rent received, at a rate analysed from the most recent transactions of comparable property investments, adjusted to take into consideration a number of factors including:
> lease term remaining;
> the relationship of current rent to the market rent;
> the location;
> for Bunnings Warehouses, distribution of competing hardware stores;
> prevailing investment market conditions; and
> other property specific conditions.
In completing the valuations, reliance was placed on market evidence of broadly comparable Bunnings Warehouses sold within the past 12 months, with capitalisation rates ranging between 7.45 per cent to 8.50 per cent (compared with the trust’s weighted average rate of 7.91 per cent).
(b) Independent valuations and valuers
Property Valuation date Valuer
Lismore, NSW 30.06.12 Colliers International, Peter Macadam AAPISouthport, QLD 30.06.12 CBRE, Tom Irving AAPIBurleigh Heads, QLD 30.06.12 CBRE, Tom Irving AAPIUnderwood, QLD 30.06.12 CBRE, Tom Irving AAPIHemmant, QLD 30.06.12 CBRE, Tristan Gasiewski AAPIMentone, VIC 30.06.12 JLL, Bernard Sweeney FAPIBayswater, VIC 30.06.12 JLL, Bernard Sweeney FAPIBalcatta, WA 30.06.12 CBRE, Jason Fenner AAPIMandurah, WA 30.06.12 Opteon, Mark Christie FAPIJoondalup, WA 30.06.12 Opteon, Mark Christie FAPI
Notes to the financial statementsFor the year ended 30 June 2012
For
per
sona
l use
onl
y

40BWP TRuST AnnuAl RepoRt 2012
10. INVESTMENT PrOPErTIES (NON-CUrrENT) (continued)
(c) Operating leases
(i) All of the properties listed in note 10(a) are leased by Bunnings Group limited except trust properties at Blackburn, Maribyrnong, Blacktown, Regency park; surplus land adjoining properties at Altona (1.0 hectare), Minchinbury (0.5 hectares), nunawading (0.1 hectares), Fyshwick (1.0 hectare); Geraldton Showrooms; showrooms co-located with Bunnings Warehouses at Bayswater, Browns plains, Dubbo and pakenham; and a pad site at Dubbo.
(ii) General information regarding the duration of leases is as follows:
> Bunnings Warehouse leases generally commit the tenant to an initial term of ten or fifteen years, followed by a number of optional terms of five years each exercisable by the tenant.
> leases to non-Bunnings tenants generally commit the tenant to an initial term of between five and ten years, followed by one or a number of optional terms of five years each exercisable by the tenant.
> At 30 June 2012, the minimum lease expiry (being the duration until which the tenants’ committed terms expire) for the trust’s investment properties is 0.7 years (2011: 1.3 years) and the maximum lease expiry is 14.3 years (2011: 15.4 years), with a weighted average lease expiry for the portfolio of 7.7 years (2011: 8.6 years).
(iii) Generally, rents are reviewed annually in line with movements in Consumer price Indices compiled by the Australian Bureau of Statistics or a fixed percentage increase, except when a market rent review is due. Market rent reviews for most Bunnings Warehouses are due each fifth anniversary of the commencement date and for other leases at the exercise of each option by the tenant. Generally, market rents are agreed by the landlord and tenant or if not agreed, determined by an independent expert in accordance with generally accepted rent review criteria.
(iv) the tenants are generally responsible for payment of most outgoings, which include all normal rates, taxes and assessments (other than land tax in some instances). At the Browns plains property, the non-Bunnings tenants do not contribute to outgoings, but each is responsible for payment of all of its respective utilities charges.
(v) Some of the leases of Bunnings Warehouses allow for the tenant to repurchase the properties in specified circumstances:
a) at Bayswater, Morley, thornleigh and Vermont South properties, the tenant may repurchase the property from the landlord in the event that:
(i) the tenant proposes a redevelopment of the relevant property for which the tenant and landlord cannot agree commercial terms and at the time the tenant and landlord are not related bodies corporate; or
(ii) the landlord and tenant cease to be related bodies corporate. In respect to the Bunnings Warehouses at Bayswater and Vermont South properties, in the event that the tenant and landlord cease to be related bodies corporate, the tenant may only exercise the right to repurchase at the end of the initial lease term and at the end of each further option term.
b) If the right to repurchase is exercised in respect of any of these properties, the purchase price for the property will be a price to be agreed between the parties and failing agreement, a price determined by an appointed valuer based on the market value assuming vacant possession for the relevant property.
Notes to the financial statementsFor the year ended 30 June 2012
For
per
sona
l use
onl
y

41BWP TRuST AnnuAl RepoRt 2012
(vi) there are no lease commitments receivable as at the reporting date.
(vii) there were no contingent rentals recognised as revenues in the financial year.
(viii) the future minimum non-cancellable rental revenues are:
June 2012
$000
June 2011
$000
not later than one year 104,003 92,613
later than one year not later than five years 380,932 349,524
later than five years 319,493 357,435
804,428 799,572
(d) reconciliation of movement in investment properties
opening balance at the beginning of the financial year 1,225,881 1,000,111
Acquisitions during the year 61,671 196,276
Divestments during the year (14,341) (7,500)
Capital improvements 33,987 11,666
net unrealised (losses)/gains from fair value adjustments (635) 25,328
Closing balance at the end of the financial year 1,306,563 1,225,881
11. PAyABLES AND DEfErrED INCOME
Current
Trade creditors and accruals 3,474 3,034
Responsible entity’s fees payable 1,769 1,706
Rent received in advance 8,828 7,924
14,071 12,664
the trust’s exposure to liquidity risk in respect of payables is disclosed in note 17.
Notes to the financial statementsFor the year ended 30 June 2012
For
per
sona
l use
onl
y
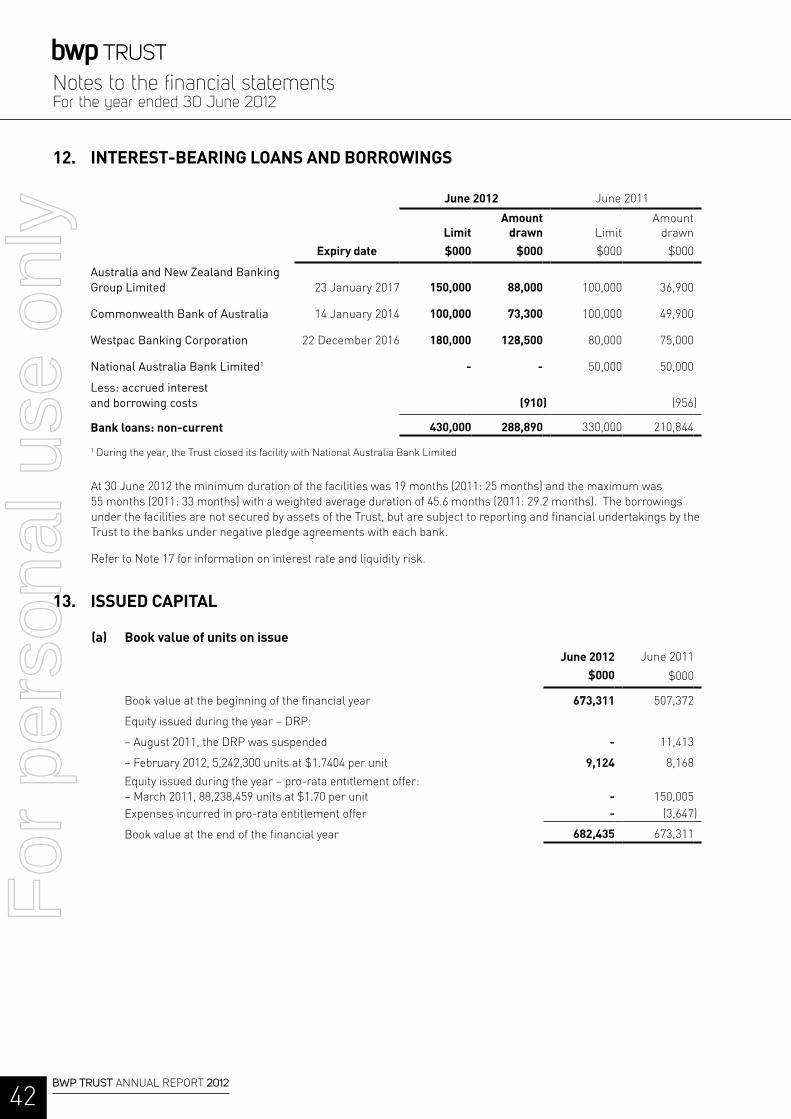
42BWP TRuST AnnuAl RepoRt 2012
12. INTErEST-BEArING LOANS AND BOrrOWINGS
June 2012 June 2011
Expiry date
Limit
$000
Amount drawn
$000
limit
$000
Amount drawn
$000
Australia and New Zealand Banking Group Limited 23 January 2017 150,000 88,000 100,000 36,900
Commonwealth Bank of Australia 14 January 2014 100,000 73,300 100,000 49,900
Westpac Banking Corporation 22 December 2016 180,000 128,500 80,000 75,000
National Australia Bank Limited1 - - 50,000 50,000
Less: accrued interest and borrowing costs (910) (956)
Bank loans: non-current 430,000 288,890 330,000 210,844
1 During the year, the trust closed its facility with national Australia Bank limited
At 30 June 2012 the minimum duration of the facilities was 19 months (2011: 25 months) and the maximum was 55 months (2011: 33 months) with a weighted average duration of 45.6 months (2011: 29.2 months). the borrowings under the facilities are not secured by assets of the trust, but are subject to reporting and financial undertakings by the trust to the banks under negative pledge agreements with each bank.
Refer to note 17 for information on interest rate and liquidity risk.
13. ISSUED CAPITAL
(a) Book value of units on issueJune 2012
$000
June 2011
$000
Book value at the beginning of the financial year 673,311 507,372
equity issued during the year – DRp:
– August 2011, the DRp was suspended - 11,413
– February 2012, 5,242,300 units at $1.7404 per unit 9,124 8,168
equity issued during the year – pro-rata entitlement offer: – March 2011, 88,238,459 units at $1.70 per unit - 150,005expenses incurred in pro-rata entitlement offer - (3,647)
Book value at the end of the financial year 682,435 673,311
Notes to the financial statementsFor the year ended 30 June 2012
For
per
sona
l use
onl
y

43BWP TRuST AnnuAl RepoRt 2012
(b) Number of ordinary units on issue
June 2012 June 2011
number of fully paid units on issue at the beginning of the financial year 520,012,793 420,711,773
Issue of units during the year – DRp 5,242,300 11,062,561
Issue of units during the year – pro-rata entitlement offer - 88,238,459
number of fully paid units on issue at the end of the financial year 525,255,093 520,012,793
(c) rightsthe trust is a unit trust of no fixed duration and the units in the trust have no right of redemption.
each unit entitles the unitholder to receive distributions as declared and, in the event of winding up the trust, to participate in all net cash proceeds from the realisation of assets of the trust in proportion to the number of and amounts paid up on units held.
(d) Distribution reinvestment Plan the DRp was in place for both the interim distribution and final distribution for the year ended 30 June 2012.
For the year ended 30 June 2011, the DRp was in place for the interim distribution but was suspended in respect of the final distribution in view of the uncertainty and volatility being experienced in the Australian equity markets and the prevailing market price of BWp trust units.
14. rESErVES
this reserve records the portion of the gain or loss on a hedging instrument in a cash flow hedge that is determined to be an effective hedge.
June 2012
$000
June 2011
$000
opening balance at the beginning of the financial year (1,308) (3,946)
net (loss)/gain on cash flow hedges for the year (14,705) 2,638
Closing balance at the end of the financial year (16,013) (1,308)
Notes to the financial statementsFor the year ended 30 June 2012
For
per
sona
l use
onl
y
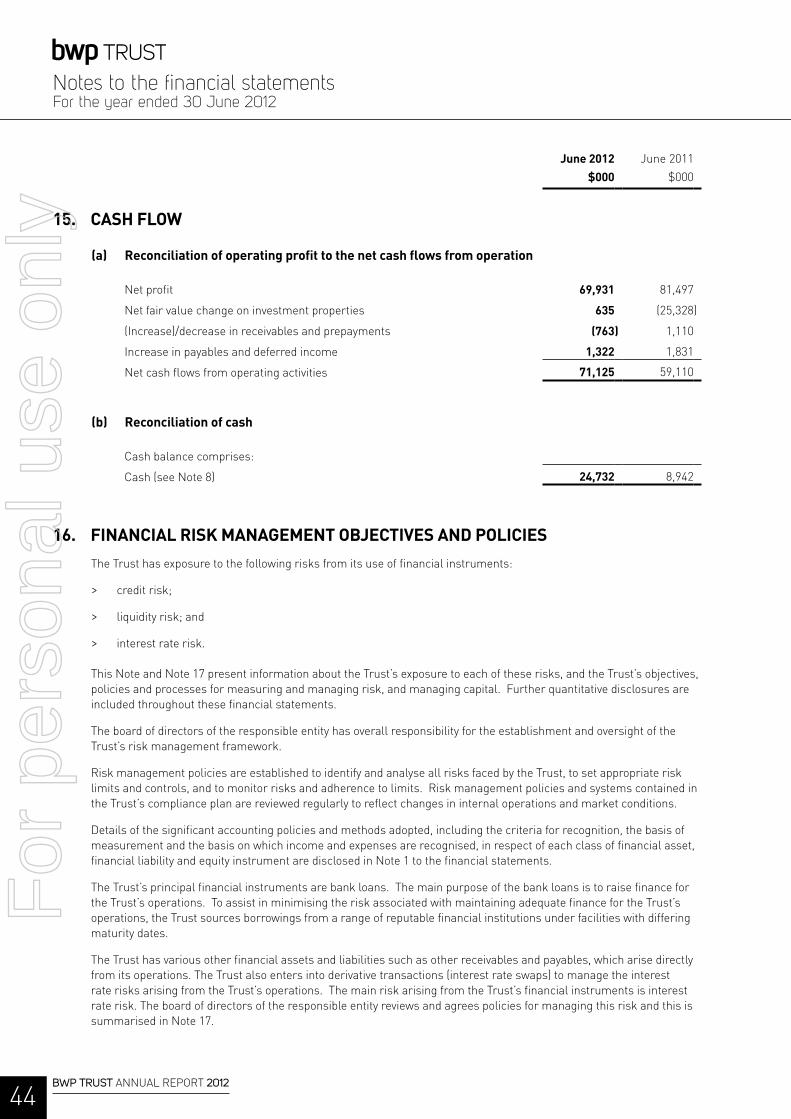
44BWP TRuST AnnuAl RepoRt 2012
June 2012
$000
June 2011
$000
15. CASH fLOW
(a) reconciliation of operating profit to the net cash flows from operation
net profit 69,931 81,497
net fair value change on investment properties 635 (25,328)
(Increase)/decrease in receivables and prepayments (763) 1,110
Increase in payables and deferred income 1,322 1,831
net cash flows from operating activities 71,125 59,110
(b) reconciliation of cash
Cash balance comprises:
Cash (see note 8) 24,732 8,942
16. fINANCIAL rISK MANAGEMENT OBJECTIVES AND POLICIES
the trust has exposure to the following risks from its use of financial instruments:
> credit risk;
> liquidity risk; and
> interest rate risk.
this note and note 17 present information about the trust’s exposure to each of these risks, and the trust’s objectives, policies and processes for measuring and managing risk, and managing capital. Further quantitative disclosures are included throughout these financial statements.
the board of directors of the responsible entity has overall responsibility for the establishment and oversight of the trust’s risk management framework.
Risk management policies are established to identify and analyse all risks faced by the trust, to set appropriate risk limits and controls, and to monitor risks and adherence to limits. Risk management policies and systems contained in the trust’s compliance plan are reviewed regularly to reflect changes in internal operations and market conditions.
Details of the significant accounting policies and methods adopted, including the criteria for recognition, the basis of measurement and the basis on which income and expenses are recognised, in respect of each class of financial asset, financial liability and equity instrument are disclosed in note 1 to the financial statements.
the trust’s principal financial instruments are bank loans. the main purpose of the bank loans is to raise finance for the trust’s operations. to assist in minimising the risk associated with maintaining adequate finance for the trust’s operations, the trust sources borrowings from a range of reputable financial institutions under facilities with differing maturity dates.
the trust has various other financial assets and liabilities such as other receivables and payables, which arise directly from its operations. the trust also enters into derivative transactions (interest rate swaps) to manage the interest rate risks arising from the trust’s operations. the main risk arising from the trust’s financial instruments is interest rate risk. the board of directors of the responsible entity reviews and agrees policies for managing this risk and this is summarised in note 17.
Notes to the financial statementsFor the year ended 30 June 2012
For
per
sona
l use
onl
y

45BWP TRuST AnnuAl RepoRt 2012
17. fINANCIAL INSTrUMENTS
the trust has recognised certain financial instruments in the accounts. these financial instruments are disclosed in notes 8, 9, 11 and 12. the main risks associated with the trust’s financial instruments and the means by which these risks are managed, the measurement of financial instruments and how capital is managed are outlined below:
(a) Concentration of credit riskCredit risk is the risk of financial loss to the trust if a customer or counterparty to a financial instrument fails to meet its contractual obligations, and arises principally from the trust’s receivables from customers, cash, and payments due to the trust under interest rate swaps.
receivablesthe credit risk associated with 96.6 per cent (2011: 96.8 per cent) of the rental income is with three tenants, Bunnings Group limited 95.0 per cent (2011: 95.3 per cent), J Blackwood and Son pty limited 1.2 per cent (2011: 1.4 per cent) and officeworks Superstores pty ltd 0.4 per cent (2011: 0.1 per cent), wholly owned subsidiaries of Wesfarmers limited. Bunnings Group limited, J Blackwood and Son pty limited, officeworks Superstores pty ltd and Wesfarmers limited are currently subject to a Deed of Cross Guarantee under which they covenant with a trustee for the benefit of each creditor that they guarantee to each creditor payment in full of any debt in the event of any entity that is included in the Deed of Cross Guarantee being wound up. Wesfarmers limited has been assigned a credit rating of A-(stable)/A2 by Standard & poor’s (Baa1(positive)/p2 – Moody’s).
Cashthe trust limits its exposure to credit risk associated with its cash by maintaining limited cash balances and having cash deposited with reputable, major financial institutions subject to regulation in Australia.
Derivative financial instrumentsthe trust limits its exposure to credit risk associated with future payments from its interest rate swaps by contracting with reputable major financial institutions subject to regulation in Australia.
Exposure to credit riskthe carrying amount of the trust’s financial assets represents the maximum credit exposure. the trust’s maximum exposure to credit risk at the reporting date was:
Carrying amount
note
June 2012
$000
June 2011
$000
Cash and short-term deposits 8 24,732 8,942
Loans and receivables 9 689 1,097
Interest rate swaps assets - 833
25,421 10,872
Notes to the financial statementsFor the year ended 30 June 2012
For
per
sona
l use
onl
y

46BWP TRuST AnnuAl RepoRt 2012
17. fINANCIAL INSTrUMENTS (continued)
(a) Concentration of credit risk (continued)
the trust’s maximum exposure to credit risk for loans and receivables at the reporting date by type of customer was:
Carrying amountJune 2012
$000
June 2011
$000
Tenants
Wesfarmers Limited subsidiaries 393 130
Other tenants 296 117
Loans
Bunnings Group Limited – (see Note 19(d)(ii)f)) - 850
689 1,097
Impairment lossesRental receivables of approximately $28,040 were overdue at 30 June 2012 (2011: $1,995).
there was no allowance for impairment in respect of receivables during the current year or the previous year.
Based on historic default rates, the trust believes that no impairment allowance is necessary in respect of receivables.
Notes to the financial statementsFor the year ended 30 June 2012
For
per
sona
l use
onl
y

47BWP TRuST AnnuAl RepoRt 2012
(b) Liquidity riskliquidity risk is the risk that the trust will not be able to meet its financial obligations as they fall due. the trust’s approach to managing liquidity is to ensure, as far as possible, that it will always have sufficient liquidity to meet its liabilities when due, under both normal and stressed conditions, without incurring unacceptable losses or risking damage to the trust’s reputation. the trust regularly updates and reviews its cash flow forecasts to assist in managing its liquidity.
the following are the contractual maturities of financial liabilities (including estimated interest payments) and receipts or payments of interest rate swaps. the amounts disclosed in the table below are the contractual undiscounted cash flows and hence will not necessarily reconcile with the amount disclosed in the statement of financial position:
30 June 2012
Carrying amount
$000
Contractual cash flows
$000
1 year
$000
1-2 years
$000
2-5 years
$000
More than 5 years
$000
Non-derivative financial liabilities
Bank loans - principal (288,890) (289,800) - (73,300) (216,500) -
Bank loans - future interest - (57,109) (14,032) (12,904) (30,173) -
Payables and deferred income (14,071) (14,071) (14,071) - - -
Derivative financial liabilities
Interest rate swaps (16,013) (18,662) (4,179) (4,640) (8,938) (905)
(318,974) (379,642) (32,282) (90,844) (255,611) (905)
30 June 2011
Non-derivative financial liabilities
Bank loans - principal (210,844) (211,800) - - (211,800) -
Bank loans - future interest - (34,331) (13,254) (13,484) (7,593) -
Payables and deferred income (12,664) (12,664) (12,664) - - -
Derivative financial liabilities
Interest rate swaps (1,308) 255 (1,167) (553) 1,421 554
(224,816) (258,540) (27,085) (14,037) (217,972) 554
(c) Interest rate riskInterest rate risk is the risk that the trust’s finances will be adversely affected by fluctuations in interest rates. to help reduce this risk in relation to bank loans, the trust has employed the use of interest rate swaps whereby, the trust agrees with various banks to exchange at specified intervals, the difference between fixed rate and floating rate interest amounts calculated by reference to an agreed notional principal amount. Any amounts paid or received relating to interest rate swaps are recognised as adjustments to interest expense over the life of each contract swap, thereby effectively fixing the interest rate on the underlying obligations. At 30 June 2012 the fixed rates varied from 4.25 per cent to 5.82 per cent (2011: 5.15 per cent to 7.72 per cent) and the floating rates were at bank bill rates plus a bank margin.
the trust has a policy of hedging the majority of its borrowings against interest rate movements to ensure stability of distributions. At 30 June 2012, the trust’s hedging cover was 65.6 per cent of borrowings, which is within the board’s preferred 50 per cent to 75 per cent range.
Notes to the financial statementsFor the year ended 30 June 2012
For
per
sona
l use
onl
y

48BWP TRuST AnnuAl RepoRt 2012
17. fINANCIAL INSTrUMENTS (continued)
(c) Interest rate risk (continued)
the trust’s exposure to interest rate risk for classes of financial assets and financial liabilities is set out below:
Carrying amountJune 2012
$000
June 2011
$000
Variable rate instruments
Cash and short-term deposits 24,732 8,942
Bank loans (288,890) (210,844)
fair value sensitivity analysis for fixed rate instrumentsthe trust does not have any fixed rate financial assets and liabilities.
Cash flow sensitivity analysis for variable rate instrumentsthe analysis below considers the impact on equity and net profit or loss due to a reasonably possible increase or decrease in interest rates. this analysis assumes that all other variables remain constant. Due to changes in market conditions since the last report, the analysis used for 2012 differs from the previous year.
Net profit Equity
50 basis points
increase $000
50 basis points
decrease $000
50 basis points
increase $000
50 basis points
decrease $000
30 June 2012
Variable rate instruments (1,449) 1,449 - -
Interest rate swaps 950 (950) 4,070 (4,489)
Net impact on net profit and equity (499) 499 4,070 (4,489)
Net profit Equity
100 basis points
increase $000
50 basis points
decrease $000
100 basis points
increase $000
50 basis points
decrease $000
30 June 2011
Variable rate instruments (2,118) 1,059 - -
Interest rate swaps 1,800 (900) 7,503 (3,901)
Net impact on net profit and equity (318) 159 7,503 (3,901)
Notes to the financial statementsFor the year ended 30 June 2012
For
per
sona
l use
onl
y

49BWP TRuST AnnuAl RepoRt 2012
(d) Net fair valuesthe carrying amounts of financial assets and financial liabilities recorded in the financial statements have been determined in accordance with the accounting policies disclosed in note 1 of the financial statements and are as follows:
June 2012
$000
June 2011
$000Book value and
fair valueBook value and
fair value
Assets and liabilities held at amortised costs
Loans and receivables 689 1,097
Cash and short-term deposits 24,732 8,942
Bank loans (288,890) (210,844)
Payables and deferred income (14,071) (12,664)
Liabilities held at fair value
Interest rate swaps (16,013) (1,308)
Interest rate swaps are measured at fair value by valuation techniques for which all inputs which have a significant effect on the recorded fair value are observable, either directly or indirectly.
Interest rates used for determining fair valuethe interest rates used to discount estimated cash flows, where applicable, are based on current market rates for similar instruments and were as follows:
2012 2011
Interest rate swaps 3.12% to 4.10% 4.98% to 6.22%
(e) Capital managementCapital requirements are assessed based on budgeted cash flows, capital expenditure commitments and potential growth opportunities and are monitored on an ongoing basis. Information on capital and equity markets is reviewed on an ongoing basis to ascertain availability and cost of various funding sources.
In order to maintain a manageable level of debt, the responsible entity has established a preferred range of 20 to 30 per cent for the trust’s gearing ratio (debt to total assets), which is monitored on a monthly basis. At 30 June 2012, the gearing level was 21.6 per cent (2011: 17.0 per cent).
the trust’s DRp was suspended for the final distribution for the year ended 30 June 2011 due to the uncertainty and volatility being experienced in the Australian equity markets and the prevailing market price of BWp trust units. the DRp was reinstated for the interim distribution for the year ended 30 June 2012, and applied to the final distribution for the year ended 30 June 2012 and will apply to subsequent distributions until notice is given of its suspension or termination.
Notes to the financial statementsFor the year ended 30 June 2012
For
per
sona
l use
onl
y

50BWP TRuST AnnuAl RepoRt 2012
18. CAPITAL EXPENDITUrE COMMITMENTS
estimated capital expenditure contracted for at balance date, but not provided for, as being payable was:
June 2012
$000
June 2011
$000
Estimated capital expenditure contracted for at balance date, but not provided for in the financial statements, which is payable:
Not later than one year:
Unrelated Parties 2,923 1,312
Related Parties 3,840 71,513
Later than one year and not later than five years:
Related Parties 18,520 33,790
25,283 106,615
Capital Commitments to unrelated parties
Wallsend
In March 2011, as part of a portfolio of properties that the trust agreed to acquire from Bunnings Group limited, the trust committed to acquire for $2.9 million, including acquisition costs, from an unrelated party a development site on which a Bunnings Warehouse is to be developed.
Capital Commitments to related parties
Rocklea
In February 2011, the trust committed to upgrade works at the Rocklea property with an estimated cost of $3.8 million. on completion of the upgrade, the parties will enter into a new ten-year lease of the Bunnings Warehouse with one ten-year option, exercisable by the tenant.
Wallsend
Following the acquisition of the development site at Wallsend from an unrelated party, the trust is committed to the development of a Bunnings Warehouse at a cost of $18.5 million. on completion of the development, the parties will enter into a new ten-year lease of the Bunnings Warehouse with five, five-year options, exercisable by the tenant.
Notes to the financial statementsFor the year ended 30 June 2012
For
per
sona
l use
onl
y

51BWP TRuST AnnuAl RepoRt 2012
19. DIrECTOr AND EXECUTIVE DISCLOSUrES AND rELATED PArTy DISCLOSUrES
(a) Details of key management personnelthe following persons were key management personnel of the responsible entity, BWp Management limited, during the financial year:
Chairman – non-executiveJ A Austin
Non-executive directorsB J H Denison R D Higgins p J Johnston p J Mansell
General Manager
G W Gernhoefer
(b) remuneration policyRemuneration expenses of the directors and executives of the responsible entity are not borne by the trust. Directors are remunerated by the responsible entity and management services are provided to the responsible entity by Wesfarmers limited.
the right of the responsible entity to be remunerated and indemnified by the trust is set out in the constitution of the trust and summarised in note 4. the constitution is lodged with ASIC and is available to unitholders on request.
For the financial year ended 30 June 2012, each director was entitled to director’s fees and/or superannuation for their services and the reimbursement of reasonable expenses. the fees paid reflect the demands on, and the responsibilities of, those directors. the advice of independent remuneration consultants is taken to establish that the fees are in line with market standards. Directors do not receive option or bonus payments, nor do they receive retirement benefits in connection with their directorships. there are no equity incentive schemes in relation to the trust.
Wesfarmers limited employees seconded to the responsible entity to provide management services to the trust are engaged in dedicated roles to act exclusively for the responsible entity on behalf of the trust and are paid directly by Wesfarmers limited. Short-term incentives paid by Wesfarmers limited to employees engaged by the responsible entity are based entirely on the performance of the trust and furthering the objectives of the trust.
(c) Unit holdings
Directors
Balance at the beginning
of the yearAcquired
during the yearSold during
the yearBalance at the
end of the year
J A Austin 295,967 - - 295,967
B J H Denison 11,205 - - 11,205
P J Johnston 78,431 - - 78,431
P J Mansell 199,351 18,649 - 218,000
Total 584,954 18,649 - 603,603
no directors have other rights or options over interests in the trust or contracts to which the director is a party or under which the director is entitled to a benefit and that confer a right to call for or deliver an interest in the trust.
Notes to the financial statementsFor the year ended 30 June 2012
For
per
sona
l use
onl
y

52BWP TRuST AnnuAl RepoRt 2012
19. DIrECTOr AND EXECUTIVE DISCLOSUrES AND rELATED PArTy DISCLOSUrES (continued)
(d) Transactions with related parties(i) Relationship with the Wesfarmers Group
Wesfarmers Investments pty limited, a controlled entity of Wesfarmers limited, holds 123,419,543 (2011: 121,112,668) units in the trust, representing 23.50 per cent of the units on issue at 30 June 2012 (2011: 23.29 per cent).
(ii) transactions with the Wesfarmers Group
During the year ended 30 June 2012, the trust had the following transactions with Wesfarmers limited subsidiaries:
a) Following approval by unitholders in March 2011, the trust agreed to acquire a property portfolio, comprising 13 Bunnings Warehouse properties, from Bunnings Group limited, a controlled entity of Wesfarmers limited. During the year ended 30 June 2011 the trust paid $161,560,000 following settlement of 10 of the 13 properties. A further $59,563,364 was paid during the year ended 30 June 2012 relating to the completion of developments of Bunnings Warehouses on two of the ten properties acquired during 2011 and the settlement of two more properties. A further $18,520,000 relating to the development of the Wallsend Bunnings Warehouse is expected to be payable in the year ending 30 June 2014, subject to the trust finalising the acquisition of the development site from an unrelated party.
b) Rent and other property income of $96,607,448 (2011: $81,725,715) was received from Bunnings Group limited. the amount includes an amount received in advance of $7,986,259 (2011: $7,713,509). As at 30 June 2012 there was also a rent receivable of $19,909 (2011: $655).
c) Rent of $1,316,544 (2011: $1,179,984) was received from J Blackwood and Son pty limited, a controlled entity of Wesfarmers limited. the amount includes an amount received in advance of $102,879 (2011: nil). As at 30 June 2012 there was no rent receivable (2011: $94,908).
d) Rent of $381,049 (2011: $83,532) was received from officeworks Superstores pty ltd, a controlled entity of Wesfarmers limited. As at 30 June 2012 there was also a rent receivable of $35,627 (2011: $34,423).
e) the responsible entity’s fee of $6,367,371 (2011: $6,047,659) is paid or payable to the responsible entity. During the year ended 30 June 2011, as part of the agreement to acquire 13 Bunnings Warehouse properties from Bunnings Group limited, the responsible entity waived its entitlement to fees in respect of properties at: Greenacre, Dubbo and Wagga Wagga in new South Wales; Fairfield Waters and Smithfield in Queensland; Caroline Springs, Craigieburn and pakenham in Victoria; Belmont, Cockburn, Harrisdale and port Kennedy in Western Australia. For the year ended 30 June 2012 the amount of fees the responsible entity had waived was $1,126,071 (2011: $344,586). under the agreement the fee waiver was for 100 per cent of the management fee payable up to the 30 June 2012 and a 50 per cent reduction in the management fee payable from 1 July 2012 to 30 June 2013.
f) In January 2012, Bunnings Group limited repaid the trust a loan of $850,000. the loan was first provided during the year ended 30 June 2006 to fund the purchase of a parcel of land adjacent to the Vermont South Bunnings Warehouse. the land was exchanged at fair value and the terms of the agreement included charging Bunnings Group limited an access fee of eight per cent annually until such time as the parcel of land is sold to an external party. the sale of the parcel of land occurred during the year ended 30 June 2012 resulting in the repayment of the loan to the trust.
g) the trust reimbursed Bunnings Group limited $5.8 million for the completion of an upgrade to the trust’s Scoresby Bunnings Warehouse.
h) the trust reimbursed Bunnings Group limited for minor capital works and repairs and maintenance incurred to the trust’s properties for which the trust had a contractual obligation to incur.
i) the trust paid $146,920 (2011: $105,084) to Wesfarmers limited for insurance premiums on a number of the trust’s properties.
Notes to the financial statementsFor the year ended 30 June 2012
For
per
sona
l use
onl
y

53BWP TRuST AnnuAl RepoRt 2012
20. ADDITIONAL INfOrMATION
(a) Principal activities and investment policy of the Trustto invest in well located, geographically diversified properties with long-term leases to substantial tenants, predominantly in the bulky goods retail sector, with the purpose of providing unitholders with a secure, growing income stream and capital growth.
(b) Commencement and life of the Trustthe trust is a unit trust of no fixed duration and was constituted under a trust Deed dated 18 June 1998 as amended. the trust is managed by BWp Management limited. Both the trust and the responsible entity are domiciled in Australia.
(c) Economic dependency96.6 per cent (2011: 96.8 per cent) of the trust’s rental income received during the year was from Bunnings Group limited, J Blackwood and Son pty limited and officeworks Superstores pty ltd, all controlled entities of Wesfarmers limited.
(d) Corporate informationthe financial report of the trust for the year ended 30 June 2012 was authorised for issue in accordance with a resolution of the directors on 9 August 2012.
Notes to the financial statementsFor the year ended 30 June 2012
For
per
sona
l use
onl
y

54BWP TRuST AnnuAl RepoRt 2012
In accordance with the Corporations Act 2001, BWp Management limited (ABn 26 082 856 424), the responsible entity of BWp trust, provides this report for the financial year that commenced 1 July 2011 and ended 30 June 2012. the information on pages 5 to 9 forms part of this directors’ report and is to be read in conjunction with the following information:
results and distributions
June 2012
$000
June 2011
$000
Net profit attributable to unitholders 69,931 81,497
Net realised profit on sale of investment property1 6,150 376
Net unrealised losses/(gains) in fair value of investment properties 635 (25,328)
Distributable profit for the year 76,716 56,545
Opening undistributed profit 9 16
Closing undistributed profit (17) (9)
Distributable amount 76,708 56,5521 net sale proceeds less original purchase price and capital expenditure since acquisition
Distributions
the following distributions have been paid by the trust or declared by the directors of the responsible entity since the commencement of the financial year ended 30 June 2012:
June 2012
$000
June 2011
$000
(a) out of the profits for the year ended 30 June 2011 on ordinary units as disclosed in last year’s directors’ report
Final distribution of 5.80 cents per ordinary unit paid on 26 August 2011. 30,161 25,159
(b) out of the profits for the year ended 30 June 2012 (see note 6 of the notes to the financial statements):
(i) Interim distribution of 6.63 cents per ordinary unit paid on 24 February 2012. 34,477 26,391
(ii) Final distribution of 8.04 cents per ordinary unit declared by the directors for payment on 29 August 2012. 42,231 30,161
Units on issue
At 30 June 2012, 525,255,093 units of BWp trust were on issue (2011: 520,012,793).
Principal activity
the principal activity is property investment.
there has been no significant change in the nature of this activity during the financial year.
Directors’ reportFor the year ended 30 June 2012
For
per
sona
l use
onl
y

55BWP TRuST AnnuAl RepoRt 2012
Trust assets
At 30 June 2012, BWp trust held assets to a total value of $1,335.2 million (2011: $1,242.1 million). the basis for valuation of the assets is disclosed in note 1 of the notes to and forming part of the financial statements.
fee paid to the responsible entity and associates
Management fees totalling $6,367,371 (2011: $6,047,659) were paid or payable to the responsible entity out of trust property during the financial year.
Trust information
BWp trust is a Managed Investment Scheme registered in Australia. BWp Management limited, the responsible entity of the trust, is incorporated and domiciled in Australia and holds an Australian Financial Services licence. the responsible entity’s parent company and ultimate parent company is Wesfarmers limited.
the registered office of the responsible entity is level 11, 40 the esplanade, perth, Western Australia, 6000. the principal administrative office of the responsible entity is level 6, 40 the esplanade, perth, Western Australia, 6000.
the trust had no employees during the financial year (2011: nil). Management services are provided to the responsible entity by Wesfarmers limited. Wesfarmers limited employees seconded to the responsible entity to provide management services to the trust are engaged in dedicated roles to act exclusively for the responsible entity on behalf of the trust and are paid directly by Wesfarmers limited. Short-term incentives paid by Wesfarmers limited to employees engaged by the responsible entity are based entirely on the performance of the trust and furthering the objectives of the trust.
Directors
Information on directorsJ A Austin B J H Denison R D Higgins p J Johnston p J Mansell
Details of the directors appear on pages 18 and 19.
no director is a former partner or director of the current auditor of the trust.
Company secretary
K A lange, FCIS, MBus
Ms K A lange has been the company secretary since 9 April 2008. Ms lange has more than 25 years’ company secretarial experience including company secretary of Woodside petroleum limited and Wesfarmers limited.
Directors’ unitholdings
units in the trust in which directors had a relevant interest at the date of this report were:
Units in the Trust
J A Austin 295,967
P J Johnston 78,431
P J Mansell 218,000
no directors have other rights or options over interests in the trust or contracts to which the director is a party or under which the director is entitled to a benefit and that confer a right to call for or deliver an interest in the trust.
Directors’ reportFor the year ended 30 June 2012
For
per
sona
l use
onl
y

56BWP TRuST AnnuAl RepoRt 2012
Insurance and indemnification of directors and officers
During or since the end of the financial year insurance has been maintained covering the entity’s directors and officers against certain liabilities incurred in that capacity. Disclosure of the nature of the liability covered by the insurance and premiums paid is subject to confidentiality requirements under the contract of insurance.
Directors and officers are indemnified by the responsible entity against the costs and expenses of defending civil or criminal proceedings in their capacity as directors and officers in which judgement is given in favour of, or acquittal is granted to, a director or officer, unless the liability arises out of conduct involving a lack of good faith.
no indemnity payment has been made under any of the arrangements referred to above during or since the end of the financial year.
review and results of operations
the operations of the trust during the financial year and the results of those operations are reviewed on pages 5 to 9 of this report and in the accompanying financial statements. this includes information on the financial position of the trust and its business strategies and prospects for future financial years.
Significant changes in the state of affairs
During the financial year, the value of the trust’s investment properties increased by $80,682,000 (2011: $225,770,000 increase) to $1,306,563,000 (2011: $1,225,881,000), and the number of investment properties increased from 70 to 72 properties at financial year end.
there were no other significant changes in the state of affairs of the trust during the financial year.
Significant events after the balance date
no matters or circumstances have arisen since the end of the financial year that have significantly affected or may significantly affect the operations, results of operations or state of affairs of the trust in subsequent financial years.
Likely developments and expected results
likely developments in and expected results of the operations of the trust in subsequent years are referred to elsewhere in this report, particularly on pages 5 to 9. In the opinion of the directors, further information on those matters could prejudice the interests of the trust and has therefore not been included in this report.
Corporate governance
In recognising the need for the highest standards of corporate behaviour and accountability, the directors of BWp Management limited support and comply with the majority of the ASX Corporate Governance principles and Recommendations. the responsible entity’s corporate governance statement is contained on pages 20 to 24 of this annual report.
Environmental regulation and performance
the trust’s operations are not subject to any particular significant environmental regulations under either Commonwealth or State legislation. the trust is not aware of any breach of environmental regulations.
Board committees
As at the date of this report, the responsible entity had an Audit and Risk Committee and Remuneration and nomination Committee. each committee is comprised of all of the board members of the responsible entity.
there were two Audit and Risk Committee and four Remuneration and nomination Committee meetings held during the year.
rounding
the amounts contained in this report and in the financial statements have been rounded to the nearest thousand dollars under the option available to the trust under ASIC Class order 98/100, unless otherwise stated. the trust is an entity to which the Class order applies.
Directors’ reportFor the year ended 30 June 2012
For
per
sona
l use
onl
y

57BWP TRuST AnnuAl RepoRt 2012
Auditor independence
the lead auditor’s independence declaration is set out on page 59 and forms part of the Directors’ Report for the year ended 30 June 2012.
Non-audit services
KpMG provided the following non-audit services to the trust during the year ended 30 June 2012 and received, or is due to receive, the following amount for the provision of these services:
taxation services $20,430
total $20,430
the Audit and Risk Committee has, following the passing of a resolution, provided the board with written advice in relation to the provision of non-audit services by KpMG.
the board has considered the Audit and Risk Committee’s advice, and the non-audit services provided by KpMG, and is satisfied that the provision of these services during the year by the auditor is compatible with, and did not compromise, the general standard of auditor independence imposed by the Corporations Act 2001. the non-audit services provided do not undermine the general principles relating to auditor independence as set out in ApeS 110 Code of ethics for professional Accountants, as they did not involve reviewing or auditing the auditor’s own work or acting in a management or decision making capacity for the trust.
Signed in accordance with a resolution of the directors of BWp Management limited.
J A Austin Chairman BWp Management limited perth, 9 August 2012
Directors’ reportFor the year ended 30 June 2012
For
per
sona
l use
onl
y

58BWP TRuST AnnuAl RepoRt 2012
In accordance with a resolution of the directors of BWp Management limited, responsible entity for the BWp trust (“the trust”), I state that:
1. In the opinion of the directors:
a) the financial statements and notes of the trust are in accordance with the Corporations Act 2001, including:
(i) giving a true and fair view of the trust’s financial position as at 30 June 2012 and of its performance for the year ended on that date; and
(ii) complying with Accounting Standards and Corporations Regulations 2001; and
b) there are reasonable grounds to believe that the trust will be able to pay its debts as and when they become due and payable; and
c) the financial statements also comply with International Financial Reporting Standards as disclosed in note 1(b).
2. this declaration has been made after receiving the declaration required to be made to the directors in accordance with section 295A of the Corporations Act 2001 for the financial period ended 30 June 2012.
For and on behalf of the board of BWp Management limited.
J A Austin Chairman BWp Management limited perth, 9 August 2012
Directors’ declarationFor the year ended 30 June 2012
For
per
sona
l use
onl
y

59BWP TRuST AnnuAl RepoRt 2012
Lead Auditor’s Independence Declaration under Section 307C of the Corporations Act 2001to: the directors of BWp Management limited, the responsible entity of BWp trust
I declare that, to the best of my knowledge and belief, in relation to the audit for the financial year ended 30 June 2012 there have been:
(i) no contraventions of the auditor independence requirements as set out in the Corporations Act 2001 in relation to the audit; and
(ii) no contraventions of any applicable code of professional conduct in relation to the audit.
KPMG D P McComish perth, 9 August 2012 Partner
Auditor’s independence declaration
For
per
sona
l use
onl
y

60BWP TRuST AnnuAl RepoRt 2012
report on the financial report
We have audited the accompanying financial report of BWp trust (the trust), which comprises the statement of financial position as at 30 June 2012, and the statement of comprehensive income, statement of changes in equity and statement of cash flows for the year ended on that date, notes 1 to 20 comprising a summary of significant accounting policies and other explanatory information and the directors’ declaration.
Directors’ responsibility for the financial report
the directors of BWp Management limited (the Responsible entity) are responsible for the preparation of the financial report that gives a true and fair view in accordance with Australian Accounting Standards and the Corporations Act 2001 and for such internal control as the directors determine is necessary to enable the preparation of the financial report that is free from material misstatement, whether due to fraud or error. In note 1(b), the directors also state, in accordance with Australian Accounting Standard AASB 101 presentation of Financial Statements, that the financial statements comply with International Financial Reporting Standards.
Auditor’s responsibility
our responsibility is to express an opinion on the financial report based on our audit. We conducted our audit in accordance with Australian Auditing Standards. these Auditing Standards require that we comply with relevant ethical requirements relating to audit engagements and plan and perform the audit to obtain reasonable assurance whether the financial report is free from material misstatement.
An audit involves performing procedures to obtain audit evidence about the amounts and disclosures in the financial report. the procedures selected depend on the auditor’s judgement, including the assessment of the risks of material misstatement of the financial report, whether due to fraud or error. In making those risk assessments, the auditor considers internal control relevant to the entity’s preparation of the financial report that gives a true and fair view in order to design audit procedures that are appropriate in the circumstances, but not for the purpose of expressing an opinion on the effectiveness of the entity’s internal control. An audit also includes evaluating the appropriateness of accounting policies used and the reasonableness of accounting estimates made by the directors of the Responsible entity, as well as evaluating the overall presentation of the financial report.
We performed the procedures to assess whether in all material respects the financial report presents fairly, in accordance with the Corporations Act 2001 and Australian Accounting Standards, a true and fair view which is consistent with our understanding of the trust’s financial position and of its performance.
We believe that the audit evidence we have obtained is sufficient and appropriate to provide a basis for our audit opinion.
Independent auditor’s report to the unitholders of BWP Trust
For
per
sona
l use
onl
y

61BWP TRuST AnnuAl RepoRt 2012
Independence
In conducting our audit, we have complied with the independence requirements of the Corporations Act 2001.
Auditor’s opinion
In our opinion:
(a) the financial report of BWp trust is in accordance with the Corporations Act 2001, including:
(i) giving a true and fair view of the trust’s financial position as at 30 June 2012 and of its performance for the year ended on that date; and
(ii) complying with Australian Accounting Standards and the Corporations Regulations 2001.
(b) the financial report also complies with International Financial Reporting Standards as disclosed in note 1(b).
KPMG D P McComish perth, 9 August 2012 Partner
Independent auditor’s report to the unitholders of BWP Trust
For
per
sona
l use
onl
y

62BWP TRuST AnnuAl RepoRt 2012
Substantial unitholders
the number of units held by the trust’s substantial unitholders and the date on which the last notice was lodged with the trust, were as follows:
Date of notice Units
Wesfarmers Limited, its subsidiaries and their associates 24 March 2011 121,112,668
Distribution of unitholders
As at 31 July 2012
range of holding Holders Units %
1 - 1,000 1,823 910,908 0.17
1,001 - 5,000 4,455 12,814,194 2.44
5,001 - 10,000 3,420 24,905,862 4.74
10,001 - 100,000 5,264 126,844,222 24.15
101,000 - over 200 359,779,907 68.50
Total 15,162 525,255,093 100.00
Unitholders holding less than a marketable parcel (254 units)
436 33,585
Voting rights
each fully paid ordinary unit carries voting rights at one vote per unit.
Unitholder information
For
per
sona
l use
onl
y

63BWP TRuST AnnuAl RepoRt 2012
Twenty largest unitholders
the twenty largest holders of ordinary units in the trust as at 31 July 2012 were:
Number of units
Percentage of capital held
Wesfarmers Investments pty ltd 123,419,543 23.50
HSBC Custody nominees (Australia) ltd 52,568,816 10.01
Jp Morgan nominees Australia ltd 49,122,529 9.35
national nominees ltd 19,762,861 3.76
Cogent nominees pty ltd <DRp> 15,389,166 2.93
RBC Dexia Investor Services Australia nominees pty ltd <BKCuSt A/C> 12,002,805 2.29
RBC Dexia Investor Services Australia nominees pty ltd <Apn A/C> 9,128,524 1.74
Citicorp nominees pty ltd <Colonial First State Inv A/C> 8,918,833 1.70
Citicorp nominees pty ltd 7,992,716 1.52
AMp life ltd 3,407,357 0.65
Sandhurst trustees ltd <SISF A/C> 1,888,259 0.36
Cogent nominees pty ltd 1,859,940 0.35
Bond Street Custodians ltd <enH property Securities A/C> 1,699,193 0.32
Milton Corporation ltd 1,363,394 0.26
Cogent nominees pty ltd <SMp Accounts> 1,354,637 0.26
Australian executor trustees ltd <no 1 Account> 1,282,692 0.24
RBC Dexia Investor Services Australia nominees pty ltd <nMSMt A/C> 1,128,590 0.21
Jp Morgan nominees Australia ltd <Cash Income A/C> 978,420 0.19
uBS Wealth Management Australia nominees pty ltd 975,557 0.19
Re Gl CM & Je Adshead pty ltd 923,251 0.18
Total 315,167,083 60.00
Unitholder information
For
per
sona
l use
onl
y

64BWP TRuST AnnuAl RepoRt 2012
This page has been left intentionally blank
For
per
sona
l use
onl
y

65BWP TRuST AnnuAl RepoRt 2012
DirectoryInvestor informationResponsible entityBWP Management LimitedABn 26 082 856 424
level 11, Wesfarmers House 40 the esplanade peRtH WA 6000
telephone: (+61 8) 9327 4356
Facsimile: (+61 8) 9327 4344
www.bwptrust.com.au
Directors and senior managementJ A Austin (Chairman)
B J H Denison (Director)
R D Higgins (Director)
p J Johnston (Director)
p J Mansell (Director)
G W Gernhoefer (General Manager)
K A lange (Secretary)
Registry managerComputershare Investor Services Pty Limitedlevel 2 45 St Georges terrace peRtH WA 6000
telephone: 1300 136 972 (within Australia)
telephone: (+61 3) 9415 4323 (outside Australia)
Facsimile: 1800 783 447 (within Australia)
Facsimile: (+61 3) 9473 2555 (outside Australia)
www.computershare.com.au
AuditorKpMG 235 St Georges terrace peRtH WA 6000
Stock exchange listingthe BWp trust is listed on the ASX and reported in the “Industrial” section in daily newspapers – code BWp.
Distribution reinvestment planthe Distribution Reinvestment plan was in place for both the interim distribution and final distribution for the year ended 30 June 2012.
Electronic payment of distributionsunitholders may nominate a bank, building society or credit union account for the payment of distributions by direct credit. payments are electronically credited on the distribution date and confirmed by mailed payment advice.
unitholders wishing to take advantage of payment by direct credit should contact the Registry Manager for more details and to obtain an application form.
Publicationsthe annual report is the main source of information for unitholders. In addition, unitholders are sent a half-year report in February each year providing a review, in summary, of the six months to December.
periodically, the trust may also send releases to the ASX covering matters of relevance to investors.
Websitethe trust’s website, www.bwptrust.com.au, is a useful source of information for unitholders. It includes details of the trust’s property portfolio, current activities and future prospects. the site also provides access to annual and half-year reports and releases made to the ASX.
Annual tax statementsAccompanying the final distribution payment in August or September each year will be an annual tax statement which details tax advantaged components of the year’s distribution.
Profit distributionsprofit distributions are paid twice yearly, normally in February and August.
Unitholder meetingsno unitholder meetings were held during the year ending 30 June 2012. Details of previous unitholder meetings and briefings are available on the trust’s website.
Unitholder enquiriesplease contact the Registry Manager if you have any questions about your unitholding or distributions.
Complaints handlingComplaints made in regard to BWp trust should be directed to the General Manager – BWp Management limited, level 11, Wesfarmers House, 40 the esplanade, perth, Western Australia, 6000. the procedure for lodgement of complaints and complaints handling is set out under the Investors tab of the BWp trust website at www.bwptrust.com.au.
Should a complainant be dissatisfied with the decision made by the Responsible entity in relation to a complaint, the complainant is entitled to take the matter up with the Financial ombudsman Service (“FoS”), an external and independent industry complaint handling scheme. FoS is located at level 12, 717 Bourke Street, Docklands, Victoria, 3008. FoS can be contacted by telephone on 1300 780 808 or by facsimile on +61 3 9613 6399, by mail at Gpo Box 3, Melbourne, Victoria, 3001, by email at [email protected], or by visiting their website at www.fos.org.au.
For
per
sona
l use
onl
y

Annual Report 2012
Printed on 55% recycled and FSC certified virgin fibre. ISO 14001 Environmental Accreditation.
www.bwptrust.com.au
Ann
ual R
epor
t 2
012
For
per
sona
l use
onl
y


![BWP AR Center-Led Procurement[1]](https://img.pdfslide.net/doc/110x75/5571fa77497959916992471c/bwp-ar-center-led-procurement1.jpg)