Embed Size (px)
Citation preview
ANNUAL REPORT 2013Years ended March 31, 2013 and 2012with Report of Independent Auditors
CONTENTS
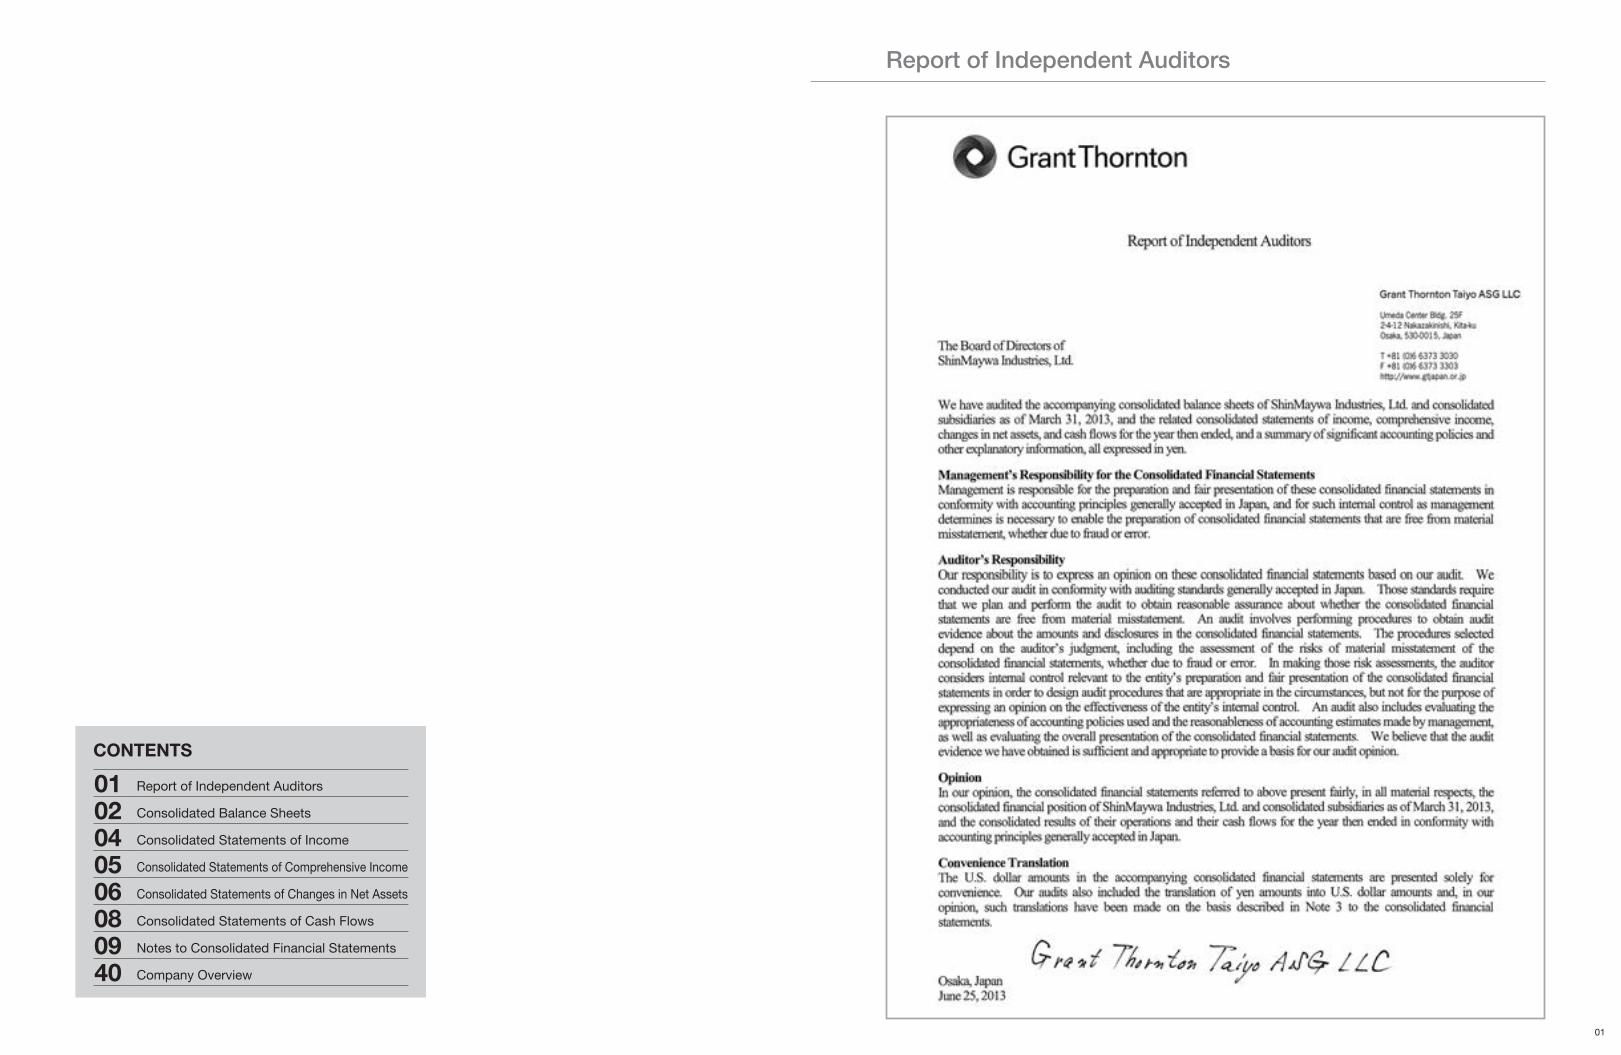
01 Report of Independent Auditors
02 Consolidated Balance Sheets
04 Consolidated Statements of Income
05 Consolidated Statements of Comprehensive Income
06 Consolidated Statements of Changes in Net Assets
08 Consolidated Statements of Cash Flows
09 Notes to Consolidated Financial Statements
40 Company Overview
Report of Independent Auditors
01
ShinMaywa Industries, Ltd. and Consolidated SubsidiariesYears ended March 31, 2013 and 2012
The accompanying notes are an integral part of these statements. The accompanying notes are an integral part of these statements.
Millions of yen Thousands of U.S. dollars (Note 3)
2013 2012 2013 2012
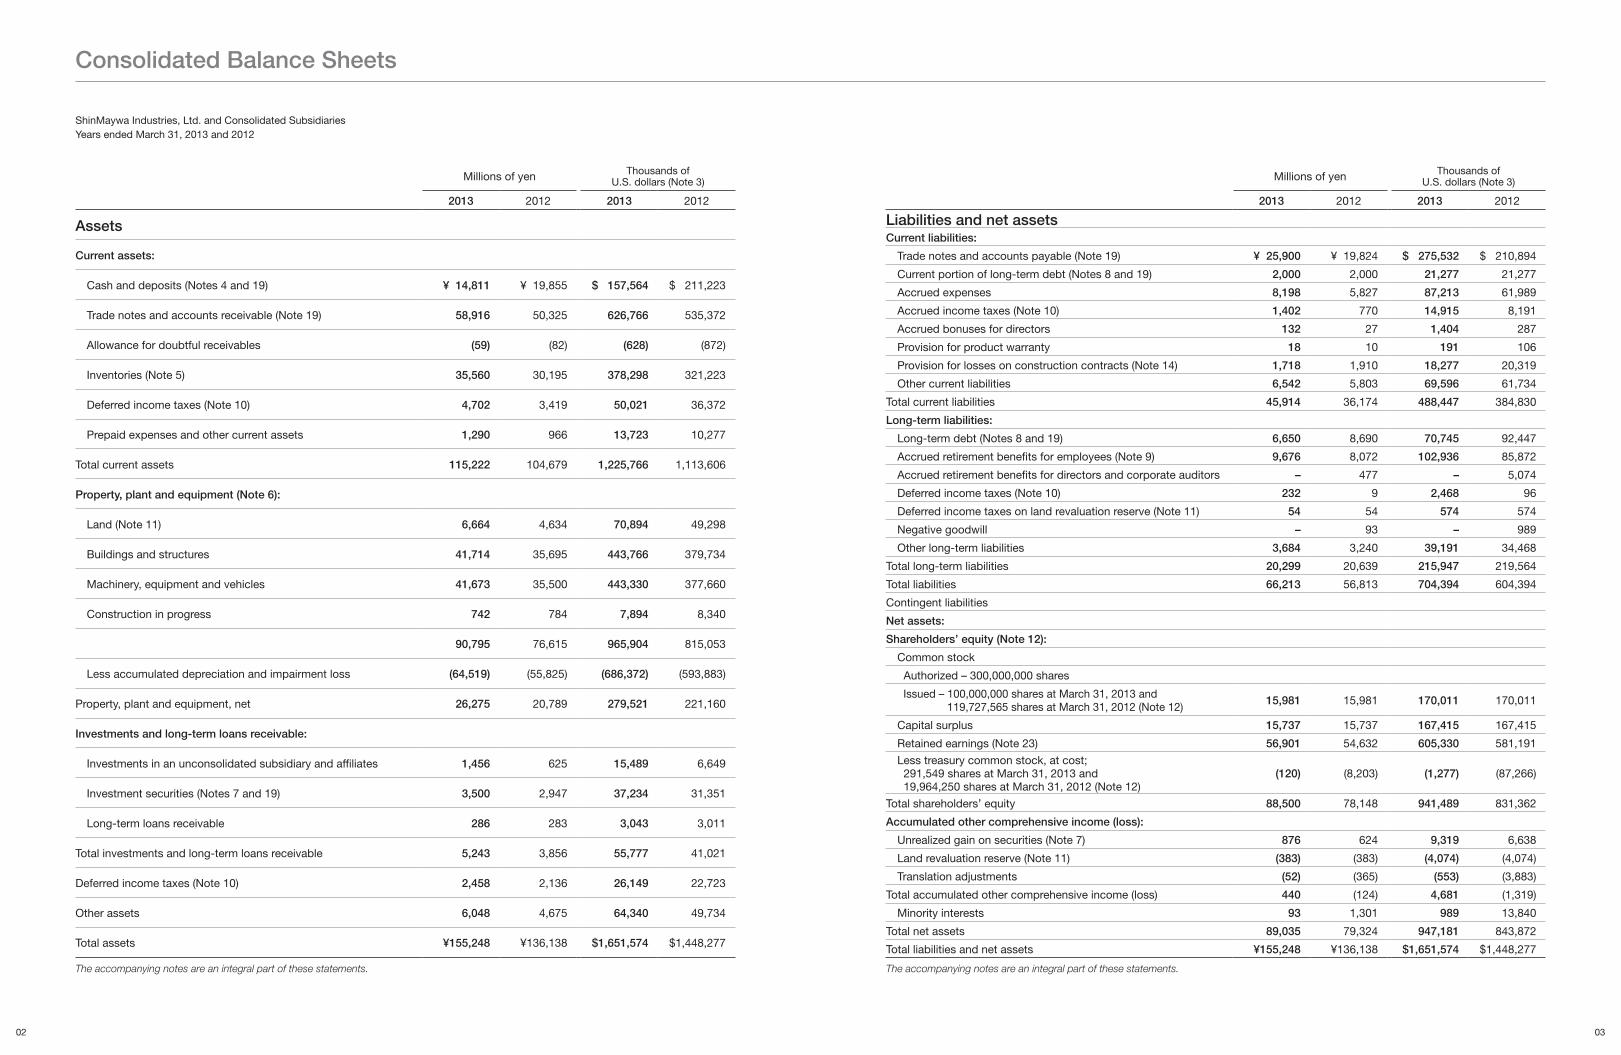
Assets
Current assets:
Cash and deposits (Notes 4 and 19) ¥ 14,811 ¥ 19,855 $ 157,564 $ 211,223
Trade notes and accounts receivable (Note 19) 58,916 50,325 626,766 535,372
Allowance for doubtful receivables (59) (82) (628) (872)
Inventories (Note 5) 35,560 30,195 378,298 321,223
Deferred income taxes (Note 10) 4,702 3,419 50,021 36,372
Prepaid expenses and other current assets 1,290 966 13,723 10,277
Total current assets 115,222 104,679 1,225,766 1,113,606
Property, plant and equipment (Note 6):
Land (Note 11) 6,664 4,634 70,894 49,298
Buildings and structures 41,714 35,695 443,766 379,734
Machinery, equipment and vehicles 41,673 35,500 443,330 377,660
Construction in progress 742 784 7,894 8,340
90,795 76,615 965,904 815,053
Less accumulated depreciation and impairment loss (64,519) (55,825) (686,372) (593,883)
Property, plant and equipment, net 26,275 20,789 279,521 221,160
Investments and long-term loans receivable:
Investments in an unconsolidated subsidiary and affiliates 1,456 625 15,489 6,649
Investment securities (Notes 7 and 19) 3,500 2,947 37,234 31,351
Long-term loans receivable 286 283 3,043 3,011
Total investments and long-term loans receivable 5,243 3,856 55,777 41,021
Deferred income taxes (Note 10) 2,458 2,136 26,149 22,723
Other assets 6,048 4,675 64,340 49,734
Total assets ¥155,248 ¥136,138 $1,651,574 $1,448,277
Millions of yen Thousands of U.S. dollars (Note 3)
2013 2012 2013 2012
Liabilities and net assetsCurrent liabilities:
Trade notes and accounts payable (Note 19) ¥ 25,900 ¥ 19,824 $ 275,532 $ 210,894
Current portion of long-term debt (Notes 8 and 19) 2,000 2,000 21,277 21,277
Accrued expenses 8,198 5,827 87,213 61,989
Accrued income taxes (Note 10) 1,402 770 14,915 8,191
Accrued bonuses for directors 132 27 1,404 287
Provision for product warranty 18 10 191 106
Provision for losses on construction contracts (Note 14) 1,718 1,910 18,277 20,319
Other current liabilities 6,542 5,803 69,596 61,734
Total current liabilities 45,914 36,174 488,447 384,830
Long-term liabilities:
Long-term debt (Notes 8 and 19) 6,650 8,690 70,745 92,447
Accrued retirement benefits for employees (Note 9) 9,676 8,072 102,936 85,872
Accrued retirement benefits for directors and corporate auditors – 477 – 5,074
Deferred income taxes (Note 10) 232 9 2,468 96
Deferred income taxes on land revaluation reserve (Note 11) 54 54 574 574
Negative goodwill – 93 – 989
Other long-term liabilities 3,684 3,240 39,191 34,468
Total long-term liabilities 20,299 20,639 215,947 219,564
Total liabilities 66,213 56,813 704,394 604,394
Contingent liabilities
Net assets:
Shareholders’ equity (Note 12):
Common stock
Authorized – 300,000,000 shares
Issued – 100,000,000 shares at March 31, 2013 and 119,727,565 shares at March 31, 2012 (Note 12)
15,981 15,981 170,011 170,011
Capital surplus 15,737 15,737 167,415 167,415
Retained earnings (Note 23) 56,901 54,632 605,330 581,191
Less treasury common stock, at cost; 291,549 shares at March 31, 2013 and 19,964,250 shares at March 31, 2012 (Note 12)
(120) (8,203) (1,277) (87,266)
Total shareholders’ equity 88,500 78,148 941,489 831,362
Accumulated other comprehensive income (loss):
Unrealized gain on securities (Note 7) 876 624 9,319 6,638
Land revaluation reserve (Note 11) (383) (383) (4,074) (4,074)
Translation adjustments (52) (365) (553) (3,883)
Total accumulated other comprehensive income (loss) 440 (124) 4,681 (1,319)
Minority interests 93 1,301 989 13,840
Total net assets 89,035 79,324 947,181 843,872
Total liabilities and net assets ¥155,248 ¥136,138 $1,651,574 $1,448,277
Consolidated Balance Sheets
0302
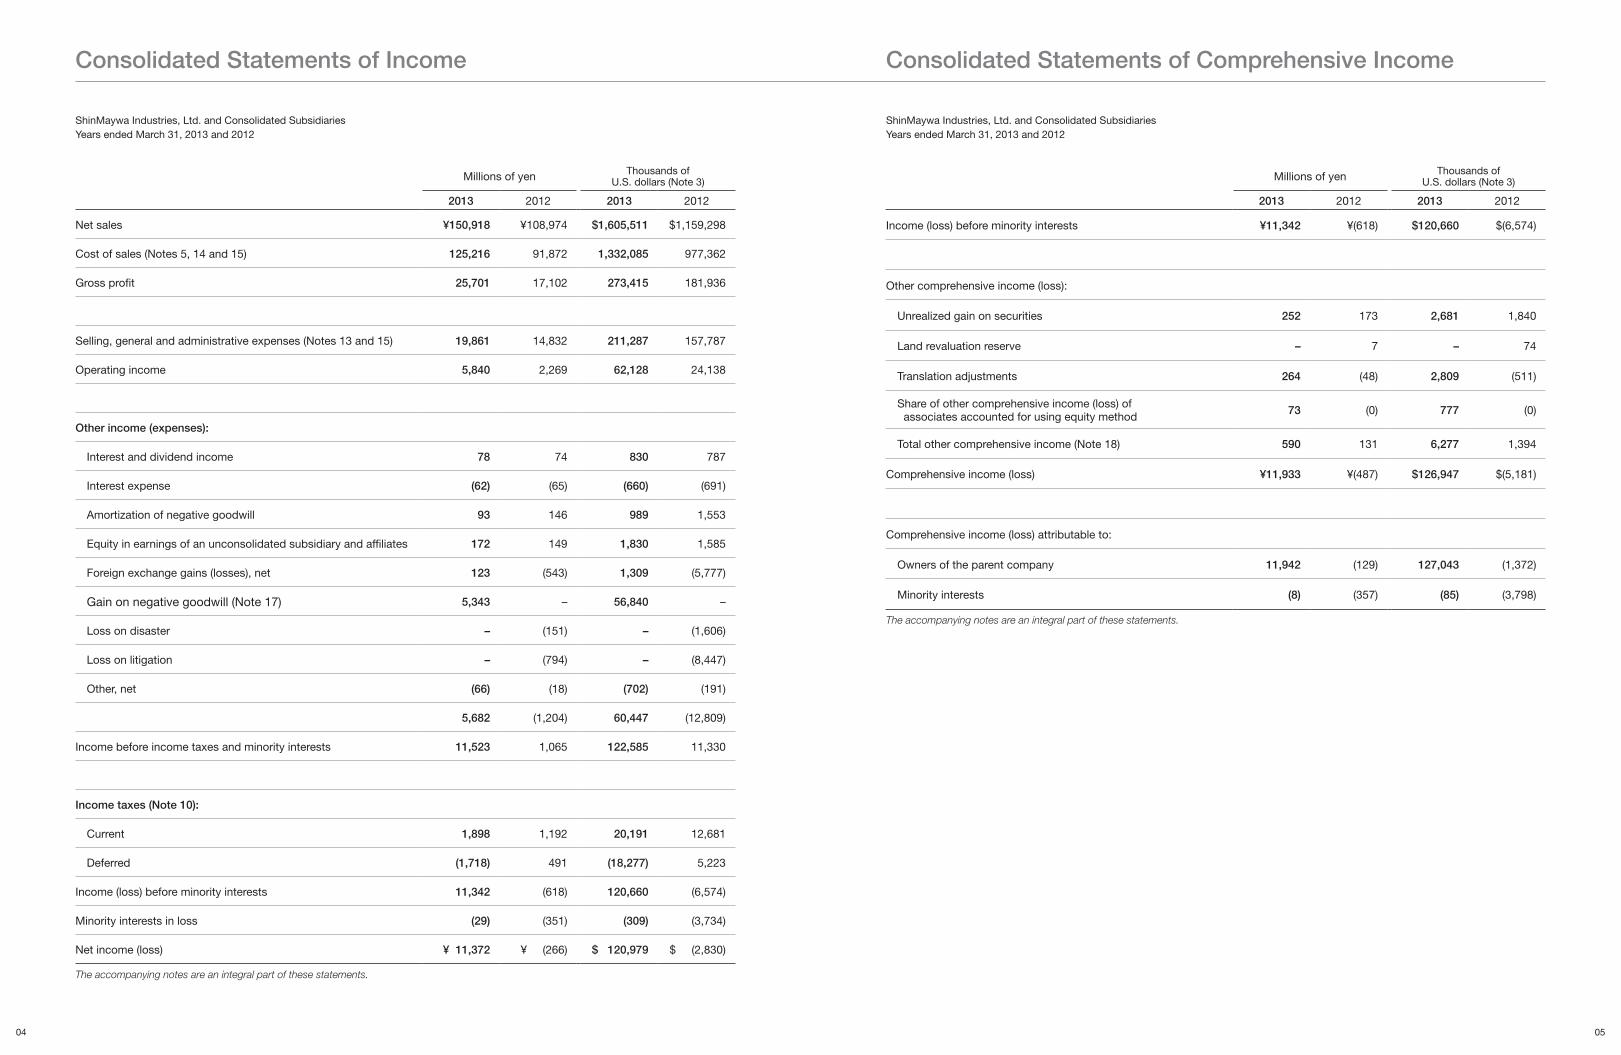
ShinMaywa Industries, Ltd. and Consolidated SubsidiariesYears ended March 31, 2013 and 2012
ShinMaywa Industries, Ltd. and Consolidated SubsidiariesYears ended March 31, 2013 and 2012
The accompanying notes are an integral part of these statements.
The accompanying notes are an integral part of these statements.
Millions of yen Thousands of U.S. dollars (Note 3)
2013 2012 2013 2012
Net sales ¥150,918 ¥108,974 $1,605,511 $1,159,298
Cost of sales (Notes 5, 14 and 15) 125,216 91,872 1,332,085 977,362
Gross profit 25,701 17,102 273,415 181,936
Selling, general and administrative expenses (Notes 13 and 15) 19,861 14,832 211,287 157,787
Operating income 5,840 2,269 62,128 24,138
Other income (expenses):
Interest and dividend income 78 74 830 787
Interest expense (62) (65) (660) (691)
Amortization of negative goodwill 93 146 989 1,553
Equity in earnings of an unconsolidated subsidiary and affiliates 172 149 1,830 1,585
Foreign exchange gains (losses), net 123 (543) 1,309 (5,777)
Gain on negative goodwill (Note 17) 5,343 – 56,840 –
Loss on disaster – (151) – (1,606)
Loss on litigation – (794) – (8,447)
Other, net (66) (18) (702) (191)
5,682 (1,204) 60,447 (12,809)
Income before income taxes and minority interests 11,523 1,065 122,585 11,330
Income taxes (Note 10):
Current 1,898 1,192 20,191 12,681
Deferred (1,718) 491 (18,277) 5,223
Income (loss) before minority interests 11,342 (618) 120,660 (6,574)
Minority interests in loss (29) (351) (309) (3,734)
Net income (loss) ¥ 11,372 ¥ (266) $ 120,979 $ (2,830)
Millions of yen Thousands of U.S. dollars (Note 3)
2013 2012 2013 2012
Income (loss) before minority interests ¥11,342 ¥(618) $120,660 $(6,574)
Other comprehensive income (loss):
Unrealized gain on securities 252 173 2,681 1,840
Land revaluation reserve – 7 – 74
Translation adjustments 264 (48) 2,809 (511)
Share of other comprehensive income (loss) of associates accounted for using equity method 73 (0) 777 (0)
Total other comprehensive income (Note 18) 590 131 6,277 1,394
Comprehensive income (loss) ¥11,933 ¥(487) $126,947 $(5,181)
Comprehensive income (loss) attributable to:
Owners of the parent company 11,942 (129) 127,043 (1,372)
Minority interests (8) (357) (85) (3,798)
Consolidated Statements of Comprehensive IncomeConsolidated Statements of Income
0504
ShinMaywa Industries, Ltd. and Consolidated SubsidiariesYears ended March 31, 2013 and 2012
Millions of yen
Number of shares of common
stock
Shareholders’ EquityAccumulated other compre-
hensive income (loss)
Minority interests
Total net assets
Common stock
Capital surplus
Retained earnings
Treasury common stock, at
cost
Unrealized gain on
securities
Land revaluation
reserveTranslation
adjustments
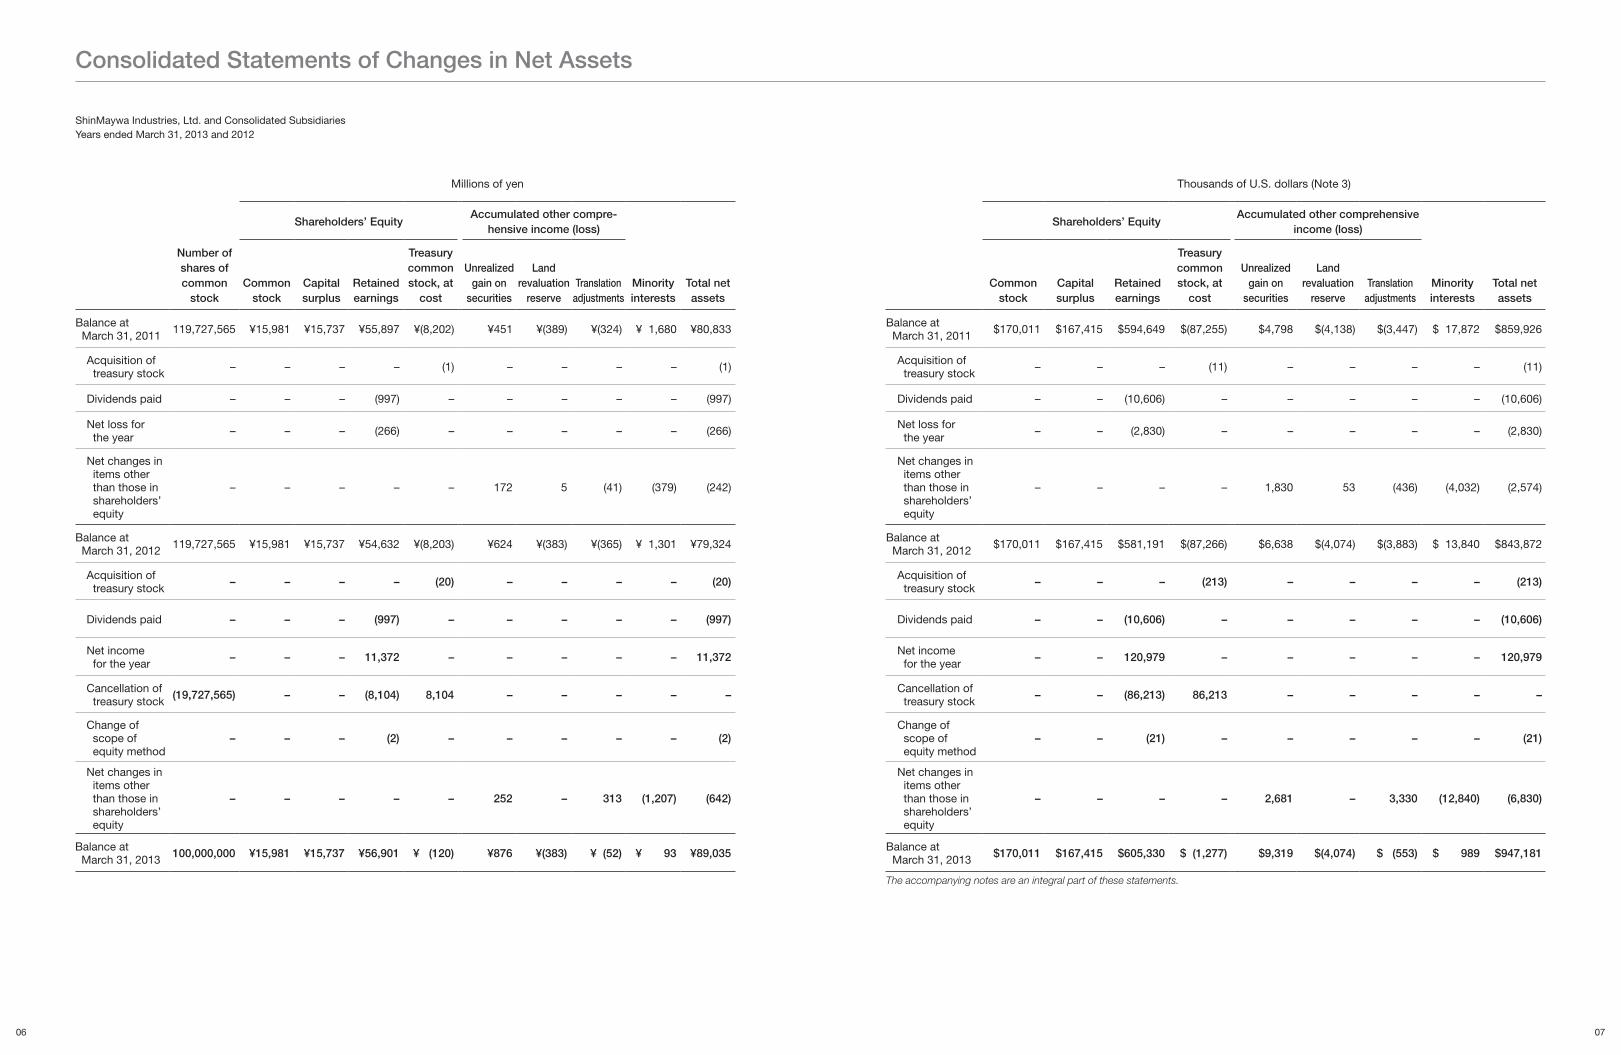
Balance at March 31, 2011 119,727,565 ¥15,981 ¥15,737 ¥55,897 ¥(8,202) ¥451 ¥(389) ¥(324) ¥ 1,680 ¥80,833
Acquisition of treasury stock
– – – – (1) – – – – (1)
Dividends paid – – – (997) – – – – – (997)
Net loss for the year – – – (266) – – – – – (266)
Net changes in items other than those in shareholders’ equity
– – – – – 172 5 (41) (379) (242)
Balance at March 31, 2012 119,727,565 ¥15,981 ¥15,737 ¥54,632 ¥(8,203) ¥624 ¥(383) ¥(365) ¥ 1,301 ¥79,324
Acquisition of treasury stock – – – – (20) – – – – (20)
Dividends paid – – – (997) – – – – – (997)
Net income for the year – – – 11,372 – – – – – 11,372
Cancellation of treasury stock (19,727,565) – – (8,104) 8,104 – – – – –
Change of scope of equity method
– – – (2) – – – – – (2)
Net changes in items other than those in shareholders’ equity
– – – – – 252 – 313 (1,207) (642)
Balance at March 31, 2013
100,000,000 ¥15,981 ¥15,737 ¥56,901 ¥ (120) ¥876 ¥(383) ¥ (52) ¥ 93 ¥89,035
Thousands of U.S. dollars (Note 3)
Shareholders’ EquityAccumulated other comprehensive
income (loss)
Minority interests
Total net assets
Common stock
Capital surplus
Retained earnings
Treasury common stock, at
cost
Unrealizedgain on
securities
Landrevaluation
reserveTranslation
adjustments
Balance at March 31, 2011 $170,011 $167,415 $594,649 $(87,255) $4,798 $(4,138) $(3,447) $ 17,872 $859,926
Acquisition of treasury stock
– – – (11) – – – – (11)
Dividends paid – – (10,606) – – – – – (10,606)
Net loss for the year – – (2,830) – – – – – (2,830)
Net changes in items other than those in shareholders’ equity
– – – – 1,830 53 (436) (4,032) (2,574)
Balance at March 31, 2012 $170,011 $167,415 $581,191 $(87,266) $6,638 $(4,074) $(3,883) $ 13,840 $843,872
Acquisition of treasury stock – – – (213) – – – – (213)
Dividends paid – – (10,606) – – – – – (10,606)
Net income for the year – – 120,979 – – – – – 120,979
Cancellation of treasury stock – – (86,213) 86,213 – – – – –
Change of scope of equity method
– – (21) – – – – – (21)
Net changes in items other than those in shareholders’ equity
– – – – 2,681 – 3,330 (12,840) (6,830)
Balance at March 31, 2013
$170,011 $167,415 $605,330 $ (1,277) $9,319 $(4,074) $ (553) $ 989 $947,181
The accompanying notes are an integral part of these statements.
Consolidated Statements of Changes in Net Assets
0706
Millions of yen Thousands of U.S. dollars (Note 3)
2013 2012 2013 2012
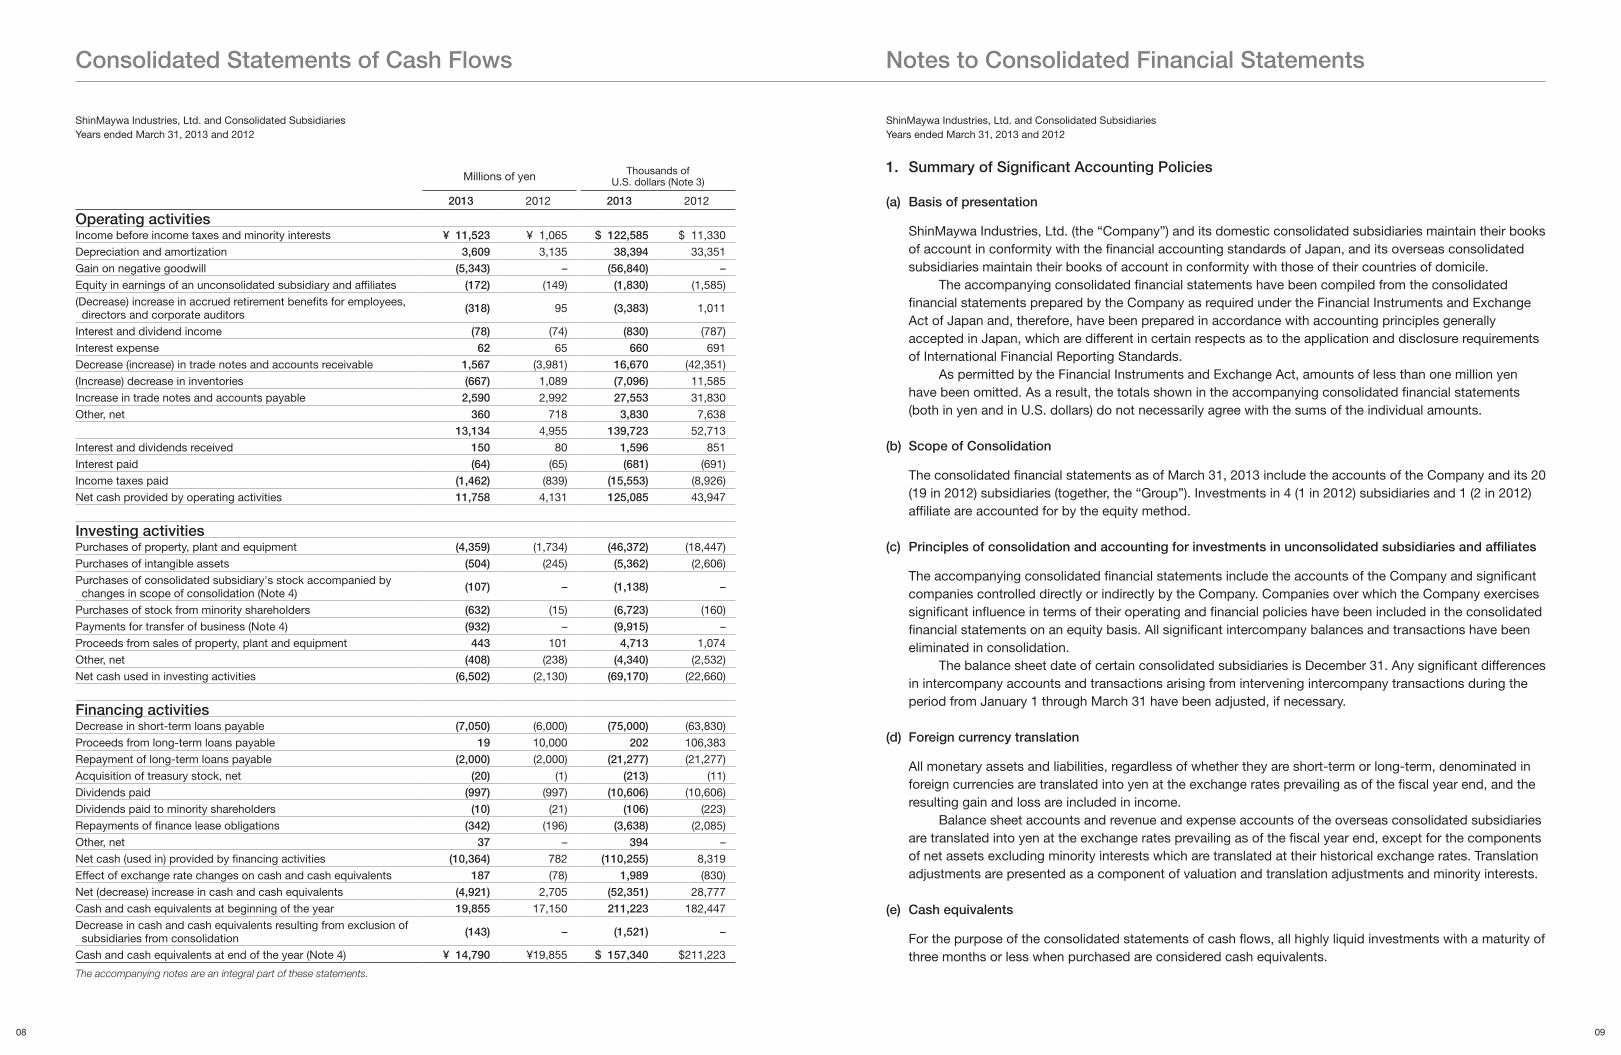
Operating activitiesIncome before income taxes and minority interests ¥ 11,523 ¥ 1,065 $ 122,585 $ 11,330
Depreciation and amortization 3,609 3,135 38,394 33,351
Gain on negative goodwill (5,343) – (56,840) –
Equity in earnings of an unconsolidated subsidiary and affiliates (172) (149) (1,830) (1,585)
(Decrease) increase in accrued retirement benefits for employees, directors and corporate auditors (318) 95 (3,383) 1,011
Interest and dividend income (78) (74) (830) (787)
Interest expense 62 65 660 691
Decrease (increase) in trade notes and accounts receivable 1,567 (3,981) 16,670 (42,351)
(Increase) decrease in inventories (667) 1,089 (7,096) 11,585
Increase in trade notes and accounts payable 2,590 2,992 27,553 31,830
Other, net 360 718 3,830 7,638
13,134 4,955 139,723 52,713
Interest and dividends received 150 80 1,596 851
Interest paid (64) (65) (681) (691)
Income taxes paid (1,462) (839) (15,553) (8,926)
Net cash provided by operating activities 11,758 4,131 125,085 43,947
Investing activitiesPurchases of property, plant and equipment (4,359) (1,734) (46,372) (18,447)
Purchases of intangible assets (504) (245) (5,362) (2,606)
Purchases of consolidated subsidiary's stock accompanied by changes in scope of consolidation (Note 4) (107) – (1,138) –
Purchases of stock from minority shareholders (632) (15) (6,723) (160)
Payments for transfer of business (Note 4) (932) – (9,915) –
Proceeds from sales of property, plant and equipment 443 101 4,713 1,074
Other, net (408) (238) (4,340) (2,532)
Net cash used in investing activities (6,502) (2,130) (69,170) (22,660)
Financing activitiesDecrease in short-term loans payable (7,050) (6,000) (75,000) (63,830)
Proceeds from long-term loans payable 19 10,000 202 106,383
Repayment of long-term loans payable (2,000) (2,000) (21,277) (21,277)
Acquisition of treasury stock, net (20) (1) (213) (11)
Dividends paid (997) (997) (10,606) (10,606)
Dividends paid to minority shareholders (10) (21) (106) (223)
Repayments of finance lease obligations (342) (196) (3,638) (2,085)
Other, net 37 – 394 –
Net cash (used in) provided by financing activities (10,364) 782 (110,255) 8,319
Effect of exchange rate changes on cash and cash equivalents 187 (78) 1,989 (830)
Net (decrease) increase in cash and cash equivalents (4,921) 2,705 (52,351) 28,777
Cash and cash equivalents at beginning of the year 19,855 17,150 211,223 182,447
Decrease in cash and cash equivalents resulting from exclusion of subsidiaries from consolidation (143) – (1,521) –
Cash and cash equivalents at end of the year (Note 4) ¥ 14,790 ¥19,855 $ 157,340 $211,223
ShinMaywa Industries, Ltd. and Consolidated SubsidiariesYears ended March 31, 2013 and 2012
ShinMaywa Industries, Ltd. and Consolidated SubsidiariesYears ended March 31, 2013 and 2012
The accompanying notes are an integral part of these statements.
1. Summary of Significant Accounting Policies
(a) Basis of presentation
ShinMaywa Industries, Ltd. (the “Company”) and its domestic consolidated subsidiaries maintain their books of account in conformity with the financial accounting standards of Japan, and its overseas consolidated subsidiaries maintain their books of account in conformity with those of their countries of domicile.
The accompanying consolidated financial statements have been compiled from the consolidated financial statements prepared by the Company as required under the Financial Instruments and Exchange Act of Japan and, therefore, have been prepared in accordance with accounting principles generally accepted in Japan, which are different in certain respects as to the application and disclosure requirements of International Financial Reporting Standards.
As permitted by the Financial Instruments and Exchange Act, amounts of less than one million yen have been omitted. As a result, the totals shown in the accompanying consolidated financial statements (both in yen and in U.S. dollars) do not necessarily agree with the sums of the individual amounts.
(b) Scope of Consolidation
The consolidated financial statements as of March 31, 2013 include the accounts of the Company and its 20 (19 in 2012) subsidiaries (together, the “Group”). Investments in 4 (1 in 2012) subsidiaries and 1 (2 in 2012) affiliate are accounted for by the equity method.
(c) Principles of consolidation and accounting for investments in unconsolidated subsidiaries and affiliates
The accompanying consolidated financial statements include the accounts of the Company and significant companies controlled directly or indirectly by the Company. Companies over which the Company exercises significant influence in terms of their operating and financial policies have been included in the consolidated financial statements on an equity basis. All significant intercompany balances and transactions have been eliminated in consolidation.
The balance sheet date of certain consolidated subsidiaries is December 31. Any significant differences in intercompany accounts and transactions arising from intervening intercompany transactions during the period from January 1 through March 31 have been adjusted, if necessary.
(d) Foreign currency translation
All monetary assets and liabilities, regardless of whether they are short-term or long-term, denominated in foreign currencies are translated into yen at the exchange rates prevailing as of the fiscal year end, and the resulting gain and loss are included in income.
Balance sheet accounts and revenue and expense accounts of the overseas consolidated subsidiaries are translated into yen at the exchange rates prevailing as of the fiscal year end, except for the components of net assets excluding minority interests which are translated at their historical exchange rates. Translation adjustments are presented as a component of valuation and translation adjustments and minority interests.
(e) Cash equivalents
For the purpose of the consolidated statements of cash flows, all highly liquid investments with a maturity of three months or less when purchased are considered cash equivalents.
Notes to Consolidated Financial StatementsConsolidated Statements of Cash Flows
0908
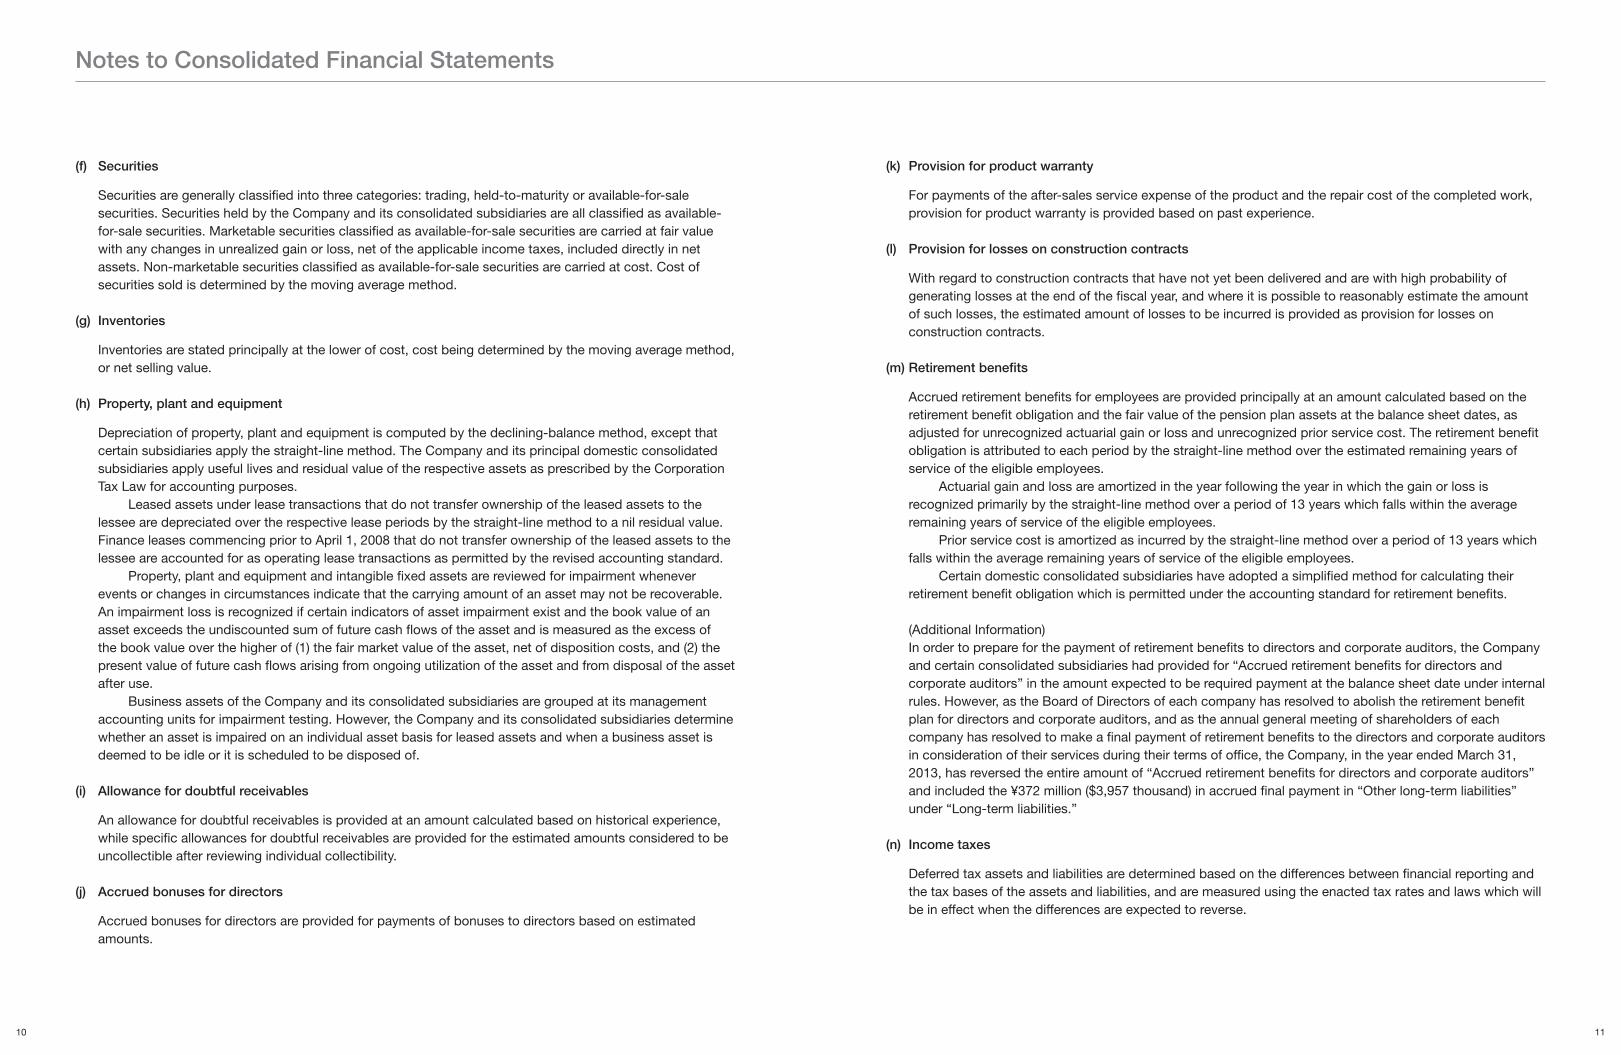
(f) Securities
Securities are generally classified into three categories: trading, held-to-maturity or available-for-sale securities. Securities held by the Company and its consolidated subsidiaries are all classified as available-for-sale securities. Marketable securities classified as available-for-sale securities are carried at fair value with any changes in unrealized gain or loss, net of the applicable income taxes, included directly in net assets. Non-marketable securities classified as available-for-sale securities are carried at cost. Cost of securities sold is determined by the moving average method.
(g) Inventories
Inventories are stated principally at the lower of cost, cost being determined by the moving average method, or net selling value.
(h) Property, plant and equipment
Depreciation of property, plant and equipment is computed by the declining-balance method, except that certain subsidiaries apply the straight-line method. The Company and its principal domestic consolidated subsidiaries apply useful lives and residual value of the respective assets as prescribed by the Corporation Tax Law for accounting purposes.
Leased assets under lease transactions that do not transfer ownership of the leased assets to the lessee are depreciated over the respective lease periods by the straight-line method to a nil residual value. Finance leases commencing prior to April 1, 2008 that do not transfer ownership of the leased assets to the lessee are accounted for as operating lease transactions as permitted by the revised accounting standard.
Property, plant and equipment and intangible fixed assets are reviewed for impairment whenever events or changes in circumstances indicate that the carrying amount of an asset may not be recoverable. An impairment loss is recognized if certain indicators of asset impairment exist and the book value of an asset exceeds the undiscounted sum of future cash flows of the asset and is measured as the excess of the book value over the higher of (1) the fair market value of the asset, net of disposition costs, and (2) the present value of future cash flows arising from ongoing utilization of the asset and from disposal of the asset after use.
Business assets of the Company and its consolidated subsidiaries are grouped at its management accounting units for impairment testing. However, the Company and its consolidated subsidiaries determine whether an asset is impaired on an individual asset basis for leased assets and when a business asset is deemed to be idle or it is scheduled to be disposed of.
(i) Allowance for doubtful receivables
An allowance for doubtful receivables is provided at an amount calculated based on historical experience, while specific allowances for doubtful receivables are provided for the estimated amounts considered to be uncollectible after reviewing individual collectibility.
(j) Accrued bonuses for directors
Accrued bonuses for directors are provided for payments of bonuses to directors based on estimated amounts.
(k) Provision for product warranty
For payments of the after-sales service expense of the product and the repair cost of the completed work, provision for product warranty is provided based on past experience.
(l) Provision for losses on construction contracts
With regard to construction contracts that have not yet been delivered and are with high probability of generating losses at the end of the fiscal year, and where it is possible to reasonably estimate the amount of such losses, the estimated amount of losses to be incurred is provided as provision for losses on construction contracts.
(m) Retirement benefits
Accrued retirement benefits for employees are provided principally at an amount calculated based on the retirement benefit obligation and the fair value of the pension plan assets at the balance sheet dates, as adjusted for unrecognized actuarial gain or loss and unrecognized prior service cost. The retirement benefit obligation is attributed to each period by the straight-line method over the estimated remaining years of service of the eligible employees.
Actuarial gain and loss are amortized in the year following the year in which the gain or loss is recognized primarily by the straight-line method over a period of 13 years which falls within the average remaining years of service of the eligible employees.
Prior service cost is amortized as incurred by the straight-line method over a period of 13 years which falls within the average remaining years of service of the eligible employees.
Certain domestic consolidated subsidiaries have adopted a simplified method for calculating their retirement benefit obligation which is permitted under the accounting standard for retirement benefits.
(Additional Information)In order to prepare for the payment of retirement benefits to directors and corporate auditors, the Company and certain consolidated subsidiaries had provided for “Accrued retirement benefits for directors and corporate auditors” in the amount expected to be required payment at the balance sheet date under internal rules. However, as the Board of Directors of each company has resolved to abolish the retirement benefit plan for directors and corporate auditors, and as the annual general meeting of shareholders of each company has resolved to make a final payment of retirement benefits to the directors and corporate auditors in consideration of their services during their terms of office, the Company, in the year ended March 31, 2013, has reversed the entire amount of “Accrued retirement benefits for directors and corporate auditors” and included the ¥372 million ($3,957 thousand) in accrued final payment in “Other long-term liabilities” under “Long-term liabilities.”
(n) Income taxes
Deferred tax assets and liabilities are determined based on the differences between financial reporting and the tax bases of the assets and liabilities, and are measured using the enacted tax rates and laws which will be in effect when the differences are expected to reverse.
Notes to Consolidated Financial Statements
1110
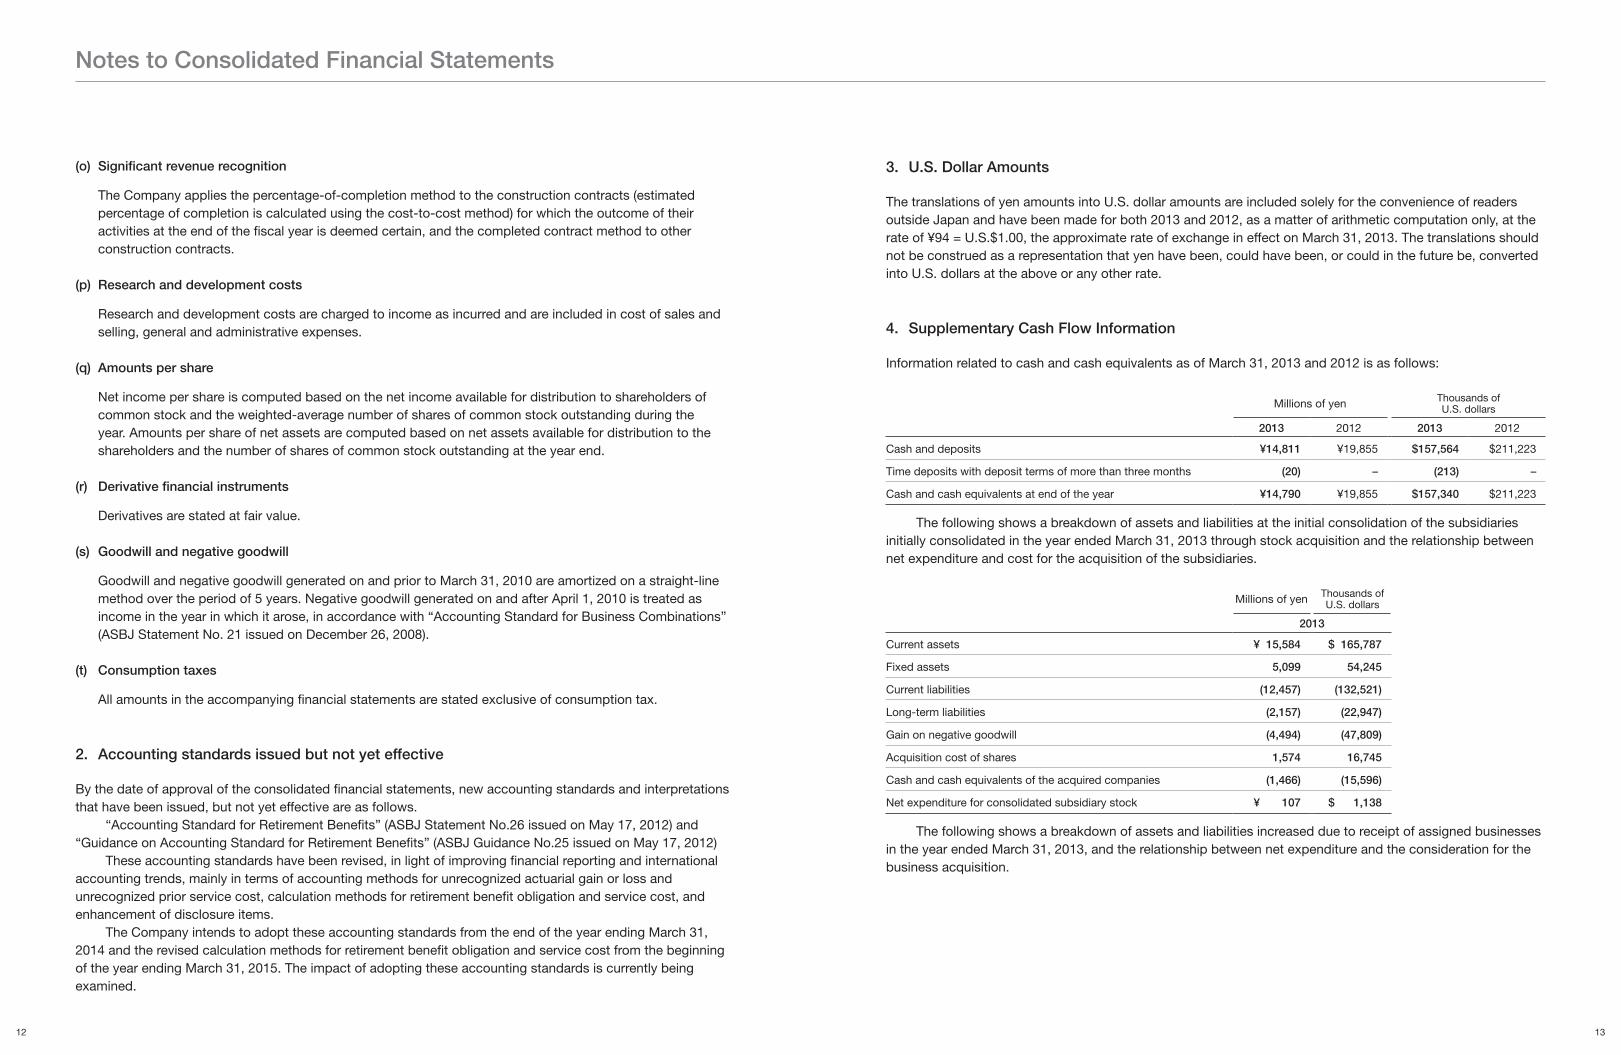
(o) Significant revenue recognition
The Company applies the percentage-of-completion method to the construction contracts (estimated percentage of completion is calculated using the cost-to-cost method) for which the outcome of their activities at the end of the fiscal year is deemed certain, and the completed contract method to other construction contracts.
(p) Research and development costs
Research and development costs are charged to income as incurred and are included in cost of sales and selling, general and administrative expenses.
(q) Amounts per share
Net income per share is computed based on the net income available for distribution to shareholders of common stock and the weighted-average number of shares of common stock outstanding during the year. Amounts per share of net assets are computed based on net assets available for distribution to the shareholders and the number of shares of common stock outstanding at the year end.
(r) Derivative financial instruments
Derivatives are stated at fair value.
(s) Goodwill and negative goodwill
Goodwill and negative goodwill generated on and prior to March 31, 2010 are amortized on a straight-line method over the period of 5 years. Negative goodwill generated on and after April 1, 2010 is treated as income in the year in which it arose, in accordance with “Accounting Standard for Business Combinations” (ASBJ Statement No. 21 issued on December 26, 2008).
(t) Consumption taxes
All amounts in the accompanying financial statements are stated exclusive of consumption tax.
2. Accounting standards issued but not yet effective
By the date of approval of the consolidated financial statements, new accounting standards and interpretations that have been issued, but not yet effective are as follows.
“Accounting Standard for Retirement Benefits” (ASBJ Statement No.26 issued on May 17, 2012) and “Guidance on Accounting Standard for Retirement Benefits” (ASBJ Guidance No.25 issued on May 17, 2012)
These accounting standards have been revised, in light of improving financial reporting and international accounting trends, mainly in terms of accounting methods for unrecognized actuarial gain or loss and unrecognized prior service cost, calculation methods for retirement benefit obligation and service cost, and enhancement of disclosure items.
The Company intends to adopt these accounting standards from the end of the year ending March 31, 2014 and the revised calculation methods for retirement benefit obligation and service cost from the beginning of the year ending March 31, 2015. The impact of adopting these accounting standards is currently being examined.
3. U.S. Dollar Amounts
The translations of yen amounts into U.S. dollar amounts are included solely for the convenience of readers outside Japan and have been made for both 2013 and 2012, as a matter of arithmetic computation only, at the rate of ¥94 = U.S.$1.00, the approximate rate of exchange in effect on March 31, 2013. The translations should not be construed as a representation that yen have been, could have been, or could in the future be, converted into U.S. dollars at the above or any other rate.
4. Supplementary Cash Flow Information
Information related to cash and cash equivalents as of March 31, 2013 and 2012 is as follows:
Millions of yen Thousands of U.S. dollars
2013 2012 2013 2012
Cash and deposits ¥14,811 ¥19,855 $157,564 $211,223
Time deposits with deposit terms of more than three months (20) – (213) –
Cash and cash equivalents at end of the year ¥14,790 ¥19,855 $157,340 $211,223
The following shows a breakdown of assets and liabilities at the initial consolidation of the subsidiaries initially consolidated in the year ended March 31, 2013 through stock acquisition and the relationship between net expenditure and cost for the acquisition of the subsidiaries.
Millions of yen Thousands of U.S. dollars
2013
Current assets ¥ 15,584 $ 165,787
Fixed assets 5,099 54,245
Current liabilities (12,457) (132,521)
Long-term liabilities (2,157) (22,947)
Gain on negative goodwill (4,494) (47,809)
Acquisition cost of shares 1,574 16,745
Cash and cash equivalents of the acquired companies (1,466) (15,596)
Net expenditure for consolidated subsidiary stock ¥ 107 $ 1,138
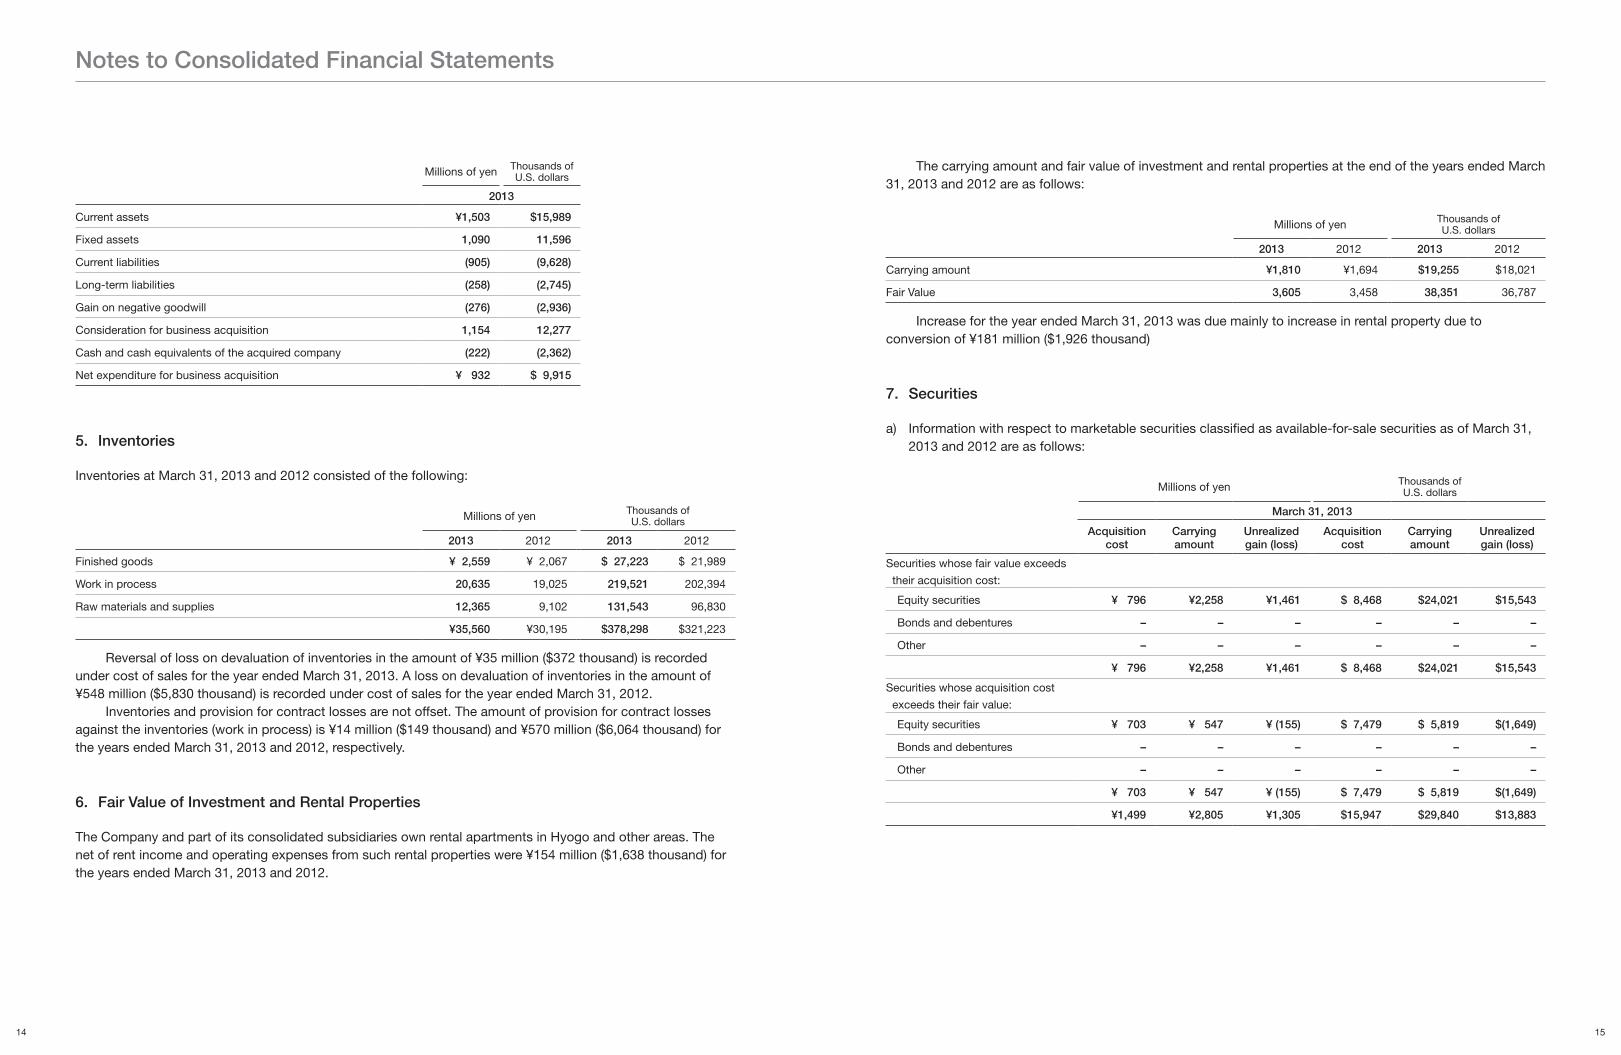
The following shows a breakdown of assets and liabilities increased due to receipt of assigned businesses in the year ended March 31, 2013, and the relationship between net expenditure and the consideration for the business acquisition.
Notes to Consolidated Financial Statements
1312
Millions of yen Thousands of U.S. dollars
2013
Current assets ¥1,503 $15,989
Fixed assets 1,090 11,596
Current liabilities (905) (9,628)
Long-term liabilities (258) (2,745)
Gain on negative goodwill (276) (2,936)
Consideration for business acquisition 1,154 12,277
Cash and cash equivalents of the acquired company (222) (2,362)
Net expenditure for business acquisition ¥ 932 $ 9,915
5. Inventories
Inventories at March 31, 2013 and 2012 consisted of the following:
Millions of yen Thousands of U.S. dollars
2013 2012 2013 2012
Finished goods ¥ 2,559 ¥ 2,067 $ 27,223 $ 21,989
Work in process 20,635 19,025 219,521 202,394
Raw materials and supplies 12,365 9,102 131,543 96,830
¥35,560 ¥30,195 $378,298 $321,223
Reversal of loss on devaluation of inventories in the amount of ¥35 million ($372 thousand) is recorded under cost of sales for the year ended March 31, 2013. A loss on devaluation of inventories in the amount of ¥548 million ($5,830 thousand) is recorded under cost of sales for the year ended March 31, 2012.
Inventories and provision for contract losses are not offset. The amount of provision for contract losses against the inventories (work in process) is ¥14 million ($149 thousand) and ¥570 million ($6,064 thousand) for the years ended March 31, 2013 and 2012, respectively.
6. Fair Value of Investment and Rental Properties
The Company and part of its consolidated subsidiaries own rental apartments in Hyogo and other areas. The net of rent income and operating expenses from such rental properties were ¥154 million ($1,638 thousand) for the years ended March 31, 2013 and 2012.
The carrying amount and fair value of investment and rental properties at the end of the years ended March 31, 2013 and 2012 are as follows:
Millions of yen Thousands of U.S. dollars
2013 2012 2013 2012
Carrying amount ¥1,810 ¥1,694 $19,255 $18,021
Fair Value 3,605 3,458 38,351 36,787
Increase for the year ended March 31, 2013 was due mainly to increase in rental property due to conversion of ¥181 million ($1,926 thousand)
7. Securities
a) Information with respect to marketable securities classified as available-for-sale securities as of March 31, 2013 and 2012 are as follows:
Millions of yen Thousands of U.S. dollars
March 31, 2013
Acquisition cost
Carrying amount
Unrealized gain (loss)
Acquisition cost
Carrying amount
Unrealized gain (loss)
Securities whose fair value exceeds
their acquisition cost:
Equity securities ¥ 796 ¥2,258 ¥1,461 $ 8,468 $24,021 $15,543
Bonds and debentures – – – – – –
Other – – – – – –
¥ 796 ¥2,258 ¥1,461 $ 8,468 $24,021 $15,543
Securities whose acquisition cost
exceeds their fair value:
Equity securities ¥ 703 ¥ 547 ¥ (155) $ 7,479 $ 5,819 $(1,649)
Bonds and debentures – – – – – –
Other – – – – – –
¥ 703 ¥ 547 ¥ (155) $ 7,479 $ 5,819 $(1,649)
¥1,499 ¥2,805 ¥1,305 $15,947 $29,840 $13,883
Notes to Consolidated Financial Statements
1514
Millions of yen Thousands of U.S. dollars
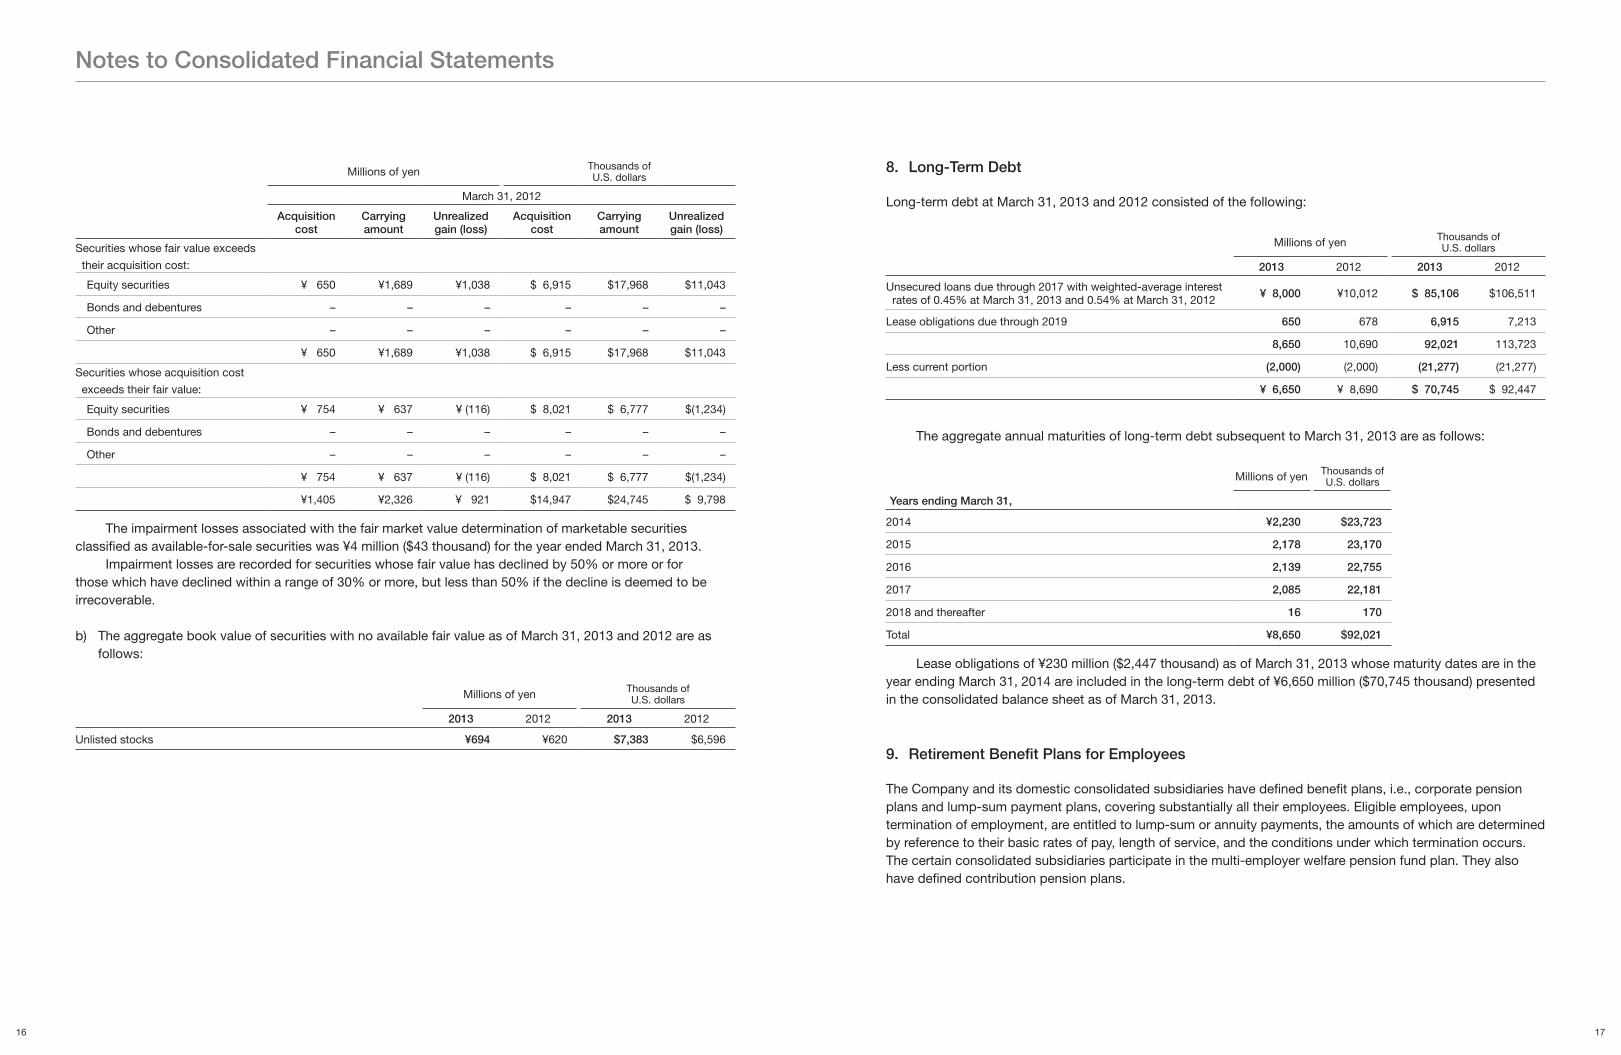
March 31, 2012
Acquisition cost
Carrying amount
Unrealized gain (loss)
Acquisition cost
Carrying amount
Unrealized gain (loss)
Securities whose fair value exceeds
their acquisition cost:
Equity securities ¥ 650 ¥1,689 ¥1,038 $ 6,915 $17,968 $11,043
Bonds and debentures – – – – – –
Other – – – – – –
¥ 650 ¥1,689 ¥1,038 $ 6,915 $17,968 $11,043
Securities whose acquisition cost
exceeds their fair value:
Equity securities ¥ 754 ¥ 637 ¥ (116) $ 8,021 $ 6,777 $(1,234)
Bonds and debentures – – – – – –
Other – – – – – –
¥ 754 ¥ 637 ¥ (116) $ 8,021 $ 6,777 $(1,234)
¥1,405 ¥2,326 ¥ 921 $14,947 $24,745 $ 9,798
The impairment losses associated with the fair market value determination of marketable securities classified as available-for-sale securities was ¥4 million ($43 thousand) for the year ended March 31, 2013.
Impairment losses are recorded for securities whose fair value has declined by 50% or more or for those which have declined within a range of 30% or more, but less than 50% if the decline is deemed to be irrecoverable.
b) The aggregate book value of securities with no available fair value as of March 31, 2013 and 2012 are as follows:
Millions of yen Thousands of U.S. dollars
2013 2012 2013 2012
Unlisted stocks ¥694 ¥620 $7,383 $6,596
8. Long-Term Debt
Long-term debt at March 31, 2013 and 2012 consisted of the following:
Millions of yen Thousands of U.S. dollars
2013 2012 2013 2012
Unsecured loans due through 2017 with weighted-average interest rates of 0.45% at March 31, 2013 and 0.54% at March 31, 2012 ¥ 8,000 ¥10,012 $ 85,106 $106,511
Lease obligations due through 2019 650 678 6,915 7,213
8,650 10,690 92,021 113,723
Less current portion (2,000) (2,000) (21,277) (21,277)
¥ 6,650 ¥ 8,690 $ 70,745 $ 92,447
The aggregate annual maturities of long-term debt subsequent to March 31, 2013 are as follows:
Millions of yen Thousands of U.S. dollars
Years ending March 31,
2014 ¥2,230 $23,723
2015 2,178 23,170
2016 2,139 22,755
2017 2,085 22,181
2018 and thereafter 16 170
Total ¥8,650 $92,021
Lease obligations of ¥230 million ($2,447 thousand) as of March 31, 2013 whose maturity dates are in the year ending March 31, 2014 are included in the long-term debt of ¥6,650 million ($70,745 thousand) presented in the consolidated balance sheet as of March 31, 2013.
9. Retirement Benefit Plans for Employees
The Company and its domestic consolidated subsidiaries have defined benefit plans, i.e., corporate pension plans and lump-sum payment plans, covering substantially all their employees. Eligible employees, upon termination of employment, are entitled to lump-sum or annuity payments, the amounts of which are determined by reference to their basic rates of pay, length of service, and the conditions under which termination occurs. The certain consolidated subsidiaries participate in the multi-employer welfare pension fund plan. They also have defined contribution pension plans.
Notes to Consolidated Financial Statements
1716
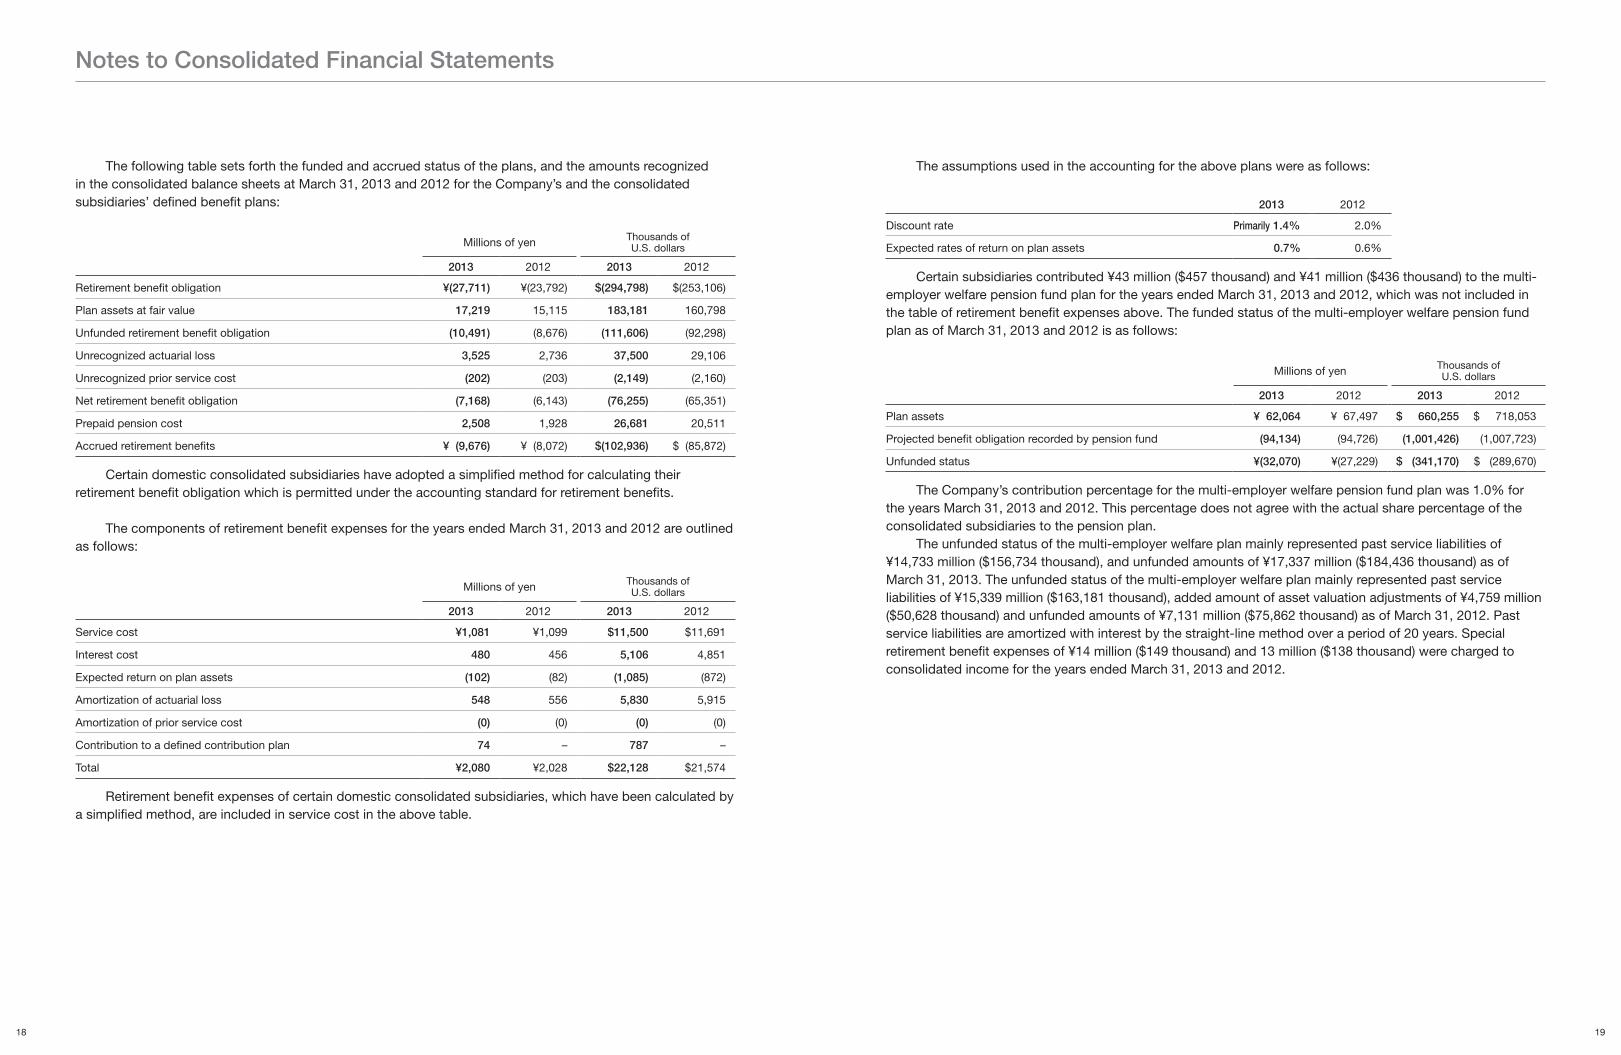
The following table sets forth the funded and accrued status of the plans, and the amounts recognized in the consolidated balance sheets at March 31, 2013 and 2012 for the Company’s and the consolidated subsidiaries’ defined benefit plans:
Millions of yen Thousands of U.S. dollars
2013 2012 2013 2012
Retirement benefit obligation ¥(27,711) ¥(23,792) $(294,798) $(253,106)
Plan assets at fair value 17,219 15,115 183,181 160,798
Unfunded retirement benefit obligation (10,491) (8,676) (111,606) (92,298)
Unrecognized actuarial loss 3,525 2,736 37,500 29,106
Unrecognized prior service cost (202) (203) (2,149) (2,160)
Net retirement benefit obligation (7,168) (6,143) (76,255) (65,351)
Prepaid pension cost 2,508 1,928 26,681 20,511
Accrued retirement benefits ¥ (9,676) ¥ (8,072) $(102,936) $ (85,872)
Certain domestic consolidated subsidiaries have adopted a simplified method for calculating their retirement benefit obligation which is permitted under the accounting standard for retirement benefits.
The components of retirement benefit expenses for the years ended March 31, 2013 and 2012 are outlined as follows:
Millions of yen Thousands of U.S. dollars
2013 2012 2013 2012
Service cost ¥1,081 ¥1,099 $11,500 $11,691
Interest cost 480 456 5,106 4,851
Expected return on plan assets (102) (82) (1,085) (872)
Amortization of actuarial loss 548 556 5,830 5,915
Amortization of prior service cost (0) (0) (0) (0)
Contribution to a defined contribution plan 74 – 787 –
Total ¥2,080 ¥2,028 $22,128 $21,574
Retirement benefit expenses of certain domestic consolidated subsidiaries, which have been calculated by a simplified method, are included in service cost in the above table.
The assumptions used in the accounting for the above plans were as follows:
2013 2012
Discount rate Primarily 1.4% 2.0%
Expected rates of return on plan assets 0.7% 0.6%
Certain subsidiaries contributed ¥43 million ($457 thousand) and ¥41 million ($436 thousand) to the multi-employer welfare pension fund plan for the years ended March 31, 2013 and 2012, which was not included in the table of retirement benefit expenses above. The funded status of the multi-employer welfare pension fund plan as of March 31, 2013 and 2012 is as follows:
Millions of yen Thousands of U.S. dollars
2013 2012 2013 2012
Plan assets ¥ 62,064 ¥ 67,497 $ 660,255 $ 718,053
Projected benefit obligation recorded by pension fund (94,134) (94,726) (1,001,426) (1,007,723)
Unfunded status ¥(32,070) ¥(27,229) $ (341,170) $ (289,670)
The Company’s contribution percentage for the multi-employer welfare pension fund plan was 1.0% for the years March 31, 2013 and 2012. This percentage does not agree with the actual share percentage of the consolidated subsidiaries to the pension plan.
The unfunded status of the multi-employer welfare plan mainly represented past service liabilities of ¥14,733 million ($156,734 thousand), and unfunded amounts of ¥17,337 million ($184,436 thousand) as of March 31, 2013. The unfunded status of the multi-employer welfare plan mainly represented past service liabilities of ¥15,339 million ($163,181 thousand), added amount of asset valuation adjustments of ¥4,759 million ($50,628 thousand) and unfunded amounts of ¥7,131 million ($75,862 thousand) as of March 31, 2012. Past service liabilities are amortized with interest by the straight-line method over a period of 20 years. Special retirement benefit expenses of ¥14 million ($149 thousand) and 13 million ($138 thousand) were charged to consolidated income for the years ended March 31, 2013 and 2012.
Notes to Consolidated Financial Statements
1918
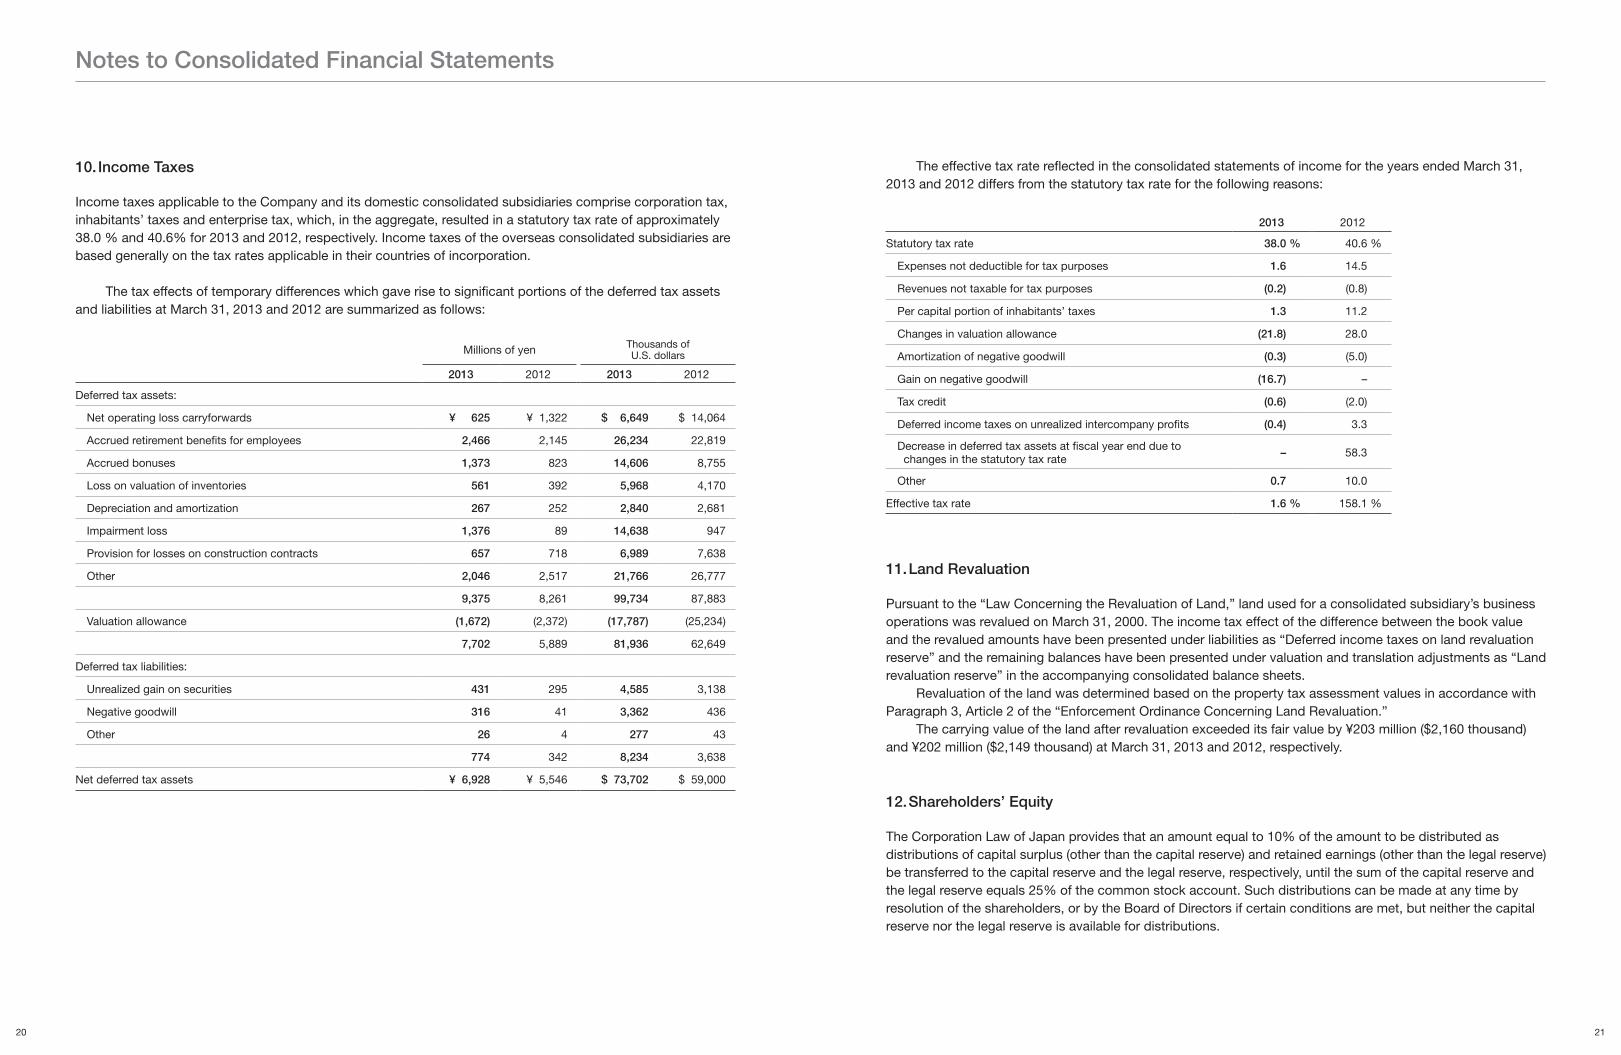
10. Income Taxes
Income taxes applicable to the Company and its domestic consolidated subsidiaries comprise corporation tax, inhabitants’ taxes and enterprise tax, which, in the aggregate, resulted in a statutory tax rate of approximately 38.0 % and 40.6% for 2013 and 2012, respectively. Income taxes of the overseas consolidated subsidiaries are based generally on the tax rates applicable in their countries of incorporation.
The tax effects of temporary differences which gave rise to significant portions of the deferred tax assets and liabilities at March 31, 2013 and 2012 are summarized as follows:
Millions of yen Thousands of U.S. dollars
2013 2012 2013 2012
Deferred tax assets:
Net operating loss carryforwards ¥ 625 ¥ 1,322 $ 6,649 $ 14,064
Accrued retirement benefits for employees 2,466 2,145 26,234 22,819
Accrued bonuses 1,373 823 14,606 8,755
Loss on valuation of inventories 561 392 5,968 4,170
Depreciation and amortization 267 252 2,840 2,681
Impairment loss 1,376 89 14,638 947
Provision for losses on construction contracts 657 718 6,989 7,638
Other 2,046 2,517 21,766 26,777
9,375 8,261 99,734 87,883
Valuation allowance (1,672) (2,372) (17,787) (25,234)
7,702 5,889 81,936 62,649
Deferred tax liabilities:
Unrealized gain on securities 431 295 4,585 3,138
Negative goodwill 316 41 3,362 436
Other 26 4 277 43
774 342 8,234 3,638
Net deferred tax assets ¥ 6,928 ¥ 5,546 $ 73,702 $ 59,000
The effective tax rate reflected in the consolidated statements of income for the years ended March 31, 2013 and 2012 differs from the statutory tax rate for the following reasons:
2013 2012
Statutory tax rate 38.0 % 40.6 %
Expenses not deductible for tax purposes 1.6 14.5
Revenues not taxable for tax purposes (0.2) (0.8)
Per capital portion of inhabitants’ taxes 1.3 11.2
Changes in valuation allowance (21.8) 28.0
Amortization of negative goodwill (0.3) (5.0)
Gain on negative goodwill (16.7) –
Tax credit (0.6) (2.0)
Deferred income taxes on unrealized intercompany profits (0.4) 3.3
Decrease in deferred tax assets at fiscal year end due to changes in the statutory tax rate – 58.3
Other 0.7 10.0
Effective tax rate 1.6 % 158.1 %
11. Land Revaluation
Pursuant to the “Law Concerning the Revaluation of Land,” land used for a consolidated subsidiary’s business operations was revalued on March 31, 2000. The income tax effect of the difference between the book value and the revalued amounts have been presented under liabilities as “Deferred income taxes on land revaluation reserve” and the remaining balances have been presented under valuation and translation adjustments as “Land revaluation reserve” in the accompanying consolidated balance sheets.
Revaluation of the land was determined based on the property tax assessment values in accordance with Paragraph 3, Article 2 of the “Enforcement Ordinance Concerning Land Revaluation.”
The carrying value of the land after revaluation exceeded its fair value by ¥203 million ($2,160 thousand) and ¥202 million ($2,149 thousand) at March 31, 2013 and 2012, respectively.
12. Shareholders’ Equity
The Corporation Law of Japan provides that an amount equal to 10% of the amount to be distributed as distributions of capital surplus (other than the capital reserve) and retained earnings (other than the legal reserve) be transferred to the capital reserve and the legal reserve, respectively, until the sum of the capital reserve and the legal reserve equals 25% of the common stock account. Such distributions can be made at any time by resolution of the shareholders, or by the Board of Directors if certain conditions are met, but neither the capital reserve nor the legal reserve is available for distributions.
Notes to Consolidated Financial Statements
2120
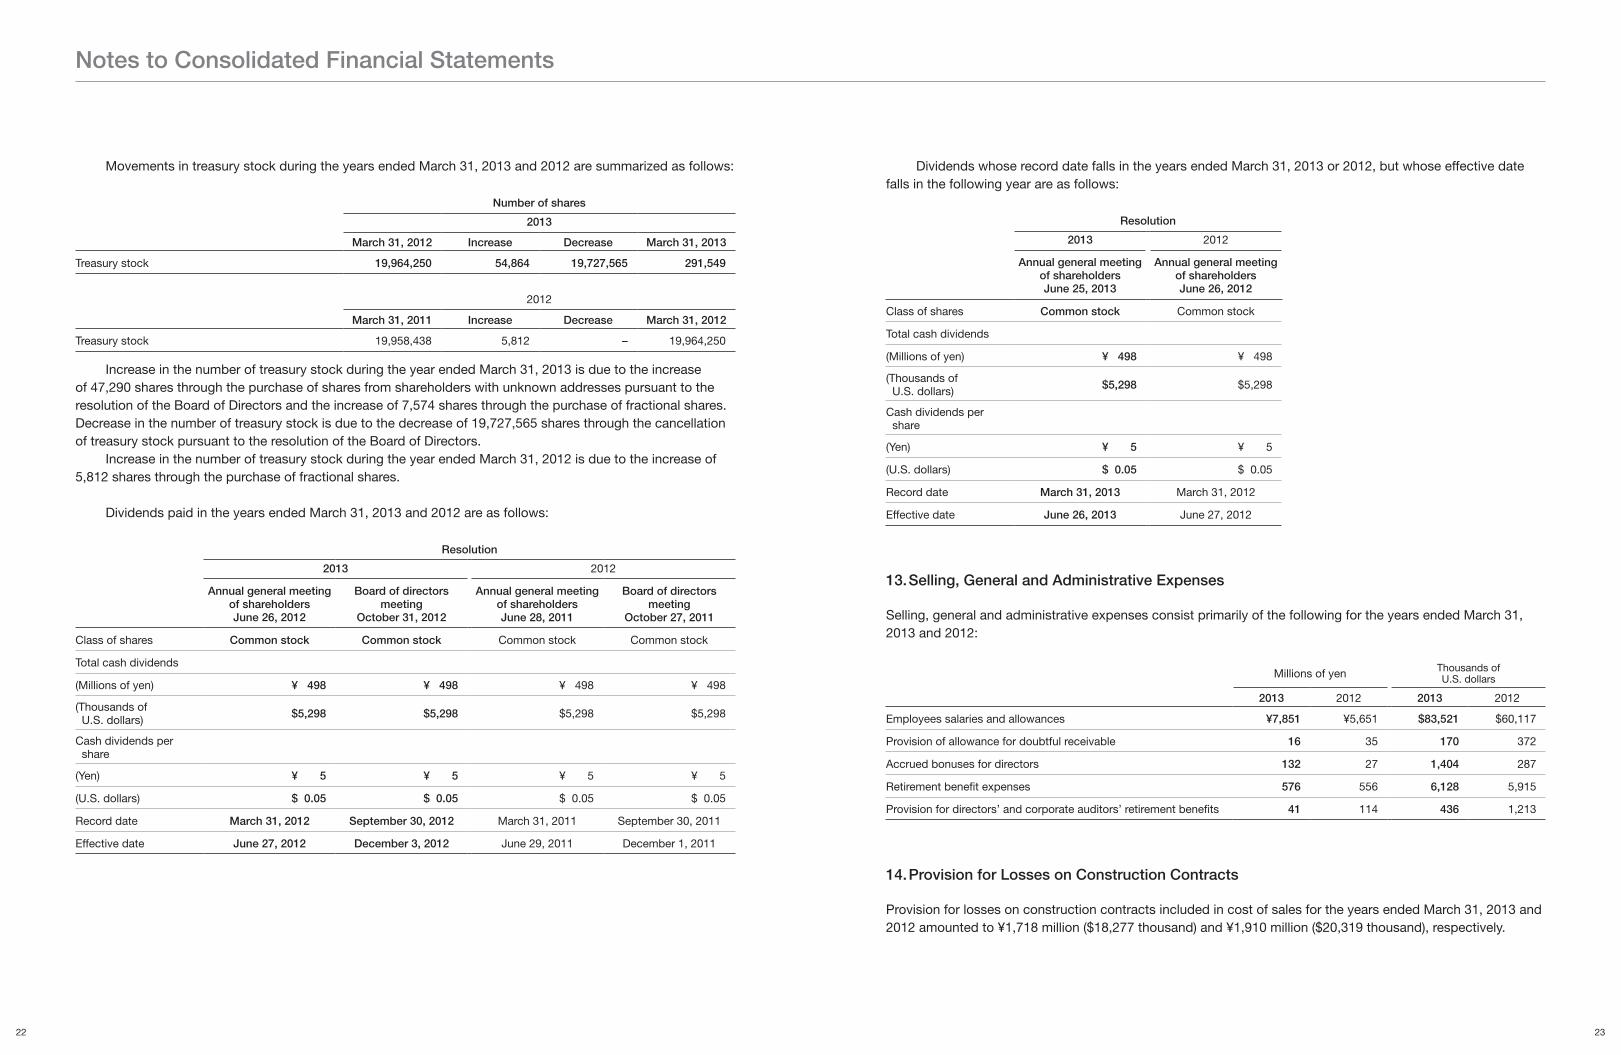
Movements in treasury stock during the years ended March 31, 2013 and 2012 are summarized as follows:
Number of shares
2013
March 31, 2012 Increase Decrease March 31, 2013
Treasury stock 19,964,250 54,864 19,727,565 291,549
2012
March 31, 2011 Increase Decrease March 31, 2012
Treasury stock 19,958,438 5,812 – 19,964,250
Increase in the number of treasury stock during the year ended March 31, 2013 is due to the increase of 47,290 shares through the purchase of shares from shareholders with unknown addresses pursuant to the resolution of the Board of Directors and the increase of 7,574 shares through the purchase of fractional shares. Decrease in the number of treasury stock is due to the decrease of 19,727,565 shares through the cancellation of treasury stock pursuant to the resolution of the Board of Directors.
Increase in the number of treasury stock during the year ended March 31, 2012 is due to the increase of 5,812 shares through the purchase of fractional shares.
Dividends paid in the years ended March 31, 2013 and 2012 are as follows:
Resolution
2013 2012
Annual general meeting of shareholdersJune 26, 2012
Board of directors meeting
October 31, 2012
Annual general meeting of shareholdersJune 28, 2011
Board of directors meeting
October 27, 2011
Class of shares Common stock Common stock Common stock Common stock
Total cash dividends
(Millions of yen) ¥ 498 ¥ 498 ¥ 498 ¥ 498
(Thousands of U.S. dollars) $5,298 $5,298 $5,298 $5,298
Cash dividends per share
(Yen) ¥ 5 ¥ 5 ¥ 5 ¥ 5
(U.S. dollars) $ 0.05 $ 0.05 $ 0.05 $ 0.05
Record date March 31, 2012 September 30, 2012 March 31, 2011 September 30, 2011
Effective date June 27, 2012 December 3, 2012 June 29, 2011 December 1, 2011
Dividends whose record date falls in the years ended March 31, 2013 or 2012, but whose effective date falls in the following year are as follows:
Resolution
2013 2012
Annual general meeting of shareholdersJune 25, 2013
Annual general meeting of shareholdersJune 26, 2012
Class of shares Common stock Common stock
Total cash dividends
(Millions of yen) ¥ 498 ¥ 498
(Thousands of U.S. dollars) $5,298 $5,298
Cash dividends per share
(Yen) ¥ 5 ¥ 5
(U.S. dollars) $ 0.05 $ 0.05
Record date March 31, 2013 March 31, 2012
Effective date June 26, 2013 June 27, 2012
13. Selling, General and Administrative Expenses
Selling, general and administrative expenses consist primarily of the following for the years ended March 31, 2013 and 2012:
Millions of yen Thousands of U.S. dollars
2013 2012 2013 2012
Employees salaries and allowances ¥7,851 ¥5,651 $83,521 $60,117
Provision of allowance for doubtful receivable 16 35 170 372
Accrued bonuses for directors 132 27 1,404 287
Retirement benefit expenses 576 556 6,128 5,915
Provision for directors’ and corporate auditors’ retirement benefits 41 114 436 1,213
14. Provision for Losses on Construction Contracts
Provision for losses on construction contracts included in cost of sales for the years ended March 31, 2013 and 2012 amounted to ¥1,718 million ($18,277 thousand) and ¥1,910 million ($20,319 thousand), respectively.
Notes to Consolidated Financial Statements
2322
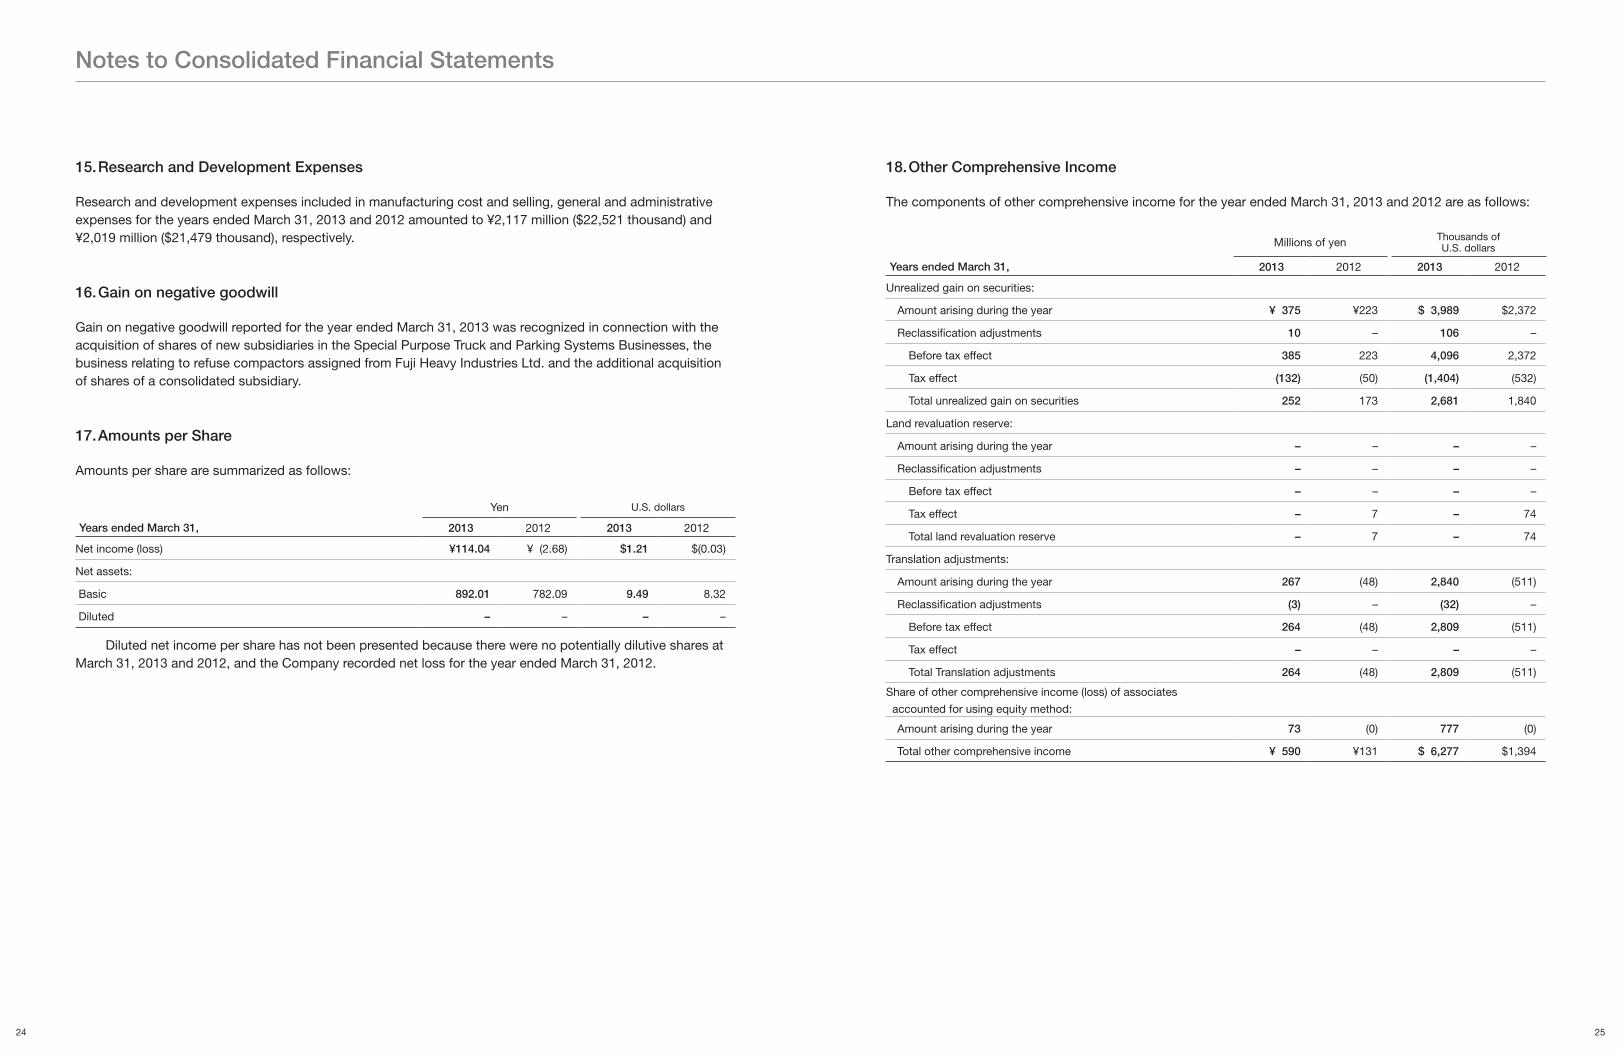
15. Research and Development Expenses
Research and development expenses included in manufacturing cost and selling, general and administrative expenses for the years ended March 31, 2013 and 2012 amounted to ¥2,117 million ($22,521 thousand) and ¥2,019 million ($21,479 thousand), respectively.
16. Gain on negative goodwill
Gain on negative goodwill reported for the year ended March 31, 2013 was recognized in connection with the acquisition of shares of new subsidiaries in the Special Purpose Truck and Parking Systems Businesses, the business relating to refuse compactors assigned from Fuji Heavy Industries Ltd. and the additional acquisition of shares of a consolidated subsidiary.
17. Amounts per Share
Amounts per share are summarized as follows:
Yen U.S. dollars
Years ended March 31, 2013 2012 2013 2012
Net income (loss) ¥114.04 ¥ (2.68) $1.21 $(0.03)
Net assets:
Basic 892.01 782.09 9.49 8.32
Diluted – – – –
Diluted net income per share has not been presented because there were no potentially dilutive shares at March 31, 2013 and 2012, and the Company recorded net loss for the year ended March 31, 2012.
18. Other Comprehensive Income
The components of other comprehensive income for the year ended March 31, 2013 and 2012 are as follows:
Millions of yen Thousands of U.S. dollars
Years ended March 31, 2013 2012 2013 2012
Unrealized gain on securities:
Amount arising during the year ¥ 375 ¥223 $ 3,989 $2,372
Reclassification adjustments 10 – 106 –
Before tax effect 385 223 4,096 2,372
Tax effect (132) (50) (1,404) (532)
Total unrealized gain on securities 252 173 2,681 1,840
Land revaluation reserve:
Amount arising during the year – – – –
Reclassification adjustments – – – –
Before tax effect – – – –
Tax effect – 7 – 74
Total land revaluation reserve – 7 – 74
Translation adjustments:
Amount arising during the year 267 (48) 2,840 (511)
Reclassification adjustments (3) – (32) –
Before tax effect 264 (48) 2,809 (511)
Tax effect – – – –
Total Translation adjustments 264 (48) 2,809 (511)
Share of other comprehensive income (loss) of associates
accounted for using equity method:
Amount arising during the year 73 (0) 777 (0)
Total other comprehensive income ¥ 590 ¥131 $ 6,277 $1,394
Notes to Consolidated Financial Statements
2524
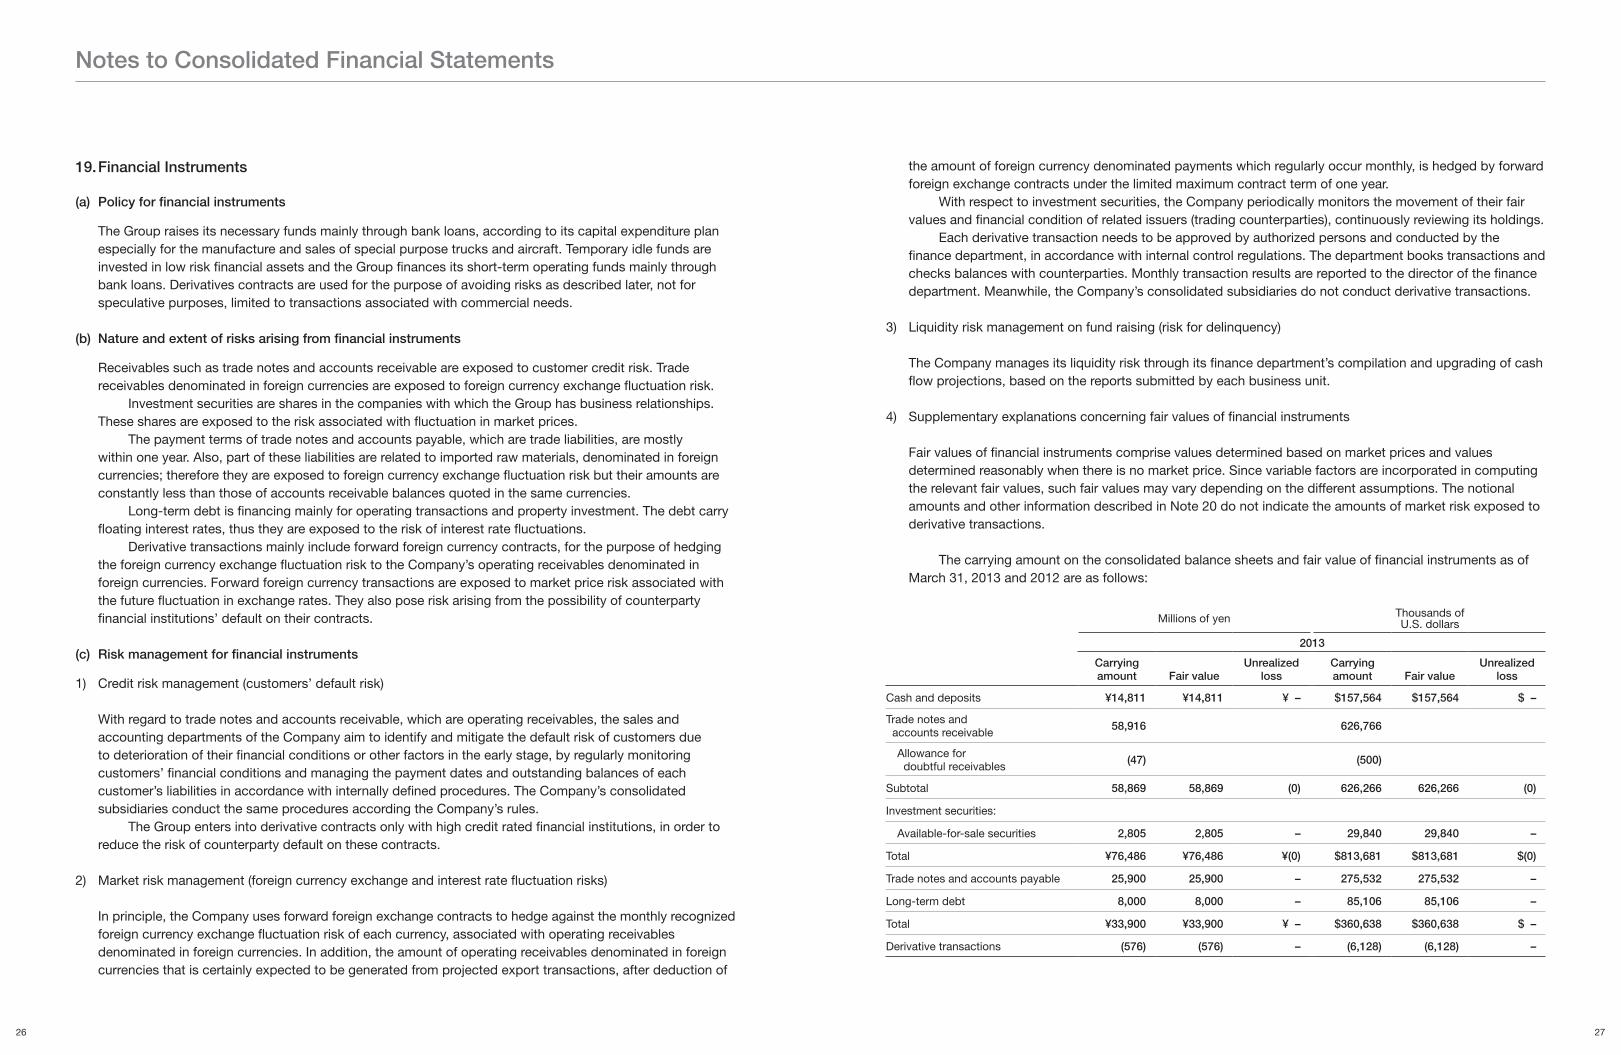
19. Financial Instruments
(a) Policy for financial instruments
The Group raises its necessary funds mainly through bank loans, according to its capital expenditure plan especially for the manufacture and sales of special purpose trucks and aircraft. Temporary idle funds are invested in low risk financial assets and the Group finances its short-term operating funds mainly through bank loans. Derivatives contracts are used for the purpose of avoiding risks as described later, not for speculative purposes, limited to transactions associated with commercial needs.
(b) Nature and extent of risks arising from financial instruments
Receivables such as trade notes and accounts receivable are exposed to customer credit risk. Trade receivables denominated in foreign currencies are exposed to foreign currency exchange fluctuation risk.
Investment securities are shares in the companies with which the Group has business relationships. These shares are exposed to the risk associated with fluctuation in market prices.
The payment terms of trade notes and accounts payable, which are trade liabilities, are mostly within one year. Also, part of these liabilities are related to imported raw materials, denominated in foreign currencies; therefore they are exposed to foreign currency exchange fluctuation risk but their amounts are constantly less than those of accounts receivable balances quoted in the same currencies.
Long-term debt is financing mainly for operating transactions and property investment. The debt carry floating interest rates, thus they are exposed to the risk of interest rate fluctuations.
Derivative transactions mainly include forward foreign currency contracts, for the purpose of hedging the foreign currency exchange fluctuation risk to the Company’s operating receivables denominated in foreign currencies. Forward foreign currency transactions are exposed to market price risk associated with the future fluctuation in exchange rates. They also pose risk arising from the possibility of counterparty financial institutions’ default on their contracts.
(c) Risk management for financial instruments
1) Credit risk management (customers’ default risk)
With regard to trade notes and accounts receivable, which are operating receivables, the sales and accounting departments of the Company aim to identify and mitigate the default risk of customers due to deterioration of their financial conditions or other factors in the early stage, by regularly monitoring customers’ financial conditions and managing the payment dates and outstanding balances of each customer’s liabilities in accordance with internally defined procedures. The Company’s consolidated subsidiaries conduct the same procedures according the Company’s rules.
The Group enters into derivative contracts only with high credit rated financial institutions, in order to reduce the risk of counterparty default on these contracts.
2) Market risk management (foreign currency exchange and interest rate fluctuation risks)
In principle, the Company uses forward foreign exchange contracts to hedge against the monthly recognized foreign currency exchange fluctuation risk of each currency, associated with operating receivables denominated in foreign currencies. In addition, the amount of operating receivables denominated in foreign currencies that is certainly expected to be generated from projected export transactions, after deduction of
the amount of foreign currency denominated payments which regularly occur monthly, is hedged by forward foreign exchange contracts under the limited maximum contract term of one year.
With respect to investment securities, the Company periodically monitors the movement of their fair values and financial condition of related issuers (trading counterparties), continuously reviewing its holdings.
Each derivative transaction needs to be approved by authorized persons and conducted by the finance department, in accordance with internal control regulations. The department books transactions and checks balances with counterparties. Monthly transaction results are reported to the director of the finance department. Meanwhile, the Company’s consolidated subsidiaries do not conduct derivative transactions.
3) Liquidity risk management on fund raising (risk for delinquency)
The Company manages its liquidity risk through its finance department’s compilation and upgrading of cash flow projections, based on the reports submitted by each business unit.
4) Supplementary explanations concerning fair values of financial instruments
Fair values of financial instruments comprise values determined based on market prices and values determined reasonably when there is no market price. Since variable factors are incorporated in computing the relevant fair values, such fair values may vary depending on the different assumptions. The notional amounts and other information described in Note 20 do not indicate the amounts of market risk exposed to derivative transactions.
The carrying amount on the consolidated balance sheets and fair value of financial instruments as of March 31, 2013 and 2012 are as follows:
Millions of yen Thousands of U.S. dollars
2013
Carrying amount Fair value
Unrealized loss
Carrying amount Fair value
Unrealized loss
Cash and deposits ¥14,811 ¥14,811 ¥ – $157,564 $157,564 $ –
Trade notes and accounts receivable
58,916 626,766
Allowance for doubtful receivables (47) (500)
Subtotal 58,869 58,869 (0) 626,266 626,266 (0)
Investment securities:
Available-for-sale securities 2,805 2,805 – 29,840 29,840 –
Total ¥76,486 ¥76,486 ¥(0) $813,681 $813,681 $(0)
Trade notes and accounts payable 25,900 25,900 – 275,532 275,532 –
Long-term debt 8,000 8,000 – 85,106 85,106 –
Total ¥33,900 ¥33,900 ¥ – $360,638 $360,638 $ –
Derivative transactions (576) (576) – (6,128) (6,128) –
Notes to Consolidated Financial Statements
2726
Millions of yen Thousands of U.S. dollars
2012
Carrying amount Fair value
Unrealized loss
Carrying amount Fair value
Unrealized loss
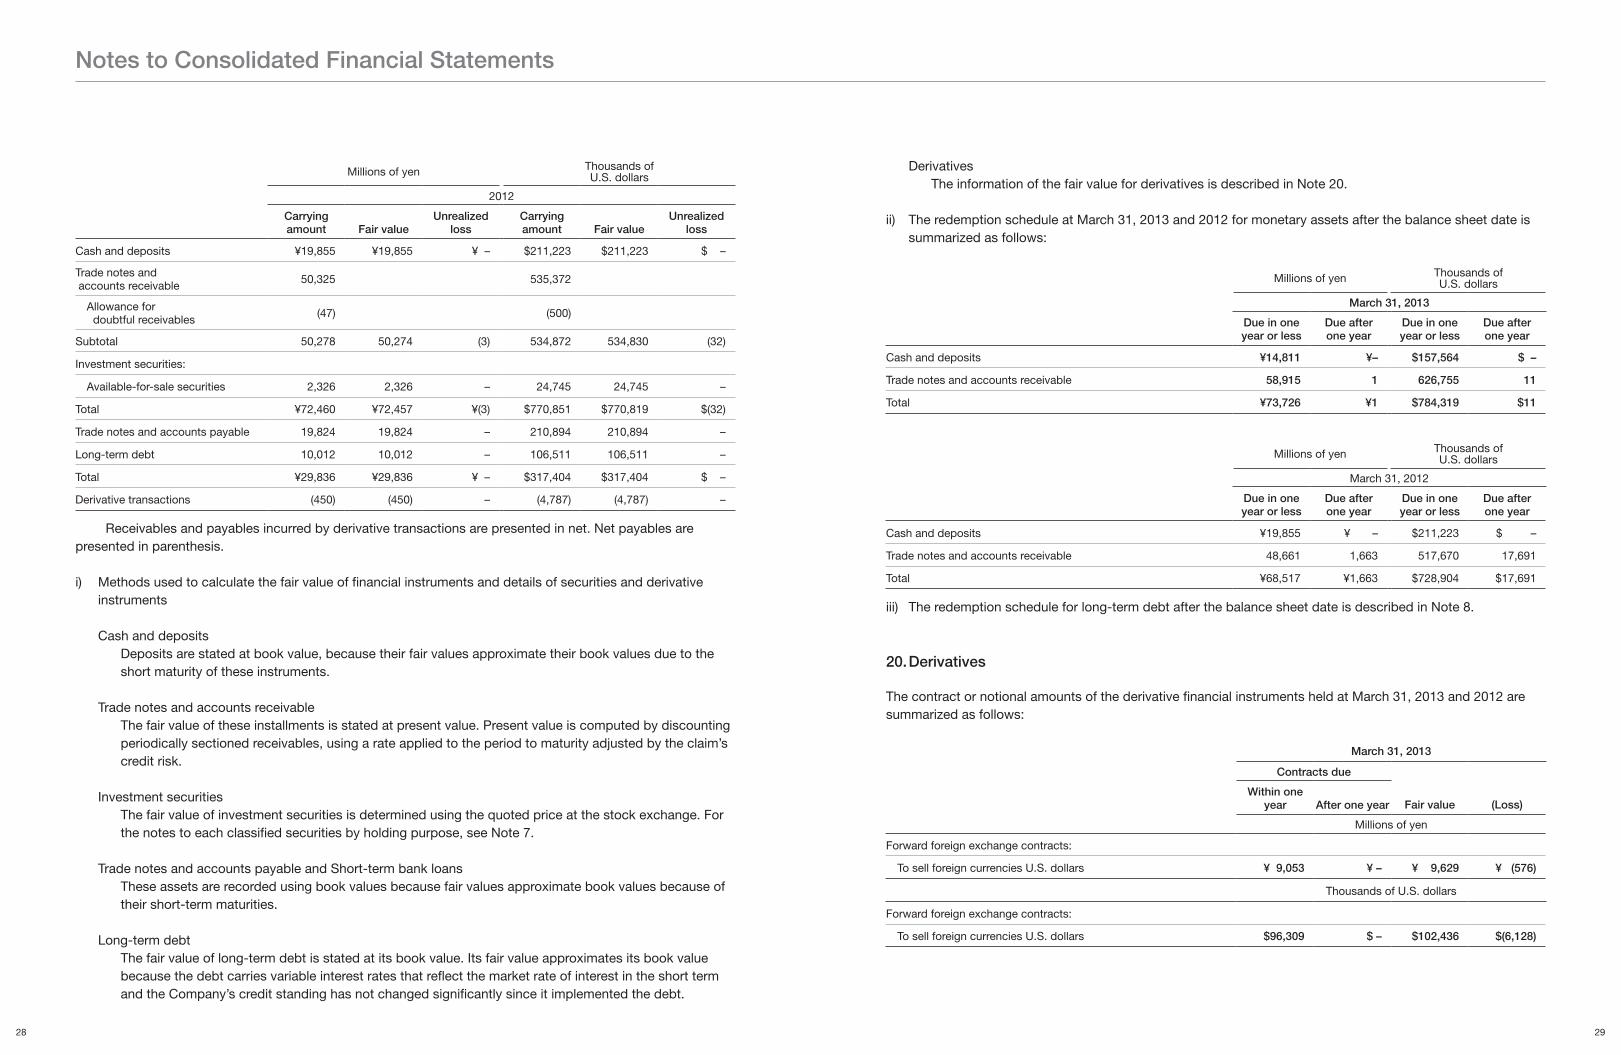
Cash and deposits ¥19,855 ¥19,855 ¥ – $211,223 $211,223 $ –
Trade notes and accounts receivable 50,325 535,372
Allowance for doubtful receivables (47) (500)
Subtotal 50,278 50,274 (3) 534,872 534,830 (32)
Investment securities:
Available-for-sale securities 2,326 2,326 – 24,745 24,745 –
Total ¥72,460 ¥72,457 ¥(3) $770,851 $770,819 $(32)
Trade notes and accounts payable 19,824 19,824 – 210,894 210,894 –
Long-term debt 10,012 10,012 – 106,511 106,511 –
Total ¥29,836 ¥29,836 ¥ – $317,404 $317,404 $ –
Derivative transactions (450) (450) – (4,787) (4,787) –
Receivables and payables incurred by derivative transactions are presented in net. Net payables are presented in parenthesis.
i) Methods used to calculate the fair value of financial instruments and details of securities and derivative instruments
Cash and deposits Deposits are stated at book value, because their fair values approximate their book values due to the short maturity of these instruments.
Trade notes and accounts receivableThe fair value of these installments is stated at present value. Present value is computed by discounting periodically sectioned receivables, using a rate applied to the period to maturity adjusted by the claim’s credit risk.
Investment securitiesThe fair value of investment securities is determined using the quoted price at the stock exchange. For the notes to each classified securities by holding purpose, see Note 7.
Trade notes and accounts payable and Short-term bank loansThese assets are recorded using book values because fair values approximate book values because of their short-term maturities.
Long-term debtThe fair value of long-term debt is stated at its book value. Its fair value approximates its book value because the debt carries variable interest rates that reflect the market rate of interest in the short term and the Company’s credit standing has not changed significantly since it implemented the debt.
DerivativesThe information of the fair value for derivatives is described in Note 20.
ii) The redemption schedule at March 31, 2013 and 2012 for monetary assets after the balance sheet date is summarized as follows:
Millions of yen Thousands of U.S. dollars
March 31, 2013
Due in oneyear or less
Due afterone year
Due in oneyear or less
Due afterone year
Cash and deposits ¥14,811 ¥– $157,564 $ –
Trade notes and accounts receivable 58,915 1 626,755 11
Total ¥73,726 ¥1 $784,319 $11
Millions of yen Thousands of U.S. dollars
March 31, 2012
Due in oneyear or less
Due afterone year
Due in oneyear or less
Due afterone year
Cash and deposits ¥19,855 ¥ – $211,223 $ –
Trade notes and accounts receivable 48,661 1,663 517,670 17,691
Total ¥68,517 ¥1,663 $728,904 $17,691
iii) The redemption schedule for long-term debt after the balance sheet date is described in Note 8.
20. Derivatives
The contract or notional amounts of the derivative financial instruments held at March 31, 2013 and 2012 are summarized as follows:
March 31, 2013
Contracts due
Within one year After one year Fair value (Loss)
Millions of yen
Forward foreign exchange contracts:
To sell foreign currencies U.S. dollars ¥ 9,053 ¥ – ¥ 9,629 ¥ (576)
Thousands of U.S. dollars
Forward foreign exchange contracts:
To sell foreign currencies U.S. dollars $96,309 $ – $102,436 $(6,128)
Notes to Consolidated Financial Statements
2928
March 31, 2012
Contracts due
Within one year After one year Fair value (Loss)
Millions of yen
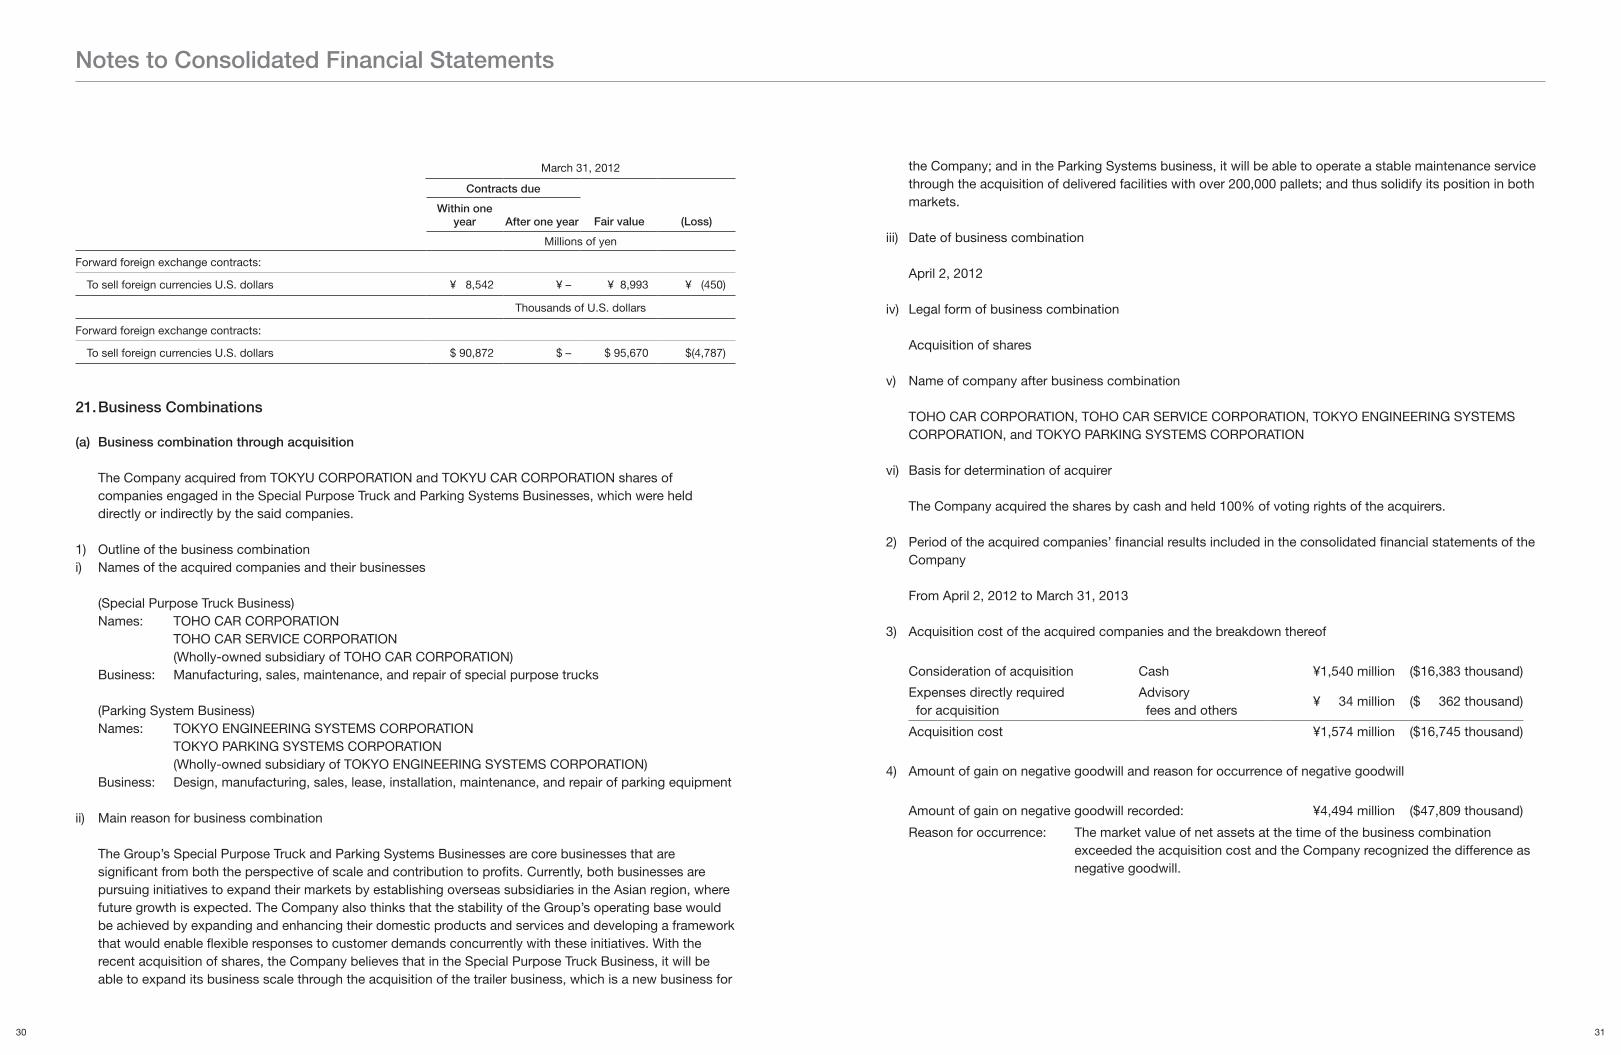
Forward foreign exchange contracts:
To sell foreign currencies U.S. dollars ¥ 8,542 ¥ – ¥ 8,993 ¥ (450)
Thousands of U.S. dollars
Forward foreign exchange contracts:
To sell foreign currencies U.S. dollars $ 90,872 $ – $ 95,670 $(4,787)
21. Business Combinations
(a) Business combination through acquisition
The Company acquired from TOKYU CORPORATION and TOKYU CAR CORPORATION shares of companies engaged in the Special Purpose Truck and Parking Systems Businesses, which were held directly or indirectly by the said companies.
1) Outline of the business combinationi) Names of the acquired companies and their businesses
(Special Purpose Truck Business)Names: TOHO CAR CORPORATION TOHO CAR SERVICE CORPORATION (Wholly-owned subsidiary of TOHO CAR CORPORATION)Business: Manufacturing, sales, maintenance, and repair of special purpose trucks
(Parking System Business)Names: TOKYO ENGINEERING SYSTEMS CORPORATION TOKYO PARKING SYSTEMS CORPORATION (Wholly-owned subsidiary of TOKYO ENGINEERING SYSTEMS CORPORATION)Business: Design, manufacturing, sales, lease, installation, maintenance, and repair of parking equipment
ii) Main reason for business combination
The Group’s Special Purpose Truck and Parking Systems Businesses are core businesses that are significant from both the perspective of scale and contribution to profits. Currently, both businesses are pursuing initiatives to expand their markets by establishing overseas subsidiaries in the Asian region, where future growth is expected. The Company also thinks that the stability of the Group’s operating base would be achieved by expanding and enhancing their domestic products and services and developing a framework that would enable flexible responses to customer demands concurrently with these initiatives. With the recent acquisition of shares, the Company believes that in the Special Purpose Truck Business, it will be able to expand its business scale through the acquisition of the trailer business, which is a new business for
the Company; and in the Parking Systems business, it will be able to operate a stable maintenance service through the acquisition of delivered facilities with over 200,000 pallets; and thus solidify its position in both markets.
iii) Date of business combination
April 2, 2012
iv) Legal form of business combination
Acquisition of shares
v) Name of company after business combination
TOHO CAR CORPORATION, TOHO CAR SERVICE CORPORATION, TOKYO ENGINEERING SYSTEMS CORPORATION, and TOKYO PARKING SYSTEMS CORPORATION
vi) Basis for determination of acquirer
The Company acquired the shares by cash and held 100% of voting rights of the acquirers.
2) Period of the acquired companies’ financial results included in the consolidated financial statements of the Company
From April 2, 2012 to March 31, 2013
3) Acquisition cost of the acquired companies and the breakdown thereof
Consideration of acquisition Cash ¥1,540 million ($16,383 thousand)
Expenses directly required for acquisition
Advisory fees and others
¥ 34 million ($ 362 thousand)
Acquisition cost ¥1,574 million ($16,745 thousand)
4) Amount of gain on negative goodwill and reason for occurrence of negative goodwill
Amount of gain on negative goodwill recorded: ¥4,494 million ($47,809 thousand)
Reason for occurrence: The market value of net assets at the time of the business combination exceeded the acquisition cost and the Company recognized the difference as negative goodwill.
Notes to Consolidated Financial Statements
3130
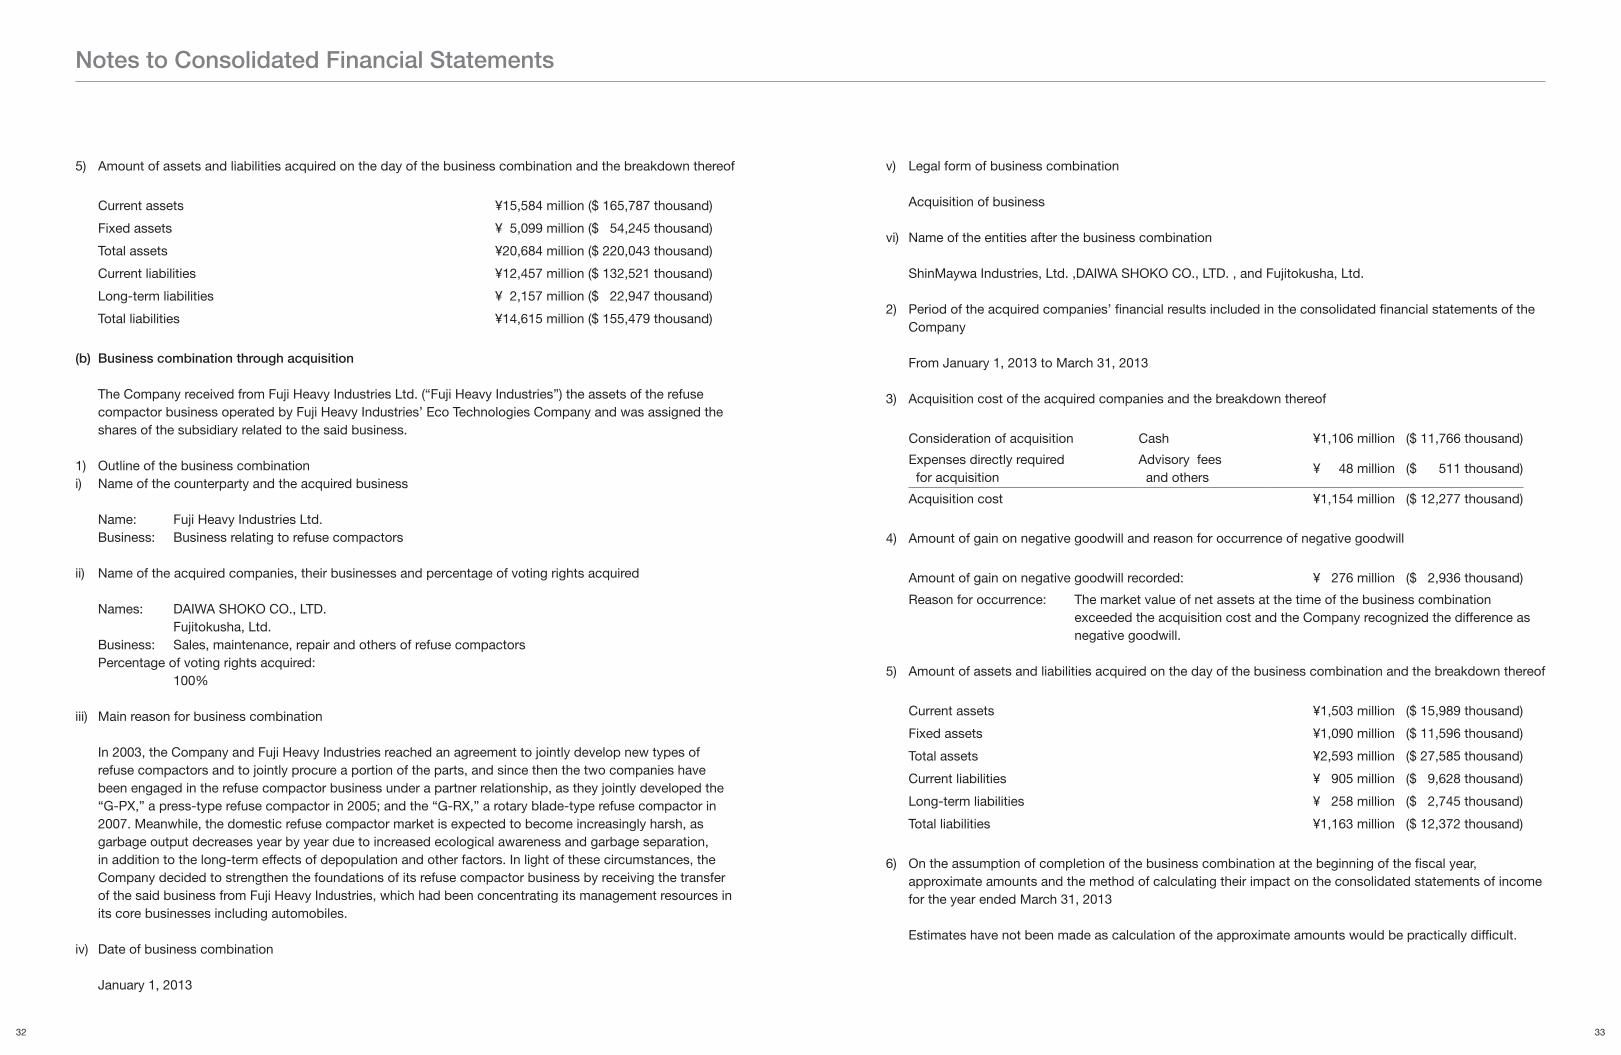
5) Amount of assets and liabilities acquired on the day of the business combination and the breakdown thereof
Current assets ¥15,584 million ($ 165,787 thousand)
Fixed assets ¥ 5,099 million ($ 54,245 thousand)
Total assets ¥20,684 million ($ 220,043 thousand)
Current liabilities ¥12,457 million ($ 132,521 thousand)
Long-term liabilities ¥ 2,157 million ($ 22,947 thousand)
Total liabilities ¥14,615 million ($ 155,479 thousand)
(b) Business combination through acquisition
The Company received from Fuji Heavy Industries Ltd. (“Fuji Heavy Industries”) the assets of the refuse compactor business operated by Fuji Heavy Industries’ Eco Technologies Company and was assigned the shares of the subsidiary related to the said business.
1) Outline of the business combinationi) Name of the counterparty and the acquired business
Name: Fuji Heavy Industries Ltd.Business: Business relating to refuse compactors
ii) Name of the acquired companies, their businesses and percentage of voting rights acquired
Names: DAIWA SHOKO CO., LTD. Fujitokusha, Ltd.Business: Sales, maintenance, repair and others of refuse compactorsPercentage of voting rights acquired: 100%
iii) Main reason for business combination
In 2003, the Company and Fuji Heavy Industries reached an agreement to jointly develop new types of refuse compactors and to jointly procure a portion of the parts, and since then the two companies have been engaged in the refuse compactor business under a partner relationship, as they jointly developed the “G-PX,” a press-type refuse compactor in 2005; and the “G-RX,” a rotary blade-type refuse compactor in 2007. Meanwhile, the domestic refuse compactor market is expected to become increasingly harsh, as garbage output decreases year by year due to increased ecological awareness and garbage separation, in addition to the long-term effects of depopulation and other factors. In light of these circumstances, the Company decided to strengthen the foundations of its refuse compactor business by receiving the transfer of the said business from Fuji Heavy Industries, which had been concentrating its management resources in its core businesses including automobiles.
iv) Date of business combination
January 1, 2013
v) Legal form of business combination
Acquisition of business
vi) Name of the entities after the business combination
ShinMaywa Industries, Ltd. ,DAIWA SHOKO CO., LTD. , and Fujitokusha, Ltd.
2) Period of the acquired companies’ financial results included in the consolidated financial statements of the Company
From January 1, 2013 to March 31, 2013
3) Acquisition cost of the acquired companies and the breakdown thereof
Consideration of acquisition Cash ¥1,106 million ($ 11,766 thousand)
Expenses directly required for acquisition
Advisory fees and others
¥ 48 million ($ 511 thousand)
Acquisition cost ¥1,154 million ($ 12,277 thousand)
4) Amount of gain on negative goodwill and reason for occurrence of negative goodwill
Amount of gain on negative goodwill recorded: ¥ 276 million ($ 2,936 thousand)
Reason for occurrence: The market value of net assets at the time of the business combination exceeded the acquisition cost and the Company recognized the difference as negative goodwill.
5) Amount of assets and liabilities acquired on the day of the business combination and the breakdown thereof
Current assets ¥1,503 million ($ 15,989 thousand)
Fixed assets ¥1,090 million ($ 11,596 thousand)
Total assets ¥2,593 million ($ 27,585 thousand)
Current liabilities ¥ 905 million ($ 9,628 thousand)
Long-term liabilities ¥ 258 million ($ 2,745 thousand)
Total liabilities ¥1,163 million ($ 12,372 thousand)
6) On the assumption of completion of the business combination at the beginning of the fiscal year, approximate amounts and the method of calculating their impact on the consolidated statements of income for the year ended March 31, 2013
Estimates have not been made as calculation of the approximate amounts would be practically difficult.
Notes to Consolidated Financial Statements
3332
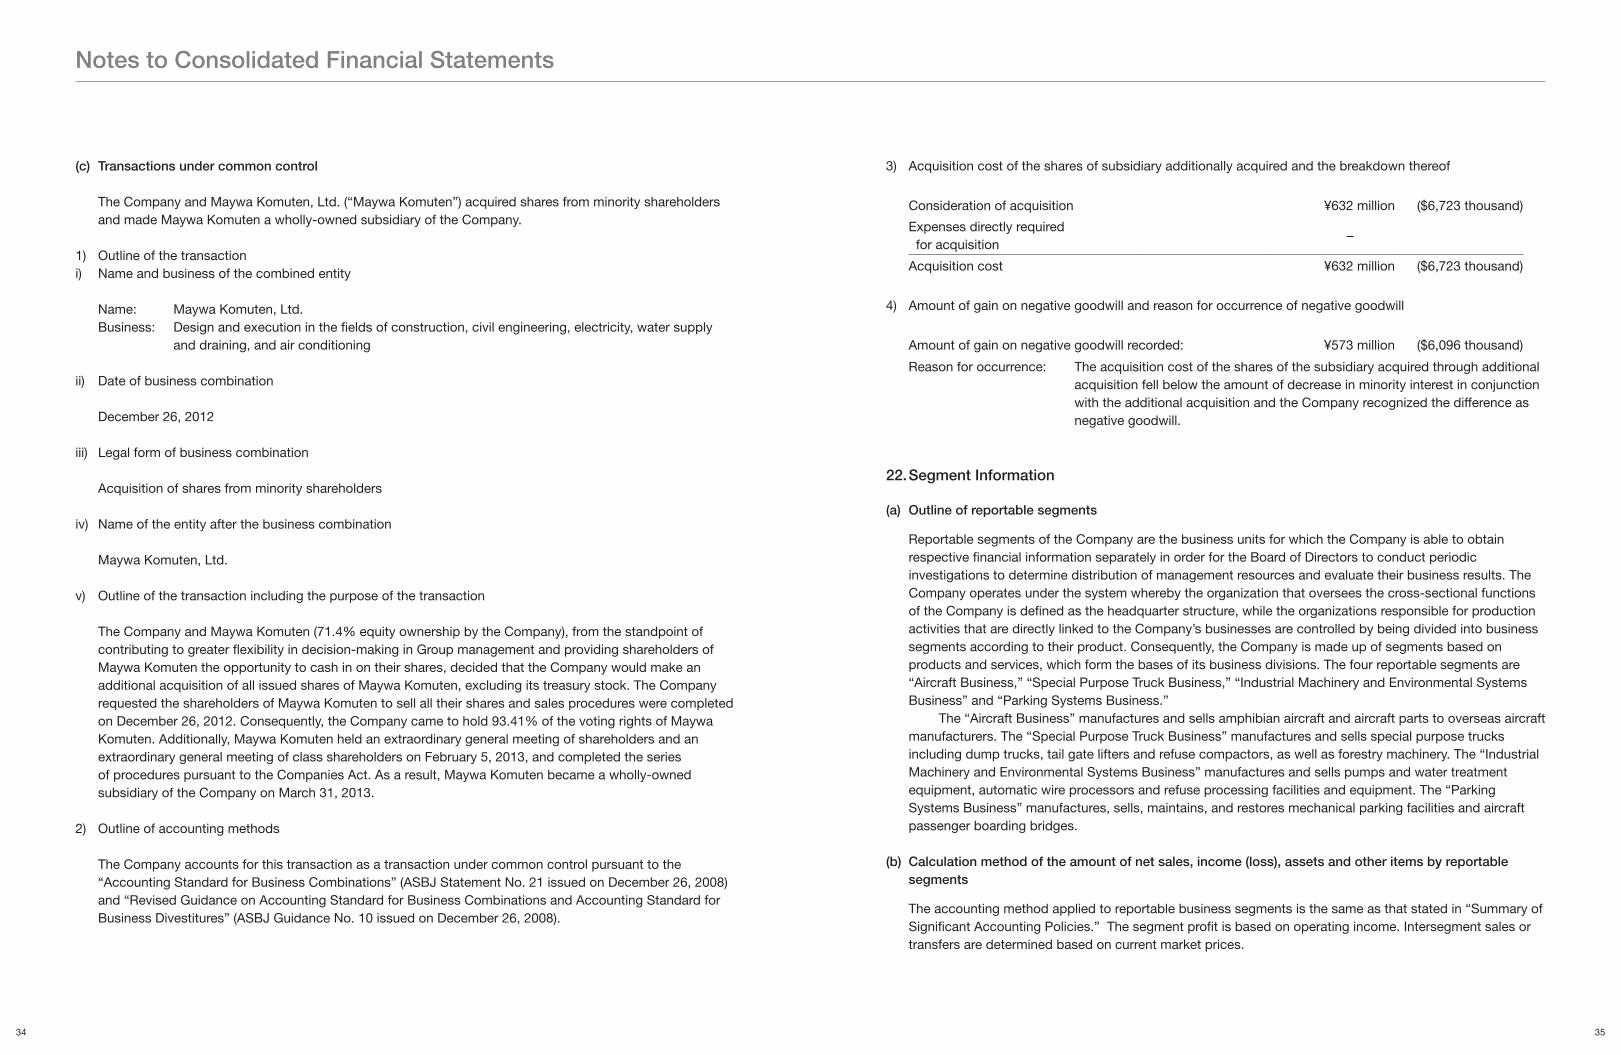
(c) Transactions under common control
The Company and Maywa Komuten, Ltd. (“Maywa Komuten”) acquired shares from minority shareholders and made Maywa Komuten a wholly-owned subsidiary of the Company.
1) Outline of the transactioni) Name and business of the combined entity
Name: Maywa Komuten, Ltd.Business: Design and execution in the fields of construction, civil engineering, electricity, water supply
and draining, and air conditioning
ii) Date of business combination
December 26, 2012
iii) Legal form of business combination
Acquisition of shares from minority shareholders
iv) Name of the entity after the business combination
Maywa Komuten, Ltd.
v) Outline of the transaction including the purpose of the transaction
The Company and Maywa Komuten (71.4% equity ownership by the Company), from the standpoint of contributing to greater flexibility in decision-making in Group management and providing shareholders of Maywa Komuten the opportunity to cash in on their shares, decided that the Company would make an additional acquisition of all issued shares of Maywa Komuten, excluding its treasury stock. The Company requested the shareholders of Maywa Komuten to sell all their shares and sales procedures were completed on December 26, 2012. Consequently, the Company came to hold 93.41% of the voting rights of Maywa Komuten. Additionally, Maywa Komuten held an extraordinary general meeting of shareholders and an extraordinary general meeting of class shareholders on February 5, 2013, and completed the series of procedures pursuant to the Companies Act. As a result, Maywa Komuten became a wholly-owned subsidiary of the Company on March 31, 2013.
2) Outline of accounting methods
The Company accounts for this transaction as a transaction under common control pursuant to the “Accounting Standard for Business Combinations” (ASBJ Statement No. 21 issued on December 26, 2008) and “Revised Guidance on Accounting Standard for Business Combinations and Accounting Standard for Business Divestitures” (ASBJ Guidance No. 10 issued on December 26, 2008).
3) Acquisition cost of the shares of subsidiary additionally acquired and the breakdown thereof
Consideration of acquisition ¥632 million ($6,723 thousand)
Expenses directly required for acquisition
–
Acquisition cost ¥632 million ($6,723 thousand)
4) Amount of gain on negative goodwill and reason for occurrence of negative goodwill
Amount of gain on negative goodwill recorded: ¥573 million ($6,096 thousand)
Reason for occurrence: The acquisition cost of the shares of the subsidiary acquired through additional acquisition fell below the amount of decrease in minority interest in conjunction with the additional acquisition and the Company recognized the difference as negative goodwill.
22. Segment Information
(a) Outline of reportable segments
Reportable segments of the Company are the business units for which the Company is able to obtain respective financial information separately in order for the Board of Directors to conduct periodic investigations to determine distribution of management resources and evaluate their business results. The Company operates under the system whereby the organization that oversees the cross-sectional functions of the Company is defined as the headquarter structure, while the organizations responsible for production activities that are directly linked to the Company’s businesses are controlled by being divided into business segments according to their product. Consequently, the Company is made up of segments based on products and services, which form the bases of its business divisions. The four reportable segments are “Aircraft Business,” “Special Purpose Truck Business,” “Industrial Machinery and Environmental Systems Business” and “Parking Systems Business.”
The “Aircraft Business” manufactures and sells amphibian aircraft and aircraft parts to overseas aircraft manufacturers. The “Special Purpose Truck Business” manufactures and sells special purpose trucks including dump trucks, tail gate lifters and refuse compactors, as well as forestry machinery. The “Industrial Machinery and Environmental Systems Business” manufactures and sells pumps and water treatment equipment, automatic wire processors and refuse processing facilities and equipment. The “Parking Systems Business” manufactures, sells, maintains, and restores mechanical parking facilities and aircraft passenger boarding bridges.
(b) Calculation method of the amount of net sales, income (loss), assets and other items by reportable segments
The accounting method applied to reportable business segments is the same as that stated in “Summary of Significant Accounting Policies.” The segment profit is based on operating income. Intersegment sales or transfers are determined based on current market prices.
Notes to Consolidated Financial Statements
3534
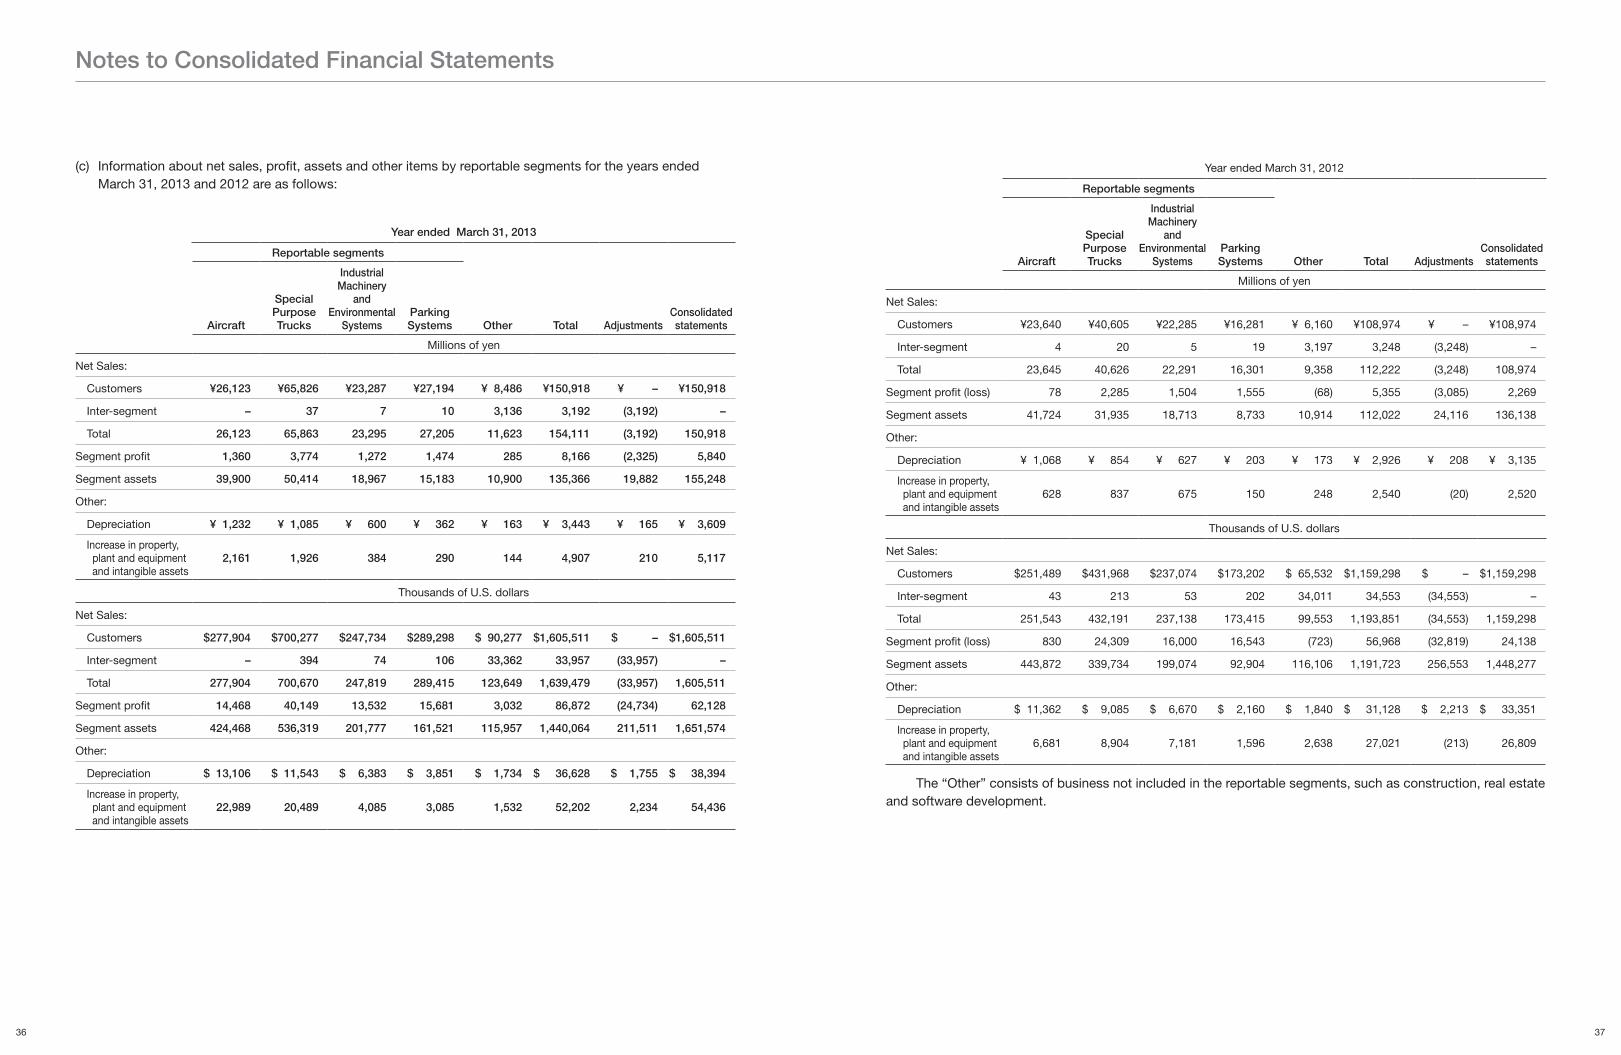
(c) Information about net sales, profit, assets and other items by reportable segments for the years ended March 31, 2013 and 2012 are as follows:
Year ended March 31, 2013
Reportable segments
Aircraft
Special Purpose Trucks
Industrial Machinery
and Environmental
SystemsParking Systems Other Total Adjustments
Consolidated statements
Millions of yen
Net Sales:
Customers ¥26,123 ¥65,826 ¥23,287 ¥27,194 ¥ 8,486 ¥150,918 ¥ – ¥150,918
Inter-segment – 37 7 10 3,136 3,192 (3,192) –
Total 26,123 65,863 23,295 27,205 11,623 154,111 (3,192) 150,918
Segment profit 1,360 3,774 1,272 1,474 285 8,166 (2,325) 5,840
Segment assets 39,900 50,414 18,967 15,183 10,900 135,366 19,882 155,248
Other:
Depreciation ¥ 1,232 ¥ 1,085 ¥ 600 ¥ 362 ¥ 163 ¥ 3,443 ¥ 165 ¥ 3,609
Increase in property, plant and equipment and intangible assets
2,161 1,926 384 290 144 4,907 210 5,117
Thousands of U.S. dollars
Net Sales:
Customers $277,904 $700,277 $247,734 $289,298 $ 90,277 $1,605,511 $ – $1,605,511
Inter-segment – 394 74 106 33,362 33,957 (33,957) –
Total 277,904 700,670 247,819 289,415 123,649 1,639,479 (33,957) 1,605,511
Segment profit 14,468 40,149 13,532 15,681 3,032 86,872 (24,734) 62,128
Segment assets 424,468 536,319 201,777 161,521 115,957 1,440,064 211,511 1,651,574
Other:
Depreciation $ 13,106 $ 11,543 $ 6,383 $ 3,851 $ 1,734 $ 36,628 $ 1,755 $ 38,394
Increase in property, plant and equipment and intangible assets
22,989 20,489 4,085 3,085 1,532 52,202 2,234 54,436
Year ended March 31, 2012
Reportable segments
Aircraft
Special Purpose Trucks
Industrial Machinery
and Environmental
SystemsParking Systems Other Total Adjustments
Consolidated statements
Millions of yen
Net Sales:
Customers ¥23,640 ¥40,605 ¥22,285 ¥16,281 ¥ 6,160 ¥108,974 ¥ – ¥108,974
Inter-segment 4 20 5 19 3,197 3,248 (3,248) –
Total 23,645 40,626 22,291 16,301 9,358 112,222 (3,248) 108,974
Segment profit (loss) 78 2,285 1,504 1,555 (68) 5,355 (3,085) 2,269
Segment assets 41,724 31,935 18,713 8,733 10,914 112,022 24,116 136,138
Other:
Depreciation ¥ 1,068 ¥ 854 ¥ 627 ¥ 203 ¥ 173 ¥ 2,926 ¥ 208 ¥ 3,135
Increase in property, plant and equipment and intangible assets
628 837 675 150 248 2,540 (20) 2,520
Thousands of U.S. dollars
Net Sales:
Customers $251,489 $431,968 $237,074 $173,202 $ 65,532 $1,159,298 $ – $1,159,298
Inter-segment 43 213 53 202 34,011 34,553 (34,553) –
Total 251,543 432,191 237,138 173,415 99,553 1,193,851 (34,553) 1,159,298
Segment profit (loss) 830 24,309 16,000 16,543 (723) 56,968 (32,819) 24,138
Segment assets 443,872 339,734 199,074 92,904 116,106 1,191,723 256,553 1,448,277
Other:
Depreciation $ 11,362 $ 9,085 $ 6,670 $ 2,160 $ 1,840 $ 31,128 $ 2,213 $ 33,351
Increase in property, plant and equipment and intangible assets
6,681 8,904 7,181 1,596 2,638 27,021 (213) 26,809
The “Other” consists of business not included in the reportable segments, such as construction, real estate and software development.
Notes to Consolidated Financial Statements
3736
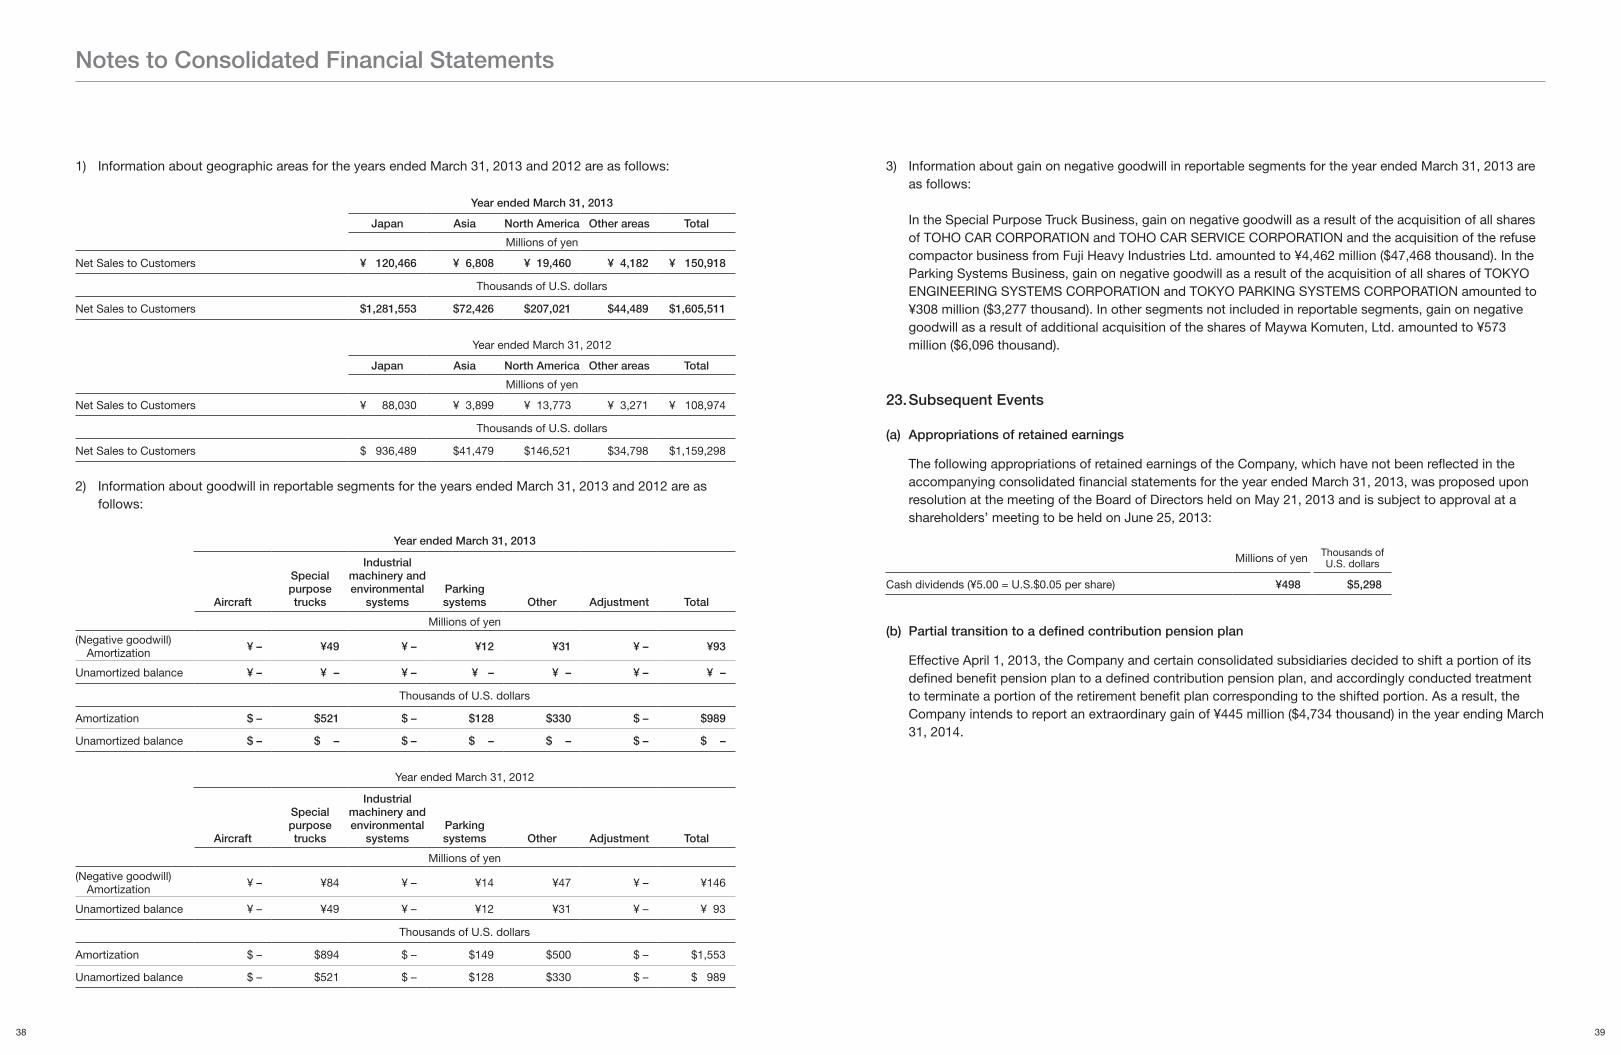
1) Information about geographic areas for the years ended March 31, 2013 and 2012 are as follows:
Year ended March 31, 2013
Japan Asia North America Other areas Total
Millions of yen
Net Sales to Customers ¥ 120,466 ¥ 6,808 ¥ 19,460 ¥ 4,182 ¥ 150,918
Thousands of U.S. dollars
Net Sales to Customers $1,281,553 $72,426 $207,021 $44,489 $1,605,511
Year ended March 31, 2012
Japan Asia North America Other areas Total
Millions of yen
Net Sales to Customers ¥ 88,030 ¥ 3,899 ¥ 13,773 ¥ 3,271 ¥ 108,974
Thousands of U.S. dollars
Net Sales to Customers $ 936,489 $41,479 $146,521 $34,798 $1,159,298
2) Information about goodwill in reportable segments for the years ended March 31, 2013 and 2012 are as follows:
Year ended March 31, 2013
Aircraft
Special purpose trucks
Industrial machinery and environmental
systemsParking systems Other Adjustment Total
Millions of yen
(Negative goodwill)Amortization ¥ – ¥49 ¥ – ¥12 ¥31 ¥ – ¥93
Unamortized balance ¥ – ¥ – ¥ – ¥ – ¥ – ¥ – ¥ –
Thousands of U.S. dollars
Amortization $ – $521 $ – $128 $330 $ – $989
Unamortized balance $ – $ – $ – $ – $ – $ – $ –
Year ended March 31, 2012
Aircraft
Special purpose trucks
Industrial machinery and environmental
systemsParking systems Other Adjustment Total
Millions of yen
(Negative goodwill)Amortization ¥ – ¥84 ¥ – ¥14 ¥47 ¥ – ¥146
Unamortized balance ¥ – ¥49 ¥ – ¥12 ¥31 ¥ – ¥ 93
Thousands of U.S. dollars
Amortization $ – $894 $ – $149 $500 $ – $1,553
Unamortized balance $ – $521 $ – $128 $330 $ – $ 989
3) Information about gain on negative goodwill in reportable segments for the year ended March 31, 2013 are as follows:
In the Special Purpose Truck Business, gain on negative goodwill as a result of the acquisition of all shares of TOHO CAR CORPORATION and TOHO CAR SERVICE CORPORATION and the acquisition of the refuse compactor business from Fuji Heavy Industries Ltd. amounted to ¥4,462 million ($47,468 thousand). In the Parking Systems Business, gain on negative goodwill as a result of the acquisition of all shares of TOKYO ENGINEERING SYSTEMS CORPORATION and TOKYO PARKING SYSTEMS CORPORATION amounted to ¥308 million ($3,277 thousand). In other segments not included in reportable segments, gain on negative goodwill as a result of additional acquisition of the shares of Maywa Komuten, Ltd. amounted to ¥573 million ($6,096 thousand).
23. Subsequent Events
(a) Appropriations of retained earnings
The following appropriations of retained earnings of the Company, which have not been reflected in the accompanying consolidated financial statements for the year ended March 31, 2013, was proposed upon resolution at the meeting of the Board of Directors held on May 21, 2013 and is subject to approval at a shareholders’ meeting to be held on June 25, 2013:
Millions of yen Thousands of U.S. dollars
Cash dividends (¥5.00 = U.S.$0.05 per share) ¥498 $5,298
(b) Partial transition to a defined contribution pension plan
Effective April 1, 2013, the Company and certain consolidated subsidiaries decided to shift a portion of its defined benefit pension plan to a defined contribution pension plan, and accordingly conducted treatment to terminate a portion of the retirement benefit plan corresponding to the shifted portion. As a result, the Company intends to report an extraordinary gain of ¥445 million ($4,734 thousand) in the year ending March 31, 2014.
Notes to Consolidated Financial Statements
3938
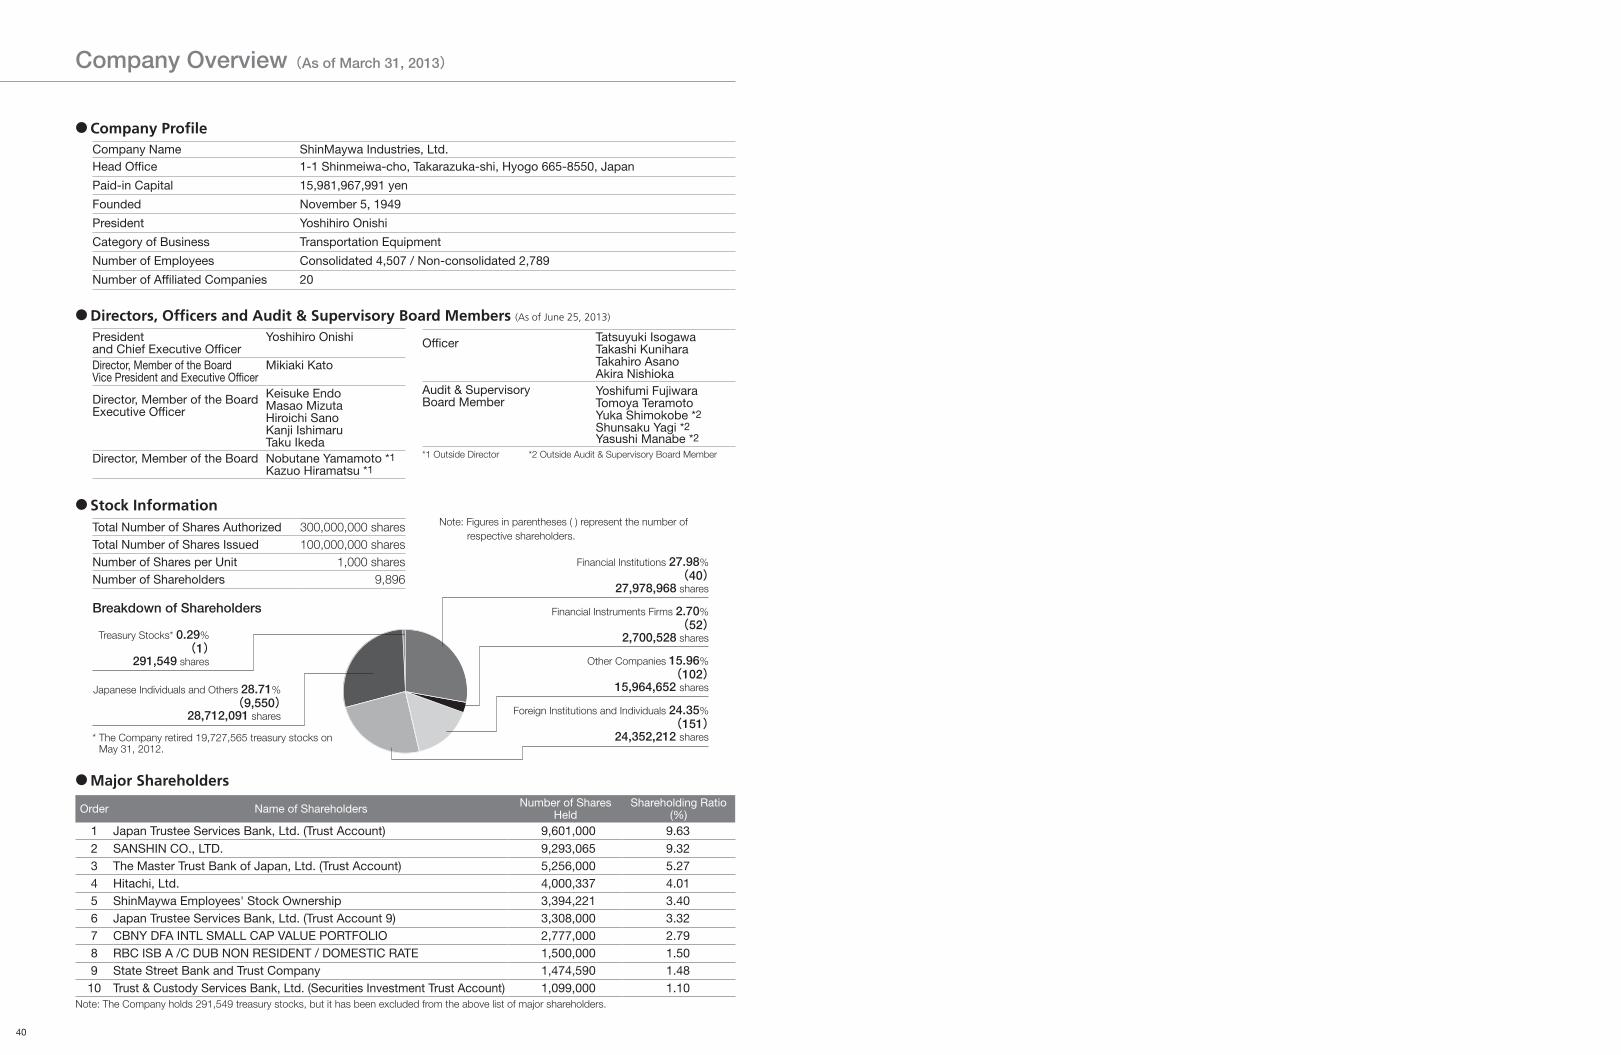
Company Overview (As of March 31, 2013)
● Major Shareholders
Order Name of Shareholders Number of SharesHeld
Shareholding Ratio(%)
1 Japan Trustee Services Bank, Ltd. (Trust Account) 9,601,000 9.632 SANSHIN CO., LTD. 9,293,065 9.323 The Master Trust Bank of Japan, Ltd. (Trust Account) 5,256,000 5.274 Hitachi, Ltd. 4,000,337 4.015 ShinMaywa Employees' Stock Ownership 3,394,221 3.406 Japan Trustee Services Bank, Ltd. (Trust Account 9) 3,308,000 3.327 CBNY DFA INTL SMALL CAP VALUE PORTFOLIO 2,777,000 2.798 RBC ISB A /C DUB NON RESIDENT / DOMESTIC RATE 1,500,000 1.509 State Street Bank and Trust Company 1,474,590 1.4810 Trust & Custody Services Bank, Ltd. (Securities Investment Trust Account) 1,099,000 1.10
Note: The Company holds 291,549 treasury stocks, but it has been excluded from the above list of major shareholders.
President and Chief Executive Officer
Yoshihiro Onishi
Director, Member of the Board Vice President and Executive Officer
Mikiaki Kato
Director, Member of the Board Executive Officer
Keisuke EndoMasao MizutaHiroichi SanoKanji IshimaruTaku Ikeda
Director, Member of the Board Nobutane Yamamoto *1Kazuo Hiramatsu *1
Officer Tatsuyuki IsogawaTakashi KuniharaTakahiro AsanoAkira Nishioka
Audit & Supervisory Board Member
Yoshifumi FujiwaraTomoya TeramotoYuka Shimokobe *2Shunsaku Yagi *2Yasushi Manabe *2
● Company ProfileCompany Name ShinMaywa Industries, Ltd.Head Office 1-1 Shinmeiwa-cho, Takarazuka-shi, Hyogo 665-8550, Japan
Paid-in Capital 15,981,967,991 yen
Founded November 5, 1949
President Yoshihiro Onishi
Category of Business Transportation Equipment
Number of Employees Consolidated 4,507 / Non-consolidated 2,789
Number of Affiliated Companies 20
*1 Outside Director *2 Outside Audit & Supervisory Board Member
● Stock InformationTotal Number of Shares Authorized 300,000,000 sharesTotal Number of Shares Issued 100,000,000 sharesNumber of Shares per Unit 1,000 sharesNumber of Shareholders 9,896
Breakdown of Shareholders
Financial Institutions 27.98%(40)
27,978,968 shares
Treasury Stocks* 0.29%(1)
291,549 shares
Japanese Individuals and Others 28.71%(9,550)
28,712,091 shares
Financial Instruments Firms 2.70%(52)
2,700,528 shares
Other Companies 15.96%(102)
15,964,652 shares
Foreign Institutions and Individuals 24.35%(151)
24,352,212 shares
Note: Figures in parentheses ( ) represent the number of respective shareholders.
* The Company retired 19,727,565 treasury stocks on May 31, 2012.
● Directors, Officers and Audit & Supervisory Board Members (As of June 25, 2013)
40
13.09
www.shinmaywa.co.jp
010_0301401372509.indd 1 2013/09/19 17:57:55


![Accrued Interest en[1]](https://img.pdfslide.net/doc/110x75/577d231d1a28ab4e1e99053c/accrued-interest-en1.jpg)


