Embed Size (px)
Citation preview

Results for the 2016
financial yearAnnual results media conference/financial analysts' presentation
23.02.2017
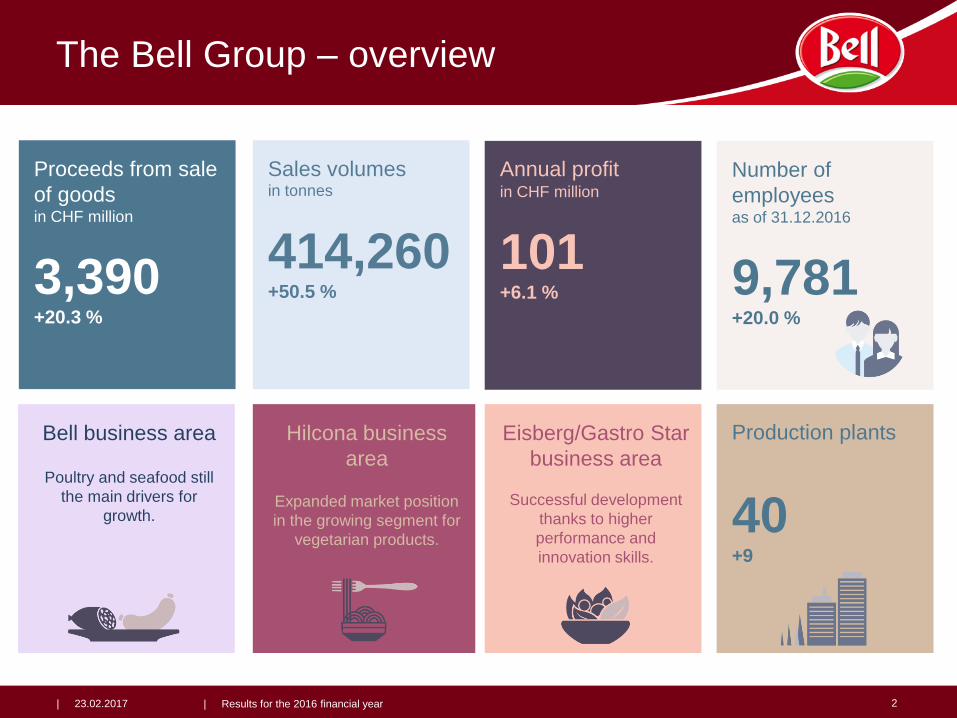
The Bell Group – overview
| 23.02.2017 2| Results for the 2016 financial year
Proceeds from sale
of goods in CHF million
3,390+20.3 %
Production plants
40+9
Number of
employeesas of 31.12.2016
9,781+20.0 %
Annual profitin CHF million
101+6.1 %
Sales volumesin tonnes
414,260 +50.5 %
Eisberg/Gastro Star
business area
Successful development
thanks to higher
performance and
innovation skills.
Hilcona business
area
Expanded market position
in the growing segment for
vegetarian products.
Bell business area
Poultry and seafood still
the main drivers for
growth.
Strengthening
market positionBusiness areas
Strategiesand
major projects
Development of
raw material prices
The Bell Group – influencing factors 2016
| 23.02.2017 | Results for the 2016 financial year 3
Market developmentand intensive
competition
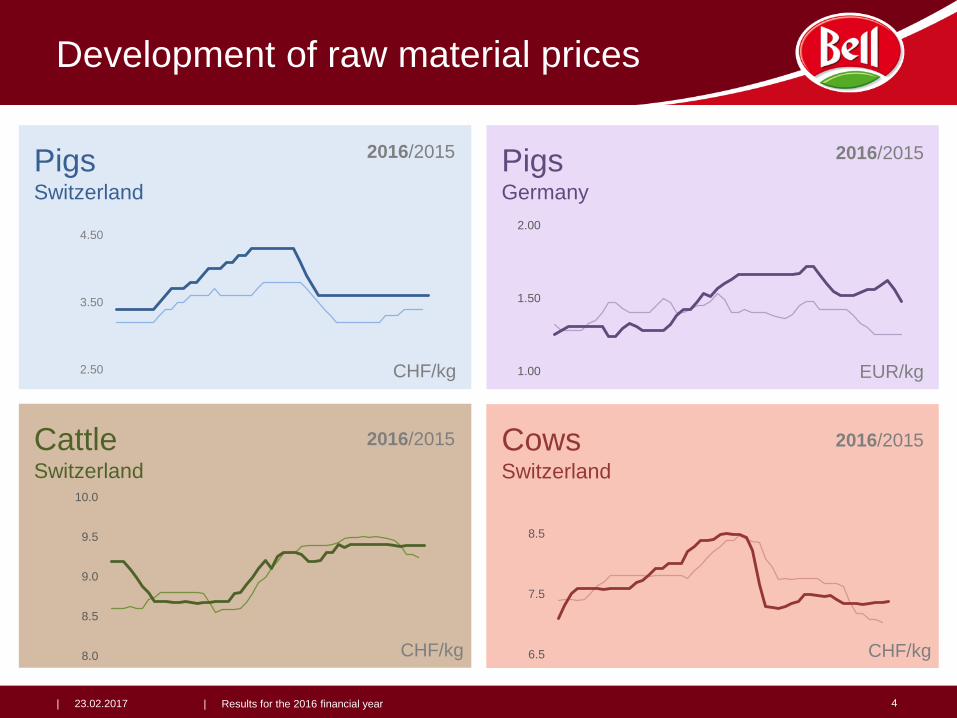
PigsGermany
CowsSwitzerland
CattleSwitzerland
PigsSwitzerland
Development of raw material prices
| 23.02.2017 4| Results for the 2016 financial year
CHF/kg
CHF/kg 1.00
1.50
2.00
2.50
3.50
4.50
8.0
8.5
9.0
9.5
10.0
6.5
7.5
8.5
CHF/kg
EUR/kg
2016/2015
2016/2015
2016/2015
2016/2015
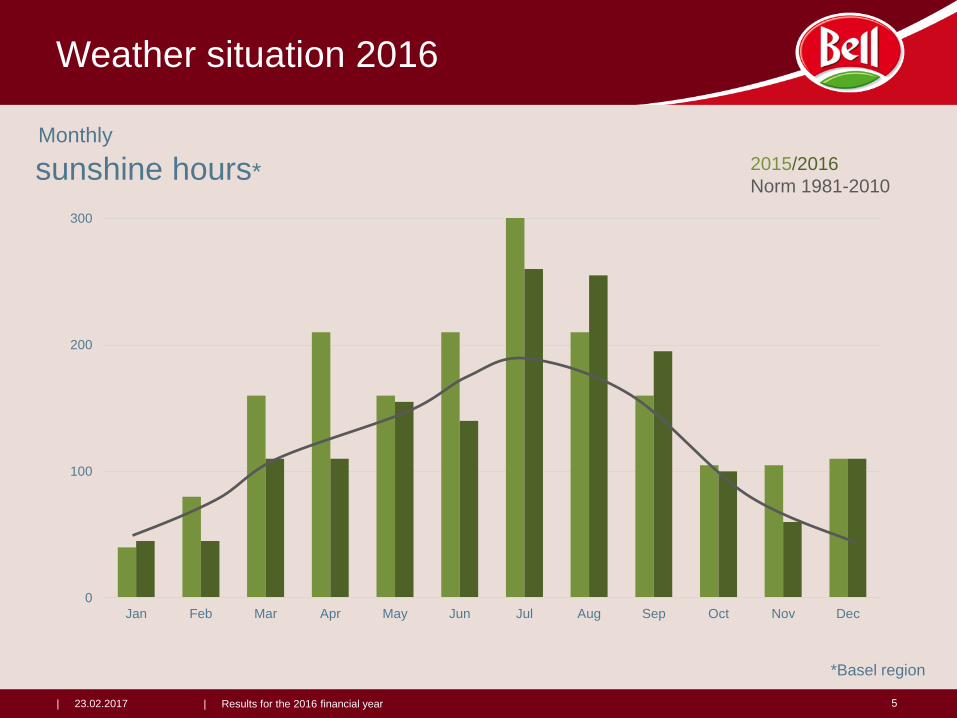
Monthly
sunshine hours*
Weather situation 2016
| 23.02.2017 5| Results for the 2016 financial year
0
100
200
300
Jan Feb Mar Apr May Jun Jul Aug Sep Oct Nov Dec
2015/2016
Norm 1981-2010
*Basel region
Strengthening market position business areas
| 23.02.2017 6
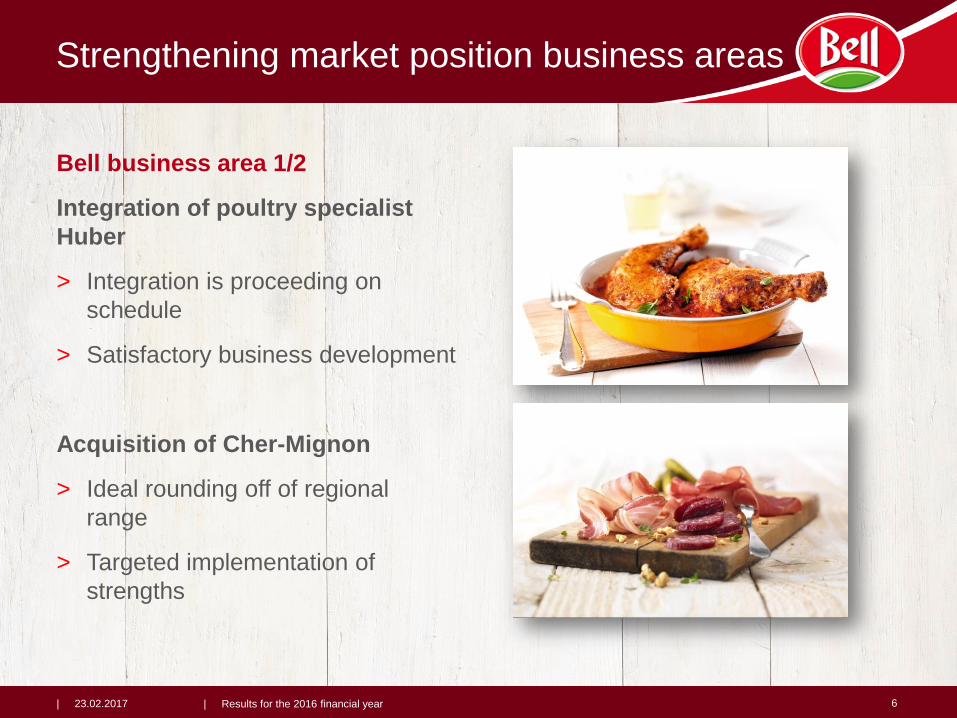
Bell business area 1/2
Integration of poultry specialist
Huber
> Integration is proceeding on
schedule
> Satisfactory business development
Acquisition of Cher-Mignon
> Ideal rounding off of regional
range
> Targeted implementation of
strengths
| Results for the 2016 financial year
Strengthening market position business areas
| 23.02.2017 7
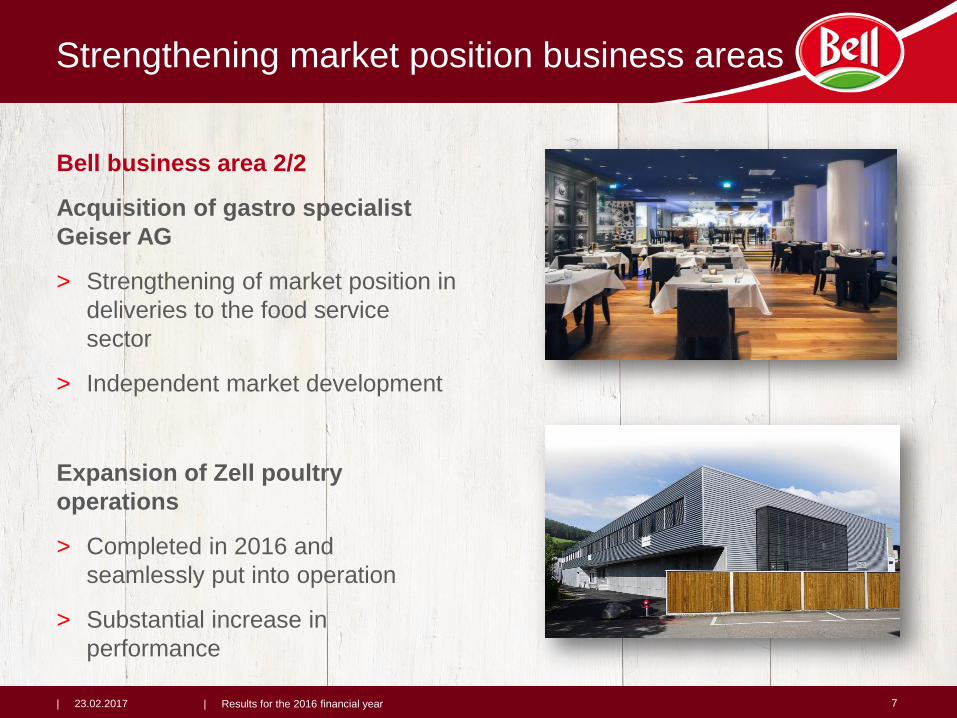
Bell business area 2/2
Acquisition of gastro specialist
Geiser AG
> Strengthening of market position in
deliveries to the food service
sector
> Independent market development
Expansion of Zell poultry
operations
> Completed in 2016 and
seamlessly put into operation
> Substantial increase in
performance
| Results for the 2016 financial year
Strengthening market position business areas
| 23.02.2017 8
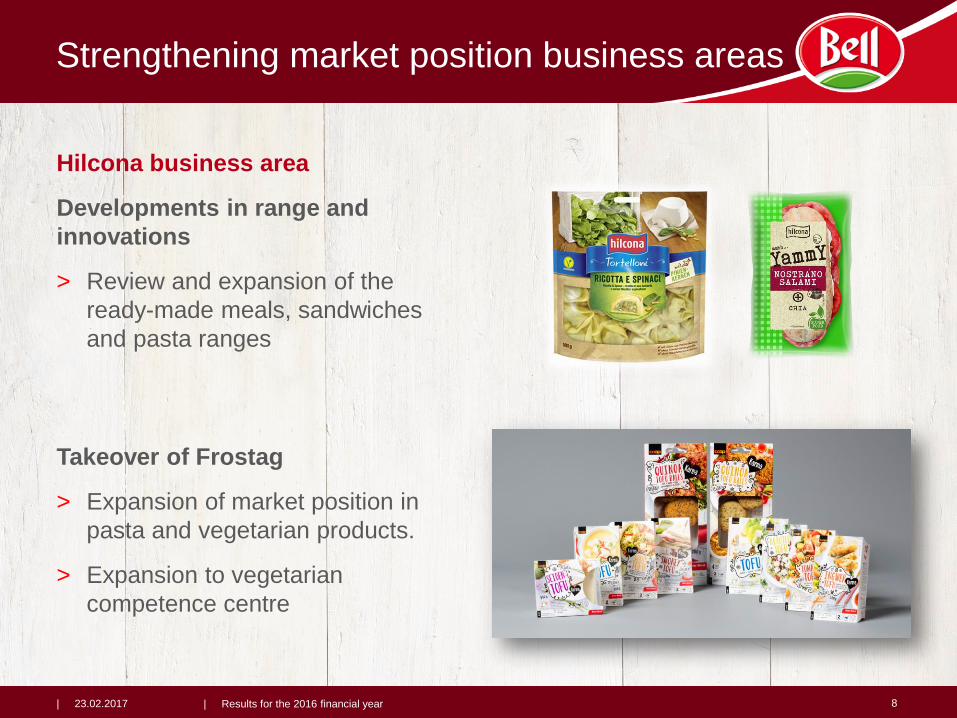
Hilcona business area
Developments in range and
innovations
> Review and expansion of the
ready-made meals, sandwiches
and pasta ranges
Takeover of Frostag
> Expansion of market position in
pasta and vegetarian products.
> Expansion to vegetarian
competence centre
| Results for the 2016 financial year
Strengthening market position business areas
| 23.02.2017 9
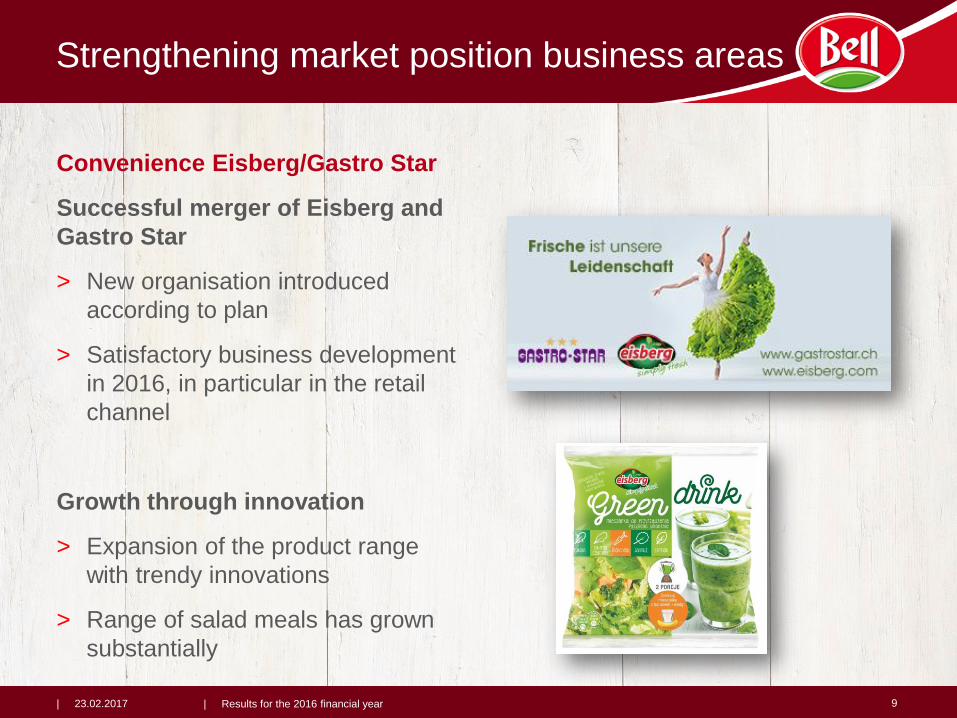
Convenience Eisberg/Gastro Star
Successful merger of Eisberg and
Gastro Star
> New organisation introduced
according to plan
> Satisfactory business development
in 2016, in particular in the retail
channel
Growth through innovation
> Expansion of the product range
with trendy innovations
> Range of salad meals has grown
substantially
| Results for the 2016 financial year
Strategies and major projects
| 23.02.2017 | Results for the 2016 financial year 10
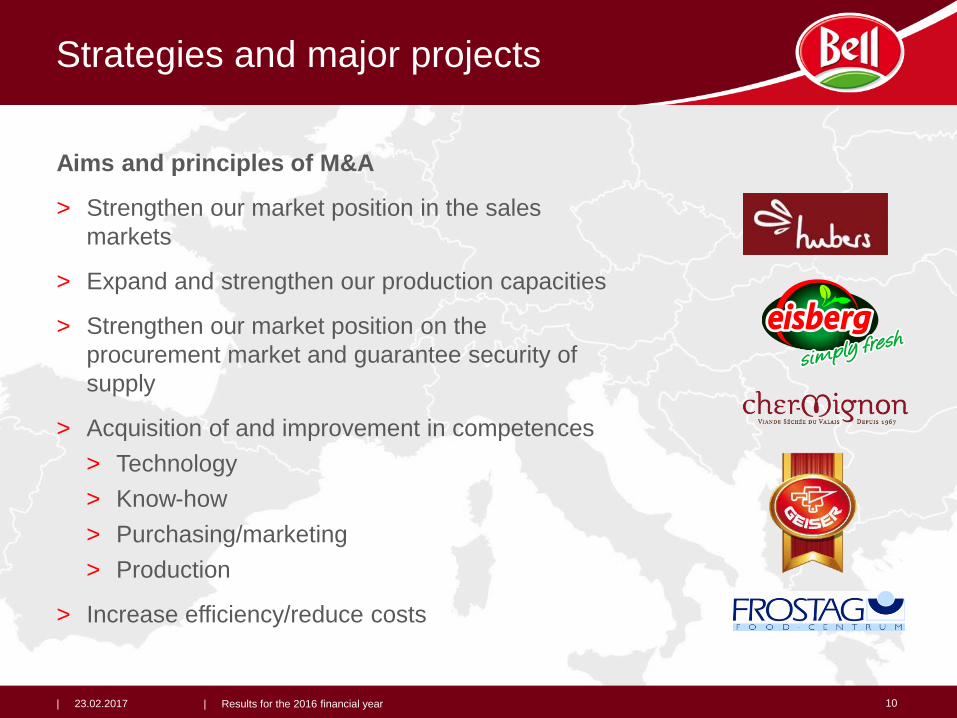
Aims and principles of M&A
> Strengthen our market position in the sales
markets
> Expand and strengthen our production capacities
> Strengthen our market position on the
procurement market and guarantee security of
supply
> Acquisition of and improvement in competences
> Technology
> Know-how
> Purchasing/marketing
> Production
> Increase efficiency/reduce costs
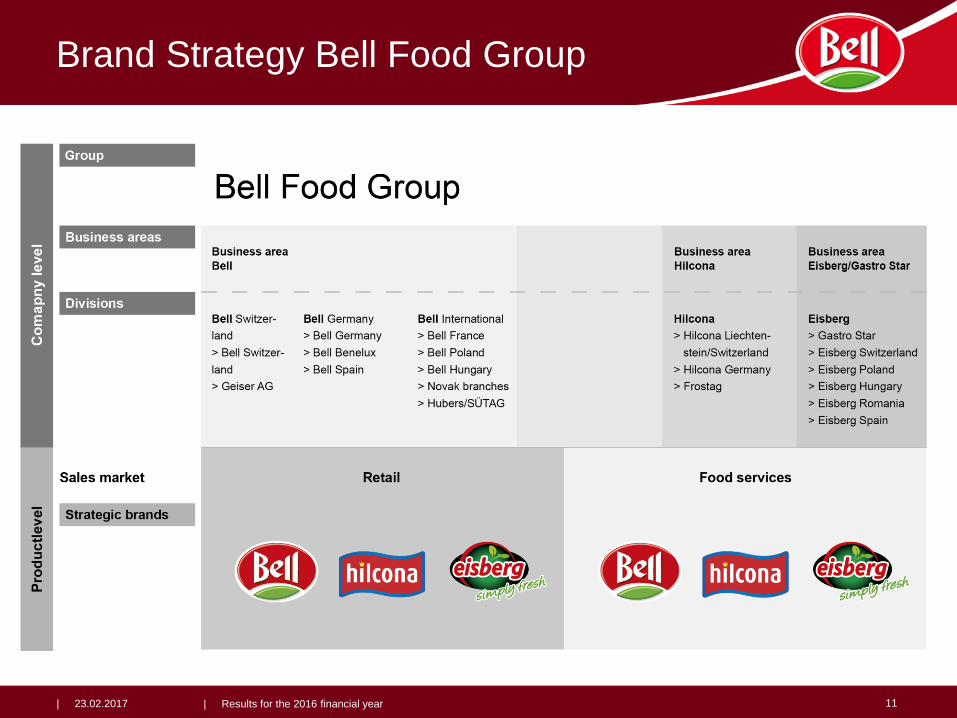
Brand Strategy Bell Food Group
| 23.02.2017 | Results for the 2016 financial year 11
Strategies and major projects
| 23.02.2017 | Results for the 2016 financial year 12
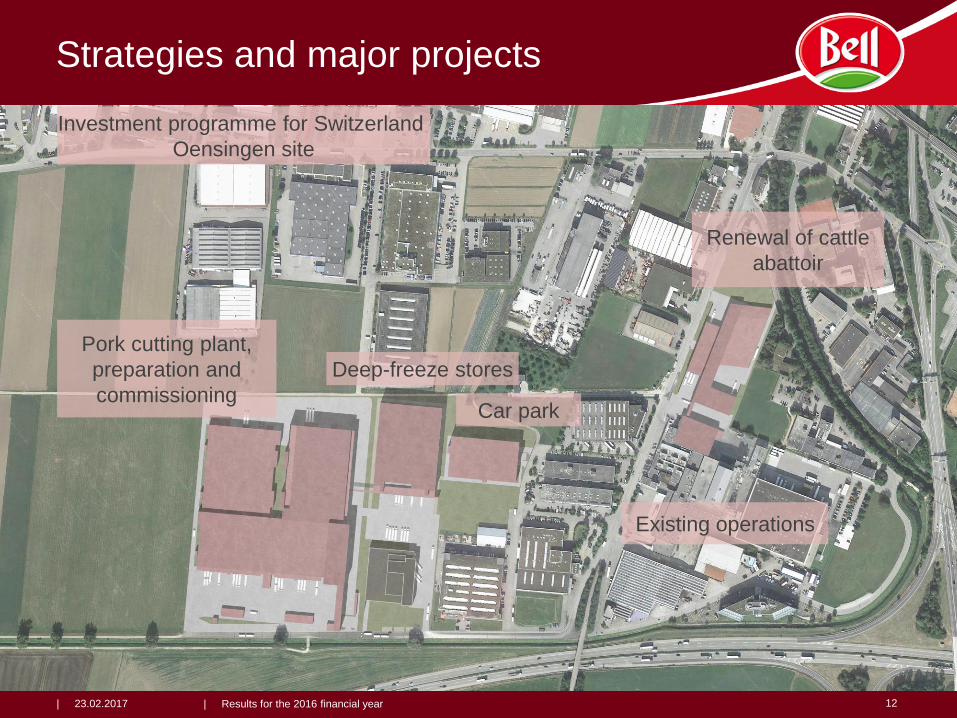
Renewal of cattle
abattoir
Deep-freeze stores
Pork cutting plant,
preparation and
commissioning
Investment programme for Switzerland
Oensingen site
Existing operations
Car park
Strategies and major projects
| 23.02.2017 | Results for the 2016 financial year 13
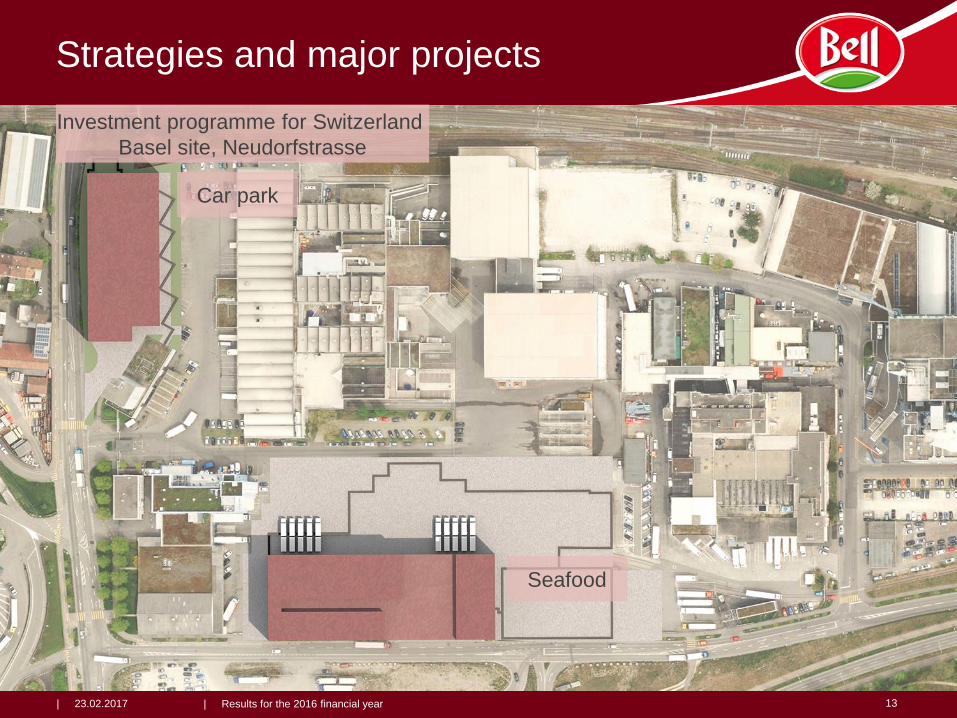
Car park
Investment programme for Switzerland
Basel site, Neudorfstrasse
Seafood
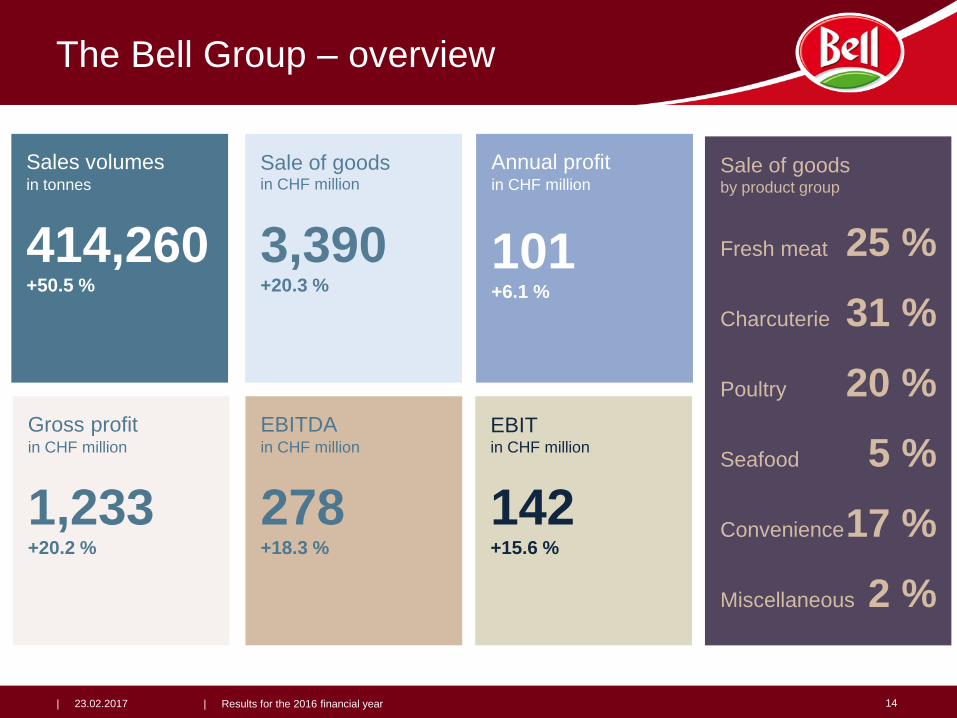
The Bell Group – overview
14
Sales volumesin tonnes
414,260 +50.5 %
EBITDAin CHF million
278+18.3 %
Gross profitin CHF million
1,233+20.2 %
| 23.02.2017 | Results for the 2016 financial year
Sale of goodsby product group
Fresh meat 25 %
Charcuterie 31 %
Poultry 20 %
Seafood 5 %
Convenience17 %
Miscellaneous 2 %
Sale of goodsin CHF million
3,390+20.3 %
Annual profitin CHF million
101+6.1 %
EBITin CHF million
142+15.6 %
The Bell Group – results for 2016
| 23.02.2017 15| Results for the 2016 financial year
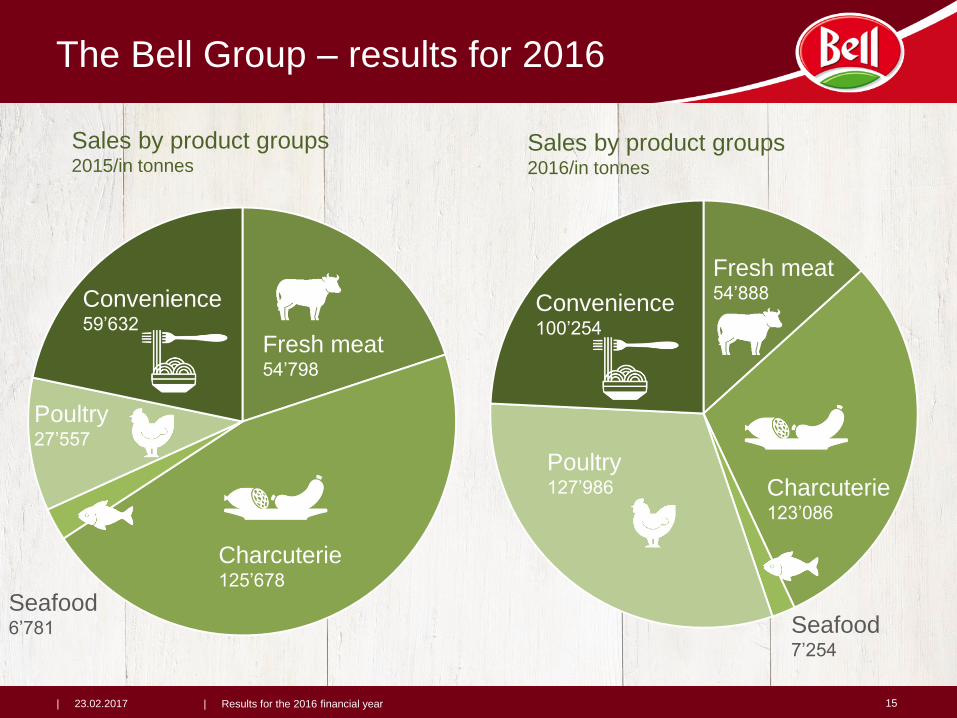
Sales by product groups2016/in tonnes
Poultry27’557
Convenience 59’632
Charcuterie 125’678
Fresh meat54’798
Seafood6’781
Sales by product groups2015/in tonnes
Poultry127’986
Convenience 100’254
Charcuterie 123’086
Fresh meat54’888
Seafood7’254
The Bell Group – results for 2016
| 23.02.2017 16| Results for the 2016 financial year
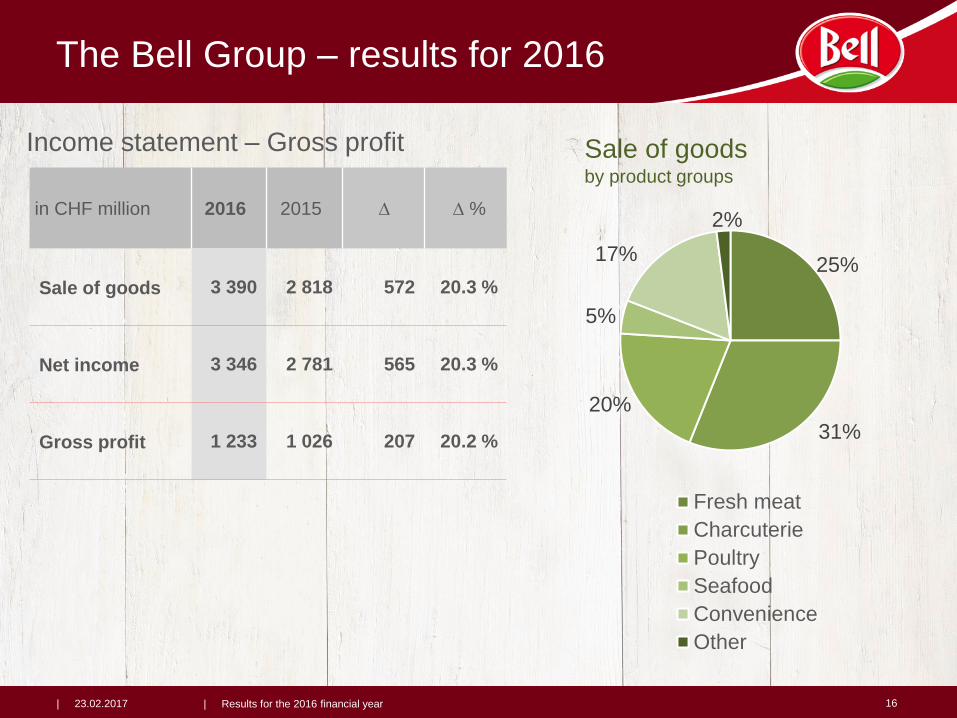
25%
31%
20%
5%
17%
2%
Fresh meat
Charcuterie
Poultry
Seafood
Convenience
Other
Sale of goodsby product groups
in CHF million 2016 2015 ∆ ∆ %
Sale of goods 3 390 2 818 572 20.3 %
Net income 3 346 2 781 565 20.3 %
Gross profit 1 233 1 026 207 20.2 %
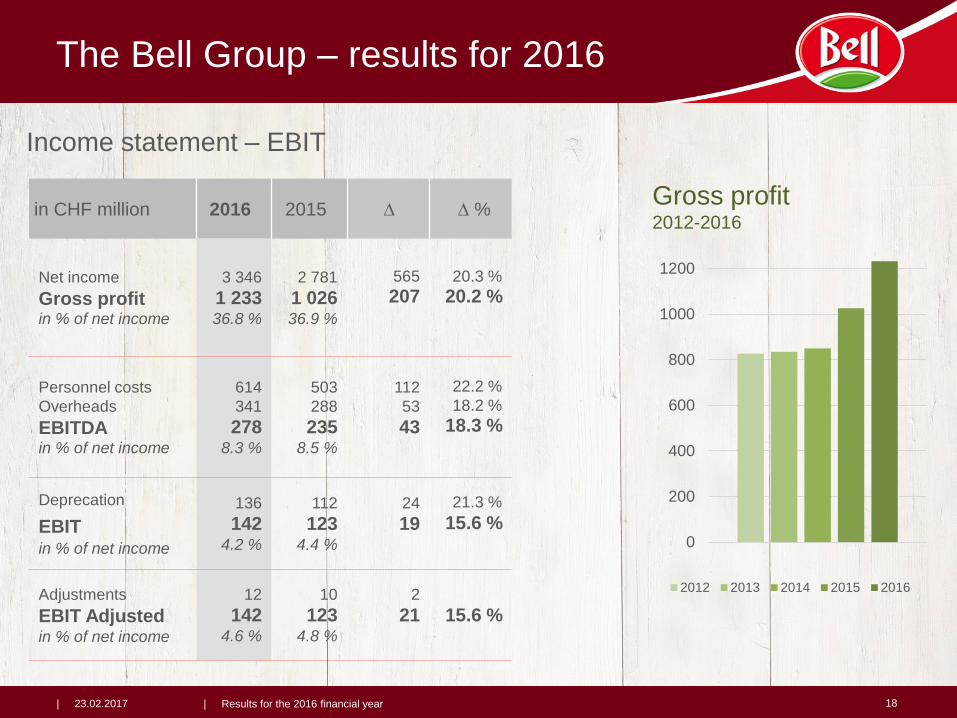
Income statement – Gross profit
The Bell Group – results for 2016
| 23.02.2017 | Results for the 2016 financial year 17
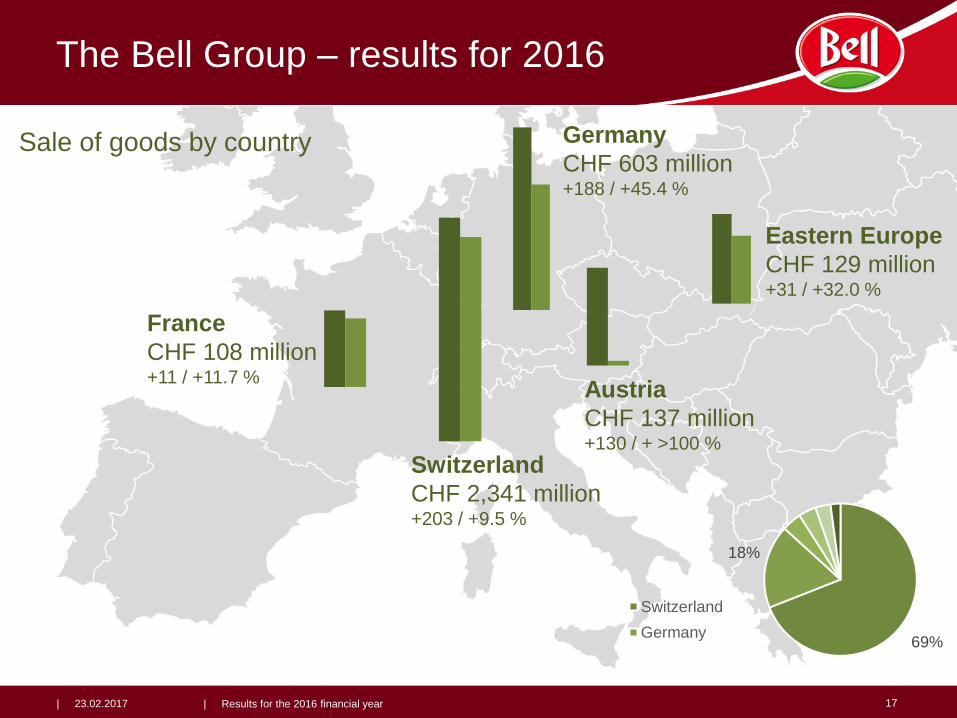
France
CHF 108 million+11 / +11.7 %
Germany
CHF 603 million+188 / +45.4 %
Austria
CHF 137 million+130 / + >100 %
Switzerland
CHF 2,341 million+203 / +9.5 %
Eastern Europe
CHF 129 million+31 / +32.0 %
69%
18%
Switzerland
Germany
Sale of goods by country
The Bell Group – results for 2016
| 23.02.2017 18| Results for the 2016 financial year
in CHF million 2016 2015 ∆ ∆ %
Net income
Gross profitin % of net income
3 346
1 23336.8 %
2 781
1 02636.9 %
565
20720.3 %
20.2 %
Personnel costs
Overheads
EBITDAin % of net income
614
341
2788.3 %
503
288
2358.5 %
112
53
43
22.2 %
18.2 %
18.3 %
Deprecation
EBITin % of net income
136
1424.2 %
112
1234.4 %
24
19
21.3 %
15.6 %
Adjustments
EBIT Adjustedin % of net income
12
1424.6 %
10
1234.8 %
2
21 15.6 %
Gross profit2012-2016
Income statement – EBIT
0
200
400
600
800
1000
1200
2012 2013 2014 2015 2016
The Bell Group – results for 2016
| 23.02.2017 19| Results for the 2016 financial year
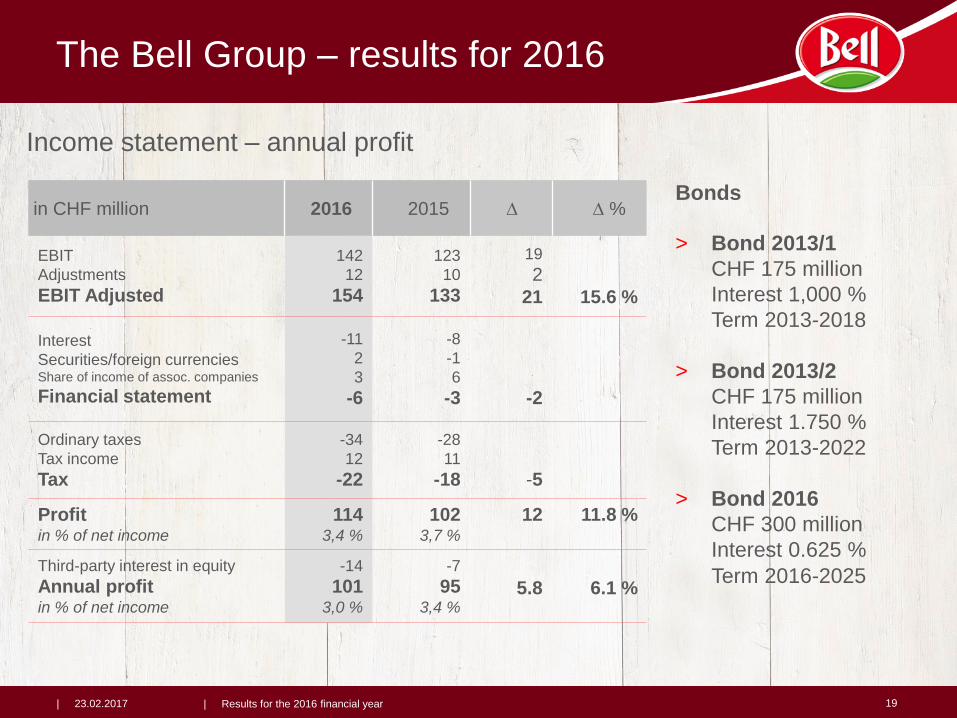
in CHF million 2016 2015 ∆ ∆ %
EBIT
Adjustments
EBIT Adjusted
142
12
154
123
10
133
19
2
21 15.6 %
Interest
Securities/foreign currenciesShare of income of assoc. companies
Financial statement
-11
2
3
-6
-8
-1
6
-3 -2
Ordinary taxes
Tax income
Tax
-34
12
-22
-28
11
-18 -5
Profitin % of net income
1143,4 %
1023,7 %
12 11.8 %
Third-party interest in equity
Annual profitin % of net income
-14
1013,0 %
-7
953,4 %
5.8 6.1 %
Bonds
> Bond 2013/1
CHF 175 million
Interest 1,000 %
Term 2013-2018
> Bond 2013/2
CHF 175 million
Interest 1.750 %
Term 2013-2022
> Bond 2016
CHF 300 million
Interest 0.625 %
Term 2016-2025
Income statement – annual profit
The Bell Group – results for 2016
| 23.02.2017 20| Results for the 2016 financial year
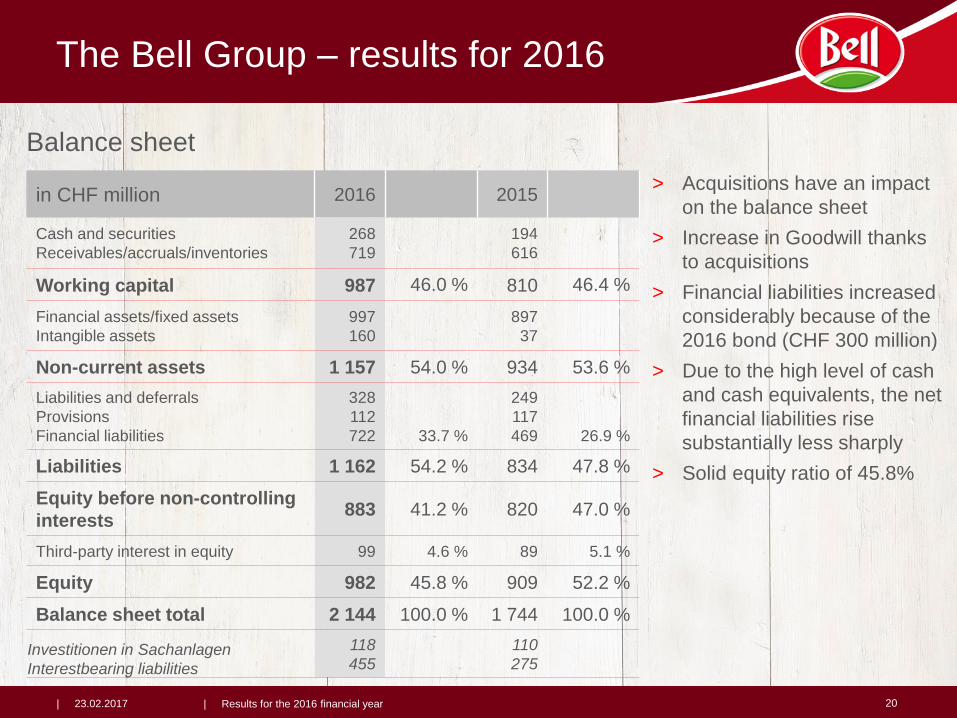
> Acquisitions have an impact
on the balance sheet
> Increase in Goodwill thanks
to acquisitions
> Financial liabilities increased
considerably because of the
2016 bond (CHF 300 million)
> Due to the high level of cash
and cash equivalents, the net
financial liabilities rise
substantially less sharply
> Solid equity ratio of 45.8%
in CHF million 2016 2015
Cash and securities
Receivables/accruals/inventories
268
719
194
616
Working capital 987 46.0 % 810 46.4 %
Financial assets/fixed assets
Intangible assets
997
160
897
37
Non-current assets 1 157 54.0 % 934 53.6 %
Liabilities and deferrals
Provisions
Financial liabilities
328
112
722 33.7 %
249
117
469 26.9 %
Liabilities 1 162 54.2 % 834 47.8 %
Equity before non-controlling
interests883 41.2 % 820 47.0 %
Third-party interest in equity 99 4.6 % 89 5.1 %
Equity 982 45.8 % 909 52.2 %
Balance sheet total 2 144 100.0 % 1 744 100.0 %
Investitionen in Sachanlagen
Interestbearing liabilities
118
455
110
275
Balance sheet
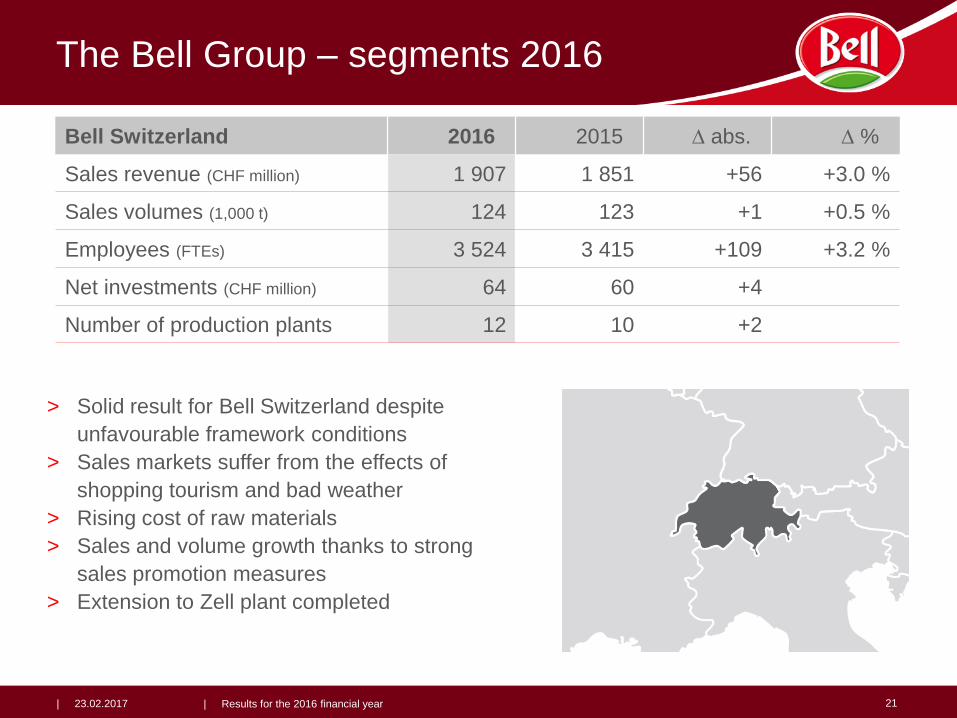
The Bell Group – segments 2016
| 23.02.2017 21| Results for the 2016 financial year
Bell Switzerland 2016 2015 ∆ abs. ∆ %
Sales revenue (CHF million) 1 907 1 851 +56 +3.0 %
Sales volumes (1,000 t) 124 123 +1 +0.5 %
Employees (FTEs) 3 524 3 415 +109 +3.2 %
Net investments (CHF million) 64 60 +4
Number of production plants 12 10 +2
> Solid result for Bell Switzerland despite
unfavourable framework conditions
> Sales markets suffer from the effects of
shopping tourism and bad weather
> Rising cost of raw materials
> Sales and volume growth thanks to strong
sales promotion measures
> Extension to Zell plant completed
The Bell Group – segments 2016
| 23.02.2017 22| Results for the 2016 financial year
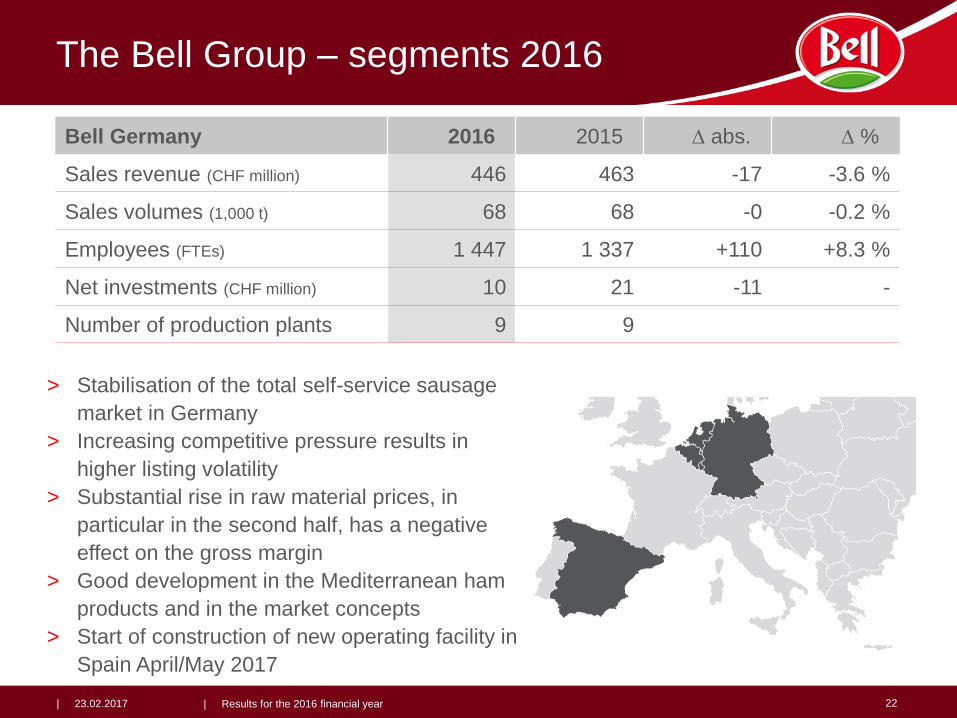
Bell Germany 2016 2015 ∆ abs. ∆ %
Sales revenue (CHF million) 446 463 -17 -3.6 %
Sales volumes (1,000 t) 68 68 -0 -0.2 %
Employees (FTEs) 1 447 1 337 +110 +8.3 %
Net investments (CHF million) 10 21 -11 -
Number of production plants 9 9
> Stabilisation of the total self-service sausage
market in Germany
> Increasing competitive pressure results in
higher listing volatility
> Substantial rise in raw material prices, in
particular in the second half, has a negative
effect on the gross margin
> Good development in the Mediterranean ham
products and in the market concepts
> Start of construction of new operating facility in
Spain April/May 2017
The Bell Group – segments 2016
| 23.02.2017 23| Results for the 2016 financial year
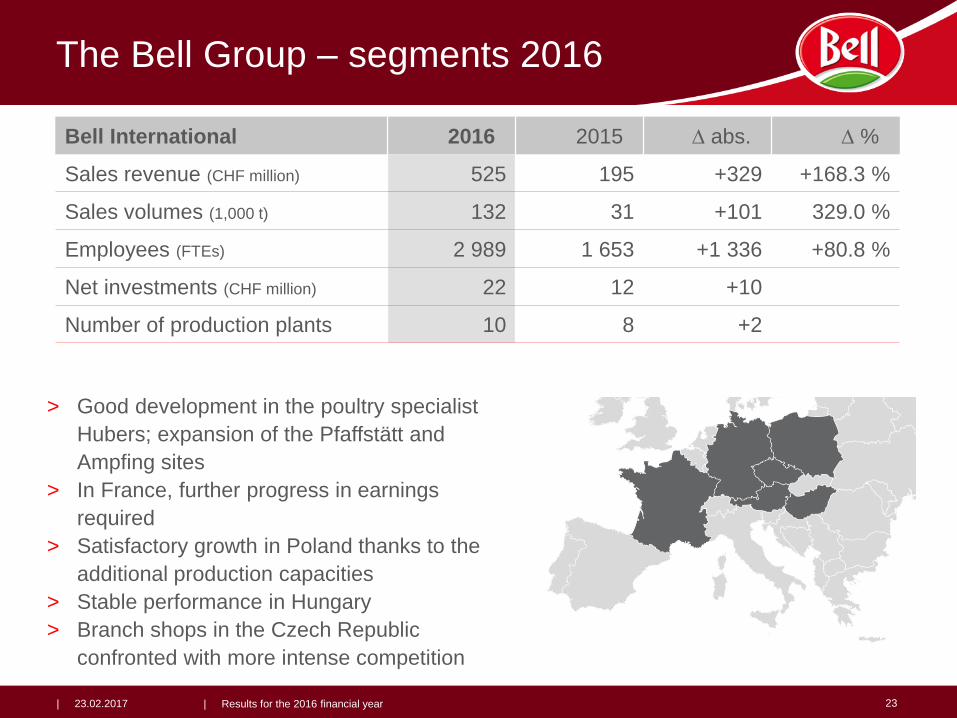
Bell International 2016 2015 ∆ abs. ∆ %
Sales revenue (CHF million) 525 195 +329 +168.3 %
Sales volumes (1,000 t) 132 31 +101 329.0 %
Employees (FTEs) 2 989 1 653 +1 336 +80.8 %
Net investments (CHF million) 22 12 +10
Number of production plants 10 8 +2
> Good development in the poultry specialist
Hubers; expansion of the Pfaffstätt and
Ampfing sites
> In France, further progress in earnings
required
> Satisfactory growth in Poland thanks to the
additional production capacities
> Stable performance in Hungary
> Branch shops in the Czech Republic
confronted with more intense competition
The Bell Group – segments 2016
| 23.02.2017 24| Results for the 2016 financial year
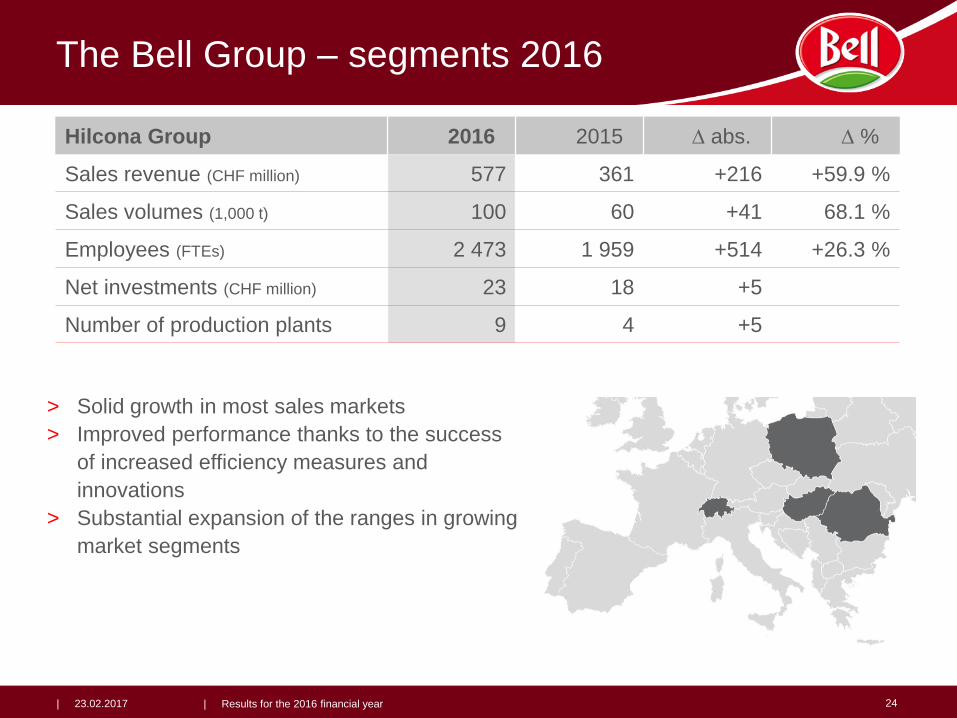
Hilcona Group 2016 2015 ∆ abs. ∆ %
Sales revenue (CHF million) 577 361 +216 +59.9 %
Sales volumes (1,000 t) 100 60 +41 68.1 %
Employees (FTEs) 2 473 1 959 +514 +26.3 %
Net investments (CHF million) 23 18 +5
Number of production plants 9 4 +5
> Solid growth in most sales markets
> Improved performance thanks to the success
of increased efficiency measures and
innovations
> Substantial expansion of the ranges in growing
market segments
The Bell Group – longer-term view
| 23.02.2017 25| Results for the 2016 financial year
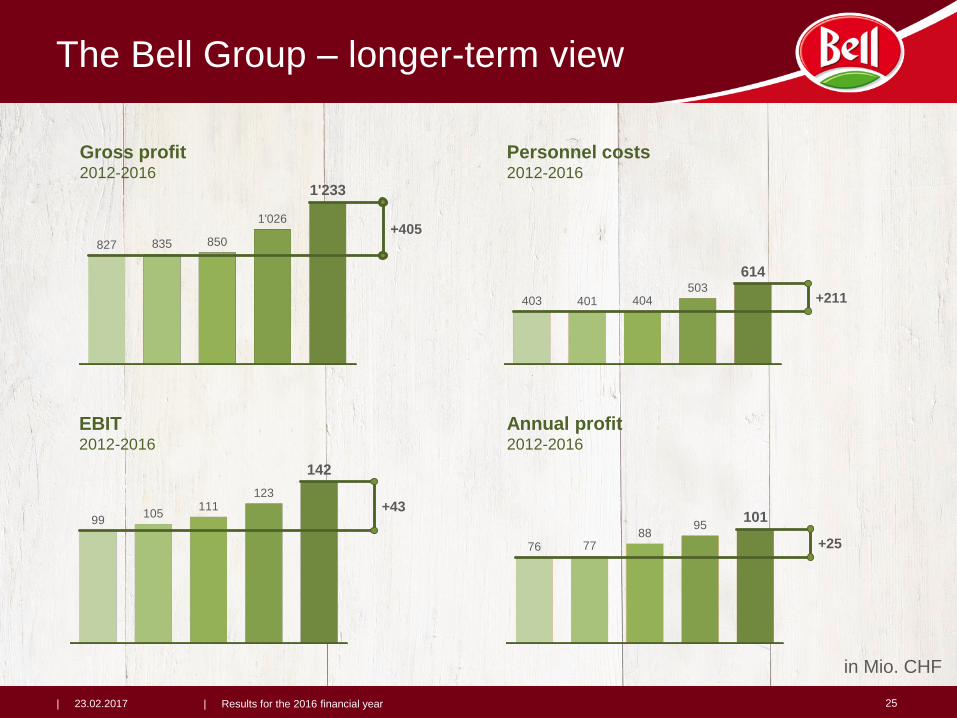
Gross profit2012-2016
Personnel costs2012-2016
EBIT2012-2016
Annual profit2012-2016
in Mio. CHF
403 401 404503
614
+211
99105
111123
142
+43
76 7788
95101
+25
827 835 850
1'026
1'233
+405
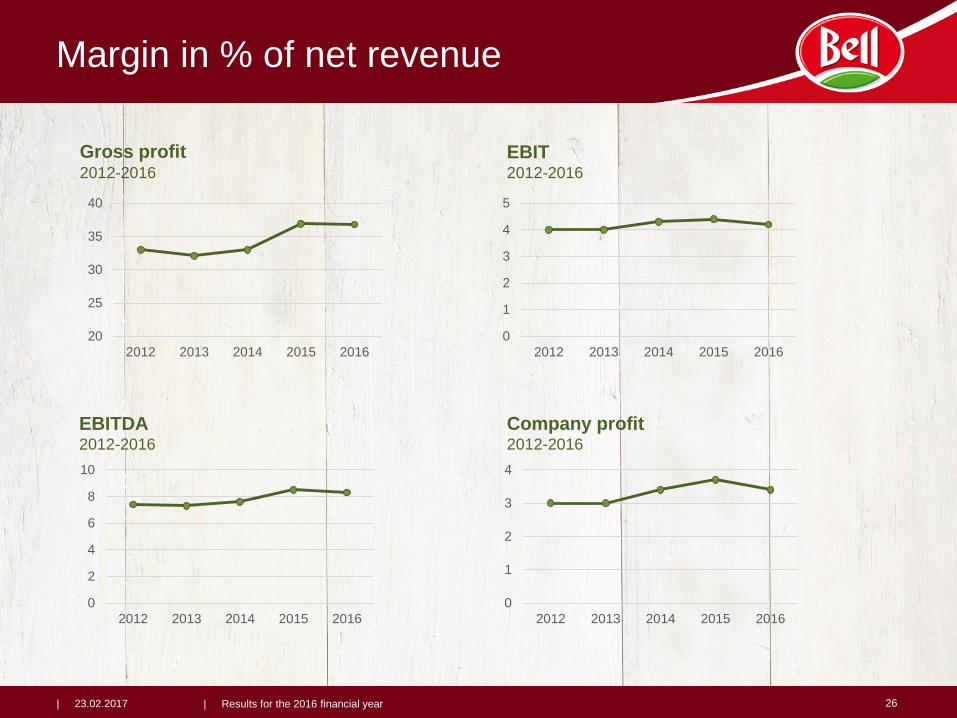
Margin in % of net revenue
| 23.02.2017 26| Results for the 2016 financial year
EBITDA2012-2016
Company profit2012-2016
EBIT2012-2016
Gross profit2012-2016
20
25
30
35
40
2012 2013 2014 2015 2016
0
2
4
6
8
10
2012 2013 2014 2015 2016
0
1
2
3
4
5
2012 2013 2014 2015 2016
0
1
2
3
4
2012 2013 2014 2015 2016
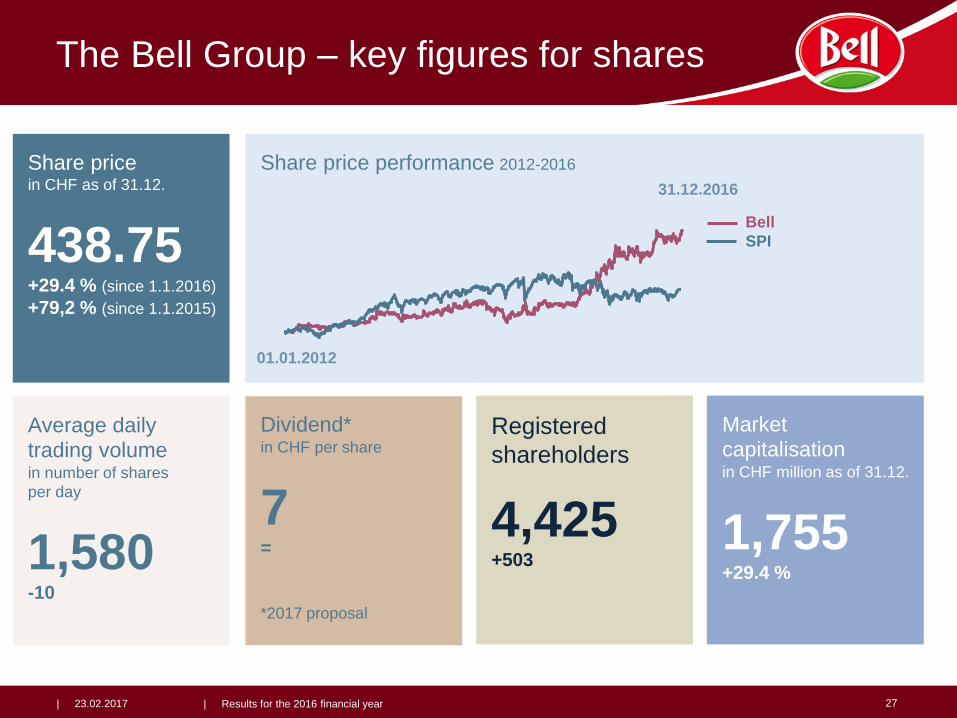
The Bell Group – key figures for shares
27
Share price in CHF as of 31.12.
438.75 +29.4 % (since 1.1.2016)
+79,2 % (since 1.1.2015)
| 23.02.2017 | Results for the 2016 financial year
Share price performance 2012-2016
Dividend*in CHF per share
7=
*2017 proposal
Average daily
trading volumein number of shares
per day
1,580-10
01.01.2012
31.12.2016
Bell
SPI
Registered
shareholders
4,425+503
Market
capitalisationin CHF million as of 31.12.
1,755+29.4 %
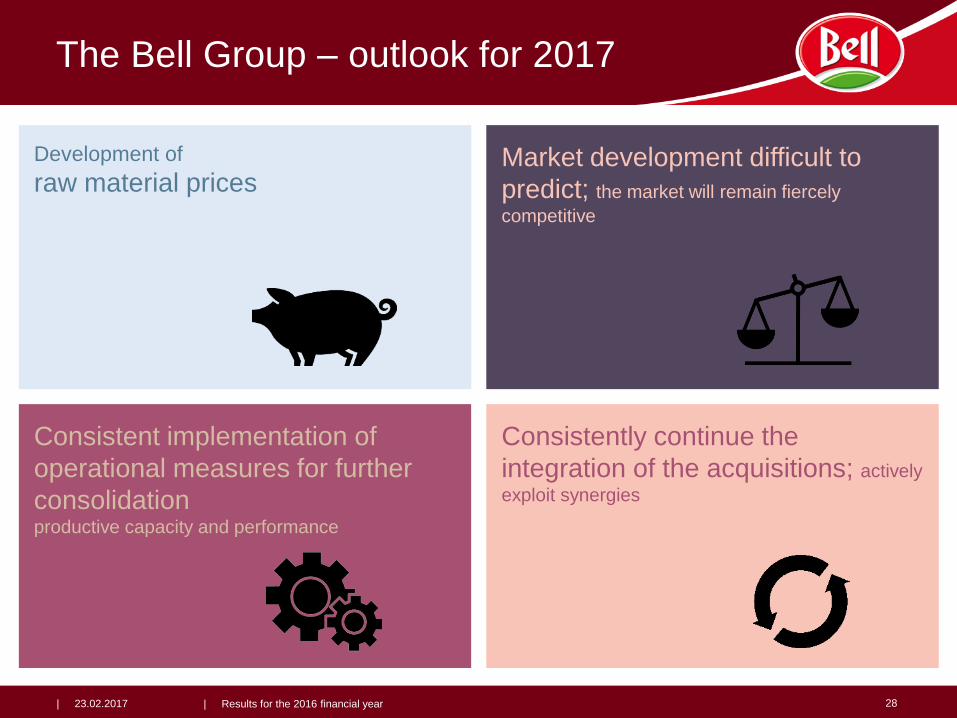
Consistently continue the
integration of the acquisitions; actively
exploit synergies
Consistent implementation of
operational measures for further
consolidationproductive capacity and performance
Development of
raw material prices
The Bell Group – outlook for 2017
| 23.02.2017 | Results for the 2016 financial year 28
Market development difficult to
predict; the market will remain fiercely
competitive


![Presentation to analysts on Audited Financial Results [Company Update]](https://img.pdfslide.net/doc/110x75/577c80a21a28abe054a988b9/presentation-to-analysts-on-audited-financial-results-company-update.jpg)


