Embed Size (px)
Citation preview
Annual Statistical Report
2015
SRI LANKA TOURISM DEVELOPMENTAUTHORITY
RESEARCH & INTERNATIONALRELATIONS DIVISION

This is the forty-seventh in the series of Annual Statistical Reports published by the Sri Lanka Tourism Development Authority (formerly “Sri Lanka Tourist Board”) and it provides a continuing review of the trends and developments of the tourism industry.

2
The report is divided into three sections. Section I contains asummary of performance of the tourism sector in 2015 andSection II presents statistical tables and charts. Section IIIcomprises the definitions of the terms and sources ofinformation.
The statistical analyses presented in this year’s report cover the following subject areas:A - Trends and Structural Characteristics of Tourist TrafficB - Scheduled Airline Operations & Passenger MovementsC - Accommodation Industry - Capacity and its UtilizationD - Income and EmploymentE - Tourist PricesF - Foreign Travel by Sri LankansG - Growth of Travel and TourismH - Revenue from Tourism
Copyright© 2015 Sri Lanka Tourism Development Authority ASR
Sri Lanka Tourism Development Authority
3
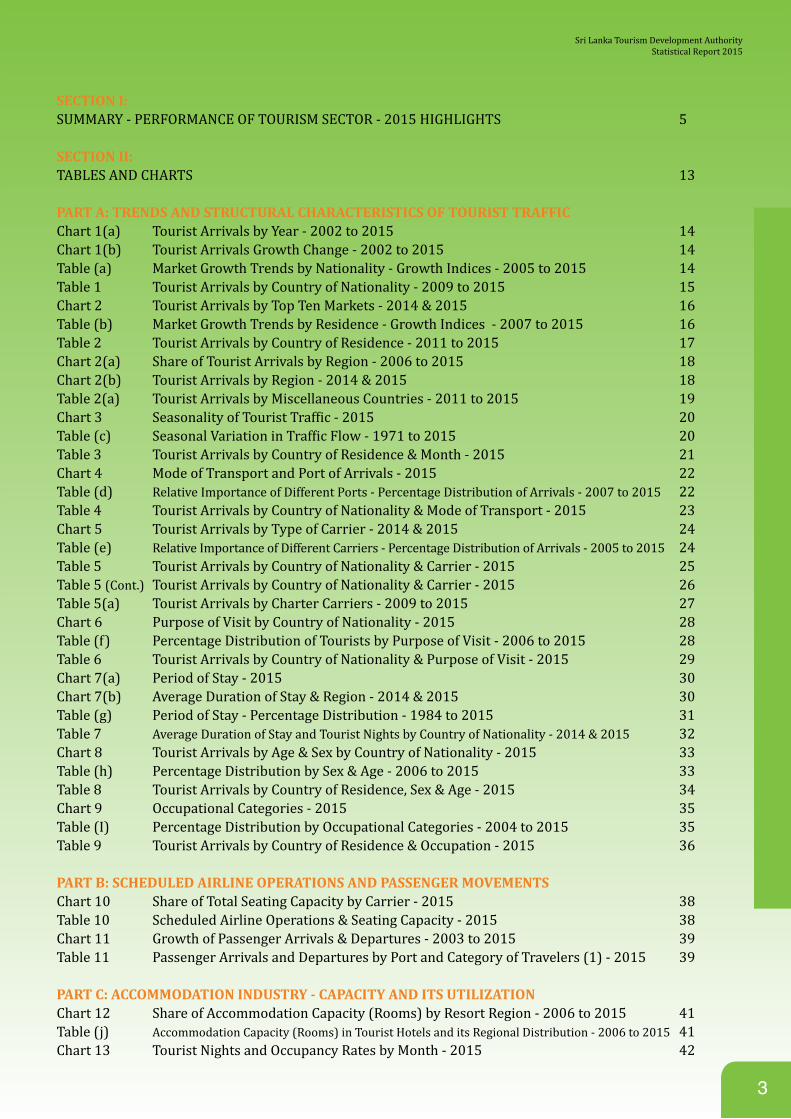
SECTION I:SUMMARY - PERFORMANCE OF TOURISM SECTOR - 2015 HIGHLIGHTS 5
SECTION II:TABLES AND CHARTS 13
PART A: TRENDS AND STRUCTURAL CHARACTERISTICS OF TOURIST TRAFFICChart 1(a) Tourist Arrivals by Year - 2002 to 2015 14Chart 1(b) Tourist Arrivals Growth Change - 2002 to 2015 14Table (a) Market Growth Trends by Nationality - Growth Indices - 2005 to 2015 14Table 1 Tourist Arrivals by Country of Nationality - 2009 to 2015 15Chart 2 Tourist Arrivals by Top Ten Markets - 2014 & 2015 16Table (b) Market Growth Trends by Residence - Growth Indices - 2007 to 2015 16Table 2 Tourist Arrivals by Country of Residence - 2011 to 2015 17Chart 2(a) Share of Tourist Arrivals by Region - 2006 to 2015 18Chart 2(b) Tourist Arrivals by Region - 2014 & 2015 18Table 2(a) Tourist Arrivals by Miscellaneous Countries - 2011 to 2015 19Chart 3 Seasonality of Tourist Traffic - 2015 20Table (c) Seasonal Variation in Traffic Flow - 1971 to 2015 20Table 3 Tourist Arrivals by Country of Residence & Month - 2015 21Chart 4 Mode of Transport and Port of Arrivals - 2015 22Table (d) Relative Importance of Different Ports - Percentage Distribution of Arrivals - 2007 to 2015 22Table 4 Tourist Arrivals by Country of Nationality & Mode of Transport - 2015 23Chart 5 Tourist Arrivals by Type of Carrier - 2014 & 2015 24Table (e) Relative Importance of Different Carriers - Percentage Distribution of Arrivals - 2005 to 2015 24Table 5 Tourist Arrivals by Country of Nationality & Carrier - 2015 25Table 5 (Cont.) Tourist Arrivals by Country of Nationality & Carrier - 2015 26Table 5(a) Tourist Arrivals by Charter Carriers - 2009 to 2015 27Chart 6 Purpose of Visit by Country of Nationality - 2015 28Table (f) Percentage Distribution of Tourists by Purpose of Visit - 2006 to 2015 28Table 6 Tourist Arrivals by Country of Nationality & Purpose of Visit - 2015 29Chart 7(a) Period of Stay - 2015 30Chart 7(b) Average Duration of Stay & Region - 2014 & 2015 30Table (g) Period of Stay - Percentage Distribution - 1984 to 2015 31Table 7 Average Duration of Stay and Tourist Nights by Country of Nationality - 2014 & 2015 32Chart 8 Tourist Arrivals by Age & Sex by Country of Nationality - 2015 33Table (h) Percentage Distribution by Sex & Age - 2006 to 2015 33Table 8 Tourist Arrivals by Country of Residence, Sex & Age - 2015 34Chart 9 Occupational Categories - 2015 35Table (I) Percentage Distribution by Occupational Categories - 2004 to 2015 35Table 9 Tourist Arrivals by Country of Residence & Occupation - 2015 36
PART B: SCHEDULED AIRLINE OPERATIONS AND PASSENGER MOVEMENTSChart 10 Share of Total Seating Capacity by Carrier - 2015 38Table 10 Scheduled Airline Operations & Seating Capacity - 2015 38Chart 11 Growth of Passenger Arrivals & Departures - 2003 to 2015 39Table 11 Passenger Arrivals and Departures by Port and Category of Travelers (1) - 2015 39
PART C: ACCOMMODATION INDUSTRY - CAPACITY AND ITS UTILIZATIONChart 12 Share of Accommodation Capacity (Rooms) by Resort Region - 2006 to 2015 41Table (j) Accommodation Capacity (Rooms) in Tourist Hotels and its Regional Distribution - 2006 to 2015 41Chart 13 Tourist Nights and Occupancy Rates by Month - 2015 42
Sri Lanka Tourism Development AuthorityStatistical Report 2015
4
Table 12 Accommodation Capacity and Guest Nights in Tourist Hotels and Supplementary Establishments - 2006 to 2015 42Chart 13(a) Occupancy Rates by Resort Region - 2014 & 2015 43Table (k) Occupancy Rates by Region - 2005 to 2015 43Table 13 Monthly Occupancy Rates in Tourist Hotels by Region - 2015 44Table 13(a) Capacity and Nights in all Accommodation Establishments by Category - 2014 & 2015 44Table 14 Foreign Guest Nights in Tourist Hotels by Region and Month - 2015 (Classified / Unclassified / Boutique Hotels) 45Table 15 Local Guest Nights in Tourist Hotels by Region and Month - 2015 45
PART D: INCOME & EMPLOYMENTChart 14 Value of Tourism - 2005 to 2015 47Table 16 Volume & Value of Tourism - 2005 to 2015 47Table 17 Foreign Exchange Earnings from Tourism - 2014 & 2015 48Table (l) Exchange Rates (Annual Average) - 2003 to 2015 48Chart 15 Direct Employment in the Tourism Industry - 2013 to 2015 49Table 18 Direct Employment in the Tourism Industry - 2013 to 2015 49
PART E: TOURIST PRICESChart 16 Tourist Price Index - 2002/2003 to 2015/2016 51Table 19 Index of Tourist Prices - 1978/79 to 2015/2016 51
PART F: FOREIGN TRAVEL BY SRI LANKANSChart 17 Sri Lankan Departures - 2003 to 2015 53Table 20 Sri Lankan Departures - Growth Trends - 1980 to 2015 53
PART G: GROWTH OF TRAVEL & TOURISMTable 21 Tourism Growth Trends - 1970 to 2015 55Table 22 Tourist Arrivals by Month - 1973 to 2015 56Table 23 Passenger Arrivals and Departures - 1981 to 2015 57
PART H: REVENUE FROM TOURISMTable 24 Conferences Held and Revenue Earned at BMICH - 1986 to 2015 59Table 25 Number of Foreign Visitors Visiting the Museums and Revenue from Sale of Tickets - 1986 to 2015 60Table 26 Number of Foreign Visitors Visiting the Cultural Triangle and Revenue from Sale of Tickets - 1986 to 2015 61Table 27 Number of Foreign Visitors to the Zoological Gardens and Revenue from Gate Fees - 1982 to 2015 62Table 28 Revenue from Foreign Visitors Visiting the Botanical Gardens - 1983 to 2015 63Table 29 Revenue from Foreign Visitors Visiting the Wild Life Parks - 1988 to 2015 64Table 30 Revenue from Embarkation Tax - 1980 to 2015 65Table 31 Public Sector Revenue from Tourism (In Rs.million) - 2011 to 2015 65
SECTION III:DEFINITIONS OF THE TERMS AND SOURCES OF INFORMATION 66
LIST OF RESEARCH PUBLICATIONS OF THE SRI LANKA TOURISM DEVELOPMENT AUTHORITY(SRI LANKA TOURIST BOARD) 68-69
Sri Lanka Tourism Development Authority
5
Performance of Tourism Sector
Highlights
Worldwide, global tourism rebounded strongly, with international tourist arrivals grew by 4.4 per cent in 2015 to a total of 1,184 million, up from 1,134 million in 2014. The highest growth of all regions with 5.0 per cent was recorded from Europe in 2015.
Sri Lanka Tourism has surged to a new high record of 1,798,380 arrivals in 2015, transcending all time high hits in the history which is an increase of 17.8 per cent over last year’s 1,527,153 arrivals.
The foreign exchange earnings increased by 27.72 per cent from Rs. 317,479 million (US $ 2,431.1 million) in 2014 to Rs. 405,492 million (US $ 2,980.6 million) in 2015.
Foreign Exchange (FE) Receipts per tourist per day recorded an increase of US $ 3.3, from US$ 160.8 to US$ 164.1 in 2015.
Due to the rise of the arrivals, tourism was able to upgrade its rank to the third level as the largest source of Foreign Exchange Earner of the national economy in 2015. Those that ranked above tourism were Foreign Remittances – Rs.948.95 billion, Textiles and Garments – Rs. 654.79 billion. The portion of tourism’s contribution to total FE earnings in 2015 amounted to 12.4 per cent.
Asia emerged as the main source of Tourism to Sri Lanka in year 2015 accounting 45.7 per cent of the total share. Western Europe was the second source of tourism with a share of 30.7 per cent.
As previous years, India emerged as the leading producer of tourism to Sri Lanka amounting 316,247 arrivals, accounting for 17.6 per cent of the total traffic. China progressed to second place with a rapid growth in tourist arrivals while UK moved down to 3rd position in 2015 from the second place in 2014.
The average duration of stay is 10.1 nights as compared to 9.9 nights in the previous year.
The room capacity in tourist hotels (Classified/unclassified & Boutique Hotels) increased by 866 rooms from 18,510 in 2014 to 19,376 in 2015.
The Room Occupancy Rate of graded accommodation increased to 74.5 per cent in 2015 as compared to 74.3 per cent in the previous year recording an increase of 0.2 percentage points.
The total foreign guest nights recorded in tourist hotels increased at a rate of 12.07 per cent in 2015 to 8,945,380 from 7,982,110 the previous year.
Employment generated in the tourism sector (both direct and indirect) increased by 6.5 per cent to 319, 436 in 2015.
Sri Lanka Tourism Development AuthorityStatistical Report 2015
6
A - WORLD TOURISM SCENE
A- International
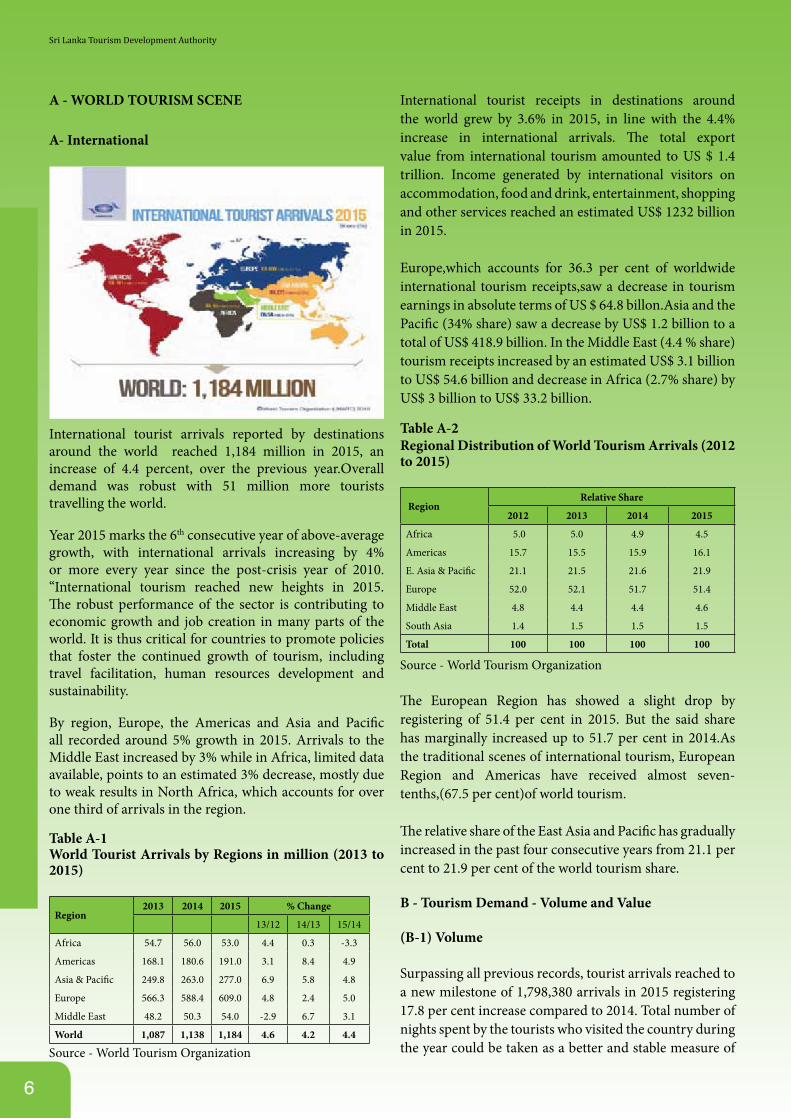
International tourist arrivals reported by destinations around the world reached 1,184 million in 2015, an increase of 4.4 percent, over the previous year.Overall demand was robust with 51 million more tourists travelling the world.
Year 2015 marks the 6th consecutive year of above-average growth, with international arrivals increasing by 4% or more every year since the post-crisis year of 2010. “International tourism reached new heights in 2015. The robust performance of the sector is contributing to economic growth and job creation in many parts of the world. It is thus critical for countries to promote policies that foster the continued growth of tourism, including travel facilitation, human resources development and sustainability.
By region, Europe, the Americas and Asia and Pacific all recorded around 5% growth in 2015. Arrivals to the Middle East increased by 3% while in Africa, limited data available, points to an estimated 3% decrease, mostly due to weak results in North Africa, which accounts for over one third of arrivals in the region.
Table A-1 World Tourist Arrivals by Regions in million (2013 to 2015)
Region2013 2014 2015 % Change
13/12 14/13 15/14
Africa 54.7 56.0 53.0 4.4 0.3 -3.3
Americas 168.1 180.6 191.0 3.1 8.4 4.9
Asia & Pacific 249.8 263.0 277.0 6.9 5.8 4.8
Europe 566.3 588.4 609.0 4.8 2.4 5.0
Middle East 48.2 50.3 54.0 -2.9 6.7 3.1
World 1,087 1,138 1,184 4.6 4.2 4.4
Source - World Tourism Organization
International tourist receipts in destinations around the world grew by 3.6% in 2015, in line with the 4.4% increase in international arrivals. The total export value from international tourism amounted to US $ 1.4 trillion. Income generated by international visitors on accommodation, food and drink, entertainment, shopping and other services reached an estimated US$ 1232 billion in 2015.
Europe,which accounts for 36.3 per cent of worldwide international tourism receipts,saw a decrease in tourism earnings in absolute terms of US $ 64.8 billon.Asia and the Pacific (34% share) saw a decrease by US$ 1.2 billion to a total of US$ 418.9 billion. In the Middle East (4.4 % share) tourism receipts increased by an estimated US$ 3.1 billion to US$ 54.6 billion and decrease in Africa (2.7% share) by US$ 3 billion to US$ 33.2 billion.
Table A-2 Regional Distribution of World Tourism Arrivals (2012 to 2015)
RegionRelative Share
2012 2013 2014 2015
Africa 5.0 5.0 4.9 4.5
Americas 15.7 15.5 15.9 16.1
E. Asia & Pacific 21.1 21.5 21.6 21.9
Europe 52.0 52.1 51.7 51.4
Middle East 4.8 4.4 4.4 4.6
South Asia 1.4 1.5 1.5 1.5
Total 100 100 100 100
Source - World Tourism Organization
The European Region has showed a slight drop by registering of 51.4 per cent in 2015. But the said share has marginally increased up to 51.7 per cent in 2014.As the traditional scenes of international tourism, European Region and Americas have received almost seven-tenths,(67.5 per cent)of world tourism.
The relative share of the East Asia and Pacific has gradually increased in the past four consecutive years from 21.1 per cent to 21.9 per cent of the world tourism share.
B - Tourism Demand - Volume and Value
(B-1) Volume
Surpassing all previous records, tourist arrivals reached to a new milestone of 1,798,380 arrivals in 2015 registering 17.8 per cent increase compared to 2014. Total number of nights spent by the tourists who visited the country during the year could be taken as a better and stable measure of
Sri Lanka Tourism Development Authority
7
tourism volume.Reported number of Tourist Nights in 2015 was 18,163,638 showing an increase of 20.14 per cent with an average duration of 10.1 nights(See Table 7 & 12).
(B-2) Value
As a whole, the official tourist receipts for 2015 were estimated to be Rs. 405,492 million as compared to Rs. 317,479 million in 2014 representing an increase of 28 per cent. In terms of US Dollars, the total tourist receipts were estimated as US$ 2980.6 million, as against US$ 2431.1 million for the previous year, showing an increase 23 per cent.
The Per Capita Tourist Receipts increased up to US$ 1,657 recording an increase of 4.1 per cent compared to US$ 1592 in 2014. The Per Capita Tourist Receipts per day amounted to US$ 164.1, which showed an increase of 2 per cent as compared to US $ 160.8 in 2014.
Tourism plays an important role as one of the core source of Foreign Exchange Earner in overall economy of Sri Lanka. The relative importance of the sector can be recognized from the following Table. (Table B-1)
Table B-1 Relative Importance of Tourism as FE Earner
2014 2015
Sector
FE Earnings
(Rs. Million)
%of Total
FEEarnings
Rank Sector
FE Earnings
(Rs. Million)
% ofTotal
FEEarnings
Rank
Workers’ Remittances 916,344 29.3% 1 Workers’
Remittances 948,957 29.1% 1
Textiles & Garments 643,688 20.6% 2 Textiles &
Garments 654,794 20.1% 2
Tourism 317,479 10.2% 3 Tourism 405,492 12.4% 3
Transportation Services 251,086 8.0% 4 Transportation
Services 286,017 8.8% 4
Tea 212,588 6.8% 5 Tea 182,054 5.6% 5
Rubber based Products 116,168 3.7% 6
Computer & Information Technology Services
109,314 3.3% 6
Computer & Information Technology Services
97,652 3.1% 7 Rubber based Products 103,263 3.2% 7
Gems, Diamonds and Jewellery
51,385 1.6% 8 Spices 51,278 1.6% 8
Coconut 46,517 1.5% 9 Petroleum Products 50,461 1.5% 9
Others 472,429 15.1% Others 473,616 14.5%
Total 3,125,336 100.0% Total 3,265,245 100.0%
Source - Central Bank of Sri Lanka - Sri Lanka Tourism Development Authority
The analysis of the tourism rank in the National Economy reveals that tourism was the 3rd position as one largest earner of Foreign Exchange in 2015. It was next to Workers’ Remittances, Textiles & Garments.Even though ranked in the 3rd position, the contribution of tourism to the total FE earnings increased up to 12.4 per cent from 10.2 per cent compared to the previous year. The top two FE earners who accounted for 49.2 per cent of the total amount, namely Workers’ Remittances 29.1 per cent, Textiles and Garments 20.1 per cent. However, Tourism was able to improve its contribution by 2.2 percentage points in 2015 against component of 2014. C - Sources of Tourism Demand - Markets
Although other source markets have increased their demand,Western Europe remained as the major source market in year 2015 as well. These improvement in other markets and performance of Western Europe can be seen by referring the below table. (Table C-1).
Admiring
Table C-1 Tourism Arrivals by Regions (2012, 2013, 2014 & 2015)
Market Region % change
2012 2013 2014 2015 2013/2012 2014/2013 2015/2014
America-North 59,236 65,616 72,653 84,943 10.8 10.7 16.9
Asia-North East 73,942 102,851 185,907 273,844 39.1 80.8 47.5
Asia -South East 58,788 82,748 94,604 89,013 36.5 10.8 (5.9)
Asia -South 247,559 326,556 370,299 459,415 31.9 13.4 24.1
Australasia 57,776 60,836 65,252 71,672 5.3 7.3 9.8
Europe-West 373,063 421,037 479,007 552,442 12.9 13.8 15.3
Europe-East 72,401 125,695 154,153 148,458 73.6 22.6 (3.7)
Middle East 56,169 80,509 88,991 101,066 43.3 10.5 13.6
Others 6,671 11,247 16,287 17,527 68.8 95.4 7.6
Total 1,005,605 1,274,593 1,527,153 1,798,380 26.7 19.8 17.8
Tourist arrivals from different source market regions for the past four consecutive years is indicated in table c-1.As a whole, it is noteworthy that all the source markets shows significant growth of their arrivals except Asia – South East Region and Europe- East Region in year 2015. Western Europe showed an increase of 15.33 per cent compared to the previous year. South Asia was second major source market, recording 24.1 percent of increase compared to the year 2014. Further, North East Asia, Europe East and Middle East placed third, fourth and fifth positions recording increase of 47.5 per cent, drop of 3.69 per cent and increase of 13.6 percent respectively as compared to the last year. Rest of the source market regions recorded decrease during the year, showing Asia-South East by 5.9 per cent and increase in Australasia 9.84 per cent.It should be noted that as a whole, all the markets recorded an increase of 17.76 percent compared to the previous year.
Sri Lanka Tourism Development AuthorityStatistical Report 2015
8
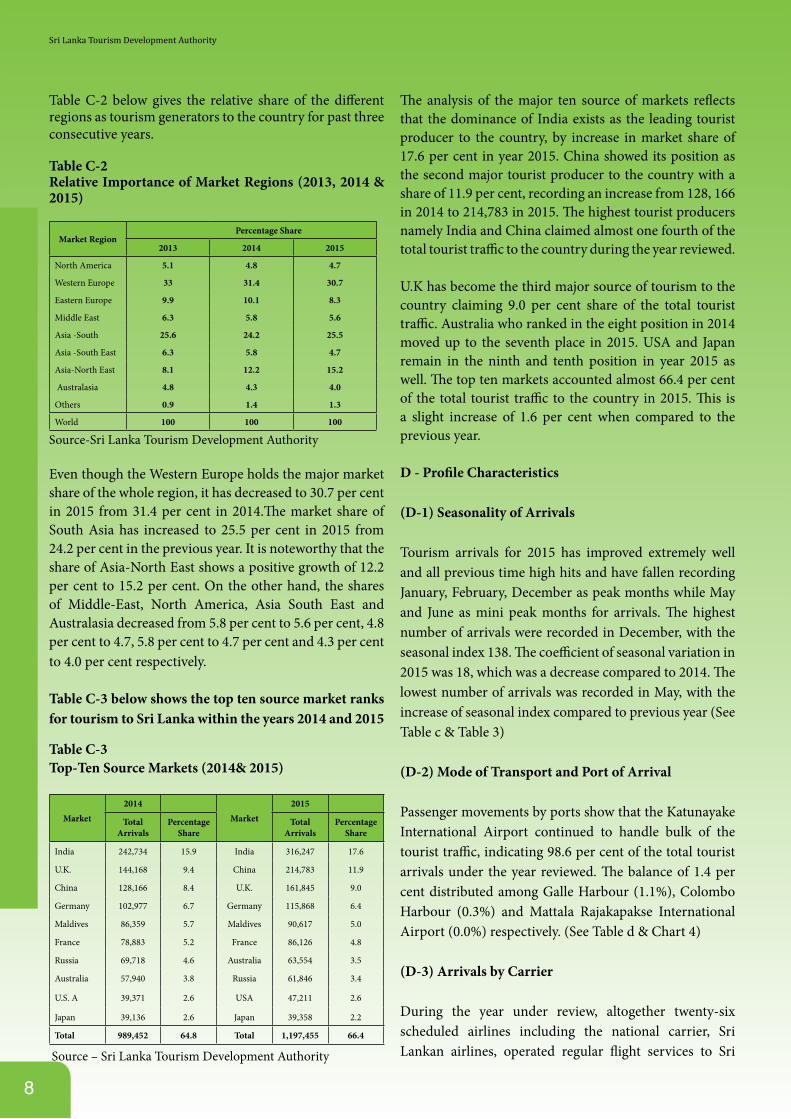
Table C-2 below gives the relative share of the different regions as tourism generators to the country for past three consecutive years.
Table C-2Relative Importance of Market Regions (2013, 2014 & 2015)
Market Region Percentage Share
2013 2014 2015
North America 5.1 4.8 4.7
Western Europe 33 31.4 30.7
Eastern Europe 9.9 10.1 8.3
Middle East 6.3 5.8 5.6
Asia -South 25.6 24.2 25.5
Asia -South East 6.3 5.8 4.7
Asia-North East 8.1 12.2 15.2
Australasia 4.8 4.3 4.0
Others 0.9 1.4 1.3
World 100 100 100
Source-Sri Lanka Tourism Development Authority
Even though the Western Europe holds the major market share of the whole region, it has decreased to 30.7 per cent in 2015 from 31.4 per cent in 2014.The market share of South Asia has increased to 25.5 per cent in 2015 from 24.2 per cent in the previous year. It is noteworthy that the share of Asia-North East shows a positive growth of 12.2 per cent to 15.2 per cent. On the other hand, the shares of Middle-East, North America, Asia South East and Australasia decreased from 5.8 per cent to 5.6 per cent, 4.8 per cent to 4.7, 5.8 per cent to 4.7 per cent and 4.3 per cent to 4.0 per cent respectively.
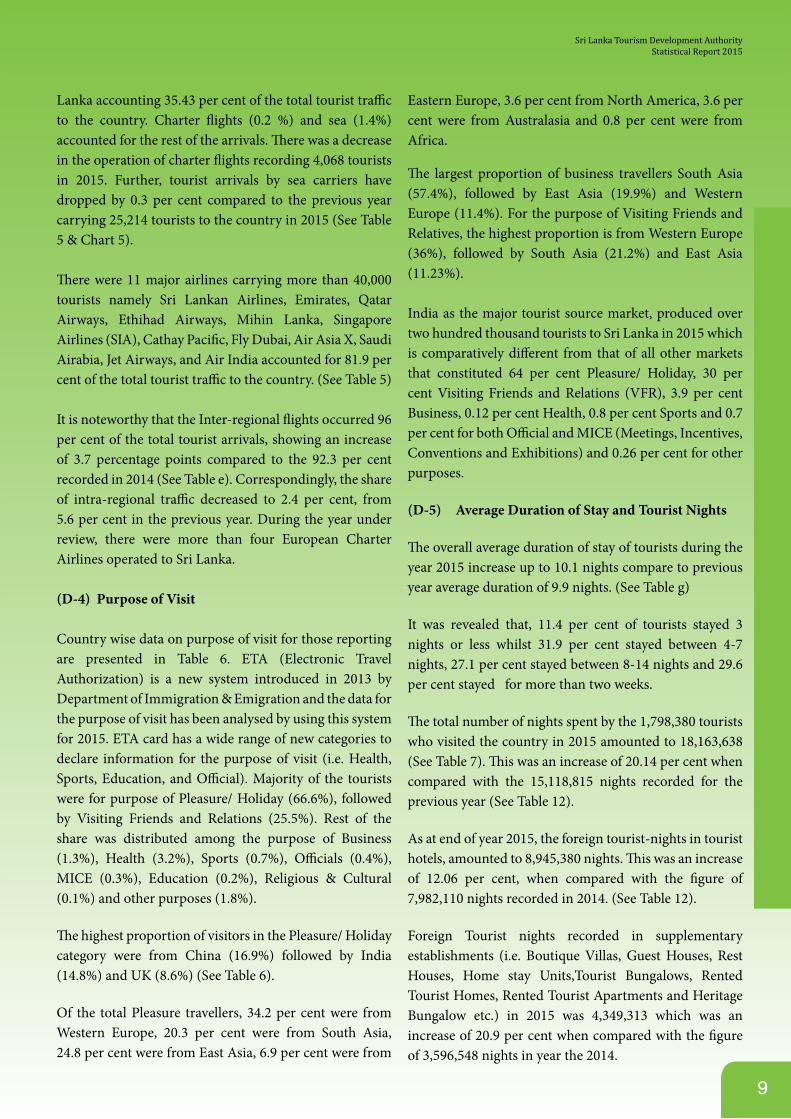
Table C-3 below shows the top ten source market ranks for tourism to Sri Lanka within the years 2014 and 2015
Table C-3 Top-Ten Source Markets (2014& 2015)
Market2014
Market2015
TotalArrivals
Percentage Share
TotalArrivals
Percentage Share
India 242,734 15.9 India 316,247 17.6
U.K. 144,168 9.4 China 214,783 11.9
China 128,166 8.4 U.K. 161,845 9.0
Germany 102,977 6.7 Germany 115,868 6.4
Maldives 86,359 5.7 Maldives 90,617 5.0
France 78,883 5.2 France 86,126 4.8
Russia 69,718 4.6 Australia 63,554 3.5
Australia 57,940 3.8 Russia 61,846 3.4
U.S. A 39,371 2.6 USA 47,211 2.6
Japan 39,136 2.6 Japan 39,358 2.2
Total 989,452 64.8 Total 1,197,455 66.4
Source – Sri Lanka Tourism Development Authority
The analysis of the major ten source of markets reflects that the dominance of India exists as the leading tourist producer to the country, by increase in market share of 17.6 per cent in year 2015. China showed its position as the second major tourist producer to the country with a share of 11.9 per cent, recording an increase from 128, 166 in 2014 to 214,783 in 2015. The highest tourist producers namely India and China claimed almost one fourth of the total tourist traffic to the country during the year reviewed.
U.K has become the third major source of tourism to the country claiming 9.0 per cent share of the total tourist traffic. Australia who ranked in the eight position in 2014 moved up to the seventh place in 2015. USA and Japan remain in the ninth and tenth position in year 2015 as well. The top ten markets accounted almost 66.4 per cent of the total tourist traffic to the country in 2015. This is a slight increase of 1.6 per cent when compared to the previous year.
D - Profile Characteristics
(D-1) Seasonality of Arrivals
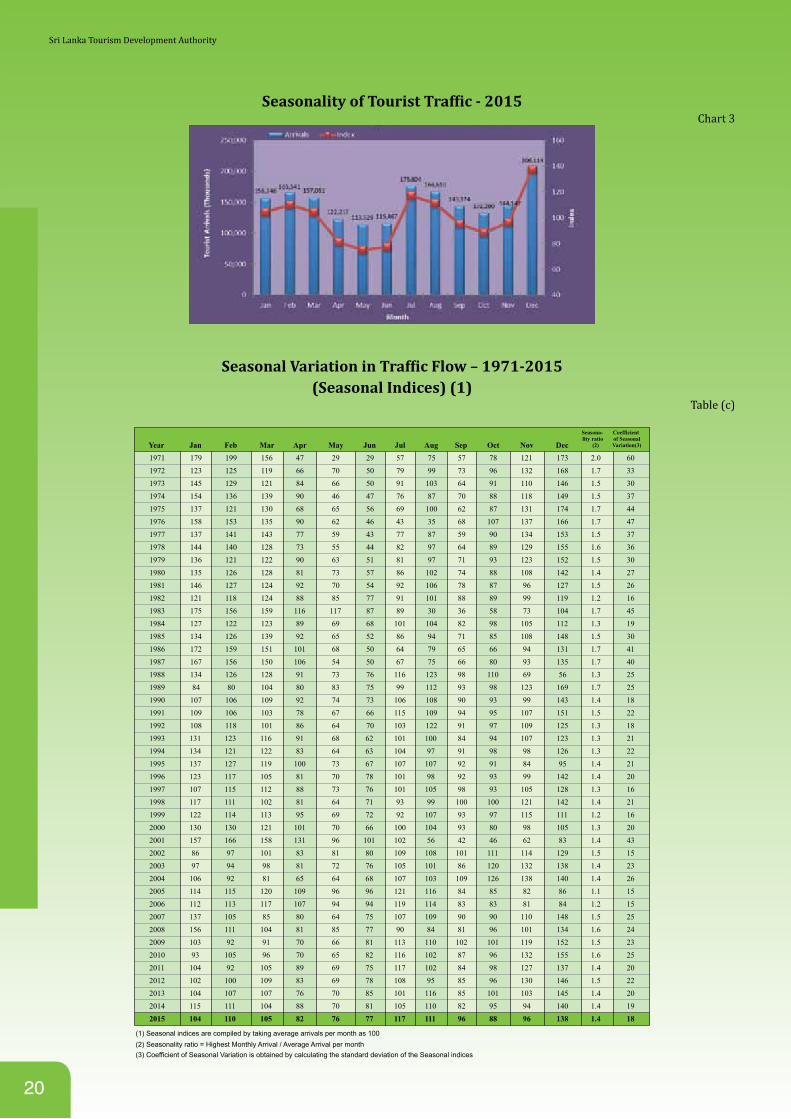
Tourism arrivals for 2015 has improved extremely well and all previous time high hits and have fallen recording January, February, December as peak months while May and June as mini peak months for arrivals. The highest number of arrivals were recorded in December, with the seasonal index 138. The coefficient of seasonal variation in 2015 was 18, which was a decrease compared to 2014. The lowest number of arrivals was recorded in May, with the increase of seasonal index compared to previous year (See Table c & Table 3)
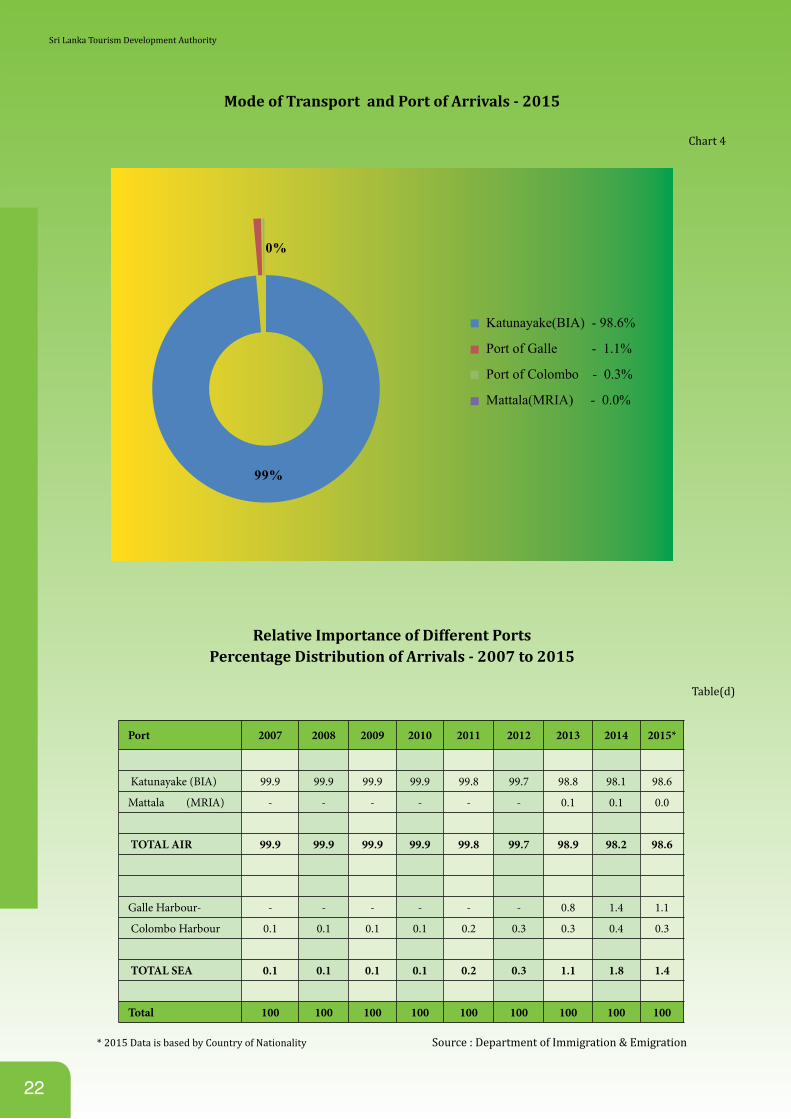
(D-2) Mode of Transport and Port of Arrival
Passenger movements by ports show that the Katunayake International Airport continued to handle bulk of the tourist traffic, indicating 98.6 per cent of the total tourist arrivals under the year reviewed. The balance of 1.4 per cent distributed among Galle Harbour (1.1%), Colombo Harbour (0.3%) and Mattala Rajakapakse International Airport (0.0%) respectively. (See Table d & Chart 4)
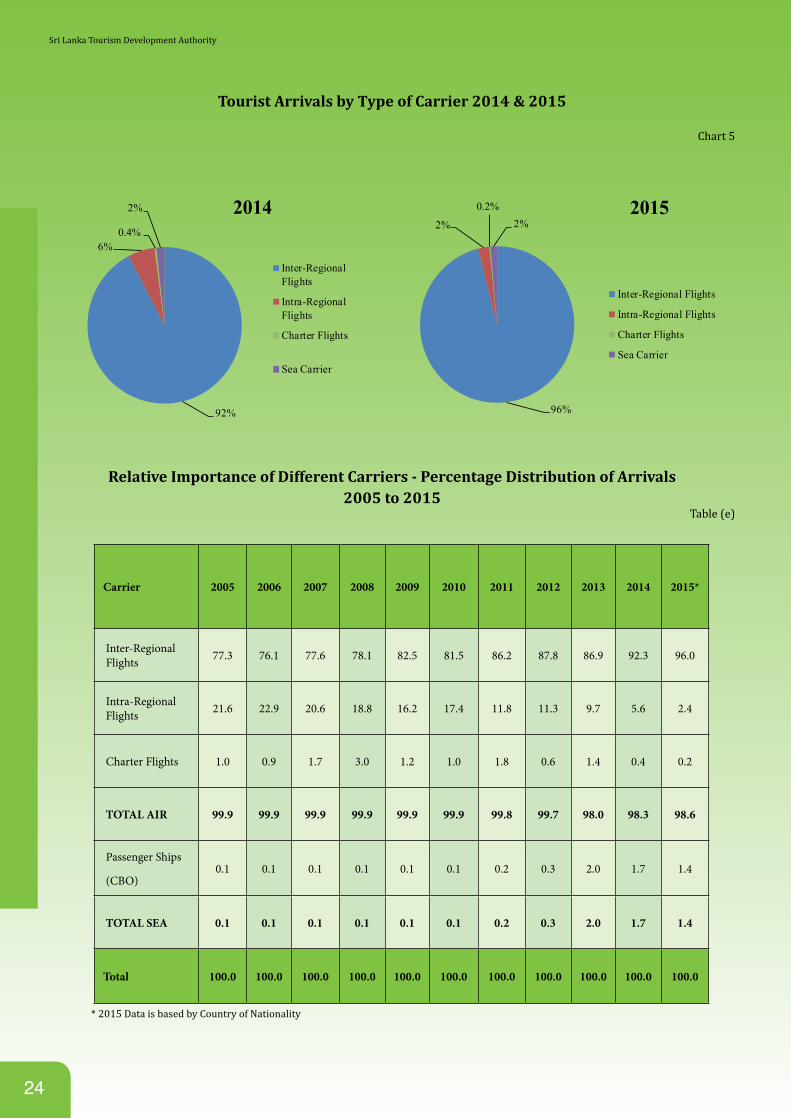
(D-3) Arrivals by Carrier
During the year under review, altogether twenty-six scheduled airlines including the national carrier, Sri Lankan airlines, operated regular flight services to Sri
Sri Lanka Tourism Development Authority
9
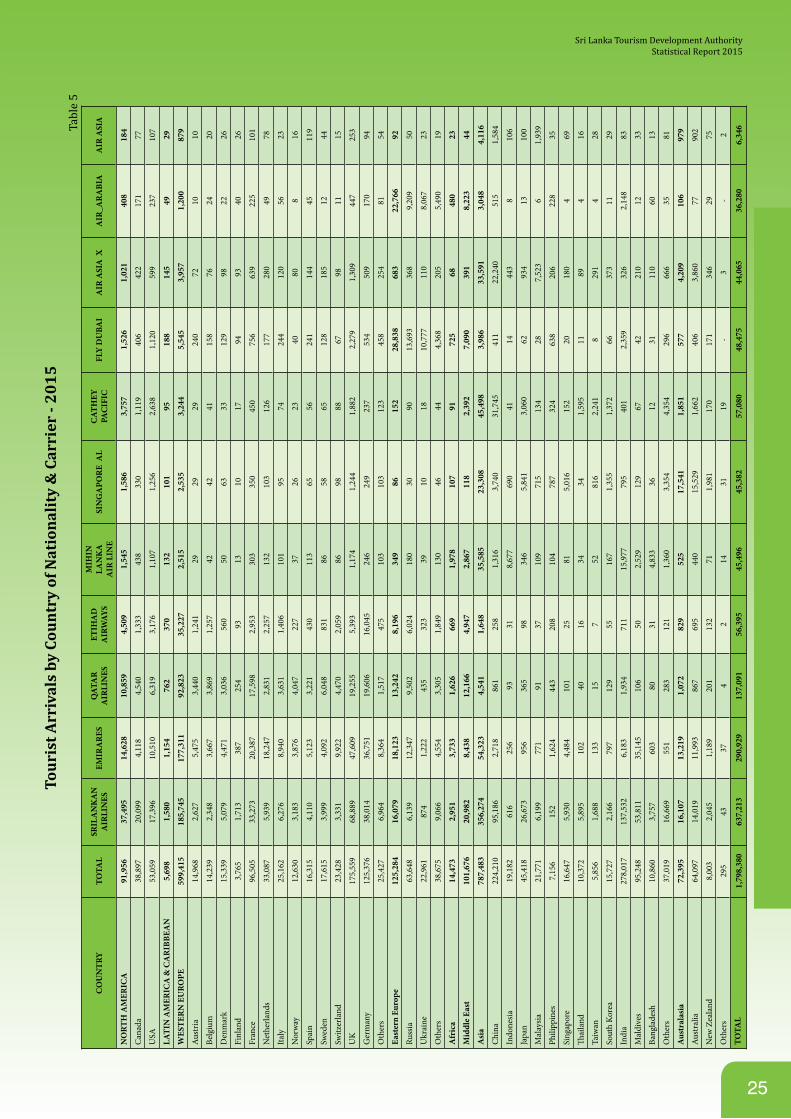
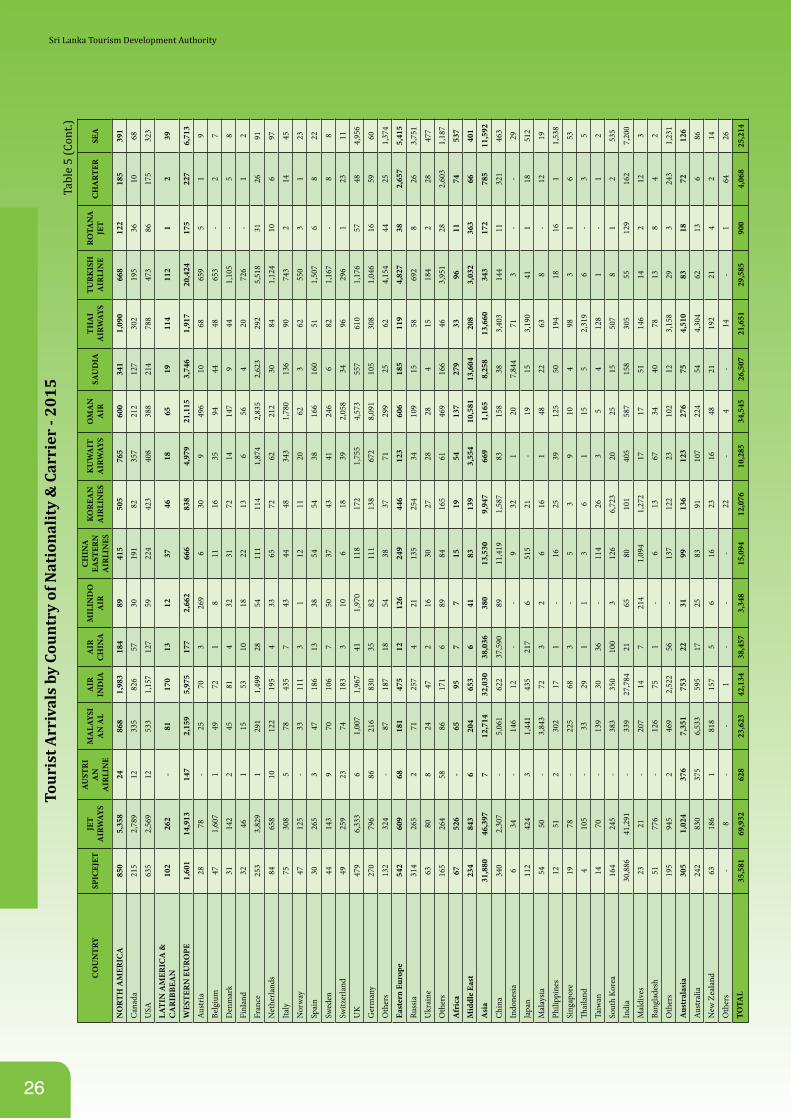
Lanka accounting 35.43 per cent of the total tourist traffic to the country. Charter flights (0.2 %) and sea (1.4%) accounted for the rest of the arrivals. There was a decrease in the operation of charter flights recording 4,068 tourists in 2015. Further, tourist arrivals by sea carriers have dropped by 0.3 per cent compared to the previous year carrying 25,214 tourists to the country in 2015 (See Table 5 & Chart 5).
There were 11 major airlines carrying more than 40,000 tourists namely Sri Lankan Airlines, Emirates, Qatar Airways, Ethihad Airways, Mihin Lanka, Singapore Airlines (SIA), Cathay Pacific, Fly Dubai, Air Asia X, Saudi Airabia, Jet Airways, and Air India accounted for 81.9 per cent of the total tourist traffic to the country. (See Table 5)
It is noteworthy that the Inter-regional flights occurred 96 per cent of the total tourist arrivals, showing an increase of 3.7 percentage points compared to the 92.3 per cent recorded in 2014 (See Table e). Correspondingly, the share of intra-regional traffic decreased to 2.4 per cent, from 5.6 per cent in the previous year. During the year under review, there were more than four European Charter Airlines operated to Sri Lanka.
(D-4) Purpose of Visit
Country wise data on purpose of visit for those reporting are presented in Table 6. ETA (Electronic Travel Authorization) is a new system introduced in 2013 by Department of Immigration & Emigration and the data for the purpose of visit has been analysed by using this system for 2015. ETA card has a wide range of new categories to declare information for the purpose of visit (i.e. Health, Sports, Education, and Official). Majority of the tourists were for purpose of Pleasure/ Holiday (66.6%), followed by Visiting Friends and Relations (25.5%). Rest of the share was distributed among the purpose of Business (1.3%), Health (3.2%), Sports (0.7%), Officials (0.4%), MICE (0.3%), Education (0.2%), Religious & Cultural (0.1%) and other purposes (1.8%).
The highest proportion of visitors in the Pleasure/ Holiday category were from China (16.9%) followed by India (14.8%) and UK (8.6%) (See Table 6).
Of the total Pleasure travellers, 34.2 per cent were from Western Europe, 20.3 per cent were from South Asia, 24.8 per cent were from East Asia, 6.9 per cent were from
Eastern Europe, 3.6 per cent from North America, 3.6 per cent were from Australasia and 0.8 per cent were from Africa.
The largest proportion of business travellers South Asia (57.4%), followed by East Asia (19.9%) and Western Europe (11.4%). For the purpose of Visiting Friends and Relatives, the highest proportion is from Western Europe (36%), followed by South Asia (21.2%) and East Asia (11.23%).
India as the major tourist source market, produced over two hundred thousand tourists to Sri Lanka in 2015 which is comparatively different from that of all other markets that constituted 64 per cent Pleasure/ Holiday, 30 per cent Visiting Friends and Relations (VFR), 3.9 per cent Business, 0.12 per cent Health, 0.8 per cent Sports and 0.7 per cent for both Official and MICE (Meetings, Incentives, Conventions and Exhibitions) and 0.26 per cent for other purposes.
(D-5) Average Duration of Stay and Tourist Nights
The overall average duration of stay of tourists during the year 2015 increase up to 10.1 nights compare to previous year average duration of 9.9 nights. (See Table g)
It was revealed that, 11.4 per cent of tourists stayed 3 nights or less whilst 31.9 per cent stayed between 4-7 nights, 27.1 per cent stayed between 8-14 nights and 29.6 per cent stayed for more than two weeks.
The total number of nights spent by the 1,798,380 tourists who visited the country in 2015 amounted to 18,163,638 (See Table 7). This was an increase of 20.14 per cent when compared with the 15,118,815 nights recorded for the previous year (See Table 12).
As at end of year 2015, the foreign tourist-nights in tourist hotels, amounted to 8,945,380 nights. This was an increase of 12.06 per cent, when compared with the figure of 7,982,110 nights recorded in 2014. (See Table 12).
Foreign Tourist nights recorded in supplementary establishments (i.e. Boutique Villas, Guest Houses, Rest Houses, Home stay Units,Tourist Bungalows, Rented Tourist Homes, Rented Tourist Apartments and Heritage Bungalow etc.) in 2015 was 4,349,313 which was an increase of 20.9 per cent when compared with the figure of 3,596,548 nights in year the 2014.
Sri Lanka Tourism Development AuthorityStatistical Report 2015
10
Noted that, the tourist occupied in other establishments (unregistered accommodations units and private houses) amounted to 4,868,945 nights in 2015, which was an increase of 37.53 per cent compared to 3,540,157 nights recorded in 2014.
It is noteworthy to understand that only 49.2 per cent of the tourist nights were spent in graded establishments and another 23.9 per cent were spent in supplementary accommodation establishments. The rest of the tourists, (26.8%) were spent in unregistered accommodations units and private houses (See Table 12).
(D-6) Age & Sex Distributions
Of the total tourists in 2015, 53.6 per cent were male and the rest of the 46.4 per cent were female (See Table h).
In the case of age distribution, the majority of the tourists were in between 30-39 years, accounting for 22.6 per cent of the total tourists, recording a decrease of 1.1 per cent over 23.7 per cent recorded in 2014. Compared to the year 2014 age groups of 3-19, 20-29, 50-59 and 60 & over showed increases while 30-39 showed decrease of their age brackets.
(D-7) Occupation
According to the notifications of the of the arrival cards, 79.9 per cent of the tourists who arrived to Sri Lanka during the year 2015 were gainfully occupied. Compared to the previous year, this was an increase of 0.8 percentage points over 79.1 per cent in 2014.Retired Persons constituted 5.4 per cent while the 14.7 per cent declared themselves as having no occupation. Those in the “No Occupation” category were mainly housewives and dependants (See Tables 9 & I).
Of the tourists who engaged in money making occupations, 18.6 per cent were engaged in “Other Occupations” viz. : white-collar workers in the non-executive grades and skilled/ semi-skilled workers.
Others in gainful occupations were Businessmen (21.3 per cent), Executives (10.7 per cent), Professionals (21.3 per cent), Scientists & Technicians (6.4 per cent) and Educationists (7.8 per cent).
E- Scheduled Airline Operations
During the year 2015, there were twenty-six scheduled airlines operated flights to Sri Lanka including National Carrier, Sri Lankan Airline. (See Table 5).
During the summer season from May to October, the number of flights operated per week amounted to 585 with a seating capacity of 129,522 per week whilst during the winter season from November to April in 2015,the number of flights operated amounted to 579 per week, with a seating capacity of 126,926 per week. (See Table 10).
F- Passenger Movement
As a whole, in term of two-way passenger traffic into and out of the country was amounted 6.48 million for the year, through the main access point. This represents an increase of 13.7 per cent as compared to the both way passenger traffic of 5.7 million recorded for the previous year(See Table 11 & 23). Katunayake International Airport being one of the air access points to Sri Lanka, handled 99.1 per cent of the total passenger movement during the year. Newly established, Mattala Rajapaksa International Airport handled 0.03 per cent of the total passenger movement during this year. The analysis of the composition of this up & down passenger traffic revealed that almost half of these passengers (56.7%) were tourist passengers. The both way Sri Lankans accounted for 41.8 per cent of the total. (See Table 11).
G - Tourism Supply
(G-1) Accommodation Capacity
The total number of Tourist Hotel units increased to 354 units with 19,376 rooms from 334 units with 18,510 rooms in the previous year. [See Table 13(a)].
Further, total supply of supplementary accommodation units increased to 1,409 units in 2015 from 1,265 units in 2014. Consequently, the total room capacity in these units increased by 786 from 9916 to 10,702 under the reviewed period.
The percentage distribution of room capacity of graded accommodations units by star category was 14.1 per cent in five star category, 10.8 per cent in four star category,
Sri Lanka Tourism Development Authority
11
7.6 per cent in three star category, 8.9 percent in two star category, 6.8 per cent in one-star category and 49.5 per cent in unclassified category and 2.2 per cent in Boutique Hotels (See Table 12 & 13).
In term of resort regions, the distribution of room capacity was 20.5 per cent in Colombo City, 15.7 per cent in the Greater Colombo region, 35 per cent in the South Coast region, 4.6 percent in East Coast region, 5.3 per cent in the High Country region, 18.6 per cent in the Ancient Cities regions and the balance 0.3 per cent in the North Region (See Table j).
(G-2) Occupancy Rate
The Overall annual room occupancy rate of tourist hotels increased to 74.5 per cent in 2015 from 74.3 per cent in the previous year (see Table K)
During the year, all the regions except Northern region and high country have recorded significant increase in room occupancy rates when compared with the corresponding figures for 2014. East Coast has recorded an increase of 0.3 percentage points compared to the previous year. Greater Colombo has recorded an increase of 0.4 percentage points compared to the previous year. South Coast, Ancient Cities and Colombo City showed their increases by 1.2, 0.2 and 0.5 percentage points respectively. It is noted that there were four tourist hotels in Northern region for the year review and annual room occupancy rate was 72 per cent. (See Table k & Table 13)
It is important to highlight that the highest overall monthly occupancy rate of 82.8 per cent was recorded in December due to the highest tourist traffic to the country while the lowest monthly occupancy rate of 63.5 per cent in May. (Table 13).
(G-3) Guest Nights
As a result of the high tourist flow to the country, the total foreign guest nights recorded in all tourist hotels amounted to 8,945,380 which was an increase of 12 per cent against the amount of 7,982,110 nights recorded in the previous year in 2014. (See Table 12). The total domestic guest nights in tourist hotels also recorded a decrease of 23.4 per cent amounting decrease from 2,072,886 to 1,588,223 during the period. Altogether a total of 10,533,603 guest nights
have recorded in 354 tourist hotels. This was a significant increase of 4.7 per cent compared to the corresponding figure in 2014. (See Table 13(a)).
Notably, that there was an increase in the total guest nights of supplementary accommodation establishments, during the year. The growth of foreign guest nights indicated as 20.9 per cent, from 3,596,548 in 2013 to 4,349,313 in 2015. (See Table 12).
In the case of local guest nights in these supplementary establishments were increased by 24.3 per cent, from 512,017 in 2014 to 636,644 in 2015. As a proportion to the total guest nights in supplementary establishments, the local guest nights were 12.8 per cent during the year. (See Table 13(a))
In terms of distribution of foreign guest nights in tourist hotel accommodations (Classified / Unclassified & Boutique Hotels) by resort regions shows that 35.5 per cent of the total foreign guest nights have been recorded in the hotels in the South Coast Region recording the highest proportion. The hotels in Colombo City Region have been claimed for 21.3 per cent, Greater Colombo Region 17.2 per cent, Ancient Cities Region 16.7 per cent, Hill Country 5.2 per cent, East Coast Region 3.8 per cent and Northern Region 0.2 per cent during the year. (See Table 14).
In the case of foreign guest night distribution in tourist hotels, 33.5 per cent in unclassified category claiming the highest proportion. Five-star category recorded the second highest proportion indicating 19.1 per cent of the total foreign guest nights. Four stars, three stars, two stars and one star categories claimed 14.8 per cent,10.3 per cent, 10.98 per cent and 9.3 per cent and Boutique Hotels 1.97 per cent respectively (See Table 13(a) )
H - Employment in the Tourism Industry
The total number of persons directly employed in the tourist industry amounted to 135,930 in 2015, representing an increase of 4.7 per cent over the corresponding figure of the previous year.(See Table 18).
As same as in the previous years, majority of those employees were in the accommodation and catering sector.This amount is 80.6 per cent of the total direct
Sri Lanka Tourism Development AuthorityStatistical Report 2015
12
employment, recording a substantial increase of 4.3 per cent against the previous year amount of 105,001.Due to the more registration of Travel Agents and Tour Operators,the employment in this sector has increased again to 9483 which was an increase of 4.3 per cent compared to the previous year.
For the year 2015 total amount of 6,369 direct employments was recorded under the Air Line sector indicating an increase of 7.2 per cent. Meanwhile, agencies providing recreational facilities showed an improvement of their employment capacity recording an increase of 11.5 per cent. Tourist guides have increased to an amount of 4,590 and it was an increase of 3.8 per cent showed under the employment of Tourist Shops amounting to 1,796 over the previous year amounted of 1,680. (See Table 18)
Although the majority of the total direct employment was under the category of Technical, Clerical allied and Supervisory, it showed a marginal improvement of 3.6 per cent over the previous year. The said category claimed a share of more than half of the total employment recording 51.4 per cent. The rest of the share constituted of Manual and Operative grades (34%) and the balance 14.6 per cent for the Managerial grades.
It was estimated that the total indirect employment in the supplying sector in 2015 was estimated to 183,506 (See Table 21). As a result of increased tourist arrivals in year 2015, both direct and indirect employment adds up to 319,436. This was a gradual increase of 6.5 per cent over the figure of 299,890 recorded in 2014.
The ratio of jobs generated, both directly and indirectly, to the number of tourist arrivals for the year review was, one job for every 5.6 arrivals. Due to the more arrivals & using new technology in tourism establishments, this ratio has increased from one job for every four arrivals compared with the previous year.
I - Tourist Prices
Tourist price indices were computed for three major expenditure items on which tourists spend money on accommodations, meals and transport which covers two third of the total tourists spending during their visit. As at end of the year reviewed, the overall tourist price index showed an increase of 3.6 per cent, when compared with
the previous year. It has increased by 241 points from 6,880 in the 2014/2015 season, to 7121 in the 2015/2016 season (See Table 19). It reveals in which the prices of Accommodation Sector increased by 2.96 per cent while Food & Beverage sector increased by 3.98 per cent and Transport Sector increased by 4.6 per cent.
J - Public Sector Revenue
Public sector institutions derive revenue from tourism in variety of ways, namely direct and indirect taxes, fees and levies, profits from business undertakings etc. However, statistics of revenue collections are readily available only from few sources, such as tourism development levy, embarkation tax, Income of Tourism Development Authority, entrance fees to Cultural Triangle, Wildlife Parks, Museums, Zoological Gardens, Botanical Gardens, BMICH etc. The revenue collections from some of these sources are given in Tables 24 to 31.
In 2015, the revenue collected from the listed sources amounted to Rs 8,282.7 million as compared to Rs 7,476.4 million collected from the same sources in the previous year. This was a increase of 10.8 per cent.
Out of the total revenue collected in 2015, the top three contributors were; Cultural Triangle Entrance Fees –Rs.2,495.5 million, Embarkation Taxes – Rs.1,968.5 million and Tourism Development Levy - Rs.1,014.8 million. The Wild Life Parks, Zoological Gardens and Botanical Gardens also contributed considerable amounts recording Rs. 1,011.6 millions, Rs. 813.9 millions & Rs. 435.1 million respectively.
The government earns substantial amount of income in addition to the above revenue as indirect taxes such as from electricity, water, post and telecommunication, lease rentals etc. The presented figures are only a partial indication of total revenue from tourism.
Sri Lanka Tourism Development Authority

PART A
14
PART A: TRENDS & STRUCUTRAL CHARACTERISTCS OF TOURIST TRAFFIC
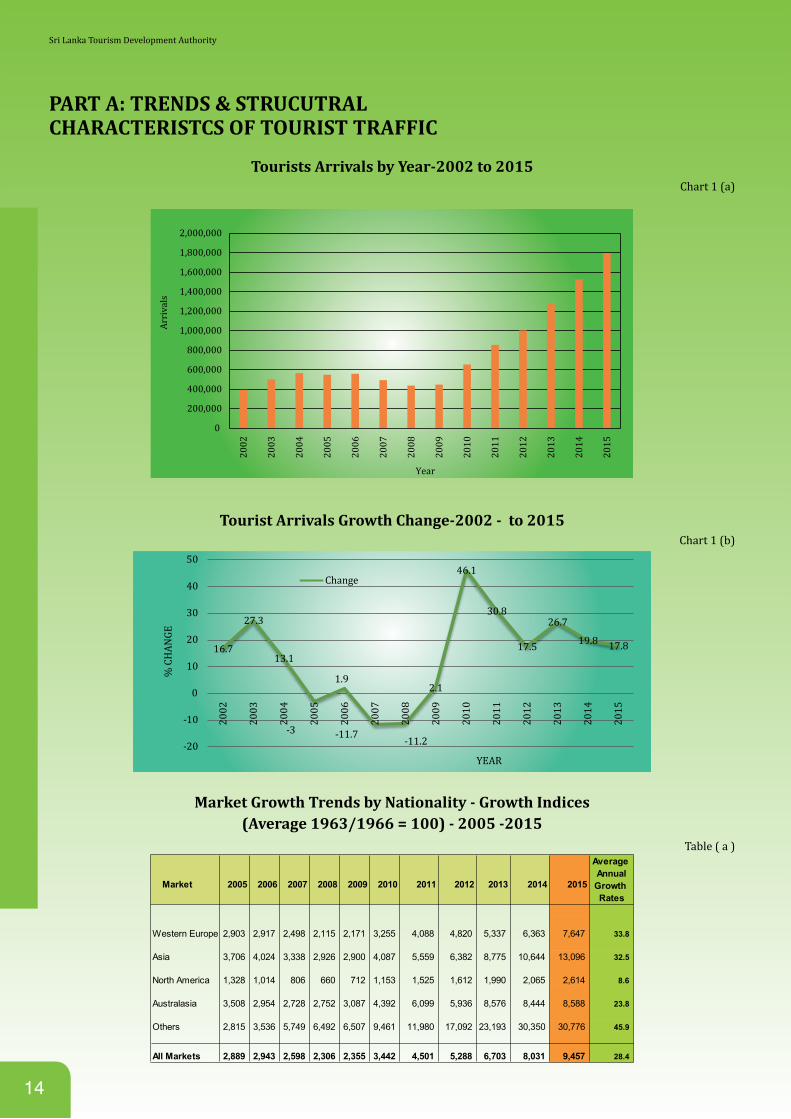
Tourists Arrivals by Year-2002 to 2015Chart 1 (a)
0
200,000
400,000
600,000
800,000
1,000,000
1,200,000
1,400,000
1,600,000
1,800,000
2,000,00020
02
2003
2004
2005
2006
2007
2008
2009
2010
2011
2012
2013
2014
2015
Arri
vals
Year
Tourist Arrivals Growth Change-2002 - to 2015Chart 1 (b)
16.7
27.3
13.1
-3
1.9
-11.7 -11.2
2.1
46.1
30.8
17.5
26.7
19.8 17.8
-20
-10
0
10
20
30
40
50
2002
2003
2004
2005
2006
2007
2008
2009
2010
2011
2012
2013
2014
2015
% C
HAN
GE
YEAR
Change
Market Growth Trends by Nationality - Growth Indices (Average 1963/1966 = 100) - 2005 -2015
Table ( a )Average AnnualGrowth Market 2005 2006 2007 2008 2009 2010 2011 2012 2013 2014 2015Rates
Western Europe 2,903 2,917 2,498 2,115 2,171 3,255 4,088 4,820 5,337 6,363 7,647 33.8
Asia 3,706 4,024 3,338 2,926 2,900 4,087 5,559 6,382 8,775 10,644 13,096 32.5
North America 1,328 1,014 806 660 712 1,153 1,525 1,612 1,990 2,065 2,614 8.6
Australasia 3,508 2,954 2,728 2,752 3,087 4,392 6,099 5,936 8,576 8,444 8,588 23.8
Others 2,815 3,536 5,749 6,492 6,507 9,461 11,980 17,092 23,193 30,350 30,776 45.9
All Markets 2,889 2,943 2,598 2,306 2,355 3,442 4,501 5,288 6,703 8,031 9,457 28.4
Sri Lanka Tourism Development Authority
15
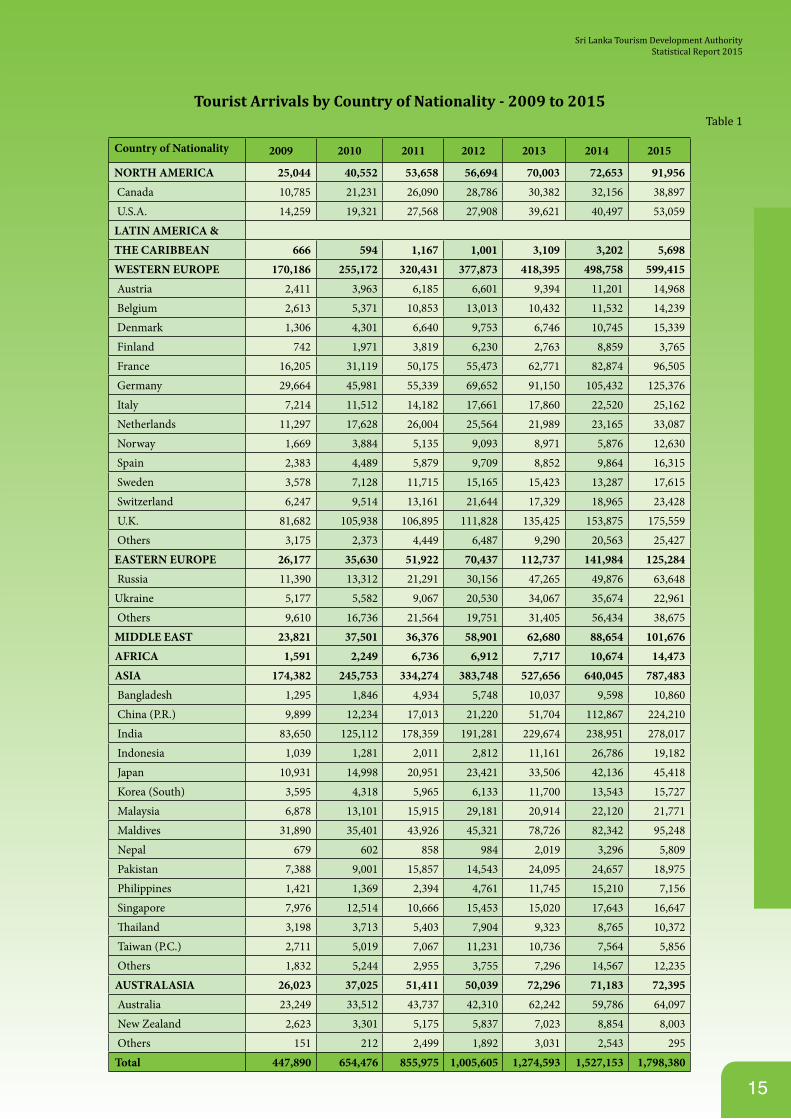
Tourist Arrivals by Country of Nationality - 2009 to 2015 Table 1
Country of Nationality 2009 2010 2011 2012 2013 2014 2015
NORTH AMERICA 25,044 40,552 53,658 56,694 70,003 72,653 91,956 Canada 10,785 21,231 26,090 28,786 30,382 32,156 38,897 U.S.A. 14,259 19,321 27,568 27,908 39,621 40,497 53,059LATIN AMERICA &THE CARIBBEAN 666 594 1,167 1,001 3,109 3,202 5,698WESTERN EUROPE 170,186 255,172 320,431 377,873 418,395 498,758 599,415 Austria 2,411 3,963 6,185 6,601 9,394 11,201 14,968 Belgium 2,613 5,371 10,853 13,013 10,432 11,532 14,239 Denmark 1,306 4,301 6,640 9,753 6,746 10,745 15,339 Finland 742 1,971 3,819 6,230 2,763 8,859 3,765 France 16,205 31,119 50,175 55,473 62,771 82,874 96,505 Germany 29,664 45,981 55,339 69,652 91,150 105,432 125,376 Italy 7,214 11,512 14,182 17,661 17,860 22,520 25,162 Netherlands 11,297 17,628 26,004 25,564 21,989 23,165 33,087 Norway 1,669 3,884 5,135 9,093 8,971 5,876 12,630 Spain 2,383 4,489 5,879 9,709 8,852 9,864 16,315 Sweden 3,578 7,128 11,715 15,165 15,423 13,287 17,615 Switzerland 6,247 9,514 13,161 21,644 17,329 18,965 23,428 U.K. 81,682 105,938 106,895 111,828 135,425 153,875 175,559 Others 3,175 2,373 4,449 6,487 9,290 20,563 25,427EASTERN EUROPE 26,177 35,630 51,922 70,437 112,737 141,984 125,284 Russia 11,390 13,312 21,291 30,156 47,265 49,876 63,648Ukraine 5,177 5,582 9,067 20,530 34,067 35,674 22,961 Others 9,610 16,736 21,564 19,751 31,405 56,434 38,675MIDDLE EAST 23,821 37,501 36,376 58,901 62,680 88,654 101,676AFRICA 1,591 2,249 6,736 6,912 7,717 10,674 14,473ASIA 174,382 245,753 334,274 383,748 527,656 640,045 787,483 Bangladesh 1,295 1,846 4,934 5,748 10,037 9,598 10,860 China (P.R.) 9,899 12,234 17,013 21,220 51,704 112,867 224,210 India 83,650 125,112 178,359 191,281 229,674 238,951 278,017 Indonesia 1,039 1,281 2,011 2,812 11,161 26,786 19,182 Japan 10,931 14,998 20,951 23,421 33,506 42,136 45,418 Korea (South) 3,595 4,318 5,965 6,133 11,700 13,543 15,727 Malaysia 6,878 13,101 15,915 29,181 20,914 22,120 21,771 Maldives 31,890 35,401 43,926 45,321 78,726 82,342 95,248 Nepal 679 602 858 984 2,019 3,296 5,809 Pakistan 7,388 9,001 15,857 14,543 24,095 24,657 18,975 Philippines 1,421 1,369 2,394 4,761 11,745 15,210 7,156 Singapore 7,976 12,514 10,666 15,453 15,020 17,643 16,647 Thailand 3,198 3,713 5,403 7,904 9,323 8,765 10,372 Taiwan (P.C.) 2,711 5,019 7,067 11,231 10,736 7,564 5,856 Others 1,832 5,244 2,955 3,755 7,296 14,567 12,235AUSTRALASIA 26,023 37,025 51,411 50,039 72,296 71,183 72,395 Australia 23,249 33,512 43,737 42,310 62,242 59,786 64,097 New Zealand 2,623 3,301 5,175 5,837 7,023 8,854 8,003 Others 151 212 2,499 1,892 3,031 2,543 295Total 447,890 654,476 855,975 1,005,605 1,274,593 1,527,153 1,798,380
Sri Lanka Tourism Development AuthorityStatistical Report 2015
16
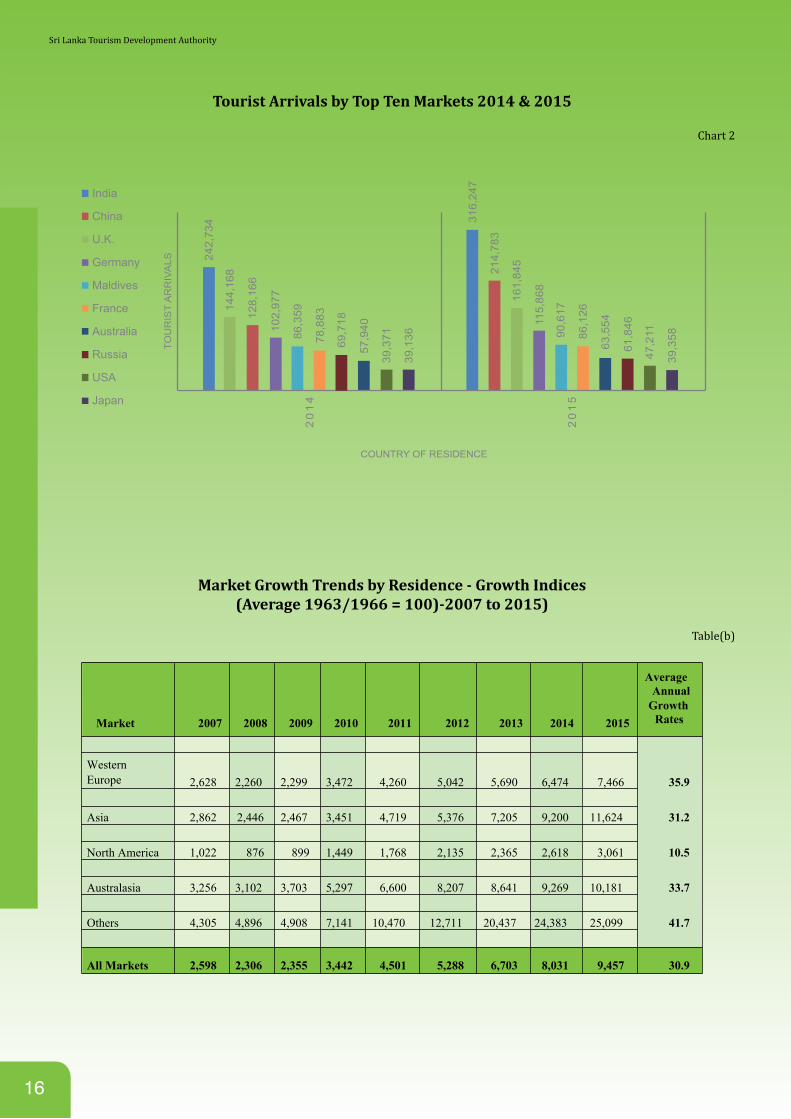
Tourist Arrivals by Top Ten Markets 2014 & 2015
Chart 2
India
China
U.K.
Germany
Maldives
France
Australia
Russia
USA
Japan
TOU
RIS
T A
RR
IVA
LS 242,
734 31
6,24
7
214,
783
161,
845
115,
868
90,6
17
86,1
26
63,5
54
61,8
46
47,2
11
39,3
58
102,
977
86,3
592
01
4
20
15
COUNTRY OF RESIDENCE
78,8
83
39,3
71
39,1
36
128,
166
144,
168
57,9
40
69,7
18
Market Growth Trends by Residence - Growth Indices(Average 1963/1966 = 100)-2007 to 2015)
Table(b)
Average Annual
Growth Market 2007 2008 2009 2010 2011 2012 2013 2014 2015 Rates
Western Europe 2,628 2,260 2,299 3,472 4,260 5,042 5,690 6,474 7,466 35.9
Asia 2,862 2,446 2,467 3,451 4,719 5,376 7,205 9,200 11,624 31.2
North America 1,022 876 899 1,449 1,768 2,135 2,365 2,618 3,061 10.5
Australasia 3,256 3,102 3,703 5,297 6,600 8,207 8,641 9,269 10,181 33.7
Others 4,305 4,896 4,908 7,141 10,470 12,711 20,437 24,383 25,099 41.7
All Markets 2,598 2,306 2,355 3,442 4,501 5,288 6,703 8,031 9,457 30.9
Sri Lanka Tourism Development Authority
17
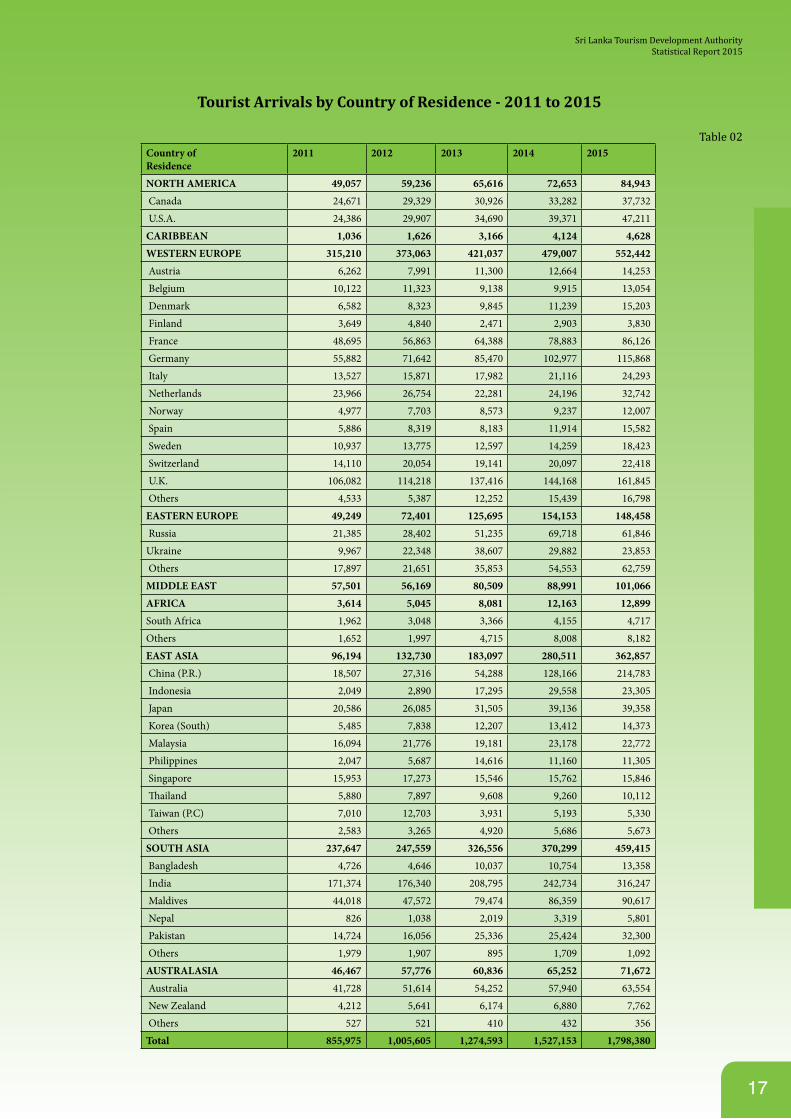
Tourist Arrivals by Country of Residence - 2011 to 2015
Table 02Country of Residence
2011 2012 2013 2014 2015
NORTH AMERICA 49,057 59,236 65,616 72,653 84,943 Canada 24,671 29,329 30,926 33,282 37,732 U.S.A. 24,386 29,907 34,690 39,371 47,211CARIBBEAN 1,036 1,626 3,166 4,124 4,628WESTERN EUROPE 315,210 373,063 421,037 479,007 552,442 Austria 6,262 7,991 11,300 12,664 14,253 Belgium 10,122 11,323 9,138 9,915 13,054 Denmark 6,582 8,323 9,845 11,239 15,203 Finland 3,649 4,840 2,471 2,903 3,830 France 48,695 56,863 64,388 78,883 86,126 Germany 55,882 71,642 85,470 102,977 115,868 Italy 13,527 15,871 17,982 21,116 24,293 Netherlands 23,966 26,754 22,281 24,196 32,742 Norway 4,977 7,703 8,573 9,237 12,007 Spain 5,886 8,319 8,183 11,914 15,582 Sweden 10,937 13,775 12,597 14,259 18,423 Switzerland 14,110 20,054 19,141 20,097 22,418 U.K. 106,082 114,218 137,416 144,168 161,845 Others 4,533 5,387 12,252 15,439 16,798EASTERN EUROPE 49,249 72,401 125,695 154,153 148,458 Russia 21,385 28,402 51,235 69,718 61,846Ukraine 9,967 22,348 38,607 29,882 23,853 Others 17,897 21,651 35,853 54,553 62,759MIDDLE EAST 57,501 56,169 80,509 88,991 101,066AFRICA 3,614 5,045 8,081 12,163 12,899South Africa 1,962 3,048 3,366 4,155 4,717Others 1,652 1,997 4,715 8,008 8,182EAST ASIA 96,194 132,730 183,097 280,511 362,857 China (P.R.) 18,507 27,316 54,288 128,166 214,783 Indonesia 2,049 2,890 17,295 29,558 23,305 Japan 20,586 26,085 31,505 39,136 39,358 Korea (South) 5,485 7,838 12,207 13,412 14,373 Malaysia 16,094 21,776 19,181 23,178 22,772 Philippines 2,047 5,687 14,616 11,160 11,305 Singapore 15,953 17,273 15,546 15,762 15,846 Thailand 5,880 7,897 9,608 9,260 10,112 Taiwan (P.C) 7,010 12,703 3,931 5,193 5,330 Others 2,583 3,265 4,920 5,686 5,673SOUTH ASIA 237,647 247,559 326,556 370,299 459,415 Bangladesh 4,726 4,646 10,037 10,754 13,358 India 171,374 176,340 208,795 242,734 316,247 Maldives 44,018 47,572 79,474 86,359 90,617 Nepal 826 1,038 2,019 3,319 5,801 Pakistan 14,724 16,056 25,336 25,424 32,300 Others 1,979 1,907 895 1,709 1,092AUSTRALASIA 46,467 57,776 60,836 65,252 71,672 Australia 41,728 51,614 54,252 57,940 63,554 New Zealand 4,212 5,641 6,174 6,880 7,762 Others 527 521 410 432 356Total 855,975 1,005,605 1,274,593 1,527,153 1,798,380
Sri Lanka Tourism Development AuthorityStatistical Report 2015
18
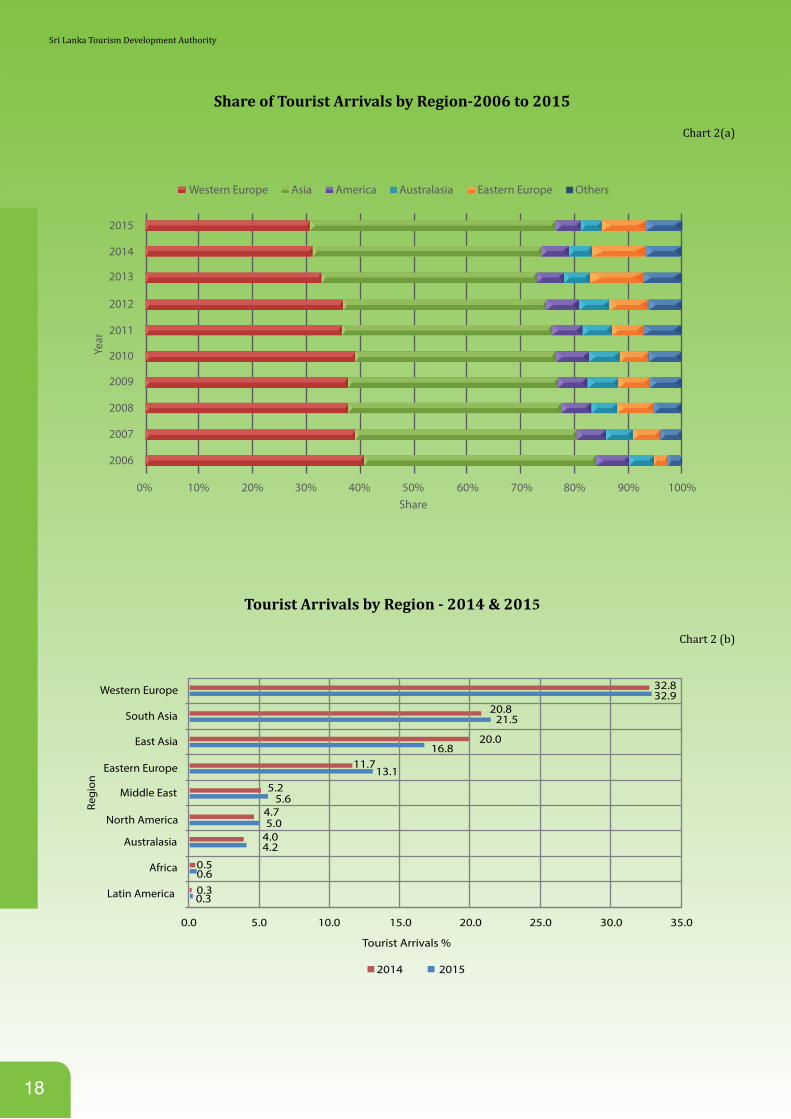
Share of Tourist Arrivals by Region-2006 to 2015
Chart 2(a)
Western Europe
2015
2014
2013
2012
2011
2010Year
Share
2009
2008
2007
2006
0% 10% 20% 30% 40% 50% 60% 70% 80% 90% 100%
Asia America Australasia Eastern Europe Others
Tourist Arrivals by Region - 2014 & 2015
Chart 2 (b)
South Asia
East Asia
Regi
on
Tourist Arrivals %
Australasia 4.04.2
20.821.5
20.016.8
Middle East 5.25.6
Africa 0.50.6
Eastern Europe 11.713.1
Western Europe 32.832.9
Latin America 0.30.3
North America4.75.0
0.0 5.0 10.0 15.0
2014 2015
20.0 25.0 30.0 35.0
Sri Lanka Tourism Development Authority
19
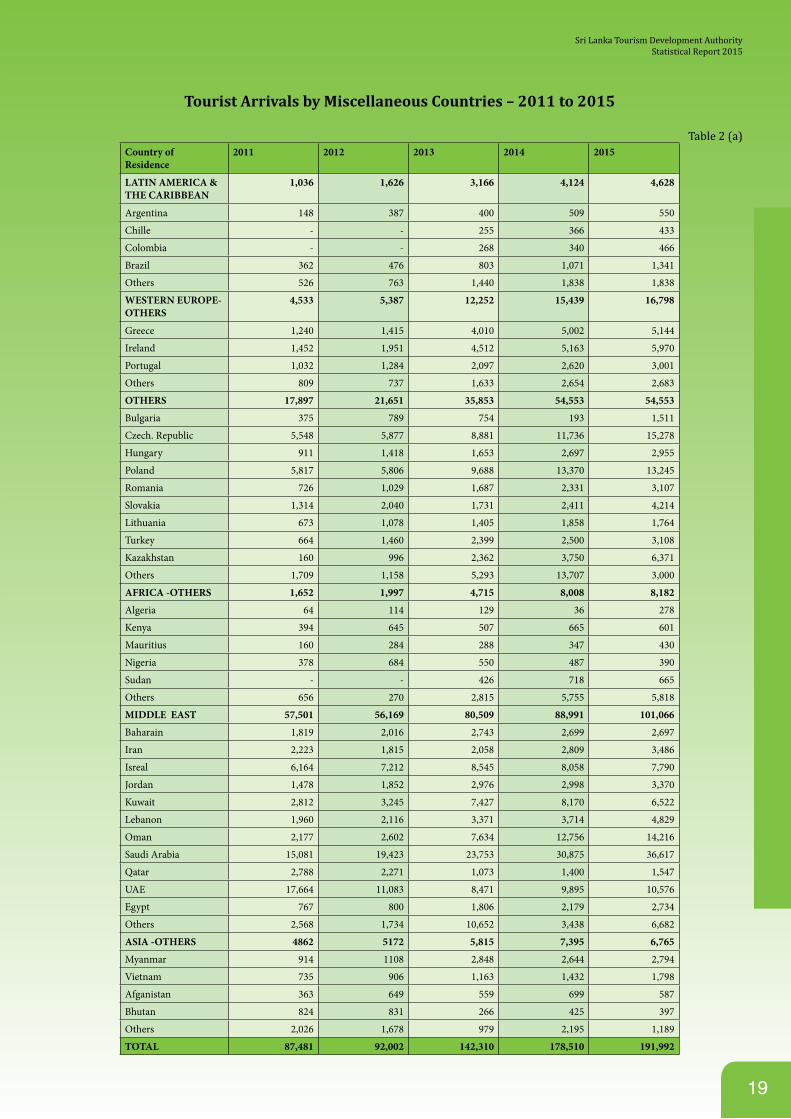
Tourist Arrivals by Miscellaneous Countries – 2011 to 2015
Table 2 (a)Country ofResidence
2011 2012 2013 2014 2015
LATIN AMERICA & THE CARIBBEAN
1,036 1,626 3,166 4,124 4,628
Argentina 148 387 400 509 550
Chille - - 255 366 433
Colombia - - 268 340 466
Brazil 362 476 803 1,071 1,341
Others 526 763 1,440 1,838 1,838
WESTERN EUROPE-OTHERS
4,533 5,387 12,252 15,439 16,798
Greece 1,240 1,415 4,010 5,002 5,144
Ireland 1,452 1,951 4,512 5,163 5,970
Portugal 1,032 1,284 2,097 2,620 3,001
Others 809 737 1,633 2,654 2,683
OTHERS 17,897 21,651 35,853 54,553 54,553
Bulgaria 375 789 754 193 1,511
Czech. Republic 5,548 5,877 8,881 11,736 15,278
Hungary 911 1,418 1,653 2,697 2,955
Poland 5,817 5,806 9,688 13,370 13,245
Romania 726 1,029 1,687 2,331 3,107
Slovakia 1,314 2,040 1,731 2,411 4,214
Lithuania 673 1,078 1,405 1,858 1,764
Turkey 664 1,460 2,399 2,500 3,108
Kazakhstan 160 996 2,362 3,750 6,371
Others 1,709 1,158 5,293 13,707 3,000
AFRICA -OTHERS 1,652 1,997 4,715 8,008 8,182
Algeria 64 114 129 36 278
Kenya 394 645 507 665 601
Mauritius 160 284 288 347 430
Nigeria 378 684 550 487 390
Sudan - - 426 718 665
Others 656 270 2,815 5,755 5,818
MIDDLE EAST 57,501 56,169 80,509 88,991 101,066
Baharain 1,819 2,016 2,743 2,699 2,697
Iran 2,223 1,815 2,058 2,809 3,486
Isreal 6,164 7,212 8,545 8,058 7,790
Jordan 1,478 1,852 2,976 2,998 3,370
Kuwait 2,812 3,245 7,427 8,170 6,522
Lebanon 1,960 2,116 3,371 3,714 4,829
Oman 2,177 2,602 7,634 12,756 14,216
Saudi Arabia 15,081 19,423 23,753 30,875 36,617
Qatar 2,788 2,271 1,073 1,400 1,547
UAE 17,664 11,083 8,471 9,895 10,576
Egypt 767 800 1,806 2,179 2,734
Others 2,568 1,734 10,652 3,438 6,682
ASIA -OTHERS 4862 5172 5,815 7,395 6,765
Myanmar 914 1108 2,848 2,644 2,794
Vietnam 735 906 1,163 1,432 1,798
Afganistan 363 649 559 699 587
Bhutan 824 831 266 425 397
Others 2,026 1,678 979 2,195 1,189
TOTAL 87,481 92,002 142,310 178,510 191,992
Sri Lanka Tourism Development AuthorityStatistical Report 2015
20
Seasonality of Tourist Traffic - 2015Chart 3
Seasonal Variation in Traffic Flow – 1971-2015(Seasonal Indices) (1)
Table (c)
Seasona- Coefficientlity ratio of Seasonal
Year Jan Feb Mar Apr May Jun Jul Aug Sep Oct Nov Dec (2) Variation(3)
1971 179 199 156 47 29 29 57 75 57 78 121 173 2.0 601972 123 125 119 66 70 50 79 99 73 96 132 168 1.7 331973 145 129 121 84 66 50 91 103 64 91 110 146 1.5 301974 154 136 139 90 46 47 76 87 70 88 118 149 1.5 371975 137 121 130 68 65 56 69 100 62 87 131 174 1.7 441976 158 153 135 90 62 46 43 35 68 107 137 166 1.7 471977 137 141 143 77 59 43 77 87 59 90 134 153 1.5 371978 144 140 128 73 55 44 82 97 64 89 129 155 1.6 361979 136 121 122 90 63 51 81 97 71 93 123 152 1.5 301980 135 126 128 81 73 57 86 102 74 88 108 142 1.4 271981 146 127 124 92 70 54 92 106 78 87 96 127 1.5 261982 121 118 124 88 85 77 91 101 88 89 99 119 1.2 161983 175 156 159 116 117 87 89 30 36 58 73 104 1.7 451984 127 122 123 89 69 68 101 104 82 98 105 112 1.3 191985 134 126 139 92 65 52 86 94 71 85 108 148 1.5 301986 172 159 151 101 68 50 64 79 65 66 94 131 1.7 411987 167 156 150 106 54 50 67 75 66 80 93 135 1.7 401988 134 126 128 91 73 76 116 123 98 110 69 56 1.3 251989 84 80 104 80 83 75 99 112 93 98 123 169 1.7 251990 107 106 109 92 74 73 106 108 90 93 99 143 1.4 181991 109 106 103 78 67 66 115 109 94 95 107 151 1.5 221992 108 118 101 86 64 70 103 122 91 97 109 125 1.3 181993 131 123 116 91 68 62 101 100 84 94 107 123 1.3 211994 134 121 122 83 64 63 104 97 91 98 98 126 1.3 221995 137 127 119 100 73 67 107 107 92 91 84 95 1.4 211996 123 117 105 81 70 78 101 98 92 93 99 142 1.4 201997 107 115 112 88 73 76 101 105 98 93 105 128 1.3 161998 117 111 102 81 64 71 93 99 100 100 121 142 1.4 211999 122 114 113 95 69 72 92 107 93 97 115 111 1.2 162000 130 130 121 101 70 66 100 104 93 80 98 105 1.3 202001 157 166 158 131 96 101 102 56 42 46 62 83 1.4 432002 86 97 101 83 81 80 109 108 101 111 114 129 1.5 152003 97 94 98 81 72 76 105 101 86 120 132 138 1.4 232004 106 92 81 65 64 68 107 103 109 126 138 140 1.4 262005 114 115 120 109 96 96 121 116 84 85 82 86 1.1 152006 112 113 117 107 94 94 119 114 83 83 81 84 1.2 152007 137 105 85 80 64 75 107 109 90 90 110 148 1.5 252008 156 111 104 81 85 77 90 84 81 96 101 134 1.6 242009 103 92 91 70 66 81 113 110 102 101 119 152 1.5 232010 93 105 96 70 65 82 116 102 87 96 132 155 1.6 252011 104 92 105 89 69 75 117 102 84 98 127 137 1.4 202012 102 100 109 83 69 78 108 95 85 96 130 146 1.5 222013 104 107 107 76 70 85 101 116 85 101 103 145 1.4 202014 115 111 104 88 70 81 105 110 82 95 94 140 1.4 192015 104 110 105 82 76 77 117 111 96 88 96 138 1.4 18
(2) Seasonality ratio = Highest Monthly Arrival / Average Arrival per month(3) Coefficient of Seasonal Variation is obtained by calculating the standard deviation of the Seasonal indices
(1) Seasonal indices are compiled by taking average arrivals per month as 100
Sri Lanka Tourism Development Authority
21
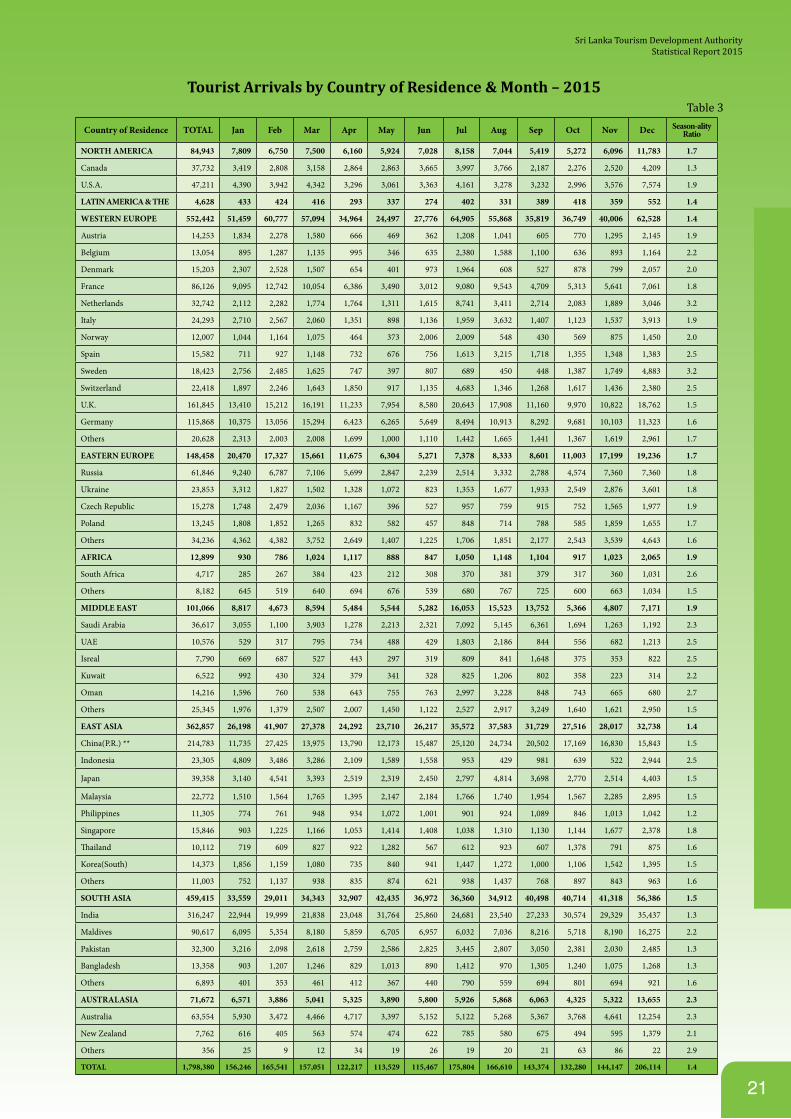
Tourist Arrivals by Country of Residence & Month – 2015 Table 3
Country of Residence TOTAL Jan Feb Mar Apr May Jun Jul Aug Sep Oct Nov Dec Season-alityRatio
NORTH AMERICA 84,943 7,809 6,750 7,500 6,160 5,924 7,028 8,158 7,044 5,419 5,272 6,096 11,783 1.7
Canada 37,732 3,419 2,808 3,158 2,864 2,863 3,665 3,997 3,766 2,187 2,276 2,520 4,209 1.3
U.S.A. 47,211 4,390 3,942 4,342 3,296 3,061 3,363 4,161 3,278 3,232 2,996 3,576 7,574 1.9
LATIN AMERICA & THE 4,628 433 424 416 293 337 274 402 331 389 418 359 552 1.4
WESTERN EUROPE 552,442 51,459 60,777 57,094 34,964 24,497 27,776 64,905 55,868 35,819 36,749 40,006 62,528 1.4
Austria 14,253 1,834 2,278 1,580 666 469 362 1,208 1,041 605 770 1,295 2,145 1.9
Belgium 13,054 895 1,287 1,135 995 346 635 2,380 1,588 1,100 636 893 1,164 2.2
Denmark 15,203 2,307 2,528 1,507 654 401 973 1,964 608 527 878 799 2,057 2.0
France 86,126 9,095 12,742 10,054 6,386 3,490 3,012 9,080 9,543 4,709 5,313 5,641 7,061 1.8
Netherlands 32,742 2,112 2,282 1,774 1,764 1,311 1,615 8,741 3,411 2,714 2,083 1,889 3,046 3.2
Italy 24,293 2,710 2,567 2,060 1,351 898 1,136 1,959 3,632 1,407 1,123 1,537 3,913 1.9
Norway 12,007 1,044 1,164 1,075 464 373 2,006 2,009 548 430 569 875 1,450 2.0
Spain 15,582 711 927 1,148 732 676 756 1,613 3,215 1,718 1,355 1,348 1,383 2.5
Sweden 18,423 2,756 2,485 1,625 747 397 807 689 450 448 1,387 1,749 4,883 3.2
Switzerland 22,418 1,897 2,246 1,643 1,850 917 1,135 4,683 1,346 1,268 1,617 1,436 2,380 2.5
U.K. 161,845 13,410 15,212 16,191 11,233 7,954 8,580 20,643 17,908 11,160 9,970 10,822 18,762 1.5
Germany 115,868 10,375 13,056 15,294 6,423 6,265 5,649 8,494 10,913 8,292 9,681 10,103 11,323 1.6
Others 20,628 2,313 2,003 2,008 1,699 1,000 1,110 1,442 1,665 1,441 1,367 1,619 2,961 1.7
EASTERN EUROPE 148,458 20,470 17,327 15,661 11,675 6,304 5,271 7,378 8,333 8,601 11,003 17,199 19,236 1.7
Russia 61,846 9,240 6,787 7,106 5,699 2,847 2,239 2,514 3,332 2,788 4,574 7,360 7,360 1.8
Ukraine 23,853 3,312 1,827 1,502 1,328 1,072 823 1,353 1,677 1,933 2,549 2,876 3,601 1.8
Czech Republic 15,278 1,748 2,479 2,036 1,167 396 527 957 759 915 752 1,565 1,977 1.9
Poland 13,245 1,808 1,852 1,265 832 582 457 848 714 788 585 1,859 1,655 1.7
Others 34,236 4,362 4,382 3,752 2,649 1,407 1,225 1,706 1,851 2,177 2,543 3,539 4,643 1.6
AFRICA 12,899 930 786 1,024 1,117 888 847 1,050 1,148 1,104 917 1,023 2,065 1.9
South Africa 4,717 285 267 384 423 212 308 370 381 379 317 360 1,031 2.6
Others 8,182 645 519 640 694 676 539 680 767 725 600 663 1,034 1.5
MIDDLE EAST 101,066 8,817 4,673 8,594 5,484 5,544 5,282 16,053 15,523 13,752 5,366 4,807 7,171 1.9
Saudi Arabia 36,617 3,055 1,100 3,903 1,278 2,213 2,321 7,092 5,145 6,361 1,694 1,263 1,192 2.3
UAE 10,576 529 317 795 734 488 429 1,803 2,186 844 556 682 1,213 2.5
Isreal 7,790 669 687 527 443 297 319 809 841 1,648 375 353 822 2.5
Kuwait 6,522 992 430 324 379 341 328 825 1,206 802 358 223 314 2.2
Oman 14,216 1,596 760 538 643 755 763 2,997 3,228 848 743 665 680 2.7
Others 25,345 1,976 1,379 2,507 2,007 1,450 1,122 2,527 2,917 3,249 1,640 1,621 2,950 1.5
EAST ASIA 362,857 26,198 41,907 27,378 24,292 23,710 26,217 35,572 37,583 31,729 27,516 28,017 32,738 1.4
China(P.R.) ** 214,783 11,735 27,425 13,975 13,790 12,173 15,487 25,120 24,734 20,502 17,169 16,830 15,843 1.5
Indonesia 23,305 4,809 3,486 3,286 2,109 1,589 1,558 953 429 981 639 522 2,944 2.5
Japan 39,358 3,140 4,541 3,393 2,519 2,319 2,450 2,797 4,814 3,698 2,770 2,514 4,403 1.5
Malaysia 22,772 1,510 1,564 1,765 1,395 2,147 2,184 1,766 1,740 1,954 1,567 2,285 2,895 1.5
Philippines 11,305 774 761 948 934 1,072 1,001 901 924 1,089 846 1,013 1,042 1.2
Singapore 15,846 903 1,225 1,166 1,053 1,414 1,408 1,038 1,310 1,130 1,144 1,677 2,378 1.8
Thailand 10,112 719 609 827 922 1,282 567 612 923 607 1,378 791 875 1.6
Korea(South) 14,373 1,856 1,159 1,080 735 840 941 1,447 1,272 1,000 1,106 1,542 1,395 1.5
Others 11,003 752 1,137 938 835 874 621 938 1,437 768 897 843 963 1.6
SOUTH ASIA 459,415 33,559 29,011 34,343 32,907 42,435 36,972 36,360 34,912 40,498 40,714 41,318 56,386 1.5
India 316,247 22,944 19,999 21,838 23,048 31,764 25,860 24,681 23,540 27,233 30,574 29,329 35,437 1.3
Maldives 90,617 6,095 5,354 8,180 5,859 6,705 6,957 6,032 7,036 8,216 5,718 8,190 16,275 2.2
Pakistan 32,300 3,216 2,098 2,618 2,759 2,586 2,825 3,445 2,807 3,050 2,381 2,030 2,485 1.3
Bangladesh 13,358 903 1,207 1,246 829 1,013 890 1,412 970 1,305 1,240 1,075 1,268 1.3
Others 6,893 401 353 461 412 367 440 790 559 694 801 694 921 1.6
AUSTRALASIA 71,672 6,571 3,886 5,041 5,325 3,890 5,800 5,926 5,868 6,063 4,325 5,322 13,655 2.3
Australia 63,554 5,930 3,472 4,466 4,717 3,397 5,152 5,122 5,268 5,367 3,768 4,641 12,254 2.3
New Zealand 7,762 616 405 563 574 474 622 785 580 675 494 595 1,379 2.1
Others 356 25 9 12 34 19 26 19 20 21 63 86 22 2.9
TOTAL 1,798,380 156,246 165,541 157,051 122,217 113,529 115,467 175,804 166,610 143,374 132,280 144,147 206,114 1.4
Sri Lanka Tourism Development AuthorityStatistical Report 2015
22
Mode of Transport and Port of Arrivals - 2015
Chart 4
Relative Importance of Different Ports Percentage Distribution of Arrivals - 2007 to 2015
Table(d)
Port 2007 2008 2009 2010 2011 2012 2013 2014 2015*
Katunayake (BIA) 99.9 99.9 99.9 99.9 99.8 99.7 98.8 98.1 98.6
Mattala (MRIA) - - - - - - 0.1 0.1 0.0
TOTAL AIR 99.9 99.9 99.9 99.9 99.8 99.7 98.9 98.2 98.6
Galle Harbour- - - - - - - 0.8 1.4 1.1
Colombo Harbour 0.1 0.1 0.1 0.1 0.2 0.3 0.3 0.4 0.3
TOTAL SEA 0.1 0.1 0.1 0.1 0.2 0.3 1.1 1.8 1.4
Total 100 100 100 100 100 100 100 100 100 * 2015 Data is based by Country of Nationality Source : Department of Immigration & Emigration
Sri Lanka Tourism Development Authority
23
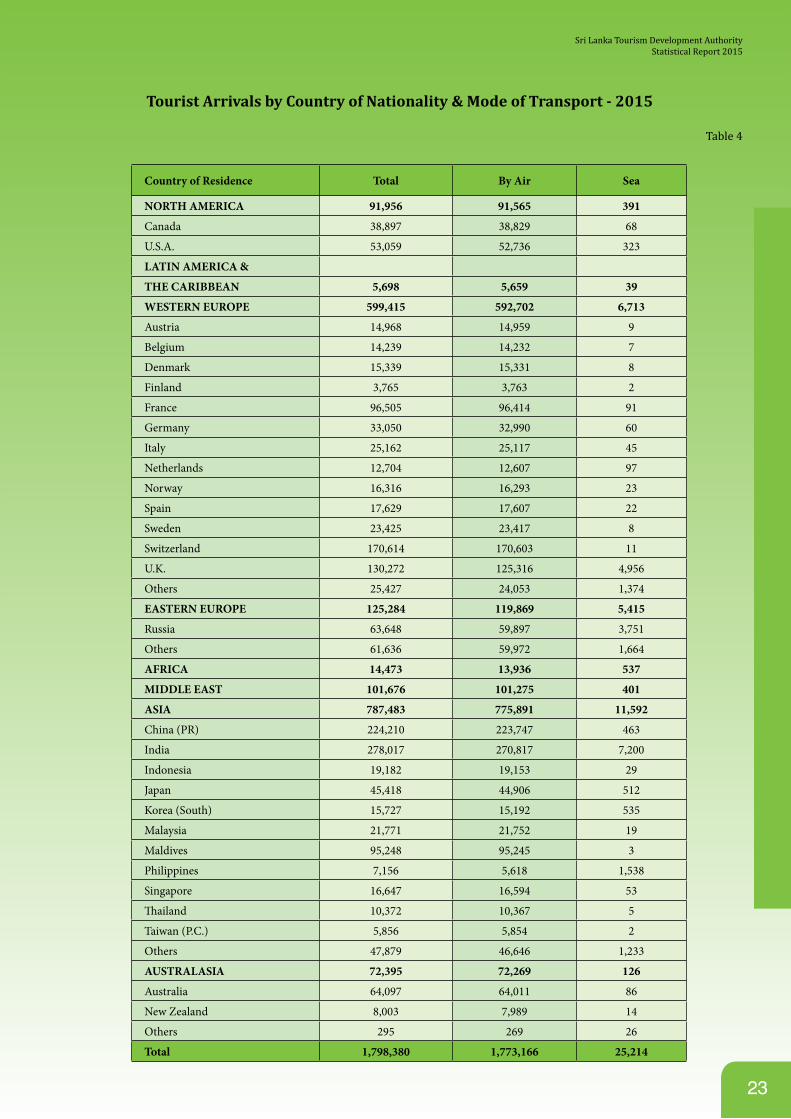
Tourist Arrivals by Country of Nationality & Mode of Transport - 2015
Table 4
Country of Residence Total By Air Sea
NORTH AMERICA 91,956 91,565 391
Canada 38,897 38,829 68
U.S.A. 53,059 52,736 323
LATIN AMERICA &
THE CARIBBEAN 5,698 5,659 39
WESTERN EUROPE 599,415 592,702 6,713
Austria 14,968 14,959 9
Belgium 14,239 14,232 7
Denmark 15,339 15,331 8
Finland 3,765 3,763 2
France 96,505 96,414 91
Germany 33,050 32,990 60
Italy 25,162 25,117 45
Netherlands 12,704 12,607 97
Norway 16,316 16,293 23
Spain 17,629 17,607 22
Sweden 23,425 23,417 8
Switzerland 170,614 170,603 11
U.K. 130,272 125,316 4,956
Others 25,427 24,053 1,374
EASTERN EUROPE 125,284 119,869 5,415
Russia 63,648 59,897 3,751
Others 61,636 59,972 1,664
AFRICA 14,473 13,936 537
MIDDLE EAST 101,676 101,275 401
ASIA 787,483 775,891 11,592
China (PR) 224,210 223,747 463
India 278,017 270,817 7,200
Indonesia 19,182 19,153 29
Japan 45,418 44,906 512
Korea (South) 15,727 15,192 535
Malaysia 21,771 21,752 19
Maldives 95,248 95,245 3
Philippines 7,156 5,618 1,538
Singapore 16,647 16,594 53
Thailand 10,372 10,367 5
Taiwan (P.C.) 5,856 5,854 2
Others 47,879 46,646 1,233
AUSTRALASIA 72,395 72,269 126
Australia 64,097 64,011 86
New Zealand 8,003 7,989 14
Others 295 269 26
Total 1,798,380 1,773,166 25,214
Sri Lanka Tourism Development AuthorityStatistical Report 2015
24
Tourist Arrivals by Type of Carrier 2014 & 2015
Chart 5
96%
2%
0.2%2%
2015
Inter-Regional Flights
Intra-Regional Flights
Charter Flights
Sea Carrier
92%
6%0.4%
2% 2014
Inter-RegionalFlights
Intra-RegionalFlights
Charter Flights
Sea Carrier
Relative Importance of Different Carriers - Percentage Distribution of Arrivals2005 to 2015
Table (e)
Carrier 2005 2006 2007 2008 2009 2010 2011 2012 2013 2014 2015*
Inter-Regional Flights 77.3 76.1 77.6 78.1 82.5 81.5 86.2 87.8 86.9 92.3 96.0
Intra-Regional Flights 21.6 22.9 20.6 18.8 16.2 17.4 11.8 11.3 9.7 5.6 2.4
Charter Flights 1.0 0.9 1.7 3.0 1.2 1.0 1.8 0.6 1.4 0.4 0.2
TOTAL AIR 99.9 99.9 99.9 99.9 99.9 99.9 99.8 99.7 98.0 98.3 98.6
Passenger Ships
(CBO)0.1 0.1 0.1 0.1 0.1 0.1 0.2 0.3 2.0 1.7 1.4
TOTAL SEA 0.1 0.1 0.1 0.1 0.1 0.1 0.2 0.3 2.0 1.7 1.4
Total 100.0 100.0 100.0 100.0 100.0 100.0 100.0 100.0 100.0 100.0 100.0
* 2015 Data is based by Country of Nationality
Sri Lanka Tourism Development Authority
25
CO
UN
TRY
TOTA
LSR
ILA
NK
AN
A
IRLI
NES
EMIR
AR
ESQ
ATA
R
AIR
LIN
ESET
IHA
D
AIR
WAY
S
MIH
INLA
NK
AA
IR L
INE
SIN
GA
POR
E A
LC
ATH
EY
PAC
IFIC
FLY
DU
BAI
AIR
ASI
A X
AIR
_AR
ABI
AA
IR A
SIA
NO
RTH
AM
ERIC
A91
,956
37,4
9514
,628
10,8
594,
509
1,54
51,
586
3,75
71,
526
1,02
140
818
4
Can
ada
38,8
9720
,099
4,11
84,
540
1,33
343
833
01,
119
406
422
171
77
USA
53,0
5917
,396
10,5
106,
319
3,17
61,
107
1,25
62,
638
1,12
059
923
710
7
LATI
N A
MER
ICA
& C
AR
IBBE
AN
5,69
81,
580
1,15
476
237
013
210
195
188
145
4929
WES
TER
N E
URO
PE59
9,41
518
5,74
517
7,31
192
,823
35,2
272,
515
2,53
53,
244
5,54
53,
957
1,20
087
9
Aust
ria14
,968
2,62
75,
475
3,44
01,
241
2929
2924
072
1010
Belg
ium
14,2
392,
348
3,66
73,
869
1,25
742
4241
158
7624
20
Den
mar
k15
,339
5,07
94,
471
3,03
656
050
6333
129
9822
26
Finl
and
3,76
51,
713
387
254
9313
1017
9493
4026
Fran
ce96
,505
33,2
7320
,387
17,5
982,
953
303
350
450
756
639
225
101
Net
herla
nds
33,0
875,
939
18,2
472,
831
2,25
713
210
312
617
728
049
78
Italy
25,1
626,
276
8,94
03,
631
1,40
610
195
7424
412
056
23
Nor
way
12,6
303,
183
3,87
64,
047
227
3726
2340
808
16
Spai
n16
,315
4,11
05,
123
3,22
143
011
365
5624
114
445
119
Swed
en17
,615
3,99
94,
092
6,04
883
186
5865
128
185
1244
Switz
erla
nd23
,428
3,33
19,
922
4,47
02,
059
8698
8867
9811
15
UK
175,
559
68,8
8947
,609
19,2
555,
393
1,17
41,
244
1,88
22,
279
1,30
944
725
3
Ger
man
y12
5,37
638
,014
36,7
5119
,606
16,0
4524
624
923
753
450
917
094
Oth
ers
25,4
276,
964
8,36
41,
517
475
103
103
123
458
254
8154
East
ern
Euro
pe12
5,28
416
,079
18,1
2313
,242
8,19
634
986
152
28,8
3868
322
,766
92
Russ
ia63
,648
6,13
912
,347
9,50
26,
024
180
3090
13,6
9336
89,
209
50
Ukr
aine
22,9
6187
41,
222
435
323
3910
1810
,777
110
8,06
723
Oth
ers
38,6
759,
066
4,55
43,
305
1,84
913
046
444,
368
205
5,49
019
Afr
ica
14,4
732,
951
3,73
31,
626
669
1,97
810
791
725
6848
023
Mid
dle
East
101,
676
20,9
828,
438
12,1
664,
947
2,86
711
82,
392
7,09
039
18,
223
44
Asi
a78
7,48
335
6,27
454
,323
4,54
11,
648
35,5
8523
,308
45,4
983,
986
33,5
913,
048
4,11
6
Chi
na22
4,21
095
,186
2,71
886
125
81,
316
3,74
031
,745
411
22,2
4051
51,
584
Indo
nesia
19,1
8261
625
693
318,
677
690
4114
443
810
6
Japa
n45
,418
26,6
7395
636
598
346
5,84
13,
060
6293
413
100
Mal
aysia
21,7
716,
199
771
9137
109
715
134
287,
523
61,
939
Phili
ppin
es7,
156
152
1,62
444
320
810
478
732
463
820
622
835
Sing
apor
e16
,647
5,93
04,
484
101
2581
5,01
615
220
180
469
Thai
land
10,3
725,
895
102
4016
3434
1,59
511
894
16
Taiw
an5,
856
1,68
813
315
752
816
2,24
18
291
428
Sout
h Ko
rea
15,7
272,
166
797
129
5516
71,
355
1,37
266
373
1129
Indi
a27
8,01
713
7,53
26,
183
1,93
471
115
,977
795
401
2,35
932
62,
148
83
Mal
dive
s95
,248
53,8
1135
,145
106
502,
529
129
6742
210
1233
Bang
lade
sh10
,860
3,75
760
380
314,
833
3612
3111
060
13
Oth
ers
37,0
1916
,669
551
283
121
1,36
03,
354
4,35
429
666
635
81
Aus
tral
asia
72,3
9516
,107
13,2
191,
072
829
525
17,5
411,
851
577
4,20
910
697
9
Aust
ralia
64,0
9714
,019
11,9
9386
769
544
015
,529
1,66
240
63,
860
7790
2
New
Zea
land
8,00
32,
045
1,18
920
113
271
1,98
117
017
134
629
75
Oth
ers
295
4337
42
1431
19‐
3‐
2
TOTA
L1,
798,
380
637,
213
290,
929
137,
091
56,3
9545
,496
45,3
8257
,080
48,4
7544
,065
36,2
806,
346
Tou
rist
Arr
ival
s by
Cou
ntr
y of
Nat
ion
alit
y &
Car
rier
- 2
01
5Ta
ble
5
Sri Lanka Tourism Development AuthorityStatistical Report 2015
26
Tou
rist
Arr
ival
s by
Cou
ntr
y of
Nat
ion
alit
y &
Car
rier
- 2
01
5 Ta
ble
5 (C
ont.)
CO
UN
TRY
SPIC
EJET
JET
AIR
WAY
S
AUST
RI
AN
AIR
LIN
E
MA
LAYS
IA
N A
LA
IRIN
DIA
AIR
CH
INA
MIL
IND
OA
IR
CH
INA
EAST
ERN
AIR
LIN
ES
KO
REA
NA
IRLI
NES
KU
WA
ITA
IRW
AYS
OM
AN
AIR
SAU
DIA
THA
IA
IRW
AYS
TUR
KIS
HA
IRLI
NE
ROTA
NA
JET
CH
ART
ERSE
A
NO
RTH
AM
ERIC
A85
05,
358
2486
81,
983
184
8941
550
576
560
034
11,
090
668
122
185
391
Can
ada
215
2,78
912
335
826
5730
191
8235
721
212
730
219
536
1068
USA
635
2,56
912
533
1,15
712
759
224
423
408
388
214
788
473
8617
532
3
LATI
N A
MER
ICA
&
CA
RIB
BEA
N10
226
2-
8117
013
1237
4618
6519
114
112
12
39
WES
TER
N E
URO
PE1,
601
14,9
1314
72,
159
5,97
517
72,
662
666
838
4,97
921
,115
3,74
61,
917
20,4
2417
522
76,
713
Aust
ria28
78-
2570
326
96
309
496
1068
659
51
9
Belg
ium
471,
607
149
721
811
1635
9444
4865
3‐
27
Den
mar
k31
142
245
814
3231
7214
147
944
1,10
5‐
58
Finl
and
3246
115
5310
1822
136
564
2072
6‐
12
Fran
ce25
33,
829
129
11,
499
2854
111
114
1,87
42,
835
2,62
329
25,
518
3126
91
Net
herla
nds
8465
810
122
195
433
6572
6221
230
841,
124
106
97
Italy
7530
85
7843
57
4344
4834
31,
780
136
9074
32
1445
Nor
way
4712
5-
3311
13
112
1120
623
6255
03
123
Spai
n30
265
347
186
1338
5454
3816
616
051
1,50
76
822
Swed
en44
143
970
106
750
3743
4124
66
821,
167
‐8
8
Switz
erla
nd49
259
2374
183
310
618
392,
058
3496
296
123
11
UK
479
6,33
36
1,00
71,
967
411,
970
118
172
1,75
54,
573
557
610
1,17
657
484,
956
Ger
man
y27
079
686
216
830
3582
111
138
672
8,09
110
530
81,
046
1659
60
Oth
ers
132
324
-87
187
1854
3837
7129
925
624,
154
4425
1,37
4
East
ern
Euro
pe54
260
968
181
475
1212
624
944
612
360
618
511
94,
827
382,
657
5,41
5
Russ
ia31
426
52
7125
74
2113
525
434
109
1558
692
826
3,75
1
Ukr
aine
6380
824
472
1630
2728
284
1518
42
2847
7
Oth
ers
165
264
5886
171
689
8416
561
469
166
463,
951
282,
603
1,18
7
Afr
ica
6752
6-
6595
77
1519
5413
727
933
9611
7453
7
Mid
dle
East
234
843
620
465
36
4183
139
3,55
410
,581
13,6
0420
83,
032
363
6640
1
Asi
a31
,880
46,3
977
12,7
1432
,030
38,0
3638
013
,530
9,94
766
91,
165
8,25
813
,660
343
172
785
11,5
92
Chi
na34
02,
307
-5,
061
622
37,5
9089
11,4
191,
587
8315
838
3,40
314
411
321
463
Indo
nesia
634
-14
612
--
932
120
7,84
471
3-
-29
Japa
n11
242
43
1,44
143
521
76
515
21-
1915
3,19
041
118
512
Mal
aysia
5450
-3,
843
723
26
161
4822
638
-12
19
Phili
ppin
es12
512
302
171
-16
2539
125
5019
418
161
1,53
8
Sing
apor
e19
78-
225
683
-5
39
104
983
16
53
Thai
land
410
5-
3329
11
36
115
52,
319
6-
35
Taiw
an14
70-
139
3036
-11
426
35
412
81
-1
2
Sout
h Ko
rea
164
245
-38
335
010
03
126
6,72
320
2515
507
81
253
5
Indi
a30
,886
41,2
91-
339
27,7
8421
6580
101
405
587
158
305
5512
916
27,
200
Mal
dive
s23
21-
207
147
214
1,09
41,
272
1717
5114
614
212
3
Bang
lade
sh51
776
-12
675
1-
613
6734
4078
138
42
Oth
ers
195
945
246
92,
522
56-
137
122
2310
212
3,15
829
324
31,
231
Aus
tral
asia
305
1,02
437
67,
351
753
2231
9913
612
327
675
4,51
083
1872
126
Aust
ralia
242
830
375
6,53
359
517
2583
9110
722
454
4,30
462
136
86
New
Zea
land
6318
61
818
157
56
1623
1648
2119
221
42
14
Oth
ers
-8
--
1-
--
22-
4-
14-
164
26
TOTA
L35
,581
69,9
3262
823
,623
42,1
3438
,457
3,34
815
,094
12,0
7610
,285
34,5
4526
,507
21,6
5129
,585
900
4,06
825
,214
Sri Lanka Tourism Development Authority
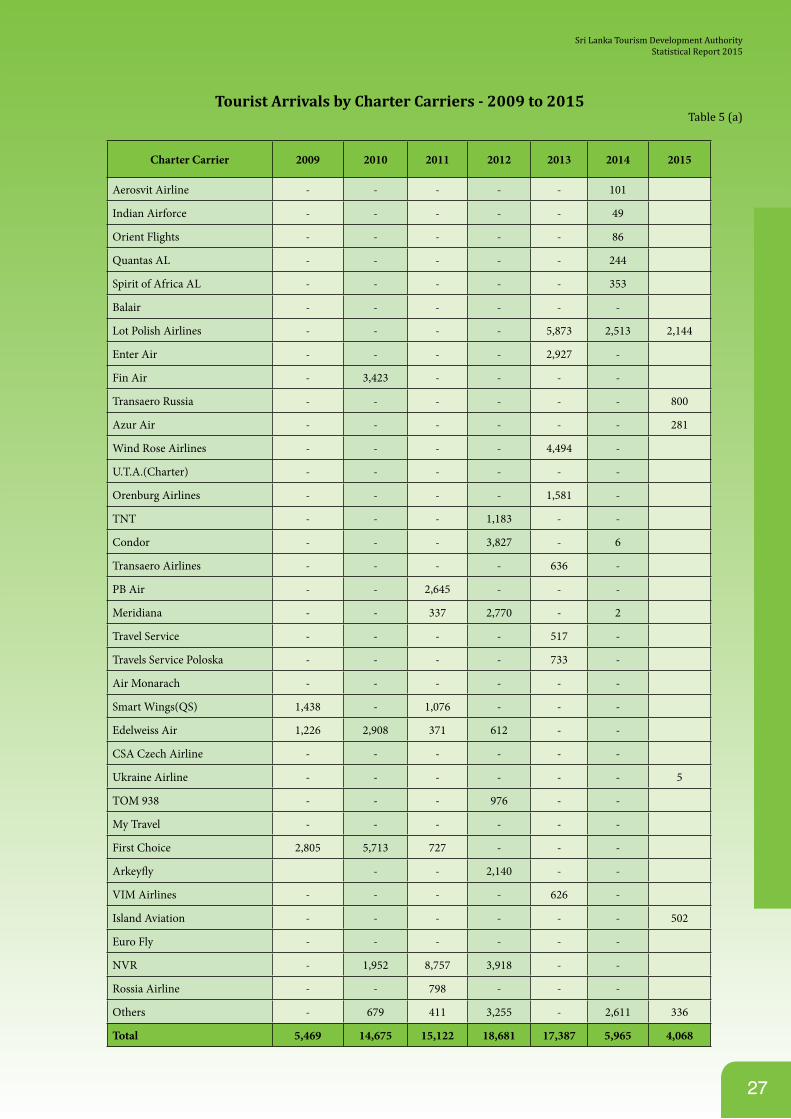
27
Tourist Arrivals by Charter Carriers - 2009 to 2015Table 5 (a)
Charter Carrier 2009 2010 2011 2012 2013 2014 2015
Aerosvit Airline - - - - - 101
Indian Airforce - - - - - 49
Orient Flights - - - - - 86
Quantas AL - - - - - 244
Spirit of Africa AL - - - - - 353
Balair - - - - - -
Lot Polish Airlines - - - - 5,873 2,513 2,144
Enter Air - - - - 2,927 -
Fin Air - 3,423 - - - -
Transaero Russia - - - - - - 800
Azur Air - - - - - - 281
Wind Rose Airlines - - - - 4,494 -
U.T.A.(Charter) - - - - - -
Orenburg Airlines - - - - 1,581 -
TNT - - - 1,183 - -
Condor - - - 3,827 - 6
Transaero Airlines - - - - 636 -
PB Air - - 2,645 - - -
Meridiana - - 337 2,770 - 2
Travel Service - - - - 517 -
Travels Service Poloska - - - - 733 -
Air Monarach - - - - - -
Smart Wings(QS) 1,438 - 1,076 - - -
Edelweiss Air 1,226 2,908 371 612 - -
CSA Czech Airline - - - - - -
Ukraine Airline - - - - - - 5
TOM 938 - - - 976 - -
My Travel - - - - - -
First Choice 2,805 5,713 727 - - -
Arkeyfly - - 2,140 - -
VIM Airlines - - - - 626 -
Island Aviation - - - - - - 502
Euro Fly - - - - - -
NVR - 1,952 8,757 3,918 - -
Rossia Airline - - 798 - - -
Others - 679 411 3,255 - 2,611 336
Total 5,469 14,675 15,122 18,681 17,387 5,965 4,068
Sri Lanka Tourism Development AuthorityStatistical Report 2015
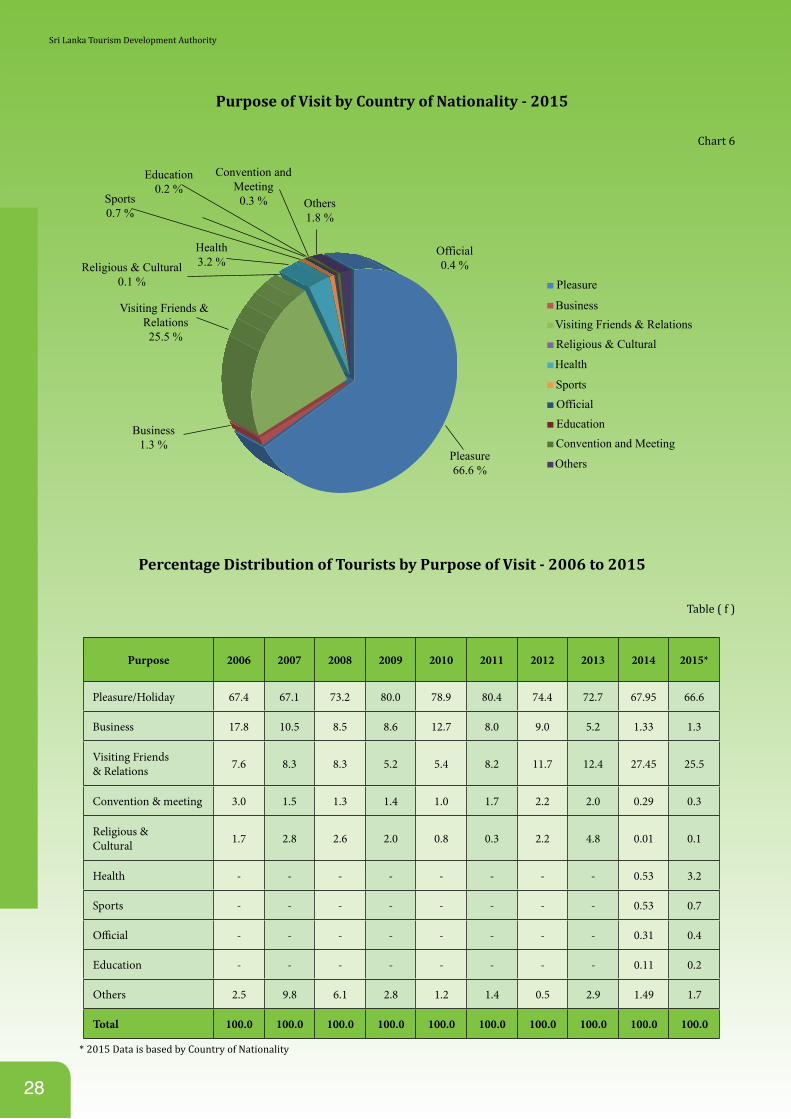
28
Purpose of Visit by Country of Nationality - 2015
Chart 6
Business1.3 %
Visiting Friends & Relations25.5 %
Religious & Cultural0.1 %
Health3.2 %
Education0.2 %
Convention andMeeting0.3 %Sports
0.7 %Others1.8 %
Official0.4 %
Pleasure66.6 %
Pleasure
BusinessVisiting Friends & Relations
Religious & Cultural
Health
SportsOfficialEducationConvention and Meeting
Others
Percentage Distribution of Tourists by Purpose of Visit - 2006 to 2015
Table ( f )
Purpose 2006 2007 2008 2009 2010 2011 2012 2013 2014 2015*
Pleasure/Holiday 67.4 67.1 73.2 80.0 78.9 80.4 74.4 72.7 67.95 66.6
Business 17.8 10.5 8.5 8.6 12.7 8.0 9.0 5.2 1.33 1.3
Visiting Friends & Relations 7.6 8.3 8.3 5.2 5.4 8.2 11.7 12.4 27.45 25.5
Convention & meeting 3.0 1.5 1.3 1.4 1.0 1.7 2.2 2.0 0.29 0.3
Religious & Cultural 1.7 2.8 2.6 2.0 0.8 0.3 2.2 4.8 0.01 0.1
Health - - - - - - - - 0.53 3.2
Sports - - - - - - - - 0.53 0.7
Official - - - - - - - - 0.31 0.4
Education - - - - - - - - 0.11 0.2
Others 2.5 9.8 6.1 2.8 1.2 1.4 0.5 2.9 1.49 1.7
Total 100.0 100.0 100.0 100.0 100.0 100.0 100.0 100.0 100.0 100.0
* 2015 Data is based by Country of Nationality
Sri Lanka Tourism Development Authority
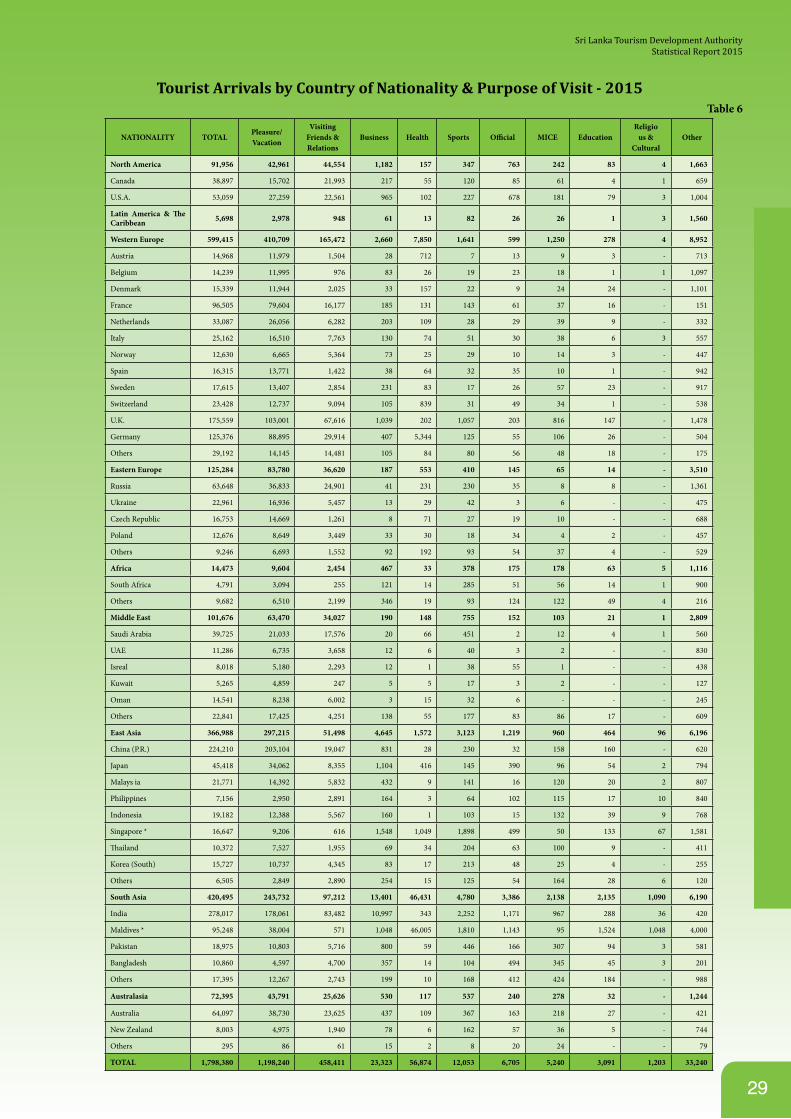
29
Tourist Arrivals by Country of Nationality & Purpose of Visit - 2015Table 6
NATIONALITY TOTALPleasure/Vacation
VisitingFriends &Relations
Business Health Sports Official MICE EducationReligio
us &Cultural
Other
North America 91,956 42,961 44,554 1,182 157 347 763 242 83 4 1,663
Canada 38,897 15,702 21,993 217 55 120 85 61 4 1 659
U.S.A. 53,059 27,259 22,561 965 102 227 678 181 79 3 1,004
Latin America & The Caribbean 5,698 2,978 948 61 13 82 26 26 1 3 1,560
Western Europe 599,415 410,709 165,472 2,660 7,850 1,641 599 1,250 278 4 8,952
Austria 14,968 11,979 1,504 28 712 7 13 9 3 ‐ 713
Belgium 14,239 11,995 976 83 26 19 23 18 1 1 1,097
Denmark 15,339 11,944 2,025 33 157 22 9 24 24 - 1,101
France 96,505 79,604 16,177 185 131 143 61 37 16 - 151
Netherlands 33,087 26,056 6,282 203 109 28 29 39 9 - 332
Italy 25,162 16,510 7,763 130 74 51 30 38 6 3 557
Norway 12,630 6,665 5,364 73 25 29 10 14 3 - 447
Spain 16,315 13,771 1,422 38 64 32 35 10 1 - 942
Sweden 17,615 13,407 2,854 231 83 17 26 57 23 - 917
Switzerland 23,428 12,737 9,094 105 839 31 49 34 1 - 538
U.K. 175,559 103,001 67,616 1,039 202 1,057 203 816 147 - 1,478
Germany 125,376 88,895 29,914 407 5,344 125 55 106 26 - 504
Others 29,192 14,145 14,481 105 84 80 56 48 18 - 175
Eastern Europe 125,284 83,780 36,620 187 553 410 145 65 14 - 3,510
Russia 63,648 36,833 24,901 41 231 230 35 8 8 - 1,361
Ukraine 22,961 16,936 5,457 13 29 42 3 6 - - 475
Czech Republic 16,753 14,669 1,261 8 71 27 19 10 - - 688
Poland 12,676 8,649 3,449 33 30 18 34 4 2 - 457
Others 9,246 6,693 1,552 92 192 93 54 37 4 - 529
Africa 14,473 9,604 2,454 467 33 378 175 178 63 5 1,116
South Africa 4,791 3,094 255 121 14 285 51 56 14 1 900
Others 9,682 6,510 2,199 346 19 93 124 122 49 4 216
Middle East 101,676 63,470 34,027 190 148 755 152 103 21 1 2,809
Saudi Arabia 39,725 21,033 17,576 20 66 451 2 12 4 1 560
UAE 11,286 6,735 3,658 12 6 40 3 2 - - 830
Isreal 8,018 5,180 2,293 12 1 38 55 1 - - 438
Kuwait 5,265 4,859 247 5 5 17 3 2 - - 127
Oman 14,541 8,238 6,002 3 15 32 6 - - - 245
Others 22,841 17,425 4,251 138 55 177 83 86 17 - 609
East Asia 366,988 297,215 51,498 4,645 1,572 3,123 1,219 960 464 96 6,196
China (P.R.) 224,210 203,104 19,047 831 28 230 32 158 160 - 620
Japan 45,418 34,062 8,355 1,104 416 145 390 96 54 2 794
Malays ia 21,771 14,392 5,832 432 9 141 16 120 20 2 807
Philippines 7,156 2,950 2,891 164 3 64 102 115 17 10 840
Indonesia 19,182 12,388 5,567 160 1 103 15 132 39 9 768
Singapore * 16,647 9,206 616 1,548 1,049 1,898 499 50 133 67 1,581
Thailand 10,372 7,527 1,955 69 34 204 63 100 9 - 411
Korea (South) 15,727 10,737 4,345 83 17 213 48 25 4 - 255
Others 6,505 2,849 2,890 254 15 125 54 164 28 6 120
South Asia 420,495 243,732 97,212 13,401 46,431 4,780 3,386 2,138 2,135 1,090 6,190
India 278,017 178,061 83,482 10,997 343 2,252 1,171 967 288 36 420
Maldives * 95,248 38,004 571 1,048 46,005 1,810 1,143 95 1,524 1,048 4,000
Pakistan 18,975 10,803 5,716 800 59 446 166 307 94 3 581
Bangladesh 10,860 4,597 4,700 357 14 104 494 345 45 3 201
Others 17,395 12,267 2,743 199 10 168 412 424 184 - 988
Australasia 72,395 43,791 25,626 530 117 537 240 278 32 - 1,244
Australia 64,097 38,730 23,625 437 109 367 163 218 27 - 421
New Zealand 8,003 4,975 1,940 78 6 162 57 36 5 - 744
Others 295 86 61 15 2 8 20 24 - - 79
TOTAL 1,798,380 1,198,240 458,411 23,323 56,874 12,053 6,705 5,240 3,091 1,203 33,240
Sri Lanka Tourism Development AuthorityStatistical Report 2015
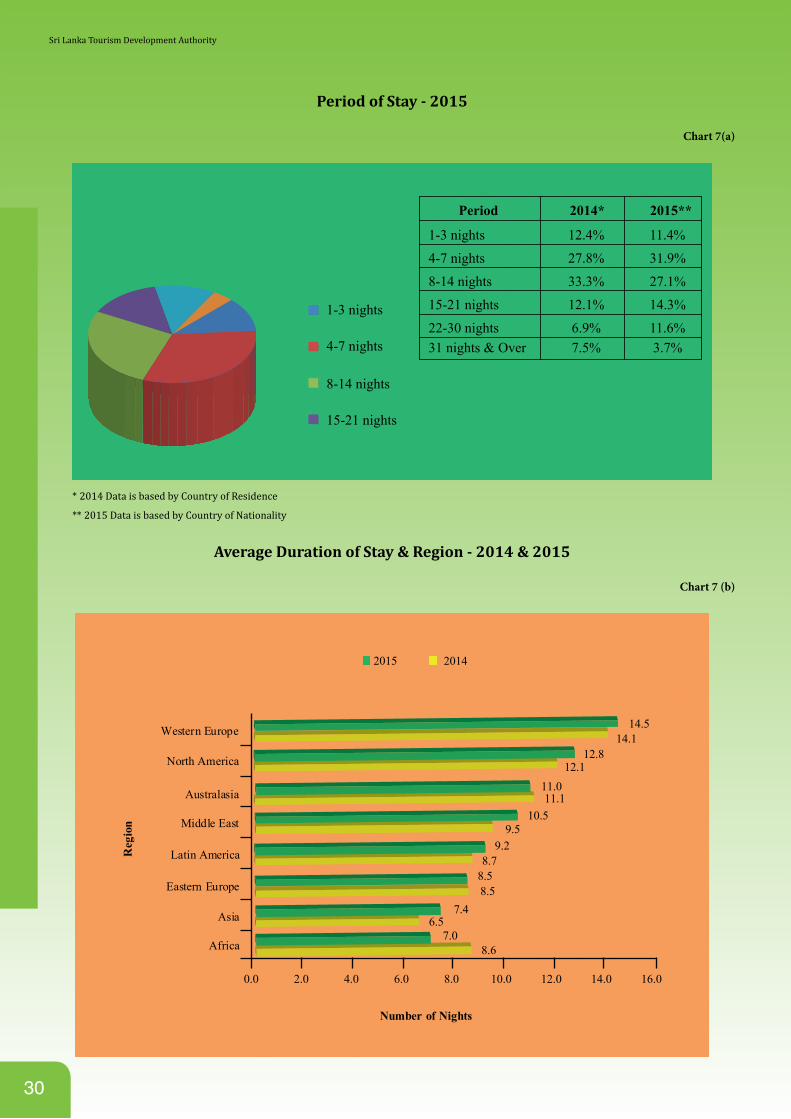
30
Period of Stay - 2015
Chart 7(a)
Period 2014* 2015**
1-3 nights 12.4% 11.4%
4-7 nights 27.8% 31.9%
8-14 nights 33.3% 27.1%
15-21 nights 12.1% 14.3%
22-30 nights 6.9% 11.6%31 nights & Over 7.5% 3.7%
1-3 nights
4-7 nights
8-14 nights
15-21 nights
* 2014 Data is based by Country of Residence
** 2015 Data is based by Country of Nationality
Average Duration of Stay & Region - 2014 & 2015
Chart 7 (b)
Number of Nights
Reg
ion
0.0 2.0 4.0 6.0 8.0 10.0 12.0 14.0 16.0
11.111.0
Australasia
6.57.4Asia
8.67.0
Africa
2015 2014
12.112.8North America
8.79.2
Latin America
14.114.5Western Europe
8.58.5
Eastern Europe
9.510.5Middle East
Sri Lanka Tourism Development Authority
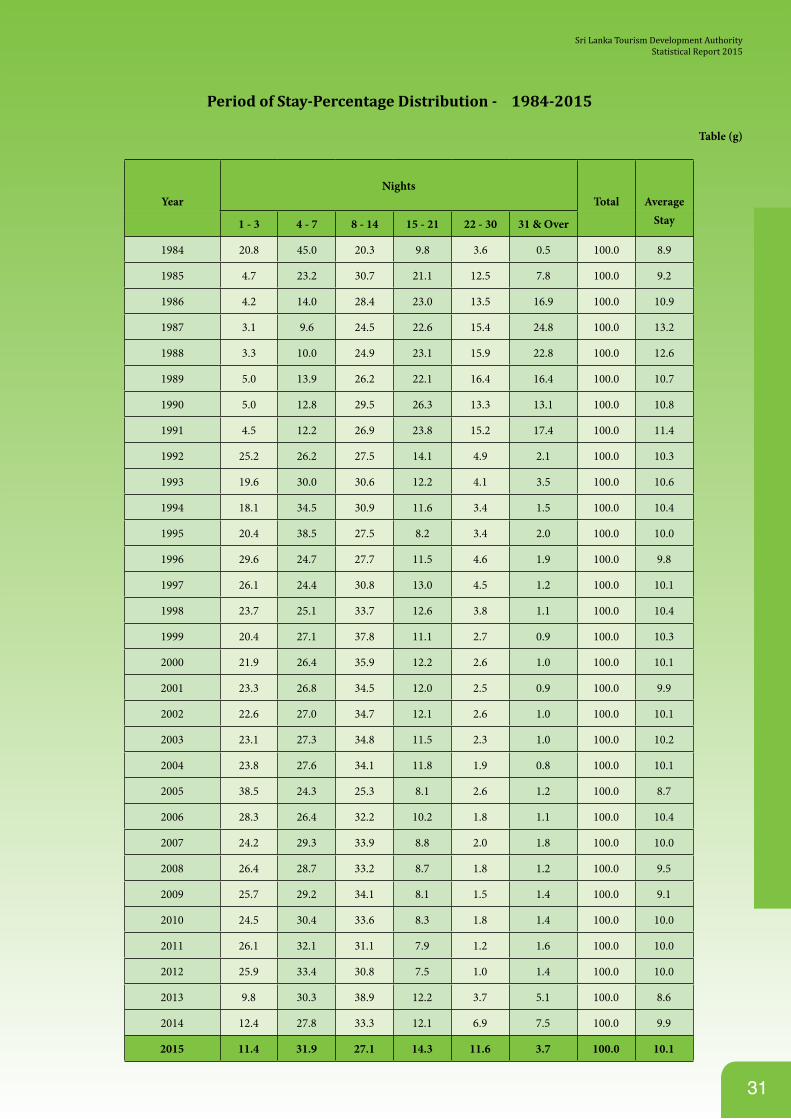
31
Period of Stay-Percentage Distribution - 1984-2015
Table (g)
YearNights
Total Average
1 - 3 4 - 7 8 - 14 15 - 21 22 - 30 31 & Over Stay
1984 20.8 45.0 20.3 9.8 3.6 0.5 100.0 8.9
1985 4.7 23.2 30.7 21.1 12.5 7.8 100.0 9.2
1986 4.2 14.0 28.4 23.0 13.5 16.9 100.0 10.9
1987 3.1 9.6 24.5 22.6 15.4 24.8 100.0 13.2
1988 3.3 10.0 24.9 23.1 15.9 22.8 100.0 12.6
1989 5.0 13.9 26.2 22.1 16.4 16.4 100.0 10.7
1990 5.0 12.8 29.5 26.3 13.3 13.1 100.0 10.8
1991 4.5 12.2 26.9 23.8 15.2 17.4 100.0 11.4
1992 25.2 26.2 27.5 14.1 4.9 2.1 100.0 10.3
1993 19.6 30.0 30.6 12.2 4.1 3.5 100.0 10.6
1994 18.1 34.5 30.9 11.6 3.4 1.5 100.0 10.4
1995 20.4 38.5 27.5 8.2 3.4 2.0 100.0 10.0
1996 29.6 24.7 27.7 11.5 4.6 1.9 100.0 9.8
1997 26.1 24.4 30.8 13.0 4.5 1.2 100.0 10.1
1998 23.7 25.1 33.7 12.6 3.8 1.1 100.0 10.4
1999 20.4 27.1 37.8 11.1 2.7 0.9 100.0 10.3
2000 21.9 26.4 35.9 12.2 2.6 1.0 100.0 10.1
2001 23.3 26.8 34.5 12.0 2.5 0.9 100.0 9.9
2002 22.6 27.0 34.7 12.1 2.6 1.0 100.0 10.1
2003 23.1 27.3 34.8 11.5 2.3 1.0 100.0 10.2
2004 23.8 27.6 34.1 11.8 1.9 0.8 100.0 10.1
2005 38.5 24.3 25.3 8.1 2.6 1.2 100.0 8.7
2006 28.3 26.4 32.2 10.2 1.8 1.1 100.0 10.4
2007 24.2 29.3 33.9 8.8 2.0 1.8 100.0 10.0
2008 26.4 28.7 33.2 8.7 1.8 1.2 100.0 9.5
2009 25.7 29.2 34.1 8.1 1.5 1.4 100.0 9.1
2010 24.5 30.4 33.6 8.3 1.8 1.4 100.0 10.0
2011 26.1 32.1 31.1 7.9 1.2 1.6 100.0 10.0
2012 25.9 33.4 30.8 7.5 1.0 1.4 100.0 10.0
2013 9.8 30.3 38.9 12.2 3.7 5.1 100.0 8.6
2014 12.4 27.8 33.3 12.1 6.9 7.5 100.0 9.9
2015 11.4 31.9 27.1 14.3 11.6 3.7 100.0 10.1
Sri Lanka Tourism Development AuthorityStatistical Report 2015

32
Average Duration of Stay and Tourist Nights by Country of Residence - 2014/2015
Table 7
2014 2015 *
Country of Nationality ArrivalsAverage
Duration ofstay**
Tourist nights** Arrivals
AverageDuration of
stayTourist nights
NORTH AMERICA 72,653 12.1 876,991 84,943 12.7 1,071,740
Canada 33,282 11.8 392,728 37,732 12.5 471,940
U.S.A. 39,371 12.3 484,263 47,211 12.7 599,800
Latin America & The Caribbean 4,124 8.7 35,879 4,628 9.2 41,969
WESTERN EUROPE 479,007 14.1 6,705,348 552,442 14.3 7,895,991
Austria 12,664 16.0 202,624 14,253 14.8 211,427
Belgium 9,915 11.0 109,065 13,054 11.1 144,306
Denmark 11,239 17.8 200,054 15,203 16.1 244,192
Finland 2,903 16.0 46,448 3,830 14.0 53,557
France 78,883 12.5 986,038 86,126 13.0 1,122,967
Germany 102,977 15.8 1,627,037 115,868 15.1 1,751,610
Italy 21,116 15.3 323,075 24,293 13.9 337,406
Netherlands 24,196 17.3 418,591 32,742 16.6 544,467
Norway 9,237 8.5 78,515 12,007 9.9 119,118
Spain 11,914 11.8 140,585 15,582 11.2 175,196
Sweden 14,259 14.3 203,904 18,423 15.1 278,506
Switzerland 20,097 15.5 311,504 22,418 14.3 319,836
U.K. 144,168 13.0 1,874,184 161,845 14.7 2,385,490
Others 15,439 11.9 183,724 16,798 12.4 207,913
EASTERN EUROPE 154,153 8.6 1,340,971 148,458 8.4 1,243,869
Russia 69,718 10.0 679,180 61,846 10.5 648,842
Ukraine 29,882 8.4 251,009 23,853 7.2 172,189
Others 54,553 7.2 392,782 62,759 6.7 422,838
MIDDLE EAST 88,991 9.5 845,415 101.066 10.5 1,046,035
AFRICA 12,163 8.6 104,602 12,899 7.1 89,004
ASIA 650,810 6.5 4,366,376 822,272 7.4 5,997,899
China (P.R.) 128,166 9.8 1,256,027 214,783 9.5 2,033,425
India 242,734 5.3 1,286,490 316,247 5.8 1,819,894
Indonesia 29,558 3.0 88,674 23,305 5.0 116,808
Japan 39,136 9.7 379,619 39,358 8.6 339,738
Korea (South) 13,412 5.0 67,060 14,373 6.6 94,718
Malaysia 23,178 7.0 162,246 22,772 7.9 179,659
Maldives 86,359 7.0 604,513 90,617 8.9 807,438
Pakistan 25,424 4.5 114,408 32,300 5.6 179,880
Philippines 11,160 6.0 66,960 11,305 5.0 56,662
Singapore 15,762 7.5 118,215 15,846 8.0 126,480
Thai land 9,260 8.5 78,710 10,112q 8.0 80,717
Bangaladesh 10,754 5.5 59,147 13,358 4.8 64,472
Others 15,907 5.3 84,307 17,896 5.5 98,002
AUSTRALASIA 65,252 11.1 803,136 71,672 10.8 777,131
Australia 57,940 12.0 695,280 63,554 10.7 677,967
New Zealand 6,880 15.3 105,264 7,762 12.6 97,680
Others 432 6.0 2,592 356 4.2 1,484
TOTAL 1,527,153 9.9 15,118,815 1,798,380 10.1 18,163,638
Sri Lanka Tourism Development Authority
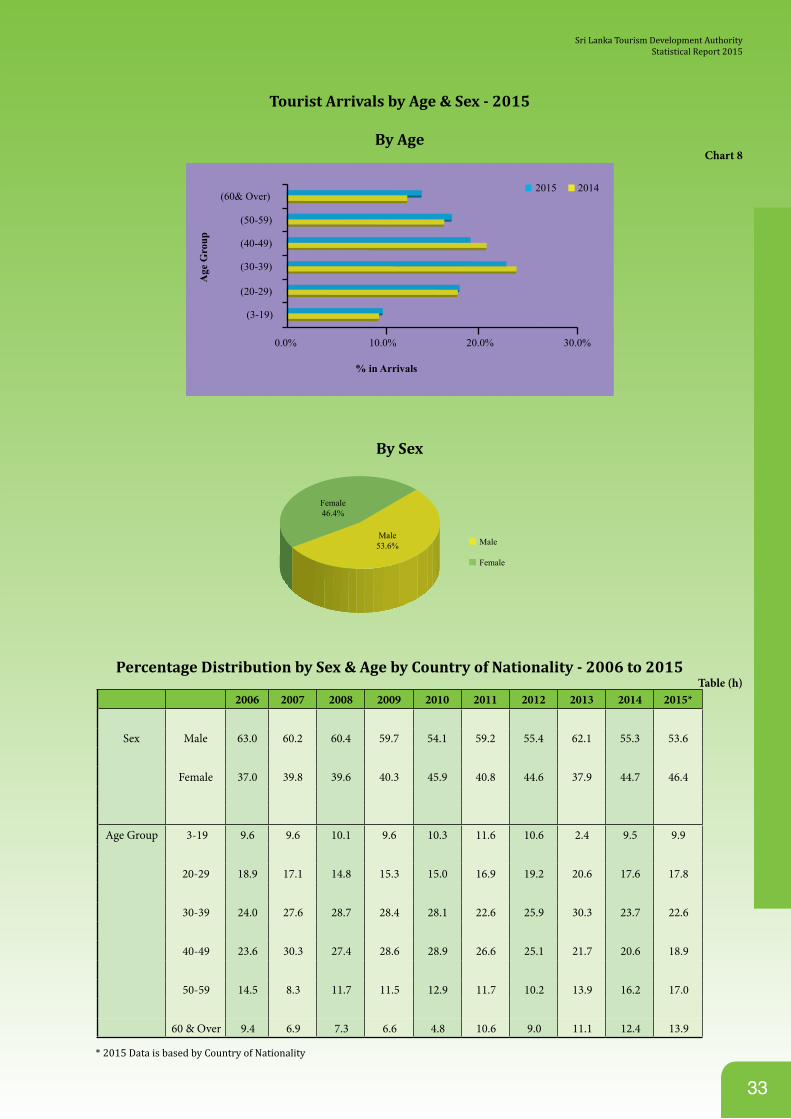
33
Tourist Arrivals by Age & Sex - 2015
By AgeChart 8
(60& Over)
(50-59)
(40-49)
(30-39)
(20-29)
(3-19)
0.0% 10.0%
% in Arrivals
Age
Gro
up
20.0% 30.0%
2015 2014
By Sex
Male
Female
Male53.6%
Female46.4%
Percentage Distribution by Sex & Age by Country of Nationality - 2006 to 2015Table (h)
2006 2007 2008 2009 2010 2011 2012 2013 2014 2015*
Sex Male 63.0 60.2 60.4 59.7 54.1 59.2 55.4 62.1 55.3 53.6 Female 37.0 39.8 39.6 40.3 45.9 40.8 44.6 37.9 44.7 46.4
Age Group 3-19 9.6 9.6 10.1 9.6 10.3 11.6 10.6 2.4 9.5 9.9 20-29 18.9 17.1 14.8 15.3 15.0 16.9 19.2 20.6 17.6 17.8 30-39 24.0 27.6 28.7 28.4 28.1 22.6 25.9 30.3 23.7 22.6 40-49 23.6 30.3 27.4 28.6 28.9 26.6 25.1 21.7 20.6 18.9 50-59 14.5 8.3 11.7 11.5 12.9 11.7 10.2 13.9 16.2 17.0 60 & Over 9.4 6.9 7.3 6.6 4.8 10.6 9.0 11.1 12.4 13.9
* 2015 Data is based by Country of Nationality
Sri Lanka Tourism Development AuthorityStatistical Report 2015
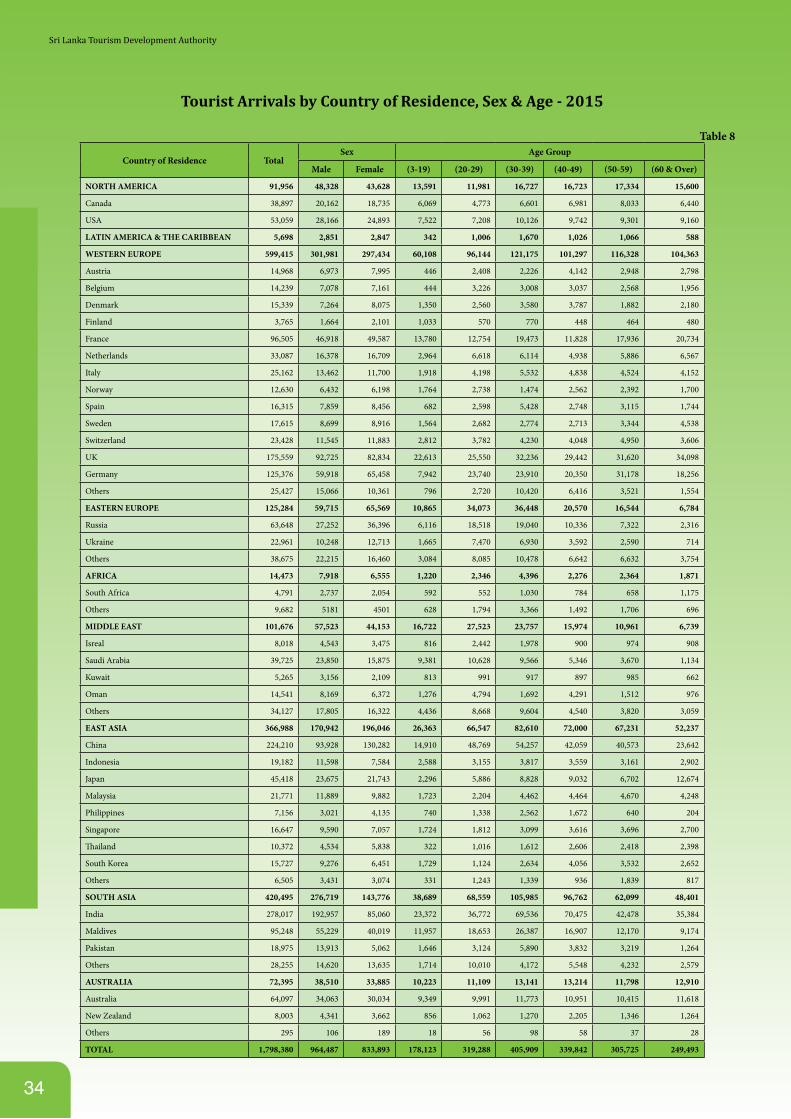
34
Tourist Arrivals by Country of Residence, Sex & Age - 2015
Table 8
Country of Residence TotalSex Age Group
Male Female (3‐19) (20‐29) (30‐39) (40‐49) (50‐59) (60 & Over)
NORTH AMERICA 91,956 48,328 43,628 13,591 11,981 16,727 16,723 17,334 15,600
Canada 38,897 20,162 18,735 6,069 4,773 6,601 6,981 8,033 6,440
USA 53,059 28,166 24,893 7,522 7,208 10,126 9,742 9,301 9,160
LATIN AMERICA & THE CARIBBEAN 5,698 2,851 2,847 342 1,006 1,670 1,026 1,066 588
WESTERN EUROPE 599,415 301,981 297,434 60,108 96,144 121,175 101,297 116,328 104,363
Austria 14,968 6,973 7,995 446 2,408 2,226 4,142 2,948 2,798
Belgium 14,239 7,078 7,161 444 3,226 3,008 3,037 2,568 1,956
Denmark 15,339 7,264 8,075 1,350 2,560 3,580 3,787 1,882 2,180
Finland 3,765 1,664 2,101 1,033 570 770 448 464 480
France 96,505 46,918 49,587 13,780 12,754 19,473 11,828 17,936 20,734
Netherlands 33,087 16,378 16,709 2,964 6,618 6,114 4,938 5,886 6,567
Italy 25,162 13,462 11,700 1,918 4,198 5,532 4,838 4,524 4,152
Norway 12,630 6,432 6,198 1,764 2,738 1,474 2,562 2,392 1,700
Spain 16,315 7,859 8,456 682 2,598 5,428 2,748 3,115 1,744
Sweden 17,615 8,699 8,916 1,564 2,682 2,774 2,713 3,344 4,538
Switzerland 23,428 11,545 11,883 2,812 3,782 4,230 4,048 4,950 3,606
UK 175,559 92,725 82,834 22,613 25,550 32,236 29,442 31,620 34,098
Germany 125,376 59,918 65,458 7,942 23,740 23,910 20,350 31,178 18,256
Others 25,427 15,066 10,361 796 2,720 10,420 6,416 3,521 1,554
EASTERN EUROPE 125,284 59,715 65,569 10,865 34,073 36,448 20,570 16,544 6,784
Russia 63,648 27,252 36,396 6,116 18,518 19,040 10,336 7,322 2,316
Ukraine 22,961 10,248 12,713 1,665 7,470 6,930 3,592 2,590 714
Others 38,675 22,215 16,460 3,084 8,085 10,478 6,642 6,632 3,754
AFRICA 14,473 7,918 6,555 1,220 2,346 4,396 2,276 2,364 1,871
South Africa 4,791 2,737 2,054 592 552 1,030 784 658 1,175
Others 9,682 5181 4501 628 1,794 3,366 1,492 1,706 696
MIDDLE EAST 101,676 57,523 44,153 16,722 27,523 23,757 15,974 10,961 6,739
Isreal 8,018 4,543 3,475 816 2,442 1,978 900 974 908
Saudi Arabia 39,725 23,850 15,875 9,381 10,628 9,566 5,346 3,670 1,134
Kuwait 5,265 3,156 2,109 813 991 917 897 985 662
Oman 14,541 8,169 6,372 1,276 4,794 1,692 4,291 1,512 976
Others 34,127 17,805 16,322 4,436 8,668 9,604 4,540 3,820 3,059
EAST ASIA 366,988 170,942 196,046 26,363 66,547 82,610 72,000 67,231 52,237
China 224,210 93,928 130,282 14,910 48,769 54,257 42,059 40,573 23,642
Indonesia 19,182 11,598 7,584 2,588 3,155 3,817 3,559 3,161 2,902
Japan 45,418 23,675 21,743 2,296 5,886 8,828 9,032 6,702 12,674
Malaysia 21,771 11,889 9,882 1,723 2,204 4,462 4,464 4,670 4,248
Philippines 7,156 3,021 4,135 740 1,338 2,562 1,672 640 204
Singapore 16,647 9,590 7,057 1,724 1,812 3,099 3,616 3,696 2,700
Thailand 10,372 4,534 5,838 322 1,016 1,612 2,606 2,418 2,398
South Korea 15,727 9,276 6,451 1,729 1,124 2,634 4,056 3,532 2,652
Others 6,505 3,431 3,074 331 1,243 1,339 936 1,839 817
SOUTH ASIA 420,495 276,719 143,776 38,689 68,559 105,985 96,762 62,099 48,401
India 278,017 192,957 85,060 23,372 36,772 69,536 70,475 42,478 35,384
Maldives 95,248 55,229 40,019 11,957 18,653 26,387 16,907 12,170 9,174
Pakistan 18,975 13,913 5,062 1,646 3,124 5,890 3,832 3,219 1,264
Others 28,255 14,620 13,635 1,714 10,010 4,172 5,548 4,232 2,579
AUSTRALIA 72,395 38,510 33,885 10,223 11,109 13,141 13,214 11,798 12,910
Australia 64,097 34,063 30,034 9,349 9,991 11,773 10,951 10,415 11,618
New Zealand 8,003 4,341 3,662 856 1,062 1,270 2,205 1,346 1,264
Others 295 106 189 18 56 98 58 37 28
TOTAL 1,798,380 964,487 833,893 178,123 319,288 405,909 339,842 305,725 249,493
Sri Lanka Tourism Development Authority
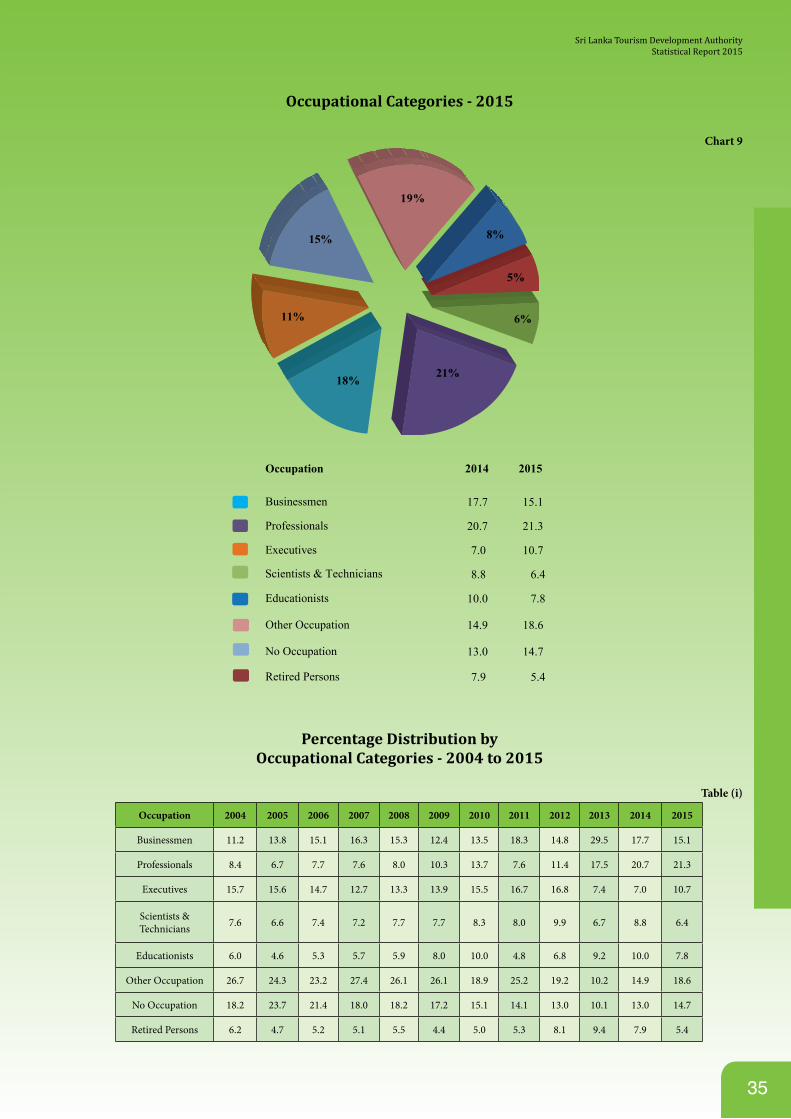
35
Occupational Categories - 2015
Chart 9
19%
8%
5%
6%
21%18%
11%
15%
Occupation 2014 2015
Businessmen 17.7 15.1
Professionals 20.7 21.3
Executives 7.0 10.7
Scientists & Technicians 8.8 6.4
Educationists 10.0 7.8
Other Occupation 14.9 18.6
No Occupation 13.0 14.7
Retired Persons 7.9 5.4
Percentage Distribution by Occupational Categories - 2004 to 2015
Table (i)
Occupation 2004 2005 2006 2007 2008 2009 2010 2011 2012 2013 2014 2015
Businessmen 11.2 13.8 15.1 16.3 15.3 12.4 13.5 18.3 14.8 29.5 17.7 15.1
Professionals 8.4 6.7 7.7 7.6 8.0 10.3 13.7 7.6 11.4 17.5 20.7 21.3
Executives 15.7 15.6 14.7 12.7 13.3 13.9 15.5 16.7 16.8 7.4 7.0 10.7
Scientists & Technicians 7.6 6.6 7.4 7.2 7.7 7.7 8.3 8.0 9.9 6.7 8.8 6.4
Educationists 6.0 4.6 5.3 5.7 5.9 8.0 10.0 4.8 6.8 9.2 10.0 7.8
Other Occupation 26.7 24.3 23.2 27.4 26.1 26.1 18.9 25.2 19.2 10.2 14.9 18.6
No Occupation 18.2 23.7 21.4 18.0 18.2 17.2 15.1 14.1 13.0 10.1 13.0 14.7
Retired Persons 6.2 4.7 5.2 5.1 5.5 4.4 5.0 5.3 8.1 9.4 7.9 5.4
Sri Lanka Tourism Development AuthorityStatistical Report 2015
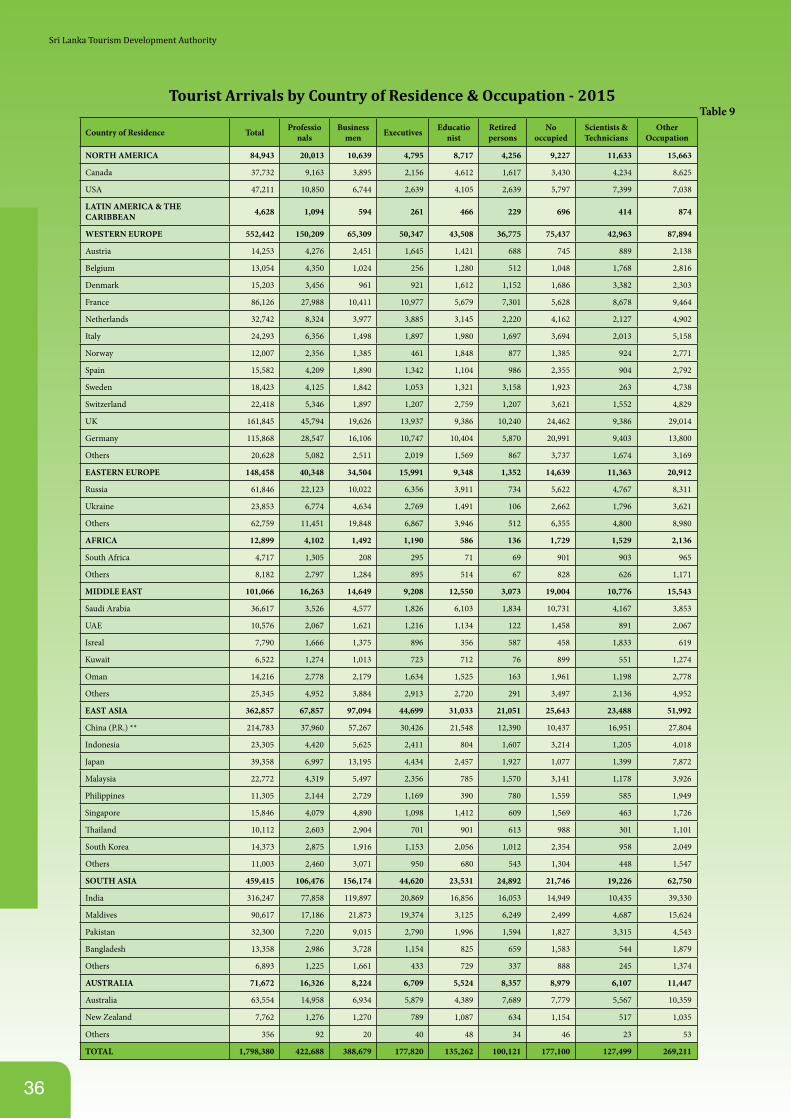
36
Tourist Arrivals by Country of Residence & Occupation - 2015Table 9
Country of Residence Total Professionals
Businessmen Executives Educatio
nistRetired persons
No occupied
Scientists & Technicians
Other Occupation
NORTH AMERICA 84,943 20,013 10,639 4,795 8,717 4,256 9,227 11,633 15,663
Canada 37,732 9,163 3,895 2,156 4,612 1,617 3,430 4,234 8,625
USA 47,211 10,850 6,744 2,639 4,105 2,639 5,797 7,399 7,038
LATIN AMERICA & THE CARIBBEAN 4,628 1,094 594 261 466 229 696 414 874
WESTERN EUROPE 552,442 150,209 65,309 50,347 43,508 36,775 75,437 42,963 87,894
Austria 14,253 4,276 2,451 1,645 1,421 688 745 889 2,138
Belgium 13,054 4,350 1,024 256 1,280 512 1,048 1,768 2,816
Denmark 15,203 3,456 961 921 1,612 1,152 1,686 3,382 2,303
France 86,126 27,988 10,411 10,977 5,679 7,301 5,628 8,678 9,464
Netherlands 32,742 8,324 3,977 3,885 3,145 2,220 4,162 2,127 4,902
Italy 24,293 6,356 1,498 1,897 1,980 1,697 3,694 2,013 5,158
Norway 12,007 2,356 1,385 461 1,848 877 1,385 924 2,771
Spain 15,582 4,209 1,890 1,342 1,104 986 2,355 904 2,792
Sweden 18,423 4,125 1,842 1,053 1,321 3,158 1,923 263 4,738
Switzerland 22,418 5,346 1,897 1,207 2,759 1,207 3,621 1,552 4,829
UK 161,845 45,794 19,626 13,937 9,386 10,240 24,462 9,386 29,014
Germany 115,868 28,547 16,106 10,747 10,404 5,870 20,991 9,403 13,800
Others 20,628 5,082 2,511 2,019 1,569 867 3,737 1,674 3,169
EASTERN EUROPE 148,458 40,348 34,504 15,991 9,348 1,352 14,639 11,363 20,912
Russia 61,846 22,123 10,022 6,356 3,911 734 5,622 4,767 8,311
Ukraine 23,853 6,774 4,634 2,769 1,491 106 2,662 1,796 3,621
Others 62,759 11,451 19,848 6,867 3,946 512 6,355 4,800 8,980
AFRICA 12,899 4,102 1,492 1,190 586 136 1,729 1,529 2,136
South Africa 4,717 1,305 208 295 71 69 901 903 965
Others 8,182 2,797 1,284 895 514 67 828 626 1,171
MIDDLE EAST 101,066 16,263 14,649 9,208 12,550 3,073 19,004 10,776 15,543
Saudi Arabia 36,617 3,526 4,577 1,826 6,103 1,834 10,731 4,167 3,853
UAE 10,576 2,067 1,621 1,216 1,134 122 1,458 891 2,067
Isreal 7,790 1,666 1,375 896 356 587 458 1,833 619
Kuwait 6,522 1,274 1,013 723 712 76 899 551 1,274
Oman 14,216 2,778 2,179 1,634 1,525 163 1,961 1,198 2,778
Others 25,345 4,952 3,884 2,913 2,720 291 3,497 2,136 4,952
EAST ASIA 362,857 67,857 97,094 44,699 31,033 21,051 25,643 23,488 51,992
China (P.R.) ** 214,783 37,960 57,267 30,426 21,548 12,390 10,437 16,951 27,804
Indonesia 23,305 4,420 5,625 2,411 804 1,607 3,214 1,205 4,018
Japan 39,358 6,997 13,195 4,434 2,457 1,927 1,077 1,399 7,872
Malaysia 22,772 4,319 5,497 2,356 785 1,570 3,141 1,178 3,926
Philippines 11,305 2,144 2,729 1,169 390 780 1,559 585 1,949
Singapore 15,846 4,079 4,890 1,098 1,412 609 1,569 463 1,726
Thailand 10,112 2,603 2,904 701 901 613 988 301 1,101
South Korea 14,373 2,875 1,916 1,153 2,056 1,012 2,354 958 2,049
Others 11,003 2,460 3,071 950 680 543 1,304 448 1,547
SOUTH ASIA 459,415 106,476 156,174 44,620 23,531 24,892 21,746 19,226 62,750
India 316,247 77,858 119,897 20,869 16,856 16,053 14,949 10,435 39,330
Maldives 90,617 17,186 21,873 19,374 3,125 6,249 2,499 4,687 15,624
Pakistan 32,300 7,220 9,015 2,790 1,996 1,594 1,827 3,315 4,543
Bangladesh 13,358 2,986 3,728 1,154 825 659 1,583 544 1,879
Others 6,893 1,225 1,661 433 729 337 888 245 1,374
AUSTRALIA 71,672 16,326 8,224 6,709 5,524 8,357 8,979 6,107 11,447
Australia 63,554 14,958 6,934 5,879 4,389 7,689 7,779 5,567 10,359
New Zealand 7,762 1,276 1,270 789 1,087 634 1,154 517 1,035
Others 356 92 20 40 48 34 46 23 53
TOTAL 1,798,380 422,688 388,679 177,820 135,262 100,121 177,100 127,499 269,211
Sri Lanka Tourism Development Authority
PART B
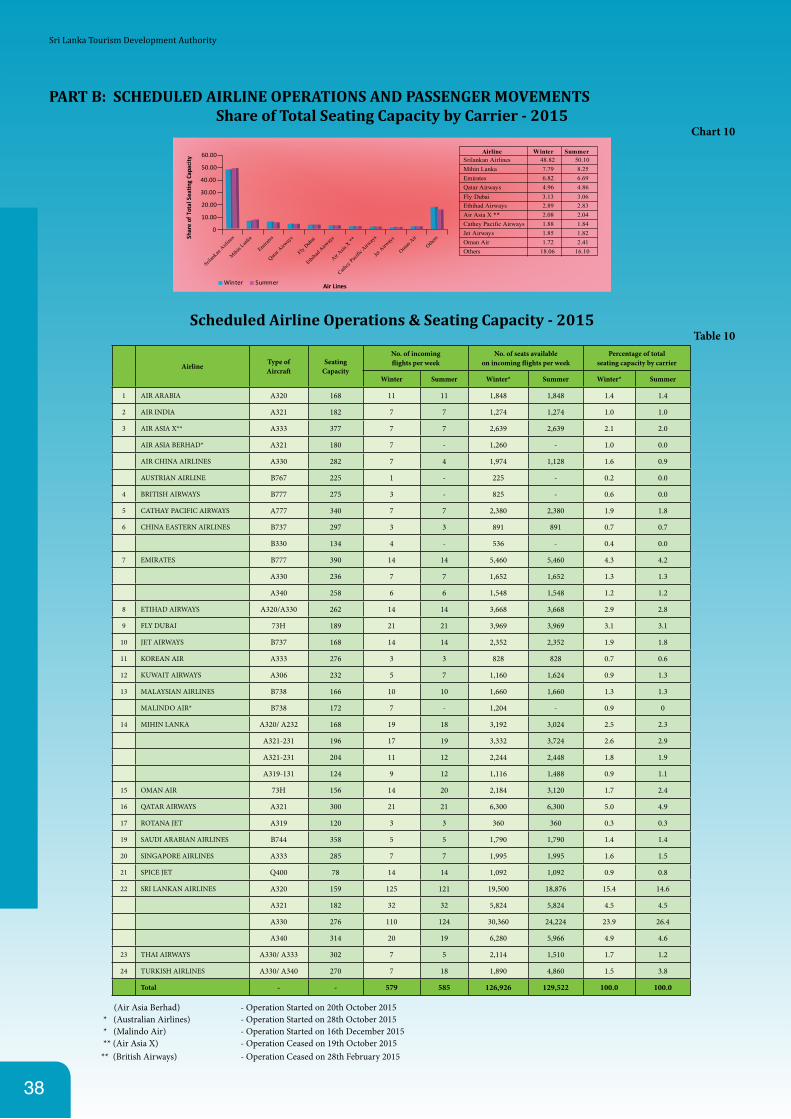
38
PART B: SCHEDULED AIRLINE OPERATIONS AND PASSENGER MOVEMENTSShare of Total Seating Capacity by Carrier - 2015
Chart 10Airline Winter Summer
Srilankan Airlines
Srilank
an A
irline
s
48.82 50.10Mihin Lanka
Mihin L
anka
7.79 8.25Emirates
Emirates
6.82 6.69Qatar Airways
Qatar A
irway
s
4.96 4.86
Ethihad Airways
Ethiha
d Airw
ays
2.89 2.83Fly Dubai
Fly Dub
ai
3.13 3.06
Air Asia X **
Air Asia
X **
2.08 2.04Cathey Pacific Airways
Cathey
Pacific
Airw
ays
1.88 1.84Jet Airways
Jet A
irway
s1.85 1.82
Oman AirOman
Air
1.72 2.41Others
Others
18.06 16.10
0
10.00
20.00
30.00
40.00
50.00
60.00
Shar
e of
Tot
al S
eatin
g Ca
paci
ty
Air LinesWinter Summer
Scheduled Airline Operations & Seating Capacity - 2015Table 10
Airline Type ofAircraft
SeatingCapacity
No. of incomingflights per week
No. of seats availableon incoming flights per week
Percentage of totalseating capacity by carrier
Winter Summer Winter* Summer Winter* Summer
1 AIR ARABIA A320 168 11 11 1,848 1,848 1.4 1.4
2 AIR INDIA A321 182 7 7 1,274 1,274 1.0 1.0
3 AIR ASIA X** A333 377 7 7 2,639 2,639 2.1 2.0
AIR ASIA BERHAD* A321 180 7 - 1,260 - 1.0 0.0
AIR CHINA AIRLINES A330 282 7 4 1,974 1,128 1.6 0.9
AUSTRIAN AIRLINE B767 225 1 - 225 - 0.2 0.0
4 BRITISH AIRWAYS B777 275 3 - 825 - 0.6 0.0
5 CATHAY PACIFIC AIRWAYS A777 340 7 7 2,380 2,380 1.9 1.8
6 CHINA EASTERN AIRLINES B737 297 3 3 891 891 0.7 0.7
B330 134 4 - 536 - 0.4 0.0
7 EMIRATES B777 390 14 14 5,460 5,460 4.3 4.2
A330 236 7 7 1,652 1,652 1.3 1.3
A340 258 6 6 1,548 1,548 1.2 1.2
8 ETIHAD AIRWAYS A320/A330 262 14 14 3,668 3,668 2.9 2.8
9 FLY DUBAI 73H 189 21 21 3,969 3,969 3.1 3.1
10 JET AIRWAYS B737 168 14 14 2,352 2,352 1.9 1.8
11 KOREAN AIR A333 276 3 3 828 828 0.7 0.6
12 KUWAIT AIRWAYS A306 232 5 7 1,160 1,624 0.9 1.3
13 MALAYSIAN AIRLINES B738 166 10 10 1,660 1,660 1.3 1.3
MALINDO AIR* B738 172 7 - 1,204 - 0.9 0
14 MIHIN LANKA A320/ A232 168 19 18 3,192 3,024 2.5 2.3
A321-231 196 17 19 3,332 3,724 2.6 2.9
A321-231 204 11 12 2,244 2,448 1.8 1.9
A319-131 124 9 12 1,116 1,488 0.9 1.1
15 OMAN AIR 73H 156 14 20 2,184 3,120 1.7 2.4
16 QATAR AIRWAYS A321 300 21 21 6,300 6,300 5.0 4.9
17 ROTANA JET A319 120 3 3 360 360 0.3 0.3
19 SAUDI ARABIAN AIRLINES B744 358 5 5 1,790 1,790 1.4 1.4
20 SINGAPORE AIRLINES A333 285 7 7 1,995 1,995 1.6 1.5
21 SPICE JET Q400 78 14 14 1,092 1,092 0.9 0.8
22 SRI LANKAN AIRLINES A320 159 125 121 19,500 18,876 15.4 14.6
A321 182 32 32 5,824 5,824 4.5 4.5
A330 276 110 124 30,360 24,224 23.9 26.4
A340 314 20 19 6,280 5,966 4.9 4.6
23 THAI AIRWAYS A330/ A333 302 7 5 2,114 1,510 1.7 1.2
24 TURKISH AIRLINES A330/ A340 270 7 18 1,890 4,860 1.5 3.8
Total - - 579 585 126,926 129,522 100.0 100.0 (Air Asia Berhad) - Operation Started on 20th October 2015 * (Australian Airlines) - Operation Started on 28th October 2015 * (Malindo Air) - Operation Started on 16th December 2015 ** (Air Asia X) - Operation Ceased on 19th October 2015 ** (British Airways) - Operation Ceased on 28th February 2015
Sri Lanka Tourism Development Authority
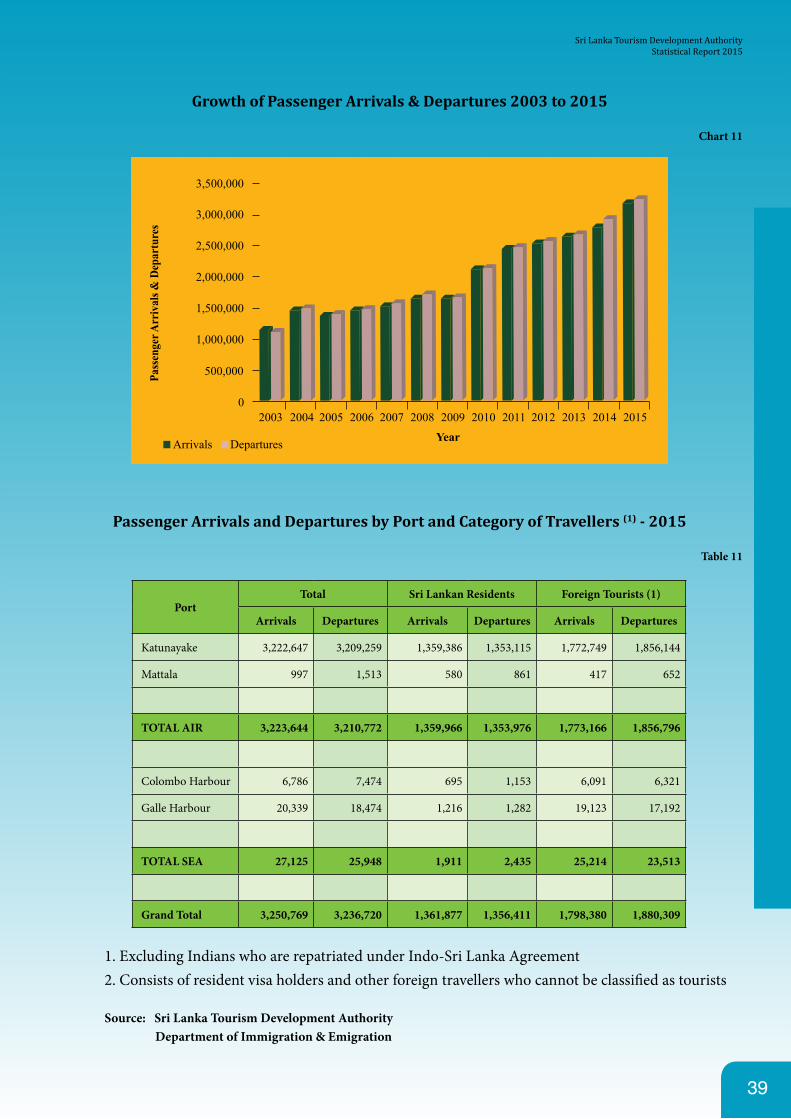
39
Growth of Passenger Arrivals & Departures 2003 to 2015
Chart 11
3,500,000
3,000,000
2,500,000
2,000,000
1,500,000
1,000,000
500,000
02003 2004 2005 2006 2007 2008 2009
YearArrivals Departures
Pass
enge
r Arr
ival
s & D
epar
ture
s
2010 2011 2012 2013 2014 2015
Passenger Arrivals and Departures by Port and Category of Travellers (1) - 2015
Table 11
PortTotal Sri Lankan Residents Foreign Tourists (1)
Arrivals Departures Arrivals Departures Arrivals Departures
Katunayake 3,222,647 3,209,259 1,359,386 1,353,115 1,772,749 1,856,144
Mattala 997 1,513 580 861 417 652
TOTAL AIR 3,223,644 3,210,772 1,359,966 1,353,976 1,773,166 1,856,796
Colombo Harbour 6,786 7,474 695 1,153 6,091 6,321
Galle Harbour 20,339 18,474 1,216 1,282 19,123 17,192
TOTAL SEA 27,125 25,948 1,911 2,435 25,214 23,513
Grand Total 3,250,769 3,236,720 1,361,877 1,356,411 1,798,380 1,880,309
1. Excluding Indians who are repatriated under Indo-Sri Lanka Agreement 2. Consists of resident visa holders and other foreign travellers who cannot be classified as tourists
Source: Sri Lanka Tourism Development Authority Department of Immigration & Emigration
Sri Lanka Tourism Development AuthorityStatistical Report 2015

PART C
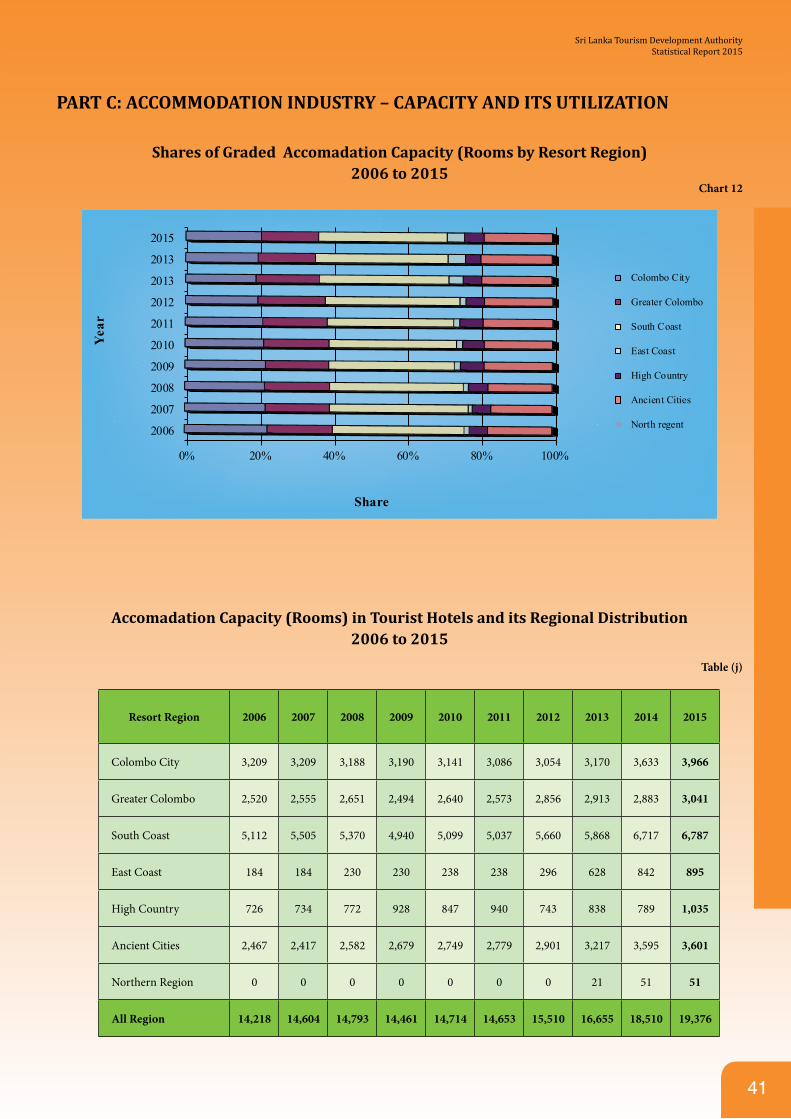
41
PART C: ACCOMMODATION INDUSTRY – CAPACITY AND ITS UTILIZATION
Shares of Graded Accomadation Capacity (Rooms by Resort Region)2006 to 2015
Chart 12
0% 20% 40% 60% 80% 100%
2006
2007
2008
2009
2010
2011
2012
2013
2013
2015
Share
Yea
r
Colombo City
Greater Colombo
South Coast
East Coast
High Country
Ancient Cities
North regent
Accomadation Capacity (Rooms) in Tourist Hotels and its Regional Distribution2006 to 2015
Table (j)
Resort Region 2006 2007 2008 2009 2010 2011 2012 2013 2014 2015
Colombo City 3,209 3,209 3,188 3,190 3,141 3,086 3,054 3,170 3,633 3,966
Greater Colombo 2,520 2,555 2,651 2,494 2,640 2,573 2,856 2,913 2,883 3,041
South Coast 5,112 5,505 5,370 4,940 5,099 5,037 5,660 5,868 6,717 6,787
East Coast 184 184 230 230 238 238 296 628 842 895
High Country 726 734 772 928 847 940 743 838 789 1,035
Ancient Cities 2,467 2,417 2,582 2,679 2,749 2,779 2,901 3,217 3,595 3,601
Northern Region 0 0 0 0 0 0 0 21 51 51
All Region 14,218 14,604 14,793 14,461 14,714 14,653 15,510 16,655 18,510 19,376
Sri Lanka Tourism Development AuthorityStatistical Report 2015
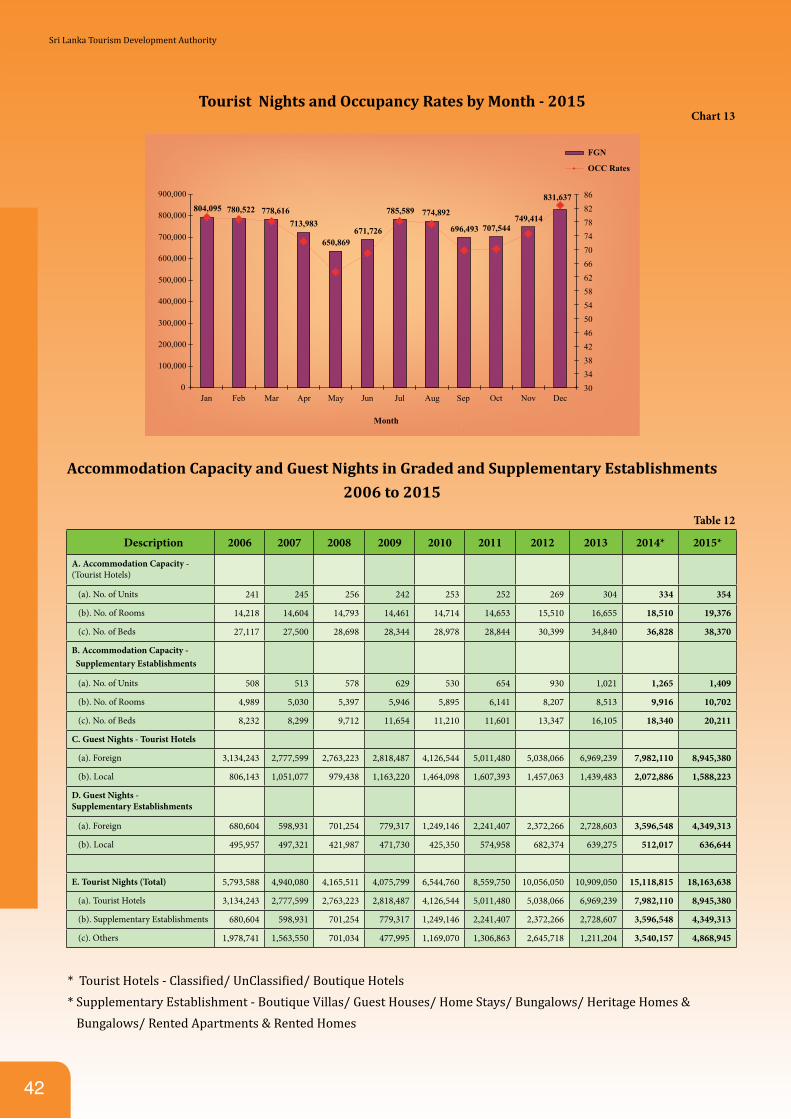
42
Tourist Nights and Occupancy Rates by Month - 2015Chart 13
0
100,000
200,000
300,000
400,000
500,000
600,000
700,000
800,000
900,000
Jan Feb Mar Apr May Jun Jul Aug Sep Oct Nov Dec
Month
804,095 780,522 778,616713,983
650,869671,726
785,589 774,892
696,493 707,544749,414
831,637
FGN
OCC Rates
303438424650545862667074788286
Accommodation Capacity and Guest Nights in Graded and Supplementary Establishments
2006 to 2015
Table 12
Description 2006 2007 2008 2009 2010 2011 2012 2013 2014* 2015*
A. Accommodation Capacity -(Tourist Hotels)
(a). No. of Units 241 245 256 242 253 252 269 304 334 354
(b). No. of Rooms 14,218 14,604 14,793 14,461 14,714 14,653 15,510 16,655 18,510 19,376
(c). No. of Beds 27,117 27,500 28,698 28,344 28,978 28,844 30,399 34,840 36,828 38,370
B. Accommodation Capacity - Supplementary Establishments
(a). No. of Units 508 513 578 629 530 654 930 1,021 1,265 1,409
(b). No. of Rooms 4,989 5,030 5,397 5,946 5,895 6,141 8,207 8,513 9,916 10,702
(c). No. of Beds 8,232 8,299 9,712 11,654 11,210 11,601 13,347 16,105 18,340 20,211
C. Guest Nights - Tourist Hotels
(a). Foreign 3,134,243 2,777,599 2,763,223 2,818,487 4,126,544 5,011,480 5,038,066 6,969,239 7,982,110 8,945,380
(b). Local 806,143 1,051,077 979,438 1,163,220 1,464,098 1,607,393 1,457,063 1,439,483 2,072,886 1,588,223
D. Guest Nights - Supplementary Establishments
(a). Foreign 680,604 598,931 701,254 779,317 1,249,146 2,241,407 2,372,266 2,728,603 3,596,548 4,349,313
(b). Local 495,957 497,321 421,987 471,730 425,350 574,958 682,374 639,275 512,017 636,644
E. Tourist Nights (Total) 5,793,588 4,940,080 4,165,511 4,075,799 6,544,760 8,559,750 10,056,050 10,909,050 15,118,815 18,163,638
(a). Tourist Hotels 3,134,243 2,777,599 2,763,223 2,818,487 4,126,544 5,011,480 5,038,066 6,969,239 7,982,110 8,945,380
(b). Supplementary Establishments 680,604 598,931 701,254 779,317 1,249,146 2,241,407 2,372,266 2,728,607 3,596,548 4,349,313
(c). Others 1,978,741 1,563,550 701,034 477,995 1,169,070 1,306,863 2,645,718 1,211,204 3,540,157 4,868,945
* Tourist Hotels - Classified/ UnClassified/ Boutique Hotels * Supplementary Establishment - Boutique Villas/ Guest Houses/ Home Stays/ Bungalows/ Heritage Homes &
Bungalows/ Rented Apartments & Rented Homes
Sri Lanka Tourism Development Authority
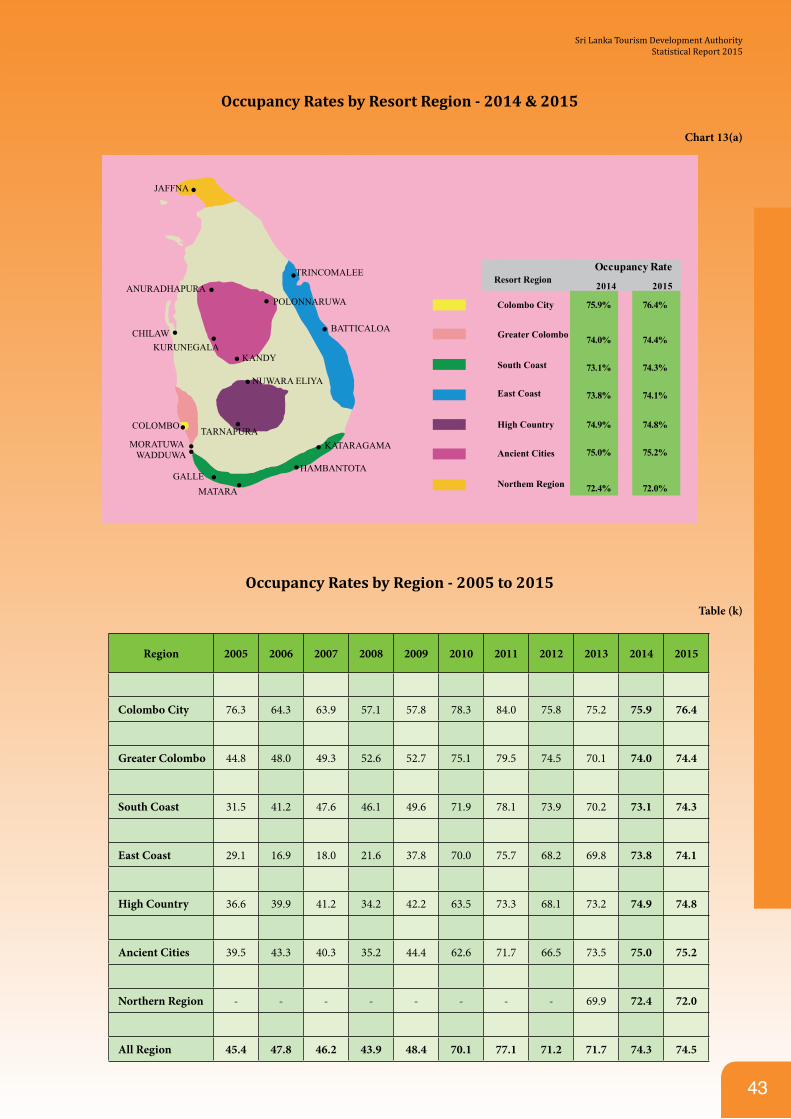
43
Occupancy Rates by Resort Region - 2014 & 2015
Chart 13(a)
2014 2015
75.9% 76.4%
74.0% 74.4%
73.1% 74.3%
73.8% 74.1%
74.9% 74.8%
75.0% 75.2%
72.4% 72.0%
Occupancy Rate
JAFFNA
TRINCOMALEE
Colombo City
Resort Region
Greater Colombo
South Coast
East Coast
High Country
Ancient Cities
Northem Region
POLONNARUWA
BATTICALOA
KANDYKURUNEGALA
COLOMBO
MORATUWAWADDUWA
GALLEMATARA
HAMBANTOTA
KATARAGAMA
NUWARA ELIYA
TARNAPURA
CHILAW
ANURADHAPURA
Occupancy Rates by Region - 2005 to 2015
Table (k)
Region 2005 2006 2007 2008 2009 2010 2011 2012 2013 2014 2015
Colombo City 76.3 64.3 63.9 57.1 57.8 78.3 84.0 75.8 75.2 75.9 76.4
Greater Colombo 44.8 48.0 49.3 52.6 52.7 75.1 79.5 74.5 70.1 74.0 74.4
South Coast 31.5 41.2 47.6 46.1 49.6 71.9 78.1 73.9 70.2 73.1 74.3
East Coast 29.1 16.9 18.0 21.6 37.8 70.0 75.7 68.2 69.8 73.8 74.1
High Country 36.6 39.9 41.2 34.2 42.2 63.5 73.3 68.1 73.2 74.9 74.8
Ancient Cities 39.5 43.3 40.3 35.2 44.4 62.6 71.7 66.5 73.5 75.0 75.2
Northern Region - - - - - - - - 69.9 72.4 72.0
All Region 45.4 47.8 46.2 43.9 48.4 70.1 77.1 71.2 71.7 74.3 74.5
Sri Lanka Tourism Development AuthorityStatistical Report 2015
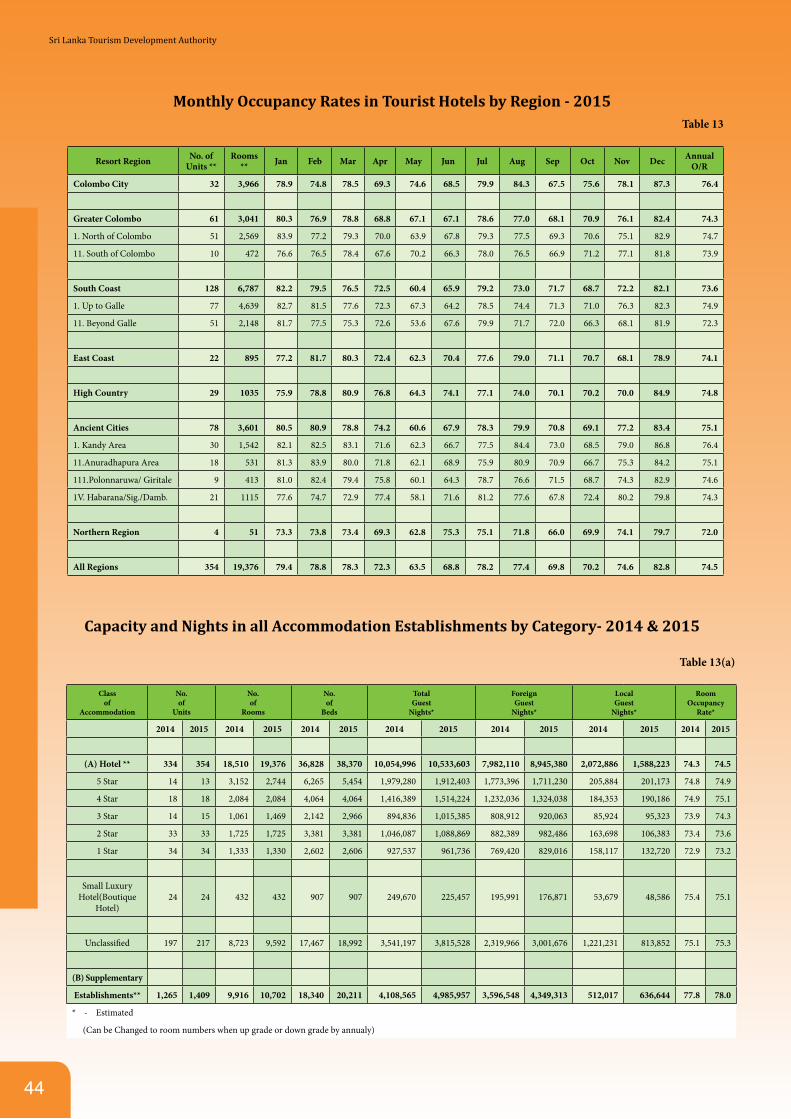
44
Monthly Occupancy Rates in Tourist Hotels by Region - 2015 Table 13
Resort Region No. of Units **
Rooms ** Jan Feb Mar Apr May Jun Jul Aug Sep Oct Nov Dec Annual
O/R
Colombo City 32 3,966 78.9 74.8 78.5 69.3 74.6 68.5 79.9 84.3 67.5 75.6 78.1 87.3 76.4
Greater Colombo 61 3,041 80.3 76.9 78.8 68.8 67.1 67.1 78.6 77.0 68.1 70.9 76.1 82.4 74.3
1. North of Colombo 51 2,569 83.9 77.2 79.3 70.0 63.9 67.8 79.3 77.5 69.3 70.6 75.1 82.9 74.7
11. South of Colombo 10 472 76.6 76.5 78.4 67.6 70.2 66.3 78.0 76.5 66.9 71.2 77.1 81.8 73.9
South Coast 128 6,787 82.2 79.5 76.5 72.5 60.4 65.9 79.2 73.0 71.7 68.7 72.2 82.1 73.6
1. Up to Galle 77 4,639 82.7 81.5 77.6 72.3 67.3 64.2 78.5 74.4 71.3 71.0 76.3 82.3 74.9
11. Beyond Galle 51 2,148 81.7 77.5 75.3 72.6 53.6 67.6 79.9 71.7 72.0 66.3 68.1 81.9 72.3
East Coast 22 895 77.2 81.7 80.3 72.4 62.3 70.4 77.6 79.0 71.1 70.7 68.1 78.9 74.1
High Country 29 1035 75.9 78.8 80.9 76.8 64.3 74.1 77.1 74.0 70.1 70.2 70.0 84.9 74.8
Ancient Cities 78 3,601 80.5 80.9 78.8 74.2 60.6 67.9 78.3 79.9 70.8 69.1 77.2 83.4 75.1
1. Kandy Area 30 1,542 82.1 82.5 83.1 71.6 62.3 66.7 77.5 84.4 73.0 68.5 79.0 86.8 76.4
11.Anuradhapura Area 18 531 81.3 83.9 80.0 71.8 62.1 68.9 75.9 80.9 70.9 66.7 75.3 84.2 75.1
111.Polonnaruwa/ Giritale 9 413 81.0 82.4 79.4 75.8 60.1 64.3 78.7 76.6 71.5 68.7 74.3 82.9 74.6
1V. Habarana/Sig./Damb. 21 1115 77.6 74.7 72.9 77.4 58.1 71.6 81.2 77.6 67.8 72.4 80.2 79.8 74.3
Northern Region 4 51 73.3 73.8 73.4 69.3 62.8 75.3 75.1 71.8 66.0 69.9 74.1 79.7 72.0
All Regions 354 19,376 79.4 78.8 78.3 72.3 63.5 68.8 78.2 77.4 69.8 70.2 74.6 82.8 74.5
Capacity and Nights in all Accommodation Establishments by Category- 2014 & 2015
Table 13(a)
Classof
Accommodation
No.of
Units
No.of
Rooms
No.of
Beds
TotalGuest
Nights*
ForeignGuest
Nights*
LocalGuest
Nights*
RoomOccupancy
Rate*
2014 2015 2014 2015 2014 2015 2014 2015 2014 2015 2014 2015 2014 2015
(A) Hotel ** 334 354 18,510 19,376 36,828 38,370 10,054,996 10,533,603 7,982,110 8,945,380 2,072,886 1,588,223 74.3 74.5
5 Star 14 13 3,152 2,744 6,265 5,454 1,979,280 1,912,403 1,773,396 1,711,230 205,884 201,173 74.8 74.9
4 Star 18 18 2,084 2,084 4,064 4,064 1,416,389 1,514,224 1,232,036 1,324,038 184,353 190,186 74.9 75.1
3 Star 14 15 1,061 1,469 2,142 2,966 894,836 1,015,385 808,912 920,063 85,924 95,323 73.9 74.3
2 Star 33 33 1,725 1,725 3,381 3,381 1,046,087 1,088,869 882,389 982,486 163,698 106,383 73.4 73.6
1 Star 34 34 1,333 1,330 2,602 2,606 927,537 961,736 769,420 829,016 158,117 132,720 72.9 73.2
Small LuxuryHotel(Boutique
Hotel)24 24 432 432 907 907 249,670 225,457 195,991 176,871 53,679 48,586 75.4 75.1
Unclassified 197 217 8,723 9,592 17,467 18,992 3,541,197 3,815,528 2,319,966 3,001,676 1,221,231 813,852 75.1 75.3
(B) Supplementary
Establishments** 1,265 1,409 9,916 10,702 18,340 20,211 4,108,565 4,985,957 3,596,548 4,349,313 512,017 636,644 77.8 78.0
* - Estimated
(Can be Changed to room numbers when up grade or down grade by annualy)
Sri Lanka Tourism Development Authority
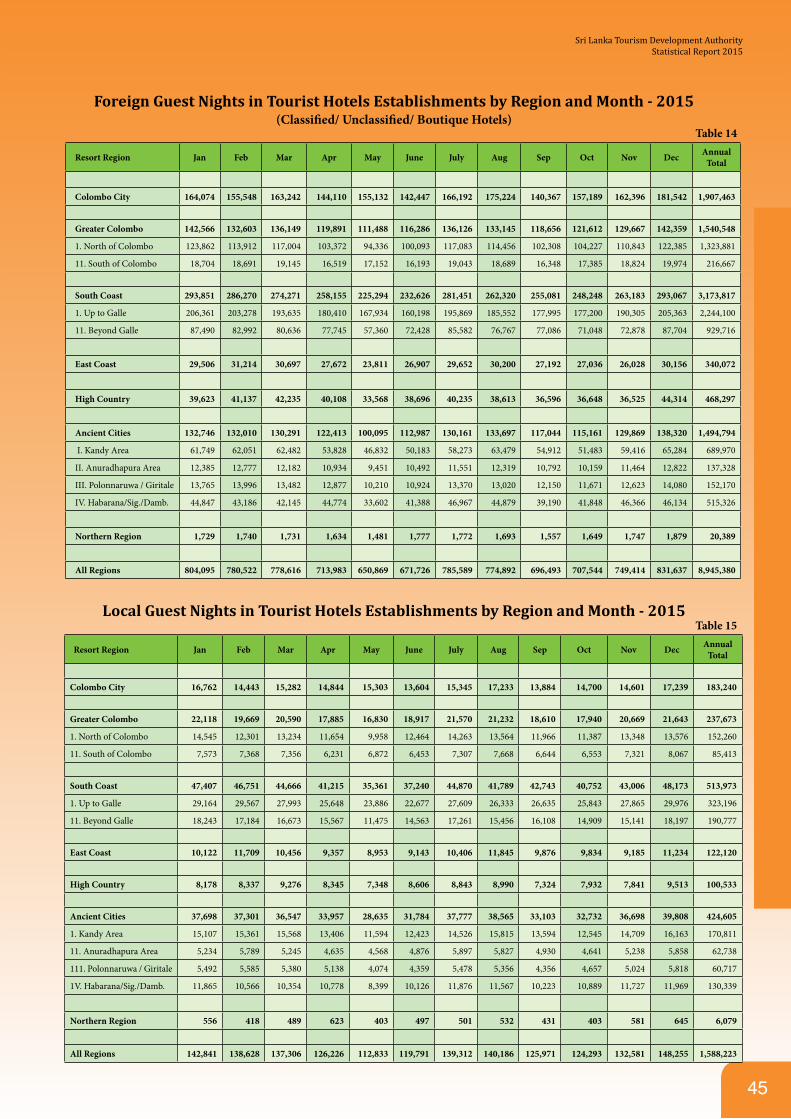
45
Foreign Guest Nights in Tourist Hotels Establishments by Region and Month - 2015 (Classified/ Unclassified/ Boutique Hotels)
Table 14
Resort Region Jan Feb Mar Apr May June July Aug Sep Oct Nov Dec Annual Total
Colombo City 164,074 155,548 163,242 144,110 155,132 142,447 166,192 175,224 140,367 157,189 162,396 181,542 1,907,463
Greater Colombo 142,566 132,603 136,149 119,891 111,488 116,286 136,126 133,145 118,656 121,612 129,667 142,359 1,540,548
1. North of Colombo 123,862 113,912 117,004 103,372 94,336 100,093 117,083 114,456 102,308 104,227 110,843 122,385 1,323,881
11. South of Colombo 18,704 18,691 19,145 16,519 17,152 16,193 19,043 18,689 16,348 17,385 18,824 19,974 216,667
South Coast 293,851 286,270 274,271 258,155 225,294 232,626 281,451 262,320 255,081 248,248 263,183 293,067 3,173,817
1. Up to Galle 206,361 203,278 193,635 180,410 167,934 160,198 195,869 185,552 177,995 177,200 190,305 205,363 2,244,100
11. Beyond Galle 87,490 82,992 80,636 77,745 57,360 72,428 85,582 76,767 77,086 71,048 72,878 87,704 929,716
East Coast 29,506 31,214 30,697 27,672 23,811 26,907 29,652 30,200 27,192 27,036 26,028 30,156 340,072
High Country 39,623 41,137 42,235 40,108 33,568 38,696 40,235 38,613 36,596 36,648 36,525 44,314 468,297
Ancient Cities 132,746 132,010 130,291 122,413 100,095 112,987 130,161 133,697 117,044 115,161 129,869 138,320 1,494,794
I. Kandy Area 61,749 62,051 62,482 53,828 46,832 50,183 58,273 63,479 54,912 51,483 59,416 65,284 689,970
II. Anuradhapura Area 12,385 12,777 12,182 10,934 9,451 10,492 11,551 12,319 10,792 10,159 11,464 12,822 137,328
III. Polonnaruwa / Giritale 13,765 13,996 13,482 12,877 10,210 10,924 13,370 13,020 12,150 11,671 12,623 14,080 152,170
IV. Habarana/Sig./Damb. 44,847 43,186 42,145 44,774 33,602 41,388 46,967 44,879 39,190 41,848 46,366 46,134 515,326
Northern Region 1,729 1,740 1,731 1,634 1,481 1,777 1,772 1,693 1,557 1,649 1,747 1,879 20,389
All Regions 804,095 780,522 778,616 713,983 650,869 671,726 785,589 774,892 696,493 707,544 749,414 831,637 8,945,380
Local Guest Nights in Tourist Hotels Establishments by Region and Month - 2015Table 15
Resort Region Jan Feb Mar Apr May June July Aug Sep Oct Nov Dec Annual Total
Colombo City 16,762 14,443 15,282 14,844 15,303 13,604 15,345 17,233 13,884 14,700 14,601 17,239 183,240
Greater Colombo 22,118 19,669 20,590 17,885 16,830 18,917 21,570 21,232 18,610 17,940 20,669 21,643 237,673
1. North of Colombo 14,545 12,301 13,234 11,654 9,958 12,464 14,263 13,564 11,966 11,387 13,348 13,576 152,260
11. South of Colombo 7,573 7,368 7,356 6,231 6,872 6,453 7,307 7,668 6,644 6,553 7,321 8,067 85,413
South Coast 47,407 46,751 44,666 41,215 35,361 37,240 44,870 41,789 42,743 40,752 43,006 48,173 513,973
1. Up to Galle 29,164 29,567 27,993 25,648 23,886 22,677 27,609 26,333 26,635 25,843 27,865 29,976 323,196
11. Beyond Galle 18,243 17,184 16,673 15,567 11,475 14,563 17,261 15,456 16,108 14,909 15,141 18,197 190,777
East Coast 10,122 11,709 10,456 9,357 8,953 9,143 10,406 11,845 9,876 9,834 9,185 11,234 122,120
High Country 8,178 8,337 9,276 8,345 7,348 8,606 8,843 8,990 7,324 7,932 7,841 9,513 100,533
Ancient Cities 37,698 37,301 36,547 33,957 28,635 31,784 37,777 38,565 33,103 32,732 36,698 39,808 424,605
1. Kandy Area 15,107 15,361 15,568 13,406 11,594 12,423 14,526 15,815 13,594 12,545 14,709 16,163 170,811
11. Anuradhapura Area 5,234 5,789 5,245 4,635 4,568 4,876 5,897 5,827 4,930 4,641 5,238 5,858 62,738
111. Polonnaruwa / Giritale 5,492 5,585 5,380 5,138 4,074 4,359 5,478 5,356 4,356 4,657 5,024 5,818 60,717
1V. Habarana/Sig./Damb. 11,865 10,566 10,354 10,778 8,399 10,126 11,876 11,567 10,223 10,889 11,727 11,969 130,339
Northern Region 556 418 489 623 403 497 501 532 431 403 581 645 6,079
All Regions 142,841 138,628 137,306 126,226 112,833 119,791 139,312 140,186 125,971 124,293 132,581 148,255 1,588,223
Sri Lanka Tourism Development AuthorityStatistical Report 2015

PART D
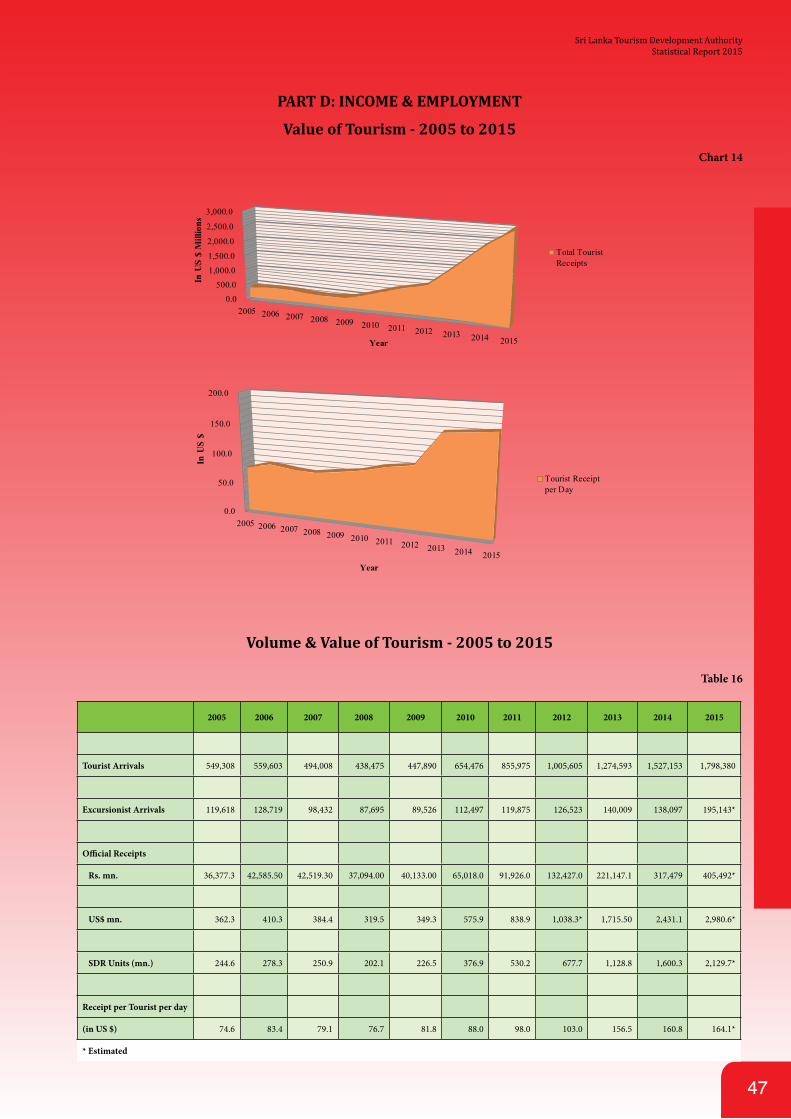
47
PART D: INCOME & EMPLOYMENT
Value of Tourism - 2005 to 2015
Chart 14
0.0
50.0
100.0
150.0
200.0
2005 2006 2007 2008 2009 2010 2011 2012 2013 2014 2015
In U
S $
Year
Tourist Receiptper Day
0.0500.0
1,000.0
1,500.0
2,000.0
2,500.0
3,000.0
2005 2006 2007 2008 2009 2010 2011 2012 2013 2014 2015
In U
S $
Mill
ions
Year
Total TouristReceipts
Volume & Value of Tourism - 2005 to 2015
Table 16
2005 2006 2007 2008 2009 2010 2011 2012 2013 2014 2015
Tourist Arrivals 549,308 559,603 494,008 438,475 447,890 654,476 855,975 1,005,605 1,274,593 1,527,153 1,798,380
Excursionist Arrivals 119,618 128,719 98,432 87,695 89,526 112,497 119,875 126,523 140,009 138,097 195,143*
Official Receipts
Rs. mn. 36,377.3 42,585.50 42,519.30 37,094.00 40,133.00 65,018.0 91,926.0 132,427.0 221,147.1 317,479 405,492*
US$ mn. 362.3 410.3 384.4 319.5 349.3 575.9 838.9 1,038.3* 1,715.50 2,431.1 2,980.6*
SDR Units (mn.) 244.6 278.3 250.9 202.1 226.5 376.9 530.2 677.7 1,128.8 1,600.3 2,129.7*
Receipt per Tourist per day
(in US $) 74.6 83.4 79.1 76.7 81.8 88.0 98.0 103.0 156.5 160.8 164.1*
* Estimated
Sri Lanka Tourism Development AuthorityStatistical Report 2015
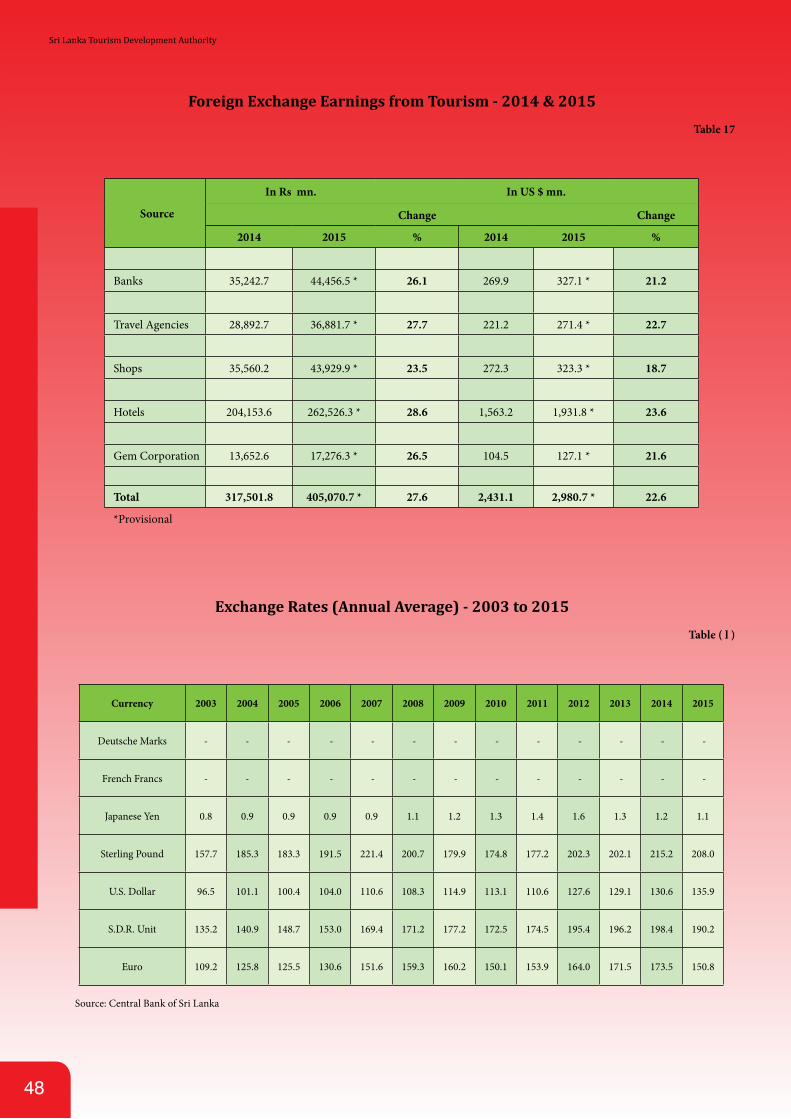
48
Foreign Exchange Earnings from Tourism - 2014 & 2015
Table 17
Source
In Rs mn. In US $ mn.
Change Change
2014 2015 % 2014 2015 %
Banks 35,242.7 44,456.5 * 26.1 269.9 327.1 * 21.2
Travel Agencies 28,892.7 36,881.7 * 27.7 221.2 271.4 * 22.7
Shops 35,560.2 43,929.9 * 23.5 272.3 323.3 * 18.7
Hotels 204,153.6 262,526.3 * 28.6 1,563.2 1,931.8 * 23.6
Gem Corporation 13,652.6 17,276.3 * 26.5 104.5 127.1 * 21.6
Total 317,501.8 405,070.7 * 27.6 2,431.1 2,980.7 * 22.6
*Provisional
Exchange Rates (Annual Average) - 2003 to 2015
Table ( l )
Currency 2003 2004 2005 2006 2007 2008 2009 2010 2011 2012 2013 2014 2015
Deutsche Marks - - - - - - - - - - - - -
French Francs - - - - - - - - - - - - -
Japanese Yen 0.8 0.9 0.9 0.9 0.9 1.1 1.2 1.3 1.4 1.6 1.3 1.2 1.1
Sterling Pound 157.7 185.3 183.3 191.5 221.4 200.7 179.9 174.8 177.2 202.3 202.1 215.2 208.0
U.S. Dollar 96.5 101.1 100.4 104.0 110.6 108.3 114.9 113.1 110.6 127.6 129.1 130.6 135.9
S.D.R. Unit 135.2 140.9 148.7 153.0 169.4 171.2 177.2 172.5 174.5 195.4 196.2 198.4 190.2
Euro 109.2 125.8 125.5 130.6 151.6 159.3 160.2 150.1 153.9 164.0 171.5 173.5 150.8
Source: Central Bank of Sri Lanka
Sri Lanka Tourism Development Authority
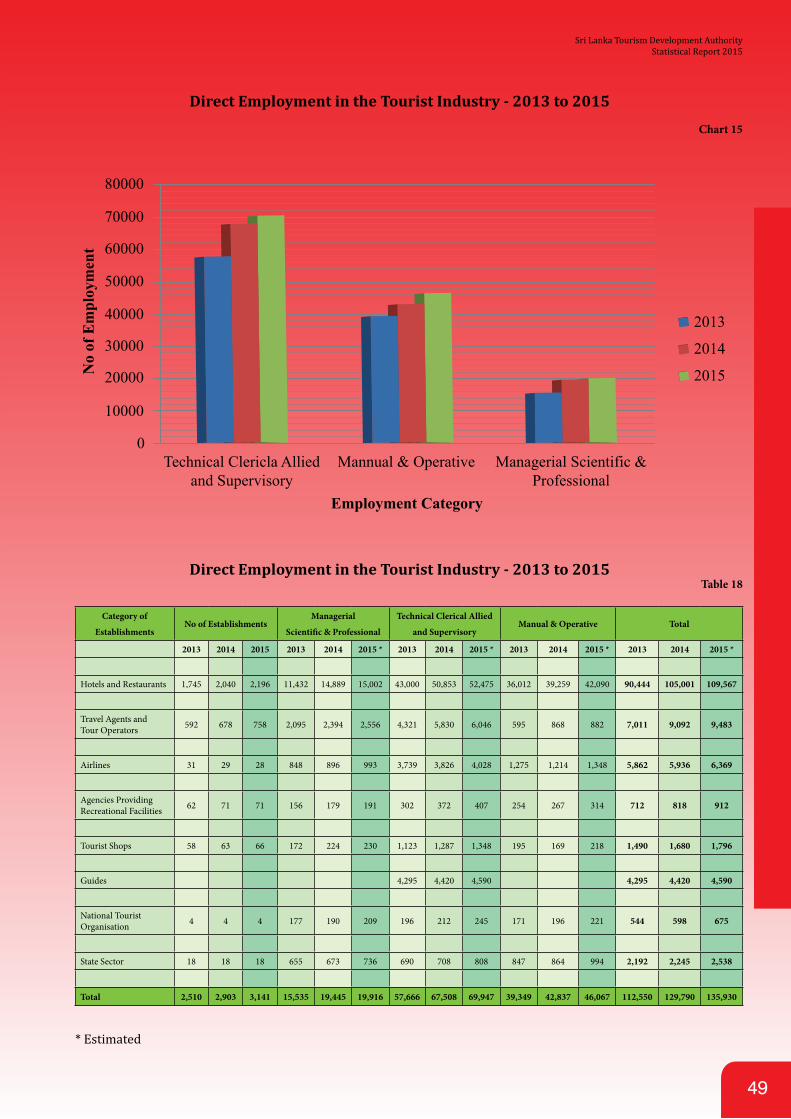
49
Direct Employment in the Tourist Industry - 2013 to 2015
Chart 15
80000
70000
60000
50000
40000
30000
20000
10000
0Technical Clericla Allied
and SupervisoryMannual & Operative
2013
2014
2015
Managerial Scientific &Professional
Employment Category
No
of E
mpl
oym
ent
Direct Employment in the Tourist Industry - 2013 to 2015Table 18
Category of
EstablishmentsNo of Establishments
Managerial
Scientific & Professional
Technical Clerical Allied
and SupervisoryManual & Operative Total
2013 2014 2015 2013 2014 2015 * 2013 2014 2015 * 2013 2014 2015 * 2013 2014 2015 *
Hotels and Restaurants 1,745 2,040 2,196 11,432 14,889 15,002 43,000 50,853 52,475 36,012 39,259 42,090 90,444 105,001 109,567
Travel Agents and Tour Operators 592 678 758 2,095 2,394 2,556 4,321 5,830 6,046 595 868 882 7,011 9,092 9,483
Airlines 31 29 28 848 896 993 3,739 3,826 4,028 1,275 1,214 1,348 5,862 5,936 6,369
Agencies Providing Recreational Facilities 62 71 71 156 179 191 302 372 407 254 267 314 712 818 912
Tourist Shops 58 63 66 172 224 230 1,123 1,287 1,348 195 169 218 1,490 1,680 1,796
Guides 4,295 4,420 4,590 4,295 4,420 4,590
National Tourist Organisation 4 4 4 177 190 209 196 212 245 171 196 221 544 598 675
State Sector 18 18 18 655 673 736 690 708 808 847 864 994 2,192 2,245 2,538
Total 2,510 2,903 3,141 15,535 19,445 19,916 57,666 67,508 69,947 39,349 42,837 46,067 112,550 129,790 135,930
* Estimated
Sri Lanka Tourism Development AuthorityStatistical Report 2015
PART E
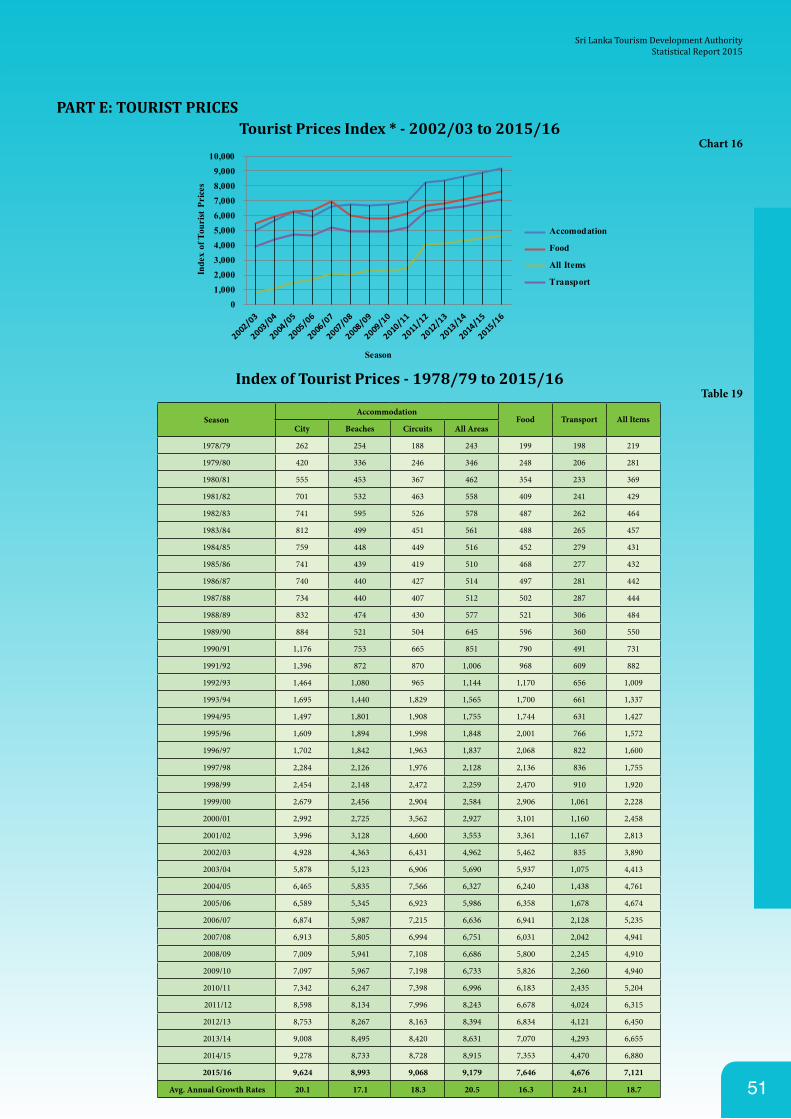
51
PART E: TOURIST PRICESTourist Prices Index * - 2002/03 to 2015/16
Chart 16
01,0002,0003,0004,0005,0006,0007,0008,0009,000
10,000
Inde
x of
Tou
rist
Pri
ces
Season
Accomodation
Food
All Items
Transport
Index of Tourist Prices - 1978/79 to 2015/16Table 19
SeasonAccommodation
City Beaches Circuits All AreasFood Transport All Items
1978/79 262 254 188 243 199 198 219
1979/80 420 336 246 346 248 206 281
1980/81 555 453 367 462 354 233 369
1981/82 701 532 463 558 409 241 429
1982/83 741 595 526 578 487 262 464
1983/84 812 499 451 561 488 265 457
1984/85 759 448 449 516 452 279 431
1985/86 741 439 419 510 468 277 432
1986/87 740 440 427 514 497 281 442
1987/88 734 440 407 512 502 287 444
1988/89 832 474 430 577 521 306 484
1989/90 884 521 504 645 596 360 550
1990/91 1,176 753 665 851 790 491 731
1991/92 1,396 872 870 1,006 968 609 882
1992/93 1,464 1,080 965 1,144 1,170 656 1,009
1993/94 1,695 1,440 1,829 1,565 1,700 661 1,337
1994/95 1,497 1,801 1,908 1,755 1,744 631 1,427
1995/96 1,609 1,894 1,998 1,848 2,001 766 1,572
1996/97 1,702 1,842 1,963 1,837 2,068 822 1,600
1997/98 2,284 2,126 1,976 2,128 2,136 836 1,755
1998/99 2,454 2,148 2,472 2,259 2,470 910 1,920
1999/00 2,679 2,456 2,904 2,584 2,906 1,061 2,228
2000/01 2,992 2,725 3,562 2,927 3,101 1,160 2,458
2001/02 3,996 3,128 4,600 3,553 3,361 1,167 2,813
2002/03 4,928 4,363 6,431 4,962 5,462 835 3,890
2003/04 5,878 5,123 6,906 5,690 5,937 1,075 4,413
2004/05 6,465 5,835 7,566 6,327 6,240 1,438 4,761
2005/06 6,589 5,345 6,923 5,986 6,358 1,678 4,674
2006/07 6,874 5,987 7,215 6,636 6,941 2,128 5,235
2007/08 6,913 5,805 6,994 6,751 6,031 2,042 4,941
2008/09 7,009 5,941 7,108 6,686 5,800 2,245 4,910
2009/10 7,097 5,967 7,198 6,733 5,826 2,260 4,940
2010/11 7,342 6,247 7,398 6,996 6,183 2,435 5,204
2011/12 8,598 8,134 7,996 8,243 6,678 4,024 6,315
2012/13 8,753 8,267 8,163 8,394 6,834 4,121 6,450
2013/14 9,008 8,495 8,420 8,631 7,070 4,293 6,655
2014/15 9,278 8,733 8,728 8,915 7,353 4,470 6,880
2015/16 9,624 8,993 9,068 9,179 7,646 4,676 7,121
Avg. Annual Growth Rates 20.1 17.1 18.3 20.5 16.3 24.1 18.7
Sri Lanka Tourism Development AuthorityStatistical Report 2015

PART F
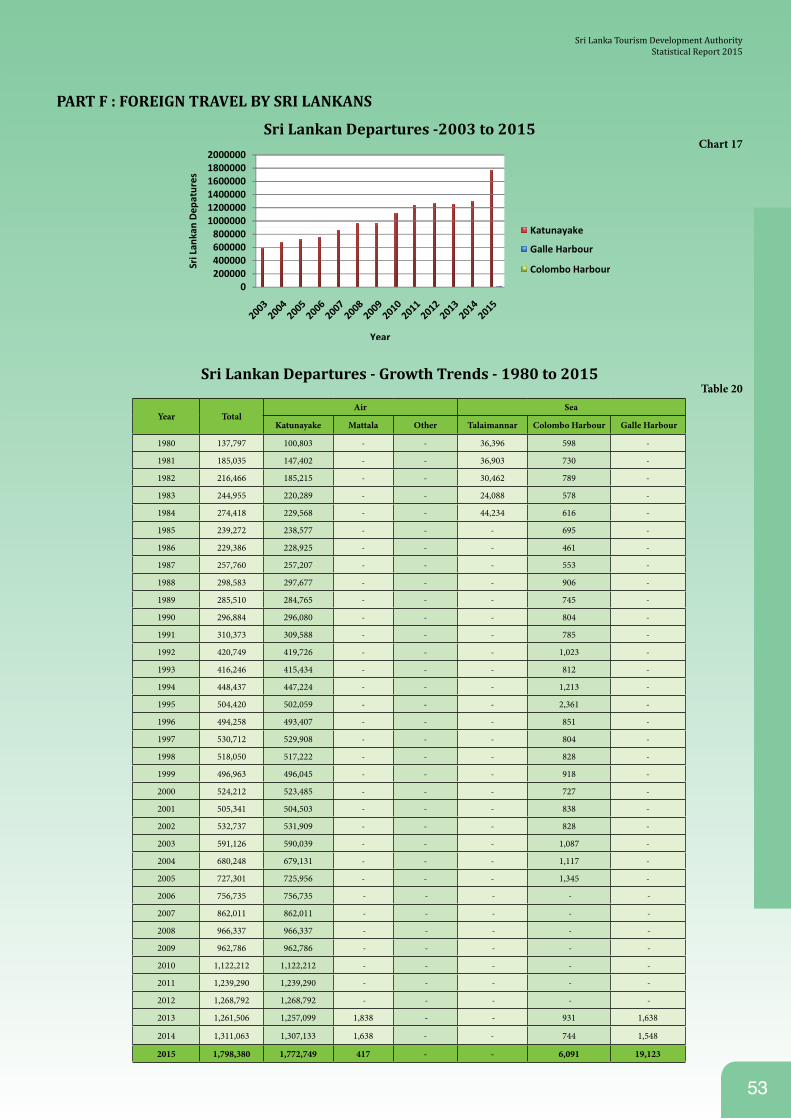
53
PART F : FOREIGN TRAVEL BY SRI LANKANS
Sri Lankan Departures -2003 to 2015Chart 17
Sri Lankan Departures - Growth Trends - 1980 to 2015Table 20
Year TotalAir Sea
Katunayake Mattala Other Talaimannar Colombo Harbour Galle Harbour
1980 137,797 100,803 - - 36,396 598 -
1981 185,035 147,402 - - 36,903 730 -
1982 216,466 185,215 - - 30,462 789 -
1983 244,955 220,289 - - 24,088 578 -
1984 274,418 229,568 - - 44,234 616 -
1985 239,272 238,577 - - - 695 -
1986 229,386 228,925 - - - 461 -
1987 257,760 257,207 - - - 553 -
1988 298,583 297,677 - - - 906 -
1989 285,510 284,765 - - - 745 -
1990 296,884 296,080 - - - 804 -
1991 310,373 309,588 - - - 785 -
1992 420,749 419,726 - - - 1,023 -
1993 416,246 415,434 - - - 812 -
1994 448,437 447,224 - - - 1,213 -
1995 504,420 502,059 - - - 2,361 -
1996 494,258 493,407 - - - 851 -
1997 530,712 529,908 - - - 804 -
1998 518,050 517,222 - - - 828 -
1999 496,963 496,045 - - - 918 -
2000 524,212 523,485 - - - 727 -
2001 505,341 504,503 - - - 838 -
2002 532,737 531,909 - - - 828 -
2003 591,126 590,039 - - - 1,087 -
2004 680,248 679,131 - - - 1,117 -
2005 727,301 725,956 - - - 1,345 -
2006 756,735 756,735 - - - - -
2007 862,011 862,011 - - - - -
2008 966,337 966,337 - - - - -
2009 962,786 962,786 - - - - -
2010 1,122,212 1,122,212 - - - - -
2011 1,239,290 1,239,290 - - - - -
2012 1,268,792 1,268,792 - - - - -
2013 1,261,506 1,257,099 1,838 - - 931 1,638
2014 1,311,063 1,307,133 1,638 - - 744 1,548
2015 1,798,380 1,772,749 417 - - 6,091 19,123
Sri Lanka Tourism Development AuthorityStatistical Report 2015
PART G
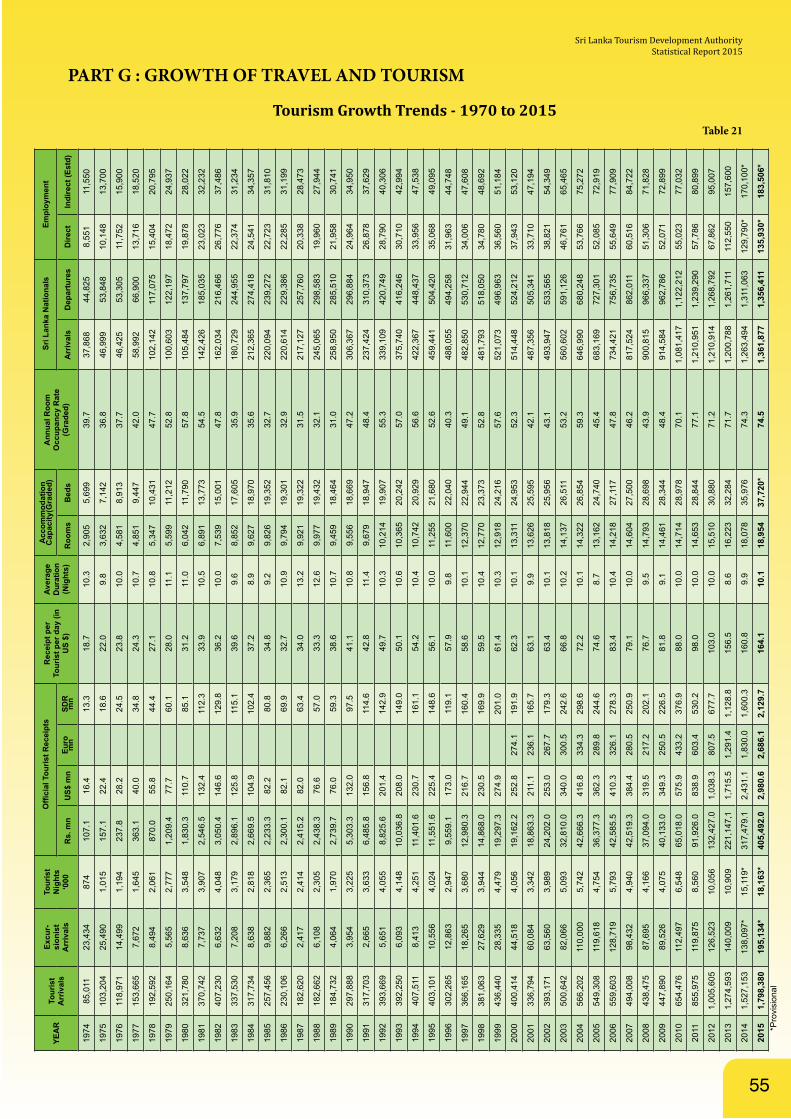
55
PART G : GROWTH OF TRAVEL AND TOURISM
Tourism Growth Trends - 1970 to 2015Table 21
YEA
RTo
uris
t A
rriv
als
Excu
r-
sion
ist
Arr
ival
s
Tour
ist
Nig
hts
‘000
O
ffici
al T
ouris
t Rec
eipt
sR
ecei
pt p
er
Tour
ist p
er d
ay (i
n U
S $)
Aver
age
Dur
atio
n (N
ight
s)
Acc
omm
odat
ion
Cap
acity
(Gra
ded)
Ann
ual R
oom
O
ccup
ancy
Rat
e (G
rade
d)
Sri
Lank
a N
atio
nals
Empl
oym
ent
Rs.
mn
US$
mn
Euro
m
nSD
R
mn
Roo
ms
Bed
sA
rriv
als
Dep
artu
res
Dire
ctIn
dire
ct (E
std)
1974
85,0
1123
,434
874
107.
116
.413
.318
.710
.32,
905
5,69
939
.737
,868
44,8
258,
551
11,5
50
1975
103,
204
25,4
901,
015
157.
122
.418
.622
.09.
83,
632
7,14
236
.846
,999
53,8
4810
,148
13,7
00
1976
118,
971
14,4
991,
194
237.
828
.224
.523
.810
.04,
581
8,91
337
.746
,425
53,3
0511
,752
15,9
00
1977
153,
665
7,67
21,
645
363.
140
.034
.824
.310
.74,
851
9,44
742
.058
,992
66,9
0013
,716
18,5
20
1978
192,
592
8,49
42,
061
870.
055
.844
.427
.110
.85,
347
10,4
3147
.710
2,14
211
7,07
515
,404
20,7
95
1979
250,
164
5,56
52,
777
1,20
9.4
77.7
60.1
28.0
11.1
5,59
911
,212
52.8
100,
603
122,
197
18,4
7224
,937
1980
321,
780
8,63
63,
548
1,83
0.3
110.
785
.131
.211
.06,
042
11,7
9057
.810
5,48
413
7,79
719
,878
28,0
22
1981
370,
742
7,73
73,
907
2,54
6.5
132.
411
2.3
33.9
10.5
6,89
113
,773
54.5
142,
426
185,
035
23,0
2332
,232
1982
407,
230
6,63
24,
048
3,05
0.4
146.
612
9.8
36.2
10.0
7,53
915
,001
47.8
162,
034
216,
466
26,7
7637
,486
1983
337,
530
7,20
83,
179
2,89
6.1
125.
811
5.1
39.6
9.6
8,85
217
,605
35.9
180,
729
244,
955
22,3
7431
,234
1984
317,
734
8,63
82,
818
2,66
9.5
104.
910
2.4
37.2
8.9
9,62
718
,970
35.6
212,
365
274,
418
24,5
4134
,357
1985
257,
456
9,88
22,
365
2,23
3.3
82.2
80.8
34.8
9.2
9,82
619
,352
32.7
220,
094
239,
272
22,7
2331
,810
1986
230,
106
6,26
62,
513
2,30
0.1
82.1
69.9
32.7
10.9
9,79
419
,301
32.9
220,
614
229,
386
22,2
8531
,199
1987
182,
620
2,41
72,
414
2,41
5.2
82.0
63.4
34.0
13.2
9,92
119
,322
31.5
217,
127
257,
760
20,3
3828
,473
1988
182,
662
6,10
82,
305
2,43
8.3
76.6
57.0
33.3
12.6
9,97
719
,432
32.1
245,
065
298,
583
19,9
6027
,944
1989
184,
732
4,06
41,
970
2,73
9.7
76.0
59.3
38.6
10.7
9,45
918
,464
31.0
258,
950
285,
510
21,9
5830
,741
1990
297,
888
3,95
43,
225
5,30
3.3
132.
097
.541
.110
.89,
556
18,6
6947
.230
6,36
729
6,88
424
,964
34,9
50
1991
317,
703
2,66
53,
633
6,48
5.8
156.
811
4.6
42.8
11.4
9,67
918
,947
48.4
237,
424
310,
373
26,8
7837
,629
1992
393,
669
5,65
14,
055
8,82
5.6
201.
414
2.9
49.7
10.3
10,2
1419
,907
55.3
339,
109
420,
749
28,7
9040
,306
1993
392,
250
6,09
34,
148
10,0
36.8
208.
014
9.0
50.1
10.6
10,3
6520
,242
57.0
375,
740
416,
246
30,7
1042
,994
1994
407,
511
8,41
34,
251
11,4
01.6
230.
716
1.1
54.2
10.4
10,7
4220
,929
56.6
422,
367
448,
437
33,9
5647
,538
1995
403,
101
10,5
564,
024
11,5
51.6
225.
414
8.6
56.1
10.0
11,2
5521
,680
52.6
459,
441
504,
420
35,0
6849
,095
1996
302,
265
12,8
632,
947
9,55
9.1
173.
011
9.1
57.9
9.8
11,6
0022
,040
40.3
488,
055
494,
258
31,9
6344
,748
1997
366,
165
18,2
653,
680
12,9
80.3
216.
716
0.4
58.6
10.1
12,3
7022
,944
49.1
482,
850
530,
712
34,0
0647
,608
1998
381,
063
27,6
293,
944
14,8
68.0
230.
516
9.9
59.5
10.4
12,7
7023
,373
52.8
481,
793
518,
050
34,7
8048
,692
1999
436,
440
28,3
354,
479
19,2
97.3
274.
920
1.0
61.4
10.3
12,9
1824
,216
57.6
521,
073
496,
963
36,5
6051
,184
2000
400,
414
44,5
184,
056
19,1
62.2
252.
827
4.1
191.
962
.310
.113
,311
24,9
5352
.351
4,44
852
4,21
237
,943
53,1
20
2001
336,
794
60,0
843,
342
18,8
63.3
211.
123
6.1
165.
763
.19.
913
,626
25,5
9542
.148
7,35
650
5,34
133
,710
47,1
94
2002
393,
171
63,5
603,
989
24,2
02.0
253.
026
7.7
179.
363
.410
.113
,818
25,9
5643
.149
3,94
753
3,56
538
,821
54,3
49
2003
500,
642
82,0
665,
093
32,8
10.0
340.
030
0.5
242.
666
.810
.214
,137
26,5
1153
.256
0,60
259
1,12
646
,761
65,4
65
2004
566,
202
110,
000
5,74
242
,666
.341
6.8
334.
329
8.6
72.2
10.1
14,3
2226
,854
59.3
646,
990
680,
248
53,7
6675
,272
2005
549,
308
119,
618
4,75
436
,377
.336
2.3
289.
824
4.6
74.6
8.7
13,1
6224
,740
45.4
683,
169
727,
301
52,0
8572
,919
2006
559,
603
128,
719
5,79
342
,585
.541
0.3
326.
127
8.3
83.4
10.4
14,2
1827
,117
47.8
734,
421
756,
735
55,6
4977
,909
2007
494,
008
98,4
324,
940
42,5
19.3
384.
428
0.5
250.
979
.110
.014
,604
27,5
0046
.281
7,52
486
2,01
160
,516
84,7
22
2008
438,
475
87,6
954,
166
37,0
94.0
319.
521
7.2
202.
176
.79.
514
,793
28,6
9843
.990
0,81
596
6,33
751
,306
71,8
28
2009
447,
890
89,5
264,
075
40,1
33.0
349.
325
0.5
226.
581
.89.
114
,461
28,3
4448
.491
4,58
496
2,78
652
,071
72,8
99
2010
654,
476
112,
497
6,54
865
,018
.057
5.9
433.
237
6.9
88.0
10.0
14,7
1428
,978
70.1
1,08
1,41
71,
122,
212
55,0
2377
,032
2011
855,
975
119,
875
8,56
091
,926
.083
8.9
603.
453
0.2
98.0
10.0
14,6
5328
,844
77.1
1,21
0,95
11,
239,
290
57,7
8680
,899
2012
1,00
5,60
512
6,52
310
,056
132,
427.
01,
038.
380
7.5
677.
710
3.0
10.0
15,5
1030
,880
71.2
1,21
0,91
41,
268,
792
67,8
6295
,007
2013
1,27
4,59
314
0,00
910
,909
221,
147,
11,
715.
51,
291.
41,
128.
815
6.5
8.6
16,2
2332
,284
71.7
1,20
0,78
81,
261,
711
112,
550
157,
600
2014
1,52
7,15
313
8,09
7*15
,119
*31
7,47
9.1
2,43
1.1
1,83
0.0
1,60
0.3
160.
89.
918
,078
35,9
7674
.31,
263,
494
1,31
1,06
312
9,79
0*17
0,10
0*
2015
1,79
8,38
019
5,13
4*18
,163
*40
5,49
2.0
2,98
0.6
2,68
6.1
2,12
9.7
164.
110
.118
,954
37,7
20*
74.5
1,36
1,87
71,
356,
411
135,
930*
183,
506*
*Pro
visi
onal
Sri Lanka Tourism Development AuthorityStatistical Report 2015
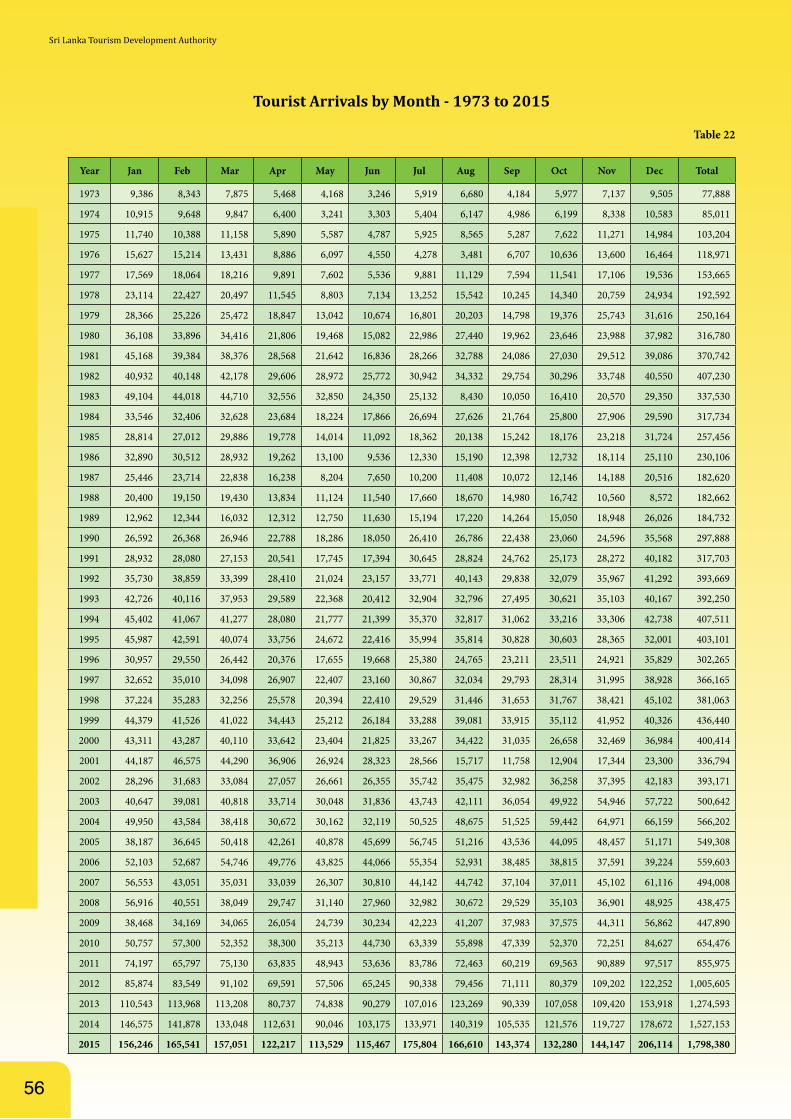
56
Tourist Arrivals by Month - 1973 to 2015
Table 22
Year Jan Feb Mar Apr May Jun Jul Aug Sep Oct Nov Dec Total
1973 9,386 8,343 7,875 5,468 4,168 3,246 5,919 6,680 4,184 5,977 7,137 9,505 77,888
1974 10,915 9,648 9,847 6,400 3,241 3,303 5,404 6,147 4,986 6,199 8,338 10,583 85,011
1975 11,740 10,388 11,158 5,890 5,587 4,787 5,925 8,565 5,287 7,622 11,271 14,984 103,204
1976 15,627 15,214 13,431 8,886 6,097 4,550 4,278 3,481 6,707 10,636 13,600 16,464 118,971
1977 17,569 18,064 18,216 9,891 7,602 5,536 9,881 11,129 7,594 11,541 17,106 19,536 153,665
1978 23,114 22,427 20,497 11,545 8,803 7,134 13,252 15,542 10,245 14,340 20,759 24,934 192,592
1979 28,366 25,226 25,472 18,847 13,042 10,674 16,801 20,203 14,798 19,376 25,743 31,616 250,164
1980 36,108 33,896 34,416 21,806 19,468 15,082 22,986 27,440 19,962 23,646 23,988 37,982 316,780
1981 45,168 39,384 38,376 28,568 21,642 16,836 28,266 32,788 24,086 27,030 29,512 39,086 370,742
1982 40,932 40,148 42,178 29,606 28,972 25,772 30,942 34,332 29,754 30,296 33,748 40,550 407,230
1983 49,104 44,018 44,710 32,556 32,850 24,350 25,132 8,430 10,050 16,410 20,570 29,350 337,530
1984 33,546 32,406 32,628 23,684 18,224 17,866 26,694 27,626 21,764 25,800 27,906 29,590 317,734
1985 28,814 27,012 29,886 19,778 14,014 11,092 18,362 20,138 15,242 18,176 23,218 31,724 257,456
1986 32,890 30,512 28,932 19,262 13,100 9,536 12,330 15,190 12,398 12,732 18,114 25,110 230,106
1987 25,446 23,714 22,838 16,238 8,204 7,650 10,200 11,408 10,072 12,146 14,188 20,516 182,620
1988 20,400 19,150 19,430 13,834 11,124 11,540 17,660 18,670 14,980 16,742 10,560 8,572 182,662
1989 12,962 12,344 16,032 12,312 12,750 11,630 15,194 17,220 14,264 15,050 18,948 26,026 184,732
1990 26,592 26,368 26,946 22,788 18,286 18,050 26,410 26,786 22,438 23,060 24,596 35,568 297,888
1991 28,932 28,080 27,153 20,541 17,745 17,394 30,645 28,824 24,762 25,173 28,272 40,182 317,703
1992 35,730 38,859 33,399 28,410 21,024 23,157 33,771 40,143 29,838 32,079 35,967 41,292 393,669
1993 42,726 40,116 37,953 29,589 22,368 20,412 32,904 32,796 27,495 30,621 35,103 40,167 392,250
1994 45,402 41,067 41,277 28,080 21,777 21,399 35,370 32,817 31,062 33,216 33,306 42,738 407,511
1995 45,987 42,591 40,074 33,756 24,672 22,416 35,994 35,814 30,828 30,603 28,365 32,001 403,101
1996 30,957 29,550 26,442 20,376 17,655 19,668 25,380 24,765 23,211 23,511 24,921 35,829 302,265
1997 32,652 35,010 34,098 26,907 22,407 23,160 30,867 32,034 29,793 28,314 31,995 38,928 366,165
1998 37,224 35,283 32,256 25,578 20,394 22,410 29,529 31,446 31,653 31,767 38,421 45,102 381,063
1999 44,379 41,526 41,022 34,443 25,212 26,184 33,288 39,081 33,915 35,112 41,952 40,326 436,440
2000 43,311 43,287 40,110 33,642 23,404 21,825 33,267 34,422 31,035 26,658 32,469 36,984 400,414
2001 44,187 46,575 44,290 36,906 26,924 28,323 28,566 15,717 11,758 12,904 17,344 23,300 336,794
2002 28,296 31,683 33,084 27,057 26,661 26,355 35,742 35,475 32,982 36,258 37,395 42,183 393,171
2003 40,647 39,081 40,818 33,714 30,048 31,836 43,743 42,111 36,054 49,922 54,946 57,722 500,642
2004 49,950 43,584 38,418 30,672 30,162 32,119 50,525 48,675 51,525 59,442 64,971 66,159 566,202
2005 38,187 36,645 50,418 42,261 40,878 45,699 56,745 51,216 43,536 44,095 48,457 51,171 549,308
2006 52,103 52,687 54,746 49,776 43,825 44,066 55,354 52,931 38,485 38,815 37,591 39,224 559,603
2007 56,553 43,051 35,031 33,039 26,307 30,810 44,142 44,742 37,104 37,011 45,102 61,116 494,008
2008 56,916 40,551 38,049 29,747 31,140 27,960 32,982 30,672 29,529 35,103 36,901 48,925 438,475
2009 38,468 34,169 34,065 26,054 24,739 30,234 42,223 41,207 37,983 37,575 44,311 56,862 447,890
2010 50,757 57,300 52,352 38,300 35,213 44,730 63,339 55,898 47,339 52,370 72,251 84,627 654,476
2011 74,197 65,797 75,130 63,835 48,943 53,636 83,786 72,463 60,219 69,563 90,889 97,517 855,975
2012 85,874 83,549 91,102 69,591 57,506 65,245 90,338 79,456 71,111 80,379 109,202 122,252 1,005,605
2013 110,543 113,968 113,208 80,737 74,838 90,279 107,016 123,269 90,339 107,058 109,420 153,918 1,274,593
2014 146,575 141,878 133,048 112,631 90,046 103,175 133,971 140,319 105,535 121,576 119,727 178,672 1,527,153
2015 156,246 165,541 157,051 122,217 113,529 115,467 175,804 166,610 143,374 132,280 144,147 206,114 1,798,380
Sri Lanka Tourism Development Authority
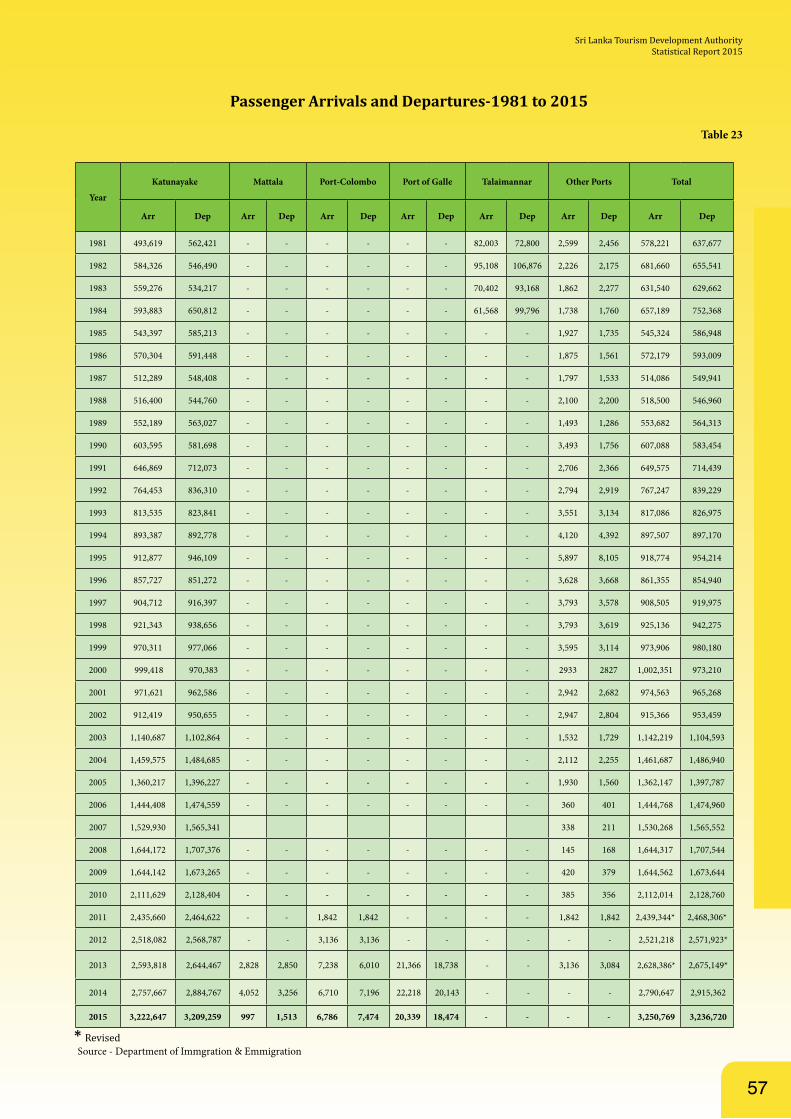
57
Passenger Arrivals and Departures-1981 to 2015
Table 23
Year
Katunayake Mattala Port-Colombo Port of Galle Talaimannar Other Ports Total
Arr Dep Arr Dep Arr Dep Arr Dep Arr Dep Arr Dep Arr Dep
1981 493,619 562,421 - - - - - - 82,003 72,800 2,599 2,456 578,221 637,677
1982 584,326 546,490 - - - - - - 95,108 106,876 2,226 2,175 681,660 655,541
1983 559,276 534,217 - - - - - - 70,402 93,168 1,862 2,277 631,540 629,662
1984 593,883 650,812 - - - - - - 61,568 99,796 1,738 1,760 657,189 752,368
1985 543,397 585,213 - - - - - - - - 1,927 1,735 545,324 586,948
1986 570,304 591,448 - - - - - - - - 1,875 1,561 572,179 593,009
1987 512,289 548,408 - - - - - - - - 1,797 1,533 514,086 549,941
1988 516,400 544,760 - - - - - - - - 2,100 2,200 518,500 546,960
1989 552,189 563,027 - - - - - - - - 1,493 1,286 553,682 564,313
1990 603,595 581,698 - - - - - - - - 3,493 1,756 607,088 583,454
1991 646,869 712,073 - - - - - - - - 2,706 2,366 649,575 714,439
1992 764,453 836,310 - - - - - - - - 2,794 2,919 767,247 839,229
1993 813,535 823,841 - - - - - - - - 3,551 3,134 817,086 826,975
1994 893,387 892,778 - - - - - - - - 4,120 4,392 897,507 897,170
1995 912,877 946,109 - - - - - - - - 5,897 8,105 918,774 954,214
1996 857,727 851,272 - - - - - - - - 3,628 3,668 861,355 854,940
1997 904,712 916,397 - - - - - - - - 3,793 3,578 908,505 919,975
1998 921,343 938,656 - - - - - - - - 3,793 3,619 925,136 942,275
1999 970,311 977,066 - - - - - - - - 3,595 3,114 973,906 980,180
2000 999,418 970,383 - - - - - - - - 2933 2827 1,002,351 973,210
2001 971,621 962,586 - - - - - - - - 2,942 2,682 974,563 965,268
2002 912,419 950,655 - - - - - - - - 2,947 2,804 915,366 953,459
2003 1,140,687 1,102,864 - - - - - - - - 1,532 1,729 1,142,219 1,104,593
2004 1,459,575 1,484,685 - - - - - - - - 2,112 2,255 1,461,687 1,486,940
2005 1,360,217 1,396,227 - - - - - - - - 1,930 1,560 1,362,147 1,397,787
2006 1,444,408 1,474,559 - - - - - - - - 360 401 1,444,768 1,474,960
2007 1,529,930 1,565,341 338 211 1,530,268 1,565,552
2008 1,644,172 1,707,376 - - - - - - - - 145 168 1,644,317 1,707,544
2009 1,644,142 1,673,265 - - - - - - - - 420 379 1,644,562 1,673,644
2010 2,111,629 2,128,404 - - - - - - - - 385 356 2,112,014 2,128,760
2011 2,435,660 2,464,622 - - 1,842 1,842 - - - - 1,842 1,842 2,439,344* 2,468,306*
2012 2,518,082 2,568,787 - - 3,136 3,136 - - - - - - 2,521,218 2,571,923*
2013 2,593,818 2,644,467 2,828 2,850 7,238 6,010 21,366 18,738 - - 3,136 3,084 2,628,386* 2,675,149*
2014 2,757,667 2,884,767 4,052 3,256 6,710 7,196 22,218 20,143 - - - - 2,790,647 2,915,362
2015 3,222,647 3,209,259 997 1,513 6,786 7,474 20,339 18,474 - - - - 3,250,769 3,236,720
* Revised Source - Department of Immgration & Emmigration
Sri Lanka Tourism Development AuthorityStatistical Report 2015
PART H
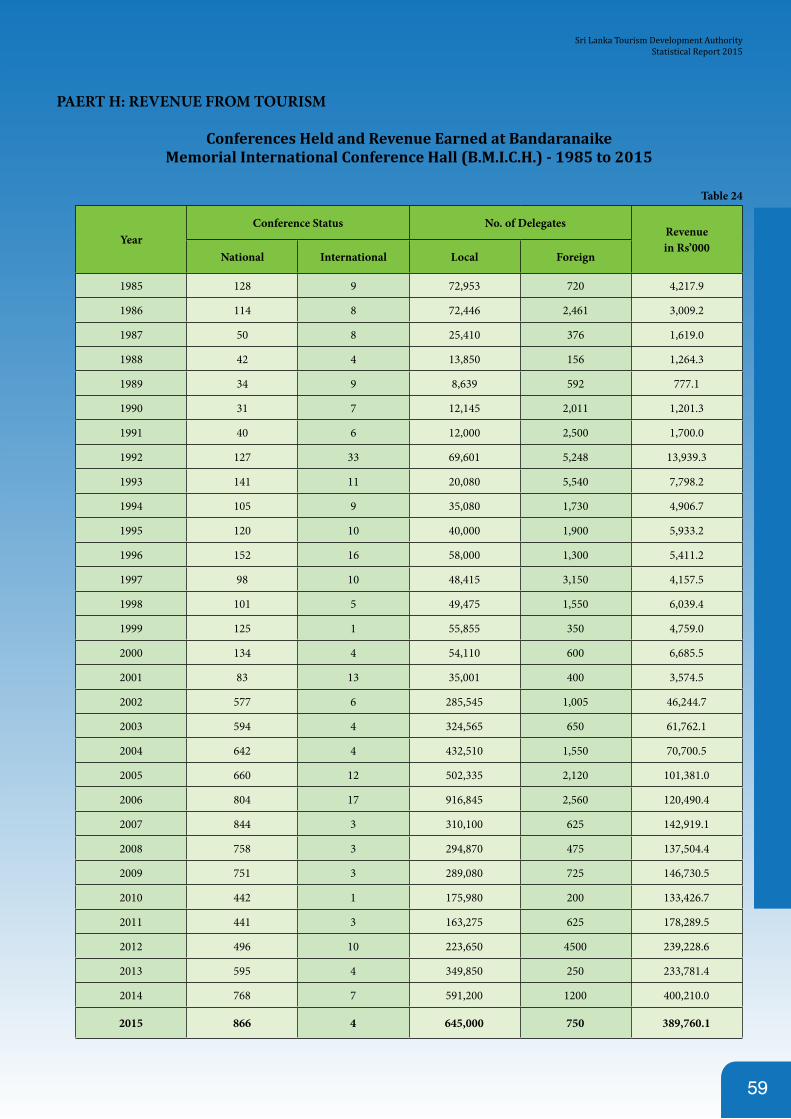
59
PAERT H: REVENUE FROM TOURISM
Conferences Held and Revenue Earned at BandaranaikeMemorial International Conference Hall (B.M.I.C.H.) - 1985 to 2015
Table 24
YearConference Status No. of Delegates
Revenuein Rs’000
National International Local Foreign
1985 128 9 72,953 720 4,217.9
1986 114 8 72,446 2,461 3,009.2
1987 50 8 25,410 376 1,619.0
1988 42 4 13,850 156 1,264.3
1989 34 9 8,639 592 777.1
1990 31 7 12,145 2,011 1,201.3
1991 40 6 12,000 2,500 1,700.0
1992 127 33 69,601 5,248 13,939.3
1993 141 11 20,080 5,540 7,798.2
1994 105 9 35,080 1,730 4,906.7
1995 120 10 40,000 1,900 5,933.2
1996 152 16 58,000 1,300 5,411.2
1997 98 10 48,415 3,150 4,157.5
1998 101 5 49,475 1,550 6,039.4
1999 125 1 55,855 350 4,759.0
2000 134 4 54,110 600 6,685.5
2001 83 13 35,001 400 3,574.5
2002 577 6 285,545 1,005 46,244.7
2003 594 4 324,565 650 61,762.1
2004 642 4 432,510 1,550 70,700.5
2005 660 12 502,335 2,120 101,381.0
2006 804 17 916,845 2,560 120,490.4
2007 844 3 310,100 625 142,919.1
2008 758 3 294,870 475 137,504.4
2009 751 3 289,080 725 146,730.5
2010 442 1 175,980 200 133,426.7
2011 441 3 163,275 625 178,289.5
2012 496 10 223,650 4500 239,228.6
2013 595 4 349,850 250 233,781.4
2014 768 7 591,200 1200 400,210.0
2015 866 4 645,000 750 389,760.1
Sri Lanka Tourism Development AuthorityStatistical Report 2015
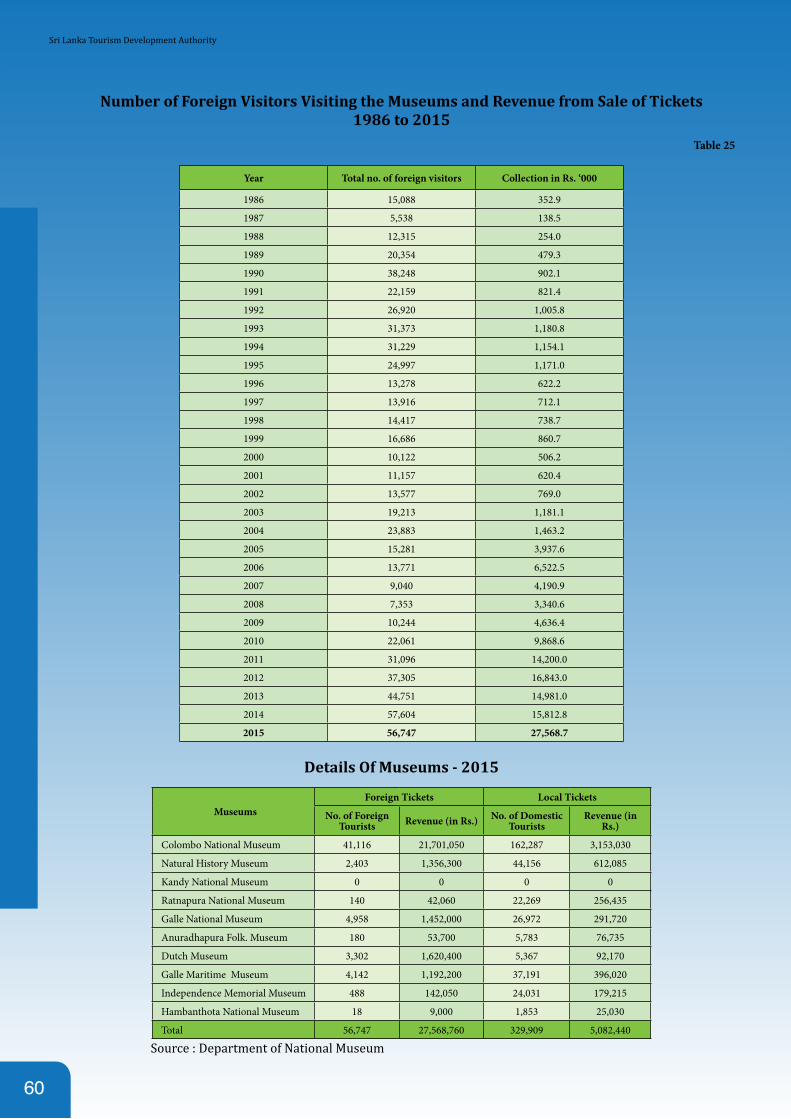
60
Number of Foreign Visitors Visiting the Museums and Revenue from Sale of Tickets 1986 to 2015
Table 25
Year Total no. of foreign visitors Collection in Rs. ‘000
1986 15,088 352.9
1987 5,538 138.5
1988 12,315 254.0
1989 20,354 479.3
1990 38,248 902.1
1991 22,159 821.4
1992 26,920 1,005.8
1993 31,373 1,180.8
1994 31,229 1,154.1
1995 24,997 1,171.0
1996 13,278 622.2
1997 13,916 712.1
1998 14,417 738.7
1999 16,686 860.7
2000 10,122 506.2
2001 11,157 620.4
2002 13,577 769.0
2003 19,213 1,181.1
2004 23,883 1,463.2
2005 15,281 3,937.6
2006 13,771 6,522.5
2007 9,040 4,190.9
2008 7,353 3,340.6
2009 10,244 4,636.4
2010 22,061 9,868.6
2011 31,096 14,200.0
2012 37,305 16,843.0
2013 44,751 14,981.0
2014 57,604 15,812.8
2015 56,747 27,568.7
Details Of Museums - 2015
MuseumsForeign Tickets Local Tickets
No. of Foreign Tourists Revenue (in Rs.) No. of Domestic
TouristsRevenue (in
Rs.)
Colombo National Museum 41,116 21,701,050 162,287 3,153,030
Natural History Museum 2,403 1,356,300 44,156 612,085
Kandy National Museum 0 0 0 0
Ratnapura National Museum 140 42,060 22,269 256,435
Galle National Museum 4,958 1,452,000 26,972 291,720
Anuradhapura Folk. Museum 180 53,700 5,783 76,735
Dutch Museum 3,302 1,620,400 5,367 92,170
Galle Maritime Museum 4,142 1,192,200 37,191 396,020
Independence Memorial Museum 488 142,050 24,031 179,215
Hambanthota National Museum 18 9,000 1,853 25,030
Total 56,747 27,568,760 329,909 5,082,440
Source : Department of National Museum
Sri Lanka Tourism Development Authority
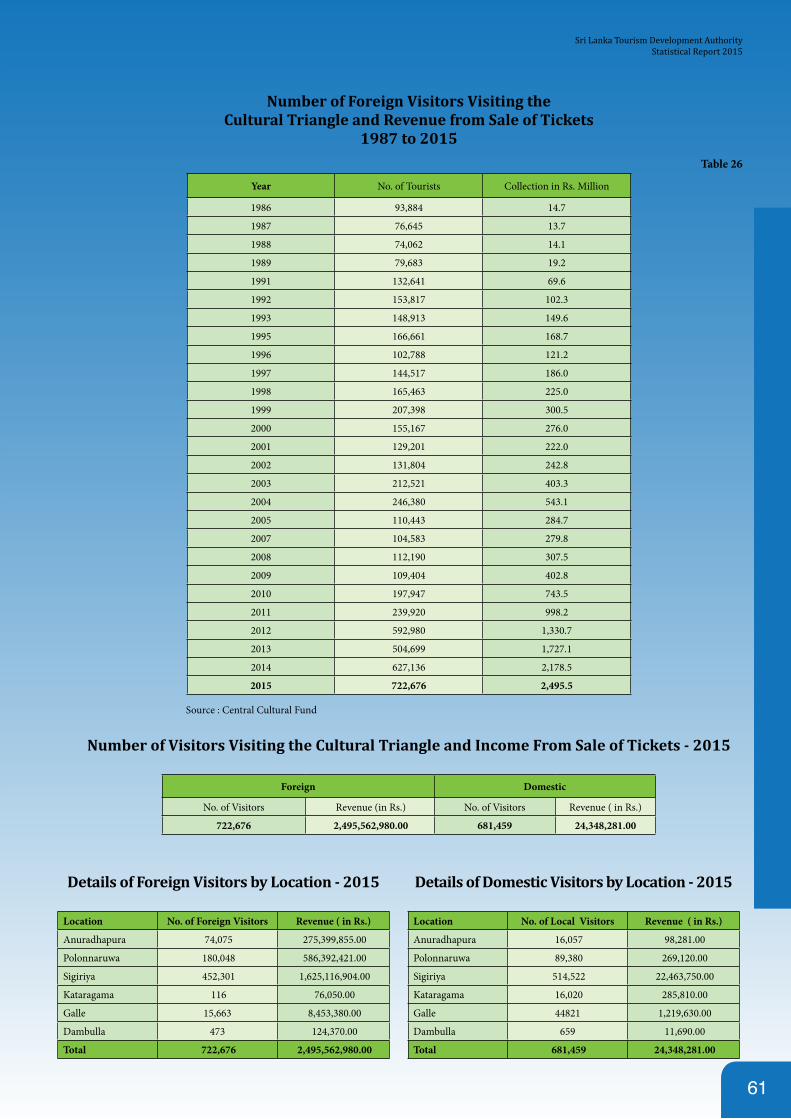
61
Number of Foreign Visitors Visiting theCultural Triangle and Revenue from Sale of Tickets
1987 to 2015
Table 26
Year No. of Tourists Collection in Rs. Million
1986 93,884 14.7
1987 76,645 13.7
1988 74,062 14.1
1989 79,683 19.2
1991 132,641 69.6
1992 153,817 102.3
1993 148,913 149.6
1995 166,661 168.7
1996 102,788 121.2
1997 144,517 186.0
1998 165,463 225.0
1999 207,398 300.5
2000 155,167 276.0
2001 129,201 222.0
2002 131,804 242.8
2003 212,521 403.3
2004 246,380 543.1
2005 110,443 284.7
2007 104,583 279.8
2008 112,190 307.5
2009 109,404 402.8
2010 197,947 743.5
2011 239,920 998.2
2012 592,980 1,330.7
2013 504,699 1,727.1
2014 627,136 2,178.5
2015 722,676 2,495.5
Source : Central Cultural Fund
Number of Visitors Visiting the Cultural Triangle and Income From Sale of Tickets - 2015
Foreign Domestic
No. of Visitors Revenue (in Rs.) No. of Visitors Revenue ( in Rs.)
722,676 2,495,562,980.00 681,459 24,348,281.00
Details of Foreign Visitors by Location - 2015
Location No. of Foreign Visitors Revenue ( in Rs.)
Anuradhapura 74,075 275,399,855.00
Polonnaruwa 180,048 586,392,421.00
Sigiriya 452,301 1,625,116,904.00
Kataragama 116 76,050.00
Galle 15,663 8,453,380.00
Dambulla 473 124,370.00
Total 722,676 2,495,562,980.00
Details of Domestic Visitors by Location - 2015
Location No. of Local Visitors Revenue ( in Rs.)
Anuradhapura 16,057 98,281.00
Polonnaruwa 89,380 269,120.00
Sigiriya 514,522 22,463,750.00
Kataragama 16,020 285,810.00
Galle 44821 1,219,630.00
Dambulla 659 11,690.00
Total 681,459 24,348,281.00
Sri Lanka Tourism Development AuthorityStatistical Report 2015
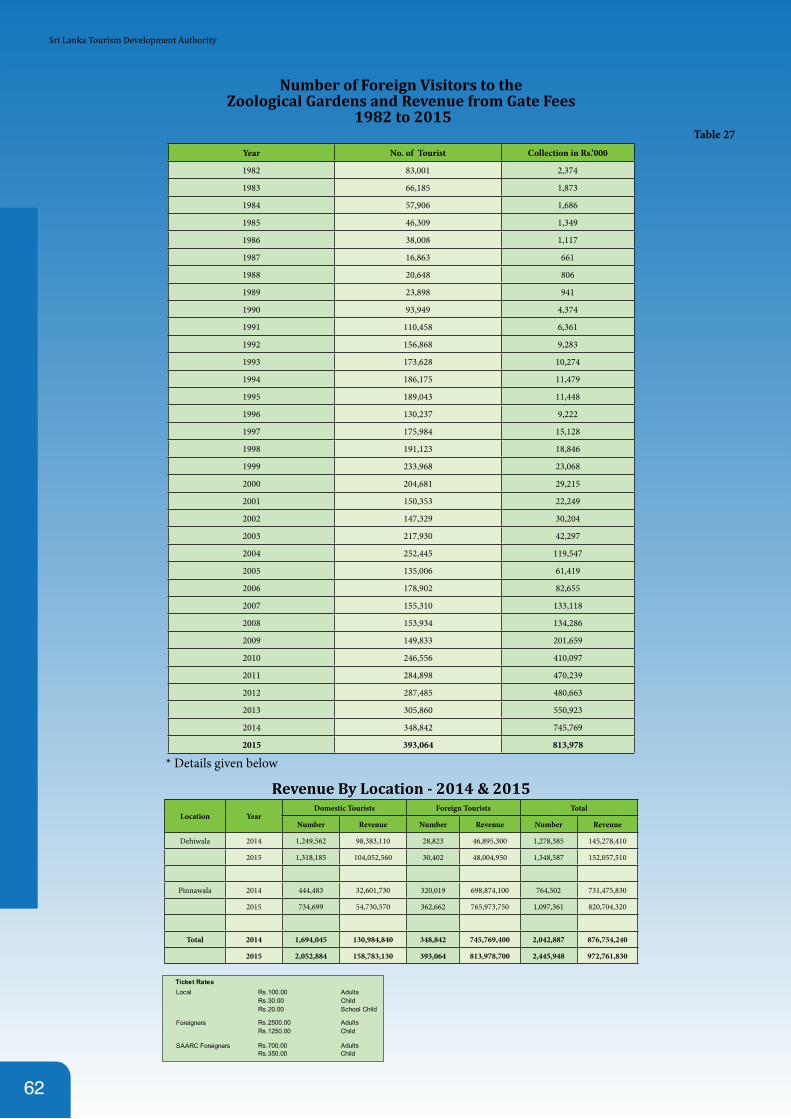
62
Number of Foreign Visitors to theZoological Gardens and Revenue from Gate Fees
1982 to 2015Table 27
Year No. of Tourist Collection in Rs.’000
1982 83,001 2,374
1983 66,185 1,873
1984 57,906 1,686
1985 46,309 1,349
1986 38,008 1,117
1987 16,863 661
1988 20,648 806
1989 23,898 941
1990 93,949 4,374
1991 110,458 6,361
1992 156,868 9,283
1993 173,628 10,274
1994 186,175 11,479
1995 189,043 11,448
1996 130,237 9,222
1997 175,984 15,128
1998 191,123 18,846
1999 233,968 23,068
2000 204,681 29,215
2001 150,353 22,249
2002 147,329 30,204
2003 217,930 42,297
2004 252,445 119,547
2005 135,006 61,419
2006 178,902 82,655
2007 155,310 133,118
2008 153,934 134,286
2009 149,833 201,659
2010 246,556 410,097
2011 284,898 470,239
2012 287,485 480,663
2013 305,860 550,923
2014 348,842 745,769
2015 393,064 813,978
* Details given below
Revenue By Location - 2014 & 2015
Location YearDomestic Tourists Foreign Tourists Total
Number Revenue Number Revenue Number Revenue
Dehiwala 2014 1,249,562 98,383,110 28,823 46,895,300 1,278,385 145,278,410
2015 1,318,185 104,052,560 30,402 48,004,950 1,348,587 152,057,510
Pinnawala 2014 444,483 32,601,730 320,019 698,874,100 764,502 731,475,830
2015 734,699 54,730,570 362,662 765,973,750 1,097,361 820,704,320
Total 2014 1,694,045 130,984,840 348,842 745,769,400 2,042,887 876,754,240
2015 2,052,884 158,783,130 393,064 813,978,700 2,445,948 972,761,830
Ticket RatesLocal Rs.100.00 Adults
Rs.30.00 ChildRs.20.00 School Child
Foreigners Rs.2500.00 AdultsRs.1250.00 Child
SAARC Foreigners Rs.700.00 AdultsRs.350.00 Child
Sri Lanka Tourism Development Authority
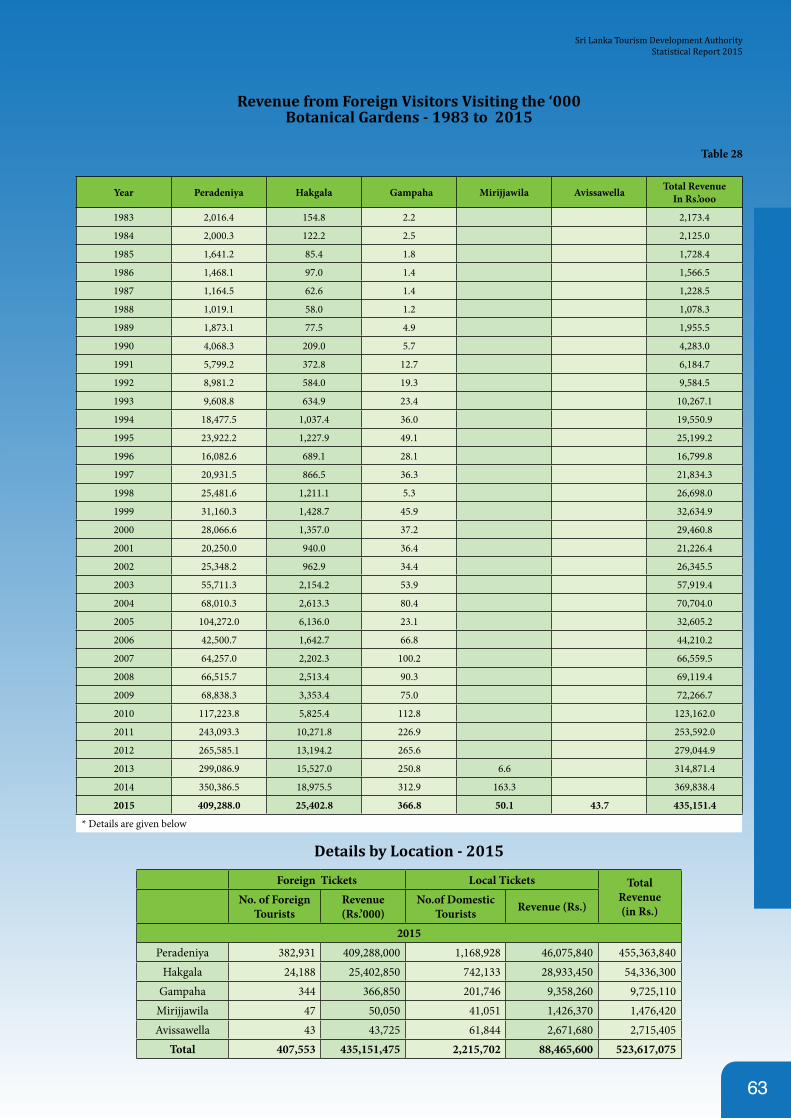
63
Revenue from Foreign Visitors Visiting the ‘000Botanical Gardens - 1983 to 2015
Table 28
Year Peradeniya Hakgala Gampaha Mirijjawila Avissawella Total Revenue In Rs.’ooo
1983 2,016.4 154.8 2.2 2,173.4
1984 2,000.3 122.2 2.5 2,125.0
1985 1,641.2 85.4 1.8 1,728.4
1986 1,468.1 97.0 1.4 1,566.5
1987 1,164.5 62.6 1.4 1,228.5
1988 1,019.1 58.0 1.2 1,078.3
1989 1,873.1 77.5 4.9 1,955.5
1990 4,068.3 209.0 5.7 4,283.0
1991 5,799.2 372.8 12.7 6,184.7
1992 8,981.2 584.0 19.3 9,584.5
1993 9,608.8 634.9 23.4 10,267.1
1994 18,477.5 1,037.4 36.0 19,550.9
1995 23,922.2 1,227.9 49.1 25,199.2
1996 16,082.6 689.1 28.1 16,799.8
1997 20,931.5 866.5 36.3 21,834.3
1998 25,481.6 1,211.1 5.3 26,698.0
1999 31,160.3 1,428.7 45.9 32,634.9
2000 28,066.6 1,357.0 37.2 29,460.8
2001 20,250.0 940.0 36.4 21,226.4
2002 25,348.2 962.9 34.4 26,345.5
2003 55,711.3 2,154.2 53.9 57,919.4
2004 68,010.3 2,613.3 80.4 70,704.0
2005 104,272.0 6,136.0 23.1 32,605.2
2006 42,500.7 1,642.7 66.8 44,210.2
2007 64,257.0 2,202.3 100.2 66,559.5
2008 66,515.7 2,513.4 90.3 69,119.4
2009 68,838.3 3,353.4 75.0 72,266.7
2010 117,223.8 5,825.4 112.8 123,162.0
2011 243,093.3 10,271.8 226.9 253,592.0
2012 265,585.1 13,194.2 265.6 279,044.9
2013 299,086.9 15,527.0 250.8 6.6 314,871.4
2014 350,386.5 18,975.5 312.9 163.3 369,838.4
2015 409,288.0 25,402.8 366.8 50.1 43.7 435,151.4
* Details are given below
Details by Location - 2015
Foreign Tickets Local Tickets Total Revenue(in Rs.)
No. of Foreign Tourists
Revenue(Rs.’000)
No.of Domestic Tourists Revenue (Rs.)
2015Peradeniya 382,931 409,288,000 1,168,928 46,075,840 455,363,840
Hakgala 24,188 25,402,850 742,133 28,933,450 54,336,300Gampaha 344 366,850 201,746 9,358,260 9,725,110
Mirijjawila 47 50,050 41,051 1,426,370 1,476,420Avissawella 43 43,725 61,844 2,671,680 2,715,405
Total 407,553 435,151,475 2,215,702 88,465,600 523,617,075
Sri Lanka Tourism Development AuthorityStatistical Report 2015
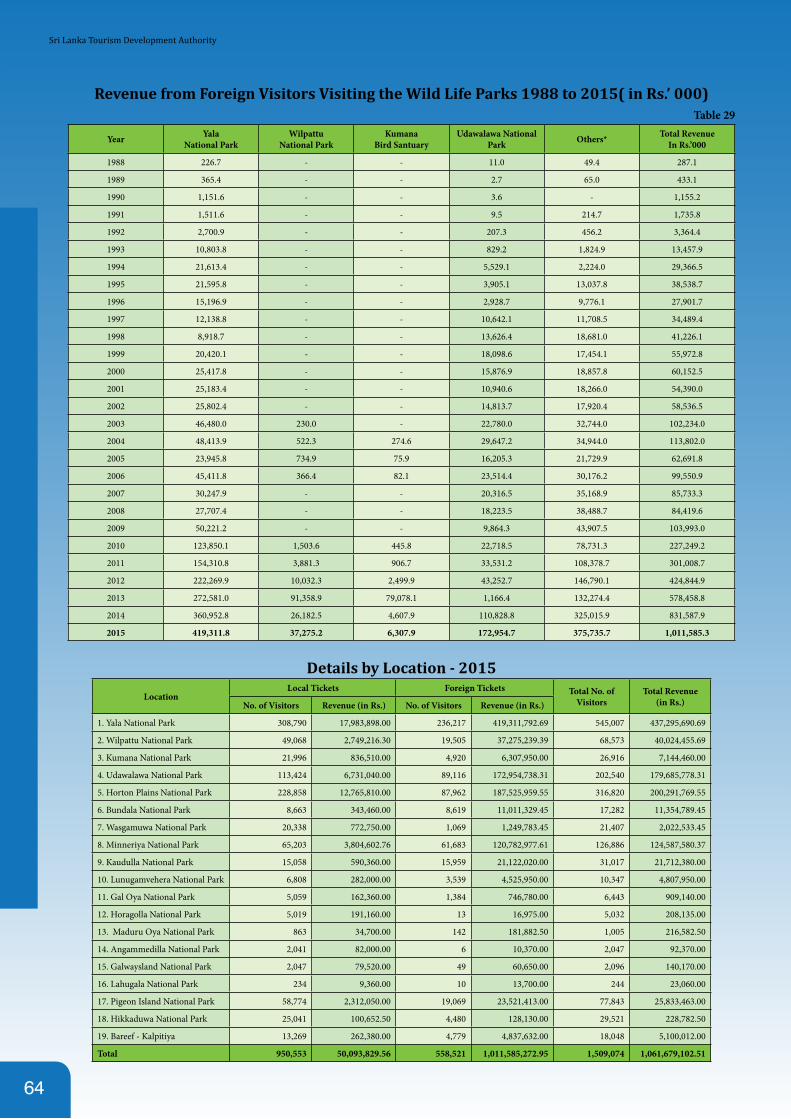
64
Revenue from Foreign Visitors Visiting the Wild Life Parks 1988 to 2015( in Rs.’ 000)Table 29
Year Yala National Park
Wilpattu National Park
Kumana Bird Santuary
Udawalawa National Park Others* Total Revenue
In Rs.’000
1988 226.7 - - 11.0 49.4 287.1
1989 365.4 - - 2.7 65.0 433.1
1990 1,151.6 - - 3.6 - 1,155.2
1991 1,511.6 - - 9.5 214.7 1,735.8
1992 2,700.9 - - 207.3 456.2 3,364.4
1993 10,803.8 - - 829.2 1,824.9 13,457.9
1994 21,613.4 - - 5,529.1 2,224.0 29,366.5
1995 21,595.8 - - 3,905.1 13,037.8 38,538.7
1996 15,196.9 - - 2,928.7 9,776.1 27,901.7
1997 12,138.8 - - 10,642.1 11,708.5 34,489.4
1998 8,918.7 - - 13,626.4 18,681.0 41,226.1
1999 20,420.1 - - 18,098.6 17,454.1 55,972.8
2000 25,417.8 - - 15,876.9 18,857.8 60,152.5
2001 25,183.4 - - 10,940.6 18,266.0 54,390.0
2002 25,802.4 - - 14,813.7 17,920.4 58,536.5
2003 46,480.0 230.0 - 22,780.0 32,744.0 102,234.0
2004 48,413.9 522.3 274.6 29,647.2 34,944.0 113,802.0
2005 23,945.8 734.9 75.9 16,205.3 21,729.9 62,691.8
2006 45,411.8 366.4 82.1 23,514.4 30,176.2 99,550.9
2007 30,247.9 - - 20,316.5 35,168.9 85,733.3
2008 27,707.4 - - 18,223.5 38,488.7 84,419.6
2009 50,221.2 - - 9,864.3 43,907.5 103,993.0
2010 123,850.1 1,503.6 445.8 22,718.5 78,731.3 227,249.2
2011 154,310.8 3,881.3 906.7 33,531.2 108,378.7 301,008.7
2012 222,269.9 10,032.3 2,499.9 43,252.7 146,790.1 424,844.9
2013 272,581.0 91,358.9 79,078.1 1,166.4 132,274.4 578,458.8
2014 360,952.8 26,182.5 4,607.9 110,828.8 325,015.9 831,587.9
2015 419,311.8 37,275.2 6,307.9 172,954.7 375,735.7 1,011,585.3
Details by Location - 2015
LocationLocal Tickets Foreign Tickets Total No. of
VisitorsTotal Revenue
(in Rs.)No. of Visitors Revenue (in Rs.) No. of Visitors Revenue (in Rs.)
1. Yala National Park 308,790 17,983,898.00 236,217 419,311,792.69 545,007 437,295,690.69
2. Wilpattu National Park 49,068 2,749,216.30 19,505 37,275,239.39 68,573 40,024,455.69
3. Kumana National Park 21,996 836,510.00 4,920 6,307,950.00 26,916 7,144,460.00
4. Udawalawa National Park 113,424 6,731,040.00 89,116 172,954,738.31 202,540 179,685,778.31
5. Horton Plains National Park 228,858 12,765,810.00 87,962 187,525,959.55 316,820 200,291,769.55
6. Bundala National Park 8,663 343,460.00 8,619 11,011,329.45 17,282 11,354,789.45
7. Wasgamuwa National Park 20,338 772,750.00 1,069 1,249,783.45 21,407 2,022,533.45
8. Minneriya National Park 65,203 3,804,602.76 61,683 120,782,977.61 126,886 124,587,580.37
9. Kaudulla National Park 15,058 590,360.00 15,959 21,122,020.00 31,017 21,712,380.00
10. Lunugamvehera National Park 6,808 282,000.00 3,539 4,525,950.00 10,347 4,807,950.00
11. Gal Oya National Park 5,059 162,360.00 1,384 746,780.00 6,443 909,140.00
12. Horagolla National Park 5,019 191,160.00 13 16,975.00 5,032 208,135.00
13. Maduru Oya National Park 863 34,700.00 142 181,882.50 1,005 216,582.50
14. Angammedilla National Park 2,041 82,000.00 6 10,370.00 2,047 92,370.00
15. Galwaysland National Park 2,047 79,520.00 49 60,650.00 2,096 140,170.00
16. Lahugala National Park 234 9,360.00 10 13,700.00 244 23,060.00
17. Pigeon Island National Park 58,774 2,312,050.00 19,069 23,521,413.00 77,843 25,833,463.00
18. Hikkaduwa National Park 25,041 100,652.50 4,480 128,130.00 29,521 228,782.50
19. Bareef - Kalpitiya 13,269 262,380.00 4,779 4,837,632.00 18,048 5,100,012.00
Total 950,553 50,093,829.56 558,521 1,011,585,272.95 1,509,074 1,061,679,102.51
Sri Lanka Tourism Development Authority
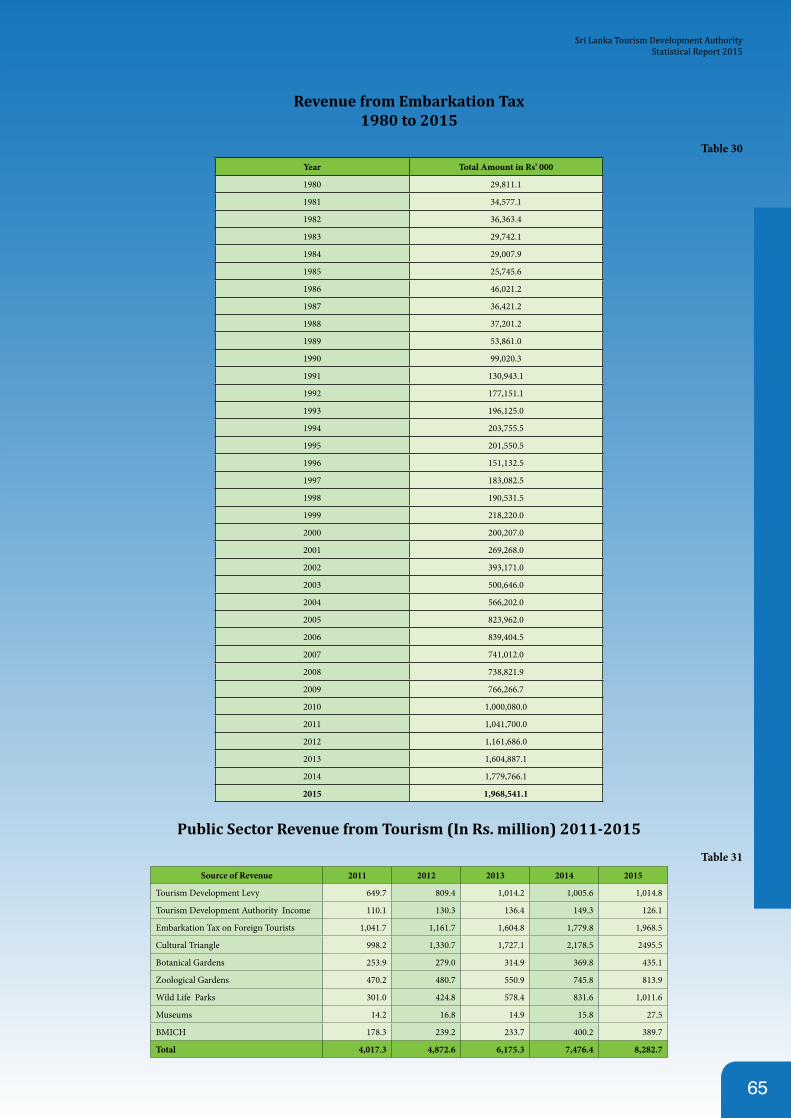
65
Revenue from Embarkation Tax1980 to 2015
Table 30Year Total Amount in Rs’ 000
1980 29,811.1
1981 34,577.1
1982 36,363.4
1983 29,742.1
1984 29,007.9
1985 25,745.6
1986 46,021.2
1987 36,421.2
1988 37,201.2
1989 53,861.0
1990 99,020.3
1991 130,943.1
1992 177,151.1
1993 196,125.0
1994 203,755.5
1995 201,550.5
1996 151,132.5
1997 183,082.5
1998 190,531.5
1999 218,220.0
2000 200,207.0
2001 269,268.0
2002 393,171.0
2003 500,646.0
2004 566,202.0
2005 823,962.0
2006 839,404.5
2007 741,012.0
2008 738,821.9
2009 766,266.7
2010 1,000,080.0
2011 1,041,700.0
2012 1,161,686.0
2013 1,604,887.1
2014 1,779,766.1
2015 1,968,541.1
Public Sector Revenue from Tourism (In Rs. million) 2011-2015
Table 31Source of Revenue 2011 2012 2013 2014 2015
Tourism Development Levy 649.7 809.4 1,014.2 1,005.6 1,014.8
Tourism Development Authority Income 110.1 130.3 136.4 149.3 126.1
Embarkation Tax on Foreign Tourists 1,041.7 1,161.7 1,604.8 1,779.8 1,968.5
Cultural Triangle 998.2 1,330.7 1,727.1 2,178.5 2495.5
Botanical Gardens 253.9 279.0 314.9 369.8 435.1
Zoological Gardens 470.2 480.7 550.9 745.8 813.9
Wild Life Parks 301.0 424.8 578.4 831.6 1,011.6
Museums 14.2 16.8 14.9 15.8 27.5
BMICH 178.3 239.2 233.7 400.2 389.7
Total 4,017.3 4,872.6 6,175.3 7,476.4 8,282.7
Sri Lanka Tourism Development AuthorityStatistical Report 2015
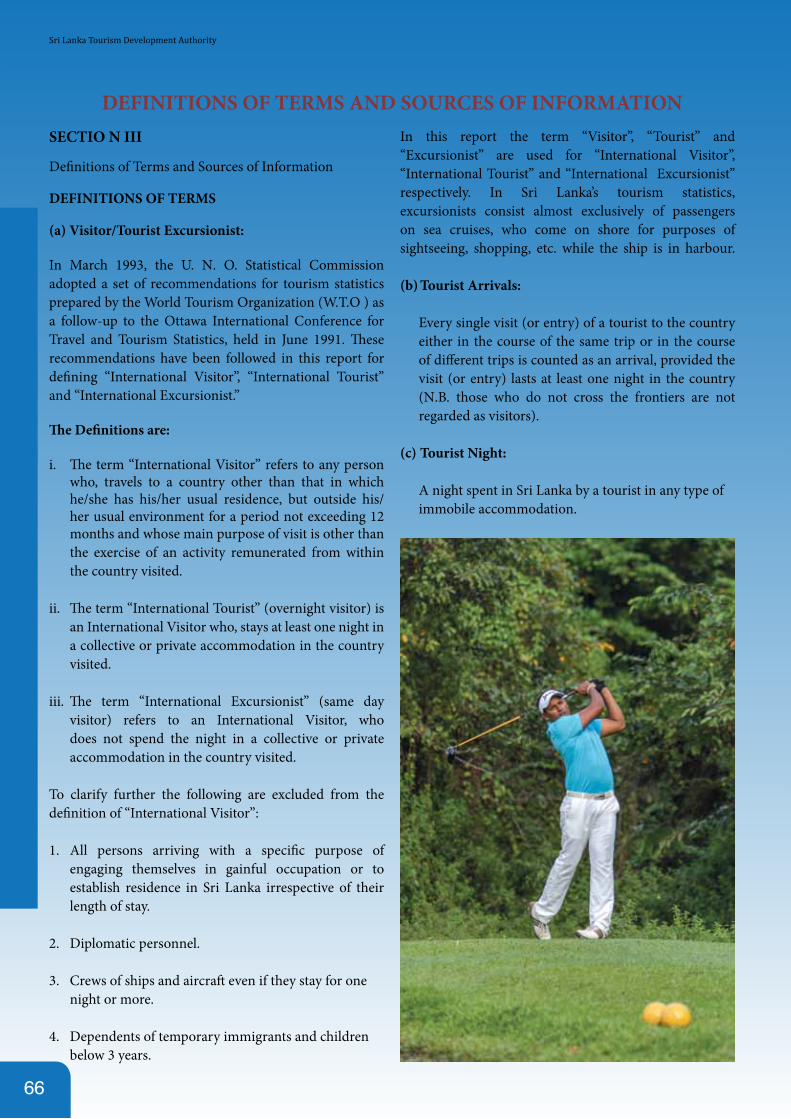
66
SECTIO N III
Definitions of Terms and Sources of Information
DEFINITIONS OF TERMS
(a) Visitor/Tourist Excursionist:
In March 1993, the U. N. O. Statistical Commission adopted a set of recommendations for tourism statistics prepared by the World Tourism Organization (W.T.O ) as a follow-up to the Ottawa International Conference for Travel and Tourism Statistics, held in June 1991. These recommendations have been followed in this report for defining “International Visitor”, “International Tourist” and “International Excursionist.”
The Definitions are:
i. The term “International Visitor” refers to any person who, travels to a country other than that in which he/she has his/her usual residence, but outside his/her usual environment for a period not exceeding 12 months and whose main purpose of visit is other than the exercise of an activity remunerated from within the country visited.
ii. The term “International Tourist” (overnight visitor) is an International Visitor who, stays at least one night in a collective or private accommodation in the country visited.
iii. The term “International Excursionist” (same day visitor) refers to an International Visitor, who does not spend the night in a collective or private accommodation in the country visited.
To clarify further the following are excluded from the definition of “International Visitor”:
1. All persons arriving with a specific purpose of engaging themselves in gainful occupation or to establish residence in Sri Lanka irrespective of their length of stay.
2. Diplomatic personnel.
3. Crews of ships and aircraft even if they stay for one night or more.
4. Dependents of temporary immigrants and children below 3 years.
In this report the term “Visitor”, “Tourist” and “Excursionist” are used for “International Visitor”, “International Tourist” and “International Excursionist” respectively. In Sri Lanka’s tourism statistics, excursionists consist almost exclusively of passengers on sea cruises, who come on shore for purposes of sightseeing, shopping, etc. while the ship is in harbour. (b) Tourist Arrivals:
Every single visit (or entry) of a tourist to the country either in the course of the same trip or in the course of different trips is counted as an arrival, provided the visit (or entry) lasts at least one night in the country (N.B. those who do not cross the frontiers are not regarded as visitors).
(c) Tourist Night:
A night spent in Sri Lanka by a tourist in any type of immobile accommodation.
DEFINITIONS OF TERMS AND SOURCES OF INFORMATION
Sri Lanka Tourism Development Authority
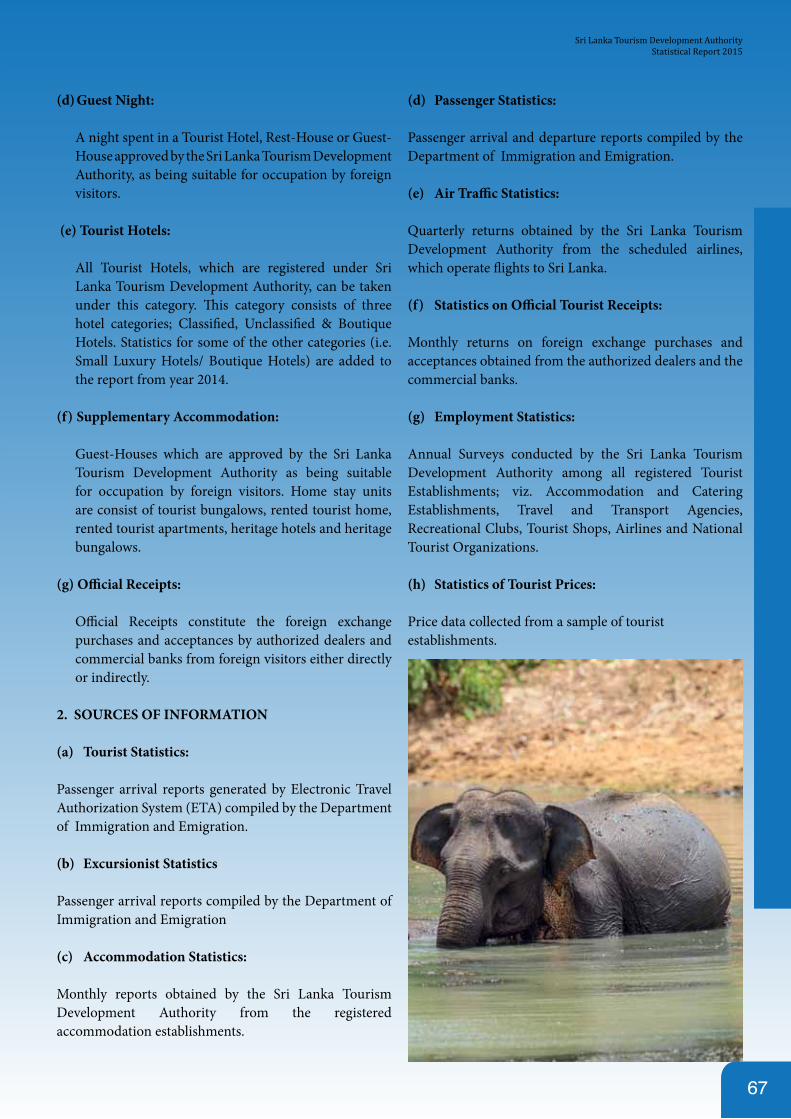
67
(d) Guest Night:
A night spent in a Tourist Hotel, Rest-House or Guest-House approved by the Sri Lanka Tourism Development Authority, as being suitable for occupation by foreign visitors.
(e) Tourist Hotels:
All Tourist Hotels, which are registered under Sri Lanka Tourism Development Authority, can be taken under this category. This category consists of three hotel categories; Classified, Unclassified & Boutique Hotels. Statistics for some of the other categories (i.e. Small Luxury Hotels/ Boutique Hotels) are added to the report from year 2014.
(f) Supplementary Accommodation:
Guest-Houses which are approved by the Sri Lanka Tourism Development Authority as being suitable for occupation by foreign visitors. Home stay units are consist of tourist bungalows, rented tourist home, rented tourist apartments, heritage hotels and heritage bungalows.
(g) Official Receipts:
Official Receipts constitute the foreign exchange purchases and acceptances by authorized dealers and commercial banks from foreign visitors either directly or indirectly.
2. SOURCES OF INFORMATION
(a) Tourist Statistics:
Passenger arrival reports generated by Electronic Travel Authorization System (ETA) compiled by the Department of Immigration and Emigration.
(b) Excursionist Statistics Passenger arrival reports compiled by the Department of Immigration and Emigration
(c) Accommodation Statistics:
Monthly reports obtained by the Sri Lanka Tourism Development Authority from the registered accommodation establishments.
(d) Passenger Statistics:
Passenger arrival and departure reports compiled by the Department of Immigration and Emigration.
(e) Air Traffic Statistics: Quarterly returns obtained by the Sri Lanka Tourism Development Authority from the scheduled airlines, which operate flights to Sri Lanka.
(f) Statistics on Official Tourist Receipts:
Monthly returns on foreign exchange purchases and acceptances obtained from the authorized dealers and the commercial banks. (g) Employment Statistics:
Annual Surveys conducted by the Sri Lanka Tourism Development Authority among all registered Tourist Establishments; viz. Accommodation and Catering Establishments, Travel and Transport Agencies, Recreational Clubs, Tourist Shops, Airlines and National Tourist Organizations.
(h) Statistics of Tourist Prices:
Price data collected from a sample of tourist establishments.
Sri Lanka Tourism Development AuthorityStatistical Report 2015
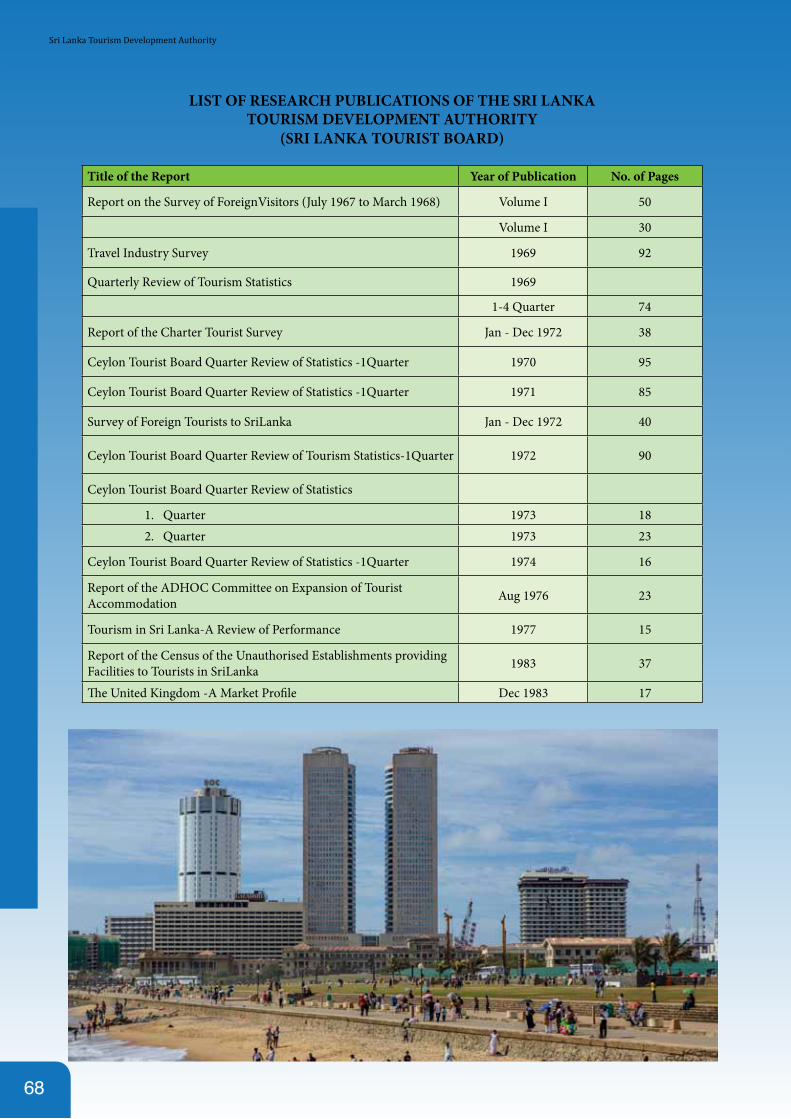
68
LIST OF RESEARCH PUBLICATIONS OF THE SRI LANKA TOURISM DEVELOPMENT AUTHORITY
(SRI LANKA TOURIST BOARD)
Title of the Report Year of Publication No. of Pages
Report on the Survey of ForeignVisitors (July 1967 to March 1968) Volume I 50
Volume I 30
Travel Industry Survey 1969 92
Quarterly Review of Tourism Statistics 1969
1-4 Quarter 74
Report of the Charter Tourist Survey Jan - Dec 1972 38
Ceylon Tourist Board Quarter Review of Statistics -1Quarter 1970 95
Ceylon Tourist Board Quarter Review of Statistics -1Quarter 1971 85
Survey of Foreign Tourists to SriLanka Jan - Dec 1972 40
Ceylon Tourist Board Quarter Review of Tourism Statistics-1Quarter 1972 90
Ceylon Tourist Board Quarter Review of Statistics
1. Quarter 1973 182. Quarter 1973 23
Ceylon Tourist Board Quarter Review of Statistics -1Quarter 1974 16
Report of the ADHOC Committee on Expansion of Tourist Accommodation Aug 1976 23
Tourism in Sri Lanka-A Review of Performance 1977 15
Report of the Census of the Unauthorised Establishments providing Facilities to Tourists in SriLanka 1983 37
The United Kingdom -A Market Profile Dec 1983 17
Sri Lanka Tourism Development Authority
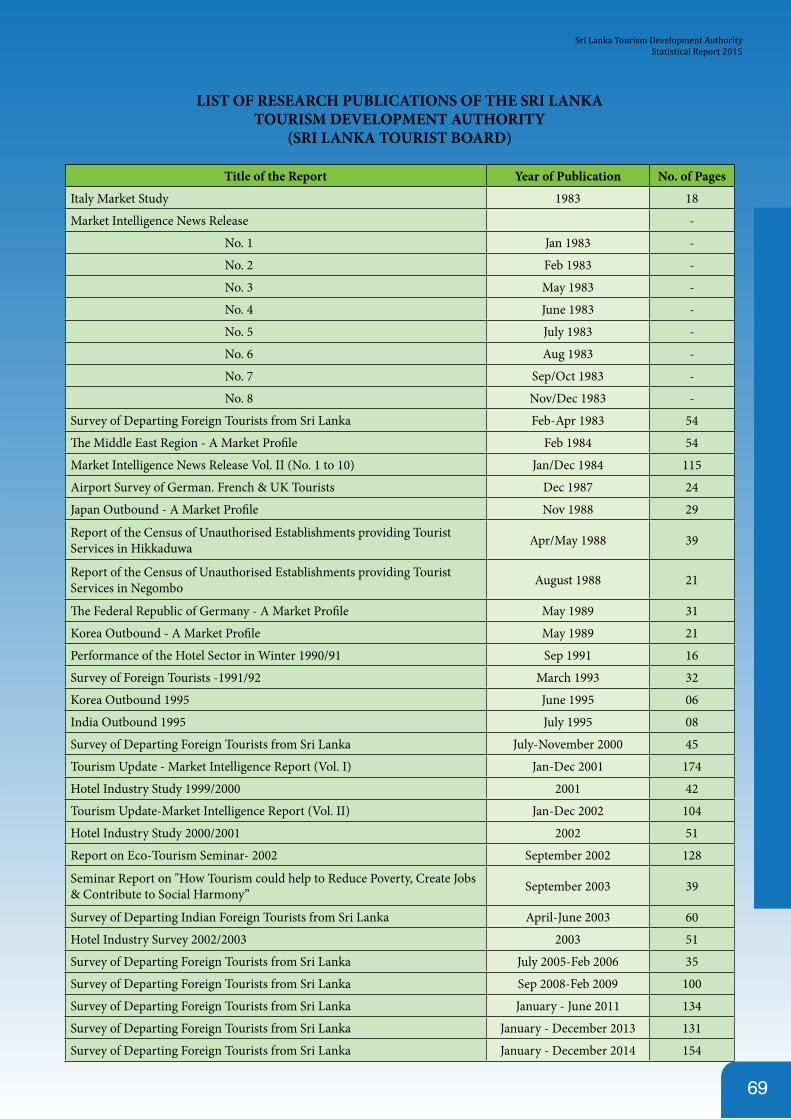
69
LIST OF RESEARCH PUBLICATIONS OF THE SRI LANKA TOURISM DEVELOPMENT AUTHORITY
(SRI LANKA TOURIST BOARD)
Title of the Report Year of Publication No. of Pages
Italy Market Study 1983 18
Market Intelligence News Release -
No. 1 Jan 1983 -
No. 2 Feb 1983 -
No. 3 May 1983 -
No. 4 June 1983 -
No. 5 July 1983 -
No. 6 Aug 1983 -
No. 7 Sep/Oct 1983 -
No. 8 Nov/Dec 1983 -
Survey of Departing Foreign Tourists from Sri Lanka Feb-Apr 1983 54
The Middle East Region - A Market Profile Feb 1984 54
Market Intelligence News Release Vol. II (No. 1 to 10) Jan/Dec 1984 115
Airport Survey of German. French & UK Tourists Dec 1987 24
Japan Outbound - A Market Profile Nov 1988 29
Report of the Census of Unauthorised Establishments providing Tourist Services in Hikkaduwa Apr/May 1988 39
Report of the Census of Unauthorised Establishments providing Tourist Services in Negombo August 1988 21
The Federal Republic of Germany - A Market Profile May 1989 31
Korea Outbound - A Market Profile May 1989 21
Performance of the Hotel Sector in Winter 1990/91 Sep 1991 16
Survey of Foreign Tourists -1991/92 March 1993 32
Korea Outbound 1995 June 1995 06
India Outbound 1995 July 1995 08
Survey of Departing Foreign Tourists from Sri Lanka July-November 2000 45
Tourism Update - Market Intelligence Report (Vol. I) Jan-Dec 2001 174
Hotel Industry Study 1999/2000 2001 42
Tourism Update-Market Intelligence Report (Vol. II) Jan-Dec 2002 104
Hotel Industry Study 2000/2001 2002 51
Report on Eco-Tourism Seminar- 2002 September 2002 128
Seminar Report on "How Tourism could help to Reduce Poverty, Create Jobs & Contribute to Social Harmony” September 2003 39
Survey of Departing Indian Foreign Tourists from Sri Lanka April-June 2003 60
Hotel Industry Survey 2002/2003 2003 51
Survey of Departing Foreign Tourists from Sri Lanka July 2005-Feb 2006 35
Survey of Departing Foreign Tourists from Sri Lanka Sep 2008-Feb 2009 100
Survey of Departing Foreign Tourists from Sri Lanka January - June 2011 134
Survey of Departing Foreign Tourists from Sri Lanka January - December 2013 131
Survey of Departing Foreign Tourists from Sri Lanka January - December 2014 154
Sri Lanka Tourism Development AuthorityStatistical Report 2015

Comments & SuggestionsTel : + 94 11 2437055/ + 94 11 2426800 (Ext. 151/155)
E-mail : [email protected]

Reasearch & International Relations DivisionSri Lanka Tourism Development Authority
P. O. Box 1504No. 80, Galle Road
Colombo - 03Sri Lanka.
Tel : + 94 11 2437055/ + 94 11 2426800Fax : + 94 11 2380943
Email : [email protected] : www.sltda.lk
Printed by ANCL Printing Dept.