Embed Size (px)
Citation preview
Manitoba Health, Seniors and Ac ve Living Annual Sta s cs 2017-2018
22Manitoba Health, Seniors and Ac ve Living Annual Sta s cs 2017-2018
Manitoba Health, Seniors and Ac ve Living Annual Sta s cs 2017-20183
Table of ContentsPreface 5
How to Use This Report 6
Important Notes and Data Cau ons 7
Addi onal Publica ons to Consider 8Demographics 9 Map of Manitoba Regional Health Authori es 10 Popula on Pyramids 11 Pregnancy 12 Births 13 Deaths 14 Dependency Ra o 15 Dependency Ra o 16
Popula on Health Status and Mortality 17 Premature Mortality 18 Infant Mortality 19 Child Mortality 20
Disease and Injury 21 Hypertension (High Blood Pressure) 22 Diabetes 23 Lower Limb Amputa ons among Residents with Diabetes 24 Chronic Obstruc ve Pulmonary Disease (COPD) 25 Acute Myocardial Infarc on (Heart A ack) 26 Stroke 27 Chronic Condi ons 28 Injury Hospitaliza on 29 Injury Mortality 30
Mental Illness 31 Cumula ve Mental Illness 32 Mood and Anxiety Disorders 33 Personality Disorders 34 Schizophrenia 35 Substance Abuse 36 Hospitaliza on for Self-Infl icted Injury 37 Suicide 38
Health Services Insurance Plan 39 Insured Services per Capita 40
Use of Medical Services 41 Number of General Prac oners and Specialists 42 Number of Nurses and Nurse Prac oners 43 Physician Use - Overall 44
44Manitoba Health, Seniors and Ac ve Living Annual Sta s cs 2017-2018
Physician Use - Primary Care 45 Physician Use - Specialist Care 46 Majority of Care 47 Ambulatory Care Visits 48
Use of Hospital Services 49 Map of Hospitals by Facility Size 50 Use of Hospitals 51 Inpa ent Hospital Separa ons 52 Hospitaliza ons by Service Type 53 Day Surgery 54 Hospitaliza on for Ambulatory Care Sensi ve Condi ons 55 Alternate Level of Care 56
High Profi le Surgeries 57 Coronary Artery Bypass Gra Surgery and Percutaneous Coronary Interven on Surgery 58 Hip Replacement 59 Knee Replacement 60 Cataract Surgery 61 Paediatric Dental Extrac on 62
Women’s Reproduc ve Health 63 Hysterectomy 64 Caesarean Sec on 65 Vaginal Birth a er Caesarean Sec on 66
Use of Home Care Services 67 Total Home Care Clients 68 Home Care Admissions and Discharges 69
Use of Personal Care Homes 71 Map of Personal Care Homes by Facility Size 72 Personal Care Home Admissions 73 Median Wait Times for Personal Care Home Admission 74 Median Length of Stay (Years) at Personal Care Homes 75
Preventa ve Services 77 Breast Cancer Screening 78 Cervical Cancer Screening 79 Infl uenza Immuniza ons 80 Pneumococcal Immuniza ons 81
Prescrip on Drug Use 83 Pharmaceu cal Use 84 Drugs Dispensed per User 85 Total Drug Expenditures by Plan and RHA 86
Glossary 87
Manitoba Health, Seniors and Ac ve Living Annual Sta s cs 2017-20185
Preface
Manitoba Health, Seniors and Ac ve Living’s Annual Sta s cs report is designed for a broad audience that includes health professionals, researchers, policymakers and the general public. This report de-scribes Manitoba’s popula on, health u liza on and health status using key health indicators measured both over me and for the most recently available fi scal or calendar year.
Manitoba’s health care system is a broad network of services and programs. Overseeing this system is Manitoba Health, Seniors and Ac ve Living, a department of the provincial government. Primarily, ser-vices are delivered through regional health authori es—fi ve regional agencies set up by the province to meet the local needs of Manitobans—Winnipeg RHA, Southern Health-Santé Sud, Interlake-Eastern RHA, Prairie Mountain Health and Northern Health Region.
In Manitoba, the regional health authori es are responsible, within the context of broad provincial policy direc on, for assessing and priori zing needs and health goals, and developing and managing health services in their region.
Any inquiries pertaining to this publica on generally or in reference to specifi c indicators should be ad-dressed to:
Informa on Management and Analy cs BranchManitoba Health, Seniors and Ac ve LivingRoom 4044300 Carlton StreetWinnipeg, Manitoba R3B 3M9Phone: (204)-786-7229
Karen HerdDeputy MinisterManitoba Health, Seniors and Ac ve Living

66Manitoba Health, Seniors and Ac ve Living Annual Sta s cs 2017-2018
How to Use This Report The Manitoba Health, Seniors and Ac ve Living Annual Sta s cs report is a descrip ve report com-prised of 13 sec ons. The report looks at the distribu on of the popula on, mortality, disease and injury, prevalence of mental illness, physician and hospital services, use of home care and personal care homes, preventa ve services and prescrip on drug use. Unless otherwise stated, indicators in this report are popula on-based rather than service-based. In other words, the indicators refl ect where people live, not where they received services.
For most indicators the report provides a rate by RHA and then a more in-depth look or “Highlight” at the Manitoba level. For some indicators, the data is only presented at the Manitoba level. The majority of the indicators report data for the 2017/2018 fi scal year. Where most recent data was not available, the prior year was used. However, in some instances due to small numbers, mul ple years had to be combined to ensure confi den ality and to achieve stable rates. For more informa on on how the indicators were calculated and defi ned please refer to the glossary.
Indicators found in this report show similar trends to indicators found in other public documents. However, exact rates in this report cannot be directly compared due to diff erent inclusion and exclu-sion criteria.
The report provides descrip ve analyses of indicators, not explanatory. Indicators are produced us-ing administra ve data, which does not include informa on on context, history or local circumstanc-es. The informa on in this report should be used in conjunc on with informa on from other sources so that regional and provincial planners, and decision-makers can make well-informed decisions.
Manitoba Health, Seniors and Ac ve Living Annual Sta s cs 2017-20187
Important Notes and Data CautionsThroughout the report, the RHAs are shown in a par cular order based on their overall health status as measured by the premature mortality rate (PMR). PMR was calculated for the RHAs by the Manitoba Centre for Health Policy for the RHA Indicators Atlas 2013¹. A death before the age of 75 is considered to be premature; therefore the PMR is the average annual rate of deaths before the age of 75, per 1,000 residents under 75. The RHA with the lowest PMR (best overall health status) appears at the top of the graph. The RHA with the highest PMR (poorest overall health status) appears at the bo om of the graph.
Two types of rates are presented in this report: crude rates and adjusted rates.
Crude rates:• A crude rate is the expression of the frequency of an event in a defi ned popula on in a de-
fi ned period of me. It is calculated by dividing the number of observa ons by the suitable popula on and mul plying by an appropriate mul plier (such as 100 to create a percentage). Although crude rates do not take diff erences in popula on structure into account, they are vital for policy and programming as they represent the actual rate in a given popula on.
Adjusted Rates:• The adjustment of rates is a sta s cal process that makes groups such as those in par cular
geographic areas comparable by removing the eff ects of demographic diff erences such as age and gender distribu on. Essen ally, adjusted rates tell us what the rates would be if each geographic area had the same age and sex distribu on. Therefore, adjusted rates are fi c onal rates which use sta s cal models to remove the eff ects of age and sex diff erences to allow for comparisons across popula ons.
Accordingly, while adjusted rates have been sta s cally modelled to be comparable to each other, they should be considered fi c onal in the sense that they do not measure anything directly. Please note that these adjusted rates cannot be compared to other rates which have not received the same adjustment.
Sta s cal Tes ng:
Sta s cal tes ng was performed to determine whether regional rates were sta s cally signifi cantly diff erent from the Manitoba rate for each me period. If a diff erence was sta s cally diff erent, then we are 99 per cent confi dent that this diff erence is not just due to chance.
Please note the following data cau ons when reading the graphs:(*) Indicates that the region is sta s cally diff erent from Manitoba.(!) Indicates that the regional rate should be used with cau on due to small numbers.(-) Indicates that the regional rate is suppressed because the numerator contains a small number of individuals which could poten ally be iden fi ed.(..) Indicates that there was no data for this me period.
1
¹ Fransoo R, Martens P, Burland E, The Need to Know Team, Prior H, Burchill C. Manitoba RHA Indicators Atlas 2013, Winnipeg, MB: Manitoba Centre for Health Policy, October 2013.
88Manitoba Health, Seniors and Ac ve Living Annual Sta s cs 2017-2018
Additional Publications to ConsiderWhile this report has a empted to provide an overview of sta s cs from across the health care system, it is by no means exhaus ve.
For more detailed informa on on cancer incidence and mortality, please refer to the following link from CancerCare Manitoba:www.cancercare.mb.ca/Research/epidemiology-cancer-registry/reports
The regional health authori es also provide sta s cs in the comprehensive Community Health Assess-ments which are conducted every fi ve years. The reports for each of the RHAs can be found at:
Interlake-Eastern RHAwww.ierha.ca/default.aspx?cid=11205
Northern Health Regionwww.northernhealthregion.ca/default.aspx?cid=234&lang=1
Southern Health-Santé Sudwww.southernhealth.ca/about-your-region/plans-and-reports/community-health-assessment/
Prairie Mountain Healthwww.prairiemountainhealth.ca/index.php/11-about-us/296-community-health-assessment
Winnipeg RHAwww.wrha.mb.ca/research/cha/
Manitoba Health, Seniors and Ac ve Living Annual Sta s cs 2017-20189
Demographics
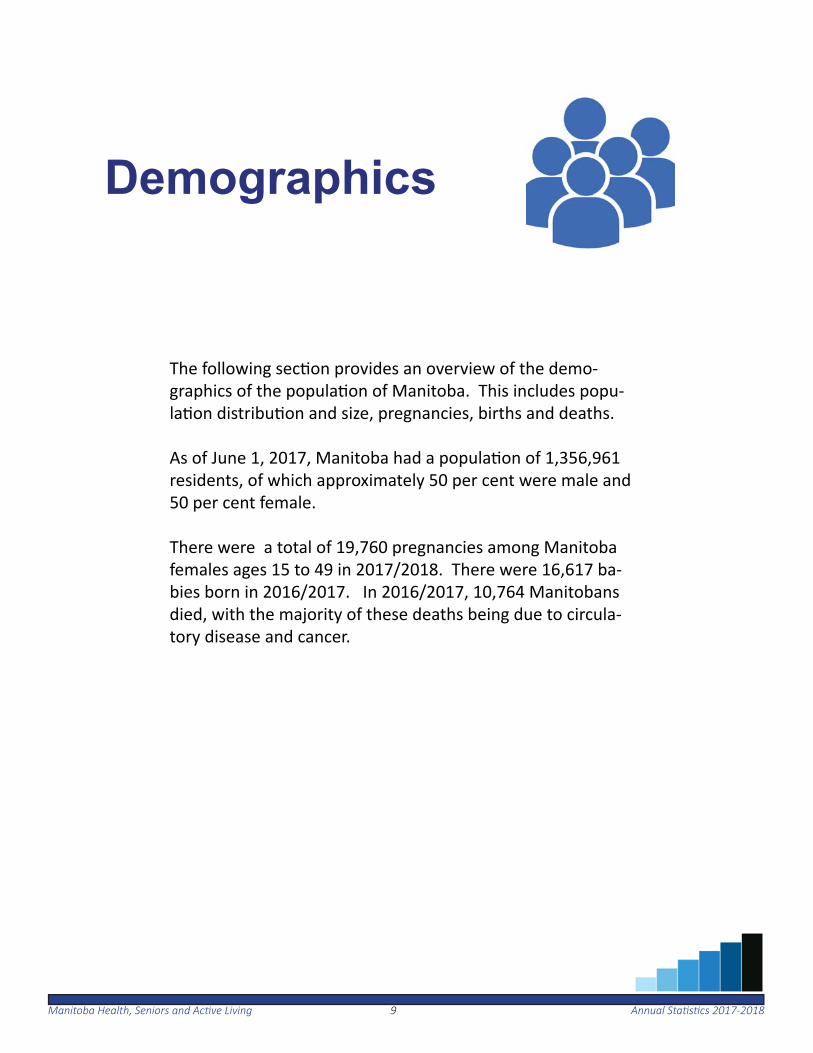
The following sec on provides an overview of the demo-graphics of the popula on of Manitoba. This includes popu-la on distribu on and size, pregnancies, births and deaths.
As of June 1, 2017, Manitoba had a popula on of 1,356,961 residents, of which approximately 50 per cent were male and 50 per cent female.
There were a total of 19,760 pregnancies among Manitoba females ages 15 to 49 in 2017/2018. There were 16,617 ba-bies born in 2016/2017. In 2016/2017, 10,764 Manitobans died, with the majority of these deaths being due to circula-tory disease and cancer.
1010Manitoba Health, Seniors and Ac ve Living Annual Sta s cs 2017-2018
DEMOGRAPHICS
/
/
/
/
/
/
/
/
/
/
/
/
/
/
/
/
/
/
/ /
/
/
/
/
/
/
//
/ /
/
/
/
/
/
/
/
/
/
/
//
/ /
/
/
/
/
Gimli
Morden
Virden
Roblin
Souris MorrisCarman
Altona
Ashern
Gillam
Dauphin
BRANDON
Winkler
Selkirk
Russell
Neepawa
Oakbank
BissettHodgson
Brochet
Sprague
Emerson
Thompson
Mafeking
Flin Flon
Ste. Anne
Steinbach
Killarney
MinnedosaStonewall
Bloodvein
Lynn Lake
Churchill
Swan River
Whitemouth
Pine Falls
Beausejour
Shamattawa
Niverville
Gypsumville
LeafRapids
Grand Rapids
OxfordHouse
Norway House
Berens River
Lac duBonnet
St Rosedu Lac
Portage laPrairie
NORTHERN
INTERLAKE-EASTERN
SOUTHERN
PRAIRIEMOUNTAIN
WINNIPEG
50 0 50 100 150 20025Kilometers
Hudson
Bay
Cedar
Lake
Lake
Winnipegosis
Lake
Winnipeg
LakeReindeer
Highrock
Lake
Lake
SouthernIndian Churchill
River
LakeSplit
LakeSipiwesk
StephensLake
River
Nelso
n
LakeKnee
LakeGods
Rive
r
River
Hayes
Gods
LakeIsland
LakeCross
(c) Province of Manitoba, 2018Updated February 2018
Cartography by: Information Management & Analytics, Manitoba Health, Seniors, and Active Living
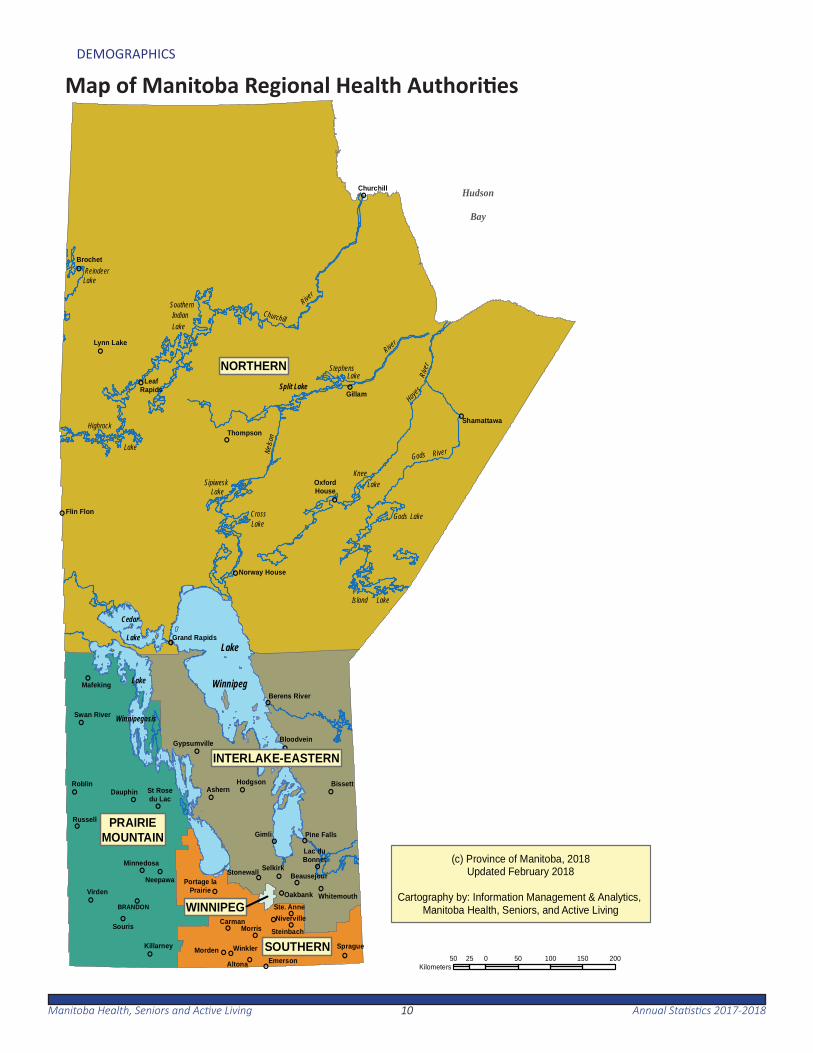
Map of Manitoba Regional Health Authori es
1111Manitoba Health, Seniors and Ac ve Living Annual Sta s cs 2017-2018
DEMOGRAPHICS
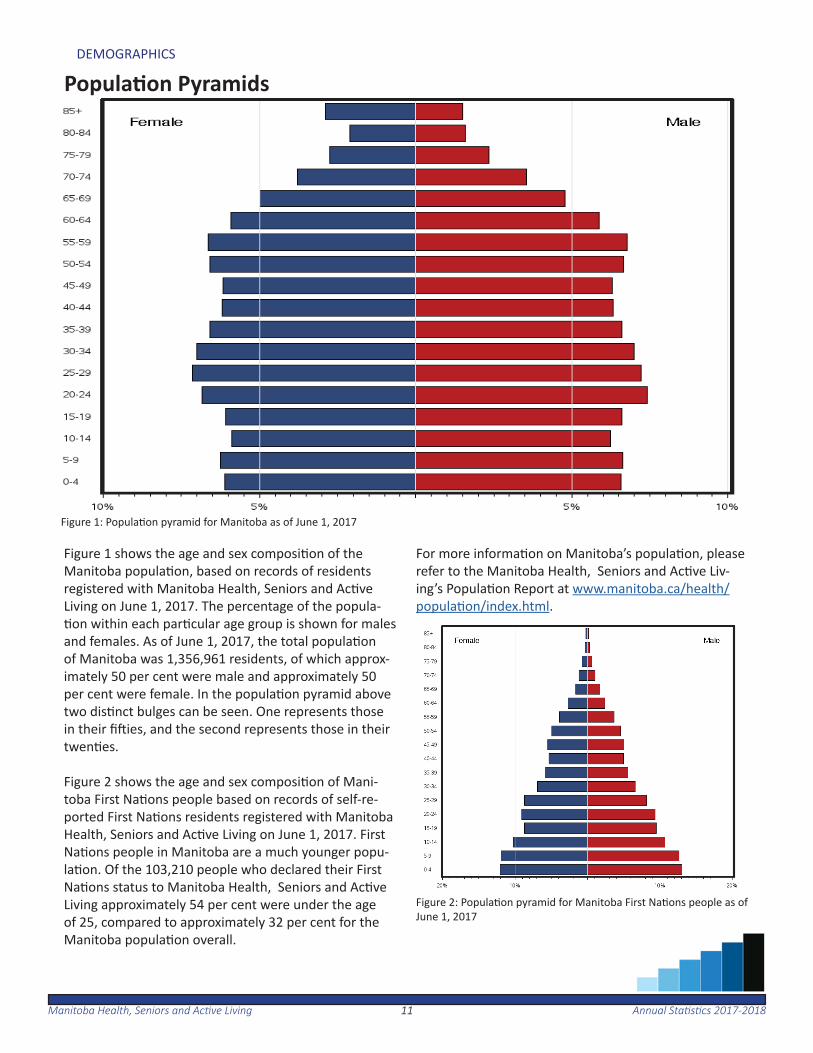
Figure 1 shows the age and sex composi on of the Manitoba popula on, based on records of residents registered with Manitoba Health, Seniors and Ac ve Living on June 1, 2017. The percentage of the popula- on within each par cular age group is shown for males
and females. As of June 1, 2017, the total popula on of Manitoba was 1,356,961 residents, of which approx-imately 50 per cent were male and approximately 50 per cent were female. In the popula on pyramid above two dis nct bulges can be seen. One represents those in their fi ies, and the second represents those in their twen es.
Figure 2 shows the age and sex composi on of Mani-toba First Na ons people based on records of self-re-ported First Na ons residents registered with Manitoba Health, Seniors and Ac ve Living on June 1, 2017. First Na ons people in Manitoba are a much younger popu-la on. Of the 103,210 people who declared their First Na ons status to Manitoba Health, Seniors and Ac ve Living approximately 54 per cent were under the age of 25, compared to approximately 32 per cent for the Manitoba popula on overall.
For more informa on on Manitoba’s popula on, please refer to the Manitoba Health, Seniors and Ac ve Liv-ing’s Popula on Report at www.manitoba.ca/health/popula on/index.html.
Figure 2: Popula on pyramid for Manitoba First Na ons people as of June 1, 2017
Figure 1: Popula on pyramid for Manitoba as of June 1, 2017
Popula on Pyramids
1212Manitoba Health, Seniors and Ac ve Living Annual Sta s cs 2017-2018
DEMOGRAPHICS
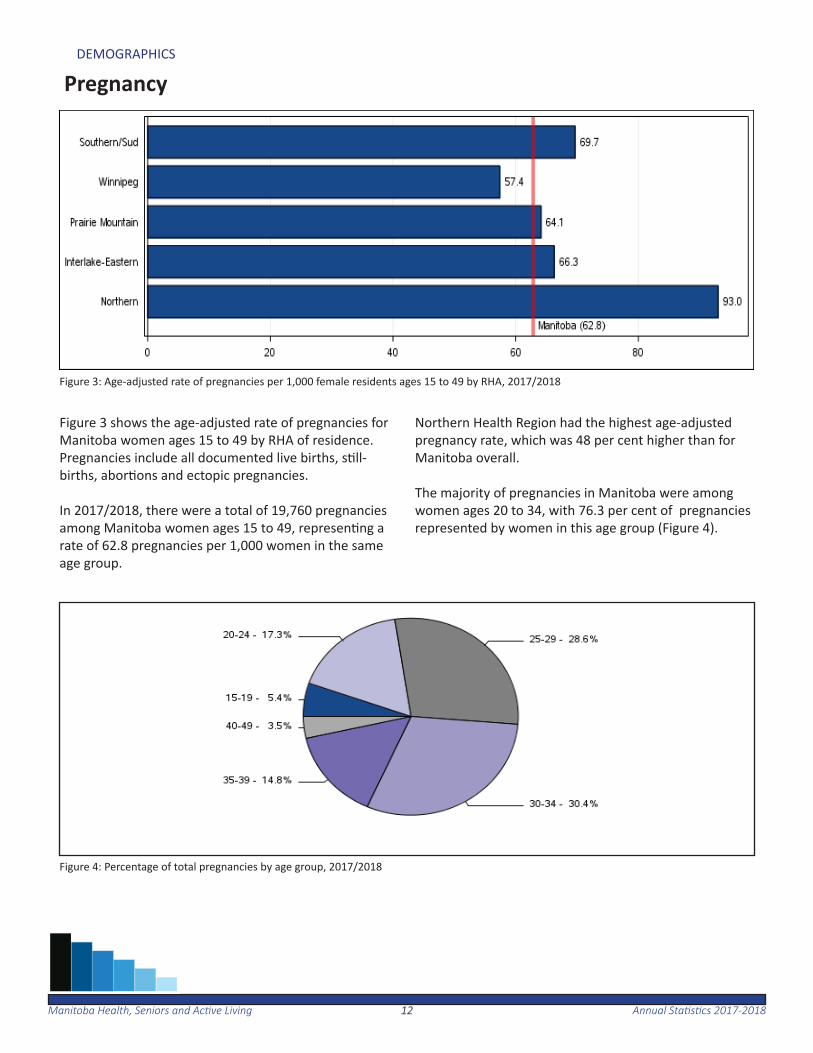
Figure 3 shows the age-adjusted rate of pregnancies for Manitoba women ages 15 to 49 by RHA of residence. Pregnancies include all documented live births, s ll-births, abor ons and ectopic pregnancies.
In 2017/2018, there were a total of 19,760 pregnancies among Manitoba women ages 15 to 49, represen ng a rate of 62.8 pregnancies per 1,000 women in the same age group.
Northern Health Region had the highest age-adjusted pregnancy rate, which was 48 per cent higher than for Manitoba overall.
The majority of pregnancies in Manitoba were among women ages 20 to 34, with 76.3 per cent of pregnancies represented by women in this age group (Figure 4).
Pregnancy
Figure 3: Age-adjusted rate of pregnancies per 1,000 female residents ages 15 to 49 by RHA, 2017/2018
Figure 4: Percentage of total pregnancies by age group, 2017/2018
1313Manitoba Health, Seniors and Ac ve Living Annual Sta s cs 2017-2018
DEMOGRAPHICS
Births
Figure 5: Crude rate of total births per 1,000 residents by RHA of residence, 2016/2017
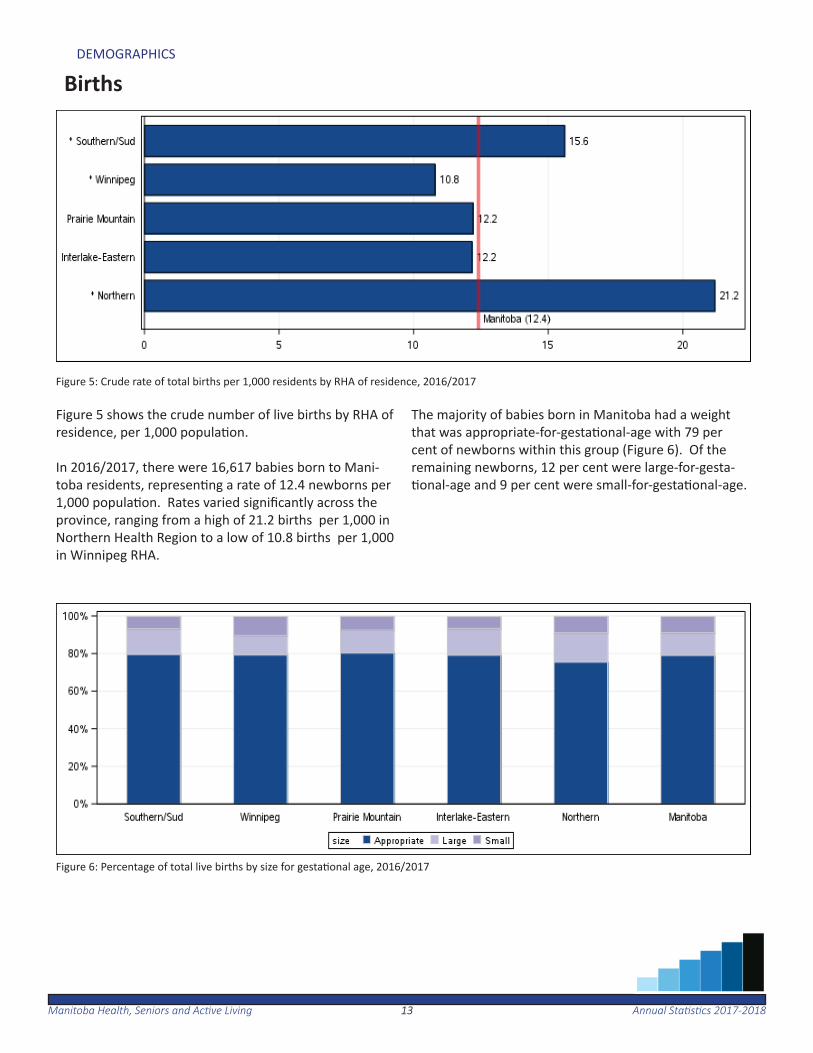
Figure 5 shows the crude number of live births by RHA of residence, per 1,000 popula on.
In 2016/2017, there were 16,617 babies born to Mani-toba residents, represen ng a rate of 12.4 newborns per 1,000 popula on. Rates varied signifi cantly across the province, ranging from a high of 21.2 births per 1,000 in Northern Health Region to a low of 10.8 births per 1,000 in Winnipeg RHA.
The majority of babies born in Manitoba had a weight that was appropriate-for-gesta onal-age with 79 per cent of newborns within this group (Figure 6). Of the remaining newborns, 12 per cent were large-for-gesta- onal-age and 9 per cent were small-for-gesta onal-age.
Figure 6: Percentage of total live births by size for gesta onal age, 2016/2017
1414Manitoba Health, Seniors and Ac ve Living Annual Sta s cs 2017-2018
DEMOGRAPHICS
Deaths
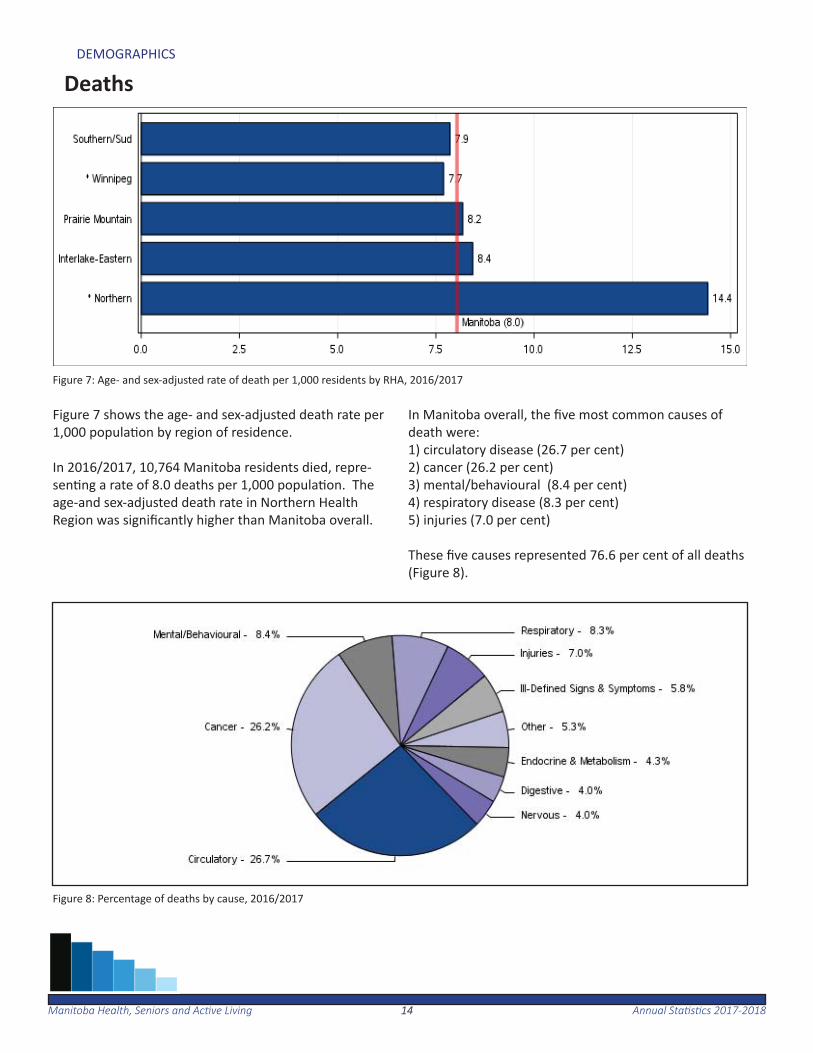
Figure 7: Age- and sex-adjusted rate of death per 1,000 residents by RHA, 2016/2017
Figure 7 shows the age- and sex-adjusted death rate per 1,000 popula on by region of residence.
In 2016/2017, 10,764 Manitoba residents died, repre-sen ng a rate of 8.0 deaths per 1,000 popula on. The age-and sex-adjusted death rate in Northern Health Region was signifi cantly higher than Manitoba overall.
In Manitoba overall, the fi ve most common causes of death were:1) circulatory disease (26.7 per cent)2) cancer (26.2 per cent)3) mental/behavioural (8.4 per cent)4) respiratory disease (8.3 per cent)5) injuries (7.0 per cent)
These fi ve causes represented 76.6 per cent of all deaths (Figure 8).
Figure 8: Percentage of deaths by cause, 2016/2017
1515Manitoba Health, Seniors and Ac ve Living Annual Sta s cs 2017-2018
DEMOGRAPHICS
Dependency Ra o
Figure 9: Youth 0-19 and seniors 65 and older as a per cent of popula on 20 to 64 years by RHA, 2017/2018
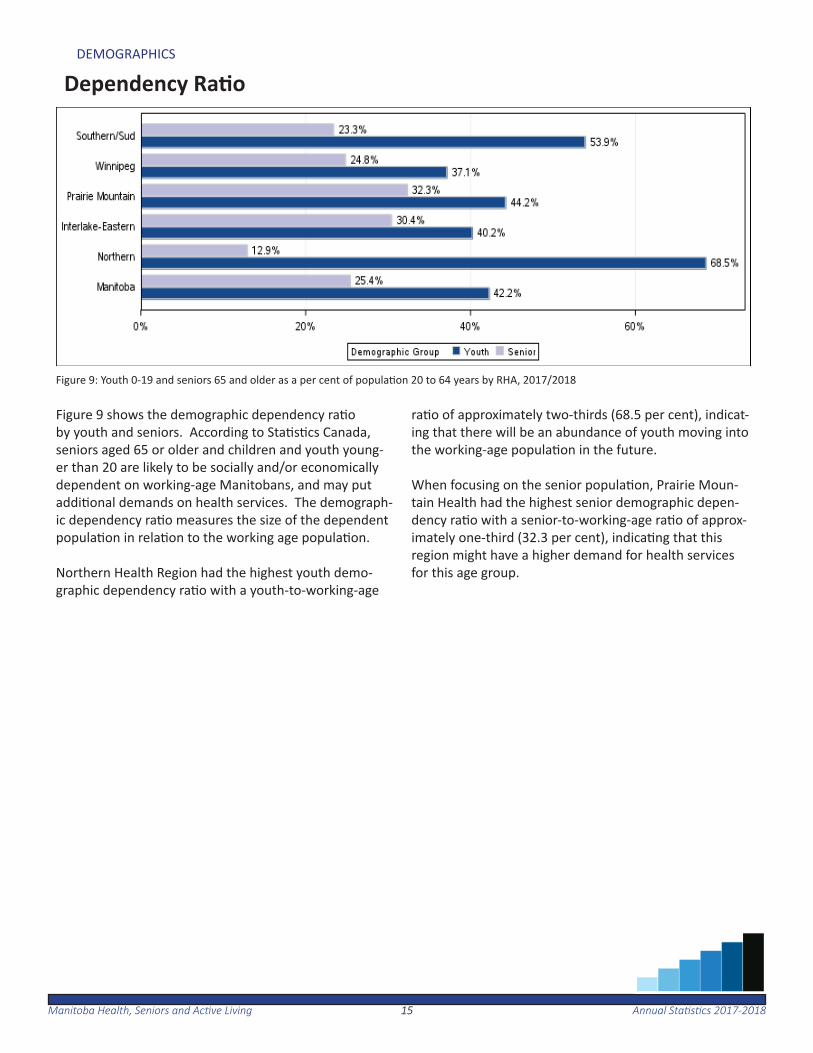
Figure 9 shows the demographic dependency ra o by youth and seniors. According to Sta s cs Canada, seniors aged 65 or older and children and youth young-er than 20 are likely to be socially and/or economically dependent on working-age Manitobans, and may put addi onal demands on health services. The demograph-ic dependency ra o measures the size of the dependent popula on in rela on to the working age popula on.
Northern Health Region had the highest youth demo-graphic dependency ra o with a youth-to-working-age
ra o of approximately two-thirds (68.5 per cent), indicat-ing that there will be an abundance of youth moving into the working-age popula on in the future.
When focusing on the senior popula on, Prairie Moun-tain Health had the highest senior demographic depen-dency ra o with a senior-to-working-age ra o of approx-imately one-third (32.3 per cent), indica ng that this region might have a higher demand for health services for this age group.
1616Manitoba Health, Seniors and Ac ve Living Annual Sta s cs 2017-2018
DEMOGRAPHICS
Dependency Ra o
Figure 10: Youth 0-19 and seniors 65 and older as a per cent of popula on 20 to 64 years, 2008/2009 to 2017/2018
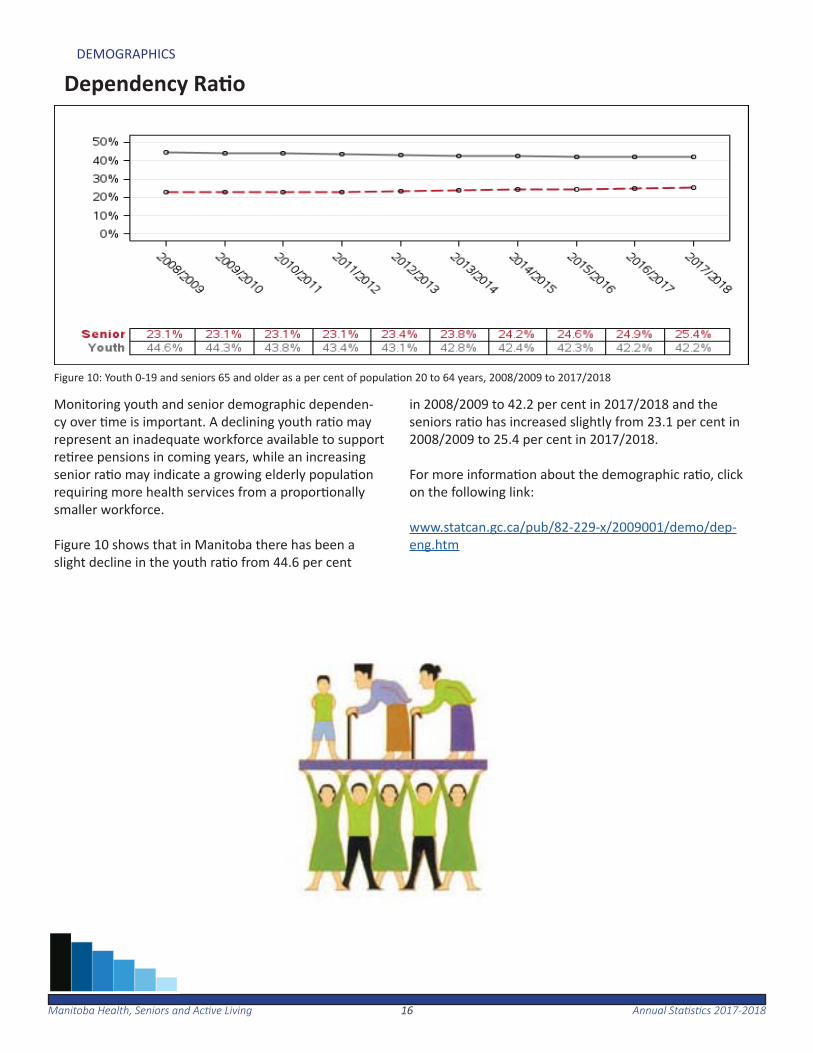
Monitoring youth and senior demographic dependen-cy over me is important. A declining youth ra o may represent an inadequate workforce available to support re ree pensions in coming years, while an increasing senior ra o may indicate a growing elderly popula on requiring more health services from a propor onally smaller workforce.
Figure 10 shows that in Manitoba there has been a slight decline in the youth ra o from 44.6 per cent
in 2008/2009 to 42.2 per cent in 2017/2018 and the seniors ra o has increased slightly from 23.1 per cent in 2008/2009 to 25.4 per cent in 2017/2018.
For more informa on about the demographic ra o, click on the following link:
www.statcan.gc.ca/pub/82-229-x/2009001/demo/dep-eng.htm
Manitoba Health, Seniors and Ac ve Living Annual Sta s cs 2017-201817
Population Health Status and Mortality
The following sec on provides an overview of popula on health status and mortality within Manitoba. This includes premature mortality rates, infant mortality rates and child mortality rates.
From 2012/2013 to 2016/2017 an average of 4,028 Manitoba residents died each year before the age of 75. For the same me period there was an annual average of about 82 infant
deaths, and 95 deaths of children between the ages of one and 19. The rate of death for male children remained consis-tently higher than female children.
1818Manitoba Health, Seniors and Ac ve Living Annual Sta s cs 2017-2018
POPULATION HEALTH STATUS AND MORTALITY
Premature Mortality
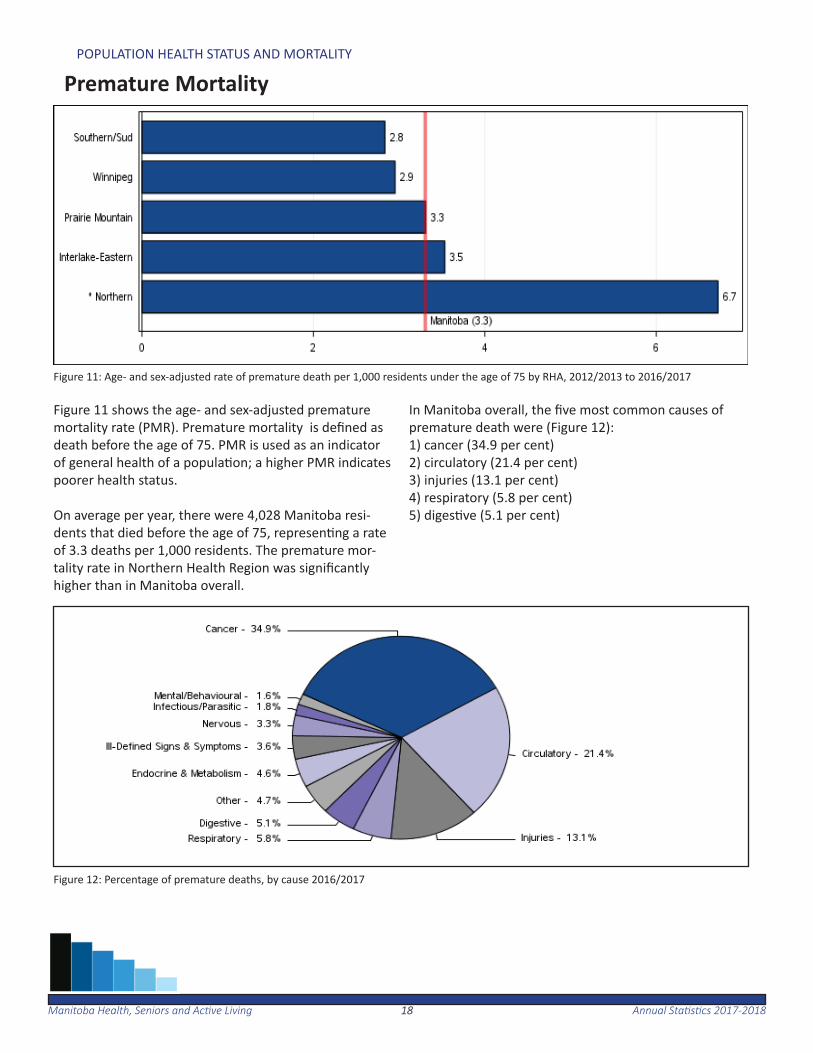
Figure 11: Age- and sex-adjusted rate of premature death per 1,000 residents under the age of 75 by RHA, 2012/2013 to 2016/2017
Figure 11 shows the age- and sex-adjusted premature mortality rate (PMR). Premature mortality is defi ned as death before the age of 75. PMR is used as an indicator of general health of a popula on; a higher PMR indicates poorer health status.
On average per year, there were 4,028 Manitoba resi-dents that died before the age of 75, represen ng a rate of 3.3 deaths per 1,000 residents. The premature mor-tality rate in Northern Health Region was signifi cantly higher than in Manitoba overall.
In Manitoba overall, the fi ve most common causes of premature death were (Figure 12):1) cancer (34.9 per cent)2) circulatory (21.4 per cent)3) injuries (13.1 per cent)4) respiratory (5.8 per cent)5) diges ve (5.1 per cent)
Figure 12: Percentage of premature deaths, by cause 2016/2017
1919Manitoba Health, Seniors and Ac ve Living Annual Sta s cs 2017-2018
POPULATION HEALTH STATUS AND MORTALITY
Infant Mortality
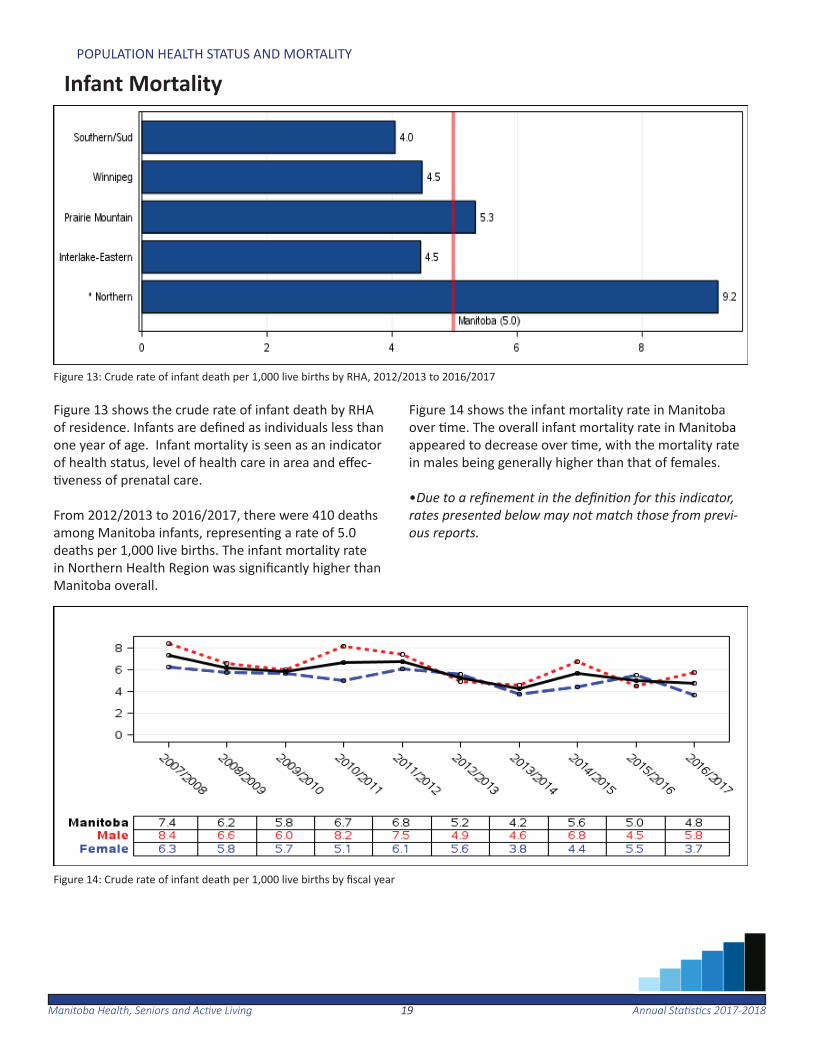
Figure 13: Crude rate of infant death per 1,000 live births by RHA, 2012/2013 to 2016/2017
Figure 13 shows the crude rate of infant death by RHA of residence. Infants are defi ned as individuals less than one year of age. Infant mortality is seen as an indicator of health status, level of health care in area and eff ec- veness of prenatal care.
From 2012/2013 to 2016/2017, there were 410 deaths among Manitoba infants, represen ng a rate of 5.0 deaths per 1,000 live births. The infant mortality rate in Northern Health Region was signifi cantly higher than Manitoba overall.
Figure 14 shows the infant mortality rate in Manitoba over me. The overall infant mortality rate in Manitoba appeared to decrease over me, with the mortality rate in males being generally higher than that of females.
•Due to a refi nement in the defi ni on for this indicator, rates presented below may not match those from previ-ous reports.
Figure 14: Crude rate of infant death per 1,000 live births by fi scal year
2020Manitoba Health, Seniors and Ac ve Living Annual Sta s cs 2017-2018
POPULATION HEALTH STATUS AND MORTALITY
Child Mortality
Figure 15: Age- and sex-adjusted rate of death per 100,000 children age one to 19 by RHA, 2012/2013 to 2016/2017
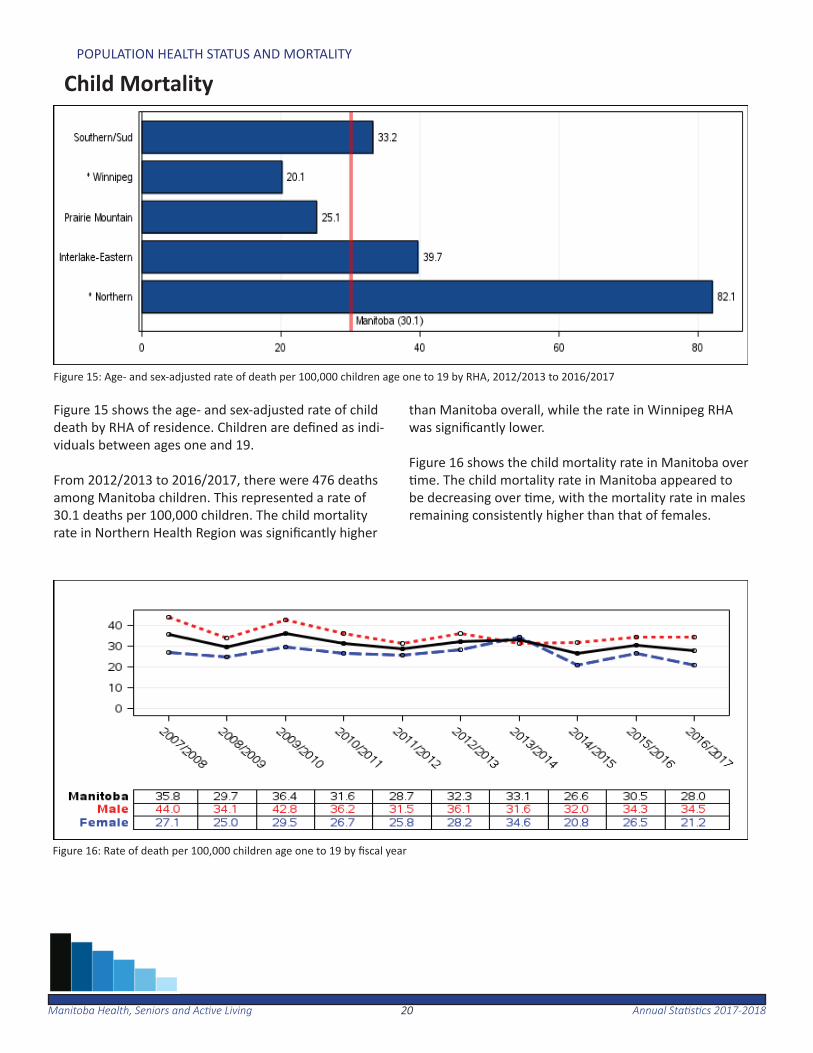
Figure 15 shows the age- and sex-adjusted rate of child death by RHA of residence. Children are defi ned as indi-viduals between ages one and 19.
From 2012/2013 to 2016/2017, there were 476 deaths among Manitoba children. This represented a rate of 30.1 deaths per 100,000 children. The child mortality rate in Northern Health Region was signifi cantly higher
than Manitoba overall, while the rate in Winnipeg RHA was signifi cantly lower.
Figure 16 shows the child mortality rate in Manitoba over me. The child mortality rate in Manitoba appeared to
be decreasing over me, with the mortality rate in males remaining consistently higher than that of females.
Figure 16: Rate of death per 100,000 children age one to 19 by fi scal year
Manitoba Health, Seniors and Ac ve Living Annual Sta s cs 2017-201821
Disease and Injury
The following sec on provides an overview of the burden of illness for selected diseases and chronic condi ons, along with injury hos-pitaliza ons and deaths due to injury.
In 2016/2017, 29.2 per cent of Manitobans age 20 and older had hypertension, and 9.3 percent of Manitobans age one and older had diabetes.
From 2013/2014 to 2017/2018, 1,072 Manitobans age 19 and older with diabetes had a lower limb amputa on.
The rate of chronic obstruc ve pulmonary disease (COPD) among Manitoba residents age 35 and older was 12.6 per cent in 2016/2017.
In the same me period, there were approximately four heart at-tacks and two strokes for every 1,000 Manitoba residents age 40 and older.
In 2016/2017, 54.8 per cent of Manitobans age 40 and older had one or more of the following chronic condi ons: diabetes, hyper-tension, ischemic heart disease, heart failure, stroke or chronic obstruc ve pulmonary disease (COPD).
For the same me period, there were 8,984 injury-related hospital-iza ons. In 2016/2017 there were 662 deaths where injury was the cause of death.
2222Manitoba Health, Seniors and Ac ve Living Annual Sta s cs 2017-2018
DISEASE AND INJURY
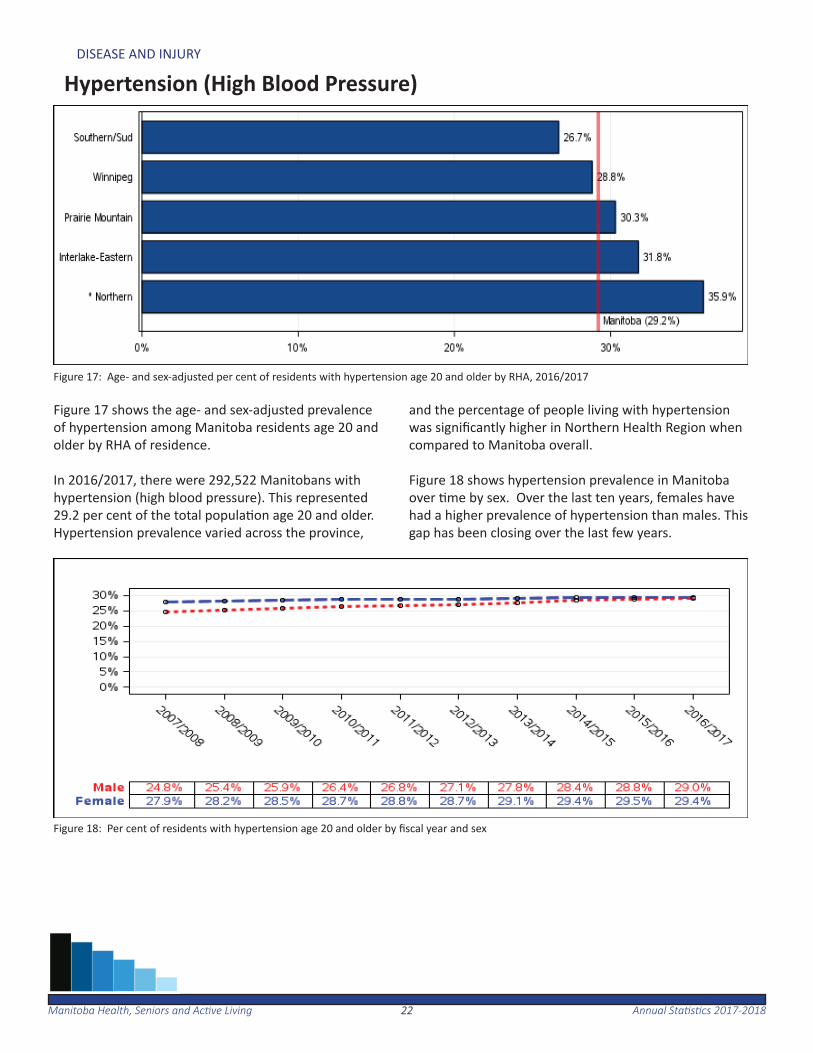
Hypertension (High Blood Pressure)
Figure 17: Age- and sex-adjusted per cent of residents with hypertension age 20 and older by RHA, 2016/2017
Figure 17 shows the age- and sex-adjusted prevalence of hypertension among Manitoba residents age 20 and older by RHA of residence.
In 2016/2017, there were 292,522 Manitobans with hypertension (high blood pressure). This represented 29.2 per cent of the total popula on age 20 and older. Hypertension prevalence varied across the province,
and the percentage of people living with hypertension was signifi cantly higher in Northern Health Region when compared to Manitoba overall.
Figure 18 shows hypertension prevalence in Manitoba over me by sex. Over the last ten years, females have had a higher prevalence of hypertension than males. This gap has been closing over the last few years.
Figure 18: Per cent of residents with hypertension age 20 and older by fi scal year and sex
2323Manitoba Health, Seniors and Ac ve Living Annual Sta s cs 2017-2018
DISEASE AND INJURY
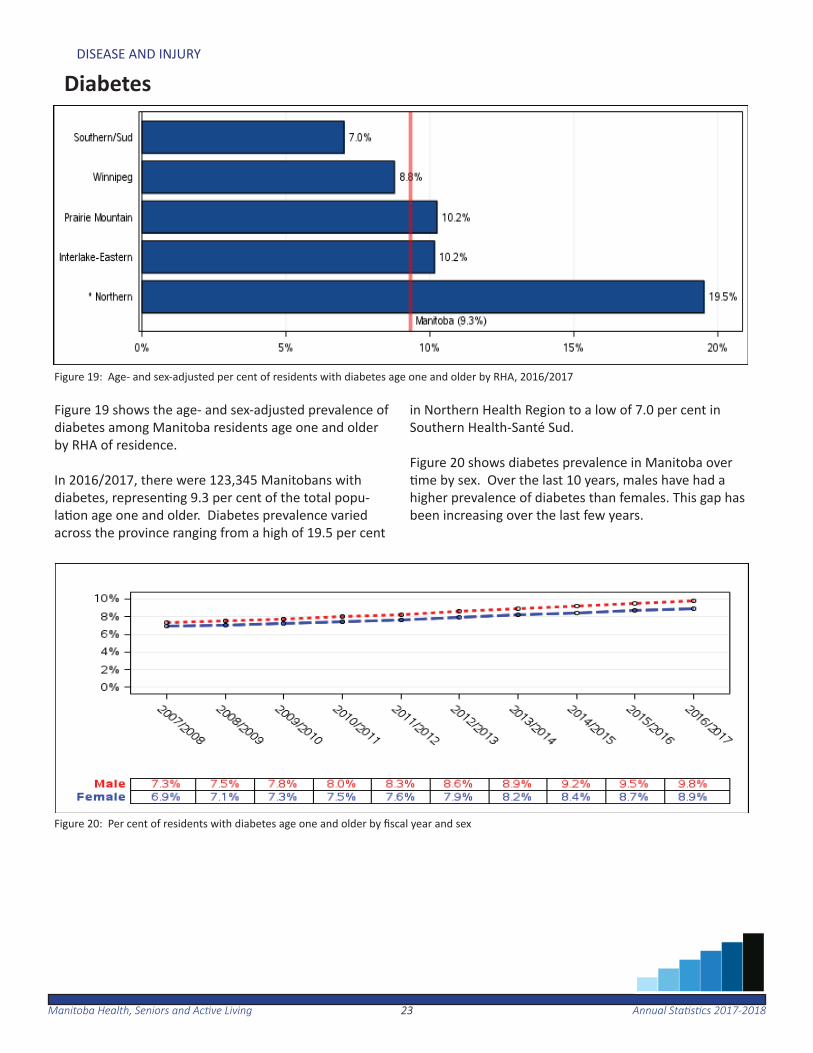
Diabetes
Figure 19: Age- and sex-adjusted per cent of residents with diabetes age one and older by RHA, 2016/2017
Figure 19 shows the age- and sex-adjusted prevalence of diabetes among Manitoba residents age one and older by RHA of residence.
In 2016/2017, there were 123,345 Manitobans with diabetes, represen ng 9.3 per cent of the total popu-la on age one and older. Diabetes prevalence varied across the province ranging from a high of 19.5 per cent
in Northern Health Region to a low of 7.0 per cent in Southern Health-Santé Sud.
Figure 20 shows diabetes prevalence in Manitoba over me by sex. Over the last 10 years, males have had a
higher prevalence of diabetes than females. This gap has been increasing over the last few years.
Figure 20: Per cent of residents with diabetes age one and older by fi scal year and sex
2424Manitoba Health, Seniors and Ac ve Living Annual Sta s cs 2017-2018
DISEASE AND INJURY
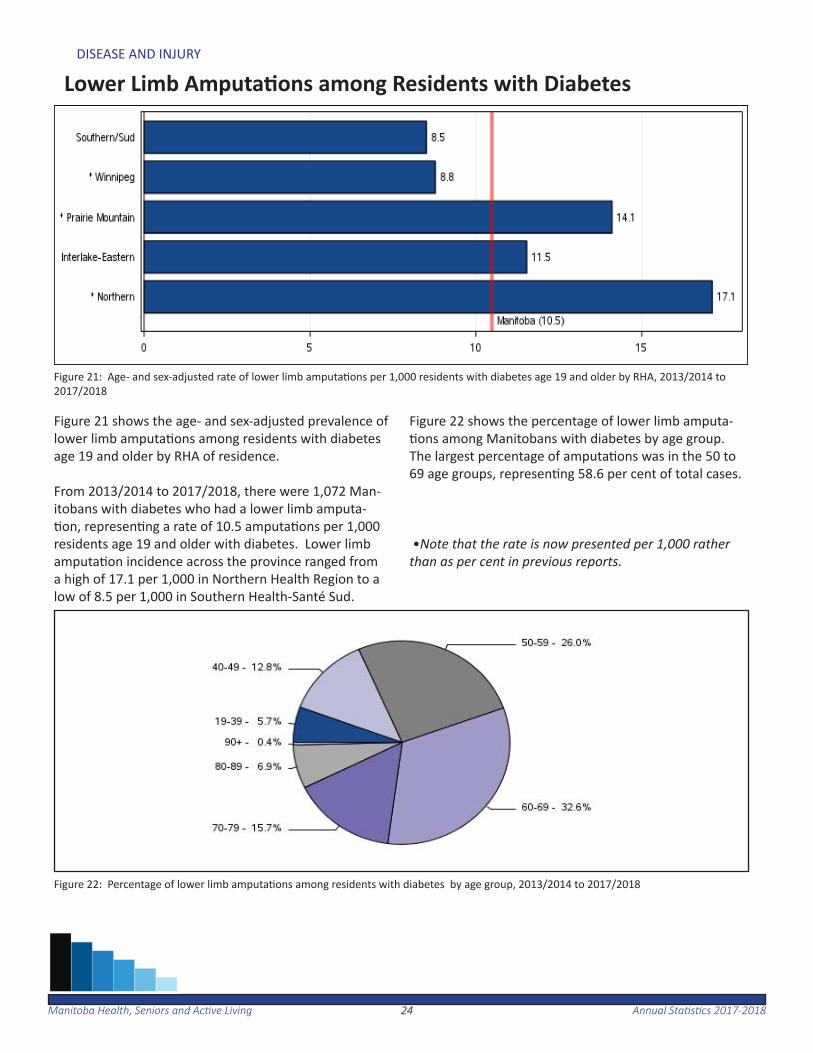
Lower Limb Amputa ons among Residents with Diabetes
Figure 21: Age- and sex-adjusted rate of lower limb amputa ons per 1,000 residents with diabetes age 19 and older by RHA, 2013/2014 to 2017/2018
Figure 22: Percentage of lower limb amputa ons among residents with diabetes by age group, 2013/2014 to 2017/2018
Figure 21 shows the age- and sex-adjusted prevalence of lower limb amputa ons among residents with diabetes age 19 and older by RHA of residence.
From 2013/2014 to 2017/2018, there were 1,072 Man-itobans with diabetes who had a lower limb amputa- on, represen ng a rate of 10.5 amputa ons per 1,000
residents age 19 and older with diabetes. Lower limb amputa on incidence across the province ranged from a high of 17.1 per 1,000 in Northern Health Region to a low of 8.5 per 1,000 in Southern Health-Santé Sud.
Figure 22 shows the percentage of lower limb amputa- ons among Manitobans with diabetes by age group.
The largest percentage of amputa ons was in the 50 to 69 age groups, represen ng 58.6 per cent of total cases.
•Note that the rate is now presented per 1,000 rather than as per cent in previous reports.
2525Manitoba Health, Seniors and Ac ve Living Annual Sta s cs 2017-2018
DISEASE AND INJURY
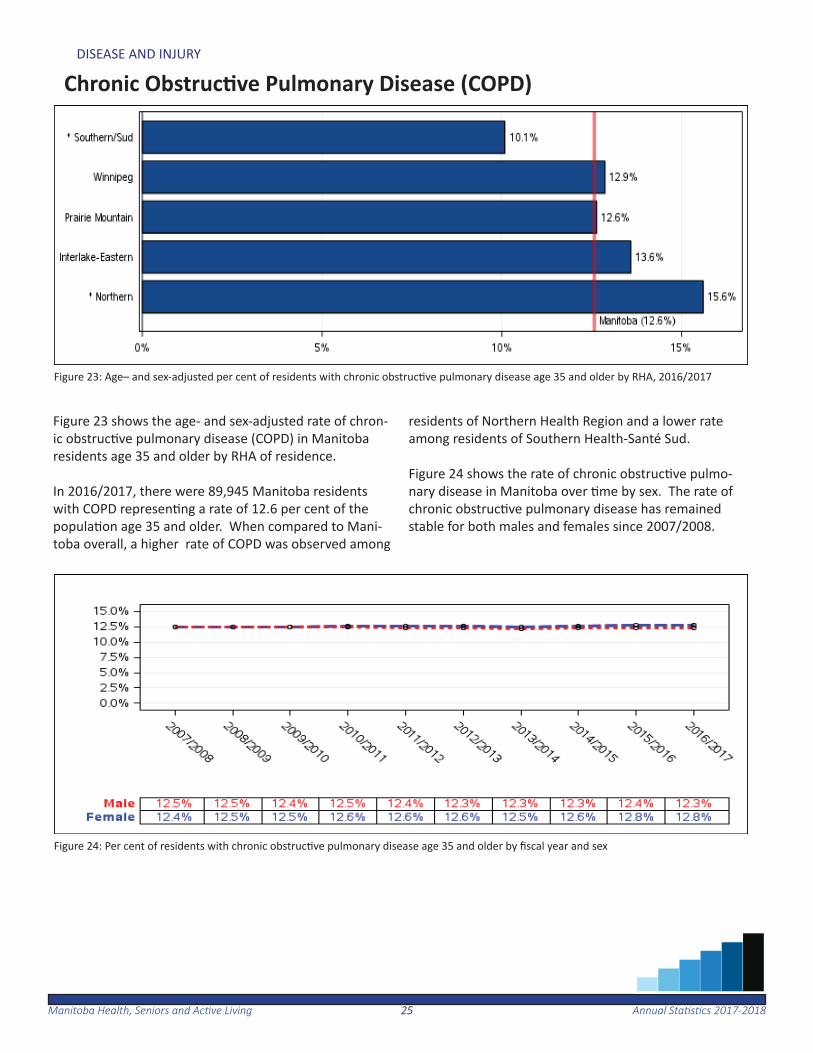
Chronic Obstruc ve Pulmonary Disease (COPD)
Figure 23: Age– and sex-adjusted per cent of residents with chronic obstruc ve pulmonary disease age 35 and older by RHA, 2016/2017
Figure 24: Per cent of residents with chronic obstruc ve pulmonary disease age 35 and older by fi scal year and sex
Figure 23 shows the age- and sex-adjusted rate of chron-ic obstruc ve pulmonary disease (COPD) in Manitoba residents age 35 and older by RHA of residence. In 2016/2017, there were 89,945 Manitoba residents with COPD represen ng a rate of 12.6 per cent of the popula on age 35 and older. When compared to Mani-toba overall, a higher rate of COPD was observed among
residents of Northern Health Region and a lower rate among residents of Southern Health-Santé Sud.
Figure 24 shows the rate of chronic obstruc ve pulmo-nary disease in Manitoba over me by sex. The rate of chronic obstruc ve pulmonary disease has remained stable for both males and females since 2007/2008.
2626Manitoba Health, Seniors and Ac ve Living Annual Sta s cs 2017-2018
DISEASE AND INJURY
Acute Myocardial Infarc on (Heart A ack)
Figure 25: Age- and sex-adjusted rate of heart a ack per 1,000 residents age 40 and older by RHA, 2016/2017
Figure 26: Rate of heart a ack per 1,000 residents age 40 and older by fi scal year and sex
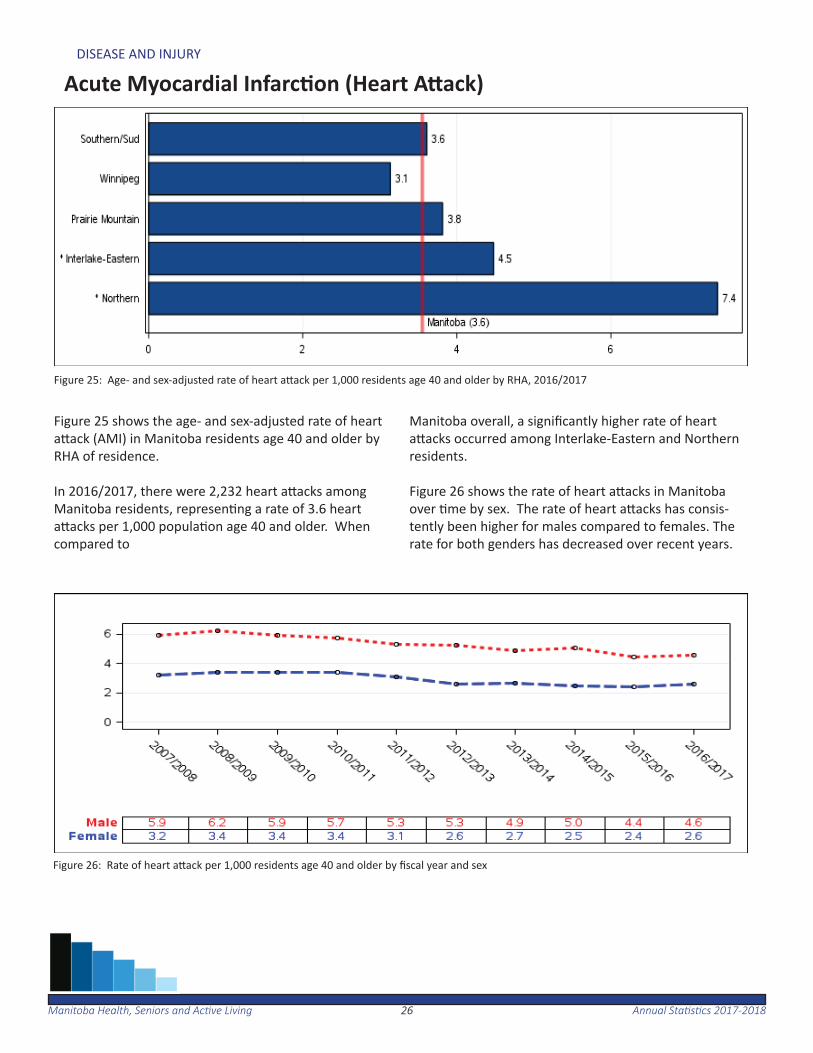
Figure 25 shows the age- and sex-adjusted rate of heart a ack (AMI) in Manitoba residents age 40 and older by RHA of residence.
In 2016/2017, there were 2,232 heart a acks among Manitoba residents, represen ng a rate of 3.6 heart a acks per 1,000 popula on age 40 and older. When compared to
Manitoba overall, a signifi cantly higher rate of heart a acks occurred among Interlake-Eastern and Northern residents.
Figure 26 shows the rate of heart a acks in Manitoba over me by sex. The rate of heart a acks has consis-tently been higher for males compared to females. The rate for both genders has decreased over recent years.

2727Manitoba Health, Seniors and Ac ve Living Annual Sta s cs 2017-2018
DISEASE AND INJURY
Stroke
Figure 27: Age- and sex-adjusted rate of stroke per 1,000 residents age 40 and older by RHA, 2016/2017
Figure 28: Rate of stroke per 1,000 residents age 40 and older by fi scal year and sex
Figure 27 shows the age- and sex-adjusted stroke rate in Manitoba residents age 40 and older by RHA of resi-dence. In 2016/2017, there were 1,498 strokes among Manitoba residents, represen ng a rate of 2.4 strokes per 1,000 popula on age 40 and older. Rates varied across the
province, with the Northern rate signifi cantly higher than Manitoba overall.
Figure 28 shows the stroke rate in Manitoba residents over me and sex. The rate of strokes for females and males has been rela vely stable over the last 10 years at between 2.3 and 2.9 per 1,000 popula on.
2828Manitoba Health, Seniors and Ac ve Living Annual Sta s cs 2017-2018
DISEASE AND INJURY
Chronic Condi ons
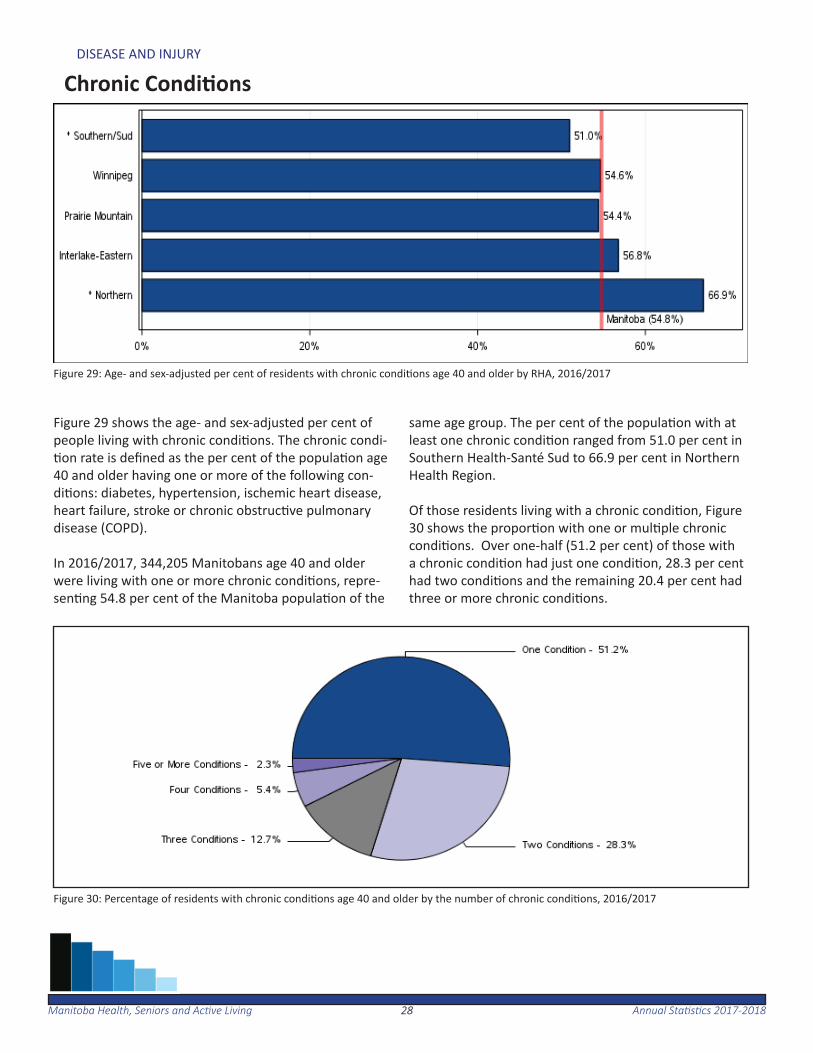
Figure 29 shows the age- and sex-adjusted per cent of people living with chronic condi ons. The chronic condi- on rate is defi ned as the per cent of the popula on age
40 and older having one or more of the following con-di ons: diabetes, hypertension, ischemic heart disease, heart failure, stroke or chronic obstruc ve pulmonary disease (COPD).
In 2016/2017, 344,205 Manitobans age 40 and older were living with one or more chronic condi ons, repre-sen ng 54.8 per cent of the Manitoba popula on of the
same age group. The per cent of the popula on with at least one chronic condi on ranged from 51.0 per cent in Southern Health-Santé Sud to 66.9 per cent in Northern Health Region.
Of those residents living with a chronic condi on, Figure 30 shows the propor on with one or mul ple chronic condi ons. Over one-half (51.2 per cent) of those with a chronic condi on had just one condi on, 28.3 per cent had two condi ons and the remaining 20.4 per cent had three or more chronic condi ons.
Figure 29: Age- and sex-adjusted per cent of residents with chronic condi ons age 40 and older by RHA, 2016/2017
Figure 30: Percentage of residents with chronic condi ons age 40 and older by the number of chronic condi ons, 2016/2017
2929Manitoba Health, Seniors and Ac ve Living Annual Sta s cs 2017-2018
DISEASE AND INJURY
Injury Hospitaliza on
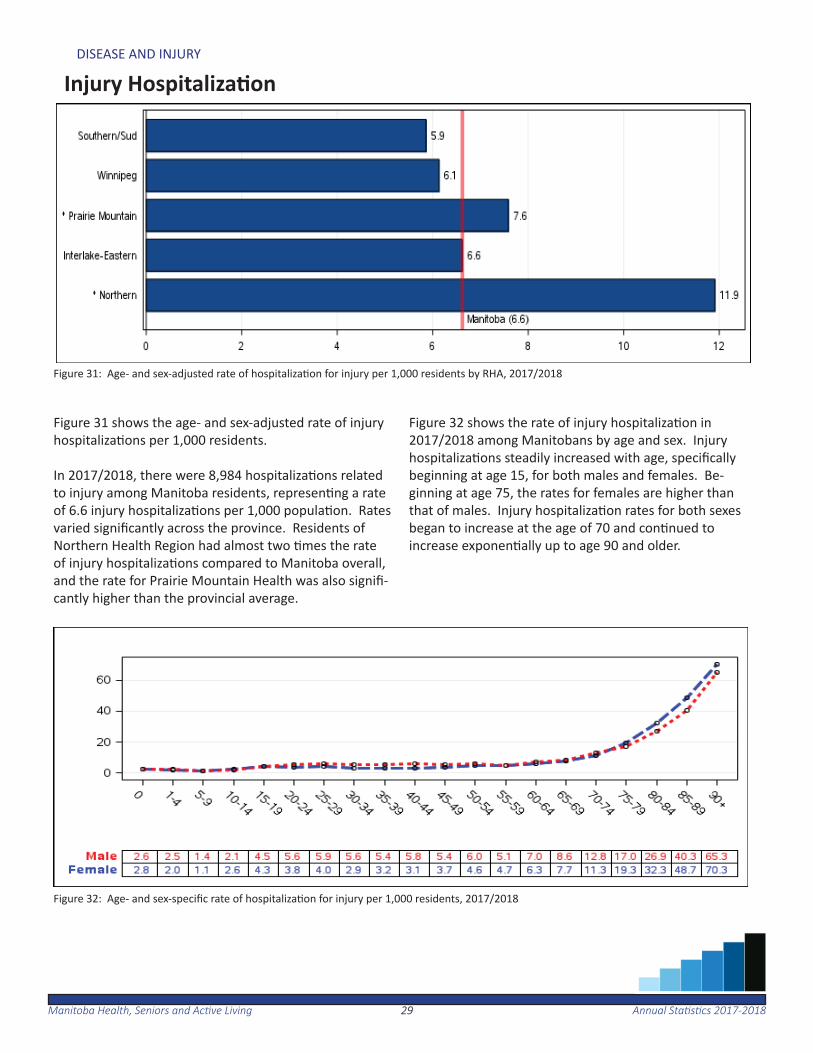
Figure 31 shows the age- and sex-adjusted rate of injury hospitaliza ons per 1,000 residents. In 2017/2018, there were 8,984 hospitaliza ons related to injury among Manitoba residents, represen ng a rate of 6.6 injury hospitaliza ons per 1,000 popula on. Rates varied signifi cantly across the province. Residents of Northern Health Region had almost two mes the rate of injury hospitaliza ons compared to Manitoba overall, and the rate for Prairie Mountain Health was also signifi -cantly higher than the provincial average.
Figure 32 shows the rate of injury hospitaliza on in 2017/2018 among Manitobans by age and sex. Injury hospitaliza ons steadily increased with age, specifi cally beginning at age 15, for both males and females. Be-ginning at age 75, the rates for females are higher than that of males. Injury hospitaliza on rates for both sexes began to increase at the age of 70 and con nued to increase exponen ally up to age 90 and older.
Figure 31: Age- and sex-adjusted rate of hospitaliza on for injury per 1,000 residents by RHA, 2017/2018
Figure 32: Age- and sex-specifi c rate of hospitaliza on for injury per 1,000 residents, 2017/2018
3030Manitoba Health, Seniors and Ac ve Living Annual Sta s cs 2017-2018
DISEASE AND INJURY
Injury Mortality
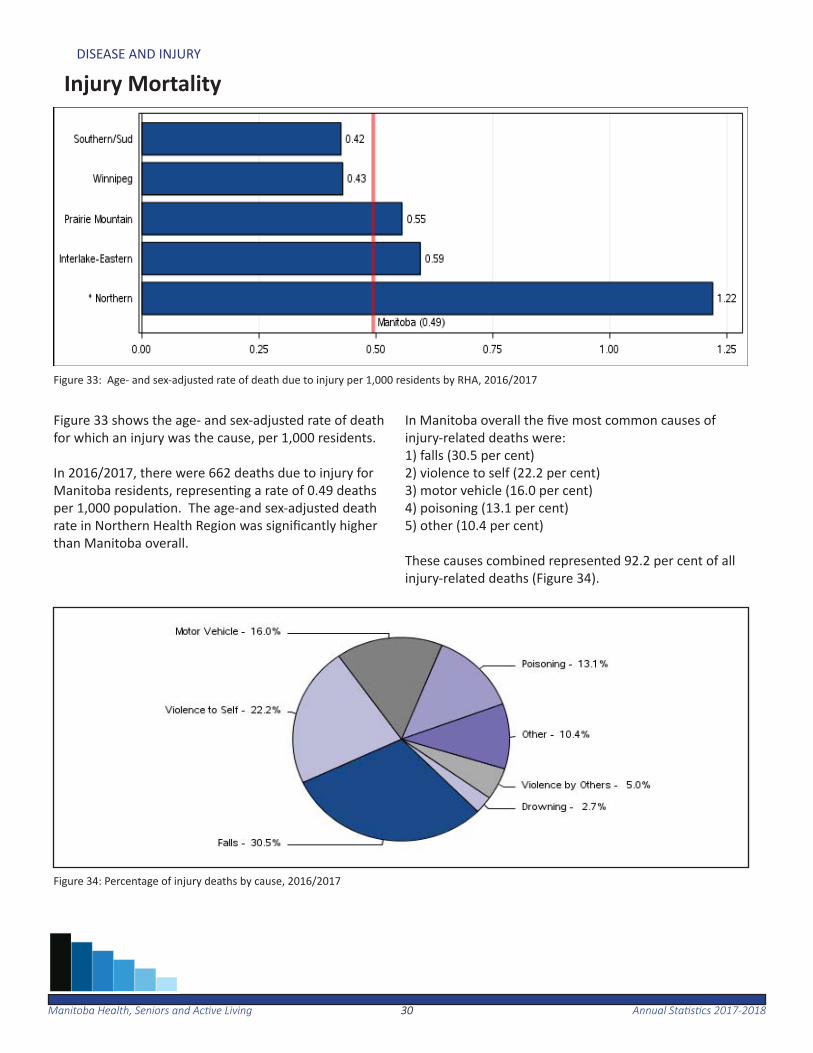
Figure 33 shows the age- and sex-adjusted rate of death for which an injury was the cause, per 1,000 residents.
In 2016/2017, there were 662 deaths due to injury for Manitoba residents, represen ng a rate of 0.49 deaths per 1,000 popula on. The age-and sex-adjusted death rate in Northern Health Region was signifi cantly higher than Manitoba overall.
In Manitoba overall the fi ve most common causes of injury-related deaths were:1) falls (30.5 per cent)2) violence to self (22.2 per cent)3) motor vehicle (16.0 per cent)4) poisoning (13.1 per cent)5) other (10.4 per cent)
These causes combined represented 92.2 per cent of all injury-related deaths (Figure 34).
Figure 33: Age- and sex-adjusted rate of death due to injury per 1,000 residents by RHA, 2016/2017
Figure 34: Percentage of injury deaths by cause, 2016/2017
Manitoba Health, Seniors and Ac ve Living Annual Sta s cs 2017-201831
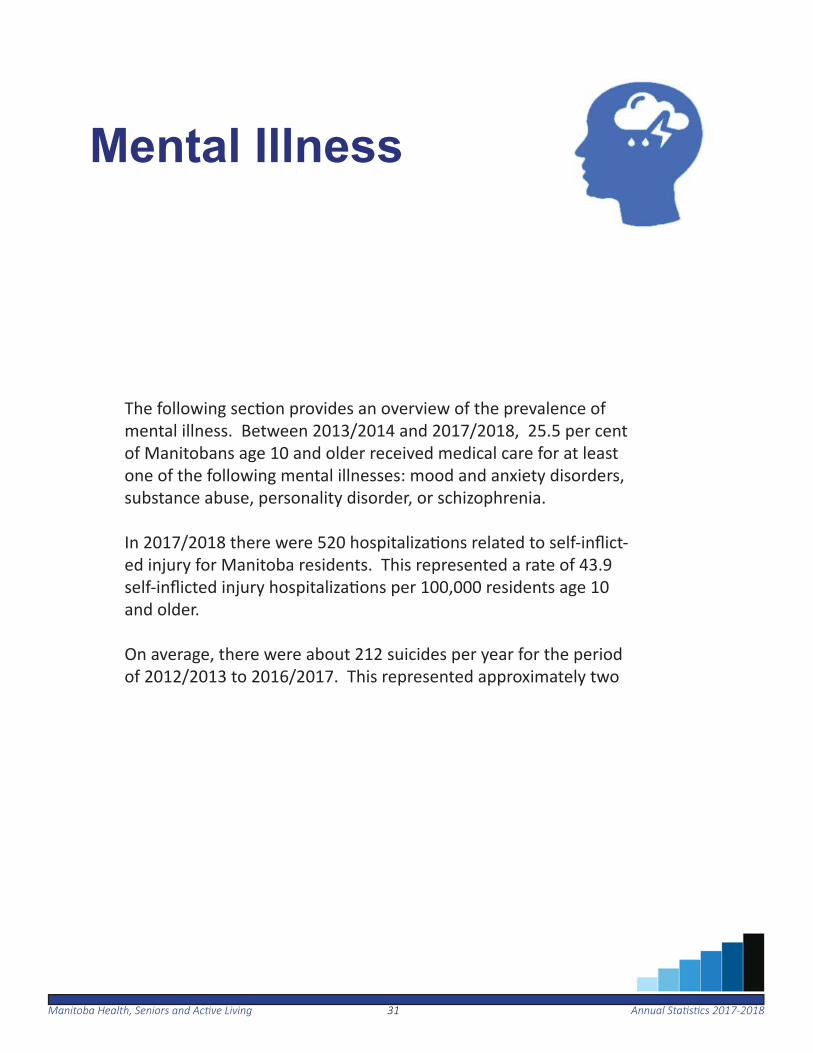
Mental Illness
The following sec on provides an overview of the prevalence of mental illness. Between 2013/2014 and 2017/2018, 25.5 per cent of Manitobans age 10 and older received medical care for at least one of the following mental illnesses: mood and anxiety disorders, substance abuse, personality disorder, or schizophrenia.
In 2017/2018 there were 520 hospitaliza ons related to self-infl ict-ed injury for Manitoba residents. This represented a rate of 43.9 self-infl icted injury hospitaliza ons per 100,000 residents age 10 and older.
On average, there were about 212 suicides per year for the period of 2012/2013 to 2016/2017. This represented approximately two
3232Manitoba Health, Seniors and Ac ve Living Annual Sta s cs 2017-2018
MENTAL ILLNESS
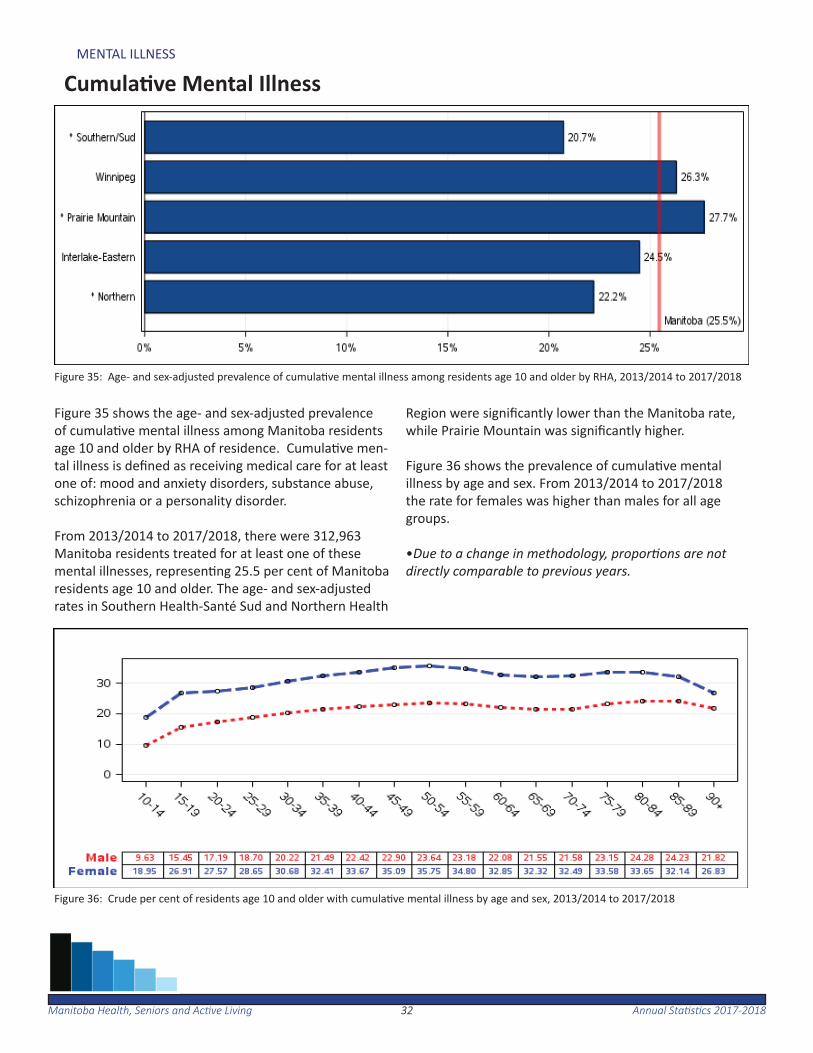
Cumula ve Mental Illness
Figure 35: Age- and sex-adjusted prevalence of cumula ve mental illness among residents age 10 and older by RHA, 2013/2014 to 2017/2018
Figure 35 shows the age- and sex-adjusted prevalence of cumula ve mental illness among Manitoba residents age 10 and older by RHA of residence. Cumula ve men-tal illness is defi ned as receiving medical care for at least one of: mood and anxiety disorders, substance abuse, schizophrenia or a personality disorder.
From 2013/2014 to 2017/2018, there were 312,963 Manitoba residents treated for at least one of these mental illnesses, represen ng 25.5 per cent of Manitoba residents age 10 and older. The age- and sex-adjusted rates in Southern Health-Santé Sud and Northern Health
Region were signifi cantly lower than the Manitoba rate, while Prairie Mountain was signifi cantly higher.
Figure 36 shows the prevalence of cumula ve mental illness by age and sex. From 2013/2014 to 2017/2018 the rate for females was higher than males for all age groups.
•Due to a change in methodology, propor ons are not directly comparable to previous years.
Figure 36: Crude per cent of residents age 10 and older with cumula ve mental illness by age and sex, 2013/2014 to 2017/2018
3333Manitoba Health, Seniors and Ac ve Living Annual Sta s cs 2017-2018
MENTAL ILLNESS
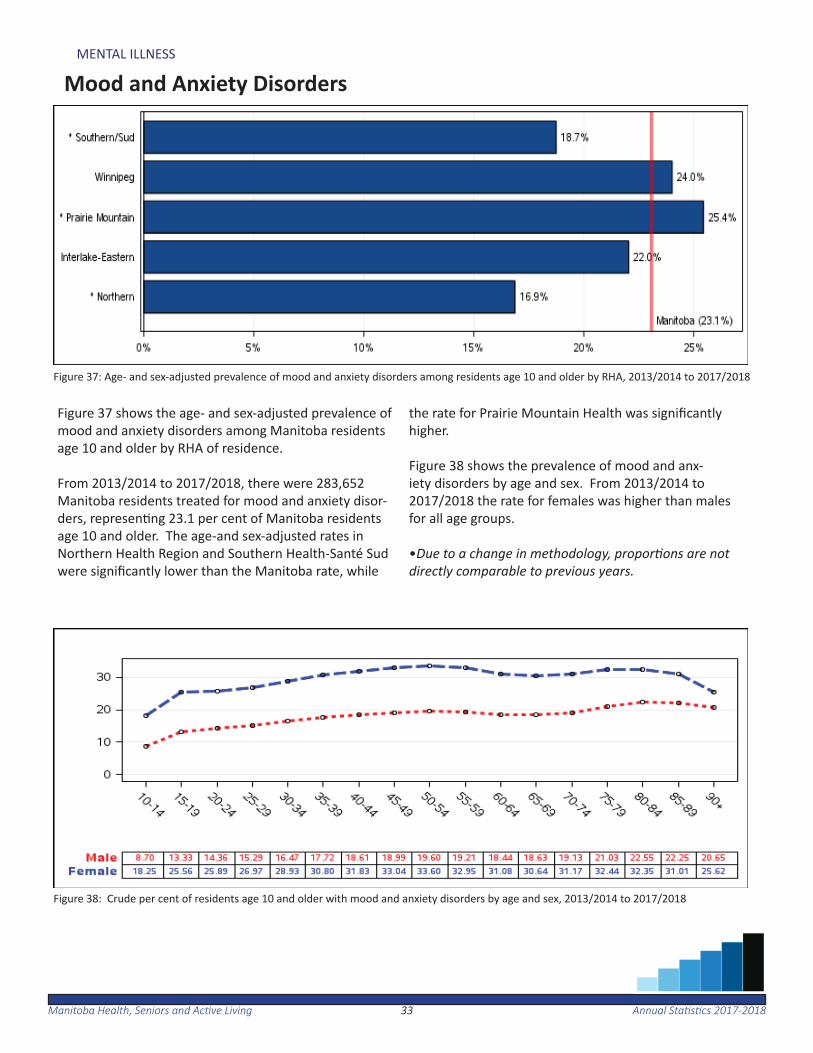
Mood and Anxiety Disorders
Figure 37: Age- and sex-adjusted prevalence of mood and anxiety disorders among residents age 10 and older by RHA, 2013/2014 to 2017/2018
Figure 38: Crude per cent of residents age 10 and older with mood and anxiety disorders by age and sex, 2013/2014 to 2017/2018
Figure 37 shows the age- and sex-adjusted prevalence of mood and anxiety disorders among Manitoba residents age 10 and older by RHA of residence.
From 2013/2014 to 2017/2018, there were 283,652 Manitoba residents treated for mood and anxiety disor-ders, represen ng 23.1 per cent of Manitoba residents age 10 and older. The age-and sex-adjusted rates in Northern Health Region and Southern Health-Santé Sud were signifi cantly lower than the Manitoba rate, while
the rate for Prairie Mountain Health was signifi cantly higher.
Figure 38 shows the prevalence of mood and anx-iety disorders by age and sex. From 2013/2014 to 2017/2018 the rate for females was higher than males for all age groups.
•Due to a change in methodology, propor ons are not directly comparable to previous years.
3434Manitoba Health, Seniors and Ac ve Living Annual Sta s cs 2017-2018
MENTAL ILLNESS
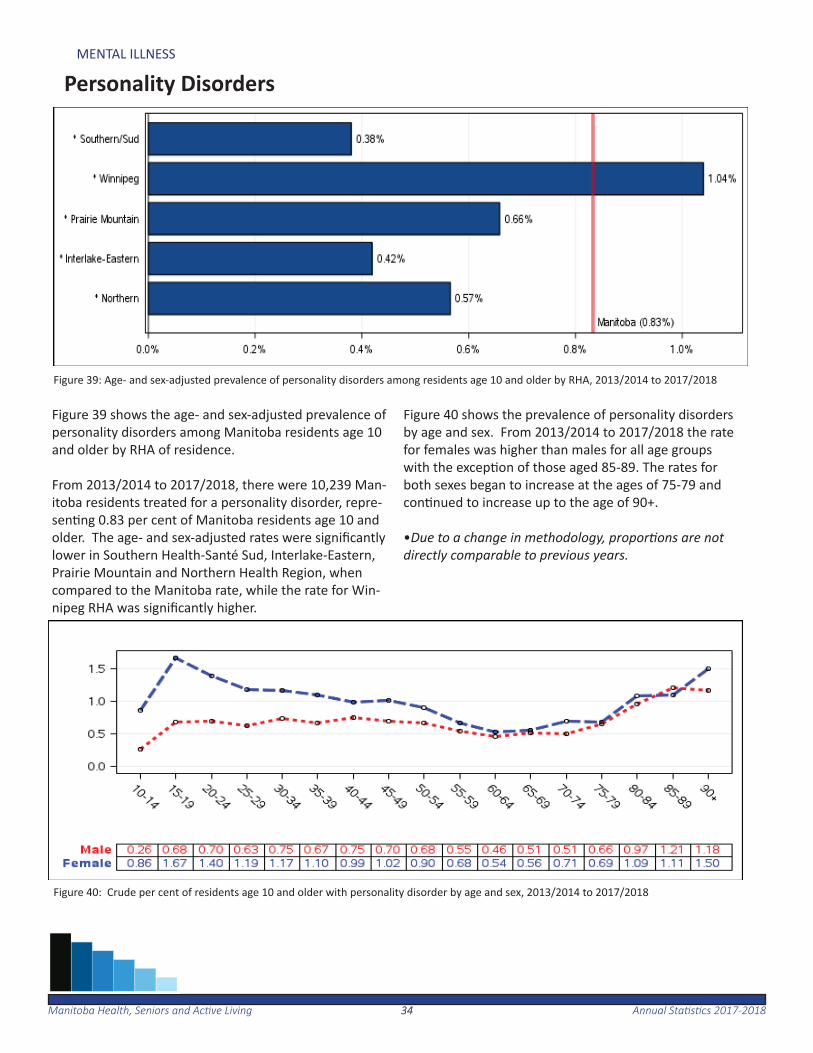
Personality Disorders
Figure 39 shows the age- and sex-adjusted prevalence of personality disorders among Manitoba residents age 10 and older by RHA of residence.
From 2013/2014 to 2017/2018, there were 10,239 Man-itoba residents treated for a personality disorder, repre-sen ng 0.83 per cent of Manitoba residents age 10 and older. The age- and sex-adjusted rates were signifi cantly lower in Southern Health-Santé Sud, Interlake-Eastern, Prairie Mountain and Northern Health Region, when compared to the Manitoba rate, while the rate for Win-nipeg RHA was signifi cantly higher.
Figure 40 shows the prevalence of personality disorders by age and sex. From 2013/2014 to 2017/2018 the rate for females was higher than males for all age groups with the excep on of those aged 85-89. The rates for both sexes began to increase at the ages of 75-79 and con nued to increase up to the age of 90+.
•Due to a change in methodology, propor ons are not directly comparable to previous years.
Figure 39: Age- and sex-adjusted prevalence of personality disorders among residents age 10 and older by RHA, 2013/2014 to 2017/2018
Figure 40: Crude per cent of residents age 10 and older with personality disorder by age and sex, 2013/2014 to 2017/2018
3535Manitoba Health, Seniors and Ac ve Living Annual Sta s cs 2017-2018
MENTAL ILLNESS
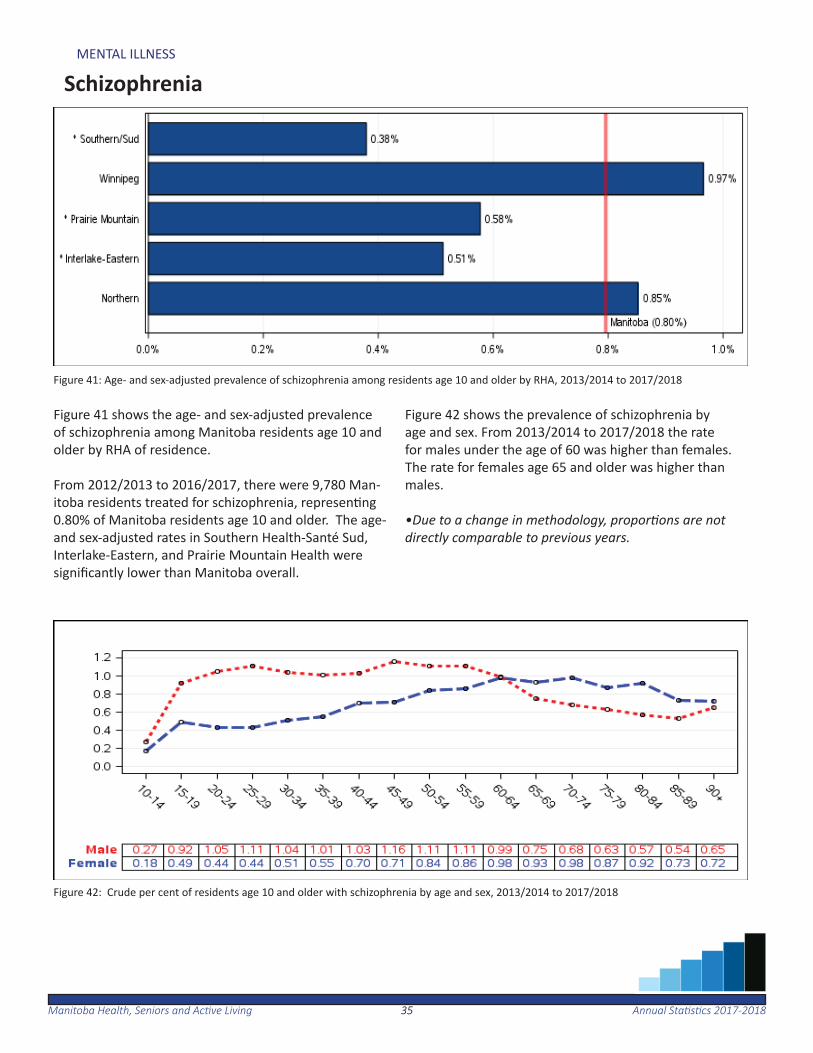
Schizophrenia
Figure 41: Age- and sex-adjusted prevalence of schizophrenia among residents age 10 and older by RHA, 2013/2014 to 2017/2018
Figure 42: Crude per cent of residents age 10 and older with schizophrenia by age and sex, 2013/2014 to 2017/2018
Figure 41 shows the age- and sex-adjusted prevalence of schizophrenia among Manitoba residents age 10 and older by RHA of residence.
From 2012/2013 to 2016/2017, there were 9,780 Man-itoba residents treated for schizophrenia, represen ng 0.80% of Manitoba residents age 10 and older. The age- and sex-adjusted rates in Southern Health-Santé Sud, Interlake-Eastern, and Prairie Mountain Health were signifi cantly lower than Manitoba overall.
Figure 42 shows the prevalence of schizophrenia by age and sex. From 2013/2014 to 2017/2018 the rate for males under the age of 60 was higher than females. The rate for females age 65 and older was higher than males.
•Due to a change in methodology, propor ons are not directly comparable to previous years.

3636Manitoba Health, Seniors and Ac ve Living Annual Sta s cs 2017-2018
MENTAL ILLNESS
Substance Abuse
Figure 43 shows the age- and sex-adjusted prevalence of substance abuse among Manitoba residents age 10 and older by RHA of residence.
From 2013/2014 to 2017/2018, there were 55,520 Man-itoba residents treated for substance abuse, represent-ing 4.5 per cent of Manitoba residents age 10 and older. The rate for Northern Health Region was almost two mes higher than the Manitoba rate, while the rate for
Southern Health-Santé Sud was signifi cantly lower.
Figure 44 shows the prevalence of substance abuse by age and sex. From 2013/2014 to 2017/2018 the rate for males age 20+ was higher than females.
•Due to a change in methodology, propor ons are not directly comparable to previous years.
Figure 43: Age- and sex-adjusted prevalence of substance abuse among residents age 10 and older by RHA, 2013/2014 to 2017/2018
Figure 44: Crude per cent of residents age 10 and older with substance abuse by age and sex, 2013/2014 to 2017/2018
3737Manitoba Health, Seniors and Ac ve Living Annual Sta s cs 2017-2018
MENTAL ILLNESS
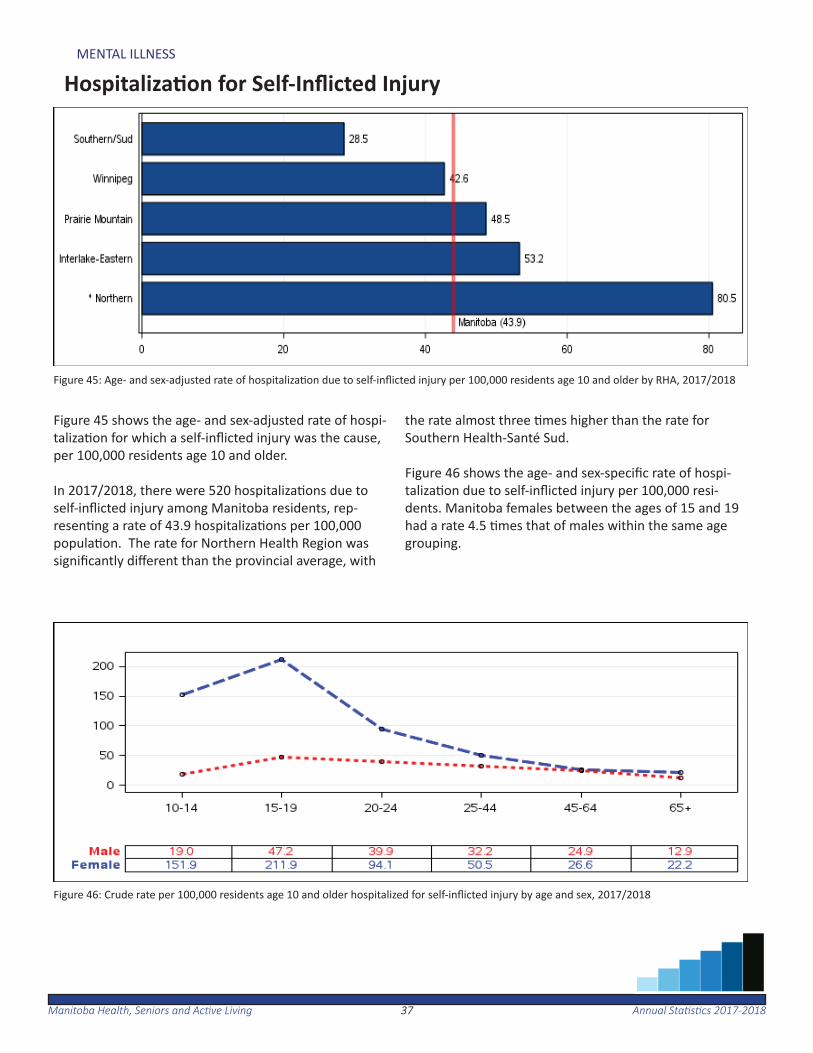
Hospitaliza on for Self-Infl icted Injury
Figure 45 shows the age- and sex-adjusted rate of hospi-taliza on for which a self-infl icted injury was the cause, per 100,000 residents age 10 and older.
In 2017/2018, there were 520 hospitaliza ons due to self-infl icted injury among Manitoba residents, rep-resen ng a rate of 43.9 hospitaliza ons per 100,000 popula on. The rate for Northern Health Region was signifi cantly diff erent than the provincial average, with
the rate almost three mes higher than the rate for Southern Health-Santé Sud.
Figure 46 shows the age- and sex-specifi c rate of hospi-taliza on due to self-infl icted injury per 100,000 resi-dents. Manitoba females between the ages of 15 and 19 had a rate 4.5 mes that of males within the same age grouping.
Figure 45: Age- and sex-adjusted rate of hospitaliza on due to self-infl icted injury per 100,000 residents age 10 and older by RHA, 2017/2018
Figure 46: Crude rate per 100,000 residents age 10 and older hospitalized for self-infl icted injury by age and sex, 2017/2018
3838Manitoba Health, Seniors and Ac ve Living Annual Sta s cs 2017-2018
MENTAL ILLNESS
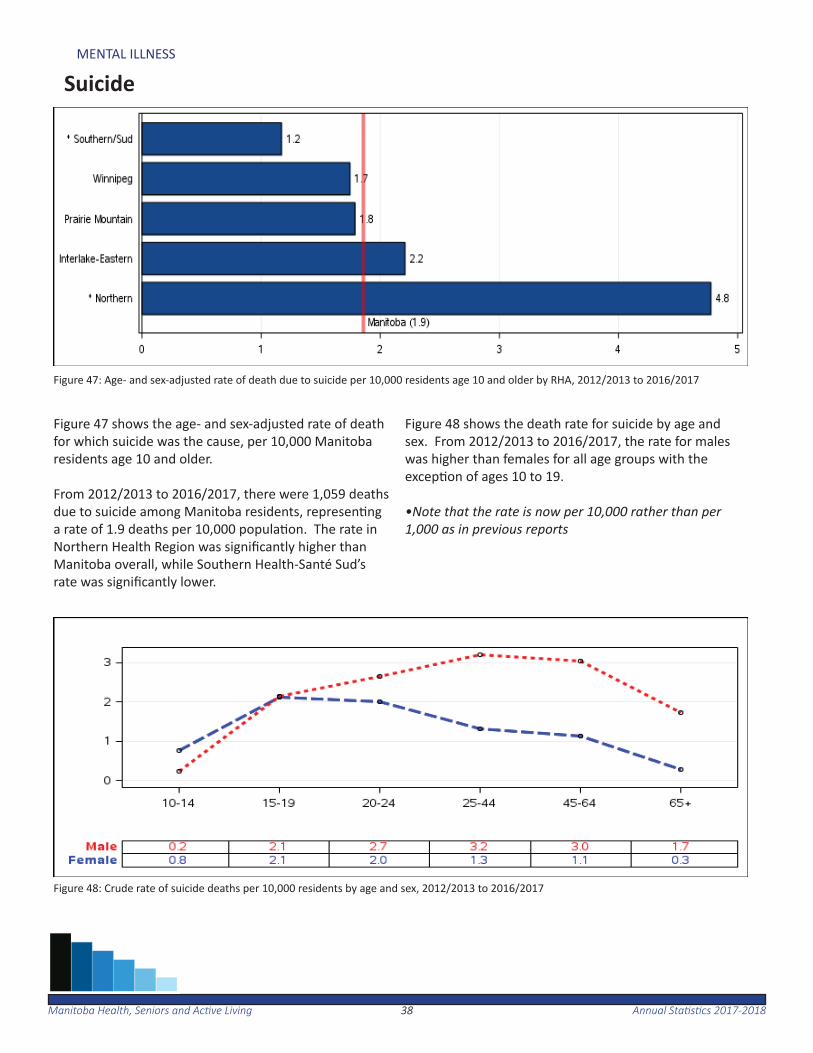
Suicide
Figure 47: Age- and sex-adjusted rate of death due to suicide per 10,000 residents age 10 and older by RHA, 2012/2013 to 2016/2017
Figure 48: Crude rate of suicide deaths per 10,000 residents by age and sex, 2012/2013 to 2016/2017
Figure 47 shows the age- and sex-adjusted rate of death for which suicide was the cause, per 10,000 Manitoba residents age 10 and older.
From 2012/2013 to 2016/2017, there were 1,059 deaths due to suicide among Manitoba residents, represen ng a rate of 1.9 deaths per 10,000 popula on. The rate in Northern Health Region was signifi cantly higher than Manitoba overall, while Southern Health-Santé Sud’s rate was signifi cantly lower.
Figure 48 shows the death rate for suicide by age and sex. From 2012/2013 to 2016/2017, the rate for males was higher than females for all age groups with the excep on of ages 10 to 19.
•Note that the rate is now per 10,000 rather than per 1,000 as in previous reports

Manitoba Health, Seniors and Ac ve Living Annual Sta s cs 2017-201839
Health Services Insurance Plan
Manitoba residents who are Canadian ci zens or have immigrant status (including work/study permit holders), and who are either a permanent resident of Manitoba or reside in Manitoba for at least six months of the year, are eligible for Manitoba Health, Seniors and Ac ve Living coverage.
The Health Services Insurance Plan operates outside the Provincial Consolidated Fund and provides for payment of insured services for hospitals, personal care homes, and health care providers on behalf of Manitoba residents. Other plans include the pre-scrip on drugs program (Pharmacare), Ambulance, Air Ambulance, and Northern Pa ent Transporta on programs.
4040Manitoba Health, Seniors and Ac ve Living Annual Sta s cs 2017-2018
HEALTH SERVICES INSURANCE PLAN
Insured Services per Capita
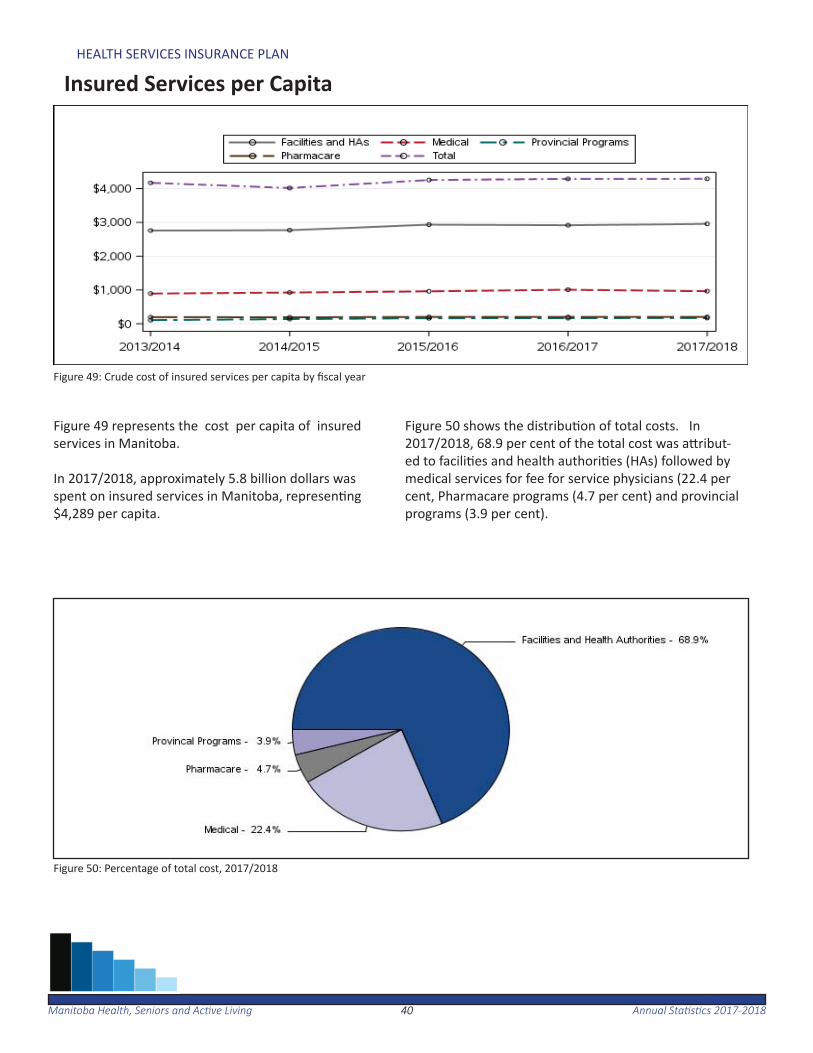
Figure 49: Crude cost of insured services per capita by fi scal year
Figure 49 represents the cost per capita of insured services in Manitoba.
In 2017/2018, approximately 5.8 billion dollars was spent on insured services in Manitoba, represen ng $4,289 per capita.
Figure 50 shows the distribu on of total costs. In 2017/2018, 68.9 per cent of the total cost was a ribut-ed to facili es and health authori es (HAs) followed by medical services for fee for service physicians (22.4 per cent, Pharmacare programs (4.7 per cent) and provincial programs (3.9 per cent).
Figure 50: Percentage of total cost, 2017/2018
Manitoba Health, Seniors and Ac ve Living Annual Sta s cs 2017-201841
Use of Medical Services
The following sec on provides an overview of the use of medical services in Manitoba. This includes number of physicians and nurses, physician use, ma-jority of care and ambulatory care visit rates.
In 2017 there were 18,275 nurses and 2,824 physi-cians registered in Manitoba. About 78.5 per cent of Manitoba residents saw a physician at least once in 2017/2018. On average, these Manitobans saw a physician about fi ve mes.
Nearly three-quarters (70.9 per cent) of residents saw the same physician for more than 50 per cent of their ambulatory visits.
Overall, 73.0 per cent of Manitoba residents saw a primary care physician and 37.4 per cent visit-ed a specialist care physician at least once during 2017/2018.

4242Manitoba Health, Seniors and Ac ve Living Annual Sta s cs 2017-2018
USE OF MEDICAL SERVICES
Number of General Prac oners and Specialists
Figure 51: Number of General Prac oners and Specialists in Manitoba, 2013 - 2017
Figure 51 shows the number of general prac oners and specialists in Manitoba as reported by the College of Physicians and Surgeons of Manitoba by calendar year.
For 2017, there were a total of 2,824 physicians in Man-itoba. This consisted of nearly even numbers of family physicians and specialists.

4343Manitoba Health, Seniors and Ac ve Living Annual Sta s cs 2017-2018
USE OF MEDICAL SERVICES
Number of Nurses and Nurse Prac oners
Figure 52 shows the number of registered nurses (RNs), licensed prac cal nurses (LPN)s and registered psy-chiatric nurses (RPNs) as reported by their respec ve colleges in Manitoba. For 2017, there were 18,275 registered RNs, LPNs and RPNs in Manitoba, of which 75.0 per cent were regis-tered nurses. The remaining 25.0 per cent consisted of registered psychiatric nurses and licensed prac cal nurses.
Figure 53 shows the number of nurse prac oners in Manitoba. The number of registered nurse prac oners increased from 131 in 2013 to 204 in 2017.
•The data included in this report represents ac ve reg-istra ons for each classifi ca on/designa on. All classifi -ca ons of nurses in Manitoba may be employed across a variety of se ngs and in various roles, including and not limited to direct care in community, acute, long term/residen al care; academia/research; administra on, and government. Nursing posi ons exist in and outside of provincially-funded healthcare organiza ons. (See appendix for further details)
Figure 52: Number of RNs, LPNs and RPNs in Manitoba, 2013 - 2017
Figure 53: Number of Nurse Prac oners in Manitoba, 2013 - 2017
4444Manitoba Health, Seniors and Ac ve Living Annual Sta s cs 2017-2018
USE OF MEDICAL SERVICES
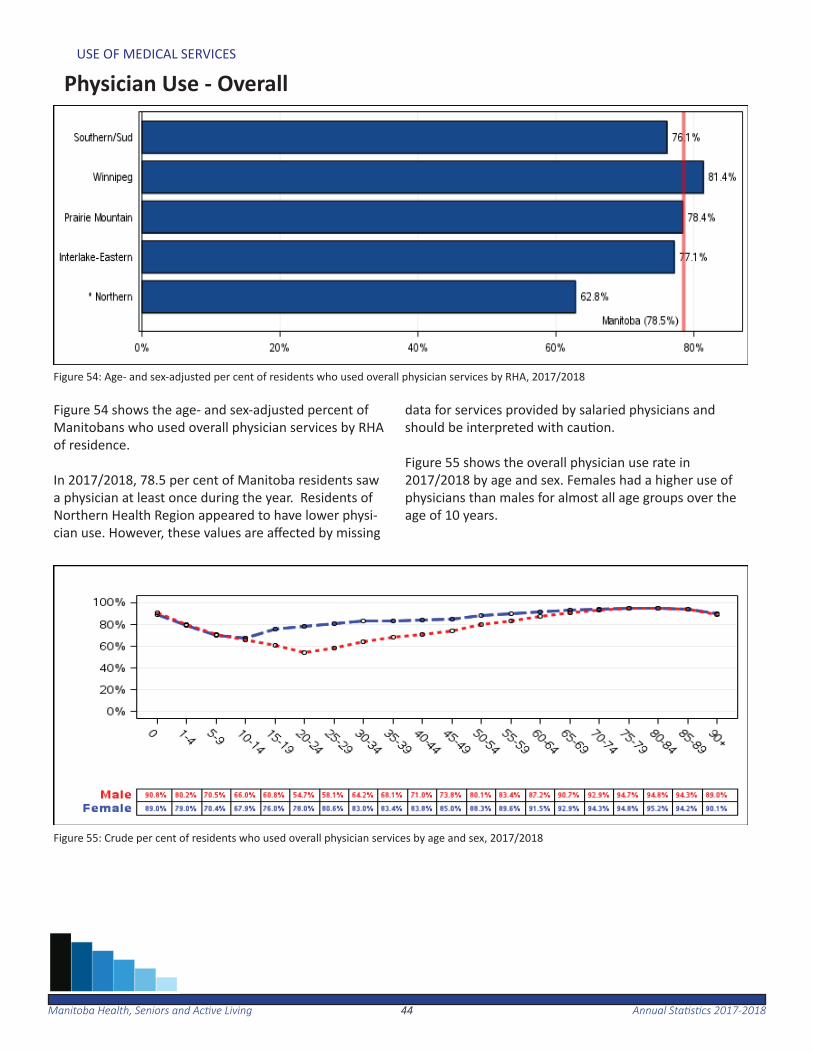
Physician Use - Overall
Figure 54: Age- and sex-adjusted per cent of residents who used overall physician services by RHA, 2017/2018
Figure 55: Crude per cent of residents who used overall physician services by age and sex, 2017/2018
Figure 54 shows the age- and sex-adjusted percent of Manitobans who used overall physician services by RHA of residence.
In 2017/2018, 78.5 per cent of Manitoba residents saw a physician at least once during the year. Residents of Northern Health Region appeared to have lower physi-cian use. However, these values are aff ected by missing
data for services provided by salaried physicians and should be interpreted with cau on.
Figure 55 shows the overall physician use rate in 2017/2018 by age and sex. Females had a higher use of physicians than males for almost all age groups over the age of 10 years.
4545Manitoba Health, Seniors and Ac ve Living Annual Sta s cs 2017-2018
USE OF MEDICAL SERVICES
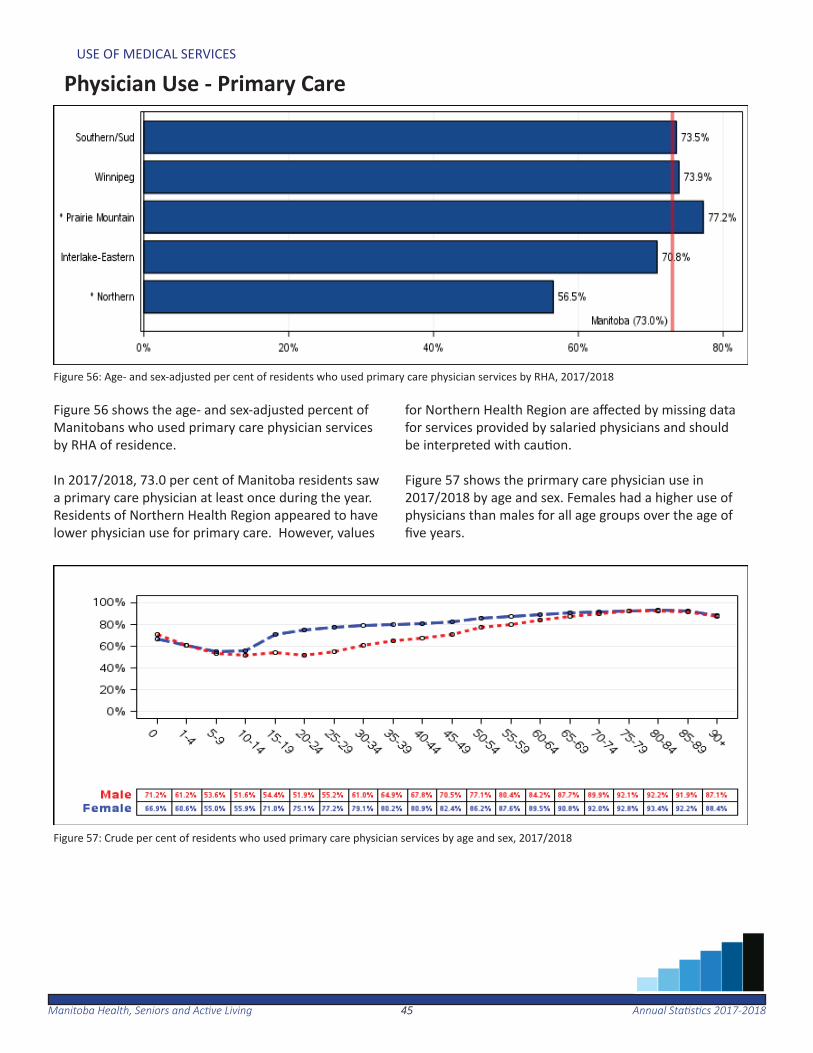
Physician Use - Primary Care
Figure 56: Age- and sex-adjusted per cent of residents who used primary care physician services by RHA, 2017/2018
Figure 57: Crude per cent of residents who used primary care physician services by age and sex, 2017/2018
Figure 56 shows the age- and sex-adjusted percent of Manitobans who used primary care physician services by RHA of residence.
In 2017/2018, 73.0 per cent of Manitoba residents saw a primary care physician at least once during the year. Residents of Northern Health Region appeared to have lower physician use for primary care. However, values
for Northern Health Region are aff ected by missing data for services provided by salaried physicians and should be interpreted with cau on.
Figure 57 shows the prirmary care physician use in 2017/2018 by age and sex. Females had a higher use of physicians than males for all age groups over the age of fi ve years.

4646Manitoba Health, Seniors and Ac ve Living Annual Sta s cs 2017-2018
USE OF MEDICAL SERVICES
Physician Use - Specialist Care
Figure 58: Age- and sex-adjusted per cent of residents who used specialist physician services by RHA, 2017/2018
Figure 59: Crude per cent of residents who used specialist physician services by age and sex, 2017/2018
Figure 58 shows the age- and sex-adjusted per cent of Manitobans who used specialist care services by RHA of residence.
In 2017/2018, 37.4 per cent of Manitoba residents saw a specialist care physician at least once during the year. Residents of Prairie Mountain Health , Southern Health-Santé Sud and Northern Health Region appeared to have lower per cent of physician use for specialist care. However, values for Northern Health Region are af-
fected by missing data for services provided by salaried physicians and should be interpreted with cau on.
Figure 59 shows the specialist physician use rate in 2017/2018 by age and sex. Females had a higher use of physicians than males for all age groups over the age of 15 years up to 69 years. This may be a ributed to wom-en seeing specialists for obstetrical and gynaecological care.
4747Manitoba Health, Seniors and Ac ve Living Annual Sta s cs 2017-2018
USE OF MEDICAL SERVICES
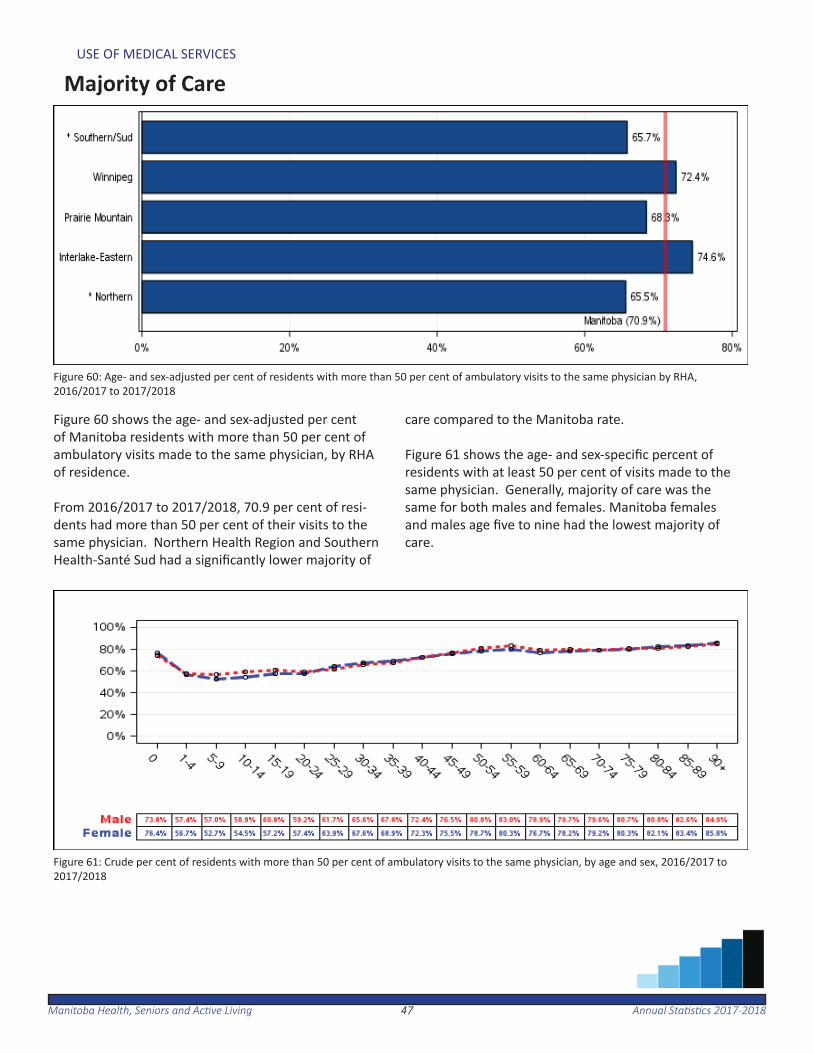
Majority of Care
Figure 60: Age- and sex-adjusted per cent of residents with more than 50 per cent of ambulatory visits to the same physician by RHA, 2016/2017 to 2017/2018
Figure 61: Crude per cent of residents with more than 50 per cent of ambulatory visits to the same physician, by age and sex, 2016/2017 to 2017/2018
Figure 60 shows the age- and sex-adjusted per cent of Manitoba residents with more than 50 per cent of ambulatory visits made to the same physician, by RHA of residence. From 2016/2017 to 2017/2018, 70.9 per cent of resi-dents had more than 50 per cent of their visits to the same physician. Northern Health Region and Southern Health-Santé Sud had a signifi cantly lower majority of
care compared to the Manitoba rate.
Figure 61 shows the age- and sex-specifi c percent of residents with at least 50 per cent of visits made to the same physician. Generally, majority of care was the same for both males and females. Manitoba females and males age fi ve to nine had the lowest majority of care.
4848Manitoba Health, Seniors and Ac ve Living Annual Sta s cs 2017-2018
USE OF MEDICAL SERVICES
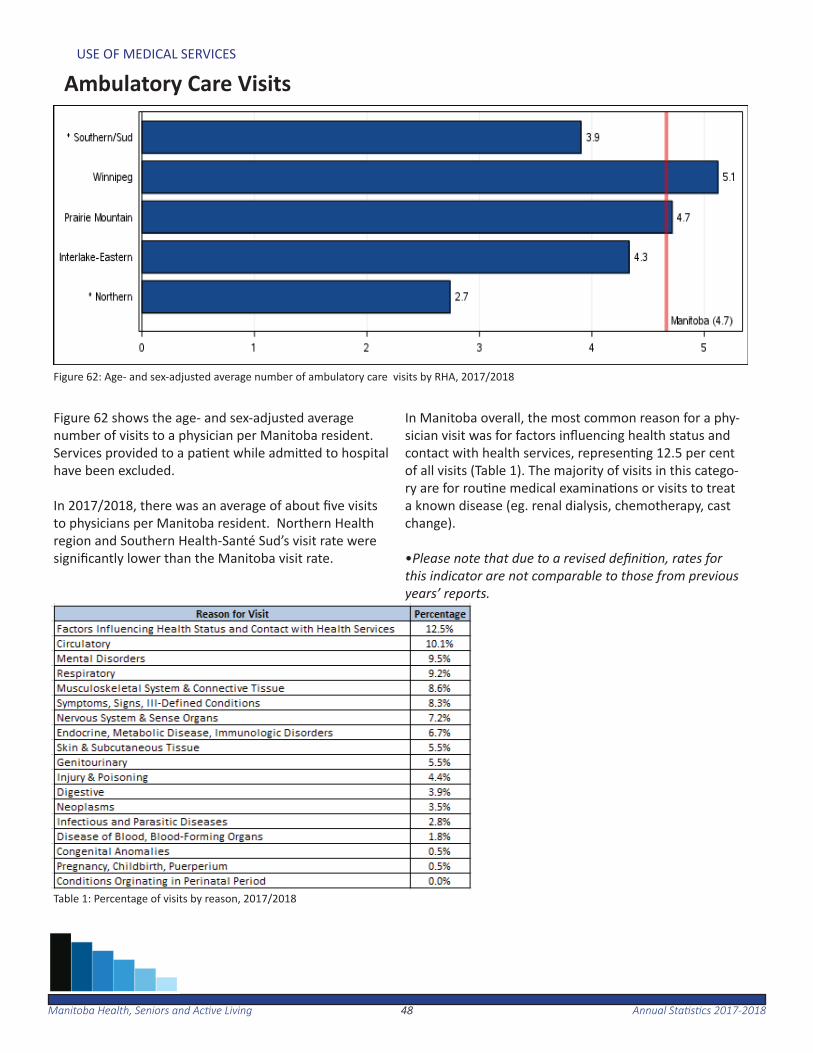
Ambulatory Care Visits
Figure 62: Age- and sex-adjusted average number of ambulatory care visits by RHA, 2017/2018
Figure 62 shows the age- and sex-adjusted average number of visits to a physician per Manitoba resident. Services provided to a pa ent while admi ed to hospital have been excluded.
In 2017/2018, there was an average of about fi ve visits to physicians per Manitoba resident. Northern Health region and Southern Health-Santé Sud’s visit rate were signifi cantly lower than the Manitoba visit rate.
In Manitoba overall, the most common reason for a phy-sician visit was for factors infl uencing health status and contact with health services, represen ng 12.5 per cent of all visits (Table 1). The majority of visits in this catego-ry are for rou ne medical examina ons or visits to treat a known disease (eg. renal dialysis, chemotherapy, cast change).
•Please note that due to a revised defi ni on, rates for this indicator are not comparable to those from previous years’ reports.
Table 1: Percentage of visits by reason, 2017/2018
Manitoba Health, Seniors and Ac ve Living Annual Sta s cs 2017-201849
Use of Hospital Services
The following sec on provides an overview of the use of hospi-tal services, appropriateness of care and propor on of alternate level of care days in Manitoba. This includes use of hospitals, hospital separa on rates, day surgery rates, hospitaliza ons for ambulatory care sensi ve condi ons and alternate level of care days.
In 2017/2018, there were 75 acute and chronic care facili es along with two long term psychiatric facili es.
About 6 per cent of Manitoba residents were admi ed as inpa- ents to a hospital in 2017/2018. In total, there were 114,062
inpa ent hospitaliza ons.
There were a total of 106,520 hospital day surgery visits among Manitoba residents in 2017/2018. Nearly half of these visits were for procedures involving the diges ve system.
Ambulatory care sensi ve condi ons (ACSC) is a measure of access to appropriate medical care. While not all admissions for these condi ons are avoidable, signifi cantly elevated rates o en refl ect problems obtaining access to primary care. In 2017/2018, the rate of hospitaliza on for ACSC was 6.8 per 1,000 residents. Alternate level of care (ALC) days are inpa ent days in which a pa ent no longer requires the level of care their care se ng provides, and where the pa ent is awai ng discharge to a more appropriate non-acute care se ng. In 2017/2018, 4.9 per cent of all hospitalized cases had one or more ALC days associated with them.
5050Manitoba Health, Seniors and Ac ve Living Annual Sta s cs 2017-2018
USE OF HOSPITAL SERVICES
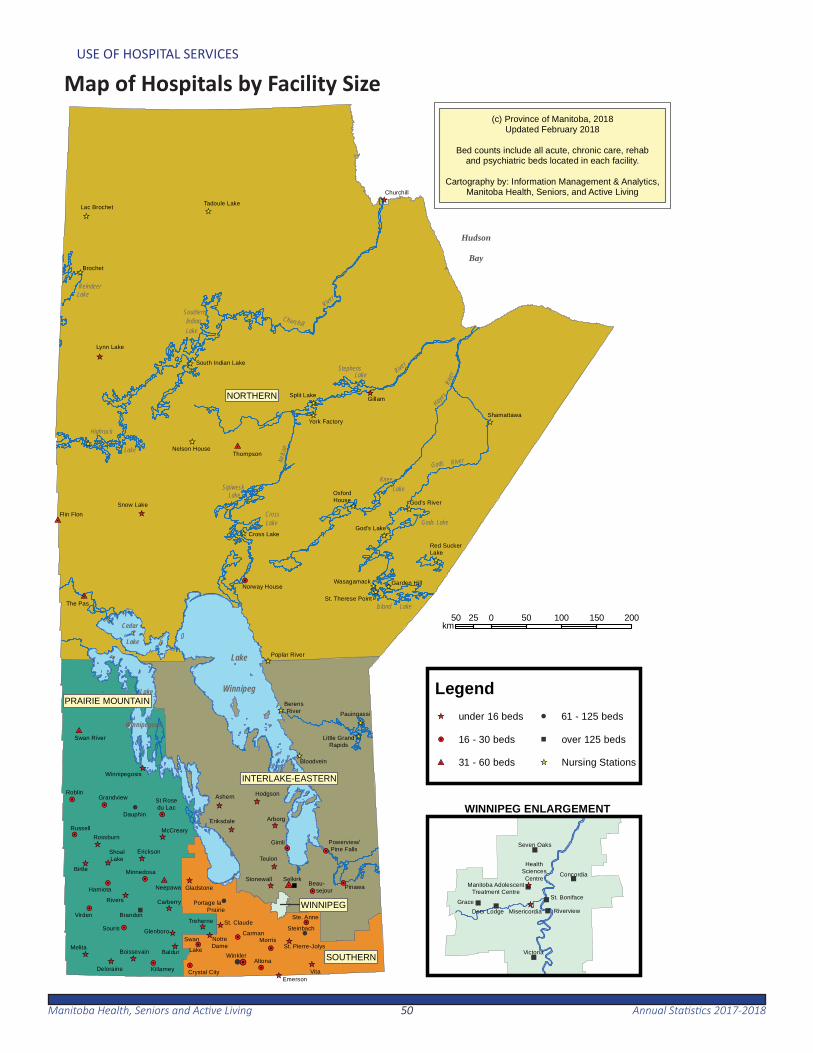
Map of Hospitals by Facility Size
;
_̂
4
_̂
_̂
!H
4_̂
_̂
#I
_̂
_̂
_̂
_̂
!H
_̂
_̂
!H
!H
_̂
!H
_̂
!H
!H_̂_̂
!H
_̂
!H #I
_̂
!H
_̂
_̂
_̂
_̂
_̂
!H
_̂
!H
!H!H
!H
#I
!H
_̂
_̂
!H
_̂
4!H
#I
#I
_̂
!H
!H
_̂
_̂ _̂
_̂
_̂
_̂
_̂
_̂
_̂
_̂
_̂
_̂
_̂
_̂
_̂
_̂
_̂
_̂
_̂
_̂
_̂
_̂
_̂_̂
_̂
Portage la Prairie
St Rosedu Lac
Lac Brochet
BerensRiver
Norway House
OxfordHouse
Little GrandRapids
ShoalLake
Grandview
Deloraine
Shamattawa
Beau- sejour
Powerview/Pine Falls
Pinawa
Swan River
Churchill
Lynn Lake
Boissevain
StonewallMinnedosa
Killarney
Steinbach
Ste. Anne
Flin Flon
McCreary
Thompson
Emerson
Eriksdale
Brochet
Hodgson
Winnipegosis
Melita
Neepawa
Russell
Selkirk
Winkler
Dauphin
Gillam
Ashern
Altona
CarmanMorris
Arborg
Roblin
Virden
Teulon
Gimli
Brandon
Baldur
Birtle
Treherne
Rossburn
Erickson
Gladstone
Carberry
Souris
Rivers
Hamiota
GlenboroNotreDame
Nelson House
Crystal City
Bloodvein
Swan Lake
Garden Hill
Red SuckerLake
Vita
Poplar River
South Indian Lake
God's Lake
Snow Lake
Cross Lake
Wasagamack
Pauingassi
Tadoule Lake
York Factory
Split Lake
God's River
St. Pierre-Jolys
St. Therese PointThe Pas
;
St. Claude
!H4
#I
NORTHERN
INTERLAKE-EASTERN
SOUTHERN
PRAIRIE MOUNTAIN
WINNIPEG
50 0 50 100 150 20025km
Hudson
Bay
Cedar
Lake
Lake
Winnipegosis
Lake
Winnipeg
LakeReindeer
Highrock
Lake
Lake
SouthernIndian Churchill
River
LakeSipiwesk
StephensLake Rive
r
Nelso
n
LakeKnee
LakeGods
Rive
r
River
Hayes
Gods
LakeIsland
LakeCross
" _̂"
"
"
"
"
"
"
_̂
Concordia
Seven Oaks
Manitoba AdolescentTreatment Centre
HealthSciencesCentre
Victoria
St. BonifaceGrace
MisericordiaDeer Lodge Riverview
(c) Province of Manitoba, 2018Updated February 2018
Bed counts include all acute, chronic care, rehaband psychiatric beds located in each facility.
Cartography by: Information Management & Analytics,Manitoba Health, Seniors, and Active Living
WINNIPEG ENLARGEMENT
Legend
#I 31 - 60 beds
!H 16 - 30 beds
_̂ under 16 beds
; over 125 beds
4 61 - 125 beds
Nursing Stations_̂
5151Manitoba Health, Seniors and Ac ve Living Annual Sta s cs 2017-2018
USE OF HOSPITAL SERVICES
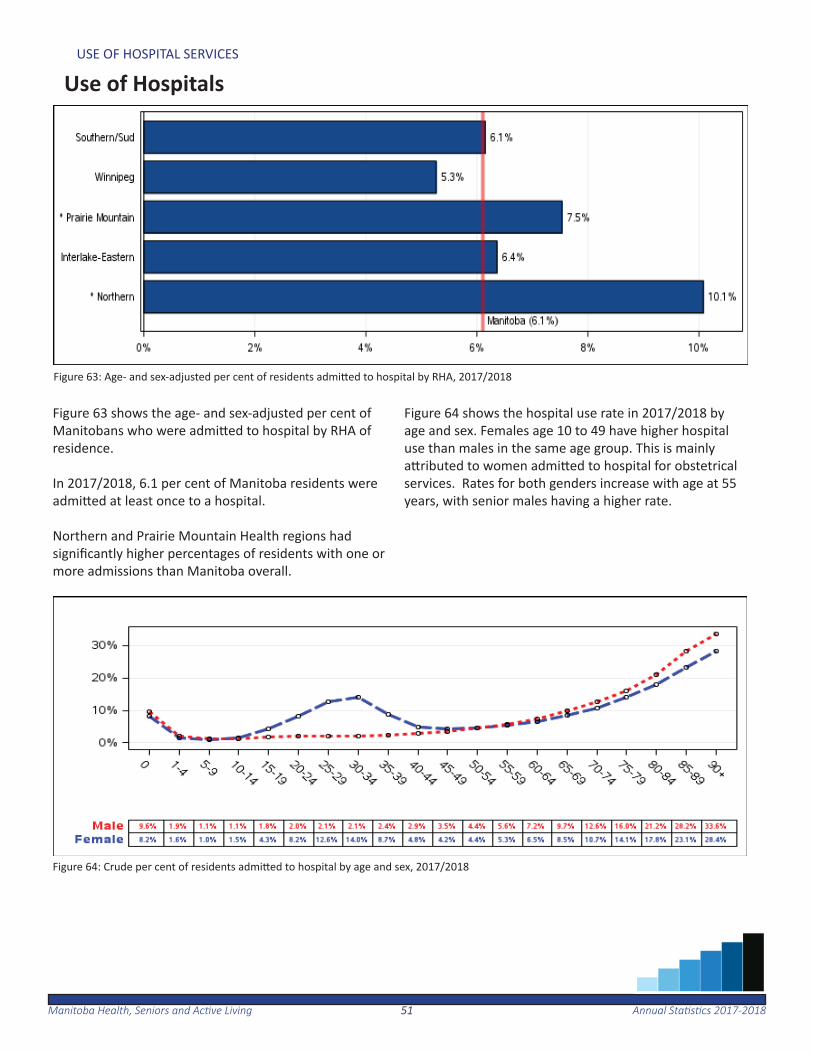
Use of Hospitals
Figure 63: Age- and sex-adjusted per cent of residents admi ed to hospital by RHA, 2017/2018
Figure 63 shows the age- and sex-adjusted per cent of Manitobans who were admi ed to hospital by RHA of residence. In 2017/2018, 6.1 per cent of Manitoba residents were admi ed at least once to a hospital.
Northern and Prairie Mountain Health regions had signifi cantly higher percentages of residents with one or more admissions than Manitoba overall.
Figure 64 shows the hospital use rate in 2017/2018 by age and sex. Females age 10 to 49 have higher hospital use than males in the same age group. This is mainly a ributed to women admi ed to hospital for obstetrical services. Rates for both genders increase with age at 55 years, with senior males having a higher rate.
Figure 64: Crude per cent of residents admi ed to hospital by age and sex, 2017/2018
5252Manitoba Health, Seniors and Ac ve Living Annual Sta s cs 2017-2018
USE OF HOSPITAL SERVICES
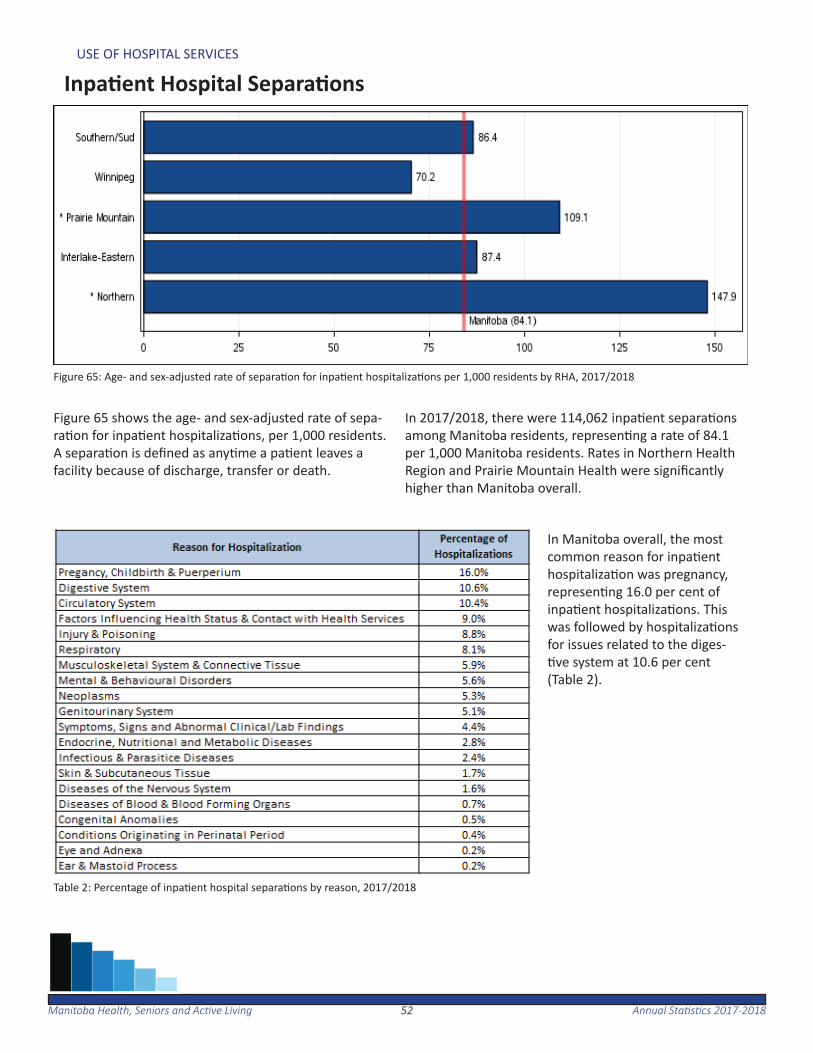
Inpa ent Hospital Separa ons
Figure 65: Age- and sex-adjusted rate of separa on for inpa ent hospitaliza ons per 1,000 residents by RHA, 2017/2018
Table 2: Percentage of inpa ent hospital separa ons by reason, 2017/2018
Figure 65 shows the age- and sex-adjusted rate of sepa-ra on for inpa ent hospitaliza ons, per 1,000 residents. A separa on is defi ned as any me a pa ent leaves a facility because of discharge, transfer or death.
In 2017/2018, there were 114,062 inpa ent separa ons among Manitoba residents, represen ng a rate of 84.1 per 1,000 Manitoba residents. Rates in Northern Health Region and Prairie Mountain Health were signifi cantly higher than Manitoba overall.
In Manitoba overall, the most common reason for inpa ent hospitaliza on was pregnancy, represen ng 16.0 per cent of inpa ent hospitaliza ons. This was followed by hospitaliza ons for issues related to the diges- ve system at 10.6 per cent
(Table 2).
5353Manitoba Health, Seniors and Ac ve Living Annual Sta s cs 2017-2018
USE OF HOSPITAL SERVICES
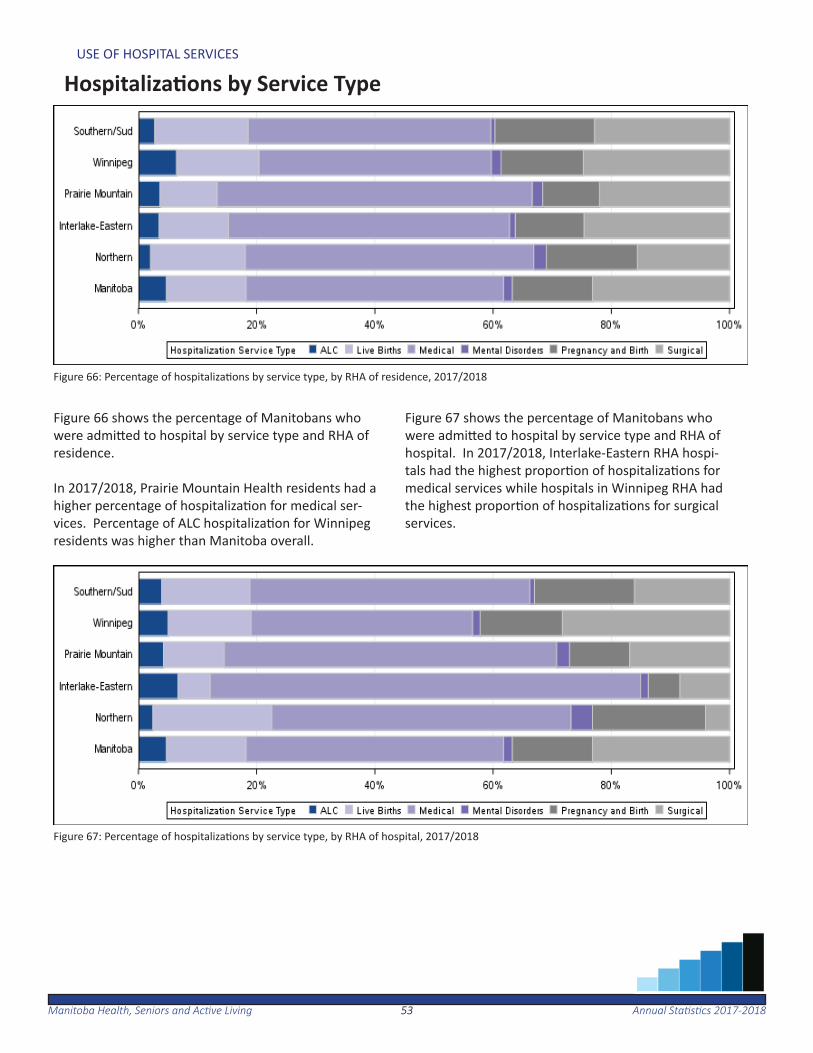
Hospitaliza ons by Service Type
Figure 66: Percentage of hospitaliza ons by service type, by RHA of residence, 2017/2018
Figure 67: Percentage of hospitaliza ons by service type, by RHA of hospital, 2017/2018
Figure 66 shows the percentage of Manitobans who were admi ed to hospital by service type and RHA of residence.
In 2017/2018, Prairie Mountain Health residents had a higher percentage of hospitaliza on for medical ser-vices. Percentage of ALC hospitaliza on for Winnipeg residents was higher than Manitoba overall.
Figure 67 shows the percentage of Manitobans who were admi ed to hospital by service type and RHA of hospital. In 2017/2018, Interlake-Eastern RHA hospi-tals had the highest propor on of hospitaliza ons for medical services while hospitals in Winnipeg RHA had the highest propor on of hospitaliza ons for surgical services.

5454Manitoba Health, Seniors and Ac ve Living Annual Sta s cs 2017-2018
USE OF HOSPITAL SERVICES
Day Surgery
Figure 68: Age– and sex-adjusted rate of day surgery hospitaliza on per 1,000 residents by RHA, 2017/2018
Table 3: Percentage of day surgery hospitaliza on by reason, 2017/2018
Figure 68 shows the age- and sex-adjusted rate of day surgery hospitaliza on per 1,000 residents. Day surgery is defi ned as surgical services received on an outpa ent basis. In 2017/2018, there were 106,520 day surgery hospital-iza ons among Manitoba residents, represen ng a rate of 78.5 per 1,000 Manitoba residents.
The most common reason for day surgery hospitaliza- on in Manitoba was for an interven on on the diges- ve tract, represen ng 45.1 per cent of all day surgery
hospitaliza ons (Table 3).
5555Manitoba Health, Seniors and Ac ve Living Annual Sta s cs 2017-2018
USE OF HOSPITAL SERVICES
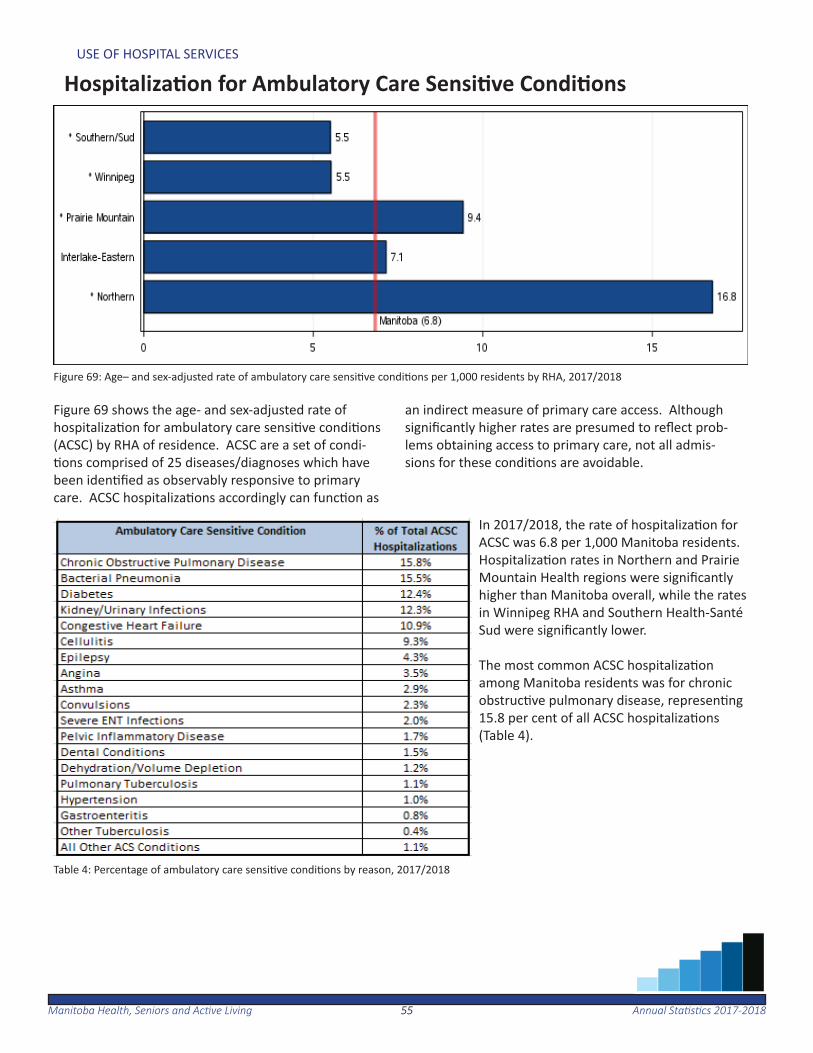
Hospitaliza on for Ambulatory Care Sensi ve Condi ons
Figure 69: Age– and sex-adjusted rate of ambulatory care sensi ve condi ons per 1,000 residents by RHA, 2017/2018
Table 4: Percentage of ambulatory care sensi ve condi ons by reason, 2017/2018
Figure 69 shows the age- and sex-adjusted rate of hospitaliza on for ambulatory care sensi ve condi ons (ACSC) by RHA of residence. ACSC are a set of condi- ons comprised of 25 diseases/diagnoses which have
been iden fi ed as observably responsive to primary care. ACSC hospitaliza ons accordingly can func on as
an indirect measure of primary care access. Although signifi cantly higher rates are presumed to refl ect prob-lems obtaining access to primary care, not all admis-sions for these condi ons are avoidable.
In 2017/2018, the rate of hospitaliza on for ACSC was 6.8 per 1,000 Manitoba residents. Hospitaliza on rates in Northern and Prairie Mountain Health regions were signifi cantly higher than Manitoba overall, while the rates in Winnipeg RHA and Southern Health-Santé Sud were signifi cantly lower.
The most common ACSC hospitaliza on among Manitoba residents was for chronic obstruc ve pulmonary disease, represen ng 15.8 per cent of all ACSC hospitaliza ons (Table 4).
5656Manitoba Health, Seniors and Ac ve Living Annual Sta s cs 2017-2018
USE OF HOSPITAL SERVICES
Alternate Level of Care
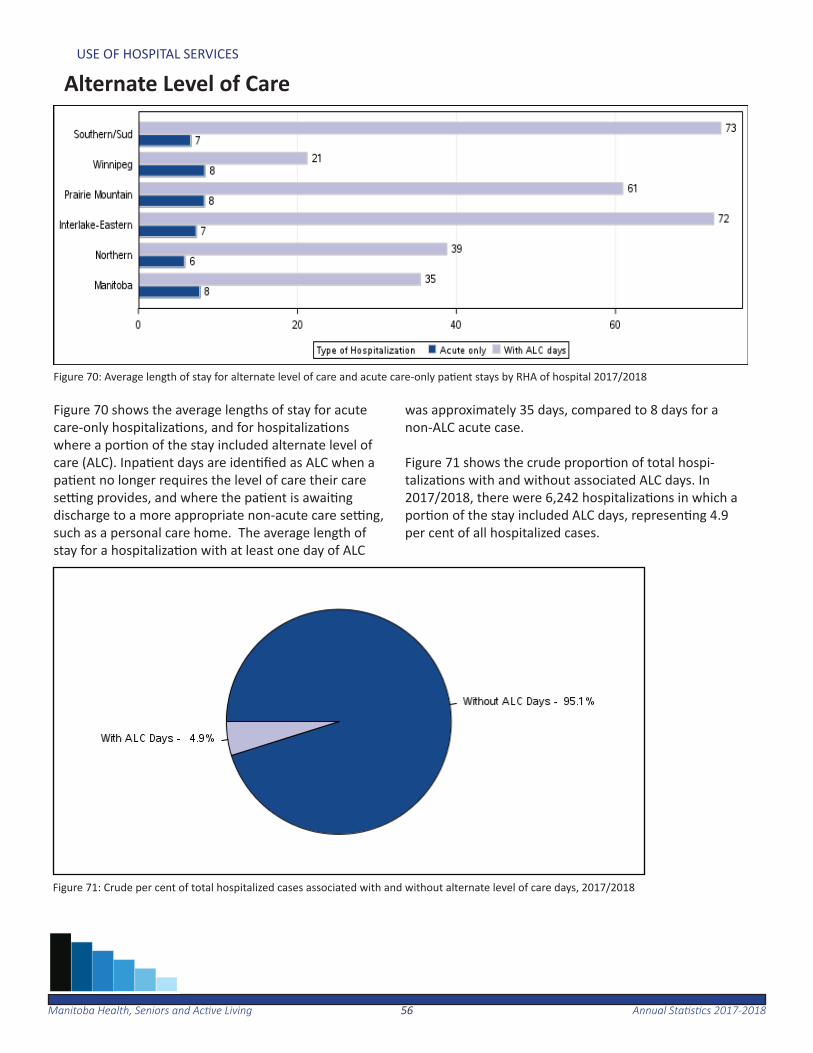
Figure 70: Average length of stay for alternate level of care and acute care-only pa ent stays by RHA of hospital 2017/2018
Figure 70 shows the average lengths of stay for acute care-only hospitaliza ons, and for hospitaliza ons where a por on of the stay included alternate level of care (ALC). Inpa ent days are iden fi ed as ALC when a pa ent no longer requires the level of care their care se ng provides, and where the pa ent is awai ng discharge to a more appropriate non-acute care se ng, such as a personal care home. The average length of stay for a hospitaliza on with at least one day of ALC
was approximately 35 days, compared to 8 days for a non-ALC acute case.
Figure 71 shows the crude propor on of total hospi-taliza ons with and without associated ALC days. In 2017/2018, there were 6,242 hospitaliza ons in which a por on of the stay included ALC days, represen ng 4.9 per cent of all hospitalized cases.
Figure 71: Crude per cent of total hospitalized cases associated with and without alternate level of care days, 2017/2018
Manitoba Health, Seniors and Ac ve Living Annual Sta s cs 2017-201857
High Profi le Surgeries
The following sec on provides an overview of high profi le sur-gery rates for the Manitoba popula on, including rates for cor-onary surgeries, hip replacement surgeries, knee replacement surgeries, cataract surgeries and paediatric dental extrac ons.
For the period of 2013/2014 to 2017/2018, there was about one coronary artery bypass gra surgery and nearly four per-cutaneous coronary interven on surgeries per 1,000 Manitoba residents age 40 and older.
In 2017/2018, there were almost three hip replacement sur-geries and almost four knee replacement surgeries per 1,000 Manitoba residents age 40 and older.
In 2016/2017, there were about 28 cataract surgeries per 1,000 Manitoba residents age 50 and older.
There were about 10 dental extrac on surgeries per 1,000 chil-dren under the age of six in 2017/2018.
5858Manitoba Health, Seniors and Ac ve Living Annual Sta s cs 2017-2018
HIGH PROFILE SURGERIES
Coronary Artery Bypass Gra Surgery and Percutaneous Coronary Interven on Surgery
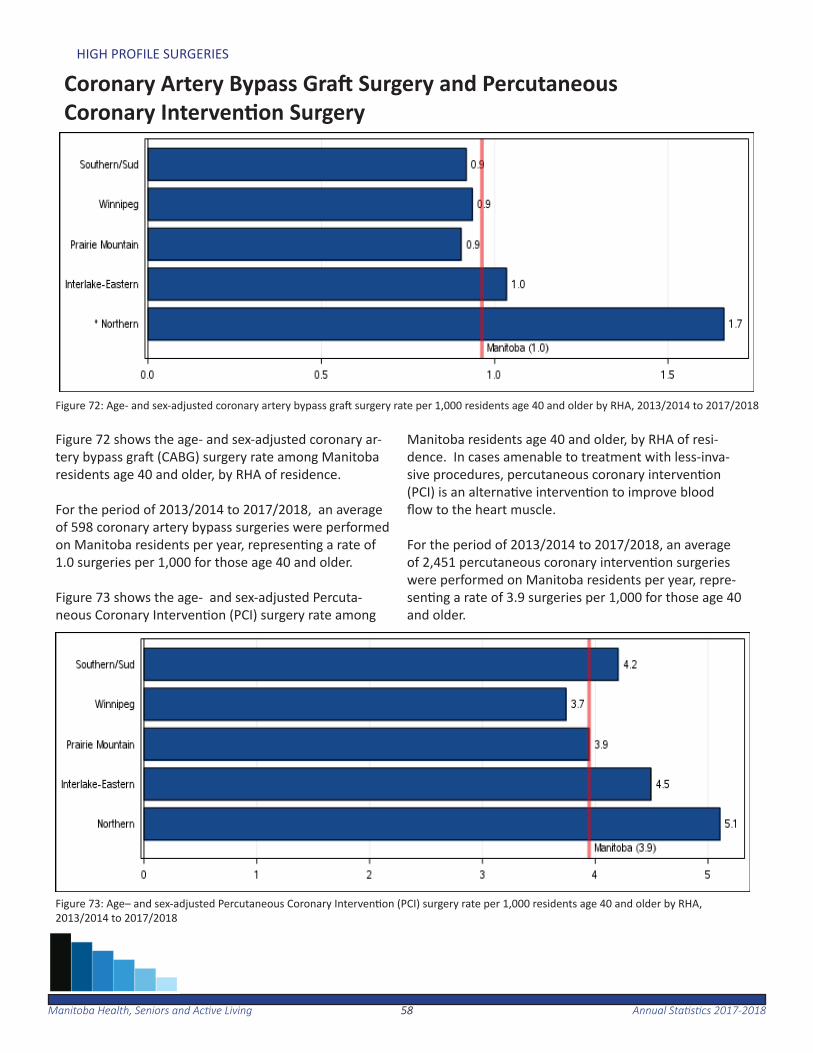
Figure 72: Age- and sex-adjusted coronary artery bypass gra surgery rate per 1,000 residents age 40 and older by RHA, 2013/2014 to 2017/2018
Figure 72 shows the age- and sex-adjusted coronary ar-tery bypass gra (CABG) surgery rate among Manitoba residents age 40 and older, by RHA of residence. For the period of 2013/2014 to 2017/2018, an average of 598 coronary artery bypass surgeries were performed on Manitoba residents per year, represen ng a rate of 1.0 surgeries per 1,000 for those age 40 and older.
Figure 73 shows the age- and sex-adjusted Percuta-neous Coronary Interven on (PCI) surgery rate among
Manitoba residents age 40 and older, by RHA of resi-dence. In cases amenable to treatment with less-inva-sive procedures, percutaneous coronary interven on (PCI) is an alterna ve interven on to improve blood fl ow to the heart muscle.
For the period of 2013/2014 to 2017/2018, an average of 2,451 percutaneous coronary interven on surgeries were performed on Manitoba residents per year, repre-sen ng a rate of 3.9 surgeries per 1,000 for those age 40 and older.
Figure 73: Age– and sex-adjusted Percutaneous Coronary Interven on (PCI) surgery rate per 1,000 residents age 40 and older by RHA, 2013/2014 to 2017/2018
5959Manitoba Health, Seniors and Ac ve Living Annual Sta s cs 2017-2018
HIGH PROFILE SURGERIES
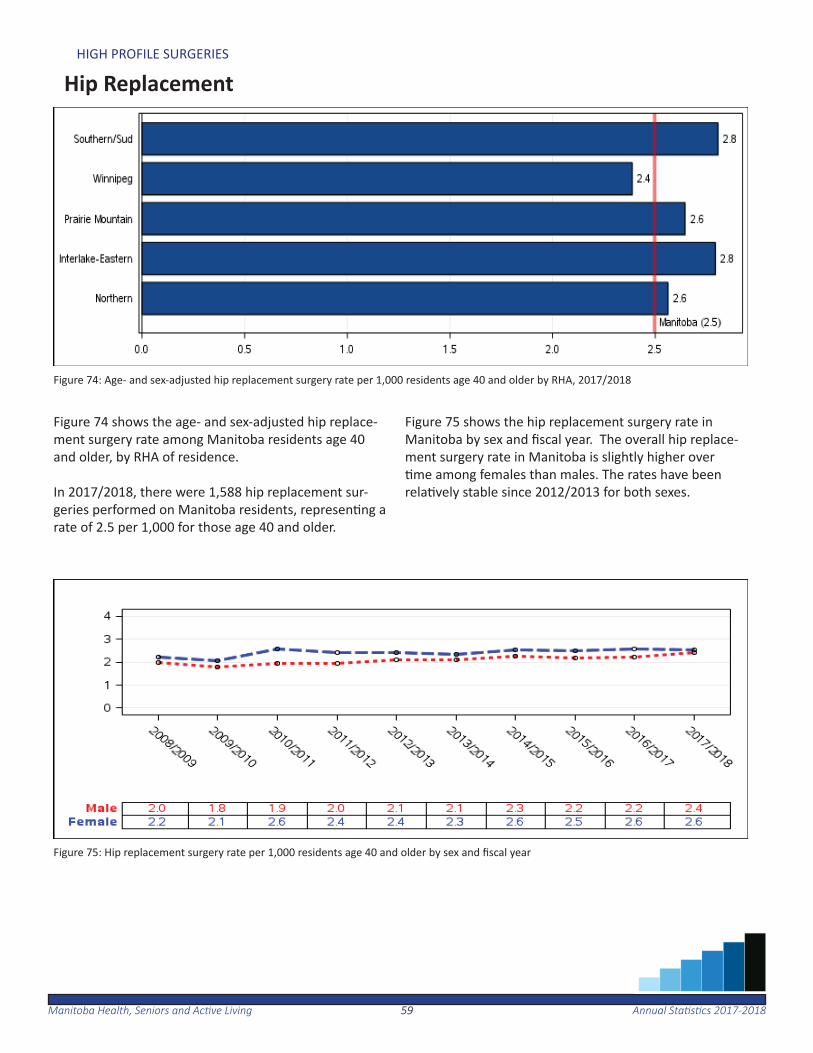
Hip Replacement
Figure 74: Age- and sex-adjusted hip replacement surgery rate per 1,000 residents age 40 and older by RHA, 2017/2018
Figure 74 shows the age- and sex-adjusted hip replace-ment surgery rate among Manitoba residents age 40 and older, by RHA of residence.
In 2017/2018, there were 1,588 hip replacement sur-geries performed on Manitoba residents, represen ng a rate of 2.5 per 1,000 for those age 40 and older.
Figure 75 shows the hip replacement surgery rate in Manitoba by sex and fi scal year. The overall hip replace-ment surgery rate in Manitoba is slightly higher over me among females than males. The rates have been
rela vely stable since 2012/2013 for both sexes.
Figure 75: Hip replacement surgery rate per 1,000 residents age 40 and older by sex and fi scal year
6060Manitoba Health, Seniors and Ac ve Living Annual Sta s cs 2017-2018
HIGH PROFILE SURGERIES
Knee Replacement
Figure 76: Age- and sex-adjusted knee replacement surgery rate per 1,000 residents age 40 and older by RHA, 2017/2018
Figure 77: Knee replacement surgery rate per 1,000 residents age 40 and older by sex and fi scal year
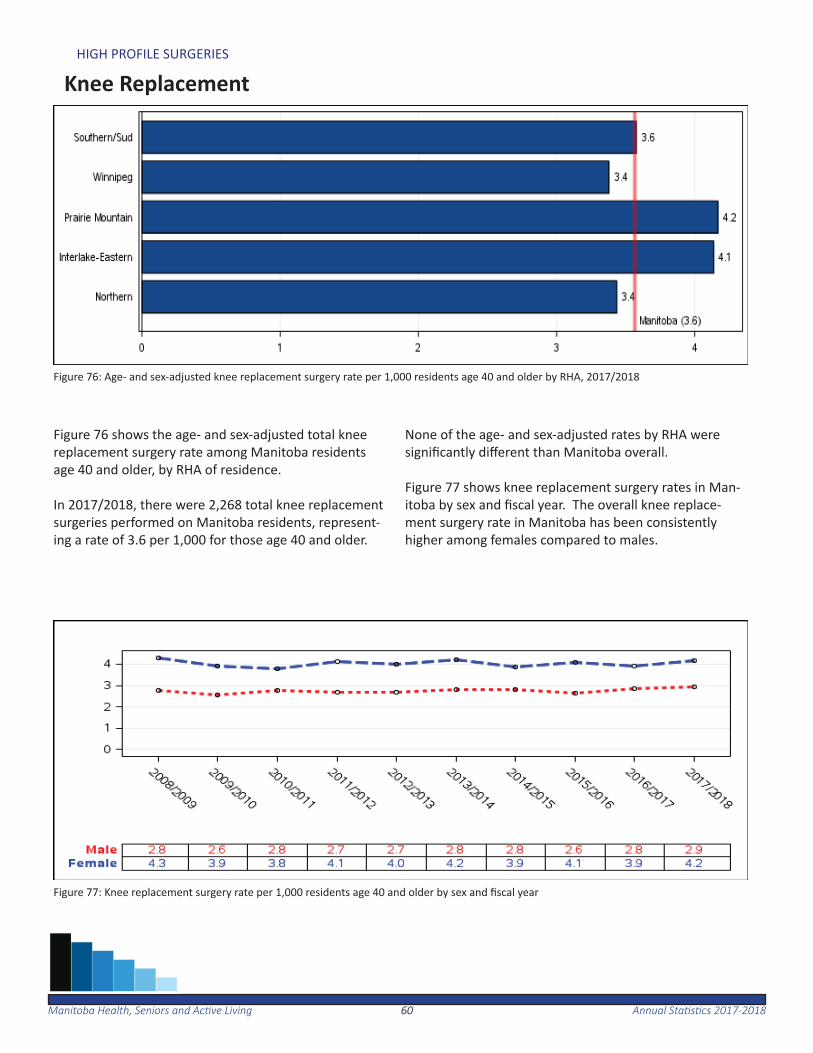
Figure 76 shows the age- and sex-adjusted total knee replacement surgery rate among Manitoba residents age 40 and older, by RHA of residence. In 2017/2018, there were 2,268 total knee replacement surgeries performed on Manitoba residents, represent-ing a rate of 3.6 per 1,000 for those age 40 and older.
None of the age- and sex-adjusted rates by RHA were signifi cantly diff erent than Manitoba overall.
Figure 77 shows knee replacement surgery rates in Man-itoba by sex and fi scal year. The overall knee replace-ment surgery rate in Manitoba has been consistently higher among females compared to males.
6161Manitoba Health, Seniors and Ac ve Living Annual Sta s cs 2017-2018
HIGH PROFILE SURGERIES
Cataract Surgery
Figure 78: Age- and sex-adjusted rate of cataract surgery per 1,000 residents age 50 and older by RHA, 2016/2017
Figure 79 Age- and sex-adjusted rate of cataract surgery per 1,000 residents age 50 and older by age and sex, 2016/2017
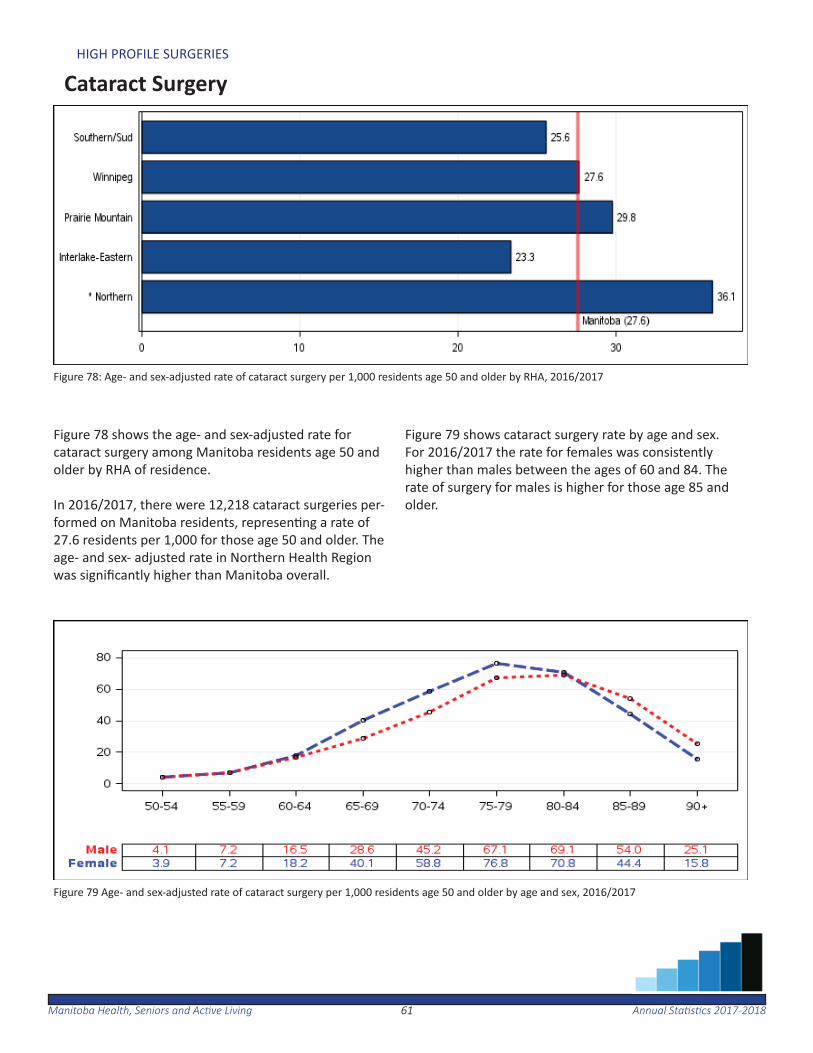
Figure 78 shows the age- and sex-adjusted rate for cataract surgery among Manitoba residents age 50 and older by RHA of residence. In 2016/2017, there were 12,218 cataract surgeries per-formed on Manitoba residents, represen ng a rate of 27.6 residents per 1,000 for those age 50 and older. The age- and sex- adjusted rate in Northern Health Region was signifi cantly higher than Manitoba overall.
Figure 79 shows cataract surgery rate by age and sex. For 2016/2017 the rate for females was consistently higher than males between the ages of 60 and 84. The rate of surgery for males is higher for those age 85 and older.
6262Manitoba Health, Seniors and Ac ve Living Annual Sta s cs 2017-2018
HIGH PROFILE SURGERIES
Paediatric Dental Extrac on
Figure 80: Age- and sex-adjusted rate of dental extrac on for children under the age of six per 1,000 children under the age of six by RHA, 2017/2018
Figure 81: Crude rate of paediatric dental extrac ons and total paediatric dental surgeries by fi scal year
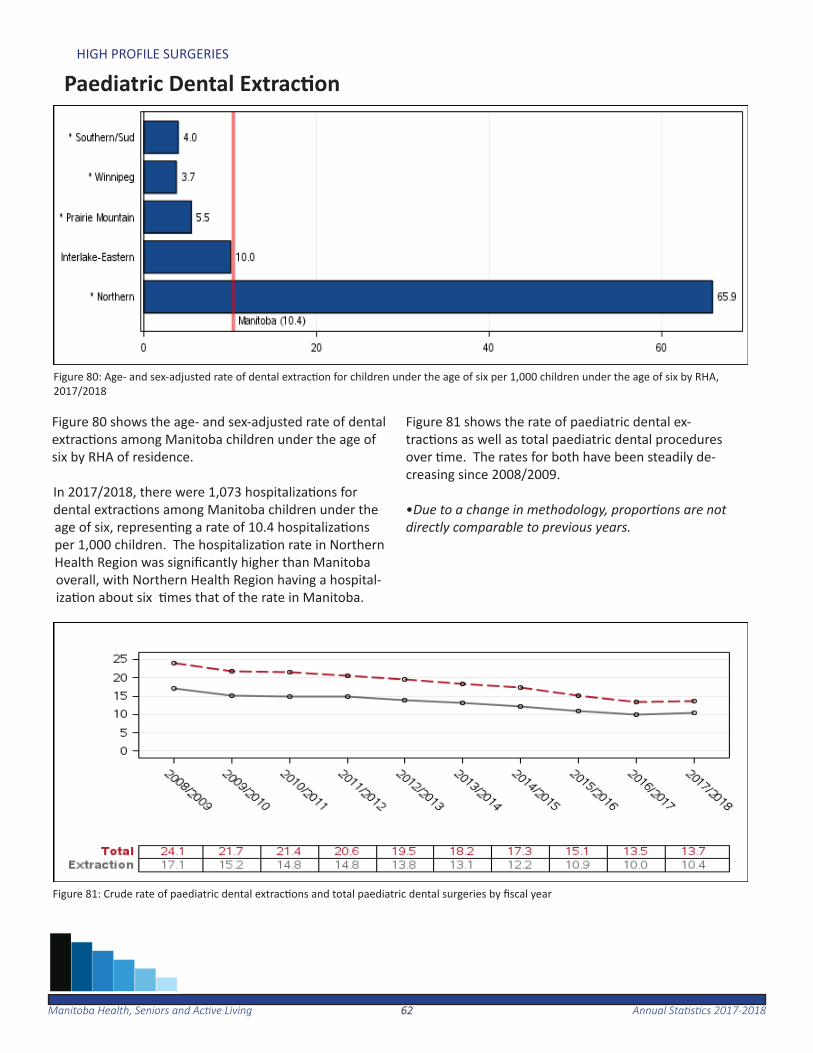
Figure 80 shows the age- and sex-adjusted rate of dental extrac ons among Manitoba children under the age of six by RHA of residence.
In 2017/2018, there were 1,073 hospitaliza ons for dental extrac ons among Manitoba children under the age of six, represen ng a rate of 10.4 hospitaliza ons per 1,000 children. The hospitaliza on rate in Northern Health Region was signifi cantly higher than Manitoba overall, with Northern Health Region having a hospital-iza on about six mes that of the rate in Manitoba.
Figure 81 shows the rate of paediatric dental ex-trac ons as well as total paediatric dental procedures over me. The rates for both have been steadily de-creasing since 2008/2009.
•Due to a change in methodology, propor ons are not directly comparable to previous years.
Manitoba Health, Seniors and Ac ve Living Annual Sta s cs 2017-201863
Women’s Reproductive Health
The following sec on provides an overview of selected wom-en’s reproduc ve health indicators, including hysterectomy rates, propor on of deliveries by caesarean sec on and propor- on of vaginal births a er caesarean sec ons.
In 2017/2018, of every 1,000 Manitoba women between the ages of 20 to 84 approximately three had a hysterectomy. Provincially, 24.4 per cent of total deliveries were caesarean deliveries among women between the ages of 15 to 54, and 29.8 per cent of women having a previous caesarean sec on delivered vaginally.
6464Manitoba Health, Seniors and Ac ve Living Annual Sta s cs 2017-2018
WOMEN’S REPRODUCTIVE HEALTH
Hysterectomy
Figure 82: Age-adjusted hysterectomy rate per 1,000 female residents ages 20 to 84 by RHA, 2017/2018
Figure 83: Hysterectomies performed by age group, 2017/2018
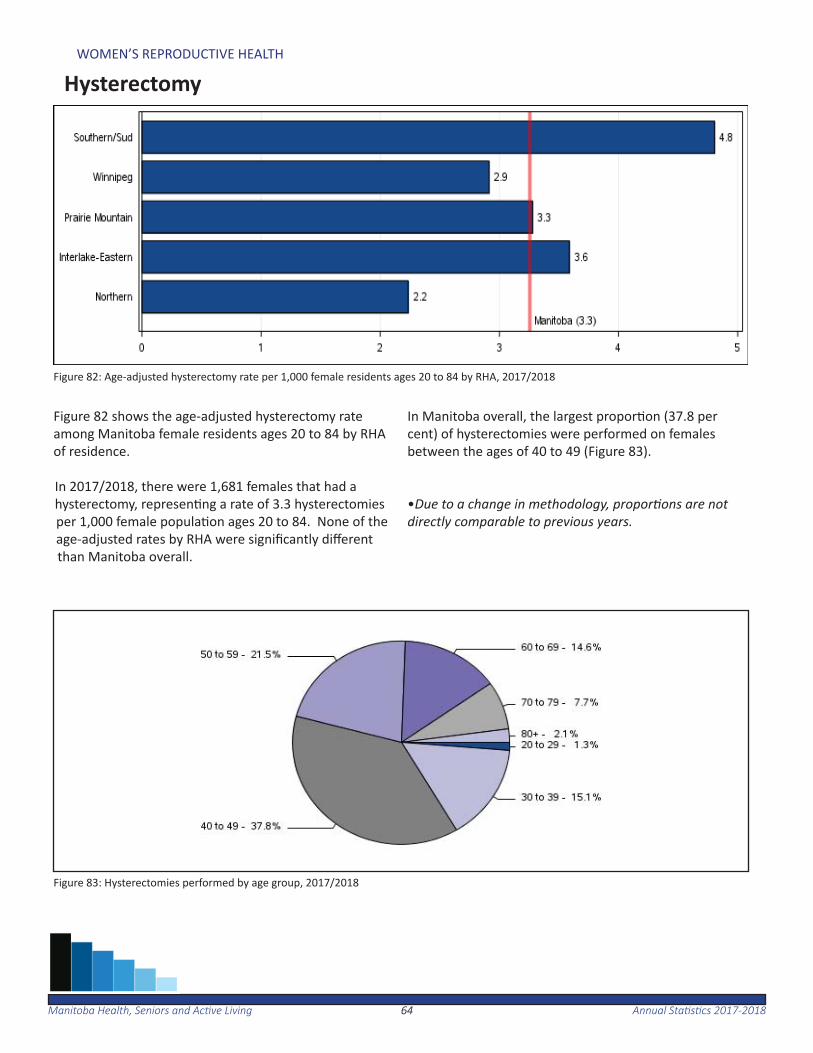
Figure 82 shows the age-adjusted hysterectomy rate among Manitoba female residents ages 20 to 84 by RHA of residence.
In 2017/2018, there were 1,681 females that had a hysterectomy, represen ng a rate of 3.3 hysterectomies per 1,000 female popula on ages 20 to 84. None of the age-adjusted rates by RHA were signifi cantly diff erent than Manitoba overall.
In Manitoba overall, the largest propor on (37.8 per cent) of hysterectomies were performed on females between the ages of 40 to 49 (Figure 83).
•Due to a change in methodology, propor ons are not directly comparable to previous years.
6565Manitoba Health, Seniors and Ac ve Living Annual Sta s cs 2017-2018
WOMEN’S REPRODUCTIVE HEALTH
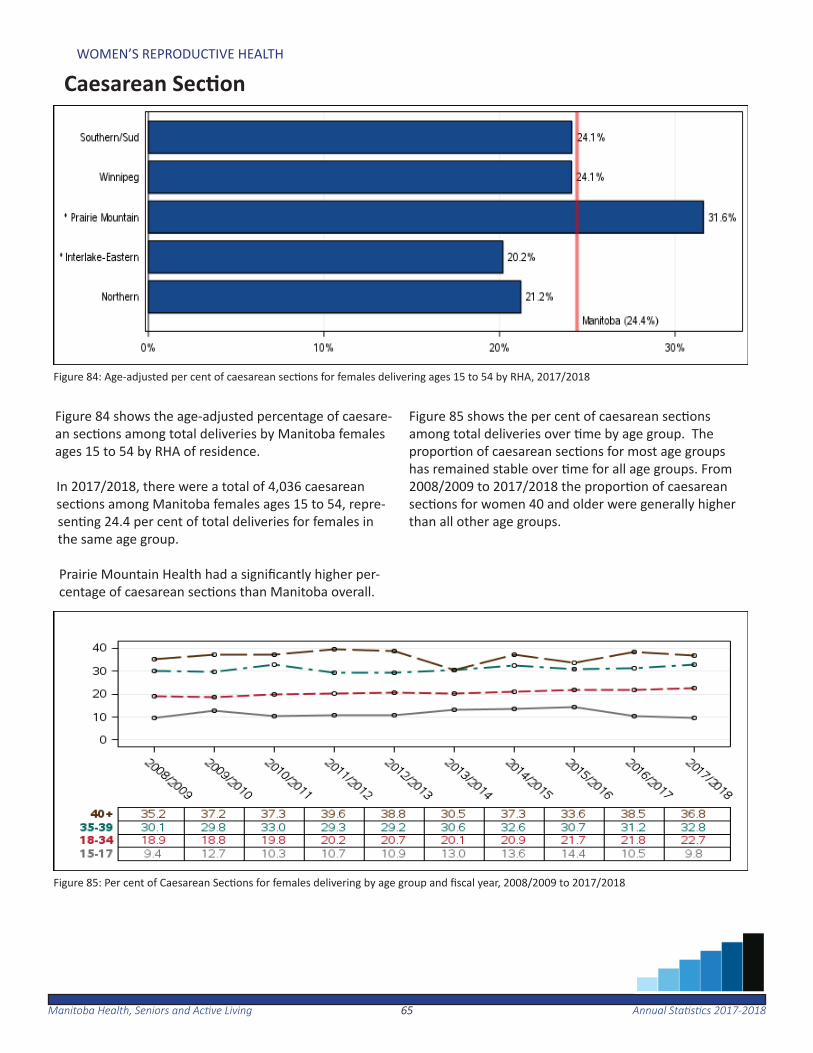
Caesarean Sec on
Figure 84: Age-adjusted per cent of caesarean sec ons for females delivering ages 15 to 54 by RHA, 2017/2018
Figure 85: Per cent of Caesarean Sec ons for females delivering by age group and fi scal year, 2008/2009 to 2017/2018
Figure 84 shows the age-adjusted percentage of caesare-an sec ons among total deliveries by Manitoba females ages 15 to 54 by RHA of residence.
In 2017/2018, there were a total of 4,036 caesarean sec ons among Manitoba females ages 15 to 54, repre-sen ng 24.4 per cent of total deliveries for females in the same age group.
Prairie Mountain Health had a signifi cantly higher per-centage of caesarean sec ons than Manitoba overall.
Figure 85 shows the per cent of caesarean sec ons among total deliveries over me by age group. The propor on of caesarean sec ons for most age groups has remained stable over me for all age groups. From 2008/2009 to 2017/2018 the propor on of caesarean sec ons for women 40 and older were generally higher than all other age groups.

6666Manitoba Health, Seniors and Ac ve Living Annual Sta s cs 2017-2018
WOMEN’S REPRODUCTIVE HEALTH
Vaginal Birth a er Caesarean Sec on
Figure 86: Age-adjusted per cent of vaginal births a er caesarean sec ons for females delivering ages 15 to 54 by RHA, 2013/2014 to 2017/2018
Figure 87: Per cent of vaginal births a er caesarean sec on by age group, 2013/2014 to 2017/2018
Figure 86 shows the age-adjusted per cent of vaginal births among Manitoba females ages 15 to 54 who pre-viously had a caesarean sec on, by RHA of residence. On average, there were 627 vaginal births a er caesar-ean sec ons by Manitoba females ages 15 to 54 each year for the period of 2013/2014 to 2017/2018. This represented 29.8 per cent of females who gave birth af-ter a previous caesarean sec on. Southern Health-Santé
Sud had a signifi cantly higher percentage of vaginal birth a er caesarean sec on, while Prairie Mountain Health was signifi cantly lower than the Manitoba rate overall.
The majority of women (62.5 per cent) who had a vag-inal birth a er previous caesarean sec on were among women ages 25 to 34 (Figure 87).
Manitoba Health, Seniors and Ac ve Living Annual Sta s cs 2017-201867
Use of Home Care Services
The following sec on provides an overview of the home care program in Manitoba. The home care program has the respon-sibility for the development and implementa on of a compre-hensive range of in-home services. The program also maintains and manages the assessment and wai ng list for personal care home placement in each regional health authority.
This sec on includes sta s cs on the total number of clients re-ceiving co-ordinated care as well as the total number of admis-sions to and discharges from the home care program.
In 2017/2018, there were 16,574 Manitoba residents admi ed to home care, while 15,616 were discharged.

6868Manitoba Health, Seniors and Ac ve Living Annual Sta s cs 2017-2018
USE OF HOME CARE SERVICES
Total Home Care Clients
Figure 88: Total number of clients in Home Care at March 31, 2018
Figure 88 shows the total number of clients receiving coordinated home care services at March 31, 2018.
On March 31, 2018, there was a total of 26,531 clients in home care. Of these, 57.4 per cent of clients resided in Winnipeg RHA.
6969Manitoba Health, Seniors and Ac ve Living Annual Sta s cs 2017-2018
USE OF HOME CARE SERVICES
Home Care Admissions and Discharges
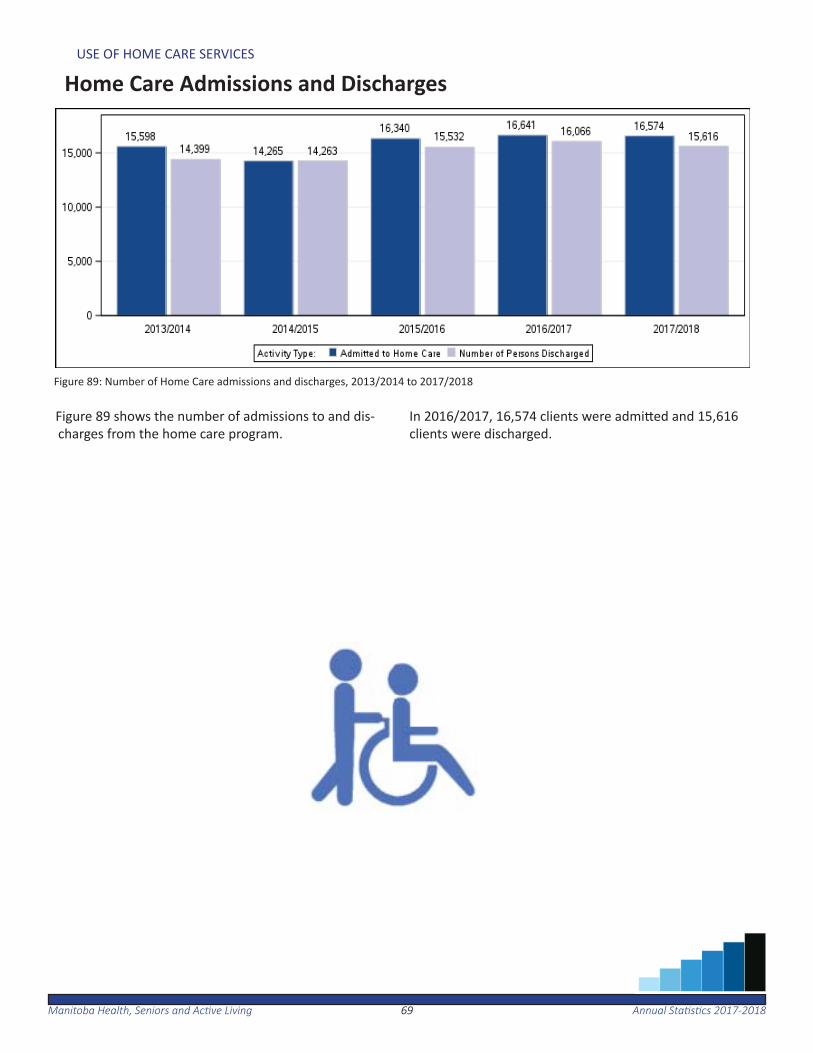
Figure 89: Number of Home Care admissions and discharges, 2013/2014 to 2017/2018
Figure 89 shows the number of admissions to and dis-charges from the home care program.
In 2016/2017, 16,574 clients were admi ed and 15,616 clients were discharged.

7070Manitoba Health, Seniors and Ac ve Living Annual Sta s cs 2017-2018
This page inten onally le blank.
Manitoba Health, Seniors and Ac ve Living Annual Sta s cs 2017-201871
Use of Personal Care Homes
The following sec on provides an overview of personal care home (PCH) use in Manitoba. This includes PCH admissions, median wait me for admission, and median length of stay.
PCHs are residen al facili es which are predominately intended for adults age 75 and older that may have a chronic condi on, disability or can no longer live independently. In 2017/2018, there were 125 PCHs in Manitoba.
In Manitoba, 2.9 per cent of the popula on age 75 and older were admi ed to a PCH from 2016/2017 to 2017/2018. The median wait me for placement into a PCH was approximately eight weeks, and the median length of me a resident spent in PCH was two years. Length of stay is associated with level of care on admission, as sicker pa ents spend less me in a PCH than healthier pa ents do.

7272Manitoba Health, Seniors and Ac ve Living Annual Sta s cs 2017-2018
USE OF PERSONAL CARE HOMES
!H
#I
!H !H
!H
!H
#I
!H
!H
!H
!H
#I 4
!H
!H
!H
#I
#I#I
#I !H!H
#I!H
!H
4
!H
#I
!H
!H #I
#I
!H
;
#I
#I
!H
!H
!H
4!H
#I
!H
#I
4
!H
#I
!H
!H
!H
!H
!H#I#I
4
#I!H
44
Portage
St Rosedu Lac
Norway House
ShoalLake
GilbertPlains
Deloraine
Beau- sejour
Powerview/Pine Falls
Lac duBonnet
Swan River
Boissevain
StonewallMinnedosa
Killarney
Steinbach
Ste. Anne
Flin Flon
McCreary
Thompson
Emerson
Eriksdale
Hodgson
Winnipegosis
Melita
Neepawa
Russell
Selkirk
Winkler
Dauphin
Ashern
Altona
Carman
Morris
Arborg
Roblin
Virden
Teulon
Gimli
Wawanesa
Brandon
Baldur
Birtle
Treherne
RossburnErickson
Gladstone
Carberry
Souris
Rivers
Hamiota
Glenboro
Notre Dame
Nelson House
PilotMound
Vita
St. Pierre
The Pas
Manitou
Elkhorn
Hartney
Reston
Morden
St. Claude
SandyLake
Grandview
Benito
Niverville
Grunthal
Macgregor WhitemouthOakbank
Lundar
44!.#0
;4 #044
#I!H
44
!H!H #I#I !H!H
#I;
444
#I#I
#04
#I#I
NORTHERN
INTERLAKE-EASTERN
SOUTHERN
PRAIRIE MOUNTAIN
WINNIPEG
50 0 50 100 150 20025km
Hudson
Bay
Cedar
Lake
Lake
Winnipegosis
Lake
Winnipeg
LakeReindeer
Highrock
Lake
Lake
SouthernIndian Churchill
River
LakeSplit
LakeSipiwesk
StephensLake
River
Nelso
n
LakeKnee
LakeGods
Rive
r
River
Hayes
Gods
LakeIsland
LakeCross
(c) Province of Manitoba, 2018Updated February 2018
Bed counts include all regular and respite bedslocated in each facility.
Cartography by: Information Management & Analytics,Manitoba Health, Seniors, and Active Living
Legend
#I 31 - 60 beds
!H 16 - 30 beds
_̂ under 16 beds
; over 125 beds
4 61 - 125 beds
WINNIPEG38 Personal Care Homes
representing 5,549 licensedbeds were in operation as of
1, 201
Map of Personal Care Homes by Facility Size
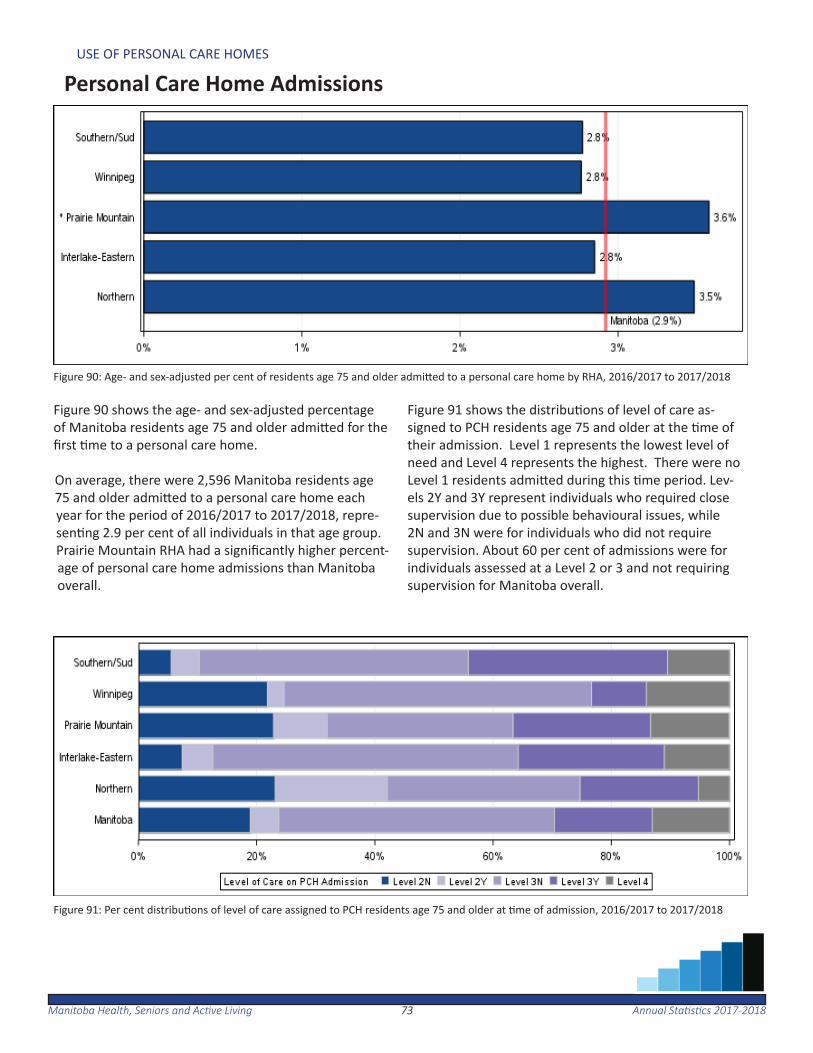
7373Manitoba Health, Seniors and Ac ve Living Annual Sta s cs 2017-2018
USE OF PERSONAL CARE HOMES
Personal Care Home Admissions
Figure 90: Age- and sex-adjusted per cent of residents age 75 and older admi ed to a personal care home by RHA, 2016/2017 to 2017/2018
Figure 91: Per cent distribu ons of level of care assigned to PCH residents age 75 and older at me of admission, 2016/2017 to 2017/2018
Figure 90 shows the age- and sex-adjusted percentage of Manitoba residents age 75 and older admi ed for the fi rst me to a personal care home.
On average, there were 2,596 Manitoba residents age 75 and older admi ed to a personal care home each year for the period of 2016/2017 to 2017/2018, repre-sen ng 2.9 per cent of all individuals in that age group. Prairie Mountain RHA had a signifi cantly higher percent-age of personal care home admissions than Manitoba overall.
Figure 91 shows the distribu ons of level of care as-signed to PCH residents age 75 and older at the me of their admission. Level 1 represents the lowest level of need and Level 4 represents the highest. There were no Level 1 residents admi ed during this me period. Lev-els 2Y and 3Y represent individuals who required close supervision due to possible behavioural issues, while 2N and 3N were for individuals who did not require supervision. About 60 per cent of admissions were for individuals assessed at a Level 2 or 3 and not requiring supervision for Manitoba overall.
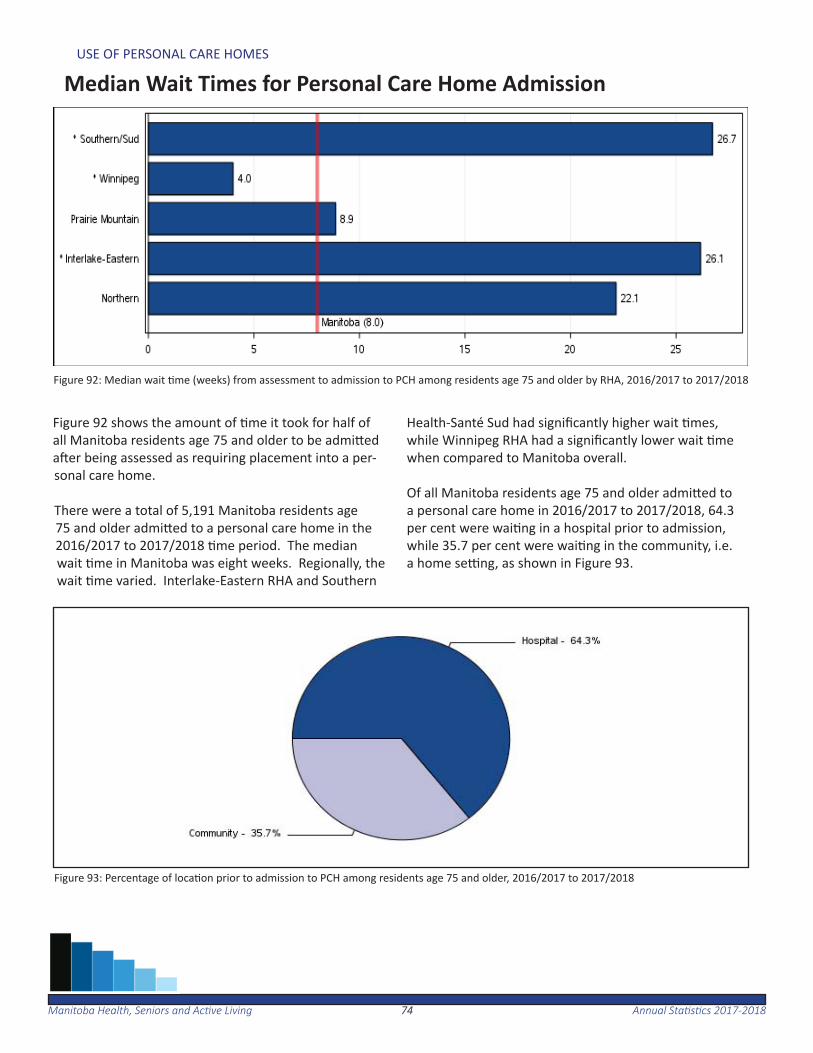
7474Manitoba Health, Seniors and Ac ve Living Annual Sta s cs 2017-2018
USE OF PERSONAL CARE HOMES
Median Wait Times for Personal Care Home Admission
Figure 92: Median wait me (weeks) from assessment to admission to PCH among residents age 75 and older by RHA, 2016/2017 to 2017/2018
Figure 93: Percentage of loca on prior to admission to PCH among residents age 75 and older, 2016/2017 to 2017/2018
Figure 92 shows the amount of me it took for half of all Manitoba residents age 75 and older to be admi ed a er being assessed as requiring placement into a per-sonal care home.
There were a total of 5,191 Manitoba residents age 75 and older admi ed to a personal care home in the 2016/2017 to 2017/2018 me period. The median wait me in Manitoba was eight weeks. Regionally, the wait me varied. Interlake-Eastern RHA and Southern
Health-Santé Sud had signifi cantly higher wait mes, while Winnipeg RHA had a signifi cantly lower wait me when compared to Manitoba overall.
Of all Manitoba residents age 75 and older admi ed to a personal care home in 2016/2017 to 2017/2018, 64.3 per cent were wai ng in a hospital prior to admission, while 35.7 per cent were wai ng in the community, i.e. a home se ng, as shown in Figure 93.

7575Manitoba Health, Seniors and Ac ve Living Annual Sta s cs 2017-2018
USE OF PERSONAL CARE HOMES
Median Length of Stay (Years) at Personal Care Homes
Table 5: Median length of me (years) spent in a personal care home for residents age 75 and older by RHA, 2016/2017 - 2017/2018
Table 5 shows the length of me for which half of all Manitoba residents age 75 and older stayed in a PCH following admission, by level of care at admission.
On average, there were 3,039 Manitoba residents age 75 and older discharged from a personal care home each year for the period of 2016/2017 to 2017/2018.
The overall median length of stay was two years. Re-gionally, the length of stay varied from a high of 2.6 years in Northern RHA to a low of 1.8 years in Prairie
Mountain Health and Winnipeg RHA. Across levels of care, residents admi ed as a level 4 (sicker pa ents) had a length of stay of 1.2 years compared to those admi ed as a level 1 or 2 (healthier pa ents) who had a length of stay of 2.6 years.
Figure 94 shows the median personal care home length of stay over me. The median length of stay has been decreasing over the last few me periods from a high of 2.4 years in 2008-2010 to two years in 2016-2018.
Figure 94: Median length of stay (years) over me in personal care homes, 2008/2009—2009/2010 to 2016/2017—2017/2018

7676Manitoba Health, Seniors and Ac ve Living Annual Sta s cs 2017-2018
This page inten onally le blank.
Manitoba Health, Seniors and Ac ve Living Annual Sta s cs 2017-201877
Preventative Services
The following sec on provides an overview of preventa ve and screening services for selected programs available in Manitoba. Detailed informa on on immuniza ons have not been included in this report, as they are shown in Manitoba Health, Seniors and Ac ve Living’s annual Manitoba Immuniza on Monitoring System (MIMS) report at:
www.manitoba.ca/health/publichealth/surveillance/reports.html#infl uenza
In Manitoba, breast screening mammograms are provided through the Manitoba Breast Screening Program to check women ages 50 to 74 for early signs of breast cancer.
For the period of 2016/2017 to 2017/2018, there were 106,284 Manitoba female residents ages 50 to 74 who had a mammo-gram, represen ng 55.7 per cent of the female popula on in the same age group.
Papanicolaou (Pap) tests are provided to Manitoba females ages 21 to 69 for the early detec on of cervical cancer. For the period of 2015/2016 to 2017/2018, there were 218,704 Man-itoba females ages 21 to 69 who had a Pap test, represen ng 51.6 per cent of the female popula on in the same age group.
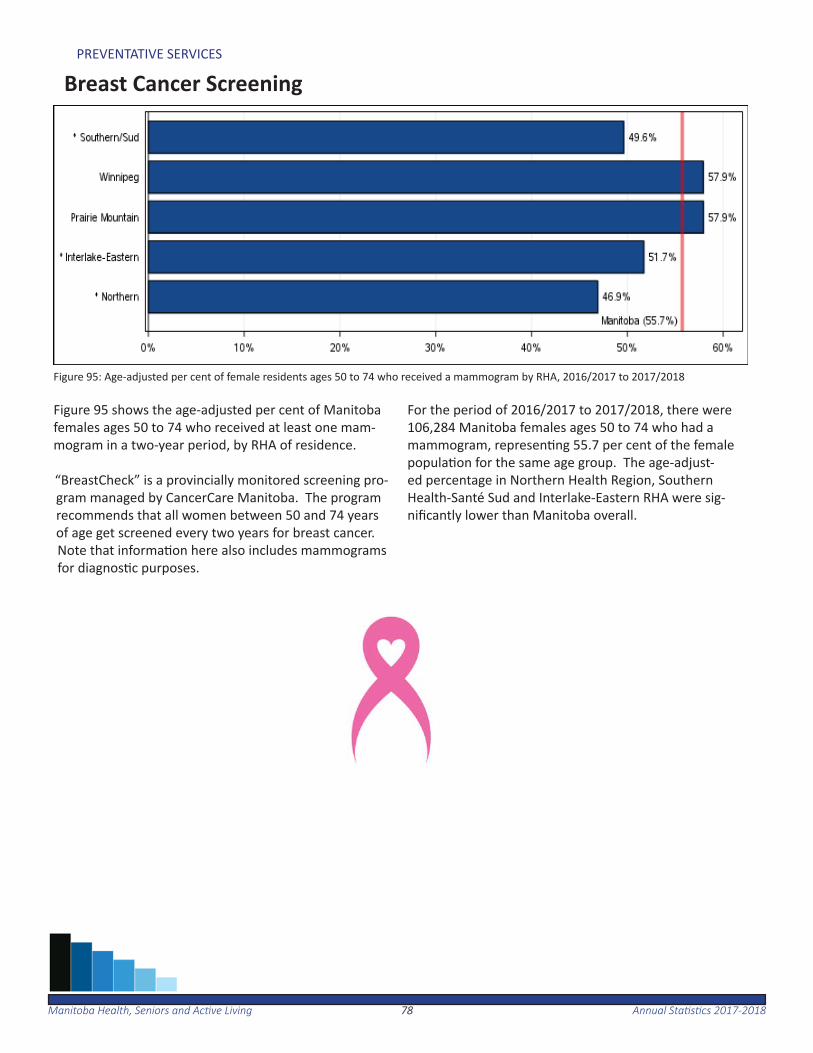
7878Manitoba Health, Seniors and Ac ve Living Annual Sta s cs 2017-2018
PREVENTATIVE SERVICES
Breast Cancer Screening
Figure 95 shows the age-adjusted per cent of Manitoba females ages 50 to 74 who received at least one mam-mogram in a two-year period, by RHA of residence.
“BreastCheck” is a provincially monitored screening pro-gram managed by CancerCare Manitoba. The program recommends that all women between 50 and 74 years of age get screened every two years for breast cancer. Note that informa on here also includes mammograms for diagnos c purposes.
For the period of 2016/2017 to 2017/2018, there were 106,284 Manitoba females ages 50 to 74 who had a mammogram, represen ng 55.7 per cent of the female popula on for the same age group. The age-adjust-ed percentage in Northern Health Region, Southern Health-Santé Sud and Interlake-Eastern RHA were sig-nifi cantly lower than Manitoba overall.
Figure 95: Age-adjusted per cent of female residents ages 50 to 74 who received a mammogram by RHA, 2016/2017 to 2017/2018
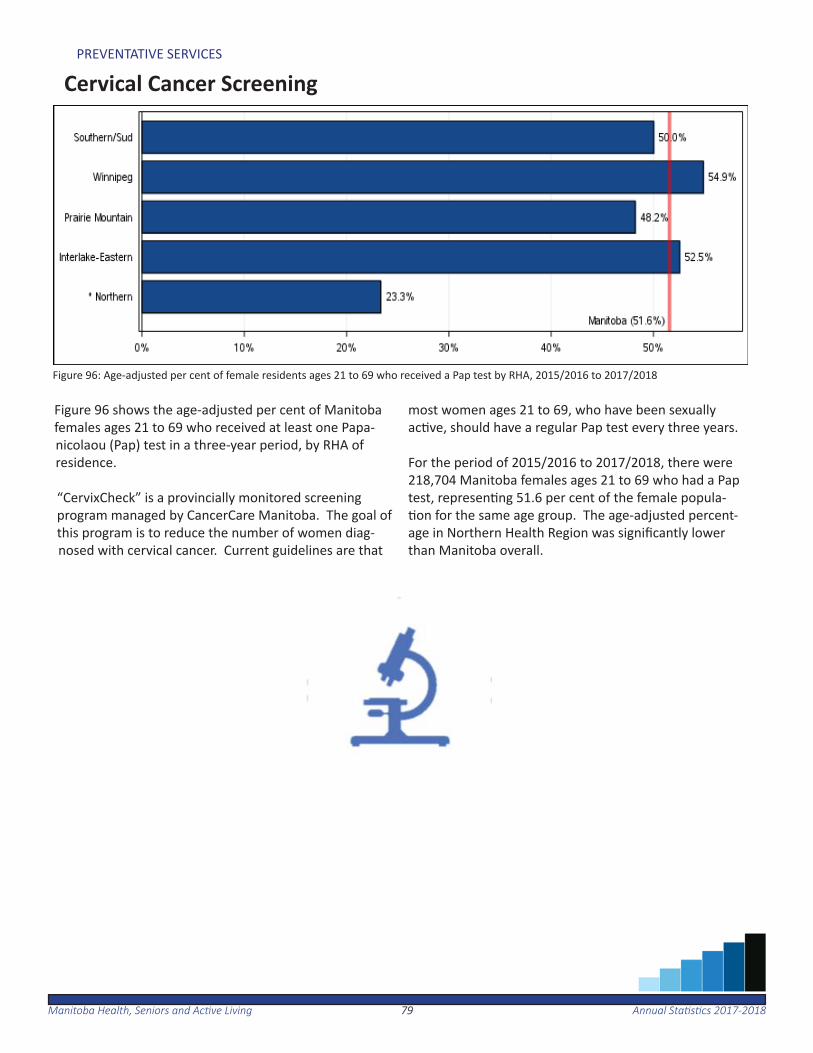
7979Manitoba Health, Seniors and Ac ve Living Annual Sta s cs 2017-2018
PREVENTATIVE SERVICES
Cervical Cancer Screening
Figure 96 shows the age-adjusted per cent of Manitoba females ages 21 to 69 who received at least one Papa-nicolaou (Pap) test in a three-year period, by RHA of residence.
“CervixCheck” is a provincially monitored screening program managed by CancerCare Manitoba. The goal of this program is to reduce the number of women diag-nosed with cervical cancer. Current guidelines are that
most women ages 21 to 69, who have been sexually ac ve, should have a regular Pap test every three years.
For the period of 2015/2016 to 2017/2018, there were 218,704 Manitoba females ages 21 to 69 who had a Pap test, represen ng 51.6 per cent of the female popula- on for the same age group. The age-adjusted percent-
age in Northern Health Region was signifi cantly lower than Manitoba overall.
Figure 96: Age-adjusted per cent of female residents ages 21 to 69 who received a Pap test by RHA, 2015/2016 to 2017/2018
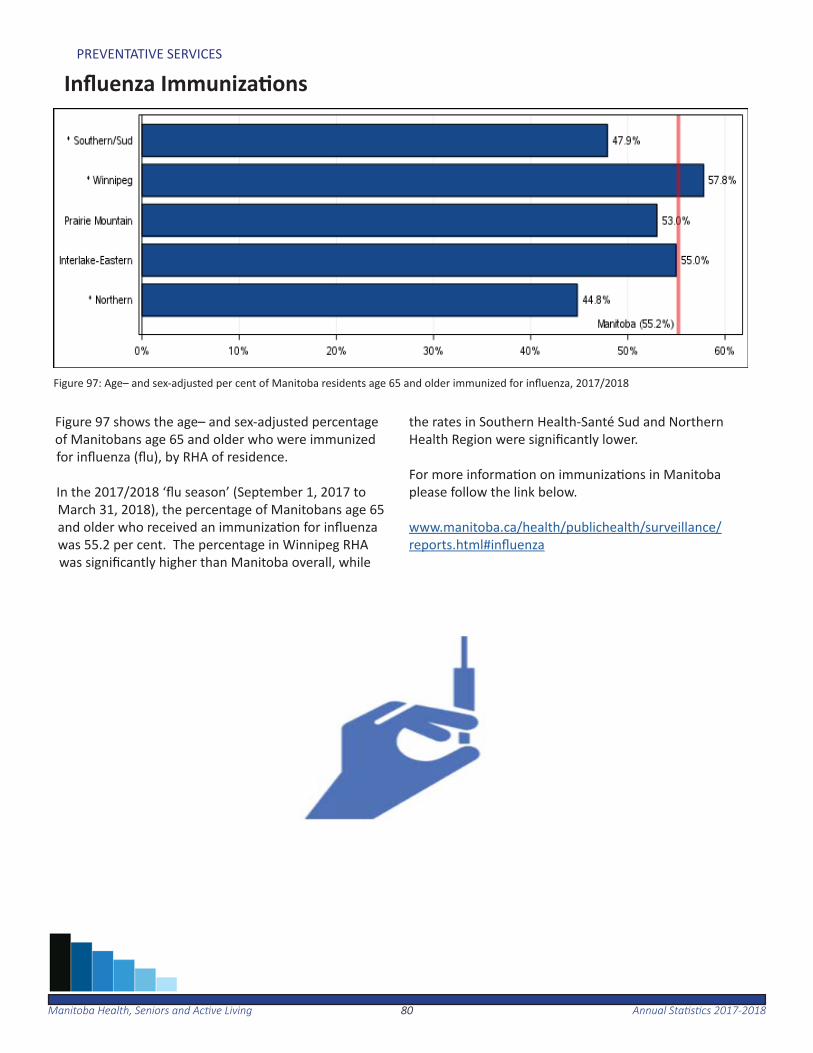
8080Manitoba Health, Seniors and Ac ve Living Annual Sta s cs 2017-2018
PREVENTATIVE SERVICES
Infl uenza Immuniza ons
Figure 97 shows the age– and sex-adjusted percentage of Manitobans age 65 and older who were immunized for infl uenza (fl u), by RHA of residence.
In the 2017/2018 ‘fl u season’ (September 1, 2017 to March 31, 2018), the percentage of Manitobans age 65 and older who received an immuniza on for infl uenza was 55.2 per cent. The percentage in Winnipeg RHA was signifi cantly higher than Manitoba overall, while
the rates in Southern Health-Santé Sud and Northern Health Region were signifi cantly lower.
For more informa on on immuniza ons in Manitoba please follow the link below.
www.manitoba.ca/health/publichealth/surveillance/reports.html#infl uenza
Figure 97: Age– and sex-adjusted per cent of Manitoba residents age 65 and older immunized for infl uenza, 2017/2018
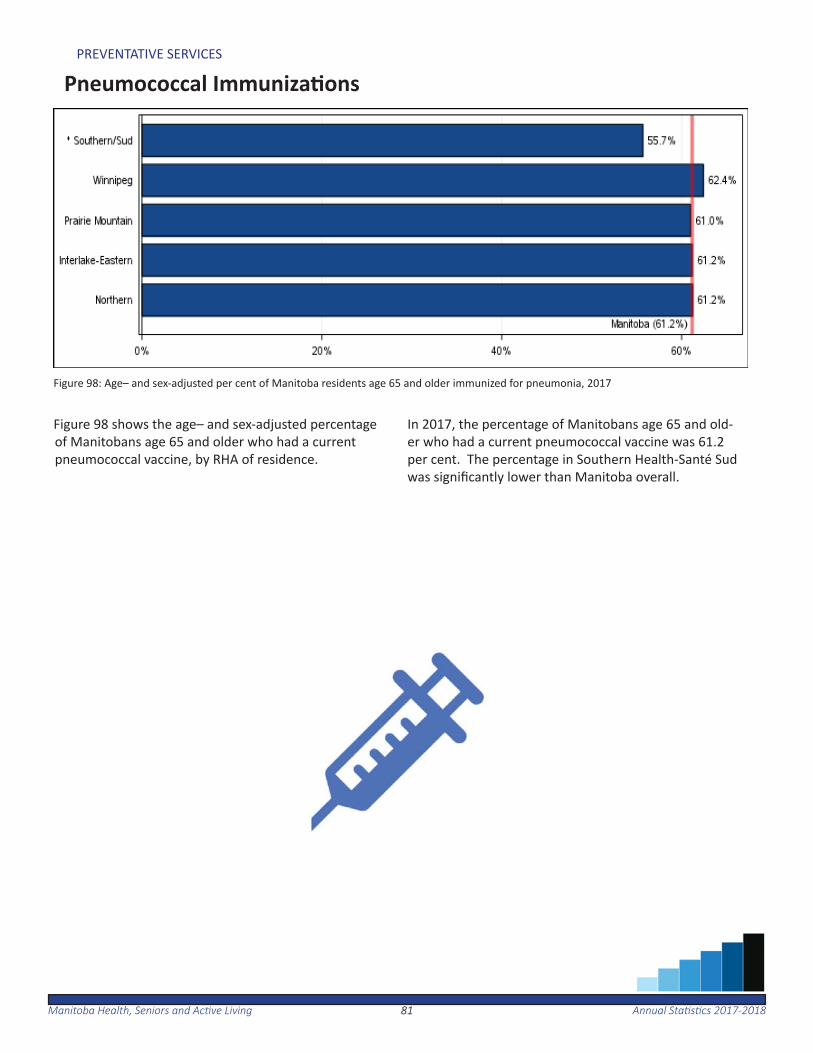
8181Manitoba Health, Seniors and Ac ve Living Annual Sta s cs 2017-2018
PREVENTATIVE SERVICES
Pneumococcal Immuniza ons
Figure 98 shows the age– and sex-adjusted percentage of Manitobans age 65 and older who had a current pneumococcal vaccine, by RHA of residence.
In 2017, the percentage of Manitobans age 65 and old-er who had a current pneumococcal vaccine was 61.2 per cent. The percentage in Southern Health-Santé Sud was signifi cantly lower than Manitoba overall.
Figure 98: Age– and sex-adjusted per cent of Manitoba residents age 65 and older immunized for pneumonia, 2017
8282Manitoba Health, Seniors and Ac ve Living Annual Sta s cs 2017-2018
This page inten onally le blank.
Manitoba Health, Seniors and Ac ve Living Annual Sta s cs 2017-201883
Prescription Drug Use
The following sec on provides an overview of prescrip on drug use and paid expenditures by drug benefi t plan in Manitoba.
In 2017/2018, 66.3 per cent of Manitoba residents had at least one prescrip on dispensed. On average, these residents were prescribed about four diff erent types of drugs in the fi scal year.
Manitoba paid $270.9 million in drug expenditures for eligible Manitobans through the Pharmacare program, $70.5 million through Family Services, $11.3 million through nursing home care and $3.5 million through pallia ve care.
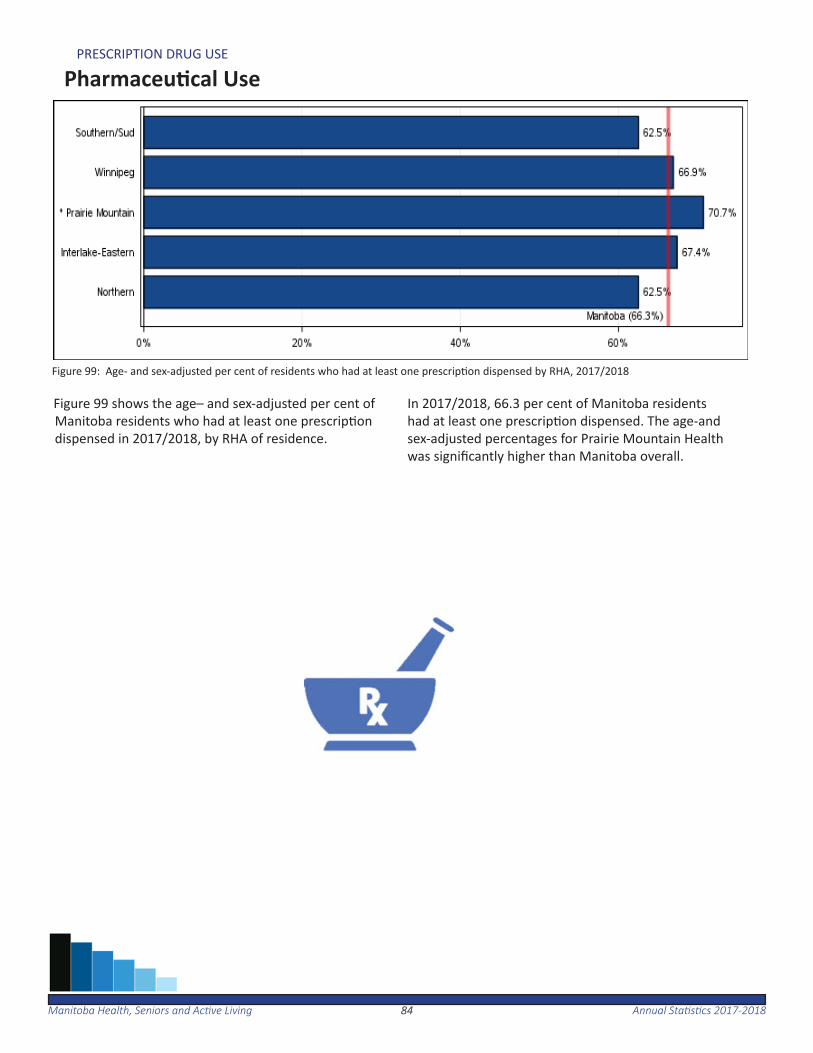
8484Manitoba Health, Seniors and Ac ve Living Annual Sta s cs 2017-2018
PRESCRIPTION DRUG USE
Pharmaceu cal Use
Figure 99 shows the age– and sex-adjusted per cent of Manitoba residents who had at least one prescrip on dispensed in 2017/2018, by RHA of residence.
In 2017/2018, 66.3 per cent of Manitoba residents had at least one prescrip on dispensed. The age-and sex-adjusted percentages for Prairie Mountain Health was signifi cantly higher than Manitoba overall.
Figure 99: Age- and sex-adjusted per cent of residents who had at least one prescrip on dispensed by RHA, 2017/2018

8585Manitoba Health, Seniors and Ac ve Living Annual Sta s cs 2017-2018
PRESCRIPTION DRUG USE
Drugs Dispensed per User
Figure 100: Age- and sex-adjusted average number of drug types dispensed per user by RHA, 2017/2018
Figure 100 shows the age- and sex-adjusted average number of drug types dispensed per Manitoba resident, who had at least one drug dispensed, by RHA of resi-dence.
In 2017/2018, an average of 4.1 drug types were dis-pensed per user. The age- and sex-adjusted number
varied signifi cantly across the province, ranging from 3.8 drug types per Southern Health-Santé Sud resident to 4.6 drug types per Northern Health Region resident.
•Due to a change in methodology, propor ons are not directly comparable to previous years.
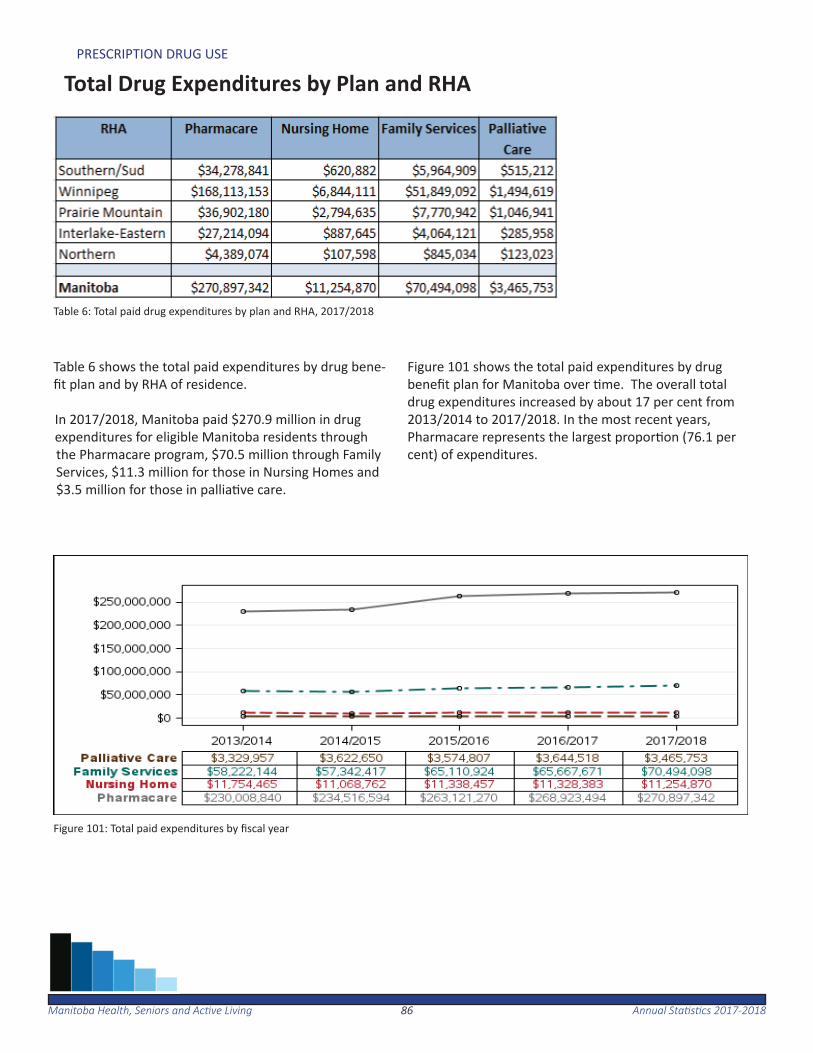
8686Manitoba Health, Seniors and Ac ve Living Annual Sta s cs 2017-2018
PRESCRIPTION DRUG USE
Total Drug Expenditures by Plan and RHA
Table 6 shows the total paid expenditures by drug bene-fi t plan and by RHA of residence.
In 2017/2018, Manitoba paid $270.9 million in drug expenditures for eligible Manitoba residents through the Pharmacare program, $70.5 million through Family Services, $11.3 million for those in Nursing Homes and $3.5 million for those in pallia ve care.
Figure 101 shows the total paid expenditures by drug benefi t plan for Manitoba over me. The overall total drug expenditures increased by about 17 per cent from 2013/2014 to 2017/2018. In the most recent years, Pharmacare represents the largest propor on (76.1 per cent) of expenditures.
Table 6: Total paid drug expenditures by plan and RHA, 2017/2018
Figure 101: Total paid expenditures by fi scal year
Manitoba Health, Seniors and Ac ve Living Annual Sta s cs 2017-201887
Glossary
The glossary provides explana ons and defi ni ons for the indi-cators and key terms used in this report. The method used to calculate each indicator is described in this sec on.

8888Manitoba Health, Seniors and Ac ve Living Annual Sta s cs 2017-2018
GLOSSARY
Acute Myocardial Infarc on (Heart A ack) RateCalculated as the number of hospitaliza ons or deaths due to acute myocardial infarc on (AMI) in residents age 40
or older per 1,000 residents age 40 or older. The denominator was residents age 40 or older as of June 1. Rates were age- and sex-adjusted to the Manitoba popula on age 40 or older. AMI is defi ned by ICD-9-CM code 410 or ICD-10-CA code I21 in the most responsible diagnosis fi eld for hospitaliza on or as the cause of death in Vital Sta s cs death fi les. Persons discharged alive from hospital a er less than three days were excluded as likely ‘rule-out’ AMI cases. Adjusted RateA sta s cal process that makes groups such as those in par cular geographic areas comparable by removing the eff ects of demographic diff erences such as age and sex distribu on. Essen ally, adjusted rates tell us what the rates would be if each geographic area had the same age and sex distribu on. Therefore, adjusted rates are fi c onal rates which use sta s cal models to remove the eff ects of age and sex diff erences and to allow for comparisons across popula ons.
Accordingly, while adjusted rates have been sta s cally modelled to be comparable to each other, they should be considered fi c onal in the sense that they do not measure anything directly. Please note that these adjusted rates cannot be compared to other rates which have not received the same adjustment.
Alternate Level of Care (ALC)Inpa ent hospital days are iden fi ed as ALC when a pa ent no longer requires the level of care their acute care se ng provides, and where the pa ent is awai ng discharge to a more appropriate non-acute care se ng, such as personal care home placement.
The average lengths of stay for acute care hospitaliza ons, and for hospitaliza ons where a por on of the stay includ-ed ALC were calculated.
Ambulatory Care Visit RateThis is the average number of visits to physicians per resident. The denominator is all residents as of June 1. The number was age- and sex-adjusted to the Manitoba popula on.
The term ‘ambulatory visits’ captures virtually all contacts with physicians, except during inpa ent hospitaliza on and emergency room visits. Ambulatory visits include regular offi ce visits, walk-in clinics, home visits, nursinsg home visits, visits to outpa ent departments of hospitals and visits for prenatal care. As of 2016/2017, visits to Nurse Prac - oners are included.
Birth Rate
Calculated as the number of live births per 1,000 residents. The denominator was all residents as of June 1. The Vital Sta s cs birth records were used to count live births.
8989Manitoba Health, Seniors and Ac ve Living Annual Sta s cs 2017-2018
GLOSSARY
Breast Cancer Screening RateThe propor on of female residents ages 50 to 74 who had at least one mammogram in a two-year period. The de-nominator was all female residents ages 50 to 74 as of June 1 of the second year. The propor on was age- adjusted to the Manitoba female popula on ages 50 to 74. The indicator includes both screening and diagnos c mammo-grams, iden fi ed by the following tariff s in the physician claims:
• 7098 (radiology, intraluminal dilata on, mammography, bilateral)• 7099 (radiology, intraluminal dilata on, mammography, unilateral)• 7104 (screening mammography bilateral)
Cataract Surgery RateThe number of cataract replacement surgeries performed on residents age 50 or older, per 1,000 residents age 50 or older. The denominator was residents age 50 or older as of June 1st. The rate was age and sex-adjusted to the Manitoba popula on age 50 or older. Cataract surgery was defi ned by a physician claim with tariff codes 5611, 5612 and tariff prefi x 2 (surgery), or a hospital separa on with ICD-9-CM procedure codes 13.11, 13.19, 13.2, 13.3, 13.41, 13.42, 13.43, 13.51, 13.59, or CCI code 1.CL.89. Addi onal cataract surgeries for Manitoba residents were added from medical reciprocal claims for out of province procedures, including Alberta (tariff codes 27.72 and 27.72A) and Saskatchewan (tariff codes 135S, 136S, 226S and 325S). The most recent medical reciprocal claims data available for cataract surgery rates were provided.Caesarean Sec on RateThe propor on of caesarean sec on procedures among female residents ages 15 to 54. The denominator was total in-hospital deliveries among female residents ages 15 to 54 at hospital admission. The rate was age-adjusted to the Manitoba female popula on ages 15 to 54 who delivered in the same year. Caesarean sec on procedures were defi ned by ICD-9-CM procedure codes 74.0, 74.1, 74.2, 74.9 or CCI code 5.MD.60 in any procedure fi eld in hospital abstracts.
Cervical Cancer Screening RateThe propor on of female residents ages 21 to 69 who received at least one Papanicolaou (Pap) test in a three-year period. The denominator was all female residents ages 21 to 69 on June 1 of the middle year. The propor on was age-adjusted to the Manitoba female popula on ages 21 to 69. The indicator is defi ned by a physician visit with a tariff code for a Pap test, including a visit for a physical or regional exam with a Pap test, or a visit for Pap tes ng only. The tariff s used were as follows:
• 8470 – regional gynaecological exam, including cytological smear of the cervix, provided by a GP/FP• 8495 – complete physical and gynaecological exam, including cytological smear of the cervix, provided by an OB/GYN specialist• 8496 – regional gynaecological exam, including cytological smear of the cervix, provided by an OB/GYN spe- cialist• 8498 – complete physical and gynaecological exam, including cytological smear of the cervix, provided by a GP/FP• 9795 – cytological smear of the cervix for cancer screening
9090Manitoba Health, Seniors and Ac ve Living Annual Sta s cs 2017-2018
GLOSSARY
Child Mortality RateCalculated as the number of deaths among children ages one to 19 years in a fi ve-year period, per 100,000 chil-drenages one to 19 years in the same me period. The rates were age- and sex-adjusted to the overall Manitoba popula on ages one to 19 years old. The Vital Sta s cs death records were used to count deaths. Rates fl uctuate in areas with small popula ons; therefore fi ve years of data was used instead of a single year.
Chronic Condi ons Prevalence RateThe propor on of residents age 40 or older having one or more of the following condi ons: diabetes, hypertension, ischemic heart disease, heart failure, stroke or chronic obstruc ve pulmonary disease (COPD). The denominator was residents age 40 or older as of June 1st. The propor on was age- and sex-adjusted to the Manitoba popula on age 40 or older. The chronic condi ons were defi ned as follows:• Diabetes:
—at least one hospitaliza on or two physician visits over a two-year period with a diagnosis defi ned by ICD-9- CM codes 250 or ICD-10-CA codes E10-E14
• Hypertension: —at least one hospitaliza on or two physician visits over a two-year period with a diagnosis defi ned by ICD-9- CM code 401-405 or ICD-10-CA codes I10-I13, I15 • Ischemic heart disease: —at least one hospitaliza on or two physician visits over a one-year period with a diagnosis defi ned by ICD-9- CM codes 410-414 or ICD-10-CA codes I20-I25
• Heart failure: —at least one hospitaliza on or two physician visits over a one-year period with a diagnosis defi ned by ICD-9- CM code 428 or ICD-10-CA code I50 • Stroke: —at least one hospitaliza on or two physician visits over a one-year period with a diagnosis defi ned by ICD-9- CM codes 430, 431, 434, 435, 436 or ICD-10-CA codes G45, H34.0, H34.1, I60, I61, I63, I64 • COPD: —at least one hospitaliza on or one physician visit over a one-year period with a diagnosis defi ned by ICD-9- CM code 491, 492, 496 or ICD-10-CA codes J41-J44
Chronic Obstruc ve Pulmonary Disease (COPD) Prevalence RateThe propor on of residents age 35 and older with chronic obstruc ve pulmonary disease (COPD). The denominator was residents age 35 or older as of June 1. The propor on was age- and sex-adjusted to the Manitoba popula on age 35 or older. COPD is defi ned as at least one hospitaliza on or one physician visit over a one-year period with a diagnosis defi ned by ICD9-CM 491, 492, 496 or ICD-10-CA codes J41-J44.
9191Manitoba Health, Seniors and Ac ve Living Annual Sta s cs 2017-2018
GLOSSARY
Coronary Artery Bypass Gra Surgery RateThe number of bypass surgeries performed on residents age 40 or older, in a fi ve-year period, per 1,000 residents age 40 or older. The denominator was residents age 40 or older during the same me period. The rate was age- and sex-adjusted to the Manitoba popula on age 40 or older. Bypass surgery was defi ned by ICD-9-CM procedure codes 36.10-36.14, 36.19 or CCI code 1.IJ.76 in any procedure fi eld in hospital abstracts.
Cumula ve Mental Illness Prevalence RateThe propor on of residents age 10 or older who received treatment for any of the following in a fi ve-year period: mood and anxiety, disorders substance abuse, personality disorders, or schizophrenia. The propor on was age- and sex-adjusted to the Manitoba popula on age 10 or older. See corresponding glossary entries for defi ni ons on specif-ic mental illnesses.
Day SurgeryThe total number of day surgery separa ons per 1,000 residents. The denominator was all residents as of June 1st. The rate was age- and sex-adjusted to the Manitoba popula on.
Day Surgery hospitaliza ons involve surgical services on an outpa ent basis and are typically less than one day. All Manitoba hospitals were included; personal care homes, nursing sta ons and long-term care facili es were excluded (Deer Lodge Centre, Manitoba Adolescent Treatment Centre, Rehabilita on Centre for Children and Riverview Health Centre).
Death CausesThe distribu on of causes of death based on Vital Sta s cs fi les, using the 21 chapters of the Interna onal Classifi ca- on of Diseases (ICD-10-CA) system. Results are provided at the Manitoba level, but not by RHA due to the rela vely
small number of deaths by cause in smaller areas.
Death RateCalculated as the number of deaths per 1,000 residents. The denominator was all residents as of June 1st. The rates were age- and sex- adjusted to the overall Manitoba popula on. The Vital Sta s cs death records were used to count deaths.
Dependency Ra oThe demographic dependency ra o measures the size of the dependent popula on in rela on to the working age popula on as of June 1.
• Youth dependency is residents ages 0 to 19 per 100 residents aged 20 to 64 • Senior dependency is residents age 65 or older per 100 residents aged 20 to 64
Diabetes Prevalence RateThe propor on of residents age one or older with at least one hospitaliza on or at least two physician visits with a diagnosis of diabetes within a two-year period. A diabetes diagnosis was defi ned as ICD-9-CM codes 250 or ICD-10-CA codes E10-E14. The denominator was residents age one or older as of June 1st of the second year. The propor on
9292Manitoba Health, Seniors and Ac ve Living Annual Sta s cs 2017-2018
GLOSSARY
Although the case defi ni on uses a two-year period to defi ne cases, an annual number was derived by using the ear-liest date of hospitaliza on or the later of the two physician claims as the case date. The defi ni on for diabetes was derived from the Canadian Chronic Disease Surveillance System (CCDSS). This defi ni on has been validated and is the defi ni on u lized by Manitoba Health, Seniors and Ac ve Living. Because prevalence has a mul -year and mul ple-health-system-encounter defi ni on threshold, these values may increase from submission year to submission year over the most recent disease defi ni on period. This means that new versions of the CCDSS may increase counts for previous CCDSS versions as new health informa on is captured, as illustrated by the following example:
• An individual has only one physician visit for diabetes in 2013/2014 and none in 2012/2013, and thus does not meet the threshold for diabetes prevalence or incidence during the 2012/2013 - 2013/2014 period.
• The same individual has another physician visit for diabetes in 2014/2015, thus mee ng the threshold for the 2013/2014 - 2014/2015 period. However, since the incidence is assigned to the year of the fi rst physician visit (2013/2014), this increases the 2012/2013 - 2013/2014 incidence prevalence counts by one case.
Drug Program Expenditures by Plan and RHAThe total paid expenditures by drug benefi t plan and RHA of residence is shown. Drug program expenditures are grouped into the following categories: Pharmacare, Nursing Home, Family Services and Pallia ve Care. Expenditure data is taken from the Drug Program Informa on Network (DPIN).
Pharmacare is a drug benefi t program for eligible Manitoba residents, regardless of disease or age, whose income is seriously aff ected by high prescrip on drug costs. Pharmacare coverage is based on both an individual’s total family income and the amount they pay for eligible prescrip on drugs. Each year the individual is required to pay a por on of the cost of the eligible prescrip on drugs. This amount is the annual Phar-macare deduc ble. The deduc ble is set based on the adjusted family income.
Drugs Dispensed per User The average number of diff erent types of drugs dispensed to each resident who had at least one prescrip on dis-pensed. The number was age- and sex-adjusted to the Manitoba popula on. A ‘diff erent’ drug type was determined by fourth-level class of the Anatomic, Therapeu c, Chemical (ATC) classifi ca on system. This level essen ally sepa-rates drugs used for diff erent health problems. A person could have several prescrip ons for drugs in the same 4th level ATC class, but this would only count as one drug type in the year.
Drug Program Informa on Network (DPIN)An electronic, on-line, point-of-sale prescrip on drug database. It links all community pharmacies (but not phar-macies in hospitals or personal care homes) and captures informa on about all Manitoba residents, including most prescrip ons dispensed to registered First Na ons. DPIN contains informa on—such as unique pa ent iden fi ca- on, age, date of birth, sex, medica on history, over-the-counter medica on history, pa ent postal code, new drug
prescribed, date dispensed, and unique pharmacy iden fi ca on number. DPIN is maintained by Manitoba Health, Seniors and Ac ve Living.

9393Manitoba Health, Seniors and Ac ve Living Annual Sta s cs 2017-2018
GLOSSARY
First Na ons ResidentsResidents who have registered with Manitoba Health, Seniors and Ac ve Living as a ‘Status or Treaty Indian.’ En tle-ments of land, vo ng rights, and Band membership are received by registered First Na ons. A registered First Na on resident may be living in a First Na on community (on-reserve) or in a non-First Na on community (off -reserve).
Hip Replacement RateThe number of total hip replacements performed on residents age 40 or older, per 1,000 residents age 40 or older. The denominator was all residents age 40 or older as of June 1st. The rate was age- and sex-adjusted to the Manito-ba popula on age 40 or older. Hip replacements were defi ned by ICD-9-CM codes 81.50, 81.51, or 81.53 or CCI code 1.VA.53.LA-PN or 1.VA.53.PN-PN in any procedure fi eld in hospital abstracts. This defi ni on includes revisions on previously performed hip replacements and excludes par al hip replacements.
Home CareThe Manitoba Home Care Program, established in its present form in 1974, is the oldest comprehensive, prov-vince-wide, universal home care program in Canada. Home care is provided to Manitoba residents of all ages based on assessed need and taking into account other resources available to the individual including family, community resources and other programs. Home care services are provided free of charge. Reassessments at pre-determined intervals are the basis for decisions by case managers to discharge individuals from the program or to change the type or amount of services delivered by the Manitoba ome Care Program.
Home Care: Admissions and DischargesThe annual number of admissions and discharges to Manitoba residents is shown.
Home Care: Total Home Care ClientsThe average monthly number of Manitoba residents receiving co-ordinated home care services by RHA on the last day of the fi scal year.
Hospital Discharge Abstract DatabaseHospital abstracts are completed at the point of discharge for all separa ons from acute care facili es. Abstracts are completed for all inpa ent stays as well as some day surgery stays. Since April 1, 2004, they include up to 25 diagno-sis codes based on the Interna onal Classifi ca on of Diseases, 10th Revision, Canada (ICD-10-CA) and 20 procedure (interven on) codes based on the Canadian Classifi ca on of Health Interven ons (CCI). Informa on on Manitoba residents who are admi ed to out-of-province acute care facili es is captured through reciprocal Hospital Claims data, housed at Manitoba Health, Seniors and Ac ve Living.
Hospital Separa on RateThe total number of inpa ent hospital separa ons of residents, per 1,000 residents. The denominator was all resi-dents as of June 1. The rate was age- and sex-adjusted to the Manitoba popula on.
A separa on from a health care facility occurs any me when a pa ent leaves because of discharge, transfer or death. In a fi scal year, a resident could be hospitalized more than once, so this indicator shows the total number of sepa-ra ons from acute care facili es. All Manitoba hospitals were included; personal care homes, nursing sta ons and

9494Manitoba Health, Seniors and Ac ve Living Annual Sta s cs 2017-2018
GLOSSARY
care facili es were excluded (Deer Lodge Centre, Manitoba Adolescent Treatment Centre, Rehabilita on Centre for Children and Riverview Health Centre). Out-of-province hospitaliza ons for Manitoba residents were also included. In cases of birth, newborn hospitaliza ons were excluded. For 2017/2018, Norway House hospital informa on was not available.
Hospital Use RateThe propor on of residents who were admi ed to an acute care hospital at least once. The denominator was all resi-dents as of June 1st. The propor on was age- and sex-adjusted to the Manitoba popula on.
All Manitoba hospitals were included; personal care homes, nursing sta ons and long-term care facili es were ex-cluded (Deer Lodge Centre, Manitoba Adolescent Treatment Centre, Rehabilita on Centre for Children and Riverview Health Centre). Out-of-province hospitaliza ons for Manitoba residents were also included. In cases of birth, newborn hospitaliza ons were excluded. Outpa ent and day surgery services were excluded. For 2017/2018, Norway House hospital informa on was not available.
Hospitaliza on Rate for Ambulatory Care Sensi ve Condi ons (ACSC)The rate at which residents ages 0 to 74 were hospitalized for ambulatory care sensi ve condi ons, per 1,000 resi-dents ages 0 to 74. The denominator was all residents ages 0 to 74 as of June 1. The rate was age- and sex-adjusted to the Manitoba popula on ages 0 to 74. All Manitoba hospitals were included; personal care homes, nursing sta- ons and long-term care facili es were excluded (Deer Lodge and Riverview). Individuals who died in hospital were
excluded from the numerator. For 2017/2018, Norway House hospital informa on was not available.
ACSC are a set of condi ons comprised of 25 diseases/diagnoses, which have been iden fi ed as observably respon-sive to primary care. ACSC hospitaliza ons accordingly can func on as an indirect measure of primary care access. Although signifi cantly higher rates are presumed to refl ect problems obtaining access to primary care, not all admis-sions for these condi ons are avoidable.
ACSC include (with ICD-10-CA and CCI codes): •Congenital syphilis: Z38 & A50 •Immuniza on-related & preventable condi ons (primary diagnoses): A35, A37, A80, I00, I01 •Hemophilus meningi s for age 1-5 only: G00.0 •Epilepsy: G40, G41 •Convulsions: R56 •Severe ENT infec ons: procedure code 1.DF.53.JATS and diagnosis code H66, J02, J03, J06, J312 •Pulmonary tuberculosis: A15.0, A15.1, A15.2, A15.3, A15.7, A15.9, A16.0, A16.1, A62, A16.7, A16.9 •Other tuberculosis: A15.4, A15.5, A15.6, A15.8, A16.3, A16.4, A16.5, A16.8, A17, A18, A19 •COPD: J41, J42, J43, J44, J47. There is a new combina on code of acute lower respiratory infec on for pa- ents with COPD (J44) and J10.0, J11.0, J12, J13, J14, J15, J16, J18, J21, J22 •Acute bronchi s: secondary diagnosis of J41, J42, J43, J44, J47 where J20 is the primary diagnosis •Bacterial pneumonia: primary diagnosis of J13, J14, J15.3, J15.4, J15.7, J15.9, J16, J18. Exclude cases with secondary diagnosis of sickle cell anemia: D57.0, D57.1, D57.2, and D57.8. Exclude pa ents < 2 months old •Asthma: primary diagnosis of J45
9595Manitoba Health, Seniors and Ac ve Living Annual Sta s cs 2017-2018
GLOSSARY
• Conges ve heart failure: i. exclude cases with certain cardiac interven ons (all categories):1.HB.53, 1.HB.54, 1.HB.55, 1.HD.53, 1.HD.54, 1.HD.55, 1.HZ.53, 1.HZ.55, 1.HZ.85, 1.IJ.50, 1.IJ.57.GQ, 1.IJ.76 ii. where the primary diagnosis is: I50, J81 • Hypertension: primary diagnosis of I10.0, I10.1, I11 and exclude cardiac surgery as stated above. • Angina: exclude cases with any surgical interven on in CCI sec on 1, 2 or 5. And include primary diagnosis of I20, I23.82, I24.0, I24.8, I24.9 • Celluli s: incision of skin and subcutaneous ssue interven on. Exclude cases with any surgical interven- on except incision of skin and subcutaneous ssue where it is the only listed interven on. Include primary diagnosis of :L03, L04, L08, L44.4, L88, L92.2, L98.0, L98.3 • Diabetes: primary diagnosis of: E10.1, E10.6, E10.7, E10.9, E11.0, E11.1, E11.6, E11.7, E11.9, E13.0, E13.1, E13.6, E13.7, E13.9, E14.0, E14.1, E14.6, E14.7, E14.9 • Hypoglycemia: primary diagnosis of E16.0, E16.1, E16.2 • Gastroenteri s: K52.2, K52.8, K52.9 • Kidney/urinary infec on: N10, N11, N12, N13.6, N15.8, N15.9, N16.0-N16.5, N28.83-N28.85, N36.9, N39.0, N39.9 • Dehydra on/volume deple on: primary diagnosis of E86 • Iron defi ciency anemia: age <= 5 and primary diagnosis of: D50.1, D50.8, D50.9 • Nutri onal defi ciencies: primary diagnosis of E40, E41, E42, E43, E55.0, E64.3 • Failure to thrive: age < 1 and primary diagnosis of R62 • Pelvic infl ammatory disease: i. exclude cases with surgical procedure of hysterectomy: 1.RM.87, 1.RM.89, 1.RM.91, 5.CA.89.CK, 5.CA.89.DA, 5.CA.89.GB, 5.CA.89.WJ, 5.CA.89.WK ii. primary diagnosis of: N70, N73, N99.4 for females only • Dental condi ons: K02-K06, K08, K09.8, K09.9, K12, K13
Hypertension (High Blood Pressure) Prevalence RateThe propor on of residents age 20 or older with at least one hospitaliza on or at least two physician visits with a di-agnosis of hypertension within a two-year period. A hypertension diagnosis was defi ned as ICD-9-CM codes 401-405 or ICD-10-CA codes I10-I13, I15. The denominator was residents age 20 or older as of June 1st of the second year. The propor on was age- and sex-adjusted to the Manitoba popula on age 20 or older.
Although the case defi ni on uses a two-year period to defi ne cases, an annual number is derived by using the earliest date of hospitaliza on or the later of the two physician claims as the case date. The defi ni on for hypertension was derived from the Canadian Chronic Disease Surveillance System (CCDSS). This defi ni on has been validated and is the defi ni on u lized by Manitoba Health, Seniors and Ac ve Living.
Because prevalence has a mul -year and mul ple-health-system-encounter defi ni on threshold, these values may in-crease from submission year to submission year over the most recent disease defi ni on period. This means that new
9696Manitoba Health, Seniors and Ac ve Living Annual Sta s cs 2017-2018
GLOSSARY
versions of the CCDSS may increase counts for previous CCDSS versions as new health informa on is captured, as illustrated by the following example:
• An individual has only one physician visit for diabetes in 2013/2014 and none in 2012/2013, and thus does not meet the threshold for diabetes prevalence or incidence during the 2012/2013 - 2013/2014 period.
• The same individual has another physician visit for diabetes in 2014/2015, thus mee ng the threshold for the 2013/2014 - 2014/2015 period. However, since the incidence is assigned to the year of the fi rst phy sician visit (2013/2014), this increases the 2012/2013 - 2013/2014 incidence prevalence counts by one case.
Hysterectomy RateThe number of hysterectomy surgeries performed on female residents ages 20 to 84, per 1,000 female residents ages 20 to 84. The denominator was female residents ages 20 to 84 as of June 1. The rate was age-adjusted to the Mani-toba female popula on ages 20 to 84. Hysterectomy surgery was defi ned by ICD-9-CM procedure codes 68.4 - 68.9 or CCI codes 1.RM.87, 1.RM.89, 1.RM.91, 5.CA.89.CK, 5.CA.89.GB, 5.CA.89.WJ, 5.MD.60.RC, 5.MD.60.RD, 5.MD.60.KE, 5.MD.60.CB in any procedure fi eld in hospital abstracts.
Immuniza on for Infl uenza (Flu) RateThe propor on of residents age 65 or older who received a vaccine for the infl uenza season (September through March). The denominator was all residents age 65 or older as of the day they received the fi rst vaccine dose during the season. Flu shots were defi ned by physician tariff codes 8791, 8792, 8793, or 8799 in Manitoba Immuniza on Monitoring System (MIMS) and Panorama data.
Immuniza on for Pneumonia RateThe propor on of residents age 65 or older who ever received a vaccine for pneumonia. The denominator was all residents age 65 or older as of September 1. For most seniors, a pneumococcal vaccina on is considered a ‘once in a life me’ event, so these rates show the cumula ve percent of residents who ever had a pneumococcal vaccina on, as defi ned by physician tariff codes 8681-8694 and 8961 in MIMS and Panorama data.
Infant Mortality RateCalculated as the number of deaths among infants under one year of age, in a fi ve-year period, per 1,000 live births in the same me period. The Vital Sta s cs death records were used to count deaths. Rates fl uctuate in areas with small popula ons; therefore fi ve years of data was used instead of a single year.
Injury Hospitaliza on RateThe number of hospital separa ons of residents for which any injury code was included as one of the diagnoses in hospital abstracts per 1,000 residents. The denominator was all residents as of June 1st. Rates were age- and sex-ad-justed to the Manitoba popula on.
Hospitaliza ons were defi ned as any inpa ent stay with an external cause of injury diagnosis code, ICD-9-CM codes E800-E999; ICD-10-CA codes V01-Y89. Excluded from the hospitaliza ons due to injury are those related to medical error or complica ons, as follows:
9797Manitoba Health, Seniors and Ac ve Living Annual Sta s cs 2017-2018
GLOSSARY
• misadventures during surgical or medical care, ICD-9-CM codes E870-E876; ICD-10-CA codes Y60-Y69, Y88.1 • reac ons or complica ons due to medical care, ICD-9-CM codes E878-E879; ICD-10-CA codes Y70-Y84, Y88.2, Y88.3 • adverse eff ects due to drugs, ICD-9-CM codes E930-E949; ICD-10-CA codes Y40-Y59, Y88.0
All Manitoba hospitals were included; personal care homes, nursing sta ons and long-term care facili es were ex-cluded (Riverview, Deer Lodge, Rehabilita on Centre for Children and Adolescent Treatment Centre). Newborn birth injuries or deaths, s llbirths and brain deaths were excluded. For 2017/2018, Norway House hospital informa on was not available.
Injury Mortality CausesThe distribu on of causes of injury death based on Vital Sta s cs fi les, using the Interna onal Classifi ca on of Diseas-es (ICD-10-CA) system. Excluded are codes for misadventures, reac ons, complica ons, or adverse eff ects of medical, surgical or pharmaceu cal treatments (see list in Injury Mortality Rate). Results are provided at the Manitoba level, but not by RHA due to the rela vely small number of deaths by cause in smaller areas.
Injury Mortality RateCalculated as the number of deaths due to injury per 1,000 residents, based on Vital Sta s cs death codes. The denominator was all residents as of June 1st. Rates were age- and sex-adjusted to the Manitoba popula on. Injury deaths were defi ned as records with ICD-10-CA cause of death codes of V01-Y89.
Excluded from the deaths due to injury are those related to medical error or complica ons, as follows: • misadventures during surgical or medical care, ICD-9-CM codes E870-E876; ICD-10-CA codes Y60-Y69, Y88.1 • reac ons or complica ons due to medical care, ICD-9-CM codes E878-E879; ICD-10-CA codes Y70-Y84, Y88.2, Y88.3 • adverse eff ects due to drugs, ICD-9-CM codes E930-E949; ICD-10-CA codes Y40-Y59, Y88.0
Insured Services per CapitaThe total dollars spent on insured services in Manitoba per capita. The denominator was the number of residents as of June 1.
The Health Services Insurance Plan operates outside the Provincial Consolidated Fund and provides for payment of insured services for hospitals, personal care homes, and health care providers on behalf of Manitoba residents. Other plans include the prescrip on drugs program (Pharmacare), Ambulance, Air Ambulance, and Northern Pa ents Transporta on programs.
Knee Replacement RateThe number of total knee replacements performed on residents age 40 or older, per 1,000 residents age 40 or older. The denominator was all residents age 40 or older as of June 1st. The rate was age- and sex-adjusted to the Man-itoba popula on age 40 or older. Knee replacements were defi ned by ICD-9-CM codes 81.54, 81.55, or CCI codes 1.VG.53.LA.PN and 1.VG.53.LA.PP in any procedure fi eld in hospital abstracts. This defi ni on includes revisions on previously performed knee replacements and excludes par al knee replacements.
9898Manitoba Health, Seniors and Ac ve Living Annual Sta s cs 2017-2018
GLOSSARY
Lower Limb Amputa ons among Residents with DiabetesThe propor on of residents age 19 or older with diabetes who had a lower limb amputa on (below or including the knee) in a fi ve-year period. The denominator was residents age 19 or older with diabetes in the year prior to study pe-riod. See Diabetes Prevalence rate defi ni on. The propor on was age– and sex-adjusted to the Manitoba popula on age 19 or older with diabetes. Amputa on was defi ned by ICD-9-CM procedure codes 84.1-84.17 or CCI codes 1.VC.93, 1.VG.93, 1.VQ.93, 1.WA.93, 1.WE.93, 1.WJ.93, 1.WL.93, 1.WM.93 in any procedure fi eld in hospital abstracts. Cases of amputa ons due to accidental injury were excluded. These were defi ned by ICD-9-CM diagnosis codes 895-897 or ICD-10-CA codes S78, S88, S98, T05.3, T05.4, T05.5, and T13.6.
Majority of CareThe propor on of residents receiving more than 50 per cent of their ambulatory visits over a two-year period from the same physician. The denominator includes all residents with at least three ambulatory visits in the same two-year me period. The propor on was age- and sex-adjusted to the Manitoba popula on.
For children ages 0 to 14, visits included those to a General Prac oner/Family Prac oner (GP/FP), Pediatrician or Nurse Prac oner (NP); for those ages 15 to 59, only GP/FPs or NPs were used; for those age 60+, it could be a GP/FP, NP or an Internal Medicine specialist.
Mood and Anxiety DisordersThe propor on of residents age 10 or older diagnosed with depression and/or anxiety disorder in a fi ve-year period by any of the following:
• one or more hospitaliza ons with a diagnosis for depressive disorder, aff ec ve psychoses, neuro c depres- sion or adjustment reac on: ICD–9–CM codes 296.2–296.8, 300.4, 309 or 311; ICD–10–CA codes F31, F32, F33, F341, F38.0, F38.1, F41.2, F43.1, F43.2, F43.8, F53.0, F93.0 or with a diagnosis for a manic disorder, anxiety state, phobic disorders, obsessive–compulsive disorders or hypochondriasis: ICD–9–CM codes 296.1, 300.0, 300.2, 300.3, 300.7; ICD–10–CA codes F40, F41.0, F41.1, F41.3, F41.8, F41.9, F42, F45.2
• one or more hospitaliza ons with a diagnosis for anxiety disorders: ICD–9–CM code 300; ICD–10–CA codes F32, F341, F40, F41, F42, F44, F45.0, F45.1, F45.2, F48, F68.0, or F99 AND one or more prescrip ons for an an depressant, anxioly c or mood stabilizer: ATC codes N05AN01, N05BA, N06A
• one or more physician visits with a diagnosis for depressive disorder or aff ec ve psychoses: ICD–9–CM codes 296, 311
• one or more physician visits with a diagnosis for anxiety disorders: ICD–9–CM code 300 AND one or more prescrip ons for an an depressant, anxioly c or mood stabilizer: ATC codes N05AN01, N05BA, N06A
• three or more physician visits with a diagnosis for anxiety disorders or adjustment reac on: ICD–9–CM code 300, 309
The propor on was age and sex-adjusted to the Manitoba popula on age 10 or older.
9999Manitoba Health, Seniors and Ac ve Living Annual Sta s cs 2017-2018
GLOSSARY
Nursing Regulatory CollegesIn Manitoba, there are three (3) nursing regulatory colleges. In order to work in these regulated health professions, individuals must be registered with their respec ve regulatory college:
College of Registered Nurses of Manitoba (CRNM): • Registered Nurse • Registered Nurse (Nurse Prac oner) • Registered Nurse (Authorized Prescriber)
College of Registered Psychiatric Nurses of Manitoba (CRPNM): • Registered Psychiatric Nurse
College of Licensed Prac cal Nurses of Manitoba (CLPNM): • Licensed Prac cal Nurse
Paediatric Dental Extrac on RateThe number of dental extrac ons among resident children under the age of six, per 1,000 children under the age of six. The denominator was resident children under the age of six as of June 1. The rate was sex-adjusted to the Man-itoba popula on under the age of six. Dental extrac ons were defi ned by ICD-9-CM codes 23.01, 23.09, 23.11, 23.19 or CCI codes 1.FE.57, 1.FE.89. Paediatric dental extrac ons performed outside of hospitals (e.g., in den sts’ offi ces) were not included, so the rates reported may underes mate the extent of severe early childhood tooth decay.
Paediatric Dental Surgery RateThe number of dental surgeries among children under the age of six, per 1,000 children under the age of six. The de-nominator was resident children under the age of six as of June 1st. The rate was sex-adjusted to the Manitoba popu-la on under the age of six. Dental surgeries were defi ned by ICD9-CM procedure code 23 or CCI code 1.FE. Paediatric dental surgeries performed outside of hospital (e.g. In den sts’ offi ce) were not included, so the rates reported may underes mate the extent of early childhood dental issues.
Percutaneous Coronary Interven on Surgery RateThe number of percutaneous coronary interven on (PCI) surgeries performed on residents age 40 or older, per 1,000 residents age 40 or older in a fi ve-year period. The denominator was residents age 40 or older during the same me period. The rate was age– and sex-adjusted to the Manitoba popula on age 40 or older. PCI was defi ned by ICD-9-CM procedure codes 36.01, 36.02, 36.05, and 36.06 or CCI code 1.IJ.50 and 1.IJ.57 in an procedure fi eld in hospital abstracts.
Personal Care Homes (PCH)Personal care homes (PCHs), or nursing homes, are residen al facili es for persons with chronic illness or disability who can no longer remain safely at home even with home care services. Residents of PCHs are predominantly older adults. In Manitoba, PCHs can be proprietary (for profi t) or non-proprietary. PCH data is populated by assessment, admission and discharge forms. An assessment form for placement in to a PCH is fi lled out by the resident while in an acute care facility or at home. The assessment applica on is reviewed to decide if the person is eligible for admis-sion. There may be a wai ng period between admission approval and actual admission.
100100Manitoba Health, Seniors and Ac ve Living Annual Sta s cs 2017-2018
GLOSSARY
Personal Care Home, AdmissionsThe percentage of residents age 75 and older admi ed to a PCH in a year (values shown are the annual average). Residence was assigned based on the loca on of the PCH. The denominator was all residents age 75 and older in the same period. The propor on was age- and-sex adjusted to the Manitoba popula on age 75 and older.
Personal Care Home, Level of Care on AdmissionThe distribu on of level of care assigned to PCH residents 75 years of age and older at the me of their admission to a provincial PCH in a two-year period. Level 1 represents the lowest level of need, and Level 4 represents the highest.
For the report years there were zero residents admi ed at level of care 1. Levels 2 and 3 were stra fi ed by the close supervision indicator (coded as yes/no on assessment to indicate the need for close supervision due to possible be-havioural issues), but due to small numbers level 4 was not stra fi ed.
Personal Care Home, Median Length of Stay at Personal Care HomesThe median length of stay (in years) of PCH residents age 75 and older, over a two-year period, according to their level of care on admission. The median length of stay is the amount of me which half of all residents stayed.
Personal Care Home, Median Wait Time for AdmissionThe amount of me it took for half of all residents, age 75 and older, to be admi ed, a er being assessed as requiring PCH placement. The median wait me is provided in weeks and is shown for a two-year me period.
Personality Disorders Prevalence RateThe propor on of residents age 10 or older diagnosed with personality disorders in a fi ve-year period, by any of the following:
• one or more hospitaliza ons with a diagnosis for personality disorders, ICD-9-CM code 301; ICD-10-CA codes F34.0, F60, F61, F62, F68.1, F68.8, F69 • one or more physician visits with a diagnosis for personality disorders, ICD-9-CM code 301.
The propor on was age- and sex-adjusted to the Manitoba popula on age 10 or older.
Pharmaceu cal Use RateThe propor on of residents who had at least one prescrip on dispensed in one year. The denominator was all resi-dents as of June 1. The propor on was age- and-sex adjusted to the Manitoba popula on. This includes all prescrip- ons dispensed from community-based pharmacies across Manitoba. Prescrip on data is captured in Manitoba’s
Drug Program Informa on Network (DPIN) (see glossary entry above).
Physician ClaimsThese are claims for payment submi ed to the provincial government by physicians for services they provide. Fee-for-service physicians receive payment based on these claims, while those submi ed by salaried physicians are only for administra ve purposes (referred to as “shadow billing”).
101101Manitoba Health, Seniors and Ac ve Living Annual Sta s cs 2017-2018
GLOSSARY
Physician Use RateThe propor on of residents who received at least one ambulatory visit. The denominator was all residents as of June 1. The propor on was age- and sex-adjusted to the Manitoba popula on.
The term ‘ambulatory visits’ captures virtually all contacts with physicians, except during inpa ent hospitaliza on and emergency room visits. Ambulatory visits include regular offi ce visits, walk-in clinics, home visits, nursing home visits, visits to outpa ent departments of hospitals, and prenatal visits. As of 2016/2017, visits to Nurse Prac oners are included.
Popula onPopula on data shown in this report was based on records of residents registered with Manitoba Health, Seniors and Ac ve Living on June 1. Registered individuals include persons who reside in the province of Manitoba, as well as new Manitobans arriving from another province (eligible for coverage a er a wai ng period of up to three months), new Manitobans from another country (eligible for coverage immediately if they have landed immigrant status), and foreign ci zens holding a one-year or more work permit. Manitoba residents not covered include armed forces and federal peniten ary inmates.
Popula on PyramidA graph showing the age and sex distribu on of a popula on. The percentage of residents within each fi ve-year age group is shown for both males and females. Most developing countries have a popula on pyramid triangular in shape, indica ng a very young popula on with few people in the oldest age groups. Most developed countries have a popula on pyramid that looks more rectangular with the young and middle-aged people represen ng similar and smaller percentages of the popula on, and more elderly people in the top part of the pyramid.
Premature Mortality RateCalculated as the number of deaths among residents under the age of 75 years, in a fi ve-year period, per 1,000 residents under the age of 75 years in the same me period. The rates were age- and sex-adjusted to the overall Manitoba popula on. The Manitoba Vital Sta s cs death records were used to count deaths.
Pregnancy RateCalculated using data from hospital records by taking the ra o of all live and s ll births, abor ons and ectopic preg-nancies for females ages 15 to 49 to the female popula on ages 15 to 49. The denominator was female residents ages 15 to 49 as of June 1. Rates were age- and sex- adjusted to the Manitoba female popula on ages 15 to 49.
Pregnancy was defi ned as follows: • A hospitaliza on for one of the following diagnoses: Live birth: • ICD10 - Z37, ICD9 – V27 Missed Abor on: • ICD10 – O02.1, ICD9 - 632 Ectopic Pregnancy: • ICD10 – O00, ICD9 – 633
102102Manitoba Health, Seniors and Ac ve Living Annual Sta s cs 2017-2018
GLOSSARY
Abor on (spontaneous or medical): • ICD10 – O03, O04, O05, O06, O07 • ICD9 – 634, 635, 636, 637 Intrauterine death: • ICD10 – O36.4, ICD9- 656.4
– OR –
• A Hospitaliza on with one of the following procedures: Surgical Termina on of Pregnancy: • CCI – 5.CA.89, 5.CA.90, ICD9 - 69.01, 69.51, 74.91 Surgical Removal of extra-uterine (ectopic) pregnancy: • CCI – 5.CA.93, ICD9 – 66.62, 74 Pharmacological Termina on of Pregnancy: • CCI – 5.CA.88, ICD9 - 75.0 Interven ons during labour and delivery: • CCI – 5.MD.5, 5.MD.60, ICD9—74
Regional Health Authority (RHA)Manitoba’s health care system is a broad network of services and programs. Overseeing this system is Manitoba Health, Seniors and Ac ve Living, a department of the provincial government. For the mostpart, the actual services are delivered through local regional health authori es - fi ve regional agencies set up by the province to meet the local needs of Manitobans. As of April of 2013, the RHAs were Win-nipeg Health Region, Southern Health-Santé Sud, Interlake-Eastern RHA, Prairie Mountain Health and Northern Health Region.
In Manitoba, the regional health authori es are responsible, within the context of broad provincial policy direc on, for assessing and priori zing needs and health goals, and developing and managing an integrated approach to their own health care system.
The Regional Health Authori es Act legisla on came into force in 1997. It sets out the condi ons under which the RHAs are incorporated, as well as defi ning du es and responsibili es of the RHAs and the Minister of Health. Both par es are responsible for policy, assessment of health status and ensuring eff ec ve health planning and delivery.
Indicators in this report, unless otherwise indicated, are presented by RHA of residence. In other words, indicators refl ect where people live, not where they received services.
Schizophrenia Prevalence RateThe propor on of residents age 10 or older diagnosed with schizophrenia, in a fi ve-year period, by any of the follow-ing: • one or more hospitaliza ons with a diagnosis for schizophrenia, ICD-9-CM code 295; ICD-10-CA codes F20, F21, F23.2, F25 • one or more physician visits with a diagnosis for schizophrenia, ICD-9-CM code 295.
The propor on was age- and sex-adjusted to the Manitoba popula on age 10 or older.

103103Manitoba Health, Seniors and Ac ve Living Annual Sta s cs 2017-2018
GLOSSARY
Self-Infl icted Injury Hospitaliza on RateThe number of hospital separa ons of residents age 10 or older for which any self-infl icted injury code was included as one of the diagnoses per 1,000 residents age 10 or older. The denominator was residents age 10 or older as of June 1. Rates were age- and sex-adjusted to the Manitoba popula on age 10 or older.
Hospitaliza ons were defi ned as any inpa ent stay with a self-infl icted external cause of injury diagnosis code, ICD-9-CM codes E950-E959; ICD-10-CA codes X60-X84.
Size for Gesta onal AgeSize for gesta onal age is a measure of fetal growth. Birth weight and gesta onal age were taken from the Manitoba Vital Sta s cs birth records. Size for gesta onal age is classifi ed as follows:
• Small-for-Gestational-Age: Infants that are at or below the 10th percentile in birth weight, from an infant population of the same sex and gesta onal age.
• Large-for-Gestational-Age: Infants that are at or above the 90th percentile in birth weight, from an infant population of the same sex and gesta onal age.
• Appropriate-for-Gestational-Age: A birth is considered to be appropriate for gestational age if the birth weight is between the 10th and 90th percen les for the infant’s gesta onal age and sex.
Stroke RateCalculated as the number of hospitaliza ons or deaths due to stroke in residents age 40 or older per 1,000 residents age 40 or older. The denominator was residents age 40 or older as of June 1st. Rates were age- and sex-adjusted to the Manitoba popula on age 40 or older. Stroke is defi ned by ICD-9-CM codes 431, 434, 436 or ICD-10-CA codes I61, I63, I64 in the most responsible diagnosis fi eld for hospitaliza on or as the cause of death in Manitoba Vital Sta s cs death fi les. This defi ni on will not capture minor strokes which did not result in hospitaliza on or death. Substance Abuse Prevalence RateThe propor on of residents age 10 or older diagnosed with substance abuse in a fi ve-year period, by any of the follow-ing: • one or more hospitaliza ons with a diagnosis for alcoholic or drug psychoses, alcohol or drug dependence or nondependent abuse of drugs, ICD-9-CM code 291, 292, 303, 304, 305; ICD-10-CA codes F10-F19, F55 • one or more physician visits with a diagnosis for alcoholic or drug psychoses, alcohol or drug dependence or nondependent abuse of drugs, ICD-9-CM code 291, 292, 303, 304, 305.
The propor on was age- and sex-adjusted to the Manitoba popula on age 10 or older.
Suicide RateThe number of deaths due to suicide among residents age 10 or older, in a fi ve-year period, per 10,000 residents. The denominator was residents age 10 or older per year. Rates were age- and sex-adjusted to the Manitoba pop-ula on age 10 or older. Suicides were defi ned as any death record in Manitoba Vital Sta s cs data with any of the following causes:
104104Manitoba Health, Seniors and Ac ve Living Annual Sta s cs 2017-2018
GLOSSARY
• accidental poisoning, ICD-9-CM codes E850-E854, E858, E862, E868; ICD-10-CA codes X40-X42, X46, X47 • poisoning with undetermined intent, ICD-10-CA codes Y10-Y12, Y16, Y17 • self-infl icted poisoning, ICD-9-CM codes E950-E952; ICD-10-CA codes X60-X69 • self-infl icted injury by hanging, strangula on and suff oca on, ICD-9-CM code E953; ICD-10-CA code X70 · • self-infl icted injury by drowning, ICD-9-CM code E954; ICD-10-CA code X71 • self-infl icted injury by fi rearms and explosives, ICD-9-CM code E955; ICD-10-CA codes X72-X75 • self-infl icted injury by smoke, fi re, fl ames, steam, hot vapours and hot objects, ICD-9-CM codes E958.1, E958.2; ICD-10-CA codes X76, X77 • self-infl icted injury by cu ng or piercing instruments, ICD-9-CM code E956; ICD-10-CA codes X78, X79 • self-infl icted injury by jumping from high places, ICD-9-CM code E957; ICD-10-CA code X80 • self-infl icted injury by jumping or lying before a moving object, ICD-9-CM code E958.0; ICD-10-CA code X81 • self-infl icted injury by crashing a motor vehicle, ICD-9-CM code E958.5; ICD-10-CA code X82 • self-infl icted injury by other and unspecifi ed means, ICD-9-CM codes E958.3, E958.4, E958.6-E958.9; ICD- 10-CA codes X83, X84 • late eff ects of self-infl icted injury, ICD-9-CM code E959
Vaginal Birth A er Caesarean Sec on RateThe propor on of female residents ages 15 to 54 giving birth vaginally, in a fi ve-year period, who had previously had at least one delivery by caesarean sec on (C-sec on). The denominator was female residents ages 15 to 54 delivering in the same me period who had at least one previous C-sec on delivery. A woman is determined to have experi-enced a delivery a er C-sec on if each of the following criteria is met using hospital abstract data:
1. Presence of a uterine scar from previous surgery (ICD-9-CM diagnosis code of 654.2 or ICD-10 code of O34.201, O34.203, O34.209, O34.291, O34.293, O34,299 or O75.701, O75.703, O75.709) 2. Any single ICD-9-CM or ICD-10 diagnoses code indica ng a delivery.
ICD-9-CM 650, V27.0, V27.2, V27.3, V27.5, or V27.6, in any posi onICD-10 -CAO1, O2, O4, O6, O7, O8, O9, O30-O35, O37, O36.0, O36.1, O36.2, O36.3, O36.5, O36.6, O36.7, O36.8, O36.9 and with a sixth digit of ‘1’ or ‘2’; Z37.0, Z37.2, Z37.3, Z37.5, or Z37.6, in any posi on
To obtain the numerator, all women who had C-sec on deliveries in the current fi scal year are removed from the denominator pool. C-sec on deliveries are iden fi ed by ICD-9-CM procedure codes 74.0, 74.1, 74.2, 74.4, or 74.99 or CCI procedure code 5.MD.60 in any posi on. The percent is age-adjusted to the Manitoba female popula on ages 15 to 54.
105105Manitoba Health, Seniors and Ac ve Living Annual Sta s cs 2017-2018
GLOSSARY
Vital Sta s cs DatabaseBirth Database:The central Vital Sta s cs Registry in each province and territory provides data from birth registra ons to Sta s cs Can-ada. The following data items are reported for each birth by all provinces and territories for inclusion in the Canadian Vital Sta s cs system: • date and place of birth • child’s sex, birth weight and gesta onal age • parent’s age, marital status and birthplace • mother’s place of residence • type of birth (single or mul ple)
Death Database:The central Vital Sta s cs Registry in each province and territory provides data from death cer fi cates to Sta s cs Canada. The following data items are reported for each death by all provinces and territories for inclusion in the Canadian Vital Sta s cs system: • age, sex, marital status, place of residence and birth place of the deceased • date of death • underlying cause of death classifi ed to the “World Health Organiza on Interna onal Classifi ca on of Dis- ease and Related Health Problems” (ICD) • province or territory of occurrence of death • place of accident • autopsy informa on