Embed Size (px)
Citation preview
STATE OF NEW YORKOFFICE OF THE STATE COMPTROLLEROFFICE OF THE STATE COMPTROLLER
OFFICE OF OPERATIONSDIVISION OF PAYROLL, ACCOUNTING AND REVENUE SERVICES
Comptroller’s Annual Report to the Legislatureon State Funds Cash Basis of Accounting
(Pursuant to Section 8(9) of the State Finance Law)FISCAL YEAR ENDED MARCH 31 2013FISCAL YEAR ENDED MARCH 31, 2013
THOMAS P. DiNAPOLISTATE COMPTROLLER
_____________________________________________________
Additional information relating to New York State finances is
available at the Comptroller’s website at:
www.osc.state.ny.us
If you would like to be deleted from our mailing list or if your address has changed, please contact the Bureau of Financial Reporting and Oil Spill Remediation at (518) 474-3277, send an email to [email protected] or write to:
Office of the State Comptroller
Bureau of Financial Reporting and Oil Spill Remediation 110 State Street - 9th Floor Albany, NY 12236
_____________________________________________________
STATE OF NEW YORKOFFICE OF OPERATIONS
DIVISION OF PAYROLL, ACCOUNTING AND REVENUE SERVICES BUREAU OF FINANCIAL REPORTING AND OIL SPILL REMEDIATION
COMPTROLLER'S ANNUAL REPORT TO THE LEGISLATURE ON STATE FUNDS - CASH BASIS OF ACCOUNTINGFISCAL YEAR ENDED MARCH 31, 2013
TABLE OF CONTENTS
Combined Statements of Cash Receipts, Disbursements and Changes in Fund Balances/Equity
Governmental Funds - Receipts (Graphic Illustration) 6Governmental Funds - Disbursements (Graphic Illustration) 7
Exhibit A Governmental Funds 8Exhibit A Supplemental Governmental Funds - Classified by State, Federal Special Revenue and Capital Projects 9Exhibit B Proprietary Funds 10Exhibit C Trust Funds 11Exhibit D Governmental Funds - Budgetary Basis Report - Financial Plan and Actual 12
Notes to Financial Statements 16
Combining Statements of Cash Receipts, Disbursements and Changes in Fund Balances/Equity
Exhibit A-1 General Fund 23Exhibit A-2 Special Revenue Funds - State 25
Special Revenue Funds - Federal 34Special Revenue Funds - State and Federal 36
Exhibit A-3 Debt Service Funds 37Exhibit A-4 Capital Projects Funds - State 39
Capital Projects Funds - State and Federal 46
Exhibit B-1 Enterprise Funds 47Exhibit B-2 Internal Service Funds 49
Exhibit C-1 Pension Trust Fund 50Exhibit C-2 Private Purpose Trust Funds 51Exhibit C-3 Agency Funds 52Exhibit C-4 Sole Custody Funds and Accounts 53
Supplementary Schedules
Schedule 1 Governmental Funds - Schedule of Net Tax Receipts 60Schedule 2 Governmental Funds - Combined Statement of Receipts and Other Financing Sources 61Schedule 3 Governmental Funds - Schedule of Tax Receipts : Fiscal Years 2003-04 thru 2012-13 64Schedule 4 Governmental Funds - Combining Schedule of Tax Receipts 65Schedule 5 Governmental Funds - State Tax Receipts per Capita : Fiscal Years 2003-04 thru 2012-13 67
Governmental Funds - Receipts : Ten Year Trend Analysis (Graphic Illustration) 68Governmental Funds - Receipts to Disbursements : Ten Year Trend Analysis (Graphic Illustration) 69
Schedule 6 Governmental Funds - Schedule of Receipts, Disbursements and Other Financing Sources (Uses) : Fiscal Years 2003-04 thru 2012-13 70Schedule 6 Supplemental Governmental Funds - State Funds- Schedule of Receipts, Disbursements and
Other Financing Sources (Uses) : Fiscal Years 2003-04 thru 2012-13 71Governmental Funds - Local Assistance Grants (Graphic Illustration) 72Governmental Funds - Local Assistance Grants by Funding Source (Graphic Illustration) 73
STATE OF NEW YORKOFFICE OF OPERATIONS
DIVISION OF PAYROLL, ACCOUNTING AND REVENUE SERVICES BUREAU OF FINANCIAL REPORTING AND OIL SPILL REMEDIATION
COMPTROLLER'S ANNUAL REPORT TO THE LEGISLATURE ON STATE FUNDS - CASH BASIS OF ACCOUNTINGFISCAL YEAR ENDED MARCH 31, 2013
TABLE OF CONTENTSSupplementary Schedules (continued)
Schedule 7 Governmental Funds - Local Assistance Disbursements - by Program 74
Statement of Appropriation Transactions (in Force) :Schedule 8 All Funds by Fund Type 76Schedule 9 All Funds by Agency 77
Schedule of Disbursements of Federal Awards:Schedule 10 American Recovery and Reinvestment Act of 2009 83
Appropriated Loans Receivable :Schedule 11 Summary of Appropriated Loans Receivable Transactions By Agency and Public Benefit Corporations - Governmental Funds 85Schedule 12 Summary of Appropriated Loans Receivable Transactions By Agency and Public Benefit Corporations - General Fund 86Schedule 13 Summary of Appropriated Loans Receivable Transactions By Agency and Public Benefit Corporations - Special Revenue Funds 87Schedule 14 Summary of Appropriated Loans Receivable Transactions By Agency and Public Benefit Corporations - Capital Projects Funds 88
State Debt Activity :Schedule 15 Statement of State General Obligation Debt Activity 90Schedule 16 General Obligation Debt - Authorized, Issued and Outstanding 91Schedule 17 General Obligation Debt - Principal and Interest Payments : Fiscal Years 2003-04 thru 2012-13 92Schedule 18 Future General Obligation Debt Service Requirements Payable from Debt Service Funds 95Schedule 19 Debt Service Funds - Lease Purchase and Other Financing Agreements Disbursements 97Schedule 20 Future Lease/Purchase and Contractual Obligation Requirements Payable from Debt Service Funds 98
State Debt Outstanding as of March 31 : Fiscal Years 2003-04 thru 2012-13 (Graphic Illustration) 100Schedule 21 State Debt Outstanding as of March 31 : Fiscal Years 2003-04 thru 2012-13 101Schedule 21a State-Supported Debt Outstanding as of March 31 Per Capita : Fiscal Years 2003-04 thru 2012-13 102Schedule 21b State-Funded Debt Obligations Outstanding as of March 31 Per Capita : Fiscal Years 2003-04 thru 2012-13 103Schedule 21c State-Related Debt Obligations Outstanding as of March 31 Per Capita : Fiscal Years 2003-04 thru 2012-13 104
Combining Statements of Selected Departmental Disbursements :Schedule 22 General Fund 105Schedule 23 Special Revenue Funds - State 107Schedule 24 Special Revenue Funds - Federal 109Schedule 25 Debt Service Funds 110Schedule 26 Capital Projects Funds - State 111Schedule 27 Capital Projects Funds - Federal 112
STATE OF NEW YORKOFFICE OF OPERATIONS
DIVISION OF PAYROLL, ACCOUNTING AND REVENUE SERVICES BUREAU OF FINANCIAL REPORTING AND OIL SPILL REMEDIATION
COMPTROLLER'S ANNUAL REPORT TO THE LEGISLATURE ON STATE FUNDS - CASH BASIS OF ACCOUNTINGFISCAL YEAR ENDED MARCH 31, 2013
TABLE OF CONTENTS
Supplementary Schedules (continued)
Other Supplementary Schedules :
Schedule 28 Tax Stabilization Reserve Account - Statement of Net Cash Transactions : Fiscal Years 1945-1946 thru 2012-2013 113Schedule 29 Short-Term Investment Pool: Fiscal Years 2003-04 thru 2012-13 115Schedule 30 Report of Investment Yields, Portfolio Balances and Interest Earnings 116Schedule 31 Short-Term Investment Portfolio Balances 117Schedule 32 Temporary Loans Outstanding : Fiscal Years 2003-04 thru 2012-13 118Schedule 33 Temporary Loans Outstanding as of March 31, 2013 119Schedule 34 Summary of Cash Advance Accounts By Agency 122Appendix State Fund Structure (Graphic Illustration) 130
State Fund Structure and List of Joint Custody Funds 131

(ACTION)………..………...…………...…………………..………...……………..Accelerated Capacity and Transportation Improvements of the Nineties(AGP)……………..………...…………...………………..………...…………………………………………………………………...Aquaculture Grants Program(ARRA)…………..………...…………...…………………………………………………..………………..American Recovery and Reinvestment Act of 2009(BTOP)…………..………...…………...………………...……………………………………………………...Broadband Technology Opportunities Program(CAS)…………..………...…………...………………...……………………...…………………………………………………………..Central Accounting System(CHIPS)…………..………...…………...……………...…………………………………………………………..Consolidated Highway Improvement Programs(COPS)…………..………...…………...………………………………………………………………………………………………..Certificates of Participation(CUNY)…………..………...…………...……………….…………..………...………………………………………………………...City University of New York(CUTRA)…………..………...…………...………….…………..………...…………………………………….City University Tuition Reimbursement Account(CW/CA)………..………...…………...……………………….…………..………...………………………………………………………..Clean Water / Clean Air (DASNY)…………..………...…………...………….…………..………...………………………………………..Dormitory Authority of the State of New York(DDSO)…………..………...…………...………………..………...………………………………………………...Developmental Disabilities Services Offices(DEC)…………..………...…………...…………………..………...………………………………………………...Department of Environmental Conservation(DHCR)…………..………...…………...…………………………………………………………………………….Division of Housing and Community Renewal(DHHS)…………..………...…………...…………………………………………………………….United States Department of Health and Human Services(DMV)……………..………...…………...…………………………………………………………………………………………….Department of Motor Vehicles(DOCCS)…………..………...…………...…………………………………………………………….Department of Corrections and Community Supervision(DOH)………………………..………...………….……..………...…………………………………………………………………………..Department of Health(DOL)………………………..………...………….………..………...…………………………………………………………………………..Department of Labor(DOS)…………………………..………...………………………………………………………………………………………………………...Department of State(DOT)…………………………..………...………………………….…………..………...…………………………………………….Department of Transportation(DSAS)…………………………..………...………….…………..………...……………………………………………. Division of Substance Abuse Services (EFC)…………………………..………...………….…………..………...………………………………..New York State Environmental Facilities Corporation(ENCON)……………………..………...…………………………………………………………...New York State Department of Environmental Conservation(EPIC)…………………………..………...…………………………………………………………………………..Elderly Pharmaceutical Insurance Coverage(ERDA)………………………..………...…………………………………………………………………………...Energy Research and Development Authority(FBI)…………………………..………...…………………..………...……………………………………………………………..Federal Bureau of Investigation(FMAP)………………………..………...……………...…………………………………………………………………...Federal Medical Assistance Percentage(HAF)……………………………..………...………………………………………………………………………………………………..Housing Assistance Fund(HCRA)………………..………...…………...………………………………………………………………………………………………..Health Care Reform Act(HEAL NY)…………..………...…………...………………………………………………………….Health Care Equity and Affordability Law for New Yorkers(HESC)………………..………...…………...……………...…………………………………………………………….Higher Education Services Corporation(HFA)…………………..………...…………...……………………...……………………………………………………………………..Housing Finance Agency(HHC)…………………..………...…………...……………...……………………………………………………………………...Health and Hospital Corporation(HURD)………………..………...…………...……………………...………………………………………………………….Housing and Urban Renewal District(ICAC)………………..………...…………...……………….…………..………...………………………………………………...Internet Crimes Against Children(IFR)………………..………...…………...…………...………………………………………………………………………..SUNY Income Fund Reimbursable(IFTA)…………………..………...…………...…………………………………………………………………………………..International Fuel Tax Agreement
GLOSSARY OF ACRONYMS
FISCAL YEAR ENDED MARCH 31, 2013
STATE OF NEW YORKOFFICE OF OPERATIONS
DIVISION OF PAYROLL, ACCOUNTING AND REVENUE SERVICESBUREAU OF FINANCIAL REPORTING AND OIL SPILL REMEDIATION
COMPTROLLER'S ANNUAL REPORT TO THE LEGISLATURE ON STATE FUNDS - CASH BASIS OF ACCOUNTING
GLOSSARY OF ACRONYMS
FISCAL YEAR ENDED MARCH 31, 2013
STATE OF NEW YORKOFFICE OF OPERATIONS
DIVISION OF PAYROLL, ACCOUNTING AND REVENUE SERVICESBUREAU OF FINANCIAL REPORTING AND OIL SPILL REMEDIATION
COMPTROLLER'S ANNUAL REPORT TO THE LEGISLATURE ON STATE FUNDS - CASH BASIS OF ACCOUNTING
(IMMICS)……………..………...…………...…………………………………………………………………..Interagency Mail and Messenger Courier Service(IOLA)………………..………...…………...…………...………...………………………………………………………………………..Interest on Lawyer Account(JAG)…………………..………...…………...………….…………..………...…………………………………………………………...Justice Assistance Grant(LGAC)………………..………...…………...……………………………………………………………..New York Local Government Assistance Corporation(LGATF)……………..………...…………...……………….…………..………...………………………………………..Local Government Assistance Tax Fund(LLC)…………………..………...…………...…………...…………………………………………………………………………….Limited Liability Corporation(MAC)………………..………...…………...………………….…………..………...……………………………………………...Municipal Assistance Corporation(MBBA)………………..………...…………...…………….…………..………...…………………………………………………….Municipal Bond Bank Agency(MCTD)………………..………...…………...…………………………………………………………………...Metropolitan Commuter Transportation District(MMIS)………………..………...…………...………………..………...……………………………………………..Medicaid Management Information System(MTA)…………………..………...…………...……………...………………………………………………………………..Metropolitan Transportation Authority(NYC)……………..………...…………...……………..………...…….………………………………………………………………………………...New York City (NYCCC)……………..………...…………...…………………………………………………………………………………….New York City Convention Center(NYT)…………..………...…………...………………………..………...………...………………………………………………………………..New York Network(OASAS)………………..………...…………...……………...…………………………………………….Office of Alcoholism and Substance Abuse Services(OFT)…………………..………...…………...…………...…………………………………………………………………………………….Office for Technology(OGS)…………………..………...…………...……………...…………………………………………………………………………….Office of General Services(OMH)………………..………...…………...……………………...…………………………………………………………………………..Office of Mental Health(OPWDD)…………..………...…………...…………...………………………………………………………...Office for People with Developmental Disabilities(OSC)…………………..………...…………...……………...……………………………………………………………………….Office of the State Comptroller(OTDA)……………..………...…………...……………………………………………………………………….Office of Temporary and Disability Assistance(PASNY)………………..………...…………...………………………………………………………………………….Power Authority of the State of New York(PIT)……………………..………...…………...………………………………………………………………………………………………..Personal Income Tax(RBTF)…………………..………...…………...……...…………………………………………………………………………………..Revenue Bond Tax Fund(RPI)…………………..………...…………...…………….…..…………………………………………………………………….Rensselaer Polytechnic Institute(SFS)…………………..………...…………...……………………….…………..………...…………………………………………..Statewide Financial System(SFSF)…………………..………...…………...……………………………………………………………………………………...State Fiscal Stabilization Fund(SHIPS)…………………..………...…………...….…………..………...…………………………………………..Suburban Highway Improvement Programs(SPARCS)…………………..………...………….…………………………………………………….Statewide Planning and Research Cooperative System(STAR)…………………..………...…………...…..……………………………………………………………………………………………….School Tax Relief(STARC)………………..………...…………...…………………………………………………………………………………..State Tax Receivable Corporation(STIP)……………………..………...…………...………………………………………………………………………………………..Short-Term Investment Pool(SUNY)…………………..………...…………...………………………………………………………………………………………..State University of New York(TANF)…………………..………...…………...…………………...…………………………………………………...Temporary Assistance for Needy Families(TFA)……………………..………...…………...……………………………………………………………………………………...Transitional Finance Agency(UDC)……………………..………...…………...……...…………………………………………………………………………...Urban Development Corporation(UI)………………………..………...…………...…………………………………………………………………………………………..Unemployment Insurance(USDA)…………………..………...…………...………..………...…………………………………………………….United States Department of Agriculture
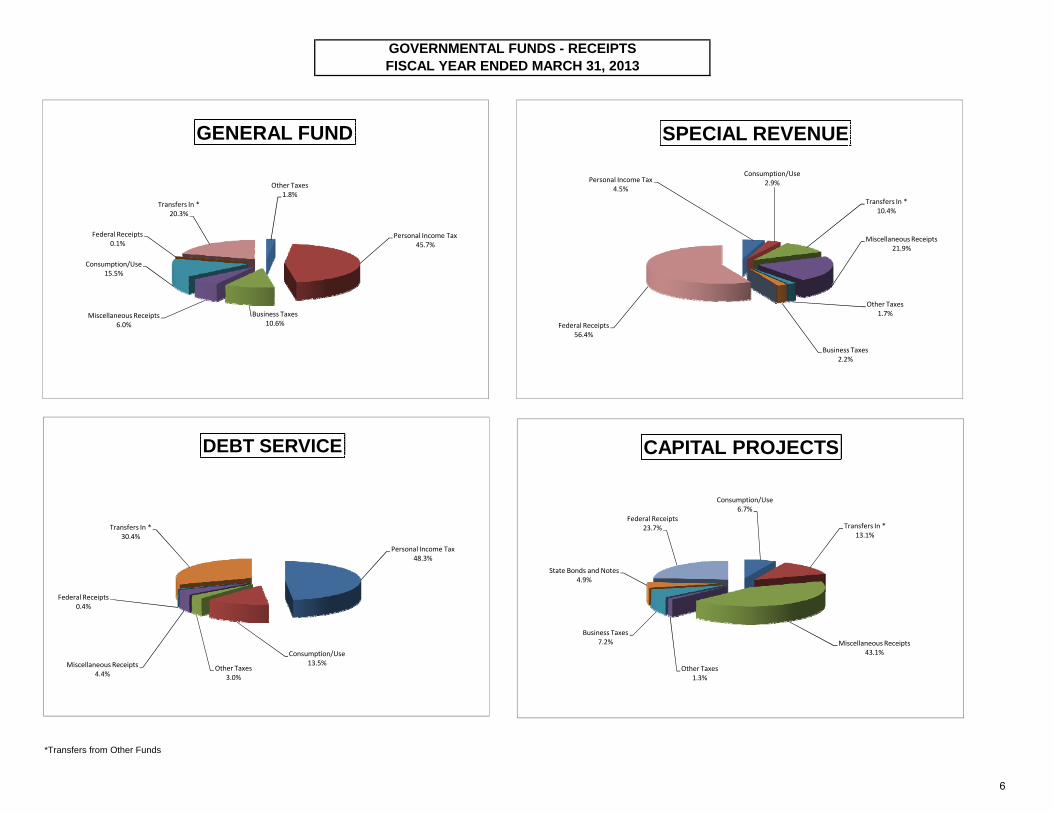
FISCAL YEAR ENDED MARCH 31, 2013GOVERNMENTAL FUNDS - RECEIPTS
Personal Income Tax4.5%
Consumption/Use2.9%
Transfers In *10.4%
Miscellaneous Receipts21.9%
Other Taxes1.7%
Business Taxes2.2%
Federal Receipts56.4%
SPECIAL REVENUE
Other Taxes1.8%
Personal Income Tax45.7%
Business Taxes10.6%
Miscellaneous Receipts6.0%
Consumption/Use15.5%
Federal Receipts0.1%
Transfers In *20.3%
GENERAL FUND
*Transfers from Other Funds
*Transfers from Other Funds
Personal Income Tax48.3%
Consumption/Use13.5%
Other Taxes3.0%
Miscellaneous Receipts4.4%
Federal Receipts0.4%
Transfers In *30.4%
DEBT SERVICE
Consumption/Use6.7%
Transfers In *13.1%
Miscellaneous Receipts43.1%
Other Taxes1.3%
Business Taxes7.2%
State Bonds and Notes4.9%
Federal Receipts23.7%
CAPITAL PROJECTS
6
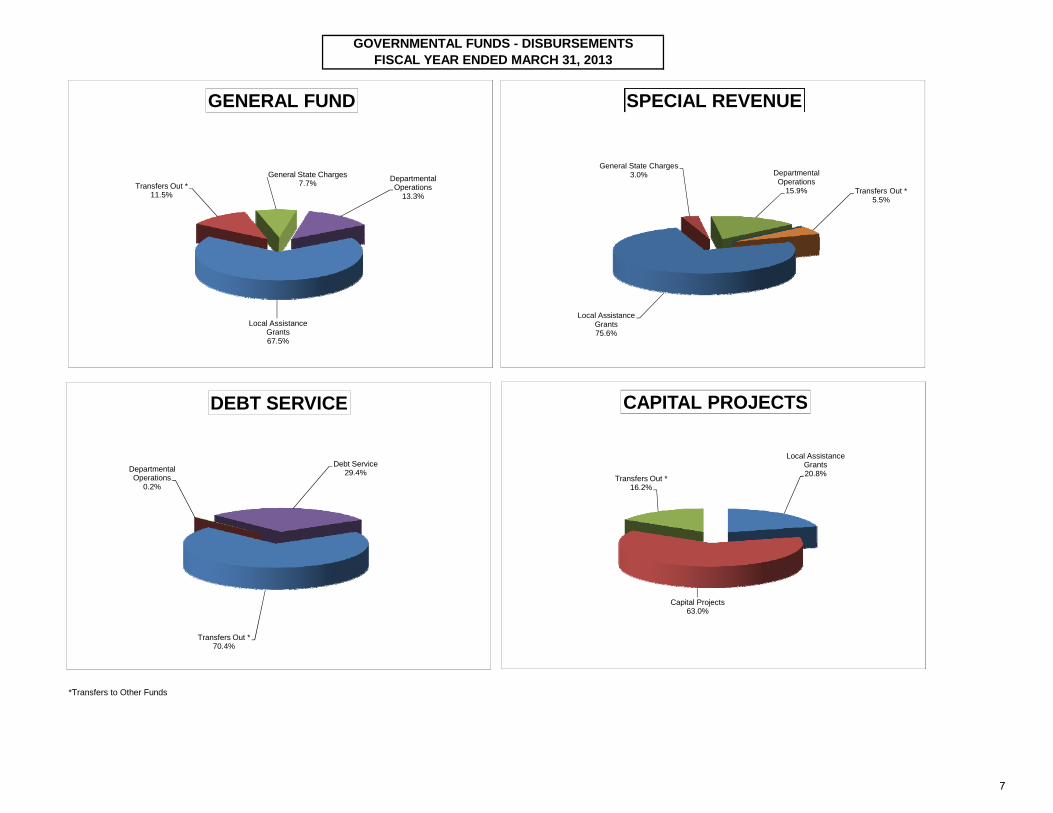
FISCAL YEAR ENDED MARCH 31, 2013GOVERNMENTAL FUNDS - DISBURSEMENTS
Local Assistance Grants75.6%
General State Charges3.0% Departmental
Operations15.9% Transfers Out *
5.5%
SPECIAL REVENUE
DEBT SERVICE CAPITAL PROJECTS
Local Assistance Grants67.5%
Transfers Out *11.5%
General State Charges7.7% Departmental
Operations13.3%
GENERAL FUND
*Transfers to Other Funds
Transfers Out *70.4%
Departmental Operations
0.2%
Debt Service29.4%
DEBT SERVICE
Local Assistance Grants20.8%
Capital Projects63.0%
Transfers Out *16.2%
CAPITAL PROJECTS
7
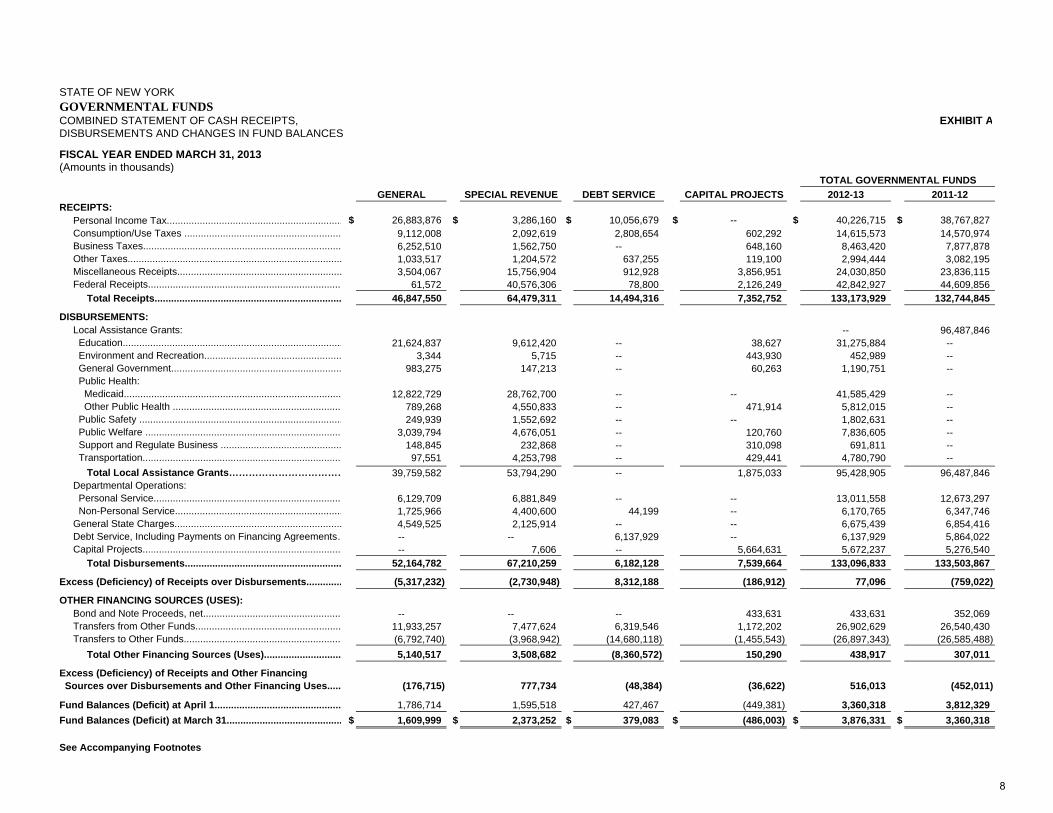
STATE OF NEW YORK GOVERNMENTAL FUNDS COMBINED STATEMENT OF CASH RECEIPTS, EXHIBIT ADISBURSEMENTS AND CHANGES IN FUND BALANCES
FISCAL YEAR ENDED MARCH 31, 2013(Amounts in thousands)
TOTAL GOVERNMENTAL FUNDSGENERAL SPECIAL REVENUE DEBT SERVICE CAPITAL PROJECTS 2012-13 2011-12
RECEIPTS: Personal Income Tax................................................................ $ 26,883,876 $ 3,286,160 $ 10,056,679 $ -- $ 40,226,715 $ 38,767,827 Consumption/Use Taxes ......................................................... 9,112,008 2,092,619 2,808,654 602,292 14,615,573 14,570,974 Business Taxes........................................................................ 6,252,510 1,562,750 -- 648,160 8,463,420 7,877,878 Other Taxes.............................................................................. 1,033,517 1,204,572 637,255 119,100 2,994,444 3,082,195 Miscellaneous Receipts............................................................ 3,504,067 15,756,904 912,928 3,856,951 24,030,850 23,836,115 Federal Receipts...................................................................... 61,572 40,576,306 78,800 2,126,249 42,842,927 44,609,856 Total Receipts.................................................................... 46,847,550 64,479,311 14,494,316 7,352,752 133,173,929 132,744,845
DISBURSEMENTS: Local Assistance Grants: -- 96,487,846 Education................................................................................ 21,624,837 9,612,420 -- 38,627 31,275,884 -- Environment and Recreation.................................................. 3,344 5,715 -- 443,930 452,989 -- General Government.............................................................. 983,275 147,213 -- 60,263 1,190,751 -- Public Health: Medicaid............................................................................... 12,822,729 28,762,700 -- -- 41,585,429 -- Other Public Health ............................................................. 789,268 4,550,833 -- 471,914 5,812,015 -- Public Safety .......................................................................... 249,939 1,552,692 -- -- 1,802,631 -- Public Welfare ....................................................................... 3,039,794 4,676,051 -- 120,760 7,836,605 -- Support and Regulate Business ............................................ 148,845 232,868 -- 310,098 691,811 -- Transportation........................................................................ 97,551 4,253,798 -- 429,441 4,780,790 -- Total Local Assistance Grants……………………………… 39,759,582 53,794,290 -- 1,875,033 95,428,905 96,487,846 Departmental Operations: Personal Service.................................................................... 6,129,709 6,881,849 -- -- 13,011,558 12,673,297 Non-Personal Service............................................................. 1,725,966 4,400,600 44,199 -- 6,170,765 6,347,746 General State Charges............................................................. 4,549,525 2,125,914 -- -- 6,675,439 6,854,416 Debt Service, Including Payments on Financing Agreements… -- -- 6,137,929 -- 6,137,929 5,864,022 Capital Projects........................................................................ -- 7,606 -- 5,664,631 5,672,237 5,276,540 Total Disbursements......................................................... 52,164,782 67,210,259 6,182,128 7,539,664 133,096,833 133,503,867
Excess (Deficiency) of Receipts over Disbursements............. (5,317,232) (2,730,948) 8,312,188 (186,912) 77,096 (759,022)
OTHER FINANCING SOURCES (USES): Bond and Note Proceeds, net.................................................. -- -- -- 433,631 433,631 352,069 Transfers from Other Funds..................................................... 11,933,257 7,477,624 6,319,546 1,172,202 26,902,629 26,540,430 Transfers to Other Funds......................................................... (6,792,740) (3,968,942) (14,680,118) (1,455,543) (26,897,343) (26,585,488) Total Other Financing Sources (Uses)............................ 5,140,517 3,508,682 (8,360,572) 150,290 438,917 307,011
Excess (Deficiency) of Receipts and Other Financing Sources over Disbursements and Other Financing Uses..... (176,715) 777,734 (48,384) (36,622) 516,013 (452,011)
Fund Balances (Deficit) at April 1.............................................. 1,786,714 1,595,518 427,467 (449,381) 3,360,318 3,812,329Fund Balances (Deficit) at March 31.......................................... $ 1,609,999 $ 2,373,252 $ 379,083 $ (486,003) $ 3,876,331 $ 3,360,318
See Accompanying Footnotes
8
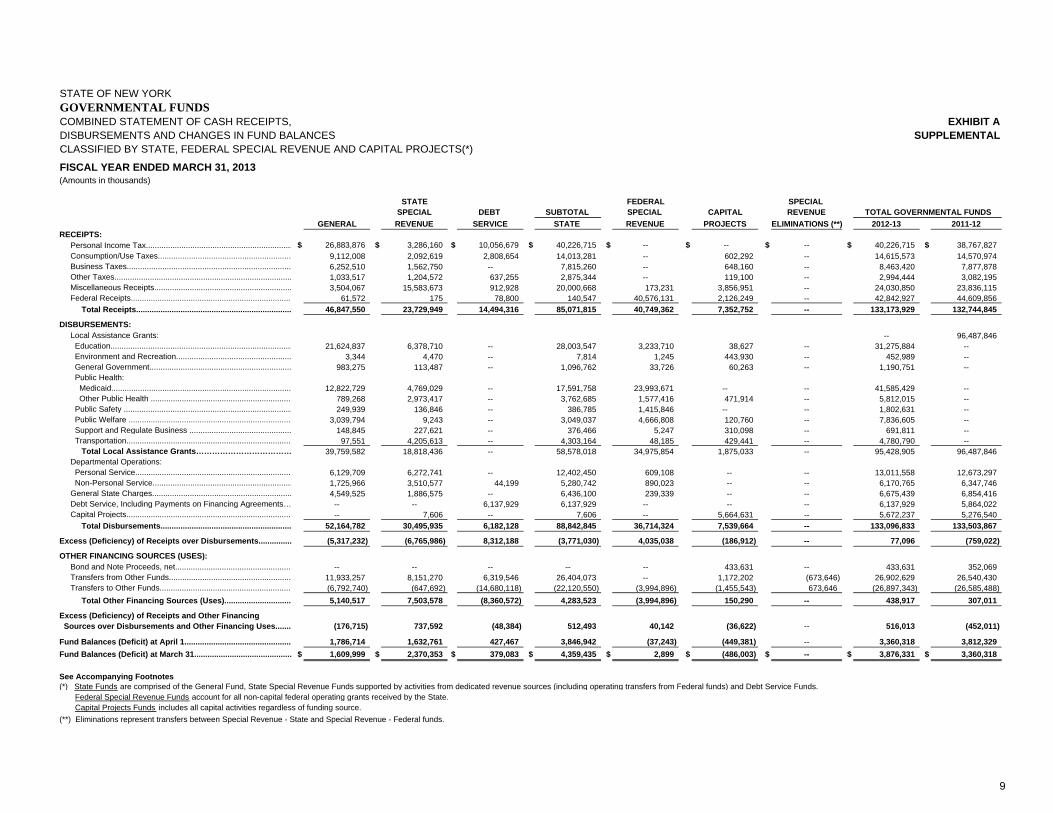
STATE OF NEW YORK GOVERNMENTAL FUNDSCOMBINED STATEMENT OF CASH RECEIPTS, EXHIBIT ADISBURSEMENTS AND CHANGES IN FUND BALANCES SUPPLEMENTALCLASSIFIED BY STATE, FEDERAL SPECIAL REVENUE AND CAPITAL PROJECTS(*)
FISCAL YEAR ENDED MARCH 31, 2013(Amounts in thousands)
STATE FEDERAL SPECIAL SPECIAL DEBT SUBTOTAL SPECIAL CAPITAL REVENUE TOTAL GOVERNMENTAL FUNDS
GENERAL REVENUE SERVICE STATE REVENUE PROJECTS ELIMINATIONS (**) 2012-13 2011-12RECEIPTS: Personal Income Tax.................................................................. $ 26,883,876 $ 3,286,160 $ 10,056,679 $ 40,226,715 $ -- $ -- $ -- $ 40,226,715 $ 38,767,827 Consumption/Use Taxes............................................................ 9,112,008 2,092,619 2,808,654 14,013,281 -- 602,292 -- 14,615,573 14,570,974 Business Taxes.......................................................................... 6,252,510 1,562,750 -- 7,815,260 -- 648,160 -- 8,463,420 7,877,878 Other Taxes................................................................................ 1,033,517 1,204,572 637,255 2,875,344 -- 119,100 -- 2,994,444 3,082,195 Miscellaneous Receipts.............................................................. 3,504,067 15,583,673 912,928 20,000,668 173,231 3,856,951 -- 24,030,850 23,836,115 Federal Receipts......................................................................... 61,572 175 78,800 140,547 40,576,131 2,126,249 -- 42,842,927 44,609,856 Total Receipts...................................................................... 46,847,550 23,729,949 14,494,316 85,071,815 40,749,362 7,352,752 -- 133,173,929 132,744,845
DISBURSEMENTS: Local Assistance Grants: -- 96,487,846 Education.................................................................................. 21,624,837 6,378,710 -- 28,003,547 3,233,710 38,627 -- 31,275,884 -- Environment and Recreation.................................................... 3,344 4,470 -- 7,814 1,245 443,930 -- 452,989 -- General Government................................................................ 983,275 113,487 -- 1,096,762 33,726 60,263 -- 1,190,751 -- Public Health: Medicaid................................................................................. 12,822,729 4,769,029 -- 17,591,758 23,993,671 -- -- 41,585,429 -- Other Public Health ................................................................ 789,268 2,973,417 -- 3,762,685 1,577,416 471,914 -- 5,812,015 -- Public Safety ............................................................................ 249,939 136,846 -- 386,785 1,415,846 -- -- 1,802,631 -- Public Welfare .......................................................................... 3,039,794 9,243 -- 3,049,037 4,666,808 120,760 -- 7,836,605 -- Support and Regulate Business .............................................. 148,845 227,621 -- 376,466 5,247 310,098 -- 691,811 -- Transportation........................................................................... 97,551 4,205,613 -- 4,303,164 48,185 429,441 -- 4,780,790 -- Total Local Assistance Grants……………………………… 39,759,582 18,818,436 -- 58,578,018 34,975,854 1,875,033 -- 95,428,905 96,487,846 Departmental Operations: Personal Service....................................................................... 6,129,709 6,272,741 -- 12,402,450 609,108 -- -- 13,011,558 12,673,297 Non-Personal Service............................................................... 1,725,966 3,510,577 44,199 5,280,742 890,023 -- -- 6,170,765 6,347,746 General State Charges............................................................... 4,549,525 1,886,575 -- 6,436,100 239,339 -- -- 6,675,439 6,854,416 Debt Service, Including Payments on Financing Agreements… -- -- 6,137,929 6,137,929 -- -- -- 6,137,929 5,864,022 Capital Projects........................................................................... -- 7,606 -- 7,606 -- 5,664,631 -- 5,672,237 5,276,540 Total Disbursements........................................................... 52,164,782 30,495,935 6,182,128 88,842,845 36,714,324 7,539,664 -- 133,096,833 133,503,867
Excess (Deficiency) of Receipts over Disbursements............... (5,317,232) (6,765,986) 8,312,188 (3,771,030) 4,035,038 (186,912) -- 77,096 (759,022)
OTHER FINANCING SOURCES (USES): Bond and Note Proceeds, net..................................................... -- -- -- -- -- 433,631 -- 433,631 352,069 Transfers from Other Funds....................................................... 11,933,257 8,151,270 6,319,546 26,404,073 -- 1,172,202 (673,646) 26,902,629 26,540,430 Transfers to Other Funds............................................................ (6,792,740) (647,692) (14,680,118) (22,120,550) (3,994,896) (1,455,543) 673,646 (26,897,343) (26,585,488) Total Other Financing Sources (Uses)............................... 5,140,517 7,503,578 (8,360,572) 4,283,523 (3,994,896) 150,290 -- 438,917 307,011
Excess (Deficiency) of Receipts and Other Financing Sources over Disbursements and Other Financing Uses....... (176,715) 737,592 (48,384) 512,493 40,142 (36,622) -- 516,013 (452,011)
Fund Balances (Deficit) at April 1................................................. 1,786,714 1,632,761 427,467 3,846,942 (37,243) (449,381) -- 3,360,318 3,812,329Fund Balances (Deficit) at March 31............................................ $ 1,609,999 $ 2,370,353 $ 379,083 $ 4,359,435 $ 2,899 $ (486,003) $ -- $ 3,876,331 $ 3,360,318
See Accompanying Footnotes(*) State Funds are comprised of the General Fund, State Special Revenue Funds supported by activities from dedicated revenue sources (including operating transfers from Federal funds) and Debt Service Funds. Federal Special Revenue Funds account for all non-capital federal operating grants received by the State. Capital Projects Funds includes all capital activities regardless of funding source. (**) Eliminations represent transfers between Special Revenue - State and Special Revenue - Federal funds.
9
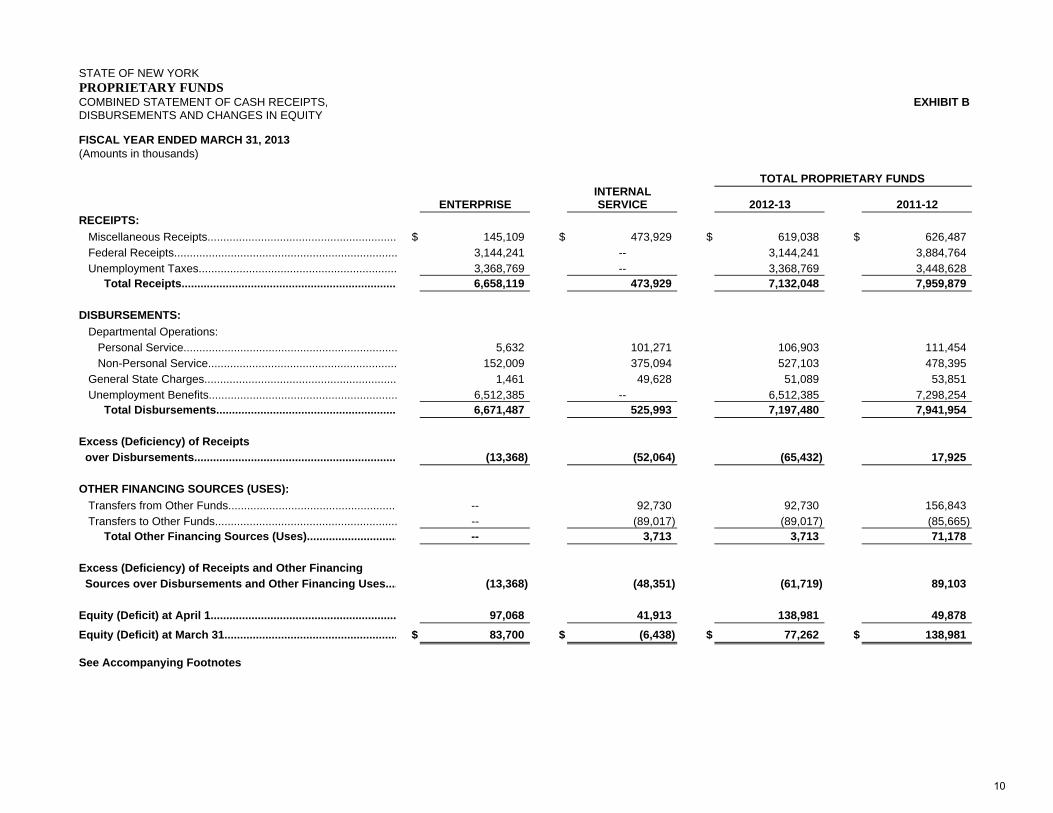
STATE OF NEW YORKPROPRIETARY FUNDSCOMBINED STATEMENT OF CASH RECEIPTS, EXHIBIT BDISBURSEMENTS AND CHANGES IN EQUITY
FISCAL YEAR ENDED MARCH 31, 2013 (Amounts in thousands)
TOTAL PROPRIETARY FUNDS INTERNAL
ENTERPRISE SERVICE 2012-13 2011-12RECEIPTS: Miscellaneous Receipts............................................................ $ 145,109 $ 473,929 $ 619,038 $ 626,487 Federal Receipts....................................................................... 3,144,241 -- 3,144,241 3,884,764 Unemployment Taxes............................................................... 3,368,769 -- 3,368,769 3,448,628 Total Receipts..................................................................... 6,658,119 473,929 7,132,048 7,959,879
DISBURSEMENTS: Departmental Operations: Personal Service.................................................................... 5,632 101,271 106,903 111,454 Non-Personal Service............................................................ 152,009 375,094 527,103 478,395 General State Charges............................................................. 1,461 49,628 51,089 53,851 Unemployment Benefits............................................................ 6,512,385 -- 6,512,385 7,298,254 Total Disbursements.......................................................... 6,671,487 525,993 7,197,480 7,941,954
Excess (Deficiency) of Receipts over Disbursements................................................................. (13,368) (52,064) (65,432) 17,925
OTHER FINANCING SOURCES (USES): Transfers from Other Funds...................................................... -- 92,730 92,730 156,843 Transfers to Other Funds.......................................................... -- (89,017) (89,017) (85,665) Total Other Financing Sources (Uses)............................. -- 3,713 3,713 71,178
Excess (Deficiency) of Receipts and Other Financing Sources over Disbursements and Other Financing Uses.... (13,368) (48,351) (61,719) 89,103
Equity (Deficit) at April 1........................................................... 97,068 41,913 138,981 49,878Equity (Deficit) at March 31....................................................... $ 83,700 $ (6,438) $ 77,262 $ 138,981
See Accompanying Footnotes
10
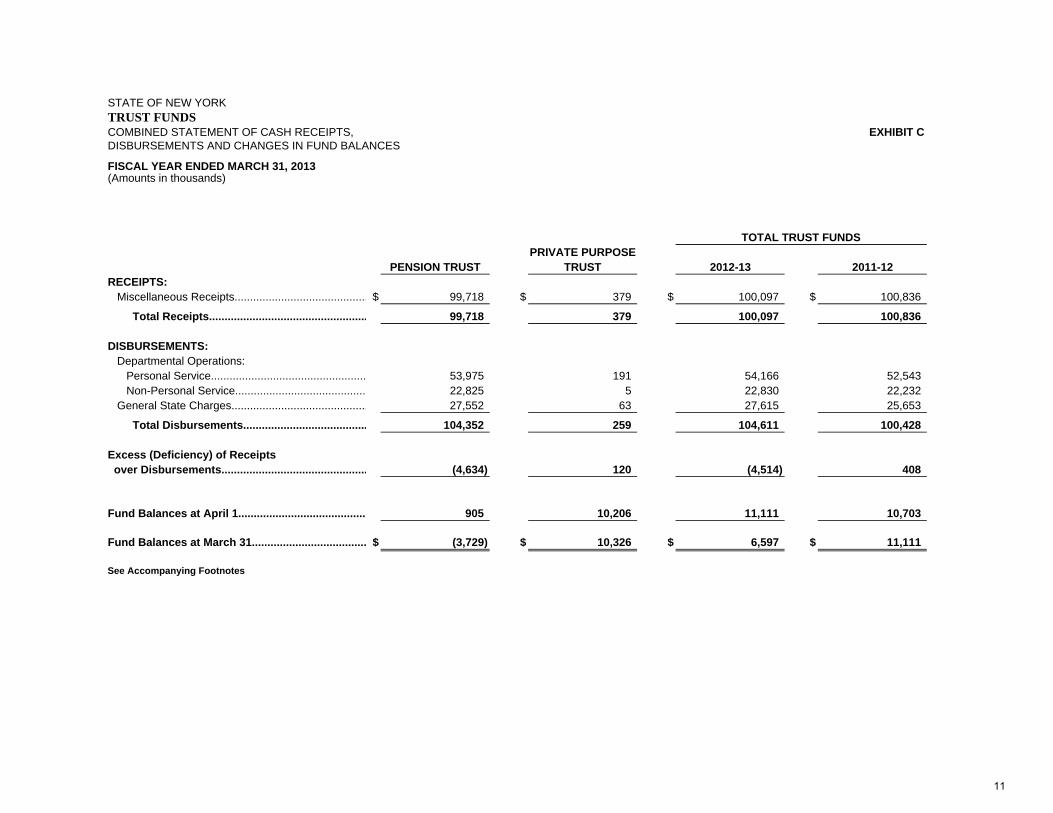
STATE OF NEW YORK TRUST FUNDSCOMBINED STATEMENT OF CASH RECEIPTS, EXHIBIT CDISBURSEMENTS AND CHANGES IN FUND BALANCES
FISCAL YEAR ENDED MARCH 31, 2013(Amounts in thousands)
TOTAL TRUST FUNDSPRIVATE PURPOSE
PENSION TRUST TRUST 2012-13 2011-12RECEIPTS: Miscellaneous Receipts........................................... $ 99,718 $ 379 $ 100,097 $ 100,836
Total Receipts................................................... 99,718 379 100,097 100,836
DISBURSEMENTS: Departmental Operations: Personal Service.................................................. 53,975 191 54,166 52,543 Non-Personal Service.......................................... 22,825 5 22,830 22,232 General State Charges............................................ 27,552 63 27,615 25,653
Total Disbursements........................................ 104,352 259 104,611 100,428
Excess (Deficiency) of Receipts over Disbursements............................................... (4,634) 120 (4,514) 408
Fund Balances at April 1.......................................... 905 10,206 11,111 10,703
Fund Balances at March 31..................................... $ (3,729) $ 10,326 $ 6,597 $ 11,111
See Accompanying Footnotes
11
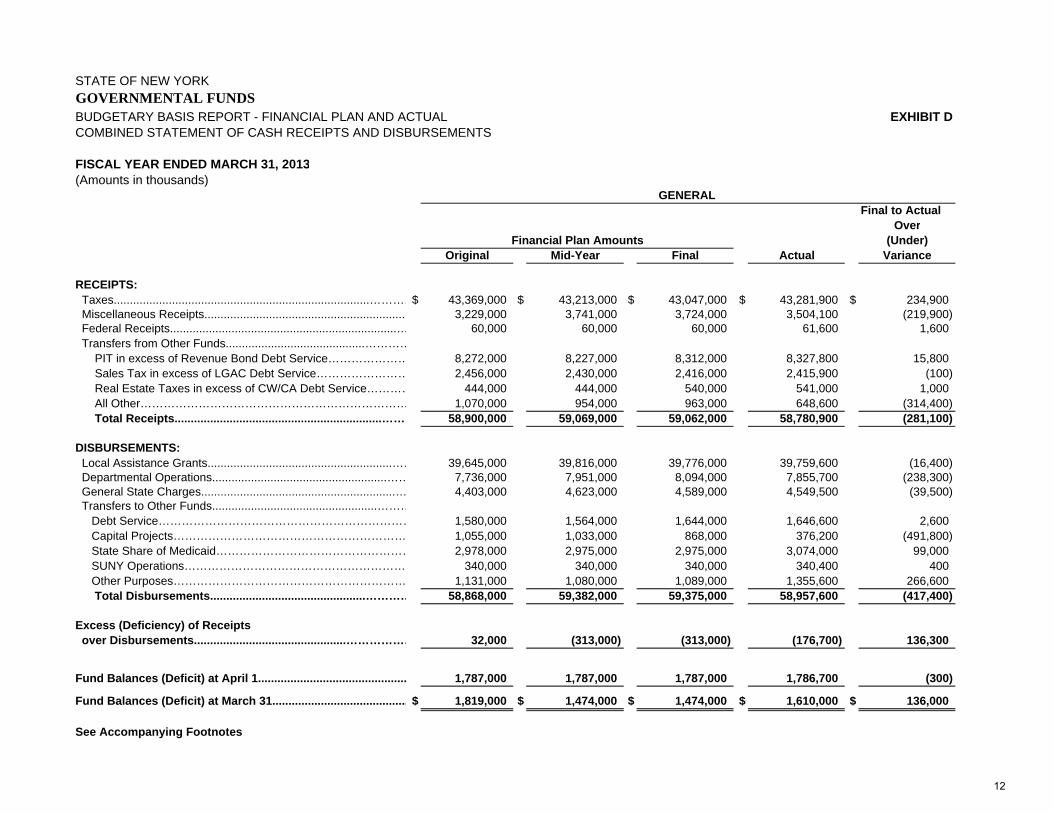
STATE OF NEW YORKGOVERNMENTAL FUNDSBUDGETARY BASIS REPORT - FINANCIAL PLAN AND ACTUAL EXHIBIT DCOMBINED STATEMENT OF CASH RECEIPTS AND DISBURSEMENTS
FISCAL YEAR ENDED MARCH 31, 2013(Amounts in thousands)
Final to ActualOver
(Under)Original Mid-Year Final Actual Variance
RECEIPTS: Taxes...............................................................................…………$ 43,369,000 $ 43,213,000 $ 43,047,000 $ 43,281,900 $ 234,900 Miscellaneous Receipts............................................................... 3,229,000 3,741,000 3,724,000 3,504,100 (219,900) Federal Receipts......................................................................… 60,000 60,000 60,000 61,600 1,600 Transfers from Other Funds...........................................………… PIT in excess of Revenue Bond Debt Service………………… 8,272,000 8,227,000 8,312,000 8,327,800 15,800 Sales Tax in excess of LGAC Debt Service…………………… 2,456,000 2,430,000 2,416,000 2,415,900 (100) Real Estate Taxes in excess of CW/CA Debt Service………… 444,000 444,000 540,000 541,000 1,000 All Other…………………………………………………………… 1,070,000 954,000 963,000 648,600 (314,400) Total Receipts................................................................……… 58,900,000 59,069,000 59,062,000 58,780,900 (281,100)
DISBURSEMENTS: Local Assistance Grants.........................................................…… 39,645,000 39,816,000 39,776,000 39,759,600 (16,400) Departmental Operations......................................................…… 7,736,000 7,951,000 8,094,000 7,855,700 (238,300) General State Charges............................................................… 4,403,000 4,623,000 4,589,000 4,549,500 (39,500) Transfers to Other Funds...................................................……… Debt Service………………………………………………………… 1,580,000 1,564,000 1,644,000 1,646,600 2,600 Capital Projects…………………………………………………… 1,055,000 1,033,000 868,000 376,200 (491,800) State Share of Medicaid…………………………………………… 2,978,000 2,975,000 2,975,000 3,074,000 99,000 SUNY Operations………………………………………………… 340,000 340,000 340,000 340,400 400 Other Purposes…………………………………………………… 1,131,000 1,080,000 1,089,000 1,355,600 266,600 Total Disbursements................................................………… 58,868,000 59,382,000 59,375,000 58,957,600 (417,400)
Excess (Deficiency) of Receipts over Disbursements...............................................……………… 32,000 (313,000) (313,000) (176,700) 136,300
Fund Balances (Deficit) at April 1.............................................. 1,787,000 1,787,000 1,787,000 1,786,700 (300)
Fund Balances (Deficit) at March 31.......................................... $ 1,819,000 $ 1,474,000 $ 1,474,000 $ 1,610,000 $ 136,000
See Accompanying Footnotes
GENERAL
Financial Plan Amounts
12
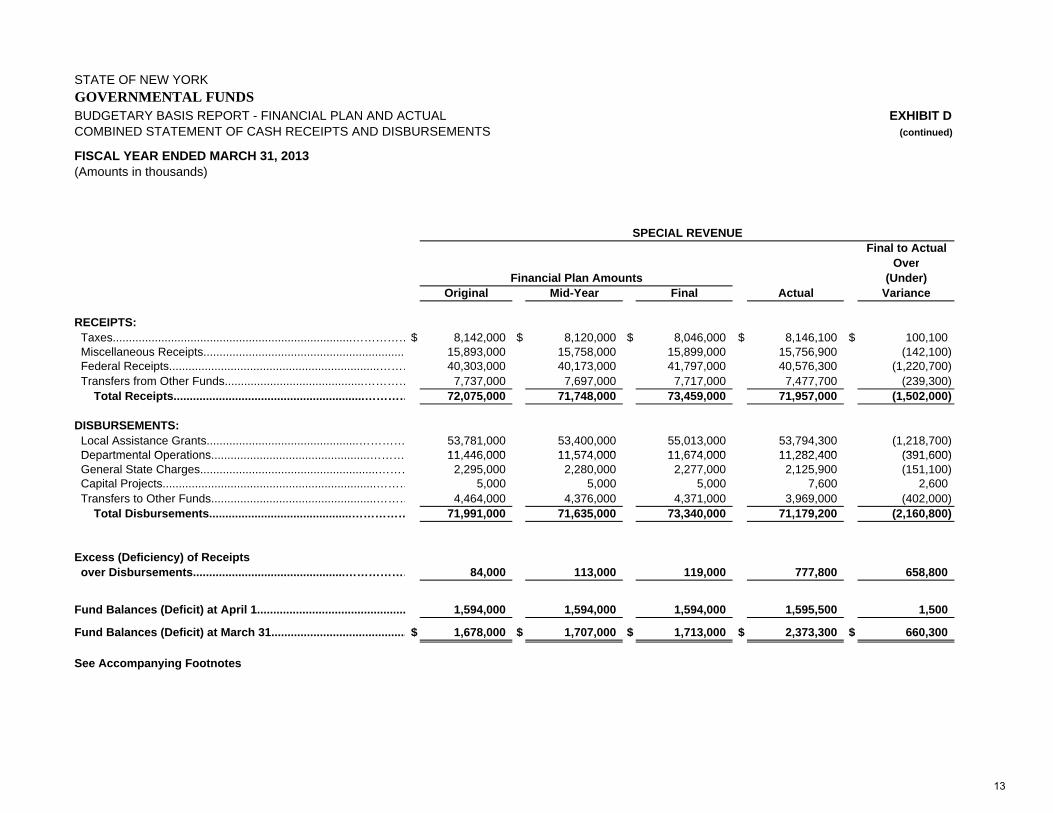
STATE OF NEW YORKGOVERNMENTAL FUNDSBUDGETARY BASIS REPORT - FINANCIAL PLAN AND ACTUAL EXHIBIT DCOMBINED STATEMENT OF CASH RECEIPTS AND DISBURSEMENTS (continued)
FISCAL YEAR ENDED MARCH 31, 2013 (Amounts in thousands)
Final to ActualOver
(Under)Original Mid-Year Final Actual Variance
RECEIPTS: Taxes..........................................................................……………$ 8,142,000 $ 8,120,000 $ 8,046,000 $ 8,146,100 $ 100,100 Miscellaneous Receipts............................................................... 15,893,000 15,758,000 15,899,000 15,756,900 (142,100) Federal Receipts.................................................................……… 40,303,000 40,173,000 41,797,000 40,576,300 (1,220,700) Transfers from Other Funds...........................................………… 7,737,000 7,697,000 7,717,000 7,477,700 (239,300) Total Receipts...........................................................………… 72,075,000 71,748,000 73,459,000 71,957,000 (1,502,000)
DISBURSEMENTS: Local Assistance Grants...............................................………… 53,781,000 53,400,000 55,013,000 53,794,300 (1,218,700)Departmental Operations 11 446 000 11 574 000 11 674 000 11 282 400 (391 600)
SPECIAL REVENUE
Financial Plan Amounts
Departmental Operations.................................................……… 11,446,000 11,574,000 11,674,000 11,282,400 (391,600) General State Charges.......................................................……… 2,295,000 2,280,000 2,277,000 2,125,900 (151,100) Capital Projects..................................................................……… 5,000 5,000 5,000 7,600 2,600 Transfers to Other Funds...................................................……… 4,464,000 4,376,000 4,371,000 3,969,000 (402,000) Total Disbursements............................................…………… 71,991,000 71,635,000 73,340,000 71,179,200 (2,160,800)
Excess (Deficiency) of Receipts over Disbursements...............................................……………… 84,000 113,000 119,000 777,800 658,800
Fund Balances (Deficit) at April 1.............................................. 1,594,000 1,594,000 1,594,000 1,595,500 1,500
Fund Balances (Deficit) at March 31.......................................... $ 1,678,000 $ 1,707,000 $ 1,713,000 $ 2,373,300 $ 660,300
See Accompanying Footnotes
13
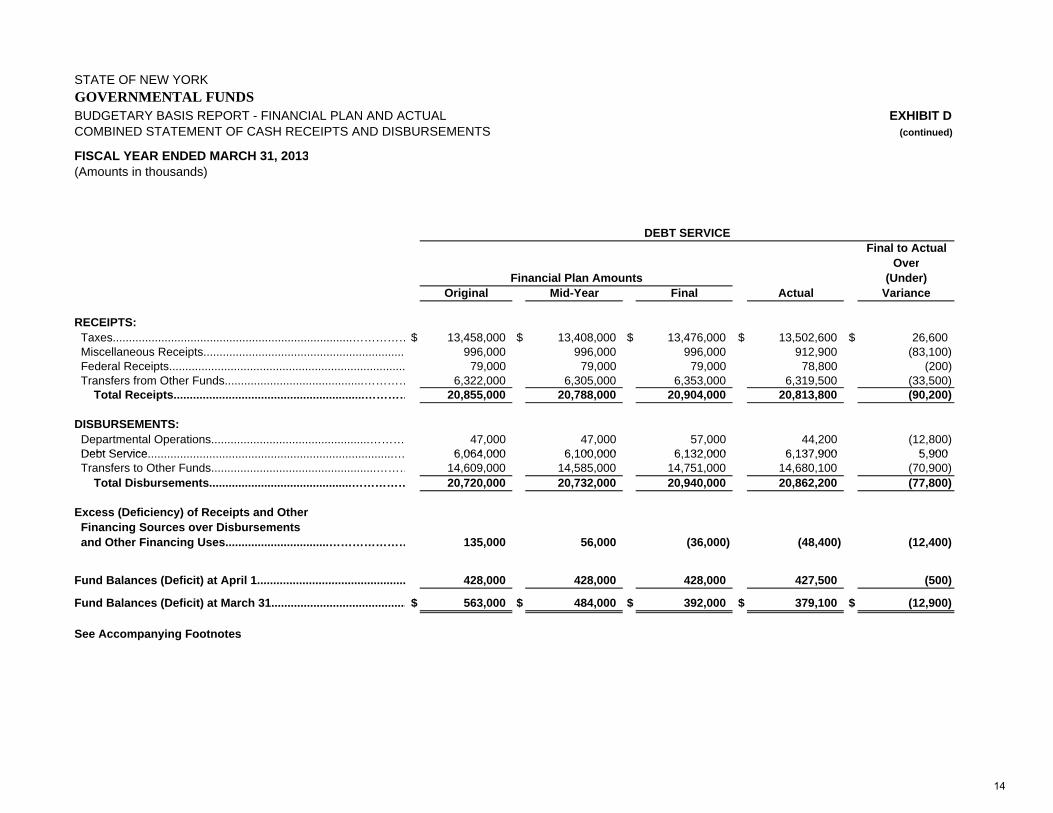
STATE OF NEW YORKGOVERNMENTAL FUNDSBUDGETARY BASIS REPORT - FINANCIAL PLAN AND ACTUAL EXHIBIT DCOMBINED STATEMENT OF CASH RECEIPTS AND DISBURSEMENTS (continued)
FISCAL YEAR ENDED MARCH 31, 2013(Amounts in thousands)
Final to ActualOver
(Under)Original Mid-Year Final Actual Variance
RECEIPTS: Taxes..........................................................................……………$ 13,458,000 $ 13,408,000 $ 13,476,000 $ 13,502,600 $ 26,600 Miscellaneous Receipts............................................................... 996,000 996,000 996,000 912,900 (83,100) Federal Receipts......................................................................... 79,000 79,000 79,000 78,800 (200) Transfers from Other Funds...........................................………… 6,322,000 6,305,000 6,353,000 6,319,500 (33,500) Total Receipts...........................................................………… 20,855,000 20,788,000 20,904,000 20,813,800 (90,200)
DISBURSEMENTS: Departmental Operations.................................................……… 47,000 47,000 57,000 44,200 (12,800)Debt Service 6 064 000 6 100 000 6 132 000 6 137 900 5 900
DEBT SERVICE
Financial Plan Amounts
Debt Service............................................................................… 6,064,000 6,100,000 6,132,000 6,137,900 5,900 Transfers to Other Funds...................................................……… 14,609,000 14,585,000 14,751,000 14,680,100 (70,900) Total Disbursements............................................…………… 20,720,000 20,732,000 20,940,000 20,862,200 (77,800)
Excess (Deficiency) of Receipts and Other Financing Sources over Disbursements and Other Financing Uses................................………………… 135,000 56,000 (36,000) (48,400) (12,400)
Fund Balances (Deficit) at April 1.............................................. 428,000 428,000 428,000 427,500 (500)
Fund Balances (Deficit) at March 31.......................................... $ 563,000 $ 484,000 $ 392,000 $ 379,100 $ (12,900)
See Accompanying Footnotes
14
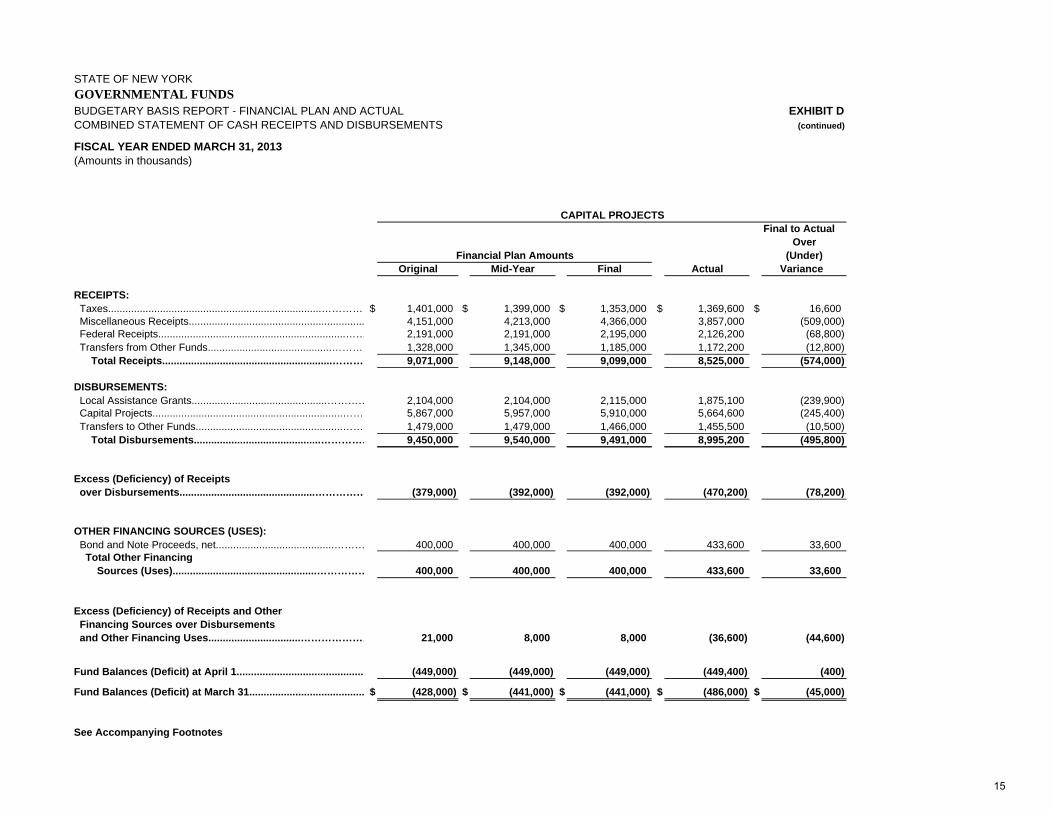
STATE OF NEW YORKGOVERNMENTAL FUNDSBUDGETARY BASIS REPORT - FINANCIAL PLAN AND ACTUAL EXHIBIT DCOMBINED STATEMENT OF CASH RECEIPTS AND DISBURSEMENTS (continued)
FISCAL YEAR ENDED MARCH 31, 2013(Amounts in thousands)
Final to ActualOver
(Under)Original Mid-Year Final Actual Variance
RECEIPTS: Taxes..........................................................................……………$ 1,401,000 $ 1,399,000 $ 1,353,000 $ 1,369,600 $ 16,600 Miscellaneous Receipts............................................................. 4,151,000 4,213,000 4,366,000 3,857,000 (509,000) Federal Receipts.................................................................…… 2,191,000 2,191,000 2,195,000 2,126,200 (68,800) Transfers from Other Funds...........................................………… 1,328,000 1,345,000 1,185,000 1,172,200 (12,800) Total Receipts...........................................................………… 9,071,000 9,148,000 9,099,000 8,525,000 (574,000)
DISBURSEMENTS: Local Assistance Grants...............................................………… 2,104,000 2,104,000 2,115,000 1,875,100 (239,900) Capital Projects..................................................................……… 5,867,000 5,957,000 5,910,000 5,664,600 (245,400) Transfers to Other Funds...................................................……… 1,479,000 1,479,000 1,466,000 1,455,500 (10,500) Total Disbursements............................................…………… 9,450,000 9,540,000 9,491,000 8,995,200 (495,800)
CAPITAL PROJECTS
Financial Plan Amounts
Excess (Deficiency) of Receipts over Disbursements...............................................…………… (379,000) (392,000) (392,000) (470,200) (78,200)
OTHER FINANCING SOURCES (USES): Bond and Note Proceeds, net.........................................……… 400,000 400,000 400,000 433,600 33,600 Total Other Financing Sources (Uses)..................................................…………… 400,000 400,000 400,000 433,600 33,600
Excess (Deficiency) of Receipts and Other Financing Sources over Disbursements and Other Financing Uses................................………………… 21,000 8,000 8,000 (36,600) (44,600)
Fund Balances (Deficit) at April 1............................................. (449,000) (449,000) (449,000) (449,400) (400)
Fund Balances (Deficit) at March 31........................................ $ (428,000) $ (441,000) $ (441,000) $ (486,000) $ (45,000)
See Accompanying Footnotes
15
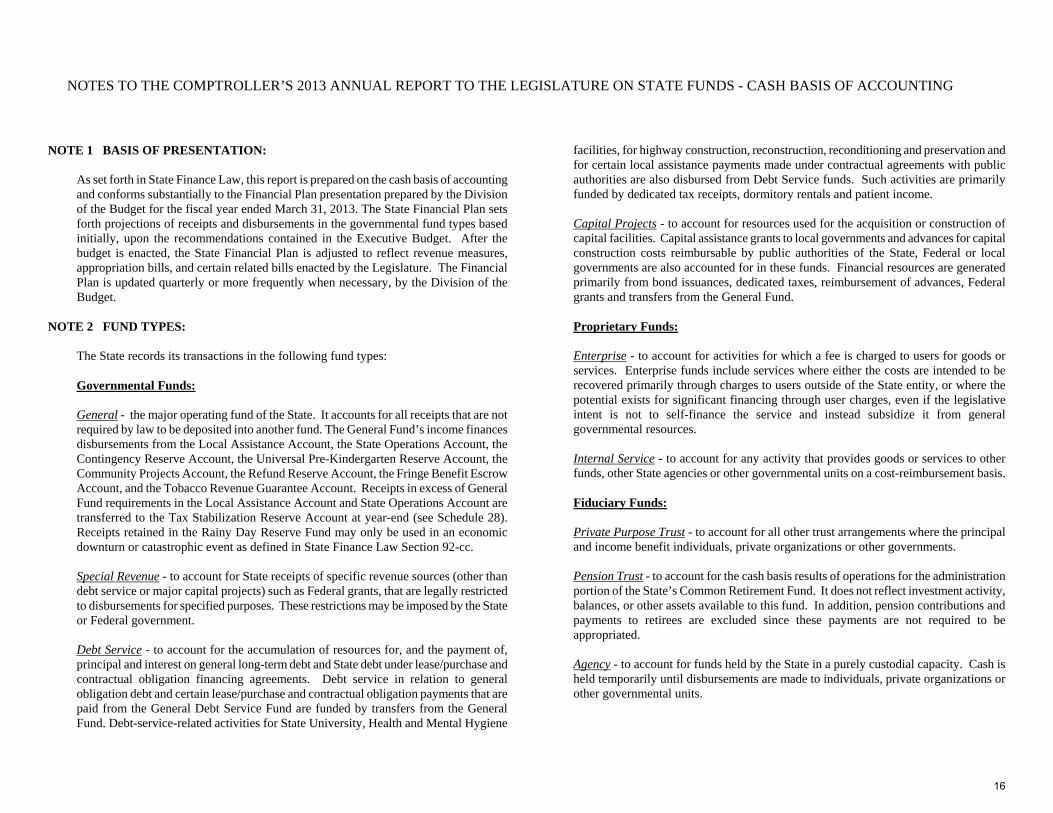
NOTES TO THE COMPTROLLER’S 2013 ANNUAL REPORT TO THE LEGISLATURE ON STATE FUNDS - CASH BASIS OF ACCOUNTING
NOTE 1 BASIS OF PRESENTATION:
As set forth in State Finance Law, this report is prepared on the cash basis of accounting and conforms substantially to the Financial Plan presentation prepared by the Division of the Budget for the fiscal year ended March 31, 2013. The State Financial Plan sets forth projections of receipts and disbursements in the governmental fund types based initially, upon the recommendations contained in the Executive Budget. After the budget is enacted, the State Financial Plan is adjusted to reflect revenue measures, appropriation bills, and certain related bills enacted by the Legislature. The Financial Plan is updated quarterly or more frequently when necessary, by the Division of the Budget.
NOTE 2 FUND TYPES:
The State records its transactions in the following fund types:
Governmental Funds:
General - the major operating fund of the State. It accounts for all receipts that are not required by law to be deposited into another fund. The General Fund’s income finances disbursements from the Local Assistance Account, the State Operations Account, the Contingency Reserve Account, the Universal Pre-Kindergarten Reserve Account, the Community Projects Account, the Refund Reserve Account, the Fringe Benefit Escrow Account, and the Tobacco Revenue Guarantee Account. Receipts in excess of General Fund requirements in the Local Assistance Account and State Operations Account are transferred to the Tax Stabilization Reserve Account at year-end (see Schedule 28). Receipts retained in the Rainy Day Reserve Fund may only be used in an economic downturn or catastrophic event as defined in State Finance Law Section 92-cc. Special Revenue - to account for State receipts of specific revenue sources (other than debt service or major capital projects) such as Federal grants, that are legally restricted to disbursements for specified purposes. These restrictions may be imposed by the State or Federal government.
Debt Service - to account for the accumulation of resources for, and the payment of, principal and interest on general long-term debt and State debt under lease/purchase and contractual obligation financing agreements. Debt service in relation to general obligation debt and certain lease/purchase and contractual obligation payments that are paid from the General Debt Service Fund are funded by transfers from the General Fund. Debt-service-related activities for State University, Health and Mental Hygiene
facilities, for highway construction, reconstruction, reconditioning and preservation and for certain local assistance payments made under contractual agreements with public authorities are also disbursed from Debt Service funds. Such activities are primarily funded by dedicated tax receipts, dormitory rentals and patient income. Capital Projects - to account for resources used for the acquisition or construction of capital facilities. Capital assistance grants to local governments and advances for capital construction costs reimbursable by public authorities of the State, Federal or local governments are also accounted for in these funds. Financial resources are generated primarily from bond issuances, dedicated taxes, reimbursement of advances, Federal grants and transfers from the General Fund.
Proprietary Funds:
Enterprise - to account for activities for which a fee is charged to users for goods or services. Enterprise funds include services where either the costs are intended to be recovered primarily through charges to users outside of the State entity, or where the potential exists for significant financing through user charges, even if the legislative intent is not to self-finance the service and instead subsidize it from general governmental resources.
Internal Service - to account for any activity that provides goods or services to other funds, other State agencies or other governmental units on a cost-reimbursement basis.
Fiduciary Funds:
Private Purpose Trust - to account for all other trust arrangements where the principal and income benefit individuals, private organizations or other governments. Pension Trust - to account for the cash basis results of operations for the administration portion of the State’s Common Retirement Fund. It does not reflect investment activity, balances, or other assets available to this fund. In addition, pension contributions and payments to retirees are excluded since these payments are not required to be appropriated.
Agency - to account for funds held by the State in a purely custodial capacity. Cash is held temporarily until disbursements are made to individuals, private organizations or other governmental units.
16
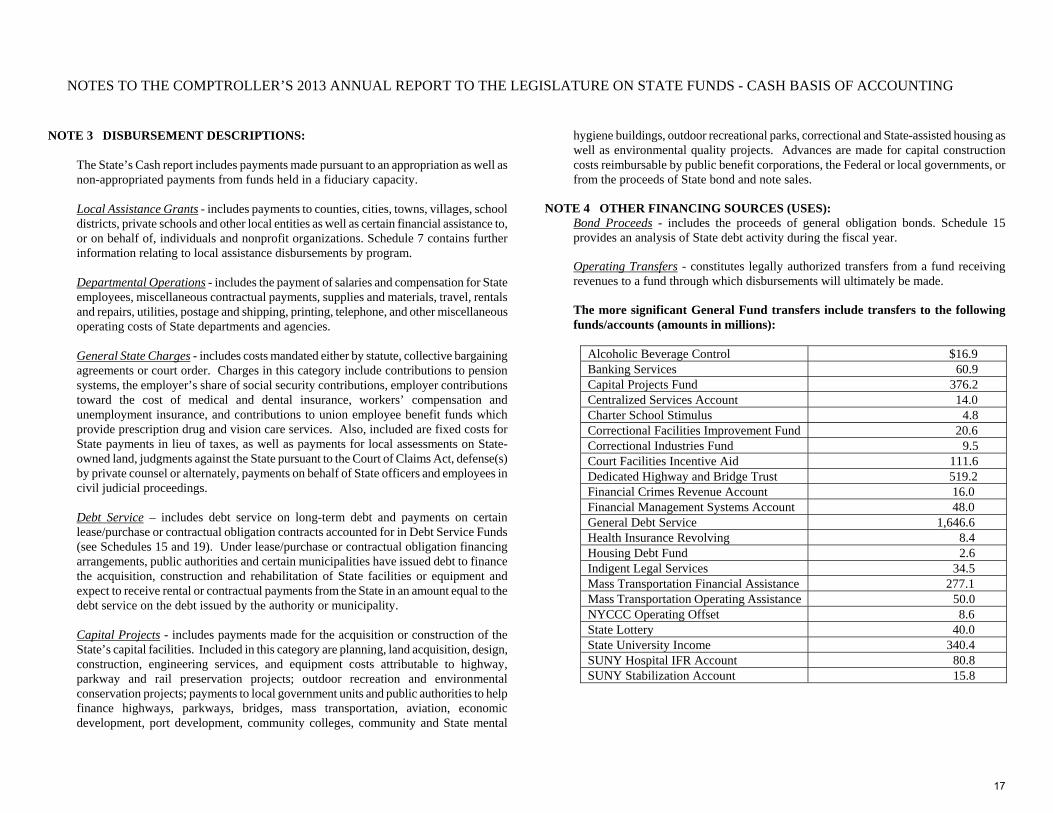
NOTES TO THE COMPTROLLER’S 2013 ANNUAL REPORT TO THE LEGISLATURE ON STATE FUNDS - CASH BASIS OF ACCOUNTING
NOTE 3 DISBURSEMENT DESCRIPTIONS:
The State’s Cash report includes payments made pursuant to an appropriation as well as non-appropriated payments from funds held in a fiduciary capacity.
Local Assistance Grants - includes payments to counties, cities, towns, villages, school districts, private schools and other local entities as well as certain financial assistance to, or on behalf of, individuals and nonprofit organizations. Schedule 7 contains further information relating to local assistance disbursements by program.
Departmental Operations - includes the payment of salaries and compensation for State employees, miscellaneous contractual payments, supplies and materials, travel, rentals and repairs, utilities, postage and shipping, printing, telephone, and other miscellaneous operating costs of State departments and agencies.
General State Charges - includes costs mandated either by statute, collective bargaining agreements or court order. Charges in this category include contributions to pension systems, the employer’s share of social security contributions, employer contributions toward the cost of medical and dental insurance, workers’ compensation and unemployment insurance, and contributions to union employee benefit funds which provide prescription drug and vision care services. Also, included are fixed costs for State payments in lieu of taxes, as well as payments for local assessments on State- owned land, judgments against the State pursuant to the Court of Claims Act, defense(s) by private counsel or alternately, payments on behalf of State officers and employees in civil judicial proceedings.
Debt Service – includes debt service on long-term debt and payments on certain lease/purchase or contractual obligation contracts accounted for in Debt Service Funds (see Schedules 15 and 19). Under lease/purchase or contractual obligation financing arrangements, public authorities and certain municipalities have issued debt to finance the acquisition, construction and rehabilitation of State facilities or equipment and expect to receive rental or contractual payments from the State in an amount equal to the debt service on the debt issued by the authority or municipality. Capital Projects - includes payments made for the acquisition or construction of the State’s capital facilities. Included in this category are planning, land acquisition, design, construction, engineering services, and equipment costs attributable to highway, parkway and rail preservation projects; outdoor recreation and environmental conservation projects; payments to local government units and public authorities to help finance highways, parkways, bridges, mass transportation, aviation, economic development, port development, community colleges, community and State mental
hygiene buildings, outdoor recreational parks, correctional and State-assisted housing as well as environmental quality projects. Advances are made for capital construction costs reimbursable by public benefit corporations, the Federal or local governments, or from the proceeds of State bond and note sales.
NOTE 4 OTHER FINANCING SOURCES (USES): Bond Proceeds - includes the proceeds of general obligation bonds. Schedule 15 provides an analysis of State debt activity during the fiscal year. Operating Transfers - constitutes legally authorized transfers from a fund receiving revenues to a fund through which disbursements will ultimately be made. The more significant General Fund transfers include transfers to the following funds/accounts (amounts in millions):
Alcoholic Beverage Control $16.9 Banking Services 60.9 Capital Projects Fund 376.2 Centralized Services Account 14.0 Charter School Stimulus 4.8 Correctional Facilities Improvement Fund 20.6 Correctional Industries Fund 9.5 Court Facilities Incentive Aid 111.6 Dedicated Highway and Bridge Trust 519.2 Financial Crimes Revenue Account 16.0 Financial Management Systems Account 48.0 General Debt Service 1,646.6 Health Insurance Revolving 8.4 Housing Debt Fund 2.6 Indigent Legal Services 34.5 Mass Transportation Financial Assistance 277.1 Mass Transportation Operating Assistance 50.0 NYCCC Operating Offset 8.6 State Lottery 40.0 State University Income 340.4 SUNY Hospital IFR Account 80.8 SUNY Stabilization Account 15.8
17
NOTES TO THE COMPTROLLER’S 2013 ANNUAL REPORT TO THE LEGISLATURE ON STATE FUNDS - CASH BASIS OF ACCOUNTING
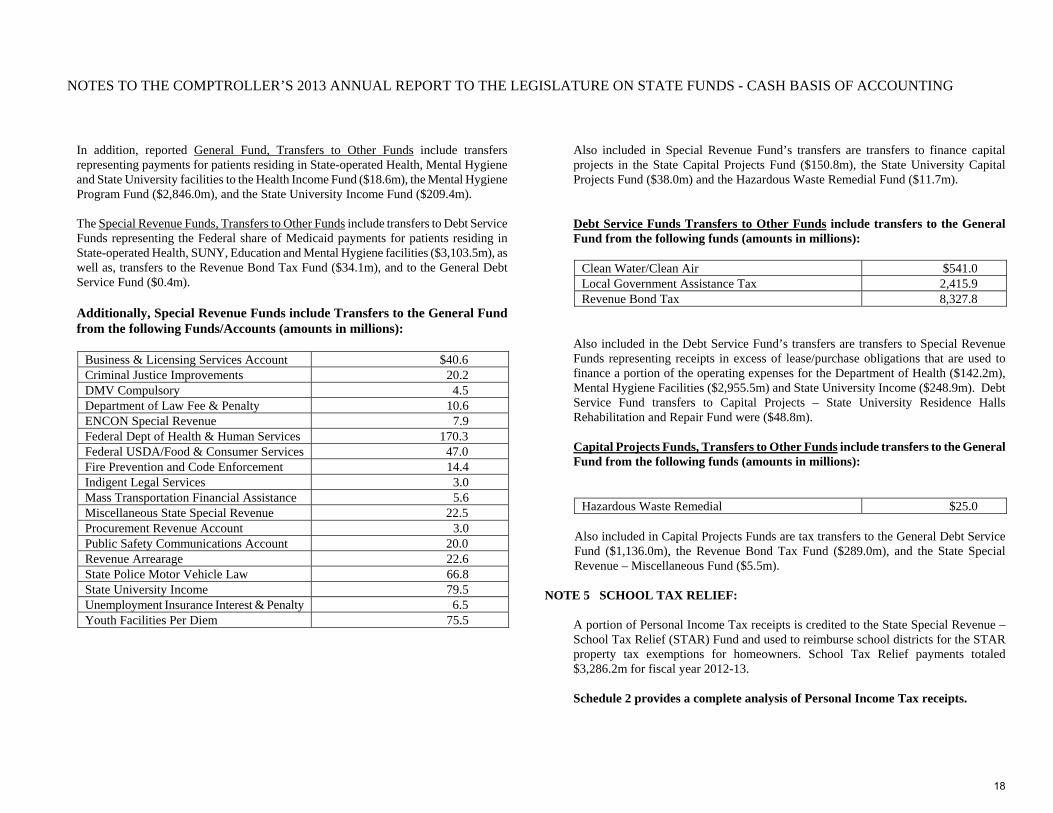
In addition, reported General Fund, Transfers to Other Funds include transfers representing payments for patients residing in State-operated Health, Mental Hygiene and State University facilities to the Health Income Fund ($18.6m), the Mental Hygiene Program Fund ($2,846.0m), and the State University Income Fund ($209.4m). The Special Revenue Funds, Transfers to Other Funds include transfers to Debt Service Funds representing the Federal share of Medicaid payments for patients residing in State-operated Health, SUNY, Education and Mental Hygiene facilities ($3,103.5m), as well as, transfers to the Revenue Bond Tax Fund ($34.1m), and to the General Debt Service Fund ($0.4m). Additionally, Special Revenue Funds include Transfers to the General Fund from the following Funds/Accounts (amounts in millions):
Business & Licensing Services Account $40.6 Criminal Justice Improvements 20.2 DMV Compulsory 4.5 Department of Law Fee & Penalty 10.6 ENCON Special Revenue 7.9 Federal Dept of Health & Human Services 170.3 Federal USDA/Food & Consumer Services 47.0 Fire Prevention and Code Enforcement 14.4 Indigent Legal Services 3.0 Mass Transportation Financial Assistance 5.6 Miscellaneous State Special Revenue 22.5 Procurement Revenue Account 3.0 Public Safety Communications Account 20.0 Revenue Arrearage 22.6 State Police Motor Vehicle Law 66.8 State University Income 79.5 Unemployment Insurance Interest & Penalty 6.5 Youth Facilities Per Diem 75.5
Also included in Special Revenue Fund’s transfers are transfers to finance capital projects in the State Capital Projects Fund ($150.8m), the State University Capital Projects Fund ($38.0m) and the Hazardous Waste Remedial Fund ($11.7m).
Debt Service Funds Transfers to Other Funds include transfers to the General Fund from the following funds (amounts in millions):
Clean Water/Clean Air $541.0 Local Government Assistance Tax 2,415.9 Revenue Bond Tax 8,327.8
Also included in the Debt Service Fund’s transfers are transfers to Special Revenue Funds representing receipts in excess of lease/purchase obligations that are used to finance a portion of the operating expenses for the Department of Health ($142.2m), Mental Hygiene Facilities ($2,955.5m) and State University Income ($248.9m). Debt Service Fund transfers to Capital Projects – State University Residence Halls Rehabilitation and Repair Fund were ($48.8m). Capital Projects Funds, Transfers to Other Funds include transfers to the General Fund from the following funds (amounts in millions):
Hazardous Waste Remedial $25.0
Also included in Capital Projects Funds are tax transfers to the General Debt Service Fund ($1,136.0m), the Revenue Bond Tax Fund ($289.0m), and the State Special Revenue – Miscellaneous Fund ($5.5m).
NOTE 5 SCHOOL TAX RELIEF:
A portion of Personal Income Tax receipts is credited to the State Special Revenue – School Tax Relief (STAR) Fund and used to reimburse school districts for the STAR property tax exemptions for homeowners. School Tax Relief payments totaled $3,286.2m for fiscal year 2012-13. Schedule 2 provides a complete analysis of Personal Income Tax receipts.
18
NOTES TO THE COMPTROLLER’S 2013 ANNUAL REPORT TO THE LEGISLATURE ON STATE FUNDS - CASH BASIS OF ACCOUNTING
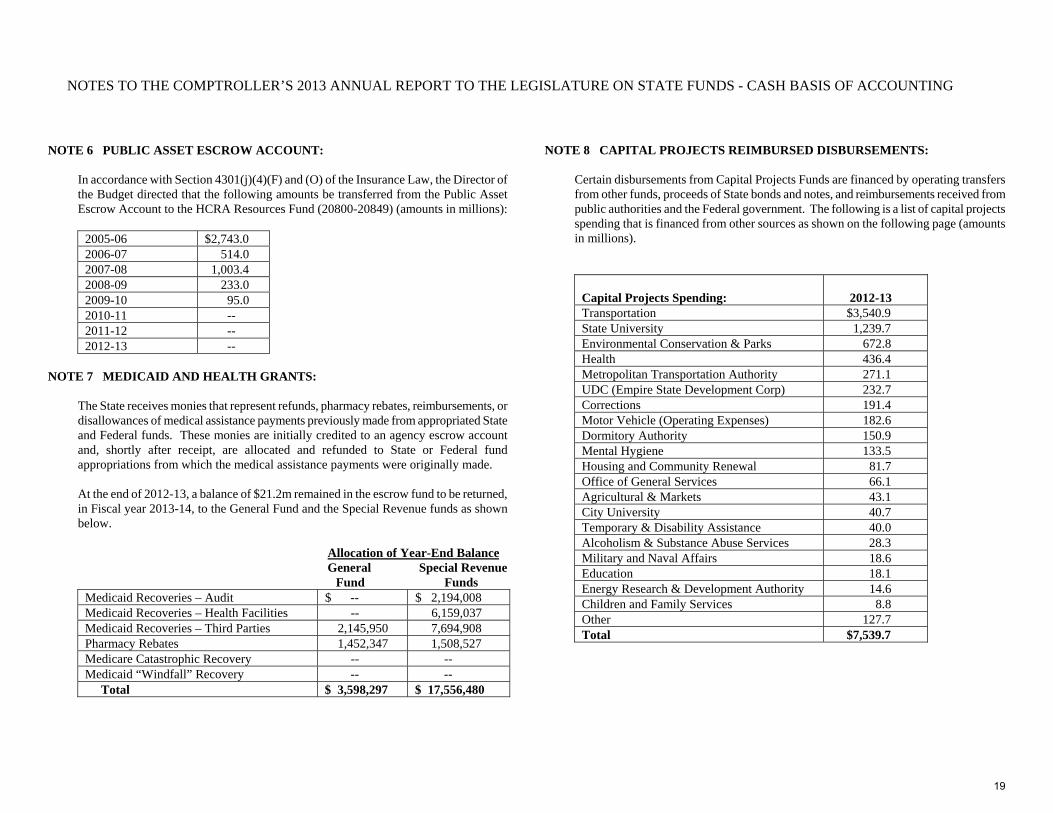
NOTE 6 PUBLIC ASSET ESCROW ACCOUNT:
In accordance with Section 4301(j)(4)(F) and (O) of the Insurance Law, the Director of the Budget directed that the following amounts be transferred from the Public Asset Escrow Account to the HCRA Resources Fund (20800-20849) (amounts in millions):
2005-06 $2,743.0 2006-07 514.0 2007-08 1,003.4 2008-09 233.0 2009-10 95.0 2010-11 -- 2011-12 -- 2012-13 --
NOTE 7 MEDICAID AND HEALTH GRANTS:
The State receives monies that represent refunds, pharmacy rebates, reimbursements, or disallowances of medical assistance payments previously made from appropriated State and Federal funds. These monies are initially credited to an agency escrow account and, shortly after receipt, are allocated and refunded to State or Federal fund appropriations from which the medical assistance payments were originally made. At the end of 2012-13, a balance of $21.2m remained in the escrow fund to be returned, in Fiscal year 2013-14, to the General Fund and the Special Revenue funds as shown below.
Allocation of Year-End Balance General Special Revenue
Fund Funds Medicaid Recoveries – Audit $ -- $ 2,194,008 Medicaid Recoveries – Health Facilities -- 6,159,037 Medicaid Recoveries – Third Parties 2,145,950 7,694,908 Pharmacy Rebates 1,452,347 1,508,527 Medicare Catastrophic Recovery -- -- Medicaid “Windfall” Recovery -- -- Total $ 3,598,297 $ 17,556,480
NOTE 8 CAPITAL PROJECTS REIMBURSED DISBURSEMENTS:
Certain disbursements from Capital Projects Funds are financed by operating transfers from other funds, proceeds of State bonds and notes, and reimbursements received from public authorities and the Federal government. The following is a list of capital projects spending that is financed from other sources as shown on the following page (amounts in millions).
Capital Projects Spending:
2012-13
Transportation $3,540.9 State University 1,239.7 Environmental Conservation & Parks 672.8 Health 436.4 Metropolitan Transportation Authority 271.1 UDC (Empire State Development Corp) 232.7 Corrections 191.4 Motor Vehicle (Operating Expenses) 182.6 Dormitory Authority 150.9 Mental Hygiene 133.5 Housing and Community Renewal 81.7 Office of General Services 66.1 Agricultural & Markets 43.1 City University 40.7 Temporary & Disability Assistance 40.0 Alcoholism & Substance Abuse Services 28.3 Military and Naval Affairs 18.6 Education 18.1 Energy Research & Development Authority 14.6 Children and Family Services 8.8 Other 127.7 Total $7,539.7
19
NOTES TO THE COMPTROLLER’S 2013 ANNUAL REPORT TO THE LEGISLATURE ON STATE FUNDS - CASH BASIS OF ACCOUNTING
Source of Financing
2012-13
Percentage of Spending
Supported by:
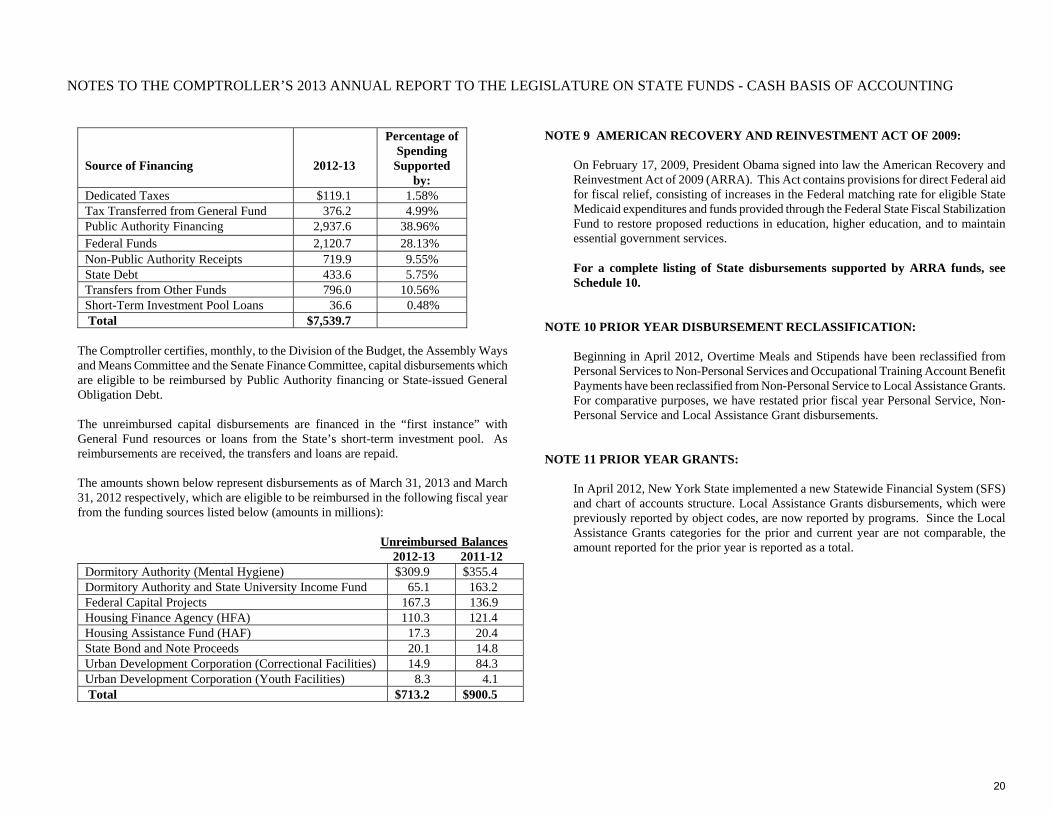
Dedicated Taxes $119.1 1.58% Tax Transferred from General Fund 376.2 4.99% Public Authority Financing 2,937.6 38.96% Federal Funds 2,120.7 28.13% Non-Public Authority Receipts 719.9 9.55% State Debt 433.6 5.75% Transfers from Other Funds 796.0 10.56% Short-Term Investment Pool Loans 36.6 0.48% Total $7,539.7
The Comptroller certifies, monthly, to the Division of the Budget, the Assembly Ways and Means Committee and the Senate Finance Committee, capital disbursements which are eligible to be reimbursed by Public Authority financing or State-issued General Obligation Debt. The unreimbursed capital disbursements are financed in the “first instance” with General Fund resources or loans from the State’s short-term investment pool. As reimbursements are received, the transfers and loans are repaid. The amounts shown below represent disbursements as of March 31, 2013 and March 31, 2012 respectively, which are eligible to be reimbursed in the following fiscal year from the funding sources listed below (amounts in millions): Unreimbursed Balances
2012-13 2011-12 Dormitory Authority (Mental Hygiene) $309.9 $355.4 Dormitory Authority and State University Income Fund 65.1 163.2 Federal Capital Projects 167.3 136.9 Housing Finance Agency (HFA) 110.3 121.4 Housing Assistance Fund (HAF) 17.3 20.4 State Bond and Note Proceeds 20.1 14.8 Urban Development Corporation (Correctional Facilities) 14.9 84.3 Urban Development Corporation (Youth Facilities) 8.3 4.1 Total $713.2 $900.5
NOTE 9 AMERICAN RECOVERY AND REINVESTMENT ACT OF 2009:
On February 17, 2009, President Obama signed into law the American Recovery and Reinvestment Act of 2009 (ARRA). This Act contains provisions for direct Federal aid for fiscal relief, consisting of increases in the Federal matching rate for eligible State Medicaid expenditures and funds provided through the Federal State Fiscal Stabilization Fund to restore proposed reductions in education, higher education, and to maintain essential government services. For a complete listing of State disbursements supported by ARRA funds, see Schedule 10.
NOTE 10 PRIOR YEAR DISBURSEMENT RECLASSIFICATION:
Beginning in April 2012, Overtime Meals and Stipends have been reclassified from Personal Services to Non-Personal Services and Occupational Training Account Benefit Payments have been reclassified from Non-Personal Service to Local Assistance Grants. For comparative purposes, we have restated prior fiscal year Personal Service, Non-Personal Service and Local Assistance Grant disbursements.
NOTE 11 PRIOR YEAR GRANTS:
In April 2012, New York State implemented a new Statewide Financial System (SFS) and chart of accounts structure. Local Assistance Grants disbursements, which were previously reported by object codes, are now reported by programs. Since the Local Assistance Grants categories for the prior and current year are not comparable, the amount reported for the prior year is reported as a total.
20
NOTES TO THE COMPTROLLER’S 2013 ANNUAL REPORT TO THE LEGISLATURE ON STATE FUNDS CASH BASIS OF ACCOUNTING
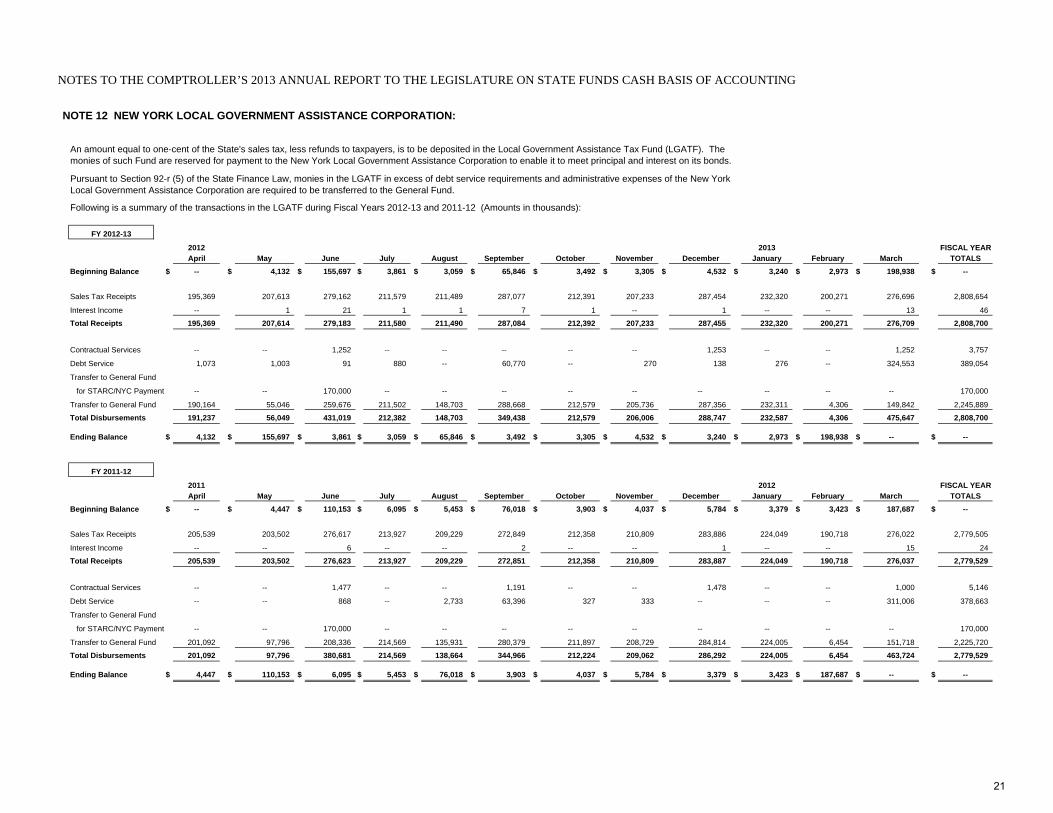
NOTE 12 NEW YORK LOCAL GOVERNMENT ASSISTANCE CORPORATION:
Following is a summary of the transactions in the LGATF during Fiscal Years 2012-13 and 2011-12 (Amounts in thousands):
FY 2012-13
2012 2013 FISCAL YEARApril May June July August September October November December January February March TOTALS
Beginning Balance $ -- $ 4,132 $ 155,697 $ 3,861 $ 3,059 $ 65,846 $ 3,492 $ 3,305 $ 4,532 $ 3,240 $ 2,973 $ 198,938 $ --
Sales Tax Receipts 195,369 207,613 279,162 211,579 211,489 287,077 212,391 207,233 287,454 232,320 200,271 276,696 2,808,654
Interest Income -- 1 21 1 1 7 1 -- 1 -- -- 13 46
Total Receipts 195,369 207,614 279,183 211,580 211,490 287,084 212,392 207,233 287,455 232,320 200,271 276,709 2,808,700
Contractual Services -- -- 1,252 -- -- -- -- -- 1,253 -- -- 1,252 3,757
Debt Service 1,073 1,003 91 880 -- 60,770 -- 270 138 276 -- 324,553 389,054
Transfer to General Fund
for STARC/NYC Payment -- -- 170,000 -- -- -- -- -- -- -- -- -- 170,000
Transfer to General Fund 190,164 55,046 259,676 211,502 148,703 288,668 212,579 205,736 287,356 232,311 4,306 149,842 2,245,889
Total Disbursements 191,237 56,049 431,019 212,382 148,703 349,438 212,579 206,006 288,747 232,587 4,306 475,647 2,808,700
Ending Balance $ 4,132 $ 155,697 $ 3,861 $ 3,059 $ 65,846 $ 3,492 $ 3,305 $ 4,532 $ 3,240 $ 2,973 $ 198,938 $ -- $ --
FY 2011-12
2011 2012 FISCAL YEARApril May June July August September October November December January February March TOTALS
Beginning Balance $ -- $ 4,447 $ 110,153 $ 6,095 $ 5,453 $ 76,018 $ 3,903 $ 4,037 $ 5,784 $ 3,379 $ 3,423 $ 187,687 $ --
Sales Tax Receipts 205,539 203,502 276,617 213,927 209,229 272,849 212,358 210,809 283,886 224,049 190,718 276,022 2,779,505
Interest Income -- -- 6 -- -- 2 -- -- 1 -- -- 15 24
Total Receipts 205,539 203,502 276,623 213,927 209,229 272,851 212,358 210,809 283,887 224,049 190,718 276,037 2,779,529
Contractual Services -- -- 1,477 -- -- 1,191 -- -- 1,478 -- -- 1,000 5,146
Debt Service -- -- 868 -- 2,733 63,396 327 333 -- -- -- 311,006 378,663
Transfer to General Fund
for STARC/NYC Payment -- -- 170,000 -- -- -- -- -- -- -- -- -- 170,000
Transfer to General Fund 201,092 97,796 208,336 214,569 135,931 280,379 211,897 208,729 284,814 224,005 6,454 151,718 2,225,720
Total Disbursements 201,092 97,796 380,681 214,569 138,664 344,966 212,224 209,062 286,292 224,005 6,454 463,724 2,779,529
Ending Balance $ 4,447 $ 110,153 $ 6,095 $ 5,453 $ 76,018 $ 3,903 $ 4,037 $ 5,784 $ 3,379 $ 3,423 $ 187,687 $ -- $ --
An amount equal to one-cent of the State's sales tax, less refunds to taxpayers, is to be deposited in the Local Government Assistance Tax Fund (LGATF). The monies of such Fund are reserved for payment to the New York Local Government Assistance Corporation to enable it to meet principal and interest on its bonds.
Pursuant to Section 92-r (5) of the State Finance Law, monies in the LGATF in excess of debt service requirements and administrative expenses of the New York Local Government Assistance Corporation are required to be transferred to the General Fund.
21
NOTES TO THE COMPTROLLER’S 2013 ANNUAL REPORT TO THE LEGISLATURE ON STATE FUNDS CASH BASIS OF ACCOUNTING
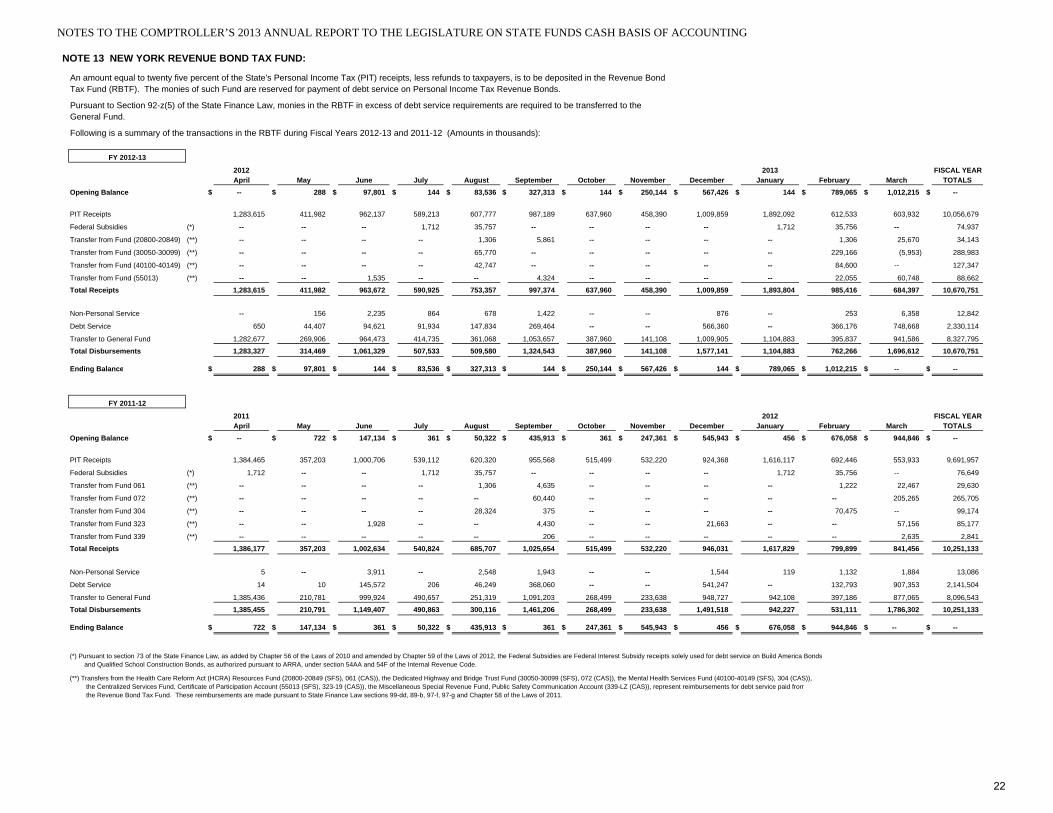
NOTE 13 NEW YORK REVENUE BOND TAX FUND:
An amount equal to twenty five percent of the State's Personal Income Tax (PIT) receipts, less refunds to taxpayers, is to be deposited in the Revenue BondTax Fund (RBTF). The monies of such Fund are reserved for payment of debt service on Personal Income Tax Revenue Bonds.
Pursuant to Section 92-z(5) of the State Finance Law, monies in the RBTF in excess of debt service requirements are required to be transferred to the General Fund.
Following is a summary of the transactions in the RBTF during Fiscal Years 2012-13 and 2011-12 (Amounts in thousands):
FY 2012-13
2012 2013 FISCAL YEARApril May June July August September October November December January February March TOTALS
Opening Balance $ -- $ 288 $ 97,801 $ 144 $ 83,536 $ 327,313 $ 144 $ 250,144 $ 567,426 $ 144 $ 789,065 $ 1,012,215 $ --
PIT Receipts 1,283,615 411,982 962,137 589,213 607,777 987,189 637,960 458,390 1,009,859 1,892,092 612,533 603,932 10,056,679
Federal Subsidies (*) -- -- -- 1,712 35,757 -- -- -- -- 1,712 35,756 -- 74,937
Transfer from Fund (20800-20849) (**) -- -- -- -- 1,306 5,861 -- -- -- -- 1,306 25,670 34,143
Transfer from Fund (30050-30099) (**) -- -- -- -- 65,770 -- -- -- -- -- 229,166 (5,953) 288,983
Transfer from Fund (40100-40149) (**) -- -- -- -- 42,747 -- -- -- -- -- 84,600 -- 127,347
Transfer from Fund (55013) (**) -- -- 1,535 -- -- 4,324 -- -- -- -- 22,055 60,748 88,662
Total Receipts 1,283,615 411,982 963,672 590,925 753,357 997,374 637,960 458,390 1,009,859 1,893,804 985,416 684,397 10,670,751
Non-Personal Service -- 156 2,235 864 678 1,422 -- -- 876 -- 253 6,358 12,842
Debt Service 650 44,407 94,621 91,934 147,834 269,464 -- -- 566,360 -- 366,176 748,668 2,330,114
Transfer to General Fund 1,282,677 269,906 964,473 414,735 361,068 1,053,657 387,960 141,108 1,009,905 1,104,883 395,837 941,586 8,327,795
Total Disbursements 1,283,327 314,469 1,061,329 507,533 509,580 1,324,543 387,960 141,108 1,577,141 1,104,883 762,266 1,696,612 10,670,751
Ending Balance $ 288 $ 97,801 $ 144 $ 83,536 $ 327,313 $ 144 $ 250,144 $ 567,426 $ 144 $ 789,065 $ 1,012,215 $ -- $ --
FY 2011-12
2011 2012 FISCAL YEARApril May June July August September October November December January February March TOTALS
Opening Balance $ -- $ 722 $ 147,134 $ 361 $ 50,322 $ 435,913 $ 361 $ 247,361 $ 545,943 $ 456 $ 676,058 $ 944,846 $ --
PIT Receipts 1,384,465 357,203 1,000,706 539,112 620,320 955,568 515,499 532,220 924,368 1,616,117 692,446 553,933 9,691,957
Federal Subsidies (*) 1,712 -- -- 1,712 35,757 -- -- -- -- 1,712 35,756 -- 76,649
Transfer from Fund 061 (**) -- -- -- -- 1,306 4,635 -- -- -- -- 1,222 22,467 29,630
Transfer from Fund 072 (**) -- -- -- -- -- 60,440 -- -- -- -- -- 205,265 265,705
Transfer from Fund 304 (**) -- -- -- -- 28,324 375 -- -- -- -- 70,475 -- 99,174
Transfer from Fund 323 (**) -- -- 1,928 -- -- 4,430 -- -- 21,663 -- -- 57,156 85,177
Transfer from Fund 339 (**) -- -- -- -- -- 206 -- -- -- -- -- 2,635 2,841
Total Receipts 1,386,177 357,203 1,002,634 540,824 685,707 1,025,654 515,499 532,220 946,031 1,617,829 799,899 841,456 10,251,133
Non-Personal Service 5 -- 3,911 -- 2,548 1,943 -- -- 1,544 119 1,132 1,884 13,086
Debt Service 14 10 145,572 206 46,249 368,060 -- -- 541,247 -- 132,793 907,353 2,141,504
Transfer to General Fund 1,385,436 210,781 999,924 490,657 251,319 1,091,203 268,499 233,638 948,727 942,108 397,186 877,065 8,096,543
Total Disbursements 1,385,455 210,791 1,149,407 490,863 300,116 1,461,206 268,499 233,638 1,491,518 942,227 531,111 1,786,302 10,251,133
Ending Balance $ 722 $ 147,134 $ 361 $ 50,322 $ 435,913 $ 361 $ 247,361 $ 545,943 $ 456 $ 676,058 $ 944,846 $ -- $ --
(*) Pursuant to section 73 of the State Finance Law, as added by Chapter 56 of the Laws of 2010 and amended by Chapter 59 of the Laws of 2012, the Federal Subsidies are Federal Interest Subsidy receipts solely used for debt service on Build America Bonds and Qualified School Construction Bonds, as authorized pursuant to ARRA, under section 54AA and 54F of the Internal Revenue Code.
(**) Transfers from the Health Care Reform Act (HCRA) Resources Fund (20800-20849 (SFS), 061 (CAS)), the Dedicated Highway and Bridge Trust Fund (30050-30099 (SFS), 072 (CAS)), the Mental Health Services Fund (40100-40149 (SFS), 304 (CAS)), the Centralized Services Fund, Certificate of Participation Account (55013 (SFS), 323-19 (CAS)), the Miscellaneous Special Revenue Fund, Public Safety Communication Account (339-LZ (CAS)), represent reimbursements for debt service paid from the Revenue Bond Tax Fund. These reimbursements are made pursuant to State Finance Law sections 99-dd, 89-b, 97-f, 97-g and Chapter 58 of the Laws of 2011.
22
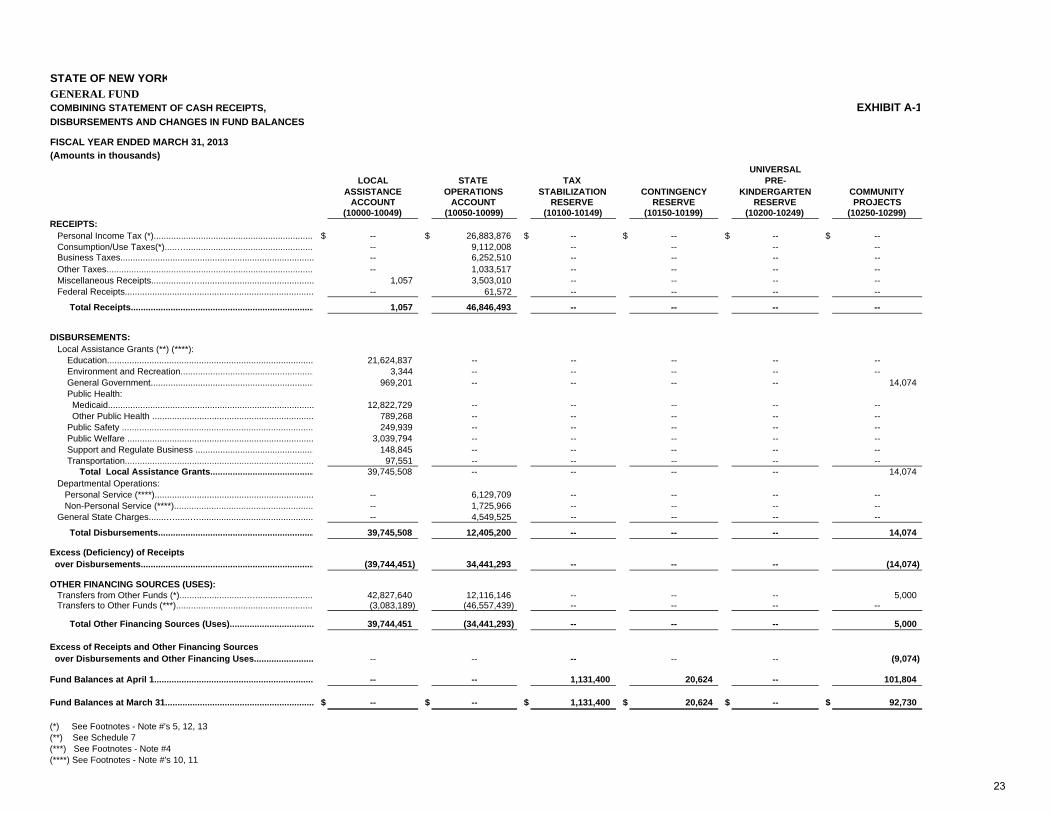
STATE OF NEW YORKGENERAL FUNDCOMBINING STATEMENT OF CASH RECEIPTS, EXHIBIT A-1DISBURSEMENTS AND CHANGES IN FUND BALANCES
FISCAL YEAR ENDED MARCH 31, 2013(Amounts in thousands)
UNIVERSALLOCAL STATE TAX PRE-
ASSISTANCE OPERATIONS STABILIZATION CONTINGENCY KINDERGARTEN COMMUNITYACCOUNT ACCOUNT RESERVE RESERVE RESERVE PROJECTS
(10000-10049) (10050-10099) (10100-10149) (10150-10199) (10200-10249) (10250-10299)RECEIPTS: Personal Income Tax (*)................................................................. $ -- $ 26,883,876 $ -- $ -- $ -- $ -- Consumption/Use Taxes(*).....….................................................... -- 9,112,008 -- -- -- -- Business Taxes.............................................................................. -- 6,252,510 -- -- -- -- Other Taxes.................................................................................... -- 1,033,517 -- -- -- -- Miscellaneous Receipts................….............................................. 1,057 3,503,010 -- -- -- -- Federal Receipts............................................................................ -- 61,572 -- -- -- --
Total Receipts.......................................................................... 1,057 46,846,493 -- -- -- --
DISBURSEMENTS: Local Assistance Grants (**) (****): Education................................................................................... 21,624,837 -- -- -- -- -- Environment and Recreation...................................................... 3,344 -- -- -- -- -- General Government.................................................................. 969,201 -- -- -- -- 14,074 Public Health: Medicaid................................................................................... 12,822,729 -- -- -- -- -- Other Public Health ................................................................. 789,268 -- -- -- -- -- Public Safety ............................................................................. 249,939 -- -- -- -- -- Public Welfare ........................................................................... 3,039,794 -- -- -- -- -- Support and Regulate Business ................................................ 148,845 -- -- -- -- -- Transportation............................................................................ 97,551 -- -- -- -- -- Total Local Assistance Grants.......................................... 39,745,508 -- -- -- -- 14,074 Departmental Operations: Personal Service (****)................................................................ -- 6,129,709 -- -- -- -- Non-Personal Service (****)........................................................ -- 1,725,966 -- -- -- -- General State Charges.......…......….............................................. -- 4,549,525 -- -- -- --
Total Disbursements............................................................... 39,745,508 12,405,200 -- -- -- 14,074
Excess (Deficiency) of Receipts over Disbursements...................................................................... (39,744,451) 34,441,293 -- -- -- (14,074)
OTHER FINANCING SOURCES (USES): Transfers from Other Funds (*)...........................…........................ 42,827,640 12,116,146 -- -- -- 5,000 Transfers to Other Funds (***)........................................................ (3,083,189) (46,557,439) -- -- -- --
Total Other Financing Sources (Uses).................................. 39,744,451 (34,441,293) -- -- -- 5,000
Excess of Receipts and Other Financing Sources over Disbursements and Other Financing Uses........................ -- -- -- -- -- (9,074)
Fund Balances at April 1................................................................ -- -- 1,131,400 20,624 -- 101,804
Fund Balances at March 31............................................................ $ -- $ -- $ 1,131,400 $ 20,624 $ -- $ 92,730
(*) See Footnotes - Note #'s 5, 12, 13(**) See Schedule 7(***) See Footnotes - Note #4(****) See Footnotes - Note #'s 10, 11
23
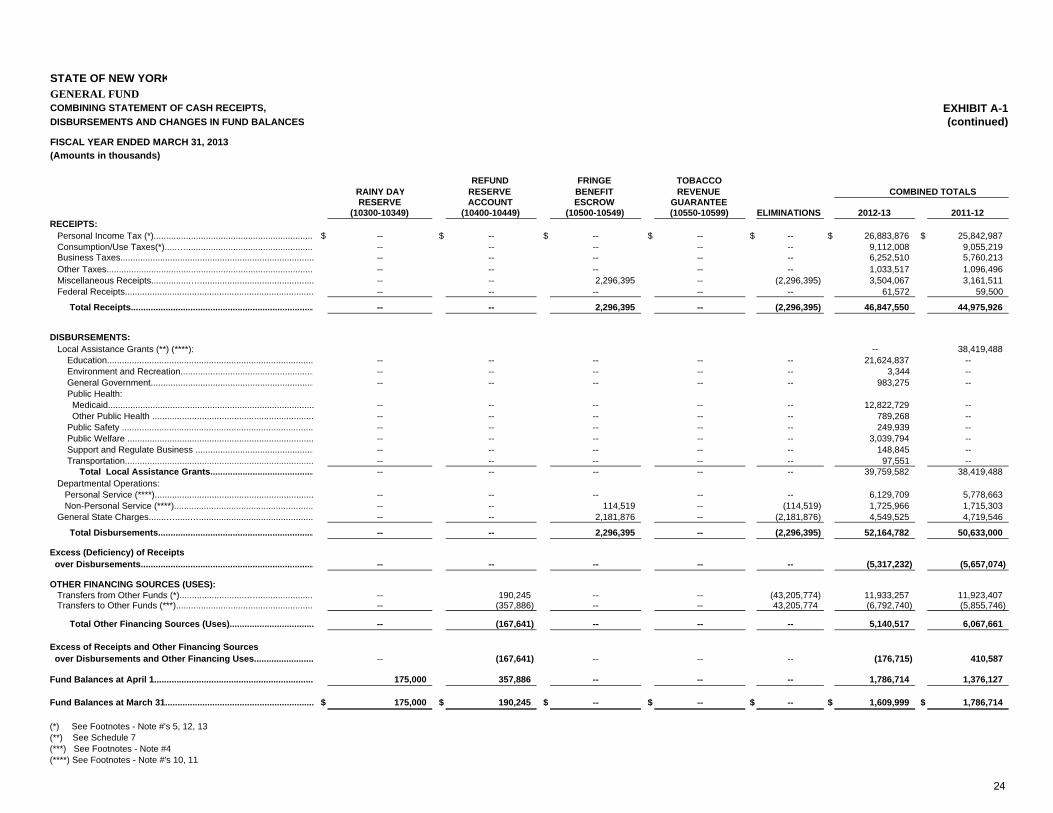
STATE OF NEW YORKGENERAL FUNDCOMBINING STATEMENT OF CASH RECEIPTS,DISBURSEMENTS AND CHANGES IN FUND BALANCES
FISCAL YEAR ENDED MARCH 31, 2013(Amounts in thousands)
RECEIPTS: Personal Income Tax (*)................................................................. Consumption/Use Taxes(*).....….................................................... Business Taxes.............................................................................. Other Taxes.................................................................................... Miscellaneous Receipts................….............................................. Federal Receipts............................................................................
Total Receipts..........................................................................
DISBURSEMENTS: Local Assistance Grants (**) (****): Education................................................................................... Environment and Recreation...................................................... General Government.................................................................. Public Health: Medicaid................................................................................... Other Public Health ................................................................. Public Safety ............................................................................. Public Welfare ........................................................................... Support and Regulate Business ................................................ Transportation............................................................................ Total Local Assistance Grants.......................................... Departmental Operations: Personal Service (****)................................................................ Non-Personal Service (****)........................................................ General State Charges.......…......…..............................................
Total Disbursements...............................................................
Excess (Deficiency) of Receipts over Disbursements......................................................................
OTHER FINANCING SOURCES (USES): Transfers from Other Funds (*)...........................…........................ Transfers to Other Funds (***)........................................................
Total Other Financing Sources (Uses)..................................
Excess of Receipts and Other Financing Sources over Disbursements and Other Financing Uses........................
Fund Balances at April 1................................................................
Fund Balances at March 31............................................................
(*) See Footnotes - Note #'s 5, 12, 13(**) See Schedule 7(***) See Footnotes - Note #4(****) See Footnotes - Note #'s 10, 11
EXHIBIT A-1(continued)
REFUND FRINGE TOBACCO RAINY DAY RESERVE BENEFIT REVENUE COMBINED TOTALS RESERVE ACCOUNT ESCROW GUARANTEE
(10300-10349) (10400-10449) (10500-10549) (10550-10599) ELIMINATIONS 2012-13 2011-12
$ -- $ -- $ -- $ -- $ -- $ 26,883,876 $ 25,842,987-- -- -- -- -- 9,112,008 9,055,219-- -- -- -- -- 6,252,510 5,760,213-- -- -- -- -- 1,033,517 1,096,496-- -- 2,296,395 -- (2,296,395) 3,504,067 3,161,511-- -- -- -- -- 61,572 59,500
-- -- 2,296,395 -- (2,296,395) 46,847,550 44,975,926
-- 38,419,488-- -- -- -- -- 21,624,837 ---- -- -- -- -- 3,344 ---- -- -- -- -- 983,275 -- -- -- -- -- -- 12,822,729 ---- -- -- -- -- 789,268 ---- -- -- -- -- 249,939 ---- -- -- -- -- 3,039,794 ---- -- -- -- -- 148,845 ---- -- -- -- -- 97,551 ---- -- -- -- -- 39,759,582 38,419,488
-- -- -- -- -- 6,129,709 5,778,663-- -- 114,519 -- (114,519) 1,725,966 1,715,303-- -- 2,181,876 -- (2,181,876) 4,549,525 4,719,546
-- -- 2,296,395 -- (2,296,395) 52,164,782 50,633,000
-- -- -- -- -- (5,317,232) (5,657,074)
-- 190,245 -- -- (43,205,774) 11,933,257 11,923,407-- (357,886) -- -- 43,205,774 (6,792,740) (5,855,746)
-- (167,641) -- -- -- 5,140,517 6,067,661
-- (167,641) -- -- -- (176,715) 410,587
175,000 357,886 -- -- -- 1,786,714 1,376,127
$ 175,000 $ 190,245 $ -- $ -- $ -- $ 1,609,999 $ 1,786,714
24
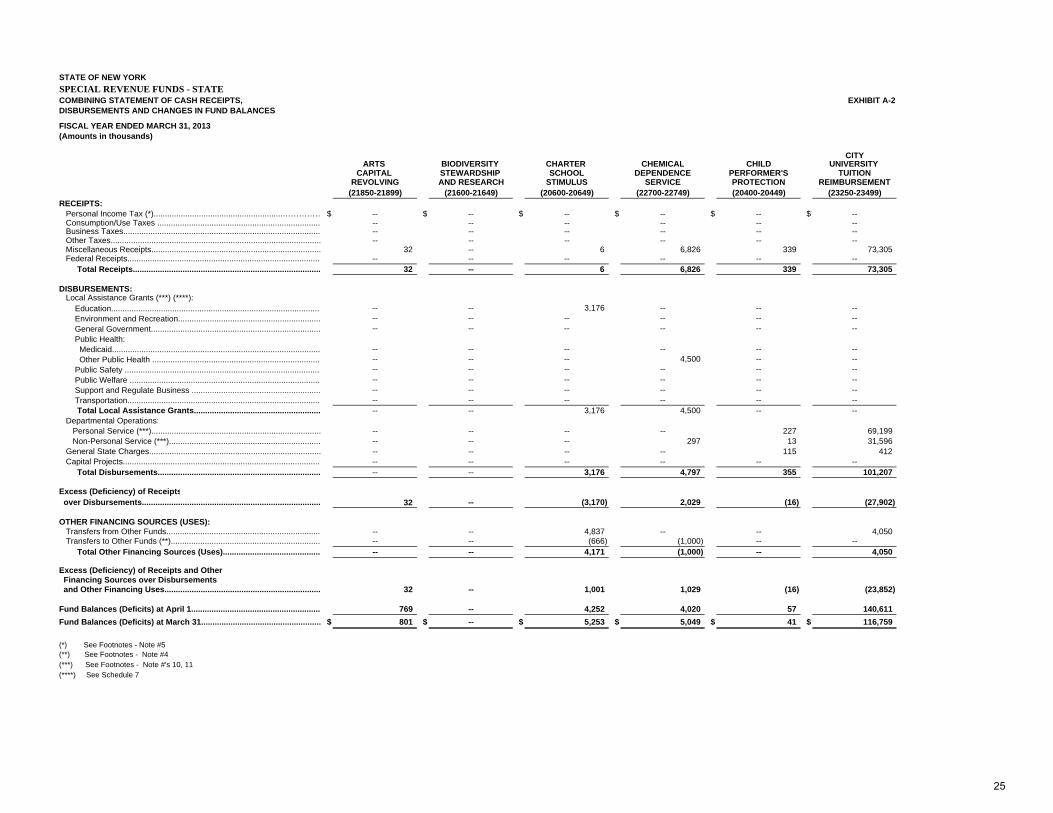
STATE OF NEW YORKSPECIAL REVENUE FUNDS - STATECOMBINING STATEMENT OF CASH RECEIPTS, EXHIBIT A-2DISBURSEMENTS AND CHANGES IN FUND BALANCES
FISCAL YEAR ENDED MARCH 31, 2013 (Amounts in thousands)
CITY ARTS BIODIVERSITY CHARTER CHEMICAL CHILD UNIVERSITY
CAPITAL STEWARDSHIP SCHOOL DEPENDENCE PERFORMER'S TUITIONREVOLVING AND RESEARCH STIMULUS SERVICE PROTECTION REIMBURSEMENT
(21850-21899) (21600-21649) (20600-20649) (22700-22749) (20400-20449) (23250-23499)RECEIPTS: Personal Income Tax (*).........................................................…………… $ -- $ -- $ -- $ -- $ -- $ -- Consumption/Use Taxes ........................................................................ -- -- -- -- -- -- Business Taxes....................................................................................... -- -- -- -- -- -- Other Taxes............................................................................................. -- -- -- -- -- -- Miscellaneous Receipts........................................................................... 32 -- 6 6,826 339 73,305 Federal Receipts...................................................................................... -- -- -- -- -- -- Total Receipts................................................................................... 32 -- 6 6,826 339 73,305
DISBURSEMENTS: Local Assistance Grants (***) (****): Education............................................................................................. -- -- 3,176 -- -- -- Environment and Recreation............................................................... -- -- -- -- -- -- General Government........................................................................... -- -- -- -- -- -- Public Health: Medicaid............................................................................................ -- -- -- -- -- -- Other Public Health ........................................................................... -- -- -- 4,500 -- -- Public Safety ....................................................................................... -- -- -- -- -- -- Public Welfare ..................................................................................... -- -- -- -- -- -- Support and Regulate Business ......................................................... -- -- -- -- -- -- Transportation...................................................................................... -- -- -- -- -- -- Total Local Assistance Grants........................................................ -- -- 3,176 4,500 -- -- Departmental Operations: Personal Service (***)........................................................................... -- -- -- -- 227 69,199 Non-Personal Service (***)................................................................... -- -- -- 297 13 31,596 General State Charges............................................................................ -- -- -- -- 115 412 Capital Projects........................................................................................ -- -- -- -- -- -- Total Disbursements........................................................................ -- -- 3,176 4,797 355 101,207
Excess (Deficiency) of Receipts over Disbursements............................................................................... 32 -- (3,170) 2,029 (16) (27,902)
OTHER FINANCING SOURCES (USES): Transfers from Other Funds.................................................................... -- -- 4,837 -- -- 4,050 Transfers to Other Funds (**).................................................................. -- -- (666) (1,000) -- -- Total Other Financing Sources (Uses)........................................... -- -- 4,171 (1,000) -- 4,050
Excess (Deficiency) of Receipts and Other Financing Sources over Disbursements and Other Financing Uses..................................................................... 32 -- 1,001 1,029 (16) (23,852)
Fund Balances (Deficits) at April 1......................................................... 769 -- 4,252 4,020 57 140,611Fund Balances (Deficits) at March 31..................................................... $ 801 $ -- $ 5,253 $ 5,049 $ 41 $ 116,759
(*) See Footnotes - Note #5(**) See Footnotes - Note #4(***) See Footnotes - Note #'s 10, 11(****) See Schedule 7
25
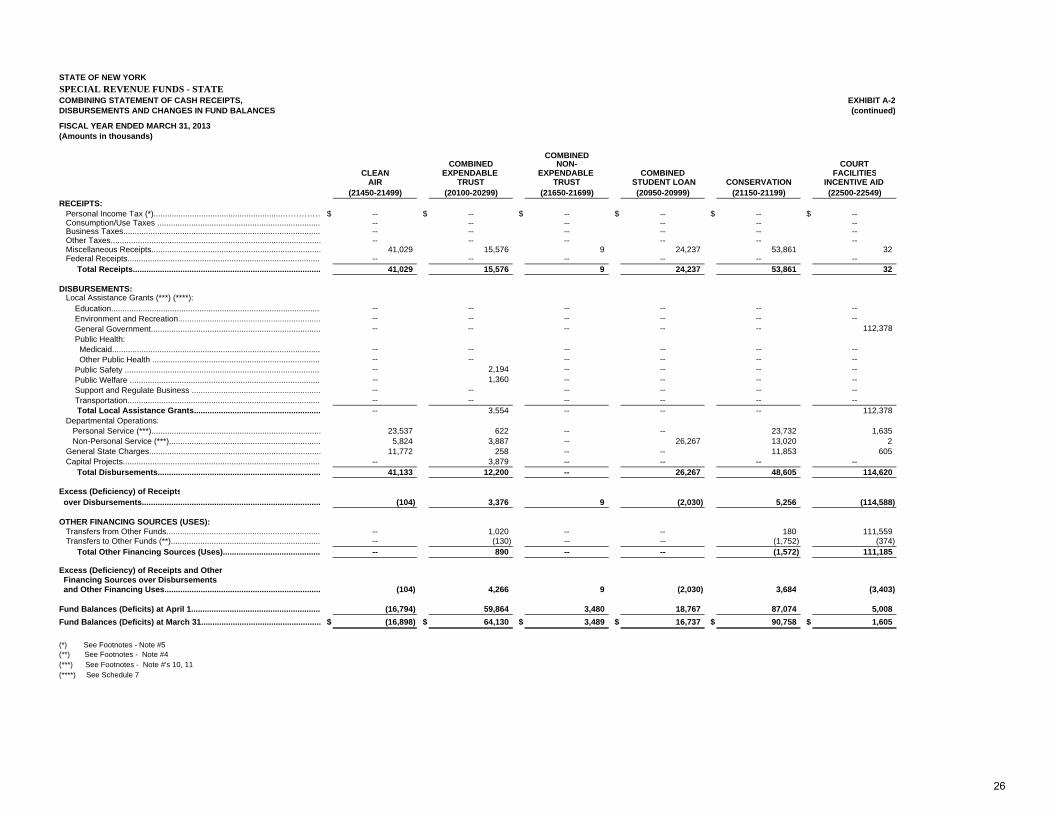
STATE OF NEW YORKSPECIAL REVENUE FUNDS - STATECOMBINING STATEMENT OF CASH RECEIPTS, DISBURSEMENTS AND CHANGES IN FUND BALANCES
FISCAL YEAR ENDED MARCH 31, 2013 (Amounts in thousands)
RECEIPTS: Personal Income Tax (*).........................................................…………… Consumption/Use Taxes ........................................................................ Business Taxes....................................................................................... Other Taxes............................................................................................. Miscellaneous Receipts........................................................................... Federal Receipts...................................................................................... Total Receipts...................................................................................
DISBURSEMENTS: Local Assistance Grants (***) (****): Education............................................................................................. Environment and Recreation............................................................... General Government........................................................................... Public Health: Medicaid............................................................................................ Other Public Health ........................................................................... Public Safety ....................................................................................... Public Welfare ..................................................................................... Support and Regulate Business ......................................................... Transportation...................................................................................... Total Local Assistance Grants........................................................ Departmental Operations: Personal Service (***)........................................................................... Non-Personal Service (***)................................................................... General State Charges............................................................................ Capital Projects........................................................................................ Total Disbursements........................................................................
Excess (Deficiency) of Receipts over Disbursements...............................................................................
OTHER FINANCING SOURCES (USES): Transfers from Other Funds.................................................................... Transfers to Other Funds (**).................................................................. Total Other Financing Sources (Uses)...........................................
Excess (Deficiency) of Receipts and Other Financing Sources over Disbursements and Other Financing Uses.....................................................................
Fund Balances (Deficits) at April 1.........................................................Fund Balances (Deficits) at March 31.....................................................
(*) See Footnotes - Note #5(**) See Footnotes - Note #4(***) See Footnotes - Note #'s 10, 11(****) See Schedule 7
EXHIBIT A-2(continued)
COMBINEDCOMBINED NON- COURT
CLEAN EXPENDABLE EXPENDABLE COMBINED FACILITIESAIR TRUST TRUST STUDENT LOAN CONSERVATION INCENTIVE AID
(21450-21499) (20100-20299) (21650-21699) (20950-20999) (21150-21199) (22500-22549)
$ -- $ -- $ -- $ -- $ -- $ ---- -- -- -- -- ---- -- -- -- -- ---- -- -- -- -- --
41,029 15,576 9 24,237 53,861 32 -- -- -- -- -- -- 41,029 15,576 9 24,237 53,861 32
-- -- -- -- -- -- -- -- -- -- -- -- -- -- -- -- -- 112,378
-- -- -- -- -- ---- -- -- -- -- ---- 2,194 -- -- -- ---- 1,360 -- -- -- --
-- -- -- -- -- -- -- -- -- -- -- -- -- 3,554 -- -- -- 112,378
23,537 622 -- -- 23,732 1,635 5,824 3,887 -- 26,267 13,020 2 11,772 258 -- -- 11,853 605 -- 3,879 -- -- -- -- 41,133 12,200 -- 26,267 48,605 114,620
(104) 3,376 9 (2,030) 5,256 (114,588)
-- 1,020 -- -- 180 111,559 -- (130) -- -- (1,752) (374) -- 890 -- -- (1,572) 111,185
(104) 4,266 9 (2,030) 3,684 (3,403)
(16,794) 59,864 3,480 18,767 87,074 5,008$ (16,898) $ 64,130 $ 3,489 $ 16,737 $ 90,758 $ 1,605
26

STATE OF NEW YORKSPECIAL REVENUE FUNDS - STATECOMBINING STATEMENT OF CASH RECEIPTS, DISBURSEMENTS AND CHANGES IN FUND BALANCES
FISCAL YEAR ENDED MARCH 31, 2013 (Amounts in thousands)
RECEIPTS: Personal Income Tax (*).........................................................…………… Consumption/Use Taxes ........................................................................ Business Taxes....................................................................................... Other Taxes............................................................................................. Miscellaneous Receipts........................................................................... Federal Receipts...................................................................................... Total Receipts...................................................................................
DISBURSEMENTS: Local Assistance Grants (***) (****): Education............................................................................................. Environment and Recreation............................................................... General Government........................................................................... Public Health: Medicaid............................................................................................ Other Public Health ........................................................................... Public Safety ....................................................................................... Public Welfare ..................................................................................... Support and Regulate Business ......................................................... Transportation...................................................................................... Total Local Assistance Grants........................................................ Departmental Operations: Personal Service (***)........................................................................... Non-Personal Service (***)................................................................... General State Charges............................................................................ Capital Projects........................................................................................ Total Disbursements........................................................................
Excess (Deficiency) of Receipts over Disbursements...............................................................................
OTHER FINANCING SOURCES (USES): Transfers from Other Funds.................................................................... Transfers to Other Funds (**).................................................................. Total Other Financing Sources (Uses)...........................................
Excess (Deficiency) of Receipts and Other Financing Sources over Disbursements and Other Financing Uses.....................................................................
Fund Balances (Deficits) at April 1.........................................................Fund Balances (Deficits) at March 31.....................................................
(*) See Footnotes - Note #5(**) See Footnotes - Note #4(***) See Footnotes - Note #'s 10, 11(****) See Schedule 7
EXHIBIT A-2(continued)
DRINKING DEDICATED WATER ENVIRONMENTAL EQUIPMENT
MASS PROGRAM MGT ENCON PROTECTION LOAN FUNDTRANSPORTATION AND EMPLOYMENT SPECIAL AND OIL SPILL FOR THE
TRUST ADMINISTRATION TRAINING REVENUE COMPENSATION DISABLED(20850-20899) (23100-23149) (22550-22599) (21050-21149) (21200-21249) (21350-21399)
$ -- $ -- $ -- $ -- $ -- $ --103,208 -- -- -- -- --
372,063 -- -- -- -- ---- -- -- -- -- --
168,403 9,295 8 77,810 43,850 69 -- -- -- -- -- -- 643,674 9,295 8 77,810 43,850 69
-- -- -- -- -- -- -- -- -- 997 -- -- -- -- -- -- -- --
-- -- -- -- -- ---- -- -- -- -- ---- -- -- -- -- ---- -- -- -- -- --
-- -- -- -- -- -- 646,604 -- -- -- -- -- 646,604 -- -- 997 -- --
-- 4,011 -- 49,340 10,848 -- -- 292 -- 19,000 15,857 9 -- 2,012 -- 19,570 5,328 -- 3,727 -- -- -- -- -- 650,331 6,315 -- 88,907 32,033 9
(6,657) 2,980 8 (11,097) 11,817 60
-- -- -- 15,267 -- -- -- -- -- (7,900) (14,878) (7) -- -- -- 7,367 (14,878) (7)
(6,657) 2,980 8 (3,730) (3,061) 53
78,727 (7,392) 41 (28,299) 13,412 472$ 72,070 $ (4,412) $ 49 $ (32,029) $ 10,351 $ 525
27
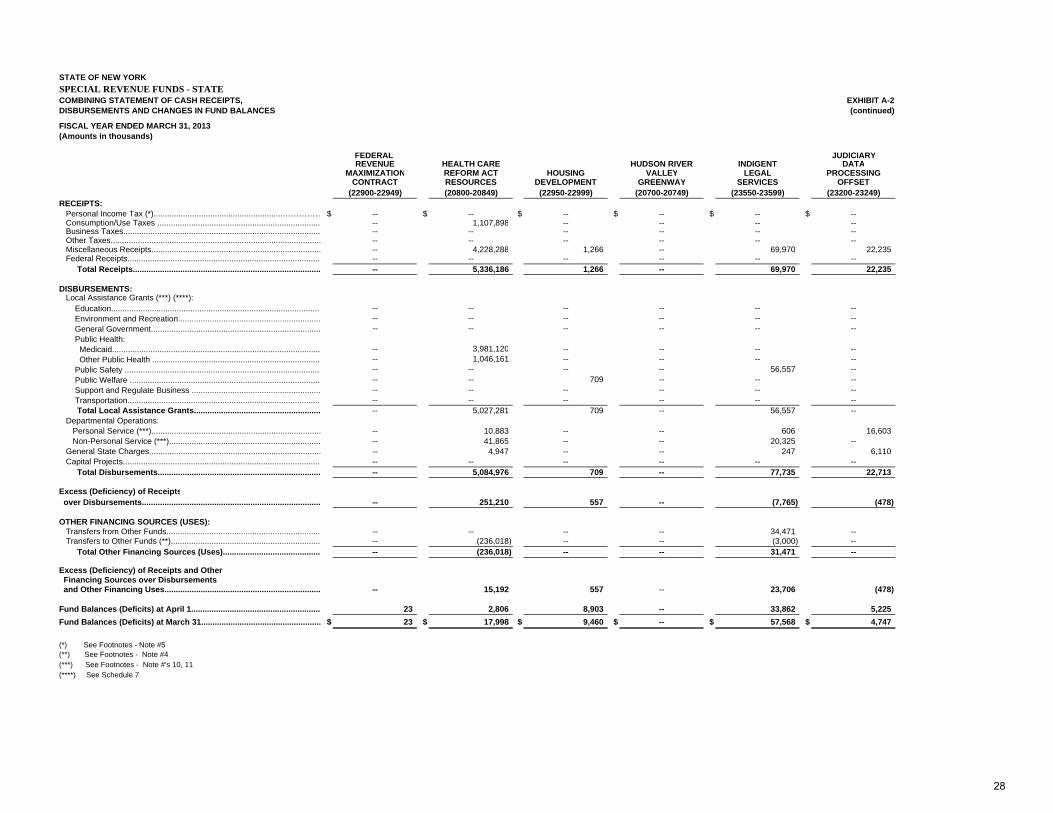
STATE OF NEW YORKSPECIAL REVENUE FUNDS - STATECOMBINING STATEMENT OF CASH RECEIPTS, DISBURSEMENTS AND CHANGES IN FUND BALANCES
FISCAL YEAR ENDED MARCH 31, 2013 (Amounts in thousands)
RECEIPTS: Personal Income Tax (*).........................................................…………… Consumption/Use Taxes ........................................................................ Business Taxes....................................................................................... Other Taxes............................................................................................. Miscellaneous Receipts........................................................................... Federal Receipts...................................................................................... Total Receipts...................................................................................
DISBURSEMENTS: Local Assistance Grants (***) (****): Education............................................................................................. Environment and Recreation............................................................... General Government........................................................................... Public Health: Medicaid............................................................................................ Other Public Health ........................................................................... Public Safety ....................................................................................... Public Welfare ..................................................................................... Support and Regulate Business ......................................................... Transportation...................................................................................... Total Local Assistance Grants........................................................ Departmental Operations: Personal Service (***)........................................................................... Non-Personal Service (***)................................................................... General State Charges............................................................................ Capital Projects........................................................................................ Total Disbursements........................................................................
Excess (Deficiency) of Receipts over Disbursements...............................................................................
OTHER FINANCING SOURCES (USES): Transfers from Other Funds.................................................................... Transfers to Other Funds (**).................................................................. Total Other Financing Sources (Uses)...........................................
Excess (Deficiency) of Receipts and Other Financing Sources over Disbursements and Other Financing Uses.....................................................................
Fund Balances (Deficits) at April 1.........................................................Fund Balances (Deficits) at March 31.....................................................
(*) See Footnotes - Note #5(**) See Footnotes - Note #4(***) See Footnotes - Note #'s 10, 11(****) See Schedule 7
EXHIBIT A-2(continued)
FEDERAL JUDICIARYREVENUE HEALTH CARE HUDSON RIVER INDIGENT DATA
MAXIMIZATION REFORM ACT HOUSING VALLEY LEGAL PROCESSINGCONTRACT RESOURCES DEVELOPMENT GREENWAY SERVICES OFFSET
(22900-22949) (20800-20849) (22950-22999) (20700-20749) (23550-23599) (23200-23249)
$ -- $ -- $ -- $ -- $ -- $ ---- 1,107,898 -- -- -- ---- -- -- -- -- ---- -- -- -- -- ---- 4,228,288 1,266 -- 69,970 22,235-- -- -- -- -- ---- 5,336,186 1,266 -- 69,970 22,235
-- -- -- -- -- ---- -- -- -- -- ---- -- -- -- -- --
-- 3,981,120 -- -- -- ---- 1,046,161 -- -- -- ---- -- -- -- 56,557 ---- -- 709 -- -- ---- -- -- -- -- ---- -- -- -- -- ---- 5,027,281 709 -- 56,557 --
-- 10,883 -- -- 606 16,603-- 41,865 -- -- 20,325 ---- 4,947 -- -- 247 6,110-- -- -- -- -- ---- 5,084,976 709 -- 77,735 22,713
-- 251,210 557 -- (7,765) (478)
-- -- -- -- 34,471 ---- (236,018) -- -- (3,000) ---- (236,018) -- -- 31,471 --
-- 15,192 557 -- 23,706 (478)
23 2,806 8,903 -- 33,862 5,225$ 23 $ 17,998 $ 9,460 $ -- $ 57,568 $ 4,747
28
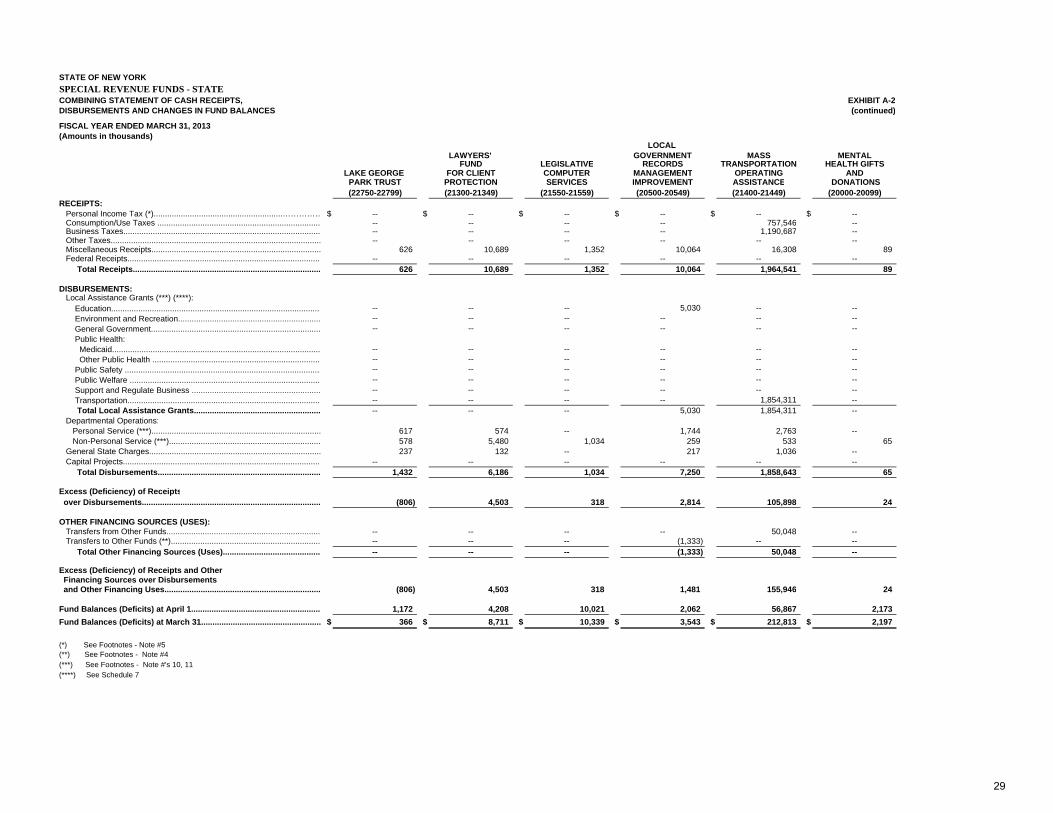
STATE OF NEW YORKSPECIAL REVENUE FUNDS - STATECOMBINING STATEMENT OF CASH RECEIPTS, DISBURSEMENTS AND CHANGES IN FUND BALANCES
FISCAL YEAR ENDED MARCH 31, 2013 (Amounts in thousands)
RECEIPTS: Personal Income Tax (*).........................................................…………… Consumption/Use Taxes ........................................................................ Business Taxes....................................................................................... Other Taxes............................................................................................. Miscellaneous Receipts........................................................................... Federal Receipts...................................................................................... Total Receipts...................................................................................
DISBURSEMENTS: Local Assistance Grants (***) (****): Education............................................................................................. Environment and Recreation............................................................... General Government........................................................................... Public Health: Medicaid............................................................................................ Other Public Health ........................................................................... Public Safety ....................................................................................... Public Welfare ..................................................................................... Support and Regulate Business ......................................................... Transportation...................................................................................... Total Local Assistance Grants........................................................ Departmental Operations: Personal Service (***)........................................................................... Non-Personal Service (***)................................................................... General State Charges............................................................................ Capital Projects........................................................................................ Total Disbursements........................................................................
Excess (Deficiency) of Receipts over Disbursements...............................................................................
OTHER FINANCING SOURCES (USES): Transfers from Other Funds.................................................................... Transfers to Other Funds (**).................................................................. Total Other Financing Sources (Uses)...........................................
Excess (Deficiency) of Receipts and Other Financing Sources over Disbursements and Other Financing Uses.....................................................................
Fund Balances (Deficits) at April 1.........................................................Fund Balances (Deficits) at March 31.....................................................
(*) See Footnotes - Note #5(**) See Footnotes - Note #4(***) See Footnotes - Note #'s 10, 11(****) See Schedule 7
EXHIBIT A-2(continued)
LOCAL LAWYERS' GOVERNMENT MASS MENTAL
FUND LEGISLATIVE RECORDS TRANSPORTATION HEALTH GIFTSLAKE GEORGE FOR CLIENT COMPUTER MANAGEMENT OPERATING AND
PARK TRUST PROTECTION SERVICES IMPROVEMENT ASSISTANCE DONATIONS(22750-22799) (21300-21349) (21550-21559) (20500-20549) (21400-21449) (20000-20099)
$ -- $ -- $ -- $ -- $ -- $ ---- -- -- -- 757,546 ---- -- -- -- 1,190,687 ---- -- -- -- -- --
626 10,689 1,352 10,064 16,308 89-- -- -- -- -- --
626 10,689 1,352 10,064 1,964,541 89
-- -- -- 5,030 -- ---- -- -- -- -- ---- -- -- -- -- --
-- -- -- -- -- ---- -- -- -- -- ---- -- -- -- -- ---- -- -- -- -- ---- -- -- -- -- ---- -- -- -- 1,854,311 ---- -- -- 5,030 1,854,311 --
617 574 -- 1,744 2,763 --578 5,480 1,034 259 533 65237 132 -- 217 1,036 --
-- -- -- -- -- --1,432 6,186 1,034 7,250 1,858,643 65
(806) 4,503 318 2,814 105,898 24
-- -- -- -- 50,048 ---- -- -- (1,333) -- ---- -- -- (1,333) 50,048 --
(806) 4,503 318 1,481 155,946 24
1,172 4,208 10,021 2,062 56,867 2,173$ 366 $ 8,711 $ 10,339 $ 3,543 $ 212,813 $ 2,197
29
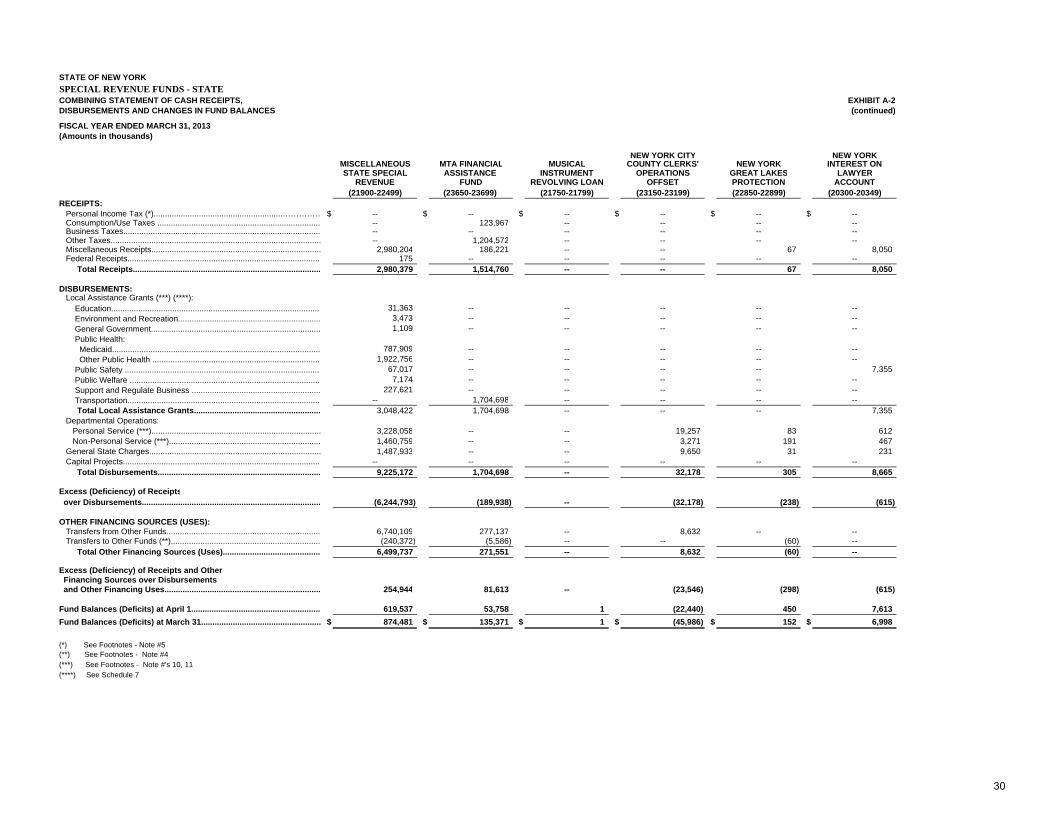
STATE OF NEW YORKSPECIAL REVENUE FUNDS - STATECOMBINING STATEMENT OF CASH RECEIPTS, DISBURSEMENTS AND CHANGES IN FUND BALANCES
FISCAL YEAR ENDED MARCH 31, 2013 (Amounts in thousands)
RECEIPTS: Personal Income Tax (*).........................................................…………… Consumption/Use Taxes ........................................................................ Business Taxes....................................................................................... Other Taxes............................................................................................. Miscellaneous Receipts........................................................................... Federal Receipts...................................................................................... Total Receipts...................................................................................
DISBURSEMENTS: Local Assistance Grants (***) (****): Education............................................................................................. Environment and Recreation............................................................... General Government........................................................................... Public Health: Medicaid............................................................................................ Other Public Health ........................................................................... Public Safety ....................................................................................... Public Welfare ..................................................................................... Support and Regulate Business ......................................................... Transportation...................................................................................... Total Local Assistance Grants........................................................ Departmental Operations: Personal Service (***)........................................................................... Non-Personal Service (***)................................................................... General State Charges............................................................................ Capital Projects........................................................................................ Total Disbursements........................................................................
Excess (Deficiency) of Receipts over Disbursements...............................................................................
OTHER FINANCING SOURCES (USES): Transfers from Other Funds.................................................................... Transfers to Other Funds (**).................................................................. Total Other Financing Sources (Uses)...........................................
Excess (Deficiency) of Receipts and Other Financing Sources over Disbursements and Other Financing Uses.....................................................................
Fund Balances (Deficits) at April 1.........................................................Fund Balances (Deficits) at March 31.....................................................
(*) See Footnotes - Note #5(**) See Footnotes - Note #4(***) See Footnotes - Note #'s 10, 11(****) See Schedule 7
EXHIBIT A-2(continued)
NEW YORK CITY NEW YORKMISCELLANEOUS MTA FINANCIAL MUSICAL COUNTY CLERKS' NEW YORK INTEREST ONSTATE SPECIAL ASSISTANCE INSTRUMENT OPERATIONS GREAT LAKES LAWYER
REVENUE FUND REVOLVING LOAN OFFSET PROTECTION ACCOUNT(21900-22499) (23650-23699) (21750-21799) (23150-23199) (22850-22899) (20300-20349)
$ -- $ -- $ -- $ -- $ -- $ ---- 123,967 -- -- -- ---- -- -- -- -- ---- 1,204,572 -- -- -- --2,980,204 186,221 -- -- 67 8,050
175 -- -- -- -- --2,980,379 1,514,760 -- -- 67 8,050
31,363 -- -- -- -- --3,473 -- -- -- -- --1,109 -- -- -- -- --
787,909 -- -- -- -- --1,922,756 -- -- -- -- --
67,017 -- -- -- -- 7,3557,174 -- -- -- -- --
227,621 -- -- -- -- ---- 1,704,698 -- -- -- --3,048,422 1,704,698 -- -- -- 7,355
3,228,058 -- -- 19,257 83 6121,460,759 -- -- 3,271 191 4671,487,933 -- -- 9,650 31 231
-- -- -- -- -- --9,225,172 1,704,698 -- 32,178 305 8,665
(6,244,793) (189,938) -- (32,178) (238) (615)
6,740,109 277,137 -- 8,632 -- --(240,372) (5,586) -- -- (60) --
6,499,737 271,551 -- 8,632 (60) --
254,944 81,613 -- (23,546) (298) (615)
619,537 53,758 1 (22,440) 450 7,613$ 874,481 $ 135,371 $ 1 $ (45,986) $ 152 $ 6,998
30
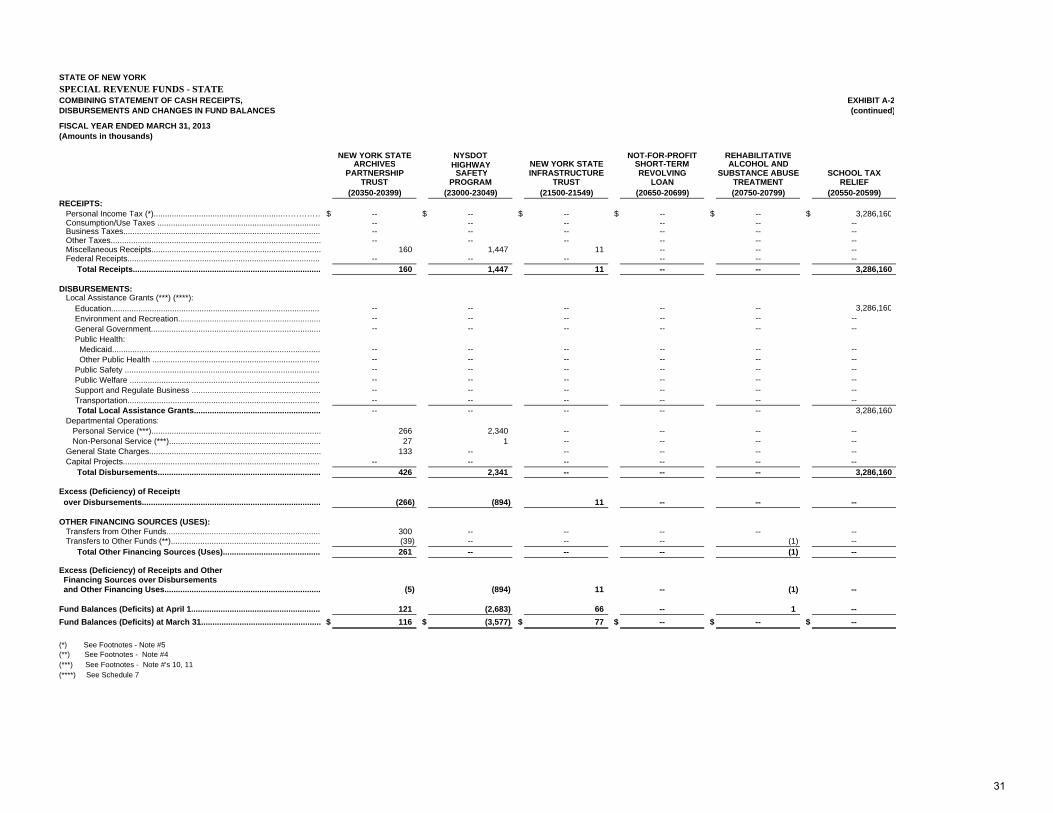
STATE OF NEW YORKSPECIAL REVENUE FUNDS - STATECOMBINING STATEMENT OF CASH RECEIPTS, DISBURSEMENTS AND CHANGES IN FUND BALANCES
FISCAL YEAR ENDED MARCH 31, 2013 (Amounts in thousands)
RECEIPTS: Personal Income Tax (*).........................................................…………… Consumption/Use Taxes ........................................................................ Business Taxes....................................................................................... Other Taxes............................................................................................. Miscellaneous Receipts........................................................................... Federal Receipts...................................................................................... Total Receipts...................................................................................
DISBURSEMENTS: Local Assistance Grants (***) (****): Education............................................................................................. Environment and Recreation............................................................... General Government........................................................................... Public Health: Medicaid............................................................................................ Other Public Health ........................................................................... Public Safety ....................................................................................... Public Welfare ..................................................................................... Support and Regulate Business ......................................................... Transportation...................................................................................... Total Local Assistance Grants........................................................ Departmental Operations: Personal Service (***)........................................................................... Non-Personal Service (***)................................................................... General State Charges............................................................................ Capital Projects........................................................................................ Total Disbursements........................................................................
Excess (Deficiency) of Receipts over Disbursements...............................................................................
OTHER FINANCING SOURCES (USES): Transfers from Other Funds.................................................................... Transfers to Other Funds (**).................................................................. Total Other Financing Sources (Uses)...........................................
Excess (Deficiency) of Receipts and Other Financing Sources over Disbursements and Other Financing Uses.....................................................................
Fund Balances (Deficits) at April 1.........................................................Fund Balances (Deficits) at March 31.....................................................
(*) See Footnotes - Note #5(**) See Footnotes - Note #4(***) See Footnotes - Note #'s 10, 11(****) See Schedule 7
EXHIBIT A-2(continued)
NEW YORK STATE NYSDOT NOT-FOR-PROFIT REHABILITATIVEARCHIVES HIGHWAY NEW YORK STATE SHORT-TERM ALCOHOL AND
PARTNERSHIP SAFETY INFRASTRUCTURE REVOLVING SUBSTANCE ABUSE SCHOOL TAXTRUST PROGRAM TRUST LOAN TREATMENT RELIEF
(20350-20399) (23000-23049) (21500-21549) (20650-20699) (20750-20799) (20550-20599)
$ -- $ -- $ -- $ -- $ -- $ 3,286,160-- -- -- -- -- ---- -- -- -- -- ---- -- -- -- -- --
160 1,447 11 -- -- ---- -- -- -- -- --
160 1,447 11 -- -- 3,286,160
-- -- -- -- -- 3,286,160-- -- -- -- -- ---- -- -- -- -- --
-- -- -- -- -- ---- -- -- -- -- ---- -- -- -- -- ---- -- -- -- -- ---- -- -- -- -- ---- -- -- -- -- ---- -- -- -- -- 3,286,160
266 2,340 -- -- -- --27 1 -- -- -- --
133 -- -- -- -- ---- -- -- -- -- --
426 2,341 -- -- -- 3,286,160
(266) (894) 11 -- -- --
300 -- -- -- -- --(39) -- -- -- (1) --261 -- -- -- (1) --
(5) (894) 11 -- (1) --
121 (2,683) 66 -- 1 --$ 116 $ (3,577) $ 77 $ -- $ -- $ --
31
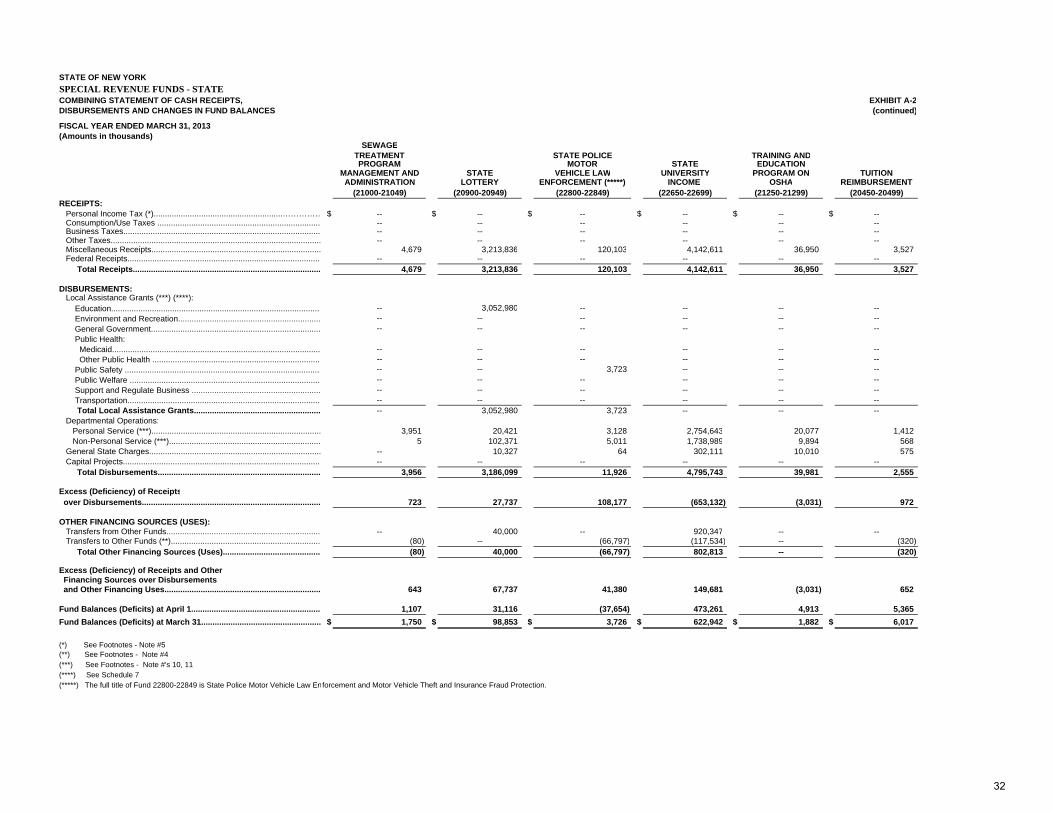
STATE OF NEW YORKSPECIAL REVENUE FUNDS - STATECOMBINING STATEMENT OF CASH RECEIPTS, DISBURSEMENTS AND CHANGES IN FUND BALANCES
FISCAL YEAR ENDED MARCH 31, 2013 (Amounts in thousands)
RECEIPTS: Personal Income Tax (*).........................................................…………… Consumption/Use Taxes ........................................................................ Business Taxes....................................................................................... Other Taxes............................................................................................. Miscellaneous Receipts........................................................................... Federal Receipts...................................................................................... Total Receipts...................................................................................
DISBURSEMENTS: Local Assistance Grants (***) (****): Education............................................................................................. Environment and Recreation............................................................... General Government........................................................................... Public Health: Medicaid............................................................................................ Other Public Health ........................................................................... Public Safety ....................................................................................... Public Welfare ..................................................................................... Support and Regulate Business ......................................................... Transportation...................................................................................... Total Local Assistance Grants........................................................ Departmental Operations: Personal Service (***)........................................................................... Non-Personal Service (***)................................................................... General State Charges............................................................................ Capital Projects........................................................................................ Total Disbursements........................................................................
Excess (Deficiency) of Receipts over Disbursements...............................................................................
OTHER FINANCING SOURCES (USES): Transfers from Other Funds.................................................................... Transfers to Other Funds (**).................................................................. Total Other Financing Sources (Uses)...........................................
Excess (Deficiency) of Receipts and Other Financing Sources over Disbursements and Other Financing Uses.....................................................................
Fund Balances (Deficits) at April 1.........................................................Fund Balances (Deficits) at March 31.....................................................
(*) See Footnotes - Note #5(**) See Footnotes - Note #4(***) See Footnotes - Note #'s 10, 11(****) See Schedule 7(*****) The full title of Fund 22800-22849 is State Police Motor Vehicle Law En
EXHIBIT A-2(continued)
SEWAGETREATMENT STATE POLICE TRAINING ANDPROGRAM MOTOR STATE EDUCATION
MANAGEMENT AND STATE VEHICLE LAW UNIVERSITY PROGRAM ON TUITIONADMINISTRATION LOTTERY ENFORCEMENT (*****) INCOME OSHA REIMBURSEMENT
(21000-21049) (20900-20949) (22800-22849) (22650-22699) (21250-21299) (20450-20499)
$ -- $ -- $ -- $ -- $ -- $ ---- -- -- -- -- --
-- -- -- -- -- -- -- -- -- -- -- --
4,679 3,213,836 120,103 4,142,611 36,950 3,527-- -- -- -- -- --
4,679 3,213,836 120,103 4,142,611 36,950 3,527
-- 3,052,980 -- -- -- ---- -- -- -- -- ---- -- -- -- -- --
-- -- -- -- -- ---- -- -- -- -- ---- -- 3,723 -- -- ---- -- -- -- -- ---- -- -- -- -- ---- -- -- -- -- ---- 3,052,980 3,723 -- -- --
3,951 20,421 3,128 2,754,643 20,077 1,4125 102,371 5,011 1,738,989 9,894 568
-- 10,327 64 302,111 10,010 575-- -- -- -- -- --
3,956 3,186,099 11,926 4,795,743 39,981 2,555
723 27,737 108,177 (653,132) (3,031) 972
-- 40,000 -- 920,347 -- --(80) -- (66,797) (117,534) -- (320)(80) 40,000 (66,797) 802,813 -- (320)
643 67,737 41,380 149,681 (3,031) 652
1,107 31,116 (37,654) 473,261 4,913 5,365$ 1,750 $ 98,853 $ 3,726 $ 622,942 $ 1,882 $ 6,017
forcement and Motor Vehicle Theft and Insurance Fraud Protection.
32
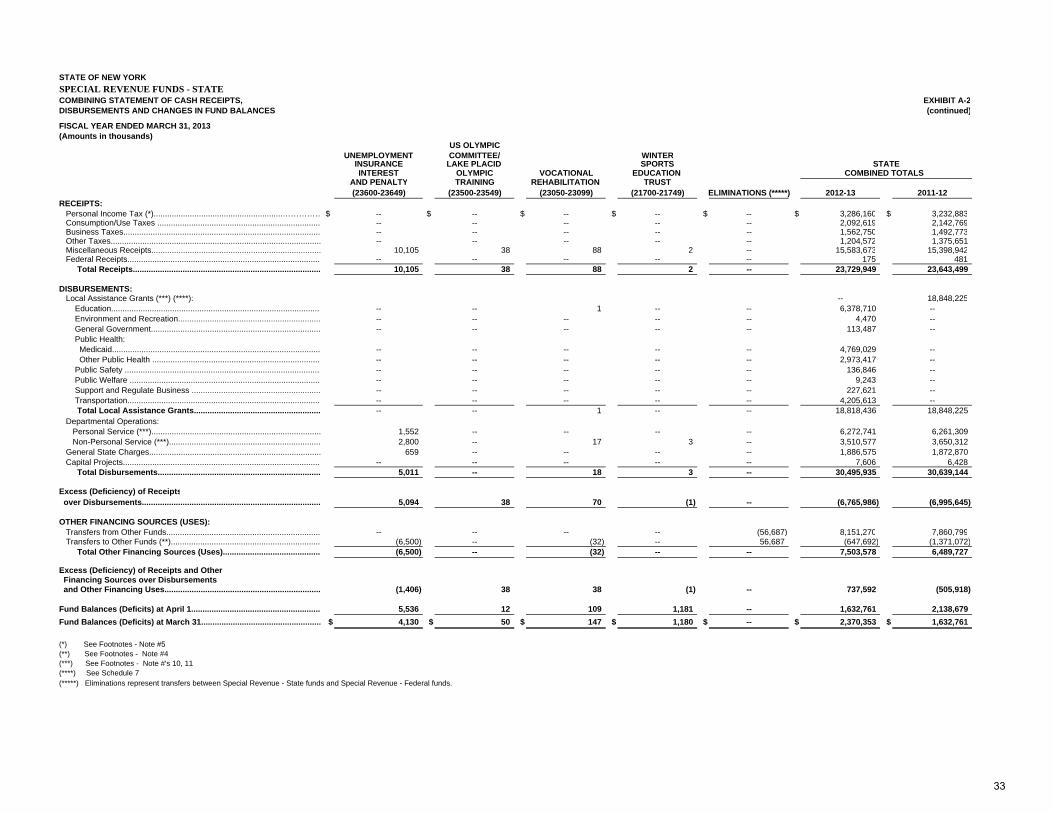
STATE OF NEW YORK SPECIAL REVENUE FUNDS - STATECOMBINING STATEMENT OF CASH RECEIPTS, EXHIBIT A-2DISBURSEMENTS AND CHANGES IN FUND BALANCES (continued)
FISCAL YEAR ENDED MARCH 31, 2013 (Amounts in thousands)
US OLYMPICUNEMPLOYMENT COMMITTEE/ WINTER
INSURANCE LAKE PLACID SPORTSINTEREST OLYMPIC VOCATIONAL EDUCATION
AND PENALTY TRAINING REHABILITATION TRUST(23600-23649) (23500-23549) (23050-23099) (21700-21749) ELIMINATIONS (*****) 2012-13 2011-12
RECEIPTS: Personal Income Tax (*).........................................................…………… $ -- $ -- $ -- $ -- $ -- $ 3,286,160 $ 3,232,883 Consumption/Use Taxes ........................................................................ -- -- -- -- -- 2,092,619 2,142,769 Business Taxes....................................................................................... -- -- -- -- -- 1,562,750 1,492,773 Other Taxes............................................................................................. -- -- -- -- -- 1,204,572 1,375,651 Miscellaneous Receipts........................................................................... 10,105 38 88 2 -- 15,583,673 15,398,942 Federal Receipts...................................................................................... -- -- -- -- -- 175 481 Total Receipts................................................................................... 10,105 38 88 2 -- 23,729,949 23,643,499
DISBURSEMENTS: Local Assistance Grants (***) (****): -- 18,848,225 Education............................................................................................. -- -- 1 -- -- 6,378,710 -- Environment and Recreation............................................................... -- -- -- -- -- 4,470 -- General Government........................................................................... -- -- -- -- -- 113,487 -- Public Health: Medicaid............................................................................................ -- -- -- -- -- 4,769,029 -- Other Public Health ........................................................................... -- -- -- -- -- 2,973,417 -- Public Safety ....................................................................................... -- -- -- -- -- 136,846 -- Public Welfare ..................................................................................... -- -- -- -- -- 9,243 -- Support and Regulate Business ......................................................... -- -- -- -- -- 227,621 -- Transportation...................................................................................... -- -- -- -- -- 4,205,613 -- Total Local Assistance Grants........................................................ -- -- 1 -- -- 18,818,436 18,848,225 Departmental Operations: Personal Service (***)........................................................................... 1,552 -- -- -- -- 6,272,741 6,261,309 Non-Personal Service (***)................................................................... 2,800 -- 17 3 -- 3,510,577 3,650,312 General State Charges............................................................................ 659 -- -- -- -- 1,886,575 1,872,870 Capital Projects........................................................................................ -- -- -- -- -- 7,606 6,428 Total Disbursements........................................................................ 5,011 -- 18 3 -- 30,495,935 30,639,144
Excess (Deficiency) of Receipts over Disbursements............................................................................... 5,094 38 70 (1) -- (6,765,986) (6,995,645)
OTHER FINANCING SOURCES (USES): Transfers from Other Funds.................................................................... -- -- -- -- (56,687) 8,151,270 7,860,799 Transfers to Other Funds (**).................................................................. (6,500) -- (32) -- 56,687 (647,692) (1,371,072) Total Other Financing Sources (Uses)........................................... (6,500) -- (32) -- -- 7,503,578 6,489,727
Excess (Deficiency) of Receipts and Other Financing Sources over Disbursements and Other Financing Uses..................................................................... (1,406) 38 38 (1) -- 737,592 (505,918)
Fund Balances (Deficits) at April 1......................................................... 5,536 12 109 1,181 -- 1,632,761 2,138,679Fund Balances (Deficits) at March 31..................................................... $ 4,130 $ 50 $ 147 $ 1,180 $ -- $ 2,370,353 $ 1,632,761
(*) See Footnotes - Note #5(**) See Footnotes - Note #4(***) See Footnotes - Note #'s 10, 11(****) See Schedule 7(*****) Eliminations represent transfers between Special Revenue - State funds and Special Revenue - Federal funds.
STATECOMBINED TOTALS
33
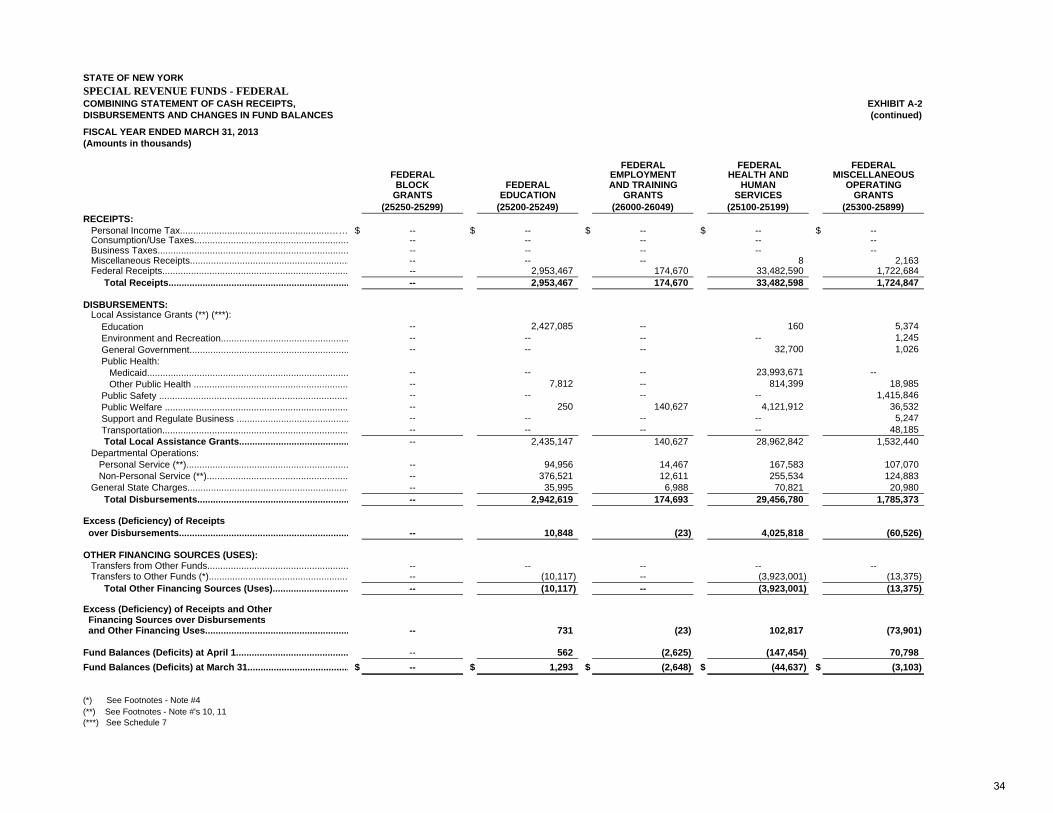
STATE OF NEW YORKSPECIAL REVENUE FUNDS - FEDERALCOMBINING STATEMENT OF CASH RECEIPTS, EXHIBIT A-2DISBURSEMENTS AND CHANGES IN FUND BALANCES (continued)
FISCAL YEAR ENDED MARCH 31, 2013 (Amounts in thousands)
FEDERAL FEDERAL FEDERALFEDERAL EMPLOYMENT HEALTH AND MISCELLANEOUS
BLOCK FEDERAL AND TRAINING HUMAN OPERATINGGRANTS EDUCATION GRANTS SERVICES GRANTS
(25250-25299) (25200-25249) (26000-26049) (25100-25199) (25300-25899)RECEIPTS: Personal Income Tax.........................................................…… $ -- $ -- $ -- $ -- $ -- Consumption/Use Taxes........................................................... -- -- -- -- -- Business Taxes......................................................................... -- -- -- -- -- Miscellaneous Receipts............................................................. -- -- -- 8 2,163 Federal Receipts....................................................................... -- 2,953,467 174,670 33,482,590 1,722,684 Total Receipts..................................................................... -- 2,953,467 174,670 33,482,598 1,724,847
DISBURSEMENTS: Local Assistance Grants (**) (***): Education -- 2,427,085 -- 160 5,374 Environment and Recreation................................................. -- -- -- -- 1,245 General Government............................................................. -- -- -- 32,700 1,026 Public Health: Medicaid............................................................................. -- -- -- 23,993,671 -- Other Public Health ........................................................... -- 7,812 -- 814,399 18,985 Public Safety ........................................................................ -- -- -- -- 1,415,846 Public Welfare ...................................................................... -- 250 140,627 4,121,912 36,532 Support and Regulate Business ........................................... -- -- -- -- 5,247 Transportation....................................................................... -- -- -- -- 48,185 Total Local Assistance Grants.......................................... -- 2,435,147 140,627 28,962,842 1,532,440 Departmental Operations: Personal Service (**).............................................................. -- 94,956 14,467 167,583 107,070 Non-Personal Service (**)...................................................... -- 376,521 12,611 255,534 124,883 General State Charges.............................................................. -- 35,995 6,988 70,821 20,980 Total Disbursements.......................................................... -- 2,942,619 174,693 29,456,780 1,785,373
Excess (Deficiency) of Receipts over Disbursements................................................................. -- 10,848 (23) 4,025,818 (60,526)
OTHER FINANCING SOURCES (USES): Transfers from Other Funds...................................................... -- -- -- -- -- Transfers to Other Funds (*)..................................................... -- (10,117) -- (3,923,001) (13,375) Total Other Financing Sources (Uses)............................. -- (10,117) -- (3,923,001) (13,375)
Excess (Deficiency) of Receipts and Other Financing Sources over Disbursements and Other Financing Uses....................................................... -- 731 (23) 102,817 (73,901)
Fund Balances (Deficits) at April 1........................................... -- 562 (2,625) (147,454) 70,798Fund Balances (Deficits) at March 31....................................... $ -- $ 1,293 $ (2,648) $ (44,637) $ (3,103)
(*) See Footnotes - Note #4(**) See Footnotes - Note #'s 10, 11(***) See Schedule 7
34
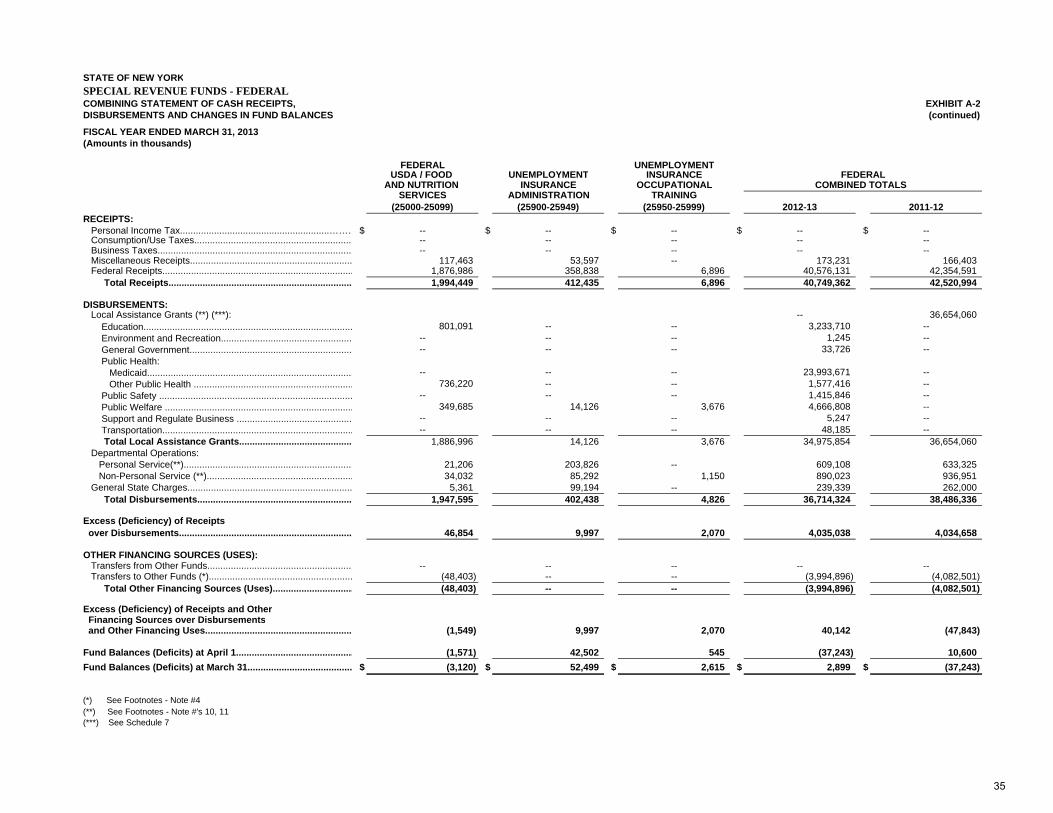
STATE OF NEW YORKSPECIAL REVENUE FUNDS - FEDERALCOMBINING STATEMENT OF CASH RECEIPTS, EXHIBIT A-2DISBURSEMENTS AND CHANGES IN FUND BALANCES (continued)
FISCAL YEAR ENDED MARCH 31, 2013 (Amounts in thousands)
FEDERAL UNEMPLOYMENTUSDA / FOOD UNEMPLOYMENT INSURANCE
AND NUTRITION INSURANCE OCCUPATIONALSERVICES ADMINISTRATION TRAINING
(25000-25099) (25900-25949) (25950-25999) 2012-13 2011-12RECEIPTS: Personal Income Tax.........................................................……… $ -- $ -- $ -- $ -- $ -- Consumption/Use Taxes............................................................. -- -- -- -- -- Business Taxes........................................................................... -- -- -- -- -- Miscellaneous Receipts.............................................................. 117,463 53,597 -- 173,231 166,403 Federal Receipts......................................................................... 1,876,986 358,838 6,896 40,576,131 42,354,591 Total Receipts...................................................................... 1,994,449 412,435 6,896 40,749,362 42,520,994
DISBURSEMENTS: Local Assistance Grants (**) (***): -- 36,654,060 Education................................................................................ 801,091 -- -- 3,233,710 -- Environment and Recreation.................................................. -- -- -- 1,245 -- General Government.............................................................. -- -- -- 33,726 -- Public Health: Medicaid............................................................................... -- -- -- 23,993,671 -- Other Public Health ............................................................. 736,220 -- -- 1,577,416 -- Public Safety .......................................................................... -- -- -- 1,415,846 -- Public Welfare ........................................................................ 349,685 14,126 3,676 4,666,808 -- Support and Regulate Business ............................................ -- -- -- 5,247 -- Transportation......................................................................... -- -- -- 48,185 -- Total Local Assistance Grants........................................... 1,886,996 14,126 3,676 34,975,854 36,654,060 Departmental Operations: Personal Service(**)................................................................. 21,206 203,826 -- 609,108 633,325 Non-Personal Service (**)........................................................ 34,032 85,292 1,150 890,023 936,951 General State Charges............................................................... 5,361 99,194 -- 239,339 262,000 Total Disbursements........................................................... 1,947,595 402,438 4,826 36,714,324 38,486,336
Excess (Deficiency) of Receipts over Disbursements.................................................................. 46,854 9,997 2,070 4,035,038 4,034,658
OTHER FINANCING SOURCES (USES): Transfers from Other Funds........................................................ -- -- -- -- -- Transfers to Other Funds (*)....................................................... (48,403) -- -- (3,994,896) (4,082,501) Total Other Financing Sources (Uses)............................... (48,403) -- -- (3,994,896) (4,082,501)
Excess (Deficiency) of Receipts and Other Financing Sources over Disbursements and Other Financing Uses........................................................ (1,549) 9,997 2,070 40,142 (47,843)
Fund Balances (Deficits) at April 1............................................. (1,571) 42,502 545 (37,243) 10,600Fund Balances (Deficits) at March 31........................................ $ (3,120) $ 52,499 $ 2,615 $ 2,899 $ (37,243)
(*) See Footnotes - Note #4(**) See Footnotes - Note #'s 10, 11(***) See Schedule 7
COMBINED TOTALS FEDERAL
35
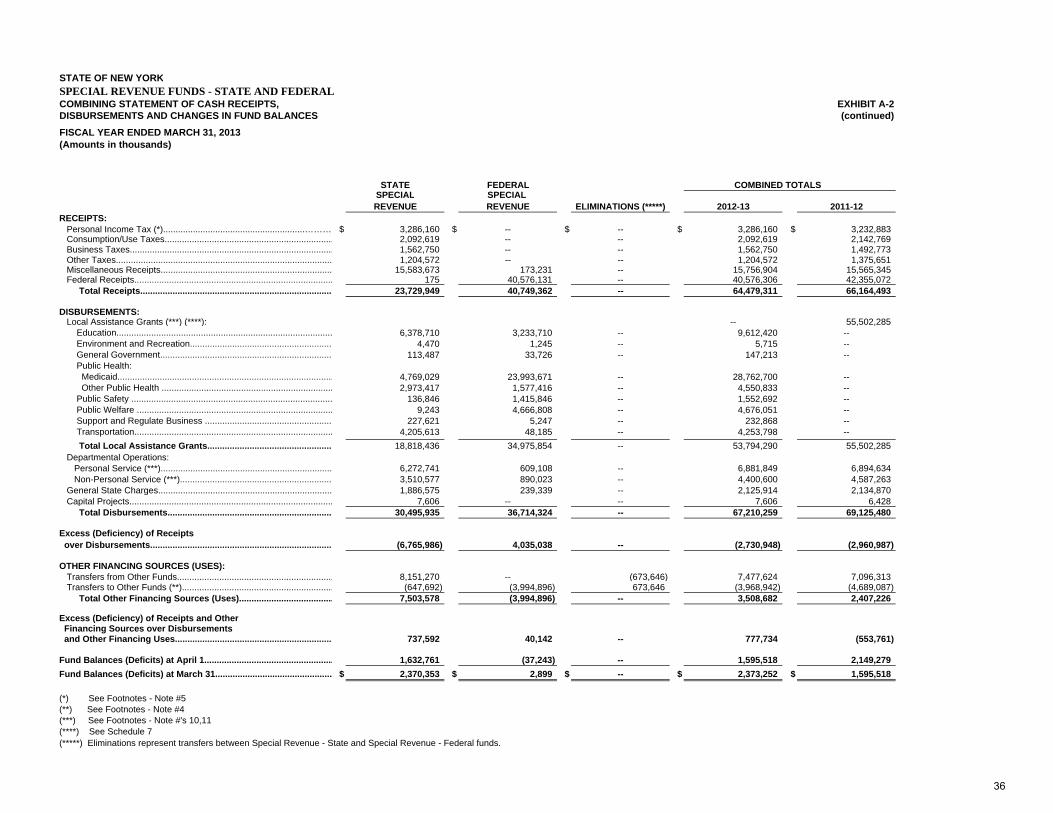
STATE OF NEW YORKSPECIAL REVENUE FUNDS - STATE AND FEDERALCOMBINING STATEMENT OF CASH RECEIPTS, EXHIBIT A-2DISBURSEMENTS AND CHANGES IN FUND BALANCES (continued)FISCAL YEAR ENDED MARCH 31, 2013 (Amounts in thousands)
STATE FEDERAL COMBINED TOTALS SPECIAL SPECIAL REVENUE REVENUE ELIMINATIONS (*****) 2012-13 2011-12
RECEIPTS: Personal Income Tax (*).........................................................……… $ 3,286,160 $ -- $ -- $ 3,286,160 $ 3,232,883 Consumption/Use Taxes.................................................................... 2,092,619 -- -- 2,092,619 2,142,769 Business Taxes.................................................................................. 1,562,750 -- -- 1,562,750 1,492,773 Other Taxes....................................................................................... 1,204,572 -- -- 1,204,572 1,375,651 Miscellaneous Receipts..................................................................... 15,583,673 173,231 -- 15,756,904 15,565,345 Federal Receipts................................................................................ 175 40,576,131 -- 40,576,306 42,355,072 Total Receipts............................................................................. 23,729,949 40,749,362 -- 64,479,311 66,164,493
DISBURSEMENTS: Local Assistance Grants (***) (****): -- 55,502,285 Education....................................................................................... 6,378,710 3,233,710 -- 9,612,420 -- Environment and Recreation......................................................... 4,470 1,245 -- 5,715 -- General Government..................................................................... 113,487 33,726 -- 147,213 -- Public Health: Medicaid....................................................................................... 4,769,029 23,993,671 -- 28,762,700 -- Other Public Health ..................................................................... 2,973,417 1,577,416 -- 4,550,833 -- Public Safety ................................................................................. 136,846 1,415,846 -- 1,552,692 -- Public Welfare ............................................................................... 9,243 4,666,808 -- 4,676,051 -- Support and Regulate Business ................................................... 227,621 5,247 -- 232,868 -- Transportation................................................................................ 4,205,613 48,185 -- 4,253,798 -- Total Local Assistance Grants.................................................. 18,818,436 34,975,854 -- 53,794,290 55,502,285 Departmental Operations: Personal Service (***)..................................................................... 6,272,741 609,108 -- 6,881,849 6,894,634 Non-Personal Service (***)............................................................. 3,510,577 890,023 -- 4,400,600 4,587,263 General State Charges...................................................................... 1,886,575 239,339 -- 2,125,914 2,134,870 Capital Projects.................................................................................. 7,606 -- -- 7,606 6,428 Total Disbursements.................................................................. 30,495,935 36,714,324 -- 67,210,259 69,125,480
Excess (Deficiency) of Receipts over Disbursements......................................................................... (6,765,986) 4,035,038 -- (2,730,948) (2,960,987)
OTHER FINANCING SOURCES (USES): Transfers from Other Funds............................................................... 8,151,270 -- (673,646) 7,477,624 7,096,313 Transfers to Other Funds (**)............................................................. (647,692) (3,994,896) 673,646 (3,968,942) (4,689,087) Total Other Financing Sources (Uses)...................................... 7,503,578 (3,994,896) -- 3,508,682 2,407,226
Excess (Deficiency) of Receipts and Other Financing Sources over Disbursements and Other Financing Uses............................................................... 737,592 40,142 -- 777,734 (553,761)
Fund Balances (Deficits) at April 1.................................................... 1,632,761 (37,243) -- 1,595,518 2,149,279Fund Balances (Deficits) at March 31............................................... $ 2,370,353 $ 2,899 $ -- $ 2,373,252 $ 1,595,518
(*) See Footnotes - Note #5(**) See Footnotes - Note #4(***) See Footnotes - Note #'s 10,11(****) See Schedule 7(*****) Eliminations represent transfers between Special Revenue - State and Special Revenue - Federal funds.
36
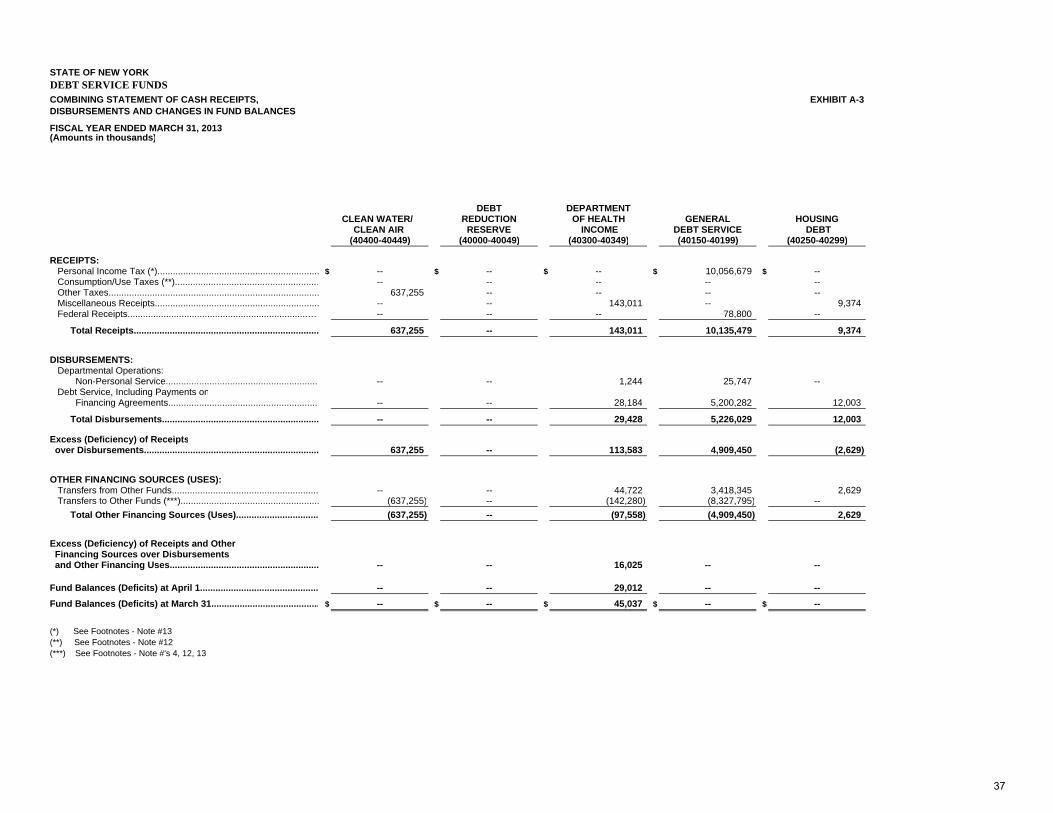
STATE OF NEW YORK DEBT SERVICE FUNDS COMBINING STATEMENT OF CASH RECEIPTS, EXHIBIT A-3DISBURSEMENTS AND CHANGES IN FUND BALANCES
FISCAL YEAR ENDED MARCH 31, 2013(Amounts in thousands)
DEBT DEPARTMENTCLEAN WATER/ REDUCTION OF HEALTH GENERAL HOUSING
CLEAN AIR RESERVE INCOME DEBT SERVICE DEBT(40400-40449) (40000-40049) (40300-40349) (40150-40199) (40250-40299)
RECEIPTS: Personal Income Tax (*)............................................................... $ -- $ -- $ -- $ 10,056,679 $ -- Consumption/Use Taxes (**).......................................................… -- -- -- -- -- Other Taxes.................................................................................. 637,255 -- -- -- -- Miscellaneous Receipts................................................................ -- -- 143,011 -- 9,374 Federal Receipts......................................................................…… -- -- -- 78,800 --
Total Receipts........................................................................ 637,255 -- 143,011 10,135,479 9,374
DISBURSEMENTS: Departmental Operations: Non-Personal Service............................................................ -- -- 1,244 25,747 -- Debt Service, Including Payments on Financing Agreements........................................................... -- -- 28,184 5,200,282 12,003
Total Disbursements............................................................. -- -- 29,428 5,226,029 12,003
Excess (Deficiency) of Receipts over Disbursements.................................................................... 637,255 -- 113,583 4,909,450 (2,629)
OTHER FINANCING SOURCES (USES): Transfers from Other Funds......................................................... -- -- 44,722 3,418,345 2,629 Transfers to Other Funds (***)...................................................... (637,255) -- (142,280) (8,327,795) -- Total Other Financing Sources (Uses)................................ (637,255) -- (97,558) (4,909,450) 2,629
Excess (Deficiency) of Receipts and Other Financing Sources over Disbursements and Other Financing Uses.......................................................... -- -- 16,025 -- --
Fund Balances (Deficits) at April 1.............................................. -- -- 29,012 -- --Fund Balances (Deficits) at March 31.......................................... $ -- $ -- $ 45,037 $ -- $ --
(*) See Footnotes - Note #13(**) See Footnotes - Note #12(***) See Footnotes - Note #'s 4, 12, 13
37
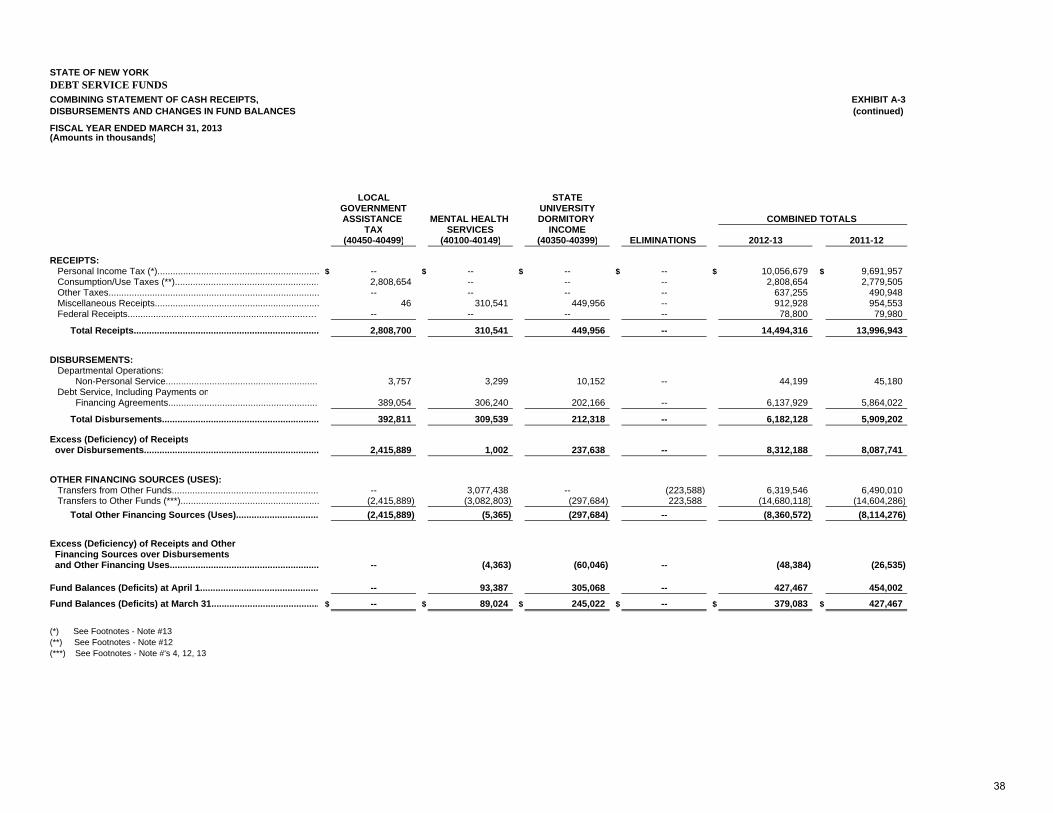
STATE OF NEW YORK DEBT SERVICE FUNDS COMBINING STATEMENT OF CASH RECEIPTS, DISBURSEMENTS AND CHANGES IN FUND BALANCES
FISCAL YEAR ENDED MARCH 31, 2013(Amounts in thousands)
RECEIPTS: Personal Income Tax (*)............................................................... Consumption/Use Taxes (**).......................................................… Other Taxes.................................................................................. Miscellaneous Receipts................................................................ Federal Receipts......................................................................……
Total Receipts........................................................................
DISBURSEMENTS: Departmental Operations: Non-Personal Service............................................................ Debt Service, Including Payments on Financing Agreements...........................................................
Total Disbursements.............................................................
Excess (Deficiency) of Receipts over Disbursements....................................................................
OTHER FINANCING SOURCES (USES): Transfers from Other Funds......................................................... Transfers to Other Funds (***)...................................................... Total Other Financing Sources (Uses)................................
Excess (Deficiency) of Receipts and Other Financing Sources over Disbursements and Other Financing Uses..........................................................
Fund Balances (Deficits) at April 1..............................................Fund Balances (Deficits) at March 31..........................................
(*) See Footnotes - Note #13(**) See Footnotes - Note #12(***) See Footnotes - Note #'s 4, 12, 13
EXHIBIT A-3(continued)
LOCAL STATEGOVERNMENT UNIVERSITYASSISTANCE MENTAL HEALTH DORMITORY COMBINED TOTALS
TAX SERVICES INCOME(40450-40499) (40100-40149) (40350-40399) ELIMINATIONS 2012-13 2011-12
$ -- $ -- $ -- $ -- $ 10,056,679 $ 9,691,9572,808,654 -- -- -- 2,808,654 2,779,505-- -- -- -- 637,255 490,948
46 310,541 449,956 -- 912,928 954,553-- -- -- -- 78,800 79,980
2,808,700 310,541 449,956 -- 14,494,316 13,996,943
3,757 3,299 10,152 -- 44,199 45,180
389,054 306,240 202,166 -- 6,137,929 5,864,022
392,811 309,539 212,318 -- 6,182,128 5,909,202
2,415,889 1,002 237,638 -- 8,312,188 8,087,741
-- 3,077,438 -- (223,588) 6,319,546 6,490,010(2,415,889) (3,082,803) (297,684) 223,588 (14,680,118) (14,604,286)(2,415,889) (5,365) (297,684) -- (8,360,572) (8,114,276)
-- (4,363) (60,046) -- (48,384) (26,535)
-- 93,387 305,068 -- 427,467 454,002$ -- $ 89,024 $ 245,022 $ -- $ 379,083 $ 427,467
38
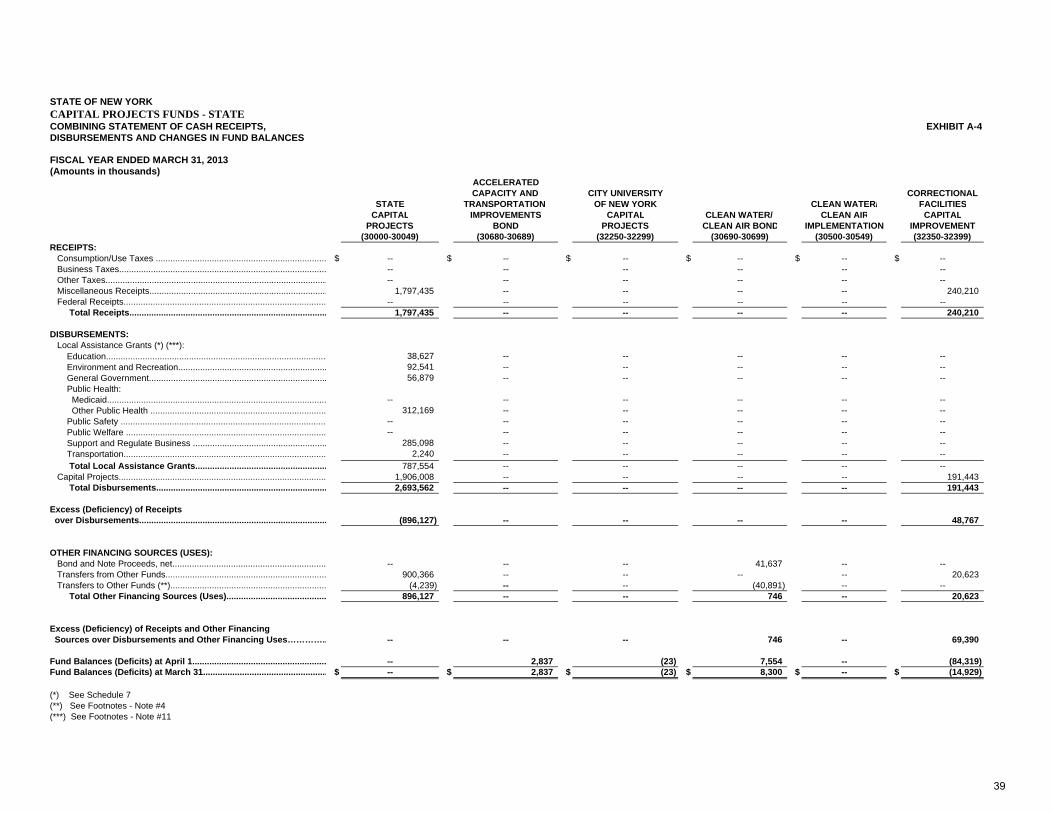
STATE OF NEW YORK CAPITAL PROJECTS FUNDS - STATECOMBINING STATEMENT OF CASH RECEIPTS, EXHIBIT A-4DISBURSEMENTS AND CHANGES IN FUND BALANCES
FISCAL YEAR ENDED MARCH 31, 2013 (Amounts in thousands)
ACCELERATEDCAPACITY AND CITY UNIVERSITY CORRECTIONAL
STATE TRANSPORTATION OF NEW YORK CLEAN WATER/ FACILITIESCAPITAL IMPROVEMENTS CAPITAL CLEAN WATER/ CLEAN AIR CAPITAL
PROJECTS BOND PROJECTS CLEAN AIR BOND IMPLEMENTATION IMPROVEMENT(30000-30049) (30680-30689) (32250-32299) (30690-30699) (30500-30549) (32350-32399)
RECEIPTS: Consumption/Use Taxes ...................................................................... $ -- $ -- $ -- $ -- $ -- $ -- Business Taxes..................................................................................... -- -- -- -- -- -- Other Taxes........................................................................................... -- -- -- -- -- -- Miscellaneous Receipts......................................................................... 1,797,435 -- -- -- -- 240,210 Federal Receipts................................................................................... -- -- -- -- -- -- Total Receipts................................................................................. 1,797,435 -- -- -- -- 240,210
DISBURSEMENTS: Local Assistance Grants (*) (***): Education.......................................................................................... 38,627 -- -- -- -- -- Environment and Recreation............................................................. 92,541 -- -- -- -- -- General Government......................................................................... 56,879 -- -- -- -- -- Public Health: Medicaid.......................................................................................... -- -- -- -- -- -- Other Public Health ........................................................................ 312,169 -- -- -- -- -- Public Safety .................................................................................... -- -- -- -- -- -- Public Welfare .................................................................................. -- -- -- -- -- -- Support and Regulate Business ....................................................... 285,098 -- -- -- -- -- Transportation................................................................................... 2,240 -- -- -- -- -- Total Local Assistance Grants...................................................... 787,554 -- -- -- -- -- Capital Projects..................................................................................... 1,906,008 -- -- -- -- 191,443 Total Disbursements...................................................................... 2,693,562 -- -- -- -- 191,443
Excess (Deficiency) of Receipts over Disbursements............................................................................. (896,127) -- -- -- -- 48,767
OTHER FINANCING SOURCES (USES): Bond and Note Proceeds, net............................................................... -- -- -- 41,637 -- -- Transfers from Other Funds.................................................................. 900,366 -- -- -- -- 20,623 Transfers to Other Funds (**)................................................................ (4,239) -- -- (40,891) -- -- Total Other Financing Sources (Uses)......................................... 896,127 -- -- 746 -- 20,623
Excess (Deficiency) of Receipts and Other Financing Sources over Disbursements and Other Financing Uses………….. -- -- -- 746 -- 69,390
Fund Balances (Deficits) at April 1....................................................... -- 2,837 (23) 7,554 -- (84,319)Fund Balances (Deficits) at March 31................................................... $ -- $ 2,837 $ (23) $ 8,300 $ -- $ (14,929)
(*) See Schedule 7(**) See Footnotes - Note #4(***) See Footnotes - Note #11
39
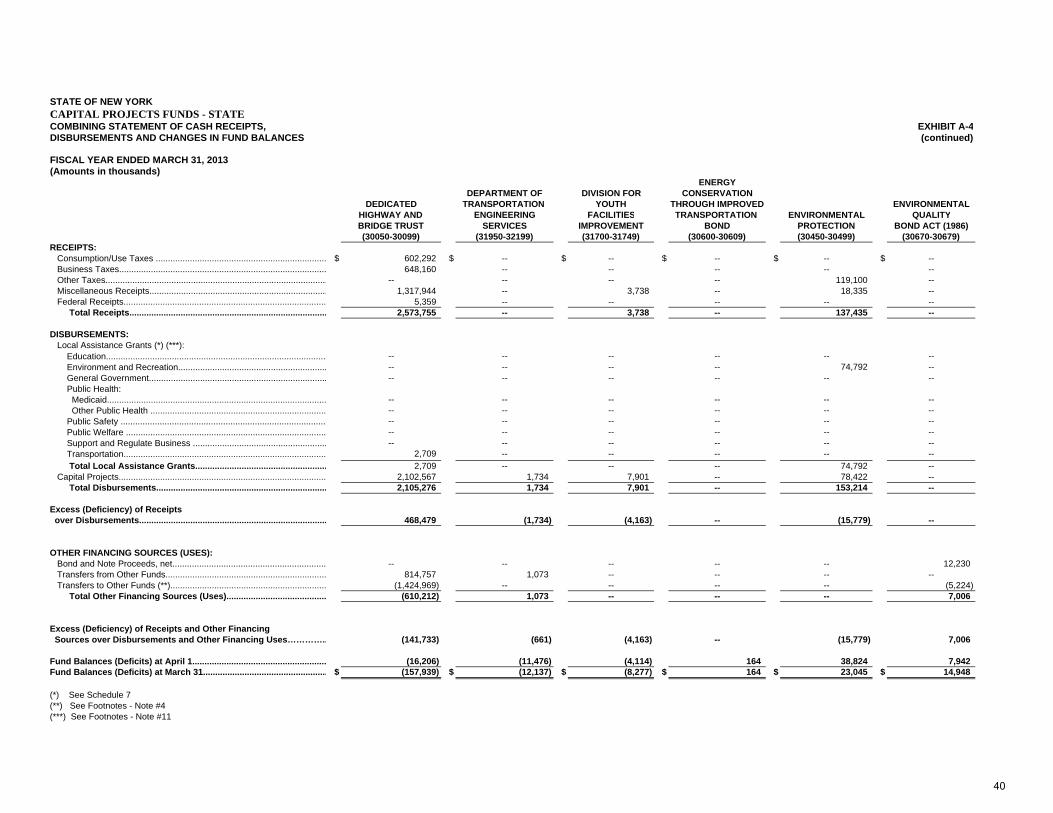
STATE OF NEW YORK CAPITAL PROJECTS FUNDS - STATECOMBINING STATEMENT OF CASH RECEIPTS, DISBURSEMENTS AND CHANGES IN FUND BALANCES
FISCAL YEAR ENDED MARCH 31, 2013 (Amounts in thousands)
RECEIPTS: Consumption/Use Taxes ...................................................................... Business Taxes..................................................................................... Other Taxes........................................................................................... Miscellaneous Receipts......................................................................... Federal Receipts................................................................................... Total Receipts.................................................................................
DISBURSEMENTS: Local Assistance Grants (*) (***): Education.......................................................................................... Environment and Recreation............................................................. General Government......................................................................... Public Health: Medicaid.......................................................................................... Other Public Health ........................................................................ Public Safety .................................................................................... Public Welfare .................................................................................. Support and Regulate Business ....................................................... Transportation................................................................................... Total Local Assistance Grants...................................................... Capital Projects..................................................................................... Total Disbursements......................................................................
Excess (Deficiency) of Receipts over Disbursements.............................................................................
OTHER FINANCING SOURCES (USES): Bond and Note Proceeds, net............................................................... Transfers from Other Funds.................................................................. Transfers to Other Funds (**)................................................................ Total Other Financing Sources (Uses).........................................
Excess (Deficiency) of Receipts and Other Financing Sources over Disbursements and Other Financing Uses…………..
Fund Balances (Deficits) at April 1.......................................................Fund Balances (Deficits) at March 31...................................................
(*) See Schedule 7(**) See Footnotes - Note #4(***) See Footnotes - Note #11
EXHIBIT A-4(continued)
ENERGYDEPARTMENT OF DIVISION FOR CONSERVATION
DEDICATED TRANSPORTATION YOUTH THROUGH IMPROVED ENVIRONMENTALHIGHWAY AND ENGINEERING FACILITIES TRANSPORTATION ENVIRONMENTAL QUALITYBRIDGE TRUST SERVICES IMPROVEMENT BOND PROTECTION BOND ACT (1986)(30050-30099) (31950-32199) (31700-31749) (30600-30609) (30450-30499) (30670-30679)
$ 602,292 $ -- $ -- $ -- $ -- $ --648,160 -- -- -- -- --
-- -- -- -- 119,100 --1,317,944 -- 3,738 -- 18,335 --
5,359 -- -- -- -- --2,573,755 -- 3,738 -- 137,435 --
-- -- -- -- -- ---- -- -- -- 74,792 ---- -- -- -- -- --
-- -- -- -- -- ---- -- -- -- -- ---- -- -- -- -- ---- -- -- -- -- ---- -- -- -- -- --
2,709 -- -- -- -- --2,709 -- -- -- 74,792 --
2,102,567 1,734 7,901 -- 78,422 --2,105,276 1,734 7,901 -- 153,214 --
468,479 (1,734) (4,163) -- (15,779) --
-- -- -- -- -- 12,230814,757 1,073 -- -- -- --
(1,424,969) -- -- -- -- (5,224)(610,212) 1,073 -- -- -- 7,006
(141,733) (661) (4,163) -- (15,779) 7,006
(16,206) (11,476) (4,114) 164 38,824 7,942$ (157,939) $ (12,137) $ (8,277) $ 164 $ 23,045 $ 14,948
40
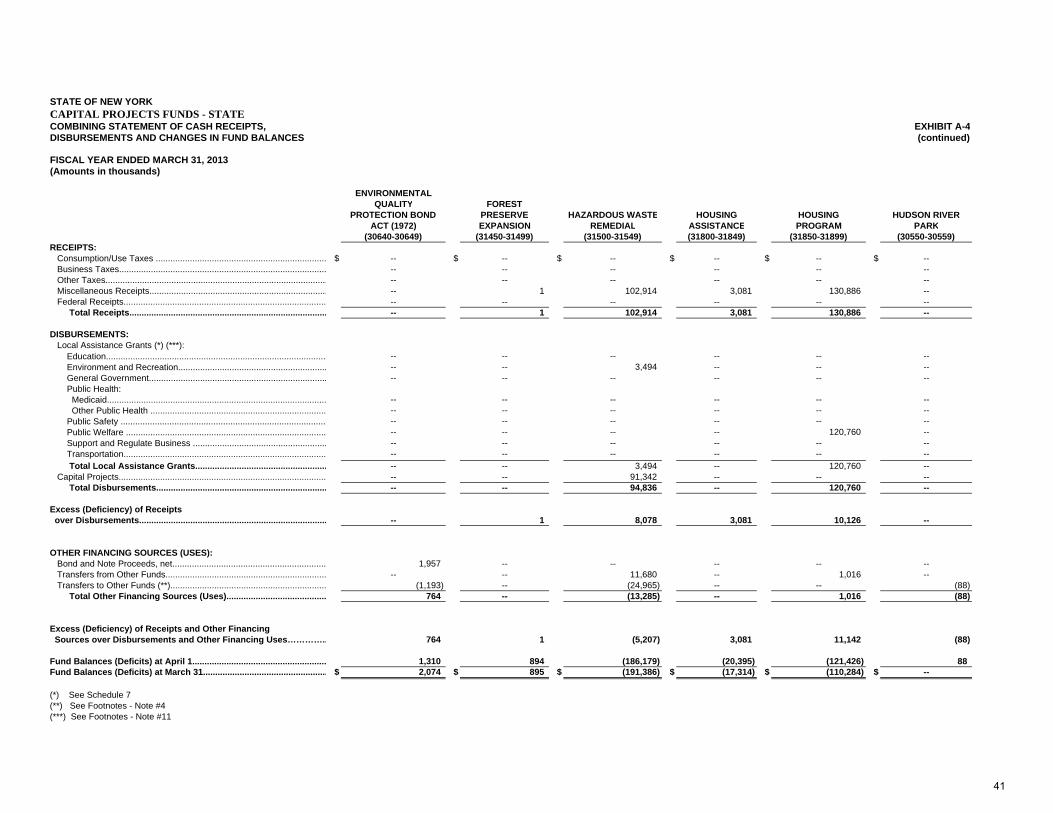
STATE OF NEW YORK CAPITAL PROJECTS FUNDS - STATECOMBINING STATEMENT OF CASH RECEIPTS, DISBURSEMENTS AND CHANGES IN FUND BALANCES
FISCAL YEAR ENDED MARCH 31, 2013 (Amounts in thousands)
RECEIPTS: Consumption/Use Taxes ...................................................................... Business Taxes..................................................................................... Other Taxes........................................................................................... Miscellaneous Receipts......................................................................... Federal Receipts................................................................................... Total Receipts.................................................................................
DISBURSEMENTS: Local Assistance Grants (*) (***): Education.......................................................................................... Environment and Recreation............................................................. General Government......................................................................... Public Health: Medicaid.......................................................................................... Other Public Health ........................................................................ Public Safety .................................................................................... Public Welfare .................................................................................. Support and Regulate Business ....................................................... Transportation................................................................................... Total Local Assistance Grants...................................................... Capital Projects..................................................................................... Total Disbursements......................................................................
Excess (Deficiency) of Receipts over Disbursements.............................................................................
OTHER FINANCING SOURCES (USES): Bond and Note Proceeds, net............................................................... Transfers from Other Funds.................................................................. Transfers to Other Funds (**)................................................................ Total Other Financing Sources (Uses).........................................
Excess (Deficiency) of Receipts and Other Financing Sources over Disbursements and Other Financing Uses…………..
Fund Balances (Deficits) at April 1.......................................................Fund Balances (Deficits) at March 31...................................................
(*) See Schedule 7(**) See Footnotes - Note #4(***) See Footnotes - Note #11
EXHIBIT A-4(continued)
ENVIRONMENTALQUALITY FOREST
PROTECTION BOND PRESERVE HAZARDOUS WASTE HOUSING HOUSING HUDSON RIVERACT (1972) EXPANSION REMEDIAL ASSISTANCE PROGRAM PARK
(30640-30649) (31450-31499) (31500-31549) (31800-31849) (31850-31899) (30550-30559)
$ -- $ -- $ -- $ -- $ -- $ ---- -- -- -- -- ---- -- -- -- -- --
-- 1 102,914 3,081 130,886 ---- -- -- -- -- ---- 1 102,914 3,081 130,886 --
-- -- -- -- -- ---- -- 3,494 -- -- ---- -- -- -- -- --
-- -- -- -- -- ---- -- -- -- -- ---- -- -- -- -- ---- -- -- -- 120,760 ---- -- -- -- -- ---- -- -- -- -- ---- -- 3,494 -- 120,760 ---- -- 91,342 -- -- ---- -- 94,836 -- 120,760 --
-- 1 8,078 3,081 10,126 --
1,957 -- -- -- -- ---- -- 11,680 -- 1,016 --
(1,193) -- (24,965) -- -- (88)764 -- (13,285) -- 1,016 (88)
764 1 (5,207) 3,081 11,142 (88)
1,310 894 (186,179) (20,395) (121,426) 88$ 2,074 $ 895 $ (191,386) $ (17,314) $ (110,284) $ --
41
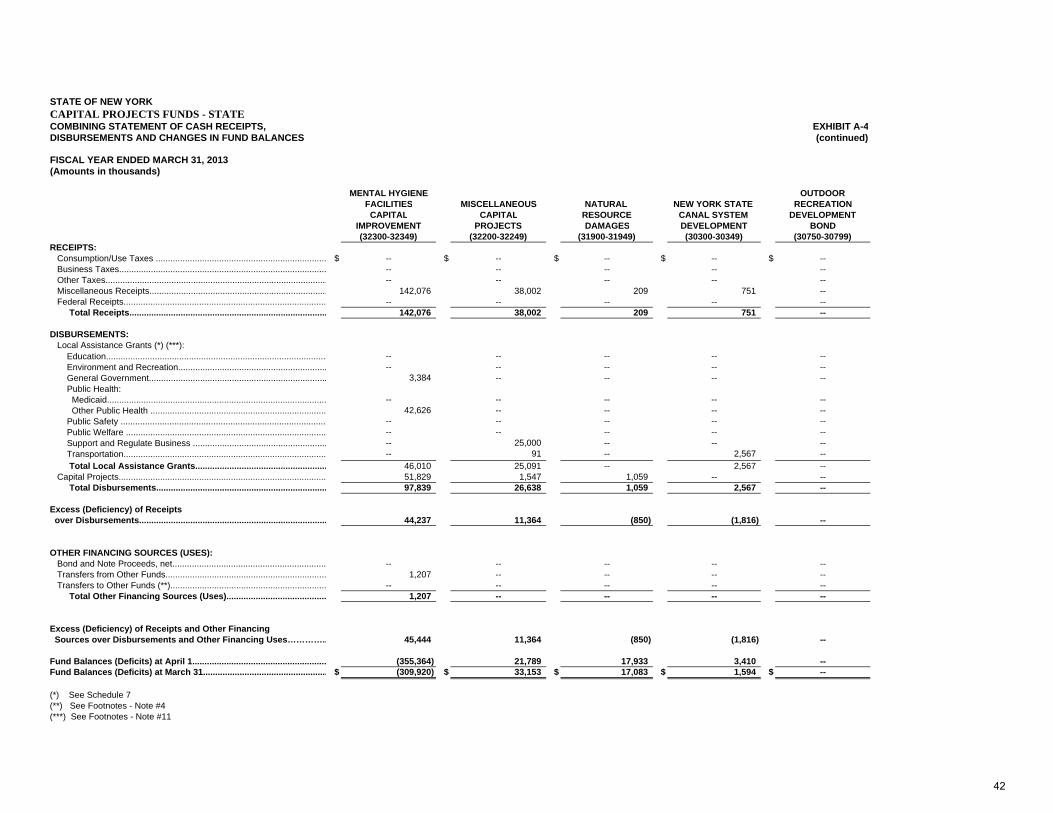
STATE OF NEW YORK CAPITAL PROJECTS FUNDS - STATECOMBINING STATEMENT OF CASH RECEIPTS, DISBURSEMENTS AND CHANGES IN FUND BALANCES
FISCAL YEAR ENDED MARCH 31, 2013 (Amounts in thousands)
RECEIPTS: Consumption/Use Taxes ...................................................................... Business Taxes..................................................................................... Other Taxes........................................................................................... Miscellaneous Receipts......................................................................... Federal Receipts................................................................................... Total Receipts.................................................................................
DISBURSEMENTS: Local Assistance Grants (*) (***): Education.......................................................................................... Environment and Recreation............................................................. General Government......................................................................... Public Health: Medicaid.......................................................................................... Other Public Health ........................................................................ Public Safety .................................................................................... Public Welfare .................................................................................. Support and Regulate Business ....................................................... Transportation................................................................................... Total Local Assistance Grants...................................................... Capital Projects..................................................................................... Total Disbursements......................................................................
Excess (Deficiency) of Receipts over Disbursements.............................................................................
OTHER FINANCING SOURCES (USES): Bond and Note Proceeds, net............................................................... Transfers from Other Funds.................................................................. Transfers to Other Funds (**)................................................................ Total Other Financing Sources (Uses).........................................
Excess (Deficiency) of Receipts and Other Financing Sources over Disbursements and Other Financing Uses…………..
Fund Balances (Deficits) at April 1.......................................................Fund Balances (Deficits) at March 31...................................................
(*) See Schedule 7(**) See Footnotes - Note #4(***) See Footnotes - Note #11
EXHIBIT A-4(continued)
MENTAL HYGIENE OUTDOORFACILITIES MISCELLANEOUS NATURAL NEW YORK STATE RECREATION
CAPITAL CAPITAL RESOURCE CANAL SYSTEM DEVELOPMENTIMPROVEMENT PROJECTS DAMAGES DEVELOPMENT BOND(32300-32349) (32200-32249) (31900-31949) (30300-30349) (30750-30799)
$ -- $ -- $ -- $ -- $ ---- -- -- -- ---- -- -- -- --
142,076 38,002 209 751 ---- -- -- -- --
142,076 38,002 209 751 --
-- -- -- -- ---- -- -- -- --
3,384 -- -- -- --
-- -- -- -- --42,626 -- -- -- --
-- -- -- -- ---- -- -- -- ---- 25,000 -- -- ---- 91 -- 2,567 --
46,010 25,091 -- 2,567 --51,829 1,547 1,059 -- --97,839 26,638 1,059 2,567 --
44,237 11,364 (850) (1,816) --
-- -- -- -- --1,207 -- -- -- --
-- -- -- -- --1,207 -- -- -- --
45,444 11,364 (850) (1,816) --
(355,364) 21,789 17,933 3,410 --$ (309,920) $ 33,153 $ 17,083 $ 1,594 $ --
42
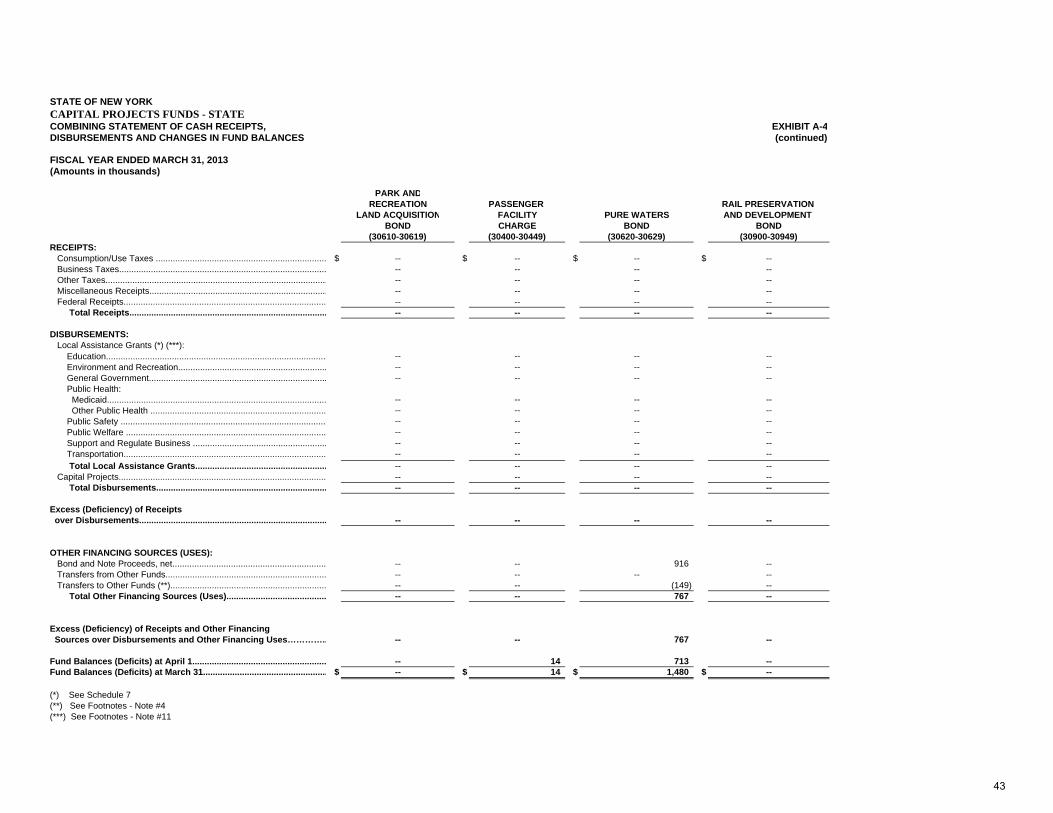
STATE OF NEW YORK CAPITAL PROJECTS FUNDS - STATECOMBINING STATEMENT OF CASH RECEIPTS, DISBURSEMENTS AND CHANGES IN FUND BALANCES
FISCAL YEAR ENDED MARCH 31, 2013 (Amounts in thousands)
RECEIPTS: Consumption/Use Taxes ...................................................................... Business Taxes..................................................................................... Other Taxes........................................................................................... Miscellaneous Receipts......................................................................... Federal Receipts................................................................................... Total Receipts.................................................................................
DISBURSEMENTS: Local Assistance Grants (*) (***): Education.......................................................................................... Environment and Recreation............................................................. General Government......................................................................... Public Health: Medicaid.......................................................................................... Other Public Health ........................................................................ Public Safety .................................................................................... Public Welfare .................................................................................. Support and Regulate Business ....................................................... Transportation................................................................................... Total Local Assistance Grants...................................................... Capital Projects..................................................................................... Total Disbursements......................................................................
Excess (Deficiency) of Receipts over Disbursements.............................................................................
OTHER FINANCING SOURCES (USES): Bond and Note Proceeds, net............................................................... Transfers from Other Funds.................................................................. Transfers to Other Funds (**)................................................................ Total Other Financing Sources (Uses).........................................
Excess (Deficiency) of Receipts and Other Financing Sources over Disbursements and Other Financing Uses…………..
Fund Balances (Deficits) at April 1.......................................................Fund Balances (Deficits) at March 31...................................................
(*) See Schedule 7(**) See Footnotes - Note #4(***) See Footnotes - Note #11
EXHIBIT A-4(continued)
PARK ANDRECREATION PASSENGER RAIL PRESERVATION
LAND ACQUISITION FACILITY PURE WATERS AND DEVELOPMENT BOND CHARGE BOND BOND
(30610-30619) (30400-30449) (30620-30629) (30900-30949)
$ -- $ -- $ -- $ ---- -- -- ---- -- -- ---- -- -- ---- -- -- ---- -- -- --
-- -- -- ---- -- -- ---- -- -- --
-- -- -- ---- -- -- ---- -- -- ---- -- -- ---- -- -- ---- -- -- ---- -- -- ---- -- -- ---- -- -- --
-- -- -- --
-- -- 916 ---- -- -- ---- -- (149) ---- -- 767 --
-- -- 767 --
-- 14 713 --$ -- $ 14 $ 1,480 $ --
43
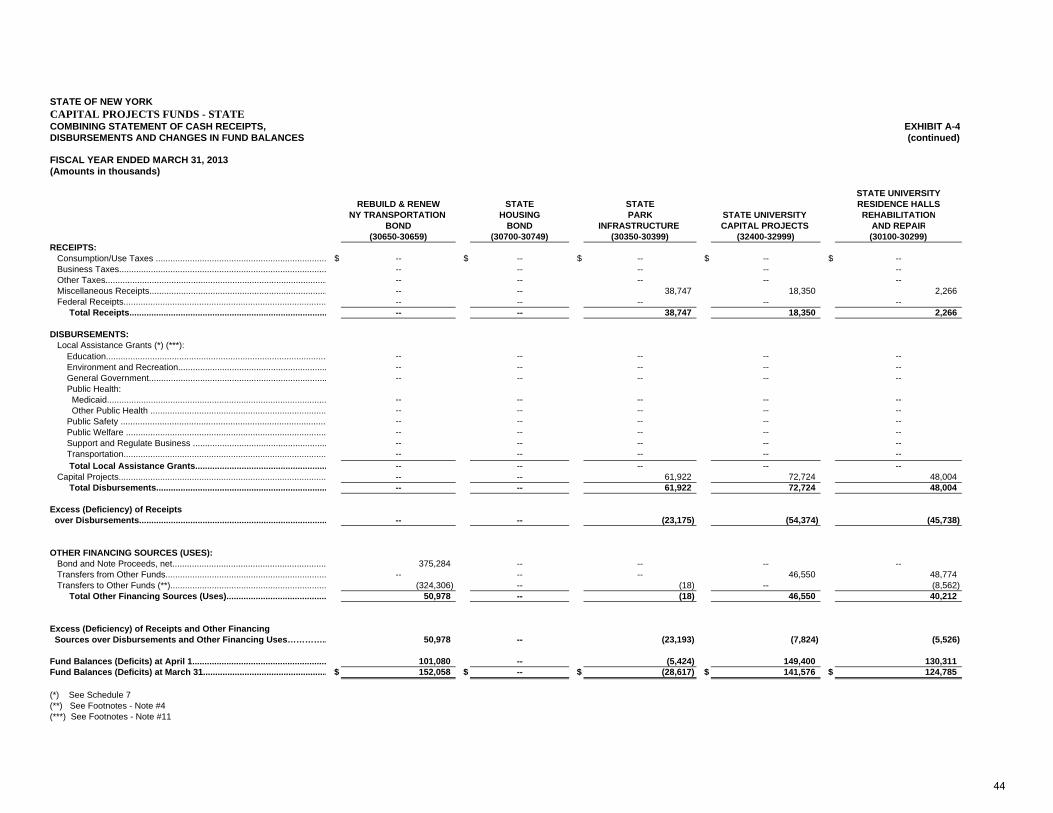
STATE OF NEW YORK CAPITAL PROJECTS FUNDS - STATECOMBINING STATEMENT OF CASH RECEIPTS, DISBURSEMENTS AND CHANGES IN FUND BALANCES
FISCAL YEAR ENDED MARCH 31, 2013 (Amounts in thousands)
RECEIPTS: Consumption/Use Taxes ...................................................................... Business Taxes..................................................................................... Other Taxes........................................................................................... Miscellaneous Receipts......................................................................... Federal Receipts................................................................................... Total Receipts.................................................................................
DISBURSEMENTS: Local Assistance Grants (*) (***): Education.......................................................................................... Environment and Recreation............................................................. General Government......................................................................... Public Health: Medicaid.......................................................................................... Other Public Health ........................................................................ Public Safety .................................................................................... Public Welfare .................................................................................. Support and Regulate Business ....................................................... Transportation................................................................................... Total Local Assistance Grants...................................................... Capital Projects..................................................................................... Total Disbursements......................................................................
Excess (Deficiency) of Receipts over Disbursements.............................................................................
OTHER FINANCING SOURCES (USES): Bond and Note Proceeds, net............................................................... Transfers from Other Funds.................................................................. Transfers to Other Funds (**)................................................................ Total Other Financing Sources (Uses).........................................
Excess (Deficiency) of Receipts and Other Financing Sources over Disbursements and Other Financing Uses…………..
Fund Balances (Deficits) at April 1.......................................................Fund Balances (Deficits) at March 31...................................................
(*) See Schedule 7(**) See Footnotes - Note #4(***) See Footnotes - Note #11
EXHIBIT A-4(continued)
STATE UNIVERSITYREBUILD & RENEW STATE STATE RESIDENCE HALLS
NY TRANSPORTATION HOUSING PARK STATE UNIVERSITY REHABILITATIONBOND BOND INFRASTRUCTURE CAPITAL PROJECTS AND REPAIR
(30650-30659) (30700-30749) (30350-30399) (32400-32999) (30100-30299)
$ -- $ -- $ -- $ -- $ ---- -- -- -- ---- -- -- -- ---- -- 38,747 18,350 2,266-- -- -- -- ---- -- 38,747 18,350 2,266
-- -- -- -- ---- -- -- -- ---- -- -- -- --
-- -- -- -- ---- -- -- -- ---- -- -- -- ---- -- -- -- ---- -- -- -- ---- -- -- -- ---- -- -- -- ---- -- 61,922 72,724 48,004-- -- 61,922 72,724 48,004
-- -- (23,175) (54,374) (45,738)
375,284 -- -- -- ---- -- -- 46,550 48,774
(324,306) -- (18) -- (8,562)50,978 -- (18) 46,550 40,212
50,978 -- (23,193) (7,824) (5,526)
101,080 -- (5,424) 149,400 130,311$ 152,058 $ -- $ (28,617) $ 141,576 $ 124,785
44
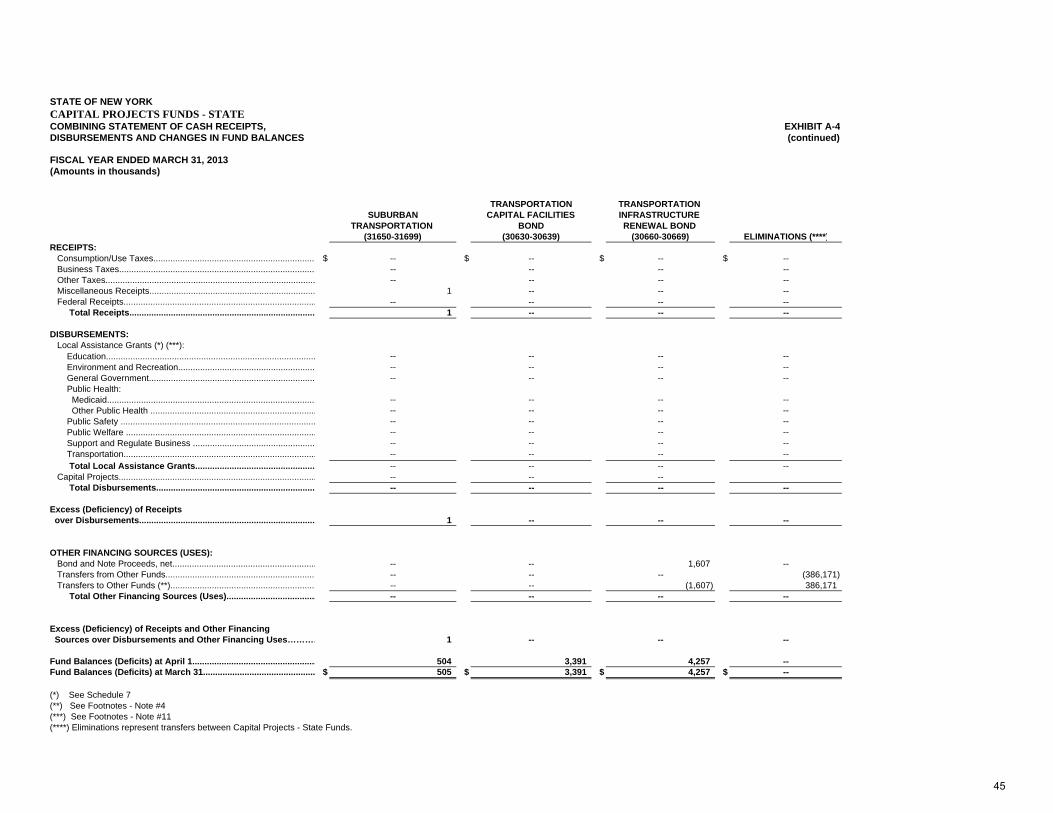
STATE OF NEW YORK CAPITAL PROJECTS FUNDS - STATECOMBINING STATEMENT OF CASH RECEIPTS, EXHIBIT A-4DISBURSEMENTS AND CHANGES IN FUND BALANCES (continued)
FISCAL YEAR ENDED MARCH 31, 2013 (Amounts in thousands)
TRANSPORTATION TRANSPORTATION SUBURBAN CAPITAL FACILITIES INFRASTRUCTURE
TRANSPORTATION BOND RENEWAL BOND (31650-31699) (30630-30639) (30660-30669) ELIMINATIONS (****)
RECEIPTS: Consumption/Use Taxes.................................................................. $ -- $ -- $ -- $ -- Business Taxes................................................................................ -- -- -- -- Other Taxes...................................................................................... -- -- -- -- Miscellaneous Receipts.................................................................... 1 -- -- -- Federal Receipts............................................................................... -- -- -- -- Total Receipts............................................................................ 1 -- -- --
DISBURSEMENTS: Local Assistance Grants (*) (***): Education...................................................................................... -- -- -- -- Environment and Recreation........................................................ -- -- -- -- General Government.................................................................... -- -- -- -- Public Health: Medicaid..................................................................................... -- -- -- -- Other Public Health .................................................................... -- -- -- -- Public Safety ................................................................................ -- -- -- -- Public Welfare .............................................................................. -- -- -- -- Support and Regulate Business .................................................. -- -- -- -- Transportation............................................................................... -- -- -- -- Total Local Assistance Grants................................................. -- -- -- -- Capital Projects................................................................................. -- -- -- Total Disbursements................................................................. -- -- -- --
Excess (Deficiency) of Receipts over Disbursements........................................................................ 1 -- -- --
OTHER FINANCING SOURCES (USES): Bond and Note Proceeds, net........................................................... -- -- 1,607 -- Transfers from Other Funds............................................................. -- -- -- (386,171) Transfers to Other Funds (**)........................................................... -- -- (1,607) 386,171 Total Other Financing Sources (Uses)..................................... -- -- -- --
Excess (Deficiency) of Receipts and Other Financing Sources over Disbursements and Other Financing Uses………… 1 -- -- --
Fund Balances (Deficits) at April 1................................................... 504 3,391 4,257 --Fund Balances (Deficits) at March 31.............................................. $ 505 $ 3,391 $ 4,257 $ --
(*) See Schedule 7(**) See Footnotes - Note #4(***) See Footnotes - Note #11(****) Eliminations represent transfers between Capital Projects - State Funds.
45
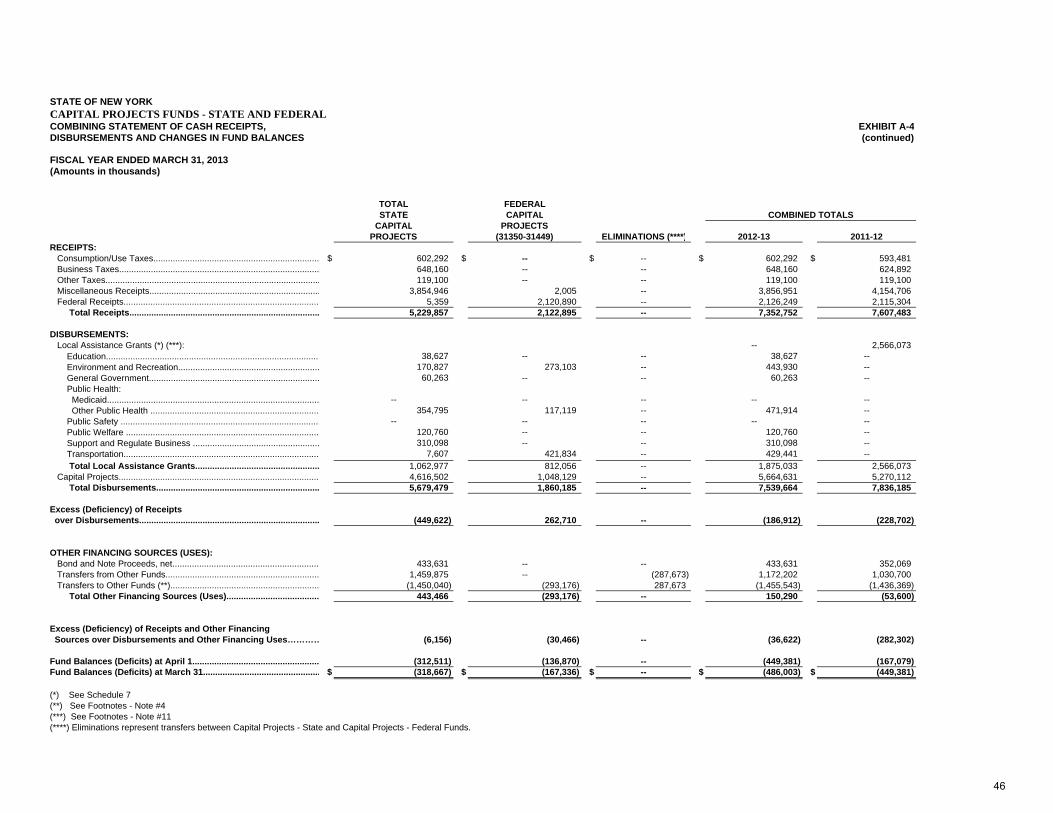
STATE OF NEW YORK CAPITAL PROJECTS FUNDS - STATE AND FEDERALCOMBINING STATEMENT OF CASH RECEIPTS, EXHIBIT A-4DISBURSEMENTS AND CHANGES IN FUND BALANCES (continued)
FISCAL YEAR ENDED MARCH 31, 2013 (Amounts in thousands)
TOTAL FEDERALSTATE CAPITAL
CAPITAL PROJECTS PROJECTS (31350-31449) ELIMINATIONS (****) 2012-13 2011-12
RECEIPTS: Consumption/Use Taxes.................................................................... $ 602,292 $ -- $ -- $ 602,292 $ 593,481 Business Taxes.................................................................................. 648,160 -- -- 648,160 624,892 Other Taxes........................................................................................ 119,100 -- -- 119,100 119,100 Miscellaneous Receipts...................................................................... 3,854,946 2,005 -- 3,856,951 4,154,706 Federal Receipts................................................................................ 5,359 2,120,890 -- 2,126,249 2,115,304 Total Receipts.............................................................................. 5,229,857 2,122,895 -- 7,352,752 7,607,483
DISBURSEMENTS: Local Assistance Grants (*) (***): -- 2,566,073 Education....................................................................................... 38,627 -- -- 38,627 -- Environment and Recreation.......................................................... 170,827 273,103 -- 443,930 -- General Government...................................................................... 60,263 -- -- 60,263 -- Public Health: Medicaid....................................................................................... -- -- -- -- -- Other Public Health ..................................................................... 354,795 117,119 -- 471,914 -- Public Safety .................................................................................. -- -- -- -- -- Public Welfare ............................................................................... 120,760 -- -- 120,760 -- Support and Regulate Business .................................................... 310,098 -- -- 310,098 -- Transportation................................................................................ 7,607 421,834 -- 429,441 -- Total Local Assistance Grants................................................... 1,062,977 812,056 -- 1,875,033 2,566,073 Capital Projects.................................................................................. 4,616,502 1,048,129 -- 5,664,631 5,270,112 Total Disbursements................................................................... 5,679,479 1,860,185 -- 7,539,664 7,836,185
Excess (Deficiency) of Receipts over Disbursements.......................................................................... (449,622) 262,710 -- (186,912) (228,702)
OTHER FINANCING SOURCES (USES): Bond and Note Proceeds, net............................................................ 433,631 -- -- 433,631 352,069 Transfers from Other Funds............................................................... 1,459,875 -- (287,673) 1,172,202 1,030,700 Transfers to Other Funds (**)............................................................. (1,450,040) (293,176) 287,673 (1,455,543) (1,436,369) Total Other Financing Sources (Uses)...................................... 443,466 (293,176) -- 150,290 (53,600)
Excess (Deficiency) of Receipts and Other Financing Sources over Disbursements and Other Financing Uses………… (6,156) (30,466) -- (36,622) (282,302)
Fund Balances (Deficits) at April 1.................................................... (312,511) (136,870) -- (449,381) (167,079)Fund Balances (Deficits) at March 31................................................ $ (318,667) $ (167,336) $ -- $ (486,003) $ (449,381)
(*) See Schedule 7(**) See Footnotes - Note #4(***) See Footnotes - Note #11(****) Eliminations represent transfers between Capital Projects - State and Capital Projects - Federal Funds.
COMBINED TOTALS
46
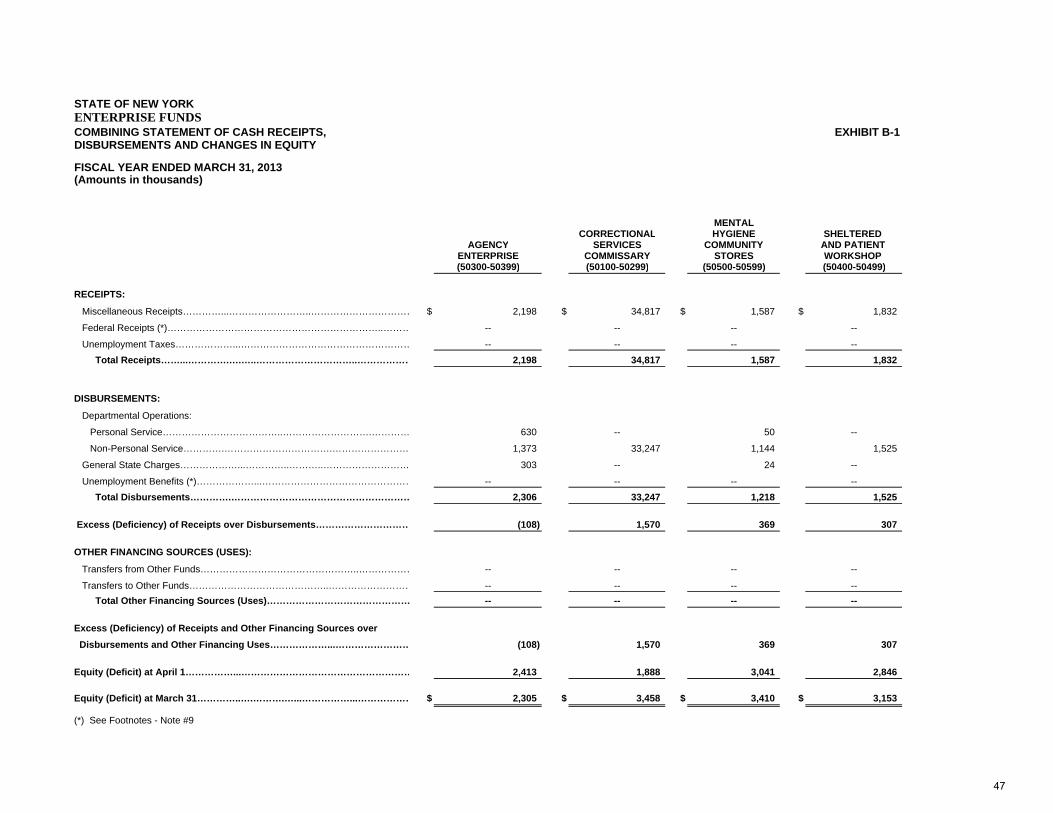
STATE OF NEW YORKENTERPRISE FUNDSCOMBINING STATEMENT OF CASH RECEIPTS, EXHIBIT B-1DISBURSEMENTS AND CHANGES IN EQUITY
FISCAL YEAR ENDED MARCH 31, 2013(Amounts in thousands)
MENTALCORRECTIONAL HYGIENE SHELTERED
AGENCY SERVICES COMMUNITY AND PATIENT ENTERPRISE COMMISSARY STORES WORKSHOP (50300-50399) (50100-50299) (50500-50599) (50400-50499)
RECEIPTS:
Miscellaneous Receipts…………...……………………..…………………………… $ 2,198 $ 34,817 $ 1,587 $ 1,832
Federal Receipts (*)…………………………………………………………..……… -- -- -- --
Unemployment Taxes………………...……………………………………………… -- -- -- -- Total Receipts……...………….….…..…………………………..……………… 2,198 34,817 1,587 1,832
DISBURSEMENTS:
Departmental Operations:
Personal Service………………………………..……………………….………… 630 -- 50 --
Non-Personal Service………….…………………………….…………………… 1,373 33,247 1,144 1,525
General State Charges………………...…………..………..……………………… 303 -- 24 --
Unemployment Benefits (*)………………...………………………………………… -- -- -- -- Total Disbursements………….………………………………………………… 2,306 33,247 1,218 1,525
Excess (Deficiency) of Receipts over Disbursements………………………… (108) 1,570 369 307
OTHER FINANCING SOURCES (USES):
Transfers from Other Funds…………………………………………..……………… -- -- -- --
Transfers to Other Funds……………………………………..……………………… -- -- -- -- Total Other Financing Sources (Uses)……………………………………… -- -- -- --
Excess (Deficiency) of Receipts and Other Financing Sources over
Disbursements and Other Financing Uses………………...…………………… (108) 1,570 369 307
Equity (Deficit) at April 1……………...……………………………………………… 2,413 1,888 3,041 2,846
Equity (Deficit) at March 31…………..….……….…...……………...……………… $ 2,305 $ 3,458 $ 3,410 $ 3,153
(*) See Footnotes - Note #9
47
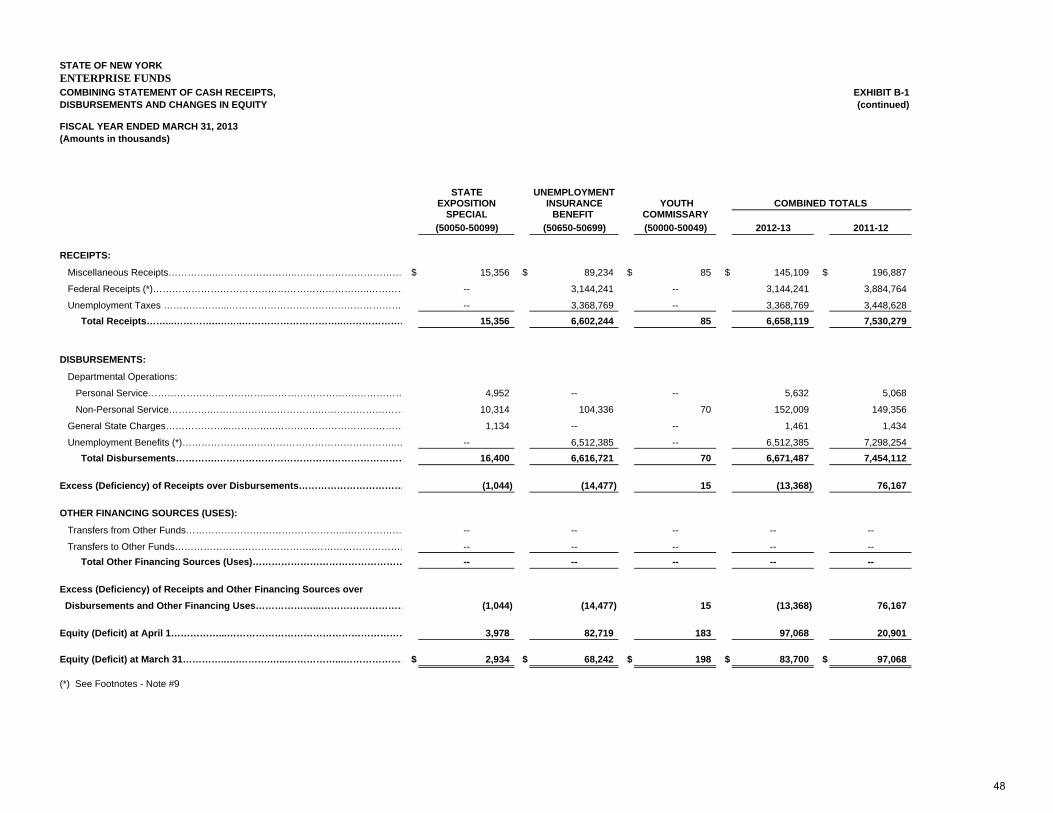
STATE OF NEW YORKENTERPRISE FUNDSCOMBINING STATEMENT OF CASH RECEIPTS, EXHIBIT B-1DISBURSEMENTS AND CHANGES IN EQUITY (continued)
FISCAL YEAR ENDED MARCH 31, 2013(Amounts in thousands)
STATE UNEMPLOYMENTEXPOSITION INSURANCE YOUTH
SPECIAL BENEFIT COMMISSARY(50050-50099) (50650-50699) (50000-50049) 2012-13 2011-12
RECEIPTS:
Miscellaneous Receipts…………...……………………..…………………………… $ 15,356 $ 89,234 $ 85 $ 145,109 $ 196,887
Federal Receipts (*)…………………………………………………………..………… -- 3,144,241 -- 3,144,241 3,884,764
Unemployment Taxes ………………...………………………………………………. -- 3,368,769 -- 3,368,769 3,448,628 Total Receipts……...………….….…..…………………………..………………… 15,356 6,602,244 85 6,658,119 7,530,279
DISBURSEMENTS:
Departmental Operations:
Personal Service………………………………..……………………….…………… 4,952 -- -- 5,632 5,068
Non-Personal Service………….…………………………….……………………… 10,314 104,336 70 152,009 149,356
General State Charges………………...…………..………..………………………… 1,134 -- -- 1,461 1,434
Unemployment Benefits (*)………………...………………………………………..… -- 6,512,385 -- 6,512,385 7,298,254 Total Disbursements………….…………………………………………………… 16,400 6,616,721 70 6,671,487 7,454,112
Excess (Deficiency) of Receipts over Disbursements…………………………… (1,044) (14,477) 15 (13,368) 76,167
OTHER FINANCING SOURCES (USES):
Transfers from Other Funds…………………………………………..……………… -- -- -- -- --
Transfers to Other Funds……………………………………..………………………… -- -- -- -- -- Total Other Financing Sources (Uses)………………………………………… -- -- -- -- --
Excess (Deficiency) of Receipts and Other Financing Sources over
Disbursements and Other Financing Uses………………...……………………… (1,044) (14,477) 15 (13,368) 76,167
Equity (Deficit) at April 1……………...………………………………………………… 3,978 82,719 183 97,068 20,901
Equity (Deficit) at March 31…………..….……….…...……………...…………………$ 2,934 $ 68,242 $ 198 $ 83,700 $ 97,068
(*) See Footnotes - Note #9
COMBINED TOTALS
48
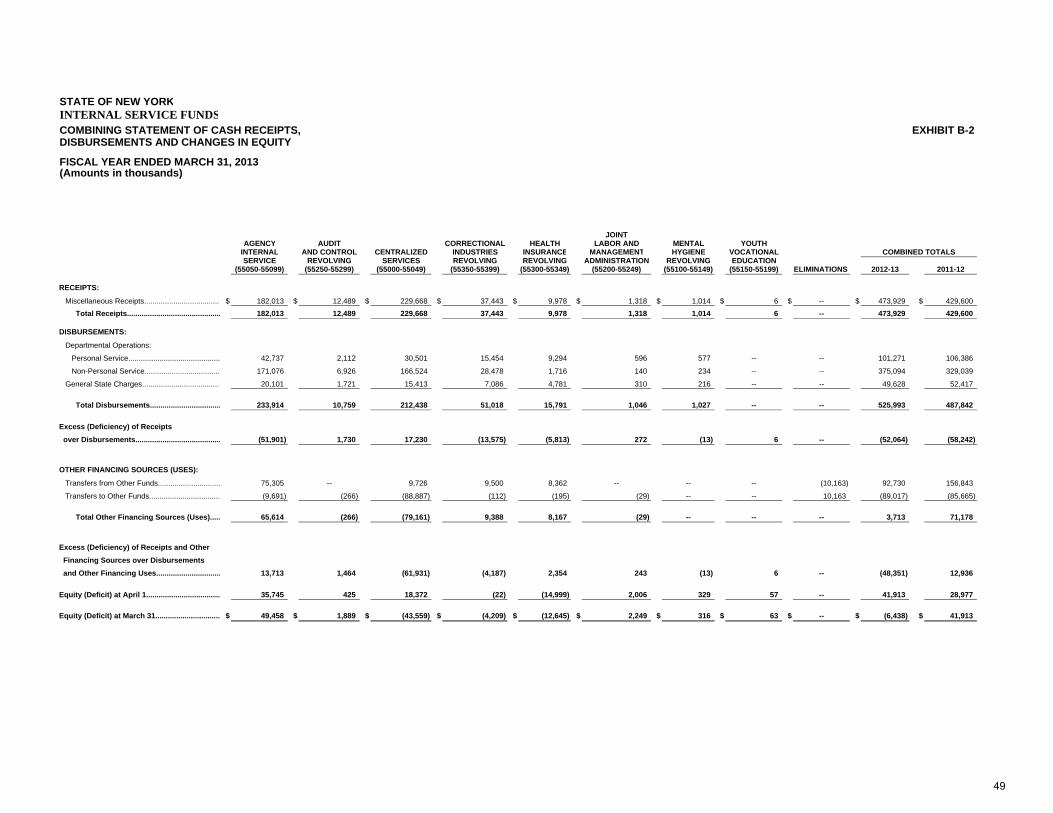
STATE OF NEW YORKINTERNAL SERVICE FUNDSCOMBINING STATEMENT OF CASH RECEIPTS, EXHIBIT B-2DISBURSEMENTS AND CHANGES IN EQUITY
FISCAL YEAR ENDED MARCH 31, 2013 (Amounts in thousands)
JOINTAGENCY AUDIT CORRECTIONAL HEALTH LABOR AND MENTAL YOUTH
INTERNAL AND CONTROL CENTRALIZED INDUSTRIES INSURANCE MANAGEMENT HYGIENE VOCATIONAL COMBINED TOTALSSERVICE REVOLVING SERVICES REVOLVING REVOLVING ADMINISTRATION REVOLVING EDUCATION
(55050-55099) (55250-55299) (55000-55049) (55350-55399) (55300-55349) (55200-55249) (55100-55149) (55150-55199) ELIMINATIONS 2012-13 2011-12
RECEIPTS:
Miscellaneous Receipts.................................... $ 182,013 $ 12,489 $ 229,668 $ 37,443 $ 9,978 $ 1,318 $ 1,014 $ 6 $ -- $ 473,929 $ 429,600 Total Receipts............................................. 182,013 12,489 229,668 37,443 9,978 1,318 1,014 6 -- 473,929 429,600
DISBURSEMENTS:
Departmental Operations:
Personal Service............................................ 42,737 2,112 30,501 15,454 9,294 596 577 -- -- 101,271 106,386
Non-Personal Service.................................... 171,076 6,926 166,524 28,478 1,716 140 234 -- -- 375,094 329,039
General State Charges..................................... 20,101 1,721 15,413 7,086 4,781 310 216 -- -- 49,628 52,417
Total Disbursements.................................. 233,914 10,759 212,438 51,018 15,791 1,046 1,027 -- -- 525,993 487,842
Excess (Deficiency) of Receipts
over Disbursements......................................... (51,901) 1,730 17,230 (13,575) (5,813) 272 (13) 6 -- (52,064) (58,242)
OTHER FINANCING SOURCES (USES):
Transfers from Other Funds.............................. 75,305 -- 9,726 9,500 8,362 -- -- -- (10,163) 92,730 156,843
Transfers to Other Funds.................................. (9,691) (266) (88,887) (112) (195) (29) -- -- 10,163 (89,017) (85,665)
Total Other Financing Sources (Uses)..... 65,614 (266) (79,161) 9,388 8,167 (29) -- -- -- 3,713 71,178
Excess (Deficiency) of Receipts and Other
Financing Sources over Disbursements
and Other Financing Uses............................... 13,713 1,464 (61,931) (4,187) 2,354 243 (13) 6 -- (48,351) 12,936
Equity (Deficit) at April 1.................................... 35,745 425 18,372 (22) (14,999) 2,006 329 57 -- 41,913 28,977
Equity (Deficit) at March 31............................... $ 49,458 $ 1,889 $ (43,559) $ (4,209) $ (12,645) $ 2,249 $ 316 $ 63 $ -- $ (6,438) $ 41,913
49
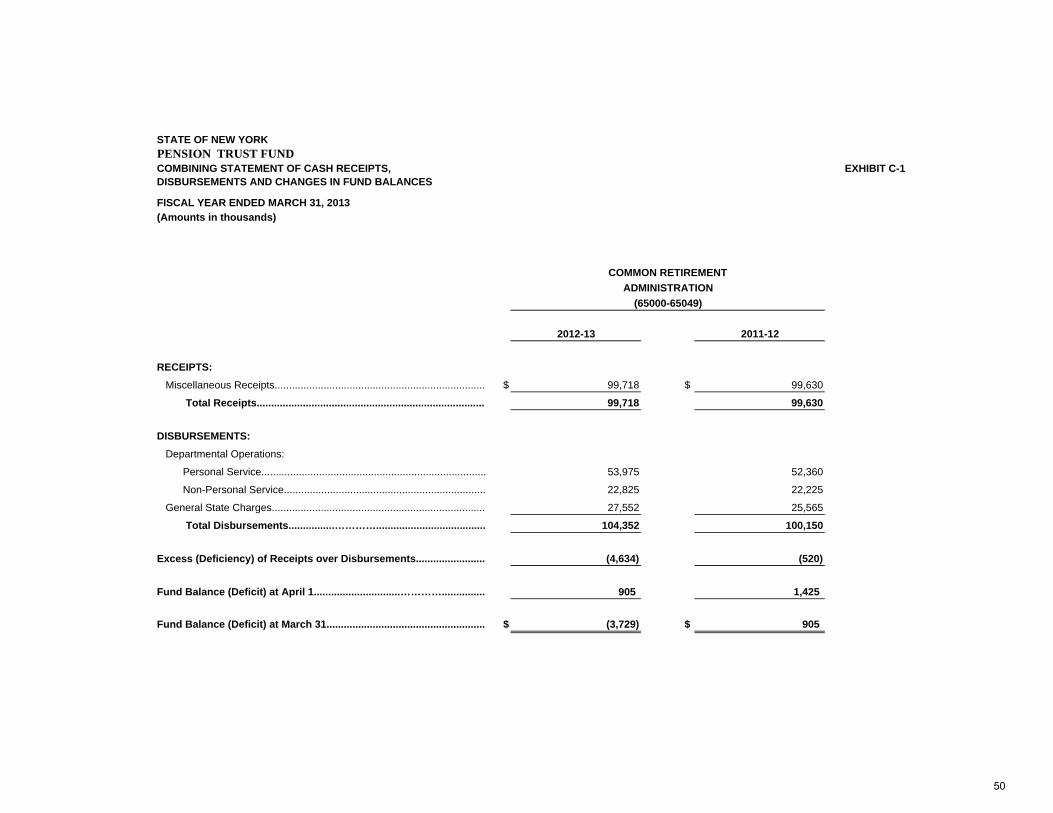
STATE OF NEW YORKPENSION TRUST FUND COMBINING STATEMENT OF CASH RECEIPTS, EXHIBIT C-1DISBURSEMENTS AND CHANGES IN FUND BALANCES
FISCAL YEAR ENDED MARCH 31, 2013(Amounts in thousands)
COMMON RETIREMENTADMINISTRATION
(65000-65049)
2012-13 2011-12
RECEIPTS: Miscellaneous Receipts......................................................................... $ 99,718 $ 99,630
Total Receipts................................................................................ 99,718 99,630
DISBURSEMENTS: Departmental Operations:
Personal Service.............................................................................. 53,975 52,360
Non-Personal Service...................................................................... 22,825 22,225
General State Charges.......................................................................... 27,552 25,565
Total Disbursements................…………...................................... 104,352 100,150
Excess (Deficiency) of Receipts over Disbursements........................ (4,634) (520)
Fund Balance (Deficit) at April 1..............................…………............... 905 1,425
Fund Balance (Deficit) at March 31....................................................... $ (3,729) $ 905
50
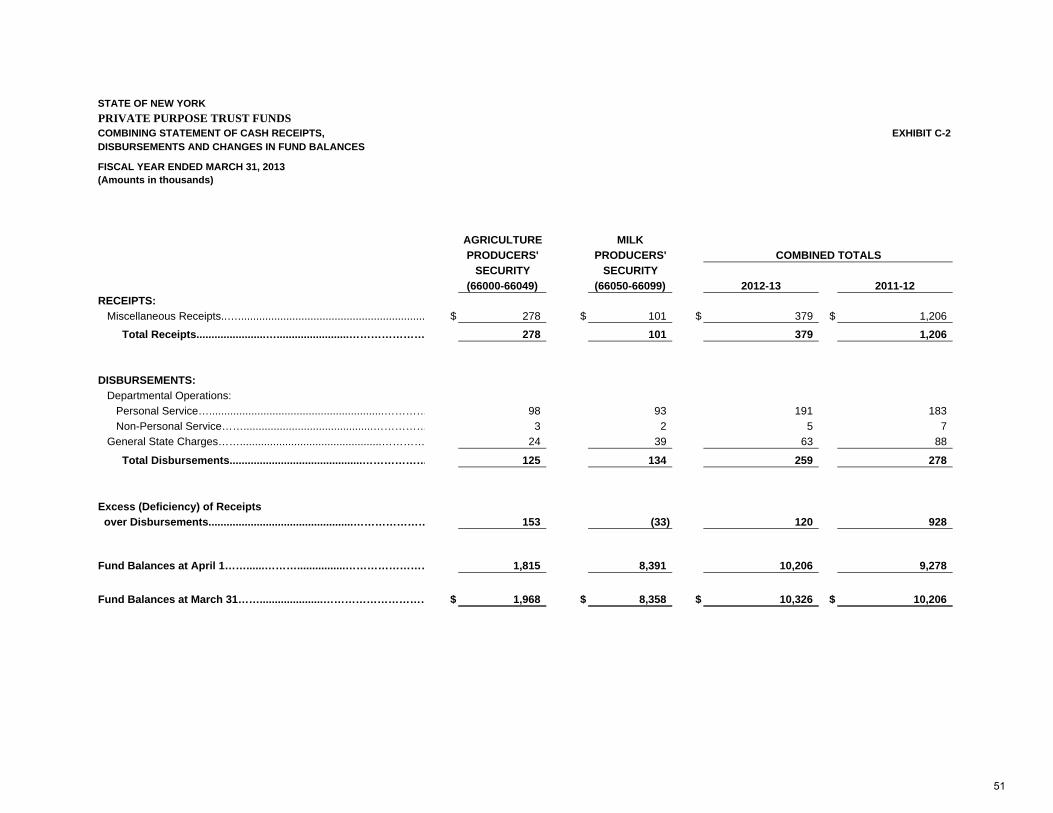
STATE OF NEW YORKPRIVATE PURPOSE TRUST FUNDSCOMBINING STATEMENT OF CASH RECEIPTS, EXHIBIT C-2DISBURSEMENTS AND CHANGES IN FUND BALANCES
FISCAL YEAR ENDED MARCH 31, 2013(Amounts in thousands)
AGRICULTURE MILKPRODUCERS' PRODUCERS' COMBINED TOTALS
SECURITY SECURITY(66000-66049) (66050-66099) 2012-13 2011-12
RECEIPTS: Miscellaneous Receipts..….............................................................. $ 278 $ 101 $ 379 $ 1,206
Total Receipts.......................…........................………………… 278 101 379 1,206
DISBURSEMENTS: Departmental Operations: Personal Service…..........................................................………… 98 93 191 183 Non-Personal Service……...........................................…………… 3 2 5 7 General State Charges……...............................................………… 24 39 63 88
Total Disbursements............................................……………… 125 134 259 278
Excess (Deficiency) of Receipts over Disbursements................................................………………… 153 (33) 120 928
Fund Balances at April 1……......………................…………………… 1,815 8,391 10,206 9,278
Fund Balances at March 31…….....................………………………… $ 1,968 $ 8,358 $ 10,326 $ 10,206
51
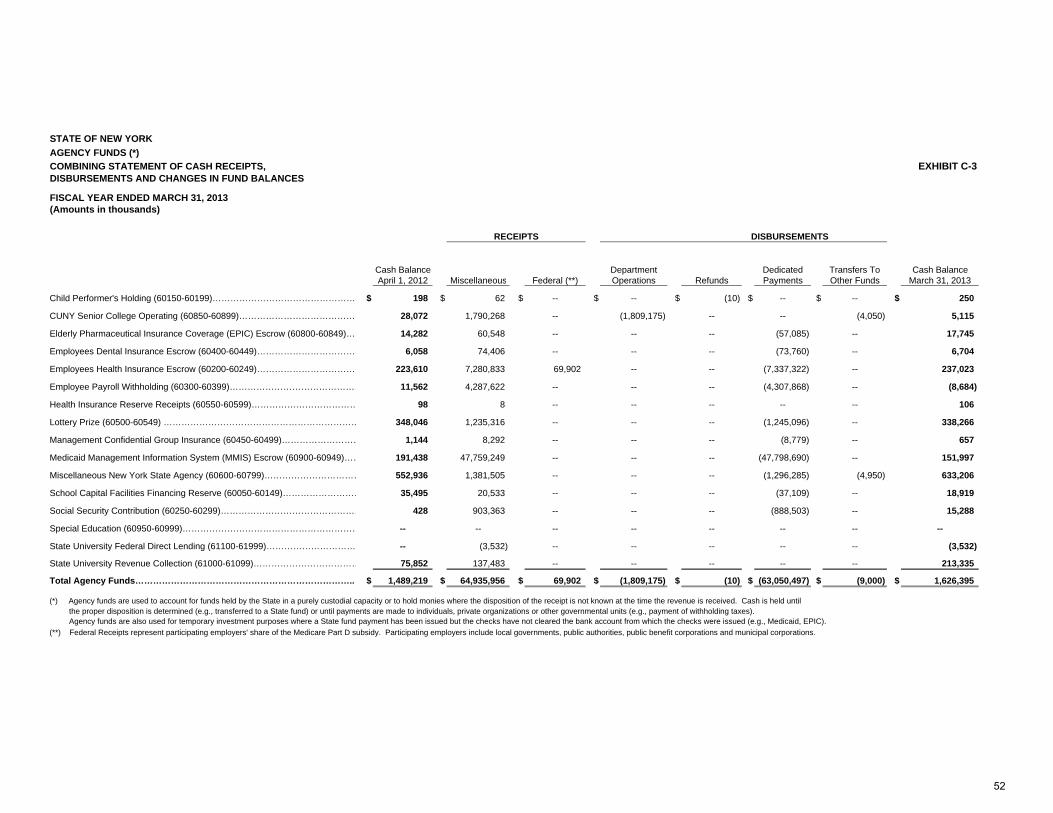
STATE OF NEW YORKAGENCY FUNDS (*)COMBINING STATEMENT OF CASH RECEIPTS, EXHIBIT C-3DISBURSEMENTS AND CHANGES IN FUND BALANCES
FISCAL YEAR ENDED MARCH 31, 2013(Amounts in thousands)
Cash Balance Department Dedicated Transfers To Cash BalanceApril 1, 2012 Miscellaneous Federal (**) Operations Refunds Payments Other Funds March 31, 2013
Child Performer's Holding (60150-60199)…………………………………………… $ 198 $ 62 $ -- $ -- $ (10) $ -- $ -- $ 250
CUNY Senior College Operating (60850-60899)…………………………………… 28,072 1,790,268 -- (1,809,175) -- -- (4,050) 5,115
Elderly Pharmaceutical Insurance Coverage (EPIC) Escrow (60800-60849)…… 14,282 60,548 -- -- -- (57,085) -- 17,745
Employees Dental Insurance Escrow (60400-60449)……………………………… 6,058 74,406 -- -- -- (73,760) -- 6,704
Employees Health Insurance Escrow (60200-60249)……………………………… 223,610 7,280,833 69,902 -- -- (7,337,322) -- 237,023
Employee Payroll Withholding (60300-60399)……………………………………… 11,562 4,287,622 -- -- -- (4,307,868) -- (8,684)
Health Insurance Reserve Receipts (60550-60599)……………………………… 98 8 -- -- -- -- -- 106
Lottery Prize (60500-60549) ………………………………………………………… 348,046 1,235,316 -- -- -- (1,245,096) -- 338,266
Management Confidential Group Insurance (60450-60499)……………………… 1,144 8,292 -- -- -- (8,779) -- 657
Medicaid Management Information System (MMIS) Escrow (60900-60949)…… 191,438 47,759,249 -- -- -- (47,798,690) -- 151,997
Miscellaneous New York State Agency (60600-60799)…………………………… 552,936 1,381,505 -- -- -- (1,296,285) (4,950) 633,206
School Capital Facilities Financing Reserve (60050-60149)……………………… 35,495 20,533 -- -- -- (37,109) -- 18,919
Social Security Contribution (60250-60299)………………………………………… 428 903,363 -- -- -- (888,503) -- 15,288
Special Education (60950-60999)…………………………………………………… -- -- -- -- -- -- -- --
State University Federal Direct Lending (61100-61999)…………………………… -- (3,532) -- -- -- -- -- (3,532)
State University Revenue Collection (61000-61099)……………………………… 75,852 137,483 -- -- -- -- -- 213,335
Total Agency Funds……………………………………………………………….. $ 1,489,219 $ 64,935,956 $ 69,902 $ (1,809,175) $ (10) $ (63,050,497) $ (9,000) $ 1,626,395
(*) Agency funds are used to account for funds held by the State in a purely custodial capacity or to hold monies where the disposition of the receipt is not known at the time the revenue is received. Cash is held until the proper disposition is determined (e.g., transferred to a State fund) or until payments are made to individuals, private organizations or other governmental units (e.g., payment of withholding taxes). Agency funds are also used for temporary investment purposes where a State fund payment has been issued but the checks have not cleared the bank account from which the checks were issued (e.g., Medicaid, EPIC).(**) Federal Receipts represent participating employers' share of the Medicare Part D subsidy. Participating employers include local governments, public authorities, public benefit corporations and municipal corporations.
RECEIPTS DISBURSEMENTS
52
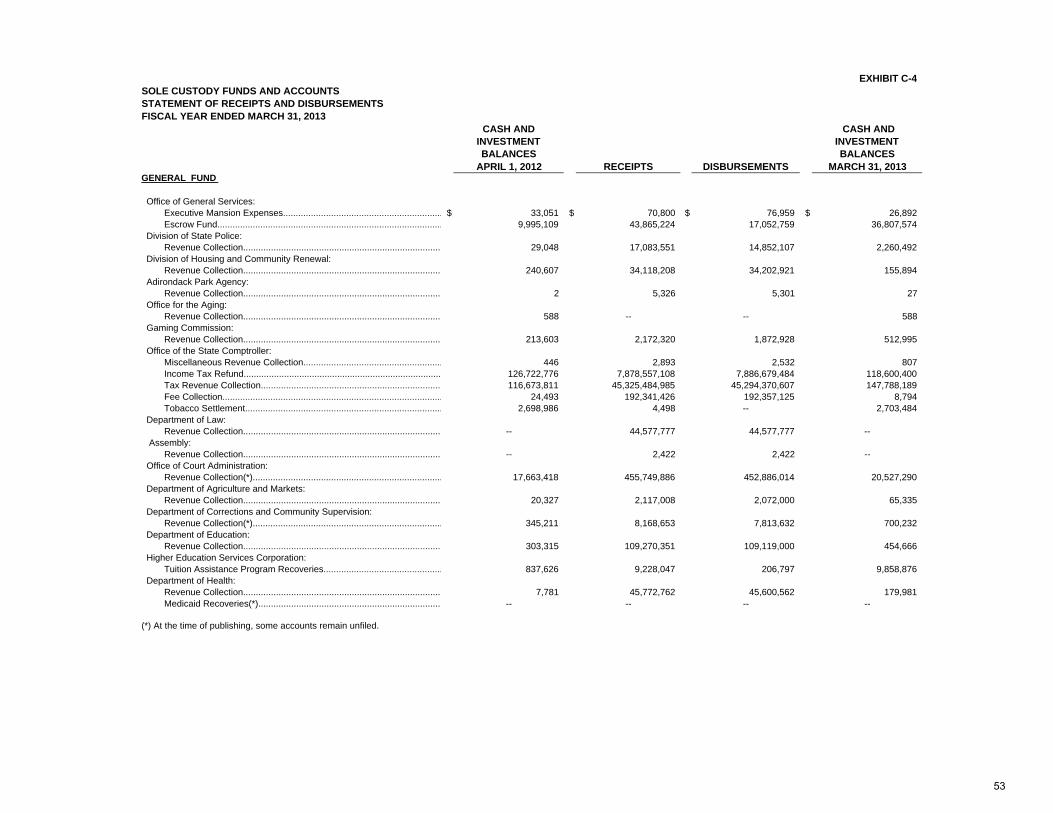
EXHIBIT C-4SOLE CUSTODY FUNDS AND ACCOUNTSSTATEMENT OF RECEIPTS AND DISBURSEMENTSFISCAL YEAR ENDED MARCH 31, 2013
CASH AND INVESTMENT BALANCES
CASH AND INVESTMENT BALANCES
APRIL 1, 2012 RECEIPTS DISBURSEMENTS MARCH 31, 2013GENERAL FUND Office of General Services: Executive Mansion Expenses............................................................... $ 33,051 $ 70,800 $ 76,959 $ 26,892 Escrow Fund......................................................................................... 9,995,109 43,865,224 17,052,759 36,807,574 Division of State Police: Revenue Collection.............................................................................. 29,048 17,083,551 14,852,107 2,260,492 Division of Housing and Community Renewal: Revenue Collection.............................................................................. 240,607 34,118,208 34,202,921 155,894 Adirondack Park Agency: Revenue Collection.............................................................................. 2 5,326 5,301 27 Office for the Aging: Revenue Collection.............................................................................. 588 -- -- 588 Gaming Commission: Revenue Collection.............................................................................. 213,603 2,172,320 1,872,928 512,995 Office of the State Comptroller: Miscellaneous Revenue Collection....................................................... 446 2,893 2,532 807 Income Tax Refund.............................................................................. 126,722,776 7,878,557,108 7,886,679,484 118,600,400 Tax Revenue Collection....................................................................... 116,673,811 45,325,484,985 45,294,370,607 147,788,189 Fee Collection....................................................................................... 24,493 192,341,426 192,357,125 8,794 Tobacco Settlement.............................................................................. 2,698,986 4,498 -- 2,703,484 Department of Law: Revenue Collection.............................................................................. -- 44,577,777 44,577,777 -- Assembly: Revenue Collection.............................................................................. -- 2,422 2,422 -- Office of Court Administration: Revenue Collection(*)........................................................................... 17,663,418 455,749,886 452,886,014 20,527,290 Department of Agriculture and Markets: Revenue Collection.............................................................................. 20,327 2,117,008 2,072,000 65,335 Department of Corrections and Community Supervision: Revenue Collection(*)........................................................................... 345,211 8,168,653 7,813,632 700,232 Department of Education: Revenue Collection.............................................................................. 303,315 109,270,351 109,119,000 454,666 Higher Education Services Corporation: Tuition Assistance Program Recoveries............................................... 837,626 9,228,047 206,797 9,858,876 Department of Health: Revenue Collection.............................................................................. 7,781 45,772,762 45,600,562 179,981 Medicaid Recoveries(*)........................................................................ -- -- -- --
(*) At the time of publishing, some accounts remain unfiled.
53
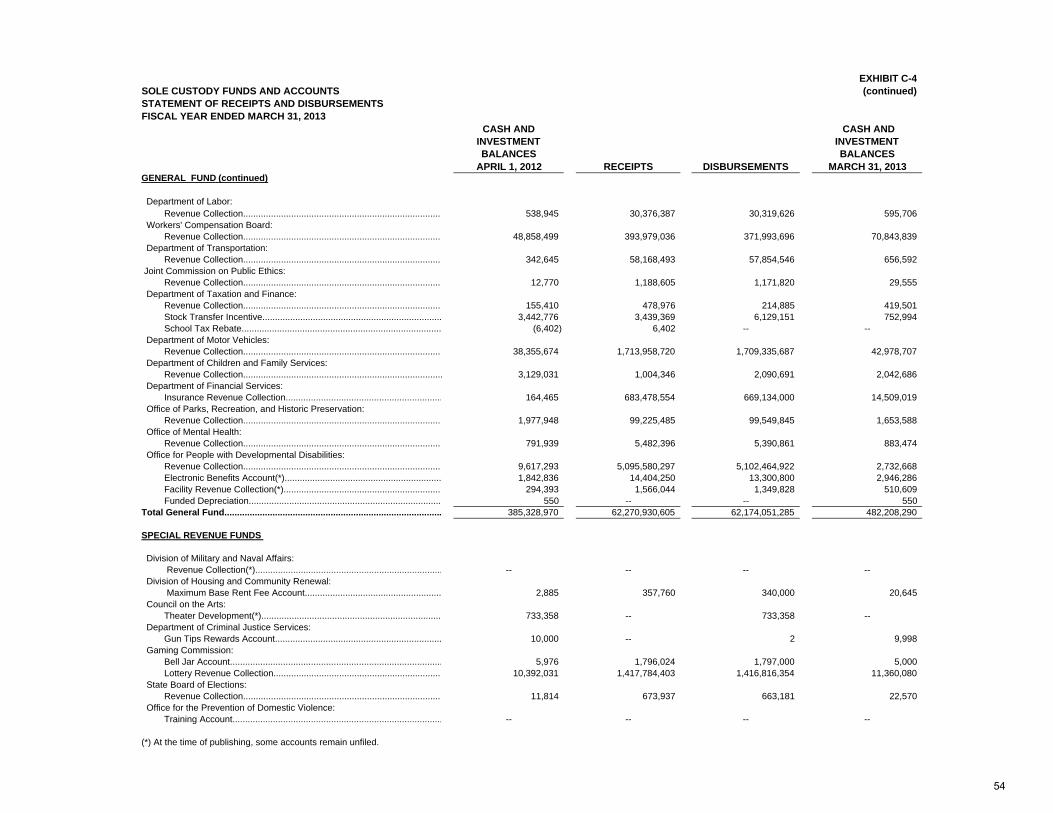
EXHIBIT C-4SOLE CUSTODY FUNDS AND ACCOUNTS (continued)STATEMENT OF RECEIPTS AND DISBURSEMENTSFISCAL YEAR ENDED MARCH 31, 2013
CASH AND INVESTMENT BALANCES
CASH AND INVESTMENT BALANCES
APRIL 1, 2012 RECEIPTS DISBURSEMENTS MARCH 31, 2013GENERAL FUND (continued) Department of Labor: Revenue Collection.............................................................................. 538,945 30,376,387 30,319,626 595,706 Workers' Compensation Board: Revenue Collection.............................................................................. 48,858,499 393,979,036 371,993,696 70,843,839 Department of Transportation: Revenue Collection.............................................................................. 342,645 58,168,493 57,854,546 656,592 Joint Commission on Public Ethics: Revenue Collection.............................................................................. 12,770 1,188,605 1,171,820 29,555 Department of Taxation and Finance: Revenue Collection.............................................................................. 155,410 478,976 214,885 419,501 Stock Transfer Incentive....................................................................... 3,442,776 3,439,369 6,129,151 752,994 School Tax Rebate............................................................................... (6,402) 6,402 -- -- Department of Motor Vehicles: Revenue Collection.............................................................................. 38,355,674 1,713,958,720 1,709,335,687 42,978,707 Department of Children and Family Services: Revenue Collection............................................................................... 3,129,031 1,004,346 2,090,691 2,042,686 Department of Financial Services: Insurance Revenue Collection.............................................................. 164,465 683,478,554 669,134,000 14,509,019 Office of Parks, Recreation, and Historic Preservation: Revenue Collection.............................................................................. 1,977,948 99,225,485 99,549,845 1,653,588 Office of Mental Health: Revenue Collection.............................................................................. 791,939 5,482,396 5,390,861 883,474 Office for People with Developmental Disabilities: Revenue Collection.............................................................................. 9,617,293 5,095,580,297 5,102,464,922 2,732,668 Electronic Benefits Account(*).............................................................. 1,842,836 14,404,250 13,300,800 2,946,286 Facility Revenue Collection(*).............................................................. 294,393 1,566,044 1,349,828 510,609 Funded Depreciation............................................................................ 550 -- -- 550 Total General Fund...................................................................................... 385,328,970 62,270,930,605 62,174,051,285 482,208,290
SPECIAL REVENUE FUNDS
Division of Military and Naval Affairs: Revenue Collection(*).......................................................................... -- -- -- -- Division of Housing and Community Renewal: Maximum Base Rent Fee Account...................................................... 2,885 357,760 340,000 20,645 Council on the Arts: Theater Development(*)....................................................................... 733,358 -- 733,358 -- Department of Criminal Justice Services: Gun Tips Rewards Account.................................................................. 10,000 -- 2 9,998 Gaming Commission: Bell Jar Account.................................................................................... 5,976 1,796,024 1,797,000 5,000 Lottery Revenue Collection.................................................................. 10,392,031 1,417,784,403 1,416,816,354 11,360,080 State Board of Elections: Revenue Collection.............................................................................. 11,814 673,937 663,181 22,570 Office for the Prevention of Domestic Violence: Training Account................................................................................... -- -- -- --
(*) At the time of publishing, some accounts remain unfiled.
54
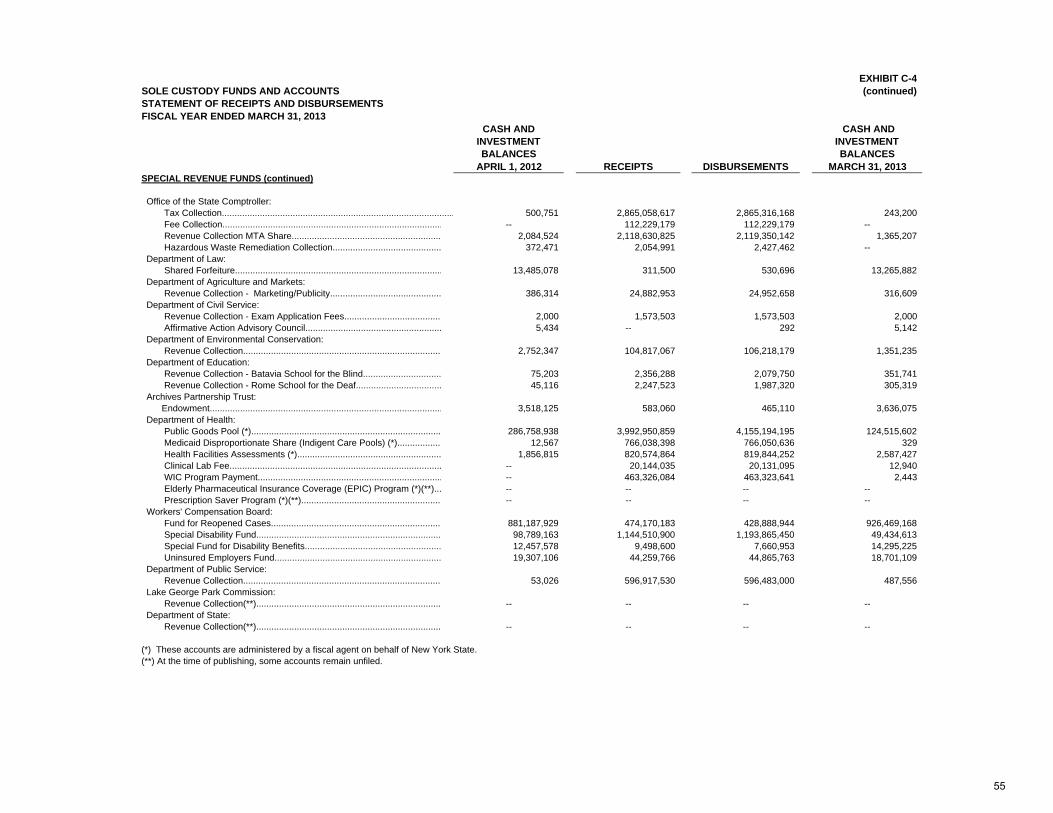
EXHIBIT C-4SOLE CUSTODY FUNDS AND ACCOUNTS (continued)STATEMENT OF RECEIPTS AND DISBURSEMENTSFISCAL YEAR ENDED MARCH 31, 2013
CASH AND INVESTMENT BALANCES
CASH AND INVESTMENT BALANCES
APRIL 1, 2012 RECEIPTS DISBURSEMENTS MARCH 31, 2013SPECIAL REVENUE FUNDS (continued)
Office of the State Comptroller: Tax Collection............................................................................................ 500,751 2,865,058,617 2,865,316,168 243,200 Fee Collection....................................................................................... -- 112,229,179 112,229,179 -- Revenue Collection MTA Share........................................................... 2,084,524 2,118,630,825 2,119,350,142 1,365,207 Hazardous Waste Remediation Collection........................................... 372,471 2,054,991 2,427,462 -- Department of Law: Shared Forfeiture.................................................................................. 13,485,078 311,500 530,696 13,265,882 Department of Agriculture and Markets: Revenue Collection - Marketing/Publicity............................................ 386,314 24,882,953 24,952,658 316,609 Department of Civil Service: Revenue Collection - Exam Application Fees...................................... 2,000 1,573,503 1,573,503 2,000 Affirmative Action Advisory Council...................................................... 5,434 -- 292 5,142 Department of Environmental Conservation: Revenue Collection.............................................................................. 2,752,347 104,817,067 106,218,179 1,351,235 Department of Education: Revenue Collection - Batavia School for the Blind............................... 75,203 2,356,288 2,079,750 351,741 Revenue Collection - Rome School for the Deaf.................................. 45,116 2,247,523 1,987,320 305,319 Archives Partnership Trust: Endowment............................................................................................ 3,518,125 583,060 465,110 3,636,075 Department of Health: Public Goods Pool (*)........................................................................... 286,758,938 3,992,950,859 4,155,194,195 124,515,602 Medicaid Disproportionate Share (Indigent Care Pools) (*)................. 12,567 766,038,398 766,050,636 329 Health Facilities Assessments (*)......................................................... 1,856,815 820,574,864 819,844,252 2,587,427 Clinical Lab Fee.................................................................................... -- 20,144,035 20,131,095 12,940 WIC Program Payment......................................................................... -- 463,326,084 463,323,641 2,443 Elderly Pharmaceutical Insurance Coverage (EPIC) Program (*)(**)... -- -- -- -- Prescription Saver Program (*)(**)....................................................... -- -- -- -- Workers' Compensation Board: Fund for Reopened Cases................................................................... 881,187,929 474,170,183 428,888,944 926,469,168 Special Disability Fund......................................................................... 98,789,163 1,144,510,900 1,193,865,450 49,434,613 Special Fund for Disability Benefits...................................................... 12,457,578 9,498,600 7,660,953 14,295,225 Uninsured Employers Fund.................................................................. 19,307,106 44,259,766 44,865,763 18,701,109 Department of Public Service: Revenue Collection.............................................................................. 53,026 596,917,530 596,483,000 487,556 Lake George Park Commission: Revenue Collection(**)......................................................................... -- -- -- -- Department of State: Revenue Collection(**)......................................................................... -- -- -- --
(*) These accounts are administered by a fiscal agent on behalf of New York State.(**) At the time of publishing, some accounts remain unfiled.
55
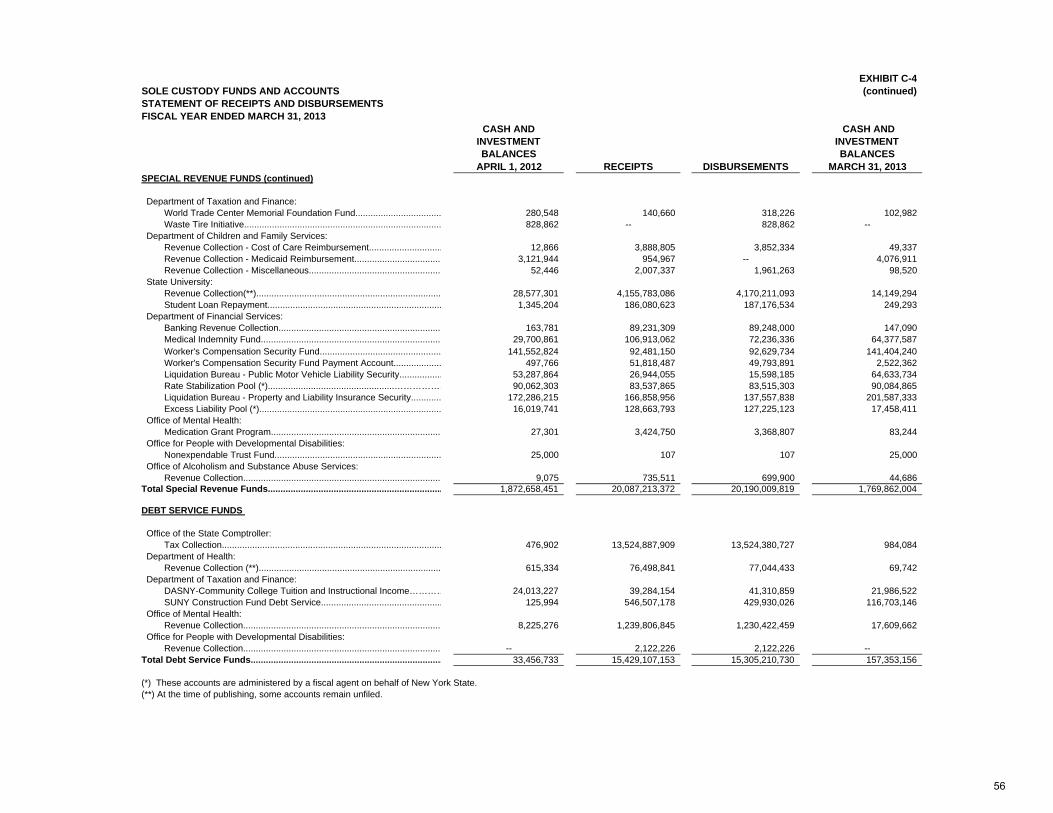
EXHIBIT C-4SOLE CUSTODY FUNDS AND ACCOUNTS (continued)STATEMENT OF RECEIPTS AND DISBURSEMENTSFISCAL YEAR ENDED MARCH 31, 2013
CASH AND INVESTMENT BALANCES
CASH AND INVESTMENT BALANCES
APRIL 1, 2012 RECEIPTS DISBURSEMENTS MARCH 31, 2013SPECIAL REVENUE FUNDS (continued)
Department of Taxation and Finance: World Trade Center Memorial Foundation Fund.................................. 280,548 140,660 318,226 102,982 Waste Tire Initiative.............................................................................. 828,862 -- 828,862 -- Department of Children and Family Services: Revenue Collection - Cost of Care Reimbursement............................. 12,866 3,888,805 3,852,334 49,337 Revenue Collection - Medicaid Reimbursement.................................. 3,121,944 954,967 -- 4,076,911 Revenue Collection - Miscellaneous.................................................... 52,446 2,007,337 1,961,263 98,520 State University: Revenue Collection(**)......................................................................... 28,577,301 4,155,783,086 4,170,211,093 14,149,294 Student Loan Repayment..................................................................... 1,345,204 186,080,623 187,176,534 249,293 Department of Financial Services: Banking Revenue Collection................................................................ 163,781 89,231,309 89,248,000 147,090 Medical Indemnity Fund....................................................................... 29,700,861 106,913,062 72,236,336 64,377,587 Worker's Compensation Security Fund................................................ 141,552,824 92,481,150 92,629,734 141,404,240 Worker's Compensation Security Fund Payment Account................... 497,766 51,818,487 49,793,891 2,522,362 Liquidation Bureau - Public Motor Vehicle Liability Security................. 53,287,864 26,944,055 15,598,185 64,633,734 Rate Stabilization Pool (*)..................................................……………… 90,062,303 83,537,865 83,515,303 90,084,865 Liquidation Bureau - Property and Liability Insurance Security............ 172,286,215 166,858,956 137,557,838 201,587,333 Excess Liability Pool (*)........................................................................ 16,019,741 128,663,793 127,225,123 17,458,411 Office of Mental Health: Medication Grant Program................................................................... 27,301 3,424,750 3,368,807 83,244 Office for People with Developmental Disabilities: Nonexpendable Trust Fund.................................................................. 25,000 107 107 25,000 Office of Alcoholism and Substance Abuse Services: Revenue Collection.............................................................................. 9,075 735,511 699,900 44,686 Total Special Revenue Funds..................................................................... 1,872,658,451 20,087,213,372 20,190,009,819 1,769,862,004
DEBT SERVICE FUNDS Office of the State Comptroller: Tax Collection....................................................................................... 476,902 13,524,887,909 13,524,380,727 984,084 Department of Health: Revenue Collection (**)........................................................................ 615,334 76,498,841 77,044,433 69,742 Department of Taxation and Finance: DASNY-Community College Tuition and Instructional Income………… 24,013,227 39,284,154 41,310,859 21,986,522 SUNY Construction Fund Debt Service................................................ 125,994 546,507,178 429,930,026 116,703,146 Office of Mental Health: Revenue Collection.............................................................................. 8,225,276 1,239,806,845 1,230,422,459 17,609,662 Office for People with Developmental Disabilities: Revenue Collection.............................................................................. -- 2,122,226 2,122,226 --Total Debt Service Funds............................................................................ 33,456,733 15,429,107,153 15,305,210,730 157,353,156
(*) These accounts are administered by a fiscal agent on behalf of New York State.(**) At the time of publishing, some accounts remain unfiled.
56
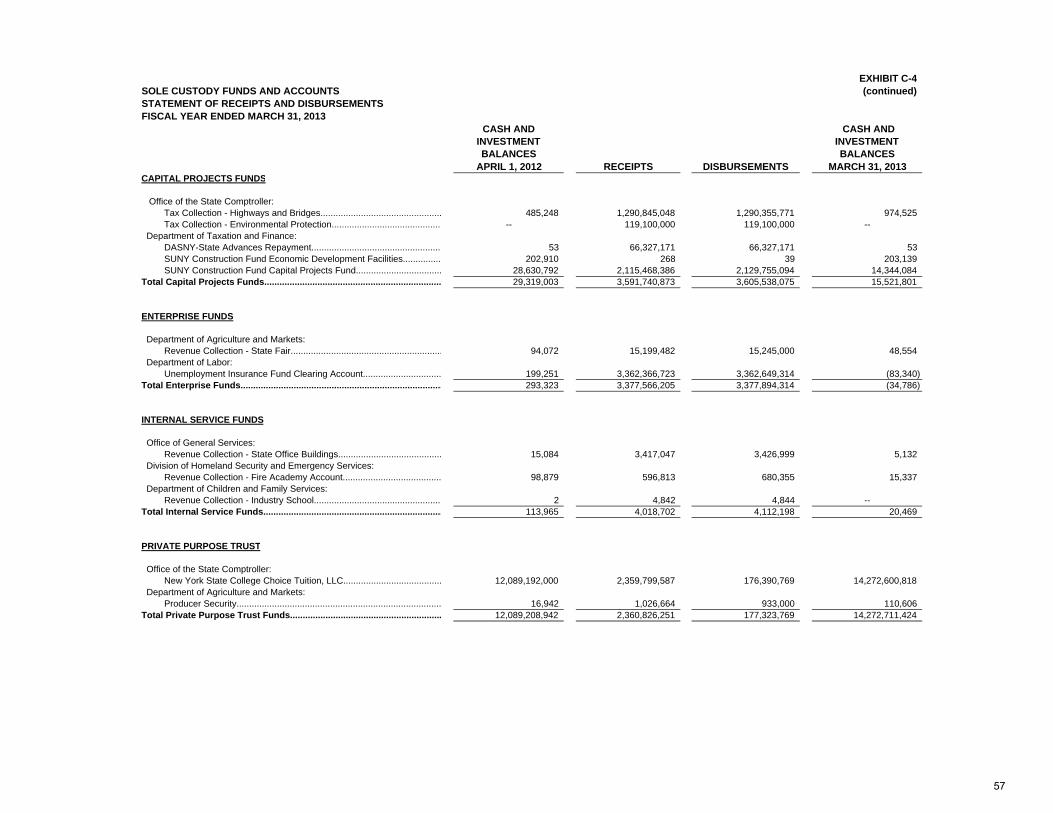
EXHIBIT C-4SOLE CUSTODY FUNDS AND ACCOUNTS (continued)STATEMENT OF RECEIPTS AND DISBURSEMENTSFISCAL YEAR ENDED MARCH 31, 2013
CASH AND INVESTMENT BALANCES
CASH AND INVESTMENT BALANCES
APRIL 1, 2012 RECEIPTS DISBURSEMENTS MARCH 31, 2013CAPITAL PROJECTS FUNDS
Office of the State Comptroller: Tax Collection - Highways and Bridges................................................ 485,248 1,290,845,048 1,290,355,771 974,525 Tax Collection - Environmental Protection........................................... -- 119,100,000 119,100,000 -- Department of Taxation and Finance: DASNY-State Advances Repayment................................................... 53 66,327,171 66,327,171 53 SUNY Construction Fund Economic Development Facilities............... 202,910 268 39 203,139 SUNY Construction Fund Capital Projects Fund.................................. 28,630,792 2,115,468,386 2,129,755,094 14,344,084 Total Capital Projects Funds...................................................................... 29,319,003 3,591,740,873 3,605,538,075 15,521,801
ENTERPRISE FUNDS
Department of Agriculture and Markets: Revenue Collection - State Fair............................................................ 94,072 15,199,482 15,245,000 48,554 Department of Labor: Unemployment Insurance Fund Clearing Account............................... 199,251 3,362,366,723 3,362,649,314 (83,340) Total Enterprise Funds................................................................................ 293,323 3,377,566,205 3,377,894,314 (34,786)
INTERNAL SERVICE FUNDS
Office of General Services: Revenue Collection - State Office Buildings......................................... 15,084 3,417,047 3,426,999 5,132 Division of Homeland Security and Emergency Services: Revenue Collection - Fire Academy Account....................................... 98,879 596,813 680,355 15,337 Department of Children and Family Services: Revenue Collection - Industry School.................................................. 2 4,842 4,844 --Total Internal Service Funds....................................................................... 113,965 4,018,702 4,112,198 20,469
PRIVATE PURPOSE TRUST Office of the State Comptroller: New York State College Choice Tuition, LLC....................................... 12,089,192,000 2,359,799,587 176,390,769 14,272,600,818 Department of Agriculture and Markets: Producer Security................................................................................. 16,942 1,026,664 933,000 110,606 Total Private Purpose Trust Funds............................................................ 12,089,208,942 2,360,826,251 177,323,769 14,272,711,424
57
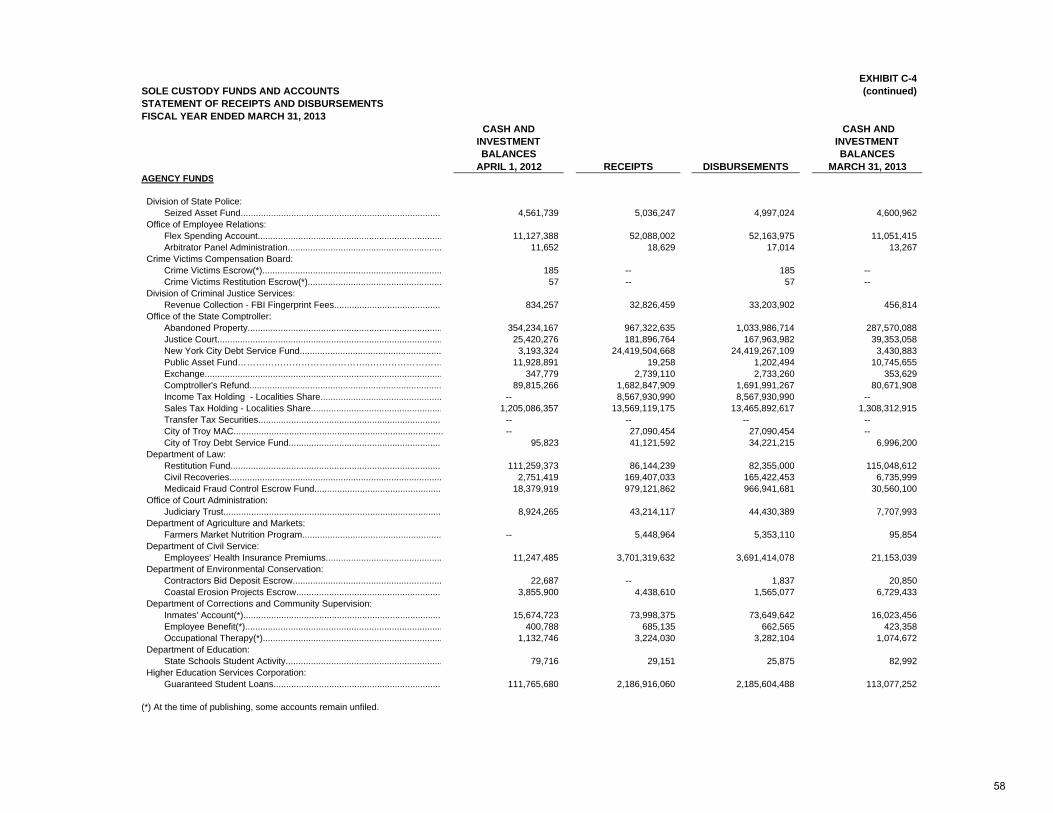
EXHIBIT C-4SOLE CUSTODY FUNDS AND ACCOUNTS (continued)STATEMENT OF RECEIPTS AND DISBURSEMENTSFISCAL YEAR ENDED MARCH 31, 2013
CASH AND INVESTMENT BALANCES
CASH AND INVESTMENT BALANCES
APRIL 1, 2012 RECEIPTS DISBURSEMENTS MARCH 31, 2013AGENCY FUNDS Division of State Police: Seized Asset Fund............................................................................... 4,561,739 5,036,247 4,997,024 4,600,962 Office of Employee Relations: Flex Spending Account......................................................................... 11,127,388 52,088,002 52,163,975 11,051,415 Arbitrator Panel Administration............................................................. 11,652 18,629 17,014 13,267 Crime Victims Compensation Board: Crime Victims Escrow(*)....................................................................... 185 -- 185 -- Crime Victims Restitution Escrow(*)..................................................... 57 -- 57 -- Division of Criminal Justice Services: Revenue Collection - FBI Fingerprint Fees.......................................... 834,257 32,826,459 33,203,902 456,814 Office of the State Comptroller: Abandoned Property............................................................................. 354,234,167 967,322,635 1,033,986,714 287,570,088 Justice Court......................................................................................... 25,420,276 181,896,764 167,963,982 39,353,058 New York City Debt Service Fund........................................................ 3,193,324 24,419,504,668 24,419,267,109 3,430,883 Public Asset Fund……………………………………..…………………… 11,928,891 19,258 1,202,494 10,745,655 Exchange.............................................................................................. 347,779 2,739,110 2,733,260 353,629 Comptroller's Refund............................................................................ 89,815,266 1,682,847,909 1,691,991,267 80,671,908 Income Tax Holding - Localities Share................................................ -- 8,567,930,990 8,567,930,990 -- Sales Tax Holding - Localities Share.................................................... 1,205,086,357 13,569,119,175 13,465,892,617 1,308,312,915 Transfer Tax Securities........................................................................ -- -- -- -- City of Troy MAC................................................................................... -- 27,090,454 27,090,454 -- City of Troy Debt Service Fund............................................................ 95,823 41,121,592 34,221,215 6,996,200 Department of Law: Restitution Fund................................................................................... 111,259,373 86,144,239 82,355,000 115,048,612 Civil Recoveries.................................................................................... 2,751,419 169,407,033 165,422,453 6,735,999 Medicaid Fraud Control Escrow Fund.................................................. 18,379,919 979,121,862 966,941,681 30,560,100 Office of Court Administration: Judiciary Trust...................................................................................... 8,924,265 43,214,117 44,430,389 7,707,993 Department of Agriculture and Markets: Farmers Market Nutrition Program....................................................... -- 5,448,964 5,353,110 95,854 Department of Civil Service: Employees' Health Insurance Premiums.............................................. 11,247,485 3,701,319,632 3,691,414,078 21,153,039 Department of Environmental Conservation: Contractors Bid Deposit Escrow........................................................... 22,687 -- 1,837 20,850 Coastal Erosion Projects Escrow......................................................... 3,855,900 4,438,610 1,565,077 6,729,433 Department of Corrections and Community Supervision: Inmates' Account(*).............................................................................. 15,674,723 73,998,375 73,649,642 16,023,456 Employee Benefit(*).............................................................................. 400,788 685,135 662,565 423,358 Occupational Therapy(*)....................................................................... 1,132,746 3,224,030 3,282,104 1,074,672 Department of Education: State Schools Student Activity.............................................................. 79,716 29,151 25,875 82,992 Higher Education Services Corporation: Guaranteed Student Loans.................................................................. 111,765,680 2,186,916,060 2,185,604,488 113,077,252
(*) At the time of publishing, some accounts remain unfiled.
58
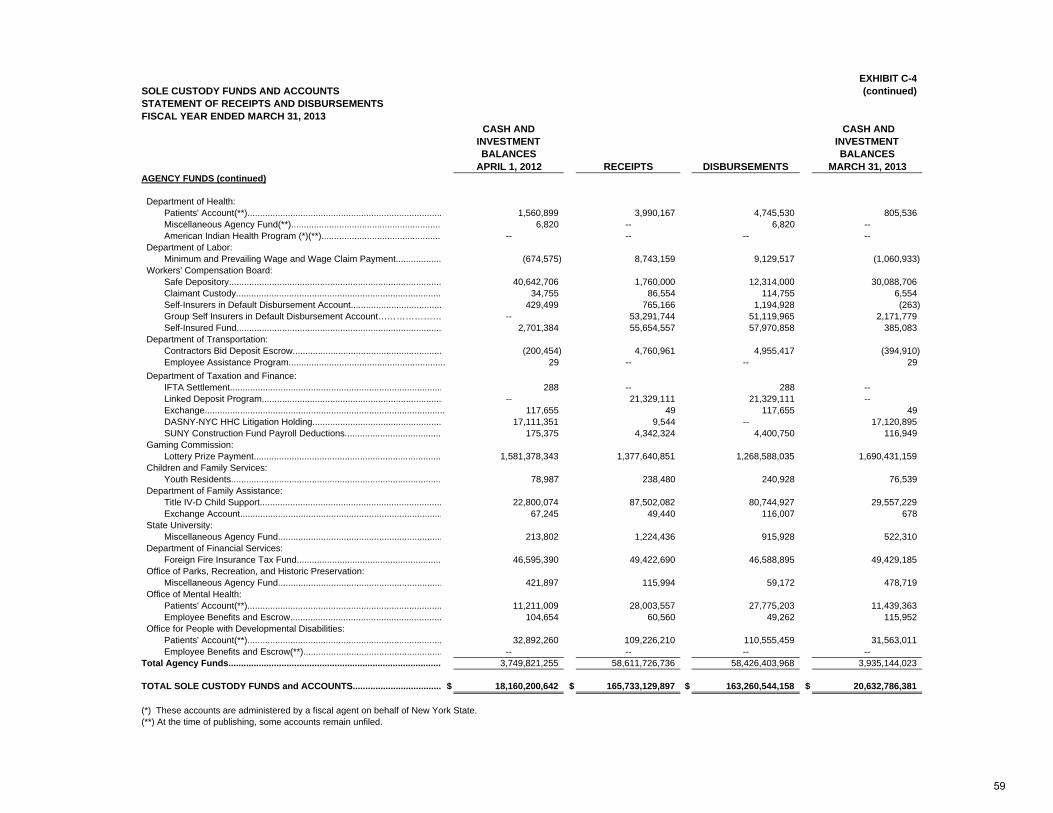
EXHIBIT C-4SOLE CUSTODY FUNDS AND ACCOUNTS (continued)STATEMENT OF RECEIPTS AND DISBURSEMENTSFISCAL YEAR ENDED MARCH 31, 2013
CASH AND INVESTMENT BALANCES
CASH AND INVESTMENT BALANCES
APRIL 1, 2012 RECEIPTS DISBURSEMENTS MARCH 31, 2013AGENCY FUNDS (continued) Department of Health: Patients' Account(**)............................................................................. 1,560,899 3,990,167 4,745,530 805,536 Miscellaneous Agency Fund(**)........................................................... 6,820 -- 6,820 -- American Indian Health Program (*)(**)............................................... -- -- -- -- Department of Labor: Minimum and Prevailing Wage and Wage Claim Payment.................. (674,575) 8,743,159 9,129,517 (1,060,933) Workers' Compensation Board: Safe Depository.................................................................................... 40,642,706 1,760,000 12,314,000 30,088,706 Claimant Custody................................................................................. 34,755 86,554 114,755 6,554 Self-Insurers in Default Disbursement Account.................................... 429,499 765,166 1,194,928 (263) Group Self Insurers in Default Disbursement Account………………… -- 53,291,744 51,119,965 2,171,779 Self-Insured Fund................................................................................. 2,701,384 55,654,557 57,970,858 385,083 Department of Transportation: Contractors Bid Deposit Escrow........................................................... (200,454) 4,760,961 4,955,417 (394,910) Employee Assistance Program.............................................................. 29 -- -- 29 Department of Taxation and Finance: IFTA Settlement.................................................................................... 288 -- 288 -- Linked Deposit Program....................................................................... -- 21,329,111 21,329,111 -- Exchange............................................................................................... 117,655 49 117,655 49 DASNY-NYC HHC Litigation Holding................................................... 17,111,351 9,544 -- 17,120,895 SUNY Construction Fund Payroll Deductions...................................... 175,375 4,342,324 4,400,750 116,949 Gaming Commission: Lottery Prize Payment.......................................................................... 1,581,378,343 1,377,640,851 1,268,588,035 1,690,431,159 Children and Family Services: Youth Residents................................................................................... 78,987 238,480 240,928 76,539 Department of Family Assistance: Title IV-D Child Support........................................................................ 22,800,074 87,502,082 80,744,927 29,557,229 Exchange Account................................................................................ 67,245 49,440 116,007 678 State University: Miscellaneous Agency Fund................................................................. 213,802 1,224,436 915,928 522,310 Department of Financial Services: Foreign Fire Insurance Tax Fund......................................................... 46,595,390 49,422,690 46,588,895 49,429,185 Office of Parks, Recreation, and Historic Preservation: Miscellaneous Agency Fund................................................................. 421,897 115,994 59,172 478,719 Office of Mental Health: Patients' Account(**)............................................................................. 11,211,009 28,003,557 27,775,203 11,439,363 Employee Benefits and Escrow............................................................ 104,654 60,560 49,262 115,952 Office for People with Developmental Disabilities: Patients' Account(**)............................................................................. 32,892,260 109,226,210 110,555,459 31,563,011 Employee Benefits and Escrow(**)....................................................... -- -- -- --Total Agency Funds.................................................................................... 3,749,821,255 58,611,726,736 58,426,403,968 3,935,144,023
TOTAL SOLE CUSTODY FUNDS and ACCOUNTS................................... $ 18,160,200,642 $ 165,733,129,897 $ 163,260,544,158 $ 20,632,786,381
(*) These accounts are administered by a fiscal agent on behalf of New York State.(**) At the time of publishing, some accounts remain unfiled.
59
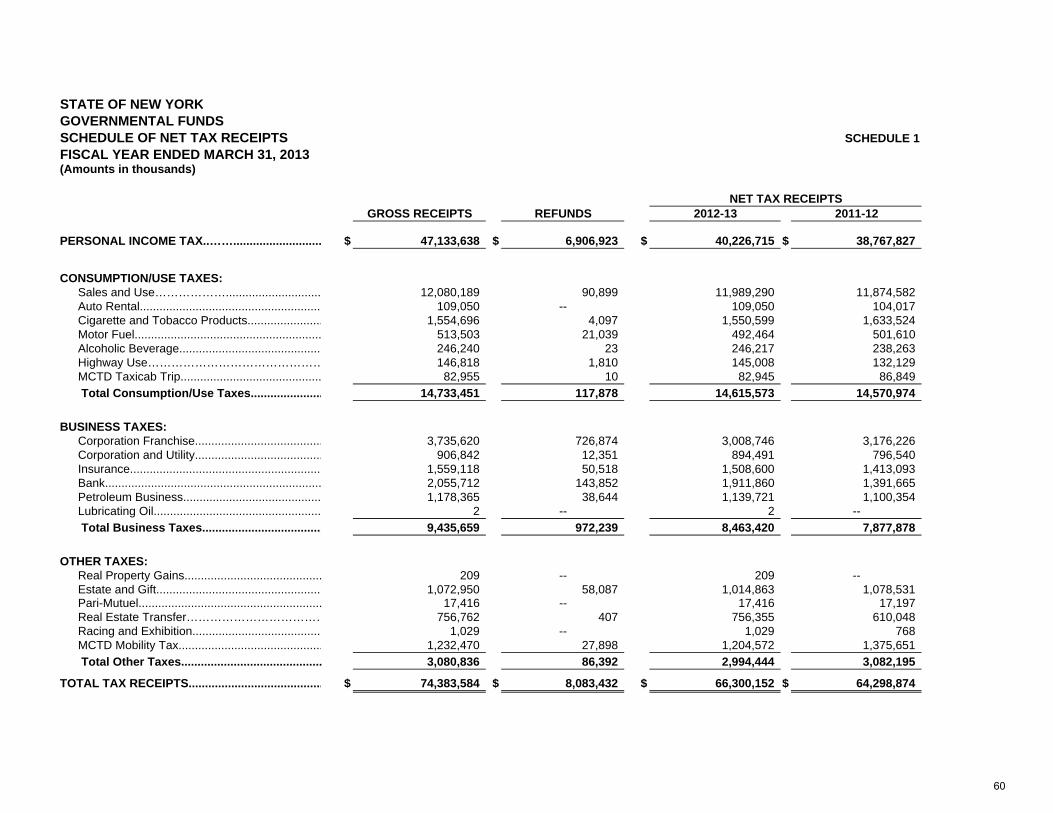
STATE OF NEW YORKGOVERNMENTAL FUNDSSCHEDULE OF NET TAX RECEIPTS SCHEDULE 1FISCAL YEAR ENDED MARCH 31, 2013(Amounts in thousands)
GROSS RECEIPTS REFUNDS 2012-13 2011-12
PERSONAL INCOME TAX..……........................... $ 47,133,638 $ 6,906,923 $ 40,226,715 $ 38,767,827
CONSUMPTION/USE TAXES:
Sales and Use………………............................. 12,080,189 90,899 11,989,290 11,874,582 Auto Rental........................................................ 109,050 -- 109,050 104,017 Cigarette and Tobacco Products....................... 1,554,696 4,097 1,550,599 1,633,524 Motor Fuel......................................................... 513,503 21,039 492,464 501,610 Alcoholic Beverage............................................ 246,240 23 246,217 238,263 Highway Use……………………………………… 146,818 1,810 145,008 132,129 MCTD Taxicab Trip........................................... 82,955 10 82,945 86,849 Total Consumption/Use Taxes...................... 14,733,451 117,878 14,615,573 14,570,974
BUSINESS TAXES:
Corporation Franchise....................................... 3,735,620 726,874 3,008,746 3,176,226 Corporation and Utility....................................... 906,842 12,351 894,491 796,540 Insurance........................................................... 1,559,118 50,518 1,508,600 1,413,093 Bank.................................................................. 2,055,712 143,852 1,911,860 1,391,665 Petroleum Business.......................................... 1,178,365 38,644 1,139,721 1,100,354 Lubricating Oil................................................... 2 -- 2 -- Total Business Taxes..................................... 9,435,659 972,239 8,463,420 7,877,878
OTHER TAXES: Real Property Gains.......................................... 209 -- 209 -- Estate and Gift................................................... 1,072,950 58,087 1,014,863 1,078,531 Pari-Mutuel........................................................ 17,416 -- 17,416 17,197 Real Estate Transfer……………………………… 756,762 407 756,355 610,048 Racing and Exhibition........................................ 1,029 -- 1,029 768 MCTD Mobility Tax............................................ 1,232,470 27,898 1,204,572 1,375,651 Total Other Taxes........................................... 3,080,836 86,392 2,994,444 3,082,195
TOTAL TAX RECEIPTS......................................... $ 74,383,584 $ 8,083,432 $ 66,300,152 $ 64,298,874
NET TAX RECEIPTS
60
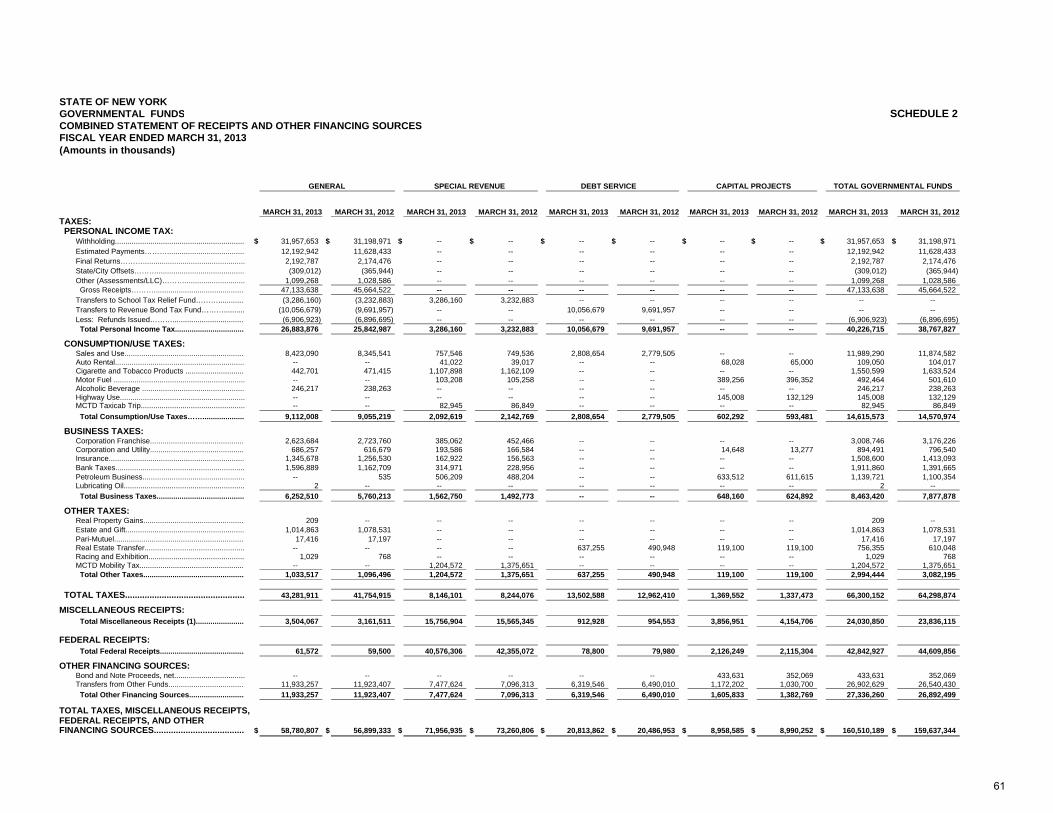
STATE OF NEW YORKGOVERNMENTAL FUNDS SCHEDULE 2COMBINED STATEMENT OF RECEIPTS AND OTHER FINANCING SOURCES FISCAL YEAR ENDED MARCH 31, 2013(Amounts in thousands)
GENERAL SPECIAL REVENUE DEBT SERVICE CAPITAL PROJECTS TOTAL GOVERNMENTAL FUNDS
MARCH 31, 2013 MARCH 31, 2012 MARCH 31, 2013 MARCH 31, 2012 MARCH 31, 2013 MARCH 31, 2012 MARCH 31, 2013 MARCH 31, 2012 MARCH 31, 2013 MARCH 31, 2012TAXES: PERSONAL INCOME TAX: Withholding.............................................................. $ 31,957,653 $ 31,198,971 $ -- $ -- $ -- $ -- $ -- $ -- $ 31,957,653 $ 31,198,971 Estimated Payments………..................................... 12,192,942 11,628,433 -- -- -- -- -- -- 12,192,942 11,628,433 Final Returns………................................................. 2,192,787 2,174,476 -- -- -- -- -- -- 2,192,787 2,174,476 State/City Offsets……….......................................... (309,012) (365,944) -- -- -- -- -- -- (309,012) (365,944) Other (Assessments/LLC)………............................. 1,099,268 1,028,586 -- -- -- -- -- -- 1,099,268 1,028,586 Gross Receipts………............................................ 47,133,638 45,664,522 -- -- -- -- -- -- 47,133,638 45,664,522 Transfers to School Tax Relief Fund………............. (3,286,160) (3,232,883) 3,286,160 3,232,883 -- -- -- -- -- -- Transfers to Revenue Bond Tax Fund……….......... (10,056,679) (9,691,957) -- -- 10,056,679 9,691,957 -- -- -- -- Less: Refunds Issued………................................... (6,906,923) (6,896,695) -- -- -- -- -- -- (6,906,923) (6,896,695) Total Personal Income Tax.................................. 26,883,876 25,842,987 3,286,160 3,232,883 10,056,679 9,691,957 -- -- 40,226,715 38,767,827
CONSUMPTION/USE TAXES: Sales and Use.......................................................... 8,423,090 8,345,541 757,546 749,536 2,808,654 2,779,505 -- -- 11,989,290 11,874,582 Auto Rental.............................................................. -- -- 41,022 39,017 -- -- 68,028 65,000 109,050 104,017 Cigarette and Tobacco Products ............................. 442,701 471,415 1,107,898 1,162,109 -- -- -- -- 1,550,599 1,633,524 Motor Fuel ............................................................... -- -- 103,208 105,258 -- -- 389,256 396,352 492,464 501,610 Alcoholic Beverage ................................................. 246,217 238,263 -- -- -- -- -- -- 246,217 238,263 Highway Use............................................................ -- -- -- -- -- -- 145,008 132,129 145,008 132,129 MCTD Taxicab Trip.................................................. -- -- 82,945 86,849 -- -- -- -- 82,945 86,849 Total Consumption/Use Taxes……..................... 9,112,008 9,055,219 2,092,619 2,142,769 2,808,654 2,779,505 602,292 593,481 14,615,573 14,570,974
BUSINESS TAXES: Corporation Franchise.............................................. 2,623,684 2,723,760 385,062 452,466 -- -- -- -- 3,008,746 3,176,226 Corporation and Utility.............................................. 686,257 616,679 193,586 166,584 -- -- 14,648 13,277 894,491 796,540 Insurance................................................................. 1,345,678 1,256,530 162,922 156,563 -- -- -- -- 1,508,600 1,413,093 Bank Taxes.............................................................. 1,596,889 1,162,709 314,971 228,956 -- -- -- -- 1,911,860 1,391,665 Petroleum Business................................................. -- 535 506,209 488,204 -- -- 633,512 611,615 1,139,721 1,100,354 Lubricating Oil.......................................................... 2 -- -- -- -- -- -- -- 2 -- Total Business Taxes.......................................... 6,252,510 5,760,213 1,562,750 1,492,773 -- -- 648,160 624,892 8,463,420 7,877,878
OTHER TAXES: Real Property Gains................................................. 209 -- -- -- -- -- -- -- 209 -- Estate and Gift......................................................... 1,014,863 1,078,531 -- -- -- -- -- -- 1,014,863 1,078,531 Pari-Mutuel............................................................... 17,416 17,197 -- -- -- -- -- -- 17,416 17,197 Real Estate Transfer................................................ -- -- -- -- 637,255 490,948 119,100 119,100 756,355 610,048 Racing and Exhibition.............................................. 1,029 768 -- -- -- -- -- -- 1,029 768 MCTD Mobility Tax................................................... -- -- 1,204,572 1,375,651 -- -- -- -- 1,204,572 1,375,651 Total Other Taxes................................................. 1,033,517 1,096,496 1,204,572 1,375,651 637,255 490,948 119,100 119,100 2,994,444 3,082,195
TOTAL TAXES................................................. 43,281,911 41,754,915 8,146,101 8,244,076 13,502,588 12,962,410 1,369,552 1,337,473 66,300,152 64,298,874
MISCELLANEOUS RECEIPTS: Total Miscellaneous Receipts (1)........................ 3,504,067 3,161,511 15,756,904 15,565,345 912,928 954,553 3,856,951 4,154,706 24,030,850 23,836,115
FEDERAL RECEIPTS: Total Federal Receipts......................................... 61,572 59,500 40,576,306 42,355,072 78,800 79,980 2,126,249 2,115,304 42,842,927 44,609,856
OTHER FINANCING SOURCES: Bond and Note Proceeds, net.................................. -- -- -- -- -- -- 433,631 352,069 433,631 352,069 Transfers from Other Funds..................................... 11,933,257 11,923,407 7,477,624 7,096,313 6,319,546 6,490,010 1,172,202 1,030,700 26,902,629 26,540,430 Total Other Financing Sources........................... 11,933,257 11,923,407 7,477,624 7,096,313 6,319,546 6,490,010 1,605,833 1,382,769 27,336,260 26,892,499
TOTAL TAXES, MISCELLANEOUS RECEIPTS,FEDERAL RECEIPTS, AND OTHERFINANCING SOURCES..................................... $ 58,780,807 $ 56,899,333 $ 71,956,935 $ 73,260,806 $ 20,813,862 $ 20,486,953 $ 8,958,585 $ 8,990,252 $ 160,510,189 $ 159,637,344
61
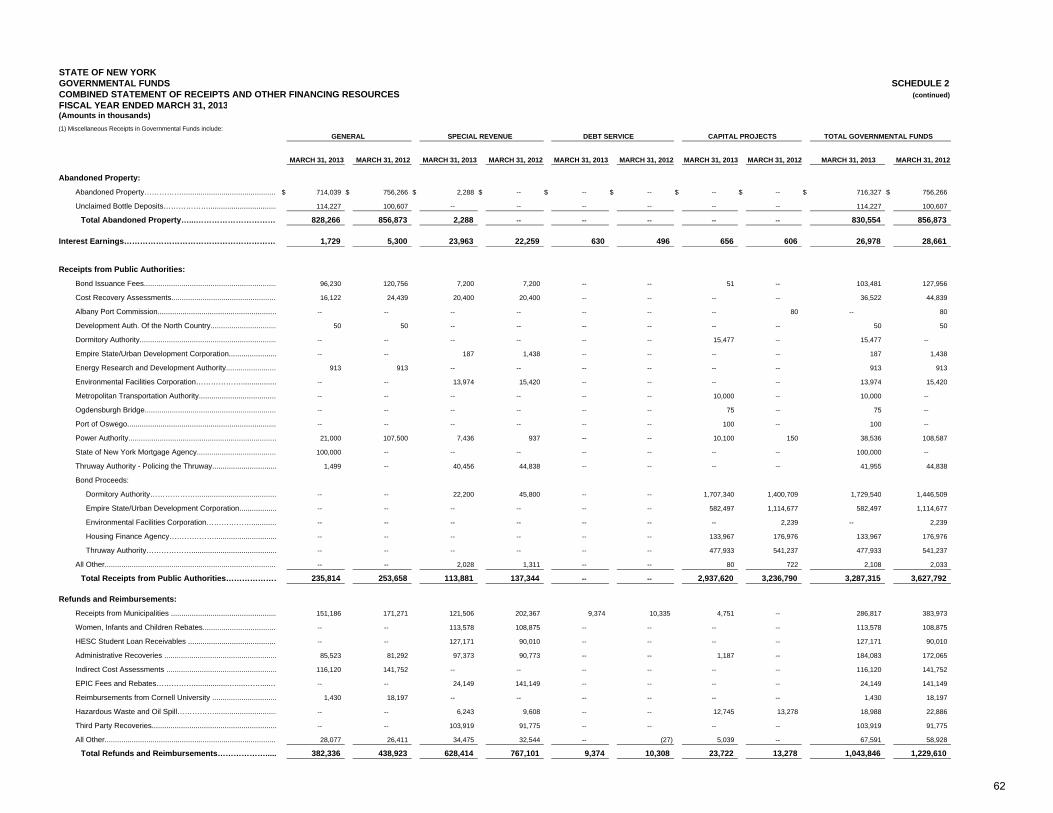
STATE OF NEW YORKGOVERNMENTAL FUNDS SCHEDULE 2COMBINED STATEMENT OF RECEIPTS AND OTHER FINANCING RESOURCES (continued)FISCAL YEAR ENDED MARCH 31, 2013(Amounts in thousands) (1) Miscellaneous Receipts in Governmental Funds include:
GENERAL SPECIAL REVENUE DEBT SERVICE CAPITAL PROJECTS TOTAL GOVERNMENTAL FUNDS
MARCH 31, 2013 MARCH 31, 2012 MARCH 31, 2013 MARCH 31, 2012 MARCH 31, 2013 MARCH 31, 2012 MARCH 31, 2013 MARCH 31, 2012 MARCH 31, 2013 MARCH 31, 2012
Abandoned Property:
Abandoned Property…………….............................................. $ 714,039 $ 756,266 $ 2,288 $ -- $ -- $ -- $ -- $ -- $ 716,327 $ 756,266
Unclaimed Bottle Deposits………………................................. 114,227 100,607 -- -- -- -- -- -- 114,227 100,607
Total Abandoned Property…...…………………………. 828,266 856,873 2,288 -- -- -- -- -- 830,554 856,873
Interest Earnings………………………………………………… 1,729 5,300 23,963 22,259 630 496 656 606 26,978 28,661
Receipts from Public Authorities:
Bond Issuance Fees................................................................ 96,230 120,756 7,200 7,200 -- -- 51 -- 103,481 127,956
Cost Recovery Assessments................................................... 16,122 24,439 20,400 20,400 -- -- -- -- 36,522 44,839
Albany Port Commission......................................................... -- -- -- -- -- -- -- 80 -- 80
Development Auth. Of the North Country................................ 50 50 -- -- -- -- -- -- 50 50
Dormitory Authority.................................................................. -- -- -- -- -- -- 15,477 -- 15,477 --
Empire State/Urban Development Corporation....................... -- -- 187 1,438 -- -- -- -- 187 1,438
Energy Research and Development Authority........................ 913 913 -- -- -- -- -- -- 913 913
Environmental Facilities Corporation………………................. -- -- 13,974 15,420 -- -- -- -- 13,974 15,420
Metropolitan Transportation Authority..................................... -- -- -- -- -- -- 10,000 -- 10,000 --
Ogdensburgh Bridge............................................................... -- -- -- -- -- -- 75 -- 75 --
Port of Oswego........................................................................ -- -- -- -- -- -- 100 -- 100 --
Power Authority....................................................................... 21,000 107,500 7,436 937 -- -- 10,100 150 38,536 108,587
State of New York Mortgage Agency...................................... 100,000 -- -- -- -- -- -- -- 100,000 --
Thruway Authority - Policing the Thruway............................... 1,499 -- 40,456 44,838 -- -- -- -- 41,955 44,838
Bond Proceeds:
Dormitory Authority………………....................................... -- -- 22,200 45,800 -- -- 1,707,340 1,400,709 1,729,540 1,446,509
Empire State/Urban Development Corporation.................. -- -- -- -- -- -- 582,497 1,114,677 582,497 1,114,677
Environmental Facilities Corporation………………............ -- -- -- -- -- -- -- 2,239 -- 2,239
Housing Finance Agency……………….............................. -- -- -- -- -- -- 133,967 176,976 133,967 176,976
Thruway Authority………………......................................... -- -- -- -- -- -- 477,933 541,237 477,933 541,237
All Other................................................................................... -- -- 2,028 1,311 -- -- 80 722 2,108 2,033
Total Receipts from Public Authorities………………… 235,814 253,658 113,881 137,344 -- -- 2,937,620 3,236,790 3,287,315 3,627,792
Refunds and Reimbursements:
Receipts from Municipalities ................................................... 151,186 171,271 121,506 202,367 9,374 10,335 4,751 -- 286,817 383,973
Women, Infants and Children Rebates.................................... -- -- 113,578 108,875 -- -- -- -- 113,578 108,875
HESC Student Loan Receivables ........................................... -- -- 127,171 90,010 -- -- -- -- 127,171 90,010
Administrative Recoveries ...................................................... 85,523 81,292 97,373 90,773 -- -- 1,187 -- 184,083 172,065
Indirect Cost Assessments ..................................................... 116,120 141,752 -- -- -- -- -- -- 116,120 141,752
EPIC Fees and Rebates…………….................…....…….....… -- -- 24,149 141,149 -- -- -- -- 24,149 141,149
Reimbursements from Cornell University ............................... 1,430 18,197 -- -- -- -- -- -- 1,430 18,197
Hazardous Waste and Oil Spill…………….............................. -- -- 6,243 9,608 -- -- 12,745 13,278 18,988 22,886
Third Party Recoveries............................................................ -- -- 103,919 91,775 -- -- -- -- 103,919 91,775
All Other................................................................................... 28,077 26,411 34,475 32,544 -- (27) 5,039 -- 67,591 58,928
Total Refunds and Reimbursements………………..... 382,336 438,923 628,414 767,101 9,374 10,308 23,722 13,278 1,043,846 1,229,610
62
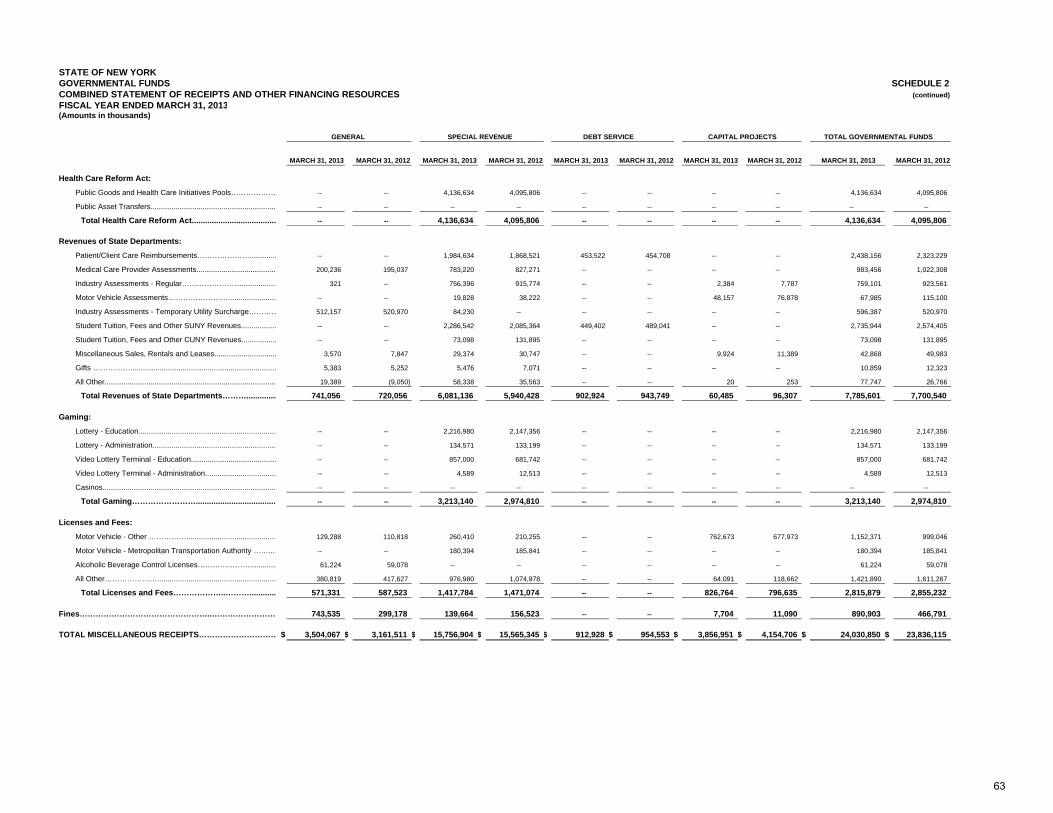
STATE OF NEW YORKGOVERNMENTAL FUNDS SCHEDULE 2COMBINED STATEMENT OF RECEIPTS AND OTHER FINANCING RESOURCES (continued)FISCAL YEAR ENDED MARCH 31, 2013(Amounts in thousands)
GENERAL SPECIAL REVENUE DEBT SERVICE CAPITAL PROJECTS TOTAL GOVERNMENTAL FUNDS
MARCH 31, 2013 MARCH 31, 2012 MARCH 31, 2013 MARCH 31, 2012 MARCH 31, 2013 MARCH 31, 2012 MARCH 31, 2013 MARCH 31, 2012 MARCH 31, 2013 MARCH 31, 2012
Health Care Reform Act:
Public Goods and Health Care Initiatives Pools……………… -- -- 4,136,634 4,095,806 -- -- -- -- 4,136,634 4,095,806
Public Asset Transfers............................................................. -- -- -- -- -- -- -- -- -- --
Total Health Care Reform Act...................................... -- -- 4,136,634 4,095,806 -- -- -- -- 4,136,634 4,095,806
Revenues of State Departments:
Patient/Client Care Reimbursements…………………............. -- -- 1,984,634 1,868,521 453,522 454,708 -- -- 2,438,156 2,323,229
Medical Care Provider Assessments....................................... 200,236 195,037 783,220 827,271 -- -- -- -- 983,456 1,022,308
Industry Assessments - Regular……………………................. 321 -- 756,396 915,774 -- -- 2,384 7,787 759,101 923,561
Motor Vehicle Assessments……………………....................... -- -- 19,828 38,222 -- -- 48,157 76,878 67,985 115,100
Industry Assessments - Temporary Utility Surcharge………… 512,157 520,970 84,230 -- -- -- -- -- 596,387 520,970
Student Tuition, Fees and Other SUNY Revenues................. -- -- 2,286,542 2,085,364 449,402 489,041 -- -- 2,735,944 2,574,405
Student Tuition, Fees and Other CUNY Revenues................. -- -- 73,098 131,895 -- -- -- -- 73,098 131,895
Miscellaneous Sales, Rentals and Leases.............................. 3,570 7,847 29,374 30,747 -- -- 9,924 11,389 42,868 49,983
Gifts ……………...................................................................... 5,383 5,252 5,476 7,071 -- -- -- -- 10,859 12,323
All Other................................................................................... 19,389 (9,050) 58,338 35,563 -- -- 20 253 77,747 26,766
Total Revenues of State Departments……….............. 741,056 720,056 6,081,136 5,940,428 902,924 943,749 60,485 96,307 7,785,601 7,700,540
Gaming:
Lottery - Education.................................................................. -- -- 2,216,980 2,147,356 -- -- -- -- 2,216,980 2,147,356
Lottery - Administration............................................................ -- -- 134,571 133,199 -- -- -- -- 134,571 133,199
Video Lottery Terminal - Education......................................... -- -- 857,000 681,742 -- -- -- -- 857,000 681,742
Video Lottery Terminal - Administration.................................. -- -- 4,589 12,513 -- -- -- -- 4,589 12,513
Casinos.................................................................................... -- -- -- -- -- -- -- -- -- --
Total Gaming……………………..................................... -- -- 3,213,140 2,974,810 -- -- -- -- 3,213,140 2,974,810
Licenses and Fees:
Motor Vehicle - Other ……………........................................... 129,288 110,818 260,410 210,255 -- -- 762,673 677,973 1,152,371 999,046
Motor Vehicle - Metropolitan Transportation Authority ……...… -- -- 180,394 185,841 -- -- -- -- 180,394 185,841
Alcoholic Beverage Control Licenses…………………............. 61,224 59,078 -- -- -- -- -- -- 61,224 59,078
All Other…………………......................................................... 380,819 417,627 976,980 1,074,978 -- -- 64,091 118,662 1,421,890 1,611,267
Total Licenses and Fees………………..………............ 571,331 587,523 1,417,784 1,471,074 -- -- 826,764 796,635 2,815,879 2,855,232
Fines…………………………………………..…………………… 743,535 299,178 139,664 156,523 -- -- 7,704 11,090 890,903 466,791
TOTAL MISCELLANEOUS RECEIPTS………………………… $ 3,504,067 $ 3,161,511 $ 15,756,904 $ 15,565,345 $ 912,928 $ 954,553 $ 3,856,951 $ 4,154,706 $ 24,030,850 $ 23,836,115
63
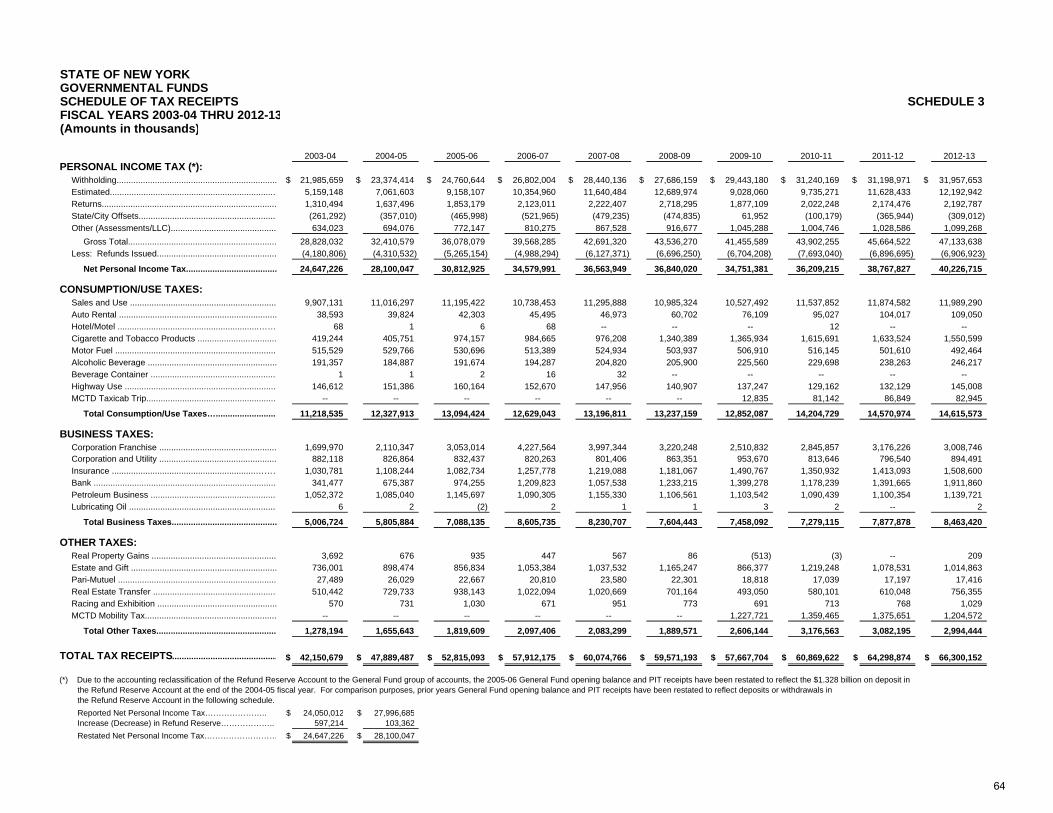
STATE OF NEW YORKGOVERNMENTAL FUNDSSCHEDULE OF TAX RECEIPTS SCHEDULE 3FISCAL YEARS 2003-04 THRU 2012-13(Amounts in thousands)
2003-04 2004-05 2005-06 2006-07 2007-08 2008-09 2009-10 2010-11 2011-12 2012-13PERSONAL INCOME TAX (*): Withholding................................................................... $ 21,985,659 $ 23,374,414 $ 24,760,644 $ 26,802,004 $ 28,440,136 $ 27,686,159 $ 29,443,180 $ 31,240,169 $ 31,198,971 $ 31,957,653 Estimated....................................................................… 5,159,148 7,061,603 9,158,107 10,354,960 11,640,484 12,689,974 9,028,060 9,735,271 11,628,433 12,192,942 Returns......................................................................... 1,310,494 1,637,496 1,853,179 2,123,011 2,222,407 2,718,295 1,877,109 2,022,248 2,174,476 2,192,787 State/City Offsets.......................................................... (261,292) (357,010) (465,998) (521,965) (479,235) (474,835) 61,952 (100,179) (365,944) (309,012) Other (Assessments/LLC)............................................ 634,023 694,076 772,147 810,275 867,528 916,677 1,045,288 1,004,746 1,028,586 1,099,268 Gross Total.............................................................. 28,828,032 32,410,579 36,078,079 39,568,285 42,691,320 43,536,270 41,455,589 43,902,255 45,664,522 47,133,638 Less: Refunds Issued.................................................. (4,180,806) (4,310,532) (5,265,154) (4,988,294) (6,127,371) (6,696,250) (6,704,208) (7,693,040) (6,896,695) (6,906,923)
Net Personal Income Tax...................................... 24,647,226 28,100,047 30,812,925 34,579,991 36,563,949 36,840,020 34,751,381 36,209,215 38,767,827 40,226,715
CONSUMPTION/USE TAXES: Sales and Use ............................................................. 9,907,131 11,016,297 11,195,422 10,738,453 11,295,888 10,985,324 10,527,492 11,537,852 11,874,582 11,989,290 Auto Rental .................................................................. 38,593 39,824 42,303 45,495 46,973 60,702 76,109 95,027 104,017 109,050 Hotel/Motel ...........................................................…… 68 1 6 68 -- -- -- 12 -- -- Cigarette and Tobacco Products ................................. 419,244 405,751 974,157 984,665 976,208 1,340,389 1,365,934 1,615,691 1,633,524 1,550,599 Motor Fuel .................................................................... 515,529 529,766 530,696 513,389 524,934 503,937 506,910 516,145 501,610 492,464 Alcoholic Beverage ...................................................... 191,357 184,887 191,674 194,287 204,820 205,900 225,560 229,698 238,263 246,217 Beverage Container ..................................................... 1 1 2 16 32 -- -- -- -- -- Highway Use ................................................................ 146,612 151,386 160,164 152,670 147,956 140,907 137,247 129,162 132,129 145,008 MCTD Taxicab Trip....................................................... -- -- -- -- -- -- 12,835 81,142 86,849 82,945
Total Consumption/Use Taxes….......................... 11,218,535 12,327,913 13,094,424 12,629,043 13,196,811 13,237,159 12,852,087 14,204,729 14,570,974 14,615,573
BUSINESS TAXES: Corporation Franchise ................................................. 1,699,970 2,110,347 3,053,014 4,227,564 3,997,344 3,220,248 2,510,832 2,845,857 3,176,226 3,008,746 Corporation and Utility ................................................. 882,118 826,864 832,437 820,263 801,406 863,351 953,670 813,646 796,540 894,491 Insurance ............................................................……… 1,030,781 1,108,244 1,082,734 1,257,778 1,219,088 1,181,067 1,490,767 1,350,932 1,413,093 1,508,600 Bank ............................................................................. 341,477 675,387 974,255 1,209,823 1,057,538 1,233,215 1,399,278 1,178,239 1,391,665 1,911,860 Petroleum Business ..................................................... 1,052,372 1,085,040 1,145,697 1,090,305 1,155,330 1,106,561 1,103,542 1,090,439 1,100,354 1,139,721 Lubricating Oil .............................................................. 6 2 (2) 2 1 1 3 2 -- 2
Total Business Taxes............................................ 5,006,724 5,805,884 7,088,135 8,605,735 8,230,707 7,604,443 7,458,092 7,279,115 7,877,878 8,463,420
OTHER TAXES: Real Property Gains .................................................... 3,692 676 935 447 567 86 (513) (3) -- 209 Estate and Gift ............................................................. 736,001 898,474 856,834 1,053,384 1,037,532 1,165,247 866,377 1,219,248 1,078,531 1,014,863 Pari-Mutuel .................................................................. 27,489 26,029 22,667 20,810 23,580 22,301 18,818 17,039 17,197 17,416 Real Estate Transfer .................................................... 510,442 729,733 938,143 1,022,094 1,020,669 701,164 493,050 580,101 610,048 756,355 Racing and Exhibition .................................................. 570 731 1,030 671 951 773 691 713 768 1,029 MCTD Mobility Tax....................................................... -- -- -- -- -- -- 1,227,721 1,359,465 1,375,651 1,204,572
Total Other Taxes.................................................. 1,278,194 1,655,643 1,819,609 2,097,406 2,083,299 1,889,571 2,606,144 3,176,563 3,082,195 2,994,444
TOTAL TAX RECEIPTS............................................ $ 42,150,679 $ 47,889,487 $ 52,815,093 $ 57,912,175 $ 60,074,766 $ 59,571,193 $ 57,667,704 $ 60,869,622 $ 64,298,874 $ 66,300,152
(*) Due to the accounting reclassification of the Refund Reserve Account to the General Fund group of accounts, the 2005-06 General Fund opening balance and PIT receipts have been restated to reflect the $1.328 billion on deposit in the Refund Reserve Account at the end of the 2004-05 fiscal year. For comparison purposes, prior years General Fund opening balance and PIT receipts have been restated to reflect deposits or withdrawals in the Refund Reserve Account in the following schedule. Reported Net Personal Income Tax………………….. $ 24,050,012 $ 27,996,685 Increase (Decrease) in Refund Reserve……………….. 597,214 103,362 Restated Net Personal Income Tax……………………… $ 24,647,226 $ 28,100,047
64
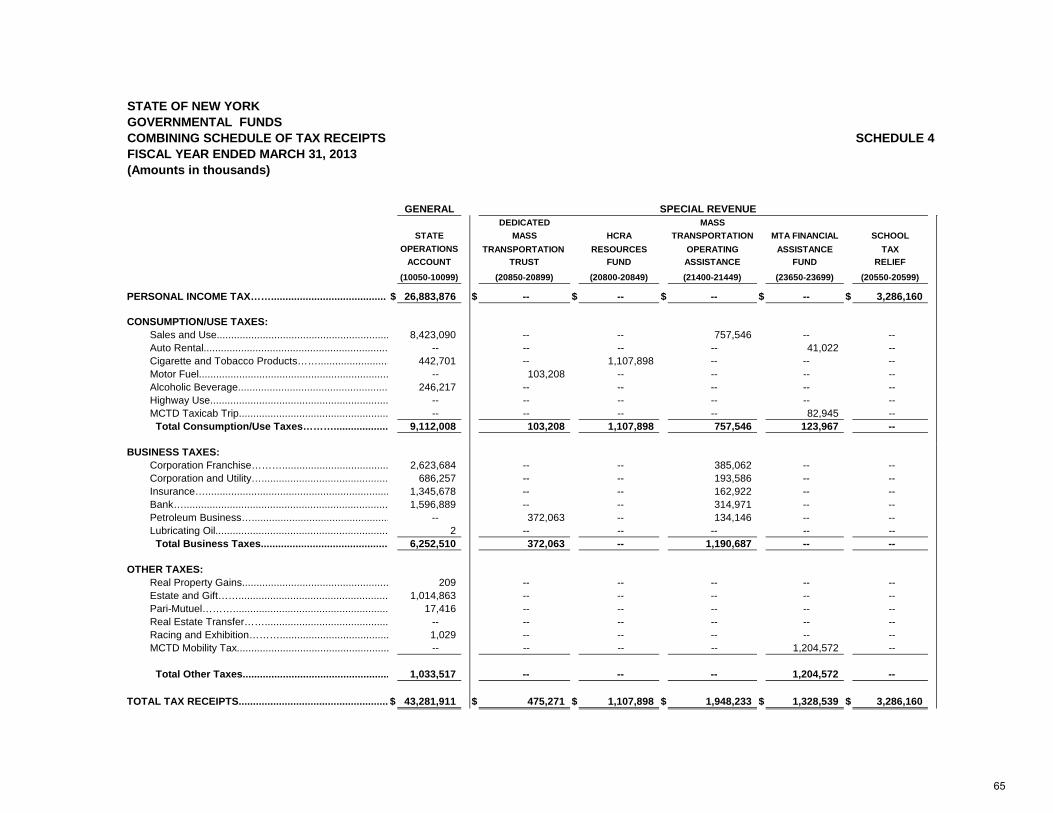
STATE OF NEW YORK GOVERNMENTAL FUNDS COMBINING SCHEDULE OF TAX RECEIPTS SCHEDULE 4FISCAL YEAR ENDED MARCH 31, 2013(Amounts in thousands)
GENERALDEDICATED MASS
STATE MASS HCRA TRANSPORTATION MTA FINANCIAL SCHOOLOPERATIONS TRANSPORTATION RESOURCES OPERATING ASSISTANCE TAX
ACCOUNT TRUST FUND ASSISTANCE FUND RELIEF
(10050-10099) (20850-20899) (20800-20849) (21400-21449) (23650-23699) (20550-20599)
PERSONAL INCOME TAX……........................................ $ 26,883,876 $ -- $ -- $ -- $ -- $ 3,286,160
CONSUMPTION/USE TAXES: Sales and Use............................................................ 8,423,090 -- -- 757,546 -- -- Auto Rental................................................................ -- -- -- -- 41,022 -- Cigarette and Tobacco Products……......................... 442,701 -- 1,107,898 -- -- -- Motor Fuel.................................................................. -- 103,208 -- -- -- -- Alcoholic Beverage.................................................... 246,217 -- -- -- -- -- Highway Use.............................................................. -- -- -- -- -- -- MCTD Taxicab Trip.................................................... -- -- -- -- 82,945 -- Total Consumption/Use Taxes………................... 9,112,008 103,208 1,107,898 757,546 123,967 --
SPECIAL REVENUE
BUSINESS TAXES: Corporation Franchise………..................................... 2,623,684 -- -- 385,062 -- -- Corporation and Utility…............................................ 686,257 -- -- 193,586 -- -- Insurance…................................................................ 1,345,678 -- -- 162,922 -- -- Bank…....................................................................... 1,596,889 -- -- 314,971 -- -- Petroleum Business…................................................ -- 372,063 -- 134,146 -- -- Lubricating Oil............................................................ 2 -- -- -- -- -- Total Business Taxes............................................. 6,252,510 372,063 -- 1,190,687 -- --
OTHER TAXES: Real Property Gains................................................... 209 -- -- -- -- -- Estate and Gift…….................................................... 1,014,863 -- -- -- -- -- Pari-Mutuel………...................................................... 17,416 -- -- -- -- -- Real Estate Transfer……........................................... -- -- -- -- -- -- Racing and Exhibition………...................................... 1,029 -- -- -- -- -- MCTD Mobility Tax..................................................... -- -- -- -- 1,204,572 --
Total Other Taxes................................................... 1,033,517 -- -- -- 1,204,572 --
TOTAL TAX RECEIPTS.................................................... $ 43,281,911 $ 475,271 $ 1,107,898 $ 1,948,233 $ 1,328,539 $ 3,286,160
65
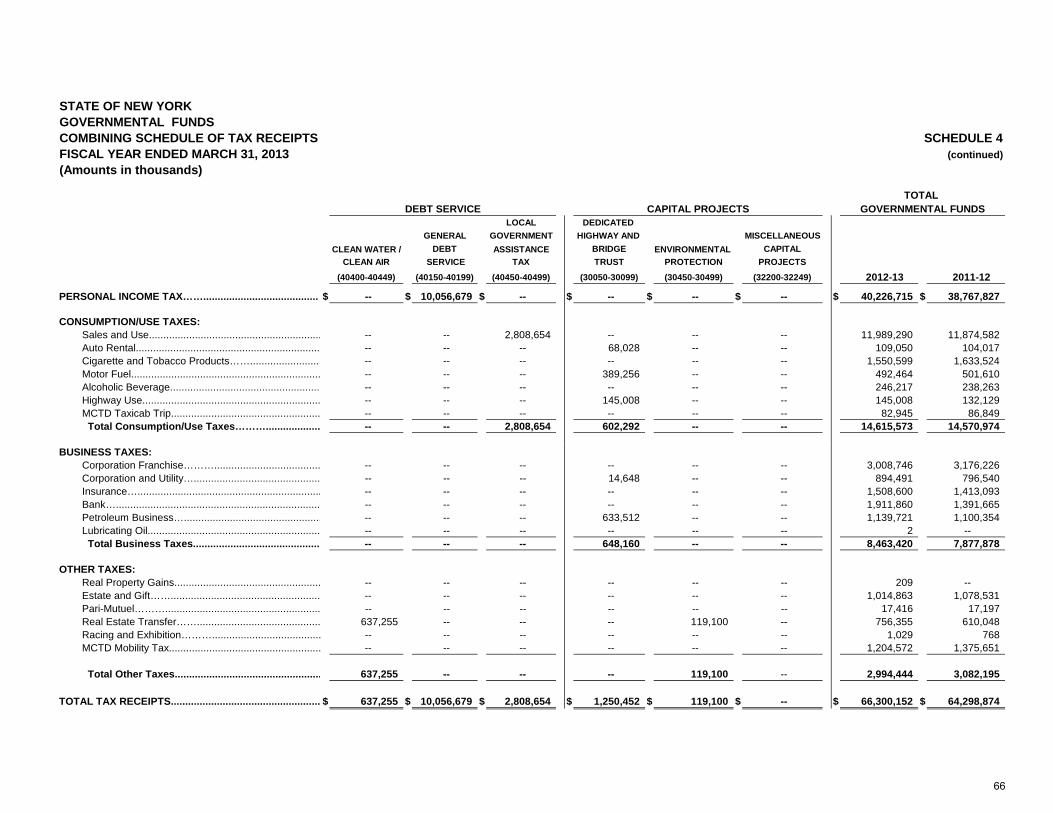
STATE OF NEW YORK GOVERNMENTAL FUNDS COMBINING SCHEDULE OF TAX RECEIPTS SCHEDULE 4FISCAL YEAR ENDED MARCH 31, 2013 (continued)(Amounts in thousands)
LOCAL DEDICATED GENERAL GOVERNMENT HIGHWAY AND MISCELLANEOUS
CLEAN WATER / DEBT ASSISTANCE BRIDGE ENVIRONMENTAL CAPITALCLEAN AIR SERVICE TAX TRUST PROTECTION PROJECTS
(40400-40449) (40150-40199) (40450-40499) (30050-30099) (30450-30499) (32200-32249) 2012-13 2011-12
PERSONAL INCOME TAX……........................................ $ -- $ 10,056,679 $ -- $ -- $ -- $ -- $ 40,226,715 $ 38,767,827
CONSUMPTION/USE TAXES: Sales and Use............................................................ -- -- 2,808,654 -- -- -- 11,989,290 11,874,582 Auto Rental................................................................ -- -- -- 68,028 -- -- 109,050 104,017 Cigarette and Tobacco Products……......................... -- -- -- -- -- -- 1,550,599 1,633,524 Motor Fuel.................................................................. -- -- -- 389,256 -- -- 492,464 501,610 Alcoholic Beverage.................................................... -- -- -- -- -- -- 246,217 238,263 Highway Use.............................................................. -- -- -- 145,008 -- -- 145,008 132,129 MCTD Taxicab Trip.................................................... -- -- -- -- -- -- 82,945 86,849 Total Consumption/Use Taxes………................... -- -- 2,808,654 602,292 -- -- 14,615,573 14,570,974
GOVERNMENTAL FUNDS TOTAL
CAPITAL PROJECTSDEBT SERVICE
BUSINESS TAXES: Corporation Franchise………..................................... -- -- -- -- -- -- 3,008,746 3,176,226 Corporation and Utility…............................................ -- -- -- 14,648 -- -- 894,491 796,540 Insurance…................................................................ -- -- -- -- -- -- 1,508,600 1,413,093 Bank…....................................................................... -- -- -- -- -- -- 1,911,860 1,391,665 Petroleum Business…................................................ -- -- -- 633,512 -- -- 1,139,721 1,100,354 Lubricating Oil............................................................ -- -- -- -- -- -- 2 -- Total Business Taxes............................................. -- -- -- 648,160 -- -- 8,463,420 7,877,878
OTHER TAXES: Real Property Gains................................................... -- -- -- -- -- -- 209 -- Estate and Gift…….................................................... -- -- -- -- -- -- 1,014,863 1,078,531 Pari-Mutuel………...................................................... -- -- -- -- -- -- 17,416 17,197 Real Estate Transfer……........................................... 637,255 -- -- -- 119,100 -- 756,355 610,048 Racing and Exhibition………...................................... -- -- -- -- -- -- 1,029 768 MCTD Mobility Tax..................................................... -- -- -- -- -- -- 1,204,572 1,375,651
Total Other Taxes................................................... 637,255 -- -- -- 119,100 -- 2,994,444 3,082,195
TOTAL TAX RECEIPTS.................................................... $ 637,255 $ 10,056,679 $ 2,808,654 $ 1,250,452 $ 119,100 $ -- $ 66,300,152 $ 64,298,874
66
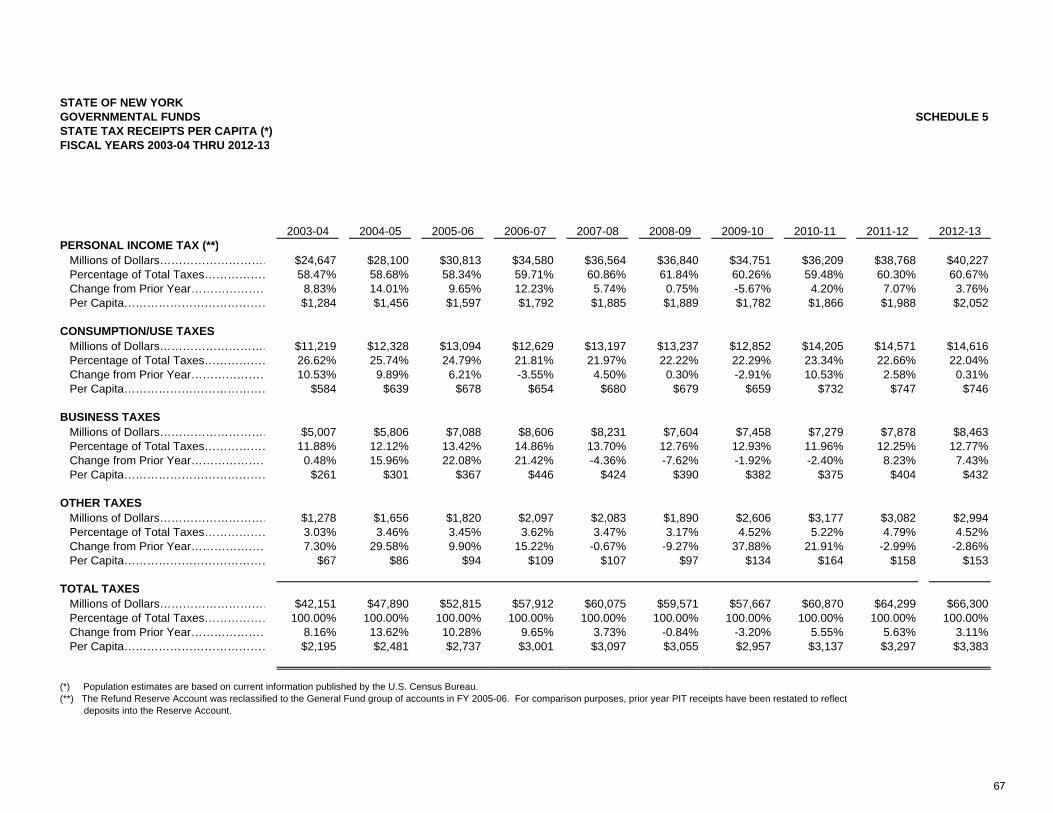
STATE OF NEW YORKGOVERNMENTAL FUNDS SCHEDULE 5STATE TAX RECEIPTS PER CAPITA (*) FISCAL YEARS 2003-04 THRU 2012-13
2003-04 2004-05 2005-06 2006-07 2007-08 2008-09 2009-10 2010-11 2011-12 2012-13PERSONAL INCOME TAX (**) Millions of Dollars………………………… $24,647 $28,100 $30,813 $34,580 $36,564 $36,840 $34,751 $36,209 $38,768 $40,227 Percentage of Total Taxes……………… 58.47% 58.68% 58.34% 59.71% 60.86% 61.84% 60.26% 59.48% 60.30% 60.67% Change from Prior Year………………… 8.83% 14.01% 9.65% 12.23% 5.74% 0.75% -5.67% 4.20% 7.07% 3.76% Per Capita………………………………… $1,284 $1,456 $1,597 $1,792 $1,885 $1,889 $1,782 $1,866 $1,988 $2,052
CONSUMPTION/USE TAXES Millions of Dollars………………………… $11,219 $12,328 $13,094 $12,629 $13,197 $13,237 $12,852 $14,205 $14,571 $14,616 Percentage of Total Taxes……………… 26.62% 25.74% 24.79% 21.81% 21.97% 22.22% 22.29% 23.34% 22.66% 22.04% Change from Prior Year………………… 10.53% 9.89% 6.21% -3.55% 4.50% 0.30% -2.91% 10.53% 2.58% 0.31% Per Capita………………………………… $584 $639 $678 $654 $680 $679 $659 $732 $747 $746
BUSINESS TAXES Millions of Dollars………………………… $5,007 $5,806 $7,088 $8,606 $8,231 $7,604 $7,458 $7,279 $7,878 $8,463 Percentage of Total Taxes……………… 11.88% 12.12% 13.42% 14.86% 13.70% 12.76% 12.93% 11.96% 12.25% 12.77% Change from Prior Year………………… 0.48% 15.96% 22.08% 21.42% -4.36% -7.62% -1.92% -2.40% 8.23% 7.43% Per Capita………………………………… $261 $301 $367 $446 $424 $390 $382 $375 $404 $432
OTHER TAXES Millions of Dollars………………………… $1,278 $1,656 $1,820 $2,097 $2,083 $1,890 $2,606 $3,177 $3,082 $2,994 Percentage of Total Taxes……………… 3.03% 3.46% 3.45% 3.62% 3.47% 3.17% 4.52% 5.22% 4.79% 4.52% Change from Prior Year………………… 7.30% 29.58% 9.90% 15.22% -0.67% -9.27% 37.88% 21.91% -2.99% -2.86% Per Capita………………………………… $67 $86 $94 $109 $107 $97 $134 $164 $158 $153
TOTAL TAXES Millions of Dollars………………………… $42,151 $47,890 $52,815 $57,912 $60,075 $59,571 $57,667 $60,870 $64,299 $66,300 Percentage of Total Taxes……………… 100.00% 100.00% 100.00% 100.00% 100.00% 100.00% 100.00% 100.00% 100.00% 100.00% Change from Prior Year………………… 8.16% 13.62% 10.28% 9.65% 3.73% -0.84% -3.20% 5.55% 5.63% 3.11% Per Capita………………………………… $2,195 $2,481 $2,737 $3,001 $3,097 $3,055 $2,957 $3,137 $3,297 $3,383
(*) Population estimates are based on current information published by the U.S. Census Bureau. (**) The Refund Reserve Account was reclassified to the General Fund group of accounts in FY 2005-06. For comparison purposes, prior year PIT receipts have been restated to reflect deposits into the Reserve Account.
67
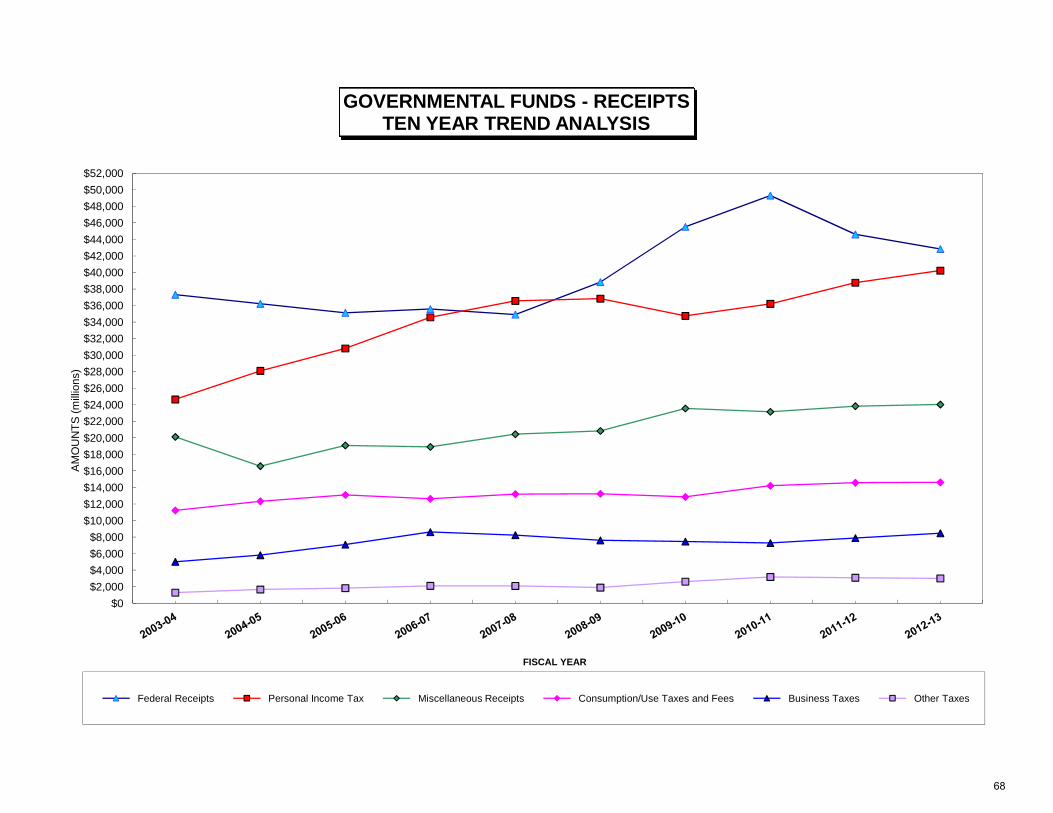
$22,000$24,000$26,000$28,000$30,000$32,000$34,000$36,000$38,000$40,000$42,000$44,000$46,000$48,000$50,000$52,000
TS (m
illio
ns)
GOVERNMENTAL FUNDS - RECEIPTSTEN YEAR TREND ANALYSIS
$0$2,000$4,000$6,000$8,000
$10,000$12,000$14,000$16,000$18,000$20,000
AM
OU
NT
FISCAL YEAR
Federal Receipts Personal Income Tax Miscellaneous Receipts Consumption/Use Taxes and Fees Business Taxes Other Taxes
68
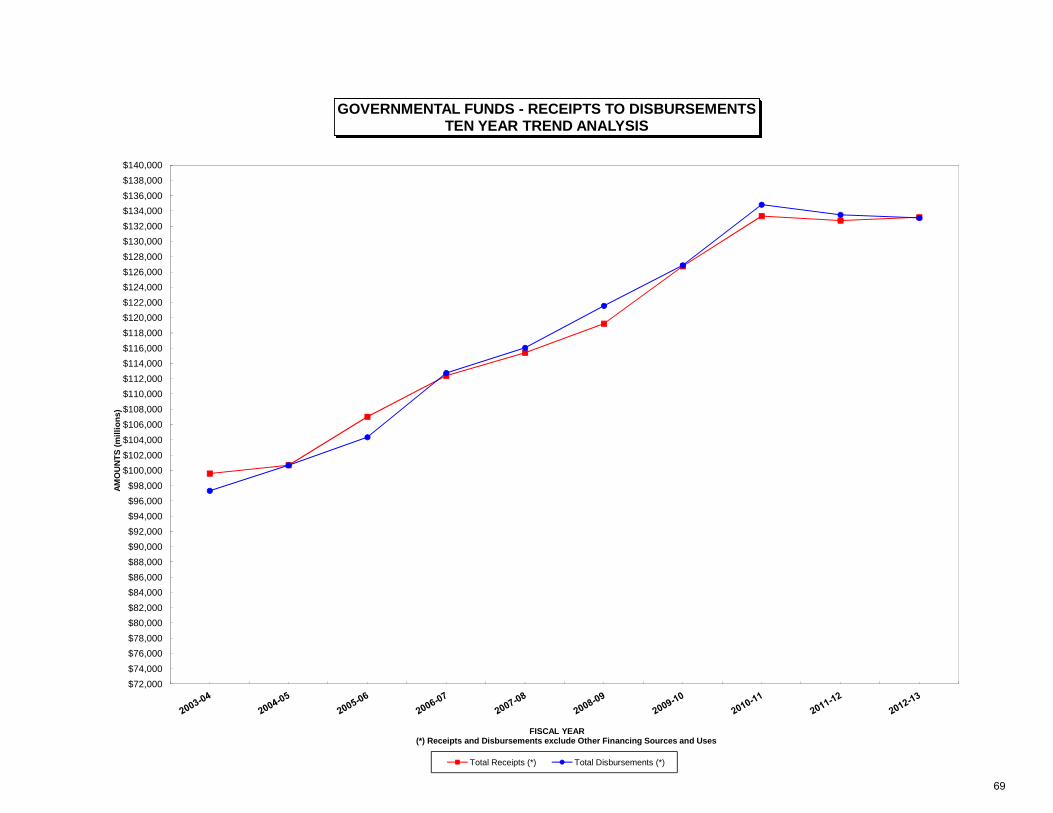
$106,000$108,000$110,000$112,000$114,000$116,000$118,000$120,000$122,000$124,000$126,000$128,000$130,000$132,000$134,000$136,000$138,000$140,000
ions
)GOVERNMENTAL FUNDS - RECEIPTS TO DISBURSEMENTS
TEN YEAR TREND ANALYSIS
$72,000$74,000$76,000$78,000$80,000$82,000$84,000$86,000$88,000$90,000$92,000$94,000$96,000$98,000
$100,000$102,000$104,000$ ,
AMO
UN
TS (m
illi
FISCAL YEAR (*) Receipts and Disbursements exclude Other Financing Sources and Uses
Total Receipts (*) Total Disbursements (*)
69
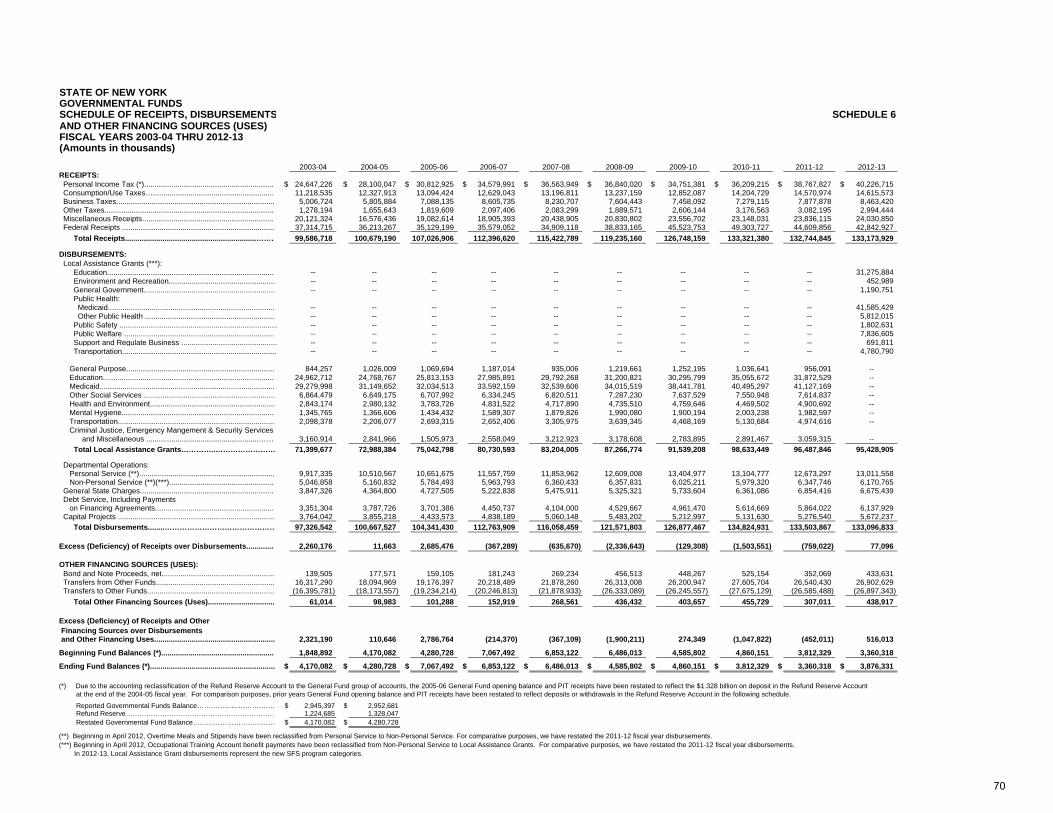
STATE OF NEW YORKGOVERNMENTAL FUNDS SCHEDULE OF RECEIPTS, DISBURSEMENTS SCHEDULE 6AND OTHER FINANCING SOURCES (USES) FISCAL YEARS 2003-04 THRU 2012-13(Amounts in thousands)
2003-04 2004-05 2005-06 2006-07 2007-08 2008-09 2009-10 2010-11 2011-12 2012-13RECEIPTS: Personal Income Tax (*)............................................................... $ 24,647,226 $ 28,100,047 $ 30,812,925 $ 34,579,991 $ 36,563,949 $ 36,840,020 $ 34,751,381 $ 36,209,215 $ 38,767,827 $ 40,226,715 Consumption/Use Taxes…........................................................... 11,218,535 12,327,913 13,094,424 12,629,043 13,196,811 13,237,159 12,852,087 14,204,729 14,570,974 14,615,573 Business Taxes............................................................................ 5,006,724 5,805,884 7,088,135 8,605,735 8,230,707 7,604,443 7,458,092 7,279,115 7,877,878 8,463,420 Other Taxes.................................................................................. 1,278,194 1,655,643 1,819,609 2,097,406 2,083,299 1,889,571 2,606,144 3,176,563 3,082,195 2,994,444 Miscellaneous Receipts................................................................ 20,121,324 16,576,436 19,082,614 18,905,393 20,438,905 20,830,802 23,556,702 23,148,031 23,836,115 24,030,850 Federal Receipts ......................................................................... 37,314,715 36,213,267 35,129,199 35,579,052 34,909,118 38,833,165 45,523,753 49,303,727 44,609,856 42,842,927 Total Receipts...............................................................……… 99,586,718 100,679,190 107,026,906 112,396,620 115,422,789 119,235,160 126,748,159 133,321,380 132,744,845 133,173,929
DISBURSEMENTS: Local Assistance Grants (***): Education................................................................................. -- -- -- -- -- -- -- -- -- 31,275,884 Environment and Recreation................................................... -- -- -- -- -- -- -- -- -- 452,989 General Government............................................................... -- -- -- -- -- -- -- -- -- 1,190,751 Public Health: Medicaid................................................................................ -- -- -- -- -- -- -- -- -- 41,585,429 Other Public Health .............................................................. -- -- -- -- -- -- -- -- -- 5,812,015 Public Safety ............................................................................ -- -- -- -- -- -- -- -- -- 1,802,631 Public Welfare ........................................................................ -- -- -- -- -- -- -- -- -- 7,836,605 Support and Regulate Business .............................................. -- -- -- -- -- -- -- -- -- 691,811 Transportation.......................................................................... -- -- -- -- -- -- -- -- -- 4,780,790
General Purpose....................................................................... 844,257 1,026,009 1,069,694 1,187,014 935,006 1,219,661 1,252,195 1,036,641 956,091 -- Education................................................................................... 24,962,712 24,768,767 25,813,153 27,985,891 29,792,268 31,200,821 30,295,799 35,055,672 31,872,529 -- Medicaid.................................................................................... 29,279,998 31,149,652 32,034,513 33,592,159 32,539,606 34,015,519 38,441,781 40,495,297 41,127,169 -- Other Social Services ............................................................... 6,864,479 6,649,175 6,707,992 6,334,245 6,820,511 7,287,230 7,637,529 7,550,948 7,614,837 -- Health and Environment............................................................ 2,843,174 2,980,132 3,783,726 4,831,522 4,717,890 4,735,510 4,759,646 4,469,502 4,900,692 -- Mental Hygiene.......................................................................... 1,345,765 1,366,606 1,434,432 1,589,307 1,879,826 1,990,080 1,900,194 2,003,238 1,982,597 -- Transportation........................................................................... 2,098,378 2,206,077 2,693,315 2,652,406 3,305,975 3,639,345 4,468,169 5,130,684 4,974,616 -- Criminal Justice, Emergency Mangement & Security Services and Miscellaneous ......................................................……… 3,160,914 2,841,966 1,505,973 2,558,049 3,212,923 3,178,608 2,783,895 2,891,467 3,059,315 -- Total Local Assistance Grants…………..…………………… 71,399,677 72,988,384 75,042,798 80,730,593 83,204,005 87,266,774 91,539,208 98,633,449 96,487,846 95,428,905
Departmental Operations: Personal Service (**)................................................................. 9,917,335 10,510,567 10,651,675 11,557,759 11,853,962 12,609,008 13,404,977 13,104,777 12,673,297 13,011,558 Non-Personal Service (**)(***)................................................... 5,046,858 5,160,832 5,784,493 5,963,793 6,360,433 6,357,831 6,025,211 5,979,320 6,347,746 6,170,765 General State Charges................................................................. 3,847,326 4,364,800 4,727,505 5,222,838 5,475,911 5,325,321 5,733,604 6,361,086 6,854,416 6,675,439 Debt Service, Including Payments on Financing Agreements.......................................................... 3,351,304 3,787,726 3,701,386 4,450,737 4,104,000 4,529,667 4,961,470 5,614,669 5,864,022 6,137,929 Capital Projects ........................................................................... 3,764,042 3,855,218 4,433,573 4,838,189 5,060,148 5,483,202 5,212,997 5,131,630 5,276,540 5,672,237 Total Disbursements........……………………………………… 97,326,542 100,667,527 104,341,430 112,763,909 116,058,459 121,571,803 126,877,467 134,824,931 133,503,867 133,096,833
Excess (Deficiency) of Receipts over Disbursements.............. 2,260,176 11,663 2,685,476 (367,289) (635,670) (2,336,643) (129,308) (1,503,551) (759,022) 77,096
OTHER FINANCING SOURCES (USES): Bond and Note Proceeds, net...................................................... 139,505 177,571 159,105 181,243 269,234 456,513 448,267 525,154 352,069 433,631 Transfers from Other Funds......................................................... 16,317,290 18,094,969 19,176,397 20,218,489 21,878,260 26,313,008 26,200,947 27,605,704 26,540,430 26,902,629 Transfers to Other Funds............................................................. (16,395,781) (18,173,557) (19,234,214) (20,246,813) (21,878,933) (26,333,089) (26,245,557) (27,675,129) (26,585,488) (26,897,343) Total Other Financing Sources (Uses)................................ 61,014 98,983 101,288 152,919 268,561 436,432 403,657 455,729 307,011 438,917
Excess (Deficiency) of Receipts and Other Financing Sources over Disbursements and Other Financing Uses.......................................................... 2,321,190 110,646 2,786,764 (214,370) (367,109) (1,900,211) 274,349 (1,047,822) (452,011) 516,013
Beginning Fund Balances (*)....................................................... 1,848,892 4,170,082 4,280,728 7,067,492 6,853,122 6,486,013 4,585,802 4,860,151 3,812,329 3,360,318
Ending Fund Balances (*)............................................................ $ 4,170,082 $ 4,280,728 $ 7,067,492 $ 6,853,122 $ 6,486,013 $ 4,585,802 $ 4,860,151 $ 3,812,329 $ 3,360,318 $ 3,876,331
(*) Due to the accounting reclassification of the Refund Reserve Account to the General Fund group of accounts, the 2005-06 General Fund opening balance and PIT receipts have been restated to reflect the $1.328 billion on deposit in the Refund Reserve Account at the end of the 2004-05 fiscal year. For comparison purposes, prior years General Fund opening balance and PIT receipts have been restated to reflect deposits or withdrawals in the Refund Reserve Account in the following schedule.
Reported Governmental Funds Balance……………………………… $ 2,945,397 $ 2,952,681 Refund Reserve………………………………………………………… 1,224,685 1,328,047 Restated Governmental Fund Balance……………………………… $ 4,170,082 $ 4,280,728 (**) Beginning in April 2012, Overtime Meals and Stipends have been reclassified from Personal Service to Non-Personal Service. For comparative purposes, we have restated the 2011-12 fiscal year disbursements.(***) Beginning in April 2012, Occupational Training Account benefit payments have been reclassified from Non-Personal Service to Local Assistance Grants. For comparative purposes, we have restated the 2011-12 fiscal year disbursements. In 2012-13, Local Assistance Grant disbursements represent the new SFS program categories.
70
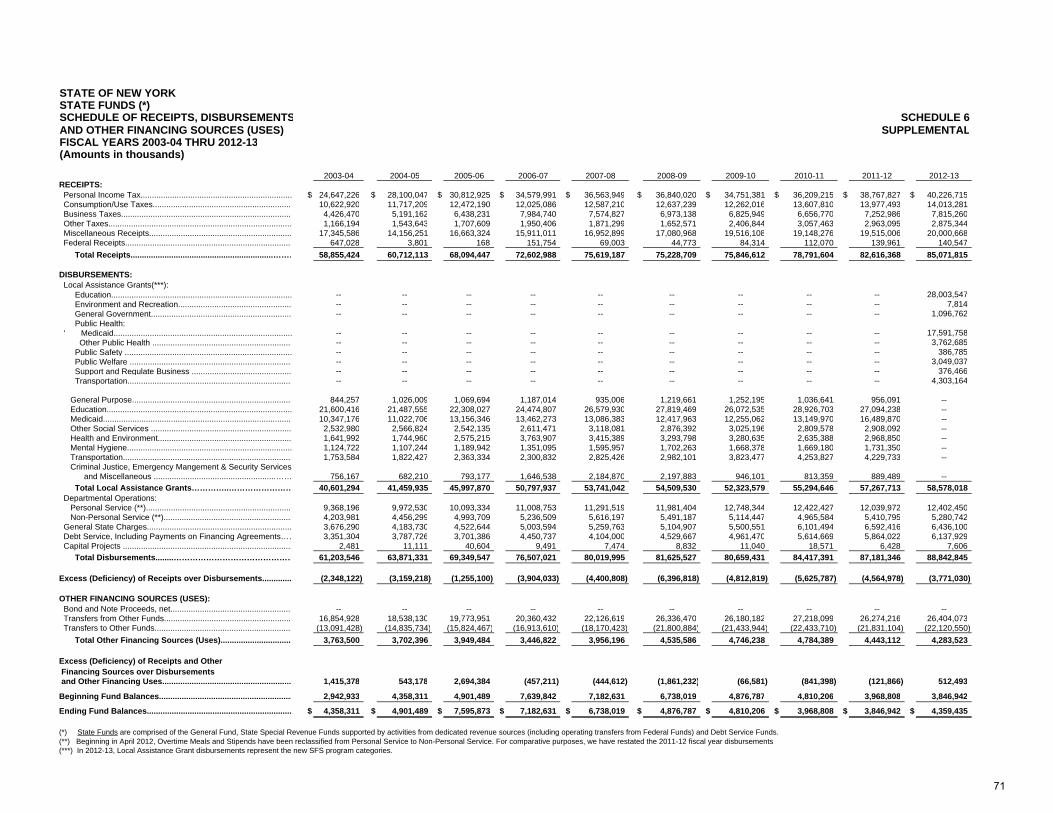
STATE OF NEW YORKSTATE FUNDS (*) SCHEDULE OF RECEIPTS, DISBURSEMENTS SCHEDULE 6AND OTHER FINANCING SOURCES (USES) SUPPLEMENTALFISCAL YEARS 2003-04 THRU 2012-13(Amounts in thousands)
2003-04 2004-05 2005-06 2006-07 2007-08 2008-09 2009-10 2010-11 2011-12 2012-13RECEIPTS: Personal Income Tax................................................................... $ 24,647,226 $ 28,100,047 $ 30,812,925 $ 34,579,991 $ 36,563,949 $ 36,840,020 $ 34,751,381 $ 36,209,215 $ 38,767,827 $ 40,226,715 Consumption/Use Taxes.............................................................. 10,622,920 11,717,209 12,472,190 12,025,086 12,587,210 12,637,239 12,262,016 13,607,810 13,977,493 14,013,281 Business Taxes............................................................................ 4,426,470 5,191,162 6,438,231 7,984,740 7,574,827 6,973,138 6,825,949 6,656,770 7,252,986 7,815,260 Other Taxes................................................................................. 1,166,194 1,543,643 1,707,609 1,950,406 1,871,299 1,652,571 2,406,844 3,057,463 2,963,095 2,875,344 Miscellaneous Receipts............................................................... 17,345,586 14,156,251 16,663,324 15,911,011 16,952,899 17,080,968 19,516,108 19,148,276 19,515,006 20,000,668 Federal Receipts.......................................................................... 647,028 3,801 168 151,754 69,003 44,773 84,314 112,070 139,961 140,547 Total Receipts...............................................................……… 58,855,424 60,712,113 68,094,447 72,602,988 75,619,187 75,228,709 75,846,612 78,791,604 82,616,368 85,071,815
DISBURSEMENTS: Local Assistance Grants(***): Education................................................................................ -- -- -- -- -- -- -- -- -- 28,003,547 Environment and Recreation.................................................. -- -- -- -- -- -- -- -- -- 7,814 General Government.............................................................. -- -- -- -- -- -- -- -- -- 1,096,762 Public Health: ' Medicaid............................................................................... -- -- -- -- -- -- -- -- -- 17,591,758 Other Public Health .............................................................. -- -- -- -- -- -- -- -- -- 3,762,685 Public Safety .......................................................................... -- -- -- -- -- -- -- -- -- 386,785 Public Welfare ........................................................................ -- -- -- -- -- -- -- -- -- 3,049,037 Support and Regulate Business ............................................ -- -- -- -- -- -- -- -- -- 376,466 Transportation......................................................................... -- -- -- -- -- -- -- -- -- 4,303,164
General Purpose....................................................................... 844,257 1,026,009 1,069,694 1,187,014 935,006 1,219,661 1,252,195 1,036,641 956,091 -- Education.................................................................................. 21,600,416 21,487,555 22,308,027 24,474,807 26,579,930 27,819,469 26,072,535 28,926,703 27,094,238 -- Medicaid.................................................................................... 10,347,176 11,022,706 13,156,346 13,462,273 13,086,383 12,417,963 12,255,062 13,149,970 16,489,870 -- Other Social Services .............................................................. 2,532,980 2,566,824 2,542,135 2,611,471 3,118,081 2,876,392 3,025,196 2,809,578 2,908,092 -- Health and Environment........................................................... 1,641,992 1,744,960 2,575,215 3,763,907 3,415,389 3,293,798 3,280,635 2,635,388 2,968,850 -- Mental Hygiene......................................................................... 1,124,722 1,107,244 1,189,942 1,351,095 1,595,957 1,702,263 1,668,378 1,669,180 1,731,350 -- Transportation........................................................................... 1,753,584 1,822,427 2,363,334 2,300,832 2,825,426 2,982,101 3,823,477 4,253,827 4,229,733 -- Criminal Justice, Emergency Mangement & Security Services and Miscellaneous ......................................................…… 756,167 682,210 793,177 1,646,538 2,184,870 2,197,883 946,101 813,359 889,489 -- Total Local Assistance Grants…………..…………………… 40,601,294 41,459,935 45,997,870 50,797,937 53,741,042 54,509,530 52,323,579 55,294,646 57,267,713 58,578,018 Departmental Operations: Personal Service (**)................................................................. 9,368,196 9,972,530 10,093,334 11,008,753 11,291,519 11,981,404 12,748,344 12,422,427 12,039,972 12,402,450 Non-Personal Service (**)......................................................... 4,203,981 4,456,299 4,993,709 5,236,509 5,616,197 5,491,187 5,114,447 4,965,584 5,410,795 5,280,742 General State Charges................................................................ 3,676,290 4,183,730 4,522,644 5,003,594 5,259,763 5,104,907 5,500,551 6,101,494 6,592,416 6,436,100 Debt Service, Including Payments on Financing Agreements…… 3,351,304 3,787,726 3,701,386 4,450,737 4,104,000 4,529,667 4,961,470 5,614,669 5,864,022 6,137,929 Capital Projects ........................................................................... 2,481 11,111 40,604 9,491 7,474 8,832 11,040 18,571 6,428 7,606 Total Disbursements........……………………………………… 61,203,546 63,871,331 69,349,547 76,507,021 80,019,995 81,625,527 80,659,431 84,417,391 87,181,346 88,842,845
Excess (Deficiency) of Receipts over Disbursements............. (2,348,122) (3,159,218) (1,255,100) (3,904,033) (4,400,808) (6,396,818) (4,812,819) (5,625,787) (4,564,978) (3,771,030)
OTHER FINANCING SOURCES (USES): Bond and Note Proceeds, net...................................................... -- -- -- -- -- -- -- -- -- -- Transfers from Other Funds......................................................... 16,854,928 18,538,130 19,773,951 20,360,432 22,126,619 26,336,470 26,180,182 27,218,099 26,274,216 26,404,073 Transfers to Other Funds............................................................. (13,091,428) (14,835,734) (15,824,467) (16,913,610) (18,170,423) (21,800,884) (21,433,944) (22,433,710) (21,831,104) (22,120,550) Total Other Financing Sources (Uses)................................ 3,763,500 3,702,396 3,949,484 3,446,822 3,956,196 4,535,586 4,746,238 4,784,389 4,443,112 4,283,523
Excess (Deficiency) of Receipts and Other Financing Sources over Disbursements and Other Financing Uses......................................................... 1,415,378 543,178 2,694,384 (457,211) (444,612) (1,861,232) (66,581) (841,398) (121,866) 512,493
Beginning Fund Balances........................................................... 2,942,933 4,358,311 4,901,489 7,639,842 7,182,631 6,738,019 4,876,787 4,810,206 3,968,808 3,846,942
Ending Fund Balances................................................................ $ 4,358,311 $ 4,901,489 $ 7,595,873 $ 7,182,631 $ 6,738,019 $ 4,876,787 $ 4,810,206 $ 3,968,808 $ 3,846,942 $ 4,359,435
(*) State Funds are comprised of the General Fund, State Special Revenue Funds supported by activities from dedicated revenue sources (including operating transfers from Federal Funds) and Debt Service Funds. (**) Beginning in April 2012, Overtime Meals and Stipends have been reclassified from Personal Service to Non-Personal Service. For comparative purposes, we have restated the 2011-12 fiscal year disbursements.(***) In 2012-13, Local Assistance Grant disbursements represent the new SFS program categories.
71
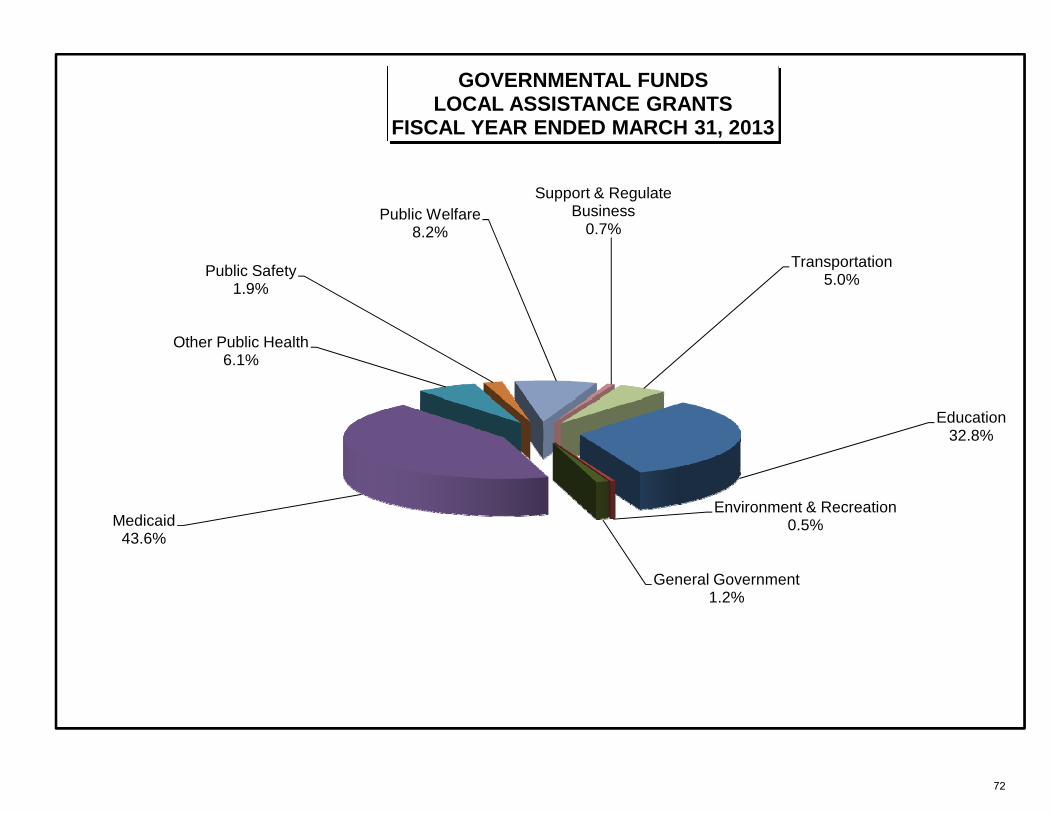
Education
Other Public Health6.1%
Public Safety1.9%
Public Welfare8.2%
Support & Regulate Business
0.7%
Transportation5.0%
GOVERNMENTAL FUNDS LOCAL ASSISTANCE GRANTS
FISCAL YEAR ENDED MARCH 31, 2013
32.8%
Environment & Recreation0.5%
General Government1.2%
Medicaid43.6%
72
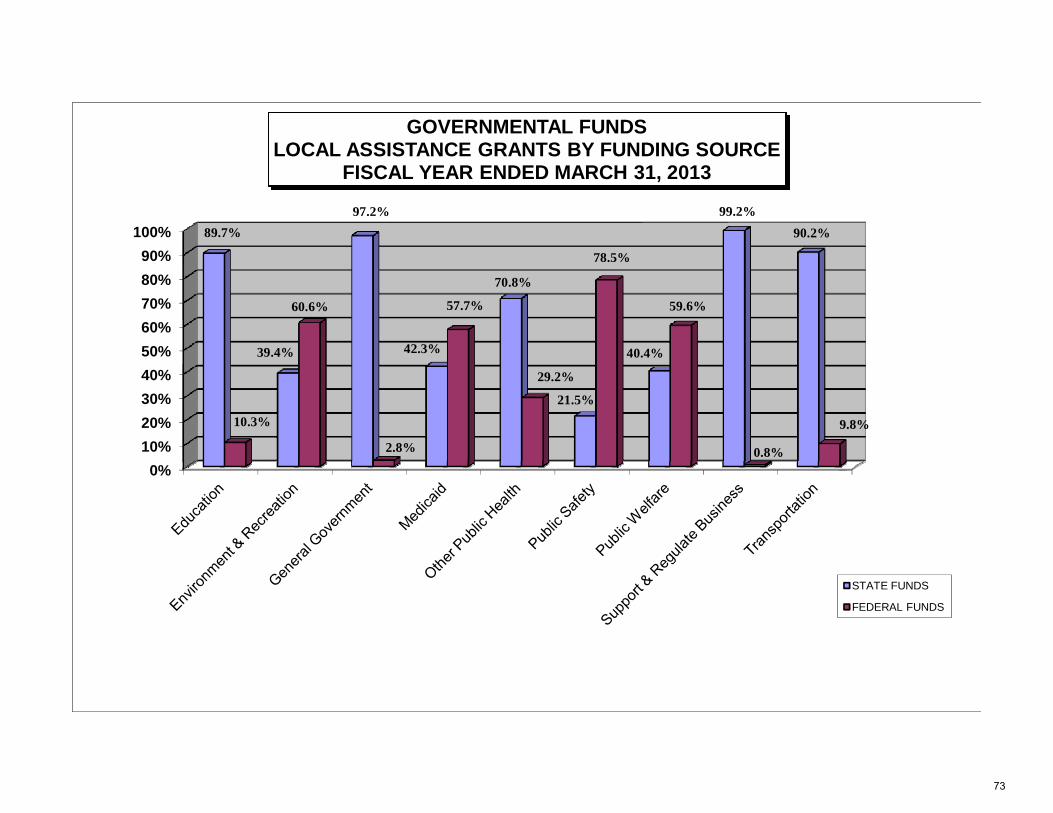
0%10%20%30%40%50%60%70%80%90%
100% 89.7%
39.4%
97.2%
42.3%
70.8%
21.5%
40.4%
99.2%90.2%
10.3%
60.6%
2.8%
57.7%
29.2%
78.5%
59.6%
0.8%
9.8%
GOVERNMENTAL FUNDS LOCAL ASSISTANCE GRANTS BY FUNDING SOURCE
FISCAL YEAR ENDED MARCH 31, 2013
STATE FUNDS
FEDERAL FUNDS
73
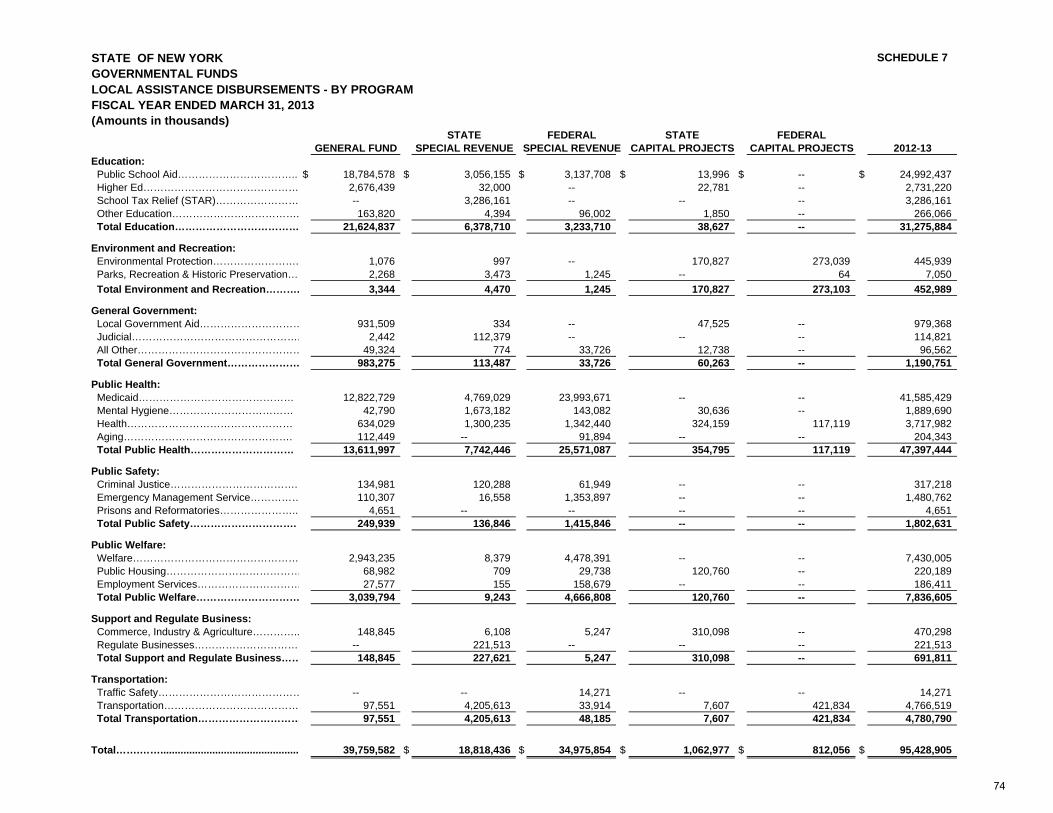
STATE OF NEW YORK SCHEDULE 7GOVERNMENTAL FUNDSLOCAL ASSISTANCE DISBURSEMENTS - BY PROGRAMFISCAL YEAR ENDED MARCH 31, 2013(Amounts in thousands)
STATE FEDERAL STATE FEDERALGENERAL FUND SPECIAL REVENUE SPECIAL REVENUE CAPITAL PROJECTS CAPITAL PROJECTS 2012-13
Education: Public School Aid…………………………….. $ 18,784,578 $ 3,056,155 $ 3,137,708 $ 13,996 $ -- $ 24,992,437 Higher Ed……………………………………… 2,676,439 32,000 -- 22,781 -- 2,731,220 School Tax Relief (STAR)…………………… -- 3,286,161 -- -- -- 3,286,161 Other Education………………………………. 163,820 4,394 96,002 1,850 -- 266,066 Total Education……………………………… 21,624,837 6,378,710 3,233,710 38,627 -- 31,275,884
Environment and Recreation: Environmental Protection……………………. 1,076 997 -- 170,827 273,039 445,939 Parks, Recreation & Historic Preservation… 2,268 3,473 1,245 -- 64 7,050 Total Environment and Recreation………. 3,344 4,470 1,245 170,827 273,103 452,989
General Government: Local Government Aid………………………… 931,509 334 -- 47,525 -- 979,368 Judicial…………………………………………. 2,442 112,379 -- -- -- 114,821 All Other………………………………………… 49,324 774 33,726 12,738 -- 96,562 Total General Government………………… 983,275 113,487 33,726 60,263 -- 1,190,751
Public Health: Medicaid……………………………………… 12,822,729 4,769,029 23,993,671 -- -- 41,585,429 Mental Hygiene……………………………… 42,790 1,673,182 143,082 30,636 -- 1,889,690 Health………………………………………… 634,029 1,300,235 1,342,440 324,159 117,119 3,717,982 Aging…………………………………………. 112,449 -- 91,894 -- -- 204,343 Total Public Health………………………… 13,611,997 7,742,446 25,571,087 354,795 117,119 47,397,444
Public Safety: Criminal Justice………………………………. 134,981 120,288 61,949 -- -- 317,218 Emergency Management Service…………… 110,307 16,558 1,353,897 -- -- 1,480,762 Prisons and Reformatories………………….. 4,651 -- -- -- -- 4,651 Total Public Safety…………………………. 249,939 136,846 1,415,846 -- -- 1,802,631
Public Welfare: Welfare………………………………………… 2,943,235 8,379 4,478,391 -- -- 7,430,005 Public Housing………………………………… 68,982 709 29,738 120,760 -- 220,189 Employment Services………………………… 27,577 155 158,679 -- -- 186,411 Total Public Welfare………………………… 3,039,794 9,243 4,666,808 120,760 -- 7,836,605
Support and Regulate Business: Commerce, Industry & Agriculture………….. 148,845 6,108 5,247 310,098 -- 470,298 Regulate Businesses………………………… -- 221,513 -- -- -- 221,513 Total Support and Regulate Business…… 148,845 227,621 5,247 310,098 -- 691,811
Transportation: Traffic Safety…………………………………… -- -- 14,271 -- -- 14,271 Transportation………………………………… 97,551 4,205,613 33,914 7,607 421,834 4,766,519 Total Transportation………………………… 97,551 4,205,613 48,185 7,607 421,834 4,780,790
Total…….……................................................ 39,759,582 $ 18,818,436 $ 34,975,854 $ 1,062,977 $ 812,056 $ 95,428,905
74
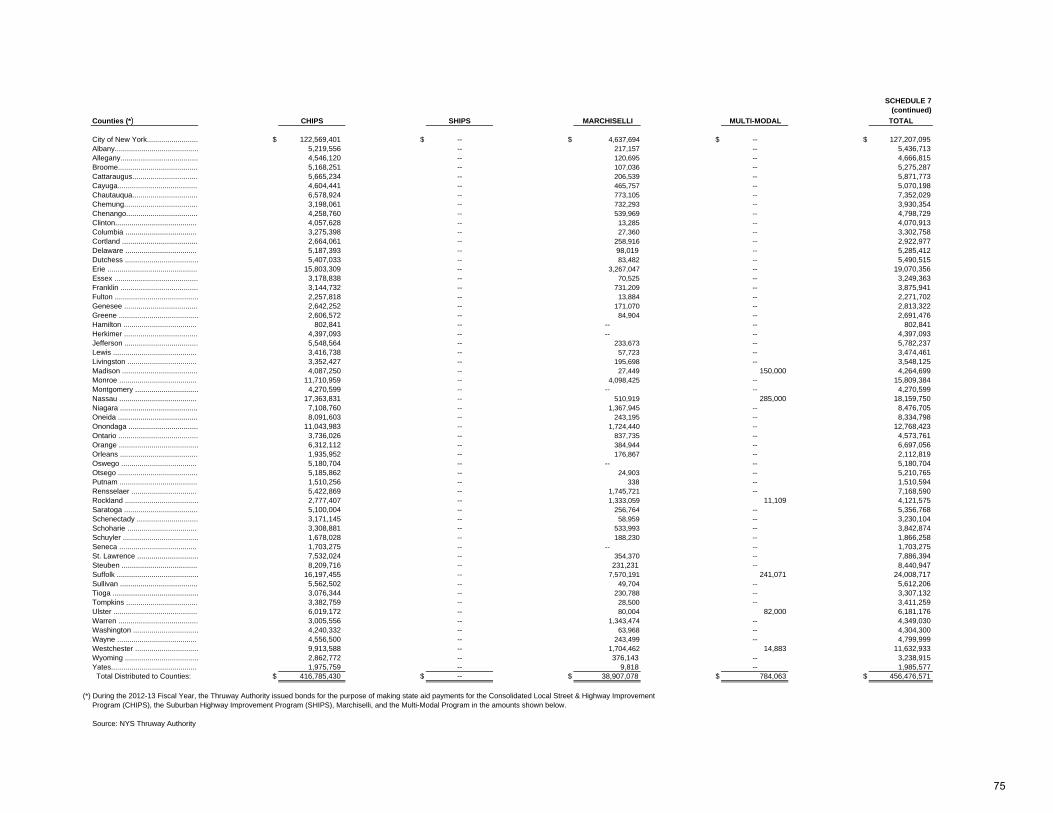
SCHEDULE 7 (continued)
Counties (*) CHIPS SHIPS MARCHISELLI MULTI-MODAL TOTAL
City of New York......................... $ 122,569,401 $ -- $ 4,637,694 $ -- $ 127,207,095Albany......................................... 5,219,556 -- 217,157 -- 5,436,713Allegany...................................... 4,546,120 -- 120,695 -- 4,666,815Broome....................................... 5,168,251 -- 107,036 -- 5,275,287Cattaraugus................................ 5,665,234 -- 206,539 -- 5,871,773Cayuga....................................... 4,604,441 -- 465,757 -- 5,070,198Chautauqua................................ 6,578,924 -- 773,105 -- 7,352,029Chemung.................................... 3,198,061 -- 732,293 -- 3,930,354Chenango................................... 4,258,760 -- 539,969 -- 4,798,729Clinton......................................... 4,057,628 -- 13,285 -- 4,070,913Columbia .................................... 3,275,398 -- 27,360 -- 3,302,758Cortland ..................................... 2,664,061 -- 258,916 -- 2,922,977Delaware .................................... 5,187,393 -- 98,019 -- 5,285,412Dutchess .................................... 5,407,033 -- 83,482 -- 5,490,515Erie ............................................ 15,803,309 -- 3,267,047 -- 19,070,356Essex ......................................... 3,178,838 -- 70,525 -- 3,249,363Franklin ...................................... 3,144,732 -- 731,209 -- 3,875,941Fulton ......................................... 2,257,818 -- 13,884 -- 2,271,702Genesee .................................... 2,642,252 -- 171,070 -- 2,813,322Greene ....................................... 2,606,572 -- 84,904 -- 2,691,476Hamilton ..................................... 802,841 -- -- -- 802,841Herkimer .................................... 4,397,093 -- -- -- 4,397,093Jefferson .................................... 5,548,564 -- 233,673 -- 5,782,237Lewis .......................................... 3,416,738 -- 57,723 -- 3,474,461Livingston ................................... 3,352,427 -- 195,698 -- 3,548,125Madison ..................................... 4,087,250 -- 27,449 150,000 4,264,699Monroe ....................................... 11,710,959 -- 4,098,425 -- 15,809,384Montgomery ............................... 4,270,599 -- -- -- 4,270,599Nassau ....................................... 17,363,831 -- 510,919 285,000 18,159,750Niagara ...................................... 7,108,760 -- 1,367,945 -- 8,476,705Oneida ....................................... 8,091,603 -- 243,195 -- 8,334,798Onondaga .................................. 11,043,983 -- 1,724,440 -- 12,768,423Ontario ....................................... 3,736,026 -- 837,735 -- 4,573,761Orange ....................................... 6,312,112 -- 384,944 -- 6,697,056Orleans ...................................... 1,935,952 -- 176,867 -- 2,112,819Oswego ...................................... 5,180,704 -- -- -- 5,180,704Otsego ....................................... 5,185,862 -- 24,903 -- 5,210,765Putnam ...................................... 1,510,256 -- 338 -- 1,510,594Rensselaer ................................. 5,422,869 -- 1,745,721 -- 7,168,590Rockland .................................... 2,777,407 -- 1,333,059 11,109 4,121,575Saratoga .................................... 5,100,004 -- 256,764 -- 5,356,768Schenectady .............................. 3,171,145 -- 58,959 -- 3,230,104Schoharie ................................... 3,308,881 -- 533,993 -- 3,842,874Schuyler ..................................... 1,678,028 -- 188,230 -- 1,866,258Seneca ....................................... 1,703,275 -- -- -- 1,703,275St. Lawrence .............................. 7,532,024 -- 354,370 -- 7,886,394Steuben ..................................... 8,209,716 -- 231,231 -- 8,440,947Suffolk ........................................ 16,197,455 -- 7,570,191 241,071 24,008,717Sullivan ...................................... 5,562,502 -- 49,704 -- 5,612,206Tioga .......................................... 3,076,344 -- 230,788 -- 3,307,132Tompkins ................................... 3,382,759 -- 28,500 -- 3,411,259Ulster ......................................... 6,019,172 -- 80,004 82,000 6,181,176Warren ....................................... 3,005,556 -- 1,343,474 -- 4,349,030Washington ................................ 4,240,332 -- 63,968 -- 4,304,300Wayne ........................................ 4,556,500 -- 243,499 -- 4,799,999Westchester ............................... 9,913,588 -- 1,704,462 14,883 11,632,933Wyoming .................................... 2,862,772 -- 376,143 -- 3,238,915Yates........................................... 1,975,759 -- 9,818 -- 1,985,577 Total Distributed to Counties: $ 416,785,430 $ -- $ 38,907,078 $ 784,063 $ 456,476,571
(*) During the 2012-13 Fiscal Year, the Thruway Authority issued bonds for the purpose of making state aid payments for the Consolidated Local Street & Highway Improvement
Program (CHIPS), the Suburban Highway Improvement Program (SHIPS), Marchiselli, and the Multi-Modal Program in the amounts shown below.
Source: NYS Thruway Authority
75
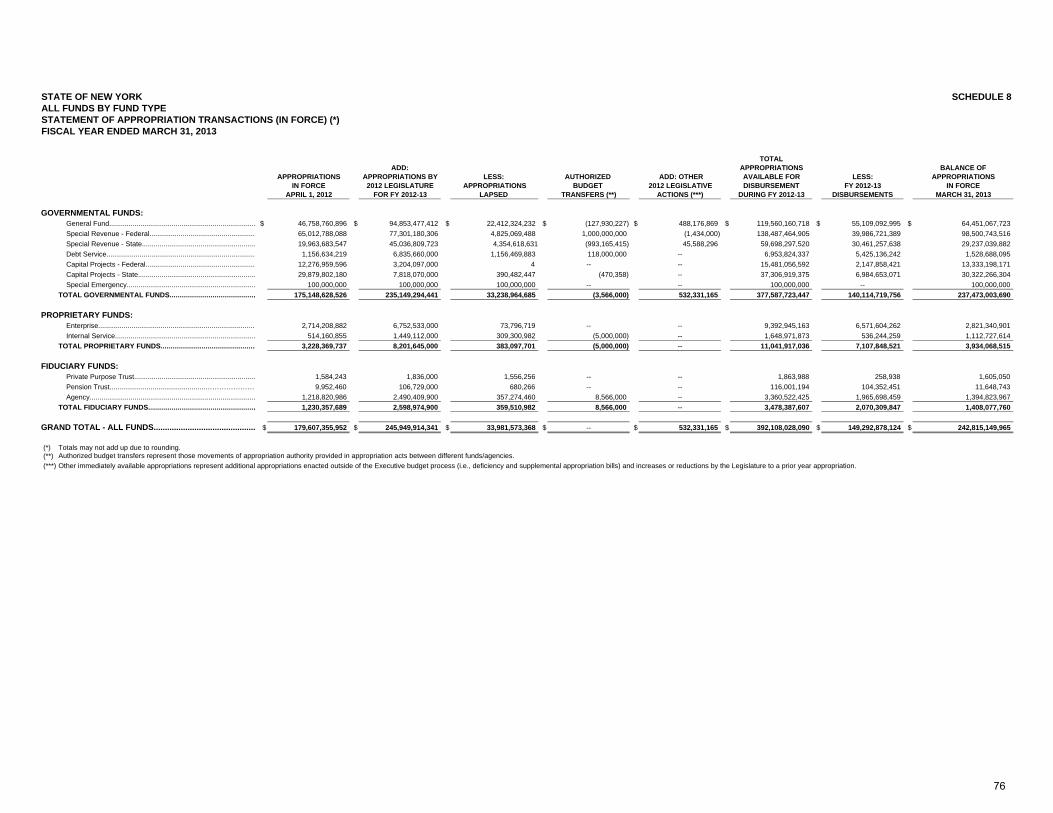
SCHEDULE 8
TOTALADD: APPROPRIATIONS BALANCE OF
APPROPRIATIONS APPROPRIATIONS BY LESS: AUTHORIZED ADD: OTHER AVAILABLE FOR LESS: APPROPRIATIONSIN FORCE 2012 LEGISLATURE APPROPRIATIONS BUDGET 2012 LEGISLATIVE DISBURSEMENT FY 2012-13 IN FORCE
APRIL 1, 2012 FOR FY 2012-13 LAPSED TRANSFERS (**) ACTIONS (***) DURING FY 2012-13 DISBURSEMENTS MARCH 31, 2013
GOVERNMENTAL FUNDS: General Fund........................................................................... $ 46,758,760,896 $ 94,853,477,412 $ 22,412,324,232 $ (127,930,227) $ 488,176,869 $ 119,560,160,718 $ 55,109,092,995 $ 64,451,067,723 Special Revenue - Federal...................................................... 65,012,788,088 77,301,180,306 4,825,069,488 1,000,000,000 (1,434,000) 138,487,464,905 39,986,721,389 98,500,743,516 Special Revenue - State.......................................................... 19,963,683,547 45,036,809,723 4,354,618,631 (993,165,415) 45,588,296 59,698,297,520 30,461,257,638 29,237,039,882 Debt Service............................................................................ 1,156,634,219 6,835,660,000 1,156,469,883 118,000,000 -- 6,953,824,337 5,425,136,242 1,528,688,095 Capital Projects - Federal........................................................ 12,276,959,596 3,204,097,000 4 -- -- 15,481,056,592 2,147,858,421 13,333,198,171 Capital Projects - State............................................................ 29,879,802,180 7,818,070,000 390,482,447 (470,358) -- 37,306,919,375 6,984,653,071 30,322,266,304 Special Emergency.................................................................. 100,000,000 100,000,000 100,000,000 -- -- 100,000,000 -- 100,000,000TOTAL GOVERNMENTAL FUNDS............................................ 175,148,628,526 235,149,294,441 33,238,964,685 (3,566,000) 532,331,165 377,587,723,447 140,114,719,756 237,473,003,690
PROPRIETARY FUNDS: Enterprise................................................................................ 2,714,208,882 6,752,533,000 73,796,719 -- -- 9,392,945,163 6,571,604,262 2,821,340,901 Internal Service........................................................................ 514,160,855 1,449,112,000 309,300,982 (5,000,000) -- 1,648,971,873 536,244,259 1,112,727,614TOTAL PROPRIETARY FUNDS................................................. 3,228,369,737 8,201,645,000 383,097,701 (5,000,000) -- 11,041,917,036 7,107,848,521 3,934,068,515
FIDUCIARY FUNDS: Private Purpose Trust.............................................................. 1,584,243 1,836,000 1,556,256 -- -- 1,863,988 258,938 1,605,050 Pension Trust.................................................………………… 9,952,460 106,729,000 680,266 -- -- 116,001,194 104,352,451 11,648,743 Agency..................................................................................... 1,218,820,986 2,490,409,900 357,274,460 8,566,000 -- 3,360,522,425 1,965,698,459 1,394,823,967TOTAL FIDUCIARY FUNDS....................................................... 1,230,357,689 2,598,974,900 359,510,982 8,566,000 -- 3,478,387,607 2,070,309,847 1,408,077,760
GRAND TOTAL - ALL FUNDS............................................. $ 179,607,355,952 $ 245,949,914,341 $ 33,981,573,368 $ -- $ 532,331,165 $ 392,108,028,090 $ 149,292,878,124 $ 242,815,149,965
(*) Totals may not add up due to rounding.(**)(***) Other immediately available appropriations represent additional appropriations enacted outside of the Executive budget process (i.e., deficiency and supplemental appropriation bills) and increases or reductions by the Legislature to a prior year appropriation.
STATE OF NEW YORKALL FUNDS BY FUND TYPESTATEMENT OF APPROPRIATION TRANSACTIONS (IN FORCE) (*)
Authorized budget transfers represent those movements of appropriation authority provided in appropriation acts between different funds/agencies.
FISCAL YEAR ENDED MARCH 31, 2013
76
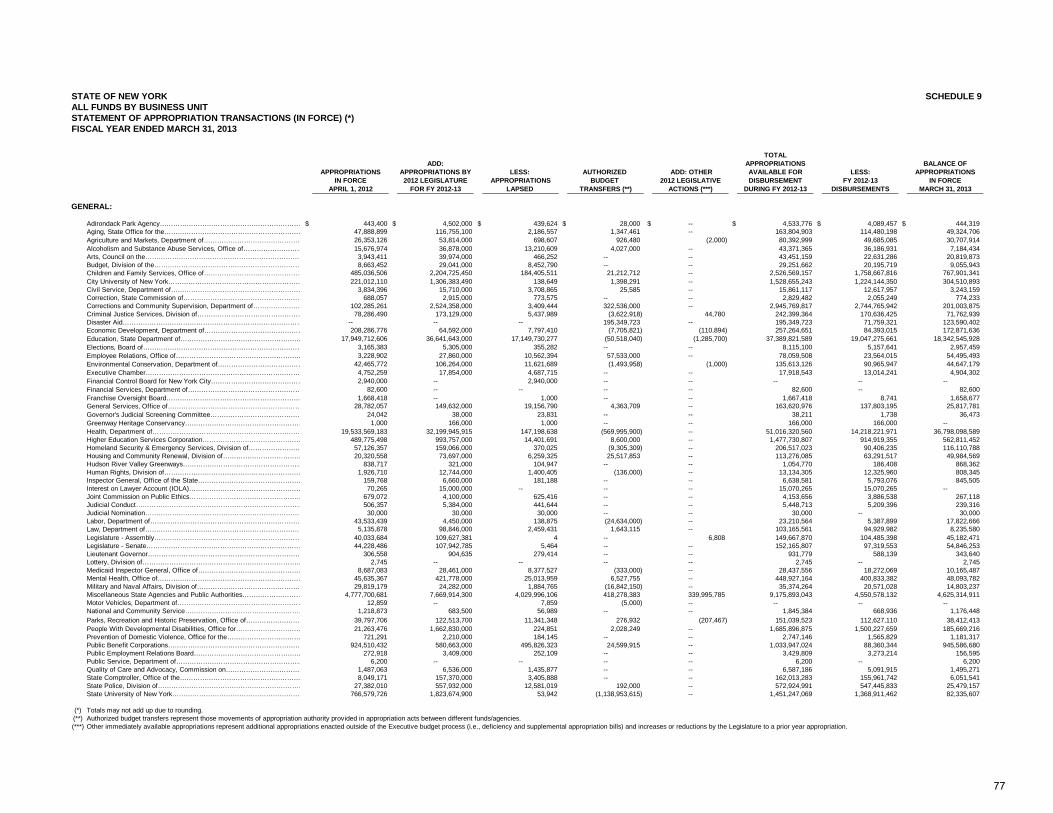
SCHEDULE 9
TOTALADD: APPROPRIATIONS BALANCE OF
APPROPRIATIONS APPROPRIATIONS BY LESS: AUTHORIZED ADD: OTHER AVAILABLE FOR LESS: APPROPRIATIONSIN FORCE 2012 LEGISLATURE APPROPRIATIONS BUDGET 2012 LEGISLATIVE DISBURSEMENT FY 2012-13 IN FORCE
APRIL 1, 2012 FOR FY 2012-13 LAPSED TRANSFERS (**) ACTIONS (***) DURING FY 2012-13 DISBURSEMENTS MARCH 31, 2013
GENERAL:
Adirondack Park Agency……………………………………………………… $ 443,400 $ 4,502,000 $ 439,624 $ 28,000 $ -- $ 4,533,776 $ 4,089,457 $ 444,319Aging, State Office for the……………………………………………………… 47,888,899 116,755,100 2,186,557 1,347,461 -- 163,804,903 114,480,198 49,324,706Agriculture and Markets, Department of……………………………………… 26,353,126 53,814,000 698,607 926,480 (2,000) 80,392,999 49,685,085 30,707,914Alcoholism and Substance Abuse Services, Office of……………………… 15,676,974 36,878,000 13,210,609 4,027,000 -- 43,371,365 36,186,931 7,184,434Arts, Council on the……………………………………………………………… 3,943,411 39,974,000 466,252 -- -- 43,451,159 22,631,286 20,819,873Budget, Division of the………………………………………………………… 8,663,452 29,041,000 8,452,790 -- -- 29,251,662 20,195,719 9,055,943Children and Family Services, Office of……………………………………… 485,036,506 2,204,725,450 184,405,511 21,212,712 -- 2,526,569,157 1,758,667,816 767,901,341City University of New York…………………………………………………… 221,012,110 1,306,383,490 138,649 1,398,291 -- 1,528,655,243 1,224,144,350 304,510,893Civil Service, Department of…………………………………………………… 3,834,396 15,710,000 3,708,865 25,585 -- 15,861,117 12,617,957 3,243,159Correction, State Commission of……………………………………………… 688,057 2,915,000 773,575 -- -- 2,829,482 2,055,249 774,233Corrections and Community Supervision, Department of………………… 102,285,261 2,524,358,000 3,409,444 322,536,000 -- 2,945,769,817 2,744,765,942 201,003,875Criminal Justice Services, Division of………………………………………… 78,286,490 173,129,000 5,437,989 (3,622,918) 44,780 242,399,364 170,636,425 71,762,939Disaster Aid……………………………………………………………………… -- -- -- 195,349,723 -- 195,349,723 71,759,321 123,590,402Economic Development, Department of……………………………………… 208,286,776 64,592,000 7,797,410 (7,705,821) (110,894) 257,264,651 84,393,015 172,871,636Education, State Department of……………………………………………… 17,949,712,606 36,641,643,000 17,149,730,277 (50,518,040) (1,285,700) 37,389,821,589 19,047,275,661 18,342,545,928Elections, Board of……………………………………………………………… 3,165,383 5,305,000 355,282 -- -- 8,115,100 5,157,641 2,957,459Employee Relations, Office of………………………………………………… 3,228,902 27,860,000 10,562,394 57,533,000 -- 78,059,508 23,564,015 54,495,493Environmental Conservation, Department of………………………………… 42,465,772 106,264,000 11,621,689 (1,493,958) (1,000) 135,613,126 90,965,947 44,647,179Executive Chamber……………………………………………………………… 4,752,259 17,854,000 4,687,715 -- -- 17,918,543 13,014,241 4,904,302Financial Control Board for New York City…………………………………… 2,940,000 -- 2,940,000 -- -- -- -- --Financial Services, Department of…………………………………………… 82,600 -- -- -- -- 82,600 -- 82,600Franchise Oversight Board…………………………………………………… 1,668,418 -- 1,000 -- -- 1,667,418 8,741 1,658,677General Services, Office of…………………………………………………… 28,782,057 149,632,000 19,156,790 4,363,709 -- 163,620,976 137,803,195 25,817,781Governor's Judicial Screening Committee…………………………………… 24,042 38,000 23,831 -- -- 38,211 1,738 36,473Greenway Heritage Conservancy……………………………………………… 1,000 166,000 1,000 -- -- 166,000 166,000 --Health, Department of………………………………………………………… 19,533,569,183 32,199,945,915 147,198,638 (569,995,900) -- 51,016,320,560 14,218,221,971 36,798,098,589Higher Education Services Corporation……………………………………… 489,775,498 993,757,000 14,401,691 8,600,000 -- 1,477,730,807 914,919,355 562,811,452Homeland Security & Emergency Services, Division of…………………… 57,126,357 159,066,000 370,025 (9,305,309) -- 206,517,023 90,406,235 116,110,788Housing and Community Renewal, Division of……………………………… 20,320,558 73,697,000 6,259,325 25,517,853 -- 113,276,085 63,291,517 49,984,569Hudson River Valley Greenways……………………………………………… 838,717 321,000 104,947 -- -- 1,054,770 186,408 868,362Human Rights Division of 1 926 710 12 744 000 1 400 405 (136 000) 13 134 305 12 325 960 808 345
STATE OF NEW YORKALL FUNDS BY BUSINESS UNITSTATEMENT OF APPROPRIATION TRANSACTIONS (IN FORCE) (*)FISCAL YEAR ENDED MARCH 31, 2013
Human Rights, Division of……………………………………………………… 1,926,710 12,744,000 1,400,405 (136,000) -- 13,134,305 12,325,960 808,345Inspector General, Office of the State………………………………………… 159,768 6,660,000 181,188 -- -- 6,638,581 5,793,076 845,505Interest on Lawyer Account (IOLA)…………………………………………… 70,265 15,000,000 -- -- -- 15,070,265 15,070,265 --Joint Commission on Public Ethics…………………………………………… 679,072 4,100,000 625,416 -- -- 4,153,656 3,886,538 267,118Judicial Conduct………………………………………………………………… 506,357 5,384,000 441,644 -- -- 5,448,713 5,209,396 239,316Judicial Nomination……………………………………………………………… 30,000 30,000 30,000 -- -- 30,000 -- 30,000Labor, Department of…………………………………………………………… 43,533,439 4,450,000 138,875 (24,634,000) -- 23,210,564 5,387,899 17,822,666Law, Department of……………………………………………………………… 5,135,878 98,846,000 2,459,431 1,643,115 -- 103,165,561 94,929,982 8,235,580Legislature - Assembly………………………………………………………… 40,033,684 109,627,381 4 -- 6,808 149,667,870 104,485,398 45,182,471Legislature - Senate…………………………………………………………… 44,228,486 107,942,785 5,464 -- -- 152,165,807 97,319,553 54,846,253Lieutenant Governor…………………………………………………………… 306,558 904,635 279,414 -- -- 931,779 588,139 343,640Lottery, Division of……………………………………………………………… 2,745 -- -- -- -- 2,745 -- 2,745Medicaid Inspector General, Office of………………………………………… 8,687,083 28,461,000 8,377,527 (333,000) -- 28,437,556 18,272,069 10,165,487Mental Health, Office of………………………………………………………… 45,635,367 421,778,000 25,013,959 6,527,755 -- 448,927,164 400,833,382 48,093,782Military and Naval Affairs, Division of………………………………………… 29,819,179 24,282,000 1,884,765 (16,842,150) -- 35,374,264 20,571,028 14,803,237Miscellaneous State Agencies and Public Authorities……………………… 4,777,700,681 7,669,914,300 4,029,996,106 418,278,383 339,995,785 9,175,893,043 4,550,578,132 4,625,314,911Motor Vehicles, Department of………………………………………………… 12,859 -- 7,859 (5,000) -- -- -- --National and Community Service……………………………………………… 1,218,873 683,500 56,989 -- -- 1,845,384 668,936 1,176,448Parks, Recreation and Historic Preservation, Office of……………………… 39,797,706 122,513,700 11,341,348 276,932 (207,467) 151,039,523 112,627,110 38,412,413People With Developmental Disabilities, Office for………………………… 21,263,476 1,662,830,000 224,851 2,028,249 -- 1,685,896,875 1,500,227,659 185,669,216Prevention of Domestic Violence, Office for the…………………………… 721,291 2,210,000 184,145 -- -- 2,747,146 1,565,829 1,181,317Public Benefit Corporations…………………………………………………… 924,510,432 580,663,000 495,826,323 24,599,915 -- 1,033,947,024 88,360,344 945,586,680Public Employment Relations Board………………………………………… 272,918 3,409,000 252,109 -- -- 3,429,809 3,273,214 156,595Public Service, Department of………………………………………………… 6,200 -- -- -- -- 6,200 -- 6,200Quality of Care and Advocacy, Commission on……………………………… 1,487,063 6,536,000 1,435,877 -- -- 6,587,186 5,091,915 1,495,271State Comptroller, Office of the……………………………………………… 8,049,171 157,370,000 3,405,888 -- -- 162,013,283 155,961,742 6,051,541State Police, Division of………………………………………………………… 27,382,010 557,932,000 12,581,019 192,000 -- 572,924,991 547,445,833 25,479,157State University of New York…………………………………………………… 766,579,726 1,823,674,900 53,942 (1,138,953,615) -- 1,451,247,069 1,368,911,462 82,335,607
(*) Totals may not add up due to rounding.(**)(***)
Authorized budget transfers represent those movements of appropriation authority provided in appropriation acts between different funds/agencies.Other immediately available appropriations represent additional appropriations enacted outside of the Executive budget process (i.e., deficiency and supplemental appropriation bills) and increases or reductions by the Legislature to a prior year appropriation.
77
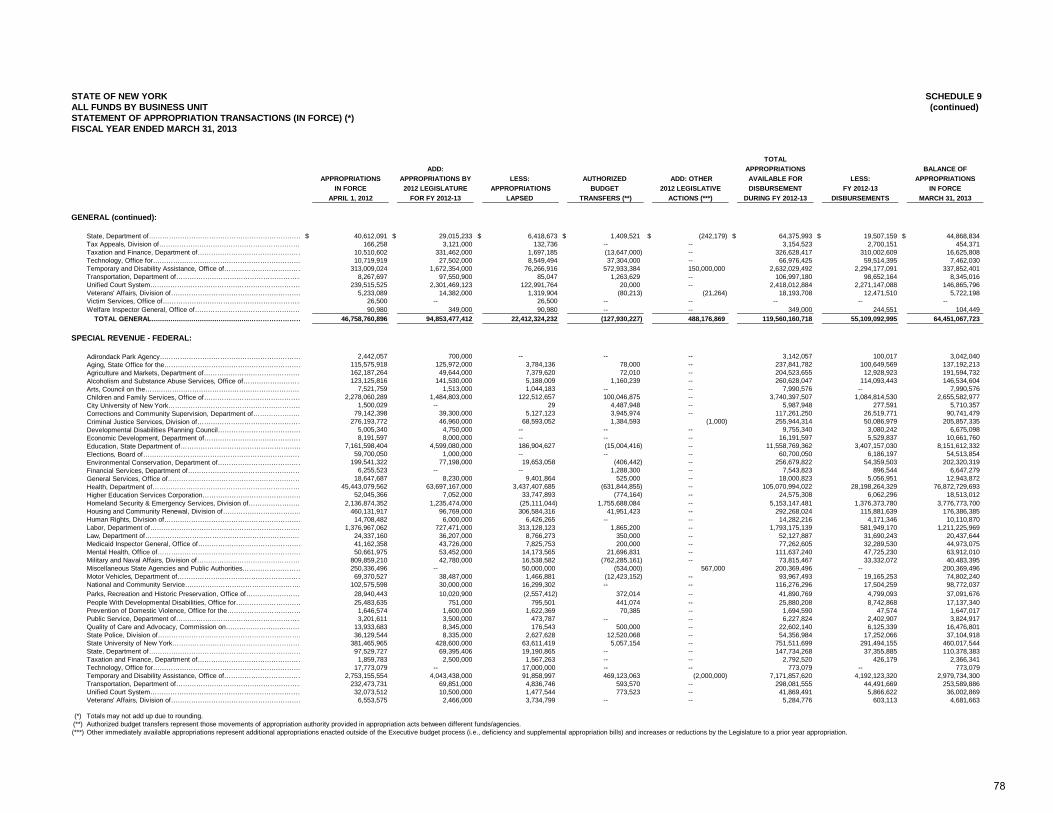
SCHEDULE 9(continued)
TOTALADD: APPROPRIATIONS BALANCE OF
APPROPRIATIONS APPROPRIATIONS BY LESS: AUTHORIZED ADD: OTHER AVAILABLE FOR LESS: APPROPRIATIONSIN FORCE 2012 LEGISLATURE APPROPRIATIONS BUDGET 2012 LEGISLATIVE DISBURSEMENT FY 2012-13 IN FORCE
APRIL 1, 2012 FOR FY 2012-13 LAPSED TRANSFERS (**) ACTIONS (***) DURING FY 2012-13 DISBURSEMENTS MARCH 31, 2013
GENERAL (continued):
State, Department of…………………………………………………………… $ 40,612,091 $ 29,015,233 $ 6,418,673 $ 1,409,521 $ (242,179) $ 64,375,993 $ 19,507,159 $ 44,868,834Tax Appeals, Division of……………………………………………………… 166,258 3,121,000 132,736 -- -- 3,154,523 2,700,151 454,371Taxation and Finance, Department of………………………………………… 10,510,602 331,462,000 1,697,185 (13,647,000) -- 326,628,417 310,002,609 16,625,808Technology, Office for………………………………………………………… 10,719,919 27,502,000 8,549,494 37,304,000 -- 66,976,425 59,514,395 7,462,030Temporary and Disability Assistance, Office of……………………………… 313,009,024 1,672,354,000 76,266,916 572,933,384 150,000,000 2,632,029,492 2,294,177,091 337,852,401Transportation, Department of………………………………………………… 8,267,697 97,550,900 85,047 1,263,629 -- 106,997,180 98,652,164 8,345,016Unified Court System…………………………………………………………… 239,515,525 2,301,469,123 122,991,764 20,000 -- 2,418,012,884 2,271,147,088 146,865,796Veterans' Affairs, Division of…………………………………………………… 5,233,089 14,382,000 1,319,904 (80,213) (21,264) 18,193,708 12,471,510 5,722,198Victim Services, Office of……………………………………………………… 26,500 -- 26,500 -- -- -- -- --Welfare Inspector General, Office of………………………………………… 90,980 349,000 90,980 -- -- 349,000 244,551 104,449 TOTAL GENERAL...................................................…………………… 46,758,760,896 94,853,477,412 22,412,324,232 (127,930,227) 488,176,869 119,560,160,718 55,109,092,995 64,451,067,723
SPECIAL REVENUE - FEDERAL:
Adirondack Park Agency……………………………………………………… 2,442,057 700,000 -- -- -- 3,142,057 100,017 3,042,040Aging, State Office for the……………………………………………………… 115,575,918 125,972,000 3,784,136 78,000 -- 237,841,782 100,649,569 137,192,213Agriculture and Markets, Department of……………………………………… 162,187,264 49,644,000 7,379,620 72,010 -- 204,523,655 12,928,923 191,594,732Alcoholism and Substance Abuse Services, Office of……………………… 123,125,816 141,530,000 5,188,009 1,160,239 -- 260,628,047 114,093,443 146,534,604Arts, Council on the……………………………………………………………… 7,521,759 1,513,000 1,044,183 -- -- 7,990,576 -- 7,990,576Children and Family Services, Office of……………………………………… 2,278,060,289 1,484,803,000 122,512,657 100,046,875 -- 3,740,397,507 1,084,814,530 2,655,582,977City University of New York…………………………………………………… 1,500,029 -- 29 4,487,948 -- 5,987,948 277,591 5,710,357Corrections and Community Supervision, Department of………………… 79,142,398 39,300,000 5,127,123 3,945,974 -- 117,261,250 26,519,771 90,741,479Criminal Justice Services, Division of………………………………………… 276,193,772 46,960,000 68,593,052 1,384,593 (1,000) 255,944,314 50,086,979 205,857,335Developmental Disabilities Planning Council………………………………… 5,005,340 4,750,000 -- -- -- 9,755,340 3,080,242 6,675,098Economic Development, Department of……………………………………… 8,191,597 8,000,000 -- -- -- 16,191,597 5,529,837 10,661,760Education, State Department of……………………………………………… 7,161,598,404 4,599,080,000 186,904,627 (15,004,416) -- 11,558,769,362 3,407,157,030 8,151,612,332Elections, Board of……………………………………………………………… 59,700,050 1,000,000 -- -- -- 60,700,050 6,186,197 54,513,854Environmental Conservation, Department of………………………………… 199,541,322 77,198,000 19,653,058 (406,442) -- 256,679,822 54,359,503 202,320,319Financial Services Department of 6 255 523 -- -- 1 288 300 -- 7 543 823 896 544 6 647 279
STATE OF NEW YORKALL FUNDS BY BUSINESS UNITSTATEMENT OF APPROPRIATION TRANSACTIONS (IN FORCE) (*)FISCAL YEAR ENDED MARCH 31, 2013
Financial Services, Department of…………………………………………… 6,255,523 1,288,300 7,543,823 896,544 6,647,279General Services, Office of…………………………………………………… 18,647,687 8,230,000 9,401,864 525,000 -- 18,000,823 5,056,951 12,943,872Health, Department of………………………………………………………… 45,443,079,562 63,697,167,000 3,437,407,685 (631,844,855) -- 105,070,994,022 28,198,264,329 76,872,729,693Higher Education Services Corporation……………………………………… 52,045,366 7,052,000 33,747,893 (774,164) -- 24,575,308 6,062,296 18,513,012Homeland Security & Emergency Services, Division of…………………… 2,136,874,352 1,235,474,000 (25,111,044) 1,755,688,084 -- 5,153,147,481 1,376,373,780 3,776,773,700Housing and Community Renewal, Division of……………………………… 460,131,917 96,769,000 306,584,316 41,951,423 -- 292,268,024 115,881,639 176,386,385Human Rights, Division of……………………………………………………… 14,708,482 6,000,000 6,426,265 -- -- 14,282,216 4,171,346 10,110,870Labor, Department of…………………………………………………………… 1,376,967,062 727,471,000 313,128,123 1,865,200 -- 1,793,175,139 581,949,170 1,211,225,969Law, Department of……………………………………………………………… 24,337,160 36,207,000 8,766,273 350,000 -- 52,127,887 31,690,243 20,437,644Medicaid Inspector General, Office of………………………………………… 41,162,358 43,726,000 7,825,753 200,000 -- 77,262,605 32,289,530 44,973,075Mental Health, Office of………………………………………………………… 50,661,975 53,452,000 14,173,565 21,696,831 -- 111,637,240 47,725,230 63,912,010Military and Naval Affairs, Division of………………………………………… 809,859,210 42,780,000 16,538,582 (762,285,161) -- 73,815,467 33,332,072 40,483,395Miscellaneous State Agencies and Public Authorities……………………… 250,336,496 -- 50,000,000 (534,000) 567,000 200,369,496 -- 200,369,496Motor Vehicles, Department of………………………………………………… 69,370,527 38,487,000 1,466,881 (12,423,152) -- 93,967,493 19,165,253 74,802,240National and Community Service……………………………………………… 102,575,598 30,000,000 16,299,302 -- -- 116,276,296 17,504,259 98,772,037Parks, Recreation and Historic Preservation, Office of……………………… 28,940,443 10,020,900 (2,557,412) 372,014 -- 41,890,769 4,799,093 37,091,676People With Developmental Disabilities, Office for………………………… 25,483,635 751,000 795,501 441,074 -- 25,880,208 8,742,868 17,137,340Prevention of Domestic Violence, Office for the…………………………… 1,646,574 1,600,000 1,622,369 70,385 -- 1,694,590 47,574 1,647,017Public Service, Department of………………………………………………… 3,201,611 3,500,000 473,787 -- -- 6,227,824 2,402,907 3,824,917Quality of Care and Advocacy, Commission on……………………………… 13,933,683 8,345,000 176,543 500,000 -- 22,602,140 6,125,339 16,476,801State Police, Division of………………………………………………………… 36,129,544 8,335,000 2,627,628 12,520,068 -- 54,356,984 17,252,066 37,104,918State University of New York…………………………………………………… 381,465,965 428,600,000 63,611,419 5,057,154 -- 751,511,699 291,494,155 460,017,544State, Department of…………………………………………………………… 97,529,727 69,395,406 19,190,865 -- -- 147,734,268 37,355,885 110,378,383Taxation and Finance, Department of………………………………………… 1,859,783 2,500,000 1,567,263 -- -- 2,792,520 426,179 2,366,341Technology, Office for………………………………………………………… 17,773,079 -- 17,000,000 -- -- 773,079 -- 773,079Temporary and Disability Assistance, Office of……………………………… 2,753,155,554 4,043,438,000 91,858,997 469,123,063 (2,000,000) 7,171,857,620 4,192,123,320 2,979,734,300Transportation, Department of………………………………………………… 232,473,731 69,851,000 4,836,746 593,570 -- 298,081,555 44,491,669 253,589,886Unified Court System…………………………………………………………… 32,073,512 10,500,000 1,477,544 773,523 -- 41,869,491 5,866,622 36,002,869Veterans' Affairs, Division of…………………………………………………… 6,553,575 2,466,000 3,734,799 -- -- 5,284,776 603,113 4,681,663
(*) Totals may not add up due to rounding.(**)(***) Other immediately available appropriations represent additional appropriations enacted outside of the Executive budget process (i.e., deficiency and supplemental appropriation bills) and increases or reductions by the Legislature to a prior year appropriation.
Authorized budget transfers represent those movements of appropriation authority provided in appropriation acts between different funds/agencies.
78
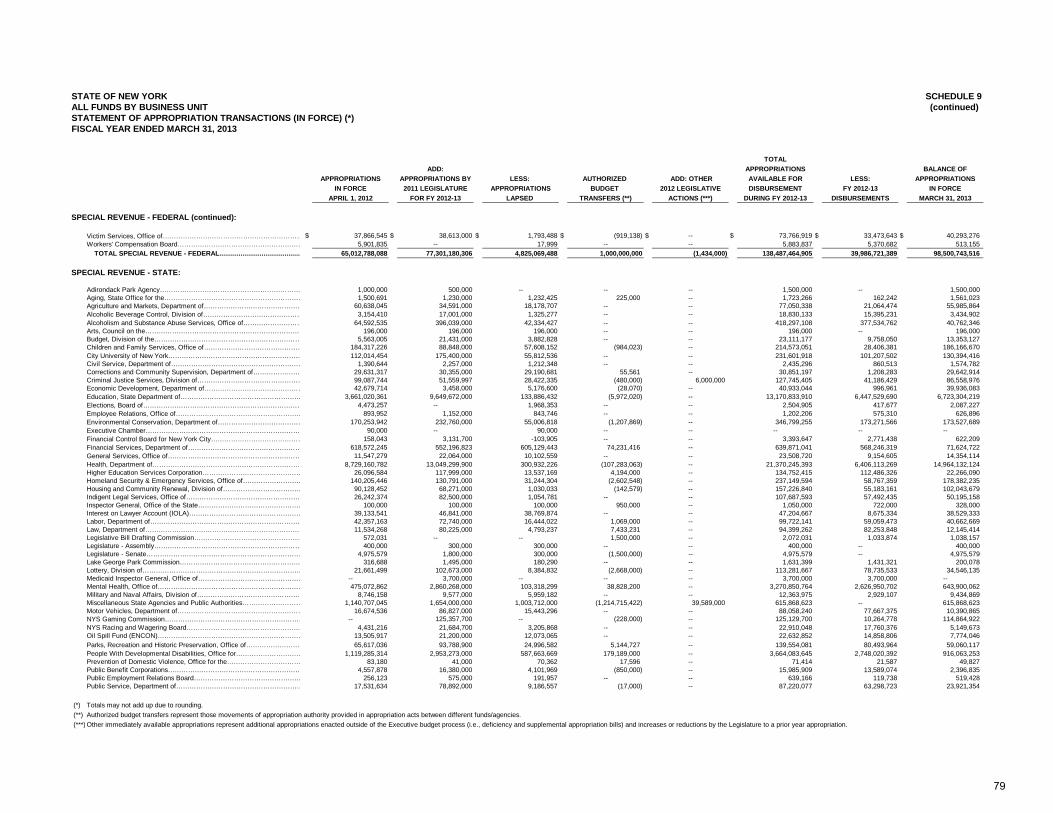
SCHEDULE 9(continued)
TOTALADD: APPROPRIATIONS BALANCE OF
APPROPRIATIONS APPROPRIATIONS BY LESS: AUTHORIZED ADD: OTHER AVAILABLE FOR LESS: APPROPRIATIONSIN FORCE 2011 LEGISLATURE APPROPRIATIONS BUDGET 2012 LEGISLATIVE DISBURSEMENT FY 2012-13 IN FORCE
APRIL 1, 2012 FOR FY 2012-13 LAPSED TRANSFERS (**) ACTIONS (***) DURING FY 2012-13 DISBURSEMENTS MARCH 31, 2013
SPECIAL REVENUE - FEDERAL (continued):
Victim Services, Office of……………………………………………………… $ 37,866,545 $ 38,613,000 $ 1,793,488 $ (919,138) $ -- $ 73,766,919 $ 33,473,643 $ 40,293,276Workers' Compensation Board………………………………………………… 5,901,835 -- 17,999 -- -- 5,883,837 5,370,682 513,155 TOTAL SPECIAL REVENUE - FEDERAL........................................... 65,012,788,088 77,301,180,306 4,825,069,488 1,000,000,000 (1,434,000) 138,487,464,905 39,986,721,389 98,500,743,516
SPECIAL REVENUE - STATE:
Adirondack Park Agency……………………………………………………… 1,000,000 500,000 -- -- -- 1,500,000 -- 1,500,000Aging, State Office for the……………………………………………………… 1,500,691 1,230,000 1,232,425 225,000 -- 1,723,266 162,242 1,561,023Agriculture and Markets, Department of……………………………………… 60,638,045 34,591,000 18,178,707 -- -- 77,050,338 21,064,474 55,985,864Alcoholic Beverage Control, Division of……………………………………… 3,154,410 17,001,000 1,325,277 -- -- 18,830,133 15,395,231 3,434,902Alcoholism and Substance Abuse Services, Office of……………………… 64,592,535 396,039,000 42,334,427 -- -- 418,297,108 377,534,762 40,762,346Arts, Council on the……………………………………………………………… 196,000 196,000 196,000 -- -- 196,000 -- 196,000Budget, Division of the………………………………………………………… 5,563,005 21,431,000 3,882,828 -- -- 23,111,177 9,758,050 13,353,127Children and Family Services, Office of……………………………………… 184,317,226 88,848,000 57,608,152 (984,023) -- 214,573,051 28,406,381 186,166,670City University of New York…………………………………………………… 112,014,454 175,400,000 55,812,536 -- -- 231,601,918 101,207,502 130,394,416Civil Service, Department of…………………………………………………… 1,390,644 2,257,000 1,212,348 -- -- 2,435,296 860,513 1,574,782Corrections and Community Supervision, Department of………………… 29,631,317 30,355,000 29,190,681 55,561 -- 30,851,197 1,208,283 29,642,914Criminal Justice Services, Division of………………………………………… 99,087,744 51,559,997 28,422,335 (480,000) 6,000,000 127,745,405 41,186,429 86,558,976Economic Development, Department of……………………………………… 42,679,714 3,458,000 5,176,600 (28,070) -- 40,933,044 996,961 39,936,083Education, State Department of……………………………………………… 3,661,020,361 9,649,672,000 133,886,432 (5,972,020) -- 13,170,833,910 6,447,529,690 6,723,304,219Elections, Board of……………………………………………………………… 4,473,257 -- 1,968,353 -- -- 2,504,905 417,677 2,087,227Employee Relations, Office of………………………………………………… 893,952 1,152,000 843,746 -- -- 1,202,206 575,310 626,896Environmental Conservation, Department of………………………………… 170,253,942 232,760,000 55,006,818 (1,207,869) -- 346,799,255 173,271,566 173,527,689Executive Chamber……………………………………………………………… 90,000 -- 90,000 -- -- -- -- --Financial Control Board for New York City…………………………………… 158,043 3,131,700 -103,905 -- -- 3,393,647 2,771,438 622,209Financial Services, Department of…………………………………………… 618,572,245 552,196,823 605,129,443 74,231,416 -- 639,871,041 568,246,319 71,624,722General Services, Office of…………………………………………………… 11,547,279 22,064,000 10,102,559 -- -- 23,508,720 9,154,605 14,354,114Health, Department of………………………………………………………… 8,729,160,782 13,049,299,900 300,932,226 (107,283,063) -- 21,370,245,393 6,406,113,269 14,964,132,124Hi h Ed ti S i C ti 26 096 584 117 999 000 13 537 169 4 194 000 134 752 415 112 486 326 22 266 090
STATE OF NEW YORKALL FUNDS BY BUSINESS UNITSTATEMENT OF APPROPRIATION TRANSACTIONS (IN FORCE) (*)FISCAL YEAR ENDED MARCH 31, 2013
Higher Education Services Corporation……………………………………… 26,096,584 117,999,000 13,537,169 4,194,000 -- 134,752,415 112,486,326 22,266,090Homeland Security & Emergency Services, Office of……………………… 140,205,446 130,791,000 31,244,304 (2,602,548) -- 237,149,594 58,767,359 178,382,235Housing and Community Renewal, Division of……………………………… 90,128,452 68,271,000 1,030,033 (142,579) -- 157,226,840 55,183,161 102,043,679Indigent Legal Services, Office of…………………………………………… 26,242,374 82,500,000 1,054,781 -- -- 107,687,593 57,492,435 50,195,158Inspector General, Office of the State………………………………………… 100,000 100,000 100,000 950,000 -- 1,050,000 722,000 328,000Interest on Lawyer Account (IOLA)…………………………………………… 39,133,541 46,841,000 38,769,874 -- -- 47,204,667 8,675,334 38,529,333Labor, Department of…………………………………………………………… 42,357,163 72,740,000 16,444,022 1,069,000 -- 99,722,141 59,059,473 40,662,669Law, Department of……………………………………………………………… 11,534,268 80,225,000 4,793,237 7,433,231 -- 94,399,262 82,253,848 12,145,414Legislative Bill Drafting Commission………………………………………… 572,031 -- -- 1,500,000 -- 2,072,031 1,033,874 1,038,157Legislature - Assembly………………………………………………………… 400,000 300,000 300,000 -- -- 400,000 -- 400,000Legislature - Senate…………………………………………………………… 4,975,579 1,800,000 300,000 (1,500,000) -- 4,975,579 -- 4,975,579Lake George Park Commission……………………………………………… 316,688 1,495,000 180,290 -- -- 1,631,399 1,431,321 200,078Lottery, Division of……………………………………………………………… 21,661,499 102,673,000 8,384,832 (2,668,000) -- 113,281,667 78,735,533 34,546,135Medicaid Inspector General, Office of………………………………………… -- 3,700,000 -- -- -- 3,700,000 3,700,000 --Mental Health, Office of………………………………………………………… 475,072,862 2,860,268,000 103,318,299 38,828,200 -- 3,270,850,764 2,626,950,702 643,900,062Military and Naval Affairs, Division of………………………………………… 8,746,158 9,577,000 5,959,182 -- -- 12,363,975 2,929,107 9,434,869Miscellaneous State Agencies and Public Authorities……………………… 1,140,707,045 1,654,000,000 1,003,712,000 (1,214,715,422) 39,589,000 615,868,623 -- 615,868,623Motor Vehicles, Department of………………………………………………… 16,674,536 86,827,000 15,443,296 -- -- 88,058,240 77,667,375 10,390,865NYS Gaming Commission……………………………………………………… -- 125,357,700 -- (228,000) -- 125,129,700 10,264,778 114,864,922NYS Racing and Wagering Board…………………………………………… 4,431,216 21,684,700 3,205,868 -- -- 22,910,048 17,760,376 5,149,673Oil Spill Fund (ENCON)………………………………………………………… 13,505,917 21,200,000 12,073,065 -- -- 22,632,852 14,858,806 7,774,046Parks, Recreation and Historic Preservation, Office of……………………… 65,617,036 93,788,900 24,996,582 5,144,727 -- 139,554,081 80,493,964 59,060,117People With Developmental Disabilities, Office for………………………… 1,119,285,314 2,953,273,000 587,663,669 179,189,000 -- 3,664,083,645 2,748,020,392 916,063,253Prevention of Domestic Violence, Office for the…………………………… 83,180 41,000 70,362 17,596 -- 71,414 21,587 49,827Public Benefit Corporations…………………………………………………… 4,557,878 16,380,000 4,101,969 (850,000) -- 15,985,909 13,589,074 2,396,835Public Employment Relations Board………………………………………… 256,123 575,000 191,957 -- -- 639,166 119,738 519,428Public Service, Department of………………………………………………… 17,531,634 78,892,000 9,186,557 (17,000) -- 87,220,077 63,298,723 23,921,354
(*) Totals may not add up due to rounding.(**)(***)
Authorized budget transfers represent those movements of appropriation authority provided in appropriation acts between different funds/agencies.Other immediately available appropriations represent additional appropriations enacted outside of the Executive budget process (i.e., deficiency and supplemental appropriation bills) and increases or reductions by the Legislature to a prior year appropriation.
79
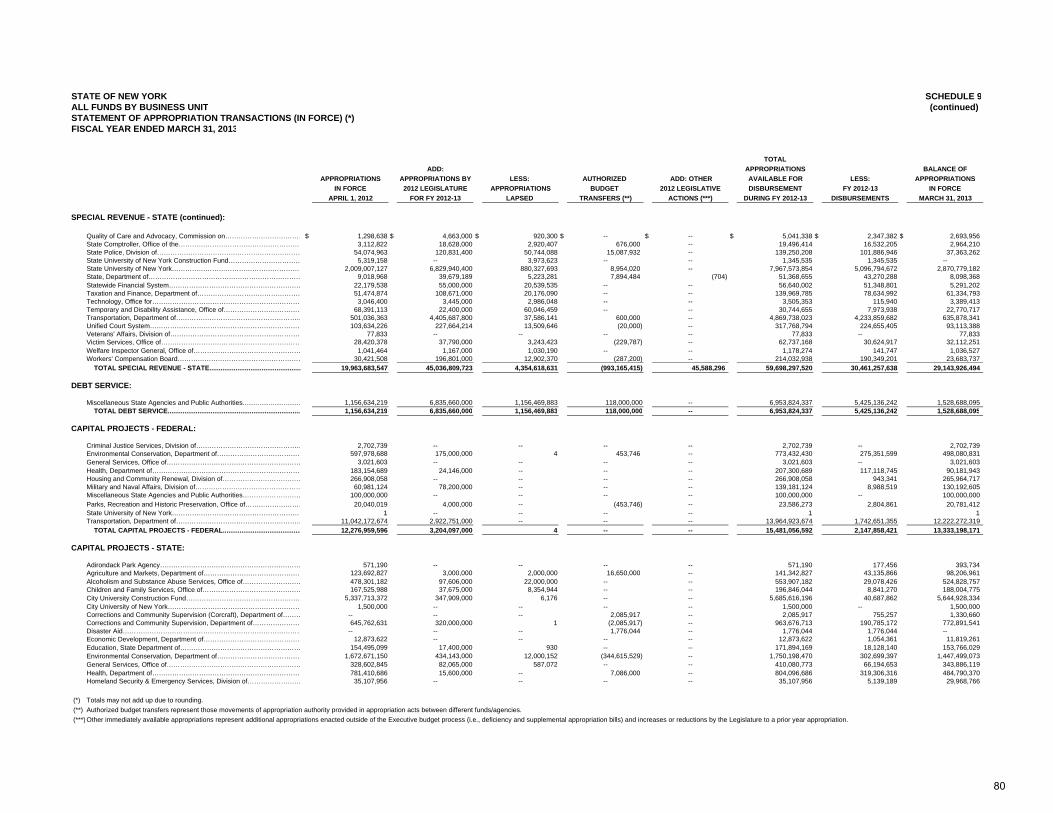
SCHEDULE 9(continued)
TOTALADD: APPROPRIATIONS BALANCE OF
APPROPRIATIONS APPROPRIATIONS BY LESS: AUTHORIZED ADD: OTHER AVAILABLE FOR LESS: APPROPRIATIONSIN FORCE 2012 LEGISLATURE APPROPRIATIONS BUDGET 2012 LEGISLATIVE DISBURSEMENT FY 2012-13 IN FORCE
APRIL 1, 2012 FOR FY 2012-13 LAPSED TRANSFERS (**) ACTIONS (***) DURING FY 2012-13 DISBURSEMENTS MARCH 31, 2013
SPECIAL REVENUE - STATE (continued):
Quality of Care and Advocacy, Commission on………………………………$ 1,298,638 $ 4,663,000 $ 920,300 $ -- $ -- $ 5,041,338 $ 2,347,382 $ 2,693,956State Comptroller, Office of the………………………………………………… 3,112,822 18,628,000 2,920,407 676,000 -- 19,496,414 16,532,205 2,964,210State Police, Division of………………………………………………………… 54,074,963 120,831,400 50,744,088 15,087,932 -- 139,250,208 101,886,946 37,363,262State University of New York Construction Fund…………………………… 5,319,158 -- 3,973,623 -- -- 1,345,535 1,345,535 --State University of New York…………………………………………………… 2,009,007,127 6,829,940,400 880,327,693 8,954,020 -- 7,967,573,854 5,096,794,672 2,870,779,182State, Department of…………………………………………………………… 9,018,968 39,679,189 5,223,281 7,894,484 (704) 51,368,655 43,270,288 8,098,368Statewide Financial System…………………………………………………… 22,179,538 55,000,000 20,539,535 -- -- 56,640,002 51,348,801 5,291,202Taxation and Finance, Department of………………………………………… 51,474,874 108,671,000 20,176,090 -- -- 139,969,785 78,634,992 61,334,793Technology, Office for…………………………………………………………… 3,046,400 3,445,000 2,986,048 -- -- 3,505,353 115,940 3,389,413Temporary and Disability Assistance, Office of……………………………… 68,391,113 22,400,000 60,046,459 -- -- 30,744,655 7,973,938 22,770,717Transportation, Department of………………………………………………… 501,036,363 4,405,687,800 37,586,141 600,000 -- 4,869,738,023 4,233,859,682 635,878,341Unified Court System…………………………………………………………… 103,634,226 227,664,214 13,509,646 (20,000) -- 317,768,794 224,655,405 93,113,388Veterans' Affairs, Division of…………………………………………………… 77,833 -- -- -- -- 77,833 -- 77,833Victim Services, Office of……………………………………………………… 28,420,378 37,790,000 3,243,423 (229,787) -- 62,737,168 30,624,917 32,112,251Welfare Inspector General, Office of………………………………………… 1,041,464 1,167,000 1,030,190 -- -- 1,178,274 141,747 1,036,527Workers' Compensation Board………………………………………………… 30,421,508 196,801,000 12,902,370 (287,200) -- 214,032,938 190,349,201 23,683,737 TOTAL SPECIAL REVENUE - STATE................................................. 19,963,683,547 45,036,809,723 4,354,618,631 (993,165,415) 45,588,296 59,698,297,520 30,461,257,638 29,143,926,494
DEBT SERVICE:
Miscellaneous State Agencies and Public Authorities............................... 1,156,634,219 6,835,660,000 1,156,469,883 118,000,000 -- 6,953,824,337 5,425,136,242 1,528,688,095 TOTAL DEBT SERVICE....................................................................... 1,156,634,219 6,835,660,000 1,156,469,883 118,000,000 -- 6,953,824,337 5,425,136,242 1,528,688,095
CAPITAL PROJECTS - FEDERAL:
Criminal Justice Services, Division of………………………………………… 2,702,739 -- -- -- -- 2,702,739 -- 2,702,739Environmental Conservation, Department of………………………………… 597,978,688 175,000,000 4 453,746 -- 773,432,430 275,351,599 498,080,831General Services, Office of…………………………………………………… 3,021,603 -- -- -- -- 3,021,603 -- 3,021,603Health, Department of…………………………………………………………… 183,154,689 24,146,000 -- -- -- 207,300,689 117,118,745 90,181,943Housing and Community Renewal, Division of……………………………… 266,908,058 -- -- -- -- 266,908,058 943,341 265,964,717Military and Naval Affairs, Division of………………………………………… 60,981,124 78,200,000 -- -- -- 139,181,124 8,988,519 130,192,605Miscellaneous State Agencies and Public Authorities……………………… 100,000,000 -- -- -- -- 100,000,000 -- 100,000,000Parks, Recreation and Historic Preservation, Office of……………………… 20,040,019 4,000,000 -- (453,746) -- 23,586,273 2,804,861 20,781,412State University of New York…………………………………………………… 1 -- -- -- -- 1 1Transportation, Department of………………………………………………… 11,042,172,674 2,922,751,000 -- -- -- 13,964,923,674 1,742,651,355 12,222,272,319 TOTAL CAPITAL PROJECTS - FEDERAL.......................................... 12,276,959,596 3,204,097,000 4 -- -- 15,481,056,592 2,147,858,421 13,333,198,171
CAPITAL PROJECTS - STATE:
Adirondack Park Agency……………………………………………………… 571,190 -- -- -- -- 571,190 177,456 393,734Agriculture and Markets, Department of……………………………………… 123,692,827 3,000,000 2,000,000 16,650,000 -- 141,342,827 43,135,866 98,206,961Alcoholism and Substance Abuse Services, Office of……………………… 478,301,182 97,606,000 22,000,000 -- -- 553,907,182 29,078,426 524,828,757Children and Family Services, Office of……………………………………… 167,525,988 37,675,000 8,354,944 -- -- 196,846,044 8,841,270 188,004,775City University Construction Fund…………………………………………… 5,337,713,372 347,909,000 6,176 -- -- 5,685,616,196 40,687,862 5,644,928,334City University of New York…………………………………………………… 1,500,000 -- -- -- -- 1,500,000 -- 1,500,000Corrections and Community Supervision (Corcraft), Department of……… -- -- -- 2,085,917 -- 2,085,917 755,257 1,330,660Corrections and Community Supervision, Department of………………… 645,762,631 320,000,000 1 (2,085,917) -- 963,676,713 190,785,172 772,891,541Disaster Aid……………………………………………………………………… -- -- -- 1,776,044 -- 1,776,044 1,776,044 --Economic Development, Department of……………………………………… 12,873,622 -- -- -- -- 12,873,622 1,054,361 11,819,261Education, State Department of……………………………………………… 154,495,099 17,400,000 930 -- -- 171,894,169 18,128,140 153,766,029Environmental Conservation, Department of………………………………… 1,672,671,150 434,143,000 12,000,152 (344,615,529) -- 1,750,198,470 302,699,397 1,447,499,073General Services, Office of…………………………………………………… 328,602,845 82,065,000 587,072 -- -- 410,080,773 66,194,653 343,886,119Health, Department of…………………………………………………………… 781,410,686 15,600,000 -- 7,086,000 -- 804,096,686 319,306,316 484,790,370Homeland Security & Emergency Services, Division of…………………… 35,107,956 -- -- -- -- 35,107,956 5,139,189 29,968,766
(*) Totals may not add up due to rounding.(**)(***)
STATE OF NEW YORK
STATEMENT OF APPROPRIATION TRANSACTIONS (IN FORCE) (*)FISCAL YEAR ENDED MARCH 31, 2013
Other immediately available appropriations represent additional appropriations enacted outside of the Executive budget process (i.e., deficiency and supplemental appropriation bills) and increases or reductions by the Legislature to a prior year appropriation.
ALL FUNDS BY BUSINESS UNIT
Authorized budget transfers represent those movements of appropriation authority provided in appropriation acts between different funds/agencies.
80
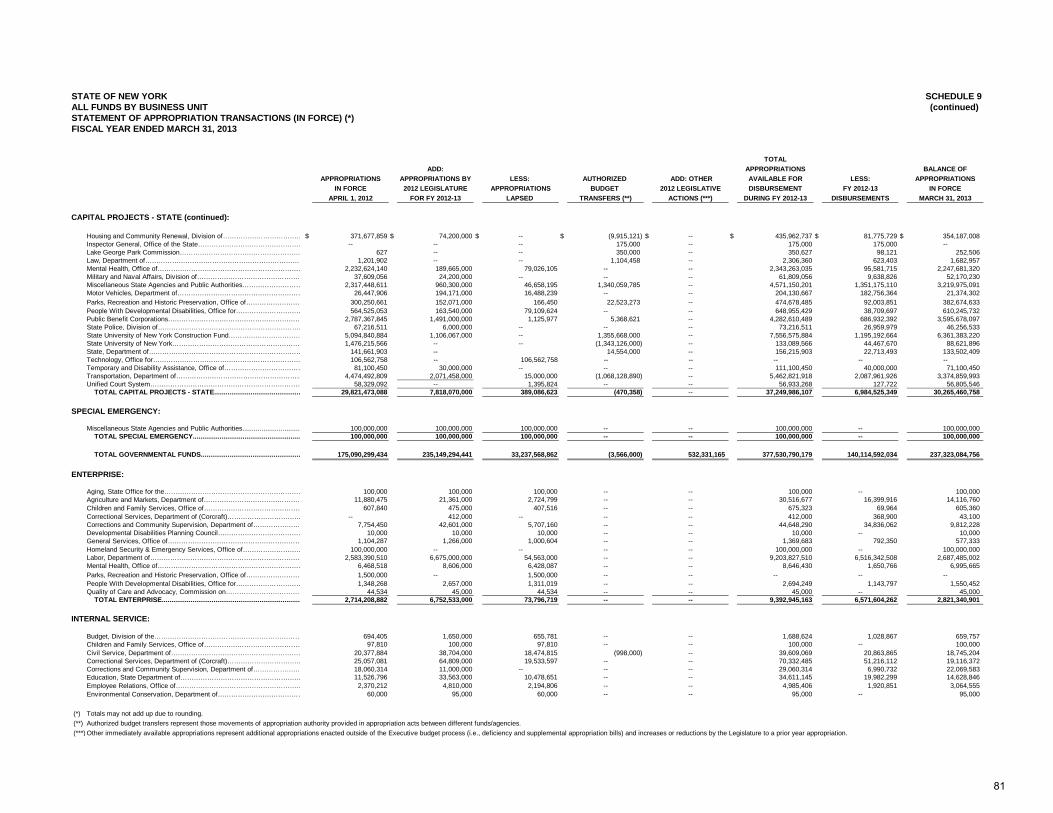
SCHEDULE 9(continued)
TOTALADD: APPROPRIATIONS BALANCE OF
APPROPRIATIONS APPROPRIATIONS BY LESS: AUTHORIZED ADD: OTHER AVAILABLE FOR LESS: APPROPRIATIONSIN FORCE 2012 LEGISLATURE APPROPRIATIONS BUDGET 2012 LEGISLATIVE DISBURSEMENT FY 2012-13 IN FORCE
APRIL 1, 2012 FOR FY 2012-13 LAPSED TRANSFERS (**) ACTIONS (***) DURING FY 2012-13 DISBURSEMENTS MARCH 31, 2013
CAPITAL PROJECTS - STATE (continued):
Housing and Community Renewal, Division of……………………………… $ 371,677,859 $ 74,200,000 $ -- $ (9,915,121) $ -- $ 435,962,737 $ 81,775,729 $ 354,187,008Inspector General, Office of the State………………………………………… -- -- -- 175,000 -- 175,000 175,000 --Lake George Park Commission……………………………………………… 627 -- -- 350,000 -- 350,627 98,121 252,506Law, Department of……………………………………………………………… 1,201,902 -- -- 1,104,458 -- 2,306,360 623,403 1,682,957Mental Health, Office of………………………………………………………… 2,232,624,140 189,665,000 79,026,105 -- -- 2,343,263,035 95,581,715 2,247,681,320Military and Naval Affairs, Division of………………………………………… 37,609,056 24,200,000 -- -- -- 61,809,056 9,638,826 52,170,230Miscellaneous State Agencies and Public Authorities……………………… 2,317,448,611 960,300,000 46,658,195 1,340,059,785 -- 4,571,150,201 1,351,175,110 3,219,975,091Motor Vehicles, Department of………………………………………………… 26,447,906 194,171,000 16,488,239 -- -- 204,130,667 182,756,364 21,374,302Parks, Recreation and Historic Preservation, Office of……………………… 300,250,661 152,071,000 166,450 22,523,273 -- 474,678,485 92,003,851 382,674,633People With Developmental Disabilities, Office for………………………… 564,525,053 163,540,000 79,109,624 -- -- 648,955,429 38,709,697 610,245,732Public Benefit Corporations…………………………………………………… 2,787,367,845 1,491,000,000 1,125,977 5,368,621 -- 4,282,610,489 686,932,392 3,595,678,097State Police, Division of………………………………………………………… 67,216,511 6,000,000 -- -- -- 73,216,511 26,959,979 46,256,533State University of New York Construction Fund…………………………… 5,094,840,884 1,106,067,000 -- 1,355,668,000 -- 7,556,575,884 1,195,192,664 6,361,383,220State University of New York…………………………………………………… 1,476,215,566 -- -- (1,343,126,000) -- 133,089,566 44,467,670 88,621,896State, Department of…………………………………………………………… 141,661,903 -- 14,554,000 -- 156,215,903 22,713,493 133,502,409Technology, Office for………………………………………………………… 106,562,758 -- 106,562,758 -- -- -- -- --Temporary and Disability Assistance, Office of……………………………… 81,100,450 30,000,000 -- -- -- 111,100,450 40,000,000 71,100,450Transportation, Department of………………………………………………… 4,474,492,809 2,071,458,000 15,000,000 (1,068,128,890) -- 5,462,821,918 2,087,961,926 3,374,859,993Unified Court System…………………………………………………………… 58,329,092 -- 1,395,824 -- -- 56,933,268 127,722 56,805,546 TOTAL CAPITAL PROJECTS - STATE............................................. 29,821,473,088 7,818,070,000 389,086,623 (470,358) -- 37,249,986,107 6,984,525,349 30,265,460,758
SPECIAL EMERGENCY:
Miscellaneous State Agencies and Public Authorities............................... 100,000,000 100,000,000 100,000,000 -- -- 100,000,000 -- 100,000,000 TOTAL SPECIAL EMERGENCY........................................................ 100,000,000 100,000,000 100,000,000 -- -- 100,000,000 -- 100,000,000
TOTAL GOVERNMENTAL FUNDS.................................................... 175,090,299,434 235,149,294,441 33,237,568,862 (3,566,000) 532,331,165 377,530,790,179 140,114,592,034 237,323,084,756
STATE OF NEW YORKALL FUNDS BY BUSINESS UNITSTATEMENT OF APPROPRIATION TRANSACTIONS (IN FORCE) (*)FISCAL YEAR ENDED MARCH 31, 2013
ENTERPRISE:
Aging, State Office for the……………………………………………………… 100,000 100,000 100,000 -- -- 100,000 -- 100,000Agriculture and Markets, Department of……………………………………… 11,880,475 21,361,000 2,724,799 -- -- 30,516,677 16,399,916 14,116,760Children and Family Services, Office of……………………………………… 607,840 475,000 407,516 -- -- 675,323 69,964 605,360Correctional Services, Department of (Corcraft)…………………………… -- 412,000 -- -- -- 412,000 368,900 43,100Corrections and Community Supervision, Department of………………… 7,754,450 42,601,000 5,707,160 -- -- 44,648,290 34,836,062 9,812,228Developmental Disabilities Planning Council………………………………… 10,000 10,000 10,000 -- -- 10,000 -- 10,000General Services, Office of…………………………………………………… 1,104,287 1,266,000 1,000,604 -- -- 1,369,683 792,350 577,333Homeland Security & Emergency Services, Office of……………………… 100,000,000 -- -- -- -- 100,000,000 -- 100,000,000Labor, Department of…………………………………………………………… 2,583,390,510 6,675,000,000 54,563,000 -- -- 9,203,827,510 6,516,342,508 2,687,485,002Mental Health, Office of………………………………………………………… 6,468,518 8,606,000 6,428,087 -- -- 8,646,430 1,650,766 6,995,665Parks, Recreation and Historic Preservation, Office of……………………… 1,500,000 -- 1,500,000 -- -- -- -- --People With Developmental Disabilities, Office for………………………… 1,348,268 2,657,000 1,311,019 -- -- 2,694,249 1,143,797 1,550,452Quality of Care and Advocacy, Commission on……………………………. 44,534 45,000 44,534 -- -- 45,000 -- 45,000 TOTAL ENTERPRISE......................................................................... 2,714,208,882 6,752,533,000 73,796,719 -- -- 9,392,945,163 6,571,604,262 2,821,340,901
INTERNAL SERVICE:
Budget, Division of the………………………………………………………… 694,405 1,650,000 655,781 -- -- 1,688,624 1,028,867 659,757Children and Family Services, Office of……………………………………… 97,810 100,000 97,810 -- -- 100,000 -- 100,000Civil Service, Department of…………………………………………………… 20,377,884 38,704,000 18,474,815 (998,000) -- 39,609,069 20,863,865 18,745,204Correctional Services, Department of (Corcraft)…………………………… 25,057,081 64,809,000 19,533,597 -- -- 70,332,485 51,216,112 19,116,372Corrections and Community Supervision, Department of………………… 18,060,314 11,000,000 -- -- -- 29,060,314 6,990,732 22,069,583Education, State Department of……………………………………………… 11,526,796 33,563,000 10,478,651 -- -- 34,611,145 19,982,299 14,628,846Employee Relations, Office of………………………………………………… 2,370,212 4,810,000 2,194,806 -- -- 4,985,406 1,920,851 3,064,555Environmental Conservation, Department of………………………………… 60,000 95,000 60,000 -- -- 95,000 -- 95,000
(*) Totals may not add up due to rounding.(**)(***)
Authorized budget transfers represent those movements of appropriation authority provided in appropriation acts between different funds/agencies.Other immediately available appropriations represent additional appropriations enacted outside of the Executive budget process (i.e., deficiency and supplemental appropriation bills) and increases or reductions by the Legislature to a prior year appropriation.
81
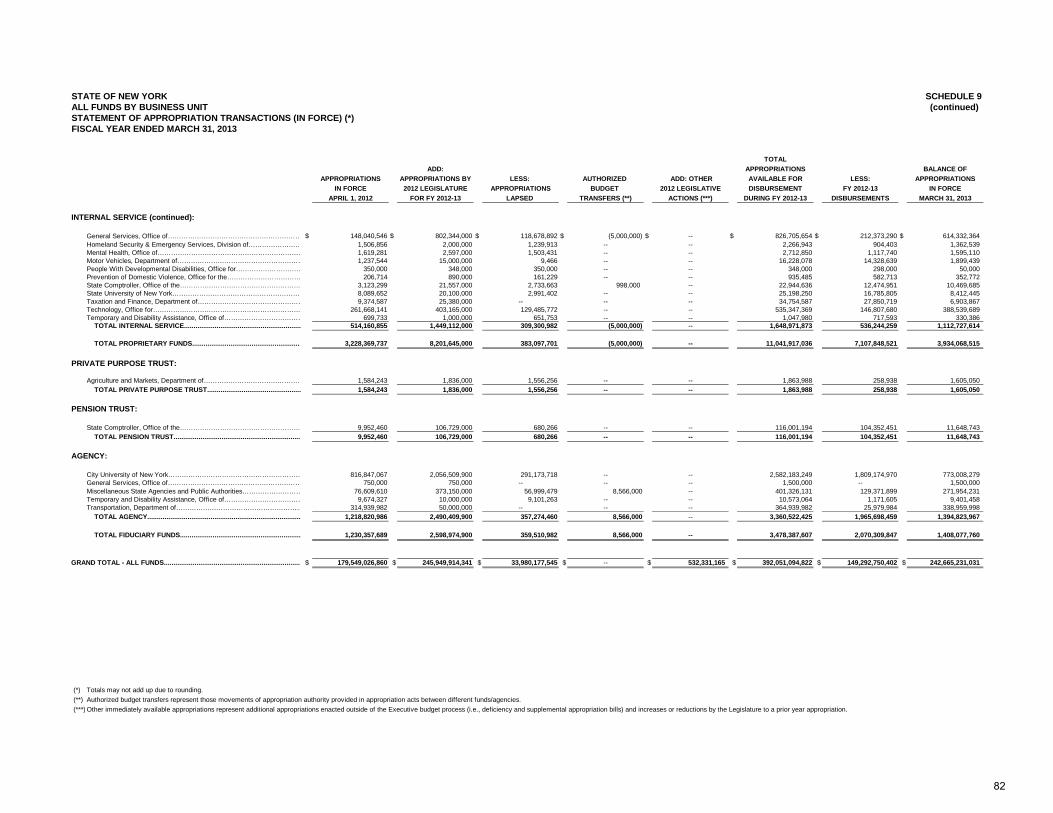
SCHEDULE 9(continued)
TOTALADD: APPROPRIATIONS BALANCE OF
APPROPRIATIONS APPROPRIATIONS BY LESS: AUTHORIZED ADD: OTHER AVAILABLE FOR LESS: APPROPRIATIONSIN FORCE 2012 LEGISLATURE APPROPRIATIONS BUDGET 2012 LEGISLATIVE DISBURSEMENT FY 2012-13 IN FORCE
APRIL 1, 2012 FOR FY 2012-13 LAPSED TRANSFERS (**) ACTIONS (***) DURING FY 2012-13 DISBURSEMENTS MARCH 31, 2013
INTERNAL SERVICE (continued):
General Services, Office of…………………………………………………… $ 148,040,546 $ 802,344,000 $ 118,678,892 $ (5,000,000) $ -- $ 826,705,654 $ 212,373,290 $ 614,332,364Homeland Security & Emergency Services, Division of…………………… 1,506,856 2,000,000 1,239,913 -- -- 2,266,943 904,403 1,362,539Mental Health, Office of………………………………………………………… 1,619,281 2,597,000 1,503,431 -- -- 2,712,850 1,117,740 1,595,110Motor Vehicles, Department of………………………………………………… 1,237,544 15,000,000 9,466 -- -- 16,228,078 14,328,639 1,899,439People With Developmental Disabilities, Office for………………………… 350,000 348,000 350,000 -- -- 348,000 298,000 50,000Prevention of Domestic Violence, Office for the…………………………… 206,714 890,000 161,229 -- -- 935,485 582,713 352,772State Comptroller, Office of the……………………………………………… 3,123,299 21,557,000 2,733,663 998,000 -- 22,944,636 12,474,951 10,469,685State University of New York…………………………………………………… 8,089,652 20,100,000 2,991,402 -- -- 25,198,250 16,785,805 8,412,445Taxation and Finance, Department of………………………………………… 9,374,587 25,380,000 -- -- -- 34,754,587 27,850,719 6,903,867Technology, Office for………………………………………………………… 261,668,141 403,165,000 129,485,772 -- -- 535,347,369 146,807,680 388,539,689Temporary and Disability Assistance, Office of……………………………… 699,733 1,000,000 651,753 -- -- 1,047,980 717,593 330,386 TOTAL INTERNAL SERVICE............................................................. 514,160,855 1,449,112,000 309,300,982 (5,000,000) -- 1,648,971,873 536,244,259 1,112,727,614
TOTAL PROPRIETARY FUNDS......................................................... 3,228,369,737 8,201,645,000 383,097,701 (5,000,000) -- 11,041,917,036 7,107,848,521 3,934,068,515
PRIVATE PURPOSE TRUST:
Agriculture and Markets, Department of……………………………………… 1,584,243 1,836,000 1,556,256 -- -- 1,863,988 258,938 1,605,050 TOTAL PRIVATE PURPOSE TRUST................................................. 1,584,243 1,836,000 1,556,256 -- -- 1,863,988 258,938 1,605,050
PENSION TRUST:
State Comptroller, Office of the……………………………………………… 9,952,460 106,729,000 680,266 -- -- 116,001,194 104,352,451 11,648,743 TOTAL PENSION TRUST.................................................................. 9,952,460 106,729,000 680,266 -- -- 116,001,194 104,352,451 11,648,743
AGENCY:
STATE OF NEW YORKALL FUNDS BY BUSINESS UNITSTATEMENT OF APPROPRIATION TRANSACTIONS (IN FORCE) (*)FISCAL YEAR ENDED MARCH 31, 2013
City University of New York…………………………………………………… 816,847,067 2,056,509,900 291,173,718 -- -- 2,582,183,249 1,809,174,970 773,008,279General Services, Office of…………………………………………………… 750,000 750,000 -- -- -- 1,500,000 -- 1,500,000Miscellaneous State Agencies and Public Authorities……………………… 76,609,610 373,150,000 56,999,479 8,566,000 -- 401,326,131 129,371,899 271,954,231Temporary and Disability Assistance, Office of……………………………… 9,674,327 10,000,000 9,101,263 -- -- 10,573,064 1,171,605 9,401,458Transportation, Department of………………………………………………… 314,939,982 50,000,000 -- -- -- 364,939,982 25,979,984 338,959,998 TOTAL AGENCY................................................................................ 1,218,820,986 2,490,409,900 357,274,460 8,566,000 -- 3,360,522,425 1,965,698,459 1,394,823,967
TOTAL FIDUCIARY FUNDS............................................................... 1,230,357,689 2,598,974,900 359,510,982 8,566,000 -- 3,478,387,607 2,070,309,847 1,408,077,760
GRAND TOTAL - ALL FUNDS........................................................................ $ 179,549,026,860 $ 245,949,914,341 $ 33,980,177,545 $ -- $ 532,331,165 $ 392,051,094,822 $ 149,292,750,402 $ 242,665,231,031
(*) Totals may not add up due to rounding.(**)(***)
Authorized budget transfers represent those movements of appropriation authority provided in appropriation acts between different funds/agencies.Other immediately available appropriations represent additional appropriations enacted outside of the Executive budget process (i.e., deficiency and supplemental appropriation bills) and increases or reductions by the Legislature to a prior year appropriation.
82
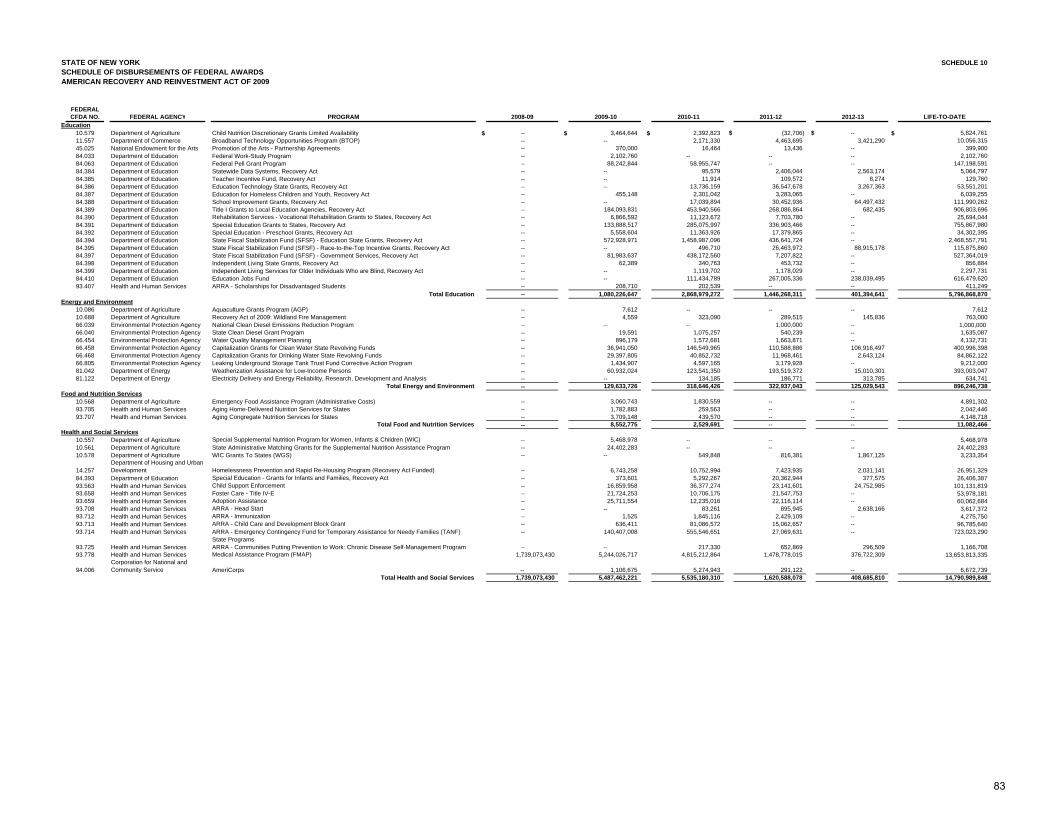
SCHEDULE 10
FEDERALCFDA NO. FEDERAL AGENCY PROGRAM 2008-09 2009-10 2010-11 2011-12 2012-13 LIFE-TO-DATE
10.579 Department of Agriculture Child Nutrition Discretionary Grants Limited Availability $ -- $ 3,464,644 $ 2,392,823 $ (32,706) $ -- $ 5,824,761 11.557 Department of Commerce Broadband Technology Opportunities Program (BTOP) -- -- 2,171,330 4,463,695 3,421,290 10,056,315 45.025 National Endowment for the Arts Promotion of the Arts - Partnership Agreements -- 370,000 16,464 13,436 -- 399,900 84.033 Department of Education Federal Work-Study Program -- 2,102,760 -- -- -- 2,102,760 84.063 Department of Education Federal Pell Grant Program -- 88,242,844 58,955,747 -- -- 147,198,591 84.384 Department of Education Statewide Data Systems, Recovery Act -- -- 95,579 2,406,044 2,563,174 5,064,797 84.385 Department of Education Teacher Incentive Fund, Recovery Act -- -- 11,914 109,572 8,274 129,760 84.386 Department of Education Education Technology State Grants, Recovery Act -- -- 13,736,159 36,547,678 3,267,363 53,551,201 84.387 Department of Education Education for Homeless Children and Youth, Recovery Act -- 455,148 2,301,042 3,283,065 -- 6,039,255 84.388 Department of Education School Improvement Grants, Recovery Act -- -- 17,039,894 30,452,936 64,497,432 111,990,262 84.389 Department of Education Title I Grants to Local Education Agencies, Recovery Act -- 184,093,831 453,940,566 268,086,864 682,435 906,803,696 84.390 Department of Education Rehabilitation Services - Vocational Rehabilitation Grants to States, Recovery Act -- 6,866,592 11,123,672 7,703,780 -- 25,694,044 84.391 Department of Education Special Education Grants to States, Recovery Act -- 133,888,517 285,075,997 336,903,466 -- 755,867,980 84.392 Department of Education Special Education - Preschool Grants, Recovery Act -- 5,558,604 11,363,926 17,379,865 -- 34,302,395 84.394 Department of Education State Fiscal Stabilization Fund (SFSF) - Education State Grants, Recovery Act -- 572,928,971 1,458,987,096 436,641,724 -- 2,468,557,791 84.395 Department of Education State Fiscal Stabilization Fund (SFSF) - Race-to-the-Top Incentive Grants, Recovery Act -- -- 496,710 26,463,972 88,915,178 115,875,860 84.397 Department of Education State Fiscal Stabilization Fund (SFSF) - Government Services, Recovery Act -- 81,983,637 438,172,560 7,207,822 -- 527,364,019 84.398 Department of Education Independent Living State Grants, Recovery Act -- 62,389 340,763 453,732 -- 856,884 84.399 Department of Education Independent Living Services for Older Individuals Who are Blind, Recovery Act -- -- 1,119,702 1,178,029 -- 2,297,731 84.410 Department of Education Education Jobs Fund -- -- 111,434,789 267,005,336 238,039,495 616,479,620 93.407 Health and Human Services ARRA - Scholarships for Disadvantaged Students -- 208,710 202,539 -- -- 411,249
Total Education -- 1,080,226,647 2,868,979,272 1,446,268,311 401,394,641 5,796,868,870
10.086 Department of Agriculture Aquaculture Grants Program (AGP) -- 7,612 -- -- -- 7,612 10.688 Department of Agriculture Recovery Act of 2009: Wildland Fire Management -- 4,559 323,090 289,515 145,836 763,000 66.039 Environmental Protection Agency National Clean Diesel Emissions Reduction Program -- -- -- 1,000,000 -- 1,000,000 66.040 Environmental Protection Agency State Clean Diesel Grant Program -- 19,591 1,075,257 540,239 -- 1,635,087 66.454 Environmental Protection Agency Water Quality Management Planning -- 896,179 1,572,681 1,663,871 -- 4,132,731 66.458 Environmental Protection Agency Capitalization Grants for Clean Water State Revolving Funds -- 36,941,050 146,549,965 110,588,886 106,916,497 400,996,398 66.468 Environmental Protection Agency Capitalization Grants for Drinking Water State Revolving Funds -- 29,397,805 40,852,732 11,968,461 2,643,124 84,862,122 66.805 Environmental Protection Agency Leaking Underground Storage Tank Trust Fund Corrective Action Program -- 1,434,907 4,597,165 3,179,928 -- 9,212,000 81.042 Department of Energy Weatherization Assistance for Low-Income Persons -- 60,932,024 123,541,350 193,519,372 15,010,301 393,003,047 81.122 Department of Energy Electricity Delivery and Energy Reliability, Research, Development and Analysis -- -- 134,185 186,771 313,785 634,741
Total Energy and Environment -- 129,633,726 318,646,426 322,937,043 125,029,543 896,246,738
10.568 Department of Agriculture Emergency Food Assistance Program (Administrative Costs) -- 3,060,743 1,830,559 -- -- 4,891,302 93.705 Health and Human Services Aging Home-Delivered Nutrition Services for States -- 1,782,883 259,563 -- -- 2,042,446 93.707 Health and Human Services Aging Congregate Nutrition Services for States -- 3,709,148 439,570 -- -- 4,148,718
Total Food and Nutrition Services -- 8,552,775 2,529,691 -- -- 11,082,466
10.557 Department of Agriculture Special Supplemental Nutrition Program for Women, Infants & Children (WIC) -- 5,468,978 -- -- -- 5,468,978 10.561 Department of Agriculture State Administrative Matching Grants for the Supplemental Nutrition Assistance Program -- 24,402,283 -- -- -- 24,402,283 10.578 Department of Agriculture WIC Grants To States (WGS) -- -- 549,848 816,381 1,867,125 3,233,354
14.257Department of Housing and Urban Development Homelessness Prevention and Rapid Re-Housing Program (Recovery Act Funded) -- 6,743,258 10,752,994 7,423,935 2,031,141 26,951,329
84.393 Department of Education Special Education - Grants for Infants and Families, Recovery Act -- 373,601 5,292,267 20,362,944 377,575 26,406,387 93.563 Health and Human Services Child Support Enforcement -- 16,859,958 36,377,274 23,141,601 24,752,985 101,131,819 93.658 Health and Human Services Foster Care - Title IV-E -- 21,724,253 10,706,175 21,547,753 -- 53,978,181 93.659 Health and Human Services Adoption Assistance -- 25,711,554 12,235,016 22,116,114 -- 60,062,684 93.708 Health and Human Services ARRA - Head Start -- -- 83,261 895,945 2,638,166 3,617,372 93.712 Health and Human Services ARRA - Immunization -- 1,525 1,845,116 2,429,109 -- 4,275,750 93.713 Health and Human Services ARRA - Child Care and Development Block Grant -- 636,411 81,086,572 15,062,657 -- 96,785,640 93.714 Health and Human Services ARRA - Emergency Contingency Fund for Temporary Assistance for Needy Families (TANF)
State Programs -- 140,407,008 555,546,651 27,069,631 -- 723,023,290
93.725 Health and Human Services ARRA - Communities Putting Prevention to Work: Chronic Disease Self-Management Program -- -- 217,330 652,869 296,509 1,166,708 93.778 Health and Human Services Medical Assistance Program (FMAP) * 1,739,073,430 5,244,026,717 4,815,212,864 1,478,778,015 376,722,309 13,653,813,335
94.006Corporation for National and Community Service AmeriCorps -- 1,106,675 5,274,943 291,122 -- 6,672,739
Total Health and Social Services 1,739,073,430 5,487,462,221 5,535,180,310 1,620,588,078 408,685,810 14,790,989,848
Food and Nutrition Services
Health and Social Services
STATE OF NEW YORK
Energy and Environment
Education
SCHEDULE OF DISBURSEMENTS OF FEDERAL AWARDSAMERICAN RECOVERY AND REINVESTMENT ACT OF 2009
83
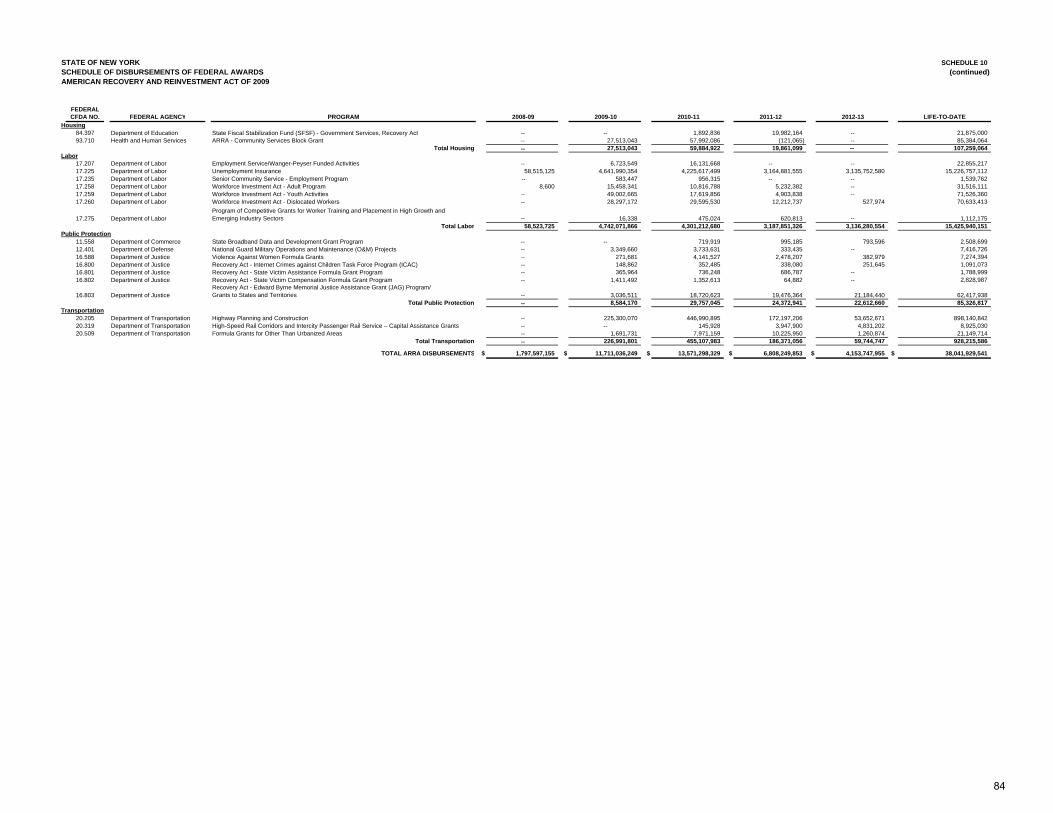
FEDERALCFDA NO. FEDERAL AGENCY PROGRAM 2008-09 2009-10 2010-11 2011-12 2012-13 LIFE-TO-DATE
84.397 Department of Education State Fiscal Stabilization Fund (SFSF) - Government Services, Recovery Act -- -- 1,892,836 19,982,164 -- 21,875,000 93.710 Health and Human Services ARRA - Community Services Block Grant -- 27,513,043 57,992,086 (121,065) -- 85,384,064
Total Housing -- 27,513,043 59,884,922 19,861,099 -- 107,259,064
17.207 Department of Labor Employment Service/Wanger-Peyser Funded Activities -- 6,723,549 16,131,668 -- -- 22,855,217 17.225 Department of Labor Unemployment Insurance 58,515,125 4,641,990,354 4,225,617,499 3,164,881,555 3,135,752,580 15,226,757,112 17.235 Department of Labor Senior Community Service - Employment Program -- 583,447 956,315 -- -- 1,539,762 17.258 Department of Labor Workforce Investment Act - Adult Program 8,600 15,458,341 10,816,788 5,232,382 -- 31,516,111 17.259 Department of Labor Workforce Investment Act - Youth Activities -- 49,002,665 17,619,856 4,903,838 -- 71,526,360 17.260 Department of Labor Workforce Investment Act - Dislocated Workers -- 28,297,172 29,595,530 12,212,737 527,974 70,633,413
17.275 Department of LaborProgram of Competitive Grants for Worker Training and Placement in High Growth and Emerging Industry Sectors -- 16,338 475,024 620,813 -- 1,112,175
Total Labor 58,523,725 4,742,071,866 4,301,212,680 3,187,851,326 3,136,280,554 15,425,940,151
11.558 Department of Commerce State Broadband Data and Development Grant Program -- -- 719,919 995,185 793,596 2,508,699 12.401 Department of Defense National Guard Military Operations and Maintenance (O&M) Projects -- 3,349,660 3,733,631 333,435 -- 7,416,726 16.588 Department of Justice Violence Against Women Formula Grants -- 271,681 4,141,527 2,478,207 382,979 7,274,394 16.800 Department of Justice Recovery Act - Internet Crimes against Children Task Force Program (ICAC) -- 148,862 352,485 338,080 251,645 1,091,073 16.801 Department of Justice Recovery Act - State Victim Assistance Formula Grant Program -- 365,964 736,248 686,787 -- 1,788,999 16.802 Department of Justice Recovery Act - State Victim Compensation Formula Grant Program -- 1,411,492 1,352,613 64,882 -- 2,828,987
16.803 Department of JusticeRecovery Act - Edward Byrne Memorial Justice Assistance Grant (JAG) Program/Grants to States and Territories -- 3,036,511 18,720,623 19,476,364 21,184,440 62,417,938
Total Public Protection -- 8,584,170 29,757,045 24,372,941 22,612,660 85,326,817
20.205 Department of Transportation Highway Planning and Construction -- 225,300,070 446,990,895 172,197,206 53,652,671 898,140,842 20.319 Department of Transportation High-Speed Rail Corridors and Intercity Passenger Rail Service – Capital Assistance Grants -- -- 145,928 3,947,900 4,831,202 8,925,030 20.509 Department of Transportation Formula Grants for Other Than Urbanized Areas -- 1,691,731 7,971,159 10,225,950 1,260,874 21,149,714
Total Transportation -- 226,991,801 455,107,983 186,371,056 59,744,747 928,215,586
TOTAL ARRA DISBURSEMENTS $ 1,797,597,155 $ 11,711,036,249 $ 13,571,298,329 $ 6,808,249,853 $ 4,153,747,955 $ 38,041,929,541
Transportation
SCHEDULE 10(continued)
Public Protection
Housing
Labor
SCHEDULE OF DISBURSEMENTS OF FEDERAL AWARDSAMERICAN RECOVERY AND REINVESTMENT ACT OF 2009
STATE OF NEW YORK
84
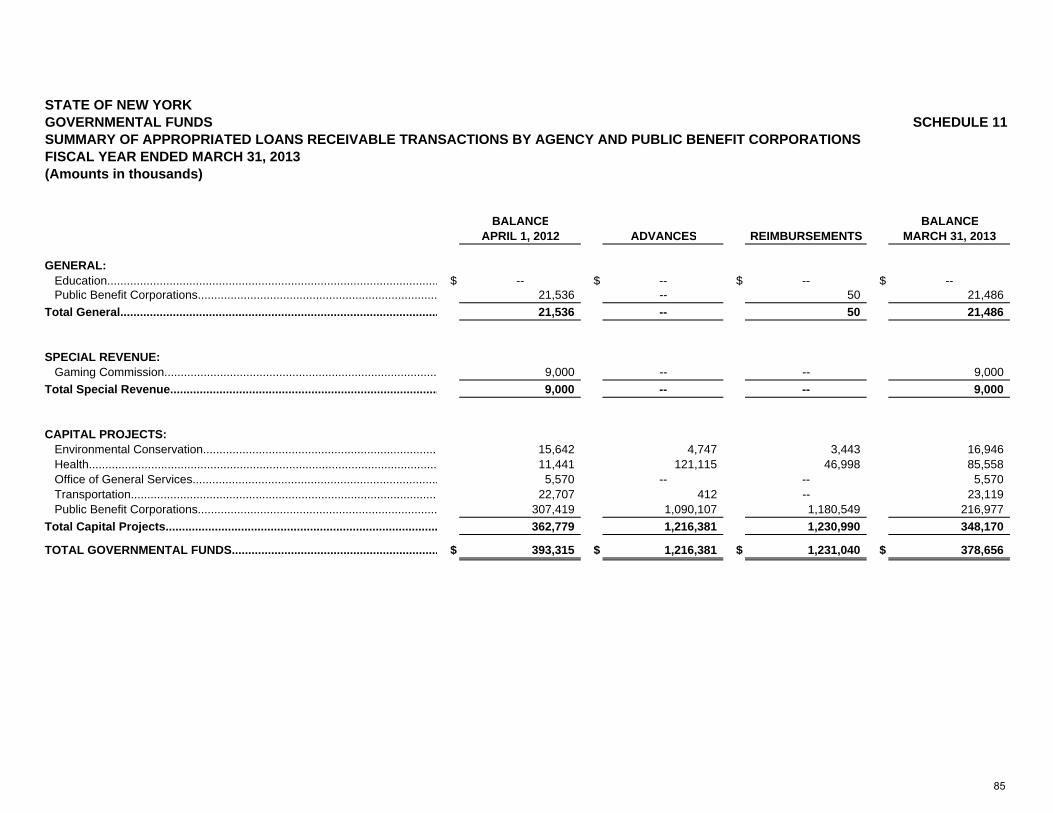
STATE OF NEW YORKGOVERNMENTAL FUNDS SCHEDULE 11
FISCAL YEAR ENDED MARCH 31, 2013(Amounts in thousands)
BALANCE BALANCEAPRIL 1, 2012 ADVANCES REIMBURSEMENTS MARCH 31, 2013
GENERAL: Education..................................................................................................... $ -- $ -- $ -- $ -- Public Benefit Corporations......................................................................... 21,536 -- 50 21,486Total General................................................................................................. 21,536 -- 50 21,486
SPECIAL REVENUE: Gaming Commission................................................................................... 9,000 -- -- 9,000Total Special Revenue.................................................................................. 9,000 -- -- 9,000
CAPITAL PROJECTS: Environmental Conservation....................................................................... 15,642 4,747 3,443 16,946 Health.......................................................................................................... 11,441 121,115 46,998 85,558 Office of General Services........................................................................... 5,570 -- -- 5,570 Transportation............................................................................................. 22,707 412 -- 23,119 Public Benefit Corporations......................................................................... 307,419 1,090,107 1,180,549 216,977Total Capital Projects................................................................................... 362,779 1,216,381 1,230,990 348,170
TOTAL GOVERNMENTAL FUNDS............................................................... $ 393,315 $ 1,216,381 $ 1,231,040 $ 378,656
SUMMARY OF APPROPRIATED LOANS RECEIVABLE TRANSACTIONS BY AGENCY AND PUBLIC BENEFIT CORPORATIONS
85
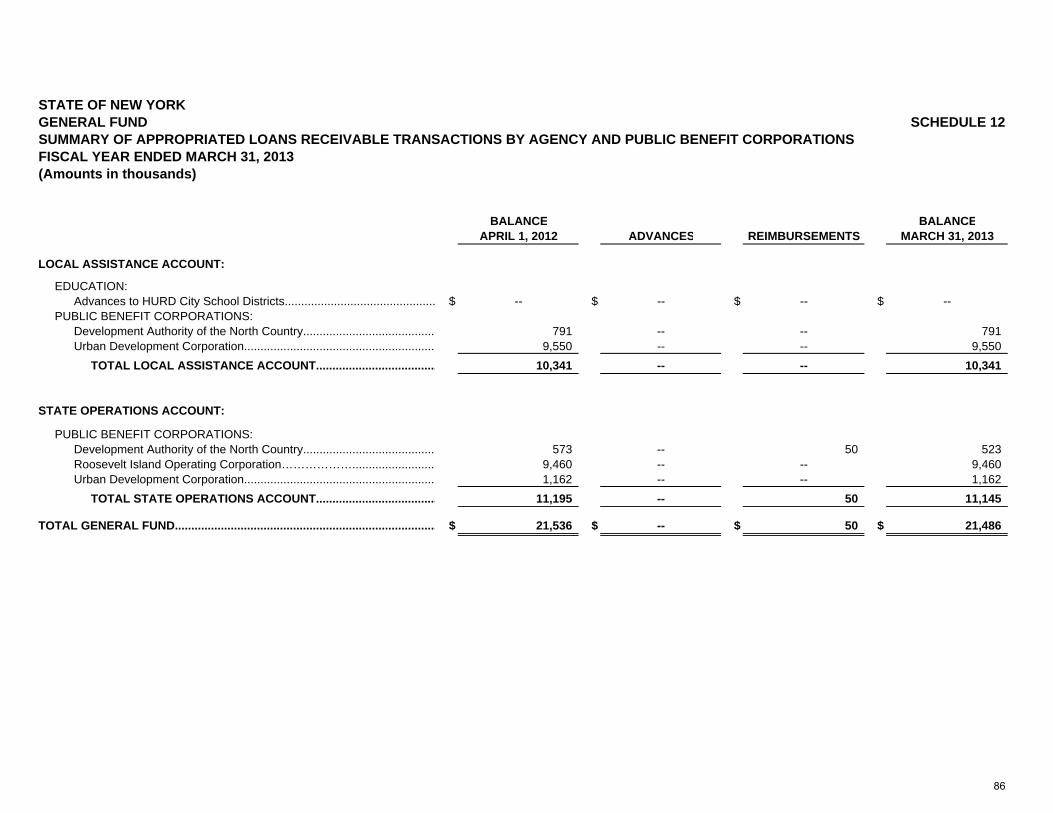
STATE OF NEW YORKGENERAL FUND SCHEDULE 12
FISCAL YEAR ENDED MARCH 31, 2013(Amounts in thousands)
BALANCE BALANCEAPRIL 1, 2012 ADVANCES REIMBURSEMENTS MARCH 31, 2013
LOCAL ASSISTANCE ACCOUNT:
EDUCATION:Advances to HURD City School Districts.............................................. $ -- $ -- $ -- $ --
PUBLIC BENEFIT CORPORATIONS: Development Authority of the North Country......................................... 791 -- -- 791Urban Development Corporation........................................................... 9,550 -- -- 9,550
TOTAL LOCAL ASSISTANCE ACCOUNT..................................... 10,341 -- -- 10,341
STATE OPERATIONS ACCOUNT:
PUBLIC BENEFIT CORPORATIONS: Development Authority of the North Country......................................... 573 -- 50 523Roosevelt Island Operating Corporation……………….......................... 9,460 -- -- 9,460Urban Development Corporation........................................................... 1,162 -- -- 1,162
TOTAL STATE OPERATIONS ACCOUNT..................................... 11,195 -- 50 11,145
TOTAL GENERAL FUND................................................................................ $ 21,536 $ -- $ 50 $ 21,486
SUMMARY OF APPROPRIATED LOANS RECEIVABLE TRANSACTIONS BY AGENCY AND PUBLIC BENEFIT CORPORATIONS
86
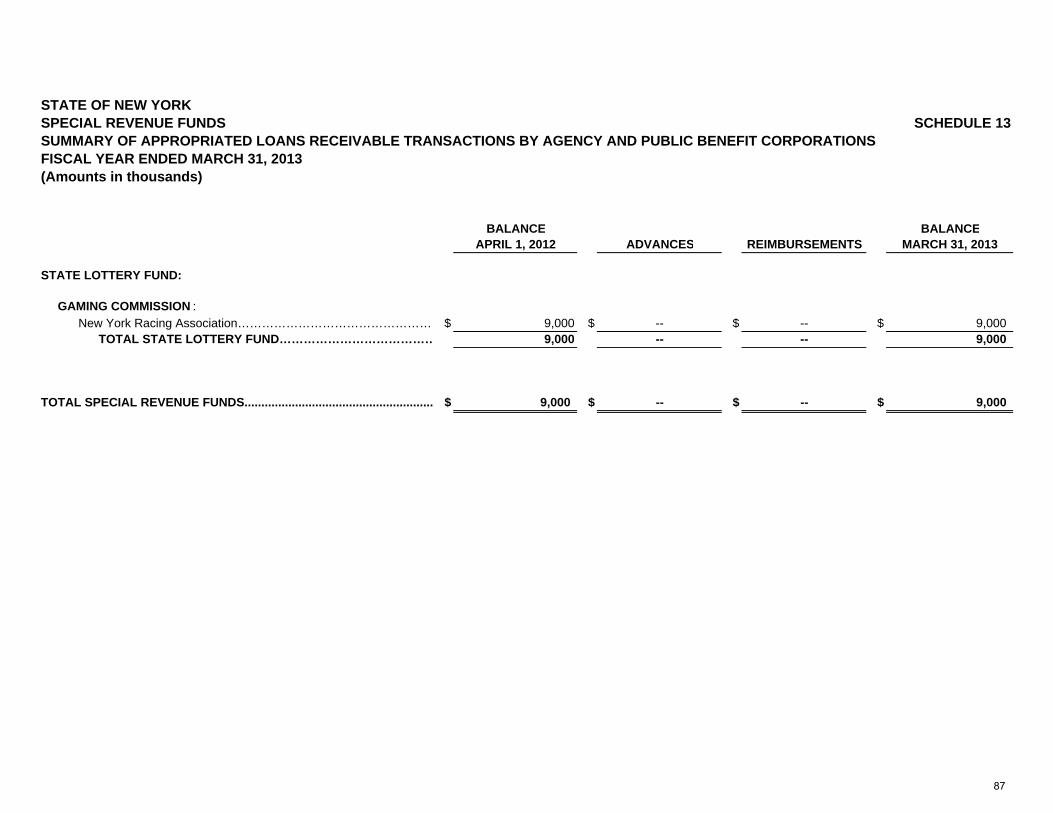
STATE OF NEW YORKSPECIAL REVENUE FUNDS SCHEDULE 13SUMMARY OF APPROPRIATED LOANS RECEIVABLE TRANSACTIONS BY AGENCY AND PUBLIC BENEFIT CORPORATIONSFISCAL YEAR ENDED MARCH 31, 2013(Amounts in thousands)
BALANCE BALANCEAPRIL 1, 2012 ADVANCES REIMBURSEMENTS MARCH 31, 2013
STATE LOTTERY FUND:
GAMING COMMISSION : New York Racing Association………………………………………… $ 9,000 $ -- $ -- $ 9,000 TOTAL STATE LOTTERY FUND………………………………… 9,000 -- -- 9,000
TOTAL SPECIAL REVENUE FUNDS........................................................ $ 9,000 $ -- $ -- $ 9,000
87
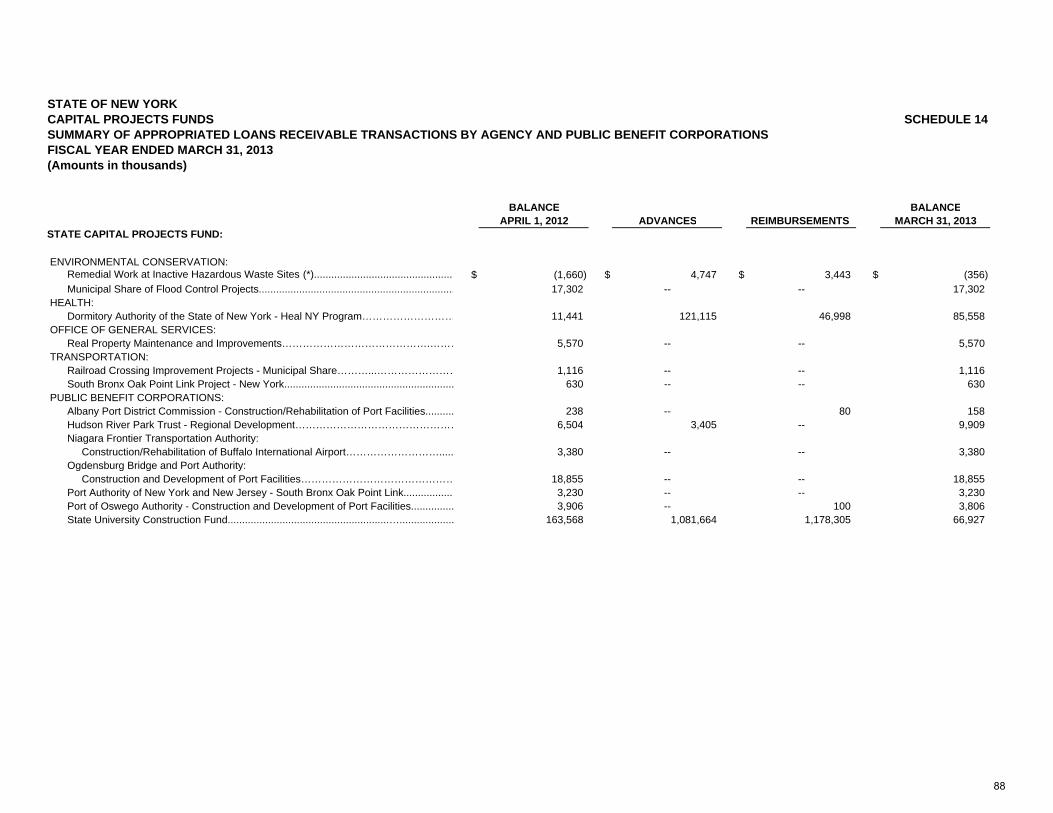
STATE OF NEW YORK CAPITAL PROJECTS FUNDS SCHEDULE 14SUMMARY OF APPROPRIATED LOANS RECEIVABLE TRANSACTIONS BY AGENCY AND PUBLIC BENEFIT CORPORATIONSFISCAL YEAR ENDED MARCH 31, 2013(Amounts in thousands)
BALANCE BALANCEAPRIL 1, 2012 ADVANCES REIMBURSEMENTS MARCH 31, 2013
STATE CAPITAL PROJECTS FUND:
ENVIRONMENTAL CONSERVATION: Remedial Work at Inactive Hazardous Waste Sites (*)................................................. $ (1,660) $ 4,747 $ 3,443 $ (356) Municipal Share of Flood Control Projects.................................................................... 17,302 -- -- 17,302 HEALTH: Dormitory Authority of the State of New York - Heal NY Program……………………… 11,441 121,115 46,998 85,558 OFFICE OF GENERAL SERVICES: Real Property Maintenance and Improvements…………………………………….……… 5,570 -- -- 5,570 TRANSPORTATION: Railroad Crossing Improvement Projects - Municipal Share………...…………………… 1,116 -- -- 1,116 South Bronx Oak Point Link Project - New York........................................................... 630 -- -- 630 PUBLIC BENEFIT CORPORATIONS: Albany Port District Commission - Construction/Rehabilitation of Port Facilities.......... 238 -- 80 158 Hudson River Park Trust - Regional Development………………………………………… 6,504 3,405 -- 9,909 Niagara Frontier Transportation Authority: Construction/Rehabilitation of Buffalo International Airport………………………..... 3,380 -- -- 3,380 Ogdensburg Bridge and Port Authority: Construction and Development of Port Facilities……………………………………… 18,855 -- -- 18,855 Port Authority of New York and New Jersey - South Bronx Oak Point Link.................. 3,230 -- -- 3,230 Port of Oswego Authority - Construction and Development of Port Facilities............... 3,906 -- 100 3,806 State University Construction Fund........................................................…................... 163,568 1,081,664 1,178,305 66,927
88
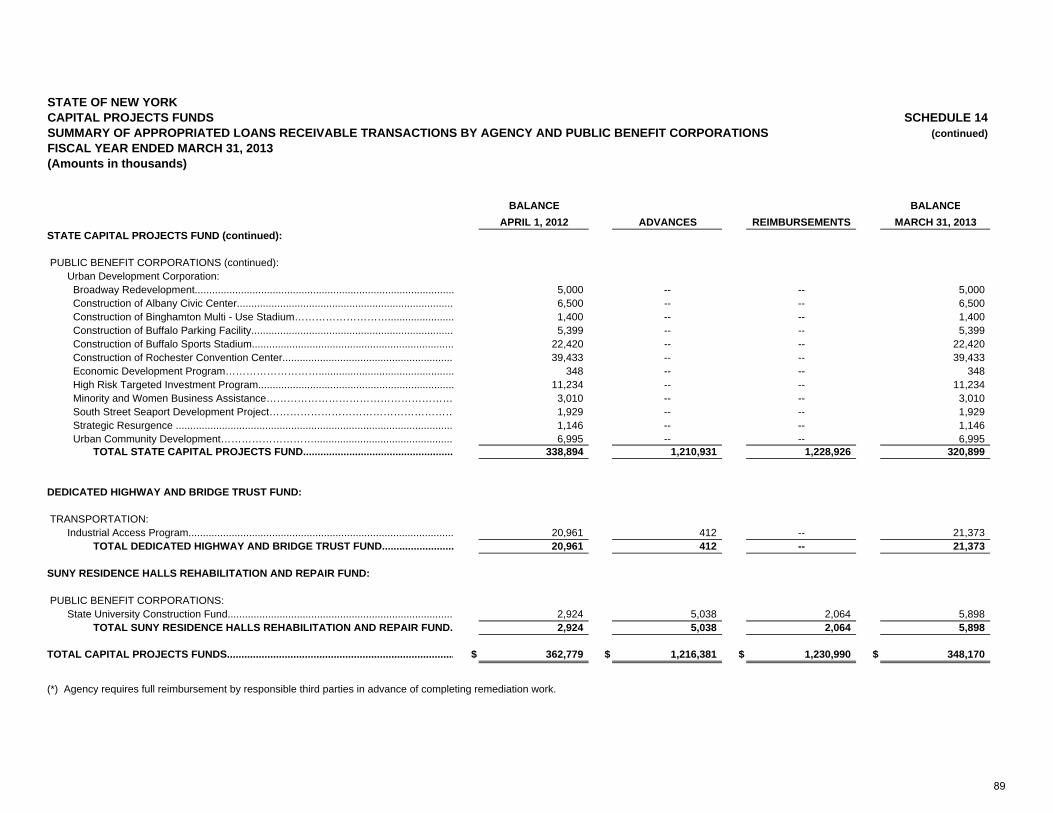
STATE OF NEW YORK CAPITAL PROJECTS FUNDS SCHEDULE 14SUMMARY OF APPROPRIATED LOANS RECEIVABLE TRANSACTIONS BY AGENCY AND PUBLIC BENEFIT CORPORATIONS (continued)FISCAL YEAR ENDED MARCH 31, 2013 (Amounts in thousands)
BALANCE BALANCE
APRIL 1, 2012 ADVANCES REIMBURSEMENTS MARCH 31, 2013STATE CAPITAL PROJECTS FUND (continued):
PUBLIC BENEFIT CORPORATIONS (continued): Urban Development Corporation: Broadway Redevelopment.......................................................................................... 5,000 -- -- 5,000 Construction of Albany Civic Center........................................................................... 6,500 -- -- 6,500 Construction of Binghamton Multi - Use Stadium………………………....................... 1,400 -- -- 1,400 Construction of Buffalo Parking Facility...................................................................... 5,399 -- -- 5,399 Construction of Buffalo Sports Stadium...................................................................... 22,420 -- -- 22,420 Construction of Rochester Convention Center............................................................ 39,433 -- -- 39,433 Economic Development Program………………………............................................... 348 -- -- 348 High Risk Targeted Investment Program.................................................................... 11,234 -- -- 11,234 Minority and Women Business Assistance……………………………………………… 3,010 -- -- 3,010 South Street Seaport Development Project……………………………………………… 1,929 -- -- 1,929 Strategic Resurgence ................................................................................................. 1,146 -- -- 1,146 Urban Community Development………………………................................................. 6,995 -- -- 6,995 TOTAL STATE CAPITAL PROJECTS FUND.................................................... 338,894 1,210,931 1,228,926 320,899
DEDICATED HIGHWAY AND BRIDGE TRUST FUND:
TRANSPORTATION: Industrial Access Program............................................................................................ 20,961 412 -- 21,373 TOTAL DEDICATED HIGHWAY AND BRIDGE TRUST FUND......................... 20,961 412 -- 21,373
SUNY RESIDENCE HALLS REHABILITATION AND REPAIR FUND:
PUBLIC BENEFIT CORPORATIONS: State University Construction Fund............................................................................... 2,924 5,038 2,064 5,898 TOTAL SUNY RESIDENCE HALLS REHABILITATION AND REPAIR FUND. 2,924 5,038 2,064 5,898
TOTAL CAPITAL PROJECTS FUNDS............................................................................... $ 362,779 $ 1,216,381 $ 1,230,990 $ 348,170
(*) Agency requires full reimbursement by responsible third parties in advance of completing remediation work.
89
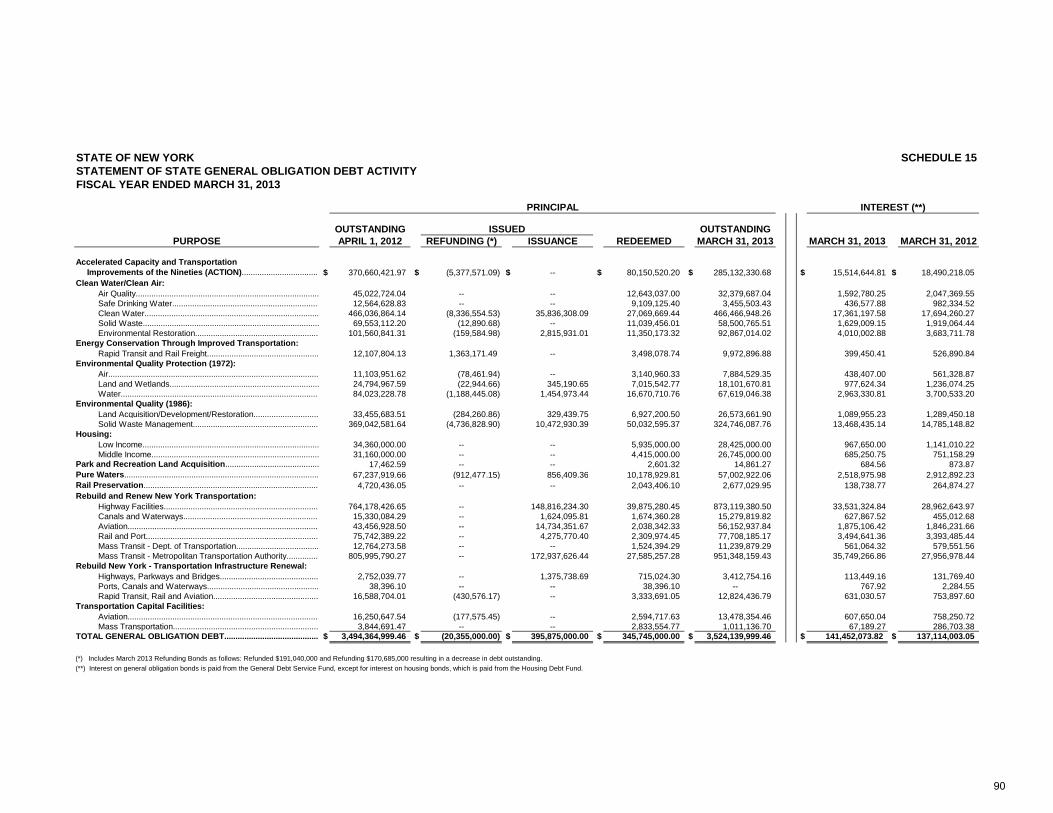
STATE OF NEW YORK SCHEDULE 15STATEMENT OF STATE GENERAL OBLIGATION DEBT ACTIVITYFISCAL YEAR ENDED MARCH 31, 2013
OUTSTANDING OUTSTANDINGPURPOSE APRIL 1, 2012 REFUNDING (*) ISSUANCE REDEEMED MARCH 31, 2013 MARCH 31, 2013 MARCH 31, 2012
Accelerated Capacity and Transportation Improvements of the Nineties (ACTION).................................. $ 370,660,421.97 $ (5,377,571.09) $ -- $ 80,150,520.20 $ 285,132,330.68 $ 15,514,644.81 $ 18,490,218.05Clean Water/Clean Air: Air Quality.................................................................................. 45,022,724.04 -- -- 12,643,037.00 32,379,687.04 1,592,780.25 2,047,369.55 Safe Drinking Water.................................................................. 12,564,628.83 -- -- 9,109,125.40 3,455,503.43 436,577.88 982,334.52 Clean Water.............................................................................. 466,036,864.14 (8,336,554.53) 35,836,308.09 27,069,669.44 466,466,948.26 17,361,197.58 17,694,260.27 Solid Waste............................................................................... 69,553,112.20 (12,890.68) -- 11,039,456.01 58,500,765.51 1,629,009.15 1,919,064.44 Environmental Restoration........................................................ 101,560,841.31 (159,584.98) 2,815,931.01 11,350,173.32 92,867,014.02 4,010,002.88 3,683,711.78Energy Conservation Through Improved Transportation: Rapid Transit and Rail Freight.................................................. 12,107,804.13 1,363,171.49 -- 3,498,078.74 9,972,896.88 399,450.41 526,890.84Environmental Quality Protection (1972): Air.............................................................................................. 11,103,951.62 (78,461.94) -- 3,140,960.33 7,884,529.35 438,407.00 561,328.87 Land and Wetlands................................................................... 24,794,967.59 (22,944.66) 345,190.65 7,015,542.77 18,101,670.81 977,624.34 1,236,074.25 Water......................................................................................... 84,023,228.78 (1,188,445.08) 1,454,973.44 16,670,710.76 67,619,046.38 2,963,330.81 3,700,533.20Environmental Quality (1986): Land Acquisition/Development/Restoration............................. 33,455,683.51 (284,260.86) 329,439.75 6,927,200.50 26,573,661.90 1,089,955.23 1,289,450.18 Solid Waste Management......................................................... 369,042,581.64 (4,736,828.90) 10,472,930.39 50,032,595.37 324,746,087.76 13,468,435.14 14,785,148.82Housing: Low Income............................................................................... 34,360,000.00 -- -- 5,935,000.00 28,425,000.00 967,650.00 1,141,010.22 Middle Income........................................................................... 31,160,000.00 -- -- 4,415,000.00 26,745,000.00 685,250.75 751,158.29Park and Recreation Land Acquisition.......................................... 17,462.59 -- -- 2,601.32 14,861.27 684.56 873.87Pure Waters 67 237 919 66 (912 477 15) 856 409 36 10 178 929 81 57 002 922 06 2 518 975 98 2 912 892 23
INTEREST (**)
ISSUED
PRINCIPAL
Pure Waters....................................................................................... 67,237,919.66 (912,477.15) 856,409.36 10,178,929.81 57,002,922.06 2,518,975.98 2,912,892.23Rail Preservation............................................................................... 4,720,436.05 -- -- 2,043,406.10 2,677,029.95 138,738.77 264,874.27Rebuild and Renew New York Transportation: Highway Facilities...................................................................... 764,178,426.65 -- 148,816,234.30 39,875,280.45 873,119,380.50 33,531,324.84 28,962,643.97 Canals and Waterways............................................................. 15,330,084.29 -- 1,624,095.81 1,674,360.28 15,279,819.82 627,867.52 455,012.68 Aviation...................................................................................... 43,456,928.50 -- 14,734,351.67 2,038,342.33 56,152,937.84 1,875,106.42 1,846,231.66 Rail and Port.............................................................................. 75,742,389.22 -- 4,275,770.40 2,309,974.45 77,708,185.17 3,494,641.36 3,393,485.44 Mass Transit - Dept. of Transportation..................................... 12,764,273.58 -- -- 1,524,394.29 11,239,879.29 561,064.32 579,551.56 Mass Transit - Metropolitan Transportation Authority............... 805,995,790.27 -- 172,937,626.44 27,585,257.28 951,348,159.43 35,749,266.86 27,956,978.44Rebuild New York - Transportation Infrastructure Renewal: Highways, Parkways and Bridges............................................ 2,752,039.77 -- 1,375,738.69 715,024.30 3,412,754.16 113,449.16 131,769.40 Ports, Canals and Waterways.................................................. 38,396.10 -- -- 38,396.10 -- 767.92 2,284.55 Rapid Transit, Rail and Aviation............................................... 16,588,704.01 (430,576.17) -- 3,333,691.05 12,824,436.79 631,030.57 753,897.60Transportation Capital Facilities: Aviation...................................................................................... 16,250,647.54 (177,575.45) -- 2,594,717.63 13,478,354.46 607,650.04 758,250.72 Mass Transportation................................................................. 3,844,691.47 -- -- 2,833,554.77 1,011,136.70 67,189.27 286,703.38TOTAL GENERAL OBLIGATION DEBT........................................... $ 3,494,364,999.46 $ (20,355,000.00) $ 395,875,000.00 $ 345,745,000.00 $ 3,524,139,999.46 $ 141,452,073.82 $ 137,114,003.05
(*) Includes March 2013 Refunding Bonds as follows: Refunded $191,040,000 and Refunding $170,685,000 resulting in a decrease in debt outstanding.(**) Interest on general obligation bonds is paid from the General Debt Service Fund, except for interest on housing bonds, which is paid from the Housing Debt Fund.
90
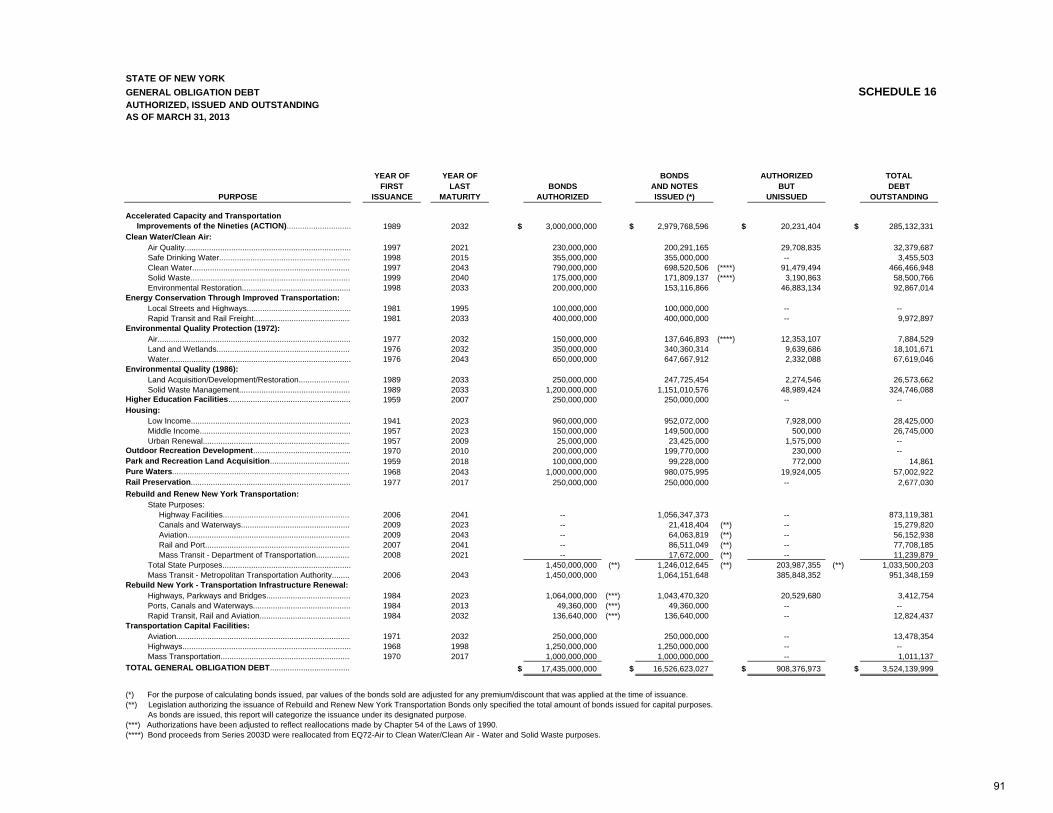
STATE OF NEW YORKGENERAL OBLIGATION DEBT SCHEDULE 16AUTHORIZED, ISSUED AND OUTSTANDINGAS OF MARCH 31, 2013
YEAR OF YEAR OF BONDS AUTHORIZED TOTALFIRST LAST BONDS AND NOTES BUT DEBT
PURPOSE ISSUANCE MATURITY AUTHORIZED ISSUED (*) UNISSUED OUTSTANDING
Accelerated Capacity and Transportation Improvements of the Nineties (ACTION)............................. 1989 2032 $ 3,000,000,000 $ 2,979,768,596 $ 20,231,404 $ 285,132,331Clean Water/Clean Air: Air Quality........................................................................... 1997 2021 230,000,000 200,291,165 29,708,835 32,379,687 Safe Drinking Water........................................................... 1998 2015 355,000,000 355,000,000 -- 3,455,503 Clean Water........................................................................ 1997 2043 790,000,000 698,520,506 (****) 91,479,494 466,466,948 Solid Waste........................................................................ 1999 2040 175,000,000 171,809,137 (****) 3,190,863 58,500,766 Environmental Restoration................................................. 1998 2033 200,000,000 153,116,866 46,883,134 92,867,014 Energy Conservation Through Improved Transportation: Local Streets and Highways............................................... 1981 1995 100,000,000 100,000,000 -- -- Rapid Transit and Rail Freight............................................ 1981 2033 400,000,000 400,000,000 -- 9,972,897 Environmental Quality Protection (1972): Air....................................................................................... 1977 2032 150,000,000 137,646,893 (****) 12,353,107 7,884,529 Land and Wetlands............................................................. 1976 2032 350,000,000 340,360,314 9,639,686 18,101,671 Water.................................................................................. 1976 2043 650,000,000 647,667,912 2,332,088 67,619,046 Environmental Quality (1986): Land Acquisition/Development/Restoration........................ 1989 2033 250,000,000 247,725,454 2,274,546 26,573,662 Solid Waste Management.................................................. 1989 2033 1,200,000,000 1,151,010,576 48,989,424 324,746,088 Higher Education Facilities....................................................... 1959 2007 250,000,000 250,000,000 -- --Housing: Low Income........................................................................ 1941 2023 960,000,000 952,072,000 7,928,000 28,425,000 Middle Income.................................................................... 1957 2023 150,000,000 149,500,000 500,000 26,745,000 Urban Renewal................................................................... 1957 2009 25,000,000 23,425,000 1,575,000 --Outdoor Recreation Development............................................ 1970 2010 200,000,000 199,770,000 230,000 --Park and Recreation Land Acquisition.................................... 1959 2018 100,000,000 99,228,000 772,000 14,861 Pure Waters................................................................................. 1968 2043 1,000,000,000 980,075,995 19,924,005 57,002,922 Rail Preservation........................................................................ 1977 2017 250,000,000 250,000,000 -- 2,677,030 Rebuild and Renew New York Transportation: State Purposes: Highway Facilities.......................................................... 2006 2041 -- 1,056,347,373 -- 873,119,381 Canals and Waterways.................................................. 2009 2023 -- 21,418,404 (**) -- 15,279,820 Aviation.......................................................................... 2009 2043 -- 64,063,819 (**) -- 56,152,938 Rail and Port.................................................................. 2007 2041 -- 86,511,049 (**) -- 77,708,185 Mass Transit - Department of Transportation................ 2008 2021 -- 17,672,000 (**) -- 11,239,879 Total State Purposes.......................................................... 1,450,000,000 (**) 1,246,012,645 (**) 203,987,355 (**) 1,033,500,203 Mass Transit - Metropolitan Transportation Authority......... 2006 2043 1,450,000,000 1,064,151,648 385,848,352 951,348,159 Rebuild New York - Transportation Infrastructure Renewal: Highways, Parkways and Bridges...................................... 1984 2023 1,064,000,000 (***) 1,043,470,320 20,529,680 3,412,754 Ports, Canals and Waterways............................................ 1984 2013 49,360,000 (***) 49,360,000 -- -- Rapid Transit, Rail and Aviation......................................... 1984 2032 136,640,000 (***) 136,640,000 -- 12,824,437 Transportation Capital Facilities: Aviation............................................................................... 1971 2032 250,000,000 250,000,000 -- 13,478,354 Highways............................................................................ 1968 1998 1,250,000,000 1,250,000,000 -- -- Mass Transportation........................................................... 1970 2017 1,000,000,000 1,000,000,000 -- 1,011,137 TOTAL GENERAL OBLIGATION DEBT.................................... $ 17,435,000,000 $ 16,526,623,027 $ 908,376,973 $ 3,524,139,999
(*) For the purpose of calculating bonds issued, par values of the bonds sold are adjusted for any premium/discount that was applied at the time of issuance.(**) Legislation authorizing the issuance of Rebuild and Renew New York Transportation Bonds only specified the total amount of bonds issued for capital purposes. As bonds are issued, this report will categorize the issuance under its designated purpose. (***) Authorizations have been adjusted to reflect reallocations made by Chapter 54 of the Laws of 1990.(****) Bond proceeds from Series 2003D were reallocated from EQ72-Air to Clean Water/Clean Air - Water and Solid Waste purposes.
91
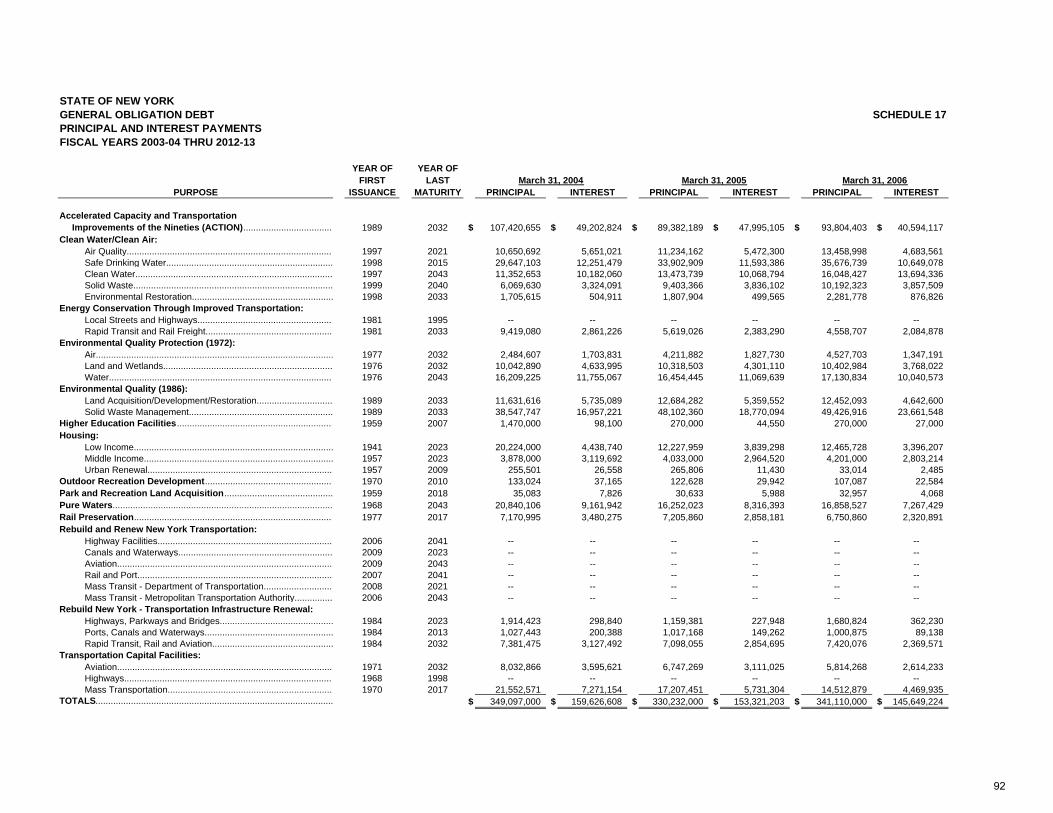
STATE OF NEW YORKGENERAL OBLIGATION DEBT SCHEDULE 17PRINCIPAL AND INTEREST PAYMENTS FISCAL YEARS 2003-04 THRU 2012-13
YEAR OF YEAR OFFIRST LAST
PURPOSE ISSUANCE MATURITY PRINCIPAL INTEREST PRINCIPAL INTEREST PRINCIPAL INTEREST
Accelerated Capacity and Transportation Improvements of the Nineties (ACTION).................................... 1989 2032 $ 107,420,655 $ 49,202,824 $ 89,382,189 $ 47,995,105 $ 93,804,403 $ 40,594,117Clean Water/Clean Air: Air Quality.................................................................................. 1997 2021 10,650,692 5,651,021 11,234,162 5,472,300 13,458,998 4,683,561 Safe Drinking Water.................................................................. 1998 2015 29,647,103 12,251,479 33,902,909 11,593,386 35,676,739 10,649,078 Clean Water.............................................................................. 1997 2043 11,352,653 10,182,060 13,473,739 10,068,794 16,048,427 13,694,336 Solid Waste............................................................................... 1999 2040 6,069,630 3,324,091 9,403,366 3,836,102 10,192,323 3,857,509 Environmental Restoration........................................................ 1998 2033 1,705,615 504,911 1,807,904 499,565 2,281,778 876,826Energy Conservation Through Improved Transportation: Local Streets and Highways...................................................... 1981 1995 -- -- -- -- -- -- Rapid Transit and Rail Freight.................................................. 1981 2033 9,419,080 2,861,226 5,619,026 2,383,290 4,558,707 2,084,878Environmental Quality Protection (1972): Air.............................................................................................. 1977 2032 2,484,607 1,703,831 4,211,882 1,827,730 4,527,703 1,347,191 Land and Wetlands................................................................... 1976 2032 10,042,890 4,633,995 10,318,503 4,301,110 10,402,984 3,768,022 Water......................................................................................... 1976 2043 16,209,225 11,755,067 16,454,445 11,069,639 17,130,834 10,040,573Environmental Quality (1986): Land Acquisition/Development/Restoration.............................. 1989 2033 11,631,616 5,735,089 12,684,282 5,359,552 12,452,093 4,642,600 Solid Waste Management......................................................... 1989 2033 38,547,747 16,957,221 48,102,360 18,770,094 49,426,916 23,661,548Higher Education Facilities.............................................................. 1959 2007 1,470,000 98,100 270,000 44,550 270,000 27,000Housing: Low Income............................................................................... 1941 2023 20,224,000 4,438,740 12,227,959 3,839,298 12,465,728 3,396,207 Middle Income........................................................................... 1957 2023 3,878,000 3,119,692 4,033,000 2,964,520 4,201,000 2,803,214 Urban Renewal......................................................................... 1957 2009 255,501 26,558 265,806 11,430 33,014 2,485Outdoor Recreation Development................................................... 1970 2010 133,024 37,165 122,628 29,942 107,087 22,584Park and Recreation Land Acquisition........................................... 1959 2018 35,083 7,826 30,633 5,988 32,957 4,068Pure Waters....................................................................................... 1968 2043 20,840,106 9,161,942 16,252,023 8,316,393 16,858,527 7,267,429Rail Preservation............................................................................... 1977 2017 7,170,995 3,480,275 7,205,860 2,858,181 6,750,860 2,320,891Rebuild and Renew New York Transportation: Highway Facilities..................................................................... 2006 2041 -- -- -- -- -- -- Canals and Waterways............................................................. 2009 2023 -- -- -- -- -- -- Aviation..................................................................................... 2009 2043 -- -- -- -- -- -- Rail and Port............................................................................. 2007 2041 -- -- -- -- -- -- Mass Transit - Department of Transportation........................... 2008 2021 -- -- -- -- -- -- Mass Transit - Metropolitan Transportation Authority............... 2006 2043 -- -- -- -- -- --Rebuild New York - Transportation Infrastructure Renewal: Highways, Parkways and Bridges............................................. 1984 2023 1,914,423 298,840 1,159,381 227,948 1,680,824 362,230 Ports, Canals and Waterways................................................... 1984 2013 1,027,443 200,388 1,017,168 149,262 1,000,875 89,138 Rapid Transit, Rail and Aviation................................................ 1984 2032 7,381,475 3,127,492 7,098,055 2,854,695 7,420,076 2,369,571Transportation Capital Facilities: Aviation..................................................................................... 1971 2032 8,032,866 3,595,621 6,747,269 3,111,025 5,814,268 2,614,233 Highways................................................................................... 1968 1998 -- -- -- -- -- -- Mass Transportation................................................................. 1970 2017 21,552,571 7,271,154 17,207,451 5,731,304 14,512,879 4,469,935TOTALS.............................................................................................. $ 349,097,000 $ 159,626,608 $ 330,232,000 $ 153,321,203 $ 341,110,000 $ 145,649,224
March 31, 2005 March 31, 2006March 31, 2004
92
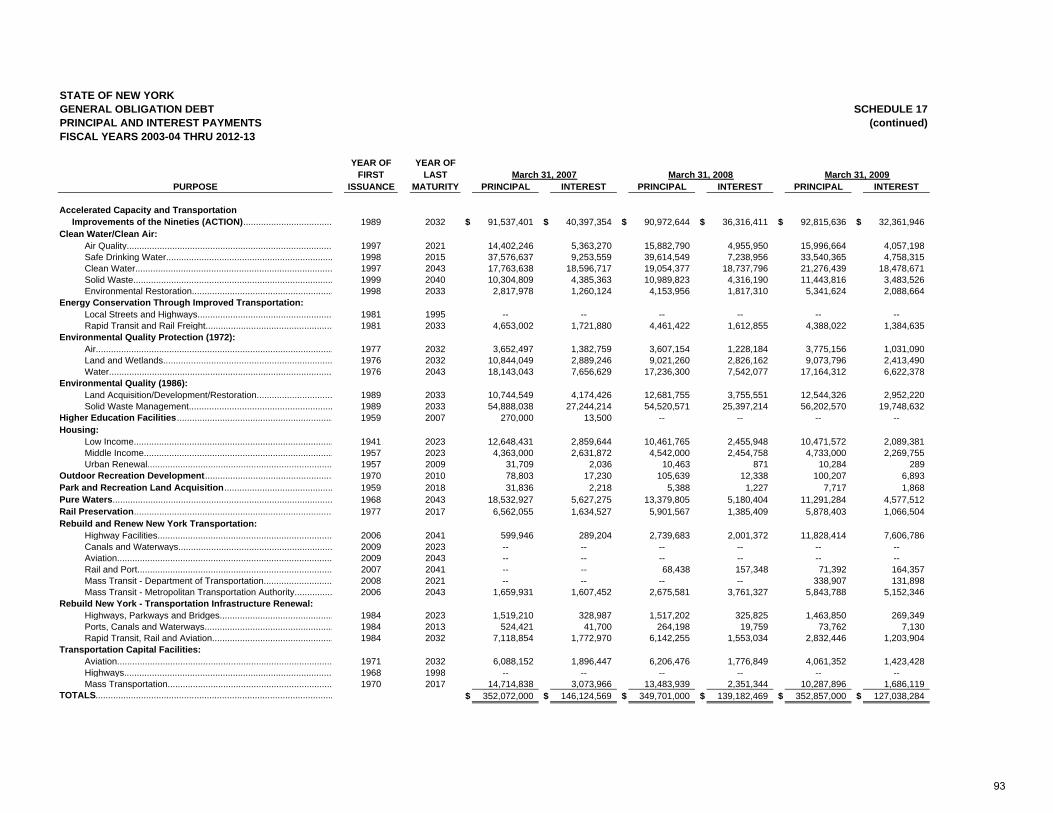
STATE OF NEW YORKGENERAL OBLIGATION DEBT SCHEDULE 17PRINCIPAL AND INTEREST PAYMENTS (continued)FISCAL YEARS 2003-04 THRU 2012-13
YEAR OF YEAR OFFIRST LAST
PURPOSE ISSUANCE MATURITY PRINCIPAL INTEREST PRINCIPAL INTEREST PRINCIPAL INTEREST
Accelerated Capacity and Transportation Improvements of the Nineties (ACTION)................................... 1989 2032 $ 91,537,401 $ 40,397,354 $ 90,972,644 $ 36,316,411 $ 92,815,636 $ 32,361,946Clean Water/Clean Air: Air Quality................................................................................. 1997 2021 14,402,246 5,363,270 15,882,790 4,955,950 15,996,664 4,057,198 Safe Drinking Water.................................................................. 1998 2015 37,576,637 9,253,559 39,614,549 7,238,956 33,540,365 4,758,315 Clean Water.............................................................................. 1997 2043 17,763,638 18,596,717 19,054,377 18,737,796 21,276,439 18,478,671 Solid Waste............................................................................... 1999 2040 10,304,809 4,385,363 10,989,823 4,316,190 11,443,816 3,483,526 Environmental Restoration........................................................ 1998 2033 2,817,978 1,260,124 4,153,956 1,817,310 5,341,624 2,088,664Energy Conservation Through Improved Transportation: Local Streets and Highways..................................................... 1981 1995 -- -- -- -- -- -- Rapid Transit and Rail Freight.................................................. 1981 2033 4,653,002 1,721,880 4,461,422 1,612,855 4,388,022 1,384,635Environmental Quality Protection (1972): Air.............................................................................................. 1977 2032 3,652,497 1,382,759 3,607,154 1,228,184 3,775,156 1,031,090 Land and Wetlands................................................................... 1976 2032 10,844,049 2,889,246 9,021,260 2,826,162 9,073,796 2,413,490 Water........................................................................................ 1976 2043 18,143,043 7,656,629 17,236,300 7,542,077 17,164,312 6,622,378Environmental Quality (1986): Land Acquisition/Development/Restoration.............................. 1989 2033 10,744,549 4,174,426 12,681,755 3,755,551 12,544,326 2,952,220 Solid Waste Management......................................................... 1989 2033 54,888,038 27,244,214 54,520,571 25,397,214 56,202,570 19,748,632Higher Education Facilities.............................................................. 1959 2007 270,000 13,500 -- -- -- --Housing: Low Income............................................................................... 1941 2023 12,648,431 2,859,644 10,461,765 2,455,948 10,471,572 2,089,381 Middle Income........................................................................... 1957 2023 4,363,000 2,631,872 4,542,000 2,454,758 4,733,000 2,269,755 Urban Renewal......................................................................... 1957 2009 31,709 2,036 10,463 871 10,284 289Outdoor Recreation Development.................................................. 1970 2010 78,803 17,230 105,639 12,338 100,207 6,893Park and Recreation Land Acquisition........................................... 1959 2018 31,836 2,218 5,388 1,227 7,717 1,868Pure Waters....................................................................................... 1968 2043 18,532,927 5,627,275 13,379,805 5,180,404 11,291,284 4,577,512Rail Preservation............................................................................... 1977 2017 6,562,055 1,634,527 5,901,567 1,385,409 5,878,403 1,066,504Rebuild and Renew New York Transportation: Highway Facilities..................................................................... 2006 2041 599,946 289,204 2,739,683 2,001,372 11,828,414 7,606,786 Canals and Waterways............................................................. 2009 2023 -- -- -- -- -- -- Aviation..................................................................................... 2009 2043 -- -- -- -- -- -- Rail and Port............................................................................. 2007 2041 -- -- 68,438 157,348 71,392 164,357 Mass Transit - Department of Transportation........................... 2008 2021 -- -- -- -- 338,907 131,898 Mass Transit - Metropolitan Transportation Authority............... 2006 2043 1,659,931 1,607,452 2,675,581 3,761,327 5,843,788 5,152,346Rebuild New York - Transportation Infrastructure Renewal: Highways, Parkways and Bridges............................................. 1984 2023 1,519,210 328,987 1,517,202 325,825 1,463,850 269,349 Ports, Canals and Waterways................................................... 1984 2013 524,421 41,700 264,198 19,759 73,762 7,130 Rapid Transit, Rail and Aviation................................................ 1984 2032 7,118,854 1,772,970 6,142,255 1,553,034 2,832,446 1,203,904Transportation Capital Facilities: Aviation..................................................................................... 1971 2032 6,088,152 1,896,447 6,206,476 1,776,849 4,061,352 1,423,428 Highways.................................................................................. 1968 1998 -- -- -- -- -- -- Mass Transportation................................................................. 1970 2017 14,714,838 3,073,966 13,483,939 2,351,344 10,287,896 1,686,119TOTALS.............................................................................................. $ 352,072,000 $ 146,124,569 $ 349,701,000 $ 139,182,469 $ 352,857,000 $ 127,038,284
March 31, 2008 March 31, 2009March 31, 2007
93
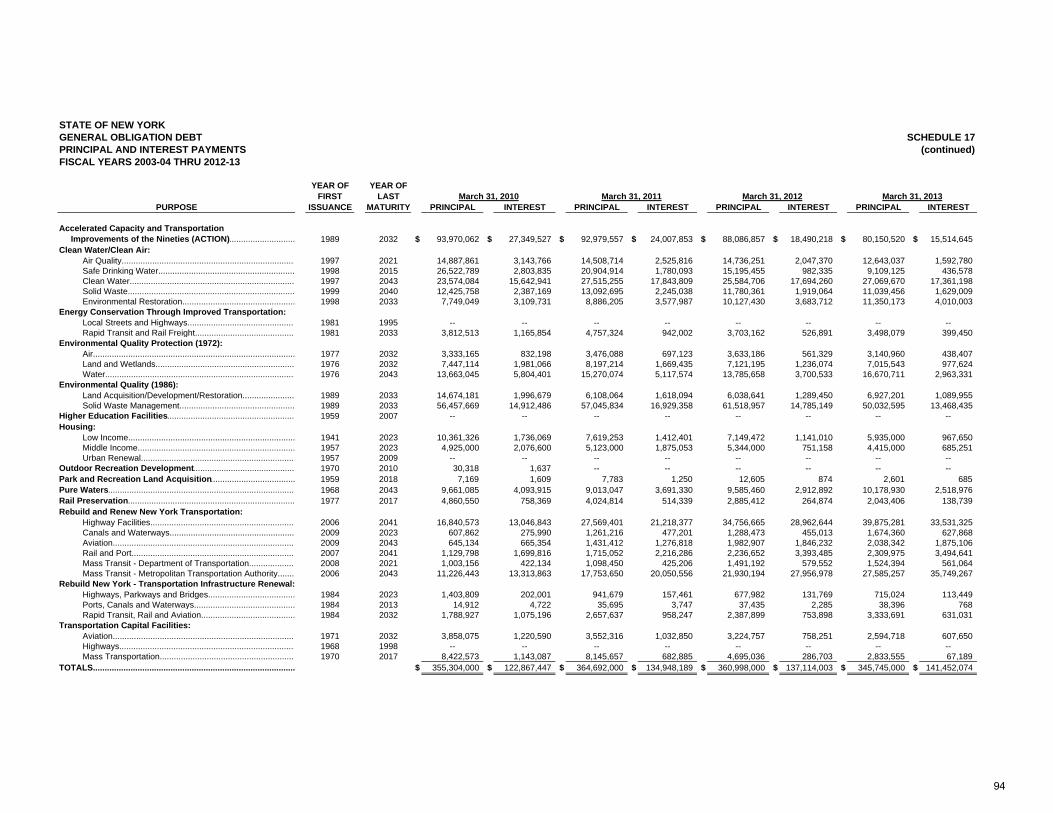
STATE OF NEW YORKGENERAL OBLIGATION DEBT SCHEDULE 17PRINCIPAL AND INTEREST PAYMENTS (continued)FISCAL YEARS 2003-04 THRU 2012-13
YEAR OF YEAR OFFIRST LAST
PURPOSE ISSUANCE MATURITY PRINCIPAL INTEREST PRINCIPAL INTEREST PRINCIPAL INTEREST PRINCIPAL INTEREST
Accelerated Capacity and Transportation Improvements of the Nineties (ACTION)............................ 1989 2032 $ 93,970,062 $ 27,349,527 $ 92,979,557 $ 24,007,853 $ 88,086,857 $ 18,490,218 $ 80,150,520 $ 15,514,645Clean Water/Clean Air: Air Quality.......................................................................... 1997 2021 14,887,861 3,143,766 14,508,714 2,525,816 14,736,251 2,047,370 12,643,037 1,592,780 Safe Drinking Water.......................................................... 1998 2015 26,522,789 2,803,835 20,904,914 1,780,093 15,195,455 982,335 9,109,125 436,578 Clean Water...................................................................... 1997 2043 23,574,084 15,642,941 27,515,255 17,843,809 25,584,706 17,694,260 27,069,670 17,361,198 Solid Waste....................................................................... 1999 2040 12,425,758 2,387,169 13,092,695 2,245,038 11,780,361 1,919,064 11,039,456 1,629,009 Environmental Restoration................................................ 1998 2033 7,749,049 3,109,731 8,886,205 3,577,987 10,127,430 3,683,712 11,350,173 4,010,003Energy Conservation Through Improved Transportation: Local Streets and Highways.............................................. 1981 1995 -- -- -- -- -- -- -- -- Rapid Transit and Rail Freight........................................... 1981 2033 3,812,513 1,165,854 4,757,324 942,002 3,703,162 526,891 3,498,079 399,450Environmental Quality Protection (1972): Air...................................................................................... 1977 2032 3,333,165 832,198 3,476,088 697,123 3,633,186 561,329 3,140,960 438,407 Land and Wetlands........................................................... 1976 2032 7,447,114 1,981,066 8,197,214 1,669,435 7,121,195 1,236,074 7,015,543 977,624 Water................................................................................. 1976 2043 13,663,045 5,804,401 15,270,074 5,117,574 13,785,658 3,700,533 16,670,711 2,963,331Environmental Quality (1986): Land Acquisition/Development/Restoration...................... 1989 2033 14,674,181 1,996,679 6,108,064 1,618,094 6,038,641 1,289,450 6,927,201 1,089,955 Solid Waste Management................................................. 1989 2033 56,457,669 14,912,486 57,045,834 16,929,358 61,518,957 14,785,149 50,032,595 13,468,435Higher Education Facilities...................................................... 1959 2007 -- -- -- -- -- -- -- --Housing: Low Income....................................................................... 1941 2023 10,361,326 1,736,069 7,619,253 1,412,401 7,149,472 1,141,010 5,935,000 967,650 Middle Income................................................................... 1957 2023 4,925,000 2,076,600 5,123,000 1,875,053 5,344,000 751,158 4,415,000 685,251 Urban Renewal.................................................................. 1957 2009 -- -- -- -- -- -- -- --Outdoor Recreation Development........................................... 1970 2010 30,318 1,637 -- -- -- -- -- --Park and Recreation Land Acquisition.................................... 1959 2018 7,169 1,609 7,783 1,250 12,605 874 2,601 685Pure Waters................................................................................ 1968 2043 9,661,085 4,093,915 9,013,047 3,691,330 9,585,460 2,912,892 10,178,930 2,518,976Rail Preservation....................................................................... 1977 2017 4,860,550 758,369 4,024,814 514,339 2,885,412 264,874 2,043,406 138,739Rebuild and Renew New York Transportation: Highway Facilities.............................................................. 2006 2041 16,840,573 13,046,843 27,569,401 21,218,377 34,756,665 28,962,644 39,875,281 33,531,325 Canals and Waterways..................................................... 2009 2023 607,862 275,990 1,261,216 477,201 1,288,473 455,013 1,674,360 627,868 Aviation.............................................................................. 2009 2043 645,134 665,354 1,431,412 1,276,818 1,982,907 1,846,232 2,038,342 1,875,106 Rail and Port...................................................................... 2007 2041 1,129,798 1,699,816 1,715,052 2,216,286 2,236,652 3,393,485 2,309,975 3,494,641 Mass Transit - Department of Transportation.................... 2008 2021 1,003,156 422,134 1,098,450 425,206 1,491,192 579,552 1,524,394 561,064 Mass Transit - Metropolitan Transportation Authority....... 2006 2043 11,226,443 13,313,863 17,753,650 20,050,556 21,930,194 27,956,978 27,585,257 35,749,267Rebuild New York - Transportation Infrastructure Renewal: Highways, Parkways and Bridges..................................... 1984 2023 1,403,809 202,001 941,679 157,461 677,982 131,769 715,024 113,449 Ports, Canals and Waterways........................................... 1984 2013 14,912 4,722 35,695 3,747 37,435 2,285 38,396 768 Rapid Transit, Rail and Aviation........................................ 1984 2032 1,788,927 1,075,196 2,657,637 958,247 2,387,899 753,898 3,333,691 631,031Transportation Capital Facilities: Aviation.............................................................................. 1971 2032 3,858,075 1,220,590 3,552,316 1,032,850 3,224,757 758,251 2,594,718 607,650 Highways........................................................................... 1968 1998 -- -- -- -- -- -- -- -- Mass Transportation.......................................................... 1970 2017 8,422,573 1,143,087 8,145,657 682,885 4,695,036 286,703 2,833,555 67,189TOTALS...................................................................................... $ 355,304,000 $ 122,867,447 $ 364,692,000 $ 134,948,189 $ 360,998,000 $ 137,114,003 $ 345,745,000 $ 141,452,074
March 31, 2012 March 31, 2013March 31, 2011March 31, 2010
94
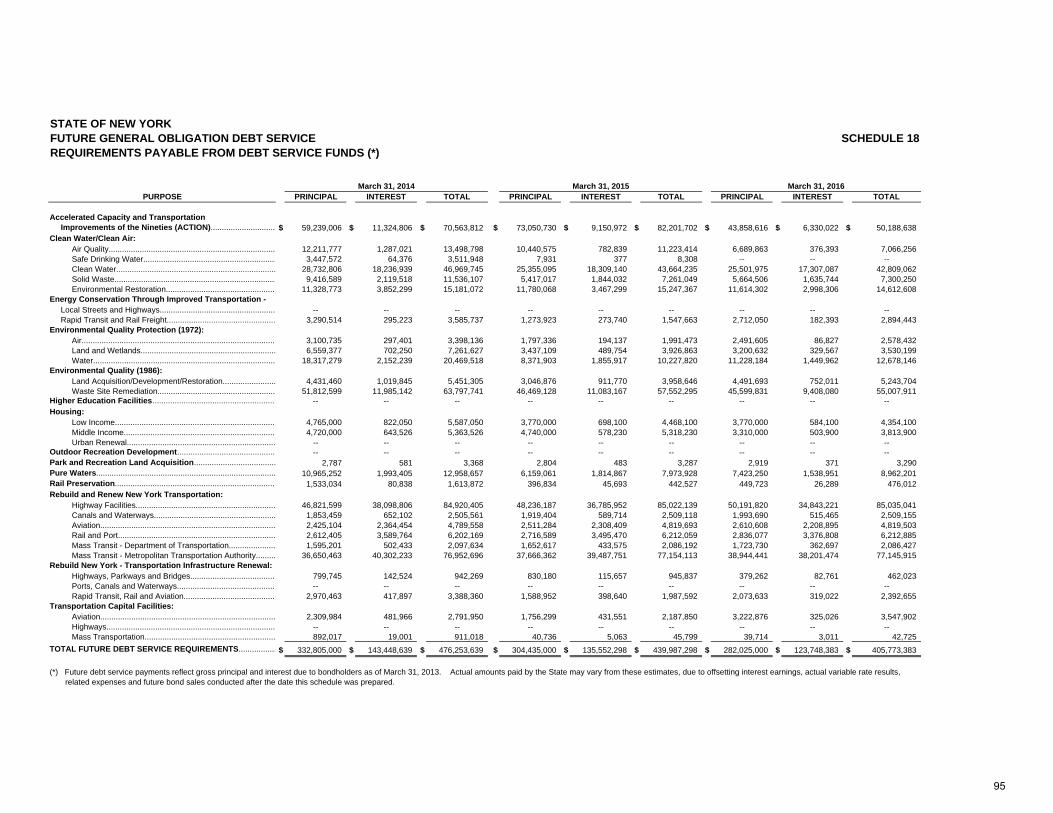
STATE OF NEW YORKFUTURE GENERAL OBLIGATION DEBT SERVICE SCHEDULE 18REQUIREMENTS PAYABLE FROM DEBT SERVICE FUNDS (*)
PURPOSE PRINCIPAL INTEREST TOTAL PRINCIPAL INTEREST TOTAL PRINCIPAL INTEREST TOTAL
Accelerated Capacity and Transportation Improvements of the Nineties (ACTION)............................. $ 59,239,006 $ 11,324,806 $ 70,563,812 $ 73,050,730 $ 9,150,972 $ 82,201,702 $ 43,858,616 $ 6,330,022 $ 50,188,638Clean Water/Clean Air: Air Quality........................................................................... 12,211,777 1,287,021 13,498,798 10,440,575 782,839 11,223,414 6,689,863 376,393 7,066,256 Safe Drinking Water............................................................ 3,447,572 64,376 3,511,948 7,931 377 8,308 -- -- -- Clean Water........................................................................ 28,732,806 18,236,939 46,969,745 25,355,095 18,309,140 43,664,235 25,501,975 17,307,087 42,809,062 Solid Waste......................................................................... 9,416,589 2,119,518 11,536,107 5,417,017 1,844,032 7,261,049 5,664,506 1,635,744 7,300,250 Environmental Restoration.................................................. 11,328,773 3,852,299 15,181,072 11,780,068 3,467,299 15,247,367 11,614,302 2,998,306 14,612,608Energy Conservation Through Improved Transportation - Local Streets and Highways.................................................... -- -- -- -- -- -- -- -- -- Rapid Transit and Rail Freight................................................. 3,290,514 295,223 3,585,737 1,273,923 273,740 1,547,663 2,712,050 182,393 2,894,443Environmental Quality Protection (1972): Air........................................................................................ 3,100,735 297,401 3,398,136 1,797,336 194,137 1,991,473 2,491,605 86,827 2,578,432 Land and Wetlands............................................................. 6,559,377 702,250 7,261,627 3,437,109 489,754 3,926,863 3,200,632 329,567 3,530,199 Water.................................................................................. 18,317,279 2,152,239 20,469,518 8,371,903 1,855,917 10,227,820 11,228,184 1,449,962 12,678,146Environmental Quality (1986): Land Acquisition/Development/Restoration........................ 4,431,460 1,019,845 5,451,305 3,046,876 911,770 3,958,646 4,491,693 752,011 5,243,704 Waste Site Remediation..................................................... 51,812,599 11,985,142 63,797,741 46,469,128 11,083,167 57,552,295 45,599,831 9,408,080 55,007,911Higher Education Facilities........................................................ -- -- -- -- -- -- -- -- --Housing: Low Income......................................................................... 4,765,000 822,050 5,587,050 3,770,000 698,100 4,468,100 3,770,000 584,100 4,354,100 Middle Income..................................................................... 4,720,000 643,526 5,363,526 4,740,000 578,230 5,318,230 3,310,000 503,900 3,813,900 Urban Renewal................................................................... -- -- -- -- -- -- -- -- --Outdoor Recreation Development............................................ -- -- -- -- -- -- -- -- --Park and Recreation Land Acquisition..................................... 2,787 581 3,368 2,804 483 3,287 2,919 371 3,290Pure Waters................................................................................. 10,965,252 1,993,405 12,958,657 6,159,061 1,814,867 7,973,928 7,423,250 1,538,951 8,962,201Rail Preservation......................................................................... 1,533,034 80,838 1,613,872 396,834 45,693 442,527 449,723 26,289 476,012Rebuild and Renew New York Transportation: Highway Facilities............................................................... 46,821,599 38,098,806 84,920,405 48,236,187 36,785,952 85,022,139 50,191,820 34,843,221 85,035,041 Canals and Waterways....................................................... 1,853,459 652,102 2,505,561 1,919,404 589,714 2,509,118 1,993,690 515,465 2,509,155 Aviation............................................................................... 2,425,104 2,364,454 4,789,558 2,511,284 2,308,409 4,819,693 2,610,608 2,208,895 4,819,503 Rail and Port....................................................................... 2,612,405 3,589,764 6,202,169 2,716,589 3,495,470 6,212,059 2,836,077 3,376,808 6,212,885 Mass Transit - Department of Transportation..................... 1,595,201 502,433 2,097,634 1,652,617 433,575 2,086,192 1,723,730 362,697 2,086,427 Mass Transit - Metropolitan Transportation Authority......... 36,650,463 40,302,233 76,952,696 37,666,362 39,487,751 77,154,113 38,944,441 38,201,474 77,145,915Rebuild New York - Transportation Infrastructure Renewal: Highways, Parkways and Bridges....................................... 799,745 142,524 942,269 830,180 115,657 945,837 379,262 82,761 462,023 Ports, Canals and Waterways............................................. -- -- -- -- -- -- -- -- -- Rapid Transit, Rail and Aviation.......................................... 2,970,463 417,897 3,388,360 1,588,952 398,640 1,987,592 2,073,633 319,022 2,392,655Transportation Capital Facilities: Aviation............................................................................... 2,309,984 481,966 2,791,950 1,756,299 431,551 2,187,850 3,222,876 325,026 3,547,902 Highways............................................................................ -- -- -- -- -- -- -- -- -- Mass Transportation........................................................... 892,017 19,001 911,018 40,736 5,063 45,799 39,714 3,011 42,725TOTAL FUTURE DEBT SERVICE REQUIREMENTS................. $ 332,805,000 $ 143,448,639 $ 476,253,639 $ 304,435,000 $ 135,552,298 $ 439,987,298 $ 282,025,000 $ 123,748,383 $ 405,773,383
(*) Future debt service payments reflect gross principal and interest due to bondholders as of March 31, 2013. Actual amounts paid by the State may vary from these estimates, due to offsetting interest earnings, actual variable rate results, related expenses and future bond sales conducted after the date this schedule was prepared.
March 31, 2014 March 31, 2015 March 31, 2016
95
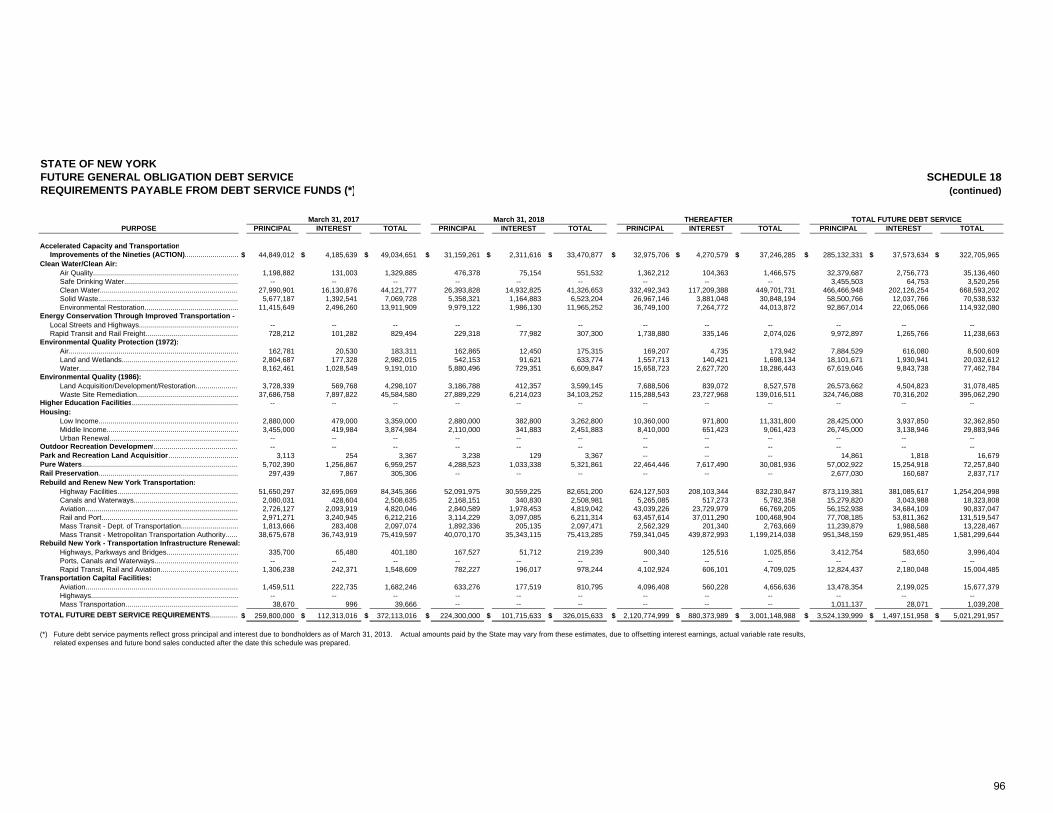
STATE OF NEW YORKFUTURE GENERAL OBLIGATION DEBT SERVICE SCHEDULE 18REQUIREMENTS PAYABLE FROM DEBT SERVICE FUNDS (*) (continued)
PURPOSE PRINCIPAL INTEREST TOTAL PRINCIPAL INTEREST TOTAL PRINCIPAL INTEREST TOTAL PRINCIPAL INTEREST TOTAL
Accelerated Capacity and Transportation Improvements of the Nineties (ACTION)........................... $ 44,849,012 $ 4,185,639 $ 49,034,651 $ 31,159,261 $ 2,311,616 $ 33,470,877 $ 32,975,706 $ 4,270,579 $ 37,246,285 $ 285,132,331 $ 37,573,634 $ 322,705,965Clean Water/Clean Air: Air Quality......................................................................... 1,198,882 131,003 1,329,885 476,378 75,154 551,532 1,362,212 104,363 1,466,575 32,379,687 2,756,773 35,136,460 Safe Drinking Water......................................................... -- -- -- -- -- -- -- -- -- 3,455,503 64,753 3,520,256 Clean Water...................................................................... 27,990,901 16,130,876 44,121,777 26,393,828 14,932,825 41,326,653 332,492,343 117,209,388 449,701,731 466,466,948 202,126,254 668,593,202 Solid Waste...................................................................... 5,677,187 1,392,541 7,069,728 5,358,321 1,164,883 6,523,204 26,967,146 3,881,048 30,848,194 58,500,766 12,037,766 70,538,532 Environmental Restoration............................................... 11,415,649 2,496,260 13,911,909 9,979,122 1,986,130 11,965,252 36,749,100 7,264,772 44,013,872 92,867,014 22,065,066 114,932,080Energy Conservation Through Improved Transportation - Local Streets and Highways.................................................. -- -- -- -- -- -- -- -- -- -- -- -- Rapid Transit and Rail Freight............................................... 728,212 101,282 829,494 229,318 77,982 307,300 1,738,880 335,146 2,074,026 9,972,897 1,265,766 11,238,663Environmental Quality Protection (1972): Air..................................................................................... 162,781 20,530 183,311 162,865 12,450 175,315 169,207 4,735 173,942 7,884,529 616,080 8,500,609 Land and Wetlands........................................................... 2,804,687 177,328 2,982,015 542,153 91,621 633,774 1,557,713 140,421 1,698,134 18,101,671 1,930,941 20,032,612 Water................................................................................ 8,162,461 1,028,549 9,191,010 5,880,496 729,351 6,609,847 15,658,723 2,627,720 18,286,443 67,619,046 9,843,738 77,462,784Environmental Quality (1986): Land Acquisition/Development/Restoration...................... 3,728,339 569,768 4,298,107 3,186,788 412,357 3,599,145 7,688,506 839,072 8,527,578 26,573,662 4,504,823 31,078,485 Waste Site Remediation................................................... 37,686,758 7,897,822 45,584,580 27,889,229 6,214,023 34,103,252 115,288,543 23,727,968 139,016,511 324,746,088 70,316,202 395,062,290Higher Education Facilities...................................................... -- -- -- -- -- -- -- -- -- -- -- --Housing: Low Income...................................................................... 2,880,000 479,000 3,359,000 2,880,000 382,800 3,262,800 10,360,000 971,800 11,331,800 28,425,000 3,937,850 32,362,850 Middle Income.................................................................. 3,455,000 419,984 3,874,984 2,110,000 341,883 2,451,883 8,410,000 651,423 9,061,423 26,745,000 3,138,946 29,883,946 Urban Renewal................................................................. -- -- -- -- -- -- -- -- -- -- -- --Outdoor Recreation Development........................................... -- -- -- -- -- -- -- -- -- -- -- --Park and Recreation Land Acquisition................................... 3,113 254 3,367 3,238 129 3,367 -- -- -- 14,861 1,818 16,679Pure Waters.............................................................................. 5,702,390 1,256,867 6,959,257 4,288,523 1,033,338 5,321,861 22,464,446 7,617,490 30,081,936 57,002,922 15,254,918 72,257,840Rail Preservation...................................................................... 297,439 7,867 305,306 -- -- -- -- -- -- 2,677,030 160,687 2,837,717Rebuild and Renew New York Transportation: Highway Facilities............................................................. 51,650,297 32,695,069 84,345,366 52,091,975 30,559,225 82,651,200 624,127,503 208,103,344 832,230,847 873,119,381 381,085,617 1,254,204,998 Canals and Waterways..................................................... 2,080,031 428,604 2,508,635 2,168,151 340,830 2,508,981 5,265,085 517,273 5,782,358 15,279,820 3,043,988 18,323,808 Aviation............................................................................. 2,726,127 2,093,919 4,820,046 2,840,589 1,978,453 4,819,042 43,039,226 23,729,979 66,769,205 56,152,938 34,684,109 90,837,047 Rail and Port..................................................................... 2,971,271 3,240,945 6,212,216 3,114,229 3,097,085 6,211,314 63,457,614 37,011,290 100,468,904 77,708,185 53,811,362 131,519,547 Mass Transit - Dept. of Transportation............................. 1,813,666 283,408 2,097,074 1,892,336 205,135 2,097,471 2,562,329 201,340 2,763,669 11,239,879 1,988,588 13,228,467 Mass Transit - Metropolitan Transportation Authority....... 38,675,678 36,743,919 75,419,597 40,070,170 35,343,115 75,413,285 759,341,045 439,872,993 1,199,214,038 951,348,159 629,951,485 1,581,299,644Rebuild New York - Transportation Infrastructure Renewal: Highways, Parkways and Bridges.................................... 335,700 65,480 401,180 167,527 51,712 219,239 900,340 125,516 1,025,856 3,412,754 583,650 3,996,404 Ports, Canals and Waterways.......................................... -- -- -- -- -- -- -- -- -- -- -- -- Rapid Transit, Rail and Aviation....................................... 1,306,238 242,371 1,548,609 782,227 196,017 978,244 4,102,924 606,101 4,709,025 12,824,437 2,180,048 15,004,485Transportation Capital Facilities: Aviation............................................................................. 1,459,511 222,735 1,682,246 633,276 177,519 810,795 4,096,408 560,228 4,656,636 13,478,354 2,199,025 15,677,379 Highways.......................................................................... -- -- -- -- -- -- -- -- -- -- -- -- Mass Transportation......................................................... 38,670 996 39,666 -- -- -- -- -- -- 1,011,137 28,071 1,039,208TOTAL FUTURE DEBT SERVICE REQUIREMENTS.............. $ 259,800,000 $ 112,313,016 $ 372,113,016 $ 224,300,000 $ 101,715,633 $ 326,015,633 $ 2,120,774,999 $ 880,373,989 $ 3,001,148,988 $ 3,524,139,999 $ 1,497,151,958 $ 5,021,291,957
(*) Future debt service payments reflect gross principal and interest due to bondholders as of March 31, 2013. Actual amounts paid by the State may vary from these estimates, due to offsetting interest earnings, actual variable rate results, related expenses and future bond sales conducted after the date this schedule was prepared.
March 31, 2017 March 31, 2018 THEREAFTER TOTAL FUTURE DEBT SERVICE
96
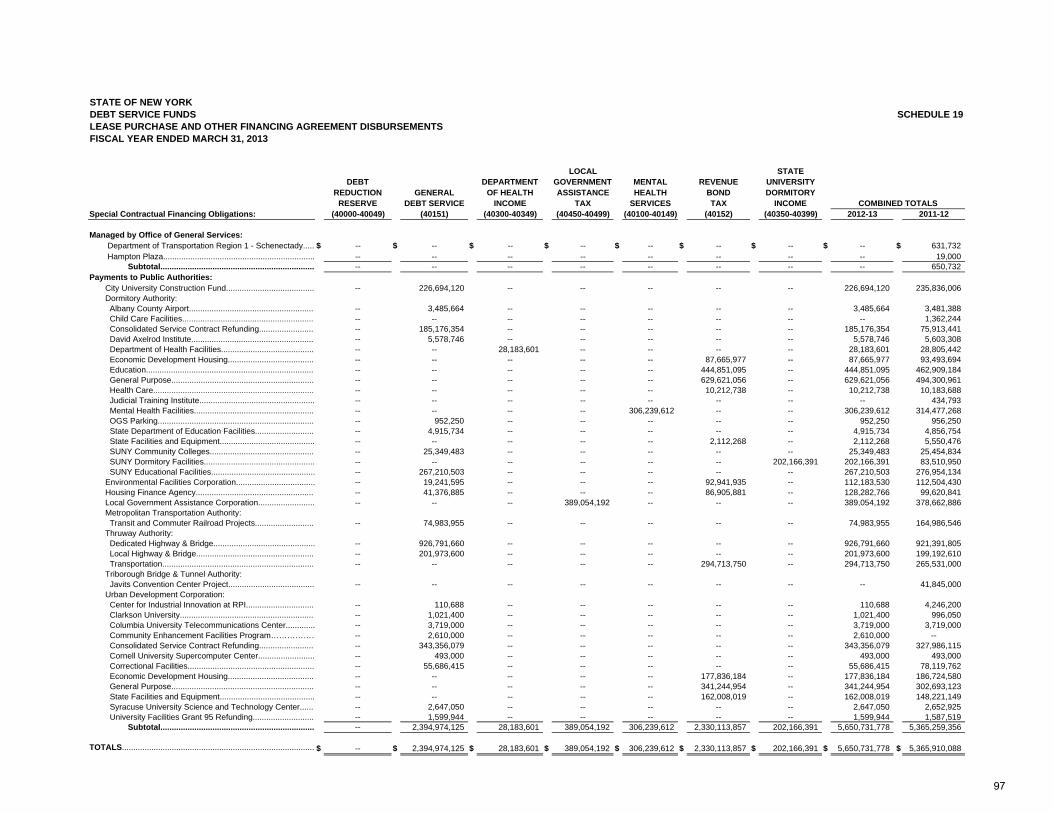
STATE OF NEW YORKDEBT SERVICE FUNDS SCHEDULE 19LEASE PURCHASE AND OTHER FINANCING AGREEMENT DISBURSEMENTSFISCAL YEAR ENDED MARCH 31, 2013
LOCAL STATEDEBT DEPARTMENT GOVERNMENT MENTAL REVENUE UNIVERSITY
REDUCTION GENERAL OF HEALTH ASSISTANCE HEALTH BOND DORMITORYRESERVE DEBT SERVICE INCOME TAX SERVICES TAX INCOME
Special Contractual Financing Obligations: (40000-40049) (40151) (40300-40349) (40450-40499) (40100-40149) (40152) (40350-40399) 2012-13 2011-12
Managed by Office of General Services: Department of Transportation Region 1 - Schenectady..... $ -- $ -- $ -- $ -- $ -- $ -- $ -- $ -- $ 631,732 Hampton Plaza................................................................... -- -- -- -- -- -- -- -- 19,000 Subtotal.................................................................... -- -- -- -- -- -- -- -- 650,732 Payments to Public Authorities: City University Construction Fund....................................... -- 226,694,120 -- -- -- -- -- 226,694,120 235,836,006 Dormitory Authority: Albany County Airport........................................................ -- 3,485,664 -- -- -- -- -- 3,485,664 3,481,388 Child Care Facilities........................................................... -- -- -- -- -- -- -- -- 1,362,244 Consolidated Service Contract Refunding......................... -- 185,176,354 -- -- -- -- -- 185,176,354 75,913,441 David Axelrod Institute....................................................... -- 5,578,746 -- -- -- -- -- 5,578,746 5,603,308 Department of Health Facilities.......................................... -- -- 28,183,601 -- -- -- -- 28,183,601 28,805,442 Economic Development Housing....................................... -- -- -- -- -- 87,665,977 -- 87,665,977 93,493,694 Education........................................................................... -- -- -- -- -- 444,851,095 -- 444,851,095 462,909,184 General Purpose................................................................ -- -- -- -- -- 629,621,056 -- 629,621,056 494,300,961 Health Care........................................................................ -- -- -- -- -- 10,212,738 -- 10,212,738 10,183,688 Judicial Training Institute................................................... -- -- -- -- -- -- -- -- 434,793 Mental Health Facilities...................................................... -- -- -- -- 306,239,612 -- -- 306,239,612 314,477,268 OGS Parking...................................................................... -- 952,250 -- -- -- -- -- 952,250 956,250 State Department of Education Facilities........................... -- 4,915,734 -- -- -- -- -- 4,915,734 4,856,754 State Facilities and Equipment.......................................... -- -- -- -- -- 2,112,268 -- 2,112,268 5,550,476 SUNY Community Colleges............................................... -- 25,349,483 -- -- -- -- -- 25,349,483 25,454,834 SUNY Dormitory Facilities................................................. -- -- -- -- -- -- 202,166,391 202,166,391 83,510,950 SUNY Educational Facilities.............................................. -- 267,210,503 -- -- -- -- -- 267,210,503 276,954,134 Environmental Facilities Corporation................................... -- 19,241,595 -- -- -- 92,941,935 -- 112,183,530 112,504,430 Housing Finance Agency..................................................... -- 41,376,885 -- -- -- 86,905,881 -- 128,282,766 99,620,841 Local Government Assistance Corporation......................... -- -- -- 389,054,192 -- -- -- 389,054,192 378,662,886 Metropolitan Transportation Authority: Transit and Commuter Railroad Projects........................... -- 74,983,955 -- -- -- -- -- 74,983,955 164,986,546 Thruway Authority: Dedicated Highway & Bridge............................................. -- 926,791,660 -- -- -- -- -- 926,791,660 921,391,805 Local Highway & Bridge..................................................... -- 201,973,600 -- -- -- -- -- 201,973,600 199,192,610 Transportation.................................................................... -- -- -- -- -- 294,713,750 -- 294,713,750 265,531,000 Triborough Bridge & Tunnel Authority: Javits Convention Center Project...................................... -- -- -- -- -- -- -- -- 41,845,000 Urban Development Corporation: Center for Industrial Innovation at RPI............................... -- 110,688 -- -- -- -- -- 110,688 4,246,200 Clarkson University............................................................ -- 1,021,400 -- -- -- -- -- 1,021,400 996,050 Columbia University Telecommunications Center............. -- 3,719,000 -- -- -- -- -- 3,719,000 3,719,000 Community Enhancement Facilities Program……………… -- 2,610,000 -- -- -- -- -- 2,610,000 -- Consolidated Service Contract Refunding......................... -- 343,356,079 -- -- -- -- -- 343,356,079 327,986,115 Cornell University Supercomputer Center......................... -- 493,000 -- -- -- -- -- 493,000 493,000 Correctional Facilities........................................................ -- 55,686,415 -- -- -- -- -- 55,686,415 78,119,762 Economic Development Housing....................................... -- -- -- -- -- 177,836,184 -- 177,836,184 186,724,580 General Purpose................................................................ -- -- -- -- -- 341,244,954 -- 341,244,954 302,693,123 State Facilities and Equipment.......................................... -- -- -- -- -- 162,008,019 -- 162,008,019 148,221,149 Syracuse University Science and Technology Center....... -- 2,647,050 -- -- -- -- -- 2,647,050 2,652,925 University Facilities Grant 95 Refunding............................ -- 1,599,944 -- -- -- -- -- 1,599,944 1,587,519 Subtotal.................................................................... -- 2,394,974,125 28,183,601 389,054,192 306,239,612 2,330,113,857 202,166,391 5,650,731,778 5,365,259,356
TOTALS..................................................................................... $ -- $ 2,394,974,125 $ 28,183,601 $ 389,054,192 $ 306,239,612 $ 2,330,113,857 $ 202,166,391 $ 5,650,731,778 $ 5,365,910,088
COMBINED TOTALS
97
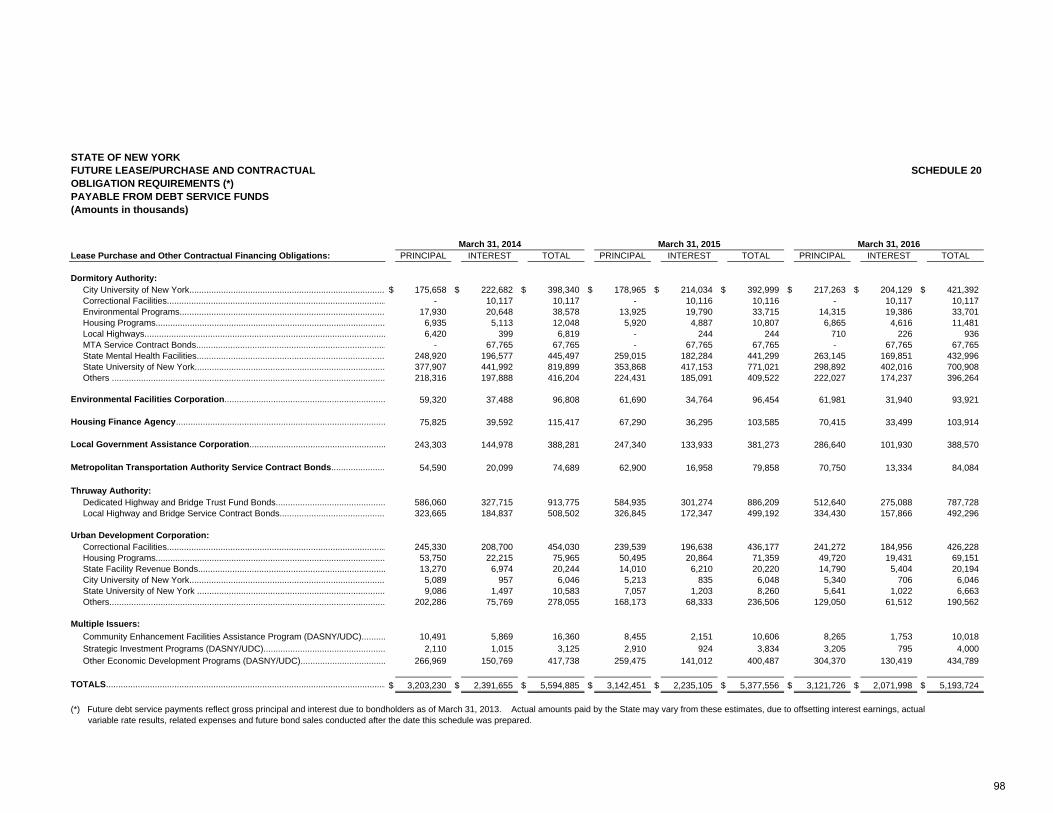
STATE OF NEW YORKFUTURE LEASE/PURCHASE AND CONTRACTUAL SCHEDULE 20OBLIGATION REQUIREMENTS (*)PAYABLE FROM DEBT SERVICE FUNDS(Amounts in thousands)
Lease Purchase and Other Contractual Financing Obligations: PRINCIPAL INTEREST TOTAL PRINCIPAL INTEREST TOTAL PRINCIPAL INTEREST TOTAL
Dormitory Authority: City University of New York................................................................................ $ 175,658 $ 222,682 $ 398,340 $ 178,965 $ 214,034 $ 392,999 $ 217,263 $ 204,129 $ 421,392 Correctional Facilities.......................................................................................... . - 10,117 10,117 - 10,116 10,116 - 10,117 10,117 Environmental Programs.................................................................................... . 17,930 20,648 38,578 13,925 19,790 33,715 14,315 19,386 33,701 Housing Programs.............................................................................................. . 6,935 5,113 12,048 5,920 4,887 10,807 6,865 4,616 11,481 Local Highways................................................................................................... . 6,420 399 6,819 - 244 244 710 226 936 MTA Service Contract Bonds.............................................................................. . - 67,765 67,765 - 67,765 67,765 - 67,765 67,765 State Mental Health Facilities............................................................................. 248,920 196,577 445,497 259,015 182,284 441,299 263,145 169,851 432,996 State University of New York.............................................................................. 377,907 441,992 819,899 353,868 417,153 771,021 298,892 402,016 700,908 Others ................................................................................................................ 218,316 197,888 416,204 224,431 185,091 409,522 222,027 174,237 396,264
Environmental Facilities Corporation.................................................................. . 59,320 37,488 96,808 61,690 34,764 96,454 61,981 31,940 93,921
Housing Finance Agency...................................................................................... . 75,825 39,592 115,417 67,290 36,295 103,585 70,415 33,499 103,914
Local Government Assistance Corporation........................................................ 243,303 144,978 388,281 247,340 133,933 381,273 286,640 101,930 388,570
Metropolitan Transportation Authority Service Contract Bonds...................... 54,590 20,099 74,689 62,900 16,958 79,858 70,750 13,334 84,084
Thruway Authority: Dedicated Highway and Bridge Trust Fund Bonds............................................. 586,060 327,715 913,775 584,935 301,274 886,209 512,640 275,088 787,728 Local Highway and Bridge Service Contract Bonds........................................... 323,665 184,837 508,502 326,845 172,347 499,192 334,430 157,866 492,296
Urban Development Corporation: Correctional Facilities.......................................................................................... 245,330 208,700 454,030 239,539 196,638 436,177 241,272 184,956 426,228 Housing Programs.............................................................................................. . 53,750 22,215 75,965 50,495 20,864 71,359 49,720 19,431 69,151 State Facility Revenue Bonds............................................................................. 13,270 6,974 20,244 14,010 6,210 20,220 14,790 5,404 20,194 City University of New York................................................................................ . 5,089 957 6,046 5,213 835 6,048 5,340 706 6,046 State University of New York ............................................................................. 9,086 1,497 10,583 7,057 1,203 8,260 5,641 1,022 6,663 Others................................................................................................................. 202,286 75,769 278,055 168,173 68,333 236,506 129,050 61,512 190,562
Multiple Issuers: Community Enhancement Facilities Assistance Program (DASNY/UDC).......... 10,491 5,869 16,360 8,455 2,151 10,606 8,265 1,753 10,018 Strategic Investment Programs (DASNY/UDC).................................................. 2,110 1,015 3,125 2,910 924 3,834 3,205 795 4,000 Other Economic Development Programs (DASNY/UDC)................................... 266,969 150,769 417,738 259,475 141,012 400,487 304,370 130,419 434,789
TOTALS................................................................................................................... $ 3,203,230 $ 2,391,655 $ 5,594,885 $ 3,142,451 $ 2,235,105 $ 5,377,556 $ 3,121,726 $ 2,071,998 $ 5,193,724
(*) Future debt service payments reflect gross principal and interest due to bondholders as of March 31, 2013. Actual amounts paid by the State may vary from these estimates, due to offsetting interest earnings, actual variable rate results, related expenses and future bond sales conducted after the date this schedule was prepared.
March 31, 2014 March 31, 2015 March 31, 2016
98
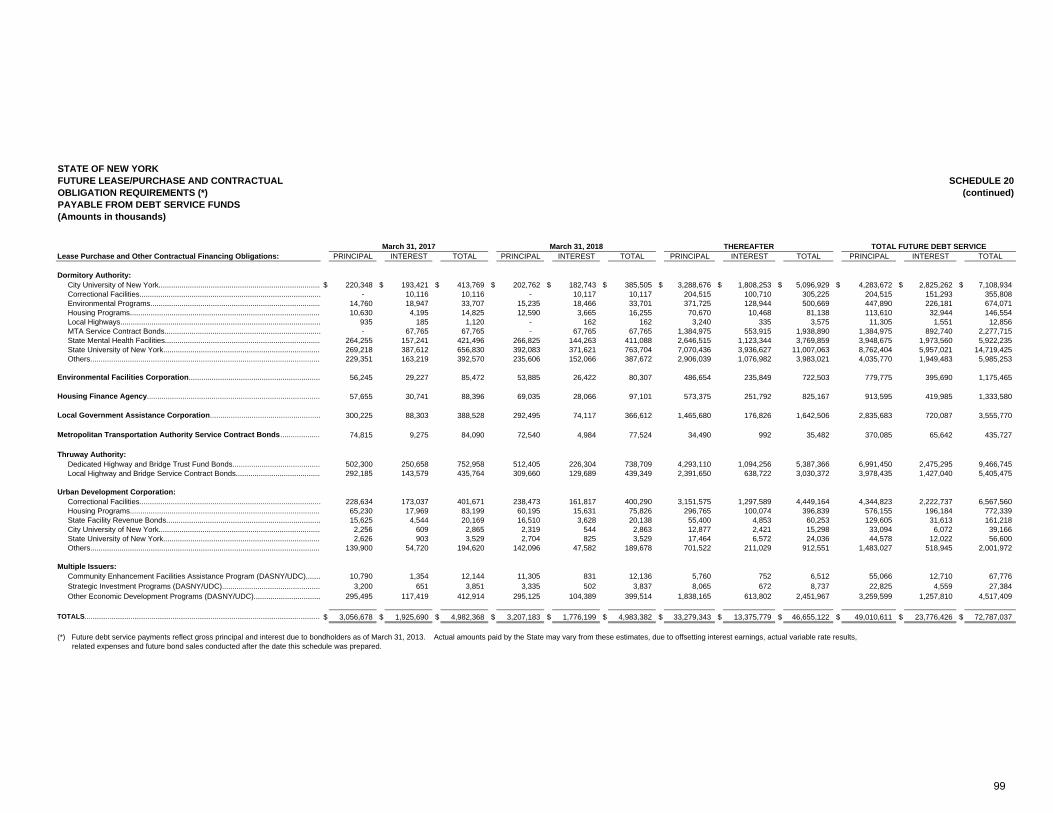
STATE OF NEW YORKFUTURE LEASE/PURCHASE AND CONTRACTUAL SCHEDULE 20OBLIGATION REQUIREMENTS (*) (continued)PAYABLE FROM DEBT SERVICE FUNDS(Amounts in thousands)
Lease Purchase and Other Contractual Financing Obligations: PRINCIPAL INTEREST TOTAL PRINCIPAL INTEREST TOTAL PRINCIPAL INTEREST TOTAL PRINCIPAL INTEREST TOTAL
Dormitory Authority: City University of New York.............................................................................. $ 220,348 $ 193,421 $ 413,769 $ 202,762 $ 182,743 $ 385,505 $ 3,288,676 $ 1,808,253 $ 5,096,929 $ 4,283,672 $ 2,825,262 $ 7,108,934 Correctional Facilities....................................................................................... . - 10,116 10,116 - 10,117 10,117 204,515 100,710 305,225 204,515 151,293 355,808 Environmental Programs.................................................................................. . 14,760 18,947 33,707 15,235 18,466 33,701 371,725 128,944 500,669 447,890 226,181 674,071 Housing Programs............................................................................................ . 10,630 4,195 14,825 12,590 3,665 16,255 70,670 10,468 81,138 113,610 32,944 146,554 Local Highways................................................................................................ . 935 185 1,120 - 162 162 3,240 335 3,575 11,305 1,551 12,856 MTA Service Contract Bonds........................................................................... . - 67,765 67,765 - 67,765 67,765 1,384,975 553,915 1,938,890 1,384,975 892,740 2,277,715 State Mental Health Facilities........................................................................... 264,255 157,241 421,496 266,825 144,263 411,088 2,646,515 1,123,344 3,769,859 3,948,675 1,973,560 5,922,235 State University of New York............................................................................ 269,218 387,612 656,830 392,083 371,621 763,704 7,070,436 3,936,627 11,007,063 8,762,404 5,957,021 14,719,425 Others............................................................................................................... 229,351 163,219 392,570 235,606 152,066 387,672 2,906,039 1,076,982 3,983,021 4,035,770 1,949,483 5,985,253
Environmental Facilities Corporation............................................................... . 56,245 29,227 85,472 53,885 26,422 80,307 486,654 235,849 722,503 779,775 395,690 1,175,465
Housing Finance Agency................................................................................... . 57,655 30,741 88,396 69,035 28,066 97,101 573,375 251,792 825,167 913,595 419,985 1,333,580
Local Government Assistance Corporation..................................................... 300,225 88,303 388,528 292,495 74,117 366,612 1,465,680 176,826 1,642,506 2,835,683 720,087 3,555,770
Metropolitan Transportation Authority Service Contract Bonds................... 74,815 9,275 84,090 72,540 4,984 77,524 34,490 992 35,482 370,085 65,642 435,727
Thruway Authority: Dedicated Highway and Bridge Trust Fund Bonds.......................................... 502,300 250,658 752,958 512,405 226,304 738,709 4,293,110 1,094,256 5,387,366 6,991,450 2,475,295 9,466,745 Local Highway and Bridge Service Contract Bonds......................................... 292,185 143,579 435,764 309,660 129,689 439,349 2,391,650 638,722 3,030,372 3,978,435 1,427,040 5,405,475
Urban Development Corporation: Correctional Facilities....................................................................................... 228,634 173,037 401,671 238,473 161,817 400,290 3,151,575 1,297,589 4,449,164 4,344,823 2,222,737 6,567,560 Housing Programs............................................................................................ . 65,230 17,969 83,199 60,195 15,631 75,826 296,765 100,074 396,839 576,155 196,184 772,339 State Facility Revenue Bonds.......................................................................... 15,625 4,544 20,169 16,510 3,628 20,138 55,400 4,853 60,253 129,605 31,613 161,218 City University of New York.............................................................................. . 2,256 609 2,865 2,319 544 2,863 12,877 2,421 15,298 33,094 6,072 39,166 State University of New York............................................................................ 2,626 903 3,529 2,704 825 3,529 17,464 6,572 24,036 44,578 12,022 56,600 Others............................................................................................................... 139,900 54,720 194,620 142,096 47,582 189,678 701,522 211,029 912,551 1,483,027 518,945 2,001,972
Multiple Issuers: Community Enhancement Facilities Assistance Program (DASNY/UDC)....... 10,790 1,354 12,144 11,305 831 12,136 5,760 752 6,512 55,066 12,710 67,776 Strategic Investment Programs (DASNY/UDC)............................................... 3,200 651 3,851 3,335 502 3,837 8,065 672 8,737 22,825 4,559 27,384 Other Economic Development Programs (DASNY/UDC)................................ 295,495 117,419 412,914 295,125 104,389 399,514 1,838,165 613,802 2,451,967 3,259,599 1,257,810 4,517,409
TOTALS............................................................................................................................ $ 3,056,678 $ 1,925,690 $ 4,982,368 $ 3,207,183 $ 1,776,199 $ 4,983,382 $ 33,279,343 $ 13,375,779 $ 46,655,122 $ 49,010,611 $ 23,776,426 $ 72,787,037
(*) Future debt service payments reflect gross principal and interest due to bondholders as of March 31, 2013. Actual amounts paid by the State may vary from these estimates, due to offsetting interest earnings, actual variable rate results, related expenses and future bond sales conducted after the date this schedule was prepared.
March 31, 2017 March 31, 2018 THEREAFTER TOTAL FUTURE DEBT SERVICE
99
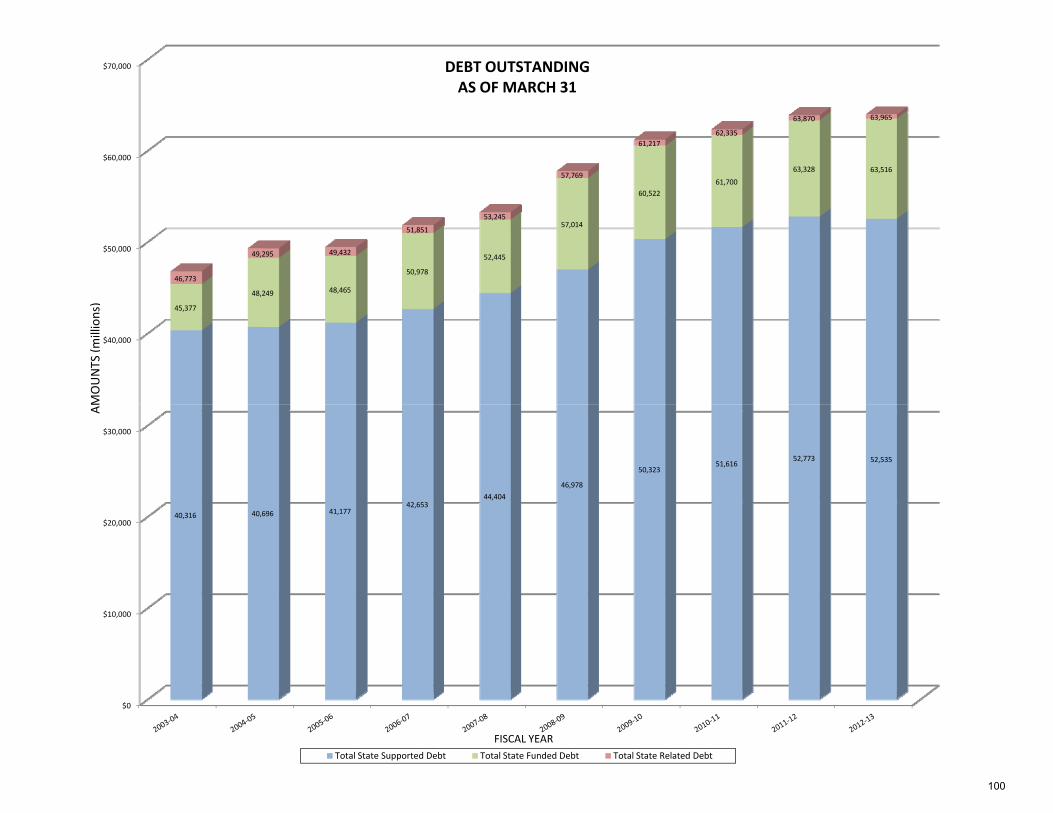
$40,000
$50,000
$60,000
$70,000
45,377
48,249 48,465
50,978
52,445
57,014
60,52261,700
63,328 63,516
46,773
49,295 49,432
51,851
53,245
57,769
61,21762,335
63,870 63,965
DEBT OUTSTANDINGAS OF MARCH 31
MOUNTS
(millions)
$0
$10,000
$20,000
$30,000
40,316 40,696 41,17742,653
44,40446,978
50,32351,616
52,773 52,535
Total State Supported Debt Total State Funded Debt Total State Related Debt
FISCAL YEAR
AM
100
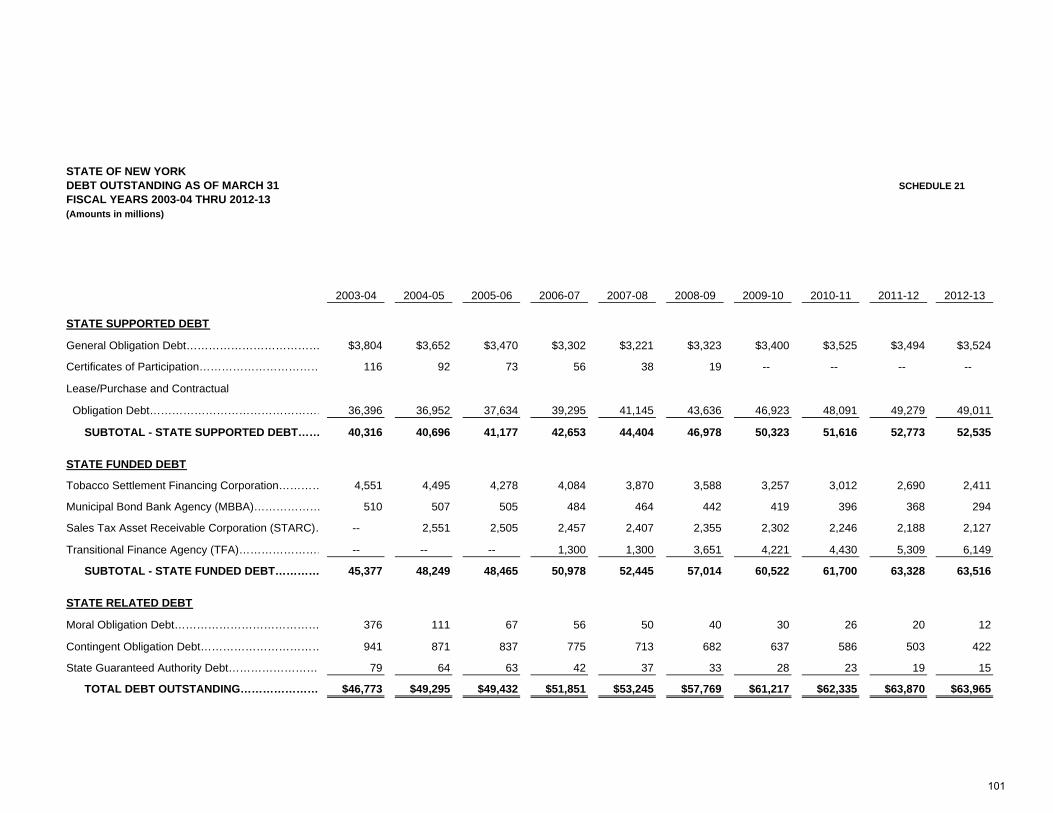
STATE OF NEW YORKDEBT OUTSTANDING AS OF MARCH 31 FISCAL YEARS 2003-04 THRU 2012-13(Amounts in millions)
2003-04 2004-05 2005-06 2006-07 2007-08 2008-09 2009-10 2010-11 2011-12 2012-13
STATE SUPPORTED DEBT
General Obligation Debt……………………………… $3,804 $3,652 $3,470 $3,302 $3,221 $3,323 $3,400 $3,525 $3,494 $3,524
Certificates of Participation…………………………… 116 92 73 56 38 19 -- -- -- --
Lease/Purchase and Contractual
Obligation Debt………………………………………… 36,396 36,952 37,634 39,295 41,145 43,636 46,923 48,091 49,279 49,011
SUBTOTAL - STATE SUPPORTED DEBT…… 40,316 40,696 41,177 42,653 44,404 46,978 50,323 51,616 52,773 52,535
STATE FUNDED DEBT
Tobacco Settlement Financing Corporation………… 4,551 4,495 4,278 4,084 3,870 3,588 3,257 3,012 2,690 2,411
Municipal Bond Bank Agency (MBBA)……………… 510 507 505 484 464 442 419 396 368 294
Sales Tax Asset Receivable Corporation (STARC)… -- 2,551 2,505 2,457 2,407 2,355 2,302 2,246 2,188 2,127
Transitional Finance Agency (TFA)…………………… -- -- -- 1,300 1,300 3,651 4,221 4,430 5,309 6,149
SUBTOTAL - STATE FUNDED DEBT………… 45,377 48,249 48,465 50,978 52,445 57,014 60,522 61,700 63,328 63,516
STATE RELATED DEBT
Moral Obligation Debt………………………………… 376 111 67 56 50 40 30 26 20 12
Contingent Obligation Debt…………………………… 941 871 837 775 713 682 637 586 503 422
State Guaranteed Authority Debt……………………… 79 64 63 42 37 33 28 23 19 15
TOTAL DEBT OUTSTANDING…………………… $46,773 $49,295 $49,432 $51,851 $53,245 $57,769 $61,217 $62,335 $63,870 $63,965
SCHEDULE 21
101
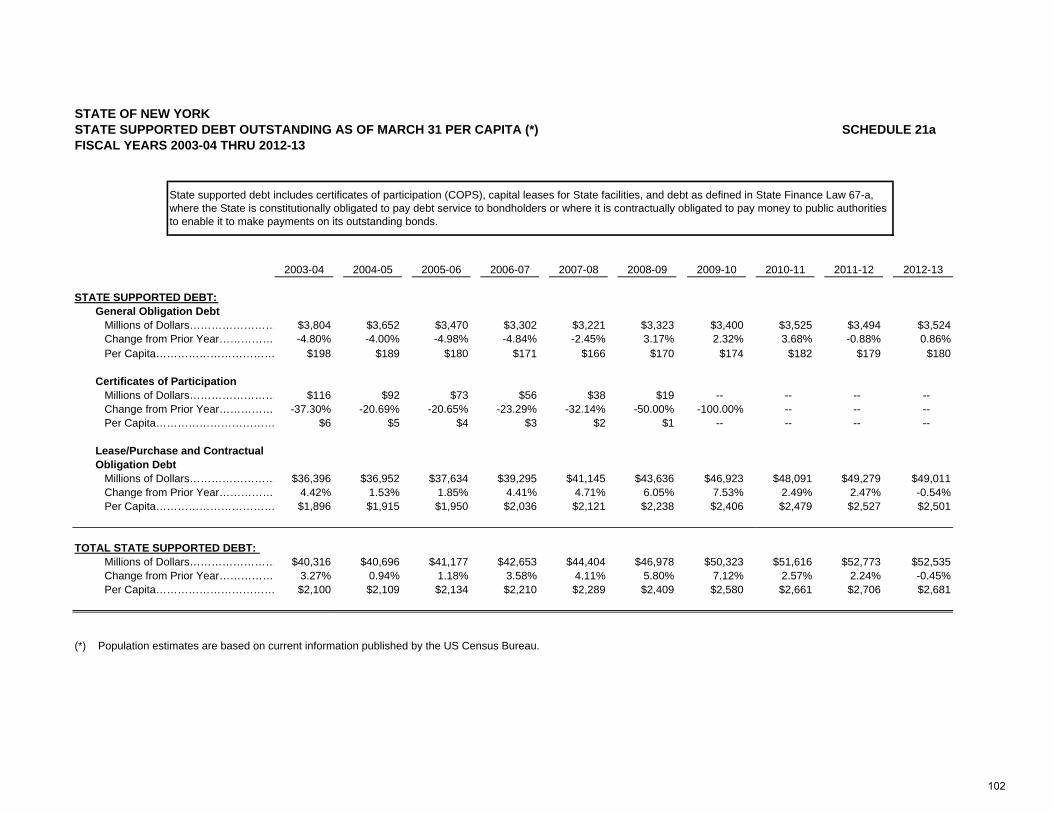
STATE OF NEW YORKSTATE SUPPORTED DEBT OUTSTANDING AS OF MARCH 31 PER CAPITA (*) FISCAL YEARS 2003-04 THRU 2012-13
2003-04 2004-05 2005-06 2006-07 2007-08 2008-09 2009-10 2010-11 2011-12 2012-13
STATE SUPPORTED DEBT: General Obligation Debt Millions of Dollars…………………… $3,804 $3,652 $3,470 $3,302 $3,221 $3,323 $3,400 $3,525 $3,494 $3,524 Change from Prior Year…………… -4.80% -4.00% -4.98% -4.84% -2.45% 3.17% 2.32% 3.68% -0.88% 0.86% Per Capita…………………………… $198 $189 $180 $171 $166 $170 $174 $182 $179 $180
Certificates of Participation Millions of Dollars…………………… $116 $92 $73 $56 $38 $19 -- -- -- -- Change from Prior Year…………… -37.30% -20.69% -20.65% -23.29% -32.14% -50.00% -100.00% -- -- -- Per Capita…………………………… $6 $5 $4 $3 $2 $1 -- -- -- --
Lease/Purchase and Contractual Obligation Debt Millions of Dollars…………………… $36,396 $36,952 $37,634 $39,295 $41,145 $43,636 $46,923 $48,091 $49,279 $49,011 Change from Prior Year…………… 4.42% 1.53% 1.85% 4.41% 4.71% 6.05% 7.53% 2.49% 2.47% -0.54% Per Capita…………………………… $1,896 $1,915 $1,950 $2,036 $2,121 $2,238 $2,406 $2,479 $2,527 $2,501
TOTAL STATE SUPPORTED DEBT: Millions of Dollars…………………… $40,316 $40,696 $41,177 $42,653 $44,404 $46,978 $50,323 $51,616 $52,773 $52,535 Change from Prior Year…………… 3.27% 0.94% 1.18% 3.58% 4.11% 5.80% 7.12% 2.57% 2.24% -0.45% Per Capita…………………………… $2,100 $2,109 $2,134 $2,210 $2,289 $2,409 $2,580 $2,661 $2,706 $2,681
(*) Population estimates are based on current information published by the US Census Bureau.
SCHEDULE 21a
State supported debt includes certificates of participation (COPS), capital leases for State facilities, and debt as defined in State Finance Law 67-a, where the State is constitutionally obligated to pay debt service to bondholders or where it is contractually obligated to pay money to public authorities to enable it to make payments on its outstanding bonds.
102
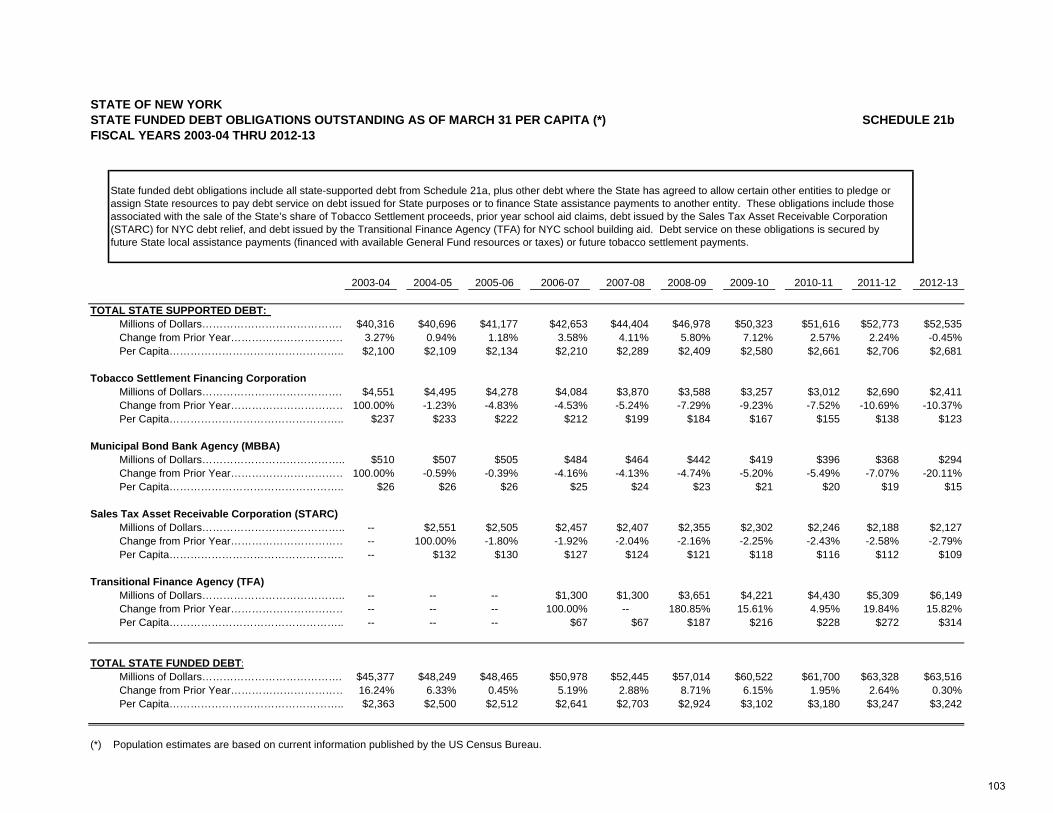
STATE OF NEW YORKSTATE FUNDED DEBT OBLIGATIONS OUTSTANDING AS OF MARCH 31 PER CAPITA (*) FISCAL YEARS 2003-04 THRU 2012-13
2003-04 2004-05 2005-06 2006-07 2007-08 2008-09 2009-10 2010-11 2011-12 2012-13
TOTAL STATE SUPPORTED DEBT: Millions of Dollars…………………………………. $40,316 $40,696 $41,177 $42,653 $44,404 $46,978 $50,323 $51,616 $52,773 $52,535 Change from Prior Year…………………………… 3.27% 0.94% 1.18% 3.58% 4.11% 5.80% 7.12% 2.57% 2.24% -0.45% Per Capita………………………………………….. $2,100 $2,109 $2,134 $2,210 $2,289 $2,409 $2,580 $2,661 $2,706 $2,681
Tobacco Settlement Financing Corporation Millions of Dollars…………………………………. $4,551 $4,495 $4,278 $4,084 $3,870 $3,588 $3,257 $3,012 $2,690 $2,411 Change from Prior Year…………………………… 100.00% -1.23% -4.83% -4.53% -5.24% -7.29% -9.23% -7.52% -10.69% -10.37% Per Capita………………………………………….. $237 $233 $222 $212 $199 $184 $167 $155 $138 $123
Municipal Bond Bank Agency (MBBA) Millions of Dollars………………………………….. $510 $507 $505 $484 $464 $442 $419 $396 $368 $294 Change from Prior Year…………………………… 100.00% -0.59% -0.39% -4.16% -4.13% -4.74% -5.20% -5.49% -7.07% -20.11% Per Capita………………………………………….. $26 $26 $26 $25 $24 $23 $21 $20 $19 $15
Sales Tax Asset Receivable Corporation (STARC) Millions of Dollars………………………………….. -- $2,551 $2,505 $2,457 $2,407 $2,355 $2,302 $2,246 $2,188 $2,127 Change from Prior Year…………………………… -- 100.00% -1.80% -1.92% -2.04% -2.16% -2.25% -2.43% -2.58% -2.79% Per Capita………………………………………….. -- $132 $130 $127 $124 $121 $118 $116 $112 $109
Transitional Finance Agency (TFA) Millions of Dollars………………………………….. -- -- -- $1,300 $1,300 $3,651 $4,221 $4,430 $5,309 $6,149 Change from Prior Year…………………………… -- -- -- 100.00% -- 180.85% 15.61% 4.95% 19.84% 15.82% Per Capita………………………………………….. -- -- -- $67 $67 $187 $216 $228 $272 $314
TOTAL STATE FUNDED DEBT: Millions of Dollars…………………………………. $45,377 $48,249 $48,465 $50,978 $52,445 $57,014 $60,522 $61,700 $63,328 $63,516 Change from Prior Year…………………………… 16.24% 6.33% 0.45% 5.19% 2.88% 8.71% 6.15% 1.95% 2.64% 0.30% Per Capita………………………………………….. $2,363 $2,500 $2,512 $2,641 $2,703 $2,924 $3,102 $3,180 $3,247 $3,242
(*) Population estimates are based on current information published by the US Census Bureau.
SCHEDULE 21b
State funded debt obligations include all state-supported debt from Schedule 21a, plus other debt where the State has agreed to allow certain other entities to pledge or assign State resources to pay debt service on debt issued for State purposes or to finance State assistance payments to another entity. These obligations include those associated with the sale of the State’s share of Tobacco Settlement proceeds, prior year school aid claims, debt issued by the Sales Tax Asset Receivable Corporation (STARC) for NYC debt relief, and debt issued by the Transitional Finance Agency (TFA) for NYC school building aid. Debt service on these obligations is secured by future State local assistance payments (financed with available General Fund resources or taxes) or future tobacco settlement payments.
103
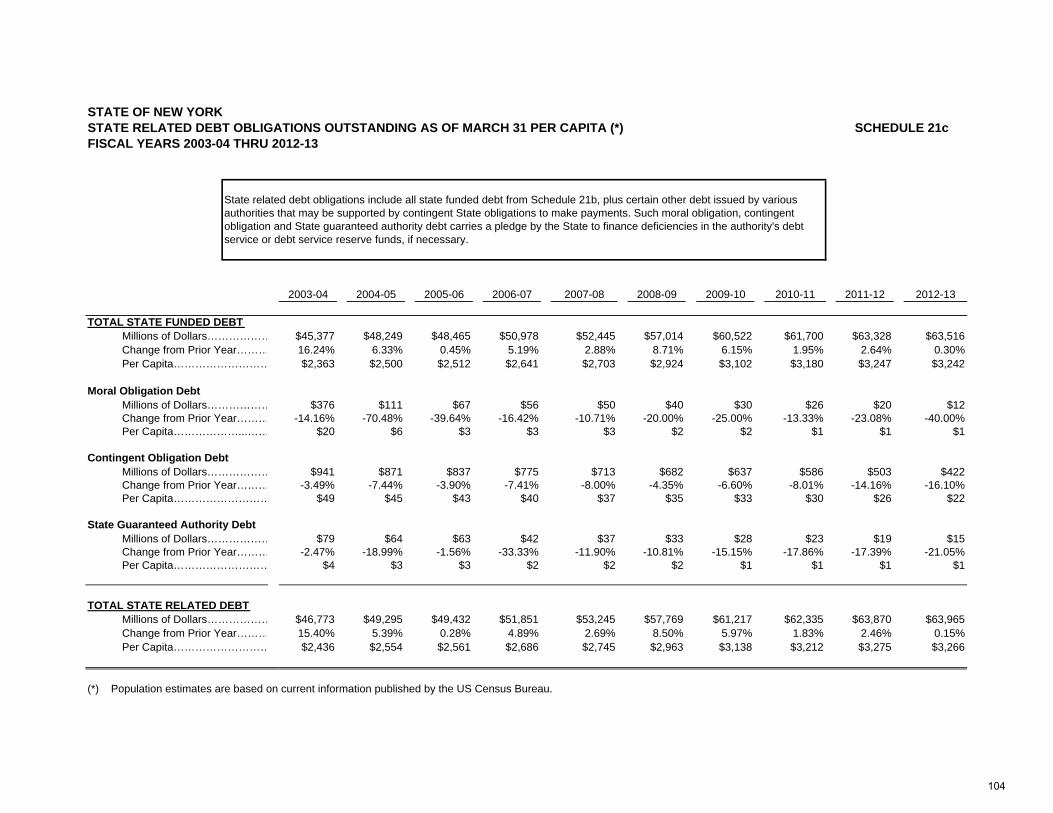
STATE OF NEW YORK STATE RELATED DEBT OBLIGATIONS OUTSTANDING AS OF MARCH 31 PER CAPITA (*) FISCAL YEARS 2003-04 THRU 2012-13
2003-04 2004-05 2005-06 2006-07 2007-08 2008-09 2009-10 2010-11 2011-12 2012-13
TOTAL STATE FUNDED DEBT: Millions of Dollars……………… $45,377 $48,249 $48,465 $50,978 $52,445 $57,014 $60,522 $61,700 $63,328 $63,516 Change from Prior Year……… 16.24% 6.33% 0.45% 5.19% 2.88% 8.71% 6.15% 1.95% 2.64% 0.30% Per Capita……………………… $2,363 $2,500 $2,512 $2,641 $2,703 $2,924 $3,102 $3,180 $3,247 $3,242
Moral Obligation Debt Millions of Dollars……………… $376 $111 $67 $56 $50 $40 $30 $26 $20 $12 Change from Prior Year……… -14.16% -70.48% -39.64% -16.42% -10.71% -20.00% -25.00% -13.33% -23.08% -40.00% Per Capita………………...…… $20 $6 $3 $3 $3 $2 $2 $1 $1 $1
Contingent Obligation Debt Millions of Dollars……………… $941 $871 $837 $775 $713 $682 $637 $586 $503 $422 Change from Prior Year……… -3.49% -7.44% -3.90% -7.41% -8.00% -4.35% -6.60% -8.01% -14.16% -16.10% Per Capita……………………… $49 $45 $43 $40 $37 $35 $33 $30 $26 $22
State Guaranteed Authority Debt Millions of Dollars……………… $79 $64 $63 $42 $37 $33 $28 $23 $19 $15 Change from Prior Year……… -2.47% -18.99% -1.56% -33.33% -11.90% -10.81% -15.15% -17.86% -17.39% -21.05% Per Capita……………………… $4 $3 $3 $2 $2 $2 $1 $1 $1 $1
TOTAL STATE RELATED DEBT Millions of Dollars……………… $46,773 $49,295 $49,432 $51,851 $53,245 $57,769 $61,217 $62,335 $63,870 $63,965 Change from Prior Year……… 15.40% 5.39% 0.28% 4.89% 2.69% 8.50% 5.97% 1.83% 2.46% 0.15% Per Capita……………………… $2,436 $2,554 $2,561 $2,686 $2,745 $2,963 $3,138 $3,212 $3,275 $3,266
(*) Population estimates are based on current information published by the US Census Bureau.
SCHEDULE 21c
State related debt obligations include all state funded debt from Schedule 21b, plus certain other debt issued by various authorities that may be supported by contingent State obligations to make payments. Such moral obligation, contingent obligation and State guaranteed authority debt carries a pledge by the State to finance deficiencies in the authority's debt service or debt service reserve funds, if necessary.
104
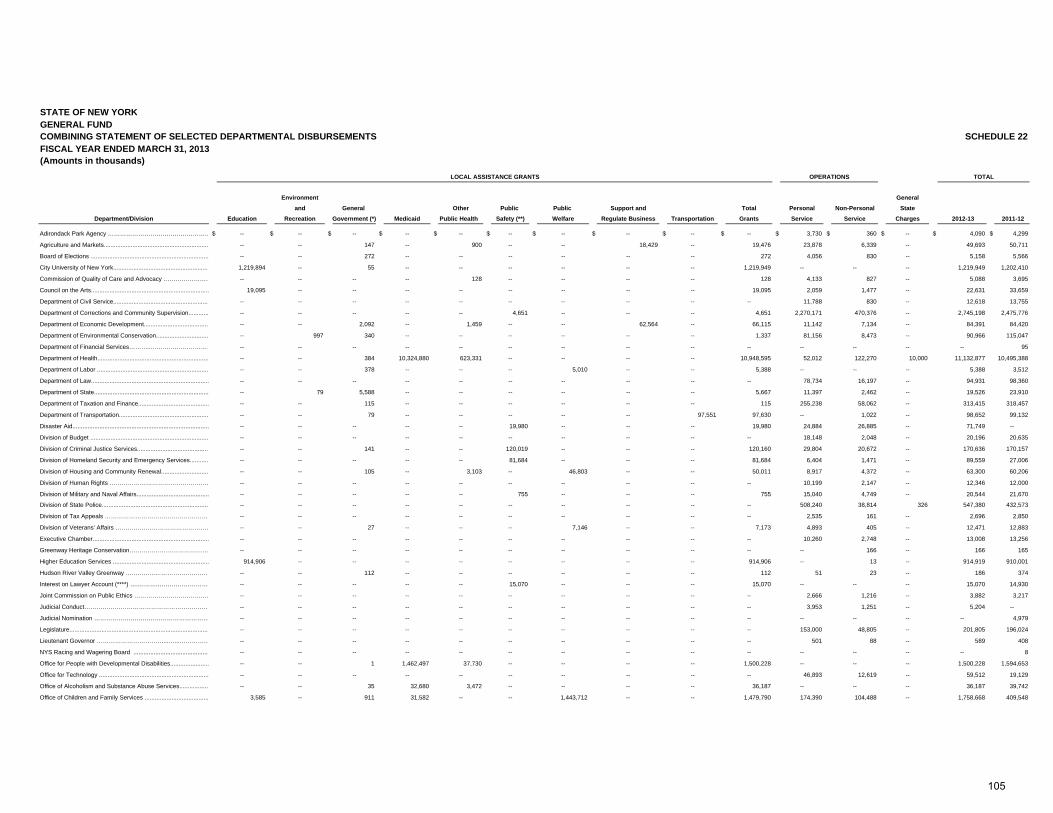
STATE OF NEW YORKGENERAL FUND COMBINING STATEMENT OF SELECTED DEPARTMENTAL DISBURSEMENTS FISCAL YEAR ENDED MARCH 31, 2013(Amounts in thousands)
LOCAL ASSISTANCE GRANTS TOTAL
Environment General
and General Other Public Public Support and Total Personal Non-Personal State
Department/Division Education Recreation Government (*) Medicaid Public Health Safety (**) Welfare Regulate Business Transportation Grants Service Service Charges 2012-13 2011-12
Adirondack Park Agency …………………………………………… $ -- $ -- $ -- $ -- $ -- $ -- $ -- $ -- $ -- $ -- $ 3,730 $ 360 $ -- $ 4,090 $ 4,299
Agriculture and Markets.............................................................. -- -- 147 -- 900 -- -- 18,429 -- 19,476 23,878 6,339 -- 49,693 50,711
Board of Elections ...................................................................... -- -- 272 -- -- -- -- -- -- 272 4,056 830 -- 5,158 5,566
City University of New York......................................................... 1,219,894 -- 55 -- -- -- -- -- -- 1,219,949 -- -- -- 1,219,949 1,202,410
Commission of Quality of Care and Advocacy …………………… -- -- -- -- 128 -- -- -- -- 128 4,133 827 -- 5,088 3,695
Council on the Arts...................................................................... 19,095 -- -- -- -- -- -- -- -- 19,095 2,059 1,477 -- 22,631 33,659
Department of Civil Service......................................................... -- -- -- -- -- -- -- -- -- -- 11,788 830 -- 12,618 13,755
Department of Corrections and Community Supervision............ -- -- -- -- -- 4,651 -- -- -- 4,651 2,270,171 470,376 -- 2,745,198 2,475,776
Department of Economic Development...................................... -- -- 2,092 -- 1,459 -- -- 62,564 -- 66,115 11,142 7,134 -- 84,391 84,420
Department of Environmental Conservation............................... -- 997 340 -- -- -- -- -- -- 1,337 81,156 8,473 -- 90,966 115,047
Department of Financial Services………...………………………… -- -- -- -- -- -- -- -- -- -- -- -- -- -- 95
Department of Health.................................................................. -- -- 384 10,324,880 623,331 -- -- -- -- 10,948,595 52,012 122,270 10,000 11,132,877 10,495,388
Department of Labor .................................................................. -- -- 378 -- -- -- 5,010 -- -- 5,388 -- -- -- 5,388 3,512
Department of Law...................................................................... -- -- -- -- -- -- -- -- -- -- 78,734 16,197 -- 94,931 98,360
Department of State.................................................................... -- 79 5,588 -- -- -- -- -- -- 5,667 11,397 2,462 -- 19,526 23,910
Department of Taxation and Finance.......................................... -- -- 115 -- -- -- -- -- -- 115 255,238 58,062 -- 313,415 318,457
Department of Transportation..................................................... -- -- 79 -- -- -- -- -- 97,551 97,630 -- 1,022 -- 98,652 99,132
Disaster Aid................................................................................. -- -- -- -- -- 19,980 -- -- -- 19,980 24,884 26,885 -- 71,749 --
Division of Budget ...................................................................... -- -- -- -- -- -- -- -- -- -- 18,148 2,048 -- 20,196 20,635
Division of Criminal Justice Services.......................................... -- -- 141 -- -- 120,019 -- -- -- 120,160 29,804 20,672 -- 170,636 170,157
Division of Homeland Security and Emergency Services........... -- -- -- -- -- 81,684 -- -- -- 81,684 6,404 1,471 -- 89,559 27,006
Division of Housing and Community Renewal............................ -- -- 105 -- 3,103 -- 46,803 -- -- 50,011 8,917 4,372 -- 63,300 60,206
Division of Human Rights …………………………………………… -- -- -- -- -- -- -- -- -- -- 10,199 2,147 -- 12,346 12,000
Division of Military and Naval Affairs........................................... -- -- -- -- -- 755 -- -- -- 755 15,040 4,749 -- 20,544 21,670
Division of State Police............................................................... -- -- -- -- -- -- -- -- -- -- 508,240 38,814 326 547,380 432,573
Division of Tax Appeals …………………………………………… -- -- -- -- -- -- -- -- -- -- 2,535 161 -- 2,696 2,850
Division of Veterans' Affairs ………………………………………… -- -- 27 -- -- -- 7,146 -- -- 7,173 4,893 405 -- 12,471 12,883
Executive Chamber..................................................................... -- -- -- -- -- -- -- -- -- -- 10,260 2,748 -- 13,008 13,256
Greenway Heritage Conservation………………………………… -- -- -- -- -- -- -- -- -- -- -- 166 -- 166 165
Higher Education Services ......................................................... 914,906 -- -- -- -- -- -- -- -- 914,906 -- 13 -- 914,919 910,001
Hudson River Valley Greenway ….………..……………………… -- -- 112 -- -- -- -- -- -- 112 51 23 -- 186 374
Interest on Lawyer Account (****) ….………..…………………… -- -- -- -- -- 15,070 -- -- -- 15,070 -- -- -- 15,070 14,930
Joint Commission on Public Ethics …………………………….… -- -- -- -- -- -- -- -- -- -- 2,666 1,216 -- 3,882 3,217
Judicial Conduct……………………………………………………… -- -- -- -- -- -- -- -- -- -- 3,953 1,251 -- 5,204 --
Judicial Nomination ………………………………………………… -- -- -- -- -- -- -- -- -- -- -- -- -- -- 4,979
Legislature................................................................................... -- -- -- -- -- -- -- -- -- -- 153,000 48,805 -- 201,805 196,024
Lieutenant Governor ……………………………...…...…………… -- -- -- -- -- -- -- -- -- -- 501 88 -- 589 408
NYS Racing and Wagering Board ............................................. -- -- -- -- -- -- -- -- -- -- -- -- -- -- 8
Office for People with Developmental Disabilities....................... -- -- 1 1,462,497 37,730 -- -- -- -- 1,500,228 -- -- -- 1,500,228 1,594,653
Office for Technology ................................................................. -- -- -- -- -- -- -- -- -- -- 46,893 12,619 -- 59,512 19,129
Office of Alcoholism and Substance Abuse Services................. -- -- 35 32,680 3,472 -- -- -- -- 36,187 -- -- -- 36,187 39,742
Office of Children and Family Services ...................................... 3,585 -- 911 31,582 -- -- 1,443,712 -- -- 1,479,790 174,390 104,488 -- 1,758,668 409,548
SCHEDULE 22
OPERATIONS
105
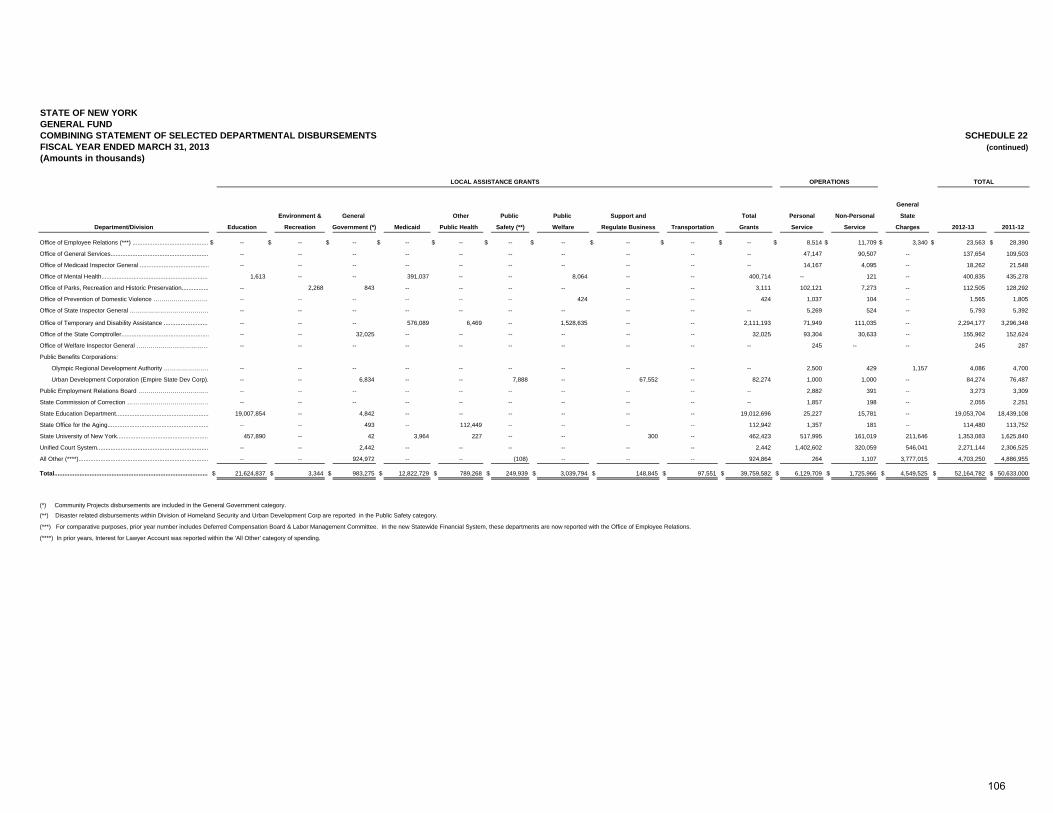
STATE OF NEW YORKGENERAL FUNDCOMBINING STATEMENT OF SELECTED DEPARTMENTAL DISBURSEMENTS FISCAL YEAR ENDED MARCH 31, 2013 (continued)(Amounts in thousands)
LOCAL ASSISTANCE GRANTS TOTAL
General
Environment & General Other Public Public Support and Total Personal Non-Personal State
Department/Division Education Recreation Government (*) Medicaid Public Health Safety (**) Welfare Regulate Business Transportation Grants Service Service Charges 2012-13 2011-12
Office of Employee Relations (***) ............................................. $ -- $ -- $ -- $ -- $ -- $ -- $ -- $ -- $ -- $ -- $ 8,514 $ 11,709 $ 3,340 $ 23,563 $ 28,390
Office of General Services.......................................................... -- -- -- -- -- -- -- -- -- -- 47,147 90,507 -- 137,654 109,503
Office of Medicaid Inspector General ......................................... -- -- -- -- -- -- -- -- -- -- 14,167 4,095 -- 18,262 21,548
Office of Mental Health................................................................ 1,613 -- -- 391,037 -- -- 8,064 -- -- 400,714 -- 121 -- 400,835 435,278
Office of Parks, Recreation and Historic Preservation................ -- 2,268 843 -- -- -- -- -- -- 3,111 102,121 7,273 -- 112,505 128,292
Office of Prevention of Domestic Violence ……………………… -- -- -- -- -- -- 424 -- -- 424 1,037 104 -- 1,565 1,805
Office of State Inspector General ………………………………… -- -- -- -- -- -- -- -- -- -- 5,269 524 -- 5,793 5,392
Office of Temporary and Disability Assistance ........................... -- -- -- 576,089 6,469 -- 1,528,635 -- -- 2,111,193 71,949 111,035 -- 2,294,177 3,296,348
Office of the State Comptroller.................................................... -- -- 32,025 -- -- -- -- -- -- 32,025 93,304 30,633 -- 155,962 152,624
Office of Welfare Inspector General ……………………………… -- -- -- -- -- -- -- -- -- -- 245 -- -- 245 287
Public Benefits Corporations:
Olympic Regional Development Authority …………………… -- -- -- -- -- -- -- -- -- -- 2,500 429 1,157 4,086 4,700
Urban Development Corporation (Empire State Dev Corp). -- -- 6,834 -- -- 7,888 -- 67,552 -- 82,274 1,000 1,000 -- 84,274 76,487
Public Employment Relations Board ……………………………… -- -- -- -- -- -- -- -- -- -- 2,882 391 -- 3,273 3,309
State Commission of Correction ………...………………………… -- -- -- -- -- -- -- -- -- -- 1,857 198 -- 2,055 2,251
State Education Department....................................................... 19,007,854 -- 4,842 -- -- -- -- -- -- 19,012,696 25,227 15,781 -- 19,053,704 18,439,108
State Office for the Aging............................................................ -- -- 493 -- 112,449 -- -- -- -- 112,942 1,357 181 -- 114,480 113,752
State University of New York...................................................... 457,890 -- 42 3,964 227 -- -- 300 -- 462,423 517,995 161,019 211,646 1,353,083 1,625,840
Unified Court System.................................................................. -- -- 2,442 -- -- -- -- -- -- 2,442 1,402,602 320,059 546,041 2,271,144 2,306,525
All Other (****)............................................................................. -- -- 924,972 -- -- (108) -- -- -- 924,864 264 1,107 3,777,015 4,703,250 4,886,955
Total............................................................................................ $ 21,624,837 $ 3,344 $ 983,275 $ 12,822,729 $ 789,268 $ 249,939 $ 3,039,794 $ 148,845 $ 97,551 $ 39,759,582 $ 6,129,709 $ 1,725,966 $ 4,549,525 $ 52,164,782 $ 50,633,000
(*) Community Projects disbursements are included in the General Government category.
(**) Disaster related disbursements within Division of Homeland Security and Urban Development Corp are reported in the Public Safety category.
(***) For comparative purposes, prior year number includes Deferred Compensation Board & Labor Management Committee. In the new Statewide Financial System, these departments are now reported with the Office of Employee Relations.
(****) In prior years, Interest for Lawyer Account was reported within the 'All Other' category of spending.
OPERATIONS
SCHEDULE 22
106
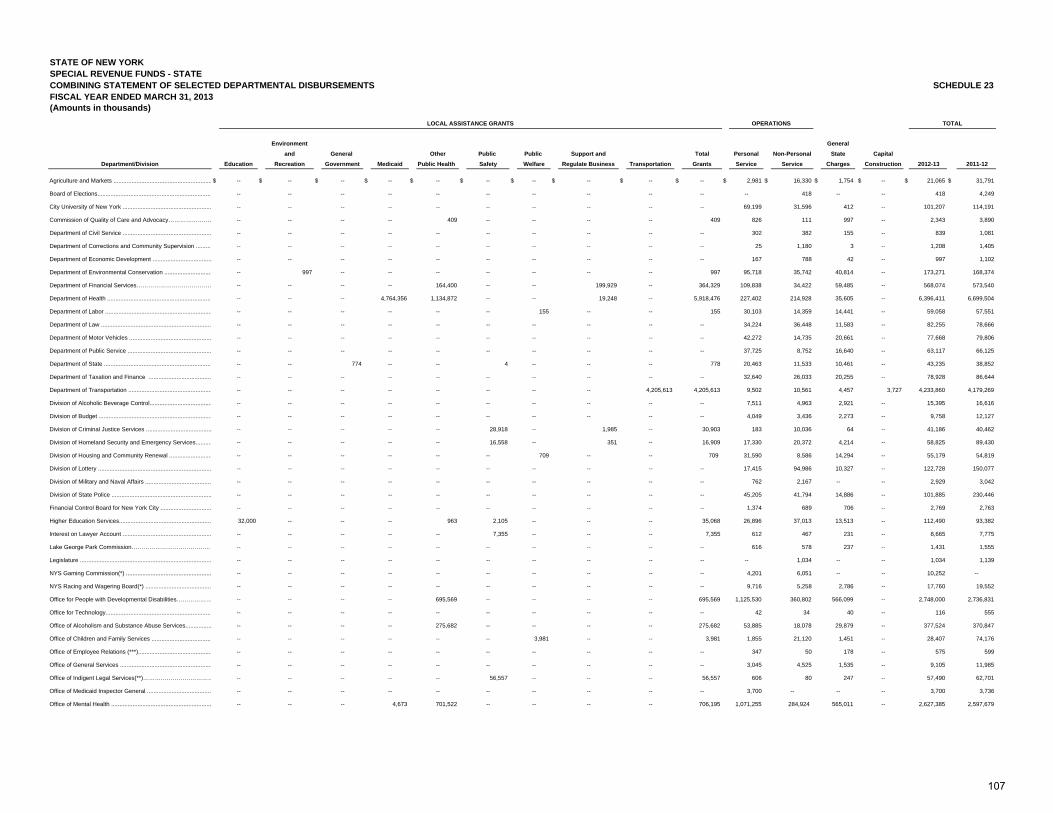
STATE OF NEW YORKSPECIAL REVENUE FUNDS - STATE COMBINING STATEMENT OF SELECTED DEPARTMENTAL DISBURSEMENTS FISCAL YEAR ENDED MARCH 31, 2013(Amounts in thousands)
LOCAL ASSISTANCE GRANTS TOTAL
Environment General
and General Other Public Public Support and Total Personal Non-Personal State Capital Department/Division Education Recreation Government Medicaid Public Health Safety Welfare Regulate Business Transportation Grants Service Service Charges Construction 2012-13 2011-12
Agriculture and Markets ............................................................ $ -- $ -- $ -- $ -- $ -- $ -- $ -- $ -- $ -- $ -- $ 2,981 $ 16,330 $ 1,754 $ -- $ 21,065 $ 31,791
Board of Elections...................................................................... -- -- -- -- -- -- -- -- -- -- -- 418 -- -- 418 4,249
City University of New York ...................................................... -- -- -- -- -- -- -- -- -- -- 69,199 31,596 412 -- 101,207 114,191
Commission of Quality of Care and Advocacy…………………… -- -- -- -- 409 -- -- -- -- 409 826 111 997 -- 2,343 3,890
Department of Civil Service ...................................................... -- -- -- -- -- -- -- -- -- -- 302 382 155 -- 839 1,081
Department of Corrections and Community Supervision ......... -- -- -- -- -- -- -- -- -- -- 25 1,180 3 -- 1,208 1,405
Department of Economic Development .................................... -- -- -- -- -- -- -- -- -- -- 167 788 42 -- 997 1,102
Department of Environmental Conservation ............................. -- 997 -- -- -- -- -- -- -- 997 95,718 35,742 40,814 -- 173,271 168,374
Department of Financial Services………………………………… -- -- -- -- 164,400 -- -- 199,929 -- 364,329 109,838 34,422 59,485 -- 568,074 573,540
Department of Health ................................................................ -- -- -- 4,764,356 1,134,872 -- -- 19,248 -- 5,918,476 227,402 214,928 35,605 -- 6,396,411 6,699,504
Department of Labor ................................................................. -- -- -- -- -- -- 155 -- -- 155 30,103 14,359 14,441 -- 59,058 57,551
Department of Law ................................................................... -- -- -- -- -- -- -- -- -- -- 34,224 36,448 11,583 -- 82,255 78,666
Department of Motor Vehicles .................................................. -- -- -- -- -- -- -- -- -- -- 42,272 14,735 20,661 -- 77,668 79,806
Department of Public Service ................................................... -- -- -- -- -- -- -- -- -- -- 37,725 8,752 16,640 -- 63,117 66,125
Department of State .................................................................. -- -- 774 -- -- 4 -- -- -- 778 20,463 11,533 10,461 -- 43,235 38,852
Department of Taxation and Finance ...................................... -- -- -- -- -- -- -- -- -- -- 32,640 26,033 20,255 -- 78,928 86,644
Department of Transportation ................................................... -- -- -- -- -- -- -- -- 4,205,613 4,205,613 9,502 10,561 4,457 3,727 4,233,860 4,179,269
Division of Alcoholic Beverage Control...................................... -- -- -- -- -- -- -- -- -- -- 7,511 4,963 2,921 -- 15,395 16,616
Division of Budget ..................................................................... -- -- -- -- -- -- -- -- -- -- 4,049 3,436 2,273 -- 9,758 12,127
Division of Criminal Justice Services ........................................ -- -- -- -- -- 28,918 -- 1,985 -- 30,903 183 10,036 64 -- 41,186 40,462
Division of Homeland Security and Emergency Services.......... -- -- -- -- -- 16,558 -- 351 -- 16,909 17,330 20,372 4,214 -- 58,825 89,430
Division of Housing and Community Renewal .......................... -- -- -- -- -- -- 709 -- -- 709 31,590 8,586 14,294 -- 55,179 54,819
Division of Lottery ..................................................................... -- -- -- -- -- -- -- -- -- -- 17,415 94,986 10,327 -- 122,728 150,077
Division of Military and Naval Affairs ........................................ -- -- -- -- -- -- -- -- -- -- 762 2,167 -- -- 2,929 3,042
Division of State Police ............................................................. -- -- -- -- -- -- -- -- -- -- 45,205 41,794 14,886 -- 101,885 230,446
Financial Control Board for New York City ............................... -- -- -- -- -- -- -- -- -- -- 1,374 689 706 -- 2,769 2,763
Higher Education Services........................................................ 32,000 -- -- -- 963 2,105 -- -- -- 35,068 26,896 37,013 13,513 -- 112,490 93,382
Interest on Lawyer Account ...................................................... -- -- -- -- -- 7,355 -- -- -- 7,355 612 467 231 -- 8,665 7,775
Lake George Park Commission…………………………………. -- -- -- -- -- -- -- -- -- -- 616 578 237 -- 1,431 1,555
Legislature ................................................................................ -- -- -- -- -- -- -- -- -- -- -- 1,034 -- -- 1,034 1,139
NYS Gaming Commission(*) .................................................... -- -- -- -- -- -- -- -- -- -- 4,201 6,051 -- -- 10,252 --
NYS Racing and Wagering Board(*) ........................................ -- -- -- -- -- -- -- -- -- -- 9,716 5,258 2,786 -- 17,760 19,552
Office for People with Developmental Disabilities……………… -- -- -- -- 695,569 -- -- -- -- 695,569 1,125,530 360,802 566,099 -- 2,748,000 2,736,831
Office for Technology................................................................. -- -- -- -- -- -- -- -- -- -- 42 34 40 -- 116 555
Office of Alcoholism and Substance Abuse Services................ -- -- -- -- 275,682 -- -- -- -- 275,682 53,885 18,078 29,879 -- 377,524 370,847
Office of Children and Family Services ..................................... -- -- -- -- -- -- 3,981 -- -- 3,981 1,855 21,120 1,451 -- 28,407 74,176
Office of Employee Relations (***)............................................. -- -- -- -- -- -- -- -- -- -- 347 50 178 -- 575 599
Office of General Services ........................................................ -- -- -- -- -- -- -- -- -- -- 3,045 4,525 1,535 -- 9,105 11,985
Office of Indigent Legal Services(**)……………………………… -- -- -- -- -- 56,557 -- -- -- 56,557 606 80 247 -- 57,490 62,701
Office of Medicaid Inspector General ....................................... -- -- -- -- -- -- -- -- -- -- 3,700 -- -- -- 3,700 3,736
Office of Mental Health ............................................................. -- -- -- 4,673 701,522 -- -- -- -- 706,195 1,071,255 284,924 565,011 -- 2,627,385 2,597,679
SCHEDULE 23
OPERATIONS
107
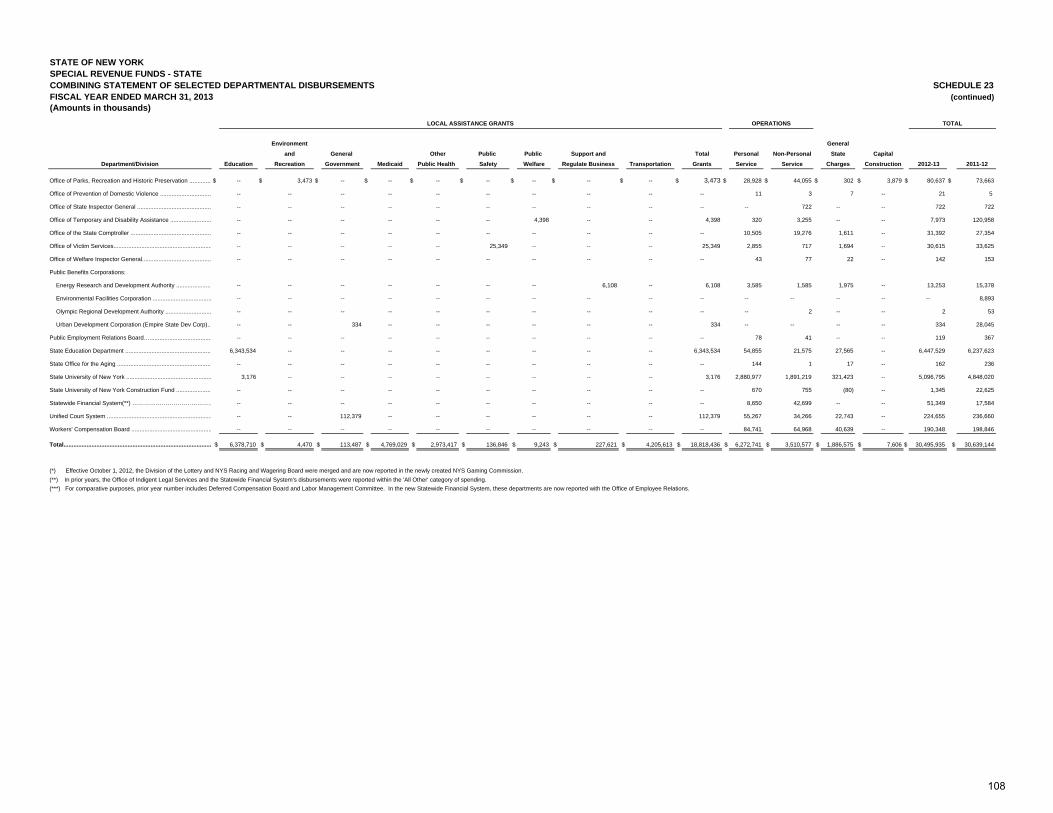
STATE OF NEW YORKSPECIAL REVENUE FUNDS - STATE COMBINING STATEMENT OF SELECTED DEPARTMENTAL DISBURSEMENTS FISCAL YEAR ENDED MARCH 31, 2013 (continued)(Amounts in thousands)
LOCAL ASSISTANCE GRANTS TOTAL
Environment General
and General Other Public Public Support and Total Personal Non-Personal State Capital Department/Division Education Recreation Government Medicaid Public Health Safety Welfare Regulate Business Transportation Grants Service Service Charges Construction 2012-13 2011-12
SCHEDULE 23
OPERATIONS
Office of Parks, Recreation and Historic Preservation ............. $ -- $ 3,473 $ -- $ -- $ -- $ -- $ -- $ -- $ -- $ 3,473 $ 28,928 $ 44,055 $ 302 $ 3,879 $ 80,637 $ 73,663
Office of Prevention of Domestic Violence ............................... -- -- -- -- -- -- -- -- -- -- 11 3 7 -- 21 5
Office of State Inspector General ............................................. -- -- -- -- -- -- -- -- -- -- -- 722 -- -- 722 722
Office of Temporary and Disability Assistance ......................... -- -- -- -- -- -- 4,398 -- -- 4,398 320 3,255 -- -- 7,973 120,958
Office of the State Comptroller ................................................. -- -- -- -- -- -- -- -- -- -- 10,505 19,276 1,611 -- 31,392 27,354
Office of Victim Services............................................................ -- -- -- -- -- 25,349 -- -- -- 25,349 2,855 717 1,694 -- 30,615 33,625
Office of Welfare Inspector General.......................................... -- -- -- -- -- -- -- -- -- -- 43 77 22 -- 142 153
Public Benefits Corporations:
Energy Research and Development Authority ..................... -- -- -- -- -- -- -- 6,108 -- 6,108 3,585 1,585 1,975 -- 13,253 15,378
Environmental Facilities Corporation .................................... -- -- -- -- -- -- -- -- -- -- -- -- -- -- -- 8,893
Olympic Regional Development Authority ............................ -- -- -- -- -- -- -- -- -- -- -- 2 -- -- 2 53
Urban Development Corporation (Empire State Dev Corp).. -- -- 334 -- -- -- -- -- -- 334 -- -- -- -- 334 28,045
Public Employment Relations Board…...................................... -- -- -- -- -- -- -- -- -- -- 78 41 -- -- 119 367
State Education Department .................................................... 6,343,534 -- -- -- -- -- -- -- -- 6,343,534 54,855 21,575 27,565 -- 6,447,529 6,237,623
State Office for the Aging .......................................................... -- -- -- -- -- -- -- -- -- -- 144 1 17 -- 162 236
State University of New York .................................................... 3,176 -- -- -- -- -- -- -- -- 3,176 2,880,977 1,891,219 321,423 -- 5,096,795 4,848,020
State University of New York Construction Fund ..................... -- -- -- -- -- -- -- -- -- -- 670 755 (80) -- 1,345 22,625
Statewide Financial System(**) …………………………………… -- -- -- -- -- -- -- -- -- -- 8,650 42,699 -- -- 51,349 17,584
Unified Court System ................................................................ -- -- 112,379 -- -- -- -- -- -- 112,379 55,267 34,266 22,743 -- 224,655 236,660
Workers' Compensation Board ................................................. -- -- -- -- -- -- -- -- -- -- 84,741 64,968 40,639 -- 190,348 198,846
Total.......................................................................................... $ 6,378,710 $ 4,470 $ 113,487 $ 4,769,029 $ 2,973,417 $ 136,846 $ 9,243 $ 227,621 $ 4,205,613 $ 18,818,436 $ 6,272,741 $ 3,510,577 $ 1,886,575 $ 7,606 $ 30,495,935 $ 30,639,144
(*) Effective October 1, 2012, the Division of the Lottery and NYS Racing and Wagering Board were merged and are now reported in the newly created NYS Gaming Commission.(**) In prior years, the Office of Indigent Legal Services and the Statewide Financial System's disbursements were reported within the 'All Other' category of spending.(***) For comparative purposes, prior year number includes Deferred Compensation Board and Labor Management Committee. In the new Statewide Financial System, these departments are now reported with the Office of Employee Relations.
108
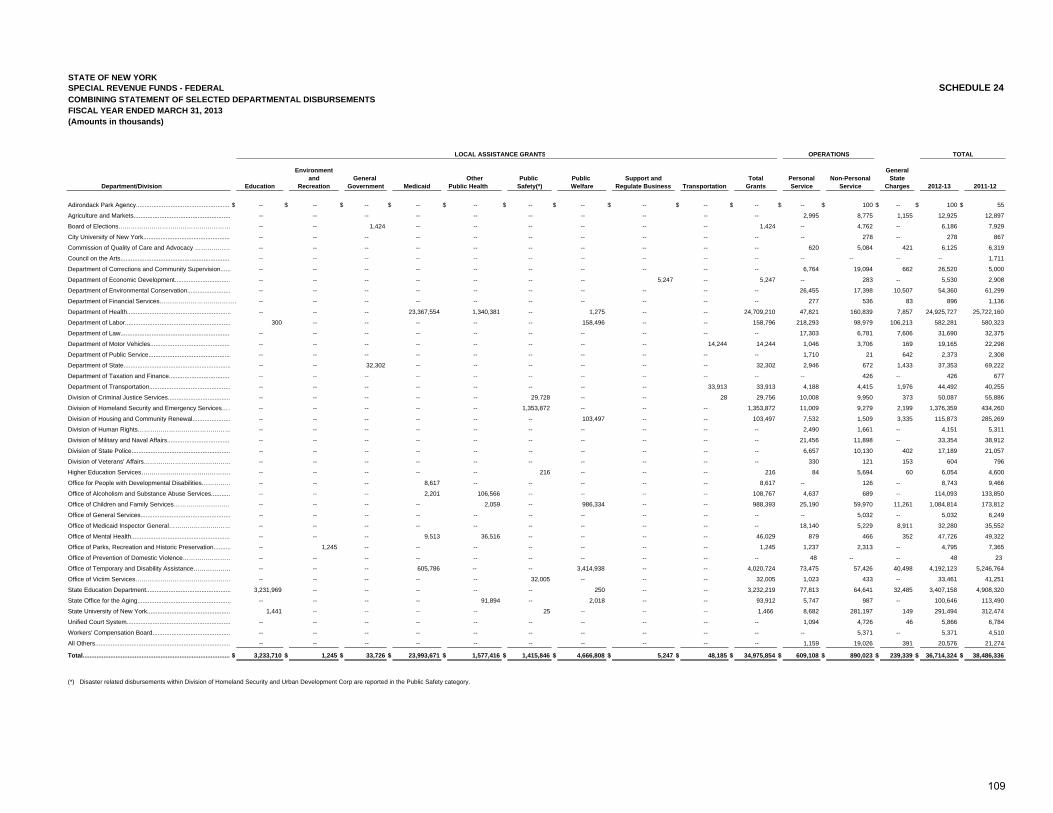
STATE OF NEW YORKSPECIAL REVENUE FUNDS - FEDERAL SCHEDULE 24COMBINING STATEMENT OF SELECTED DEPARTMENTAL DISBURSEMENTS FISCAL YEAR ENDED MARCH 31, 2013(Amounts in thousands)
LOCAL ASSISTANCE GRANTS OPERATIONS TOTAL
Environment General and General Other Public Public Support and Total Personal Non-Personal State
Department/Division Education Recreation Government Medicaid Public Health Safety(*) Welfare Regulate Business Transportation Grants Service Service Charges 2012-13 2011-12
Adirondack Park Agency.......................................................$ -- $ -- $ -- $ -- $ -- $ -- $ -- $ -- $ -- $ -- $ -- $ 100 $ -- $ 100 $ 55
Agriculture and Markets........................................................ -- -- -- -- -- -- -- -- -- -- 2,995 8,775 1,155 12,925 12,897
Board of Elections……………………………………………… -- -- 1,424 -- -- -- -- -- -- 1,424 -- 4,762 -- 6,186 7,929
City University of New York................................................... -- -- -- -- -- -- -- -- -- -- -- 278 -- 278 867
Commission of Quality of Care and Advocacy ……………… -- -- -- -- -- -- -- -- -- -- 620 5,084 421 6,125 6,319
Council on the Arts................................................................ -- -- -- -- -- -- -- -- -- -- -- -- -- -- 1,711
Department of Corrections and Community Supervision...... -- -- -- -- -- -- -- -- -- -- 6,764 19,094 662 26,520 5,000
Department of Economic Development................................ -- -- -- -- -- -- -- 5,247 -- 5,247 -- 283 -- 5,530 2,908
Department of Environmental Conservation......................... -- -- -- -- -- -- -- -- -- -- 26,455 17,398 10,507 54,360 61,299
Department of Financial Services………………………………… -- -- -- -- -- -- -- -- -- -- 277 536 83 896 1,136
Department of Health............................................................ -- -- -- 23,367,554 1,340,381 -- 1,275 -- -- 24,709,210 47,821 160,839 7,857 24,925,727 25,722,160
Department of Labor............................................................. 300 -- -- -- -- -- 158,496 -- -- 158,796 218,293 98,979 106,213 582,281 580,323
Department of Law................................................................ -- -- -- -- -- -- -- -- -- -- 17,303 6,781 7,606 31,690 32,375
Department of Motor Vehicles............................................... -- -- -- -- -- -- -- -- 14,244 14,244 1,046 3,706 169 19,165 22,298
Department of Public Service................................................ -- -- -- -- -- -- -- -- -- -- 1,710 21 642 2,373 2,308
Department of State.............................................................. -- -- 32,302 -- -- -- -- -- -- 32,302 2,946 672 1,433 37,353 69,222
Department of Taxation and Finance.................................... -- -- -- -- -- -- -- -- -- -- -- 426 -- 426 677
Department of Transportation............................................... -- -- -- -- -- -- -- -- 33,913 33,913 4,188 4,415 1,976 44,492 40,255
Division of Criminal Justice Services.................................... -- -- -- -- -- 29,728 -- -- 28 29,756 10,008 9,950 373 50,087 55,886
Division of Homeland Security and Emergency Services…… -- -- -- -- -- 1,353,872 -- -- -- 1,353,872 11,009 9,279 2,199 1,376,359 434,260
Division of Housing and Community Renewal...................... -- -- -- -- -- -- 103,497 -- -- 103,497 7,532 1,509 3,335 115,873 285,269
Division of Human Rights……………………………………… -- -- -- -- -- -- -- -- -- -- 2,490 1,661 -- 4,151 5,311
Division of Military and Naval Affairs..................................... -- -- -- -- -- -- -- -- -- -- 21,456 11,898 -- 33,354 38,912
Division of State Police......................................................... -- -- -- -- -- -- -- -- -- -- 6,657 10,130 402 17,189 21,057
Division of Veterans' Affairs…………………………………… -- -- -- -- -- -- -- -- -- -- 330 121 153 604 796
Higher Education Services……………………………………… -- -- -- -- -- 216 -- -- -- 216 84 5,694 60 6,054 4,600
Office for People with Developmental Disabilities…………… -- -- -- 8,617 -- -- -- -- -- 8,617 -- 126 -- 8,743 9,466
Office of Alcoholism and Substance Abuse Services........... -- -- -- 2,201 106,566 -- -- -- -- 108,767 4,637 689 -- 114,093 133,850
Office of Children and Family Services……………………… -- -- -- -- 2,059 -- 986,334 -- -- 988,393 25,190 59,970 11,261 1,084,814 173,812
Office of General Services.................................................... -- -- -- -- -- -- -- -- -- -- -- 5,032 -- 5,032 6,249
Office of Medicaid Inspector General………………………… -- -- -- -- -- -- -- -- -- -- 18,140 5,229 8,911 32,280 35,552
Office of Mental Health.......................................................... -- -- -- 9,513 36,516 -- -- -- -- 46,029 879 466 352 47,726 49,322
Office of Parks, Recreation and Historic Preservation.......... -- 1,245 -- -- -- -- -- -- -- 1,245 1,237 2,313 -- 4,795 7,365
Office of Prevention of Domestic Violence…………………… -- -- -- -- -- -- -- -- -- -- 48 -- -- 48 23
Office of Temporary and Disability Assistance……………… -- -- -- 605,786 -- -- 3,414,938 -- -- 4,020,724 73,475 57,426 40,498 4,192,123 5,246,764
Office of Victim Services………………………………………… -- -- -- -- -- 32,005 -- -- -- 32,005 1,023 433 -- 33,461 41,251
State Education Department................................................. 3,231,969 -- -- -- -- -- 250 -- -- 3,232,219 77,813 64,641 32,485 3,407,158 4,908,320
State Office for the Aging...................................................... -- -- -- -- 91,894 -- 2,018 -- -- 93,912 5,747 987 -- 100,646 113,490
State University of New York................................................ 1,441 -- -- -- -- 25 -- -- -- 1,466 8,682 281,197 149 291,494 312,474
Unified Court System............................................................ -- -- -- -- -- -- -- -- -- -- 1,094 4,726 46 5,866 6,784
Workers' Compensation Board............................................. -- -- -- -- -- -- -- -- -- -- -- 5,371 -- 5,371 4,510
All Others.............................................................................. -- -- -- -- -- -- -- -- -- -- 1,159 19,026 391 20,576 21,274
Total......................................................................................$ 3,233,710 $ 1,245 $ 33,726 $ 23,993,671 $ 1,577,416 $ 1,415,846 $ 4,666,808 $ 5,247 $ 48,185 $ 34,975,854 $ 609,108 $ 890,023 $ 239,339 $ 36,714,324 $ 38,486,336
(*) Disaster related disbursements within Division of Homeland Security and Urban Development Corp are reported in the Public Safety category.
109
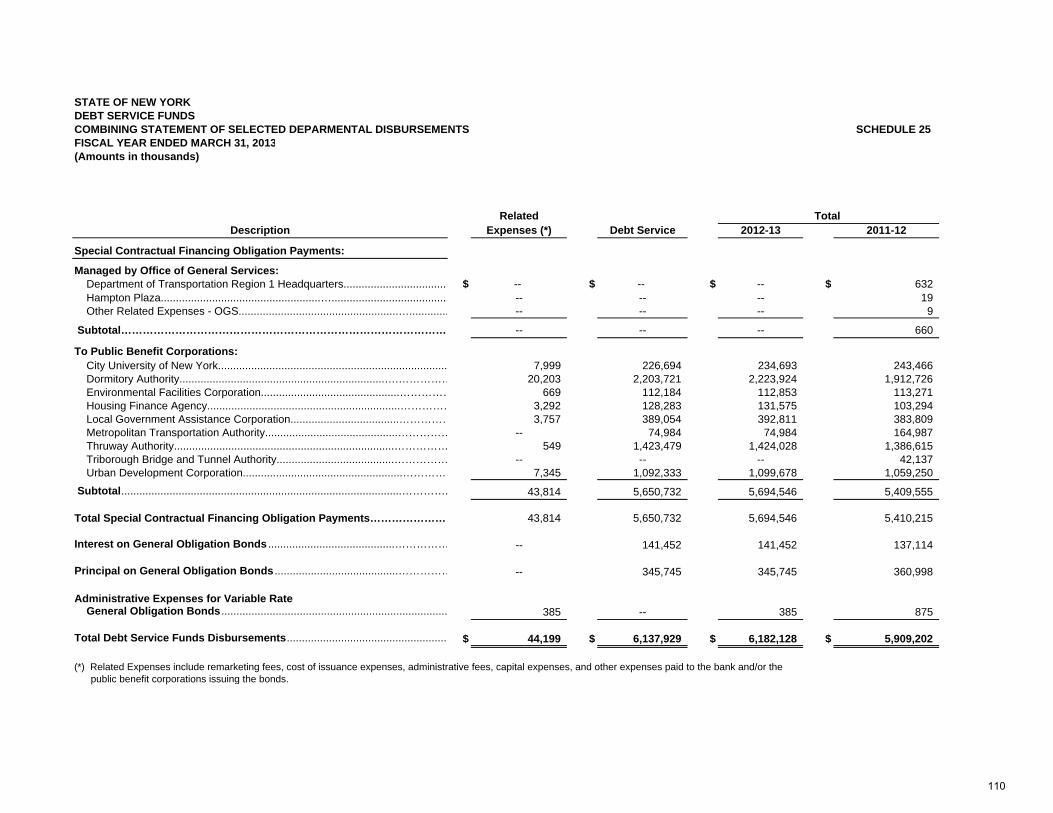
STATE OF NEW YORK DEBT SERVICE FUNDS COMBINING STATEMENT OF SELECTED DEPARMENTAL DISBURSEMENTS SCHEDULE 25 FISCAL YEAR ENDED MARCH 31, 2013(Amounts in thousands)
Related Total Description Expenses (*) Debt Service 2012-13 2011-12
Special Contractual Financing Obligation Payments:
Managed by Office of General Services: Department of Transportation Region 1 Headquarters................................... $ -- $ -- $ -- $ 632 Hampton Plaza.....................................................…....................................... -- -- -- 19 Other Related Expenses - OGS.....................................................…............. -- -- -- 9
Subtotal……………………………………………………………………………… -- -- -- 660
To Public Benefit Corporations: City University of New York............................................................................ 7,999 226,694 234,693 243,466 Dormitory Authority....................................................................….…………… 20,203 2,203,721 2,223,924 1,912,726 Environmental Facilities Corporation..............................................…………… 669 112,184 112,853 113,271 Housing Finance Agency................................................................…………… 3,292 128,283 131,575 103,294 Local Government Assistance Corporation....................................…………… 3,757 389,054 392,811 383,809 Metropolitan Transportation Authority............................................…………… -- 74,984 74,984 164,987 Thruway Authority.........................................................................…………… 549 1,423,479 1,424,028 1,386,615 Triborough Bridge and Tunnel Authority.......................................…………… -- -- -- 42,137 Urban Development Corporation.....................................................………… 7,345 1,092,333 1,099,678 1,059,250 Subtotal.............................................................................................…………. 43,814 5,650,732 5,694,546 5,409,555
Total Special Contractual Financing Obligation Payments…………………… 43,814 5,650,732 5,694,546 5,410,215
Interest on General Obligation Bonds ..........................................…………… -- 141,452 141,452 137,114
Principal on General Obligation Bonds .........................................…………… -- 345,745 345,745 360,998
Administrative Expenses for Variable Rate General Obligation Bonds........................................................................... 385 -- 385 875
Total Debt Service Funds Disbursements..................................................... $ 44,199 $ 6,137,929 $ 6,182,128 $ 5,909,202 (*) Related Expenses include remarketing fees, cost of issuance expenses, administrative fees, capital expenses, and other expenses paid to the bank and/or the public benefit corporations issuing the bonds.
110
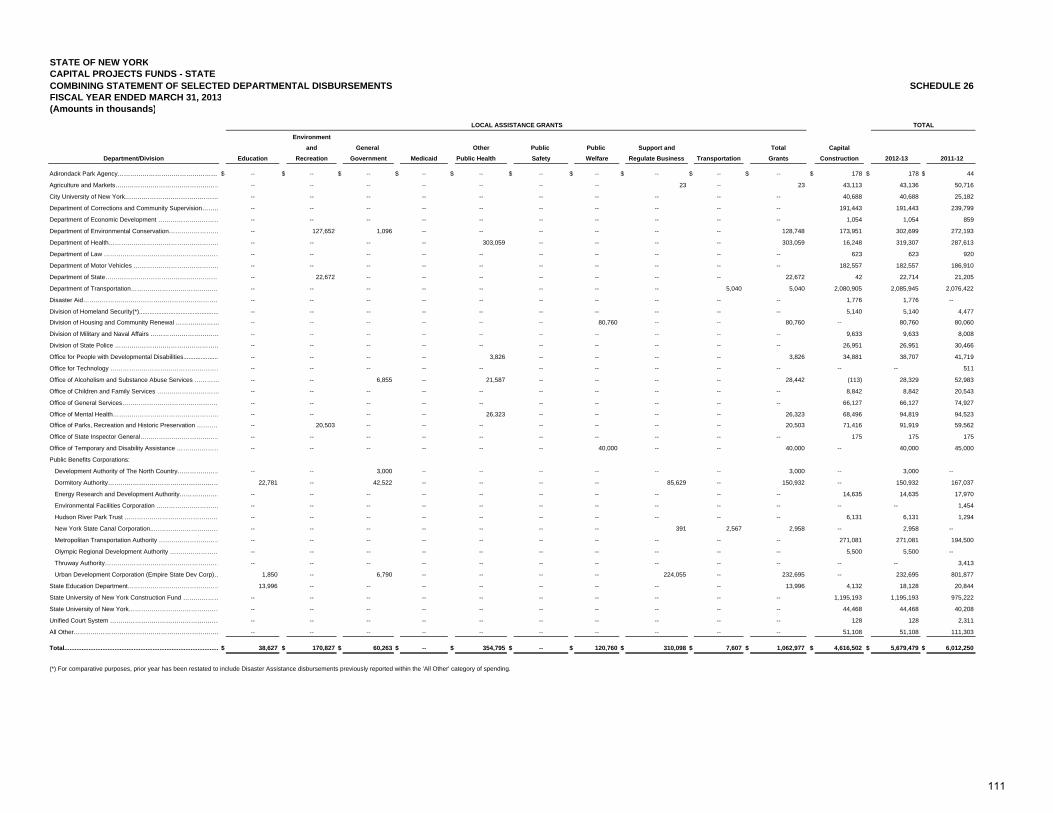
STATE OF NEW YORKCAPITAL PROJECTS FUNDS - STATE COMBINING STATEMENT OF SELECTED DEPARTMENTAL DISBURSEMENTS FISCAL YEAR ENDED MARCH 31, 2013(Amounts in thousands)
TOTAL
Environment and General Other Public Public Support and Total Capital
Department/Division Education Recreation Government Medicaid Public Health Safety Welfare Regulate Business Transportation Grants Construction 2012-13 2011-12
Adirondack Park Agency……………………………………………$ -- $ -- $ -- $ -- $ -- $ -- $ -- $ -- $ -- $ -- $ 178 $ 178 $ 44
Agriculture and Markets…………………………………………… -- -- -- -- -- -- -- 23 -- 23 43,113 43,136 50,716
City University of New York……………………………………… -- -- -- -- -- -- -- -- -- -- 40,688 40,688 25,182
Department of Corrections and Community Supervision……… -- -- -- -- -- -- -- -- -- -- 191,443 191,443 239,799
Department of Economic Development ………………………… -- -- -- -- -- -- -- -- -- -- 1,054 1,054 859
Department of Environmental Conservation…………………… -- 127,652 1,096 -- -- -- -- -- -- 128,748 173,951 302,699 272,193
Department of Health……………………………………………… -- -- -- -- 303,059 -- -- -- -- 303,059 16,248 319,307 287,613
Department of Law ………………………………………………… -- -- -- -- -- -- -- -- -- -- 623 623 920
Department of Motor Vehicles …………………………………… -- -- -- -- -- -- -- -- -- -- 182,557 182,557 186,910
Department of State………………………………………………… -- 22,672 -- -- -- -- -- -- -- 22,672 42 22,714 21,205
Department of Transportation……………………………………… -- -- -- -- -- -- -- -- 5,040 5,040 2,080,905 2,085,945 2,076,422
Disaster Aid……………….………………………………………… -- -- -- -- -- -- -- -- -- -- 1,776 1,776 --
Division of Homeland Security(*).............................................. -- -- -- -- -- -- -- -- -- -- 5,140 5,140 4,477
Division of Housing and Community Renewal ………………… -- -- -- -- -- -- 80,760 -- -- 80,760 -- 80,760 80,060
Division of Military and Naval Affairs …………………………… -- -- -- -- -- -- -- -- -- -- 9,633 9,633 8,008
Division of State Police …………………………………………… -- -- -- -- -- -- -- -- -- -- 26,951 26,951 30,466
Office for People with Developmental Disabilities..................... -- -- -- -- 3,826 -- -- -- -- 3,826 34,881 38,707 41,719
Office for Technology ……………………………………………… -- -- -- -- -- -- -- -- -- -- -- -- 511
Office of Alcoholism and Substance Abuse Services ………… -- -- 6,855 -- 21,587 -- -- -- -- 28,442 (113) 28,329 52,983
Office of Children and Family Services ………………………… -- -- -- -- -- -- -- -- -- -- 8,842 8,842 20,543
Office of General Services………………………………………… -- -- -- -- -- -- -- -- -- -- 66,127 66,127 74,927
Office of Mental Health…………………………………………… -- -- -- -- 26,323 -- -- -- -- 26,323 68,496 94,819 94,523
Office of Parks, Recreation and Historic Preservation ………… -- 20,503 -- -- -- -- -- -- -- 20,503 71,416 91,919 59,562
Office of State Inspector General………………………………… -- -- -- -- -- -- -- -- -- -- 175 175 175
Office of Temporary and Disability Assistance ………………… -- -- -- -- -- -- 40,000 -- -- 40,000 -- 40,000 45,000
Public Benefits Corporations:
Development Authority of The North Country………………… -- -- 3,000 -- -- -- -- -- -- 3,000 -- 3,000 --
Dormitory Authority……………………………………………… 22,781 -- 42,522 -- -- -- -- 85,629 -- 150,932 -- 150,932 167,037
Energy Research and Development Authority………………… -- -- -- -- -- -- -- -- -- -- 14,635 14,635 17,970
Environmental Facilities Corporation ………………………… -- -- -- -- -- -- -- -- -- -- -- -- 1,454
Hudson River Park Trust ………………………………………… -- -- -- -- -- -- -- -- -- -- 6,131 6,131 1,294
New York State Canal Corporation..…………………………… -- -- -- -- -- -- -- 391 2,567 2,958 -- 2,958 --
Metropolitan Transportation Authority ………………………… -- -- -- -- -- -- -- -- -- -- 271,081 271,081 194,500
Olympic Regional Development Authority …………………… -- -- -- -- -- -- -- -- -- -- 5,500 5,500 --
Thruway Authority………………………………………………… -- -- -- -- -- -- -- -- -- -- -- -- 3,413
Urban Development Corporation (Empire State Dev Corp)… 1,850 -- 6,790 -- -- -- -- 224,055 -- 232,695 -- 232,695 801,877
State Education Department……………………………………… 13,996 -- -- -- -- -- -- -- -- 13,996 4,132 18,128 20,844
State University of New York Construction Fund ……………… -- -- -- -- -- -- -- -- -- -- 1,195,193 1,195,193 975,222
State University of New York……………………………………… -- -- -- -- -- -- -- -- -- -- 44,468 44,468 40,208
Unified Court System ……………………………………………… -- -- -- -- -- -- -- -- -- -- 128 128 2,311
All Other……………………………………………………………. -- -- -- -- -- -- -- -- -- -- 51,108 51,108 111,303
Total......................................................................................... $ 38,627 $ 170,827 $ 60,263 $ -- $ 354,795 $ -- $ 120,760 $ 310,098 $ 7,607 $ 1,062,977 $ 4,616,502 $ 5,679,479 $ 6,012,250
SCHEDULE 26
LOCAL ASSISTANCE GRANTS
(*) For comparative purposes, prior year has been restated to include Disaster Assistance disbursements previously reported within the 'All Other' category of spending.
111
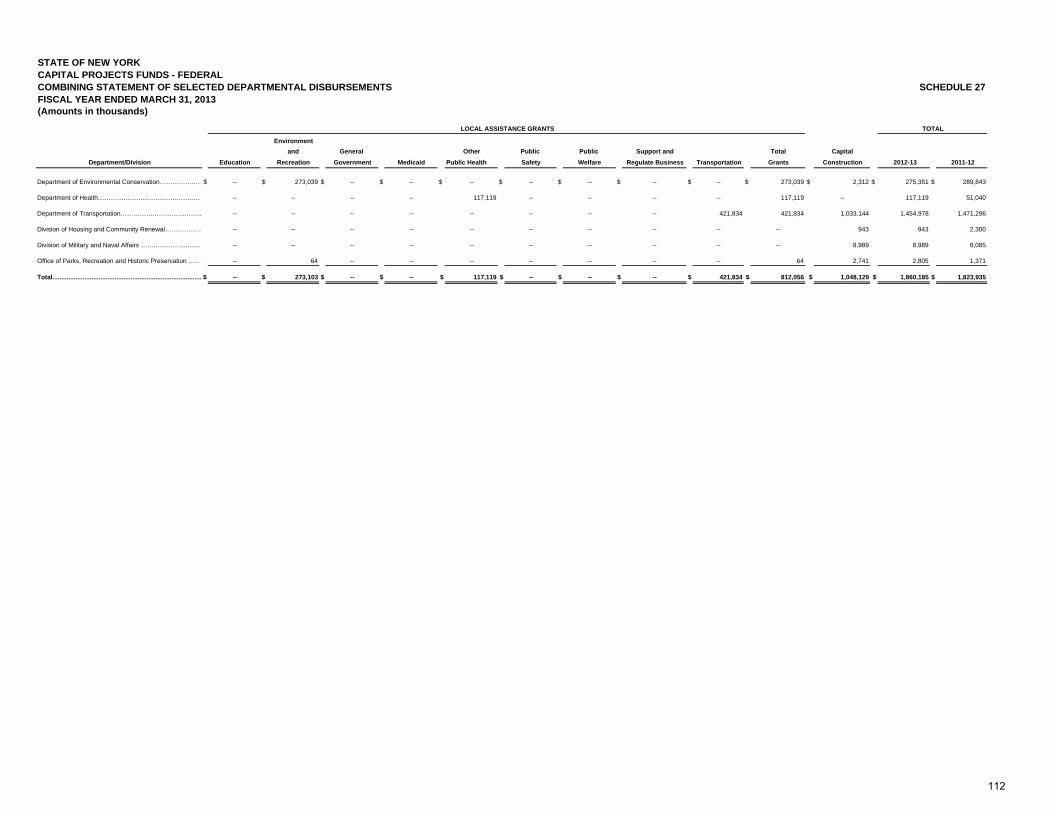
STATE OF NEW YORKCAPITAL PROJECTS FUNDS - FEDERAL COMBINING STATEMENT OF SELECTED DEPARTMENTAL DISBURSEMENTS FISCAL YEAR ENDED MARCH 31, 2013 (Amounts in thousands)
TOTAL
Environment and General Other Public Public Support and Total Capital
Department/Division Education Recreation Government Medicaid Public Health Safety Welfare Regulate Business Transportation Grants Construction 2012-13 2011-12
Department of Environmental Conservation…………………$ -- $ 273,039 $ -- $ -- $ -- $ -- $ -- $ -- $ -- $ 273,039 $ 2,312 $ 275,351 $ 289,843
Department of Health…………………………………………… -- -- -- -- 117,119 -- -- -- -- 117,119 -- 117,119 51,040
Department of Transportation………………………………… -- -- -- -- -- -- -- -- 421,834 421,834 1,033,144 1,454,978 1,471,296
Division of Housing and Community Renewal……………… -- -- -- -- -- -- -- -- -- -- 943 943 2,300
Division of Military and Naval Affairs ………………………… -- -- -- -- -- -- -- -- -- -- 8,989 8,989 8,085
Office of Parks, Recreation and Historic Preservation …… -- 64 -- -- -- -- -- -- -- 64 2,741 2,805 1,371
Total.................................................................................... $ -- $ 273,103 $ -- $ -- $ 117,119 $ -- $ -- $ -- $ 421,834 $ 812,056 $ 1,048,129 $ 1,860,185 $ 1,823,935
SCHEDULE 27
LOCAL ASSISTANCE GRANTS
112
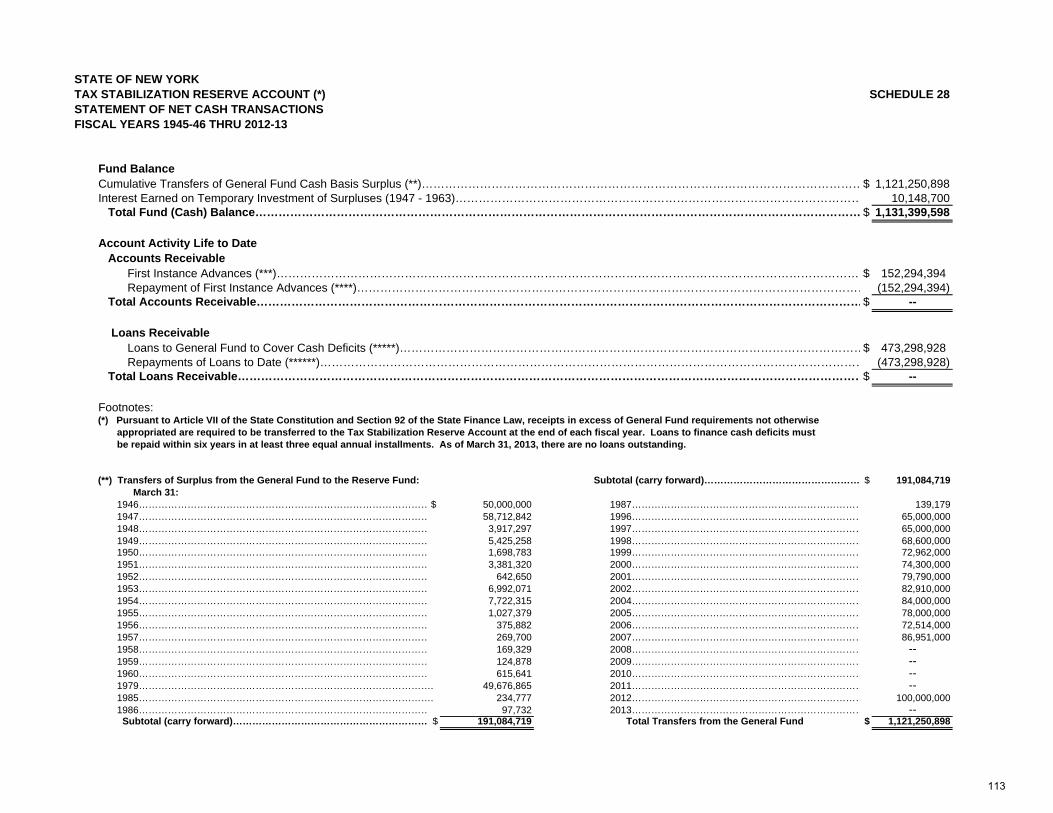
STATE OF NEW YORK TAX STABILIZATION RESERVE ACCOUNT (*) SCHEDULE 28STATEMENT OF NET CASH TRANSACTIONS FISCAL YEARS 1945-46 THRU 2012-13
Fund BalanceCumulative Transfers of General Fund Cash Basis Surplus (**)……………………………………………………………………………………………………$ 1,121,250,898Interest Earned on Temporary Investment of Surpluses (1947 - 1963)…………………………………………………………………………………………… 10,148,700 Total Fund (Cash) Balance………………………………………………………………………………………………………………………………………… $ 1,131,399,598
Account Activity Life to Date Accounts Receivable First Instance Advances (***)………………………………………………………………………………………………………………………………………$ 152,294,394 Repayment of First Instance Advances (****)…………………………………………………………………………………………………………………… (152,294,394) Total Accounts Receivable…………………………………………………………………………………………………………………………………………$ --
Loans Receivable Loans to General Fund to Cover Cash Deficits (*****)…………………………………………………………………………………………………………$ 473,298,928 Repayments of Loans to Date (******)…………………………………………………………………………………………………………………………… (473,298,928) Total Loans Receivable………………………………………………………………………………………………………………………………………………$ --
Footnotes:(*) Pursuant to Article VII of the State Constitution and Section 92 of the State Finance Law, receipts in excess of General Fund requirements not otherwise appropriated are required to be transferred to the Tax Stabilization Reserve Account at the end of each fiscal year. Loans to finance cash deficits must be repaid within six years in at least three equal annual installments. As of March 31, 2013, there are no loans outstanding.
(**) Transfers of Surplus from the General Fund to the Reserve Fund: Subtotal (carry forward)………………………………………… $ 191,084,719 March 31: 1946………………………………………………………………………………$ 50,000,000 1987……………………………………………………………… 139,179 1947……………………………………………………………………………… 58,712,842 1996……………………………………………………………… 65,000,000 1948……………………………………………………………………………… 3,917,297 1997……………………………………………………………… 65,000,000 1949……………………………………………………………………………… 5,425,258 1998……………………………………………………………… 68,600,000 1950……………………………………………………………………………… 1,698,783 1999……………………………………………………………… 72,962,000 1951……………………………………………………………………………… 3,381,320 2000……………………………………………………………… 74,300,000 1952……………………………………………………………………………… 642,650 2001……………………………………………………………… 79,790,000 1953……………………………………………………………………………… 6,992,071 2002……………………………………………………………… 82,910,000 1954……………………………………………………………………………… 7,722,315 2004……………………………………………………………… 84,000,000 1955……………………………………………………………………………… 1,027,379 2005……………………………………………………………… 78,000,000 1956……………………………………………………………………………… 375,882 2006……………………………………………………………… 72,514,000 1957……………………………………………………………………………… 269,700 2007……………………………………………………………… 86,951,000 1958……………………………………………………………………………… 169,329 2008……………………………………………………………… -- 1959……………………………………………………………………………… 124,878 2009……………………………………………………………… -- 1960……………………………………………………………………………… 615,641 2010……………………………………………………………… -- 1979………………………………………………………………………………. 49,676,865 2011……………………………………………………………… -- 1985………………………………………………………………………………. 234,777 2012……………………………………………………………… 100,000,000 1986……………………………………………………………………………… 97,732 2013……………………………………………………………… -- Subtotal (carry forward)……………………………………………………. $ 191,084,719 Total Transfers from the General Fund $ 1,121,250,898
113
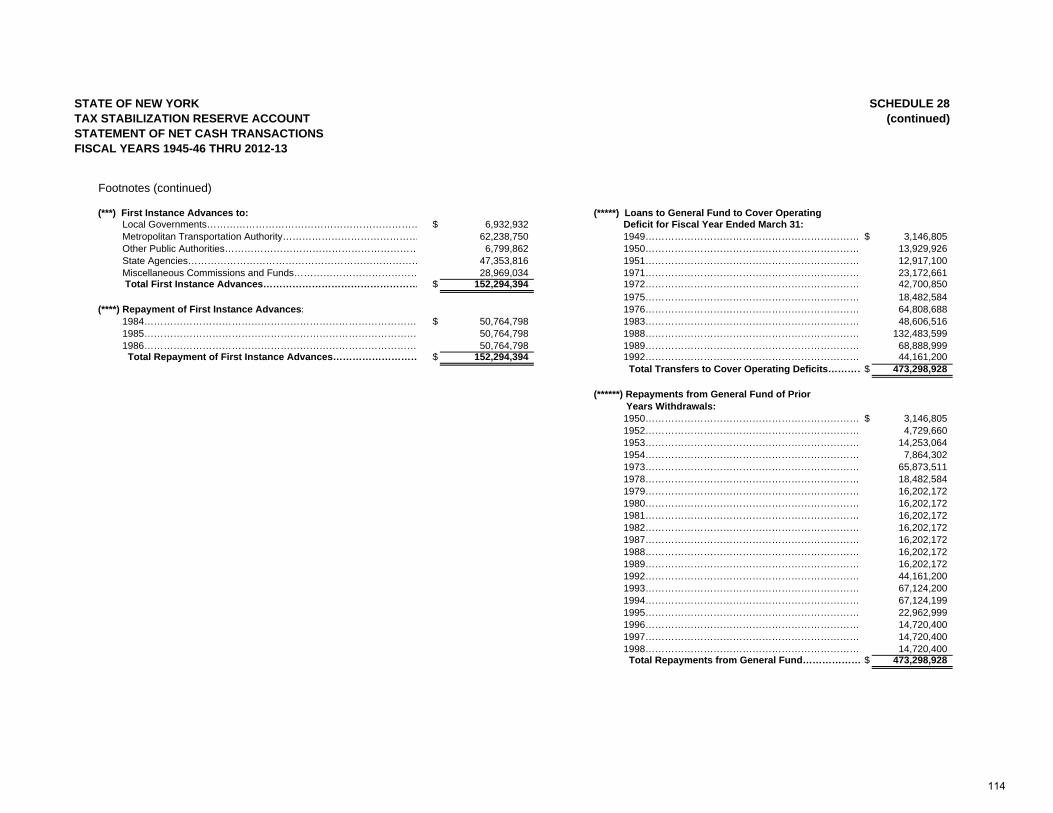
STATE OF NEW YORK SCHEDULE 28TAX STABILIZATION RESERVE ACCOUNT (continued)STATEMENT OF NET CASH TRANSACTIONS FISCAL YEARS 1945-46 THRU 2012-13
Footnotes (continued)
(***) First Instance Advances to: (*****) Loans to General Fund to Cover Operating Local Governments………………………………………………………… $ 6,932,932 Deficit for Fiscal Year Ended March 31: Metropolitan Transportation Authority…………………………………… 62,238,750 1949………………………………………………………… $ 3,146,805 Other Public Authorities…………………………………………………… 6,799,862 1950………………………………………………………… 13,929,926 State Agencies……………………………………………………………… 47,353,816 1951………………………………………………………… 12,917,100 Miscellaneous Commissions and Funds………………………………… 28,969,034 1971………………………………………………………… 23,172,661 Total First Instance Advances………………………………………… $ 152,294,394 1972………………………………………………………… 42,700,850
1975………………………………………………………… 18,482,584(****) Repayment of First Instance Advances: 1976………………………………………………………… 64,808,688 1984………………………………………………………………………… $ 50,764,798 1983………………………………………………………… 48,606,516 1985………………………………………………………………………… 50,764,798 1988………………………………………………………… 132,483,599 1986………………………………………………………………………… 50,764,798 1989………………………………………………………… 68,888,999 Total Repayment of First Instance Advances……………………… $ 152,294,394 1992………………………………………………………… 44,161,200
Total Transfers to Cover Operating Deficits…………$ 473,298,928
(******) Repayments from General Fund of Prior Years Withdrawals: 1950………………………………………………………… $ 3,146,805 1952………………………………………………………… 4,729,660 1953………………………………………………………… 14,253,064 1954………………………………………………………… 7,864,302 1973………………………………………………………… 65,873,511 1978………………………………………………………… 18,482,584 1979………………………………………………………… 16,202,172 1980………………………………………………………… 16,202,172 1981………………………………………………………… 16,202,172 1982………………………………………………………… 16,202,172 1987………………………………………………………… 16,202,172 1988………………………………………………………… 16,202,172 1989………………………………………………………… 16,202,172 1992………………………………………………………… 44,161,200 1993………………………………………………………… 67,124,200 1994………………………………………………………… 67,124,199 1995………………………………………………………… 22,962,999 1996………………………………………………………… 14,720,400 1997………………………………………………………… 14,720,400 1998………………………………………………………… 14,720,400 Total Repayments from General Fund……………… $ 473,298,928
114
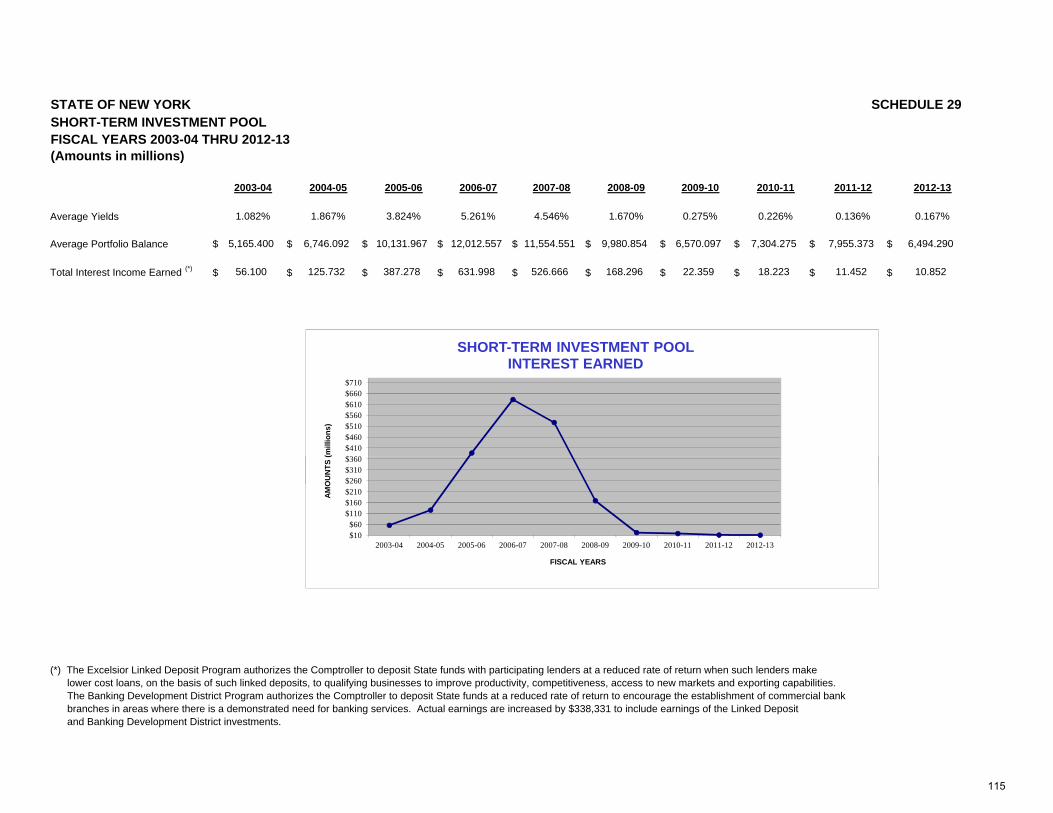
STATE OF NEW YORK SCHEDULE 29SHORT-TERM INVESTMENT POOLFISCAL YEARS 2003-04 THRU 2012-13(Amounts in millions)
2003-04 2004-05 2005-06 2006-07 2007-08 2008-09 2009-10 2010-11 2011-12 2012-13
Average Yields 1.082% 1.867% 3.824% 5.261% 4.546% 1.670% 0.275% 0.226% 0.136% 0.167%
Average Portfolio Balance $ 5,165.400 $ 6,746.092 $ 10,131.967 $ 12,012.557 $ 11,554.551 $ 9,980.854 $ 6,570.097 $ 7,304.275 $ 7,955.373 $ 6,494.290
Total Interest Income Earned (*) $ 56.100 $ 125.732 $ 387.278 $ 631.998 $ 526.666 $ 168.296 $ 22.359 $ 18.223 $ 11.452 $ 10.852
$260$310$360$410$460$510$560$610$660$710
OU
NTS
(mill
ions
)
SHORT-TERM INVESTMENT POOL INTEREST EARNED
(*) The Excelsior Linked Deposit Program authorizes the Comptroller to deposit State funds with participating lenders at a reduced rate of return when such lenders make lower cost loans, on the basis of such linked deposits, to qualifying businesses to improve productivity, competitiveness, access to new markets and exporting capabilities. The Banking Development District Program authorizes the Comptroller to deposit State funds at a reduced rate of return to encourage the establishment of commercial bank branches in areas where there is a demonstrated need for banking services. Actual earnings are increased by $338,331 to include earnings of the Linked Deposit and Banking Development District investments.
$10$60
$110$160$210$260$310$360
2003-04 2004-05 2005-06 2006-07 2007-08 2008-09 2009-10 2010-11 2011-12 2012-13
AMO
UN
TS (
FISCAL YEARS
115
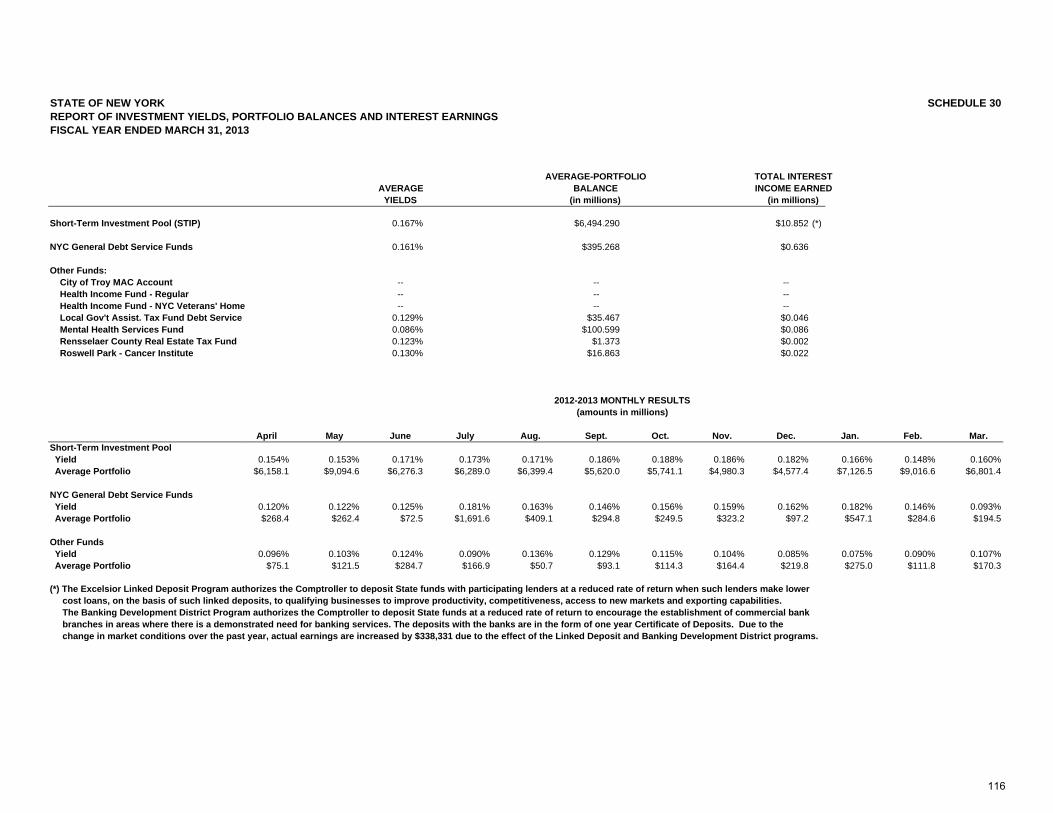
STATE OF NEW YORKREPORT OF INVESTMENT YIELDS, PORTFOLIO BALANCES AND INTEREST EARNINGSFISCAL YEAR ENDED MARCH 31, 2013
AVERAGE-PORTFOLIO TOTAL INTERESTAVERAGE BALANCE INCOME EARNED
YIELDS (in millions) (in millions)
Short-Term Investment Pool (STIP) 0.167% $6,494.290 $10.852 (*)
NYC General Debt Service Funds 0.161% $395.268 $0.636
Other Funds: City of Troy MAC Account -- -- -- Health Income Fund - Regular -- -- -- Health Income Fund - NYC Veterans' Home -- -- -- Local Gov't Assist. Tax Fund Debt Service 0.129% $35.467 $0.046 Mental Health Services Fund 0.086% $100.599 $0.086 Rensselaer County Real Estate Tax Fund 0.123% $1.373 $0.002 Roswell Park - Cancer Institute 0.130% $16.863 $0.022
2012-2013 MONTHLY RESULTS(amounts in millions)
April May June July Aug. Sept. Oct. Nov. Dec. Jan. Feb. Mar.Short-Term Investment Pool Yield 0.154% 0.153% 0.171% 0.173% 0.171% 0.186% 0.188% 0.186% 0.182% 0.166% 0.148% 0.160% Average Portfolio $6,158.1 $9,094.6 $6,276.3 $6,289.0 $6,399.4 $5,620.0 $5,741.1 $4,980.3 $4,577.4 $7,126.5 $9,016.6 $6,801.4
NYC General Debt Service Funds Yield 0.120% 0.122% 0.125% 0.181% 0.163% 0.146% 0.156% 0.159% 0.162% 0.182% 0.146% 0.093% Average Portfolio $268.4 $262.4 $72.5 $1,691.6 $409.1 $294.8 $249.5 $323.2 $97.2 $547.1 $284.6 $194.5
Other Funds Yield 0.096% 0.103% 0.124% 0.090% 0.136% 0.129% 0.115% 0.104% 0.085% 0.075% 0.090% 0.107% Average Portfolio $75.1 $121.5 $284.7 $166.9 $50.7 $93.1 $114.3 $164.4 $219.8 $275.0 $111.8 $170.3
(*) The Excelsior Linked Deposit Program authorizes the Comptroller to deposit State funds with participating lenders at a reduced rate of return when such lenders make lower cost loans, on the basis of such linked deposits, to qualifying businesses to improve productivity, competitiveness, access to new markets and exporting capabilities. The Banking Development District Program authorizes the Comptroller to deposit State funds at a reduced rate of return to encourage the establishment of commercial bank branches in areas where there is a demonstrated need for banking services. The deposits with the banks are in the form of one year Certificate of Deposits. Due to the change in market conditions over the past year, actual earnings are increased by $338,331 due to the effect of the Linked Deposit and Banking Development District programs.
SCHEDULE 30
116
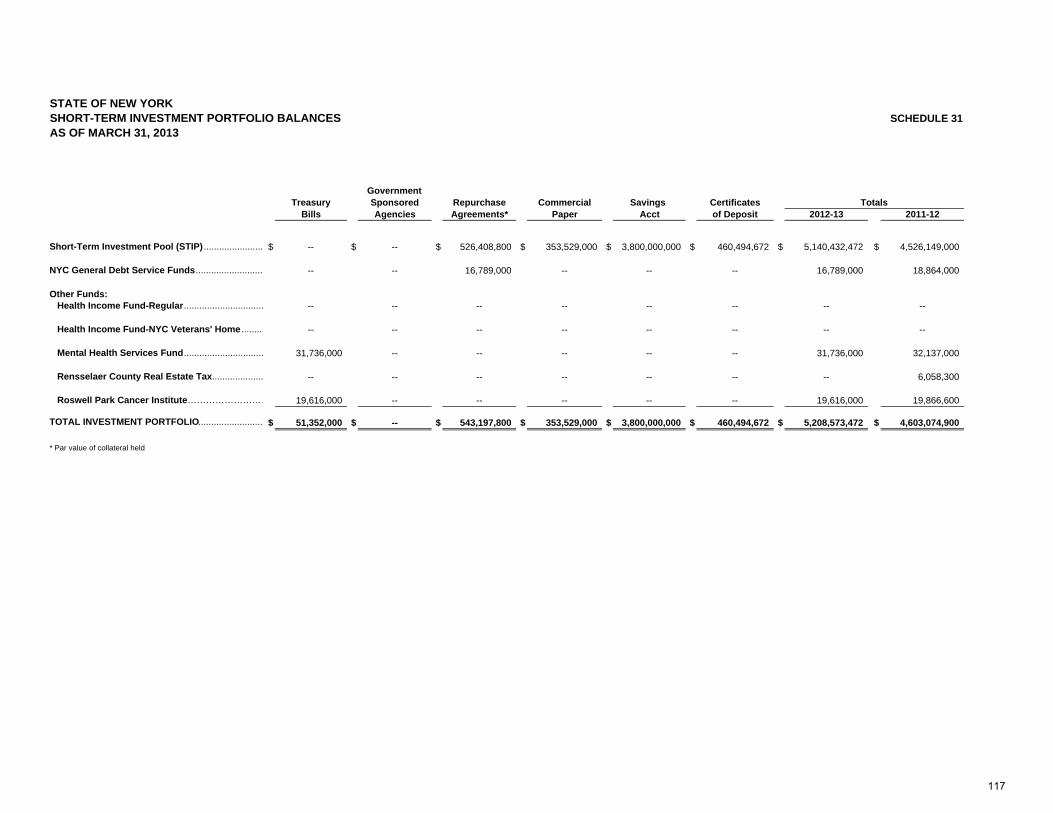
STATE OF NEW YORKSHORT-TERM INVESTMENT PORTFOLIO BALANCES SCHEDULE 31AS OF MARCH 31, 2013
GovernmentTreasury Sponsored Repurchase Commercial Savings Certificates Totals
Bills Agencies Agreements* Paper Acct of Deposit 2012-13 2011-12
Short-Term Investment Pool (STIP) ....................... $ -- $ -- $ 526,408,800 $ 353,529,000 $ 3,800,000,000 $ 460,494,672 $ 5,140,432,472 $ 4,526,149,000
NYC General Debt Service Funds.......................... -- -- 16,789,000 -- -- -- 16,789,000 18,864,000
Other Funds: Health Income Fund-Regular............................... -- -- -- -- -- -- -- --
Health Income Fund-NYC Veterans' Home ......... -- -- -- -- -- -- -- --
Mental Health Services Fund............................... 31,736,000 -- -- -- -- -- 31,736,000 32,137,000
Rensselaer County Real Estate Tax.................... -- -- -- -- -- -- -- 6,058,300
Roswell Park Cancer Institute……………………… 19,616,000 -- -- -- -- -- 19,616,000 19,866,600
TOTAL INVESTMENT PORTFOLIO......................... $ 51,352,000 $ -- $ 543,197,800 $ 353,529,000 $ 3,800,000,000 $ 460,494,672 $ 5,208,573,472 $ 4,603,074,900
* Par value of collateral held
117
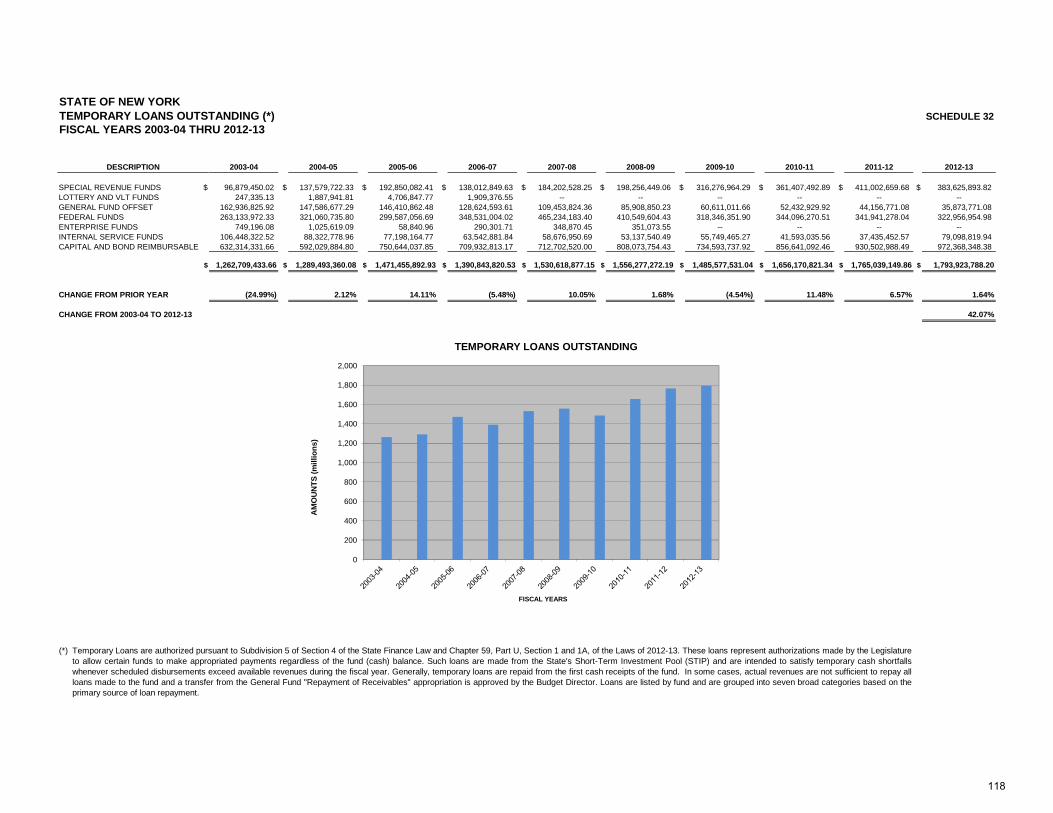
STATE OF NEW YORKTEMPORARY LOANS OUTSTANDING (*) SCHEDULE 32FISCAL YEARS 2003-04 THRU 2012-13
2003-04 2004-05 2005-06 2006-07 2007-08 2008-09 2009-10 2010-11 2011-12 2012-13
SPECIAL REVENUE FUNDS $ 96,879,450.02 $ 137,579,722.33 $ 192,850,082.41 $ 138,012,849.63 $ 184,202,528.25 $ 198,256,449.06 $ 316,276,964.29 $ 361,407,492.89 $ 411,002,659.68 $ 383,625,893.82LOTTERY AND VLT FUNDS 247,335.13 1,887,941.81 4,706,847.77 1,909,376.55 -- -- -- -- -- --GENERAL FUND OFFSET 162,936,825.92 147,586,677.29 146,410,862.48 128,624,593.61 109,453,824.36 85,908,850.23 60,611,011.66 52,432,929.92 44,156,771.08 35,873,771.08FEDERAL FUNDS 263,133,972.33 321,060,735.80 299,587,056.69 348,531,004.02 465,234,183.40 410,549,604.43 318,346,351.90 344,096,270.51 341,941,278.04 322,956,954.98ENTERPRISE FUNDS 749,196.08 1,025,619.09 58,840.96 290,301.71 348,870.45 351,073.55 -- -- -- --INTERNAL SERVICE FUNDS 106,448,322.52 88,322,778.96 77,198,164.77 63,542,881.84 58,676,950.69 53,137,540.49 55,749,465.27 41,593,035.56 37,435,452.57 79,098,819.94CAPITAL AND BOND REIMBURSABLE 632,314,331.66 592,029,884.80 750,644,037.85 709,932,813.17 712,702,520.00 808,073,754.43 734,593,737.92 856,641,092.46 930,502,988.49 972,368,348.38
$ 1,262,709,433.66 $ 1,289,493,360.08 $ 1,471,455,892.93 $ 1,390,843,820.53 $ 1,530,618,877.15 $ 1,556,277,272.19 $ 1,485,577,531.04 $ 1,656,170,821.34 $ 1,765,039,149.86 $ 1,793,923,788.20
CHANGE FROM PRIOR YEAR (24.99%) 2.12% 14.11% (5.48%) 10.05% 1.68% (4.54%) 11.48% 6.57% 1.64%
CHANGE FROM 2003-04 TO 2012-13 42.07%
DESCRIPTION
1,000
1,200
1,400
1,600
1,800
2,000
(mill
ions
)
TEMPORARY LOANS OUTSTANDING
(*) Temporary Loans are authorized pursuant to Subdivision 5 of Section 4 of the State Finance Law and Chapter 59, Part U, Section 1 and 1A, of the Laws of 2012-13. These loans represent authorizations made by the Legislatureto allow certain funds to make appropriated payments regardless of the fund (cash) balance. Such loans are made from the State's Short-Term Investment Pool (STIP) and are intended to satisfy temporary cash shortfallswhenever scheduled disbursements exceed available revenues during the fiscal year. Generally, temporary loans are repaid from the first cash receipts of the fund. In some cases, actual revenues are not sufficient to repay allloans made to the fund and a transfer from the General Fund "Repayment of Receivables" appropriation is approved by the Budget Director. Loans are listed by fund and are grouped into seven broad categories based on theprimary source of loan repayment.
0
200
400
600
800
AM
OU
NTS
FISCAL YEARS
118
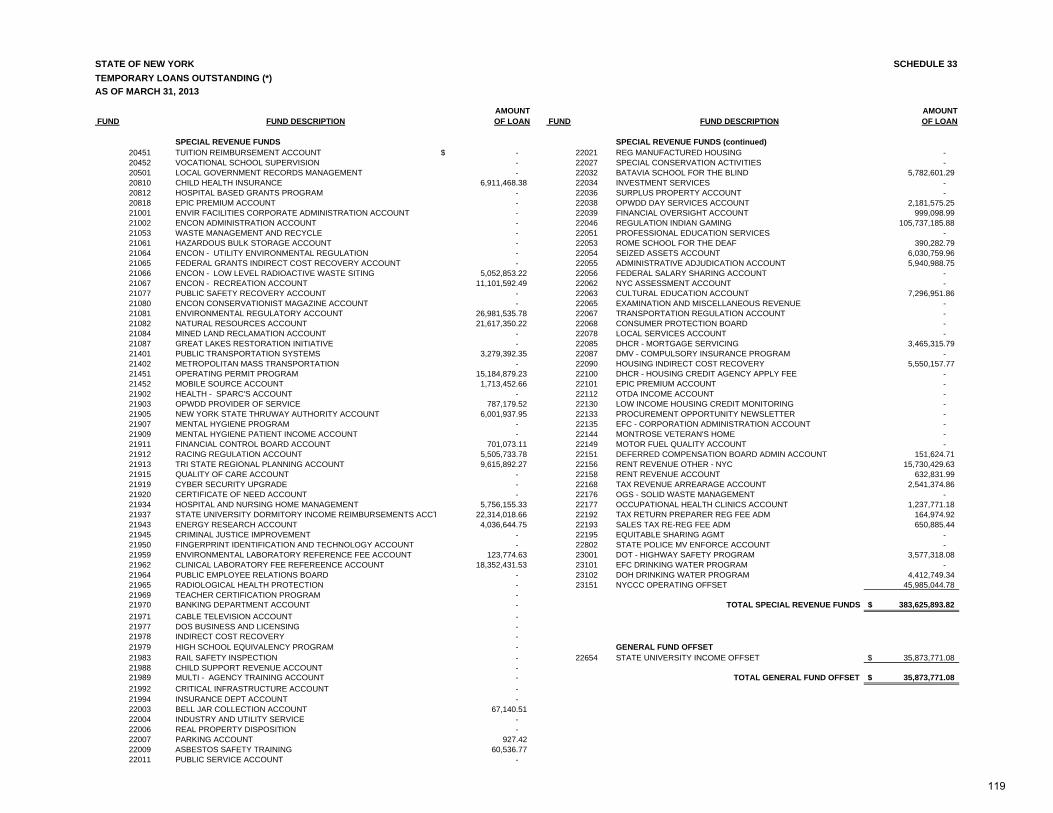
STATE OF NEW YORK SCHEDULE 33TEMPORARY LOANS OUTSTANDING (*)AS OF MARCH 31, 2013
AMOUNT AMOUNT FUND FUND DESCRIPTION OF LOAN FUND FUND DESCRIPTION OF LOAN
SPECIAL REVENUE FUNDS SPECIAL REVENUE FUNDS (continued)20451 TUITION REIMBURSEMENT ACCOUNT -$ 22021 REG MANUFACTURED HOUSING - 20452 VOCATIONAL SCHOOL SUPERVISION - 22027 SPECIAL CONSERVATION ACTIVITIES - 20501 LOCAL GOVERNMENT RECORDS MANAGEMENT - 22032 BATAVIA SCHOOL FOR THE BLIND 5,782,601.29 20810 CHILD HEALTH INSURANCE 6,911,468.38 22034 INVESTMENT SERVICES - 20812 HOSPITAL BASED GRANTS PROGRAM - 22036 SURPLUS PROPERTY ACCOUNT - 20818 EPIC PREMIUM ACCOUNT - 22038 OPWDD DAY SERVICES ACCOUNT 2,181,575.25 21001 ENVIR FACILITIES CORPORATE ADMINISTRATION ACCOUNT - 22039 FINANCIAL OVERSIGHT ACCOUNT 999,098.99 21002 ENCON ADMINISTRATION ACCOUNT - 22046 REGULATION INDIAN GAMING 105,737,185.88 21053 WASTE MANAGEMENT AND RECYCLE - 22051 PROFESSIONAL EDUCATION SERVICES - 21061 HAZARDOUS BULK STORAGE ACCOUNT - 22053 ROME SCHOOL FOR THE DEAF 390,282.79 21064 ENCON - UTILITY ENVIRONMENTAL REGULATION - 22054 SEIZED ASSETS ACCOUNT 6,030,759.96 21065 FEDERAL GRANTS INDIRECT COST RECOVERY ACCOUNT - 22055 ADMINISTRATIVE ADJUDICATION ACCOUNT 5,940,988.75 21066 ENCON - LOW LEVEL RADIOACTIVE WASTE SITING 5,052,853.22 22056 FEDERAL SALARY SHARING ACCOUNT - 21067 ENCON - RECREATION ACCOUNT 11,101,592.49 22062 NYC ASSESSMENT ACCOUNT - 21077 PUBLIC SAFETY RECOVERY ACCOUNT - 22063 CULTURAL EDUCATION ACCOUNT 7,296,951.86 21080 ENCON CONSERVATIONIST MAGAZINE ACCOUNT - 22065 EXAMINATION AND MISCELLANEOUS REVENUE - 21081 ENVIRONMENTAL REGULATORY ACCOUNT 26,981,535.78 22067 TRANSPORTATION REGULATION ACCOUNT - 21082 NATURAL RESOURCES ACCOUNT 21,617,350.22 22068 CONSUMER PROTECTION BOARD - 21084 MINED LAND RECLAMATION ACCOUNT - 22078 LOCAL SERVICES ACCOUNT - 21087 GREAT LAKES RESTORATION INITIATIVE - 22085 DHCR - MORTGAGE SERVICING 3,465,315.79 21401 PUBLIC TRANSPORTATION SYSTEMS 3,279,392.35 22087 DMV - COMPULSORY INSURANCE PROGRAM - 21402 METROPOLITAN MASS TRANSPORTATION - 22090 HOUSING INDIRECT COST RECOVERY 5,550,157.77 21451 OPERATING PERMIT PROGRAM 15,184,879.23 22100 DHCR - HOUSING CREDIT AGENCY APPLY FEE - 21452 MOBILE SOURCE ACCOUNT 1,713,452.66 22101 EPIC PREMIUM ACCOUNT - 21902 HEALTH - SPARC'S ACCOUNT - 22112 OTDA INCOME ACCOUNT - 21903 OPWDD PROVIDER OF SERVICE 787,179.52 22130 LOW INCOME HOUSING CREDIT MONITORING - 21905 NEW YORK STATE THRUWAY AUTHORITY ACCOUNT 6,001,937.95 22133 PROCUREMENT OPPORTUNITY NEWSLETTER - 21907 MENTAL HYGIENE PROGRAM - 22135 EFC - CORPORATION ADMINISTRATION ACCOUNT - 21909 MENTAL HYGIENE PATIENT INCOME ACCOUNT - 22144 MONTROSE VETERAN'S HOME - 21911 FINANCIAL CONTROL BOARD ACCOUNT 701,073.11 22149 MOTOR FUEL QUALITY ACCOUNT - 21912 RACING REGULATION ACCOUNT 5,505,733.78 22151 DEFERRED COMPENSATION BOARD ADMIN ACCOUNT 151,624.71 21913 TRI STATE REGIONAL PLANNING ACCOUNT 9,615,892.27 22156 RENT REVENUE OTHER - NYC 15,730,429.63 21915 QUALITY OF CARE ACCOUNT - 22158 RENT REVENUE ACCOUNT 632,831.99 21919 CYBER SECURITY UPGRADE - 22168 TAX REVENUE ARREARAGE ACCOUNT 2,541,374.86 21920 CERTIFICATE OF NEED ACCOUNT - 22176 OGS - SOLID WASTE MANAGEMENT - 21934 HOSPITAL AND NURSING HOME MANAGEMENT 5,756,155.33 22177 OCCUPATIONAL HEALTH CLINICS ACCOUNT 1,237,771.18 21937 STATE UNIVERSITY DORMITORY INCOME REIMBURSEMENTS ACCT 22,314,018.66 22192 TAX RETURN PREPARER REG FEE ADM 164,974.92 21943 ENERGY RESEARCH ACCOUNT 4,036,644.75 22193 SALES TAX RE-REG FEE ADM 650,885.44 21945 CRIMINAL JUSTICE IMPROVEMENT - 22195 EQUITABLE SHARING AGMT - 21950 FINGERPRINT IDENTIFICATION AND TECHNOLOGY ACCOUNT - 22802 STATE POLICE MV ENFORCE ACCOUNT - 21959 ENVIRONMENTAL LABORATORY REFERENCE FEE ACCOUNT 123,774.63 23001 DOT - HIGHWAY SAFETY PROGRAM 3,577,318.08 21962 CLINICAL LABORATORY FEE REFEREENCE ACCOUNT 18,352,431.53 23101 EFC DRINKING WATER PROGRAM - 21964 PUBLIC EMPLOYEE RELATIONS BOARD - 23102 DOH DRINKING WATER PROGRAM 4,412,749.34 21965 RADIOLOGICAL HEALTH PROTECTION - 23151 NYCCC OPERATING OFFSET 45,985,044.78 21969 TEACHER CERTIFICATION PROGRAM - 21970 BANKING DEPARTMENT ACCOUNT - TOTAL SPECIAL REVENUE FUNDS 383,625,893.82$ 21971 CABLE TELEVISION ACCOUNT - 21977 DOS BUSINESS AND LICENSING - 21978 INDIRECT COST RECOVERY - 21979 HIGH SCHOOL EQUIVALENCY PROGRAM - GENERAL FUND OFFSET21983 RAIL SAFETY INSPECTION - 22654 STATE UNIVERSITY INCOME OFFSET 35,873,771.08$ 21988 CHILD SUPPORT REVENUE ACCOUNT - 21989 MULTI - AGENCY TRAINING ACCOUNT - TOTAL GENERAL FUND OFFSET 35,873,771.08$ 21992 CRITICAL INFRASTRUCTURE ACCOUNT - 21994 INSURANCE DEPT ACCOUNT - 22003 BELL JAR COLLECTION ACCOUNT 67,140.51 22004 INDUSTRY AND UTILITY SERVICE - 22006 REAL PROPERTY DISPOSITION - 22007 PARKING ACCOUNT 927.42 22009 ASBESTOS SAFETY TRAINING 60,536.77 22011 PUBLIC SERVICE ACCOUNT -
119
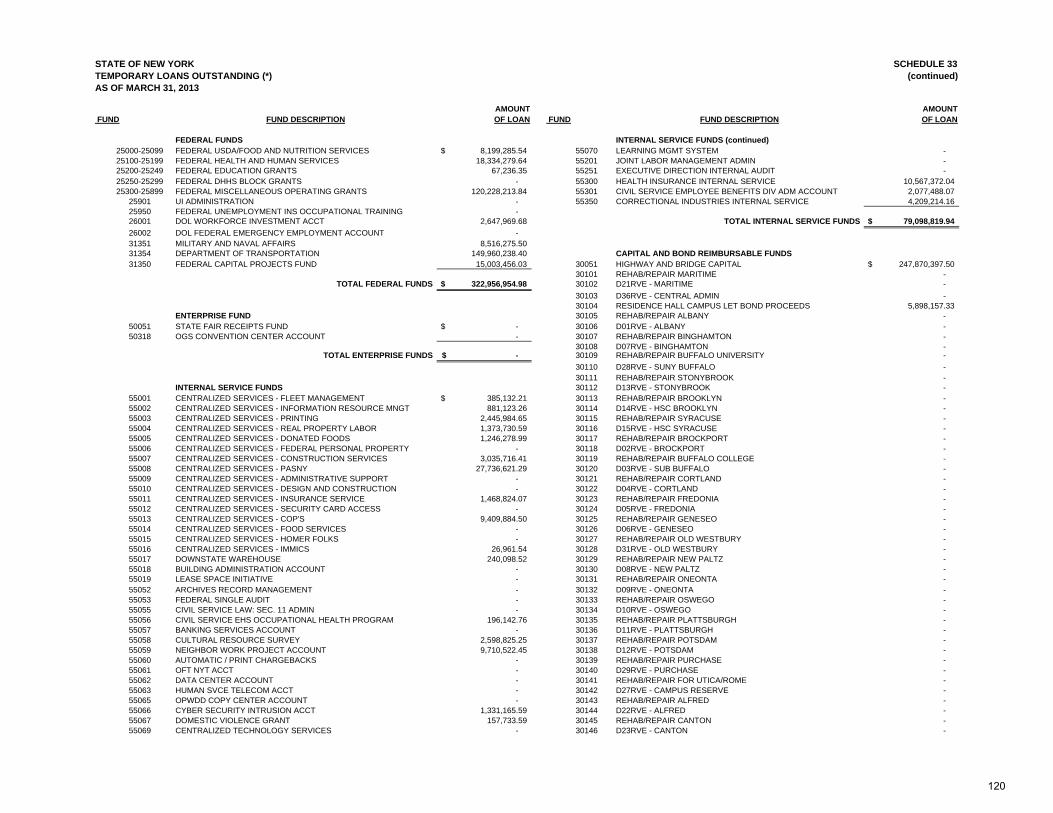
STATE OF NEW YORK SCHEDULE 33TEMPORARY LOANS OUTSTANDING (*) (continued)AS OF MARCH 31, 2013
AMOUNT AMOUNT FUND FUND DESCRIPTION OF LOAN FUND FUND DESCRIPTION OF LOAN
FEDERAL FUNDS INTERNAL SERVICE FUNDS (continued)25000-25099 FEDERAL USDA/FOOD AND NUTRITION SERVICES 8,199,285.54$ 55070 LEARNING MGMT SYSTEM - 25100-25199 FEDERAL HEALTH AND HUMAN SERVICES 18,334,279.64 55201 JOINT LABOR MANAGEMENT ADMIN - 25200-25249 FEDERAL EDUCATION GRANTS 67,236.35 55251 EXECUTIVE DIRECTION INTERNAL AUDIT - 25250-25299 FEDERAL DHHS BLOCK GRANTS - 55300 HEALTH INSURANCE INTERNAL SERVICE 10,567,372.04 25300-25899 FEDERAL MISCELLANEOUS OPERATING GRANTS 120,228,213.84 55301 CIVIL SERVICE EMPLOYEE BENEFITS DIV ADM ACCOUNT 2,077,488.07
25901 UI ADMINISTRATION - 55350 CORRECTIONAL INDUSTRIES INTERNAL SERVICE 4,209,214.16 25950 FEDERAL UNEMPLOYMENT INS OCCUPATIONAL TRAINING - 26001 DOL WORKFORCE INVESTMENT ACCT 2,647,969.68 TOTAL INTERNAL SERVICE FUNDS 79,098,819.94$ 26002 DOL FEDERAL EMERGENCY EMPLOYMENT ACCOUNT - 31351 MILITARY AND NAVAL AFFAIRS 8,516,275.50 31354 DEPARTMENT OF TRANSPORTATION 149,960,238.40 CAPITAL AND BOND REIMBURSABLE FUNDS31350 FEDERAL CAPITAL PROJECTS FUND 15,003,456.03 30051 HIGHWAY AND BRIDGE CAPITAL 247,870,397.50$
30101 REHAB/REPAIR MARITIME - TOTAL FEDERAL FUNDS 322,956,954.98$ 30102 D21RVE - MARITIME -
30103 D36RVE - CENTRAL ADMIN - 30104 RESIDENCE HALL CAMPUS LET BOND PROCEEDS 5,898,157.33
ENTERPRISE FUND 30105 REHAB/REPAIR ALBANY - 50051 STATE FAIR RECEIPTS FUND -$ 30106 D01RVE - ALBANY - 50318 OGS CONVENTION CENTER ACCOUNT - 30107 REHAB/REPAIR BINGHAMTON -
30108 D07RVE - BINGHAMTON - TOTAL ENTERPRISE FUNDS -$ 30109 REHAB/REPAIR BUFFALO UNIVERSITY -
30110 D28RVE - SUNY BUFFALO - 30111 REHAB/REPAIR STONYBROOK -
INTERNAL SERVICE FUNDS 30112 D13RVE - STONYBROOK - 55001 CENTRALIZED SERVICES - FLEET MANAGEMENT 385,132.21$ 30113 REHAB/REPAIR BROOKLYN - 55002 CENTRALIZED SERVICES - INFORMATION RESOURCE MNGT 881,123.26 30114 D14RVE - HSC BROOKLYN - 55003 CENTRALIZED SERVICES - PRINTING 2,445,984.65 30115 REHAB/REPAIR SYRACUSE - 55004 CENTRALIZED SERVICES - REAL PROPERTY LABOR 1,373,730.59 30116 D15RVE - HSC SYRACUSE - 55005 CENTRALIZED SERVICES - DONATED FOODS 1,246,278.99 30117 REHAB/REPAIR BROCKPORT - 55006 CENTRALIZED SERVICES - FEDERAL PERSONAL PROPERTY - 30118 D02RVE - BROCKPORT - 55007 CENTRALIZED SERVICES - CONSTRUCTION SERVICES 3,035,716.41 30119 REHAB/REPAIR BUFFALO COLLEGE - 55008 CENTRALIZED SERVICES - PASNY 27,736,621.29 30120 D03RVE - SUB BUFFALO - 55009 CENTRALIZED SERVICES - ADMINISTRATIVE SUPPORT - 30121 REHAB/REPAIR CORTLAND - 55010 CENTRALIZED SERVICES - DESIGN AND CONSTRUCTION - 30122 D04RVE - CORTLAND -
55011 CENTRALIZED SERVICES - INSURANCE SERVICE 1,468,824.07 30123 REHAB/REPAIR FREDONIA - 55012 CENTRALIZED SERVICES - SECURITY CARD ACCESS - 30124 D05RVE - FREDONIA - 55013 CENTRALIZED SERVICES - COP'S 9,409,884.50 30125 REHAB/REPAIR GENESEO - 55014 CENTRALIZED SERVICES - FOOD SERVICES - 30126 D06RVE - GENESEO - 55015 CENTRALIZED SERVICES - HOMER FOLKS - 30127 REHAB/REPAIR OLD WESTBURY - 55016 CENTRALIZED SERVICES - IMMICS 26,961.54 30128 D31RVE - OLD WESTBURY - 55017 DOWNSTATE WAREHOUSE 240,098.52 30129 REHAB/REPAIR NEW PALTZ - 55018 BUILDING ADMINISTRATION ACCOUNT - 30130 D08RVE - NEW PALTZ - 55019 LEASE SPACE INITIATIVE - 30131 REHAB/REPAIR ONEONTA - 55052 ARCHIVES RECORD MANAGEMENT - 30132 D09RVE - ONEONTA - 55053 FEDERAL SINGLE AUDIT - 30133 REHAB/REPAIR OSWEGO - 55055 CIVIL SERVICE LAW: SEC. 11 ADMIN - 30134 D10RVE - OSWEGO - 55056 CIVIL SERVICE EHS OCCUPATIONAL HEALTH PROGRAM 196,142.76 30135 REHAB/REPAIR PLATTSBURGH -
55057 BANKING SERVICES ACCOUNT - 30136 D11RVE - PLATTSBURGH - 55058 CULTURAL RESOURCE SURVEY 2,598,825.25 30137 REHAB/REPAIR POTSDAM - 55059 NEIGHBOR WORK PROJECT ACCOUNT 9,710,522.45 30138 D12RVE - POTSDAM - 55060 AUTOMATIC / PRINT CHARGEBACKS - 30139 REHAB/REPAIR PURCHASE -
55061 OFT NYT ACCT - 30140 D29RVE - PURCHASE - 55062 DATA CENTER ACCOUNT - 30141 REHAB/REPAIR FOR UTICA/ROME - 55063 HUMAN SVCE TELECOM ACCT - 30142 D27RVE - CAMPUS RESERVE - 55065 OPWDD COPY CENTER ACCOUNT - 30143 REHAB/REPAIR ALFRED - 55066 CYBER SECURITY INTRUSION ACCT 1,331,165.59 30144 D22RVE - ALFRED - 55067 DOMESTIC VIOLENCE GRANT 157,733.59 30145 REHAB/REPAIR CANTON - 55069 CENTRALIZED TECHNOLOGY SERVICES - 30146 D23RVE - CANTON -
120
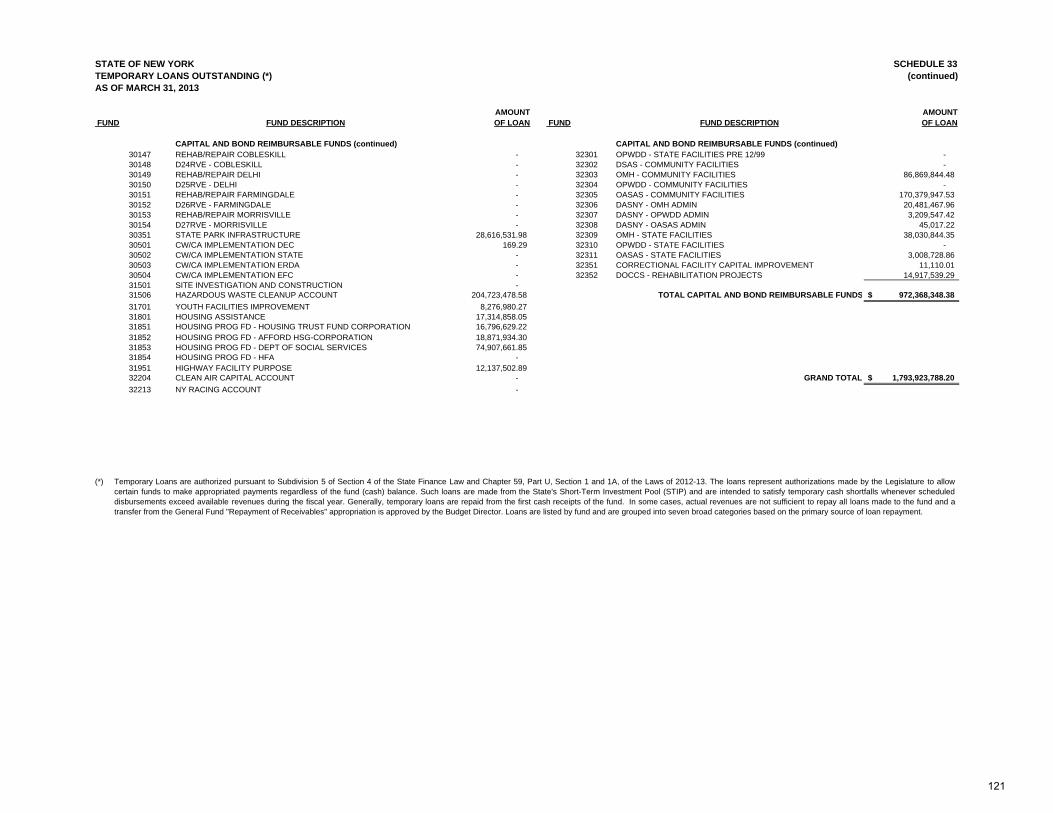
STATE OF NEW YORK SCHEDULE 33TEMPORARY LOANS OUTSTANDING (*) (continued)AS OF MARCH 31, 2013
AMOUNT AMOUNT FUND FUND DESCRIPTION OF LOAN FUND FUND DESCRIPTION OF LOAN
CAPITAL AND BOND REIMBURSABLE FUNDS (continued) CAPITAL AND BOND REIMBURSABLE FUNDS (continued)30147 REHAB/REPAIR COBLESKILL - 32301 OPWDD - STATE FACILITIES PRE 12/99 - 30148 D24RVE - COBLESKILL - 32302 DSAS - COMMUNITY FACILITIES - 30149 REHAB/REPAIR DELHI - 32303 OMH - COMMUNITY FACILITIES 86,869,844.48 30150 D25RVE - DELHI - 32304 OPWDD - COMMUNITY FACILITIES - 30151 REHAB/REPAIR FARMINGDALE - 32305 OASAS - COMMUNITY FACILITIES 170,379,947.53 30152 D26RVE - FARMINGDALE - 32306 DASNY - OMH ADMIN 20,481,467.96 30153 REHAB/REPAIR MORRISVILLE - 32307 DASNY - OPWDD ADMIN 3,209,547.42 30154 D27RVE - MORRISVILLE - 32308 DASNY - OASAS ADMIN 45,017.22 30351 STATE PARK INFRASTRUCTURE 28,616,531.98 32309 OMH - STATE FACILITIES 38,030,844.35 30501 CW/CA IMPLEMENTATION DEC 169.29 32310 OPWDD - STATE FACILITIES - 30502 CW/CA IMPLEMENTATION STATE - 32311 OASAS - STATE FACILITIES 3,008,728.86 30503 CW/CA IMPLEMENTATION ERDA - 32351 CORRECTIONAL FACILITY CAPITAL IMPROVEMENT 11,110.01 30504 CW/CA IMPLEMENTATION EFC - 32352 DOCCS - REHABILITATION PROJECTS 14,917,539.29 31501 SITE INVESTIGATION AND CONSTRUCTION - 31506 HAZARDOUS WASTE CLEANUP ACCOUNT 204,723,478.58 TOTAL CAPITAL AND BOND REIMBURSABLE FUNDS 972,368,348.38$ 31701 YOUTH FACILITIES IMPROVEMENT 8,276,980.27 31801 HOUSING ASSISTANCE 17,314,858.05 31851 HOUSING PROG FD - HOUSING TRUST FUND CORPORATION 16,796,629.22 31852 HOUSING PROG FD - AFFORD HSG-CORPORATION 18,871,934.30 31853 HOUSING PROG FD - DEPT OF SOCIAL SERVICES 74,907,661.85 31854 HOUSING PROG FD - HFA - 31951 HIGHWAY FACILITY PURPOSE 12,137,502.89 32204 CLEAN AIR CAPITAL ACCOUNT - GRAND TOTAL 1,793,923,788.20$ 32213 NY RACING ACCOUNT -
(*) Temporary Loans are authorized pursuant to Subdivision 5 of Section 4 of the State Finance Law and Chapter 59, Part U, Section 1 and 1A, of the Laws of 2012-13. The loans represent authorizations made by the Legislature to allowcertain funds to make appropriated payments regardless of the fund (cash) balance. Such loans are made from the State's Short-Term Investment Pool (STIP) and are intended to satisfy temporary cash shortfalls whenever scheduleddisbursements exceed available revenues during the fiscal year. Generally, temporary loans are repaid from the first cash receipts of the fund. In some cases, actual revenues are not sufficient to repay all loans made to the fund and atransfer from the General Fund "Repayment of Receivables" appropriation is approved by the Budget Director. Loans are listed by fund and are grouped into seven broad categories based on the primary source of loan repayment.
121
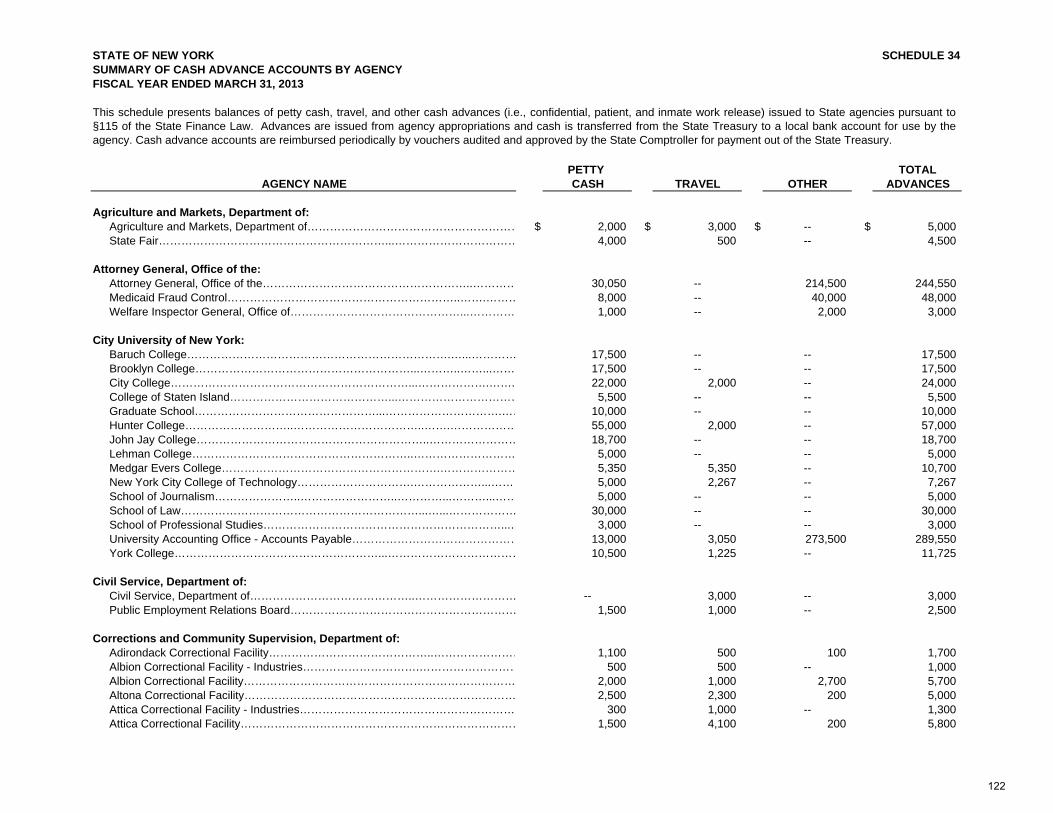
STATE OF NEW YORK SCHEDULE 34SUMMARY OF CASH ADVANCE ACCOUNTS BY AGENCY FISCAL YEAR ENDED MARCH 31, 2013
PETTY TOTALAGENCY NAME CASH TRAVEL OTHER ADVANCES
Agriculture and Markets, Department of:Agriculture and Markets, Department of………………………………………………… $ 2,000 $ 3,000 $ -- $ 5,000 State Fair……………………………………………………...…………………………… 4,000 500 -- 4,500
Attorney General, Office of the:Attorney General, Office of the………………………………………………..………… 30,050 -- 214,500 244,550 Medicaid Fraud Control……………………………………………………..…….……… 8,000 -- 40,000 48,000 Welfare Inspector General, Office of………………………………………...………… 1,000 -- 2,000 3,000
City University of New York:Baruch College…………………………………………………………….…...………… 17,500 -- -- 17,500 Brooklyn College…………………………………………………...………..……...…… 17,500 -- -- 17,500 City College………………………………………………………...……………….……. 22,000 2,000 -- 24,000 College of Staten Island……………………………………...…………………………… 5,500 -- -- 5,500 Graduate School…………………………………………...………………………….…… 10,000 -- -- 10,000 Hunter College………………………..……………………………..…….……………… 55,000 2,000 -- 57,000 John Jay College……………………………………………………..…………………… 18,700 -- -- 18,700 Lehman College…………………………………………………..……………………… 5,000 -- -- 5,000 Medgar Evers College………………………………………………….………………… 5,350 5,350 -- 10,700 New York City College of Technology………………………….………………...……… 5,000 2,267 -- 7,267 School of Journalism…………………..……………………..…………...………...…… 5,000 -- -- 5,000 School of Law………………………………………………………...…...……………… 30,000 -- -- 30,000 School of Professional Studies………………………………………………………...… 3,000 -- -- 3,000 University Accounting Office - Accounts Payable……………………………………… 13,000 3,050 273,500 289,550 York College………………………………………………...……………………………… 10,500 1,225 -- 11,725
Civil Service, Department of: Civil Service, Department of……………………………………..……………………… -- 3,000 -- 3,000 Public Employment Relations Board…………………………………………………… 1,500 1,000 -- 2,500
Corrections and Community Supervision, Department of:Adirondack Correctional Facility……………………………………..…………………… 1,100 500 100 1,700 Albion Correctional Facility - Industries………………………….……………………… 500 500 -- 1,000 Albion Correctional Facility……………………………………………………………… 2,000 1,000 2,700 5,700 Altona Correctional Facility……………………………………………………………… 2,500 2,300 200 5,000 Attica Correctional Facility - Industries………………………………………………… 300 1,000 -- 1,300 Attica Correctional Facility………………………………………………………………… 1,500 4,100 200 5,800
This schedule presents balances of petty cash, travel, and other cash advances (i.e., confidential, patient, and inmate work release) issued to State agencies pursuant to§115 of the State Finance Law. Advances are issued from agency appropriations and cash is transferred from the State Treasury to a local bank account for use by theagency. Cash advance accounts are reimbursed periodically by vouchers audited and approved by the State Comptroller for payment out of the State Treasury.
122
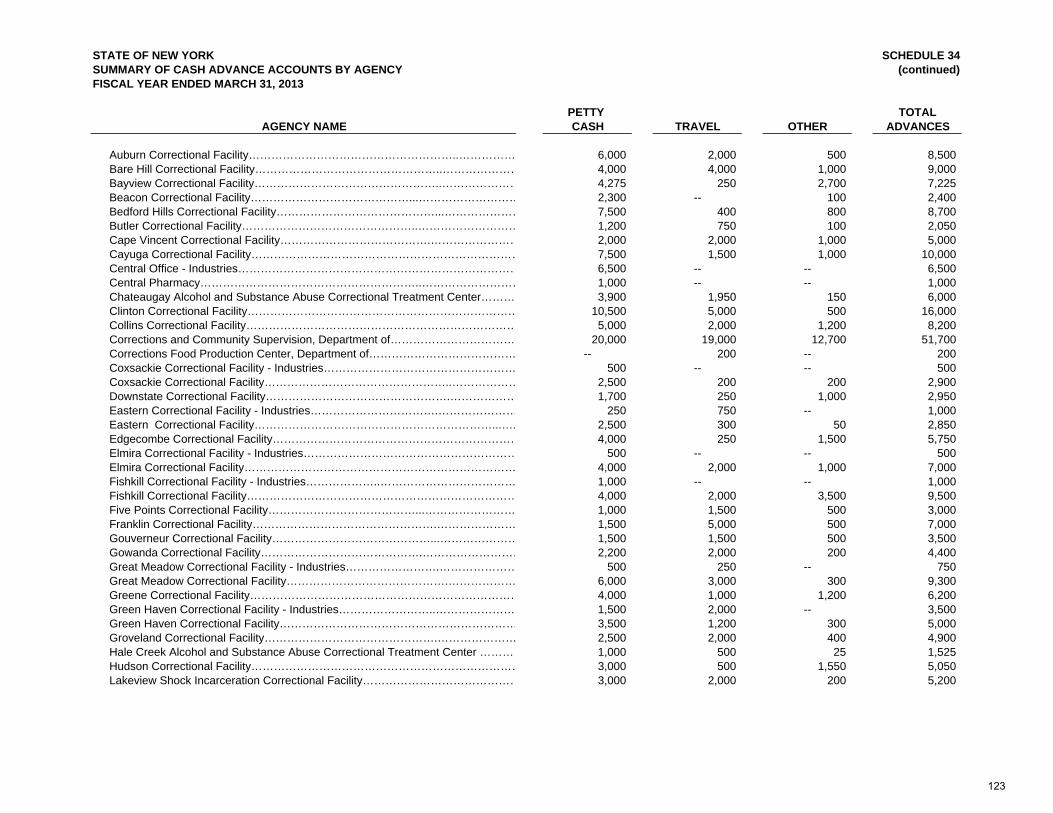
STATE OF NEW YORK SCHEDULE 34SUMMARY OF CASH ADVANCE ACCOUNTS BY AGENCY (continued)FISCAL YEAR ENDED MARCH 31, 2013
PETTY TOTALAGENCY NAME CASH TRAVEL OTHER ADVANCES
Auburn Correctional Facility………………………………………………..…………… 6,000 2,000 500 8,500 Bare Hill Correctional Facility…………………………………………..………………… 4,000 4,000 1,000 9,000 Bayview Correctional Facility…………………………………………..………………… 4,275 250 2,700 7,225 Beacon Correctional Facility……………………………………...……………………… 2,300 -- 100 2,400 Bedford Hills Correctional Facility……………………………………...………………… 7,500 400 800 8,700 Butler Correctional Facility………………………………………..……………………… 1,200 750 100 2,050 Cape Vincent Correctional Facility………………………………….…………………… 2,000 2,000 1,000 5,000 Cayuga Correctional Facility……………………………………………………………… 7,500 1,500 1,000 10,000 Central Office - Industries………………………………………………………………… 6,500 -- -- 6,500 Central Pharmacy…………………………………………………..……………………… 1,000 -- -- 1,000 Chateaugay Alcohol and Substance Abuse Correctional Treatment Center……… 3,900 1,950 150 6,000 Clinton Correctional Facility……………………………………………………………… 10,500 5,000 500 16,000 Collins Correctional Facility……………………………………………………………… 5,000 2,000 1,200 8,200 Corrections and Community Supervision, Department of…………………………… 20,000 19,000 12,700 51,700 Corrections Food Production Center, Department of………………………………… -- 200 -- 200 Coxsackie Correctional Facility - Industries…………………………………………… 500 -- -- 500 Coxsackie Correctional Facility…………………………………………..……………… 2,500 200 200 2,900 Downstate Correctional Facility………………………………………….……………… 1,700 250 1,000 2,950 Eastern Correctional Facility - Industries…………………………….………………… 250 750 -- 1,000 Eastern Correctional Facility………………………………………………………...…. 2,500 300 50 2,850 Edgecombe Correctional Facility………………………………………………………… 4,000 250 1,500 5,750 Elmira Correctional Facility - Industries………………………………………………… 500 -- -- 500 Elmira Correctional Facility……………………………………………………………… 4,000 2,000 1,000 7,000 Fishkill Correctional Facility - Industries………………..……………………………… 1,000 -- -- 1,000 Fishkill Correctional Facility……………………………………………………………… 4,000 2,000 3,500 9,500 Five Points Correctional Facility…………………………………...…………………… 1,000 1,500 500 3,000 Franklin Correctional Facility………………………………………….………………… 1,500 5,000 500 7,000 Gouverneur Correctional Facility……………………………………...………………… 1,500 1,500 500 3,500 Gowanda Correctional Facility…………………………………….……………………… 2,200 2,000 200 4,400 Great Meadow Correctional Facility - Industries…………………….………………… 500 250 -- 750 Great Meadow Correctional Facility…………………………………….……………… 6,000 3,000 300 9,300 Greene Correctional Facility……………………………………………………………… 4,000 1,000 1,200 6,200 Green Haven Correctional Facility - Industries……………………..………………… 1,500 2,000 -- 3,500 Green Haven Correctional Facility……………………………………………………… 3,500 1,200 300 5,000 Groveland Correctional Facility……………………………………….………………… 2,500 2,000 400 4,900 Hale Creek Alcohol and Substance Abuse Correctional Treatment Center ………… 1,000 500 25 1,525 Hudson Correctional Facility……………………………………………………………… 3,000 500 1,550 5,050 Lakeview Shock Incarceration Correctional Facility…………………………………… 3,000 2,000 200 5,200
123
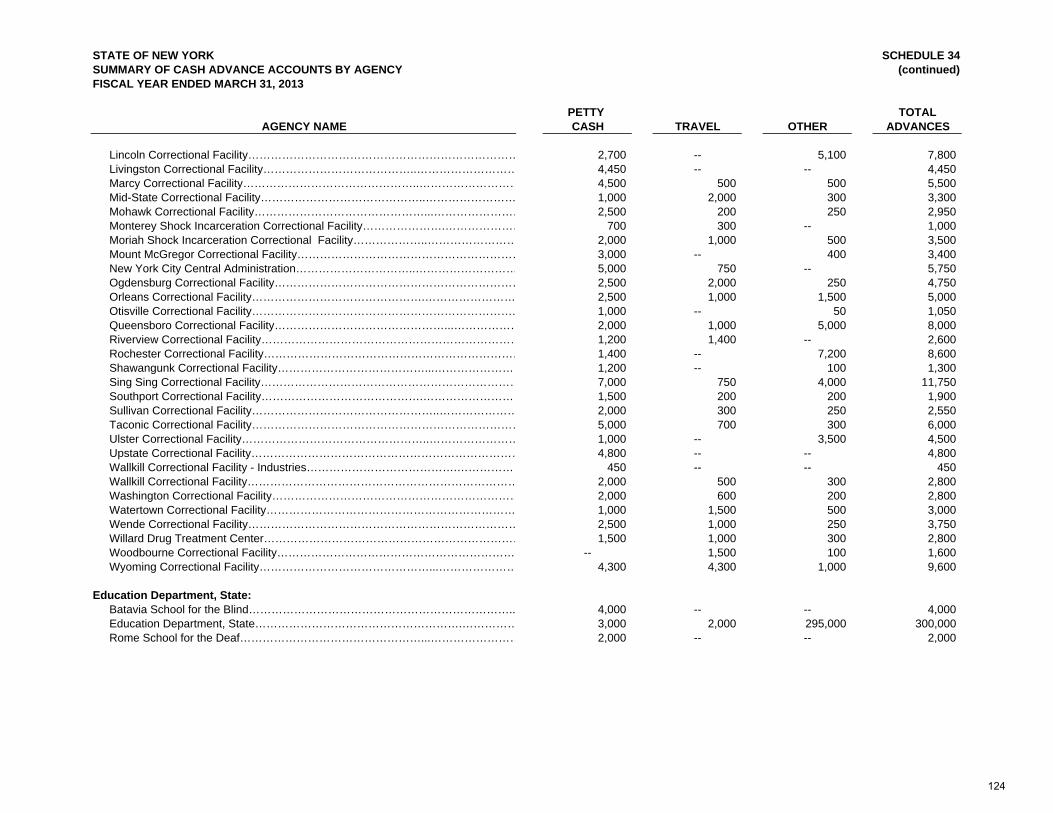
STATE OF NEW YORK SCHEDULE 34SUMMARY OF CASH ADVANCE ACCOUNTS BY AGENCY (continued)FISCAL YEAR ENDED MARCH 31, 2013
PETTY TOTALAGENCY NAME CASH TRAVEL OTHER ADVANCES
Lincoln Correctional Facility……………………………………………………………… 2,700 -- 5,100 7,800 Livingston Correctional Facility…………………………………..……………………… 4,450 -- -- 4,450 Marcy Correctional Facility………………………………………..……………………… 4,500 500 500 5,500 Mid-State Correctional Facility……………………………………..…………………… 1,000 2,000 300 3,300 Mohawk Correctional Facility………………………………………...…………………… 2,500 200 250 2,950 Monterey Shock Incarceration Correctional Facility………………….………………… 700 300 -- 1,000 Moriah Shock Incarceration Correctional Facility………………..…………………… 2,000 1,000 500 3,500 Mount McGregor Correctional Facility…………………………………………………… 3,000 -- 400 3,400 New York City Central Administration…………………………..……………………… 5,000 750 -- 5,750 Ogdensburg Correctional Facility………………………………………………………… 2,500 2,000 250 4,750 Orleans Correctional Facility……………………………………….…………………… 2,500 1,000 1,500 5,000 Otisville Correctional Facility……………………………………………………………. 1,000 -- 50 1,050 Queensboro Correctional Facility………………………………………...……………… 2,000 1,000 5,000 8,000 Riverview Correctional Facility…………………………………………………………… 1,200 1,400 -- 2,600 Rochester Correctional Facility…………………………………………………………… 1,400 -- 7,200 8,600 Shawangunk Correctional Facility…………………………………...…………………… 1,200 -- 100 1,300 Sing Sing Correctional Facility…………………………………………………………… 7,000 750 4,000 11,750 Southport Correctional Facility…………………………………….……………………… 1,500 200 200 1,900 Sullivan Correctional Facility…………………………………………..………………… 2,000 300 250 2,550 Taconic Correctional Facility……………………………………………………………… 5,000 700 300 6,000 Ulster Correctional Facility…………………………………………..…………………… 1,000 -- 3,500 4,500 Upstate Correctional Facility……………………………………………………………… 4,800 -- -- 4,800 Wallkill Correctional Facility - Industries………………………………….……………… 450 -- -- 450 Wallkill Correctional Facility……………………………………………………………… 2,000 500 300 2,800 Washington Correctional Facility………………………………………………………… 2,000 600 200 2,800 Watertown Correctional Facility………………………………………………………… 1,000 1,500 500 3,000 Wende Correctional Facility……………………………………………………………… 2,500 1,000 250 3,750 Willard Drug Treatment Center…………………………………………………………… 1,500 1,000 300 2,800 Woodbourne Correctional Facility……………………………………………………… -- 1,500 100 1,600 Wyoming Correctional Facility………………………………………...………………… 4,300 4,300 1,000 9,600
Education Department, State:Batavia School for the Blind…………………………………………………………….. 4,000 -- -- 4,000 Education Department, State……………………………………………….…………… 3,000 2,000 295,000 300,000 Rome School for the Deaf…………………………………………...…………………… 2,000 -- -- 2,000
124
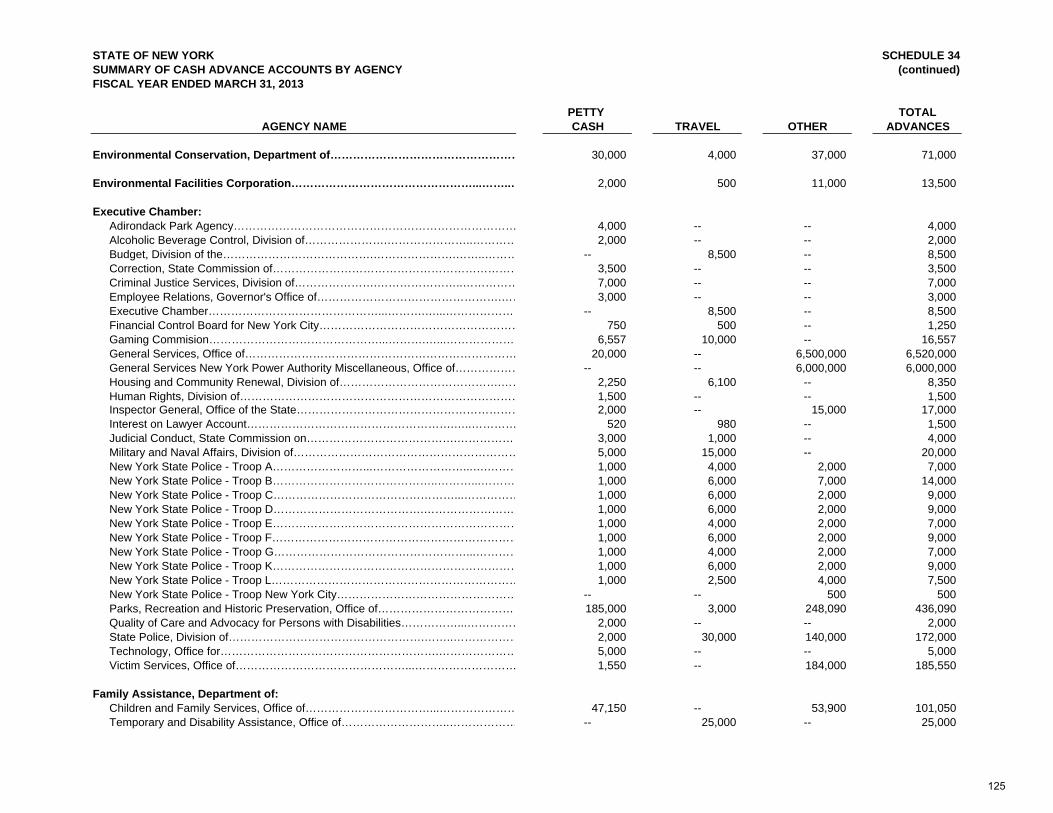
STATE OF NEW YORK SCHEDULE 34SUMMARY OF CASH ADVANCE ACCOUNTS BY AGENCY (continued)FISCAL YEAR ENDED MARCH 31, 2013
PETTY TOTALAGENCY NAME CASH TRAVEL OTHER ADVANCES
Environmental Conservation, Department of…………………………………………… 30,000 4,000 37,000 71,000
Environmental Facilities Corporation…………………………………………...……..… 2,000 500 11,000 13,500
Executive Chamber:Adirondack Park Agency………………………………………………………………… 4,000 -- -- 4,000 Alcoholic Beverage Control, Division of………………….…………………..………… 2,000 -- -- 2,000 Budget, Division of the………………………………….………………….……..……… -- 8,500 -- 8,500 Correction, State Commission of………………………………………………………… 3,500 -- -- 3,500 Criminal Justice Services, Division of………………….…………………..…………… 7,000 -- -- 7,000 Employee Relations, Governor's Office of………………………………………….…… 3,000 -- -- 3,000 Executive Chamber………………………………………...……….…...………………… -- 8,500 -- 8,500 Financial Control Board for New York City……………………………………………… 750 500 -- 1,250 Gaming Commision………………………………………...……….…...………………… 6,557 10,000 -- 16,557 General Services, Office of……………………………………………………………… 20,000 -- 6,500,000 6,520,000 General Services New York Power Authority Miscellaneous, Office of……………… -- -- 6,000,000 6,000,000 Housing and Community Renewal, Division of…………………………………….…… 2,250 6,100 -- 8,350 Human Rights, Division of………………………………………………………………… 1,500 -- -- 1,500 Inspector General, Office of the State…………………………………………………… 2,000 -- 15,000 17,000 Interest on Lawyer Account……………………………………………….…..………… 520 980 -- 1,500 Judicial Conduct, State Commission on………………………………….……………… 3,000 1,000 -- 4,000 Military and Naval Affairs, Division of…………………………………………………… 5,000 15,000 -- 20,000 New York State Police - Troop A……………………...……………………...….……… 1,000 4,000 2,000 7,000 New York State Police - Troop B……………………………………..………...……… 1,000 6,000 7,000 14,000 New York State Police - Troop C…………………………………………...…………… 1,000 6,000 2,000 9,000 New York State Police - Troop D………………………………….……………………… 1,000 6,000 2,000 9,000 New York State Police - Troop E………………………………………………………… 1,000 4,000 2,000 7,000 New York State Police - Troop F………………………………………………………… 1,000 6,000 2,000 9,000 New York State Police - Troop G……………………………………………...………… 1,000 4,000 2,000 7,000 New York State Police - Troop K………………………………………………………… 1,000 6,000 2,000 9,000 New York State Police - Troop L………………………………………………………… 1,000 2,500 4,000 7,500 New York State Police - Troop New York City………………………………………… -- -- 500 500 Parks, Recreation and Historic Preservation, Office of………………………………… 185,000 3,000 248,090 436,090 Quality of Care and Advocacy for Persons with Disabilities……………...…………… 2,000 -- -- 2,000 State Police, Division of…………………………………………….……..……………… 2,000 30,000 140,000 172,000 Technology, Office for………………………………………………….………………… 5,000 -- -- 5,000 Victim Services, Office of………………………………………...……………………… 1,550 -- 184,000 185,550
Family Assistance, Department of:Children and Family Services, Office of……………………………...………………… 47,150 -- 53,900 101,050 Temporary and Disability Assistance, Office of………………………..……………… -- 25,000 -- 25,000
125
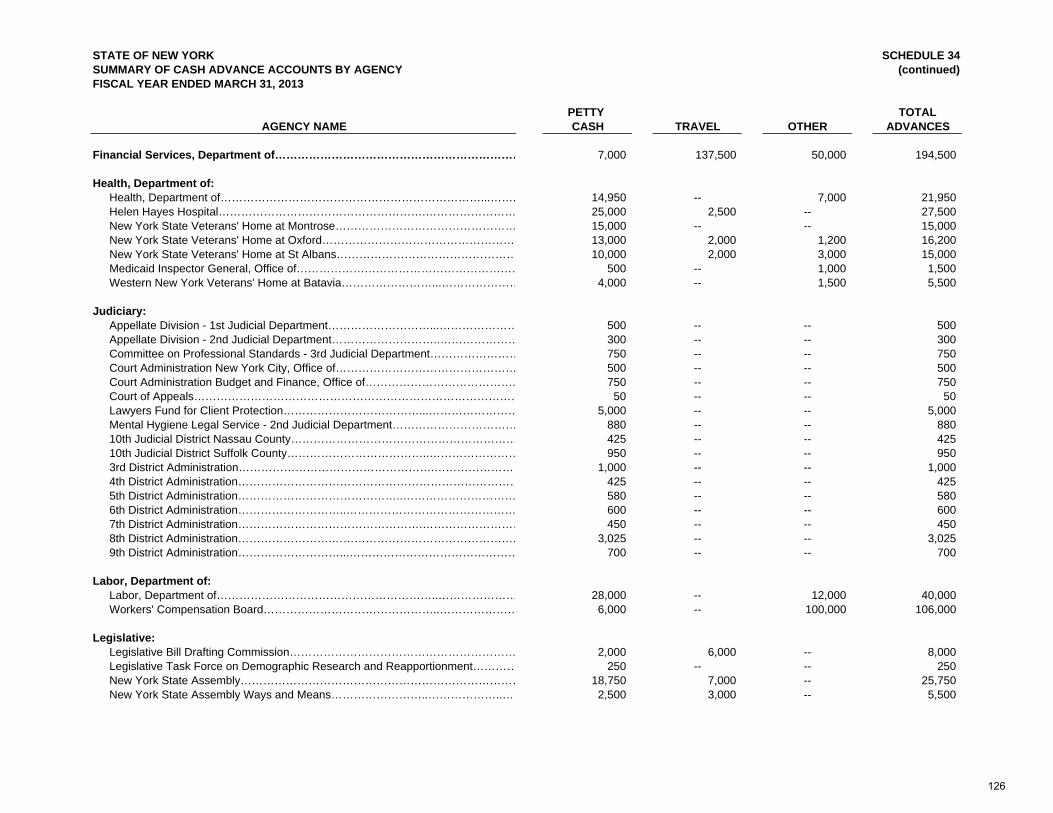
STATE OF NEW YORK SCHEDULE 34SUMMARY OF CASH ADVANCE ACCOUNTS BY AGENCY (continued)FISCAL YEAR ENDED MARCH 31, 2013
PETTY TOTALAGENCY NAME CASH TRAVEL OTHER ADVANCES
Financial Services, Department of………………………………………………………… 7,000 137,500 50,000 194,500
Health, Department of:Health, Department of……………………………………………………………...……. 14,950 -- 7,000 21,950 Helen Hayes Hospital……………………………………………….…………………… 25,000 2,500 -- 27,500 New York State Veterans' Home at Montrose………………………………………… 15,000 -- -- 15,000 New York State Veterans' Home at Oxford…………………………………………… 13,000 2,000 1,200 16,200 New York State Veterans' Home at St Albans………………………………………… 10,000 2,000 3,000 15,000 Medicaid Inspector General, Office of…………………………………………………… 500 -- 1,000 1,500 Western New York Veterans' Home at Batavia……………………...………………… 4,000 -- 1,500 5,500
Judiciary:Appellate Division - 1st Judicial Department………………………...………………… 500 -- -- 500 Appellate Division - 2nd Judicial Department………………………..………………… 300 -- -- 300 Committee on Professional Standards - 3rd Judicial Department…………………… 750 -- -- 750 Court Administration New York City, Office of………………………………………… 500 -- -- 500 Court Administration Budget and Finance, Office of…………………………………. 750 -- -- 750 Court of Appeals…………………………………………………………………………… 50 -- -- 50 Lawyers Fund for Client Protection………………………………...…………………… 5,000 -- -- 5,000 Mental Hygiene Legal Service - 2nd Judicial Department…………………………… 880 -- -- 880 10th Judicial District Nassau County…………………………………………………… 425 -- -- 425 10th Judicial District Suffolk County………………………………..…………………… 950 -- -- 950 3rd District Administration…………………………………………….…………………… 1,000 -- -- 1,000 4th District Administration………………………………………………………………… 425 -- -- 425 5th District Administration……………………………………..………………………… 580 -- -- 580 6th District Administration………………………..……………………………………… 600 -- -- 600 7th District Administration………………………………………….……………………… 450 -- -- 450 8th District Administration…………………….…………………………………………. 3,025 -- -- 3,025 9th District Administration………………………...……………………………………… 700 -- -- 700
Labor, Department of:Labor, Department of…………………………………………………..………………… 28,000 -- 12,000 40,000 Workers' Compensation Board………………………………………..………………… 6,000 -- 100,000 106,000
Legislative:Legislative Bill Drafting Commission…………………………………………………… 2,000 6,000 -- 8,000 Legislative Task Force on Demographic Research and Reapportionment………… 250 -- -- 250 New York State Assembly………………………………………………………………… 18,750 7,000 -- 25,750 New York State Assembly Ways and Means……………………..………………..…… 2,500 3,000 -- 5,500
126
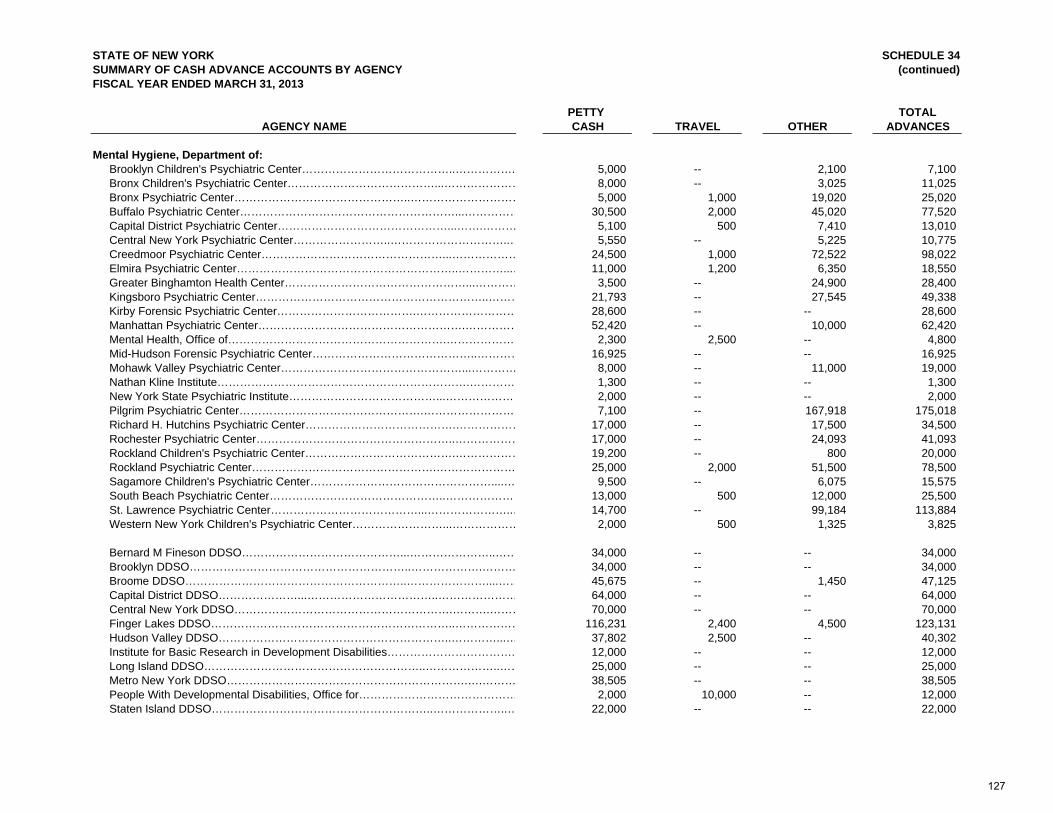
STATE OF NEW YORK SCHEDULE 34SUMMARY OF CASH ADVANCE ACCOUNTS BY AGENCY (continued)FISCAL YEAR ENDED MARCH 31, 2013
PETTY TOTALAGENCY NAME CASH TRAVEL OTHER ADVANCES
Mental Hygiene, Department of:Brooklyn Children's Psychiatric Center…………………………………..……………. 5,000 -- 2,100 7,100 Bronx Children's Psychiatric Center…………………………………...………………… 8,000 -- 3,025 11,025 Bronx Psychiatric Center………………………………………..………………………… 5,000 1,000 19,020 25,020 Buffalo Psychiatric Center…………………………………………………...…………… 30,500 2,000 45,020 77,520 Capital District Psychiatric Center………………………………………...…….……… 5,100 500 7,410 13,010 Central New York Psychiatric Center……………………..…………………………..… 5,550 -- 5,225 10,775 Creedmoor Psychiatric Center…………………………………………...……………… 24,500 1,000 72,522 98,022 Elmira Psychiatric Center…………………………………………………..…………...… 11,000 1,200 6,350 18,550 Greater Binghamton Health Center…………………………………………...………… 3,500 -- 24,900 28,400 Kingsboro Psychiatric Center……………………………………………………..……… 21,793 -- 27,545 49,338 Kirby Forensic Psychiatric Center……………………………….……………………… 28,600 -- -- 28,600 Manhattan Psychiatric Center……………………………………………….…………… 52,420 -- 10,000 62,420 Mental Health, Office of………………………………………………….………………… 2,300 2,500 -- 4,800 Mid-Hudson Forensic Psychiatric Center……………………………………..………… 16,925 -- -- 16,925 Mohawk Valley Psychiatric Center…………………………………………...………… 8,000 -- 11,000 19,000 Nathan Kline Institute………………………………………………………….………… 1,300 -- -- 1,300 New York State Psychiatric Institute…………………………………...………………… 2,000 -- -- 2,000 Pilgrim Psychiatric Center………………………………………….……………………… 7,100 -- 167,918 175,018 Richard H. Hutchins Psychiatric Center………………………………….……………… 17,000 -- 17,500 34,500 Rochester Psychiatric Center……………………………………………..……………… 17,000 -- 24,093 41,093 Rockland Children's Psychiatric Center………………………………….……………… 19,200 -- 800 20,000 Rockland Psychiatric Center………………………………………….………………… 25,000 2,000 51,500 78,500 Sagamore Children's Psychiatric Center…………………………………………....… 9,500 -- 6,075 15,575 South Beach Psychiatric Center………………………………………..………………… 13,000 500 12,000 25,500 St. Lawrence Psychiatric Center…………………………………...…………………..… 14,700 -- 99,184 113,884 Western New York Children's Psychiatric Center……………………...……………… 2,000 500 1,325 3,825
Bernard M Fineson DDSO……………………………………...…………………..…… 34,000 -- -- 34,000 Brooklyn DDSO…………………………………………………..……………….……… 34,000 -- -- 34,000 Broome DDSO…………………………………………………..…………………....…… 45,675 -- 1,450 47,125 Capital District DDSO…………………...……………………………..………………… 64,000 -- -- 64,000 Central New York DDSO………………………………………………….……….……… 70,000 -- -- 70,000 Finger Lakes DDSO………………………………………………………..……………… 116,231 2,400 4,500 123,131 Hudson Valley DDSO……………………………………………………..…………...… 37,802 2,500 -- 40,302 Institute for Basic Research in Development Disabilities……………………………. 12,000 -- -- 12,000 Long Island DDSO…………………………………………………..………………..…… 25,000 -- -- 25,000 Metro New York DDSO……………………………………………………….….……… 38,505 -- -- 38,505 People With Developmental Disabilities, Office for…………………………………… 2,000 10,000 -- 12,000 Staten Island DDSO…………………………………………………..………………..… 22,000 -- -- 22,000
127
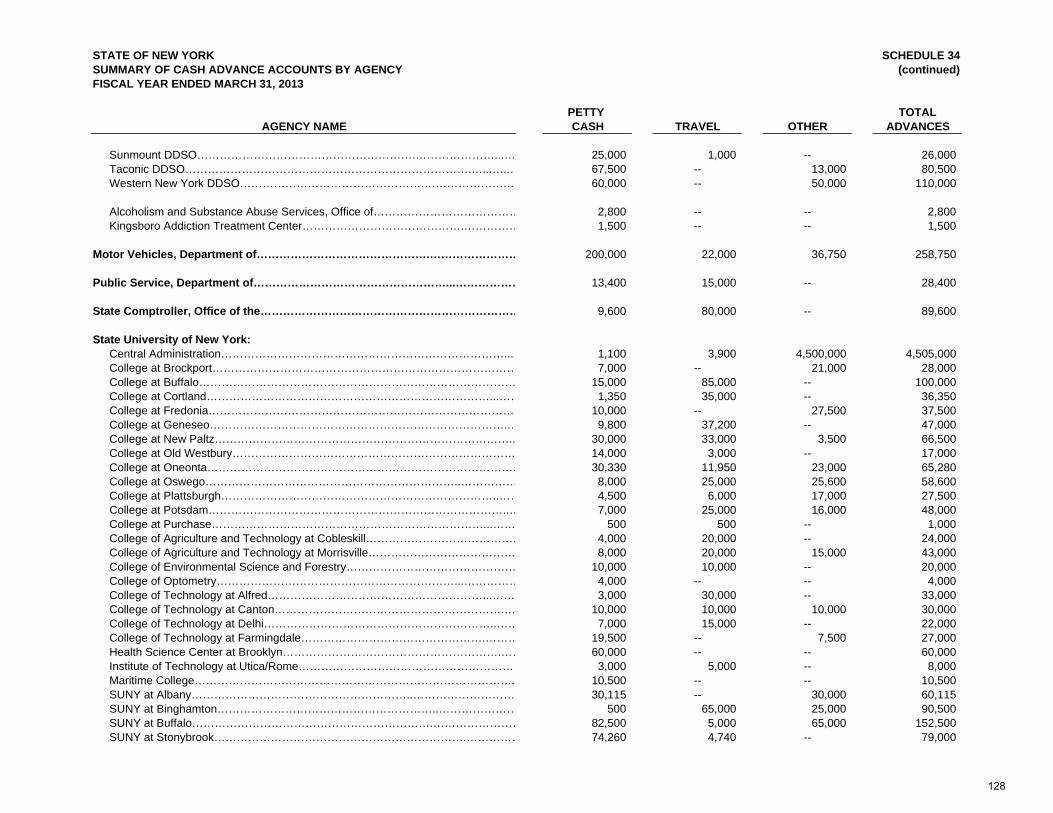
STATE OF NEW YORK SCHEDULE 34SUMMARY OF CASH ADVANCE ACCOUNTS BY AGENCY (continued)FISCAL YEAR ENDED MARCH 31, 2013
PETTY TOTALAGENCY NAME CASH TRAVEL OTHER ADVANCES
Sunmount DDSO………………………………………………….…………………...… 25,000 1,000 -- 26,000 Taconic DDSO………………………………………………………………….…...…..… 67,500 -- 13,000 80,500 Western New York DDSO………………………………………….………………….… 60,000 -- 50,000 110,000
Alcoholism and Substance Abuse Services, Office of………………………………… 2,800 -- -- 2,800 Kingsboro Addiction Treatment Center…………………………………….…………… 1,500 -- -- 1,500
Motor Vehicles, Department of……………………………………….…………………… 200,000 22,000 36,750 258,750
Public Service, Department of……………………………………………...……………… 13,400 15,000 -- 28,400
State Comptroller, Office of the…………………………………………………………… 9,600 80,000 -- 89,600
State University of New York:Central Administration…………………………………………………………………...… 1,100 3,900 4,500,000 4,505,000College at Brockport……………………………………………………………………… 7,000 -- 21,000 28,000College at Buffalo………………………………………………………………………… 15,000 85,000 -- 100,000College at Cortland…………………………………………………………………...…… 1,350 35,000 -- 36,350College at Fredonia………………………………………………………………………… 10,000 -- 27,500 37,500College at Geneseo……………………………………………………………………..… 9,800 37,200 -- 47,000College at New Paltz…………………………………………………………………….. 30,000 33,000 3,500 66,500College at Old Westbury………………………………………………………………… 14,000 3,000 -- 17,000College at Oneonta………………………………………………………………………. 30,330 11,950 23,000 65,280College at Oswego…………………………………………………………..…………… 8,000 25,000 25,600 58,600College at Plattsburgh………………………………………………………………..…… 4,500 6,000 17,000 27,500College at Potsdam……………………………………………………………………..… 7,000 25,000 16,000 48,000College at Purchase………………………………………………………………...…… 500 500 -- 1,000College of Agriculture and Technology at Cobleskill…………………………………. 4,000 20,000 -- 24,000College of Agriculture and Technology at Morrisville………………………………… 8,000 20,000 15,000 43,000College of Environmental Science and Forestry……………………………………… 10,000 10,000 -- 20,000College of Optometry………………………………………………………...…………… 4,000 -- -- 4,000College of Technology at Alfred…………………………………………………...…… 3,000 30,000 -- 33,000College of Technology at Canton…………………………………………………….… 10,000 10,000 10,000 30,000College of Technology at Delhi……………………………………………………..…… 7,000 15,000 -- 22,000College of Technology at Farmingdale………………………………………….……… 19,500 -- 7,500 27,000Health Science Center at Brooklyn………………………………………………….…… 60,000 -- -- 60,000Institute of Technology at Utica/Rome…………………………………………………… 3,000 5,000 -- 8,000Maritime College…………………………………………………………………………. 10,500 -- -- 10,500SUNY at Albany…………………………………………………..……………………… 30,115 -- 30,000 60,115SUNY at Binghamton…………………………………………………..………………… 500 65,000 25,000 90,500SUNY at Buffalo……………………………………………………….…………………… 82,500 5,000 65,000 152,500SUNY at Stonybrook………………………………………………………….…………… 74,260 4,740 -- 79,000
128
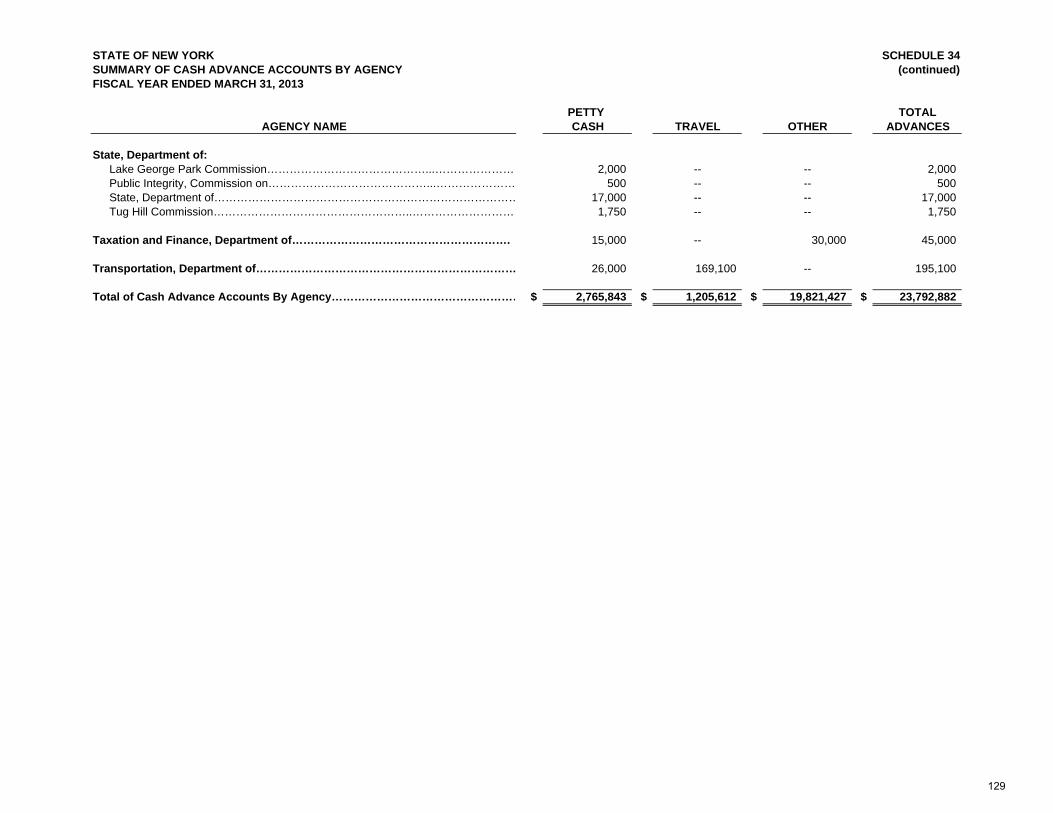
STATE OF NEW YORK SCHEDULE 34SUMMARY OF CASH ADVANCE ACCOUNTS BY AGENCY (continued)FISCAL YEAR ENDED MARCH 31, 2013
PETTY TOTALAGENCY NAME CASH TRAVEL OTHER ADVANCES
State, Department of:Lake George Park Commission……………………………………...…………………… 2,000 -- -- 2,000 Public Integrity, Commission on……………………………………...………………… 500 -- -- 500 State, Department of……………………………………………………………………… 17,000 -- -- 17,000 Tug Hill Commission……………………………………………..………………………… 1,750 -- -- 1,750
Taxation and Finance, Department of…………………………………………………. 15,000 -- 30,000 45,000
Transportation, Department of…………………………………………………………… 26,000 169,100 -- 195,100
Total of Cash Advance Accounts By Agency…………………………………………… $ 2,765,843 $ 1,205,612 $ 19,821,427 $ 23,792,882
129
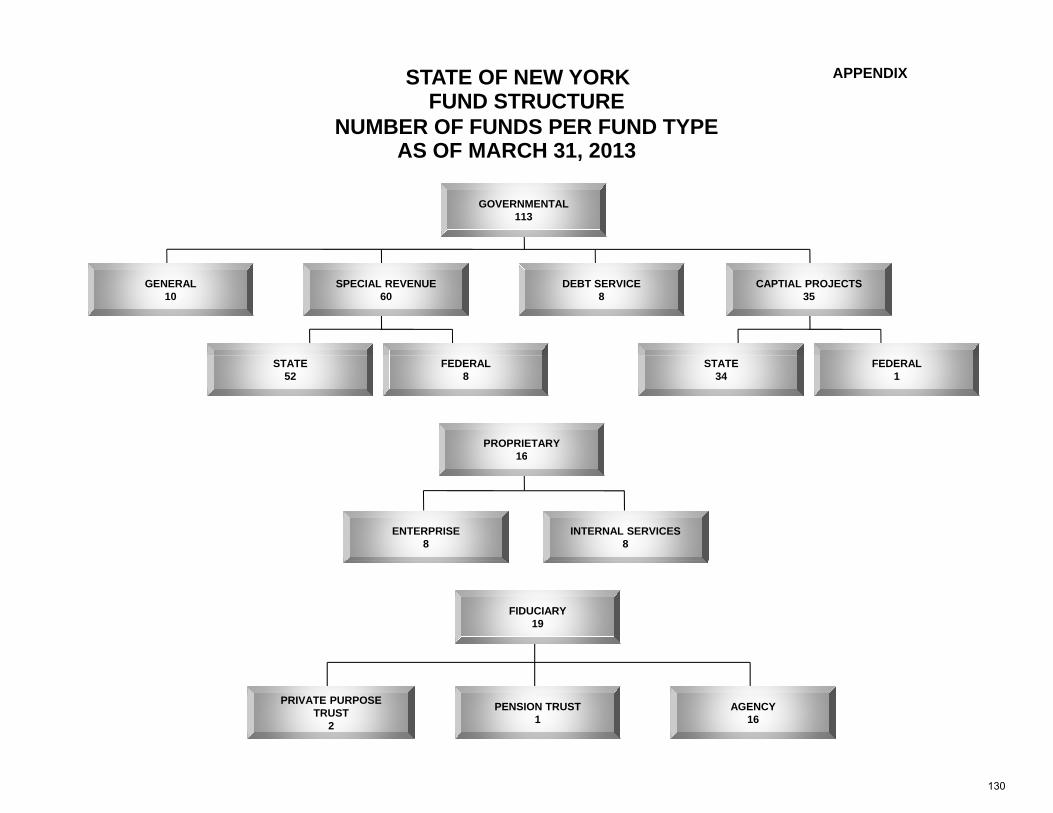
STATE OF NEW YORKFUND STRUCTURE
NUMBER OF FUNDS PER FUND TYPEAS OF MARCH 31 2013
APPENDIX
AS OF MARCH 31, 2013
GOVERNMENTAL113
GENERAL10
SPECIAL REVENUE60
DEBT SERVICE8
CAPTIAL PROJECTS35
STATE52
FEDERAL8
STATE34
FEDERAL1
PROPRIETARY1616
INTERNAL SERVICES8
ENTERPRISE8
FIDUCIARY19
AGENCY16
PENSION TRUST1
PRIVATE PURPOSE TRUST
2
130
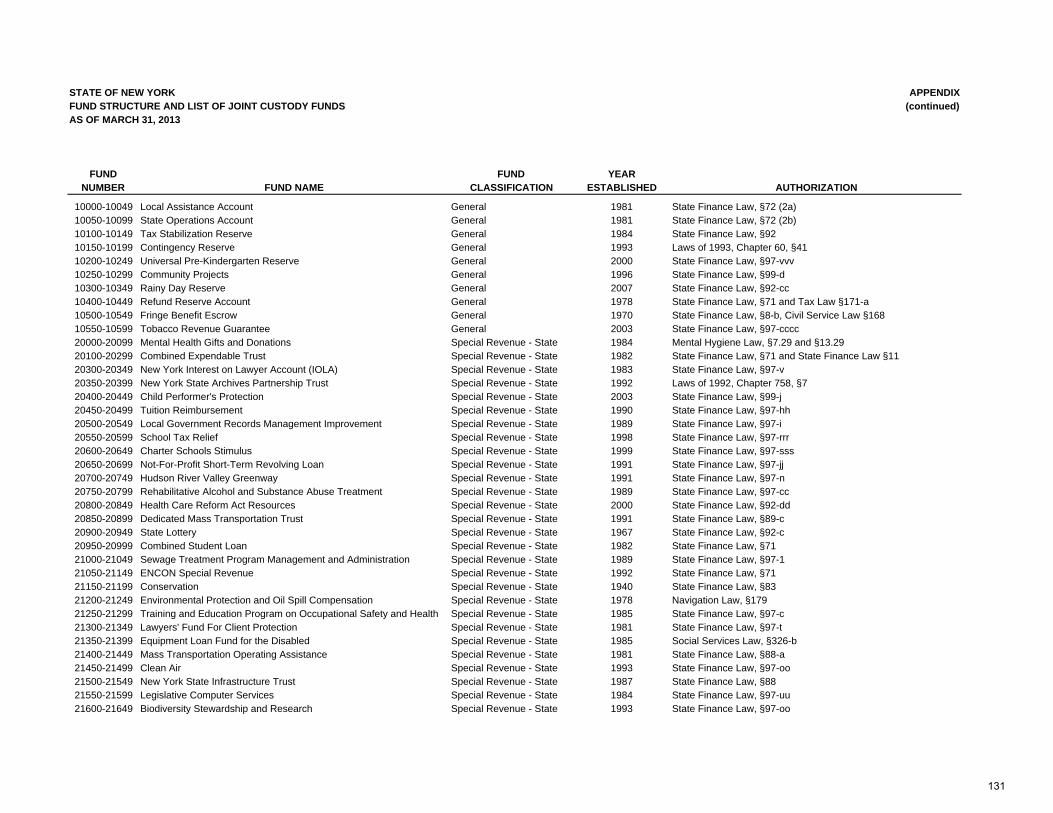
STATE OF NEW YORK APPENDIXFUND STRUCTURE AND LIST OF JOINT CUSTODY FUNDS (continued)AS OF MARCH 31, 2013
FUND FUND YEARNUMBER FUND NAME CLASSIFICATION ESTABLISHED AUTHORIZATION
10000-10049 Local Assistance Account General 1981 State Finance Law, §72 (2a)10050-10099 State Operations Account General 1981 State Finance Law, §72 (2b)10100-10149 Tax Stabilization Reserve General 1984 State Finance Law, §9210150-10199 Contingency Reserve General 1993 Laws of 1993, Chapter 60, §41 10200-10249 Universal Pre-Kindergarten Reserve General 2000 State Finance Law, §97-vvv10250-10299 Community Projects General 1996 State Finance Law, §99-d10300-10349 Rainy Day Reserve General 2007 State Finance Law, §92-cc10400-10449 Refund Reserve Account General 1978 State Finance Law, §71 and Tax Law §171-a10500-10549 Fringe Benefit Escrow General 1970 State Finance Law, §8-b, Civil Service Law §16810550-10599 Tobacco Revenue Guarantee General 2003 State Finance Law, §97-cccc20000-20099 Mental Health Gifts and Donations Special Revenue - State 1984 Mental Hygiene Law, §7.29 and §13.2920100-20299 Combined Expendable Trust Special Revenue - State 1982 State Finance Law, §71 and State Finance Law §1120300-20349 New York Interest on Lawyer Account (IOLA) Special Revenue - State 1983 State Finance Law, §97-v20350-20399 New York State Archives Partnership Trust Special Revenue - State 1992 Laws of 1992, Chapter 758, §720400-20449 Child Performer's Protection Special Revenue - State 2003 State Finance Law, §99-j20450-20499 Tuition Reimbursement Special Revenue - State 1990 State Finance Law, §97-hh20500-20549 Local Government Records Management Improvement Special Revenue - State 1989 State Finance Law, §97-i20550-20599 School Tax Relief Special Revenue - State 1998 State Finance Law, §97-rrr20600-20649 Charter Schools Stimulus Special Revenue - State 1999 State Finance Law, §97-sss20650-20699 Not-For-Profit Short-Term Revolving Loan Special Revenue - State 1991 State Finance Law, §97-jj20700-20749 Hudson River Valley Greenway Special Revenue - State 1991 State Finance Law, §97-n20750-20799 Rehabilitative Alcohol and Substance Abuse Treatment Special Revenue - State 1989 State Finance Law, §97-cc20800-20849 Health Care Reform Act Resources Special Revenue - State 2000 State Finance Law, §92-dd20850-20899 Dedicated Mass Transportation Trust Special Revenue - State 1991 State Finance Law, §89-c20900-20949 State Lottery Special Revenue - State 1967 State Finance Law, §92-c20950-20999 Combined Student Loan Special Revenue - State 1982 State Finance Law, §7121000-21049 Sewage Treatment Program Management and Administration Special Revenue - State 1989 State Finance Law, §97-121050-21149 ENCON Special Revenue Special Revenue - State 1992 State Finance Law, §7121150-21199 Conservation Special Revenue - State 1940 State Finance Law, §8321200-21249 Environmental Protection and Oil Spill Compensation Special Revenue - State 1978 Navigation Law, §17921250-21299 Training and Education Program on Occupational Safety and Health Special Revenue - State 1985 State Finance Law, §97-c21300-21349 Lawyers' Fund For Client Protection Special Revenue - State 1981 State Finance Law, §97-t21350-21399 Equipment Loan Fund for the Disabled Special Revenue - State 1985 Social Services Law, §326-b21400-21449 Mass Transportation Operating Assistance Special Revenue - State 1981 State Finance Law, §88-a21450-21499 Clean Air Special Revenue - State 1993 State Finance Law, §97-oo21500-21549 New York State Infrastructure Trust Special Revenue - State 1987 State Finance Law, §8821550-21599 Legislative Computer Services Special Revenue - State 1984 State Finance Law, §97-uu21600-21649 Biodiversity Stewardship and Research Special Revenue - State 1993 State Finance Law, §97-oo
131
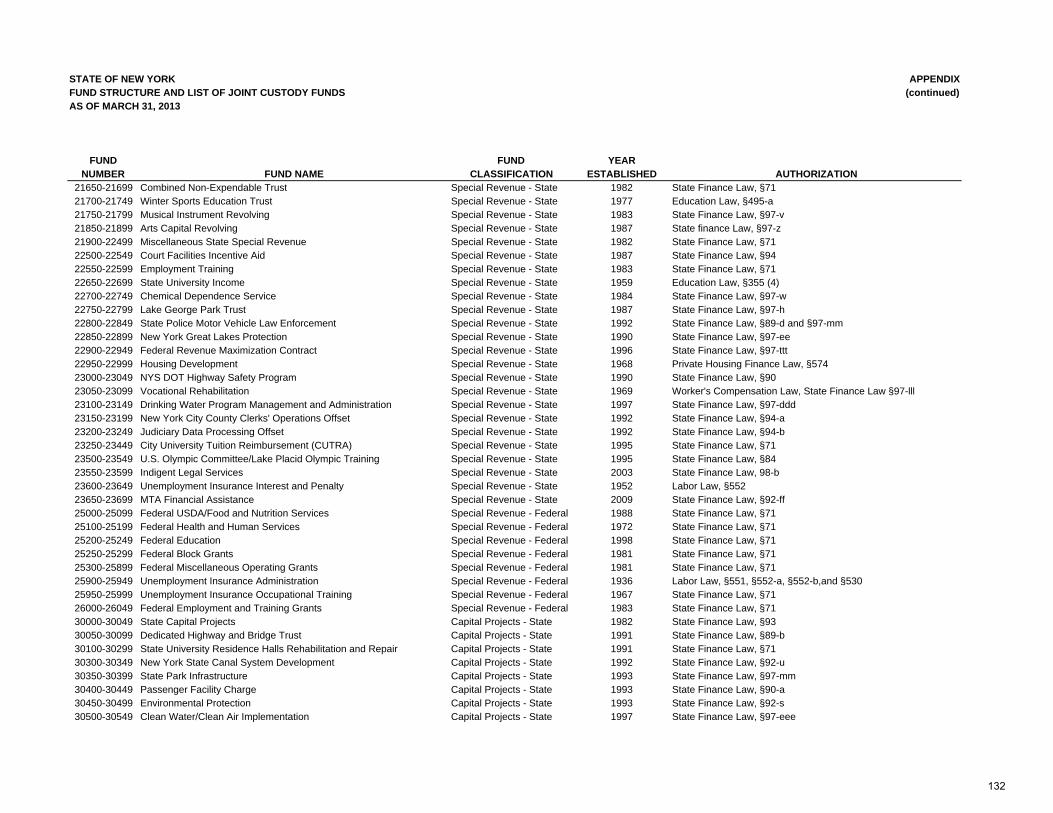
STATE OF NEW YORK APPENDIXFUND STRUCTURE AND LIST OF JOINT CUSTODY FUNDS (continued)AS OF MARCH 31, 2013
FUND FUND YEARNUMBER FUND NAME CLASSIFICATION ESTABLISHED AUTHORIZATION
21650-21699 Combined Non-Expendable Trust Special Revenue - State 1982 State Finance Law, §7121700-21749 Winter Sports Education Trust Special Revenue - State 1977 Education Law, §495-a21750-21799 Musical Instrument Revolving Special Revenue - State 1983 State Finance Law, §97-v21850-21899 Arts Capital Revolving Special Revenue - State 1987 State finance Law, §97-z21900-22499 Miscellaneous State Special Revenue Special Revenue - State 1982 State Finance Law, §7122500-22549 Court Facilities Incentive Aid Special Revenue - State 1987 State Finance Law, §9422550-22599 Employment Training Special Revenue - State 1983 State Finance Law, §7122650-22699 State University Income Special Revenue - State 1959 Education Law, §355 (4)22700-22749 Chemical Dependence Service Special Revenue - State 1984 State Finance Law, §97-w22750-22799 Lake George Park Trust Special Revenue - State 1987 State Finance Law, §97-h22800-22849 State Police Motor Vehicle Law Enforcement Special Revenue - State 1992 State Finance Law, §89-d and §97-mm22850-22899 New York Great Lakes Protection Special Revenue - State 1990 State Finance Law, §97-ee22900-22949 Federal Revenue Maximization Contract Special Revenue - State 1996 State Finance Law, §97-ttt22950-22999 Housing Development Special Revenue - State 1968 Private Housing Finance Law, §574 23000-23049 NYS DOT Highway Safety Program Special Revenue - State 1990 State Finance Law, §9023050-23099 Vocational Rehabilitation Special Revenue - State 1969 Worker's Compensation Law, State Finance Law §97-lll23100-23149 Drinking Water Program Management and Administration Special Revenue - State 1997 State Finance Law, §97-ddd23150-23199 New York City County Clerks' Operations Offset Special Revenue - State 1992 State Finance Law, §94-a23200-23249 Judiciary Data Processing Offset Special Revenue - State 1992 State Finance Law, §94-b23250-23449 City University Tuition Reimbursement (CUTRA) Special Revenue - State 1995 State Finance Law, §7123500-23549 U.S. Olympic Committee/Lake Placid Olympic Training Special Revenue - State 1995 State Finance Law, §8423550-23599 Indigent Legal Services Special Revenue - State 2003 State Finance Law, 98-b23600-23649 Unemployment Insurance Interest and Penalty Special Revenue - State 1952 Labor Law, §55223650-23699 MTA Financial Assistance Special Revenue - State 2009 State Finance Law, §92-ff25000-25099 Federal USDA/Food and Nutrition Services Special Revenue - Federal 1988 State Finance Law, §7125100-25199 Federal Health and Human Services Special Revenue - Federal 1972 State Finance Law, §7125200-25249 Federal Education Special Revenue - Federal 1998 State Finance Law, §7125250-25299 Federal Block Grants Special Revenue - Federal 1981 State Finance Law, §7125300-25899 Federal Miscellaneous Operating Grants Special Revenue - Federal 1981 State Finance Law, §7125900-25949 Unemployment Insurance Administration Special Revenue - Federal 1936 Labor Law, §551, §552-a, §552-b,and §53025950-25999 Unemployment Insurance Occupational Training Special Revenue - Federal 1967 State Finance Law, §7126000-26049 Federal Employment and Training Grants Special Revenue - Federal 1983 State Finance Law, §7130000-30049 State Capital Projects Capital Projects - State 1982 State Finance Law, §9330050-30099 Dedicated Highway and Bridge Trust Capital Projects - State 1991 State Finance Law, §89-b30100-30299 State University Residence Halls Rehabilitation and Repair Capital Projects - State 1991 State Finance Law, §7130300-30349 New York State Canal System Development Capital Projects - State 1992 State Finance Law, §92-u30350-30399 State Park Infrastructure Capital Projects - State 1993 State Finance Law, §97-mm30400-30449 Passenger Facility Charge Capital Projects - State 1993 State Finance Law, §90-a30450-30499 Environmental Protection Capital Projects - State 1993 State Finance Law, §92-s30500-30549 Clean Water/Clean Air Implementation Capital Projects - State 1997 State Finance Law, §97-eee
132
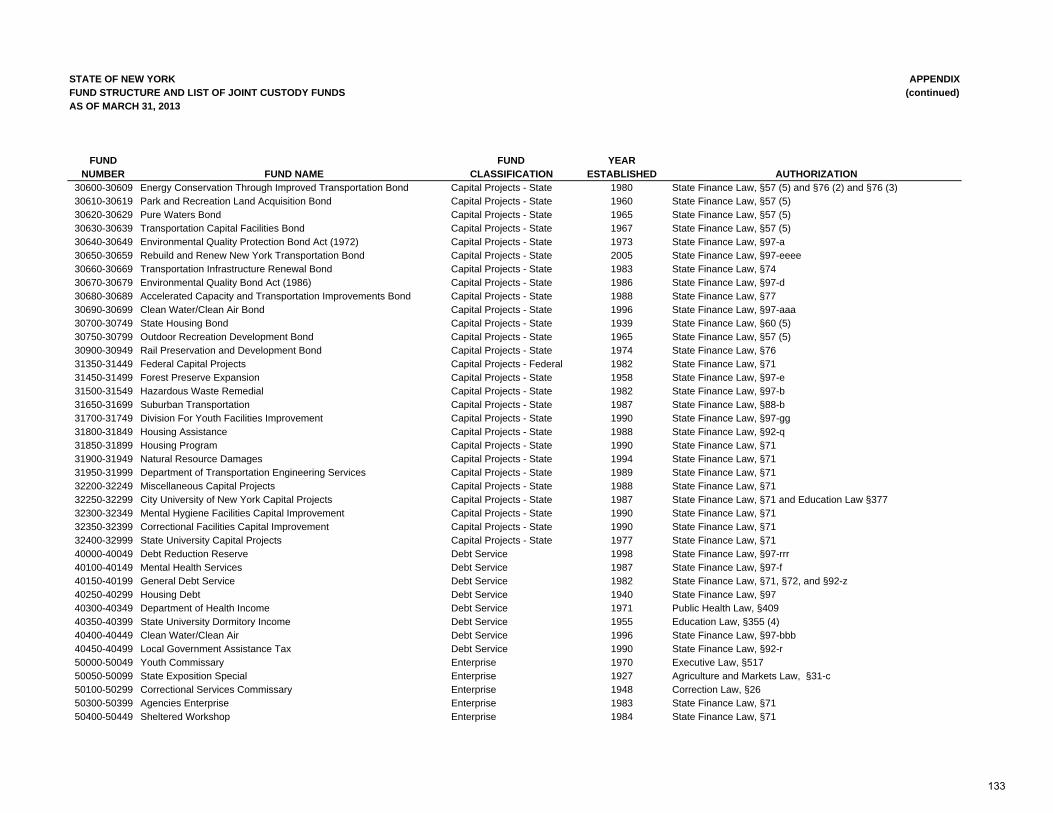
STATE OF NEW YORK APPENDIXFUND STRUCTURE AND LIST OF JOINT CUSTODY FUNDS (continued)AS OF MARCH 31, 2013
FUND FUND YEARNUMBER FUND NAME CLASSIFICATION ESTABLISHED AUTHORIZATION
30600-30609 Energy Conservation Through Improved Transportation Bond Capital Projects - State 1980 State Finance Law, §57 (5) and §76 (2) and §76 (3)30610-30619 Park and Recreation Land Acquisition Bond Capital Projects - State 1960 State Finance Law, §57 (5)30620-30629 Pure Waters Bond Capital Projects - State 1965 State Finance Law, §57 (5)30630-30639 Transportation Capital Facilities Bond Capital Projects - State 1967 State Finance Law, §57 (5)30640-30649 Environmental Quality Protection Bond Act (1972) Capital Projects - State 1973 State Finance Law, §97-a30650-30659 Rebuild and Renew New York Transportation Bond Capital Projects - State 2005 State Finance Law, §97-eeee30660-30669 Transportation Infrastructure Renewal Bond Capital Projects - State 1983 State Finance Law, §7430670-30679 Environmental Quality Bond Act (1986) Capital Projects - State 1986 State Finance Law, §97-d30680-30689 Accelerated Capacity and Transportation Improvements Bond Capital Projects - State 1988 State Finance Law, §7730690-30699 Clean Water/Clean Air Bond Capital Projects - State 1996 State Finance Law, §97-aaa30700-30749 State Housing Bond Capital Projects - State 1939 State Finance Law, §60 (5)30750-30799 Outdoor Recreation Development Bond Capital Projects - State 1965 State Finance Law, §57 (5)30900-30949 Rail Preservation and Development Bond Capital Projects - State 1974 State Finance Law, §7631350-31449 Federal Capital Projects Capital Projects - Federal 1982 State Finance Law, §7131450-31499 Forest Preserve Expansion Capital Projects - State 1958 State Finance Law, §97-e31500-31549 Hazardous Waste Remedial Capital Projects - State 1982 State Finance Law, §97-b31650-31699 Suburban Transportation Capital Projects - State 1987 State Finance Law, §88-b31700-31749 Division For Youth Facilities Improvement Capital Projects - State 1990 State Finance Law, §97-gg31800-31849 Housing Assistance Capital Projects - State 1988 State Finance Law, §92-q31850-31899 Housing Program Capital Projects - State 1990 State Finance Law, §7131900-31949 Natural Resource Damages Capital Projects - State 1994 State Finance Law, §71 31950-31999 Department of Transportation Engineering Services Capital Projects - State 1989 State Finance Law, §71 32200-32249 Miscellaneous Capital Projects Capital Projects - State 1988 State Finance Law, §7132250-32299 City University of New York Capital Projects Capital Projects - State 1987 State Finance Law, §71 and Education Law §37732300-32349 Mental Hygiene Facilities Capital Improvement Capital Projects - State 1990 State Finance Law, §7132350-32399 Correctional Facilities Capital Improvement Capital Projects - State 1990 State Finance Law, §7132400-32999 State University Capital Projects Capital Projects - State 1977 State Finance Law, §7140000-40049 Debt Reduction Reserve Debt Service 1998 State Finance Law, §97-rrr40100-40149 Mental Health Services Debt Service 1987 State Finance Law, §97-f40150-40199 General Debt Service Debt Service 1982 State Finance Law, §71, §72, and §92-z40250-40299 Housing Debt Debt Service 1940 State Finance Law, §9740300-40349 Department of Health Income Debt Service 1971 Public Health Law, §40940350-40399 State University Dormitory Income Debt Service 1955 Education Law, §355 (4)40400-40449 Clean Water/Clean Air Debt Service 1996 State Finance Law, §97-bbb40450-40499 Local Government Assistance Tax Debt Service 1990 State Finance Law, §92-r50000-50049 Youth Commissary Enterprise 1970 Executive Law, §51750050-50099 State Exposition Special Enterprise 1927 Agriculture and Markets Law, §31-c50100-50299 Correctional Services Commissary Enterprise 1948 Correction Law, §2650300-50399 Agencies Enterprise Enterprise 1983 State Finance Law, §7150400-50449 Sheltered Workshop Enterprise 1984 State Finance Law, §71
133
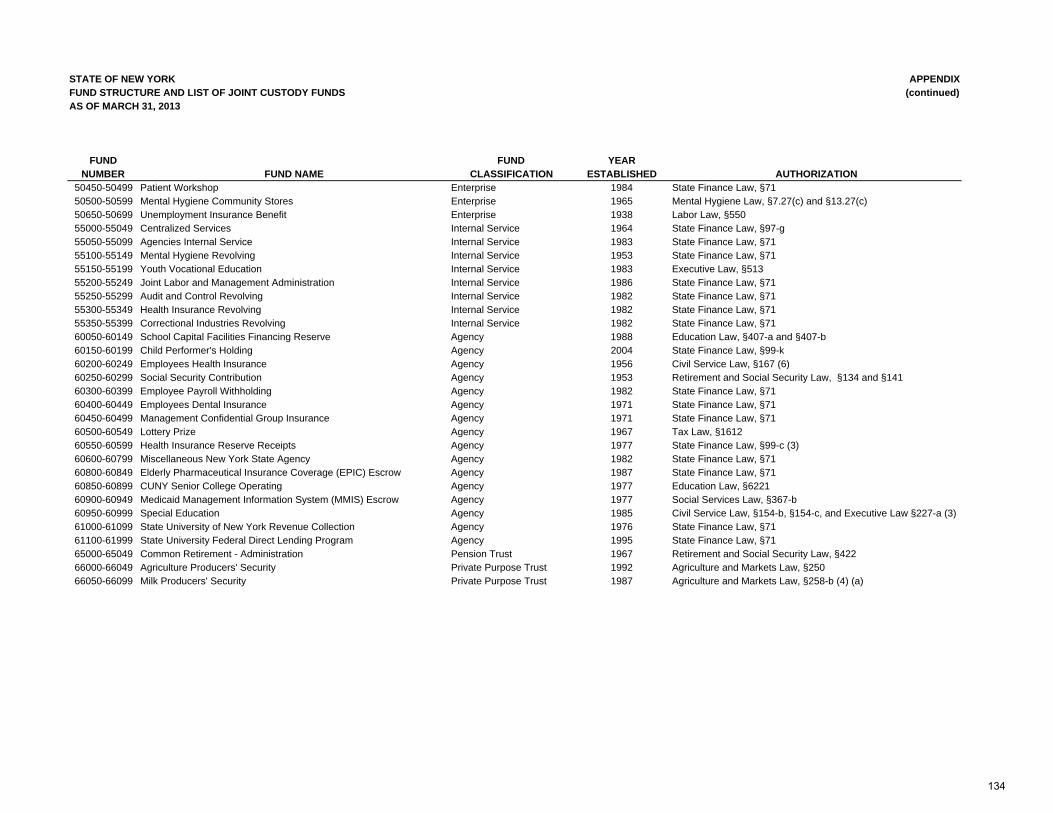
STATE OF NEW YORK APPENDIXFUND STRUCTURE AND LIST OF JOINT CUSTODY FUNDS (continued)AS OF MARCH 31, 2013
FUND FUND YEARNUMBER FUND NAME CLASSIFICATION ESTABLISHED AUTHORIZATION
50450-50499 Patient Workshop Enterprise 1984 State Finance Law, §7150500-50599 Mental Hygiene Community Stores Enterprise 1965 Mental Hygiene Law, §7.27(c) and §13.27(c)50650-50699 Unemployment Insurance Benefit Enterprise 1938 Labor Law, §55055000-55049 Centralized Services Internal Service 1964 State Finance Law, §97-g55050-55099 Agencies Internal Service Internal Service 1983 State Finance Law, §7155100-55149 Mental Hygiene Revolving Internal Service 1953 State Finance Law, §7155150-55199 Youth Vocational Education Internal Service 1983 Executive Law, §51355200-55249 Joint Labor and Management Administration Internal Service 1986 State Finance Law, §7155250-55299 Audit and Control Revolving Internal Service 1982 State Finance Law, §7155300-55349 Health Insurance Revolving Internal Service 1982 State Finance Law, §7155350-55399 Correctional Industries Revolving Internal Service 1982 State Finance Law, §7160050-60149 School Capital Facilities Financing Reserve Agency 1988 Education Law, §407-a and §407-b60150-60199 Child Performer's Holding Agency 2004 State Finance Law, §99-k60200-60249 Employees Health Insurance Agency 1956 Civil Service Law, §167 (6)60250-60299 Social Security Contribution Agency 1953 Retirement and Social Security Law, §134 and §14160300-60399 Employee Payroll Withholding Agency 1982 State Finance Law, §7160400-60449 Employees Dental Insurance Agency 1971 State Finance Law, §7160450-60499 Management Confidential Group Insurance Agency 1971 State Finance Law, §7160500-60549 Lottery Prize Agency 1967 Tax Law, §161260550-60599 Health Insurance Reserve Receipts Agency 1977 State Finance Law, §99-c (3)60600-60799 Miscellaneous New York State Agency Agency 1982 State Finance Law, §7160800-60849 Elderly Pharmaceutical Insurance Coverage (EPIC) Escrow Agency 1987 State Finance Law, §7160850-60899 CUNY Senior College Operating Agency 1977 Education Law, §622160900-60949 Medicaid Management Information System (MMIS) Escrow Agency 1977 Social Services Law, §367-b60950-60999 Special Education Agency 1985 Civil Service Law, §154-b, §154-c, and Executive Law §227-a (3)61000-61099 State University of New York Revenue Collection Agency 1976 State Finance Law, §7161100-61999 State University Federal Direct Lending Program Agency 1995 State Finance Law, §7165000-65049 Common Retirement - Administration Pension Trust 1967 Retirement and Social Security Law, §42266000-66049 Agriculture Producers' Security Private Purpose Trust 1992 Agriculture and Markets Law, §25066050-66099 Milk Producers' Security Private Purpose Trust 1987 Agriculture and Markets Law, §258-b (4) (a)
134
STATE OF NEW YORK OFFICE OF THE STATE COMPTROLLER
OFFICE OF OPERATIONS DIVISION OF PAYROLL, ACCOUNTING AND REVENUE SERVICES
THOMAS P. DiNAPOLI
STATE COMPTROLLER
Christopher Gorka Deputy Comptroller, Payroll, Accounting and Revenue Services
David J. Hasso, CPA, CGFM Assistant Comptroller, Payroll, Accounting and Revenue Services Bureau of Financial Reporting and Oil Spill Remediation
Suzette Barsoum Baker, CPA, CGFM Executive Director Timothy Reilly, Esq., CPA Assistant Director Carrie Piser Assistant Chief Accountant, Cash Basis Financial Reporting Melissa Clayton Principal Accountant, Cash Basis Financial Reporting Deidre Clark Assistant Chief Accountant, GAAP Basis Financial Reporting
Report Contributors
Luann Antrim Donna Benson Laura Canham-Lunde Lisa Cardinale, CPA Gregory Cerio Debbie DiVirgilio Michael Donadio Donna Greenberg, CPA, CGFM
Bo Jiang David Krein Krista Leslie Sean Lichorowiec Rosemary Liss Jill Losi Althea Medford Stephen Raptoulis, CPA
David Richter Bret Smith Christopher Smith Glen Sposato Eric Swanson Chuck Trimbach Christopher Tuohy
135