Embed Size (px)
Citation preview
Anthropogenic Global Warming
What are the threats?What are the facts?What is best to do?
Objectives
Examine in a thorough, yet understandable way, the theory of man made global warming
Analyze its plausibility
Review other factors, besides CO2, that may also impact the climate.
Give a prediction of the global climate for the next 30-40 years
What are the said to be the negative consequences of man made global warming?
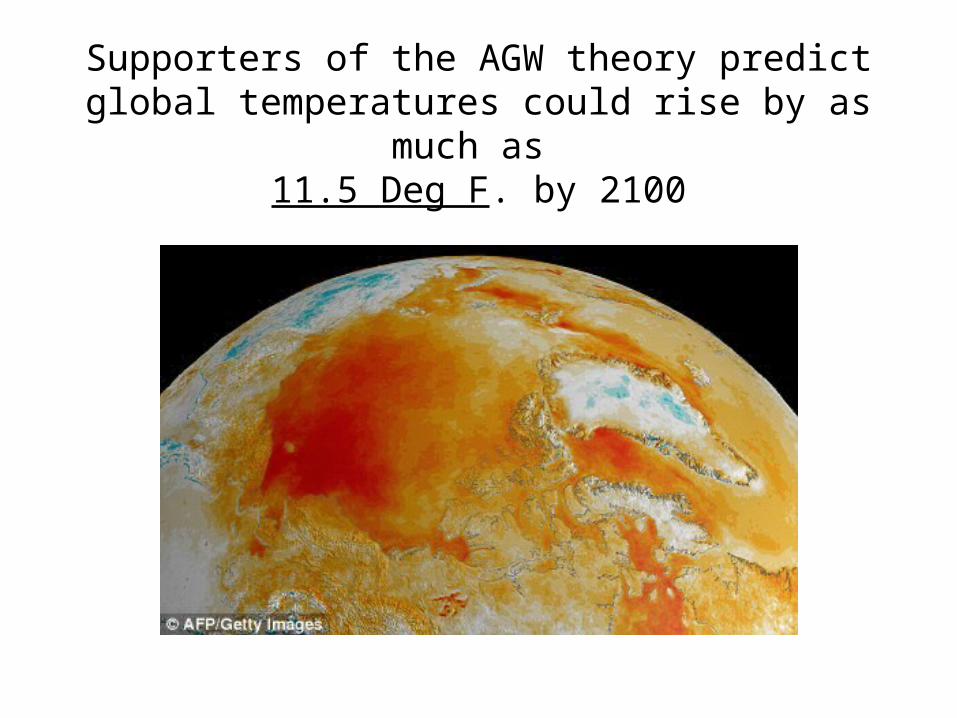
Supporters of the AGW theory predict global temperatures could rise by as much as
11.5 Deg F. by 2100
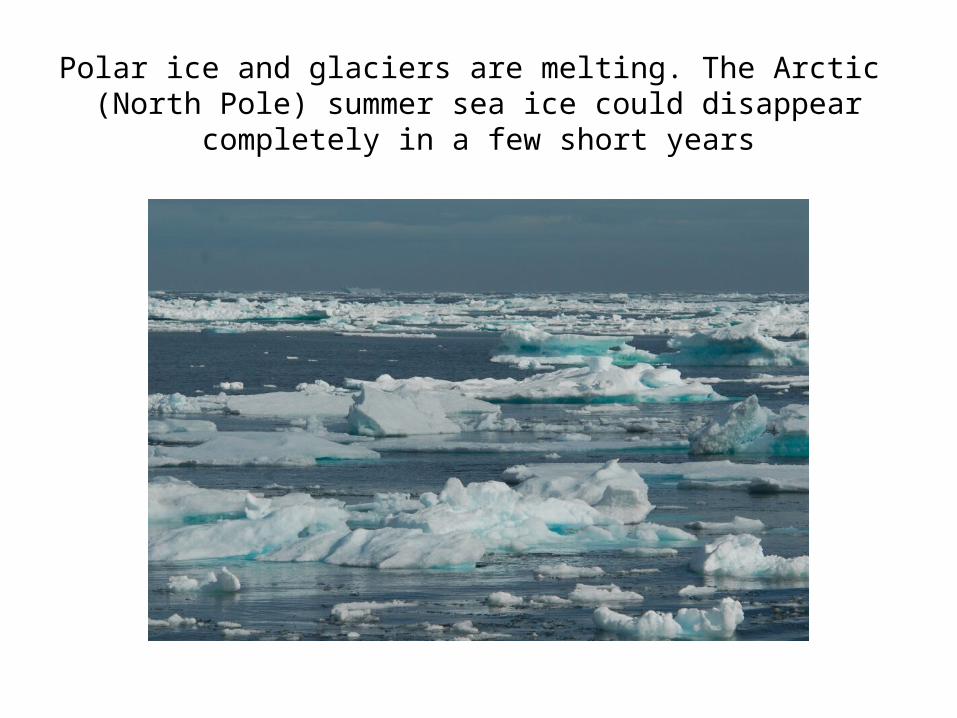
Polar ice and glaciers are melting. The Arctic (North Pole) summer sea ice could disappear
completely in a few short years
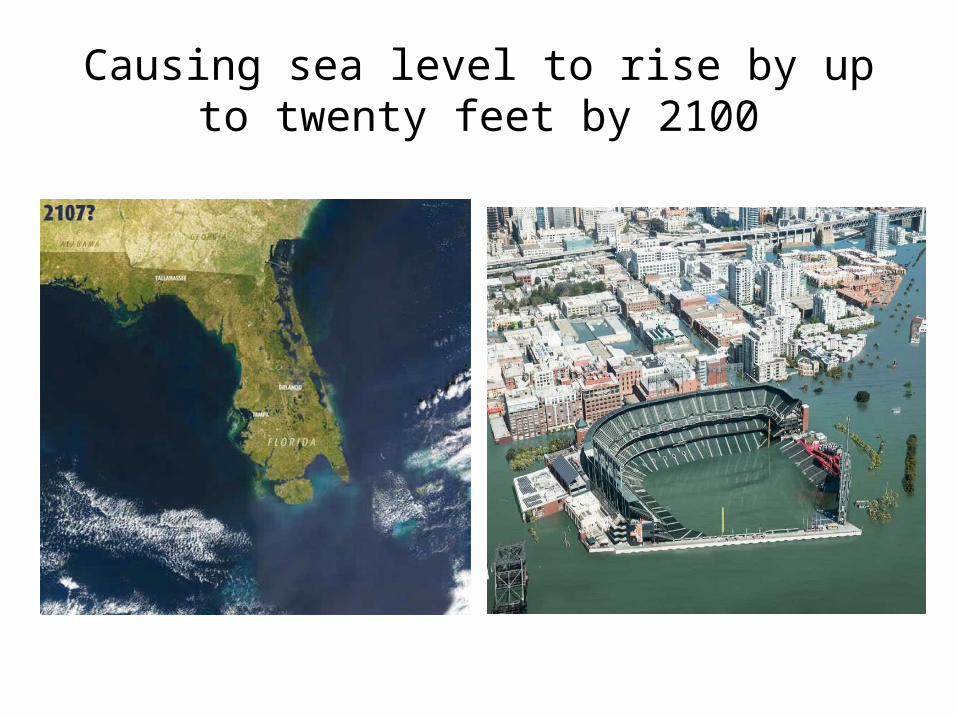
Causing sea level to rise by up to twenty feet by 2100
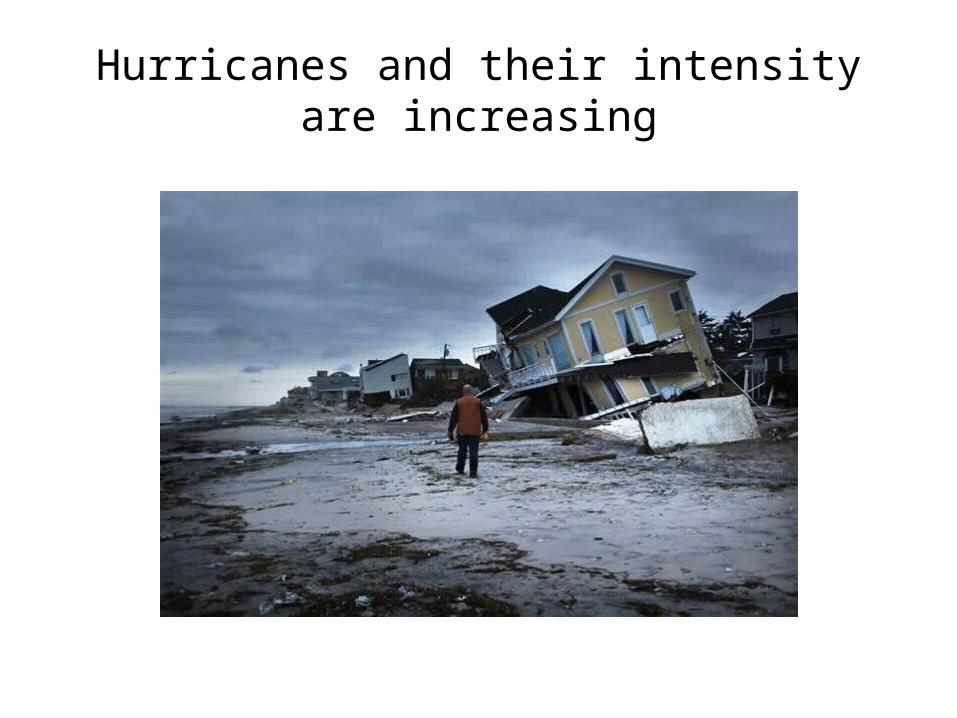
Hurricanes and their intensity are increasing
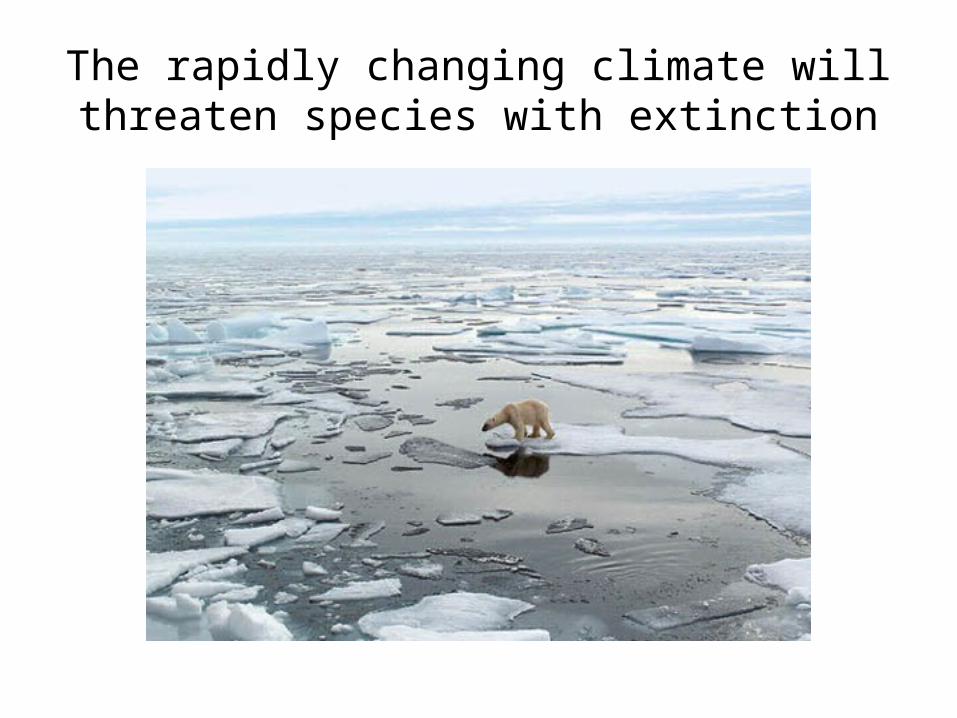
The rapidly changing climate will threaten species with extinction
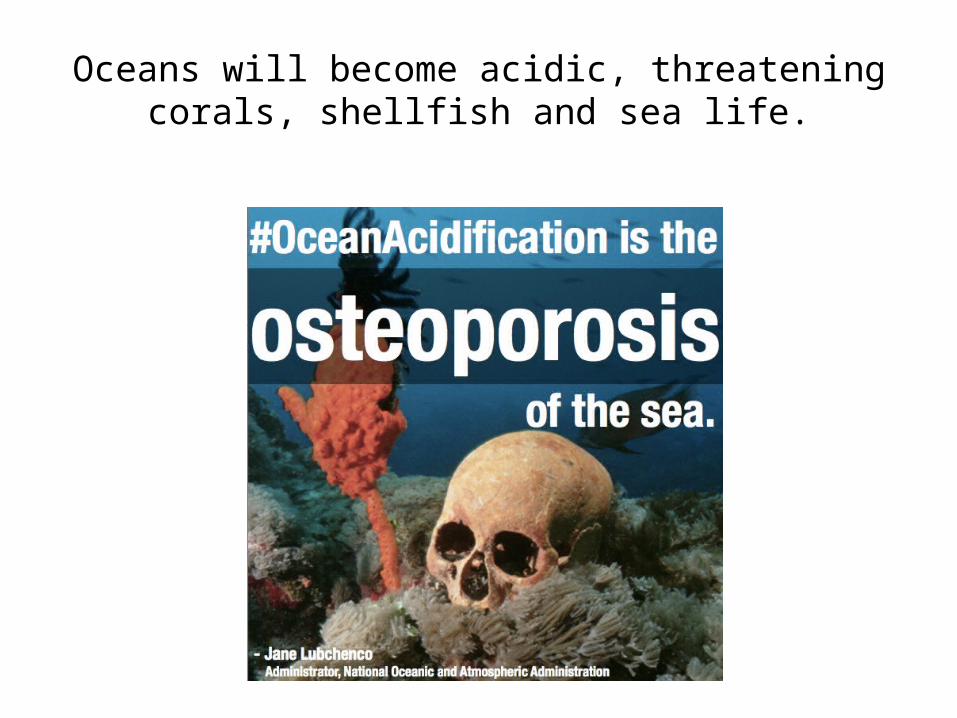
Oceans will become acidic, threatening corals, shellfish and sea life.
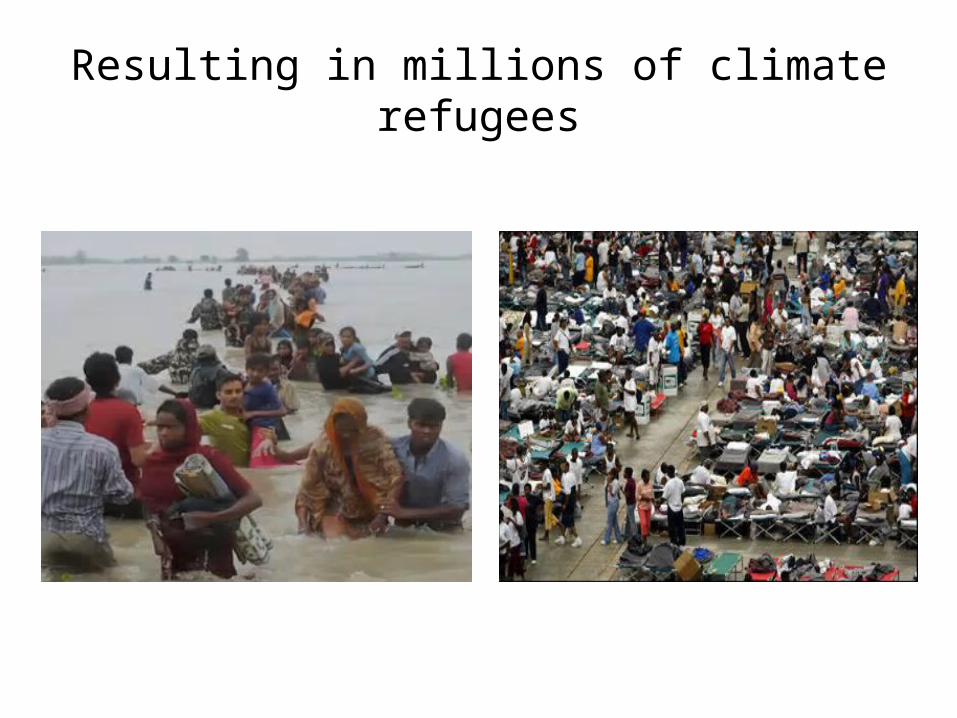
Resulting in millions of climate refugees

But, will this happen?

Things to consider……
“No amount of experimentation can prove me right, but a single experiment can prove me wrong.”
Einstein
Other things to consider
They say there is overwhelming “scientific consensus” about global warming.
But…..consensus is a political term…..there should never be consensus with regard to science. Many major scientific discoveries were contrary to the popular held beliefs of the time.
Is there not consensus with the answer of these two statements?
*The Mississippi is the longest river in the United States?
*The temperature of outer space either hot or cold.
But the two statements are not correct.
• The Missouri River (not the Mississippi River) is the longest river in the USA by several hundred miles.
• Space is a vacuum. Vacuums have no temperature. So Space is neither hot nor cold.
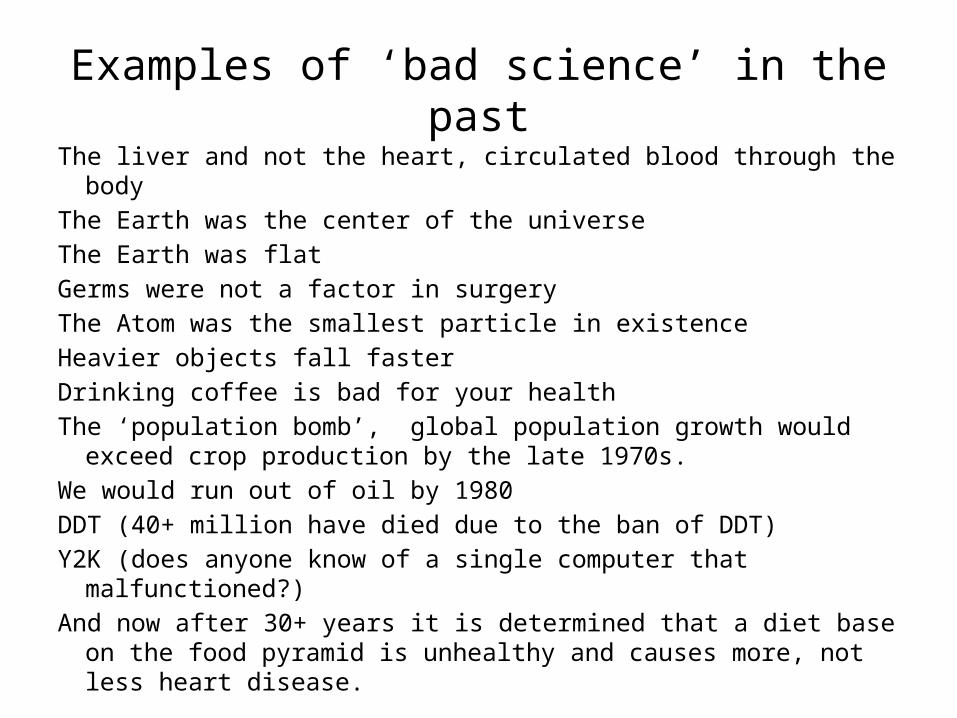
Examples of ‘bad science’ in the pastThe liver and not the heart, circulated blood through the bodyThe Earth was the center of the universeThe Earth was flatGerms were not a factor in surgeryThe Atom was the smallest particle in existenceHeavier objects fall fasterDrinking coffee is bad for your healthThe ‘population bomb’, global population growth would exceed crop
production by the late 1970s.We would run out of oil by 1980DDT (40+ million have died due to the ban of DDT)Y2K (does anyone know of a single computer that malfunctioned?)And now after 30+ years it is determined that a diet base on the food
pyramid is unhealthy and causes more, not less heart disease.
Observation
• According to the U.N. Intergovernmental Panel on Climate Change (IPCC), global temperatures increased +0.74 deg C in the last century (1906-2005).
• There is general agreement that there has been some minor warming during the last century…….from whatever cause.
• Scientific Method…..
Theories and concepts must be proven through observation.
So what is the observation?
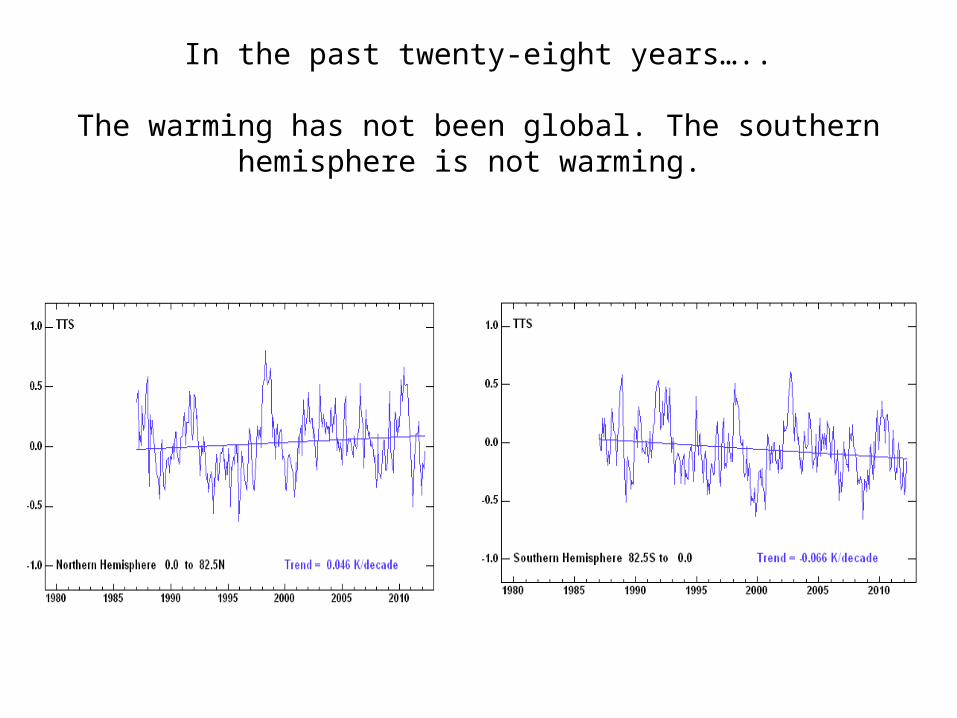
In the past twenty-eight years…..
The warming has not been global. The southern hemisphere is not warming.
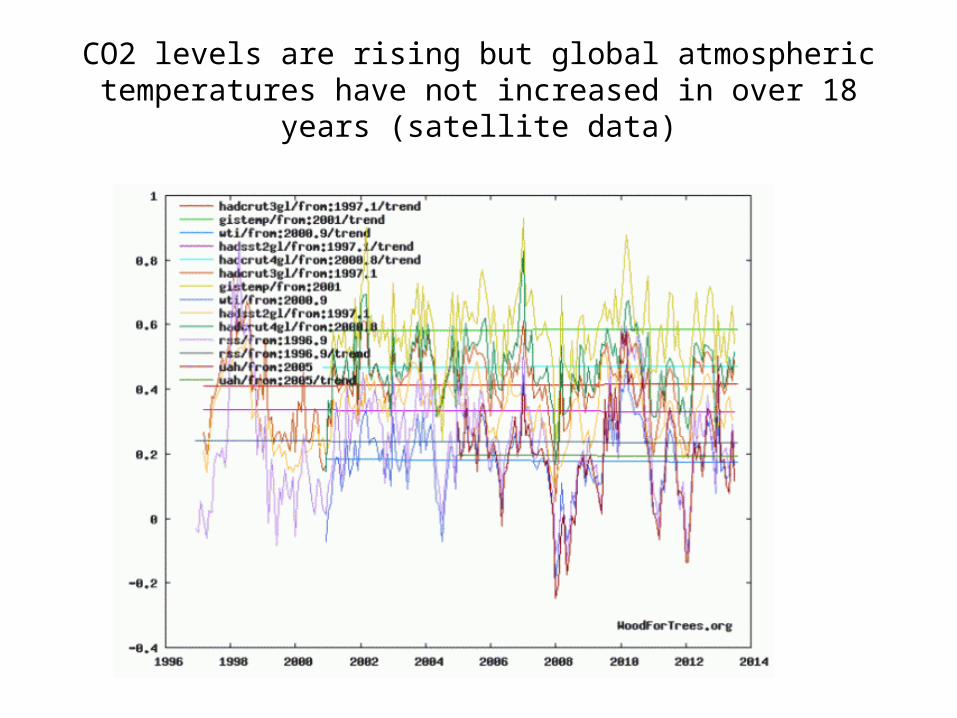
CO2 levels are rising but global atmospheric temperatures have not increased in over 18 years (satellite data)
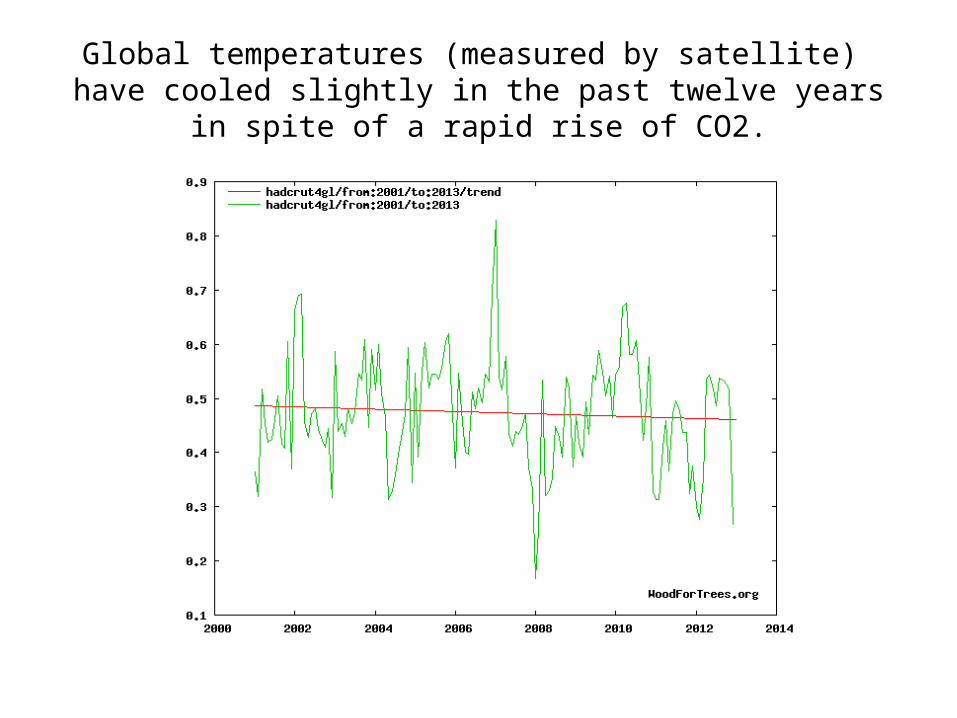
Global temperatures (measured by satellite) have cooled slightly in the past twelve years in spite of a rapid rise of CO2.
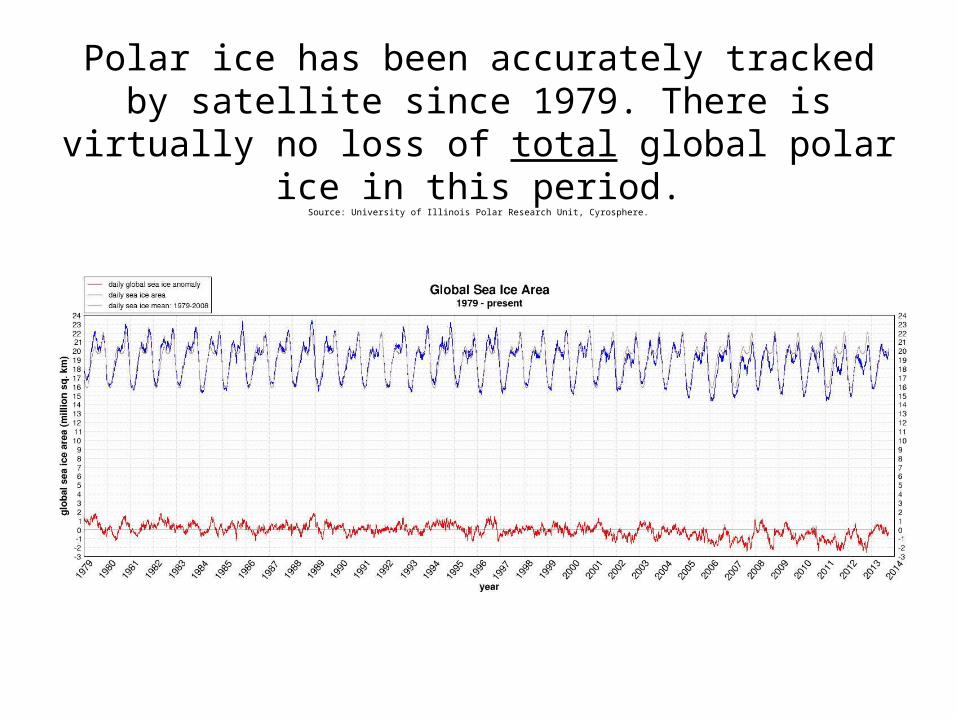
Polar ice has been accurately tracked by satellite since 1979. There is virtually no loss of total
global polar ice in this period.Source: University of Illinois Polar Research Unit, Cyrosphere.
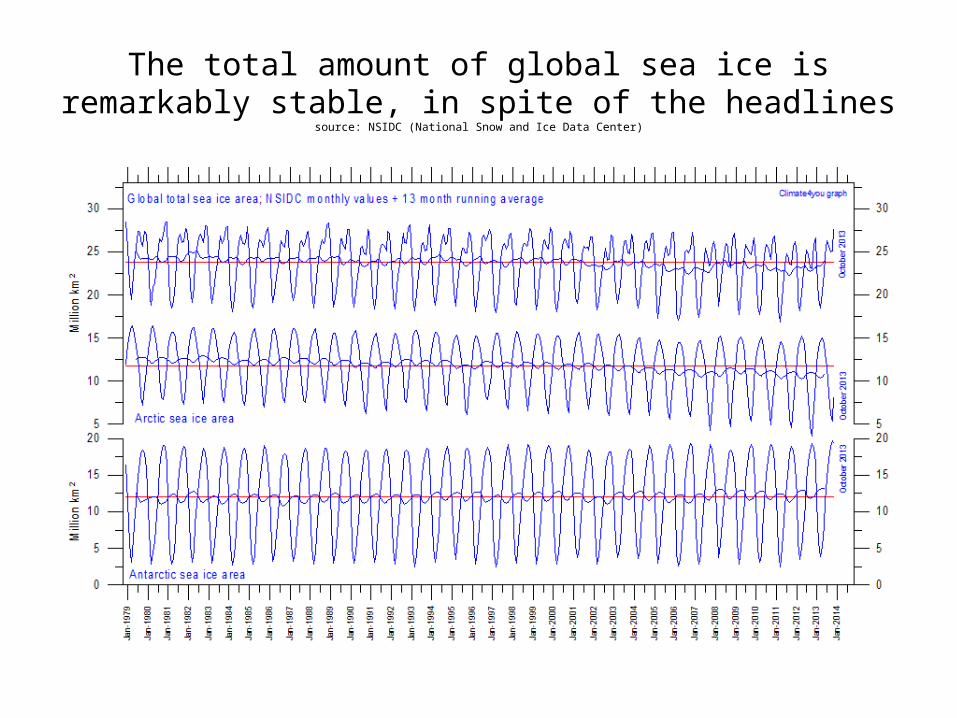
The total amount of global sea ice is remarkably stable, in spite of the headlines
source: NSIDC (National Snow and Ice Data Center)
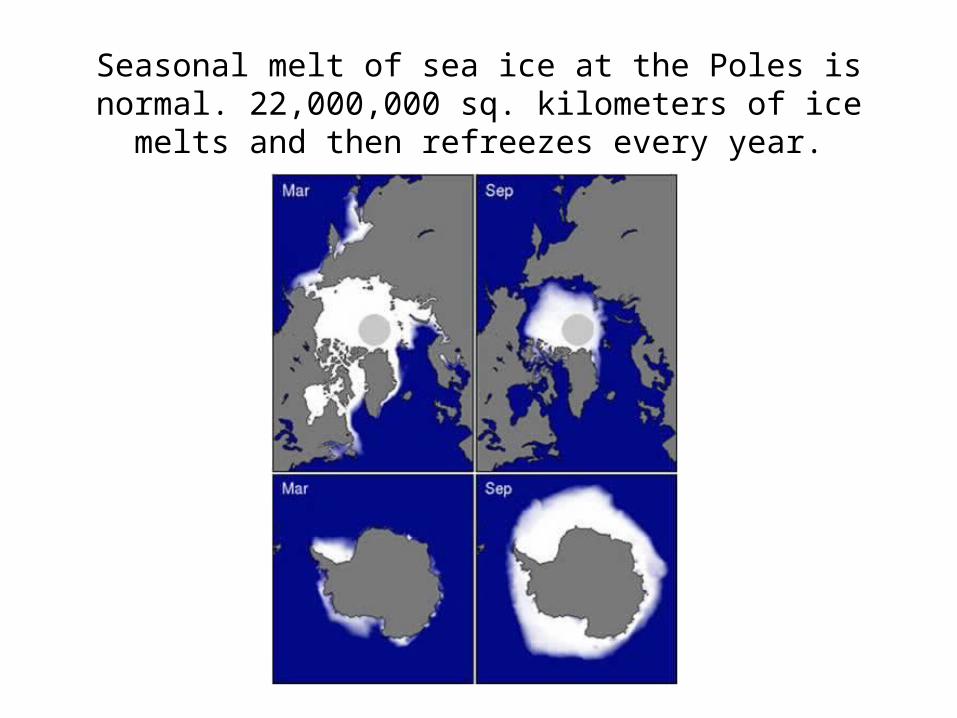
Seasonal melt of sea ice at the Poles is normal. 22,000,000 sq. kilometers of ice melts and then refreezes every year.
If all the Arctic (North Pole) ice melted……How high would the sea rise?
Answer: None. The Arctic is floating ice.
Land on ice must melt to cause sea level to rise.
Where is the ice on land?
Antarctica has 90%.
Greenland 10%
Glaciers make up a small fraction……
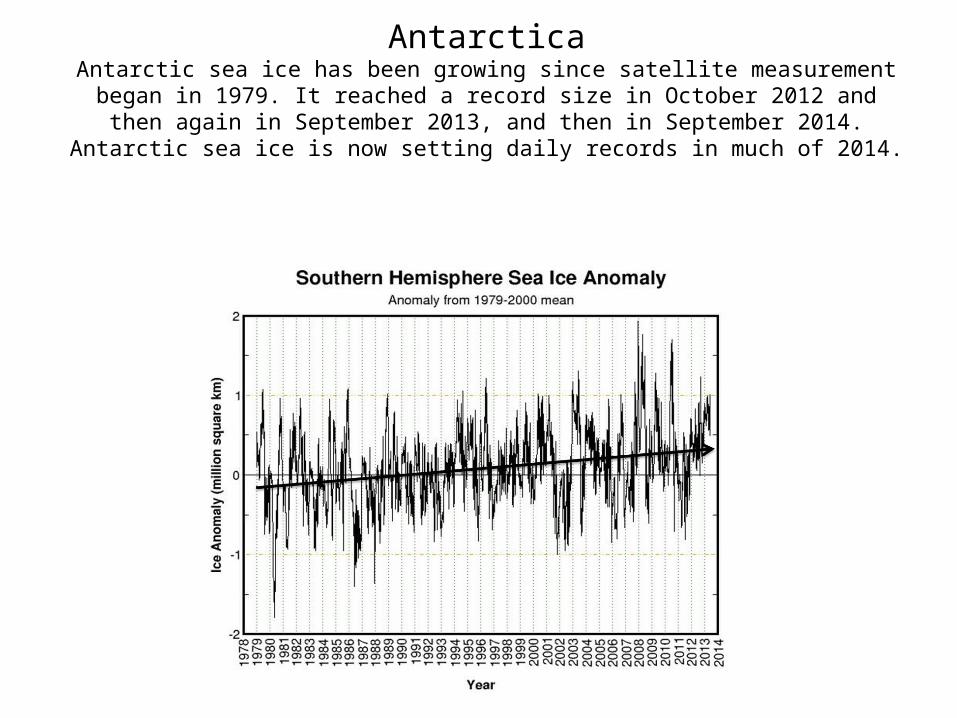
AntarcticaAntarctic sea ice has been growing since satellite measurement began in 1979. It
reached a record size in October 2012 and then again in September 2013, and then in September 2014. Antarctic sea ice is now setting daily records in much of
2014.
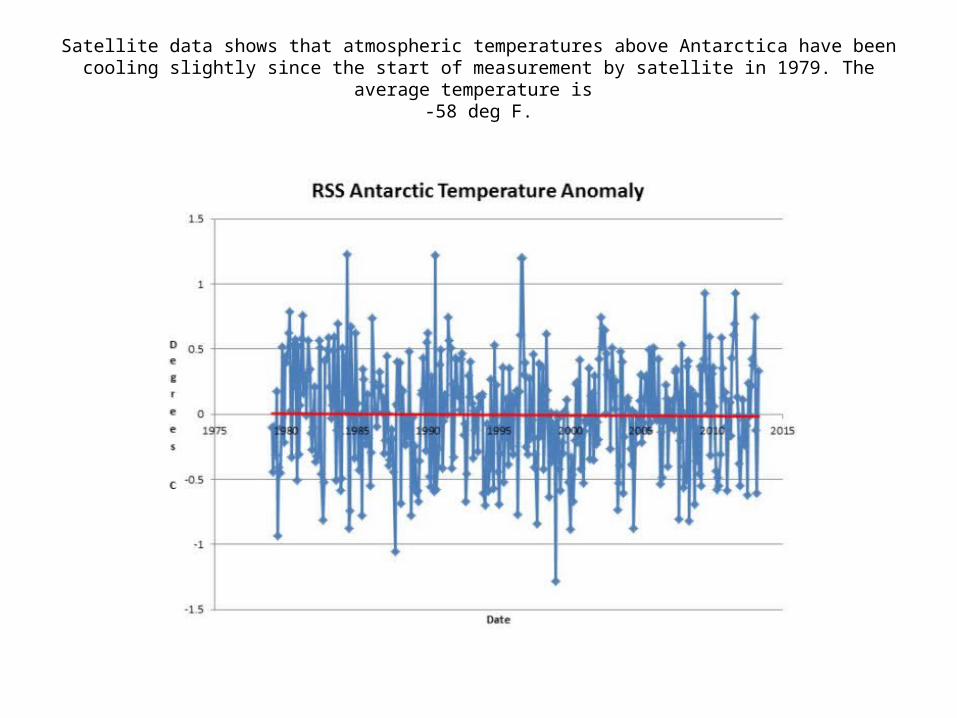
Satellite data shows that atmospheric temperatures above Antarctica have been cooling slightly since the start of measurement by satellite in 1979. The average temperature is
-58 deg F.
What happens in Antarctica is the key to sea level rise.
• Sea ice is greatly influenced by temperature, especially water temperature
• Sea ice has been growing in Antarctica for 30 years. Temperatures have been cooling in 96% of Antarctica for 50 years (but not at the Peninsula)
• The average temperature in Antarctic interior is -58 degrees F. It is also the highest Continent on earth with an average altitude of 8,200 feet.
• Antarctica is classified as a desert. It is the driest place on earth. There is little snow.
• If the man made global warming theory is true, sea ice will melt, but the higher humidity will cause much more snow in the interior and overall ice volumes will grow. This is also true of Greenland.
• Mankind has little impact on the climate in Antarctica
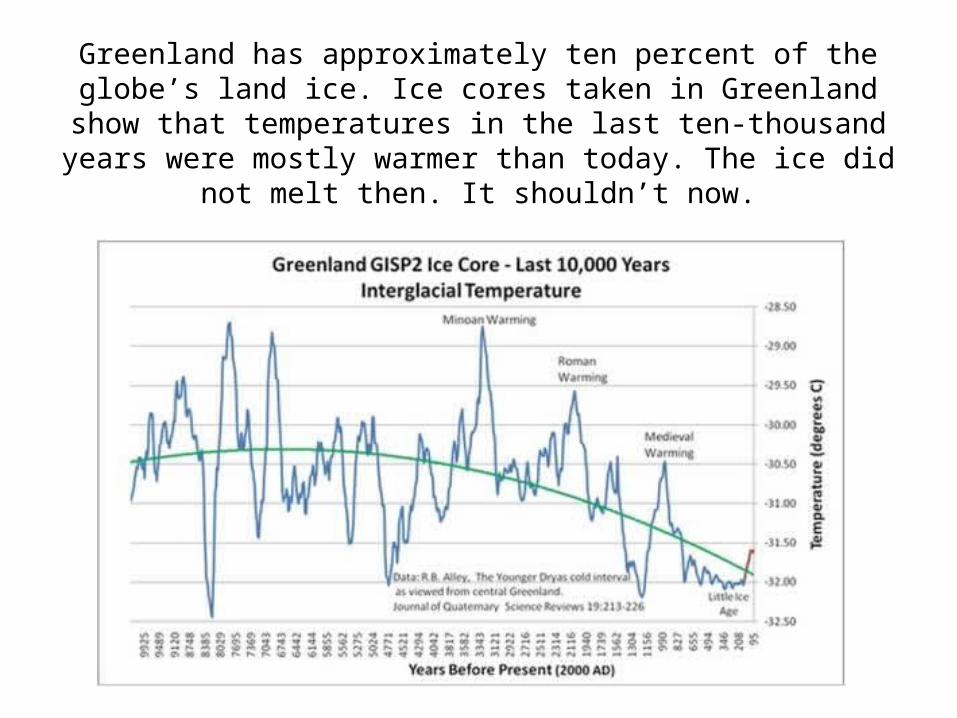
Greenland has approximately ten percent of the globe’s land ice. Ice cores taken in Greenland show that temperatures in the last ten-
thousand years were mostly warmer than today. The ice did not melt then. It shouldn’t now.
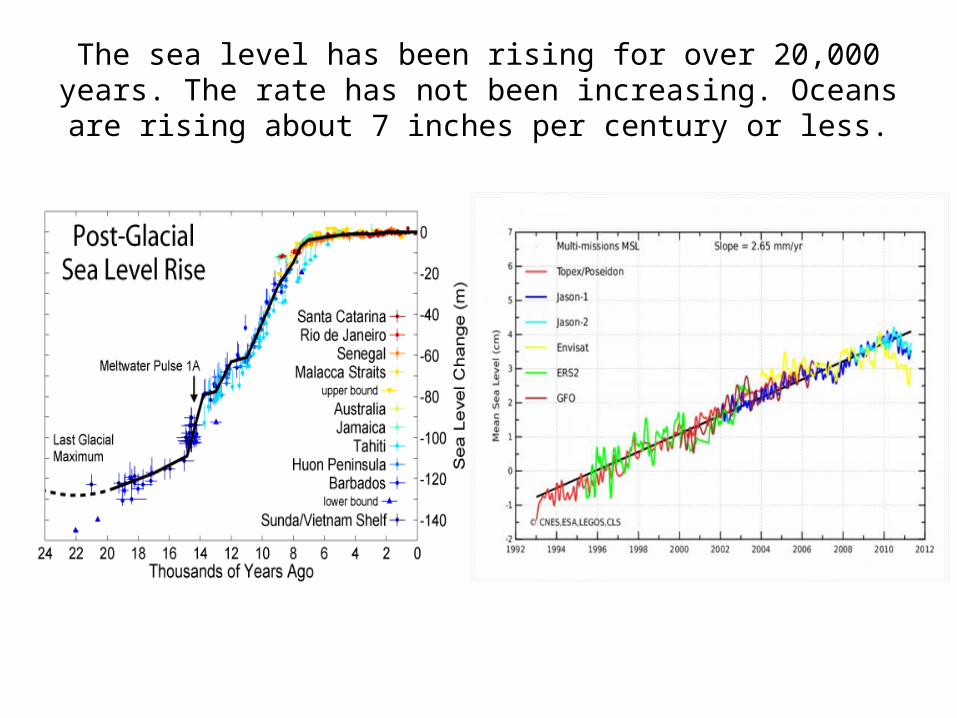
The sea level has been rising for over 20,000 years. The rate has not been increasing. Oceans are rising about 7 inches per century
or less.
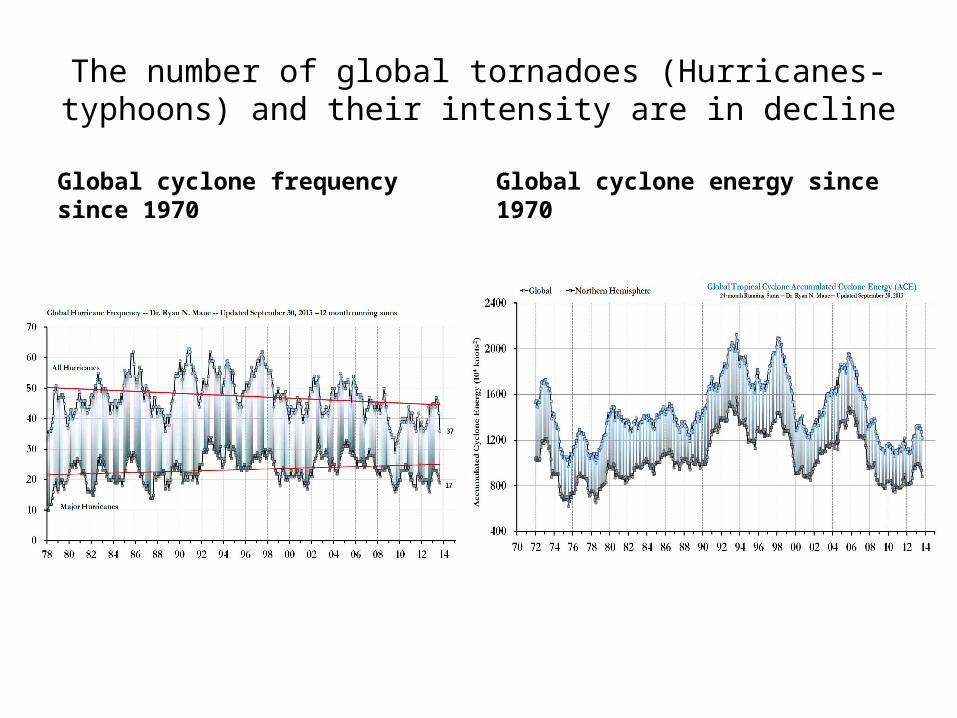
The number of global tornadoes (Hurricanes-typhoons) and their intensity are in decline
Global cyclone frequency since 1970 Global cyclone energy since 1970
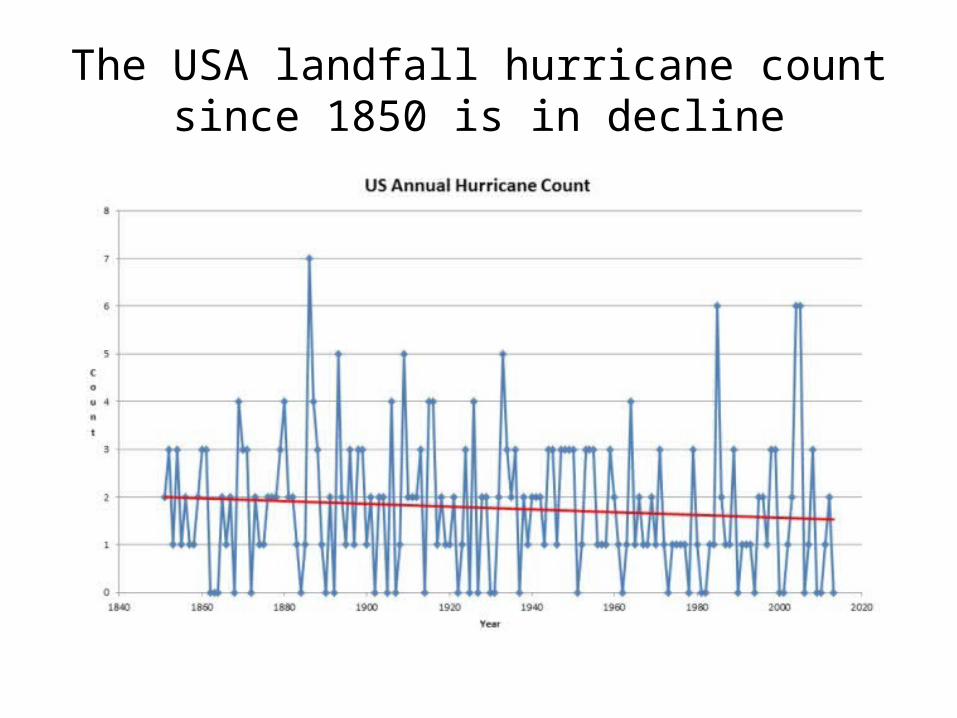
The USA landfall hurricane count since 1850 is in decline
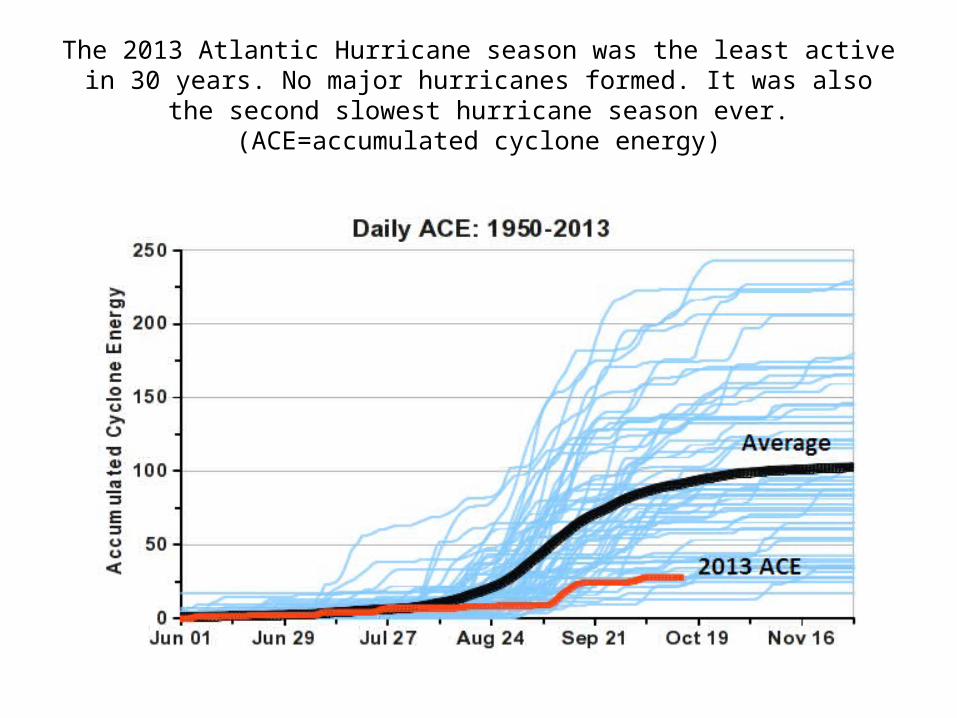
The 2013 Atlantic Hurricane season was the least active in 30 years. No major hurricanes formed. It was also the second slowest
hurricane season ever. (ACE=accumulated cyclone energy)
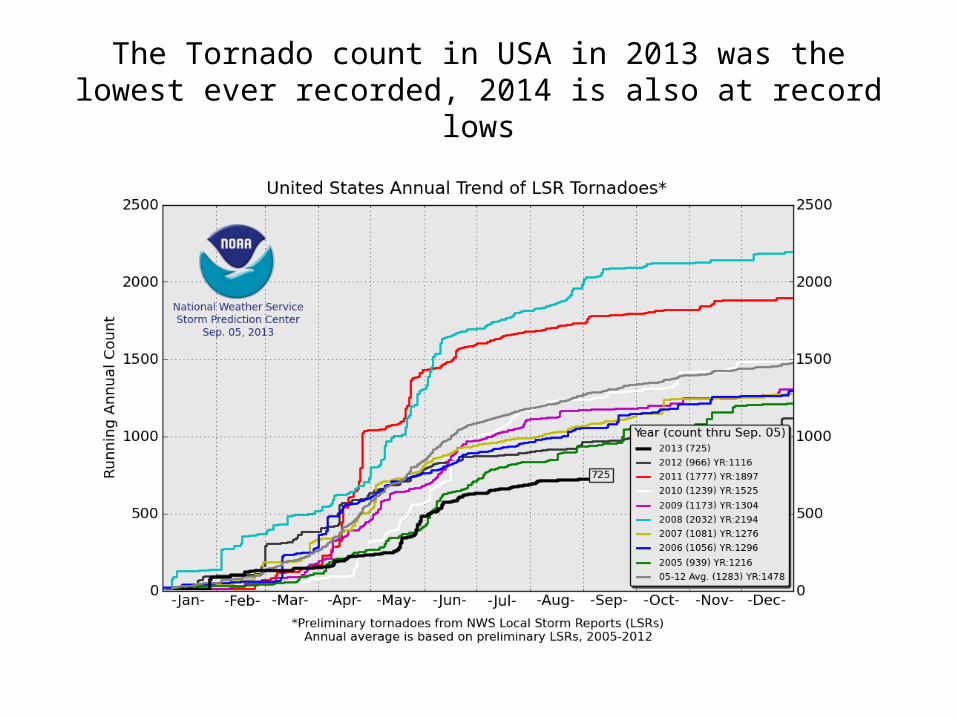
The Tornado count in USA in 2013 was the lowest ever recorded, 2014 is also at record lows
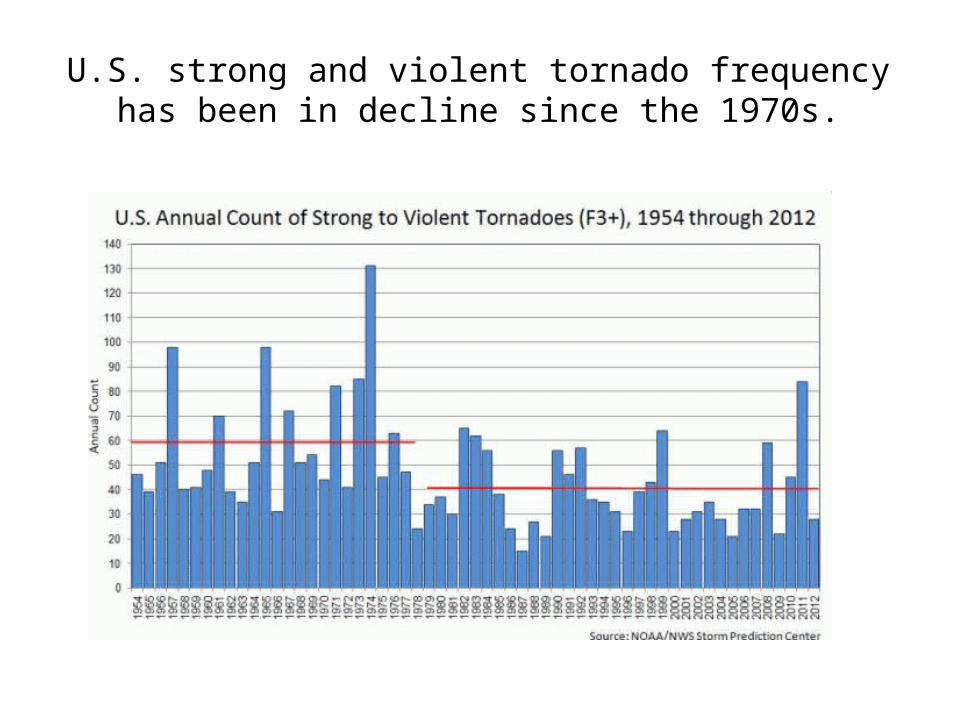
U.S. strong and violent tornado frequency has been in decline since the 1970s.
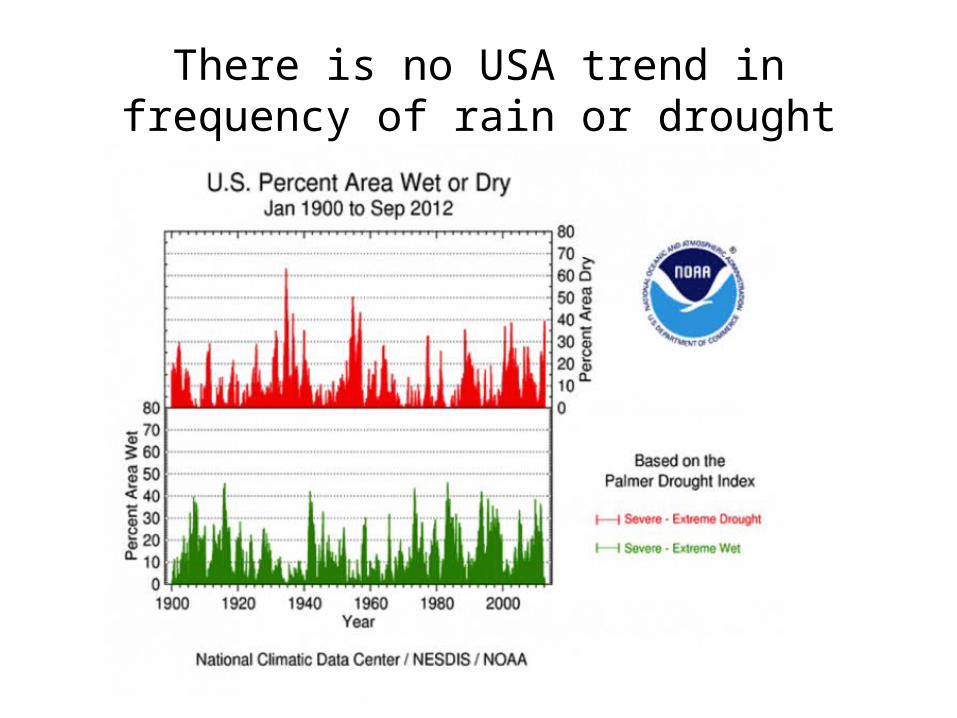
There is no USA trend in frequency of rain or drought
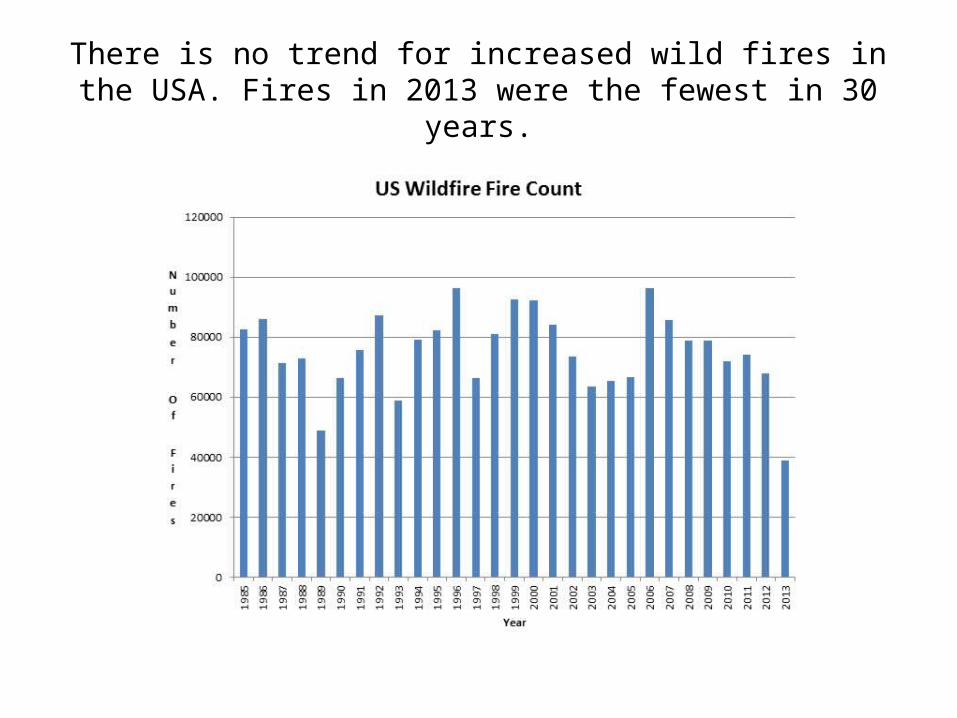
There is no trend for increased wild fires in the USA. Fires in 2013 were the fewest in 30 years.
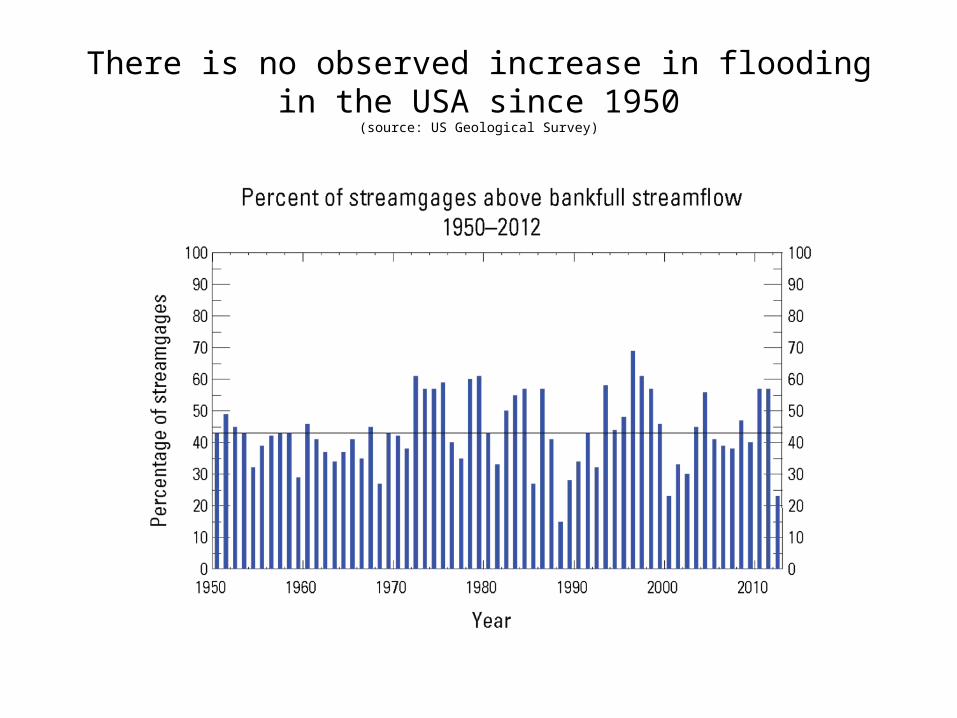
There is no observed increase in flooding in the USA since 1950(source: US Geological Survey)
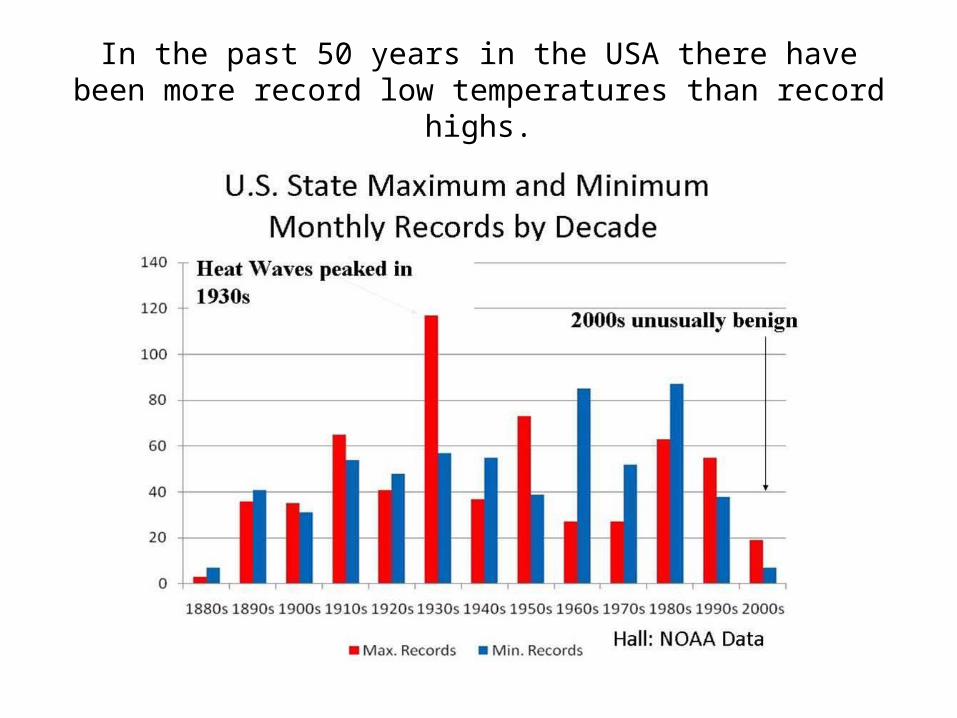
In the past 50 years in the USA there have been more record low temperatures than record highs.
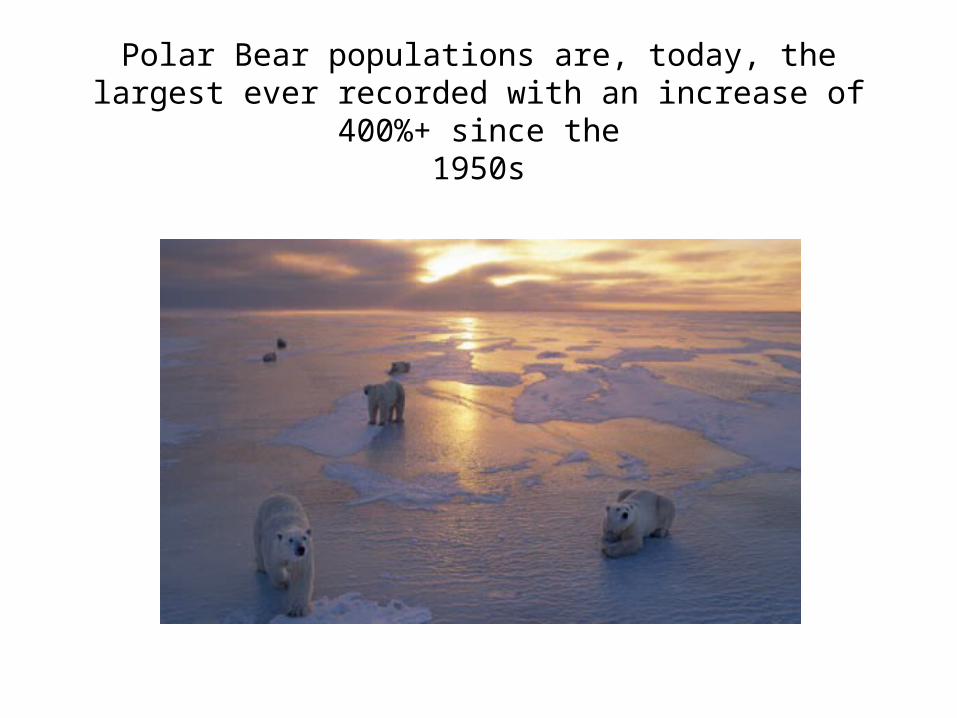
Polar Bear populations are, today, the largest ever recorded with an increase of 400%+ since the
1950s
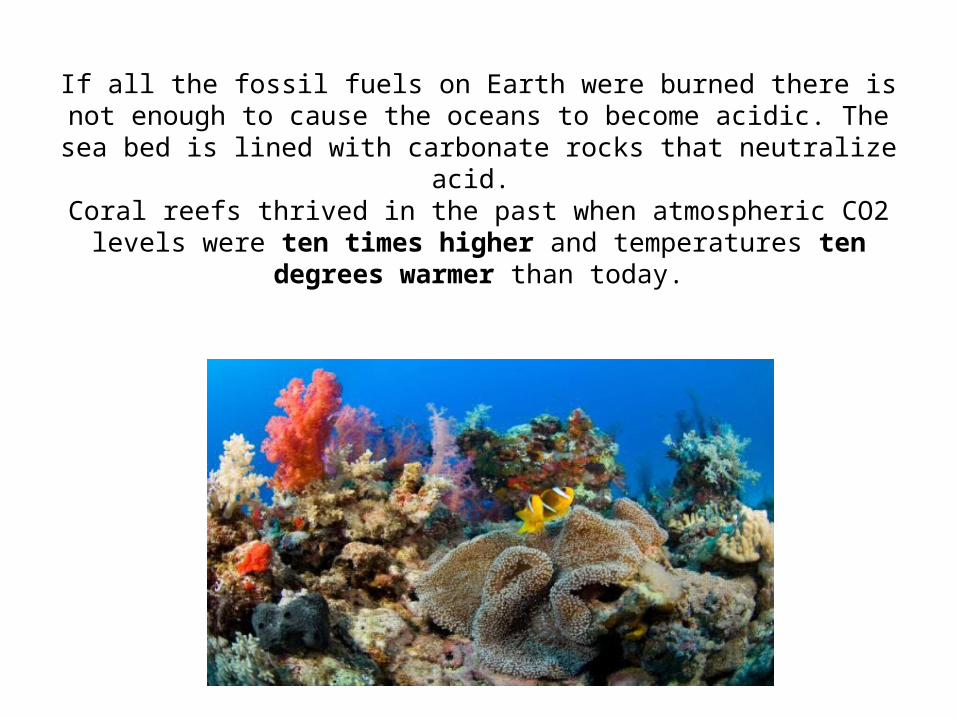
If all the fossil fuels on Earth were burned there is not enough to cause the oceans to become acidic. The sea bed is lined with
carbonate rocks that neutralize acid. Coral reefs thrived in the past when atmospheric CO2 levels were
ten times higher and temperatures ten degrees warmer than today.
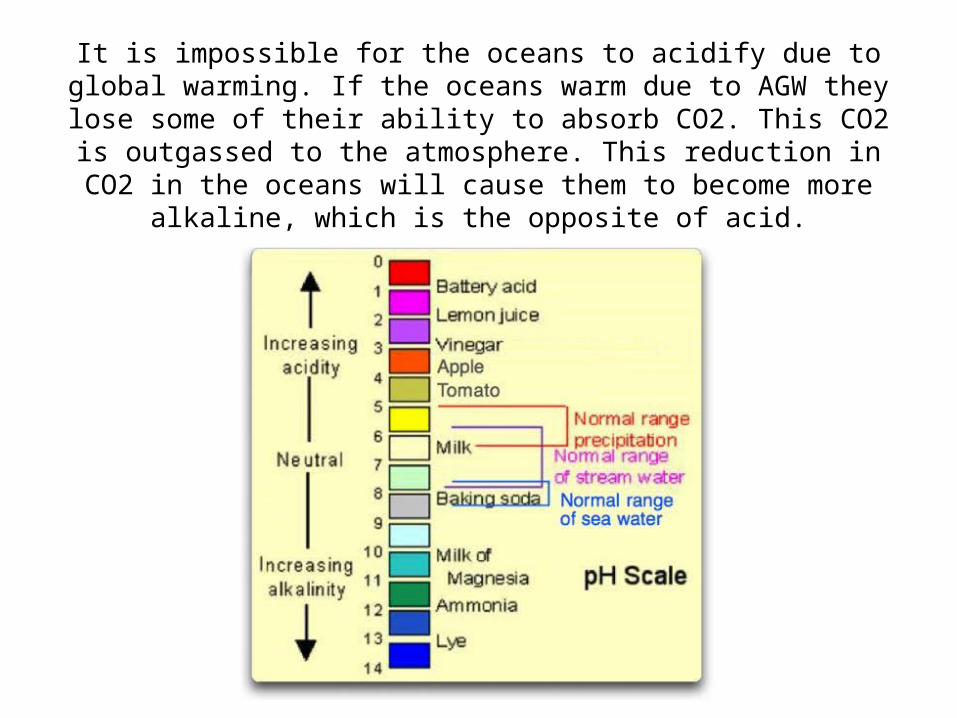
It is impossible for the oceans to acidify due to global warming. If the oceans warm due to AGW they lose some of their ability to
absorb CO2. This CO2 is outgassed to the atmosphere. This reduction in CO2 in the oceans will cause them to become more
alkaline, which is the opposite of acid.
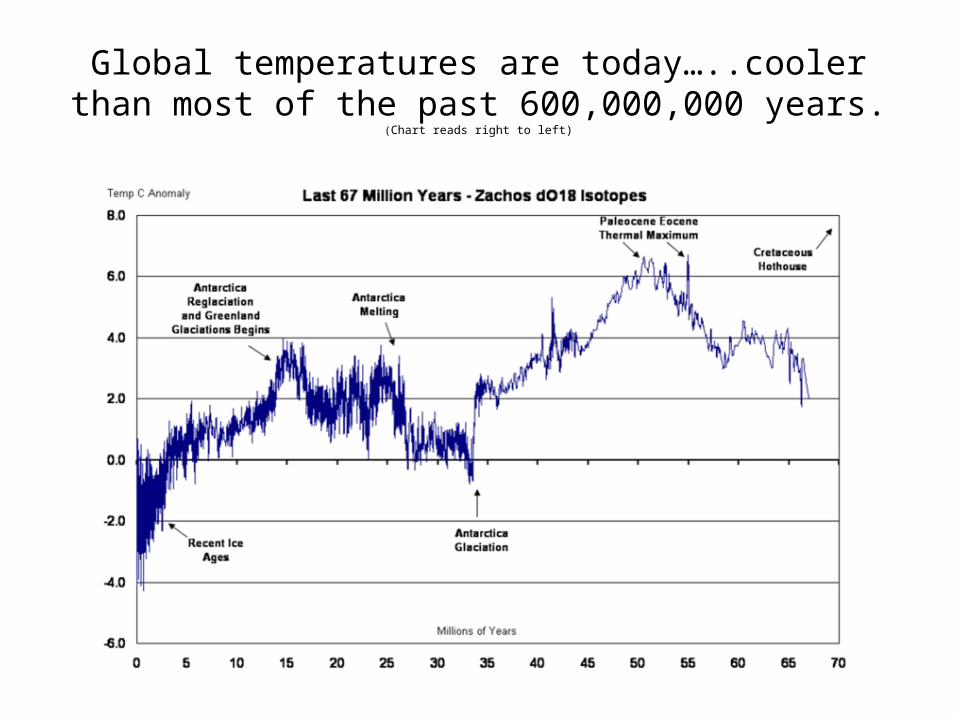
Global temperatures are today…..cooler than most of the past 600,000,000 years. (Chart reads right to left)
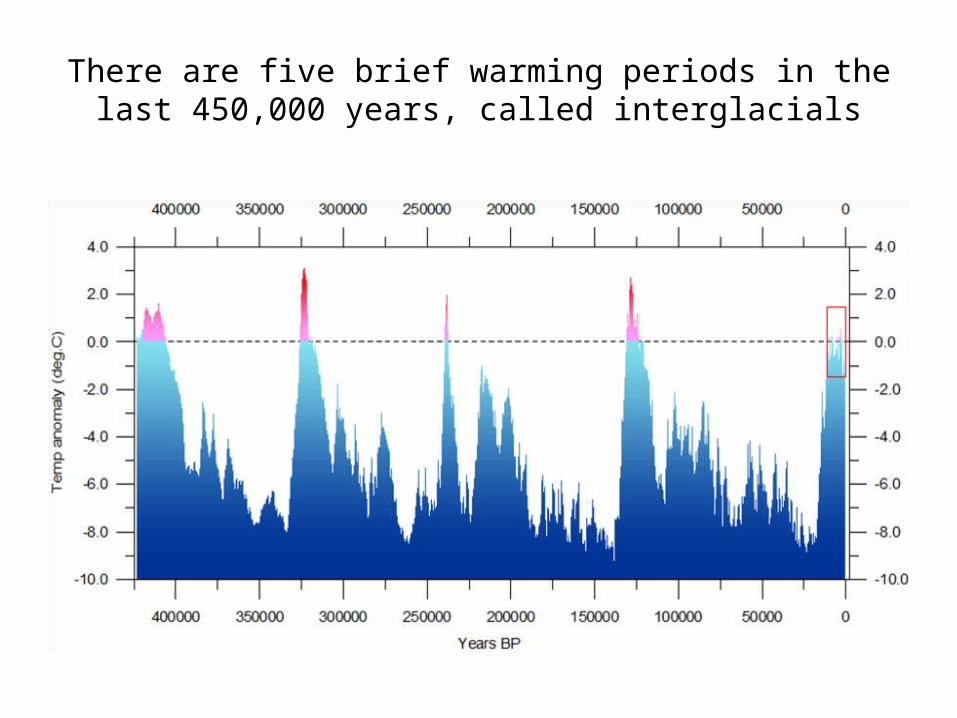
There are five brief warming periods in the last 450,000 years, called interglacials
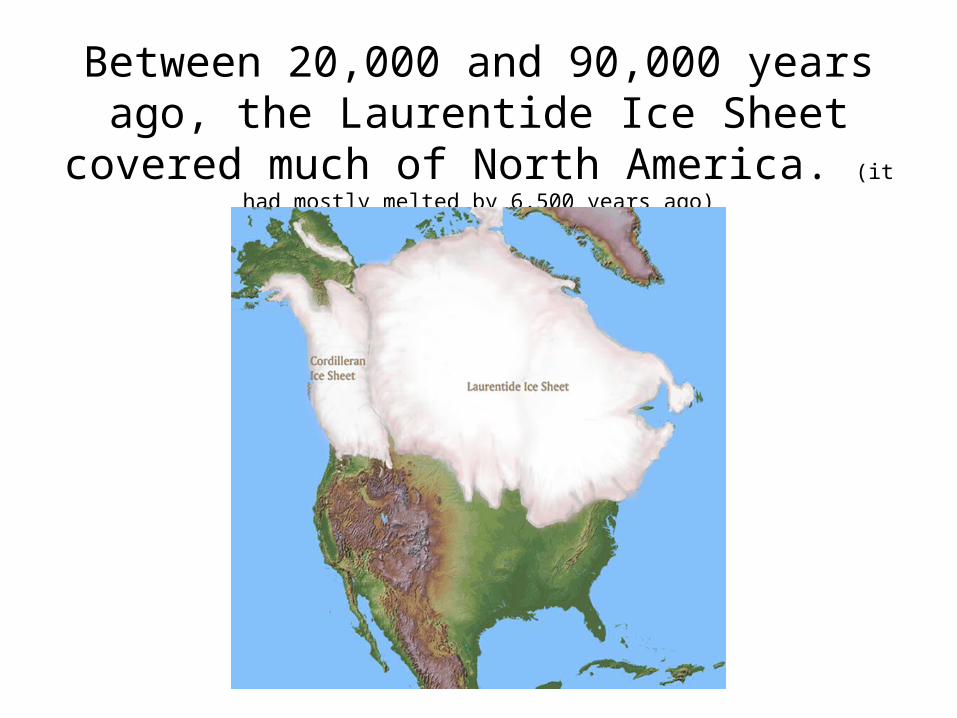
Between 20,000 and 90,000 years ago, the Laurentide Ice Sheet covered much of North
America. (it had mostly melted by 6,500 years ago)
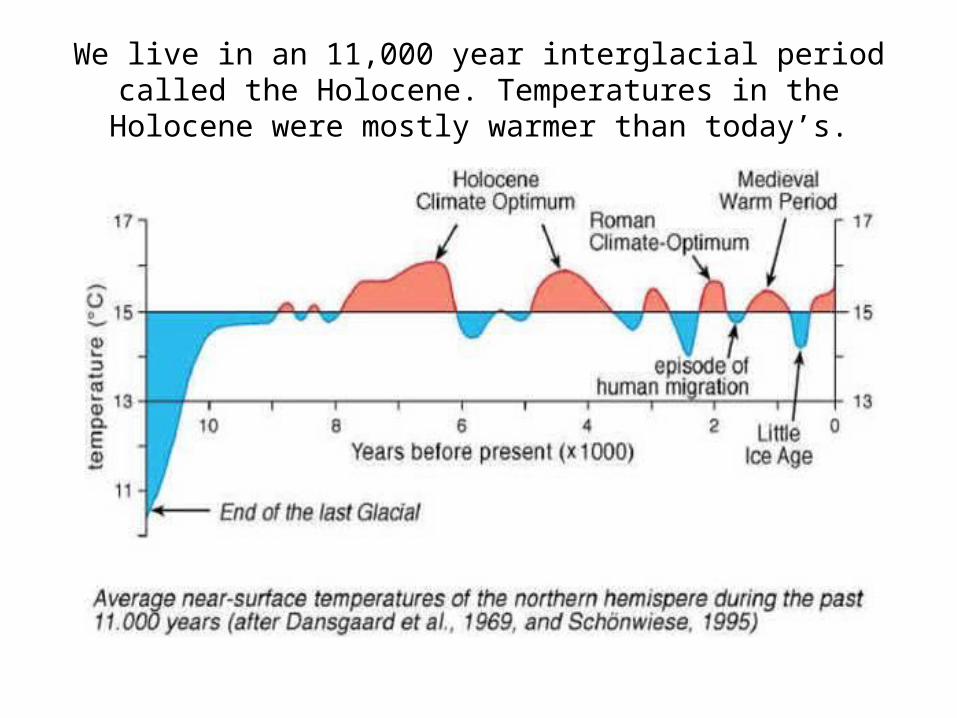
We live in an 11,000 year interglacial period called the Holocene. Temperatures in the Holocene were mostly warmer than today’s.
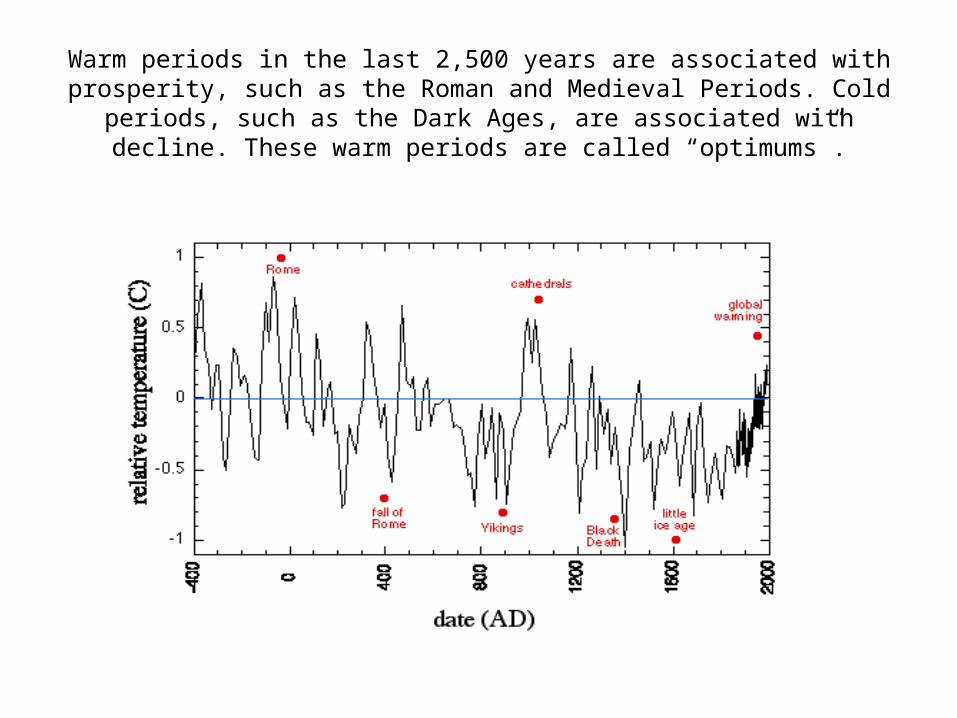
Warm periods in the last 2,500 years are associated with prosperity, such as the Roman and Medieval Periods. Cold periods, such as the
Dark Ages, are associated with decline. These warm periods are called “optimums”.
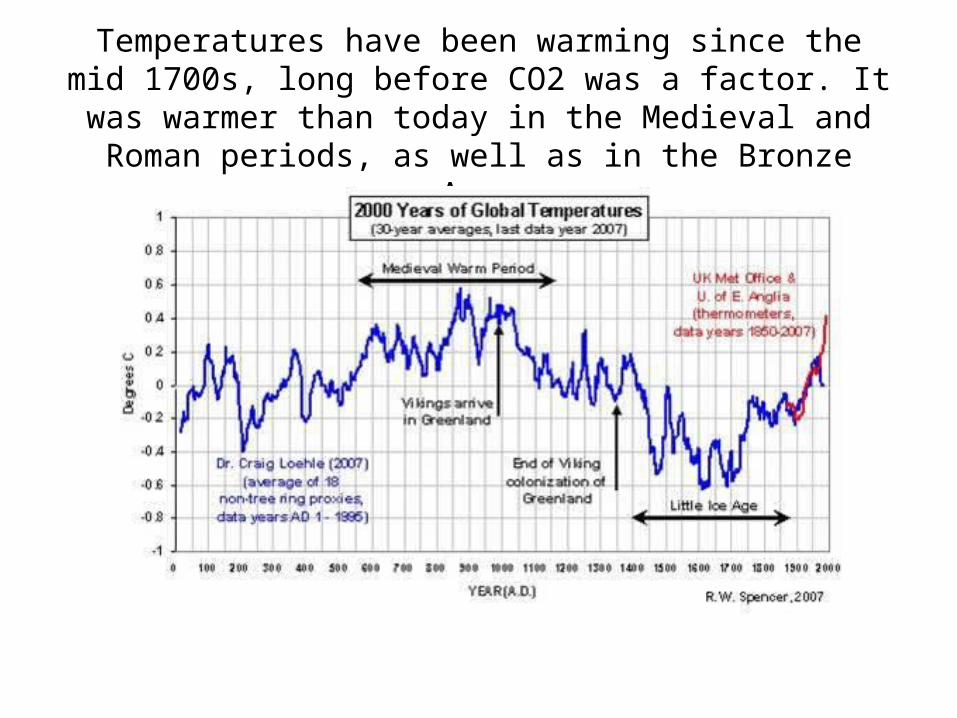
Temperatures have been warming since the mid 1700s, long before CO2 was a factor. It was warmer than today in the
Medieval and Roman periods, as well as in the Bronze Age.
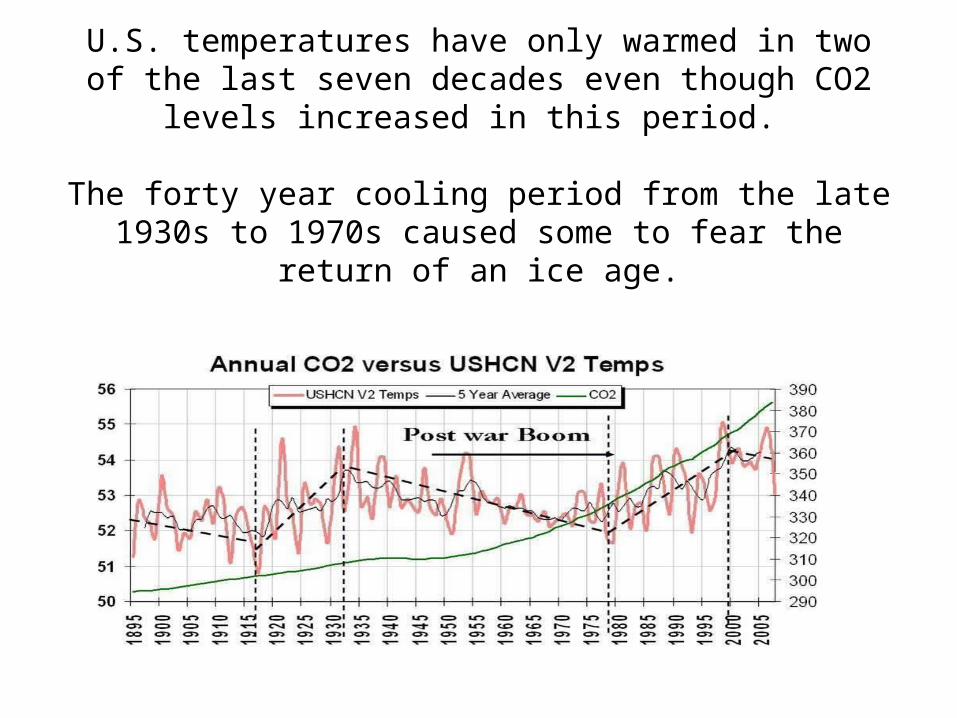
U.S. temperatures have only warmed in two of the last seven decades even though CO2 levels increased in this period.
The forty year cooling period from the late 1930s to 1970s caused some to fear the return of an ice age.

Time Magazine cover December 1979
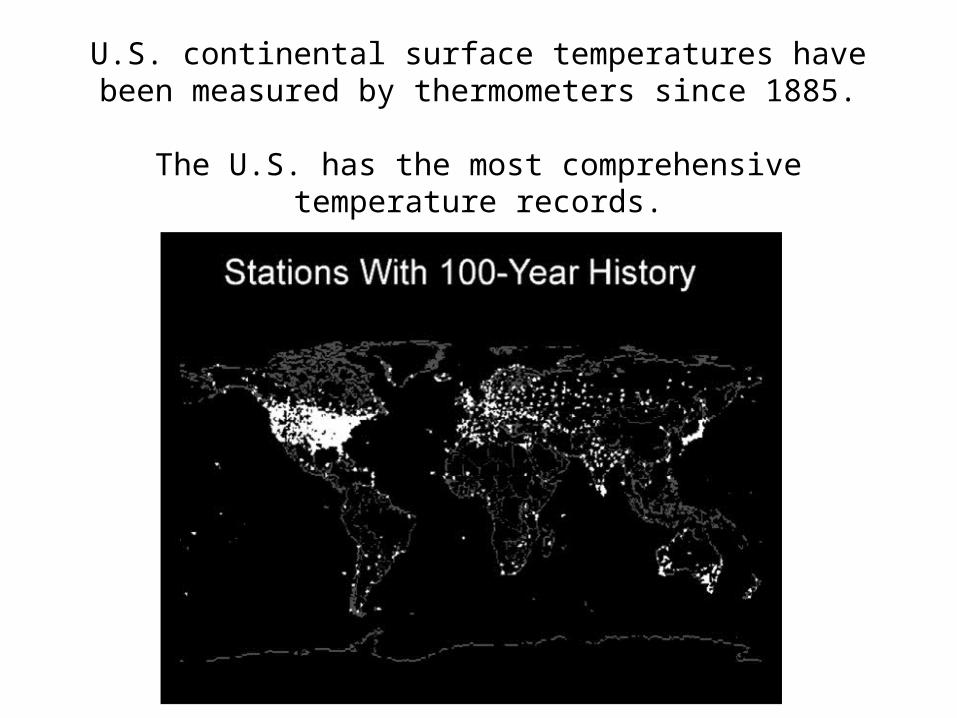
U.S. continental surface temperatures have been measured by thermometers since 1885.
The U.S. has the most comprehensive temperature records.
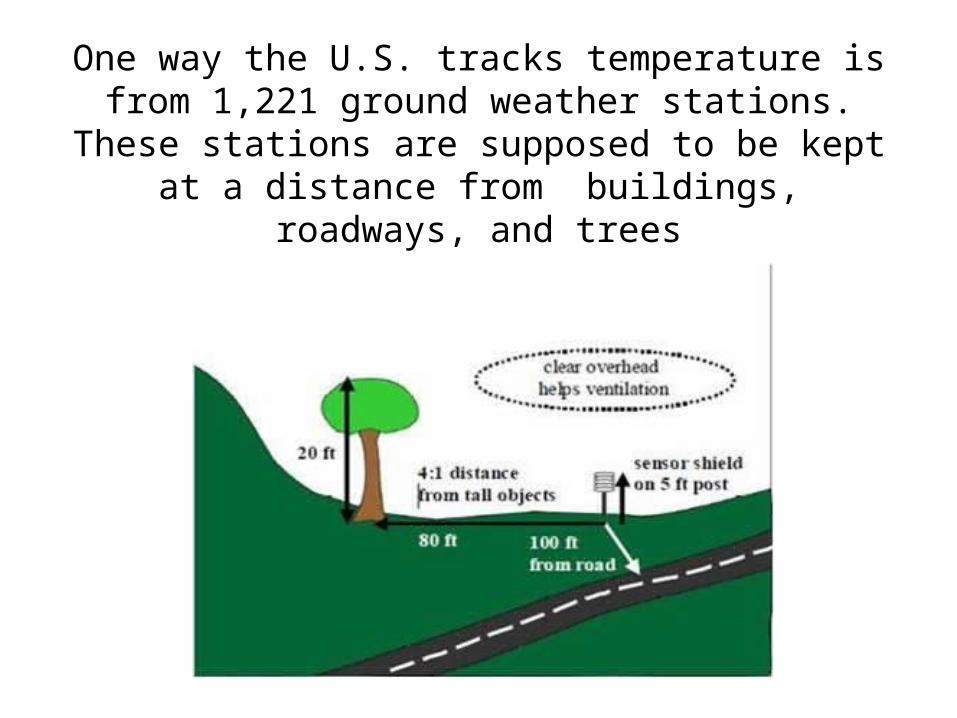
One way the U.S. tracks temperature is from 1,221 ground weather stations.
These stations are supposed to be kept at a distance from buildings, roadways, and trees
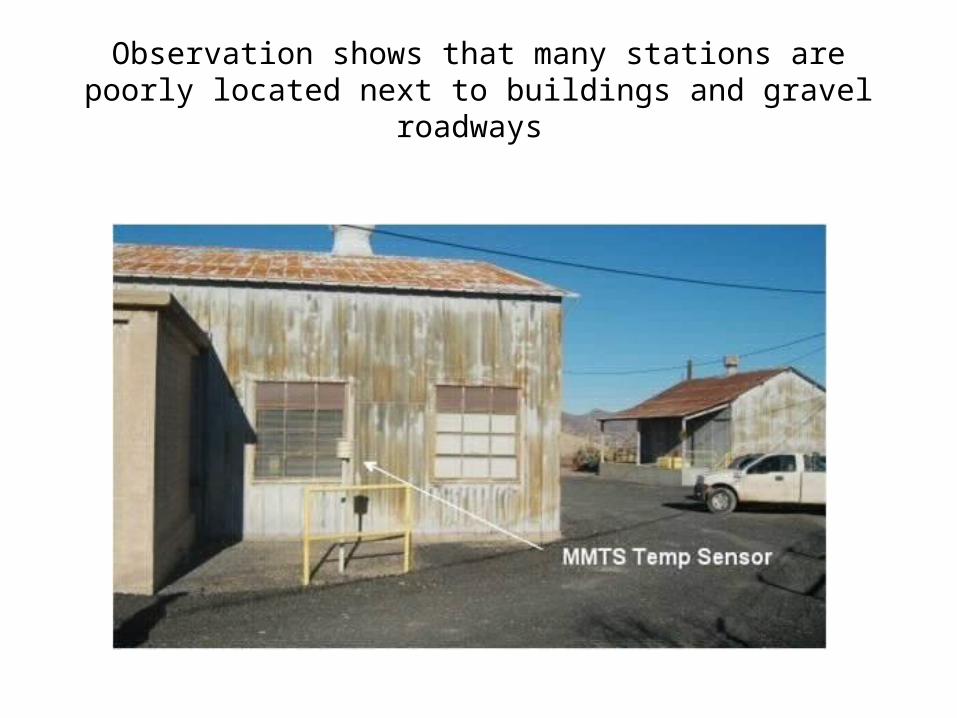
Observation shows that many stations are poorly located next to buildings and gravel roadways
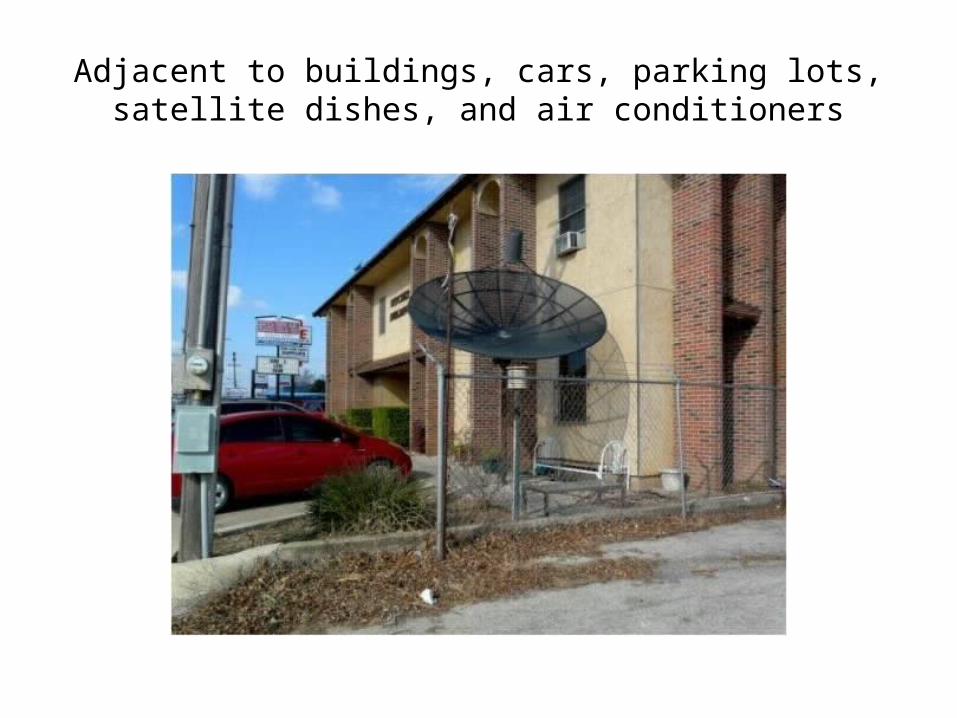
Adjacent to buildings, cars, parking lots, satellite dishes, and air conditioners
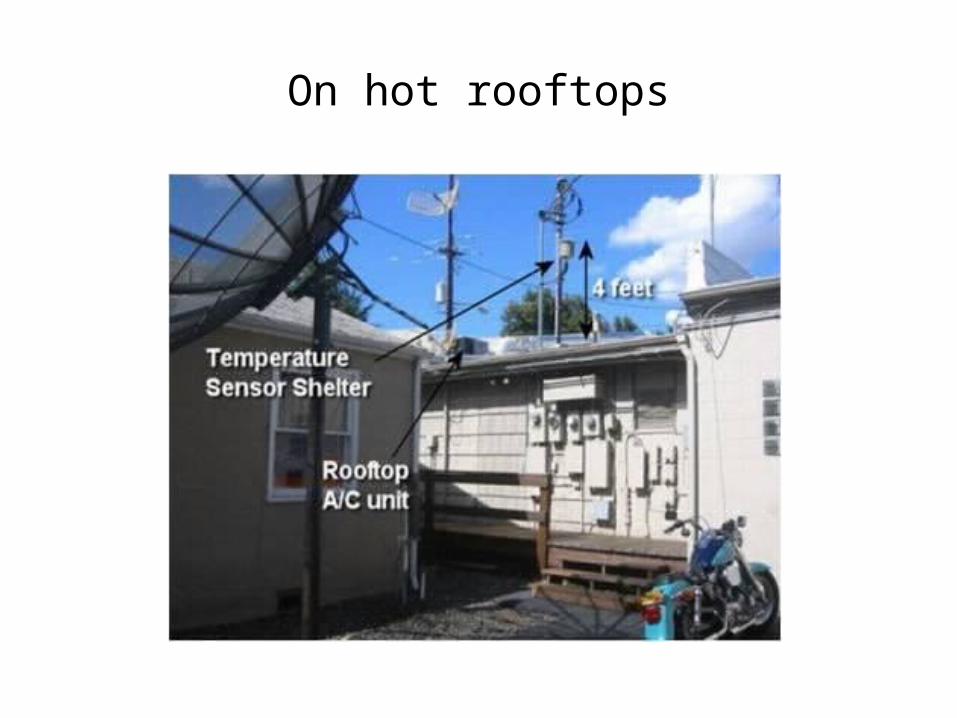
On hot rooftops
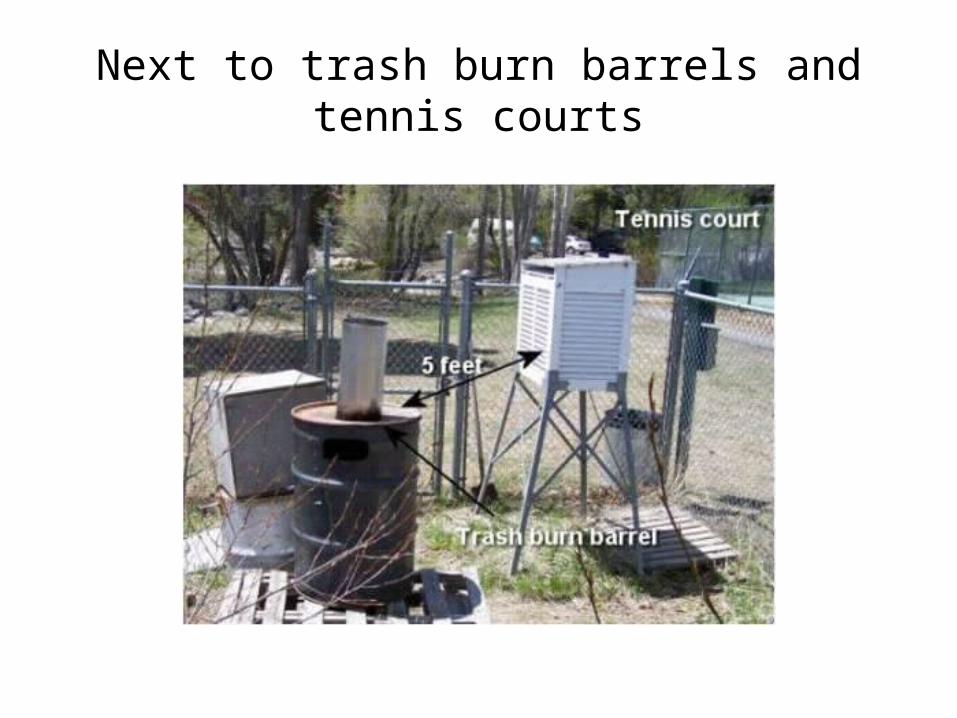
Next to trash burn barrels and tennis courts
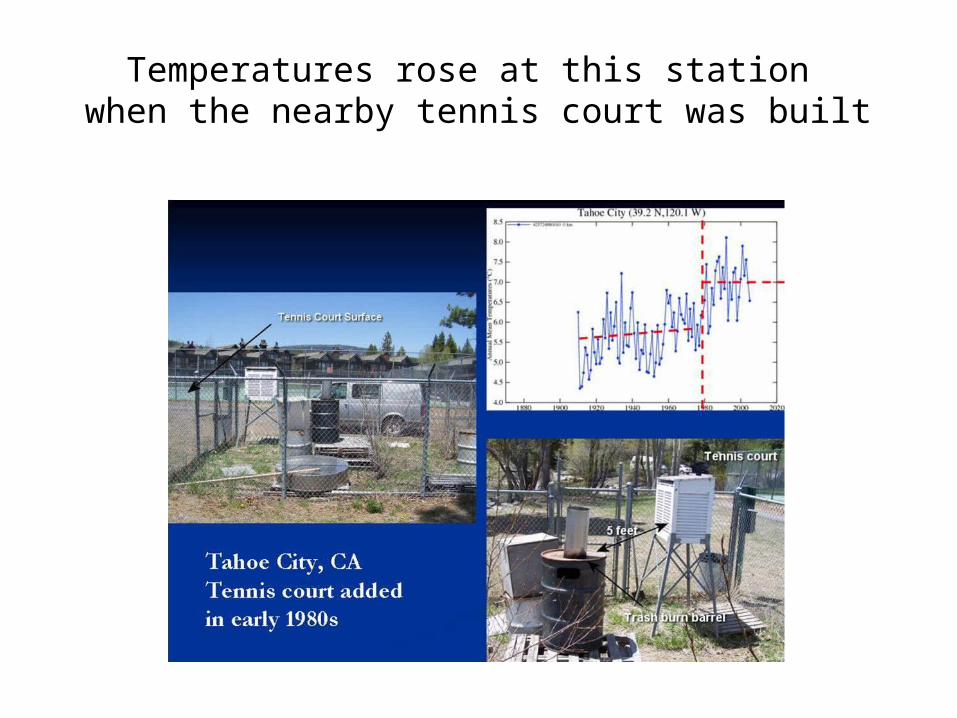
Temperatures rose at this station when the nearby tennis court was built
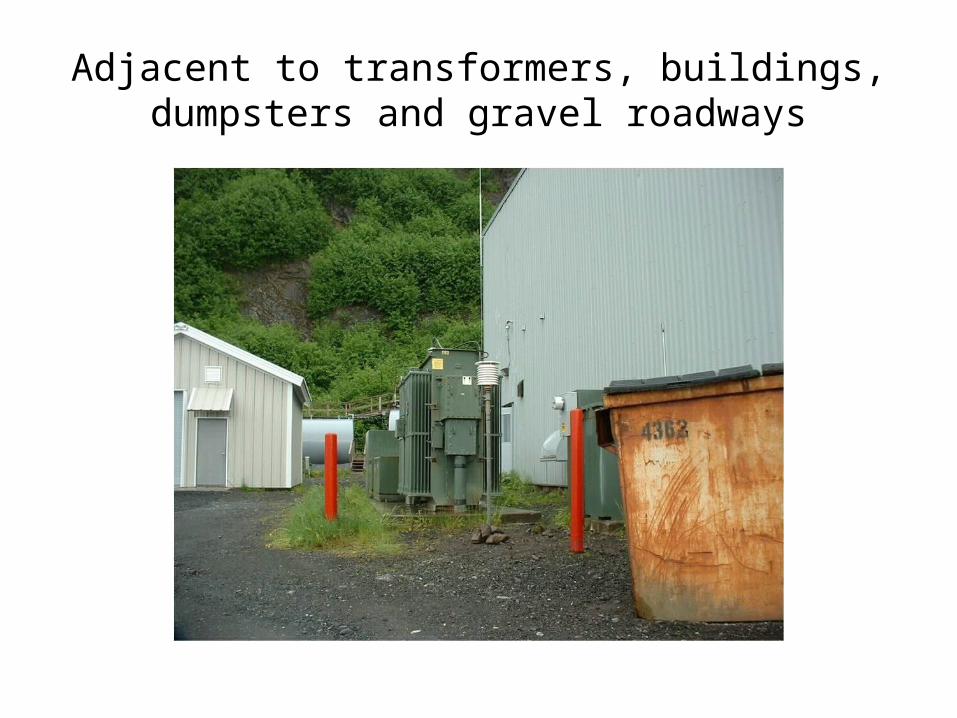
Adjacent to transformers, buildings, dumpsters and gravel roadways
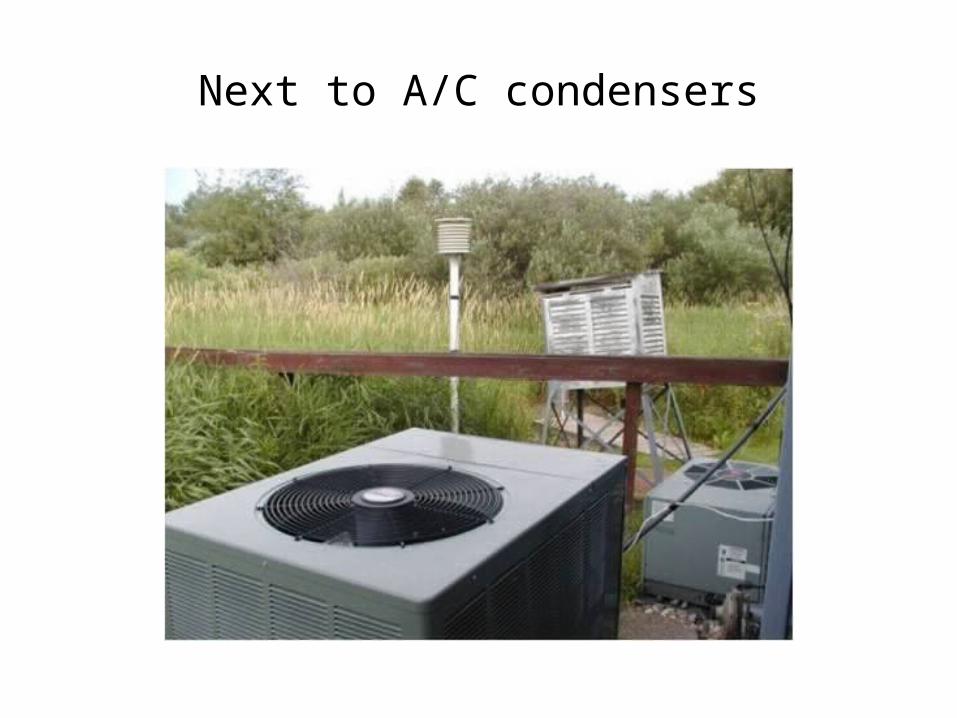
Next to A/C condensers
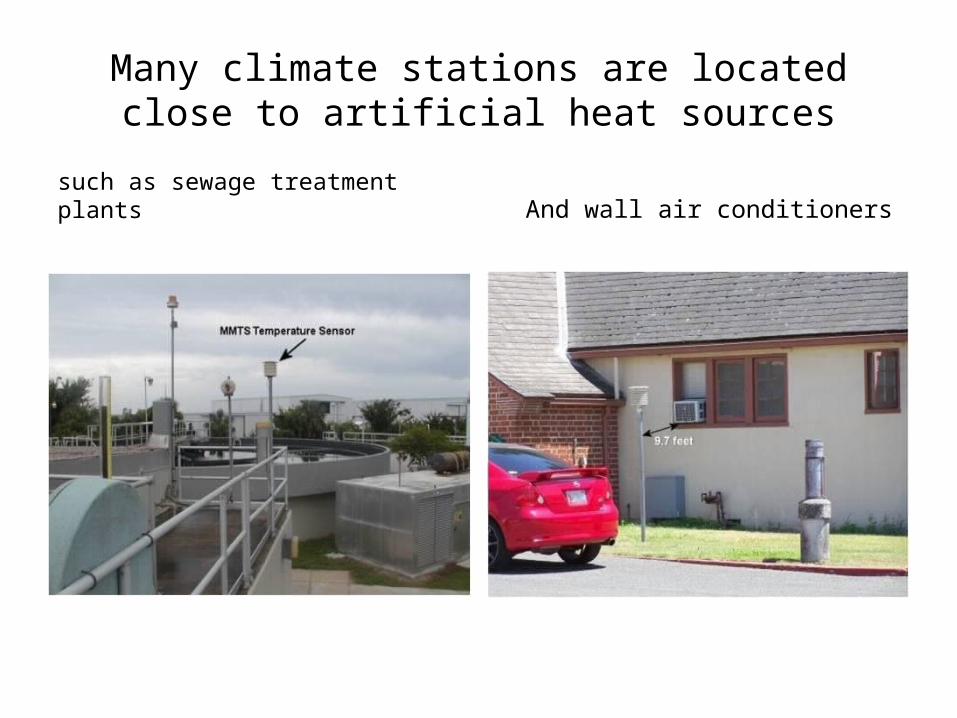
Many climate stations are located close to artificial heat sources
such as sewage treatment plants And wall air conditioners
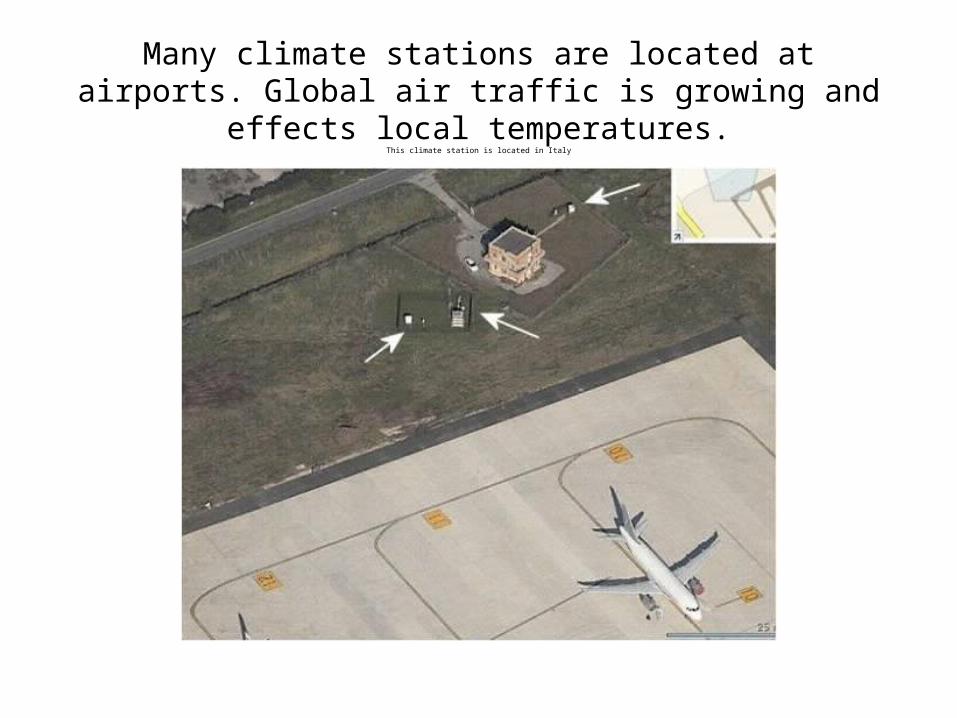
Many climate stations are located at airports. Global air traffic is growing and effects local temperatures.
This climate station is located in Italy
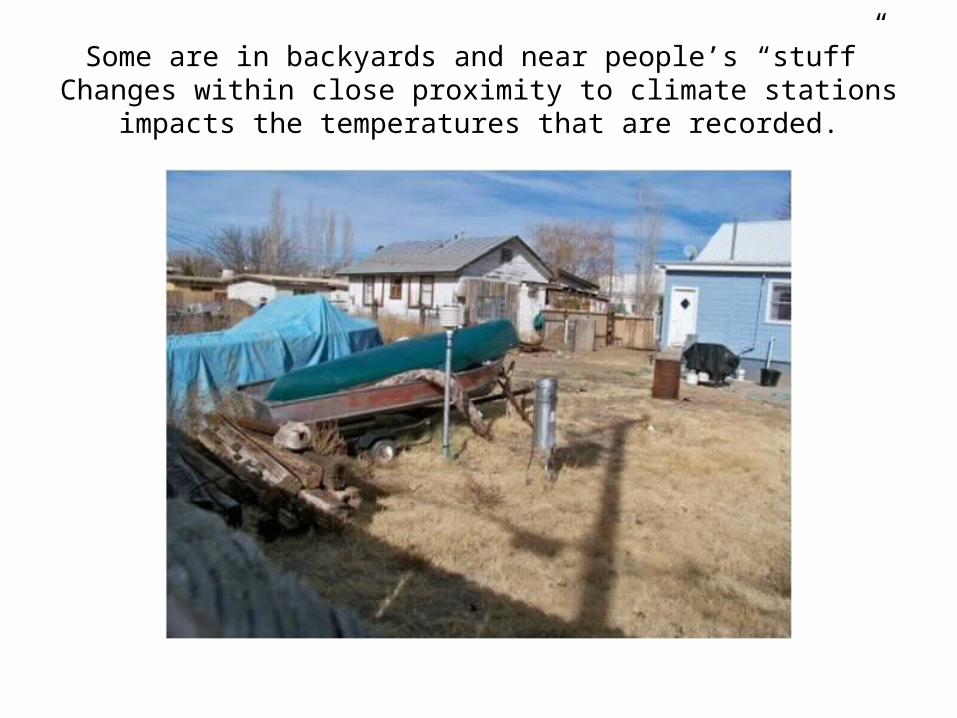
Some are in backyards and near people’s “stuff”Changes within close proximity to climate stations impacts the
temperatures that are recorded.
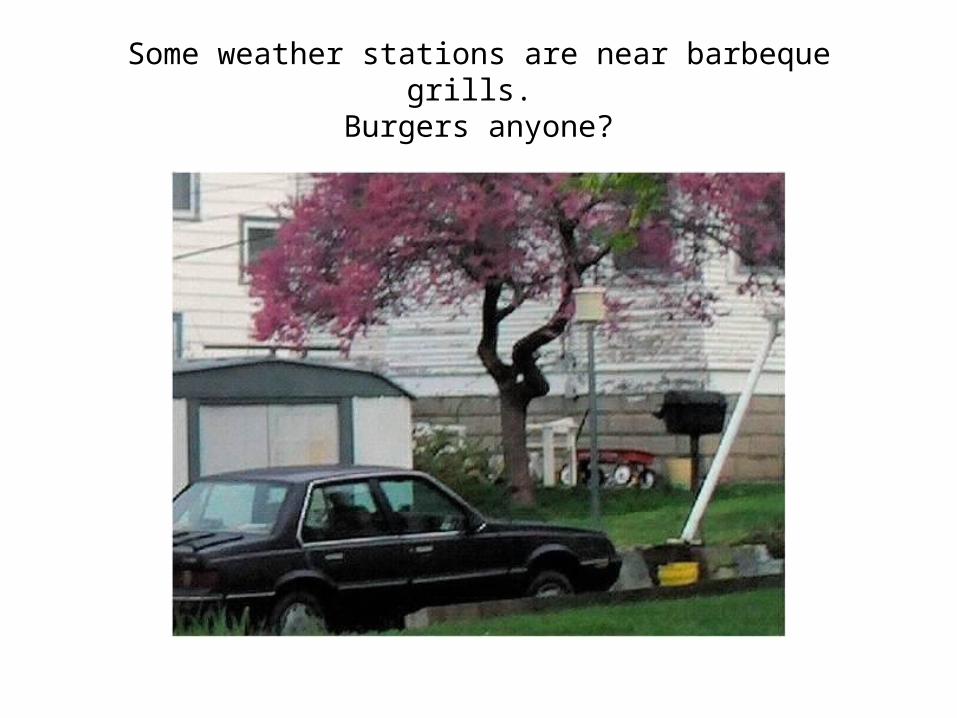
Some weather stations are near barbeque grills. Burgers anyone?
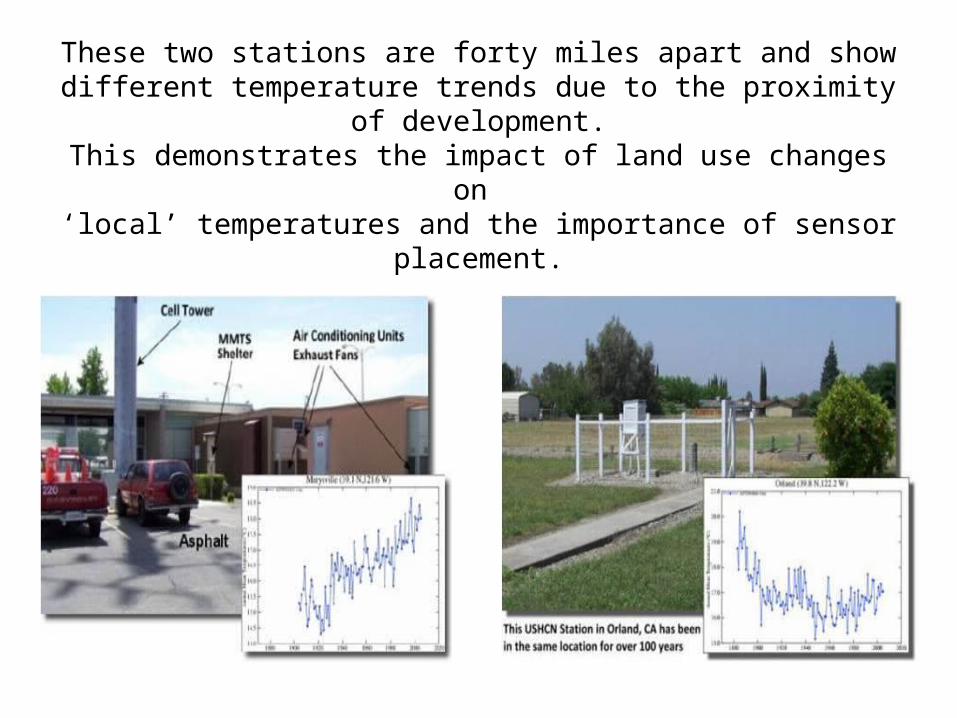
These two stations are forty miles apart and show different temperature trends due to the proximity of development.
This demonstrates the impact of land use changes on ‘local’ temperatures and the importance of sensor
placement.
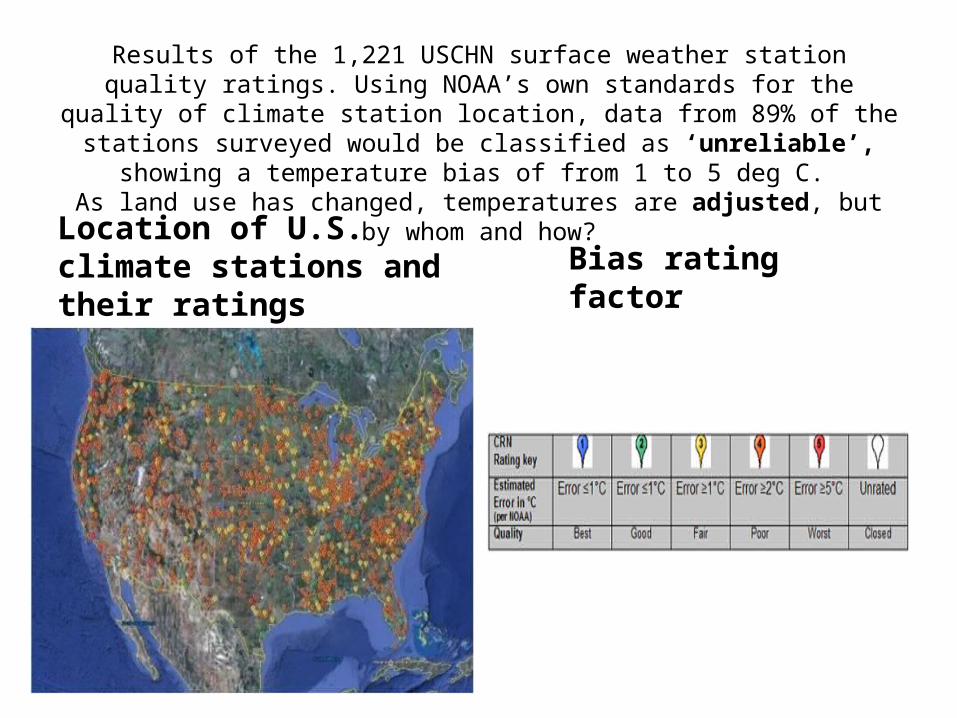
Results of the 1,221 USCHN surface weather station quality ratings. Using NOAA’s own standards for the quality of climate station
location, data from 89% of the stations surveyed would be classified as ‘unreliable’, showing a temperature bias of from 1 to 5 deg C.
As land use has changed, temperatures are adjusted, but by whom and how?
Location of U.S. climate stations and their ratings Bias rating factor
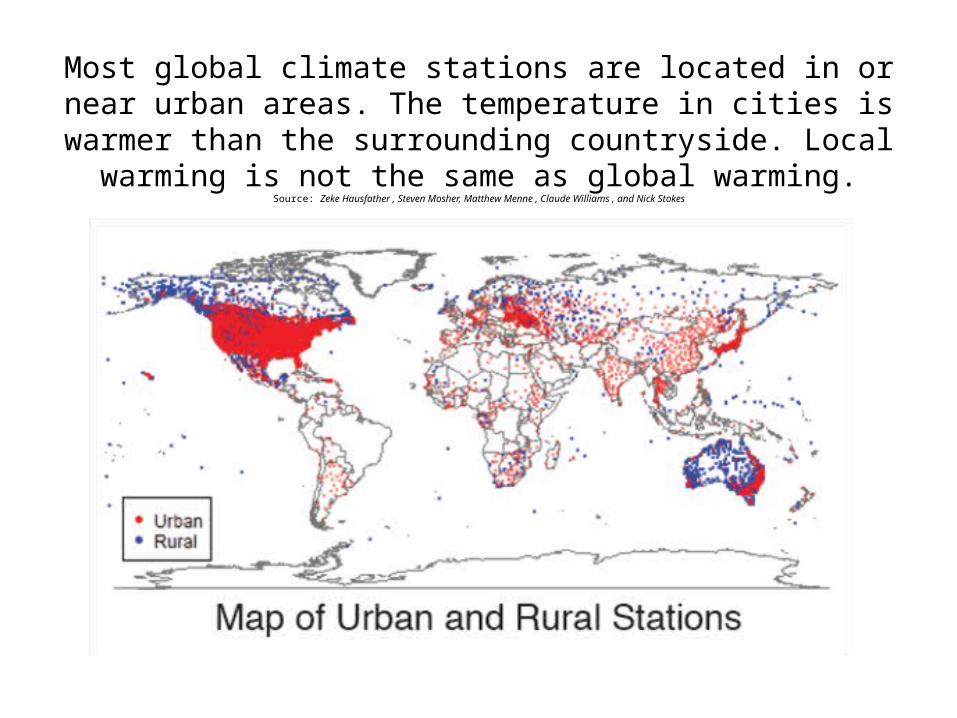
Most global climate stations are located in or near urban areas. The temperature in cities is warmer than the
surrounding countryside. Local warming is not the same as global warming.
Source: Zeke Hausfather , Steven Mosher, Matthew Menne , Claude Williams , and Nick Stokes
URBAN HEAT ISLAND EFFECT
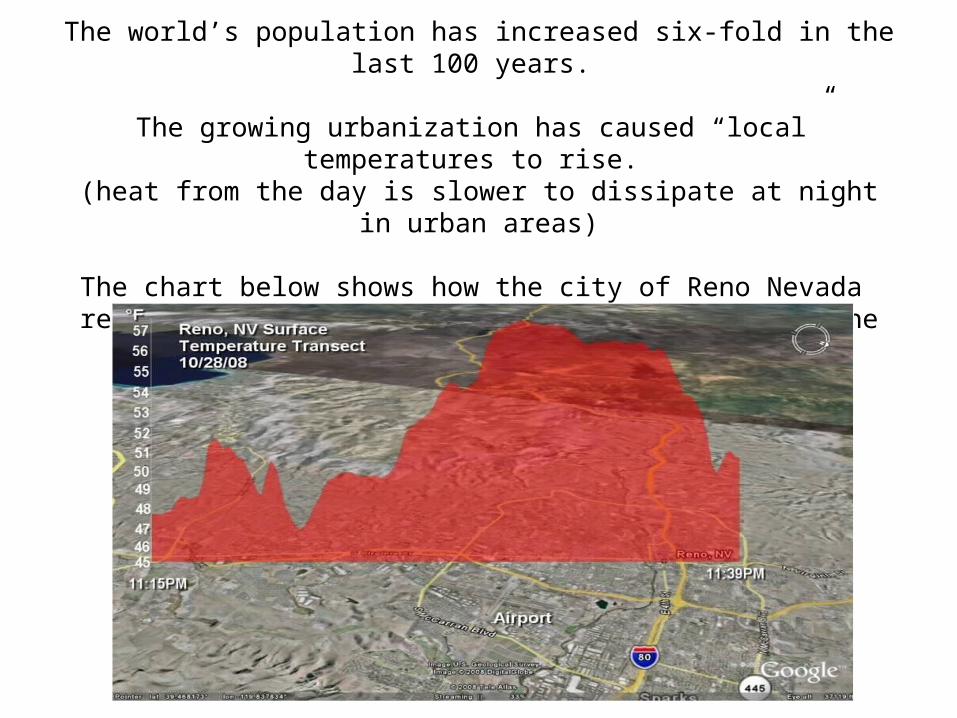
The world’s population has increased six-fold in the last 100 years.
The growing urbanization has caused “local” temperatures to rise. (heat from the day is slower to dissipate at night in urban areas)
The chart below shows how the city of Reno Nevada retains the heat of the day as one drives from the suburbs and into the city.
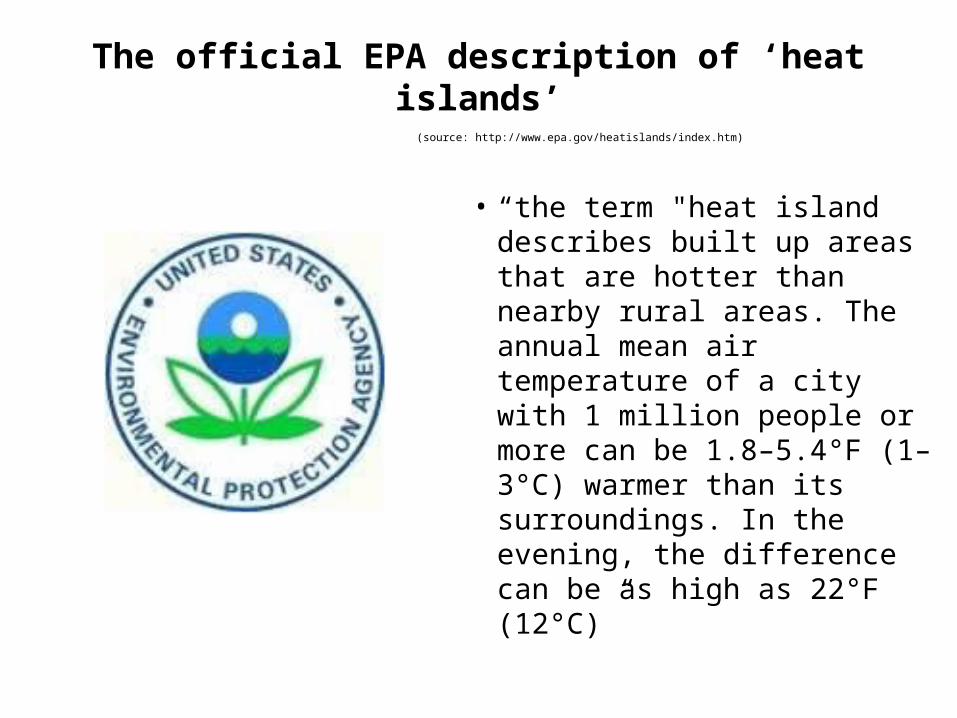
The official EPA description of ‘heat islands’ (source: http://www.epa.gov/heatislands/index.htm)
• “the term "heat island describes built up areas that are hotter than nearby rural areas. The annual mean air temperature of a city with 1 million people or more can be 1.8–5.4°F (1–3°C) warmer than its surroundings. In the evening, the difference can be as high as 22°F (12°C)”
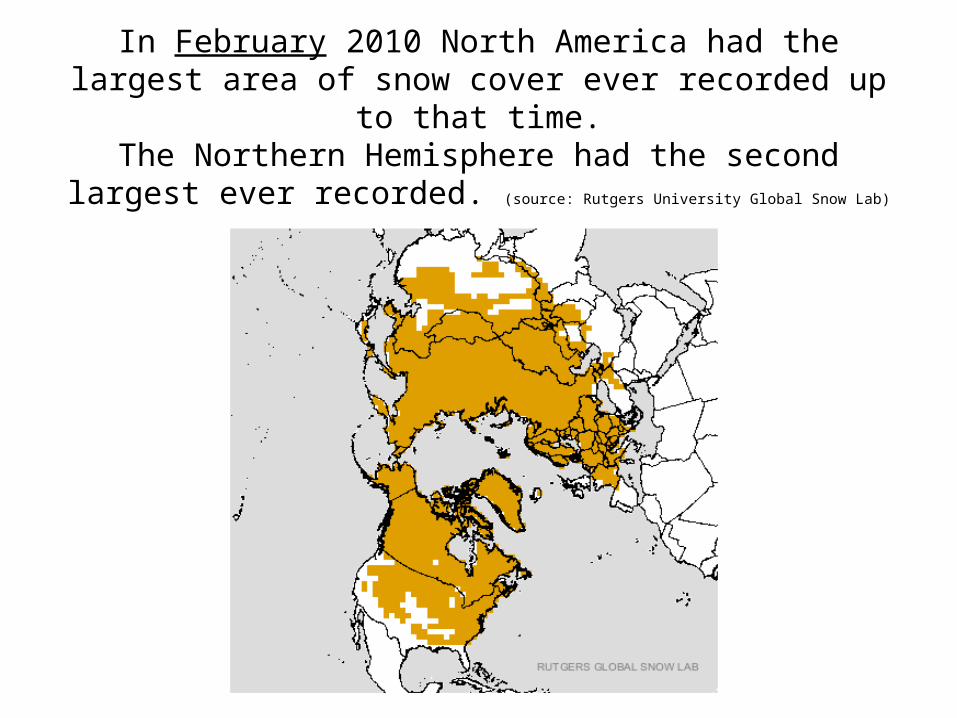
In February 2010 North America had the largest area of snow cover ever recorded up to that time.
The Northern Hemisphere had the second largest ever recorded. (source: Rutgers University Global Snow Lab)
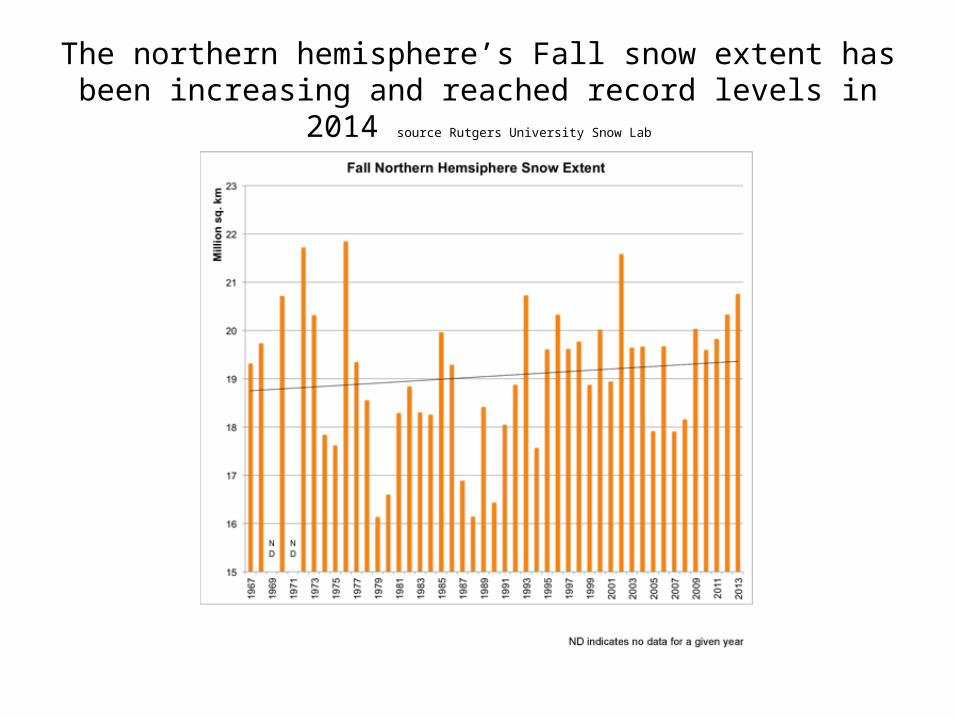
The northern hemisphere’s Fall snow extent has been increasing and reached record levels in 2014 source Rutgers University Snow Lab
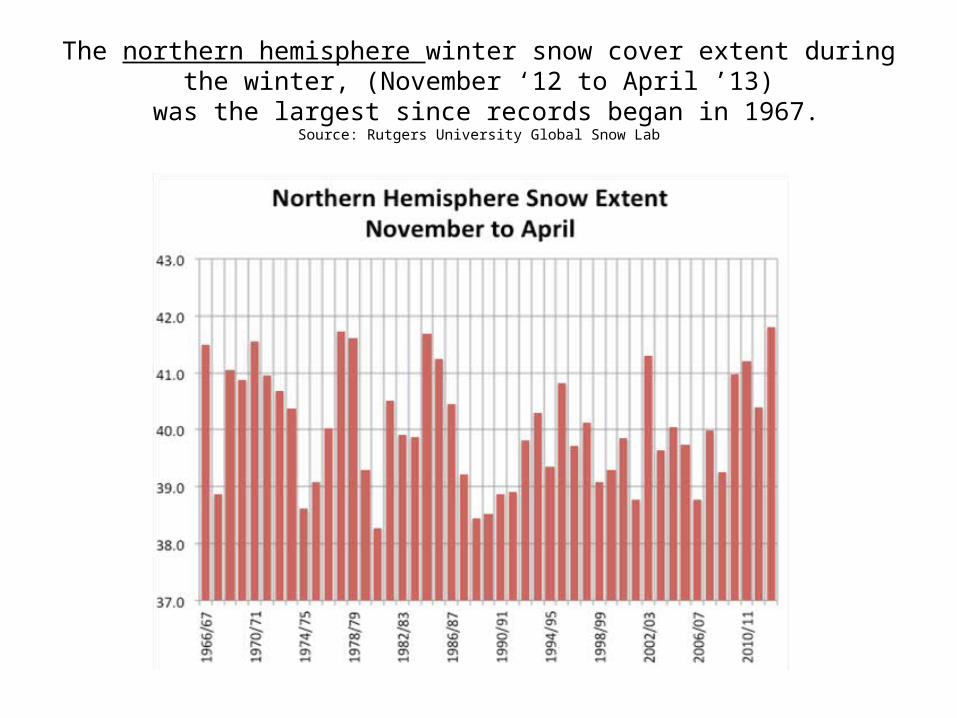
The northern hemisphere winter snow cover extent during the winter, (November ‘12 to April ’13)
was the largest since records began in 1967.Source: Rutgers University Global Snow Lab
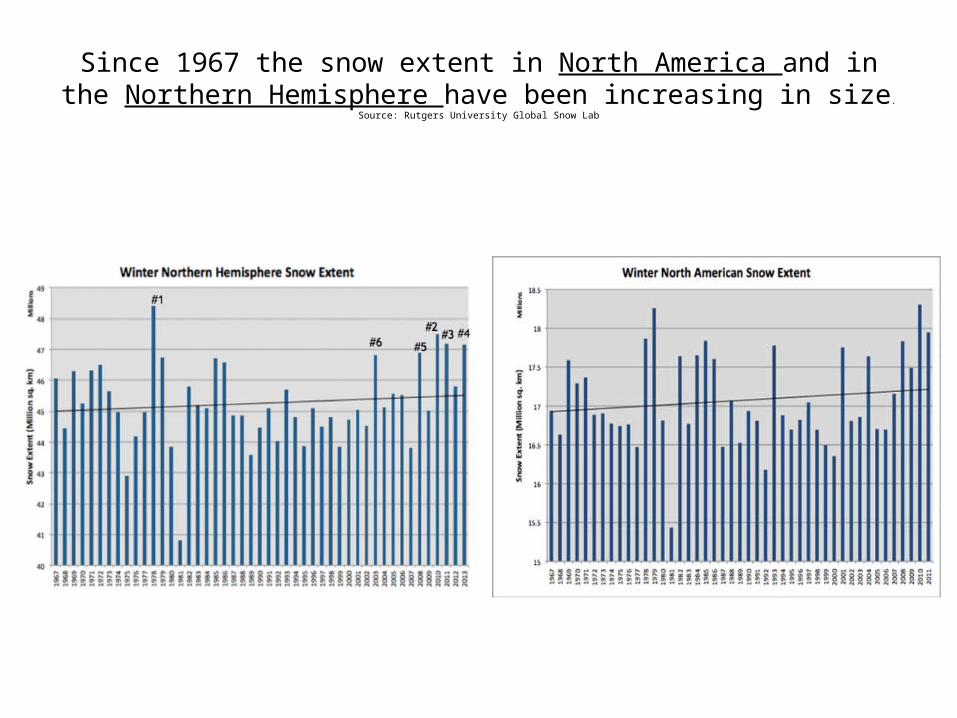
Since 1967 the snow extent in North America and in the Northern Hemisphere have been increasing in size.
Source: Rutgers University Global Snow Lab
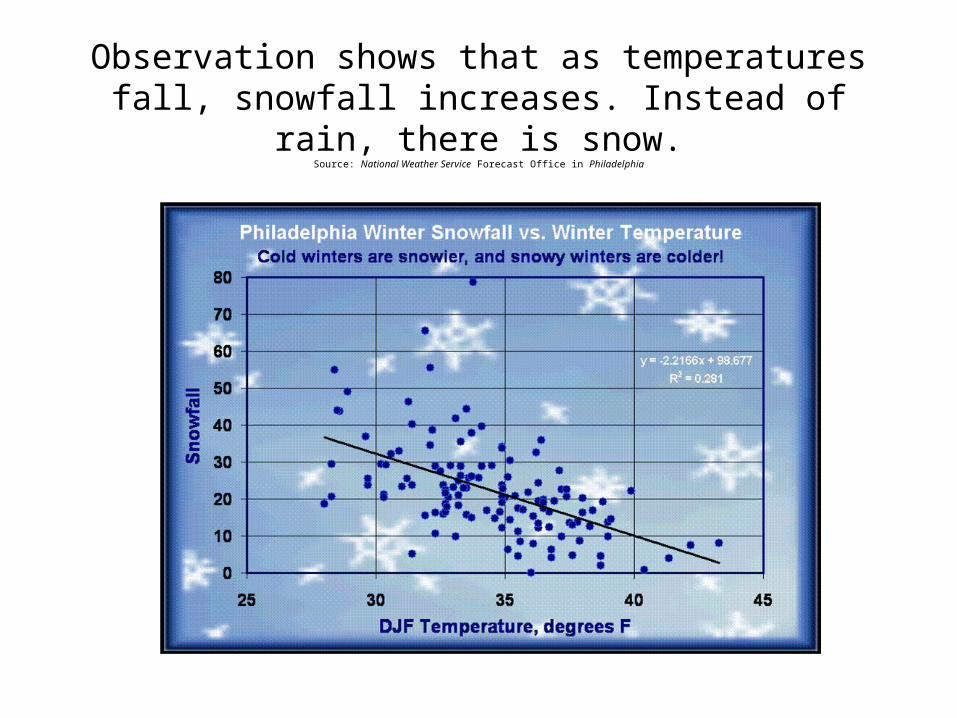
Observation shows that as temperatures fall, snowfall increases. Instead of rain, there is snow.
Source: National Weather Service Forecast Office in Philadelphia