Embed Size (px)
Citation preview

INSTRUCTION MANUAL
Serial No._____________________
072710
World Precision Instruments
ww
w.w
pii
nc.c
om
Apollo 1000One-channel Free Radical Analyzer

APOLLO 1000
World PreciSioN iNStrumeNtS iii
Copyright © 2010 by World Precision Instruments, Inc. All rights reserved. No part of this publication may be
reproduced or translated into any language, in any form, without prior written permission of World Precision
Instruments, Inc.
CONTeNTSAbout this MAnuAl ............................................................................................................................... 1introduction ............................................................................................................................................ 2
Features ...................................................................................................................................................... 2instruMent description .................................................................................................................... 4
parts list ..................................................................................................................................................... 4unpacking ................................................................................................................................................. 4instrument description.......................................................................................................................... 5
operAting instructions ...................................................................................................................12using external poise control .............................................................................................................12
set-up And cAlibrAtion oF no sensors ..................................................................................15initial set-up ............................................................................................................................................15calibration of the no sensor ............................................................................................................15calibration kit .........................................................................................................................................15
cAlibrAtion by cheMicAl generAtion oF no ......................................................................16calibration procedure ..........................................................................................................................17creating a calibration curve .............................................................................................................18
cAlibrAtion oF no sensor by decoMposition oF snAp ................................................20Method 1: calibration by decomposition of a s-nitrosothiol compound using cucl as a catalyst ......................................................................................................................................................20Method 2: calibration by decomposition of snAp using cucl2 as a catalyst ..................22preparing an no standard using no gas ....................................................................................28Measurement of no ............................................................................................................................30Maintenance of no sensors .............................................................................................................31Maintenance of nitric oxide Microsensors ..................................................................................35
set-up And cAlibrAtion oF hpo sensors ................................................................................36initial set-up ............................................................................................................................................36the structure of the hpo sensor ....................................................................................................36calibration of the hpo sensor .......................................................................................................36Maintenance of hpo sensors ...........................................................................................................38
set-up And cAlibrAtion oF oxygen sensors .......................................................................41initial set-up ............................................................................................................................................41polarization .............................................................................................................................................41Zero (oxygen) point calibration ........................................................................................................42gas phase calibration .........................................................................................................................42Aqueous measurements .....................................................................................................................43creating a calibration curve ..............................................................................................................45calibration method for o2 measurements in living tissue or blood ...................................45probe structure and Assembly .........................................................................................................46changing the membrane sleeve .....................................................................................................46clean the Membrane ...........................................................................................................................47care of the electrode ...........................................................................................................................48
APOLLO 1000
iv World PreciSioN iNStrumeNtS
handling precaution ............................................................................................................................48storage ......................................................................................................................................................48
speciFicAtions ..........................................................................................................................................49temperature ..........................................................................................................................................49poise Voltage ..........................................................................................................................................49transimpedance Amplifier, current ................................................................................................49Voltage Amplifier ..................................................................................................................................49power supply ..........................................................................................................................................50digital circuitry ......................................................................................................................................50
Appendix A: reFerence tAbles .......................................................................................................51Appendix b: stAndArd solutions ...............................................................................................56
standard 1mM h2o2 solution ...........................................................................................................56200ml of 0.1M pbs buffer solution ...............................................................................................56100mM standard snAp solution ......................................................................................................56
Appendix c: using Apollo 1000 with dAtA-trAx ...............................................................58install data-trax software..................................................................................................................58launch data-trax ................................................................................................................................64configuring data-trax for the Apollo 1000 ................................................................................67installing the drivers manually .........................................................................................................78
index .............................................................................................................................................................82wArrAnty ..................................................................................................................................................86
claims and returns ..............................................................................................................................86
APOLLO 1000
World PreciSioN iNStrumeNtS 1
AbOUT ThIS MANUAL
the following symbols are used in this guide:
this symbol indicates a cAution. cautions warn against actions that can cause damage to equipment. please read these carefully.
this symbol indicates a wArning. warnings alert you to actions that can cause personal injury or pose a physical threat. please read these carefully.
notes and tips contain helpful information.
APOLLO 1000
2 World PreciSioN iNStrumeNtS
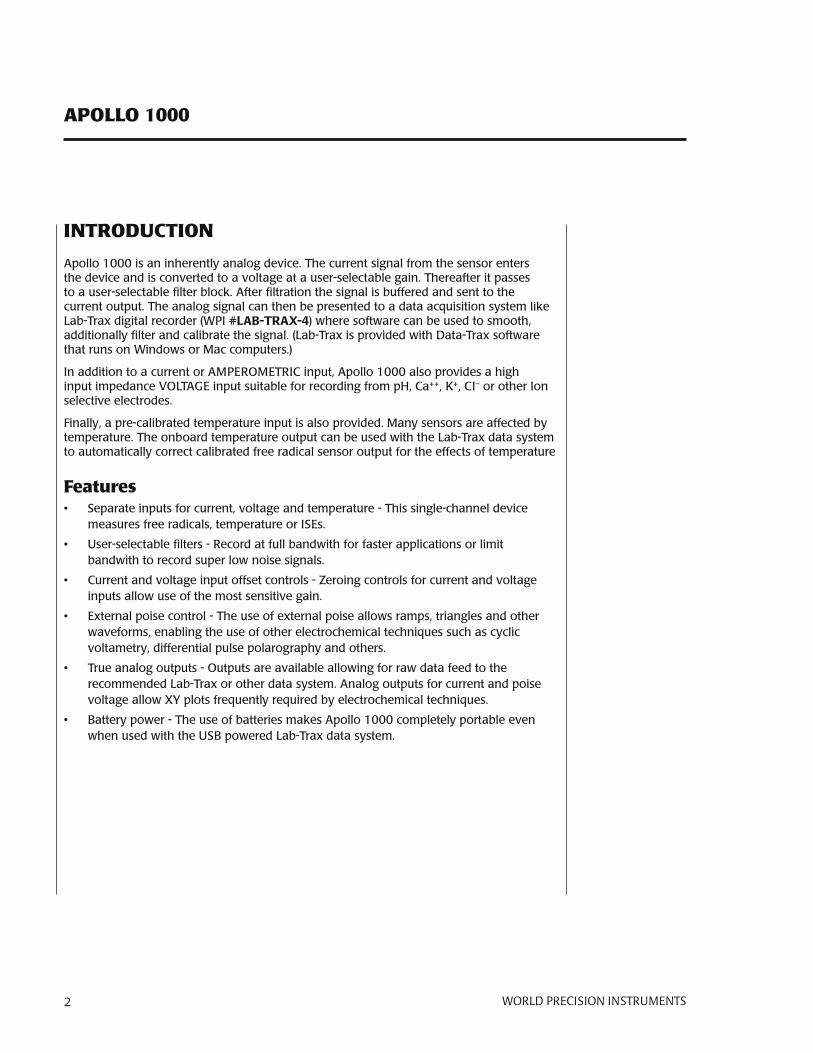
INTROdUCTION
Apollo 1000 is an inherently analog device. the current signal from the sensor enters the device and is converted to a voltage at a user-selectable gain. thereafter it passes to a user-selectable filter block. After filtration the signal is buffered and sent to the current output. the analog signal can then be presented to a data acquisition system like lab-trax digital recorder (wpi #LAB-TRAX-4) where software can be used to smooth, additionally filter and calibrate the signal. (lab-trax is provided with data-trax software that runs on windows or Mac computers.)
in addition to a current or AMperoMetric input, Apollo 1000 also provides a high input impedance VoltAge input suitable for recording from ph, ca++, K+, ci-- or other ion selective electrodes.
Finally, a pre-calibrated temperature input is also provided. Many sensors are affected by temperature. the onboard temperature output can be used with the lab-trax data system to automatically correct calibrated free radical sensor output for the effects of temperature
Features• separate inputs for current, voltage and temperature - this single-channel device
measures free radicals, temperature or ises.
• user-selectable filters - record at full bandwith for faster applications or limit bandwith to record super low noise signals.
• current and voltage input offset controls - Zeroing controls for current and voltage inputs allow use of the most sensitive gain.
• external poise control - the use of external poise allows ramps, triangles and other waveforms, enabling the use of other electrochemical techniques such as cyclic voltametry, differential pulse polarography and others.
• true analog outputs - outputs are available allowing for raw data feed to the recommended lab-trax or other data system. Analog outputs for current and poise voltage allow xy plots frequently required by electrochemical techniques.
• battery power - the use of batteries makes Apollo 1000 completely portable even when used with the usb powered lab-trax data system.
APOLLO 1000
World PreciSioN iNStrumeNtS 3
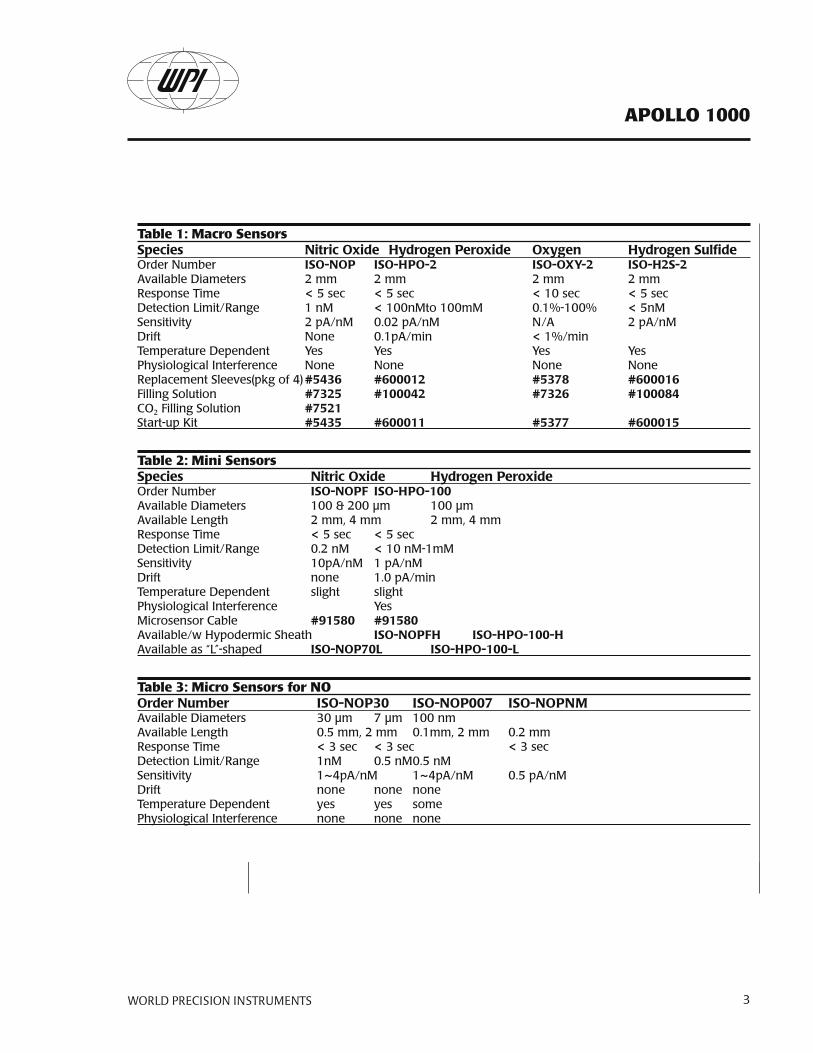
Table 1: Macro SensorsSpecies NitricOxide HydrogenPeroxide Oxygen HydrogenSulfideorder number ISO-NOP ISO-HPO-2 ISO-OXY-2 ISO-H2S-2Available diameters 2 mm 2 mm 2 mm 2 mmresponse time < 5 sec < 5 sec < 10 sec < 5 secdetection limit/range 1 nM < 100nMto 100mM 0.1%-100% < 5nMsensitivity 2 pA/nM 0.02 pA/nM n/A 2 pA/nMdrift none 0.1pA/min < 1%/min temperature dependent yes yes yes yesphysiological interference none none none nonereplacement sleeves(pkg of 4) #5436 #600012 #5378 #600016Filling solution #7325 #100042 #7326 #100084co2 Filling solution #7521start-up Kit #5435 #600011 #5377 #600015
Table 2: Mini SensorsSpecies NitricOxide HydrogenPeroxide order number ISO-NOPF ISO-HPO-100 Available diameters 100 & 200 µm 100 µm Available length 2 mm, 4 mm 2 mm, 4 mm response time < 5 sec < 5 sec detection limit/range 0.2 nM < 10 nM-1mM sensitivity 10pA/nM 1 pA/nM drift none 1.0 pA/min temperature dependent slight slight physiological interference yes Microsensor cable #91580 #91580 Available/w hypodermic sheath ISO-NOPFH ISO-HPO-100-H Available as “l”-shaped ISO-NOP70L ISO-HPO-100-L
Table 3: Micro Sensors for NOOrderNumber ISO-NOP30 ISO-NOP007 ISO-NOPNMAvailable diameters 30 µm 7 µm 100 nmAvailable length 0.5 mm, 2 mm 0.1mm, 2 mm 0.2 mmresponse time < 3 sec < 3 sec < 3 secdetection limit/range 1nM 0.5 nM 0.5 nMsensitivity 1~4pA/nM 1~4pA/nM 0.5 pA/nMdrift none none nonetemperature dependent yes yes somephysiological interference none none none

APOLLO 1000
4 World PreciSioN iNStrumeNtS
INSTRUMeNT deSCRIPTION
Parts ListAfter unpacking, verify that there is no visible damage to the instrument. Verify that all items are included:
(1) APOLLO1000 1-channel Free radical Analyzer system(1) Sensor (owner's choice)(1) startup kit (1) 132910.085 pocket screwdriver (1) 500128 plug shorting, bnc (1) 500258coaxial cable, 12" (1) 91210Assembly test resistor 1g (1) ISO-TEMP-2temperature detector (1) 91580 cable Microsensor
Unpackingupon receipt of this instrument, make a thorough inspection of the contents and check for possible damage. Missing cartons or obvious damage to cartons should be noted on the delivery receipt before signing. concealed damage should be reported at once to the carrier and an inspection requested. please read the section entitled “claims and returns” on page 84 of this manual. please contact wpi customer service if any parts are missing at 941.371.1003 or [email protected].
Returns: do not return any goods to wpi without obtaining prior approval (rMA # required) and instructions from wpi’s returns department. goods returned (unauthorized) by collect freight may be refused. if a return shipment is necessary, use the original container, if possible. if the original container is not available, use a suitable substitute that is rigid and of adequate size. wrap the instrument in paper or plastic surrounded with at least 100mm (four inches) of shock absorbing material. For further details, please read the section entitled “claims and returns” on page 84 of this manual.
APOLLO 1000
World PreciSioN iNStrumeNtS 5
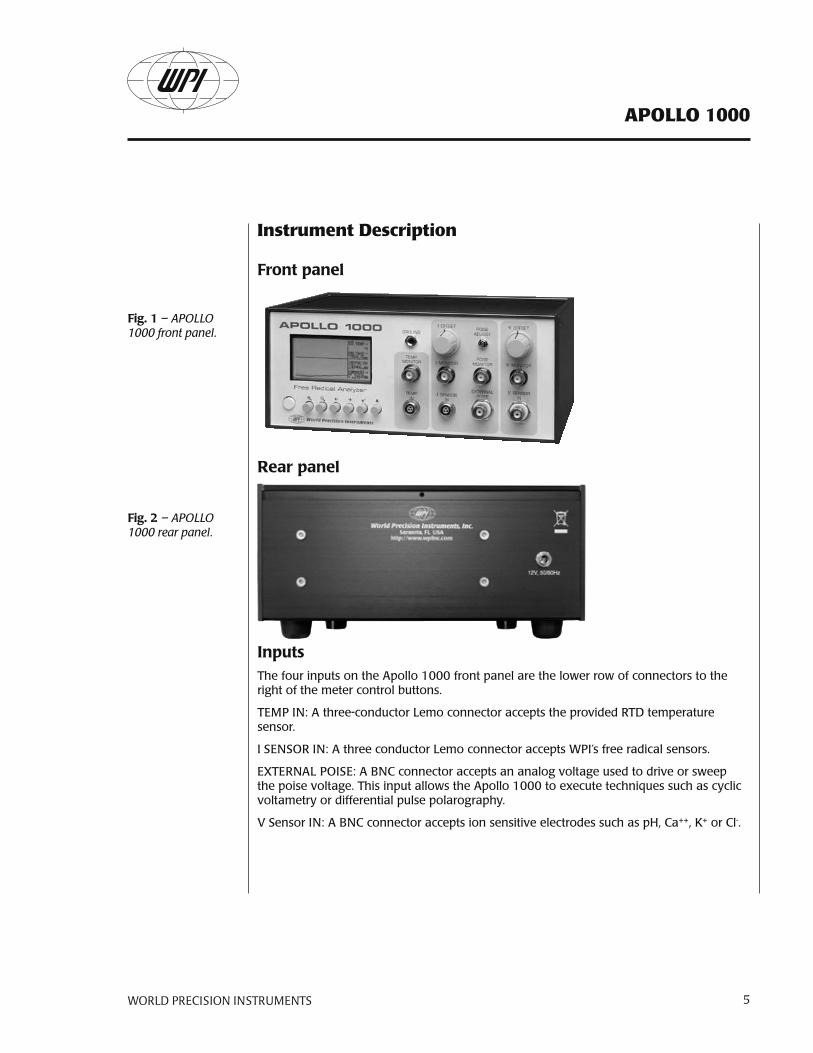
Instrument description
Frontpanel
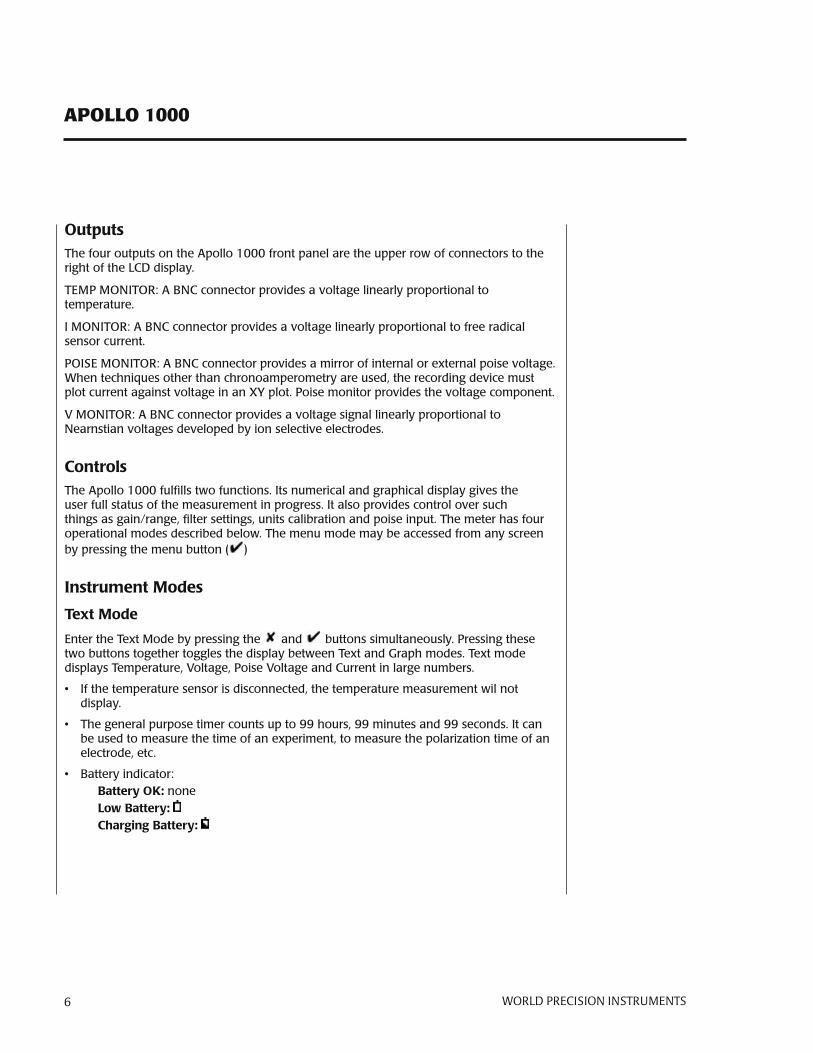
Rearpanel
Inputsthe four inputs on the Apollo 1000 front panel are the lower row of connectors to the right of the meter control buttons.
teMp in: A three-conductor lemo connector accepts the provided rtd temperature sensor.
i sensor in: A three conductor lemo connector accepts wpi’s free radical sensors.
externAl poise: A bnc connector accepts an analog voltage used to drive or sweep the poise voltage. this input allows the Apollo 1000 to execute techniques such as cyclic voltametry or differential pulse polarography.
V sensor in: A bnc connector accepts ion sensitive electrodes such as ph, ca++, K+ or cl-.
Fig.1 – APOLLO 1000 front panel.
Fig.2– APOLLO 1000 rear panel.
APOLLO 1000
6 World PreciSioN iNStrumeNtS
Outputsthe four outputs on the Apollo 1000 front panel are the upper row of connectors to the right of the lcd display.
teMp Monitor: A bnc connector provides a voltage linearly proportional to temperature.
i Monitor: A bnc connector provides a voltage linearly proportional to free radical sensor current.
poise Monitor: A bnc connector provides a mirror of internal or external poise voltage. when techniques other than chronoamperometry are used, the recording device must plot current against voltage in an xy plot. poise monitor provides the voltage component.
V Monitor: A bnc connector provides a voltage signal linearly proportional to nearnstian voltages developed by ion selective electrodes.
Controlsthe Apollo 1000 fulfills two functions. its numerical and graphical display gives the user full status of the measurement in progress. it also provides control over such things as gain/range, filter settings, units calibration and poise input. the meter has four operational modes described below. the menu mode may be accessed from any screen by pressing the menu button ( )
InstrumentModes
TextMode
enter the text Mode by pressing the and buttons simultaneously. pressing these two buttons together toggles the display between text and graph modes. text mode displays temperature, Voltage, poise Voltage and current in large numbers.
• if the temperature sensor is disconnected, the temperature measurement wil not display.
• the general purpose timer counts up to 99 hours, 99 minutes and 99 seconds. it can be used to measure the time of an experiment, to measure the polarization time of an electrode, etc.
• battery indicator:BatteryOK: noneLowBattery:ChargingBattery:
APOLLO 1000
World PreciSioN iNStrumeNtS 7
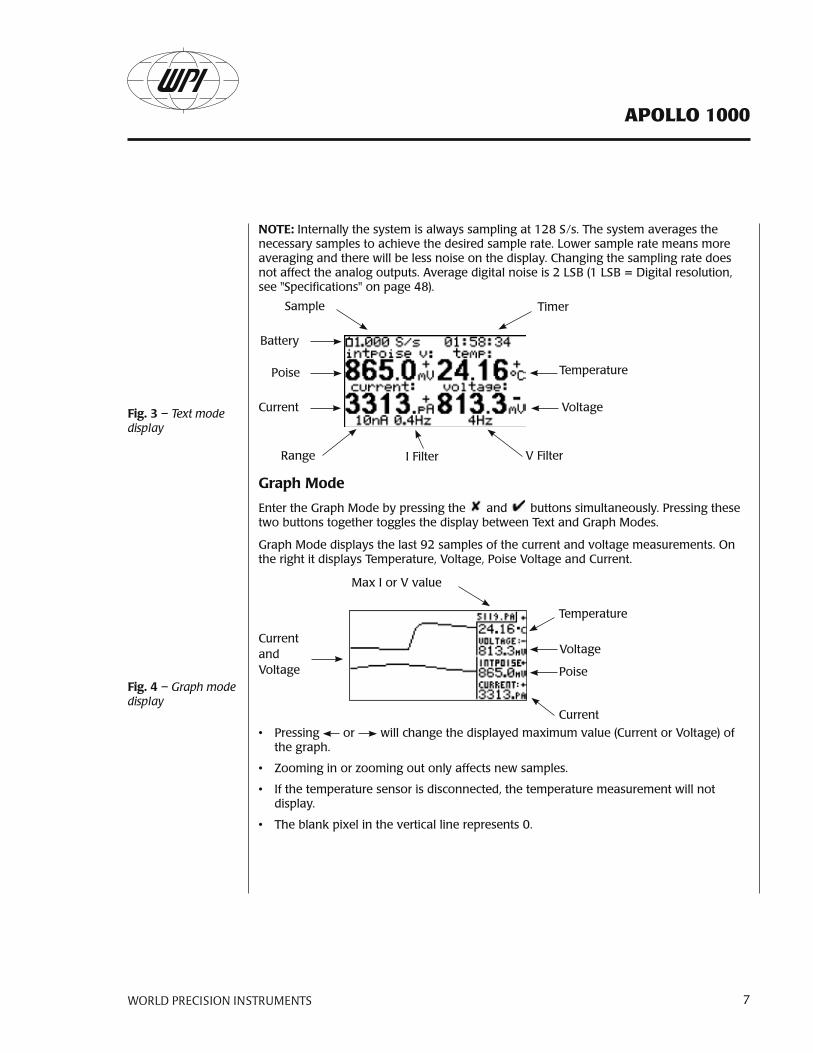
NOTE: internally the system is always sampling at 128 s/s. the system averages the necessary samples to achieve the desired sample rate. lower sample rate means more averaging and there will be less noise on the display. changing the sampling rate does not affect the analog outputs. Average digital noise is 2 lsb (1 lsb = digital resolution, see "specifications" on page 48).
sample timer
battery
temperaturepoise
current Voltage
range i Filter V Filter
GraphMode
enter the graph Mode by pressing the and buttons simultaneously. pressing these two buttons together toggles the display between text and graph Modes.
graph Mode displays the last 92 samples of the current and voltage measurements. on the right it displays temperature, Voltage, poise Voltage and current.
Max i or V value
temperature
VoltagecurrentandVoltage poise
current
• pressing or will change the displayed maximum value (current or Voltage) of the graph.
• Zooming in or zooming out only affects new samples.
• if the temperature sensor is disconnected, the temperature measurement will not display.
• the blank pixel in the vertical line represents 0.
Fig.3 – Text mode display
Fig.4 – Graph mode display
APOLLO 1000
8 World PreciSioN iNStrumeNtS
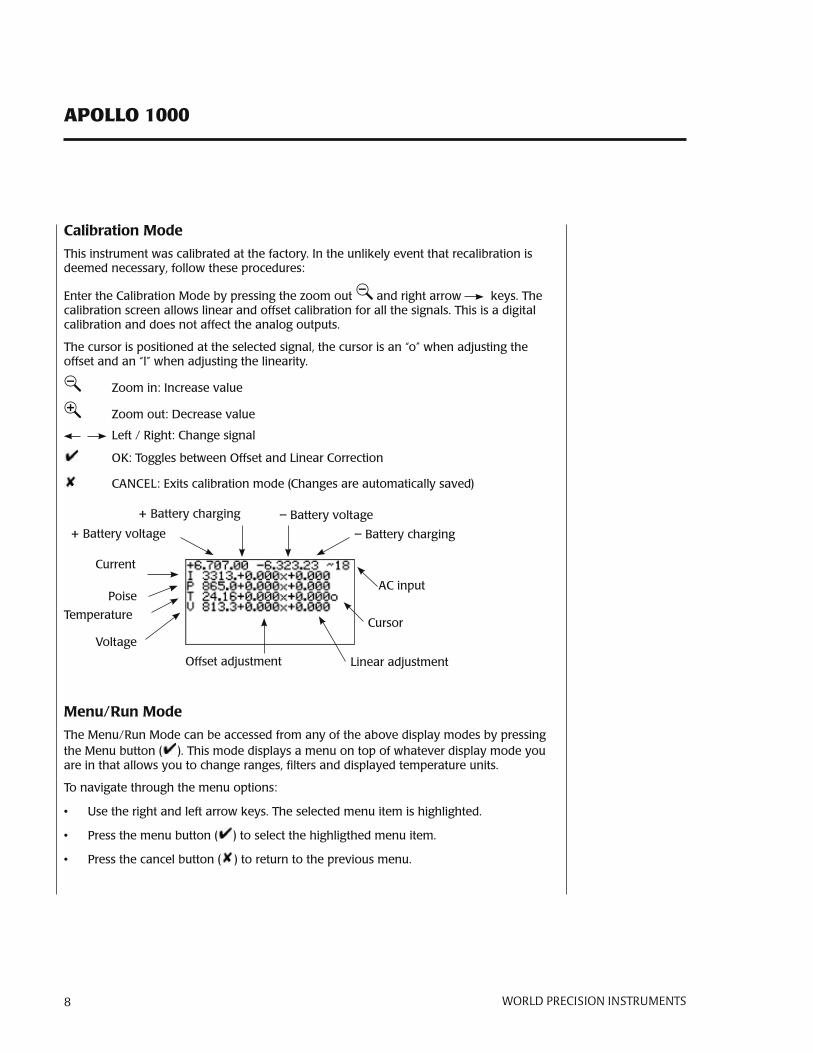
CalibrationMode
this instrument was calibrated at the factory. in the unlikely event that recalibration is deemed necessary, follow these procedures:
enter the calibration Mode by pressing the zoom out and right arrow keys. the calibration screen allows linear and offset calibration for all the signals. this is a digital calibration and does not affect the analog outputs.
the cursor is positioned at the selected signal, the cursor is an “o” when adjusting the offset and an “l” when adjusting the linearity.
Zoom in: increase value
Zoom out: decrease value
left / right: change signal
oK: toggles between offset and linear correction
cAncel: exits calibration mode (changes are automatically saved)
+ battery voltage – battery charging
current
Ac inputpoise
temperaturecursor
Voltage
offset adjustment linear adjustment
+ battery charging – battery voltage
Menu/RunMode
the Menu/run Mode can be accessed from any of the above display modes by pressing the Menu button ( ). this mode displays a menu on top of whatever display mode you are in that allows you to change ranges, filters and displayed temperature units.
to navigate through the menu options:
• use the right and left arrow keys. the selected menu item is highlighted.
• press the menu button ( ) to select the highligthed menu item.
• press the cancel button ( ) to return to the previous menu.
APOLLO 1000
World PreciSioN iNStrumeNtS 9
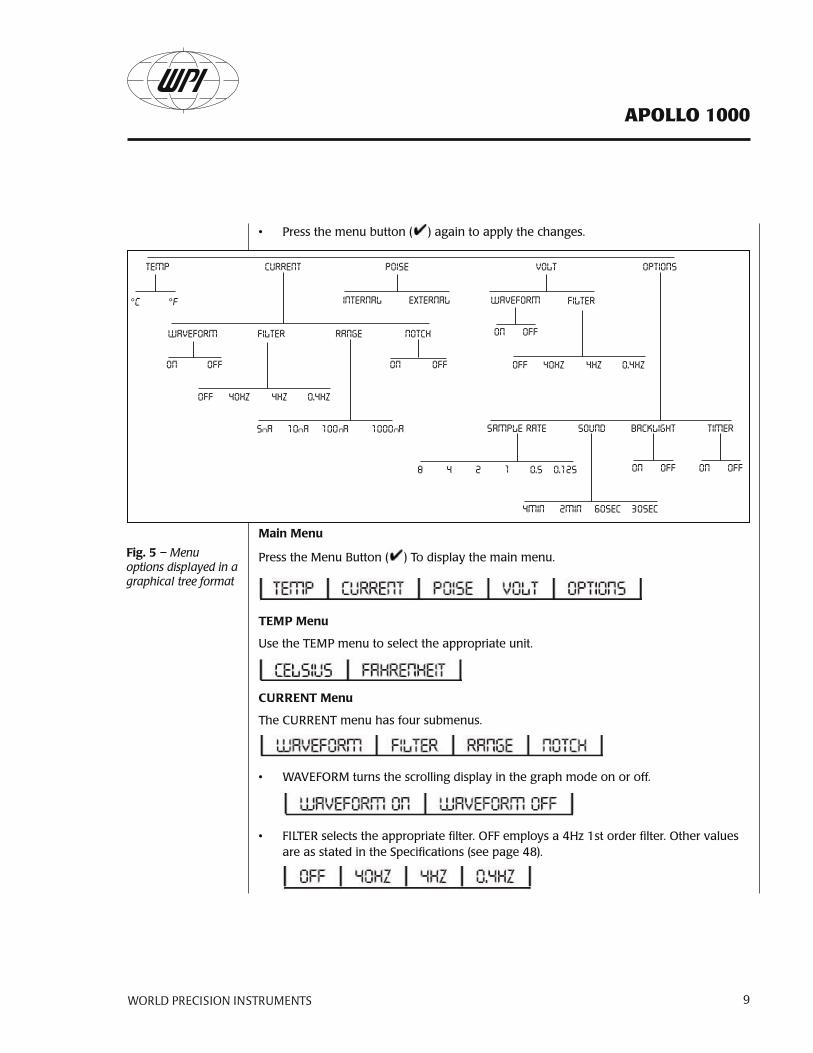
• press the menu button ( ) again to apply the changes.
MainMenu
press the Menu button ( ) to display the main menu.
TEMPMenu
use the teMp menu to select the appropriate unit.
CURRENTMenu
the current menu has four submenus.
• wAVeForM turns the scrolling display in the graph mode on or off.
• Filter selects the appropriate filter. oFF employs a 4hz 1st order filter. other values are as stated in the specifications (see page 48).
Fig.5 – Menu options displayed in a graphical tree format
TEMP CURRENT
INTERNAL EXTERNAL
SAMPLE RATE SOUND BACKLIGHT TIMER
WAVEFORM
ON OFF
FILTER
OFF 40HZ 4HZ
5 A
0.4HZ
RANGE NOTCH
ON OFF
POISE VOLT
ON OFF
WAVEFORM FILTER
OPTIONS
°C °F
ON OFF248 0.51 0.125
2MIN4MIN 60SEC 30SEC
ON OFF
OFF 40HZ 4HZ 0.4HZ
n 10 An 100 An 1000 An
APOLLO 1000
10 World PreciSioN iNStrumeNtS
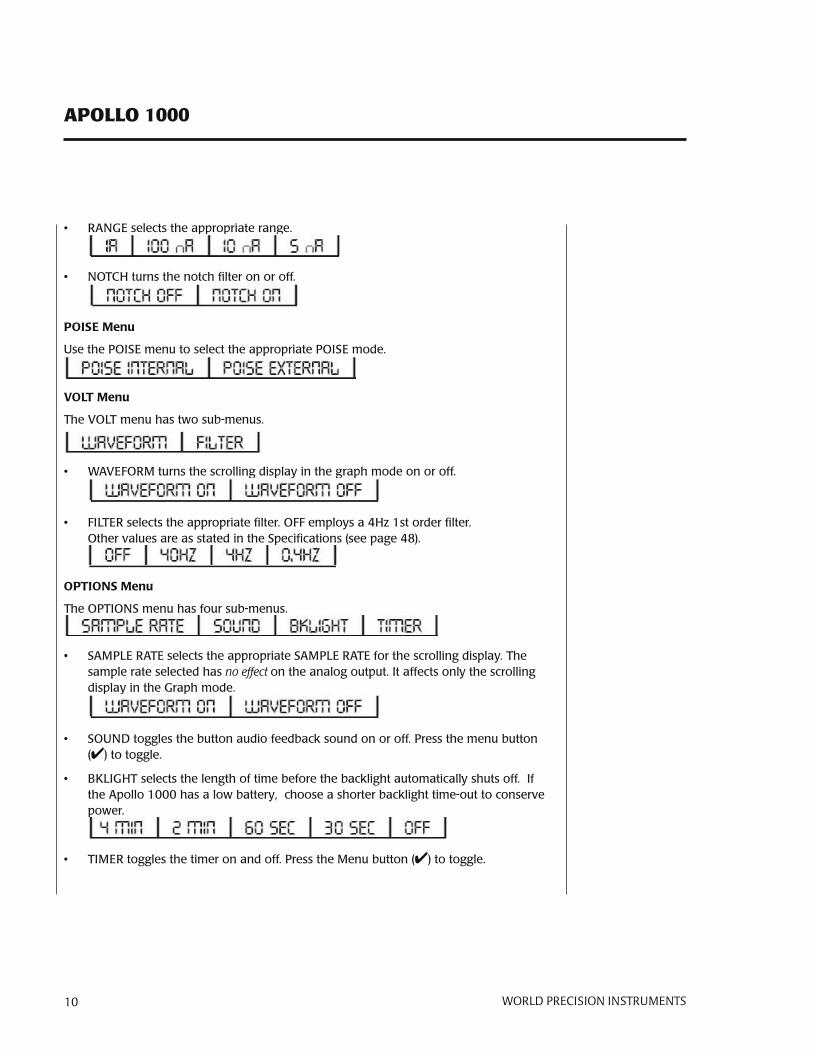
• rAnge selects the appropriate range.
• notch turns the notch filter on or off.
POISEMenu
use the poise menu to select the appropriate poise mode.
VOLTMenu
the Volt menu has two sub-menus.
• wAVeForM turns the scrolling display in the graph mode on or off.
• Filter selects the appropriate filter. oFF employs a 4hz 1st order filter. other values are as stated in the specifications (see page 48).
OPTIONSMenu
the options menu has four sub-menus.
• sAMple rAte selects the appropriate sAMple rAte for the scrolling display. the sample rate selected has no effect on the analog output. it affects only the scrolling display in the graph mode.
• sound toggles the button audio feedback sound on or off. press the menu button (4) to toggle.
• bKlight selects the length of time before the backlight automatically shuts off. if the Apollo 1000 has a low battery, choose a shorter backlight time-out to conserve power.
• tiMer toggles the timer on and off. press the Menu button (4) to toggle.
APOLLO 1000
World PreciSioN iNStrumeNtS 11
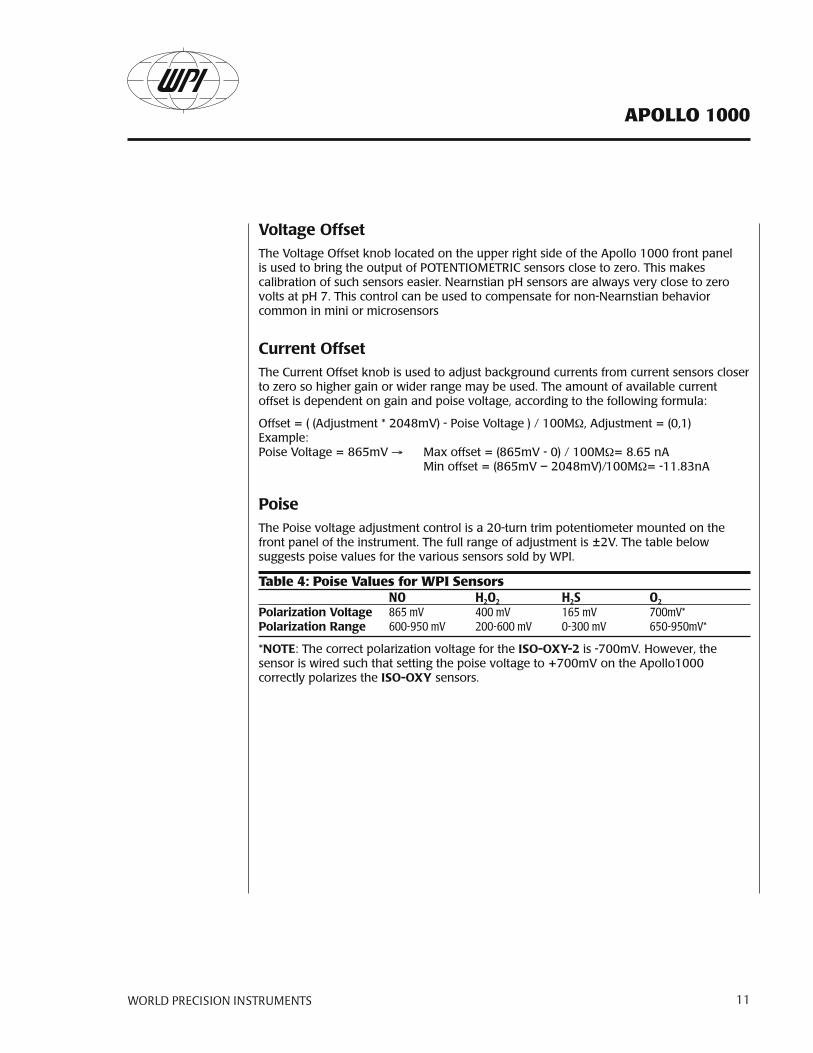
VoltageOffsetthe Voltage offset knob located on the upper right side of the Apollo 1000 front panel is used to bring the output of potentioMetric sensors close to zero. this makes calibration of such sensors easier. nearnstian ph sensors are always very close to zero volts at ph 7. this control can be used to compensate for non-nearnstian behavior common in mini or microsensors
CurrentOffsetthe current offset knob is used to adjust background currents from current sensors closer to zero so higher gain or wider range may be used. the amount of available current offset is dependent on gain and poise voltage, according to the following formula:
offset = ( (Adjustment * 2048mV) - poise Voltage ) / 100MΩ, Adjustment = (0,1)example: poise Voltage = 865mV → Max offset = (865mV - 0) / 100MΩ= 8.65 nA Min offset = (865mV – 2048mV)/100MΩ= -11.83nA
Poisethe poise voltage adjustment control is a 20-turn trim potentiometer mounted on the front panel of the instrument. the full range of adjustment is ±2V. the table below suggests poise values for the various sensors sold by wpi.
Table 4: Poise Values for WPI Sensors NO H2O2 H2S O2
PolarizationVoltage 865mV 400mV 165mV 700mV*PolarizationRange 600-950mV 200-600mV 0-300mV 650-950mV*
*NOTE: the correct polarization voltage for the ISO-OXY-2 is -700mV. however, the sensor is wired such that setting the poise voltage to +700mV on the Apollo1000 correctly polarizes the ISO-OXY sensors.
APOLLO 1000
12 World PreciSioN iNStrumeNtS
OPeRATINg INSTRUCTIONS
Using external Poise control
Groundingandnoiseconcernswhile the Apollo 1000 is protected against eMi, it may still be necessary to provide additional shielding. enclosing the system in a Faraday cage is the best way to shield against stray electric fields. Faraday cages can be constructed of copper screening, but they must be soldered completely along any joining seams. place all the instruments and the sample into a grounded Faraday cage.
it may not be possible to put the whole measurement system in a Faraday cage for shielding. For example, consider a flow-through system when the probe is immersed into the effluent of a perfusion system or placed directly into the vein or the heart of an animal. in this case, grounding the external bathing fluid, vein, or tissue with a Ag/Agcl reference electrode will often help significantly. if pumps or other electrical instruments are used in a flow-through system, the associated equipment or instruments should be grounded, as well. use a common ground for all equipment in the experiment.
After careful grounding and shielding of the electronic equipment and the probe system, sometimes movement of people in the immediate vicinity causes current fluctuations. these are due to variations in the resulting stray capacitance. there are several ways to minimize these effects. when the measurements are made in vivo, ground the animals. in addition, the operator may need to be grounded because large static charges can be generated by the operator’s body. wrist straps connected to ground the operator may be helpful.
Setupanduseforcurrentsensorsin almost all cases, amperometric sensors must equilibrate in the measuring medium. typically, on immersion, large currents are observed. these initial currents will move toward zero rapidly at first then eventually settling to a smaller non-zero value. see Appendix A, table 6, page 54 shows expected final currents and approximate settling times.
NOTE: sensors are not ready to use or calibrate until observed current values are stable.
Offsetonce currents are stable, use the current offset knob to move the baseline current as close to zero as possible.
APOLLO 1000
World PreciSioN iNStrumeNtS 13
SettingRangein an analog device, gain can be a powerful tool. it literally amplifies small signals up to the point where they can be recorded by chart recorders or data acquisition systems. First stage gain improves signal-to-noise and generally makes recording easier. there is a cost, however. the use of gain narrows the range of observable signal.
For example, suppose an amplifier has a baseline noise of 1mV. if a perfectly noiseless sine wave signal with an amplitude of 2mV is presented to the input and the amplifier has a gain of x1, the signal-to-noise ratio will be 2:1. if, however, the gain is set to x10 the 2mV signal will increase to 20mV, but the amplifier noise will remain the same. the signal to noise will then improve to 20:1.
higher gains produce even better performance. if this is so, why don’t all amplifiers have incredibly high gains to get the best noise performance, particularly in the case of free radical sensors whose currents are vanishingly small? the problem occurs with observable range. Amplifiers cannot output a voltage greater than the supply voltage used to run them. Most amplifiers run on ±5V. in our example above, if we used a gain of x10,000 the output signal would be 20V (0.002Vx10,000). the amplifier, powered by ±5 volts, would swing to its maximum voltage of 5V and appear over ranged. the use of gain improves our resolution and narrows our range. in our example above, a gain of 10,000 would limit our observable range to ±0.5mV.
in the context of recording the output from free radical sensors, a series of gains or ranges are provided. the narrower the range, the higher the signal-to-noise and the quieter the recording. sensors of this type, however, can produce standing or background current offsets that make use of more sensitive ranges impossible. to remedy this, Apollo 1000 provides a current offset knob (discussed below) which can move the baseline closer to zero, enabling the use of a more sensitive range.
in most cases free radical sensors will require a period of time to “polarize” or equilibrate. during this settling time, currents can be in the tens of nanoamps and will require a larger and less sensitive range to see the progress. once the sensor is stable, however, use the current position control to adjust the current as close to zero as possible, and then apply the most sensitive (smallest) range in which the signal can be seen.
NOTE: Apollo 1000 provides current ranges of 5nA, 10nA, 100nA and 1µA.
APOLLO 1000
14 World PreciSioN iNStrumeNtS
SettingFiltersthe Apollo 1000 has four built-in user-selectable low pass filters which can be useful in conditioning signals before presenting them to a recorder. the filters included in the Apollo 1000 are 4th order active low pass filters. this means that they pass signals below the set filter point. in the case of a 40 hz filter, all frequencies or signals above 40 hz are blocked and signals or frequencies below 40 hz are passed. low-pass filters with cutoffs of 0.4 hz, 4 hz and 40 hz are available in the Apollo 1000 and are selected from the Filter menu in the lcd display.
the Apollo 1000 also makes a second kind of filter available to the user. this is described as a notch filter and is designed to remove signal at a single selected frequency. spectral analysis of the noise developed by membrane sensors indicated a significant noise component in the very low frequency range. the notch filter removes this.
Filters are generally thought of as devices to remove noise. in reality, they remove signal. this can greatly increase the time it takes for signals to reach final value and can even distort faster waveforms and prevent them from reaching their final values.
the lower your set filter, the longer your signal will take to reach final value. if you are measuring very small changes in current, you may want to use a lower filter setting to reduce noise. using a lower filter will make it difficult or impossible to see fast signals. conversely, if you are trying to see fast changes such as those associated with stop flow or fast kinetic studies, you should use a higher filter setting – 40 hz, for example.
APOLLO 1000
World PreciSioN iNStrumeNtS 15
SeT-UP ANd CALIbRATION OF NO SeNSORS
Initial set-upplug the nitric oxide (no) sensor into the input connector on the bottom of the required input channel on the Apollo 1000. using the screwdriver provided, set the poise voltage for nitric oxide to 865mV by adjusting the poise Adjust potentiometer screw on the front panel of the Apollo 1000. set appropriate gain and filter. For most sensors or applications, the 10nA range and 1.4hz filter is appropriate. be sure to give the sensor enough time to polarize before beginning the calibration.
Calibration of the NO sensorAccurate measurements of no require an accurate calibration. three calibration methods are described in this section.
• the first and most convenient method is based on a simple chemical reaction which generates known amounts of no (from no-2 ). this method can only be used with the 2.0mm sensor (wpi #ISO-NOP).
CAUTION: this method use h2so4 (sulfuric acid) and can only be used with the 2mm sensor. use of this method with solid state (dry) no sensors will cause irreparable damage.
• the second method is based on the decomposition of the s-nitrosothiol no-donor (snAp) using either cucl as described in Method 1 or cucl2 as outlined in Method 2, as a catalyst. the no liberated from snAp is used to calibrate the sensor.
• the third method involves preparing aqueous solutions of no from saturated no solutions prepared with no gas.
WARNING:THISMETHOdUSESNOGASWITHCANBEFATALIFITISMISHANdLEd.
Calibration kitperform the calibration using the no calibration kit (wpi catalog #5435) which consists of the following items: plastic stand with two holes, two glass vials, two silicon septums without holes, two silicon septums with holes and radial slit, one short needle, one long needle.
the chemicals required for the calibration are not provided.
NOTE: the no chamber (wpi#NOCHM) can be used as an alternative to the use of the calibration kit. designed specifically for use with 2.0mm electrodes, the chamber can be adapted to other probes. calibration temperatures from 4 - 40°c can be controlled using an external circulating bath.
APOLLO 1000
16 World PreciSioN iNStrumeNtS
CALIbRATION by CheMICAL geNeRATION OF NO
this method is recommended for use only with the 2.0mm sensor (wpi #ISO-NOP).
the first step is to prepare the following two solutions:
solution #1: 0.1M h2so4 + 0.1 M Ki
to make 500ml of solution requires:
4.9g of h2so4 (2.7ml of concentrated h2so4 {18.4 M})
8.3g of Ki
slowly add the sulfuric acid to about 400ml of distilled water while stirring. then add the Ki and mix; finally add distilled water to a final volume of 500ml.
solution #2: 50µM Kno2 (or nano2)
the recommended method for preparing this solution is to purchase an ion chromatography liquid nitrite standard (nano2 or Kno2) which may be diluted as appropriate. standard nitrite is available from wpi (#7357).
Alternatively, crystalline reagent Kno2 may be used, but the user should note that Kno2 is extremely hygroscopic and degrades once exposed to atmospheric moisture. it is therefore recommended that if the crystalline reagent is to be used that the reagent packaged under argon be purchased (available from eastman Kodak chem #105 7462), and that it be stored in a desiccator. while this will extend the life of the reagent, it will need to be replaced more frequently than will the liquid standard. the standard nitrite solution prepared from this compound should be stored in a gas-tight bottle and refrigerated.
this method of calibration is based on the following reaction:
2Kno2 + 2Ki+ 2h2so4 --> 2no+ i2 + 2h2o+ 2K2so4
where a known amount of Kno2 is added to produce a known amount of no. the quantity (and so the concentration) of no generated can be calculated directly from the stoichiometry if the concentrations of the reactants are known. since Ki and h2so4 are present in great excess the limiting reagent is Kno2. experiments have demonstrated that the nitric oxide generated from this reaction will persist sufficiently long to calibrate the no sensor easily and accurately since the reaction goes to completion, the equation above states that the ratio between Kno2 and no is 1:1. therefore the amount of no generated in the solution will be equal to the amount of Kno2 added. the final concentration of no will be equal to the diluted concentration of Kno2 in the solution.
APOLLO 1000
World PreciSioN iNStrumeNtS 17
Calibration procedure
1. Allow the sensor to polarize according to the times shown in Appendix A "table 6: range of standard calibration Values for Various probes" on page 54.
2. record the value of the sensor current before removing it from the distilled water in which the tip has been immersed during storage.
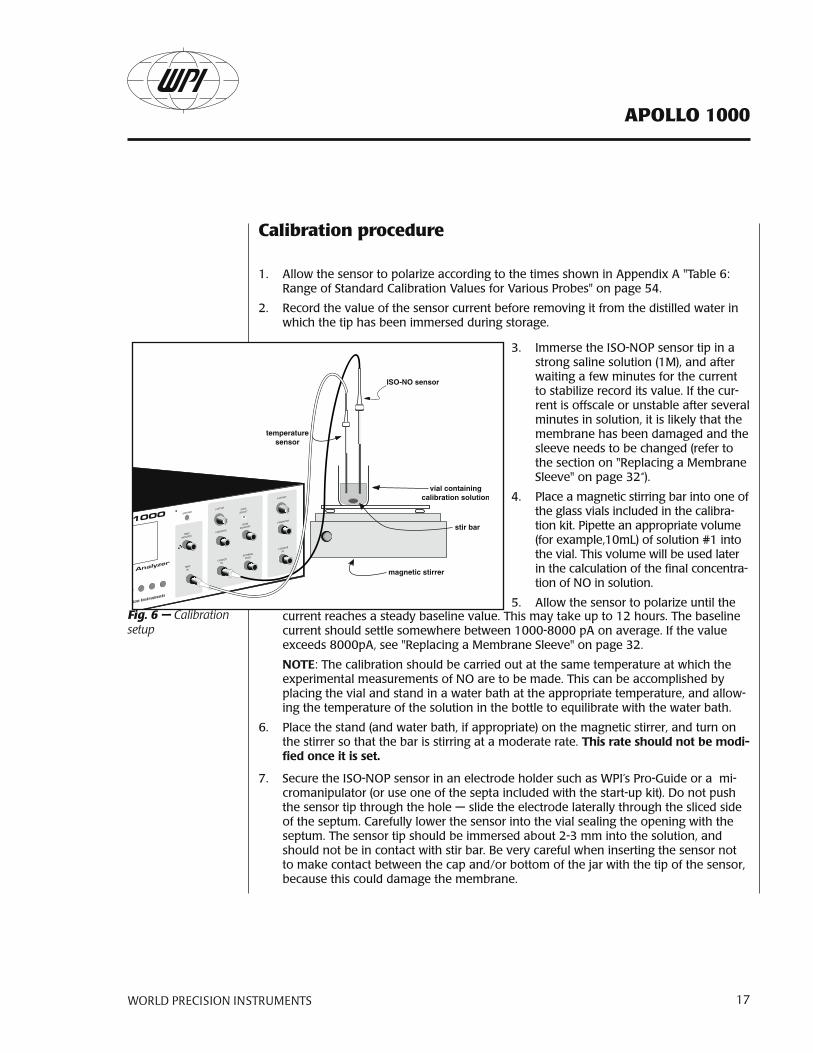
Fig. 6 — Calibration setup
3. immerse the iso-nop sensor tip in a strong saline solution (1M), and after waiting a few minutes for the current to stabilize record its value. if the cur-rent is offscale or unstable after several minutes in solution, it is likely that the membrane has been damaged and the sleeve needs to be changed (refer to the section on "replacing a Membrane sleeve" on page 32“).
4. place a magnetic stirring bar into one of the glass vials included in the calibra-tion kit. pipette an appropriate volume (for example,10ml) of solution #1 into the vial. this volume will be used later in the calculation of the final concentra-tion of no in solution.
5. Allow the sensor to polarize until the current reaches a steady baseline value. this may take up to 12 hours. the baseline current should settle somewhere between 1000-8000 pA on average. if the value exceeds 8000pA, see "replacing a Membrane sleeve" on page 32.
NOTE: the calibration should be carried out at the same temperature at which the experimental measurements of no are to be made. this can be accomplished by placing the vial and stand in a water bath at the appropriate temperature, and allow-ing the temperature of the solution in the bottle to equilibrate with the water bath.
6. place the stand (and water bath, if appropriate) on the magnetic stirrer, and turn on the stirrer so that the bar is stirring at a moderate rate. Thisrateshouldnotbemodi-fiedonceitisset.
7. secure the iso-nop sensor in an electrode holder such as wpi’s pro-guide or a mi-cromanipulator (or use one of the septa included with the start-up kit). do not push the sensor tip through the hole — slide the electrode laterally through the sliced side of the septum. carefully lower the sensor into the vial sealing the opening with the septum. the sensor tip should be immersed about 2-3 mm into the solution, and should not be in contact with stir bar. be very careful when inserting the sensor not to make contact between the cap and/or bottom of the jar with the tip of the sensor, because this could damage the membrane.
APOLLO 1000
18 World PreciSioN iNStrumeNtS
8. wait until the current on the display becomes stable again before continuing. this may take several minutes if the sensor has undergone a large temperature change.
9. if you feel it necessary to de-gas solution #1 prior to calibration, this can be done by inserting one of the long stainless steel needles included with the calibration kit through the septum so that the tip is in the solution. Attach the needle through ap-propriate tubing to a source of pure argon gas (nitrogen may also be used). insert one of the short needles included with the kit through the septum such that the needle tip is clearly exposed (not in the solution) inside the vial. the small needle allows gas to escape, thereby avoiding a buildup of pressure. purge the solution at low pressure (5psi or less) for 15 minutes.
10. once purging is complete and the gas source is turned off, remove the purging and pressure relief needles.
11. Allow a few minutes for the temperature to equilibrate with the water bath again since purging with the gas may have changed the temperature.
12. once a stable baseline is re-established, record the value. the quiescent baseline cur-rent is an indicator of the health of the sensor.
13. generally, it is not necessary to pre-purge the calibration solution, since the no de-cays only very slowly in this solution.
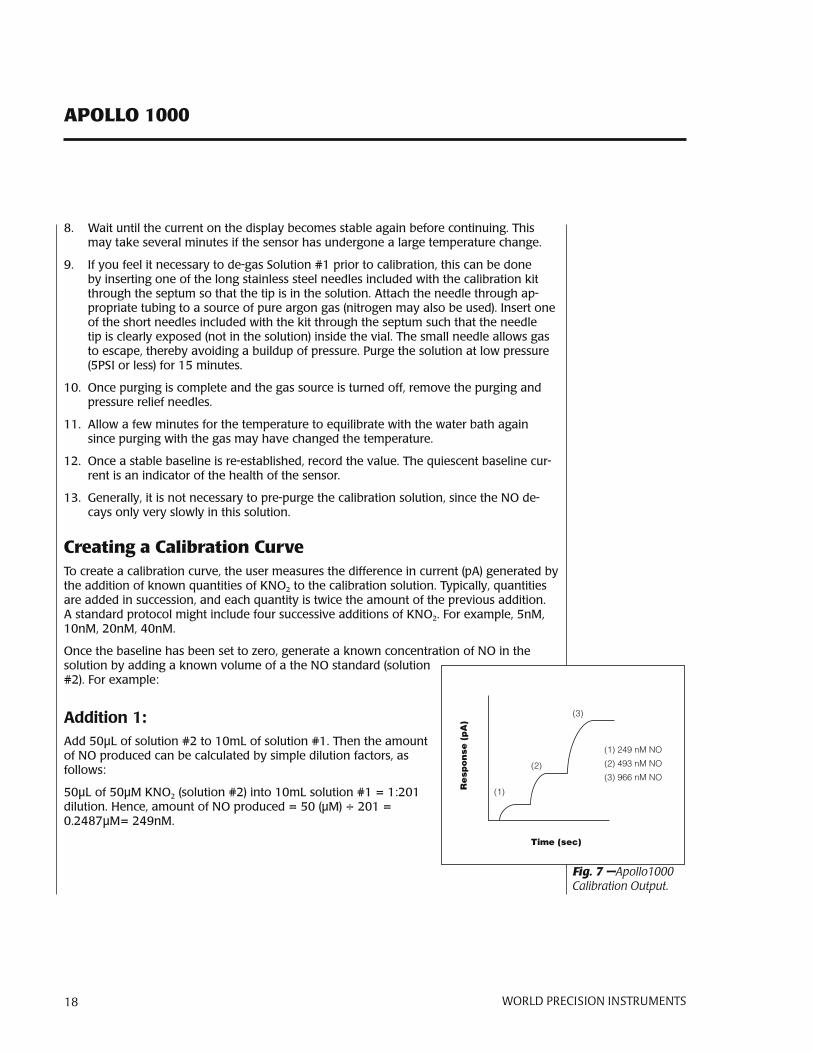
Creating a Calibration Curveto create a calibration curve, the user measures the difference in current (pA) generated by the addition of known quantities of Kno2 to the calibration solution. typically, quantities are added in succession, and each quantity is twice the amount of the previous addition. A standard protocol might include four successive additions of Kno2. For example, 5nM, 10nM, 20nM, 40nM.
once the baseline has been set to zero, generate a known concentration of no in the solution by adding a known volume of a the no standard (solution #2). For example:
Addition1:Add 50µl of solution #2 to 10ml of solution #1. then the amount of no produced can be calculated by simple dilution factors, as follows:
50µl of 50µM Kno2 (solution #2) into 10ml solution #1 = 1:201 dilution. hence, amount of no produced = 50 (µM) ÷ 201 = 0.2487µM= 249nM.
Fig. 7 —Apollo1000 Calibration Output.
APOLLO 1000
World PreciSioN iNStrumeNtS 19
Addition2:
• 100µl of solution #2 added to the above solution will produce 493nM no (for example, dilution factor = 1:101.5).
• the output from the Apollo 1000 will look similar to the example shown in Figure 7: here three sequential additions of Kno2 have been made to solution #1.
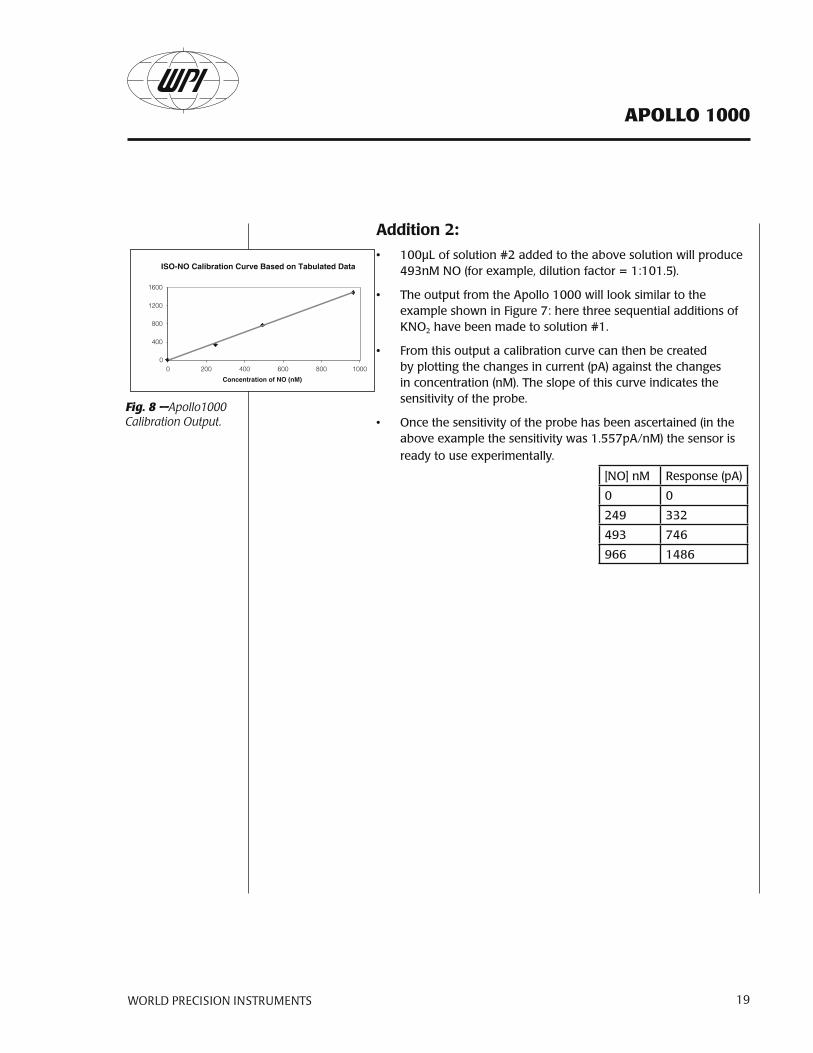
• From this output a calibration curve can then be created by plotting the changes in current (pA) against the changes in concentration (nM). the slope of this curve indicates the sensitivity of the probe.
• once the sensitivity of the probe has been ascertained (in the above example the sensitivity was 1.557pA/nM) the sensor is ready to use experimentally.
ISO-NO Calibration Curve Based on Tabulated Data
0
400
800
1200
1600
0 200 400 600 800 1000
Concentration of NO (nM)
Res
po
nse
(p
A)
Fig. 8 —Apollo1000 Calibration Output.
[no] nM response (pA)
0 0
249 332
493 746
966 1486
APOLLO 1000
20 World PreciSioN iNStrumeNtS
CALIbRATION OF NO SeNSOR by deCOMPOSITION OF SNAP
this method can be used to calibrate all no sensors (see Zhang, et al., “novel calibration Method for nitric oxide Microsensors by stoichiometrical generation of nitric oxide from snAp” Electroanalysis, 2000, 12: 6).
s-nitroso-n-acetyl –d,l-penicillamine (snAp) is a stable no-containing compound that can be used for quantitative generation of no in solution. snAp decomposes to no and a disulfide byproduct when dissolved in water. however, the rate of decomposition of snAp is very slow. the kinetics controlling the decomposition of snAp depend on several parameters including ph, presence of catalyst, temperature and light.
in the procedure described here, snAp is used in combination with a catalyst to generate known amounts no in solution which can then be used to accurately calibrate various no sensors. the protocol does not investigate all parameters involved in snAp decomposition, nor is it intended to propose a model by which snAp is decomposed.
two methods are described here for the calibration of no sensors based on decomposition of snAp. the first method relies on the use of cucl (cuprous chloride) as a catalyst for the 100% conversion of snAp into no. this method is extremely accurate but technically more demanding than the second method, which relies on the use of cucl2 (cupric chloride) for the partial but quantifiable conversion of snAp to no.
Method 1: Calibration by decomposition of a S-nitrosothiol compound using CuCl as a catalystthis method of calibration results in the 100% conversion of snAp to no. the amount of no produced, therefore, is based on the final concentration of snAp.
CAUTION: the described calibration procedure requires the use of cuprous (i) chloride, cucl, where cucl is the active catalyst for the conversion of snAp to no. the calibration curve assumes only the presence of cucl and hence a 100%
conversion efficiency of snAp to no (see “A novel method to calibrate nitric oxide microsensors by stoichiometrical generation of nitric oxide from snAp”, x. Zhang, et. al., electroanalysis, 2000, 12(6),425-428). however, in the presence of oxygen cucl is readily oxidized to cucl2. this will happen naturally if the compound is exposed to air and/or there is inadequate storage of cucl. the oxidation product cucl2 is much less efficient at catalyzing the conversion of snAp to no, and this would appear during calibration as an apparent low sensitivity of the electrode to no.
since cucl is readily oxidized to cucl2 special precautions must be taken to keep it in its reduced state prior to any calibration. it is recommended that cucl be stored under inert conditions and if used in solution then the solution must be degassed with inert gas and absent of all oxygen.
APOLLO 1000
World PreciSioN iNStrumeNtS 21
NOTE: if your laboratory is not adequately equipped to satisfy the conditions for storage and use of cucl, see"Method 2: calibration by decomposition of snAp using cucl2 as a catalyst" on page 22, which describes a similar calibration procedure based on the use of cupric (ii) chloride cucl2, in which cucl2 is the active catalyst for the conversion of snAp to no.
GettingStartedprepare the following solutions:
#1—Saturatedsolutionofcuprouschloride: this should be prepared by adding 150mg cucl to 500ml distilled deoxygenated water. the distilled water can be deoxygenated by purging with pure nitrogen or argon gas for 15 min. the saturated cucl solution will have a concentration of approximately 2.4mM at room temperature and should be kept in the dark prior to use.
#2—StandardSNAPsolution: to prepare the standard solution of snAp, weigh approximately 5.0mg +/- 2.0mg of snAp and add it to solution #1. calculate the molarity of snAp solution.decomposition of snAp in the stock solution proceeds very slowly due to the presence of chelating reagent, edtA. thus the rate of decomposition is negligible and the stock solution of snAp remains relatively stable for at least 5 hours if kept in refrigerator.
NOTE: the purity of standard reagent, snAp, is very important for the reported data. use high grade snAp with purity of 95% or better. snAp can be purchased from wpi (#snAp25, snAp50, snAp100).
TIP: For complete instructions on making standard 100mM snAp and calculating the molarity of snAp solution, see Appendix b, page 84.
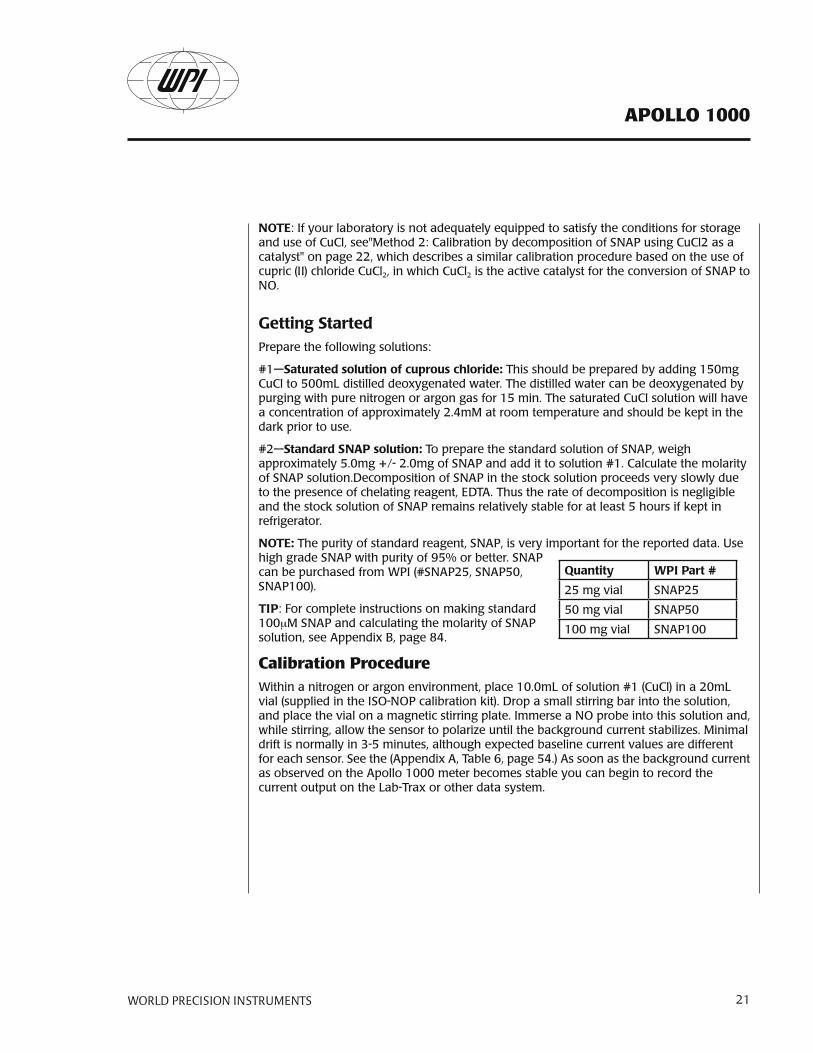
Calibration Procedurewithin a nitrogen or argon environment, place 10.0ml of solution #1 (cucl) in a 20ml vial (supplied in the iso-nop calibration kit). drop a small stirring bar into the solution, and place the vial on a magnetic stirring plate. immerse a no probe into this solution and, while stirring, allow the sensor to polarize until the background current stabilizes. Minimal drift is normally in 3-5 minutes, although expected baseline current values are different for each sensor. see the (Appendix A, table 6, page 54.) As soon as the background current as observed on the Apollo 1000 meter becomes stable you can begin to record the current output on the lab-trax or other data system.
Quantity WPIPart#
25 mg vial snAp25
50 mg vial snAp50
100 mg vial snAp100
APOLLO 1000
22 World PreciSioN iNStrumeNtS
next, inject 3 aliquots containing 5µl, 10µl and 20µl sequentially of the snAp stock solution (solution #2) into the vial containing cuprous chloride solution. depending on the required calibration range (for example, the final amount of no produced) desired, the volumes of snAp stock solution could be increased to produce a greater concentration of no. it is recommended that calibration range be kept close to the anticipated experimental concentration of no.
immediately following the first addition of snAp into solution#1 the current (pA) output from the iso-no will be seen to increase rapidly. within a few seconds the response will reach a plateau and the second aliquot of snAp can then be added. successive additions of the remaining aliquots of snAp can be made in a similar way.
A calibration curve can be constructed by plotting the signal output (pA) vs. concentration (nM) of snAp. each addition of snAp corresponds to equivalent no concentration. the response should be very linear from 10 to 1000nM. the sensitivity of the no probe can be established from the gradient or slope of the response curve. the sensitivity of the iso-nop sensor is about 1pA/nM. After the sensitivity of the no probe is established, the data-trax software can be programmed to display data in either concentration directly (for example, nM, mM) or redox current (for example, pA, nA).
NOTE:remember that most no probes are sensitive to temperature changes. it is therefore recommended that the calibration of a no sensor is performed at the experimental temperature.
Method 2: Calibration by decomposition of SNAP using CuCl2 as a catalystthis method of calibration relies on the use of cucl2 for the partial but quantifiable conversion of snAp to no. this procedure can be used as an alternative to the previous method in which cucl is the active catalyst for the conversion of snAp to no. in this procedure cucl2 is substituted as a catalyst for ease-of-handling.
NOTE:experimentally it has been shown that cucl2 is less efficient as a catalyst in the conversion of snAp to no (for example, , conversion ratio is reduced to approximately 60%). the accuracy of the calibration may also be reduced.
s-nitriso-n-acetyl-d,l-penicillamine (snAp) is a stable no-containing compound that can be used for quantitative generation of no in solution. snAp decomposes to no and a disulfide byproduct when dissolved in water. however, the rate of decomposition is very slow. the kinetics of decomposition for this reagent is a function of several parameters including ph, presence of a catalyst, temperature and light.
in the procedure described here, snAp is used in combination with a catalyst, cupric (ii) chloride (cucl2), to generate a known quantity of no in solution. note that this protocol does not investigate the effects of all parameters involved in snAp decomposition nor does it propose a model by which no is decomposed. the presented procedure provides an empirical estimation of the amount of generated no based on the molarity of a standard stock solution of snAp under a controlled set of parameters.
APOLLO 1000
World PreciSioN iNStrumeNtS 23
GettingStartedprepare the following solutions:
solution #1: dissolve 5mg edtA in 250ml of water (hplc grade).
solution #2: prepare 250ml 0.1M cupric (ii) chloride in distilled water.
PreparingstandardSNAPsolutionto prepare the standard solution of snAp, weigh approximately 5.0mg +/- 2.0mg of snAp and add it to solution #1. calculate the molarity of snAp solution. decomposition of snAp in the stock solution proceeds very slowly due to the presence of chelating reagent, edtA. thus the rate of decomposition is negligible and the stock solution of snAp remains relatively stable for at least 5 hours if kept in refrigerator.
NOTE: the purity of standard reagent, snAp, is very important for the reported data. use high grade snAp with purity of 95% or better. snAp can be purchased from wpi (#SNAP25, SNAP50, SNAP100).
TIP: For complete instructions on making standard 100mM snAp and calculating the molarity of snAp solution, see Appendix b, page 84.
CalibrationProcedureplace 10.0ml of solution #2 in a 20ml vial (supplied in the calibration kit). drop a small stirring bar into the solution, and place the vial on a magnetic stirring plate. immerse a no probe into this solution, and while stirring, allow the background current to stabilize. the appropriate time for stabilization depends on the model of the sensor. refer to the Appendix A, table 6, page 54 for suggested times. As soon as the background current becomes stable start the recording.
next, sequentially inject three aliquots of snAp solution, 5µl, 10µl, and 20µl, into the vial containing copper chloride solution. the current output will rapidly increase upon addition of first aliquot and will reach a plateau within a few seconds. inject the second aliquot, 10µl, as soon as the first signal reaches a plateau. Finally add the third aliquot as the second signal reaches its plateau. if aliquots are not added promptly when reaching the previous plateau, the signal will slowly decline because generated no is quickly oxidized to nitrite and nitrate which will not be detected by the probe.
NOTE: you can adjust the volume of injected aliquots according to the concentration of snAp stock solution. decrease the volume of aliquot if electrode is very sensitive or increase the volume of aliquot if the electrode is less sensitive.
because no sensors can be calibrated in a linear fashion, the magnitude of every signal should almost double as the volume of snAp solution added is doubled in the course of the calibration. use the recorded data to construct a calibration curve. the calibration curve can be simply constructed by plotting the signal output (for example, in pA) vs. the concentration of snAp added at that time. note that every addition of snAp solution

APOLLO 1000
24 World PreciSioN iNStrumeNtS
corresponds to a particular no concentration. this will be discussed below. After the sensitivity of the no probe is established, the data-trax software can be programmed to display data in either concentration directly (for example, nM, mM) or redox current (for example, pA, nA).
the standard snAp solution can be used for the calibration of no probes throughout the day. store the solution in the dark and refrigerate when not in use. prepare a fresh stock solution of snAp in the beginning of every day to ensure minimal decomposition of snAp in the stock solution. concentration of snAp decreases to 5-10% of its nominal value after approximately 4-5 hours.
NOTE: remember that most no probes are sensitive to changes in temperature. it is therefore recommended that the calibration of your sensor is performed at a constant experimental temperature.
PredictingthelevelofdetectableNOaccordingtothemolarratioofSNAPinthepresenceofcatalyst(MethodII)experiments have shown that snAp is decomposed instantaneously under the following set of experimental conditions:
temperature 25°c
catalyst solution 0.1M copper chloride
snAp wpi, 98% purity. Fresh stock solution with 5 mg/250 ml solution edtA added.
copper chloride is at equilibrium with ambient air (aerobic conditions).
snAp (rsno) decomposes to no and a disulfide byproduct according to the following equation:
2RSNO➡2NO+RS–SR
theoretically, the concentration of generated no should be equal to the final concentration of snAp in the copper chloride solution in the calibration vial if the decomposition goes to completion and if the generated no is detected quickly before it is oxidized to nitrite and nitrate.
however, it is expected that the level of detectable no will be below the theoretical value because the copper chloride solution is at equilibrium with ambient air, and consequently a portion of the generated no would have been immediately oxidized to nitrite and nitrate before it was measured by the no sensor. in addition, it is possible that decomposition of snAp does not go to completion even in the presence of a catalyst. results on the kinetics of snAp decomposition in the presence of a catalyst in an anaerobic environment are published elsewhere (Zhang et al., “novel calibration Method for nitric oxide Microsensors by stoichiometrical generation of nitric oxide from snAp”, electroanalysis, 2000, 12: 6).
APOLLO 1000
World PreciSioN iNStrumeNtS 25
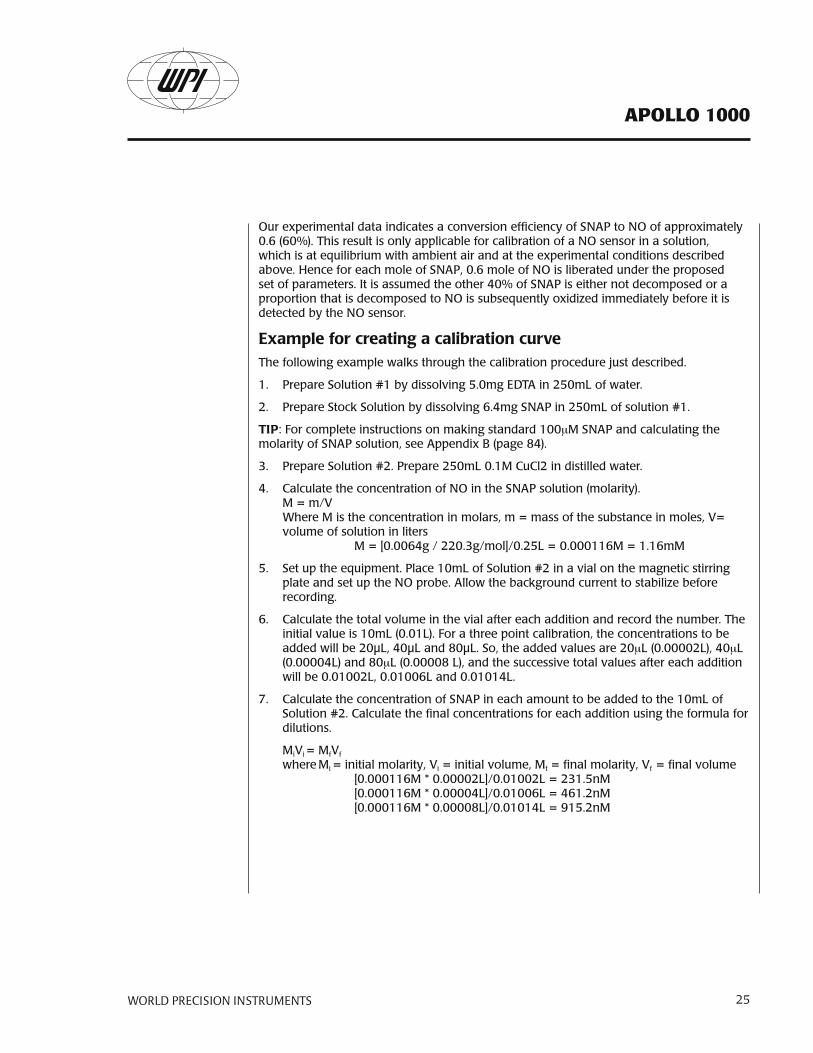
our experimental data indicates a conversion efficiency of snAp to no of approximately 0.6 (60%). this result is only applicable for calibration of a no sensor in a solution, which is at equilibrium with ambient air and at the experimental conditions described above. hence for each mole of snAp, 0.6 mole of no is liberated under the proposed set of parameters. it is assumed the other 40% of snAp is either not decomposed or a proportion that is decomposed to no is subsequently oxidized immediately before it is detected by the no sensor.
Exampleforcreatingacalibrationcurvethe following example walks through the calibration procedure just described.
1. prepare solution #1 by dissolving 5.0mg edtA in 250ml of water.
2. prepare stock solution by dissolving 6.4mg snAp in 250ml of solution #1.
TIP: For complete instructions on making standard 100mM snAp and calculating the molarity of snAp solution, see Appendix b (page 84).
3. prepare solution #2. prepare 250ml 0.1M cucl2 in distilled water.
4. calculate the concentration of no in the snAp solution (molarity). M = m/V
where M is the concentration in molars, m = mass of the substance in moles, V= volume of solution in liters M = [0.0064g / 220.3g/mol]/0.25l = 0.000116M = 1.16mM
5. set up the equipment. place 10ml of solution #2 in a vial on the magnetic stirring plate and set up the no probe. Allow the background current to stabilize before recording.
6. calculate the total volume in the vial after each addition and record the number. the initial value is 10ml (0.01l). For a three point calibration, the concentrations to be added will be 20µl, 40µl and 80µl. so, the added values are 20ml (0.00002l), 40ml (0.00004l) and 80ml (0.00008 l), and the successive total values after each addition will be 0.01002l, 0.01006l and 0.01014l.
7. calculate the concentration of snAp in each amount to be added to the 10ml of solution #2. calculate the final concentrations for each addition using the formula for dilutions.
MiVi = MfVf
where Mi = initial molarity, Vi = initial volume, Mf = final molarity, Vf = final volume [0.000116M * 0.00002l]/0.01002l = 231.5nM [0.000116M * 0.00004l]/0.01006l = 461.2nM [0.000116M * 0.00008l]/0.01014l = 915.2nM
APOLLO 1000
26 World PreciSioN iNStrumeNtS
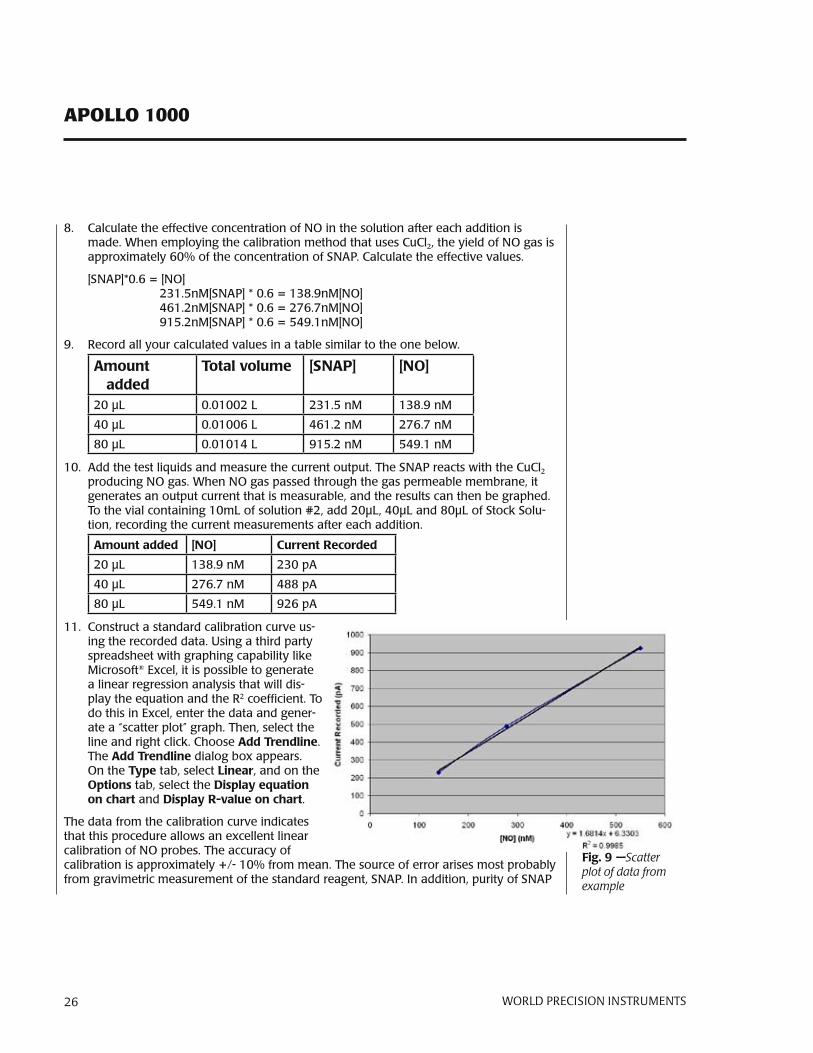
8. calculate the effective concentration of no in the solution after each addition is made. when employing the calibration method that uses cucl2, the yield of no gas is approximately 60% of the concentration of snAp. calculate the effective values.
[snAp]*0.6 = [no] 231.5nM[snAp] * 0.6 = 138.9nM[no] 461.2nM[snAp] * 0.6 = 276.7nM[no] 915.2nM[snAp] * 0.6 = 549.1nM[no]
9. record all your calculated values in a table similar to the one below.
Amountadded
Totalvolume [SNAP] [NO]
20 µl 0.01002 l 231.5 nM 138.9 nM
40 µl 0.01006 l 461.2 nM 276.7 nM
80 µl 0.01014 l 915.2 nM 549.1 nM
10. Add the test liquids and measure the current output. the snAp reacts with the cucl2 producing no gas. when no gas passed through the gas permeable membrane, it generates an output current that is measurable, and the results can then be graphed. to the vial containing 10ml of solution #2, add 20µl, 40µl and 80µl of stock solu-tion, recording the current measurements after each addition.
Amountadded [NO] CurrentRecorded
20 µl 138.9 nM 230 pA
40 µl 276.7 nM 488 pA
80 µl 549.1 nM 926 pA
11. construct a standard calibration curve us-ing the recorded data. using a third party spreadsheet with graphing capability like Microsoft® excel, it is possible to generate a linear regression analysis that will dis-play the equation and the r2 coefficient. to do this in excel, enter the data and gener-ate a “scatter plot” graph. then, select the line and right click. choose AddTrendline. the AddTrendline dialog box appears. on the Type tab, select Linear, and on the Options tab, select the displayequationonchart and displayR-valueonchart.
the data from the calibration curve indicates that this procedure allows an excellent linear calibration of no probes. the accuracy of calibration is approximately +/- 10% from mean. the source of error arises most probably from gravimetric measurement of the standard reagent, snAp. in addition, purity of snAp
Fig.9—Scatter plot of data from example
APOLLO 1000
World PreciSioN iNStrumeNtS 27
as well as partial oxidation of generated no in the calibration solution could contribute to this error. such a deviation may not be so important when no is quantified in biological systems because most often the ability to measure changes in the basal concentration of no is more significant than measurement of the absolute level of no.
Preparing an NO Standard using NO gasthis method can be used with all no sensors and has the advantage of allowing the user to calibrate no sensors in the same environment in which the experimental measurements will be made. however, it has the disadvantages of added cost, inconvenience, and greater hazard to the user. All of these factors must be taken into consideration.
WARNING:NITRICOXIdEMUSTBEHANdLEdONLYINAWELL-VENTILATEdAREA,TYPICALLYALABORATORYFUMEHOOdWITHFORCEdVENTILATION.THEU.S.OCCUPATIONALSAFETYANdHEALTHAdMINISTRATIONHASSETA
TIME-WEIGHTEdAVERAGEMAXIMUMNOVALUEAS25PPM.THATISTOSAY,25PPMISCITEdASTHEMAXIMUMCONCENTRATIONTOWHICHWORKERSMAYBECONTINUALLYEXPOSEd.BRIEFINHALATIONOFCONCENTRATIONSASLOWAS200PPMCOULdPROdUCEdELAYEdPULMONARYEdEMAWHICHMAYBEFATALAFTERANASYMPTOMATICPERIOdOFUPTO48HOURSAFTERTHEINITIALEXPOSURE.ITISTHEREFORECRITICALTHATTHEPERSONNELHANdLINGTHEGASBETHOROUGHLYFAMILIARWITHTHEMATERIALSAFETYdATASHEET(MSdS)ANdPROPERHANdLINGPROCEdURES.THEPRECAUTIONSRECOMMENdEdBYTHEGASMANUFACTURERMUSTBEFOLLOWEd.
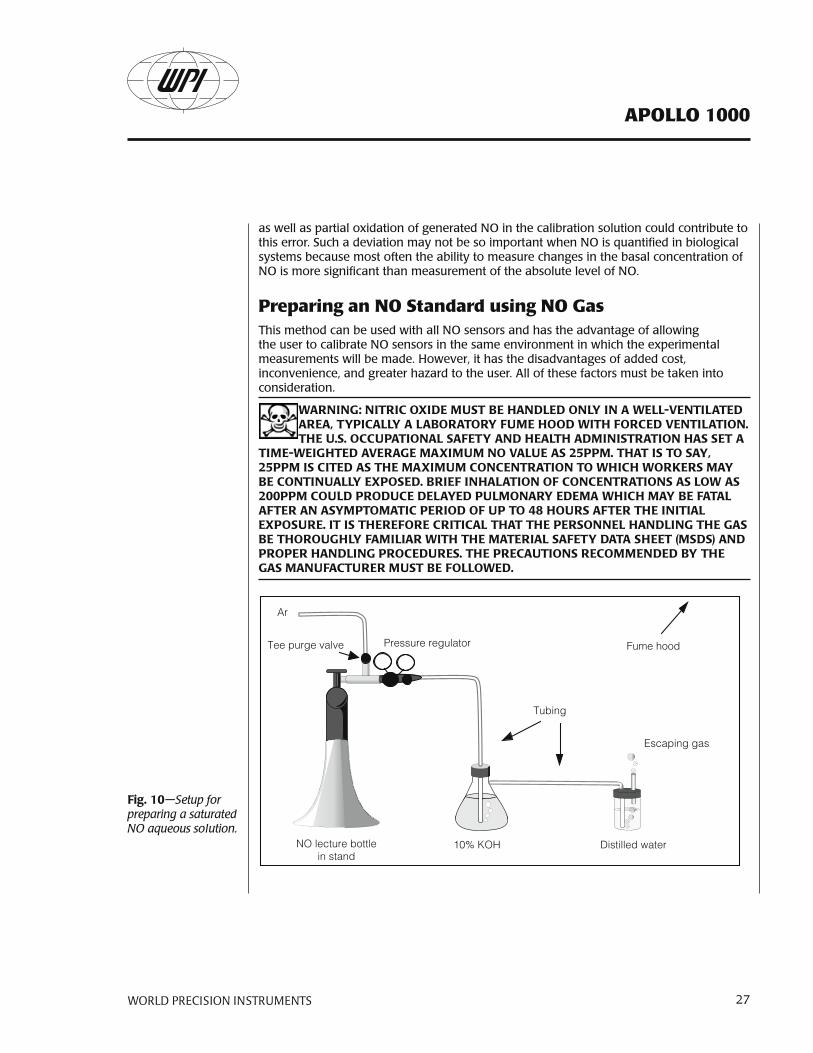
Fig.10—Setup for preparing a saturated NO aqueous solution.
APOLLO 1000
28 World PreciSioN iNStrumeNtS
1. Becertainthefumehoodisfunctioning.InhalationofNOgasispotentiallyfatal.SeetheWARNINGonthepreviouspage.
2. Make sure that all fittings and connections are secure. the tubing to be used should not be permeable to no. we recommend tygon® tubing if a polymer tubing is to be used; this is permeable to no but has the best performance compared to other polymer tubing of which we are currently aware. ideally glass tubing should be used. if tygon® tubing is used, note that prolonged exposure to no affects its properties; therefore it is recommended that the tubing be inspected frequently and that it be replaced when it appears to be brittle. the pressure regulator and tee purge adaptor should be stainless steel since nitric oxide is corrosive.
3. prepare 100ml of a 10% (by weight) Koh solution and place it in the sidearm flask as illustrated in Figure 7, on the previous page. the flask should be sealed with a stopper through which the tubing passes by means of a luer fitting to a syringe needle which extends almost to the bottom of the flask. tubing is used to connect the side arm of the flask to the vial containing the water to be equilibrated with no. the Koh solution is used to remove other nitrogen oxides from the no gas.
4. place 20ml of distilled (preferably deionized) water in a small glass vial. seal the vial with a stopper and insert through the stopper a long syringe needle which extends almost to the base of the vial. connect this syringe needle to the tubing from the Koh flask, as illustrated. insert an additional shorter syringe needle which should not extend into the solution. this acts as a pressure relief during purging.
5. place the distilled water vial in an ice-water bath. reducing the temperature increases the solubility of no in solution. thus when the solution is used at room temperature you will be assured of a saturated no solution.
6. purge the system with argon (or nitrogen) gas for a period of 30 minutes at a moder-ate flow rate such that the pressure is maintained at a safe level (1-2psi). when purg-ing it should be observed that gas is indeed bubbling through the Koh solution as well as the distilled water. After 30 minutes turn off the argon source, and switch the tee purge valve to the correct position for purging with no from the lecture bottle.
7. purge the system with no for 5-10 minutes if using a pure source (longer if the no source is not pure). Again make sure that gas is bubbling solutions.
WARNING:NOISNOWESCAPINGFROMTHEPRESSURERELIEFNEEdLEINTHESTOPPEROFTHEdISTILLEdWATERVIAL.ITISIMPERATIVETHATTHEFUMEHOOdBERUNNINGATMAXIMUMCAPACITYWITHTHEFRONT
PANELCLOSEd.)
8. After the time in step 7 has elapsed turn off the no source.
9. immediately remove the two needles from the distilled water vial.
APOLLO 1000
World PreciSioN iNStrumeNtS 29
10. set the tee purge valve for purging with argon (or nitrogen) gas, and turn on the argon source. purge the system for 5-10 minutes at a moderate flow rate. gas should be bubbling through the Koh and then escaping from the flask into the atmosphere. Again be sure that the fume hood is ventilating well.
11. turn off the argon (or nitrogen) source, and allow the fume hood to continue to venti-late for 10-15 minutes so as to ensure that all traces of no gas are removed from the atmosphere.
12. the solution of distilled water should now be saturated with no. the concentration of no produced by this saturation is dependent upon the temperature. At 0°c, the concentration is approximately 3.3mM, and at 20°c the concentration is approxi-mately 1.91mM.
13. dilutions of known concentration can be prepared from this saturated solution. in preparing a dilution, be careful not to unseal the vial, for this exposes the solution to atmospheric oxygen.
once the dilutions are prepared, it is a simple matter to calibrate the instrument.
Measurement of NOit is not within the scope of this manual to outline in detail how to use no sensors to measure no in every experimental set up the user may encounter. there are, however, some guiding principles of which the user should be aware to exploit fully the capabilities of the technology. these are outlined below.
NOdeliveryFor measurement of no to be made, the no must reach the sensor surface so it can react on the electrode surface. this point is of particular concern, because in many experiments the lifetime of no is short. this is especially true in biological systems where compounds such as hemoglobin can reduce the half-life of no to less than a second. it is therefore critical that the experimental set up is designed to maximize delivery of no to the sensor. in particular, the tip of the sensor must placed as close as possible to the site of no release.
APOLLO 1000
30 World PreciSioN iNStrumeNtS
durabilityandhandlingthe user must exercise caution when handling any no sensor to avoid actions which could damage the sensor tip. the sensor membrane and membrane coatings are extremely delicate and improper handling will lead to damage.
Environmentalinfluencesthere are two environmental parameters to which no sensors are quite sensitive: temperature and electrical interference, both of which are discussed in greater detail below
Temperaturenote that the sensitivity of the no sensor is temperature-dependent. this is due to the effects of temperature on the partial pressure of no in either liquid or gas samples, on the permeability of the membrane or coatings, and on the conductivities of various circuit components. it is therefore recommended that any calibration is performed at the same temperature as the experiment and that temperature be held constant.
ElectricalinterferenceAlthough nitric oxide monitoring using the Apollo 1000 involves the measurement of extremely small currents, the intrinsic noise level of the Apollo 1000 and no sensors is low enough to provide accurate measurements of nitric oxide. however, various external electrical noise sources may couple to the system electromagnetically and produce large extraneous signals in the output record. the magnitude of this external noise depends on the environment of the laboratory. if the interference introduced by the electrical signals in the environment is large, ground and shield the system properly.
Maintenance of NO Sensorsthe various no sensors, if well cared for, will require very little maintenance
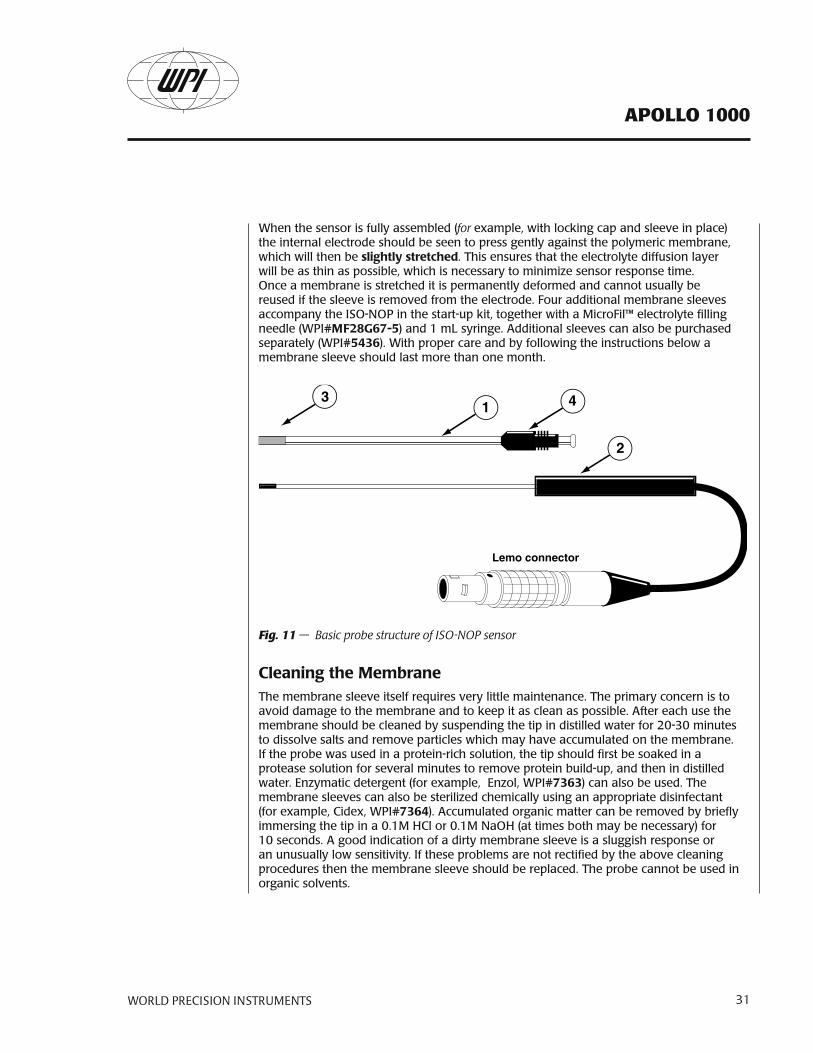
MaintenanceoftheISO-NOPwhen the iso-nop sensor is not being used it should be left connected to the Apollo 1000 in the on position (or to pre-polarizer NSA-3 with the tip suspended in distilled water. the basic structure of the iso-nop sensor is quite simple (see Fig. 11). it consists
of an internal no-sensing working/counter electrode combination . this electrode fits
inside a disposable protective stainless steel sleeve (wpi#5436) which must contain fresh electrolyte (wpi#7325), and is separated from the external environment by a gas
permeable polymeric membrane covering the end of the stainless sleeve. the other
end of the sleeve is flanged. the locking cap is used to attach the sleeve to the probe
handle .
APOLLO 1000
World PreciSioN iNStrumeNtS 31
when the sensor is fully assembled (for example, with locking cap and sleeve in place) the internal electrode should be seen to press gently against the polymeric membrane, which will then be slightlystretched. this ensures that the electrolyte diffusion layer will be as thin as possible, which is necessary to minimize sensor response time. once a membrane is stretched it is permanently deformed and cannot usually be reused if the sleeve is removed from the electrode. Four additional membrane sleeves accompany the iso-nop in the start-up kit, together with a MicroFil™ electrolyte filling needle (wpi#MF28G67-5) and 1 ml syringe. Additional sleeves can also be purchased separately (wpi#5436). with proper care and by following the instructions below a membrane sleeve should last more than one month.
1
2
3
Lemo connector
4
Fig. 11 — Basic probe structure of ISO-NOP sensor
CleaningtheMembranethe membrane sleeve itself requires very little maintenance. the primary concern is to avoid damage to the membrane and to keep it as clean as possible. After each use the membrane should be cleaned by suspending the tip in distilled water for 20-30 minutes to dissolve salts and remove particles which may have accumulated on the membrane. if the probe was used in a protein-rich solution, the tip should first be soaked in a protease solution for several minutes to remove protein build-up, and then in distilled water. enzymatic detergent (for example, enzol, wpi#7363) can also be used. the membrane sleeves can also be sterilized chemically using an appropriate disinfectant (for example, cidex, wpi#7364). Accumulated organic matter can be removed by briefly immersing the tip in a 0.1M hcl or 0.1M naoh (at times both may be necessary) for 10 seconds. A good indication of a dirty membrane sleeve is a sluggish response or an unusually low sensitivity. if these problems are not rectified by the above cleaning procedures then the membrane sleeve should be replaced. the probe cannot be used in organic solvents.
APOLLO 1000
32 World PreciSioN iNStrumeNtS
ReplacingaMembraneSleeveeven with the best of care and proper maintenance, the membrane sleeve will eventually need to be replaced. replacement is simple and straightforward.
1. unscrew the locking cap from the handle.
2. hold the stainless steel sleeve and remove it with the locking cap from the internal electrode assembly, being careful not to bend the electrode assembly when doing so.
3. rinse the internal electrode with distilled water (particularly the tip) and let it soak for at least 15 minutes. be careful not to let water get up into the handle. depending on the scale, the current on the Apollo 1000 meter should go offscale when the electrode is being rinsed.
4. gently dry the electrode with a soft tissue (Kimwipes). be sure to dry thoroughly the flat surface at the tip of the electrode. After drying the current should stabilize fairly quickly to a low value (for example, 0 - 20 pA). if this occurs, it is a good indication that the electrode is functioning properly.
5. if the electrode is not clean, repeat steps 3 and 4. if necessary the iso-nop rejuve-nator (wpi#JUV) can be used restore sensitivity of an old electrode (contact wpi for assistance).
6. remove the locking cap from the old used sleeve, and gently slide it onto the new replacement sleeve. Additional membrane kits (wpi#5436) may be purchased sepa-rately.
7. wet the internal electrode by immersing the tip 1-2cm into the iso-nop electrolyte (wpi #7325) provided in the iso-nop start-up kit. the current will rise rapidly offs-cale. using the MicroFil™ nonmetallic syringe needle (wpi #MF28G67-5) and 1 ml plastic syringe (supplied) inject approximately 100 microliters of electrolyte directly into the new sleeve, starting at the membrane tip and drawing the MicroFil out of the sleeve as it fills. the filling process should be performed slowly enough so as not to create turbulence, which could introduce air bubbles into the electrolyte. the MicroFil supplied should be less than the length of the sleeve, so that it will not puncture the delicate membrane at the tip of the sleeve during injection. if the MicroFil is longer than the sleeve it can be cut to the correct length.
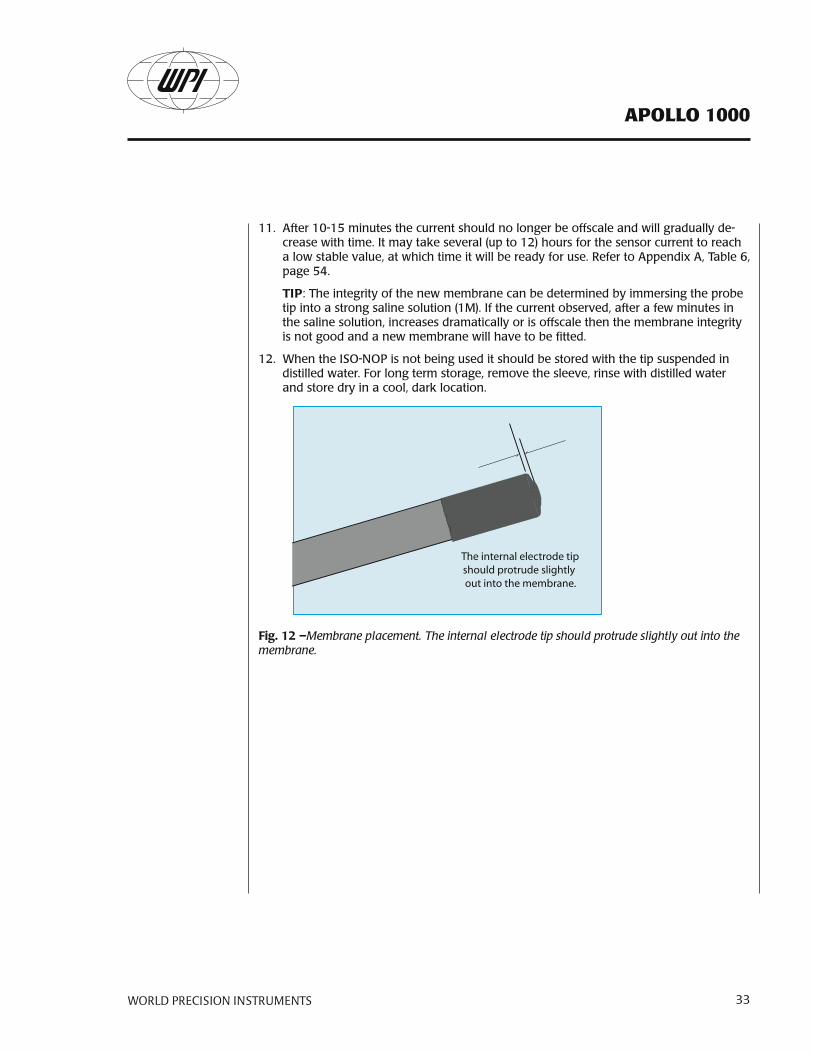
8. slowly and smoothly insert the electrode into the sleeve, and screw the locking cap into the handle. the electrode should be observed to press gently against the mem-brane. (seeFig.12, below.)
9. the current displayed on the meter at this time will be high or offscale.
10. suspend the tip of the newly assembled probe in distilled water.
APOLLO 1000
World PreciSioN iNStrumeNtS 33
11. After 10-15 minutes the current should no longer be offscale and will gradually de-crease with time. it may take several (up to 12) hours for the sensor current to reach a low stable value, at which time it will be ready for use. refer to Appendix A, table 6, page 54.
TIP: the integrity of the new membrane can be determined by immersing the probe tip into a strong saline solution (1M). if the current observed, after a few minutes in the saline solution, increases dramatically or is offscale then the membrane integrity is not good and a new membrane will have to be fitted.
12. when the iso-nop is not being used it should be stored with the tip suspended in distilled water. For long term storage, remove the sleeve, rinse with distilled water and store dry in a cool, dark location.
The internal electrode tipshould protrude slightly out into the membrane.
Fig.12–Membrane placement. The internal electrode tip should protrude slightly out into the membrane.
APOLLO 1000
34 World PreciSioN iNStrumeNtS
Maintenance of Nitric Oxide Microsensorswpi’s nitric oxide microsensors are maintenance-free consumable sensors that are warranted against defect for 30 days from the date of purchase. the following information should increase the lifetime of the sensor:
Tipcarethe surface of the sensor tip is very sensitive and is covered with a layer of proprietary selective membranes. the tip of the sensor should never be handled as this will damage the membranes and compromise the electrode’s selectivity for no. during use the electrode should be held securely, preferably using a micromanipulator or other similar device that permits accurate positioning, such as wpi’s proguide electrode holder/positioner (wpi part #47520,47510,47530,47540).
the electrode should be cleaned periodically in distilled water and dried using soft tissue paper. organic contamination can be removed using a mild enzymatic detergent such as enZol (wpi #7363).
Sterilizationthe following methods can be used to sterilize the sensor:
• ethylene oxide
• cidex solution (wpi #7364)
Storageno microsensors should be stored dry in a cool place away from direct sunlight. they can also be left attached to an iso-no Activator (wpi # NSA-3). the Activator maintains the sensor in a polarized state, ready for immediate use when required. it is not required for no microsensors to be immersed in solution for the activator to maintain polarization of the electrode.
APOLLO 1000
World PreciSioN iNStrumeNtS 35
SeT-UP ANd CALIbRATION OF hPO SeNSORS
Initial Set-upplug the hpo sensor into the input connector on the bottom of the required input channel on the Apollo 1000. using the screwdriver provided, set the poise voltage for hydrogen peroxide to 400mV by adjusting the poise Adjust potentiometer screw on the front panel of the Apollo 1000. set appropriate gain; For most sensors or applications, 10 nA range is appropriate. be sure to give the sensor enough time to polarize before beginning the calibration.
The structure of the hPO sensor the basic structure of the iso-hpo-2 sensor is identical to that of the iso-nop nitric oxide sensor (see Fig.11), although there are significant differences in the type of materials used.
it consists of an internal working/counter electrode combination. this electrode fits inside a disposable stainless steel sleeve (wpi#600012) which must contain fresh refillable electrolyte (wpi#100042), and is separated from the external environment by a membrane covering the end of the stainless sleeve. the other end of the sleeve is flanged. the locking cap is used to attach the sleeve to the probe handle. when the sensor is fully assembled ,the internal electrode should be pressing gently against the membrane, which will then be slightly stretched. (seeFig.12, page 33.) this ensures that the electrolyte diffusion layer will be as thin as possible, which is necessary to minimize sensor response time.
reuse of a previously installed membrane sleeve is not recommended. once a membrane is stretched, it is permanently deformed. A re-installed sleeve does not achieve the same tightness of fit, and as a result, the electrode’s performance will be unreliable. Four additional membrane sleeves (wpi#600012), a MicroFil™ electrolyte filling needle (wpi#MF28G67-5) and 1ml syringe are provided in the iso-hpo startup-kit (wpi#600011).
with proper care and by following the instructions below, a membrane sleeve should last more than one month.
Calibration of the hPO Sensor hydrogen peroxide (h2o2) is a very important product in the biological system. the determination of h2o2 requires an accurate method of calibration. Amperometeric (electrochemical) determination using the Apollo 1000 is a very reliable method to measure h2o2. the instrument measures the amount of h2o2 oxidized on the surface of
APOLLO 1000
36 World PreciSioN iNStrumeNtS
the sensor using a poise voltage of +400mV. the oxidation of h2o2 at the sensor surface produces a small current (pA), which is detected by the Apollo 1000. the amount of current produced is linearly proportional to amount of h2o2 in the experiment.
ItemsRequired
• plastic stand with two holes
• one glass vial
• 1.0mM h2o2. standard solution (to make standard solution, see Appendix b, page 55.)
• 0.01M pbs buffer solution (Sigma-Aldrich P4417-100tAB) (to make standard solution, see Appendix b, page 55.)
NOTE: the multi-port measurement chamber (wpi#NOCHM-4) can be used as an alternative calibration kit, specifically for use at different temperature condition. calibration temperatures from 4 - 40°c can be controlled using an external circulating bath (contact wpi for information).
CalibrationProcedure1. turn on the Apollo 1000 and connect the iso-hpo-2 sensor to the input. using the
screwdriver provided, set the poise voltage for nitric oxide to 865mV by adjusting the poise Adjust potentiometer screw. it is important that the poise is set before plugging in the electrode, because improper poise can cause damage to the electrode. set the current range to 10mA
2. Measure an appropriate volume (for example, 10 ml) of pbs buffer solution (0.01M) into a glass vial. place the vial on a magnetic stirring plate and put a small stir bar into the vial. set the stir rate at a medium speed.
3. remove the sensor from the electrolyte solution in which the tip has been immersed during storage. immerse the iso-hpo-2 sensor tip in pbs buffer solution (0.01M), the sensor tip should be immersed about 0.3-0.5mm into the solution, and should not be touched by the stir bar.
4. record the current value after a 10-15 minute settling period. if the current is offs-cale or unstable after a half hour in solution, it is likely that the membrane has been damaged and the sleeve needs to be changed (refer to the section on “changing the Membrane sleeve”).
NOTE: the calibration should be carried out at the temperature at which the samples of h2o2 are to be measured. this can be accomplished by placing the vial and stand in a water bath at the appropriate temperature, and allowing the temperature of the solution in the bottle to equilibrate with the water bath.
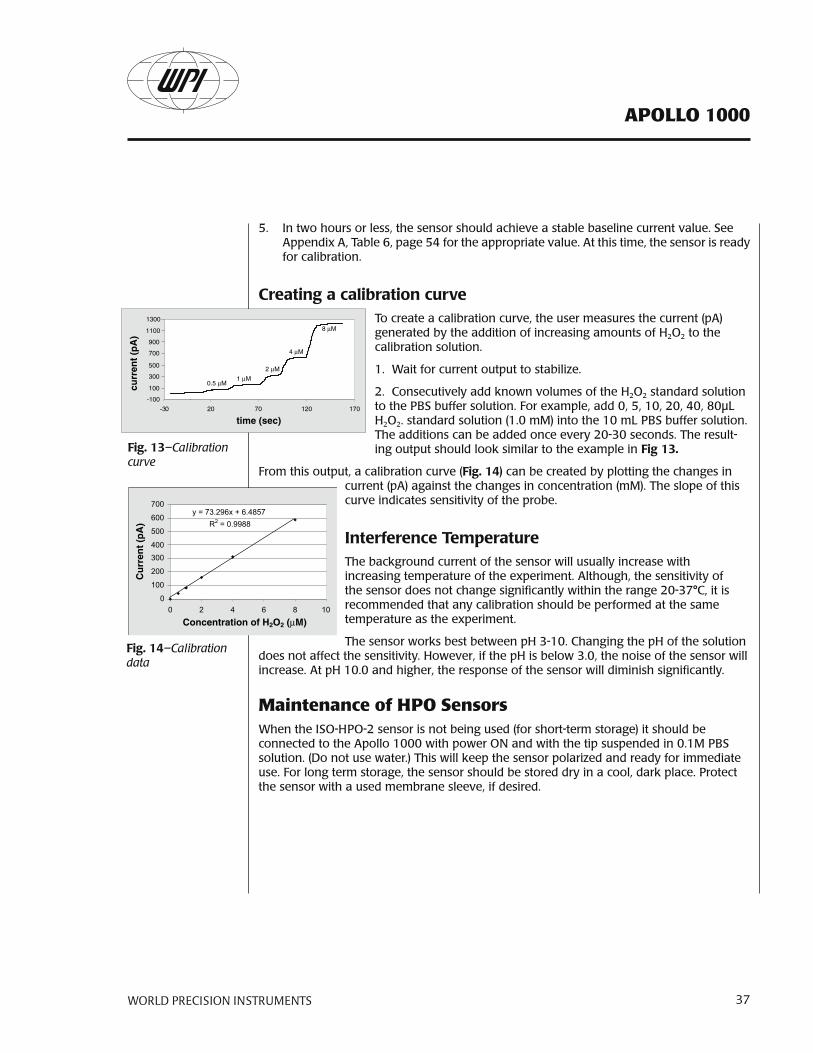
APOLLO 1000
World PreciSioN iNStrumeNtS 37
5. in two hours or less, the sensor should achieve a stable baseline current value. see Appendix A, table 6, page 54 for the appropriate value. At this time, the sensor is ready for calibration.
Creatingacalibrationcurveto create a calibration curve, the user measures the current (pA) generated by the addition of increasing amounts of h2o2 to the calibration solution.
1. wait for current output to stabilize.
2. consecutively add known volumes of the h2o2 standard solution to the pbs buffer solution. For example, add 0, 5, 10, 20, 40, 80µl h2o2. standard solution (1.0 mM) into the 10 ml pbs buffer solution. the additions can be added once every 20-30 seconds. the result-ing output should look similar to the example in Fig13.
From this output, a calibration curve (Fig.14) can be created by plotting the changes in current (pA) against the changes in concentration (mM). the slope of this curve indicates sensitivity of the probe.
InterferenceTemperaturethe background current of the sensor will usually increase with increasing temperature of the experiment. Although, the sensitivity of the sensor does not change significantly within the range 20-37°c, it is recommended that any calibration should be performed at the same temperature as the experiment.
the sensor works best between ph 3-10. changing the ph of the solution does not affect the sensitivity. however, if the ph is below 3.0, the noise of the sensor will increase. At ph 10.0 and higher, the response of the sensor will diminish significantly.
Maintenance of hPO Sensorswhen the iso-hpo-2 sensor is not being used (for short-term storage) it should be connected to the Apollo 1000 with power on and with the tip suspended in 0.1M pbs solution. (do not use water.) this will keep the sensor polarized and ready for immediate use. For long term storage, the sensor should be stored dry in a cool, dark place. protect the sensor with a used membrane sleeve, if desired.
y = 73.296x + 6.4857R2 = 0.9988
0
100
200
300400
500
600
700
0 2 4 6 8 10
Concentration of H2O2 (µM)
Cu
rren
t (p
A)
-100
100
300
500
700
900
1100
1300
-30 20 70 120 170
time (sec)
curr
ent
(pA
)
0.5 µM1 µM
2 µM
4 µM
8 µM
Fig.14–Calibration data
Fig.13–Calibration curve
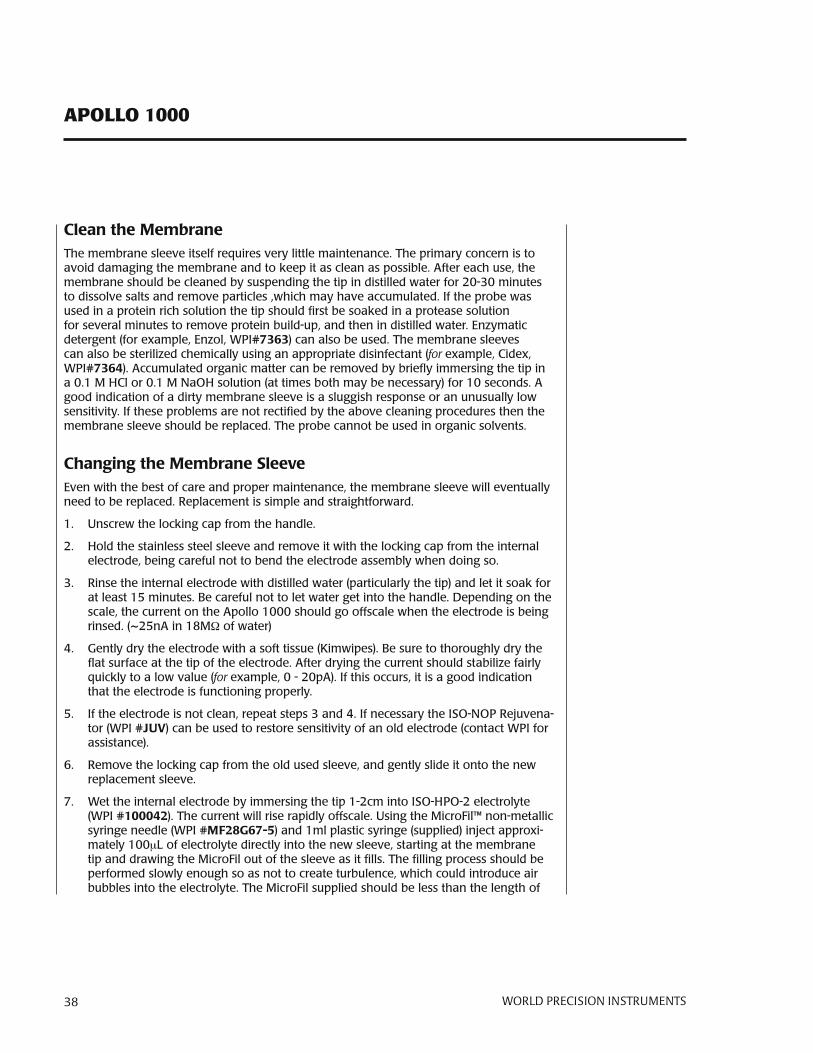
APOLLO 1000
38 World PreciSioN iNStrumeNtS
CleantheMembranethe membrane sleeve itself requires very little maintenance. the primary concern is to avoid damaging the membrane and to keep it as clean as possible. After each use, the membrane should be cleaned by suspending the tip in distilled water for 20-30 minutes to dissolve salts and remove particles ,which may have accumulated. if the probe was used in a protein rich solution the tip should first be soaked in a protease solution for several minutes to remove protein build-up, and then in distilled water. enzymatic detergent (for example, enzol, wpi#7363) can also be used. the membrane sleeves can also be sterilized chemically using an appropriate disinfectant (for example, cidex, wpi#7364). Accumulated organic matter can be removed by briefly immersing the tip in a 0.1 M hcl or 0.1 M naoh solution (at times both may be necessary) for 10 seconds. A good indication of a dirty membrane sleeve is a sluggish response or an unusually low sensitivity. if these problems are not rectified by the above cleaning procedures then the membrane sleeve should be replaced. the probe cannot be used in organic solvents.
ChangingtheMembraneSleeveeven with the best of care and proper maintenance, the membrane sleeve will eventually need to be replaced. replacement is simple and straightforward.
1. unscrew the locking cap from the handle.
2. hold the stainless steel sleeve and remove it with the locking cap from the internal electrode, being careful not to bend the electrode assembly when doing so.
3. rinse the internal electrode with distilled water (particularly the tip) and let it soak for at least 15 minutes. be careful not to let water get into the handle. depending on the scale, the current on the Apollo 1000 should go offscale when the electrode is being rinsed. (~25nA in 18MΩ of water)
4. gently dry the electrode with a soft tissue (Kimwipes). be sure to thoroughly dry the flat surface at the tip of the electrode. After drying the current should stabilize fairly quickly to a low value (for example, 0 - 20pA). if this occurs, it is a good indication that the electrode is functioning properly.
5. if the electrode is not clean, repeat steps 3 and 4. if necessary the iso-nop rejuvena-tor (wpi #JUV) can be used to restore sensitivity of an old electrode (contact wpi for assistance).
6. remove the locking cap from the old used sleeve, and gently slide it onto the new replacement sleeve.
7. wet the internal electrode by immersing the tip 1-2cm into iso-hpo-2 electrolyte (wpi #100042). the current will rise rapidly offscale. using the MicroFil™ non-metallic syringe needle (wpi #MF28G67-5) and 1ml plastic syringe (supplied) inject approxi-mately 100ml of electrolyte directly into the new sleeve, starting at the membrane tip and drawing the MicroFil out of the sleeve as it fills. the filling process should be performed slowly enough so as not to create turbulence, which could introduce air bubbles into the electrolyte. the MicroFil supplied should be less than the length of
APOLLO 1000
World PreciSioN iNStrumeNtS 39
the sleeve, so that it will not puncture the delicate membrane at the tip of the sleeve during injection. if the MicroFil is longer than the sleeve it can be cut to the correct length.
8. slowly and smoothly insert the electrode into the sleeve, and screw the locking cap into the handle. the electrode should be observed to press gently against the mem-brane.
9. the current at this time will be high or offscale.
10. suspend the tip of the newly assembled probe in 0.1M pbs buffer solution.
11. After 10-15 minutes the current should no longer be offscale and will gradually de-crease with time. it may take several (up to 2) hours for the sensor current to reach a low stable value, at which time it will be ready for use. see Appendix A, table 6, page 54.
12. if the current observed, after a few minutes in the saline solution, increases dramati-cally or is off scale, then the membrane integrity is not good and a new membrane will have to be fitted. Additional iso-hpo-2 membranes (packages of 4) are available from wpi (wpi #600012).
Storagestore the electrode with its tip immersed in electrolyte solution in the sealed vial provided with the electrode. For long term storage, remove the membrane sleeve, rinse with distilled water and store dry in a cool, dark location. protect the inner electrode by using an old membrane sleeve with the membrane removed or place it inside a suitable box to prevent damage.
APOLLO 1000
40 World PreciSioN iNStrumeNtS
SeT-UP ANd CALIbRATION OF OxygeN SeNSORS
the iso-oxy-2 in combination with Apollo 1000 amperometrically measures the concentration of oxygen in aqueous solutions and can be used short term (2 hours or less) in a gas mixture. the sensor houses a platinum working electrode and a silver counter/reference electrode inside a stainless steel sleeve. A gas-permeable polymer membrane is fitted over the end of the sleeve which allows oxygen to pass while blocking liquids, ions and particulate matter. oxygen diffuses through the membrane and is reduced at the platinum cathode which is held at -0.7V when the instrument is on. this results in an electrical current being generated, the magnitude of which is determined by the rate of diffusion to the electrode which is proportional to the partial pressure of oxygen outside the membrane. thus the current serves as a measure of the partial pressure of oxygen.
the iso-oxy-2 comes ready to use. All the user must do is attach the sensor to the Apollo 1000, set the correct poise and voltage, turn the power on and wait for the current to decay to a stable value (this usually takes several hours). (see Appendix A, table 6, page 54 for polarization time.) the current can be monitored directly on the Apollo 1000. once the current stabilizes the user may then calibrate the electrode.
Initial Set-upplug the oxygen sensor into the input connector on the bottom of the required input channel on the Apollo 1000. using the screwdriver provided, set the poise voltage for nitric oxide to +700mV by adjusting the poise Adjust potentiometer screw on the front panel of the Apollo 1000. set appropriate gain; for the iso-oxy-2, the 100 nA range is appropriate.
NOTE: the polarity is reversed on the iso-0xy-2 sensor so that the Apollo 1000 must be set to +700mV even though the actual poise voltage is -700mV.
For accurate results the sensor probe must be calibrated at the same temperature expected at the measurement site.
After initially connecting the oxygen sensor to the Apollo 1000 in on position, the probe current will be high. the current will decrease and settle to a stable value after a period of time, typically two to four hours. see Appendix A, table 6, page 54 for expected current values.
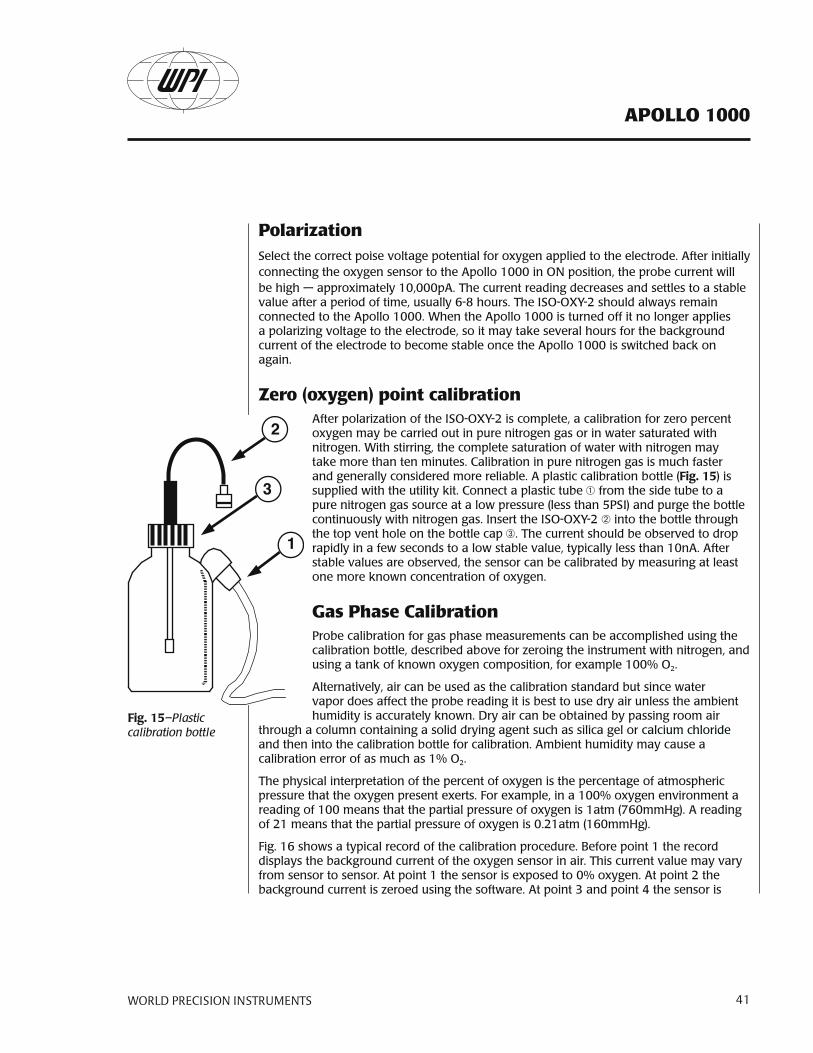
APOLLO 1000
World PreciSioN iNStrumeNtS 41
Polarizationselect the correct poise voltage potential for oxygen applied to the electrode. After initially connecting the oxygen sensor to the Apollo 1000 in on position, the probe current will be high — approximately 10,000pA. the current reading decreases and settles to a stable value after a period of time, usually 6-8 hours. the iso-oxy-2 should always remain connected to the Apollo 1000. when the Apollo 1000 is turned off it no longer applies a polarizing voltage to the electrode, so it may take several hours for the background current of the electrode to become stable once the Apollo 1000 is switched back on again.
Zero (oxygen) point calibrationAfter polarization of the iso-oxy-2 is complete, a calibration for zero percent oxygen may be carried out in pure nitrogen gas or in water saturated with nitrogen. with stirring, the complete saturation of water with nitrogen may take more than ten minutes. calibration in pure nitrogen gas is much faster and generally considered more reliable. A plastic calibration bottle (Fig.15) is supplied with the utility kit. connect a plastic tube ➀ from the side tube to a pure nitrogen gas source at a low pressure (less than 5psi) and purge the bottle continuously with nitrogen gas. insert the iso-oxy-2 ➁ into the bottle through the top vent hole on the bottle cap ➂. the current should be observed to drop rapidly in a few seconds to a low stable value, typically less than 10nA. After stable values are observed, the sensor can be calibrated by measuring at least one more known concentration of oxygen.
gas Phase Calibrationprobe calibration for gas phase measurements can be accomplished using the calibration bottle, described above for zeroing the instrument with nitrogen, and using a tank of known oxygen composition, for example 100% o2.
Alternatively, air can be used as the calibration standard but since water vapor does affect the probe reading it is best to use dry air unless the ambient humidity is accurately known. dry air can be obtained by passing room air
through a column containing a solid drying agent such as silica gel or calcium chloride and then into the calibration bottle for calibration. Ambient humidity may cause a calibration error of as much as 1% o2.
the physical interpretation of the percent of oxygen is the percentage of atmospheric pressure that the oxygen present exerts. For example, in a 100% oxygen environment a reading of 100 means that the partial pressure of oxygen is 1atm (760mmhg). A reading of 21 means that the partial pressure of oxygen is 0.21atm (160mmhg).
Fig. 16 shows a typical record of the calibration procedure. before point 1 the record displays the background current of the oxygen sensor in air. this current value may vary from sensor to sensor. At point 1 the sensor is exposed to 0% oxygen. At point 2 the background current is zeroed using the software. At point 3 and point 4 the sensor is
Fig.15–Plastic calibration bottle
2
3
1
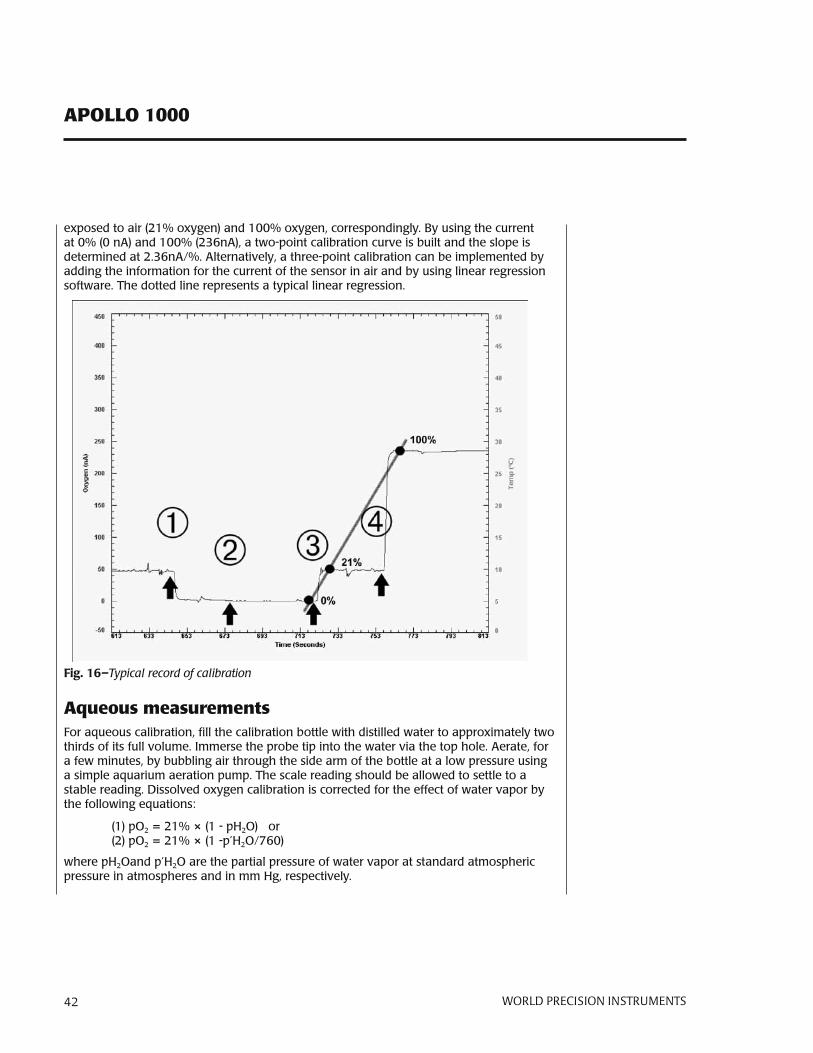
APOLLO 1000
42 World PreciSioN iNStrumeNtS
exposed to air (21% oxygen) and 100% oxygen, correspondingly. by using the current at 0% (0 nA) and 100% (236nA), a two-point calibration curve is built and the slope is determined at 2.36nA/%. Alternatively, a three-point calibration can be implemented by adding the information for the current of the sensor in air and by using linear regression software. the dotted line represents a typical linear regression.
Fig.16–Typical record of calibration
Aqueous measurementsFor aqueous calibration, fill the calibration bottle with distilled water to approximately two thirds of its full volume. immerse the probe tip into the water via the top hole. Aerate, for a few minutes, by bubbling air through the side arm of the bottle at a low pressure using a simple aquarium aeration pump. the scale reading should be allowed to settle to a stable reading. dissolved oxygen calibration is corrected for the effect of water vapor by the following equations:
(1) po2 = 21% × (1 - ph2o) or(2) po2 = 21% × (1 -p’h2o/760)
where ph2oand p’h2o are the partial pressure of water vapor at standard atmospheric pressure in atmospheres and in mm hg, respectively.
APOLLO 1000
World PreciSioN iNStrumeNtS 43
For example, the ph2o in water- saturated air at 24°c is 22 mm hg (see Appendix A, table 4). therefore the po2 = 21% x (1 - 22/760) = 20.4%. note that for purposes of oxygen measurements liquid water is considered to be “water-saturated air”.
you may obtain zero % oxygen concentration by adding several mg na2s2o3 per 20ml of solution. Alternatively, the solution may be bubbled with nitrogen gas for 15-20 minutes.
to determine the dissolved oxygen concentration in parts per million (ppm), see Appendix A, table 1, page 50. this table gives the solubility of oxygen in water at different temperatures at an ambient pressure of 1 atm. if the solution temperature is 25°c, for example, the oxygen concentration when the probe is in water is 8.4ppm. you do not need to correct for the water-vapor effect for a ppm calibration since the values in table 1 are obtained in “water-saturated air” at an atmospheric pressure of 760mmhg.
the unit ppm is equivalent to mg/l. this is illustrated as follows. the solubility of oxygen in water at 0° according to the Merck index is 4.889ml per 100ml.
using the ideal gas law we can calculate the number of moles of oxygen present in 100ml:
pV = nrt n = p*V/r*t n = (0.21)*(4.889x10-3) / (0.08206)*(273) n = 45.8 x 10⁻⁶ moles
where p is the partial pressure of oxygen, V is the volume of oxygen, n is the number of moles of oxygen, r is the universal gas constant, and t is the absolute temperature. From the number of moles of oxygen we can calculate the number of grams of oxygen:
45.8 x 10-6 mol * 32g/mol 1.46 x 10⁻³ g
therefore there will be (1.46 x 10⁻³g /0.1l) 14.6mg of oxygen per liter. since 1 l of water has a mass of 1000 g, and there are 1 million mg in 1000g, the concentration in ppm shall be:
(14.6 x 10⁻³g/l) / (1000g/l) = 14.6ppm
NOTE:this value corresponds to that given in Appendix A, table 1, .
For accurate results the temperature of the water sample and the fluid being tested should be identical, and they should be continuously stirred using a magnetic stirrer.
when measuring fluid samples for dissolved oxygen, periodically rinse the exterior of the probe with distilled water, blot the membrane dry and recheck the electrode’s calibration as described above.
APOLLO 1000
44 World PreciSioN iNStrumeNtS
Creating a calibration curveto create a calibration plot, the user measures the current (nA) of the sensor at various concentrations of oxygen. the calibration is usually either a two-point or three-point calibration, and typically includes measurements at 0% oxygen, air (21% oxygen) or 100% oxygen. regardless of which calibration points are chosen, the corresponding correction for water vapor in case of aqueous measurements should be applied. (see Appendix A, table 4.)
Calibration method for O2 measurements in living tissue or bloodthe Apollo 1000 and iso-oxy-2 probe may be used in applications involving o2 measurements in vitro or in vivo in living tissue or fluids such as blood. you may still use the calibration procedure in this manual for these measurements since a membrane-covered amperometric oxygen electrode will always measure oxygen activity, not concentration. Although it is normal to think in terms of dissolved oxygen concentration, it is actually more appropriate to define oxygen in solution in terms of activity, since this
is the “effective concentration”. For example, in distilled water the activity coefficient, gc, is close to unity; but in solutions with high salt concentration the activity coefficient is different from unity and concentration and activity of dissolved oxygen are no longer equal: the oxygen concentration falling with salt concentration increase, while activity remains constant. For a membrane-covered oxygen electrode this is an important effect since an oxygen detector only responds to the difference in activity across the membrane rather than the concentration difference. so in samples containing an electrolyte, while the oxygen concentration falls with increasing salt concentration the probe current remains constant.
thus, if it is necessary to have a measure of dissolved oxygen in terms of concentration, then the calibration is somewhat more complicated since the relationship between activity and concentration may change with the change of salt concentration in the samples. the activity coefficient, a ratio of the activity to the concentration, generally cannot be predicted and one must rely on empirical determinations since the compositions of living fluids such as blood are extremely complicated. one may directly use the fluid to be tested as a “solvent” to prepare a calibration standard. Alternatively, one may use the bunsen absorption coefficient (a), to calculate oxygen concentration in blood in terms of the results with the oxygen electrode. the equation is:
€
C = amolar volume × K
× (Pt −PH2O ) ×PO2
where K is a conversion factor depending on the unit of pressure chosen (1 per atm), pt and ph2o are the total pressure of gas and the partial pressures of water respectively. po2 is the partial pressure of oxygen in blood obtained from the measurements with the oxygen electrode. bunsen coefficients for solubility of oxygen in plasma and blood can be found in Appendix A, table 5, page 53. however, it is very important to calibrate at the same temperature as that of the measurement site.
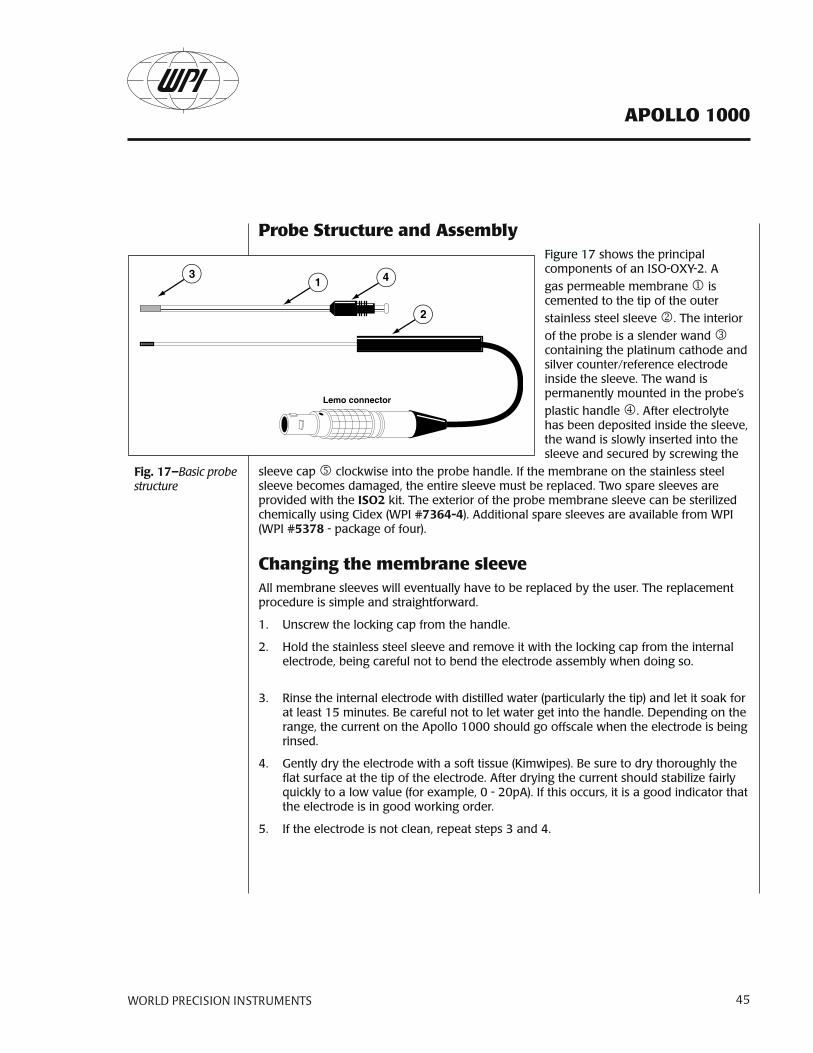
APOLLO 1000
World PreciSioN iNStrumeNtS 45
Probe Structure and AssemblyFigure 17 shows the principal components of an iso-oxy-2. A
gas permeable membrane j is cemented to the tip of the outer
stainless steel sleeve k. the interior
of the probe is a slender wand l containing the platinum cathode and silver counter/reference electrode inside the sleeve. the wand is permanently mounted in the probe’s
plastic handle m. After electrolyte has been deposited inside the sleeve, the wand is slowly inserted into the sleeve and secured by screwing the
sleeve cap n clockwise into the probe handle. if the membrane on the stainless steel sleeve becomes damaged, the entire sleeve must be replaced. two spare sleeves are provided with the ISO2 kit. the exterior of the probe membrane sleeve can be sterilized chemically using cidex (wpi #7364-4). Additional spare sleeves are available from wpi (wpi #5378 - package of four).
Changing the membrane sleeveAll membrane sleeves will eventually have to be replaced by the user. the replacement procedure is simple and straightforward.
1. unscrew the locking cap from the handle.
2. hold the stainless steel sleeve and remove it with the locking cap from the internal electrode, being careful not to bend the electrode assembly when doing so.
3. rinse the internal electrode with distilled water (particularly the tip) and let it soak for at least 15 minutes. be careful not to let water get into the handle. depending on the range, the current on the Apollo 1000 should go offscale when the electrode is being rinsed.
4. gently dry the electrode with a soft tissue (Kimwipes). be sure to dry thoroughly the flat surface at the tip of the electrode. After drying the current should stabilize fairly quickly to a low value (for example, 0 - 20pA). if this occurs, it is a good indicator that the electrode is in good working order.
5. if the electrode is not clean, repeat steps 3 and 4.
1
2
3
Lemo connector
4
Fig.17–Basic probe structure
APOLLO 1000
46 World PreciSioN iNStrumeNtS
6. remove the locking cap from the old used sleeve, and gently slide it onto the new replacement sleeve.
7. dip the internal electrode 1-2cm into the electrolyte , the current should go offscale during this. using the MicroFil™ non-metallic syringe needle (wpi #MF28G67-5) and 1ml plastic syringe (supplied) inject approximately 100ul of electrolyte directly into the new sleeve. the MicroFil supplied should be less than the length of the sleeve, so that it will not puncture the delicate membrane at the tip of the sleeve during injec-tion. if the MicroFil is longer than the sleeve it can be cut to the correct length.
8. slowly and smoothly insert the electrode into the sleeve, and screw the locking cap into the handle. the electrode should be observed to press gently against the mem-brane.
9. the current at this time will be high or offscale.
10. suspend the tip of the new assembled probe in 0.1M pbs buffer solution.
11. After 10-15 minutes the current should no longer be offscale and will gradually decrease with time. it may take several hours for the sensor current to reach a low stable value, at which time it will be ready for use.
12. if the current observed, after a few minutes in the saline solution, increases dramati-cally or is offscale, then the membrane integrity is not good and a new membrane will have to be fitted.
13. when the iso-oxy-2 is not being used it should be stored with the tip suspended in distilled water. For long term storage, remove the membrane sleeve and rinse and store the electrode dry. An old sleeve with the membrane removed can be used to protect the delicate inner electrode.
Clean the Membranethe membrane sleeve itself requires very little maintenance. the primary concern is to avoid damaging the membrane and to keep it as clean as possible. After each use, the membrane should be cleaned by suspending the tip in distilled water for 20-30 minutes to dissolve salts and remove particles ,which may have accumulated on the membrane. if the probe was used in a protein rich solution the tip should first be soaked in a protease solution for several minutes to remove protein build-up, and then in distilled water. enzymatic detergent (for example, enzol, wpi #7363-4) can also be used. the membrane sleeves can also be sterilized chemically using an appropriate disinfectant (for example, cidex, wpi #7364). Accumulated organic matter can be removed by briefly immersing the tip in a 0.1 M hcl or 0.1 M naoh solution (at times both may be necessary) for 10 seconds. A good indication of a dirty membrane sleeve is a sluggish response or an unusually low sensitivity. if these problems are not rectified by the above cleaning procedures then the membrane sleeve should be replaced. the probe cannot be used in organic solvents.
APOLLO 1000
World PreciSioN iNStrumeNtS 47
Care of the electrodethe reduction of oxygen and other trace impurities causes a decrease in the surface activity of the working electrode. this phenomenon is referred to as “poisoning”, and over time has the effect of gradually reducing the electrode’s capability to generate a sufficient redox current. As such, it is recommended to use the following guidelines to maximize the life of the electrode:
if the oxygen electrode is being used on a daily basis, it’s recommended that the instrument be left on continuously with the electrode connected to maintain polarization. however; if the electrode is not to be used for a period of more than 2-3 days, it’s recommended that the electrode be disconnected from the instrument, and stored with the tip immersed in distilled water. this practice will reduce the possibility of a gradual reduction of electrode surface activity (as discussed above) under long term polarization. if the electrode will not be used for a long period of time (several months), refer to the “storage” section below.
handling Precautionwhen passing the o2 probe through small holes, gaskets or o-rings, allow sufficient clearance so that the probe tip is not damaged by abrasion. the probe tip should slide through openings easily before sealing the probe shaft to assure an air-tight fit.
StorageFor long term storage (several months) unscrew and remove the sleeve from the probe handle, rinse the electrode tip and the sleeve with distilled water. when both are dry, replace sleeve to protect probe wand but do not screw the sleeve completely onto the handle.
APOLLO 1000
48 World PreciSioN iNStrumeNtS
SPeCIFICATIONS
Temperature device: 1000Ω rtd Amplifier: linearized,range: ±128 °cAccuracy ±0.05 °cAnalog output: 32 °c = 1VAnalog output max current: ±50mAdigital resolution 0.0039 °c
Poise Voltagerange: ±2Vdigital resolution: 62.5µVAnalog output: x2 AmplificationAnalog output max current: +/-15mA
Transimpedance Amplifier, Currentbias current 250fAFull scale ranges: ±1µA, ±100nA, ±10nA, ±5nAdigital resolution: 31.25pA, 3.125pA, 312.5fA, 156.25fAoffset adjustment: ±10 nA poise and range dependent( see offset section)Filters: low pass Filters F0: 40 hz 1st order, F1: 40 hz 4th order, F2: 4 hz 4th order, F3:
0.4hz 4th order notch Filter: twin “t” Active notch Filter @ 0.2hzAnalog output: 4V = selected rangeAnalog output max current: Filters off: +5mA/-12mA, Any filter on: ±50mA
Voltage Amplifierrange: ±2Vinput impedance 1015Ωdigital resolution: 62.5µVoffset adjustment: ±950mVFilters: F0: 30khz 1st order,- F1: 40 hz 4th order,- F2: 4 hz 4th order,
F3: 0.4 hz 4th orderAnalog output x 2 AmplificationAnalog output max current: Filters off: ± 15mA, Any filter on: ± 50mA
APOLLO 1000
World PreciSioN iNStrumeNtS 49
Power Supplyinternal batteries: 10x 1.2V 1300mAhestimated operating time: 120 hours +external Ac Adapter: 12V Ac @ 1 AmpMax charging time: 234 minutes (controlled internally)
digital Circuitry128x64 graphic lcd with green led backlight8-bit Microcontroller @ 4Mhz
16-bit Analog to digital converter
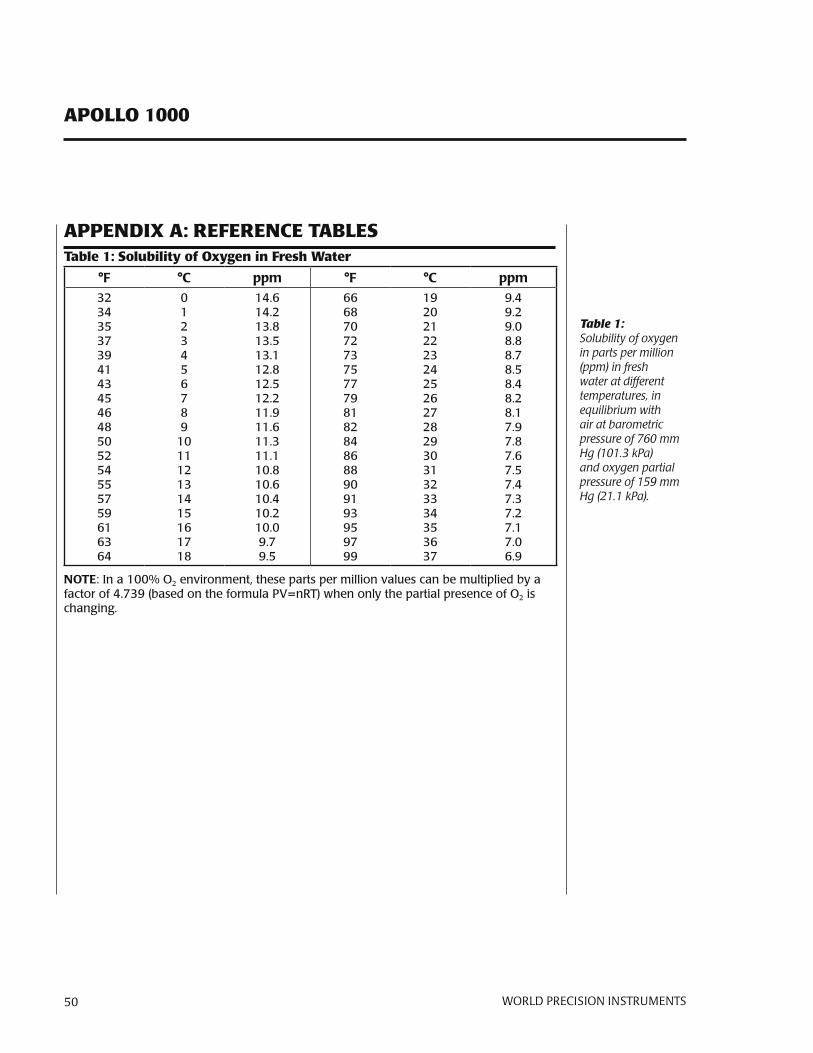
APOLLO 1000
50 World PreciSioN iNStrumeNtS
APPeNdIx A: ReFeReNCe TAbLeSTable 1: Solubility of Oxygen in Fresh Water
°F °C ppm °F °C ppm32343537394143454648505254555759616364
0123456789
101112131415161718
14.614.213.813.513.112.812.512.211.911.611.311.110.810.610.410.210.09.79.5
66687072737577798182848688909193959799
19202122232425262728293031323334353637
9.49.29.08.88.78.58.48.28.17.97.87.67.57.47.37.27.17.06.9
NOTE: in a 100% o2 environment, these parts per million values can be multiplied by a factor of 4.739 (based on the formula pV=nrt) when only the partial presence of o2 is changing.
Table 1:Solubility of oxygen in parts per million (ppm) in fresh water at different temperatures, in equilibrium with air at barometric pressure of 760 mm Hg (101.3 kPa) and oxygen partial pressure of 159 mm Hg (21.1 kPa).
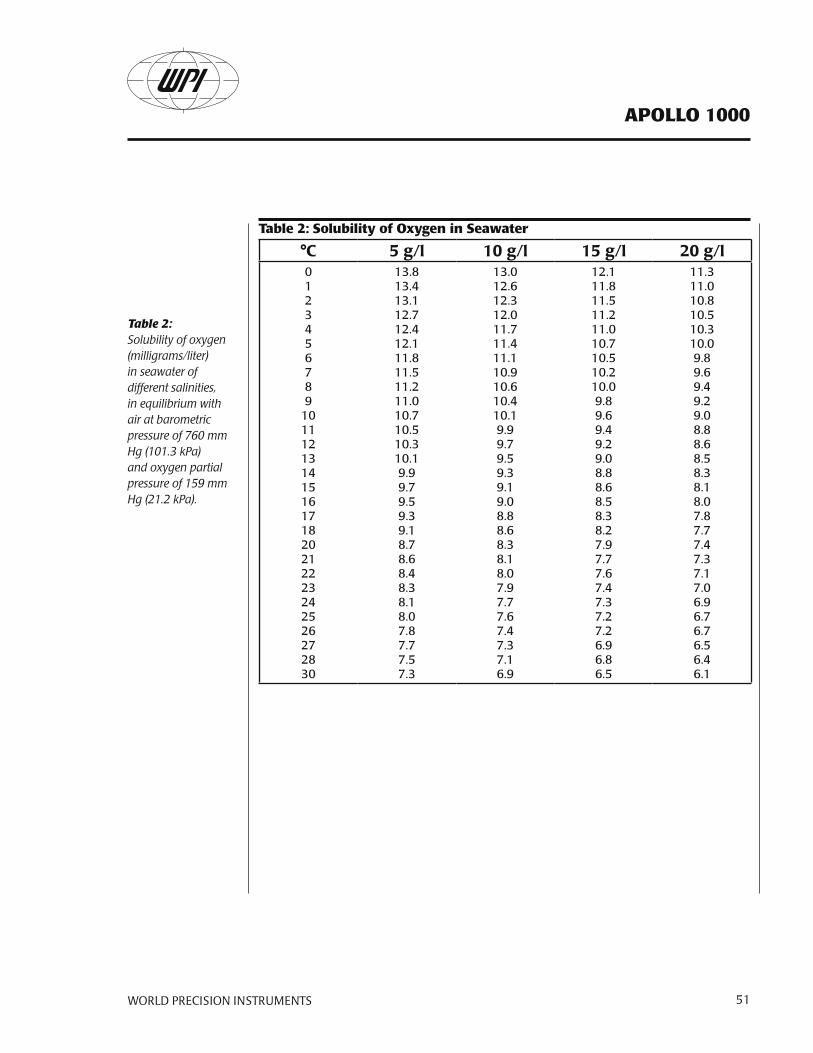
APOLLO 1000
World PreciSioN iNStrumeNtS 51
Table 2: Solubility of Oxygen in Seawater
°C 5g/l 10g/l 15g/l 20g/l0123456789
10111213141516171820212223242526272830
13.813.413.112.712.412.111.811.511.211.010.710.510.310.19.99.79.59.39.18.78.68.48.38.18.07.87.77.57.3
13.012.612.312.011.711.411.110.910.610.410.19.99.79.59.39.19.08.88.68.38.18.07.97.77.67.47.37.16.9
12.111.811.511.211.010.710.510.210.09.89.69.49.29.08.88.68.58.38.27.97.77.67.47.37.27.26.96.86.5
11.311.010.810.510.310.09.89.69.49.29.08.88.68.58.38.18.07.87.77.47.37.17.06.96.76.76.56.46.1
Table 2:Solubility of oxygen (milligrams/liter) in seawater of different salinities, in equilibrium with air at barometric pressure of 760 mm Hg (101.3 kPa) and oxygen partial pressure of 159 mm Hg (21.2 kPa).
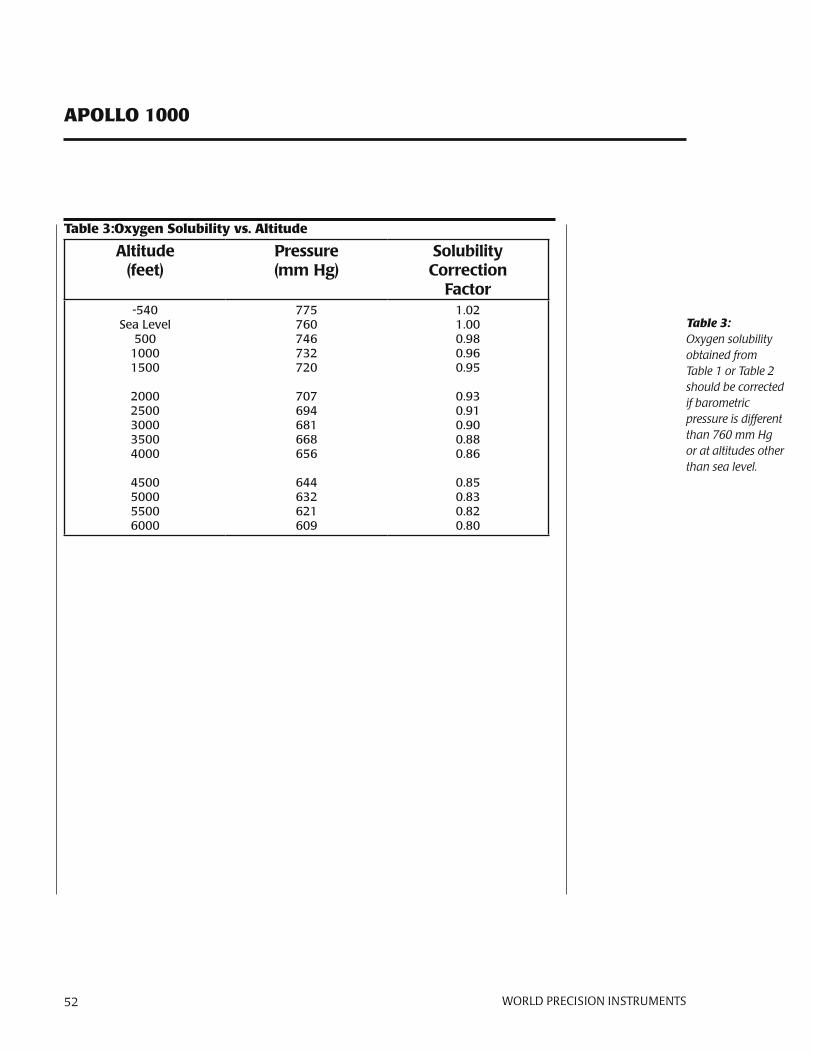
APOLLO 1000
52 World PreciSioN iNStrumeNtS
Table 3:Oxygen Solubility vs. Altitude
Altitude(feet)
Pressure(mmHg)
SolubilityCorrection
Factor-540
sea level500
10001500
20002500300035004000
4500500055006000
775760746732720
707694681668656
644632621609
1.021.000.980.960.95
0.930.910.900.880.86
0.850.830.820.80
Table 3:Oxygen solubility obtained fromTable 1 or Table 2 should be corrected if barometric pressure is different than 760 mm Hg or at altitudes other than sea level.
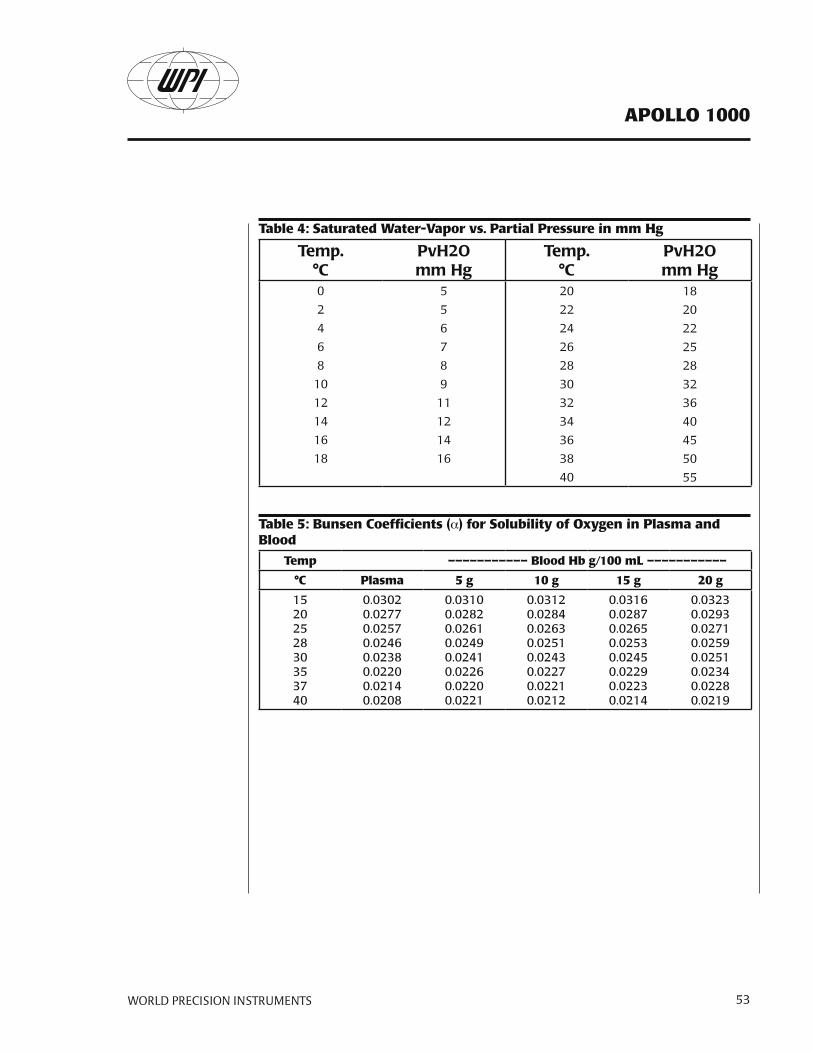
APOLLO 1000
World PreciSioN iNStrumeNtS 53
Table 4: Saturated Water-Vapor vs. Partial Pressure in mm hg
Temp.°C
PvH2OmmHg
Temp.°C
PvH2OmmHg
0
2
4
6
8
10
12
14
16
18
5
5
6
7
8
9
11
12
14
16
20
22
24
26
28
30
32
34
36
38
40
18
20
22
25
28
32
36
40
45
50
55
Table 5: bunsen Coefficients (a) for Solubility of Oxygen in Plasma and blood
Temp ––––––––––– blood hb g/100 mL –––––––––––
°C Plasma 5 g 10 g 15 g 20 g
1520252830353740
0.03020.02770.02570.02460.02380.02200.02140.0208
0.03100.02820.02610.02490.02410.02260.02200.0221
0.03120.02840.02630.02510.02430.02270.02210.0212
0.03160.02870.02650.02530.02450.02290.02230.0214
0.03230.02930.02710.02590.02510.02340.02280.0219
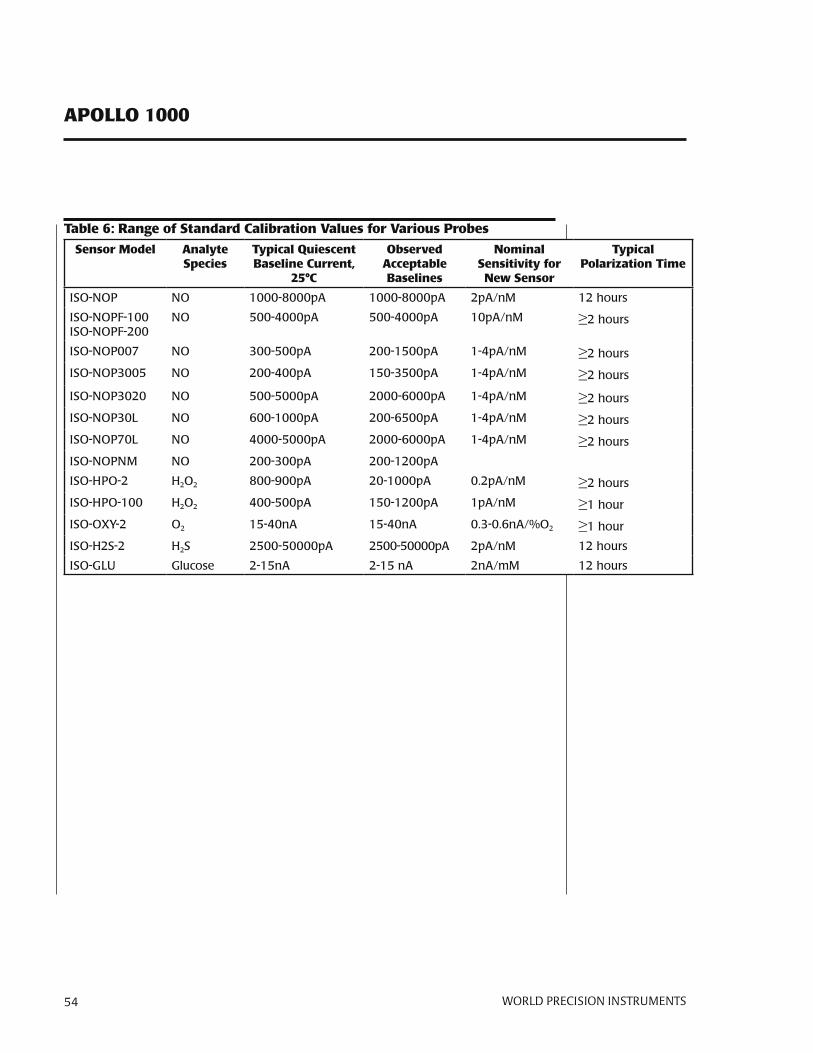
APOLLO 1000
54 World PreciSioN iNStrumeNtS
Table 6: Range of Standard Calibration Values for Various Probes
Sensor Model Analyte Species
Typical Quiescent baseline Current,
25°C
Observed Acceptable baselines
Nominal Sensitivity for New Sensor
Typical Polarization Time
iso-nop no 1000-8000pA 1000-8000pA 2pA/nM 12 hours
iso-nopF-100iso-nopF-200
no 500-4000pA 500-4000pA 10pA/nM ≥2 hours
iso-nop007 no 300-500pA 200-1500pA 1-4pA/nM ≥2 hours
iso-nop3005 no 200-400pA 150-3500pA 1-4pA/nM ≥2 hours
iso-nop3020 no 500-5000pA 2000-6000pA 1-4pA/nM ≥2 hours
iso-nop30l no 600-1000pA 200-6500pA 1-4pA/nM ≥2 hours
iso-nop70l no 4000-5000pA 2000-6000pA 1-4pA/nM ≥2 hours
iso-nopnM no 200-300pA 200-1200pA
iso-hpo-2 h2o2 800-900pA 20-1000pA 0.2pA/nM ≥2 hours
iso-hpo-100 h2o2 400-500pA 150-1200pA 1pA/nM ≥1 hour
iso-oxy-2 o2 15-40nA 15-40nA 0.3-0.6nA/%o2 ≥1 hour
iso-h2s-2 h2s 2500-50000pA 2500-50000pA 2pA/nM 12 hours
iso-glu glucose 2-15nA 2-15 nA 2nA/mM 12 hours
APOLLO 1000
World PreciSioN iNStrumeNtS 55
APPeNdIx b: STANdARd SOLUTIONS
this appendix describes how to make standard solutions used in procedures in this manual.
Standard 1mM h2O2 Solutionhydrogen peroxide solution is commercially available and is commonly sold with a stabilizer compound in solution. usually these solutions are within a known concentration range (for example, 2-4% h202). there are many published procedures for standardizing h202 solutions, such as the titration method using potassium permanganate. the h202 sensor can detect low nM concentrations, so, wpi recommends the following procedure.
1. weigh 67.5mg Acetanilide (sigma-Aldrich 397237) and dissolve it into 250 ml of dh2o in a volumetric flask.
2. remove 1ml of this solution and put it in a clean container.
3. Add 231ml of 2-4% h2o2 (sigma-Aldrich 323381) to the flask.
4. then, use the removed 1ml of solution from step 2 to dilute the solution in the flask to exactly 250ml again.
5. store this standard solution in an amber bottle, if available, or alternatively, wrap aluminum foil around the bottle to limit light intrusion. this solution should be refrigerated.
200mL of 0.1M PbS buffer Solutiondissolve 1 sigma tablet (sigma-Aldrich p4417-100tAb) into 200 ml dho.
100mM Standard SNAP SolutionsnAp is a green crystalline compound that is sold in 25mg, 50mg and 100mg vials (wpi # snAp25, snAp50, snAp100). both the crystalline form and the liquid solution of snAp are photo-sensitive and tend to degrade over time. wrap the vial of snAp compound in aluminum foil and store it in the freezer to slow its degradation. similarly, store the bottle of snAp solution in an amber bottle or wrap it with aluminum foil and store it in the refrigerator.
NOTE: the decomposition of snAp at low temperature, in the dark and in the absence of trace metal ions proceeds slowly because of the edtA (a chelating reagent).
APOLLO 1000
56 World PreciSioN iNStrumeNtS
wpi technicians recommend making fresh standard snAp solution daily to ensure accurate calibration of no sensors.
to make a 100mM solution of snAp:
1. Accurately weigh out 5.0mg edtA (a preservative) and place it in a clean, dry bottle that will hold at least 250ml.
2. use a clean, dry 250ml volumetric flask to accurately measure 250ml of hplc pure water (hplc grade, sigma).
TIP: if your research demands an oxygen-free sample, you can de-oxygenate this solution by purging it with pure nitrogen or argon gas for 15 minutes.
3. pour the water into the bottle with edtA. replace the cap and shake it for a few sec-onds to dissolve the edtA. it dissolves rapidly.
4. Accurately weight out 5.6mg of crushed, crystalline snAp.
TIP: crush any clumps of snAp powder with a clean instrument like a glass stirring rod, a popsicle stick or a tooth pick. if you prefer, place the 5.6mg snAp on a small piece of filter paper, fold the paper in half and rub it gently between your fingers to break up any clumps. be careful not to spill any of the compound.
5. Add the 5.6mg snAp to the edtA solution. Verify that none of the green snAp com-pound is left on your filter paper or measuring tray. replace the cap and shake it for a few seconds until the green flecks dissolve into solution.
6. store this standard solution in an amber bottle, if available, or alternatively, wrap alu-minum foil around the bottle to limit light intrusion. this solution should be refriger-ated.
the concentration of snAp (f.w.= 220.3) in the stock solution is calculated as follows:
[c] = [A•w/(M•V)]1000 [c] = concentration of snAp (µM)A = purity of snAp M = formula weight of snAp (220.3g/mol)w = weight of snAp (mg)V = volume of the solution (l)
if snAp purity is 98.5%, the concentration of standard snAp stock solution describe above is:
[c] = [0.985 x 5.6mg/(220.3g/mol x 0.25l)] x 1000 = 100.1 µM
NOTE:the purity of snAp used is extremely important to ensure an accurate calibration. we recommend the use of high grade snAp with minimal purity of 98% or better.
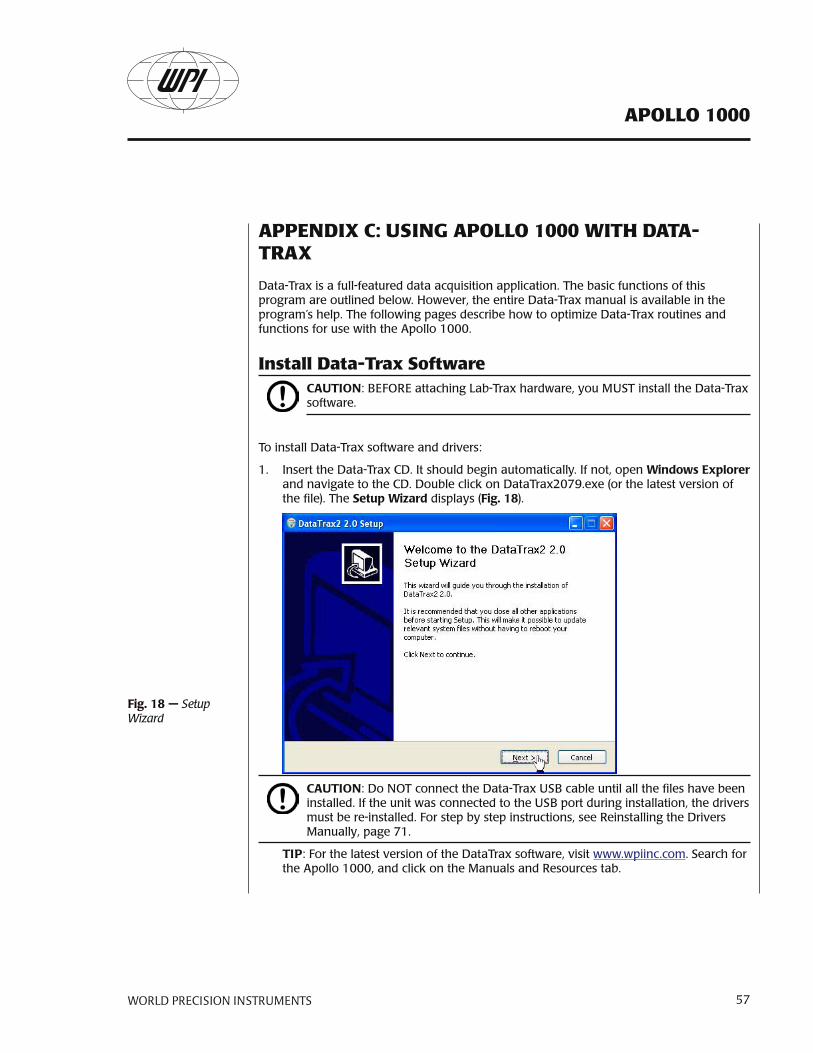
APOLLO 1000
World PreciSioN iNStrumeNtS 57
APPeNdIx C: USINg APOLLO 1000 WITh dATA-TRAx
data-trax is a full-featured data acquisition application. the basic functions of this program are outlined below. however, the entire data-trax manual is available in the program’s help. the following pages describe how to optimize data-trax routines and functions for use with the Apollo 1000.
Install data-Trax SoftwareCAUTION: beFore attaching lab-trax hardware, you Must install the data-trax software.
to install data-trax software and drivers:
1. insert the data-trax cd. it should begin automatically. if not, open WindowsExplorer and navigate to the cd. double click on datatrax2079.exe (or the latest version of the file). the SetupWizard displays (Fig.18).
CAUTION: do not connect the data-trax usb cable until all the files have been installed. if the unit was connected to the usb port during installation, the drivers must be re-installed. For step by step instructions, see reinstalling the drivers Manually, page 71.
TIP: For the latest version of the datatrax software, visit www.wpiinc.com. search for the Apollo 1000, and click on the Manuals and resources tab.
Fig.18— Setup Wizard
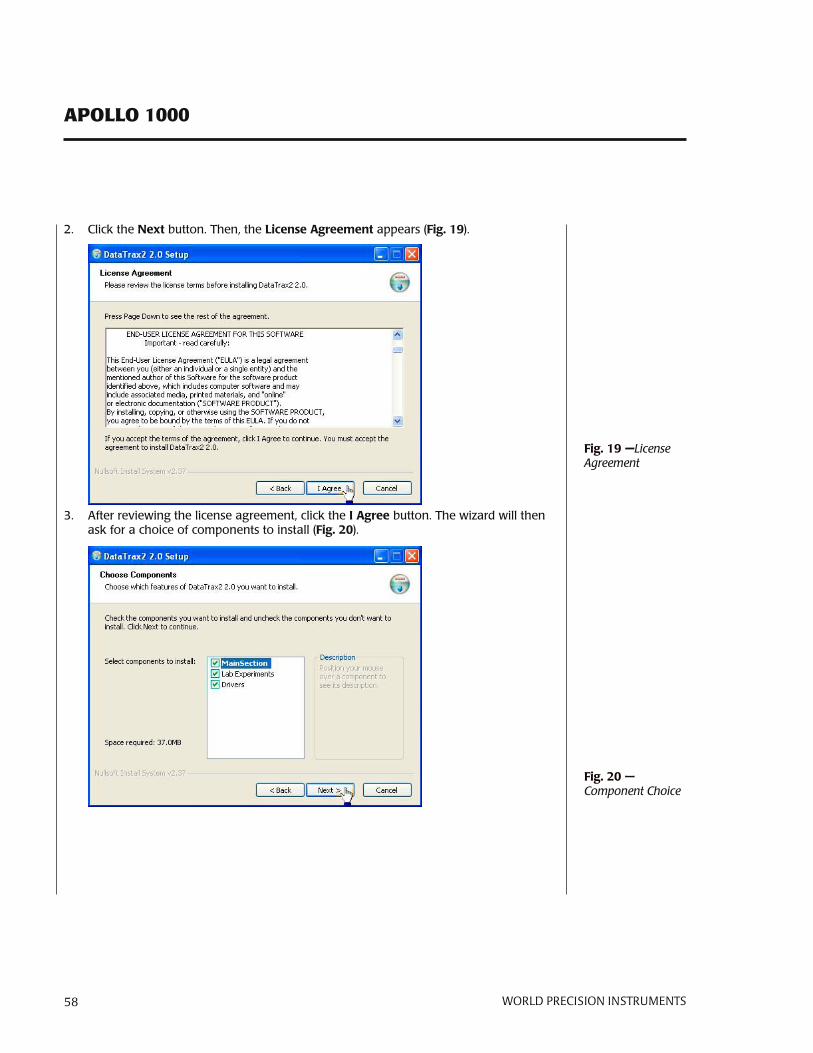
APOLLO 1000
58 World PreciSioN iNStrumeNtS
2. click theNext button. then, the LicenseAgreement appears (Fig.19).
3. After reviewing the license agreement, click the IAgree button. the wizard will then ask for a choice of components to install (Fig.20).
Fig.19 —License Agreement
Fig.20— Component Choice
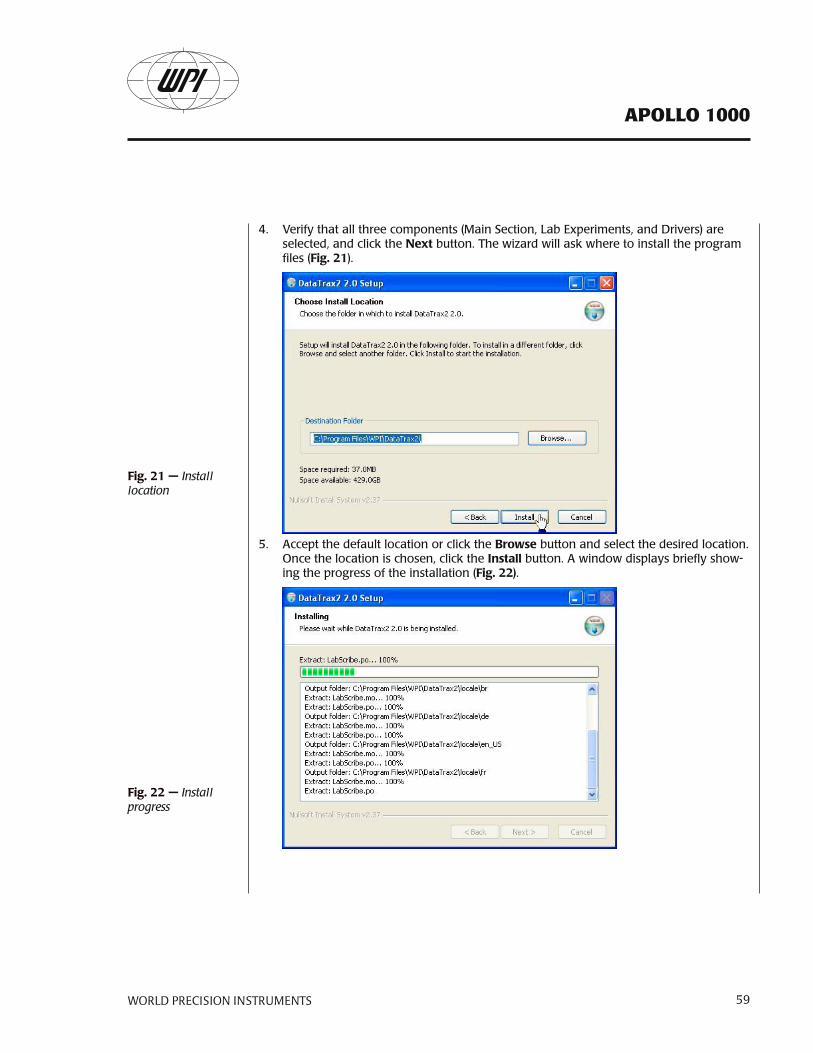
APOLLO 1000
World PreciSioN iNStrumeNtS 59
4. Verify that all three components (Main section, lab experiments, and drivers) are selected, and click the Next button. the wizard will ask where to install the program files (Fig.21).
5. Accept the default location or click the Browse button and select the desired location. once the location is chosen, click the Install button. A window displays briefly show-ing the progress of the installation (Fig.22).
Fig.21—Install location
Fig.22— Install progress
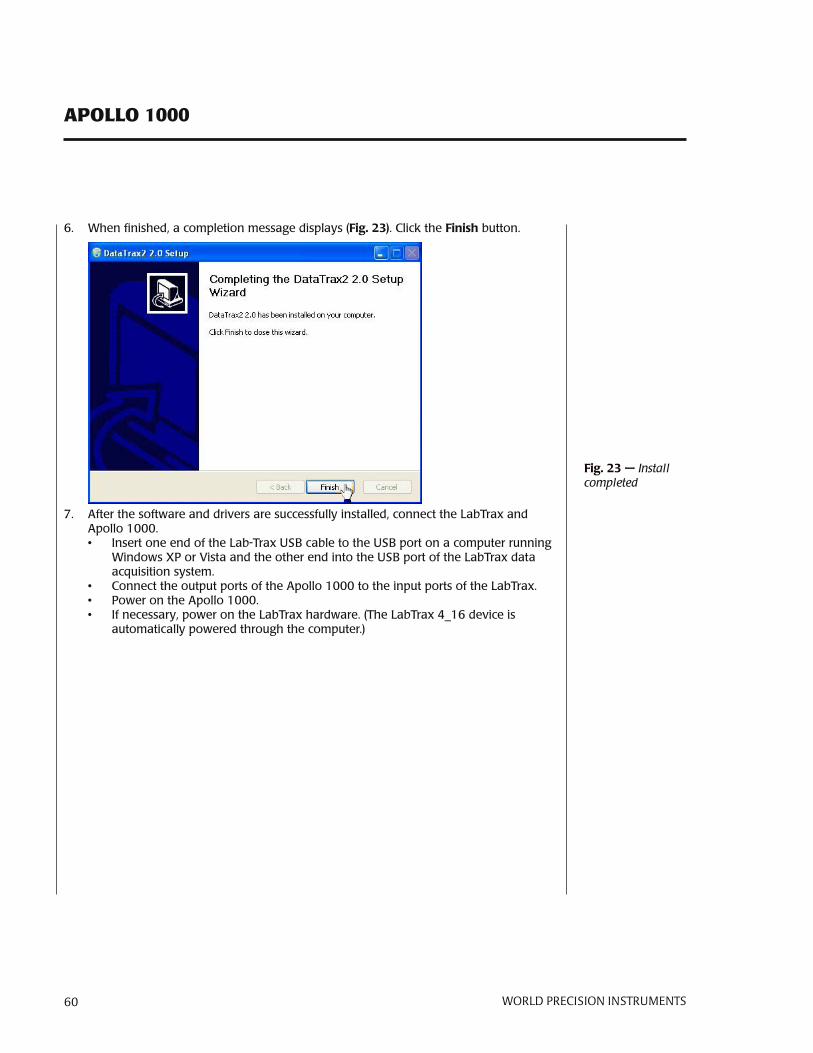
APOLLO 1000
60 World PreciSioN iNStrumeNtS
6. when finished, a completion message displays (Fig.23). click the Finish button.
7. After the software and drivers are successfully installed, connect the labtrax and Apollo 1000. • insert one end of the lab-trax usb cable to the usb port on a computer running
windows xp or Vista and the other end into the usb port of the labtrax data acquisition system.
• connect the output ports of the Apollo 1000 to the input ports of the labtrax. • power on the Apollo 1000.• if necessary, power on the labtrax hardware. (the labtrax 4_16 device is
automatically powered through the computer.)
Fig.23—Install completed
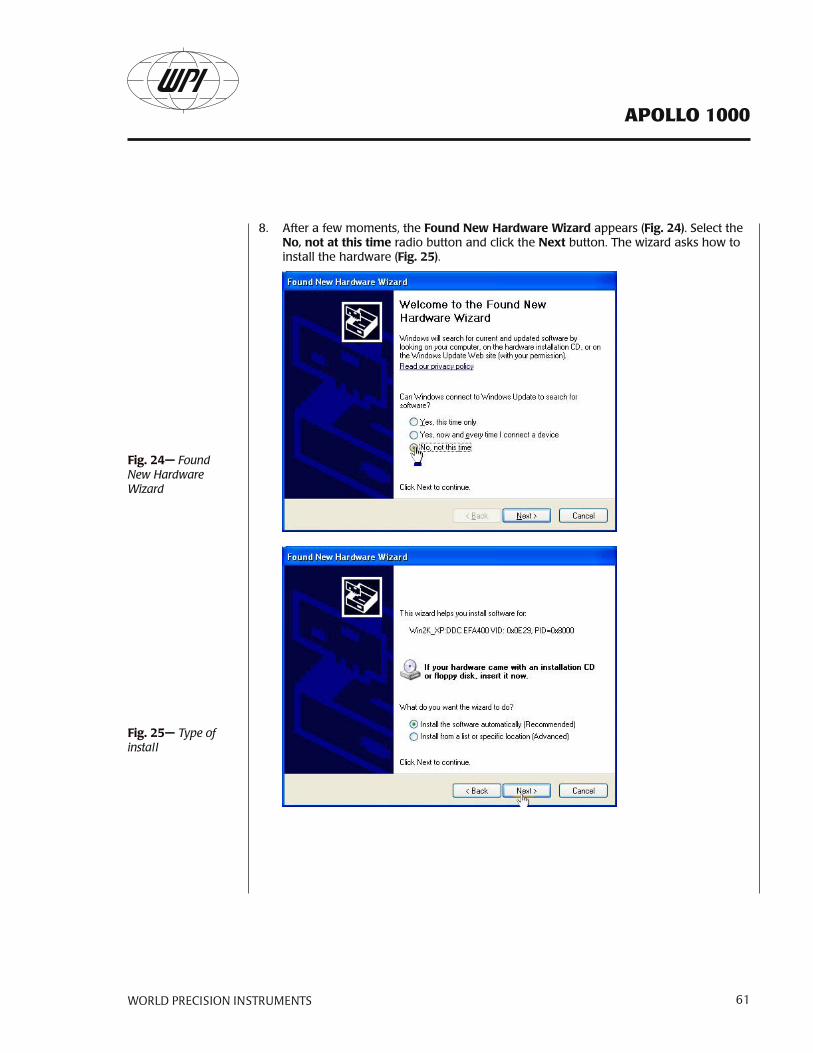
APOLLO 1000
World PreciSioN iNStrumeNtS 61
8. After a few moments, the FoundNewHardwareWizard appears (Fig.24). select the No,notatthistime radio button and click the Next button. the wizard asks how to install the hardware (Fig.25).
Fig.24— Found New Hardware Wizard
Fig.25— Type of install
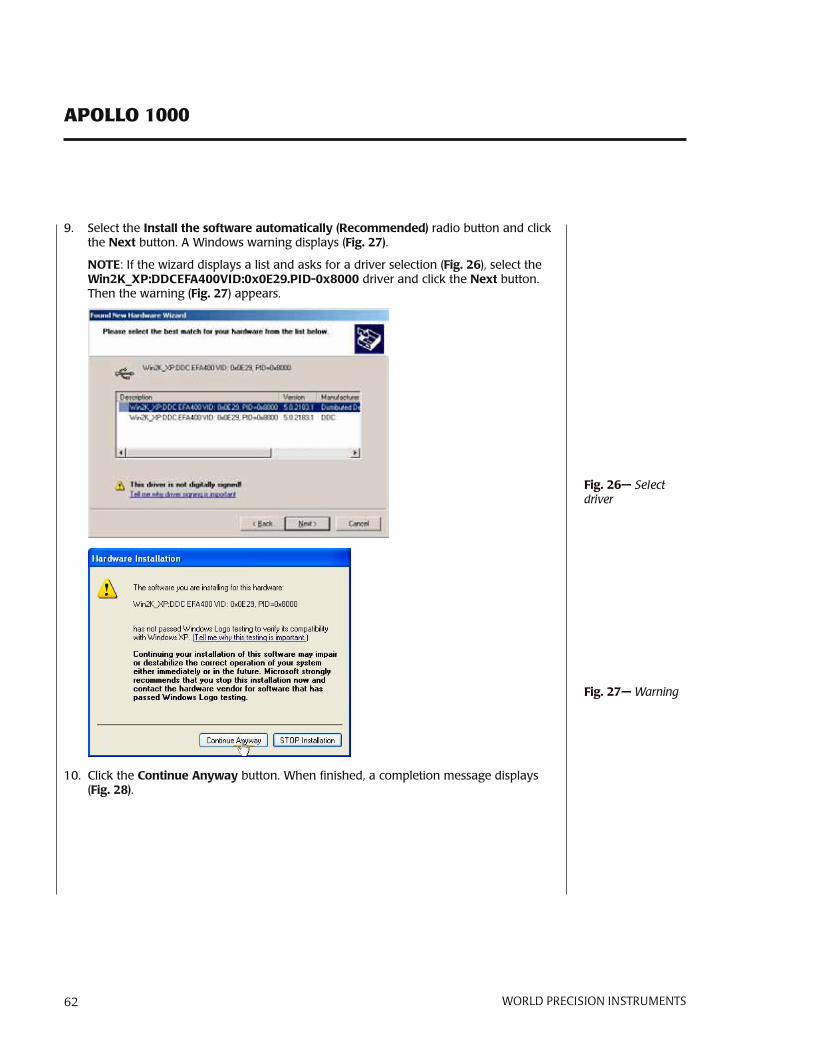
APOLLO 1000
62 World PreciSioN iNStrumeNtS
9. select the Installthesoftwareautomatically(Recommended) radio button and click the Next button. A windows warning displays (Fig.27).
NOTE: if the wizard displays a list and asks for a driver selection (Fig.26), select the Win2K_XP:ddCEFA400VId:0x0E29.PId-0x8000 driver and click the Next button. then the warning (Fig.27) appears.
10. click the ContinueAnyway button. when finished, a completion message displays (Fig.28).
Fig.27— Warning
Fig.26—Select driver
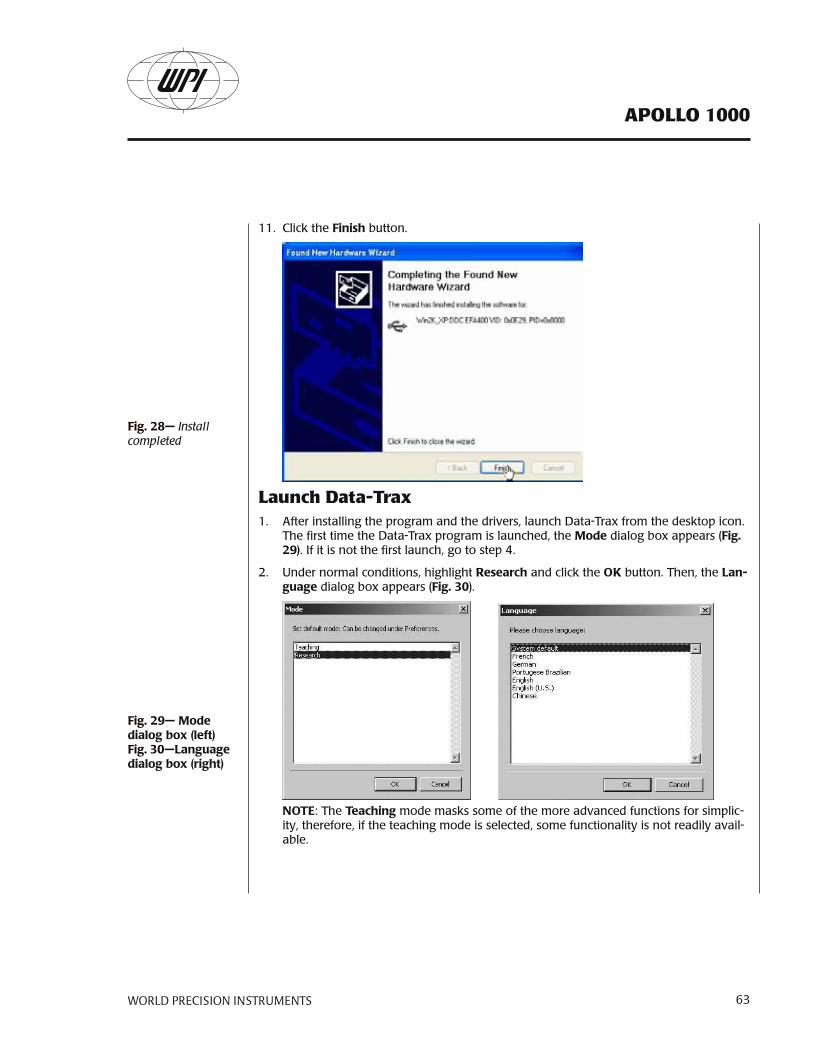
APOLLO 1000
World PreciSioN iNStrumeNtS 63
11. click the Finish button.
Launch data-Trax 1. After installing the program and the drivers, launch data-trax from the desktop icon.
the first time the data-trax program is launched, the Mode dialog box appears (Fig.29). if it is not the first launch, go to step 4.
2. under normal conditions, highlight Research and click the OK button. then, the Lan-guage dialog box appears (Fig.30).
NOTE: the Teaching mode masks some of the more advanced functions for simplic-ity, therefore, if the teaching mode is selected, some functionality is not readily avail-able.
Fig.28— Install completed
Fig.29—Modedialogbox(left)Fig.30—Languagedialogbox(right)
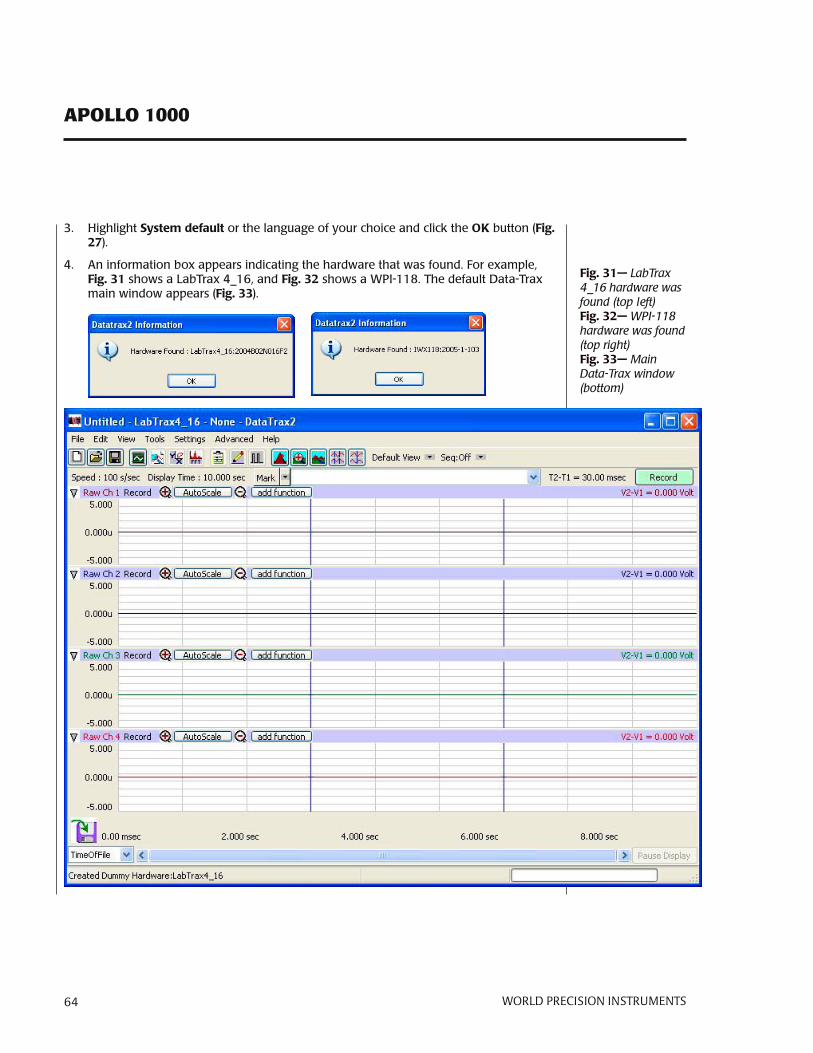
APOLLO 1000
64 World PreciSioN iNStrumeNtS
3. highlight Systemdefault or the language of your choice and click the OK button (Fig.27).
4. An information box appears indicating the hardware that was found. For example, Fig.31 shows a labtrax 4_16, and Fig.32 shows a wpi-118. the default data-trax main window appears (Fig.33).
Fig.31— LabTrax 4_16 hardware was found (top left)Fig.32— WPI-118 hardware was found (top right)Fig.33—Main Data-Trax window (bottom)
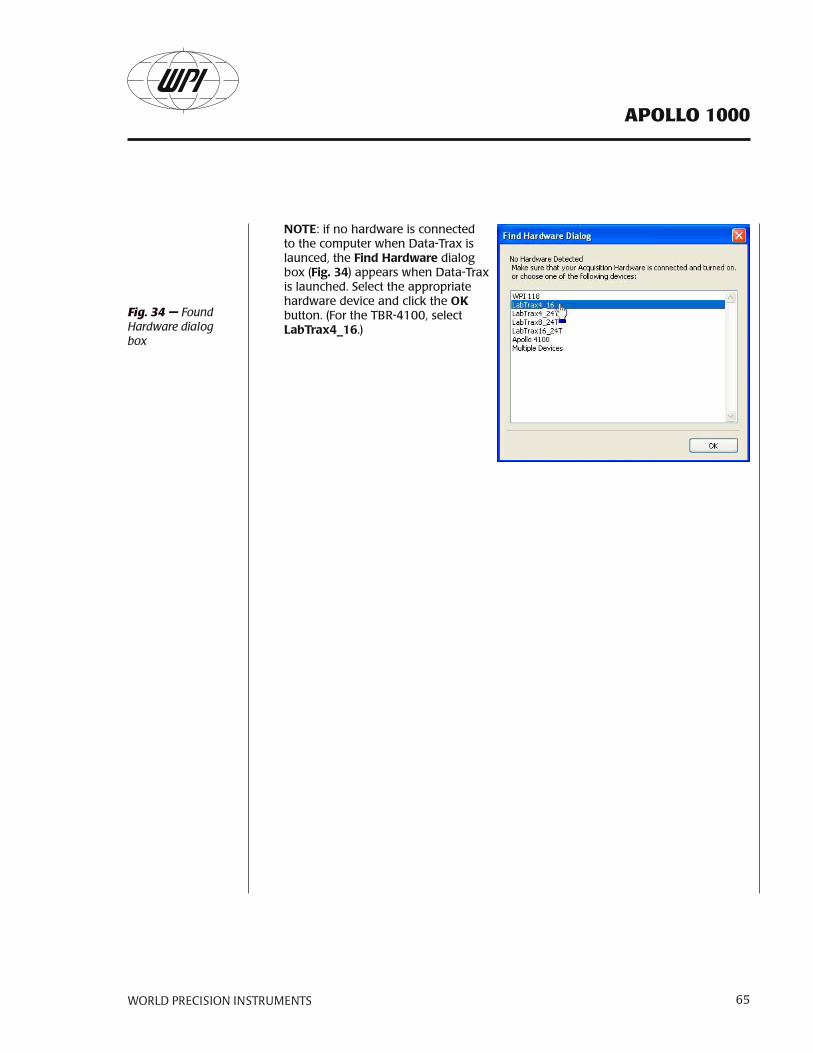
APOLLO 1000
World PreciSioN iNStrumeNtS 65
NOTE: if no hardware is connected to the computer when data-trax is launced, the FindHardware dialog box (Fig.34) appears when data-trax is launched. select the appropriate hardware device and click the OK button. (For the tbr-4100, select LabTrax4_16.)
Fig. 34 — Found Hardware dialog box

APOLLO 1000
66 World PreciSioN iNStrumeNtS
Configuring data-Trax for the Apollo 1000the data-trax main window may be used with its default settings to record information, but because data-trax is a general-purpose data acquisition software, it may be desirable to optimize the settings for use with the Apollo 1000. wpi recommends the following configuration changes to optimize data-trax for the Apollo 1000.
1. to change the basic default settings, open the Preferencesdialog window (Fig.36) by selecting the Editmenu and choosingPreferences(Fig.35).
From the preferences dialog window, the following options may be modified to suit the research need: • number of channels (up to four)• sampling rate• width of the data-trax display window – this defines the increment of time
displayed in a single frame.• height of the data-trax display window – this defines the range of the voltage
display in the data-trax window. the voltage range for any channel may be conveniently scaled automatically by clicking on the Autoscale button located on the header bar of the appropriate channel.
• channel name (optional)
NOTE: At any time, you may select the default settings by choosing the Settingsmenu and selectingdefault. this will configure the system to display the maximum number of channels available and sets the default values for the data window width and height.
Fig.35—Edit menu (above)Fig.36— Preferences Dialog window, Channel Tab (left)
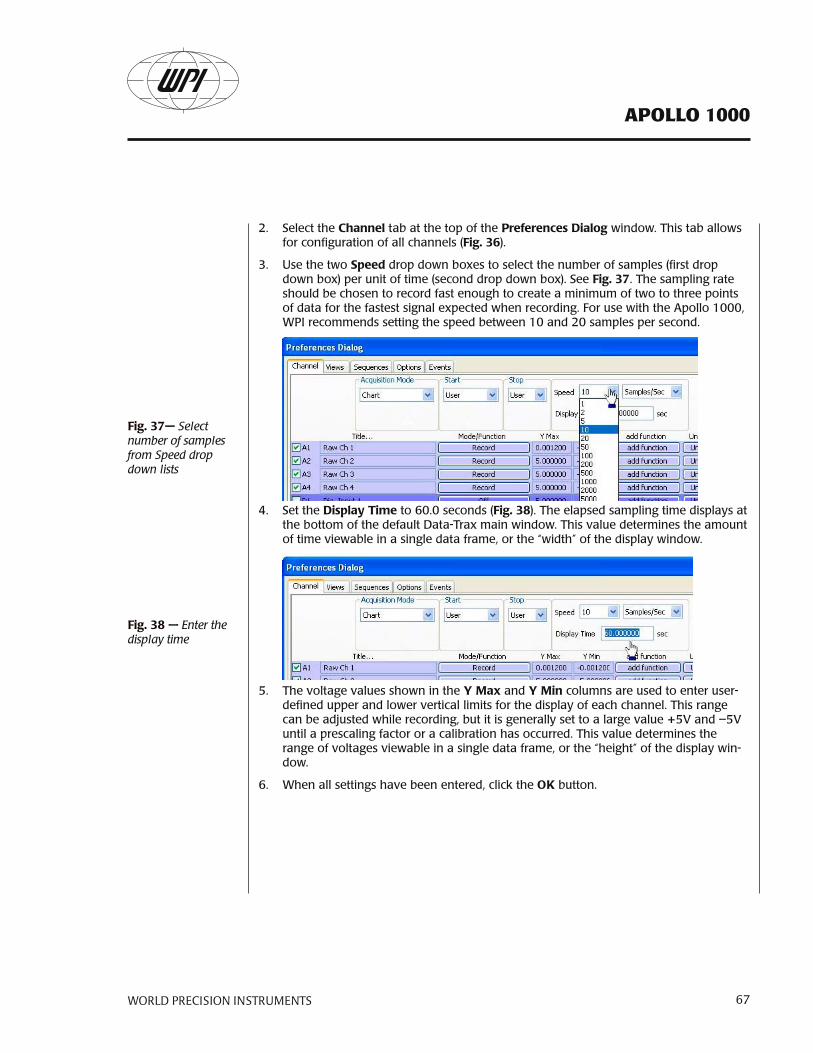
APOLLO 1000
World PreciSioN iNStrumeNtS 67
2. select the Channel tab at the top of the Preferencesdialog window. this tab allows for configuration of all channels (Fig.36).
3. use the two Speeddrop down boxes to select the number of samples (first drop down box) per unit of time (second drop down box). see Fig.37. the sampling rate should be chosen to record fast enough to create a minimum of two to three points of data for the fastest signal expected when recording. For use with the Apollo 1000, wpi recommends setting the speed between 10 and 20 samples per second.
4. set the displayTime to 60.0 seconds (Fig.38). the elapsed sampling time displays at the bottom of the default data-trax main window. this value determines the amount of time viewable in a single data frame, or the “width” of the display window.
5. the voltage values shown in the YMax and YMin columns are used to enter user-defined upper and lower vertical limits for the display of each channel. this range can be adjusted while recording, but it is generally set to a large value +5V and –5V until a prescaling factor or a calibration has occurred. this value determines the range of voltages viewable in a single data frame, or the “height” of the display win-dow.
6. when all settings have been entered, click the OK button.
Fig.37— Select number of samples from Speed drop down lists
Fig.38— Enter the display time
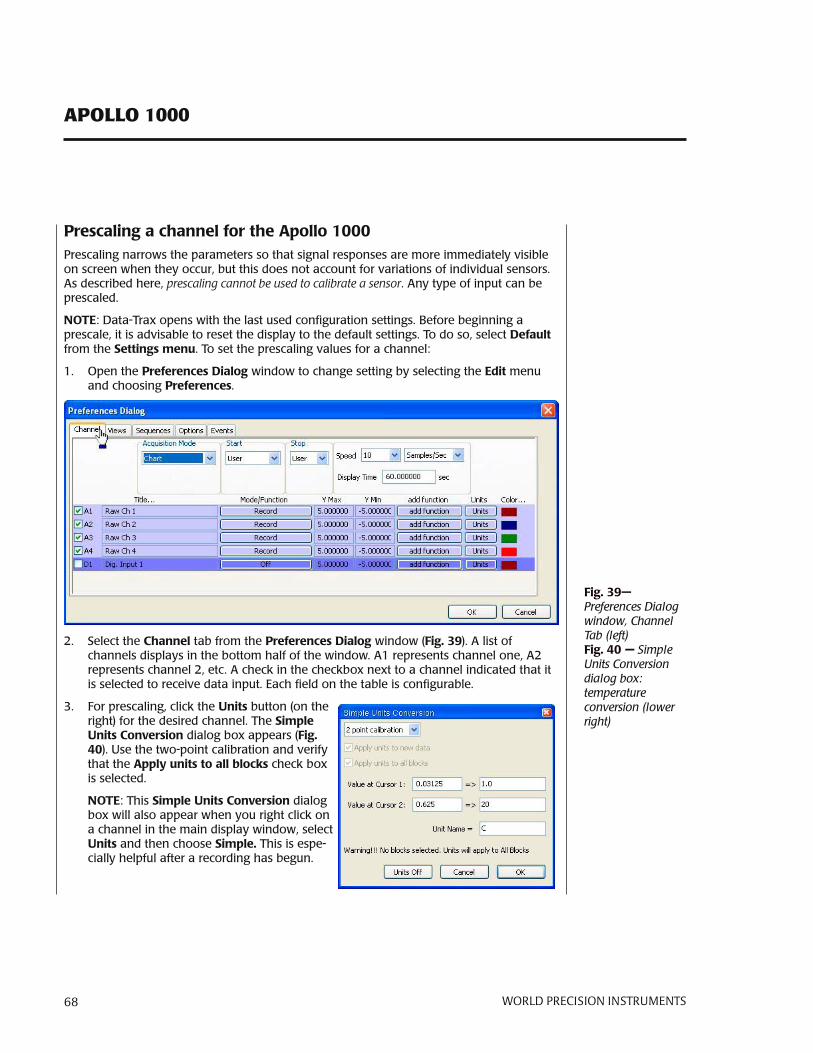
APOLLO 1000
68 World PreciSioN iNStrumeNtS
PrescalingachannelfortheApollo1000prescaling narrows the parameters so that signal responses are more immediately visible on screen when they occur, but this does not account for variations of individual sensors. As described here, prescaling cannot be used to calibrate a sensor. Any type of input can be prescaled.
NOTE: data-trax opens with the last used configuration settings. before beginning a prescale, it is advisable to reset the display to the default settings. to do so, select default from the Settingsmenu. to set the prescaling values for a channel:
1. open the Preferencesdialog window to change setting by selecting the Editmenu and choosingPreferences.
2. select the Channel tab from the Preferencesdialog window (Fig.39). A list of channels displays in the bottom half of the window. A1 represents channel one, A2 represents channel 2, etc. A check in the checkbox next to a channel indicated that it is selected to receive data input. each field on the table is configurable.
3. For prescaling, click the Units button (on the right) for the desired channel. the SimpleUnitsConversion dialog box appears (Fig.40). use the two-point calibration and verify that the Applyunitstoallblocks check box is selected.
NOTE: this SimpleUnitsConversion dialog box will also appear when you right click on a channel in the main display window, select Units and then choose Simple.this is espe-cially helpful after a recording has begun.
Fig.39—Preferences Dialog window, Channel Tab (left)Fig.40 — Simple Units Conversion dialog box: temperature conversion (lower right)
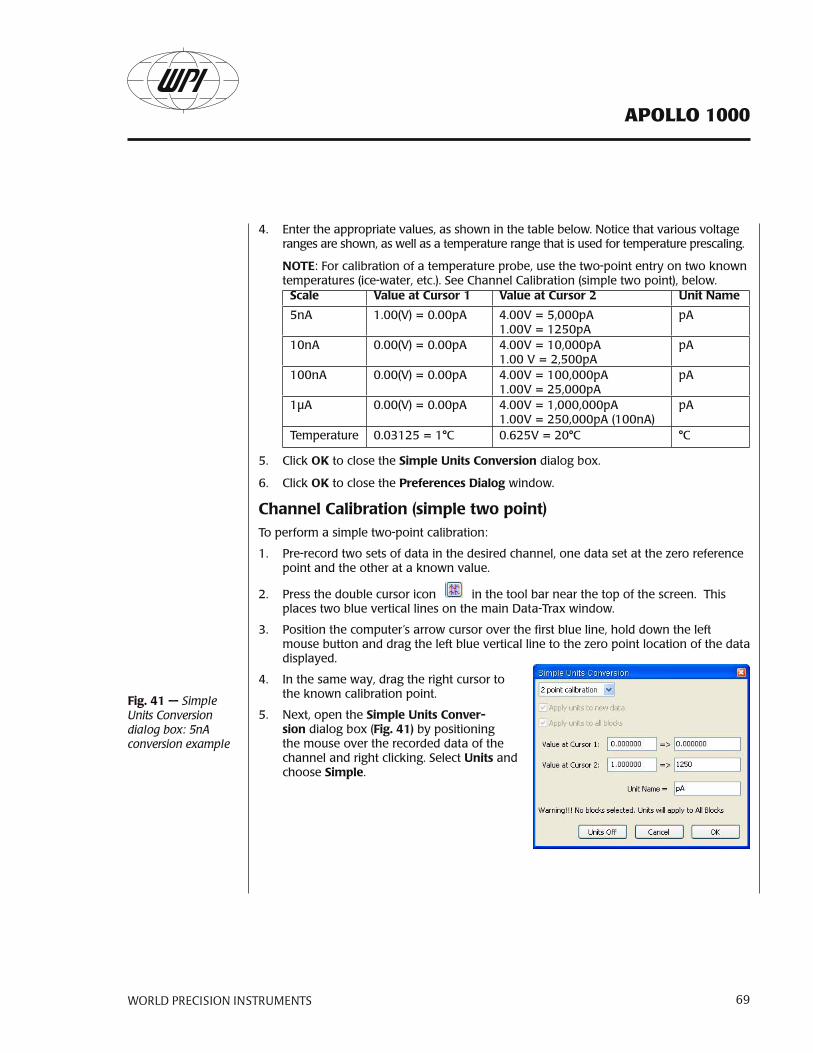
APOLLO 1000
World PreciSioN iNStrumeNtS 69
4. enter the appropriate values, as shown in the table below. notice that various voltage ranges are shown, as well as a temperature range that is used for temperature prescaling.
NOTE: For calibration of a temperature probe, use the two-point entry on two known temperatures (ice-water, etc.). see channel calibration (simple two point), below.
Scale ValueatCursor1 ValueatCursor2 UnitName
5nA 1.00(V) = 0.00pA 4.00V = 5,000pA1.00V = 1250pA
pA
10nA 0.00(V) = 0.00pA 4.00V = 10,000pA1.00 V = 2,500pA
pA
100nA 0.00(V) = 0.00pA 4.00V = 100,000pA1.00V = 25,000pA
pA
1µA 0.00(V) = 0.00pA 4.00V = 1,000,000pA1.00V = 250,000pA (100nA)
pA
temperature 0.03125 = 1°c 0.625V = 20°c °c
5. click OKto close theSimpleUnitsConversiondialog box.
6. clickOKto close thePreferencesdialogwindow.
ChannelCalibration(simpletwopoint)to perform a simple two-point calibration:
1. pre-record two sets of data in the desired channel, one data set at the zero reference point and the other at a known value.
2. press the double cursor icon in the tool bar near the top of the screen. this places two blue vertical lines on the main data-trax window.
3. position the computer’s arrow cursor over the first blue line, hold down the left mouse button and drag the left blue vertical line to the zero point location of the data displayed.
4. in the same way, drag the right cursor to the known calibration point.
5. next, open the SimpleUnitsConver-sion dialog box (Fig.41) by positioning the mouse over the recorded data of the channel and right clicking. select Units and choose Simple.
Fig.41—Simple Units Conversion dialog box: 5nA conversion example
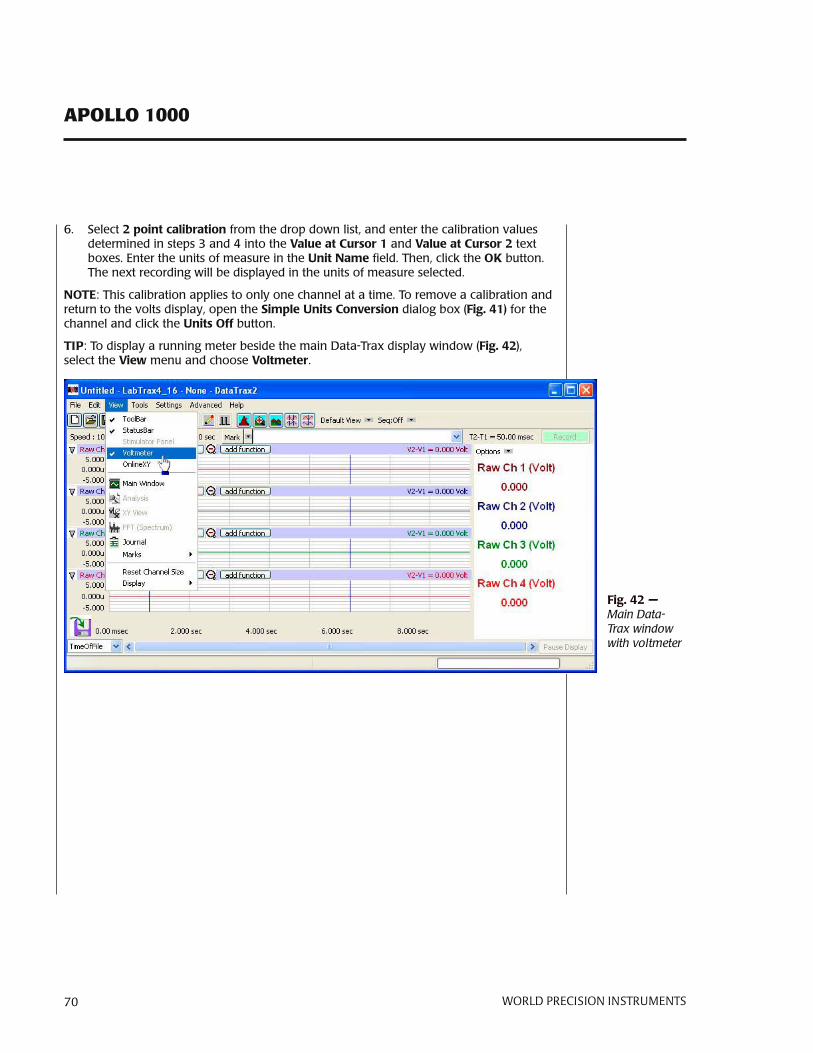
APOLLO 1000
70 World PreciSioN iNStrumeNtS
6. select 2pointcalibration from the drop down list, and enter the calibration values determined in steps 3 and 4 into the ValueatCursor1 and ValueatCursor2 text boxes. enter the units of measure in the UnitName field. then, click the OK button. the next recording will be displayed in the units of measure selected.
NOTE: this calibration applies to only one channel at a time. to remove a calibration and return to the volts display, open the SimpleUnitsConversion dialog box (Fig.41) for the channel and click the UnitsOff button.
TIP: to display a running meter beside the main data-trax display window (Fig.42), select the View menu and choose Voltmeter.
Fig.42— Main Data-Trax window with voltmeter
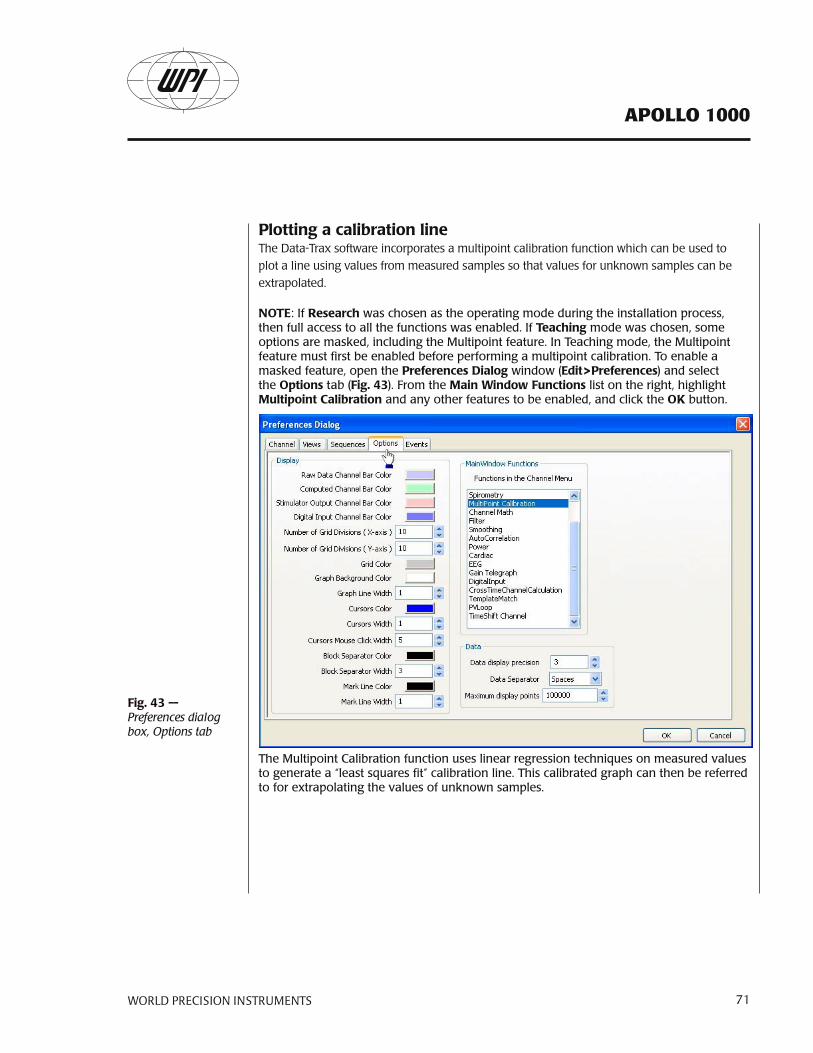
APOLLO 1000
World PreciSioN iNStrumeNtS 71
Plottingacalibrationlinethe data-trax software incorporates a multipoint calibration function which can be used to plot a line using values from measured samples so that values for unknown samples can be extrapolated.
NOTE: if Research was chosen as the operating mode during the installation process, then full access to all the functions was enabled. if Teaching mode was chosen, some options are masked, including the Multipoint feature. in teaching mode, the Multipoint feature must first be enabled before performing a multipoint calibration. to enable a masked feature, open the Preferencesdialog window (Edit>Preferences) and select the Options tab (Fig.43). From the MainWindowFunctions list on the right, highlight MultipointCalibration and any other features to be enabled, and click the OK button.
the Multipoint calibration function uses linear regression techniques on measured values to generate a “least squares fit” calibration line. this calibrated graph can then be referred to for extrapolating the values of unknown samples.
Fig.43—Preferences dialog box, Options tab
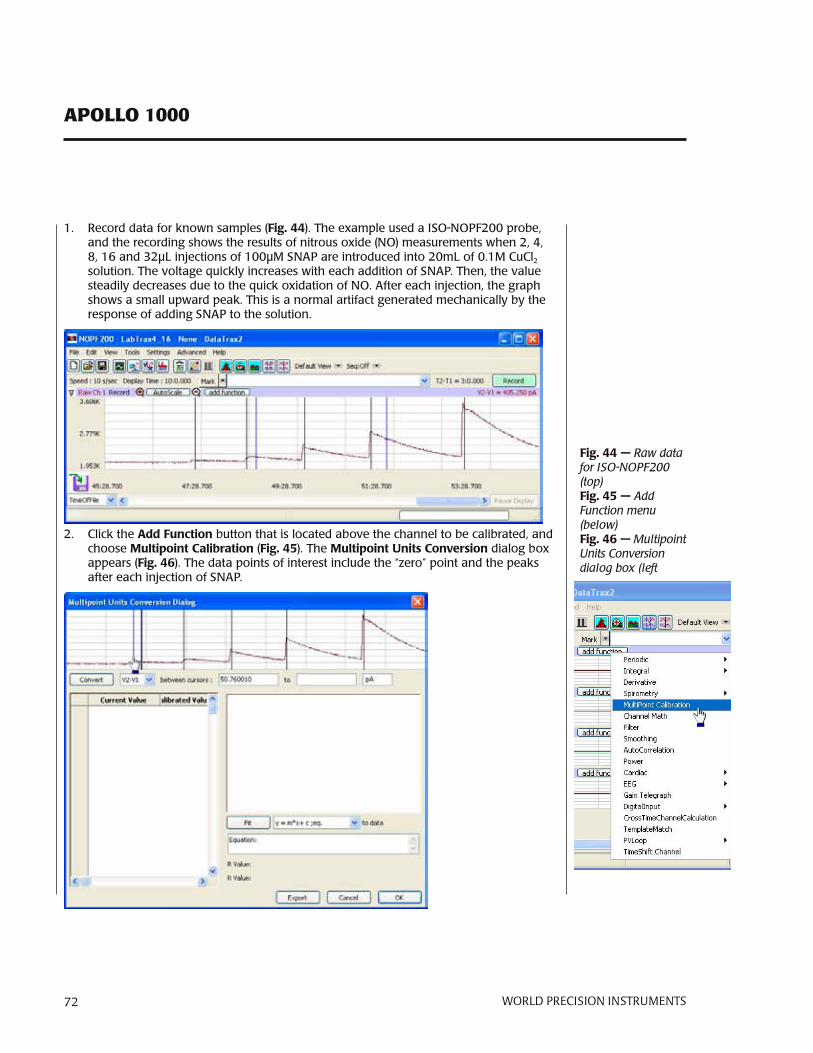
APOLLO 1000
72 World PreciSioN iNStrumeNtS
1. record data for known samples (Fig.44). the example used a iso-nopF200 probe, and the recording shows the results of nitrous oxide (no) measurements when 2, 4, 8, 16 and 32µl injections of 100µM snAp are introduced into 20ml of 0.1M cucl2 solution. the voltage quickly increases with each addition of snAp. then, the value steadily decreases due to the quick oxidation of no. After each injection, the graph shows a small upward peak. this is a normal artifact generated mechanically by the response of adding snAp to the solution.
2. click the AddFunctionbutton that is located above the channel to be calibrated, and chooseMultipointCalibration(Fig.45). the MultipointUnitsConversion dialog box appears (Fig.46). the data points of interest include the “zero” point and the peaks after each injection of snAp.
Fig.44— Raw data for ISO-NOPF200 (top)Fig.45—Add Function menu (below)Fig.46— Multipoint Units Conversion dialog box (left
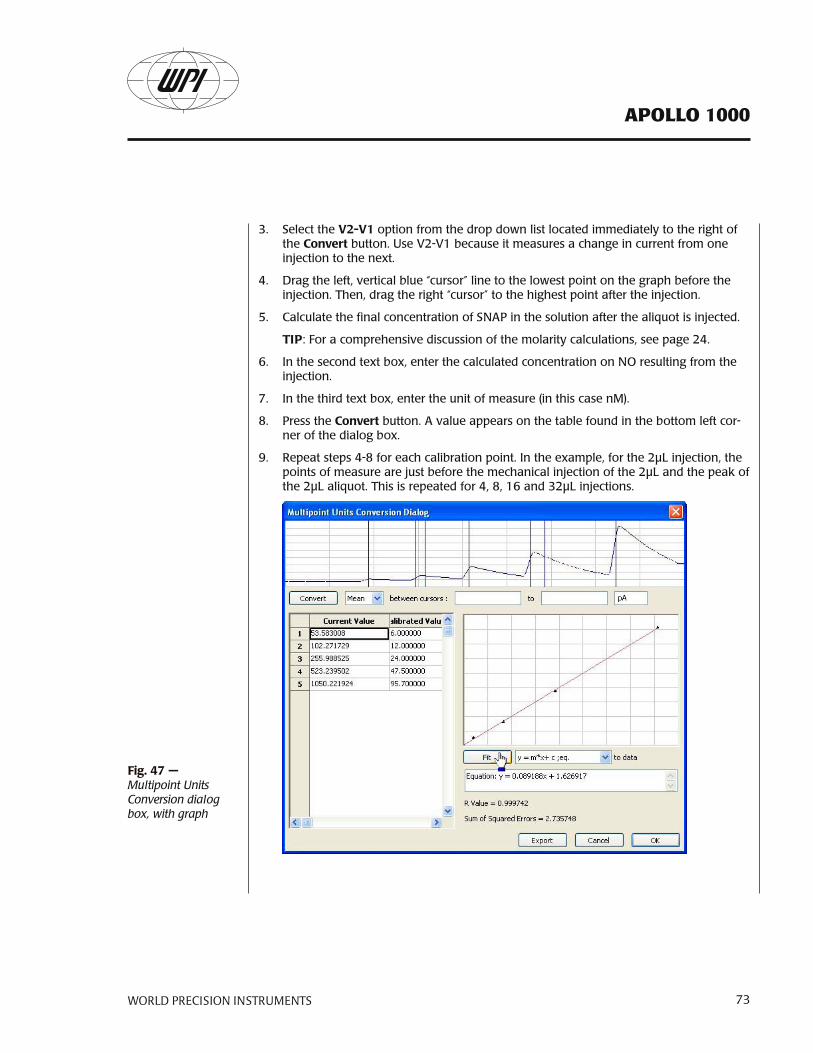
APOLLO 1000
World PreciSioN iNStrumeNtS 73
3. select the V2-V1 option from the drop down list located immediately to the right of the Convert button. use V2-V1 because it measures a change in current from one injection to the next.
4. drag the left, vertical blue “cursor” line to the lowest point on the graph before the injection. then, drag the right “cursor” to the highest point after the injection.
5. calculate the final concentration of snAp in the solution after the aliquot is injected.
TIP: For a comprehensive discussion of the molarity calculations, see page 24.
6. in the second text box, enter the calculated concentration on no resulting from the injection.
7. in the third text box, enter the unit of measure (in this case nM).
8. press the Convert button. A value appears on the table found in the bottom left cor-ner of the dialog box.
9. repeat steps 4-8 for each calibration point. in the example, for the 2µl injection, the points of measure are just before the mechanical injection of the 2µl and the peak of the 2µl aliquot. this is repeated for 4, 8, 16 and 32µl injections.
Fig.47—Multipoint Units Conversion dialog box, with graph
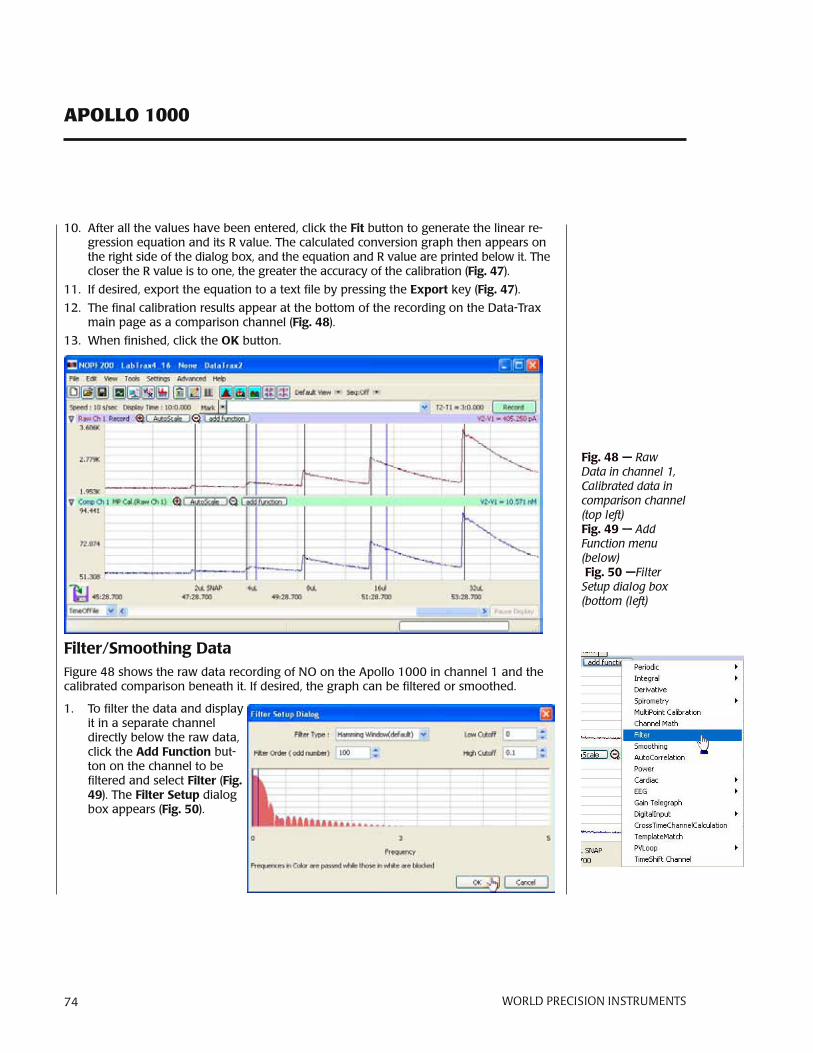
APOLLO 1000
74 World PreciSioN iNStrumeNtS
10. After all the values have been entered, click the Fit button to generate the linear re-gression equation and its r value. the calculated conversion graph then appears on the right side of the dialog box, and the equation and r value are printed below it. the closer the r value is to one, the greater the accuracy of the calibration (Fig.47).
11. if desired, export the equation to a text file by pressing the Export key (Fig.47).
12. the final calibration results appear at the bottom of the recording on the data-trax main page as a comparison channel (Fig.48).
13. when finished, click the OK button.
Filter/SmoothingdataFigure 48 shows the raw data recording of no on the Apollo 1000 in channel 1 and the calibrated comparison beneath it. if desired, the graph can be filtered or smoothed.
1. to filter the data and display it in a separate channel directly below the raw data, click the AddFunction but-ton on the channel to be filtered and select Filter(Fig.49). the FilterSetup dialog box appears (Fig.50).
Fig.48— Raw Data in channel 1, Calibrated data in comparison channel (top left) Fig.49— Add Function menu (below)Fig.50—Filter Setup dialog box (bottom (left)

APOLLO 1000
World PreciSioN iNStrumeNtS 75
2. select the appropriate filter from the FilterType drop down list. wpi routinely uses the HammingWindow filter.
3. enter the appropriate values. wpi recommends a FilterOrder of 100, LowCutoff of 0 and a HighCuttoff of 0.1.
4. click the OK button. A new comparison channel displays at the bottom of the main data-trax window. when applied to the raw data in Figure 48, a typical hamming filter generates a less noisy output trace similar to the raw data in channel (Fig.51).
5. if desired, additional smoothing can also be added to the filtered data. click the AddFunction button of the desired channel and select Smoothing(Fig.52). the Smoothing dialog box appears (Fig.53). wpi often adds a moving average that is 60 points on each side, by selecting Mov-ingAverage from the SmoothingType drop down list and entering 60 in the Pointsoneachside text field. click the OK button when finished.
Fig.51— Raw Data in channel 1, filtered data in first comparison channel (Comp Ch 1), smoothed data in second comparison channel (Comp Ch 2) (top)Fig.52— Add Function menu (below)Fig.53—Smoothing dialog box (bottom)

APOLLO 1000
76 World PreciSioN iNStrumeNtS
TIP: to change the parameters of a function, click on the name of the configured channel (highlighted region of Fig.54) to display the popup menu and select SetupFunction. the function dialog box appears with the previous settings. edit the settings, as desired, and click the OK button. the changes will display in the channel on the main data-trax window.
Fig.54— Edit the function settings of a previously modified channel
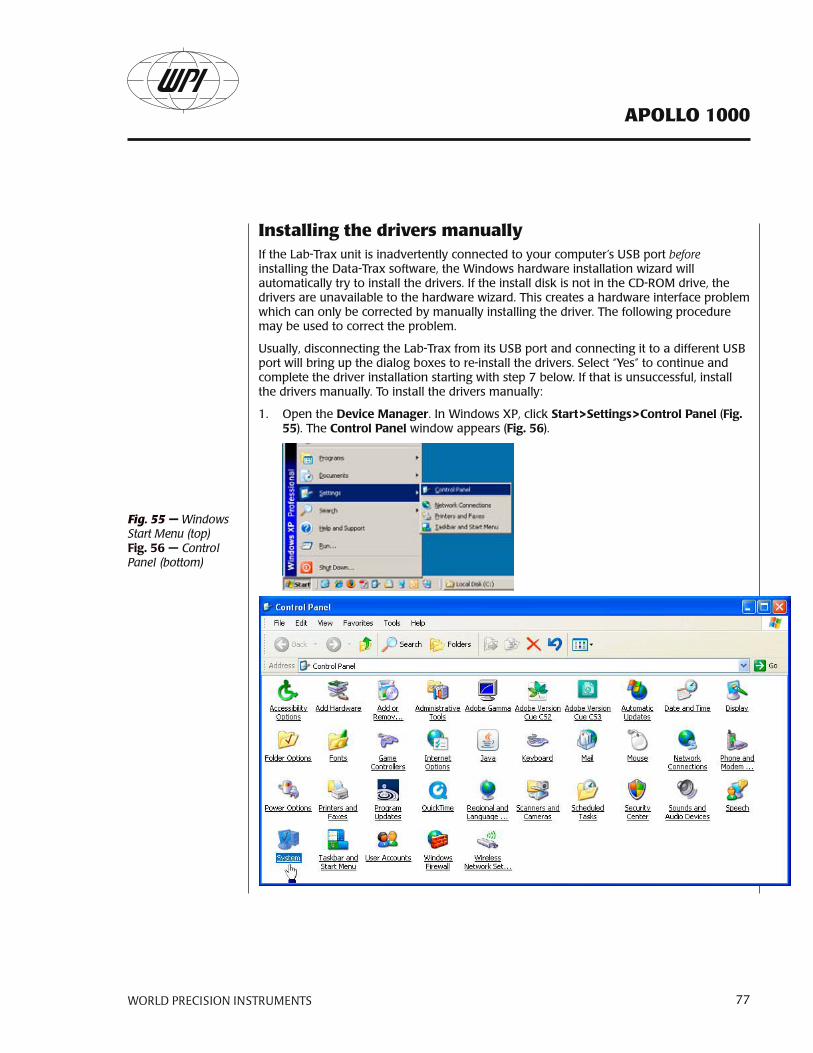
APOLLO 1000
World PreciSioN iNStrumeNtS 77
Installing the drivers manuallyif the lab-trax unit is inadvertently connected to your computer’s usb port before installing the data-trax software, the windows hardware installation wizard will automatically try to install the drivers. if the install disk is not in the cd-roM drive, the drivers are unavailable to the hardware wizard. this creates a hardware interface problem which can only be corrected by manually installing the driver. the following procedure may be used to correct the problem.
usually, disconnecting the lab-trax from its usb port and connecting it to a different usb port will bring up the dialog boxes to re-install the drivers. select “yes” to continue and complete the driver installation starting with step 7 below. if that is unsuccessful, install the drivers manually. to install the drivers manually:
1. open the deviceManager. in windows xp, click Start>Settings>ControlPanel(Fig.55). the ControlPanel window appears (Fig.56).
Fig. 55 — Windows Start Menu (top)Fig.56—Control Panel (bottom)
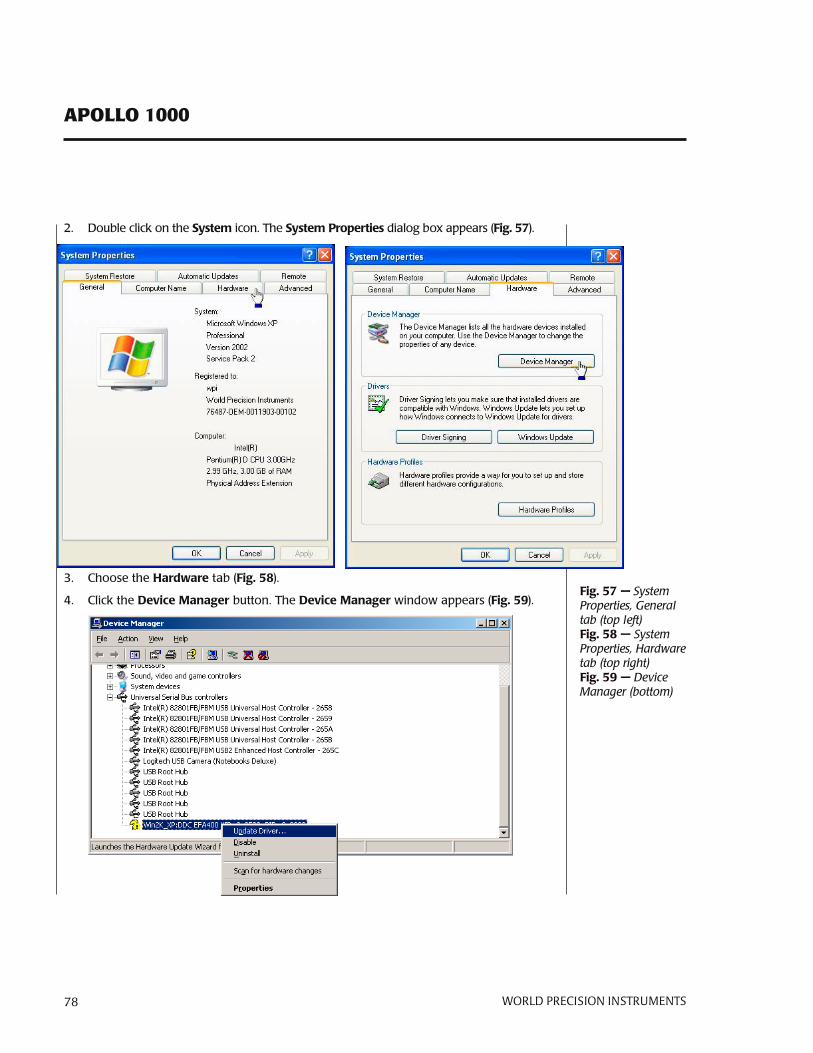
APOLLO 1000
78 World PreciSioN iNStrumeNtS
2. double click on the System icon. the SystemProperties dialog box appears (Fig.57).
3. choose the Hardware tab (Fig.58).
4. click the deviceManager button. the deviceManager window appears (Fig.59).
Fig.57 — System Properties, General tab (top left)Fig.58— System Properties, Hardware tab (top right)Fig.59— Device Manager (bottom)
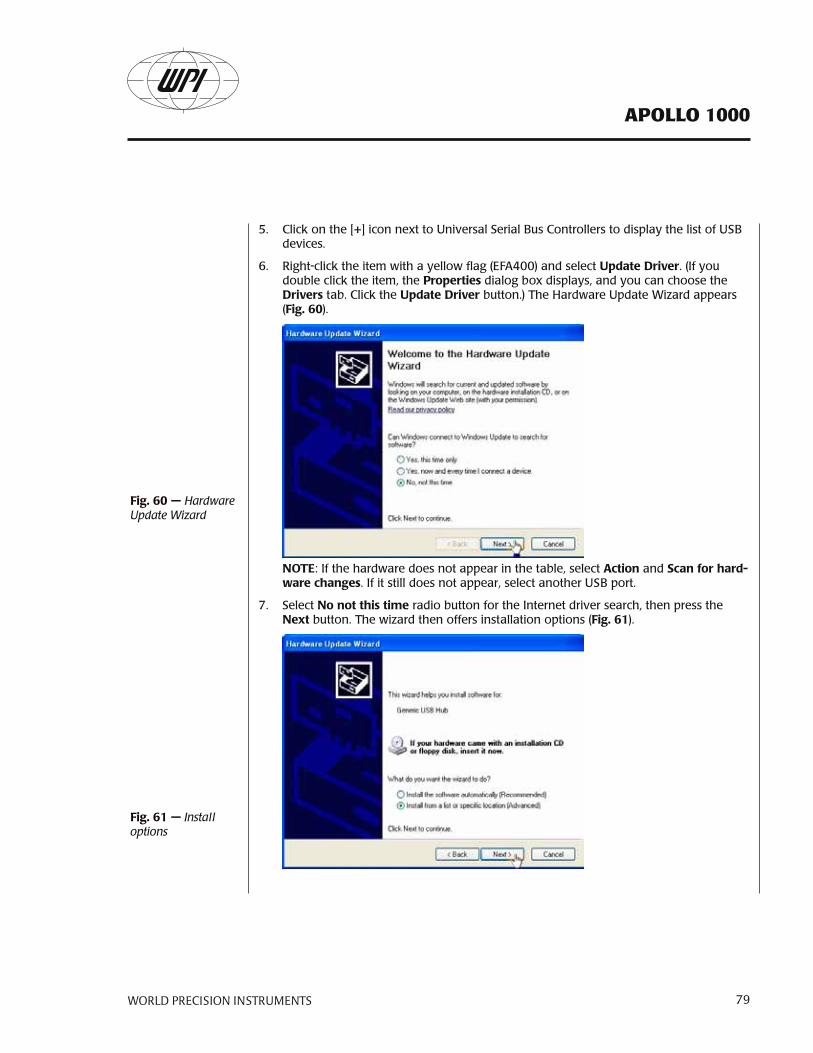
APOLLO 1000
World PreciSioN iNStrumeNtS 79
5. click on the [+] icon next to universal serial bus controllers to display the list of usb devices.
6. right-click the item with a yellow flag (eFA400) and select Updatedriver. (if you double click the item, the Properties dialog box displays, and you can choose the drivers tab. click the Updatedriver button.) the hardware update wizard appears (Fig.60).
NOTE: if the hardware does not appear in the table, select Action and Scanforhard-warechanges. if it still does not appear, select another usb port.
7. select Nonotthistime radio button for the internet driver search, then press the Next button. the wizard then offers installation options (Fig.61).
Fig.60—Hardware Update Wizard
Fig.61— Install options
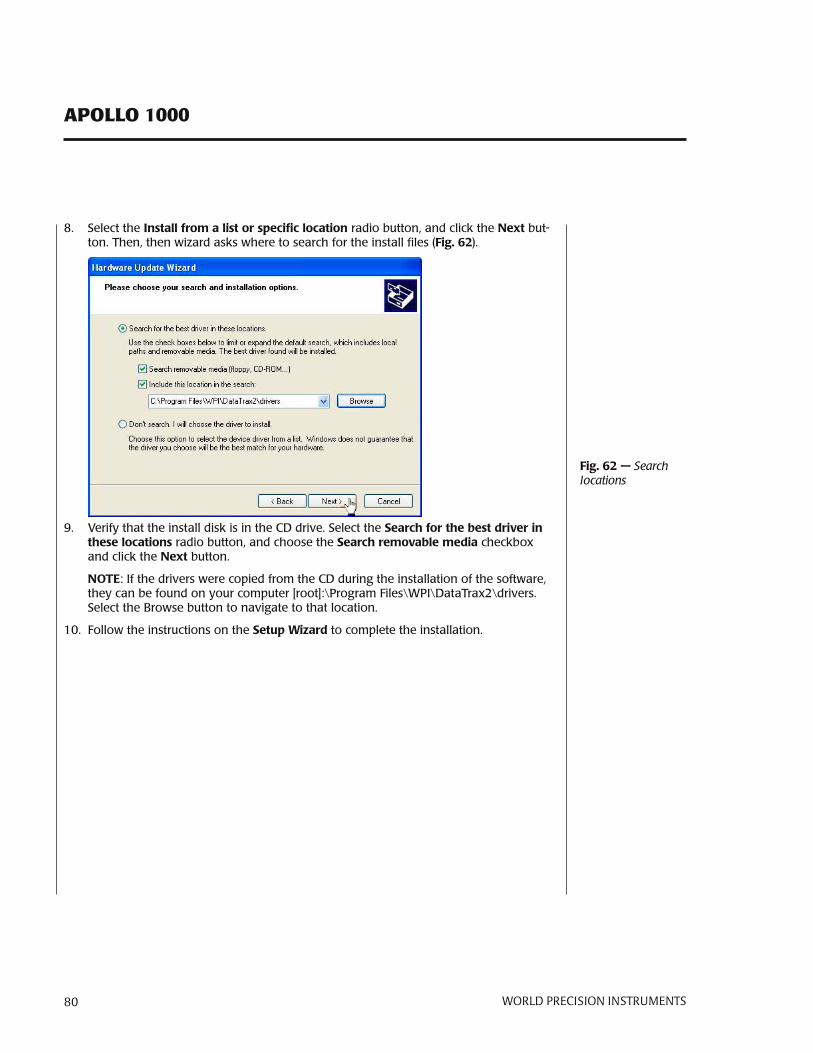
APOLLO 1000
80 World PreciSioN iNStrumeNtS
8. select the Installfromalistorspecificlocation radio button, and click the Next but-ton. then, then wizard asks where to search for the install files (Fig.62).
9. Verify that the install disk is in the cd drive. select the Searchforthebestdriverintheselocations radio button, and choose the Searchremovablemedia checkbox and click the Next button.
NOTE: if the drivers were copied from the cd during the installation of the software, they can be found on your computer [root]:\program Files\wpi\datatrax2\drivers. select the browse button to navigate to that location.
10. Follow the instructions on the SetupWizard to complete the installation.
Fig.62— Search locations
APOLLO 1000
World PreciSioN iNStrumeNtS 81
INdex
Aactivity coefficient 44amperometric 2anaerobic environment 24analog 2aqueous calibration 42argon 16, 18, 21, 28, 29atmospheric pressure 41,
42, 43
bbandwith 2baseline current 12battery 2, 6bKlight 10blood 44bunsen coefficients 53
Ccalibration curve 18, 19,
20, 22, 23, 25, 26, 37, 42, 44
calibration mode 8catalyst 15, 20, 21, 22, 24cidex 31, 34, 38, 45, 46conversion efficiency 20,
25cucl 15, 20, 21, 22cucl2 15, 20, 21, 22, 25,
26, 72cupric chloride 20cuprous chloride 20, 21, 22current menu 9current offset 11, 13
ddata acquisition 57, 66data-trax 22, 24, 57, 66,
77configure 66install 57launch 63license Agreement 58reinstall 77voltmeter 70
device Manager 77
differential pulse polarography 2
display time 67dissolved oxygen
calibration 42drift 21driver selection 62
eeffective concentration 26,
44electrode 30eMi 12enzol 31, 38, 46enzymatic detergent 31,
38, 46externAl poise 5
FFaraday cage 12fast kinetic studies 14Filter 9, 10filter data 74fume hood 28
ggains 13gas permeable polymeric
membrane 30graph mode 7gravimetric 26
hh2o2 35, 36, 37, 54, 55h2so4 15, 16hamming 75hcl 31, 38, 46hpo sensor 35hydrogen peroxide 3, 35
Ii Monitor 6inputs 5ion chromatography 16i sensor in 5ises 2iso-h2s-2 3, 54
iso-hpo-2 3, 35, 36, 37, 38, 39, 54
iso-hpo-100 3, 54iso-nop 3, 15, 16, 17, 22,
30, 31, 32, 33, 35, 38, 54
iso-nop007 3, 54iso-nop30 3iso-nopF 3, 54iso-nopnM 3, 54iso-nop rejuvenator 32,
38iso-oxy-2 3, 40, 41, 44,
45, 46, 54
KKno2 16, 18, 19Koh 28, 29
Llab-trax 2labtrax 60
driver selection 62lemo 5linear regression 26living tissue 44locking cap 30low pass filters 14
Mmacro sensors 3main menu 9membrane 30membrane, cleaning 31membrane sleeve,
replacement 32menu/run mode 8MicroFil 31, 32, 35, 38, 46microsensors 11micro sensors for no 3mini sensors 3MiVi = MfVf 25M = m/V 25modes 6multipoint calibration 71Multipoint units conversion
APOLLO 1000
82 World PreciSioN iNStrumeNtS
72
Nnaoh 31, 38, 46nearnstian ph sensors 11nitric oxide 27nitric oxide microsensors
34nitric oxide sensor 15, 35nitrogen 18, 21, 28, 29,
41, 43no delivery 29no, environmental
influences 30no gas 15, 26, 28, 29noise 13no measurement 29no microsensors, storage
34no sensor calibration 15no sensors maintenance
30notch 10notch filter 14
Oo2 41, 44, 47, 54options menu 10outputs 2, 6oxygen calibration 42oxygen sensor 40, 41oxygen solubility vs.
altitude 52
Pparts list 4pbs buffer 36, 37, 39, 46perfusion system 12plasma 53platinum cathode 40, 45poise 11poise 10poise control 2poise Monitor 6polarize 15, 17, 21, 35polarography 2, 5polymer tubing 28potentiometer 11
preferences dialog 66prescaling 68probe 45probe handle 30protease 31, 38, 46pulmonary edema 27
Qquiescent baseline 18
RrAnge 10redox current 24research mode 63, 71returns 4
Ssaline solution 17, 33, 39,
46sAMple rAte 10sampling 7sampling rate 66saturated water-vapor vs.
partial pressure in mmhg 53
scatter plot 26screwdriver 4simple units conversion
68sleeve 30, 45smoothing 75snAp 15, 20, 21, 22, 23,
24, 25, 26, 72snAp solution 55solubility of oxygen in fresh
water 50solubility of oxygen in
seawater 51sound 10standard solutions 55sterilize 34stoichiometry 16stop flow 14storage 34, 39, 47
Tteaching mode 63, 71temperature detector 4temperature input 2
teMp in 5teMp menu 9teMp Monitor 6test resistor 4text mode 6tiMer 10two-point calibration 68tygon 28
Uunpacking 4update driver 79
VV Monitor 6Voltage offset 11voltametry 2, 5Volt menu 10voltmeter 70V sensor in 5
Wwand 45water-saturated air 43wAVeForM 9, 10
Zzooming 7
APOLLO 1000
World PreciSioN iNStrumeNtS 83

APOLLO 1000
84 World PreciSioN iNStrumeNtS
WARRANTy
wpi (world precision instruments, inc.) warrants to the original purchaser that this equipment, including its components and parts, shall be free from defects in material and workmanship for a period of one year* from the date of receipt. wpi’s obligation under this warranty shall be limited to repair or replacement, at wpi’s option, of the equipment or defective components or parts upon receipt thereof f.o.b. wpi, sarasota, Florida u.s.A. return of a repaired instrument shall be f.o.b. sarasota.
the above warranty is contingent upon normal usage and does not cover products which have been modified without wpi’s approval or which have been subjected to unusual physical or electrical stress or on which the original identification marks have been removed or altered. the above warranty will not apply if adjustment, repair or parts replacement is required because of accident, neglect, misuse, failure of electric power, air conditioning, humidity control, or causes other than normal and ordinary usage.
to the extent that any of its equipment is furnished by a manufacturer other than wpi, the foregoing warranty shall be applicable only to the extent of the warranty furnished by such other manufacturer. this warranty will not apply to appearance terms, such as knobs, handles, dials or the like.
wpi makes no warranty of any kind, express or implied or statutory, including without limitation any warranties of merchantability and/or fitness for a particular purpose. wpi shall not be liable for any damages, whether direct, indirect, special or consequential arising from a failure of this product to operate in the manner desired by the user. wpi shall not be liable for any damage to data or property that may be caused directly or indirectly by use of this product.
Claims and Returns• inspect all shipments upon receipt. Missing cartons or obvious damage to cartons should be noted on the delivery receipt before signing. concealed loss or damage should be reported at once to the carrier and an inspection requested. All claims for shortage or damage must be made within 10 days after receipt of shipment. claims for lost shipments must be made within 30 days of invoice or other notification of shipment. please save damaged or pilfered cartons until claim settles. in some instances, photographic documentation may be required. some items are time sensitive; wpi assumes no extended warranty or any liability for use beyond the date specified on the container.
• wpi cannot be held responsible for items damaged in shipment en route to us. please enclose merchandise in its original shipping container to avoid damage from handling. we recommend that you insure merchandise when shipping. the customer is responsible for paying shipping expenses including adequate insurance on all items returned.
• do not return any goods to wpi without obtaining prior approval and instructions (rMA#) from our returns department. goods returned unauthorized or by collect freight may be refused. the rMA# must be clearly displayed on the outside of the box, or the package will not be accepted. please contact the rMA department for a request form.
• goods returned for repair must be reasonably clean and free of hazardous materials.
• A handling fee is charged for goods returned for exchange or credit. this fee may add up to 25% of the sale price depending on the condition of the item. goods ordered in error are also subject to the handling fee.
• equipment which was built as a special order cannot be returned.
• Always refer to the rMA# when contacting wpi to obtain a status of your returned item.
• For any other issues regarding a claim or return, please contact the rMA department
Warning: This equipment is not designed or intended for use on humans.
* Electrodes, batteries and other consumable parts are warranted for 30 days only from the date on which the customer receives these items.
World Precision Instruments, Inc.international trade center, 175 Sarasota center Blvd., Sarasota Fl 34240-9258
tel: 941-371-1003 • Fax: 941-377-5428 • e-mail: [email protected]: Astonbury Farm Business centre • Aston, Stevenage, Hertfordshire SG2 7eG • tel: 01438-880025 • Fax: 01438-880026 • e-mail: [email protected]
germany: Zossener Str. 55, 10961 Berlin • tel: 030-6188845 • Fax: 030-6188670 • e-mail: [email protected]