Embed Size (px)
Citation preview
Minutes of EFC WP15 Corrosion in the Refinery Industry 9 March 2004
Appendix 8
Case study
Assessing Operating limits for C-0.5Mo steel in
high temperature H2 service
Hennie de Bruyn Statoil
Assessing operating limits forC-0,5Mo steel in high temperature
H2 service (case study)
Hennie de BruynEFC WP15 – 9 March 2004
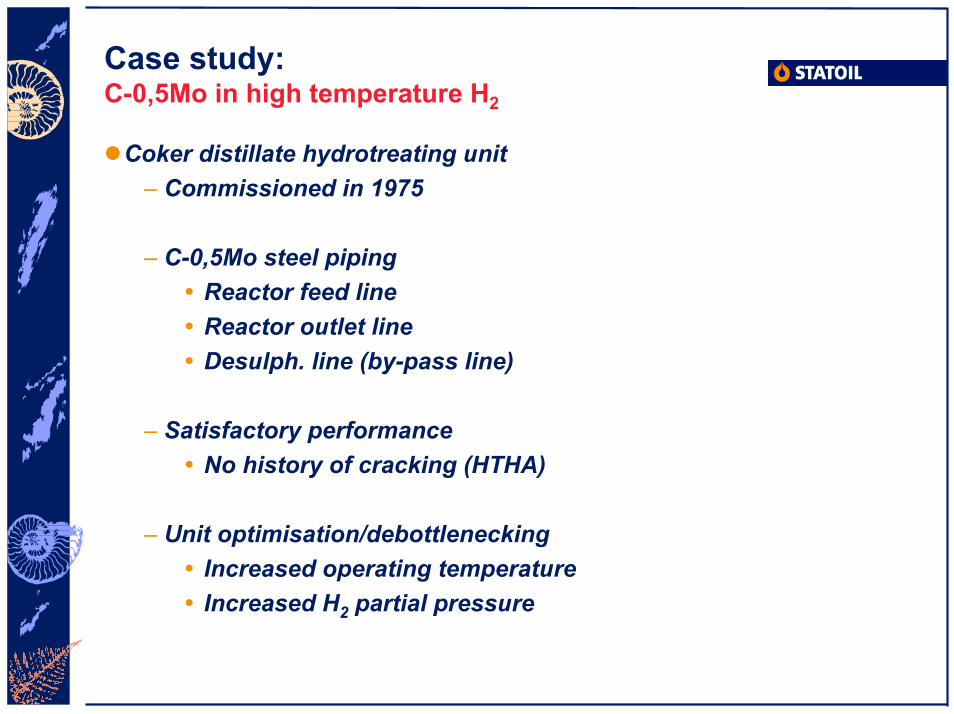
Case study:C-0,5Mo in high temperature H2
Coker distillate hydrotreating unit– Commissioned in 1975
– C-0,5Mo steel pipingReactor feed lineReactor outlet lineDesulph. line (by-pass line)
– Satisfactory performanceNo history of cracking (HTHA)
– Unit optimisation/debottleneckingIncreased operating temperatureIncreased H2 partial pressure
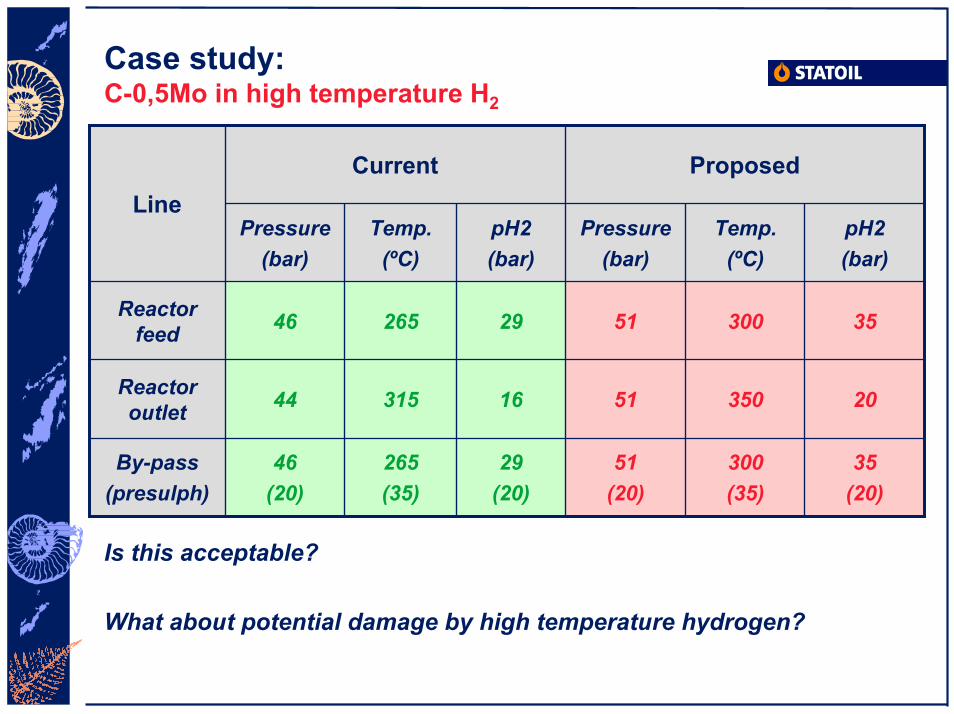
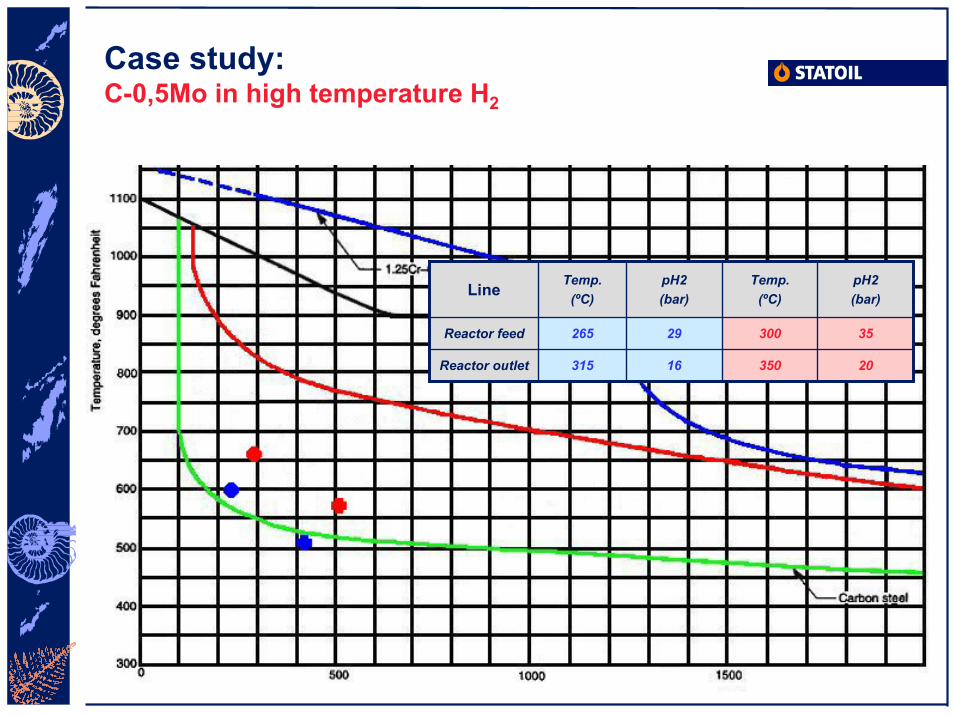
Case study:C-0,5Mo in high temperature H2
35(20)
300(35)
51(20)
29(20)
265(35)
46(20)
By-pass(presulph)
20350511631544Reactor outlet
35300512926546Reactor feed
pH2(bar)
Temp.(ºC)
Pressure(bar)
pH2(bar)
Temp.(ºC)
Pressure(bar)
ProposedCurrentLine
Is this acceptable?
What about potential damage by high temperature hydrogen?
Case study:C-0,5Mo in high temperature H2
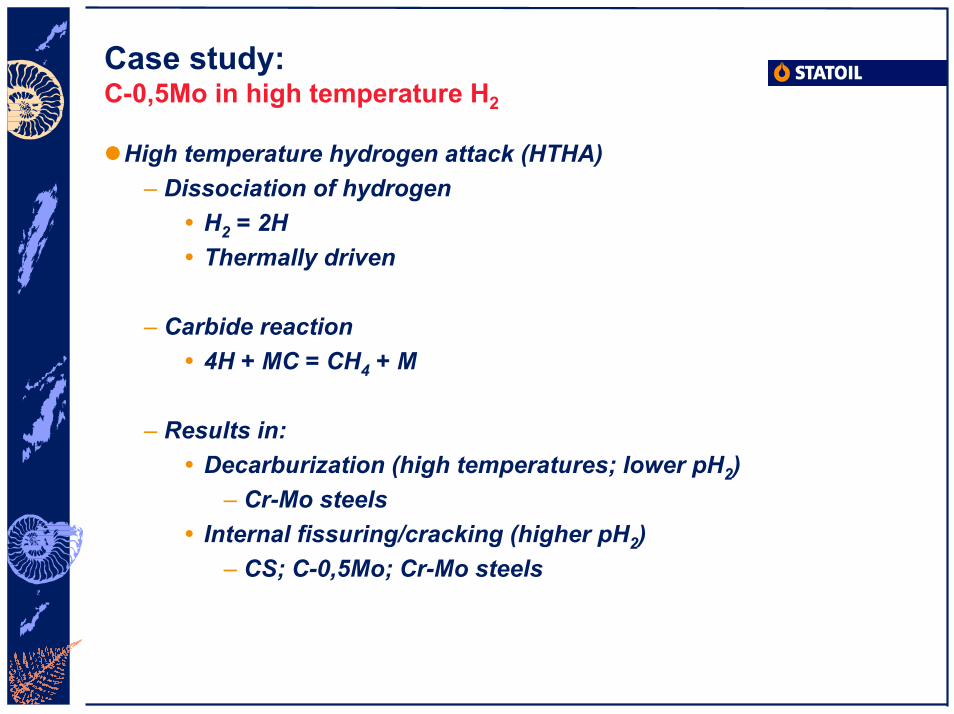
High temperature hydrogen attack (HTHA)– Dissociation of hydrogen
H2 = 2HThermally driven
– Carbide reaction4H + MC = CH4 + M
– Results in:Decarburization (high temperatures; lower pH2)
– Cr-Mo steelsInternal fissuring/cracking (higher pH2)
– CS; C-0,5Mo; Cr-Mo steels
Case study:C-0,5Mo in high temperature H2
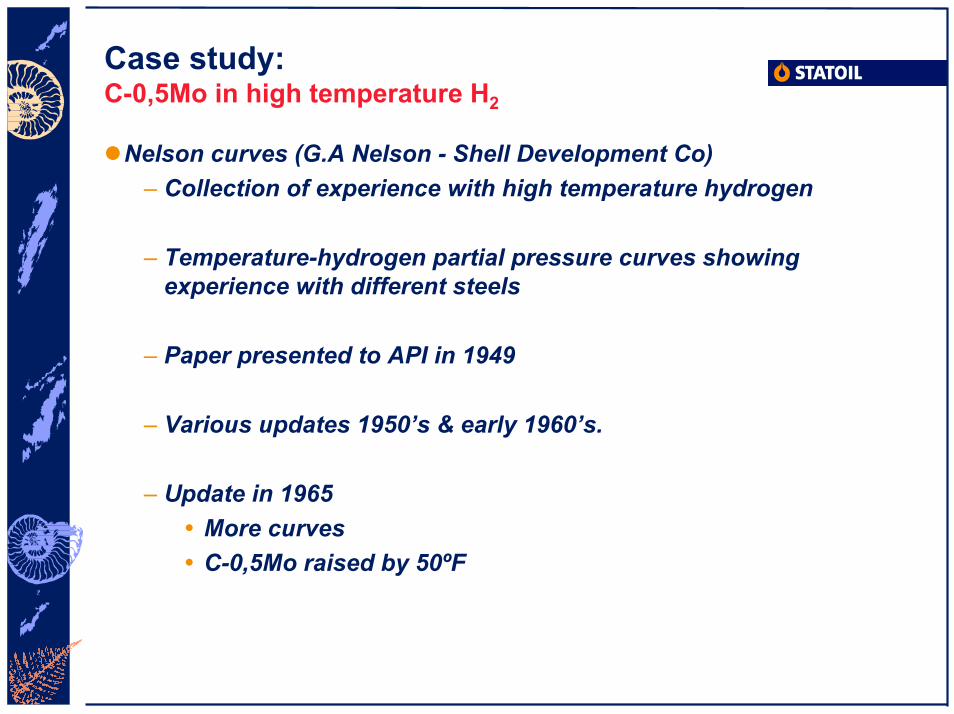
Nelson curves (G.A Nelson - Shell Development Co)– Collection of experience with high temperature hydrogen
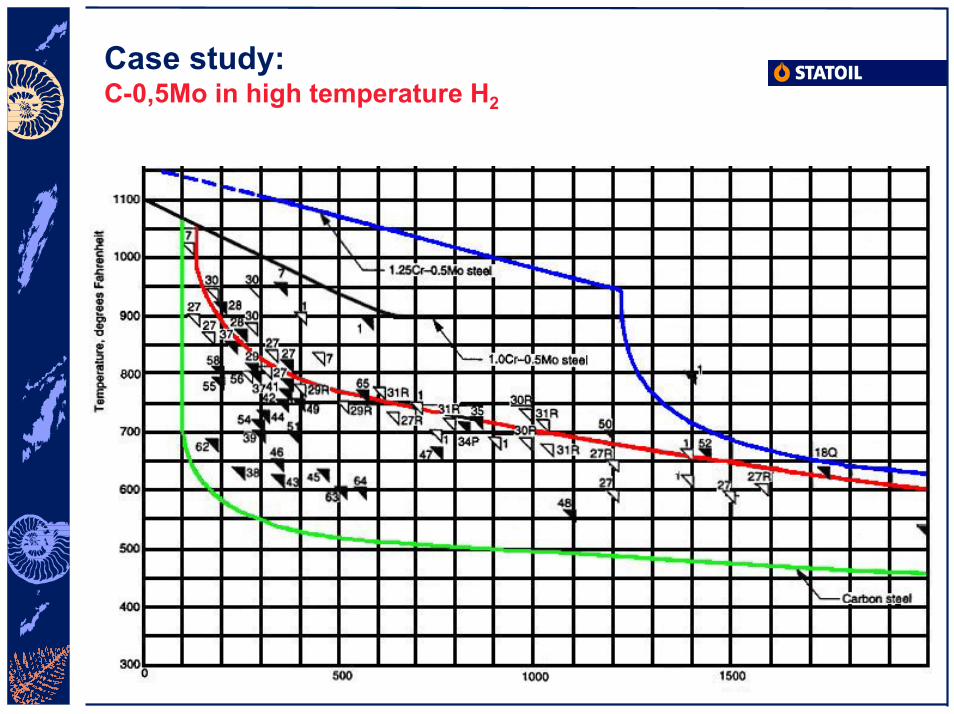
– Temperature-hydrogen partial pressure curves showing experience with different steels
– Paper presented to API in 1949
– Various updates 1950’s & early 1960’s.
– Update in 1965More curvesC-0,5Mo raised by 50ºF
Case study:C-0,5Mo in high temperature H2
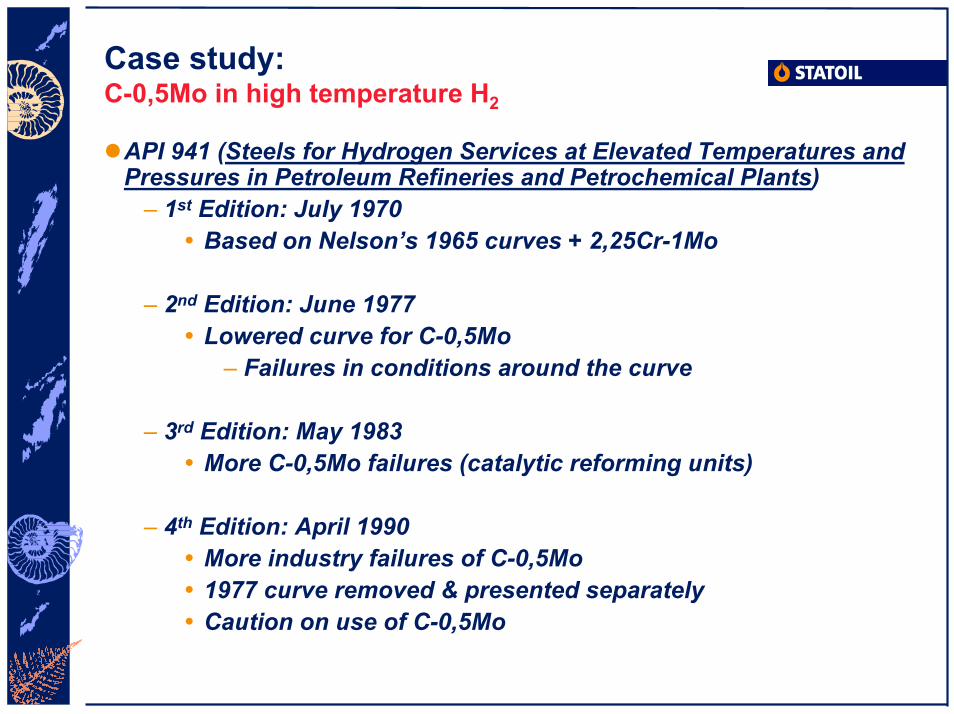
API 941 (Steels for Hydrogen Services at Elevated Temperatures and Pressures in Petroleum Refineries and Petrochemical Plants)
– 1st Edition: July 1970Based on Nelson’s 1965 curves + 2,25Cr-1Mo
– 2nd Edition: June 1977Lowered curve for C-0,5Mo
– Failures in conditions around the curve
– 3rd Edition: May 1983More C-0,5Mo failures (catalytic reforming units)
– 4th Edition: April 1990More industry failures of C-0,5Mo1977 curve removed & presented separatelyCaution on use of C-0,5Mo
Case study:C-0,5Mo in high temperature H2
Case study:C-0,5Mo in high temperature H2
2035016315Reactor outlet
3530029265Reactor feed
pH2(bar)
Temp.(ºC)
pH2(bar)
Temp.(ºC)Line
Case study:C-0,5Mo in high temperature H2
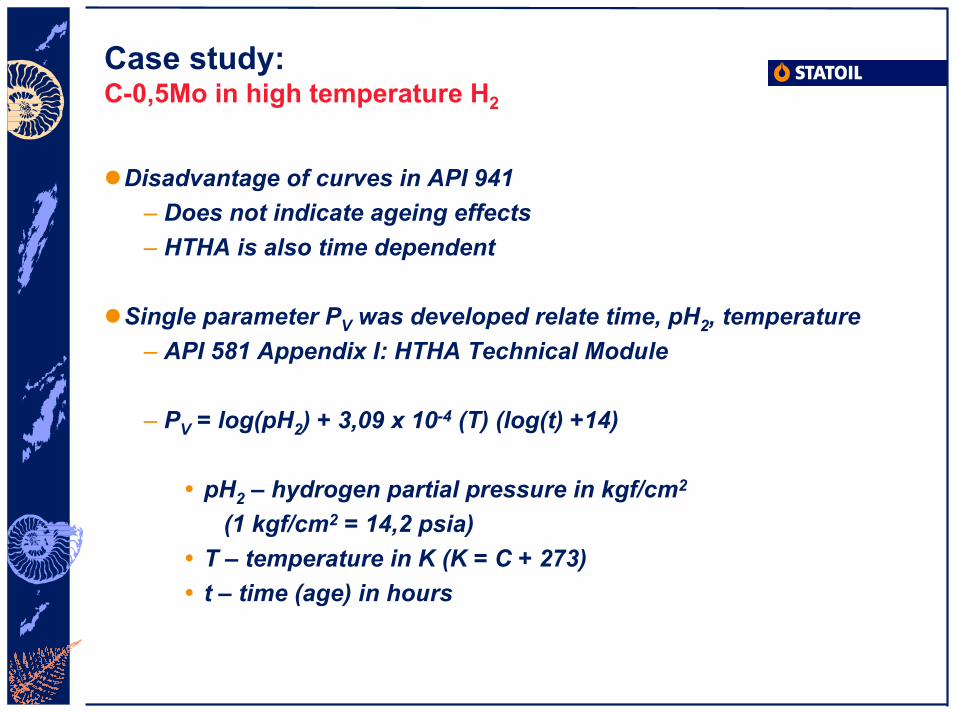
Disadvantage of curves in API 941– Does not indicate ageing effects– HTHA is also time dependent
Single parameter PV was developed relate time, pH2, temperature– API 581 Appendix I: HTHA Technical Module
– PV = log(pH2) + 3,09 x 10⁻⁴ (T) (log(t) +14)
pH2 – hydrogen partial pressure in kgf/cm2
(1 kgf/cm2 = 14,2 psia)T – temperature in K (K = C + 273)t – time (age) in hours
Case study:C-0,5Mo in high temperature H2
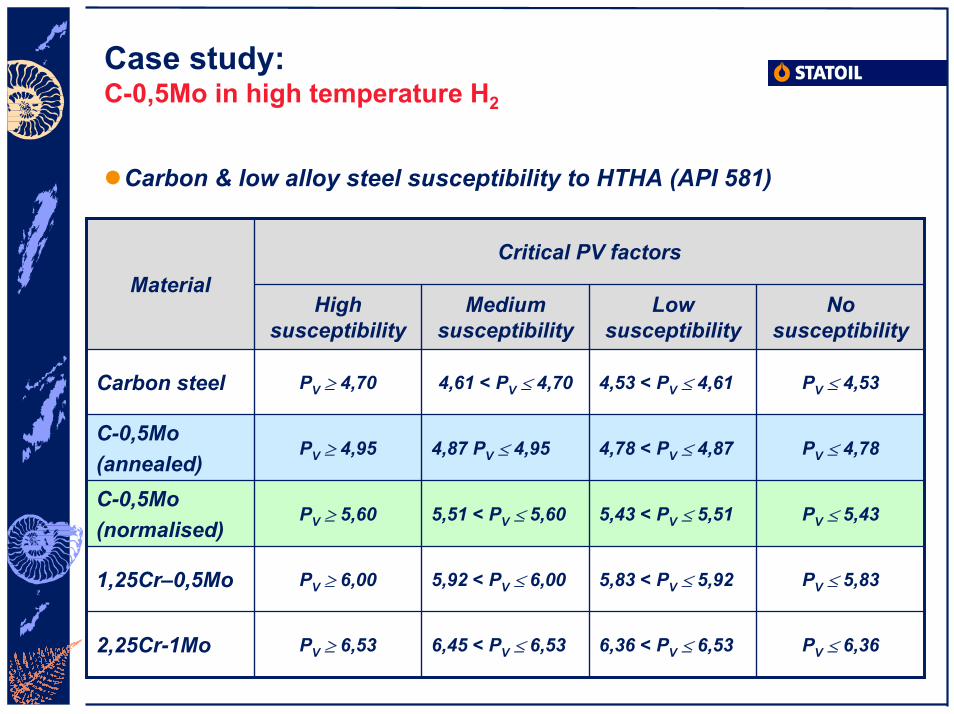
Carbon & low alloy steel susceptibility to HTHA (API 581)
PV [ 6,366,36 < PV [ 6,536,45 < PV [ 6,53PV m 6,532,25Cr-1Mo
PV [ 5,835,83 < PV [ 5,925,92 < PV [ 6,00PV m 6,001,25Cr–0,5Mo
PV [ 5,435,43 < PV [ 5,515,51 < PV [ 5,60PV m 5,60C-0,5Mo(normalised)
PV [ 4,784,78 < PV [ 4,874,87 PV [ 4,95PV m 4,95C-0,5Mo(annealed)
PV [ 4,534,53 < PV [ 4,614,61 < PV [ 4,70PV m 4,70Carbon steel
No susceptibility
Low susceptibility
Medium susceptibility
High susceptibility
Critical PV factorsMaterial
Case study:C-0,5Mo in high temperature H2
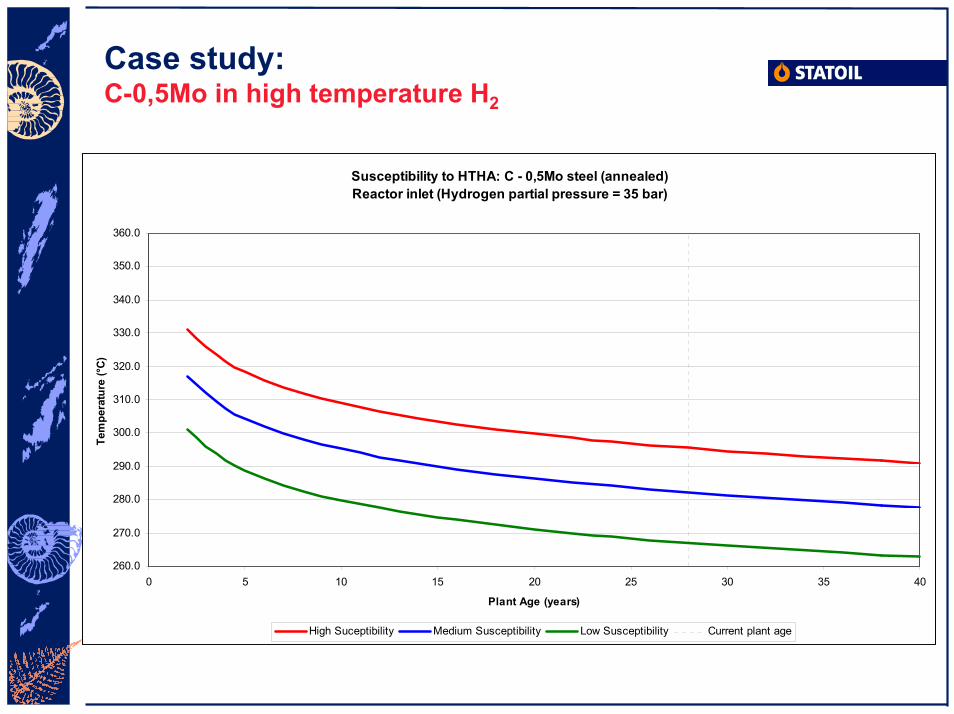
Susceptibility to HTHA: C - 0,5Mo steel (annealed)Reactor inlet (Hydrogen partial pressure = 35 bar)
260.0
270.0
280.0
290.0
300.0
310.0
320.0
330.0
340.0
350.0
360.0
0 5 10 15 20 25 30 35 40
Plant Age (years)
Tem
pera
ture
(°C)
High Suceptibility Medium Susceptibility Low Susceptibility Current plant age

Case study:C-0,5Mo in high temperature H2
Susceptibility to HTHA: C - 0,5Mo steel (normalised)Reactor Inlet (Hydrogen partial pressure = 35 bar)
360.0
370.0
380.0
390.0
400.0
410.0
420.0
430.0
440.0
450.0
460.0
0 5 10 15 20 25 30 35 40
Plant Age (years)
Tem
pera
ture
(°C
)
High Susceptibility Medium Susceptibility Low Susceptibility Current plant age
Case study:C-0,5Mo in high temperature H2
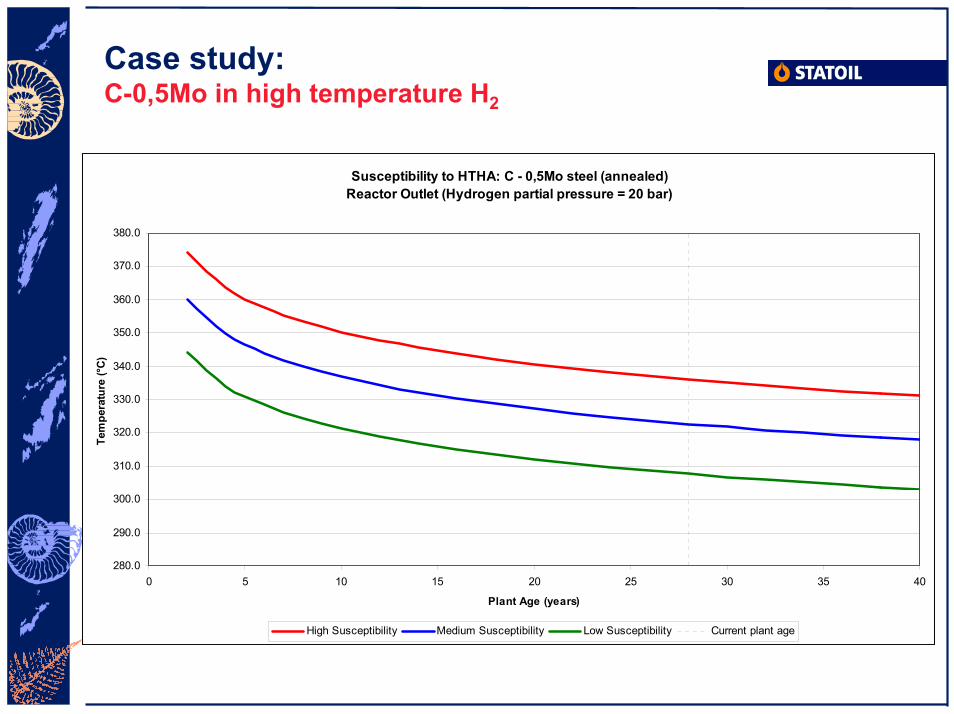
Susceptibility to HTHA: C - 0,5Mo steel (annealed)Reactor Outlet (Hydrogen partial pressure = 20 bar)
280.0
290.0
300.0
310.0
320.0
330.0
340.0
350.0
360.0
370.0
380.0
0 5 10 15 20 25 30 35 40
Plant Age (years)
Tem
pera
ture
(°C
)
High Susceptibility Medium Susceptibility Low Susceptibility Current plant age
Case study:C-0,5Mo in high temperature H2
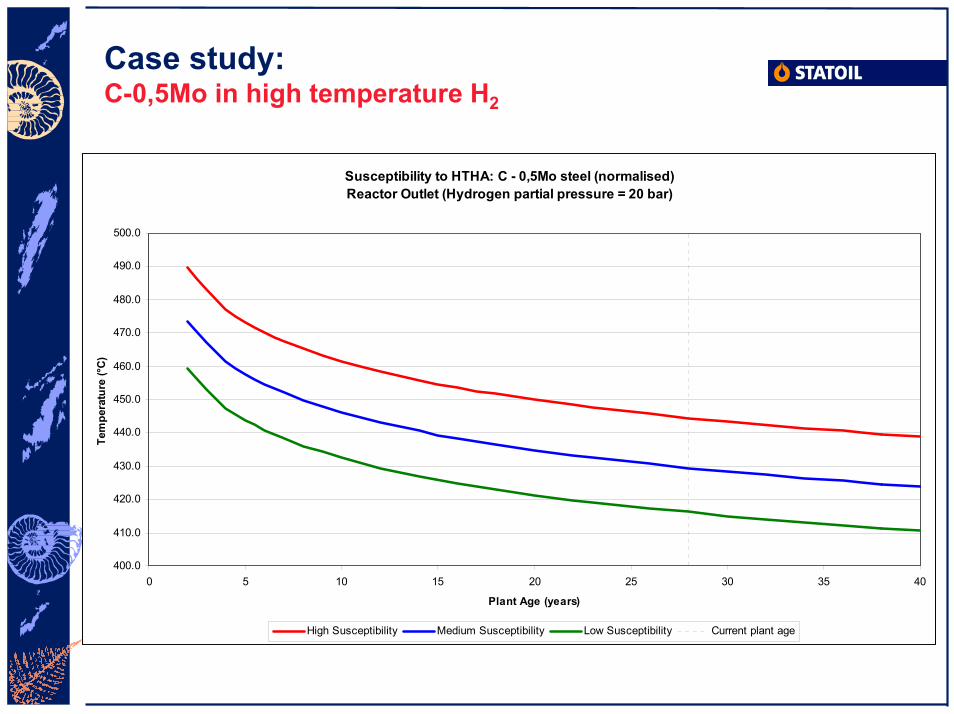
Susceptibility to HTHA: C - 0,5Mo steel (normalised)Reactor Outlet (Hydrogen partial pressure = 20 bar)
400.0
410.0
420.0
430.0
440.0
450.0
460.0
470.0
480.0
490.0
500.0
0 5 10 15 20 25 30 35 40
Plant Age (years)
Tem
pera
ture
(°C
)
High Susceptibility Medium Susceptibility Low Susceptibility Current plant age
Case study:C-0,5Mo in high temperature H2
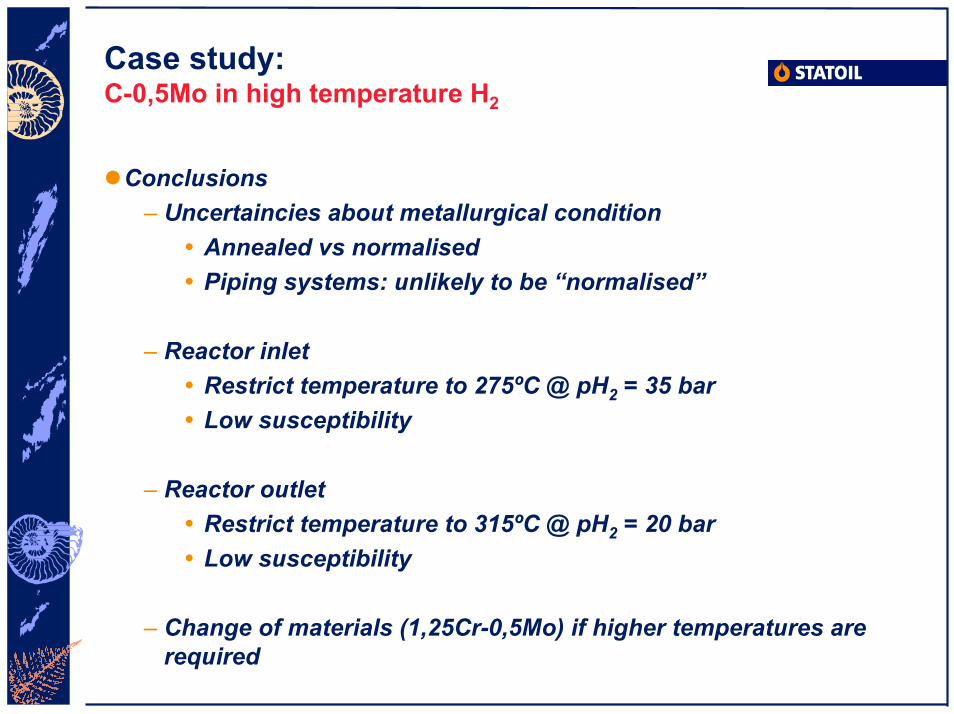
Conclusions– Uncertaincies about metallurgical condition
Annealed vs normalisedPiping systems: unlikely to be “normalised”
– Reactor inletRestrict temperature to 275ºC @ pH2 = 35 barLow susceptibility
– Reactor outletRestrict temperature to 315ºC @ pH2 = 20 barLow susceptibility
– Change of materials (1,25Cr-0,5Mo) if higher temperatures are required
Minutes of EFC WP15 Corrosion in the Refinery Industry 9 March 2004
Appendix 9
Naphtenic acid corrosion
Studies at Eni Technologie
Roberto Riva Eni
1
San Donato Milanese, 9 March 2004
Naphthenic acid corrosion of 9%Cr 1%Mo steel
Roberto Riva, Giovanna Gabetta, Marino Tolomio, Pietro Bruni
• Opportunity crude oils are cheap, but potentially corrosive becausethey may contain naphthenic acids and a high concentration ofsulphur.
• Chemical analysis alone cannot predict their corrosivity; still, the totalacid number (TAN) and the content of sulphur are key parameters.
• There is a subtle interaction between naphthenic acids and sulphur,which can be described by a simple model.
At a fixed concentration of naphthenic acids the model predicts 1) naphthenic acid corrosion at low S content 2) inhibition of naphthenic acid corrosion at intermediate S content 3) sulphidic corrosion at high S content.
Background
2
• Testing the model that describes the interaction betweennaphthenic acids and sulphur.
• Developing a laboratory test capable of predicting thecorrosivity of opportunity crudes, which could become aplanning tool for refineries. We focus on furnace tubes.
Aims of the experimental work ofEnitecnologie
• Rotating specimen (9% Cr, 1% Mo) in a sealed autoclave at 340°C.
• Two kinds of oil: 1) Ural crude oil (1.5% wt sulphur, TAN=0.2) 2) lubricant base oil (3.8ppm wt sulphur, TAN=0.16).
• Acidity is increased through addition of a mixture of syntheticnaphthenic acids (Fluka 70340, average molecular weight 230).
• Evaluation of the rate of corrosion through weight loss after cleaning.
• Evaluation of the weight of corrosion product deposited on the surfaceof the metal: difference between weight after test and after cleaning.
Experimental procedure
3
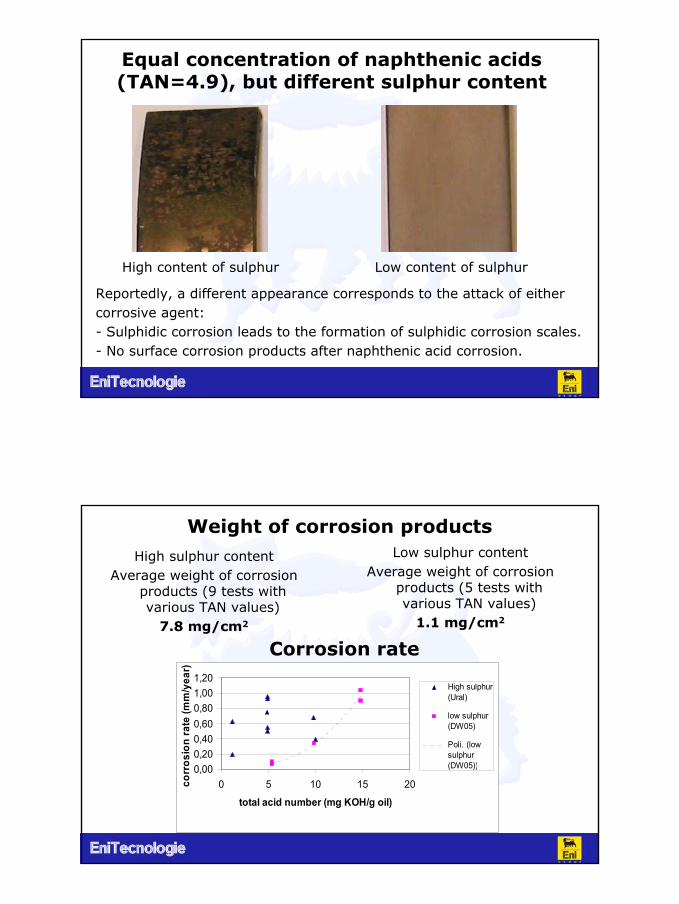
Equal concentration of naphthenic acids(TAN=4.9), but different sulphur content
High content of sulphur Low content of sulphur
Reportedly, a different appearance corresponds to the attack of eithercorrosive agent:- Sulphidic corrosion leads to the formation of sulphidic corrosion scales.- No surface corrosion products after naphthenic acid corrosion.
Weight of corrosion productsHigh sulphur content
Average weight of corrosionproducts (9 tests withvarious TAN values)
7.8 mg/cm2
Low sulphur contentAverage weight of corrosion
products (5 tests withvarious TAN values)
1.1 mg/cm2
Corrosion rate
0,000,200,400,600,801,001,20
0 5 10 15 20
total acid number (mg KOH/g oil)
corr
osio
n ra
te (m
m/y
ear)
High sulphur(Ural)
low sulphur(DW05)
Poli. (lowsulphur(DW05))
4
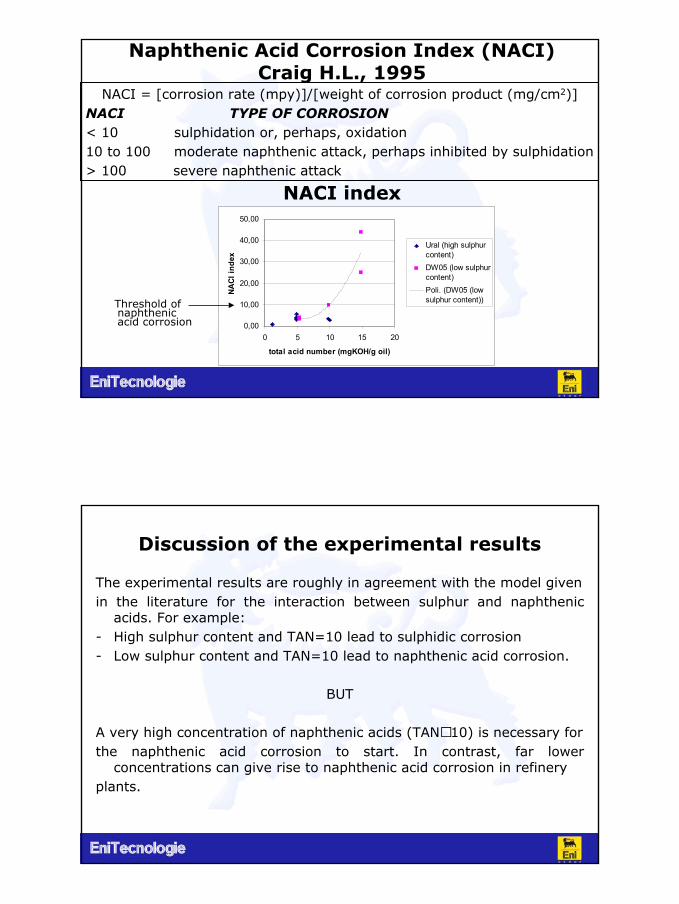
Naphthenic Acid Corrosion Index (NACI)Craig H.L., 1995
NACI = [corrosion rate (mpy)]/[weight of corrosion product (mg/cm2)]NACI TYPE OF CORROSION< 10 sulphidation or, perhaps, oxidation10 to 100 moderate naphthenic attack, perhaps inhibited by sulphidation> 100 severe naphthenic attack
NACI index
0,00
10,00
20,00
30,00
40,00
50,00
0 5 10 15 20
total acid number (mgKOH/g oil)
NACI
inde
xUral (high sulphurcontent)DW05 (low sulphurcontent)Poli. (DW05 (lowsulphur content)) Threshold of
naphthenicacid corrosion
Discussion of the experimental results
The experimental results are roughly in agreement with the model givenin the literature for the interaction between sulphur and naphthenic
acids. For example:- High sulphur content and TAN=10 lead to sulphidic corrosion- Low sulphur content and TAN=10 lead to naphthenic acid corrosion.
BUT
A very high concentration of naphthenic acids (TAN 10) is necessary forthe naphthenic acid corrosion to start. In contrast, far lower
concentrations can give rise to naphthenic acid corrosion in refineryplants.
5
Pitfalls of sealed autoclave tests
The pressure reached in sealed autoclave tests is probably too high(20 to 30 bar). The compounds containing sulphur decomposegradually during the test, the concentration of dissolved H2S risesconsequently and appears to favour sulphidic corrosion.
• The experiments have confirmed the interaction betweensulphur and naphthenic acids. The results are roughly inagreement with the model given in the literature.
• Very high concentrations of naphthenic acids (TAN 10) wererequired for the onset naphthenic acid corrosion. Suchbehaviour is surprising even for 9% Cr-1% Mo steel, which isquite resistant to naphthenic acids . Far lower concentrations(TAN 0.5) are potentially corrosive in refinery plants. Theexperimental set-up probably needs modifying, if plantconditions are to be reproduced.
Conclusions

6
Alternative autoclave tests
According to the literature, a closer agreement between laboratorytests and plant experience could be obtained with either of thefollowing pieces of equipment:
• Pressure relief valve and condenser: at 3 to 7 bar and threedays’ exposure corrosion rates are much closer to those experiencedon refinery plants. (Kane & Cayard, 1998)
• Refreshed rotating cylinder apparatus: low fluid consumption( 10 litres per 24 hours), high pressure (69 bar) (Pritchard A.M. etal., 2001).
Minutes of EFC WP15 Corrosion in the Refinery Industry 9 March 2004
Appendix 10
Naphtenic acid corrosion
A neural network approach
S. Trasatti University of Milan

1
Naphtenic acid corrosion: a neuralnetwork approach
Stefano P. Trasatti, Francesco MazzaDip.to di Chimica Fisica ed Elettrochimica, Università di Milano
Via C.Golgi 19 - 20133 Milano
EFC meeting 2004 - Enitecnologie 8/9 March 2004
Neural NetworkMathematical model simulating neuronal activity of the human brain.It’s an Artificial Intelligence System enables us to embed structuredhuman knowledge into workable algorithms. NN learns the “weights”
of the correlation between input and output data apparently notconnected by any model (training step)
Target: to predict output from input not used in the training step and toobtain information on the involved mechanism

2
Neural network structure:Multilayer Perceptron
Transfer functions typically used by NNnodes and neurons

3
Neural Network features• Advantages
– Adaptability to phenomena which are changing– High level og robustness (tolerance limit)– Non-linear calculation tool
• Limitations
– Close box tool (no mechanistic understanding of the processbeing modelled)
– High number of data for training step– Data filtering and codification
Neural Network applications• Recognition of characters and images• Analysis of spectra (Raman, NMR, IR, etc.)• Petrochemical industry (rock properties, well productivity,
seismic images)• Noise filtering• Chemical process optimization (recognition offailure
cases)• Loan calculation (banks)• Medical diagnosis (electroencephalogram analysis)
4
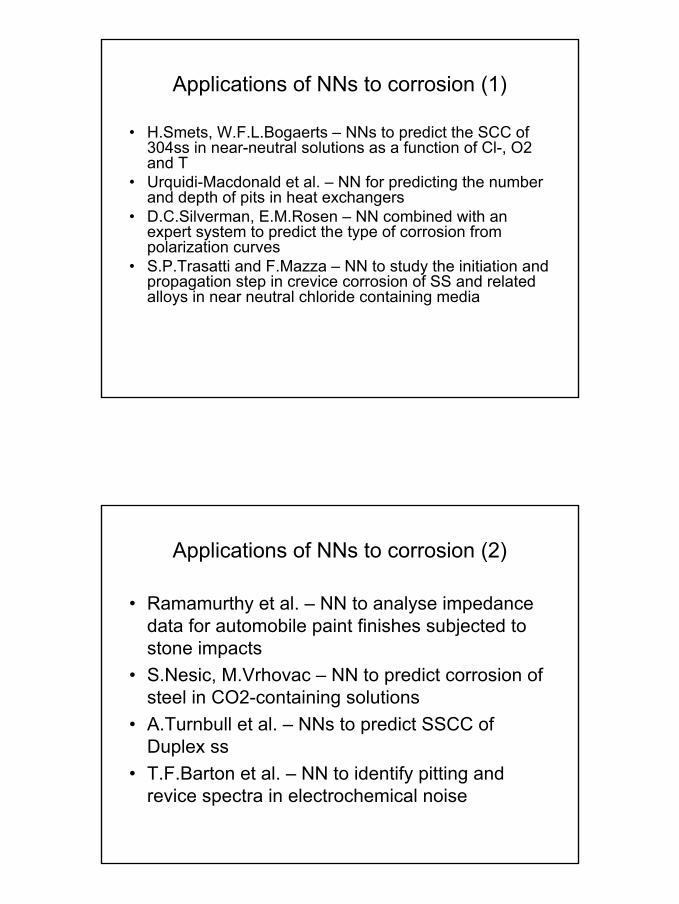
Applications of NNs to corrosion (1)
• H.Smets, W.F.L.Bogaerts – NNs to predict the SCC of304ss in near-neutral solutions as a function of Cl-, O2and T
• Urquidi-Macdonald et al. – NN for predicting the numberand depth of pits in heat exchangers
• D.C.Silverman, E.M.Rosen – NN combined with anexpert system to predict the type of corrosion frompolarization curves
• S.P.Trasatti and F.Mazza – NN to study the initiation andpropagation step in crevice corrosion of SS and relatedalloys in near neutral chloride containing media
Applications of NNs to corrosion (2)
• Ramamurthy et al. – NN to analyse impedancedata for automobile paint finishes subjected tostone impacts
• S.Nesic, M.Vrhovac – NN to predict corrosion ofsteel in CO2-containing solutions
• A.Turnbull et al. – NNs to predict SSCC ofDuplex ss
• T.F.Barton et al. – NN to identify pitting andrevice spectra in electrochemical noise
5
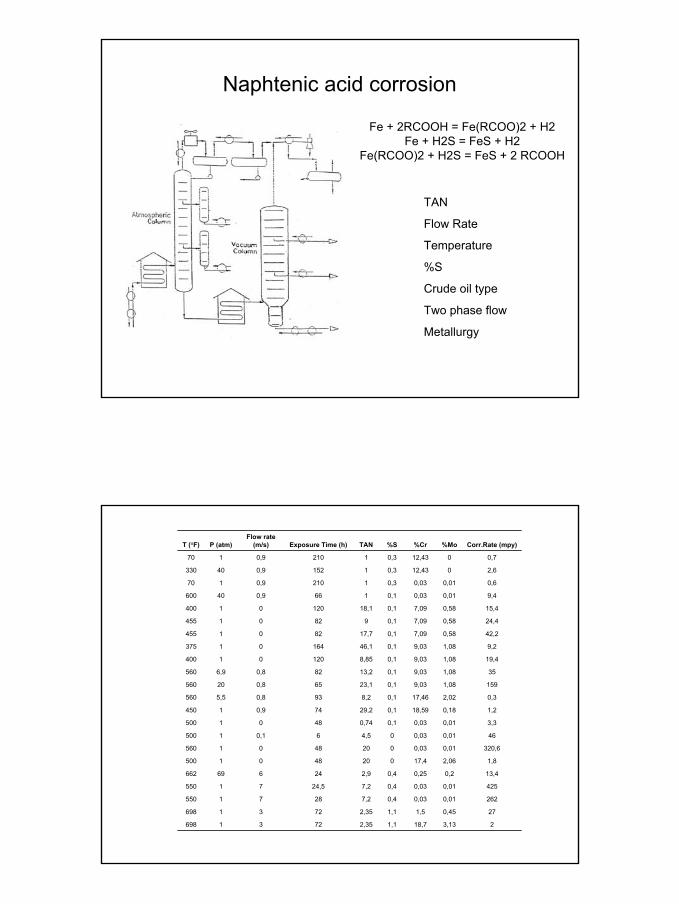
Naphtenic acid corrosion
Fe + 2RCOOH = Fe(RCOO)2 + H2Fe + H2S = FeS + H2
Fe(RCOO)2 + H2S = FeS + 2 RCOOH
TAN
Flow Rate
Temperature
%S
Crude oil type
Two phase flow
Metallurgy
23,1318,71,12,357231698
270,451,51,12,357231698
2620,010,030,47,22871550
4250,010,030,47,224,571550
13,40,20,250,42,924669662
1,82,0617,40204801500
320,60,010,030204801560
460,010,0304,560,11500
3,30,010,030,10,744801500
1,20,1818,590,129,2740,91450
0,32,0217,460,18,2930,85,5560
1591,089,030,123,1650,820560
351,089,030,113,2820,86,9560
19,41,089,030,18,8512001400
9,21,089,030,146,116401375
42,20,587,090,117,78201455
24,40,587,090,198201455
15,40,587,090,118,112001400
9,40,010,030,11660,940600
0,60,010,030,312100,9170
2,6012,430,311520,940330
0,7012,430,312100,9170
Corr.Rate (mpy)%Mo%Cr%STANExposure Time (h)Flow rate
(m/s)P (atm)T (°F)
6
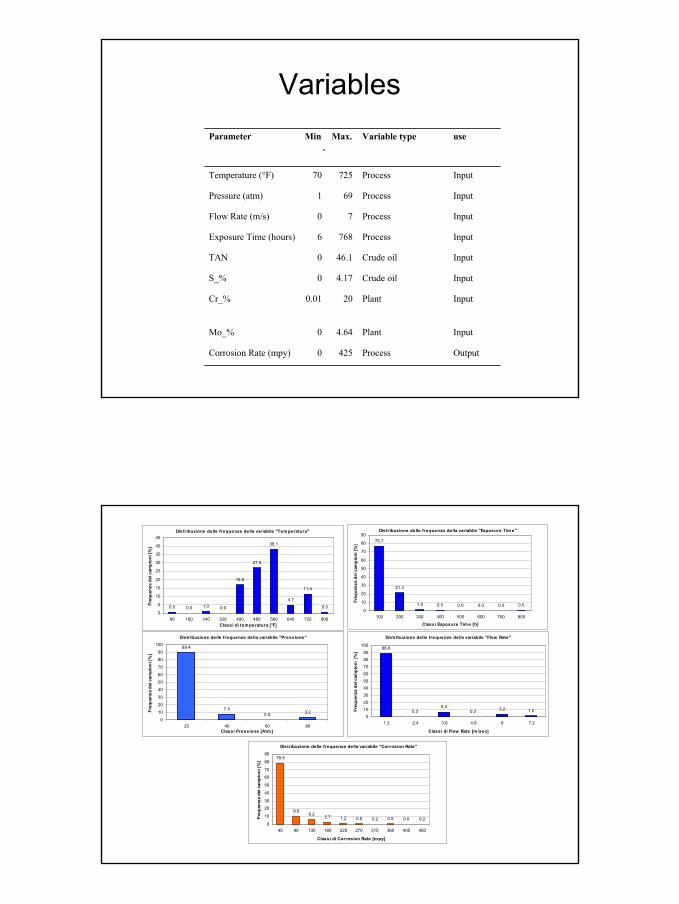
Variables
OutputProcess4250Corrosion Rate (mpy)
InputPlant4.640Mo_%
InputPlant200.01Cr_%
InputCrude oil4.170S_%
InputCrude oil46.10TAN
InputProcess7686Exposure Time (hours)
InputProcess70Flow Rate (m/s)
InputProcess691Pressure (atm)
InputProcess72570Temperature (°F)
useVariable typeMax.Min.
Parameter
Distribuzione delle frequenze della variabile "Exposure Tim e"
76.7
21.3
1.0 0.5 0.0 0.0 0.0 0.50
10
20
30
40
50
60
70
80
90
100 200 300 400 500 600 700 800
Classi Exposure Time [h]
Freq
uenz
a de
i cam
pion
i [%
]
Distribuzione delle frequenze della variabile "Temperatura"
0.5 0.0 1.0 0.0
16.8
27.0
38.1
4.7
11.4
0.50
5
10
15
20
25
30
35
40
45
80 160 240 320 400 480 560 640 720 800Classi di temperatura [°F]
Freq
uenz
a de
i cam
pion
i [%
]
Distribuzione delle frequenze della variabile "Pressione"
89.4
7.40.0 3.2
0
10
20
30
40
50
60
70
80
90
100
20 40 60 80Classi Pressione [Atm]
Freq
uenz
a de
i cam
pion
i [%
]
Distribuzione delle frequenze della variabile "Flow Rate"
88.6
0.26.4
0.2 3.2 1.20
102030405060708090
100
1.2 2.4 3.6 4.8 6 7.2
Classi di Flow Rate [m /sec]
Freq
uenz
a de
i cam
pion
i [%
]
Distribuzione delle frequenze della variabile "Corrosion Rate"
78.5
9.96.2 2.7 1.2 0.5 0.2 0.5 0.0 0.2
0
10
20
30
40
50
60
70
80
90
45 90 135 180 225 270 315 360 405 450
Classi di Corrosion Rate [mpy]
Freq
uenz
a de
i cam
pion
i [%
]
7
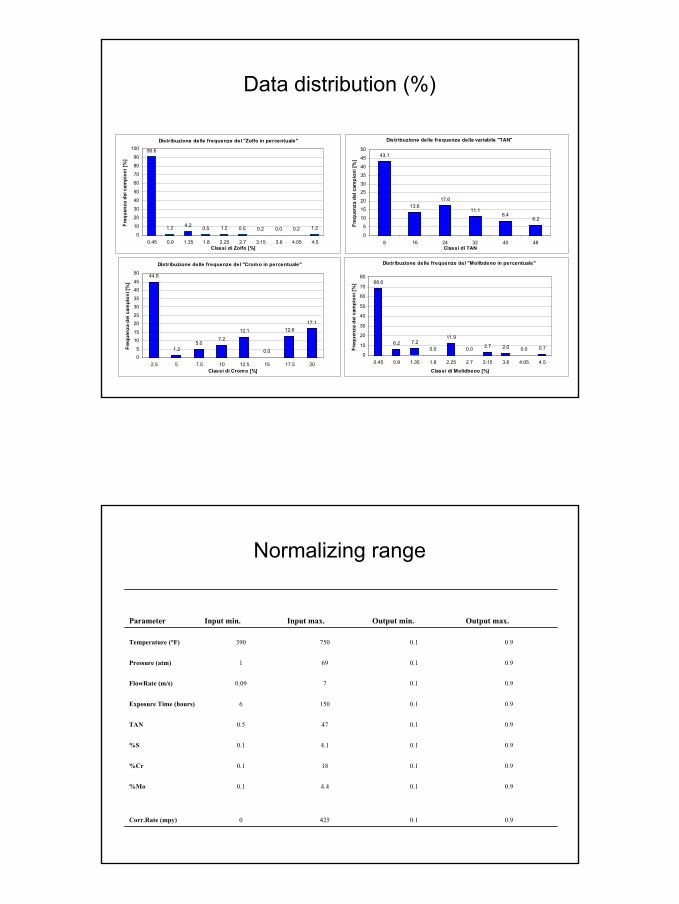
Data distribution (%)
Distribuzione delle frequenze della variabile "TAN"
43.1
13.617.6
11.18.4
6.2
0
5
10
15
20
2530
35
40
45
50
8 16 24 32 40 48Classi di TAN
Freq
uenz
a de
i cam
pion
i [%
]
Distribuzione delle frequenze del "Zolfo in percentuale"
90.6
1.2 4.2 0.5 1.2 0.5 0.2 0.0 0.2 1.20
10
20
30
40
50
60
70
80
90
100
0.45 0.9 1.35 1.8 2.25 2.7 3.15 3.6 4.05 4.5Classi di Zolfo [%]
Freq
uenz
a de
i cam
pion
i [%
]
Distribuzione delle frequenze del "Cromo in percentuale"
44.8
1.25.0
7.212.1
0.0
12.617.1
05
1015
2025
3035
4045
50
2.5 5 7.5 10 12.5 15 17.5 20Classi di Cromo [%]
Freq
uenz
a de
i cam
pion
i [%
]
Distribuzione delle frequenze del "Molibdeno in percentuale"
68.6
6.2 7.20.0
11.9
0.0 2.7 2.0 0.0 0.70
10
20
30
40
50
60
70
80
0.45 0.9 1.35 1.8 2.25 2.7 3.15 3.6 4.05 4.5
Classi di Molidbeno [%]
Freq
uenz
a de
i cam
pion
i [%
]
Normalizing range
0.90.14250Corr.Rate (mpy)
0.90.14.40.1%Mo
0.90.1180.1%Cr
0.90.14.10.1%S
0.90.1470.5TAN
0.90.11506Exposure Time (hours)
0.90.170.09FlowRate (m/s)
0.90.1691Pressure (atm)
0.90.1750390Temperature (°F)
Output max.Output min.Input max.Input min.Parameter
8
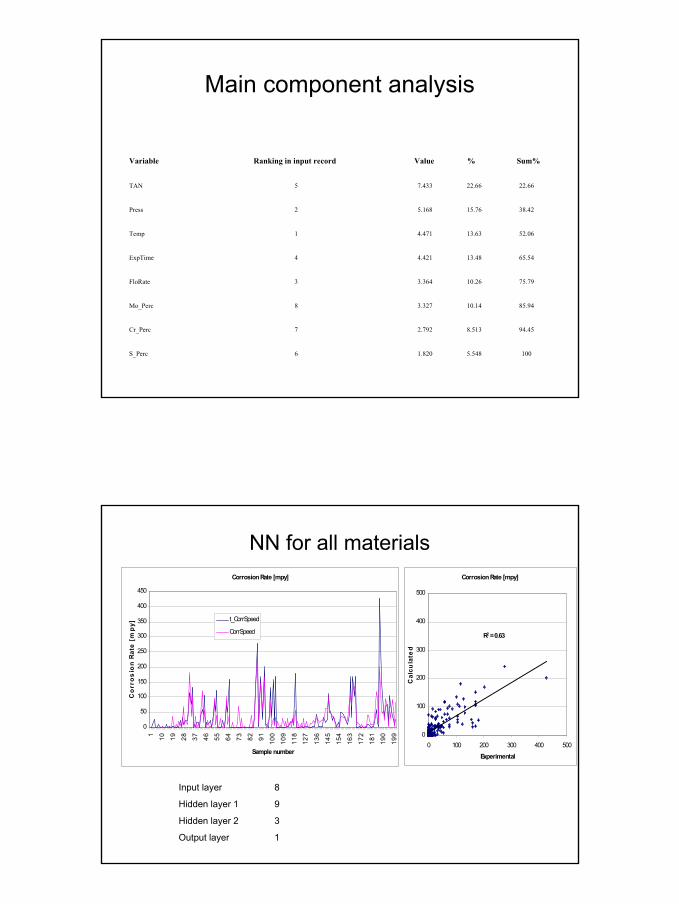
Main component analysis
1005.5481.8206S_Perc
94.458.5132.7927Cr_Perc
85.9410.143.3278Mo_Perc
75.7910.263.3643FloRate
65.5413.484.4214ExpTime
52.0613.634.4711Temp
38.4215.765.1682Press
22.6622.667.4335TAN
Sum% % Value Ranking in input recordVariable
NN for all materialsCorrosion Rate [mpy]
R2 = 0.63
0
100
200
300
400
500
0 100 200 300 400 500
Experimental
Cal
cula
ted
Corrosion Rate [mpy]
0
50
100
150
200
250
300
350
400
450
1 10 19 28 37 46 55 64 73 82 91 100
109
118
127
136
145
154
163
172
181
190
199
Sample number
Cor
rosi
on
Rate
[m
py] t_CorrSpeed
CorrSpeed
Input layer 8
Hidden layer 1 9
Hidden layer 2 3
Output layer 1
9
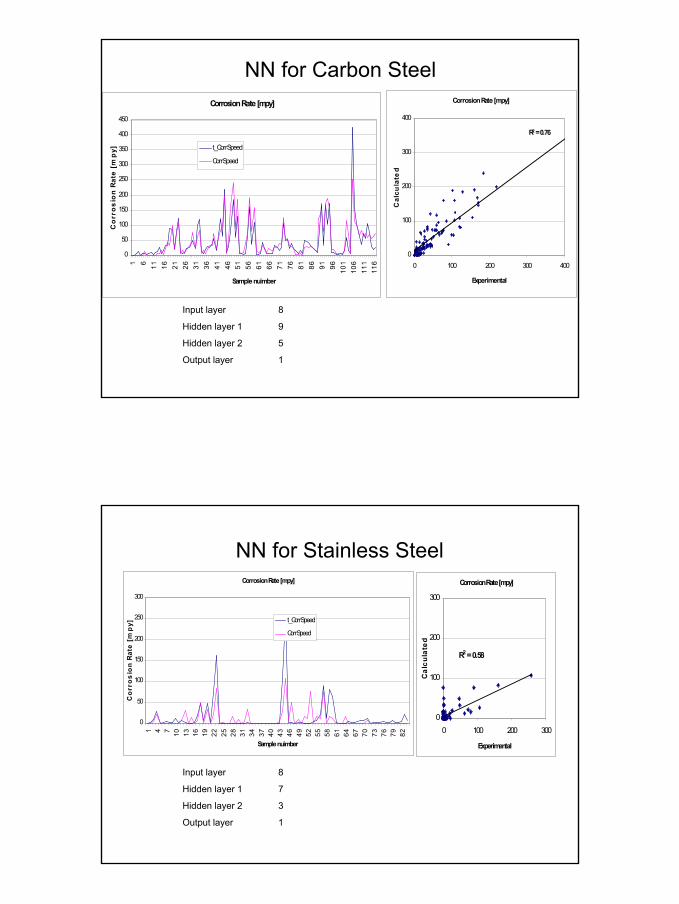
NN for Carbon SteelCorrosion Rate [mpy]
R2 = 0.76
0
100
200
300
400
0 100 200 300 400
Experimental
Cal
cula
ted
Corrosion Rate [mpy]
0
50
100
150
200
250
300
350
400
450
1 6 11 16 21 26 31 36 41 46 51 56 61 66 71 76 81 86 91 96 101
106
111
116
Sample nuimber
Cor
rosi
on
Rate
[mp
y] t_CorrSpeed
CorrSpeed
Input layer 8
Hidden layer 1 9
Hidden layer 2 5
Output layer 1
NN for Stainless SteelCorrosion Rate [mpy]
R2 = 0.58
0
100
200
300
0 100 200 300
Experimental
Cal
cula
ted
Corrosion Rate [mpy]
0
50
100
150
200
250
300
1 4 7 10 13 16 19 22 25 28 31 34 37 40 43 46 49 52 55 58 61 64 67 70 73 76 79 82
Sample nuimber
Cor
ros
ion
Rat
e [m
py] t_CorrSpeed
CorrSpeed
Input layer 8
Hidden layer 1 7
Hidden layer 2 3
Output layer 1
10
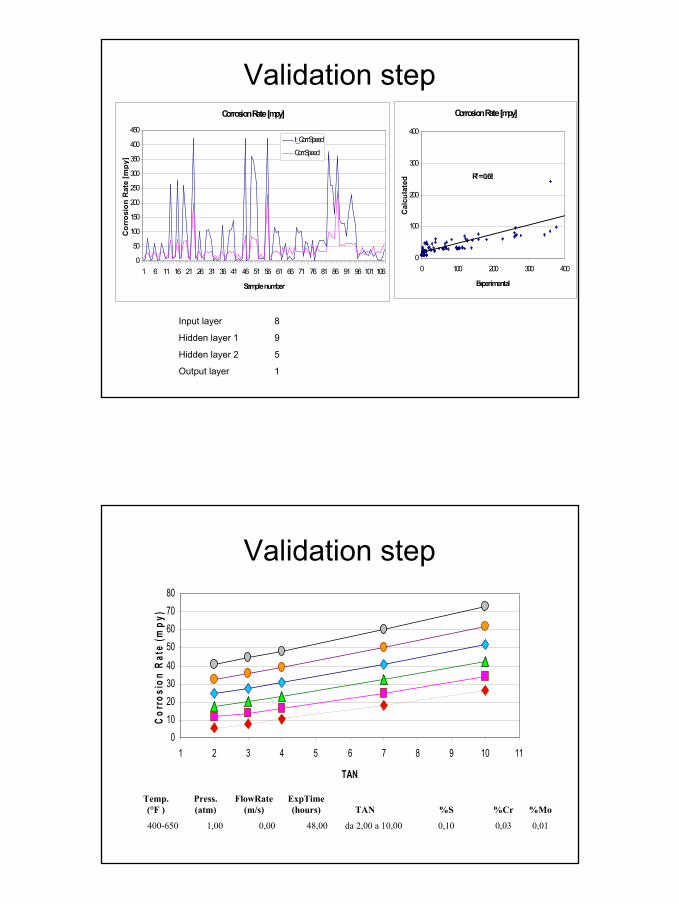
Validation stepCorrosion Rate [mpy]
R2= 0.68
0
100
200
300
400
0 100 200 300 400
Experimental
Cal
cula
ted
Corrosion Rate [mpy]
0
50
100
150
200
250
300
350
400
450
1 6 11 16 21 26 31 36 41 46 51 56 61 66 71 76 81 86 91 96 101 106
Sample number
Cor
rosi
on R
ate
[mpy
]
t_CorrSpeed
CorrSpeed
Input layer 8
Hidden layer 1 9
Hidden layer 2 5
Output layer 1
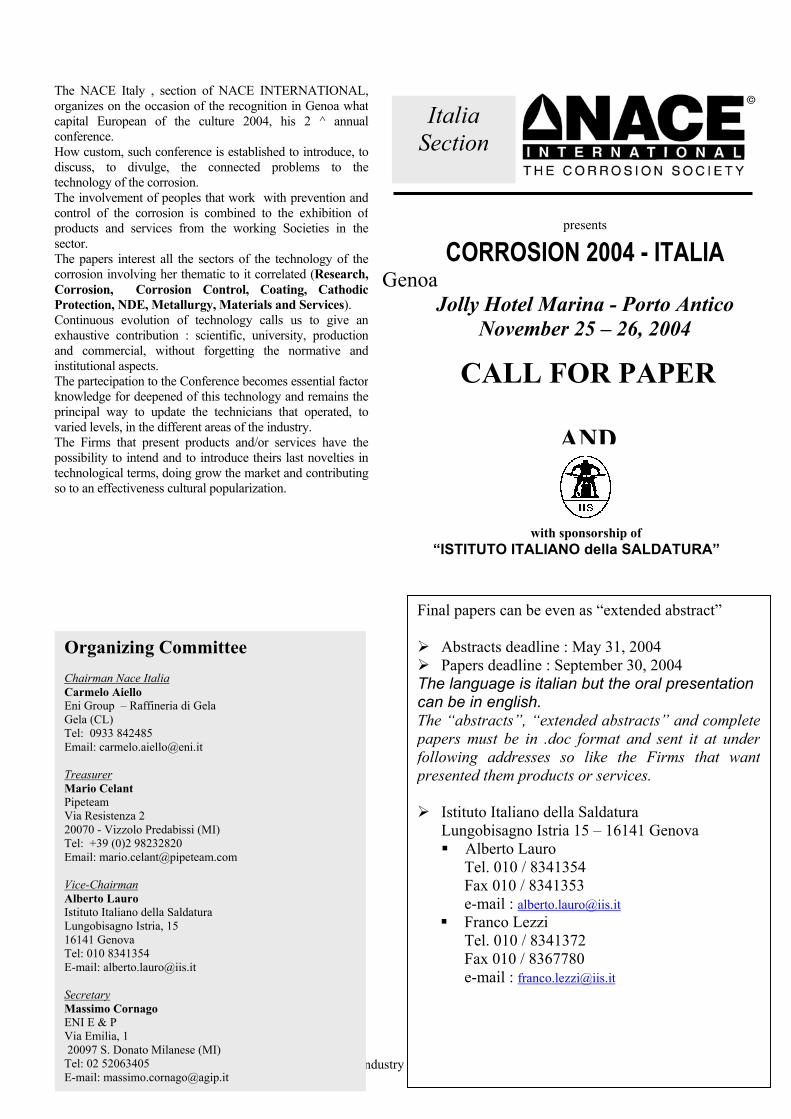
Validation step
0,010,030,10da 2,00 a 10,0048,000,001,00400-650
%Mo%Cr%STANExpTime(hours)
FlowRate(m/s)
Press.(atm)
Temp.(°F )
010203040
50607080
1 2 3 4 5 6 7 8 9 10 11
TAN
Cor
rosi
on R
ate
(mpy
)

11
Validation Step
57.435.4180.114.8168.01.920.0644.0
61.5540.5180.114.8168.01.925.0644.0
46.1313180.19.9168.01.919.0644.0
29.732.4180.15.4168.01.916.0644.0
34.053.9180.15.4108.01.918.0644.0
26.4526.4180.19.8163.01.937.0644.0
50.3315.3180.110180.01.916.0644.0
25.0837.4180.14.9104.01.925.0644.0
31.8619.7180.14.9108.01.918.0644.0
33.9321.6180.14.996.01.918.0644.0
21.7336.6180.14.9108.01.928.0644.0
45.8429.5180.14.984.03.220.0644.0
26.0724.4180.11.272.03.222.0644.0
20.137.5180.11.2228.03.219.0644.0
Corr.Ratepredetta
Corr.Rate(mpy)
%Mo%Cr%STANExp.Time(ore)
FlowRate(m/s)
Press.(atm)
Temp.(°F
)

Minutes of EFC WP15 Corrosion in the Refinery Industry 9 March 2004
Appendix 11
Nace Italia 2004 Conference
sion in the Refinery Industry 9 March 2004
ItaliaSection
The NACE Italy , section of NACE INTERNATIONAL,organizes on the occasion of the recognition in Genoa whatcapital European of the culture 2004, his 2 ^ annualconference.How custom, such conference is established to introduce, todiscuss, to divulge, the connected problems to thetechnology of the corrosion.The involvement of peoples that work with prevention andcontrol of the corrosion is combined to the exhibition ofproducts and services from the working Societies in thesector.The papers interest all the sectors of the technology of thecorrosion involving her thematic to it correlated (Research,Corrosion, Corrosion Control, Coating, CathodicProtection, NDE, Metallurgy, Materials and Services).Continuous evolution of technology calls us to give anexhaustive contribution : scientific, university, productionand commercial, without forgetting the normative andinstitutional aspects.The partecipation to the Conference becomes essential factorknowledge for deepened of this technology and remains theprincipal way to update the technicians that operated, tovaried levels, in the different areas of the industry.The Firms that present products and/or services have thepossibility to intend and to introduce theirs last novelties intechnological terms, doing grow the market and contributingso to an effectiveness cultural popularization.
CORROGenoa
Jolly HotNov
Final papers ca
Abstracts d Papers dead
The languagecan be in engThe “abstractspapers must befollowing addrpresented them
Istituto ItaliLungobisag Alberto
Tel. 010Fax 010e-mail :
Franco Tel. 010Fax 010e-mail :
“ISTITUTO I
presents
SION 2004 - ITALIA
el Marina - Porto Anticoember 25 – 26, 2004
n be even as “extended abstract”
eadline : May 31, 2004line : September 30, 2004 is italian but the oral presentationlish.”, “extended abstracts” and complete in .doc format and sent it at underesses so like the Firms that want products or services.
ano della Saldaturano Istria 15 – 16141 Genova Lauro / 8341354 / 8341353 [email protected] / 8341372 / 8367780 [email protected]
with sponsorship ofTALIANO della SALDATURA”
Minutes of EFC WP15 Corro
Organizing CommitteeChairman Nace ItaliaCarmelo AielloEni Group – Raffineria di GelaGela (CL)Tel: 0933 842485Email: [email protected]
TreasurerMario CelantPipeteamVia Resistenza 220070 - Vizzolo Predabissi (MI)Tel: +39 (0)2 98232820Email: [email protected]
Vice-ChairmanAlberto LauroIstituto Italiano della SaldaturaLungobisagno Istria, 1516141 GenovaTel: 010 8341354E-mail: [email protected]
SecretaryMassimo CornagoENI E & PVia Emilia, 1 20097 S. Donato Milanese (MI)Tel: 02 52063405E-mail: [email protected]
CALL FOR PAPER
AND


![Assessing the Potential Benefits and Limits of Electric ...€¦ · have already been experiencing elevated levels of curtailment [2]. It is projected that the curtailment level will](https://img.pdfslide.net/doc/110x75/5f09d80a7e708231d428c301/assessing-the-potential-benefits-and-limits-of-electric-have-already-been-experiencing.jpg)