Embed Size (px)
Citation preview

APPENDIX B
Geotechnical Investigation Report
Preliminary Geotechnical Investigation
Bassett Townhome Project
San Jose, California
Report No. 247567 has been prepared for:
LEGACY PARTNERS BASSETT, LLC
4000 East Third Avenue, Suite 600, Foster City, California 94404
January 13, 2016
1920 Old Middlefield Way, Mountain View, California 94043-2209 Main: 650.967.2365 Fax: 650.967.2785 website: www.trcsolutions.com
Wilson Wong, P.E. Project Engineer
Scott M. Leck, P.E., G.E. Principal Geotechnical Engineer Quality Assurance Reviewer
Page i 247567
TABLE OF CONTENTS
1.0 INTRODUCTION ....................................................................................................................... 1
1.1 Project Description ........................................................................................................ 1 1.2 Scope of Services .......................................................................................................... 1
2.0 SITE CONDITIONS .................................................................................................................... 1 2.1 Site Geology ................................................................................................................. 1 2.2 Previous Exploration Program ......................................................................................... 2 2.3 Subsurface Conditions.................................................................................................... 2 2.4 Ground Water ............................................................................................................... 2
3.0 GEOLOGIC HAZARDS ................................................................................................................ 2 3.1 Fault Rupture ................................................................................................................ 3 3.2 Maximum Estimated Ground Shaking .............................................................................. 3
Table 1. Summary of Peak Ground Acceleration Values ..................................................... 3 3.3 Future Earthquake Probabilities ...................................................................................... 3 3.4 Liquefaction .................................................................................................................. 4
3.4.1 CPT Based Liquefaction Analysis ........................................................................ 4 3.4.2 SPT Based Liquefaction Analysis ........................................................................ 5 3.4.3 Potential for Ground Rupture/Sand Boils .............................................................. 5
3.5 Dry Seismic Settlement .................................................................................................. 5 3.6 Lateral Spreading .......................................................................................................... 6 3.7 Seismically Induced Waves ............................................................................................. 6 3.8 Flooding and Reservoir Inundation ................................................................................... 6 3.9 Soil Erosion .................................................................................................................. 6 3.10 Subsidence ................................................................................................................... 6 3.11 Soil Expansion .............................................................................................................. 7
4.0 CONCLUSIONS AND PRELIMINARY DEVELOPMENT RECOMMENDATIONS ................................... 7 4.1 Primary Geotechnical Concerns ....................................................................................... 7
4.1.1 Strong Seismic Shaking ..................................................................................... 7 4.1.2 Demolition Debris ............................................................................................. 7 4.1.3 Potential Liquefaction Induced Settlement ........................................................... 8 4.1.4 Potential Ground Surface Rupture ....................................................................... 8 4.1.5 Undocumented Fill ............................................................................................ 8
4.2 Design-Level Geotechnical Investigation ........................................................................... 8 5.0 PRELIMINARY FOUNDATIONS RECOMMENDATIONS .................................................................. 8
5.1 2013 CBC Site Coefficients and Site Seismic Coefficients .................................................. 8 Table 2. 2013 CBC Site Class and Site Seismic Coefficients ............................................. 9
5.2 Footings ....................................................................................................................... 9 7.1 Reinforced Mat Foundations ........................................................................................... 9
6.0 LIMITATIONS ......................................................................................................................... 10 7.0 REFERENCES ......................................................................................................................... 11 FIGURE 1 — VICINITY MAP FIGURE 2 — SITE PLAN FIGURE 3 — REGIONAL FAULT MAP
APPENDIX A — BORING LOGS FROM PREVIOUS INVESTIGATION APPENDIX B — LABORATORY TEST DATA FROM PREVIOUS INVESTIGATION
Page 1 247567
PRELIMINARY GEOTECHNICAL INVESTIGATION BASSETT TOWNHOME PROJECT
SAN JOSE, CALIFORNIA
1.0 INTRODUCTION This report presents the results of our preliminary geotechnical investigation for the Bassett Townhome project to be constructed in San Jose, California. The site location is shown on the Vicinity Map, Figure 1. The purpose of our investigation was to evaluate the geologic and subsurface conditions and to provide preliminary geotechnical recommendations for design of the proposed project. As you know, we prepared a geotechnical report for a similar project on an adjacent site in 2011. The information contained in this report is based on the subsurface conditions on the adjacent site and assume similar subsurface conditions exist at the Bassett Townhome project site. For our use, we received preliminary architectural plans titled, “Bassett Townhomes,” prepared by BDE Architecture dated April 17, 2015.
1.1 Project Description Based on the preliminary plans provided, we understand the project consists of developing the site with 30, three-story townhome units with slab-on-grade floors. The townhomes will likely be of wood-frame construction. The project will also include paved driveways, pedestrian walkways, landscaping and underground utilities. The site currently consists of three parcels encompassing approximately ¾ of an acre. The project area in bounded by train tracks to the north, Terraine Street to the west, Bassett Street to the south and North San Pedro Street to the east. The street-level layout of the proposed development is shown on the Site Plan, Figure 2. Structural loads have not been provided to us; therefore we assumed that structural loads will be representative for this type of construction.
1.2 Scope of Services Our scope of services was presented in our agreement with you dated November 30, 2015. To accomplish this work, we provided the following services:
Review of the previous exploration of subsurface conditions and laboratory testing at the
adjacent project site.
Engineering analysis to evaluate structure foundations, and site earthwork.
Preparation of this report to summarize our findings and to present our preliminary conclusions and recommendations.
2.0 SITE CONDITIONS 2.1 Site Geology
The Bassett Townhome project area is shown on geologic maps by Wesling and Helley (1989) Wagner (1991) and Graymer (2006) as alluvium. Graymer describes the alluvium as Holocene age. Wesling and Helley (1989) describe the soil as Holocene age medium to dark gray, dense, sandy to silty clay
Legacy Partners Bassett, LLC Bassett Townhome Project
Page 2 247567
floodplain deposits with lenses of coarser silts, sands and pebbles found between levee deposits of Coyote Creek and Guadalupe River.
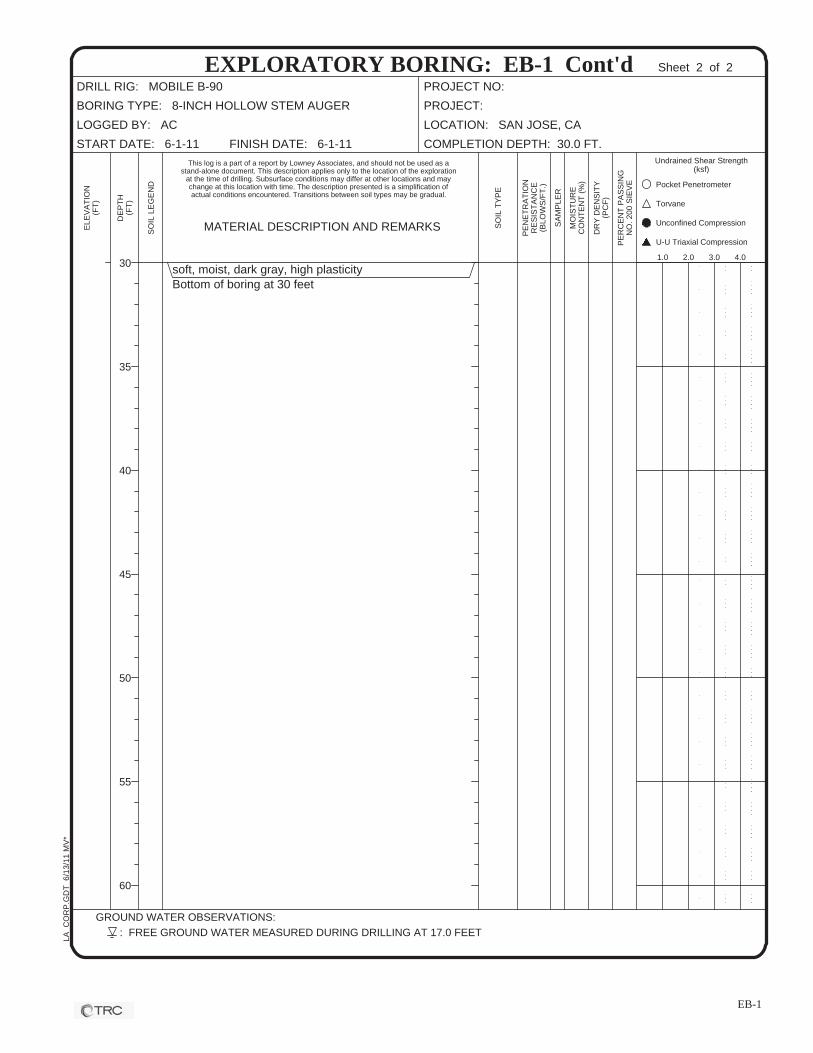
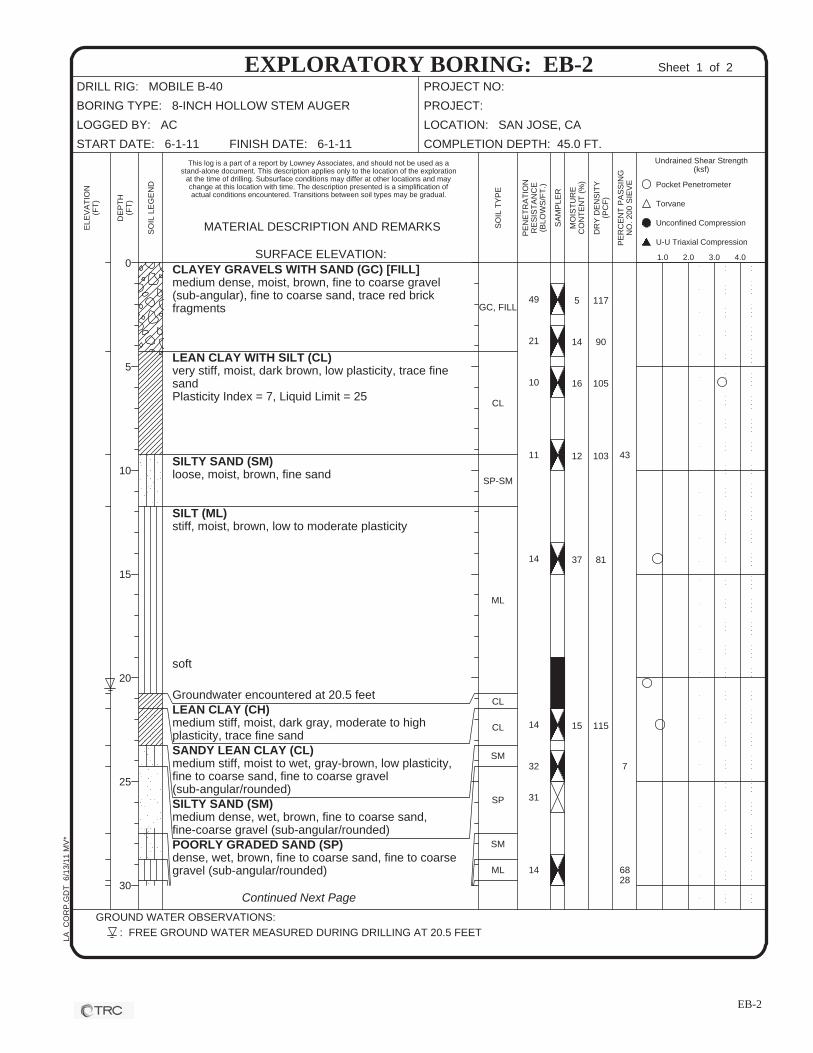
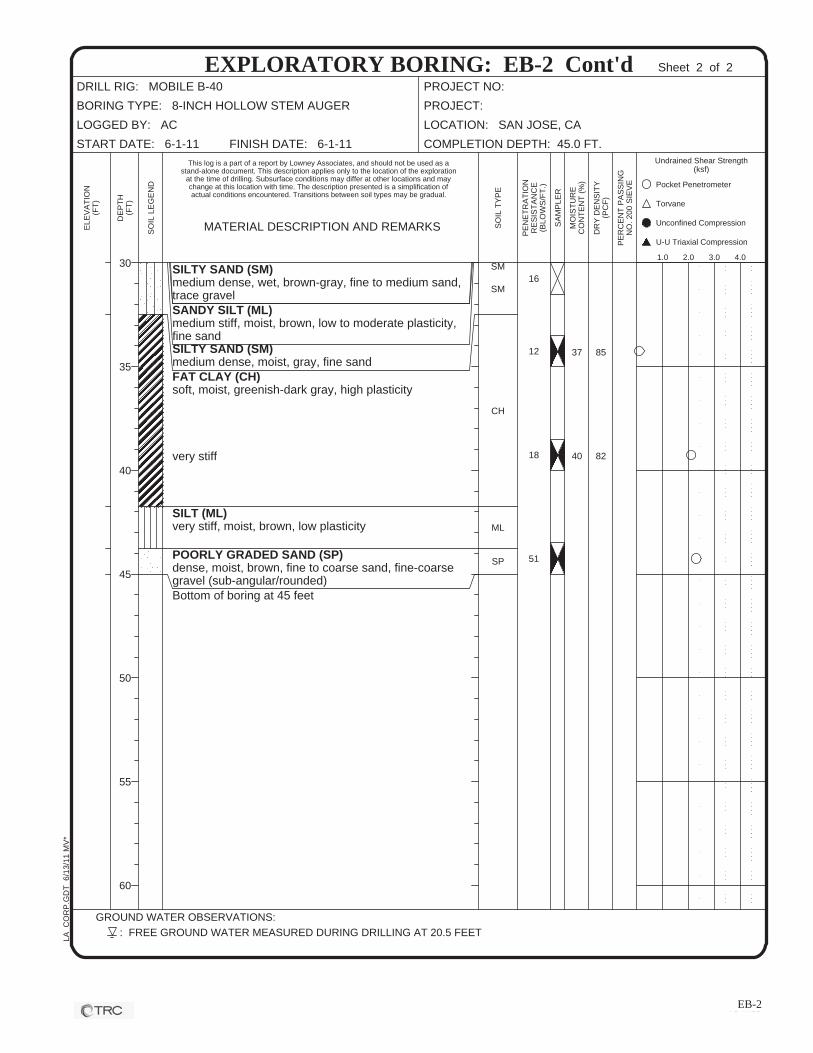
2.2 Previous Exploration Program Subsurface exploration for the adjacent project was performed on May 26, 2011 and June 1, 2011. The exploration included drilling two borings with truck-mounted hollow stem auger drilling equipment to depths of 30 and 45 feet. The exploration also included advancing two cone penetration tests (CPTs) to depths of 75 feet. The logs of the borings and CPTs are included in Appendix A; laboratory tests are discussed in Appendix B.
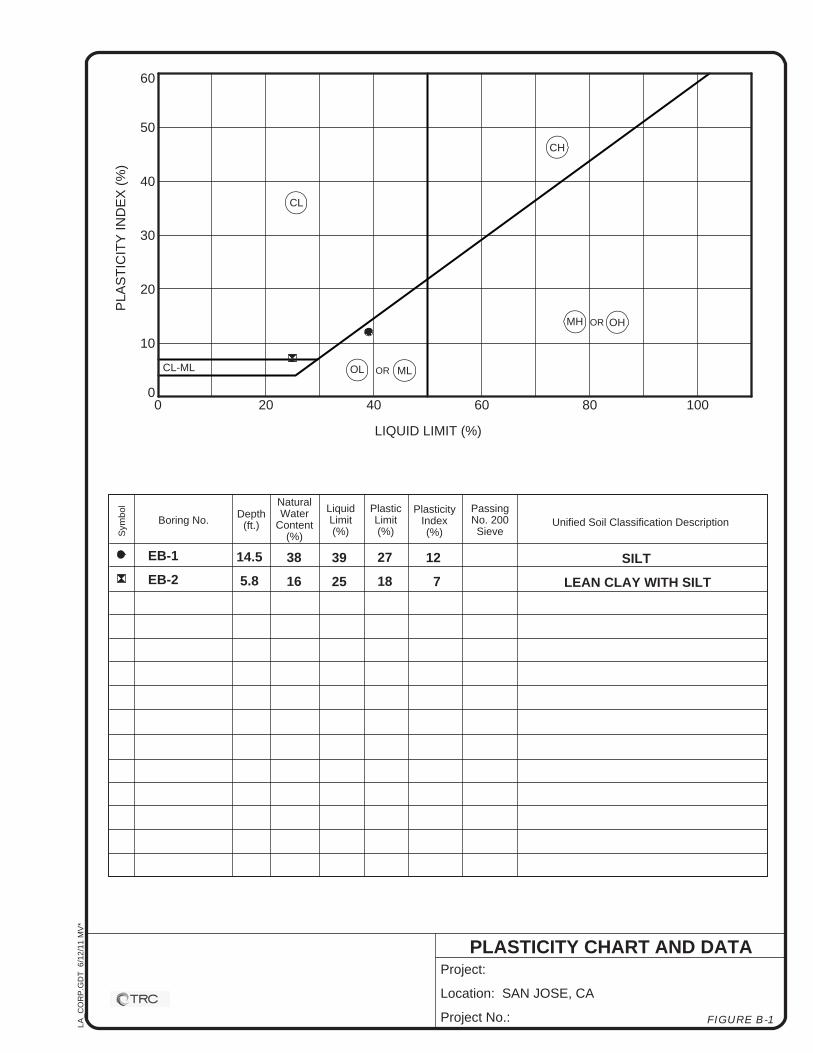
2.3 Subsurface Conditions Soils encountered in the CPTs were generally interpreted to include interbedded layers of silty clay, clayey silt and clay with a few layers of silty sand, sand and gravelly sand. Undrained shear strengths were interpreted to range from 200 to more than 3,200 pounds per square foot (psf), indicating soft to very stiff silts and clays. The silty sand, sand and gravelly sand layers were interpreted to be loose to very dense. The borings encountered 2½ to 4½ feet of medium dense clayey gravel fill at the ground surface. Beneath the 2½ feet of soil fill in EB-1, the exploration encountered 1 foot of asphalt. Below the asphalt or fill, the borings encountered medium stiff to very stiff lean to silty clay, soft to stiff silt and medium stiff fat clay to depths of approximately 20 feet. From 20 to 30 feet below the ground surface (the maximum depth for boring EB-1), the borings encountered loose to medium dense silty sand and medium dense to dense poorly graded sand. From 30 to 40 feet below the ground surface, boring EB-2 encountered medium dense silty sand and soft to very stiff fat clay. From 40 to 45 feet below the ground surface, boring EB-2 encountered very stiff silt and dense poorly graded sand. Two plasticity index (PI) tests were performed on a silt and lean clay sample collected from EB-1 at a depth of 14½ feet and EB-2 at a depth of 5½ feet, respectively. The tests results in PIs of 12 and 7 for the silt and lean clay, respectively, indicating low plasticity and expansion potential of soil below the fill.
2.4 Ground Water
Free ground water was encountered in the borings at depths of 17 and 20½ feet. Based on pore pressure dissipation measurements, CPTs encountered groundwater at a depth of 14 feet. Based on the depth to historically high ground water map prepared by the California Geological Survey for the San Jose West Quadrangle (CGS, 2002), the depth to historically high ground water levels in the site vicinity is estimated to be approximately 10 feet below the ground surface. Based on the above information, we judge a ground water depth of 10 feet to be appropriate for design. Our borings and CPTs were backfilled immediately after drilling. Fluctuations in the level of the ground water may occur due to variations in rainfall, underground drainage patterns, and other factors not evident at the time measurements were made.
3.0 GEOLOGIC HAZARDS
A brief qualitative evaluation of geologic hazards was made during this investigation. Our comments concerning these hazards are presented below.
Legacy Partners Bassett, LLC Bassett Townhome Project
Page 3 247567
3.1 Fault Rupture
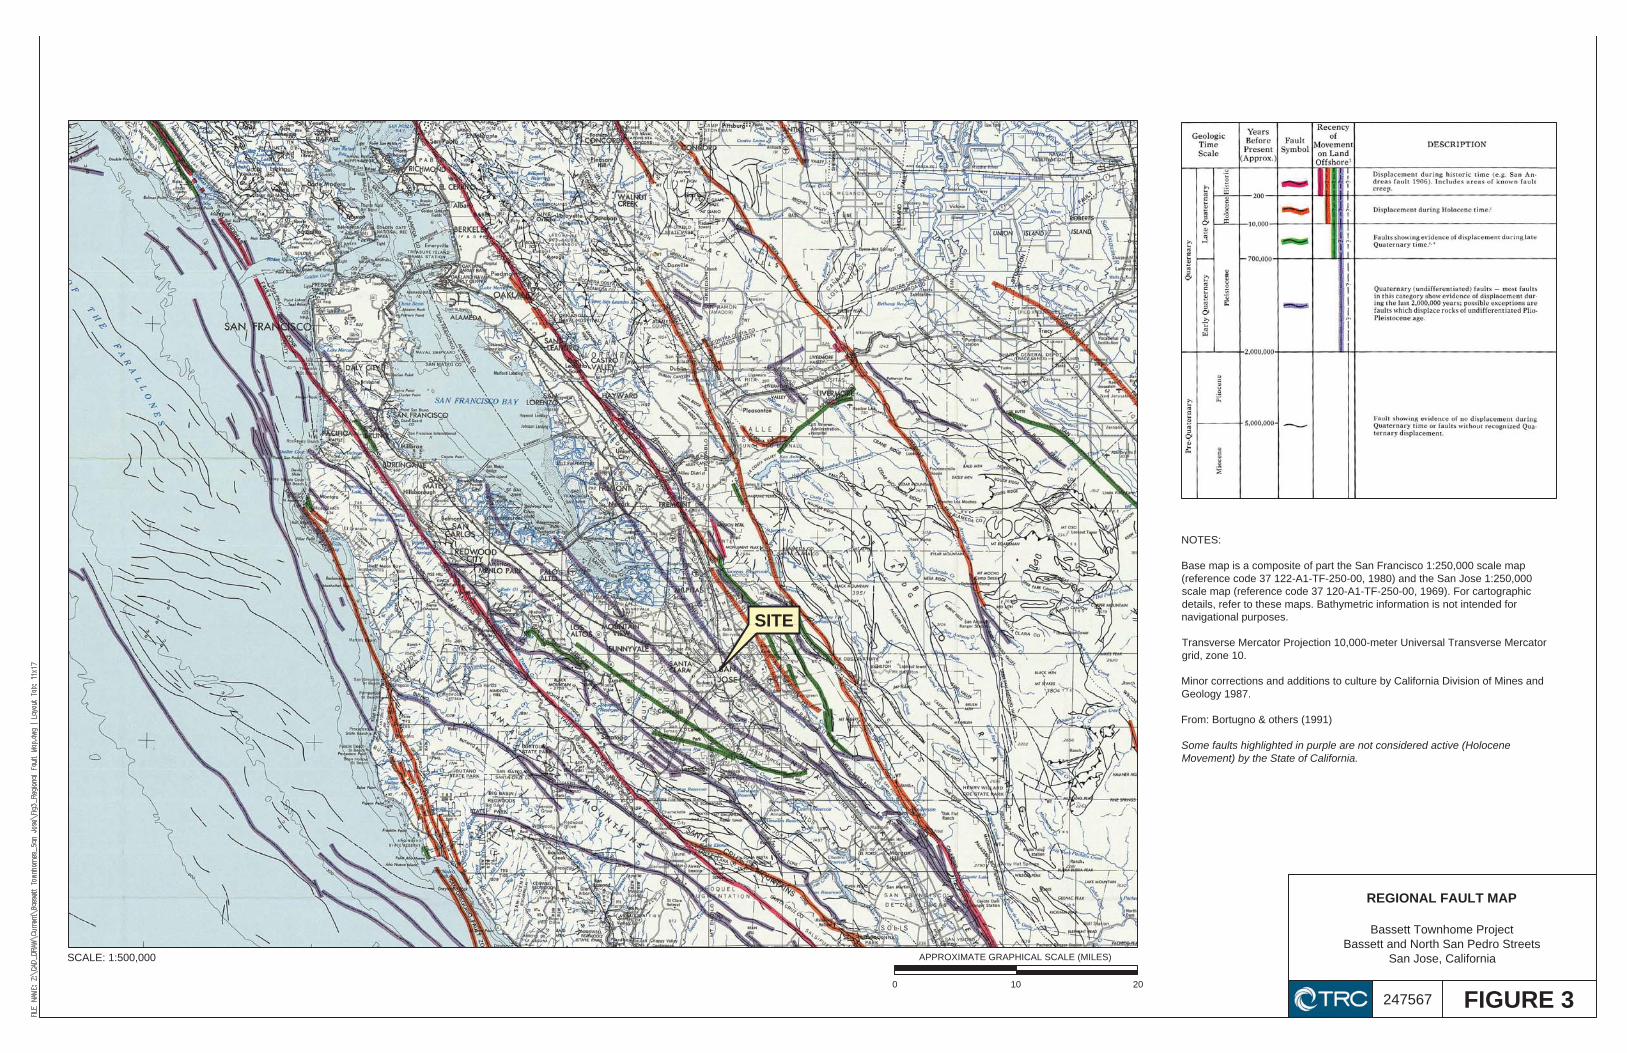
The San Francisco Bay Area is one of the most seismically active regions in the United States. The significant earthquakes that occur in the Bay Area are generally associated with crustal movement along well-defined active fault zones of the San Andreas Fault system, which regionally trend in a northwesterly direction. The site is not located within a currently designated Alquist-Priolo Earthquake Fault Zone (known formerly as a Special Studies Zone), a Santa Clara County Fault Rupture Hazard Zone (SCC, 2002) or a City of San Jose Fault Hazard Zone (1983). As shown on Figure 3, no known surface expression of active faults is believed to cross the site. Fault rupture through the site, therefore, is not anticipated.
3.2 Maximum Estimated Ground Shaking
The peak ground acceleration was chosen based on data from Table 1, which summarizes different probabilistic and deterministically derived peak ground accelerations. Based on the available data, we judge a peak ground acceleration of 0.50g to be appropriate for geotechnical analyses.
Table 1. Summary of Peak Ground Acceleration Values
Data Source Type Peak Ground Acceleration
(g) Notes
USGS Seismic Hazard Curves, Response Parameters and Design Parameters program
v5.1.0 PGAM 0.50 Equation 11.8-1 of
ASCE 7-10
CGS Seismic Hazard Zone Report 048, Figure 3.5
Probabilistic 10% in 50
years 0.50
USGS 2008 Interactive Deaggregation Web Tool
Probabilistic 10% in 50
years 0.50
USGS 2008 Interactive Deaggregation Web Tool
Probabilistic 2% in 50
years 0.76
Caltrans ARS Web Tool v2.3.06 Deterministic 0.49 Silvery Creek Fault, period of 0.01 second
3.3 Future Earthquake Probabilities
Although research on earthquake prediction has greatly increased in recent years, seismologists cannot predict when or where an earthquake will occur. The U.S. Geological Survey’s Working Group on California Earthquake Probabilities (WGCEP, 2014) estimates there is a 72 percent chance of at least one magnitude 6.7 earthquake occurring in the San Francisco Bay region between 2014 and 2044. This result is an important outcome of WGCEP’s work because any major earthquake can cause damage throughout the region. The 1989 Loma Prieta earthquake demonstrated this potential by causing severe damage in Oakland and San Francisco, more than 50 miles from the fault epicenter. Although earthquakes can cause damage at a considerable distance, shaking will be very intense near the fault rupture. Therefore, earthquakes located in urbanized areas of the region have the potential to cause much more damage than the 1989 Loma Prieta earthquake.
Legacy Partners Bassett, LLC Bassett Townhome Project
Page 4 247567
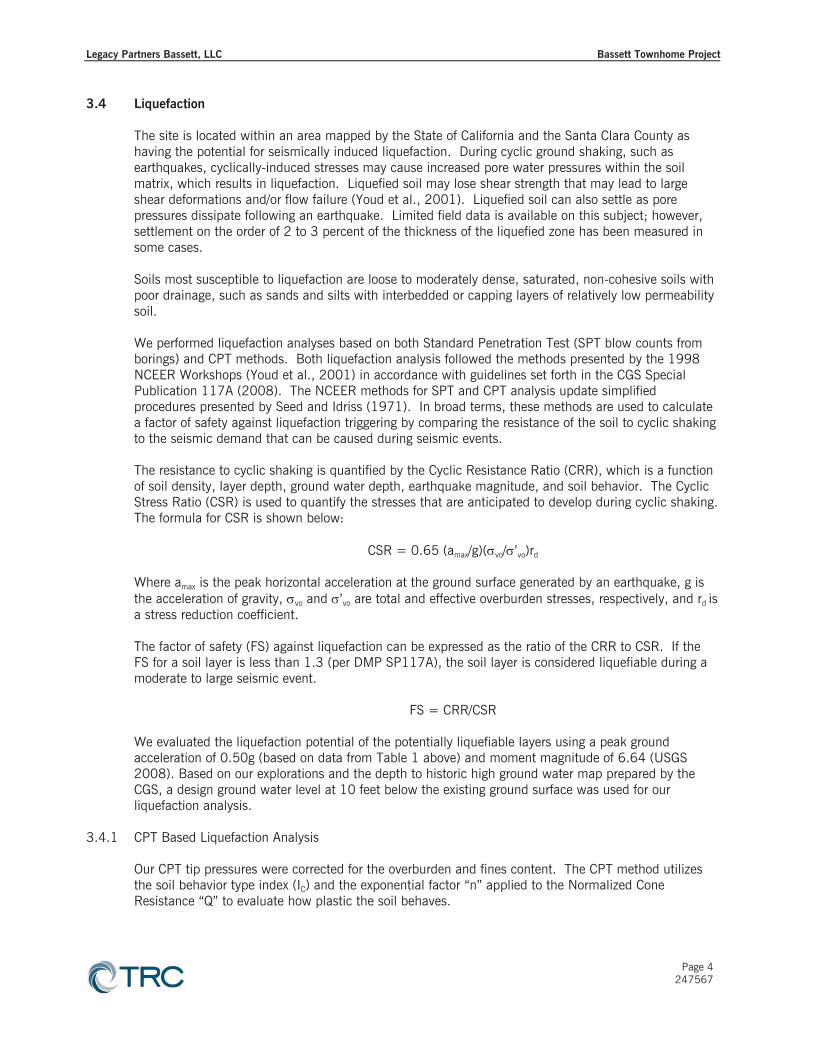
3.4 Liquefaction
The site is located within an area mapped by the State of California and the Santa Clara County as having the potential for seismically induced liquefaction. During cyclic ground shaking, such as earthquakes, cyclically-induced stresses may cause increased pore water pressures within the soil matrix, which results in liquefaction. Liquefied soil may lose shear strength that may lead to large shear deformations and/or flow failure (Youd et al., 2001). Liquefied soil can also settle as pore pressures dissipate following an earthquake. Limited field data is available on this subject; however, settlement on the order of 2 to 3 percent of the thickness of the liquefied zone has been measured in some cases. Soils most susceptible to liquefaction are loose to moderately dense, saturated, non-cohesive soils with poor drainage, such as sands and silts with interbedded or capping layers of relatively low permeability soil. We performed liquefaction analyses based on both Standard Penetration Test (SPT blow counts from borings) and CPT methods. Both liquefaction analysis followed the methods presented by the 1998 NCEER Workshops (Youd et al., 2001) in accordance with guidelines set forth in the CGS Special Publication 117A (2008). The NCEER methods for SPT and CPT analysis update simplified procedures presented by Seed and Idriss (1971). In broad terms, these methods are used to calculate a factor of safety against liquefaction triggering by comparing the resistance of the soil to cyclic shaking to the seismic demand that can be caused during seismic events.
The resistance to cyclic shaking is quantified by the Cyclic Resistance Ratio (CRR), which is a function of soil density, layer depth, ground water depth, earthquake magnitude, and soil behavior. The Cyclic Stress Ratio (CSR) is used to quantify the stresses that are anticipated to develop during cyclic shaking. The formula for CSR is shown below:
CSR = 0.65 (amax/g)( vo/ ’vo)rd
Where amax is the peak horizontal acceleration at the ground surface generated by an earthquake, g is the acceleration of gravity, vo and ’vo are total and effective overburden stresses, respectively, and rd is a stress reduction coefficient.
The factor of safety (FS) against liquefaction can be expressed as the ratio of the CRR to CSR. If the FS for a soil layer is less than 1.3 (per DMP SP117A), the soil layer is considered liquefiable during a moderate to large seismic event.
FS = CRR/CSR
We evaluated the liquefaction potential of the potentially liquefiable layers using a peak ground acceleration of 0.50g (based on data from Table 1 above) and moment magnitude of 6.64 (USGS 2008). Based on our explorations and the depth to historic high ground water map prepared by the CGS, a design ground water level at 10 feet below the existing ground surface was used for our liquefaction analysis.
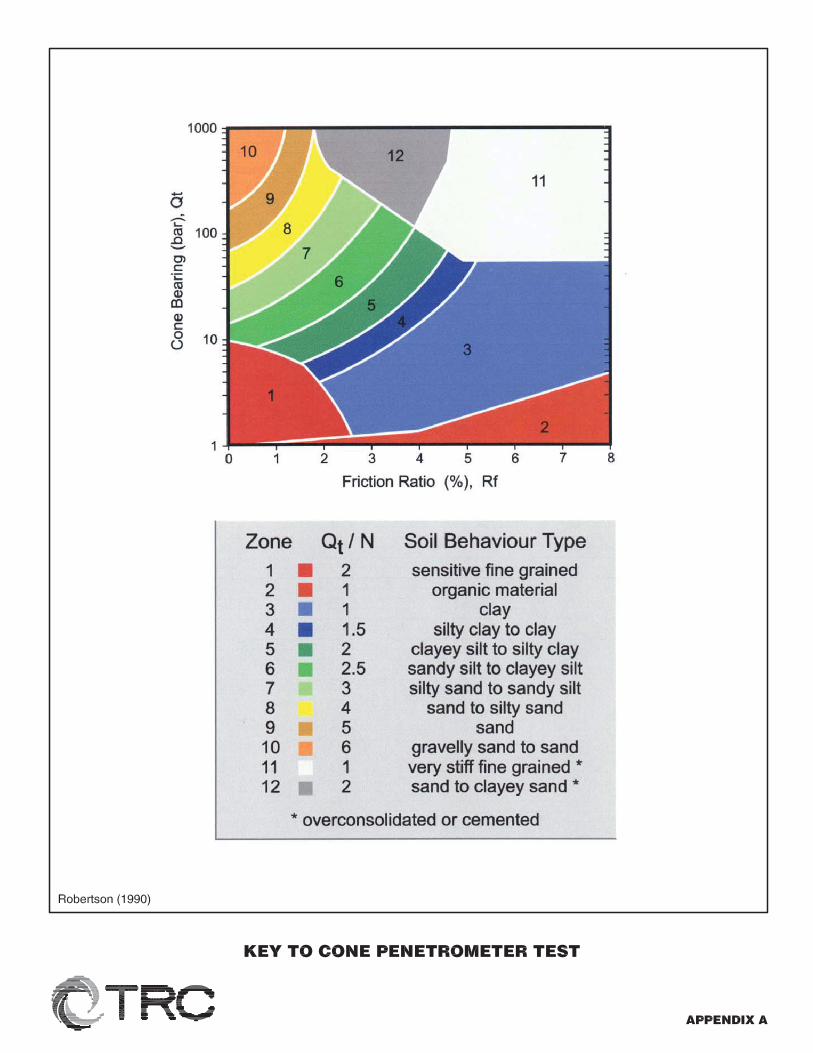
3.4.1 CPT Based Liquefaction Analysis Our CPT tip pressures were corrected for the overburden and fines content. The CPT method utilizes the soil behavior type index (IC) and the exponential factor “n” applied to the Normalized Cone Resistance “Q” to evaluate how plastic the soil behaves.
Legacy Partners Bassett, LLC Bassett Townhome Project
Page 5 247567
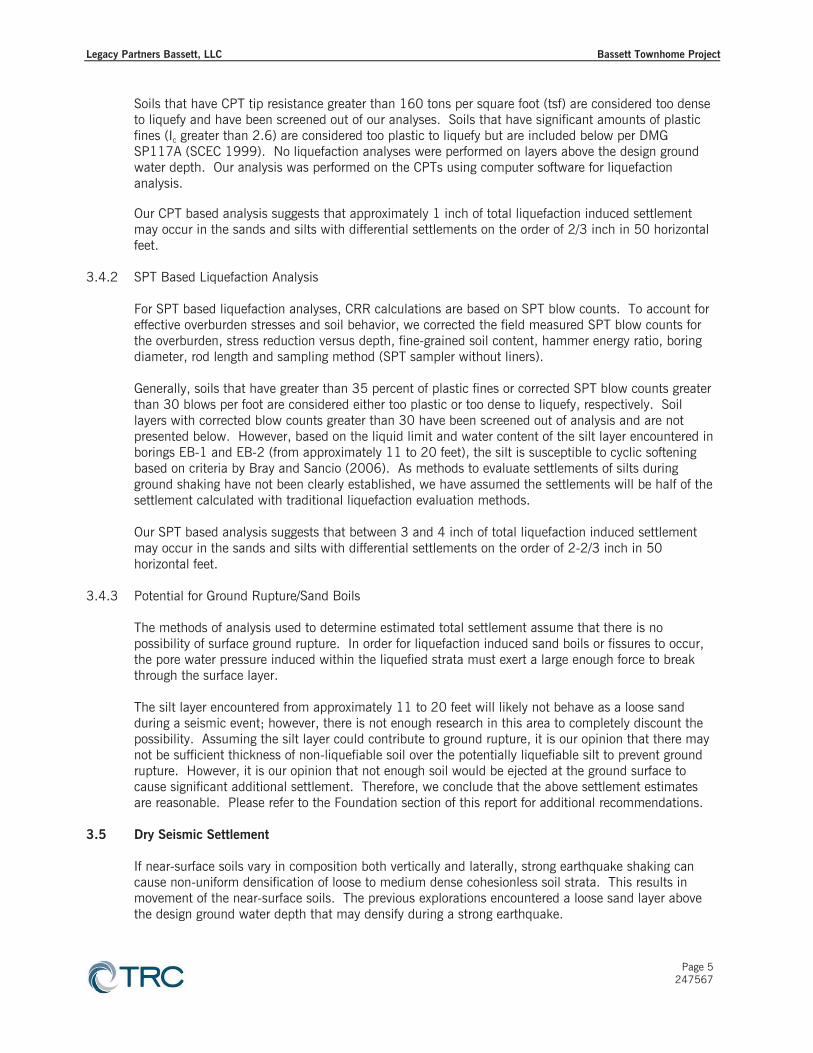
Soils that have CPT tip resistance greater than 160 tons per square foot (tsf) are considered too dense to liquefy and have been screened out of our analyses. Soils that have significant amounts of plastic fines (Ic greater than 2.6) are considered too plastic to liquefy but are included below per DMG SP117A (SCEC 1999). No liquefaction analyses were performed on layers above the design ground water depth. Our analysis was performed on the CPTs using computer software for liquefaction analysis. Our CPT based analysis suggests that approximately 1 inch of total liquefaction induced settlement may occur in the sands and silts with differential settlements on the order of 2/3 inch in 50 horizontal feet.
3.4.2 SPT Based Liquefaction Analysis
For SPT based liquefaction analyses, CRR calculations are based on SPT blow counts. To account for effective overburden stresses and soil behavior, we corrected the field measured SPT blow counts for the overburden, stress reduction versus depth, fine-grained soil content, hammer energy ratio, boring diameter, rod length and sampling method (SPT sampler without liners). Generally, soils that have greater than 35 percent of plastic fines or corrected SPT blow counts greater than 30 blows per foot are considered either too plastic or too dense to liquefy, respectively. Soil layers with corrected blow counts greater than 30 have been screened out of analysis and are not presented below. However, based on the liquid limit and water content of the silt layer encountered in borings EB-1 and EB-2 (from approximately 11 to 20 feet), the silt is susceptible to cyclic softening based on criteria by Bray and Sancio (2006). As methods to evaluate settlements of silts during ground shaking have not been clearly established, we have assumed the settlements will be half of the settlement calculated with traditional liquefaction evaluation methods. Our SPT based analysis suggests that between 3 and 4 inch of total liquefaction induced settlement may occur in the sands and silts with differential settlements on the order of 2-2/3 inch in 50 horizontal feet.
3.4.3 Potential for Ground Rupture/Sand Boils
The methods of analysis used to determine estimated total settlement assume that there is no possibility of surface ground rupture. In order for liquefaction induced sand boils or fissures to occur, the pore water pressure induced within the liquefied strata must exert a large enough force to break through the surface layer. The silt layer encountered from approximately 11 to 20 feet will likely not behave as a loose sand during a seismic event; however, there is not enough research in this area to completely discount the possibility. Assuming the silt layer could contribute to ground rupture, it is our opinion that there may not be sufficient thickness of non-liquefiable soil over the potentially liquefiable silt to prevent ground rupture. However, it is our opinion that not enough soil would be ejected at the ground surface to cause significant additional settlement. Therefore, we conclude that the above settlement estimates are reasonable. Please refer to the Foundation section of this report for additional recommendations.
3.5 Dry Seismic Settlement
If near-surface soils vary in composition both vertically and laterally, strong earthquake shaking can cause non-uniform densification of loose to medium dense cohesionless soil strata. This results in movement of the near-surface soils. The previous explorations encountered a loose sand layer above the design ground water depth that may densify during a strong earthquake.
Legacy Partners Bassett, LLC Bassett Townhome Project
Page 6 247567
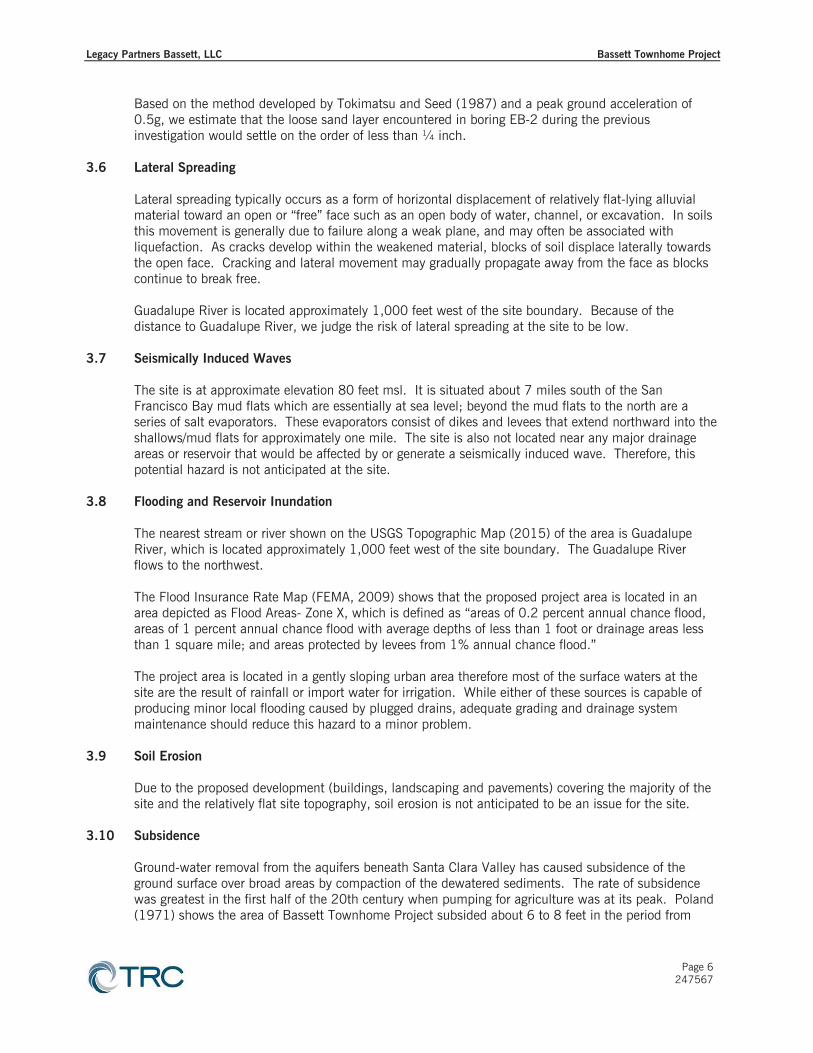
Based on the method developed by Tokimatsu and Seed (1987) and a peak ground acceleration of 0.5g, we estimate that the loose sand layer encountered in boring EB-2 during the previous investigation would settle on the order of less than ¼ inch.
3.6 Lateral Spreading
Lateral spreading typically occurs as a form of horizontal displacement of relatively flat-lying alluvial material toward an open or “free” face such as an open body of water, channel, or excavation. In soils this movement is generally due to failure along a weak plane, and may often be associated with liquefaction. As cracks develop within the weakened material, blocks of soil displace laterally towards the open face. Cracking and lateral movement may gradually propagate away from the face as blocks continue to break free. Guadalupe River is located approximately 1,000 feet west of the site boundary. Because of the distance to Guadalupe River, we judge the risk of lateral spreading at the site to be low.
3.7 Seismically Induced Waves
The site is at approximate elevation 80 feet msl. It is situated about 7 miles south of the San Francisco Bay mud flats which are essentially at sea level; beyond the mud flats to the north are a series of salt evaporators. These evaporators consist of dikes and levees that extend northward into the shallows/mud flats for approximately one mile. The site is also not located near any major drainage areas or reservoir that would be affected by or generate a seismically induced wave. Therefore, this potential hazard is not anticipated at the site.
3.8 Flooding and Reservoir Inundation
The nearest stream or river shown on the USGS Topographic Map (2015) of the area is Guadalupe River, which is located approximately 1,000 feet west of the site boundary. The Guadalupe River flows to the northwest. The Flood Insurance Rate Map (FEMA, 2009) shows that the proposed project area is located in an area depicted as Flood Areas- Zone X, which is defined as “areas of 0.2 percent annual chance flood, areas of 1 percent annual chance flood with average depths of less than 1 foot or drainage areas less than 1 square mile; and areas protected by levees from 1% annual chance flood.” The project area is located in a gently sloping urban area therefore most of the surface waters at the site are the result of rainfall or import water for irrigation. While either of these sources is capable of producing minor local flooding caused by plugged drains, adequate grading and drainage system maintenance should reduce this hazard to a minor problem.
3.9 Soil Erosion
Due to the proposed development (buildings, landscaping and pavements) covering the majority of the site and the relatively flat site topography, soil erosion is not anticipated to be an issue for the site.
3.10 Subsidence
Ground-water removal from the aquifers beneath Santa Clara Valley has caused subsidence of the ground surface over broad areas by compaction of the dewatered sediments. The rate of subsidence was greatest in the first half of the 20th century when pumping for agriculture was at its peak. Poland (1971) shows the area of Bassett Townhome Project subsided about 6 to 8 feet in the period from
Legacy Partners Bassett, LLC Bassett Townhome Project
Page 7 247567
1934 to 1967. Subsidence has stopped or greatly slowed now because of improved ground-water management. In our judgment regional subsidence will not pose a hazard at the project site.
3.11 Soil Expansion
Plasticity Index (PI) tests of near surface soils collected during our previous investigations resulted in PIs of 12 and 7, indicating low to moderate expansion potential due to changes in soil moisture content. Therefore, we judge that, if typical recommendations for this condition are followed during design and construction, soil expansion will not pose a threat to the proposed improvements.
4.0 CONCLUSIONS AND PRELIMINARY DEVELOPMENT RECOMMENDATIONS
From a geotechnical engineering viewpoint, it is our opinion that the site is suitable for the proposed development. The preliminary recommendations that follow are intended to be used for conceptual planning and preliminary design of the project. A design-level geotechnical investigation should be performed once a conceptual design has been finalized. Results from a design-level investigation would be used to supplement the preliminary findings and develop specific geotechnical recommendations for the project.
4.1 Primary Geotechnical Concerns
The primary geotechnical and geologic concerns at the site are as follows:
Strong seismic shaking
Demolition of the existing buildings prior to site development
Potential for liquefaction induced settlement
Potential for ground surface rupture
Undocumented fill We have prepared a brief description of the issues and present typical approaches to manage potential concerns associated with the long-term performance of the development.
4.1.1 Strong Seismic Shaking
We recommend that, at a minimum, the proposed project be designed in accordance with the seismic design criteria as discussed in the Maximum Estimated Ground Shaking section above, and the site seismic coefficients presented in Table 1.
4.1.2 Demolition Debris
Construction debris both above and below grade is anticipated as a result of the site demolition required prior to site grading. The debris should be either: 1) collected and off-hauled to an appropriate facility prior to beginning the earthwork for the project, or 2) the concrete crushed and re-used as fill at the site. If generated, recycled materials containing asphalt concrete (AC) should not be used below interior floor slabs, therefore if recycled materials are proposed to be re-used beneath interior floor slabs, AC pavements should be segregated from the debris. It has been our experience that some debris will remain in the soil on-site after the demolition contractor has completed their work. Therefore, it should be anticipated that some debris would be encountered in excavations for
Legacy Partners Bassett, LLC Bassett Townhome Project
Page 8 247567
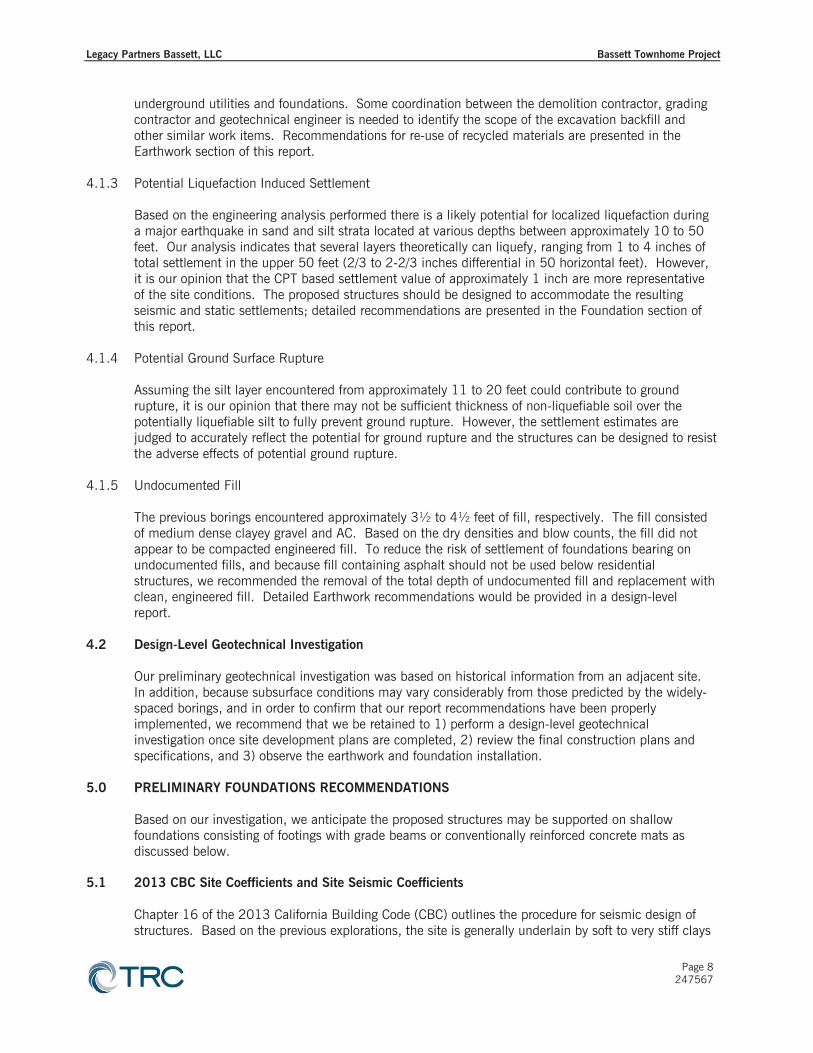
underground utilities and foundations. Some coordination between the demolition contractor, grading contractor and geotechnical engineer is needed to identify the scope of the excavation backfill and other similar work items. Recommendations for re-use of recycled materials are presented in the Earthwork section of this report.
4.1.3 Potential Liquefaction Induced Settlement
Based on the engineering analysis performed there is a likely potential for localized liquefaction during a major earthquake in sand and silt strata located at various depths between approximately 10 to 50 feet. Our analysis indicates that several layers theoretically can liquefy, ranging from 1 to 4 inches of total settlement in the upper 50 feet (2/3 to 2-2/3 inches differential in 50 horizontal feet). However, it is our opinion that the CPT based settlement value of approximately 1 inch are more representative of the site conditions. The proposed structures should be designed to accommodate the resulting seismic and static settlements; detailed recommendations are presented in the Foundation section of this report.
4.1.4 Potential Ground Surface Rupture
Assuming the silt layer encountered from approximately 11 to 20 feet could contribute to ground rupture, it is our opinion that there may not be sufficient thickness of non-liquefiable soil over the potentially liquefiable silt to fully prevent ground rupture. However, the settlement estimates are judged to accurately reflect the potential for ground rupture and the structures can be designed to resist the adverse effects of potential ground rupture.
4.1.5 Undocumented Fill The previous borings encountered approximately 3½ to 4½ feet of fill, respectively. The fill consisted of medium dense clayey gravel and AC. Based on the dry densities and blow counts, the fill did not appear to be compacted engineered fill. To reduce the risk of settlement of foundations bearing on undocumented fills, and because fill containing asphalt should not be used below residential structures, we recommended the removal of the total depth of undocumented fill and replacement with clean, engineered fill. Detailed Earthwork recommendations would be provided in a design-level report.
4.2 Design-Level Geotechnical Investigation
Our preliminary geotechnical investigation was based on historical information from an adjacent site. In addition, because subsurface conditions may vary considerably from those predicted by the widely-spaced borings, and in order to confirm that our report recommendations have been properly implemented, we recommend that we be retained to 1) perform a design-level geotechnical investigation once site development plans are completed, 2) review the final construction plans and specifications, and 3) observe the earthwork and foundation installation.
5.0 PRELIMINARY FOUNDATIONS RECOMMENDATIONS Based on our investigation, we anticipate the proposed structures may be supported on shallow foundations consisting of footings with grade beams or conventionally reinforced concrete mats as discussed below.
5.1 2013 CBC Site Coefficients and Site Seismic Coefficients
Chapter 16 of the 2013 California Building Code (CBC) outlines the procedure for seismic design of structures. Based on the previous explorations, the site is generally underlain by soft to very stiff clays
Legacy Partners Bassett, LLC Bassett Townhome Project
Page 9 247567
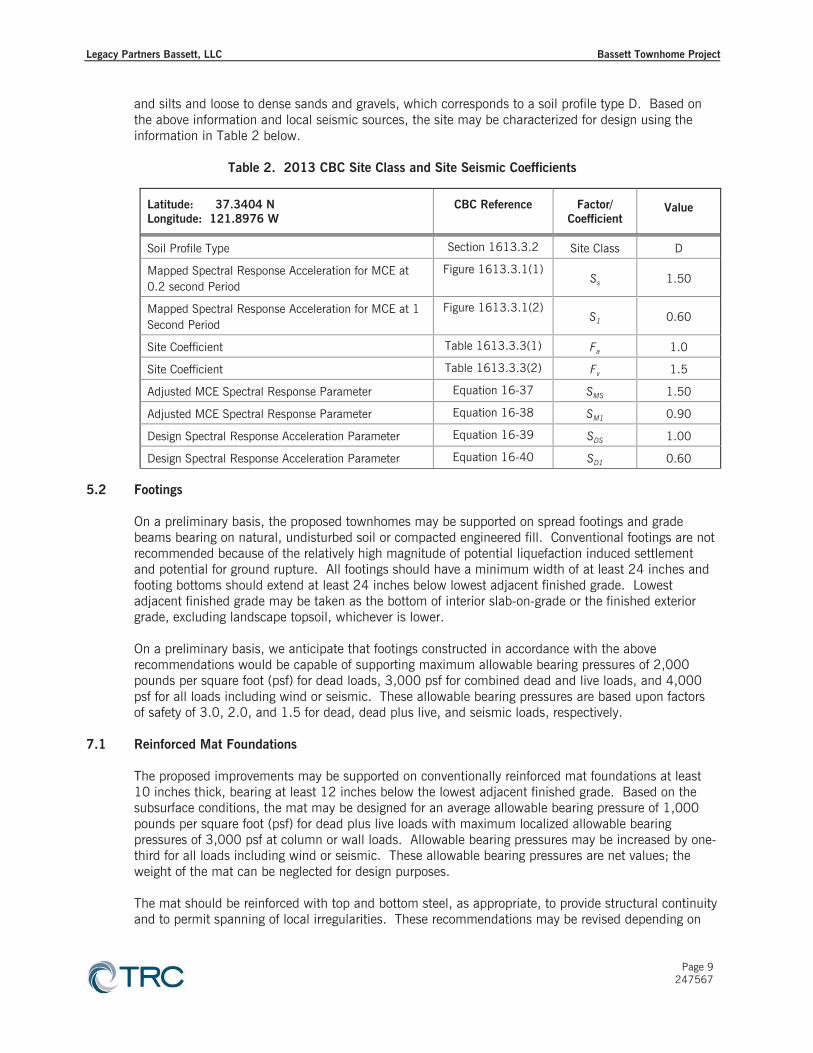
and silts and loose to dense sands and gravels, which corresponds to a soil profile type D. Based on the above information and local seismic sources, the site may be characterized for design using the information in Table 2 below.
Table 2. 2013 CBC Site Class and Site Seismic Coefficients
Latitude: 37.3404 N Longitude: 121.8976 W
CBC Reference Factor/ Coefficient
Value
Soil Profile Type Section 1613.3.2 Site Class D
Mapped Spectral Response Acceleration for MCE at 0.2 second Period
Figure 1613.3.1(1) Ss 1.50
Mapped Spectral Response Acceleration for MCE at 1 Second Period
Figure 1613.3.1(2) S1 0.60
Site Coefficient Table 1613.3.3(1) Fa 1.0
Site Coefficient Table 1613.3.3(2) Fv 1.5
Adjusted MCE Spectral Response Parameter Equation 16-37 SMS 1.50
Adjusted MCE Spectral Response Parameter Equation 16-38 SM1 0.90
Design Spectral Response Acceleration Parameter Equation 16-39 SDS 1.00
Design Spectral Response Acceleration Parameter Equation 16-40 SD1 0.60
5.2 Footings On a preliminary basis, the proposed townhomes may be supported on spread footings and grade beams bearing on natural, undisturbed soil or compacted engineered fill. Conventional footings are not recommended because of the relatively high magnitude of potential liquefaction induced settlement and potential for ground rupture. All footings should have a minimum width of at least 24 inches and footing bottoms should extend at least 24 inches below lowest adjacent finished grade. Lowest adjacent finished grade may be taken as the bottom of interior slab-on-grade or the finished exterior grade, excluding landscape topsoil, whichever is lower. On a preliminary basis, we anticipate that footings constructed in accordance with the above recommendations would be capable of supporting maximum allowable bearing pressures of 2,000 pounds per square foot (psf) for dead loads, 3,000 psf for combined dead and live loads, and 4,000 psf for all loads including wind or seismic. These allowable bearing pressures are based upon factors of safety of 3.0, 2.0, and 1.5 for dead, dead plus live, and seismic loads, respectively.
7.1 Reinforced Mat Foundations
The proposed improvements may be supported on conventionally reinforced mat foundations at least 10 inches thick, bearing at least 12 inches below the lowest adjacent finished grade. Based on the subsurface conditions, the mat may be designed for an average allowable bearing pressure of 1,000 pounds per square foot (psf) for dead plus live loads with maximum localized allowable bearing pressures of 3,000 psf at column or wall loads. Allowable bearing pressures may be increased by one-third for all loads including wind or seismic. These allowable bearing pressures are net values; the weight of the mat can be neglected for design purposes. The mat should be reinforced with top and bottom steel, as appropriate, to provide structural continuity and to permit spanning of local irregularities. These recommendations may be revised depending on
Legacy Partners Bassett, LLC Bassett Townhome Project
Page 10 247567
the particular design method selected by the structural engineer. It is essential that we observe the subgrade of the mat foundation prior to placement of reinforcing steel.
6.0 LIMITATIONS
This report has been prepared for the sole use of Legacy Partners Bassett, LLC, specifically for preliminary design of the proposed Bassett Townhomes project in San Jose, California. The opinions, conclusions, and recommendations presented in this report have been formulated in accordance with accepted geotechnical engineering practices that exist in the San Francisco Bay Area at the time this report was written. No other warranty, expressed or implied, is made or should be inferred. The opinions, conclusions and recommendations contained in this report are based upon the information obtained from our prior investigation, which included data from widely separated discrete locations, visual observations from our site reconnaissance, and review of other geotechnical data provided to us, along with local experience and engineering judgment. The recommendations presented in this report are based on the assumption that soil and geologic conditions at the adjacent site do not deviate substantially from those encountered or extrapolated from the information collected during our investigation. We are not responsible for the data presented by others. We should be retained to review the geotechnical aspects of the final plans and specifications for conformance with our recommendations. The recommendations provided in this report are based on the assumption that we will be retained to provide observation and testing services during construction to confirm that conditions are similar to that assumed for design and to form an opinion as to whether the work has been performed in accordance with the project plans and specifications. If we are not retained for these services, TRC cannot assume any responsibility for any potential claims that may arise during or after construction as a result of misuse or misinterpretation of TRC’s report by others. Furthermore, TRC will cease to be the Geotechnical-Engineer-of-Record if we are not retained for these services and/or at the time another consultant is retained for follow up service to this report. The opinions presented in this report are valid as of the present date for the property evaluated. Changes in the condition of the property will likely occur with the passage of time due to natural processes and/or the works of man. In addition, changes in applicable standards of practice can occur as a result of legislation and/or the broadening of knowledge. Furthermore, geotechnical issues may arise that were not apparent at the time of our investigation. Accordingly, the opinions presented in this report may be invalidated, wholly or partially, by changes outside of our control. Therefore, this report is subject to review and should not be relied upon after a period of three years, nor should it be used, or is it applicable, for any other properties.
Legacy Partners Bassett, LLC Bassett Townhome Project
Page 11 247567
7.0 REFERENCES
Bray, J.D. and Sancio, R.B., 2006, Assessment of the Liquefaction Susceptibility of Fine-Grained Soils, Journal of Geotechnical and Geoenvironmental Engineering, ASCE, 132 (9).
California Building Code, 2013, Structural Engineering Design Provisions, Vol. 2.
California Geological Survey, 2002, State of California Seismic Hazard Report, San Jose West Quadrangle, Seismic Hazard Zone Report 058.
City of San Jose, 1983, City of San Jose Fault Hazard Map, San Jose West Quadrangle, scale 1:24,000.
County of Santa Clara Office of Emergency Services, 2011, Annex to 2010 Association of Bay Area Local Hazard Mitigation Plan – Taming Natural Disasters, Figure 4-18: Potential Dam Failure Inundation Areas, December.
County of Santa Clara Planning Office, 2013, County Geologic Hazard Zone Maps,
http://www.sccgov.org/sites/PLANNING/GIS/GEOHAZARDZONES/Pages/SCCGeoHazardZoneMaps.aspx.
Federal Emergency Management Agency, 2009, Flood Insurance Rate Map, Santa Clara County,
California and Incorporated Areas, Panel 234 of 830, Map 06085C0234H, effective date May 18, 2009.
Graymer, R.W. et al., 2006, Geologic Map of the San Francisco Bay Region, U.S. Geological Survey,
California Geological Survey, Scientific Investigation Map 2918 Ishihara, K. and Yoshimine, M., 1990, Evaluation of Settlements in Sand Deposits Following
Liquefaction During Earthquakes, Soils and Foundations, 32 (1): 173-188. Poland, J.F., 1971, Land subsidence in the Santa Clara Valley, Alameda, San Mateo, and Santa
Clara Counties, California: U.S. Geological Survey Technical Report 2, scale 1:125,000. Southern California Earthquake Center (SCEC), 1999, Recommended Procedures for Implementation
of DMG Special Publication 117A, Guidelines for Analyzing and Mitigating Liquefaction Hazards in California, University of Southern California, March.
Tokimatsu, K., and H.B. Seed. (1987). “Evaluation of settlements in sands due to earthquake
shaking.” J. Geotech. Eng. Div., ASCE, 113(8), 861-78. United States Geological Survey, 2008, Geologic Hazards Science Center – 2008 Interactive
Deaggregations, http://geohazards.usgs.gov/deaggint/2008/
U.S. Geological Survey, 2013, US Seismic Design Maps, Earthquake Hazards Program, http://earthquake.usgs.gov/designmaps/us/application.php.
Wagner, D.L. et al, 1991, Geologic Mpa of the San Francisco- San Jose Quadrangle, Regional
Geologic Map Series, Map No. 5A, Sheet 1, State of California Division of Mines and Geology, 1:250,000 scale.

Legacy Partners Bassett, LLC Bassett Townhome Project
Page 12 247567
Wesling, J.R. and Helley, E.J., 1989, Quaternary Geologic Map of the San Jose West Quadrangle, Santa Clara County, California, Department of the Interior, U.S. Geological Survey, Open-File Report 89-672.
WGCEP [Working Group on California Earthquake Probabilities], 2014, The Uniform California
Earthquake Rupture Forecast, Version 2: U.S Geological Survey, Open File Report 2014-2044.
Youd, T.L. and C.T. Garris, 1995, Liquefaction-Induced Ground-Surface Disruption: Journal of
Geotechnical Engineering, Vol. 121, No. 11, pp. 805 - 809.
Youd, T.L. and Idriss, I.M., et al., 2001, Liquefaction Resistance of Soils: Summary Report From the 1996 NCEER and 1998 NCEER/NSF Workshops on Evaluation of Liquefaction Resistance of Soils, ASCE Geotechnical and Geoenviromental Journal, October 2001.
* * * * * * * * * * * * *

APPROXIMATESITEBOUNDARY
Highway 87 - Guadalupe Freeway
Coleman AvenueColeman Avenue
Railroad Tracks
Railroad Tracks
Railroad Tracks
Wes
tJu
lian
Stre
etBassett S
treet
North San Pedro Street
Terraine Street
Old West Julian Street
North Market Street
West Julian Street
North 1st Street
West Julian Street
West St. James Street St.
JamesPark
Guadalupe River
GuadalupeRiver Park
RylandPark
North 2nd Street
North 3rd Street
Railr
oad
Trac
ks
North San Pedro Street
VICINITY MAP
FILE
NA
ME
: Z:\C
AD
_DR
AW
\Cur
rent
\Bas
sett
Tow
nhom
es_S
an J
ose\
Fig1
_Vic
inity
Map
.dw
g | L
ayou
t Tab
: 8x1
1
FIGURE 1APPROXIMATE SCALE (FEET)
500 1,0000
N
SOURCE AERIAL PHOTO: Google Earth, March 2015.
Bassett Townhome ProjectBassett and North San Pedro Streets
San Jose, California
247567
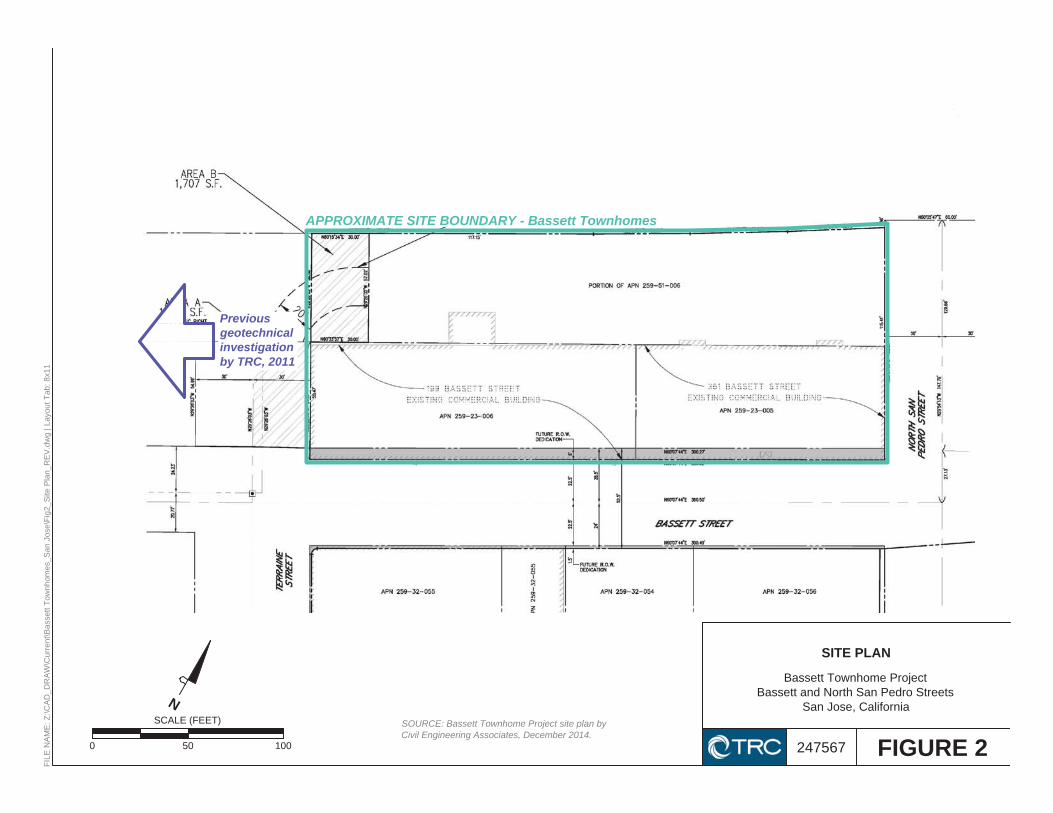
APPROXIMATE SITE BOUNDARY - Bassett Townhomes
Previousgeotechnicalinvestigationby TRC, 2011
FILE
NA
ME
: Z:\C
AD
_DR
AW
\Cur
rent
\Bas
sett
Tow
nhom
es_S
an J
ose\
Fig2
_Site
Pla
n_R
EV
.dw
g | L
ayou
t Tab
: 8x1
1
SCALE (FEET)
50 1000 FIGURE 2
Bassett Townhome ProjectBassett and North San Pedro Streets
San Jose, California
SITE PLAN
247567
SOURCE: Bassett Townhome Project site plan byCivil Engineering Associates, December 2014.
N
SITE
REGIONAL FAULT MAP
SCALE: 1:500,000 APPROXIMATE GRAPHICAL SCALE (MILES)
100 20
NOTES:
Base map is a composite of part the San Francisco 1:250,000 scale map(reference code 37 122-A1-TF-250-00, 1980) and the San Jose 1:250,000scale map (reference code 37 120-A1-TF-250-00, 1969). For cartographicdetails, refer to these maps. Bathymetric information is not intended fornavigational purposes.
Transverse Mercator Projection 10,000-meter Universal Transverse Mercatorgrid, zone 10.
Minor corrections and additions to culture by California Division of Mines andGeology 1987.
From: Bortugno & others (1991)
Some faults highlighted in purple are not considered active (HoloceneMovement) by the State of California.
FIGURE 3
Bassett Townhome ProjectBassett and North San Pedro Streets
San Jose, California
247567
Page A-1 247567
APPENDIX A
BORING AND CPT LOGS FROM PREVIOUS INVESTIGATION

CLAYEY GRAVELS (GC) [FILL]medium dense, moist, brownfine to coarse sand, fine to coarse gravel(sub-angular/rounded)Asphalt (AC) [FILL]LEAN CLAY WITH SILT (CL)very stiff, moist, brown, low plasticityLEAN CLAY (CL)very stiff, moist, brown, low plasticity, trace fine sand
SILTY CLAY (CL)stiff, moist, brown, low plasticity, shells present
SILT (ML)medium stiff, moist, brown, low plasticity, trace sandand shells
Plasticity Index = 12, Liquid Limit = 39
softtrace sand
FAT CLAY (CH)medium stiff, moist, dark gray, moderate to highplasticity, trace fine to coarse sand
LEAN CLAY WITH SAND (CL)medium stiff, moist, light gray-brown, low plasticity, fineto coarse sand, trace fine gravel (sub-angular/rounded)SILTY SAND (SM)loose, wet, brown to greenish gray, fine sand
medium dense
POORLY GRADED SAND WITH SILTmedium dense, moist, gray, fine sand
FAT CLAY (CH)
GC, FILL
AC, FILL
CL
CL
CL
ML
CH
CL
SM
SP-SM
CH
33
18
19
27
38
25
31
45
64
106
108
97
82
100
19
12
16
12
11
13
11
13
31
21
PE
NE
TRA
TIO
NR
ES
ISTA
NC
E(B
LOW
S/F
T.)
1.0 2.0 3.0 4.0SURFACE ELEVATION:
SA
MP
LER
DRILL RIG: MOBILE B-90BORING TYPE: 8-INCH HOLLOW STEM AUGERLOGGED BY: ACSTART DATE: 6-1-11 FINISH DATE: 6-1-11
GROUND WATER OBSERVATIONS:
Sheet 1 of 2
DE
PTH
(FT) Torvane
: FREE GROUND WATER MEASURED DURING DRILLING AT 17.0 FEET
SO
IL T
YP
E
MATERIAL DESCRIPTION AND REMARKSSO
IL L
EG
EN
D
PROJECT NO: 184153PROJECT: NORTH SAN PEDRO APARTMENTSLOCATION: SAN JOSE, CACOMPLETION DEPTH: 30.0 FT.
DR
Y D
EN
SIT
Y(P
CF)
PE
RC
EN
T P
AS
SIN
GN
O. 2
00 S
IEV
E
MO
ISTU
RE
CO
NTE
NT
(%)
Continued Next Page
EXPLORATORY BORING: EB-1
0
5
10
15
20
25
30
Undrained Shear Strength(ksf)
U-U Triaxial Compression
ELE
VA
TIO
N(F
T)
EB-1184153
Pocket Penetrometer
This log is a part of a report by Lowney Associates, and should not be used as astand-alone document. This description applies only to the location of the exploration
at the time of drilling. Subsurface conditions may differ at other locations and maychange at this location with time. The description presented is a simplification ofactual conditions encountered. Transitions between soil types may be gradual.
Unconfined Compression
LA_C
OR
P.G
DT
6/1
3/11
MV
*
soft, moist, dark gray, high plasticityBottom of boring at 30 feet
PE
NE
TRA
TIO
NR
ES
ISTA
NC
E(B
LOW
S/F
T.)
1.0 2.0 3.0 4.0
SA
MP
LER
DRILL RIG: MOBILE B-90BORING TYPE: 8-INCH HOLLOW STEM AUGERLOGGED BY: ACSTART DATE: 6-1-11 FINISH DATE: 6-1-11
GROUND WATER OBSERVATIONS:
Sheet 2 of 2
DE
PTH
(FT) Torvane
: FREE GROUND WATER MEASURED DURING DRILLING AT 17.0 FEET
SO
IL T
YP
E
MATERIAL DESCRIPTION AND REMARKSSO
IL L
EG
EN
D
PROJECT NO: 184153PROJECT: NORTH SAN PEDRO APARTMENTSLOCATION: SAN JOSE, CACOMPLETION DEPTH: 30.0 FT.
DR
Y D
EN
SIT
Y(P
CF)
PE
RC
EN
T P
AS
SIN
GN
O. 2
00 S
IEV
E
MO
ISTU
RE
CO
NTE
NT
(%)
EXPLORATORY BORING: EB-1 Cont'd
30
35
40
45
50
55
60
Undrained Shear Strength(ksf)
U-U Triaxial Compression
ELE
VA
TIO
N(F
T)
EB-1184153
Pocket Penetrometer
This log is a part of a report by Lowney Associates, and should not be used as astand-alone document. This description applies only to the location of the exploration
at the time of drilling. Subsurface conditions may differ at other locations and maychange at this location with time. The description presented is a simplification ofactual conditions encountered. Transitions between soil types may be gradual.
Unconfined Compression
LA_C
OR
P.G
DT
6/1
3/11
MV
*
CLAYEY GRAVELS WITH SAND (GC) [FILL]medium dense, moist, brown, fine to coarse gravel(sub-angular), fine to coarse sand, trace red brickfragments
LEAN CLAY WITH SILT (CL)very stiff, moist, dark brown, low plasticity, trace finesandPlasticity Index = 7, Liquid Limit = 25
SILTY SAND (SM)loose, moist, brown, fine sand
SILT (ML)stiff, moist, brown, low to moderate plasticity
soft
Groundwater encountered at 20.5 feetLEAN CLAY (CH)medium stiff, moist, dark gray, moderate to highplasticity, trace fine sandSANDY LEAN CLAY (CL)medium stiff, moist to wet, gray-brown, low plasticity,fine to coarse sand, fine to coarse gravel(sub-angular/rounded)SILTY SAND (SM)medium dense, wet, brown, fine to coarse sand,fine-coarse gravel (sub-angular/rounded)POORLY GRADED SAND (SP)dense, wet, brown, fine to coarse sand, fine to coarsegravel (sub-angular/rounded)
GC, FILL
CL
SP-SM
ML
CL
CL
SM
SP
SM
ML
5
14
16
12
37
15
43
7
6828
117
90
105
103
81
115
49
21
10
11
14
14
32
31
14
PE
NE
TRA
TIO
NR
ES
ISTA
NC
E(B
LOW
S/F
T.)
1.0 2.0 3.0 4.0SURFACE ELEVATION:
SA
MP
LER
DRILL RIG: MOBILE B-40BORING TYPE: 8-INCH HOLLOW STEM AUGERLOGGED BY: ACSTART DATE: 6-1-11 FINISH DATE: 6-1-11
GROUND WATER OBSERVATIONS:
Sheet 1 of 2
DE
PTH
(FT) Torvane
: FREE GROUND WATER MEASURED DURING DRILLING AT 20.5 FEET
SO
IL T
YP
E
MATERIAL DESCRIPTION AND REMARKSSO
IL L
EG
EN
D
PROJECT NO: 184153PROJECT: NORTH SAN PEDRO APARTMENTSLOCATION: SAN JOSE, CACOMPLETION DEPTH: 45.0 FT.
DR
Y D
EN
SIT
Y(P
CF)
PE
RC
EN
T P
AS
SIN
GN
O. 2
00 S
IEV
E
MO
ISTU
RE
CO
NTE
NT
(%)
Continued Next Page
EXPLORATORY BORING: EB-2
0
5
10
15
20
25
30
Undrained Shear Strength(ksf)
U-U Triaxial Compression
ELE
VA
TIO
N(F
T)
EB-2184153
Pocket Penetrometer
This log is a part of a report by Lowney Associates, and should not be used as astand-alone document. This description applies only to the location of the exploration
at the time of drilling. Subsurface conditions may differ at other locations and maychange at this location with time. The description presented is a simplification ofactual conditions encountered. Transitions between soil types may be gradual.
Unconfined Compression
LA_C
OR
P.G
DT
6/1
3/11
MV
*
SILTY SAND (SM)medium dense, wet, brown-gray, fine to medium sand,trace gravelSANDY SILT (ML)medium stiff, moist, brown, low to moderate plasticity,fine sandSILTY SAND (SM)medium dense, moist, gray, fine sandFAT CLAY (CH)soft, moist, greenish-dark gray, high plasticity
very stiff
SILT (ML)very stiff, moist, brown, low plasticity
POORLY GRADED SAND (SP)dense, moist, brown, fine to coarse sand, fine-coarsegravel (sub-angular/rounded)Bottom of boring at 45 feet
SM
SM
CH
ML
SP
37
40
85
82
16
12
18
51
PE
NE
TRA
TIO
NR
ES
ISTA
NC
E(B
LOW
S/F
T.)
1.0 2.0 3.0 4.0
SA
MP
LER
DRILL RIG: MOBILE B-40BORING TYPE: 8-INCH HOLLOW STEM AUGERLOGGED BY: ACSTART DATE: 6-1-11 FINISH DATE: 6-1-11
GROUND WATER OBSERVATIONS:
Sheet 2 of 2
DE
PTH
(FT) Torvane
: FREE GROUND WATER MEASURED DURING DRILLING AT 20.5 FEET
SO
IL T
YP
E
MATERIAL DESCRIPTION AND REMARKSSO
IL L
EG
EN
D
PROJECT NO: 184153PROJECT: NORTH SAN PEDRO APARTMENTSLOCATION: SAN JOSE, CACOMPLETION DEPTH: 45.0 FT.
DR
Y D
EN
SIT
Y(P
CF)
PE
RC
EN
T P
AS
SIN
GN
O. 2
00 S
IEV
E
MO
ISTU
RE
CO
NTE
NT
(%)
EXPLORATORY BORING: EB-2 Cont'd
30
35
40
45
50
55
60
Undrained Shear Strength(ksf)
U-U Triaxial Compression
ELE
VA
TIO
N(F
T)
EB-2184153
Pocket Penetrometer
This log is a part of a report by Lowney Associates, and should not be used as astand-alone document. This description applies only to the location of the exploration
at the time of drilling. Subsurface conditions may differ at other locations and maychange at this location with time. The description presented is a simplification ofactual conditions encountered. Transitions between soil types may be gradual.
Unconfined Compression
LA_C
OR
P.G
DT
6/1
3/11
MV
*

TRC SolutionsProject North San Pedro Apartments Operator BH-JB Filename SDF(313).cptJob Number 33512 Cone Number DSG1023 GPSHole Number CPT-01 Date and Time 5/26/2011 8:24:11 AM Maximum Depth 75.13 ftWater Table Depth 14.00 ft
Net Area Ratio .8
Cone Size 10cm squared Soil Behavior Referance*Soil behavior type and SPT based on data from UBC-1983
0
10
20
30
40
50
60
70
80
0 500 TIPTSF 0 8
FRICTIONTSF 0 10
Fs/Qt% 0 120
SPT N0 12
1 - sensitive fine grained
2 - organic material
3 - clay
4 - silty clay to clay
5 - clayey silt to silty clay
6 - sandy silt to clayey silt
7 - silty sand to sandy silt
8 - sand to silty sand
9 - sand
10 - gravelly sand to sand
11 - very stiff fine grained (*)
12 - sand to clayey sand (*)
CPT DATA
DE
PTH
(ft)
SOIL
BE
HA
VIO
RTY
PE

TRC SolutionsProject North San Pedro Apartments Operator BH-JB Filename SDF(314).cptJob Number 33512 Cone Number DSG1023 GPSHole Number CPT-02 Date and Time 5/26/2011 10:10:05 AM Maximum Depth 75.46 ftWater Table Depth 14.00 ft
Net Area Ratio .8
Cone Size 10cm squared Soil Behavior Referance*Soil behavior type and SPT based on data from UBC-1983
0
10
20
30
40
50
60
70
80
0 500 TIPTSF 0 8
FRICTIONTSF 0 10
Fs/Qt% 0 120
SPT N0 12
1 - sensitive fine grained
2 - organic material
3 - clay
4 - silty clay to clay
5 - clayey silt to silty clay
6 - sandy silt to clayey silt
7 - silty sand to sandy silt
8 - sand to silty sand
9 - sand
10 - gravelly sand to sand
11 - very stiff fine grained (*)
12 - sand to clayey sand (*)
CPT DATA
DE
PTH
(ft)
SOIL
BE
HA
VIO
RTY
PE

Page B-1 247567
APPENDIX B
LABORATORY TEST DATA FROM PREVIOUS INVESTIGATION
0
10
20
30
40
50
60
0 20 40 60 80 100
OR
ORCL-ML
38
16
12
7
PlasticLimit(%)
PlasticityIndex(%)
Unified Soil Classification Description
OL
Sym
bol Passing
No. 200Sieve
27
18
39
25
PLA
STI
CIT
Y IN
DE
X (%
)
LiquidLimit(%)
EB-1
EB-214.5
5.8
Boring No.
CH
MH
CL
OH
ML
SILT
LEAN CLAY WITH SILT
Depth(ft.)
NaturalWater
Content(%)
LIQUID LIMIT (%)
FIGURE B-1
PLASTICITY CHART AND DATAProject: NORTH SAN PEDRO APARTMENTS
Location: SAN JOSE, CA
Project No.: 184153
LA_C
OR
P.G
DT
6/1
2/11
MV
*
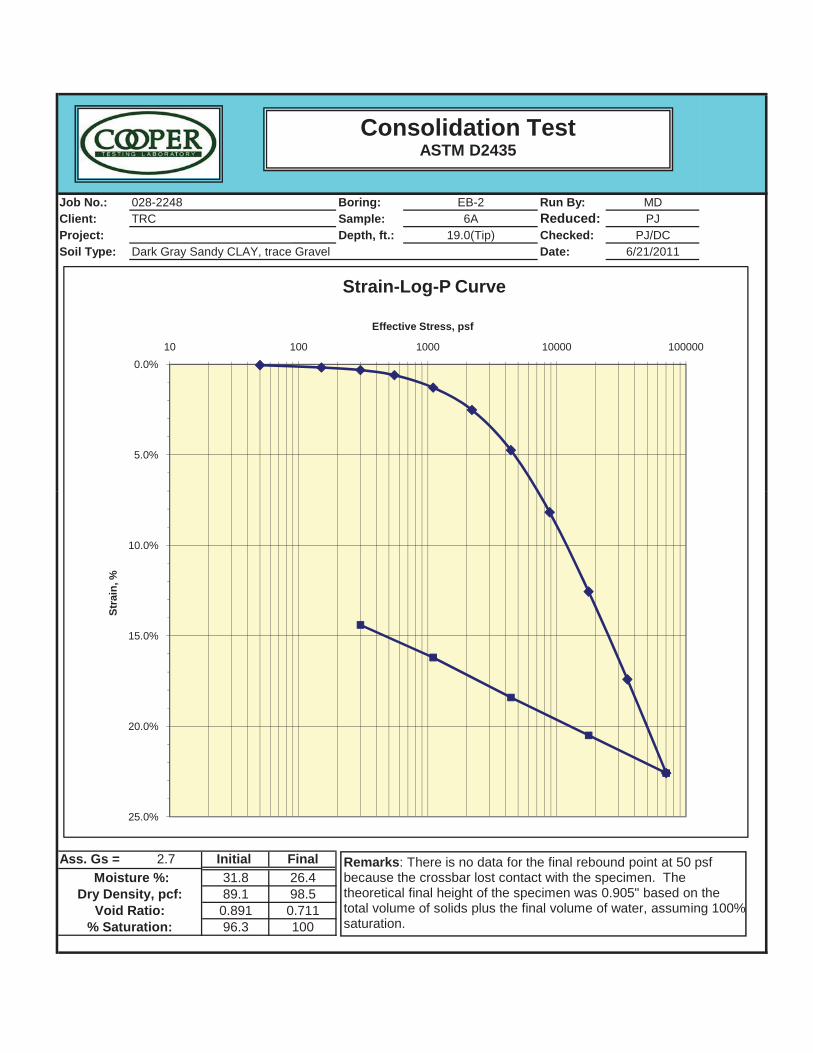
Job No.: Boring: Run By: MDClient: Sample: Reduced: PJProject: Depth, ft.: Checked: PJ/DCSoil Type: Dark Gray Sandy CLAY, trace Gravel Date: 6/21/2011
EB-26A
19.0(Tip)N. San Pedro Apts. - 184153TRC028-2248
0.0%
5.0%
10 100 1000 10000 100000
Effective Stress, psf
Strain-Log-P Curve
Consolidation TestASTM D2435
Ass. Gs = 2.7 Initial Final31.8 26.489.1 98.50.891 0.71196.3 100
Void Ratio:% Saturation:
Dry Density, pcf: Moisture %:
10.0%
15.0%
20.0%
25.0%
Stra
in, %
Remarks: There is no data for the final rebound point at 50 psf because the crossbar lost contact with the specimen. The theoretical final height of the specimen was 0.905" based on the total volume of solids plus the final volume of water, assuming 100% saturation.
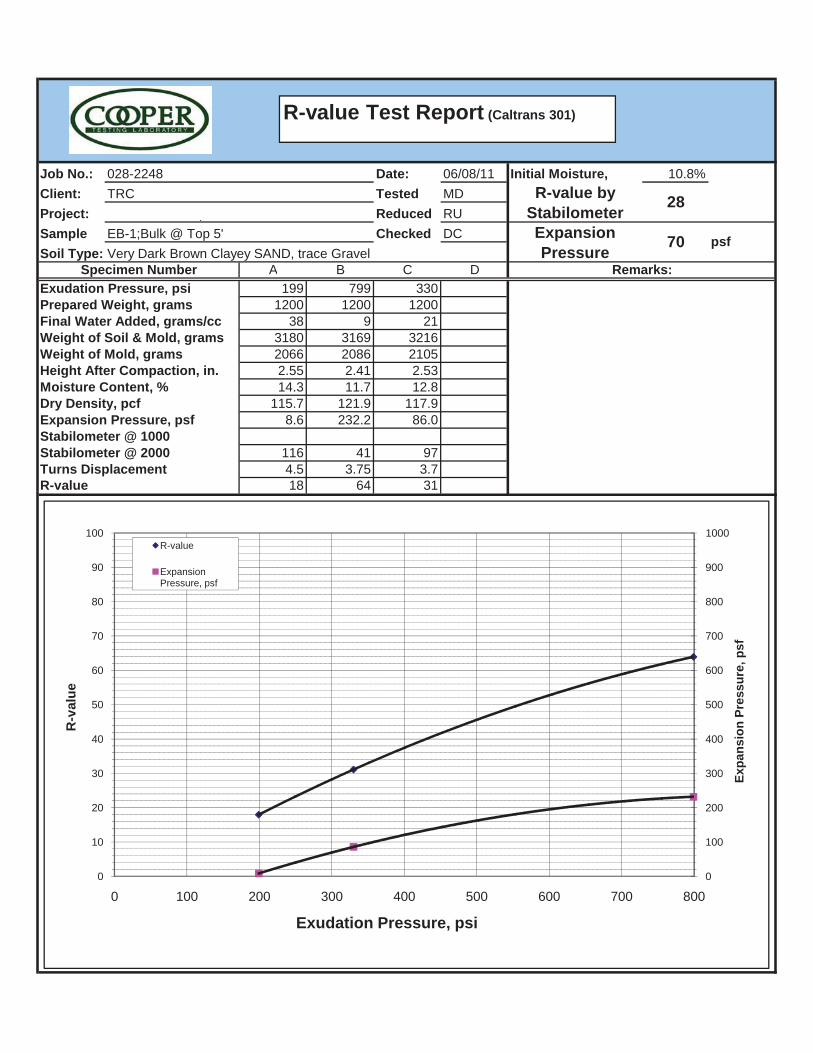
R-value Test Report (Caltrans 301)
Job No.: 028-2248 Date: 06/08/11 Initial Moisture, 10.8%Client: TRC Tested MD R-value by
Stabilometer 28Project: N. San Pedro Apts - 184153 Reduced RUSample EB-1;Bulk @ Top 5' Checked DC Expansion
Pressure 70 psfSoil Type: Very Dark Brown Clayey SAND, trace Gravel
Specimen Number A B C D Remarks:Exudation Pressure, psi 199 799 330Prepared Weight, grams 1200 1200 1200Final Water Added, grams/cc 38 9 21Weight of Soil & Mold, grams 3180 3169 3216Weight of Mold, grams 2066 2086 2105Height After Compaction, in. 2.55 2.41 2.53Moisture Content, % 14.3 11.7 12.8Dry Density, pcf 115.7 121.9 117.9Expansion Pressure, psf 8.6 232.2 86.0Stabilometer @ 1000 Stabilometer @ 2000 116 41 97Turns Displacement 4.5 3.75 3.7R-value 18 64 31
0
100
200
300
400
500
600
700
800
900
1000
0
10
20
30
40
50
60
70
80
90
100
0 100 200 300 400 500 600 700 800
Expa
nsio
n Pr
essu
re, p
sf
R-v
alue
Exudation Pressure, psi
R-value
Expansion Pressure, psf


![APPENDIX F Geotechnical Investigation Report · Geotechnical Investigation Report!!!!! [Page left intentionally blank.] ... obtained from previous investigation, and slope stability](https://img.pdfslide.net/doc/110x75/5ed3369c20ca8951594598e3/appendix-f-geotechnical-investigation-report-geotechnical-investigation-report.jpg)