Embed Size (px)
Citation preview

Appendix F Preliminary Geotechnical Investigation for Proposed
Solar Plant, Lost Hills, Kern County, California

F I N A L R E P O R T
PRELIMINARY GEOTECHNICALINVESTIGATION FOR PROPOSEDSOLAR PLANT, LOST HILLS,KERN COUNTY, CALIFORNIA
Prepared For
NextLight Renewable Power, LLC353 Sacramento Street, Suite 2100San Francisco, CA 94111
January 26, 2010Project No. 29871499
URS Corporation2020 East First Street, Suite 400Santa Ana, California 92705-4032
Preliminary Geotechnical Investigation, NextLight Lost Hills
T:\!12\NextLight Lost Hills\9000 Deliverables\9101 Rpt\Final\Rpt-LostHills.doc, 1/26/2010 i
TABLE OF CONTENTS
SECTION PAGE
ACRONYMS AND ABBREVIATIONS................................................................................................. III
EXECUTIVE SUMMARY ........................................................................................................... ES-1
1.0 AUTHORIZATION AND PROJECT DESCRIPTION ................................................................ 1-1
2.0 FIELD EXPLORATION AND LABORATORY TESTING .......................................................... 2-1
2.1 Borings ............................................................................................................ 2-1
2.2 Electrical Resistivity Testing............................................................................ 2-1
2.3 Laboratory Testing........................................................................................... 2-2
3.0 SITE SURFACE AND GEOLOGIC CONDITIONS .................................................................. 3-1
3.1 Regional Geologic Conditions.......................................................................... 3-1
3.2 Local Geologic Setting..................................................................................... 3-1
3.3 Surface Conditions........................................................................................... 3-2
3.4 Subsurface Soil Conditions .............................................................................. 3-2
3.5 Groundwater Conditions .................................................................................. 3-3
3.6 Geologic Hazards............................................................................................. 3-3
3.6.1 General ...........................................................................................................3-33.6.2 Landslides ......................................................................................................3-33.6.3 Flooding and Erosion ......................................................................................3-33.6.4 Subsidence......................................................................................................3-43.6.5 Poor Soil Conditions (Expansive, Collapsible, or Corrosive Soils)...................3-43.6.6 Primary Ground Rupture.................................................................................3-53.6.7 Strong Ground Motion ....................................................................................3-53.6.8 Liquefaction....................................................................................................3-53.6.9 Seismically Induced Settlement.......................................................................3-6
4.0 CONCLUSIONS AND RECOMMENDATIONS ........................................................................ 4-1
4.1 General ............................................................................................................ 4-1
4.2 Shallow Foundations........................................................................................ 4-1
4.3 Deep Foundation for PV Support Structure ...................................................... 4-3
4.4 Earthwork ........................................................................................................ 4-3
4.4.1 General Grading Requirements .......................................................................4-34.4.2 Demolition......................................................................................................4-44.4.3 Site Preparation and Removals ........................................................................4-44.4.4 Site Dewatering and Control of Water .............................................................4-54.4.5 Fill Materials ..................................................................................................4-54.4.6 Trenches .........................................................................................................4-64.4.7 Fill Placement and Compaction.......................................................................4-6
4.5 Temporary Excavations.................................................................................... 4-7
Preliminary Geotechnical Investigation, NextLight Lost Hills
T:\!12\NextLight Lost Hills\9000 Deliverables\9101 Rpt\Final\Rpt-LostHills.doc, 1/26/2010 ii
4.6 Anticipated Excavation Conditions .................................................................. 4-8
4.7 Recommendations for Future Geotechnical Investigation ................................. 4-8
5.0 LIMITATIONS ................................................................................................................. 5-1
6.0 REFERENCES................................................................................................................ 6-1
Figures
1 Site Location and Regional Geologic Map2 Site Plan and Approximate Exploration Locations
Appendices
A BoringsB Electrical Resistivity Testing DataC Laboratory Testing
Preliminary Geotechnical Investigation, NextLight Lost Hills
T:\!12\NextLight Lost Hills\9000 Deliverables\9101 Rpt\Final\Rpt-LostHills.doc, 1/26/2010 iii
ACRONY MS AND AB BRE V IAT I ONS
bgs below the ground surface
BV Black and Veatch
CGS California Geological Survey
CDMG California Division of Mines and Geology
FEMA Federal Emergency Management Agency
lbs/in2 pounds per square inch
lbs/ft2 pounds per square foot
lbs/ft3 pounds per cubic foot
mm millimeter
MSL above mean sea-level
NextLight NextLight Renewable Power, LLC
PV photovoltaic
RFP request for proposal
SAFZ San Andreas fault zone
URS URS Corporation
USGS United States Geological Survey
Preliminary Geotechnical Investigation, NextLight Lost Hills
T:\!12\NextLight Lost Hills\9000 Deliverables\9101 Rpt\Final\Rpt-LostHills.doc, 1/26/2010 ES-1
EX E CUTIV E SU MMA RY
This report summarizes the geotechnical investigation performed by URS Corporation (URS) for the
proposed solar plant that NextLight Renewable Power, LLC (NextLight) is considering constructing near
Lost Hills, California. The project site is basically an open rectangular field measuring approximately
one-half mile by one mile.
Three borings were advanced at spacings of approximately one-half mile. Surficial geologic materials
consist of Holocene-age alluvial fan deposits. The material encountered in the upper five feet includes
very stiff fat clay (CH), stiff lean clay (CL), and loose to medium dense clayey sand (SC) and silty sand
(SM). The deeper soils, from 5 to 26.5 feet below ground surface, also encompass a range of soils,
including interbedded medium dense clayey sand (SC) and stiff to very stiff lean clay (CL); interbedded
loose clayey sand (SC) and silty sand (SM); and stiff to very stiff fat clay (CH). Dense, poorly graded
sand with silt (SP-SM) was encountered in the lower part of boring BV-3. Groundwater was not
encountered during our subsurface investigation to the maximum depth explored (26.5 feet) and is
anticipated to be greater than 50 feet below ground surface.
Geologic and seismic hazards that might affect the site were reviewed using published reports and data.
Our assessment suggests that there is little to no potential for landslides, subsidence, fault surface rupture,
liquefaction, and seismic settlement, and some potential for flooding and erosion, poor soil conditions,
and strong ground shaking. With appropriate mitigation, all identified geologic and seismic hazards are
considered less than significant. To the extent of the information available for this investigation, geologic
and seismic hazards do not appear to represent a “fatal flaw” for the proposed development.
Based on the results of URS’ geotechnical investigation, the site appears suitable, from a geotechnical
standpoint and at a feasibility level, for the proposed development of a solar plant. Consistent with usual
NextLight practice, shallow spread footings may be used to support the transformers and pre-engineered
O&M Building; the PV panel support structures may be supported on either shallow or deep foundations.
Some issues remain to be investigated with respect to founding the PV panel supports on spread footings
bearing on the ground surface. These include the effects of agricultural plowing on the near surface soil;
the extent and characteristics of expansive clays that may be found near ground surface in part of the site;
the effects of erosion, which could undermine footings having no embedment; and the depth and effects
of frost penetration. Recommendations are also provided for site earthwork, including electrical trenches,
and for future, more detailed geotechnical investigation for the project.
Preliminary Geotechnical Investigation, NextLight Lost Hills
T:\!12\NextLight Lost Hills\9000 Deliverables\9101 Rpt\Final\Rpt-LostHills.doc, 1/26/2010 1-1
1.0 AUTHO RI ZAT I ON AN D PR OJ E C T DE S CRIP T I ON
This report summarizes the geotechnical investigation performed by URS Corporation (URS) for the
proposed solar plant that NextLight Renewable Power, LLC (NextLight) is considering building near
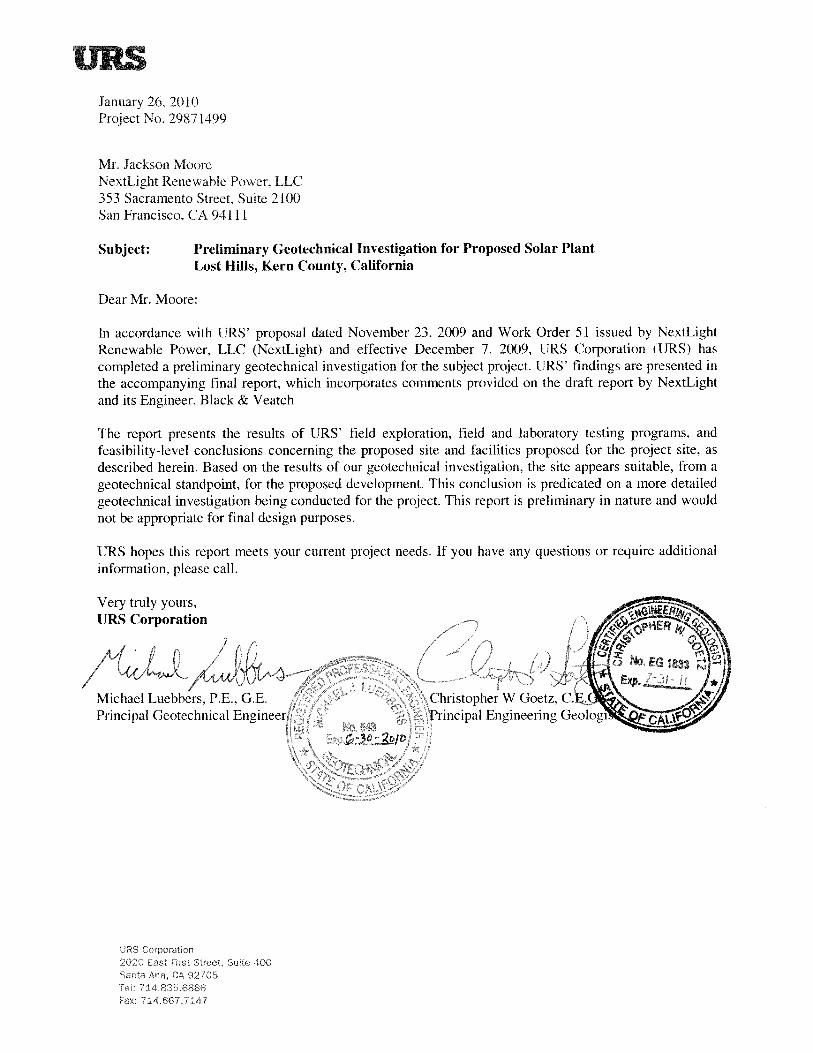
Lost Hills, California. Figure 1, Site Location Map, shows the site location. URS’ geotechnical services
were authorized under URS’ Master Services Agreement with NextLight by NextLight Order No. 51
dated December 7, 2009. The scope of services is described in the request for proposal (RFP) issued by
NextLight’s engineer, Black and Veatch (BV), and URS’ proposal dated November 23, 2009.
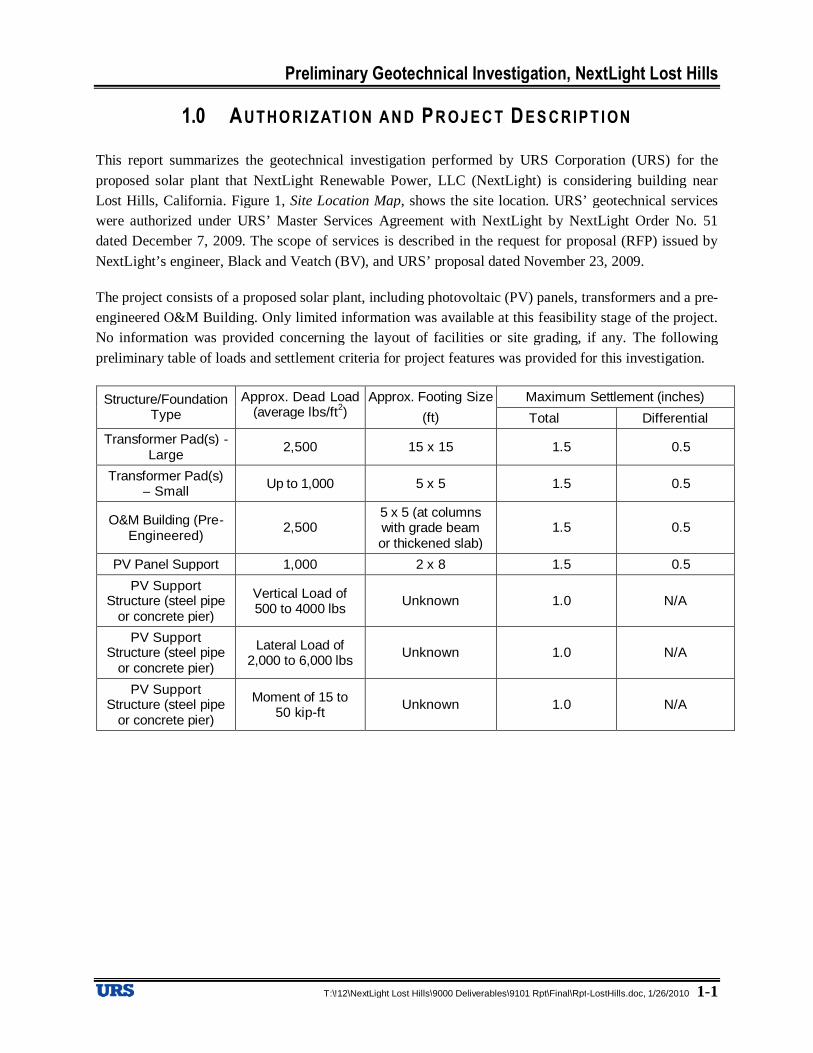
The project consists of a proposed solar plant, including photovoltaic (PV) panels, transformers and a pre-
engineered O&M Building. Only limited information was available at this feasibility stage of the project.
No information was provided concerning the layout of facilities or site grading, if any. The following
preliminary table of loads and settlement criteria for project features was provided for this investigation.
Maximum Settlement (inches)Structure/FoundationType
Approx. Dead Load(average lbs/ft
2)
Approx. Footing Size
(ft) Total Differential
Transformer Pad(s) -Large
2,500 15 x 15 1.5 0.5
Transformer Pad(s)– Small
Up to 1,000 5 x 5 1.5 0.5
O&M Building (Pre-Engineered)
2,5005 x 5 (at columnswith grade beamor thickened slab)
1.5 0.5
PV Panel Support 1,000 2 x 8 1.5 0.5
PV SupportStructure (steel pipe
or concrete pier)
Vertical Load of500 to 4000 lbs
Unknown 1.0 N/A
PV SupportStructure (steel pipe
or concrete pier)
Lateral Load of2,000 to 6,000 lbs
Unknown 1.0 N/A
PV SupportStructure (steel pipe
or concrete pier)
Moment of 15 to50 kip-ft
Unknown 1.0 N/A
Preliminary Geotechnical Investigation, NextLight Lost Hills
T:\!12\NextLight Lost Hills\9000 Deliverables\9101 Rpt\Final\Rpt-LostHills.doc, 1/26/2010 2-1
2.0 F IE LD EX P L ORATI ON AND LAB ORATORY TE S T IN G
URS performed borings and electrical resistivity tests, as well as laboratory tests for the subject project, as
described in 02211 – Subsurface Investigation provided by BV.
2.1 BORINGS
URS advanced three 26.5-foot deep test borings at the site using a Central Mine Equipment Company
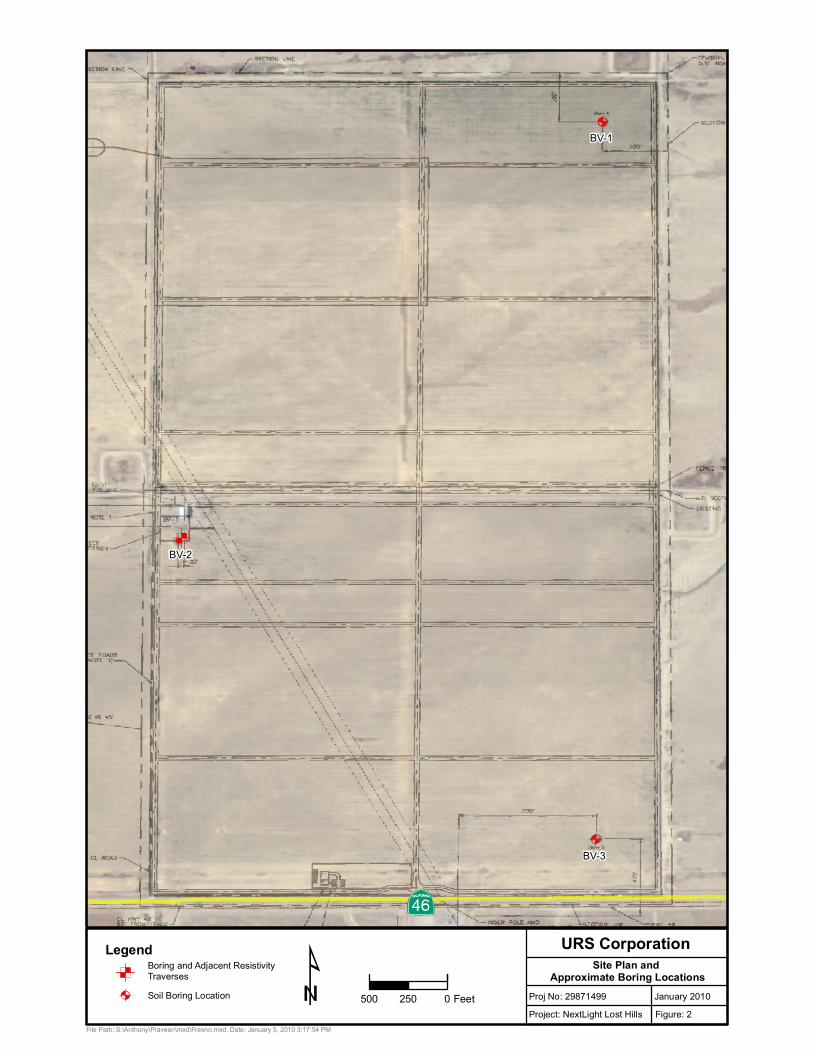
(CME) 55 drill rig and hollow-stem augers. Figure 2 shows the approximate locations of the borings,
designated BV-1, -2 and -3; the latitudes and longitudes of the borings are indicated on the borings logs.
The borings were advanced following ASTM D 1452, “Standard Practice for Soil Exploration and
Sampling by Auger Borings”. Soil samples and blow count data were obtained for each boring. The
samples were taken with Standard Penetration Test (SPT) 2-inch split barrel sampler and a 3-inch
diameter thin-wall tube sampler. Appendix A presents additional details concerning the boring program,
the boring logs, and a key to the boring logs. URS’ field engineer transported the samples to URS’
geotechnical laboratory in Santa Ana for review and testing.
2.2 ELECTRICAL RESISTIVITY TESTING
URS performed electrical resistivity testing along two perpendicular traverses (ER-1 and ER-2) in the
vicinity of boring BV-2 on December 17 and 18, 2009. Figure 2 shows the approximate location of boring
BV-2.
The tests were performed with a SuperSting R1/IP, DC-Memory Earth Resistivity Meter manufactured by
Advanced Geosciences, Inc. following ASTM G 57, “Standard Test Method for Field Measurement of
Soil Resistivity Using the Wenner Four-Electrode Method” and IEEE 81, “IEEE Guide for Measuring
Earth Resistivity, Ground Impedance, and Earth Surface Potentials of a Ground System”.
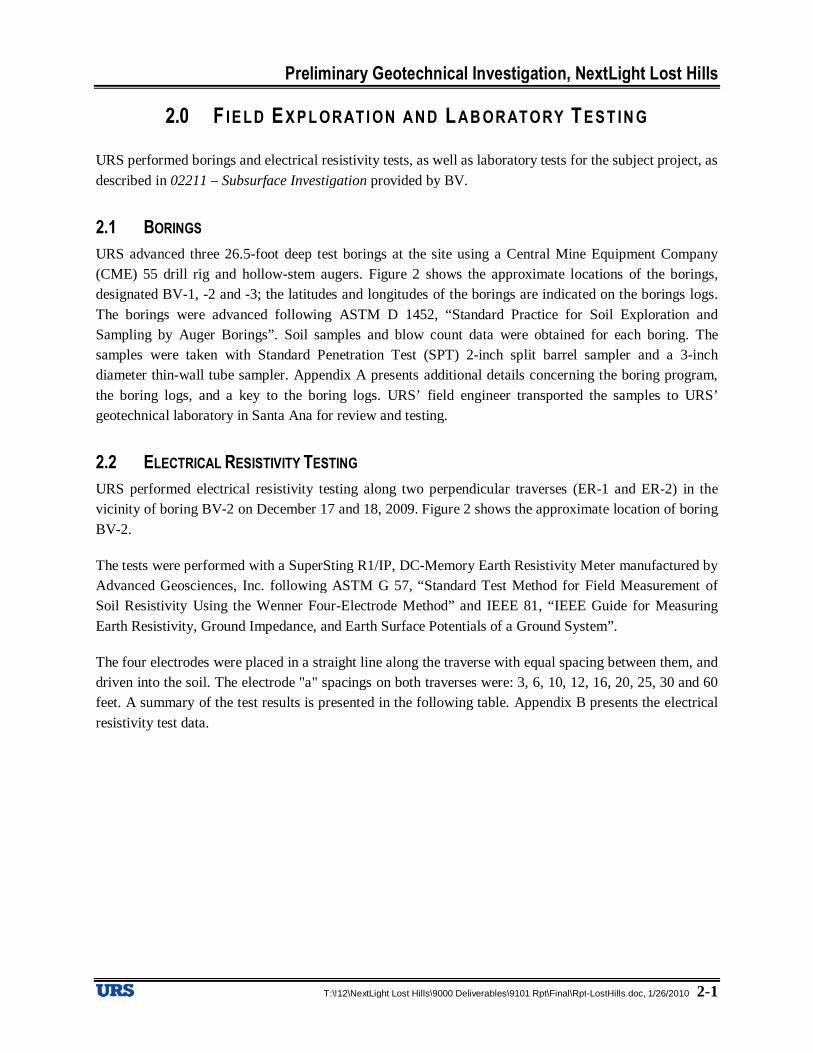
The four electrodes were placed in a straight line along the traverse with equal spacing between them, and
driven into the soil. The electrode "a" spacings on both traverses were: 3, 6, 10, 12, 16, 20, 25, 30 and 60
feet. A summary of the test results is presented in the following table. Appendix B presents the electrical
resistivity test data.
Preliminary Geotechnical Investigation, NextLight Lost Hills
T:\!12\NextLight Lost Hills\9000 Deliverables\9101 Rpt\Final\Rpt-LostHills.doc, 1/26/2010 2-2
Traverse ER-1 Traverse ER-2
ElectrodeSpacing, a
(ft)
MeasuredResistance,
R(ohms)
Soil Resistivity(ohm-cm)
MeasuredResistance,
R(ohms)
Soil Resistivity(ohm-cm)
3 10.07 5786 8.55 4915
6 3.8 4364 2.37 2724
10 2.27 4351 1.59 3035
12 1.63 3748 1.41 3245
16 1.231 3772 1.037 3178
20 0.7931 3038 0.8143 3119
25 0.4413 2113 0.5402 2586
30 0.5762 3310 0.3942 2265
60 0.1975 2269 0.2152 2473
Average 3639 3133
Notes:
1. Soil resistivity is calculated per ASTM G57 by the following formula:
Soil Resistivity = 2πaR (using consistent units)
2. Probe embedment was 3 inches.
2.3 LABORATORY TESTING
Laboratory testing was performed on selected samples authorized by BV. The tests consisted of in situ
water content; liquid limit, plastic limit and plasticity index; and particle-size distribution. Appendix C
provides the test procedures used and presents a summary of the results.
Preliminary Geotechnical Investigation, NextLight Lost Hills
T:\!12\NextLight Lost Hills\9000 Deliverables\9101 Rpt\Final\Rpt-LostHills.doc, 1/26/2010 3-1
3.0 S ITE SURFACE AN D GE OL O GI C C ON DIT I ONS
3.1 REGIONAL GEOLOGIC CONDITIONS
The project site is located in the southwestern portion of the Great Valley geomorphic province of
California. The Great Valley, also known as the Central Valley is an elongate, northwest trending, nearly
flat lowland that is located between the Sierra Nevada Mountains on the east and the Coast Ranges on the
west. The Sacramento River drains the northern portion of the Great Valley and the San Joaquin River
drains the southern portion of the valley. The southern part of the Great Valley, where the project site is
located, is also known as the San Joaquin Valley.
The Great Valley consists of the alluvial flood and delta plains of the Sacramento River, the San Joaquin
River and their tributaries. The region has persisted as a shallow marine embayment and later as a
lowland for the entire Cenozoic and the latest Mesozoic eras (from about 100 million years ago to
present). The valley originated below sea level as an offshore area that was later enclosed by uplift of the
Coast Ranges. Over the millennia the valley was filled by the sediments eroded from the Coast Ranges
and the Sierra Nevada Mountains. In the late Cenozoic much of the Great Valley was occupied by
shallow brackish and freshwater lakes (Norris and Webb, 1990).
The project site is in a seismically active region that will be subjected to future seismic shaking during
earthquakes generated by any of several surrounding active faults. The San Andreas fault is located
approximately 14 miles southwest of the site. It is a right-lateral, strike-slip fault that extends over 700
miles (1,120 km) from the Gulf of California to Cape Mendocino in northern California. Several historic
earthquakes on the San Andreas fault zone (SAFZ) have produced significant seismic shaking at the
project site. The most notable example is the January 9, 1857 Fort Tejon earthquake, one of the greatest
earthquakes ever recorded in the United States. The Fort Tejon earthquake produced a surface rupture of
over 217 miles (350 kilometers) in length along the San Andreas fault zone from Cholame on the north to
the Cajon Pass area on the south. The epicenter of the Fort Tejon earthquake was located approximately
22 miles (35 kilometers) south of the site. This earthquake, which was estimated to be near magnitude 8,
produced an average slip of 15 feet and a maximum slip of 30 feet in the Carrizo Plain area. Strong
shaking caused by the earthquake was reported to have lasted at least one minute.
3.2 LOCAL GEOLOGIC SETTING
The project site is located within the Antelope Plain at elevations ranging between approximately 580 to
620 feet above mean sea level (National Geodetic Vertical Datum of 1929 datum). The Antelope Plain is
a nearly flat, shallow, northeast sloping surface formed from alluvial fan deposits derived from the
Temblor Range, which is located towards the southwest.
In the vicinity of the project site, the generally flat Antelope Plain is slightly interrupted by the Lost Hills
and the Antelope Hills. The Lost Hills and Antelope Hills are the surface expression of northwest-
trending anticlinal folds that form oil traps along the west side of the San Joaquin Valley. The Lost Hill
Oil Field, discovered in 1910 (California Division of Mines, 1943), is located about 5 miles to the
Preliminary Geotechnical Investigation, NextLight Lost Hills
T:\!12\NextLight Lost Hills\9000 Deliverables\9101 Rpt\Final\Rpt-LostHills.doc, 1/26/2010 3-2
northeast of the project site and the Belridge Oil Field, discovered in 1911 (California Division of Mines,
1943) in the Antelope Hills, is located about 3 miles to the southeast.
Based on a review of regional geologic maps of the area (USGS, 1921; CDMG, 1964), surficial geologic
materials on site consist of Holocene-age alluvial fan deposits that are typically comprised of fine sandy
soil (see Figure 1). These conditions were generally confirmed during URS’s site subsurface investigation
which included the advancement and logging of three hollow stem auger soil borings to a maximum depth
of 26.5 feet. As shown on the borings logs presented in Appendix A, soil encountered during the our
subsurface investigation generally consisted of interlayered silty sand, clay, clayey sand, and sandy clay
that was typically dry to moist and medium dense (stiff) in place. Near surface soils within the upper 6-
to 12-inches were noted to be relatively loose and disturbed from past plowing and agricultural
operations.
Soil Survey maps for the project site (USDA Soil Conservation Service, 1988) indicate that near surface
soils generally consist of fine sandy, silty, and clayey loams.
3.3 SURFACE CONDITIONS
The project site is located on the north side of Paso Robles Highway (Highway 46), with the southwest
corner being about one-half mile east of the intersection of Highway 46 and West Side Highway
(Highway 33). The project site is basically an open rectangular field measuring approximately one-half
mile by one mile. At the time of the field work in December 2009, the field was barren and had been
plowed, so the surface was quite uneven.
On the south side of the project site, approximately at one-quarter mile west of the southeast corner of the
site, adjacent to Highway 46, there is an electrical substation regulating power supply in the area. Within
the site itself, approximately one-half mile north of the southwest corner of the site, there is an abandoned
building, which resembled a workshop supported by steel pillars and steel roof and had no walls. It
appeared like the workshop was drawing its power supply from the adjacent overhead line running across
the site. Also, four irrigation lines run east-west across the site at regular intervals from north to south.
Concrete manhole covers extend at least a foot above the ground at regular intervals along the irrigation
lines.
3.4 SUBSURFACE SOIL CONDITIONS
Based on the subsurface investigations at the site (see boring logs in Appendix A), the site subsurface
varies at the three borings, which are spaced with approximately one-half mile between the closest
boreholes. The material encountered in the upper five feet includes very stiff fat clay (CH), stiff lean clay
(CL), and loose to medium dense clayey sand (SC) and silty sand (SM). The deeper soils, from 5 to 26.5
feet below ground surface, also encompass a range of soils, including interbedded medium dense clayey
sand (SC) and stiff to very stiff lean clay (CL), interbedded loose clayey sand (SC) and silty sand (SM),
stiff to very stiff fat clay (CH). Dense, poorly graded sand with silt (SP-SM) was encountered in the lower
part of boring BV-3.
Preliminary Geotechnical Investigation, NextLight Lost Hills
T:\!12\NextLight Lost Hills\9000 Deliverables\9101 Rpt\Final\Rpt-LostHills.doc, 1/26/2010 3-3
The soil samples generally reacted strongly when exposed to dilute hydrochloric acid, indicating the
presence of carbonate cementation. A thin layer of hardpan was encountered in boring BV-1 at about 22
feet below ground surface.
3.5 GROUNDWATER CONDITIONS
Based on our review of available published and unpublished literature, useful historic groundwater data
are not available for the project site and immediate vicinity. Groundwater was not encountered during our
subsurface investigation to the maximum depth explored (26.5 feet) and is anticipated to be greater than
50 feet below ground surface.
3.6 GEOLOGIC HAZARDS
3.6.1 General
Geologic and seismic hazards are those hazards that may impact a site due to the surrounding geologic
and seismic conditions. Geologic hazards include landslides, flooding and erosion, subsidence, and poor
soil conditions. Seismic hazards include phenomena that occur during or soon after an earthquake, such as
primary ground rupture, strong ground shaking, liquefaction and seismically induced settlement. The
potential for these hazards to impact the site have been assessed at a feasilbility level and are summarized
in the following sections. Our assessment of these hazards was based on guidelines established by the
California Division of Mines and Geology (1986 and 1997A).
Our assessment of geologic and seismic hazards suggests that there is little to no potential for landslides,
subsidence, fault surface rupture, liquefaction, and seismic settlement, and some potential for flooding
and erosion, poor soil conditions, and strong ground shaking. With appropriate mitigation, all identified
geologic and seismic hazards are considered less than significant. To the extent of the information
available for this investigation, geologic and seismic hazards do not appear to represent a “fatal flaw” for
the proposed development.
3.6.2 Landslides
The proposed project lies in the relatively flat-lying Antelope Plain, where landslides would not be
expected to occur. Therefore, landslides are not anticipated to pose a hazard to the proposed project.
3.6.3 Flooding and Erosion
Flooding and the consequent erosion associated with flooding are those hazards that are the result of
concentrated flow of stormwater during torrential rains. Based on both our review of published maps and
on observations during our site work, site topography is relatively flat, void of significant drainages or
collection areas, and inclined gently toward the northeast at average gradients of approximately 1 percent.
The southern portion of the site is not located within a 100-year flood zone, but is located within a 500-
year flood zone on the official Federal Emergency Management Agency (FEMA) Flood Insurance Rate
Map of the area (Kern County, Unincorporated and Incorporated Areas Community Panel # 06029 0625
E and Community Panel # 06029 1175 E, effective date September 26, 2008). Therefore, the potential for
flooding and erosion within the southern portion of the site is considered to be low.
Preliminary Geotechnical Investigation, NextLight Lost Hills
T:\!12\NextLight Lost Hills\9000 Deliverables\9101 Rpt\Final\Rpt-LostHills.doc, 1/26/2010 3-4
The northern portion of the site is located within the 100-year flood zone according to the official FEMA
Flood Insurance Rate Map of the area (Kern County, Unincorporated and Incorporated Areas Community
Panel # 06029 0625 E and Community Panel # 06029 1175 E, effective date September 26, 2008).
Therefore, there is some potential for flooding within the northern portions of the site during the lifetime
of the development. Appropriate drainage and flood control measures should be incorporated into project
designs for portions of the site within the 100-year flood zone.
3.6.4 Subsidence
The extraction of water or petroleum from sedimentary source rocks can cause the permanent collapse of
the pore space previously occupied by the removed fluid. The compaction of subsurface sediments by
fluid withdrawal will cause subsidence of the ground surface overlying a pumped reservoir. If the volume
of water or petroleum removed is sufficiently great, the amount of resulting subsidence may be sufficient
to damage nearby engineered structures. Significant quantities of water or petroleum are not being
extracted beneath the area occupied by the site. Subsidence is therefore not anticipated to pose a
significant hazard to the project site, barring such extraction in the future.
3.6.5 Poor Soil Conditions (Expansive, Collapsible, or Corrosive Soils)
Expansive soils are fine-grained soils (generally high plasticity clays) that can undergo a significant
increase in volume with an increase in water content and a significant decrease in volume with a decrease
in water content. Changes in the water content of a highly expansive soil can result in severe distress to
structures constructed on or against the soil.
As indicated on the boring logs (see Appendix A), fine-grained, highly plastic, and potentially expansive
soils were encountered in the near surface during our subsurface investigation. Further testing and
analysis of site soils should be performed as part of a design phase study. Proposed structures may require
special designs to mitigate the adverse effects of expansive soils.
Collapsible soils are those that undergo settlement upon wetting, even without the application of
additional load. The process of collapse with the addition of water is known as hydrocompaction.
Hydrocompaction occurs when water weakens or destroys the bonds between soil particles and severely
reduces the bearing capacity of the soil. Typical collapsible soils are lightly colored, are low in plasticity
and have relatively low densities. Collapsible soils are typically associated with alluvial fans, windblown
materials, or colluvium. Because the project site is located on an alluvial fan, there is some potential for
collapsible soils. The potential for collapsible soils would need to be addressed during the design phase
of the project and if collapsible soils are found to occur at the site, mitigation measures may be necessary
to reduce or eliminate the hazard.
Corrosive soils are materials that have the potential to adversely impact buried metallic pipes, concrete,
and other underground structures due to their chemical makeup. Factors that influence soil corrosivity
include pH, electrical resistivity, and chemical constituents (chloride, sulfate, etc.).
Based on our review of the Soil Survey maps for the project site (USDA Soil Conservation Service,
1988), near surface soils are typically slightly acidic to slightly alkaline (pH = 6.6 – 8.4), are highly
Preliminary Geotechnical Investigation, NextLight Lost Hills
T:\!12\NextLight Lost Hills\9000 Deliverables\9101 Rpt\Final\Rpt-LostHills.doc, 1/26/2010 3-5
corrosive to uncoated steel, and are mildly to moderately corrosive to concrete materials. On the basis of
this information, there is a potential for site soils to be moderately to severely corrosive to metallic and
concrete building materials. Further testing and analysis of site soils is recommended as part of a design
phase study to evaluate the chemical activity of onsite soils and their potential impact on buried metallic
pipes and other underground structures. Mitigation measures may be necessary to reduce or eliminate the
hazard.
3.6.6 Primary Ground Rupture
Primary ground rupture is ground deformation that occurs along the surface trace of the causative fault
during an earthquake. No active faults are known to exist within the subject site. Further, there is no
geomorphic expression of faulting in the site vicinity. The site is not included within the boundaries of an
“Earthquake Fault Zone” as defined by the State of California in the Alquist-Priolo Earthquake Fault
Zoning Act (California Division of Mines and Geology, 1997B). Therefore, primary ground rupture is
not considered a hazard to the project.
3.6.7 Strong Ground Motion
The site is located within a seismically active region that is well-known for active faulting and historic
seismicity. Because the site is in a seismically active region, it follows that it will be subjected to future
seismic shaking and strong ground motion resulting from seismic activity along local and more distant
active faults. As such, structural improvements should be designed to accommodate expected strong
ground shaking.
3.6.8 Liquefaction
Liquefaction is a phenomenon whereby, during periods of oscillatory ground motion caused by an event
such as an earthquake, the pore-water pressure in a loose, saturated granular soil and some fine-grained
soils increases to the point where the effective stress in the soil is zero and the soil loses a portion of its
shear strength (initial liquefaction). Structures founded on or above potentially liquefiable soils may
experience bearing capacity failures, vertical settlement (both total and differential) and lateral
displacement (due to lateral spreading of the ground). The factors known to influence liquefaction
potential include soil characteristics (particle-size distribution, plasticity, water content), relative density,
presence or absence of groundwater, stress tensor (effective confining stresses, shear stress) and the
intensity and duration of the seismic ground shaking. The granular soils most susceptible to liquefaction
are loose, saturated sands and non-plastic silty soils located below the water table.
The potential for liquefaction at the site is considered to be low. This is due to the absence of near surface
groundwater and the generally dense, finer-grained, cohesive nature of the subsurface materials.
However, no specific information is available relative to the material and groundwater conditions at
depths greater than those explored by the borings for this investigation (26 feet), and no judgment can be
rendered concerning the deeper material.
Preliminary Geotechnical Investigation, NextLight Lost Hills
T:\!12\NextLight Lost Hills\9000 Deliverables\9101 Rpt\Final\Rpt-LostHills.doc, 1/26/2010 3-6
3.6.9 Seismically Induced Settlement
Seismically induced settlement may occur as a result of liquefaction, but also when relatively soft or loose
soils are densified during earthquake shaking. Subsurface conditions susceptible to this hazard include
loose or porous, poorly cemented soils or soft bedrock near the ground surface. As indicated on the
Boring Logs (Appendix A), the project site is underlain by alluvial materials that are relatively dense in
place. Therefore, we consider the potential for differential seismically induced settlement to be low at the
site. However, no specific information is available relative to the material and groundwater conditions at
depths greater than those explored by the borings for this investigation (26 feet), and no judgment can be
rendered concerning the deeper material.
Preliminary Geotechnical Investigation, NextLight Lost Hills
T:\!12\NextLight Lost Hills\9000 Deliverables\9101 Rpt\Final\Rpt-LostHills.doc, 1/26/2010 4-1
4.0 CONCL US I ONS AND RE C OM ME NDAT I ONS
4.1 GENERAL
Based on the results of URS’ geotechnical investigation, the site appears suitable, from a geotechnical
standpoint and at a feasibility level, for the proposed development of a solar plant. This conclusion is
predicated on the following: (1) the project is as described in the RFP and herein; (2) the conclusions and
recommends provided herein and in any addenda are incorporated in the design and construction of the
facility; (3) URS conducts more detailed geotechnical investigations for final design of the project; and
(4) URS observes in real time the subsurface conditions encountered during construction and evaluates
these together with the information presented in this report and confirms the recommendations in this
report or, if appropriate, makes such additional recommendations as may be necessary.
The following sections provide feasibility-level recommendations for project features.
4.2 SHALLOW FOUNDATIONS
The RFP provided loads and settlement criteria for PV panel support structures, transformers (large and
small) and a pre-engineered O&M Building; these are tabulated in Section 1.0. NextLight typically
provides shallow spread footings to support the transformers and pre-engineered O&M Building; the PV
panel support structures may be supported on either shallow or deep foundations. The deep foundation
option for the PV panel support structures is addressed in Section 4.3.
URS concludes that the transformers, O&M Building and PV panel support structures, with loads as
stated in Section 1.0, may be founded on shallow spread footings supported on a pad of compacted fill to
help control differential settlements and potential heave due to potentially expansive clay. However, the
use of deep foundations for the PV panel support structures, covered in Section 4.3, may prove to be a
better choice from the standpoints of performance and cost. URS recommends that the base of the shallow
spread footings be embedded at least 18 inches below the overlying ground or slab-on-grade surface. The
ground under the spread footings should be prepared as recommended in this section and in Section 4.4.
NextLight may also consider founding the PV panel support foundations at grade, i.e., with no
embedment. Based on discussions with BV, URS understands that the PV panel supports are quite
flexible and tolerate significant movement, more than is actually reflected in the value in Section 1.0.
Several factors should be considered: most of the site is a plowed field; clays that may be expansive were
found near the surface in part of the site; erosion may undermine footings with no embedment; and the
depth and effects of frost penetration. These factors should be studied in more detail by more detailed
geotechnical investigations. With respect to the plowed field and expansion clay issues, careful study
should be made of the upper few feet of the site. Perhaps shallow test pits with in-place density tests are
the best means of doing this. NextLight may elect to treat erosion as a maintenance issue, to be dealt with
as it occurs. The depth of frost penetration may be relatively slight. The generalized map presented by
U.S. Navy Department of the Navy (1986, Figure 7) suggests it is on the order of 5 inches.
Preliminary Geotechnical Investigation, NextLight Lost Hills
T:\!12\NextLight Lost Hills\9000 Deliverables\9101 Rpt\Final\Rpt-LostHills.doc, 1/26/2010 4-2
Because some of the site soil is judged to be expansive, it may be necessary to mitigate this condition, at
least in some areas of the site. If this proves to be case during more detailed geotechnical investigations, it
may be necessary to overexcavate the ground under the foundations and floor slab area and place a pad of
compacted, relatively impervious, non-expansive fill material. For feasibility planning purposes, the pad
of non-expansive fill material should extend at least 3.0 feet below the base of the foundations and to a
lateral distance of at least 3.0 feet beyond the footing perimeter. For the O&M Building, the ground
should be overexcavated under the floor slab to the same elevation as the building footings. In addition,
the ground surface around the O&M Building perimeter should slope downward at least 5 percent away
from the structure for a distance of at least 5 feet and at least 2 percent for an additional 10 feet. Rainfall
falling on the roof should be collected by a gutter and downspout system and discharged at a safe distance
from the building to avoid extra infiltration near the building. No plants requiring irrigation should be
allowed within 20 feet of the O&M Building.
Assuming sand is used to construct the fill pad under the footings, the coefficient1 of vertical subgrade
reaction for a one-foot square plate, kv1, is estimated as 350 pounds per cubic inch (300 tons per cubic
foot) based on the estimated material characteristics. If a low-plasticity clay is used, to construct the fill
pad under the footings, the coefficient of vertical subgrade reaction for a one-foot square plate, kv1, is
estimated as 175 pounds per cubic inch (150 tons per cubic foot) based on the estimated material
characteristics. These values assume that the material is not saturated; if the material were saturated the
coefficient of subgrade reaction would be less.
The coefficient of subgrade reaction for a one-foot square plate is as classically defined in Terzaghi
(1955) and Scott (1981). The kv1 values must be adjusted for size effects to account for the “range of
influence” of the loaded area or “effective diameter of the slab’s reaction area”, B, which, due to the load
distribution provided by the reinforced concrete mat, is larger than the actual loaded area (Terzaghi 1955),
but may be much smaller than the footing or mat. Additional project details, including the values of B
developed by the structural engineer and the results of additional site subsurface exploration, will be
needed to prepare more detailed recommendations for kv.
Sustained lateral forces, such as lateral earth pressures, and transient lateral forces, such as the horizontal
component of seismic forces, may be applied to structures and their foundations. Resistance to lateral
displacement due to such forces may result either from sliding resistance on the base of the foundation or
from passive resistance on the sides of the foundation. If sliding friction and passive resistance are
combined for the purposes of checking resistance to sliding, only one-half of the passive resistance
calculated according to the following paragraph should be considered.
For feasibility planning, the ultimate passive earth pressure acting on the sides of a footing in an area of
horizontal ground may be taken as 400 lbs/ft2 per foot of depth (equivalent fluid weighing 400 lbs/ft3).
This value applies provided the ground surface adjacent to the footing is essentially horizontal for a
distance of a least 2.5 times the vertical distance from the ground surface to the bottom of the footing. A
factor of safety of at least 2.0 should be applied to the ultimate passive earth pressure for the static case
and a factor of safety of at least 1.5 should be applied for cases that include transient loading (e.g.,
1 The coefficient of subgrade reaction is sometimes referred to as a “modulus”, but does not have the units of amodulus, that is, its unit are force per distance cubed, rather than force per distance squared.
Preliminary Geotechnical Investigation, NextLight Lost Hills
T:\!12\NextLight Lost Hills\9000 Deliverables\9101 Rpt\Final\Rpt-LostHills.doc, 1/26/2010 4-3
seismic and wind gusts, but not sustained wind load). For ground that is not covered with concrete or
asphalt flatwork, the upper 12 inches of ground should be considered non-existent for the purposes of
selecting the ground surface for use in the passive pressure calculation. On the opposite side of the
footing, the active pressure, which reduces the effective passive resistance, should be taken as 40 lbs/ft2
per foot of depth (equivalent fluid weighing 40 lbs/ft3).
For spread footings cast directly on the subgrade, an ultimate coefficient of friction of 0.35 may be used.
A factor of safety of at least 1.5 should be applied to the ultimate frictional resistance for the static case
and a factor of safety of at least 1.3 should be applied for cases that include transient loading (seismic and
wind gusts, but not sustained wind load).
4.3 DEEP FOUNDATION FOR PV SUPPORT STRUCTURE
As an alternative to shallow spread footings, BV indicated that the PV support structures may also be
supported on W6x9 steel I-beams driven into the ground, and the RFP indicates that steel posts and
concrete piers can also be used. URS concludes that the PV panel support structures, with loads as stated
in Section 1.0, may be founded on deep foundations. Considering the presence of potentially expansive
clay at the site, the use of deep foundations for the PV panel support structures may be a better choice
from the standpoints of performance and cost than shallow footings, which were discussed in Section 4.2.
Either type of deep foundation, cast-in-drilled-hole (CIDH) piles (i.e., concrete piers) or driven steel
sections (an H-pile or pipe), should be workable from a geotechnical standpoint. If lateral loading is
predominantly unidirectional (as it may be if wind loading far exceeds seismic loading), then a section
with a greater structural resistance in one direction relative to the orthogonal direction may be
advantageous.
URS does not anticipate that any unusual difficulty will be encountered during pile construction by a
competent specialist contractor. URS does not anticipate that groundwater will be encountered by the
excavations for CIDH piles. Where sand is penetrated during excavation of CIDH piles, some moderate
caving may occur, but excessive caving is not anticipated based on the performance of the three borings
advanced for this investigation.
4.4 EARTHWORK
URS understands that the Project will consist of excavation for the foundations for the O&M Building,
transformers, and, if spread footings are used, PV panel support structures. Trenches for buried electrical
cables are also planned. No site grading has been identified at this feasibility stage of the project.
4.4.1 General Grading Requirements
In case of any conflict between this report and the project specifications for earthwork, the Geotechnical
Engineer-of-Record should be consulted to verify which provision should prevail.

Preliminary Geotechnical Investigation, NextLight Lost Hills
T:\!12\NextLight Lost Hills\9000 Deliverables\9101 Rpt\Final\Rpt-LostHills.doc, 1/26/2010 4-4
Earthwork will consist primarily of excavation for footings, removal of any unsuitable soil identified by
the Geotechnical Engineer-of-Record and replacement with compacted fill, subgrade preparation, placing
and compacting fill, and electrical trench excavation and backfill.
4.4.2 Demolition
URS is unaware of any required demolition. However, if any demolition is identified, URS recommends
that it observe and document demolition operations of below-grade items in the vicinity of project
facilities. Documentation should include the limits and extent of demolition and cavities created by such
operations. Soil that is loosened or disturbed by demolition must also be removed. No facilities should be
constructed in areas where removals and/or fill placement have not been documented.
Pipes that are abandoned should be removed or backfilled with concrete. If a pipe is not entirely removed,
the end(s) of the remaining pipe should be permanently blocked so that soil or other material cannot enter
the pipe that is left in place.
4.4.3 Site Preparation and Removals
Prior to earthwork, the areas to be cut, to receive fill, or to receive stockpile materials should be cleared
and stripped of all debris, deleterious materials, organics and vegetation, and remnants resulting from site
demolition. At the time of the field investigation in December 2009, there appeared to be little vegetation
that would require removal. Cleared and grubbed material, as well as all rubble waste that may be
encountered or created, should be disposed of onsite in an area with no facilities or offsite.
URS should observe the exposed excavated surface to confirm that satisfactory subgrade soil, appropriate
for the allowable bearing pressure and other geotechnical parameters recommended, has been
encountered. If loose, soft, or otherwise unsuitable materials or undocumented fill are encountered at
planned subgrade level, overexcavation or other mitigative measures may be required. The Contractor
should obtain URS’ approval of the planned subgrade or bottom of overexcavation before placing any fill
or foundation rebar on the bottom.
Prior to placement of fill, the bottoms of excavations should be scarified to a depth of at least 6 inches,
moisture conditioned to be at or slightly above the optimum water content, and compacted to at least 95
percent relative compaction if the subgrade is coarse-grained and 90 percent if it is fine-grained. The
terms “coarse-grained” and “fine-grained” soils are as defined by ASTM D 2487, "Standard
Classification of Soils for Engineering Purposes (Unified Soil Classification System)". URS recommends
compacting wet of the optimum water content obtained by ASTM D 1557 (and closer to the optimum
water content given by ASTM D 698) to help reduce the formation of a flocculated soil structure that is
brittle and more susceptible to settlement with the addition of moisture over time. Relative compaction is
a measure of the degree of soil compaction and is defined as the ratio of the in situ dry density divided by
the material's maximum dry density as measured by a reference test procedure. The reference test
procedure for this project is ASTM D1557, “Standard Test Methods for Laboratory Compaction
Characteristics of Soil Using Modified Effort (56,000 ft-lbf/ft3 (2,700 kN-m/m3))”.
Preliminary Geotechnical Investigation, NextLight Lost Hills
T:\!12\NextLight Lost Hills\9000 Deliverables\9101 Rpt\Final\Rpt-LostHills.doc, 1/26/2010 4-5
4.4.4 Site Dewatering and Control of Water
To provide dry working conditions and to protect excavations from erosion, debris, and local sloughing,
surface drainage should be controlled near open trenches and should be directed away from them. Trench
operations should not interfere materially with the surface or subsurface flow without adequate provisions
to correct for the interference. If any excavation floods, the contractor should remove wet soils to the
depth indicated by URS.
Based on the site subsurface explorations, it is unlikely that groundwater will be encountered during
construction. However, localized perched water conditions may exist within the subsurface, especially
given the presence of clay layers at shallow depth that could trap infiltration or cause it to move laterally.
Adequate measures should be in place in order to insure proper drainage of excavations in the event that
perched water is encountered.
4.4.5 Fill Materials
URS anticipates that the materials that will be excavated are mainly lean and fat clays (CL and CH per
ASTM D 2487) and silty and clayey sand (SM and SC). While the sands should be suitable for reuse in
fills that will be overlain by project facilities, the reuse of the clays should be avoided due to their
potential to change volume (swell or contract) in response to changes in water content. In addition, when
the clay is excavated, it will likely be below the optimum water content and in the form of large coherent
clods. In these circumstances, the earthwork contractor will have difficulty modifying the water content of
the material to obtain the correct water content to allow compaction to be achieved.
Engineered Fill material for use in the pad of fill placed beneath the shallow foundations or the O&M
building slab-on-grade should consist of sand excavated from the project site or imported from offsite
sources that is suitable for use in constructing engineered fill. Suitability should be determined by the
Geotechnical Engineer-of-Record. Materials for use as Engineered Fill should not contain rocks or hard
lumps greater than 6 inches in maximum dimension and should have at least 80 percent passing the 9.5
mm (3/8 inch) sieve and at least 5 percent passing the 0.075 mm (No. 200) sieve. Engineered Fill
materials should be free of organics, debris, or other deleterious materials. Particles greater than ¾ inch in
size (gravel and cobbles) should be placed so that they are completely surrounded by the compacted fill
matrix. The Contractor must not nest rocks, nor should it use perishable, spongy, hazardous, or other
improper materials in filling. Provided that surface vegetation, topsoil and other deleterious materials are
removed, it is URS’ opinion that the on-site sands are suitable for use as Engineered Fill.
Any imported materials should have water-soluble sulfate and chloride contents that are less than 1000
parts per million and 500 parts per million, respectively, pH greater than 7.0, minimum electrical
resistivity greater than 6,000 ohms-centimeter and Expansion Index less than 20.
Most of the site soil encountered in the borings would be suitable for fill material that is placed against
the sides of the transformer pads and PV panel support structure footings.
Preliminary Geotechnical Investigation, NextLight Lost Hills
T:\!12\NextLight Lost Hills\9000 Deliverables\9101 Rpt\Final\Rpt-LostHills.doc, 1/26/2010 4-6
4.4.6 Trenches
Trenches will be required for electric cabling; the trenches will have a width of approximately 3 to 4 feet
and a depth relative to finished grade of up to 4 feet. DC cabling will be mostly direct burial (underground
feeder (UF)) cable. AC medium voltage will include some direct burial cable and some routed in conduit.
URS recommends that direct burial cable and conduit have a minimum cover of 24 inches from the
finished grade to provide adequate structural cover.
Trenches for conduits and direct burial cables may be excavated manually or with mechanical trenching
equipment. Walls of trenches should be essentially vertical. Two types of material are used for trench
backfill: Initial Backfill Material and Common Backfill Material.
Initial backfill should consist of satisfactory materials free from rocks 25 millimeters (1 inch) or larger in
any dimension or free from rocks of such size as recommended by the manufacturer, whichever is
smaller.
Common Trench Backfill Material may consist of site soil or import material approved by URS that is
free of organic matter, clay balls, and debris. Common Trench Backfill material should have no cobbles,
stones, or soil lumps (chunks) greater than 100 mm (4 inches) in any dimension, and no less than 75
percent by weight passing the 25 mm (l inch) sieve. Where particles larger than 1 inch in any dimension is
included in the material, these particles should be completely surrounded by finer soil; no nesting of
particles should be allowed.
Most site soils encountered at shallow depth in the three borings should be usable as Common Trench
Backfill Material. However, as discussed above, URS anticipates that the contractor will have difficulty in
bringing the clays to uniform, proper water content.
Initial Backfill Material should be placed and compacted with approved tampers from the bottom of the
trench to an elevation at least one foot above the cable or conduit. The backfill should be brought up
evenly on both sides of the cable or conduit for its full length.
The remainder of the trench (above the Initial Backfill Material) should be filled with satisfactory
Common Trench Backfill Material.
4.4.7 Fill Placement and Compaction
All fill materials, except trench backfill, should be placed in lifts not exceeding 6 to 8 inches in thickness,
measured after spreading and before compaction. The fill material should be at water contents above the
optimum water content prior to being placed on the subgrade or fill surface for compaction. Coarse-
grained soils (generally sands) as defined by ASTM D 2487 should be compacted to at least 95 percent
relative compaction and fine-grained soils to at least 90 percent relative compaction. URS recommends
compacting wet of the optimum water content obtained by ASTM D 1557 (and closer to the optimum
water content given by ASTM D 698) to help reduce the formation of a flocculated soil structure that is
brittle and more susceptible to settlement with the addition of moisture over time. Appropriate lightweight
compaction equipment should be used above and adjacent to pipes, walls or footings, if any, so as not to
Preliminary Geotechnical Investigation, NextLight Lost Hills
T:\!12\NextLight Lost Hills\9000 Deliverables\9101 Rpt\Final\Rpt-LostHills.doc, 1/26/2010 4-7
overstress or displace them. Where lightweight equipment is used, the lift thickness should not exceed 4
inches, measured after spreading and before compaction.
Trench backfill material should be placed in lifts not exceeding 10 inches in thickness, measured after
spreading and before compaction. The fill material should be at water contents above the optimum water
content prior to being placed on the trench bottom or fill surface for compaction. If a trench passes under
or within the zone of influence of a structure or foundation the trench backfill should be compacted to a
relative compaction of at least 95 percent if the backfill material is coarse grained (generally sands) as
defined by ASTM D 2487; fine-grained backfill should be compacted to a relative compaction of at least
90 percent. In locations where the trench backfill cannot affect any facility, the compaction requirement
can be reduced: coarse-grained soils should be compacted to at least 90 percent relative compaction and
fine-grained soils to at least 85 percent relative compaction.
Water flooding or jetting methods of compaction should not be permitted.
The field density of fill should be determined in accordance with the Sand Cone Method (ASTM D 1556,
"Standard Test Method for Density and Unit Weight of Soil in Place by the Sand-Cone Method") or the
Nuclear Method (ASTM D 6938, "Standard Test Methods for In-Place Density and Water Content of Soil
and Soil-Aggregate by Nuclear Methods (Shallow Depth)").
4.5 TEMPORARY EXCAVATIONS
URS anticipates that the materials exposed in site excavations could consist of sandy or clayey alluvial
soils. All temporary excavations should conform to Cal-OSHA guidelines. Based on the results of the
field investigations, the alluvial soils may be classified as Types A, B or C (depending on location) for the
purpose of OSHA classification of earth materials exposed in temporary excavations (Appendix A of
subpart P of 29 CFR part 1926). With restrictions, Type A, B and C soils generally correspond to
allowable temporary slope inclinations of 0.75:1, 1.0:1 and 1.5:1 (horizontal to vertical), respectively. For
shallow (less than 5 feet) foundation excavations constructed near vertical, the granular alluvial soils may
also have low cohesion and the potential to cave and slough. This general recommendation is based
largely on observations made of conditions exposed at the ground surface and in nearby road cuts and
should be reviewed frequently as the excavations progress. An Excavation Competent Person, as defined
by California-OSHA, should review all excavations and have responsibility for excavation safety during
construction.
The maximum anticipated depth of trench excavations for electrical conduits is four feet. These trench
excavations should be made with nearly vertical sides. Sheeting and shoring should be used whenever
required by safety considerations, as discussed in the previous paragraph. Cal/OSHA regulations do not
require that trenches that are less than five feet deep be shored, but deeper trenches should be sheeted and
shored in all cases.
Steep slopes are particularly susceptible to shallow slope sloughing in periods of heavy rainfall or upslope
surface runoff. This is particularly true for fill slopes constructed of soil, as well as slopes in the
alluvium/colluvium. It may be necessary to protect the slope face during periods of heavy rainfall by
diverting surface runoff away from the temporary slope or other measures. It may also be necessary to
Preliminary Geotechnical Investigation, NextLight Lost Hills
T:\!12\NextLight Lost Hills\9000 Deliverables\9101 Rpt\Final\Rpt-LostHills.doc, 1/26/2010 4-8
treat the slopes with some type of protective material to keep them from drying out depending on the
length of time that the temporary slope will be exposed and whether it would be possible to remove the
desiccated material prior to refilling the excavation.
4.6 ANTICIPATED EXCAVATION CONDITIONS
URS anticipates that the materials that will be excavated are mainly very stiff lean and fat clays (CL and
CH per ASTM D 2487) and medium dense silty and clayey sand (SM and SC). The soils generally
reacted strongly when exposed to dilute hydrochloric acid, indicating the presence of carbonate
cementation. Some hardpan was encountered in boring BV-1 at about 22 feet below ground surface. URS
anticipates that the excavations for footings and trenches can be made with such conventional excavation
methods as the bucket of large backhoes or excavators or bulldozers with rippers. Scrapers with push
dozers might also prove workable for extensive areas of excavation.
4.7 RECOMMENDATIONS FOR FUTURE GEOTECHNICAL INVESTIGATION
It is our understanding that NextLight will be considering the feasibility of developing the Lost Hills site
for a solar power plant, using the information in this report as well as information developed by others.
Assuming NextLight decided to develop the project, additional geotechnical studies would be appropriate,
as discussed below.
Additional exploration of the site would be required to obtain more detailed information concerning
subsurface conditions and to obtain samples for laboratory testing of classification properties, engineering
properties and corrosion potential vis-à-vis concrete and steel. For the PV panel supports, URS
recommends a maximum spacing of 200 feet between subsurface explorations.
A mixture of exploration methods would seem to be well-suited to the size of the site. These could
include backhoe pits, hollow-stem auger borings with SPT and thin-wall tube sampling, and Cone
Penetration Test soundings (CPTs). Opening a pit with a backhoe allows the geologist to get a detailed
view of the subsurface that cannot be achieved with borings or CPTs. They also facilitate the taking of
bulk samples and allow performance of in-place density tests, which are much more reliable than
laboratory density tests. CPTs effectively provide a continuous profile of the subsurface but do not yield a
sample of the material; rather the type of material and its engineering properties are estimated using the
parameters measured during the test.
If the project will be designed for seismic, then the properties (preferably the shear-wave velocity) of the
material in the upper 100 feet should be determined. In addition, depth to groundwater should be
measured; if groundwater is deep (deeper than at least 50 feet), then liquefaction can be excluded on the
basis that the soil is unsaturated and thus is not subject to classical earthquake-induced liquefaction.
In the laboratory, some testing should be performed to evaluation key engineering properties as well as
corrosion potential vis-à-vis concrete and steel.
Preliminary Geotechnical Investigation, NextLight Lost Hills
T:\!12\NextLight Lost Hills\9000 Deliverables\9101 Rpt\Final\Rpt-LostHills.doc, 1/26/2010 5-1
5.0 L IM ITAT I ONS
URS has prepared this report for the exclusive use of NextLight and BV for feasibility evaluation of the
site for the proposed solar plant and preliminary planning. No other use is anticipated or authorized by
URS. The report may be used only by the client for the project and purposes described herein, within a
reasonable time period during, which the onsite and offsite conditions affecting the project should not
change due to the actions of man or nature. This report is not suitable for final design or construction
purposes.
This report presents recommendations for feasibility evaluation/preliminary planning of the proposed
solar plant. The findings and recommendations presented in this report are based upon soil conditions
inferred from URS’ limited site explorations, interpolation of the soil conditions between exploration
locations, and extrapolation of these conditions throughout the proposed site area. The extent of
investigation as well as specific exploration locations were dictated by the RFP. The findings and
recommendations are further based on the assumption that the subsurface conditions do not deviate
appreciably from those reported and those assumed. In view of the general geology of the area, the
potential for encountering conditions different from those assumed cannot be discounted. If different
conditions are encountered, they must be brought to URS’ attention in a timely manner so that the need
for revised recommendations can be evaluated. In the event that changes in design loads or structural
characteristics described in this report or in documents provided to us are made, URS should review its
design recommendations and their applicability to the revised design plans. In this way, any required
supplemental recommendations can be made in a timely manner.
Professional judgments presented in this report are based on URS’ evaluations of the technical
information gathered, its understanding of the proposed construction, and its general experience in the
geotechnical field. URS’ services have been performed according to generally accepted geotechnical
engineering practices followed in the project area at the time the services were provided. No warranty is
expressed or implied. The report is issued with the understanding that the owner and client choose the risk
they decide to incur by the expenditures involved in the engineering and construction.
Preliminary Geotechnical Investigation, NextLight Lost Hills
T:\!12\NextLight Lost Hills\9000 Deliverables\9101 Rpt\Final\Rpt-LostHills.doc, 1/26/2010 6-1
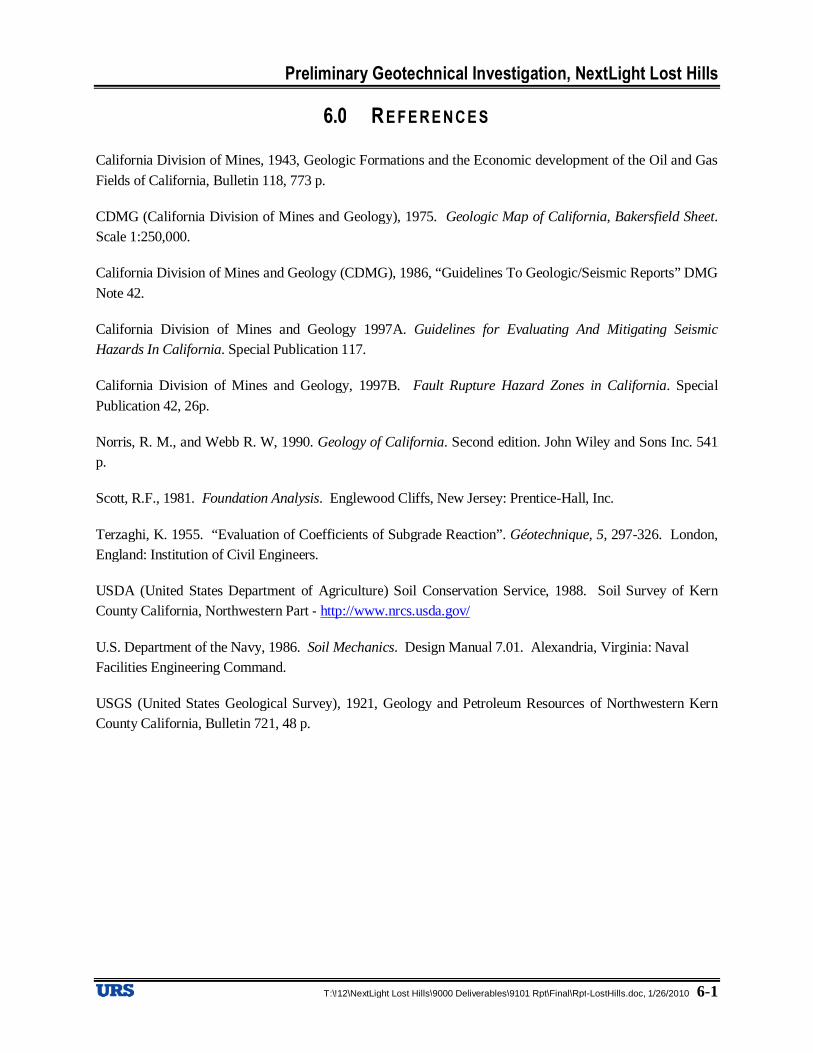
6.0 RE FE RE NCE S
California Division of Mines, 1943, Geologic Formations and the Economic development of the Oil and Gas
Fields of California, Bulletin 118, 773 p.
CDMG (California Division of Mines and Geology), 1975. Geologic Map of California, Bakersfield Sheet.
Scale 1:250,000.
California Division of Mines and Geology (CDMG), 1986, “Guidelines To Geologic/Seismic Reports” DMG
Note 42.
California Division of Mines and Geology 1997A. Guidelines for Evaluating And Mitigating Seismic
Hazards In California. Special Publication 117.
California Division of Mines and Geology, 1997B. Fault Rupture Hazard Zones in California. Special
Publication 42, 26p.
Norris, R. M., and Webb R. W, 1990. Geology of California. Second edition. John Wiley and Sons Inc. 541
p.
Scott, R.F., 1981. Foundation Analysis. Englewood Cliffs, New Jersey: Prentice-Hall, Inc.
Terzaghi, K. 1955. “Evaluation of Coefficients of Subgrade Reaction”. Géotechnique, 5, 297-326. London,
England: Institution of Civil Engineers.
USDA (United States Department of Agriculture) Soil Conservation Service, 1988. Soil Survey of Kern
County California, Northwestern Part - http://www.nrcs.usda.gov/
U.S. Department of the Navy, 1986. Soil Mechanics. Design Manual 7.01. Alexandria, Virginia: Naval
Facilities Engineering Command.
USGS (United States Geological Survey), 1921, Geology and Petroleum Resources of Northwestern Kern
County California, Bulletin 721, 48 p.
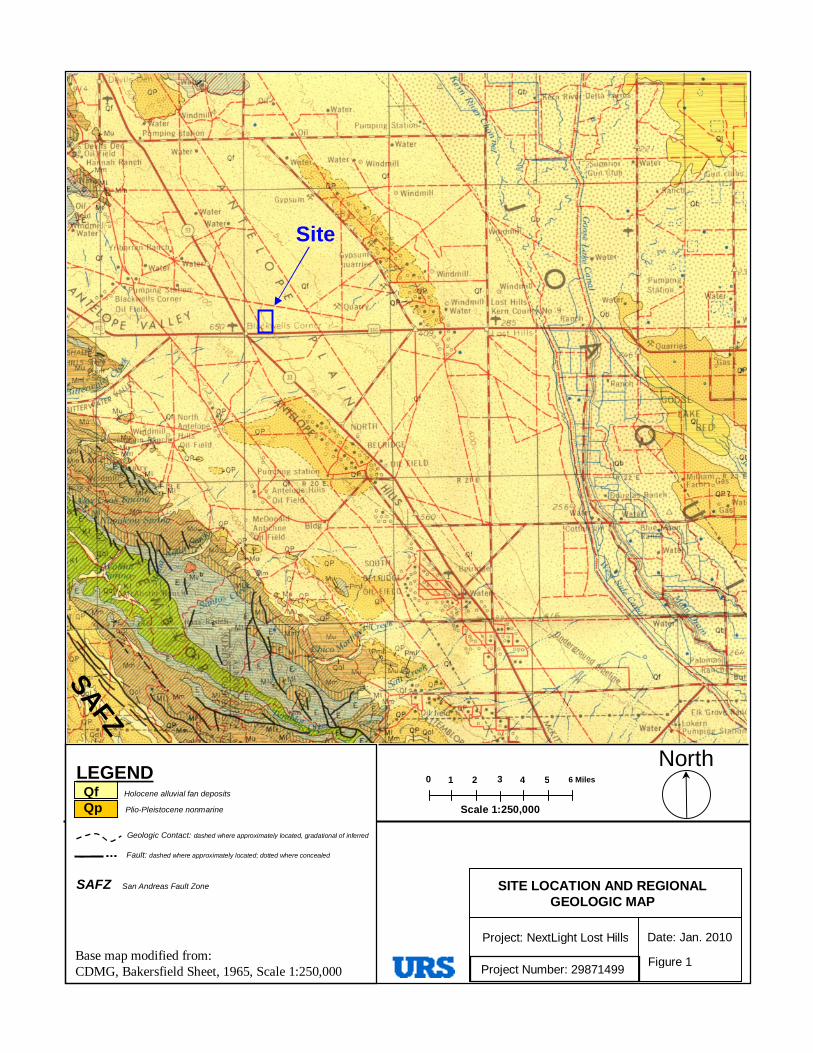
SITE LOCATION AND REGIONALGEOLOGIC MAP
Project: NextLight Lost Hills
Project Number: 29871499
Date: Jan. 2010
Figure 1
LEGENDQf Holocene alluvial fan deposits
Qp Plio-Pleistocene nonmarine
Geologic Contact: dashed where approximately located, gradational of inferred
Fault: dashed where approximately located; dotted where concealed
SAFZ San Andreas Fault Zone
Base map modified from:CDMG, Bakersfield Sheet, 1965, Scale 1:250,000
Site
SA
FZ
North
Scale 1:250,000
0 1 2 3 4 5 6 Miles
BV-3
BV-2
BV-1
Site Plan and Approximate Boring Locations
LegendBoring and Adjacent Resistivity TraversesSoil Boring Location
URS Corporation
January 2010Figure: 2
Proj No: 29871499Project: NextLight Lost Hills
500 0250 Feet
File Path: S:\Anthony\Praveen\mxd\Fresno.mxd, Date: January 5, 2010 3:17:54 PM

Appendix A
Borings
T:\!12\NextLight Lost Hills\9000 Deliverables\9101 Rpt\Final\Rpt-LostHills.doc/ 1/26/2010 A-1
Appendix A
Borings
IntroductionOn December 18, 2009, URS and Technicon Engineering Services, Inc. (Technicon), of Fresno,
California, advanced three test borings at the site. The boring locations, depths, sample types and sample
intervals were defined by the owner’s engineer. The field work was observed by a URS geotechnical
engineer.
Boring MethodologyTechnicon provided a Central Mine Equipment Company (CME) 55 drilling rig equipped with 3-3/4 inch
inside diameter hollow-stem augers and operators to perform the drilling and sampling operations. Each
of the three borings was advanced to a total depth of 26.5 feet.
Figure 2 shows the approximate locations of the borings, designated BV-1, -2 and -3. The latitudes and
longitudes of the boring locations are measured by GPS and are indicated on the respective borings logs.
The logs also record the ground elevation at the borings indicted by the GPS unit; however, GPS
elevations are typically less accurate than horizontal locations.
The borings were advanced following ASTM D 1452, “Standard Practice for Soil Exploration and
Sampling by Auger Borings”.
Soil samples and blow count data were obtained for each boring. The samples were taken with Standard
Penetration Test (SPT) 2-inch split barrel samplers following ASTM D 1586, "Standard Test Method for
Penetration Test and Split-Barrel Sampling of Soils". One sample was taken with a thin-wall tube
following ASTM D 1587, “Standard Practice for Thin-Walled Tube Sampling of Soils for Geotechnical
Purposes”.
The SPTs consisted of driving a standard thick-wall sampling barrel into the soil at the bottom of the
boring a total length of 18 inches or to refusal, whichever occurs first, with a 140 pound out-of-hole
automatic hammer falling 30 inches. According to information provided by Technicon Engineering
Services, Inc., the hammer efficiency is approximately 88 percent. A summary of hammer efficiency
measurements made on April 20, 2009, for another project is in Table A-1 following this text.
The SPT sampler has a nominal outside diameter of 2 inches; the sampling shoe (entrance) has a nominal
inside diameter of 1-3/8 inches; and the sampling barrel has a nominal inside diameter of 1-1/2 inches.
Liners were not used, as is common California practice.
The number of blows required to drive the SPT sampler was recorded for every 6 inches of penetration.
The first 6 inch increment of penetration is considered to be a "seating interval" in highly disturbed soils
at the base of the borehole; and therefore, the corresponding blow count is not normally taken into
consideration. The total number of blows for the last 12 inch penetration, commonly referred to as the “N
value”, has been used to reflect the penetration resistance. The degree of relative density of granular soils
T:\!12\NextLight Lost Hills\9000 Deliverables\9101 Rpt\Final\Rpt-LostHills.doc/ 1/26/2010 A-2
and the degree of consistency of cohesive soils are generally described on the boring logs according to the
following conventional correlation:
Granular Soils Cohesive Soils
SPT Blow Count, N Description SPT Blow Count, N Description
< 4 Very Loose < 2 Very Soft
4 - 10 Loose 2 - 4 Soft
10 - 30 Medium Dense 4 - 8 Medium Stiff
30 - 50 Dense 8 - 15 Stiff
> 50 Very Dense 15 - 30 Very Stiff
> 30 Hard
The relative density and consistency descriptions given on the logs may deviate from the correlation for a
number of reasons, including reliance on other test results, the engineer's judgment based on manual
manipulation of the sample, and simplification of the logs to increase readability. It is widely accepted
that SPT blow count correlations, including those above, are overly simplistic and the blow counts should
be adjusted for other factors, which may include, depending on the application, the effective vertical
pressure at the sample depth and the details of the sampling system (such as hammer efficiency, rods,
sampler details, and techniques used). The relative density and consistency descriptions on the logs are
based on the unadjusted SPT blow count recorded in the field and reported on the logs.
The boring logs were initiated in the field by the URS field engineer who recorded soil characteristics,
observations, sample locations, and other drilling information. The earth materials encountered were
visually classified in general accordance with the Unified Soil Classification System (ASTM D 2488,
“Standard Practice for Description and Identification of Soils (Visual-Manual Procedure)”). The final
boring logs were prepared on the basis of visual observation of the samples and results of the laboratory
tests.
As permitted by Kern County regulations, the boreholes were backfilled with the boring cuttings
following completion. Any excess cuttings were spread around the borehole location in a manner to avoid
damaging the area or leaving it in an unsightly condition. URS’ engineer transported the samples to URS’
geotechnical laboratory for review and testing.
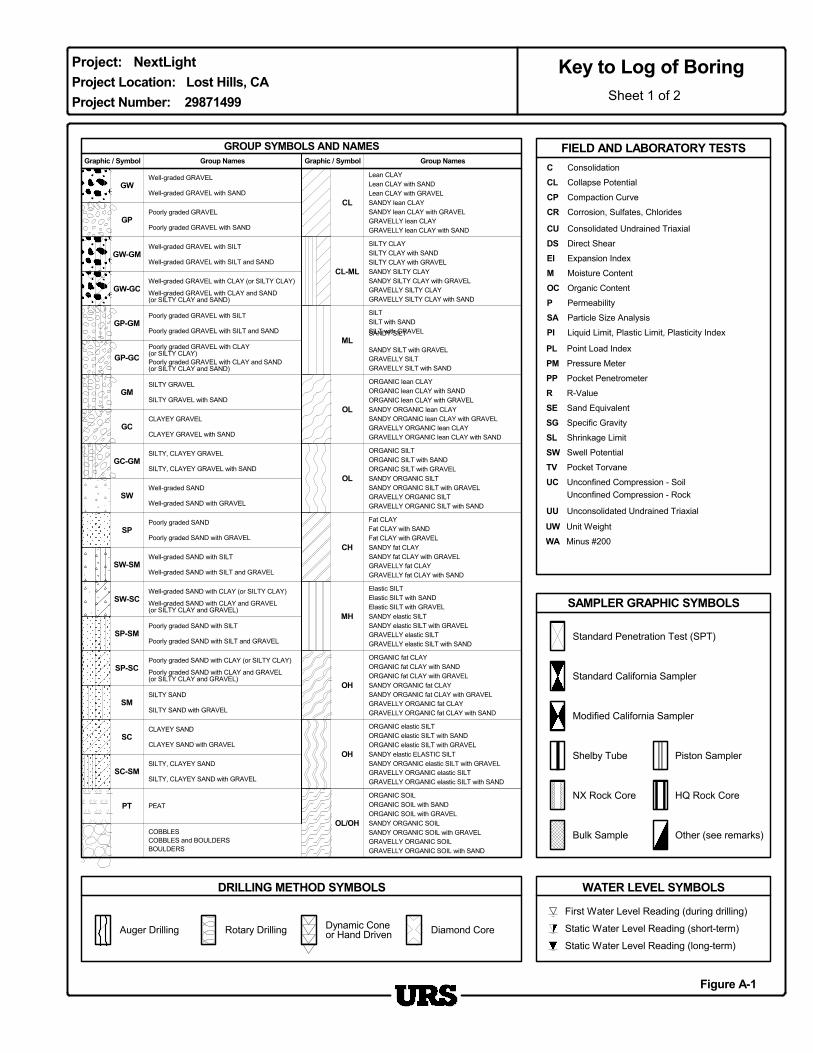
ResultsThe key to the logs of boring is presented after this text and Table A-1, and the logs of the borings are
presented in alphanumerical order following the key. Groundwater was not encountered in the borings.
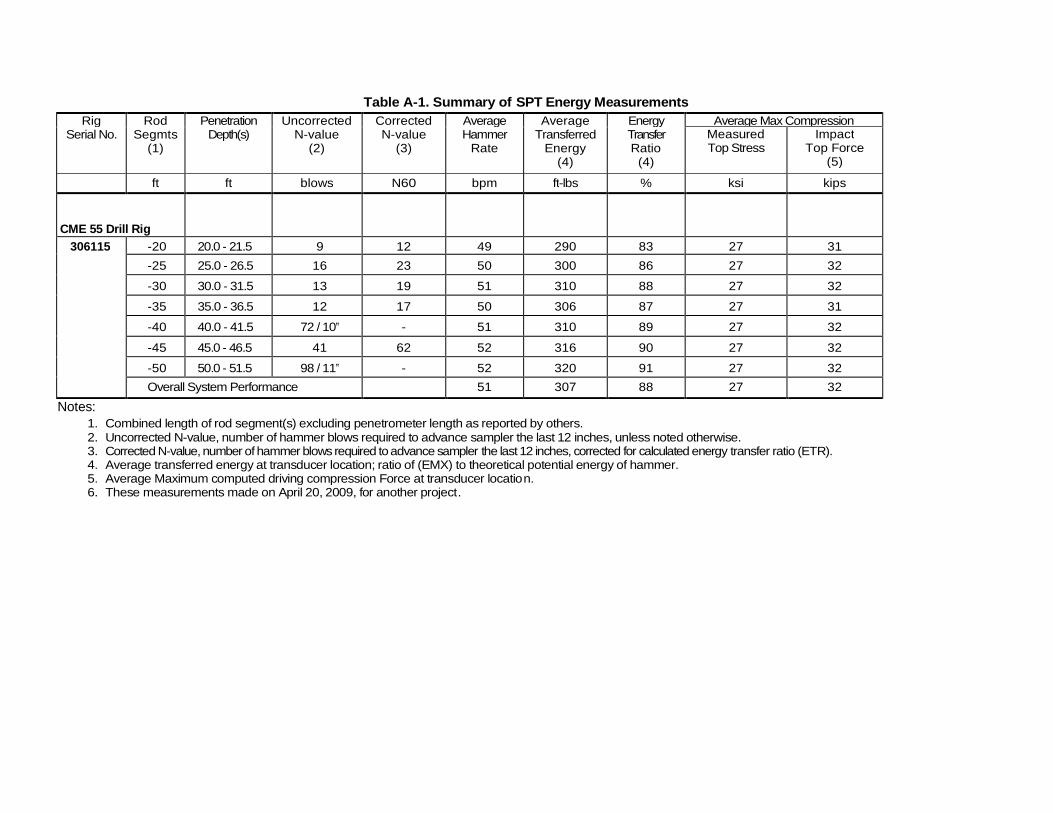
Table A-1. Summary of SPT Energy Measurements
Average Max CompressionRigSerial No.
RodSegmts
(1)
PenetrationDepth(s)
UncorrectedN-value
(2)
CorrectedN-value
(3)
AverageHammer
Rate
AverageTransferred
Energy(4)
EnergyTransferRatio
(4)
MeasuredTop Stress
ImpactTop Force
(5)
ft ft blows N60 bpm ft-lbs % ksi kips
CME 55 Drill Rig
306115 -20 20.0 - 21.5 9 12 49 290 83 27 31
-25 25.0 - 26.5 16 23 50 300 86 27 32
-30 30.0 - 31.5 13 19 51 310 88 27 32
-35 35.0 - 36.5 12 17 50 306 87 27 31
-40 40.0 - 41.5 72 / 10” - 51 310 89 27 32
-45 45.0 - 46.5 41 62 52 316 90 27 32
-50 50.0 - 51.5 98 / 11” - 52 320 91 27 32
Overall System Performance 51 307 88 27 32
Notes:1. Combined length of rod segment(s) excluding penetrometer length as reported by others.2. Uncorrected N-value, number of hammer blows required to advance sampler the last 12 inches, unless noted otherwise.3. Corrected N-value,number ofhammer blows required toadvance sampler the last12 inches, corrected for calculated energy transfer ratio (ETR).4. Average transferred energy at transducer location; ratio of (EMX) to theoretical potential energy of hammer.5. Average Maximum computed driving compression Force at transducer location.6. These measurements made on April 20, 2009, for another project.
ML
OH
Project Location: Lost Hills, CA
SM
SC
GW
GW-GM
CL
SILTY SAND
CL-ML
Other (see remarks)COBBLES and BOULDERSBOULDERS
PT
SILTY GRAVEL
CLAYEY GRAVEL
Project Number: 29871499
Static Water Level Reading (long-term)
Poorly graded GRAVEL with SAND
Poorly graded GRAVEL with SILT and SAND
Poorly graded GRAVEL with CLAY and SAND(or SILTY CLAY and SAND)
FIELD AND LABORATORY TESTS
WATER LEVEL SYMBOLS
Dynamic Coneor Hand DrivenRotary Drilling
Shelby Tube
NX Rock Core
Bulk Sample
Piston Sampler
HQ Rock Core
CLAYEY SAND
Diamond Core
GRAVELLY fat CLAY with SAND
ORGANIC fat CLAYORGANIC fat CLAY with SANDORGANIC fat CLAY with GRAVELSANDY ORGANIC fat CLAY
Elastic SILT with SAND
UU
SILTY, CLAYEY GRAVEL
SANDY fat CLAY
PPR
SL
Poorly graded SAND
Poorly graded SAND with GRAVEL
Poorly graded SAND with SILT and GRAVEL
SANDY lean CLAY
Unconsolidated Undrained Triaxial
UC
SILTY CLAYSILTY CLAY with SAND
Pressure MeterPMPocket Penetrometer
GRAVELLY fat CLAY
TV
SANDY fat CLAY with GRAVEL
Well-graded SAND with CLAY and GRAVEL(or SILTY CLAY and GRAVEL)
ORGANIC lean CLAY with SANDORGANIC lean CLAY with GRAVELSANDY ORGANIC lean CLAYSANDY ORGANIC lean CLAY with GRAVEL
Fat CLAY with SANDFat CLAY with GRAVEL
Well-graded SAND
ORGANIC elastic SILT with SAND
Well-graded GRAVEL with SILT
Well-graded GRAVEL with CLAY and SAND(or SILTY CLAY and SAND)
Well-graded SAND with CLAY (or SILTY CLAY)
Poorly graded GRAVEL
Poorly graded GRAVEL with CLAY(or SILTY CLAY)
Poorly graded SAND with SILT
Poorly graded SAND with CLAY (or SILTY CLAY)
Well-graded SAND with SILT and GRAVEL
Lean CLAY
COBBLES
SANDY ORGANIC elastic SILT with GRAVELGRAVELLY ORGANIC elastic SILTGRAVELLY ORGANIC elastic SILT with SAND
GW-GC
GP-GM
GP-GC
GM
Poorly graded SAND with CLAY and GRAVEL(or SILTY CLAY and GRAVEL)
SILTY, CLAYEY SAND with GRAVEL
Project: NextLight
Well-graded GRAVEL with SAND
Standard Penetration Test (SPT)
CLAYEY SAND with GRAVEL
SILTY SAND with GRAVEL
SILT with SAND
DRILLING METHOD SYMBOLS
SILTY CLAY with GRAVELSANDY SILTY CLAYSANDY SILTY CLAY with GRAVEL
GRAVELLY SILTY CLAY with SAND
SILT with GRAVELSANDY SILT
SANDY SILT with GRAVEL
PEAT
Well-graded GRAVEL with SILT and SAND
Well-graded GRAVEL with CLAY (or SILTY CLAY)
GRAVELLY ORGANIC fat CLAY
GRAVELLY SILTY CLAY
Well-graded SAND with GRAVEL
Sheet 1 of 2
Key to Log of Boring
GRAVELLY lean CLAY with SAND
GROUP SYMBOLS AND NAMES
GRAVELLY ORGANIC SOIL
OL/OH
ORGANIC SOILORGANIC SOIL with SANDORGANIC SOIL with GRAVEL
SANDY ORGANIC SOIL with GRAVEL
MH
GRAVELLY ORGANIC SOIL with SAND
WA
SANDY elastic ELASTIC SILT
SANDY ORGANIC SOIL
M
GRAVELLY lean CLAY
SAMPLER GRAPHIC SYMBOLS
OH
SA
Well-graded GRAVEL
Poorly graded GRAVEL with SILT
Group Names
EI
Standard California Sampler
SILTY GRAVEL with SAND
CLAYEY GRAVEL with SAND
Modified California Sampler
Well-graded SAND with SILT
Figure A-1
First Water Level Reading (during drilling)
SC-SM
Graphic / Symbol Graphic / Symbol Group Names
SILTY, CLAYEY SAND
GC
GP
GC-GM
SP-SC
SW
SP
SW-SM
SILTY, CLAYEY GRAVEL with SAND
Lean CLAY with SAND
GRAVELLY SILTGRAVELLY SILT with SAND
SILT
ORGANIC SILT with SANDORGANIC SILT with GRAVELSANDY ORGANIC SILT
Lean CLAY with GRAVEL
SANDY lean CLAY with GRAVEL
ORGANIC lean CLAY
GRAVELLY ORGANIC lean CLAYGRAVELLY ORGANIC lean CLAY with SAND
Fat CLAY
Elastic SILT with GRAVELSANDY elastic SILT
C
GRAVELLY ORGANIC fat CLAY with SAND
Elastic SILT
ORGANIC elastic SILT with GRAVEL
SW-SC
SP-SM
Liquid Limit, Plastic Limit, Plasticity Index
GRAVELLY elastic SILT with SAND
SANDY elastic SILT with GRAVEL
OL
OL
CH
Static Water Level Reading (short-term)
SANDY ORGANIC fat CLAY with GRAVEL
ORGANIC elastic SILT
SANDY ORGANIC SILT with GRAVELGRAVELLY ORGANIC SILTGRAVELLY ORGANIC SILT with SAND
ORGANIC SILT
PI
GRAVELLY elastic SILT
Pocket Torvane
CL
Auger Drilling
Consolidation
Collapse Potential
CP Compaction Curve
CR Corrosion, Sulfates, Chlorides
CU Consolidated Undrained Triaxial
DS Direct Shear
Expansion Index
Moisture Content
OC Organic Content
P Permeability
Particle Size Analysis
PL Point Load Index
R-Value
SE Sand Equivalent
SG Specific Gravity
Shrinkage Limit
SW Swell Potential
Unconfined Compression - SoilUnconfined Compression - Rock
UW Unit Weight
Minus #200
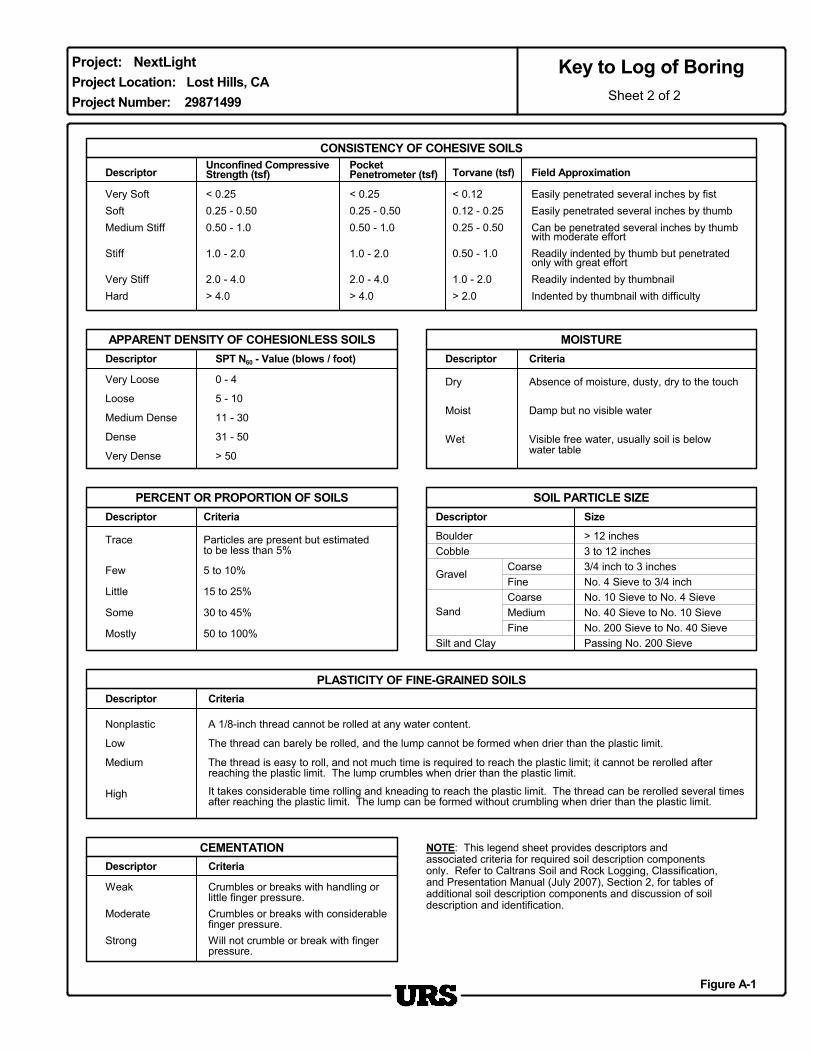
Crumbles or breaks with considerablefinger pressure.
< 0.25Very Soft
It takes considerable time rolling and kneading to reach the plastic limit. The thread can be rerolled several timesafter reaching the plastic limit. The lump can be formed without crumbling when drier than the plastic limit.
SOIL PARTICLE SIZE
Crumbles or breaks with handling orlittle finger pressure.
Will not crumble or break with fingerpressure.
1.0 - 2.0> 2.0
Weak
Moderate
CoarseNo. 4 Sieve to 3/4 inchFine
CoarseCobble
PLASTICITY OF FINE-GRAINED SOILS
Project Number: 29871499
Particles are present but estimatedto be less than 5%
0.25 - 0.50
Low
Very StiffHard
Medium Stiff 0.50 - 1.0 0.50 - 1.0 0.25 - 0.50
< 0.120.12 - 0.25
SPT N60 - Value (blows / foot)
0.25 - 0.50Soft
PocketPenetrometer (tsf)
2.0 - 4.0> 4.0
2.0 - 4.0> 4.0
< 0.25Easily penetrated several inches by thumb
PERCENT OR PROPORTION OF SOILS
Can be penetrated several inches by thumbwith moderate effort
Torvane (tsf)Unconfined CompressiveStrength (tsf) Field Approximation
Damp but no visible water
Dry
Project: NextLight
Readily indented by thumb but penetratedonly with great effort
3 to 12 inches
Loose
Very Loose
30 to 45%
Little 15 to 25%
Few 5 to 10% 3/4 inch to 3 inches
> 12 inches
Descriptor
Gravel
Trace
Criteria
Boulder
SandNo. 10 Sieve to No. 4 Sieve
Project Location: Lost Hills, CA
Absence of moisture, dusty, dry to the touch
Passing No. 200 Sieve50 to 100%Mostly
Descriptor Size
CONSISTENCY OF COHESIVE SOILS
Stiff 1.0 - 2.0
Silt and Clay
The thread can barely be rolled, and the lump cannot be formed when drier than the plastic limit.
Strong
NOTE: This legend sheet provides descriptors andassociated criteria for required soil description componentsonly. Refer to Caltrans Soil and Rock Logging, Classification,and Presentation Manual (July 2007), Section 2, for tables ofadditional soil description components and discussion of soildescription and identification.
Medium
CriteriaDescriptor
Some
The thread is easy to roll, and not much time is required to reach the plastic limit; it cannot be rerolled afterreaching the plastic limit. The lump crumbles when drier than the plastic limit.
No. 200 Sieve to No. 40 Sieve
A 1/8-inch thread cannot be rolled at any water content.
CriteriaDescriptor
Indented by thumbnail with difficultyReadily indented by thumbnail
Easily penetrated several inches by fist
High
Nonplastic
CEMENTATION
5 - 10
Medium Dense
Dense
Descriptor
Figure A-1
Key to Log of Boring
1.0 - 2.0
31 - 50
Sheet 2 of 2
> 50
FineMedium No. 40 Sieve to No. 10 Sieve
Descriptor
Visible free water, usually soil is belowwater table
Criteria
11 - 30
0 - 4
Wet
APPARENT DENSITY OF COHESIONLESS SOILS MOISTURE
Moist
Descriptor
0.50 - 1.0
Very Dense
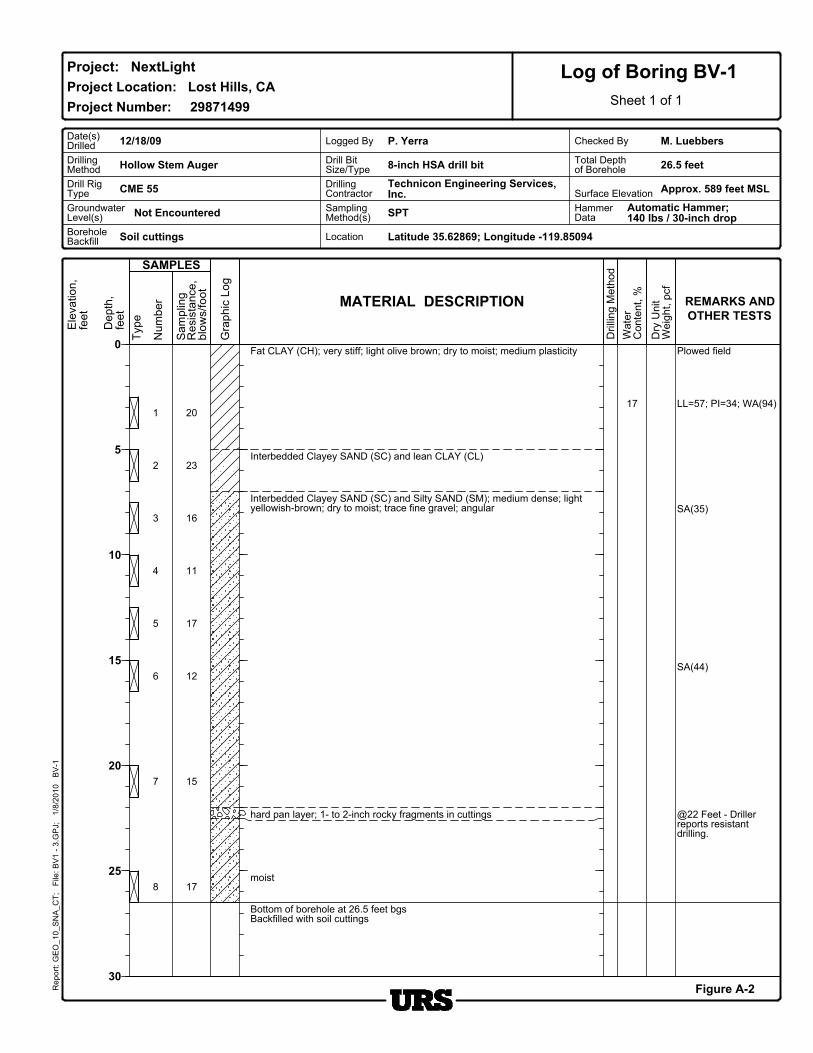
Drill BitSize/Type
BoreholeBackfill
M. Luebbers
@22 Feet - Drillerreports resistantdrilling.
SA(44)
SA(35)
LL=57; PI=34; WA(94)
Plowed field
Location
Technicon Engineering Services,Inc.
Checked By
Soil cuttings
17
Latitude 35.62869; Longitude -119.85094
26.5 feet
12/18/09
Automatic Hammer;140 lbs / 30-inch drop
GroundwaterLevel(s)
Hollow Stem AugerDrillingMethod
P. Yerra
Total Depthof Borehole
201
17
15
12
17
11
3
23
4
16
Bottom of borehole at 26.5 feet bgsBackfilled with soil cuttings
moist
hard pan layer; 1- to 2-inch rocky fragments in cuttings
Interbedded Clayey SAND (SC) and Silty SAND (SM); medium dense; lightyellowish-brown; dry to moist; trace fine gravel; angular
2
Fat CLAY (CH); very stiff; light olive brown; dry to moist; medium plasticity
8-inch HSA drill bit
8
7
6
5
Interbedded Clayey SAND (SC) and lean CLAY (CL)
0
5
10
15
20
25
30Figure A-2
Project: NextLight
Sheet 1 of 1
Report: GEO_10_SNA_CT; File: BV1 - 3.GPJ; 1/8/2010 BV-1
Project Number: 29871499
Log of Boring BV-1Project Location: Lost Hills, CA
HammerData
Type
Graphic Log
Approx. 589 feet MSL
Not Encountered
DrillingContractor Surface Elevation
SPT
REMARKS AND
OTHER TESTS
SamplingMethod(s)
Logged ByDate(s)Drilled
Drill RigType CME 55
Water
Content, %
Depth,
feet
Elevation,
feet
SAMPLES
Drilling M
ethod
Sampling
Resistance,
blows/foot
Number
Dry Unit
Weight, pcf
MATERIAL DESCRIPTION
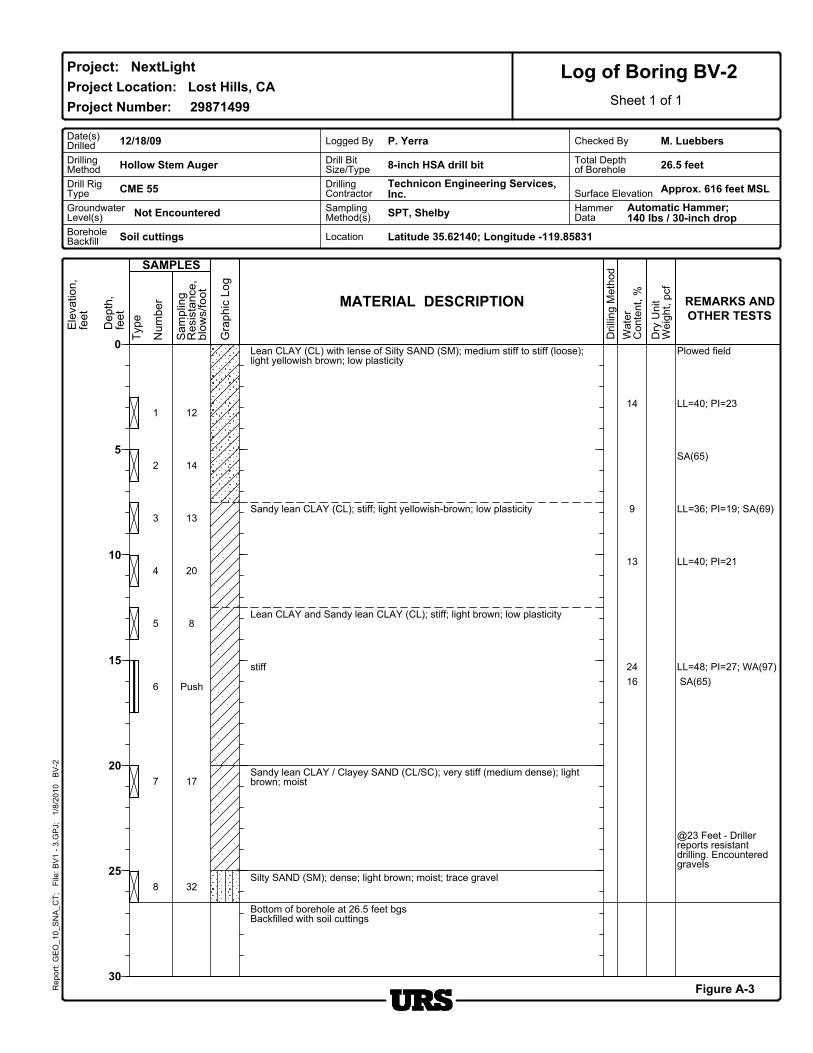
LL=36; PI=19; SA(69)
BoreholeBackfill
Technicon Engineering Services,Inc.
@23 Feet - Drillerreports resistantdrilling. Encounteredgravels
SA(65)
LL=40; PI=21
SA(65)
LL=40; PI=23
Plowed field
Latitude 35.62140; Longitude -119.85831
LL=48; PI=27; WA(97)
14
GroundwaterLevel(s)
Checked By
Hollow Stem AugerDrillingMethod
Drill BitSize/Type
Total Depthof Borehole
M. Luebbers
Automatic Hammer;140 lbs / 30-inch drop
P. Yerra
Push
8
20
13
14
12
32
1
16
24
13
9
Bottom of borehole at 26.5 feet bgsBackfilled with soil cuttings
Silty SAND (SM); dense; light brown; moist; trace gravel
Sandy lean CLAY / Clayey SAND (CL/SC); very stiff (medium dense); lightbrown; moist
stiff
Lean CLAY and Sandy lean CLAY (CL); stiff; light brown; low plasticity
Sandy lean CLAY (CL); stiff; light yellowish-brown; low plasticity
Lean CLAY (CL) with lense of Silty SAND (SM); medium stiff to stiff (loose);light yellowish brown; low plasticity
17
26.5 feet
8
7
6
5
4
3
2
Water
Content, %
0
5
10
15
20
25
30Figure A-3
Project: NextLight
Sheet 1 of 1
Log of Boring BV-2
12/18/09
Report: GEO_10_SNA_CT; File: BV1 - 3.GPJ; 1/8/2010 BV-2
Project Number: 29871499
Sampling
Resistance,
blows/foot
Project Location: Lost Hills, CA
Graphic Log
Approx. 616 feet MSL
Not Encountered
DrillingContractor Surface ElevationCME 55
SPT, ShelbyHammerData
SamplingMethod(s)
Logged ByDate(s)Drilled
Drill RigType
Location
8-inch HSA drill bit
Soil cuttings
Number
Elevation,
feet
SAMPLES
Drilling M
ethod
Type
Depth,
feet
Dry Unit
Weight, pcf
MATERIAL DESCRIPTION REMARKS AND
OTHER TESTS
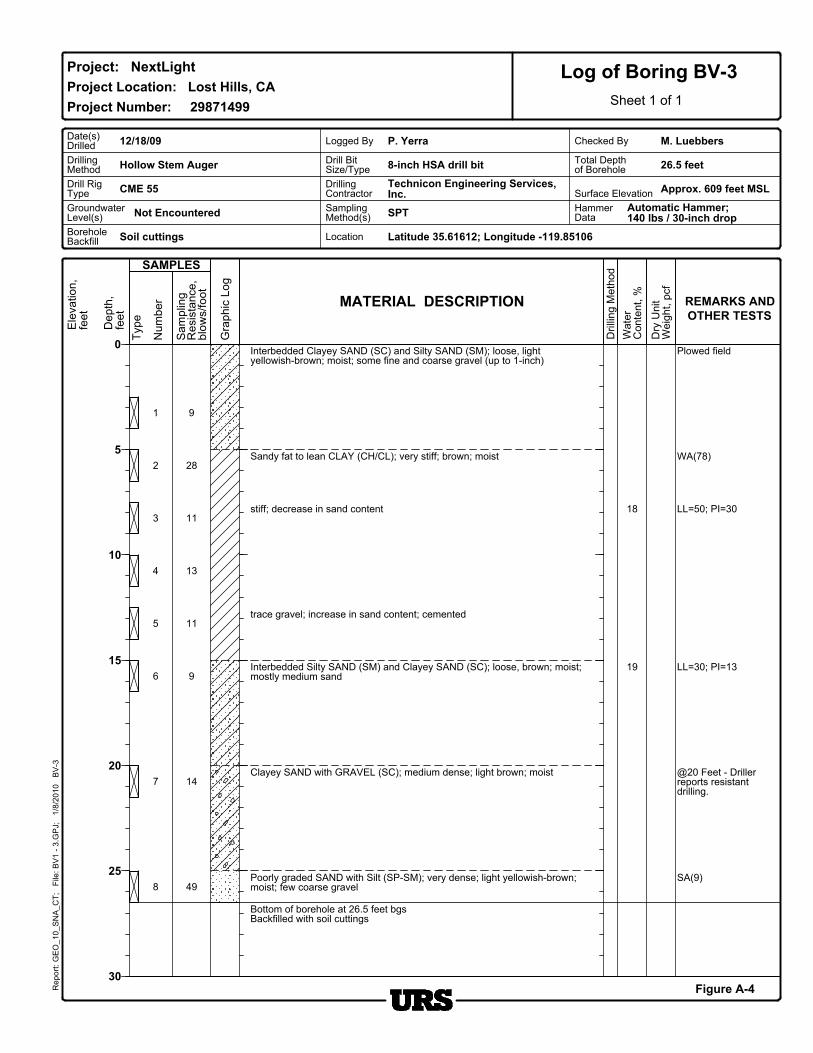
@20 Feet - Drillerreports resistantdrilling.
Drill BitSize/Type
BoreholeBackfill
Technicon Engineering Services,Inc.
SA(9)
Automatic Hammer;140 lbs / 30-inch drop
LL=30; PI=13
LL=50; PI=30
WA(78)
Plowed field
Soil cuttings
P. Yerra
Latitude 35.61612; Longitude -119.85106
18
12/18/09
GroundwaterLevel(s)
Checked By
DrillingMethod
Total Depthof Borehole
M. Luebbers
Hollow Stem Auger
1
49
14
9
11
13
11
9
4
19
28
Bottom of borehole at 26.5 feet bgsBackfilled with soil cuttings
Poorly graded SAND with Silt (SP-SM); very dense; light yellowish-brown;moist; few coarse gravel
Clayey SAND with GRAVEL (SC); medium dense; light brown; moist
Interbedded Silty SAND (SM) and Clayey SAND (SC); loose, brown; moist;mostly medium sand
trace gravel; increase in sand content; cemented
stiff; decrease in sand content
Sandy fat to lean CLAY (CH/CL); very stiff; brown; moist2
3
8
7
6
5
Interbedded Clayey SAND (SC) and Silty SAND (SM); loose, lightyellowish-brown; moist; some fine and coarse gravel (up to 1-inch)
0
5
10
15
20
25
30Figure A-4
Project: NextLight
Sheet 1 of 1
Sampling
Resistance,
blows/foot
26.5 feet8-inch HSA drill bit
Report: GEO_10_SNA_CT; File: BV1 - 3.GPJ; 1/8/2010 BV-3
Project Number: 29871499
Log of Boring BV-3Project Location: Lost Hills, CA
Type
Graphic Log
Approx. 609 feet MSL
Not Encountered
DrillingContractor Surface ElevationCME 55
SPTSamplingMethod(s)
Logged ByDate(s)Drilled
Drill RigType
Location
HammerData
Number
Depth,
feet
Elevation,
feet
SAMPLES
Drilling M
ethod
Dry Unit
Weight, pcf
MATERIAL DESCRIPTION REMARKS AND
OTHER TESTS
Water
Content, %

Appendix B
Electrical Resistivity Testing Data
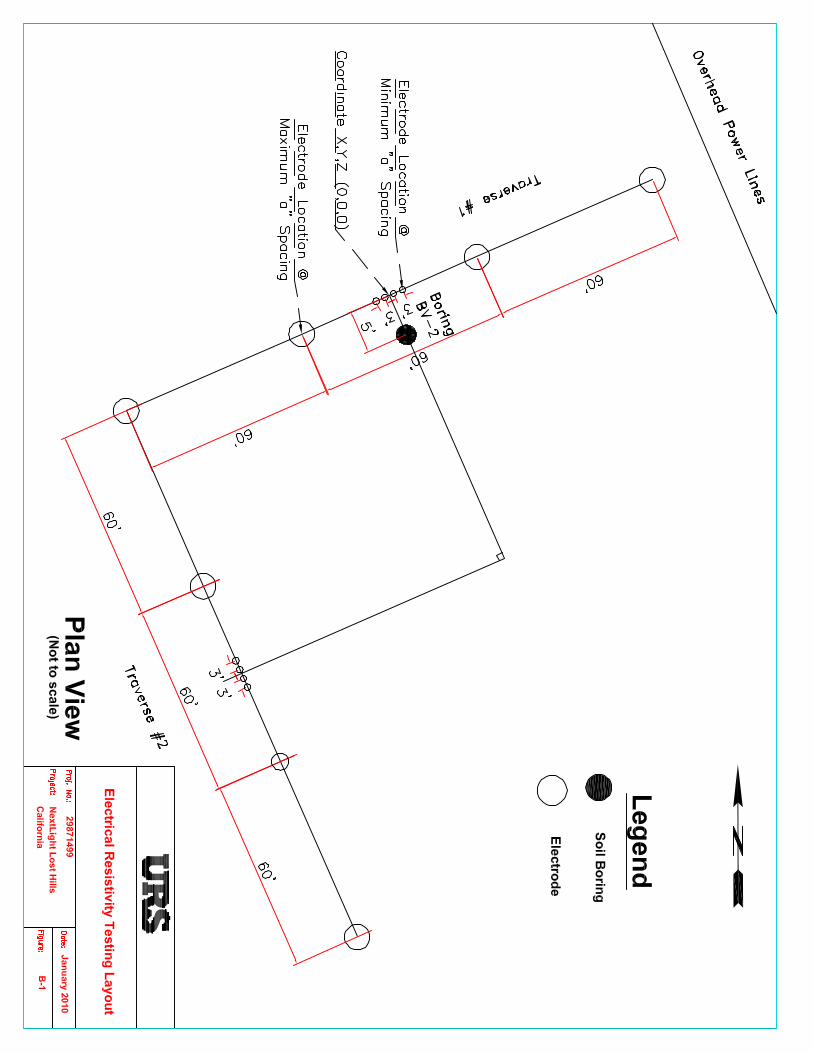
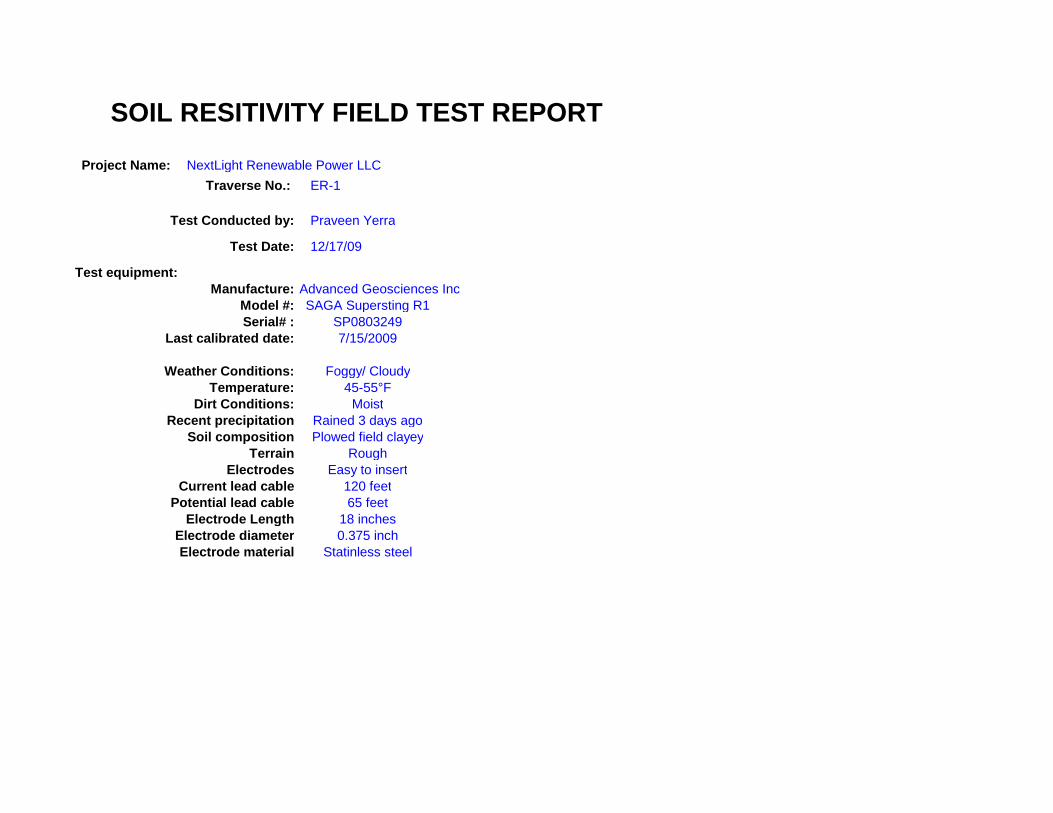
SOIL RESITIVITY FIELD TEST REPORT
Project Name: NextLight Renewable Power LLC
Traverse No.: ER-1
Test Conducted by: Praveen Yerra
Test Date: 12/17/09
Test equipment:Manufacture: Advanced Geosciences Inc
Model #: SAGA Supersting R1Serial# : SP0803249
Last calibrated date: 7/15/2009
Weather Conditions: Foggy/ CloudyTemperature: 45-55°F
Dirt Conditions: MoistRecent precipitation Rained 3 days ago
Soil composition Plowed field clayeyTerrain Rough
Electrodes Easy to insertCurrent lead cable 120 feet
Potential lead cable 65 feetElectrode Length 18 inches
Electrode diameter 0.375 inchElectrode material Statinless steel
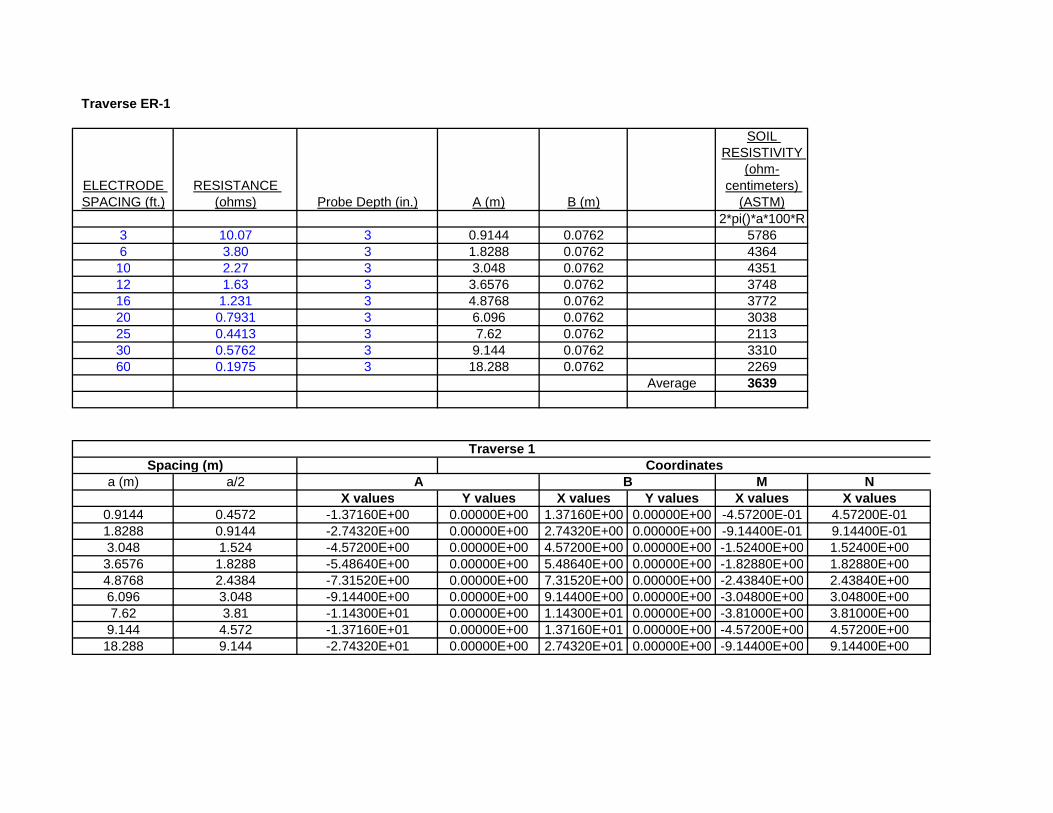
Traverse ER-1
ELECTRODESPACING (ft.)
RESISTANCE(ohms) Probe Depth (in.) A (m) B (m)
SOILRESISTIVITY
(ohm-centimeters)
(ASTM)
2*pi()*a*100*R3 10.07 3 0.9144 0.0762 57866 3.80 3 1.8288 0.0762 436410 2.27 3 3.048 0.0762 435112 1.63 3 3.6576 0.0762 374816 1.231 3 4.8768 0.0762 377220 0.7931 3 6.096 0.0762 303825 0.4413 3 7.62 0.0762 211330 0.5762 3 9.144 0.0762 331060 0.1975 3 18.288 0.0762 2269
Average 3639
a (m) a/2X values Y values X values Y values X values X values
0.9144 0.4572 -1.37160E+00 0.00000E+00 1.37160E+00 0.00000E+00 -4.57200E-01 4.57200E-011.8288 0.9144 -2.74320E+00 0.00000E+00 2.74320E+00 0.00000E+00 -9.14400E-01 9.14400E-013.048 1.524 -4.57200E+00 0.00000E+00 4.57200E+00 0.00000E+00 -1.52400E+00 1.52400E+003.6576 1.8288 -5.48640E+00 0.00000E+00 5.48640E+00 0.00000E+00 -1.82880E+00 1.82880E+004.8768 2.4384 -7.31520E+00 0.00000E+00 7.31520E+00 0.00000E+00 -2.43840E+00 2.43840E+006.096 3.048 -9.14400E+00 0.00000E+00 9.14400E+00 0.00000E+00 -3.04800E+00 3.04800E+007.62 3.81 -1.14300E+01 0.00000E+00 1.14300E+01 0.00000E+00 -3.81000E+00 3.81000E+009.144 4.572 -1.37160E+01 0.00000E+00 1.37160E+01 0.00000E+00 -4.57200E+00 4.57200E+0018.288 9.144 -2.74320E+01 0.00000E+00 2.74320E+01 0.00000E+00 -9.14400E+00 9.14400E+00
Traverse 1Spacing (m) Coordinates
A B M N

Project Name: NextLight Renewable Power LLCTraverse No.: ER-2
Test Conducted by: Praveen Yerra
Test Date: 12/18/09
Test equipment:Manufacture: Advanced Geosciences Inc
Model #: SAGA Supersting R1Serial# : SP0803249
Last calibrated date: 7/15/2009
Weather: Temperature: 40-50°FConditions: Cloudy/Windy
Dirt Conditions: MoistRecent precipitation Mist overnight; rained 4 days ago
Soil composition Plowed field clayeyTerrain Rough
Electrodes Easy to insertCurrent lead cable 120 feet
Potential lead cable 65 feetElectrode Length 18 inches
Electrode diameter 0.375 inchElectrode material Statinless steel

Traverse ER-2
ELECTRODESPACING (ft.)
RESISTANCE(ohms) Probe Depth (in.) A (m) B (m) A/B
SOILRESISTIVITY
(ohm-centimeters)
(ASTM)
2*pi()*a*100*R3 8.55 3 0.9144 0.0762 12 49156 2.37 3 1.8288 0.0762 24 272410 1.59 3 3.048 0.0762 40 303512 1.41 3 3.6576 0.0762 48 324516 1.037 3 4.8768 0.0762 64 317820 0.8143 3 6.096 0.0762 80 311925 0.5402 3 7.62 0.0762 100 258630 0.3942 3 9.144 0.0762 120 226560 0.2152 3 18.288 0.0762 240 2473
Average 3133
a (m) a/2X values Y values X values Y values X values X values
0.9144 0.4572 2.74320E+01 2.60604E+01 2.74320E+01 2.88036E+01 2.74320E+01 2.74320E+011.8288 0.9144 2.74320E+01 2.46888E+01 2.74320E+01 3.01752E+01 2.74320E+01 2.74320E+013.048 1.524 2.74320E+01 2.28600E+01 2.74320E+01 3.20040E+01 2.74320E+01 2.74320E+013.6576 1.8288 2.74320E+01 2.19456E+01 2.74320E+01 3.29184E+01 2.74320E+01 2.74320E+014.8768 2.4384 2.74320E+01 2.01168E+01 2.74320E+01 3.47472E+01 2.74320E+01 2.74320E+016.096 3.048 2.74320E+01 1.82880E+01 2.74320E+01 3.65760E+01 2.74320E+01 2.74320E+017.62 3.81 2.74320E+01 1.60020E+01 2.74320E+01 3.88620E+01 2.74320E+01 2.74320E+019.144 4.572 2.74320E+01 1.37160E+01 2.74320E+01 4.11480E+01 2.74320E+01 2.74320E+0118.288 9.144 2.74320E+01 0.00000E+00 2.74320E+01 5.48640E+01 2.74320E+01 2.74320E+01
Traverse 2Spacing (m) Coordinates
A B M N
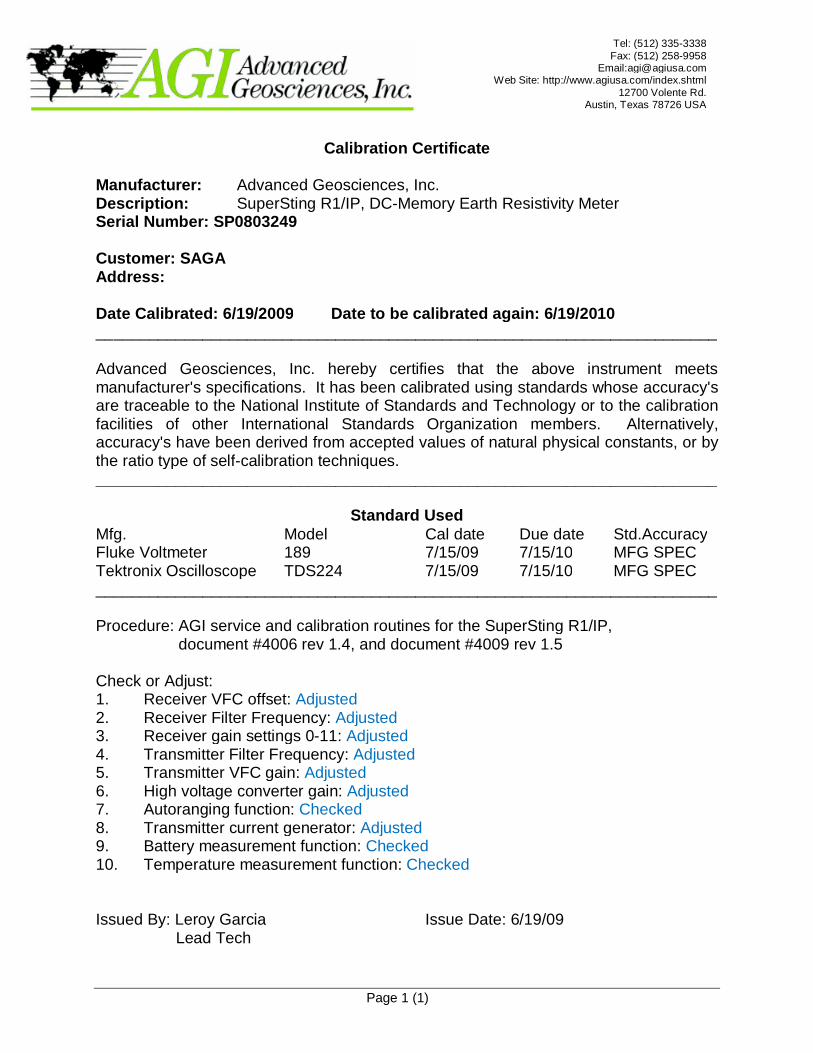
Page 1 (1)
Tel: (512) 335-3338Fax: (512) 258-9958
Email:[email protected] Site: http://www.agiusa.com/index.shtml
12700 Volente Rd.Austin, Texas 78726 USA
Calibration Certificate
Manufacturer: Advanced Geosciences, Inc.Description: SuperSting R1/IP, DC-Memory Earth Resistivity MeterSerial Number: SP0803249
Customer: SAGAAddress:
Date Calibrated: 6/19/2009 Date to be calibrated again: 6/19/2010______________________________________________________________________
Advanced Geosciences, Inc. hereby certifies that the above instrument meetsmanufacturer's specifications. It has been calibrated using standards whose accuracy'sare traceable to the National Institute of Standards and Technology or to the calibrationfacilities of other International Standards Organization members. Alternatively,accuracy's have been derived from accepted values of natural physical constants, or bythe ratio type of self-calibration techniques.______________________________________________________________________
Standard UsedMfg. Model Cal date Due date Std.AccuracyFluke Voltmeter 189 7/15/09 7/15/10 MFG SPECTektronix Oscilloscope TDS224 7/15/09 7/15/10 MFG SPEC______________________________________________________________________
Procedure: AGI service and calibration routines for the SuperSting R1/IP,document #4006 rev 1.4, and document #4009 rev 1.5
Check or Adjust:1. Receiver VFC offset: Adjusted2. Receiver Filter Frequency: Adjusted3. Receiver gain settings 0-11: Adjusted4. Transmitter Filter Frequency: Adjusted5. Transmitter VFC gain: Adjusted6. High voltage converter gain: Adjusted7. Autoranging function: Checked8. Transmitter current generator: Adjusted9. Battery measurement function: Checked10. Temperature measurement function: Checked
Issued By: Leroy Garcia Issue Date: 6/19/09Lead Tech

T:\!12\NextLight Lost Hills\9000 Deliverables\9101 Rpt\Draft\Rpt draft-LostHills.doc/ 1/8/2010 B-1
Appendix C
Laboratory Testing
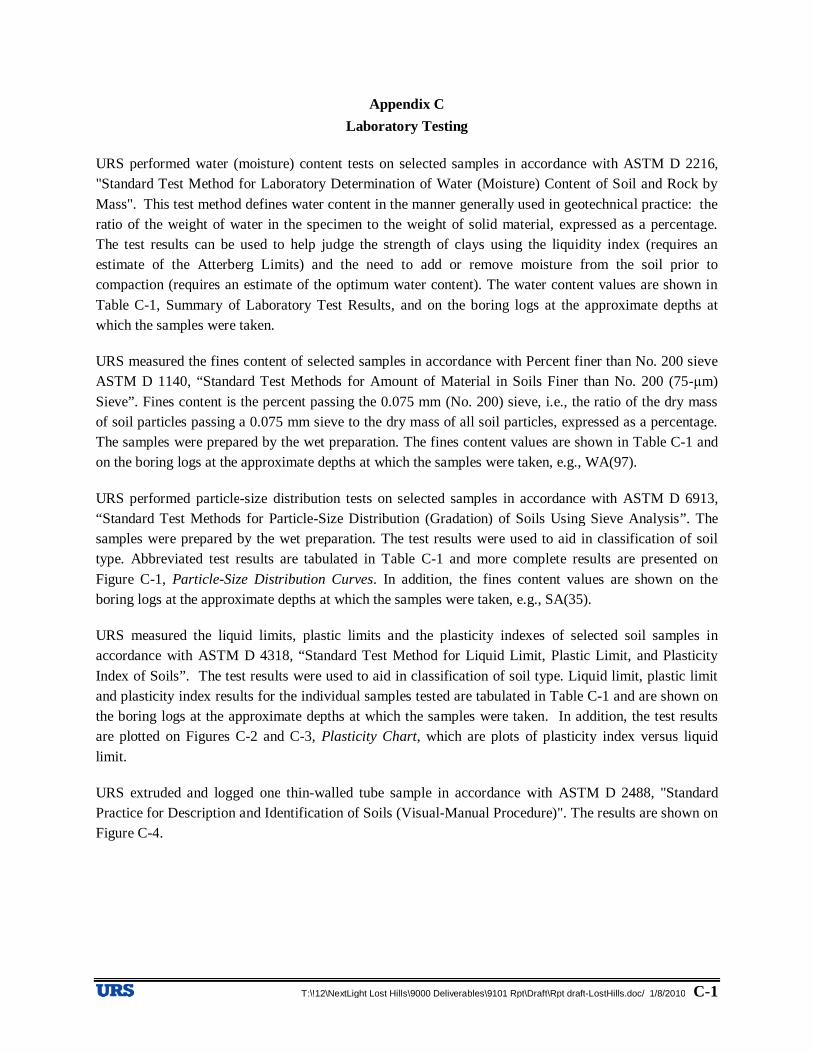
T:\!12\NextLight Lost Hills\9000 Deliverables\9101 Rpt\Draft\Rpt draft-LostHills.doc/ 1/8/2010 C-1
Appendix C
Laboratory Testing
URS performed water (moisture) content tests on selected samples in accordance with ASTM D 2216,
"Standard Test Method for Laboratory Determination of Water (Moisture) Content of Soil and Rock by
Mass". This test method defines water content in the manner generally used in geotechnical practice: the
ratio of the weight of water in the specimen to the weight of solid material, expressed as a percentage.
The test results can be used to help judge the strength of clays using the liquidity index (requires an
estimate of the Atterberg Limits) and the need to add or remove moisture from the soil prior to
compaction (requires an estimate of the optimum water content). The water content values are shown in
Table C-1, Summary of Laboratory Test Results, and on the boring logs at the approximate depths at
which the samples were taken.
URS measured the fines content of selected samples in accordance with Percent finer than No. 200 sieve
ASTM D 1140, “Standard Test Methods for Amount of Material in Soils Finer than No. 200 (75-μm)
Sieve”. Fines content is the percent passing the 0.075 mm (No. 200) sieve, i.e., the ratio of the dry mass
of soil particles passing a 0.075 mm sieve to the dry mass of all soil particles, expressed as a percentage.
The samples were prepared by the wet preparation. The fines content values are shown in Table C-1 and
on the boring logs at the approximate depths at which the samples were taken, e.g., WA(97).
URS performed particle-size distribution tests on selected samples in accordance with ASTM D 6913,
“Standard Test Methods for Particle-Size Distribution (Gradation) of Soils Using Sieve Analysis”. The
samples were prepared by the wet preparation. The test results were used to aid in classification of soil
type. Abbreviated test results are tabulated in Table C-1 and more complete results are presented on
Figure C-1, Particle-Size Distribution Curves. In addition, the fines content values are shown on the
boring logs at the approximate depths at which the samples were taken, e.g., SA(35).
URS measured the liquid limits, plastic limits and the plasticity indexes of selected soil samples in
accordance with ASTM D 4318, “Standard Test Method for Liquid Limit, Plastic Limit, and Plasticity
Index of Soils”. The test results were used to aid in classification of soil type. Liquid limit, plastic limit
and plasticity index results for the individual samples tested are tabulated in Table C-1 and are shown on
the boring logs at the approximate depths at which the samples were taken. In addition, the test results
are plotted on Figures C-2 and C-3, Plasticity Chart, which are plots of plasticity index versus liquid
limit.
URS extruded and logged one thin-walled tube sample in accordance with ASTM D 2488, "Standard
Practice for Description and Identification of Soils (Visual-Manual Procedure)". The results are shown on
Figure C-4.
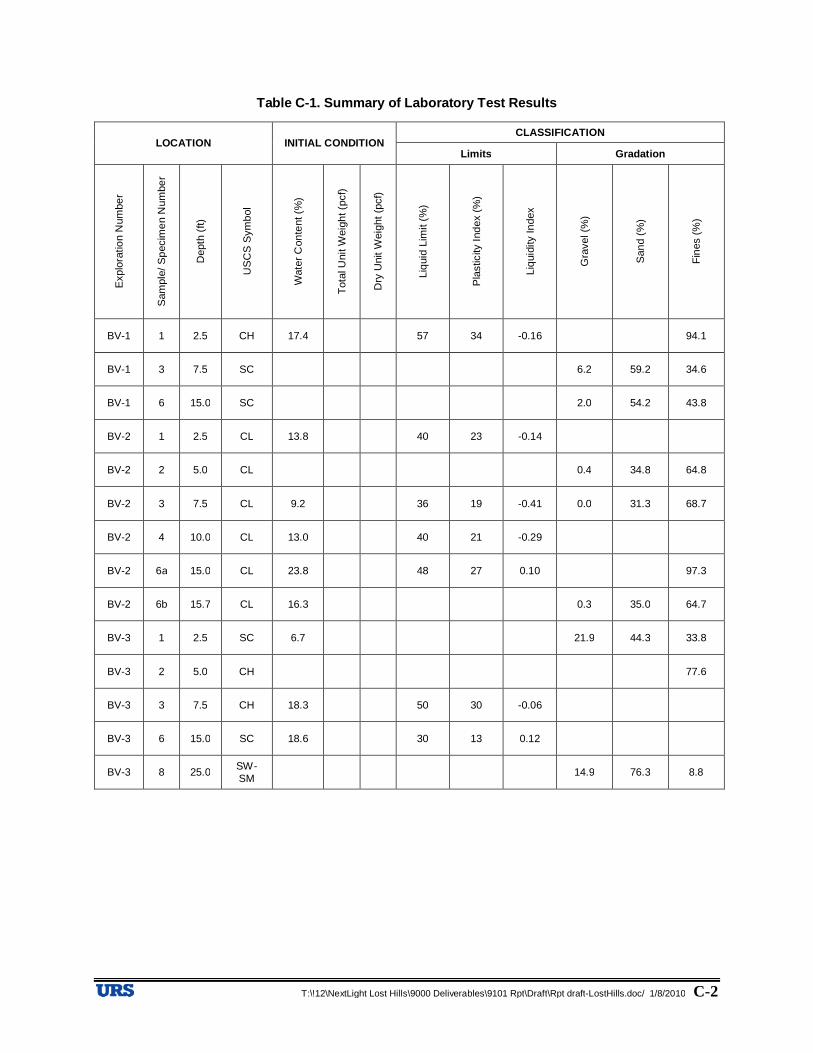
T:\!12\NextLight Lost Hills\9000 Deliverables\9101 Rpt\Draft\Rpt draft-LostHills.doc/ 1/8/2010 C-2
Table C-1. Summary of Laboratory Test Results
CLASSIFICATIONLOCATION INITIAL CONDITION
Limits Gradation
Explo
ratio
nN
um
be
r
Sam
ple
/S
pecim
en
Num
be
r
Depth
(ft)
US
CS
Sym
bol
Wate
rC
on
tent(%
)
Tota
lUnit
Weig
ht(p
cf)
Dry
Unit
Weig
ht
(pcf)
Liq
uid
Lim
it(%
)
Pla
stic
ityIn
dex
(%)
Liq
uid
ity
Index
Gra
vel(%
)
San
d(%
)
Fin
es
(%)
BV-1 1 2.5 CH 17.4 57 34 -0.16 94.1
BV-1 3 7.5 SC 6.2 59.2 34.6
BV-1 6 15.0 SC 2.0 54.2 43.8
BV-2 1 2.5 CL 13.8 40 23 -0.14
BV-2 2 5.0 CL 0.4 34.8 64.8
BV-2 3 7.5 CL 9.2 36 19 -0.41 0.0 31.3 68.7
BV-2 4 10.0 CL 13.0 40 21 -0.29
BV-2 6a 15.0 CL 23.8 48 27 0.10 97.3
BV-2 6b 15.7 CL 16.3 0.3 35.0 64.7
BV-3 1 2.5 SC 6.7 21.9 44.3 33.8
BV-3 2 5.0 CH 77.6
BV-3 3 7.5 CH 18.3 50 30 -0.06
BV-3 6 15.0 SC 18.6 30 13 0.12
BV-3 8 25.0SW-SM
14.9 76.3 8.8
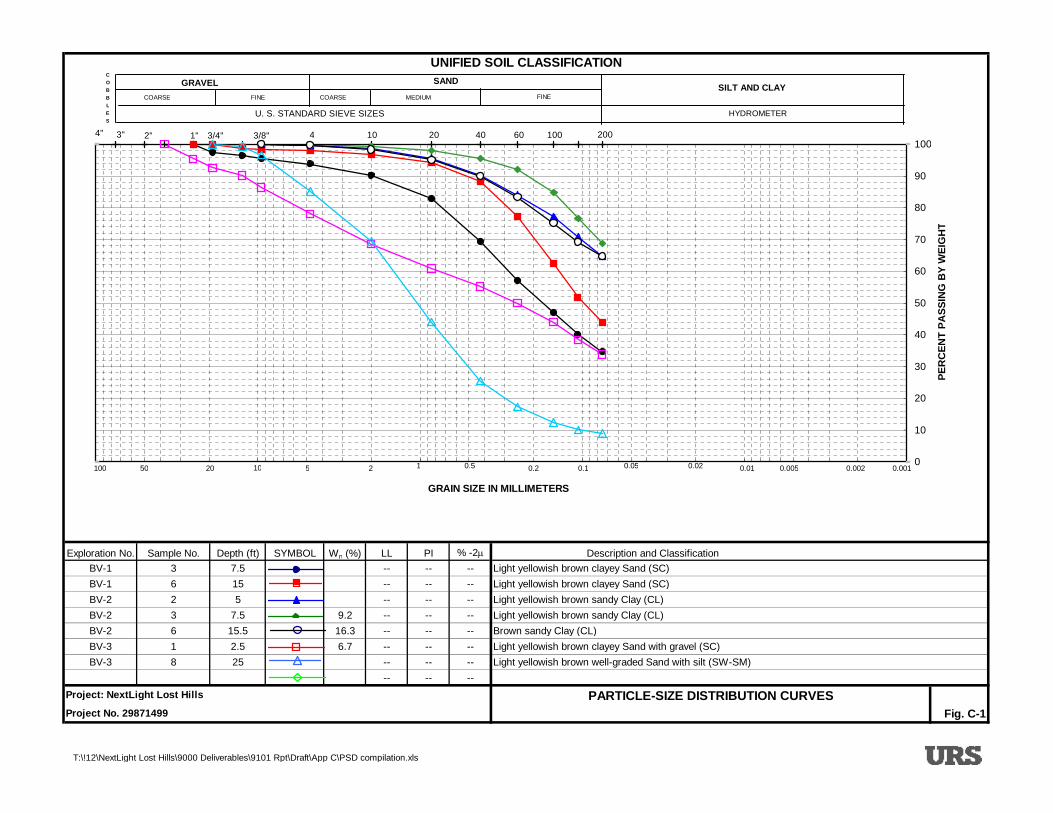
UNIFIED SOIL CLASSIFICATION
Exploration No. Sample No. Depth (ft) SYMBOL Wn (%) LL PI % -2m Description and Classification
BV-1 3 7.5 -- -- -- Light yellowish brown clayey Sand (SC)
BV-1 6 15 -- -- -- Light yellowish brown clayey Sand (SC)
BV-2 2 5 -- -- -- Light yellowish brown sandy Clay (CL)
BV-2 3 7.5 9.2 -- -- -- Light yellowish brown sandy Clay (CL)
BV-2 6 15.5 16.3 -- -- -- Brown sandy Clay (CL)
BV-3 1 2.5 6.7 -- -- -- Light yellowish brown clayey Sand with gravel (SC)
BV-3 8 25 -- -- -- Light yellowish brown well-graded Sand with silt (SW-SM)
-- -- --
Project: NextLight Lost Hills PARTICLE-SIZE DISTRIBUTION CURVES
Project No. 29871499 Fig. C-1
0
10
20
30
40
50
60
70
80
90
100
GRAIN SIZE IN MILLIMETERS
PE
RC
EN
TP
AS
SIN
GB
YW
EIG
HT
3" 2" 1" 3/4" 3/8" 4 10 20 40 60 100 200
0.0010.010.1110100 50 20 5 2 0.5 0.2 0.05 0.02 0.005 0.002
U. S. STANDARD SIEVE SIZES
C
O
B
B
L
E
S
GRAVEL SANDSILT AND CLAY
COARSE FINE COARSE FINEMEDIUM
HYDROMETER
4"
T:\!12\NextLight Lost Hills\9000 Deliverables\9101 Rpt\Draft\App C\PSD compilation.xls
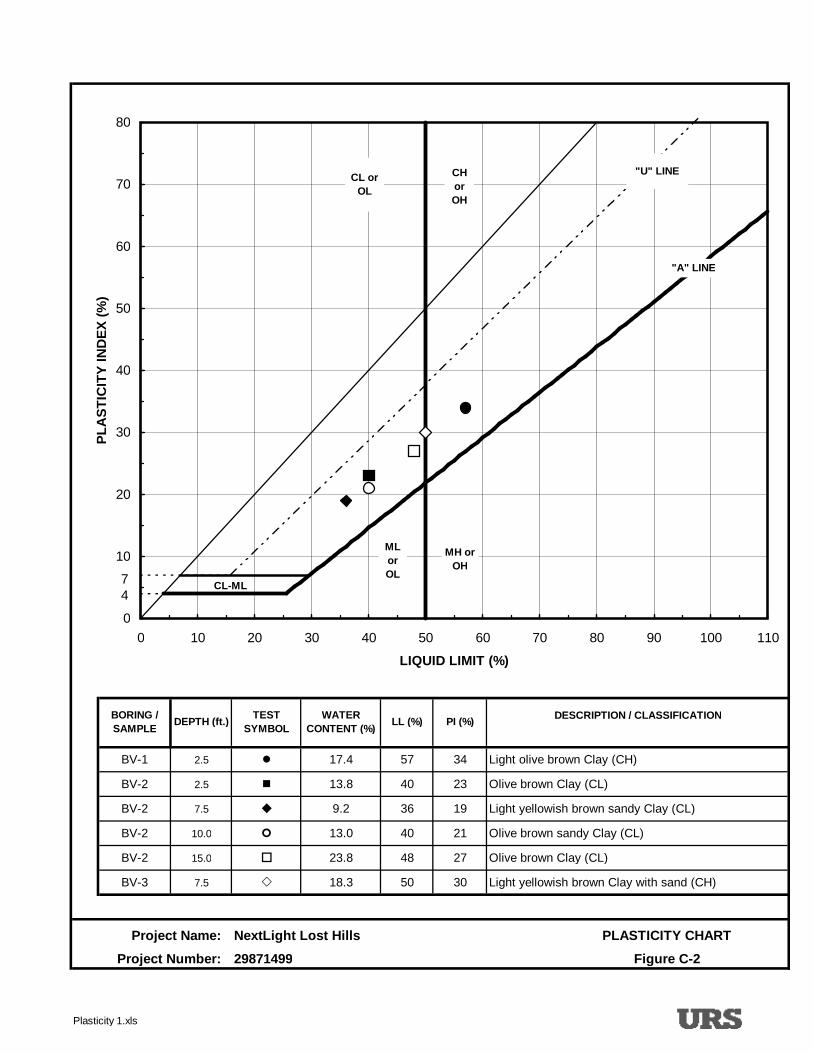
DESCRIPTION / CLASSIFICATION
BV-1 2.5 l 17.4 57 34 Light olive brown Clay (CH)
BV-2 2.5 n 13.8 40 23 Olive brown Clay (CL)
BV-2 7.5 u 9.2 36 19 Light yellowish brown sandy Clay (CL)
BV-2 10.0 13.0 40 21 Olive brown sandy Clay (CL)
BV-2 15.0 o 23.8 48 27 Olive brown Clay (CL)
BV-3 7.5 18.3 50 30 Light yellowish brown Clay with sand (CH)
Project Name: PLASTICITY CHART
Project Number: Figure C-2
NextLight Lost Hills
29871499
WATER
CONTENT (%)
BORING /
SAMPLEDEPTH (ft.)
TEST
SYMBOLLL (%) PI (%)
CL-ML
0
10
20
30
40
50
60
70
80
0 10 20 30 40 50 60 70 80 90 100 110
LIQUID LIMIT (%)
PL
AS
TIC
ITY
IND
EX
(%)
74
ML
or
OL
CL or
OL
CH
or
OH
MH or
OH
"U" LINE
"A" LINE
Plasticity 1.xls
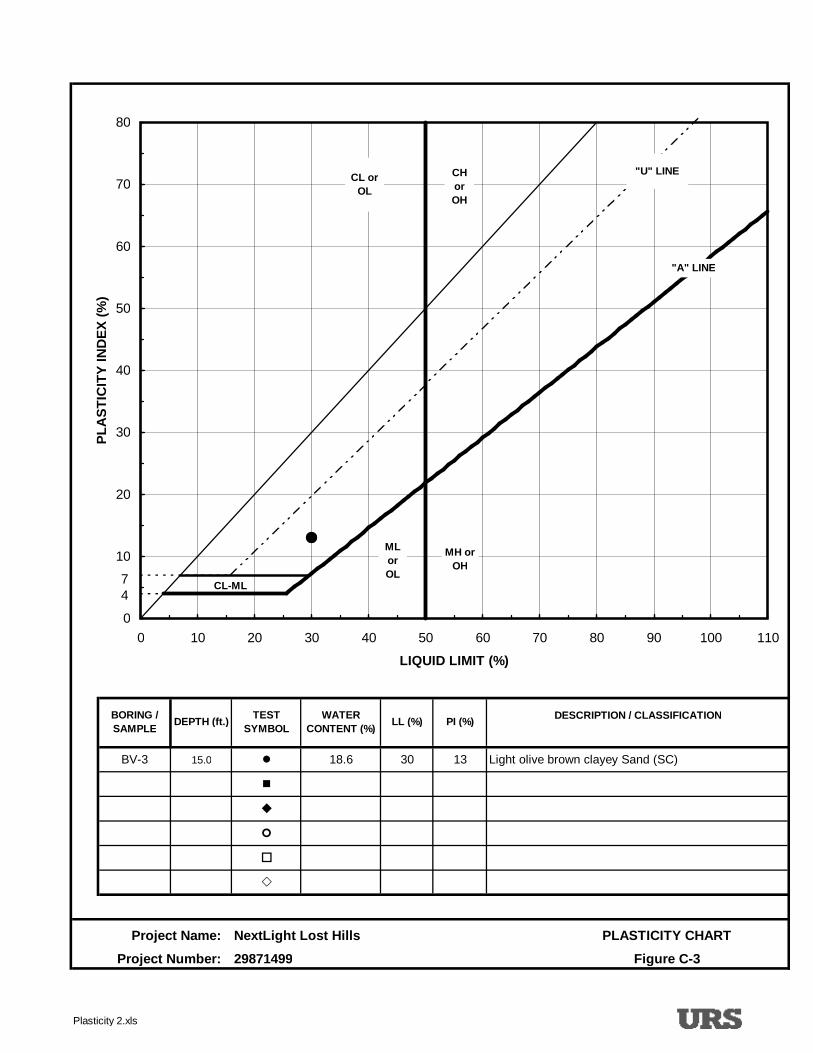
DESCRIPTION / CLASSIFICATION
BV-3 15.0 l 18.6 30 13 Light olive brown clayey Sand (SC)
n
u
o
Project Name: PLASTICITY CHART
Project Number: Figure C-3
NextLight Lost Hills
29871499
WATER
CONTENT (%)
BORING /
SAMPLEDEPTH (ft.)
TEST
SYMBOLLL (%) PI (%)
CL-ML
0
10
20
30
40
50
60
70
80
0 10 20 30 40 50 60 70 80 90 100 110
LIQUID LIMIT (%)
PL
AS
TIC
ITY
IND
EX
(%)
74
ML
or
OL
CL or
OL
CH
or
OH
MH or
OH
"U" LINE
"A" LINE
Plasticity 2.xls
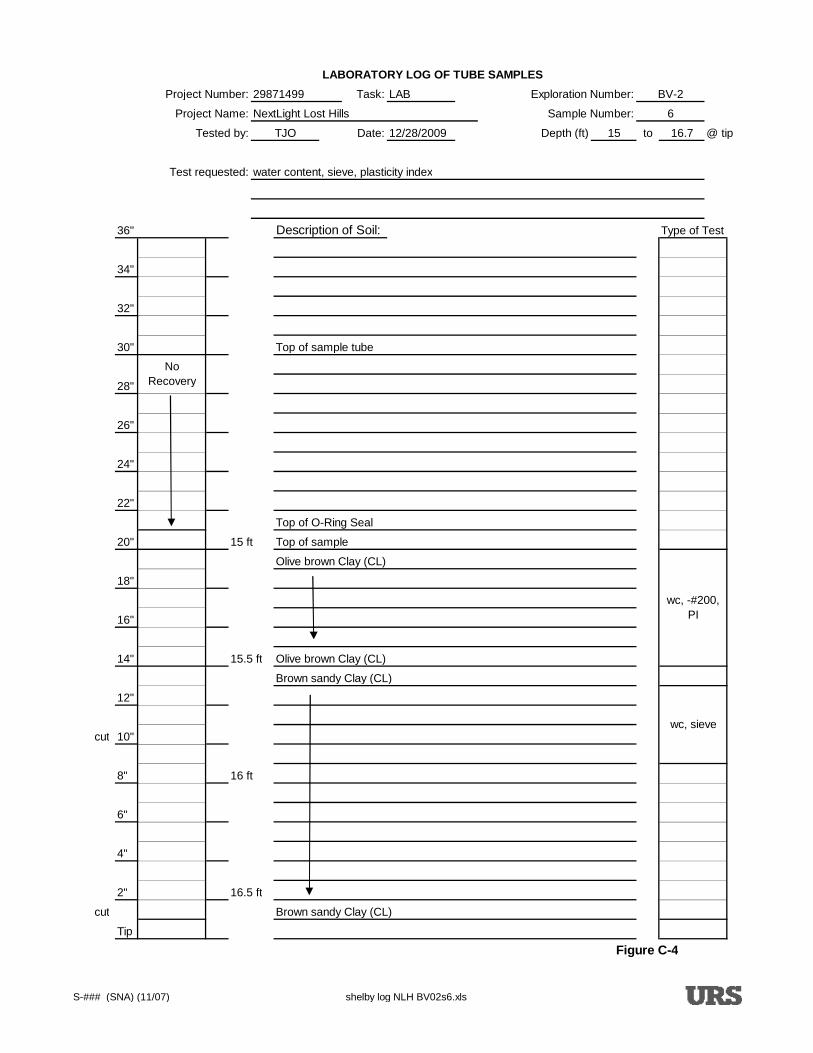
LABORATORY LOG OF TUBE SAMPLES
Project Number: Task: Exploration Number:
Project Name: Sample Number:
Tested by: Date: Depth (ft) to @ tip
Test requested: water content, sieve, plasticity index
36" Description of Soil: Type of Test
34"
32"
30" Top of sample tube
28"
26"
24"
22"
Top of O-Ring Seal
20" 15 ft Top of sample
Olive brown Clay (CL)
18"
16"
14" 15.5 ft Olive brown Clay (CL)
Brown sandy Clay (CL)
12"
cut 10"
8" 16 ft
6"
4"
2" 16.5 ft
cut Brown sandy Clay (CL)
Tip
Figure C-4
BV-2
6
1512/28/2009 16.7
29871499 LAB
NextLight Lost Hills
TJO
wc, sieve
wc, -#200,
PI
No
Recovery
S-### (SNA) (11/07) shelby log NLH BV02s6.xls