Embed Size (px)
Citation preview
SAR Post-Fire Monitoring Report
Appendix G
Sediment Quantity and Nutrient Load
Reduction Report
Page 1 |
Sediment Quantity and Nutrient Load Reduction Report 2018-2019 Leach Canyon Dam and McVicker Canyon Basin Prepared by Melissa Varela, Watershed Protection Division Riverside County Flood Control and Water Conservation District October 17, 2019
The Holy Fire, a wildfire that began in August 2018, burned approximately 23,000 acres of the Cleveland National Forest. In anticipation of future debris flows sourcing from the Holy Fire burn area during storm season, the Riverside County Flood Control and Water Conservation District ("District") immediately began “capacity preparation” at two District facilities, Leach Canyon Dam and McVicker Canyon Basin. These facilities drain to Lake Elsinore, a 303(d) listed “impaired” waterbody for nutrients and organic enrichment/low dissolved oxygen. As efforts continued from November 2018 to April 2019, the sediment removal maintenance provided protection to downstream communities, enhanced debris basin capacity; meanwhile, preventing sediment and nutrient loads from reaching Lake Elsinore and impacting water quality. The District’s effective post Holy Fire response activities in 2018-2019 resulted in the removal of approximately 178,904 CY of wet sediment material from 2 debris basins, which otherwise would have been conveyed by storm flows to Lake Elsinore. This memo presents an evaluation of the nutrient load effected by the removal of this debris flow material.
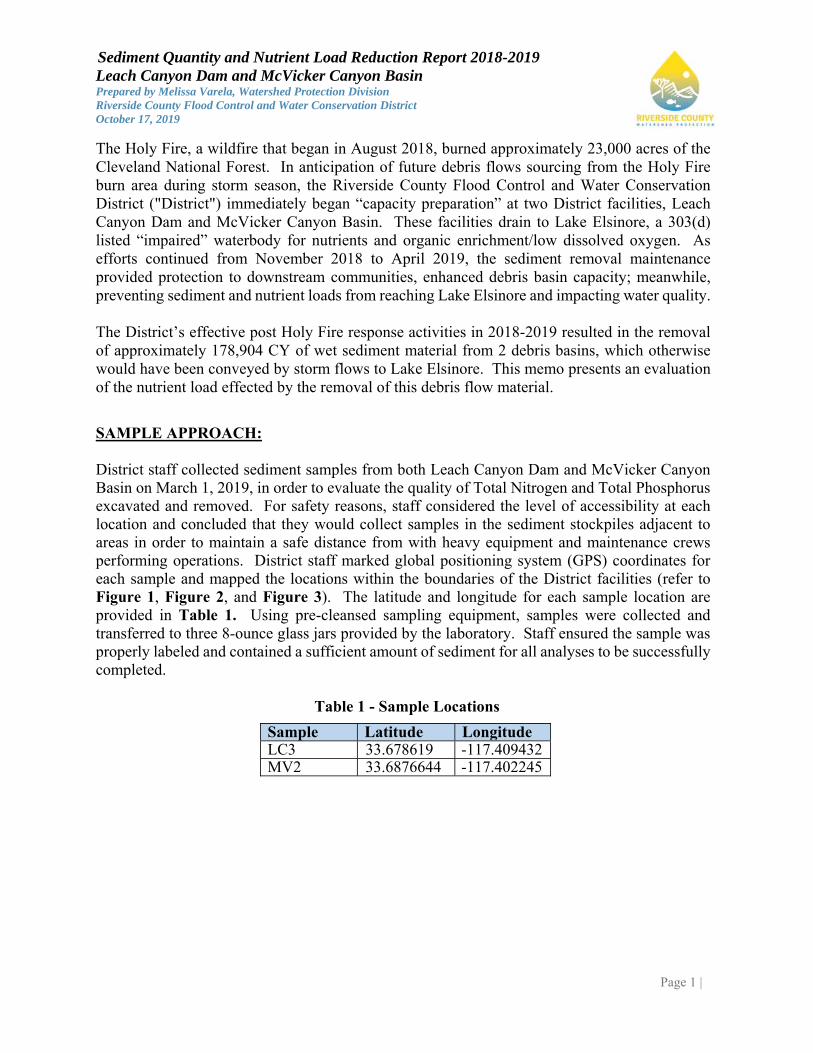
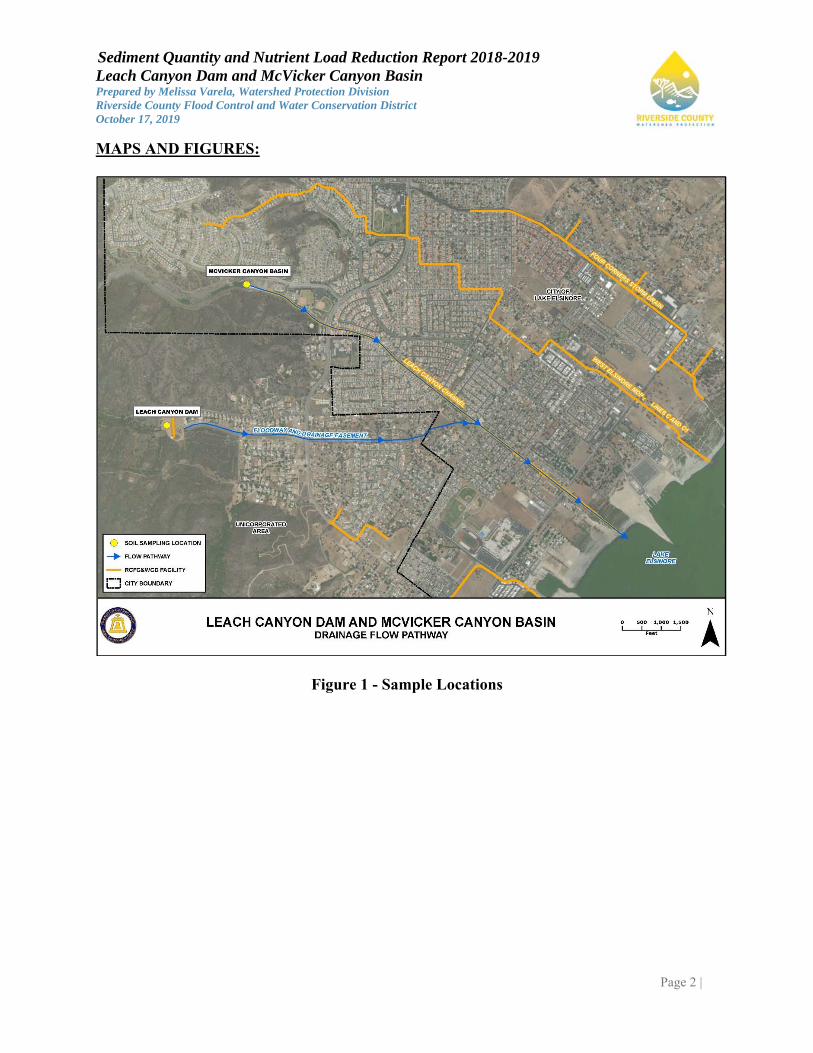
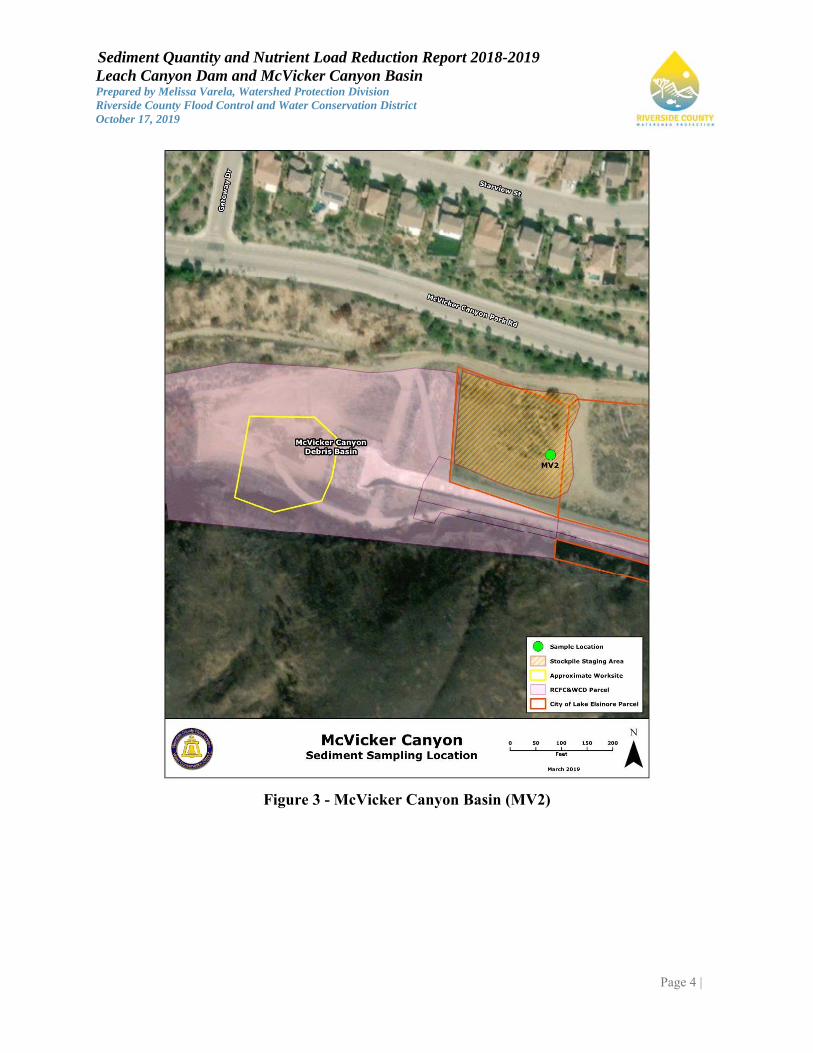
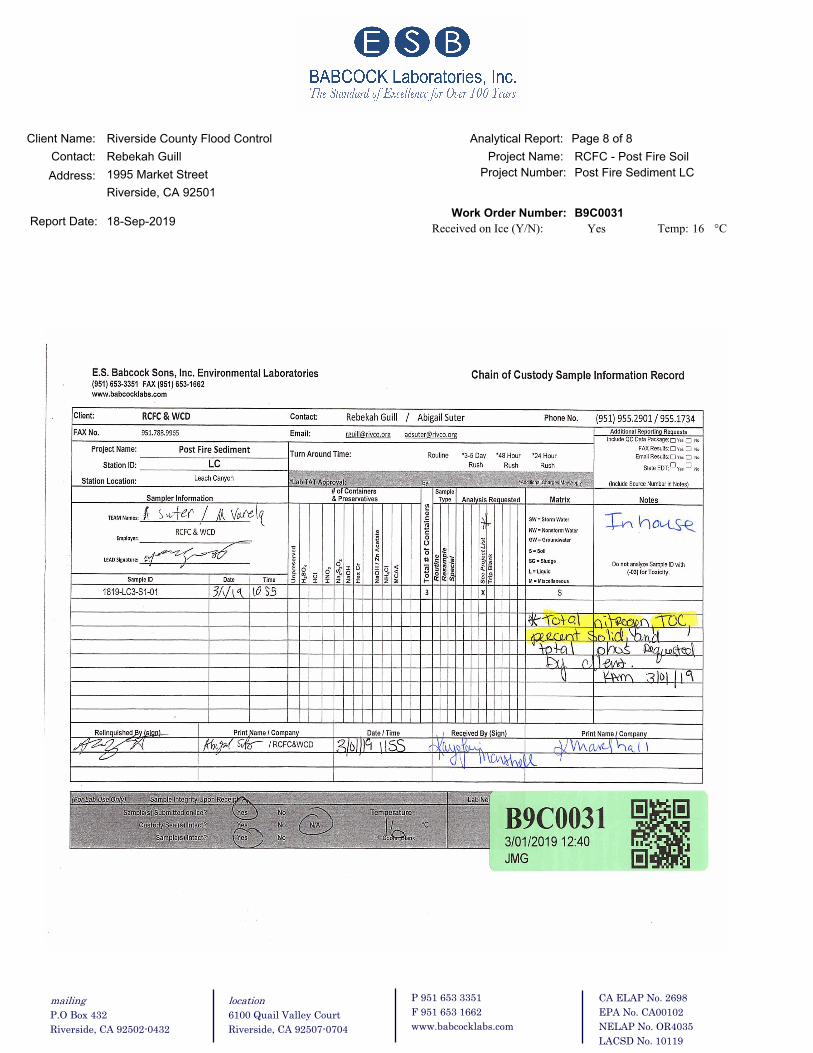
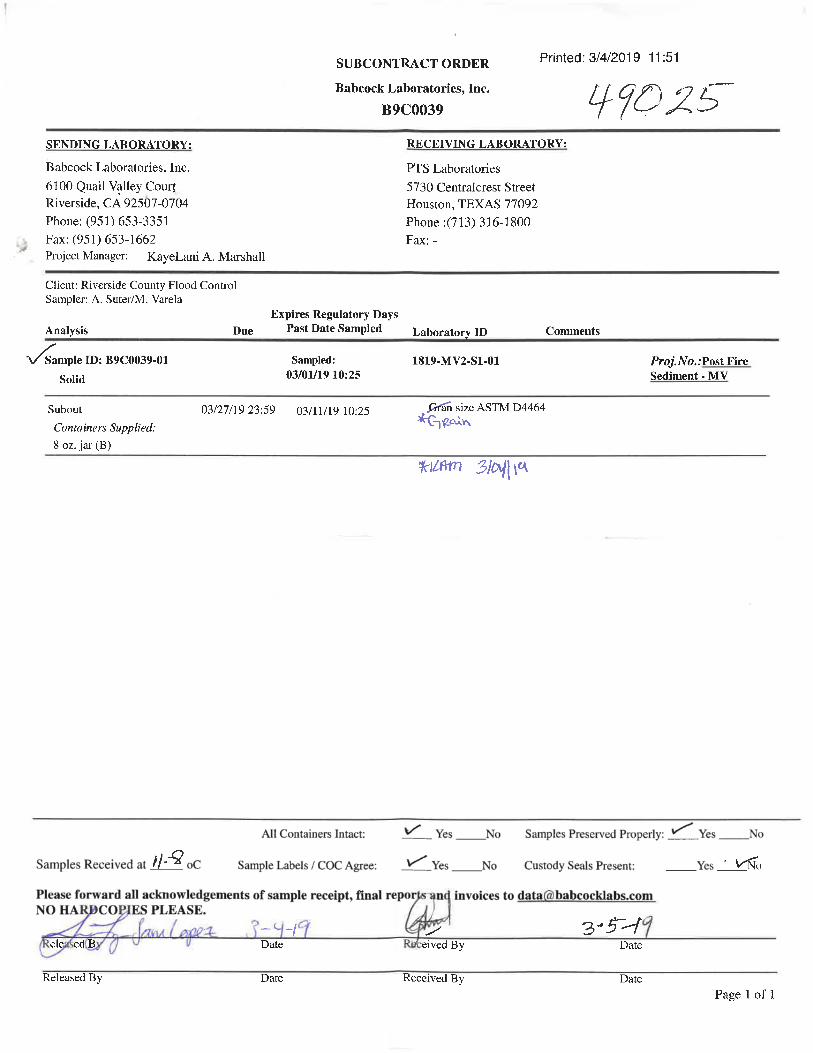
SAMPLE APPROACH: District staff collected sediment samples from both Leach Canyon Dam and McVicker Canyon Basin on March 1, 2019, in order to evaluate the quality of Total Nitrogen and Total Phosphorus excavated and removed. For safety reasons, staff considered the level of accessibility at each location and concluded that they would collect samples in the sediment stockpiles adjacent to areas in order to maintain a safe distance from with heavy equipment and maintenance crews performing operations. District staff marked global positioning system (GPS) coordinates for each sample and mapped the locations within the boundaries of the District facilities (refer to Figure 1, Figure 2, and Figure 3). The latitude and longitude for each sample location are provided in Table 1. Using pre-cleansed sampling equipment, samples were collected and transferred to three 8-ounce glass jars provided by the laboratory. Staff ensured the sample was properly labeled and contained a sufficient amount of sediment for all analyses to be successfully completed.
Table 1 - Sample Locations
Sample Latitude LongitudeLC3 33.678619 -117.409432MV2 33.6876644 -117.402245
Page 2 |
Sediment Quantity and Nutrient Load Reduction Report 2018-2019 Leach Canyon Dam and McVicker Canyon Basin Prepared by Melissa Varela, Watershed Protection Division Riverside County Flood Control and Water Conservation District October 17, 2019
MAPS AND FIGURES:
Figure 1 - Sample Locations
Page 3 |
Sediment Quantity and Nutrient Load Reduction Report 2018-2019 Leach Canyon Dam and McVicker Canyon Basin Prepared by Melissa Varela, Watershed Protection Division Riverside County Flood Control and Water Conservation District October 17, 2019
Figure 2 - Leach Canyon Dam (LC3)
Page 4 |
Sediment Quantity and Nutrient Load Reduction Report 2018-2019 Leach Canyon Dam and McVicker Canyon Basin Prepared by Melissa Varela, Watershed Protection Division Riverside County Flood Control and Water Conservation District October 17, 2019
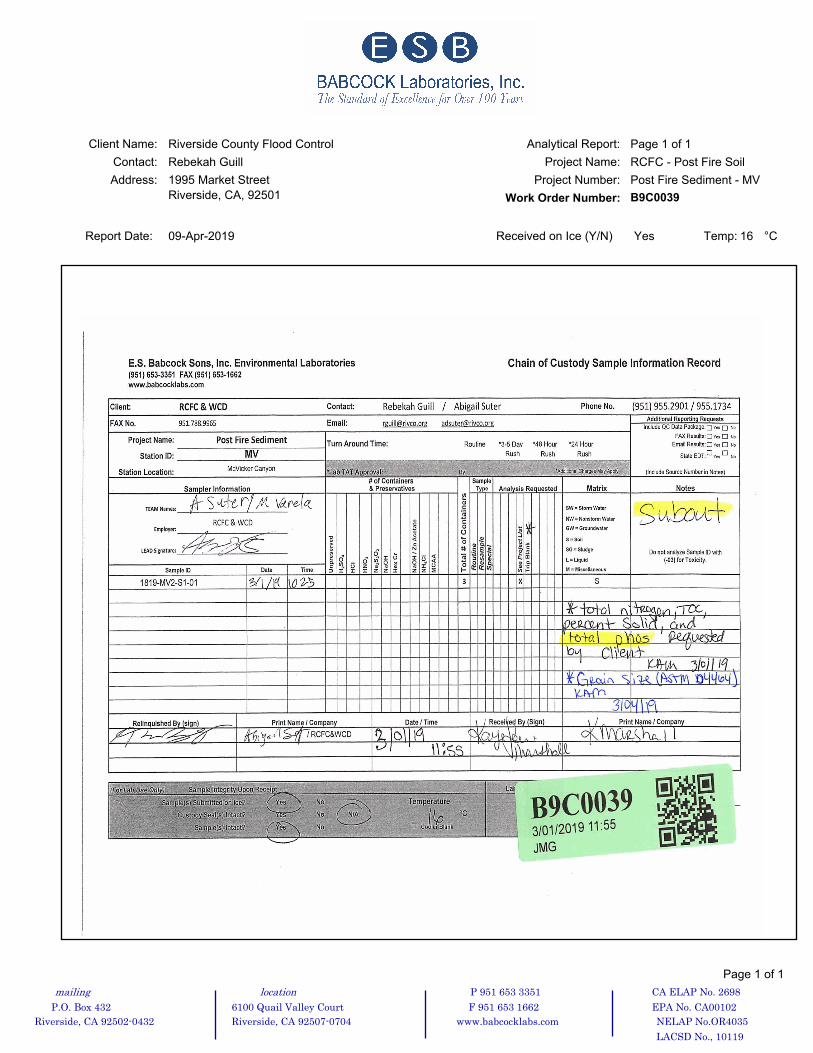
Figure 3 - McVicker Canyon Basin (MV2)
Page 5 |
Sediment Quantity and Nutrient Load Reduction Report 2018-2019 Leach Canyon Dam and McVicker Canyon Basin Prepared by Melissa Varela, Watershed Protection Division Riverside County Flood Control and Water Conservation District October 17, 2019
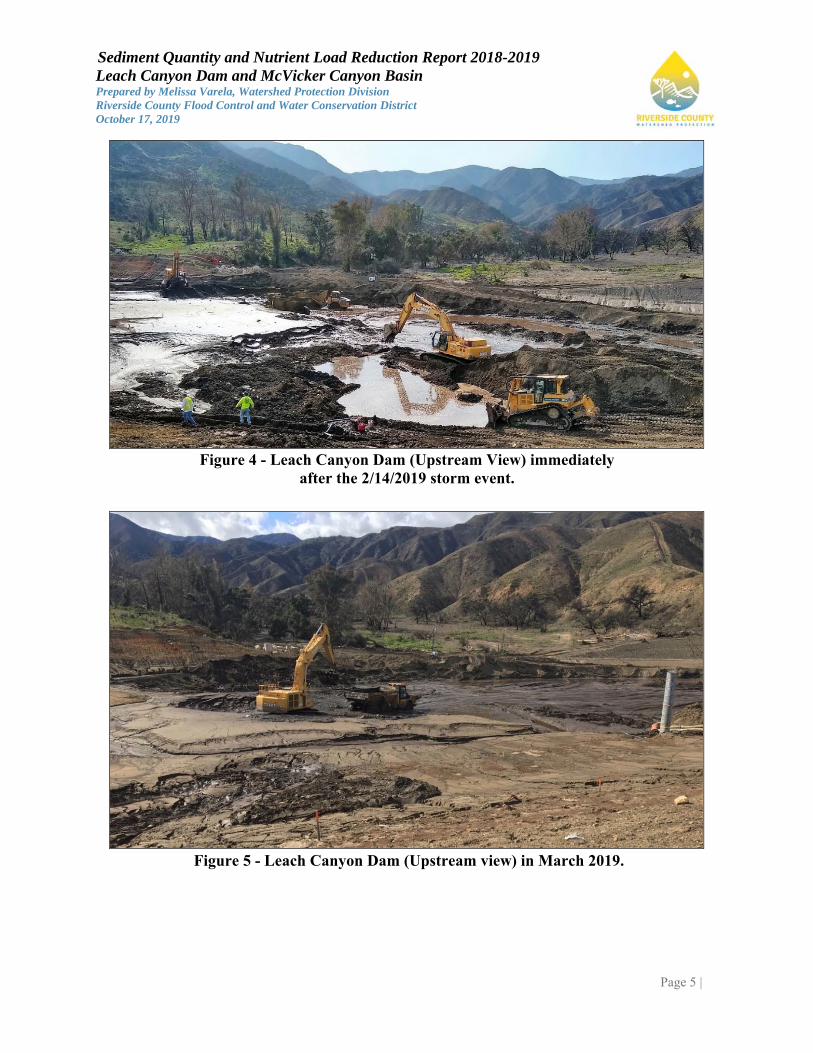
Figure 4 - Leach Canyon Dam (Upstream View) immediately
after the 2/14/2019 storm event.
Figure 5 - Leach Canyon Dam (Upstream view) in March 2019.
Page 6 |
Sediment Quantity and Nutrient Load Reduction Report 2018-2019 Leach Canyon Dam and McVicker Canyon Basin Prepared by Melissa Varela, Watershed Protection Division Riverside County Flood Control and Water Conservation District October 17, 2019
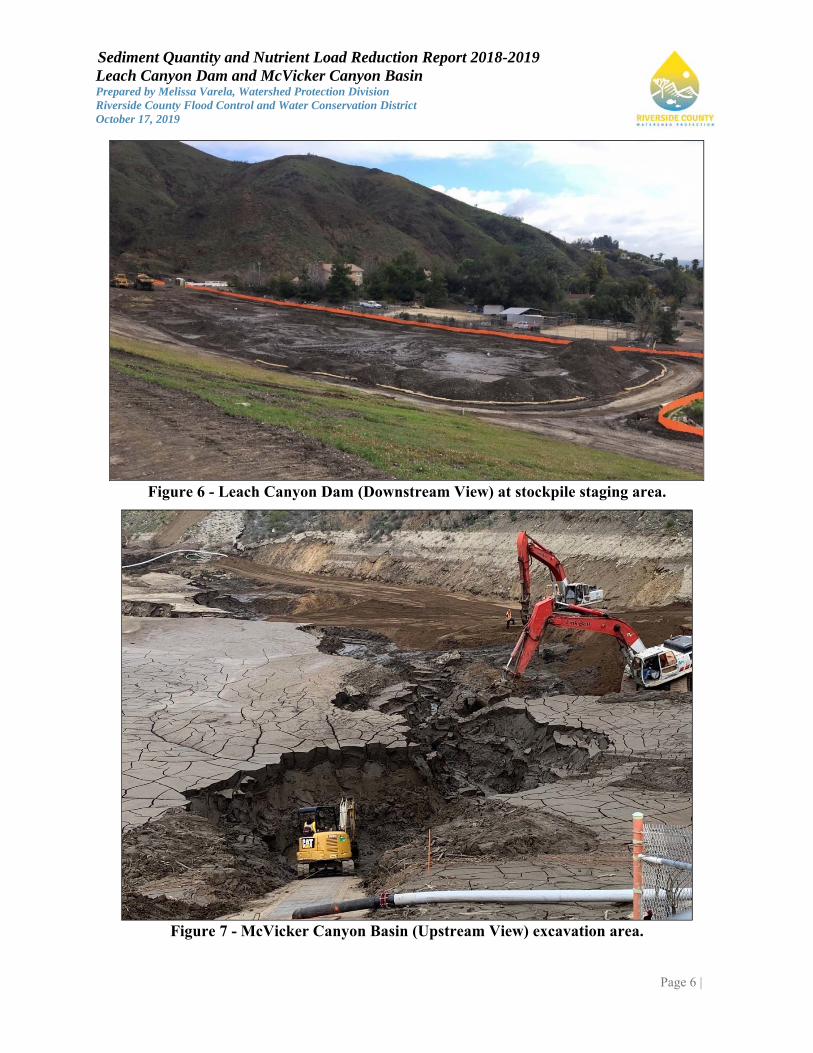
Figure 6 - Leach Canyon Dam (Downstream View) at stockpile staging area.
Figure 7 - McVicker Canyon Basin (Upstream View) excavation area.
Page 7 |
Sediment Quantity and Nutrient Load Reduction Report 2018-2019 Leach Canyon Dam and McVicker Canyon Basin Prepared by Melissa Varela, Watershed Protection Division Riverside County Flood Control and Water Conservation District October 17, 2019
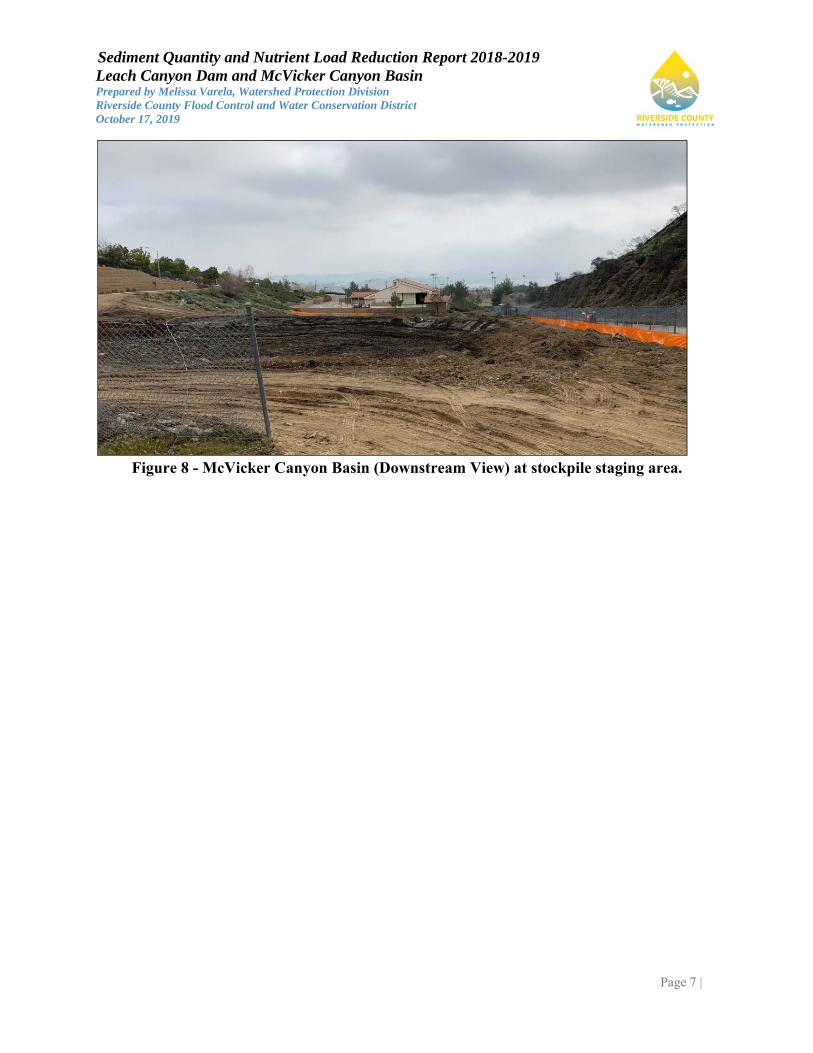
Figure 8 - McVicker Canyon Basin (Downstream View) at stockpile staging area.
Page 8 |
Sediment Quantity and Nutrient Load Reduction Report 2018-2019 Leach Canyon Dam and McVicker Canyon Basin Prepared by Melissa Varela, Watershed Protection Division Riverside County Flood Control and Water Conservation District October 17, 2019
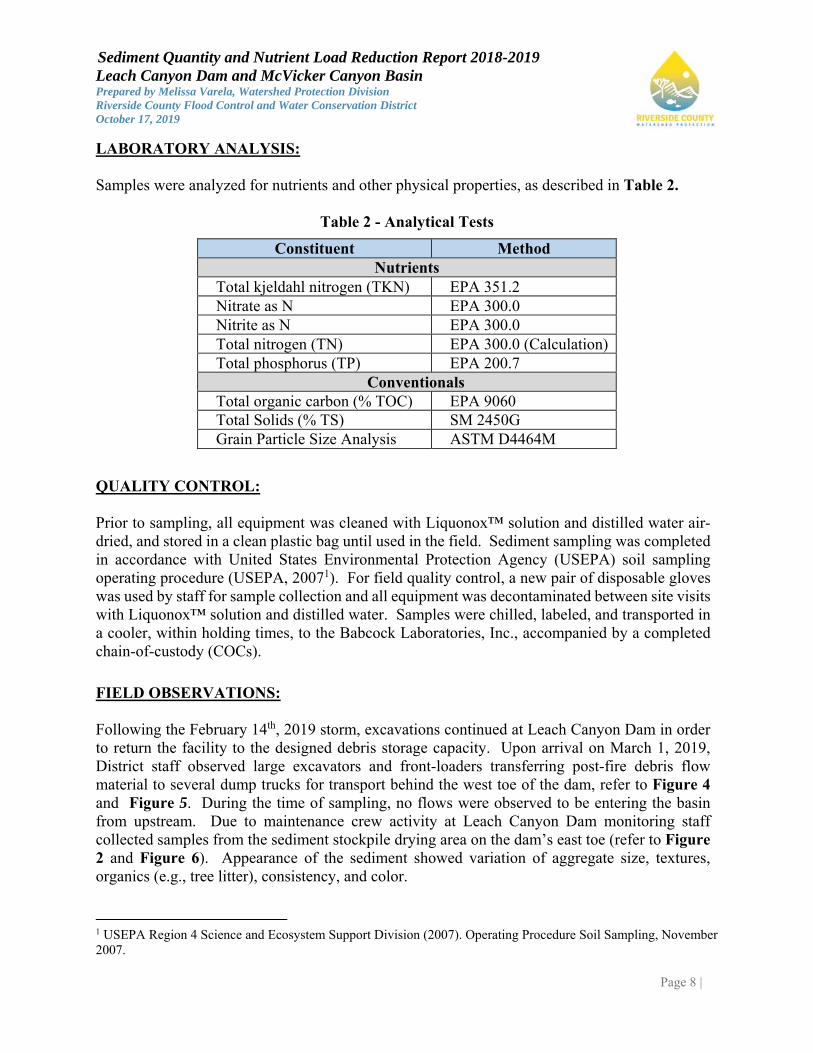
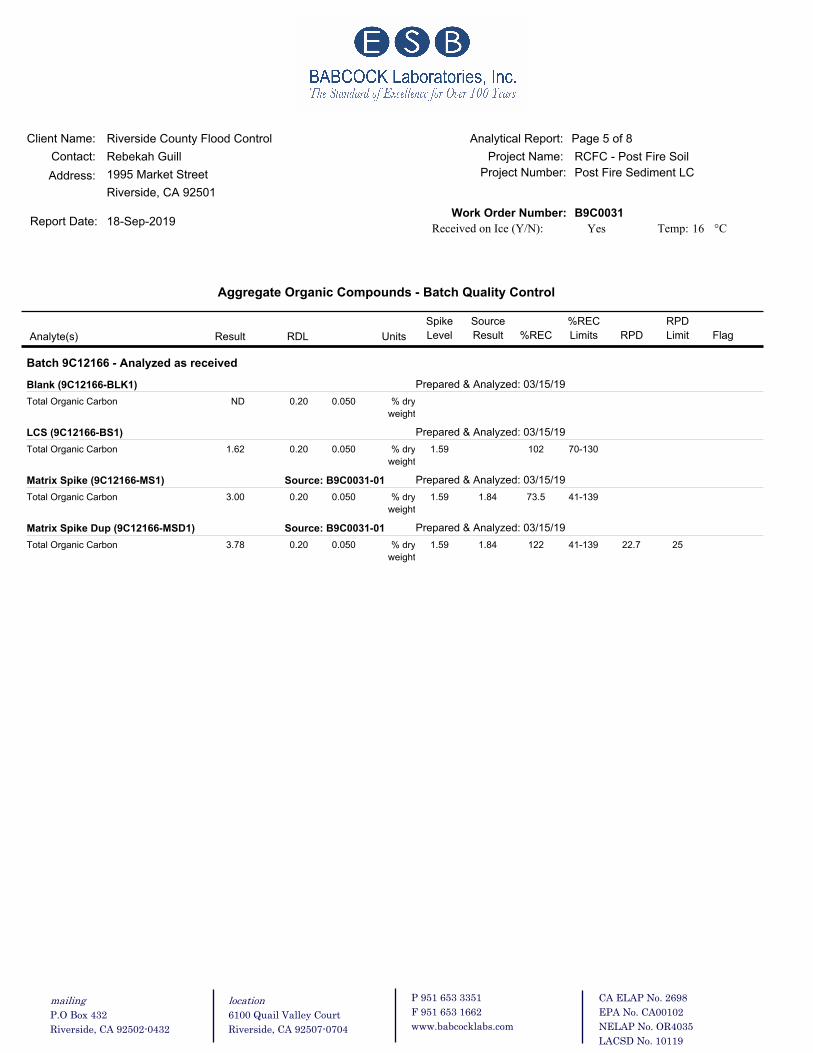
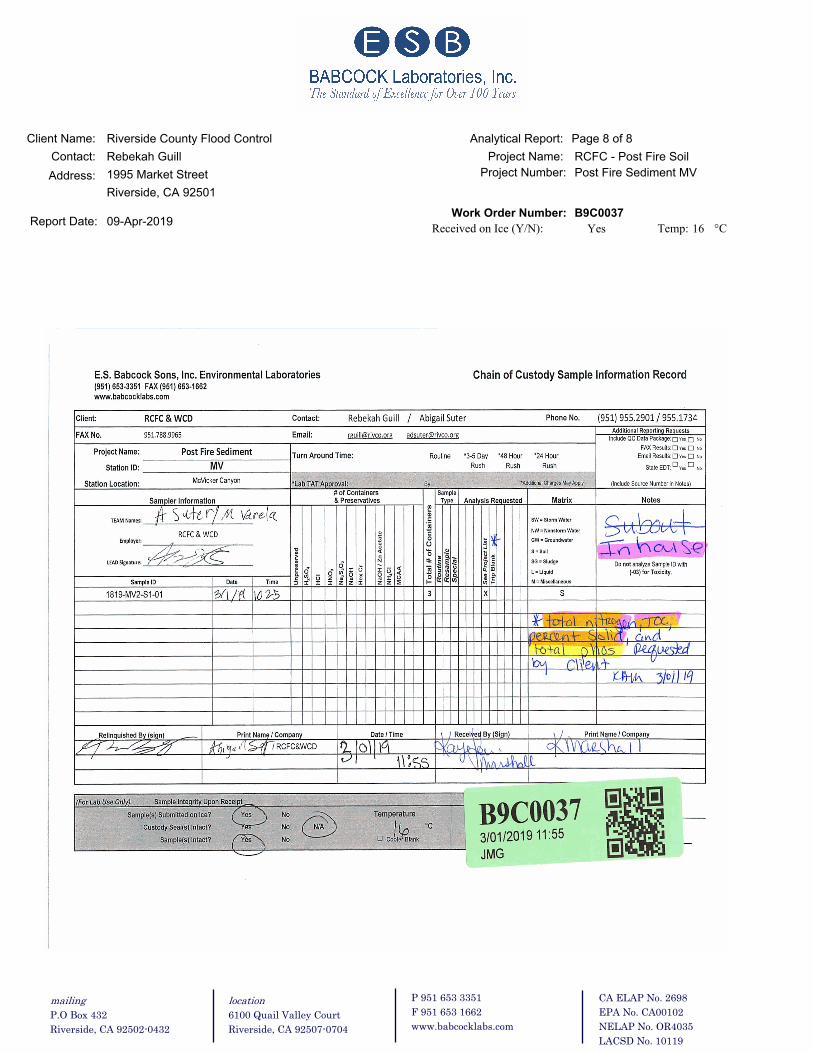
LABORATORY ANALYSIS: Samples were analyzed for nutrients and other physical properties, as described in Table 2.
Table 2 - Analytical Tests
Constituent MethodNutrients
Total kjeldahl nitrogen (TKN) EPA 351.2 Nitrate as N EPA 300.0 Nitrite as N EPA 300.0 Total nitrogen (TN) EPA 300.0 (Calculation) Total phosphorus (TP) EPA 200.7
Conventionals Total organic carbon (% TOC) EPA 9060Total Solids (% TS) SM 2450G Grain Particle Size Analysis ASTM D4464M
QUALITY CONTROL:
Prior to sampling, all equipment was cleaned with Liquonox™ solution and distilled water air-dried, and stored in a clean plastic bag until used in the field. Sediment sampling was completed in accordance with United States Environmental Protection Agency (USEPA) soil sampling operating procedure (USEPA, 20071). For field quality control, a new pair of disposable gloves was used by staff for sample collection and all equipment was decontaminated between site visits with Liquonox™ solution and distilled water. Samples were chilled, labeled, and transported in a cooler, within holding times, to the Babcock Laboratories, Inc., accompanied by a completed chain-of-custody (COCs).
FIELD OBSERVATIONS: Following the February 14th, 2019 storm, excavations continued at Leach Canyon Dam in order to return the facility to the designed debris storage capacity. Upon arrival on March 1, 2019, District staff observed large excavators and front-loaders transferring post-fire debris flow material to several dump trucks for transport behind the west toe of the dam, refer to Figure 4 and Figure 5. During the time of sampling, no flows were observed to be entering the basin from upstream. Due to maintenance crew activity at Leach Canyon Dam monitoring staff collected samples from the sediment stockpile drying area on the dam’s east toe (refer to Figure 2 and Figure 6). Appearance of the sediment showed variation of aggregate size, textures, organics (e.g., tree litter), consistency, and color.
1 USEPA Region 4 Science and Ecosystem Support Division (2007). Operating Procedure Soil Sampling, November 2007.
Page 9 |
Sediment Quantity and Nutrient Load Reduction Report 2018-2019 Leach Canyon Dam and McVicker Canyon Basin Prepared by Melissa Varela, Watershed Protection Division Riverside County Flood Control and Water Conservation District October 17, 2019
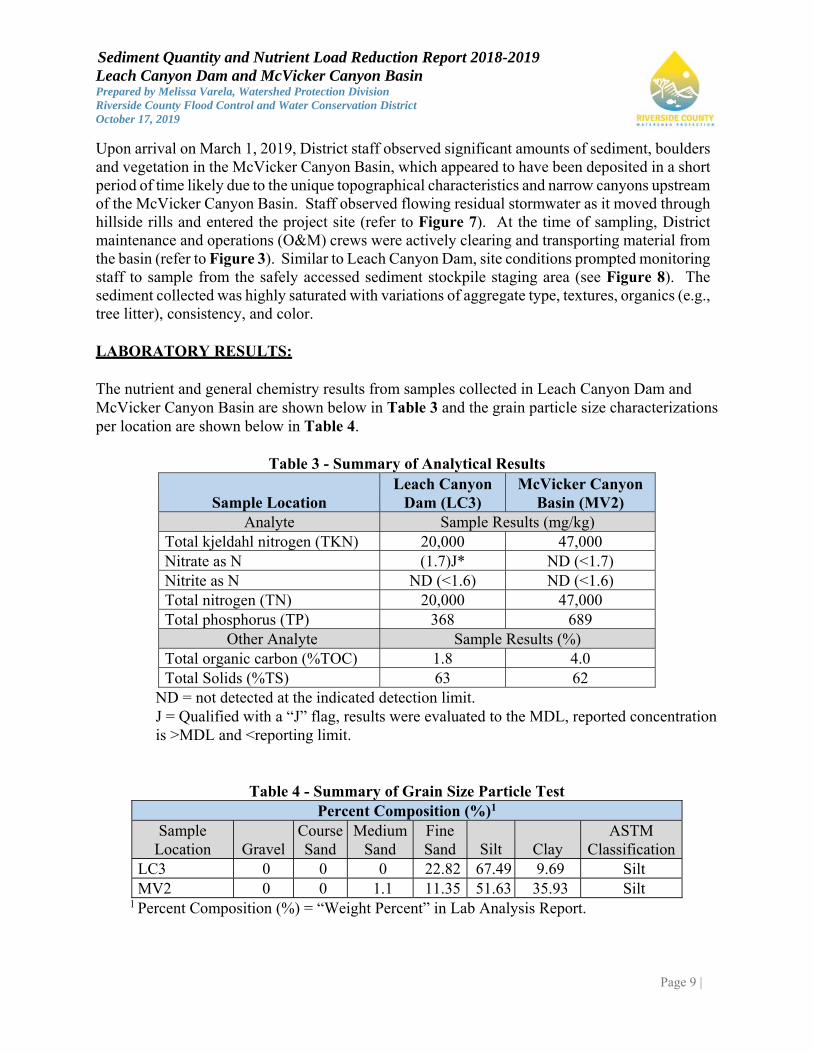
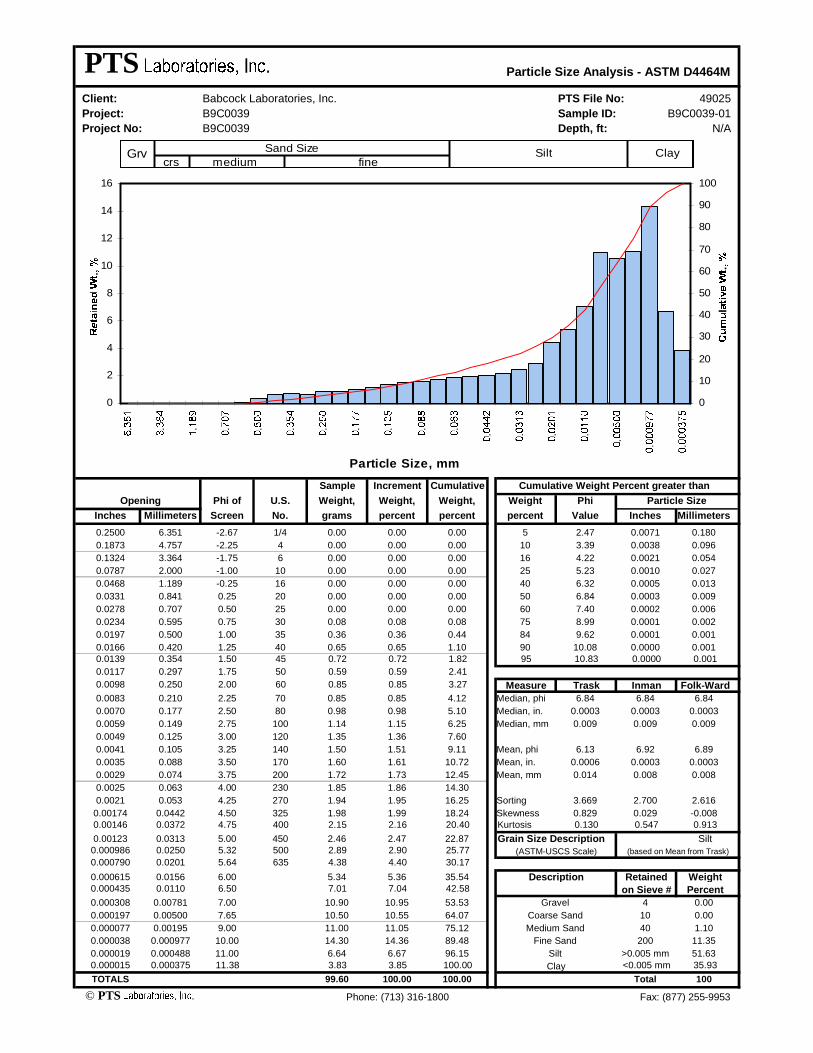
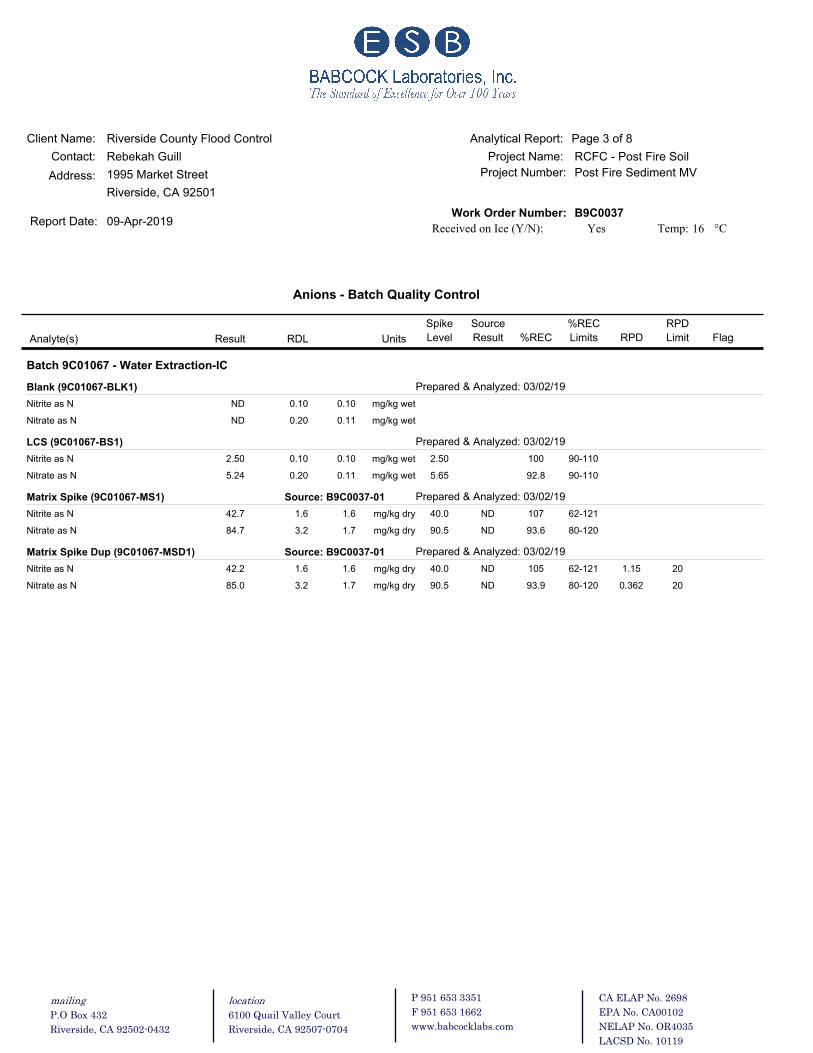
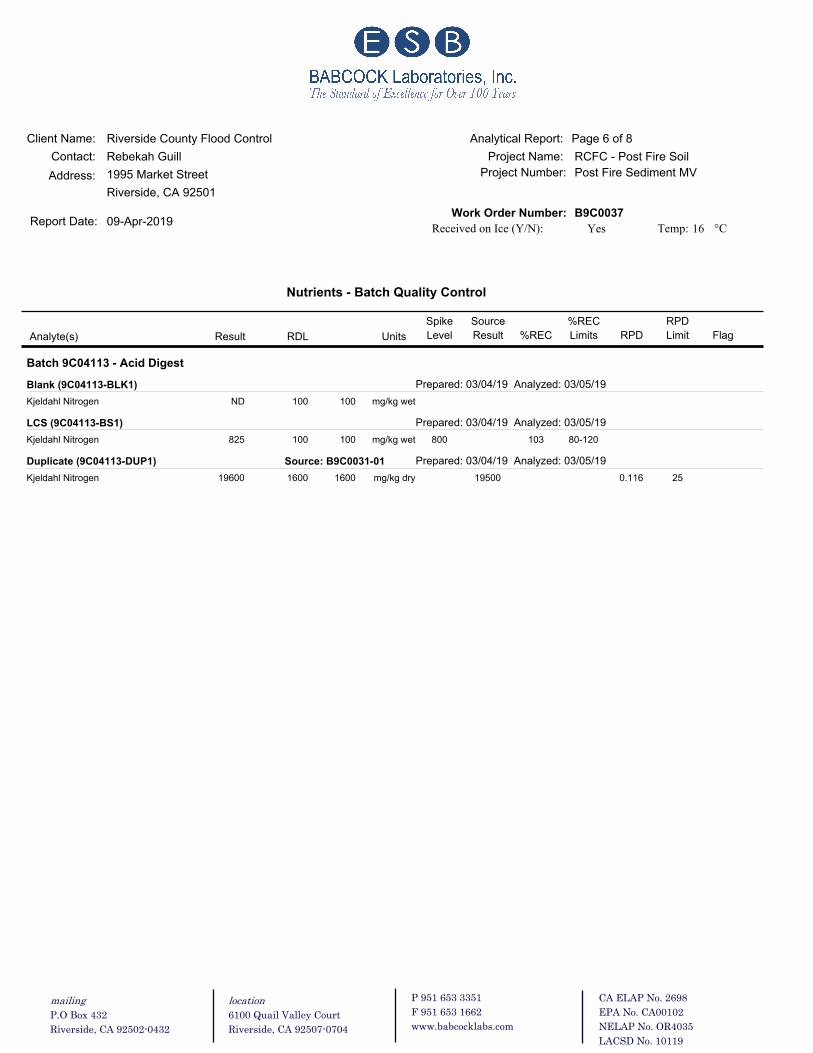
Upon arrival on March 1, 2019, District staff observed significant amounts of sediment, boulders and vegetation in the McVicker Canyon Basin, which appeared to have been deposited in a short period of time likely due to the unique topographical characteristics and narrow canyons upstream of the McVicker Canyon Basin. Staff observed flowing residual stormwater as it moved through hillside rills and entered the project site (refer to Figure 7). At the time of sampling, District maintenance and operations (O&M) crews were actively clearing and transporting material from the basin (refer to Figure 3). Similar to Leach Canyon Dam, site conditions prompted monitoring staff to sample from the safely accessed sediment stockpile staging area (see Figure 8). The sediment collected was highly saturated with variations of aggregate type, textures, organics (e.g., tree litter), consistency, and color. LABORATORY RESULTS: The nutrient and general chemistry results from samples collected in Leach Canyon Dam and McVicker Canyon Basin are shown below in Table 3 and the grain particle size characterizations per location are shown below in Table 4.
Table 3 - Summary of Analytical Results
Sample Location Leach Canyon
Dam (LC3) McVicker Canyon
Basin (MV2) Analyte Sample Results (mg/kg)
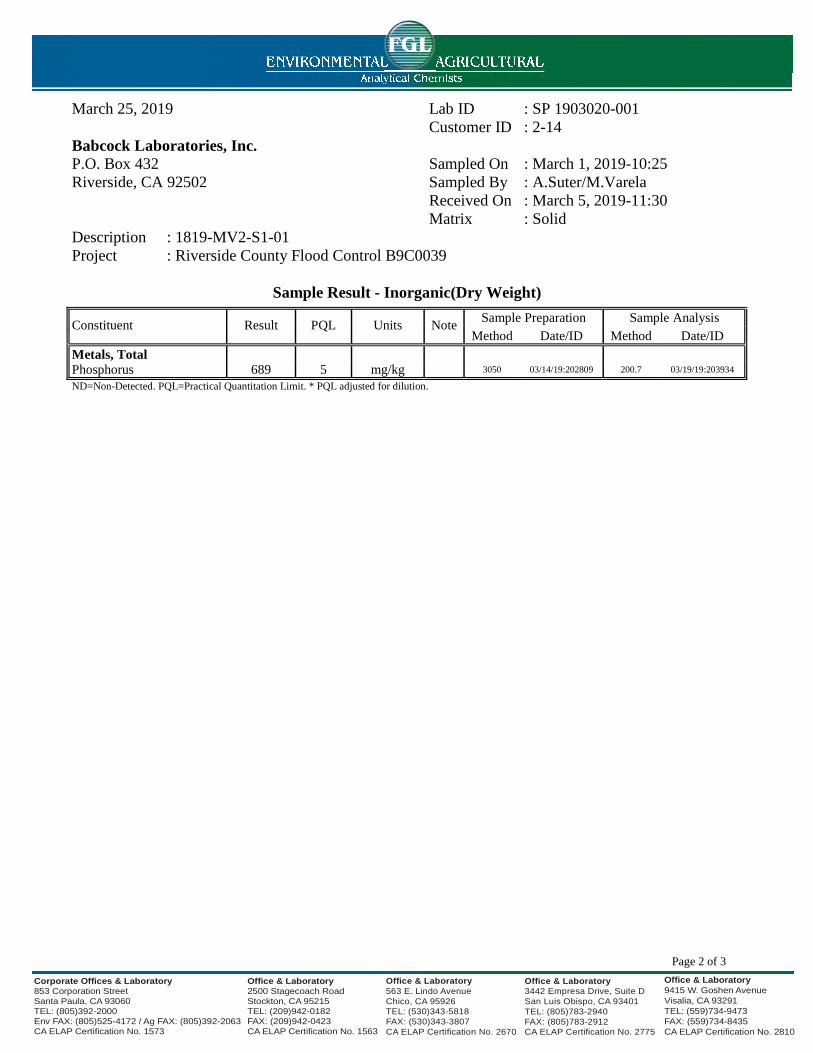
Total kjeldahl nitrogen (TKN) 20,000 47,000 Nitrate as N (1.7)J* ND (<1.7) Nitrite as N ND (<1.6) ND (<1.6) Total nitrogen (TN) 20,000 47,000 Total phosphorus (TP) 368 689
Other Analyte Sample Results (%) Total organic carbon (%TOC) 1.8 4.0 Total Solids (%TS) 63 62
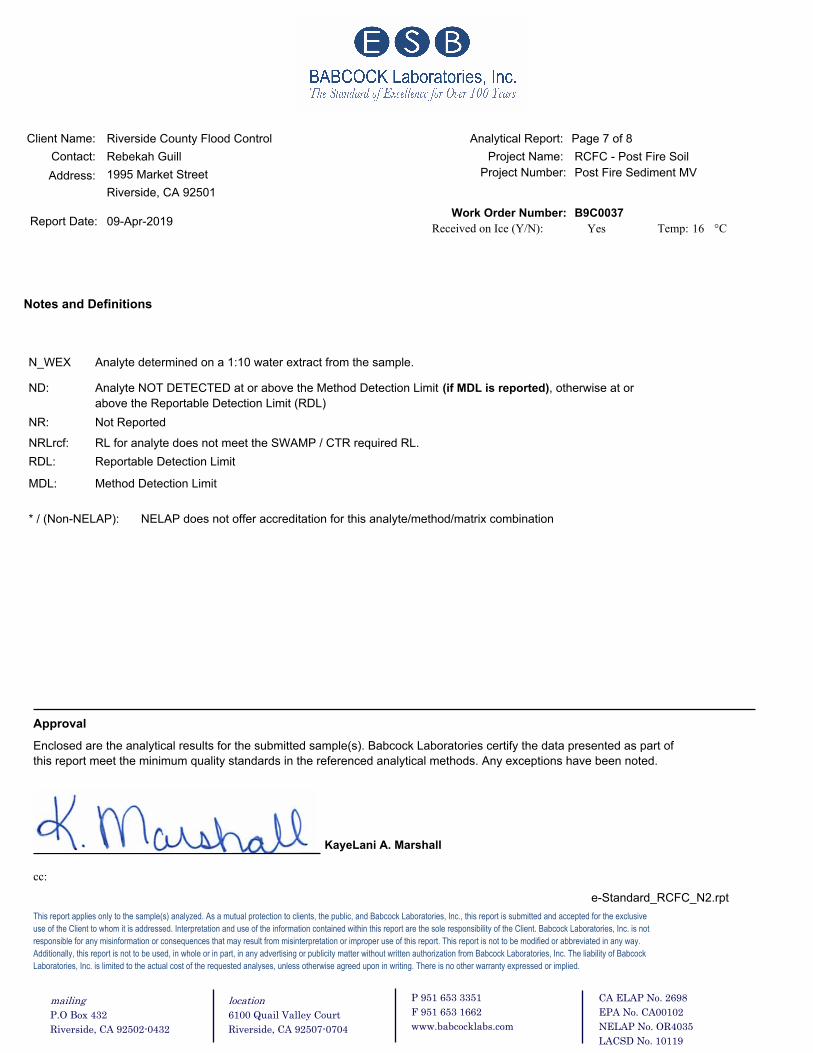
ND = not detected at the indicated detection limit. J = Qualified with a “J” flag, results were evaluated to the MDL, reported concentration is >MDL and <reporting limit.
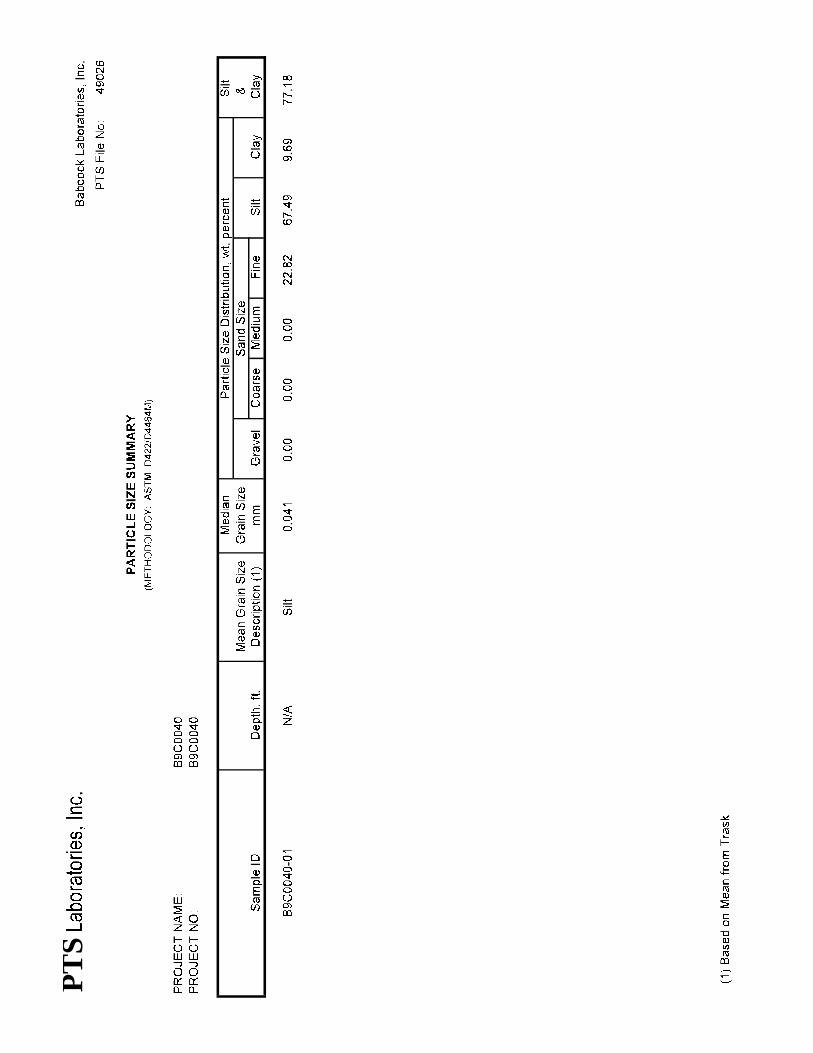
Table 4 - Summary of Grain Size Particle Test Percent Composition (%)1
Sample Location Gravel
Course Sand
Medium Sand
Fine Sand Silt Clay
ASTM Classification
LC3 0 0 0 22.82 67.49 9.69 Silt MV2 0 0 1.1 11.35 51.63 35.93 Silt
1 Percent Composition (%) = “Weight Percent” in Lab Analysis Report.
Page 10 |
Sediment Quantity and Nutrient Load Reduction Report 2018-2019 Leach Canyon Dam and McVicker Canyon Basin Prepared by Melissa Varela, Watershed Protection Division Riverside County Flood Control and Water Conservation District October 17, 2019
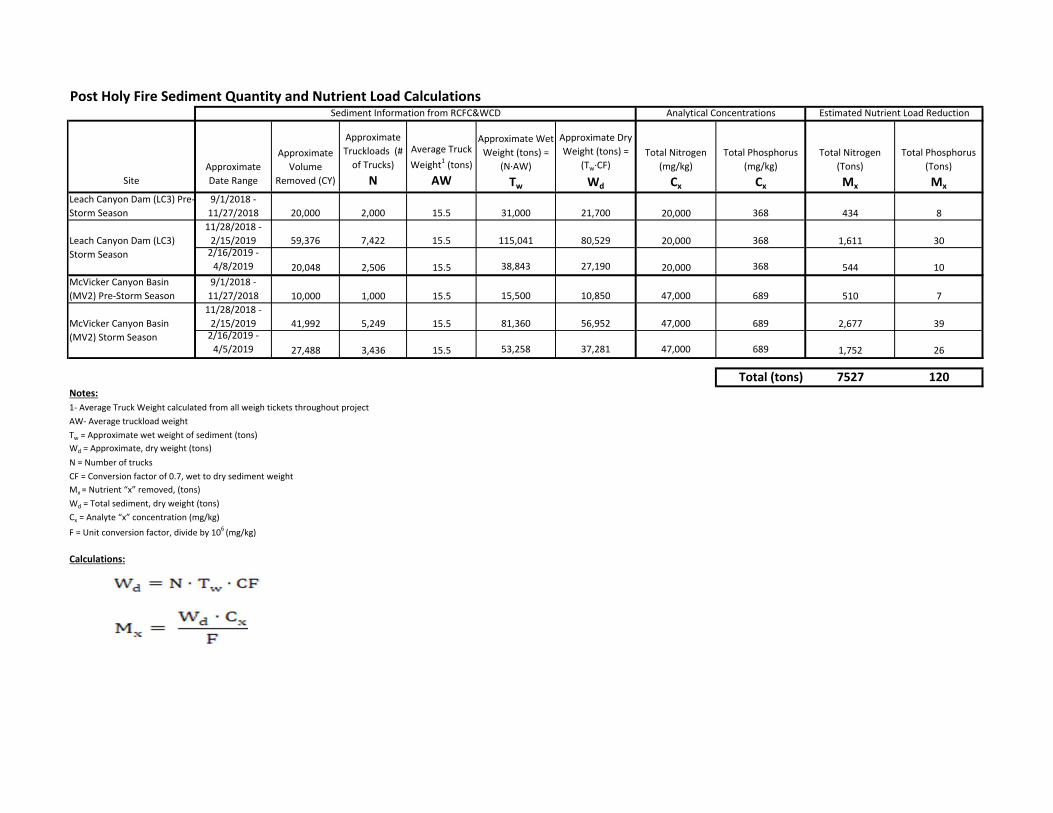
SEDIMENT DATA RESULTS: The District used a standardized formula to estimate the total mass of sediment removed from Leach Canyon Dam and McVicker Canyon Basin during the sediment removal activities from September 2018 to April 2019. In addition, the District used the nutrient concentrations to estimate the total load of nutrients removed in the sediment. District facility from September 2018 to April 2019, District staff recorded the following sediment removal metrics from each site location per month:
Total wet sediment volume removed (cubic yards); Number of truckloads (# of trucks); Average wet sediment weight per single truckload (tons)
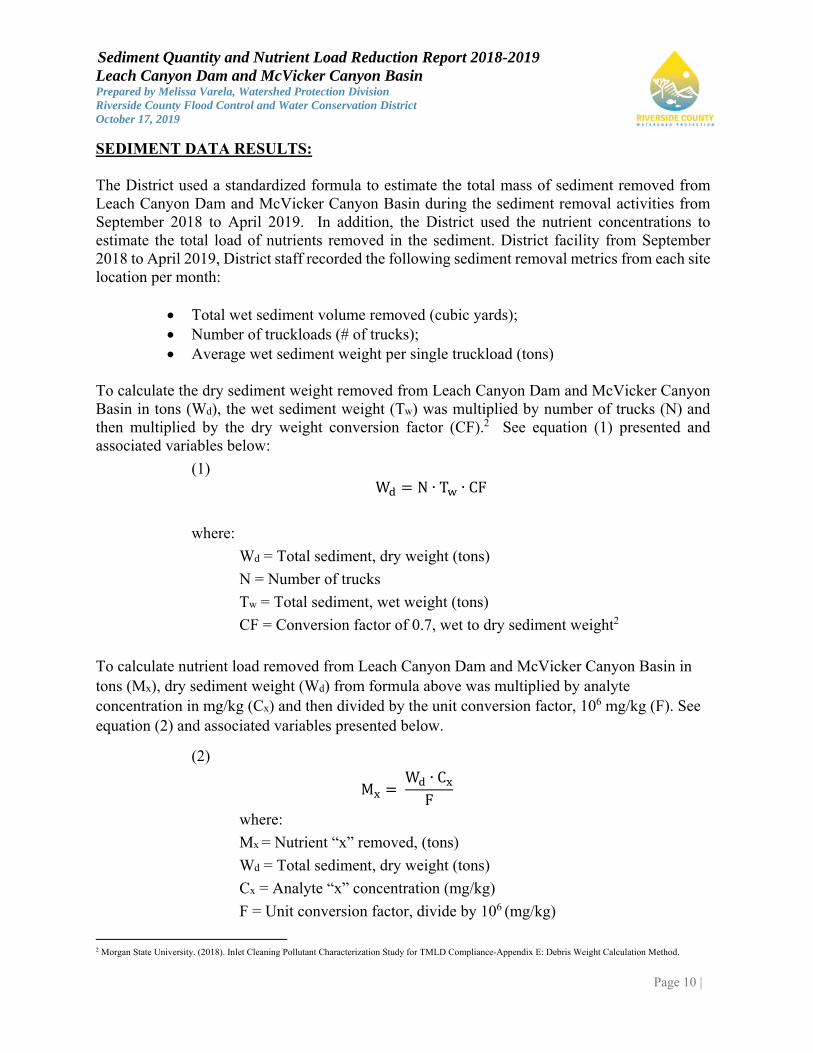
To calculate the dry sediment weight removed from Leach Canyon Dam and McVicker Canyon Basin in tons (Wd), the wet sediment weight (Tw) was multiplied by number of trucks (N) and then multiplied by the dry weight conversion factor (CF).2 See equation (1) presented and associated variables below:
(1) W N ∙ T ∙ CF
where:
Wd = Total sediment, dry weight (tons)
N = Number of trucks
Tw = Total sediment, wet weight (tons)
CF = Conversion factor of 0.7, wet to dry sediment weight2
To calculate nutrient load removed from Leach Canyon Dam and McVicker Canyon Basin in tons (Mx), dry sediment weight (Wd) from formula above was multiplied by analyte concentration in mg/kg (Cx) and then divided by the unit conversion factor, 106 mg/kg (F). See equation (2) and associated variables presented below.
(2)
M W ∙ C
F
where:
Mx = Nutrient “x” removed, (tons)
Wd = Total sediment, dry weight (tons)
Cx = Analyte “x” concentration (mg/kg)
F = Unit conversion factor, divide by 106 (mg/kg)
2 Morgan State University. (2018). Inlet Cleaning Pollutant Characterization Study for TMLD Compliance-Appendix E: Debris Weight Calculation Method.
Page 11 |
Sediment Quantity and Nutrient Load Reduction Report 2018-2019 Leach Canyon Dam and McVicker Canyon Basin Prepared by Melissa Varela, Watershed Protection Division Riverside County Flood Control and Water Conservation District October 17, 2019
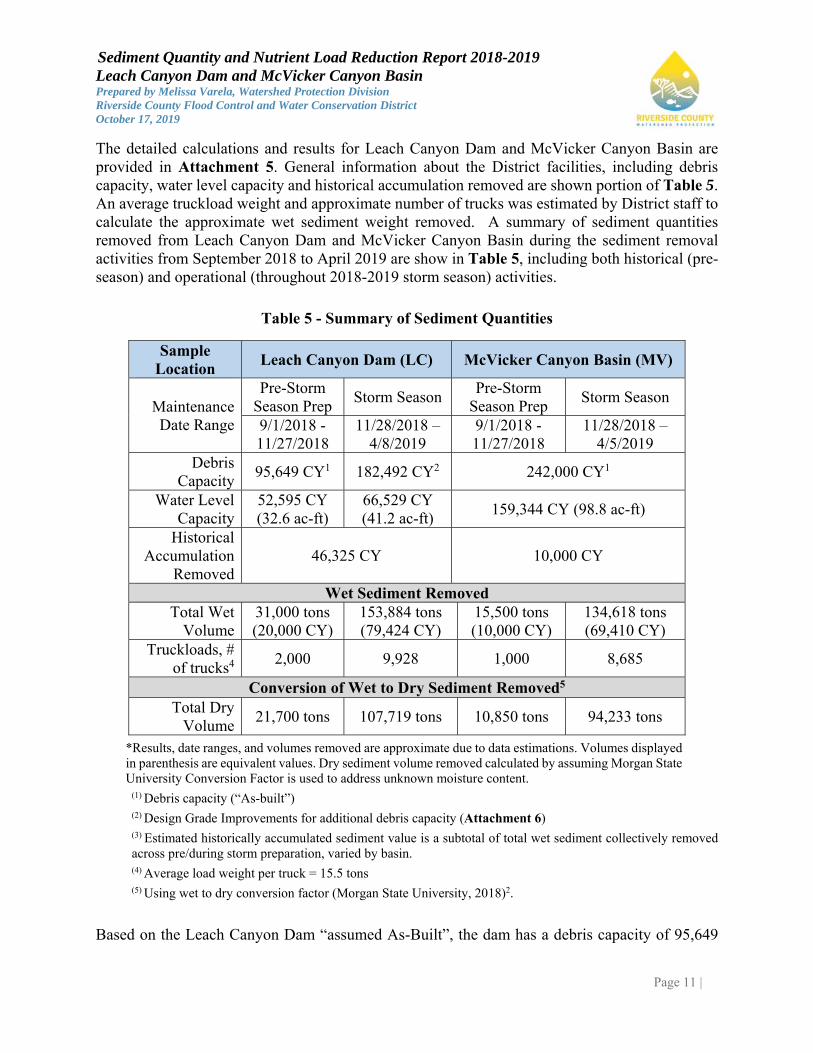
The detailed calculations and results for Leach Canyon Dam and McVicker Canyon Basin are provided in Attachment 5. General information about the District facilities, including debris capacity, water level capacity and historical accumulation removed are shown portion of Table 5. An average truckload weight and approximate number of trucks was estimated by District staff to calculate the approximate wet sediment weight removed. A summary of sediment quantities removed from Leach Canyon Dam and McVicker Canyon Basin during the sediment removal activities from September 2018 to April 2019 are show in Table 5, including both historical (pre-season) and operational (throughout 2018-2019 storm season) activities.
Table 5 - Summary of Sediment Quantities
Sample Location
Leach Canyon Dam (LC) McVicker Canyon Basin (MV)
Maintenance Date Range
Pre-Storm Season Prep
Storm Season Pre-Storm
Season Prep Storm Season
9/1/2018 - 11/27/2018
11/28/2018 – 4/8/2019
9/1/2018 - 11/27/2018
11/28/2018 – 4/5/2019
Debris Capacity 95,649 CY1 182,492 CY2 242,000 CY1
Water Level Capacity
52,595 CY (32.6 ac-ft)
66,529 CY (41.2 ac-ft)
159,344 CY (98.8 ac-ft)
Historical Accumulation
Removed 46,325 CY 10,000 CY
Wet Sediment Removed Total Wet
Volume 31,000 tons (20,000 CY)
153,884 tons (79,424 CY)
15,500 tons (10,000 CY)
134,618 tons (69,410 CY)
Truckloads, # of trucks4
2,000 9,928 1,000 8,685
Conversion of Wet to Dry Sediment Removed5 Total Dry
Volume 21,700 tons 107,719 tons 10,850 tons 94,233 tons
*Results, date ranges, and volumes removed are approximate due to data estimations. Volumes displayed in parenthesis are equivalent values. Dry sediment volume removed calculated by assuming Morgan State University Conversion Factor is used to address unknown moisture content.
(1) Debris capacity (“As-built”) (2) Design Grade Improvements for additional debris capacity (Attachment 6) (3) Estimated historically accumulated sediment value is a subtotal of total wet sediment collectively removed across pre/during storm preparation, varied by basin. (4) Average load weight per truck = 15.5 tons (5) Using wet to dry conversion factor (Morgan State University, 2018)2.
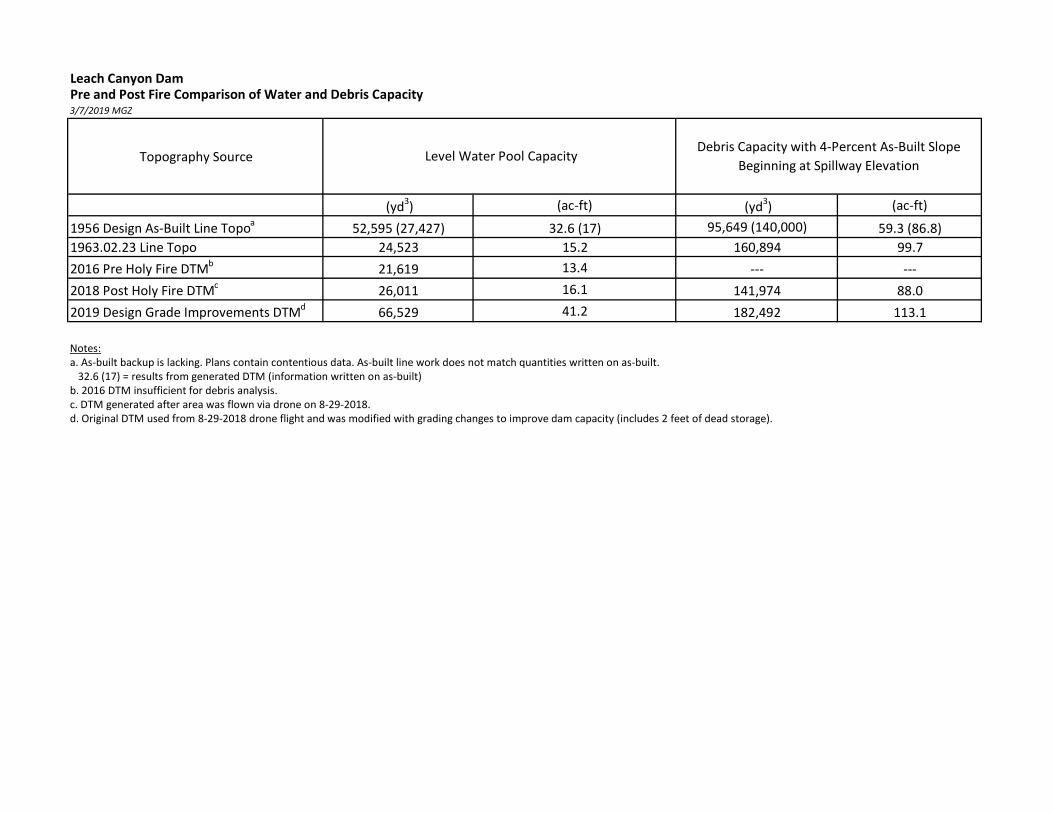
Based on the Leach Canyon Dam “assumed As-Built”, the dam has a debris capacity of 95,649
Page 12 |
Sediment Quantity and Nutrient Load Reduction Report 2018-2019 Leach Canyon Dam and McVicker Canyon Basin Prepared by Melissa Varela, Watershed Protection Division Riverside County Flood Control and Water Conservation District October 17, 2019
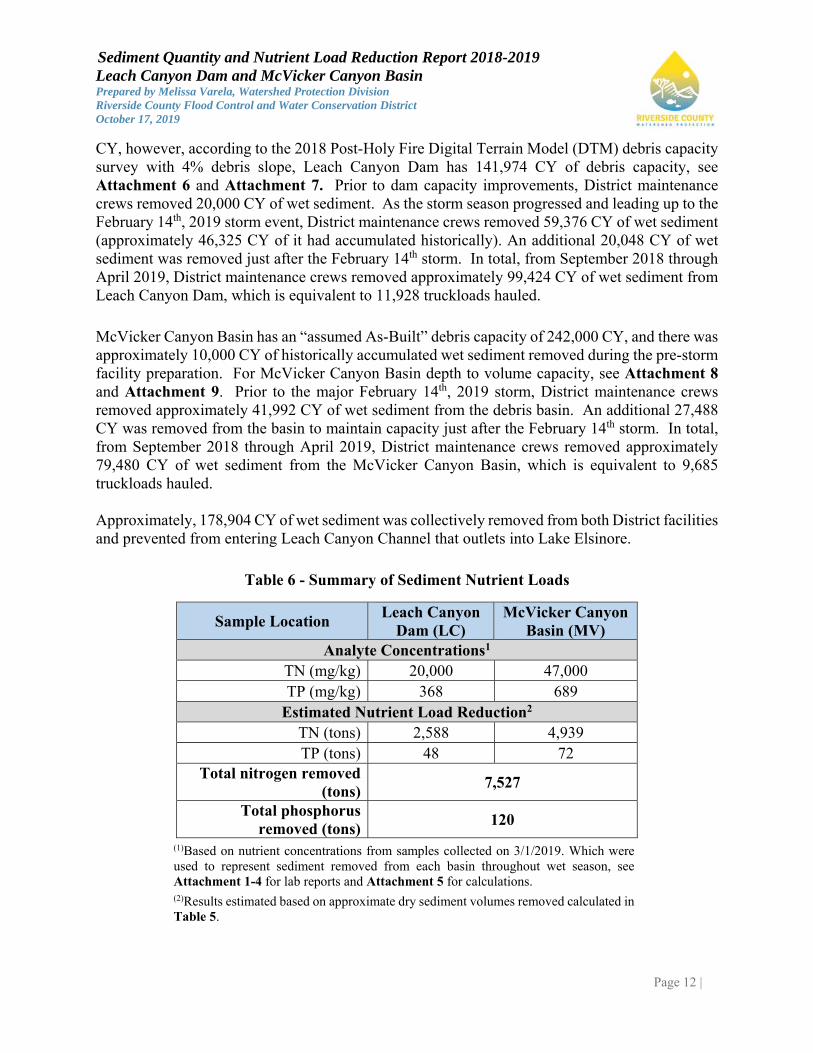
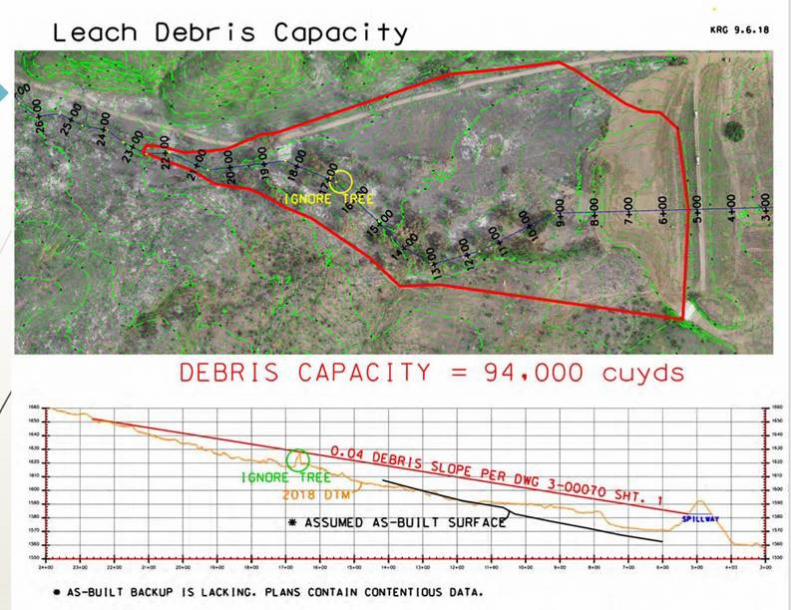
CY, however, according to the 2018 Post-Holy Fire Digital Terrain Model (DTM) debris capacity survey with 4% debris slope, Leach Canyon Dam has 141,974 CY of debris capacity, see Attachment 6 and Attachment 7. Prior to dam capacity improvements, District maintenance crews removed 20,000 CY of wet sediment. As the storm season progressed and leading up to the February 14th, 2019 storm event, District maintenance crews removed 59,376 CY of wet sediment (approximately 46,325 CY of it had accumulated historically). An additional 20,048 CY of wet sediment was removed just after the February 14th storm. In total, from September 2018 through April 2019, District maintenance crews removed approximately 99,424 CY of wet sediment from Leach Canyon Dam, which is equivalent to 11,928 truckloads hauled.
McVicker Canyon Basin has an “assumed As-Built” debris capacity of 242,000 CY, and there was approximately 10,000 CY of historically accumulated wet sediment removed during the pre-storm facility preparation. For McVicker Canyon Basin depth to volume capacity, see Attachment 8 and Attachment 9. Prior to the major February 14th, 2019 storm, District maintenance crews removed approximately 41,992 CY of wet sediment from the debris basin. An additional 27,488 CY was removed from the basin to maintain capacity just after the February 14th storm. In total, from September 2018 through April 2019, District maintenance crews removed approximately 79,480 CY of wet sediment from the McVicker Canyon Basin, which is equivalent to 9,685 truckloads hauled. Approximately, 178,904 CY of wet sediment was collectively removed from both District facilities and prevented from entering Leach Canyon Channel that outlets into Lake Elsinore.
Table 6 - Summary of Sediment Nutrient Loads
Sample Location Leach Canyon
Dam (LC) McVicker Canyon
Basin (MV) Analyte Concentrations1
TN (mg/kg) 20,000 47,000 TP (mg/kg) 368 689
Estimated Nutrient Load Reduction2
TN (tons) 2,588 4,939 TP (tons) 48 72
Total nitrogen removed (tons)
7,527
Total phosphorus removed (tons)
120
(1)Based on nutrient concentrations from samples collected on 3/1/2019. Which were used to represent sediment removed from each basin throughout wet season, see Attachment 1-4 for lab reports and Attachment 5 for calculations. (2)Results estimated based on approximate dry sediment volumes removed calculated in Table 5.
Page 13 |
Sediment Quantity and Nutrient Load Reduction Report 2018-2019 Leach Canyon Dam and McVicker Canyon Basin Prepared by Melissa Varela, Watershed Protection Division Riverside County Flood Control and Water Conservation District October 17, 2019
Using the nutrient concentrations reported and estimated sediment volume removed from the basins, District staff determined that approximately 7,527 (dry tons) of Total nitrogen and 120 (dry tons) of Total phosphorus were collectively removed from Leach Canyon Dam and McVicker Canyon Basin, see Table 6 above for nutrient data summary.
CONCLUSIONS:
Overall, this study suggests that a significant amount of nutrient and sediment loads were removed from both District facilities between September 2018 and April 2019 in order to improve and maintain overall debris capacity, capture eroding sediment mobilized by major rain events, protect downstream communities, and prevent further impacts to a receiving water listed as “impaired” for nutrients and low dissolved oxygen.
ATTACHMENTS:
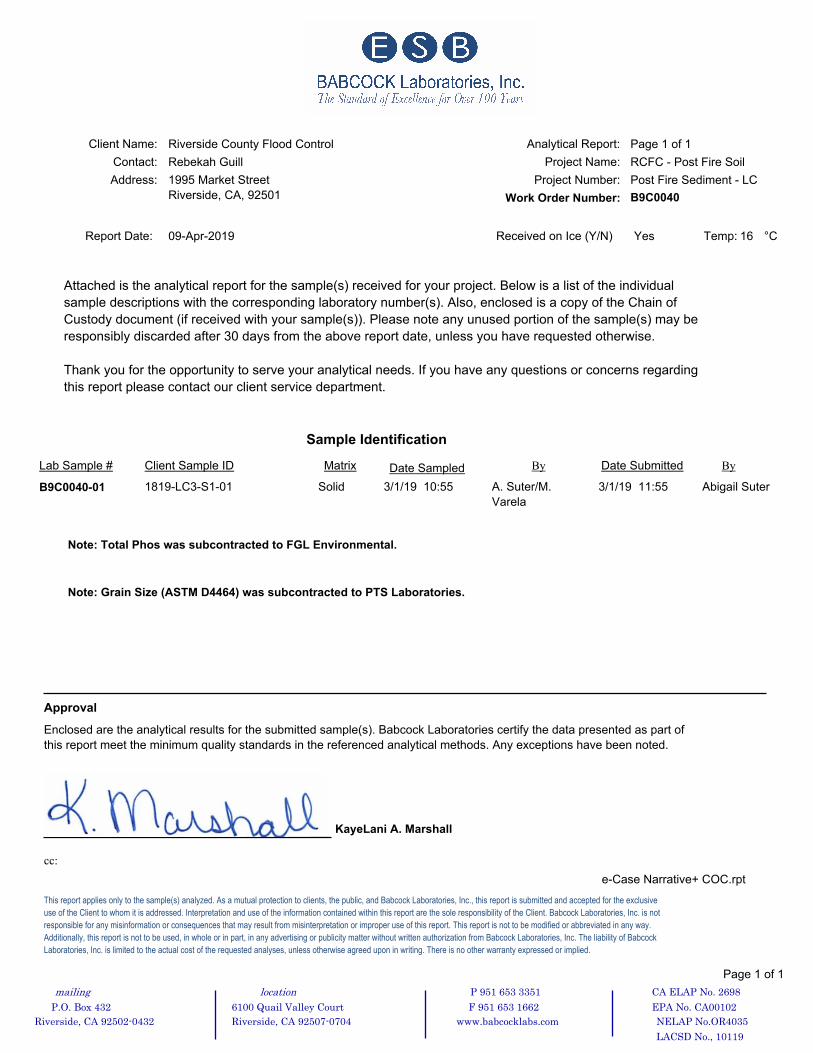
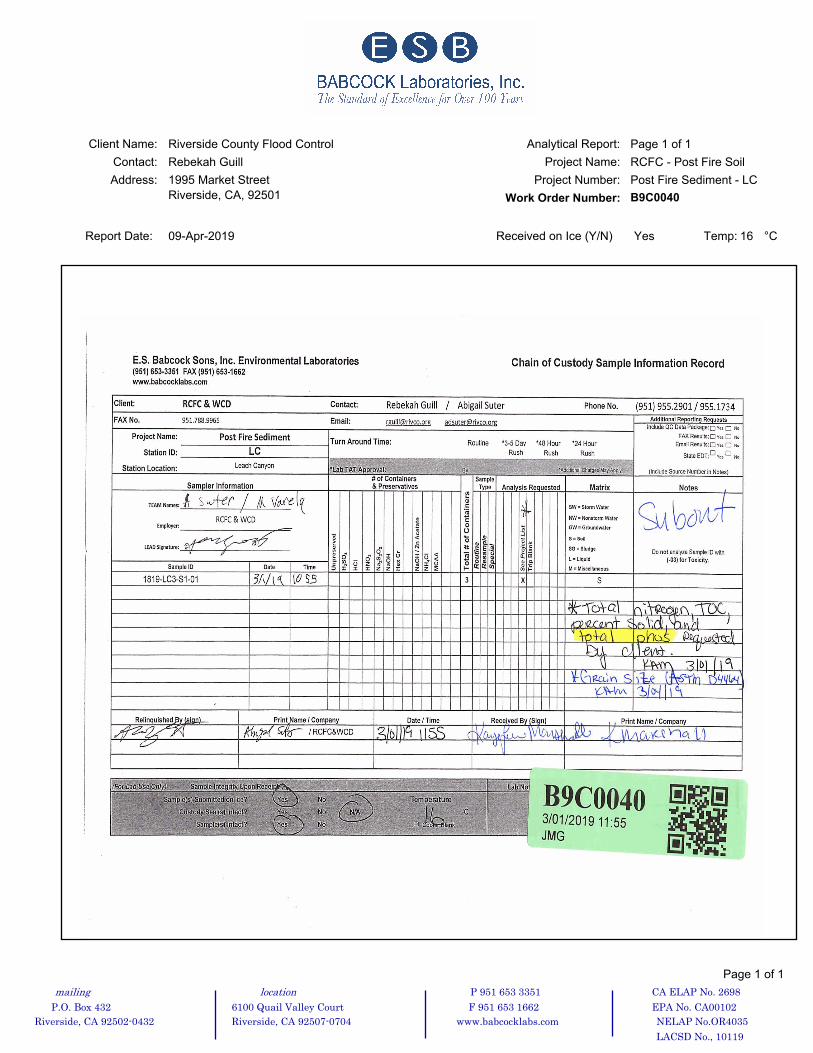
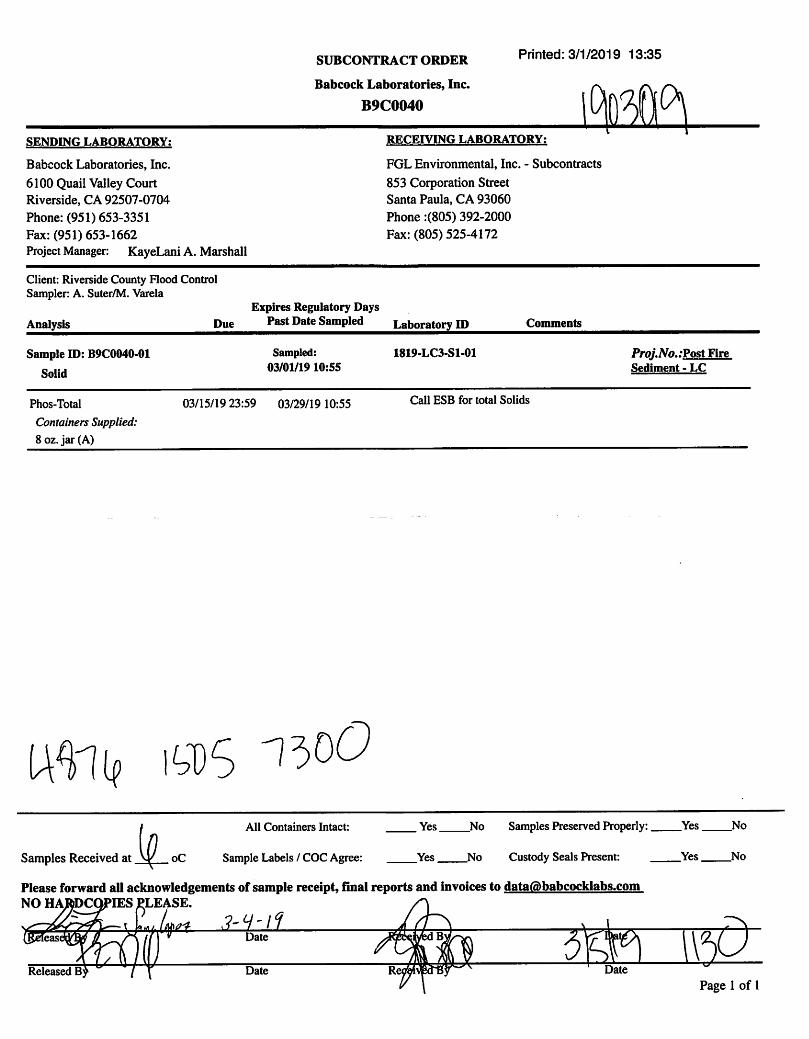
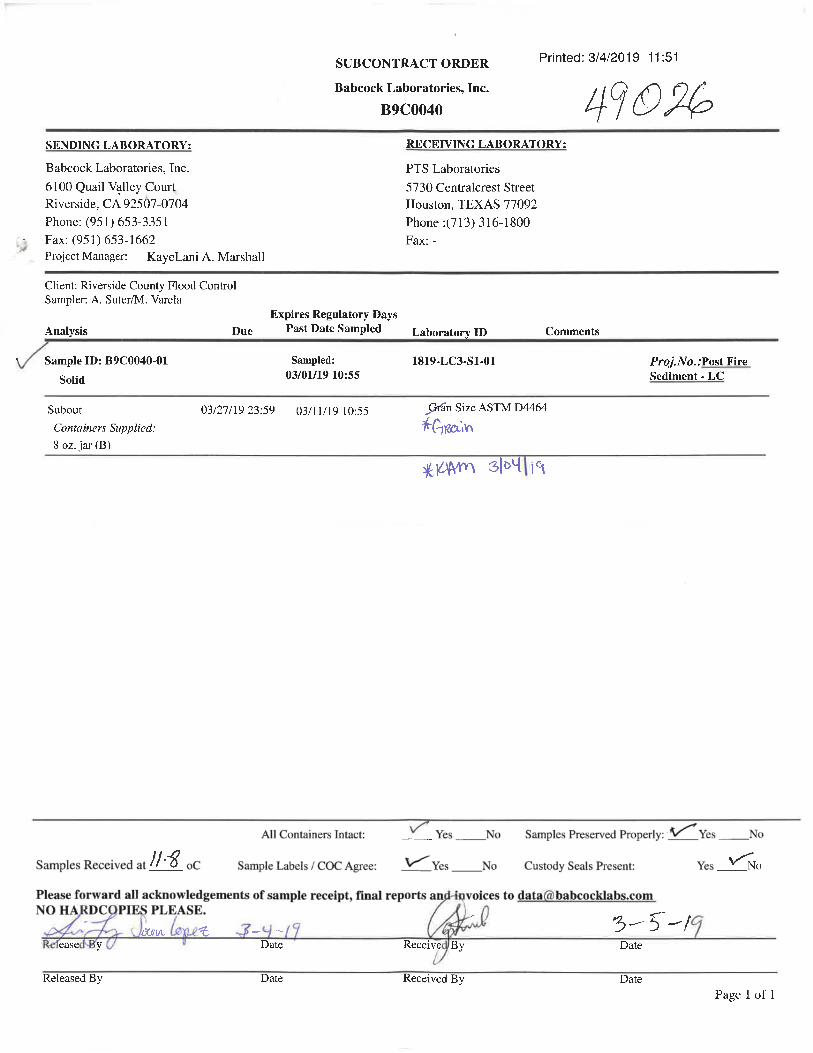
Attachment 1: Babcock Analytical Results – LC3 (TP/Grain Size Test), 4/9/19 (B9C0040-01)
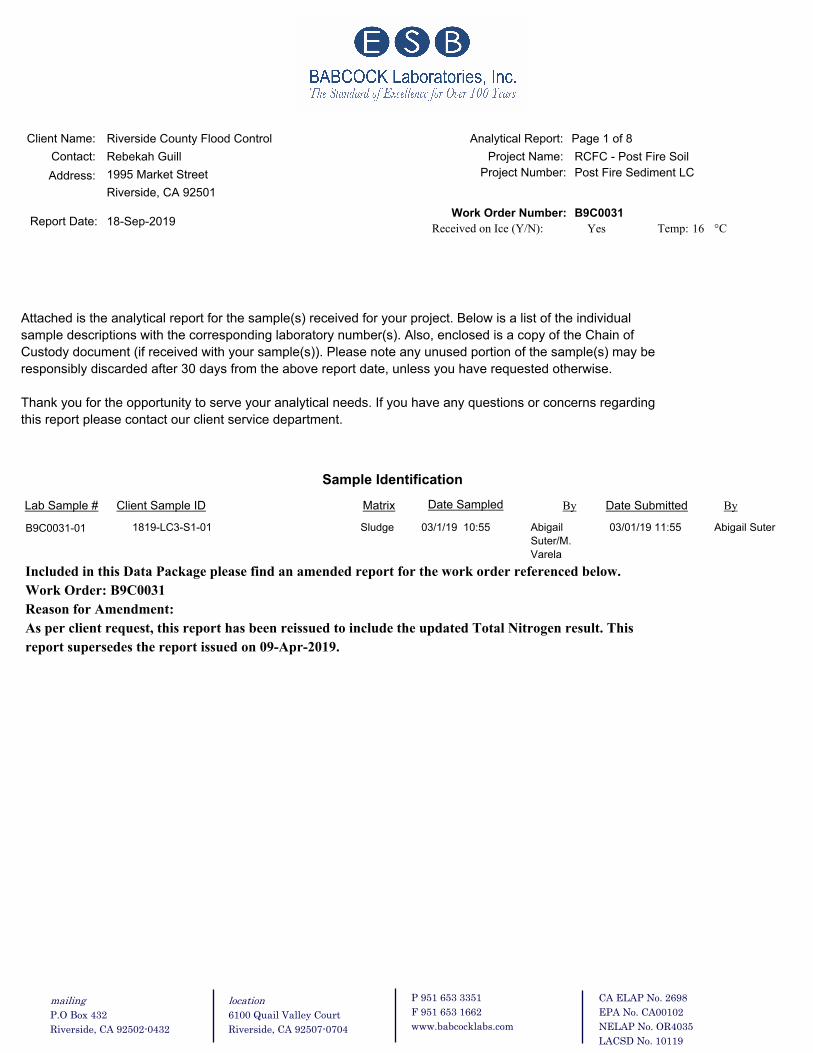
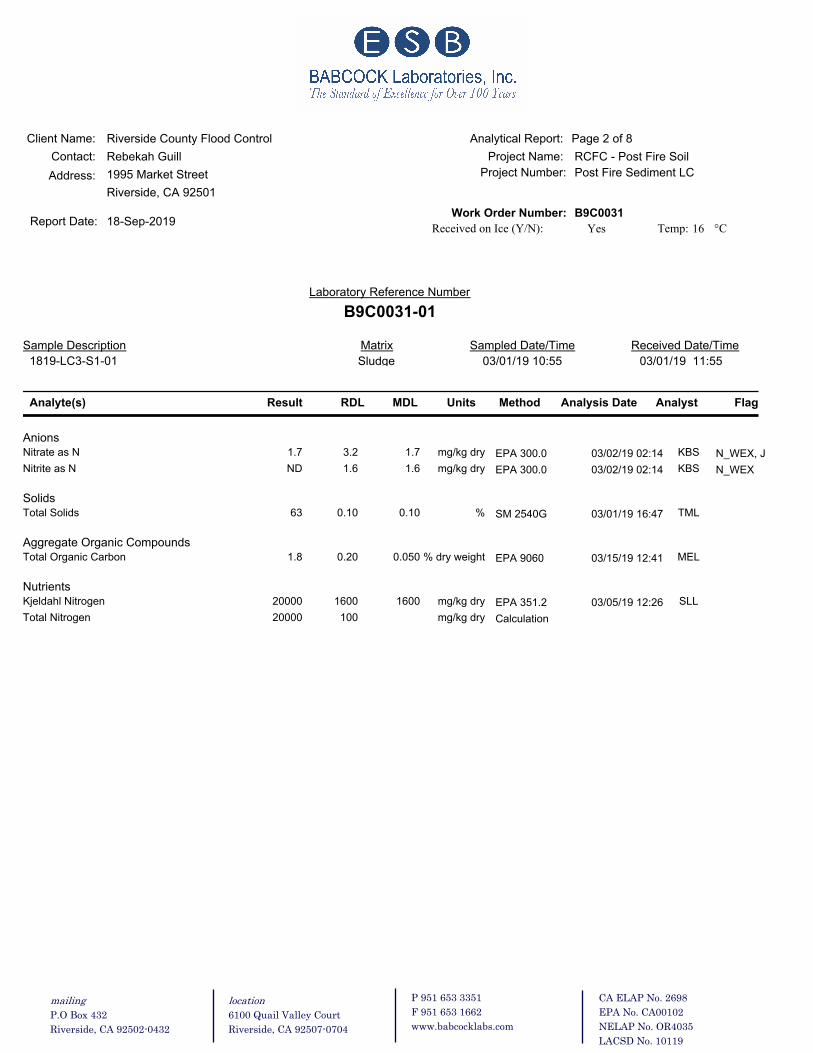
Attachment 2: Babcock Analytical Results – LC3 (General/Nutrients), 9/18/19 (B9C0031) Revised-0101
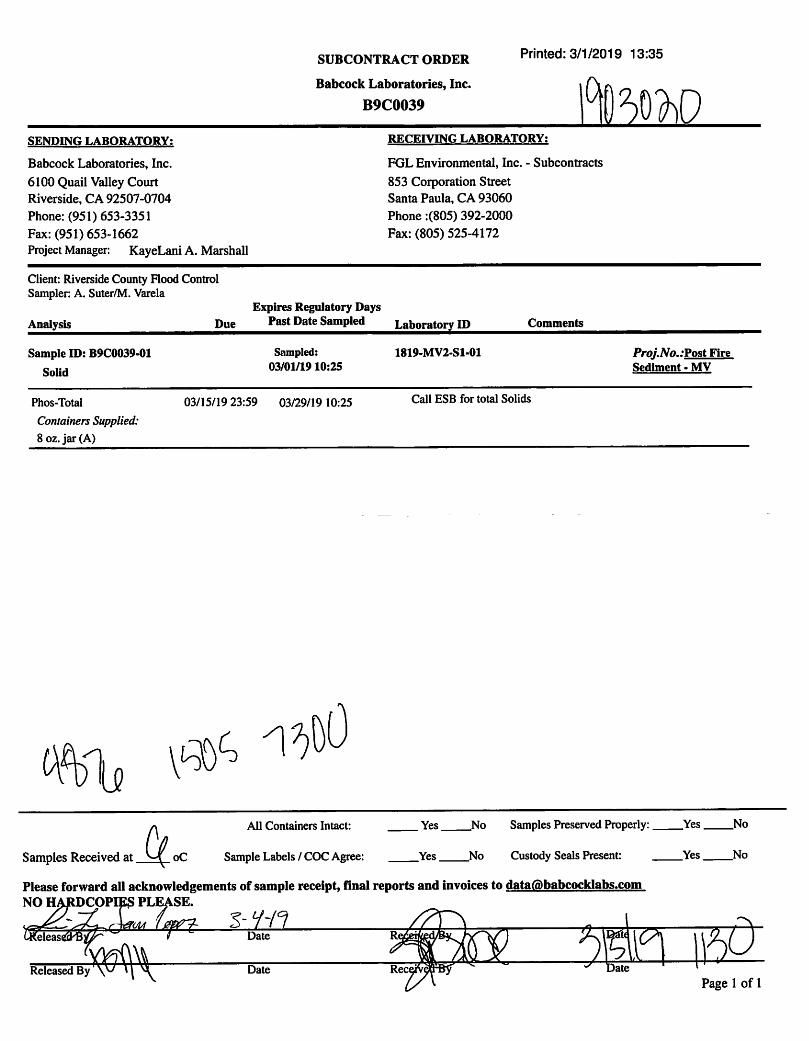
Attachment 3: Babcock Analytical Results – MV2 (TP/Grain Size Test), 4/9/19 (B9C0039-01)
Attachment 4: Babcock Analytical Results – MV2 (General/Nutrients), 4/9/19 (B9C0037-01)
Attachment 5: Post Holy Fire Sediment Quantity and Nutrient Load Calculations
Attachment 6: Leach Canyon Dam Pre and Post Fire Comparison of Water and Debris Capacity
Attachment 7: Leach Canyon Debris Capacity
Attachment 8: McVicker Depth to Volume Capacity
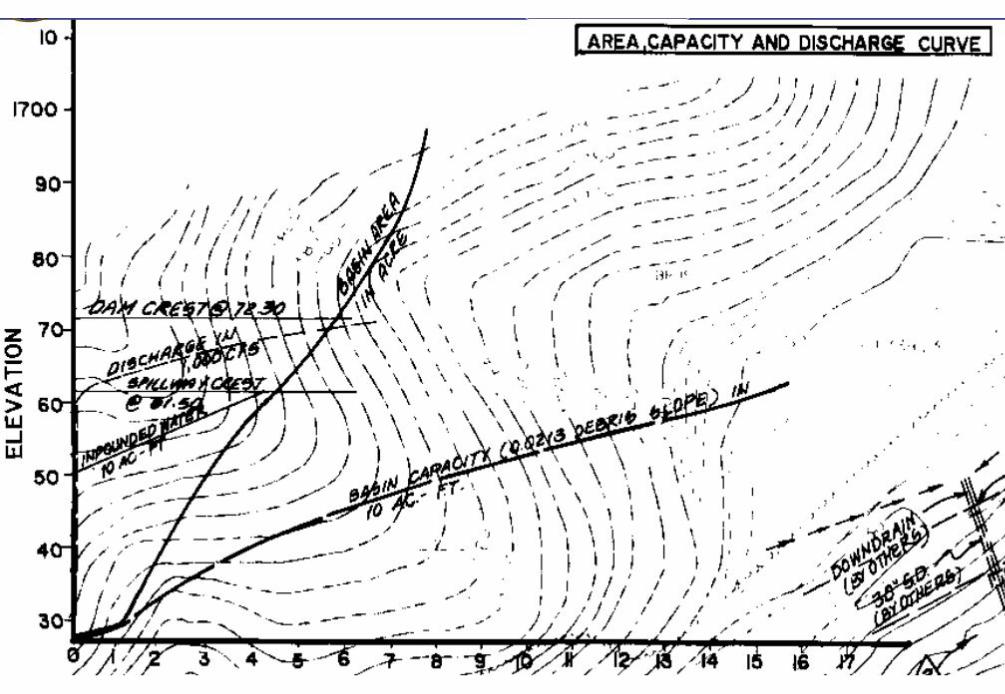
Attachment 9: McVicker Capacity Curve
Work Order Number:
Report Date: 09-Apr-2019
Contact:
Client Name:
Address:
Project Name:
Page 1 of 1Analytical Report:
Project Number:
°C 16Temp:YesReceived on Ice (Y/N)
1995 Market Street
Riverside, CA, 92501
Riverside County Flood Control
Rebekah Guill RCFC - Post Fire Soil
Post Fire Sediment - LC
B9C0040
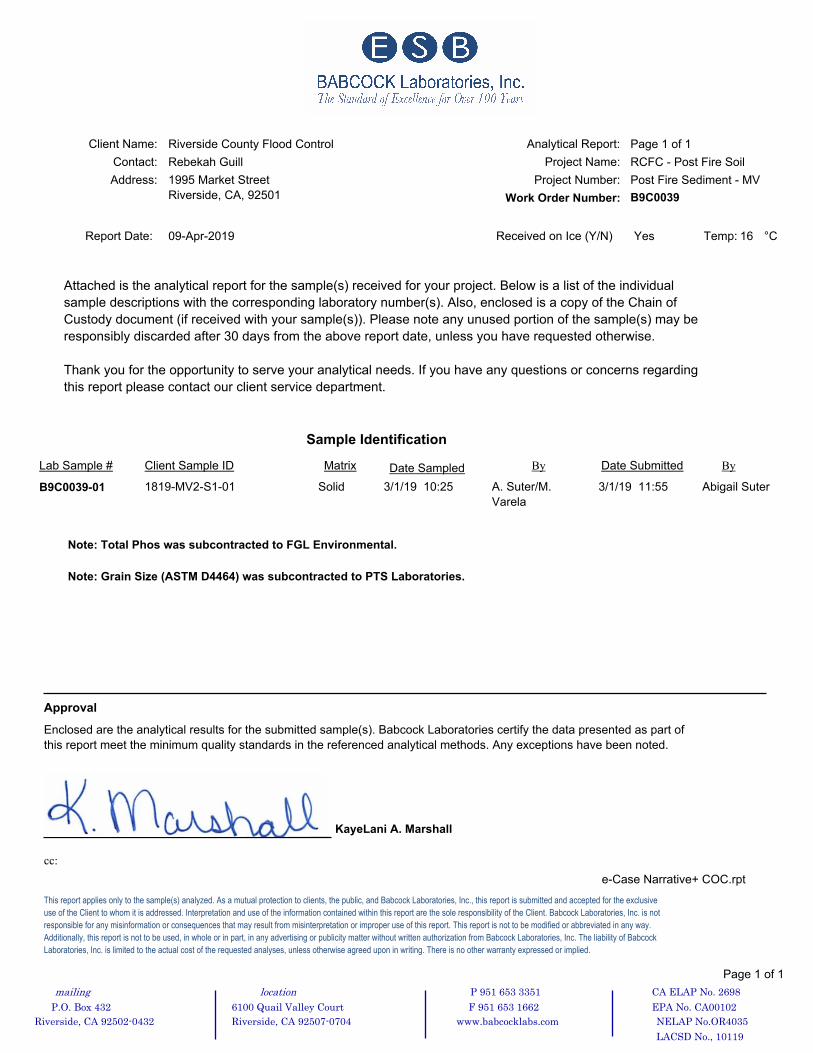
Attached is the analytical report for the sample(s) received for your project. Below is a list of the individual
sample descriptions with the corresponding laboratory number(s). Also, enclosed is a copy of the Chain of
Custody document (if received with your sample(s)). Please note any unused portion of the sample(s) may be
responsibly discarded after 30 days from the above report date, unless you have requested otherwise.
Thank you for the opportunity to serve your analytical needs. If you have any questions or concerns regarding
this report please contact our client service department.
Lab Sample # Client Sample ID Matrix Date Sampled
Sample Identification
Date SubmittedBy By
B9C0040-01 1819-LC3-S1-01 Solid 3/1/19 10:55 A. Suter/M.
Varela
3/1/19 11:55 Abigail Suter
Note: Total Phos was subcontracted to FGL Environmental.
Note: Grain Size (ASTM D4464) was subcontracted to PTS Laboratories.
e-Case Narrative+ COC.rpt
This report applies only to the sample(s) analyzed. As a mutual protection to clients, the public, and Babcock Laboratories, Inc., this report is submitted and accepted for the exclusive
use of the Client to whom it is addressed. Interpretation and use of the information contained within this report are the sole responsibility of the Client. Babcock Laboratories, Inc. is not
responsible for any misinformation or consequences that may result from misinterpretation or improper use of this report. This report is not to be modified or abbreviated in any way.
Additionally, this report is not to be used, in whole or in part, in any advertising or publicity matter without written authorization from Babcock Laboratories, Inc. The liability of Babcock
Laboratories, Inc. is limited to the actual cost of the requested analyses, unless otherwise agreed upon in writing. There is no other warranty expressed or implied.
Enclosed are the analytical results for the submitted sample(s). Babcock Laboratories certify the data presented as part of
this report meet the minimum quality standards in the referenced analytical methods. Any exceptions have been noted.
Approval
cc:
KayeLani A. Marshall
Page 1 of 1
mailing location P 951 653 3351 CA ELAP No. 2698
P.O. Box 432 6100 Quail Valley Court F 951 653 1662 EPA No. CA00102
Riverside, CA 92502-0432 Riverside, CA 92507-0704 www.babcocklabs.com NELAP No.OR4035
LACSD No., 10119
Work Order Number:
Report Date: 09-Apr-2019
Contact:
Client Name:
Address:
Project Name:
Page 1 of 1Analytical Report:
Project Number:
°C 16Temp:YesReceived on Ice (Y/N)
1995 Market Street
Riverside, CA, 92501
Riverside County Flood Control
Rebekah Guill RCFC - Post Fire Soil
Post Fire Sediment - LC
B9C0040
Page 1 of 1
mailing location P 951 653 3351 CA ELAP No. 2698
P.O. Box 432 6100 Quail Valley Court F 951 653 1662 EPA No. CA00102
Riverside, CA 92502-0432 Riverside, CA 92507-0704 www.babcocklabs.com NELAP No.OR4035
LACSD No., 10119

March 25, 2019
Babcock Laboratories, Inc. Lab ID : SP 1903019P.O. Box 432Riverside, CA 92502
Customer : 2-14
Laboratory ReportThis Page is to be Stamped
Introduction: This report package contains total of 3 pages divided into 3 sections:
Case Narrative (1 pages) : An overview of the work performed at FGL.Sample Results (1 page) : Results for each sample submitted.Quality Control (1 page) : Supporting Quality Control (QC) results.
Case Narrative
This Case Narrative pertains to the following samples:
Sample DescriptionDate
SampledDate
ReceivedFGL Lab ID # Matrix
1819-LC3-S1-01 03/01/2019 03/05/2019 SP 1903019-001 Sld
Sampling and Receipt Information: All samples were received in acceptable condition and withintemperature requirements, unless noted on the Condition Upon Receipt (CUR) form. All samples arrivedat 6 °C. All samples were prepared and analyzed within the method specified hold time. All sampleswere checked for pH if acid or base preservation is required (except for VOAs). For details of samplereceipt information, please see the attached Chain of Custody and Condition Upon Receipt Form.
Quality Control: All samples were prepared and analyzed according to the following tables:
Inorganic - Metals QC
200.7 03/19/2019:203934 All analysis quality controls are within established criteria.
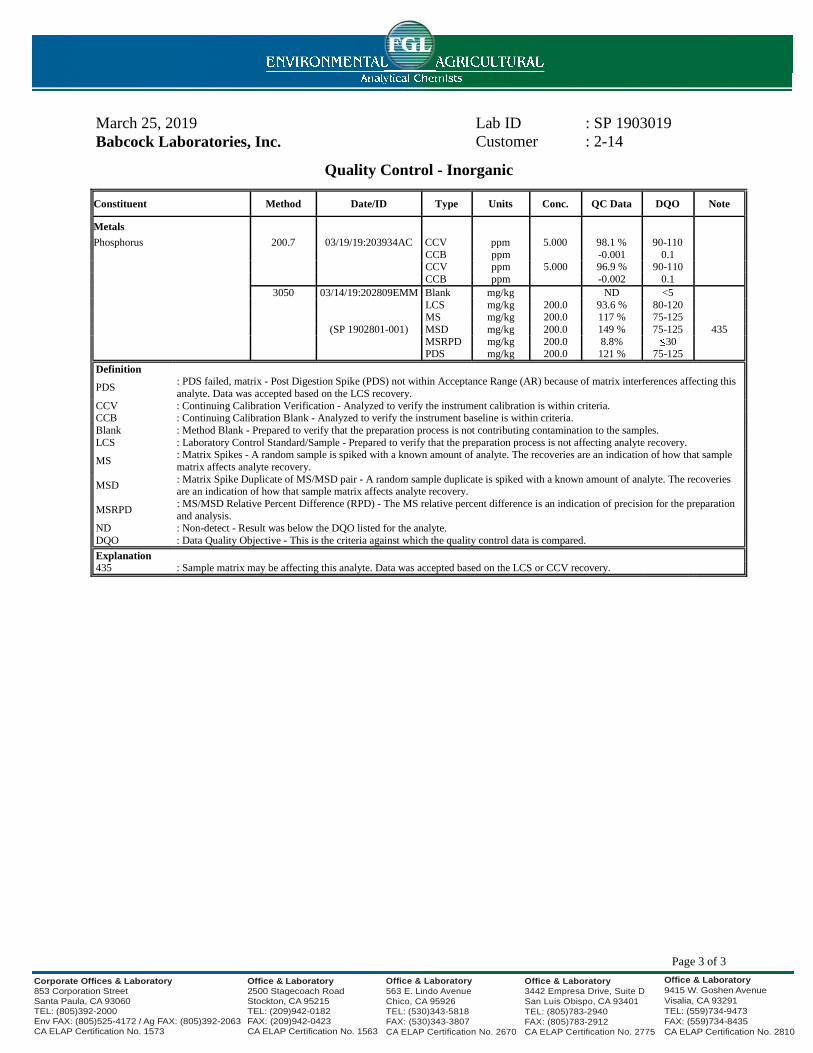
305003/14/2019:202809 All preparation quality controls are within established criteria, except:The following note applies to Phosphorus:435 Sample matrix may be affecting this analyte. Data was accepted based on the LCS or CCV recovery.
Certification:: I certify that this data package is in compliance with ELAP standards, both technicallyand for completeness, except for any conditions listed above. Release of the data contained in this datapackage is authorized by the Laboratory Director or his designee, as verified by the following electronicsignature.
KD:DMBDigitial Signature Stamp Y = 09.5
Corporate Offices & Laboratory853 Corporation StreetSanta Paula, CA 93060TEL: (805)392-2000Env FAX: (805)525-4172 / Ag FAX: (805)392-2063CA ELAP Certification No. 1573
Office & Laboratory2500 Stagecoach RoadStockton, CA 95215TEL: (209)942-0182FAX: (209)942-0423CA ELAP Certification No. 1563
Office & Laboratory563 E. Lindo AvenueChico, CA 95926TEL: (530)343-5818FAX: (530)343-3807CA ELAP Certification No. 2670
Office & Laboratory9415 W. Goshen AvenueVisalia, CA 93291TEL: (559)734-9473FAX: (559)734-8435CA ELAP Certification No. 2810
Office & Laboratory3442 Empresa Drive, Suite DSan Luis Obispo, CA 93401TEL: (805)783-2940FAX: (805)783-2912CA ELAP Certification No. 2775
Reviewed andApproved By
Kelly A. Dunnahoo, B.S.Digitally signed by Kelly A. Dunnahoo, B.S.Title: Laboratory DirectorDate: 2019-03-25
Page 1 of 3

March 25, 2019 Lab ID : SP 1903019-001Customer ID : 2-14
Babcock Laboratories, Inc.Sampled On : March 1, 2019-10:55Sampled By : A.Suter/M.VarelaReceived On : March 5, 2019-11:30
P.O. Box 432Riverside, CA 92502
Matrix : SolidDescription : 1819-LC3-S1-01Project : Riverside County Flood Control (B9C0040-01)This Page is to be Stamped
Sample Result - Inorganic(Dry Weight)
Sample Preparation Sample AnalysisConstituent Result PQL Units Note
Method Date/ID Method Date/ID
Metals, TotalPhosphorus 368 5 mg/kg 3050 03/14/19:202809 200.7 03/19/19:203934
ND=Non-Detected. PQL=Practical Quantitation Limit. * PQL adjusted for dilution.
Corporate Offices & Laboratory853 Corporation StreetSanta Paula, CA 93060TEL: (805)392-2000Env FAX: (805)525-4172 / Ag FAX: (805)392-2063CA ELAP Certification No. 1573
Office & Laboratory2500 Stagecoach RoadStockton, CA 95215TEL: (209)942-0182FAX: (209)942-0423CA ELAP Certification No. 1563
Office & Laboratory563 E. Lindo AvenueChico, CA 95926TEL: (530)343-5818FAX: (530)343-3807CA ELAP Certification No. 2670
Office & Laboratory9415 W. Goshen AvenueVisalia, CA 93291TEL: (559)734-9473FAX: (559)734-8435CA ELAP Certification No. 2810
Office & Laboratory3442 Empresa Drive, Suite DSan Luis Obispo, CA 93401TEL: (805)783-2940FAX: (805)783-2912CA ELAP Certification No. 2775
Page 2 of 3
This Page is to be StampedMarch 25, 2019 Lab ID : SP 1903019Babcock Laboratories, Inc. Customer : 2-14
Quality Control - Inorganic
Constituent Method Date/ID Type Units Conc. QC Data DQO Note
Metals
Phosphorus 200.7 03/19/19:203934AC CCV ppm 5.000 98.1 % 90-110CCB ppm -0.001 0.1CCV ppm 5.000 96.9 % 90-110CCB ppm -0.002 0.1
3050 03/14/19:202809EMM Blank mg/kg ND <5LCS mg/kg 200.0 93.6 % 80-120MS mg/kg 200.0 117 % 75-125
(SP 1902801-001) MSD mg/kg 200.0 149 % 75-125 435MSRPD mg/kg 200.0 8.8% 30PDS mg/kg 200.0 121 % 75-125
Definition
PDS: PDS failed, matrix - Post Digestion Spike (PDS) not within Acceptance Range (AR) because of matrix interferences affecting thisanalyte. Data was accepted based on the LCS recovery.
CCV : Continuing Calibration Verification - Analyzed to verify the instrument calibration is within criteria.CCB : Continuing Calibration Blank - Analyzed to verify the instrument baseline is within criteria.Blank : Method Blank - Prepared to verify that the preparation process is not contributing contamination to the samples.LCS : Laboratory Control Standard/Sample - Prepared to verify that the preparation process is not affecting analyte recovery.
MS: Matrix Spikes - A random sample is spiked with a known amount of analyte. The recoveries are an indication of how that samplematrix affects analyte recovery.
MSD: Matrix Spike Duplicate of MS/MSD pair - A random sample duplicate is spiked with a known amount of analyte. The recoveriesare an indication of how that sample matrix affects analyte recovery.
MSRPD: MS/MSD Relative Percent Difference (RPD) - The MS relative percent difference is an indication of precision for the preparationand analysis.
ND : Non-detect - Result was below the DQO listed for the analyte.DQO : Data Quality Objective - This is the criteria against which the quality control data is compared.
Explanation435 : Sample matrix may be affecting this analyte. Data was accepted based on the LCS or CCV recovery.
Corporate Offices & Laboratory853 Corporation StreetSanta Paula, CA 93060TEL: (805)392-2000Env FAX: (805)525-4172 / Ag FAX: (805)392-2063CA ELAP Certification No. 1573
Office & Laboratory2500 Stagecoach RoadStockton, CA 95215TEL: (209)942-0182FAX: (209)942-0423CA ELAP Certification No. 1563
Office & Laboratory563 E. Lindo AvenueChico, CA 95926TEL: (530)343-5818FAX: (530)343-3807CA ELAP Certification No. 2670
Office & Laboratory9415 W. Goshen AvenueVisalia, CA 93291TEL: (559)734-9473FAX: (559)734-8435CA ELAP Certification No. 2810
Office & Laboratory3442 Empresa Drive, Suite DSan Luis Obispo, CA 93401TEL: (805)783-2940FAX: (805)783-2912CA ELAP Certification No. 2775
Page 3 of 3

5730 Centralcrest St. Houston, TX 77092Telephone (713) 316-1800 Fax (877) 225-9953
March 8, 2019
KayeLani A. Marshall,Project Manager,Babcock Laboratories, Inc.6100 Quail Valley Court,Riverside, CA 92507-0704.
Re: PTS File No: 49026Project Name: B9C0040Job Number: B9C0040
Subject: Laser Particle Size Analyses – [1 Sample – B9C0040-01].
Dear KayeLani A. Marshall:
Please find enclosed report for Physical Properties analyses conducted upon one (1) soil
samples received from the above referenced project.
All analyses were performed by applicable ASTM, EPA, or API methodologies. The sample is
currently in storage and will be retained for thirty days past completion of testing at no charge.
Please note that the sample will be disposed of at that time. You may contact me regarding
storage, disposal, or return of the sample.
PTS Laboratories appreciates the opportunity to be of service. If you have any questions or
require additional information, please contact me or Emeka Anazodo at (713) 316-1800.
Sincerely,PTS Laboratories, Inc.
Chidi UmehFlow Laboratory Supervisor
Encl.

PT
S
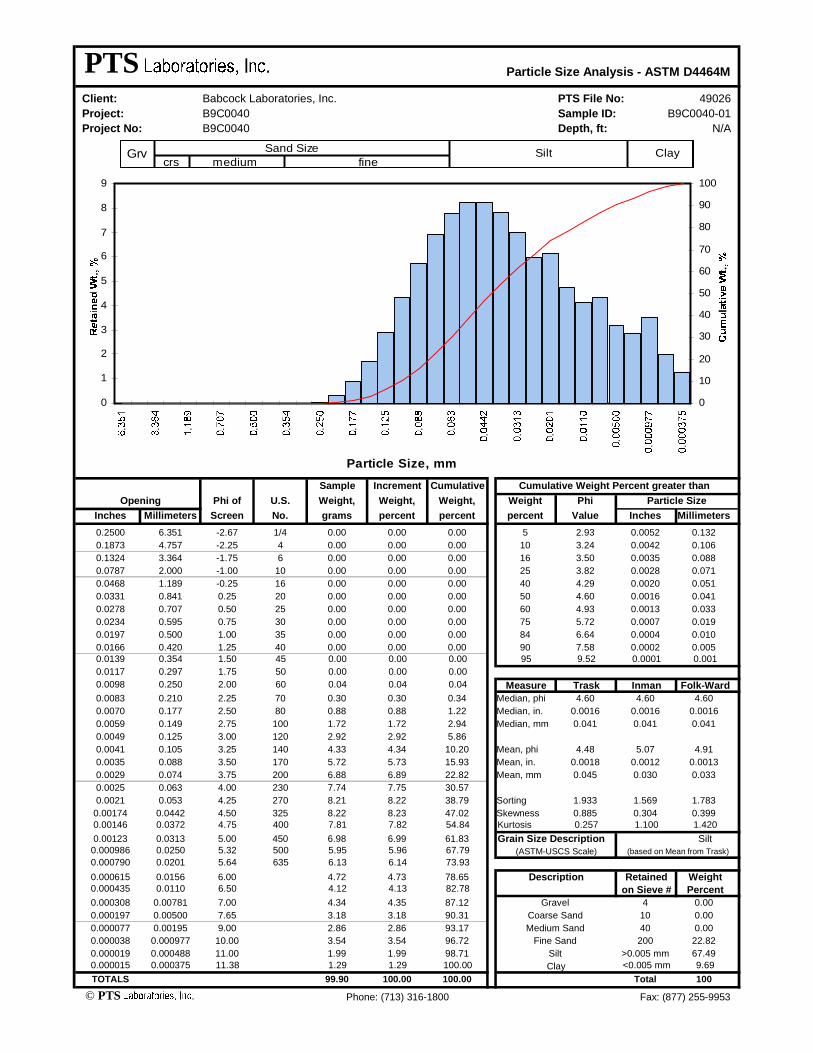
PTS Particle Size Analysis - ASTM D4464M
Client: Babcock Laboratories, Inc. PTS File No: 49026
Project: B9C0040 Sample ID: B9C0040-01
Project No: B9C0040 Depth, ft: N/A
Sample Increment Cumulative Cumulative Weight Percent greater than
Opening Phi of U.S. Weight, Weight, Weight, Weight Phi Particle Size
Inches Millimeters Screen No. grams percent percent percent Value Inches Millimeters
0.2500 6.351 -2.67 1/4 0.00 0.00 0.00 5 2.93 0.0052 0.132
0.1873 4.757 -2.25 4 0.00 0.00 0.00 10 3.24 0.0042 0.106
0.1324 3.364 -1.75 6 0.00 0.00 0.00 16 3.50 0.0035 0.088
0.0787 2.000 -1.00 10 0.00 0.00 0.00 25 3.82 0.0028 0.071
0.0468 1.189 -0.25 16 0.00 0.00 0.00 40 4.29 0.0020 0.051
0.0331 0.841 0.25 20 0.00 0.00 0.00 50 4.60 0.0016 0.041
0.0278 0.707 0.50 25 0.00 0.00 0.00 60 4.93 0.0013 0.033
0.0234 0.595 0.75 30 0.00 0.00 0.00 75 5.72 0.0007 0.019
0.0197 0.500 1.00 35 0.00 0.00 0.00 84 6.64 0.0004 0.010
0.0166 0.420 1.25 40 0.00 0.00 0.00 90 7.58 0.0002 0.0050.0139 0.354 1.50 45 0.00 0.00 0.00 95 9.52 0.0001 0.001
0.0117 0.297 1.75 50 0.00 0.00 0.00
0.0098 0.250 2.00 60 0.04 0.04 0.04 Measure Trask Inman Folk-Ward
0.0083 0.210 2.25 70 0.30 0.30 0.34 Median, phi 4.60 4.60 4.60
0.0070 0.177 2.50 80 0.88 0.88 1.22 Median, in. 0.0016 0.0016 0.0016
0.0059 0.149 2.75 100 1.72 1.72 2.94 Median, mm 0.041 0.041 0.041
0.0049 0.125 3.00 120 2.92 2.92 5.86
0.0041 0.105 3.25 140 4.33 4.34 10.20 Mean, phi 4.48 5.07 4.91
0.0035 0.088 3.50 170 5.72 5.73 15.93 Mean, in. 0.0018 0.0012 0.0013
0.0029 0.074 3.75 200 6.88 6.89 22.82 Mean, mm 0.045 0.030 0.033
0.0025 0.063 4.00 230 7.74 7.75 30.57
0.0021 0.053 4.25 270 8.21 8.22 38.79 Sorting 1.933 1.569 1.783
0.00174 0.0442 4.50 325 8.22 8.23 47.02 Skewness 0.885 0.304 0.3990.00146 0.0372 4.75 400 7.81 7.82 54.84 Kurtosis 0.257 1.100 1.420
0.00123 0.0313 5.00 450 6.98 6.99 61.83 Grain Size Description Silt0.000986 0.0250 5.32 500 5.95 5.96 67.79 (ASTM-USCS Scale) (based on Mean from Trask)
0.000790 0.0201 5.64 635 6.13 6.14 73.93
0.000615 0.0156 6.00 4.72 4.73 78.65 Description Retained Weight0.000435 0.0110 6.50 4.12 4.13 82.78 on Sieve # Percent
0.000308 0.00781 7.00 4.34 4.35 87.12 Gravel 4 0.00
0.000197 0.00500 7.65 3.18 3.18 90.31 Coarse Sand 10 0.00
0.000077 0.00195 9.00 2.86 2.86 93.17 Medium Sand 40 0.00
0.000038 0.000977 10.00 3.54 3.54 96.72 Fine Sand 200 22.82
0.000019 0.000488 11.00 1.99 1.99 98.71 Silt >0.005 mm 67.490.000015 0.000375 11.38 1.29 1.29 100.00 Clay <0.005 mm 9.69
TOTALS 99.90 100.00 100.00 Total 100
© PTS Phone: (713) 316-1800 Fax: (877) 255-9953
0
1
2
3
4
5
6
7
8
9
Particle Size, mm
0
10
20
30
40
50
60
70
80
90
100
ClaySiltmedium
Sand Size
crs fineGrv
Client Name:
Report Date:
Riverside County Flood Control
1995 Market Street
Rebekah Guill
Riverside, CA 92501
Contact:
Address: Project Number:
Analytical Report: Page 1 of 8
Project Name:
18-Sep-2019Work Order Number: B9C0031
16YesReceived on Ice (Y/N): Temp: °C
RCFC - Post Fire Soil
Post Fire Sediment LC
Attached is the analytical report for the sample(s) received for your project. Below is a list of the individual
sample descriptions with the corresponding laboratory number(s). Also, enclosed is a copy of the Chain of
Custody document (if received with your sample(s)). Please note any unused portion of the sample(s) may be
responsibly discarded after 30 days from the above report date, unless you have requested otherwise.
Thank you for the opportunity to serve your analytical needs. If you have any questions or concerns regarding
this report please contact our client service department.
Sample Identification
Lab Sample # Client Sample ID Matrix Date Sampled Date SubmittedBy By
Sludge1819-LC3-S1-01 B9C0031-01 03/1/19 10:55 Abigail
Suter/M.
Varela
Abigail Suter03/01/19 11:55
Included in this Data Package please find an amended report for the work order referenced below.
Work Order: B9C0031
Reason for Amendment:
As per client request, this report has been reissued to include the updated Total Nitrogen result. This
report supersedes the report issued on 09-Apr-2019.
CA ELAP No. 2698
EPA No. CA00102
NELAP No. OR4035
LACSD No. 10119
P 951 653 3351
F 951 653 1662
www.babcocklabs.com
location
6100 Quail Valley Court
Riverside, CA 92507-0704
mailing
P.O Box 432
Riverside, CA 92502-0432
Client Name:
Report Date:
Riverside County Flood Control
1995 Market Street
Rebekah Guill
Riverside, CA 92501
Contact:
Address: Project Number:
Analytical Report: Page 2 of 8
Project Name:
18-Sep-2019Work Order Number: B9C0031
16YesReceived on Ice (Y/N): Temp: °C
RCFC - Post Fire Soil
Post Fire Sediment LC
1819-LC3-S1-01
Laboratory Reference Number
Sludge
Matrix
03/01/19 11:55
B9C0031-01
Received Date/TimeSampled Date/Time
03/01/19 10:55
Sample Description
ResultAnalyte(s) RDL Analysis DateMethod Flag Units AnalystMDL
Anions1.7Nitrate as N 3.2 mg/kg dry EPA 300.0 03/02/19 02:14 KBS1.7 N_WEX, J
NDNitrite as N 1.6 mg/kg dry EPA 300.0 03/02/19 02:14 KBS1.6 N_WEX
Solids63Total Solids 0.10 % SM 2540G 03/01/19 16:47 TML0.10
Aggregate Organic Compounds1.8Total Organic Carbon 0.20 % dry weight EPA 9060 03/15/19 12:41 MEL0.050
Nutrients20000Kjeldahl Nitrogen 1600 mg/kg dry EPA 351.2 03/05/19 12:26 SLL1600
20000Total Nitrogen 100 mg/kg dry Calculation
CA ELAP No. 2698
EPA No. CA00102
NELAP No. OR4035
LACSD No. 10119
P 951 653 3351
F 951 653 1662
www.babcocklabs.com
location
6100 Quail Valley Court
Riverside, CA 92507-0704
mailing
P.O Box 432
Riverside, CA 92502-0432

Client Name:
Report Date:
Riverside County Flood Control
1995 Market Street
Rebekah Guill
Riverside, CA 92501
Contact:
Address: Project Number:
Analytical Report: Page 3 of 8
Project Name:
18-Sep-2019Work Order Number: B9C0031
16YesReceived on Ice (Y/N): Temp: °C
RCFC - Post Fire Soil
Post Fire Sediment LC
Result RDL Units Level
Spike
Result
Source
%REC
%REC
Limits RPD
RPD
Limit Flag Analyte(s)
Anions - Batch Quality Control
Batch 9C01067 - Water Extraction-IC
Blank (9C01067-BLK1) Prepared & Analyzed: 03/02/19
Nitrite as N ND 0.10 mg/kg wet0.10
Nitrate as N ND 0.20 mg/kg wet0.11
LCS (9C01067-BS1) Prepared & Analyzed: 03/02/19
Nitrite as N 2.50 0.10 2.50 90-110100mg/kg wet0.10
Nitrate as N 5.24 0.20 5.65 90-11092.8mg/kg wet0.11
Matrix Spike (9C01067-MS1) Prepared & Analyzed: 03/02/19 Source: B9C0037-01
Nitrite as N 42.7 1.6 40.0 ND 62-121107mg/kg dry1.6
Nitrate as N 84.7 3.2 90.5 ND 80-12093.6mg/kg dry1.7
Matrix Spike Dup (9C01067-MSD1) Prepared & Analyzed: 03/02/19 Source: B9C0037-01
Nitrite as N 42.2 1.6 40.0 ND 2062-121105 1.15mg/kg dry1.6
Nitrate as N 85.0 3.2 90.5 ND 2080-12093.9 0.362mg/kg dry1.7
CA ELAP No. 2698
EPA No. CA00102
NELAP No. OR4035
LACSD No. 10119
P 951 653 3351
F 951 653 1662
www.babcocklabs.com
location
6100 Quail Valley Court
Riverside, CA 92507-0704
mailing
P.O Box 432
Riverside, CA 92502-0432
Client Name:
Report Date:
Riverside County Flood Control
1995 Market Street
Rebekah Guill
Riverside, CA 92501
Contact:
Address: Project Number:
Analytical Report: Page 4 of 8
Project Name:
18-Sep-2019Work Order Number: B9C0031
16YesReceived on Ice (Y/N): Temp: °C
RCFC - Post Fire Soil
Post Fire Sediment LC
Result RDL Units Level
Spike
Result
Source
%REC
%REC
Limits RPD
RPD
Limit Flag Analyte(s)
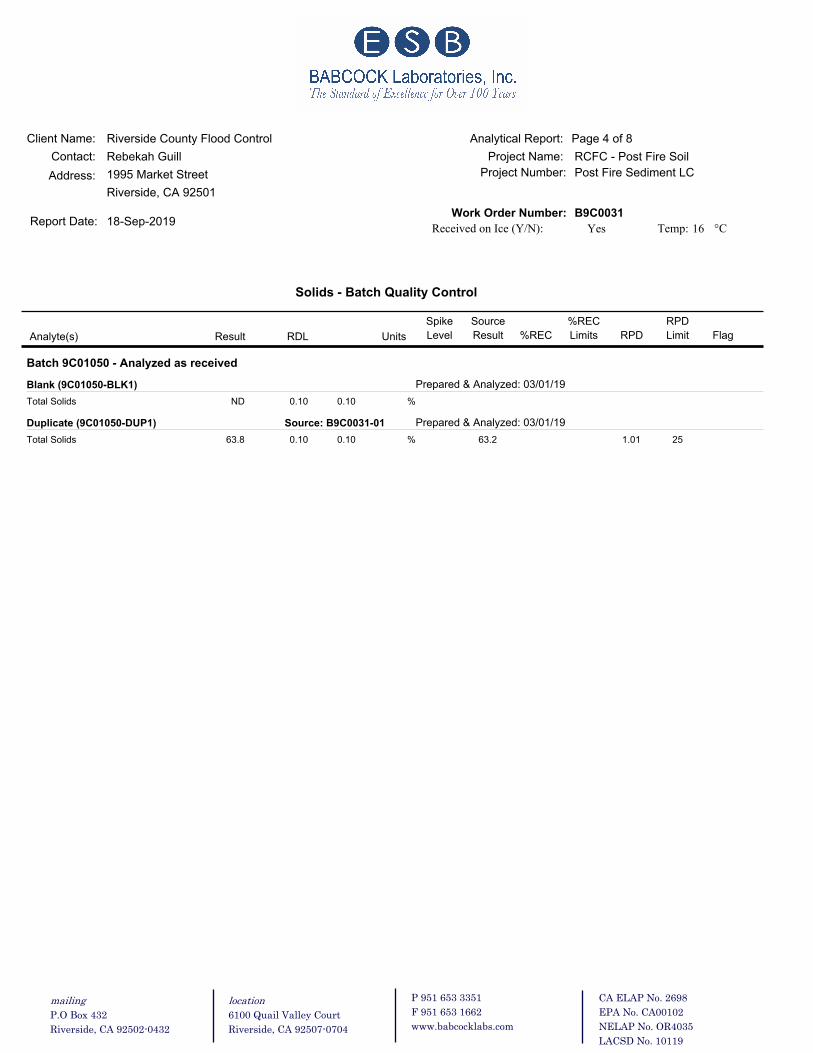
Solids - Batch Quality Control
Batch 9C01050 - Analyzed as received
Blank (9C01050-BLK1) Prepared & Analyzed: 03/01/19
Total Solids ND 0.10 %0.10
Duplicate (9C01050-DUP1) Prepared & Analyzed: 03/01/19 Source: B9C0031-01
Total Solids 63.8 0.10 63.2 251.01%0.10
CA ELAP No. 2698
EPA No. CA00102
NELAP No. OR4035
LACSD No. 10119
P 951 653 3351
F 951 653 1662
www.babcocklabs.com
location
6100 Quail Valley Court
Riverside, CA 92507-0704
mailing
P.O Box 432
Riverside, CA 92502-0432
Client Name:
Report Date:
Riverside County Flood Control
1995 Market Street
Rebekah Guill
Riverside, CA 92501
Contact:
Address: Project Number:
Analytical Report: Page 5 of 8
Project Name:
18-Sep-2019Work Order Number: B9C0031
16YesReceived on Ice (Y/N): Temp: °C
RCFC - Post Fire Soil
Post Fire Sediment LC
Result RDL Units Level
Spike
Result
Source
%REC
%REC
Limits RPD
RPD
Limit Flag Analyte(s)
Aggregate Organic Compounds - Batch Quality Control
Batch 9C12166 - Analyzed as received
Blank (9C12166-BLK1) Prepared & Analyzed: 03/15/19
Total Organic Carbon ND 0.20 % dry
weight
0.050
LCS (9C12166-BS1) Prepared & Analyzed: 03/15/19
Total Organic Carbon 1.62 0.20 1.59 70-130102% dry
weight
0.050
Matrix Spike (9C12166-MS1) Prepared & Analyzed: 03/15/19 Source: B9C0031-01
Total Organic Carbon 3.00 0.20 1.59 1.84 41-13973.5% dry
weight
0.050
Matrix Spike Dup (9C12166-MSD1) Prepared & Analyzed: 03/15/19 Source: B9C0031-01
Total Organic Carbon 3.78 0.20 1.59 1.84 2541-139122 22.7% dry
weight
0.050
CA ELAP No. 2698
EPA No. CA00102
NELAP No. OR4035
LACSD No. 10119
P 951 653 3351
F 951 653 1662
www.babcocklabs.com
location
6100 Quail Valley Court
Riverside, CA 92507-0704
mailing
P.O Box 432
Riverside, CA 92502-0432

Client Name:
Report Date:
Riverside County Flood Control
1995 Market Street
Rebekah Guill
Riverside, CA 92501
Contact:
Address: Project Number:
Analytical Report: Page 6 of 8
Project Name:
18-Sep-2019Work Order Number: B9C0031
16YesReceived on Ice (Y/N): Temp: °C
RCFC - Post Fire Soil
Post Fire Sediment LC
Result RDL Units Level
Spike
Result
Source
%REC
%REC
Limits RPD
RPD
Limit Flag Analyte(s)
Nutrients - Batch Quality Control
Batch 9C04113 - Acid Digest
Blank (9C04113-BLK1) Prepared: 03/04/19 Analyzed: 03/05/19
Kjeldahl Nitrogen ND 100 mg/kg wet100
LCS (9C04113-BS1) Prepared: 03/04/19 Analyzed: 03/05/19
Kjeldahl Nitrogen 825 100 800 80-120103mg/kg wet100
Duplicate (9C04113-DUP1) Prepared: 03/04/19 Analyzed: 03/05/19 Source: B9C0031-01
Kjeldahl Nitrogen 19600 1600 19500 250.116mg/kg dry1600
CA ELAP No. 2698
EPA No. CA00102
NELAP No. OR4035
LACSD No. 10119
P 951 653 3351
F 951 653 1662
www.babcocklabs.com
location
6100 Quail Valley Court
Riverside, CA 92507-0704
mailing
P.O Box 432
Riverside, CA 92502-0432
Client Name:
Report Date:
Riverside County Flood Control
1995 Market Street
Rebekah Guill
Riverside, CA 92501
Contact:
Address: Project Number:
Analytical Report: Page 7 of 8
Project Name:
18-Sep-2019Work Order Number: B9C0031
16YesReceived on Ice (Y/N): Temp: °C
RCFC - Post Fire Soil
Post Fire Sediment LC
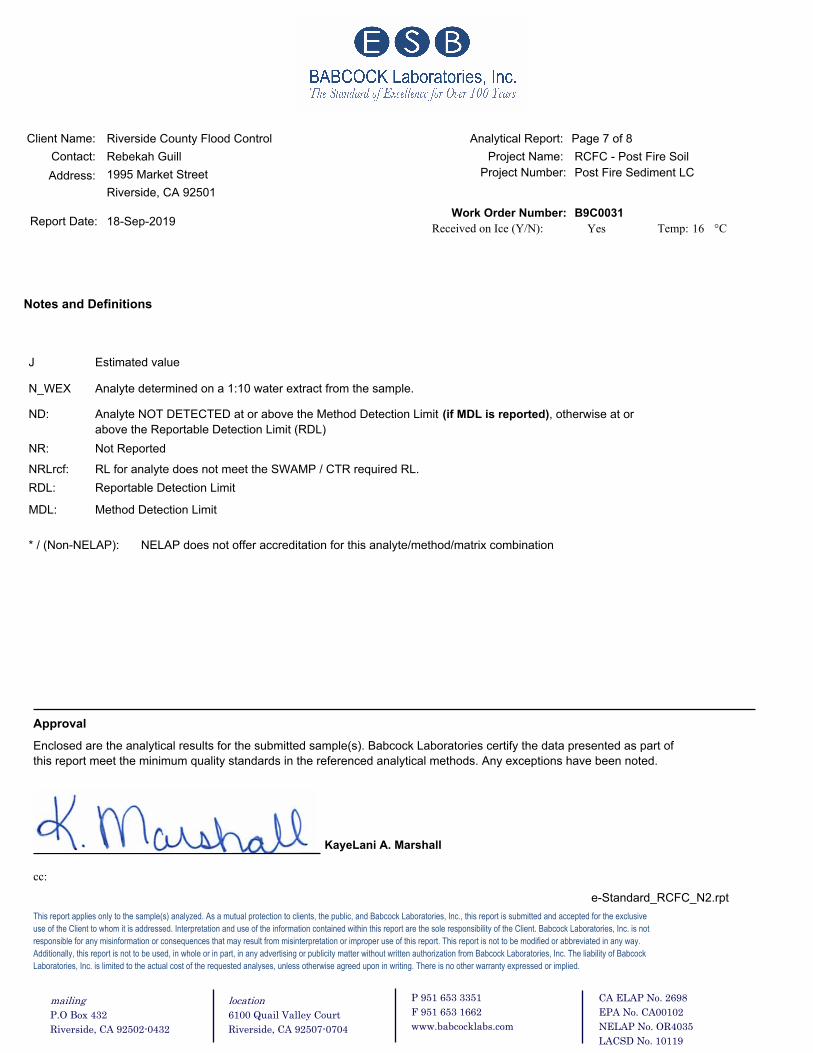
Notes and Definitions
J Estimated value
N_WEX Analyte determined on a 1:10 water extract from the sample.
NR: Not Reported
ND: Analyte NOT DETECTED at or above the Method Detection Limit (if MDL is reported), otherwise at or
above the Reportable Detection Limit (RDL)
RDL: Reportable Detection Limit
MDL: Method Detection Limit
NRLrcf: RL for analyte does not meet the SWAMP / CTR required RL.
* / (Non-NELAP): NELAP does not offer accreditation for this analyte/method/matrix combination
e-Standard_RCFC_N2.rpt
This report applies only to the sample(s) analyzed. As a mutual protection to clients, the public, and Babcock Laboratories, Inc., this report is submitted and accepted for the exclusive
use of the Client to whom it is addressed. Interpretation and use of the information contained within this report are the sole responsibility of the Client. Babcock Laboratories, Inc. is not
responsible for any misinformation or consequences that may result from misinterpretation or improper use of this report. This report is not to be modified or abbreviated in any way.
Additionally, this report is not to be used, in whole or in part, in any advertising or publicity matter without written authorization from Babcock Laboratories, Inc. The liability of Babcock
Laboratories, Inc. is limited to the actual cost of the requested analyses, unless otherwise agreed upon in writing. There is no other warranty expressed or implied.
Enclosed are the analytical results for the submitted sample(s). Babcock Laboratories certify the data presented as part of
this report meet the minimum quality standards in the referenced analytical methods. Any exceptions have been noted.
Approval
cc:
KayeLani A. Marshall
CA ELAP No. 2698
EPA No. CA00102
NELAP No. OR4035
LACSD No. 10119
P 951 653 3351
F 951 653 1662
www.babcocklabs.com
location
6100 Quail Valley Court
Riverside, CA 92507-0704
mailing
P.O Box 432
Riverside, CA 92502-0432
Client Name:
Report Date:
Riverside County Flood Control
1995 Market Street
Rebekah Guill
Riverside, CA 92501
Contact:
Address: Project Number:
Analytical Report: Page 8 of 8
Project Name:
18-Sep-2019Work Order Number: B9C0031
16YesReceived on Ice (Y/N): Temp: °C
RCFC - Post Fire Soil
Post Fire Sediment LC
CA ELAP No. 2698
EPA No. CA00102
NELAP No. OR4035
LACSD No. 10119
P 951 653 3351
F 951 653 1662
www.babcocklabs.com
location
6100 Quail Valley Court
Riverside, CA 92507-0704
mailing
P.O Box 432
Riverside, CA 92502-0432
Work Order Number:
Report Date: 09-Apr-2019
Contact:
Client Name:
Address:
Project Name:
Page 1 of 1Analytical Report:
Project Number:
°C 16Temp:YesReceived on Ice (Y/N)
1995 Market Street
Riverside, CA, 92501
Riverside County Flood Control
Rebekah Guill RCFC - Post Fire Soil
Post Fire Sediment - MV
B9C0039
Attached is the analytical report for the sample(s) received for your project. Below is a list of the individual
sample descriptions with the corresponding laboratory number(s). Also, enclosed is a copy of the Chain of
Custody document (if received with your sample(s)). Please note any unused portion of the sample(s) may be
responsibly discarded after 30 days from the above report date, unless you have requested otherwise.
Thank you for the opportunity to serve your analytical needs. If you have any questions or concerns regarding
this report please contact our client service department.
Lab Sample # Client Sample ID Matrix Date Sampled
Sample Identification
Date SubmittedBy By
B9C0039-01 1819-MV2-S1-01 Solid 3/1/19 10:25 A. Suter/M.
Varela
3/1/19 11:55 Abigail Suter
Note: Total Phos was subcontracted to FGL Environmental.
Note: Grain Size (ASTM D4464) was subcontracted to PTS Laboratories.
e-Case Narrative+ COC.rpt
This report applies only to the sample(s) analyzed. As a mutual protection to clients, the public, and Babcock Laboratories, Inc., this report is submitted and accepted for the exclusive
use of the Client to whom it is addressed. Interpretation and use of the information contained within this report are the sole responsibility of the Client. Babcock Laboratories, Inc. is not
responsible for any misinformation or consequences that may result from misinterpretation or improper use of this report. This report is not to be modified or abbreviated in any way.
Additionally, this report is not to be used, in whole or in part, in any advertising or publicity matter without written authorization from Babcock Laboratories, Inc. The liability of Babcock
Laboratories, Inc. is limited to the actual cost of the requested analyses, unless otherwise agreed upon in writing. There is no other warranty expressed or implied.
Enclosed are the analytical results for the submitted sample(s). Babcock Laboratories certify the data presented as part of
this report meet the minimum quality standards in the referenced analytical methods. Any exceptions have been noted.
Approval
cc:
KayeLani A. Marshall
Page 1 of 1
mailing location P 951 653 3351 CA ELAP No. 2698
P.O. Box 432 6100 Quail Valley Court F 951 653 1662 EPA No. CA00102
Riverside, CA 92502-0432 Riverside, CA 92507-0704 www.babcocklabs.com NELAP No.OR4035
LACSD No., 10119
Work Order Number:
Report Date: 09-Apr-2019
Contact:
Client Name:
Address:
Project Name:
Page 1 of 1Analytical Report:
Project Number:
°C 16Temp:YesReceived on Ice (Y/N)
1995 Market Street
Riverside, CA, 92501
Riverside County Flood Control
Rebekah Guill RCFC - Post Fire Soil
Post Fire Sediment - MV
B9C0039
Page 1 of 1
mailing location P 951 653 3351 CA ELAP No. 2698
P.O. Box 432 6100 Quail Valley Court F 951 653 1662 EPA No. CA00102
Riverside, CA 92502-0432 Riverside, CA 92507-0704 www.babcocklabs.com NELAP No.OR4035
LACSD No., 10119
March 25, 2019
Babcock Laboratories, Inc. Lab ID : SP 1903020P.O. Box 432Riverside, CA 92502
Customer : 2-14
Laboratory ReportThis Page is to be Stamped
Introduction: This report package contains total of 3 pages divided into 3 sections:
Case Narrative (1 pages) : An overview of the work performed at FGL.Sample Results (1 page) : Results for each sample submitted.Quality Control (1 page) : Supporting Quality Control (QC) results.
Case Narrative
This Case Narrative pertains to the following samples:
Sample DescriptionDate
SampledDate
ReceivedFGL Lab ID # Matrix
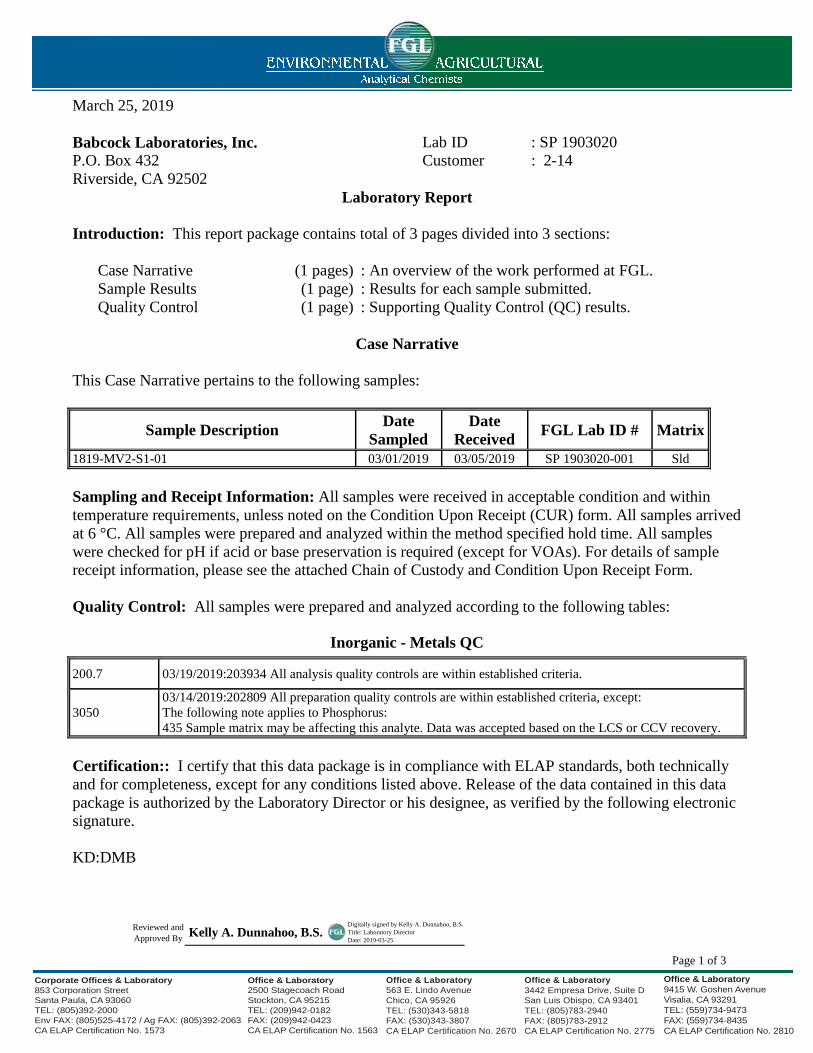
1819-MV2-S1-01 03/01/2019 03/05/2019 SP 1903020-001 Sld
Sampling and Receipt Information: All samples were received in acceptable condition and withintemperature requirements, unless noted on the Condition Upon Receipt (CUR) form. All samples arrivedat 6 °C. All samples were prepared and analyzed within the method specified hold time. All sampleswere checked for pH if acid or base preservation is required (except for VOAs). For details of samplereceipt information, please see the attached Chain of Custody and Condition Upon Receipt Form.
Quality Control: All samples were prepared and analyzed according to the following tables:
Inorganic - Metals QC
200.7 03/19/2019:203934 All analysis quality controls are within established criteria.
305003/14/2019:202809 All preparation quality controls are within established criteria, except:The following note applies to Phosphorus:435 Sample matrix may be affecting this analyte. Data was accepted based on the LCS or CCV recovery.
Certification:: I certify that this data package is in compliance with ELAP standards, both technicallyand for completeness, except for any conditions listed above. Release of the data contained in this datapackage is authorized by the Laboratory Director or his designee, as verified by the following electronicsignature.
KD:DMBDigitial Signature Stamp Y = 09.5
Corporate Offices & Laboratory853 Corporation StreetSanta Paula, CA 93060TEL: (805)392-2000Env FAX: (805)525-4172 / Ag FAX: (805)392-2063CA ELAP Certification No. 1573
Office & Laboratory2500 Stagecoach RoadStockton, CA 95215TEL: (209)942-0182FAX: (209)942-0423CA ELAP Certification No. 1563
Office & Laboratory563 E. Lindo AvenueChico, CA 95926TEL: (530)343-5818FAX: (530)343-3807CA ELAP Certification No. 2670
Office & Laboratory9415 W. Goshen AvenueVisalia, CA 93291TEL: (559)734-9473FAX: (559)734-8435CA ELAP Certification No. 2810
Office & Laboratory3442 Empresa Drive, Suite DSan Luis Obispo, CA 93401TEL: (805)783-2940FAX: (805)783-2912CA ELAP Certification No. 2775
Reviewed andApproved By
Kelly A. Dunnahoo, B.S.Digitally signed by Kelly A. Dunnahoo, B.S.Title: Laboratory DirectorDate: 2019-03-25
Page 1 of 3
March 25, 2019 Lab ID : SP 1903020-001Customer ID : 2-14
Babcock Laboratories, Inc.Sampled On : March 1, 2019-10:25Sampled By : A.Suter/M.VarelaReceived On : March 5, 2019-11:30
P.O. Box 432Riverside, CA 92502
Matrix : SolidDescription : 1819-MV2-S1-01Project : Riverside County Flood Control B9C0039This Page is to be Stamped
Sample Result - Inorganic(Dry Weight)
Sample Preparation Sample AnalysisConstituent Result PQL Units Note
Method Date/ID Method Date/ID
Metals, TotalPhosphorus 689 5 mg/kg 3050 03/14/19:202809 200.7 03/19/19:203934
ND=Non-Detected. PQL=Practical Quantitation Limit. * PQL adjusted for dilution.
Corporate Offices & Laboratory853 Corporation StreetSanta Paula, CA 93060TEL: (805)392-2000Env FAX: (805)525-4172 / Ag FAX: (805)392-2063CA ELAP Certification No. 1573
Office & Laboratory2500 Stagecoach RoadStockton, CA 95215TEL: (209)942-0182FAX: (209)942-0423CA ELAP Certification No. 1563
Office & Laboratory563 E. Lindo AvenueChico, CA 95926TEL: (530)343-5818FAX: (530)343-3807CA ELAP Certification No. 2670
Office & Laboratory9415 W. Goshen AvenueVisalia, CA 93291TEL: (559)734-9473FAX: (559)734-8435CA ELAP Certification No. 2810
Office & Laboratory3442 Empresa Drive, Suite DSan Luis Obispo, CA 93401TEL: (805)783-2940FAX: (805)783-2912CA ELAP Certification No. 2775
Page 2 of 3

This Page is to be StampedMarch 25, 2019 Lab ID : SP 1903020Babcock Laboratories, Inc. Customer : 2-14
Quality Control - Inorganic
Constituent Method Date/ID Type Units Conc. QC Data DQO Note
Metals
Phosphorus 200.7 03/19/19:203934AC CCV ppm 5.000 96.9 % 90-110CCB ppm -0.002 0.1CCV ppm 5.000 97.1 % 90-110CCB ppm 0.0004 0.1
3050 03/14/19:202809EMM Blank mg/kg ND <5LCS mg/kg 200.0 93.6 % 80-120MS mg/kg 200.0 117 % 75-125
(SP 1902801-001) MSD mg/kg 200.0 149 % 75-125 435MSRPD mg/kg 200.0 8.8% 30PDS mg/kg 200.0 121 % 75-125
Definition
PDS: PDS failed, matrix - Post Digestion Spike (PDS) not within Acceptance Range (AR) because of matrix interferences affecting thisanalyte. Data was accepted based on the LCS recovery.
CCV : Continuing Calibration Verification - Analyzed to verify the instrument calibration is within criteria.CCB : Continuing Calibration Blank - Analyzed to verify the instrument baseline is within criteria.Blank : Method Blank - Prepared to verify that the preparation process is not contributing contamination to the samples.LCS : Laboratory Control Standard/Sample - Prepared to verify that the preparation process is not affecting analyte recovery.
MS: Matrix Spikes - A random sample is spiked with a known amount of analyte. The recoveries are an indication of how that samplematrix affects analyte recovery.
MSD: Matrix Spike Duplicate of MS/MSD pair - A random sample duplicate is spiked with a known amount of analyte. The recoveriesare an indication of how that sample matrix affects analyte recovery.
MSRPD: MS/MSD Relative Percent Difference (RPD) - The MS relative percent difference is an indication of precision for the preparationand analysis.
ND : Non-detect - Result was below the DQO listed for the analyte.DQO : Data Quality Objective - This is the criteria against which the quality control data is compared.
Explanation435 : Sample matrix may be affecting this analyte. Data was accepted based on the LCS or CCV recovery.
Corporate Offices & Laboratory853 Corporation StreetSanta Paula, CA 93060TEL: (805)392-2000Env FAX: (805)525-4172 / Ag FAX: (805)392-2063CA ELAP Certification No. 1573
Office & Laboratory2500 Stagecoach RoadStockton, CA 95215TEL: (209)942-0182FAX: (209)942-0423CA ELAP Certification No. 1563
Office & Laboratory563 E. Lindo AvenueChico, CA 95926TEL: (530)343-5818FAX: (530)343-3807CA ELAP Certification No. 2670
Office & Laboratory9415 W. Goshen AvenueVisalia, CA 93291TEL: (559)734-9473FAX: (559)734-8435CA ELAP Certification No. 2810
Office & Laboratory3442 Empresa Drive, Suite DSan Luis Obispo, CA 93401TEL: (805)783-2940FAX: (805)783-2912CA ELAP Certification No. 2775
Page 3 of 3
5730 Centralcrest St. Houston, TX 77092Telephone (713) 316-1800 Fax (877) 225-9953
March 8, 2019
KayeLani A. Marshall,Project Manager,Babcock Laboratories, Inc.6100 Quail Valley Court,Riverside, CA 92507-0704.
Re: PTS File No: 49025Project Name: B9C0039Job Number: B9C0039
Subject: Laser Particle Size Analyses – [1 Sample – B9C0039-01].
Dear KayeLani A. Marshall:
Please find enclosed report for Physical Properties analyses conducted upon one (1) soil
samples received from the above referenced project.
All analyses were performed by applicable ASTM, EPA, or API methodologies. The sample is
currently in storage and will be retained for thirty days past completion of testing at no charge.
Please note that the sample will be disposed of at that time. You may contact me regarding
storage, disposal, or return of the sample.
PTS Laboratories appreciates the opportunity to be of service. If you have any questions or
require additional information, please contact me or Emeka Anazodo at (713) 316-1800.
Sincerely,PTS Laboratories, Inc.
Chidi UmehFlow Laboratory Supervisor
Encl.

PT
S
PTS Particle Size Analysis - ASTM D4464M
Client: Babcock Laboratories, Inc. PTS File No: 49025
Project: B9C0039 Sample ID: B9C0039-01
Project No: B9C0039 Depth, ft: N/A
Sample Increment Cumulative Cumulative Weight Percent greater than
Opening Phi of U.S. Weight, Weight, Weight, Weight Phi Particle Size
Inches Millimeters Screen No. grams percent percent percent Value Inches Millimeters
0.2500 6.351 -2.67 1/4 0.00 0.00 0.00 5 2.47 0.0071 0.180
0.1873 4.757 -2.25 4 0.00 0.00 0.00 10 3.39 0.0038 0.096
0.1324 3.364 -1.75 6 0.00 0.00 0.00 16 4.22 0.0021 0.054
0.0787 2.000 -1.00 10 0.00 0.00 0.00 25 5.23 0.0010 0.027
0.0468 1.189 -0.25 16 0.00 0.00 0.00 40 6.32 0.0005 0.013
0.0331 0.841 0.25 20 0.00 0.00 0.00 50 6.84 0.0003 0.009
0.0278 0.707 0.50 25 0.00 0.00 0.00 60 7.40 0.0002 0.006
0.0234 0.595 0.75 30 0.08 0.08 0.08 75 8.99 0.0001 0.002
0.0197 0.500 1.00 35 0.36 0.36 0.44 84 9.62 0.0001 0.001
0.0166 0.420 1.25 40 0.65 0.65 1.10 90 10.08 0.0000 0.0010.0139 0.354 1.50 45 0.72 0.72 1.82 95 10.83 0.0000 0.001
0.0117 0.297 1.75 50 0.59 0.59 2.41
0.0098 0.250 2.00 60 0.85 0.85 3.27 Measure Trask Inman Folk-Ward
0.0083 0.210 2.25 70 0.85 0.85 4.12 Median, phi 6.84 6.84 6.84
0.0070 0.177 2.50 80 0.98 0.98 5.10 Median, in. 0.0003 0.0003 0.0003
0.0059 0.149 2.75 100 1.14 1.15 6.25 Median, mm 0.009 0.009 0.009
0.0049 0.125 3.00 120 1.35 1.36 7.60
0.0041 0.105 3.25 140 1.50 1.51 9.11 Mean, phi 6.13 6.92 6.89
0.0035 0.088 3.50 170 1.60 1.61 10.72 Mean, in. 0.0006 0.0003 0.0003
0.0029 0.074 3.75 200 1.72 1.73 12.45 Mean, mm 0.014 0.008 0.008
0.0025 0.063 4.00 230 1.85 1.86 14.30
0.0021 0.053 4.25 270 1.94 1.95 16.25 Sorting 3.669 2.700 2.616
0.00174 0.0442 4.50 325 1.98 1.99 18.24 Skewness 0.829 0.029 -0.0080.00146 0.0372 4.75 400 2.15 2.16 20.40 Kurtosis 0.130 0.547 0.913
0.00123 0.0313 5.00 450 2.46 2.47 22.87 Grain Size Description Silt0.000986 0.0250 5.32 500 2.89 2.90 25.77 (ASTM-USCS Scale) (based on Mean from Trask)
0.000790 0.0201 5.64 635 4.38 4.40 30.17
0.000615 0.0156 6.00 5.34 5.36 35.54 Description Retained Weight0.000435 0.0110 6.50 7.01 7.04 42.58 on Sieve # Percent
0.000308 0.00781 7.00 10.90 10.95 53.53 Gravel 4 0.00
0.000197 0.00500 7.65 10.50 10.55 64.07 Coarse Sand 10 0.00
0.000077 0.00195 9.00 11.00 11.05 75.12 Medium Sand 40 1.10
0.000038 0.000977 10.00 14.30 14.36 89.48 Fine Sand 200 11.35
0.000019 0.000488 11.00 6.64 6.67 96.15 Silt >0.005 mm 51.630.000015 0.000375 11.38 3.83 3.85 100.00 Clay <0.005 mm 35.93
TOTALS 99.60 100.00 100.00 Total 100
© PTS Phone: (713) 316-1800 Fax: (877) 255-9953
0
2
4
6
8
10
12
14
16
Particle Size, mm
0
10
20
30
40
50
60
70
80
90
100
ClaySiltmedium
Sand Size
crs fineGrv
Client Name:
Report Date:
Riverside County Flood Control
1995 Market Street
Rebekah Guill
Riverside, CA 92501
Contact:
Address: Project Number:
Analytical Report: Page 1 of 8
Project Name:
09-Apr-2019Work Order Number: B9C0037
16YesReceived on Ice (Y/N): Temp: °C
RCFC - Post Fire Soil
Post Fire Sediment MV
Attached is the analytical report for the sample(s) received for your project. Below is a list of the individual
sample descriptions with the corresponding laboratory number(s). Also, enclosed is a copy of the Chain of
Custody document (if received with your sample(s)). Please note any unused portion of the sample(s) may be
responsibly discarded after 30 days from the above report date, unless you have requested otherwise.
Thank you for the opportunity to serve your analytical needs. If you have any questions or concerns regarding
this report please contact our client service department.
Sample Identification
Lab Sample # Client Sample ID Matrix Date Sampled Date SubmittedBy By
Sludge1819-MV2-S1-01 B9C0037-01 03/1/19 10:25 Abigail
Suter/M.
Varela
Abigail Suter03/01/19 11:55
CA ELAP No. 2698
EPA No. CA00102
NELAP No. OR4035
LACSD No. 10119
P 951 653 3351
F 951 653 1662
www.babcocklabs.com
location
6100 Quail Valley Court
Riverside, CA 92507-0704
mailing
P.O Box 432
Riverside, CA 92502-0432

Client Name:
Report Date:
Riverside County Flood Control
1995 Market Street
Rebekah Guill
Riverside, CA 92501
Contact:
Address: Project Number:
Analytical Report: Page 2 of 8
Project Name:
09-Apr-2019Work Order Number: B9C0037
16YesReceived on Ice (Y/N): Temp: °C
RCFC - Post Fire Soil
Post Fire Sediment MV
ResultAnalyte(s) RDL Analysis DateMethod Flag Units
Sample Description
03/01/19 10:25
Sampled Date/Time Received Date/Time
B9C0037-01
Analyst
03/01/19 11:55
Matrix
Sludge
Laboratory Reference Number
MDL
1819-MV2-S1-01
AnionsNDNitrate as N 3.2 mg/kg dry EPA 300.0 03/02/19 02:26 KBS1.7 N_WEX
NDNitrite as N 1.6 mg/kg dry EPA 300.0 03/02/19 02:26 KBS1.6 N_WEX
Solids62Total Solids 0.10 % SM 2540G 03/01/19 16:47 TML0.10
Aggregate Organic Compounds4.0Total Organic Carbon 0.20 % dry weight EPA 9060 03/15/19 12:57 MEL0.050
Nutrients47000Kjeldahl Nitrogen 2600 mg/kg dry EPA 351.2 03/05/19 12:54 SLL2600
47000Total Nitrogen 100 mg/kg dry Calculation
CA ELAP No. 2698
EPA No. CA00102
NELAP No. OR4035
LACSD No. 10119
P 951 653 3351
F 951 653 1662
www.babcocklabs.com
location
6100 Quail Valley Court
Riverside, CA 92507-0704
mailing
P.O Box 432
Riverside, CA 92502-0432
Client Name:
Report Date:
Riverside County Flood Control
1995 Market Street
Rebekah Guill
Riverside, CA 92501
Contact:
Address: Project Number:
Analytical Report: Page 3 of 8
Project Name:
09-Apr-2019Work Order Number: B9C0037
16YesReceived on Ice (Y/N): Temp: °C
RCFC - Post Fire Soil
Post Fire Sediment MV
Result RDL Units Level
Spike
Result
Source
%REC
%REC
Limits RPD
RPD
Limit Flag Analyte(s)
Anions - Batch Quality Control
Batch 9C01067 - Water Extraction-IC
Blank (9C01067-BLK1) Prepared & Analyzed: 03/02/19
Nitrite as N ND 0.10 mg/kg wet0.10
Nitrate as N ND 0.20 mg/kg wet0.11
LCS (9C01067-BS1) Prepared & Analyzed: 03/02/19
Nitrite as N 2.50 0.10 2.50 90-110100mg/kg wet0.10
Nitrate as N 5.24 0.20 5.65 90-11092.8mg/kg wet0.11
Matrix Spike (9C01067-MS1) Prepared & Analyzed: 03/02/19 Source: B9C0037-01
Nitrite as N 42.7 1.6 40.0 ND 62-121107mg/kg dry1.6
Nitrate as N 84.7 3.2 90.5 ND 80-12093.6mg/kg dry1.7
Matrix Spike Dup (9C01067-MSD1) Prepared & Analyzed: 03/02/19 Source: B9C0037-01
Nitrite as N 42.2 1.6 40.0 ND 2062-121105 1.15mg/kg dry1.6
Nitrate as N 85.0 3.2 90.5 ND 2080-12093.9 0.362mg/kg dry1.7
CA ELAP No. 2698
EPA No. CA00102
NELAP No. OR4035
LACSD No. 10119
P 951 653 3351
F 951 653 1662
www.babcocklabs.com
location
6100 Quail Valley Court
Riverside, CA 92507-0704
mailing
P.O Box 432
Riverside, CA 92502-0432

Client Name:
Report Date:
Riverside County Flood Control
1995 Market Street
Rebekah Guill
Riverside, CA 92501
Contact:
Address: Project Number:
Analytical Report: Page 4 of 8
Project Name:
09-Apr-2019Work Order Number: B9C0037
16YesReceived on Ice (Y/N): Temp: °C
RCFC - Post Fire Soil
Post Fire Sediment MV
Result RDL Units Level
Spike
Result
Source
%REC
%REC
Limits RPD
RPD
Limit Flag Analyte(s)
Solids - Batch Quality Control
Batch 9C01050 - Analyzed as received
Blank (9C01050-BLK1) Prepared & Analyzed: 03/01/19
Total Solids ND 0.10 %0.10
Duplicate (9C01050-DUP1) Prepared & Analyzed: 03/01/19 Source: B9C0031-01
Total Solids 63.8 0.10 63.2 251.01%0.10
CA ELAP No. 2698
EPA No. CA00102
NELAP No. OR4035
LACSD No. 10119
P 951 653 3351
F 951 653 1662
www.babcocklabs.com
location
6100 Quail Valley Court
Riverside, CA 92507-0704
mailing
P.O Box 432
Riverside, CA 92502-0432

Client Name:
Report Date:
Riverside County Flood Control
1995 Market Street
Rebekah Guill
Riverside, CA 92501
Contact:
Address: Project Number:
Analytical Report: Page 5 of 8
Project Name:
09-Apr-2019Work Order Number: B9C0037
16YesReceived on Ice (Y/N): Temp: °C
RCFC - Post Fire Soil
Post Fire Sediment MV
Result RDL Units Level
Spike
Result
Source
%REC
%REC
Limits RPD
RPD
Limit Flag Analyte(s)
Aggregate Organic Compounds - Batch Quality Control
Batch 9C12166 - Analyzed as received
Blank (9C12166-BLK1) Prepared & Analyzed: 03/15/19
Total Organic Carbon ND 0.20 % dry
weight
0.050
LCS (9C12166-BS1) Prepared & Analyzed: 03/15/19
Total Organic Carbon 1.62 0.20 1.59 70-130102% dry
weight
0.050
Matrix Spike (9C12166-MS1) Prepared & Analyzed: 03/15/19 Source: B9C0031-01
Total Organic Carbon 3.00 0.20 1.59 1.84 41-13973.5% dry
weight
0.050
Matrix Spike Dup (9C12166-MSD1) Prepared & Analyzed: 03/15/19 Source: B9C0031-01
Total Organic Carbon 3.78 0.20 1.59 1.84 2541-139122 22.7% dry
weight
0.050
CA ELAP No. 2698
EPA No. CA00102
NELAP No. OR4035
LACSD No. 10119
P 951 653 3351
F 951 653 1662
www.babcocklabs.com
location
6100 Quail Valley Court
Riverside, CA 92507-0704
mailing
P.O Box 432
Riverside, CA 92502-0432
Client Name:
Report Date:
Riverside County Flood Control
1995 Market Street
Rebekah Guill
Riverside, CA 92501
Contact:
Address: Project Number:
Analytical Report: Page 6 of 8
Project Name:
09-Apr-2019Work Order Number: B9C0037
16YesReceived on Ice (Y/N): Temp: °C
RCFC - Post Fire Soil
Post Fire Sediment MV
Result RDL Units Level
Spike
Result
Source
%REC
%REC
Limits RPD
RPD
Limit Flag Analyte(s)
Nutrients - Batch Quality Control
Batch 9C04113 - Acid Digest
Blank (9C04113-BLK1) Prepared: 03/04/19 Analyzed: 03/05/19
Kjeldahl Nitrogen ND 100 mg/kg wet100
LCS (9C04113-BS1) Prepared: 03/04/19 Analyzed: 03/05/19
Kjeldahl Nitrogen 825 100 800 80-120103mg/kg wet100
Duplicate (9C04113-DUP1) Prepared: 03/04/19 Analyzed: 03/05/19 Source: B9C0031-01
Kjeldahl Nitrogen 19600 1600 19500 250.116mg/kg dry1600
CA ELAP No. 2698
EPA No. CA00102
NELAP No. OR4035
LACSD No. 10119
P 951 653 3351
F 951 653 1662
www.babcocklabs.com
location
6100 Quail Valley Court
Riverside, CA 92507-0704
mailing
P.O Box 432
Riverside, CA 92502-0432
Client Name:
Report Date:
Riverside County Flood Control
1995 Market Street
Rebekah Guill
Riverside, CA 92501
Contact:
Address: Project Number:
Analytical Report: Page 7 of 8
Project Name:
09-Apr-2019Work Order Number: B9C0037
16YesReceived on Ice (Y/N): Temp: °C
RCFC - Post Fire Soil
Post Fire Sediment MV
Notes and Definitions
N_WEX Analyte determined on a 1:10 water extract from the sample.
NR: Not Reported
ND: Analyte NOT DETECTED at or above the Method Detection Limit (if MDL is reported), otherwise at or
above the Reportable Detection Limit (RDL)
RDL: Reportable Detection Limit
MDL: Method Detection Limit
NRLrcf: RL for analyte does not meet the SWAMP / CTR required RL.
* / (Non-NELAP): NELAP does not offer accreditation for this analyte/method/matrix combination
e-Standard_RCFC_N2.rpt
This report applies only to the sample(s) analyzed. As a mutual protection to clients, the public, and Babcock Laboratories, Inc., this report is submitted and accepted for the exclusive
use of the Client to whom it is addressed. Interpretation and use of the information contained within this report are the sole responsibility of the Client. Babcock Laboratories, Inc. is not
responsible for any misinformation or consequences that may result from misinterpretation or improper use of this report. This report is not to be modified or abbreviated in any way.
Additionally, this report is not to be used, in whole or in part, in any advertising or publicity matter without written authorization from Babcock Laboratories, Inc. The liability of Babcock
Laboratories, Inc. is limited to the actual cost of the requested analyses, unless otherwise agreed upon in writing. There is no other warranty expressed or implied.
Enclosed are the analytical results for the submitted sample(s). Babcock Laboratories certify the data presented as part of
this report meet the minimum quality standards in the referenced analytical methods. Any exceptions have been noted.
Approval
cc:
KayeLani A. Marshall
CA ELAP No. 2698
EPA No. CA00102
NELAP No. OR4035
LACSD No. 10119
P 951 653 3351
F 951 653 1662
www.babcocklabs.com
location
6100 Quail Valley Court
Riverside, CA 92507-0704
mailing
P.O Box 432
Riverside, CA 92502-0432
Client Name:
Report Date:
Riverside County Flood Control
1995 Market Street
Rebekah Guill
Riverside, CA 92501
Contact:
Address: Project Number:
Analytical Report: Page 8 of 8
Project Name:
09-Apr-2019Work Order Number: B9C0037
16YesReceived on Ice (Y/N): Temp: °C
RCFC - Post Fire Soil
Post Fire Sediment MV
CA ELAP No. 2698
EPA No. CA00102
NELAP No. OR4035
LACSD No. 10119
P 951 653 3351
F 951 653 1662
www.babcocklabs.com
location
6100 Quail Valley Court
Riverside, CA 92507-0704
mailing
P.O Box 432
Riverside, CA 92502-0432
Site
Approximate
Date Range
Approximate
Volume
Removed (CY)
Approximate
Truckloads (#
of Trucks)
N
Average Truck
Weight1 (tons)
AW
Approximate Wet
Weight (tons) =
(N∙AW)
Tw
Approximate Dry
Weight (tons) =
(Tw∙CF)
Wd
Total Nitrogen
(mg/kg)
Cx
Total Phosphorus
(mg/kg)
Cx
Total Nitrogen
(Tons)
Mx
Total Phosphorus
(Tons)
MxLeach Canyon Dam (LC3) Pre‐
Storm Season
9/1/2018 ‐
11/27/2018 20,000 2,000 15.5 31,000 21,700 20,000 368 434 8
11/28/2018 ‐
2/15/2019 59,376 7,422 15.5 115,041 80,529 20,000 368 1,611 302/16/2019 ‐
4/8/2019 20,048 2,506 15.5 38,843 27,190 20,000 368 544 10
McVicker Canyon Basin
(MV2) Pre‐Storm Season
9/1/2018 ‐
11/27/2018 10,000 1,000 15.5 15,500 10,850 47,000 689 510 7
11/28/2018 ‐
2/15/2019 41,992 5,249 15.5 81,360 56,952 47,000 689 2,677 392/16/2019 ‐
4/5/2019 27,488 3,436 15.5 53,258 37,281 47,000 689 1,752 26
Total (tons) 7527 120Notes:
Wd = Approximate, dry weight (tons)
N = Number of trucks
CF = Conversion factor of 0.7, wet to dry sediment weight
Mx = Nutrient “x” removed, (tons)
Wd = Total sediment, dry weight (tons)
Cx = Analyte “x” concentration (mg/kg)
F = Unit conversion factor, divide by 106 (mg/kg)
Calculations:
Post Holy Fire Sediment Quantity and Nutrient Load Calculations
1‐ Average Truck Weight calculated from all weigh tickets throughout project
AW‐ Average truckload weight
Tw = Approximate wet weight of sediment (tons)
Sediment Information from RCFC&WCD Analytical Concentrations Estimated Nutrient Load Reduction
Leach Canyon Dam (LC3)
Storm Season
McVicker Canyon Basin
(MV2) Storm Season
Leach Canyon Dam
3/7/2019 MGZ
Topography Source
(yd3) (ac-ft) (yd3) (ac-ft)
1956 Design As-Built Line Topoa 52,595 (27,427) 32.6 (17) 95,649 (140,000) 59.3 (86.8)1963.02.23 Line Topo 24,523 15.2 160,894 99.72016 Pre Holy Fire DTMb 21,619 13.4 --- ---2018 Post Holy Fire DTMc 26,011 16.1 141,974 88.02019 Design Grade Improvements DTMd 66,529 41.2 182,492 113.1
Notes:a. As-built backup is lacking. Plans contain contentious data. As-built line work does not match quantities written on as-built. 32.6 (17) = results from generated DTM (information written on as-built)b. 2016 DTM insufficient for debris analysis. c. DTM generated after area was flown via drone on 8-29-2018.d. Original DTM used from 8-29-2018 drone flight and was modified with grading changes to improve dam capacity (includes 2 feet of dead storage).
Level Water Pool Capacity Debris Capacity with 4-Percent As-Built Slope
Beginning at Spillway Elevation
Pre and Post Fire Comparison of Water and Debris Capacity
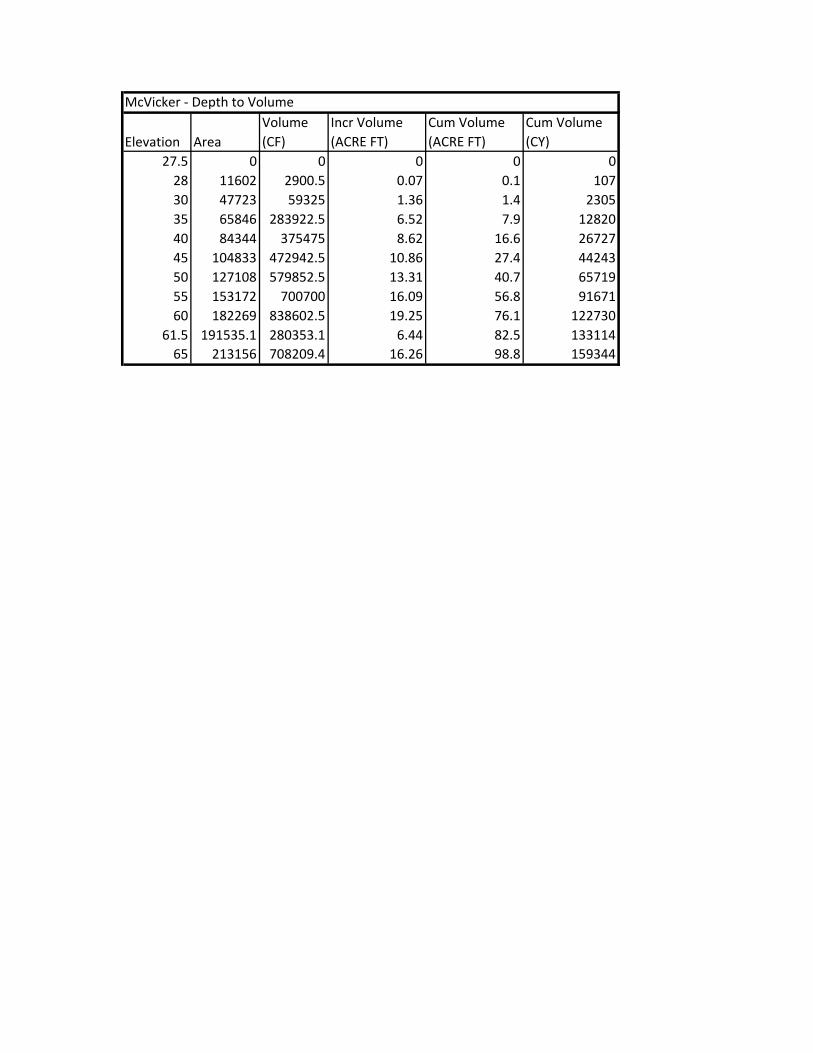
Elevation Area
Volume
(CF)
Incr Volume
(ACRE FT)
Cum Volume
(ACRE FT)
Cum Volume
(CY)
27.5 0 0 0 0 0
28 11602 2900.5 0.07 0.1 107
30 47723 59325 1.36 1.4 2305
35 65846 283922.5 6.52 7.9 12820
40 84344 375475 8.62 16.6 26727
45 104833 472942.5 10.86 27.4 44243
50 127108 579852.5 13.31 40.7 65719
55 153172 700700 16.09 56.8 91671
60 182269 838602.5 19.25 76.1 122730
61.5 191535.1 280353.1 6.44 82.5 133114
65 213156 708209.4 16.26 98.8 159344
McVicker ‐ Depth to Volume