Embed Size (px)
Citation preview

SEDIMENT SOURCES and SEDIMENT LOADINGS
Allen Gellis, PhDResearch Geomorphologist
U.S. Geological SurveyBaltimore, MD
Outline of Talk
• Factors affecting sediment loadings
• Sediment yields
• Concept of sediment fingerprinting
• Examples from the Chesapeake Bay
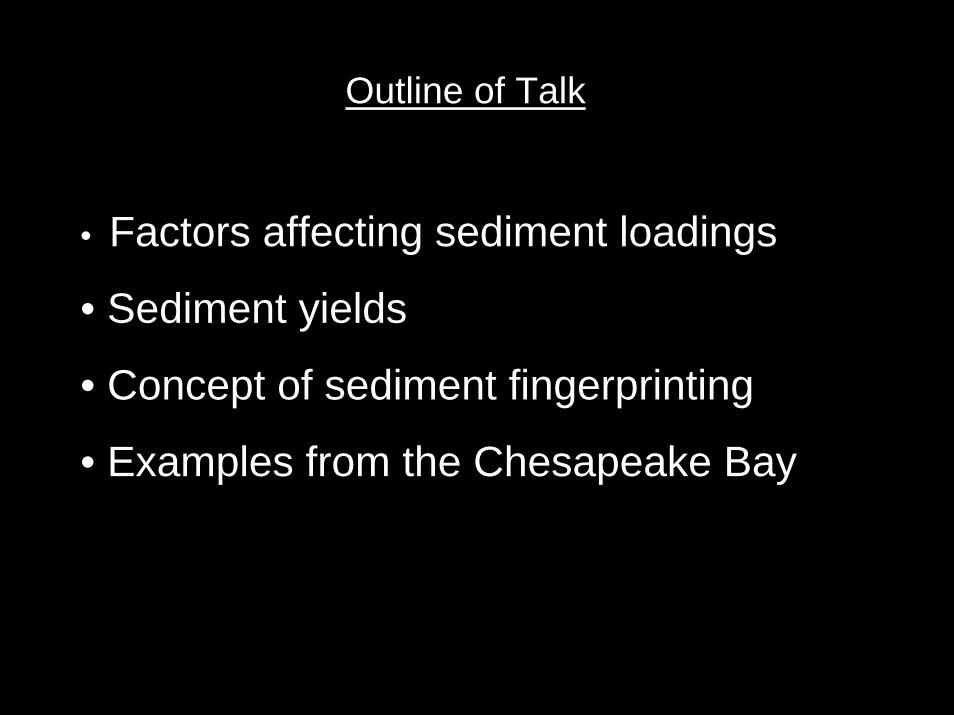
suspended sediment versus bedload
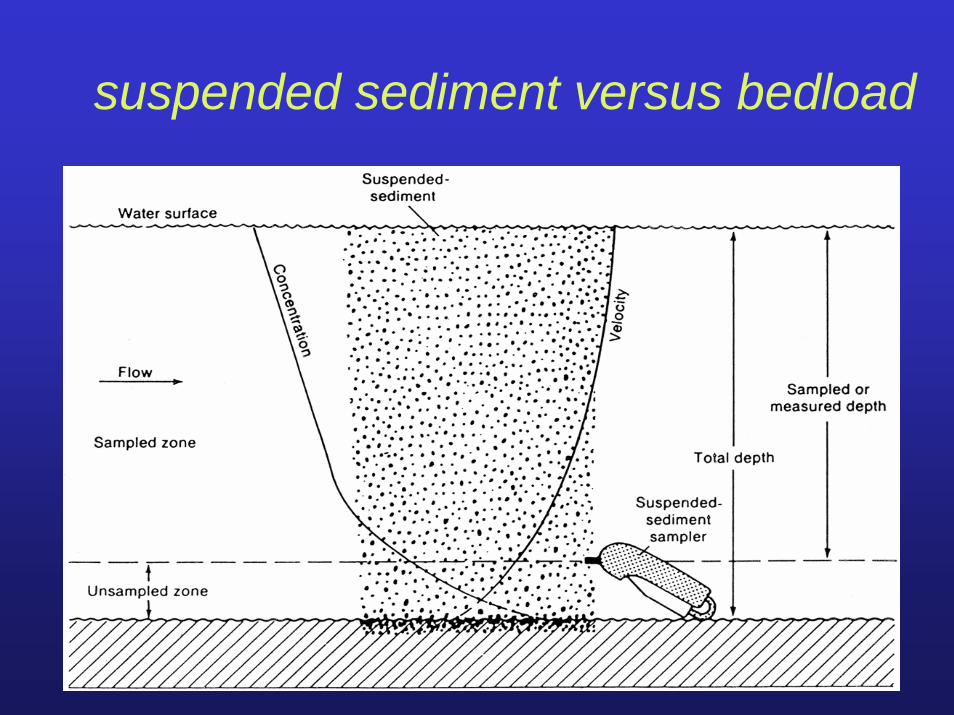
Impacts of Suspended Sediment
• Habitat – burial, light attenuation, channel morphology changes
• Water supply – taste, odor, blocking intakes, reservoir sedimentation
• Infrastructure – sedimentation, flooding
• Water quality – solid transport of contaminants bound to sediment
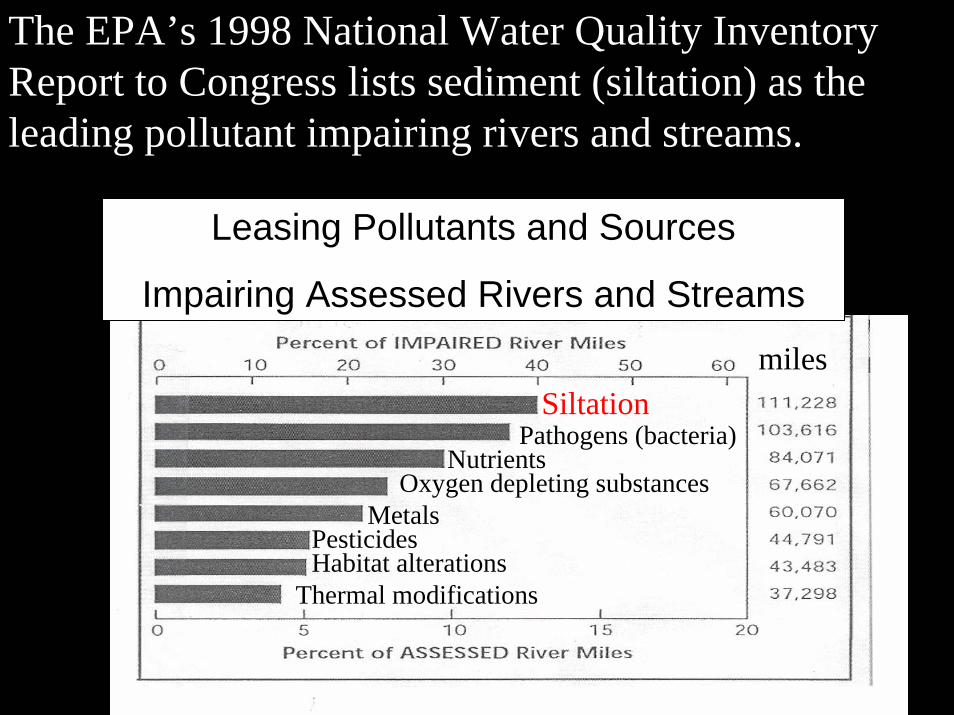
The EPA’s 1998 National Water Quality Inventory Report to Congress lists sediment (siltation) as the leading pollutant impairing rivers and streams.
Leasing Pollutants and Sources
Impairing Assessed Rivers and Streams
Siltationmiles
Pathogens (bacteria)Nutrients
Oxygen depleting substancesMetals
PesticidesHabitat alterations
Thermal modifications
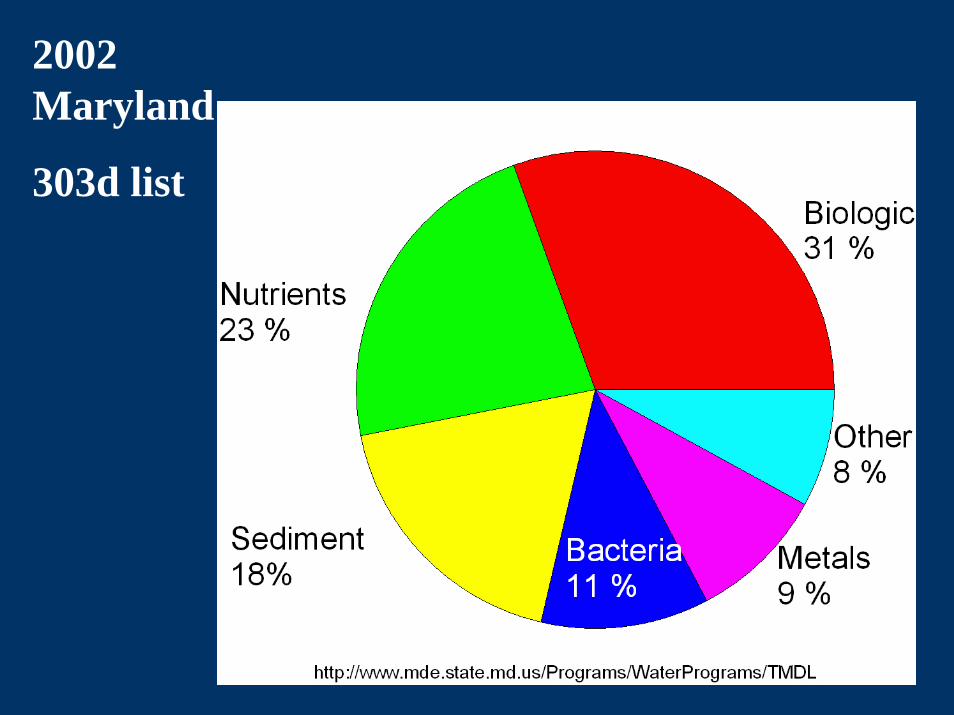
2002 Maryland
303d list
miles
Pathogens (bacteria)Nutrients
Oxygen depleting substancesMetals
PesticidesHabitat alterations
Thermal modifications
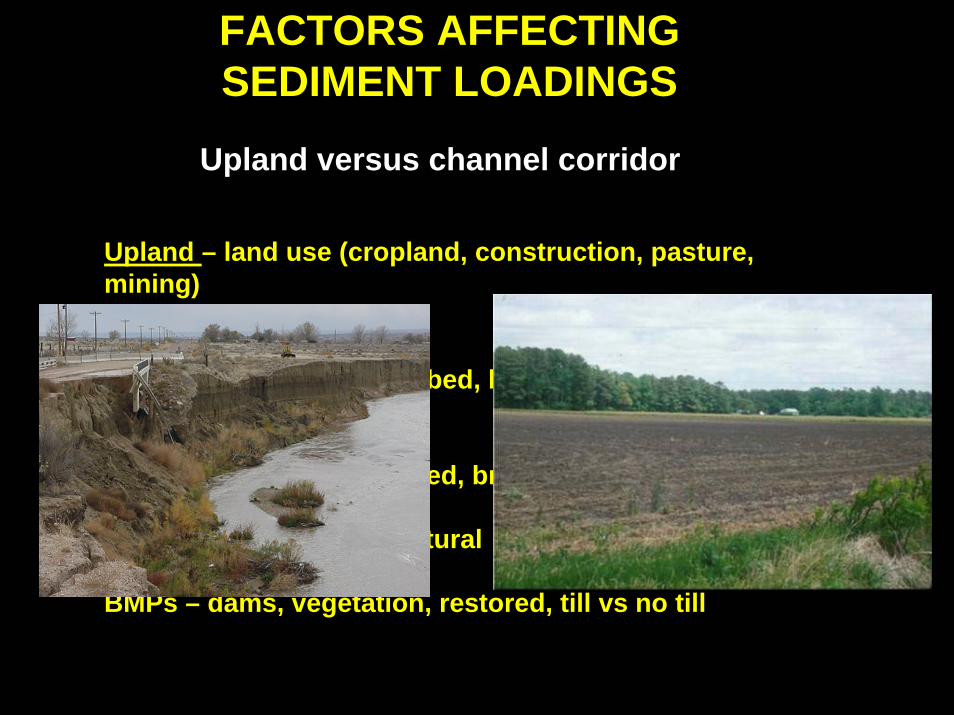
FACTORS AFFECTING SEDIMENT LOADINGS
Upland versus channel corridor
Upland – land use (cropland, construction, pasture, mining)soils, geology, slope
Channel corridor- banks, bed, bars, floodplain, riparian Corridor
Channel condition – incised, braided, channelized
Human caused versus natural
BMPs – dams, vegetation, restored, till vs no till
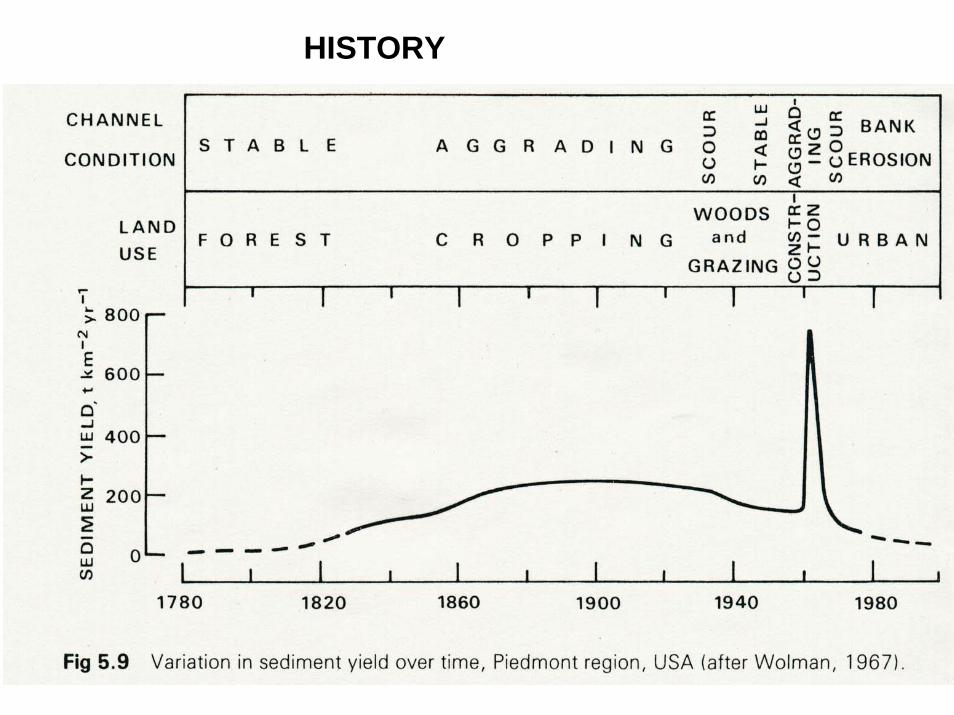
HISTORY
Sediment Storage and Residence Time
Trimble (1975) – 90% of eroded sediment
in the Southern Piedmont is still in storage
(hillslopes and valley)
Costa (1975) – 86% of sediment is still in storage
in Maryland Piedmont
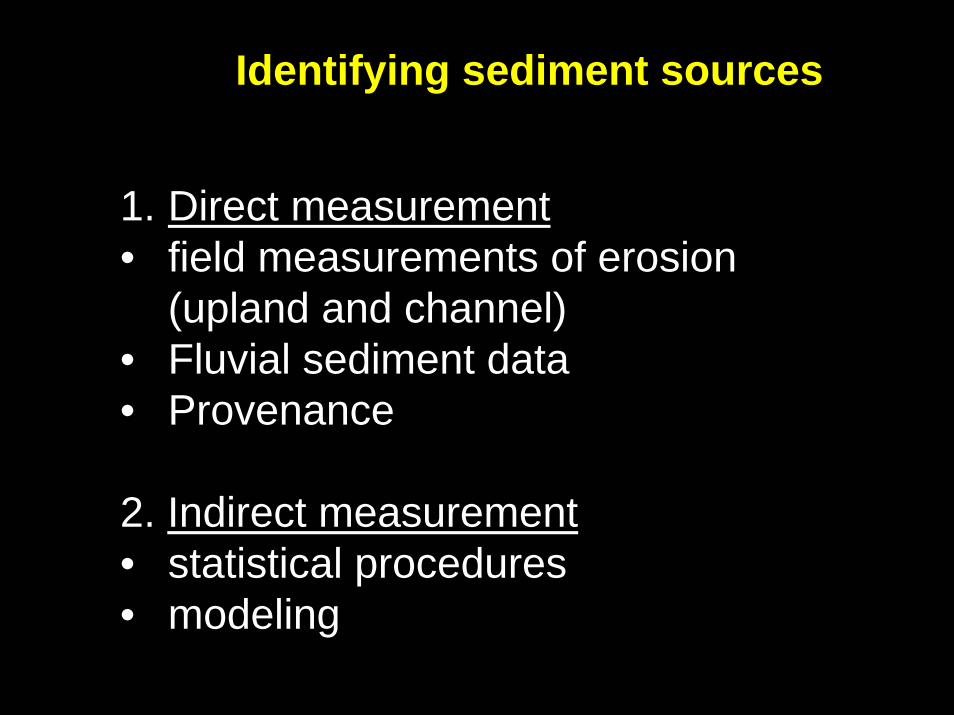
Identifying sediment sources
1. Direct measurement• field measurements of erosion
(upland and channel)• Fluvial sediment data • Provenance
2. Indirect measurement• statistical procedures• modeling
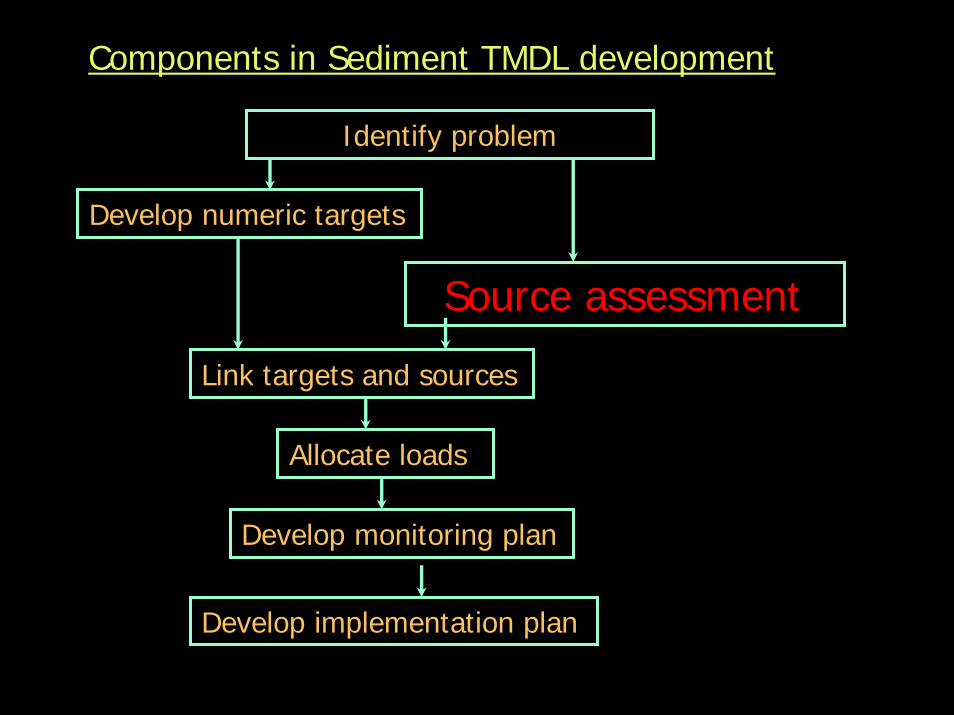
Components in Sediment TMDL development
Identify problem
Develop numeric targets
Source assessment
Link targets and sources
Allocate loads
Develop monitoring plan
Develop implementation plan
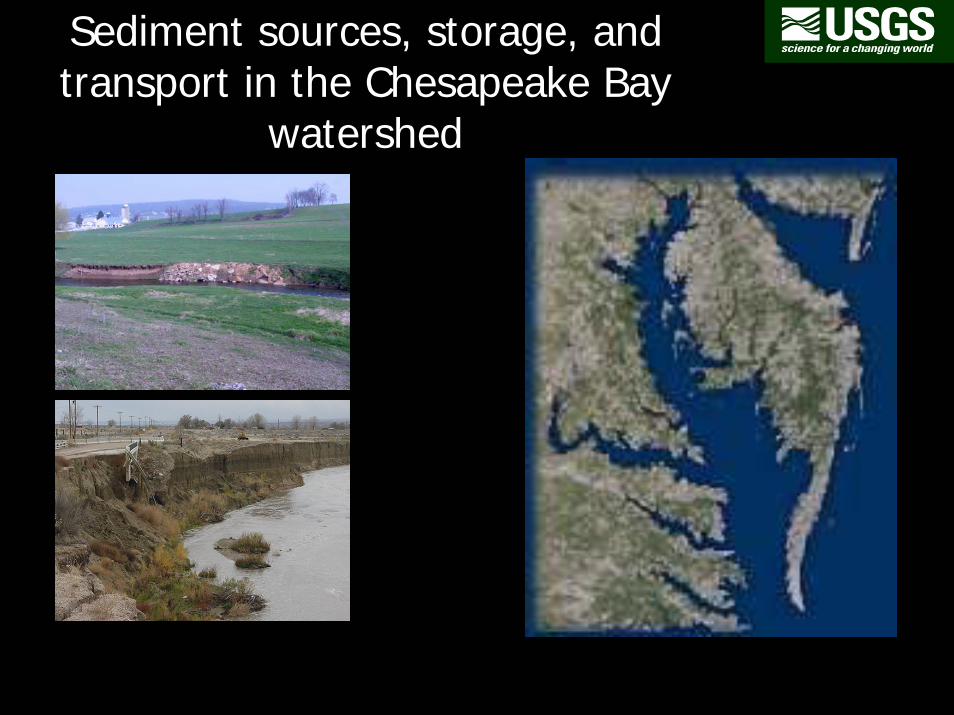
Sediment sources, storage, and transport in the Chesapeake Bay
watershed
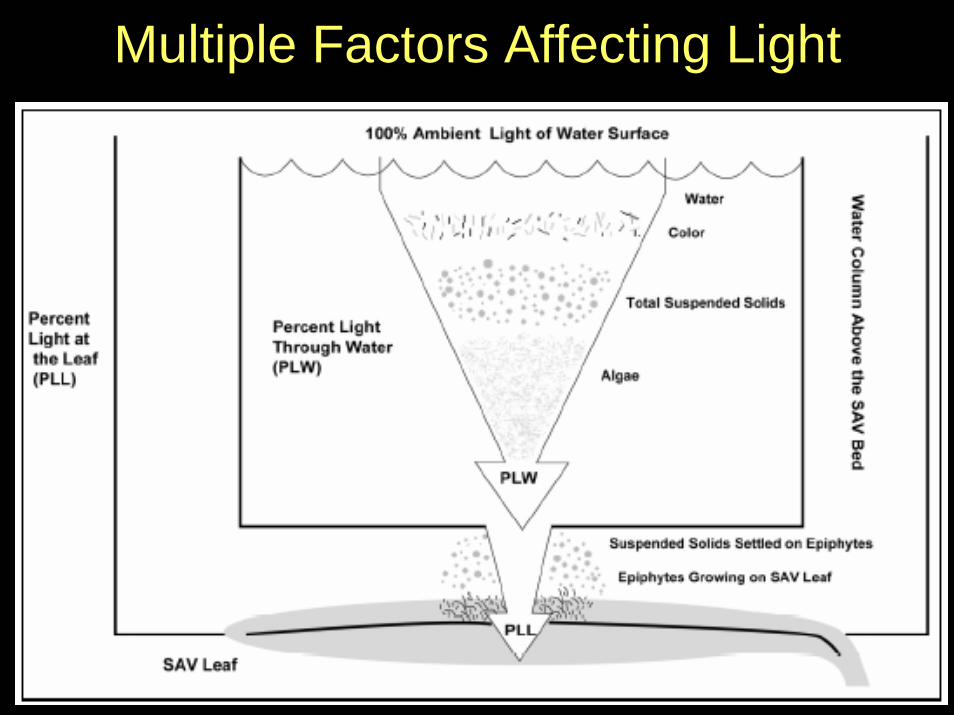
Multiple Factors Affecting Light
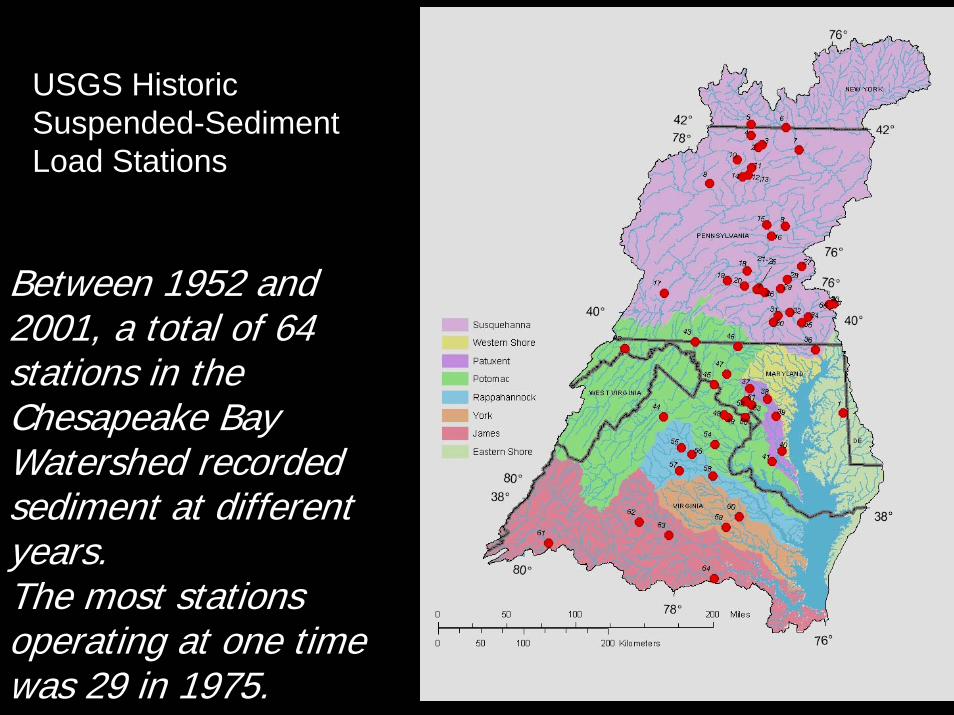
USGS Historic Suspended-Sediment Load Stations
Between 1952 and 2001, a total of 64 stations in the Chesapeake Bay Watershed recorded sediment at different years.The most stations operating at one time was 29 in 1975.
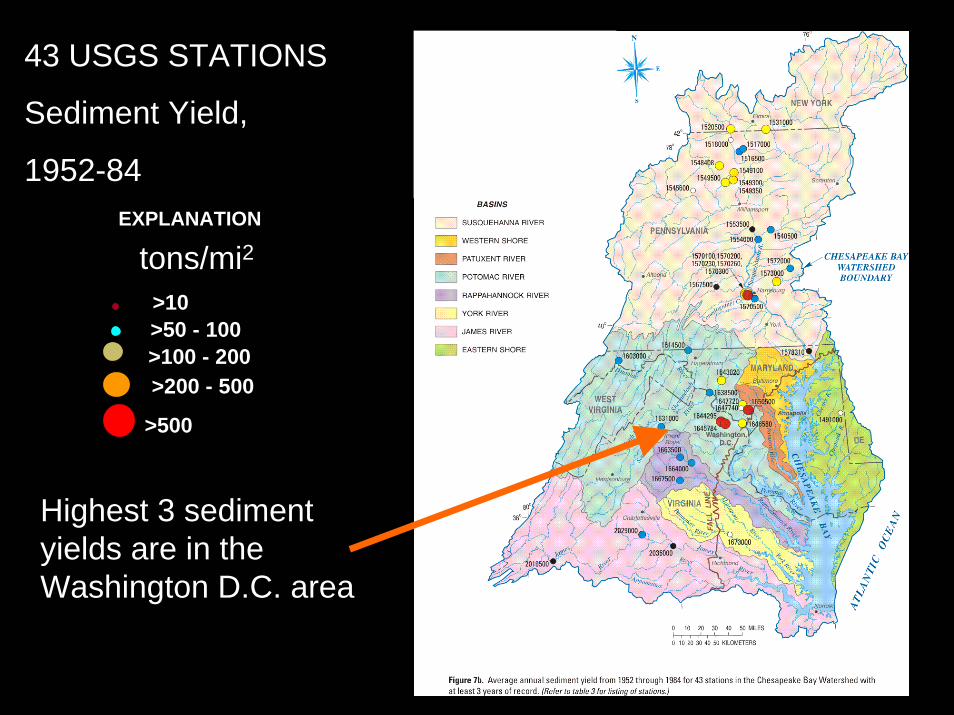
43 USGS STATIONS
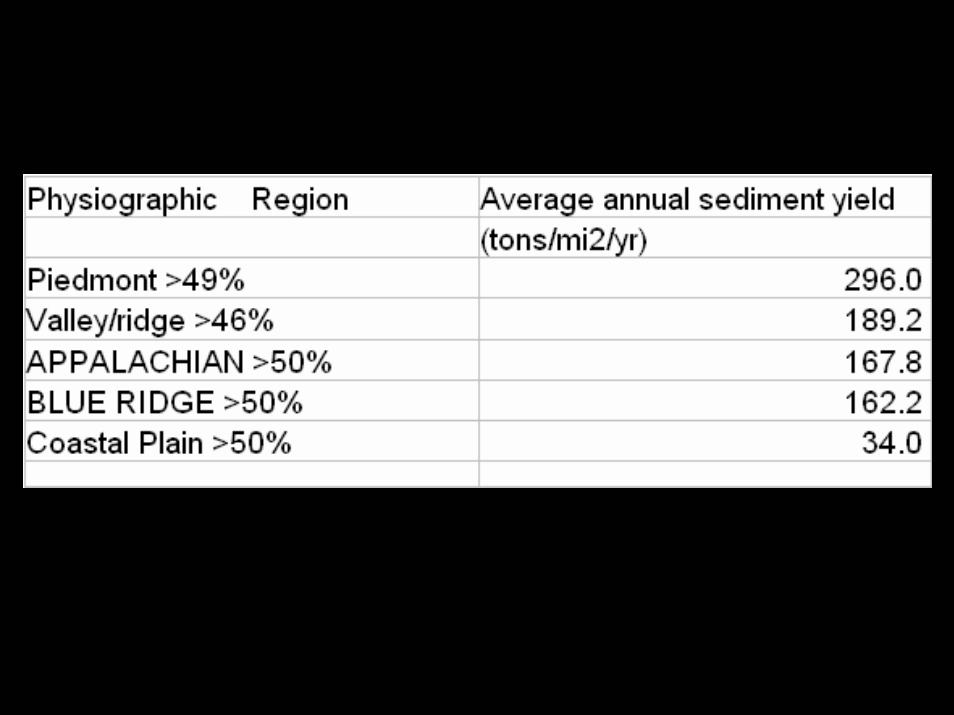
Sediment Yield,
1952-84
>10>50 - 100>100 - 200>200 - 500
>500
tons/mi2EXPLANATION
Highest 3 sediment yields are in the Washington D.C. area
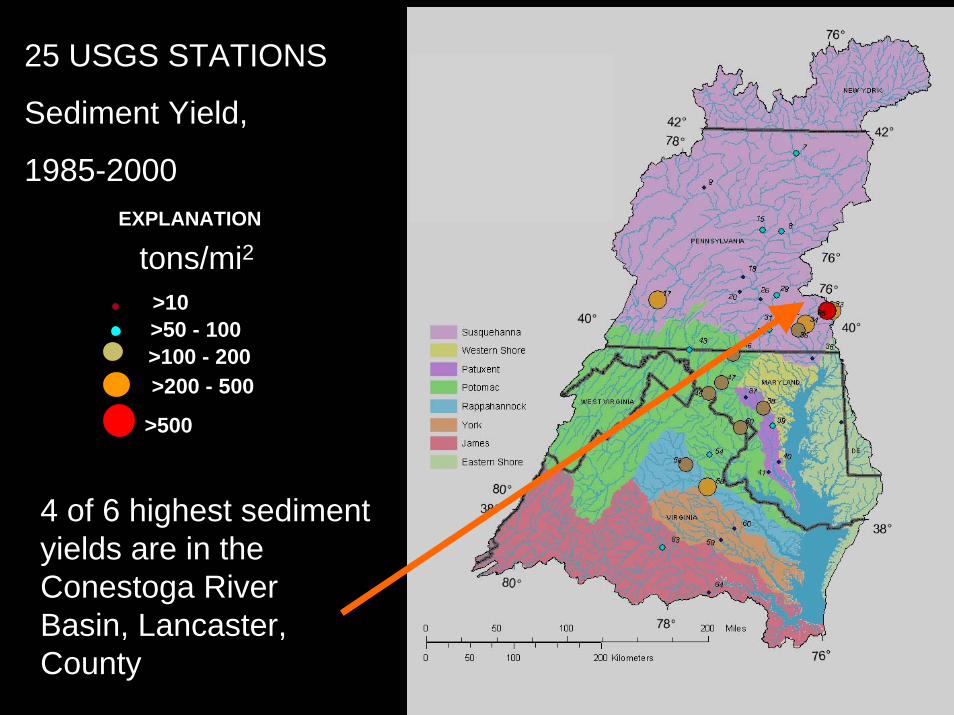
25 USGS STATIONS
Sediment Yield,
1985-2000
>10>50 - 100>100 - 200>200 - 500
>500
tons/mi2EXPLANATION
4 of 6 highest sediment yields are in the Conestoga River Basin, Lancaster, County
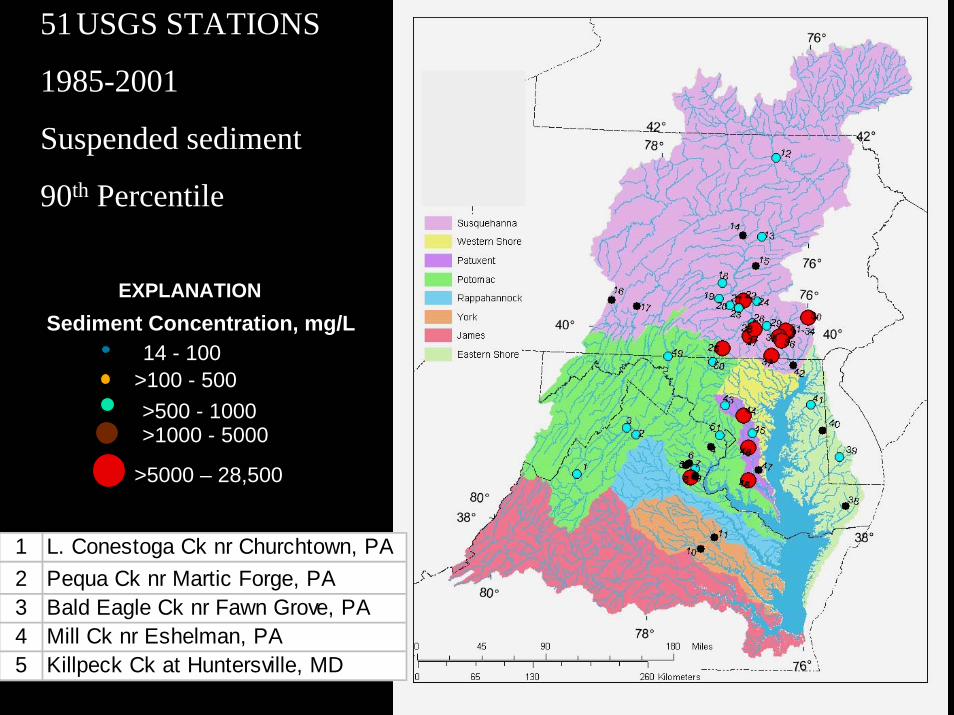
51 USGS STATIONS
1985-2001
Suspended sediment
90th Percentile
14 - 100>100 - 500>500 - 1000>1000 - 5000
>5000 – 28,500
Sediment Concentration, mg/LEXPLANATION
1 L. Conestoga Ck nr Churchtown, PA2 Pequa Ck nr Martic Forge, PA3 Bald Eagle Ck nr Fawn Grove, PA4 Mill Ck nr Eshelman, PA5 Killpeck Ck at Huntersville, MD
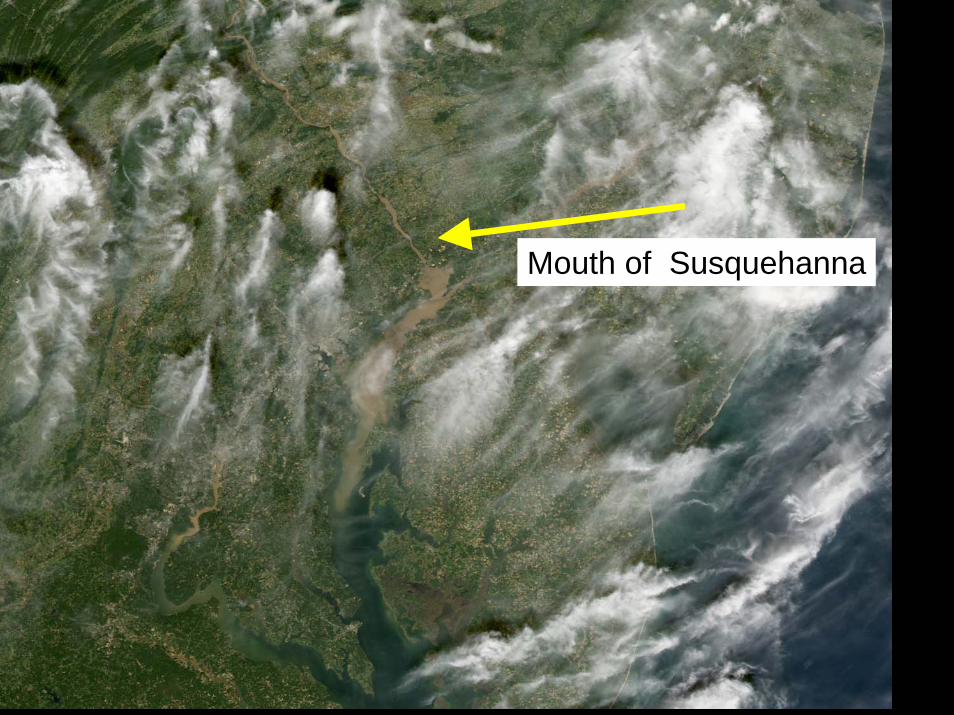
Mouth of Susquehanna
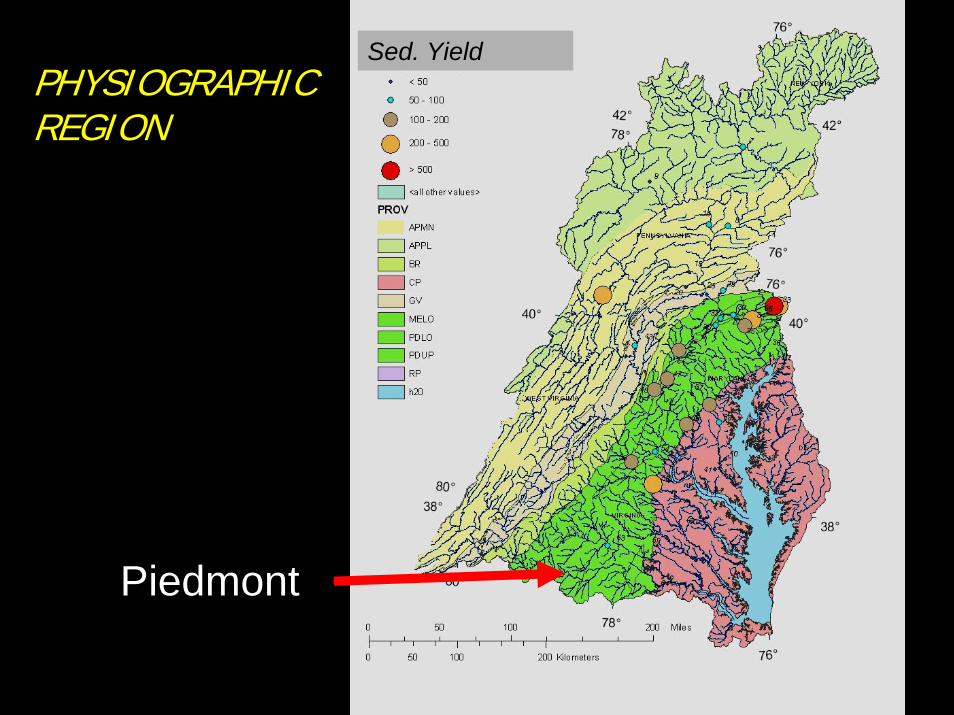
Sed. YieldPHYSIOGRAPHICREGION
Piedmont
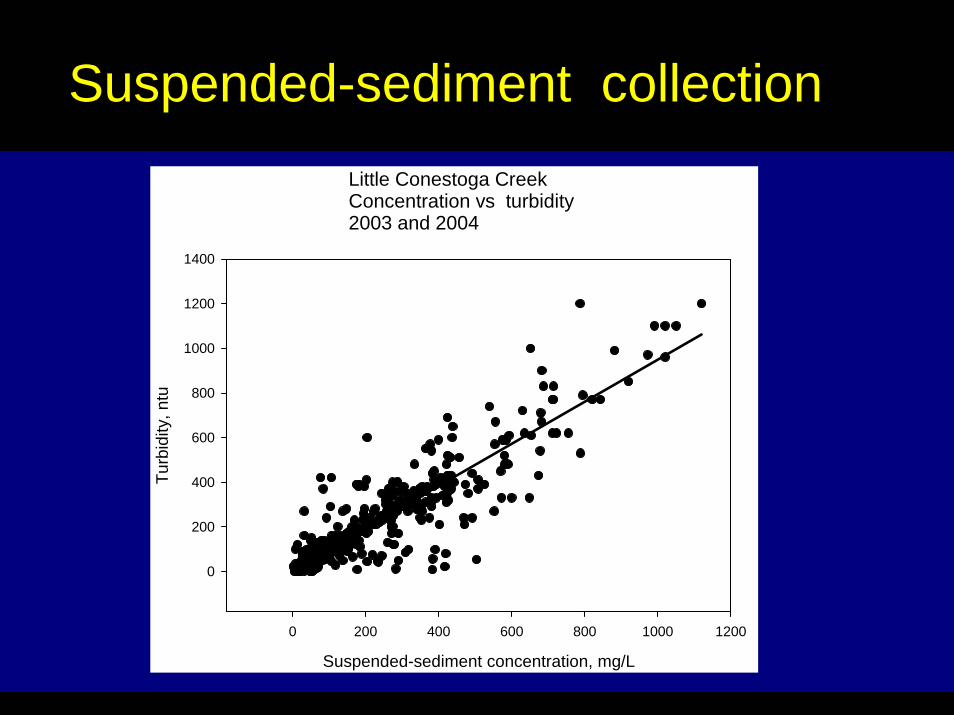
Suspended-sediment collection
• isokinetic samplers• automatic samplers• pump
Little Conestoga CreekConcentration vs turbidity2003 and 2004
Suspended-sediment concentration, mg/L
0 200 400 600 800 1000 1200
Turb
idity
, ntu
0
200
400
600
800
1000
1200
1400
SEDIMENT FINGERPRINTING
Underlying principle – potential sediment sources can be characterized using a number of diagnostic physical and chemical properties
Comparison of these fingerprints with equivalent information for suspended sediment samples permits the relative importance of the potential sources
Walling et al., 1999
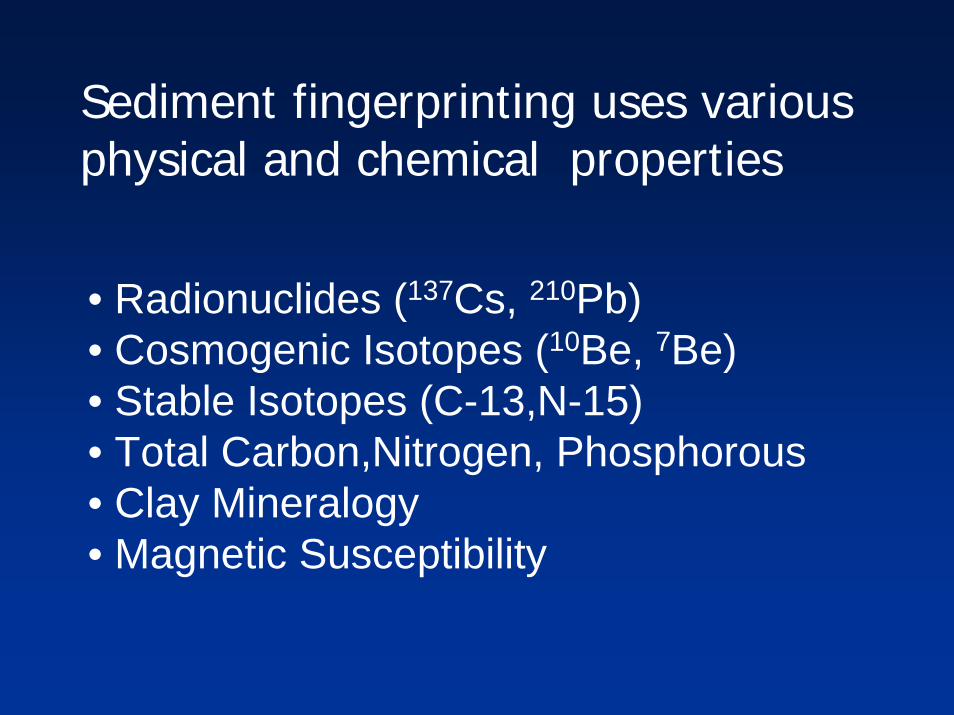
Sediment fingerprinting uses various physical and chemical properties
• Radionuclides (137Cs, 210Pb)• Cosmogenic Isotopes (10Be, 7Be) • Stable Isotopes (C-13,N-15)• Total Carbon,Nitrogen, Phosphorous• Clay Mineralogy• Magnetic Susceptibility
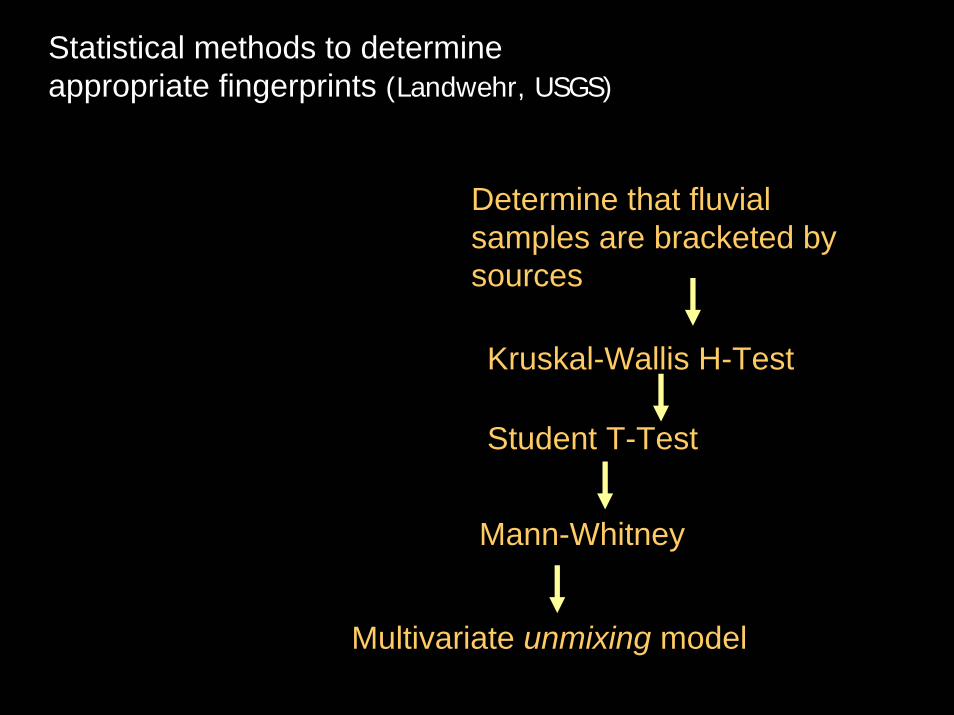
Statistical methods to determine appropriate fingerprints (Landwehr, USGS)
Determine that fluvial samples are bracketed by sources
Kruskal-Wallis H-Test
Student T-Test
Mann-Whitney
Multivariate unmixing model
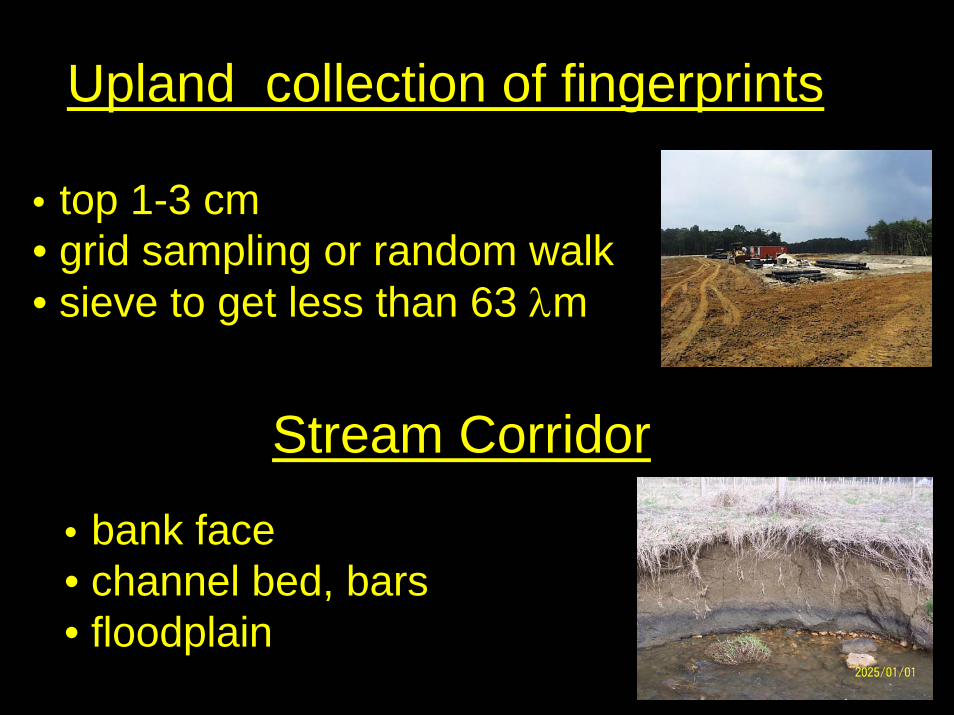
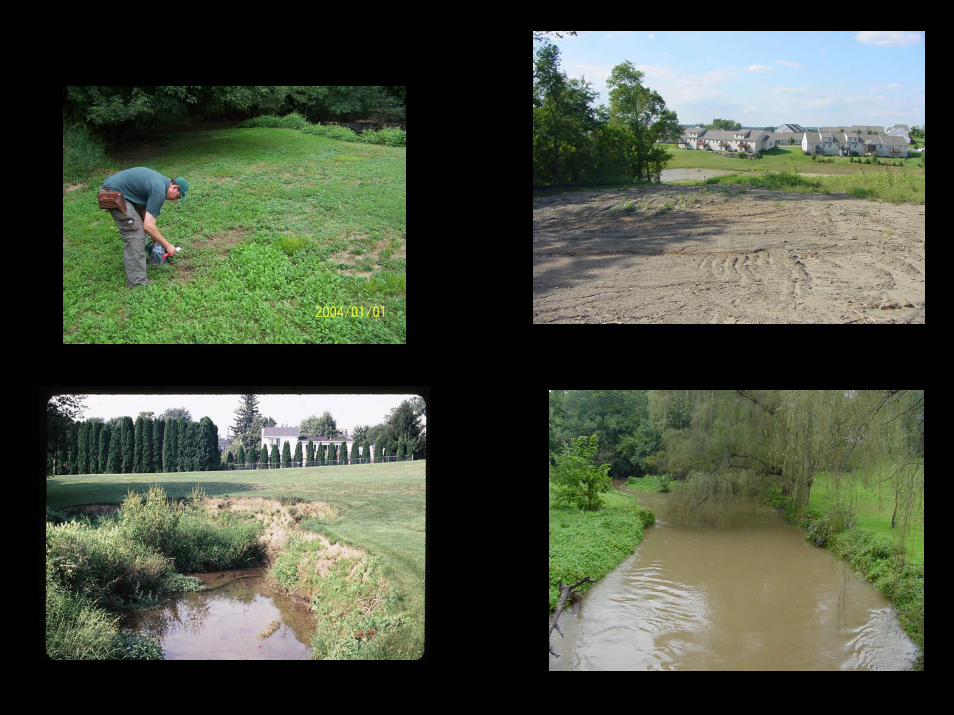
Upland collection of fingerprints
• top 1-3 cm• grid sampling or random walk• sieve to get less than 63 λm
Stream Corridor
• bank face • channel bed, bars• floodplain
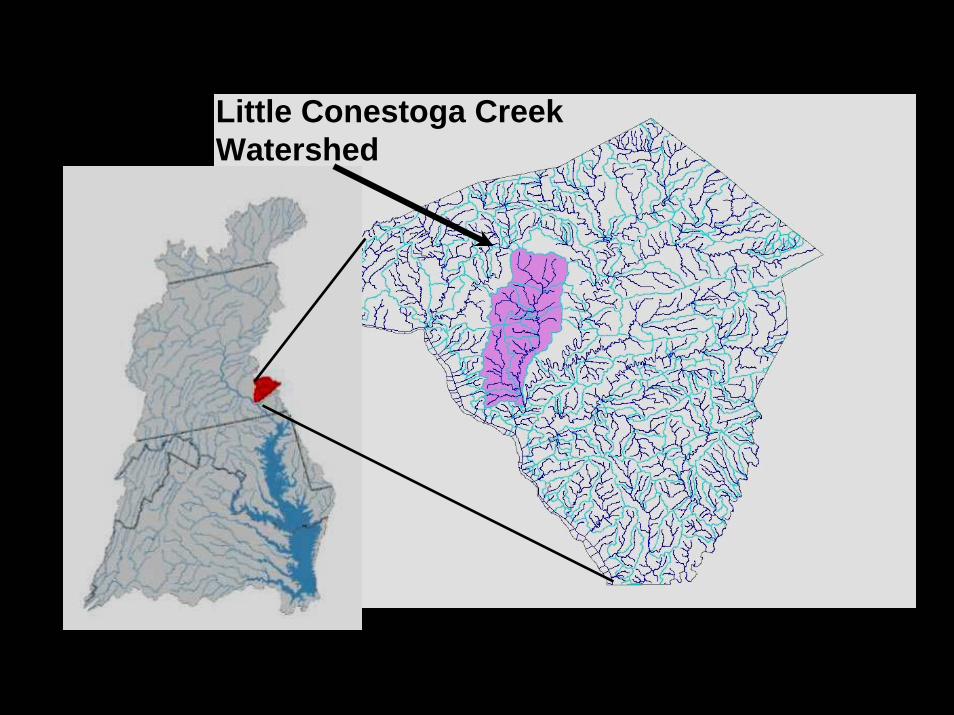
Little Conestoga Creek Watershed
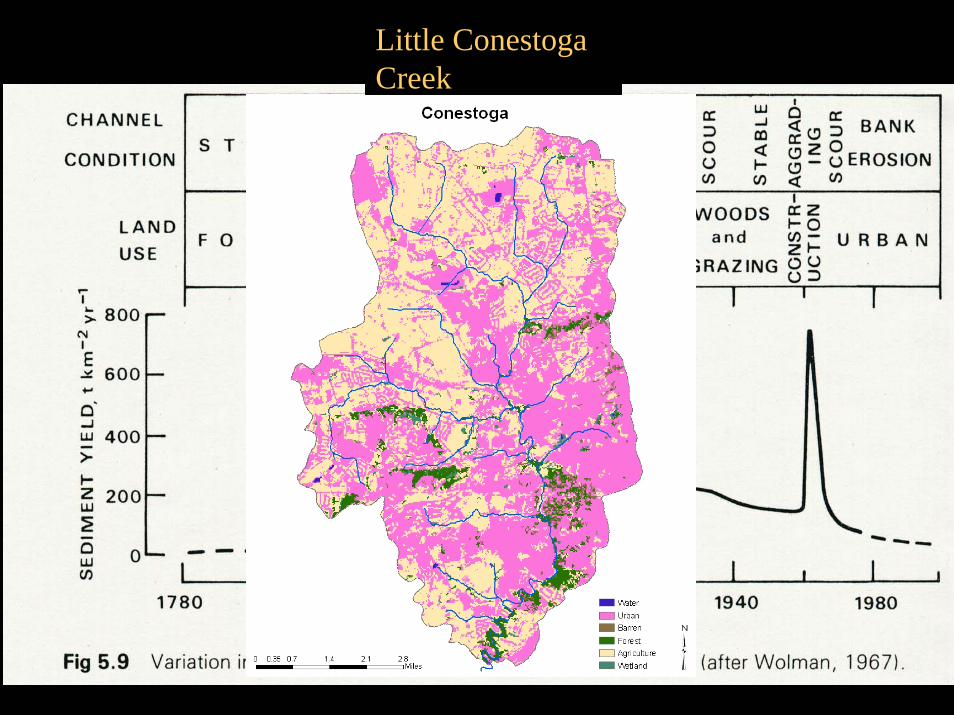
Little Conestoga Creek
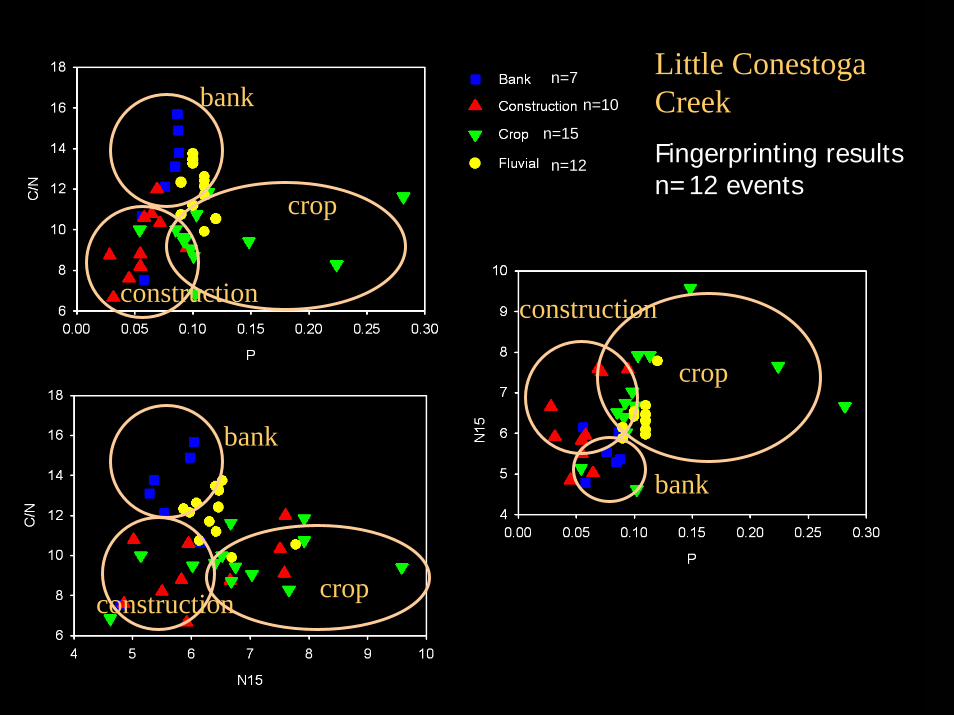
Little Conestoga CreekFingerprinting results n=12 events
n=7
n=10
n=15
n=12
bank
crop
construction
bank
construction crop
crop
construction
bank
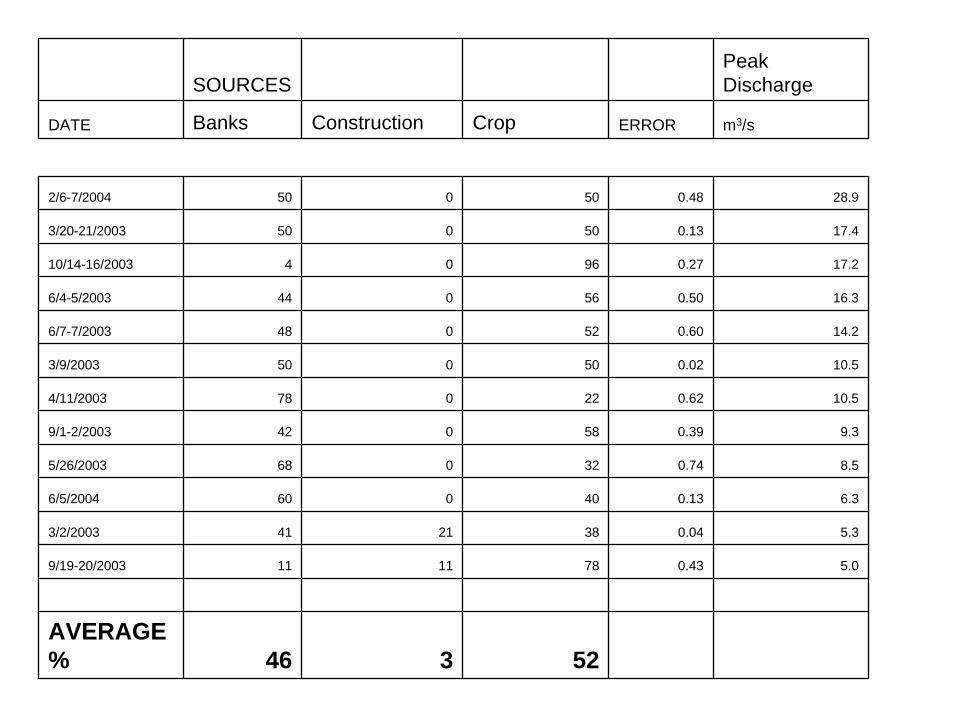
SOURCESPeak Discharge
DATE Banks Construction Crop ERROR m3/s
2/6-7/2004 50 0 50 0.48 28.9
3/20-21/2003 50 0 50 0.13 17.4
10/14-16/2003 4 0 96 0.27 17.2
6/4-5/2003 44 0 56 0.50 16.3
6/7-7/2003 48 0 52 0.60 14.2
3/9/2003 50 0 50 0.02 10.5
4/11/2003 78 0 22 0.62 10.5
9/1-2/2003 42 0 58 0.39 9.3
5/26/2003 68 0 32 0.74 8.5
6/5/2004 60 0 40 0.13 6.3
3/2/2003 41 21 38 0.04 5.3
9/19-20/2003 11 11 78 0.43 5.0
AVERAGE % 46 3 52
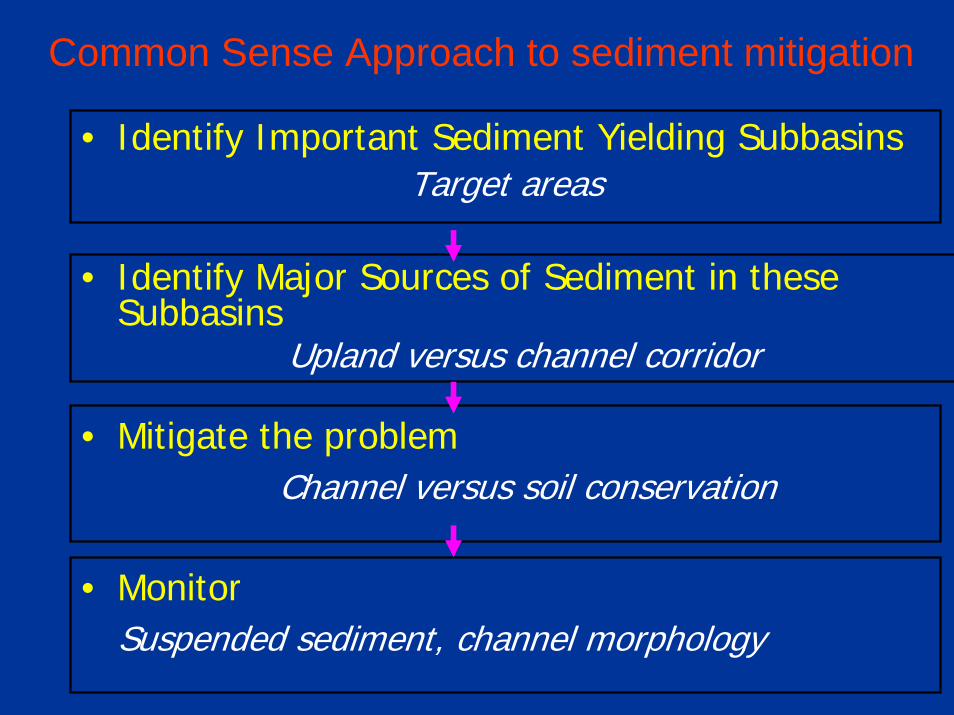
Common Sense Approach to sediment mitigation
• Identify Important Sediment Yielding SubbasinsTarget areas
• Mitigate the problemChannel versus soil conservation
• MonitorSuspended sediment, channel morphology
• Identify Major Sources of Sediment in these Subbasins
Upland versus channel corridor
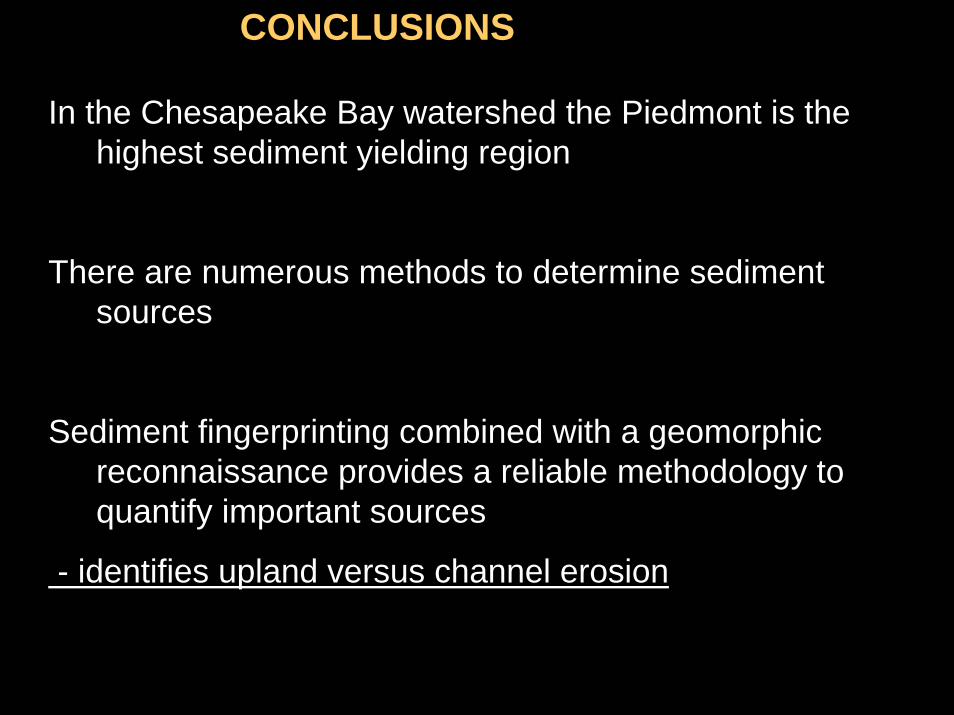
CONCLUSIONS
In the Chesapeake Bay watershed the Piedmont is the highest sediment yielding region
There are numerous methods to determine sediment sources
Sediment fingerprinting combined with a geomorphic reconnaissance provides a reliable methodology to quantify important sources
- identifies upland versus channel erosion