Embed Size (px)
Citation preview

Application of a Virtual Reality and an Ergonomics
Framework for Production Time Optimization:
Case study in pen production
Alireza Alipour
Submitted to the
Institute of Graduate Studies and Research
in partial fulfillment of the requirements for the degree of
Master of Science
in
Mechanical Engineering
Eastern Mediterranean University
July, 2016
Gazimağusa, North Cyprus

Approval of the Institute of Graduate Studies and Research
Prof. Dr. Mustafa Tümer
Acting Director
I certify that this thesis satisfies the requirements as a thesis for the degree of Master
of Science in Mechanical Engineering.
Assoc. Prof. Dr. Hasan Hacışevki
Chair, Department of Mechanical Engineering
We certify that we have read this thesis and that in our opinion it is fully adequate in
scope and quality as a thesis for the degree of Master of Science in Mechanical
Engineering.
Assoc. Prof. Dr. Qasim Zeeshan
Supervisor
Examining Committee
1. Assoc. Prof. Dr. Hasan Hacışevki
2. Assoc. Prof. Dr. Qasim Zeeshan
3. Asst. Prof. Dr. Davut Solyalı

iii
ABSTRACT
The goal of an efficient workstation design is to minimize the stress on the users by
eliminating the risk of fatigue and injury, and consequently improve the production
time. The primary goal of this research is to study and establish a relation between
Ergonomics, Time Study, and Virtual Reality techniques for developing an integrated
approach for designing and evaluating of assembly workstations. This proposed
integrated approach is applied to improve the design of common storage bins which
are being used in workstations for storage in repetitive manual assembly processes,
in order to decrease the production time, reduce the fatigue on worker, mitigate the
risk of Work-related Musculoskeletal Disorders, and consequently improve the
productivity. The objective of this research is to improve the design of a common
storage bin used to hold the four parts in the assembly process of pen production.
However, these days most of pen production assembly lines are automated, but in
small and medium size enterprises this assembly process is still performed manually.
Since this assembly task is simple and can be generalized to any other assembly task,
therefore it is chosen as a case study. The participants in this experimental study are
10 people, 5 men and 5 women. The average age, body weight, and stature of the
participants is 32.6 years, 181.4 cm, and 79.7 for males; and 32.8 years, 166.6 cm,
69.6 kg for females. Their age is between 24 to 43 years. A digital camera is used to
record the real time experiments. Proplanner Software is used for Time study and
observing experiments. DELMIA Human Activity Analysis is used to study the
fatigue in virtual environment. The comparison of the real time and simulation
experimental results show that the proposed storage bin could improve the time for
pick-up of 30 parts by about 11.5 seconds and decreases the fatigue by 42.5%. It is

iv
demonstrated that the redesign of a common storage bin based on proposed technique
improves the productivity and efficiency of the workstation.
Keywords: Small and medium size enterprise, Ergonomics, Time study, Virtual
reality, DELMIA, Fatigue, storage bin.
v
ÖZ
verimli bir iş istasyonu tasarımı amacı yorgunluk ve yaralanma riskini ortadan
kaldırarak kullanıcılar stresi en aza indirmek ve dolayısıyla üretim süresini
arttırmaktır. Bu araştırmanın temel amacı, çalışma ve tasarım ve montaj iş
istasyonları değerlendirmek için entegre bir yaklaşım geliştirmek için Ergonomi,
Zaman Etüdü ve Sanal Gerçeklik teknikleri arasında bir ilişki kurmaktır. Önerilen bu
entegre yaklaşım İşle ilgili musculoskeletal riskini azaltmak, işçi üzerindeki
yorgunluğu azaltmak, üretim süresini azaltmak için, tekrarlanan el montaj
süreçlerinde depolama için iş istasyonlarında kullanılmakta olan ortak depolama
kutuları tasarımını geliştirmek için uygulanan Bozukluklar, ve sonuç olarak
verimliliğini artırır. Bu araştırmanın amacı, kalem üretimi montaj sürecinde dört
bölümden tutmak için kullanılan ortak bir depolama kutusu tasarımını geliştirmektir.
Ancak, en çok kalem üretim montaj hatları bu gün otomatik, ancak küçük ve orta
ölçekli işletmelerde bu montaj işlemi hala elle yapılır. Bu montaj, basit bir iştir ve
diğer montaj görev jeneralize olabilir beri, bu nedenle bir vaka çalışması olarak
seçilmiştir. Bu deneysel çalışmada katılımcılar 10 kişi, 5 erkek ve 5 kadın vardır.
Katılımcıların ortalama yaşı, vücut ağırlığı ve boy 32.6 yıl, 181.4 cm, erkeklerde 79.7
olduğu; ve 32.8 yıl, 166.6 cm, kadınlarda 69.6 kg. Yaşları 24 ila 43 yıl arasındadır.
Bir dijital fotoğraf makinesi gerçek zamanlı deneyler kaydetmek için kullanılır.
Proplanner Yazılım Zaman çalışma ve gözlem deneyleri için kullanılır. DELMIA
İnsan Etkinlik Analizi sanal ortamda yorgunluk incelemek için kullanılır. Gerçek
zamanlı ve simülasyon deney sonuçlarının karşılaştırılması önerilen depolama kutusu
yaklaşık 11.5 saniye 30 parça pick-up için zaman geliştirmek ve% 42,5 ile
yorgunluğu azalttığı olamayacağını göstermektedir. Teklif tekniğine dayalı ortak bir

vi
depolama kutusu yeniden tasarlanması iş istasyonunun verimliliğini ve etkinliğini
artırdığı gösterilmiştir.
Anahtar kelimeler: Küçük ve orta ölçekli işletme, Ergonomi, Zaman etüdü, Sanal
gerçeklik, DELMIA, Yorgunluk, depolama kutusu.

vii
ACKNOWLEDGMENT
At the first, I would like to express my genuine appreciation to the numerous people
who have supported me for writing this research and finish my Master program in
Mechanical Engineering. I wish to appreciate foremost from Prof. Dr. Qasim Zeeshan
that guide and support me into this field of infinite area of science.
Second person that I want appreciate from whom is Mr. Poorya Ghafoorpoor that be
like my kindness brother and without his guidance and feedbacks this research would
have been impossible.
My special appreciation is for my lovely family that always had my back like a
mountain, and I can never reimburse their kindness and love. Thus, I would like to
wholeheartedly and sincerely present my thesis to my mother, my father and my
brother that encouraged me every moment in my life to achieve my ambitious
expectations.
I also want to present my deepest thanks to my lovely friends Farzad Khodabakhshi,
Golnaz Yaghobnezhadzangane, Kourosh and Sara fakoornia, Mehraveh Rahimzadeh
and yaghub Gavilian that be next to me in these two years.
At the end, I want to appreciate Assoc. prof. Urhan Korhan and Mr. Ali Vatankhah
that guides me in this thesis.

viii
TABLE OF CONTENTS
ABSTRACT ............................................................................................................ iii
ÖZ …... .................................................................................................................... v
ACKNOWLEDGMENT........................................................................................ vii
LIST OF TABLES ................................................................................................. xii
LIST OF FIGURES .............................................................................................. xiii
LIST OF ABBREVIATIONS ................................................................................ xv
LIST OF SYMBOLS ............................................................................................ xvi
1 INTRODUCTION ................................................................................................ 1
2 BACKGROUND .................................................................................................. 4
2.1 Definition of Ergonomics .............................................................................. 4
2.1.1 Cognitive Ergonomics ........................................................................... 5
2.1.2 Organizational Ergonomics ................................................................... 6
2.1.3 Physical Ergonomics:............................................................................. 6
2.1.3.1 Advantage of Physical Ergonomics ............................................... 7
2.1.3.1.1 Increased Productivity ............................................................ 7
2.1.3.1.2 Reduced turnover and absenteeism ......................................... 7
2.1.3.1.3 Improved quality ..................................................................... 7
2.1.3.1.4 Improved efficiency ................................................................ 7
2.1.3.1.5 Improved employee morale .................................................... 7
2.1.3.1.6 Reduced downtime.................................................................. 7
2.1.3.2 Task Physical Characteristics ......................................................... 8
2.1.3.2.1 Awkward postures .................................................................. 8
2.1.3.2.2 Excessive force ....................................................................... 8

ix
2.1.3.2.3 Repetition ................................................................................ 9
2.1.3.2.4 Contact stress .......................................................................... 9
2.1.3.2.5 Static muscle loading ............................................................ 10
2.1.3.2.6 Vibration ............................................................................... 10
2.1.3.3 Task Environmental characteristics .............................................. 11
2.1.3.3.1 Whole Body Vibration .......................................................... 11
2.1.3.3.2 Lighting ................................................................................. 11
2.1.3.3.3 Noise ..................................................................................... 11
2.1.3.3.4 Heat stress ............................................................................. 11
2.1.3.3.5 Cold stress ............................................................................. 11
2.2 Measurement ergonomic methods ............................................................... 12
2.2.1 Pen-paper based observational methods .............................................. 13
2.2.1.1 RULA Method .............................................................................. 14
2.2.2 Observational Methods Based on Computer or Video Tape ............... 17
2.2.3 Direct/Instrumental Methods ............................................................... 18
2.2.4 Self-Reporting Method ........................................................................ 19
2.3 Time Study .................................................................................................. 19
2.3.1 Definition of time study ....................................................................... 19
2.3.2 Objective of Time Study ...................................................................... 20
2.3.3 Time study techniques ......................................................................... 20
2.3.4 Time Study Instruments ....................................................................... 21
2.4 Virtual Reality ............................................................................................. 21
2.4.1 Definition of Virtual Reality ................................................................ 21
2.4.2 Definition of Virtual Manufacturing .................................................... 21
3 LITERATURE REVIEW ................................................................................... 23

x
4 METHODOLOGY ............................................................................................. 28
4.1 Case study .................................................................................................... 28
4.2 Problem ....................................................................................................... 29
4.3 Goals of the research: .................................................................................. 32
4.4 Solution ....................................................................................................... 32
4.5 Experiment participants: .............................................................................. 34
4.6 Experiment requirements ............................................................................ 35
4.6.1 Standard conditions .............................................................................. 35
4.6.2 Necessary sources and equipment ....................................................... 35
4.7 The Experimental Study .............................................................................. 37
4.7.1 Experiment Steps ................................................................................. 37
4.7.1.1 Time Study Database .................................................................... 37
4.7.1.1.1 Time database related to experiment with common bin ....... 37
4.7.1.1.2 Time database related to experiment with proposed bin ...... 40
4.7.1.2 Database related to the experiment with virtual reality software . 41
4.7.1.3 Part distribution program .............................................................. 43
4.7.1.4 Calculation of the time results ...................................................... 43
4.7.1.5 Calculation of the final time for picking up parts ........................ 44
4.7.1.6 Calculate the fatigue value ........................................................... 45
5 RESULTS AND DISCUSSION ......................................................................... 47
5.1 Calculate the results for assembly time and fatigue value .......................... 47
5.2 Discussion ................................................................................................... 49
6 CONCLUSION ................................................................................................... 54
6.1 Conclusion ................................................................................................... 54
6.2 Future works ................................................................................................ 55

xi
REFERENCES ...................................................................................................... 57
APPENDIX ............................................................................................................ 69
Appendix C: The result of Fatigue Value for hand posture ........................... 80
Appendix D: The program for distribute the parts in different segments in
common bin .................................................................................................... 81
Appendix E: The complete calculation of one complete virtual experiment . 82

xii
LIST OF TABLES
Table 1. Different pen-and-paper-based observational techniques .......................... 16
Table 2. Different computer-aided and videotaping observational methods ............ 17
Table 3. Different time study techniques ................................................................. 20
Table 4. litreture review summary ............................................................................ 27
Table 5. Age, body weight, and stature of the participants ...................................... 34
Table 6. The average age, body weight, and stature of the subjects ......................... 35
Table 7. The results of the experiments on common storage bin for 10 time
experiment................................................................................................................. 48
Table 8. The results for experiment on proposed storage bin for 10-time experiment
................................................................................................................................... 49
Table 9. Fatigue value for common storage bin ....................................................... 80
Table 10. Fatigue value for proposed storage bin ..................................................... 80

xiii
LIST OF FIGURES
Figure 1. The division of internal ergonomics association ......................................... 5
Figure 2. Different awkward posture .......................................................................... 8
Figure 3. Contact stress on wrist and knee ............................................................... 10
Figure 4. Different kinds of measurement ergonomic methods ............................... 13
Figure 5. RULA Employee Assessment Worksheet ................................................. 15
Figure 6. Layout of the pen assembly workstation ................................................... 29
Figure 7. Harmful area for wrist for picking up a part in the normal plastic storage bin
(area 1) ...................................................................................................................... 30
Figure 8. Dangerous range according RULA method .............................................. 31
Figure 9. Random pattern of distribution for 50 parts in PSB .................................. 31
Figure 10. Bad position of parts that are so small and placed on the edge ............... 32
Figure 11. 2D view of the proposed storage bin ....................................................... 33
Figure 12. (a) Sitting work place for female; (b) Sitting work place for male ......... 35
Figure 13. 3D design of the bottom of pen in DELMIA .......................................... 36
Figure 14. Standard storage bin ................................................................................ 36
Figure 15. Proposed design for the storage bin ........................................................ 36
Figure 16. The partition pattern of the common bin ................................................. 38
Figure 17. Structure of time database for one experiment ........................................ 39
Figure 18. Partition pattern of the proposed bin ....................................................... 41
Figure 19. Simulation of a hand worker position and analysis for segment 1 .......... 41
Figure 20. Pattern of different parts positions in every segment in normal storage bin
................................................................................................................................... 43
Figure 21. The result that software program calculates for distribution 30 parts ..... 44

xiv
Figure 22. Applied methodology scheme for evaluating time and fatigue index ..... 46
Figure 23. Comparison time of assembly for Real environment experiments between
common and proposed bins ...................................................................................... 50
Figure 24. Comparison time of assembly for virtual reality experiments between
common and proposed bin ........................................................................................ 51
Figure 25. Comparison fatigue value between common and proposed bin .............. 51
Figure 26. Comparison time of assembly between virtual and real experiments on a
common bin .............................................................................................................. 53
Figure 27. Comparison time of assembly between virtual and real experiments on a
proposed bin .............................................................................................................. 53

xv
LIST OF ABBREVIATIONS
RULA Rapid Upper Limb Assessment
VR Virtual Reality
VM Virtual Manufacturing
VE Virtual Environment
WMSD Work-related Musculoskeletal Disorders
MSD Musculoskeletal Disorders
APAS Ariel Performance Analysis System
PTSS Predetermined Time Standard System
3-D 3-Dimension
CAD Computer-Aided Design
OWAS Ovako Working posture Analysis System
3DSSPP 3-Dimensional Static Strength Prediction Program
REBA Rapid Entire Body Assessment
PSB Plastic Storage Bin

xvi
LIST OF SYMBOLS
T Time for choosing and picking up a part
kf The part that is chosen and picked up
kn Part number
An Area number of the segment in bottom of bin

1
Chapter 1
2 INTRODUCTION
Nowadays the small and medium size enterprises are playing an important role in
most of the countries. Many products those are produced automatically in high-tech
enterprises are still made manually by human workforce in small and medium size
enterprises. Therefore, if the workers do not have good condition in workstation, it
effect on decrease the production and quality, and increase the time production. So
that, if the small and medium size enterprises could not solve this problem, they will
lose out the competition with other company.
The main concern in designing a work system is improvement of machines and tools
and enhancing efficiency to achieve more benefits for enterprises [1]. Therefore, after
the managers and owners of companies have tried all common methods to improve
the company’s benefits (e.g. Cost reduction, quality increase, etc.), ergonomic
principles will be considered to improve the poor designed [2, 3]. When an operator
works in a workplace with deficient ergonomics for a long time, it can cause physical
and emotional stress, inefficiency and pain and consequently low productivity and
poor quality of work [4, 5]. Therefore, the workstation should be designed in the way
that the worker does operations with better motions and expend less energy and thus
reduce and mitigate the risk of injury.

2
In the past, workplace ergonomic considerations have often been reactive, time-
consuming, incomplete, sporadic, and difficult. human interactions have been
evaluated in relatively delayed stages of the process using physical scale models [6],
thus, ergonomic experts who were consulted after problems occurred in the
workplace examined data from injuries that had been observed and reported. There
are now emerging technologies supporting simulation-based engineering to address
this in a proactive manner. These allow the workplaces and the tasks to be simulated
even before the facilities are physically in place [7].
The ergonomic design methodology using Digital human models (DHM) makes the
iterative process of design evaluation, diagnosis and revision more rapid and
economical. (DHM) simulation systems such as DELMIA contribute to the efficiency
of product design process. These systems have been utilized as an effective design
tool to visualize the interaction of a human and workstation system (such as passenger
car interior, fighter cockpit, and factory workplace) and to evaluate the human–
workstation interaction from ergonomic aspects (such as reach, visibility and
comfort), and The use of human modeling tools makes fast tests possible, allowing to
verify the first designs and accelerate this initial design phase as well as provide the
development of a standardized evaluation methodology [8, 9].
The evaluation in the real workplace and Human factor integration are so time
consuming and costly [10]. A possible solution in manufacturing systems is the use
of virtual modeling, which allows for the visualization of the products and an analysis
of the diverse aspects of the product-person interaction at any stage of the product-
process [9, 11].

3
Finally, if the new ergonomic design does not reach the goal, the whole design and
evaluation should be repeated again. Therefore, the ergonomic method needs to equip
with several tools. Evaluation time and design cost can be decreased by utilizing
Virtual reality and Time Study methods. The first goal of this research is to study and
make a relation between Ergonomics, Time Study, and Virtual Reality methods for
creating an integrated method for design and evaluation of assembly workstations.
Second one is to redesign the common storage bin that is being used in a workstation
for repetitive assembly and apply the proposed integrated method to evaluate how
this proposed storage bin could improve the productivity and decrease the fatigue and
WMSDs risk.

4
Chapter 2
2 BACKGROUND
2.1 Definition of Ergonomics
Work design is a new field of science that has the objective of outlining an
arrangement in the workplace to fit it better to the human administrators in order to
boost the organization productivity. In the United States, it is commonly known as
human factors, while internationally it is called ergonomics, which is gotten from the
Greek words for work (erg) and laws (nomos) [12].
Ergonomics is more than providing a new chair for people. Public awareness of what
“ergonomics” means is limited; but during recent years, public understanding of the
“ergonomics” has increased. Most people think that ergonomics is about “chair” or
about “doing things in a healthy and safe way”. Ergonomics is a field of study that
aims to find different ways to keep people safe, efficient, comfortable, and productive
while they do their tasks [13, 14].
There are many different definitions in the scientific literature such as below
definition from Ergo Web Inc.:
Ergonomics removes barriers to quality, productivity, and safe human performance
in human-machine systems by fitting products, equipment, tools, systems, tasks, jobs,
and environments to people. [15]
5
There are many definitions like above citation; that mention the basic principle in
ergonomics is to “design the task and tools to fit the person, rather than making the
person to adjust himself to the task or tools” [13, 14, 16].
Therefore, the final aim of ergonomics is to optimize the performance, safety,
efficiency, health, and comfort of labor within the machine-human environment
system.
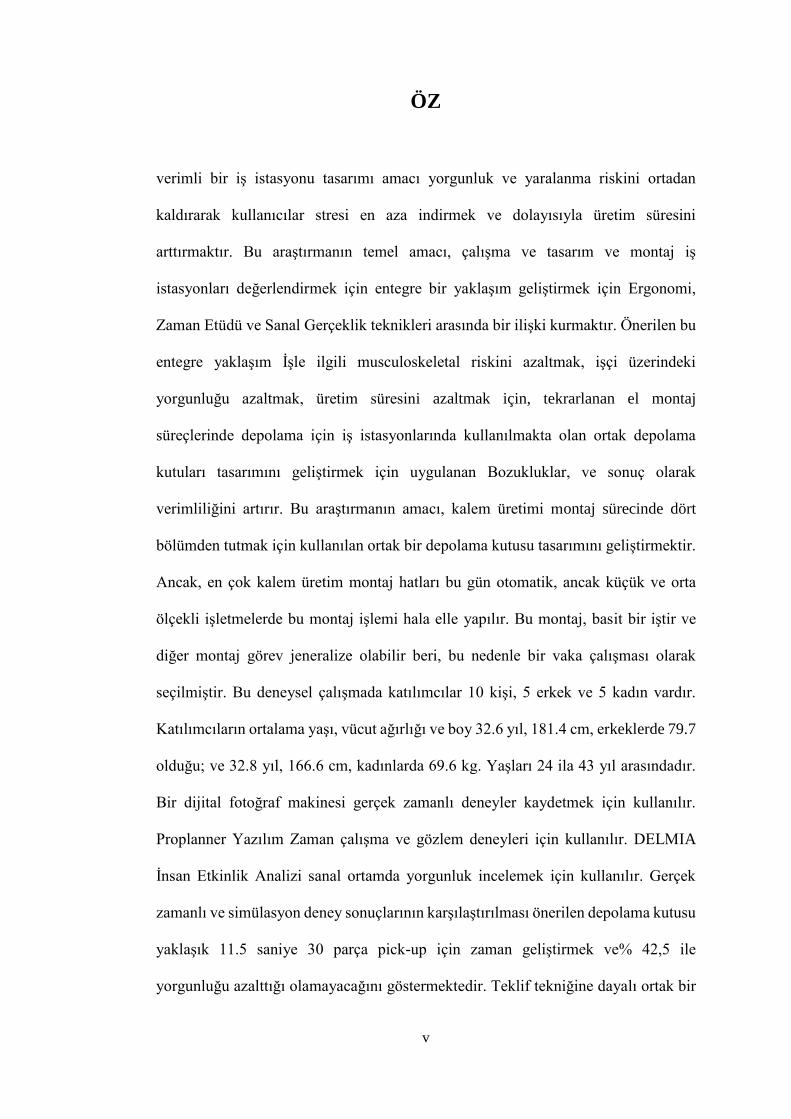
As is shown in Figure 1, the Internal Ergonomics Association divides into three parts,
which are Cognitive Ergonomics, Organization Ergonomics and Physical
Ergonomics [17, 18].
Figure 1. The division of internal ergonomics association
2.1.1 Cognitive Ergonomics
Cognitive ergonomics is a branch of ergonomics that studies the mental processes
such as memory, perception, motor response, and reasoning as they affect the humans

6
and other parts of a system and their interaction among each other. The topics that are
relevant to cognitive ergonomics are human reliability, decision-making, mental
workload, human-computer interaction, work stress, skilled performance and training
as these may relate to human-system design [17, 18]. For instance, design a software
interface with the user center focus or redesign the management to increase the human
reliability and cognitive workload.
2.1.2 Organizational Ergonomics
Organizational ergonomics is a branch of ergonomics that is concerned with the
optimization of systems. The subjects that are studied in organizational ergonomics
includes: communication, teamwork, work design, telework, virtual organization,
cooperative work, community ergonomics and quality management [17, 18].
2.1.3 Physical Ergonomics:
Physical ergonomics studies the physical and physiological stresses and the response
of the human body to them. It needs several characteristics of the human like
physiology, anatomy, biomechanics and all other fields that are related to physical
activities. When the ergonomic principles are ignored in the shop floor, it is certain
that musculoskeletal disorders (MSD) are a potential outcome; and it is not an
appropriate event for the enterprise. So ergonomic principles are required in the
systems [17, 18].
Physical ergonomics is used in manufacturing system with many different objectives,
which one of them is the reduction of MSD-risk or decrease in worker’s compensation
cost. The other benefits of physical ergonomics are increased productivity, reduced
turnover and absenteeism, improved quality, improved efficiency, improved
employee morale and reduced downtime [17].

7
2.1.3.1 Advantage of Physical Ergonomics
2.1.3.1.1 Increased Productivity
Usually, productivity could be increased 10-15 percent of the ergonomic
improvement. Studies have shown that the outcome at a computer workstation could
be increased 25 percent by using ergonomic furniture that also causes an improvement
in employee’s wellbeing [17, 19].
2.1.3.1.2 Reduced turnover and absenteeism
When people feel comfortable in their work, they have less motivation to take time
off from work and leave their work for discomfort [17].
2.1.3.1.3 Improved quality
Improve quality has direct connection with decrease errors and product defects When
comfort increase [19].
2.1.3.1.4 Improved efficiency
Improved efficiency happens by bringing the items closer to the workplace or doing
a task with fewer motions, so the task can take less time and cause less muscular
fatigue and injury [20].
2.1.3.1.5 Improved employee morale
Ergonomics allows the businesses spread the message that “we value your health and
we care about you” across all levels of enterprise, from shop floor to the employees
in the office [19, 21].
2.1.3.1.6 Reduced downtime
Reduced downtime means solving and reduction of unplanned events like shortage of
operators, unscheduled maintenance, or equipment failure that cause manufacturing
process to stop. For example, maintenance tasks can be optimized by improving
access points during changeover tasks that results in faster task time [17].

8
An ergonomist studies the different tasks in the workplace and analyzes the effects of
them on increasing the risk of MSDs. The risk factors can be classified into task
physical characteristics and Environmental Characteristics [17].
2.1.3.2 Task Physical Characteristics
2.1.3.2.1 Awkward postures
Awkward posture is a position of body that in it the joints and limbs that connecting
to them deviates from the neutral posture and the muscles are not in stability.
Therefore, it is associated with an increased risk for injury. Examples of awkward
posture are reaching behind the body, kneeling, forward or backward bending,
twisting, squatting, and working overhead (Figure 2). When the people are in the
awkward and uncomfortable postures they cannot do their jobs right in the first time
and mistakes are more common [3, 4, 22, 23].
Figure 2. Different awkward posture [23]
2.1.3.2.2 Excessive force
Excessive force is one of the primary ergonomic risk factors. When the labor applies
high force in workstation for doing some tasks, it might occur WMSDs on the
shoulder/neck, forearm/wrist/hand. In response to high force requirement, muscle
effort increases that causes increase in fatigue and risk of MSDs. In general, “the

9
greater the force, the greater the degree of risk”. For example, lifting, lowering,
pushing, pulling, pinching, and using the hand as a hammer are several positions that
make excessive force. So eliminating the excessive force will reduce the worker
fatigue and the risk of MSDs. For example, using mechanical assists, powered
equipment, adjustable height lift tables and workstations, counter balance systems,
and ergonomic tools reduce effort for doing a task and muscle exertions [23, 24].
2.1.3.2.3 Repetition
Repetition means when a task is done over and over again with little variation also
includes repeating multiple tasks with very similar motions that involve the same
muscles and tissues. When motions are repeated frequently for long periods of time
(several hours continuously) and repeated period is 30 seconds or less, fatigue and
strain occur in the muscles and tendons, because they do not have enough time for
recovery [17, 25].
2.1.3.2.4 Contact stress
When any part of the body is pressed by an external object, contact stress happens.
Contact stress can occur in two forms: internally and externally. Internal contact stress
happens when a nerve, tendon, or blood vessel is stretched or bent around a bone or
tendon. The external contact stress occurs when a part of body is pressed by a
component of workstation for a long time, such as using a mouse for a prolonged
period, or rubbing against a part of workplace, such as the chair seat pan or edge of
the desk (Figure 3). These things might cause irritation of nerves or constriction of
blood vessels [26, 27].

10
Figure 3. Contact stress on wrist and knee [28]
2.1.3.2.5 Static muscle loading
Static muscle loading happens when a worker remains in one posture for a long time,
such as standing, sitting, or otherwise posture for a long time that can increase risk of
MSDs. So when force, posture, and duration combine with each other cause contract
the muscles and reduce blood flow to them, so create a condition that leads muscles
to fatigue and injury [5, 15].
2.1.3.2.6 Vibration
Excessive force is one of the primary ergonomic risk factors. When the labor applies
high force in workstation for doing some tasks, it might occur WMSDs on the
shoulder/neck, forearm/wrist/hand. In response to high force requirement, muscle
effort increases that causes increase in fatigue and risk of MSDs. In general, “the
greater the force, the greater the degree of risk”. For example, lifting, lowering,
pushing, pulling, pinching, and using the hand as a hammer are several positions that
make excessive force. So eliminating the excessive force will reduce the worker
fatigue and the risk of MSDs. For example, using mechanical assists, powered
equipment, adjustable height lift tables and workstations, counter balance systems,
and ergonomic tools reduce effort for doing a task and muscle exertions [23, 24].

11
2.1.3.3 Task Environmental characteristics
2.1.3.3.1 Whole Body Vibration
This kind of vibration exposure to the human body usually occurs through the seat,
platform, or feet/buttocks when riding in a vehicle [17].
2.1.3.3.2 Lighting
When the light in the workplace is set improperly, it may cause inefficiency. For
example, lighting with levels above 1000 Lux in a workstation causes glare and eye
symptoms. So the important factors about the lighting in a workstation are intensity
and color [29-31].
2.1.3.3.3 Noise
Noise is defined as a kind of sound that is unwanted and can cause pain in the ears or
may be nuisance sound. The noise can be annoying, distracting and disruptive that
can cause inefficiency [32, 33].
2.1.3.3.4 Heat stress
Heat stress is all the external and internal heat factors that make body fatigue and
distress. External factors that can cause heat stress are such as air velocity and
humidity, ambient air temperature, and radiant heat. Internal factors include
acclimatization, natural heat tolerance, core body temperature, and metabolic heat
generated by the workload. So extremely hot environment causes a decrease in
productivity while increases the rate of the risk workers disorders [34-36].
2.1.3.3.5 Cold stress
Cold stress means low temperature that causes shivering, clouded consciousness,
extremity pain, dilated pupils, ventricular fibrillation, frostbite, hypothermia or
muscle strain when core body temperature drops from normal body temperature
because of winter weather, high altitudes, or cryogenic equipment [37-39].

12
2.2 Measurement ergonomic methods
One of the most appropriate methods that can be used to estimate MSDs is the Scoring
technique. Before applying the scoring technique, first the required duties and sub-
duties must be identified, and each of them must be individually examined.
Currently, there are four methods available for applying the scoring technique in order
to evaluate musculoskeletal disorders that are shown in (Figure 4). These techniques
are Pen-paper based observational methods, Observational Methods Based on
Computer or Video Tape, Direct/Instrumental Methods, Self-Reporting Method [34,
35, 40, 41].

13
Figure 4. Different kinds of measurement ergonomic methods
The following paragraphs will explain the aforementioned ergonomic methods from
Figure 4.
2.2.1 Pen-paper based observational methods
Although, there were always some methods for recording the postures of the human
body, before the Priel’s method was developed in the early 17th century, the posture
was recorded with drawings and photographs. It was after the 17th century that new
methods for recording the posture were developed based on pen-paper [34, 42, 43].

14
Now several important and common Pen-papers based methods will be categorized
and shown in Table 1.
2.2.1.1 RULA Method
This method was developed in 1993 by Dr. Lynn McAtamney and prof. E. Nigel
corlett. RULA is a postural method for the estimation of the risks that happen to the
upper limb body. It gives a systematic and a quick assessment of the postural risks to
a worker. This technique uses a scoring system to record different positions of the
body to assess every position with numerical scores (Figure 5) [35, 44, 45].

Figure 5. RULA Employee Assessment Worksheet [1]

16
Table 1. Different pen-and-paper-based observational techniques
Techniques Creators Basic features Field of
applications
Posturegram
[46] Priel (1974)
Body postures are recorded and
categorized as digital numbers by
time sampling.
Evaluation of
the whole body
posture for
static tasks
OWAS [47] Karhu et al.
(1977)
Categorizes body position with
digital numbers
Analysis of the
whole body
posture
Posture
Targeting [46]
Corlett et al.
(1979)
Body postures are identified by
angles and directions together by
time sampling
Evaluation of
the whole body
posture for
static tasks
Rodgers
Priority for
Change [48]
Suzanne Rodgers
(1988) Categorizes body posture risk by
evaluation in three factor levels
Evaluation of
the whole body
posture for
static and
dynamic tasks
Gill & Tunes
[35, 46] (1989)
Categorizes body posture with
angles and frequency of
occurrence.
Evaluation of
the whole body
posture for
seated tasks
RULA
[35, 44, 45,
49]
McAtamney and
Corlett (1993)
Categorizes body posture with
numbers that are computed for
force and muscle activities.
Upper limb
assessment
HAMA [35] Christmansson
(1994)
Records the kinds of motion, load
handled, hand position and grasps;
the data and work activities are
linked to each other.
Upper limb
assessment
PLIBEL [35]
Kemmlert and
Kilbom
(1987),
Kemmlert (1995)
Checklist with several questions
about different body posture.
Classification
of risk factors
Strain index
[50]
J. Steven Moore
Arun Garg
(1995)
Evaluate body posture with strain
index that estimates several factors
like force, time, body position and
etc.
Evaluation of
the upper limb
MSDs for
repetitive
activities
REBA
[35, 51]
McAtamney and
Hignett (1995)
Scores the body position and load
according to action levels.
Evaluation of
the whole body
for the risk
assessment in
‘non-sedentary’
tasks

17
QEC [35] Li and Buckle
(1998)
Evaluates the body posture and
assigns a score to the repetition
activities and force/load from a
special score table.
Evaluation of
the body
posture for
static and
dynamic tasks
OCRA [52] E. Occhipinti
(1998)
Analyzes and evaluates risk factors,
force/load, body posture and time
sample
Evaluation of
the upper limb
for static or
dynamic
Repetitive
activities
2.2.2 Observational Methods Based on Computer or Video Tape
This method records the postures, workstation positions, and tasks by computer or
video recordings, and analyzes them with computers. In these methods, the
observation is based on time sampling and real-time simulation. Table 2 shows
categorizing of this method [34].
Table 2. Different computer-aided and videotaping observational methods
Techniques Creators Basic features Field of
applications
Armstrong
[35]
Armstrong et
al. (1982),
Armstrong
(1986)
Computerized data and time
sampling video for posture and
force; indicated hand position as
several kinds of pinch or grasp;
contact area with finger or hand as
coded numbers.
Upper limb
assessment
ARBAN [35] Holzmann
(1982)
Computerized analysis; Code load
situations and postures by time-
sampling; used Borg’s scale for
estimation of the muscle stress,
posture effort and vibration.
Assess physical
stress in whole
body
VIRA [35]
Persson and
Kilbom (1983),
Kilbom et al.
(1986)
Computerized real-time analysis
for duration and frequency of
postures and motion.
Upper limb
assessment
Keyserling
[35]
Keyserling
(1986)
Computerized real-time analysis
for duration and frequency of body
position in predefined body
position categories.
Evaluation of the
repetitive and
non-sedentary
tasks

18
ROTA [53] Ridd et al.
(1989)
Computerized time Sampling or
real time analysis on different
posture and activity.
Dynamic or Static
tasks
TRAC [54] van der Beek et
al. (1992)
Computerized real-time analysis or
time sampling on different posture
and activity.
Dynamic or Static
tasks
HARBO [55] Wiktorin et al.
(1995)
Computerized real-time data from
work postures; Identifying the
position of hands at three levels.
Long observation
for various types
of tasks
PEO [56] Fransson-Hall
et al. (1995)
Computerized the data that are
collected in real-time on work
activity and posture movement.
Analyze Trunk
and Upper limb
posture for
dynamic tasks and
manual handling
Wells [35] Wells et al.
(1994)
Computerized data analysis on
repetition, EMG signals,
synchronized posture and activity.
Upper limbs and
low back physical
exposure
assessment
Yen and
Radwin [35]
Yen and
Radwin (1995)
Synchronized video images with
analogue data recording.
Evaluation of the
repetitive and
arbitrary activities
For recording and motion analysis, there are several commercially systems that record
body movement and posture in 2 or 3 dimensional plane as some of the important and
common ones is mentioned in the following:
PEAK Motus System [57]
VICON System [58]
Kinemetrix 2D/3D Motion Analysis Systems [59]
SIMI Motion System (Reality Motion Systems) [60]
APAS (Ariel Performance Analysis System) [61]
2.2.3 Direct/Instrumental Methods
Body posture can be illustrated by using a direct method manually or continuously.
The manual method uses hand-held devices and continuous method uses electrical
instruments. In the manual method, in order to measure the angles of the body

19
segments, the device is attached to the body section and draws a trace on paper (Flexi-
curve) or indicates on the device (inclinometer). With electrical instrumental
methods, an electrical output signal is generated proportional to the intersegment
displacement [35, 62].
2.2.4 Self-Reporting Method
This method is used to assess the physical load force, work stress or body discomfort
by collecting the data on physical and psychosocial factors on the workstation through
paper questionnaires, interviews and worker diaries [63, 64] or use of web base
questionnaires [64, 65].
2.3 Time Study
2.3.1 Definition of time study
Time study is one of the oldest key systems ever utilized to increase productivity. So
the time study is used as an important tool in manufacturing industry for analyzing
and developing methods for evaluation of the employees. It is used to create employee
productivity standards through the broken a complex task into simple and small steps,
measuring precise time for each correct movement and detecting the wasteful motion
in the task sequence [66].
According to Meyers method, the time study is about the time of producing a product
in a workplace with three conditions. These conditions are a qualified operator,
working at a normal pace and doing a particular task. Therefore, the time study is the
time, that is determined by a qualified and prepared operator working at a normal
pace to do a particular task [66, 67].
20
2.3.2 Objective of Time Study
Time study has many principle and objectives with considering different aspects of
production. The first objective is minimizing the time that is necessary for doing a
task. The second objective is making balance between the work of the workers and
the product. The last objective is increasing the well-being, health and safety of all
human resources an environment [67, 68].
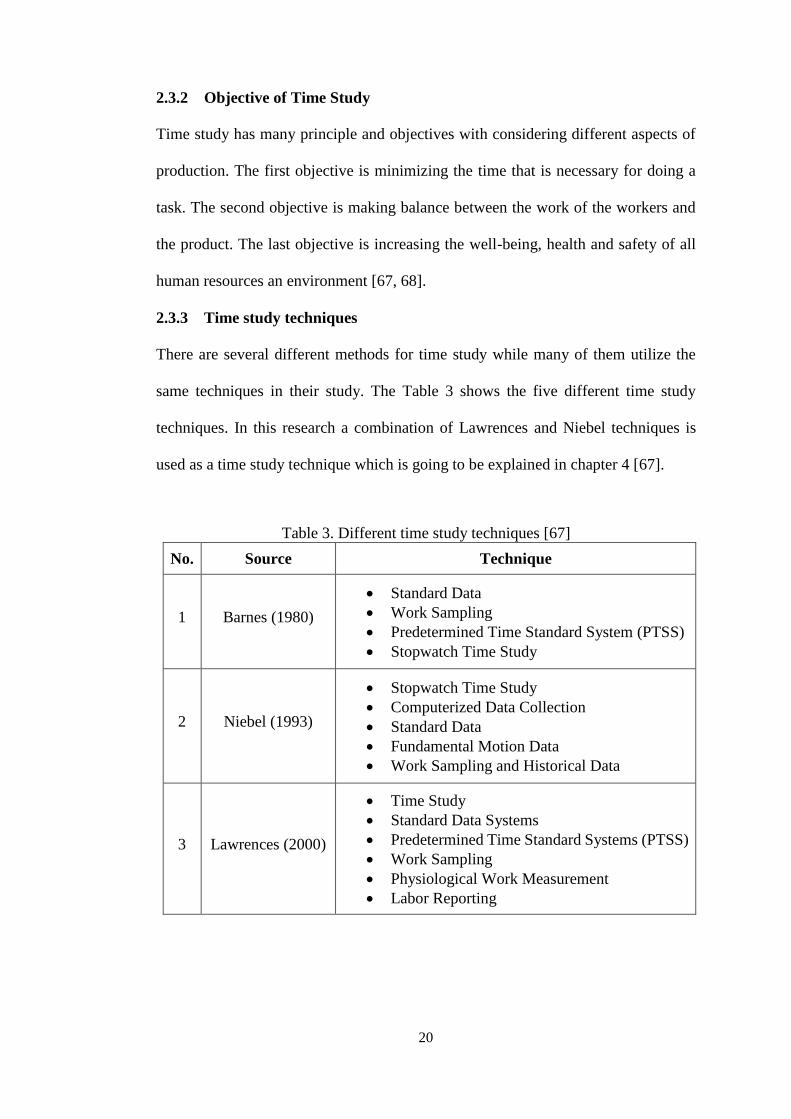
2.3.3 Time study techniques
There are several different methods for time study while many of them utilize the
same techniques in their study. The Table 3 shows the five different time study
techniques. In this research a combination of Lawrences and Niebel techniques is
used as a time study technique which is going to be explained in chapter 4 [67].
Table 3. Different time study techniques [67]
No. Source Technique
1 Barnes (1980)
Standard Data
Work Sampling
Predetermined Time Standard System (PTSS)
Stopwatch Time Study
2 Niebel (1993)
Stopwatch Time Study
Computerized Data Collection
Standard Data
Fundamental Motion Data
Work Sampling and Historical Data
3 Lawrences (2000)
Time Study
Standard Data Systems
Predetermined Time Standard Systems (PTSS)
Work Sampling
Physiological Work Measurement
Labor Reporting

21
4 Meyers and
Stewart (2002)
Predetermined Time Standard System (PTSS)
Stopwatch Time Study
Work Sampling
Standard Data
Expert Opinion and Historical Data
5 Niebel and
freivalds (2003)
Time Study
Standard Data and Formulas
Predetermine Time Standard Systems
Work Sampling
Indirect and Expense Labor Standards
2.3.4 Time Study Instruments
The time study needs several instruments that consist of a device for measuring time
and an observation board [67]. In this research a camera is utilized to capture video
from equipment and labor motions and a computer with specific software to collect
and analyze the data.
2.4 Virtual Reality
2.4.1 Definition of Virtual Reality
Virtual reality is described as “a 3-D environment, computer-synthesized,
appropriately interfaced, and might manipulate and engage simulated physical
component in the 3-D environment”. So virtual reality can be illustrated as a 3-D
artificial environment that is created with computer programming in order to simulate
an environment that is acceptable by the users. And The goal of Virtual Reality is to
make a perception and view of a real environment with utilization of multi-media that
allows the users to experience and evaluate the different scenarios with low cost and
time [69, 70].
2.4.2 Definition of Virtual Manufacturing
Virtual manufacturing (VM) is an artificial manufacturing environment that is used
for increasing the ability to control and make decisions in a manufacture enterprise.
22
Virtual manufacturing simulates a model of manufacturing levels with the same
parameters and takes all that information to the process, process management and
control, and data product [71-74].

23
Chapter 3
3 LITERATURE REVIEW
The goal of workstation design is to minimize the stress and harmful postures on the
users in order to decrease the producing time.
In this research, three different fields of mechanical and industrial science
(Ergonomics, Virtual Reality and Time Study) will be utilized in order to propose an
improved method for efficient workstation design. Therefore, in the following
chapter, there is a literature review of the related research works that are performed
in the area of Ergonomics, Virtual Reality and Time Study or their combination for
different purposes.
S. Vaclav et al. (2010) studied and suggested a method for designing a manual
assembly workspace in a CAD environment. Their method was intended to create
good work conditions to achieve productivity and high quality of work. They used
the CATIA ergonomic modules for analyzing and designing efficient solutions to
optimize the layout of manual workstations [75].
Feyen et al. (2000) offered PC-based software that allows the designers to evaluate
the proposed workstation design in order to measure the biomechanical risk. The
program was composed of a software tool for biomechanical analysis, the Three-
Dimensional static strength prediction program (3DSSPP), with a broadly used
AutoCAD as a computer-aided design software package. The software allows the

24
authors to research and study about ergonomic stuffs through designing workstation
phases with taking into consideration different designs. The authors described the use
of this 3DSSPP/AutoCAD interface in the analysis of an automotive assembly task
and compared the results with the data that was taken from a direct independent
assessment of the same task [76].
Irad Ben-gal and Joseph Bukchin (2002) introduced a new methodology for the
design of a workstation. In their research, they used the integration of response
surface methodology and factorial experiments to obtain the best design configuration
through the graphical simulation and virtual manufacturing. In this research some
method were used to bridge the gaps between them by the creation of a set of
alternative design configurations [77].
Jayaram et al. (2006) suggested two different approaches to link virtual environment
(VE) and quantitative ergonomic analysis tools in real time to study about industrial
ergonomics. The first approach aims to create methods for integrating the virtual
environment with commercially available ergonomic analysis tools, while the second
approach aims to create an ergonomic analysis module that is built-in to a VE. The
authors described the two strategies and tested them in a real industrial company as a
case study [7].
Francesco et al. (2006) offered an assembly line for product heaters. This research
studied the effects of the design of an assembly line workplace with integration of the
simulation and modeling with ergonomic analyses [78].

25
Shao-Wen et al. (2007) used virtual dynamic simulation workstation and digital
human modeling for evaluating WMSDs in automobile assembly tasks. This research
used RULA system in DELMIA software for improvement ergonomic tools in
automobile workstation [79].
Shikdar and Al-Hadhrami (2007) studied the designing of a smart workstation and its
development to operating manufacturing assembly tasks. This research developed a
design for a fully adjustable ergonomic workstation [80].
Alzuheri et al. (2010) evaluated different physical workload and work position in
manual assembly tasks with RULA method. This research proposed a framework for
avoiding WMSDs by assessing ergonomic stresses in manual assembly [81].
Ashraf shikdar et al. (2011) studied the comparison between the new design assembly
workstation (new arrangement of bins and tools) and the common design assembly
workstation (common arrangement of bins and tools). This research concluded that
the new design assembly workstation improves the performance of the worker around
44% [82].
Ibrahim H. Garbie (2011) did an experimental study about smart adjustable
workstation on ten persons in three experimental conditions (gender, chair adjustable
and table adjustable) working on an assembly of an electrical switch that consisted of
8 parts and used Minitab Statistical Software Package to analyze the results. This
research studied how to measure the rate of production in manual assembly lines in
assembly workstations that are ergonomically designed [83].

26
Adi Saptari et al. (2011) studied about the effect of jig design, assembly design,
workplace design and posture of worker on the time assembly of plugs. This research
shows that these factors are significant. However, the interaction combinations of
these factors are not important at assembly time. Meanwhile, this research used
RULA method for evaluating working posture, and found a position that take the
lowest RULA score which is safe [84].
R. Arun et al. (2013) studied the human factors and work methods for the assembly
mono block pump by simulating workplace in CATIA and Pro-E software and
analyze with RULA method for identifying WMSDs. In their study, they proposed
several methods like use of hydraulic press, screw gun and an automatic conveyor for
improvement tasks [85].
Ansari, et al. (2014) studied about 15 workers that engaged in a small-scale industry.
Several video tapes from different activities of the workers were recorded and the
images were cropped from them for analysis. In their study, they presented an
assessment of different work postures during different activities in small-scale
industry. RULA and REBA was used for evaluation of the posture and worksheet was
used for assessment [86].
In this chapter, a review of some papers on the application of Ergonomics, Virtual
Reality and Time Study for improvement of the workstation was mentioned. Though
some of these researches have tried to use a combination of two of these methods in
their designs. According to Table 4, none of these researches have considered
utilizing all of these three techniques (Ergonomics, Virtual reality and Time study)
for an efficient workstation design.

27
The approach that proposed in this research will be discussed how a combination of
these three techniques lead to an improved workstation design and as a case study
will be demonstrated how the redesign of a common storage bin based on proposed
technique improves the productivity and efficiency of the workplace.
Table 4. litreture review summary
Method Auther and date
Ergonomics
Feyen et al. (2000), Francesco et al. (2006), Jayaram et al.
(2006), Shao-Wen et al. (2007), Shikdar and Al-Hadhrami
(2007), Alzuheri et al. (2010), S. Vaclav et al. (2010),
Ibrahim H. Garbie (2011), Adi Saptari et al. (2011), R. Arun
et al. (2013), Ansari, et al. (2014).
Time Study Ibrahim H. Garbie (2011), Adi Saptari et al. (2011) , Ashraf
shikdar et al. (2011) .
Virtual Reality Feyen et al. (2000), Irad Ben-gal et al. (2002), Jayaram et al.
(2006), Francesco et al. (2006), Shao-Wen et al. (2007), S.
Vaclav et al. (2010), R. Arun et al. (2013).
Ergo & VR Feyen et al. (2000), Jayaram et al. (2006), Francesco et al.
(2006), Shao-Wen et al. (2007), S. Vaclav et al. (2010), R.
Arun et al. (2013).
Time Study &
Ergonomics Ibrahim H. Garbie (2011), Adi Saptari et al. (2011)

28
Chapter 4
4 METHODOLOGY
4.1 Case study
The selected product for this case study is a pen that composed of four parts assembled
in a factory. However, these days most of big pen production assembly lines in high-
tech factories are automated, but in small and medium size enterprise in most of the
countries, this assembly process is still manually done with human resource. Since
this assembly task is a simple task that can be generalized to any other assembly tasks,
so this assembly task was chosen as a case study. The position of the worker and the
bins are shown in Figure 6. The assembly task sequence is mentioned below:
A. Picking up the cover from the bin 1 and put it in the jig (number 6) on the
table
B. Picking up the spring from bin 4 and put it in the cover
C. Picking up the pen pipe from bin 2 and put it in the cover
D. Picking up the pen bottom from bin 3 and assemble it on the cover
E. Picking up the complete pen from the jig and placing it in the outgoing
bin (number 5)

29
Figure 6. Layout of the pen assembly workstation
4.2 Problem
Human resources are an essential part of the assembly process in small and medium
sized enterprises. The main reasons for the use of human force in assembly lines are
as below:
A. The use of human force in the assembly process is less expensive than
automation.
B. Sometimes products that are assembled by human (Handmade Brands) have
more value than assemble in automated assembly lines (series Brand).
C. Sometimes in the assembly process, make the decision is important in
unwanted events and it is hard for an automated system that makes decision
in that situation.
On the other hand, using the human resources in assembly lines involves some other
factors like time management, workplace-related injury and health risks, which must
be managed efficiently in order to increase the profits. Therefore, designing a
workstation with an enhanced environment that can increase the productivity and
decrease the workforce injuries and production time, is an important objective for
every enterprise.

30
A good design for an assembly workstation should consider the design principals of
the components of a workstation that directly or indirectly affect the people that are
working in that environment such as the design of the chair, desk, workplace
environment, tools arrangement.
In this project, the standard Plastic Storage Bin (PSB) that is used in the ordinary
workplace will be analyzed and evaluated. Based on the results of this analysis a
redesigned for the PSB will be proposed that utilizes the ergonomic principles in order
to decrease the injuries and fatigue in the worker’s wrist. Moreover, it will be
indicated how the use of the proposed ergonomic PSB will enhance the performance
of the worker, which will lead to an increase in productivity during a lengthy
assembly process.
To analyze a standard PSB, three major problems are considered. First, to load/unload
the PSB through its entrance, if parts are located in area 1 as it shown in Figure 7, the
human labor wrist angle will be in dangerous range to pick/place the part according
to the RULA method. (Figure 5, 8)
Figure 7. Harmful area for wrist for picking up a part in the normal plastic storage
bin (area 1)

31
Figure 8. Dangerous range according RULA method
1) Best position 2) Acceptable position 3) Dangerous position [87]
Secondly, according to the random parts distribution pattern, when there are a few
parts in PSB, labor needs more time to find a part and pick it up, since they are
distributed across the bin. To achieve randomly distribution pattern shown in Figure
9, fifty parts were randomly distributed in a PSB and this experiment was repeated
100 times in order to calculate the position of a part as the average of its positions in
this experiment.
Figure 9. Random pattern of distribution for 50 parts in PSB
Finally, during the assembly process, the parts are so small that they placed at the
corners or the edges of PSB, finding and picking them will be difficult and time
consuming. (Figure 10)

32
Figure 10. Bad position of parts that are so small and placed on the edge
4.3 Goals of the research:
The first purpose of this research is offering an ergonomic design for the
Plastic Storage Bin (PSB) to solve the aforementioned problems of the
traditional bins that are used in assembly workstation in order to improve the
productivity.
The second purpose of this research is to study the relation between
Ergonomics, Virtual Reality and Time Study as a powerful method to analyze
and design of the assembly procedures in a manufacturing system.
4.4 Solution
Redesign the traditional storage bin to change several parameters to improve the
workers’ performance and health is a solution in order to solve the mentioned
problems for the PSB. At first, tilt the bottom of the common storage bin to change
its angle from 0° to around 11°, this angle value must be less than 15° and more than
10° depending on the other parameters of the storage bin (in the proposed storage bin
the amount of angle is set to around 11°). The angle of the tilted bottom causes the
parts gathering at the end of storage bin because of the gravity, which results in an
acceptable position of hand for picking up the part based on the acceptable range from

33
RULA method (-15 ≤ , ≤ 15). This also makes it easier to find the parts since they all
gathered at the end of the bin instead of being randomly distributed across the bin.
To solve the third problem, in the proposed bin, the inner edges are rounded off,
which makes the parts stay away from the edges with some distance that helps the
labor picking them up easily. Figure 11 shows 2D view of the proposed storage bin.
Figure 11. 2D view of the proposed storage bin
In this research, DELMIA Software simulated a workstation with utilizing a
combination of Ergonomics, Time Study, and Virtual Reality. To increase the
accuracy of the simulation results a program was developed to generate the
distribution of the parts in the storage bin randomly. In order to perform the
experiments, a database of time and fatigue values was created to store the results for
each assembly scenario. The time study technique is utilized in order to generate the
time values for each scenario and the fatigue values for each assembly scenario were
calculated based on ergonomic analysis. After the time and amount of fatigue and
WMSDs risk was calculated for different assembly scenario, all of these values were
stored in the designed database for further analysis.
34
This research focuses on one of the steps in this assembly process, but the results can
be extended to the other steps as well. The results of our research help to design an
ergonomic workplace that is safe and efficient to increase the productivity.
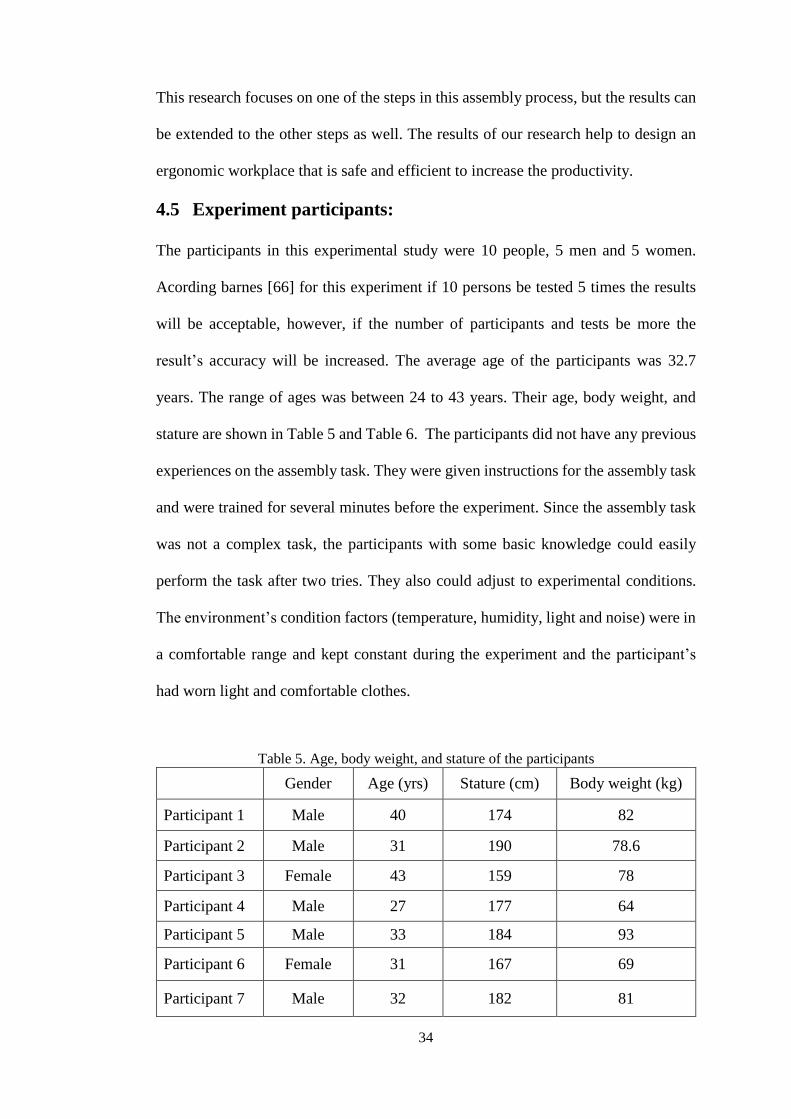
4.5 Experiment participants:
The participants in this experimental study were 10 people, 5 men and 5 women.
Acording barnes [66] for this experiment if 10 persons be tested 5 times the results
will be acceptable, however, if the number of participants and tests be more the
result’s accuracy will be increased. The average age of the participants was 32.7
years. The range of ages was between 24 to 43 years. Their age, body weight, and
stature are shown in Table 5 and Table 6. The participants did not have any previous
experiences on the assembly task. They were given instructions for the assembly task
and were trained for several minutes before the experiment. Since the assembly task
was not a complex task, the participants with some basic knowledge could easily
perform the task after two tries. They also could adjust to experimental conditions.
The environment’s condition factors (temperature, humidity, light and noise) were in
a comfortable range and kept constant during the experiment and the participant’s
had worn light and comfortable clothes.
Table 5. Age, body weight, and stature of the participants
Gender Age (yrs) Stature (cm) Body weight (kg)
Participant 1 Male 40 174 82
Participant 2 Male 31 190 78.6
Participant 3 Female 43 159 78
Participant 4 Male 27 177 64
Participant 5 Male 33 184 93
Participant 6 Female 31 167 69
Participant 7 Male 32 182 81

35
Participant 8 Female 24 161 65
Participant 9 Female 37 174 70
Participant 10 Female 29 172 66
Table 6. The average age, body weight, and stature of the subjects
Age (yrs) Stature (cm) Body weight (kg)
Male (n = 5) 32.6 181.4 79.7
Female (n = 5) 32.8 166.6 69.6
4.6 Experiment requirements
4.6.1 Standard conditions
A standard workstation environment is considered to do this experiment. This
environment should contain some standard such as standard table, chair, light and etc.
Figure 12 shows standard workplace.
Figure 12. (a) Sitting work place for female; (b) Sitting work place for male [66]
4.6.2 Necessary sources and equipment
The part that the experiments are performed on it is a part of the pen with standard
measures (Figure 13).

36
Figure 13. 3D design of the bottom of pen in DELMIA
The experiments were done on two types of bins, common and standard storage bin
shown in Figure 14 and the proposed new designed bin is shown in Figure 15. In
addition, a digital camera was used to record the experiments.
Figure 14. Standard storage bin
Figure 15. Proposed design for the storage bin

37
Two types of software are utilized to do the experiment analyzing. First, Proplanner
Software (PRO TimeEstimation 2015, version: 5.2.1.0) was used for Time study and
observing experiments. Second, DELMIA software was used to study the fatigue and
virtual reality. The method that DELMIA Human Activity Analysis uses for
analyzing worker performance is RULA for arm position assessment, with the ability
to customize RULA specifications [88].
4.7 The Experimental Study
This section will be discussed the details of the ergonomically designed smart bin and
utilized method that combines the Ergonomics, Time Study and Virtual Reality.
4.7.1 Experiment Steps
For all of the experiments, a database is created to store the results of the experiments
for further analysis. The stored results will be used to analyze the virtual experiment
and compare with the real experimental result. So create two kinds of databases are
needed:
1. A database for Time Study
2. A database for Virtual Reality
4.7.1.1 Time Study Database
4.7.1.1.1 Time database related to experiment with common bin
To create the time study database for common bin (old design), the bottom of the
common bin was divided into 6 segments (Figure 16). Based on these segments the
participants did 6 classes of experiments. In the 1st class of the experiments, one part
is placed in one of the segments that is randomly selected and the participant takes
the part and put it in the buffer for assembly. When the participant’s hand starts to
move from the buffer for picking the part from the bin recording will be started with

38
the video camera, and when participant puts the part in the buffer recording will be
finished. These recorded times are used to calculate and study the assembly time. The
participant continues this experiment until records 5 tests for each segment. After the
1st class of experiments are completed, for the 2nd class two parts will be placed in
different segments (one part in each segment) and the participant did the same
procedure. This procedure continues until 6th class in which the participants should
take randomly one of the parts which is placed in all of the segments.
Figure 16. The partition pattern of the common bin
After recording the time for all the experiments, the records are analyzed by a time
study software (Proplanner software). Proplanner calculates the process time, the
segment that participant picks the part of, and specifies the pattern distribution of
parts after the part is picked by the participant. This information is used to create the
time study database. A part of the database is shown in Figure 17.

39
Figure 17. Structure of time database for one experiment
As the Figure 17 shows, the database has all the information that needs to calculate
the processing time. The recorded information in the database is categorized to four
different data.
The first column records the segments that are filled with a part in different classes.
For example, (1, 2, 3) in class 3 means, there are three parts; one part in segment 1,
one part in segment 2 and one part in segment 3.
The initial posture of the participant hand is assumed over the assembly buffer. T is
the time that shows how long it takes for participants to move his/her hand to pick the
part from the bin and put it in the assembly buffer. The measurement unit for this time
is millisecond. For instance, for (1, 2, 3) the time is 3100 milliseconds.

40
Pf contains the information about the part that is chosen and taken by participants. Pf
illustrating two values. The first one is, specifies the segment which participant
chooses a part for taking; the second value is, specifies the segment which the part is
picked by participant (because sometimes participant move his/her hand after
choosing the part and pick it up from different segment). For example, for (1, 2, 3)
there is Pf = 2 4 and means, in that experiment participant choose a part from segment
2 but move it to segment 4 and pick it up.
K1 to K6 are the number of parts that occupied each segment. For example, for (1, 2,
3) the K1=K3=K4=K6=0 and K2=K5=1. It means that after this experiment, there
are not any parts in segments 1, 3, 4, 6 and there is a part in segment 2 and 5.
The complete results for the experiments of class 1 are listed in appendix A.
4.7.1.1.2 Time database related to experiment with proposed bin
To create the time database for the proposed bin, the bottom of the proposed bin is
divided into three segments as shown in Figure 18. Because of the gravity (bottom of
the bin has 13° incline) parts are normally being placed in just segments 1 and 2.
Based on this division, there are two classes of experiments that the participant must
perform. In the 1st class of experiments, one part is randomly placed in one of the
segments. The participant takes the part and put it in the buffer for assembly and this
procedure will be recorded by video camera. The calculation and time study
procedure are in the same manner as is explain for common bin. The participant
continues this experiment five times for each segment. For the 2nd class of
experiments, the participant puts one part in segment 1 and 2 and the participant must
take one of them and put it in the buffer for assembly.

41
Figure 18. Partition pattern of the proposed bin
4.7.1.2 Database related to the experiment with virtual reality software
To create the database for fatigue values, the labor’s hand is simulated in DELMIA
Software (ergonomic module), when s/he picks a part from different segments in the
storage bin. As it was explained before, the bottom of the common bin is divided into
six segments and the bottom of the proposed bin is divided into three segments. The
position of the hand is simulated for taking the parts from every segment. The position
of the labor’s hand in simulation is based on the position when s/he picks up the parts
of each segment in real experiment. For instance, Figure 19 shows the simulation of
hand for picking up a part from segment 1.
Figure 19. Simulation of a hand worker position and analysis for segment 1

42
After simulating the position of the labor’s hand in DELMIA, his/her hand’s
movement and posture will be analyzed by the software. DELMIA generates a lot of
information and results, but the useful results for this research are shown in Figure
19. For calculation of the fatigue value, different colors specified (Green = 0, Yellow
= 1, Orange = 2 and Red = 3).
The assigned number of each color, is proportional to the amount of fatigue it happens
in the hand. The higher number means the higher fatigue. Now for calculation of the
fatigue value for each posture the color values will be added together as the final
result. For example, in below, there is a sample of calculation of fatigue value that
shown in Figure 19:
Final result = yellow + green + red + yellow = 1 + 0 + 3 + 1 = 5
Therefore, the final score for this posture is 5. Figure 20 determines the positions of
the labor’s hand for the common storage bin. These points cover all the hand positions
that may happen for picking up and moving the parts. In addition, three different
human-labor hand postures are considered when s/he tried to take a part of the
segment. Posture 1 is to take the part of the right or left side of the segment, posture
2 is to take the part from top or bottom side of the segment and posture 3 is to take
the part from the middle of the segment.

43
Figure 20. Pattern of different parts positions in every segment in normal bin
Same way is applied for the proposed bin to calculate the fatigue value, but just for
two segments (segment 1 and 2). The complete result of fatigue value database for
one person is recorded in Appendix C.
4.7.1.3 Part distribution program
After creation of the database, random distribution of the parts in the bin is needed,
so a C++ program was written to distribute parts in the different segments of the bin
randomly. The complete program is mentioned in Appendix D.
4.7.1.4 Calculation of the time results
In order to calculate the results of the simulation, a labor takes a part of the storage
bin and assembles it. After the time and fatigue databases are created the parts are
distributed in the virtual storage bin, a part will be selected to be picked up and
assembled in the virtual environment. In addition, the time and fatigue values will be
calculated and recorded in the database.
44
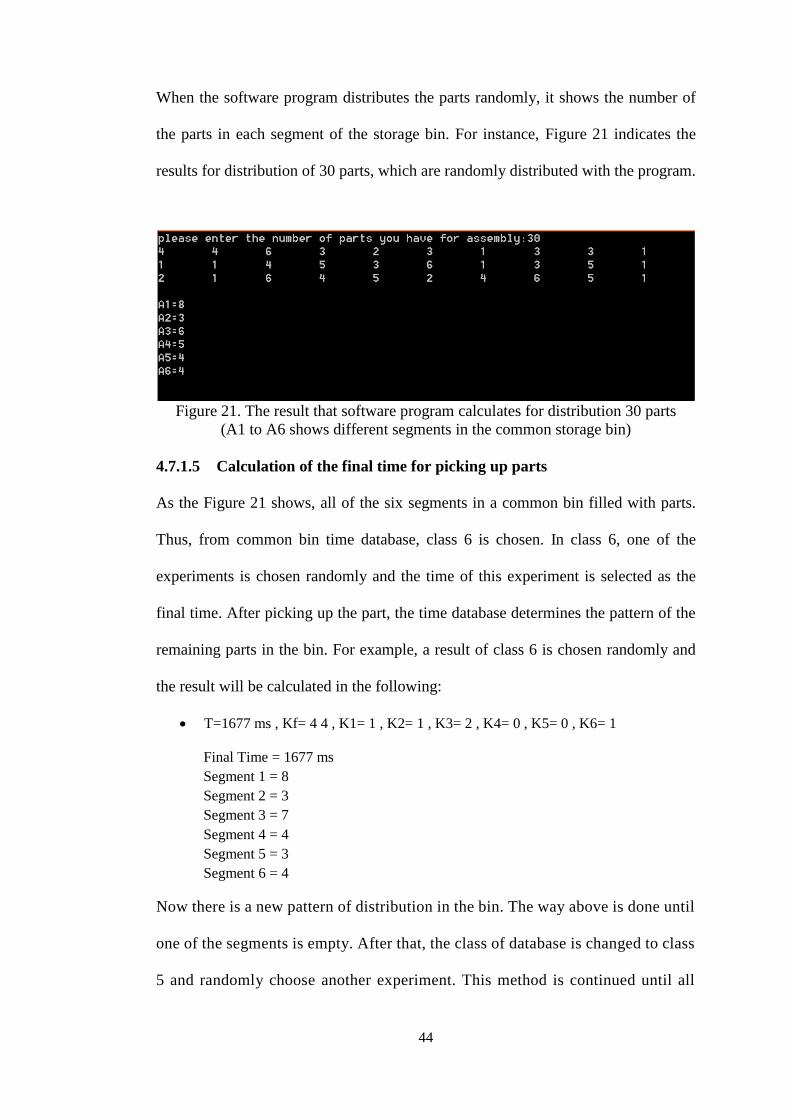
When the software program distributes the parts randomly, it shows the number of
the parts in each segment of the storage bin. For instance, Figure 21 indicates the
results for distribution of 30 parts, which are randomly distributed with the program.
Figure 21. The result that software program calculates for distribution 30 parts
(A1 to A6 shows different segments in the common storage bin)
4.7.1.5 Calculation of the final time for picking up parts
As the Figure 21 shows, all of the six segments in a common bin filled with parts.
Thus, from common bin time database, class 6 is chosen. In class 6, one of the
experiments is chosen randomly and the time of this experiment is selected as the
final time. After picking up the part, the time database determines the pattern of the
remaining parts in the bin. For example, a result of class 6 is chosen randomly and
the result will be calculated in the following:
T=1677 ms , Kf= 4 4 , K1= 1 , K2= 1 , K3= 2 , K4= 0 , K5= 0 , K6= 1
Final Time = 1677 ms
Segment 1 = 8
Segment 2 = 3
Segment 3 = 7
Segment 4 = 4
Segment 5 = 3
Segment 6 = 4
Now there is a new pattern of distribution in the bin. The way above is done until
one of the segments is empty. After that, the class of database is changed to class
5 and randomly choose another experiment. This method is continued until all

45
the parts are picked up from the bin and each time adds up to the final time, so
when all the parts are taken out of the bin, the total final time is calculated.
4.7.1.6 Calculate the fatigue value
In order to calculate the fatigue value, each time, a part is chosen for picking up from
a special segment; the fatigue value for the hand posture for that specific segment is
chosen from the fatigue value database and added to the Final Fatigue Value. This
procedure is based on random selection of three or two different postures of labor
hand to take the part of the segment (three posture for segments 1, 2, 5, 6 and two
postures for segments 3, 4). This procedure is repeated until the fatigue value for all
parts is calculated.
At the end, there are total final time and total final fatigue value for all the parts. These
values are used to compare the results of the common storage bin with the proposed
storage bin and compare them with the real experiments to calculate the amount of
errors. Figure 22 shows the complete methodology in a diagram.

Figure 22. Applied methodology scheme for evaluating time and fatigue index
Divide the bottom of storage bin to six segment
Distribute parts randomly with program
Identify which segments are full of parts
Identify the class of time database for
choosing part randomly
Choose a part randomly
Specify the segment for pick up part
Add the time to total time
Real part pick up from
different segments
Create time database
Are there any parts in
storage bin ?
Yes
No
There is a total time to pick up all
parts
Choose a position
randomly from
virtual reality
database
Add the fatigue index to
total fatigue index
Are there any parts in
the storage bin ?
Yes
No
There is a total fatigue index to
pick up all parts
Simulation of different
position of participant s
hand for pick up a part
from each segment
Analyze hand position
with DELMIA
software with RULA
method
Create virtual reality
database
Tim
e D
ata
base
Virtu
al R
eality
Datab
ase

47
Chapter 5
5 RESULTS AND DISCUSSION
This chapter evaluates the results that are obtained from taking 30 parts from common
and proposed storage bin, and discusses, how much the new proposed storage bin can
decrease the time production and fatigue rather than common storage bin, and how it
solves the mentioned problems in the methodology section.
5.1 Calculate the results for assembly time and fatigue value
In the calculation of the results, the distribution pattern of 30 parts (mentioned in
chapter 3) is used as an example, and follows that procedure to calculate the final
time and final fatigue value for other experiments performed on common and
proposed storage bin. The distribution is:
A1 = 8 - A2 = 3 - A3 = 6 - A4 = 5 - A5 = 4 - A6 = 4
All segments are filled with parts, so it is going to be placed in class 6:
Random number: 3 (experiment number 3 is chosen out of five experiments)
T=1677 ms , Kf= 4 4 , K1= 1 , K2= 1 , K3= 2 , K4= 0 , K5= 0 , K6= 1
Final Time = 1677 ms
Final fatigue value = 6 (this fatigue value is randomly selected out of two possible
postures for segment 4)
A1 = 8 , A2 = 3 , A3 = 7 , A4 = 4 , A5 = 3 , A6 = 4 ( new distribution after taking part from
segment 4)

48
Random number: 2
T=1738 ms , Kf= 4 4 , K1= 1 , K2= 1 , K3= 1 , K4= 0 , K5= 1 , K6= 1
Final Time = 1677 +1738 = 3415 ms
Final fatigue value = 6 + 6 =12
A1 = 8 , A2 = 3 , A3 = 7 , A4 = 3 , A5 = 3 , A6 = 4
The rest of this procedure is mentioned in Appendix E.
The Final Time for picking up 30 parts distributed in the common storage bin in the
virtual environment is 62386 ms; and the time for picking up 30 parts when the parts
are distributed in a common storage bin in the real environment is 65291 ms. The
distribution of parts in the real storage bin is the same as the distribution of parts in
the virtual reality). The final fatigue value of this experiment is 169. These
experiments are repeated for different distributions of 30 parts and the results are
shown in Table 7.
Table 7. The results of the experiments on common storage bin for 10-time
experiment
Number of
Experiment
Time for
Virtual Distribution (ms)
Time for
Real Distribution (ms) Fatigue Value
1 62386 65291 169
2 65116 68419 176
3 73342 69832 170
4 62078 64611 162
5 68199 68648 184
6 65154 63132 164
7 64877 65192 172
8 67211 64909 159
9 67954 70015 166
10 65730 67449 183

49
The results of the experiments for the proposed storage bin are indicated in table 8.
Table 8. The results for experiment on proposed storage bin for 10-time experiment
Number of
Experiment
Time for
Virtual Distribution (ms)
Time for
Real Distribution (ms) Fatigue Value
1 53707 55654 96
2 54678 55945 109
3 53326 54984 89
4 57555 59585 91
5 55645 54723 112
6 58456 57465 99
7 52221 56177 93
8 55549 53168 105
9 51125 51448 97
10 56659 52843 89
5.2 Discussion
The primary aim of this research was the improvement of the old standard storage bin
that is used commonly in workstations. The standard common storage bin has two
following major problems because of its design, especially when it is used in a long
period assembly process.
1. Because of the shape of the common storage bin, finding and picking the parts
takes more time when there are a few parts in the storage bin. The amount of
these wasted times is significant for long period assembly processes.
2. When a labor in an assembly task picks the parts from a standard bin
frequently for a long period, s/he feels fatigued because of the shape of the
storage bin, which forms a bad position of the wrist, forearm, and upper arm
after duration. If this repeats for a long period of working days, s/he faces
Work-related Musculoskeletal Disorders (WSMD) in his/her hands.

50
In order to solve these problems, a new ergonomic shape design was proposed for the
storage bin, and the experiments showed that this new design for storage bin can solve
and mitigate the aforementioned problems by decreasing the assembly time and the
fatigue.
The Figure 23 and 24 show a comparison between the time to complete an assembly
task using a common bin and the time using a proposed bin. The comparisons are
performed for both real and virtual reality workstations. As these diagrams show the
proposed new design for the storage bin can improve the assembly time around 11.5
seconds. At first glance, the saved time is not a big amount of time and does not look
significant, but when this time is calculated for a long period assembly procedure, a
huge amount of improvement in task time and hence a huge increase in productivity
are found.
Figure 23. Comparison time of assembly for Real environment experiments between
common and proposed bins
1 2 3 4 5 6 7 8 9 10
Time for common sorage bin(ms)
65291 68419 69832 64611 68648 63132 65192 64909 70015 67449
Time for proposed storagebin (ms)
55654 55945 54984 59585 54723 57465 56177 53168 51448 52843
45000
50000
55000
60000
65000
70000
75000
Tim
e (m
s)

51
Figure 24. Comparison time of assembly for virtual reality experiments between
common and proposed bin
Regarding the fatigue that happens in the wrist, forearm, and upper arm, the Figure
25 compares the fatigue values resulted from the experiments on the proposed and
common storage bin. As the Diagram shows, the average fatigue value in the
proposed storage bin is reduced to around 72.5 units which is almost half of the
average fatigue value in the common storage bin. Based on these results, it can be
concluded that the overall posture of the worker’s hand improves when s/he is taking
the parts from a bin with the new ergonomic design.
Figure 25. Comparison fatigue value between common and proposed bin
1 2 3 4 5 6 7 8 9 10
Time for common storage bin(ms)
62386 65116 73342 62078 68199 65154 64877 67211 67954 65730
Time for proposed storagebin (ms)
53707 54678 53326 57555 55645 58456 52221 55549 51125 56659
40000
45000
50000
55000
60000
65000
70000
75000
80000
Tim
e (m
s)
1 2 3 4 5 6 7 8 9 10
Fatigue value for old bin 169 176 170 162 184 164 172 159 166 183
Fatigue Value for new bin 96 109 89 91 112 99 93 105 97 89
60
80
100
120
140
160
180
200
Fati
gue
Val
ue

52
The improvement in the fatigue values is important, since it affects the productivity
in long periods of the assembly process. Based on the presented results of this
research and case study, it can be concluded that using the proposed ergonomic
storage bin decreases the risk of WMSDs during long period assembly processes.
The second goal of this research was to create a methodology for analysis of the
assembly tasks and processes based on a combination of Ergonomics, Time study,
and Virtual reality. The Figure 26 and 27 shows the comparison of the time results of
the experiments simulated in a virtual reality environment with the experiments
performed in a real environment for common and proposed storage bins. The error of
the VR method in calculating the time is around 5.5 seconds for common storage bin
and around 3 seconds for the proposed storage bin. This means that our proposed
method can estimate the time for the common storage bin with less than 8 % error and
estimate the time for the proposed storage bin with less than 5 % error.
The amount of fatigue value in this case study is shown and compared in Figure 25.
The comparison shows that the average fatigue value for the proposed storage bin is
72.5 units less than the average fatigue value for the common storage bin, it means
after a long period of an assembly process, a worker that uses a common storage bin
feels tired 42.5 % more than a worker that has used the proposed ergonomic storage
bin, and the percentage of the risk of WMSDs for the worker that uses common bin
is 42.5 % more than the worker that has used the proposed bin.

53
Figure 26. Comparison time of assembly between virtual and real experiments on a
common bin
Figure 27. Comparison time of assembly between virtual and real experiments on a
proposed bin
1 2 3 4 5 6 7 8 9 10
Time for Virtual Experiment (ms) 62386 65116 73342 62078 68199 65154 64877 67211 67954 65730
Time for Real Experiment (ms) 65291 68419 69832 64611 68648 63132 65192 64909 70015 67449
58000
60000
62000
64000
66000
68000
70000
72000
74000
76000
Tim
e (
ms)
1 2 3 4 5 6 7 8 9 10
Time for Virtual Experiment 53707 54678 53326 57555 55645 58456 52221 55549 51125 56659
Time for Real Experiment 55654 55945 54984 59585 54723 57465 56177 53168 51448 52843
50000
52000
54000
56000
58000
60000
62000
Tim
e (
ms)

54
Chapter 6
6 CONCLUSION
This chapter summarizes the discussion of this study and discusses the possible future
directions of the study.
6.1 Conclusion
The two following issues are studied in this research:
1. Study of an analysis method based on a combination of Ergonomics, Time
Study, and Virtual Reality to calculate the time of assembly and calculate the
percentage of fatigue and WMSDs risk after a long time repetitive assembly
process.
2. The second contribution of the proposed work in this research is a proposal
for the redesigned of the common standard storage bin to solve the several
problems that it has, when is used in a long period repetitive assembly process.
As a summary of the work in this study, at first, a new analysis method was created
by making a connection between Ergonomics, Time Study, and Virtual Reality. In
addition, a new design for a storage bin was proposed, which solves the problems
with the old standard storage bins. The new proposed analysis method was applied to
analyze how the use of the new storage bin affects the productivity of the assembly
line. The analysis results indicated that the proposed storage bin could solve the
problems of the common storage bin in lengthy assembly processes. In addition, this
analysis showed that the accuracy of our proposed method based on virtual reality is

55
acceptable, and the method can be used in place of expensive experiments in the real
environment.
The comparison of the obtained results from the application of the proposed Virtual
Reality-based method to the analysis of the new storage bin, with the results of the
real performed experiments in the real assembly environment, showed the proposed
VR-based method could calculate the results with less than 8 % error. It also showed
the time for picking 30 parts from the proposed ergonomic storage bin is around 11.5
seconds less than a common storage bin, and if the workers use the proposed
ergonomic storage bin the risk of the fatigue and WMSDs would be decreased by
42.5 % compared to use of the common standard storage bin.
6.2 Future works
For the future of this study, several directions should be considered:
In this research, the bottom of the storage bin divided into 6 segments for the
common storage bin and 3 segments for the proposed storage bin. To increase
the accuracy of the experiments and results, the bins can be divided into more
segments with interstitial forms.
This research studied the assembly process for 30 parts in the storage bin. This
situation happens when there are a few parts in the storage bin. As a future
work, the proposed method can be applied in cases with storage bin full of
parts, and calculate the time and fatigue values to study the productivity more
accurately.
Another possible future work is regarding the fatigue analysis. In this
research, fatigue values were calculated as an index of the percentage of the
fatigue effect that happens in the worker’s hand during a long time assembly

56
task. However, if this index were studied biomechanically, the amount that
the fatigue affects the productivity can be calculated based on the fatigue
value and based on this fatigue value can be measured how much the
productivity increases or decreases.
In this research, the proposed method was studied in the assembly process of
one of the parts of the studies case (A pen with 4 parts). As a future work, the
results can be extended to study the method for a complete assembly process
of the pen with assembling all the parts and study the accurate performance of
the method for a full assembly process.
57
REFERENCES
[1] Middlesworth, M., (2016). A Step-by-Step Guide to the RULA Assessment
Tool. Available: http://ergo-plus.com/rula-assessment-tool-guide/
[2] Das, B., An ergonomic approach to designing a manufacturing work system,
International Journal of Industrial Ergonomics, vol. 1, NO. 3, pp. 231-240,
1987.
[3] Konz, S., Work design: Industrial Ergonomics, 2nd ed. Grid Columbus, Ohio,
1995.
[4] Ayoub, M. A., Ergonomic deficiencies: I. Pain at work. , Occupational
Medicine, vol. 32, NO. 1, pp. 52-57, 1990.
[5] Ayoub, M. A., Ergonomic deficiencies: II. Probable causes, Occupational
Medicine, vol. 32, NO. 2, pp. 131-136, 1990.
[6] Lockton, D., HarrisonStanton, & Stanton, N. A., The design with intent method:
a design tool for influencing user behavior, Applied Ergonomics, vol. 41, pp.
382-392, 2010.
[7] Jayaram, U., Jayaram, S., shaikh, I., Kim, Y., & Palmer, C., Introducing
quantitative analysis methods into virtual environments for real-time and
continuous ergonomic evaluations, Computers in Industry, vol. 57, pp. 283-296,
2006.
58
[8] Jung, K., Kwon, O., & You, H., Development of a digital human model
generation method for ergonomic design in virtual environment, International
Journal of Industrial Ergonomics, vol. 39, pp. 744-748, 2009.
[9] Chaffin, D. B., Digital Human Modeling for Vehicle and Workplace Design,
Society of Automotive Engineers, pp. 1-14, 2001.
[10] Helander, M. G., Seven common reasons to not implement ergonomics,
International Journal of Industrial Ergonomics, vol. 25, pp. 97-101, 1999.
[11] Bowman, D., Using digital human modeling in a virtual heavy vehicle
development environment, Society of Automotive Engineers, pp. 77-99, 2001.
[12] Freivalds, A., Niebel’s Methods, standards, and work design, 12th ed.:
McGraw-Hill, 2008.
[13] Jastrzebowski, W., An outline of ergonomics, the science of work based upon
the truths drawn from the science of nature, The Central Institute for Labour
Protection, Warsaw, Poland, 1997.
[14] Dempsey, G. P., Wogalter, S. M., & Hancock, A. P., What’s in a name? Using
terms from definitions to examine the fundamental foundation of human factors
and ergonomics science, Theoretical Issues in Ergonomics Science, vol. 1, No.
1, pp. 3-10, 2000.
59
[15] Budnick, P., (2001). What is Ergonomics Really About? Available:
http://ergoweb.com/commentary-what-is-ergonomics-really-about/
[16] Casey, S., Set Phasers on Stun and Other True Tales of Design, Technology,
and Human Error, Aegean Publishing Company, Santa Barbara, California,
USA, 1993.
[17] White, C. M., Ergonomics: What is it?, The Bent Of Tau Beta Pi, pp. 24-27,
2008.
[18] Definition and Domains of Ergonomics. (2016). Available: http://www.iea.cc/
whats/index.html
[19] Hendrick, H. W., Good Ergonomics is Good Economics, in Proceedings of the
Human Factors and Ergonomics Society 40th Annual Meeting. Human Factors
and Ergonomics Society, 1996.
[20] Is That Product Ergonomic? (2004). Available: https://ergoweb.com/is-that-
product-ergonomic/
[21] MacLeod, D., The Ergonomics Kit for General Industry, Taylor & Francis,
Second Edition., 2006.
[22] Hasselquist, R. J., Increasing manufacturing productivity using human factors
principles. Proceedings of the Human Factors Society, Applied Ergonomics,
vol. 14, pp. 204-206, 1983.

60
[23] 8 Fundamental Ergonomic Principles for Better Work Performance. (2009).
Available: http://ergo-plus.com/fundamental-ergonomic-principles/
[24] 10 Principles of Ergonomics. (2008). Available: http://www.danmacleod.com/
ErgoForYou/10_principles_of_ergonomics.htm
[25] How to Recognize Ergonomic Risk Factors in the Workplace. (2009).
Available: http://ergo-plus.com/ergonomic-risk-factors/
[26] Brown, A., How to adjust your workstation for optimal comfort and
productivity, I. VSI Risk Management and Ergonomics, Ed., ed.
[27] Upper Body Risk Factors. (2011). Available: http://www.apple.com/about/
ergonomics/uprsk.html
[28] Alberts, J. T., Estill, C. F., Soluciones ergonomicas para trabajadores de la
construccion, Departamento De Saludy Servicios Humanos De Los Estados
Unidos, 2007.
[29] Veettil, H. P., Ergonomic Simulation Revisited Using Parametric Virtual
Humans in the Biomechanical Framework, ecole polytechnique fédérale de
lausanne, 2011.
[30] Beld, G. V. D., Light and Health, The Light & Health Foundation, Eindhoven,
Holland, 2003.

61
[31] Lighting Ergonomics - General. (2016). Available: www.ccohs.ca/oshanswers/
ergonomics/lighting_general.html
[32] Tiesler, G., & Oberdörster, M., Noise - A Stress Factor? Acoustic Ergonomics
Of Schools, presented at the Euronoise , Tampere, Finland, 2006.
[33] Folsom, F., Productive Silence: Noise Distraction Affects Employee
Satisfaction and Productivity, Interior Design & Space Planning, 2002.
[34] Bhattacharya, A., & MvGlothlin, J. D., Occupational Ergonomics: Theory and
Applications, 2nd ed., 2012.
[35] Li, G., & Buckle, P., Current techniques for assessing physical exposure to
work-related musculoskeletal risks, with emphasis on posture-based methods,
ERGONOMICS, vol. 42-NO. 5, pp. 674-695, 1999.
[36] Heating and Cooling for Man in Industry, 2nd ed.: American Industrial Hygiene
Association, 1975.
[37] Mital, A., Kilbom, A., & Kumar, S., Ergonomics Guidelines and Problem
Solving vol. 1: Elsevier, 2000.
[38] N. I. f. O. S. a. Health. Cold Stress. (2011). Available: www.cdc.gov/niosh/
topics/coldstress/

62
[39] O. S. a. H. Administration. Cold Stress. (2007). Available: www.osha.gov/
SLTC/emergencypreparedness/guides/cold.html
[40] Ringleberg, J., & Voskamp, P., Integrating Ergonomic Principles into C-
Standards for Machinery Design, TUTB Proposals for Guidelines. Brussels:
European Trade Union Technical Bureau for Health and Safety, 1996.
[41] Armstrong, T., Buckle, P., & Fine, L., A conceptual model for work-related
neck and upper limb musculoskeletal disorders, Scand J Work Environ Health,
vol. 19, pp. 73-84, 1993.
[42] Corlett, E. N., Madeley, S. J., & Manenica, I., Posture targetting: a technique
for recording working postures, Ergonomics, vol. 22, pp. 357-366, 1979.
[43] Priel, V. Z., A numerical de® nition of posture, Human Factors, vol. 16, pp.
576-584, 1974.
[44] McAtamney, L., & Corlett, E., RULA: a survey method for the investigation of
work-related upper limb disorders, Appl Ergon, vol. 24, pp. 91-99, 1993.
[45] Bao, S., Howarda, N., Spielholza, P., & Silversteina, B., Two posture analysis
approaches and their application in a modified Rapid Upper Limb Assessment
evaluation Ergonomics, Taylor & Francis Ltd, vol. 50, No. 12, pp. 2118-2136,
2007.

63
[46] Reid, C. R. D., Occupational Lower Extremity Risk Assessment Modeling,
University of Central Florida, 2009.
[47] Karhu, O., Kansi, P., & Kuorinka, I., Correcting working postures in industry:
a practical method for analysis, Appl Ergon, vol. 8, pp. 199-201, 1977.
[48] Rodgers, S. H., A functional job evaluation technique, in Ergonomics,
Occupational Medicine: State of the Art Reviews, vol. 7, NO. 4, pp. 679-711,
1992.
[49] Gonçalves, P. J. S., & Fernandes, N. O., RULAmatic – A Semi-Automatic
Posture Recognition System for RULA Risk Evaluation Method, in
International Conference On Innovations, 2010, pp. 266-271.
[50] The Strain Index Job Analysis Method: Q & A. (2002). Available:
www.ergoweb.com/the-strain-index-job-analysis-method-q-a/
[51] Hignett, S., & McAtamney, L., Rapid Entire Body Assessment (REBA), Appl
Ergon, vol. 31, pp. 201-205, 2000.
[52] Colombini, D., & Occhipinti, E., The Ocra index for risk assessment of WMSDs
risk with repetitive movements of the upper limbs, presented at the The Human
Factors and Ergonomics Society Annual Meeting 2000.

64
[53] Ridd, J., Nicholson, A., & Montan, A., A portable microcomputer based system
of ‘on-site’ activity and posture recording. In: Megaw, Contemporary
Ergonomics. Tayor & Francis Group, pp. 366-371, 1989.
[54] Beek, A. V. D., Galen, L. V., & Frings-Dresen, M., Working postures and
activities of lorry drivers: a reliability study of on-site observation and recording
on a pocket computer, appl Ergon, vol. 23, pp. 331-336, 1992.
[55] Wiktorin, C., Mortimer, M., Ekenval, L., Kilbom, A., & Hjelm, E., HARBO, a
simple computer-aided observation method for recording work postures,
Scandinavian Journal of Work, Environment & Health, vol. 21, pp. 440-449,
1995.
[56] Frasson-Hall, C., Gloria, R., Kilbom, A., Winkel, J., Karlqvist, L., & Wiktorin,
C., A portable ergonomic observation method (PEO) for computerised on line
recording of postures and manual handling, Appl Ergon, vol. 26, pp. 93-100,
1995.
[57] Vicon Motus. (2014). Available: http://www.motus10.com/
[58] Vicon. Vicon Vintage. (2012). Available: http://www.vicon.com
[59] Kinemetrix 3-Dimensional Motion Analysis System (2014). Available:
www.mie-uk.com/kin/
65
[60] M. M. R. Ltd. Simi reality motion systems. (1997). Available: www.simi.com
[61] A. Dynamics. Ariel Dynamics. (1994). Available: http://www.arielnet.com/
[62] Bauman, M. D., Plamondon, A., & Gagnon, D., Comparative assessment of 3D
joint marker sets for the biomechanical analysis of occupational tasks,
International Journal of Industrial Ergonomics, vol. 21, pp. 475-482, 1998.
[63] Kadefors, R., & Forsman, M., Ergonomic evaluation of complex work: a
participative approach employing video computer interaction, exemplified in a
study of order picking, International Journal of Industrial Ergonomics, vol. 25,
pp. 435-445, 2000.
[64] Borg, G., Psychophysical scaling with applications in physical work and the
perception of exertion, Scandinavian Journal of Work, Environment and
Health, vol. 16, pp. 55-58, 1990.
[65] Dane, D., Feuerstein, M., Huang, G., Dimberg, L., & Lincoln, A., properties of
a self-report index of ergonomic exposures for use in an office environment.,
Occup Environ Med, vol. 44, pp. 73-81, 2002.
[66] Barnes, R. M., Motion And Time Study Design And Measurment Of Work, 7th
ed., 1980.
[67] Hashim, N. D., Time study method implementation in manufacturing industry,
Universiti Teknikal Malaysia Melaka, 2008.

66
[68] Time Study. (2007). Available: http://www.citeman.com/1621-time-study.html
[69] Virtual Reality. (1999). Available: http://whatis.techtarget.com/definition/
virtual-reality
[70] Larijani, L. C., The virtual reality primer, McGraw-Hill, New York, 1994.
[71] Kimura, F., Product and process modeling as a kernel for virtual manufacturing
environment, CIRP Annals, vol. 42, pp. 147-150, 1993.
[72] Nahavandi, S., & Preece, C., A Virtual Manufacturing Environment With An
Element Of Reality, in Advanced Factory Automation, Fourth International
Conference, 1994, pp. 624-629.
[73] L. A. Inc., Virtual Manufacturing Technical Workshop, ed, 1995.
[74] Flaig, L. S., Alliances' future: The virtual enterprise: your new model for
success, Electronic Business, vol. 18, No. 6, pp. 153-155, 1992.
[75] Vaclav, S., Senderska, K., & Mares, A., Design of manual assembly
workstations in Catia, Materials Science and Technology vol. 10, No. 2, pp. 41-
49, 2010.
[76] Feyen, R., Liu, Y., Chaffin, D., Jimmerson, G., & Joseph, B., Computer-aided
ergonomics: a case study of incorporating ergonomics analyses into workplace
design, Applied Ergonomics, vol. 31, pp. 291-300, 2000.

67
[77] Ben-Gal, I., & Bukchin, J., the ergonomic design of workstations using virtual
manufacturing and response surface methodology, IIE Transactions vol. 34, pp.
375-391, 2002.
[78] Longo, F., Mirabelli, G., & Papoff, E., Effective Design of an Assembly Line
Using Modeling & Simulation, in Proceedings of the Winter Simulation
Conference, 2006, pp. 1893-1898.
[79] Chang, S. W., & Wng, M. J. J., Digital Human Modeling and Workplace
Evaluation: Using an Automobile Assembly Task as an Example, Human
Factors and Ergonomics in Manufacturing vol. 17 No. 5, pp. 445-455, 2007.
[80] Shikdar, A., & Al-Hadhrami, M., Smart workstation design: an ergonomics and
methods engineering approach, International journal of Industrial and Systems
Engineering, vol. 2, NO. 4, pp. 363-374, 2007.
[81] Alzuheri, A., Luong, L., & Xing, K., Ergonomics design measures in manual
assembly work, in Engineering Systems Management and Its Applications
(ICESMA), Second International Conference, 2010, pp. 1-6.
[82] Shikdar, A., Garbie, I., & Khadem, M., Development of a smart workstation for
an assembly task, in International Conference on Industrial Engineering and
Operations Management (IEOM), Kula Lumpur, Malaysia, 2011, pp. 826-831.
68
[83] Garbie, I. H., An Experimental Study On Assembly Workstation Considering
Ergonomically Issues, in 41st International Conference on Computers &
Industrial Engineering, 2011, pp. 275-282.
[84] Saptari, A., Lai, W. S., & Salleh, M. R., Jig Design, Assembly Line Design and
Work Station Design and their Effect to Productivity, Jordan Journal of
Mechanical and Industrial Engineering, vol. 5 No. 1, pp. 9-16, 2011.
[85] Prakash, R. A., Arun, B. S., Narayanan, N., & Yeshwanth, V., Design Of
Workplace For The Assembly Of Monoblock Pump, International Journal of
Research in Engineering and Technology, vol. 2, pp. 349-355, 2013.
[86] Ansari, N. A., & Evaluation, M. J., of work Posture by RULA and REBA: A
Case Study, IOSR Journal of Mechanical and Civil Engineering (IOSR-JMCE),
vol. 11, NO. 4, Ver. III, pp. 18-23, 2014.
[87] Ergonautas. RULA (Rapid Upper Limb Assessment). (2006). Available:
http://www.ergonautas.upv.es/en/metodos/rula/rula-ayuda.php
[88] Virtual Ergonomics Solution, Dassault Systems, 2008. Available:
www.3ds.com/products-services/delmia/capabilities/ergonomics/

69
8 APPENDIX
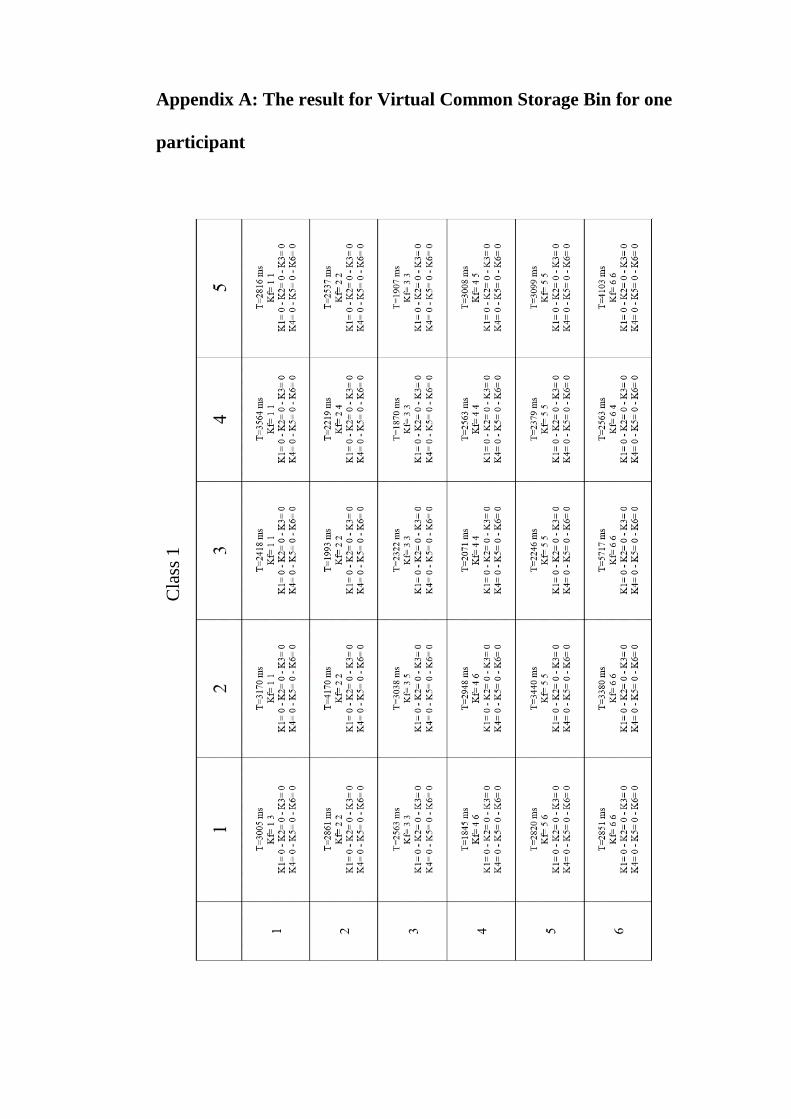
Appendix A: The result for Virtual Common Storage Bin for one
participant
Cla
ss 1

71
Cla
ss 2

Cla
ss 2

Cla
ss 3

Cla
ss 3

Cla
ss 3

Cla
ss 4

Cla
ss 4

Cla
ss 5
Cla
ss 6

Appendix B: The result for Virtual Proposed Storage Bin for one
participant
Cla
ss 1

80
Appendix C: The result of Fatigue Value for hand posture
For calculating fatigue value, special value is defined for colors:
Green = 0 , Yellow = 1 , Orange = 2 , Red = 3.
Table 9 and Table 10 shows the result of fatigue value for different positions of
hand worker that simulate and analyze with DELMIA software, to calculate each
value, four below parts of the hand will be evaluated:
Wrist (w) - Wrist Twist (wt) - Forearm (f) - Upper Arm (u).
Table 9. Fatigue value for common storage bin
Posture 1 Posture 2 Posture 3
Segment 1 W 2 + wt 0 + f 1 + u 1 = 4 W 3 + wt 0 + f 1 + u 1 = 5 W 2 + wt 0 + f 1 + u 1 = 4
Segment 2 W 2 + wt 0 + f 1 + u 1 = 4 W 3 + wt 2 + f 3 + u 1 = 9 W 2 + wt 0 + f 1 + u 1 = 4
Segment 3 W 2 + wt 0 + f 2 + u 1 = 5 W 3 + wt 1 + f 1 + u 1 = 6 --------------------
Segment 4 W 2 + wt 2 + f 1 + u 1 = 6 W 2 + wt 3 + f 1 + u 1 = 7 --------------------
Segment 5 W 3 + wt 0 + f 1 + u 1 = 5 W 3 + wt 0 + f 2 + u 1 = 6 W 3 + wt 0 + f 1 + u 0 = 4
Segment 6 W 3 + wt 1 + f 1 + u 1 = 6 W 3 + wt 3 + f 3 + u 1 = 10 W 3 + wt 0 + f 1 + u 1 = 5
Table 10. Fatigue value for proposed storage bin
Posture 1 Posture 2 Posture 3
Segment 1 W 1 + wt 0 + f 1 + u 0 =2 W 2 + wt 0 + f 1 + u 1 =4 W 1 + wt 0 + f 1 + u 0 =2
Segment 2 W 1 + wt 0 + f 2 + u 0 =3 W 1 + wt 0 + f 3 + u 1 =5 W 1 + wt 0 + f 2 + u 0 =3

Appendix D: The program for distribute the parts in different
segments in common bin

82
Appendix E: The complete calculation of one complete virtual
experiment
The distribution of parts in the common storage bin is:
A1 = 8 , A2 = 3 , A3 = 6 , A4 = 5 , A5 = 4 , A6 = 4
All segments fill with parts so class 6 is chosen for taking part:
Random number: 3
T=1677 ms , Pf= 4 4 , K1= 1 , K2= 1 , K3= 2 , K4= 0 , K5= 0 , K6= 1
Final Time = 1677 ms
Final fatigue value = 6
A1 = 8 , A2 = 3 , A3 = 7 , A4 = 4 , A5 = 3 , A6 = 4
Random number: 2
T=1738 ms , Pf= 4 4 , K1= 1 , K2= 1 , K3= 1 , K4= 0 , K5= 1 , K6= 1
Final Time = 1677 +1738 = 3415 ms
Final fatigue value = 6 + 6 =12
A1 = 8 , A2 = 3 , A3 = 7 , A4 = 3 , A5 = 3 , A6 = 4
Random number: 3
T=1677 ms , Pf= 4 4 , K1= 1 , K2= 1 , K3= 2 , K4= 0 , K5= 0 , K6= 1
Final Time = 3415 + 1677 = 5092 ms
Final fatigue value = 12 + 7 = 19
A1 = 8 , A2 = 3 , A3 = 8 , A4 = 2 , A5 = 2 , A6 = 4
Random number: 4
T=1792 ms , Pf= 1 5 , K1= 0 , K2= 1 , K3= 0 , K4= 2 , K5= 1 , K6= 1
Final Time = 5092 + 1792 = 6884 ms

83
Final fatigue value = 19 + 6 = 25
A1 = 7 , A2 = 3 , A3 = 7 , A4 = 3 , A5 = 2 , A6 = 4
Random number: 2
T=1738 ms , Pf= 4 4 , K1= 1 , K2= 1 , K3= 1 , K4= 0 , K5= 1 , K6= 1
Final Time = 6884 + 1738 = 8622 ms
Final fatigue value = 25 + 6 = 31
A1 = 7 , A2 = 3 , A3 = 7 , A4 = 2 , A5 = 2 , A6 = 4
Random number: 1
T=1875 ms , Pf= 4 4 , K1= 1 , K2= 1 , K3= 1 , K4= 0 , K5= 1 , K6= 1
Final Time = 8622 + 1875 = 10497 ms
Final fatigue value = 31 + 7 = 38
A1 = 7 , A2 = 3 , A3 = 7 , A4 = 1 , A5 = 2 , A6 = 4
Random number: 5
T=1809 ms , Pf= 2 3 , K1= 1 , K2= 0 , K3= 0 , K4= 0 , K5= 2 , K6= 2
Final Time = 10497 + 1809 = 12306 ms
Final fatigue value = 38 + 5 = 43
A1 = 7 , A2 = 2 , A3 = 6 , A4 = 0 , A5 = 3 , A6 = 5
Now results are chosen from class 5, because the segment 4 is empty; and because
A1, A2, A3, A5, A6 are fill with parts so the results is chosen from sub class (1, 2, 3,
5, 6).
Random number: 3
T=2357 ms , Pf= 6 6 , K1= 1 , K2= 1 , K3= 1 , K4= 0 , K5= 1 , K6= 0
Final Time = 12306 + 2357 = 14663 ms
Final fatigue value = 43 + 5 = 48

84
A1 = 7 , A2 = 2 , A3 = 6 , A4 = 0 , A5 = 3 , A6 = 4
Random number: 5
T=1970 ms , Pf= 3 5 , K1= 1 , K2= 1 , K3= 0 , K4= 0 , K5= 1 , K6= 1
Final Time = 14663 + 1970 = 16633 ms
Final fatigue value = 48 + 6 = 54
A1 = 7 , A2 = 2 , A3 = 5 , A4 = 0 , A5 = 3 , A6 = 4
Random number: 3
T=2357 ms , Pf= 6 6 , K1= 1 , K2= 1 , K3= 1 , K4= 0 , K5= 1 , K6= 0
Final Time = 16633 + 2357 = 18990 ms
Final fatigue value = 54 + 10 = 64
A1 = 7 , A2 = 2 , A3 = 5 , A4 = 0 , A5 = 3 , A6 = 3
Random number: 2
T=1831 ms , Pf= 2 2 , K1= 1 , K2= 0 , K3= 1 , K4= 0 , K5= 1 , K6= 1
Final Time = 18990 + 1831 = 20821 ms
Final fatigue value = 64 + 4 = 68
A1 = 7 , A2 = 1 , A3 = 5 , A4 = 0 , A5 = 3 , A6 = 3
Random number: 4
T=1897ms , Pf= 1 1 , K1= 0 , K2= 1 , K3= 1 , K4= 0 , K5= 1 , K6= 1
Final Time = 20821 + 1897 = 22718 ms
Final fatigue value = 68 + 4 = 72
A1 = 6 , A2 = 1 , A3 = 5 , A4 = 0 , A5 = 3 , A6 = 3
Random number: 4
T=1897ms , Pf= 1 1 , K1= 0 , K2= 1 , K3= 1 , K4= 0 , K5= 1 , K6= 1
Final Time = 22718 + 1897 = 24615 ms
Final fatigue value = 72 + 5 = 77

85
A1 = 5 , A2 = 1 , A3 = 5 , A4 = 0 , A5 = 3 , A6 = 3
Random number: 3
T=2357 ms , Pf= 6 6 , K1= 1 , K2= 1 , K3= 1 , K4= 0 , K5= 1 , K6= 0
Final Time = 24615 + 2357 = 26972 ms
Final fatigue value = 77 + 10 = 87
A1 = 5 , A2 = 1 , A3 = 5 , A4 = 0 , A5 = 3 , A6 = 2
Random number: 2
T=1831 ms , Pf= 2 2 , K1= 1 , K2= 0 , K3= 1 , K4= 0 , K5= 1 , K6= 1
Final Time = 26972 + 1831 = 28803 ms
Final fatigue value = 87 + 4 = 91
A1 = 5 , A2 = 0 , A3 = 5 , A4 = 0 , A5 = 3 , A6 = 2
Now results are chosen from class 4, and from sub class (1, 3, 5, 6).
Random number: 3
T=1971 ms , Pf= 6 4 , K1= 1 , K2= 0 , K3= 1 , K4= 0 , K5= 1 , K6= 0
Final Time = 28803 + 1971 = 30774 ms
Final fatigue value = 91 + 6 = 97
A1 = 5 , A2 = 0 , A3 = 5 , A4 = 0 , A5 = 3 , A6 = 1
Random number: 2
T=2105 ms , Pf= 3 3 , K1= 1 , K2= 0 , K3= 0 , K4= 0 , K5= 1 , K6= 1
Final Time = 30774 + 2105 = 32879 ms
Final fatigue value = 97 + 5 = 102
A1 = 5 , A2 = 0 , A3 = 4 , A4 = 0 , A5 = 3 , A6 = 1
Random number: 5
T=1999 ms , Pf= 1 5 , K1= 0 , K2= 0 , K3= 0 , K4= 0 , K5= 2 , K6= 1

86
Final Time = 32879 + 1999 = 34878 ms
Final fatigue value = 102 + 4 = 106
A1 = 4 , A2 = 0 , A3 = 3 , A4 = 0 , A5 = 4 , A6 = 1
Random number: 5
T=1775 ms , Pf= 3 1 , K1= 0 , K2= 1 , K3= 0 , K4= 0 , K5= 1 , K6= 1
Final Time = 34878 + 1775 = 36653 ms
Final fatigue value = 106 + 5 = 111
A1 = 3 , A2 = 1 , A3 = 2 , A4 = 0 , A5 = 4 , A6 = 1
In this step when participant took the part from segment 3, the part that is in
segment 1, move to segment 2. Therefore, now there are 5 segments that fill with
parts and again results are chosen from class 5, sub class (1, 2, 3, 5, 6).
Random number: 3
T=2357 ms , Pf= 6 6 , K1= 1 , K2= 1 , K3= 1 , K4= 0 , K5= 1 , K6= 0
Final Time = 36653 + 2357 = 39010 ms
Final fatigue value = 111 + 5 = 116
A1 = 3 , A2 = 1 , A3 = 2 , A4 = 0 , A5 = 4 , A6 = 0
Now results are chosen from class 4, sub class (1, 2, 3, 5)
Random number: 2
T=2038 ms , Pf= 5 3 , K1= 2 , K2= 1 , K3= 0 , K4= 0 , K5= 0 , K6= 0
Final Time = 39010 + 2038 = 41048 ms
Final fatigue value = 116 + 5 = 121
A1 = 4 , A2 = 1 , A3 = 1 , A4 = 0 , A5 = 3 , A6 = 0
Random number: 1
T=2284 ms , Pf= 5 5 , K1= 1 , K2= 1 , K3= 1 , K4= 0 , K5= 0 , K6= 0

87
Final Time = 41048 + 2284 = 43332 ms
Final fatigue value = 121 + 4 = 125
A1 = 4 , A2 = 1 , A3 = 1 , A4 = 0 , A5 = 2 , A6 = 0
Random number: 4
T=1777 ms , Pf= 1 1 , K1= 0 , K2= 1 , K3= 1 , K4= 0 , K5= 1 , K6= 0
Final Time = 43332 + 1777 = 45109 ms
Final fatigue value = 125 + 5 = 130
A1 = 3 , A2 = 1 , A3 = 1 , A4 = 0 , A5 = 2 , A6 = 0
Random number: 3
T=1997 ms , Pf= 2 4 , K1= 1 , K2= 0 , K3= 0 , K4= 1 , K5= 1 , K6= 0
Final Time = 45109 + 1997 = 47106 ms
Final fatigue value = 130 + 6 = 136
A1 = 3 , A2 = 0 , A3 = 0 , A4 = 1 , A5 = 2 , A6 = 0
Now the class 4 change to class 3, subclass (1, 4, 5)
Random number: 2
T=3140 ms , Pf= 5 5 , K1= 1 , K2= 0 , K3= 0 , K4= 1 , K5= 0 , K6= 0
Final Time = 47106 + 3140 = 50246 ms
Final fatigue value = 136 + 6 = 142
A1 = 3 , A2 = 0 , A3 = 0 , A4 = 1 , A5 = 1 , A6 = 0
Random number: 5
T=1796 ms , Pf= 4 4 ,K1= 1 , K2= 0 , K3= 0 , K4= 0 , K5= 1 , K6= 0
Final Time = 50246 + 1796 = 52042 ms
Final fatigue value = 142 + 7 = 149
A1 = 3 , A2 = 0 , A3 = 0 , A4 = 0 , A5 = 1 , A6 = 0

88
Now the class 3 change to class 2, subclass (1, 5)
Random number: 4
T=2139 ms , Pf= 1 3 , K1= 0 , K2= 0 , K3= 0 , K4= 0 , K5= 1 , K6= 0
Final Time = 52042 + 2139 = 54181 ms
Final fatigue value = 149 + 5 = 154
A1 = 2 , A2 = 0 , A3 = 0 , A4 = 0 , A5 = 1 , A6 = 0
Random number: 2
T=2384 ms , Pf= 5 5 , K1= 1 , K2= 0 , K3= 0 , K4= 0 , K5= 0 , K6= 0
Final Time = 54181+2384 = 56565 ms
Final fatigue value = 154 + 5 = 159
A1 = 2 - A2 = 0 - A3 = 0 - A4 = 0 - A5 = 0 - A6 = 0
Now the class 2 change to class 1, subclass 1
Random number: 1
T=3005 ms - Pf= 1 3 - K1= 0 - K2= 0 - K3= 0 - K4= 0 - K5= 0 - K6= 0
Final Time = 56565 + 3005 = 59570 ms
Final fatigue value = 159 + 5 = 164
A1 = 1 - A2 = 0 - A3 = 0 - A4 = 0 - A5 = 0 - A6 = 0
Random number: 5
T=2816 ms - Pf= 1 1 - K1= 0 - K2= 0 - K3= 0 - K4= 0 - K5= 0 - K6= 0
Final Time = 59570 + 2816 = 62386 ms
Final fatigue value = 164 + 5 = 169
A1 = 0 - A2 = 0 - A3 = 0 - A4 = 0 - A5 = 0 - A6 = 0