Embed Size (px)
Citation preview
1
In cooperation with the University of Waterloo, Canada
Application of Advanced Geophysical Logging Methods in the Characterization of a Fractured-Sedimentary Bedrock Aquifer, Ventura County, California
by John H. Williams, John W. Lane, Jr., Kamini Singha, and F. P. Haeni
An integrated suite of advanced geophysical logging methods was used to characterize the geology and hydrology of three boreholes completed in fractured-sedimentary bedrock in Ventura County, California. The geophysical methods included caliper, gamma, electromagnetic induction, borehole deviation, optical and acoustic televiewer, borehole radar, fluid resistivity, temperature, and electromagnetic flowmeter. The geophysical logging 1) provided insights useful for the overall geohydrologic characterization of the bedrock and 2) enhanced the value of information collected by other methods from the boreholes including core-sample analysis, multiple-level monitoring, and packer testing.
The logged boreholes, which have open intervals of 100 to 200 feet, penetrate a sequence of interbedded sandstone and mudstone with bedding striking 220 to 250 degrees and dipping 15 to 40 degrees to the northwest. Fractures intersected by the boreholes include fractures parallel to bedding and fractures with variable strike that dip moderately to steeply. Two to three flow zones were detected in each borehole. The flow zones consist of bedding-parallel or steeply dipping fractures or a combination of bedding-parallel fractures and moderately to steeply dipping fractures. About 75 to more than 90 percent of the measured flow under pumped conditions was produced by only one of the flow zones in each borehole.
WRIR 00-4083March 2002
U.S. Department of the InteriorU.S. Geological Survey
2 3
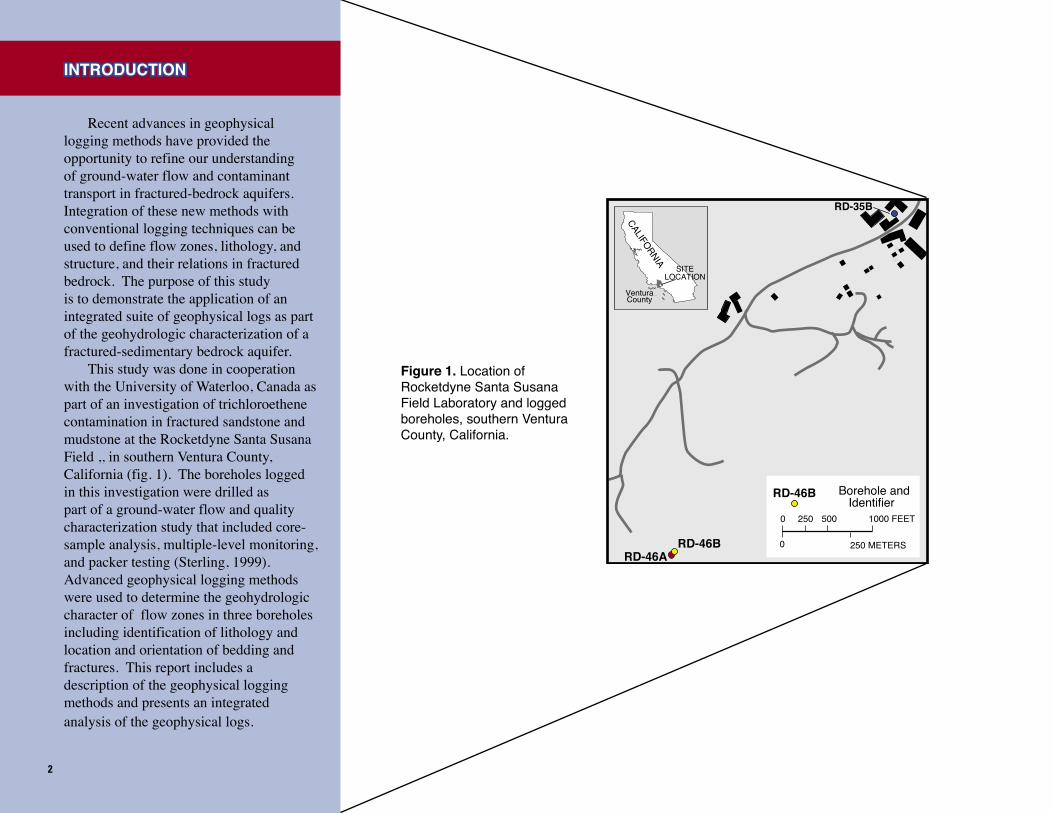
Figure 1. Location of Rocketdyne Santa Susana Field Laboratory and logged boreholes, southern Ventura County, California.
INTRODUCTION
Recent advances in geophysical logging methods have provided the opportunity to refine our understanding of ground-water flow and contaminant transport in fractured-bedrock aquifers. Integration of these new methods with conventional logging techniques can be used to define flow zones, lithology, and structure, and their relations in fractured bedrock. The purpose of this study is to demonstrate the application of an integrated suite of geophysical logs as part of the geohydrologic characterization of a fractured-sedimentary bedrock aquifer.
This study was done in cooperation with the University of Waterloo, Canada as part of an investigation of trichloroethene contamination in fractured sandstone and mudstone at the Rocketdyne Santa Susana Field ,, in southern Ventura County, California (fig. 1). The boreholes logged in this investigation were drilled as part of a ground-water flow and quality characterization study that included core-sample analysis, multiple-level monitoring, and packer testing (Sterling, 1999). Advanced geophysical logging methods were used to determine the geohydrologic character of flow zones in three boreholes including identification of lithology and location and orientation of bedding and fractures. This report includes a description of the geophysical logging methods and presents an integrated analysis of the geophysical logs.
������ �������������������������
�����������
� ���������������
������
������
������
�������������
������������
�����
�����
2 3
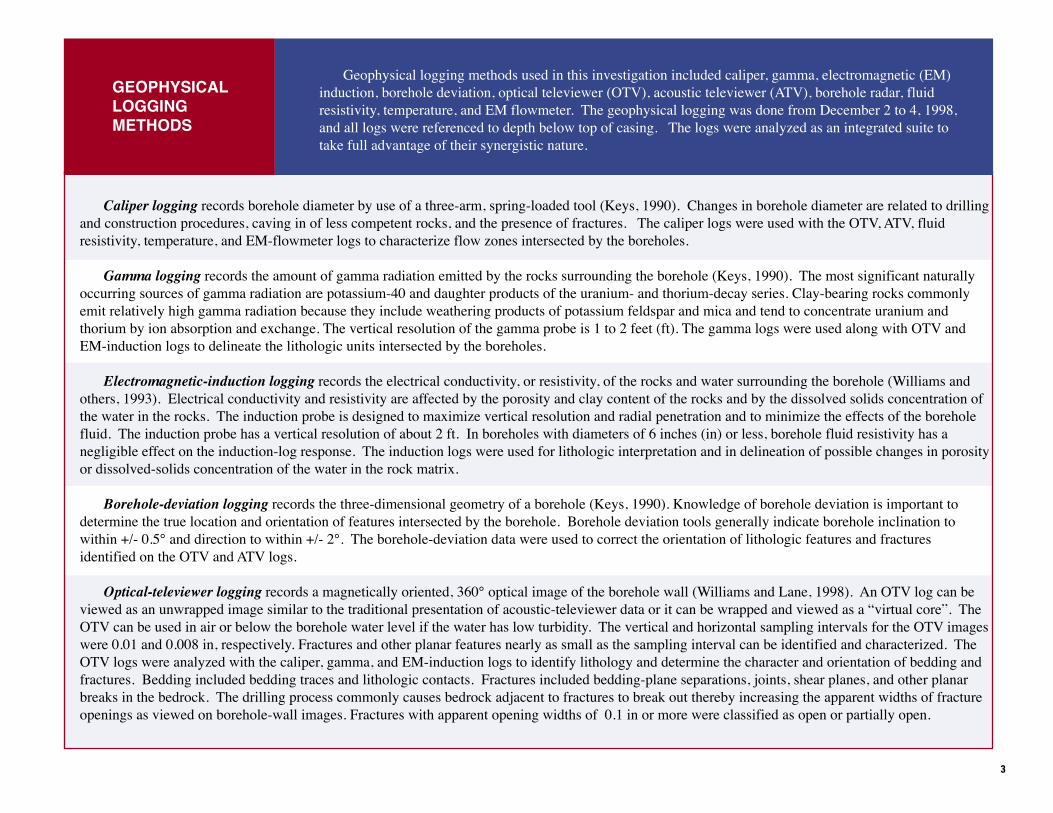
Caliper logging records borehole diameter by use of a three-arm, spring-loaded tool (Keys, 1990). Changes in borehole diameter are related to drilling and construction procedures, caving in of less competent rocks, and the presence of fractures. The caliper logs were used with the OTV, ATV, fluid resistivity, temperature, and EM-flowmeter logs to characterize flow zones intersected by the boreholes.
Gamma logging records the amount of gamma radiation emitted by the rocks surrounding the borehole (Keys, 1990). The most significant naturally occurring sources of gamma radiation are potassium-40 and daughter products of the uranium- and thorium-decay series. Clay-bearing rocks commonly emit relatively high gamma radiation because they include weathering products of potassium feldspar and mica and tend to concentrate uranium and thorium by ion absorption and exchange. The vertical resolution of the gamma probe is 1 to 2 feet (ft). The gamma logs were used along with OTV and EM-induction logs to delineate the lithologic units intersected by the boreholes.
Electromagnetic-induction logging records the electrical conductivity, or resistivity, of the rocks and water surrounding the borehole (Williams and others, 1993). Electrical conductivity and resistivity are affected by the porosity and clay content of the rocks and by the dissolved solids concentration of the water in the rocks. The induction probe is designed to maximize vertical resolution and radial penetration and to minimize the effects of the borehole fluid. The induction probe has a vertical resolution of about 2 ft. In boreholes with diameters of 6 inches (in) or less, borehole fluid resistivity has a negligible effect on the induction-log response. The induction logs were used for lithologic interpretation and in delineation of possible changes in porosity or dissolved-solids concentration of the water in the rock matrix.
Borehole-deviation logging records the three-dimensional geometry of a borehole (Keys, 1990). Knowledge of borehole deviation is important to determine the true location and orientation of features intersected by the borehole. Borehole deviation tools generally indicate borehole inclination to within +/- 0.5° and direction to within +/- 2°. The borehole-deviation data were used to correct the orientation of lithologic features and fractures identified on the OTV and ATV logs.
Optical-televiewer logging records a magnetically oriented, 360° optical image of the borehole wall (Williams and Lane, 1998). An OTV log can be viewed as an unwrapped image similar to the traditional presentation of acoustic-televiewer data or it can be wrapped and viewed as a “virtual core”. The OTV can be used in air or below the borehole water level if the water has low turbidity. The vertical and horizontal sampling intervals for the OTV images were 0.01 and 0.008 in, respectively. Fractures and other planar features nearly as small as the sampling interval can be identified and characterized. The OTV logs were analyzed with the caliper, gamma, and EM-induction logs to identify lithology and determine the character and orientation of bedding and fractures. Bedding included bedding traces and lithologic contacts. Fractures included bedding-plane separations, joints, shear planes, and other planar breaks in the bedrock. The drilling process commonly causes bedrock adjacent to fractures to break out thereby increasing the apparent widths of fracture openings as viewed on borehole-wall images. Fractures with apparent opening widths of 0.1 in or more were classified as open or partially open.
GEOPHYSICAL LOGGING METHODS
Geophysical logging methods used in this investigation included caliper, gamma, electromagnetic (EM) induction, borehole deviation, optical televiewer (OTV), acoustic televiewer (ATV), borehole radar, fluid resistivity, temperature, and EM flowmeter. The geophysical logging was done from December 2 to 4, 1998, and all logs were referenced to depth below top of casing. The logs were analyzed as an integrated suite to take full advantage of their synergistic nature.
4 5
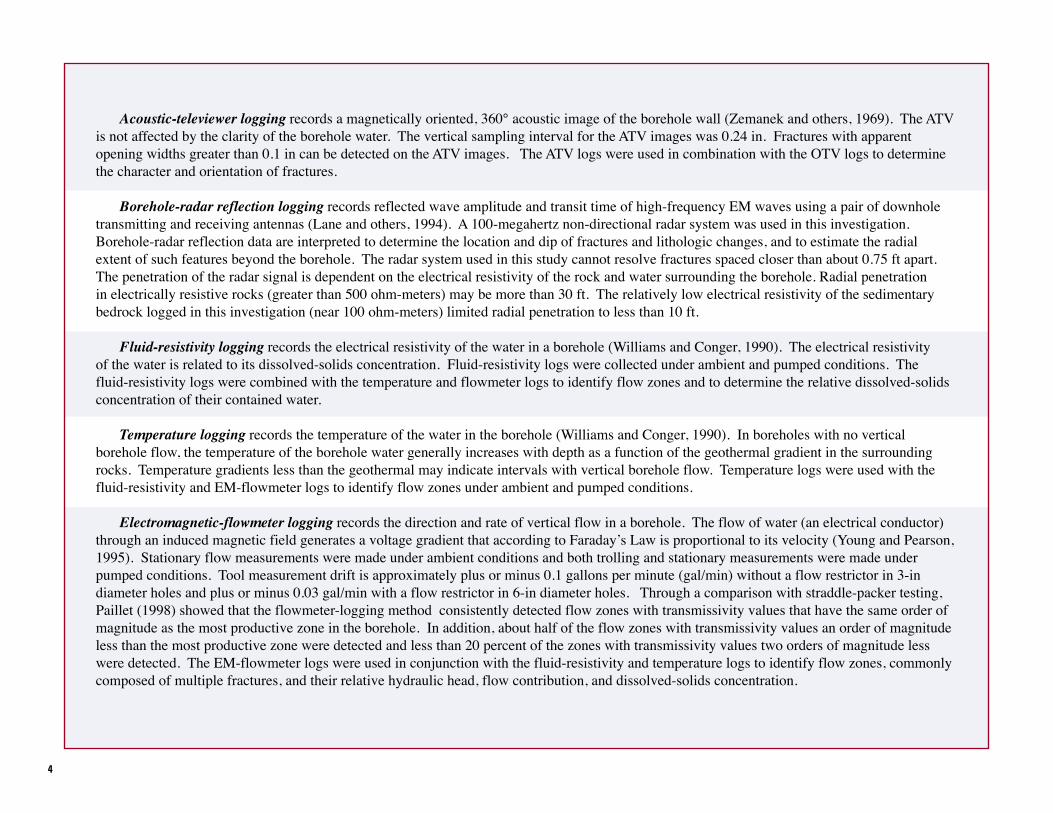
Acoustic-televiewer logging records a magnetically oriented, 360° acoustic image of the borehole wall (Zemanek and others, 1969). The ATV is not affected by the clarity of the borehole water. The vertical sampling interval for the ATV images was 0.24 in. Fractures with apparent opening widths greater than 0.1 in can be detected on the ATV images. The ATV logs were used in combination with the OTV logs to determine the character and orientation of fractures.
Borehole-radar reflection logging records reflected wave amplitude and transit time of high-frequency EM waves using a pair of downhole transmitting and receiving antennas (Lane and others, 1994). A 100-megahertz non-directional radar system was used in this investigation. Borehole-radar reflection data are interpreted to determine the location and dip of fractures and lithologic changes, and to estimate the radial extent of such features beyond the borehole. The radar system used in this study cannot resolve fractures spaced closer than about 0.75 ft apart. The penetration of the radar signal is dependent on the electrical resistivity of the rock and water surrounding the borehole. Radial penetration in electrically resistive rocks (greater than 500 ohm-meters) may be more than 30 ft. The relatively low electrical resistivity of the sedimentary bedrock logged in this investigation (near 100 ohm-meters) limited radial penetration to less than 10 ft.
Fluid-resistivity logging records the electrical resistivity of the water in a borehole (Williams and Conger, 1990). The electrical resistivity of the water is related to its dissolved-solids concentration. Fluid-resistivity logs were collected under ambient and pumped conditions. The fluid-resistivity logs were combined with the temperature and flowmeter logs to identify flow zones and to determine the relative dissolved-solids concentration of their contained water.
Temperature logging records the temperature of the water in the borehole (Williams and Conger, 1990). In boreholes with no vertical borehole flow, the temperature of the borehole water generally increases with depth as a function of the geothermal gradient in the surrounding rocks. Temperature gradients less than the geothermal may indicate intervals with vertical borehole flow. Temperature logs were used with the fluid-resistivity and EM-flowmeter logs to identify flow zones under ambient and pumped conditions.
Electromagnetic-flowmeter logging records the direction and rate of vertical flow in a borehole. The flow of water (an electrical conductor) through an induced magnetic field generates a voltage gradient that according to Faraday’s Law is proportional to its velocity (Young and Pearson, 1995). Stationary flow measurements were made under ambient conditions and both trolling and stationary measurements were made under pumped conditions. Tool measurement drift is approximately plus or minus 0.1 gallons per minute (gal/min) without a flow restrictor in 3-in diameter holes and plus or minus 0.03 gal/min with a flow restrictor in 6-in diameter holes. Through a comparison with straddle-packer testing, Paillet (1998) showed that the flowmeter-logging method consistently detected flow zones with transmissivity values that have the same order of magnitude as the most productive zone in the borehole. In addition, about half of the flow zones with transmissivity values an order of magnitude less than the most productive zone were detected and less than 20 percent of the zones with transmissivity values two orders of magnitude less were detected. The EM-flowmeter logs were used in conjunction with the fluid-resistivity and temperature logs to identify flow zones, commonly composed of multiple fractures, and their relative hydraulic head, flow contribution, and dissolved-solids concentration.
4 5
BOREHOLE RD-35B
Borehole RD-35B is cased with steel to a depth of 163 ft and completed as a 3-in diameter open hole to a depth of 360 ft. The borehole is at north latitude 34º14′08′′ and west longitude 118º40′30′′. Top of casing is 1,905.7 ft above sea level. The ambient water level in the borehole during the logging period was at a depth of 63.5 ft. Integrated analysis of the OTV, gamma, and EM-induction logs indicates that the borehole intersects a sequence of sandstone and mudstone (figs. 2 and 3) as follows:
Depth, in ft Lithology163-201 Sandstone201-202 Mudstone202-233 Sandstone233-260 Sandstone and mudstone260-301 Sandstone301-316 Mudstone and sandstone316-360 Sandstone
The sandstone had higher resistivity and radar velocity and lower gamma than the mudstone. The resistivity of the sandstones below 278 ft is lower than the resistivity of the sandstones above this depth (fig. 2). The gamma logs do not indicate an increase in clay content in the lower sandstones. Therefore, the decrease in resistivity observed in the sandstones below 278 ft is related to an increase in the dissolved-solids content of the matrix water and (or) an increase in matrix porosity.
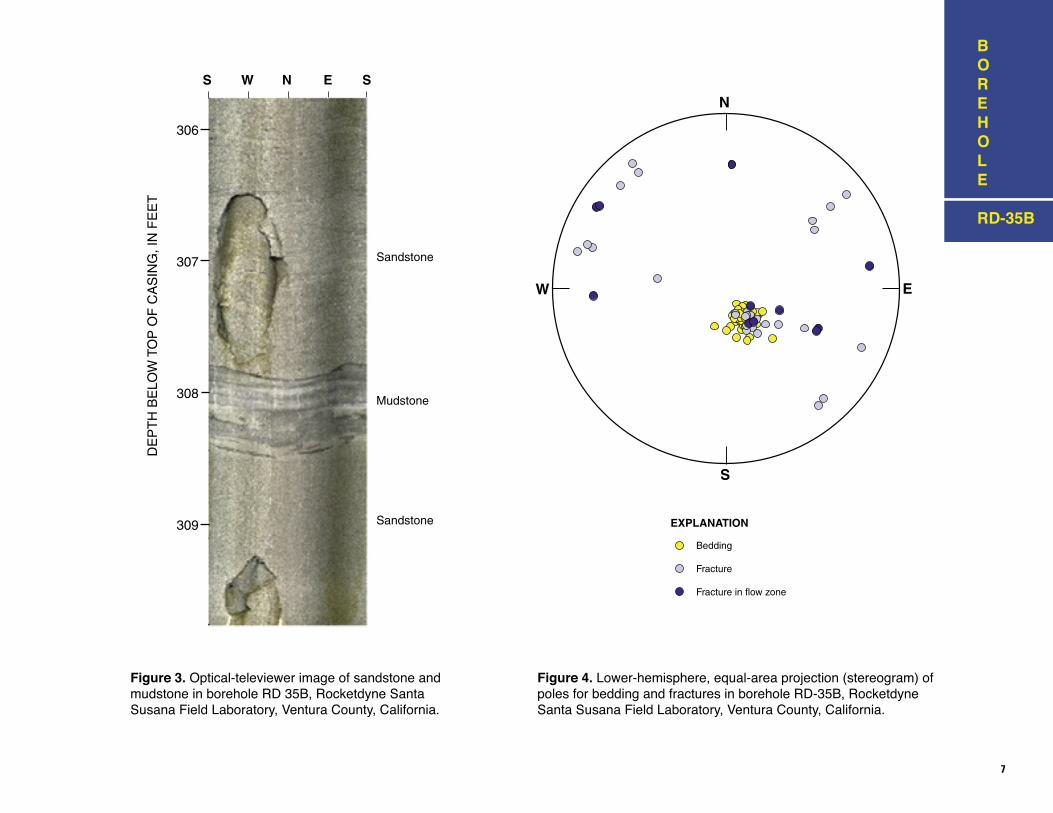
The character and orientation of bedding and fractures in borehole RD-35B were determined from the analysis of the OTV, ATV, and borehole-radar velocity logs (table 1 and fig. 4). Bedding generally strikes 220 to 260° and dips 15 to 30° to the northwest. Fractures in RD-35B include:
(1) 15 fractures that parallel bedding; (2) 7 moderately dipping fractures that generally strike 200 to 215°; and (3) 19 steeply dipping fractures that generally strike 0 to 230°.
Thirty-one of the 41 fractures appear open or partially open with maximum apparent opening widths that range from 0.1 to 3.8 inches.Integrated analysis of the EM-flowmeter, fluid-resistivity, and temperature logs with the OTV and ATV logs indicates that the borehole intersected
flow zones at 201 and 312 ft (fig. 5). The flow zone at 201 ft (fig. 6) is coincident with a thin mudstone unit within a 65-ft thick sandstone sequence. This zone consists of five fractures that strike about 200 to 230° and dip 20 to 60° to the northwest. The flow zone at 312 ft (fig. 7) is within interbedded sandstone and mudstone and consists of a bedding-parallel fracture and five steeply dipping fractures. The 201- and 312-ft flow zones appear on the borehole radar logs as intervals of low radar velocity (fig. 4).
GEOPHYSICAL LOG ANALYSIS

6 7
Figure 2. Gamma, resistivity, radar velocity, lithology, and bedding and fracture orientations for borehole RD-35B, Rocketdyne Santa Susana Field Laboratory, Ventura County, California.
BOREHOLE RD-35B
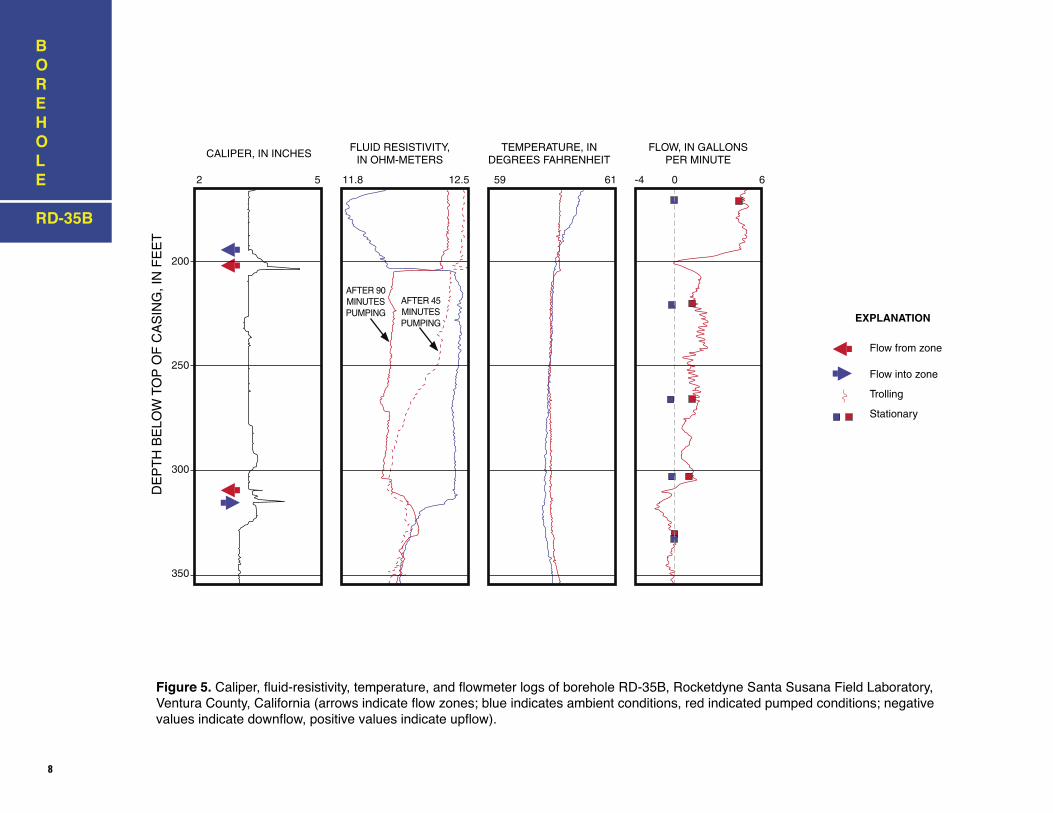
Analysis of the fluid-resistivity, temperature, and EM-flowmeter logs (fig. 5) suggests that slight downward flow occurs in borehole RD-35B under ambient conditions. Water enters RD-35B at the 201-ft flow zone, exiting at the 312-ft flow zone. The measured downward-flow rate is within the tool measurement drift of the EM flowmeter when used without a flow restrictor. The more definitive evidence for downward flow is indicated by a comparison of the fluid-resistivity logs under ambient conditions when flow is downward and pumped conditions when flow is upward. The presence of downward flow indicates that the 201-foot flow zone has a higher hydraulic head than the 312-ft zone.
RD-35B was pumped at 4.9 gal/min for 1.5 hours (h). The specific capacity of the well was 0.46 (gal/min)/ft with a drawdown of 10.7 ft. About 75 percent of the flow measured under pumped conditions was produced by the 201-ft zone; the remaining 25 percent was produced by the lower zone. Borehole fluid-resistivity logs under ambient and pumped conditions indicate that the 312-ft zone produces water that has a lower fluid resistivity (higher dissolved-solids content) than the 201-ft zone. Repeated fluid-resistivity logs illustrate that water in the borehole above the flow zones was purged between 0.5 and 1.5 h after the start of pumping.
�������������������
��������������������
������
�������
��������
���������������������
���������������������������������������
EXPLANATION
�������������������������
����������������
��������������
���������������������������
����������������������������������
��������������������������
������������������������������
����������������������������������������������������������������������������������
���
���
���
���
���
6 7
Figure 3. Optical-televiewer image of sandstone and mudstone in borehole RD 35B, Rocketdyne Santa Susana Field Laboratory, Ventura County, California.
Figure 4. Lower-hemisphere, equal-area projection (stereogram) of poles for bedding and fractures in borehole RD-35B, Rocketdyne Santa Susana Field Laboratory, Ventura County, California.
BOREHOLE RD-35B
���������
���������
��������
�����
�������������
���
���
���
���
��
��
���
���
���
��
���
���
���
����
���
��
�
�
�
�
�
Bedding
Fracture
Fracture in flow zone
�����������
8 9
BOREHOLE RD-35B
Figure 5. Caliper, fluid-resistivity, temperature, and flowmeter logs of borehole RD-35B, Rocketdyne Santa Susana Field Laboratory, Ventura County, California (arrows indicate flow zones; blue indicates ambient conditions, red indicated pumped conditions; negative values indicate downflow, positive values indicate upflow).
���
���
���
���
� � ���� ���� �� �� �� � �
������������������
��������������
EXPLANATION
��������������
����������
��������
����������������������
����������������������
����������������������������������
�������������������������������
���������������������������������
��������������������������
���
���
���
���
� � ���� ���� �� �� �� � �
������������������
��������������
EXPLANATION
��������������
����������
��������
����������������������
����������������������
����������������������������������
�������������������������������
���������������������������������
��������������������������

8 9
��������������������������
��������������������������
���������������������������
����������
������������������������ ���
���
���
���
���
� � � � �
BOREHOLE RD-35B
����������
������������������������
���������������������������
���������������������������
�����������������������������
�����������������������������
�����������������������������
� � � � � � � � � �
���
���
���
�������� �������
Figure 6. Acoustic- and optical-televiewer images of the flow zone near 201 feet in borehole RD-35B, Rocketdyne Santa Susana Field Laboratory, Ventura County, California.
Figure 7. Optical-televiewer image of the flow zone near 312 feet in borehole RD-35B, Rocketdyne Santa Susana Field Laboratory, Ventura County, California.
10 11
BOREHOLE RD-35B
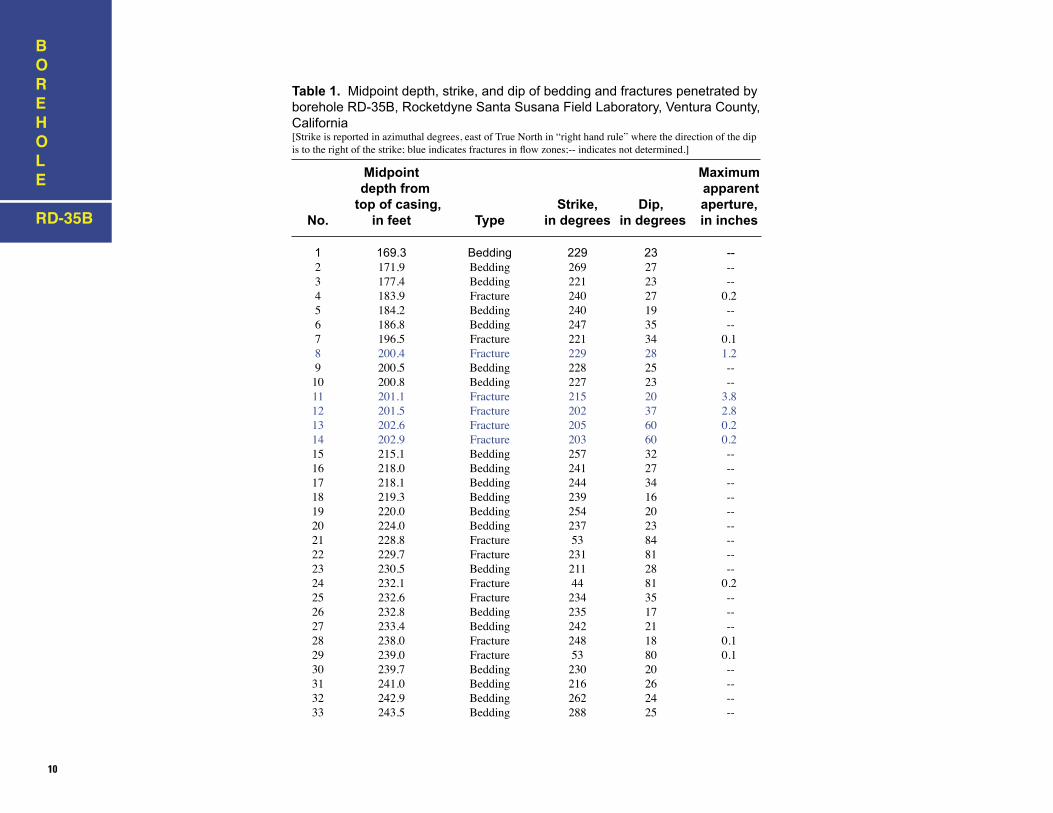
Table 1. Midpoint depth, strike, and dip of bedding and fractures penetrated by borehole RD-35B, Rocketdyne Santa Susana Field Laboratory, Ventura County, California[Strike is reported in azimuthal degrees, east of True North in “right hand rule” where the direction of the dip is to the right of the strike; blue indicates fractures in flow zones;-- indicates not determined.]
Midpoint Maximum depth from apparent top of casing, Strike, Dip, aperture, No. in feet Type in degrees in degrees in inches 1 169.3 Bedding 229 23 -- 2 171.9 Bedding 269 27 -- 3 177.4 Bedding 221 23 -- 4 183.9 Fracture 240 27 0.2 5 184.2 Bedding 240 19 -- 6 186.8 Bedding 247 35 -- 7 196.5 Fracture 221 34 0.1 8 200.4 Fracture 229 28 1.2 9 200.5 Bedding 228 25 -- 10 200.8 Bedding 227 23 -- 11 201.1 Fracture 215 20 3.8 12 201.5 Fracture 202 37 2.8 13 202.6 Fracture 205 60 0.2 14 202.9 Fracture 203 60 0.2 15 215.1 Bedding 257 32 -- 16 218.0 Bedding 241 27 -- 17 218.1 Bedding 244 34 -- 18 219.3 Bedding 239 16 -- 19 220.0 Bedding 254 20 -- 20 224.0 Bedding 237 23 -- 21 228.8 Fracture 53 84 -- 22 229.7 Fracture 231 81 -- 23 230.5 Bedding 211 28 -- 24 232.1 Fracture 44 81 0.2 25 232.6 Fracture 234 35 -- 26 232.8 Bedding 235 17 -- 27 233.4 Bedding 242 21 -- 28 238.0 Fracture 248 18 0.1 29 239.0 Fracture 53 80 0.1 30 239.7 Bedding 230 20 -- 31 241.0 Bedding 216 26 -- 32 242.9 Bedding 262 24 -- 33 243.5 Bedding 288 25 --
10 11
BOREHOLE RD-35B
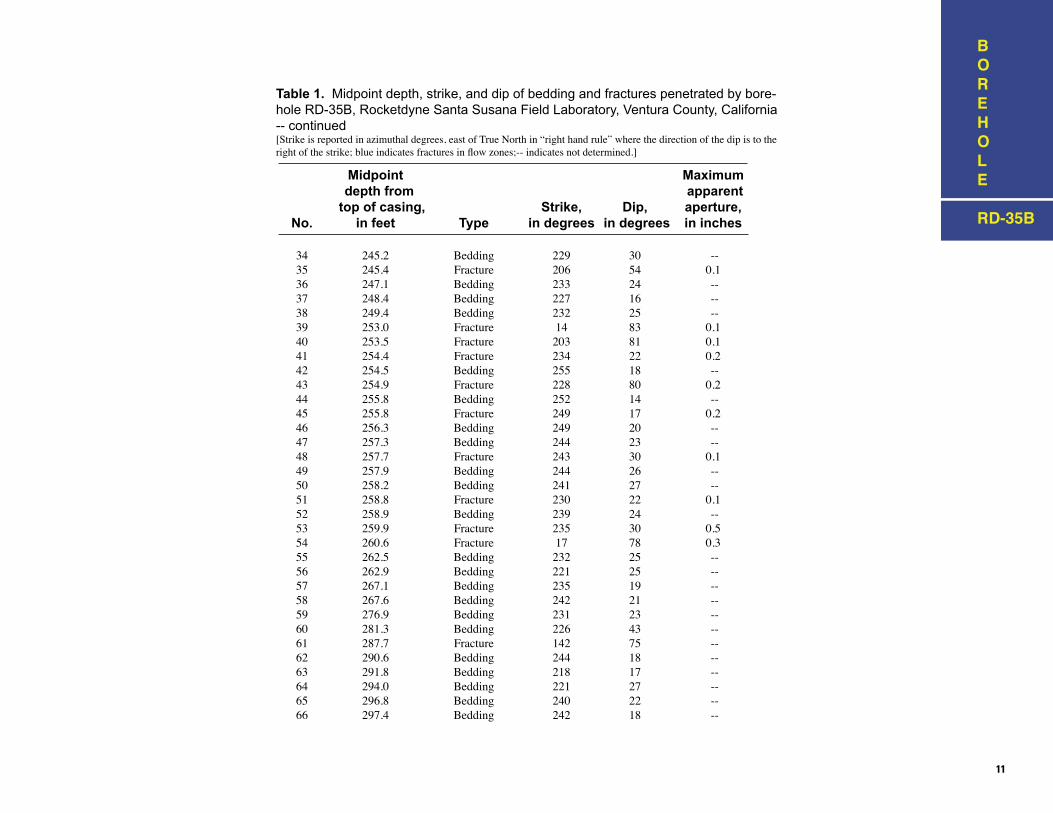
Table 1. Midpoint depth, strike, and dip of bedding and fractures penetrated by bore-hole RD-35B, Rocketdyne Santa Susana Field Laboratory, Ventura County, California -- continued[Strike is reported in azimuthal degrees, east of True North in “right hand rule” where the direction of the dip is to the right of the strike; blue indicates fractures in flow zones;-- indicates not determined.]
Midpoint Maximum depth from apparent top of casing, Strike, Dip, aperture, No. in feet Type in degrees in degrees in inches
34 245.2 Bedding 229 30 -- 35 245.4 Fracture 206 54 0.1 36 247.1 Bedding 233 24 -- 37 248.4 Bedding 227 16 -- 38 249.4 Bedding 232 25 -- 39 253.0 Fracture 14 83 0.1 40 253.5 Fracture 203 81 0.1 41 254.4 Fracture 234 22 0.2 42 254.5 Bedding 255 18 -- 43 254.9 Fracture 228 80 0.2 44 255.8 Bedding 252 14 -- 45 255.8 Fracture 249 17 0.2 46 256.3 Bedding 249 20 -- 47 257.3 Bedding 244 23 -- 48 257.7 Fracture 243 30 0.1 49 257.9 Bedding 244 26 -- 50 258.2 Bedding 241 27 -- 51 258.8 Fracture 230 22 0.1 52 258.9 Bedding 239 24 -- 53 259.9 Fracture 235 30 0.5 54 260.6 Fracture 17 78 0.3 55 262.5 Bedding 232 25 -- 56 262.9 Bedding 221 25 -- 57 267.1 Bedding 235 19 -- 58 267.6 Bedding 242 21 -- 59 276.9 Bedding 231 23 -- 60 281.3 Bedding 226 43 -- 61 287.7 Fracture 142 75 -- 62 290.6 Bedding 244 18 -- 63 291.8 Bedding 218 17 -- 64 294.0 Bedding 221 27 -- 65 296.8 Bedding 240 22 -- 66 297.4 Bedding 242 18 --
12 13
BOREHOLE RD-35B
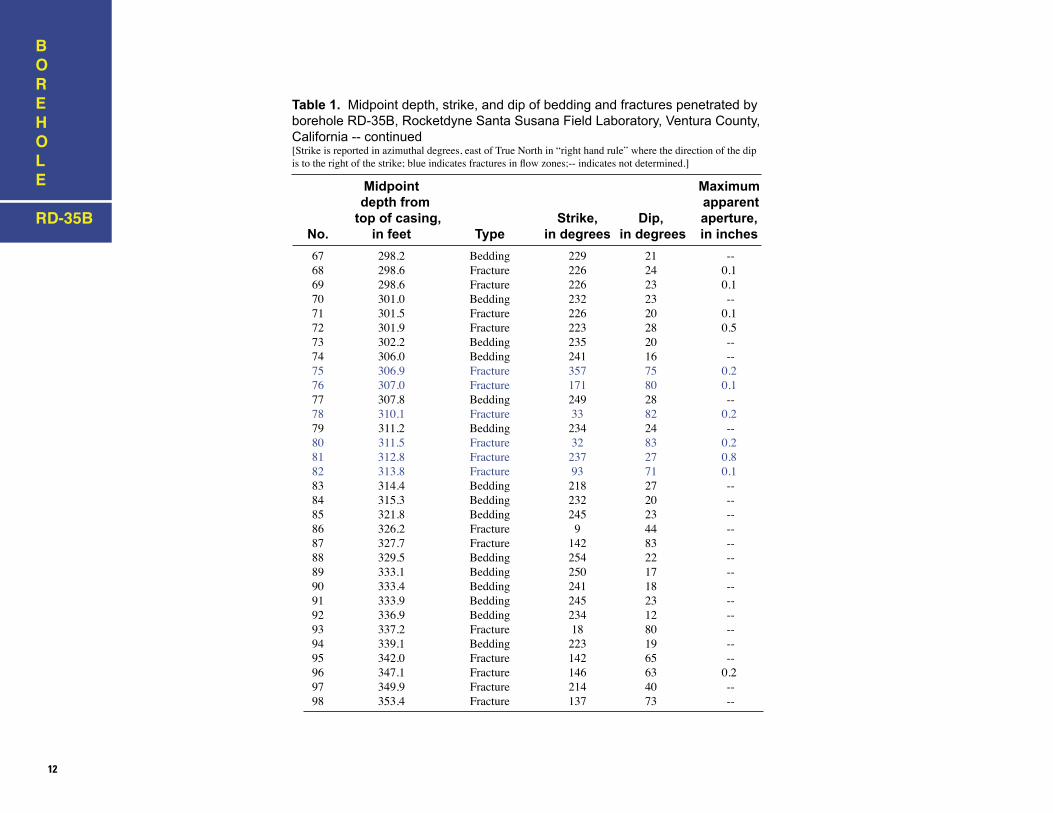
Table 1. Midpoint depth, strike, and dip of bedding and fractures penetrated by borehole RD-35B, Rocketdyne Santa Susana Field Laboratory, Ventura County, California -- continued[Strike is reported in azimuthal degrees, east of True North in “right hand rule” where the direction of the dip is to the right of the strike; blue indicates fractures in flow zones;-- indicates not determined.]
Midpoint Maximum depth from apparent top of casing, Strike, Dip, aperture, No. in feet Type in degrees in degrees in inches
67 298.2 Bedding 229 21 -- 68 298.6 Fracture 226 24 0.1 69 298.6 Fracture 226 23 0.1 70 301.0 Bedding 232 23 -- 71 301.5 Fracture 226 20 0.1 72 301.9 Fracture 223 28 0.5 73 302.2 Bedding 235 20 -- 74 306.0 Bedding 241 16 -- 75 306.9 Fracture 357 75 0.2 76 307.0 Fracture 171 80 0.1 77 307.8 Bedding 249 28 -- 78 310.1 Fracture 33 82 0.2 79 311.2 Bedding 234 24 -- 80 311.5 Fracture 32 83 0.2 81 312.8 Fracture 237 27 0.8 82 313.8 Fracture 93 71 0.1 83 314.4 Bedding 218 27 -- 84 315.3 Bedding 232 20 -- 85 321.8 Bedding 245 23 -- 86 326.2 Fracture 9 44 -- 87 327.7 Fracture 142 83 -- 88 329.5 Bedding 254 22 -- 89 333.1 Bedding 250 17 -- 90 333.4 Bedding 241 18 -- 91 333.9 Bedding 245 23 -- 92 336.9 Bedding 234 12 -- 93 337.2 Fracture 18 80 -- 94 339.1 Bedding 223 19 -- 95 342.0 Fracture 142 65 -- 96 347.1 Fracture 146 63 0.2 97 349.9 Fracture 214 40 -- 98 353.4 Fracture 137 73 --
12 13
BOREHOLE RD-46A
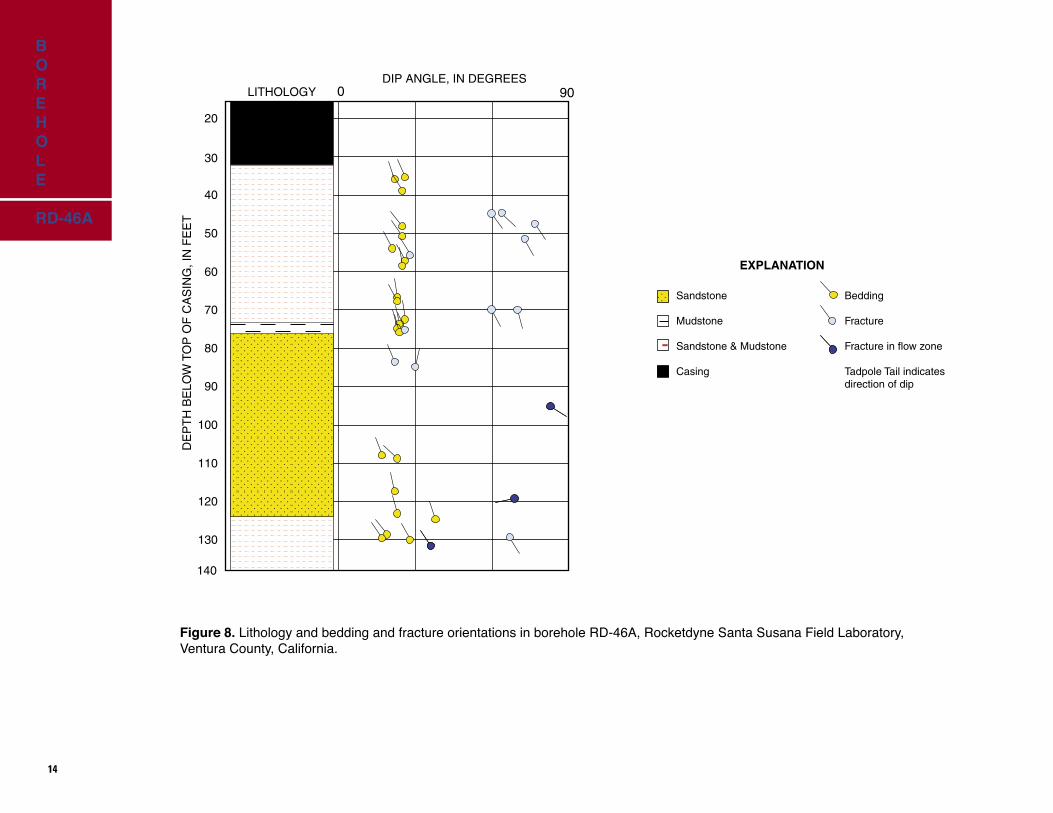
Borehole RD-46A is cased with steel to a depth of 32 ft and completed as a 6-in diameter open hole to a depth of 138 ft. The borehole is at north latitude 34º13′29′′ and west longitude 118º41′00′′.The top of casing is 1,806.1 ft above sea level. The ambient water level in the borehole during the logging period was at a depth of 66.4 ft. Analysis of the OTV log indicates the borehole intersects a sequence of sandstone and mudstone as follows:
Depth, in ft Lithology32-73 Sandstone and mudstone73-76 Mudstone with some sandstone76-124 Sandstone with some mudstone 124-129 Sandstone and mudstone (slumped/turbated)129-138 Sandstone and mudstone
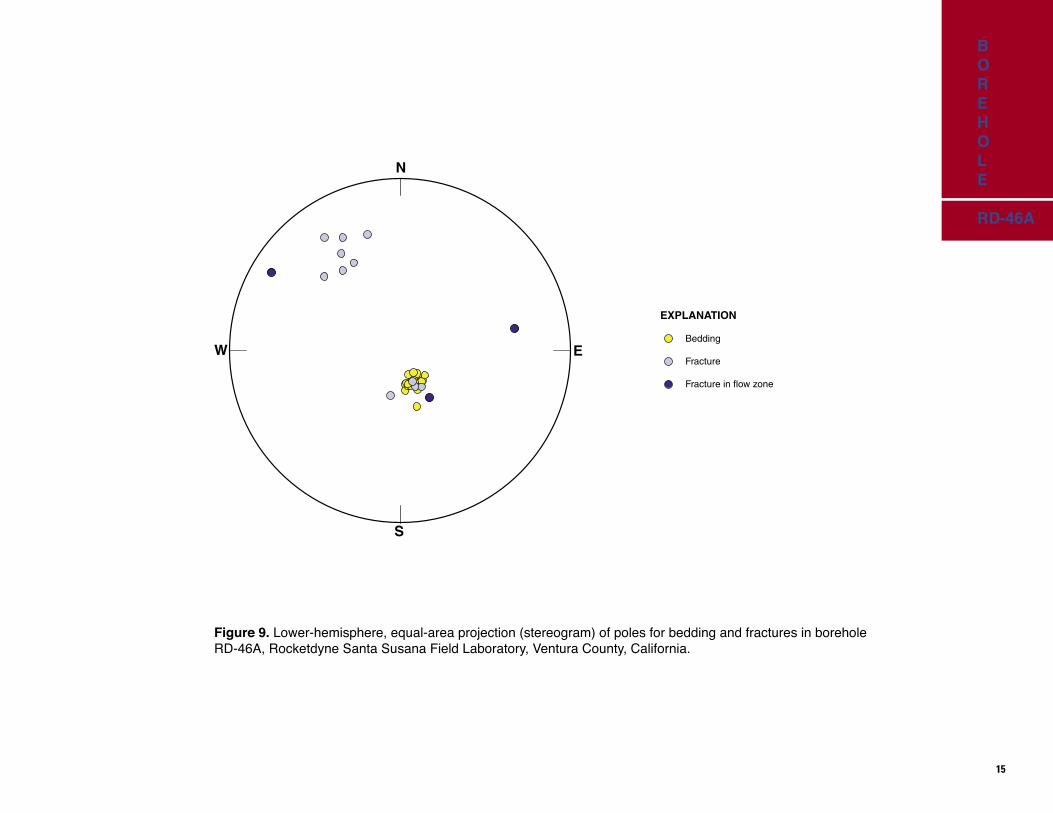
The character and orientation of bedding and fractures in borehole RD-46A were determined from the analysis of the OTV log (table 2 and figs. 8 and 9). Bedding generally strikes 235 to 260° and dips 20 to 35° to the northwest. Fractures in RD-46A include:
1) 5 fractures that parallel bedding; and2) 9 steeply-dipping fractures that generally strike 30 to 75°.
Nine of the 14 fractures appear open or partially open with maximum apparent opening widths that range from 0.1 to 1.7 inches.Integrated analysis of the fluid-resistivity, temperature, and EM-flowmeter logs with the OTV log indicates that the borehole
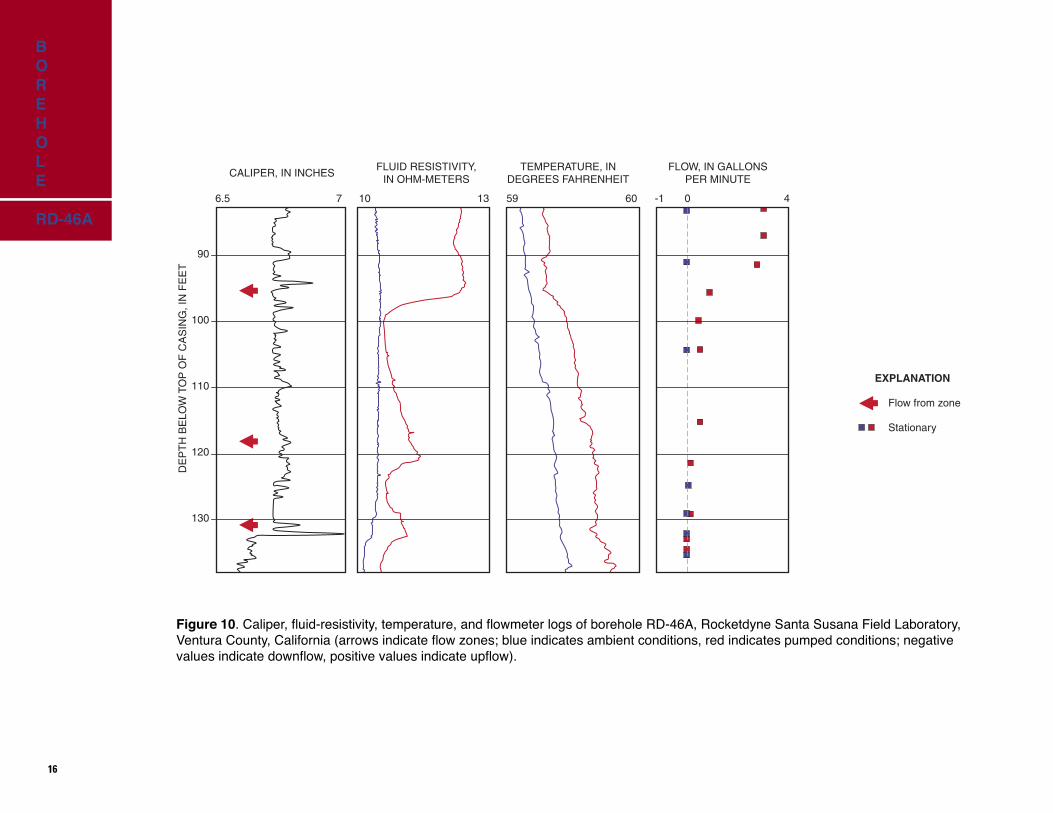
intersects flow zones at 95, 119, and 132 ft (fig. 10). The flow zones at 95 ft (fig. 11) and at 119 ft (fig. 12) both consist of a steeply dipping fracture in sandstone. The zone at 132 ft (fig. 13) consists of a bedding-parallel fracture within a 0.5 ft thick mudstone interbed.
The EM-flowmeter log (fig. 10) indicates no measurable flow occurs in borehole RD-46A under ambient conditions. The diameter of borehole RD-46A (6 in) enabled the use of a flow restrictor during EM-flowmeter logging. The lack of measurable ambient flow indicates the presence of little vertical hydraulic gradient between flow zones and (or) the lack of more than one zone that can produce or receive detectable flow under the existing gradient.
RD-46A was pumped at 3.3 gal/min for 3 h. The specific capacity of the borehole was 0.55 (gal/min)/ft with a drawdown of 6.0 ft. More than 90 percent of the flow measured under pumped conditions was produced by the 95-foot zone, less than 5 percent was produced by the 119-ft zone, and less than 2 percent was produced by the 132-ft zone. Repeated fluid-resistivity logs collected during pumping indicated that water in the borehole above the flow zones was not purged after 3 h of pumping.
14 15
���������������������������������������
������
�������
��������
���������������������
���������������������������������������
EXPLANATION
���������������������� �����������
��
��
��
��
��
��
��
��
���
���
���
���
���
����������������������������������
Figure 8. Lithology and bedding and fracture orientations in borehole RD-46A, Rocketdyne Santa Susana Field Laboratory, Ventura County, California.
BOREHOLE RD-46A
���������������������������������������
������
�������
��������
���������������������
���������������������������������������
EXPLANATION
���������������������� �����������
��
��
��
��
��
��
��
��
���
���
���
���
���
����������������������������������
14 15
Figure 9. Lower-hemisphere, equal-area projection (stereogram) of poles for bedding and fractures in borehole RD-46A, Rocketdyne Santa Susana Field Laboratory, Ventura County, California.
BOREHOLE RD-46A
�
�
� �
Bedding
Fracture
Fracture in flow zone
�����������
�
�
� �
Bedding
Fracture
Fracture in flow zone
�����������
16 17
Figure 10. Caliper, fluid-resistivity, temperature, and flowmeter logs of borehole RD-46A, Rocketdyne Santa Susana Field Laboratory, Ventura County, California (arrows indicate flow zones; blue indicates ambient conditions, red indicates pumped conditions; negative values indicate downflow, positive values indicate upflow).
BOREHOLE RD-46A
EXPLANATION
��������������
����������
������������������
���
��
���
���
���
���
� �� �� �� �� �� � �
����������������������������������
�������������������������������
���������������������������������
��������������������������
EXPLANATION
��������������
����������
������������������
���
��
���
���
���
���
� �� �� �� �� �� � �
����������������������������������
�������������������������������
���������������������������������
��������������������������

16 17
� � � � �
��
��
���
���
���
��
���
���
���
����
���
��
�
���������������������������
���
���
���
���
���
���
��
� � � � �
��
��
��
��
����������
������������������������
��������������������������
��������������������������
����������
������������������������
���
� � � � �
���
���
���
���
Figure 11. Optical-televiewer image of the flow zone near 95 feet in borehole RD-46A, Rocketdyne Sanat Susana Field laboratory, Ventura County, California.
Figure 12. Optical-televiewer image of the flow zone near 119 feet in borehole RD-46A, Rocketdyne Sanat Susana Field laboratory, Ventura County, California.
Figure 13. Optical-televiewer image of the flow zone near 132 feet in borehole RD-46A, Rocketdyne Sanat Susana Field laboratory, Ventura County, California.
BOREHOLE RD-46A
18 19
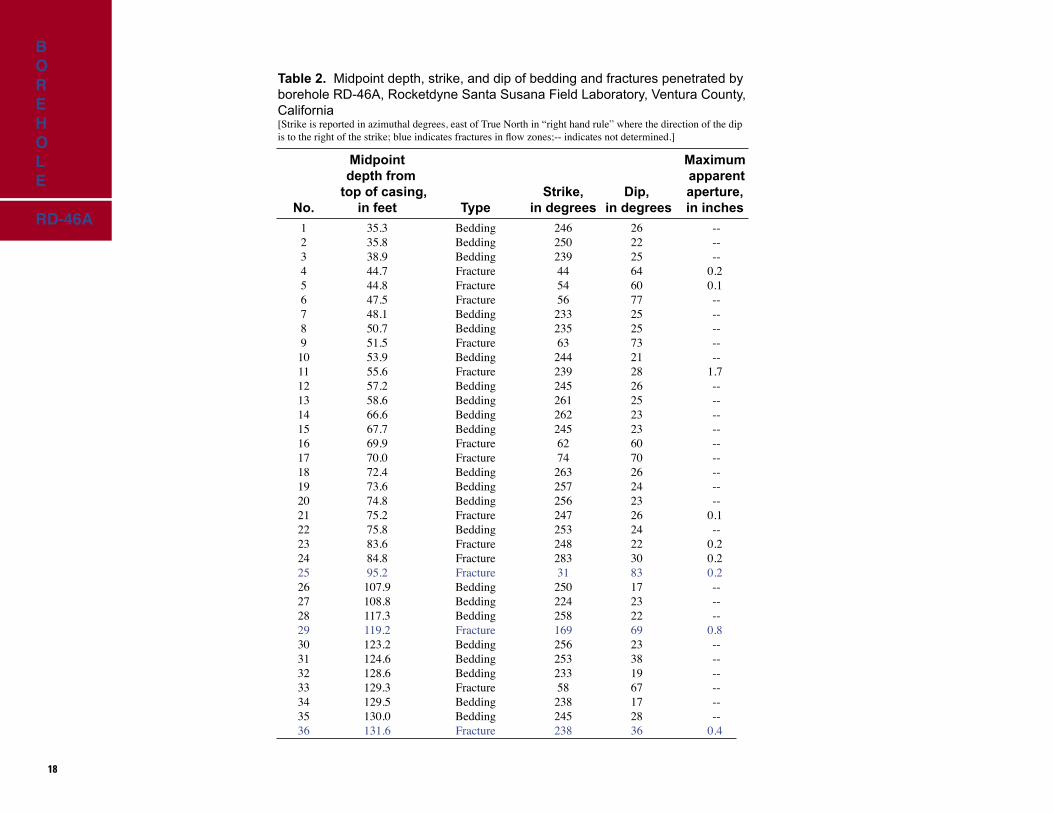
Table 2. Midpoint depth, strike, and dip of bedding and fractures penetrated by borehole RD-46A, Rocketdyne Santa Susana Field Laboratory, Ventura County, California[Strike is reported in azimuthal degrees, east of True North in “right hand rule” where the direction of the dip is to the right of the strike; blue indicates fractures in flow zones;-- indicates not determined.]
Midpoint Maximum depth from apparent top of casing, Strike, Dip, aperture, No. in feet Type in degrees in degrees in inches
1 35.3 Bedding 246 26 -- 2 35.8 Bedding 250 22 -- 3 38.9 Bedding 239 25 -- 4 44.7 Fracture 44 64 0.2 5 44.8 Fracture 54 60 0.1 6 47.5 Fracture 56 77 -- 7 48.1 Bedding 233 25 -- 8 50.7 Bedding 235 25 -- 9 51.5 Fracture 63 73 -- 10 53.9 Bedding 244 21 -- 11 55.6 Fracture 239 28 1.7 12 57.2 Bedding 245 26 -- 13 58.6 Bedding 261 25 -- 14 66.6 Bedding 262 23 -- 15 67.7 Bedding 245 23 -- 16 69.9 Fracture 62 60 -- 17 70.0 Fracture 74 70 -- 18 72.4 Bedding 263 26 -- 19 73.6 Bedding 257 24 -- 20 74.8 Bedding 256 23 -- 21 75.2 Fracture 247 26 0.1 22 75.8 Bedding 253 24 -- 23 83.6 Fracture 248 22 0.2 24 84.8 Fracture 283 30 0.2 25 95.2 Fracture 31 83 0.2 26 107.9 Bedding 250 17 -- 27 108.8 Bedding 224 23 -- 28 117.3 Bedding 258 22 -- 29 119.2 Fracture 169 69 0.8 30 123.2 Bedding 256 23 -- 31 124.6 Bedding 253 38 -- 32 128.6 Bedding 233 19 -- 33 129.3 Fracture 58 67 -- 34 129.5 Bedding 238 17 -- 35 130.0 Bedding 245 28 -- 36 131.6 Fracture 238 36 0.4
BOREHOLE RD-46A
18 19
Borehole RD-46B is cased with steel to a depth of 192 ft and completed as a 3-in diameter open hole to a depth of 364 ft. The borehole is at north latitude 34º13′29′′ and west longitude 118º41′00′′.Top of casing is at 1,807.2 ft above sea level. The ambient water level in the borehole during the logging period was at a depth of 48.4 feet. Integrated analysis of the OTV, gamma, and EM-induction logs (fig. 14) indicates the borehole intersects a sequence of sandstone and mudstone as follows:
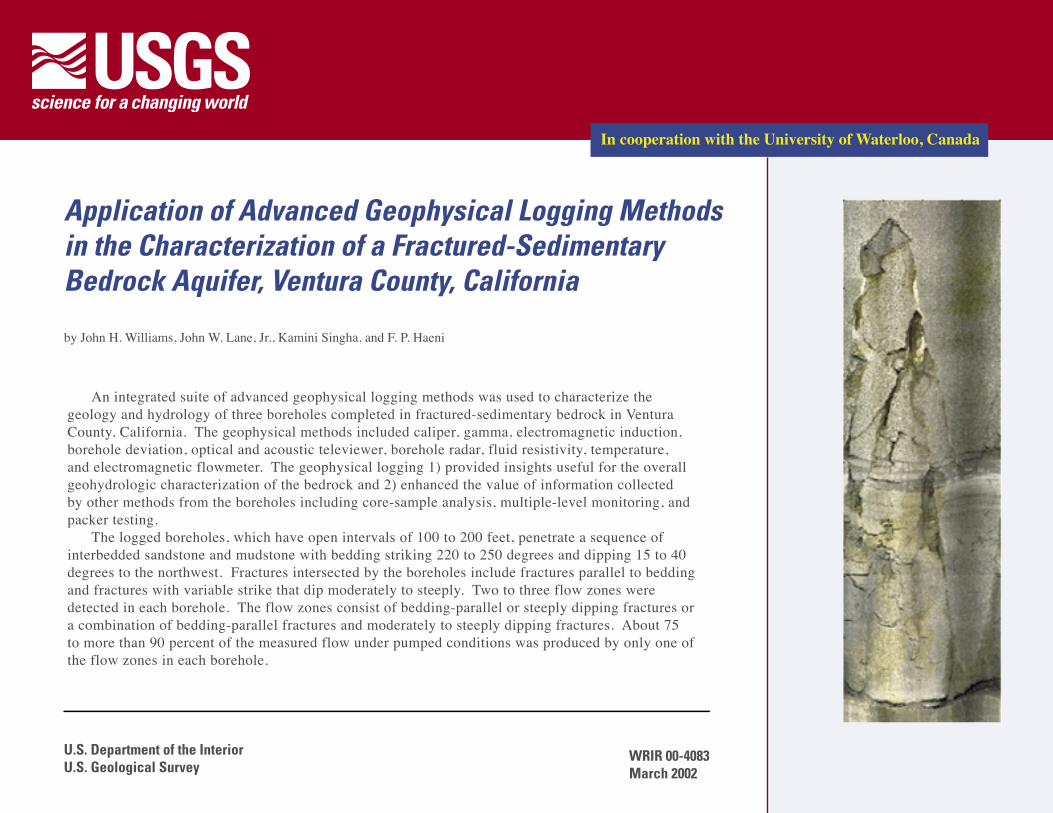
Depth, in feet Lithology192-287 Sandstone with mudstone (interbeds and clasts)287-296 Mudstone and sandstone296-332 Mudstone with sandstone332-336 Sandstone 336-358 Mudstone with sandstone358-362 Sandstone with mudstone362-364 Mudstone with sandstone
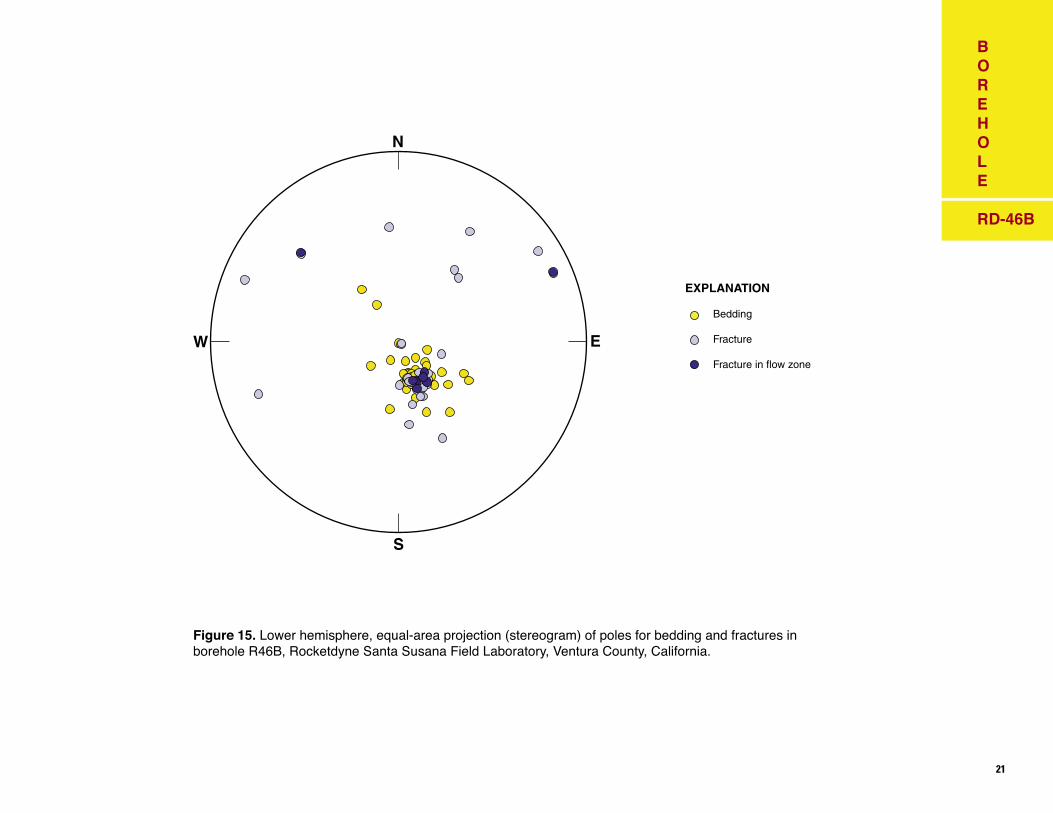
The character and orientation of bedding and fractures in borehole RD-46B were determined from the analysis of the OTV log (table 3 and figs. 14 and 15). Bedding generally strikes 230 to 250° and dips 20 to 40° to the northwest. Fractures in RD-46B include:
1) 27 fractures that parallel bedding;2) 5 moderately dipping fractures that strike generally strike 130 to 260°; and3) 7 steeply dipping fractures that have a wide range of strikes.
Thirty-three of 39 fractures appear open or partially open with maximum apparent opening widths that range from 0.1 to 0.7 inches.Integrated analysis of the fluid-resistivity, temperature, and EM-flowmeter logs with the OTV log indicates the borehole intersects flow
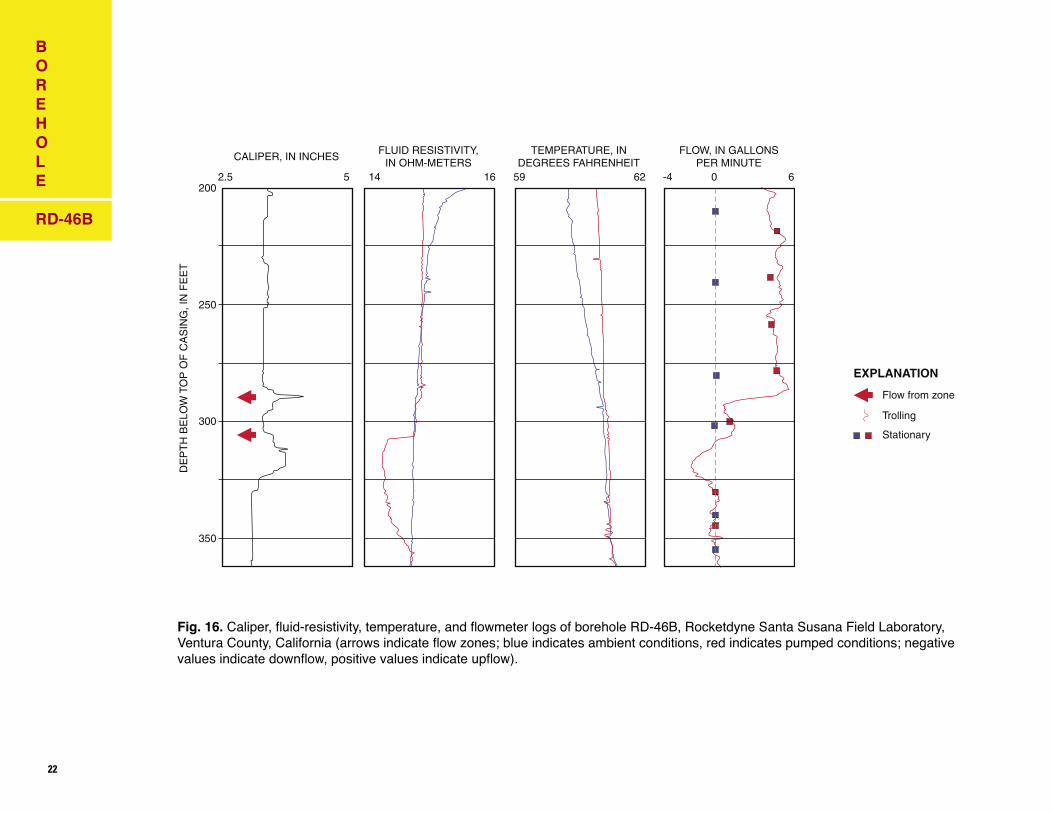
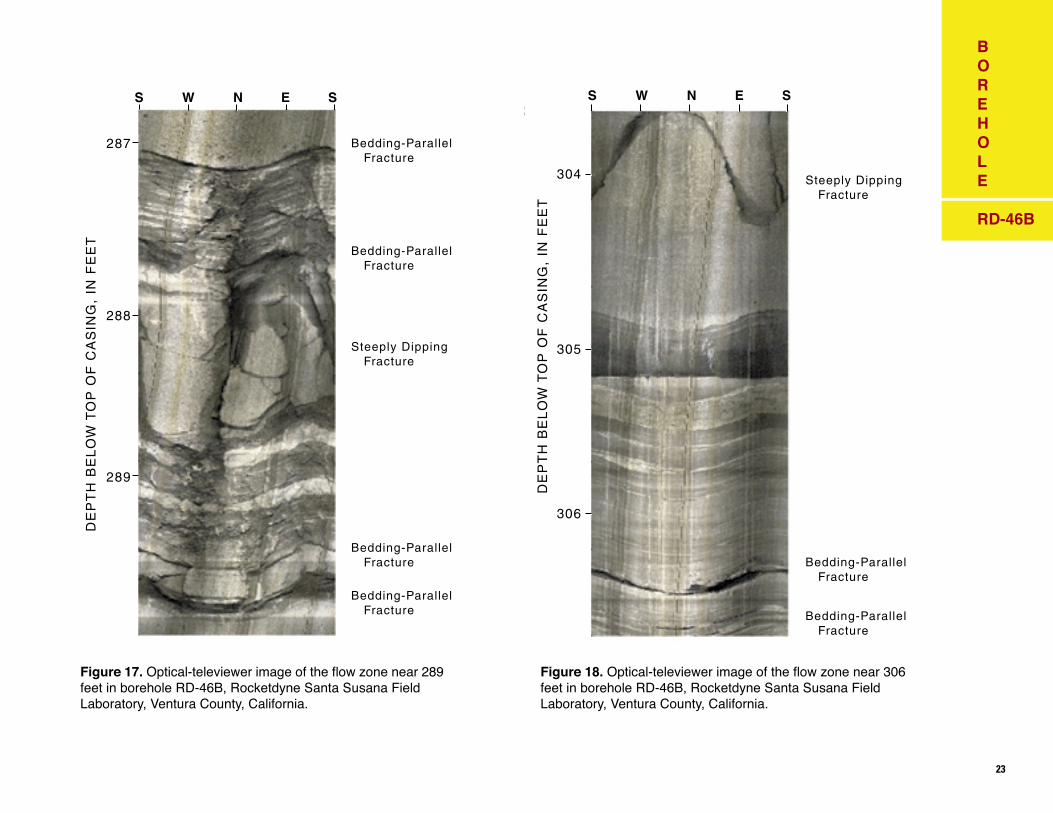
zones at 289 and 306 ft (fig. 16). The 289-ft zone is within a mudstone and sandstone sequence at the contact between the upper sandstone and the lower mudstone and sandstone units. This zone (fig. 17) consists of a series of four fractures that parallel bedding and a steeply dipping fracture. The 306-ft zone (fig. 18) consists of two bedding-parallel fractures and a steeply dipping fracture. Several other fractures that appear open intersect the borehole just below this flow zone: a fracture at 311 ft that dips 50°, and a series of bedding-parallel fractures at 313 ft.
The EM-flowmeter log (fig. 16), which was collected without a flow restrictor, indicates no measurable flow in borehole RD-46B under ambient conditions. However, a change in the gradient on the fluid temperature logs suggests that flow might be occurring at the 289-ft zone.
RD-46B was pumped at 4.8 gal/min for 2 h. The specific capacity of the borehole was 0.33 (gal/min)/ft with a drawdown of 14.4 ft. The zone at 289 ft produced about 80 percent of the flow measured under pumped conditions and the zone at 306 ft produced about 20 percent. The fluid-resistivity log under pumped conditions suggests that the 289- and 306-ft zones produced water with similar dissolved-solids content. Repeated fluid-resistivity logs indicated that the water in the borehole above the flow zones was purged within 0.75 h from the start of pumping.
BOREHOLE RD-46B
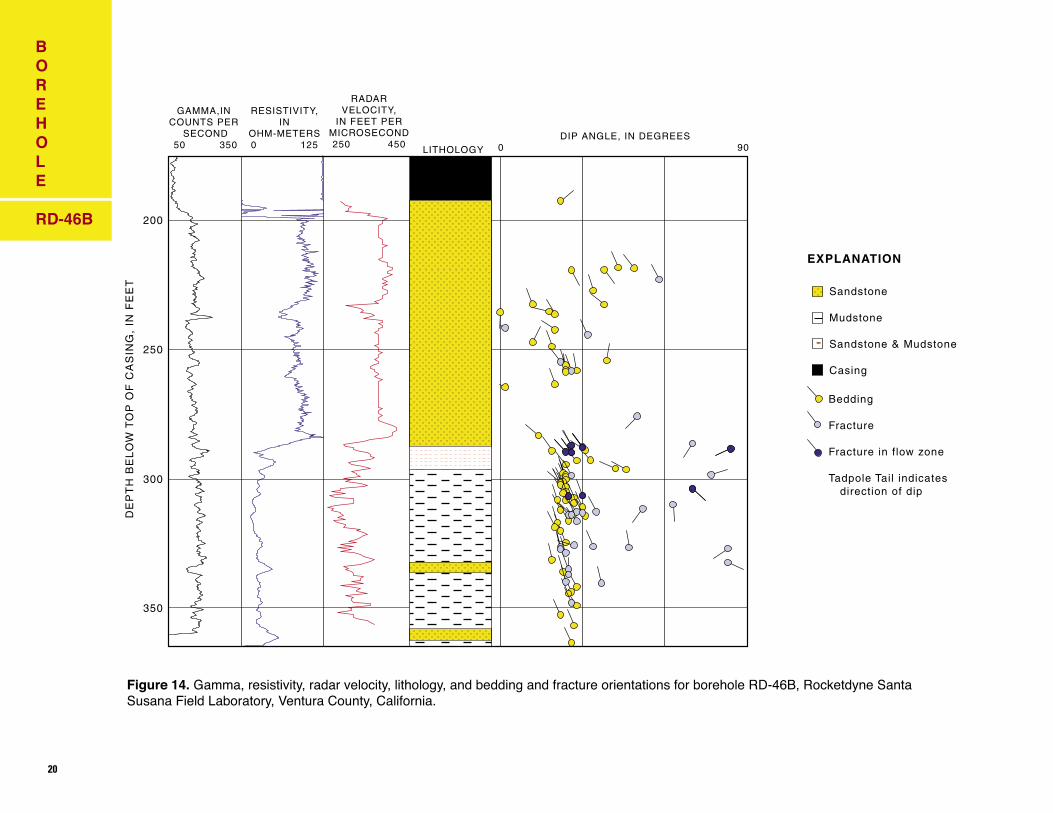
Figure 14. Gamma, resistivity, radar velocity, lithology, and bedding and fracture orientations for borehole RD-46B, Rocketdyne Santa Susana Field Laboratory, Ventura County, California.
20 21
��������������
���������������������������
��������������������
���������������������
���
���
���
���
��������������
���������������������������������������
������������������������������
�������������������������������������������������������������������������
��
��
���
��
��
���
���
���
��
���
����
���
��
�������������������
��������������������
������
�������
��������
���������������������
������������������������������������������
EXPLANATION
BOREHOLE RD-46B
��������������
���������������������������
��������������������
���������������������
���
���
���
���
��������������
���������������������������������������
������������������������������
�������������������������������������������������������������������������
��
��
���
��
��
���
���
���
��
���
����
���
��
�������������������
��������������������
������
�������
��������
���������������������
������������������������������������������
EXPLANATION
��������������
���������������������������
��������������������
���������������������
���
���
���
���
��������������
���������������������������������������
������������������������������
�������������������������������������������������������������������������
��
��
���
��
��
���
���
���
��
���
����
���
��
�������������������
��������������������
������
�������
��������
���������������������
������������������������������������������
EXPLANATION
20 21
Figure 15. Lower hemisphere, equal-area projection (stereogram) of poles for bedding and fractures in borehole R46B, Rocketdyne Santa Susana Field Laboratory, Ventura County, California.
BOREHOLE RD-46B
Bedding
Fracture
Fracture in flow zone
�����������
�
�
��
Bedding
Fracture
Fracture in flow zone
�����������
�
�
��
22 23
BOREHOLE RD-46B
Fig. 16. Caliper, fluid-resistivity, temperature, and flowmeter logs of borehole RD-46B, Rocketdyne Santa Susana Field Laboratory, Ventura County, California (arrows indicate flow zones; blue indicates ambient conditions, red indicates pumped conditions; negative values indicate downflow, positive values indicate upflow).
������������������
��������������
����������
��������
EXPLANATION
����������������������������������
������
���
���
���
� �� �� �� �� �� � �
�������������������������������
���������������������������������
��������������������������
������������������
��������������
����������
��������
EXPLANATION
����������������������������������
������
���
���
���
� �� �� �� �� �� � �
�������������������������������
���������������������������������
��������������������������
22 23
���������������������������
���������������������������
��������������������������
���������������������������
���������������������������
���
���
� � � � �
���
�����������������
���
����
�����
�����
� � � � �
���
���
���
�����������������
���
����
�����
�����
��������������������������
���������������������������
���������������������������
Figure 17. Optical-televiewer image of the flow zone near 289 feet in borehole RD-46B, Rocketdyne Santa Susana Field Laboratory, Ventura County, California.
Figure 18. Optical-televiewer image of the flow zone near 306 feet in borehole RD-46B, Rocketdyne Santa Susana Field Laboratory, Ventura County, California.
BOREHOLE RD-46B
24 25
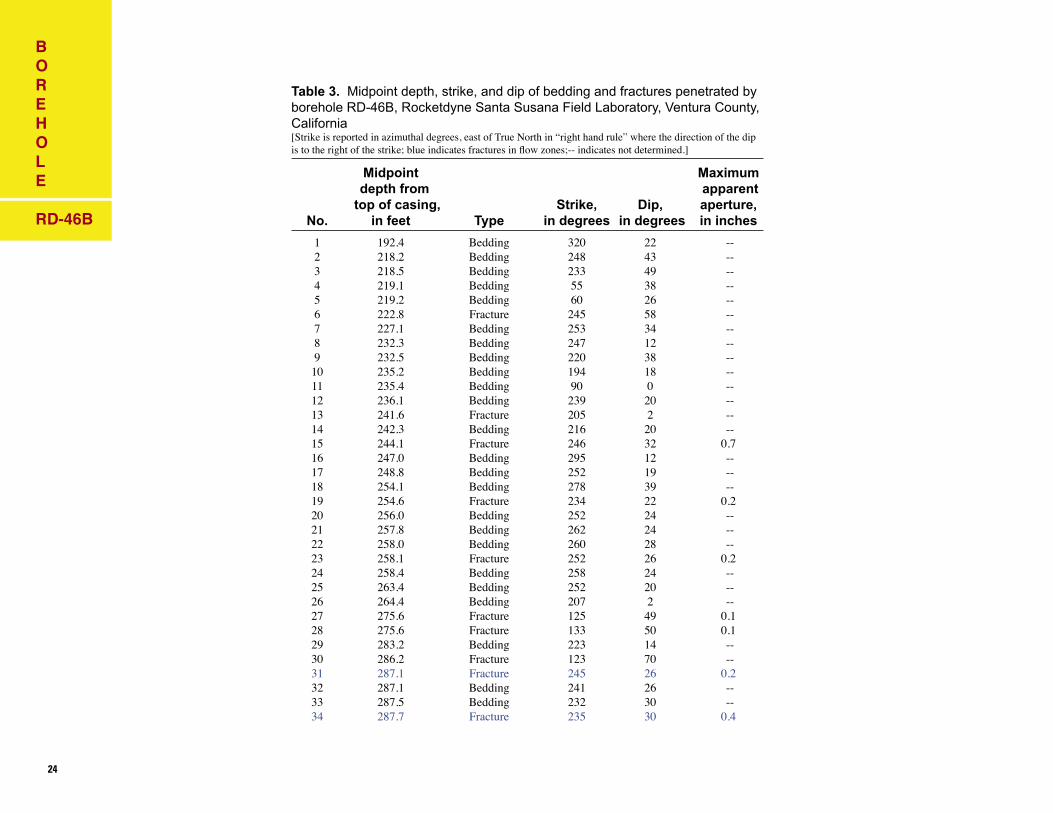
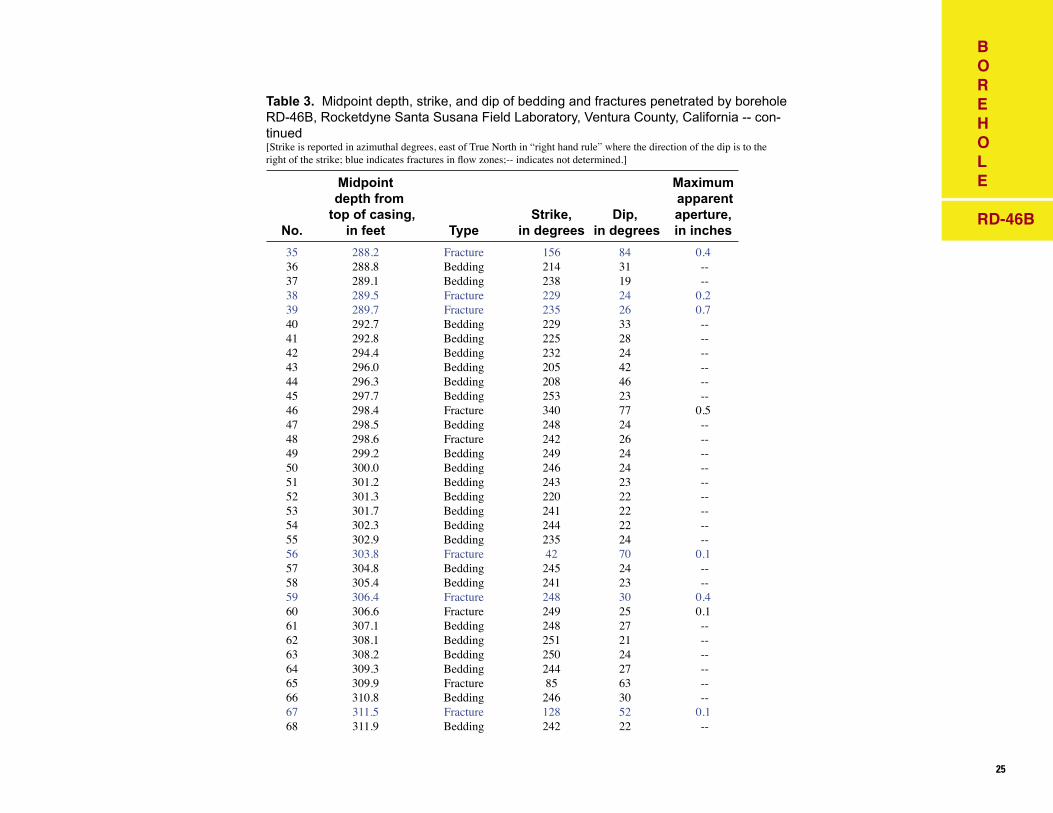
Table 3. Midpoint depth, strike, and dip of bedding and fractures penetrated by borehole RD-46B, Rocketdyne Santa Susana Field Laboratory, Ventura County, California[Strike is reported in azimuthal degrees, east of True North in “right hand rule” where the direction of the dip is to the right of the strike; blue indicates fractures in flow zones;-- indicates not determined.]
Midpoint Maximum depth from apparent top of casing, Strike, Dip, aperture, No. in feet Type in degrees in degrees in inches
1 192.4 Bedding 320 22 -- 2 218.2 Bedding 248 43 -- 3 218.5 Bedding 233 49 -- 4 219.1 Bedding 55 38 -- 5 219.2 Bedding 60 26 -- 6 222.8 Fracture 245 58 -- 7 227.1 Bedding 253 34 -- 8 232.3 Bedding 247 12 -- 9 232.5 Bedding 220 38 -- 10 235.2 Bedding 194 18 -- 11 235.4 Bedding 90 0 -- 12 236.1 Bedding 239 20 -- 13 241.6 Fracture 205 2 -- 14 242.3 Bedding 216 20 -- 15 244.1 Fracture 246 32 0.7 16 247.0 Bedding 295 12 -- 17 248.8 Bedding 252 19 -- 18 254.1 Bedding 278 39 -- 19 254.6 Fracture 234 22 0.2 20 256.0 Bedding 252 24 -- 21 257.8 Bedding 262 24 -- 22 258.0 Bedding 260 28 -- 23 258.1 Fracture 252 26 0.2 24 258.4 Bedding 258 24 -- 25 263.4 Bedding 252 20 -- 26 264.4 Bedding 207 2 -- 27 275.6 Fracture 125 49 0.1 28 275.6 Fracture 133 50 0.1 29 283.2 Bedding 223 14 -- 30 286.2 Fracture 123 70 -- 31 287.1 Fracture 245 26 0.2 32 287.1 Bedding 241 26 -- 33 287.5 Bedding 232 30 -- 34 287.7 Fracture 235 30 0.4
BOREHOLE RD-46B
24 25
Table 3. Midpoint depth, strike, and dip of bedding and fractures penetrated by borehole RD-46B, Rocketdyne Santa Susana Field Laboratory, Ventura County, California -- con-tinued[Strike is reported in azimuthal degrees, east of True North in “right hand rule” where the direction of the dip is to the right of the strike; blue indicates fractures in flow zones;-- indicates not determined.]
Midpoint Maximum depth from apparent top of casing, Strike, Dip, aperture, No. in feet Type in degrees in degrees in inches
35 288.2 Fracture 156 84 0.4 36 288.8 Bedding 214 31 -- 37 289.1 Bedding 238 19 -- 38 289.5 Fracture 229 24 0.2 39 289.7 Fracture 235 26 0.7 40 292.7 Bedding 229 33 -- 41 292.8 Bedding 225 28 -- 42 294.4 Bedding 232 24 -- 43 296.0 Bedding 205 42 -- 44 296.3 Bedding 208 46 -- 45 297.7 Bedding 253 23 -- 46 298.4 Fracture 340 77 0.5 47 298.5 Bedding 248 24 -- 48 298.6 Fracture 242 26 -- 49 299.2 Bedding 249 24 -- 50 300.0 Bedding 246 24 -- 51 301.2 Bedding 243 23 -- 52 301.3 Bedding 220 22 -- 53 301.7 Bedding 241 22 -- 54 302.3 Bedding 244 22 -- 55 302.9 Bedding 235 24 -- 56 303.8 Fracture 42 70 0.1 57 304.8 Bedding 245 24 -- 58 305.4 Bedding 241 23 -- 59 306.4 Fracture 248 30 0.4 60 306.6 Fracture 249 25 0.1 61 307.1 Bedding 248 27 -- 62 308.1 Bedding 251 21 -- 63 308.2 Bedding 250 24 -- 64 309.3 Bedding 244 27 -- 65 309.9 Fracture 85 63 -- 66 310.8 Bedding 246 30 -- 67 311.5 Fracture 128 52 0.1 68 311.9 Bedding 242 22 --
BOREHOLE RD-46B
26 27
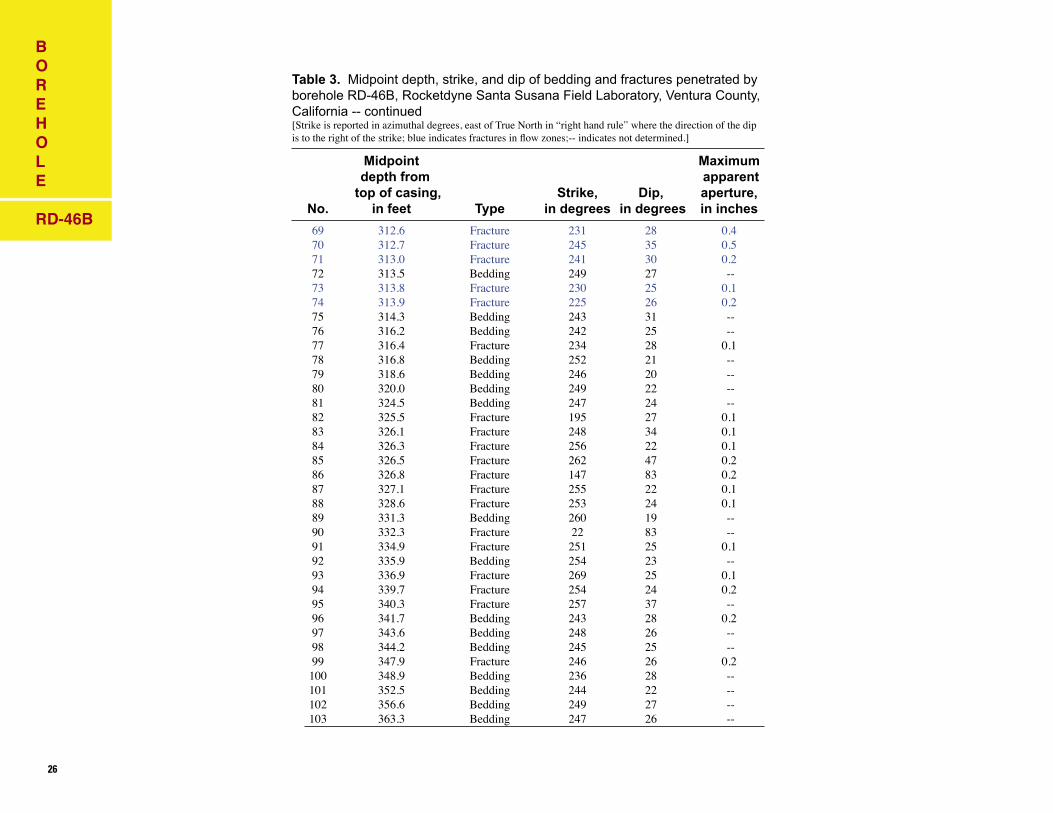
Table 3. Midpoint depth, strike, and dip of bedding and fractures penetrated by borehole RD-46B, Rocketdyne Santa Susana Field Laboratory, Ventura County, California -- continued[Strike is reported in azimuthal degrees, east of True North in “right hand rule” where the direction of the dip is to the right of the strike; blue indicates fractures in flow zones;-- indicates not determined.]
Midpoint Maximum depth from apparent top of casing, Strike, Dip, aperture, No. in feet Type in degrees in degrees in inches
69 312.6 Fracture 231 28 0.4 70 312.7 Fracture 245 35 0.5 71 313.0 Fracture 241 30 0.2 72 313.5 Bedding 249 27 -- 73 313.8 Fracture 230 25 0.1 74 313.9 Fracture 225 26 0.2 75 314.3 Bedding 243 31 -- 76 316.2 Bedding 242 25 -- 77 316.4 Fracture 234 28 0.1 78 316.8 Bedding 252 21 -- 79 318.6 Bedding 246 20 -- 80 320.0 Bedding 249 22 -- 81 324.5 Bedding 247 24 -- 82 325.5 Fracture 195 27 0.1 83 326.1 Fracture 248 34 0.1 84 326.3 Fracture 256 22 0.1 85 326.5 Fracture 262 47 0.2 86 326.8 Fracture 147 83 0.2 87 327.1 Fracture 255 22 0.1 88 328.6 Fracture 253 24 0.1 89 331.3 Bedding 260 19 -- 90 332.3 Fracture 22 83 -- 91 334.9 Fracture 251 25 0.1 92 335.9 Bedding 254 23 -- 93 336.9 Fracture 269 25 0.1 94 339.7 Fracture 254 24 0.2 95 340.3 Fracture 257 37 -- 96 341.7 Bedding 243 28 0.2 97 343.6 Bedding 248 26 -- 98 344.2 Bedding 245 25 -- 99 347.9 Fracture 246 26 0.2 100 348.9 Bedding 236 28 -- 101 352.5 Bedding 244 22 -- 102 356.6 Bedding 249 27 -- 103 363.3 Bedding 247 26 --
BOREHOLE RD-46B
26 27
The advanced geophysical logging methods used in this investigation provided an efficient means to characterize the geology and hydrology of three boreholes completed in fractured-sedimentary bedrock at the Rocketdyne Santa Susana Field Laboratory in southern Ventura County, California. The results of the geophysical logging provided insights useful for the geohydrologic characterization of the aquifer including the enhancement of the value of information collected by other borehole methods.
Boreholes RD-35B, RD-46A, and RD-46B penetrate a sequence of interbedded sandstone and mudstone, with bedding striking 220 to 250° and dipping 15 to 40° to the northwest. Fractures intersected by the boreholes include fractures that parallel bedding and fractures with variable strike that dip moderately to steeply. Most fractures appear partly open to open with maximum apparent opening widths that range from 0.1 to 3.8 in.
Flow zones were detected at depths of 201 and 312 ft in borehole RD-35B; 95, 119, and 132 ft in borehole RD-46A; and 289 and 306 ft in borehole RD-46B. Four of the flow zones consist of both bedding-parallel fractures and moderately to steeply dipping fractures, two of the zones consist of only steeply dipping fractures, and one zone consists of a single bedding-parallel fracture.
Under ambient conditions, slight downward flow between the flow zones in borehole RD-35B was identified from fluid and flowmeter logging. The fluid temperature log from RD-46B indicates that ambient flow involving the transmissive zone at 290 ft could exist.
When pumped at 3.3 to 4.9 gal/min for 1.5 to 3 h, specific capacities of the boreholes ranged from 0.33 to 0.55 (gal/min)/ft. About 75 to more than 90 percent of the measured flow under pumped conditions was produced by only one of the flow zones in each borehole. Borehole water above the flow zones was purged within 0.75 h from the start of pumping in borehole RD-46B and between 0.5 and 1.5 h after the start of pumping in borehole RD-35B. Borehole water above the flow zones was not purged in borehole RD-46A after 3 h of pumping.
SUMMARY
28
Keys, W. S., 1990, Borehole geophysics applied to ground-water investigations: U. S. Geological Survey Techniques of Water-Resources Investigations, book 2, chap. E2, 150 p.
Lane, J. W., Jr., Haeni, F. P., and Williams, J. H., 1994, Detection of bedrock fractures and lithologic changes using borehole radar at selected sites, in Proceedings of the Fifth International Conference on Ground Penetrating Radar, Kitchener, Ontario, Canada, June 12-16, 1994: Waterloo, Ontario, Waterloo Centre for Groundwater Research, p. 557-592.
Paillet, F. L., 1998, Flow modeling and permeability estimation using borehole los in heterogeneous fractured formations: Water Resources Research, v. 34, no. 5, p. 997-1010.
Sterling, S. N., 1999, Comparison of discrete depth sampling using rock core and a removable multilevel system in a TCE contaminated fractured sandstone: MS Thesis, Department of Earth Sciences, University of Waterloo, Waterloo, Ontario, Canada, 108 p.
Williams, J. H. and Conger, R. W., 1990, Preliminary delineation of contaminated water-bearing fractures intersected by open-hole bedrock wells: Ground Water Monitoring Review, v. 10, no. 3, p. 118-126.
Williams, J. H., Lapham, W. W., and Barringer, T. H., 1993, Application of electromagnetic logging to contamination investigations in glacial sand and gravel aquifers: Ground Water Monitoring and Remediation Review, v. 13, no. 3, p. 129-138.
Williams, J. H. and Lane, J. W., Jr., 1998, Advances in borehole geophysics for ground-water investigations: U. S. Geological Survey Fact Sheet 002-98, 4 p.
Young, S. C. and Pearson, H. S., 1995, The electromagnetic borehole flowmeter – description and application: Ground Water Monitoring and Remediation Review, v. 15, no. 4, p. 138-147.
For more information contact: Copies of this report can be purchased from:District Chief U.S. Geological Survey U.S. Geological Survey/WRD Branch of Information Services425 Jordan Road Box 25286Troy, NY 12180 Denver, CO 80225-0286
REFERENCES
This report and additional earth science information can be found on the World Wide Web at http://ny.usgs.gov