Embed Size (px)
Citation preview
International Research Journal of Geology and Mining (IRJGM) (2276-6618) Vol. 2(6) pp. 132-140, August 2012 Available online http://www.interesjournals.org/IRJGM Copyright © 2012 International Research Journals
Full Length Research Paper
Application of airborne magnetic data to mineral exploration in the Okene Iron Ore Province of Nigeria
Amigun J. O1*, Afolabi O2 and Ako B. D2
1Department of Applied Geophysics, Federal University of Technology, Akure, Nigeria
2Department of Geology, Obafemi Awolowo University, Ile-Ife, Nigeria
Accepted 26 July, 2012
This work involves the application of airborne magnetic method to exploration of Ajabanoko iron ore deposit in Okene area of southwestern Nigeria for the purpose of evaluating the deposit geological characteristics and resource potential. Analyses involving the application of Upward / Downward Continuation filters, Second Vertical Derivative (SVD) filter and Apparent Susceptibility filter were performed to improve the quality of the magnetic data for better understanding of the subsurface geology of the deposit. From the downward continuation and SVD analyses, the small size mineralized bodies and shallow features in the study area were mapped. The faults delineated were grouped into two based on their trend i.e. NE – SW group and NW – SE group. On the upward continuation filtered map, a west – east linear feature with a trend similar to the principal orientation of the regional faults in Okene area was delineated. From the range of magnetic susceptibility values including other analyses, four rock types namely; migmatite gneiss, granite gneiss, brecciate ferruginous quartzite and iron ore mineralization were identified. Relative high magnetic susceptible zones (0.016 – 0.017) were inferred as area that magnetite type iron ore are concentrated in the deposit. The depths to the magnetic sources in the area were determined using spectral analysis. These depths ranged from 50 m to 300 m. Keywords: Mineral exploration, Iron ore, Subsurface, Filters, Spectral analysis, Faults and Deposit.
INTRODUCTION The early geophysical exploration for iron ore in Nigeria began in 1963 when the Geological Survey of Nigeria (GSN) with the aid of the Canadian Air Service limited carried out an aeromagnetic survey of some parts of the country. This exercise led to the delineation of iron ore in some areas including the Okene district in which the present study area is located.
The successful application of geophysical methods to iron ore exploration is based upon the existence of measurable physical contrast associated with it (Telford et al, 1976). The patterns of iron mineralization in the Okene province have been discussed by Olade (1978), Adegbuyi and Olade (1990) and Adeyemo et al (1984). According to them, the iron deposits in this place though folded and faulted in parts do not have complicated structures. Other earlier workers on iron ore in the area *Corresponding Author E-mail: [email protected]
include NSDA (1975) and NSRMEA (1994). In this study, aeromagnetic data of Ajabanoko deposit
in the Okene district is analysed and interpreted with the objective of delineating its concealed iron ore bodies, mapping lithologic contacts, depth to magnetic sources and basement structures. Geology of the study area The study area which is located about 4.5 km North West of Itakpe hill, Kogi State, lies between latitude 7
0 37’ 22”
N and 70
39’ 17” N and longitudes 6
0 15’ 55”
E and 6
0 17’
15” E (Figure 1.0). The Ajabanoko area is underlain by
rocks belonging to the Igarra – Kabba – Jakura metasedimentary region in the south – western part of Nigeria (Oyawoye, 1972 and Rahaman, 1976). The metasedimentary region of south – western Nigeria is covered by the Precambrian basement rocks in which a migmatite – gneiss complex is associated with a vast series of metasedimentary rocks (i.e. ferruginous
Amigun et al. 133
Figure 1. Geological Map of Ajabanoko Iron Ore Deposit in Okene province of Nigeria. (Adapted from National Iron Ore Mining Project, Itakpe, 1994)
quartzite, schists and marble), metamorphosed igneous rock (i.e. amphibolites) and intruded by a wide range of granitic rocks. The dominant lithologic units of Ajabanoko deposit are gneisses (which are regionally emplaced), ferruginous quartzites, granites and pegmatite. The ferruginous quartzite is the source of the iron ore mineralization in the area (Olade, 1978; Fadare, 1983; Annor and Freeth, 1985). The patterns of the iron ore
mineralization in the area as shown in Figure 1.0 have been discussed by Olade (1978), Adegbuyi and Olade (1990), Adeyemo et al (1984) and NSRMEA (1994). Analysis of Aeromagnetic Data An aeromagnetic map of Kabba sheet 246 SE published
LEGEND
Outcrop of Ferruginous Quartzites
Lateritic Breccia of Ferruginous
Quartzites
Migmatitic Gneisses.Banded Biotite Gneisses
Granite Gneiss
Granite Pegmatite
Ferruginous Quartzite Boulders
Strike and Dip
Drilled Boreholes
Faults
Elevation Contour (m)
220
220
240260
280 300320
340360
240
320
280
220
200
180
200
180
170
55
50
35
55
55
53
0 100m 200m 300m
BH 1
250
SOUTHERN ORE ZONE
CENTRAL ORE ZONE
NORTHERN ORE ZONE
BH 7
BH 5
BH 8
BH 2
BH 1
70 39' 17" N
70 37' 22" N
60 15' 55"
E 6
0 17' 15"
E
134 Int. Res. J. Geol. Min.
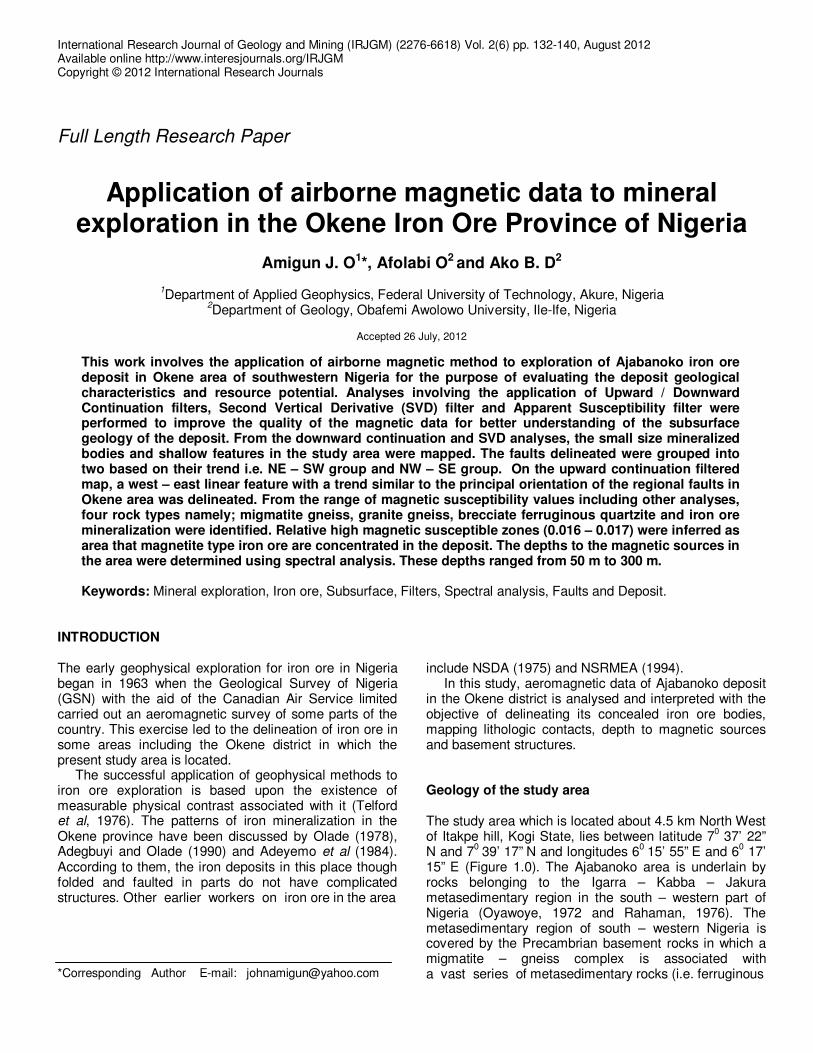
Figure 2(a). Is the aeromagnetic colour shaded map of Ajabanoko Deposit showing prominent anomalies marked (I, J, K, L, M and N) and (b). The Upward Continuation Filter Map of the Aeromagnetic data at 400 m altitude.
by the Geological Survey of Nigeria on a scale of 1: 200 covering the Ajabanoko iron ore deposit and environ was digitized and used in this study. The total magnetic field data were acquired at a
mean terrain clearance of 152.4 m with flight line separation of about 400 m along a NW – SE direction. Afterward the removal of the International Geomagnetic Reference Field (IG-
RF), the gridding of the data are made close enough i.e. grid cell size of 200 m so as to capture the anomaly details (Figure 2a).
The various analyses carried out on the
Amigun et al. 135
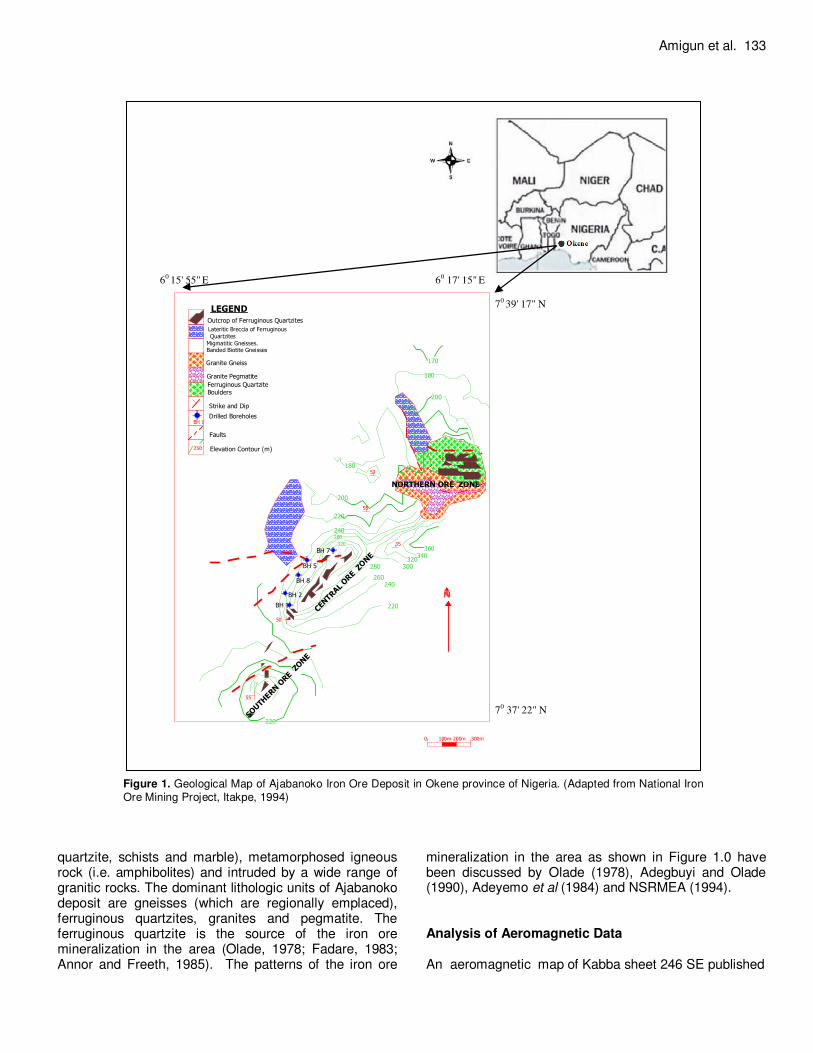
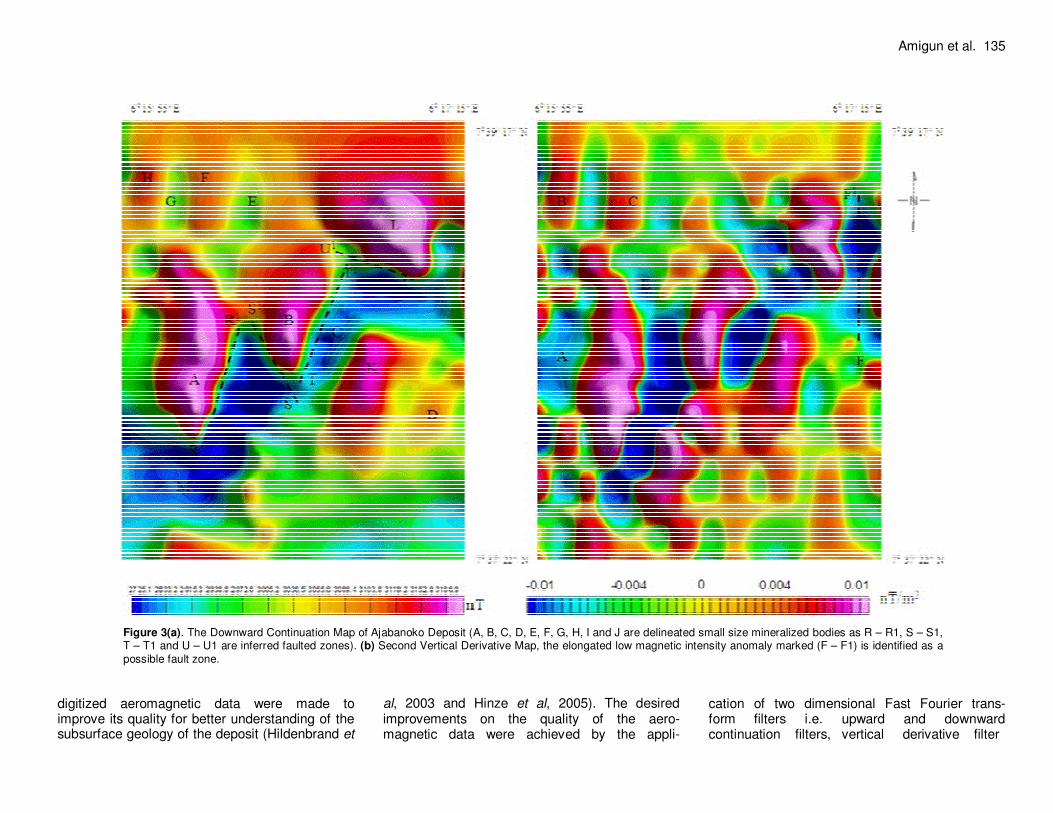
Figure 3(a). The Downward Continuation Map of Ajabanoko Deposit (A, B, C, D, E, F, G, H, I and J are delineated small size mineralized bodies as R – R1, S – S1, T – T1 and U – U1 are inferred faulted zones). (b) Second Vertical Derivative Map, the elongated low magnetic intensity anomaly marked (F – F1) is identified as a possible fault zone.
digitized aeromagnetic data were made to improve its quality for better understanding of the subsurface geology of the deposit (Hildenbrand et
al, 2003 and Hinze et al, 2005). The desired improvements on the quality of the aero- magnetic data were achieved by the appli-
cation of two dimensional Fast Fourier trans- form filters i.e. upward and downward continuation filters, vertical derivative filter
136 Int. Res. J. Geol. Min.
Table 1.0. Result of the Calculated Earth’s Magnetic Field for Ajabanoko Area using Geomagix Model
Input Parameters
Location Latitude Longitude Elevation
Nigeria 70 38' 20" 6
0 16' 15" 152.4m
Calculated Parameters
Incident Field Inclination Declination
31473nT -5.7190 -11.4138
and magnetic susceptibility filter. Mathematically according to Dobrin and Savit (1988), the Fourier transform of a space domain function f(x,y) is defined as:
F (µ, v) = ∫∫ f (x,y) . e -i(µx + vy)
dxdy ………….. (1.0)
And its reciprocal relation is given as:
f (x, y) = ∫∫ F (u,v) . e i(µx + vy)
dµ dv………….. (2.0)
Where µ and v are wave numbers in the x and y directions respectively, measured in radians per meter i.e. when x and y are in units of meter these relates to spatial “frequencies” fx and fy (in cycles per meter).
The upward continuation filter operation allows the transformation of data measured on one surface to some higher surface (Nabighian et al, 2005) and tends to smooth the original data by attenuating short-wavelength anomalies relative to their long – wavelength counterparts. Its application in this work permitted the transformation of the digitized aeromagnetic data measured from the flight altitude of 152.4 m to a height of 400 m above sea level. The generated map of the upward continuation is shown in Figure 2.0b. According to Trompat et al, 2003, the downward continuation filter when applied to potential field data brings the observation surface closer to the source therefore enhancing the responses from sources at depth. In this study, the aeromagnetic data acquired at flight attitude of 152.4m above sea level was downward continued to 1.5m to produce effect as if the data were measured near the ground. Its generated map is shown in Figure 3.0a
The second vertical derivative filter was applied to the aeromagnetic data to enhance local anomalies obscured by broader regional trends. It accentuates short-wavelength components of the anomaly field, while de-emphasizing long-wavelength components. The output of its application in the study area is shown in Figure 3.0b. The susceptibility filter computes the apparent magnetic susceptibility of magnetic sources with certain assumption applied viz: (i) that the IGRF has been removed from the data (ii) no remanent magnetization and (iii) that all magnetic response is caused by a collection of vertical prisms of infinite depth and strike extent (Montaj
TM Tutorial, 2004). Geomagix an ASCII
coded FORTRAN program was used in calculating the total magnetic field strength, geomagnetic inclination and
declination of the study area (Table 1.0) which are requisite parameters in computing the apparent magnetic susceptibility (Figure 4.0a). Table 2.0 shows some of the results of aeromagnetic derivatives of the study area computed using the filter operators in Oasis Montaj
TM, a
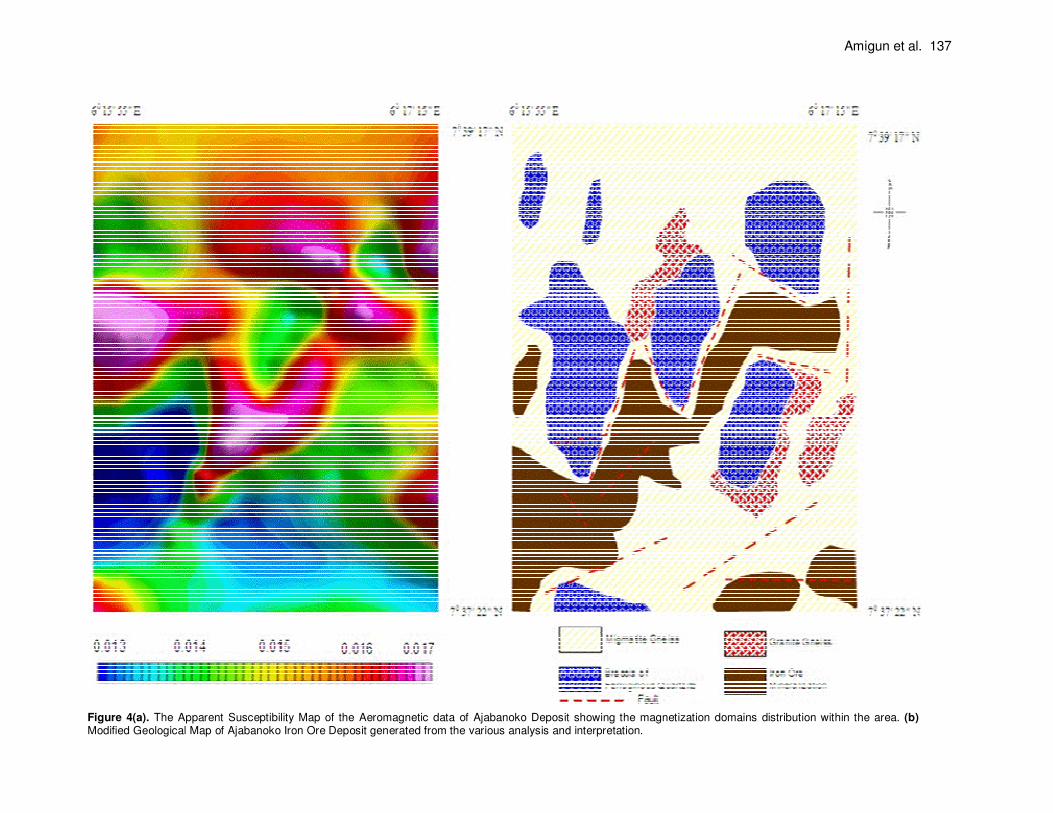
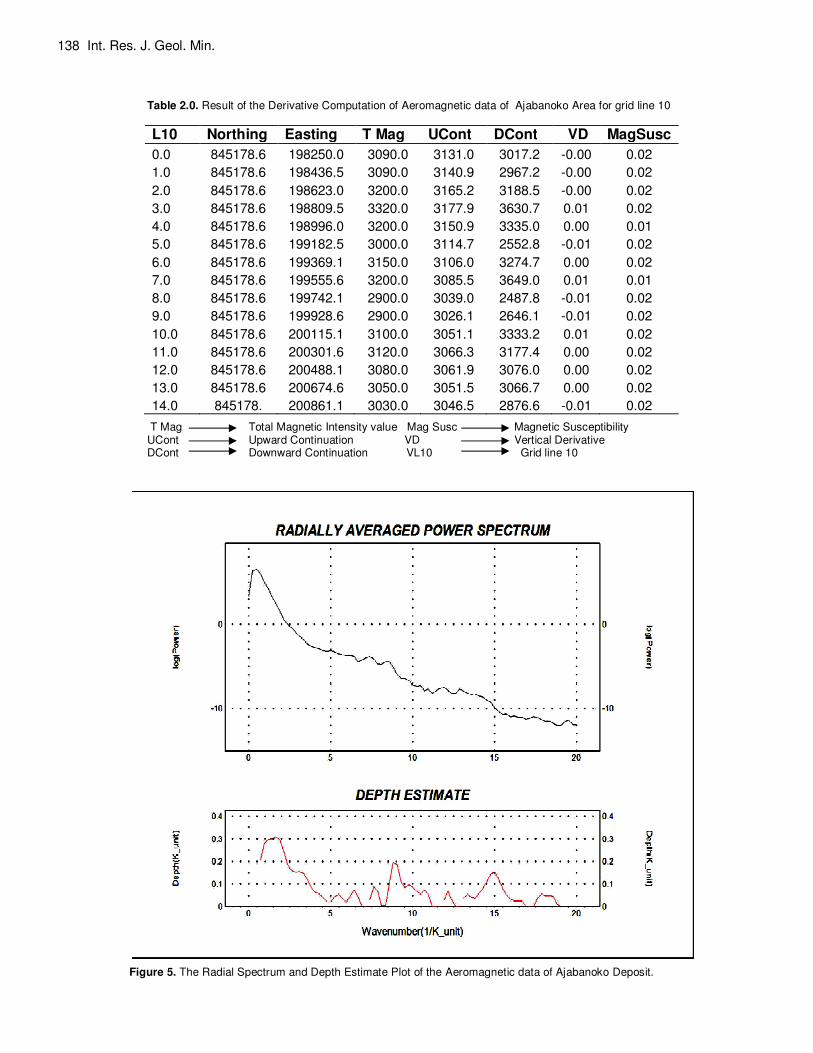
software package for potential data processing. The spectral (harmonic) analysis of potential field data
which serves as an approximate guide in estimating the depth of magnetic source (Bhattacharya, 1966) was also carried out. Figure 5.0 shows the radial averaged spectrum of the digitized aeromagnetic data of Ajabanoko area and the depth estimate plot of its analysis. DISCUSSION OF RESULTS According to Dobrin and Savit (1988), the main use of any aeromagnetic and their derivative maps in mineral prospecting is to make geological deduction from them. And from the range of magnetic intensity values of these data, information on subsurface lithology, trend and geological structures can be obtained.
In Figure 2.0a, the shaded colour aeromagnetic map of the Ajabanoko area ranges in amplitude from 2432 nT to 3267 nT suggesting contrasting rock types in the basement of the study area. The northern region of this map is characterized by relative high magnetic intensity values (3108 nT – 3267 nT) which coincides with ferruginous quartzite and gneissic rocks on the surface geological map (Figure 1.0) while the southwestern area with relative low magnetic intensity values (2432 nT – 3080 nT) coincides with the iron ore mineralization. In low latitude magnetic region specifically around the equator of which Nigeria is situated, a low / negative magnetic peak values represent typical anomalous signatures (Parasnis, 1986; Fieberg, 2002). The NE – SW low amplitude lineament anomaly marked (Q – Q
1) in Figure
2.0a may represent fault or fracture zone. This feature has a similar trend (NE – SW) with three faults mapped on the surface geological map (Fig.1.0).
The Figure 2.0b is an upward continuation colour shaded relief map of Ajabanoko area. The anomaly patterns identified in this derivative map are a qualitative representation of spatial variation in the magnetic properties of deep basement rocks and structures in the area. There is a good correlation in the trend of the low magnetic anomalies (G) in Figure 2.0b with those of the outcrops of the central iron ore zone and the northern
Amigun et al. 137
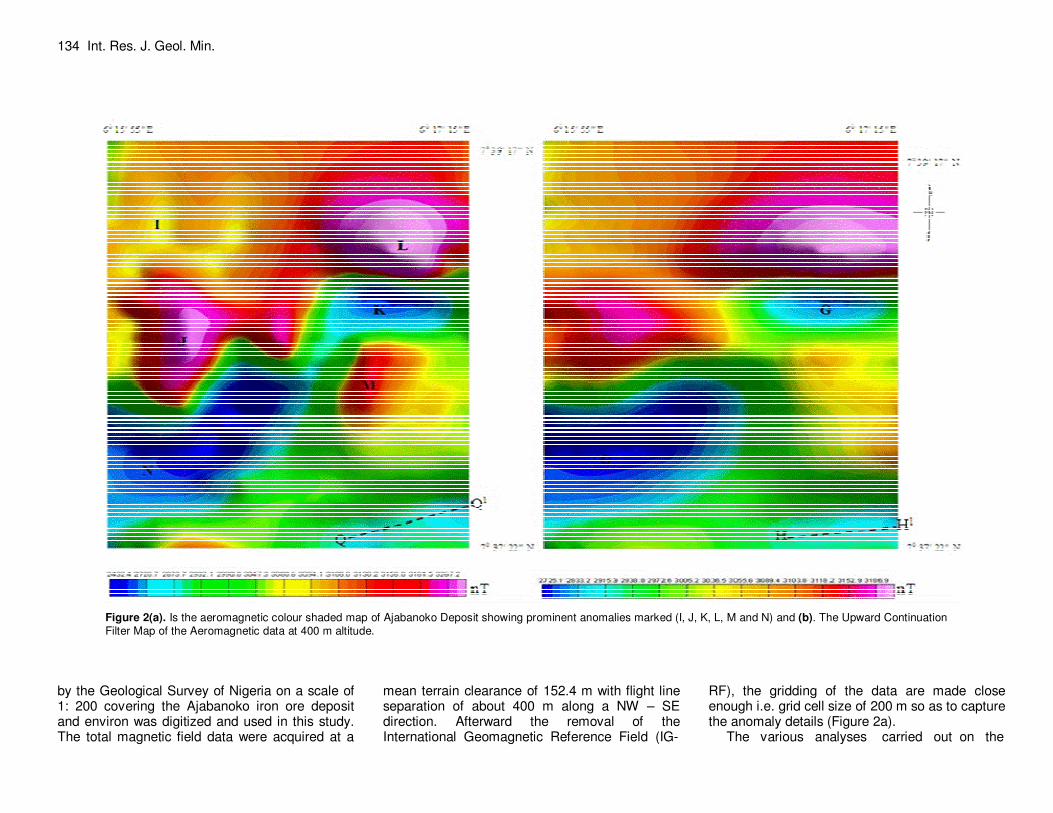
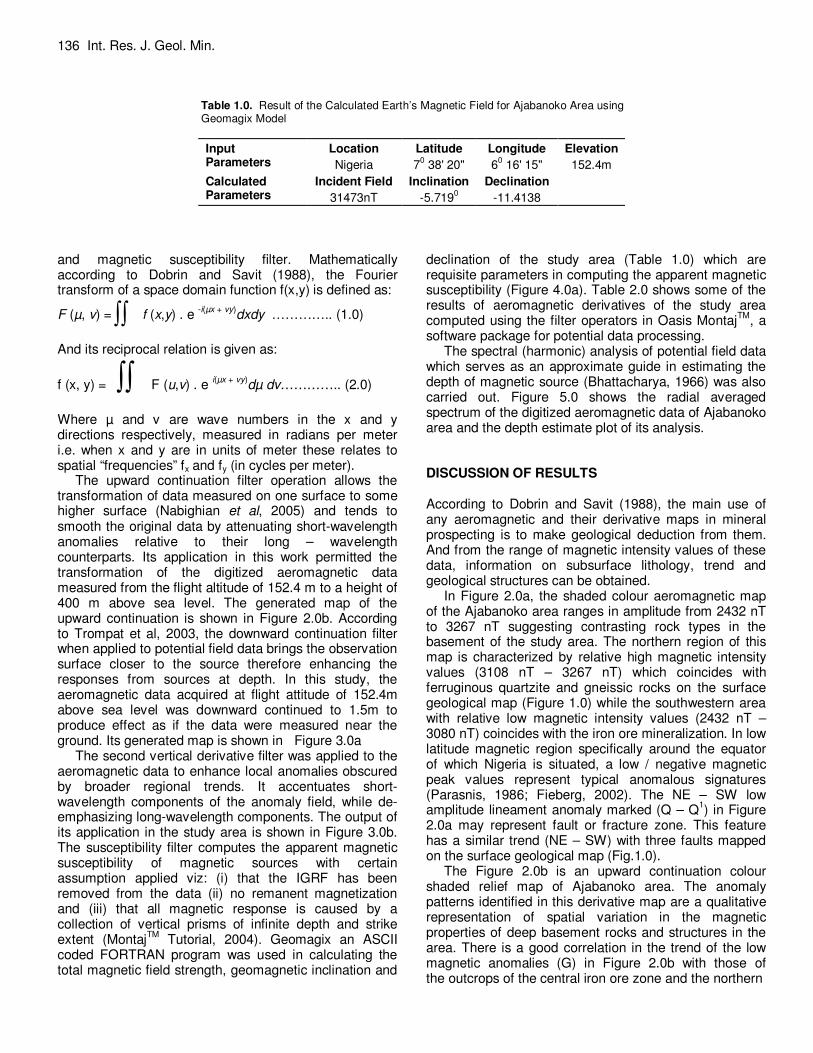
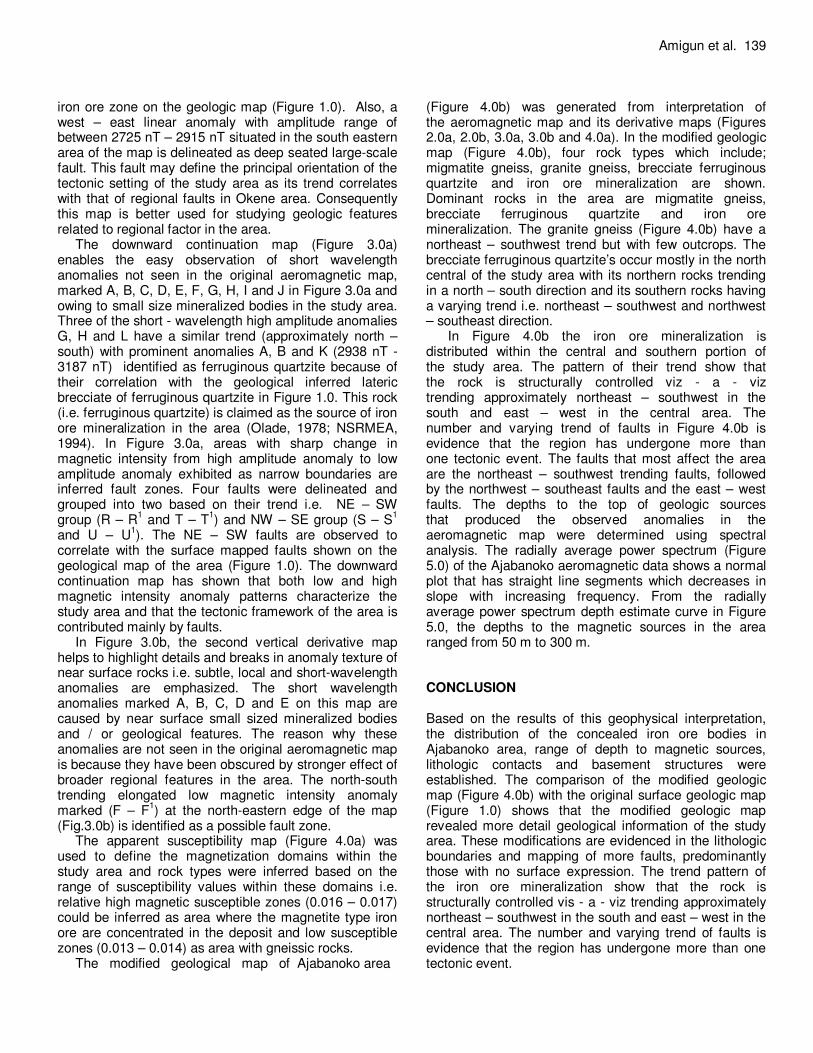
Figure 4(a). The Apparent Susceptibility Map of the Aeromagnetic data of Ajabanoko Deposit showing the magnetization domains distribution within the area. (b) Modified Geological Map of Ajabanoko Iron Ore Deposit generated from the various analysis and interpretation.
138 Int. Res. J. Geol. Min.
Table 2.0. Result of the Derivative Computation of Aeromagnetic data of Ajabanoko Area for grid line 10
L10 Northing Easting T Mag UCont DCont VD MagSusc
0.0
1.0
2.0
3.0
4.0
5.0
6.0
7.0
8.0
9.0
10.0
11.0
12.0
13.0
14.0
845178.6
845178.6
845178.6
845178.6
845178.6
845178.6
845178.6
845178.6
845178.6
845178.6
845178.6
845178.6
845178.6
845178.6
845178.
198250.0
198436.5
198623.0
198809.5
198996.0
199182.5
199369.1
199555.6
199742.1
199928.6
200115.1
200301.6
200488.1
200674.6
200861.1
3090.0
3090.0
3200.0
3320.0
3200.0
3000.0
3150.0
3200.0
2900.0
2900.0
3100.0
3120.0
3080.0
3050.0
3030.0
3131.0
3140.9
3165.2
3177.9
3150.9
3114.7
3106.0
3085.5
3039.0
3026.1
3051.1
3066.3
3061.9
3051.5
3046.5
3017.2
2967.2
3188.5
3630.7
3335.0
2552.8
3274.7
3649.0
2487.8
2646.1
3333.2
3177.4
3076.0
3066.7
2876.6
-0.00
-0.00
-0.00
0.01
0.00
-0.01
0.00
0.01
-0.01
-0.01
0.01
0.00
0.00
0.00
-0.01
0.02
0.02
0.02
0.02
0.01
0.02
0.02
0.01
0.02
0.02
0.02
0.02
0.02
0.02
0.02
T Mag Total Magnetic Intensity value Mag Susc Magnetic Susceptibility UCont Upward Continuation VD Vertical Derivative DCont Downward Continuation VL10 Grid line 10
Figure 5. The Radial Spectrum and Depth Estimate Plot of the Aeromagnetic data of Ajabanoko Deposit.
iron ore zone on the geologic map (Figure 1.0). Also, a west – east linear anomaly with amplitude range of between 2725 nT – 2915 nT situated in the south eastern area of the map is delineated as deep seated large-scale fault. This fault may define the principal orientation of the tectonic setting of the study area as its trend correlates with that of regional faults in Okene area. Consequently this map is better used for studying geologic features related to regional factor in the area.
The downward continuation map (Figure 3.0a) enables the easy observation of short wavelength anomalies not seen in the original aeromagnetic map, marked A, B, C, D, E, F, G, H, I and J in Figure 3.0a and owing to small size mineralized bodies in the study area. Three of the short - wavelength high amplitude anomalies G, H and L have a similar trend (approximately north – south) with prominent anomalies A, B and K (2938 nT - 3187 nT) identified as ferruginous quartzite because of their correlation with the geological inferred lateric brecciate of ferruginous quartzite in Figure 1.0. This rock (i.e. ferruginous quartzite) is claimed as the source of iron ore mineralization in the area (Olade, 1978; NSRMEA, 1994). In Figure 3.0a, areas with sharp change in magnetic intensity from high amplitude anomaly to low amplitude anomaly exhibited as narrow boundaries are inferred fault zones. Four faults were delineated and grouped into two based on their trend i.e. NE – SW group (R – R
1 and T – T
1) and NW – SE group (S – S
1
and U – U1). The NE – SW faults are observed to
correlate with the surface mapped faults shown on the geological map of the area (Figure 1.0). The downward continuation map has shown that both low and high magnetic intensity anomaly patterns characterize the study area and that the tectonic framework of the area is contributed mainly by faults.
In Figure 3.0b, the second vertical derivative map helps to highlight details and breaks in anomaly texture of near surface rocks i.e. subtle, local and short-wavelength anomalies are emphasized. The short wavelength anomalies marked A, B, C, D and E on this map are caused by near surface small sized mineralized bodies and / or geological features. The reason why these anomalies are not seen in the original aeromagnetic map is because they have been obscured by stronger effect of broader regional features in the area. The north-south trending elongated low magnetic intensity anomaly marked (F – F
1) at the north-eastern edge of the map
(Fig.3.0b) is identified as a possible fault zone. The apparent susceptibility map (Figure 4.0a) was
used to define the magnetization domains within the study area and rock types were inferred based on the range of susceptibility values within these domains i.e. relative high magnetic susceptible zones (0.016 – 0.017) could be inferred as area where the magnetite type iron ore are concentrated in the deposit and low susceptible zones (0.013 – 0.014) as area with gneissic rocks.
The modified geological map of Ajabanoko area
Amigun et al. 139
(Figure 4.0b) was generated from interpretation of the aeromagnetic map and its derivative maps (Figures 2.0a, 2.0b, 3.0a, 3.0b and 4.0a). In the modified geologic map (Figure 4.0b), four rock types which include; migmatite gneiss, granite gneiss, brecciate ferruginous quartzite and iron ore mineralization are shown. Dominant rocks in the area are migmatite gneiss, brecciate ferruginous quartzite and iron ore mineralization. The granite gneiss (Figure 4.0b) have a northeast – southwest trend but with few outcrops. The brecciate ferruginous quartzite’s occur mostly in the north central of the study area with its northern rocks trending in a north – south direction and its southern rocks having a varying trend i.e. northeast – southwest and northwest – southeast direction.
In Figure 4.0b the iron ore mineralization is distributed within the central and southern portion of the study area. The pattern of their trend show that the rock is structurally controlled viz - a - viz trending approximately northeast – southwest in the south and east – west in the central area. The number and varying trend of faults in Figure 4.0b is evidence that the region has undergone more than one tectonic event. The faults that most affect the area are the northeast – southwest trending faults, followed by the northwest – southeast faults and the east – west faults. The depths to the top of geologic sources that produced the observed anomalies in the aeromagnetic map were determined using spectral analysis. The radially average power spectrum (Figure 5.0) of the Ajabanoko aeromagnetic data shows a normal plot that has straight line segments which decreases in slope with increasing frequency. From the radially average power spectrum depth estimate curve in Figure 5.0, the depths to the magnetic sources in the area ranged from 50 m to 300 m. CONCLUSION Based on the results of this geophysical interpretation, the distribution of the concealed iron ore bodies in Ajabanoko area, range of depth to magnetic sources, lithologic contacts and basement structures were established. The comparison of the modified geologic map (Figure 4.0b) with the original surface geologic map (Figure 1.0) shows that the modified geologic map revealed more detail geological information of the study area. These modifications are evidenced in the lithologic boundaries and mapping of more faults, predominantly those with no surface expression. The trend pattern of the iron ore mineralization show that the rock is structurally controlled vis - a - viz trending approximately northeast – southwest in the south and east – west in the central area. The number and varying trend of faults is evidence that the region has undergone more than one tectonic event.
140 Int. Res. J. Geol. Min. ACKNOWLEDGEMENT The authors will like to thank the Management of National Iron Ore Mining Company Limited (NIOMCO), Itakpe for their fruitful co-operation and granting access to the Ajabanoko deposit. REFERENCES A Potential Supply Base for the Steel Plant at Ajaokuta. J. Min. Geol.
Vol. 20, 209 –214 Adegbuyi O, Olade MA (1990). The Precambrian Itakpe Iron Ore
Deposit in Central Nigeria. In Adeyemo B, Williams FO, Adegbuyi O (1984). Geological Exploration of
Ajabanoko Hill Deposit, Ancient Banded Iron Formation (Reg. Presentations) by Theophrastus,
S. A. Athens, Annor AE, Freeth SJ (1985). Thermotectonic Evolution of the Basement
Complex around Dobrin MB, Savit CH (1988). Introduction to Geophysical Prospecting.
McGraw-Hill Book Co. Inc. New York. P152-190, 498-578, 691-745 Fadare VO (1983). Iron Ore Formations – The Okene – Ajaokuta –
Lokoja Areas of Kwara State. Fieberg FC (2002). Ground magnetic investigations for gold prospecting
in south-western Nigeria. Presentation given at the 62nd Meeting of the German Geophysical Society, Hannover.
Geol. Surv. Open – file rep. 83, 237. Greece. P. 105-118. Hildenbrand TG (1983). A Filtering Program based on two –
dimensional Fourier Analysis; U.S. Hinze J, Aiken C, Brozena J, Coakley B, Dater D, Flanagan G,
´Forsberg R, Hildenbrand T, Keller GR, Kellogg J, Kucks R, Li X, Mainville A, Morin R, Pilkington M, Plouff D, Ravat D, Roman D, Urrutia-Fucugauchi J, V´eronneau M, Webring M, Winester D,
(2005). New standards for reducing gravity data: The North American gravity database Geophysics, 70, No. 4 pp 25–32
MontajTM
Tutorial (2004). Two – Dimensional frequency domain processing of potential field data.
Nabighian MN, Grauch JS, Hansen RO, LaFehr TR, Li Y, Peirce JW, Phillips JD, Ruder ME, (2005). The historical development of the magnetic method in exploration, Geophysics, 70, No.6, 33-61
National Iron Ore Mining Project, NIOMP Itakpe (1994). Geological Map of Ajabanoko Iron Ore Deposit. (Unpublished)
National Steel Raw Materials Exploration Agency, NSRMEA (1994). Preliminary Report on Ajabanoko Iron Ore Deposit. (Unpublished)
NSDA / VO Tecnoexport (1975). On the prospecting and exploration of Itakpe Hill iron ore deposit, Okene, Nigeria. Unpublished. P 1 – 35
Okene, Nigeria with special reference to Deformation Mechanism. Precamb. Res. 28, p.269-281.
Okene, Nigeria. Technical Report of National Steel Council Explo. Div., Kaduna, Nigeria. 14pp.
Olade MA (1978). General features of a Precambrian iron deposit and its environment at Itakpe Ridge Okene, Nigeria. Trans. Inst. Min. Metallurgy. Sect. B87 pp.81-89.
Oyawoye MO (1972). The Basement Geology of Nigeria. In: Africa Geology, Ibadan. p 66-99. Dessauvagie TFJ, Whiteman AJ (eds) (1972). Dept. of Geology, Univ. of Ibadan.
P 1 - 67 Parasnis DS (1986). Principles of Applied Geophysics, Chapman Hall,
London, pp. 43-44. Rahaman MA (1976). Review of the Basement of S.W. Nigeria. In:C.
Kogbe (ed) Geology of Nigeria. Elizabethan press, Lagos, pp. 41-58.
Telford WM, Geldart Lp, Sheriff RG, Keys DA (1976). Applied Geophysics Published by Cambridge University Press, Cambridge P 7 – 215, 632 - 692
Trompat H, Boschetti F, Hornby P (2003). Improved downward continuation of potential field data, Exploration Geophysics 34, 249–256