Embed Size (px)
Citation preview

Volume 4, Issue 2(2016) 557-570 ISSN 2347 - 3258 International Journal of Advance Research and Innovation
557 IJARI
Application of Box Behnken design in Machining of turning
samples of MMC V.Shukla, A. Maheshwari
Department of Mechanical Engineering, IILM Academy of Higher Learning, Greater Noida
Greater, Noida (UP) India
Abstract Fabrication of AA6351/Al2O3 metal matrix composites with
different percentage of reinforcement by stirs carting
method. Microstructure observations of all fabricated
samples were done to observe distribution of reinforcement.
Investigations of mechanical properties of all sample effect
of turning parameters on dimensional deviation of metal
matrix composites.
1. Introduction
Matrix material strongly influences composite’s overall
transverse modulus, shear properties, and compression
properties. Matrix material also significantly limits a
composite’s maximum permissible operating temperature.
Most of the matrix materials are relatively lighter, more
compliant, and weaker vis‐à‐vis fibers and whiskers.
However, the combination of fibers/whiskers and matrix
can be very stiff, very strong, and yet very light. Thus
most of modern composites have very high specific
strengths, i.e. very high strength/density ratios. This
makes them very useful in aerospace applications, where
weight minimization is a key design consideration. Fibers
and whiskers in composites are held together by a binder
known as matrix. This is required since fibers by
themselves given their small cross‐sectional area, cannot
be directly loaded. Further they cannot transmit load
between themselves. This limitation is addressed by
embedding fibers in a matrix material. Matrix material
serves several functions, the important ones being binds
fibers together. Transfers loads and stresses within the
composite structure and support the overall structure and
protects the composite from incursion of external agents
such as humidity, chemicals, etc. and protects fibers from
damage due to handling.
Thiagarajan Rajmohan et al [1] studied the application of
response surface methodology (RSM) and central
composite design (CCD) for modeling, optimization, and
an analysis of the influences of dominant machining
parameters on thrust force, surface roughness and burr
height in the drilling of hybrid metal matrix composites
produced through stir casting route.S. Naher et al [2]
showed many factors which influence the incorporation of
particulate in metal matrix composites (MMCs). This
paper presents work which examines the effect of
viscosity during Al–SiC MMC production. Processing
periods (up to 65 min), stirring speeds (50–500 rpm), and
re-inforcement sizes (13–100 lm) for two different
viscosity levels (1 and 300 mPa s) were investigated. S.
Tzamtzis et al [3] observed that Particulate metal matrix
composites (PMMCs) have attracted interest for
application in numerous fields.S.K. Chaudhury et al [4]
Corresponding Author,
E-mail address: [email protected];
All rights reserved: http://www.ijari.org
studied the frictional and wear behavior of Al–2Mg–
11TiO2 composites prepared through spray forming and
stir casting techniques are studied.Comparing with the
Newtonian case, the couple stress effects of fluids
containing suspensions provide an enhancement in the
load capacity, as well as a reduction in the attitude angle
and the friction parameter. D. Mandal et al [5]
investigated the wear properties on 2.5, 5 and 10 wt%
copper-coated short steel fiber reinforced Al–2Mg alloy
composites fabricated by stir casting process were carried
out using pin-on-disc wear testing apparatus. M. Baki
Karamıs et al [6] studied extrusion die wear during the
metal matrix composite (MMC) extrusion process was
investigated with regard to the size of the reinforcement
particle. T.V.S. Reddy et al [7] observed that this paper
describes an attempt to enhance the wear properties of
hypereutectic cast aluminium–silicon alloys produced by
semi-solid metal (SSM) processing technique. Luca
Casamichele et al [8] observed that indentation tests were
performed on a large automotive component (a van
gearbox) by means of a FIMEC apparatus. M.Emamy et
al [9]developeda new technique in an aluminum based
metal matrix composite in order to reveal the mechanism
of formation of TiB2 particles by mixing molten master
alloys i.e., Al–8Ti and Al–4B in the Ti:B weight ratio of
5:2. A composite containing fine TiB2 particles produced
by this technique.X.J. Wang et al [10] observed that the
fracture behavior of SiCp/AZ91 magnesium matrix
composite fabricated by stir casting is investigated using
the in situ SEM technique.T.P.D. Rajan et al [11]
observed that the effect of three different stir casting
routes on the structure and properties of fine fly ash
particles (13 lm average particle size) reinforced Al–7Si–
0.35Mg alloy composite is evaluated. Among liquid metal
stir casting, compocasting (semi solid processing),
modified compocasting and modified compocasting
followed by squeeze casting routes evaluated, the latter
has resulted in a well-dispersed and relatively
agglomerate and porosity free fly ash particle dispersed
composites.L.Ceschini et al [12] observed that The use of
aluminium-based particulate reinforced MMCs for
automotive components and aircraft structures have been
shown to be highly advantageous over their unreinforced
alloys, due to their high specific strength and stiffness and
superior wear resistance in a wide temperature range.S.
Naher et al [13] proposed that Non-homogeneous particle
Article Info
Article history:
Received 25 January 2016
Received in revised form
20 February 2016
Accepted 28 February 2016
Available online 15 June 2016
Keywords:
Metal–matrix, Reynolds, Sommer feld
number, Couple stress fluid

Volume 4, Issue 2(2016) 557-570 ISSN 2347 - 3258 International Journal of Advance Research and Innovation
558 IJARI
distribution is one of the greatest problems in casting
metal matrix composites (MMCs).S.M. Olhero et al [14]
observed that in the present work rheological properties of
aqueous concentrated AlN suspensions have been
investigated in the presence of a sintering aid,
deffloculant, binder and plasticizers, in order to screen the
most suitable experimental conditions to obtain a good
rheological behavior for tape casting thick and non-
cracked tapes with good flexibility. Suspensions
exhibiting the desired shear thinning behavior could be
prepared. S. Balasivanandha Prabu et al [15] observed that
high silicon content aluminium alloy–silicon carbide
metal matrix composite material, with 10%SiC were
successfully synthesized, using different stirring speeds
and stirring times.YucelBirol et al [16] studied cooling
slope (CS) casting process was employed in the present
work to produce A357 thixo forming feedstock. K.
Mahadevan et. al [17] observed that aluminium matrix-
based discontinuously reinforced composites are age
hardenable and can be strengthened through precipitation
hardening process.Mohamed A.Taha et al [18] observed
that Theworkability of aluminium–SiC and Al2O3-
reinforced metal matrix composites (APMMCs) prepared
by stir-casting, squeeze-casting and powder metallurgy
techniques have been studied by using up-set test.
T.Sornakumar et al [19] proposed that Bronze–alumina
metal matrix composites have been attracting the interest
of researchers in recent years, as they have many
advantageous characteristics.Arda Cetin et al [20]
observed that the damage and deformation behaviour of
particulate reinforced metal matrix composites (PMMCs)
can be highly sensitive to local variations in spatial
distribution of reinforcement particles, which markedly
depend on melt processing and solidification stages
during production of PMMCs.
From the literature review it was observed that very few
researchers investigate the effect of CNC turning
parameters on dimensional deviation of AA6351/Al2O3
metal matrix composites. Objective of the present work
was the fabrication of AA6351/Al2O3 metal matrix
composites with different percentage of reinforcement by
stir carting method. Microstructure observation of all
fabricated samples was done to observe distribution of
reinforcement. Investigations of mechanical properties of
all samples and effects of turning parameters on
dimensional deviation of metal matrix composites were
analyzed.
2. Materials and Methods
2.1 Matrix Material Most of the aerospace structures and its allied
infrastructure are made of aluminum alloy. In this context
considering Al 6351 which was used for making pressure
vessel cylinders is now testing for aircraft structures. Al
6351 has high corrosion resistance and can be seen in
forms of extruded rod bar and wire and extruded shapes.
It is easily machinable and can have a wide variety of
surface finishes. It also has good electrical and thermal
conductivities and is highly reflective to heat and light.
Due to the superior corrosion resistance, Al 6351 offers
extremely low maintenance. Al 6351 is only one-third the
weight of cast iron, with about 75% of comparable tensile
strength. Early research was done on crack phenomenon
of hallow cross sectional specimen only. In this
investigation the tensile strength on circular rod specimen
of Al 6351 is finding out by applying the loads on
universal testing machine with various dimensions. The
experimental results were found satisfactory to propose
the alternative alloy for aircraft structures. The
mechanical and physical properties of aluminum alloy
(6351) have been reviewed from literature data for the
purpose of characterizing the mechanical for
manufacturing process in engineering application.
Aluminum alloys are used in many applications in which
the combination of high strength and low weight is
attractive in air frame in which the low weight can be
significant value. Al 6351 is known for its light weight
(density = 2.7g/cm3) and good corrosion resistance to air,
water, oils and many chemicals. Thermal and electrical
conductivity is four times greater than steels. The
chemical compositions of Al 6351 are Si-0.93,Fe-0.36,
Cu-0.1, Mn-0.57, Mg-0.55, Zn 0.134, Ti- 0.014 and
remaining Al. It has higher strength amongst
Table 1: Properties of aluminum alloy (6351)
aluminum
alloy
copper magnesium Silicon iron Manganese Others
6351 0.1% 0.4-1.2% 0.6-1.3% 0.6% 0.4-1.0% 0.3%
aluminum
alloy
copper magnesium Silicon iron Manganese Others
6351 0.1% 0.4-1.2% 0.6-1.3% 0.6% 0.4-1.0% 0.3%
the 6000 series alloys. Alloy 6351 is known as a structural
alloy, in plate form. This alloy is most commonly used for
machining. Though relatively a new alloy the higher
strength of 6351 has replaced 6061 alloy in many
applications. Mechanical properties can be easily obtained
at tension tests, with great accuracy. Thus, alloy such as
6351 have significantly more silicon than magnesium or
other elements, but find themselves in the Mg2Si series.
The AA 6351 aluminum alloy is used in manufacturing
due to its strength, bearing capacity, ease of workability
and weldability. It is also used in building boat, column,
chimney, rod, mould, pipe, tube, vehicle, bridge, crane
and roof. One of the most important properties of AA
6351 aluminum alloy is that the treatment of solid
solution is not so critical. One of the major areas of Al
6351 for investigating crack phenomena is the gas
cylinders made of this material often prone to crack at
various tensile residual stresses. Sustained load cracking,
a metallurgical anomaly, occasionally develops in 6351
aluminum alloy high-pressure cylinders. The advantages
of Al 6351 have several important performance
characteristics that make them very attractive for aircraft
structures, namely light unit weight, only one third that of
steel, strength comparable to typical other aluminum
alloys, excellent corrosion resistance, with negligible
corrosion even in the presence of rain and other drastic
Volume 4, Issue 2(2016) 557-570 ISSN 2347 - 3258 International Journal of Advance Research and Innovation
559 IJARI
conditions, high toughness and resistance to low-ductility
fracture even at very low temperatures and free of any
ductile-to-brittle transition that has sometimes been fatal
to older structures and excellent fabric ability. These
performance characteristics provide significant
advantages over conventional aircraft design, fabrication
and erection of aerospace structures like light weight and
comparable strength enables the use of a higher ratio of
live load to dead load, superior corrosion resistance
resulting in lower maintenance costs, superior low-
temperature toughness eliminates concerns about brittle
fracture even in the most severe arctic weather, ease of
extrusion enables the design of more weight-efficient
beam and component cross sections, placing the metal
where it is most needed within a structural shape or
assembly including providing for interior stiffeners and
for joints and the combination of light weight and ease of
fabrication.
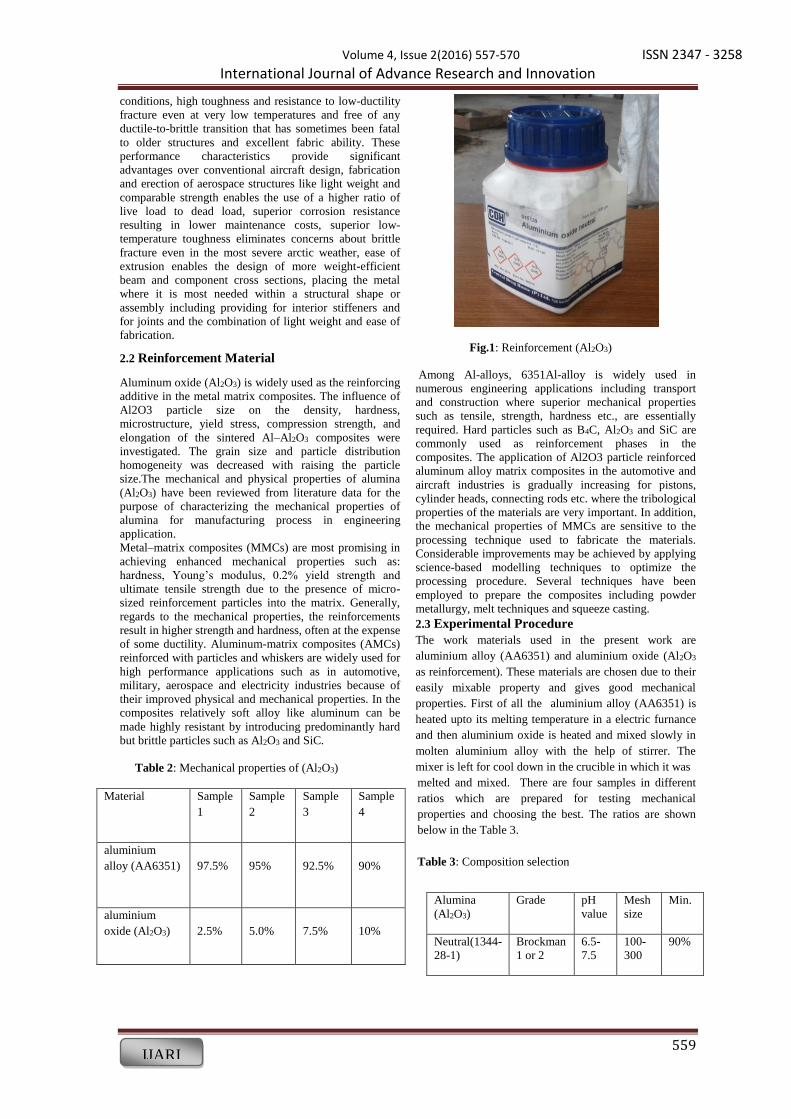
2.2 Reinforcement Material
Aluminum oxide (Al2O3) is widely used as the reinforcing
additive in the metal matrix composites. The influence of
Al2O3 particle size on the density, hardness,
microstructure, yield stress, compression strength, and
elongation of the sintered Al–Al2O3 composites were
investigated. The grain size and particle distribution
homogeneity was decreased with raising the particle
size.The mechanical and physical properties of alumina
(Al2O3) have been reviewed from literature data for the
purpose of characterizing the mechanical properties of
alumina for manufacturing process in engineering
application.
Metal–matrix composites (MMCs) are most promising in
achieving enhanced mechanical properties such as:
hardness, Young’s modulus, 0.2% yield strength and
ultimate tensile strength due to the presence of micro-
sized reinforcement particles into the matrix. Generally,
regards to the mechanical properties, the reinforcements
result in higher strength and hardness, often at the expense
of some ductility. Aluminum-matrix composites (AMCs)
reinforced with particles and whiskers are widely used for
high performance applications such as in automotive,
military, aerospace and electricity industries because of
their improved physical and mechanical properties. In the
composites relatively soft alloy like aluminum can be
made highly resistant by introducing predominantly hard
but brittle particles such as Al2O3 and SiC.
Table 2: Mechanical properties of (Al2O3)
Fig.1: Reinforcement (Al2O3)
Among Al-alloys, 6351Al-alloy is widely used in
numerous engineering applications including transport
and construction where superior mechanical properties
such as tensile, strength, hardness etc., are essentially
required. Hard particles such as B4C, Al2O3 and SiC are
commonly used as reinforcement phases in the
composites. The application of Al2O3 particle reinforced
aluminum alloy matrix composites in the automotive and
aircraft industries is gradually increasing for pistons,
cylinder heads, connecting rods etc. where the tribological
properties of the materials are very important. In addition,
the mechanical properties of MMCs are sensitive to the
processing technique used to fabricate the materials.
Considerable improvements may be achieved by applying
science-based modelling techniques to optimize the
processing procedure. Several techniques have been
employed to prepare the composites including powder
metallurgy, melt techniques and squeeze casting.
2.3 Experimental Procedure
The work materials used in the present work are
aluminium alloy (AA6351) and aluminium oxide (Al2O3
as reinforcement). These materials are chosen due to their
easily mixable property and gives good mechanical
properties. First of all the aluminium alloy (AA6351) is
heated upto its melting temperature in a electric furnance
and then aluminium oxide is heated and mixed slowly in
molten aluminium alloy with the help of stirrer. The
mixer is left for cool down in the crucible in which it was
melted and mixed. There are four samples in different
ratios which are prepared for testing mechanical
properties and choosing the best. The ratios are shown
below in the Table 3.
Table 3: Composition selection
Material Sample
1
Sample
2
Sample
3
Sample
4
aluminium
alloy (AA6351)
97.5%
95%
92.5%
90%
aluminium
oxide (Al2O3)
2.5%
5.0%
7.5%
10%
Alumina
(Al2O3)
Grade pH
value
Mesh
size
Min.
Neutral(1344-
28-1)
Brockman
1 or 2
6.5-
7.5
100-
300
90%

Volume 4, Issue 2(2016) 557-570 ISSN 2347 - 3258 International Journal of Advance Research and Innovation
560 IJARI
Fig.2: Electric furnance
Fig.3: Mechanical stirrer
Now the mixed composite after cooling is cutted into
desired shapes for testing mechanical properties on the
cutting machine. The cutting machine is an electrically
driven machine which is used to cut the hard composites.
The MMC samples prepared are shown in figures given
below.
Fig.4: MMC (2.5% of Al2O3)
The Machine on which these prepared samples are cutted
is shown in the figure given below: The MMC samples
prepared for mechanical properties testing after cutting
and finshing are shown in the figures: After preparing all
the MMC sample mechanical properties like testing of
hardness, toughness and tensile strength are to be
performed on their respective testing machines for
determining the best one in properties among all of the
different ratio samples and selecting the strongest one.
Fig. 5: MMC (5% of Al2O3)
Fig.6: MMC (7.5% of Al2O3)
Fig.7: MMC (10% of Al2O3)
2.4 Response Surface Methodology
Response surface methodology (RSM) is a collection of
mathematical and statistical techniques for empirical
model building. By careful design of experiments, the
objective is to optimize a response (output variable) which
is influenced by several independent variables(input
variables). An experiment is a series of tests, called runs,
in which changes are made in the input variables in order
to identify the reasons for changes in the output response.
Originally, RSM was developed to model experimental
responses (Box and Draper, 1987), and then migrated into
the modelling of numerical experiments. The difference is
in the type of error generated by the response. In physical
experiments, inaccuracy can be due, for example, to
measurement errors while, in computer experiments,
numerical noise is a result of incomplete convergence of
iterative processes, round-off errors or the discrete
representation of continuous physical phenomena (Giunta
et al., 1996; van Campen et al., 1990,Toropov et al.,

Volume 4, Issue 2(2016) 557-570 ISSN 2347 - 3258 International Journal of Advance Research and Innovation
561 IJARI
Fig.8: Cutting machine
Fig.9: MMC sample prepared for hardness test
Fig.10: MMC sample for tensile test
Fig.11: MMC sample prepared for toughness test
Fig.12: MMC sample prepared for microstructure
1996). In RSM, the errors are assumed to be random.The
application of RSM to design optimization is aimed at
reducing the cost of expensive analysis methods (e.g.
finite element method or CFD analysis) and their
associated numerical noise. The problem can be
approximated as described in with smooth functions that
improve the convergence of the optimization process
because they reduce the effects of noise and they allow for
the use of derivative-based algorithms. Venter et al.
(1996) have discussed the advantages of using RSM for
design optimization applications.
For example, in the case of the optimization of the
calcination of Roman cement engineer wants to find the

Volume 4, Issue 2(2016) 557-570 ISSN 2347 - 3258 International Journal of Advance Research and Innovation
562 IJARI
levels of temperature (x1) and time (x2) that maximize the
early age strength (y) of the cement. The early age
strength is a function of the levels of temperature and
time, as follows:
y = f (x1, x2) + ԑ (1)
where, ԑ represents the noise or error observed in the
response y. The surface represented by f(x1, x2) is called a
response surface. The response can be represented
graphically, either in the three-dimensional space or as
contour plotsthat help visualize the shape of the response
surface. An important aspect of RSM is the design of
experiments(Box and Draper, 1987), usually abbreviated
as DOE. These strategies were originally developed for
the model fitting of physical experiments, but can also be
applied to numerical experiments. The objective of DOE
is the selection of the points where the response should be
evaluated. Most of the criteria for optimal design of
experiments are associated with the mathematical model
of the process. Generally, these mathematical models are
polynomials with an unknown structure, so the
corresponding experiments are designed only for every
particular problem. The choice of the design of
experiments can have a large influence on the accuracy of
the approximation and the cost of constructing the
response surface.
3. Results and Discussion
3.1 Analyses of Microstructure
The microstructures of the MMC samples are seen using
metallurgical microscope. When describing the structure
of a material, we make a clear distinction between its
crystal structure and its microstructure. The term ‘crystal
structure’ is used to describe the average positions of
atoms within the unit cell, and is completely specified by
the lattice type and the fractional coordinates of the atoms.
The term ‘microstructure’ in metal matrix composites is
used to describe the appearance of the reinforcement
material. A reasonable working definition of
microstructure is the arrangement of phases and defects
within a material. Uniform distribution was observed of
all selected composition.
3.2 Analyses of Tensile Strength
The tensile testing of MMC Composite is carried out on
tensometer machine. Tensometer is a device used to
evaluate the tensile properties of materials such as their
Young’s modulus and tensile strength. It is usually a
universal testing machine loaded with a sample between
two grips that are either adjusted manually or
automatically to apply force to the specimen. The
machine works either by driving a screw or by hydraulic
ram. Testing is done by clamping the specimen in the
jaws of the tensometer. The load is applied gradually and
the material starts elongating. After the maximum load
reached the specimen breaks. The data collected from the
tensile test by tensometer has been graphically shown:-
Fig 5: (a) 2.5 % reinforcement, (b) 5 % reinforcement, (c) 7.5 % reinforcement, (d) 10 % reinforcement
Al2O3
Al2O3
X 100
Al2O3
X 100
X 100
X 100
Al2O3

Volume 4, Issue 2(2016) 557-570 ISSN 2347 - 3258 International Journal of Advance Research and Innovation
563 IJARI
Fig 5 Sample of MMC (a) Before Testing (b) After Testing
Fig.6: Tensile test of 2.5% of Al2O3 mixed with Al
Fig.7: Tensile Test of 5% of Al2O3 mixed with Al
Fig.8: Tensile Test of 7.5% of Al2O3 mixed with Al
Fig. 9: Tensile Test of 10% of Al2O3 mixed with Al
Fig10: MMC sample after toughness testing
Table 4: Tensile of MMC
Samples (of
Al2o3)
Ultimate
strength (N)
Elongation
(mm)
Break load
(N)
Break Elongation
(mm)
True UTS (N/
sq mm)
Area (sq.
mm)
2.5% 696.3 0.51 147.1 0.61 25 28.286
5.0% 637.5 0.5 205.9 0.67 22.9 28.286
7.5% 1520.1 2.36 1314 2.53 64.2 25
10% 441.3 0.38 304 0.54 15.8 28.286

Volume 4, Issue 2(2016) 557-570 ISSN 2347 - 3258 International Journal of Advance Research and Innovation
564 IJARI
3.3 Analysis of Toughness Test
In these MMC specimens toughness is tested by breaking it
with impacting force of a hammer weighing 21 kg. The
Hammer is leaved from 140 degree of angle with the initial
energy of 300 J. The table shows the results while testing as
shown in figure.
Table 4: Toughness of MMC
Compositi
on
2.5% of
Al2O3(Energ
y in J)
5% of
Al2O3(Ene
rgy in J)
7.5% of
Al2O3
(Energy in
J)
10% of
Al2O3(Ene
rgy in J)
Sample 1 6 4 8 14
Sample 2 6 4 6 10
3.4 Analysis of Hardness Test
The hardness test was carried on Rockwell Hardness testing
method in which the hardness is determined by measuring
the depth of an indentor under a large load compared to the
penetration by the preload. Rockwell hardness values are
expressed as a combination of a hardness number and a
scale symbol representing the indenter and the minor and
major loads. The hardness number is expressed by the
symbol HR and the scale designation.
The of Principle of Rockwell test is indenter moves down
into position on the part surface.A minor load is applied and
a zero reference position is established. The major load is
applied for a specified time period (dwell time) beyond
zero. The major load is released leaving the minor load
applied. It is calculated as:
Table 5 Hardness of MMC
Fig. 12 MMC sample after indentation on hardness testing
machine
4. Dimensional Deviation
As manufacturing companies pursue higher-quality
products, they spend much of their efforts monitoring and
controlling dimensional accuracy dimensional deviation
prediction of workpiece in turning of MMC samples like
spindle speed, feed rate, depth of cut, pressure of cooling
lubrication fluid and number of produced parts were taken
as input parameters and dimensional deviation of workpiece
as an output parameter. Importance of a single parameter
and their interactive influences on dimensional deviation
were statistically analyzed and values predicted from
regression. The principal goal of this paper was to
investigate the influence of depth of cut, cutting speed and
feed rate on the dimensional (length, diameter and radius)
and geometric (parallelism and angularity) deviations
obtained after turning of MMC samples. The quality of
moulds and dies subjected to milling is significant to the
final cost of these products due to the influence of milling
on subsequent finishing and polishing operations.
Therefore, better quality rough and semi-finish mills
operations result in shorter finishing and polishing cycles
and lower manufacturing costs. The principal strategies
used to optimize both productivity and surface quality when
milling hardened die and mould materials at high speeds.
Contour milling is the most common approach employed
when roughing to achieve higher metal removal rates
associated with less machining time. While finishing
milling, number of factors must be taken into account, such
as mould or die features, cutter geometry, the radial depth of
cut and the cutter path strategy.
In addition, the use of adaptive machining to
maintain a consistent cutting load by changing cutting
speed, depth of cut and feed rates may result in an improved
surface finish and higher productivity. But milling forces
change considerably during one rotation of a cutter due to
variations in chip thickness. The stability of metal cutting
operations at low spindle speeds are challenging to model
mainly because of the difficulty in predicting the process
damping. Consequently, the clearance face of the tool rubs
against the waves causing frictional forces against the
direction of motion which damp out chatter vibrations
additionally to the machining parameters, tool geometry and
work material properties, the following parameters must be
considered in order to accurately predict milling forces:
cutting temperature variation, cutter run out, cutter and
workpiece vibrations. When cavities are machined, tool
deflection changes with the cutter path, especially in
Compositions 2.5% of
Al2O3
(Hardness
in BHN)
5% of
Al2O3
(Hardness
in BHN)
7.5% of
Al2O3
(Hardness
in BHN)
10% of
Al2O3
(Hardness
in BHN)
Sample 1 49 44 49 40
Sample 2 42 32 44 49

Volume 4, Issue 2(2016) 557-570 ISSN 2347 - 3258 International Journal of Advance Research and Innovation
565 IJARI
corners. To minimize this effect, lower width of cut values
should be employed, thus diminishing the milling force
components and consequently, tool deflection. For cutting
corners the pocket milling is implemented as a module of a
commercial CAD/CAM system. The high rotational speeds
the centrifugal force presses the fingers against the inner
wall of the cutter, resulting in a frictional force that reduces
chatter vibrations. Tool deflection is considered to be the
most critical factor that influences both surface finish and
dimensional deviations, and for this reason, a number of
researchers have ad-dressed this subject matter.
4.1 Experimental Design The input process parameters for CNC turning that
determine the properties of MMC are speed of cut, feed rate
and depth of cut. The experiment is planned on the basis of
three- factor five-level central composite rotatable design,
with full imitation. Design-Expert Box Benhken is used to
conduct statistical analysis, to develop mathematical models
and to optimize the process parameters. The selected
process parameters and their limits, units and notations are
given in Table 3.5. In the experiment, the Dimensional
deviation is considered to evaluate the MMC composites.
Table 6 Process parameters
Parameters Unit Range
Speed m/min 90-170
Feed rate mm/rev 0.15-0.25
Depth of cut Mm 0.18-0.54
Table 7 Design matrix
Std.
order
Run
order
Speed
of cut
Feed
rate
Depth
of cut
Dimensional
deviation
9 1 130 0.15 0.18 1.01
17 2 130 0.2 0.36 1.05
12 3 130 0.25 0.54 1.95
10 4 130 0.25 0.18 1.30
14 5 130 0.20 0.36 1.08
5 6 90 0.20 0.18 1.03
11 7 130 0.15 0.54 1.10
15 8 130 0.20 0.36 0.90
4 9 170 0.25 0.36 2.10
13 10 130 0.20 0.36 1.05
3 11 90 0.25 0.36 1.30
7 12 90 0.20 0.54 1.20
1 13 90 0.15 0.36 0.90
8 14 170 0.20 0.54 1.60
16 15 130 0.20 0.36 1.10
2 16 170 0.15 0.36 1.06
6 17 170 0.20 0.18 1.20
4.2 Development of Mathematical Model
The aim of Analysis of variance (ANOVA) is investigating
whether the process parameters have significant effects on
MMC composite properties and conducting quantitative
analysis of the impact of various factors on experimental
results, so as to specify whether the model developed is
meaningful. The significance test of regression model and
single model coefficients and distortion test are carried out
by software Design-Expert V7. In order to make simpler,
the quadratic model stepwise deterioration method is used
to automatically delete the insignificant model conditions.
MMC composite properties of the ANOVA analysis are
shown in Table 6.
The ANOVA table indicates that the model terms can be
considered as statistically significant. The ANOVA result
shows that the speed of cut, feed rate and depth of cut are
the significant model terms associated with Dimensional
deviation. The other model terms are not important and thus
eliminated by backward elimination process to improve
model capability. It is apparent from the figure that strength
increases with the CNC turning power, while the strength
decreases at the excessive power. Increasing the CNC
turning power increases the heat input to the material,
resulting in increased strength. It can also be observed from
this plot that the turning speed has a negative effect on the
strength. Because a higher turning speed lowers the
irradiation time, causing low-heat input to the composites,
as a result, the strength decreases. This plot also indicates
that the radiation area increases with the increase of the
stand-off-distance, resulting in the increase of the strength
until it reaches its center value, the strength then starts to
decrease with the increase of stand-off-distance beyond the
center limit as a result of lower power density. Series of
process parameters meeting the optimization standards are
obtained in the mathematical model, which has been
optimized by the Design-Expert V7. Three groups of
optimized parameters are selected randomly to conduct
confirmation experiments in order to validate the
mathematical model. Repeat it three times for each group,
the actual value of the results is calculated as the average of
Volume 4, Issue 2(2016) 557-570 ISSN 2347 - 3258 International Journal of Advance Research and Innovation
566 IJARI
three trials. Table 3.5 lists the actual values, mathematical
model predictions and calculated percentage error of
confirmation experiments.
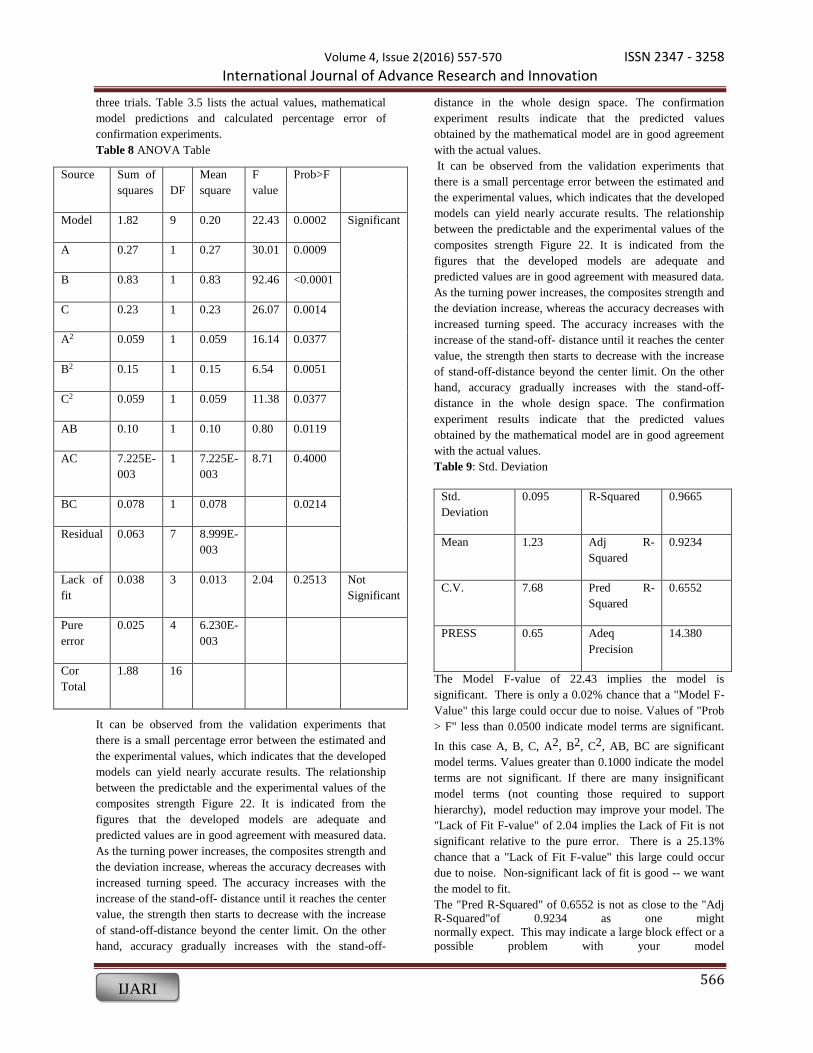
Table 8 ANOVA Table
Source Sum of
squares
DF
Mean
square
F
value
Prob>F
Model 1.82 9 0.20 22.43 0.0002 Significant
A 0.27 1 0.27 30.01 0.0009
B 0.83 1 0.83 92.46 <0.0001
C 0.23 1 0.23 26.07 0.0014
A2 0.059 1 0.059 16.14 0.0377
B2 0.15 1 0.15 6.54 0.0051
C2 0.059 1 0.059 11.38 0.0377
AB 0.10 1 0.10 0.80 0.0119
AC 7.225E-
003
1 7.225E-
003
8.71 0.4000
BC 0.078 1 0.078 0.0214
Residual 0.063 7 8.999E-
003
Lack of
fit
0.038 3 0.013 2.04 0.2513 Not
Significant
Pure
error
0.025 4 6.230E-
003
Cor
Total
1.88 16
It can be observed from the validation experiments that
there is a small percentage error between the estimated and
the experimental values, which indicates that the developed
models can yield nearly accurate results. The relationship
between the predictable and the experimental values of the
composites strength Figure 22. It is indicated from the
figures that the developed models are adequate and
predicted values are in good agreement with measured data.
As the turning power increases, the composites strength and
the deviation increase, whereas the accuracy decreases with
increased turning speed. The accuracy increases with the
increase of the stand-off- distance until it reaches the center
value, the strength then starts to decrease with the increase
of stand-off-distance beyond the center limit. On the other
hand, accuracy gradually increases with the stand-off-
distance in the whole design space. The confirmation
experiment results indicate that the predicted values
obtained by the mathematical model are in good agreement
with the actual values.
Table 9: Std. Deviation
Std.
Deviation
0.095 R-Squared 0.9665
Mean 1.23 Adj R-
Squared
0.9234
C.V. 7.68 Pred R-
Squared
0.6552
PRESS 0.65 Adeq
Precision
14.380
The Model F-value of 22.43 implies the model is
significant. There is only a 0.02% chance that a "Model F-
Value" this large could occur due to noise. Values of "Prob
> F" less than 0.0500 indicate model terms are significant.
In this case A, B, C, A2, B2, C2, AB, BC are significant
model terms. Values greater than 0.1000 indicate the model
terms are not significant. If there are many insignificant
model terms (not counting those required to support
hierarchy), model reduction may improve your model. The
"Lack of Fit F-value" of 2.04 implies the Lack of Fit is not
significant relative to the pure error. There is a 25.13%
chance that a "Lack of Fit F-value" this large could occur
due to noise. Non-significant lack of fit is good -- we want
the model to fit.
The "Pred R-Squared" of 0.6552 is not as close to the "Adj
R-Squared"of 0.9234 as one might
normally expect. This may indicate a large block effect or a
possible problem with your model

Volume 4, Issue 2(2016) 557-570 ISSN 2347 - 3258 International Journal of Advance Research and Innovation
567 IJARI
and/or data. Things to consider are model reduction,
response tranformation, outliers, etc.
"Adeq Precision" measures the signal to noise ratio. A ratio
greater than 4 is desirable. Ratio of 14.380 indicates an
adequate signal. This model can be used to navigate the
design space.
The "Pred R-Squared" of 0.6552 is not as close to the "Adj
R-Squared" of 0.9234 as one might
normally expect. This may indicate a large block effect or a
possible problem with your model
and/or data. Things to consider are model reduction,
response tranformation, outliers, etc.
"Adeq Precision" measures the signal to noise ratio. A ratio
greater than 4 is desirable. Your
ratio of 14.380 indicates an adequate signal. This model
can be used to navigate the design space.
Table 10 Diagnostics Case Statistics
Std. Order Actual
Value
Predicted
Value
Residual
1 0.90 0.99 -0.094
2 1.06 1.04 0.019
3 1.30 1.32 -0.019
4 2.10 2.01 0.094
5 1.03 0.96 0.070
6 1.20 1.24 -0.043
7 1.26 1.22 0.042
8 1.60 1.67 -0.070
9 1.01 0.99 0.024
10 1.30 1.35 -0.051
11 1.10 1.05 0.051
12 1.95 1.97 -0.024
13 1.05 1.04 0.014
14 1.08 1.04 0.044
15 0.90 1.04 -0.14
16 1.10 1.04 0.064
17 1.05 1.04 0.014
4.4.1Normal% Probability and Studentized
Residual
A normal probability plot is found by plotting the residuals
of the observed sample against the corresponding residuals
of a standard normal distribution N (0,1) . If the plot shows
a straight line, it is reasonable to assume that the observed
sample comes from a normal distribution. If the points
deviate a lot from a straight line, there is evidence against
the assumption that the random errors are an independent
sample from a normal distribution. Independence (response
variables yi are independent) this is a design issue and
Normality (response variables are normally distributed).
Look at the residuals plot. Notice that the residuals are not
symmetrically distributed about zero. They are mostly
positive with low and high values of predicted Y and mostly
negative with medium values of predicted Y. If you were to
find the means of the residuals at each level of Y and
connect those means with the line you would get a curve
with one bend. This strongly suggests that the relationship
between X and Y is not linear and you should try a
nonlinear model.
Fig.13: Graph normal% probability vsstudentizedresidual
Notice that the problem is not apparent when we look at the
marginal distribution of the residuals. Following any
modeling procedure, it is a good idea to assess the validity
of your model. Residuals and diagnostic statistics allow you
to identify patterns that are either poorly fit by the model,
have a strong influence upon the estimated parameters, or
which have a high leverage. The significant factors A, B, C,
D, AB, AC, AD, BC, BD. Values of ‘‘p-value>F’’ less than
0.0500 shows model terms are statistically significant at
95% confidence level. Perturbation curve shows the effect
of each process input parameter on mean cutting speed with
a common point where all four input parameters meats to
achieve max. mean cutting speed to interpret these
diagnostics jointly to understand any potential problems
with the model.

Volume 4, Issue 2(2016) 557-570 ISSN 2347 - 3258 International Journal of Advance Research and Innovation
568 IJARI
4.4.2 Predicted and Actual
Regression allows you to predict variables based on another
variable. In this we will focus on linear regression or
relationships that are linear (a line) rather than curvilinear (a
curve) in nature. Let’s begin with the example used in the
text in which mental health symptoms are predicted from
stress. Predicted Values select Unstandardizedand
Standardized. For Residuals, also select Unstandardizedand
Standardized. Now SPSS will save the predicted values of
symptoms based on the regression equation and the residual
or difference between the predicted values and actual values
of symptoms in the data file.
4.5 Dimensional Deviation and Cutting Speed
Quadratic Vs two factors interaction (2FI) has been found
the best fit model for cutting speed. From perturbation
curve, it is clear that cutting speed increases with increase in
value of Ton and current while Ton and current do not have
major effect on dimensional deviation. Dimensional
deviation decreases with increase in voltage and Toff. Using
desirability function, parameters have been predicted for
maximizing the machining speed and minimize dimensional
deviation.
Fig. 14: Graph predicted vs actual
The goal of optimization is to find a good set of conditions
that will meet the desired goal. It is not necessary that the
value of desirability is always 1.0 as the value is completely
dependent on how closely the lower and upper limits are set
relative to the actual optimum value. The set of conditions
possessing highest desirability value have been selected as
optimum conditions for maximum cutting speed and
minimum dimensional deviation. The constraints for the
optimization of cutting speed have been shown in fig 3b by
the help of ramp chart. Using Design expert (DX-9),
optimal solutions have been derived for specified design
space constraints for machining speed. Table 4 shows the
set of conditions correspond to maximum desirability value
for CS and minimum dimensional deviation.
Fig.15: Graph dimensional deviation vs cutting speed
4.6: Dimensional Deviation and Feed Rate
Here in this, graph is plotted between dimensional
deviation and feed rate which represents there
characteristics towards each other. The graph signifies that
where the feed rate is increased the dimensional deviation
also increases due to which the accuracy is the reduced.
Fig.16: Graph dimensional deviation vs feed rate
4.7: Relationship between Dimensional Deviation
and Depth of Cut
The experiments carried out during the reported work
include cutting specimens by varying cutting parameters
like Power and Depth of cut. The set of data obtained was
useful in developing a model for predicting depth of cut for
single pass cutting for various combinations of speed and
power.
It was found that depth of cut increases with increase in
power whereas depth of cut decreases with increase in
speed. The variation of predicted model from the actual one
may be due to the evaporation of material and getting
settled back during the experiment. The variation in depth

Volume 4, Issue 2(2016) 557-570 ISSN 2347 - 3258 International Journal of Advance Research and Innovation
569 IJARI
data may be due to ineffective utilization of blower system.
Since the specimens consist of blind holes, the removed
material during machining may get settled down before
evaporation by the blower and cause uncertainty in data.
4.8: 3 Dimensional Deviation Feed and Speed
Here in this, 3D graph the dimensional deviation, depth of
cut and feed rate which represents there characteristics
towards each other. The graph signifies that when the feed
rate and depth of cut increases the dimensional deviation
also increases due to which the accuracy is the reduced.
Fig.17: Graph dimensional deviation vs depth of cut
Fig.18: 3D Graph dimensional deviation, feed and speed
4.9 - 3 Dimensional Deviation, Doc and Speed
Here in this, 3D graph the dimensional deviation, depth of
cut and speed which represents there characteristics towards
each other. The graph signifies that when the speed and
depth of cut increases the dimensional deviation also
increases due to which the accuracy is the reduced.
Fig.19: 3D deviation, doc and speed
Conclusions
In the present investigation, it was observed that maximum
mechanical properties were obtained for AA6351/7.5% Al 2
O 3. The optimum process parameters were found to be
cutting speed 90.00, feed rate of 0.15 and depth of cut of
0.18 to achieve minimum dimensional deviation 1.12323
with the desirability equals to 0.950. In the present
investigation, it was observed that maximum mechanical
properties were obtained for AA6351/7.5% Al 2 O 3. The
optimum process parameters were found to be cutting speed
90.00, feed rate of 0.15 and depth of cut of 0.18 to achieve
minimum dimensional deviation 1.12323 with the
desirability equals to 0.950.
References
[1.] Thiagarajan Rajmohan, Kayaroganam Palanikumar,
“Application of the central composite design in optimization
of machining parameters in drilling hybrid metal matrix
composites” ,Measurement 46, 2013, 1470–1481.
[2.] S. Naher , D. Brabazon , L. Looney, “Computational and
experimental analysis of particulate distribution during Al–
SiC MMC fabrication”, Composites: Part A 38, 2007, 719–
729.
[3.] S.Tzamtzis , N.S. Barekar , N. HariBabu , J. Patel , B.K.
Dhindaw , Z. Fan, “Processing of advanced Al/SiC
particulate metal matrix composites under intensive
shearing – A novel Rheo-process”, Composites: Part A 40,
2009, 144–151.
[4.] S.K. Chaudhury, A.K. Singh, C.S. Sivaramakrishnan, S.C.
Panigrahi, “Wear and friction behavior of spray formed and
stir cast Al–2Mg–11TiO2 composites”, Wear 258, 2005,
759–767.
[5.] D. Mandal, B.K. Dutta, S.C. Panigrahi, “Wear properties of
copper-coated short steel fiber reinforced stir cast Al–2Mg
alloy composites”, Wear 265, 2008, 930–939.
[6.] M. BakiKaramıs,Fehmi Nair, “Effects of reinforcement
particle size in MMCs on extrusion die wear”, Wear 265,
2008, 1741–1750.
[7.] T.V.S. Reddy, D.K. Dwivedi, N.K. Jain, “Adhesive wear of
stir cast hypereutectic Al–Si–Mg alloy under reciprocating
sliding conditions”, Wear 266, 2009, 1–5.
[8.] Luca Casamichele, FabrizioQuadrini , Vincenzo Tagliaferri,
“Non-destructive evaluation of local mechanical properties

Volume 4, Issue 2(2016) 557-570 ISSN 2347 - 3258 International Journal of Advance Research and Innovation
570 IJARI
of Al die cast large components by means of FIMEC
indentation test” , Measurement 40, 2007, 892–897.
[9.] M. Emamy, M. Mahta, J. Rasizadeh, “Formation of TiB2
particles during dissolution of TiAl3 in Al–TiB2 metal
matrix composite using an in situ technique”, Composites
Science and Technology 66, 2006, 1063–1066.
[10.] X.J. Wang, K. Wu, W.X. Huang, H.F. Zhang, M.Y. Zheng,
D.L. Peng, “Study on fracture behavior of particulate
reinforced magnesium matrix composite using in situ
SEM”, Composites Science and Technology 67, 2007,
2253–2260.
[11.] T.P.D. Rajan, R.M. Pillai, B.C. Pai, K.G. Satyanarayana,
P.K. Rohatgi, “Fabrication and characterisation of Al–7Si–
0.35Mg/fly ash metal matrix composites processed by
different stir casting routes”, Composites Science and
Technology 67,2007, 3369–3377.
[12.] L. Ceschini, G. Minak, A. Morri, “Forging of the
AA2618/20 vol.% Al2O3p composite: Effects on
microstructure and tensile properties”, Composites Science
and Technology 69, 2009, 1783–1789.
[13.] S. Naher, D. Brabazon, L. Looney, “Simulation of the stir
casting process”, Journal of Materials Processing
Technology 143–144, 2003, 567–571.
[14.] S.M. Olhero, J.M.F. Ferreira, “Rheological characterisation
of water-based AlN slurries for the tape casting process”,
Journal of Materials Processing Technology 169, 2005,
206–213.
[15.] S. BalasivanandhaPrabu, L. Karunamoorthy, S. Kathiresan,
B. Mohan, “Influence of stirring speed and stirring time on
distribution of particles in cast metal matrix composite”,
Journal of Materials Processing Technology 171,2006, 268–
273.
[16.] YucelBirol, “A357 thixoforming feedstock produced by
cooling slope casting”, Journal of Materials Processing
Technology 186, 2007, 94–101.
[17.] K. Mahadevan, K. Raghukandan, B.C. Pai, U.T.S. Pillai, “
Influence of precipitation hardening parameters on the
fatigue strength of AA 6061-SiCp composite”, journal of
materials processing technology 198, 2008, 241–247.
[18.] Mohamed A. Taha, Nahed A. El-Mahallawy, Ahmed M. El-
Sabbagh, “Some experimental data on workability of
aluminiumparticulate-reinforced metal matrix
composites”,journal of materials processing technology 202,
2008,380–385.
[19.] T. Sornakumar, A. Senthil Kumar, “Machinability of
bronze–alumina composite with tungsten carbide cutting
tool insert, journal of materials processing technology 202,
2008, 402–405.
[20.] Arda Cetin, Ali Kalkanli, “Effect of solidification rate on
spatial distribution of SiC particles in A356 alloy
composites”, journal of materials processing technology
205, 2008, 1–8.