Embed Size (px)
Citation preview
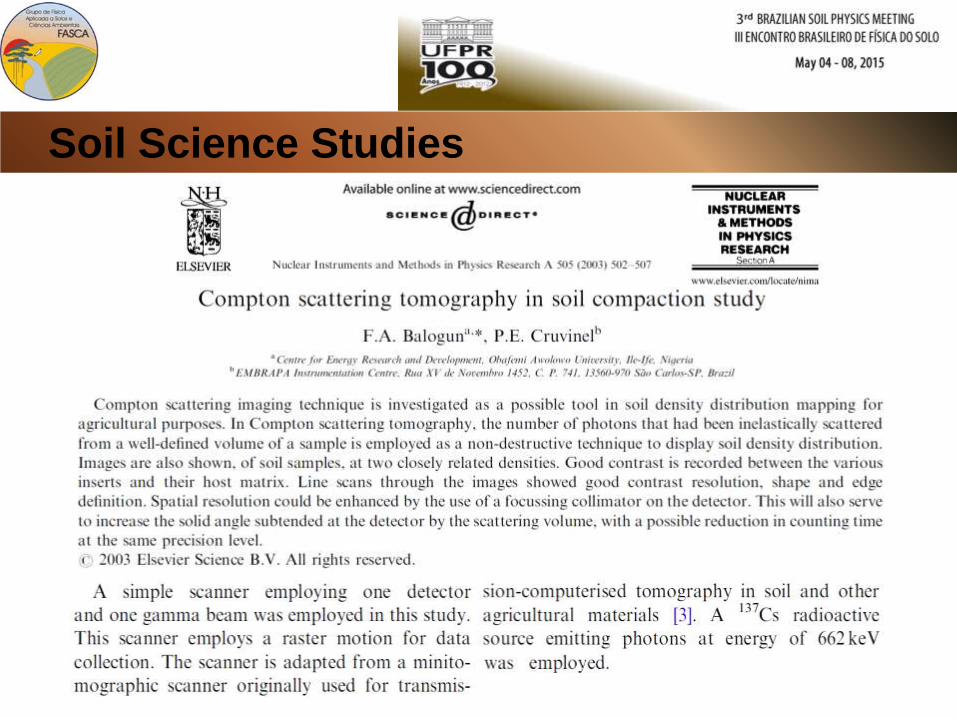
Application of computed tomography
(CT) to soil physics in Brazil from
1985-2015
Luiz Fernando Pires, Sc. D.
Laboratory of Soil Physics and Environmental Sciences, Department of Physics
State University of Ponta Grossa (UEPG), CEP 84.030-900, Ponta Grossa, PR,
Brazil – E-mail Address: [email protected]
Presentation Outline
History – X-ray, Radioactivity and CT;
Basic Concepts – Attenuation and CT;
CT Applications in Soil Physics;
Future Works;
Conclusions
HISTORICAL OVERVIEW
History
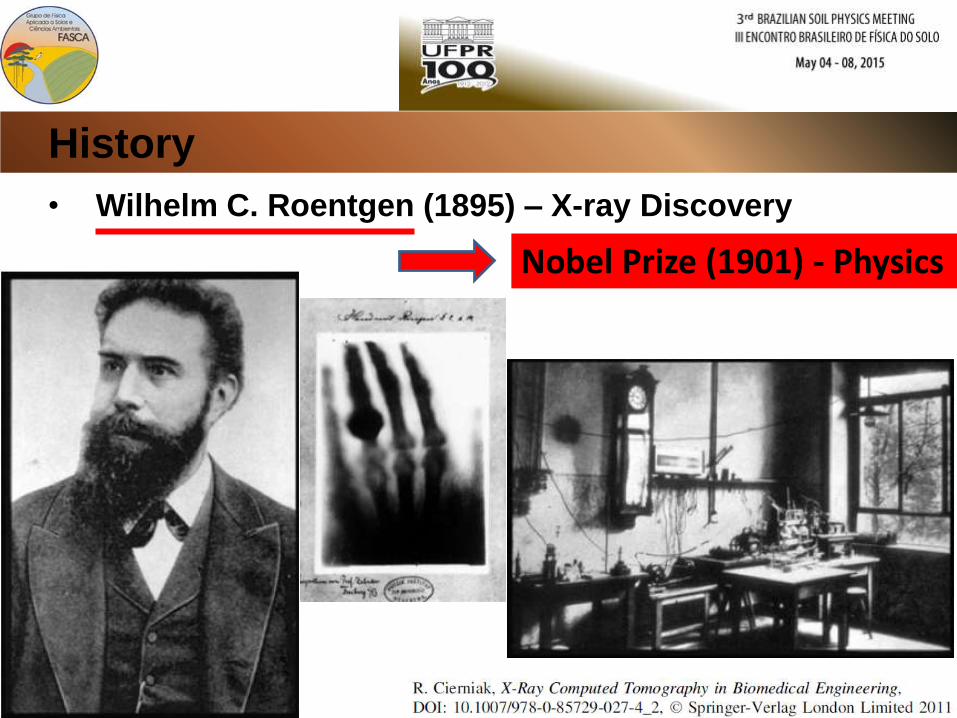
• Wilhelm C. Roentgen (1895) – X-ray Discovery
Nobel Prize (1901) - Physics
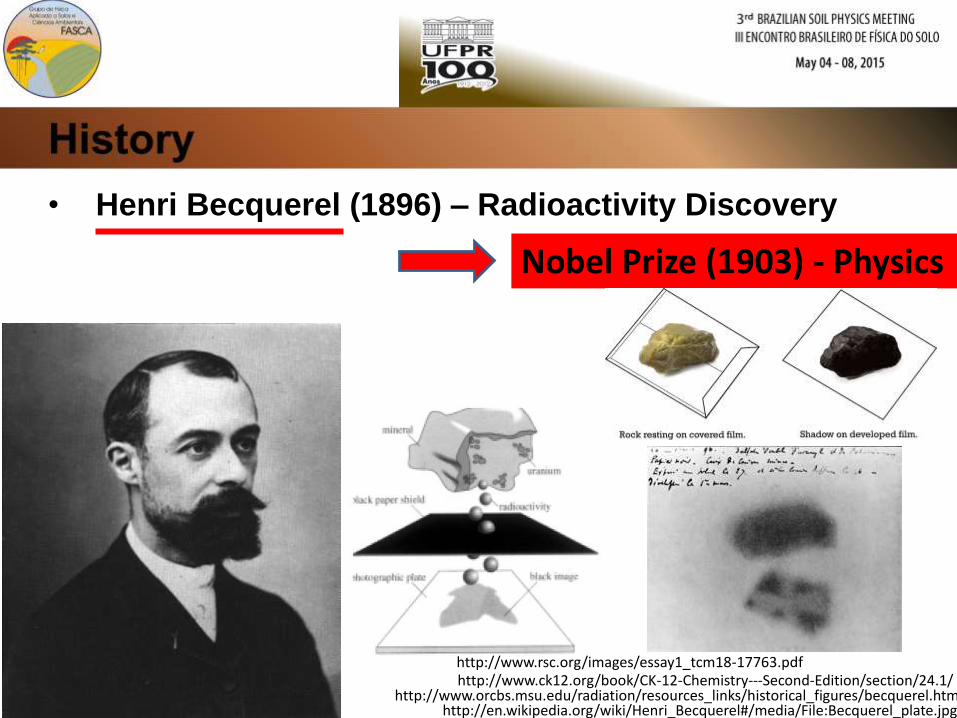
• Henri Becquerel (1896) – Radioactivity Discovery
Nobel Prize (1903) - Physics
http://www.rsc.org/images/essay1_tcm18-17763.pdfhttp://www.ck12.org/book/CK-12-Chemistry---Second-Edition/section/24.1/
http://www.orcbs.msu.edu/radiation/resources_links/historical_figures/becquerel.htmhttp://en.wikipedia.org/wiki/Henri_Becquerel#/media/File:Becquerel_plate.jpg
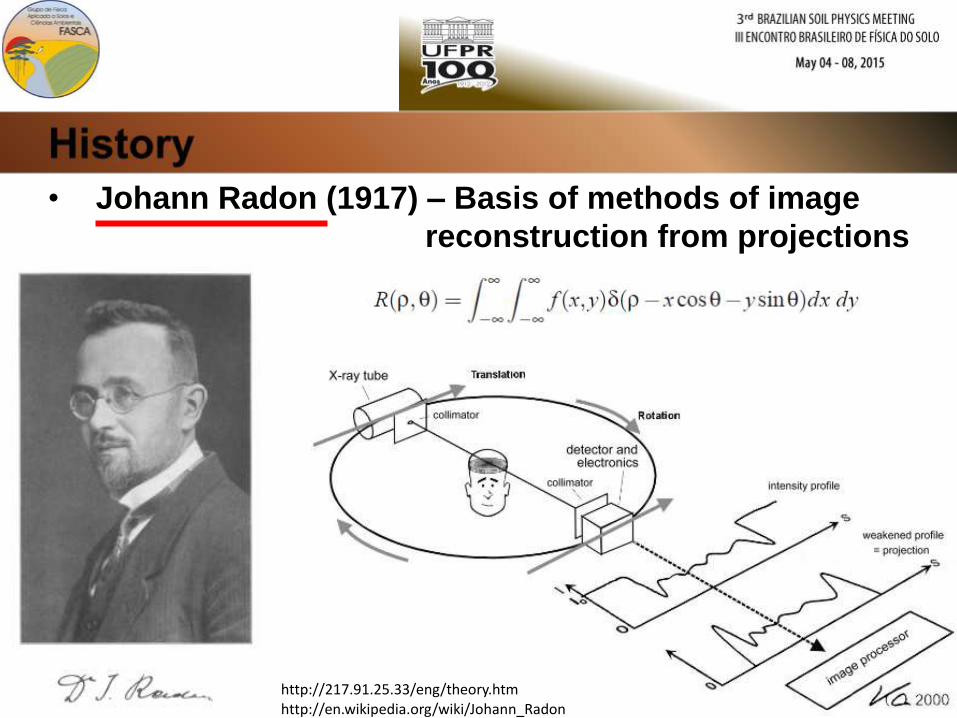
• Johann Radon (1917) – Basis of methods of image
reconstruction from projections
http://217.91.25.33/eng/theory.htmhttp://en.wikipedia.org/wiki/Johann_Radon
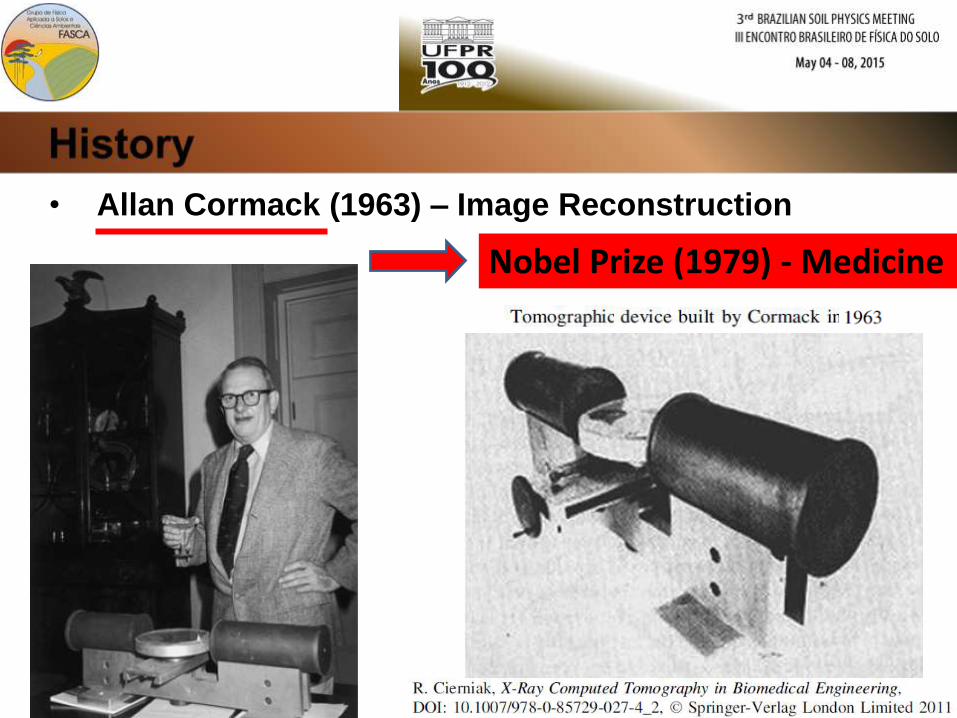
• Allan Cormack (1963) – Image Reconstruction
Nobel Prize (1979) - Medicine
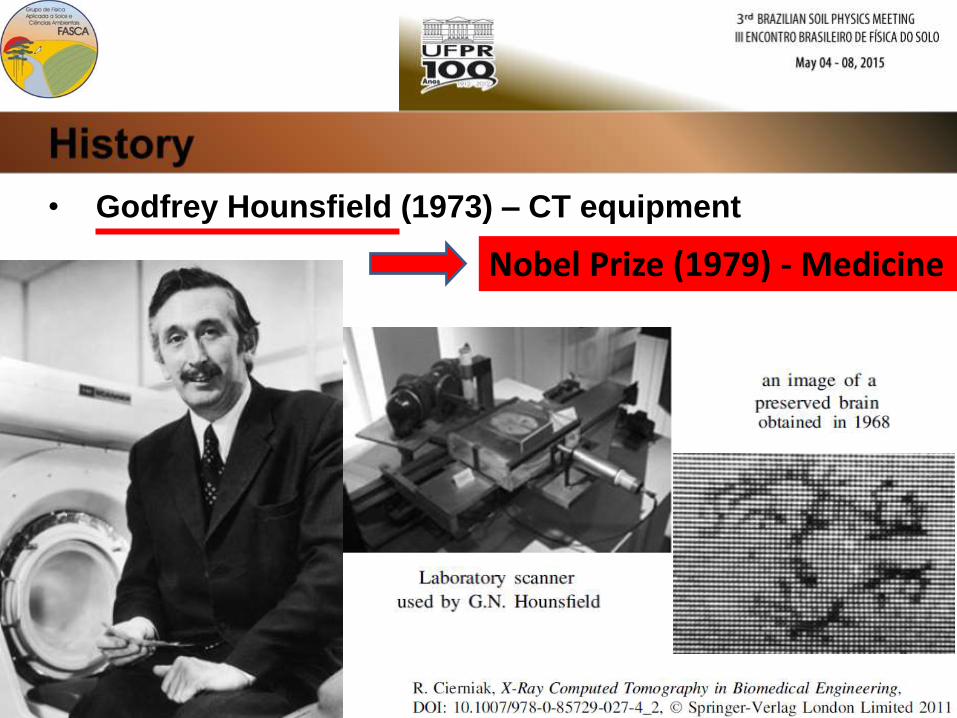
• Godfrey Hounsfield (1973) – CT equipment
Nobel Prize (1979) - Medicine
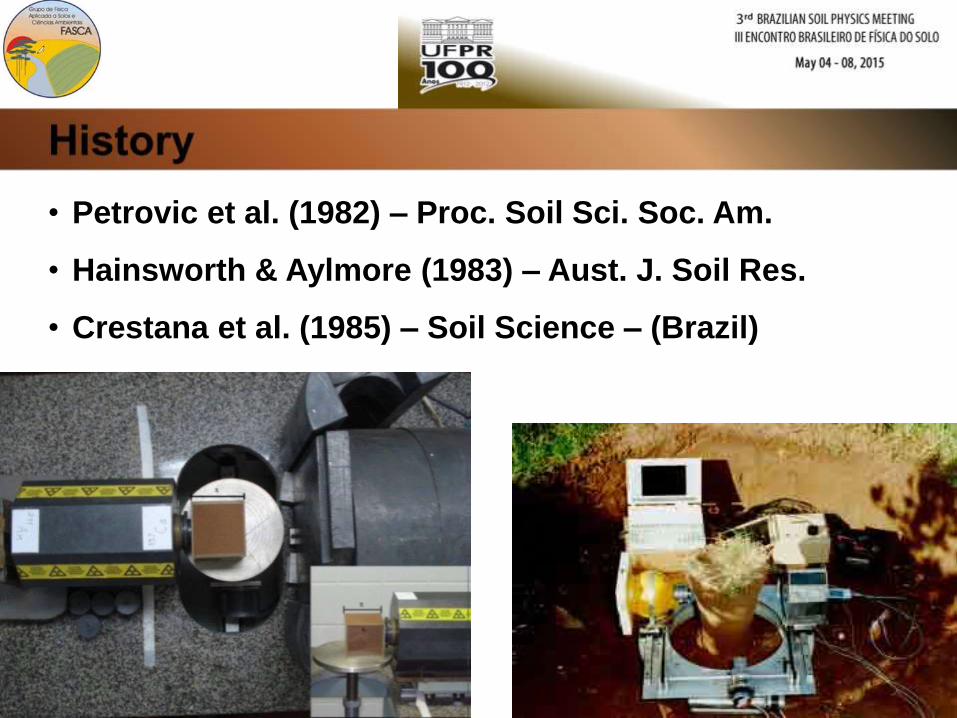
• Petrovic et al. (1982) – Proc. Soil Sci. Soc. Am.
• Hainsworth & Aylmore (1983) – Aust. J. Soil Res.
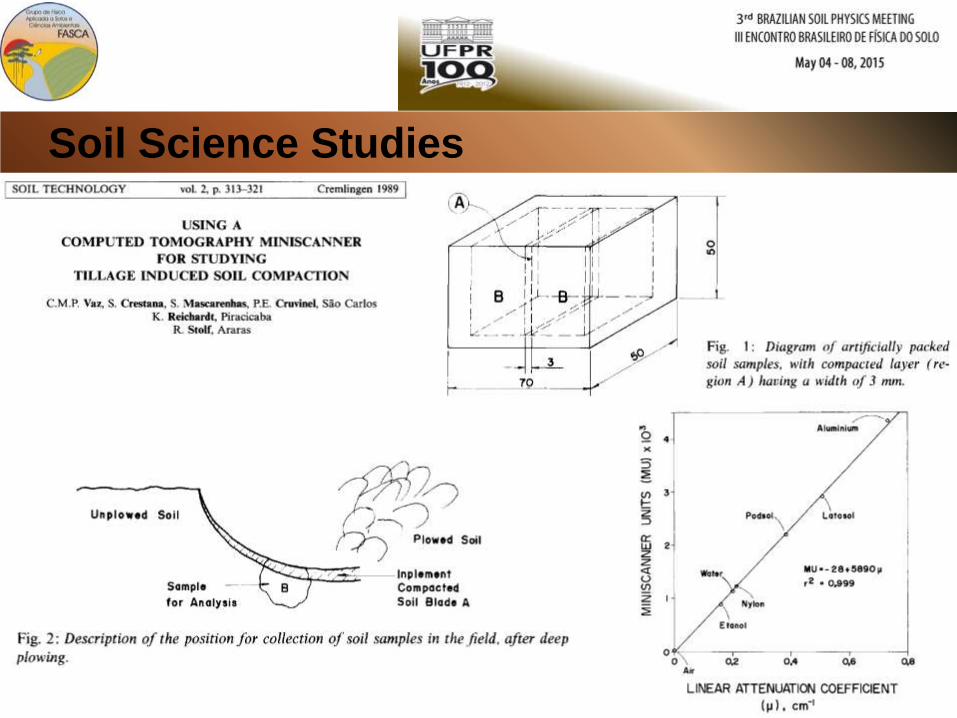
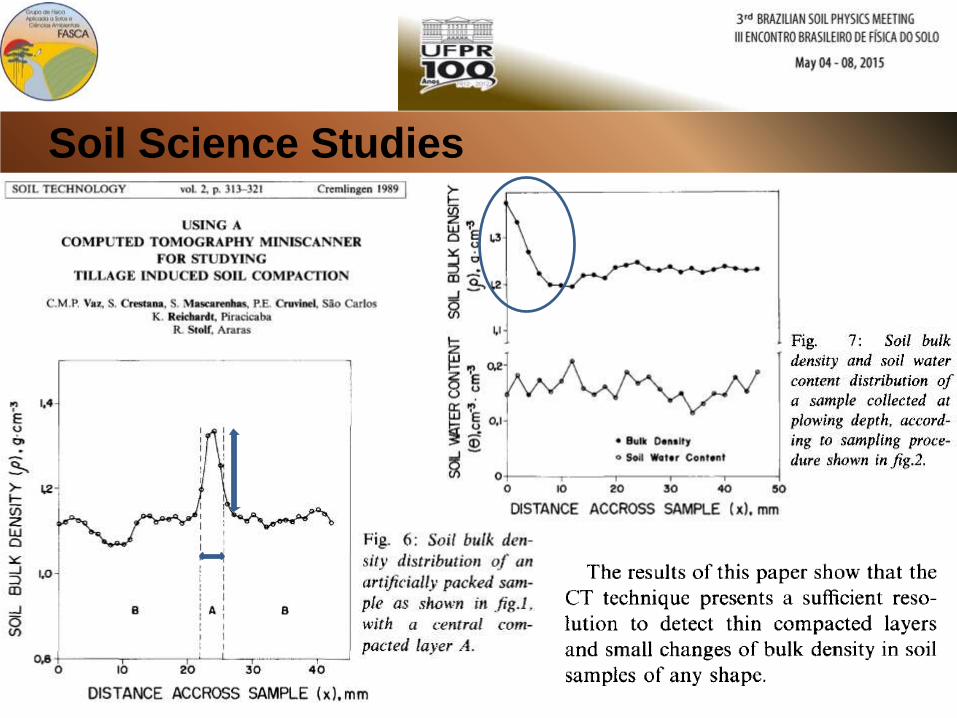
• Crestana et al. (1985) – Soil Science – (Brazil)
• Petrovic et al. (1982)
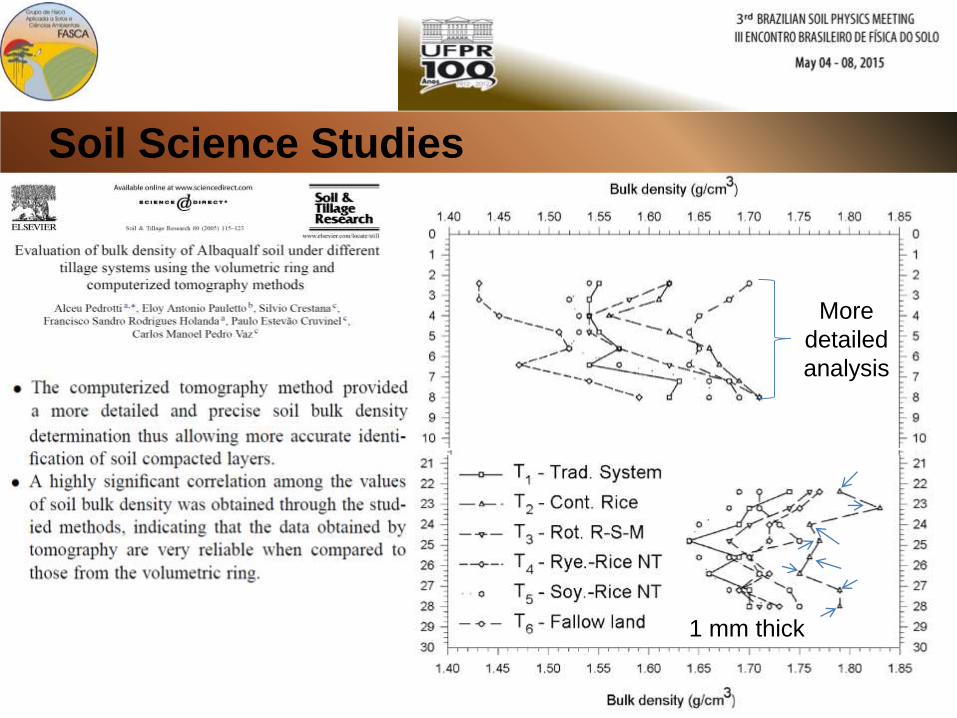
Paper: Soil Bulk Density Analysis in Three Dimensions by Computed Tomographic
Scanning, by AM Petrovic, JE Siebert and PE Rieke, Proc. Soil Sci. Soc. Am. 46(3),
445-450
“The x-ray transmission computed tomography (CT) scanner was evaluated as
a tool to determine soil bulk density. For the Metea sandy loam soil (Arenic
Hapludalfs), this CT scanner was found to have precision in the order of 19
mg/cm3. Spatial resolution or the ability to distinguish between two objects in
the scanning plane was found to range from 1.25 by 1.25 by 2 mm3 to 6.4 mm in
diameter by 2 mm. This is a potentially promising tool for research in the areas
of compaction, soil management, and cultivation.”
• Hainsworth & Aylmore (1983)
Paper: The use of computer assisted tomography to determine spatial distribution of
soil water content, by JM Hainsworth and LAG Aylmore, Australian J. Soil Res. 21(4),
435- 443
“To date no experimental technique has been capable of directly and
repetitively measuring spatial distributions of soil water content in a non-
destructive manner. The potential of computer assisted tomography (CAT) to
overcome this problem has been examined in this paper. The results obtained
from a commercially-produced X-ray CAT scanner and a conventional gamma
scanner suggest that CAT scanning can be used to determine spatial changes
in soil water content with adequate resolution for soil-plant studies.”
• Crestana et al. (1985)
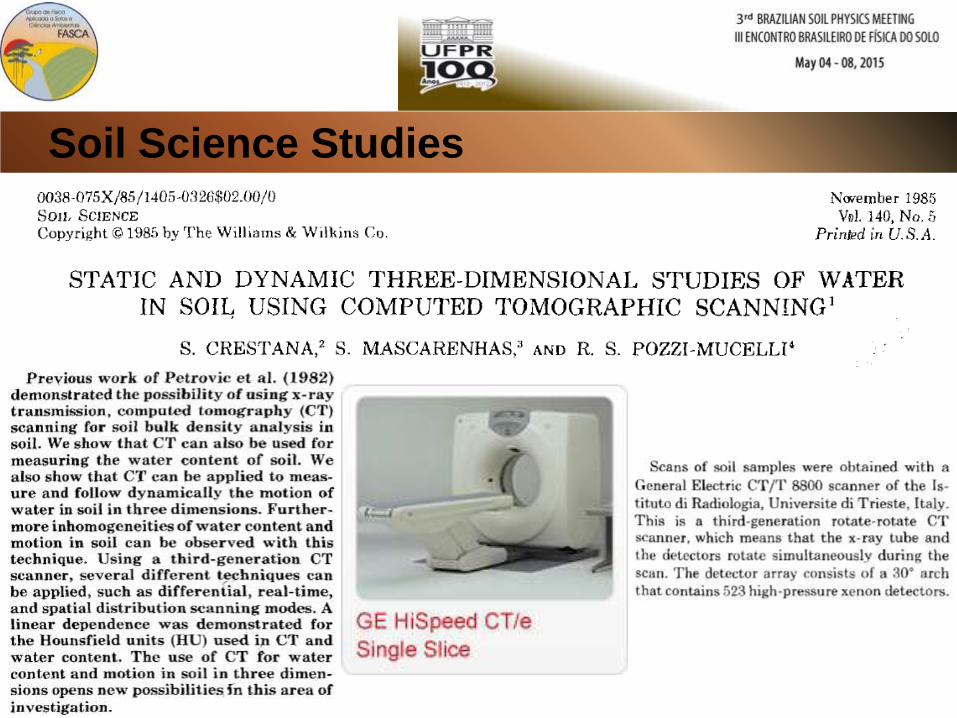
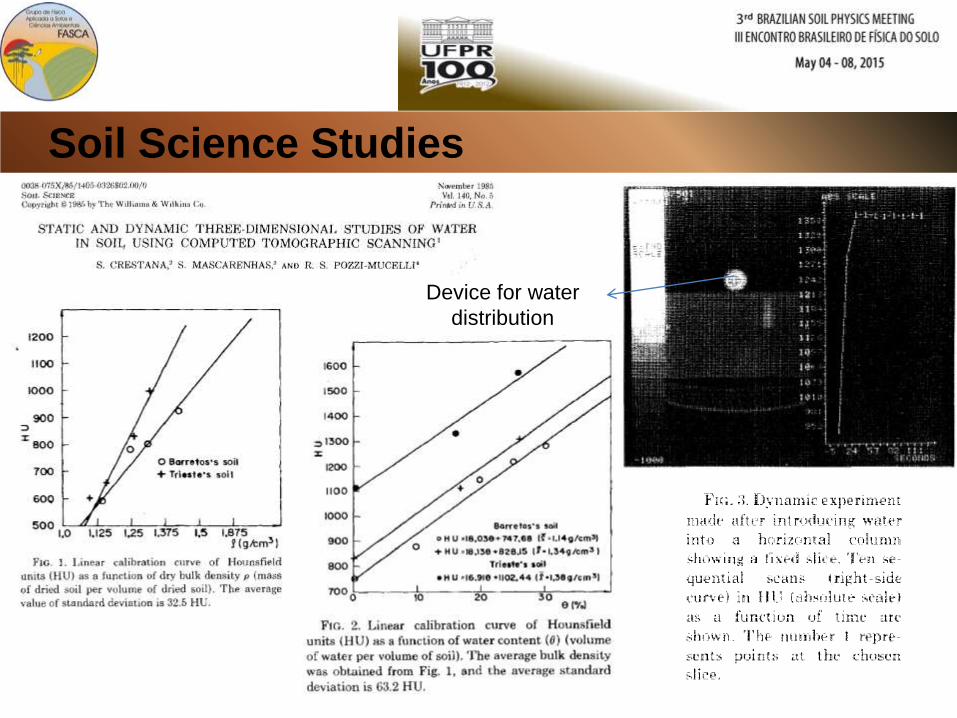
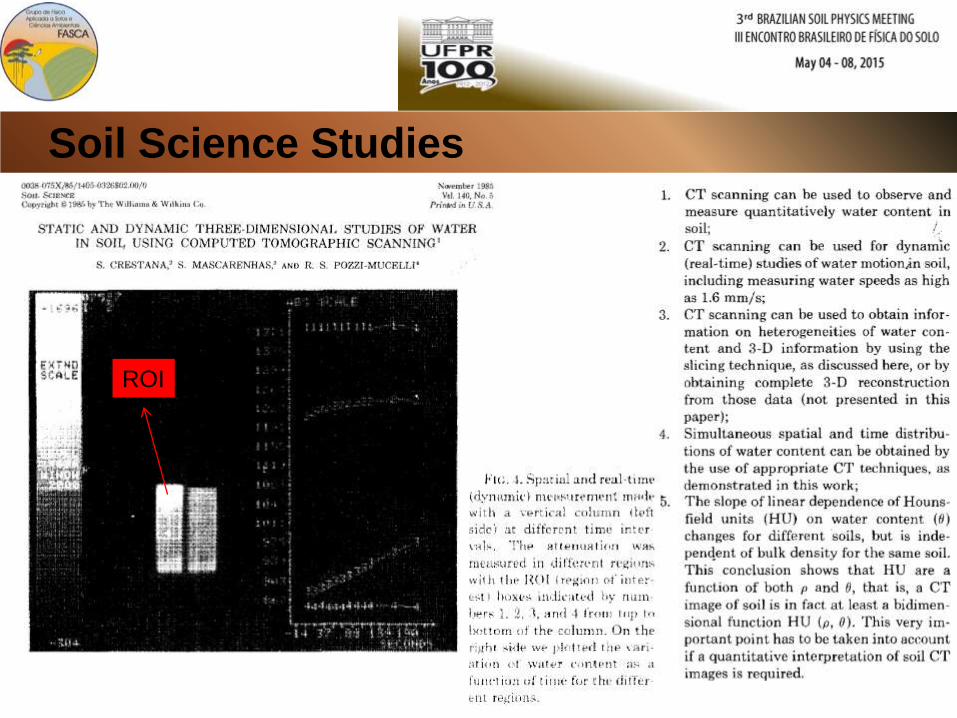
Paper: Static and dynamic three-dimensional studies of water in soil using computed
tomographic scanning, by S Crestana, S Mascarenhas, R Pozzi-Mucelli, Soil Science
140(5), 326–332.
“Previous work of Petrovic et al. (1982) demonstrated the possibility of using x-
ray transmission, computed tomography (CT) scanning for soil bulk density
analysis in soil. We show that CT can also be used for measuring the water
content of soil. We also show that CT can be applied to measure and follow
dynamically the motion of water in soil in three dimensions. The use of CT for
water content and motion in soil in three dimensions opens new possibilities in
this area of investigation.”
BASIC CONCEPTS
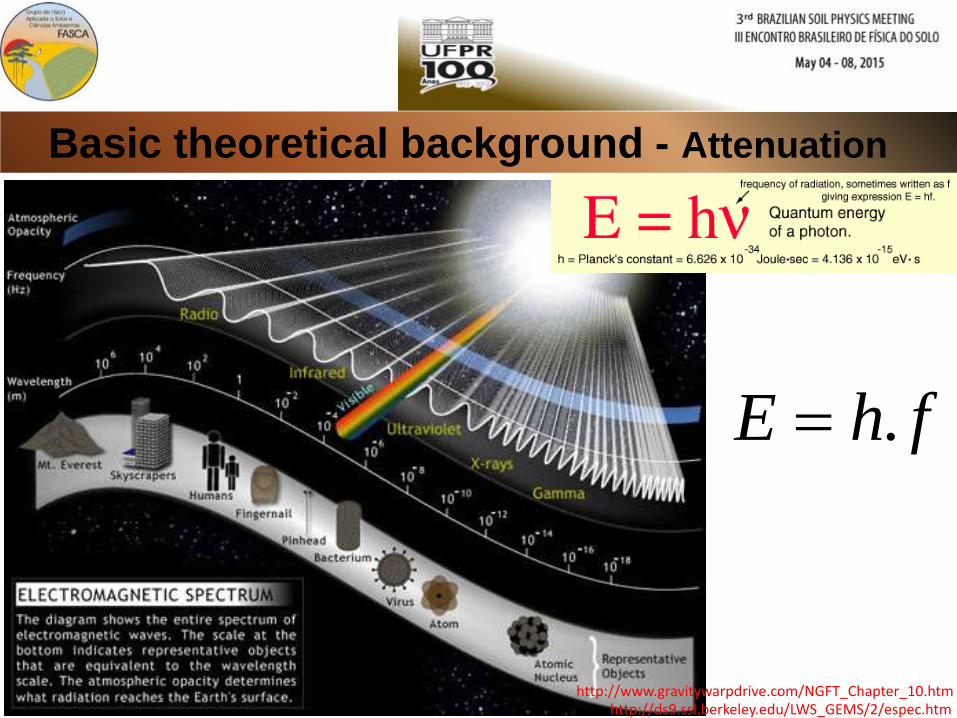
Basic theoretical background - Attenuation
fhE .
http://ds9.ssl.berkeley.edu/LWS_GEMS/2/espec.htmhttp://www.gravitywarpdrive.com/NGFT_Chapter_10.htm
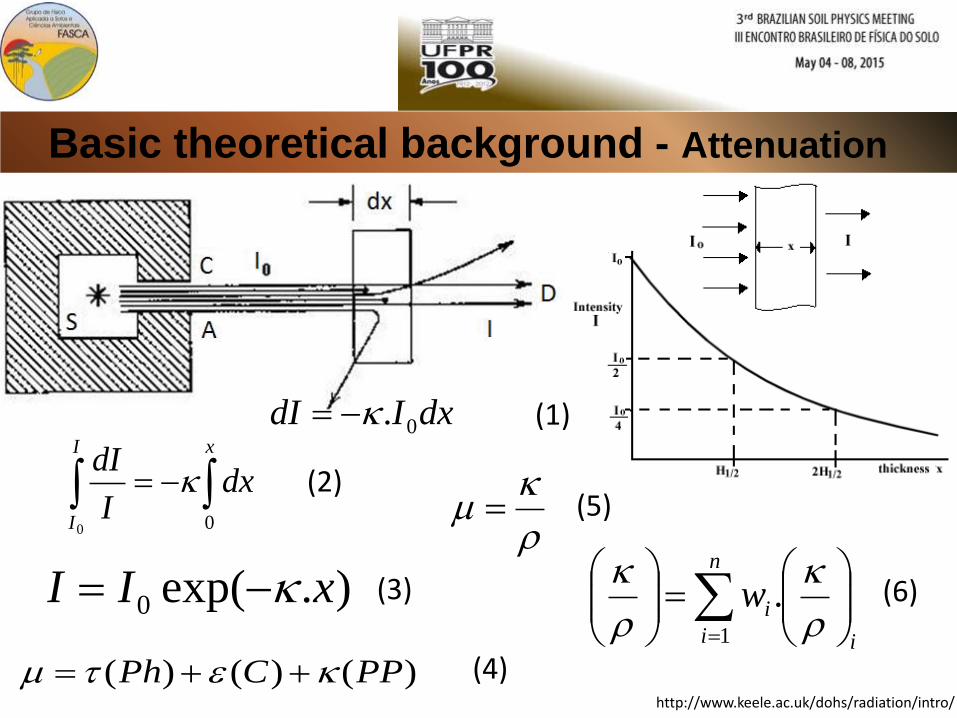
Basic theoretical background - Attenuation
(2)
I
I
x
dxI
dI
0 0
).exp(0 xII (3)
)()()( PPCPh (4)
(5)
n
i i
iw1
.
(6)
(1)dxIdI 0.
http://www.keele.ac.uk/dohs/radiation/intro/
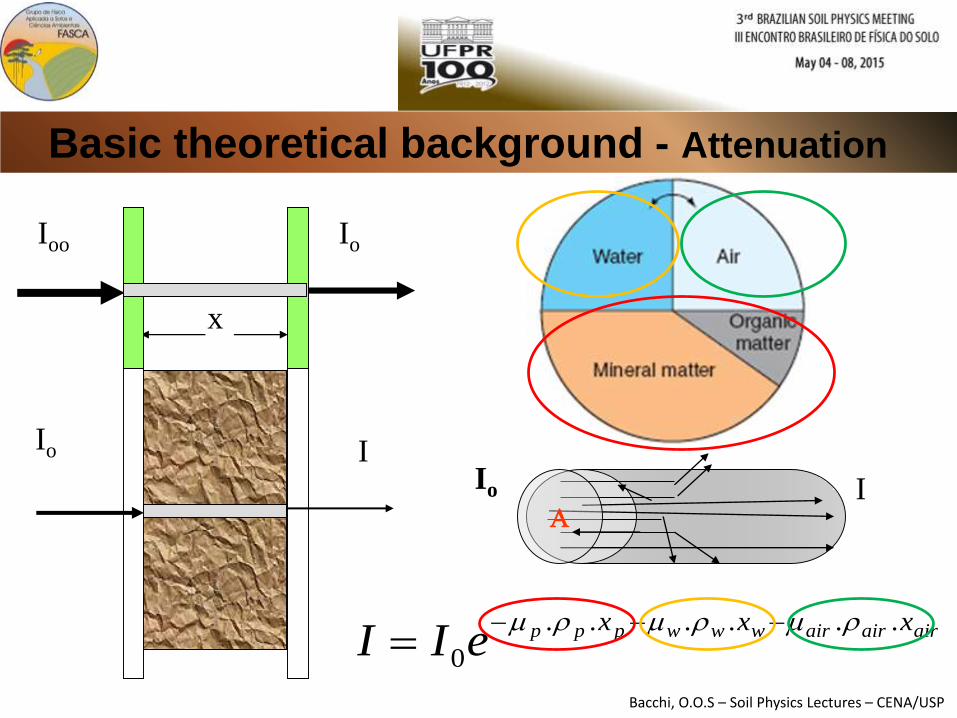
Basic theoretical background - Attenuation
x
Io I
Ioo Io
A
Io I
airairairwwwppp xxxeII
......
0
Bacchi, O.O.S – Soil Physics Lectures – CENA/USP
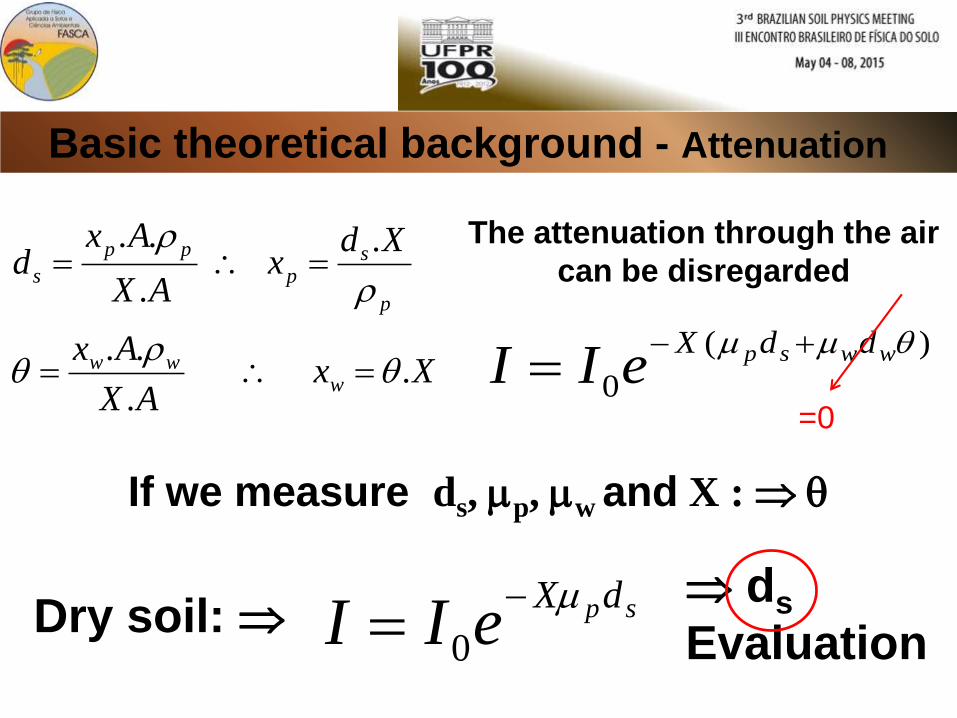
Basic theoretical background - Attenuation
XxAX
Ax
Xdx
AX
Axd
www
p
sp
pp
s
. .
..
.
.
..
The attenuation through the air
can be disregarded
)(
0
wwsp ddXeII
If we measure ds, p, w and X :
Dry soil: spdXeII
0
ds
Evaluation
=0
Basic theoretical background - Attenuation
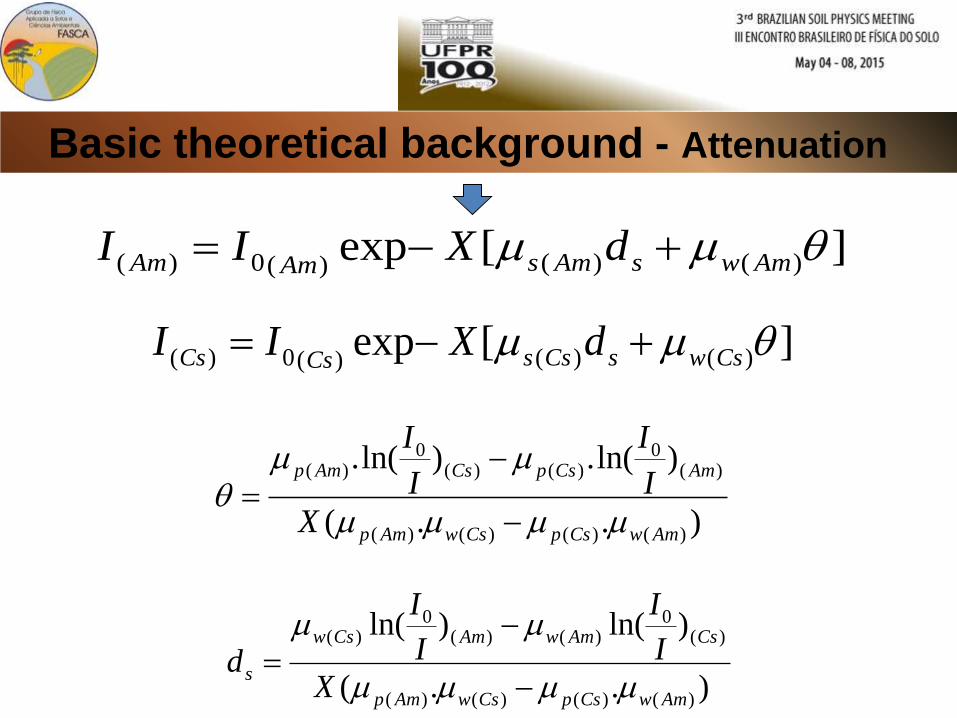
][exp )()()(0)( AmwsAmsAmAm dXII
][exp )()()(0)( CswsCssCsCs dXII
)..(
)ln(.)ln(.
)()()()(
)(0
)()(0
)(
AmwCspCswAmp
AmCspCsAmp
X
I
I
I
I
)..(
)ln()ln(
)()()()(
)(0
)()(0
)(
AmwCspCswAmp
CsAmwAmCsw
sX
I
I
I
I
d
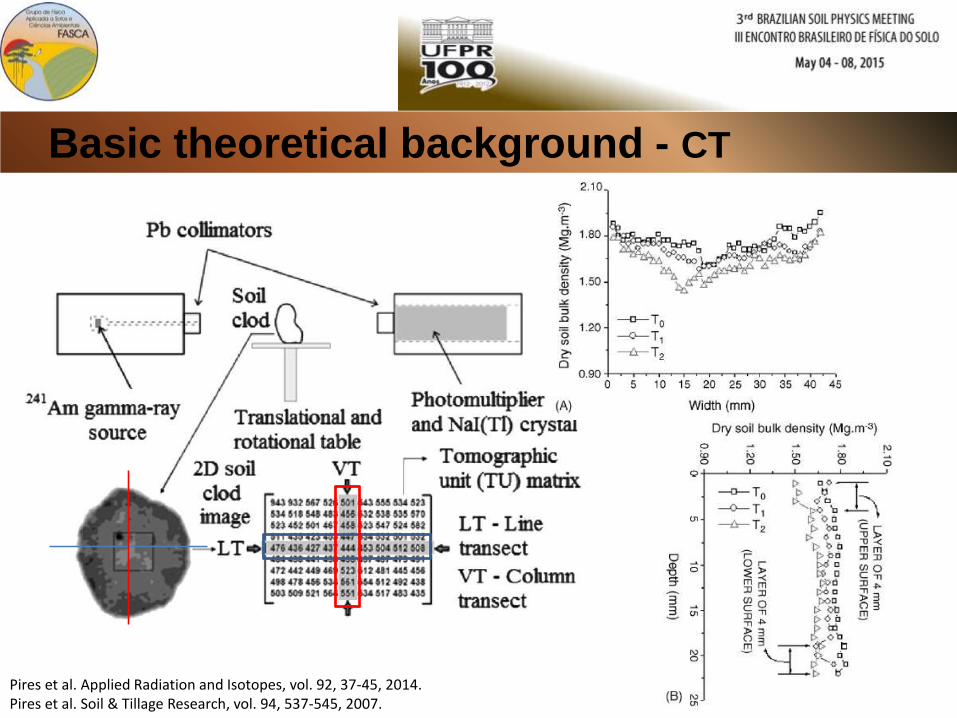
Basic theoretical background - CT
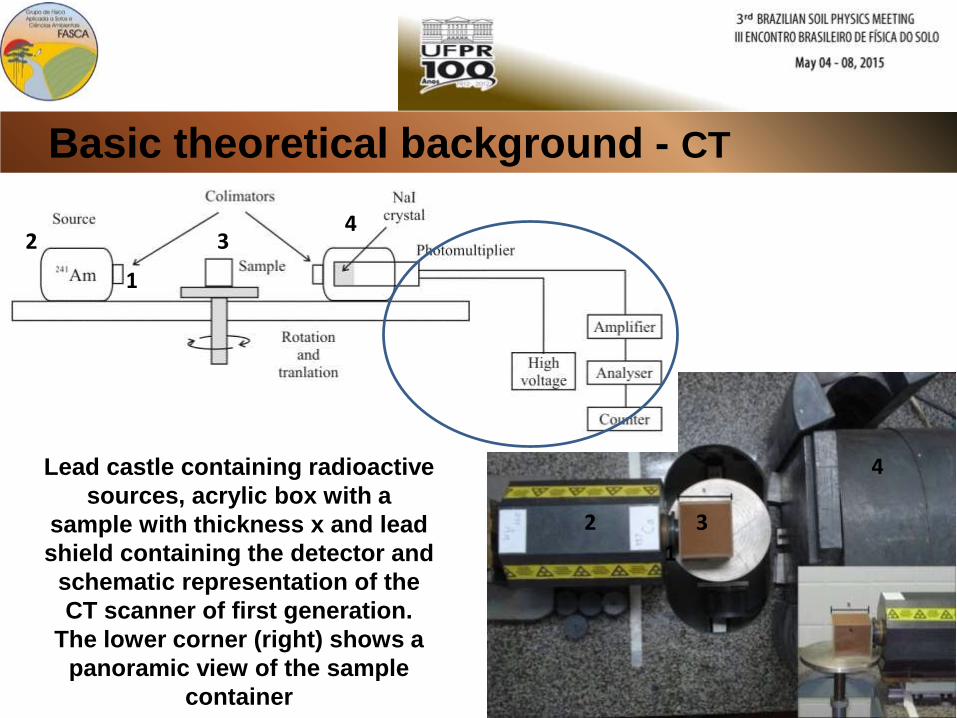
Lead castle containing radioactive
sources, acrylic box with a
sample with thickness x and lead
shield containing the detector and
schematic representation of the
CT scanner of first generation.
The lower corner (right) shows a
panoramic view of the sample
container
1
1
2
2
3
3
4
4
Basic theoretical background - CT
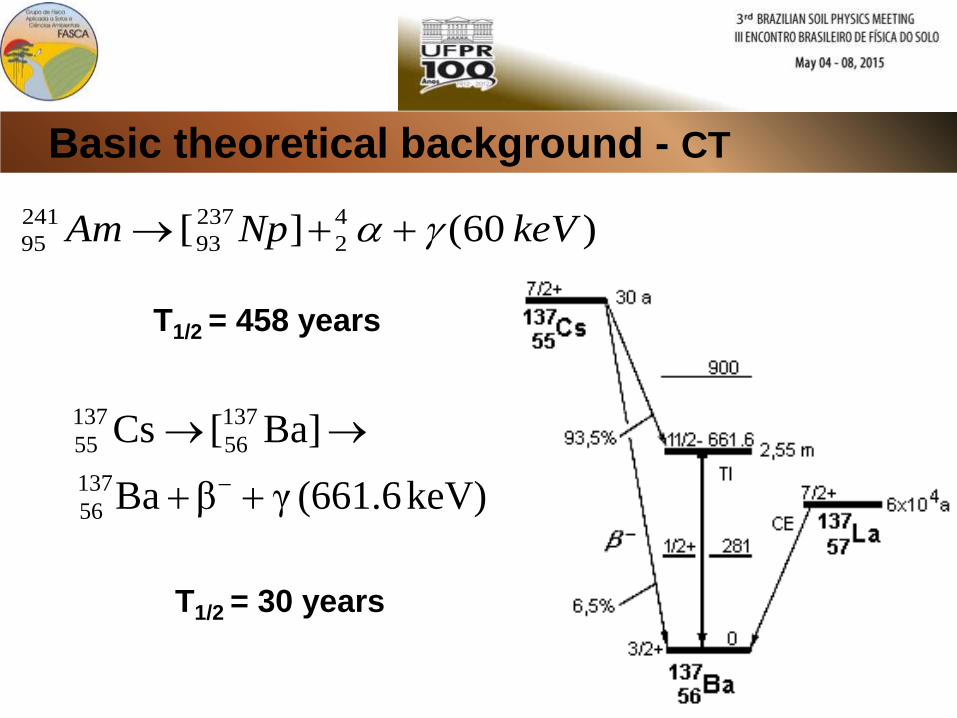
) 60(][ 4
2
237
93
241
95 keVNpAm
T1/2 = 458 years
T1/2 = 30 years
keV)(661.6γβBa
Ba][ Cs
137
56
137
56
137
55
Basic theoretical background - CT
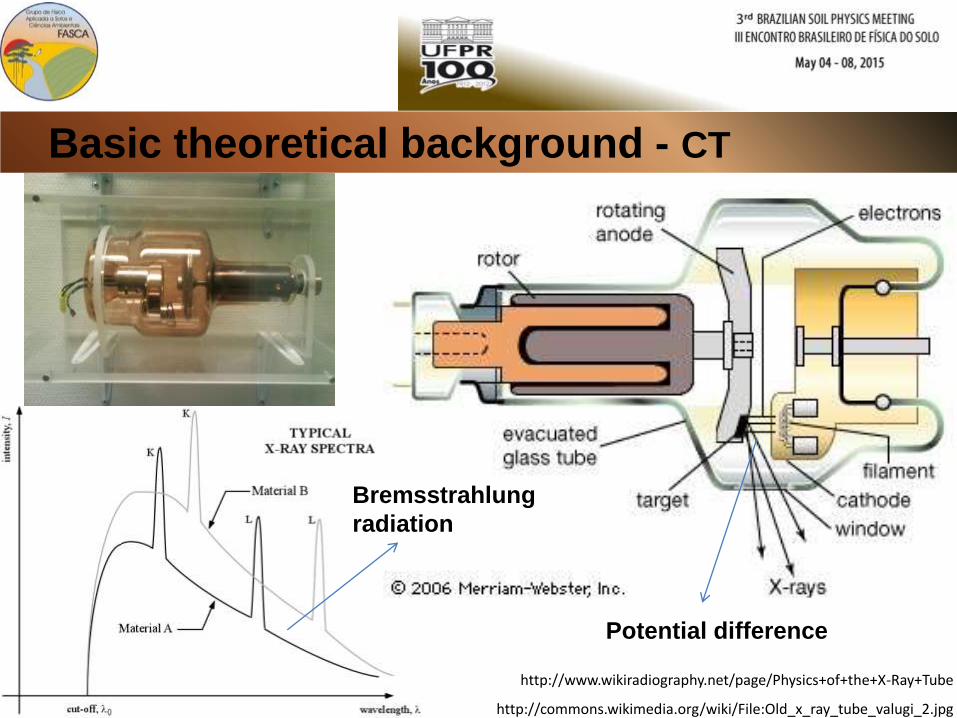
http://www.wikiradiography.net/page/Physics+of+the+X-Ray+Tube
http://commons.wikimedia.org/wiki/File:Old_x_ray_tube_valugi_2.jpg
Potential difference
Bremsstrahlung
radiation
Basic theoretical background - CT
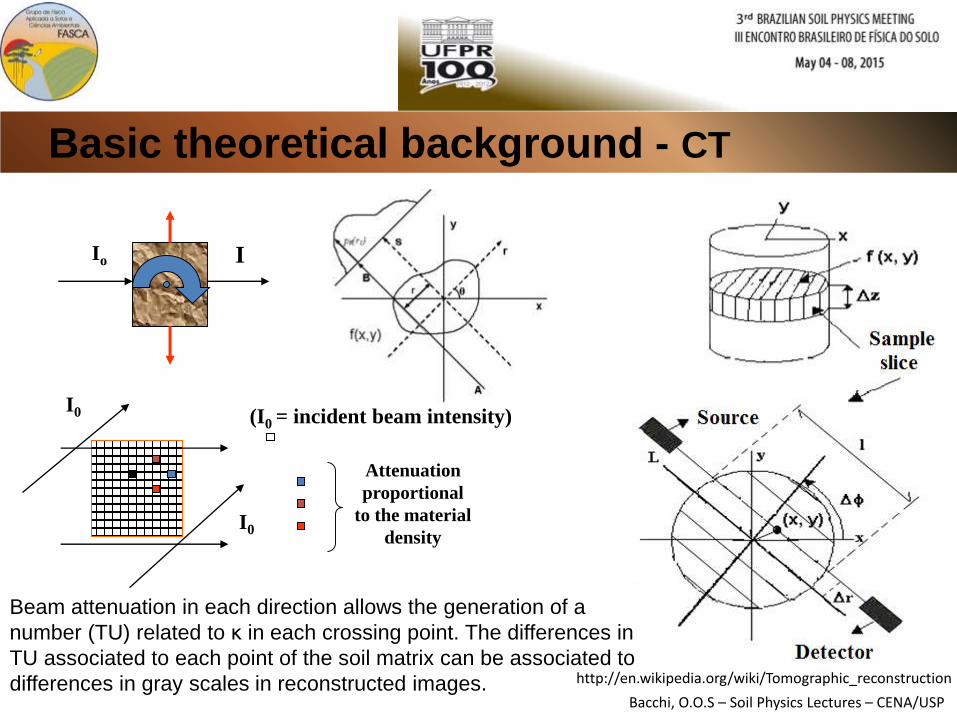
Io I
(I0 = incident beam intensity)I0
I0
Attenuation
proportional
to the material
density
Bacchi, O.O.S – Soil Physics Lectures – CENA/USP
http://en.wikipedia.org/wiki/Tomographic_reconstruction
Beam attenuation in each direction allows the generation of a
number (TU) related to κ in each crossing point. The differences in
TU associated to each point of the soil matrix can be associated to
differences in gray scales in reconstructed images.
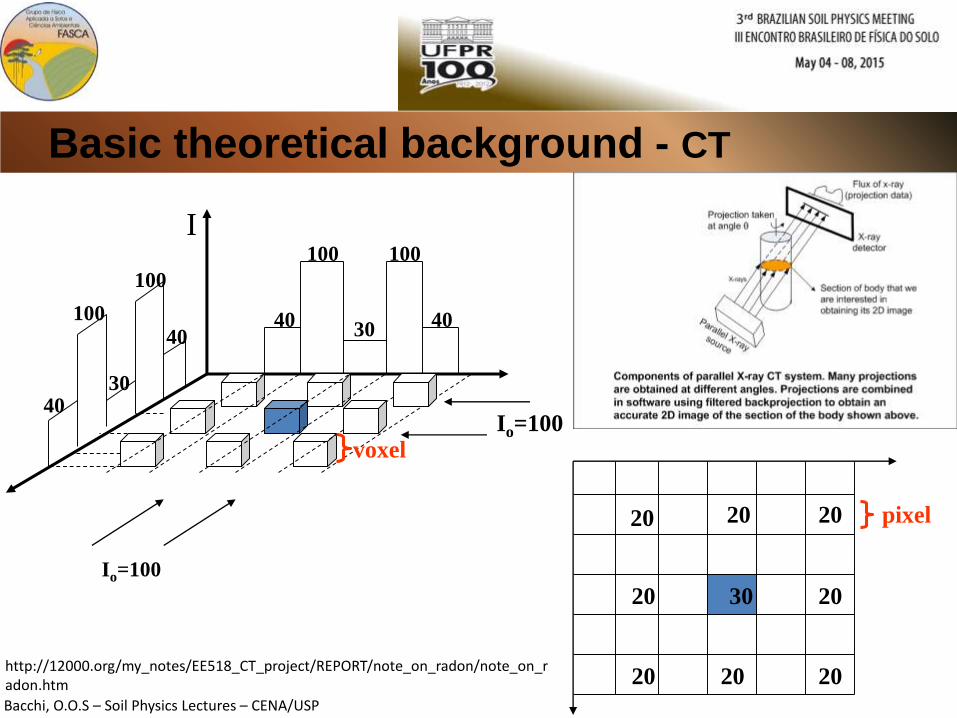
Basic theoretical background - CT
Io=100
I
40
40
100
100
30
100 100
304040
Io=100
voxel
20
20
20
20 20
20
20 20
30
pixel
http://12000.org/my_notes/EE518_CT_project/REPORT/note_on_radon/note_on_radon.htm
Bacchi, O.O.S – Soil Physics Lectures – CENA/USP
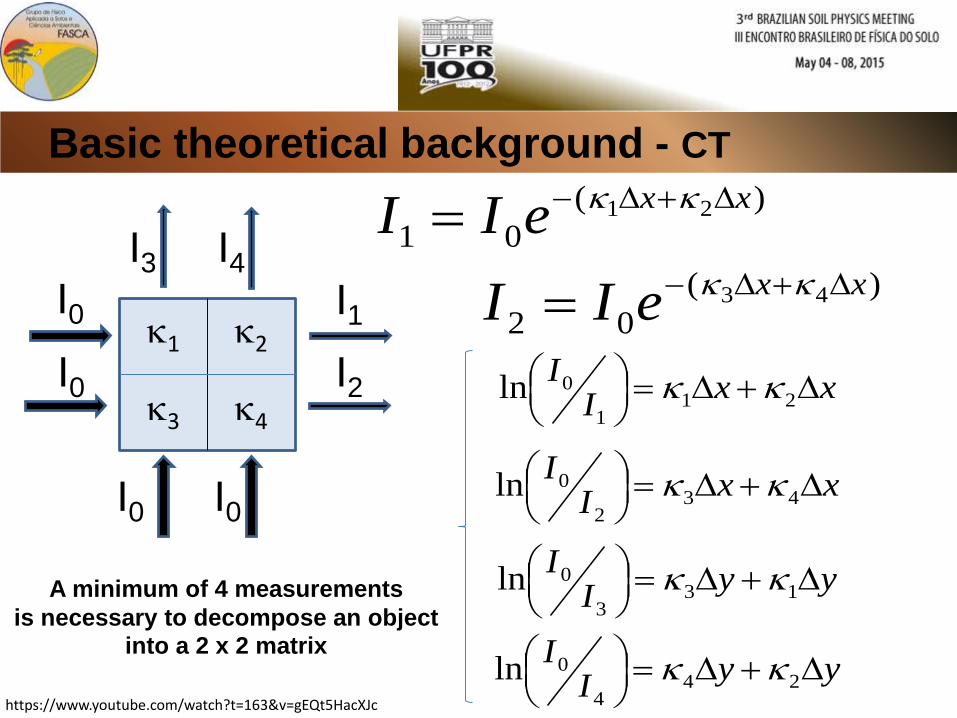
Basic theoretical background - CT
1 2
3 4
I0 I1
I0 I2
)(
0121 xx
eII
I0 I0
I3 I4)(
0243 xx
eII
xxI
I
21
1
0ln
xxI
I
43
2
0ln
yyI
I
13
3
0ln
yyI
I
24
4
0ln
A minimum of 4 measurements
is necessary to decompose an object
into a 2 x 2 matrix
https://www.youtube.com/watch?t=163&v=gEQt5HacXJc
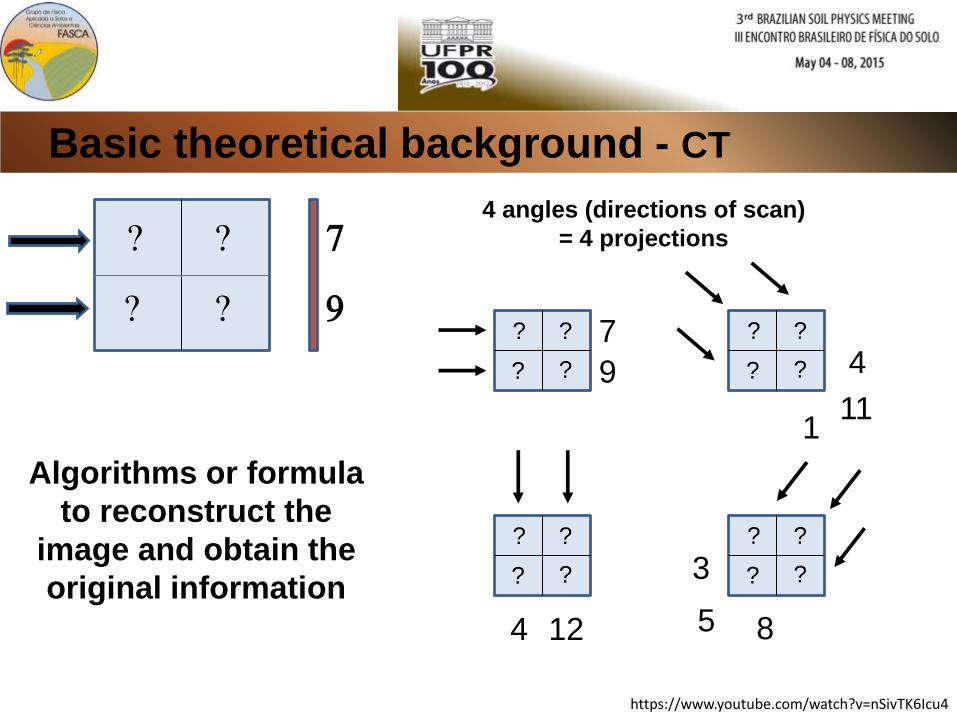
Basic theoretical background - CT
? ?
? ?
7
9
4 angles (directions of scan)
= 4 projections
? ?
? ?
7
9
? ?
? ? 4
111
? ?
? ?
124
? ?
? ?
5 8
3
Algorithms or formula
to reconstruct the
image and obtain the
original information
https://www.youtube.com/watch?v=nSivTK6Icu4
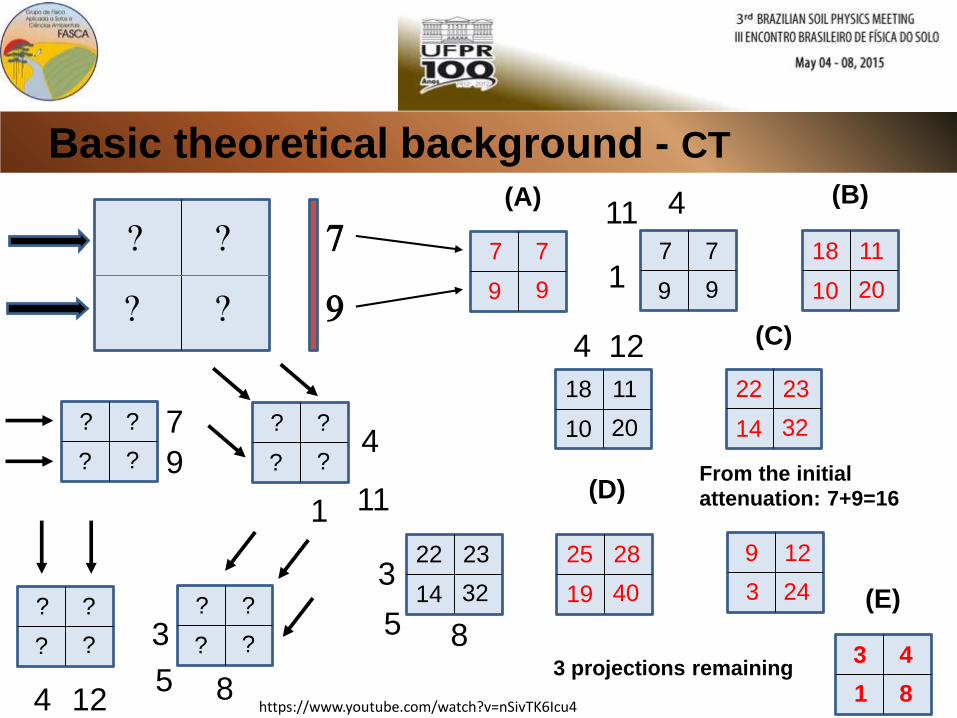
Basic theoretical background - CT
? ?
? ?
7
9
? ?
? ?
7
9
? ?
? ?4
111
? ?
? ?
124
? ?
? ?
5 8
3
7 7
9 9
(A)
7 7
9 9
411
1
(B)
18 11
10 20
18 11
10 20
124 (C)
22 23
14 32
22 23
14 323
5 8
(D)
25 28
19 40
From the initial
attenuation: 7+9=16
9 12
3 24
3 projections remaining
(E)
3 4
1 8https://www.youtube.com/watch?v=nSivTK6Icu4
Basic theoretical background - CT
0.0 0.1 0.2 0.3 0.4 0.5 0.60.0
0.1
0.2
0.3
0.4
0.5
0.6
Soil 3Soil 2
Soil 1
Air
Glycerin
Nylon
WaterAlcohol
Acrylic
TU
l (cm
-1)
Experimental Data
Linear Fit
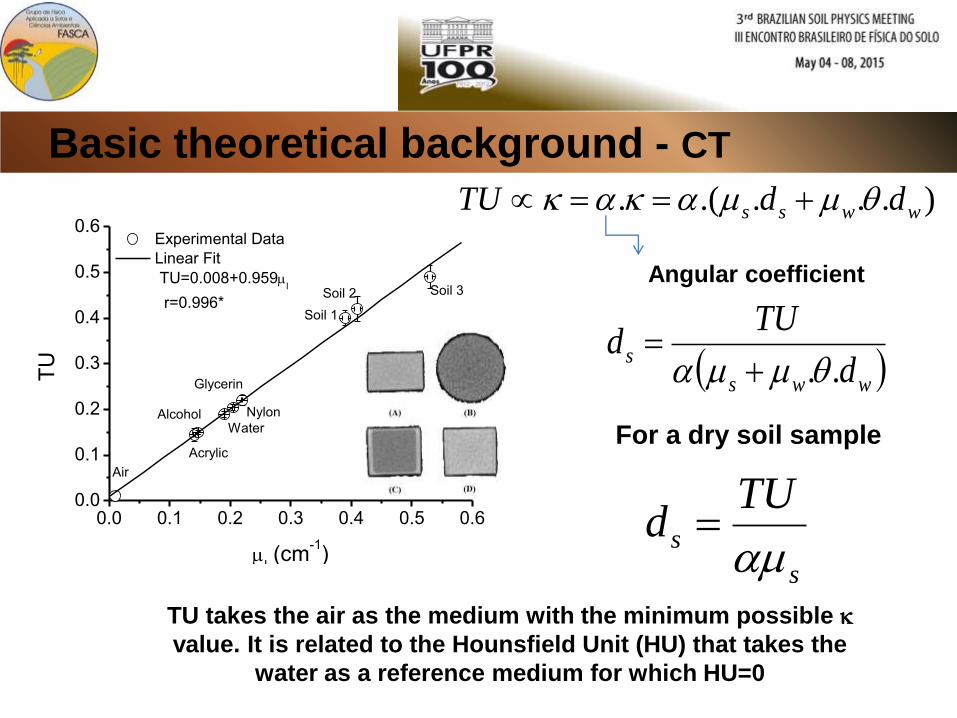
TU=0.008+0.959l
r=0.996*
)....(. wwss ddTU
wws
sd
TUd
..
For a dry soil sample
s
s
TUd
TU takes the air as the medium with the minimum possible
value. It is related to the Hounsfield Unit (HU) that takes the
water as a reference medium for which HU=0
Angular coefficient
Basic theoretical background - CT
Pires et al. Applied Radiation and Isotopes, vol. 92, 37-45, 2014.Pires et al. Soil & Tillage Research, vol. 94, 537-545, 2007.
SOME APPLICATIONS
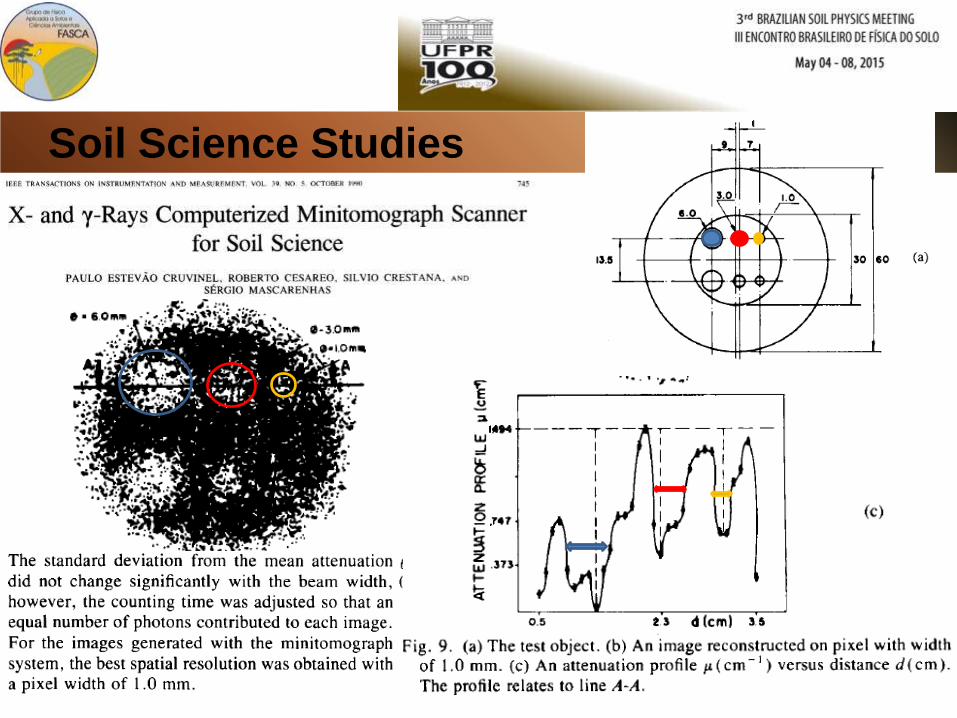
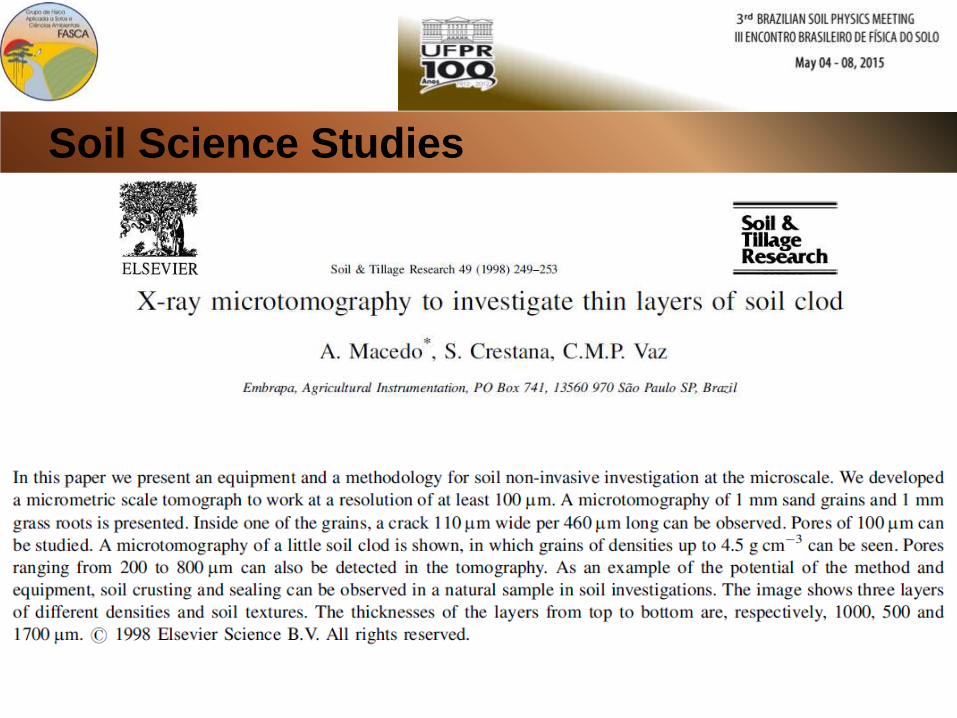
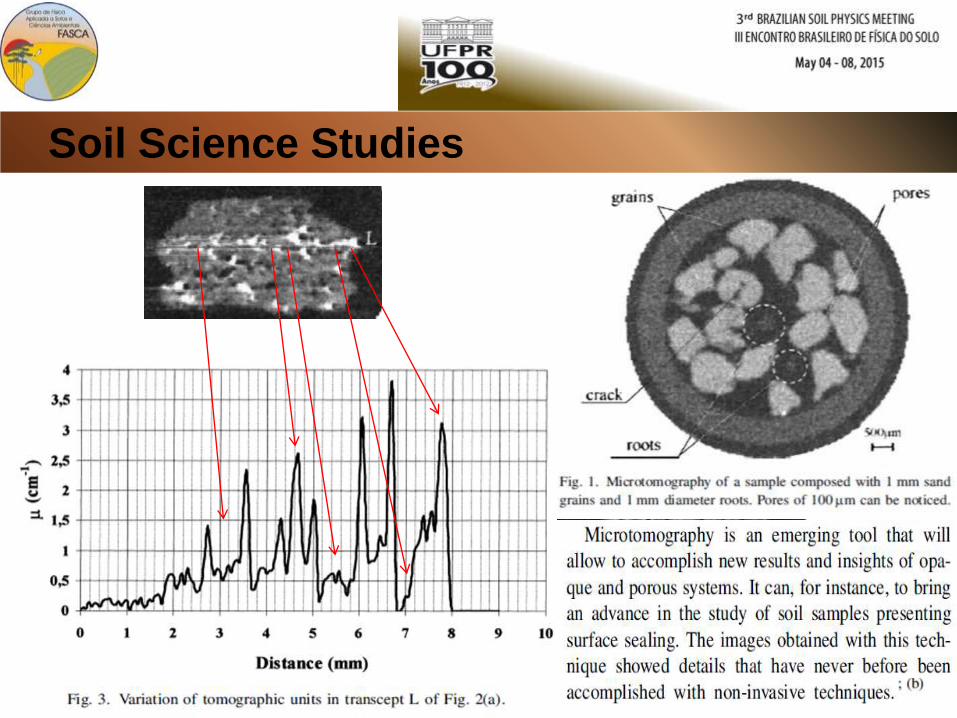
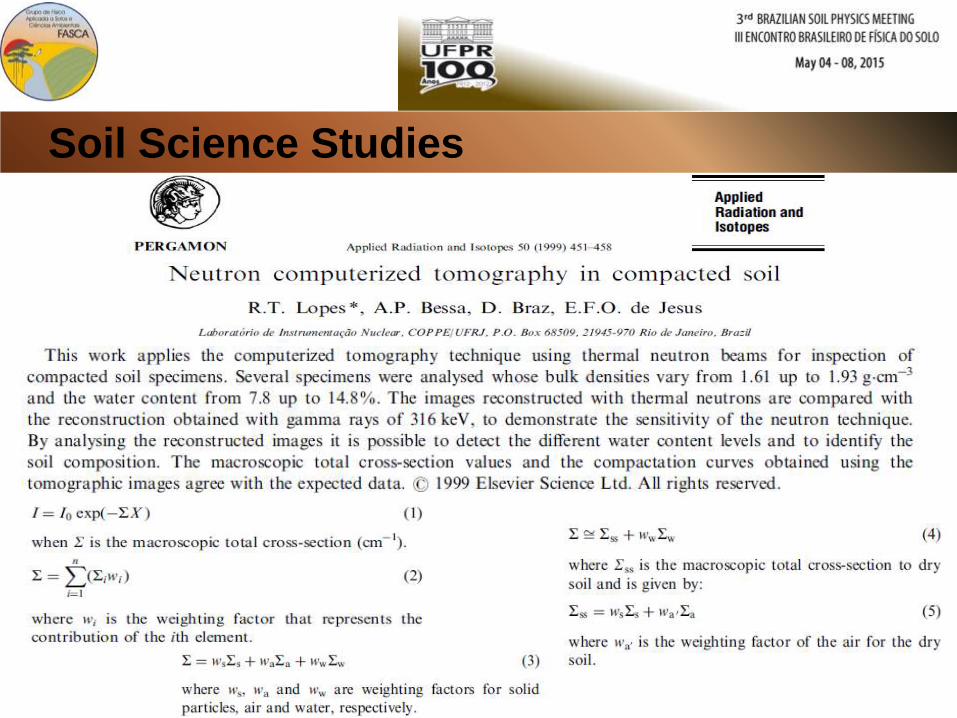
Soil Science Studies
Soil Science Studies
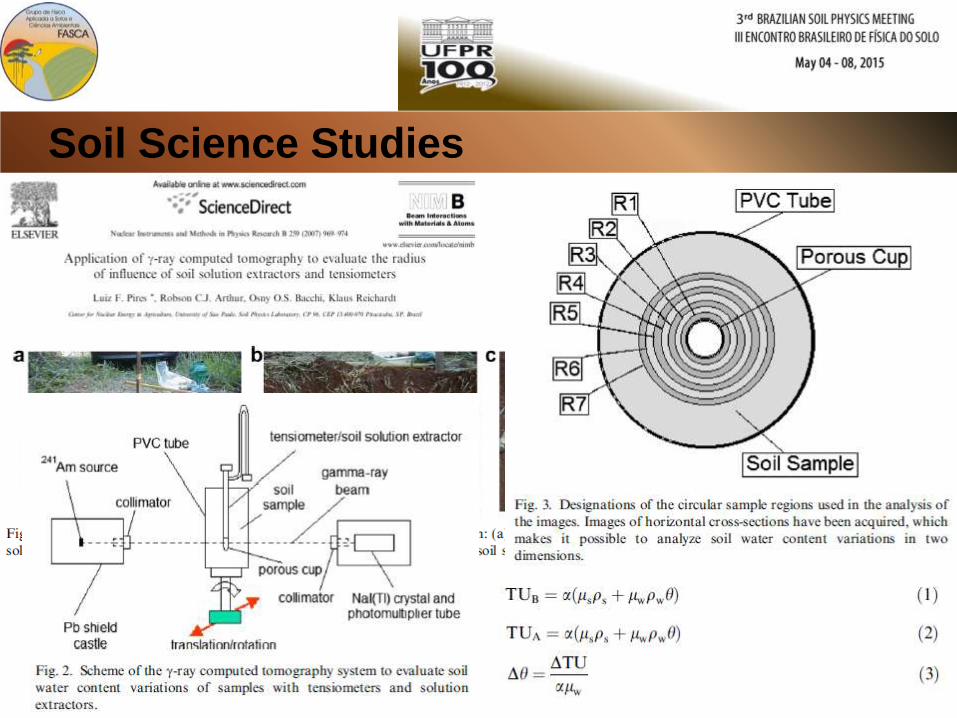
Device for water
distribution
Soil Science Studies
ROI
Soil Science Studies
Soil Science Studies
Soil Science Studies
Soil Science Studies
Soil Science Studies
Soil Science Studies
Soil Science Studies
Soil Science Studies
Region of high density
Region of low
density
Region of intermediate
density
Soil Science Studies
Soil Science Studies
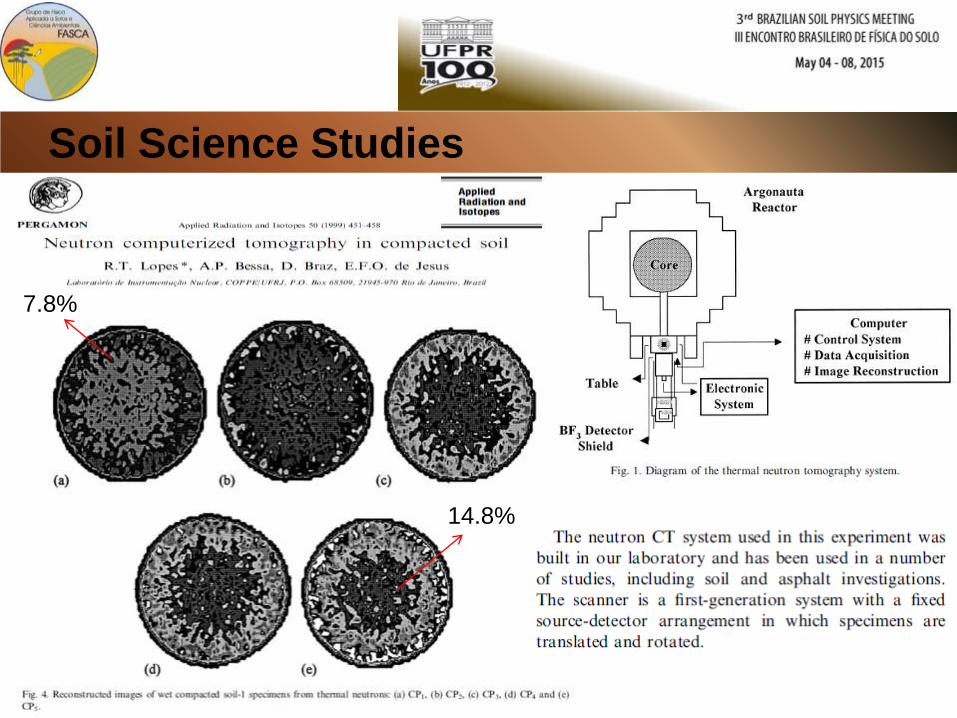
7.8%
14.8%
Soil Science Studies
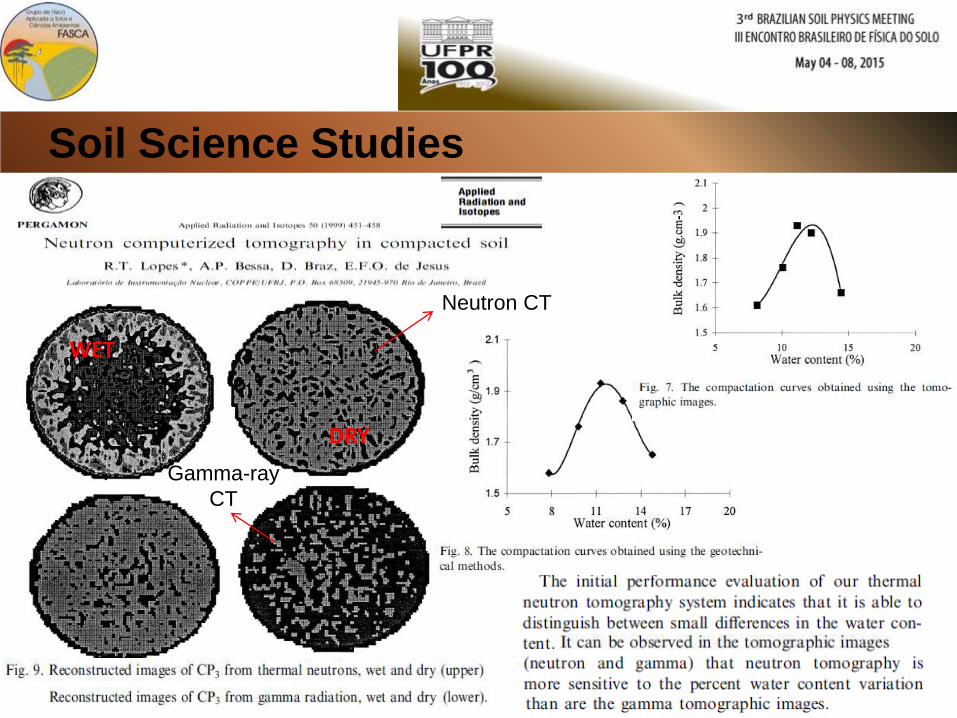
Neutron CT
Gamma-ray
CT
WET
DRY
Soil Science Studies
Soil Science Studies
Soil Science Studies
Soil Science Studies
Soil Science Studies
Soil Science Studies
Soil Science Studies
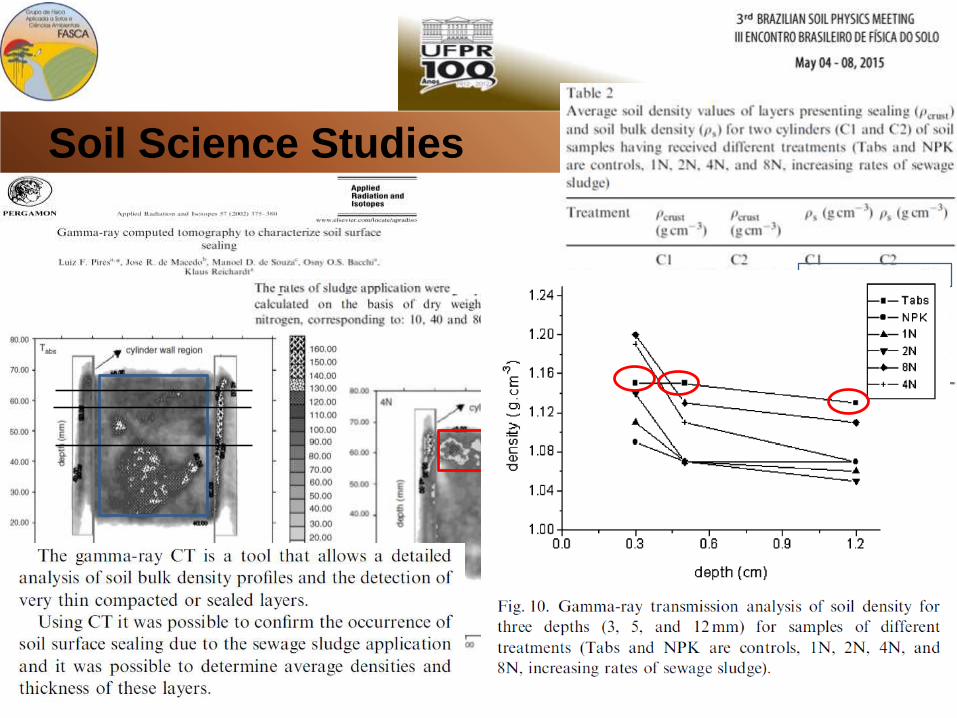
More
detailed
analysis
1 mm thick
Soil Science Studies
Soil Science Studies
Soil Science Studies
Soil Science Studies
Soil Science Studies
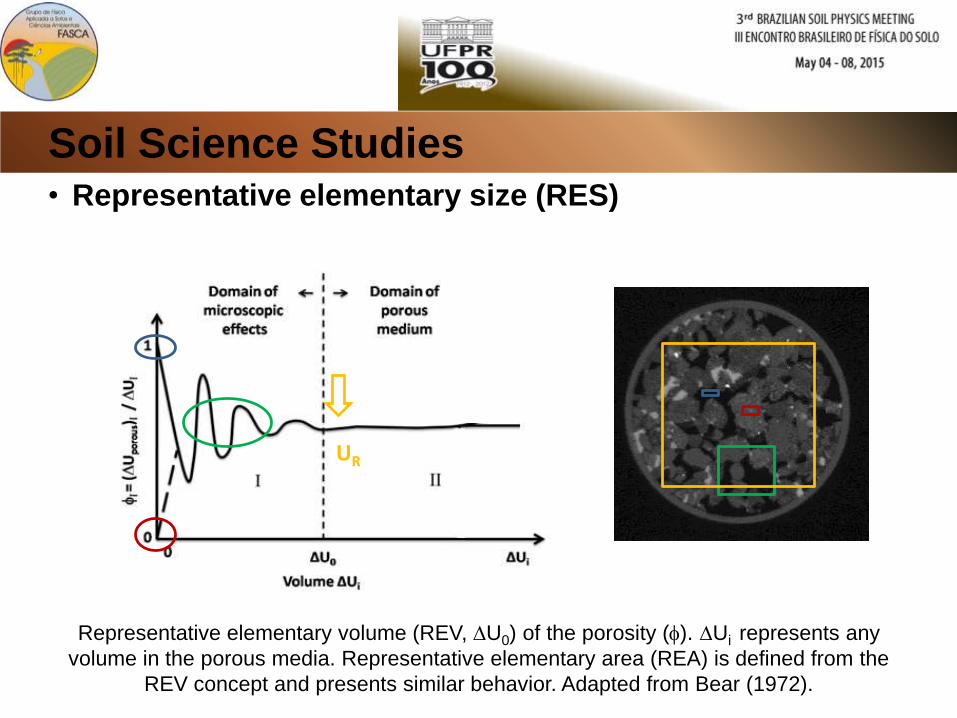
Soil Science Studies• Representative elementary size (RES)
Representative elementary volume (REV, U0) of the porosity (f). Ui represents any
volume in the porous media. Representative elementary area (REA) is defined from the
REV concept and presents similar behavior. Adapted from Bear (1972).
UR
Soil Science Studies
Soil Science Studies
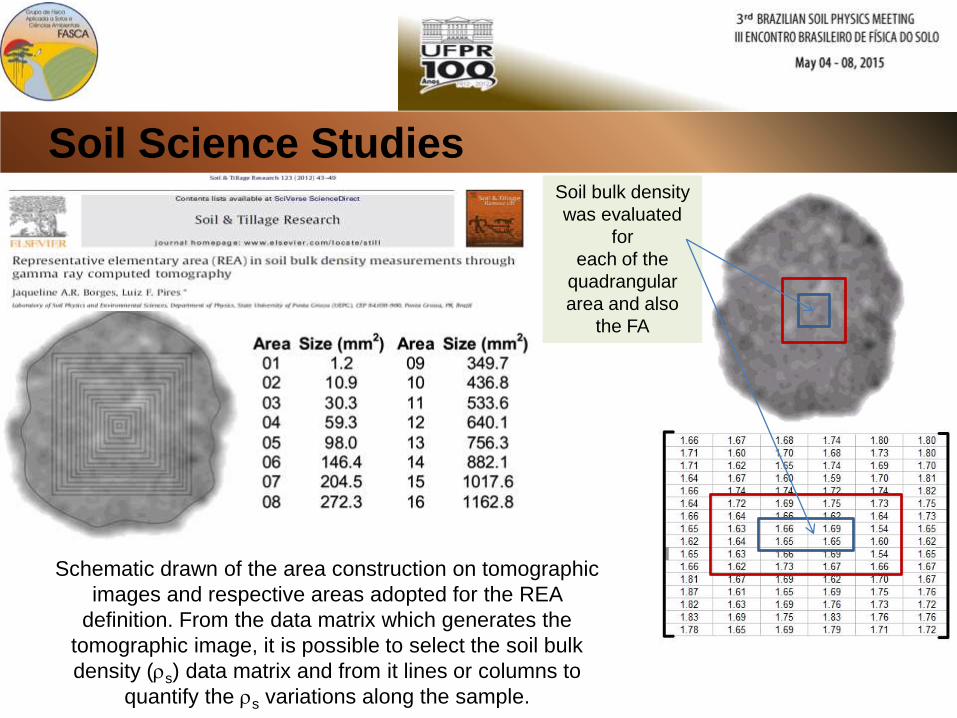
Schematic drawn of the area construction on tomographic
images and respective areas adopted for the REA
definition. From the data matrix which generates the
tomographic image, it is possible to select the soil bulk
density (s) data matrix and from it lines or columns to
quantify the s variations along the sample.
Soil bulk density
was evaluated
for
each of the
quadrangular
area and also
the FA
Soil Science Studies
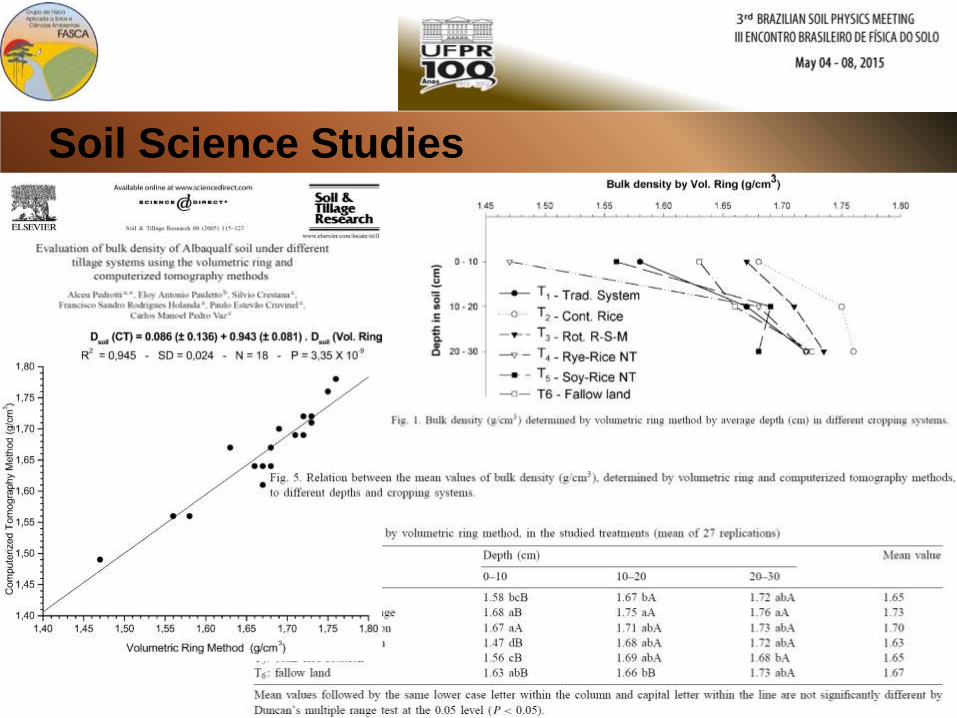
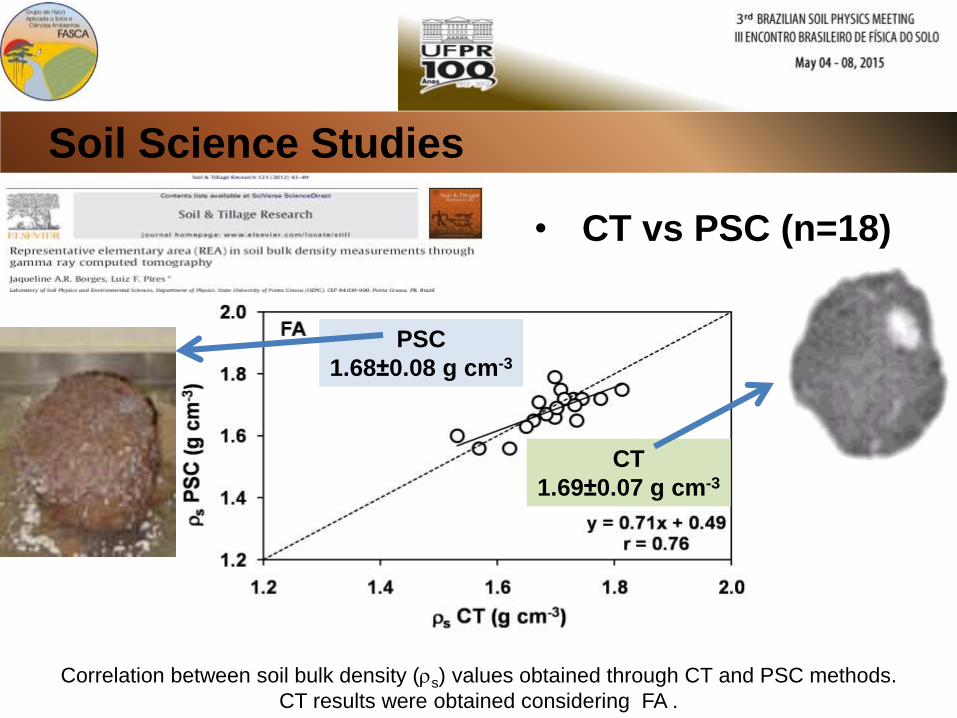
• CT vs PSC (n=18)
Correlation between soil bulk density (s) values obtained through CT and PSC methods.
CT results were obtained considering FA .
CT
1.69±0.07 g cm-3
PSC
1.68±0.08 g cm-3
Soil Science Studies
Soil Science Studies
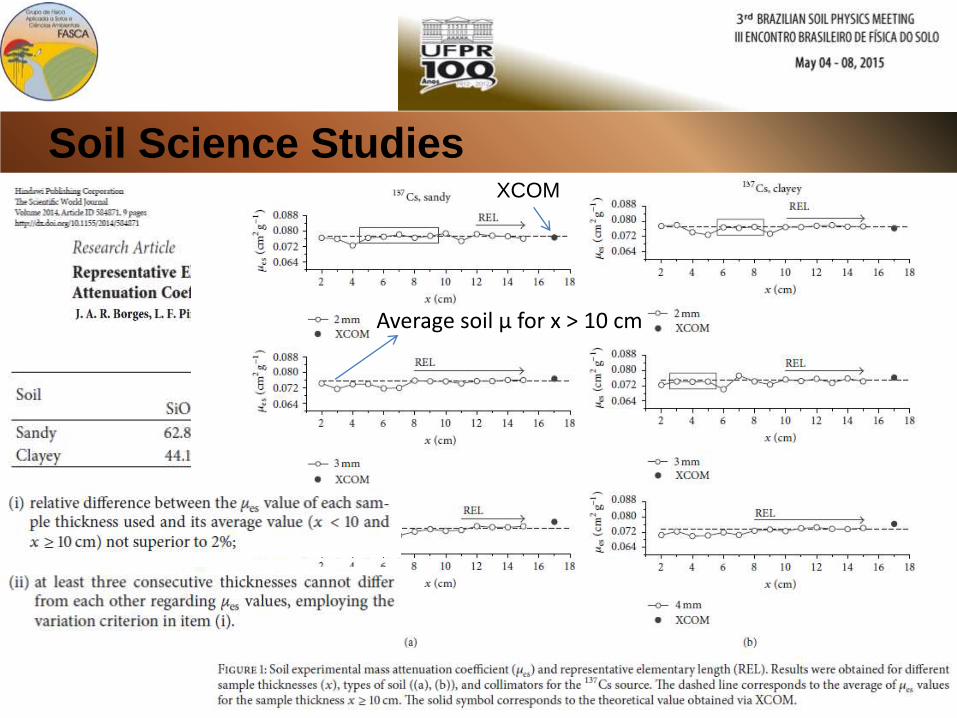
Soil Science StudiesXCOM
Average soil µ for x > 10 cm
Soil Science Studies
2 mm – x < 10 cm 2 mm – x > 10 cm
3 mm – x < 10 cm 3 mm – x > 10 cm
4 mm – x < 10 cm 4 mm – x > 10 cm
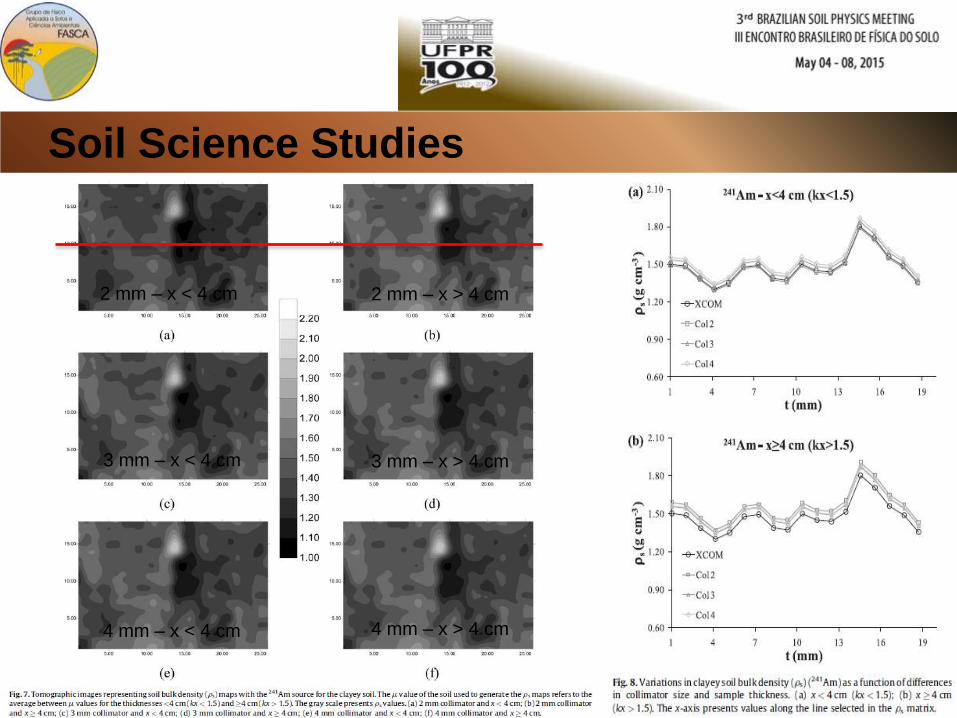
2 mm – x < 4 cm 2 mm – x > 4 cm
3 mm – x < 4 cm 3 mm – x > 4 cm
4 mm – x < 4 cm 4 mm – x > 4 cm
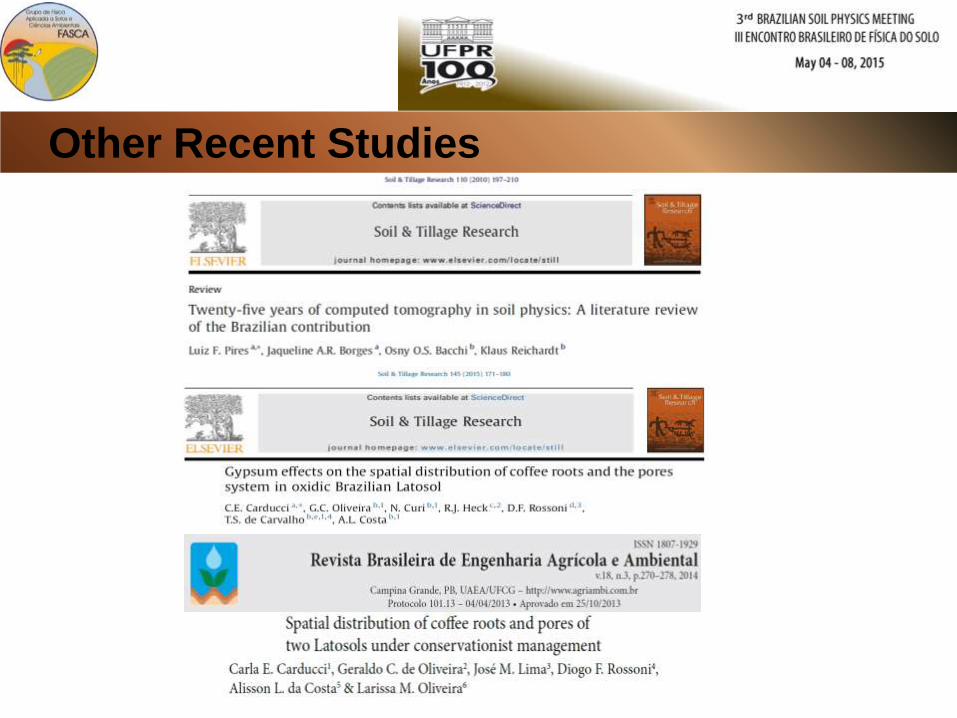
Other Recent Studies
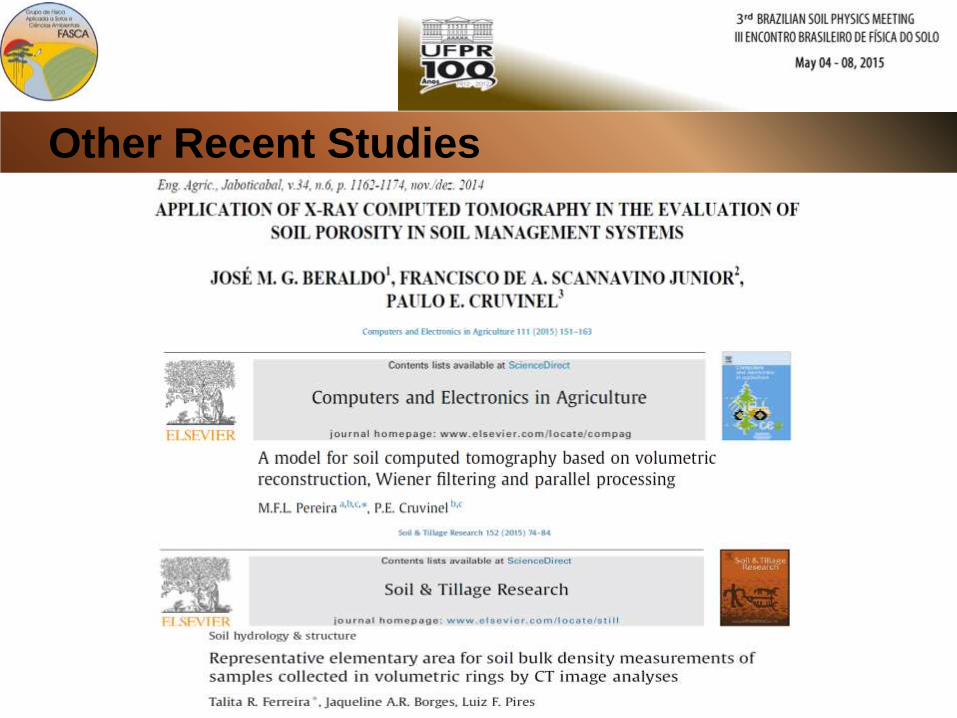
Other Recent Studies
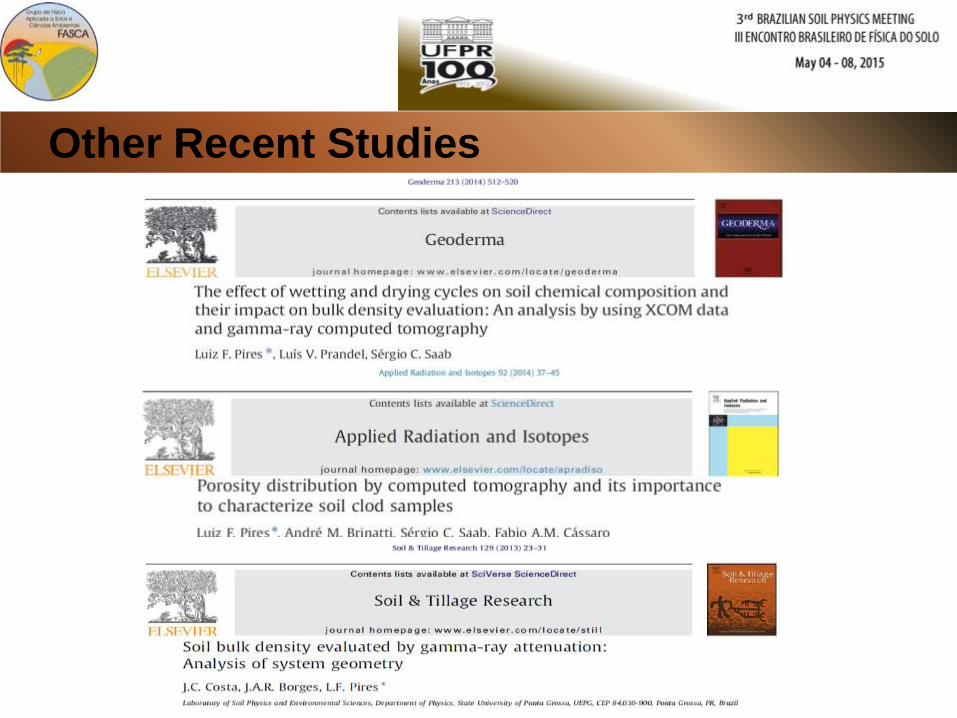
Other Recent Studies
FUTURE WORKS
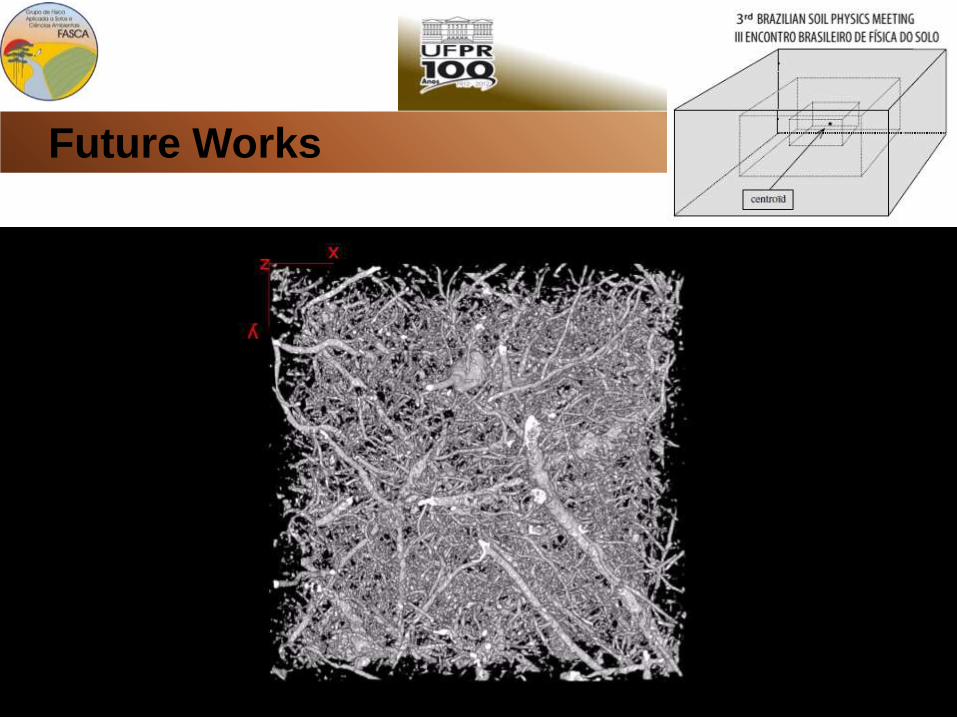
Future Works
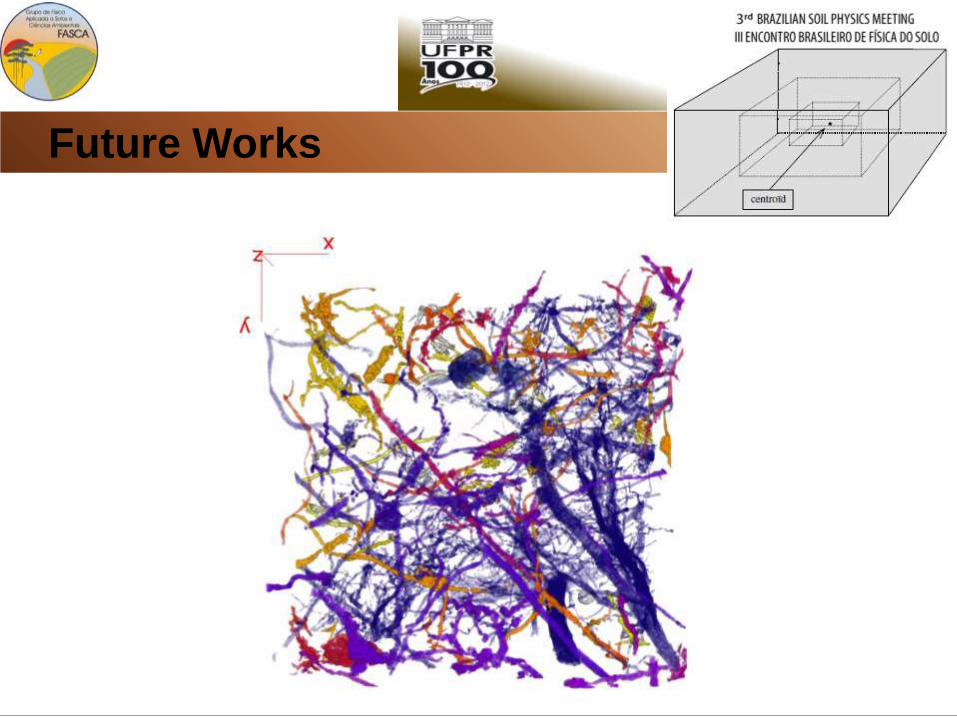
Future Works
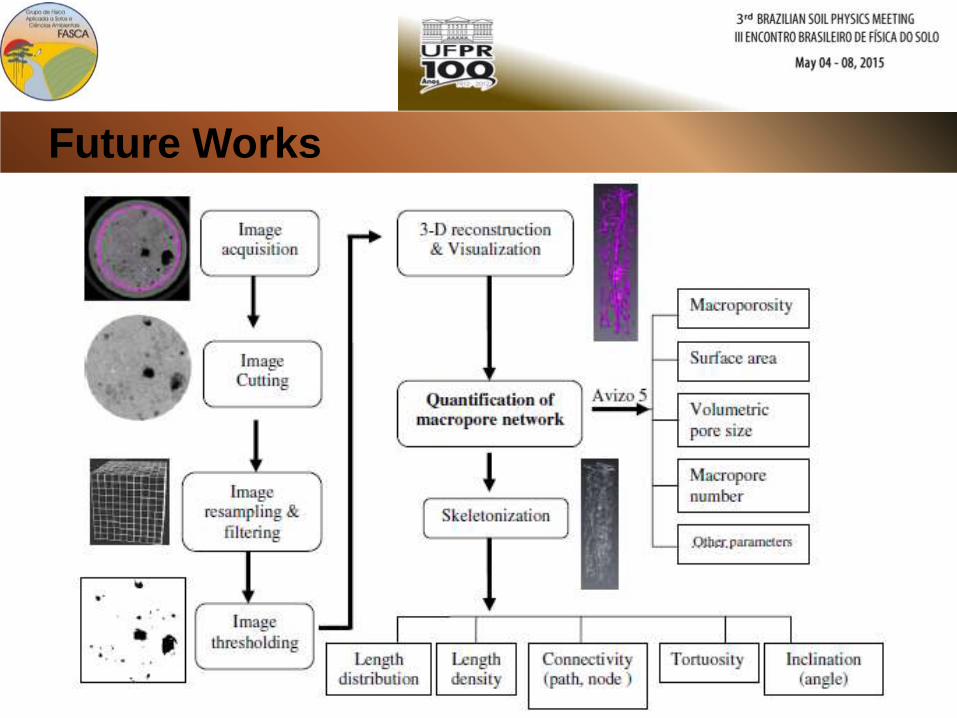
Future Works
Concluding Remarks
• From 1985 to 2015 around 83 papers, thesis and
dissertations were produced by Brazilian soil scientists in
the CT field;
• Most part of the papers deals with analyses of soil bulk
density and soil water content distribution in a non-
invasive way;
• Changes in soil structure due to management systems,
agricultural traffic, fertilizer and gypsum application have
been studied;
• Nowadays, the Brazilian soil scientists are starting to use
X-ray CT scanners of second and third generations for the
study of soil microstructure in 3 dimension (3D);
• The high cost of these CT scanners still is a problem for
the Brazilian scientists.
Acknowledgments
To Prof. Osny O. S. Bacchi and Prof. Klaus Reichardt - Laboratory of
Soil Physics, Center for Nuclear Energy in Agriculture, Piracicaba,
Brazil, for the infra-structure used to obtain the tomographic images.


![Fundamentals of cone beam computed tomography for a ...Cone beam computed tomography (CBCT, also referred to as C-arm computed tomography [CT], cone beam volume CT, or flat panel CT)](https://img.pdfslide.net/doc/110x75/611ad245d6c77f53c63c9117/fundamentals-of-cone-beam-computed-tomography-for-a-cone-beam-computed-tomography.jpg)