Embed Size (px)
DESCRIPTION
Application Virtualization Server Sizing Guide Version 5 sp1 App-V Microsoft Virtualization
Citation preview
Application Virtualization (App-V) 4.5 / 4.6 Server Sizing Guide
Technical White Paper Published: February 2012
CONTENTS
Executive Summary ............................................................................................................ 4
Application Virtualization Infrastructure Operations ....................................................... 5 Client Operations 5
Infrastructure Operations 8
App-V Server Performance ................................................................................................. 10 Test Environment 10
App-V Operations Tested 11
Objects Used in Testing 11
Performance Results .......................................................................................................... 12 Publishing Refresh 12
Package Load 13
Cached Application Launch 14
App-V Data Store Growth 15
Recommendations .............................................................................................................. 19 Management Servers Only Perform Publishing Refresh 19
IIS Servers Perform the Load (Streaming) and Launch Process 19
Database Size and Growth 20
Reporting Queries Affect Performance 20
App-V Components Scale-out in a Linear Fashion 20
Model Deployment .............................................................................................................. 21 Site Design 21
Active Directory Setup 21
App-V Server Setup 21
SQL Servers 21
Package Information 21
Hardware Specifications 22
Observations and Recommendations 25
For More Information .......................................................................................................... 31
Appendix .............................................................................................................................. 32 Load Impact Charts for Management Servers Hosted on Windows Server 2003 32
Load Impact Charts for Management Servers Hosted on Windows Server 2008 34

Load Impact Charts for IIS 6 (Windows Server 2003) 36
Load Impact Charts for IIS 7 (Windows Server 2008) 37
Application Virtualization (App-V) 4.5 / 4.6 Server Sizing Guide Page 4
EXECUTIVE SUMMARY
The Application Virtualization (App-V) Server Sizing Guide provides performance data and
analysis to assist an IT professional in properly planning an App-V infrastructure, including
the number and types of servers. This guide also provides a summary of the typical
operations and network communications that place a load on the server and the network
infrastructure. This guide provides information on App-V infrastructures using a full or
streaming infrastructure deployment with the Windows Desktop Client. This document will
not address sizing and performance for integration with Configuration Manager 2007 R2 or
App-V for Remote Desktop Services (formerly Terminal Services). Please refer to the
documentation for each respective product.
In this Guide
Understanding of the App-V operations that affect performance and sizing
Test results indicating expected performance
Performance analysis and planning guidance
Audience
This material is intended to be used by individuals in the following IT roles:
Windows Server Administrator. This individual is responsible for deploying and
maintaining application software on Windows servers, including an App-V Server.
This person will likely want to know the day-to-day impact that App-V has on
application and operating system health.
Database Administrator. This individual is primarily concerned with database-
related aspects of App-V, including backup and restore, data flow between the
Management Server and the database, and performance implications of the App-V
deployment on servers running Microsoft SQL Server.
Network Administrator. This individual is typically interested in any performance or
connectivity implications for the network infrastructure that are related to the App-V
environment.
Note: For security reasons, the sample names of forests, domains, internal resources,
organizations, and internally developed security file names used in this paper do not
represent real resource names used within Microsoft and are for illustration purposes only.
QR Code symbols, like the one shown here, may appear throughout this guide and let you
connect to supplemental material online using a mobile
phone.
Note: To get the Tag Reader, visit http://gettag.mobi on
your mobile phone browser. Or, visit
http://tag.microsoft.com/consumer/index.aspx to send a
text message to your phone with a link to the
application.
Microsoft Tag is also available for free in most mobile
application stores; just search for „Tag Reader‟ to get
started.
Situation
When planning an Application
Virtualization (App-V) implementation,
it is important to consider the
requirements and expected
performance level of App-V
infrastructure components.
Solution
This server sizing guide provides
performance data and analysis to
assist an IT professional in properly
planning an App-V infrastructure,
including the number and types of
servers.
Products & Technologies
Application Virtualization (App-V)
4.5 and 4.6
Microsoft Windows Server 2003
Microsoft Windows Server 2008
Microsoft SQL Server
Application Virtualization (App-V) 4.5 / 4.6 Server Sizing Guide Page 5
APPLICATION VIRTUALIZATION INFRASTRUCTURE OPERATIONS
Planning an App-V infrastructure to support the current user and application base requires an
understanding of the operations that will be performed by all components in the
infrastructure. The operations covered below are followed by detailed performance data and
analysis to assist administrators who are responsible for planning an App-V infrastructure.
The data and recommendations contained in this document are focused on the App-V Full
Infrastructure Deployment mode. For additional information on Configuration Manager 2007
R2 please refer to the product documentation.
Client Operations
The App-V Full Infrastructure model consists of an App-V Management Server, the App-V
Data Store on a SQL Server, and the App-V Windows Desktop Client. During normal
operations the App-V Client will perform the following steps:
1. A publishing refresh
2. Load or stream applications
3. Initiate the launch of applications
During these operations, the infrastructure components will be used to acquire the necessary
information needed to publish, load, and launch virtual applications.
Publishing Refresh
Publishing refresh is the process of the App-V Client communicating with the App-V
Management Server to receive information indicating which applications are available. This
process includes the following steps:
1. Client authenticates with Management Server by passing user credentials.
2. Management Server contacts Data Store, and uses information in cache (if applicable)
on the Management Server from previous publishing refresh operations to build list of
applications to publish to the user.
3. Management Server builds an XML file (applist.xml) with application publishing
information
4. Applist.xml file is delivered to the client.
5. Client processes XML and copies down all new ICO and OSD files necessary for the
applications.
6. File Type Associations and shortcuts are configured on the client.
7. Offline metering data uploaded from the App-V Client to the Management Server.
The publishing refresh process can be initiated in three ways:
1. At Login: This is the default option selected during App-V Client setup.
2. Manual: This can be done thru App-V Client MMC or command line.
3. Periodic: This allows for DC refreshes to occur in the background at periodic times while
the user is logged in.
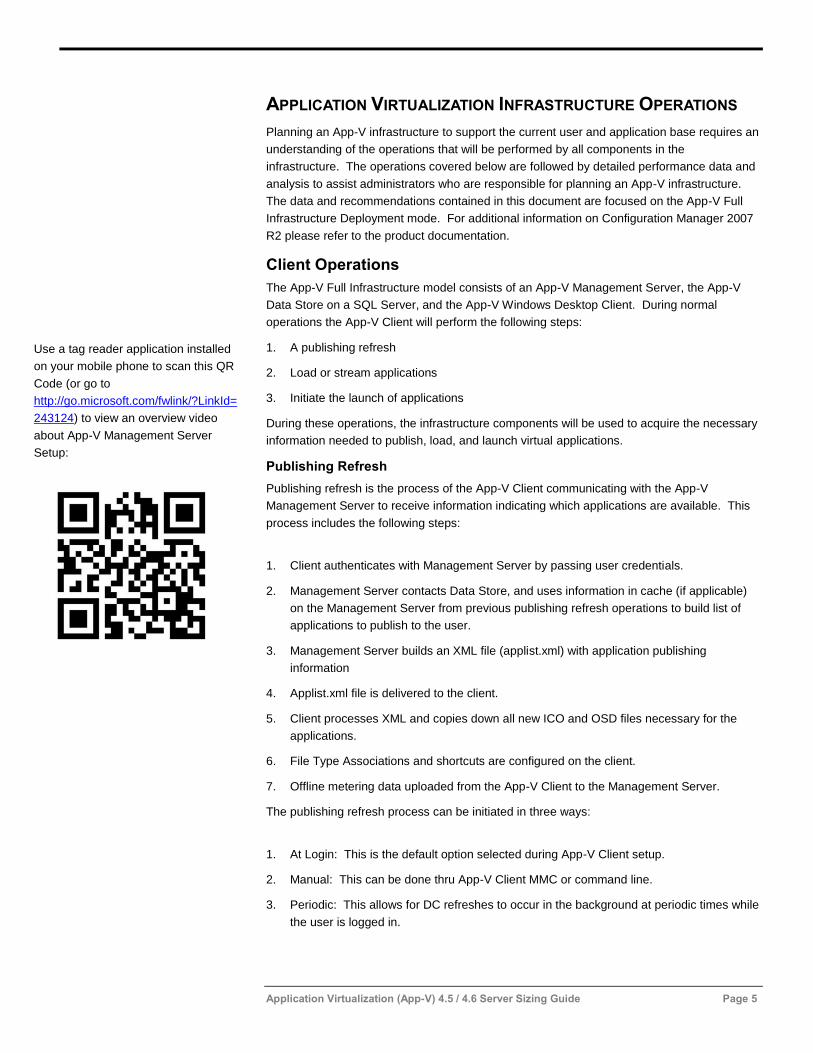
Use a tag reader application installed
on your mobile phone to scan this QR
Code (or go to
http://go.microsoft.com/fwlink/?LinkId=
243124) to view an overview video
about App-V Management Server
Setup:
Application Virtualization (App-V) 4.5 / 4.6 Server Sizing Guide Page 6
NOTE: The publishing refresh settings can be modified by adjusting the default provider
policy in the App-V Management Console.
When performing the publishing refresh process the infrastructure and, specifically, the
Management Server will have to spend time and resources authenticating users and
communicating with the Data Store to build a list of applications to present to the client.
From the client perspective, the publishing refresh workload includes;
1. Processing the application list from the server,
2. Copying the ICO and OSD files locally,
3. Propagating the shortcuts and file type associations to the client machine.
Offline Metering
One of the new features of App-V is the ability to capture usage information for applications
even if the user is offline or not connected to the App-V infrastructure. This is done by
caching the usage information to a local file (for both online and offline clients) and sending
the usage information to the Management Server the next time the client performs a
publishing refresh. In the past, this information wasn‟t captured and cached locally, thus
accurate usage information wasn‟t available for computers that were offline.
Offline metering is the default configuration on the App-V Client. Two options that can be
configured are the size of the local usage cache and the amount of data to send during a
publishing refresh. These options are configurable using the ADM Template for the App-V
Client or by editing the registry directly. Additional information on configuring these settings
is available in the App-V ADM Template whitepaper located at:
http://go.microsoft.com/fwlink/?LinkId=127120.
Package Load
On an App-V Client, before the first launch of an application in a package, the Client will need
to stream and load the package to the Client and place them into the cache. The amount of
data that will be streamed to the Client is dependent on the size of the package containing
the application or applications and how the package was sequenced. During sequencing the
package could be broken into two parts.
1. Primary Feature Block is the collection of assets (virtual registry, file system, DLLs, etc.)
in the package that is required prior to allowing the application to be launched.
Identification of Primary Feature Block (FB1) data is performed during sequencing and
allows for a package to be divided into a portion of assets (blocks) required to launch
and perform normal tasks with the applications in the package. DLLs can be broken into
separate blocks, so there is not a need for an entire DLL to be sent to the client, only the
required blocks that are needed.
2. Secondary Feature Block includes the remaining assets that are not required to be
downloaded on initial load of the package and will be downloaded at a later time, on
either an as need basis (Out of Sequence Operation) or in the background after the
initial load. These assets may be for infrequently used features or for applications in the
package that are only used sparingly.
Application Virtualization (App-V) 4.5 / 4.6 Server Sizing Guide Page 7
The creation of Primary Feature Block and Secondary Feature Block would be implemented
during sequencing and is often done to reduce the time that the user waits for the initial
launch of the application. This guide does not cover the process of creating the Primary and
Secondary Feature Blocks. However, based on decisions made during sequencing, the size
of the package that is required to stream before the launch of the application could vary
greatly and affect the user experience. Additional sequencing data is available at:
http://go.microsoft.com/fwlink/?LinkId=127120.
Background Load
With the introduction of App-V 4.5, a new feature on the Client allows for administrators to
configure triggers to download packages in their entirety (both Primary and Secondary
Feature Blocks). This option is useful for organizations that implement App-V for their mobile
workforce. In that scenario, one of the problems that could occur is that users that are not
connected to the App-V infrastructure could attempt to use a feature of a virtualized
application that has not already been downloaded into cache. This would result in an error
for the user and the inability to use the specific feature.
This feature allows administrators to configure the behavior of loading the applications into
the cache beyond the Primary and Secondary Feature Block configuration that was
determined during sequencing. This would give them more control over what is in the user‟s
client cache. These options can be configured using the App-V ADM Template mentioned
earlier in this guide, during the setup of the App-V Client, or by directly editing the registry.
The App-V ADM Template is available at: http://go.microsoft.com/fwlink/?LinkId=127120.
Through configuration of the AutoLoad Triggers and Targets an administrator can ensure that
the assets required to run all of the features of a virtualized application are delivered to the
client cache when needed. The automatic background loading of packages is regulated by
lowering the streaming thread‟s priority to the idle priority, which will allow the operating
system scheduler to only give this process CPU cycles when they are available, and would
not affect the user‟s experience. The Autoload feature does not provide bandwidth control
over the streaming process.
The Autoload settings can be configured in various combinations to control the time at which
background loading of packages will occur. Some combinations of these settings could place
additional load on the App-V infrastructure. Since the load process is network bound,
configuring the Autoload process to load all applications at login should be carefully
evaluated. This combination of settings could stress the network or the App-V streaming
component on the typical Monday morning. The login would trigger any package that the
user did not currently have in cache to begin downloading. Since most of the workforce
would be logging in at the same time this could represent a much larger user base attempting
to load applications than the network or App-V infrastructure could handle.
Application Launch
When a user launches an application by double-clicking on the application shortcut or by
using File Type Association invocation, the App-V Client will need to communicate with the
Management Server or Streaming Server for authorization. Authorization occurs by using the
user‟s ticket granted by the Active Directory® (Key Distribution Center) to ensure that the
user is still allowed to run the virtual application. Clients launching an application from a
Management Server will have their user credentials authorized against the list or authorized
users in the Data Store. Client computers launching an application from a Streaming, IIS, or
Application Virtualization (App-V) 4.5 / 4.6 Server Sizing Guide Page 8
file server will have their ticket authorized against the ACLs in the content directory. If the
client computer is currently outside of the App-V infrastructure or cannot communicate with
the App-V Server, the users cached credentials will be used. This process places a
negligible load on the client and infrastructure resources, similar to a user accessing a file
share on a server.
After the application has been authorized for the user, the App-V Client will launch the
application in the virtual environment which will include loading of personalized settings from
the user‟s profile and the personalized settings for the machine from the public profile on
Vista (All Users profile on XP). The personalized settings for the application come from the
UsrVol_sftfs_v1.pkg files and the GlblVol_sftfs_v1_UserSID.pkg files.
Infrastructure Operations
The App-V infrastructure performs operations that support successful virtual application
deployment. These operations can be initiated by the administrator, App-V Clients, and by
the infrastructure itself. These operations will place different workloads on the infrastructure
components and need to be considered when planning a deployment.
Database
The App-V SQL database is a required component in an App-V Full Infrastructure with a
Management Server. The database contains configuration information and stores usage
information for the App-V infrastructure. The following is a list of App-V Infrastructure
operations that use the database:
Publishing Refresh
Application Load
Application Launch Authorization
Server Management console
Online/Offline client application usage data collection and reporting or Offline
Metering
Most of these are lightweight operations and will place a very small load on the SQL Server.
However, the offline metering will place a load on both the server and network based on the
number of users and the amount of application usage data that is collected.
A new feature of App-V 4.5 is the ability of the Management Server to cache the application
publishing information (paths to .ico and .osd files, FTAs, etc.) for all applications from the
SQL Server to its own cache. This was done to reduce the amount of queries against the
database for each publishing refresh operation. The application publishing information will
grow in size based on the quantity of applications that are published and the number of
objects associated with each application.
In previous versions of App-V, every publishing refresh request that the server handled
required several separate queries to the Data Store to build a list of applications and acquire
publishing information for the user. With this new feature, the applications objects (publishing
information) stored in the Data Store are queried at the first publishing refresh request and
cached on the Management Server for subsequent publishing refreshes. This will cache all
of the publishing information for all applications in the Data Store. By default, the
Management Server will cache the application publishing information for three minutes,
Application Virtualization (App-V) 4.5 / 4.6 Server Sizing Guide Page 9
greatly reducing the amount of traffic between a Management Server and SQL Server on
separate machines. This value can be adjusted by adding the following registry value:
32-Bit Windows Server:
HKLM\Software\Microsoft\SoftGrid\4.5\Server\DcCacheTimeout
64-Bit Windows Server:
HKLM\Software\Wow6432Node\Microsoft\Softgrid\4.5\Server\DcCacheTimeout
DcCacheTimeout settings
o Type: DWORD
o Value: In Seconds (Default 180) with no minimum or maximum
Each request that is made for a publishing refresh will still require access to the Data Store to
build a list of applications for a specific user, but the application objects for publishing
information will already be cached on the server. After acquiring a list of applications for the
specific user in the Data Store, the applist.xml file will be built by the Management Server
using the publishing information stored on the Management Server cache. In the event that a
new application is added within the cache timeout value, the application list for the specific
user will have an application in it that does not exist in cache. If this occurs it will trigger a full
cache update. Because of this behavior, new applications will be immediately available on
the next publishing refresh.
This feature will reduce the more costly query of application publishing information to a
predictable interval and will not reduce the performance of the publishing refresh process on
a Management Server. The only queries that will need to be done from the Management
Server to the SQL Server for each publishing refresh will be acquiring the list of applications
that a user has been authorized to use and retrieving policy settings.
Active Directory
During the publishing refresh operation (full infrastructure only) and at application launch the
Active Directory will be used to authenticate and authorize users. This operation places a
negligible performance impact and shouldn‟t affect the overall planning of servers. If the
Active Directory in the environment can handle the current workload for regular user logon
and other infrastructure operations it should be adequate for an App-V infrastructure.
Content Directory
The content directory is used for storing the App-V packages and is utilized during the load
process. The content directory for an App-V infrastructure can be placed on a local directory,
remote server, or SAN. To achieve the best performance the content directory should be a
local directory on the App-V Server (Management, Streaming, IIS, or File Server) or on a
SAN that is directly connected to the App-V Server. If the content directory is on a remote
resource, every package that is streamed will have to be moved from the remote resource to
the Management, Streaming, or IIS Server before streaming it to the client. The amount of
data being transferred will depend on the number of unique packages and the size of those
packages. The impacts of this remote transfer includes increased network utilization,
increased disk I/O, memory and CPU usage on both the sending and receiving computers.
There will also be an additional latency as the streaming will go from server to server and
then to the client.
Application Virtualization (App-V) 4.5 / 4.6 Server Sizing Guide Page 10
APP-V SERVER PERFORMANCE
With the release of App-V 4.5, Microsoft went to great lengths to develop the server to handle
larger infrastructures with a minimum number of servers. This was done by not only
enhancing the built-in components previously available in App-V, but also by utilizing
additional infrastructure components common in most IT infrastructures. HTTP/HTTPS and
file streaming can also provide additional options when planning an infrastructure. The
following information provides data gathered through testing various infrastructure
operations. The end result analysis is provided to assist when choosing the number and
types of servers to use in the enterprise.
Test Environment
During the testing phase a common environment was used to allow for proper comparison
and analysis of the data being captured. This environment uses commonly found hardware
in most IT infrastructures and provides a base of information to compare with the
infrastructure that is being planned.
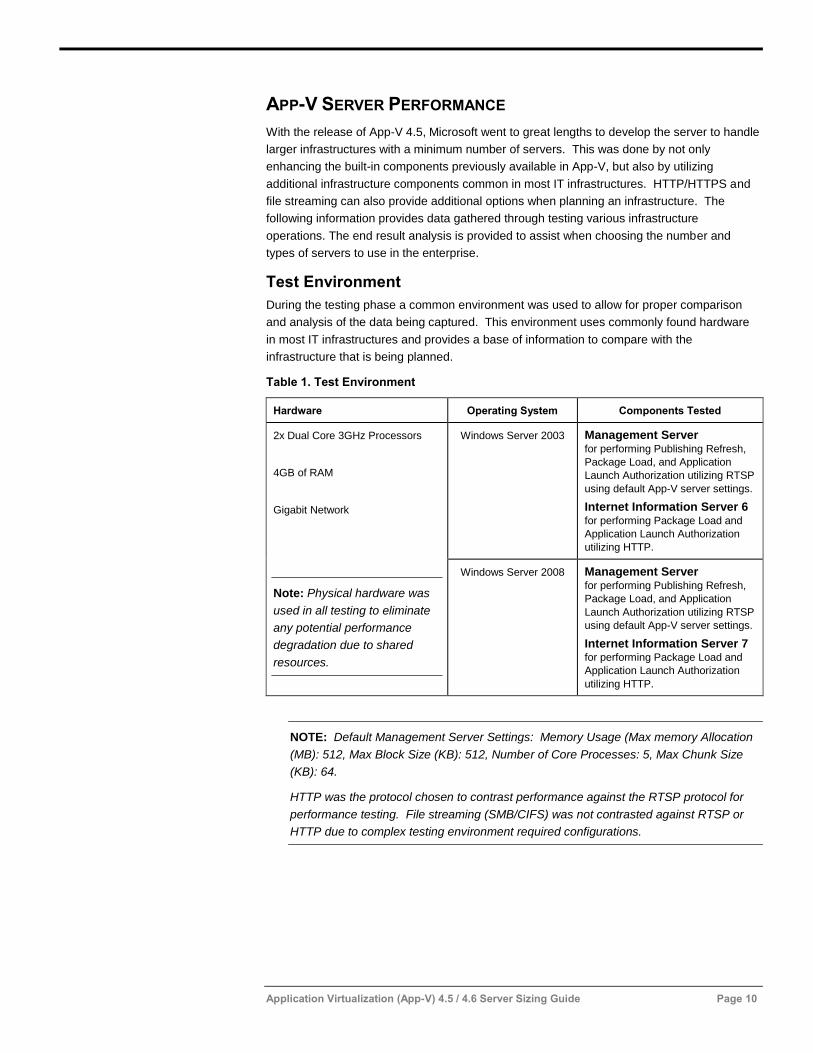
Table 1. Test Environment
Hardware Operating System Components Tested
2x Dual Core 3GHz Processors
4GB of RAM
Gigabit Network
Note: Physical hardware was
used in all testing to eliminate
any potential performance
degradation due to shared
resources.
Windows Server 2003 Management Server for performing Publishing Refresh,
Package Load, and Application
Launch Authorization utilizing RTSP
using default App-V server settings.
Internet Information Server 6
for performing Package Load and
Application Launch Authorization
utilizing HTTP.
Windows Server 2008 Management Server
for performing Publishing Refresh,
Package Load, and Application
Launch Authorization utilizing RTSP
using default App-V server settings.
Internet Information Server 7
for performing Package Load and
Application Launch Authorization
utilizing HTTP.
NOTE: Default Management Server Settings: Memory Usage (Max memory Allocation
(MB): 512, Max Block Size (KB): 512, Number of Core Processes: 5, Max Chunk Size
(KB): 64.
HTTP was the protocol chosen to contrast performance against the RTSP protocol for
performance testing. File streaming (SMB/CIFS) was not contrasted against RTSP or
HTTP due to complex testing environment required configurations.
Application Virtualization (App-V) 4.5 / 4.6 Server Sizing Guide Page 11
App-V Operations Tested
The following operations were tested to gather performance and scale recommendations.
These tasks were chosen because they are common tasks performed on a regular basis by
either the App-V infrastructure components or the administrator:
Publishing Refresh (Management Server)
Package Loads (Management and IIS)
Cached Application Launches (Management and IIS)
NOTE: Both the Management Server and IIS Servers implemented local content
package directories.
Objects Used in Testing
The following objects were chosen because to reflect a typical App-V infrastructure. The
choice of applications and number of applications was based on data gathered from
customers.
Microsoft Word for cached launches
Adobe Acrobat 8 for loads (Package 198MB)
700 Objects in the Data Store (apps, shortcuts, FTAs, etc.) for publishing refresh
o Comprised of 81 applications in 36 packages
o XML publishing file sent from App-V Server to App-V Client (331 KB)
NOTE: The size of the XML publishing file sent from the server to the client in the test
environment was 331 KB. The file was built from the objects in the Data Store which
included 81 applications in 36 packages. This file will vary in size depending on the
number of objects published to a user.
The next section describes the results for these different operations using the environment
described above.
Application Virtualization (App-V) 4.5 / 4.6 Server Sizing Guide Page 12
PERFORMANCE RESULTS
The following performance results were gathered using the environment described previously
in this document. Additional detail, in the form of charts detailing the performance trends are
in the appendix included at the end of this document.
Publishing Refresh
The publishing refresh process is only available from a Management Server. The publishing
refresh process was tested utilizing the App 4.5 Management Server (RTSP) on both
Windows Server 2003 and Windows Server 2008 servers. The publishing refresh process
data that was gathered shows that this process is bound by CPU and will be the limiting
factor in determining the maximum number of users that would be supported by a specific
App-V Management Server. The publishing refresh process was explained in greater detail
earlier in the document. The following chart and table shows the performance data for the
publishing refresh process on both operating systems:
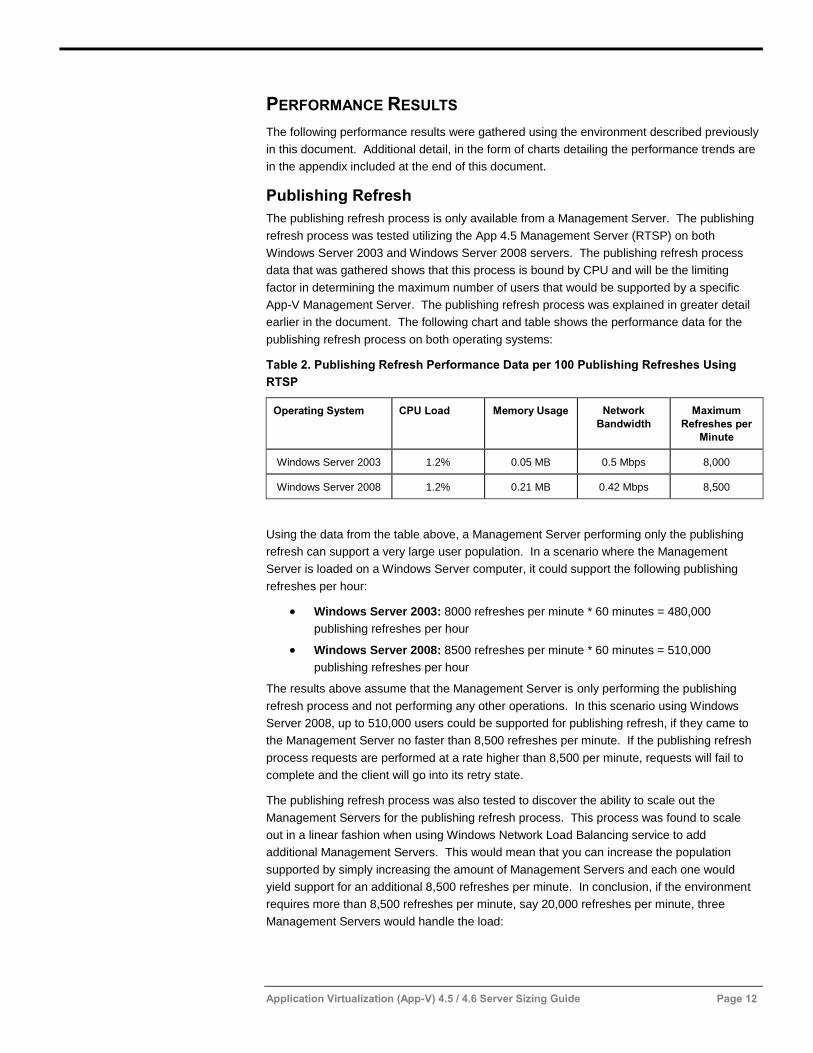
Table 2. Publishing Refresh Performance Data per 100 Publishing Refreshes Using
RTSP
Operating System CPU Load Memory Usage Network
Bandwidth
Maximum
Refreshes per
Minute
Windows Server 2003 1.2% 0.05 MB 0.5 Mbps 8,000
Windows Server 2008 1.2% 0.21 MB 0.42 Mbps 8,500
Using the data from the table above, a Management Server performing only the publishing
refresh can support a very large user population. In a scenario where the Management
Server is loaded on a Windows Server computer, it could support the following publishing
refreshes per hour:
Windows Server 2003: 8000 refreshes per minute * 60 minutes = 480,000
publishing refreshes per hour
Windows Server 2008: 8500 refreshes per minute * 60 minutes = 510,000
publishing refreshes per hour
The results above assume that the Management Server is only performing the publishing
refresh process and not performing any other operations. In this scenario using Windows
Server 2008, up to 510,000 users could be supported for publishing refresh, if they came to
the Management Server no faster than 8,500 refreshes per minute. If the publishing refresh
process requests are performed at a rate higher than 8,500 per minute, requests will fail to
complete and the client will go into its retry state.
The publishing refresh process was also tested to discover the ability to scale out the
Management Servers for the publishing refresh process. This process was found to scale
out in a linear fashion when using Windows Network Load Balancing service to add
additional Management Servers. This would mean that you can increase the population
supported by simply increasing the amount of Management Servers and each one would
yield support for an additional 8,500 refreshes per minute. In conclusion, if the environment
requires more than 8,500 refreshes per minute, say 20,000 refreshes per minute, three
Management Servers would handle the load:
Application Virtualization (App-V) 4.5 / 4.6 Server Sizing Guide Page 13
Windows Server 2003: 20,000 refreshes per minute / 8,000 refreshes per minute
maximum= 3 Management Servers
Windows Server 2008: 20,000 refreshes per minute / 8,500 refreshes per minute
maximum= ~2.3 Management Servers
Performing additional publishing refresh requests above the maximum numbers listed in the
table above resulted in failure of some of the publishing refresh requests. An App-V Client
will reattempt a publishing refresh three times (default) upon the first failure. If subsequent
reattempts fail, the client will go into disconnected operation mode (if allowed) until the next
publishing refresh period. As a result, the affected App-V Client will only be able to run
authorized applications which were published in the last successful publishing refresh.
Package Load
The package load process is available from Management Servers, Streaming Servers, IIS
Servers, or File Servers. The performance data for loading a package was captured using
Adobe Acrobat 8, a 198MB package. The tests were run on Management Servers (installed
on Windows Server 2003 and Windows Server 2008) and IIS Servers (IIS 6 on Windows
Server 2003 and IIS 7 on Windows Server 2008). Performance data was not captured from
Streaming Servers as it uses the same process as a Management Server. Also,
performance data is not presented for File Servers as it has similar performance to the IIS
Server test data captured. The package load process was explained in greater detail earlier
in this document. The package load process is network bound as it is the limiting resource.
The following chart and table shows the performance data for the package load process:
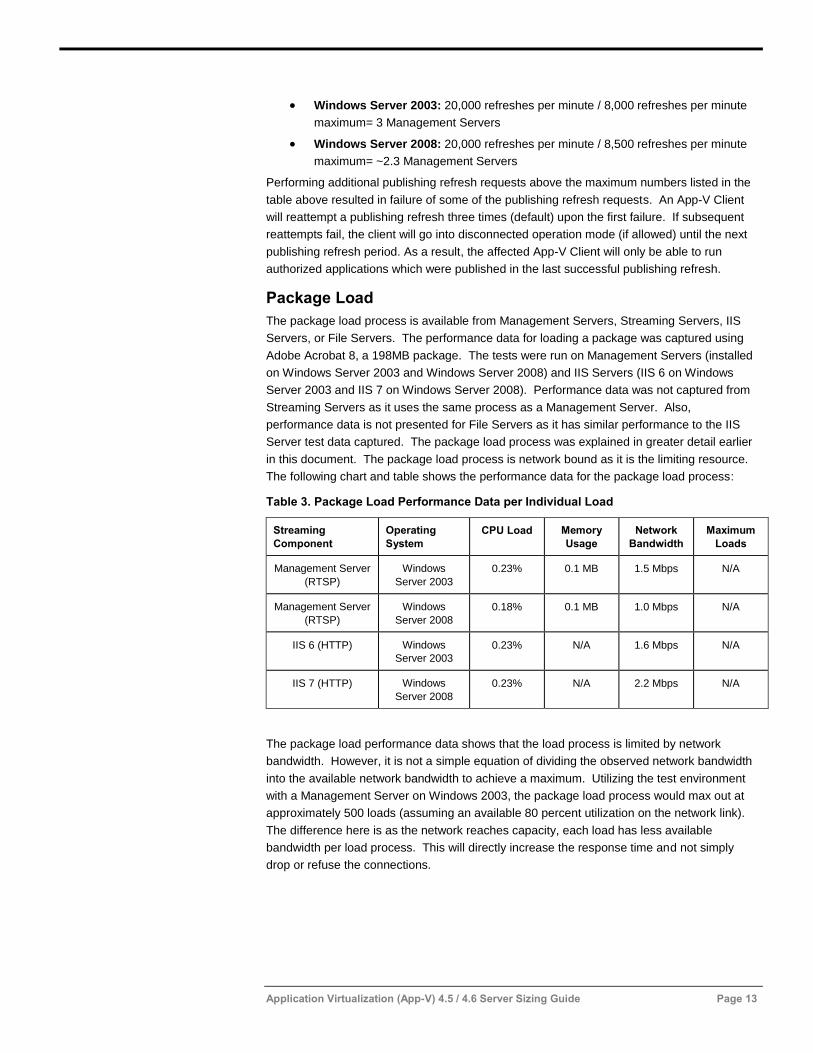
Table 3. Package Load Performance Data per Individual Load
Streaming
Component
Operating
System
CPU Load Memory
Usage
Network
Bandwidth
Maximum
Loads
Management Server
(RTSP)
Windows
Server 2003
0.23% 0.1 MB 1.5 Mbps N/A
Management Server
(RTSP)
Windows
Server 2008
0.18% 0.1 MB 1.0 Mbps N/A
IIS 6 (HTTP) Windows
Server 2003
0.23% N/A 1.6 Mbps N/A
IIS 7 (HTTP) Windows
Server 2008
0.23% N/A 2.2 Mbps N/A
The package load performance data shows that the load process is limited by network
bandwidth. However, it is not a simple equation of dividing the observed network bandwidth
into the available network bandwidth to achieve a maximum. Utilizing the test environment
with a Management Server on Windows 2003, the package load process would max out at
approximately 500 loads (assuming an available 80 percent utilization on the network link).
The difference here is as the network reaches capacity, each load has less available
bandwidth per load process. This will directly increase the response time and not simply
drop or refuse the connections.
Application Virtualization (App-V) 4.5 / 4.6 Server Sizing Guide Page 14
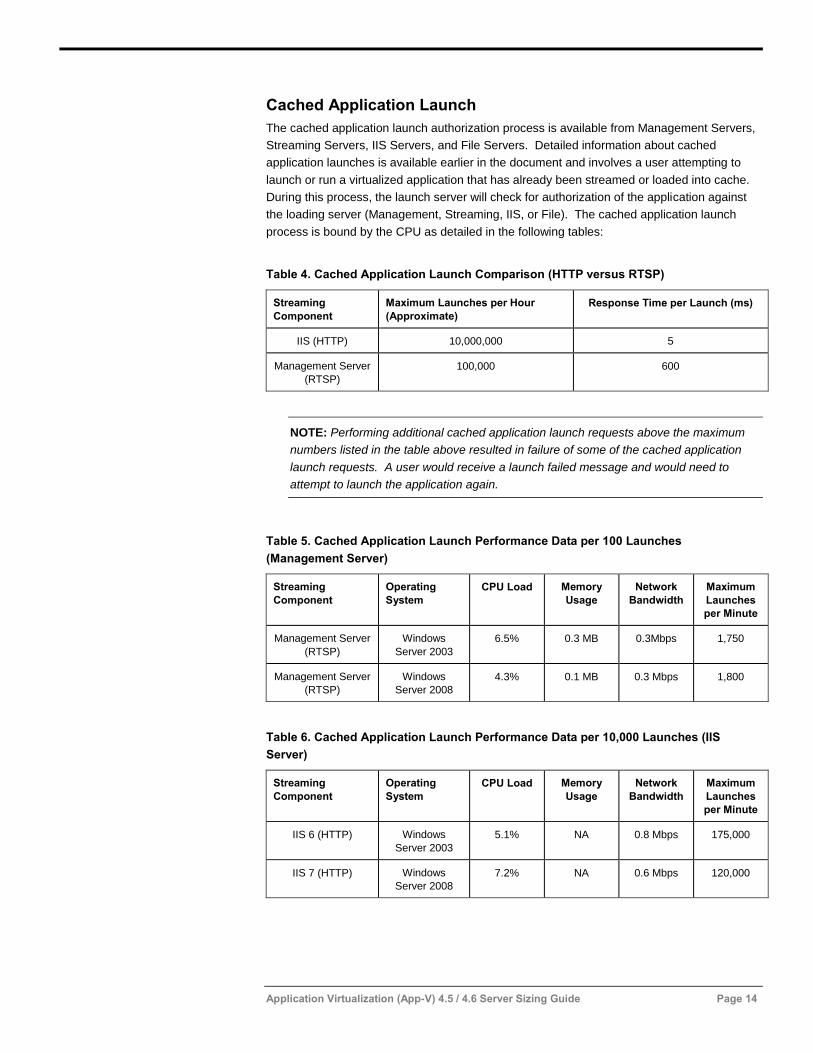
Cached Application Launch
The cached application launch authorization process is available from Management Servers,
Streaming Servers, IIS Servers, and File Servers. Detailed information about cached
application launches is available earlier in the document and involves a user attempting to
launch or run a virtualized application that has already been streamed or loaded into cache.
During this process, the launch server will check for authorization of the application against
the loading server (Management, Streaming, IIS, or File). The cached application launch
process is bound by the CPU as detailed in the following tables:
Table 4. Cached Application Launch Comparison (HTTP versus RTSP)
Streaming
Component
Maximum Launches per Hour
(Approximate)
Response Time per Launch (ms)
IIS (HTTP) 10,000,000 5
Management Server
(RTSP)
100,000 600
NOTE: Performing additional cached application launch requests above the maximum
numbers listed in the table above resulted in failure of some of the cached application
launch requests. A user would receive a launch failed message and would need to
attempt to launch the application again.
Table 5. Cached Application Launch Performance Data per 100 Launches
(Management Server)
Streaming
Component
Operating
System
CPU Load Memory
Usage
Network
Bandwidth
Maximum
Launches
per Minute
Management Server
(RTSP)
Windows
Server 2003
6.5% 0.3 MB 0.3Mbps 1,750
Management Server
(RTSP)
Windows
Server 2008
4.3% 0.1 MB 0.3 Mbps 1,800
Table 6. Cached Application Launch Performance Data per 10,000 Launches (IIS
Server)
Streaming
Component
Operating
System
CPU Load Memory
Usage
Network
Bandwidth
Maximum
Launches
per Minute
IIS 6 (HTTP) Windows
Server 2003
5.1% NA 0.8 Mbps 175,000
IIS 7 (HTTP) Windows
Server 2008
7.2% NA 0.6 Mbps 120,000
Application Virtualization (App-V) 4.5 / 4.6 Server Sizing Guide Page 15
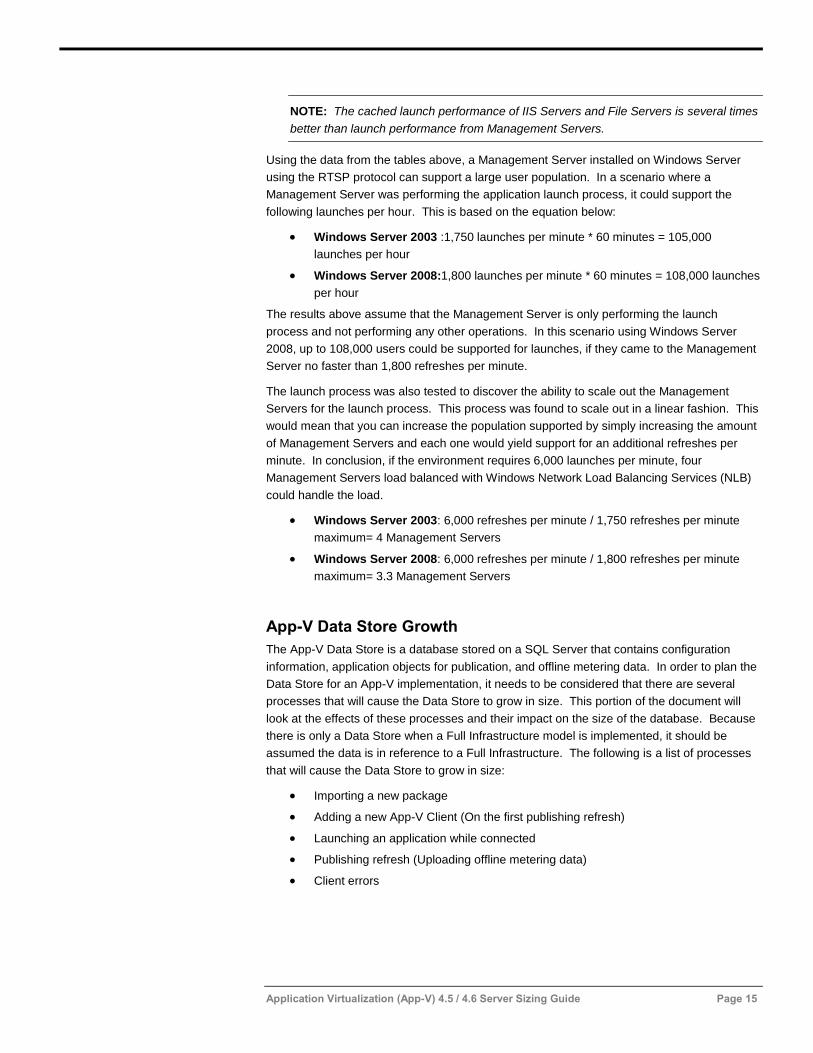
NOTE: The cached launch performance of IIS Servers and File Servers is several times
better than launch performance from Management Servers.
Using the data from the tables above, a Management Server installed on Windows Server
using the RTSP protocol can support a large user population. In a scenario where a
Management Server was performing the application launch process, it could support the
following launches per hour. This is based on the equation below:
Windows Server 2003 :1,750 launches per minute * 60 minutes = 105,000
launches per hour
Windows Server 2008:1,800 launches per minute * 60 minutes = 108,000 launches
per hour
The results above assume that the Management Server is only performing the launch
process and not performing any other operations. In this scenario using Windows Server
2008, up to 108,000 users could be supported for launches, if they came to the Management
Server no faster than 1,800 refreshes per minute.
The launch process was also tested to discover the ability to scale out the Management
Servers for the launch process. This process was found to scale out in a linear fashion. This
would mean that you can increase the population supported by simply increasing the amount
of Management Servers and each one would yield support for an additional refreshes per
minute. In conclusion, if the environment requires 6,000 launches per minute, four
Management Servers load balanced with Windows Network Load Balancing Services (NLB)
could handle the load.
Windows Server 2003: 6,000 refreshes per minute / 1,750 refreshes per minute
maximum= 4 Management Servers
Windows Server 2008: 6,000 refreshes per minute / 1,800 refreshes per minute
maximum= 3.3 Management Servers
App-V Data Store Growth
The App-V Data Store is a database stored on a SQL Server that contains configuration
information, application objects for publication, and offline metering data. In order to plan the
Data Store for an App-V implementation, it needs to be considered that there are several
processes that will cause the Data Store to grow in size. This portion of the document will
look at the effects of these processes and their impact on the size of the database. Because
there is only a Data Store when a Full Infrastructure model is implemented, it should be
assumed the data is in reference to a Full Infrastructure. The following is a list of processes
that will cause the Data Store to grow in size:
Importing a new package
Adding a new App-V Client (On the first publishing refresh)
Launching an application while connected
Publishing refresh (Uploading offline metering data)
Client errors
Application Virtualization (App-V) 4.5 / 4.6 Server Sizing Guide Page 16
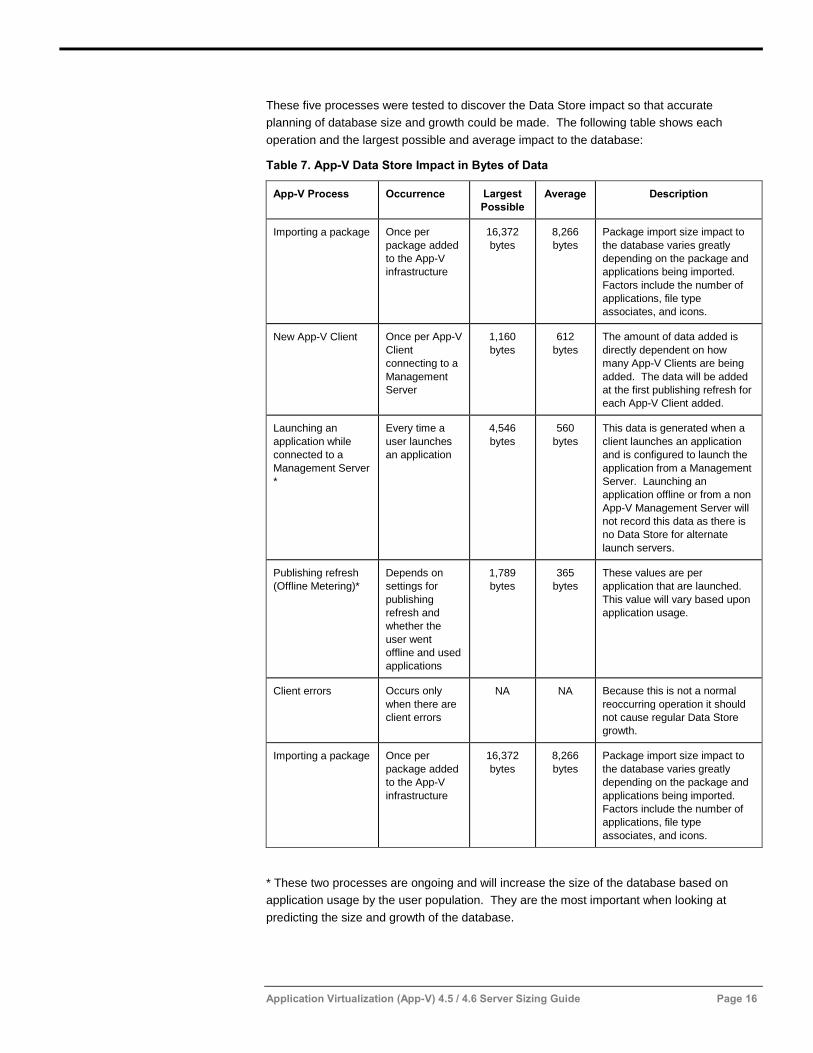
These five processes were tested to discover the Data Store impact so that accurate
planning of database size and growth could be made. The following table shows each
operation and the largest possible and average impact to the database:
Table 7. App-V Data Store Impact in Bytes of Data
App-V Process Occurrence Largest
Possible
Average Description
Importing a package Once per
package added
to the App-V
infrastructure
16,372
bytes
8,266
bytes
Package import size impact to
the database varies greatly
depending on the package and
applications being imported.
Factors include the number of
applications, file type
associates, and icons.
New App-V Client Once per App-V
Client
connecting to a
Management
Server
1,160
bytes
612
bytes
The amount of data added is
directly dependent on how
many App-V Clients are being
added. The data will be added
at the first publishing refresh for
each App-V Client added.
Launching an
application while
connected to a
Management Server
*
Every time a
user launches
an application
4,546
bytes
560
bytes
This data is generated when a
client launches an application
and is configured to launch the
application from a Management
Server. Launching an
application offline or from a non
App-V Management Server will
not record this data as there is
no Data Store for alternate
launch servers.
Publishing refresh
(Offline Metering)*
Depends on
settings for
publishing
refresh and
whether the
user went
offline and used
applications
1,789
bytes
365
bytes
These values are per
application that are launched.
This value will vary based upon
application usage.
Client errors Occurs only
when there are
client errors
NA NA Because this is not a normal
reoccurring operation it should
not cause regular Data Store
growth.
Importing a package Once per
package added
to the App-V
infrastructure
16,372
bytes
8,266
bytes
Package import size impact to
the database varies greatly
depending on the package and
applications being imported.
Factors include the number of
applications, file type
associates, and icons.
* These two processes are ongoing and will increase the size of the database based on
application usage by the user population. They are the most important when looking at
predicting the size and growth of the database.
Application Virtualization (App-V) 4.5 / 4.6 Server Sizing Guide Page 17
There are many contributing factors to database size and growth. The two main ongoing
growth base processes are launching an application from a Management Server, and the
publishing refresh process. The following scenarios present examples of database growth:
Importing an Application
Importing an application adds all of the publishing information for an application to the
database. On average, this is approximately 8KB of data. If an organization had 1,000
applications it would only increase the size of the database by approximately 8MB. Also,
after the applications are added there is no additional growth beyond application updates that
will be much smaller than 8KB of data. In summary, importing applications will not
continually grow the database beyond the initial import at a significant level.
Adding a New App-V Client
Adding new App-V Clients will increase the size of the database on the first publishing
refresh as it captures data for the specific client in order to track usage for specific machines.
This is a one-time operation and can easily be predicted by the amount of clients that will
participate with an App-V Full Infrastructure. If the environment that App-V is being deployed
to has 10,000 clients that will participate with the App-V Infrastructure, on average each client
will add approximately 600 bytes of data to the Data Store on the first publishing refresh. The
database impact would be approximately 6MB of data stored in the App-V Data Store. This
data will not continue to grow unless additional App-V Clients are added to the infrastructure.
Application Launch and Shutdown (Management Server)
The application launch process and subsequent shutdown produces an average of 560 bytes
of data that will be sent to the Management Server. This data is the message logs that
represent errors and startup and shutdown times for the application. This data is
approximately 560 bytes per launch and shutdown (total) per user. If a user launches and
shuts down one application per hour for a normal work day, it would total approximately 13KB
of data per user per day. If the organization had a population of 10,000 users, the total
impact of the database would be approximately 125 MB per day. The following equation can
be used to approximate the amount of data created by launching applications against a
Management Server:
(560 bytes per launch and shutdown) X (number of launches per day) X (user
population) = Daily database growth
Remember that if a user is launching an application and has been configured to stream and
launch the application from a Streaming Server, IIS Server, or File Server, this data is not
captured and sent to the Data Store. What this means is that the User Population portion of
this equation should really be “user population that launches applications from a
Management Server.” Application launch data generated is not stored as part of the offline
metering data. Also, Streaming Servers, IIS Servers, and File servers are not configured to
communicate with a Data Store, so this application launch data will not be recorded in any
database unless the application launch occurs against a Management Server.
Publishing Refresh (Offline Metering Recording)
A significant change was made to the App-V 4.5 Client that allows for the Data Store to more
accurately store application usage information. In previous versions of the App-V Client all of
the usage information was lost if a client did not have connectivity to the infrastructure. In
App-V 4.5 the Client behavior was changed to record all application usage information locally
Application Virtualization (App-V) 4.5 / 4.6 Server Sizing Guide Page 18
on the client computer and forward this usage information on the next publishing refresh.
Each time an application is used approximately 365 bytes of data are recorded locally, to be
forwarded to the App-V Data Store on the next publishing refresh. If one application was
launched each hour by a user all day, approximately 8.6KB of data would need to be sent to
the Data Store. For a population of 10,000 users the total would be approximately 80 MB of
data added to the Data Store each day. The following equation can be used to approximate
the amount of data created by application usage information:
(365 bytes per application launched) X (number of launches per day) X (user population)
= Daily database growth
Because this data is stored locally on the client and then forwarded to the Management
Server on publishing refresh, even clients that are launching applications from alternative
servers (Streaming, IIS, or File) will still report this information to the Management Server and
then the Data Store.
However, if an infrastructure does not include a Management Server for publishing
refresh(Streaming Infrastructure, Standalone, ESD, or SCCM R2) this data will not be
recorded as there will be no Data Store available to record the data. In this situation, the
client should not be configured to record usage information.
Client Errors
Because client errors are not a normal operation and their size is so small, no significant
database growth should be caused by this data being recorded to the database.
Application Virtualization (App-V) 4.5 / 4.6 Server Sizing Guide Page 19
RECOMMENDATIONS
This document can be used to answer questions of how many servers and what types of
servers (Management, Streaming, or IIS) should be used in designing an App-V
infrastructure. The test results imply several key recommendations to persons designing an
App-V infrastructure. The following is a list of these recommendations that are representative
of the test data presented. These recommendations may not pertain to all environments, but
will present efficient use of physical resources available in planning an App-V infrastructure.
Management Servers only perform publishing refresh
IIS Servers with local content store perform the load (streaming) and launch process
Database size and growth is primarily dependent on application launches and
application usage information
Reporting queries impact performance
App-V components scale-out in a linear fashion
Management Servers Only Perform Publishing Refresh
Management Servers can be configured to perform the publishing refresh process, stream or
load applications, and authorize the launch of cached applications. In testing it was found
that if a Management Server only performs the publishing refresh process, it can support a
very large population (approximately 480,000 publishing refreshes per hour). Implementing
the additional processes of loading and launching of cached operations are additive and will
effectively reduce the maximum population that could be supported.
If a Management Server is configured to support the publishing refresh and launching of
cached applications, each 100 publishing refresh operations and 100 launches will cause the
CPU load to increase by 1.24% for publishing refresh and 4.3% for the cached launch
process for a total of 5.54%. This will reduce the amount of both publishing refreshes and
cached application launches to approximately 1,800 users performing a launch and refresh
every minute or 108,000 refreshes and launches per hour.
Based on this information and the knowledge that IIS Servers perform the cached launch
operation with much less overhead, it is recommended to only perform the publishing refresh
process on Management Servers and separate the cached launches to an IIS Server. This
would allow designers to utilize fewer Management Servers in the environment as each one
will support approximately 8,500 publishing refreshes per minute as described in greater
detail earlier in this document.
Adding the loading or streaming of package process to a Management Server will further
reduce the performance of a single Management Server. Performance data was not
captured when performing all three operations (publishing refresh, load, and cached launch)
from a single Management Server as this is not recommended when attempting to support a
large user base.
IIS Servers Perform the Load (Streaming) and Launch Process
Performance of the launch process on an IIS server is several orders of magnitude greater
than the performance of a Management Server and should be implemented for larger
Application Virtualization (App-V) 4.5 / 4.6 Server Sizing Guide Page 20
environments. The loading process performs the same or very similar to a Management
Server implementing RTSP.
However, many organizations will want to provide a higher level of security than RTSP can
provide. In this situation the Management Server can be configured to support RTSPS with
the use of a server certificate. RTSPS implements Secure Sockets Layer (SSL)-based
security on the channel which will reduce the performance of the Management Server. This
is based on the session setup and maintenance being a CPU-intensive operation. Utilizing
an IIS Server for the launch and load process with security can utilize HTTPS. This protocol
also implements SSL-based security on the session, but many hardware-based accelerators
are available for HTTPS. The only option available for RTSPS acceleration is Chimney
Offloading, which implements the entire TCP stack on the network card.
A single IIS Server with a local content directory will support most organizations cached
launch needs as it supports over 100,000 launches per minute. It would be recommended to
have additional IIS Servers in a network load balanced cluster to provide greater levels of
availability. The load or streaming process will be similar to a Management Server and will
be limited by the network as with a Management Server.
Database Size and Growth
The database sizing and growth are primarily dependent on application launches and
reporting information. These operations are ongoing and continually add to the size of the
database. As previously described in this document, these two processes will need to be
used in cooperation with the database cleanup settings to predict the proper size of the
database. Other database operations such as adding an application, adding new App-V
Clients, and Client errors will not significantly increase the size of the database.
Reporting Queries Affect Performance
In a Full Infrastructure model, the Data Store will contain data that is useful for running
administrative reports. The built-in reports in App-V 4.5 were changed to reflect common
reports that IT administrators would need to manage their environment. However, the Data
Store contains additional usage data that no built-in reports expose. This data can be useful
for management based reports for an organization.
It is recommended to only run reports (both built-in and custom) against the production Data
Store during times of minimal or no load. This will ensure that the user population is not
affected by the additional load placed on the Data Store during reporting queries.
App-V Components Scale-out in a Linear Fashion
When planning an App-V infrastructure, most of the components scale-out in a linear fashion.
For example, if one server supports 8,500 publishing refreshes per minute, two Management
Servers will support 16,000 publishing refreshes per minute. This scale-out behavior is
common with all of the components.
Application Virtualization (App-V) 4.5 / 4.6 Server Sizing Guide Page 21
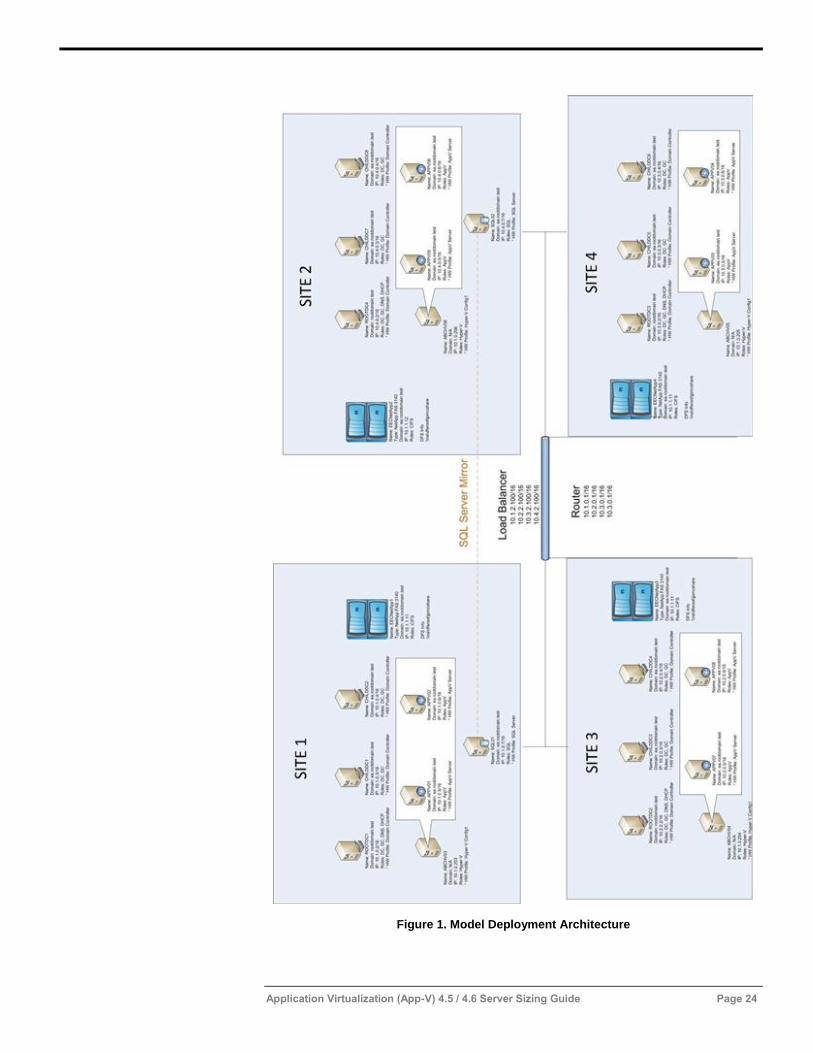
MODEL DEPLOYMENT
Based on the server sizing information presented in the preceding sections, the remainder of
this document proposes a deployment architecture that scales to meet the needs of a large
enterprise wanting to setup a cross site App-V deployment in their datacenters. The
proposed deployment architecture was modeled by building it out in our labs, key
performance measurements were taken, and the results are presented.
The following section discusses some of the important parameters that influence the
performance and scale of an App-V deployment. The choices made in this section in terms of
size of the deployment do not represent a maximum limit for an App-V deployment but were
the limits to which we tested the model deployment in our labs. The observations described
in this section were based on choices we document in design section. Customers should use
these results as general guidance; the actual results seen in a customer environment will
vary depending the specific implementation choices made.
Site Design
The model deployment consisted of multiple datacenter sites connected by a high bandwidth
and low latency connection, with 1 primary datacenter site, and 3 secondary sites The link
speed between these sites was at least 2.4 Gbps and had a latency of 2ms or lower.
Active Directory Setup
The Active Directory setup had the following key attributes
Each site had a root domain controller and 2 child domain controllers.
200,000 user accounts were created in this domain that would be used for modeling
the deployment
App-V Server Setup
The architecture modeled used the App-V server to publish packages to the users. The
deployment consisted of a total of 8 App-V virtualized Servers with 2 App-V Servers located
in each of 4 sites. A local hardware DNS load balancer was used in round robin mode to
distribute load across the servers local to the site. The App-V Servers were only used for
Publishing Refresh.
All the packages were stored on a Distributed File share and SMB streaming was used to
stream the packages to the client. The packages were stored on a NAS server on each site
and package content was duplicated using DFS technology across all sites. Branch Cache
was used for optimizing network utilization when streaming packages.
SQL Servers
There were 2 SQL Servers and there was asynchronous mirroring setup between the 2
databases. The SQL servers were run on physical hardware and were not Virtual Machines.
Local storage on the servers were used for storing the DB files.
Package Information
The model used 12,000 different applications. The size and the collateral for these
applications varied based on the functionality of the applications, but overall they fell in one of
the categories shown in the following package profile table:
Application Virtualization (App-V) 4.5 / 4.6 Server Sizing Guide Page 22
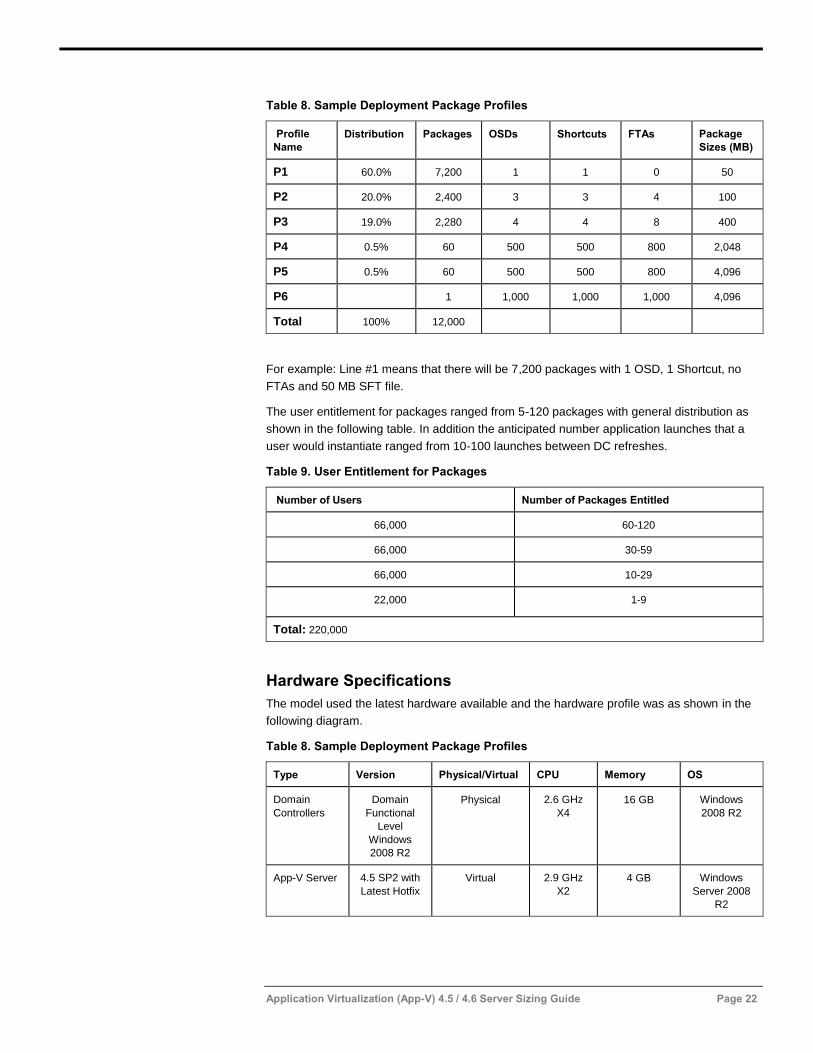
Table 8. Sample Deployment Package Profiles
Profile
Name
Distribution Packages OSDs Shortcuts FTAs Package
Sizes (MB)
P1 60.0% 7,200 1 1 0 50
P2 20.0% 2,400 3 3 4 100
P3 19.0% 2,280 4 4 8 400
P4 0.5% 60 500 500 800 2,048
P5 0.5% 60 500 500 800 4,096
P6 1 1,000 1,000 1,000 4,096
Total 100% 12,000
For example: Line #1 means that there will be 7,200 packages with 1 OSD, 1 Shortcut, no
FTAs and 50 MB SFT file.
The user entitlement for packages ranged from 5-120 packages with general distribution as
shown in the following table. In addition the anticipated number application launches that a
user would instantiate ranged from 10-100 launches between DC refreshes.
Table 9. User Entitlement for Packages
Number of Users Number of Packages Entitled
66,000 60-120
66,000 30-59
66,000 10-29
22,000 1-9
Total: 220,000
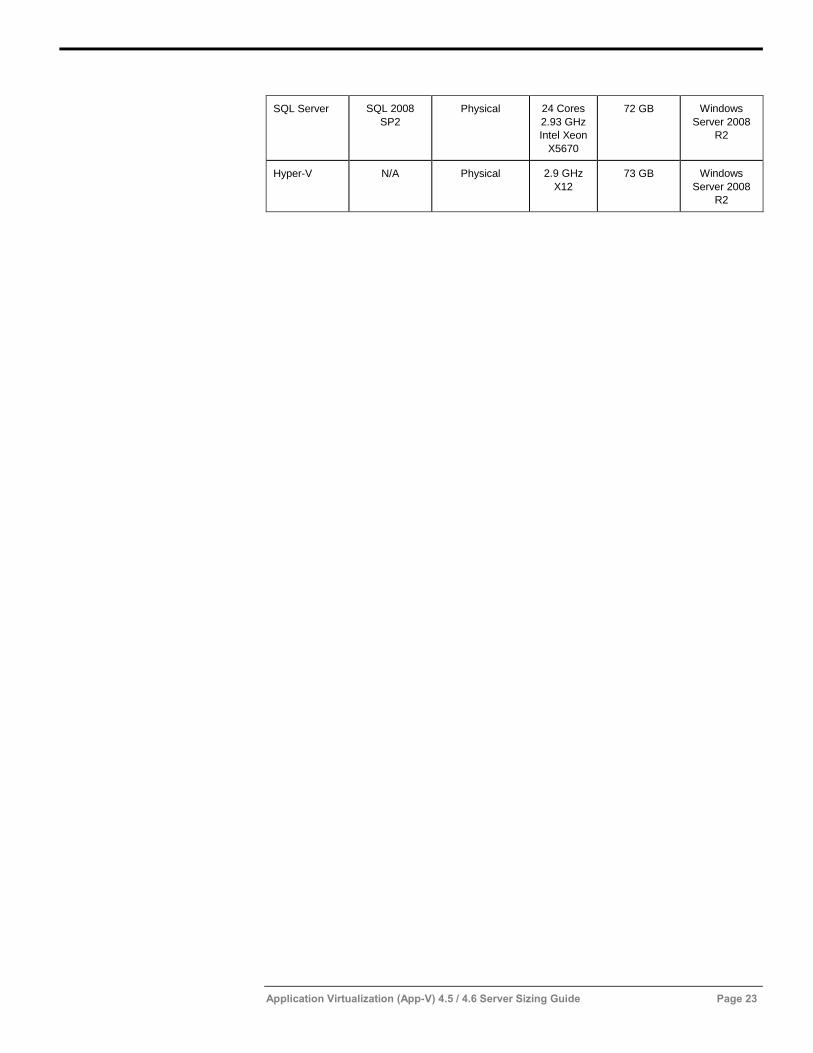
Hardware Specifications
The model used the latest hardware available and the hardware profile was as shown in the
following diagram.
Table 8. Sample Deployment Package Profiles
Type Version Physical/Virtual CPU Memory OS
Domain
Controllers
Domain
Functional
Level
Windows
2008 R2
Physical
2.6 GHz
X4
16 GB Windows
2008 R2
App-V Server 4.5 SP2 with
Latest Hotfix
Virtual 2.9 GHz
X2
4 GB Windows
Server 2008
R2
Application Virtualization (App-V) 4.5 / 4.6 Server Sizing Guide Page 23
SQL Server SQL 2008
SP2
Physical 24 Cores
2.93 GHz
Intel Xeon
X5670
72 GB Windows
Server 2008
R2
Hyper-V N/A Physical 2.9 GHz
X12
73 GB Windows
Server 2008
R2
Application Virtualization (App-V) 4.5 / 4.6 Server Sizing Guide Page 24
Figure 1. Model Deployment Architecture
Application Virtualization (App-V) 4.5 / 4.6 Server Sizing Guide Page 25
Observations and Recommendations
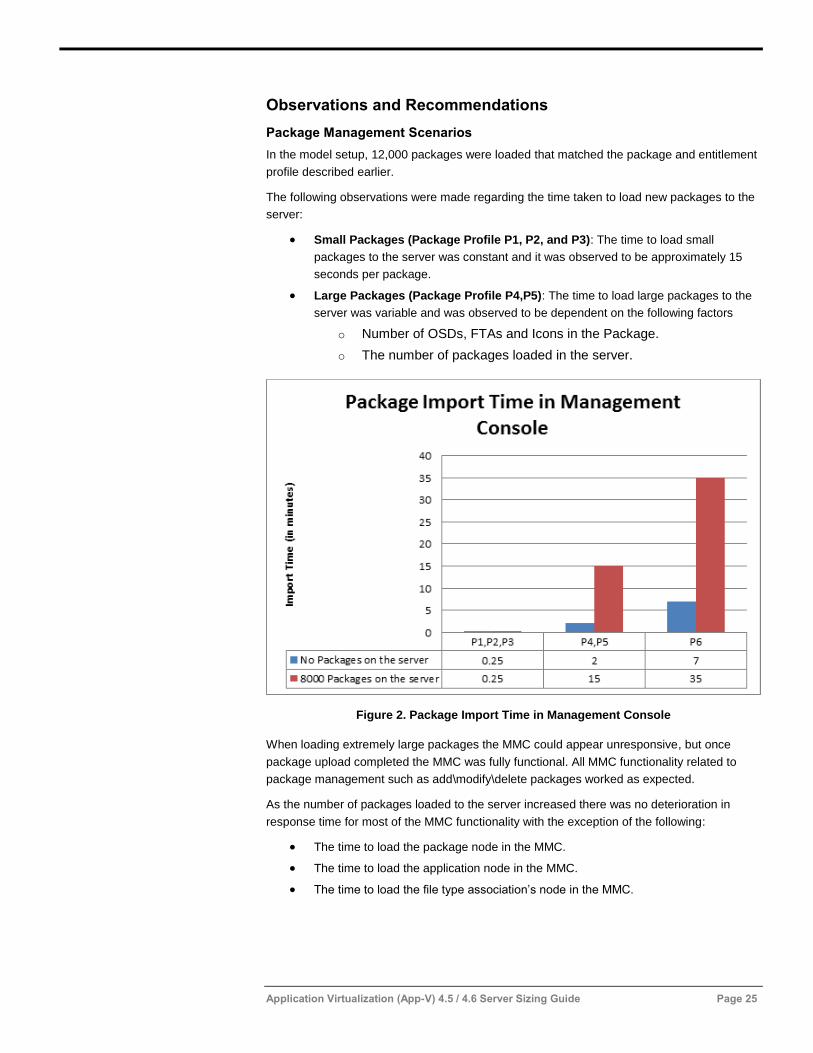
Package Management Scenarios
In the model setup, 12,000 packages were loaded that matched the package and entitlement
profile described earlier.
The following observations were made regarding the time taken to load new packages to the
server:
Small Packages (Package Profile P1, P2, and P3): The time to load small
packages to the server was constant and it was observed to be approximately 15
seconds per package.
Large Packages (Package Profile P4,P5): The time to load large packages to the
server was variable and was observed to be dependent on the following factors
o Number of OSDs, FTAs and Icons in the Package.
o The number of packages loaded in the server.
Figure 2. Package Import Time in Management Console
When loading extremely large packages the MMC could appear unresponsive, but once
package upload completed the MMC was fully functional. All MMC functionality related to
package management such as add\modify\delete packages worked as expected.
As the number of packages loaded to the server increased there was no deterioration in
response time for most of the MMC functionality with the exception of the following:
The time to load the package node in the MMC.
The time to load the application node in the MMC.
The time to load the file type association‟s node in the MMC.
Application Virtualization (App-V) 4.5 / 4.6 Server Sizing Guide Page 26
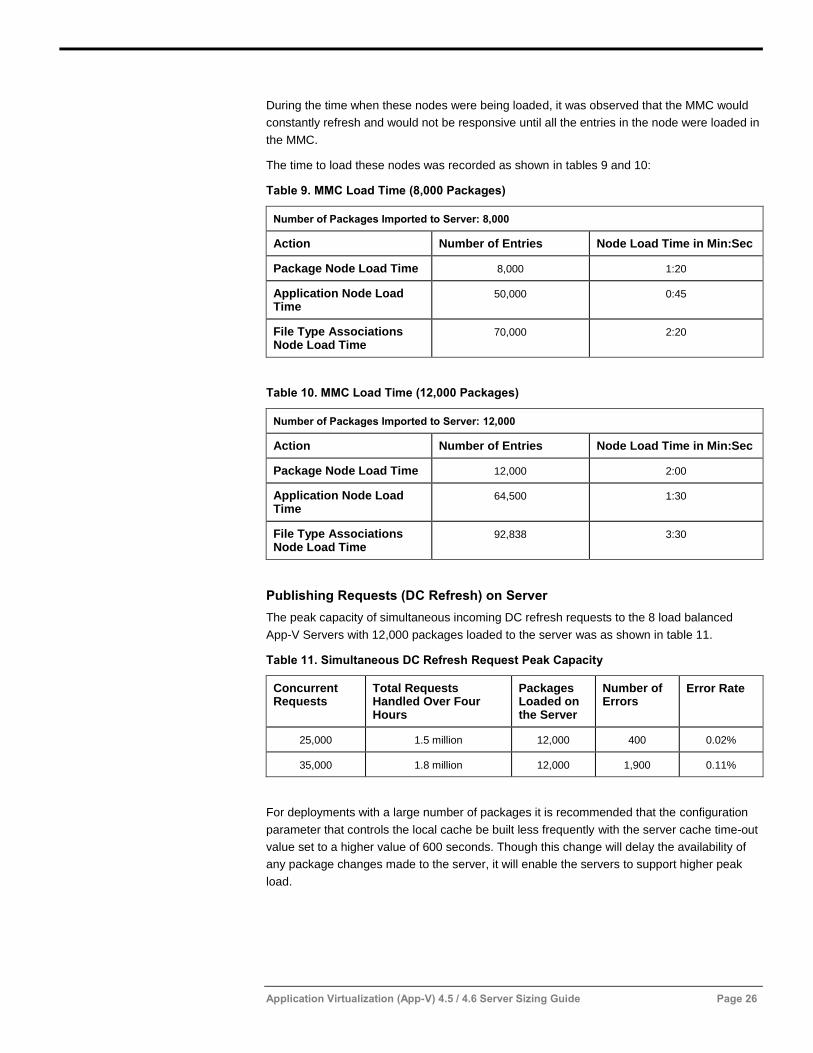
During the time when these nodes were being loaded, it was observed that the MMC would
constantly refresh and would not be responsive until all the entries in the node were loaded in
the MMC.
The time to load these nodes was recorded as shown in tables 9 and 10:
Table 9. MMC Load Time (8,000 Packages)
Number of Packages Imported to Server: 8,000
Action Number of Entries Node Load Time in Min:Sec
Package Node Load Time 8,000 1:20
Application Node Load Time
50,000 0:45
File Type Associations Node Load Time
70,000 2:20
Table 10. MMC Load Time (12,000 Packages)
Number of Packages Imported to Server: 12,000
Action Number of Entries Node Load Time in Min:Sec
Package Node Load Time 12,000 2:00
Application Node Load Time
64,500 1:30
File Type Associations Node Load Time
92,838 3:30
Publishing Requests (DC Refresh) on Server
The peak capacity of simultaneous incoming DC refresh requests to the 8 load balanced
App-V Servers with 12,000 packages loaded to the server was as shown in table 11.
Table 11. Simultaneous DC Refresh Request Peak Capacity
Concurrent Requests
Total Requests Handled Over Four Hours
Packages Loaded on the Server
Number of Errors
Error Rate
25,000 1.5 million 12,000 400 0.02%
35,000 1.8 million 12,000 1,900 0.11%
For deployments with a large number of packages it is recommended that the configuration
parameter that controls the local cache be built less frequently with the server cache time-out
value set to a higher value of 600 seconds. Though this change will delay the availability of
any package changes made to the server, it will enable the servers to support higher peak
load.
Application Virtualization (App-V) 4.5 / 4.6 Server Sizing Guide Page 27
Reporting Data
When reporting data was uploaded in conjunction with the DC Refresh scenario under a peak
load of 35000 concurrent users, we discovered that the reporting data load based on the
launch counts and user entitlement provided above severely reduced the concurrent DC
Refresh peak load the servers could handle from 35,000 to 2000 sessions across the 8 load
balanced servers. Therefore, it is recommended that for large scale deployments 1)the App-V
server only be used for publishing packages and 2) HTTP Reporting be used as the
mechanism to collect client reporting data d. App-V 4.6‟s support of client reporting over
HTTP can be leveraged as follows::
Continue to use the App-V Management Server for publishing content.
Create an HTTP Reporting Server that performs the following tasks:
Create an HTTP Publishing Server that publishes no content. Here is general
information on App-V publishing and streaming using IIS.
Parse the content of the reporting data XML files. Here is information on Support for
Client Reporting over HTTP and a blog article that provides a detailed guide on how
to set up an IIS server to do HTTP reporting.
Store the data in the central reporting database.
Configure each App-V Client to point to the HTTP Reporting Server.
Publishing Requests (DC Refresh) on Client
Testing demonstrated that up to 1600 applications could be successfully deployed to the
desktop. The applications and the associated content such as icons and file type
associations were consistently deployed to the client despite peak DC Refresh load on the
server.
The time it takes DC Refresh to complete is a function of the following:
Number of applications (OSDs) deployed
Number of file type associations deployed
Number of ICONs deployed.
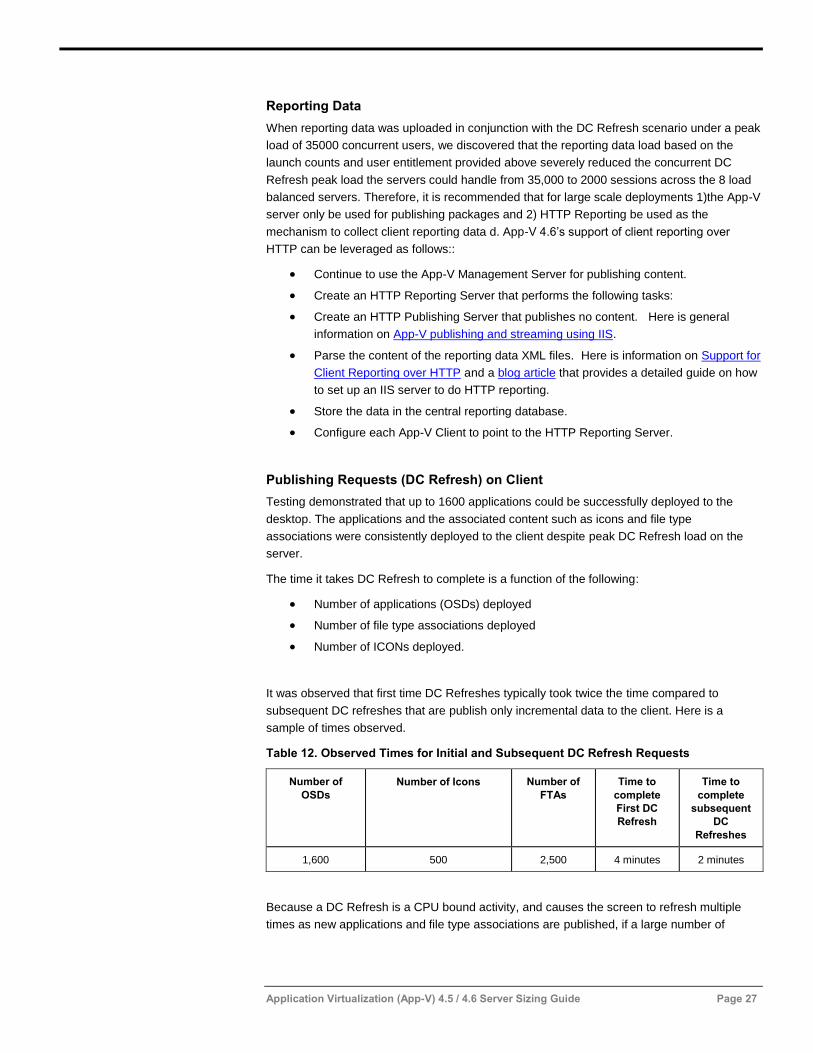
It was observed that first time DC Refreshes typically took twice the time compared to
subsequent DC refreshes that are publish only incremental data to the client. Here is a
sample of times observed.
Table 12. Observed Times for Initial and Subsequent DC Refresh Requests
Number of
OSDs
Number of Icons Number of
FTAs
Time to
complete
First DC
Refresh
Time to
complete
subsequent
DC
Refreshes
1,600 500 2,500 4 minutes 2 minutes
Because a DC Refresh is a CPU bound activity, and causes the screen to refresh multiple
times as new applications and file type associations are published, if a large number of
Application Virtualization (App-V) 4.5 / 4.6 Server Sizing Guide Page 28
applications are being deployed to the client the screen may refresh multiple times during a
DC Refresh and the current active application window may lose focus.
In order to have a better end user experience we recommend that you:
Avoid DC refreshes that deploy a very large number of new applications, file type
associations and icons in a single DC Refresh.
While there are no practical limits on the number of OSDs, FTAs, Shortcut and
Icons per package, it is strongly recommended that a deployment should try to limit
the number of such large packages with package profiles similar to P4\P5 to less
than 1-2 per user or investigate alternatives to breakdown bigger packages into
smaller packages.
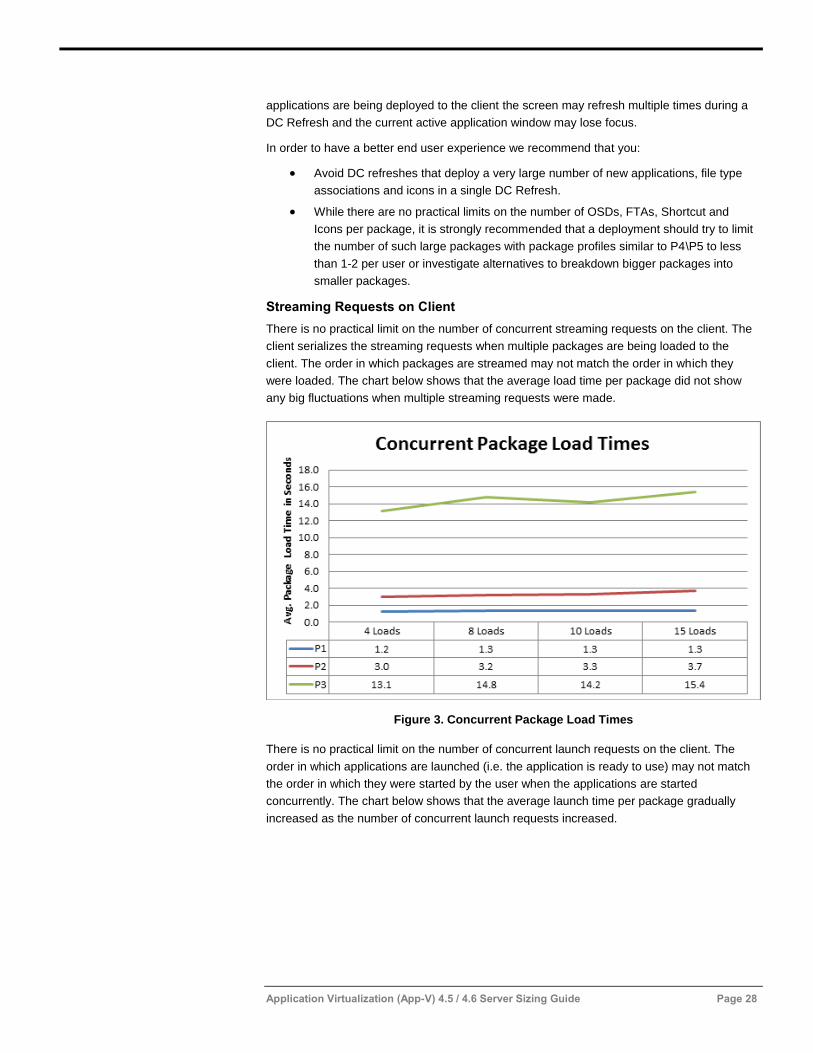
Streaming Requests on Client
There is no practical limit on the number of concurrent streaming requests on the client. The
client serializes the streaming requests when multiple packages are being loaded to the
client. The order in which packages are streamed may not match the order in which they
were loaded. The chart below shows that the average load time per package did not show
any big fluctuations when multiple streaming requests were made.
Figure 3. Concurrent Package Load Times
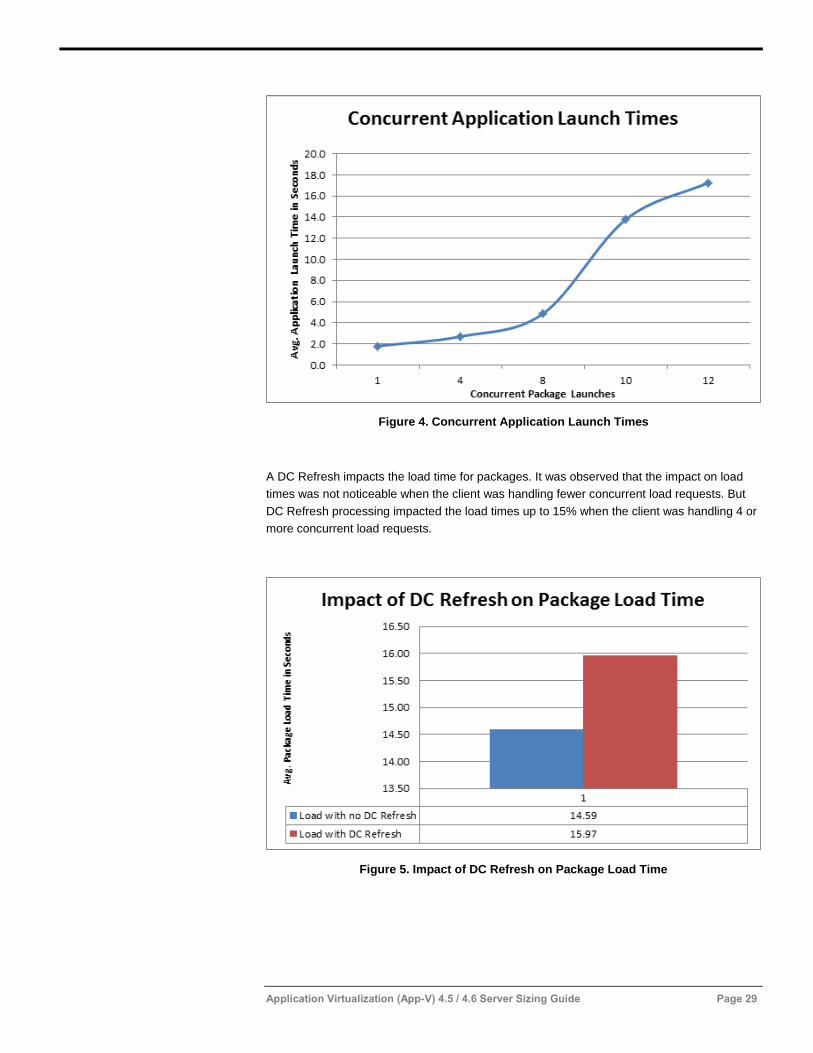
There is no practical limit on the number of concurrent launch requests on the client. The
order in which applications are launched (i.e. the application is ready to use) may not match
the order in which they were started by the user when the applications are started
concurrently. The chart below shows that the average launch time per package gradually
increased as the number of concurrent launch requests increased.
Application Virtualization (App-V) 4.5 / 4.6 Server Sizing Guide Page 29
Figure 4. Concurrent Application Launch Times
A DC Refresh impacts the load time for packages. It was observed that the impact on load
times was not noticeable when the client was handling fewer concurrent load requests. But
DC Refresh processing impacted the load times up to 15% when the client was handling 4 or
more concurrent load requests.
Figure 5. Impact of DC Refresh on Package Load Time
Application Virtualization (App-V) 4.5 / 4.6 Server Sizing Guide Page 30
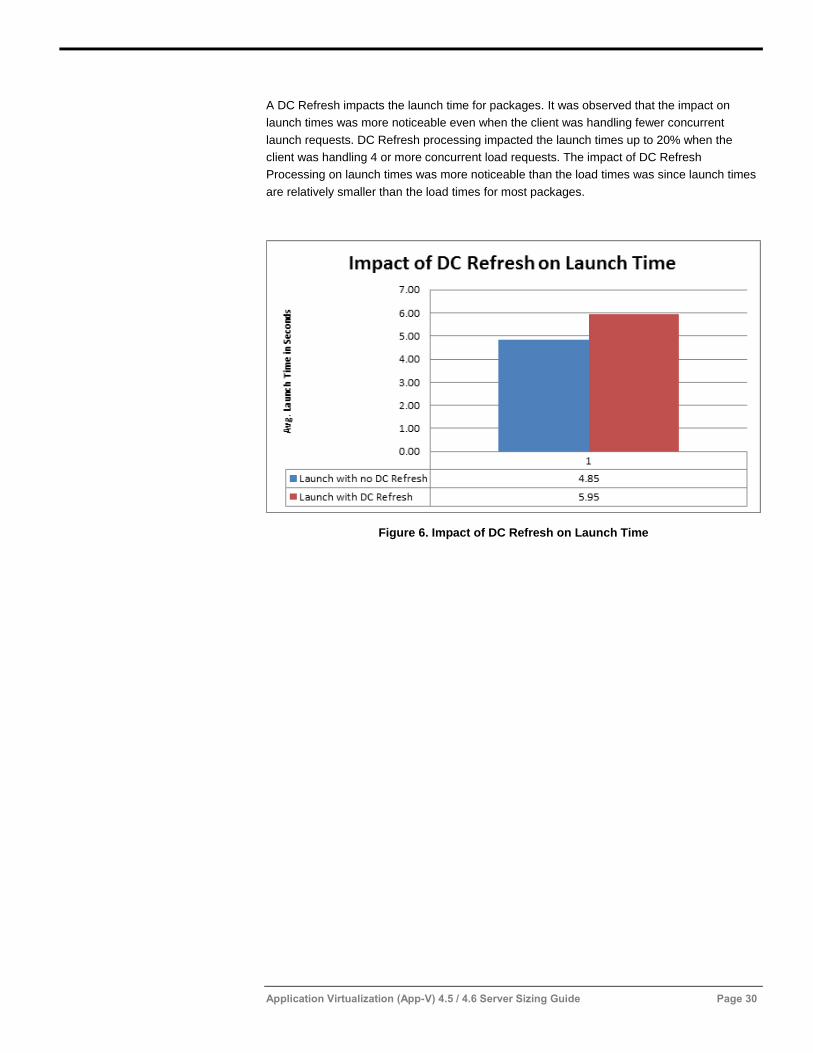
A DC Refresh impacts the launch time for packages. It was observed that the impact on
launch times was more noticeable even when the client was handling fewer concurrent
launch requests. DC Refresh processing impacted the launch times up to 20% when the
client was handling 4 or more concurrent load requests. The impact of DC Refresh
Processing on launch times was more noticeable than the load times was since launch times
are relatively smaller than the load times for most packages.
Figure 6. Impact of DC Refresh on Launch Time
Application Virtualization (App-V) 4.5 / 4.6 Server Sizing Guide Page 31
FOR MORE INFORMATION
For more information about Microsoft products or services, call the Microsoft Sales
Information Center at (800) 426-9400. In Canada, call the Microsoft Canada information
Centre at (800) 563-9048. Outside the 50 United States and Canada, please contact your
local Microsoft subsidiary. To access information through the World Wide Web, go to:
http://www.microsoft.com
http://www.microsoft.com/technet/itshowcase
The information contained in this document represents the current view of Microsoft Corporation on the issues
discussed as of the date of publication. Because Microsoft must respond to changing market conditions, it
should not be interpreted to be a commitment on the part of Microsoft, and Microsoft cannot guarantee the
accuracy of any information presented after the date of publication.
This White Paper is for informational purposes only. MICROSOFT MAKES NO WARRANTIES, EXPRESS,
IMPLIED, OR STATUTORY, AS TO THE INFORMATION IN THIS DOCUMENT.
Complying with all applicable copyright laws is the responsibility of the user. Without limiting the rights under
copyright, no part of this document may be reproduced, stored in or introduced into a retrieval system, or
transmitted in any form or by any means (electronic, mechanical, photocopying, recording, or otherwise), or for
any purpose, without the express written permission of Microsoft Corporation.
Microsoft may have patents, patent applications, trademarks, copyrights, or other intellectual property rights
covering subject matter in this document. Except as expressly provided in any written license agreement from
Microsoft, the furnishing of this document does not give you any license to these patents, trademarks,
copyrights, or other intellectual property.
Unless otherwise noted, the example companies, organizations, products, domain names, e-mail addresses,
logos, people, places, and events depicted herein are fictitious, and no association with any real company,
organization, product, domain name, e-mail address, logo, person, place, or event is intended or should be
inferred.
© 2012 Microsoft Corporation. All rights reserved.
Microsoft, Windows, and all other trademarks used in this white paper are either registered trademarks or
trademarks of Microsoft Corporation in the United States and/or other countries.
All other trademarks are property of their respective owners.
Application Virtualization (App-V) 4.5 / 4.6 Server Sizing Guide Page 32
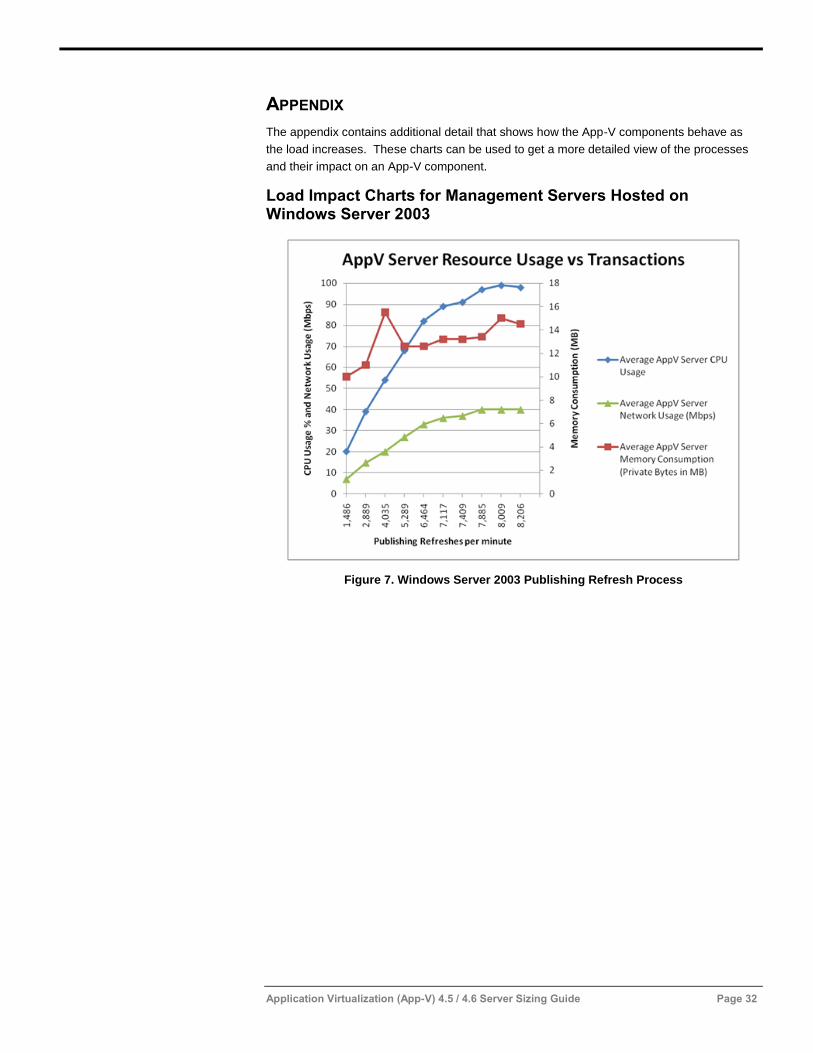
APPENDIX
The appendix contains additional detail that shows how the App-V components behave as
the load increases. These charts can be used to get a more detailed view of the processes
and their impact on an App-V component.
Load Impact Charts for Management Servers Hosted on Windows Server 2003
Figure 7. Windows Server 2003 Publishing Refresh Process
Application Virtualization (App-V) 4.5 / 4.6 Server Sizing Guide Page 33
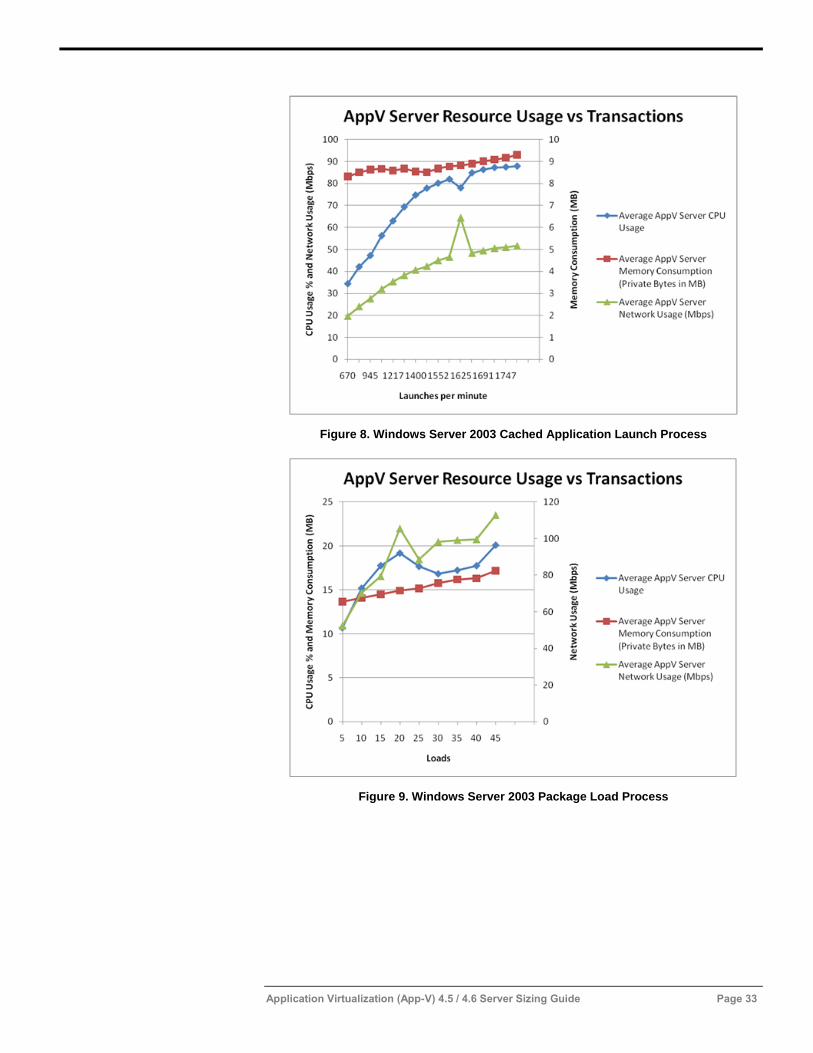
Figure 8. Windows Server 2003 Cached Application Launch Process
Figure 9. Windows Server 2003 Package Load Process
Application Virtualization (App-V) 4.5 / 4.6 Server Sizing Guide Page 34
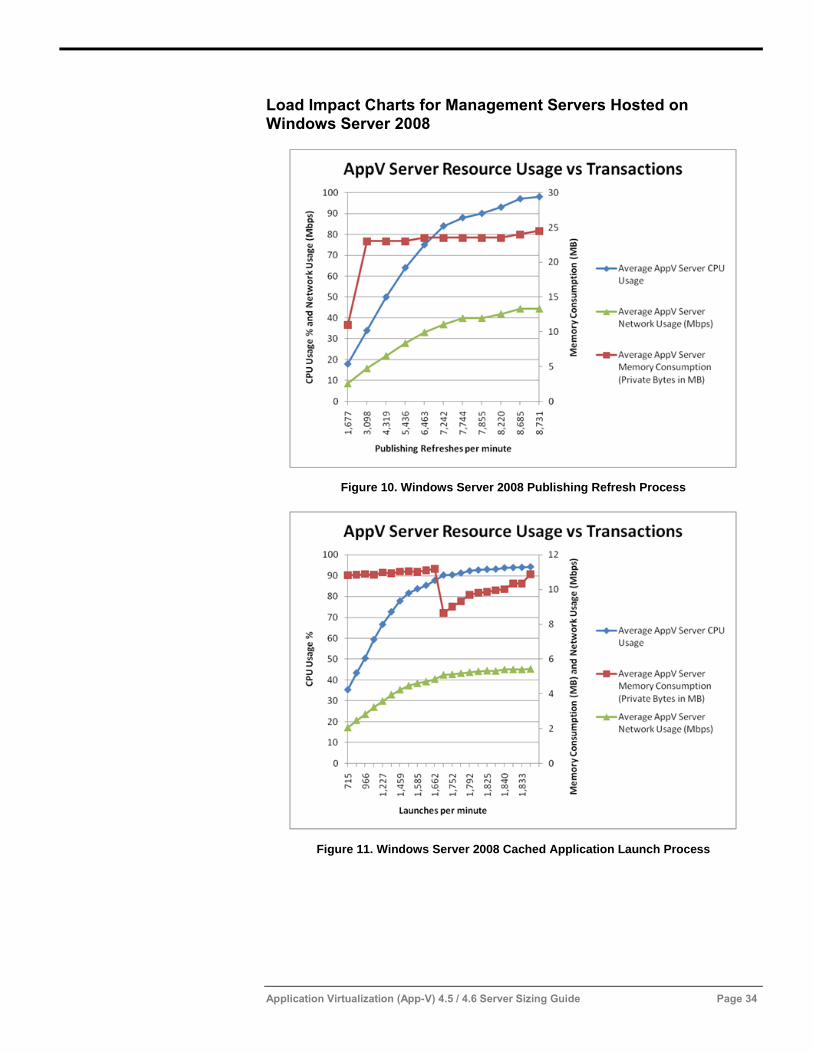
Load Impact Charts for Management Servers Hosted on Windows Server 2008
Figure 10. Windows Server 2008 Publishing Refresh Process
Figure 11. Windows Server 2008 Cached Application Launch Process
Application Virtualization (App-V) 4.5 / 4.6 Server Sizing Guide Page 35
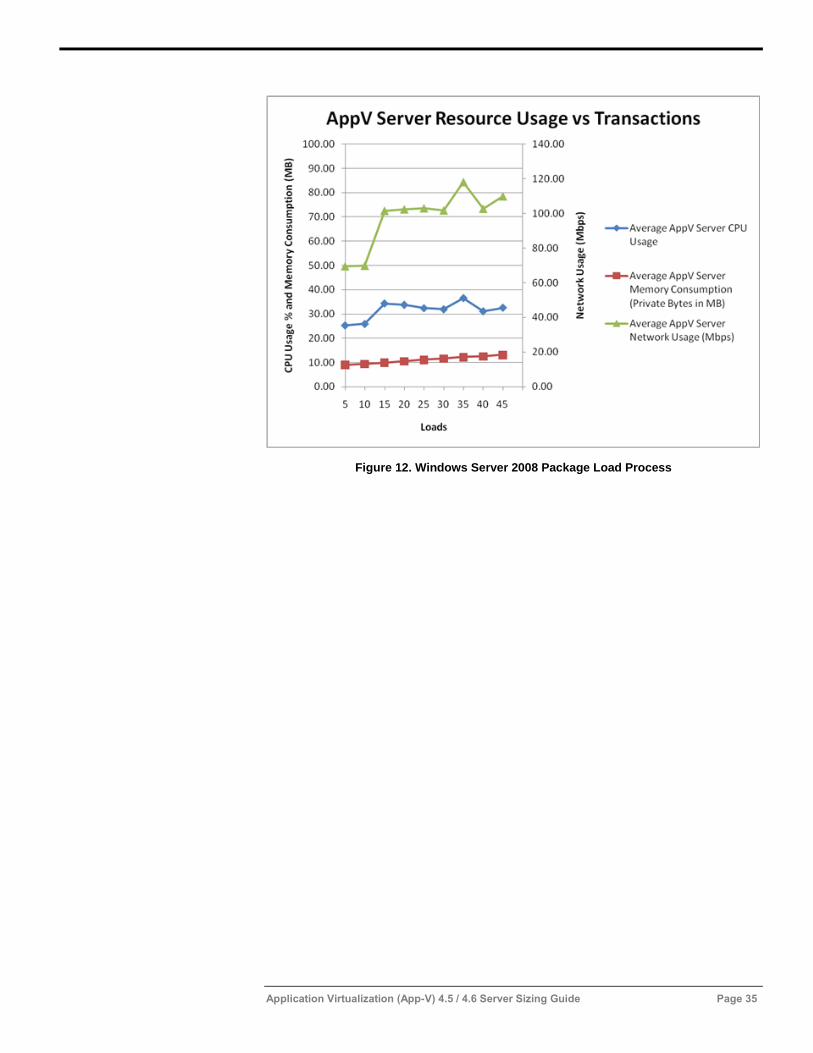
Figure 12. Windows Server 2008 Package Load Process
Application Virtualization (App-V) 4.5 / 4.6 Server Sizing Guide Page 36
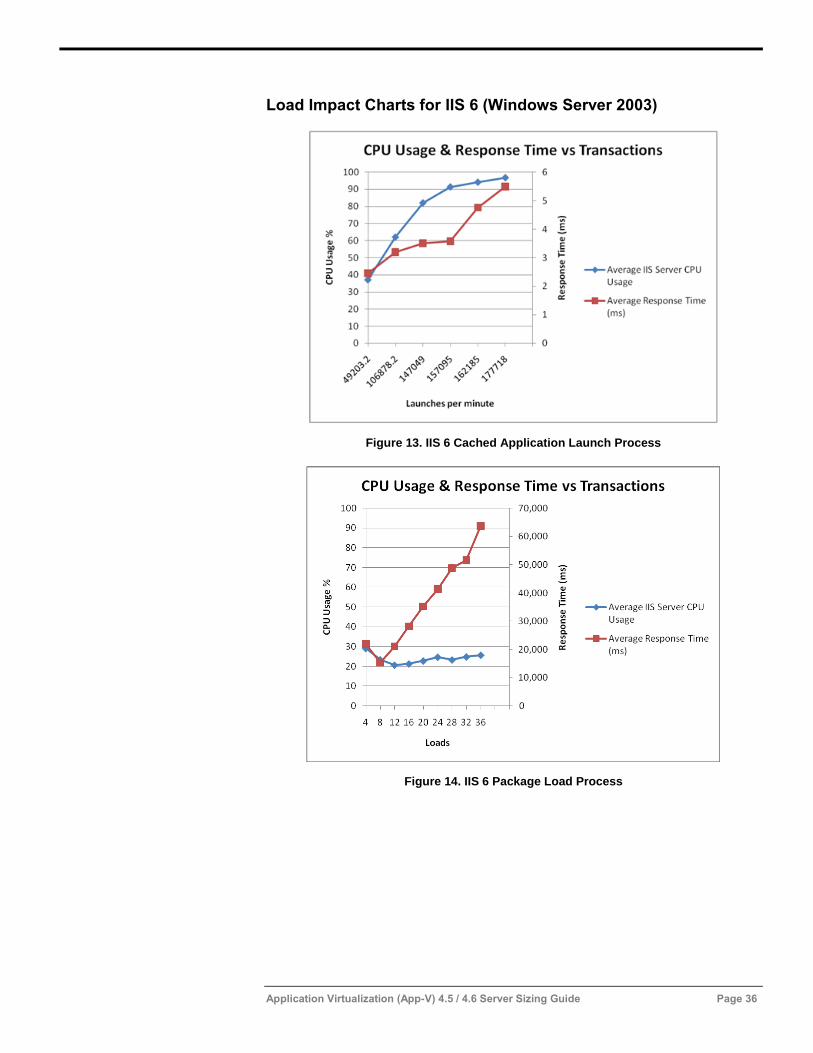
Load Impact Charts for IIS 6 (Windows Server 2003)
Figure 13. IIS 6 Cached Application Launch Process
Figure 14. IIS 6 Package Load Process
Application Virtualization (App-V) 4.5 / 4.6 Server Sizing Guide Page 37
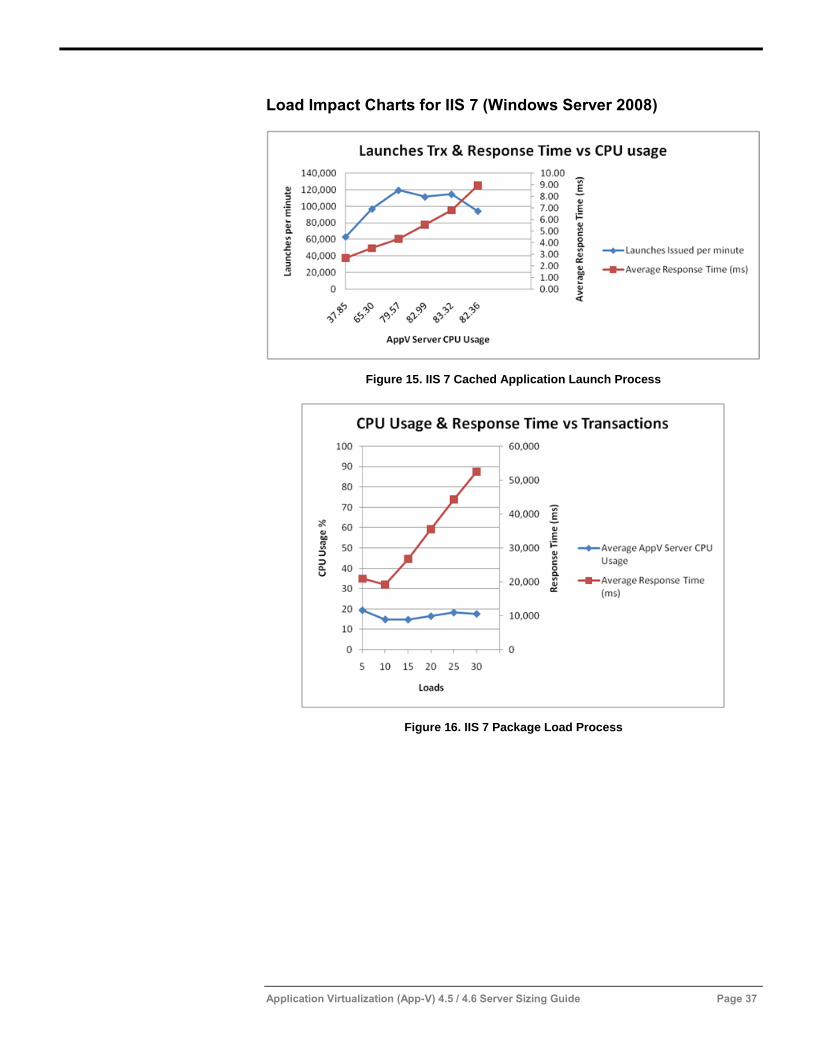
Load Impact Charts for IIS 7 (Windows Server 2008)
Figure 15. IIS 7 Cached Application Launch Process
Figure 16. IIS 7 Package Load Process