Embed Size (px)
Citation preview

Applications of Mixed Reality in Applications of Mixed Reality in ArchitectureArchitecture, Engineering, and
ConConstruction: Specification, truction: Specification,
Prototype, and EvaluationPrototype, and Evaluation
Xiangyu WangXiangyu Wang

Outline
Background Specification Prototype Development System Evaluation Summaries and Conclusions

Background
Mixed Reality (MR)
AugmentedReality (AR)
AugmentedVirtuality (AV)
Reality-Virtuality (RV) Continuum
RealEnvironment
(RE)
VirtualEnvironment
(VE)
Mixed Reality (MR): an environment where real world and virtual world objects are presented together on a single display (Milgram & Kishino 1994; Milgram and Colquhoun 1999).

Background
Goal: To systematically and comprehensively transfer the
available MR-based technology into Architecture, Engineering, and Construction (AEC) arenas.
Objectives To develop a structured specification for mapping the
available MR-based technology to specific tasks in AEC. To develop prototypes named Mixed Reality-based
collaborative virtual environments (MRCVEs) to transform the way of current design review collaboration.
To evaluate the above prototype systems in the aspect of benefits validation and usability engineering.

Classify MR Technology Analyze AEC Tasks
Map Technology to Task
Face to Face Conferencing Scenario
Usability Evaluation
Virtual Space Conferencing Scenario
PROTOTYPE DEVELOPMENT
SPECIFICATION METHODOLOGY
PROTOTYPE EVALUATION
Benefit ValidationFace-to-Face Conferencing Scenario V.S. Current Design Review Meeting
Virtual Space Scenario V.S. Current Web-based Design Collaboration
System ImprovementsEvaluation Methods
Current Collaboration Mechanisms
Groupware Issues
Concurrent Engineering, DVE, CVE
Identify Feasible MRCVE Scenarios
MRCVE Prototype Development

Specification: phase 1
Phase 1- Specify MR Technology: Classify MR (AR) based on four technological components:
Media Representation Input Mechanism Output Mechanism Tracking Technology
Specification covers only major classes of devices.
Results founded and knowledge learnt in phase 1 lays foundation of mapping technology to tasks.

Specification: phase 1
Classifying the Media Representation (as an example of findings in phase 1) Abstract-Concrete, or Schematic to 3D: high-
fidelity representation is not necessarily superior over more abstract one because each type has its own appropriate application area.
Abstract Augmenting Content Continuum
Concrete
Tex
t
2D I
mag
e &
V
ideo
3D O
bje
ct
3D
Wir
efra
me
3D D
ata
Ind
icat
ion
Pla
tfor
m,
Tab
let,
S
cree
n

Specification: phase 1
Other “continuums” for input metaphor, output metaphor, and tracking technology based on human’s cognitive aspect were also developed and elaborated in dissertation. All of these findings were used in mapping technology to AEC tasks (phase 3).

Specification: phase 2
Phase 2 – Analyze AEC Tasks
Factors from task influencing the applicability of MR technological components: Task mental requirements Working environment Physical disposition Hand occupation

Specification: phase 3
Phase 3: Map MR technology to AEC tasks based technological feasibility and usability in terms of physical and mental (human) factors
Influencing Factors(Task Side)
MR System Technological Components
(MR System Side)
Task Mental Requirements Media Representation
Working Environment Input Mechanism
Physical Disposition Output Mechanism
Hands Occupation Tracking Technology

Task Analysis
Wor
king
Enviro
nmen
t
Hand
Occupat
ion
Task Mental
Requirements
Physical
Movem
ent
Track
ing
Tech
nologyIn
pu
t M
ech
anis
m
OutputMechanism
MediaRepresentation
User Level
User Layer
MR Com
ponent
LayerTask Layer
User Layer
Task Layer
A User-Centered Framework of Layer Interactions

Methodology (procedure) for MR System Development Cycle
Task/Operation
Analyze & Breakdown
Analyze Composite Tasks
Cognitive TasksPerceptual Tasks
Information Processing Model
Feasibility
Task Mental Requirement Working Environment Physical Disposition Hand Occupation
Physical Mental
Usability
Media Representation
FeasibilityPhysical Mental
Usability
Input Mechanism
FeasibilityPhysical Mental
Usability
Output Mechanism
FeasibilityPhysical Mental
Usability
Tracking Technology
MR System Prototype
Expert Heuristic Evaluation Formative User-centered Evaluation Useful MR System
Site observation, interview etc.
Ste
p 1
Ste
p 2
Ste
p 3

Specification: phase 3
Design specification and guidelines (AEC tasks) Media Representation Input Mechanism Output Mechanism Tracking Technology

Prototype Development
Vision: To explore Mixed Reality (MR)-based tools that can provide the benefit of both 3D modeling and effective real-time collaboration to achieve design coordination objectives.

Prototype Development
MRCVE : Mixed Reality – based collaborative virtual environment to realize design review collaboration through face-to-face conferencing or virtual space conferencing.
Technology mapping to review collaboration task for realizing a Mixed Reality Collaborative Virtual Environment (MRCVE) was implemented using the methodology described earlier.

Prototype Development
Step 1 — analyze the design review task
Scan, observeInspect, discriminate,
inspectLocate, identify
Encode, estimate, compare, analyze, plan
Write
Perceptual Task
Cognitive Task
Motor Task
Composite Task
ANNOTATE design

Prototype Development
Step 1 — analyze the design review task (cont’d)
Factors Analysis
Mental requirements On composite task level, the perceptual tasks such as object inspection, identification and location, and cognitive tasks such as distance and orientation estimation, refer to an egocentric frame of reference. Also cognitive performance demands the design to be rich enough to reach a high degree of realism.
Physical disposition Move around the table either standing or sitting. Although the working space is predominantly around the table, roaming space and working volume are not limited.
Working environments
Indoor and quiet environment
Hands occupation Hands for interaction with digital content by manipulating tracking control device

Prototype Development
Step 2 — map the technology to task: Media representation: high-fidelity
representations; Input device: tangible input; Output device: video-based See-through head-
mounted-display: ARvision-stereoscopic HMD with a color video camera attached;
Tracker: large-scale pattern recognition.
Video and audio communication: Commercial Netmeeting software.

Prototype Development
Tangible interface

Prototype Development Application Scenarios
1. Face-to-face Scenario 2. Virtual Space Scenario
3. Mixed Scenario 4. Office-to-field Scenario 5. Field-to-office Scenario
Evaluation
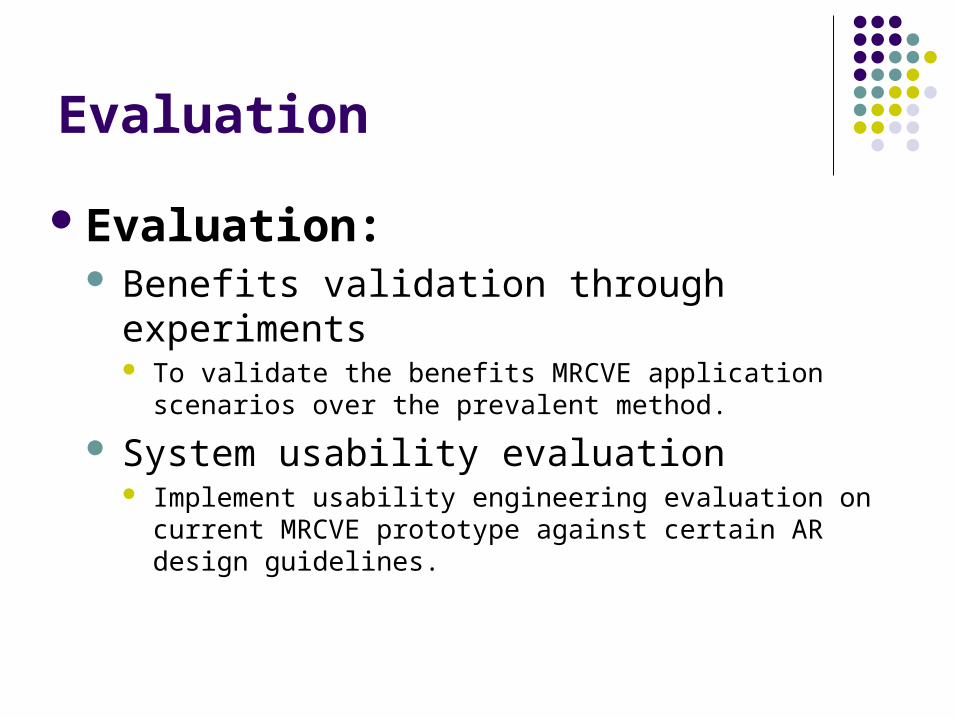
Evaluation: Benefits validation through experiments
To validate the benefits MRCVE application scenarios over the prevalent method.
System usability evaluation Implement usability engineering evaluation on current MRCVE
prototype against certain AR design guidelines.

Evaluation: benefits validation Design of experiment 1: Face-to-Face Conferencing
Scenario V.S. Prevalent Design Review Benchmark: Paper-based 3D drawing review collaboration
.
Hypotheses: When compared to traditional paper-based drawing media, Hypotheses 1: MRCD face-to-face scenario will significantly reduce the
amount of time to complete task. Hypotheses 2: MRCD face-to-face scenario will significantly reduce the
workload of design review task.
Methodology: Experiment Post-test Questionnaire: subjects need to fill it in based on their gained
experience from the experiments. NASA task load index (TLX) to measure and compare the workload of using
alternatives. Direct observation or monitor of subjects’ collaborative performance by
experimenter.

Evaluation: benefits validation
Stimulus materials: Large-scale and simple models and corresponding 3D drawings are adapted from real projects of BMW contractor.
Subject: 16 engineering undergraduate and graduate students in Purdue. Every two subjects form a group for each treatment.
Measurement: time of completion and perceived workload.
Procedure: Training session: Subjects were assigned enough time to practice how to
use the different platforms. Pre-experiment setting: Two subjects in one group played with two
different sub-models (A and B) in AutoCAD 3D environment Design error education: Every subject learned 4 design error patterns (3
known in common) Real experiment: Two subjects sat together and started error-identifying in
model C (A and B combined in a certain way) Post-session Questionnaire: Filled in post-test questionnaires and the
NASA TLX rating.

Evaluation: benefits validation
Experimental Treatments:
Paper-based 3D Drawing MRCD Face-to-face Conferencing

Combination 1 Combination 2
Period Method Pipe Model Period Method Pipe Model
Ι Paper P1 Ι Paper P2
ΙΙ MRCD P2 ΙΙ MRCD P1
Combination 3 Combination 4
Period Method Pipe Model Period Method Pipe Model
Ι MRCD P2 Ι MRCD P1
ΙΙ Paper P1 ΙΙ Paper P2
Incomplete Block Design (Single Replication of Four Group – Two Period Crossover Design)
Evaluation: benefits validation
Experimental statistical design

Statistical Model:
• Y = The time of detecting a conflict • M = the direct fixed effect of the nth method• T = the direct fixed effect of the gth pipe model • P = the fixed effect of the jth period. • , random fluctuations which are independent and
normally distributed with mean 0 and variance .
)()()( jgn PTMY
Evaluation: benefits validation
),0( N

Evaluation: benefits validation
Effect of treatments on time of completion
Raw Time Plot for Each Treatment Combination
0:00
4:48
9:36
14:24
19:12
0:00
MRCVE+P1 MRCVE+P2 Paper+P1 Paper+P2
Treatment Combination
Raw
Per
form
ance
Tim
e (m
in:s
ec)
5:24
15:09
0:00
2:24
4:48
7:12
9:36
12:00
14:24
16:48
MRCVE PaperDrawing
Treatment Conditions
Me
an
Pe
rfo
rma
nc
e T
ime
(M
in:S
ec
)

Evaluation: benefits validation
Statistical Results from SAS System
Source DF Mean Square F Value Pr > F (P Value)
Method 1 380.1525063 19.83 0.0008
Model 1 1.7622563 0.09 0.7669
Per 1 0.2376563 0.01 0.9132
Method*Model 20 12.3376563 0.62 0.4465

Evaluation: benefits validation
)()()( jgn PTMY
)(nMY
An F-test was implemented to the model to further validate the simplification. An F-Value 0.052 with corresponding P-value as 0.95 demonstrated insignificance of this simplification.

Evaluation: benefits validation
Combination Mean Value (s) Median Value (s)
MRCVE+P1 5:55 5:43
Paper Drawing+P1 13:56 12:23
MRCVE+P2 4:51 5:06
Paper Drawing+P2 16:21 16:36
)(nMY
A t-test was further implemented to model and yielded an estimated performance difference for these two methods, which is 9.75 mins (with a P-value equaling to 0.0003).
Discussion
Mean and Median Value of Each Combination

Evaluation: benefits validation
Effect of treatments on workload (NASA TLX) F-value is 0.95 and p-value is 0.3385 (insignificant)
10.40211.838
0
5
10
15
20
25
MRCVE Paper Drawing Full Score
Treatment Conditions
Mea
n R
atin
g S
co
re (
20 p
oin
t sc
ale
)
Maximum Possible Rating
Treatment Conditions

NASA TLX Rating Scores
11.9
10.4
5.6
11.212 11.6 11.6
10.4
8.7
13.9
8.7
11.5
6.87.5
0
2
4
6
8
10
12
14
16
Mean
Rati
ng
Sco
re (
20 p
oin
t scale
)
Paper Drawing MRCVE
Rating Categories F value p-value Significance
Mental demand 0.86 0.3623 Insignificant
Physical demand 23.5 <0.0001 Significant
Temporal demand 3.04 0.0913 Insignificant
Effort 0.07 0.7965 Insignificant
Performance 7.78 0.0091 Significant
Frustration level 4.71 0.0381 Significant
Statistical Results for the Each NASA TLX Rating Category

Evaluation: benefits validation Questionnaire Results (Subsection 1): Scale: 1 2 3 4 5 6 poor excellent

Evaluation: benefits validation Questionnaire Results (Subsection 2): Scale: O O O O Totally agree Totally disagree
Q1: I felt that 3D interactivity in the MRCVE system aided design comprehension. 25%; 32%; 37%; 6%. 57%
Q2: Overall, compared with paper drawing, the AR system better facilitates design collaboration tasks. 25%; 37%; 25%; 13%. 62%
Q3: The MRCVE system better facilitated communication. 19%; 12%; 38%; 31%. 69% Q4: The MRCVE system better facilitated creativity. 50%; 50%; 0%; 0%. 100% Q5: The MRCVE system better facilitated problem-solving. 44%; 31%; 19%; 6%. 75% Q6: The AR system increased the overall quality of output from the collaboration. 6%;
38%; 43%; 13%. 44% Q7: The AR system better facilitated the quantity of work I could complete in a given
amount of time. 36%; 32%; 20%; 12%. 68% Q8: The AR system increased the quality of my contribution to the project. 32%; 30%;
32%; 6%. 62% Q9: The MRCVE system increased my satisfaction with the outcome of the collaboration.
19%; 55%; 20%; 6%. 74% Q10: The AR system increased understanding between my collaborator and me. 13%; 38%;
25%; 24%. 50%

Evaluation: benefits validation Design of experiment 2: Virtual Space Conferencing
Scenario V.S. Web-based Design Collaboration
Benchmark: NavisWorks Roamer
Hypotheses: When compared to NavisWorks, Hypotheses 1: MRCD virtual space scenario will significantly reduce time for
performing the design review task. Hypotheses 2: MRCD virtual space scenario will significantly reduce the
workload of design review task.
Methodology: Experiment Questionnaire: subjects need to fill it in based on their gained experience from
the experiments. NASA task load index (TLX) to measure and compare the workload of using
alternatives. Direct observation or monitor of subjects’ collaborative performance by
experimenter.

Evaluation: benefits validation
Stimulus materials: Cluttered 3D models are adapted from real projects of BMW contractor.
Subject: 16 engineering undergraduate and graduate students in Purdue. Every two subjects form a group for each treatment.
Measurement: time of completion and perceived workload.
Procedure: Training session: Subjects were assigned enough time to practice how to use the different
platforms. Pre-experiment setting: Two subjects in one group played with two different sub-models
(A and B) in AutoCAD 3D environment Design error education: Every subject learned 4 design error patterns (3 known in
common) Real experiment: Two subjects sat together and started error-identifying in model C (A
and B combined in a certain way) Post-session Questionnaire: Filled in post-test questionnaires and the NASA TLX rating.

Evaluation: benefits validation
NavisWorks Collaboration Treatment
MRCD Virtual Space Conferencing Treatment

Evaluation: benefits validation
Experimental statistical design The same as for experiment 1.

Evaluation: benefits validation
Effect of treatments on time of completion
8.5
25.6
0
5
10
15
20
25
30
MRCVE NavisWorks
Treatment Conditions
Per
form
ance
Tim
e (m
in)
Raw Time Plot for Each Treatment Combination
05
1015202530354045
MRCVE+P1 MRCVE+P2 NavisWorks+P1 NavisWorks+P2
Treatment Combination
Raw
Per
form
ance
Tim
e (m
ins)

Evaluation: benefits validation
Statistical Results from SAS System
Source DF Mean Square F Value Pr > F (P Value)
Method 1 1183.016025 28.91 0.0002
Model 1 28.143025 0.69 0.4245
Per 1 13.359025 0.33 0.5792
Method*Model 1 4.928400 0.12 0.7351

Evaluation: benefits validation
)()()( jgn PTMY
)(nMY
An F-test was implemented to the model to further validate the simplification. An F-Value 0.547 with corresponding P-value as 0.59 demonstrated insignificance of this simplification.
Evaluation: benefits validation
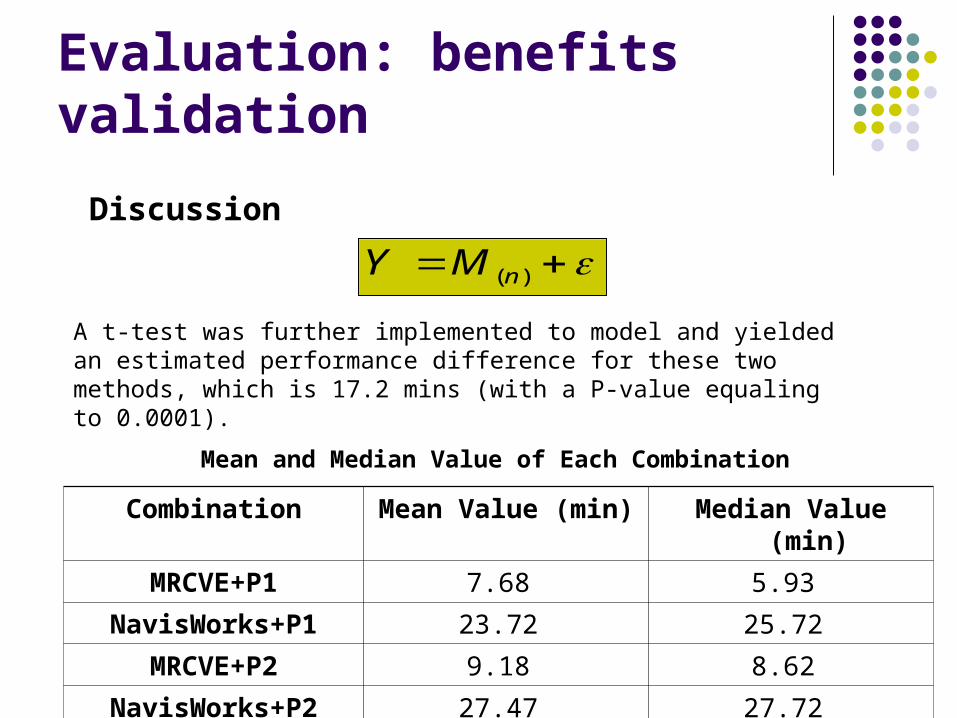
Combination Mean Value (min) Median Value (min)
MRCVE+P1 7.68 5.93
NavisWorks+P1 23.72 25.72
MRCVE+P2 9.18 8.62
NavisWorks+P2 27.47 27.72
)(nMY
A t-test was further implemented to model and yielded an estimated performance difference for these two methods, which is 17.2 mins (with a P-value equaling to 0.0001).
Discussion
Mean and Median Value of Each Combination

Evaluation: benefits validation
Effect of treatments on workload (NASA TLX) F-value is 4.92 and p-value is 0.047 (Significant)
9.535
12.932
0
5
10
15
20
25
MRCVE NavisWorks Full Score
Mean
Rati
ng
Sco
re (
20 p
oin
ts)
Maximum Possible Rating
Treatment Conditions

Rating Categories F value p-value Significance
Mental demand 0.03 0.855 Insignificant
Physical demand 1.98 0.169 Insignificant
Temporal demand 8.45 0.0068 Significant
Effort 8.75 0.006 Significant
Performance 22.98 <0.0001 Significant
Frustration level 0.53 0.4712 Insignificant
Statistical Results for the Each NASA TLX Rating Category
NASA TLX Rating Scores
12.9
10.4
8.6
11.6
14.7
12.911.3
9.510.8
11.8
6.3
8.9
5.4
9.7
0
2
4
6
8
10
12
14
16
Total
Wor
kload
Men
tal
Physic
al
Tempo
ral
Effort
Perfo
rman
ce
Frustr
ation
Rating Category
Me
an
Ra
tin
g S
co
re (
20
po
ints
sc
ale
) NavisWorks MRCVE

Evaluation: benefits validationQuestionnaire Results (Subsection 1):Scale: 1 2 3 4 5 poor excellent

Evaluation: benefits validation Questionnaire Results (Subsection 2): Scale: O O O O O Totally agree Neutral Totally disagree
Q1: I felt that 3D interactivity in the MRCVE system aided design comprehension better than the 3D interactivity in NavisWorks. 31%; 38%; 13%; 13%; 5%. 69%
Q2: Overall, compared with NavisWorks, the AR system better facilitates design collaboration tasks. 13%; 56%; 0%; 26%; 5%. 69%.
Q3: The MRCVE system better facilitated communication. 19%; 44%; 6%; 19%; 12%. 63%
Q4: The MRCVE system better facilitated creativity. 19%; 44%; 26%; 6%; 5%. 63% Q5: The MRCVE system better facilitated problem-solving. 13%; 52%; 6%; 29%;
0%. 65% Q6: The AR system increased the overall quality of output from the collaboration.
13%; 44%; 13%; 31%; 0%. 57% Q7: The AR system better facilitated the quantity of work I could complete in a given
amount of time. 44%; 26%; 13%; 13%; 4%. 70% Q8: The AR system increased the quality of my contribution to the project. 26%;
44%; 6%; 18%; 6%. 70% Q9: The MRCVE system increased my satisfaction with the outcome of the
collaboration. 13%; 50%; 19%; 13%; 5%. 63% Q10: The AR system increased understanding between my collaborator and me. 13%;
19%; 31%; 26%; 11%. 32%

Evaluation: Usability
Heuristic evaluation AR usability guidelines (Gabbard 1997) Our specification and design guidelines
Formative user-centered evaluation The two experiments mentioned earlier were also implemented
as usability experiments

Evaluation: Usability
Issues Mean Ratings Explanation Usability Suggestions
Did you often feel disoriented?
4.0 • Users felt a little disoriented with nothing in the mixed scene to use as navigational cues or landmarks. This was expected from the heuristic evaluation phase.
• The presence of directional cues, such as on-screen compass or, a navigational grid and/or a navigational map may have a positive effect on users' ability to perform navigational tasks.
Is the AR system comfortable for long-term use?
1.69 Very low score demonstrates the most important weakness of the HMD. Bulky HMD and limited cable length compromise the most significant usability issue of MRCVE system.
Easy user fatigue: Tethered by video cabling, limiting user mobility to cable length.
• High-bandwidth wireless HMD or large screen projector.
Is tracking marker lightweight, portable, non-encumbering, and comfortable thereby avoiding issues of limiting your mobility and fatigue?
4.63 Tracking ball appears to have high mobility, being light and portable.
The current size of the ball may occlude virtual objects or the entire virtual display as users are prone to holding the props.
• Reduce the size of the virtual tracking ball
Results and Interpretation of Usability Analysis for Face-to-face Conferencing Scenario. Scale: 1 2 3 4 5 6 (very little) (very much)

Evaluation: Usability
Would you be resistant to using face-to-face conferencing scenario system or similar MR systems in the future?
About 81.3% (13) gave negative response.
Would you embrace the opportunity to use the face-to-face conferencing scenario system again in the future?
About 69% (11) gave positive response.

Evaluation: Usability
Issues Mean Rating Explanation Usability Suggestions
Did you often feel disoriented?
2.93 • Neutral
Is the AR system comfortable for long-term use?
2.06 • Low score demonstrates the most important weakness of HMD. Bulky HMD.
• Large screen projector.
Is tracking marker lightweight, portable, non-encumbering, and comfortable thereby avoiding issues of limiting your mobility and fatigue?
3.94 • Size of multiple tracking markers is appropriate.
• Current size might not work for even larger models and tall models. In this case, users might have difficulties in moving around, in order to review a dead corner.
• A zooming feature controlled by a hand-held device might help.
• An elevation changing function can be programmed into a hand-held device, which is used to change the elevation
Results and Interpretation of Usability Analysis for Virtual Space Conferencing Scenario. Scale: 1 2 3 4 5 (very little) (very much)

Evaluation: Usability
Would you be resistant to using virtual space conferencing scenario or similar MR systems in the future?
About 87.5% (14) gave negative response.
Would you embrace the opportunity to use the virtual space conferencing system again in the future?
About 81.3% (13) gave positive response.
Summaries and Conclusions
Major Original Contributions of Research Work Developed a thorough methodology for mapping
appropriate MR technological components to AEC tasks. Developed usable and intuitive Mixed Reality-based
collaborative virtual environment prototypes: face-to-face conferencing scenario and virtual space conferencing scenario.
Validated the benefits of MRCVE over prevalent methods in realistic environments.
Developed a framework of usability engineering evaluation and implemented heuristic and formative usability evaluation for the two prototype.

Summaries and Conclusions Conclusions:
Experiment 1 (face-to-face vs. 3D paper-based drawing) Face-to-face conferencing scenario enabled subjects to finish same
error detection task with 9.75 mins less than 3D paper-based drawing.
There is no significant difference in the workload between face-to-face and paper-based methods. Subjects felt less frustrated and more satisfied with their performance in
using MR system. Using MR system is much more physically demanding due to the usability
issues inherent in MR system. Experiment 2 (virtual space vs. NavisWoks Roamer)
Virtual space conferencing scenario averagely reduced performance time by 17.2 mins compared against NavisWorks roamer.
There is significant difference in the workload between virtual space scenario and NavisWorks roamer. Subjects felt less time pressure and more satisfied with their performance
in using MR system.

Summaries and Conclusions
Conclusions (cont.):
Attitude of users towards the effectiveness of MRCVE systems on collaborative work was surveyed. Majority of users would embrace the opportunity to use the MRCVE systems again in the future.
Suggestions for further improvements of the human-machine interface of the MRCVE system were also produced based on the usability evaluation.

Summaries and Conclusions
Future Work Increase the usability of the MRCVE system
based on the results from usability evaluation. Industry evaluation: industry involvement in
evaluating the further development of MRCVE. The remaining two application scenarios of
MRCVE are to be explored in the future employing other tracking options.